


Bahasa
Halaman
Hukum

International Journal of Computer Science Engineering
and Information Technology Research (IJCSEITR)
ISSN(P): 2249-6831; ISSN(E): 2249-7943
Vol. 4, Issue 1, Feb 2014, 25-34
© TJPRC Pvt. Ltd.
PERFORMANCE ANALYSIS OF TURBO CODED OFDM: SUBJECTED TO
DIFFERENT CHANNELS
PRITI SUBRAMANIUM1 & RAJESHREE D. RAUT
2
1Assistant Professor, SSGB COET, Bhusawal, Maharashtra, India
2Associate Professor, RCOEM, Nagpur, Maharashtra, India
ABSTRACT
Turbo Coding is used extensively in 3G & 4G mobile. Turbo coding such as convolutional turbo coding are used
in a wireless metropolitan network standard. In this paper performance analysis of turbo coded OFDM subjected to
different channels, we are concentrating on evalution of performance of Turbo Coded Orthogonal Frequency Division
Multiplexing for channels such as Additive White Gaussian Noise, Rayleigh, Rician fading channels.
KEYWORDS: OFDM, Additive White Gaussian Noise, BER
INTRODUCTION
In wireless communications the channel is often modeled by a random attenuation know as fading signal.
Attenuation term is a simplification of the underlying physical processes and captures external interference and or electronic
noise in the receiver. The attenuation term is complex is also describes the relative time a signal takes to travel through the
channel. A channel model may either be digital or analog.
Digital Channel Models
In a digital channel the transmitted message is in the form of a digital signal at a certain protocol layer. Protocol
layers, such as the physical layer. The model may reflect channel performance measures such as bit rate, bit errors, latency
or delay, delay jitter, etc. are the examples of digital channel models are:
Binary symmetric channel (BSC), a discrete memoryless channel with a certain bit error probability.
Binary bursty bit error channel , a channel “with memory”.
Binary erasure channels (BEC), a discrete channel with a certain bit error detection (erasure) probability.
Packet erasure channel, where packets contents are lost with a certain packet loss probability or packet error rate.
Arbitrarily varying channel (AVC), where the behavior and state of the channel can change randomly.
Analog Channel Models
In an analog channel model, the transmitted message is in the form of analog signal. The signal can be a linear or
non-linear, time-continuous or time-discrete (sampled), memoryless or dynamic (resulting in burst errors), time- invariant or
time-variant (also resulting in burst errors), baseband, passband (RF signal model), real-valued or complex signal model.
Noise model, for example.
AWGN channel is a linear continuous memoryless model.
Interference model, for example cross-talk (co-channel interference) and intersymbol interference (ISI).
26 Priti Subramanium & Rajeshree D. Raut
Distortion channel are non-linear channel model causing intermodulation distortion (IMD).
Frequency response channel including attenuation and phase-shift.
Group delay model.
Radio frequency propagation model are :-
o Log-distance path loss model.
o Fading model, for eg. Rayleigh fading, Rician fading, log-normal shadow fading and frequency selective
fading.
o Doppler shift model, which combined with fading results in a time-variant system.
o Ray tracing models, which attempt to model the signal propagation and distortions for specified transmitter
receiver geometrics, terrain types, and antennas.
o Mobility models, which also causes a time-variant system.
FADING CHANNELS
In telecommunication a physical transmission medium such as a wire or to a logical connection over a multiplexed
medium such as a radio channel. A channel are used to pass an information signal, for example a digital signal. A sequence
of random numbers might also be added in to simulate external interference and/or electronic noise in the receiver.
Combination of Statistical and physical modeling. For example in wireless communications the channel is often modelled by
a random attenuation known as fading. The noise in the model captures external interference and or electronic noise in the
receiver.
Additive White Gaussian Noise (AWGN)
AWGN is a channel in which the only impairment to communication is a linear addition of wideband or white
noise with a constant spectral density and a Gaussian distribution of amplitude.
Wide-band Gaussian noise comes from many natural sources, such as the thermal vibrations of atoms in conductors
(referred to as thermal noise or Johnson Nyquist noise), shot noise, black body radiation from the earth and other
warm objects, and from celestial sources such as the Sun.
The AWGN channel is a good model for many satellite and deep space communication links.
Rayleigh Fading Channel
Rayleigh is a statistical model for the effect of a propagation environment. Rayleigh fading is viewed as a
reasonable model for tropospheric and ionospheric signal propagation as well as the effect of heavily built-up urban
environments on radio signals. Rayleigh fading is most used when there is no dominant propagation along a line of sight
between the TX and RX. Rician fading may be more applicable.
Rician Fading Channel
Rician is a stochastic model for radio propagation anomaly caused by partial cancellation of a radio signal by itself
the signal arrives at the receiver by several different paths is changing. In Rician fading typically a line of sight, is much
stronger than the others. In rician fading channel the amplitude gain is characterized by a rician distribution.
Performance Analysis of Turbo Coded OFDM: Subjected to Different Channels 27
SIMULATION MODEL USING FADING CHANNEL
Simulation Model
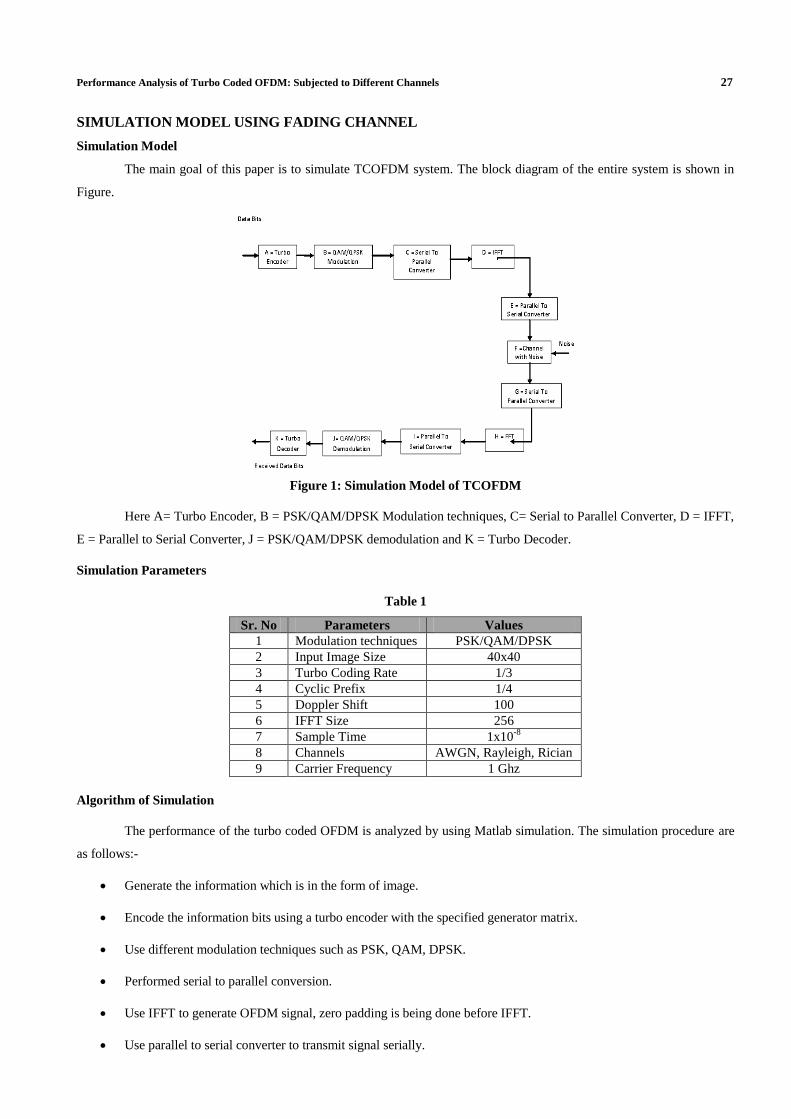
The main goal of this paper is to simulate TCOFDM system. The block diagram of the entire system is shown in
Figure.
Figure 1: Simulation Model of TCOFDM
Here A= Turbo Encoder, B = PSK/QAM/DPSK Modulation techniques, C= Serial to Parallel Converter, D = IFFT,
E = Parallel to Serial Converter, J = PSK/QAM/DPSK demodulation and K = Turbo Decoder.
Simulation Parameters
Table 1
Sr. No Parameters Values
1 Modulation techniques PSK/QAM/DPSK
2 Input Image Size 40x40
3 Turbo Coding Rate 1/3
4 Cyclic Prefix 1/4
5 Doppler Shift 100
6 IFFT Size 256
7 Sample Time 1x10⁻⁸
8 Channels AWGN, Rayleigh, Rician
9 Carrier Frequency 1 Ghz
Algorithm of Simulation
The performance of the turbo coded OFDM is analyzed by using Matlab simulation. The simulation procedure are
as follows:-
Generate the information which is in the form of image.
Encode the information bits using a turbo encoder with the specified generator matrix.
Use different modulation techniques such as PSK, QAM, DPSK.
Performed serial to parallel conversion.
Use IFFT to generate OFDM signal, zero padding is being done before IFFT.
Use parallel to serial converter to transmit signal serially.
28 Priti Subramanium & Rajeshree D. Raut
Introduce noise to simulate channel errors. The signals are transmitted over an AWGN channel.
At the receiver side, perform reverse operations to decode the received sequence.
Count the number of erroneous bits by comparing the decoded bit sequence with the original one.
Calculate the BER and plot graph.
Simulation Results
Table 2
Sr.
No.
Modulation
Techniques
Coded OFDM
over AWGN
Channel
Coded OFDM
over Rayleigh
Channel
Coded OFDM
over Rician
Channel
1 PSK = 64 BER
3.2x10⁻³
BER
0.4808
BER
0.143
2 QAM = 64 BER
3.12x10⁻⁴
BER
0.3404
BER
0.132
3 DPSK = 64 BER
8.8x10⁻³
BER
6.3x10⁻³
BER
3.12x10⁻⁴
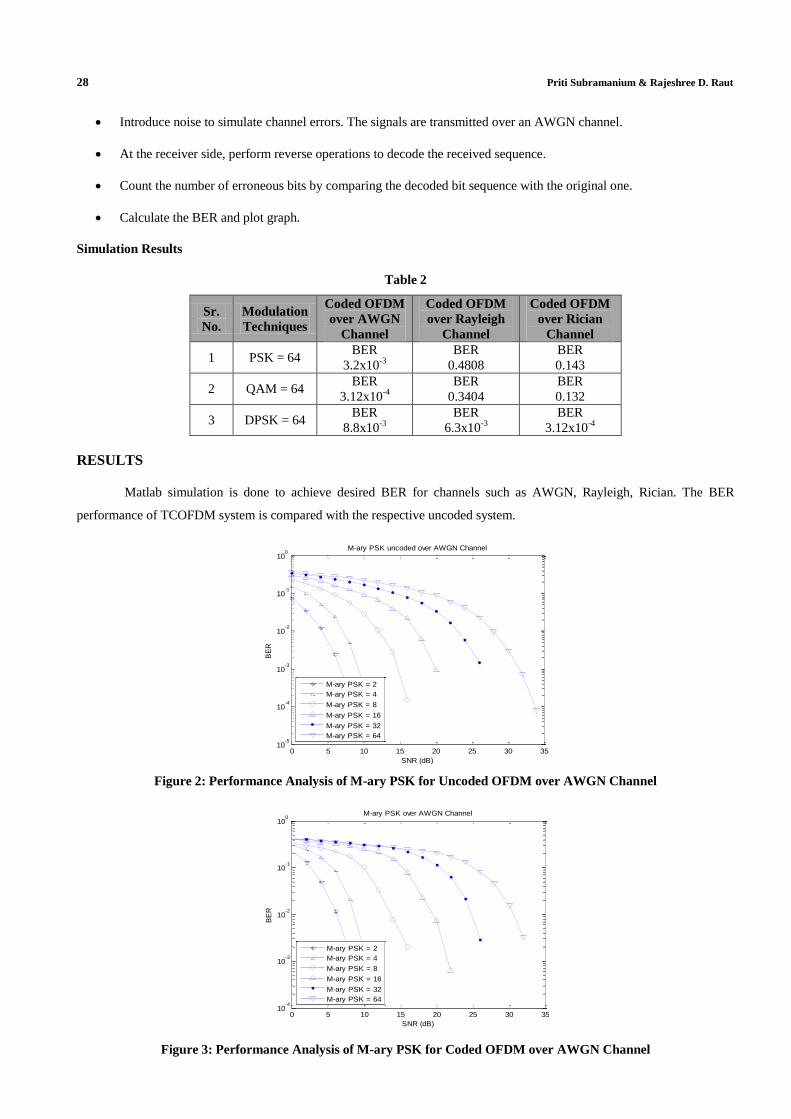
RESULTS
Matlab simulation is done to achieve desired BER for channels such as AWGN, Rayleigh, Rician. The BER
performance of TCOFDM system is compared with the respective uncoded system.
0 5 10 15 20 25 30 3510
-5
10-4
10-3
10-2
10-1
100
SNR (dB)
BE
R
M-ary PSK uncoded over AWGN Channel
M-ary PSK = 2
M-ary PSK = 4
M-ary PSK = 8
M-ary PSK = 16
M-ary PSK = 32
M-ary PSK = 64
Figure 2: Performance Analysis of M-ary PSK for Uncoded OFDM over AWGN Channel
0 5 10 15 20 25 30 3510
-4
10-3
10-2
10-1
100
SNR (dB)
BE
R
M-ary PSK over AWGN Channel
M-ary PSK = 2
M-ary PSK = 4
M-ary PSK = 8
M-ary PSK = 16
M-ary PSK = 32
M-ary PSK = 64
Figure 3: Performance Analysis of M-ary PSK for Coded OFDM over AWGN Channel
Performance Analysis of Turbo Coded OFDM: Subjected to Different Channels 29
0 5 10 15 20 25 30 35 4010
-5
10-4
10-3
10-2
10-1
100
SNR (dB)
BE
R
M-ary PSK uncoded over Rayleigh Fading Channel
M-ary PSK = 2
M-ary PSK = 4
M-ary PSK = 8
M-ary QAM = 16
M-ary QAM = 32
M-ary QAM = 64
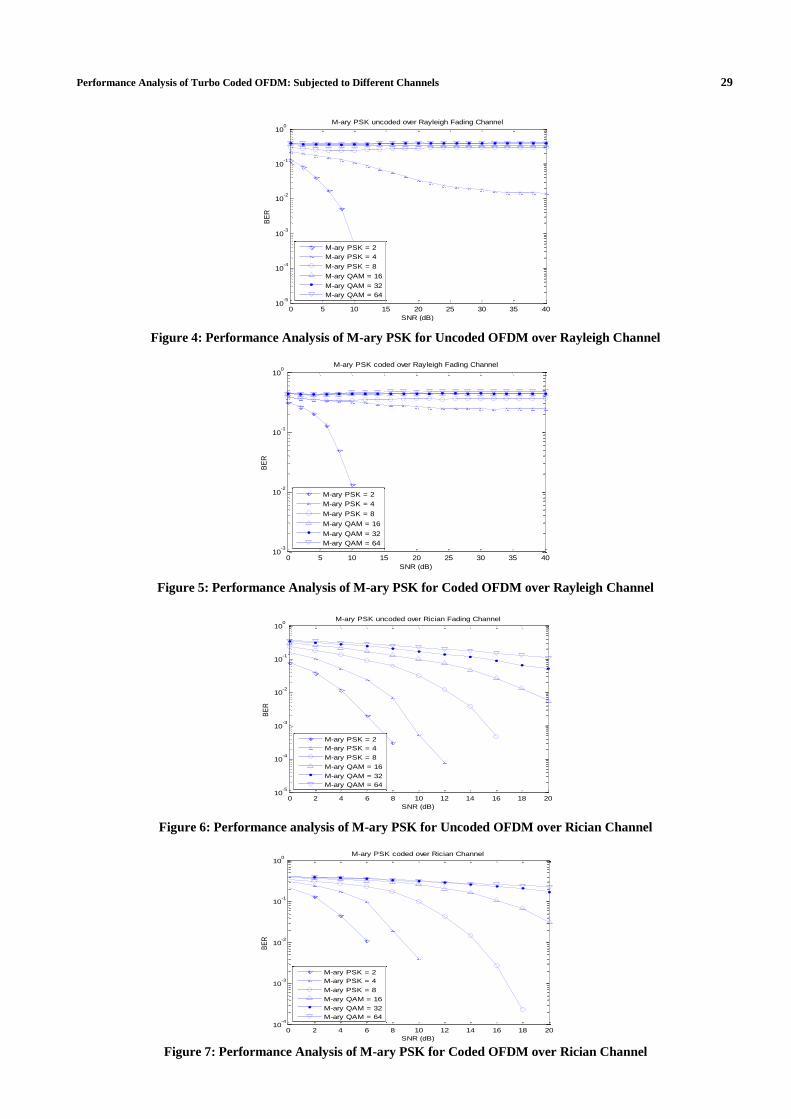
Figure 4: Performance Analysis of M-ary PSK for Uncoded OFDM over Rayleigh Channel
0 5 10 15 20 25 30 35 4010
-3
10-2
10-1
100
SNR (dB)
BE
R
M-ary PSK coded over Rayleigh Fading Channel
M-ary PSK = 2
M-ary PSK = 4
M-ary PSK = 8
M-ary QAM = 16
M-ary QAM = 32
M-ary QAM = 64
Figure 5: Performance Analysis of M-ary PSK for Coded OFDM over Rayleigh Channel
0 2 4 6 8 10 12 14 16 18 2010
-5
10-4
10-3
10-2
10-1
100
SNR (dB)
BE
R
M-ary PSK uncoded over Rician Fading Channel
M-ary PSK = 2
M-ary PSK = 4
M-ary PSK = 8
M-ary QAM = 16
M-ary QAM = 32
M-ary QAM = 64
Figure 6: Performance analysis of M-ary PSK for Uncoded OFDM over Rician Channel
0 2 4 6 8 10 12 14 16 18 2010
-4
10-3
10-2
10-1
100
SNR (dB)
BE
R
M-ary PSK coded over Rician Channel
M-ary PSK = 2
M-ary PSK = 4
M-ary PSK = 8
M-ary QAM = 16
M-ary QAM = 32
M-ary QAM = 64
Figure 7: Performance Analysis of M-ary PSK for Coded OFDM over Rician Channel
30 Priti Subramanium & Rajeshree D. Raut
0 5 10 15 20 2510
-5
10-4
10-3
10-2
10-1
100
SNR (dB)
BE
R
M-ary QAM uncoded over AWGN Channel
M-ary QAM = 2
M-ary QAM = 4
M-ary QAM = 8
M-ary QAM = 16
M-ary QAM = 32
M-ary QAM = 64
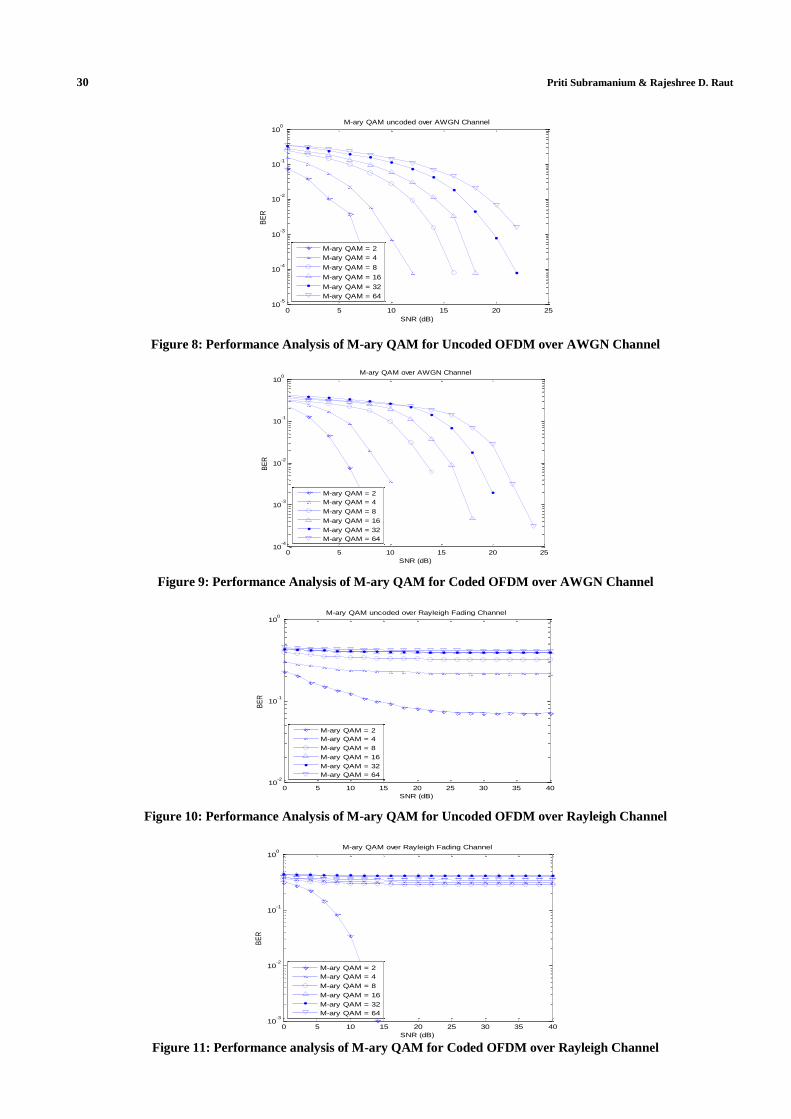
Figure 8: Performance Analysis of M-ary QAM for Uncoded OFDM over AWGN Channel
0 5 10 15 20 2510
-4
10-3
10-2
10-1
100
SNR (dB)
BE
R
M-ary QAM over AWGN Channel
M-ary QAM = 2
M-ary QAM = 4
M-ary QAM = 8
M-ary QAM = 16
M-ary QAM = 32
M-ary QAM = 64
Figure 9: Performance Analysis of M-ary QAM for Coded OFDM over AWGN Channel
0 5 10 15 20 25 30 35 4010
-2
10-1
100
SNR (dB)
BE
R
M-ary QAM uncoded over Rayleigh Fading Channel
M-ary QAM = 2
M-ary QAM = 4
M-ary QAM = 8
M-ary QAM = 16
M-ary QAM = 32
M-ary QAM = 64
Figure 10: Performance Analysis of M-ary QAM for Uncoded OFDM over Rayleigh Channel
0 5 10 15 20 25 30 35 4010
-3
10-2
10-1
100
SNR (dB)
BE
R
M-ary QAM over Rayleigh Fading Channel
M-ary QAM = 2
M-ary QAM = 4
M-ary QAM = 8
M-ary QAM = 16
M-ary QAM = 32
M-ary QAM = 64
Figure 11: Performance analysis of M-ary QAM for Coded OFDM over Rayleigh Channel
Performance Analysis of Turbo Coded OFDM: Subjected to Different Channels 31
0 5 10 15 20 25 30 35 4010
-5
10-4
10-3
10-2
10-1
100
SNR (dB)
BE
R
M-ary QAM uncoded over Rician Fading Channel
M-ary QAM = 2
M-ary QAM = 4
M-ary QAM = 8
M-ary QAM = 16
M-ary QAM = 32
M-ary QAM = 64
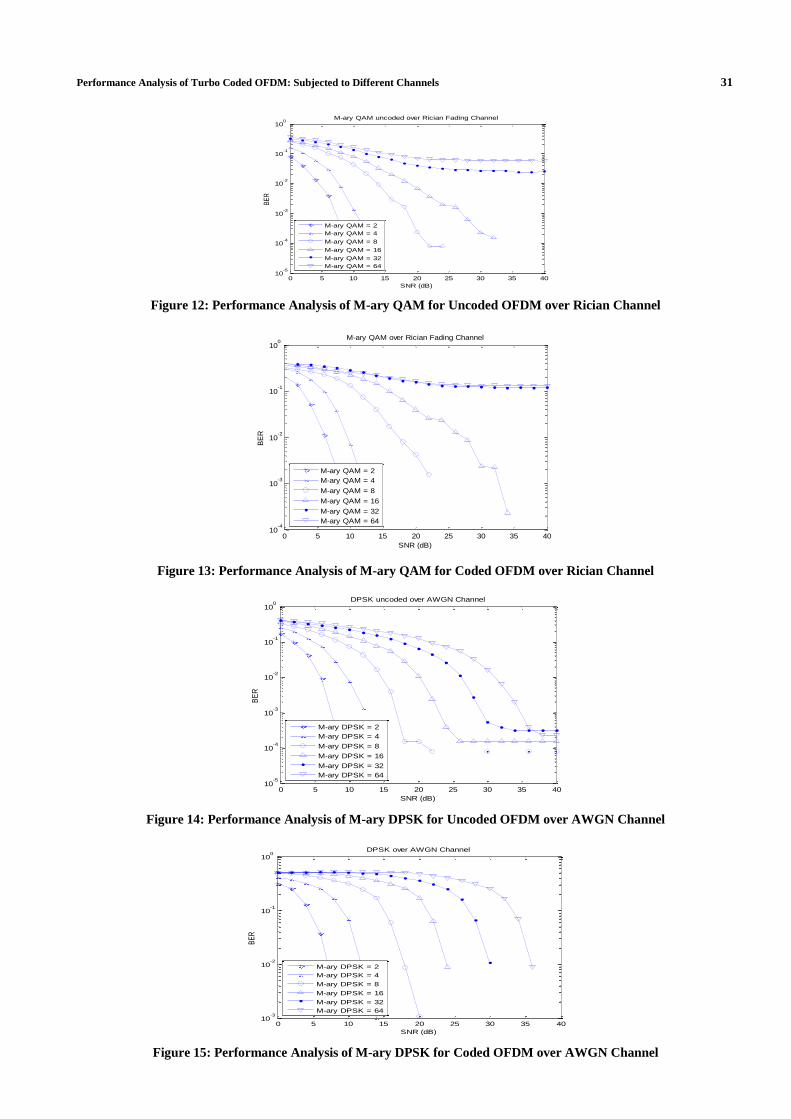
Figure 12: Performance Analysis of M-ary QAM for Uncoded OFDM over Rician Channel
0 5 10 15 20 25 30 35 4010
-4
10-3
10-2
10-1
100
SNR (dB)
BE
R
M-ary QAM over Rician Fading Channel
M-ary QAM = 2
M-ary QAM = 4
M-ary QAM = 8
M-ary QAM = 16
M-ary QAM = 32
M-ary QAM = 64
Figure 13: Performance Analysis of M-ary QAM for Coded OFDM over Rician Channel
0 5 10 15 20 25 30 35 4010
-5
10-4
10-3
10-2
10-1
100
SNR (dB)
BE
R
DPSK uncoded over AWGN Channel
M-ary DPSK = 2
M-ary DPSK = 4
M-ary DPSK = 8
M-ary DPSK = 16
M-ary DPSK = 32
M-ary DPSK = 64
Figure 14: Performance Analysis of M-ary DPSK for Uncoded OFDM over AWGN Channel
0 5 10 15 20 25 30 35 4010
-3
10-2
10-1
100
SNR (dB)
BE
R
DPSK over AWGN Channel
M-ary DPSK = 2
M-ary DPSK = 4
M-ary DPSK = 8
M-ary DPSK = 16
M-ary DPSK = 32
M-ary DPSK = 64
Figure 15: Performance Analysis of M-ary DPSK for Coded OFDM over AWGN Channel
32 Priti Subramanium & Rajeshree D. Raut
0 5 10 15 20 25 30 35 4010
-5
10-4
10-3
10-2
10-1
100
SNR (dB)
BE
R
DPSK uncoded over Rayleigh Fading Channel
M-ary DPSK = 2
M-ary DPSK = 4
M-ary DPSK = 8
M-ary DPSK = 16
M-ary DPSK = 32
M-ary DPSK = 64
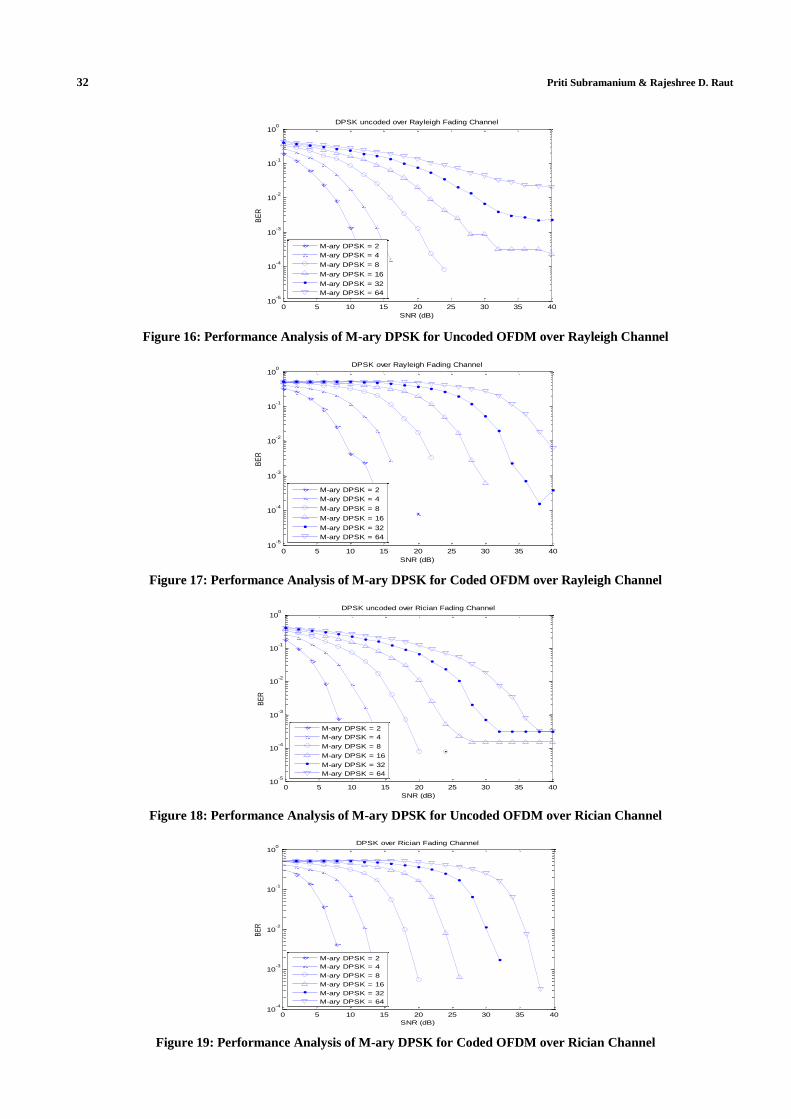
Figure 16: Performance Analysis of M-ary DPSK for Uncoded OFDM over Rayleigh Channel
0 5 10 15 20 25 30 35 4010
-5
10-4
10-3
10-2
10-1
100
SNR (dB)
BE
R
DPSK over Rayleigh Fading Channel
M-ary DPSK = 2
M-ary DPSK = 4
M-ary DPSK = 8
M-ary DPSK = 16
M-ary DPSK = 32
M-ary DPSK = 64
Figure 17: Performance Analysis of M-ary DPSK for Coded OFDM over Rayleigh Channel
0 5 10 15 20 25 30 35 4010
-5
10-4
10-3
10-2
10-1
100
SNR (dB)
BE
R
DPSK uncoded over Rician Fading Channel
M-ary DPSK = 2
M-ary DPSK = 4
M-ary DPSK = 8
M-ary DPSK = 16
M-ary DPSK = 32
M-ary DPSK = 64
Figure 18: Performance Analysis of M-ary DPSK for Uncoded OFDM over Rician Channel
0 5 10 15 20 25 30 35 4010
-4
10-3
10-2
10-1
100
SNR (dB)
BE
R
DPSK over Rician Fading Channel
M-ary DPSK = 2
M-ary DPSK = 4
M-ary DPSK = 8
M-ary DPSK = 16
M-ary DPSK = 32
M-ary DPSK = 64
Figure 19: Performance Analysis of M-ary DPSK for Coded OFDM over Rician Channel
Performance Analysis of Turbo Coded OFDM: Subjected to Different Channels 33
CONCLUSIONS
From the simulation results, we conclude that in PSK and QAM we get better results only for AWGN channel,
whereas in DPSK we get better performance in AWGN, Rayleigh & Rician fading channel.
REFERENCES
1. “Statistical properties of a sine wave plus random noise” SO Rice – Bell Syst. Tech. J, 1948.
2. McClaning, Kevin, Radio Receiver Design, Noble Publishing Coporation.
3. John G. Proakis (1995). Digital Communications ( 3rd
edition).
4. Bernard Sklar (July 1997) “ Rayleigh Fading Channels in Mobile Digital Communication Systems Part-I.
5. Ahmed Gh. Wadday, Saod A. Alseyab, Abdulkreem S. Abdullah, “ Adaptive Turbo Decoding Technique for Two
Transmit Antennas Space Time Block Code”.
6. Avijit patel, B. S. Rai, “ Performance Analysis and Formulation of Turbo Coded OFDM over Rayleigh & Rician
Fading Channel”.
7. Spyridon K. Chronoppulous, G. Tatis, P. Kostarakis “ Turbo Coded OFDM with Large number of Subcarriers”.
8. Indejeet Kaur, Dr. Y.K. Mathur “ Improving BER using turbo codes in OFDM systems.
9. M.K. Gupta, Vishwas Sharma “ To improve BER of turbo coded OFDM channel over noisy channel”.

Top Related
Copyright © 2022 FDOKUMEN

