


Bahasa
Halaman
Hukum

PATENT EXAMINATION DECISIONS AND
STRATEGIC TRADE BEHAVIOR
Alfons Palangkaraya, Paul H. Jensen* and Elizabeth Webster Centre for Microeconometrics,
Melbourne Institute of Applied Economic and Social Research, and Intellectual Property Research Institute of Australia,
The University of Melbourne
November 2005
Melbourne Institute of Applied Economic and Social Research
The University of Melbourne Victoria 3010 Australia
Telephone (03) 8344 2100 Fax (03) 8344 2111
Email [email protected] Address http://www.melbourneinstitute.com
* Corresponding author. Email: [email protected] and Telephone: 61 3 8344 2117.
PATENT EXAMINATION DECISIONS AND STRATEGIC TRADE
BEHAVIOR1
Abstract–This paper examines whether strategic trade behavior can explain the fact that
the US, Japanese and European Patent Offices – the USPTO, the JPO and the EPO –
often make different decisions about whether to grant (or reject) a given patent
application. We analyse this issue by considering whether examination decisions across
the patent offices vary systematically by inventor nationality, patent quality and
technology area using a matched sample of 33,305 non-PCT patent applications granted
by the USPTO and subjected to examination decisions at the EPO and the JPO.
JEL Classification: F13, O31, O34
I. Introduction
An invention needs to satisfy three criteria before its inventor(s) can be granted a
patent: novelty, non-obviousness and utility. These criteria form the basis of the patenting
threshold which is enshrined in the legislation of all nations which are signatories to the
World Trade Organization’s Trade-Related Aspects of Intellectual Property Matters
(TRIPS). However, empirical and anecdotal evidence suggests that patent examination
decisions may vary across patent offices (see Quillen and Webster, 2001).
Various institutional factors have been shown to affect patent examination decisions.
Cockburn et al. (2002), for example, have shown that heterogeneous patent examiners
have significant effects on the breadth of patents granted and that the incentives provided
by the USPTO to patent examiners influence the patent examination decision. Moreover, 1 Thanks are due to Helene Dernis, Akemi Tokai, and the Industrial Property Digital Library Help Desk Staff for assistance with compilation of the dataset and to Andrew Christie, Linda Cohen, John Creedy, Stuart Graham, Francis Gurry, Alan Marco, Cecil Quillen, and Kim Weatherall for helpful comments. Seminar participants at the 2005 International Industrial Organization Society Conference; the 2005 Australian Conference of Economists; the European Patent Office; WIPO; and the OECD also provided invaluable suggestions. In addition, we are grateful to Bronwyn Hall, Adam Jaffe, and Manuel Trajtenberg for provision of their dataset.
1
resource allocation decisions – including how much time is allocated to search for prior
art – may affect the quality of patent examination (Merrill et al., 2004). Patent
examination decisions may also be influenced by strategic trade factors such as favouring
local patent applications in areas of strong R&D activity (see Linck and McGarry, 1993).
In this article, we analyse whether patent examination decisions reflect such strategic
trade behavior using a matched sample of 33,305 single, common priority non-PCT
patents granted by the USPTO and subject to a final examination decision (i.e.
grant/reject) by the EPO and the JPO.2 These three patent offices – known as the trilateral
patent offices – account for more than 90 per cent of the world’s total patenting activity.
By using a matched sample of single, common priority patent examination decisions, we
effectively control for the quality of the invention.3 Our empirical approach is similar to
Graham et al. (2002) who use a matched sample of patents to investigate whether EPO
opposition procedures affect patent quality.
We use this dataset to analyse how much disharmony exists across the trilateral patent
offices in terms of their examination decisions. Of those patents granted by the USPTO
where there is a final examination decision at the other offices, we find that the JPO and
EPO reject 19.9 per cent and 3.2 per cent respectively. We then examine whether patent
examination decisions vary systematically by nationality of the inventor, patent quality
and Revealed Technological Advantage (RTA), which is an index of technological
specialization in each country. The results suggest that both offices favour local
applicants in technology areas where domestic patenting activity is strong.
2 Ideally, we would include applications (rather than grants) at the USPTO. However, for the period of the study, the USPTO only published information on granted applications. 3 However, since there is interaction between the applicant and the patent office which we do not observe, it is possible that the ex post claims for a common priority patent granted in each office are different. Therefore, the patent examination decisions compared here may be for slightly different inventions.
2
II. Patent Examination Decisions
In theory, patents are granted because they satisfy a patent office’s examination of
their novelty, inventive step and industrial applicability. In a perfect world, this should
produce the same decision in each office where examination was undertaken. However,
in practice, patent offices differ in their patent examination protocols. At the USPTO, for
example, every application filed is assumed to be a request for examination, whereas at
the EPO and the JPO patent applications are only examined upon request. The EPO also
has a well-developed system of post-grant oppositions, where objections to patent grant
decisions can be raised, while the USPTO has an (infrequently used) system of patent re-
examinations (Graham et al., 2002). Moreover, Lemley and Moore (2004) have argued
that the USPTO’s system of patent continuations makes it almost impossible for a patent
examiner to ever outrightly reject an application, which provides a perverse incentive to
grant persistent applicants.
The existence of these institutional effects raises the possibility that different patent
offices will make different decisions about an invention’s patentability i.e. a unique
invention may be granted a patent in one jurisdiction but not another. There is limited
evidence to suggest that international patent examination decisions differ (see Quillen
and Webster, 2001).4 The timing of the examination decision is also important since the
lag between application and examination dates could be used for strategic reasons.5
Regibeau and Rockett (2003), for example, provide a theoretical model demonstrating
that administrative procedures – such as a patent examinations or new therapeutic drug
4 However, this study only looks at aggregate patent statistics and therefore it is not possible to conclude that patent offices make different decisions regarding the same invention. 5 Although they do not examine strategic behaviour, Popp, Kuhl and Johnson (2003) do find evidence that country effects are significant determinants of the lag in USPTO grant decisions.
3
approvals – can be used to enhance domestic policies by delaying decisions for foreign
firms relative to their local counterparts. Empirical support for this is provided in
Dranove and Metzler (1994), who find that there are significant differences in the speed-
to-market for new product launches by foreign versus local pharmaceutical companies.
Although it is well-known that intellectual property rights affect trade flows between
developed and developing nations (see Deardorff, 1992; McCalman, 2002; Grossman and
Lai, 2004), much less is known about the effects of differences in patent regimes on trade
between developed nations. Some have argued that the JPO uses patents as a non-tariff
barrier by favoring local patent applicants over foreign applicants or by rejecting patent
applications by foreign applicants in areas of strong local R&D (Wineberg, 1988; Linck
and McGarry, 1993). However, the presence of such strategic trade behavior has not been
verified in a systematic manner.
The economic effects of different patent examination decisions are profound since
patents play a well-known role in inducing investment in inventive activity and affecting
technology transfer. Patent examination decisions are also important indicators of patent
quality: a patent which has undergone a rigorous examination is much more likely to be
held valid if later challenged in court, thereby providing greater certainty for investment
and reducing the effects of costly ex post dispute resolution proceedings (see Jensen and
Webster, 2004). There is also increasing concern that lower patent examination standards,
particularly in the US, have resulted in numerous “bad” (i.e. economically undesirable)
patents (Farrell and Merges, 2004). This potentially has serious adverse effects for the
rate of innovation since it may result in the creation of patent thickets (see Merges, 1999;
Shapiro, 2004).
4
III. Data and Explanatory Variables
A. Dataset Construction
The data for this study were derived from four main sources:
(1) the OECD Triadic Patent Family (TPF) Database;6
(2) the EPO’s public access online database (esp@cenet7);
(3) the JPO’s public access online Industrial Property Digital Library (IPDL)
databases (Patent & Utility Model Concordance, both English8 and
Japanese9 versions, and the Japanese only database10; and
(4) the NBER Patent-Citations Data File (Hall et al., 2002).
The first database provides us with a list of triadic patent families defined as a set of
patent applications for which the “priority application must have at least one equivalent
patent at the EPO, at the USPTO, and at the JPO” (Dernis and Khan, 2004, p.11). To
control for the individual invention, we only include patent families with a single priority
application.11 We constrained the dataset to include patent applications with priority
years 1990-95 for two reasons. First, it enables us to minimise the amount of data
truncation with regards to the examination decision, since this provides at least eight
years to examine the priority application (the data was downloaded in late 2004). Second,
it enables us to avoid problems associated with the effects of the introduction of the 1988
Japanese Patent Law reforms.12 The second and third data sources provide information
on the status of applications at the EPO and the JPO.
6 http://www.oecd.org/LongAbstract/0,2546,en_2649_33703_30921914_1_1_1_1,00.html. 7 http://ep.espacenet.com/search97cgi/s97_cgi.exe?Action=FormGen&Template=ep/EN/home.hts. 8 http://www4.ipdl.ncipi.go.jp/Tokujitu/tjbansakuen.ipdl?N0000=116. 9 http://www.ipdl.ncipi.go.jp/Tokujitu/tjbansaku.ipdl?N0000=110. 10 http://www1.ipdl.ncipi.go.jp/SA1/sa_search.cgi?TYPE=000&sTime=1089941778920. 11 For similar reasons, we also dropped any families involving continuation, continuation-in-parts, or divisional patent applications at the USPTO. 12 See, for example, Sakakibara and Branstetter (2001).
5
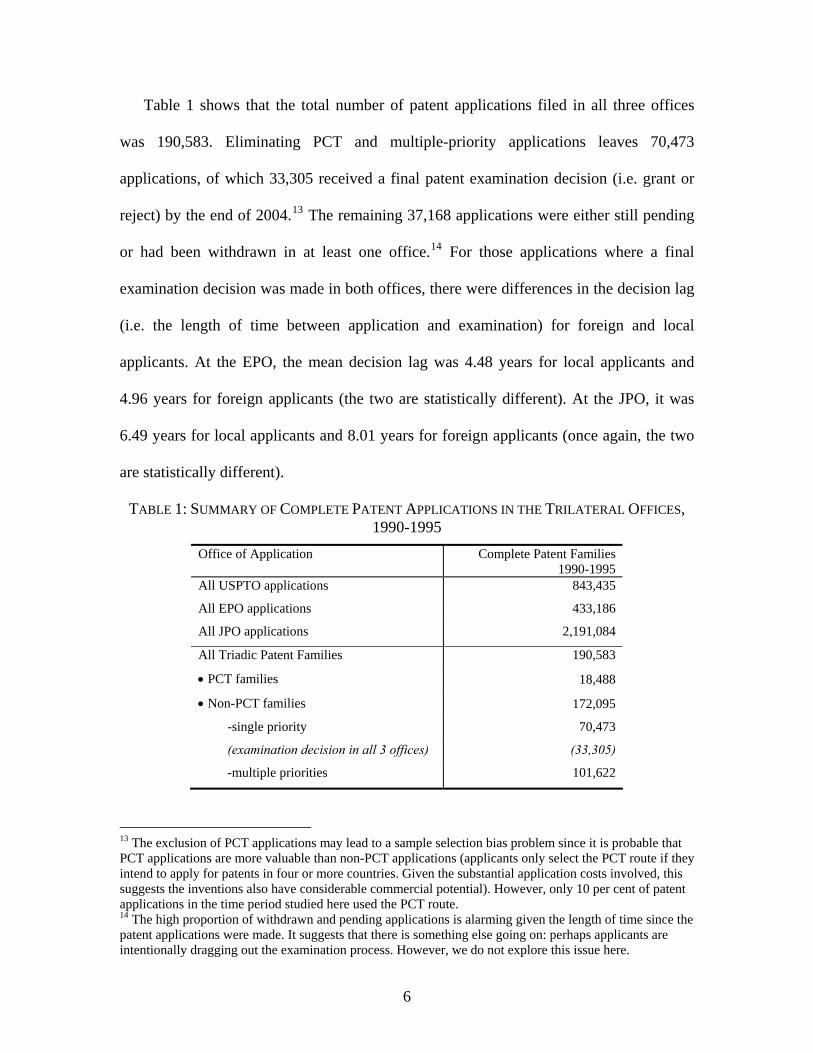
Table 1 shows that the total number of patent applications filed in all three offices
was 190,583. Eliminating PCT and multiple-priority applications leaves 70,473
applications, of which 33,305 received a final patent examination decision (i.e. grant or
reject) by the end of 2004.13 The remaining 37,168 applications were either still pending
or had been withdrawn in at least one office.14 For those applications where a final
examination decision was made in both offices, there were differences in the decision lag
(i.e. the length of time between application and examination) for foreign and local
applicants. At the EPO, the mean decision lag was 4.48 years for local applicants and
4.96 years for foreign applicants (the two are statistically different). At the JPO, it was
6.49 years for local applicants and 8.01 years for foreign applicants (once again, the two
are statistically different).
TABLE 1: SUMMARY OF COMPLETE PATENT APPLICATIONS IN THE TRILATERAL OFFICES, 1990-1995
Office of Application Complete Patent Families 1990-1995
All USPTO applications 843,435
All EPO applications 433,186
All JPO applications 2,191,084
All Triadic Patent Families 190,583
• PCT families 18,488
• Non-PCT families 172,095
-single priority 70,473
(examination decision in all 3 offices) (33,305)
-multiple priorities 101,622
13 The exclusion of PCT applications may lead to a sample selection bias problem since it is probable that PCT applications are more valuable than non-PCT applications (applicants only select the PCT route if they intend to apply for patents in four or more countries. Given the substantial application costs involved, this suggests the inventions also have considerable commercial potential). However, only 10 per cent of patent applications in the time period studied here used the PCT route. 14 The high proportion of withdrawn and pending applications is alarming given the length of time since the patent applications were made. It suggests that there is something else going on: perhaps applicants are intentionally dragging out the examination process. However, we do not explore this issue here.
6
We then match-merged the data for these 33,305 patent applications with the NBER
patent database using the USPTO patent numbers (Hall, Jaffe, and Trajtenberg 2002).
This enabled us to collect more data on each patent application; data which is not
available in the triadic patent families database such as application years, number and
country of inventors, priority countries, number of claims, technology category, and the
number of citations received.
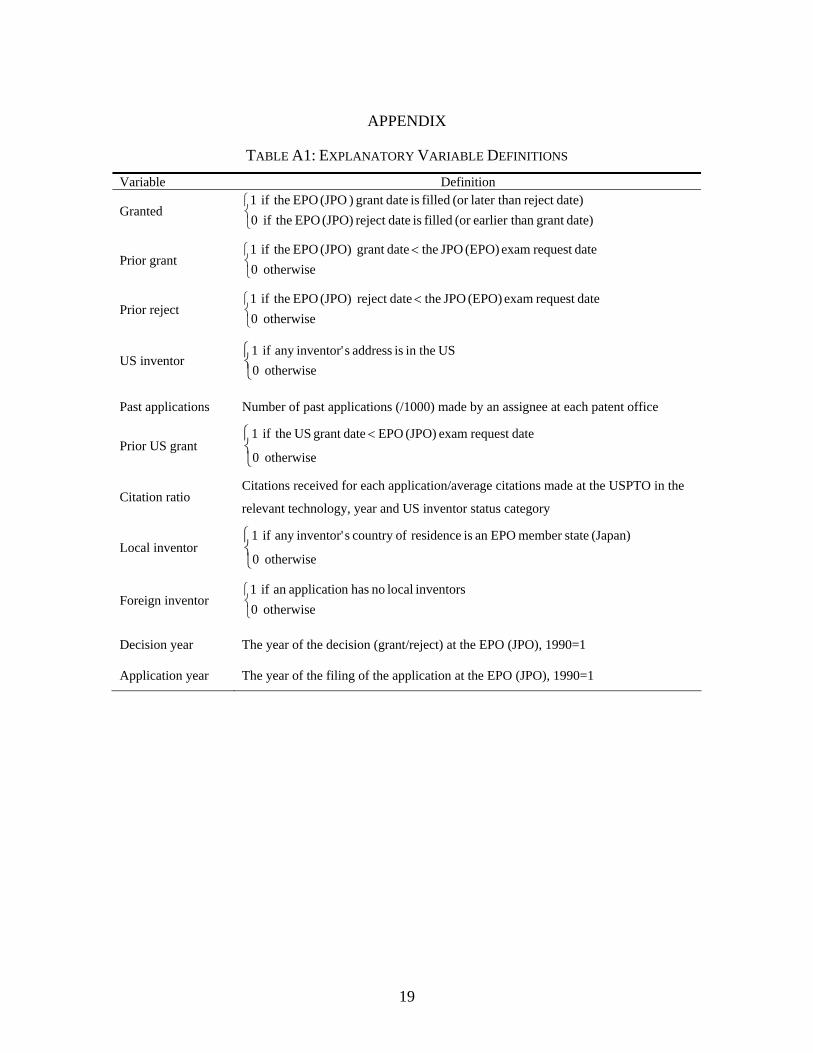
B. Explanatory Variables
In this section, we provide a summary of the explanatory variables used to examine
whether patent examination decisions are influenced by strategic trade behavior.15 To
proxy for the quality of the patent application (over and above the fact that we are using a
matched sample), we include as an independent variable the ratio of the number of
citations received (i.e. forward citations) over the average number of citations received
for that technology area, year and US inventor status (Citation ratio). Similar to academic
citations, we postulate that people – applicants, patent attorneys and examiners – find it
easier to cite the ‘stand out’ publications from the past, and these tend to represent papers
with the greatest set of new ideas for the time.16
In order to determine the relative strength of a country in a specific technology area, a
revealed technological advantage (RTA) index17 was constructed for the period 1975 to
15 Table A1 in the appendix summarizes the definition and values of the explanatory variables used. 16 Other studies – such as Harhoff et al. (1999) and Lanjouw and Schankerman (2004) – have used patent citations in similar ways as a proxy for patent value. Our proxy is slightly different in that we control for the following: the fact that some technology areas make more citations; that US inventions tend to be more cited in the USPTO; and the possible truncation issues associated with the year of application. Not only is there a considerable dispersion in the number of citations received in each technology area in our database, but patents with US inventors are twice as likely to be cited in USPTO applications as other patents and the average number of citations declines with time. Thus, we control for truncation of patent citations, but in a different way to Hall, Jaffe and Trajtenberg (2005). 17 Following Archibugi and Pianta (1992) and Huang and Miozzo (2004).
7
1999. This index is a ratio of the proportion of national patent grants from the USPTO in
a technology area to the proportion of world grants in that technology area. This index,
which is presented in Table A2, indicates that Europe had a revealed comparative
advantage in material processing and pharmaceuticals and Japan had a revealed
comparative advantage in optics and audiovisual technologies. We also constructed
dummy variables – Local inventor and Foreign inventor – based on whether a local
inventor was present or not.18 Thus, the foreign inventor dummy variable represents any
application that does not have at least one local applicant. US inventor was included to
test for possible bias for (or against) US nationals.
To control for differences in prior information, we constructed three dummy
variables: Prior grant, Prior reject and Prior US grant. The first dummy indicates if the
application was granted by the other office at an earlier date. That is, when estimating the
EPO decision, the “other office” is the JPO, and vice versa. The second variable is
similarly defined, but in this case in terms of a rejection. These dummy variables enable
us to test whether the knowledge about whether to grant (or reject) a patent application at
one office influences the examination decision at another office. The last dummy variable
indicates if the application was granted by the USPTO at a date earlier than the
examination request dates at both the EPO and at the JPO.
To control for differences in applicant persistence, we used the number of past
applications that the applicant had made to each patent office. This variable, Past
applications, was derived from our dataset and thus only includes past non-PCT triadic
applications from 1990-95. It will vary however by time, office and application. In
addition, we include two trend variables, Decision year and Application year. 18 Priority country and country of residence are highly correlated.
8
C. Descriptive Statistics
Table 2 presents data on the characteristics of the patent applications at the EPO and
the JPO by examination decision and explanatory variable. The first observation is the
level of disharmony across the two offices: overall, the JPO rejected 19.9 per cent of the
applications in this dataset, while the EPO rejected 3.2 per cent.19 20 There were, however,
some consistent patterns across the two offices. In relative terms, for example, the
rejection rates for patent applications without a local inventor (for both low and high
RTAs), or with a US inventor, were higher in both offices. However, there is a stark
difference in the magnitude of the effects across the two offices: the JPO rejected 22.6
per cent of the applications made with a US inventor, whereas the EPO rejected 5.7 per
cent. At the EPO, applications with a local inventor had a rejection rate of 1.6 per cent
compared with a rejection rate of 4.1 per cent for applications without a local inventor. At
the JPO, local inventors had a rejection rate of 15.1 per cent compared with a non-local
rejection rate of 22.8 per cent.
Information from a prior examination decision at another office had a mixed effect:
information about a prior rejection was negatively related to the grant decision, but
information about a prior grant was also negatively related. The number of past
applications also little effect on the likelihood of being granted or rejected in either
office: regardless of whether the number of past applications filed by the applicant was in
the first or fourth quartile, the rejection rate ranged from 3.3 to 4.1 per cent in the EPO
and from 20.7 to 20.8 per cent in the JPO. 19 The observed level of disharmony has important implications for the debate about patent quality: it suggests that either the JPO is rejecting “good” patent applications (i.e. committing Type I errors) or that the EPO (and the USPTO) are granting “bad” patents (i.e. committing Type II errors). We explore this issue in the next section of the paper. 20 Although we do not present the cross tabulation here, there are only 439 cases (or 1.32 per cent) where both the EPO and the JPO rejected patents granted by the USPTO.
9
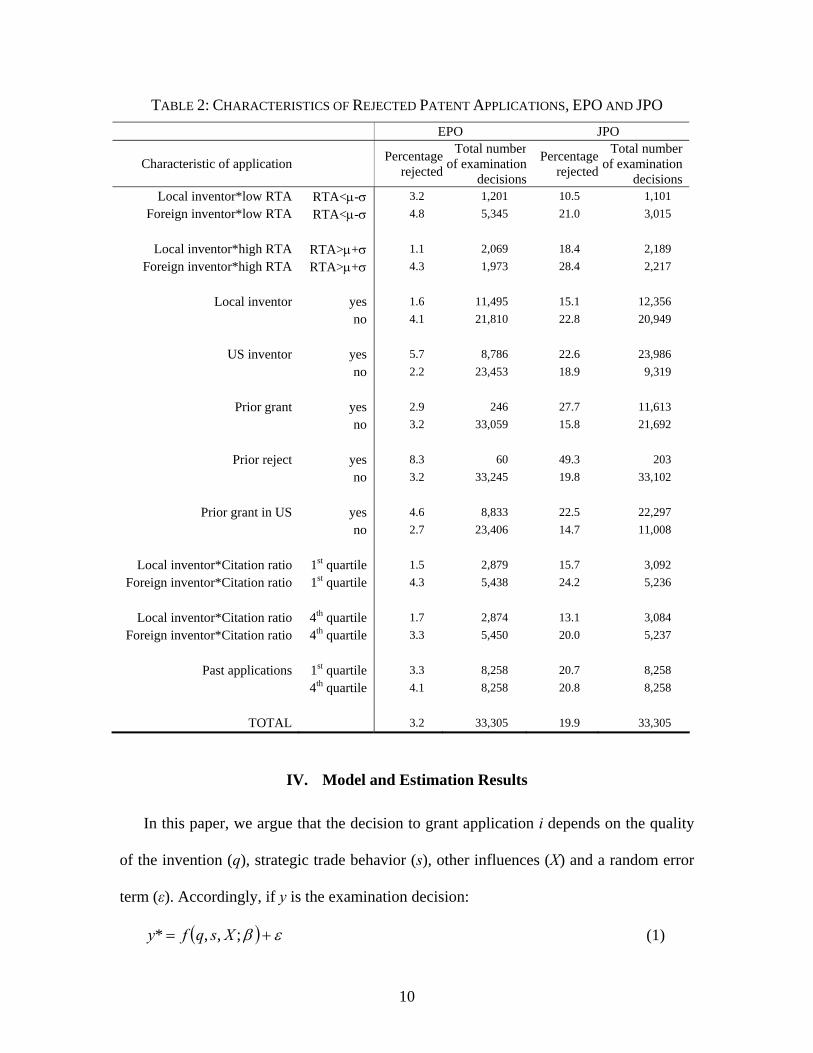
TABLE 2: CHARACTERISTICS OF REJECTED PATENT APPLICATIONS, EPO AND JPO EPO JPO
Characteristic of application Percentagerejected
Total number of examination
decisions
Percentage rejected
Total number of examination
decisions
Local inventor*low RTA RTA<μ-σ 3.2 1,201 10.5 1,101 Foreign inventor*low RTA RTA<μ-σ 4.8 5,345 21.0 3,015
Local inventor*high RTA RTA>μ+σ 1.1 2,069 18.4 2,189
Foreign inventor*high RTA RTA>μ+σ 4.3 1,973 28.4 2,217
Local inventor yes 1.6 11,495 15.1 12,356 no 4.1 21,810 22.8 20,949
US inventor yes 5.7 8,786 22.6 23,986 no 2.2 23,453 18.9 9,319
Prior grant yes 2.9 246 27.7 11,613 no 3.2 33,059 15.8 21,692
Prior reject yes 8.3 60 49.3 203 no 3.2 33,245 19.8 33,102
Prior grant in US yes 4.6 8,833 22.5 22,297 no 2.7 23,406 14.7 11,008
Local inventor*Citation ratio 1st quartile 1.5 2,879 15.7 3,092 Foreign inventor*Citation ratio 1st quartile 4.3 5,438 24.2 5,236
Local inventor*Citation ratio 4th quartile 1.7 2,874 13.1 3,084
Foreign inventor*Citation ratio 4th quartile 3.3 5,450 20.0 5,237
Past applications 1st quartile 3.3 8,258 20.7 8,258 4th quartile 4.1 8,258 20.8 8,258
TOTAL 3.2 33,305 19.9 33,305
IV. Model and Estimation Results
In this paper, we argue that the decision to grant application i depends on the quality
of the invention (q), strategic trade behavior (s), other influences (X) and a random error
term (ε). Accordingly, if y is the examination decision:
( ) εβ += ;,,* Xsqfy (1)
10
⎩⎨⎧
≤>
=rejected) if on(applicati 0* if 0granted) is on(applicati 0* if 1
yy
yi
where β is the associated vector of parameters to be estimated. Assuming
[ ]( ) [ ]( )ββ iiiiii XsqXsqXsqy exp1/exp),,|0*Pr( +=> , equation (1) can be estimated
as a binary logit model (Greene, 2003).21
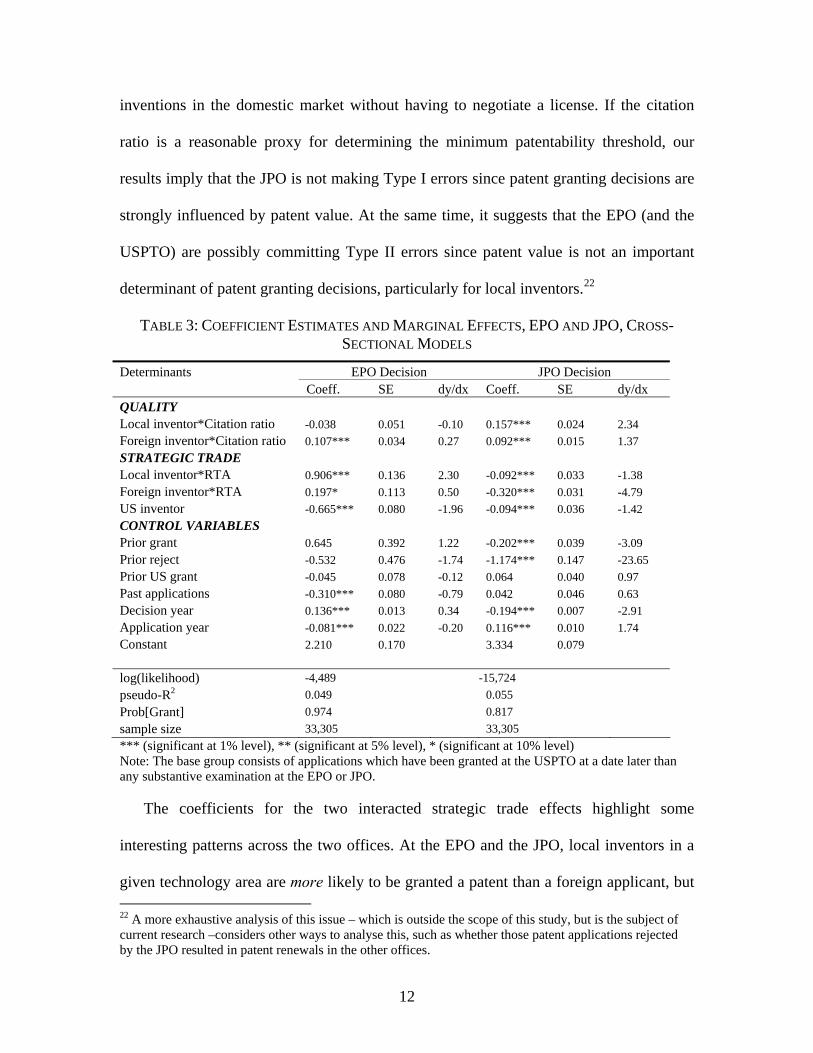
We estimated equation (1) separately for both the EPO and the JPO. Table 3 presents
the estimated coefficients and marginal effects for each of the separate patent office
equations. Using Harhoff et al.’s (1992) interpretation of forward citations as a proxy for
patent value, our results show that patent value matters, especially in the JPO where both
Citation ratio coefficients were positively related to the probability of a patent
application being granted. The size of the effect at the JPO was greater for local inventors
than for foreign inventors, suggesting that there is a systematic bias towards local
inventors. However, the fact that invention value matters for both locals and foreigners
suggests that the JPO does a good job in granting meritorious patent applications. The
situation at the EPO is somewhat different. Although valuable patent applications from
foreign inventors had a higher probability of patent grant, ceteris paribus, patent quality
had no statistically significant effect on the probability of patent grant for local inventors.
This result has relevance for the debate about whether patent offices (particularly the
USPTO) grant “bad” patents. Patent offices may be inclined to commit such Type II
errors because of the revenue generated by patent applicant fees, or because they do not
have adequate resources to examine the applications fully. On the other hand, patent
offices may also have an incentive to commit a Type I error (i.e. reject a valuable patent
application) since this enables local manufacturers and researchers to use important 21 Equation (1) could also be estimated as a binary probit, as in Guellec and van Pottelsberghe (2000).
11
inventions in the domestic market without having to negotiate a license. If the citation
ratio is a reasonable proxy for determining the minimum patentability threshold, our
results imply that the JPO is not making Type I errors since patent granting decisions are
strongly influenced by patent value. At the same time, it suggests that the EPO (and the
USPTO) are possibly committing Type II errors since patent value is not an important
determinant of patent granting decisions, particularly for local inventors.22
TABLE 3: COEFFICIENT ESTIMATES AND MARGINAL EFFECTS, EPO AND JPO, CROSS-SECTIONAL MODELS
Determinants EPO Decision JPO Decision Coeff. SE dy/dx Coeff. SE dy/dx QUALITY Local inventor*Citation ratio -0.038 0.051 -0.10 0.157*** 0.024 2.34 Foreign inventor*Citation ratio 0.107*** 0.034 0.27 0.092*** 0.015 1.37 STRATEGIC TRADE Local inventor*RTA 0.906*** 0.136 2.30 -0.092*** 0.033 -1.38 Foreign inventor*RTA 0.197* 0.113 0.50 -0.320*** 0.031 -4.79 US inventor -0.665*** 0.080 -1.96 -0.094*** 0.036 -1.42 CONTROL VARIABLES Prior grant 0.645 0.392 1.22 -0.202*** 0.039 -3.09 Prior reject -0.532 0.476 -1.74 -1.174*** 0.147 -23.65 Prior US grant -0.045 0.078 -0.12 0.064 0.040 0.97 Past applications -0.310*** 0.080 -0.79 0.042 0.046 0.63 Decision year 0.136*** 0.013 0.34 -0.194*** 0.007 -2.91 Application year -0.081*** 0.022 -0.20 0.116*** 0.010 1.74 Constant 2.210 0.170 3.334 0.079 log(likelihood) -4,489 -15,724 pseudo-R2 0.049 0.055 Prob[Grant] 0.974 0.817 sample size 33,305 33,305 *** (significant at 1% level), ** (significant at 5% level), * (significant at 10% level) Note: The base group consists of applications which have been granted at the USPTO at a date later than any substantive examination at the EPO or JPO.
The coefficients for the two interacted strategic trade effects highlight some
interesting patterns across the two offices. At the EPO and the JPO, local inventors in a
given technology area are more likely to be granted a patent than a foreign applicant, but 22 A more exhaustive analysis of this issue – which is outside the scope of this study, but is the subject of current research –considers other ways to analyse this, such as whether those patent applications rejected by the JPO resulted in patent renewals in the other offices.
12
the effect is larger at the JPO, where the average difference between the marginal effects
for local and foreign applicants is 3.41 percentage points. The two offices are also
unanimous in their treatment of patent applications from US inventors: in both cases, US
inventor is negative and statistically significant suggesting that both the EPO and the JPO
are much less likely to grant an application from a US inventor (however, at 1.96 and
1.42 percentage points respectively, the effect is fairly modest in size).
With respect to the control variables, earlier decisions at other jurisdictions seem to
be important mainly at the JPO. For example, on average, Prior reject in the JPO
estimation is negative and significant, suggesting that applications which have been
rejected at the EPO when the JPO begins its examination process have a much lower
likelihood of being granted by the JPO. However, prior grants in the US have no
significant effect on either of the other offices. And prior grants by the EPO have a
negative effect on the probability of grant at the JPO, which seems somewhat counter-
intuitive. Past applications was only significant at the EPO, but was negatively signed
suggesting that applicant persistence does not have an effect on examination decisions.23
One of the strongest results is that both offices show clear preferences for local
inventors relative to foreign inventors. To understand how these preferences vary across
technology areas, we provide some results on the marginal advantage for local (vis-à-vis
foreign) inventors by technology area in Table 4. This measure was constructed by taking
the difference between the marginal effects on the interaction terms Local inventor*RTA
23 To further test examine whether applicant behavior affects the examination decision, we estimated a fixed-effects model – not reported here – with the assignee as the fixed effect. We found that the fixed effects explained about half of the variation in the grant decision and that these fixed effects were correlated to the local and foreign inventor variables interacted with RTAs in a way which was consistent with the results in Table 3.
13
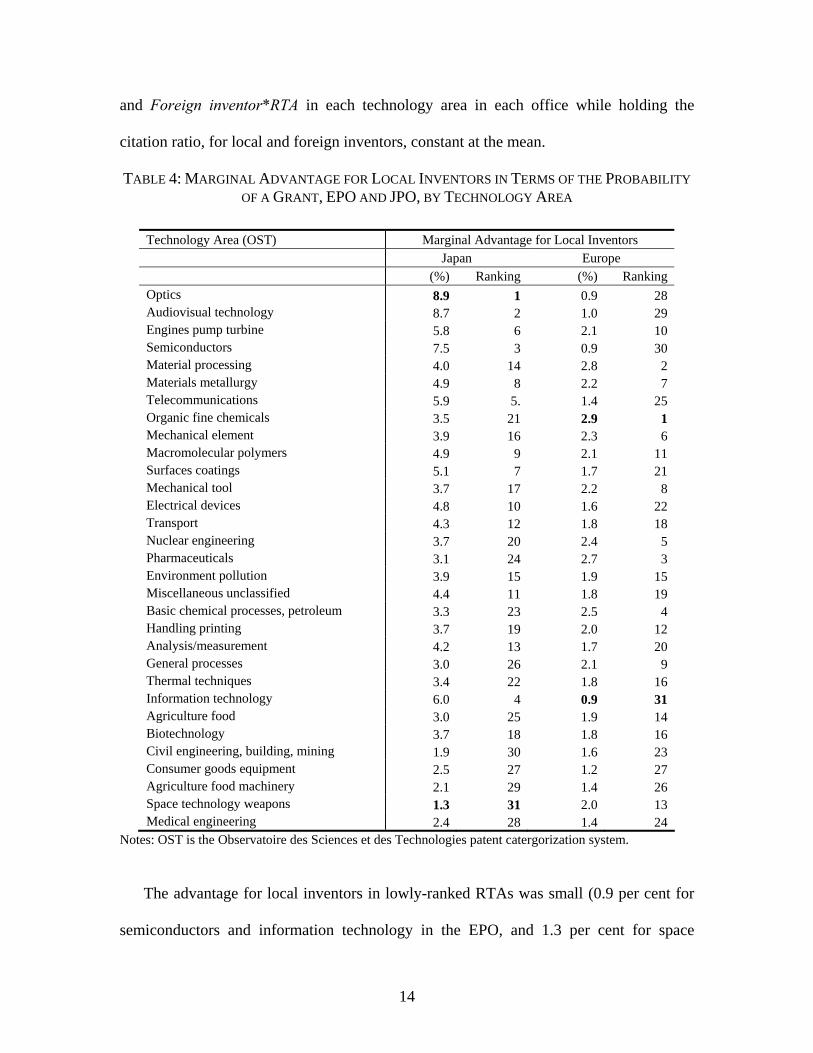
and Foreign inventor*RTA in each technology area in each office while holding the
citation ratio, for local and foreign inventors, constant at the mean.
TABLE 4: MARGINAL ADVANTAGE FOR LOCAL INVENTORS IN TERMS OF THE PROBABILITY OF A GRANT, EPO AND JPO, BY TECHNOLOGY AREA
Technology Area (OST) Marginal Advantage for Local Inventors
Japan Europe (%) Ranking (%) Ranking Optics 8.9 1 0.9 28 Audiovisual technology 8.7 2 1.0 29 Engines pump turbine 5.8 6 2.1 10 Semiconductors 7.5 3 0.9 30 Material processing 4.0 14 2.8 2 Materials metallurgy 4.9 8 2.2 7 Telecommunications 5.9 5. 1.4 25 Organic fine chemicals 3.5 21 2.9 1 Mechanical element 3.9 16 2.3 6 Macromolecular polymers 4.9 9 2.1 11 Surfaces coatings 5.1 7 1.7 21 Mechanical tool 3.7 17 2.2 8 Electrical devices 4.8 10 1.6 22 Transport 4.3 12 1.8 18 Nuclear engineering 3.7 20 2.4 5 Pharmaceuticals 3.1 24 2.7 3 Environment pollution 3.9 15 1.9 15 Miscellaneous unclassified 4.4 11 1.8 19 Basic chemical processes, petroleum 3.3 23 2.5 4 Handling printing 3.7 19 2.0 12 Analysis/measurement 4.2 13 1.7 20 General processes 3.0 26 2.1 9 Thermal techniques 3.4 22 1.8 16 Information technology 6.0 4 0.9 31 Agriculture food 3.0 25 1.9 14 Biotechnology 3.7 18 1.8 16 Civil engineering, building, mining 1.9 30 1.6 23 Consumer goods equipment 2.5 27 1.2 27 Agriculture food machinery 2.1 29 1.4 26 Space technology weapons 1.3 31 2.0 13 Medical engineering 2.4 28 1.4 24
Notes: OST is the Observatoire des Sciences et des Technologies patent catergorization system.
The advantage for local inventors in lowly-ranked RTAs was small (0.9 per cent for
semiconductors and information technology in the EPO, and 1.3 per cent for space
14
technology weapons in the JPO). However, it was much more substantial in the highest-
ranked RTAs, particularly at the JPO. For example, local inventors with patent
applications in the highest-ranked technological specialization area in Europe – organic
fine chemicals – were 2.9 per cent more likely than foreigners to receive a grant, ceteris
paribus, at the EPO. However, local inventors in highest-ranked technological
specialization area in Japan – optics –received an 8.9 per cent advantage over non-locals
at the JPO. Overall, this indicates that Japan is much more likely than Europe to give an
advantage to local inventors in areas of importance to the domestic economy.
V. Conclusion
This papers looks at the whether national strategic trade factors are a determinant of
patent examination decisions at the trilateral patent offices. The empirical model is
estimated using a newly constructed data set of 33,305 non-PCT patent applications
granted by the USPTO and subjected to final examination decisions at the EPO and the
JPO. We then compare the pattern of examination decisions at the EPO and the JPO
across inventor nationality, area of technological specialization and patent value.
This study makes a number of important contributions to the literature. First, it
provides new evidence on the level of disharmony in international patent office
examination decisions. Prior to this study, little attempt has been made to explain the
existence of the observed cross-country/region variations in patent examination decisions
while controlling for the objective quality of the underlying invention (see Lerner 2002).
This is rather surprising given the importance of the patent examination decision on the
ex ante investment decision and the recent debate on international harmonization of
15
patent policy. The results also suggest that – despite the fact that the JPO rejects a lot
more patent applications than the EPO – it consistently grants patents which have
economic value.
Second, we examine the pattern of examination decisions across technology areas.
We find strong evidence that examination decisions at both the EPO and the JPO do
depend on strategic trade factors. While both offices give preferential treatment to local
inventors, ceteris paribus, the advantage is greatest for applications in their strongest
areas of technological specialization, especially in Japan. The converse of this is that it is
harder for foreign applicants to get a patent in each jurisdiction’s dominant R&D areas.
Such discrimination provides assistance to local researchers and manufacturers since they
are able to use these inventions without licensing from the patent owners.
REFERENCES
Archibugi, D. and Pianta, M., The Technological Specialization of Advanced Countries
(Kluwer Academic, Dordrecht, 1992).
Cockburn I. M., Kortum, S. and Stern, S., “Are all Patent Examiners Equal? The Impact
of Examiner Characteristics”, NBER Working Paper W8980 (2002).
Deardorff, A.V., “Welfare Effects of Global Protection”, Economica 59 (1992), 35-51.
Dernis, H. and Khan, M., “Triadic Patent Families Methodology”, STI Working Paper
2004/2, OECD: Paris.
Dranove, D. and Metzler, D., “Do Important Drugs Reach the Market Sooner?”, RAND
Journal of Economics 25:3 (1994), 402-423.
Farrell, J. and Merges, R.P., “Incentives to Challenge and Defend Patents: Why
Litigation Won’t Reliably Fix Patent Office Errors and Why Administrative
Patent Review Might Help”, Berkeley Technology Law Journal 19:3 (2004),
943-970.
16
Greene, W.H., Econometric Analysis (Fifth Edition, MacMillan, New York, 2003).
Guellec, D. and van Pottelsberghe, B., “Applications, Grants and the Value of Patent,”
Economics Letters 69 (2000), 109-114.
Graham, S.J.H., Hall, B.H., Harhoff, D. and Mowery, D.C., “Post-Issue Patent 'Quality
Control': A Comparative Study of U.S. Patent Re-examinations and European
Patent Oppositions”, NBER Working Paper W8807 (2002).
Grossman, G.M. and Lai, E.L.C., “International Protection of Intellectual Property”,
American Economic Review 94:5 (2004), 1635-1653.
Hall, B.H., A.B. Jaffe, and Trajtenberg, M., “The NBER Patent Citations Data File:
Lessons, Insights, and Methodological Tools”, in A. B. Jaffe and M. Trajtenberg
(eds.), Patents, Citations, and Innovations: A Window on the Knowledge
Economy (Cambridge, Massachusetts: The MIT Press, 2002).
Hall, B.H., Jaffe, A. and Trajtenberg, M., “Market Value and Patent Citations”, RAND
Journal of Economics 36 (2005), 16-38.
Harhoff, D., Narin, F., Scherer, F.M. and Vopel, K., “Citation Frequency and the Value
of Patented Inventions”, Review of Economics and Statistics 81:3 (1999), 511-
515.
Huang, H-T and Miozzo, M., “Patterns of Technological Specialization in Latin
American and East Asian countries: An Analysis of Patents and Trade Flows”,
Economics of Innovation and New Technology 13:7 (2004), 615-653.
Jensen, P.H. and Webster, E., “Achieving the Optimal Power of Patent Rights”,
Australian Economic Review 37:4 (2004), 419-426.
Lanjouw, J.O. and Schankerman, M., “Protecting Intellectual Property Rights: Are Small
Firms Handicapped?”, Journal of Law and Economics 47:1 (2004), 45-74.
Lerner, J., “150 Years of Patent Office Practice”, American Economic Review 92:2
(2002), 307-330.
Lemley, M.A. and Moore, K.A., “Abolishing Patent Continuations”, Boston Law Review
84 (2004).
Linck, N.J. and McGarry, J.E., “Patent Procurement and Enforcement in Japan – A Trade
Barrier”, George Washington Journal of International Law and Economics 27
(1993), 411-431.
17
McCalman, P., “National Patents, Innovation and International Agreements”, Journal of
International Trade & Economic Development 11:1 (2002), 1-14.
Merges, R.P., “As Many as Six Impossible Patents Before Breakfast: Property Rights for
Business Concepts and Patent System Reform”, Berkeley Technology Law Journal
14 (1999), 577-615.
Merrill, S.A., Levin, R.C. and Myers, M.B., A Patent System for the 21st Century,
Committee on Intellectual Property Rights in the Knowledge-Based Economy,
National Research Council (National Academies Press, 2004).
Popp, D., Juhl, T. and Johnson, D.K.N., “Time in Purgatory: Determinants of the Grant
Lag for US Patent Applications”, NBER Working Paper W9518.
Quillen, C.D. and Webster, O.H., “Continuing Patent Applications and Performance of
the U.S. Patent Office”, Federal Circuit Bar Journal 11:1 (2001), 1-21.
Regibeau, P. and Rockett, K., “Administrative Delays as Barriers to Trade”, unpublished
mimeo dated June 2003, University of Sussex.
Sakakibara, M. and Branstetter, L., “Do Stronger Patents Induce More Innovation?
Evidence from the 1988 Japanese Patent Law Reforms”, RAND Journal of
Economics 32:1 (2001), 77-100.
Shapiro, C., “Patent System Reform: Economic Analysis and Critique”, Berkeley
Technology Law Journal 19:3 (2004), 1017-1047.
Wineberg, A., “The Japanese Patent System: A Non-Tariff Barrier to Foreign
Businesses?” Journal of World Trade Law 22:1 (1988), 11-22.
18
APPENDIX
TABLE A1: EXPLANATORY VARIABLE DEFINITIONS Variable Definition
Granted ⎩⎨⎧
date)grant anearlier th(or filled is datereject (JPO) EPO theif 0date)reject later than(or filled is dategrant ) (JPO EPO theif 1
Prior grant ⎩⎨⎧ <
otherwise 0daterequest exam (EPO) JPO the dategrant (JPO) EPO theif 1
Prior reject ⎩⎨⎧ <
otherwise 0daterequest exam (EPO) JPO the datereject (JPO) EPO theif 1
US inventor ⎩⎨⎧
otherwise 0US thein is address sinventor'any if 1
Past applications Number of past applications (/1000) made by an assignee at each patent office
Prior US grant ⎩⎨⎧ <
otherwise 0
daterequest exam (JPO) EPO dategrant US theif 1
Citation ratio Citations received for each application/average citations made at the USPTO in the
relevant technology, year and US inventor status category
Local inventor ⎩⎨⎧
otherwise 0
(Japan) statemember EPO an is residence ofcountry sinventor'any if 1
Foreign inventor ⎩⎨⎧
otherwise 0inventors local no has napplicatio an if 1
Decision year The year of the decision (grant/reject) at the EPO (JPO), 1990=1
Application year The year of the filing of the application at the EPO (JPO), 1990=1
19
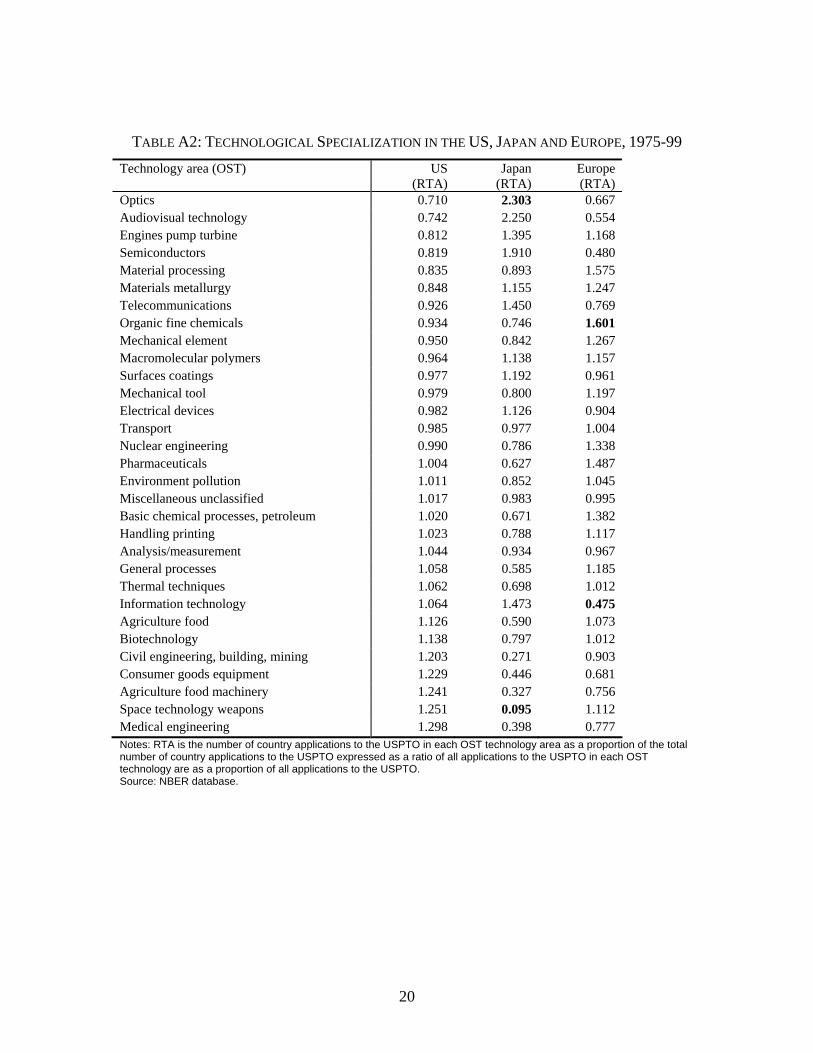
TABLE A2: TECHNOLOGICAL SPECIALIZATION IN THE US, JAPAN AND EUROPE, 1975-99 Technology area (OST) US
(RTA) Japan
(RTA) Europe (RTA)
Optics 0.710 2.303 0.667 Audiovisual technology 0.742 2.250 0.554 Engines pump turbine 0.812 1.395 1.168 Semiconductors 0.819 1.910 0.480 Material processing 0.835 0.893 1.575 Materials metallurgy 0.848 1.155 1.247 Telecommunications 0.926 1.450 0.769 Organic fine chemicals 0.934 0.746 1.601 Mechanical element 0.950 0.842 1.267 Macromolecular polymers 0.964 1.138 1.157 Surfaces coatings 0.977 1.192 0.961 Mechanical tool 0.979 0.800 1.197 Electrical devices 0.982 1.126 0.904 Transport 0.985 0.977 1.004 Nuclear engineering 0.990 0.786 1.338 Pharmaceuticals 1.004 0.627 1.487 Environment pollution 1.011 0.852 1.045 Miscellaneous unclassified 1.017 0.983 0.995 Basic chemical processes, petroleum 1.020 0.671 1.382 Handling printing 1.023 0.788 1.117 Analysis/measurement 1.044 0.934 0.967 General processes 1.058 0.585 1.185 Thermal techniques 1.062 0.698 1.012 Information technology 1.064 1.473 0.475 Agriculture food 1.126 0.590 1.073 Biotechnology 1.138 0.797 1.012 Civil engineering, building, mining 1.203 0.271 0.903 Consumer goods equipment 1.229 0.446 0.681 Agriculture food machinery 1.241 0.327 0.756 Space technology weapons 1.251 0.095 1.112 Medical engineering 1.298 0.398 0.777 Notes: RTA is the number of country applications to the USPTO in each OST technology area as a proportion of the total number of country applications to the USPTO expressed as a ratio of all applications to the USPTO in each OST technology are as a proportion of all applications to the USPTO. Source: NBER database.
20
Copyright © 2022 FDOKUMEN

