


Bahasa
Halaman
Hukum

ORGANIZATION OF THE CLASS I REGION OF THE BOVINE MAJOR
HISTOCOMPATIBILITY COMPLEX (BOLA) AND THE CHARACTERIZATION
OF A CLASS I FRAMESHIFT DELETION (BOLA-Adel) PREVALENT IN FERAL
BOVIDS
A Dissertation
by
NICOLE RAMLACHAN
Submitted to the Office of Gradua te Studies of Texas A&M University
in partial fulfillment of the requirements for the degree of
DOCTOR OF PHILOSOPHY
December 2004
Major Subject: Genetics
ORGANIZATION OF THE CLASS I REGION OF THE BOVINE MAJOR
HISTOCOMPATIBILITY COMPLEX (BOLA) AND THE
CHARACTERIZATION OF A CLASS I FRAMESHIFT DELETION (BOLA-Adel)
PREVALENT IN FERAL BOVIDS
A Dissertation
by
NICOLE RAMLACHAN
Submitted to Texas A&M University in partial fulfillment of the requirements
for the degree of
DOCTOR OF PHILOSOPHY
Approved as to style and content by:
_________________________
Loren C. Skow (Chair of Committee)
_________________________ James E. Womack
(Member)
_________________________ Geoffrey M. Kapler
(Chair of Genetics Faculty)
_________________________
Bhanu P. Chowdhary (Member)
_________________________ Rajesh C. Miranda
(Member)
_________________________ Evelyn Tiffany-Castiglioni
(Head of Department)
December 2004
Major Subject: Genetics
iii
ABSTRACT
Organization of the Class I Region of the Bovine Major Histocompatibility Complex
(BoLA) and the Characterization of a Class I Frameshift Deletion (BoLA-Adel) Prevalent in
Feral Bovids. (December 2004)
Nicole Ramlachan, B.Sc., University of Guelph, Ontario, Canada;
M.Sc., University of Guelph, Ontario, Canada
Chair of Advisory Committee: Dr. Loren Skow
The major histocompatibility complex (MHC) is a genomic region containing
genes of immunomodulatory importance. MHC class I genes encode cell-surface
glycoproteins that present peptides to circulating T cells, playing a key role in
recognition of self and non-self. Studies of MHC loci in vertebrates have examined
levels of polymorphism and molecular evolutionary processes generating diversity. The
bovine MHC (BoLA) has been associated with disease susceptibility, resistance and
progression. To delineate mechanisms by which MHC class I genes evolved to function
optimally in a species like cattle, it is necessary to study genomic organization of BoLA
to define gene content, and investigate characteristics of expressed class I molecules.
This study describes development of a physical map of BoLA class I region
derived from screening two BAC libraries, isolating positive clones and confirming gene
content, order and chromosomal location through PCR, novel BAC end sequencing
techniques, and selected BAC shotgun cloning and/or sequencing and FISH analysis. To
date, this is the most complete ordered BAC array encompassing the BoLA class I
region from the class III boundary to the extended class I region. Characterization of a
frameshift allele exhibiting trans-species polymorphism in Bos and Bison by flow
cytometry, real-time RT-PCR, 1D and 2D gel analysis is also described. This frameshift
allele encodes an early termination signal within the antigen recognition site (ARS) of
exon 3 of the BoLA BSA-Adel class I gene predicting a truncated class I protein that is
iv
soluble. An ability to assess MHC diversity in populations and provision of animals with
defined MHC haplotypes and genetic content for experimental research is necessary in
developing a basis upon which to build functional studies to elucidate associations
between haplotype and disease in bovids.
The BoLA class I region is immunologically important for disease association
studies in an economically important species. This study provides knowledge of gene
content and organization within the class I MHC region in cattle, providing a template
for more detailed analysis and elucidation of complex disease associations through
functional genomics and comparative analysis, as well as evolution of the MHC in
bovids to optimize a population’s immune response.

v
To my parents, brother, sister and nephew, extended family and friends worldwide who
share my life’s journey both in body and spirit; for always being there to fuel my passion
to cast off my bowlines and explore the unknown, yet always providing a strong anchor
and safe harbour for me to dock my heart and soul.
“Twenty years from now you will be more disappointed by the things that you didn’t do than by the ones you did do. So throw off the bowlines. Sail away from the safe harbour.
Catch the trade winds in your sails. Explore. Dream. Discover.” - Mark Twain

vi
ACKNOWLEDGEMENTS
The motto of my high school alma mater is “per ardua ad astra”, little did I
realize then that these words would be representative of my pursuit of a PhD! In my long
and sometimes arduous journey to completion of my doctoral program, I have had the
privilege to encounter many individuals who have impacted my life and shaped my
views of the academic and professional world.
I would like to thank Dr. Loren C. Skow, whom in his multi- tasking role as
advisor, P.I., committee chair, referee, sounding board, hunting/farming/fishing
connoisseur, meteorological weather consultant, debater, political advisor and mentor
extraordinaire; has been a key component to my success. I have enjoyed tracking
worldwide weather patterns and investigating the moderating effects of the Brazos
Valley on College Station weather, not to mention discussions on why one should not
plant potatoes in July in Texas! Thank you for your persistence, unwavering support,
funding (!) and overall respect of my crazy ideas, most of which have come to fruition.
You’ve instilled in me belief that I could reach my goals, giving me confidence to do it.
I am also very grateful to my committee members: Dr. James E. Womack, Dr.
Bhanu Chowdhary and Dr. Rajesh C. Miranda, for their open door policy and invaluable
advice, time and overall commitment to supporting me through my graduate program.
Thanks for teaching by example and demonstrating that real mentorship exists in the
truest sense. I may have faith in academia after all!! I would also like to thank Dr. Terje
Radusepp for her invaluable cytogenetic expertise, for providing her skills at the great
expense of her personal time and giving me irrefutable physical evidence without which
my data would be less likely to stand alone. I would also like to thank her for invaluable
discussions and advice for maintaining mental health during my graduate program!
In addition, I would like to thank the members of the Skow lab, past and present,
for technical assistance and moral support during my project: Dee Honeycutt, Daniel
McGilvray, Emily Zayac, Nicole Thornton, Christopher Childers and last but not least,
Princess Ashley Gustafson Seabury. Princess Ashley has had to contend with my mood
vii
swings and rantings as we share an office and a large part of our lives! I promise to cook
Pelau for you daily until I graduate as penance. A special thanks to the Seaburys (Chris
and Ashley) for going beyond normal confines of friendship and acting as ranch hands
during my Oklahoma sample collections! Maybe I’ll make it as a true cowgirl yet y’all!
I would also like to thank my extended support group in the TAMU family,
including the Collisson lab (Ellen, Anagha, Soon Jeon, Jyothi, and Ryan) for providing
cell culture facilities, advice, wisdom and support; the Derr lab (Jim, Natalie and Chris)
for samples, analysis and healthy debate; the Womack lab (Jan and Elaine) for fibroblast
cell culture; Dr. William Russell in Chemistry for mass spectrometry analysis, Dr.
German Rosas-Acosta for assistance in protein purification and Daniel Santillano for
support, coffee/margarita breaks and an effective reagent trade!
On a personal level I would like to acknowledge my “extended family” here in
C.S. who have provided me with a “home away from home” in the truest sense: the
Rosas-Mantilla family; Michael, Rocky and Vito Bonafede; Lisa Harrison; Troy Skwor;
Melissa Cox and Michael Golding (Local Canucks); MC Ramel, Dave Louis (the only
other member of the local chapter of the Trinidad and Tobago club!) and the Pachucos.
Thank you for your moral support, advice (albeit at most times unsolicited!) and
superferlous good times. You’ve all made my PhD experience unforgettably enjoyable,
and yes Dave, I will miss College Station!
Finally to my extended family worldwide, thanks for everything, especially to
Mummy, Daddy, Neil, Ria and Liam, for believing in me. To everyone who has longed
to see the day that their favourite career student finish this last step, after 4 years, 3 labs,
2 countries… Ah done! Je suis fini! Ya termine! So stop asking!
Now, if only I could get that MBA I’ve always wanted……just kidding.
viii
TABLE OF CONTENTS
Page
ABSTRACT………………………………………………………………………… iii
DEDICATION…………………………………………………………………….... v
ACKNOWLEDGEMENTS………………………………………………………… vi
TABLE OF CONTENTS…………………………………………………………… viii
LIST OF FIGURES……………………………………………………………….... x
LIST OF TABLES………………………………………………………………….. xiii
CHAPTER
I INTRODUCTION………………………………………………………….. 1
The major histocompatibility complex (MHC).……………………. 1 General organization and genetic content of the mammalian MHC………………………………………………………………… 3 Comparative analysis of the organization of the MHC across species……………………………..………………………… 6 The role of the major histocompatibility complex in immunity……………………………………………………………. 21 Structure of the class I MHC molecules……………………………. 24 Evolution of the MHC……………………………………………… 35 Expression and phylogenetic analysis of BoLA class I loci………... 49 Hypothesis………………………………………………………….. 51 Specific aims and objectives……………………………………….. 53 II GENOMIC ORGANIZATION OF THE BOVINE MAJOR
HISTOCOMPATIBILITY (BoLA) CLASS REGION…………………….. 55
Summary……………………………………………………………. 55 Introduction…………………………………………………………. 56 Materials and methods…………………………………………….... 60 Results………………………………………………………………. 70 Discussion…………………………………………………………... 78
ix
CHAPTER Page III A SIMPLE BAC END SEQUENCING METHOD USEFUL FOR BAC
CONTIG ASSEMBLY………………………….………………………… 91
Summary…………………………………………………………… 91 Introduction………………………………………………………… 91 Materials and methods……………………………………………... 96 Results……………………………………………………………… 98 Discussion………………………………………………………….. 100 IV ANALYSES OF BOVINE MAJOR HISTOCOMPATIBILITY (BOLA)
CLASS I LOCI REVEAL A NOVEL FRAMESHIFT MUTATION IN A
BOLA-A ALLELE PREVALENT IN WILD AND FERAL BOVIDS….... 103
Summary…………………………………………………………… 103 Introduction………………………………………………………… 104 Materials and methods………………..……………………………. 108 Results….…………………………………………………………... 112 Discussion………………………………………………………….. 118 V CHARACTERIZATION OF AN ALLELIC VARIANT OF BOLA-A BSA
(Adel) WITH A FRAMESHIFT DELETION SHOWS TRANSCRIPTION OF
SOLUBLE GENE PRODUCT ………………………………….………… 122
Summary…………………………………………………………… 122 Introduction………………………………………………………… 122 Materials and methods……………………………………………... 129 Results……………………………………………………………… 141 Discussion………………………………………………………….. 159 VI FINAL SUMMARY AND DISCUSSION……..…………………………. 170 REFERENCES…………………………………………………………………….. 176 VITA……………………………………………………………………………….. 225
x
LIST OF FIGURES
FIGURE Page
1 The HLA …………………………………………………..………...…….. 5 2 The organization of the MHC in several vertebrate species ……….…........ 7
3 MHC class I duplication blocks……………………………….….……....... 9
4 Pathways to antigen presentation by MHC molecules ……….…………… 23
5 Additional mechanisms of antigen presentation and MHC class I loading………………………………………………………………….….. 26
6 Structure of the MHC class I molecule…………………………….………. 28
7 Preliminary comparative gene maps of HLA and BoLA…..……….…….... 46
8 PCR screening of BAC clones………………..…………………….…….... 70
9 DNA fingerprinting and Southern blotting……………………………….... 73
10 Image of in silico DNA fingerprint on iCE………………………….…….. 74
11 BAC contigs and gene content across BoLA class I region..……….…….. 75
12 FISH on metaphase and interphase chromosomes with hybridization of BoLA class I BAC clones on BTA 23q21-22…………………….……….. 77
13 Fiber FISH for select BAC clones..………..…………………………….... 79
14 Clusters of MHC class I genes………….………………………….…….... 83
15 Histogram showing average read length using METHOD 1..…………….. 98
16 Histogram showing average read length using METHOD 2.……….…….. 99
17 Histogram showing average read length using METHOD 3....…………… 99
18 Genotyping and sequencing strategies………………………..…………… 109
xi
FIGURE Page
19 Chromatograph produced by GenotyperTM during genotyping analysis…… 110 20 Alignment of deletion BoLA-Adel and non-deletion BSA sequences…..….. 112
21 Phylogenetic and haplotypic analyses of BSAdel and BSA homozygous animals of the family Bovidae……………………………………………… 115
22 Additional phylogenetic analysis of BSAdel and BSA homozygous animals of the family Bovidae………………………………………………………. 116
23 Maximum likelihood tree for nonsynonymous substitutions of coding sequences of BSAdel and BSA from homozygous animals of the family Bovidae…………………………………………………………………….. 117 24 PCR products derived from cDNA from several homozygous deletion, non-deletion and heterozygous Longhorn and control animals……………. 143 25 Relative abundance in gene expression of BoLA Adel……….……………. 144
26 Relative abundance in gene expression of BoLA-A….…………………… 145
27 Relative abundance in gene expression of BoLA-A and BoLA-Adel……… 145
28 Flow cytometry data………………………………………………………… 147
29 Percentage of MHC class I positive molecules detected in Longhorn homozygous animals.............…………………………….…………………. 148
30 Percentage of MHC class I positive molecules detected……………………. 149
31 Flow cytometric analyses of MHC class I expression on fibroblasts of BoLA-BSA and Adel animals………………………………………………... 150
32 Flow cytometry data for unstimulated PBMCs from non-deletion BoLA-BSA animals…………………………………………………………. 151
33 Alignments of consensus of BoLA-Adel sequence and HLA-E complexed with ß2m and peptide………………………………………………………... 152
34 Predicted 3D structure of the BoLA-Adel encoded molecule….……………. 153
xii
FIGURE Page
35 Image of representative SDS-PAGE analysis of immunoprecipitated MHC class I protein from cell lysates of deletion (BoLA-Adel) and non-deletion (BoLA-BSA) homozygous animals….………………………. 154 36 Image of SDS-PAGE gel of immunoprecipitated MHC class I protein from cell lysates after boiling and elution of the protein G beads…………. 155
37 Immunoblot of SDS-PAGE gel separated BoLA class I immunoprecipitated protein from several animals……..…………………… 156
38 Image of SDS-PAGE gel of immunoprecipitates from cultured PBMC supernatants from several animals………………………………………….. 157
39 2D gel analysis of immunoprecipitated class I protein from PBMCs from a BoLA-Adel homozygous animal…………………………………………… 158
xiii
LIST OF TABLES
TABLE Page
1 Overgo primers……………………………………………………………. 62 2 PCR primers……………………………………………………………….. 66
3 List of PCR primers designed from BAC end sequences..………………… 67
4 BAC library screens and selected sequencing results……………..………. 71
5 Summary of informal survey results on BAC end sequencing protocols…. 95
6 Frequency of BoLA-BSA and BoLA-Adel alleles in feral and domestic bovids…………….…………………………….………………………….. 113
7 Analysis of 1200 bp of genomic sequence of BoLA-A locus deletion (BSAdel) and non-deletion (BSA) genes showing nucleotide distance (d) and proportion of non-synonymous (dN) and synonymous (dS) substitutions in 28 bovids……………………………………………….. ……………… 114
8 Number of alleles at the classical class I loci defined in human and cattle to date……………………………………………………………….……… 124 9 Sequence and annealing temperatures of primer pairs used in quantitative real-time RT-PCR analysis………………………………………………… 134 10 Antibodies used in immunoprecipitation (IP) and western blotting……….. 138
1
CHAPTER I
INTRODUCTION
The important thing in science is not so much to obtain new facts as to discover new ways of thinking about them.
- Sir William Bragg
The major histocompatibility complex (MHC)
The MHC was initially described by Peter Gorer (1937) in studies of tumour
transplantation studies in mice. It was further defined by George Snell (1951; 1948) who
found that transplantability was determined by major histocompatibility antigens
(designated H) on the surface of the cell, controlled by genes within a limited area on a
specific chromosome, that he termed the major histocompatibility complex (MHC).
Minor histocompatibility (mH) antigens were also defined by Snell (1948) using
congenic mice, and showed that in contrast to H antigens mH antigens accounted for a
much slower and more chronic graft rejection (Barth et al. 1956). These are
polymorphic, endogenously synthesized products that can be recognized by alloreactive
T cells in context of major histocompatibility complex molecules.
Recent studies demonstrated that mHags are naturally processed peptides of
intracellular proteins that associate with MHC molecules (Kotzampasaki et al. 2004).
During transplants, although donor and recipient are genotypically identical at the major
MHC (HLA) loci, mH antigens may trigger strong cellular immune responses if they
vary between donor and recipient (Goulmy et al. 1996). Following characterization of
the MHC in transplant rejection in humans and in recognizing 'self' from 'nonself'
(Dausset 1958; Dausset et al. 1975), the MHC became one of the best studied regions in
the genome of humans as well as mice.
__________________
This dissertation follows the style and format of Immunogenetics.
2
Unrelated compatibility systems have also been documented in various taxa of
multicellular organisms such as the protozoan pheromone system, the self-
incompatibility system in plants and the invertebrate allorecognition systems (Haring et
al. 1990; Hiscock and Kues 1999; Hiscock et al. 1996; Scofield et al. 1982; Vallesi et al.
1995; Vallesi et al. 1998; Weissman et al. 1990). An allorecognition system has also
been defined in a proto-chordate, Botryllus schlosseri where it is controlled by a single,
highly polymorphic locus in which there is developmentally regulated heterozygote
advantage (overdominance) that can explain both emergence and maintenance of
extraordinary polymorphism that predates development of the functional MHC in
vertebrates (De Tomaso 2004).
In addition to its role of the MHC in allo-recognition, it was later proposed that
in vertebrates, the driving force for high polymorphism of MHC loci is the diversity of
MHC-regulated immune responses to pathogens (Bodmer 1972). In addition to its role
in immune function, the MHC is of evolutionary importance as it has been identified in
all jawed vertebrates: including teleosts (Hansen et al. 1999; Matsuo et al. 2002), avians
(Sato et al. 2001; Shiina et al. 2004) and numerous mammals (Anzai et al. 2003; Band et
al. 1998; The MHC Consortium 1999; Miska et al. 2002; Wagner et al. 1999; Yuhki et
al. 2003b).
Comparative studies of the gene dense MHC in species ranging from humans to
amphioxus are elucidating early genomic events leading to the evolutionary success of
vertebrates. In initial studies, the clustering of genes in the MHC of humans and rodents
to a single genomic region was thought to be indicative of a “complex”. This
terminology has been challenged, as MHC genes are not necessarily linked or contained
in a complex on a single chromosome in some species. This is true in chickens, quail,
and duck (Shiina et al. 2004) as well as in teleosts (Hansen et al. 1999). In humans, the
MHC class I- like genes, such as those that are members of the CD1 gene family, are
found on a different chromosome to the MHC (Kulski et al. 2001a).
Close linkage of functionally related genes within the MHC was due to selection
(Abi-Rached et al. 1999). Alternative explanations for clustering could be the
3
suppression of recombination or coordinated expression of alleles in close proximity.
There seems to be some conservation within the basic genes, indicating that there may
be an evolutionary advantage in conserving the MHC as a unit, which will be discussed
later on. Semantics aside the MHC, whether it is a complex, region or mapped area of
the genome, plays an important role in comparative analyses to define evolutionary
significance or immunological importance of its molecular organization.
General organization and genetic content of the mammalian MHC
The genetic content of the MHC was first described in mice and humans, but has
since been studied in other mammalian species and appears to be evolutionarily
conserved (Beck et al. 2001; Chardon et al. 1999a; Di Palma et al. 2002; Ellis et al.
1995; Ellis et al. 1999; Gustafson et al. 2003; Holmes et al. 2003; Hurt et al. 2004;
McShane et al. 2001; Yuhki et al. 2003b). Initial characterization of the MHC in
mammals involved primarily cellular, serological, and biochemical analyses; however
molecular analysis begun later has been seen to provide most accurate information on
gene organization and content.
The typical mammalian MHC consists of three closely linked regions, I (most
telomeric), III, and II (most centromeric), occupying a single chromosomal segment.
Both class I and class II genes are embedded between well conserved framework genes,
some of which are essential for adaptive immunity (e.g., genes involved in antigen-
processing and peptide transport). Class I regions encode the classical I (class Ia) and
nonclassical I (class Ib) molecules, that differ on the basis of expression and function.
The class I loci in region I and the class II loci in region II are related in their structure,
function, and evolution; specifically encoding class I and II antigen presenting molecules
respectively. Region III, which is between regions I and II, contains loci unrelated to the
class I and II loci, however it harbors a diverse array of structurally unrelated genes,
among them several genes involved in innate immunity (e.g. cytokines, tumour necrosis
factor family members, heat shock proteins, complement factors) (Klein and Sato 1998).
4
The associations of genes within the class III region with disease are well documented
(Gruen and Weissman 2001; Yu 1998). The class III region is the most gene dense and
evolutionary conserved of the three regions (Milner and Campbell 2001).
Also present in the MHC are genes involved in other cellular control processes
like NOTCH4 (Drosophila homologue important in developmental cell signaling),
RXRB (retinoid X receptor beta which is a MHC class I promoter binding protein), SC1
(TCF19, transcription factor 19) and GNL (or HSR1, encoding guanine nucleotide
binding protein- like 1). Of 224 identified loci in the human MHC (excluding the
extended class I) 128 are predicted to be expressed, but many are still of unknown
function (Beck and Trowsdale 2000).
HLA has been used as the “gold standard” for comparative analysis for
mammalian species, as it was the first sequenced MHC (The MHC Consortium 1999).
Approximately 40% of expressed loci in the MHC are associated with the immune
system (Trowsdale 2001). The complete 3.6 Mb HLA sequence (The MHC Consortium
1999) with its 224 genetic loci (128 expressed). Analyses of adjacent gene content and
isochore boundaries revealed that sequence conservation and possibly linkage
disequilibrium extended outside the traditional MHC; thus extending the core MHC
from 3.6Mb to 8Mb to include an extended class II region (preceding class II) and a
telomeric extended class I region (Herberg et al. 1998; Stephens et al. 1999; Totaro et al.
1998; Zemmour et al. 1990). The extended class I region of the HLA was found to have
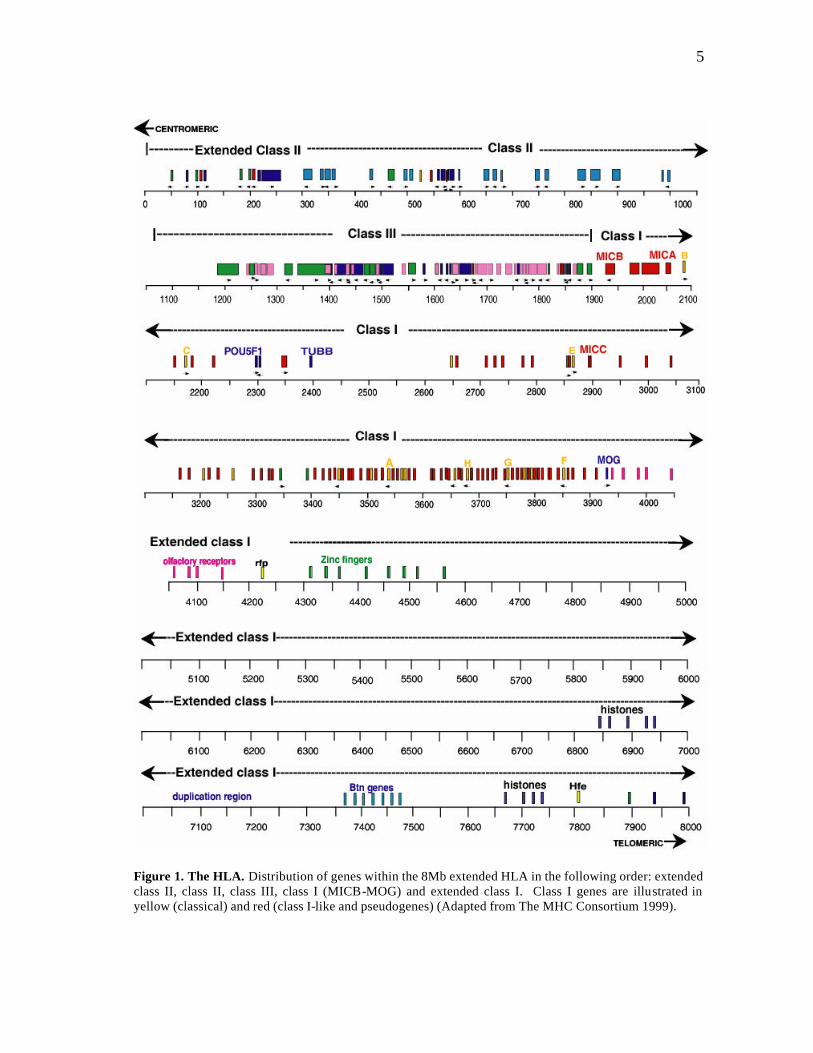
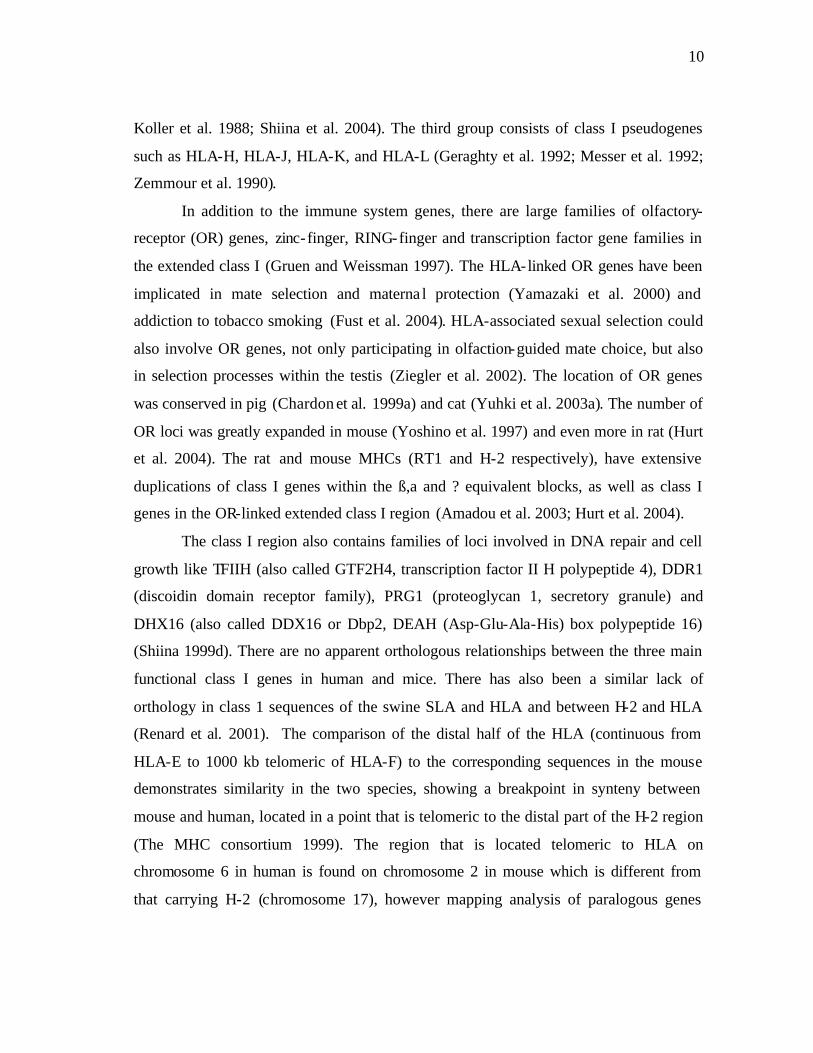
a cluster of olfactory receptor (OR) genes (Fan et al. 1995). Figure 1 shows an overview
of the distribut ion of genes in HLA and its extended flanking regions.
5
Figure 1. The HLA. Distribution of genes within the 8Mb extended HLA in the following order: extended class II, class II, class III, class I (MICB-MOG) and extended class I. Class I genes are illustrated in yellow (classical) and red (class I-like and pseudogenes) (Adapted from The MHC Consortium 1999).
6
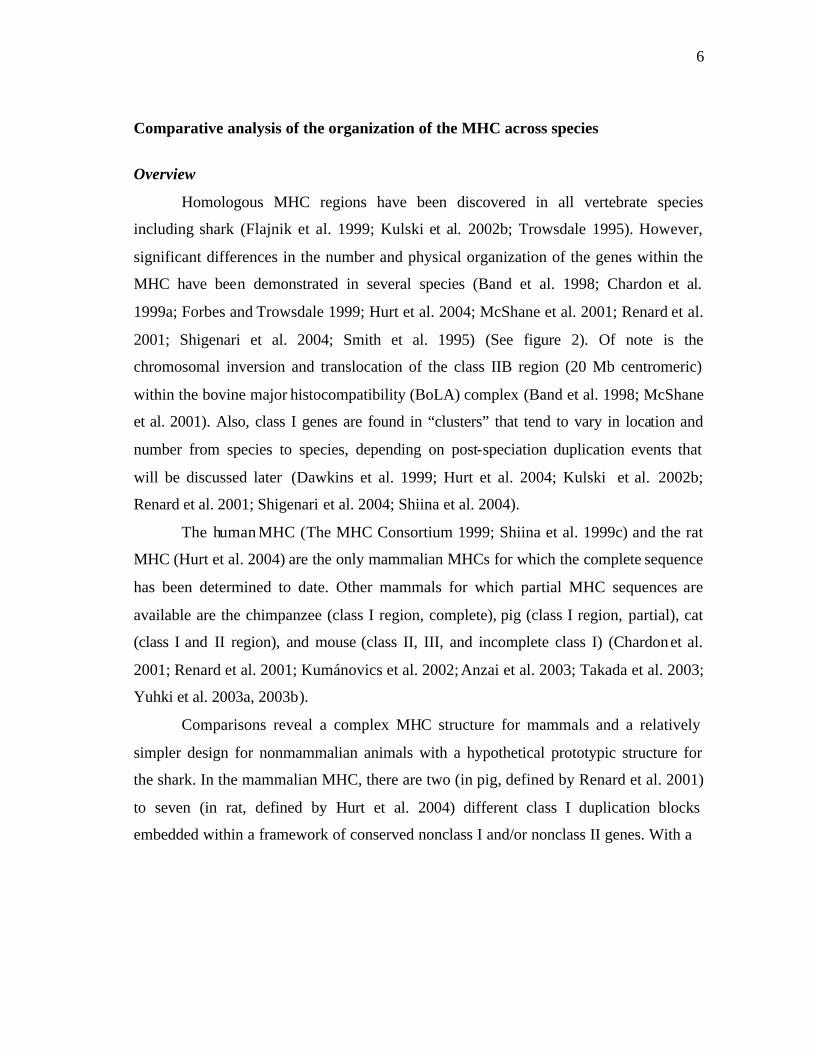
Comparative analysis of the organization of the MHC across species
Overview
Homologous MHC regions have been discovered in all vertebrate species
including shark (Flajnik et al. 1999; Kulski et al. 2002b; Trowsdale 1995). However,
significant differences in the number and physical organization of the genes within the
MHC have been demonstrated in several species (Band et al. 1998; Chardon et al.
1999a; Forbes and Trowsdale 1999; Hurt et al. 2004; McShane et al. 2001; Renard et al.
2001; Shigenari et al. 2004; Smith et al. 1995) (See figure 2). Of note is the
chromosomal inversion and translocation of the class IIB region (20 Mb centromeric)
within the bovine major histocompatibility (BoLA) complex (Band et al. 1998; McShane
et al. 2001). Also, class I genes are found in “clusters” that tend to vary in location and
number from species to species, depending on post-speciation duplication events that
will be discussed later (Dawkins et al. 1999; Hurt et al. 2004; Kulski et al. 2002b;
Renard et al. 2001; Shigenari et al. 2004; Shiina et al. 2004).
The human MHC (The MHC Consortium 1999; Shiina et al. 1999c) and the rat
MHC (Hurt et al. 2004) are the only mammalian MHCs for which the complete sequence
has been determined to date. Other mammals for which partial MHC sequences are
available are the chimpanzee (class I region, complete), pig (class I region, partial), cat
(class I and II region), and mouse (class II, III, and incomplete class I) (Chardon et al.
2001; Renard et al. 2001; Kumánovics et al. 2002; Anzai et al. 2003; Takada et al. 2003;
Yuhki et al. 2003a, 2003b).
Comparisons reveal a complex MHC structure for mammals and a relatively
simpler design for nonmammalian animals with a hypothetical prototypic structure for
the shark. In the mammalian MHC, there are two (in pig, defined by Renard et al. 2001)
to seven (in rat, defined by Hurt et al. 2004) different class I duplication blocks
embedded within a framework of conserved nonclass I and/or nonclass II genes. With a
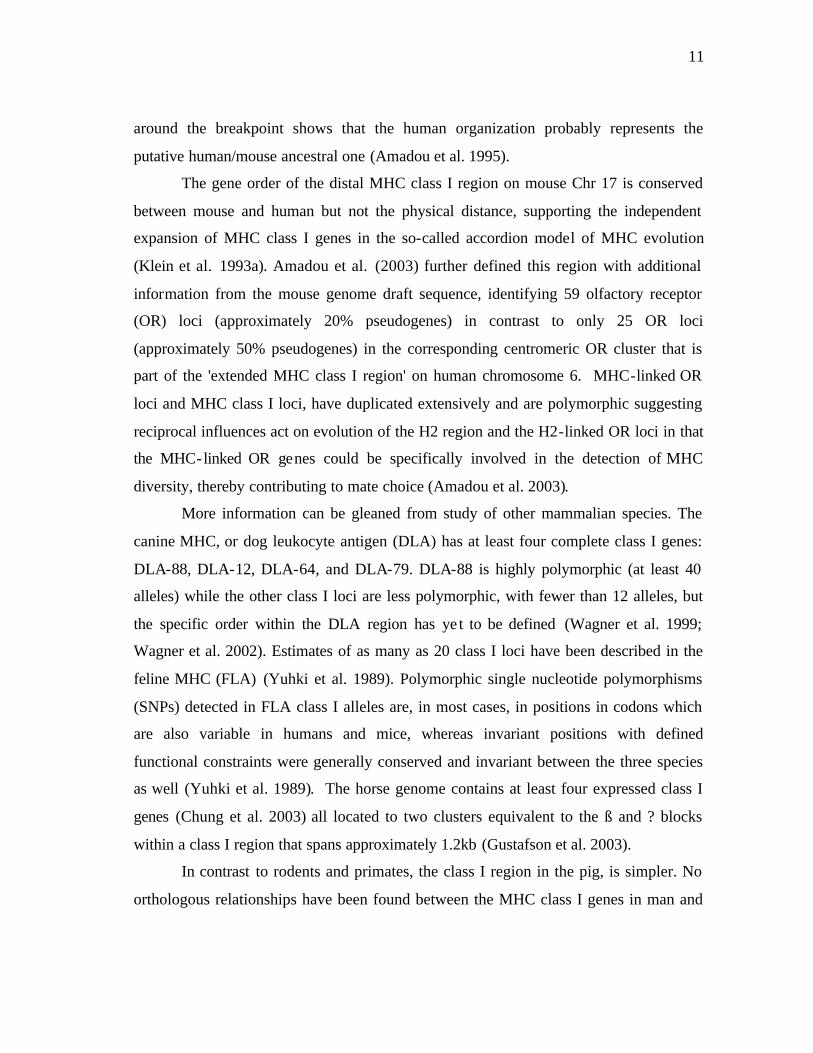
7
Figure 2. The organization of the MHC in several vertebrate species . The general organization of the MHC class I, II and III regions are conserved among jawed vertebrates, including avians, with the shark representing the prototypic vertebrate with the longest extant lineage. The number of clusters of class I sequences are indicated when known (red), with Rat having the most (8, including one telomeric cluster). This telomeric cluster is only seen in RT1 and H2 to date. The conserved framework genes in class I are illustrated in pink. The class III region (blue) is conserved in terms of gene content and location across most species. The class II region is in dark green, with the light green representing the extended class II’s framework genes. Note the centromere splitting the SLA and the NOR (or nucleolar organizing region) separating the chicken MHC into two regions BF/BL and Rfp-Y. Also of note is the chromosomal inversion and translocation within the bovine MHC. The trout MHC is dispersed, with the three regions on different chromosomes. Adapted from Skow et al. 2004 unpublished.
8
few exceptions, the class I framework genes are absent from the MHC of birds, bony
fish and sharks (Figure 2,3). Comparative genomics of the MHC reveal a highly plastic
region with major structural differences between the mammalian and nonmammalian
vertebrates. These striking differences suggest a major structural and evolutionary
division between the MHC of mammalian and nonmammalian vertebrates. In order to
better understand the diversity and complexity of the MHC genomic structure,
comparative analysis of this region in different haplotypes and various representatives of
the mammalian and nonmammalian vertebrate classes is necessary. A more detailed
analysis of the MHC organization and gene content follows, and is described by class.
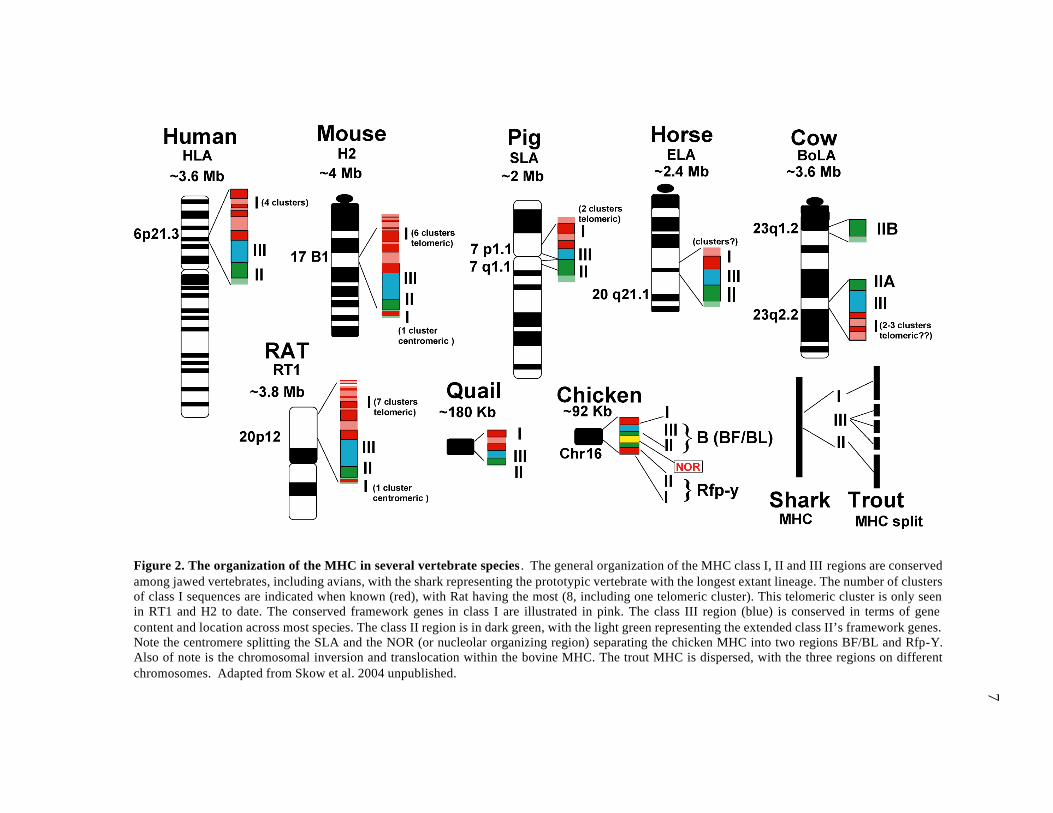
Class I
Mammalian vertebrates
The organization of the MHC class I region in nonmammalian vertebrates is
different to that in mammalian vertebrates. The class I duplication blocks and conserved
flanking framework genes observed in mammals are not evident in the nonmammalian
vertebrates (Kulski et al. 2002b). The “framework hypothesis” proposed by Amadou
(1999), explains the paradox where conserved framework genes whose alterations are
deleterious, occupy homologous locations amidst non-orthologous class I sequences
(Figures 2,3). In the class I region of HLA there are 18 HLA class I genes (6 coding and
12 pseudogenes) and 7 MHC class I-chain-related (MIC) genes (2 coding and 5
pseudogenes) spread throughout 1.8 Mb of the class I region (The MHC Consortium
1999).
The HLA class I and MIC (or PERB II) genes are organized together as a
repeating unit within three duplication blocks designated as a, ß and ? (Figures 2, 3).
The conserved framework genes are distributed between these blocks. Within these
blocks there are varying degrees of polymorphism as well as a common ancestral and
duplicative history that can be observed during comparative analysis (Kulski et al.
2002b) (Figure 3). In the SLA there are only two cluster of class I genes, while in
humans the class I genes are found within three blocks, designated ß,a and ? (Renard
9
2001; The MHC consortium 1999) (See Figure 2,3). Analysis of the genomic DNA
structure containing the MIC genes and the adjacent HLA-B and C genes shows that
segmental duplication is a recurring phenomenon during the evolution of the MHC
(Kulski et al. 1997; Mizuki et al. 1997; Shiina et al. 1998).
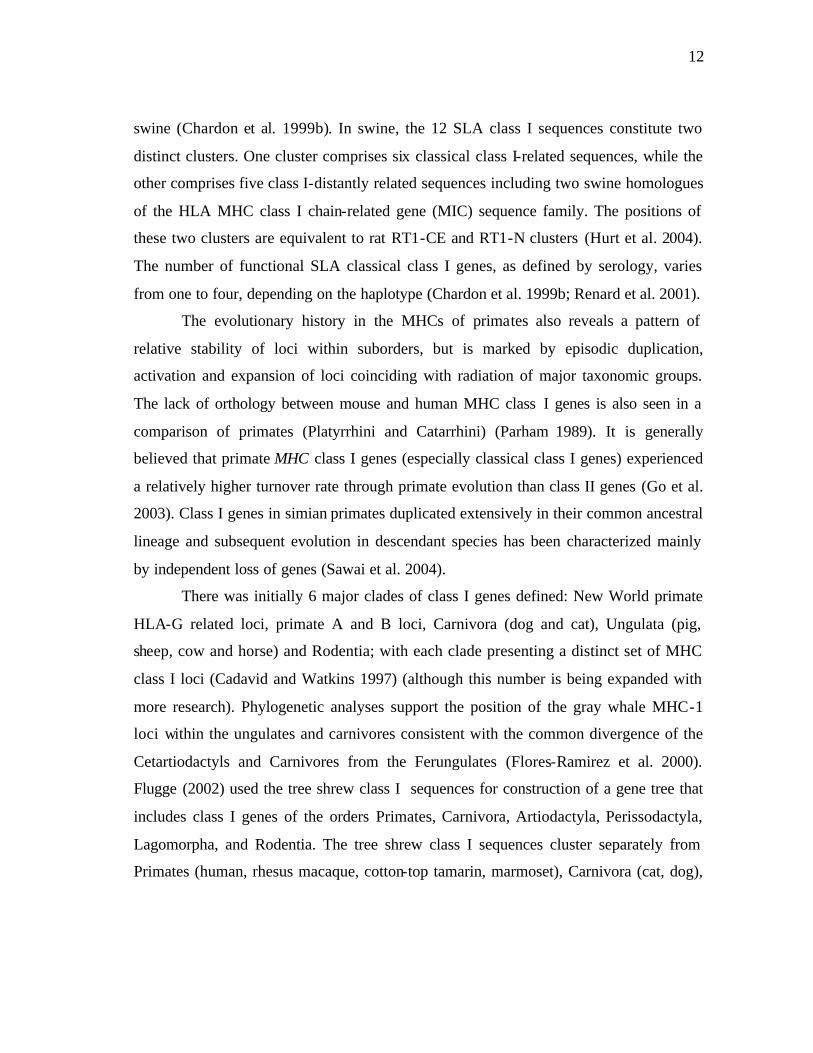
Figure 3. MHC class I duplication blocks. Class I duplication blocks (blue) are labeled as a, ß, ?, ? and Olfr. All mammals shown here have a, ß and ? blocks, except swine, which lacks the a block. Only mouse and rat have the ? and the OLFR blocks as indicated. Framework genes that flank the blocks are also shown. The orthologous relationships of class I duplication blocks and framework genes are indicated. In swine, the centromere separates the class II region from the class III and class I regions. Cass II gene region is indicated in yellow and class III genes in purple. Chicken, quail and shark lack framework genes, but maintain the order of class I and class II genomic structure as mammals. Amphioxus have no class I and class II genes but share framework genes, especially in the class III region. (Adapted from Kulski et al. 2002). HLA class I molecules are diversified into three categories. The first is the
classical genes (Ia) encoded by HLA-A, -B, and -C loci. These genes are expressed on
the surface of most nucleated cells and are highly polymorphic. The second group is the
nonclassical group (Ib) encoded by HLA-E, HLA-F and HLA-G, all of which have
limited expression on particular cell types, little polymorphism and less is known in
regards to their immunological function (Geraghty et al. 1987; Geraghty et al. 1990;
10
Koller et al. 1988; Shiina et al. 2004). The third group consists of class I pseudogenes
such as HLA-H, HLA-J, HLA-K, and HLA-L (Geraghty et al. 1992; Messer et al. 1992;
Zemmour et al. 1990).
In addition to the immune system genes, there are large families of olfactory-
receptor (OR) genes, zinc-finger, RING-finger and transcription factor gene families in
the extended class I (Gruen and Weissman 1997). The HLA-linked OR genes have been
implicated in mate selection and materna l protection (Yamazaki et al. 2000) and
addiction to tobacco smoking (Fust et al. 2004). HLA-associated sexual selection could
also involve OR genes, not only participating in olfaction-guided mate choice, but also
in selection processes within the testis (Ziegler et al. 2002). The location of OR genes
was conserved in pig (Chardon et al. 1999a) and cat (Yuhki et al. 2003a). The number of
OR loci was greatly expanded in mouse (Yoshino et al. 1997) and even more in rat (Hurt
et al. 2004). The rat and mouse MHCs (RT1 and H-2 respectively), have extensive
duplications of class I genes within the ß,a and ? equivalent blocks, as well as class I
genes in the OR-linked extended class I region (Amadou et al. 2003; Hurt et al. 2004).
The class I region also contains families of loci involved in DNA repair and cell
growth like TFIIH (also called GTF2H4, transcription factor II H polypeptide 4), DDR1
(discoidin domain receptor family), PRG1 (proteoglycan 1, secretory granule) and
DHX16 (also called DDX16 or Dbp2, DEAH (Asp-Glu-Ala-His) box polypeptide 16)
(Shiina 1999d). There are no apparent orthologous relationships between the three main
functional class I genes in human and mice. There has also been a similar lack of
orthology in class 1 sequences of the swine SLA and HLA and between H-2 and HLA
(Renard et al. 2001). The comparison of the distal half of the HLA (continuous from
HLA-E to 1000 kb telomeric of HLA-F) to the corresponding sequences in the mouse
demonstrates similarity in the two species, showing a breakpoint in synteny between
mouse and human, located in a point that is telomeric to the distal part of the H-2 region
(The MHC consortium 1999). The region that is located telomeric to HLA on
chromosome 6 in human is found on chromosome 2 in mouse which is different from
that carrying H-2 (chromosome 17), however mapping analysis of paralogous genes
11
around the breakpoint shows that the human organization probably represents the
putative human/mouse ancestral one (Amadou et al. 1995).
The gene order of the distal MHC class I region on mouse Chr 17 is conserved
between mouse and human but not the physical distance, supporting the independent
expansion of MHC class I genes in the so-called accordion model of MHC evolution
(Klein et al. 1993a). Amadou et al. (2003) further defined this region with additional
information from the mouse genome draft sequence, identifying 59 olfactory receptor
(OR) loci (approximately 20% pseudogenes) in contrast to only 25 OR loci
(approximately 50% pseudogenes) in the corresponding centromeric OR cluster that is
part of the 'extended MHC class I region' on human chromosome 6. MHC-linked OR
loci and MHC class I loci, have duplicated extensively and are polymorphic suggesting
reciprocal influences act on evolution of the H2 region and the H2-linked OR loci in that
the MHC-linked OR genes could be specifically involved in the detection of MHC
diversity, thereby contributing to mate choice (Amadou et al. 2003).
More information can be gleaned from study of other mammalian species. The
canine MHC, or dog leukocyte antigen (DLA) has at least four complete class I genes:
DLA-88, DLA-12, DLA-64, and DLA-79. DLA-88 is highly polymorphic (at least 40
alleles) while the other class I loci are less polymorphic, with fewer than 12 alleles, but
the specific order within the DLA region has ye t to be defined (Wagner et al. 1999;
Wagner et al. 2002). Estimates of as many as 20 class I loci have been described in the
feline MHC (FLA) (Yuhki et al. 1989). Polymorphic single nucleotide polymorphisms
(SNPs) detected in FLA class I alleles are, in most cases, in positions in codons which
are also variable in humans and mice, whereas invariant positions with defined
functional constraints were generally conserved and invariant between the three species
as well (Yuhki et al. 1989). The horse genome contains at least four expressed class I
genes (Chung et al. 2003) all located to two clusters equivalent to the ß and ? blocks
within a class I region that spans approximately 1.2kb (Gustafson et al. 2003).
In contrast to rodents and primates, the class I region in the pig, is simpler. No
orthologous relationships have been found between the MHC class I genes in man and
12
swine (Chardon et al. 1999b). In swine, the 12 SLA class I sequences constitute two
distinct clusters. One cluster comprises six classical class I-related sequences, while the
other comprises five class I-distantly related sequences including two swine homologues
of the HLA MHC class I chain-related gene (MIC) sequence family. The positions of
these two clusters are equivalent to rat RT1-CE and RT1-N clusters (Hurt et al. 2004).
The number of functional SLA classical class I genes, as defined by serology, varies
from one to four, depending on the haplotype (Chardon et al. 1999b; Renard et al. 2001).
The evolutionary history in the MHCs of primates also reveals a pattern of
relative stability of loci within suborders, but is marked by episodic duplication,
activation and expansion of loci coinciding with radiation of major taxonomic groups.
The lack of orthology between mouse and human MHC class I genes is also seen in a
comparison of primates (Platyrrhini and Catarrhini) (Parham 1989). It is generally
believed that primate MHC class I genes (especially classical class I genes) experienced
a relatively higher turnover rate through primate evolution than class II genes (Go et al.
2003). Class I genes in simian primates duplicated extensively in their common ancestral
lineage and subsequent evolution in descendant species has been characterized mainly
by independent loss of genes (Sawai et al. 2004).
There was initially 6 major clades of class I genes defined: New World primate
HLA-G related loci, primate A and B loci, Carnivora (dog and cat), Ungulata (pig,
sheep, cow and horse) and Rodentia; with each clade presenting a distinct set of MHC
class I loci (Cadavid and Watkins 1997) (although this number is being expanded with
more research). Phylogenetic analyses support the position of the gray whale MHC-1
loci within the ungulates and carnivores consistent with the common divergence of the
Cetartiodactyls and Carnivores from the Ferungulates (Flores-Ramirez et al. 2000).
Flugge (2002) used the tree shrew class I sequences for construction of a gene tree that
includes class I genes of the orders Primates, Carnivora, Artiodactyla, Perissodactyla,
Lagomorpha, and Rodentia. The tree shrew class I sequences cluster separately from
Primates (human, rhesus macaque, cotton-top tamarin, marmoset), Carnivora (cat, dog),
13
Artiodactyla (cattle, sheep, pig), Perissodactyla (horse, rhinoceros) and Rodentia
(mouse, rat, woodchuck, squirrel).
Phylogenetic analysis of classical class I genes, CD1 genes and non-classical
genes in jawed vertebrates shows the non-classical MHC class I genes are much more
divergent than the classical class I genes with more of a between species relationship
(Cadavid and Watkins 1997). BoLA MHC class I groups with the other mammalian
MHC class I in this analysis (Cadavid and Watkins 1997).
Non-mammalian vertebrates
Sequencing of the MHCs of several non-mammalian species has also been
accomplished. The chicken B locus is considered to represent the minimal essential
MHC within a nonmammalian vertebrate (Kaufman et al. 1999a) and is 92 kb in length
with only 19 genes. The gene density of quail MHC (containing a total of 42 genes)
(Shiina et al. 2004) is slightly higher than that in the chicken MHC B-F/B-L region with
one gene per every 4.6 kb (Kaufman et al. 1999b), but four times higher than in the HLA
region which has one gene per every 15.6 kb (The MHC consortium 1999).
There are indications that similar MHC organization exists in birds and
amphibians. Evidence suggests that the quail class I region is physically separated from
the class II region and characterized by a large number of the expressible class I loci (at
least 14), class II loci (more than 10) and other duplicated genes (pseudogenes and gene
fragments) in contrast to the chicken MHC, where the class I and class II regions are not
clearly differentiated and only at most three expressed class I loci have been detected
(Shiina et al. 2004 ; Shiina 1999b). In fact, it has been documented that a single
dominantly expressed class I locus (B-FIV) determines the immune response to certain
infectious pathogens in chickens (Kaufman 2000).
The chicken MHC is called the B-F/B-L region, and located in the B complex of
the genome. It contains classical class I a-chain (B-F) and class II ß-chain (B-LB) genes,
and determines rapid allograft rejection, mixed lymphocyte reactions and resistance to a
variety of infectious pathogens (Rogers et al. 2003). The B-F/B-L region contains 19
14
genes in 92 kb of DNA, including two C-type lectin- like genes (Kaufman et al. 1999b).
In contrast, the quail MHC contains 41 genes, corresponding to one gene per every 4.4
kb (Shiina et al. 2004). The proteins encoded by the NK and class I genes are known to
interact as ligands and receptors, and unlike quail and the chicken, the genes encoding
these proteins in mammals are found on different chromosomes (Shiina et al. 2004). This
strongly suggests an evolutionary connection between the NK C-type lectin- like
superfamily and the MHC.
Unlike the MHC of mammals, the particular haplotype of the B-F/B-L region of
the chicken B locus clearly determines susceptibility to certain infectious pathogens as
well as response to certain vaccines. The stronger association with immune response is
thought to be due to the simple MHC of chickens. The B-F/B-L region is much smaller
and simpler than the typical mammalian MHC, and expresses only a single class I gene
at a high level of RNA and protein. The peptide-binding specificity of this dominantly
expressed class I molecule in different haplotypes correlates with resistance to tumours
caused by Rous sarcoma virus, while the cell-surface expression level correlates with
susceptibility to tumours caused by Marek's disease virus (Kaufman 2000). Selection of
single dominantly expressed class I and class II molecules may be due to co-evolution
between genes within the compact chicken MHC.
Most of the framework genes (BAT1, OCT3 (POU5F1), HSR1 (GNL1), GT257,
ZNF173, ZNFB8, HCTEX4, MOG and UBD) found in mammalian MHCs have not been
found within the class I gene regions of birds and fish, but are located outside the MHC
of non-mammals, as seen in Fugu (Sambrook et al. 2002). However, FLOT and TUBB
are found in the region between the ß and ? blocks of mammals (Gunther and Walter
2001; Shiina 1999c; Shiina 1999d) and are also found in the class I gene region of the
medaka fish ((Matsuo et al. 2002) and Fugu (Clark et al. 2001). Fugu genome studies
have identified the presence of 67 of 106 human MHC orthologs, mostly outside the
Fugu MHC region and located either alone or linked in pairs (Sambrook et al. 2002).
Also, homologues of 11 out of 24 framework genes in the human class I region were not
15
identified in Fugu, including KIAA01070, IEX-1, HCR, OTF3, DHFRP, MICA, MICB,
and the skin genes CDSN, SEEK1 and SPR1 (Sambrook et al. 2002).
Other class I-like homologues
MHC class I chain related (MIC) molecules show homology with classical HLA
molecules, but do not combine with beta2 microglobulin, do not bind peptide and are not
expressed on normal circulating lymphocytes. In response to stress, MIC proteins are
expressed on the cell surface of freshly isolated gastric epithelium, endothelial cells and
fibroblasts and engage the activating natural killer cell receptor NKG2D, which is found
on many cells within the immune system (Collins 2004). Despite the highly polymorphic
nature of MIC genes, only one polymorphic position has been identified that appears to
affect the binding of NKG2D. Some MIC molecules which are expressed by tumours
appear to shed and solubilize in plasma. This soluble form of MIC engages cells
expressing NKG2D, rendering them inactive, and impairs tumour cytolysis. Similarly, a
protein encoded by human cytomegalovirus (CMV) prevents MICB surface expression
and subsequent NKG2D interaction (Collins 2004).
Some viruses also express MHC class I- like genes presumably in order to
modulate and avoid the host's immune system (Wilson and Bjorkman 1998). The human
and mouse cytomegaloviruses encode class I homologues (gpUL18 and m144)
(Chapman and Bjorkman 1998). Both viral class I proteins associate with ß2-
microglobulin but only gpUL18 can also bind endogenous peptides with the same
characteristics as peptides eluted from class I molecules (Browne et al. 1990; Chapman
and Bjorkman 1998; Fahnestock et al. 1995). The viral class I homolog gpUL18, with
high affinity for the NK cell receptors LIR-1/ILT-2, uses the same binding interaction to
recognize class I MHC molecules, and is known to serve as a natural killer cell (NK)
decoy and to ligate NK inhibitory receptors to prevent lysis of an infected target cell
(Kim et al. 2004). It has been postulated that UL18 can serve as an effective tool for the
evasion of NK-mediated cytotoxicity and for the inhibition of IFN-gamma production
during xenograft rejection (Kim et al. 2004).
16
Interestingly, there is a group of MHC-related CD1 proteins (encoded by a
cluster of five CD1 genes on chromosome 1), that present lipids and glycolipids rather
than peptides to T cells in response to microbial infections (Porcelli et al. 1998; Sugita et
al. 1998; Wilson and Bjorkman 1998). Phylogenetically, the CD1 proteins group
between class I and II, suggesting that genomic organization of the human CD1 gene
cluster may have formed prior to evolution of the present organization of the HLA class I
gene cluster (Kulski et al. 2001b; Kulski et al. 2002b). Also, the tapasin protein
sequence was recently proposed to be a modified MHC class I- like gene on the basis of
amino acid sequence similarity, predicted tertiary structure and domain organization,
(Mayer and Klein 2001). The HFE gene, in which a single mutation causes most cases
of hereditary hemochromatosis (Eijkelkamp et al. 2000), is also an unusual MHC-like
molecule, located in an inverse duplication of the telomeric HLA called the omega block
that includes the OLF and BT cluster about 4 megabases away from classical HLA.
Class III
The MHC class III region is located centrally between the class II and I regions.
It is the most gene dense region in the human genome, with 62 genes containing more
than 500 exons over 706 kb, or one gene per 11387 bp (Kulski et al. 2002b). This is
observed in all the mammalian species studied to date (Chardon et al. 1999a; Hurt et al.
2004). Gene duplication in the class III is less extensive than in the rest of the MHC
(Trowsdale and Parham 2004) and differences in the GC content (isochores) of the DNA
point to a distinct origin of the class III region (Fukagawa et al. 1995). The jawless
vertebrates (hagfish, lampreys) (Sato et al. 2000), cephalochordate, such as amphioxus
(Abi-Rached et al. 2002), and echinoderms, such as the sea-urchin (Kulski et al. 2002b),
do not appear to have any class I and class II genes, but they do have some components
of the MHC class III paralogous anchor genes such as NOTCH, PBX, C3/4/5, Bf/C2,
BAT1 and LMP/X. The protostomes (D. melanogaster and C. elegans) have orthologous
NOTCH and PBX genes (Trachtulec et al. 1997).
17
Members of the complement cascade (C2, C4 and Bf) and tumour necrosis factor
family members (TNF, LTA and LTB) are genes in class III that have characterized
immunological function. There are several other genes with possible roles in the immune
system. At the centromeric end, the G15 gene has homology to lysophosphatidic acid
acyltransferase, suggestive of a role in intracellular signaling and inflammation (Aguado
1998). The IkappaB like gene is a transcription factor of the NFkB family (Albertella
1994) and is located next to BAT1. There have been groups that suggest a further
subdivision of the MHC molecular genetic structure based on the class III/ class I
boundary region (Gruen and Weissman 1997; 2001). This is due to the number of genes
with a role in inflammation; (TNF, LFA, LST1/B144 and 1C7) that are grouped closely
together spanning 300kb of the so-called class IV region (Gruen and Weissman 2001).
Interestingly, an association between complement C4 protein polymorphism and
smoking habits in Icelandic and Hungarian subjects has also been documented which
was highly significant in females (Fust et al. 2004).
Class II
To date, all jawed vertebrates have been found to have class II genes and express
a number of different class II molecules (or isotypes) (Flajnik and Kasahara 2001).
Mammals express one or more of three classical isotypes (DR, DQ or DP) (Beck and
Trowsdale 1999), however some ruminants like cattle also express a DY isotype (Wright
1994). Comparative analysis by Figueroa et al. (1994) showed DRB loci present in
human populations diverged from one another before the prosimian and anthropoid
primates split. Major allelic lineages of DRB1 locus, were established more than 85
million years ago, however the DRB6 gene was inactivated before separation of
prosimians and anthropoids, remaining a pseudogene for more than 85 million years.
Also the primate DRB region is evolutionarily structurally and functionally unstable, as
some species have lost DRB genes and compensate functionally by substituting DOB
and/or DPB. In Otolemur garnetti, for example, one chromosome carries at least three
copies of the DRB3 pseudogene (Figueroa et al. 1994).
18
Bovine MHC (BoLA) studies also show variation in number of class II genes as
well, with one paper by Davies et al. (1994) defining 38 class IIa (DR-DQ) and 5 class
IIb (DYA-DOB-DIB) haplotypes showing that DYA, DOB and DIB genes are tightly
linked; and DYA, DOB and DIB are found only in bovids. Ballingall et al. (2004a)
suggests renaming BoLA-DIB to BoLA-DYB due to its characteristics. The class II
region of BoLA has a number of unusual features, includ ing separation of the DR and
DQ genes from the LMP2, DOA and DOB genes by a large recombination distance
(reviewed by Lewin et al. 1999). The region containing the LMP2, DOA and DOB genes
also includes the DYA and DIB genes (Stone and Muggli-Cockett 1990; van der Poel et
al. 1990).
In sheep, a class II B gene, designated DYB, physically separated from the DYA
gene by 11 kb, has been described (Wright et al. 1994). Ballingall et al. (2004a) suggests
the DY molecule is similar to the classical class II MHC molecules in structure;
however, DY is distributed non-classically and is non-polymorphic. Analysis of DYA
and DYB transcripts revealed open reading frames with potential to translate 253 and
259 amino acid proteins, respectively. Comparative sequence analysis between the DY
polypeptides and classical cattle, human and mouse class II MHC a and ß polypeptide
chains revealed 16 unique amino acid residues at positions predicted to be the putative
peptide-binding region. Expression analysis shows DY genes of cattle are capable of
translating distinctive class II MHC a and ß polypeptide chains. This limited
polymorphism and restricted pattern of transcription (Ballingall et al. 2001) is seen in
non-classical class II MHC-DO genes (Alfonso and Karlsson 2000) expressing MHC
proteins with highly specialised functions (reviewed by O'Callaghan and Bell 1998;
Alfonso and Karlsson 2000). DY genes may also express a unique class II MHC
molecule with a specialised function in ruminant DC (Ballingall et al. 2004a).
Kriener et al. (2001) in a study of DRB genes in humans and new world monkeys
demonstrated that molecular convergence had shaped exon 2 evolution in anthropoid
MHC-DRB genes, thereby providing evidence that DRB genes will continue to diversify
over time, however over 47 myr (divergence of humans and new world monkeys) these
19
genes generate and maintain characteristic motifs. The authors suggest that repeated de
novo generation of such motifs in mammals as diverse as rodents, ungulates and
primates indicates that there are common features in the targets of the immune response
in which DRB genes are involved.
In the class II region of the MHC of the domestic cat, the gene order is similar to,
but distinct from, that of human and mice; and unlike HLA and H-2, there are multiple
duplications of the DRA and DRB genes and a deleted DQ region (Beck et al. 2001).
DRB sequences isolated from three exotic cats demonstrated close association with a
particular domestic cat DRB lineage, suggesting that these allelic lineages are derived
from common ancestral alleles that existed prior to the divergence of these feline species
about 10 to 15 million years ago (Yuhki and O'Brien 1997). In the dog class II region
(DLA) there is one complete DRB gene called DLA-DRB1 with at least 24 alleles and
one full- length DQB gene, DLA-DQB1, with 20 alleles characterized to date, whereas
the DLA-DQA is less polymorphic with nine alleles and DLA-DRA appears
monomorphic (Wagner et al. 1999).
The swine MHC (SLA) class II genes code for at least one functional SLA-DR
and one SLA-DQ heterodimer product, but there are no DP encoding genes. The amino
acid alignment of the variable domains of 33 SLA classical class I chains, and 62 DR
beta and 20 DQ beta chains confirmed the exceptionally polymorphic pattern of these
polypeptides. Among the class II genes, the genes are either monomorphic, like the DRA
gene, or oligomorphic, like the DQA genes. In contrast, the DRB and DQB genes
display considerable polymorphism, which seems greater in DRB than DQB genes
(Chardon et al. 1999b).
In the sheep MHC, DR and DQ exhibits polymorphism as well (Amills et al.
1998). However in contrast to humans, high levels of polymorphism are observed in the
DQ subregion (Escayg et al. 1997) and there is no functional DP subregion (Scott et al.
1991; Deverson et al. 1991), suggesting DQ is important for antigen (Ag) presentation
(Escayg et al. 1997). In cattle, it has been shown that DQ molecules present Ag to CD4+
T cells and the inter-haplotype pairing of DQA and DQB molecules forms functional

20
restriction elements (Glass et al. 2000). There is up to two DQA2 loci in sheep with
expression of up to 23 alleles (Hickford et al. 2004). Phylogenetic analysis by Hickford
et al. (2000; 2004) revealed that some of the DQA2 sequences were more closely related
to cattle DQA3 or DQA4 than to the rest of the sheep DQA2 sequences. In cattle,
variation in the number of DQA loci has also been described (Ellis and Ballingall 1999).
The clustering of sheep sequences with similar cattle sequences was observed for
DQA2 and DQA2-like (Hickford et al. 2004) as well as DQA1 loci (Zhou and Hickford
2004). Partial genomic sequence analysis of exons 2, 3 and 4 of DYA and DIB genes
suggests that no obvious orthologues are present within the human or mouse MHC
(Stone and Muggli-Cockett 1990). However, orthologous genes have been described
within the MHC of sheep (Wright et al. 1994) and goat (Mann et al. 1993), suggesting
that they may be restricted to ruminants.
This supports the trans-species hypothesis (Klein 1987), suggesting trans-species
evolution may be common for the MHC genes. Such sequences may be derived from
primordial sequences that were present in a common ancestor and have persisted in the
sheep and cattle populations since their divergence. This pattern of evolution suggests
the action of prolonged natural selection on the DQA genes because neutral
polymorphism is not expected to persist very long in a population (Hughes and Yeager
1998a). Pathogen recognition may provide selection pressure for maintaining particular
MHC sequences, and the observation that ruminants share similar allelic sequences may
be evidence of the need for a specific immune response to a common pathogen.
Orthologous class II genes in mammals are generally conserved, however the
number of alpha and beta genes in the loci are variable dependent on species-species
local duplication events. In a recent study of monotreme class II ß sequences, Belov et
al. (2003) showed non-orthologous relationships with marsupial and eutherian ß chain
clusters and through maximum likelihood analysis placed these as the ancestral status at
the base of the mammalian clade. However, this too may be refuted, due to
inconsistencies in methods for determining order of gene duplications that created
present-day gene clusters.
21
The role of the major histocompatibility complex in immunity
In addition to its role in transplant rejection, more than 100 different autoimmune
and infectious diseases have been associated with the MHC in different vertebrate
species (da Silva 2003; Escayg et al. 1997; Gelder et al. 2003; Kaufman 2000; Keet et al.
1999; Kulski et al. 2002b; Pagany et al. 2003; Park et al. 2004b; Sharif et al. 1999). The
MHC has also been reported to be linked to an organism’s response to vaccination
(Ballingall et al. 2004b; Gelder et al. 2002) and play a role in resistance to disease
(Ballingall et al. 2004b; Escayg et al. 1997; Lewin 1989; Pagany et al. 2003). In
chickens for example, a species with the minimum essential MHC, many studies show
that the B region confers striking resistance or susceptibility to Marek's disease virus
(MDV), an oncogenic a-herpesvirus (Schat 1987; Schat et al. 1994).
In humans, the MHC has been linked to most autoimmune conditions, including
multiple sclerosis (O'Connor et al. 2001) and systemic lupus erythematosis (Truedsson et
al. 1995) as well as non- immune diseases like narcolepsy and cancer, however it has
been difficult to pinpoint relationships between disease conditions and specific alleles
(Beck and Trowsdale 2000). In some cases, however, it is clear certain alleles are
associated with resistance to disease like HLA-B*5301 and malaria (Hill 1996); or both
like HLA-DQ*0602 conferring strong susceptibility to narcolepsy but dominant
protection against type 1 diabetes (Siebold et al. 2004). Susceptibility or resistance to
HIV infection is also seen in people with certain HLA alleles (Beck and Trowsdale
2000; Mallal et al. 2002; Moore et al. 2002).
An immune response is initiated by the mammalian MHC class I and class II-
encoded cell surface proteins that function as antigen-presenting receptors for
surveillance by cytotoxic and helper T lymphocytes, respectively. The interaction of T
lymphocytes with appropriate antigen presenting cells represents the first step in clonal
selection and differentiation of immune cells. Thus the genetic processes involved in
antigen presentation are fundamental to understanding the role of genetics in animal
22
health and disease resistance. The major classes of peptide receptors encoded for by the
MHC are the class I and class II molecules.
Class I molecules are recognized by CD8+ cytotoxic T cells (CTLs) and are
expressed on the cell surface of nearly all nucleated mammalian cell types; while class II
molecules are only expressed on the surface of antigen presenting cells (APC) and
recognized by CD4+ helper (Th) cells. MHC class II molecules display exogenous
antigens, and generally MHC class I molecules present endogenous peptides at the cell
surface. However there is evidence of cross-priming as an alternative way for class I
peptide loading, thus allowing for a phagosome to cytosol pathway for MHC class I-
restricted presentation of exogenous antigens (Gromme and Neefjes 2002), thus the
segregation between the two pathways is not absolute and is another means to provide
protective immunity (See Figure 4). It has also been shown that class I molecules can
also interact with NK cells to prevent NK mediated cell lysis (Mandelboim et al. 1997;
Reyburn et al. 1997a; Reyburn et al. 1997b; Vales-Gomez et al. 2000).
The functions of some of the non-HLA framework genes in the class I region are
related to cell growth, DNA replication and repair, and regulation of transcription
(Shiina 1999c; Shiina 1999d). Using microsatellite markers within MHC, the HLA
class I and non-HLA framework gene region around the ß block has been associated
with Behçet's disease (Ota et al. 1999), psoriasis vulgaris (Oka et al. 1999), diffuse
panbronchiolitis, rheumatoid arthritis (Ota et al. 2001) and nonmelanoma skin cancer
(Oka et al. 2003). Conserved class I framework genes such as S (CDSN), SPR1, SEEK1
and STG, are expressed specifically in skin tissue and may have important roles in
psoriasis and skin cancer (Kulski et al. 2002a). Immunity-related functions of other HLA
class I conserved framework genes remain somewhat uncharacterized.
In cattle, susceptibility to mastitis has been associated with major
histocompatibility complex (MHC) haplotypes that have only a single set of DQ genes
(Park et al. 2004b). However, in an alternative study by Sharif et al. (1998) BoLA
associations with occurrence of disease in Holsteins showed a significant (P < or = 0.05)
association between BoLA-DRB3.2*23 and occurrence of severe mastitis (of which
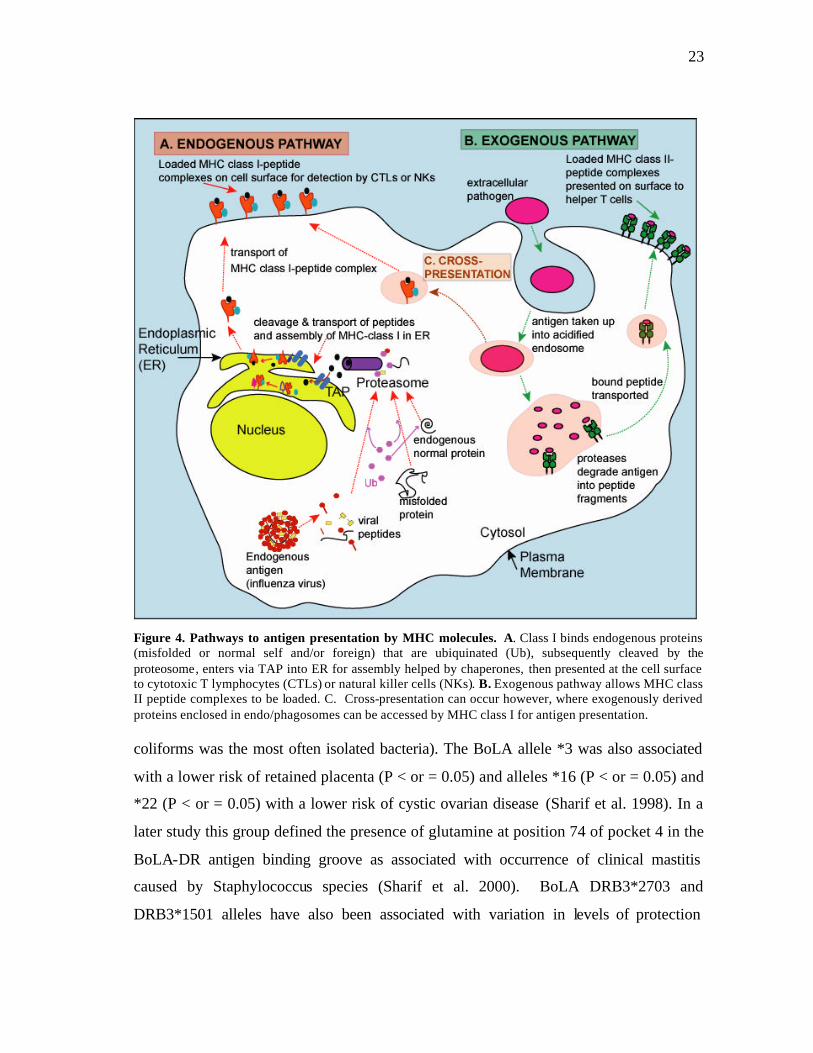
23
Figure 4. Pathways to antigen presentation by MHC molecules. A. Class I binds endogenous proteins (misfolded or normal self and/or foreign) that are ubiquinated (Ub), subsequently cleaved by the proteosome, enters via TAP into ER for assembly helped by chaperones, then presented at the cell surface to cytotoxic T lymphocytes (CTLs) or natural killer cells (NKs). B. Exogenous pathway allows MHC class II peptide complexes to be loaded. C. Cross-presentation can occur however, where exogenously derived proteins enclosed in endo/phagosomes can be accessed by MHC class I for antigen presentation. coliforms was the most often isolated bacteria). The BoLA allele *3 was also associated
with a lower risk of retained placenta (P < or = 0.05) and alleles *16 (P < or = 0.05) and
*22 (P < or = 0.05) with a lower risk of cystic ovarian disease (Sharif et al. 1998). In a
later study this group defined the presence of glutamine at position 74 of pocket 4 in the
BoLA-DR antigen binding groove as associated with occurrence of clinical mastitis
caused by Staphylococcus species (Sharif et al. 2000). BoLA DRB3*2703 and
DRB3*1501 alleles have also been associated with variation in levels of protection

24
against Theileria parva challenge following immunization (Ballingall et al. 2004b). It is
thus clear that a combination of DQ and/or DR alleles may offer protection against
certain bacterial pathogens, dependent on the haplotype and disease state of the affected
animal.
The evolution of MHC diversity and adaptive immunity is also related to fitness
and survival of the host and its progeny in terms of mating preferences, chemosensory
identity and reproductive mechanisms using both the MHC genes and a cluster of
olfactory receptor (OR) genes that are in close proximity to the MHC (Potts 2002).
Ziegler et al. (2002) proposed a MHC dependent selection of OR-bearing sperm adding
another barrier in addition to a possible olfaction-driven mate choice, in favoring both
avoidance of inbreeding and MHC heterozygosity.
Structure of the class I MHC molecule
Class Ia
Class Ia MHC molecules contain two separate polypeptide chains: a MHC-
encoded alpha “heavy” chain (43 kDa) and a non-MHC-encoded beta chain (ß2
microglobulin) (12 kDa). The antigen recognition sites (ARS) or peptide-binding region
is a groove formed from the a1 and a2 regions which interact to form a "floor" of an 8-
stranded, beta-pleated sheet with two opposite "walls" consisting of parallel strands of an
alpha-helix (a1 and a2 each contribute 4 strands of beta-pleated sheet and one alpha-
helix). A peptide about 8-10 amino acids long sits in the groove. Most of these peptides
found on MHC class I molecules are of host cell origin generated from the cleavage of
malfolded proteins or defective ribosomal products (DRiPs) (Princiotta et al. 2003).
However, endogenous polypeptides from the host cell, viral and/or intracellular bacteria
synthesized on the cell’s ribosomes are presented by MHC class I. Classically,
endogenous peptides are ubiquinated and subject to proteasomal degradation (Figure 4),
then transported into the lumen of the endoplasmic reticulum (ER) by the transporter

25
associated with antigen presentation or TAP. Loading of the resulting peptides involves
a calnexin, calreticulin and tapasin loading complex, along with an association with ß2m.
Following biosynthesis in the endoplasmic reticulum (ER) membrane, MHC
class I heavy chains associate with the soluble, small subunit ß2-microglobulin (ß2m) and
antigenic peptides of 8–11 amino acids. The assembly of these heterotrimeric complexes
is facilitated by the lectin- like chaperones calnexin and calreticulin, the thiol-dependent
oxidoreductase ERp57, and by the specialized chaperone tapasin that transiently bridges
MHC-I to the TAP peptide transporter (reviewed by Cresswell et al. 1999; Momburg
and Hengel 2002).
Cross-presentation of exogenous antigen is also facilitated by MHC class I
molecules loaded in phagosome compartments or macropinocytic vesicles once the
antigen is internalized through mechanisms of phagocytosis, receptor-mediated
endocytosis, pinocytosis and macropinocytosis (Norbury et al. 1995; Fonteneau et al.
2003) (See Figure 5). It has been showed that exogenous proteins could escape from
phagosomes and enter the cytosol (Guermonprez et al. 2003). Also cross-presentation
involves transport of exogenous proteins from the phagosome into the cytosol, where
these could join the pathway used to process endogenous antigens. This was supported
by data showing cross-presentation depends on two components of the MHC class I
pathway — the proteasome complex and the 'transporter associated with antigen
presentation' (TAP). The proteasome complex degrades proteins in the cytosol and TAP
shuttles the resulting peptide antigens into the ER for loading onto MHC class I
molecules. After exogenous proteins are exported from the phagosome through the
Sec61 channel, they are degraded by the proteasome and resulting peptide antigens are
shuttled back into the phagosome by TAP and loaded onto MHC class I molecules on
the inside of the phagosome membrane (Houde 2003).
Cross-presentation in dendritic cells occurs in a specialized, self-sufficient, ER–
phagosome mix compartment (Guermonprez et al. 2003) confirming earlier observations
that the phagosome is a fully competent antigen-processing compartment for the MHC
class I pathway (Schmitz et al. 2000). If TAP is blocked in dendritic cells there is a 60%
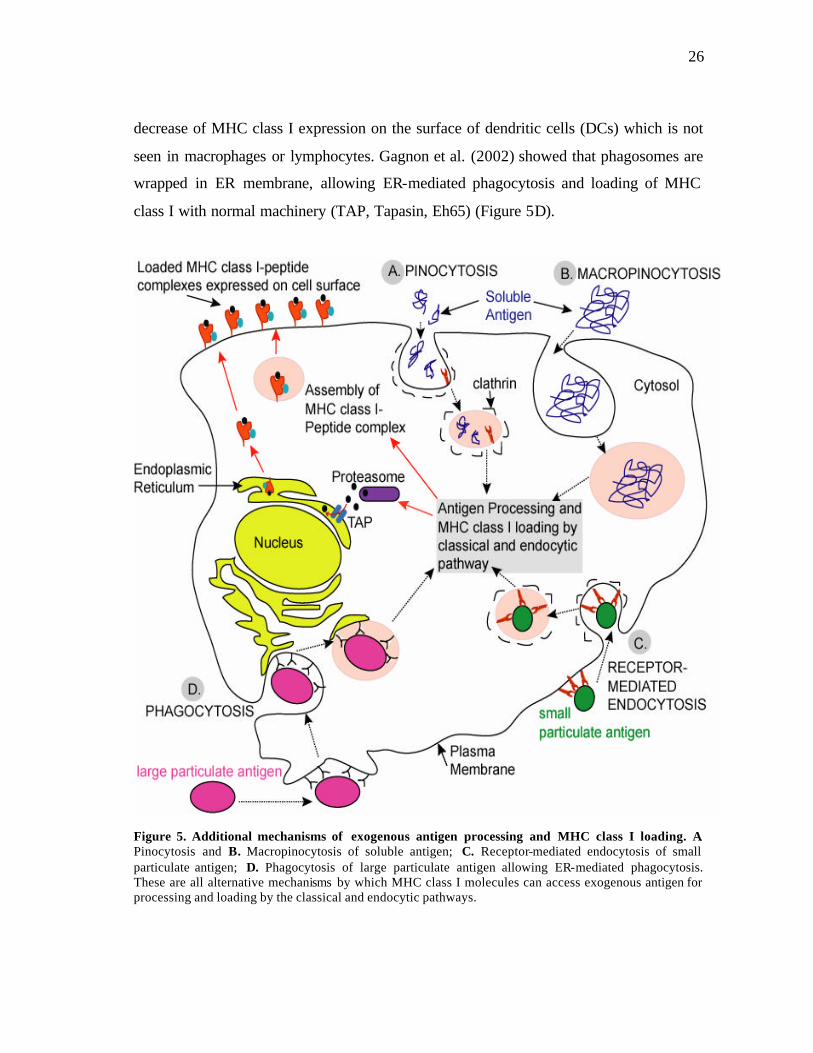
26
decrease of MHC class I expression on the surface of dendritic cells (DCs) which is not
seen in macrophages or lymphocytes. Gagnon et al. (2002) showed that phagosomes are
wrapped in ER membrane, allowing ER-mediated phagocytosis and loading of MHC
class I with normal machinery (TAP, Tapasin, Eh65) (Figure 5D).
Figure 5. Additional mechanisms of exogenous antigen processing and MHC class I loading. A. Pinocytosis and B. Macropinocytosis of soluble antigen; C. Receptor-mediated endocytosis of small particulate antigen; D. Phagocytosis of large particulate antigen allowing ER-mediated phagocytosis. These are all alternative mechanisms by which MHC class I molecules can access exogenous antigen for processing and loading by the classical and endocytic pathways.
27
The class Ia loci or classical class I loci are typically highly polymorphic; they
are expressed in all nucleated somatic cells and function to present peptides to cytotoxic
T cells. The class Ia loci are characterized by an enhanced rate of nonsynonymous
nucleotide substitution in the ARS codons, indicating that polymorphism at these loci is
selectively maintained. For any given MHC molecule, binding of a peptide usually
requires the peptide to have one or more specific amino acids at a fixed position,
frequently the terminal or penultimate amino acid of the peptide. Binding of the specific
amino acid in the groove of the MHC molecule occurs in the anchor site(s). The other
amino acids can be variable so that each MHC molecule can bind many different
peptides. Other polymorphic residues of the MHC molecule are those in contact with the
T cell receptor (TCR), which interacts with both peptide and the MHC molecule itself.
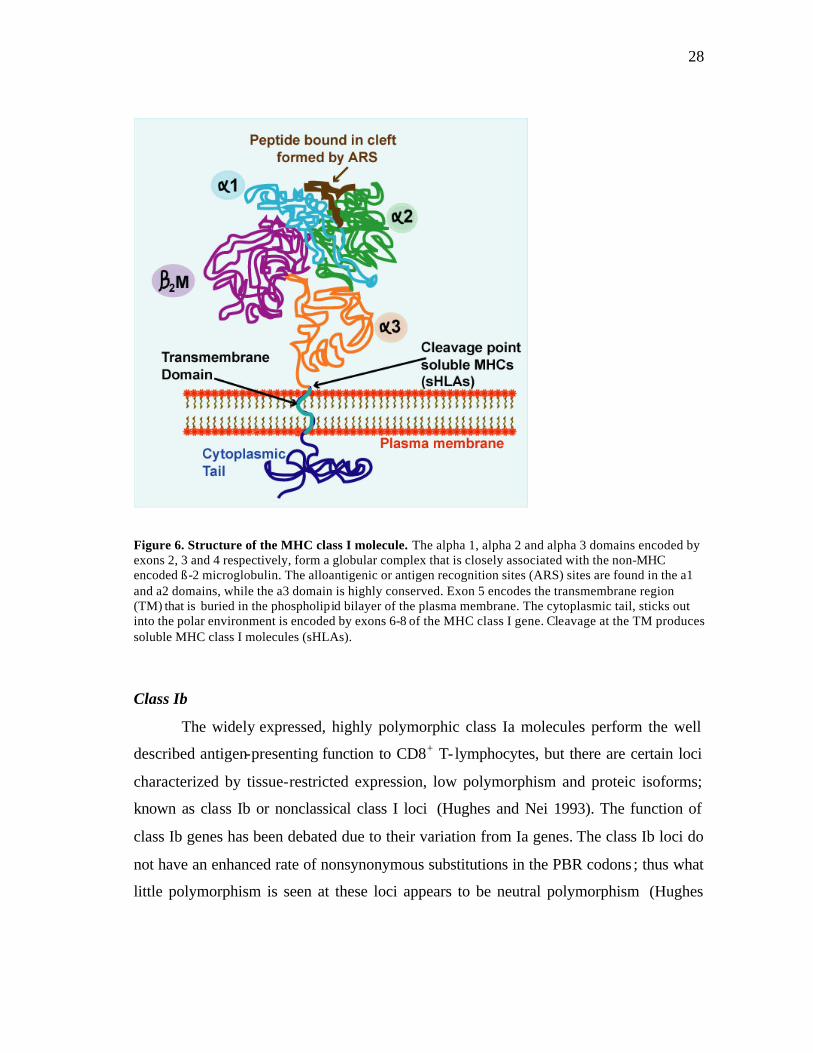
The a3 segment that is highly conserved and is homologous to Ig constant
domains is non-covalently bound to ß2 microglobulin, an invariant molecule (non-
encoded by MHC genes), also homologous to Ig constant domains. These two interact
with a1 and a2 to maintain their proper conformation. The importance of the highly
conserved region of a3 is that CD8, a molecule expressed on cytolytic T cells that
recognize class I MHC molecules, binds to this region. There is also a transmembrane
region consisting of a stretch of ~25 hydrophobic amino acids and a cytoplasmic region
(30aa) with a carboxyl terminal group containing phosphorylation sites and provides
binding sites for cytoskeletal elements. (See Figure 6). The greatest variability in amino
acids occurs in the a1 and a2 sequences forming the groove or cleft that interacts with
amino acids in the peptide fragment (Bluestone et al. 1992). Thus, the polymorphism
among class I MHC gene products creates variation in the chemical surface of the
peptide-binding groove formed by the antigen-recognition sites (ARS) of a1 and a2
regions of the class I molecule.
28
Figure 6. Structure of the MHC class I molecule. The alpha 1, alpha 2 and alpha 3 domains encoded by exons 2, 3 and 4 respectively, form a globular complex that is closely associated with the non-MHC encoded ß-2 microglobulin. The alloantigenic or antigen recognition sites (ARS) sites are found in the a1 and a2 domains, while the a3 domain is highly conserved. Exon 5 encodes the transmembrane region (TM) that is buried in the phospholipid bilayer of the plasma membrane. The cytoplasmic tail, sticks out into the polar environment is encoded by exons 6-8 of the MHC class I gene. Cleavage at the TM produces soluble MHC class I molecules (sHLAs). Class Ib
The widely expressed, highly polymorphic class Ia molecules perform the well
described antigen-presenting function to CD8+ T- lymphocytes, but there are certain loci
characterized by tissue-restricted expression, low polymorphism and proteic isoforms;
known as class Ib or nonclassical class I loci (Hughes and Nei 1993). The function of
class Ib genes has been debated due to their variation from Ia genes. The class Ib loci do
not have an enhanced rate of nonsynonymous substitutions in the PBR codons ; thus what
little polymorphism is seen at these loci appears to be neutral polymorphism (Hughes
29
and Nei 1989). However, since they are less polymorphic they can associate with
receptors that are less prone to genetic variation (Braud et al. 1999).
Natural killer (NK) cells are an essential component of the innate immunity
toward tumors and virally infected cells. While the activity of NK cells is regulated by
signals from activating and inhibitory receptors, the function of cytotoxic T cells requires
engagement of the clonotype-specific TCR by cognate Ag (Lanier 2000). Despite this
fundamental difference, NK cells and CTLs share receptor/ligand systems involved in
initiation and regulation of cellular immunity. These signals are mediated by NK cell
receptors that bind either classical MHC class I molecules or their structural relatives
such as non-classical MICA, ULBP, RAE-1, and H-60. Two separate families of NK cell
receptors have been identified: the immunoglobulin- like family (KIR, LIR) and C-type
lectin- like family (Ly49, NKG2D, and CD94/NKG2). The latter, Ly49 C-type lectin- like
proteins have been shown to interact with MHC class I molecules as determined by co-
crystal structure of Ly49A/H-2Dd and Ly49C/H-2Kb (Dimasi et al. 2004) .
One mouse nonclassical class Ib gene encodes the protein Qa-1, the dominant
ligand for CD94/NKG2 signaling receptors, which are expressed on a large fraction of
NK cells and a subpopulation of CD8+ T cells (Moser et al. 2002; Vance et al. 1998).
Expression of Qa-1/Qdm complexes on target cells inhibits killing by CD94/NKG2A+
NK cells. The CD94/NKG2 MHC class Ib recognition system appears to have an ancient
origin in evolution because a homologous system is present in humans (Kambayashi et
al. 2004). Human CD94/NKG2 receptors recognize the HLA class Ib molecule HLA-E
(Braud et al. 1998), which although not a clear homologue of Qa-1 based on overall
amino acid sequence comparison, share substitutions at the same residues that allow
similar selective binding to MHC class Ia leader derived peptides.
Associations of several class Ib molecules with ligands that are less prone to
variation has been well-documented. H2-M3 selectively binds to peptides with N-
formyl-methionine residues and HLA-E and its functional homologues in mouse (H2-
Qa1) and rat (RT-BM1) has been shown to associate with sequences derived from MHC
class Ia leader peptides (reviewed by Lau et al. 2003). NK cells recognize several HLA
30
class Ib molecules employing both immunoglobulin- like (Ig- like) and C-type lectin
receptors. The CD94/NKG2 and NKG2D lectin- like molecules, respectively, interact
with HLA-E and MICA; CD94/NKG2A functions as an inhibitory receptor, while
CD94/NKG2C and NKG2D trigger NK cell activity. HLA-E predominantly presents
nonamers from the leader sequences of other class I molecules (Lopez-Botet et al. 2000).
The HLA class Ib gene product HLA-G regulates immune responses as it binds
different receptors expressed on NK cells, T cells and myeloid cells. HLA-G1 can inhibit
NK- and T-cell-mediated lysis of target cells by its interaction with the inhibitory
receptors ILT2 and ILT4. The indirect recognition of HLA-G as peptide presented by
HLA-E and recognized by the CD94/NKG2 receptor family might help the immune
system battle tumor cells (Hofmeister and Weiss 2003). A peptide derived from HLA-
G1 constitutes the highest affinity ligand for both CD94/NKG2 receptors. In addition to
their classical antigen-presenting role, HLA class I proteins are recognised by members
of the killer immunoglobulin receptor (KIR) and leukocyte immunoglobulin- like
receptor (LILR/ILT/LIR) families. Members of the Ig- like transcript (ILT) or leucocyte
Ig- like receptor (LIR) family (ILT2 or LIR-1 and ILT4 or LIR-2), expressed by other
leucocyte lineages, interact with a broad spectrum of HLA class Ia molecules and HLA-
G1. Among Ig- like KIRs, the KIR2DL4 (p49) receptor has been shown to specifically
recognize HLA-G1; this molecule displays an unusual hybrid structure, sharing features
with inhibitory and triggering KIRs (Lopez-Botet et al. 2000).
The expression of HLA-G by invading trophoblasts suggests a role for this
molecule in embryo implantation but this issue is under continuous debate. Recently,
van de Meer et al. (2004) showed that HLA-G1+ APCs are immunoinhibitory cells that
by their local action, might be involved in the suppression of immune responses and by
their long-term effects, inefficient immune escape or tolerance. Depending on
physiopathological status, HLA-G+ APCs might act either as a help to boost or be a
threat to eliminate. Similar function for class Ib encoded molecules have not been found
in other species to date.
31
It is widely believed that HLA-G and Qa-2 (its mouse homolog) protect the fetus
from rejection by maternal natural killer cells during implantation and placentation
(Comiskey et al. 2003; Warner et al. 2002), and are thought to be functional homologs as
a result of convergent evolution (Beck and Trowsdale 2000). Recently, the mRNA
expression pattern of the Ped gene in cattle was associated with embryos of higher
quality in bovine preimplantation development, and was associated with differential
expression of an MHC class I gene (422.1) (Fair et al. 2004). Since Ped is the gene
product of Qa-2, it was concluded that a homolog of the murine and human Ped, a non-
classical class Ib, is functional in bovids.
Class Ib molecules are thus recognized by a wide variety of receptors, not only
aß TCRs, but ?d TCRs and a variety of inhibitory or activatory receptors present on NK
cells, NKT cells and cells of the monocytic/macrophagic lineage (Allan et al. 1999;
Colonna et al. 1998). It seems that while class Ia molecules inhibit NK lysis, class Ib
molecules may have a more complex role in either activating or inhibiting an immune
response.
Soluble MHC class I molecules
Soluble MHC class I molecules (sHLA) can be produced from proteolytic
cleavage or by alternative splicing of several MHC class I genes. Up to 3 species of
sHLA has been found in serum from normal humans, with mw of 44,000, 40,000, and
35–37,000 kDa (McDonald and Adamashvili 1998). The sHLA recovered at mw 44,000
disassociated into a 33,000 mw component which contained the HLA specificity and an
11,000 mw component which was ß2m. It has been postulated that these sHLAs can play
an immunomodulary role (McDonald and Adamashvili 1998).
In transplantation studies, sHLAs released from hepatocytes and the passenger
leukocyte population of the liver allograft have been considered as important
contributors for spontaneous liver tolerance upon allogeneic transplantation into fully
MHC-mismatched hosts (Dresske et al. 2002). The mechanisms of this natural liver-
related tolerance phenomenon have not been completely evaluated in detail. These
32
include the production of donor-strain soluble MHC class I antigens by the transplanted
liver (Sriwatanawongsa et al. 1995). In a related study, Piazza and associates found that
kidney transplant recipients whose serum contained anti-HLA antibody obscured by
donor sHLA had the same incidence of acute rejection as those who had no anti-HLA
antibody, while those who had antibody excess had almost five times the incidence of
acute rejection (Piazza et al. 1993). However, it is necessary to distinguish sHLA of
donor origin from that of recipient origin and studies are largely observational, perhaps
because of the difficulty in studying soluble allotypes without specific antibodies.
Because of the statistically significant association with clinical parameters, the
level of sHLA-I antigens has been suggested to represent a useful marker to predict the
evolution of viral infections and to monitor the clinical course of allografts. Elevated
levels of functional sHLA-I and soluble Fas-ligand molecules have been detected in
blood components and are postulated to play a role in the immunomodulatory effect of
autologous and allogeneic transfusions (Zavazava 1998).
In humans, sHLA levels in autoimmune disease, cancer and viral infections have
shown a correlation of elevated sHLA levels with disease activity in part due to its
interference with NK and CTL activity (Bresciani et al. 1998; Contini et al. 2000; Filaci
et al. 1997; Filaci et al. 1995; Ghio et al. 1999; Ghio et al. 2000; Migliaresi et al. 2000;
Puppo et al. 2000; Puppo et al. 1998). Several soluble forms of HLA encoded molecules
are also noted to have effects in viral and autoimmune disease. In patients with
ankylosing spondylitis, there was a high level of surface expression of free heavy chains
in monocytes and surface free heavy chains of HLA-B27 are considered as potential
disease-causing molecules (Tsai et al. 2002). HLA-G harbors several structural
characteristics, including the transcription of different membrane-bound and soluble
isoforms, a unique promoter region and a truncated cytoplasmic tail. HLA-G molecules
bind intracellular processed nonamer peptides (Diehl et al. 1996; Ishitani et al. 2003; Lee
et al. 1995) and can serve as a restriction element for HCMV-derived peptides in
transgenic mice (Lenfant et al. 2003), suggesting that HLA-G may play a role in the
immune response against viral infections in the absence of classical MHC molecules.
33
HLA-G is also the ligand of several triggering or inhibitory receptors on natural killer
(NK) cells (Lanier 1999) that could protect trophoblast cells from maternal NK lysis
and/or also promote cytokine secretion important for the placentation (Croy et al. 2003).
Secreted HLA-G5 can also bind CD8 and induces Fas/Fas ligand-mediated apoptosis in
activated CD8+ lymphocytes (Hofmeister and Weiss 2003).
When the MHC class I heavy chains (HC) are unable to assemble properly
(absence of ß2m or peptides) misfolded HCs are removed from the ER by dislocation to
the cytosol where they are subsequently degraded by the proteasome (Hughes and
Yeager 1997). This physiological process is co-opted by the human cytomegaloviral
proteins US2 and US11 that target HC for ER dislocation probably in order to subvert
antiviral CTL responses (Wiertz et al. 1996a; Wiertz et al. 1996b). At this point the
cleaved HC is treated like many other secreted or membrane- integrated ER proteins
(reviewed by Tsai et al. 2002), and dislocation of misfolded HC involves the translocon
as indicated by co-precipitation of HC en route to degradation with the translocon
subunit Sec61 (Wiertz et al. 1996a).
For example, sera of leukemia patients, but not of healthy donors, contained
elevated levels of soluble MICA (sMICA) and reduction of leukemia MIC surface
expression by shedding may impair NKG2D-mediated immune surveillance of
leukemias; so much so that determination of sMICA and sMICB levels may be
implemented as a prognostic parameter in patients with hematopoietic malignancies
(Salih et al. 2003) There is also a significant correlation of MIC heavy chain shedding
and deficiency in NK cell function with the grade of disease in prostate cancer (Wu et al.
2004).
Unusual properties of HLA-B27 include an ability of free heavy chains (FHC) to
reach the cell surface in the absence of ß2m and to maintain their peptide-binding groove
in vitro (Allen and Trowsdale 2004). The recognition of HLA-B27 in both the classical
ß2m- associated and ß2m- independent forms by members of the KIR and LILR families
could influence the function of cells from both innate and adaptive immune systems, and
34
may indicate a role for various leukocyte populations in HLA-B27-associated
inflammatory disease.
There is a body of work which establishes that the MHC determines the unique
odor of each individual. Kalmus (1955) observed that dogs had difficulty distinguishing
odors of identical twins. Subsequently, the association between the MHC-linked OR
region in determining body odour associated with mate selection,, familial relatedness
and maternal protection was defined in mice and humans (Amadou et al. 2003; Eggert et
al. 1998a; Eggert et al. 1998b; Hurst et al. 2001; Younger et al. 2001; Ziegler et al. 2002)
It seems likely that these odortypes are determined by soluble MHC antigens or their
catabolic products, but this remains unproven.
Pseudogenes
The class I and II regions contain many pseudogenes, with more than half of the
genes in the class I thought to be nonfunctional. Novel gene families in both regions
seemed to have been created by duplication events followed by divergence (Shiina
1999a). Pseudogenes may not be redundant if they played a role in generating new
alleles by gene conversion. The HLA class III region is extremely gene dense with an
expressed gene every 15 kb, and contains no pseudogenes except in haplotypes with C4
duplicated regions in its span of 800kb (The MHC Consortium 1999).
Although it was thought that pseudogenes are genomic fossils or defunct
remnants of previously functional genes, a functional role for the makorin1 pseudogene
“noncoding” RNA has been reported (Hirotsune 2003). Although 2-3% of human
processed pseudogenes are expressed, interestingly, the mouse has a much smaller
proportion of expressed pseudogenes (0.5-1%) (Yano et al. 2004). Since pseudogenes
are functionally less constrained, and have accumulated more mutations than translated
genes which allows for more rapid functional diversification than protein-coding genes
in gene regulation.
Pseudogene sequences are not translated to protein as a result of the presence of
stop codons, alterations in RNA splicing signals, or the loss of one or more exons. In the
35
HLA, the HLA-BEL and HLA-Y pseudogenes lack all of exon 3 because of a
recombination event fusing introns 2 and 3 (Williams et al. 1999). HLA-COQ and HLA-
DEL are two other HLA-A associated pseudogenes with sequence homology to both
gorilla and human MHCs (Coquillard et al. 2004). This dual species sequence homology
to human and other primates is an unusual genetic characteristic, indicating a trans-
species polymorphism within pseudogenes that may be found in the MHC class I genes
of other closely related species.
Evolution of the MHC
Origin of the MHC and putative ancestral “proto-MHC”: evidence from paralogous
and orthologous regions
The components of the adaptive immune system, including the MHC, appeared
early in vertebrate development, but have not been found in any invertebrates. The exact
order and time frame of events that shaped the MHC are still being debated, however the
genomes of all jawed vertebrates contain MHC class I/II, TCR (T cell receptor) and Ig
(immunoglobulin) genes leading to the assumption that the MHC developed after the
evolutionary split of jawed and jawless vertebrates (Kumanovics et al. 2003). Many
highly conserved anchor genes in the MHC class III region such as NOTCH 4, C4A and
B, tenascin, HSP70, BAT2, TNF family (LTA, LTB, TNFa ) have paralogous members
on different chromosomes in humans (found on chromosomes 6, 1, 9, and 19 in
humans) (Flajnik and Kasahara 2001), and synteny in mice, amphioxus and other species
(Kulski et al. 2002b).
The core of conserved synteny in jawed vertebrates supports the theory of
evolution by gene duplication first proposed by Susumu Ohno (1968) and later revisited
(Ohno 1999; Wolfe 2001), supports the existence of a “proto-MHC” in two ways. First,
there is evidence that several MHC genes (TUBB, TNXB, PBX2, NOTCH4, RXRB and
RPS18) form syntenic conserved blocks (without any class I/II genes) in amphioxus (a
protochordate) (Abi-Rached et al. 2002), as well as in C. elegans and Drosophila
36
(invertebrates) (Trachtulec et al. 1997). Secondly, Danchin et al. (2003) confirmed the
existence of a region of conserved synteny between the human MHC and a paralogous
region of 19 conserved genes in a Drosophila genomic region of less than 2 Mb.
These paralogous duplications may have resulted from either 'block' or genome
duplication events prior to and after the emergence of cartilaginous fishes. Duplicates of
VARS2, PBX2, NOTCH4, TAP2, PSMB X, RING3, COLIIA2 and RXRB can be found
on both 6p21.3 and 9q33-34, while HSPA1, C4 and TNX are inversely duplicated within
these same two chromosomal regions (Dawkins et al. 1999; Inoko et al. 1996; Kasahara
1997; Shiina 1999c). Some related regions are found at all four locations and to date, 30
gene families have been found in two, three or four of the locations (Kasahara 1999).
MHC class I, II, tapasin, RAGE, BTN and RFB30 share common ancestors as evidence
by a common IgC1 domain, and were probably derived from these ancestors by cis-
duplication and shuffling (Abi-Rached et al. 1999).
The MHC paralogous regions have several framework genes as well as
complement and cytokine genes and even a group of MHC class I- like genes with
specific function (the CD1 cluster on chromosome 1) which are representative of the
ancient set of genes present in the proto-MHC (Friedman and Hughes 2001). Abi-
Rached et al. (2002) identified 9 anchor genes in the paralogous human MHC regions in
Amphioxus . These syntenies were also reported for Fugu, zebrafish and trout (Clark et
al. 2001; Gongora et al. 1998; Hansen et al. 1999; Takami et al. 1997). Of note is that
one of the MHC paralogous regions (9q33-q34) retained the ancestral state in gene
organization, while the other paralogous regions on chromosomes 1 and 19 seem to
exhibit a substitution pattern that is under negative selection (Abi-Rached et al. 2002;
Vienne et al. 2003).
It is possible that the full- fledged adaptive immune system emerged only after
chromosomal duplication. Also, clustering of genes in an ancestral syntenic group and
linkage of MHC-encoded genes with copies in the paralogous regions may have
occurred by chance. It is also possible that linkage of such genes by chance could have
later allowed for selective advantages (e.g. linkage of LMP/PSMB7 to the MHC). No
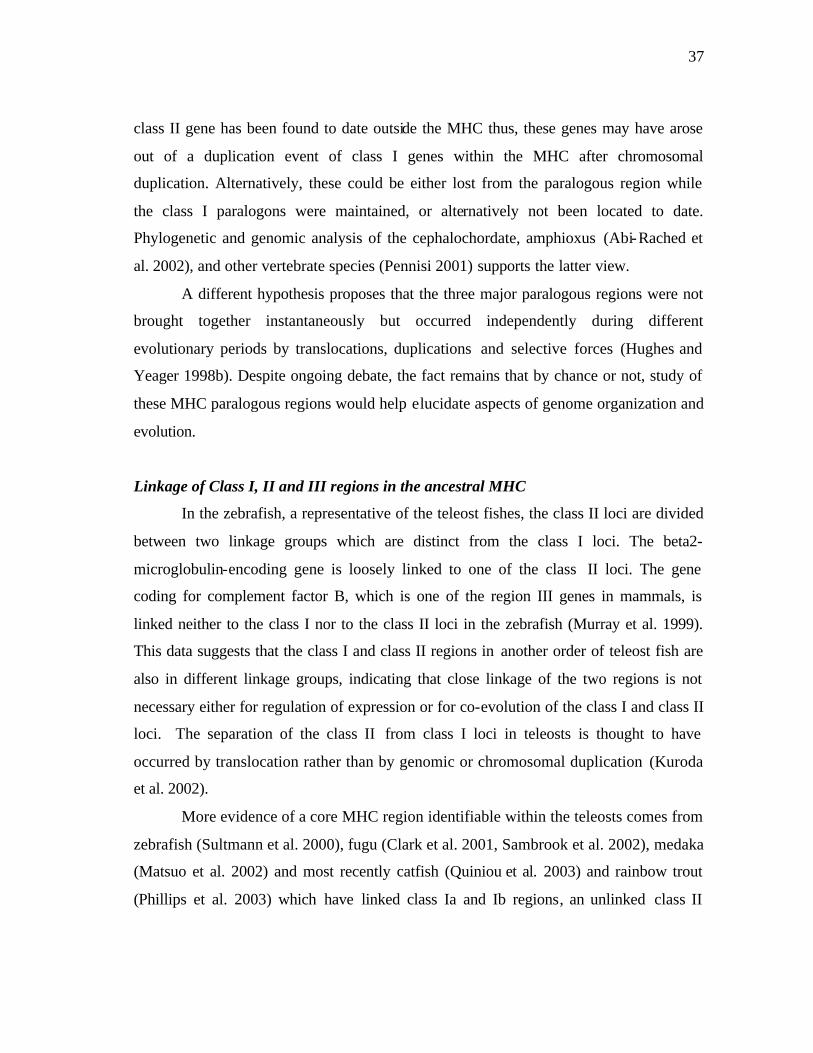
37
class II gene has been found to date outside the MHC thus, these genes may have arose
out of a duplication event of class I genes within the MHC after chromosomal
duplication. Alternatively, these could be either lost from the paralogous region while
the class I paralogons were maintained, or alternatively not been located to date.
Phylogenetic and genomic analysis of the cephalochordate, amphioxus (Abi-Rached et
al. 2002), and other vertebrate species (Pennisi 2001) supports the latter view.
A different hypothesis proposes that the three major paralogous regions were not
brought together instantaneously but occurred independently during different
evolutionary periods by translocations, duplications and selective forces (Hughes and
Yeager 1998b). Despite ongoing debate, the fact remains that by chance or not, study of
these MHC paralogous regions would help elucidate aspects of genome organization and
evolution.
Linkage of Class I, II and III regions in the ancestral MHC
In the zebrafish, a representative of the teleost fishes, the class II loci are divided
between two linkage groups which are distinct from the class I loci. The beta2-
microglobulin-encoding gene is loosely linked to one of the class II loci. The gene
coding for complement factor B, which is one of the region III genes in mammals, is
linked neither to the class I nor to the class II loci in the zebrafish (Murray et al. 1999).
This data suggests that the class I and class II regions in another order of teleost fish are
also in different linkage groups, indicating that close linkage of the two regions is not
necessary either for regulation of expression or for co-evolution of the class I and class II
loci. The separation of the class II from class I loci in teleosts is thought to have
occurred by translocation rather than by genomic or chromosomal duplication (Kuroda
et al. 2002).
More evidence of a core MHC region identifiable within the teleosts comes from
zebrafish (Sultmann et al. 2000), fugu (Clark et al. 2001, Sambrook et al. 2002), medaka
(Matsuo et al. 2002) and most recently catfish (Quiniou et al. 2003) and rainbow trout
(Phillips et al. 2003) which have linked class Ia and Ib regions, an unlinked class II
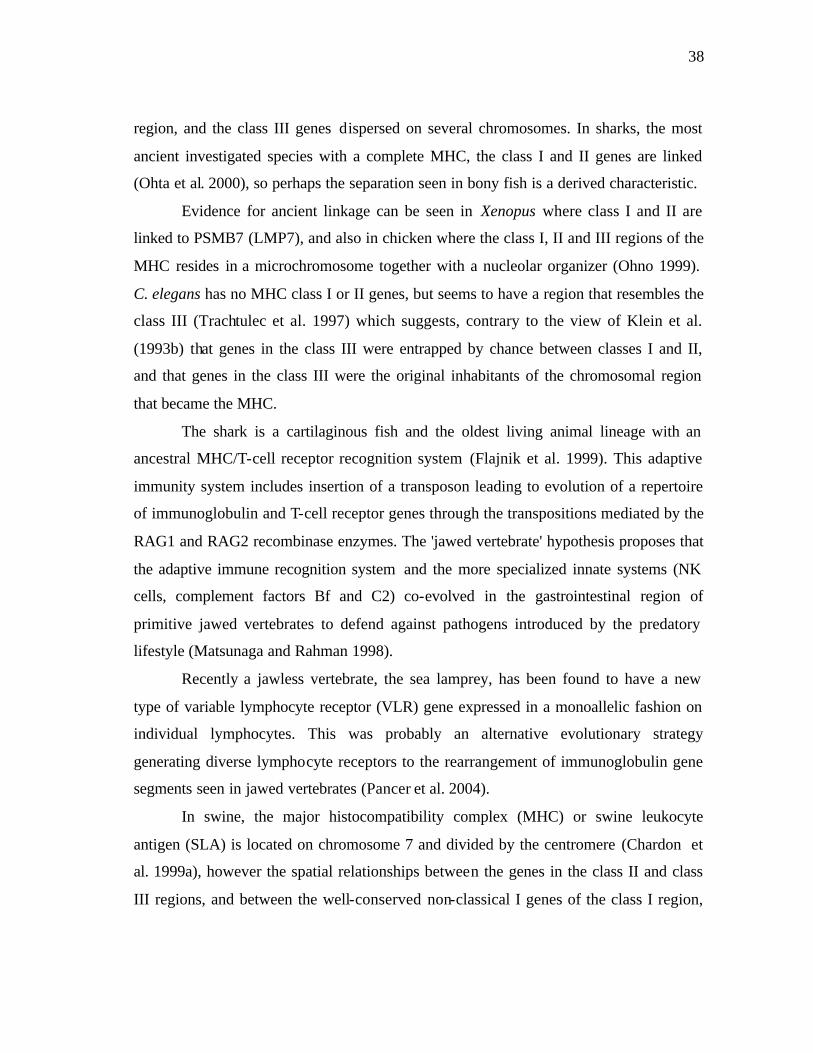
38
region, and the class III genes dispersed on several chromosomes. In sharks, the most
ancient investigated species with a complete MHC, the class I and II genes are linked
(Ohta et al. 2000), so perhaps the separation seen in bony fish is a derived characteristic.
Evidence for ancient linkage can be seen in Xenopus where class I and II are
linked to PSMB7 (LMP7), and also in chicken where the class I, II and III regions of the
MHC resides in a microchromosome together with a nucleolar organizer (Ohno 1999).
C. elegans has no MHC class I or II genes, but seems to have a region that resembles the
class III (Trachtulec et al. 1997) which suggests, contrary to the view of Klein et al.
(1993b) that genes in the class III were entrapped by chance between classes I and II,
and that genes in the class III were the original inhabitants of the chromosomal region
that became the MHC.
The shark is a cartilaginous fish and the oldest living animal lineage with an
ancestral MHC/T-cell receptor recognition system (Flajnik et al. 1999). This adaptive
immunity system includes insertion of a transposon leading to evolution of a repertoire
of immunoglobulin and T-cell receptor genes through the transpositions mediated by the
RAG1 and RAG2 recombinase enzymes. The 'jawed vertebrate' hypothesis proposes that
the adaptive immune recognition system and the more specialized innate systems (NK
cells, complement factors Bf and C2) co-evolved in the gastrointestinal region of
primitive jawed vertebrates to defend against pathogens introduced by the predatory
lifestyle (Matsunaga and Rahman 1998).
Recently a jawless vertebrate, the sea lamprey, has been found to have a new
type of variable lymphocyte receptor (VLR) gene expressed in a monoallelic fashion on
individual lymphocytes. This was probably an alternative evolutionary strategy
generating diverse lymphocyte receptors to the rearrangement of immunoglobulin gene
segments seen in jawed vertebrates (Pancer et al. 2004).
In swine, the major histocompatibility complex (MHC) or swine leukocyte
antigen (SLA) is located on chromosome 7 and divided by the centromere (Chardon et
al. 1999a), however the spatial relationships between the genes in the class II and class
III regions, and between the well-conserved non-classical I genes of the class I region,
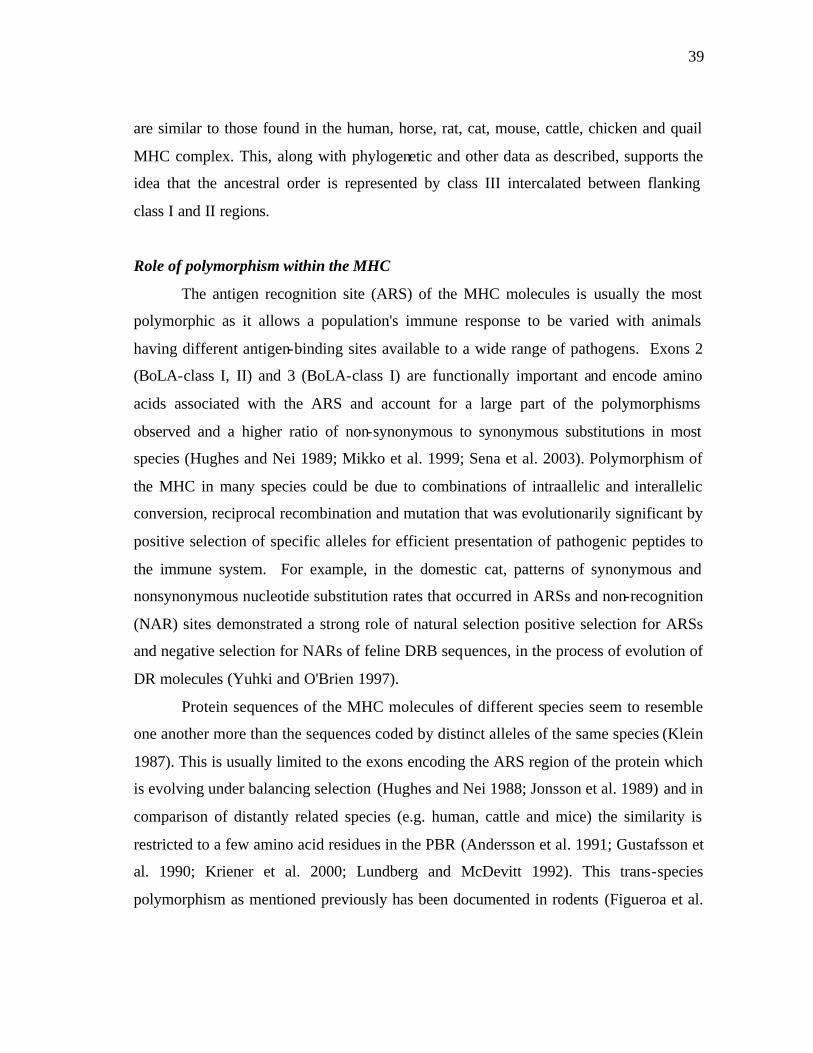
39
are similar to those found in the human, horse, rat, cat, mouse, cattle, chicken and quail
MHC complex. This, along with phylogenetic and other data as described, supports the
idea that the ancestral order is represented by class III intercalated between flanking
class I and II regions.
Role of polymorphism within the MHC
The antigen recognition site (ARS) of the MHC molecules is usually the most
polymorphic as it allows a population's immune response to be varied with animals
having different antigen-binding sites available to a wide range of pathogens. Exons 2
(BoLA-class I, II) and 3 (BoLA-class I) are functionally important and encode amino
acids associated with the ARS and account for a large part of the polymorphisms
observed and a higher ratio of non-synonymous to synonymous substitutions in most
species (Hughes and Nei 1989; Mikko et al. 1999; Sena et al. 2003). Polymorphism of
the MHC in many species could be due to combinations of intraallelic and interallelic
conversion, reciprocal recombination and mutation that was evolutionarily significant by
positive selection of specific alleles for efficient presentation of pathogenic peptides to
the immune system. For example, in the domestic cat, patterns of synonymous and
nonsynonymous nucleotide substitution rates that occurred in ARSs and non-recognition
(NAR) sites demonstrated a strong role of natural selection positive selection for ARSs
and negative selection for NARs of feline DRB sequences, in the process of evolution of
DR molecules (Yuhki and O'Brien 1997).
Protein sequences of the MHC molecules of different species seem to resemble
one another more than the sequences coded by distinct alleles of the same species (Klein
1987). This is usually limited to the exons encoding the ARS region of the protein which
is evolving under balancing selection (Hughes and Nei 1988; Jonsson et al. 1989) and in
comparison of distantly related species (e.g. human, cattle and mice) the similarity is
restricted to a few amino acid residues in the PBR (Andersson et al. 1991; Gustafsson et
al. 1990; Kriener et al. 2000; Lundberg and McDevitt 1992). This trans-species
polymorphism as mentioned previously has been documented in rodents (Figueroa et al.
40
1988), primates (Lawlor et al. 1988) and other vertebrates (Graser et al. 1996). This
phenomenon has been suggested to be a result of either direct descent (Lundberg and
McDevitt 1992), convergent evolution (Gustafsson and Andersson 1994) or by chance.
MHC polymorphism is generated initially by point mutations, then by gene
conversion that shuffles short DNA sequences between alleles or loci (Parham 1989;
Parham 1995; Ohta 1998). An important feature of the evolution of the MHC is that
some allelic lineages are older than the species themselves as allelic lineages and loci are
preserved during the evolutionary history of a particular taxon and may predate
speciation (Figueroa et al. 1994; Kuhner et al. 1991; Lawlor et al. 1988; Lawlor et al.
1990; Zemmour et al. 1990). Duplication of functional genes may have allowed for
mutations to take place in the non-functional duplicate at a rate consistent with
evolutionary requirements based on selective pressures.
In humans, certain classic MHC genes (e.g., HLA-A, HLA-B, HLA-C, HLA-DR,
HLA-DQ) are among the most polymorphic in the genome (The MHC Sequencing
Consortium 1999), and appear to be maintained by some form of balancing selection
(Hughes and Nei 1988; Hughes and Nei 1989; Takahata and Nei 1990; Takahata et al.
1992). This elevated level of polymorphism is thought to be due to exposure to a large
variety of pathogens, pathogenic mutability, and the result of co-evolutionary arms races
between hosts and parasites.
The Red Queen Hypothesis (Penn and Potts 1999) proposes that an organism’s
immune defenses will have to constantly face evolving pathogens, thus the genetic
diversity seen in the MHC was developed in part to deal with this constant race for
domination. This is evident in studies on MHC class I evolution in great apes and Old
World/New World primates and SIV, where the role of MHC class I alleles in selecting
for new populations of viruses was seen (Vogel et al. 1999). The effect of rhesus MHC
class I molecules on the evolution of SIV has also been described (O'Connor et al. 2003),
and selection pressure conferred by HLA molecules is thought to be responsible for
specific genetic variation in HIV-1 as reviewed by Carrington et al. (2002). These
41
studies provide evidence that pathogens co-evolve with the MHC class I molecules they
encounter in a population.
A high diversity (2-7%) found in the classical class I region between the
chimpanzee and human is due to balancing selection and a hitchhiking effect required
for maintaining polymorphisms. Conversely, the low level of diversity (average
nucleotide difference of 0.9%) found within the nonclassical HLA-G region (35 kb) for
example, is due probably to functional constraints and negative selection acting to
eliminate polymorphisms. The nonclassical HLA-E and -F regions were intermediate
between HLA-G and the classical class I genes in sequence diversity ( 2%). Human and
chimpanzee MHC class I diversity profile resembles the peaks and troughs observed
previously between different human genomic sequences of varying haplotypes (as
reviewed by Kulski et al. 2002b).
Evolutionarily, class Ib loci are odd in that they do not show orthologous
relationships between mammals of different orders, thus these loci may have arisen
independently in different mammalian lineages (Hughes and Nei 1989). Class Ib loci
may have evolved by duplication of class Ia loci followed by a change in expression
pattern due to mutation in the promoter region, thus do not represent mutually exclusive
groups over evolutionary time. This is apparent in that the class Ia genes of New World
primates are homologous to the human class Ib locus HLA-G (Cadavid et al. 1997) and
may be a locus in the common ancestor of New World monkeys and Old World
monkeys, apes, and hominids, but in the former duplicated to form separate class Ia loci.
In spite of the independent origin of class Ib loci in different mammals, there is evidence
that they can evolve similar functions convergently. For example the class Ib HLA-E
molecule of humans and other primates has convergently evolved features of the PBR
that are similar to those of the mouse class Ib molecule H2-Qa-1a, and there is evidence
that these molecules may bind similar peptides (Hughes and Yeager 1998b; Yeager et al.
1997).
Chardon et al. (2001) confirmed that all class I-related genes and two MIC genes
between TNFA-BAT1 and POU5F1 genes in swine MHC (SLA), demonstrate an
42
organizational similarity to human and mouse MHC class I genes and class I-derived
genes. In humans, this interval contained the classical functional HLA-B and HLA-C
loci and the functional MICA and MICB loci (The MHC consortium 1999). In mice, this
interval contained classical class Ia and class Ib genes but no MIC genes, which are not
present in the mouse genome (Amadou et al. 1999). The SLA class Ia genes were
located in a second orthologous swine segment which was also common to humans and
mice and was located between the genes HSR1 and RBF30 (Chardon et al. 2001).
In humans, over 30 class I-related and MIC genes and fragments exist in a third
segment situated between HTEX4 and MOG (kappa block). The corresponding
orthologous region contains only 2 H2 class I-related genes in mice, and only 5 RT1
class I genes in rat (Hurt et al. 2004). No class I or MIC genes have been found in the
interval between the TCTEX4 (orthologue of HTEX4) and MOG genes in pig (Renard et
al. 2001) or in the preliminary data for the horse (Gustafson et al. 2003). The existence
of class I and class I-related sequences in orthologous segments in distantly related
species argues in favour of existence of common class I ancestors in these regions before
mammal speciation. However, the differences in number of duplications and post-
speciation recombination events clearly differs from species to species, with some class I
genes heavily duplicated and others removed in the relative class I blocks.
More evidence comes from the introns flanking the polymorphic exons of the
human MHC class I loci HLA-A, -B, and -C genes. These introns have been relatively
conserved and have become locus-specific apparently as a result of recombination and
subsequent genetic drift, leading to homogenization within loci over evolutionary time.
Thus, HLA class I genes have been shaped by contrasting evolutionary forces
maintaining polymorphism in the exons and leading to conservation in the introns
(Cereb et al. 1997).
O'hUigin et al. (2000) postulated that balancing selection driving polymorphism
at HLA-B is of sufficient magnitude to explain the nucleotide diversity found at the
adjacent neutral regions. Evidence suggests that linkage to HLA-B is the main factor that
maintains polymorphisms in adjacent regions and there is little or no evidence for any
43
strong influence of another locus under balancing selection in the interval. The extent of
nucleotide diversity at these regions does not appear to be compatible with a high level
of recombination at HLA-B (O'hUigin et al. 2000). The authors showed the effects of
selection from HLA-B to TNF, some 200 kb away from HLA-B, where the diversity is
double that found at other neutral loci.
The high degree of linkage disequilibrium seen in neutral polymorphisms appears
to favor the view that HLA-B evolved in a manner reflecting "frozen haplotypes" rather
than the recombination hotspot models (Klein 1991). This mode of evolution may be
common among MHC loci. Preliminary data on class II polymorphisms indicate that at
the HLA-DQB1 locus, as at the HLA-B locus, adjacent neutral regions show a higher
than expected level of neutral polymorphism (Horton et al. 1998). According to this
view, the MHC is evolving in a conserved fashion, without high levels of mutation or
recombination, but simply by the accumulation of polymorphism over long time periods
under balancing selection. It is more likely that various MHC loci are under different
influences, the combination of which creates the diversity seen today.
Role of retroviral sequences
Human endogenous retroviral sequences (HERVs) are present in high density
within polymorphic a and ß blocks of MHC (Kulski et al. 1999c). An ancient
preduplication segment containing a HLA and PERB11 gene, an endogenous retrovirus
(HERV-16), suggests that the latter have played a major role in duplication and indel
events leading to the present organization of PERB11 and HLA class I genes.
Examination of flanking sequences suggests that HERV-I and HERV-L had occurred by
insertion into ancient L1 fragments. This study has revealed that the alpha- and beta-
block region within the MHC is rich in HERV sequences occurring at a much higher
ratio (10 to 1) than normally observed in the human genome (Kulski et al. 1999b). The
P5-1 genomic sequence appears to be an example of an HERV within the MHC that
expresses an antisense transcript with a possible role in immunity to retrovirus infection
(Kulski et al. 1999a).
44
A coevolutionary model premised on tandem duplication of single and
multipartite genomic segments has been used to explain the origins and genomic
organization of retroelements, HERV-16, DNA transposons, PERB11, and HLA class I
genes as distinct segmental combinations within the alpha- and beta-blocks of the human
MHC (Kulski et al. 1999c). This model proposes that HERV’s play a role in generating
and localizing the process (Kulski et al. 1999b). This is functionally exemplified by
large deletions within the HERV/PERV containing homologous HLA class 1 ß block in
other species, for example there is only one single hybrid chimpanzee MIC gene (a mix
of MICA and B HLA genes) in a segment of the MHC genetically linked to species-
specific handling of several viral infections (HIV/SIV, hepatitis B and C) as well as
susceptibility to various autoimmune diseases (Anzai et al. 2003).
Dawkins et al. (1999) proposes several models where homologous
recombinations between two HERVs could result in deletion of intervening DNA and in
the association of genes, or deletion/inversion of segments, or even reintegration of
deleted segments and the HERV allowing for duplication. These models, although
speculative, may corroborate with phenomena such as innate protection from re-
infection with retroviruses, rapid development of protective polymorphism and even
advantage/dominance of one species over the other due to its ability to survive infection.
Occurrence of MHC genes through “birth and death” process
These studies show that all jawed vertebrates possess MHC class I and II genes
and that the function of the genes and conserved proteins seem to be conserved.
However, this conservation remains despite the fact that there is no shared class I
lineages among mammals for instance (except within the same orders) and that class II
gene clusters (except DM genes) are not shared by mammals, birds, frogs and bony and
cartilaginous fishes (Kumanovics et al. 2003). This is best explained by a single
ancestral gene expanding through serial duplications or births, being changed by
mutation and contracted by deletions or deaths; which is commonly called the “birth and
death” process (Nei et al. 1997). The predecessor of a new lineage can be created by an
45
initial contraction leading to a single gene acting as an ancestor for subsequent
expansions and contractions.
Birth and death, also called the accordion model of MHC evolution (Klein 1998),
is supported by phylogenetic evidence of vertebrate class I and II genes as outlined in
Nei et al. (1997). Birth and death evolution is a form of species-specific independent
evolution and assumes that new genes are created by repeated gene duplication and
divergence and that some duplicate genes may remain in the genome for a long time
whereas others may be deleted or become non-functional pseudogenes. A number of
authors have studied the evolution of multigene families from this perspective and have
shown that this model of evolution can explain most multigene families concerned with
immune and antigenic systems, including the MHC (Ota 1994).
Allelic lineages within the MHC
Insertions or deletions of DNA sequences are important genetic markers to define
ancestral polymorphisms. Coupled with single nucleotide polymorphism (SNP) analysis,
these tools have been used to assign allelic lineages and study evolutionary relationships.
Chen et al. (1992) reported that the MHC class I (HLA) C locus is present only in
humans and apes, generated by gene duplication in a common ancestor. While in the
class II region of cattle and sheep, the gene cluster (DY/DI) is only observed in pecoran
arteriodactyls (Trowsdale 1995). Also there is a chromosomal inversion within the class
II region of the bovine MHC or BoLA (Band et al. 1998; McShane et al. 2001) (See
figure 7). Kuroda et al. (2002) also reported a translocation event in Zebrafish as the
hypothesized cause of the separation of class II from class I loci rather than genomic or
chromosomal duplication.
The evolution of the MHC seems to be is subject to both trans-species
polymorphism and convergent evolution. Some allelic lineages and loci are preserved
during the evolutionary history of a particular taxon and may predate speciation
(Figueroa et al. 1994; Lawlor et al. 1988; Zemmour et al. 1990). Duplication of
functional genes may have allowed for mutations to take place in the non-functional
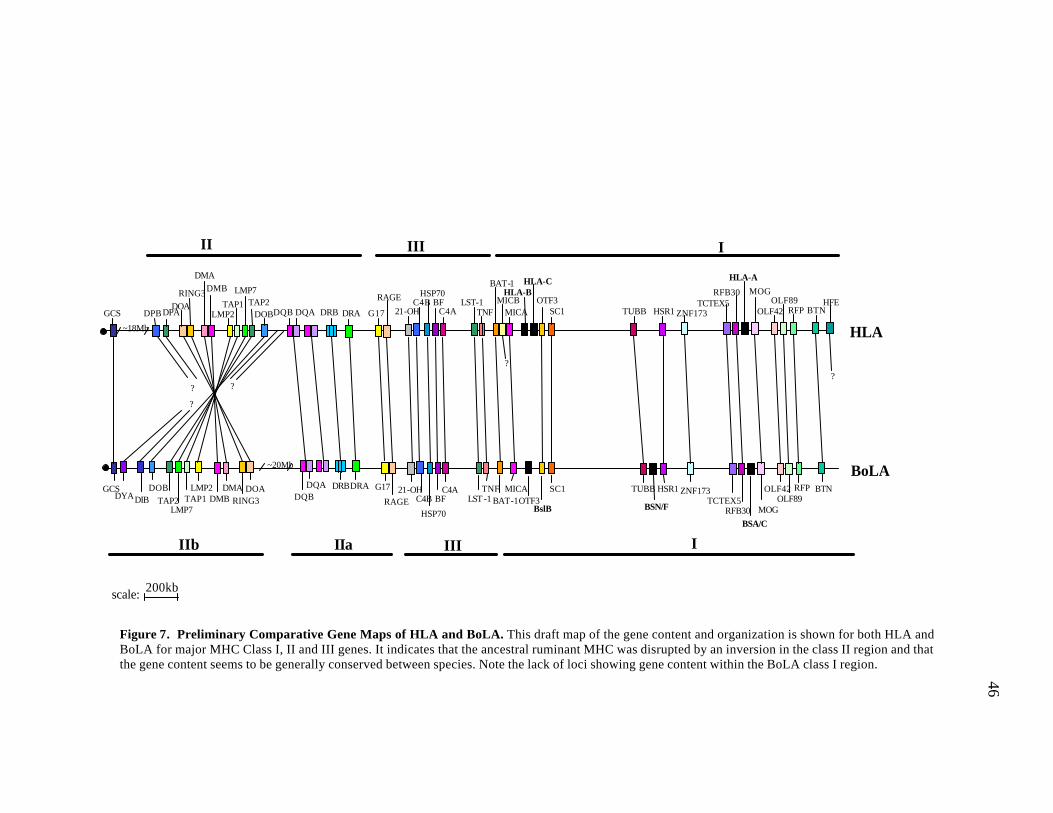
46
HLA
BoLAHSR1
C4B
C4B
BF
BF
21-OH
21-OH
LST -1
C4A
HSP70
HSP70
C4A
LST-1
BAT-1TNF
TNF
BAT-1
SC1OTF3
OTF3SC1
HSR1
TUBB
TUBB
MICA
MICA
HLA-BHLA-C
BslB BSN/F
III
ZNF173TCTEX5
RFB30
BTN
MOGBSA/C
RFPOLF89
OLF42
ZNF173TCTEX5
RFB30
HLA-AMOG
OLF42OLF89
RFP BTNHFEMICB
?
DQBDQA DRBDRA G17
RAGE
DPB DRBDQB DQA DRA G17
RAGE
DOALMP2DMBTAP2
DMATAP1
DPA
RING3
DMA
DOA
DMB
LMP2TAP1
DOBTAP2
GCS
LMP7
GCSDYA
DOBDIB
LMP7RING3
?
?
?
scale: 200kb
IIb IIa
~20Mb
~18Mb
I
II III I
?
Figure 7. Preliminary Comparative Gene Maps of HLA and BoLA. This draft map of the gene content and organization is shown for both HLA and BoLA for major MHC Class I, II and III genes. It indicates that the ancestral ruminant MHC was disrupted by an inversion in the class II region and that the gene content seems to be generally conserved between species. Note the lack of loci showing gene content within the BoLA class I region.
47
duplicate at a rate consistent with evolutionary requirements based on selective
pressures.
MHC polymorphism can also be generated initially by point mutations, then by
gene conversion that shuffles short DNA sequences between alleles or loci (Ohta 1998;
Parham 1989; Parham 1995). Recombination events may also contribute to the
generation of polymorphism in MHC genes in an essentially random process. For
example, phylogenetic trees for different regions of the ovine DQA2 gene by Hickford et
al. (2004) suggests that genetic exchanges of segments may have occurred between
ancestral alleles. This was supported by the sharing of common sequence between
alleles, despite other significant sequence variation.
Evolutionarily, the MHC is under strong selective pressure from two opposing
forces (negative and positive), enabling a balance between conservation and
diversification. Patterns of nucleotide variation at the MHC class I and class II loci
suggest evolution by overdominant (balancing) selection (Hughes and Nei 1988; Hughes
and Yeager 1998b) and frequency selection (Klein and O'hUigin 1993). High levels of
polymorphisms and heterozygosity within the MHC provides the immune system with a
selective advantage against the diversity and variability of pathogens and help to
increase the host's or population's fitness against infections (Potts 2002; Potts and Slev
1995).
The high level of polymorphisms and mutations in the MHC has the added risk
however, of generating autoimmune diseases and other genetic disorders. O'Brien and
Yuhki (1999) found reduced MHC variation contributing to uniform population
sensitivity to emerging infectious pathogens in two cases of endangered Felidae (Florida
panther and cheetah) due to species adaptation, mediated by MHC divergence.
Organisms parasitic on vertebrates are presumably under strong selective pressure to
evade host recognition systems and to render the host's immune attack ineffective. For
instance, by analyzing DNA sequences from genes encoding surface proteins of the
malaria parasite Plasmodium falciparum, Hughes and Verra (2002) provided evidence
48
for a balanced polymorphism which keeps the host from encountering a single form of
the parasite surface protein in every infection.
While MHC class II and III genes seem to have direct orthologs in different
species, it is clear that class I genes are subject to different evolutionary mechanisms
having expanded and contracted in different species. The differences observed in class I
gene composition presumably indicate a rapid evolutionary process. Like other gene
families, the MHC class I gene family may have arisen by successive gene duplications
which followed pathways differing with each species. Sequence analysis confirms the
existence of a high degree of sequence similarity between the chimpanzees and human
MHC class I region, however the 98.6% sequence identity drops to only 86.7% when the
multiple insertions/deletions (indels) are considered (Anzai et al. 2003).
More analyses of MIC genes (encoding stress- inducible glycoprotein) in other
species reveals a similar story. There are another five copies of the MIC gene family,
MICC to MICG, distributed within the human MHC class I region that are highly
fragmented in structure and appear to be nonfunctional (Kulski et al. 1999c). To date, the
MIC genes have been detected in the pig (where MIC2 is a pseudogene) (Velten et al.
1999), cattle and primate species; but are not found in the mouse or rat (Gunther and
Walter 2001). Taken together, these observations suggest that the MIC genes have
undergone extraordinary selective pressure and genomic plasticity. The reason for the
deletion and fragmentation of the MIC genes is not known, but may be due in part to the
existence of other class I-like genes replacing the functions of the MIC genes
(Radosavljevic et al. 2002). These data suggest that indels may be more important than
the more subtle single-nucleotide substitutions for shaping allelic lineage in recently
emerged primate species.
While the class III is considered the most conserved region of the MHC (as
reviewed earlier), class I and II regions seem to have evolved via a series of duplicative
events from a common ancestral gene. However, there is debate on which is ancestral,
with one hypothesis supported by phylogenetic analysis proposing class II genes arose
first (Hughes and Yeager 1998b; Klein et al. 1998). However, structural and functional
49
diversity of the itinerant class I- like genes and the restricted expression of the class II
genes suggest that the class II genes may have evolved from an ancestral form of the
class I genes. The debate of which came first, class I or class II, remains a contentious
issue (Lawlor et al. 1990; Hughes and Nei 1993; Klein et al. 1998; Hughes and Yeager
1998a; Flajnik et al. 1999).
Parham et al. (1995) noted that the pattern of nucleotide differences in HLA class
I genes shows strong locus specificity, suggesting that most newly arisen alleles result
from a combination of point mutations and intralocus recombinations. Phylogenetic
analysis in HLA class I genes produce defined sequence group ings based on loci
(Lawlor et al. 1990). By contrast, mouse H2-K, -D, and -L class I genes show weaker
locus specificity than HLA genes, indicating that interlocus gene conversion plays a
major role in the generation of murine MHC class I gene diversity (Pease et al.1991,
1993; Pullen et al. 1992; Yun et al. 1997). Interlocus gene conversion may also
predominate in cattle, where class I genes are difficult to assign to loci based on
sequence (Ellis et al. 1999). Thus, it is essential that the evolutionary pattern of
nucleotide diversity within and between loci in organisms phylogenetically intermediate
between human and mouse, for instance cattle, be examined to comprehend the
evolutionary histories of MHC class I genes.
Expression and phylogenetic analysis of BoLA class I loci
Early studies showed evidence for only one class I locus (al-Murrani et al. 1993).
However, molecular studies later identified at least three transcribed class I loci in cattle
(Garber 1994). Ennis et al. (1988) found at least four classical class I loci in cattle
arranged in haplotypes that expressed any combination of one, two or three genes,
although no one gene was expressed consistently. Holmes et al. (2003) used
phylogenetic analysis to reveal that MHC class I sequences from examples of
Cetartiodactyl species closely related to cattle were distributed among the main cattle
gene "groups". Those from more distantly related species were scattered (sheep, deer),
while others from more related taxa clustered in a species-specific manner (sitatunga,
50
giraffe); thus indicating that divergence of the MHC sequences had occurred
independently from that of the hosts from which they were obtained.
Two clear instances of interlocus recombination among the cattle MHC class I
sequences have been observed. Positive natural selection has been documented at
positions throughout the a1 and a2 domains, primarily on those amino acids directly
involved in peptide binding, although two positions in the a3 domain, a region generally
conserved in other species, were also shown to be undergoing adaptive evolution
(Holmes et al. 2003). Ellis et al. (1999) reported that none of the cattle class I genes
defined in the five haplotypes included in their study seemed to be consistently
expressed. In the human, each haplotype has three classical MHC class I loci and alleles
from all three loci are expressed, albeit at different levels. In fact, in contrast to human,
cattle haplotypes differ from one another in both the number and composition of
expressed classical class I genes. It was also found that phylogenetic analysis of
available transcribed cattle MHC class I sequences revealed complex evolutionary
relationships including possible evidence for recombination (Ellis et al. 1999).
In cattle, the number of expressed MHC class I genes varies from one to three in
different BoLA haplotypes, suggesting many rearrangements or an unequal crossing-
over of MHC class I haplotype components during their evolution (Ellis et al. 1999).
Screening of a bacteria phage genomic library from an Angus Bull (#86 Texas
Agricultural Experimental Station) with HLA B7 cDNA probe identified 18 class I loci,
5 non-classical class I genes and 12 pseudogenes or gene fragments (Hu 1996).
Problems with assignments of class I alleles to loci and determining number of
loci and expression states are also seen in other species. Analysis of classical MHC class
I genes of a homozygous thoroughbred horse defined two loci (Barbis et al. 1994;
Carpenter et al. 2001); however, the number of loci and their expression states are
unknown in horses. Chung et al. (2003) found that two or three loci could encode
classical MHC class I molecules in the horse in certain haplotypes. Also, in the SLA,
which represents the closest sequenced relative to BoLA by phylogeny, the number of

51
functional class I genes varies from 1-4 (depending on haplotype) and the class I genes
are also too closely related to clearly assign alleles to loci (Chardon et al.1999a).
Haplotypic determination of differential expression (or silencing) in the cattle
MHC class I genes would confer a high MHC diversity in cattle populations, which
seem to be maintained despite human controlled breeding programs. A highly
polymorphic MHC may have provided defense against infection from new pathogens
that the animals would not have been exposed to in the wild, but would be exposed to
during the process of domestication. Also, contributing to this MHC diversity would be
multiple domestication events of more than one ancestral population of cattle with
introgressions from wild Bovids over the course of cattle domestication to date (Ellis et
al. 1999).
The diversity in genomic order and sequence variation within the MHC reflects
that each species may harbour a certain degree of uniqueness. Comparative data obtained
from characterization of the BoLA class I genes and its alleles is needed to provide us
with a better understanding of mechanisms of immune diversity and its interactions with
the environment and genetic adaptations to disease.
Hypothesis
Insight into the evolution of the MHC can be gained from comparative genomics
in various mammalian species. Identification of conserved regions between the genomes
of distant species is a crucial step in the reconstruction of the genomic organization of
their last common ancestor. Using a comparative genomics approach to identify BAC
clones containing bovine MHC genes will allow us to assemble the BAC clones into
contigs of defined gene content and chromosomal orientation. This will allow us to
develop an ordered BAC contig map of the BoLA class I region. The research proposed
also describes the characterization of a frameshift deletion (Adel) at the predominant
functional class I locus, BoLA-A (BSA) through transcriptional, genotyping, flow
52
cytometry, phylogenetic sequence analysis and proteomics from different species of feral
and domestic bovids. Functionally, exons 2 and 3 in class I genes encode for amino acids
that form the antigen presenting site; consequently, the hypothesis is that the bovine
deletion allele, if functional, will be soluble whereas other alleles at this locus should
encode membrane-bound proteins. This research will also address expression of the
putative truncated allele.
Rationale and significance
The results of this research will provide a better understanding of the role of the
bovine MHC in disease processes that will lead to the production of healthier cattle, and
may identify a genetic basis for the anecdotal assertion that feral cattle and bison differ
from domestic cattle in response to exposure of pathogens. The ability of an organism to
identify and destroy foreign substances and to distinguish between self and non-self is
regulated by genes in the MHC, and its polymorphism is a means of adaptive speciation
to the environment.
The interaction of T lymphocytes with appropriate antigen presenting cells
represents the first step in clonal selection and differentiation of immune cells;
consequently, the genetic processes involved in antigen presentation are fundamental to
understanding the role of genetics in animal health and disease resistance. Comparative
study of the MHC in a wide range of species from humans to amphioxus will allow
elucidation of early genomic events leading to the evolutionary successes of vertebrates.
The goals of this research and the novel approaches proposed will gather data that will
be valuable to the animal health research. Extensive polymorphisms of the MHC genes
make them potential markers for the study of disease susceptibility. Information on
sequence variation of BoLA genes can also be used to study the evolutionary history of
the major histocompatibility complex. Such comparative studies in the MHC will be able
to provide insight into its evolution and function in mammalian species.

53
Specific aims and objectives
1. Organization of the BoLA class I region
In order to better define the genomic structure of BoLA class I, a comparative
genomics approach was used to identify BAC clones containing bovine class I MHC
genes and then a rigourous analysis was performed including: end sequencing, PCR,
fingerprinting, shotgun cloning, FISH and Fiber FISH to assemble the BAC clones into
contigs of defined gene content and chromosomal orientation to produce a physical
map of the class I BoLA region presented in Chapter II. Chapter III describes
development of techniques used that were pivitol in obtaining good quality BAC end
sequences, also called sequence tag connectors (STCs), used in the contig building and
initial overlapping of BAC clones onto genomic sequence obtained from the two
libraries for the class I region spanning the MHC class I region.
3. Phylogenetic analysis of frameshift deletion BoLA-Adel MHC class I gene
Genotyping of a frameshift deletion variant allele (BoLA-Adel) was used to
investigate allele frequencies in feral populations of cattle and bison, as compared to
production beef and dairy breeds. Phylogenetic analysis of Adel haplotypes was used to
reveal whether haplotypes identified in bison are unique to bison but similar to the
deletion haplotypes identified in cattle. It also allows verification of whether the Adel
mutation predates the divergence of cattle and bison, as this suggests that natural
resistance has played a role in maintaining this mutation over five million years of
evolution. This will be presented in Chapter IV.
54
3. Transcriptional and proteomic characterization of frameshift deletion BoLA-Adel
For this objective, the expression of the truncated allele at the transcriptional
level was examined by quantitative RT-PCR and flow cytometry to determine whether
the mRNA transcript is present, and if so, whether it has been modified by alternate
splicing, RNA editing or other types of epigenetic modification. We also examined the
protein product using immunoprecipitation, 2D gel analysis, matrix associated laser
desorptive ionization (MALDI-TOF) and tandem mass spectrometry to characterize the
translated class I genes in genotypically defined cattle. This is presented in Chapter V.
Finally, Chapter VI summarizes the major points of this dissertation, and
provides an overall analysis of the BoLA MHC class I region and summarizes details on
the characterization frameshift deletion allele in feral cattle and Bison, and possible roles
for an allelic form of a soluble BoLA MHC class I gene product.
55
CHAPTER II
GENOMIC ORGANIZATION OF THE BOVINE MAJOR
HISTOCOMPATIBILITY (BoLA) CLASS I REGION
What is wanted is not the will to believe, but the wish to find out, which is the exact opposite.
- Bertrand Russell
Summary
The bovine major histocompatibility complex (BoLA) class I genes play an
important role in the immune response facilitating antigen presentation and self-
discrimination by acting as ligands for CD8+ cytotoxic T cells and NK cells. An ordered
BAC array was developed for the BoLA MHC class I region from BACs isolated using
gene specific overgo primers on the CHORI 240 Hereford bovine BAC library to
complement already existing sequence data from BACS isolated from the TAMU Angus
bull BAC library. A rigourous approach was used for confirmation including
hybridization, PCR screening, DNA fingerprinting, comparison to existing bovine DNA
fingerprint maps, BAC end sequencing and PCR, BAC sequencing, fluorescence in situ
hybridization (FISH) and Fiber FISH. Two contigs containing 34 BAC clones, and 10
additional BACs identified in silico, span the BoLA class I and extended class I region
from the BAT1 class III /I boundary framework gene to the histones in the telomeric end
of BoLA. Dual-coloured FISH analysis localized selected BACs to BTA23q2.2, and
fiber FISH allowed confirmation of order and distance between BACs to a resolution of
300 kb. Assembly of all class 1 sequences containing classical class I genes was not
possible since sequence from animals of different haplotypes were pooled in this study.
However, there was confirmation of at least 8 class I genes and at least 3 clusters of class
I genes in the conserved BoLA class I region of all haplotypes studied.
56
Introduction
Nobel prize winners Peter Doherty and Rolf Zingernagel’s pioneering research
(reviewed by Ada 1994) defined the novel way that immune cells capable of killing
virus- infected cells must recognise a part of the virus together with molecules of the host
cell called major histocompatibility (MHC) antigens. The MHC was previously defined
as an important genetic component for tissue transplantations in both mice and humans
(Benacerraf and McDevitt 1972; Dausset 1981; Gorer 1937; Snell 1951). This
requirement for antigen presentation in context of the MHC, has been termed “MHC-
restriction”. It is the basis of all cellular immune responses and has been critical for our
understanding of infectious diseases, inflammatory diseases, such as rheumatoid diseases
and diabetes, the design of vaccines and efficiency of organ transplantation.
The human MHC region, or HLA, encodes the most polymorphic human proteins
known, some of which are encoded by more than 592 alleles (Forbes and Trowsdale
1999) (http://www.ebi.ac.uk/imgt/hla/stats.html). The consensus mammalian MHC
consists of three closely linked regions, I, II, and III, occupying a single chromosomal
segment of 2-4 Mb of DNA (Chardon et al. 1999a; The MHC Consortium 1999; Hurt et
al. 2004; Shiina et al. 2004).
Classical MHC class I (Ia) molecules are highly polymorphic glycoproteins
expressed on virtually all nucleated cells, with the notable exceptions of cells such as
spermatozoa or cells in immunopriviliged sites, such as the central nervous system
(CNS), placenta, hair follicles and eye (Niederkorn 2003). Class Ia molecules present
cytosol-derived antigenic peptides bound within a cleft containing polymorphic antigen
recognition sites (ARS), to cytotoxic T lymphocytes via the T cell receptor (TCR)
facilitating destruction of infected cells and limiting spread of disease. Class Ia
molecules are also recognized by natural killer (NK) cell receptors playing a role in
inhibition of NK cell lysis (Kambayashi et al. 2001; Ljunggren and Karre 1990). Non-
classical class I molecules (class Ib) are non-polymorphic, and have characteristically
57
low levels of expression and/or restricted tissue distribution (Allan et al. 2002; Lepin et
al. 2000). The gene organization and structure/function relationship of the various exons
comprising class I proteins are very similar among the class Ia and class Ib genes,
however promoter structures among all class I genes are complex and only a few
instances of conservation of class Ia promoter regulatory elements is seen among class Ib
genes (Howcroft 2003).
The MHC has been defined as a complex located on a single chromosome in
many species; including mammals, amphibians, reptiles, birds, and cartilaginous fish
(reviewed by Kumanovics et al. 2003). However, significant differences in the number
and physical organization of the genes within the MHC have been demonstrated in
several species within the Artiodactyla (Band et al. 1998; Chardon et al. 1999a; Chardon
et al. 2001; Forbes and Trowsdale 1999; McShane et al. 2001; Smith et al. 1995), within
avian species like chicken and quail (Shiina et al. 2004) and within rodentia like rat and
mouse (Hurt et al. 2004).
Comparative analyses illustrate that duplications, deletions and rearrangements,
both inter- and intra- locus, are an important characteristics of MHC organization,
especially class I genes, in most species (Hughes and Yeager 1998a; Takada et al. 2003;
Yeager and Hughes 1999). Evidence for rearrangements can be seen in the inconsistent
number of expressed class Ia genes between species; for example in humans, HLA-A, B
and C class Ia alleles are always expressed, but in other species the number of expressed
class Ia genes seems to be variable; for example ranging from 1 to 3 in horses, and 1 to 4
in cattle (Chung et al. 2003; Ellis and Ballingall 1999; Holmes et al. 2003). Also, there
seems to be no orthologue for the human class Ia genes HLA-A, B and C and the class Ib
genes E, F and G consistently found in other primates except for the shared allelic
lineages for all six loci (but not alleles) between humans and African apes (Adams and
Parham 2001). It has even been postulated that chimpanzees have experienced a severe
repertoire reduction at their orthologues of the HLA-A, -B, and -C loci predating the
(sub)speciation events, from an ancient selective sweep due to a SIV-like retroviral
pandemic resulting in only AIDS resistant animals surviving (de Groot et al. 2002).
58
The bovine lymphocyte antigen (BoLA) complex was first described by Spooner
et al. (1978). The organizational features, including a well documented disruption caused
by a single large chromosomal inversion on BTA23, has been confirmed by several
groups (Andersson et al. 1988; Andersson and Rask 1988; Band et al. 1998; Band et al.
2000; Leveziel 1984; McShane et al. 2001; Skow et al. 1996; Skow et al. 1988). This
chromosomal inversion seems to predate the divergence of the advanced pecoran
families from a common ancestor, as evidenced by conservation of chromosome banding
patterns for BTA23 and its homologues among Bovidae, Cervidae, Giraffidae and
Antilocapridae (Gallagher et al. 1992; Iannuzzi et al. 1993). McShane et al. (2001) used
fluorescent in situ hybridization (FISH) of BoLA DYA and class I BAC clones to
confirm that these genes map to discrete chromosomal locations on BTA23 and its
homologue in white-tailed deer. Thus the order in the artiodactyl families of ruminants
seems to indicate evolutionary conservation of gene order, and the organization of the
BoLA is thought to be an ancestral condition for the advanced pecorans.
Evidence for evolution of the Arteriodactyl MHC can be seen in the more than
990 kb of the 1200 kb SLA class I region of the pig major histocompatibility complex
(MHC) that has been sequenced. It is known that duplications gave rise to at least six
SLA classical class I genes and other groups of non-classical class I genes and
pseudogenes (Chardon et al. 1981; Chardon et al. 1999a; Renard et al. 2001; Shigenari et
al. 2004). Human/pig sequence comparison also revealed that the presumably functional
pig MIC2 gene was probably orthologous to the human functional MICA or MICB
genes (Renard et al. 2003). When the region of the SLA corresponding to the junction
of the class I and class III regions was sequenced, the order and molecular organization
were exactly conserved in the SLA and HLA complexes, except for the SC1 gene which
displayed a shift of the reading frame in swine. The cluster of the three SLA class I-
related genes (Ib) and the MIC1 and MIC2 genes were located in the middle of the
segment (Chardon et al. 2001), while another cluster of four classical class I genes were
located between MOG and GNL (Renard et al. 2001). However, the third and fourth
clusters of class I genes seem to be missing in the SLA. Earlier work in mapping the
59
BoLA region gave evidence of at least 4 clusters of class I genes (McShane et al. 2001;
Newkirk 2000) which is more similar to the HLA (The MHC Consortium 1999).
Research into the immune systems of economically important species, such as
cattle, is largely focused on disease control strategies. Existing vaccine failures often
relate to poor induction of cellular immune responses, thus there is increasing interest in
determining (or predicting) T cell epitopes. Thus, it is imperative to define genes of
immunological importance, such as MHC class I genes, in terms of location and
expression in cattle by comparative analysis. There is the refore a need to assess MHC
diversity in populations of cattle, to allow provision of animals with known MHC genes
and haplotypes, by relating serotyping to genotyping, for detailed analyses and to
generate mapping data. The basic approach used in the construction of whole-genome
fingerprint maps is to fingerprint a set of randomly selected clones that together
represent in a redundant fashion the genome of interest, computationally identify
overlapping clones based on shared restriction fragments, and assemble them into
ordered arrays representing contiguous stretches of DNA ("contigs”) (Schein 2004).
MHC class I genes in human and mouse have been well characterized, but little
is known about the BoLA class I genes. Previous studies identified at least 20 class I loci
by Southern blot analysis with a human cDNA probe (Lindberg and Andersson 1988).
Screening of a bacteria phage genomic library from an Angus Bull (#86 Texas
Agricultural Experimental Station) with a HLA B7 cDNA probe identified 18 class I
loci, 5 non-classical class I genes and 12 pseudogenes or gene fragments (Hu 1996).
Among these several classical class I genes that were previously identified by Garber et
al.(1993) were isolated and later fully sequenced including BSA (AF396750) and BSC
(AF396752) (McShane 1998). Also, the TAMU bovine BAC library (Cai et al. 1995)
constructed from an Angus bull Y6 in addition to BAC clones from Longhorn, Brahman
and Angus females, was screened and 16 class I containing BACs were isolated
(McShane 1998; Newkirk 2000). Several of these BAC clones from the TAMU library
were sequenced at the Baylor College of Medicine and sequence was available for
inclusion in this study.
60
This study intends to build on previous data to produce a physical map of the
BoLA class I region that can serve as a framework for complete sequencing of the area
and allow identification of immunologically important genes that can elucidate the
evolution of the MHC in bovids and Artiodactyl mammals, as well as providing us with
tools for producing a more effective immune response against pathogens and better
vaccine design. First a BAC anchor map was created to link the class I containing
CHORI and TAMU library BACs to the genetic map of the BoLA class I region. Then
these BACs were fingerprinted to be used in contig building, and FISH mapped to assign
cytogenetic position of specific BACs. Finally, BAC end sequencing and select shotgun
subclone sequencing of BACs in conjunction with fiber FISH was done to allow
anchoring of BACs and shotgun-sequenced contigs to the physical map of BoLA.
Materials and Methods
Libraries
Sequences from class I genes used in this study were obtained from three
libraries. The first is a bacteria phage genomic library from sperm DNA from an Angus
Bull (Animal #86 Texas Agricultural Experimental Station) constructed from Sau3AI
partial digests cloned into Lambda GEM11 by Xho I half-site fill- in reactions. This bull,
B86, was used by Garber et al. (1994) to identify the BoLA BSA, BSC, BSX, BSN, BSF
and Bs1b genes referred to in this study.
A bovine BAC library constructed by Cai et al. (1995) from HindIII and BamH1
digested genomic DNA from white blood cells of an Angus Bull, Y6, cloned into the
pBeloBAC11 vector (7.4kb), was previously screened by McShane (1998) and Newkirk
(2000) for clones containing BoLA sequences. This Texas A&M (TAMU) library
contains approximately 60,000 clones, representing approximately 3x genome coverage
with an average insert size of 146 kb (Cai et al. 1995). Additional screening of DNA
superpools from this BAC library by PCR typing was also done in this study.
61
Genomic DNA isolated from blood collected from Hereford bull L1 Domino
99375 in Dr. Michael MacNeil's laboratory, USDA-ARS, Miles City, MT was used to
produce the Children’s Hospital of Oakland Research Institute (CHORI-240) bovine
BAC library (Osoegawa et al. 1998). Genomic DNA was isolated from Hereford bull L1
Domino 99375 and was partially digested with MboI. Size selected DNA was cloned
into the pTARBAC1.3 vector between the BamHI sites. Ligation products were
transformed into DH10B electrocompetent cells (BRL Life Technologies) for segment 1
and DH10B T1 phage resistant electrocompetent cells (BRL Life Technologies) for
segment 2, respectively. The library has been arrayed into 384-well microtiter dishes and
also gridded onto 11 22x22cm nylon high density filters for screening by probe
hybridization. Each hybridization membrane represents over 18,000 distinct bovine BAC
clones, stamped in duplicate. This library represents 11x coverage of the genome with an
average insert size of 167kb (http://bacpac.chori.org/bovine240.htm).
Design of overgo probes
A systematic approach was used to screen high-density BAC filters with probes
generated from overlapping oligonucleotides (overgo) probes as described in Han et al.
(2000). All available sequences of framework, classical and non-classical class I genes,
ESTs, STSs, and sequenced class I MHC regions were examined. Conserved regions
within orthologous genes in the MHC were identified using alignments and GenBank
Pairwise BLAST® (Tatusova and Madden 1999). Repetitive regions were masked with
RepeatMasker. Then BLAST® was used to identify 36-bp unique fragments of DNA for
overgo probes, which were designed so that the forward and reverse primers were 20-bp
each sharing an 8-bp overlap at their 3’ ends. Overgo primers were designed to
conserved regions using the Overgo Maker program and were screened against GenBank
using *BLAST® (Altschul et al. 1990) to confirm specificity and exclude any additional
repetitive elements (Table 1).
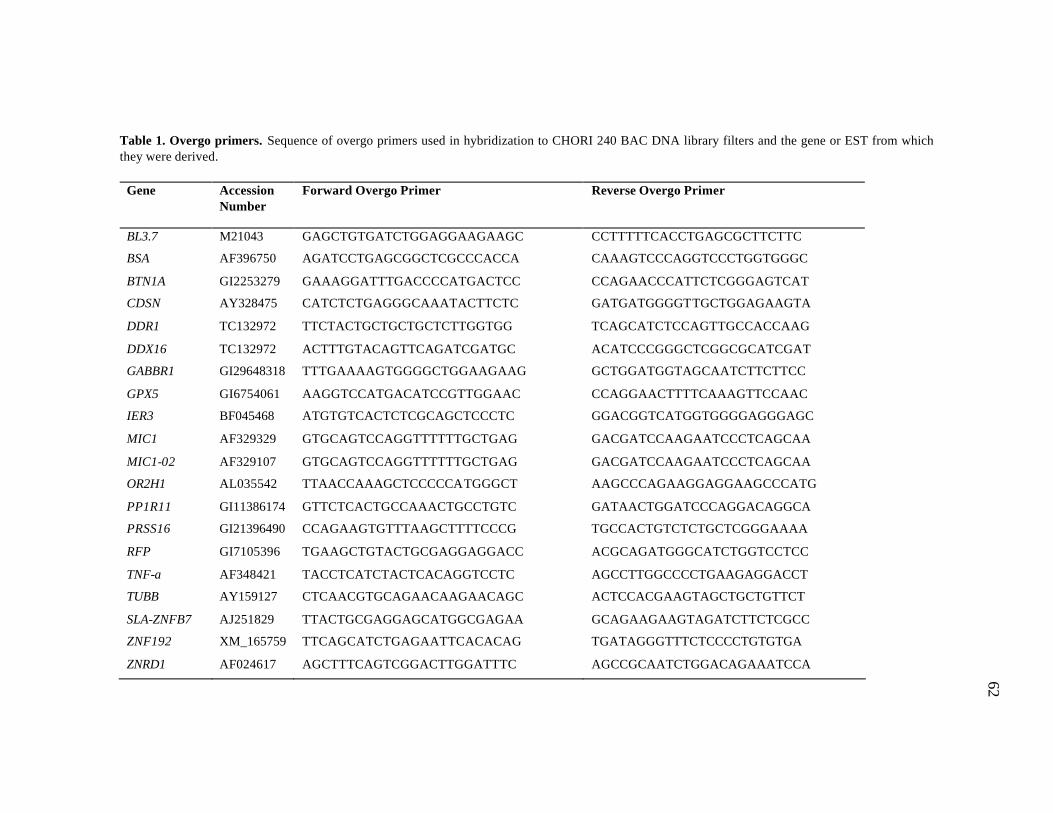
62
Table 1. Overgo primers. Sequence of overgo primers used in hybridization to CHORI 240 BAC DNA library filters and the gene or EST from which they were derived.
Gene Accession Number
Forward Overgo Primer Reverse Overgo Primer
BL3.7 M21043 GAGCTGTGATCTGGAGGAAGAAGC CCTTTTTCACCTGAGCGCTTCTTC
BSA AF396750 AGATCCTGAGCGGCTCGCCCACCA CAAAGTCCCAGGTCCCTGGTGGGC
BTN1A GI2253279 GAAAGGATTTGACCCCATGACTCC CCAGAACCCATTCTCGGGAGTCAT
CDSN AY328475 CATCTCTGAGGGCAAATACTTCTC GATGATGGGGTTGCTGGAGAAGTA
DDR1 TC132972 TTCTACTGCTGCTGCTCTTGGTGG TCAGCATCTCCAGTTGCCACCAAG
DDX16 TC132972 ACTTTGTACAGTTCAGATCGATGC ACATCCCGGGCTCGGCGCATCGAT
GABBR1 GI29648318 TTTGAAAAGTGGGGCTGGAAGAAG GCTGGATGGTAGCAATCTTCTTCC
GPX5 GI6754061 AAGGTCCATGACATCCGTTGGAAC CCAGGAACTTTTCAAAGTTCCAAC
IER3 BF045468 ATGTGTCACTCTCGCAGCTCCCTC GGACGGTCATGGTGGGGAGGGAGC
MIC1 AF329329 GTGCAGTCCAGGTTTTTTGCTGAG GACGATCCAAGAATCCCTCAGCAA
MIC1-02 AF329107 GTGCAGTCCAGGTTTTTTGCTGAG GACGATCCAAGAATCCCTCAGCAA
OR2H1 AL035542 TTAACCAAAGCTCCCCCATGGGCT AAGCCCAGAAGGAGGAAGCCCATG
PP1R11 GI11386174 GTTCTCACTGCCAAACTGCCTGTC GATAACTGGATCCCAGGACAGGCA
PRSS16 GI21396490 CCAGAAGTGTTTAAGCTTTTCCCG TGCCACTGTCTCTGCTCGGGAAAA
RFP GI7105396 TGAAGCTGTACTGCGAGGAGGACC ACGCAGATGGGCATCTGGTCCTCC
TNF-a AF348421 TACCTCATCTACTCACAGGTCCTC AGCCTTGGCCCCTGAAGAGGACCT
TUBB AY159127 CTCAACGTGCAGAACAAGAACAGC ACTCCACGAAGTAGCTGCTGTTCT
SLA-ZNFB7 AJ251829 TTACTGCGAGGAGCATGGCGAGAA GCAGAAGAAGTAGATCTTCTCGCC
ZNF192 XM_165759 TTCAGCATCTGAGAATTCACACAG TGATAGGGTTTCTCCCCTGTGTGA
ZNRD1 AF024617 AGCTTTCAGTCGGACTTGGATTTC AGCCGCAATCTGGACAGAAATCCA
63
Overgo labeling and BAC library screening by filter hybridization
High density filters from the USDA CHORI 240 bovine BAC library were
probed with pools of radiolabelled overgos to identify clones containing BoLA classical
and non-classical class I sequences. Primers were radioactively labeled either using a
modification of the BACPAC hybridization protocol or a modified overgo protocol as
described by Gustafson et al. (2003). Briefly, 10 uL labeling reaction containing 1 uM
of forward primer, 1 uM reverse primer, 150 Ci/mmol each of 32P dATP and 32P dCTP
(Amersham Biosciences, Piscataway, NJ), 2 U Klenow fragment DNA polymerase
(Roche, Indianapolis, IN), and 1x DNA Polymerase Buffer, (Promega, Madison,WI) was
incubated at 37°C for 30 mins. For each fill- in labeling reaction, 1 uL of a 250 uM
dATP and dCTP mixture was added, at 37 ºC for 15 mins (Han et al. 2000).
Unincorporated nucleotides were removed using Sephadex G-10 gravity flow columns.
The labeled overgo probes were pooled and added to the hybridization solution (20X
SSPE, 10% SDS, 5% milk, and 100X Denhardt’s) containing 50% formamide, boiled for
10 mins, chilled and then hybridized onto filters at 42 ºC for 16 hours. Filters were
washed three times at 55 ºC for 15 minutes in 2X SSPE. After overnight hybridization,
filters were washed for 30 minutes with 1mM EDTA, 1%SDS, 40mM Na2HPO4,
followed by 2X washes, 20 minutes each with 1.5x SSC, 0.1% SDS. A final 20 minute
wash was done with 0.5X SSC, 0.1%SDS. The filters were then exposed to a
Phosphoimager or film and positives identified. Positive clones were rearrayed on
membranes and hybridized with individual probes to determine which BAC clones were
positive for individual overgos.
DNA purification, fingerprinting, Southern blot analysis and contig assembly
BAC DNA was purified using a modified alkaline lysis protocol and exonuclease
digestion step using the QIAGEN™ Large-Construct kit (QIAGEN, Valencia, CA) as
per manufacturer’s instructions. An additional polyethylene glycol (PEG) purification
step was then performed to further purify DNA for downstream analysis with a 20 min
incubation of BAC DNA (dissolved in milli-q water) with 0.16 volumes of 5M NaCl,

64
0.25 volumes of 13% PEG on ice, followed by a wash in 70% ethanol and resuspension
in milli-q water to desired concentration.
BAC clones were fingerprinted using a modified protocol of Marra et al. (1997)
using restriction enzyme digestion with BamH1 or HindIII enzymes. Briefly, 500 µg of
BAC DNA was digested to completion with 10 units enzyme in a volume of 30 µl at 37
°C from 3 hours to overnight. Then 10ul of each digest was diluted with 10ul of milli-q
water, combined with 3ul of 6x Blue/Orange DNA loading dye (Promega, Madison, WI)
and run for 22 hours at 50 volts on a 0.65% TBE agarose gel stained with ethidium
bromide. Restriction fragment patterns identified overlapping BAC clones which were
assembled into draft contigs as done previously (Gustafson et al. 2003; Marra et al.
1997). In addition, double digests and fill- in labeling using DNA polymerase I large
(Klenow) Fragment kit (Promega, Madison, WI) with 250ng BAC DNA and 10 units
each of Hae III and HindIII enzymes and a- 32P-dATP in 20ul reactions, were run on 6%
polyacrylamide gels as initial confirmation of DNA fingerprint patterns.
The gel images from agarose BAC DNA fingerprinted gels were digitally
captured with the Alpha Innotech ChemiImager™ system and analyzed using IMAGE
3.0 software (Sulston et al. 1988). Preliminary contig assembly was performed using
FPC V4.7.9 (Soderlund et al. 1997). For added robustness to the BAC order, internet
contig explorer (iCE) (Fjell et al. 2003) was used to generate an in silico DNA
fingerprint display of selected clones in the BoLA MHC class I region from BAC
fingerprint maps generated from FPC processed gel images from another group (Marra
et al. 1997). DNA fragments were Southern blotted onto nylon filters for subsequent
hybridization with individual overgo probes to identify specific genes on particular BAC
fragments as previously described above.
BAC DNA sequencing
End sequencing of BAC clones was performed on an ABI 3100 automated
capillary sequencer using T7 and SP6 sequencing primers. This was done using a
modified TaqDyeDeoxy Terminator Cycle Sequencing Kit (Applied Biosystems) with
65
Big Dye™ method described in Chapter III (Ramlachan et al. in preparation). Briefly,
10µl sequencing reactions were performed using 2µl BigDye™ V1.1 (Applied
Biosystems), 2µl halfBD™ and 0.5µl MasterAmpTM PCR Enhancer (Epicentre,
Madison, WI), with approximately 1µg of BAC DNA and 10 pmol primer (T7 or SP6)
per reaction. The thermal profile was 96 ºC for 5 m, then 8 cycles of 95ºC (0.25 s), 58ºC
(0.25 s) (-1ºC/cycle), 65ºC (4 m); followed by 60 cycles of 96ºC for 25 s, 55ºC for 25 s
and 60ºC for 4 m; and finally 4 holds of 96ºC (1 min), 50ºC (1 min) and 65ºC (1 min)
then 4ºC until reactions are removed. Reactions were purified with G-50 sephadex
columns (Biomax, Odenton, MD). Sequence fragments were separated and analyzed
using an ABI 3100 Genetic Analyzer (Applied Biosystems, Foster City, CA), and are
available through GenBank.
Confirmation of overlapping BACs by PCR
PCR primers for specific genes or designed from the end sequences of selected
BAC clones (Tables 2 and 3) were used on positive BAC clones to confirm gene content
and the overlaps indicated by fingerprinting. PCR was carried out in 25 µL reactions
containing 50 ng of BAC DNA from individual clones as the template, 0.25 units of
JumpStart Red Taq Polymerase (Sigma, St.Louis, MI), 0.8 mM dNTPs, 0.4µM of each
primer, Master Amp™ PCR Enhancer (Epicentre, Madison, WI) and 10x reaction buffer
(100mM Tris-HCl, 500 mM KCl, 15mM MgCl2, 0.01% gelatin). The thermal profile
was as follows: 2 min at 95°C; 4 cycles X 30 sec at 95°C, 30 sec at 58°C (-1°C / cycle),
25 sec at 55°C; 30 cycles X 30 sec at 95°C, 30 sec at 54°C, 25 sec at 55°C; 10min at 65
°C.
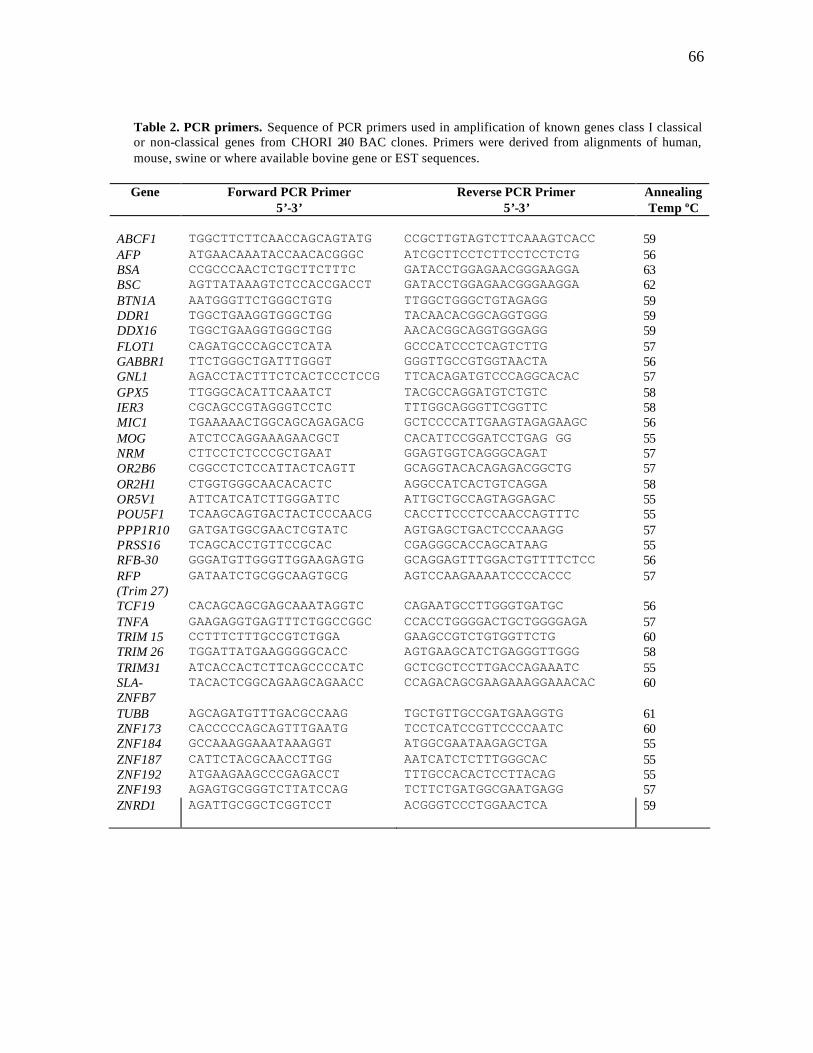
66
Table 2. PCR primers. Sequence of PCR primers used in amplification of known genes class I classical or non-classical genes from CHORI 240 BAC clones. Primers were derived from alignments of human, mouse, swine or where available bovine gene or EST sequences. Gene Forward PCR Primer
5’-3’ Reverse PCR Primer
5’-3’ Annealing Temp ºC
ABCF1
TGGCTTCTTCAACCAGCAGTATG
CCGCTTGTAGTCTTCAAAGTCACC
59
AFP ATGAACAAATACCAACACGGGC ATCGCTTCCTCTTCCTCCTCTG 56 BSA CCGCCCAACTCTGCTTCTTTC GATACCTGGAGAACGGGAAGGA 63 BSC AGTTATAAAGTCTCCACCGACCT GATACCTGGAGAACGGGAAGGA 62 BTN1A AATGGGTTCTGGGCTGTG TTGGCTGGGCTGTAGAGG 59 DDR1 TGGCTGAAGGTGGGCTGG TACAACACGGCAGGTGGG 59 DDX16 TGGCTGAAGGTGGGCTGG AACACGGCAGGTGGGAGG 59 FLOT1 CAGATGCCCAGCCTCATA GCCCATCCCTCAGTCTTG 57 GABBR1 TTCTGGGCTGATTTGGGT GGGTTGCCGTGGTAACTA 56 GNL1 AGACCTACTTTCTCACTCCCTCCG TTCACAGATGTCCCAGGCACAC 57 GPX5 TTGGGCACATTCAAATCT TACGCCAGGATGTCTGTC 58 IER3 CGCAGCCGTAGGGTCCTC TTTGGCAGGGTTCGGTTC 58 MIC1 TGAAAAACTGGCAGCAGAGACG GCTCCCCATTGAAGTAGAGAAGC 56 MOG ATCTCCAGGAAAGAACGCT CACATTCCGGATCCTGAG GG 55 NRM CTTCCTCTCCCGCTGAAT GGAGTGGTCAGGGCAGAT 57 OR2B6 CGGCCTCTCCATTACTCAGTT GCAGGTACACAGAGACGGCTG 57 OR2H1 CTGGTGGGCAACACACTC AGGCCATCACTGTCAGGA 58 OR5V1 ATTCATCATCTTGGGATTC ATTGCTGCCAGTAGGAGAC 55 POU5F1 TCAAGCAGTGACTACTCCCAACG CACCTTCCCTCCAACCAGTTTC 55 PPP1R10 GATGATGGCGAACTCGTATC AGTGAGCTGACTCCCAAAGG 57 PRSS16 TCAGCACCTGTTCCGCAC CGAGGGCACCAGCATAAG 55 RFB-30 GGGATGTTGGGTTGGAAGAGTG GCAGGAGTTTGGACTGTTTTCTCC 56 RFP (Trim 27)
GATAATCTGCGGCAAGTGCG AGTCCAAGAAAATCCCCACCC 57
TCF19 CACAGCAGCGAGCAAATAGGTC CAGAATGCCTTGGGTGATGC 56 TNFA GAAGAGGTGAGTTTCTGGCCGGC CCACCTGGGGACTGCTGGGGAGA 57 TRIM 15 CCTTTCTTTGCCGTCTGGA GAAGCCGTCTGTGGTTCTG 60 TRIM 26 TGGATTATGAAGGGGGCACC AGTGAAGCATCTGAGGGTTGGG 58 TRIM31 ATCACCACTCTTCAGCCCCATC GCTCGCTCCTTGACCAGAAATC 55 SLA-ZNFB7
TACACTCGGCAGAAGCAGAACC CCAGACAGCGAAGAAAGGAAACAC 60
TUBB AGCAGATGTTTGACGCCAAG TGCTGTTGCCGATGAAGGTG 61 ZNF173 CACCCCCAGCAGTTTGAATG TCCTCATCCGTTCCCCAATC 60 ZNF184 GCCAAAGGAAATAAAGGT ATGGCGAATAAGAGCTGA 55 ZNF187 CATTCTACGCAACCTTGG AATCATCTCTTTGGGCAC 55 ZNF192 ATGAAGAAGCCCGAGACCT TTTGCCACACTCCTTACAG 55 ZNF193 AGAGTGCGGGTCTTATCCAG TCTTCTGATGGCGAATGAGG 57 ZNRD1 AGATTGCGGCTCGGTCCT ACGGGTCCCTGGAACTCA 59
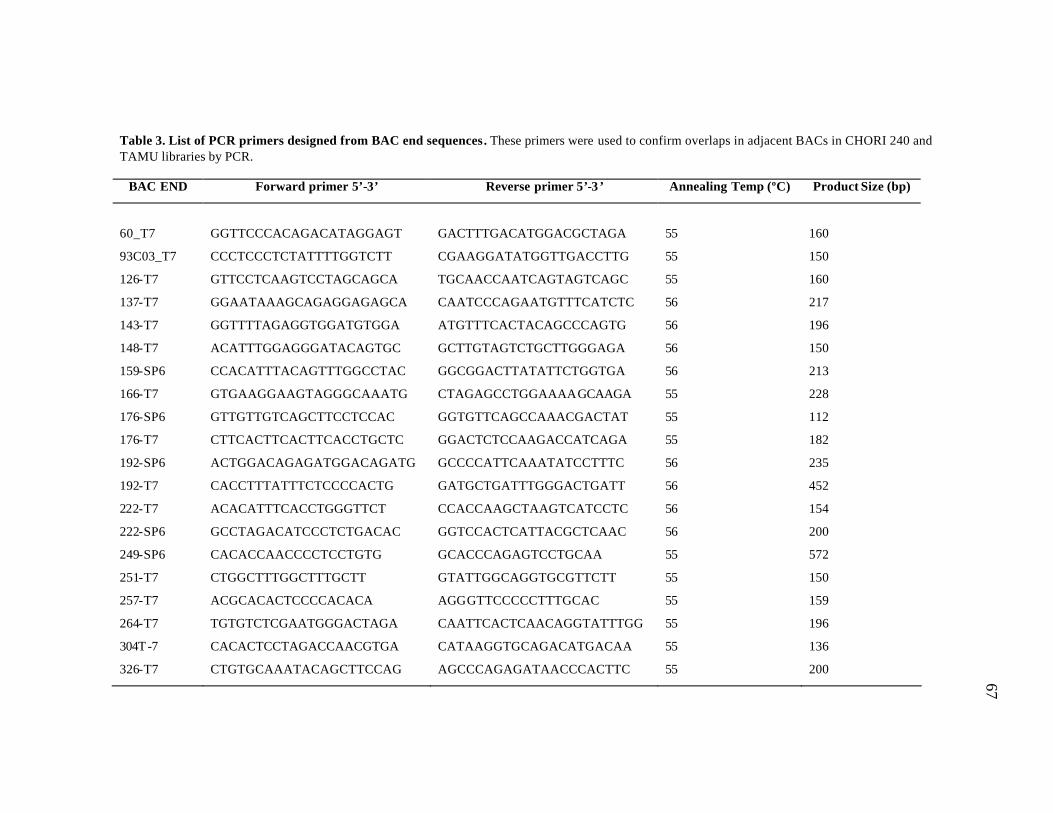
67
Table 3. List of PCR primers designed from BAC end sequences. These primers were used to confirm overlaps in adjacent BACs in CHORI 240 and TAMU libraries by PCR.
BAC END Forward primer 5’-3’ Reverse primer 5’-3 ’ Annealing Temp (ºC) Product Size (bp)
60_T7
GGTTCCCACAGACATAGGAGT
GACTTTGACATGGACGCTAGA
55
160
93C03_T7 CCCTCCCTCTATTTTGGTCTT CGAAGGATATGGTTGACCTTG 55 150
126-T7 GTTCCTCAAGTCCTAGCAGCA TGCAACCAATCAGTAGTCAGC 55 160
137-T7 GGAATAAAGCAGAGGAGAGCA CAATCCCAGAATGTTTCATCTC 56 217
143-T7 GGTTTTAGAGGTGGATGTGGA ATGTTTCACTACAGCCCAGTG 56 196
148-T7 ACATTTGGAGGGATACAGTGC GCTTGTAGTCTGCTTGGGAGA 56 150
159-SP6 CCACATTTACAGTTTGGCCTAC GGCGGACTTATATTCTGGTGA 56 213
166-T7 GTGAAGGAAGTAGGGCAAATG CTAGAGCCTGGAAAAGCAAGA 55 228
176-SP6 GTTGTTGTCAGCTTCCTCCAC GGTGTTCAGCCAAACGACTAT 55 112
176-T7 CTTCACTTCACTTCACCTGCTC GGACTCTCCAAGACCATCAGA 55 182
192-SP6 ACTGGACAGAGATGGACAGATG GCCCCATTCAAATATCCTTTC 56 235
192-T7 CACCTTTATTTCTCCCCACTG GATGCTGATTTGGGACTGATT 56 452
222-T7 ACACATTTCACCTGGGTTCT CCACCAAGCTAAGTCATCCTC 56 154
222-SP6 GCCTAGACATCCCTCTGACAC GGTCCACTCATTACGCTCAAC 56 200
249-SP6 CACACCAACCCCTCCTGTG GCACCCAGAGTCCTGCAA 55 572
251-T7 CTGGCTTTGGCTTTGCTT GTATTGGCAGGTGCGTTCTT 55 150
257-T7 ACGCACACTCCCCACACA AGGGTTCCCCCTTTGCAC 55 159
264-T7 TGTGTCTCGAATGGGACTAGA CAATTCACTCAACAGGTATTTGG 55 196
304T -7 CACACTCCTAGACCAACGTGA CATAAGGTGCAGACATGACAA 55 136
326-T7 CTGTGCAAATACAGCTTCCAG AGCCCAGAGATAACCCACTTC 55 200
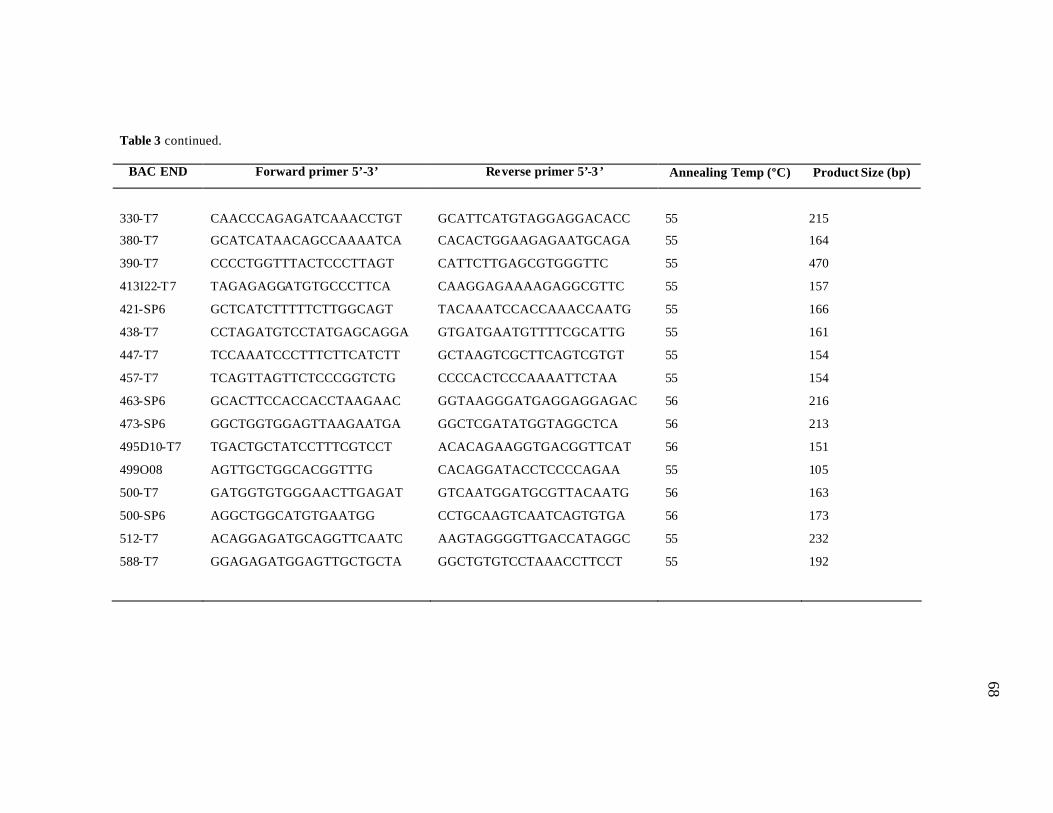
68
Table 3 continued.
BAC END Forward primer 5’-3’ Reverse primer 5’-3 ’ Annealing Temp (ºC) Product Size (bp)
330-T7
CAACCCAGAGATCAAACCTGT
GCATTCATGTAGGAGGACACC
55
215
380-T7 GCATCATAACAGCCAAAATCA CACACTGGAAGAGAATGCAGA 55 164
390-T7 CCCCTGGTTTACTCCCTTAGT CATTCTTGAGCGTGGGTTC 55 470
413I22-T7 TAGAGAGGATGTGCCCTTCA CAAGGAGAAAAGAGGCGTTC 55 157
421-SP6 GCTCATCTTTTTCTTGGCAGT TACAAATCCACCAAACCAATG 55 166
438-T7 CCTAGATGTCCTATGAGCAGGA GTGATGAATGTTTTCGCATTG 55 161
447-T7 TCCAAATCCCTTTCTTCATCTT GCTAAGTCGCTTCAGTCGTGT 55 154
457-T7 TCAGTTAGTTCTCCCGGTCTG CCCCACTCCCAAAATTCTAA 55 154
463-SP6 GCACTTCCACCACCTAAGAAC GGTAAGGGATGAGGAGGAGAC 56 216
473-SP6 GGCTGGTGGAGTTAAGAATGA GGCTCGATATGGTAGGCTCA 56 213
495D10-T7 TGACTGCTATCCTTTCGTCCT ACACAGAAGGTGACGGTTCAT 56 151
499O08 AGTTGCTGGCACGGTTTG CACAGGATACCTCCCCAGAA 55 105
500-T7 GATGGTGTGGGAACTTGAGAT GTCAATGGATGCGTTACAATG 56 163
500-SP6 AGGCTGGCATGTGAATGG CCTGCAAGTCAATCAGTGTGA 56 173
512-T7 ACAGGAGATGCAGGTTCAATC AAGTAGGGGTTGACCATAGGC 55 232
588-T7 GGAGAGATGGAGTTGCTGCTA GGCTGTGTCCTAAACCTTCCT 55 192
69
Shotgun cloning and sequencing of selected BACs
Selected BACs from the minimal tiling path were selected for shotgun cloning
and sequencing from the CHORI 240 library to add to those from the TAMU library
from which sequence was already available. Purified BAC DNA was further treated with
Plasmid-Safe DNase (Epicenter Technologies, Madison, WI) overnight at 37°C,
according to the instructions provided. Approximately 2 ug of DNA was then sheared to
approximately 2 kb fragments using the HydroshearTM Shearing Device (GeneMachines,
SanCarlos, California). The TOPO® Shotgun Subcloning Kit was used to rapidly clone
the blunt end-DNA for sequencing which was done using standard M13 and T7 plasmid
primers.
Fluorescence in situ hybridization (FISH)
Cattle blood was used for both standard short-term pokeweed (Sigma) stimulated
lymphocyte cultures to obtain interphase and metaphase chromosome preparations as
well as agarose-embedded DNA plugs to obtain DNA fibers (Heiskanen et al. 1996;
Raudsepp et al. 2004). Selected BAC clones were labeled with biotin-16-dUTP and/or
digoxigenin-11-dUTP by nick translation using Biotin- or DIG-Nick Translation Mix
(Roche Molecular Biochemicals, Indianapolis, IN), respectively, and hybridized to cattle
metaphase chromosomes individually to confirm their location to BTA23. BAC clones
were also differentially labeled and co-hybridized to metaphase chromosomes to
determine relative positions of clones.
DNA from individual BAC clones was also used in hybridization to metaphase
chromosomes to test specificity and signal intensity, then BACs with relatively clear
signals were also hybridized onto mechanically stretched DNA fibers and performed as
described previously (Raudsepp et al. 2004). Images were captured and analyzed for
each experiment with a Zeiss Axioplan2 fluorescent microscope equipped with
CYTOVISION/GENUS application software, Version 2.7 (Applied Imaging, Santa Clara, CA).
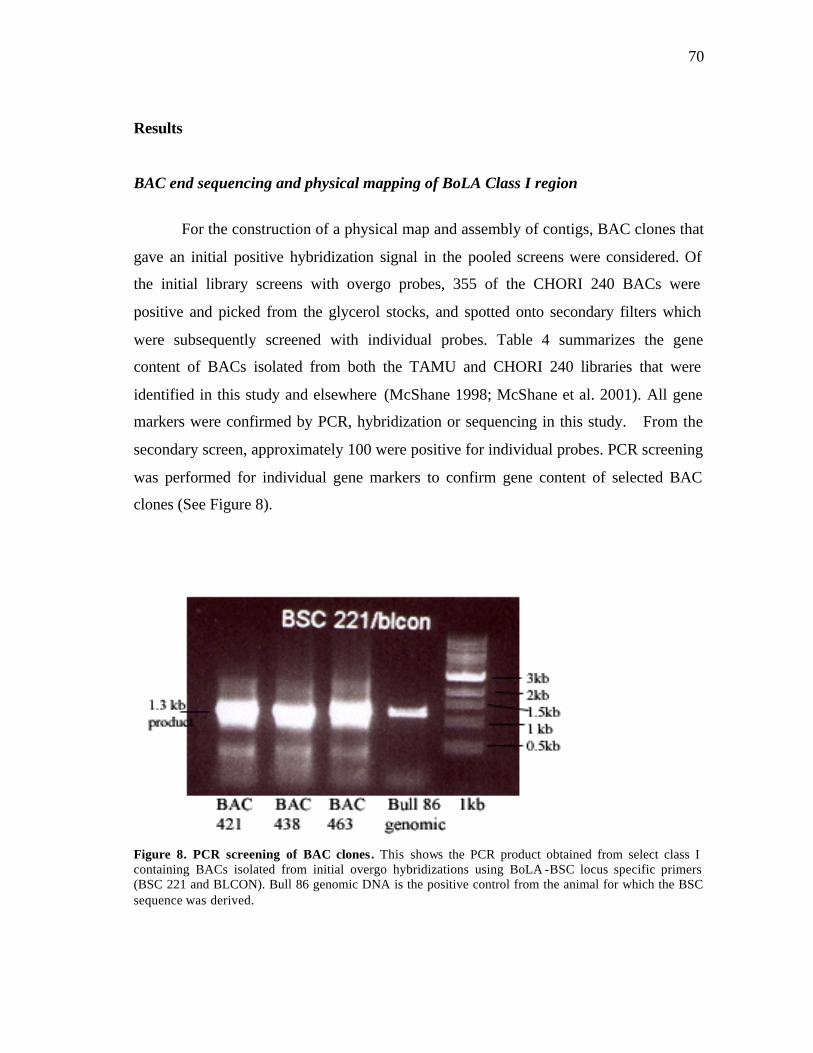
70
Results
BAC end sequencing and physical mapping of BoLA Class I region
For the construction of a physical map and assembly of contigs, BAC clones that
gave an initial positive hybridization signal in the pooled screens were considered. Of
the initial library screens with overgo probes, 355 of the CHORI 240 BACs were
positive and picked from the glycerol stocks, and spotted onto secondary filters which
were subsequently screened with individual probes. Table 4 summarizes the gene
content of BACs isolated from both the TAMU and CHORI 240 libraries that were
identified in this study and elsewhere (McShane 1998; McShane et al. 2001). All gene
markers were confirmed by PCR, hybridization or sequencing in this study. From the
secondary screen, approximately 100 were positive for individual probes. PCR screening
was performed for individual gene markers to confirm gene content of selected BAC
clones (See Figure 8).
Figure 8. PCR screening of BAC clones. This shows the PCR product obtained from select class I containing BACs isolated from initial overgo hybridizations using BoLA -BSC locus specific primers (BSC 221 and BLCON). Bull 86 genomic DNA is the positive control from the animal for which the BSC sequence was derived.
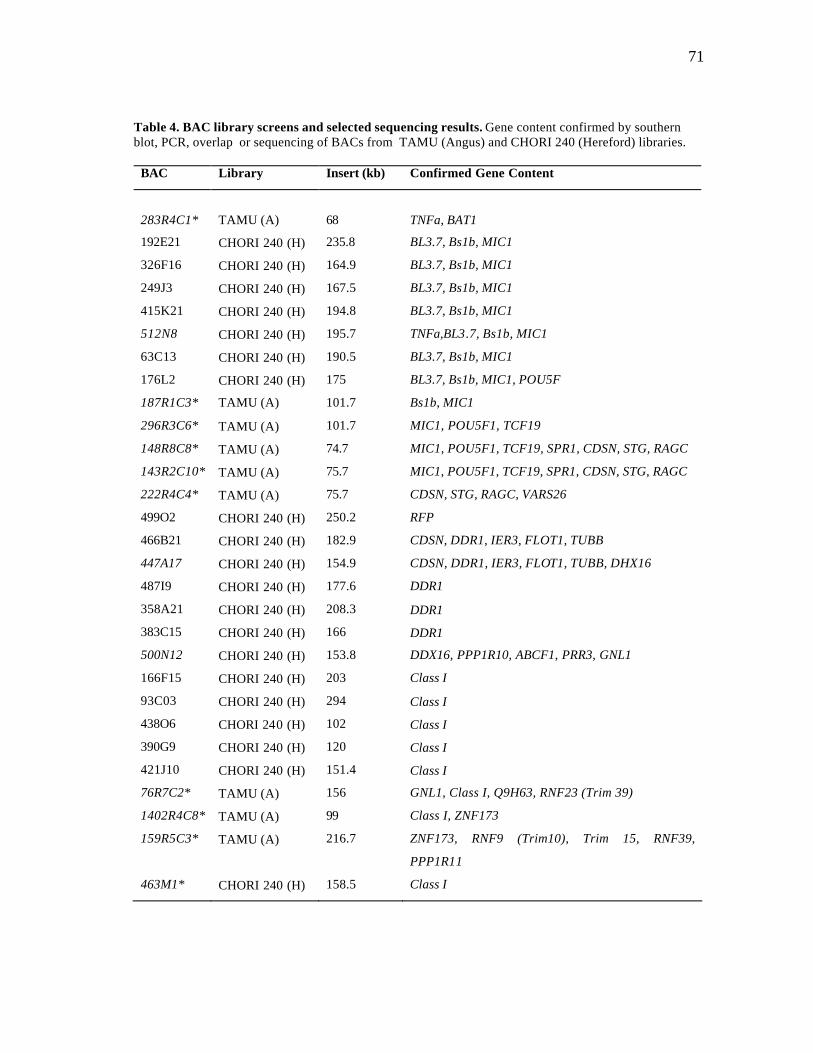
71
Table 4. BAC library screens and selected sequencing results. Gene content confirmed by southern blot, PCR, overlap or sequencing of BACs from TAMU (Angus) and CHORI 240 (Hereford) libraries.
BAC Library Insert (kb) Confirmed Gene Content
283R4C1*
TAMU (A)
68
TNFa, BAT1
192E21 CHORI 240 (H) 235.8 BL3.7, Bs1b, MIC1
326F16 CHORI 240 (H) 164.9 BL3.7, Bs1b, MIC1
249J3 CHORI 240 (H) 167.5 BL3.7, Bs1b, MIC1
415K21 CHORI 240 (H) 194.8 BL3.7, Bs1b, MIC1
512N8 CHORI 240 (H) 195.7 TNFa,BL3.7, Bs1b, MIC1
63C13 CHORI 240 (H) 190.5 BL3.7, Bs1b, MIC1
176L2 CHORI 240 (H) 175 BL3.7, Bs1b, MIC1, POU5F
187R1C3* TAMU (A) 101.7 Bs1b, MIC1
296R3C6* TAMU (A) 101.7 MIC1, POU5F1, TCF19
148R8C8* TAMU (A) 74.7 MIC1, POU5F1, TCF19, SPR1, CDSN, STG, RAGC
143R2C10* TAMU (A) 75.7 MIC1, POU5F1, TCF19, SPR1, CDSN, STG, RAGC
222R4C4* TAMU (A) 75.7 CDSN, STG, RAGC, VARS26
499O2 CHORI 240 (H) 250.2 RFP
466B21 CHORI 240 (H) 182.9 CDSN, DDR1, IER3, FLOT1, TUBB
447A17 CHORI 240 (H) 154.9 CDSN, DDR1, IER3, FLOT1, TUBB, DHX16
487I9 CHORI 240 (H) 177.6 DDR1
358A21 CHORI 240 (H) 208.3 DDR1
383C15 CHORI 240 (H) 166 DDR1
500N12 CHORI 240 (H) 153.8 DDX16, PPP1R10, ABCF1, PRR3, GNL1
166F15 CHORI 240 (H) 203 Class I
93C03 CHORI 240 (H) 294 Class I 438O6 CHORI 240 (H) 102 Class I 390G9 CHORI 240 (H) 120 Class I 421J10 CHORI 240 (H) 151.4 Class I 76R7C2* TAMU (A) 156 GNL1, Class I, Q9H63, RNF23 (Trim 39)
1402R4C8* TAMU (A) 99 Class I, ZNF173
159R5C3* TAMU (A) 216.7 ZNF173, RNF9 (Trim10), Trim 15, RNF39,
PPP1R11
463M1* CHORI 240 (H) 158.5 Class I
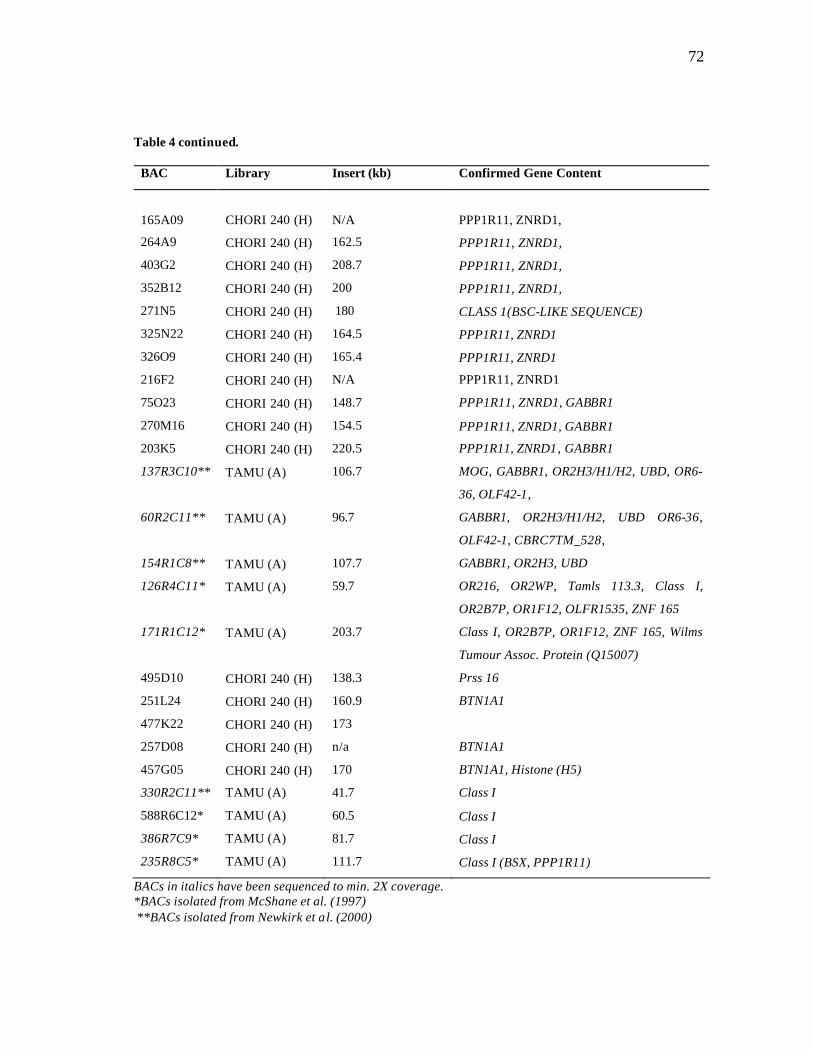
72
Table 4 continued.
BAC Library Insert (kb) Confirmed Gene Content
165A09
CHORI 240 (H)
N/A
PPP1R11, ZNRD1,
264A9 CHORI 240 (H) 162.5 PPP1R11, ZNRD1,
403G2 CHORI 240 (H) 208.7 PPP1R11, ZNRD1,
352B12 CHORI 240 (H) 200 PPP1R11, ZNRD1,
271N5 CHORI 240 (H) 180 CLASS 1(BSC-LIKE SEQUENCE)
325N22 CHORI 240 (H) 164.5 PPP1R11, ZNRD1
326O9 CHORI 240 (H) 165.4 PPP1R11, ZNRD1
216F2 CHORI 240 (H) N/A PPP1R11, ZNRD1
75O23 CHORI 240 (H) 148.7 PPP1R11, ZNRD1, GABBR1
270M16 CHORI 240 (H) 154.5 PPP1R11, ZNRD1, GABBR1
203K5 CHORI 240 (H) 220.5 PPP1R11, ZNRD1 , GABBR1
137R3C10** TAMU (A) 106.7 MOG, GABBR1, OR2H3/H1/H2, UBD, OR6-
36, OLF42-1,
60R2C11** TAMU (A) 96.7 GABBR1, OR2H3/H1/H2, UBD OR6-36,
OLF42-1, CBRC7TM_528,
154R1C8** TAMU (A) 107.7 GABBR1, OR2H3, UBD
126R4C11* TAMU (A) 59.7 OR216, OR2WP, Tamls 113.3, Class I,
OR2B7P, OR1F12, OLFR1535, ZNF 165
171R1C12* TAMU (A) 203.7 Class I, OR2B7P, OR1F12, ZNF 165, Wilms
Tumour Assoc. Protein (Q15007)
495D10 CHORI 240 (H) 138.3 Prss 16
251L24 CHORI 240 (H) 160.9 BTN1A1
477K22 CHORI 240 (H) 173
257D08 CHORI 240 (H) n/a BTN1A1
457G05 CHORI 240 (H) 170 BTN1A1, Histone (H5)
330R2C11** TAMU (A) 41.7 Class I
588R6C12* TAMU (A) 60.5 Class I 386R7C9* TAMU (A) 81.7 Class I 235R8C5* TAMU (A) 111.7 Class I (BSX, PPP1R11)
BACs in italics have been sequenced to min. 2X coverage. *BACs isolated from McShane et al. (1997) **BACs isolated from Newkirk et al. (2000)
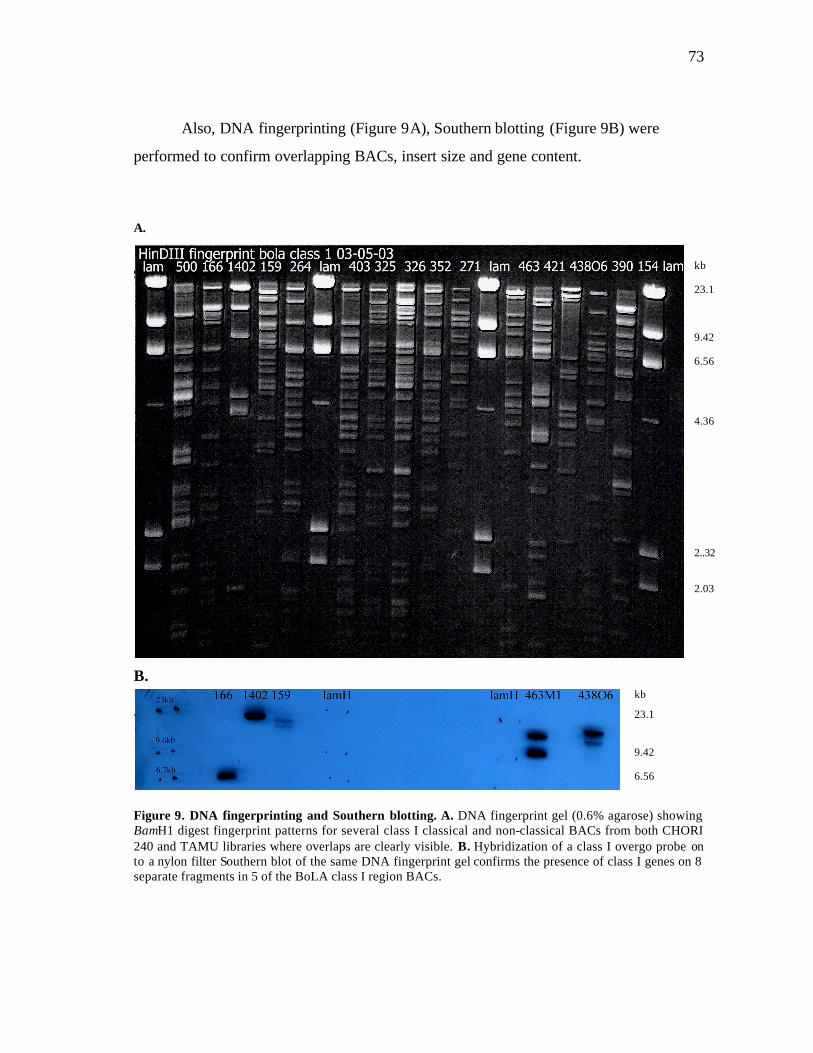
73
Also, DNA fingerprinting (Figure 9A), Southern blotting (Figure 9B) were
performed to confirm overlapping BACs, insert size and gene content.
A. 9A.
B. . Figure 9. DNA fingerprinting and Southern blotting. A. DNA fingerprint gel (0.6% agarose) showing BamH1 digest fingerprint patterns for several class I classical and non-classical BACs from both CHORI 240 and TAMU libraries where overlaps are clearly visible. B. Hybridization of a class I overgo probe on to a nylon filter Southern blot of the same DNA fingerprint gel confirms the presence of class I genes on 8 separate fragments in 5 of the BoLA class I region BACs.
23.1
9.42
6.56
4.36
2..32
2.03
kb
23.1
9.42
6.56
kb
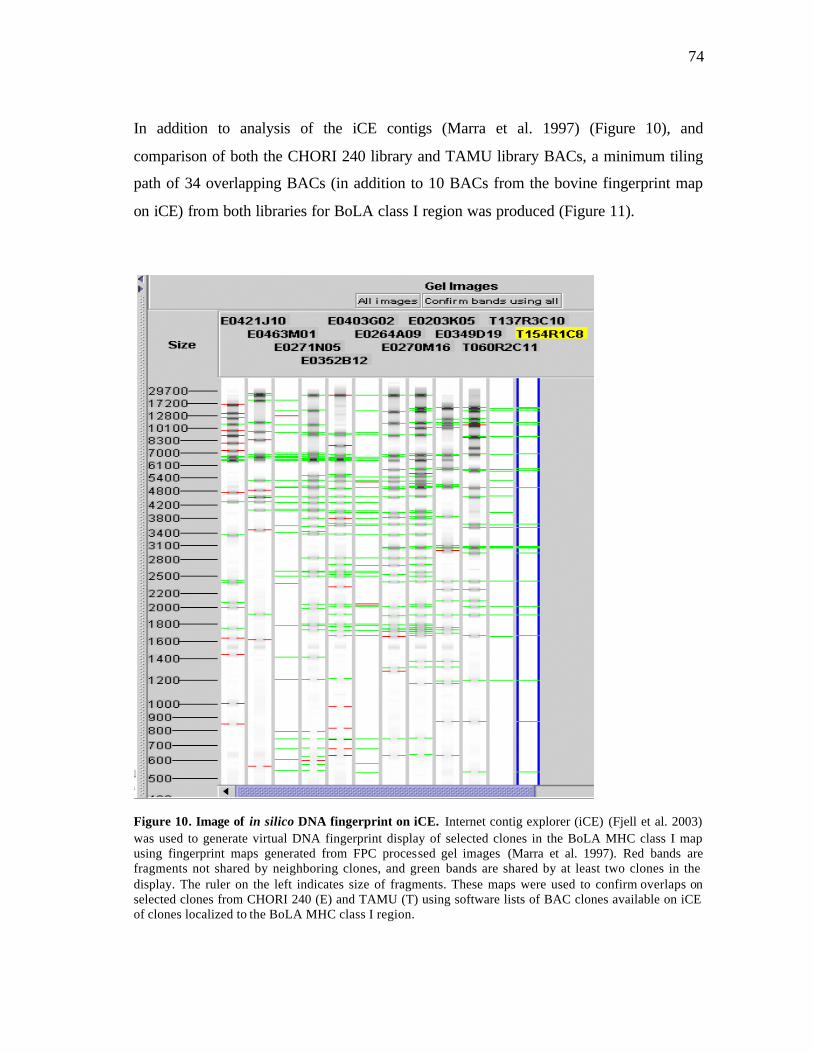
74
In addition to analysis of the iCE contigs (Marra et al. 1997) (Figure 10), and
comparison of both the CHORI 240 library and TAMU library BACs, a minimum tiling
path of 34 overlapping BACs (in addition to 10 BACs from the bovine fingerprint map
on iCE) from both libraries for BoLA class I region was produced (Figure 11).
Figure 10. Image of in silico DNA fingerprint on iCE. Internet contig explorer (iCE) (Fjell et al. 2003) was used to generate virtual DNA fingerprint display of selected clones in the BoLA MHC class I map using fingerprint maps generated from FPC processed gel images (Marra et al. 1997). Red bands are fragments not shared by neighboring clones, and green bands are shared by at least two clones in the display. The ruler on the left indicates size of fragments. These maps were used to confirm overlaps on selected clones from CHORI 240 (E) and TAMU (T) using software lists of BAC clones available on iCE of clones localized to the BoLA MHC class I region.
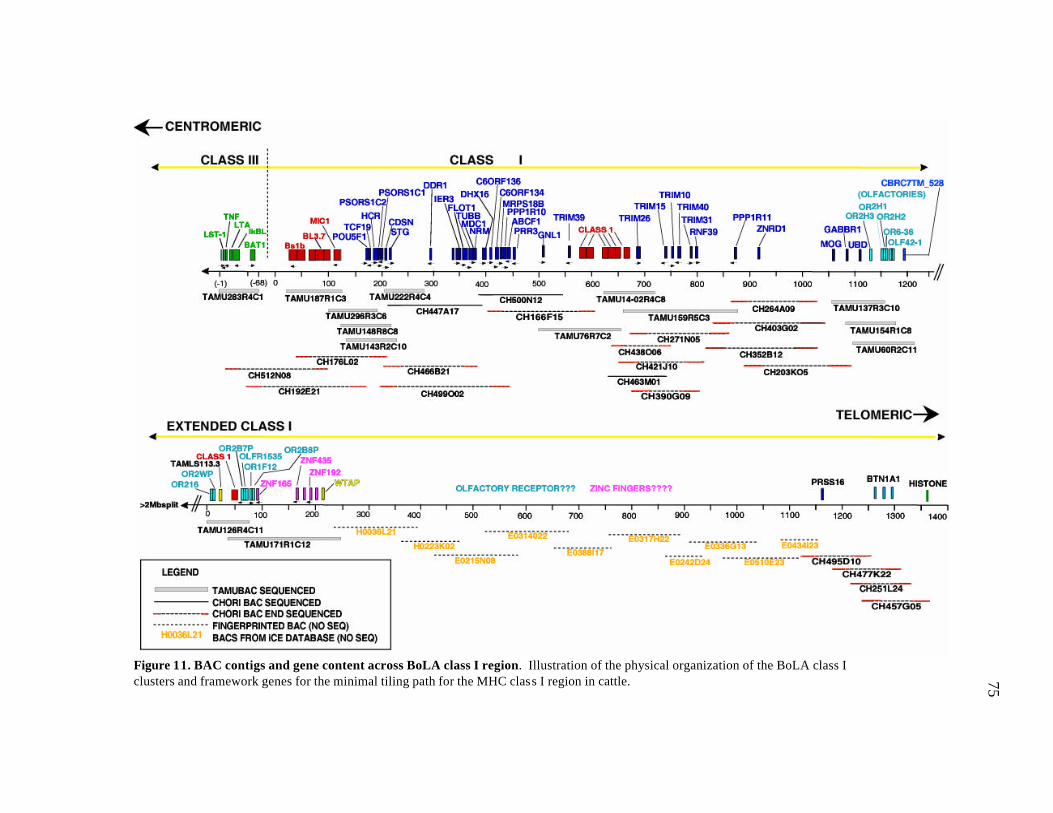
75
Figure 11. BAC contigs and gene content across BoLA class I region. Illustration of the physical organization of the BoLA class I clusters and framework genes for the minimal tiling path for the MHC class I region in cattle.
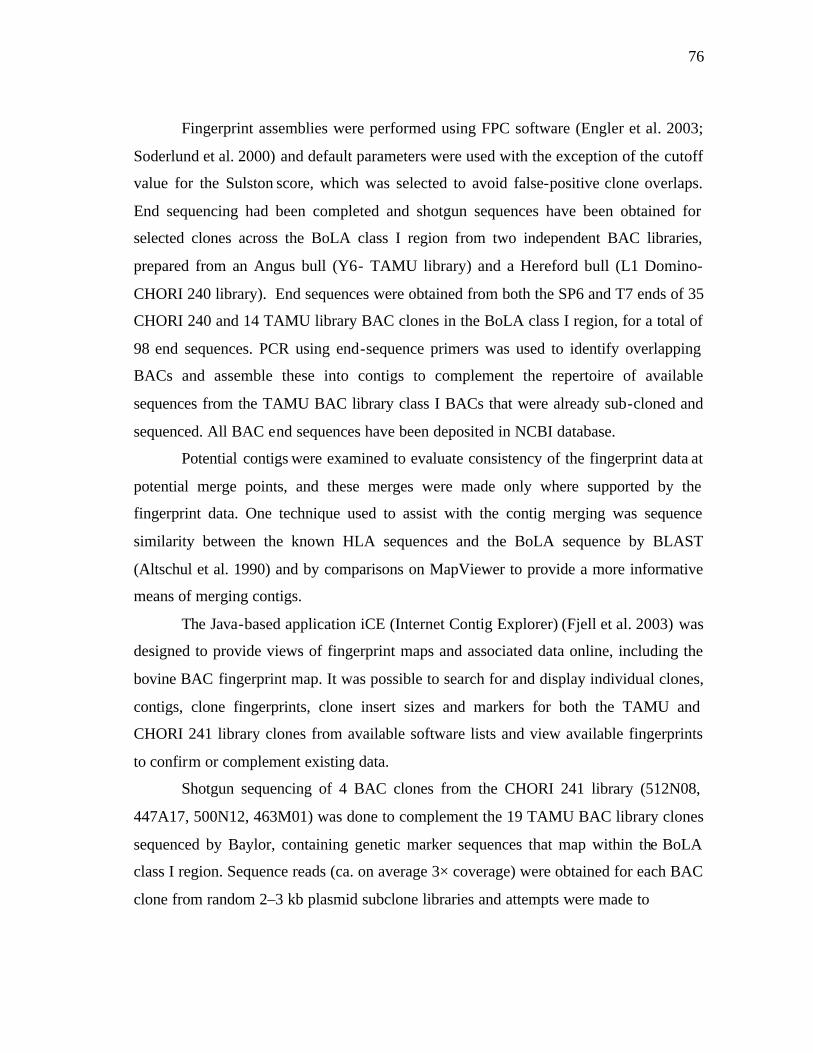
76
Fingerprint assemblies were performed using FPC software (Engler et al. 2003;
Soderlund et al. 2000) and default parameters were used with the exception of the cutoff
value for the Sulston score, which was selected to avoid false-positive clone overlaps.
End sequencing had been completed and shotgun sequences have been obtained for
selected clones across the BoLA class I region from two independent BAC libraries,
prepared from an Angus bull (Y6- TAMU library) and a Hereford bull (L1 Domino-
CHORI 240 library). End sequences were obtained from both the SP6 and T7 ends of 35
CHORI 240 and 14 TAMU library BAC clones in the BoLA class I region, for a total of
98 end sequences. PCR using end-sequence primers was used to identify overlapping
BACs and assemble these into contigs to complement the repertoire of available
sequences from the TAMU BAC library class I BACs that were already sub-cloned and
sequenced. All BAC end sequences have been deposited in NCBI database.
Potential contigs were examined to evaluate consistency of the fingerprint data at
potential merge points, and these merges were made only where supported by the
fingerprint data. One technique used to assist with the contig merging was sequence
similarity between the known HLA sequences and the BoLA sequence by BLAST
(Altschul et al. 1990) and by comparisons on MapViewer to provide a more informative
means of merging contigs.
The Java-based application iCE (Internet Contig Explorer) (Fjell et al. 2003) was
designed to provide views of fingerprint maps and associated data online, including the
bovine BAC fingerprint map. It was possible to search for and display individual clones,
contigs, clone fingerprints, clone insert sizes and markers for both the TAMU and
CHORI 241 library clones from available software lists and view available fingerprints
to confirm or complement existing data.
Shotgun sequencing of 4 BAC clones from the CHORI 241 library (512N08,
447A17, 500N12, 463M01) was done to complement the 19 TAMU BAC library clones
sequenced by Baylor, containing genetic marker sequences that map within the BoLA
class I region. Sequence reads (ca. on average 3× coverage) were obtained for each BAC
clone from random 2–3 kb plasmid subclone libraries and attempts were made to
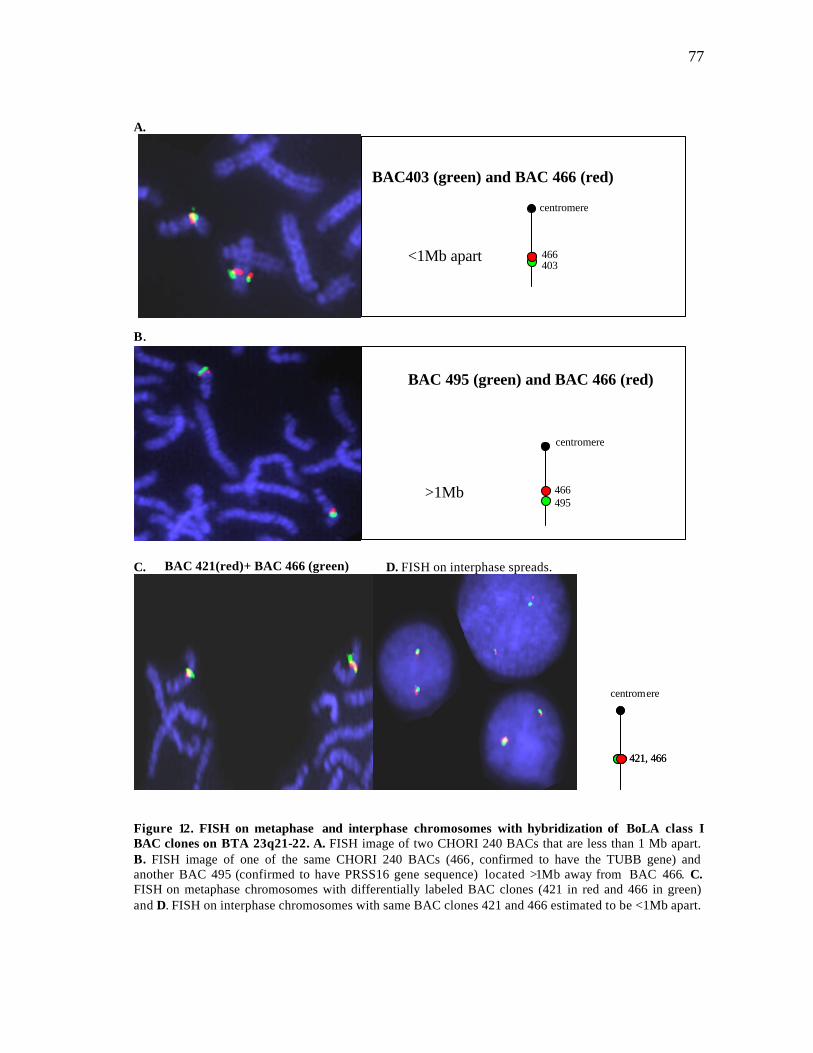
77
A.
B.
C. D. FISH on interphase spreads.
Figure 12. FISH on metaphase and interphase chromosomes with hybridization of BoLA class I BAC clones on BTA 23q21-22. A. FISH image of two CHORI 240 BACs that are less than 1 Mb apart. B. FISH image of one of the same CHORI 240 BACs (466, confirmed to have the TUBB gene) and another BAC 495 (confirmed to have PRSS16 gene sequence) located >1Mb away from BAC 466. C. FISH on metaphase chromosomes with differentially labeled BAC clones (421 in red and 466 in green) and D. FISH on interphase chromosomes with same BAC clones 421 and 466 estimated to be <1Mb apart.
421, 466 421, 466
BAC403 (green) and BAC 466 (red)
466 403
<1Mb apart
centromere
centromere
466 495
>1Mb
BAC 495 (green) and BAC 466 (red)
BAC 421(red)+ BAC 466 (green)
centromere
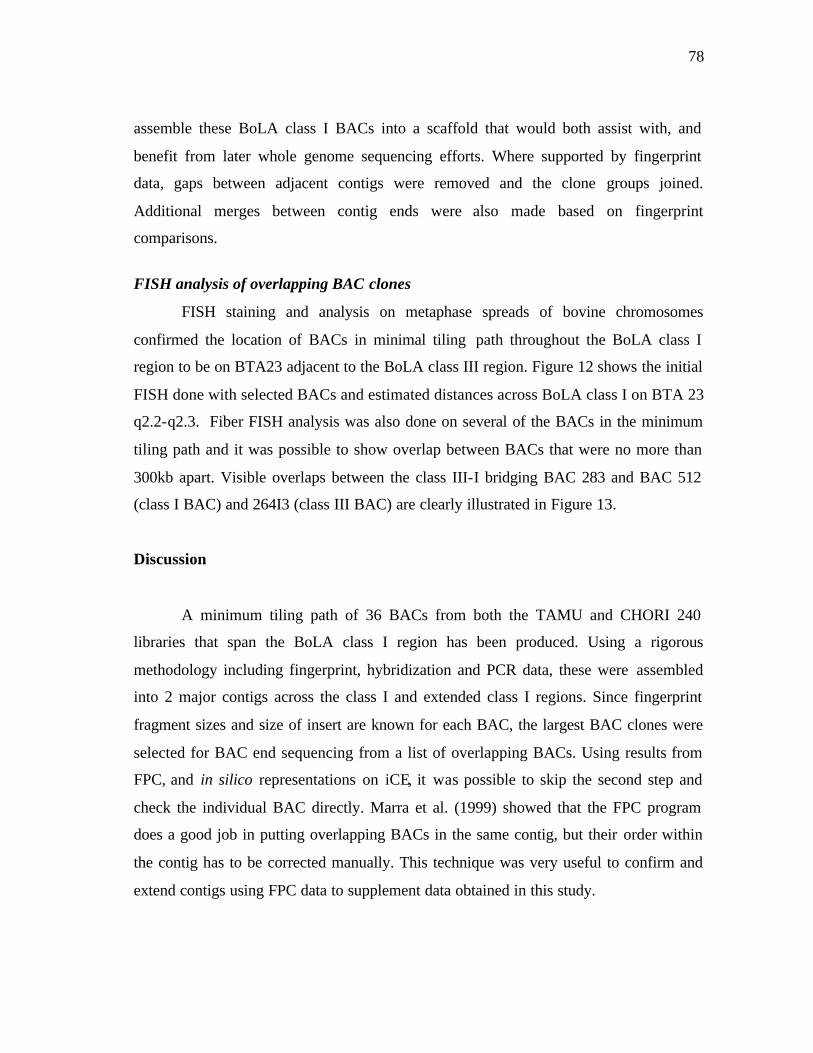
78
assemble these BoLA class I BACs into a scaffold that would both assist with, and
benefit from later whole genome sequencing efforts. Where supported by fingerprint
data, gaps between adjacent contigs were removed and the clone groups joined.
Additional merges between contig ends were also made based on fingerprint
comparisons.
FISH analysis of overlapping BAC clones
FISH staining and analysis on metaphase spreads of bovine chromosomes
confirmed the location of BACs in minimal tiling path throughout the BoLA class I
region to be on BTA23 adjacent to the BoLA class III region. Figure 12 shows the initial
FISH done with selected BACs and estimated distances across BoLA class I on BTA 23
q2.2-q2.3. Fiber FISH analysis was also done on several of the BACs in the minimum
tiling path and it was possible to show overlap between BACs that were no more than
300kb apart. Visible overlaps between the class III-I bridging BAC 283 and BAC 512
(class I BAC) and 264I3 (class III BAC) are clearly illustrated in Figure 13.
Discussion
A minimum tiling path of 36 BACs from both the TAMU and CHORI 240
libraries that span the BoLA class I region has been produced. Using a rigorous
methodology including fingerprint, hybridization and PCR data, these were assembled
into 2 major contigs across the class I and extended class I regions. Since fingerprint
fragment sizes and size of insert are known for each BAC, the largest BAC clones were
selected for BAC end sequencing from a list of overlapping BACs. Using results from
FPC, and in silico representations on iCE, it was possible to skip the second step and
check the individual BAC directly. Marra et al. (1999) showed that the FPC program
does a good job in putting overlapping BACs in the same contig, but their order within
the contig has to be corrected manually. This technique was very useful to confirm and
extend contigs using FPC data to supplement data obtained in this study.
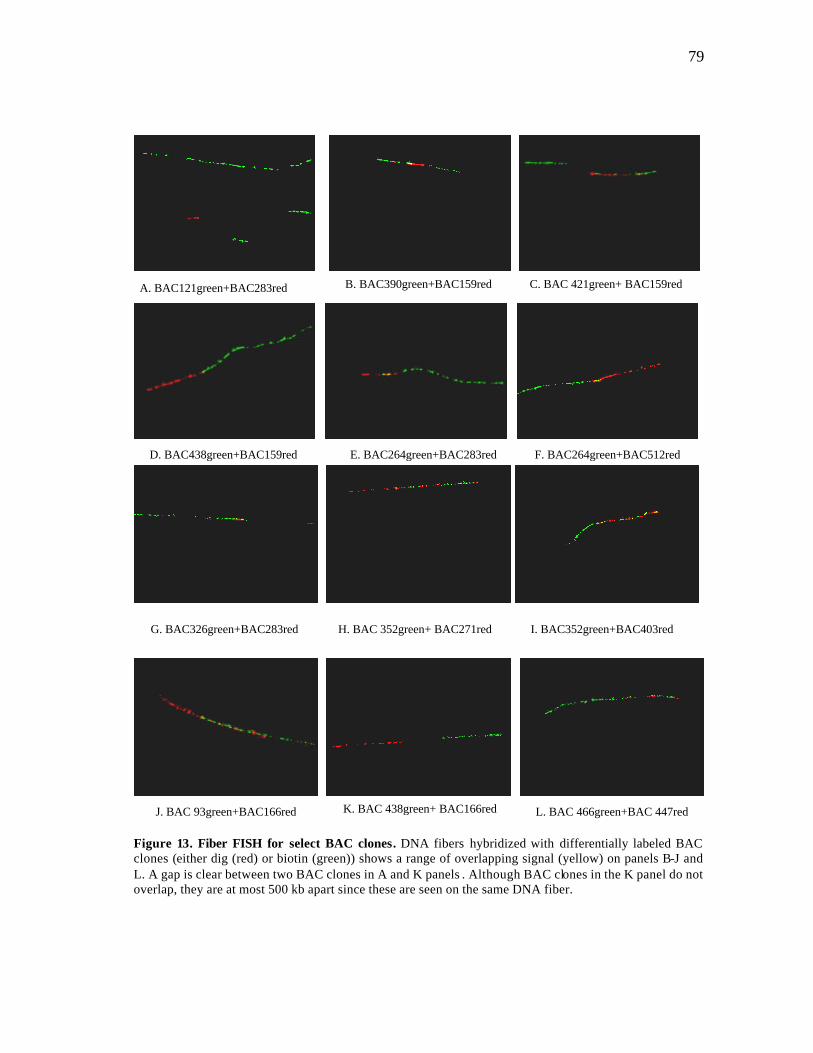
79
Figure 13. Fiber FISH for select BAC clones. DNA fibers hybridized with differentially labeled BAC clones (either dig (red) or biotin (green)) shows a range of overlapping signal (yellow) on panels B-J and L. A gap is clear between two BAC clones in A and K panels . Although BAC clones in the K panel do not overlap, they are at most 500 kb apart since these are seen on the same DNA fiber.
G. BAC326green+BAC283red I. BAC352green+BAC403red H. BAC 352green+ BAC271red
L. BAC 466green+BAC 447red K. BAC 438green+ BAC166red
J. BAC 93green+BAC166red
A. BAC121green+BAC283red B. BAC390green+BAC159red C. BAC 421green+ BAC159red
D. BAC438green+BAC159red F. BAC264green+BAC512red E. BAC264green+BAC283red
80
This chapter describes a nonradioactive, agarose gel-based, high- throughput
DNA restriction digest fingerprinting methodology first described by Marra et al. (1997)
for use in the construction of high-resolution physical maps from low-copy-number,
large- insert clones. The procedure is robust and allows for the recovery of clone insert
size information. Initially used to construct sequence tag site (STS)-based contigs, the
methodology has also been applied to whole-genome, random-clone strategies that have
resulted in the construction of high-resolution, sequence-ready physical maps of the
genomes of Arabidopsis thaliana, human, Caenorhabditis briggsae, and Cryptococcus
neoformans (Marra et al. 1997). The methodology is currently being employed in the
construction of physical maps for several other large, mammalian genomes, such as
those of mouse, rat and bovine.
Although end sequencing was used quite often to confirm overlaps, many of the
individual BAC ends had repetitive sequence that made them unsuitable for use in contig
merging. This was due to the CHORI library being created with Mbo1, which
preferentially cuts at sites of repeat structures, so the ends of the inserts are enriched for
repetitive sequence creating a biased distribution (D. Adelson, personal communication).
There was also a very limited coverage of shotgun cloned BACs, averaging ca. 3x
coverage of the TAMU library BACs which ranged in insert size from 59.6kb to 216.7kb
and 2x coverage of the 4 CHORI 240 library BACs (average insert size 154kb). Thus,
assembly into large scaffolds has not been possible, suggesting that repetitive sequences
within clones are so abundant as to make it difficult on assembly of the contigs. One of
the TAMU library BACs (159) that was critical for the merging of the class I containing
contigs is currently itself split into 61 sub-contigs. An attempt was made to combine
enough sequence reads from each of these BACs to represent ca. 3× coverage and to
perform an assembly to determine if they would assemble individually or if repetitive
sequences would interfere with proper assembly, but this was also not complete and
mirrored the individual assemblies.
Another aim of the current project was to hybridize BoLA BAC clones to
metaphase chromosomes using FISH, and to confirm overlapping BACs within 300kb of
81
each other by Fiber FISH. These data obtained for the BoLA class I region, will greatly
assist with orienting scaffold assemblies generated from WGS currently underway at
Baylor College of Medicine. A core set of clones containing class I or framework
genetic marker sequences were identified based on BAC end sequence analysis and were
given priority for FISH mapping. Fiber FISH analysis on the 34 clones of the minimum
tiling path was more difficult as several of the BACs seemed to have repetitive sequence
and were difficult to FISH, exhibiting non-specific staining in other chromosomal
locations in addition to the BTA23q21-q22 region where one would expect BoLA I BAC
clones to be located.
There are some confounding factors produced when using two libraries from a
total of four different animals with varying class I genotypes and/or serotypes. Although
class I sequence was obtained from both L1 (CHORI 240 library Hereford bull), Y6
(TAMU library Angus Bull), Longhorn and Angus females contributing BACs 14-02
and 7138-58 and even the phage library from Bull 86, assignment of allelic versus loci
designation for these sequences was not possible, since these animals are all different
haplotypes.
Assignment of location of BAC clones within the BoLA class I region was based
on a rigorous methodology using a compilation of data including hybridization, PCR,
end sequencing and FISH; which allowed greater confidence in contig merging and the
ordered BAC array. For example, BSA and BSC are PCR amplified from CHORI BACs
463, 421 and 438 which confirms the original class I hybridization signals detected, and
location of these CHORI 240 BACs fit in the tiling path. TAMU library BACs 588, 386,
7138-58 and 330 were all found to be positive by hybridization for BoLA class I
(Newkirk 2000) and sequencing data corroborates class I sequence by nucleotide
alignments within all these BACs, however we are unable to place these unto the current
BAC array, indicating the haplotypic difference of class I sequence between animals
may be a confounding factor. It is known that variable numbers of class I genes are
expressed from MHC haplotype to haplotype in cattle, although serotypic data may
suggest animals are homogeneous (Ellis et al. 1999; Garber et al. 1993; Garber et al.
82
1994; Holmes et al. 2003). Also, the A14 serotype of animals has up to three class I
genes expressed while A11 has only one class I gene expressed.
There is more evidence for intralocus recombination in the MHC than for
interlocus recombination. However, as in most multi-gene families, sequence analyses
have suggested that such events have occurred in the past. For example the human class
Ia HLA-A locus arose from a recombination between (1) a 5’ region (exon 1 through
exon 3) of a gene related to the other human class Ia loci HLA-B and –C; and (2) a 3’
region (from intron 3 to the end of the gene) from a gene closely related to the human
class I pseudogene HLA-70 (Hughes 1995). Similarly, we see evidence for interlocus
recombination from the cattle BSA and BSC genes, where BSC arose from a
recombination a segmental exhange between the 5’ region and ARS region (exons 1-3)
of a haplotypic cluster related to B13.7 and the 3’ region (exons 3-UTR) from another
phylogentic cluster containing BSA (Garber et al. 1993).
From the human, mouse and rat MHC complete sequence it is known that this
region, between GNL (HSR1) and MOG contains up to 50 classical class I genes,
pseudogenes and fragments (Amadou et al. 1999; Hurt et al. 2004; The MHC
Consortium 1999) arranged in three clusters within what is defined as the “kappa” and
“alpha” blocks within the frame work genes (Amadou 1999). Of note is that the BoLA
MHC class I seems to have another cluster of class I sequence telomeric of MOG located
within the olfactory receptor genes, UBD and TAML 113.3 microsatellite located on
BACs 171 and 126; this is similar to a class I cluster found in both rat and mouse MHCs
(Amadou et al. 2003; Hurt et al. 2004; Takada et al. 2003) in physical location, however
the exact number of olfactory genes may not be as greatly duplicated as in the rat but this
is unknown (See Figure 14).
Sequence comparisons show that the class I gene in this area is similar to
classical class I sequence, however without fully characterizing it we are unable to
determine if it is a functional gene, a pseudogene or a fragment. Cattle, swine, human,
mouse and rat MHCs also share a cluster between BAT1 and POU5F1 that has non-
classical and class I like sequence (MIC genes) and classical class I sequence in HLA
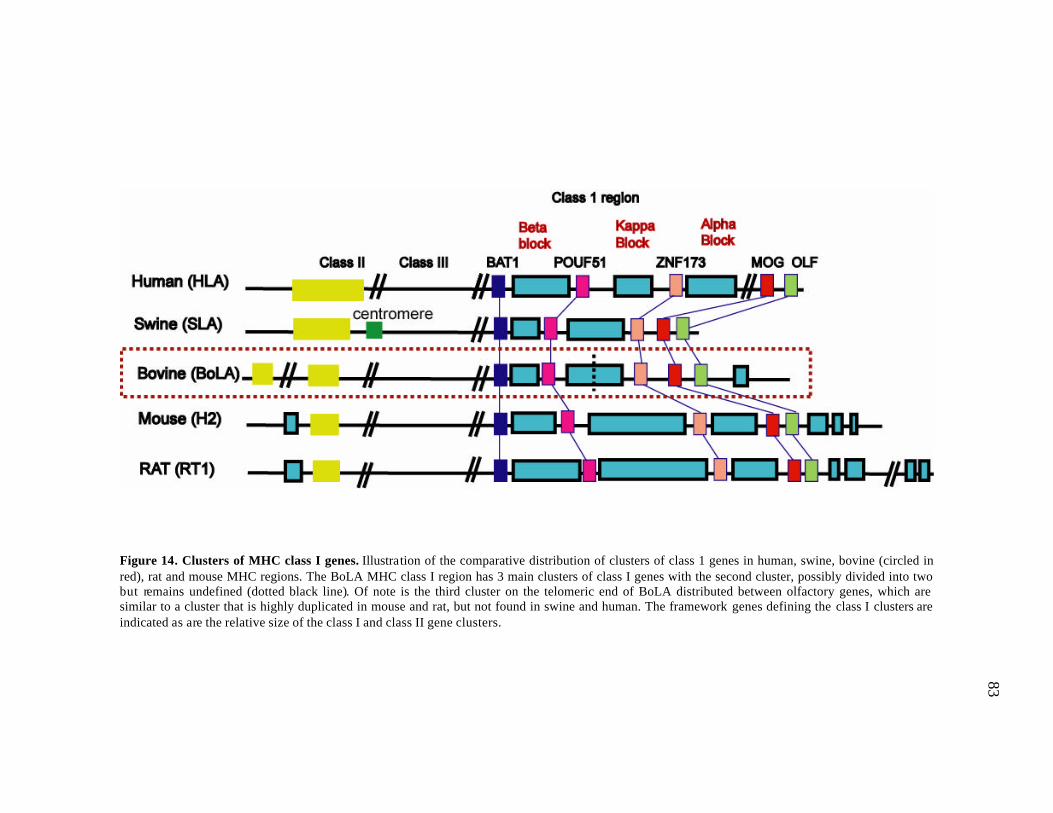
83
Figure 14. Clusters of MHC class I genes. Illustration of the comparative distribution of clusters of class 1 genes in human, swine, bovine (circled in red), rat and mouse MHC regions. The BoLA MHC class I region has 3 main clusters of class I genes with the second cluster, possibly divided into two but remains undefined (dotted black line). Of note is the third cluster on the telomeric end of BoLA distributed between olfactory genes, which are similar to a cluster that is highly duplicated in mouse and rat, but not found in swine and human. The framework genes defining the class I clusters are indicated as are the relative size of the class I and class II gene clusters.
84
called the “beta” duplication block. In BoLA, by sequence similarity analysis, this
cluster was found to have BL3.7, Bs1b and MIC 1 sequence in the BACs from the
CHORI 240 and TAMU libraries.
The data in this study supports previous data that there is at least 400kb of
sequence that holds class I or class I- like genes and pseudogenes in BoLA between GNL
and ZNF 173 (Di Palma et al. 2002; Holmes et al. 2003). It goes further to confirm at
least three clusters of class I genes present in the BoLA class I region (Figure 16). The
first cluster is adjacent to the class III region and holds the BL3.7 and MIC1 genes. The
second cluster could possib ly be separated into two clusters. The class I sequence
represented on CHORI BACs 166F15, 390G9, 438O6 and TAMU BACs 76, 14-02 and
159 could possibly be in a separated cluster flanked by the Trim 39 (RNF23) and Trim
26 (ZNF173) framework genes. The possible third cluster shares TAMU BAC 159 with
the second, but has some overlapping group of BACs that seem to be distinct from
cluster 2. One of these problem BACs (CHORI 463M1) contains class I sequence (at
least 2 genes) but seems to have very complex repeat structures that make it impossible
to achieve clear FISH data that confirms end sequence and fingerprint data. This cluster
also has CHORI library BACs 271N5 and 421J10 that have at least some fragment of
class I sequence, that contig with BACs 264A9, 403G2, 352B12, 270M16 and are
flanked by TRIM 15 (ZNFB7) and MOG telomerically. This contig also extends to the
TAMU BACs 137, 60 and 154 that contain MOG, GABBR1, UBD and olfactory genes.
The estimated size of the class I BoLA region between the framework genes
BAT1 to MOG is probably no more than 1.5Mb, then from MOG to the olfactories for
200kb. From MOG to the extended class I region is a little more difficult to estimate as
the contigs do not overlap completely, especially beyond ZNF165 into the extended
class I region with BTN1A1 and the histones. A small contig of two TAMU BACs is
located telomeric of the olfactory genes, which are BAC126 (containing microsatellite
TAML113.3 and zing finger genes including ZNF 187) and BAC171 (containing zinc
finger genes 193, 165 and 184). From iCE and FISH analysis however, it would seem
that there could be as much as 1Mb between BAC 171(containing ZNF165) and BAC
85
495D10 (containing PRSS16) and it is possible to join these two groups into one contig
using the bovine DNA fingerprinting data available on iCE. The final group of the
second contig is in the telomeric extended class I region, made of CHORI BACs
495D10, then 477K22 and 251L24 (containing BTN1A1) then lastly 457G05
(containing BTN1A1 and histone 5 sequence). BTN1A1 encoded butyrophilin which
was originally purified from cow’s milk and was subsequently identified as the
predominant protein constituent of milk in other mammals (Jack and Mather 1990).
BTN1A1 has been mapped to the extended MHC region of chromosome 6,
400kb centromeric of the Hfe gene, which was sequenced revealing a cluster of at least 5
butyrophilin- like genes, which appear to be widely expressed (Banghart et al. 1998).
Interestingly, the N-terminal domain of butyrophilin is similar to rat
myelin/oligodendrocyte glycoprotein (MOG) and chicken B blood group system (B-G)
protein (Pham-Dinh et al. 1993; Salomonsen et al. 1991). It is therefore possible that the
butyrophilin gene is the product of an exon shuffling event which occurred between
ancestors of the RFP and MOG genes, which is an example of the colocalization of a
chimeric gene and its putative progenitors (Vernet et al. 1993).
Also of interest in this study is that attempts to localize a BAC clone containing
RFP sequence resulted in only one positive BAC by hybridization and PCR (CHORI
499O2) which maps to the centromeric end of BoLA class I, overlapping BACs TAMU
143, 148, 222 and CHORI 447A17 and 466B21. This indicates that there might have
been a possible translocation of RFP like sequence to the class III/I boundary in
Bovidae. Evidence from RT1 and H2 show no indication of an RFP gene telomeric of
MOG (Hurt et al. 2004). Interestingly, an additional butyrophilin- like sequence is found
at the class II/III boundary in mouse, rat and human ( Beck et al. 1999, Hurt et al. 2004).
A strong duplicative nature is not uncommon in superfamilies of genes like butyrophilin
genes, which are members of the immunoglobulin superfamily and related to the B7
family of co-stimulatory molecules (Linsley et al. 1994).
When the genomic sequences of a 433-kb segment located between the non-
classical and classical SLA class I gene clusters in pig was compared in terms of
86
genomic organization and diversity with the orthologous region of the HLA complex
(Shigenari et al. 2004) its length was 433 kb compared with 595 kb in the corresponding
HLA class I region. This 162-kb difference in size between the swine and human
genomic segments can be explained by indel activity, and the greater variety and density
of repetitive sequences within the human MHC.
Twenty-one swine genes with strong sequence similarity to the corresponding
human genes were identified, with the gene order from the centromere to telomere of
HCR - CAT56. The human SEEK1 and DPCR1 genes are pseudogenes in swine. In this
study, a single contig spanning the region between the non-classical BoLA class I MICA
to the first cluster of Class I sequence is estimated to be 450-500kb based on insert size
of BAC clones in the minimal tiling path. Within this region at least 18 genes from
POU5F-TCF19-SPR1-CDSN-STG-RAGC-DDR1-IER3-FLOT1-TUBB-NR-DDX16-
K1AA1949-PP1R10-ABCF1-GNL-Q9H63-RNF23 (Trim 39) have been confirmed to be
in contiguous sequence contained within 3 overlapping BACs (TAMU 143,
CHORI447A17 and 500N12. It can be concluded that the region is highly conserved in
BoLA as well, and homologous to the corresponding region located between the HLA-C
and HLA-E genes in the human and the non-classical and classical SLA genes.
The contig flanked by BL3.7 in the centromeric end at the Class III/I border till
MOG is estimated to be approximately 1Mb which is equivalent in size to the
homologous region in HLA (900kb) which is reduced in the swine (500kb) (Renard et al.
2001). In addition to this 1Mb, if the BACs containing MOG and several olfactories
were added to this contig by overlapping STCs and FISH, the region is extended by an
additional 300kb. A gap greater than 2Mb separates the next contig that is about 250kb
in length containing TAML 113.3 and the zinc fingers. The next contig is separated by a
region of 1Mb that has been defined by overlapping BACs in the Bovine fingerprint
Map available on iCE in between the flanking BACs on the second contig, CHORI BAC
495D10 and TAMU BAC 171. The final group of BACs in the second contig is on the
telomeric end ending at the histones but before HFE that was not included. In total, the
extended BoLA class I seem to extend to a minimum of 6Mb of known overlapping
87
sequence, possibly extendable by several Mb in the unknown gap area between TAMU
BACs 60 and 126.
There is evidence of at least 20 class I -like sequences (classical, non-classical,
pseudogenes and gene fragments) in the cattle MHC (Ellis et al. 1999). It seems that at
least 6 of these are expressed, but data relating serotype to genotype remains perplexing
(Ellis and Ballingall 1999; Ellis et al. 1999) as individual haplotypes express anywhere
between 1 and 3 of these in varying combinations. From this analysis, Southern blotting
showed variable fragment numbers in various BACs fingerprinted from both TAMU and
CHORI 240 libraries and amplification from genomic DNA with ‘locus-specific’
primers suggests genes not expressed are absent from that animal’s haplotype which
supports previous research.
The presence of more than 3 classical class I genes could increase MHC diversity
within BoLA, and increase population fitness (as even inactivated genes could perform
this function). The functional implications of variable class I haplotypes (including
single class I locus haplotypes) in cattle, in terms of individual and population fitness,
are at present unknown. These genes may vary in terms of: polymorphism, expression
levels and even specific function. There appear to be at least 4 polymorphic loci (Ellis et
al. 1995) and from serological analyses we know of at least 50 specificities (Davies and
Antczak 1991a; Davies and Antczak 1991b; Davies et al. 1994; Garber et al. 1993;
Garber et al. 1994). Since different parasites generate different antigenic fragments, and
MHC molecules differ in the efficiency with which they bind particular sequences of
amino acids in these fragments; therefore, some MHC products would be better than
others at presenting parasite antigens to the immune system. It is conceivable that the
high levels of what seems to be redundancy seen in cattle MHC class I is an evolutionary
advantage in having a greater repertoire peptide binding capability with which to stave
off infection and to have an overall optimization of immune response in a given
population.
Evidence comes from studies on individuals infected with the human
immunodeficiency virus (HIV) where possessing a particular haplotype (HLA-B*4405)
88
confers resistance to developing AIDS as compared with another HLA-B molecule
(HLA-B*4402) (that differs by a single amino acid) (Zernich et al. 2004). This single
amino acid polymorphism that distinguishes HLA-B*4402 (Asp116) from B*4405
(Tyr116) permits B*4405 to constitutively acquire peptides without any detectable
incorporation into the transporter associated with Ag presentation (TAP)-associated
peptide loading complex even under conditions of extreme peptide starvation. This mode
of peptide capture is less susceptible to viral interference than the conventional loading
pathway used by HLA-B*4402 that involves assembly of class I molecules within the
peptide loading complex (Zernich et al. 2004). Also, when stickleback fish, which
differed in number of class II alleles, were exposed to three types of parasites, fish with
5-6 alleles resisted infection significantly more fish with fewer (or more). So it may be
the great diversity of class I and class II alleles in the population that has helped to
reduce rate of pandemics and ensure that no single parasite or pathogen can decimate the
population. Thus, resistance conferred by specific alleles to temporally variable
pathogens may contribute to the observed polymorphism at MHC genes and other
similar host defense loci in other species such as cattle.
Future systematic mapping to detect haplotypes that confer susceptibility to
common diseases requires the construction of a fully informative polymorphism map. In
humans, a 4.75 Mb of contiguous sequence for each of two common MHC haplotypes,
to which susceptibility to >100 diseases has been mapped was sequenced using a BAC-
based map (Stewart et al. 2004). There were > 18,000 SNPs detected in this region, with
an average SNP densities ranging from less than one SNP per kilobase to >60. This may
suggest that such detailed mapping to investigate disease association in cattle would
require that every base pair of the genome would be sequenced in many individuals. This
may not be necessary however, as using the comparative map produced here,
polymorphic blocks within BoLA MHC can be isolated and selected for more detailed
analysis based on disease associations known in cattle, as well as the vast information
available from the studies on H2, HLA, SLA and RT1 and the MHC of other species.
For instance, BoLA class I haplotypic structure may be defined using microsatellite
89
markers, and used to genotype animals to resolve loci and investigate susceptibility or
resistance of haplotypes with disease associations as performed for the HLA (Li et al.
2004; Rubio et al. 2002; Rubio et al. 2004).
This study provides evidence to support the presence of at least 3 clusters of class
I genes with a number of classical class I, non-classical, pseudogene and gene fragments
distributed within these clusters. More questions arise as it is now known that all loci do
not seem to be equally represented in various haplotypes as related to earlier expression
data from other groups documenting expression of 1 to 6 class I loci in bovids (Ellis and
Ballingall 1999; Ellis et al. 1999).
Paired BAC end sequence data are extremely important as sequence-tagged-
connectors to assist in assembling scaffolds for WGS sequencing projects and specific-
region sequencing projects, as with the BoLA class I region. These data, when paired
with sequencing of BAC clones, can also provide valuable preliminary information on
genome structure including, for example, repetitive element type, frequency and
variability as well as putative open reading frame frequency.
The availability of both a fingerprint map and sequence assembly for the bovine
genome from WGS sequencing would provide an opportunity to derive a direct link from
the MHC class I BAC clones, and vice versa. This linkage is useful for identification of
clones for use in functional studies of class I genes, determination of the sequence
content of BAC clones of interest identified by BAC filter hybridizations, and access to
sequencing substrates representing regions of interest within BoLA where current
sequence coverage or quality is insufficient for analysis. Examination of the linkage
between the map and the sequence is likely to identify BAC clones spanning gaps in the
sequence assembly. Additionally, map contig overlaps can be identified by sequence
where the extent of overlap is insufficient to detect with confidence using fingerprint
similarity alone. Furthermore, any discrepancies in the fingerprint map and the sequence
assembly locations would identify potential misassemblies in either the map or the
sequence. Analysis and resolution of these discrepancies would serve to improve the
quality of both the sequence assembly and the fingerprint map.
90
Comparative genomics is a powerful tool for utilization of the existing
knowledge of well-studied species, such as humans and mice, to acquire genomic data in
species like cattle, for which there is less information. BAC end sequencing of clones
from three independent BAC libraries, limited contig assembly within sequenced BAC
clones, coupled with fingerprint mapping and confirmation by FISH, allows for rigorous
validation of the physical map of the BoLA class I region presented herein. In
conjunction with bovine WGS sequencing and framework BAC sequencing currently
being done at Baylor, completion of the sequence assembly of the BoLA class I region,
using the physical map as a scaffold upon which to build, can be done elegantly and
efficiently.
Web-based programs used:
IMGT: http://www.ebi.ac.uk/imgt/hla/stats.html
BLAST: http://blast.wustl.edu or http://www.ncbi.nlm.nih.gov/blast
Repeatmasker: http://repeatmasker.genome.washington.edu/cgi-bin/RepeatMasker
Overgomaker: http://www.genome.wustl.edu/tools/?overgo.html
BAC CHORI library resources: http://bacpac.chori.org/bovine240.htm
Web-based FPC physical maps: http://www.genome.clemson.edu/fpc/
FPC home page: http://www.genome.arizona.edu/software/fpc/
Ensembl genome browser: http://www.ensembl.org
NCBI Map Viewer: http://www.ncbi.nlm.nih.gov/mapview/
iCE Home Page : http://ice.bcgsc.ca
Image—the fingerprint image analysis system: www.sanger.ac.uk/software/Image
91
CHAPTER III
A SIMPLE BAC END SEQUENCING METHOD USEFUL FOR
BAC CONTIG ASSEMBLY
The real voyage of discovery consists not in seeking new landscapes but in seeing with new eyes.
- Marcal Proust
Summary
Genome-mapping efforts can require characterization of target DNA inserts by
end sequencing of bacterial artificial chromosome (BAC) clones. Challenges to end-
sequencing difficult templates have traditionally required costly modifications. The role
of BAC end-sequencing is critical in whole genome or regional sequencing projects, as
sequence tag connectors (STC) obtained allow production of a minimal tiling path of
overlapping regions. These overlaps can be used to limit the number of clones to be
sequenced and minimize overall sequencing costs. Problems can arise in end-sequencing
of BAC clones due to complex template structure and size of insert. Here, we describe a
simple, cost-effective technique to read through BAC end sequences with a robustness
that consistently produces longer read lengths at a high quality (Phred 20 >700 bp).
Introduction
The initial foray into sequencing of the human genome required the use of
several different chromosomal maps and honing of techniques to rapidly sequence three
billion bases of DNA. One of the most useful of these resources, the BAC (bacterial
artificial chromosome) maps allowed for megabase-scale assemblies of overlapping
DNA clones into contigs. The BAC is a vector used to clone DNA fragments in
Escherichia coli cells, based on naturally occurring F-factor plasmid found in the
92
bacterium E. coli (Shizuya 1992). BACs, typically contain 100- to 200-kb inserts of
DNA, were produced as larger, more stable recombinant DNA clones than those
previously available during the human genome sequencing project (HGS), representing
the human genome more uniformly than previous systems (Poulsen 2004).
BAC-end sequences or sequence tag connectors (STCs) obtained from both ends
of the BAC clone can be used in many applications to enrich whole genome sequencing
(WGS) or other sequencing projects. Once any BAC or other large segment of DNA is
sequenced to completion by conventional shotgun approaches, these STC tags can be
used to identify a minimum tiling path of BAC clones overlapping known sequence for
targeted sequence extension. In the case of the HGS using STCs as a means of
identifying minimally overlapping clones represented only 1%-3% of the total cost of
sequencing the human genome and provided resource to reduce total sequencing cost
(Siegel et al. 1999).
STCs help researchers expand contigs and spacing helps to verify the contiguous
sequence created by assembly software. STCs can also be used to physically define and
"capture" gaps that occur when sequencing biochemistry is stalled by occasional
difficult-to-read stretches of DNA sequence. STC reads can also be used for the design
of sequence tagged sites (STSs) to be used as markers to construct the RH maps that
complement contig building. STSs generated from BAC STC reads can also enrich RH
maps. Conversely, a mapped STS can be used to isolate a BAC (or any DNA clone type)
from a library of clones representing a genome. After maps are constructed, redundancy
is unnecessary for a complete representation of the genome once the minimal tiling path
has been developed from BAC contigs.
BACs libraries from the human, murine, rat, canine, and baboon genomes with
average insert sizes ranging between 160 and 235 kb have been produced (Osoegawa et
al. 1998). Additional libraries have been made for many other plant and animal species,
including those with complex genomes like wheat (Safar et al. 2004). BAC-based
fingerprint physical maps have been produced for human (IHGSConsortium 2001;
Krzywinski et al. 2004a), mouse (Gregory et al. 2002), rat (Krzywinski et al. 2004b;
93
Schibler et al. 2004) to date, with projects in other species currently underway using
high-throughput fingerprint technology (Marra et al. 1997).
Coupled with additional information from fingerprint maps and mapping of
expressed sequence tags (ESTs) to chromosomal locations, enrichments of existing BAC
maps would allow for more easy assembly. For a typical mammalian genome, assuming
200 kb clone inserts, approximately 21 000 clones are sufficient to represent the genome
(Krzywinski et al. 2004a) which is a substantial reduction from the size of the parent
library or libraries used to construct the map.
Ease of access of information from end sequence of BAC clones that are
commonly stored on databases available online, can be used in a wide array of
applications from genome sequencing to gene discovery. Researchers can readily access
database information as well as individual BAC clones for analysis. Minimally
overlapping clones can be identified and used as a source for shotgun-sequencing
projects, to find clones for restriction fingerprints for building overlapping clone sets, to
find appropriate clones for fluorescence in situ hybridization mapping, or to select a
BAC clone that contains genes of interest (Poulsen 2004). BAC clone tiling sets have
uses other than supporting sequencing efforts, ranging from focused studies on the
structure and function of individual genes and gene families to fluorescence in situ
hybridization (FISH) and BAC array comparative genomic hybridization (Gustafson et
al. 2003; Pinkel et al. 1998).
Another use of BAC end-sequencing is in studies investigating genome
rearrangements important in evolution (McShane et al. 2001), cancer and other diseases.
Precise mapping of the rearrangements is essential for identification of pertinent genes.
End-sequence profiling (ESP) is accomplished by constructing a BAC library from a test
genome, measuring BAC end sequences, and mapping end-sequence pairs onto the
normal genome sequence. Plots of BAC end-sequences density identify copy number
abnormalities at high resolution and BACs spanning structural aberrations have end pairs
that map abnormally far apart on the normal genome sequence. These pairs can be
sequenced to determine the involved genes and breakpoint sequences. End sequenc ing of
94
approximately 8,000 clones (0.37-fold haploid genome clonal coverage) produced a
comprehensive genome copy number map of the breast cancer cell line MCF-7 genome
at better than 300-kb resolution and identified 381 genome breakpoints, and verified by
FISH mapping and sequencing (Volik S 2003). These latter applications are particularly
important for biomedical research.
There are many advantages to using E. coli as the model host in BAC libraries
including rapid growth, high stability of the DNA fragment during growth, few chimeric
clones, as well as easy and rapid purification of the BAC DNA (Poulsen 2004). The
isolation of BAC DNA from E. coli is facilitated by using an alkaline method for
purification of plasmids. To ensure that the BAC DNA is pure enough to be used for
downstream application, many modifications on standard alkaline lysis preparations
have been developed that achieve best quality BAC DNA. Plasmid prep kits have been
produced from a variety of manufacturers to facilitate BAC DNA preparations in 96-
well format or in large volume midi/maxi preps (Millipore, Qiagen) Good template
quality of large- insert template or genomic DNA is of primary importance for generating
consistent DNA sequencing results. BAC DNA presents are particularly challenging
templates that traditionally require specialized and costly modifications to sequencing
reaction chemistries or sequencing protocols and large amounts of template.
Routinely, large quantities of expensive sequencing reagents are used to
overcome BAC template restrictions. In most instances as much as 8-16ul of BigDyeTM
has been used in higher volume sequencing reactions (40ul) containing as much as 3 ug
DNA and primer in excess (80 pmol) in protocols in published literature (Crabtree et al.
2001; Schibler et al. 2000; Volik S 2003) or available online at
http://www.genome.wustl.edu/tools/protocols/mapping/bacendsequencing.pdf).
For example, Crooijmans et al. (2001) used a BAC DNA isolation REAL Prep 96
plasmid kit (Qiagen) for DNA preparation, and 40ul BAC end sequencing reactions
consisting of 16ul BAC DNA and 8ul BIG DyeTM and 8ul Half big dye 8ul of M13 F or
R (10pmol/ul). This is a standard protocol that uses large quantities of expensive
components.
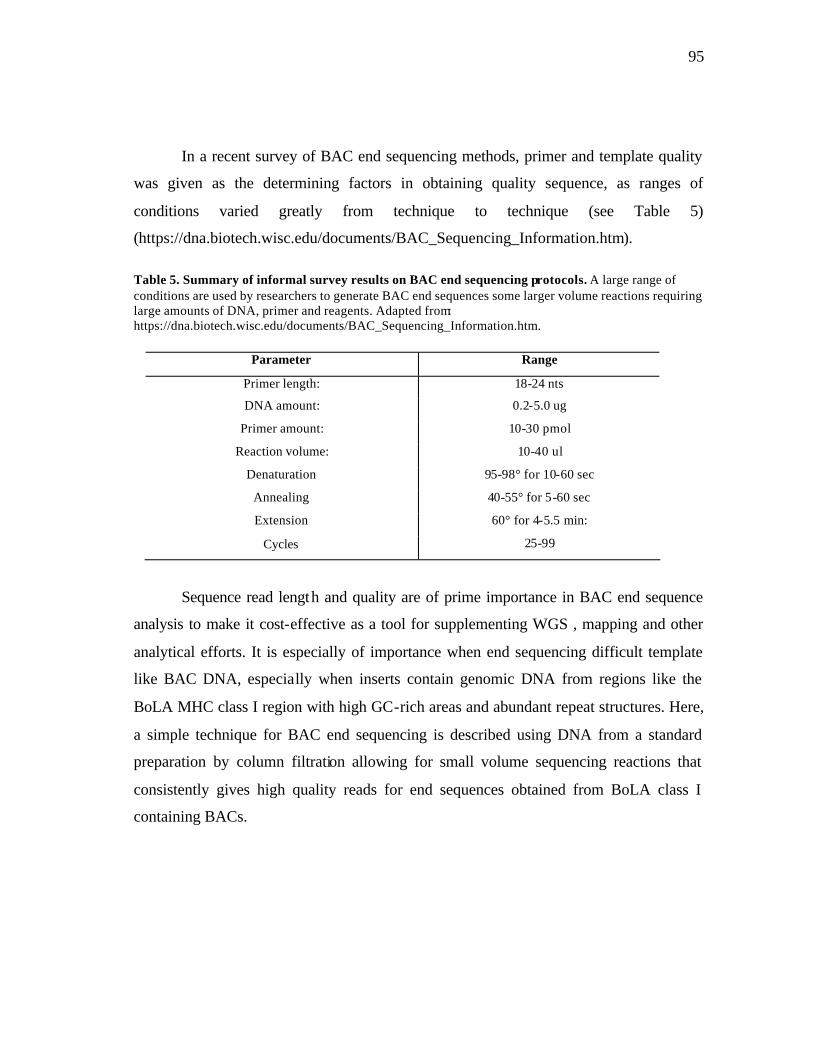
95
In a recent survey of BAC end sequencing methods, primer and template quality
was given as the determining factors in obtaining quality sequence, as ranges of
conditions varied greatly from technique to technique (see Table 5)
(https://dna.biotech.wisc.edu/documents/BAC_Sequencing_Information.htm).
Table 5. Summary of informal survey results on BAC end sequencing protocols. A large range of conditions are used by researchers to generate BAC end sequences some larger volume reactions requiring large amounts of DNA, primer and reagents. Adapted from: https://dna.biotech.wisc.edu/documents/BAC_Sequencing_Information.htm.
Parameter Range
Primer length: 18-24 nts
DNA amount: 0.2-5.0 ug
Primer amount: 10-30 pmol
Reaction volume: 10-40 ul
Denaturation 95-98° for 10-60 sec
Annealing 40-55° for 5-60 sec
Extension 60° for 4-5.5 min:
Cycles 25-99
Sequence read length and quality are of prime importance in BAC end sequence
analysis to make it cost-effective as a tool for supplementing WGS , mapping and other
analytical efforts. It is especially of importance when end sequencing difficult template
like BAC DNA, especially when inserts contain genomic DNA from regions like the
BoLA MHC class I region with high GC-rich areas and abundant repeat structures. Here,
a simple technique for BAC end sequencing is described using DNA from a standard
preparation by column filtration allowing for small volume sequencing reactions that
consistently gives high quality reads for end sequences obtained from BoLA class I
containing BACs.
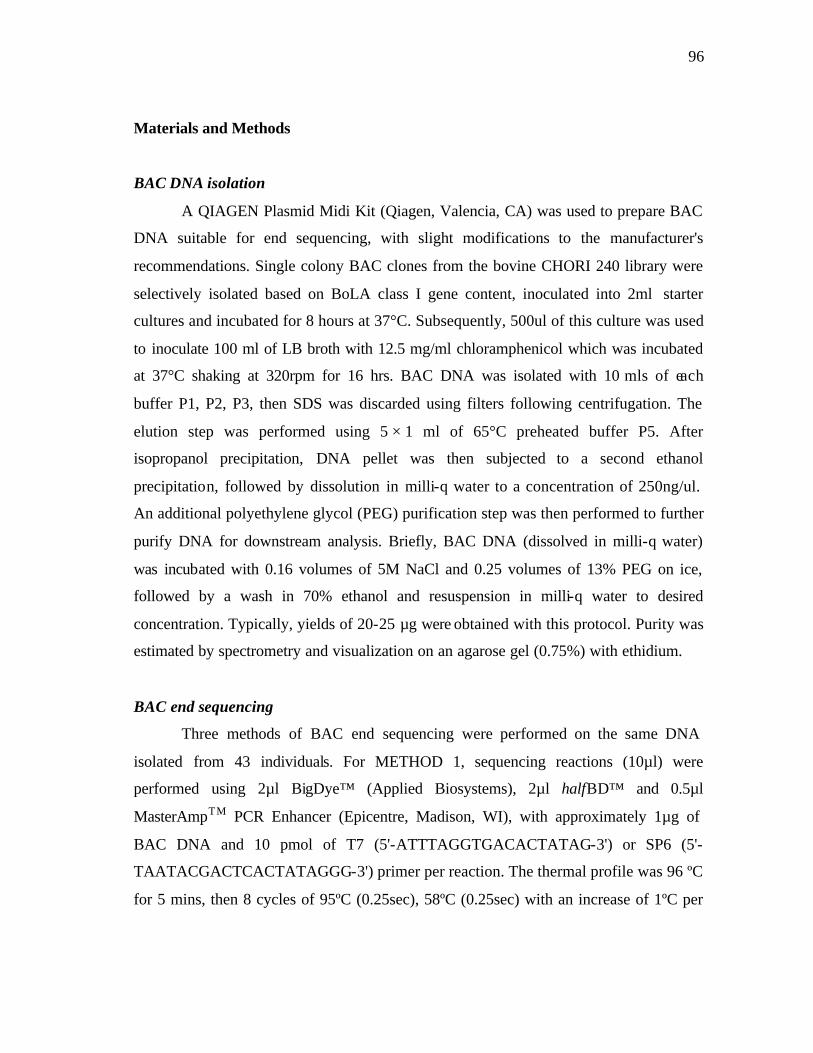
96
Materials and Methods
BAC DNA isolation
A QIAGEN Plasmid Midi Kit (Qiagen, Valencia, CA) was used to prepare BAC
DNA suitable for end sequencing, with slight modifications to the manufacturer's
recommendations. Single colony BAC clones from the bovine CHORI 240 library were
selectively isolated based on BoLA class I gene content, inoculated into 2ml starter
cultures and incubated for 8 hours at 37°C. Subsequently, 500ul of this culture was used
to inoculate 100 ml of LB broth with 12.5 mg/ml chloramphenicol which was incubated
at 37°C shaking at 320rpm for 16 hrs. BAC DNA was isolated with 10 mls of each
buffer P1, P2, P3, then SDS was discarded using filters following centrifugation. The
elution step was performed using 5 × 1 ml of 65°C preheated buffer P5. After
isopropanol precipitation, DNA pellet was then subjected to a second ethanol
precipitation, followed by dissolution in milli-q water to a concentration of 250ng/ul.
An additional polyethylene glycol (PEG) purification step was then performed to further
purify DNA for downstream analysis. Briefly, BAC DNA (dissolved in milli-q water)
was incubated with 0.16 volumes of 5M NaCl and 0.25 volumes of 13% PEG on ice,
followed by a wash in 70% ethanol and resuspension in milli-q water to desired
concentration. Typically, yields of 20-25 µg were obtained with this protocol. Purity was
estimated by spectrometry and visualization on an agarose gel (0.75%) with ethidium.
BAC end sequencing
Three methods of BAC end sequencing were performed on the same DNA
isolated from 43 individuals. For METHOD 1, sequencing reactions (10µl) were
performed using 2µl BigDye™ (Applied Biosystems), 2µl halfBD™ and 0.5µl
MasterAmpTM PCR Enhancer (Epicentre, Madison, WI), with approximately 1µg of
BAC DNA and 10 pmol of T7 (5'-ATTTAGGTGACACTATAG-3') or SP6 (5'-
TAATACGACTCACTATAGGG-3') primer per reaction. The thermal profile was 96 ºC
for 5 mins, then 8 cycles of 95ºC (0.25sec), 58ºC (0.25sec) with an increase of 1ºC per
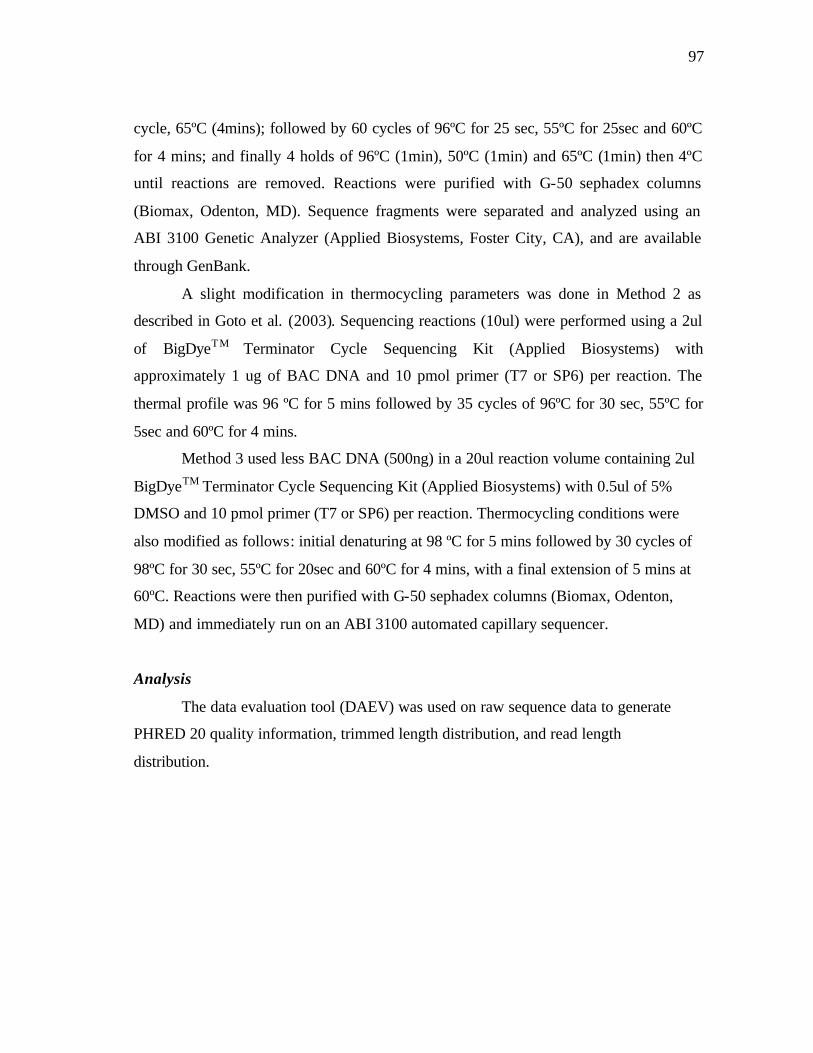
97
cycle, 65ºC (4mins); followed by 60 cycles of 96ºC for 25 sec, 55ºC for 25sec and 60ºC
for 4 mins; and finally 4 holds of 96ºC (1min), 50ºC (1min) and 65ºC (1min) then 4ºC
until reactions are removed. Reactions were purified with G-50 sephadex columns
(Biomax, Odenton, MD). Sequence fragments were separated and analyzed using an
ABI 3100 Genetic Analyzer (Applied Biosystems, Foster City, CA), and are available
through GenBank.
A slight modification in thermocycling parameters was done in Method 2 as
described in Goto et al. (2003). Sequencing reactions (10ul) were performed using a 2ul
of BigDyeTM Terminator Cycle Sequencing Kit (Applied Biosystems) with
approximately 1 ug of BAC DNA and 10 pmol primer (T7 or SP6) per reaction. The
thermal profile was 96 ºC for 5 mins followed by 35 cycles of 96ºC for 30 sec, 55ºC for
5sec and 60ºC for 4 mins.
Method 3 used less BAC DNA (500ng) in a 20ul reaction volume containing 2ul
BigDyeTM Terminator Cycle Sequencing Kit (Applied Biosystems) with 0.5ul of 5%
DMSO and 10 pmol primer (T7 or SP6) per reaction. Thermocycling conditions were
also modified as follows: initial denaturing at 98 ºC for 5 mins followed by 30 cycles of
98ºC for 30 sec, 55ºC for 20sec and 60ºC for 4 mins, with a final extension of 5 mins at
60ºC. Reactions were then purified with G-50 sephadex columns (Biomax, Odenton,
MD) and immediately run on an ABI 3100 automated capillary sequencer.
Analysis
The data evaluation tool (DAEV) was used on raw sequence data to generate
PHRED 20 quality information, trimmed length distribution, and read length
distribution.
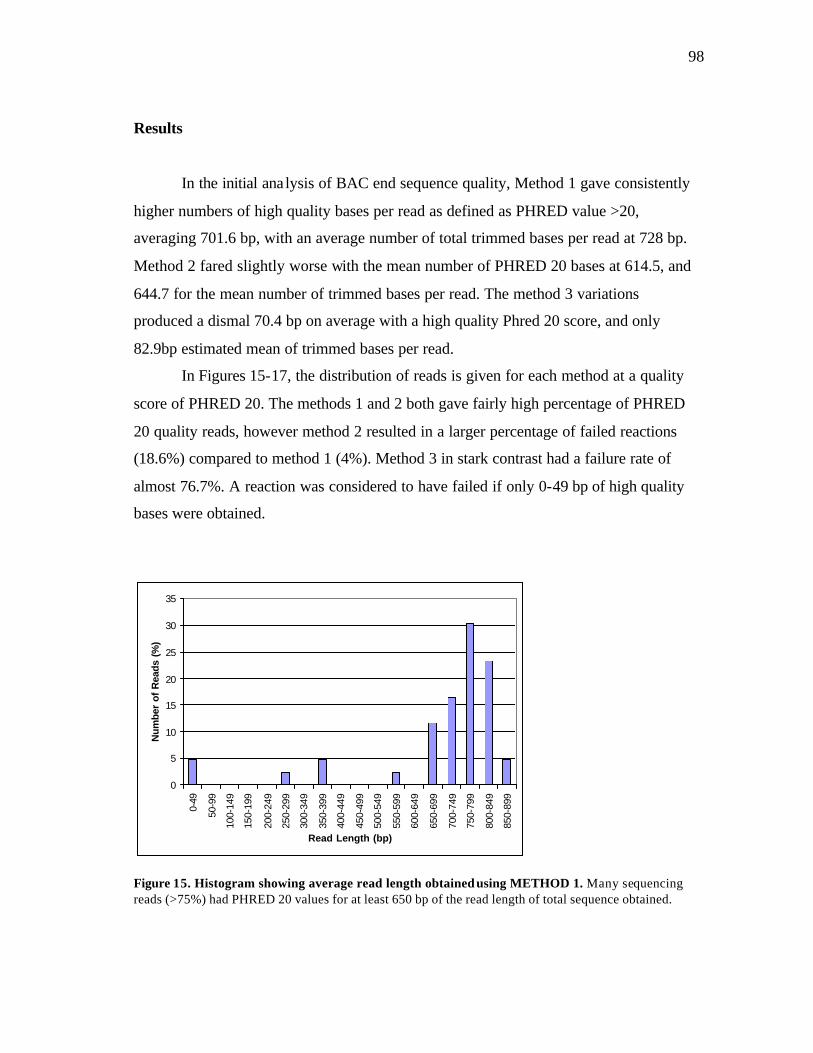
98
Results
In the initial analysis of BAC end sequence quality, Method 1 gave consistently
higher numbers of high quality bases per read as defined as PHRED value >20,
averaging 701.6 bp, with an average number of total trimmed bases per read at 728 bp.
Method 2 fared slightly worse with the mean number of PHRED 20 bases at 614.5, and
644.7 for the mean number of trimmed bases per read. The method 3 variations
produced a dismal 70.4 bp on average with a high quality Phred 20 score, and only
82.9bp estimated mean of trimmed bases per read.
In Figures 15-17, the distribution of reads is given for each method at a quality
score of PHRED 20. The methods 1 and 2 both gave fairly high percentage of PHRED
20 quality reads, however method 2 resulted in a larger percentage of failed reactions
(18.6%) compared to method 1 (4%). Method 3 in stark contrast had a failure rate of
almost 76.7%. A reaction was considered to have failed if only 0-49 bp of high quality
bases were obtained.
0
5
10
15
20
25
30
35
0-49
50-9
9
100-
149
150-
199
200-
249
250-
299
300-
349
350-
399
400-
449
450-
499
500-
549
550-
599
600-
649
650-
699
700-
749
750-
799
800-
849
850-
899
Read Length (bp)
Num
ber
of R
eads
(%
)
Figure 15. Histogram showing average read length obtained using METHOD 1. Many sequencing reads (>75%) had PHRED 20 values for at least 650 bp of the read length of total sequence obtained.
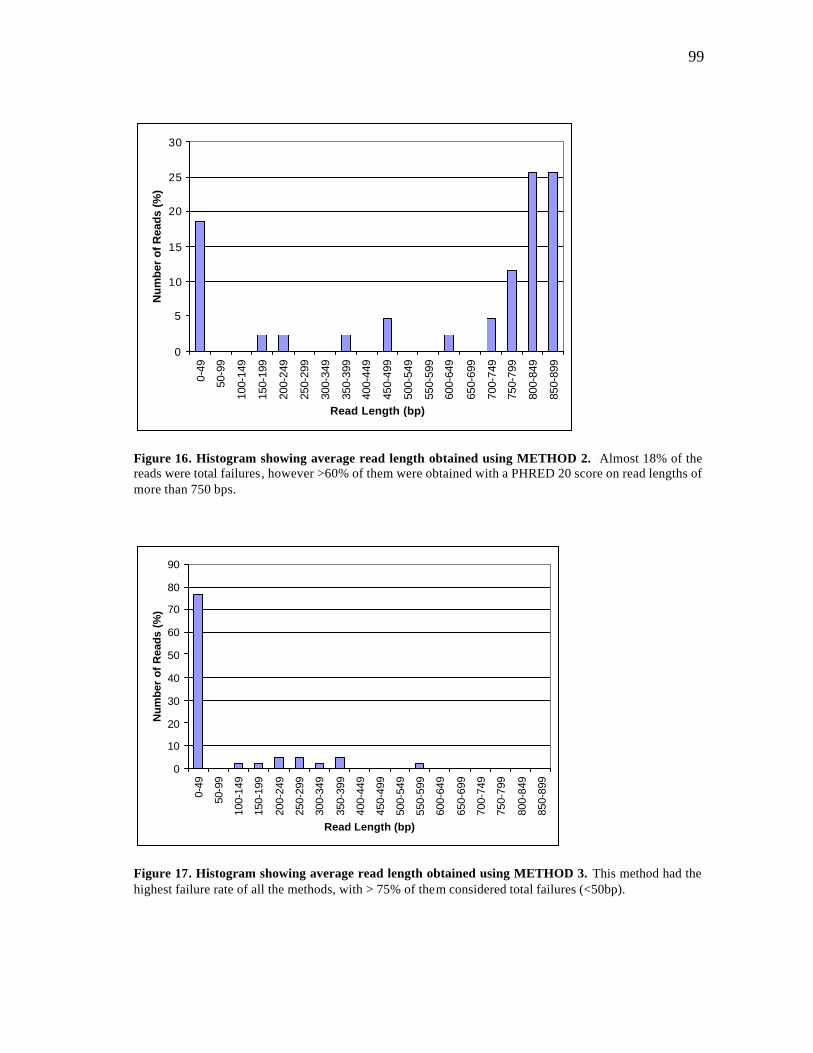
99
0
5
10
15
20
25
30
0-49
50-9
9
100-
149
150-
199
200-
249
250-
299
300-
349
350-
399
400-
449
450-
499
500-
549
550-
599
600-
649
650-
699
700-
749
750-
799
800-
849
850-
899
Read Length (bp)
Nu
mb
er o
f Rea
ds
(%)
Figure 16. Histogram showing average read length obtained using METHOD 2. Almost 18% of the reads were total failures, however >60% of them were obtained with a PHRED 20 score on read lengths of more than 750 bps.
0
10
20
30
40
50
60
70
80
90
0-49
50-9
9
100-
149
150-
199
200-
249
250-
299
300-
349
350-
399
400-
449
450-
499
500-
549
550-
599
600-
649
650-
699
700-
749
750-
799
800-
849
850-
899
Read Length (bp)
Nu
mb
er o
f R
ead
s (%
)
Figure 17. Histogram showing average read length obtained using METHOD 3. This method had the highest failure rate of all the methods, with > 75% of them considered total failures (<50bp).
100
Discussion
The standard established by the international publicly funded sequencing
community for considering a sequence finished is that it be completely contiguous, with
no gaps in the sequence, and that it have a final estimated error rate of <1 error in 10,000
bases which is measured by the PHRED 20 score. It is often difficult to obtain consistent
reads of high quality from small volume DNA cultures or robot-prepped DNA with
available kits. Although it is recommended that the DNA is prepared by column
purification or specialized multi-well kits (Qiagen or Millipore) to reduce chromosomal
contamination, it would seem the inconsistencies in DNA templates prepared robotically
may be great enough to affect the cost efficiency of doing bulk preps for smaller end
sequencing projects. In fact, in a recent larger-scale end sequencing project inconsistent
template concentration accounted for an average of 32688 reads with less than 100 bases
with phred 20 non-vector sequence out of a total 40,704 (D. Adelson, Personal
Communication).
BACs have a low ratio of the length of region of interest to the length of the
entire template molecule presenting steric and stoichiometric challenges to sequencing
reaction chemistries. Standard chemistry protocols for BAC-end sequencing require up
to 2.5-3.0 ug of purified BAC DNA template per reaction. Preparing a sufficient quantity
of template DNA for these protocols requires the growth of large volumes of BAC clone
cultures for subsequent DNA purification, adding considerable time and expense to the
completion of BAC-end sequencing projects. The results of this study suggest that 1ug
BAC DNA is enough to produce quality reads up to 700bp with no need to grow larger
cultures.
Using the same template, primer concentrations (10pmol) and BigDye V1.1 (2ul)
under the different parameters of the three methods, allows for direct comparison of
concentration and cycling conditions. The results obtained from Method 3 illustrate that
concentration (500ng template) and cycling conditions (only 30 cycles) is of prime
importance. Methods 1 and 2 were similar in volume (10ul) and composition of the
101
sequencing reactions including template concentration (1ug), however showed
significant differences in the amount of failed reactions. Although, method 2 produced a
larger number of reads with PHRED 20 values greater than 800 bp (51%) than method 1
(30%), the failure rate were almost 3-fold greater. Overall, 95% of reads obtained by
Method 1 had a >250bp with a PHRED 20 score compared to 76.7% in Method 2. This
would indicate that DNA template quality and concentration while important, is not
sufficient to guarantee the highest quality reads consistently. It would appear that the
additional touchdown cycle, longer cycling times and additional extension step might
help with hard to read templates as BACs vary in end sequence dependent on presence
of repetitive sequence.
Also, the addition of MasterAmpTM enhancer and halfBDTM helped to give a
more consistent ly high quality read as both these reagents assist with sequencing hard to
read templates. MasterAmpTM with betaine, in the PCR would eliminate the base-pair
composition dependence of DNA melting, increases the enzyme's thermal stability,
suppresses pauses of DNA polymerase, and reduces secondary DNA structure (Baskaran
et al. 1996; Mytelka and Chamberlin 1996; Rees et al. 1993). As a result, long DNA
templates, difficult DNA templates (e.g., those with a high GC content), and those with
other complex structures like BAC DNA, can be amplified at higher denaturing
temperatures, significantly reducing the effect of secondary structure without loss of
enzyme activity. Addition of DMSO in method 3 was not enough to make a difference
(although it is known to help in PCR reactions and sequencing difficult templates) as
only half the concentration of template was used as in the other methods, and the
reduction in cycling time during the PCR was not optimal to give longer reads.
It is intriguing that DNA template quality and /or concentration and primer
concentration seems to be necessary, but not sufficient, to consistently give higher
PHRED 20 read lengths. It would seem that high-throughput BAC end sequencing done
in 96-well or even 384-well format, while starting with a lower quantity of DNA than
used in these experiments, would benefit from slight changes in the chemistries and
conditions of sequencing reactions. Also, researchers interested in BAC contig mapping
102
in smaller genomic segments or in individual BAC isolation and sequence analysis
would gain from the knowledge that adding supplements and optimizing sequencing
reactions can make a difference in producing PHRED 20 quality reads in difficult
templates with hard-to-read sequence.
BACs are the central resource for insert-end sequencing, clone fingerprinting,
high-throughput sequence analysis and as a source of mapped clones for diagnostic and
functional studies. Efficient, cost-effective BAC end sequencing provides a greater
number of available STC data sets for contig building in areas that had been hindered
previously by the prohibitive cost of maintaining and processing libraries on the human
genome scale. With the number of STC data sets now expanding, BACs can be screened
computationally, then in-house with simple end-sequencing techniques so that scientists
have ready access to BACs identified as candidates for use in contig extension, analysis
of biologically significant gene content or evolutionary important rearrangements.
The techniques described in this chapter allowed for the development of a BAC
DNA purification and end sequencing protocol that consistently gave >750bp of
PHRED 20 quality end sequences for contig building and analysis during this study. It
also allowed for end sequence to be obtained from BACs with significant quantities of
repeat structures at the cloned insert sites, as was the case in the bovine CHORI genomic
library which was made with MboI digested genomic fragments. In addition, the BoLA
MHC class I region contains a significant number of repeat structures and GC-rich
regions from which it is notoriously hard to obtain high-quality sequence. Thus, this
protocol facilitated rapid production of BAC ends and STCs used in analysis of the
BoLA MHC class I region described.
__________________ *Reprinted with permission from “Analyses of bovine major histocompatibility (BoLA) class I loci reveal a novel frameshift mutation in a BoLA-A allele prevalent in wild and feral bovids” by Ramlachan et al. (2004), Immunology 2004 pp51-62. Medimond S.r.l., Bologna, Italy. 2004 by Medimond S.r.l.
103
CHAPTER IV
ANALYSES OF BOVINE MAJOR HISTOCOMPATIBILITY (BOLA) CLASS I
LOCI REVEAL A NOVEL FRAMESHIFT MUTATION IN A BOLA-A ALLELE
PREVALENT IN WILD AND FERAL BOVIDS*
The most exciting phrase to hear in science, the one that heralds new discoveries, is not ‘Eureka!’ (I have found it) but ‘That’s funny…’ - Issac Asimov.
Summary
The significance of polymorphisms in genes of the MHC to disease association
and pathogenesis has been well studied in several species. Polymorphisms in the bovine
major histocompatibility complex (BoLA) class I molecules optimizes T-cell response to
a variety of pathogens, thus optimizing a population’s immune response. We describe an
allelic form of a BoLA class I gene with a 2-base deletion in exon 2, resulting in a
frameshift, diversity at the amino acid level and an early termination signal within the
antigen recognition site (ARS) of exon 3. Genotyping of several cattle breeds and bison
showed that the deletion allele was more common among feral cattle and bison
populations. Phylogenetic analysis ind icates the frameshift deletion predates the
divergence of Bos and Bison, suggesting this allelic lineage is being maintained by
selection, especially in feral and wild bovids.
104
Introduction
The immune system of an organism functions to protect against pathogens and other
foreign threats. An immune response is initiated by the MHC class I and class II-
encoded cell surface proteins that function as antigen-presenting receptors for
surveillance by cytotoxic (CD8+) and helper (CD4+) T lymphocytes, respectively. Thus,
the genetic processes involved in antigen presentation are fundamental to understanding
the role of genetics in animal health and disease resistance. Approximately 40% of
expressed loci in the MHC are associated with the immune system (Trowsdale 2001).
The human MHC, or HLA, encodes the most polymorphic human proteins known.
HLA-B for instance has over 592 alleles (Forbes and Trowsdale 1999). Even more
remarkable is that many of these alleles are ancient, and it is common that an allele from
a particular HLA gene I more closely related to its orthologous chimpanzee than to a
paralogous HLA allele (Anzai et al. 2003; Kulski et al. 2002b). This high level of
polymorphism is also seen in BoLA, for which more than 100 different alleles from exon
2 of the BoLA-DRB3 gene have been deposited in GenBank (da Mota et al. 2004). In
addition, their high variation resides primarily in amino acids known to be important in
initiating the immune response, with some individual amino-acid sites having
heterozygosities greater than 0.7 (Hedrick 2004). Polymorphisms in the MHC class I and
II loci have been associated with autoimmune and infectious diseases (Gelder et al.
2003; Kaufman 2000; Keet et al. 1999; Pagany et al. 2003; Park et al. 2004b; Sharif et
al. 1999; Xu et al. 1993), as well as to response to immunization in vertebrates
(Ballingall et al. 2004b; Gelder et al. 2002).
Genetic polymorphism at the MHC locus is generated by nucleotide
substitutions, insertions/deletions, gene conversion and inter or intra-allelic
recombination (Ackerman and Cresswell 2004; Hughes and Nei 1989; Hughes and Nei
1993; Hughes and Pontarotti 2000). Most of these new mutations are eliminated by
genetic drift or purifying (negative) selection, and only a few are incorporated into the
105
population by chance, diversifying or balancing (natural) selection. Balancing selection
in the form of heterozygote advantage, frequency-dependent selection, or selection that
varies in time and/or space, has been proposed to explain the high variation and diversity
at major histocompatibility complex (MHC) genes. Balancing selection is a broad term
identifying any kind of natural selection in which no single allele is absolutely most fit.
Frequency dependent selection (the term given to an evolutionary process where the
fitness of a phenotype is dependent on the relative frequency of other phenotypes in a
given population) and heteroyzgote advantage (where the higher diverse genotype i.e.
heterozygotes, achieve better overall health by doubling immunological repertoire to
pathogenic peptides) are two types of balancing selection that have been suggested to
explain MHC allelic diversity. One model suggests that, rather than the number of
foreign antigens the system is protecting against, the diversity reflects the number of self
antigens with which the immune system needs to avoid reactivity (De Boer RJ 1993).
Classical class Ia peptide complexes form ligands for CD8 positive T cells and
natural killer (NK) cells, while class Ib, or non-classical class I molecules are recognized
by receptors on NK, NKT and myelo-monocytic cells (Allan et al. 2002; Colonna et al.
1998). MHC class I heterodimers can be loaded within the endoplasmic reticulum (ER)
with peptides derived from intracellular proteins. Alternatively, MHC class I molecules
may be loaded with peptides derived from extracellular proteins in a less-defined
pathway called MHC class I cross presentation, which can overlap those pathways
operating in classical MHC class I presentation (Norbury et al. 2001; Wang et al. 2001;
Yewdell et al. 1999).
Class Ib, or non-classical loci have little, if any, nucleotide variation, presumably
due to their specialized functions or perhaps due to a lack of function and are usually
neutral. However, sometimes non-classical genes appear to have increased amount of
variation due to linkage, for example HLA-H has increased variation as a result of
balancing selection acting on nearby loci such as HLA-A (Grimsley et al. 1998).
106
Insertions or deletions of DNA sequences are important genetic markers to define
ancestral polymorphisms. Coupled with single nucleotide polymorphism (SNP) analysis,
these tools can be used to assign allelic lineages and study evolutionary relationships.
For example, the class I MHC (HLA) C locus is present only in humans and apes,
generated by gene duplication in a common ancestor (Chen et al. 1992). Also, the gene
cluster (DY/DI) in the class IIb region of cattle and sheep, is observed only in pecoran
artiodactyls (Trowsdale 1995), as a consequence of a chromosomal inversion within the
class II region of BoLA (Band et al. 1998; McShane et al. 2001).
The antigen recognition sites (ARS) of the MHC molecules are usually the most
polymorphic allowing immune responses to be varied, with animals having different
antigen-binding sites available to a wide range of pathogens. Exons 2 (BoLA-class I, II)
and 3 (BoLA-class I) are functionally important encoding amino acids associated with
the ARS, accounting for a large part of the polymorphisms and the higher ratio of non-
synonymous to synonymous substitutions observed in these exons in most species
(Hughes and Nei 1989; Mikko et al. 1999; Sena et al. 2003).
Nonsynonymous to synonymous substitution rate ration, ? = dN/dS, have been
used to provide a measure of selective pressure at the protein level, with positive
selection identifiable where ? exceeds 1. As described initially by Hughes and Nei
(1989), the residues of MHC can be divided into ARS and non-ARS codons using two
independent ω ratios to show diversifying selection in the ARS of classical class I MHC
genes. More evidence of balancing selection operating at the MHC comes from many
species ranging from humans to honeycreepers, supported by transpecies polymorphism
and strikingly high dN/dS ratios at codons putatively involved in peptide interaction. In
the i' iwi for example, natural selection may have maintained variation within the MHC,
even in the face of what appears to a genetic bottleneck (Jarvi 2004).
Aguilar et al. (2004) found that MHC variation in the otherwise genetically
depauperate population of San Nicolas Island foxes is inexplicably high, and suggest that
their data support strong balancing selection. This was particularly interesting since this
107
population is genetically the most monomorphic sexually reproducing animal population
yet reported with no variation in hypervariable genetic markers, but genetic variation at
the MHC persists despite the extreme monomorphism shown by neutral markers. Also,
in a study of South American Indians, Hedrick (2002) observed that distribution of allele
frequencies and consequently heterozygosity is a function of autocorrelation of the
presence of the pathogen in subsequent generations. When there is a positive
autocorrelation over generations, the observed heterozygosity is reduced. In addition,
when the effects of lower levels of selection and dominance and the influence of genetic
drift were compared to the observed heterozygosity for two MHC genes, resistance
conferred by specific alleles to temporally variable pathogens may contribute to the
polymorphism at MHC genes and other similar host defense loci.
In a study of the MHC in domestic and wild species of Felidae, derivative gene
duplications during the Felidae radiation, abundant persistent trans-species allele
polymorphism, recombination-derived amino acid motifs, and inverted ratios of non-
synonymous to silent substitutions in the ARS of the MHC was observed (consistent
with overdominant selection) in class I and II genes (O'Brien and Yuhki 1999). MHC
diversity quantified in population studies was used to examine historic demographic
reduction in endangered species (Florida panther and cheetah) where reduced MHC
variation contributes to uniform population sensitivity to emerging infectious pathogens.
Unlike the class I genes of humans where assigning loci based on sequence is
simple, other mammalian species such as mice (Rada et al. 1990) and cattle (Ellis et al.
1999) appear to have a high degree of gene conversion in class I genes. This makes
confirming sequence-based loci groupings difficult. In the past serological testing was
used to assign haplotypes in cattle (Davies et al. 1992; Davies and Antczak 1991a;
Davies et al. 1994; Nilsson et al. 1994), but molecular-based typing has shown
discrepancies (Ellis et al. 1998; Garber et al. 1994). BoLA-A serologically typed
animals can express at least three class I genes (Ellis et al. 1999), and it is thought that
BoLA-A typing may not be allelic but rather haplotypic (Sawhney et al. 2001) since
108
more than one class I gene may be expressed. Using DNA-based methods for analyzing
BoLA class I polymorphisms is imperative to elucidate such discrepancies. Polymorphic
loci in the MHC provide useful tools for the study of evolution and to investigate the
contribution of the MHC to genetic disease, particularly of the autoimmune type.
While developing a sequence-based BoLA-A haplotyping test using DNA
sequencing analysis of the bovine MHC (BoLA) A locus, we identified a novel allele
BoLA-Adel among different breeds of cattle and North American bison. This study
describes the characterization of a frameshift deletion at the predominant functional class
I locus, BoLA-A BSA, by genotyping and phylogenetic sequence analysis of feral and
domestic bovids.
Materials and Methods
DNA collection and cell culture
Blood obtained from multiple cattle breeds and Bison was collected on
WhatmanR (Clifton, New Jersey) FTATM cards. Wild and feral bovid samples were
obtained from 172 Yellowstone and 52 Texas Bison; 70 Florida Scrub and 450 Texas
Longhorn feral cattle. Also samples were obtained from 322 pooled Bos Taurus and Bos
Indicus domestic breeds. These breeds included Holstein, Hereford, Black Angus, native
Columbian cattle and Simmental. The mixed breeds are designated by their herd names:
McGregor (Red Angus), Uvalde (Brahman/Angus), Nebraska (Holstein and Hereford),
Granada (Brahman/Angus), Hetzel (Simmental, Brahman, Angus and/or Zebu) and Vogt
(native Columbian cattle).
109
Genotyping polymerase chain reaction (PCR) amplification and sequencing
Initially, locus A-specific primers were designed to amplify BoLA A from
genomic DNA for sequencing (Figure 18A). The disc of DNA was used directly in an
initial PCR amplification using locus specific primers at the 5' UTR (Bucon New BSA
5'-CCGCCCAACTCTGCTTCTTTC-3') and exon 3 (Blcon:5'-GATACCTGGAGA-
ACGGGAAGGA-3') of BoLA A to amplify a 1329 bp product. Primary reactions (25
µl) contained 100 ng of DNA, 0.5 µM of each primer, 200 µM dNTPs and 1U of Taq
DNA polymerase (Roche diagnostics, Indianopolis, IN) with these conditions: 3 mins at
95°C, 35 cycles x 95°C for 45s, 63°C for 45 s, 72°C for 1 min; 72°C for 10 mins. A
QIAQuickR PCR purification kit (QIAGEN, Valencia, CA) was used to purify PCR
reactions, and 2 ul was sequenced using the ABI dye terminator method as outlined
below. Sequence from this original PCR product was used to design the BINDEL
primers for the nested PCR.
Genotyping was performed via a nested PCR on 1.5ul of PCR product with a
M13 sequencing primer using standard labeled-primer protocol (Oetting et al. 1995).
Thermal cycling conditions were: 5min at 95 °C , 5 cycles x 30s at 94°C, 30s at 60°C (-
1°C/cycle), 30s at 72°C; 30 cycles x 30s at 94°C, 30s at 56°C, 30s at 72 °C; 15 mins at
72°C.
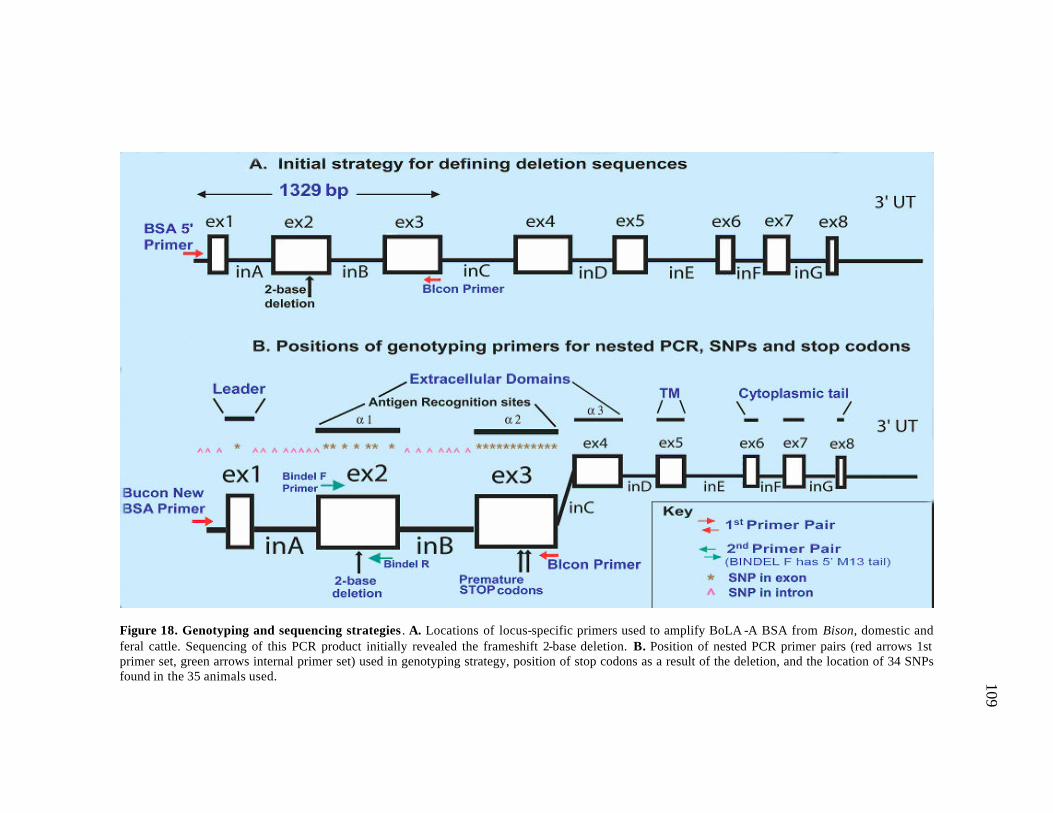
109
Figure 18. Genotyping and sequencing strategies . A. Locations of locus-specific primers used to amplify BoLA -A BSA from Bison, domestic and feral cattle. Sequencing of this PCR product initially revealed the frameshift 2-base deletion. B. Position of nested PCR primer pairs (red arrows 1st primer set, green arrows internal primer set) used in genotyping strategy, position of stop codons as a result of the deletion, and the location of 34 SNPs found in the 35 animals used.
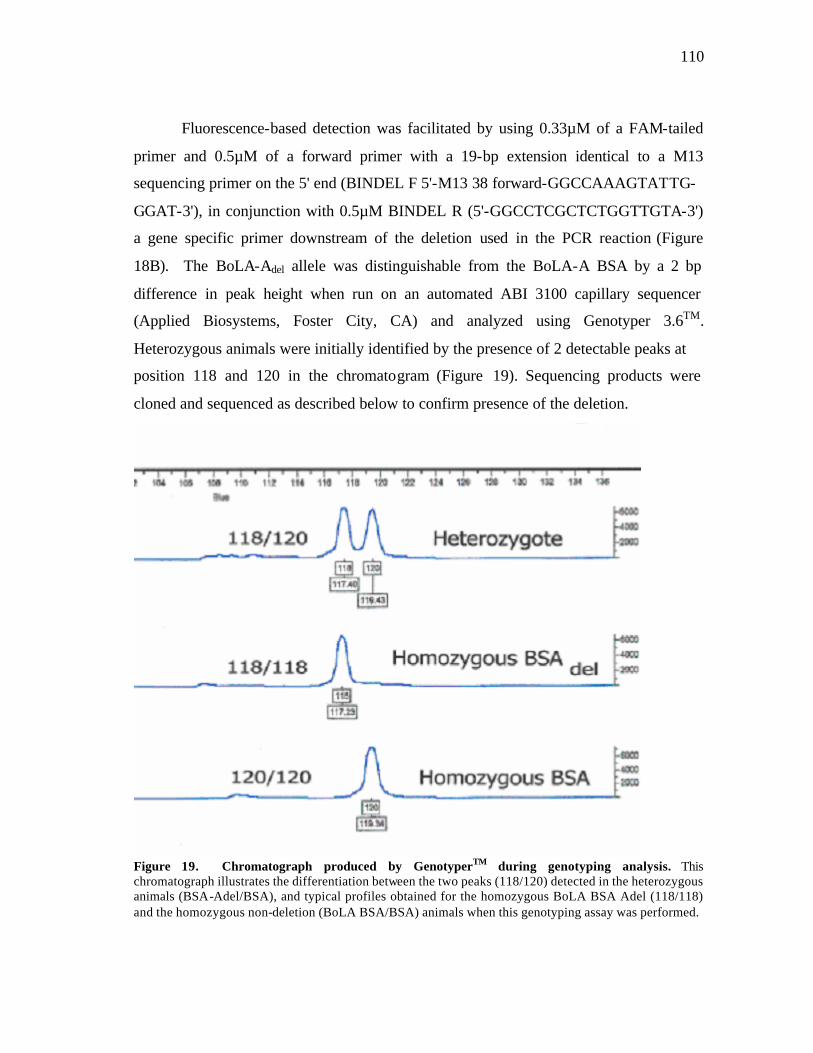
110
Fluorescence-based detection was facilitated by using 0.33µM of a FAM-tailed
primer and 0.5µM of a forward primer with a 19-bp extension identical to a M13
sequencing primer on the 5' end (BINDEL F 5'-M13 38 forward-GGCCAAAGTATTG-
GGAT-3'), in conjunction with 0.5µM BINDEL R (5'-GGCCTCGCTCTGGTTGTA-3')
a gene specific primer downstream of the deletion used in the PCR reaction (Figure
18B). The BoLA-Adel allele was distinguishable from the BoLA-A BSA by a 2 bp
difference in peak height when run on an automated ABI 3100 capillary sequencer
(Applied Biosystems, Foster City, CA) and analyzed using Genotyper 3.6TM.
Heterozygous animals were initially identified by the presence of 2 detectable peaks at
position 118 and 120 in the chromatogram (Figure 19). Sequencing products were
cloned and sequenced as described below to confirm presence of the deletion.
Figure 19. Chromatograph produced by GenotyperTM during genotyping analysis. This chromatograph illustrates the differentiation between the two peaks (118/120) detected in the heterozygous animals (BSA-Adel/BSA), and typical profiles obtained for the homozygous BoLA BSA Adel (118/118) and the homozygous non-deletion (BoLA BSA/BSA) animals when this genotyping assay was performed.
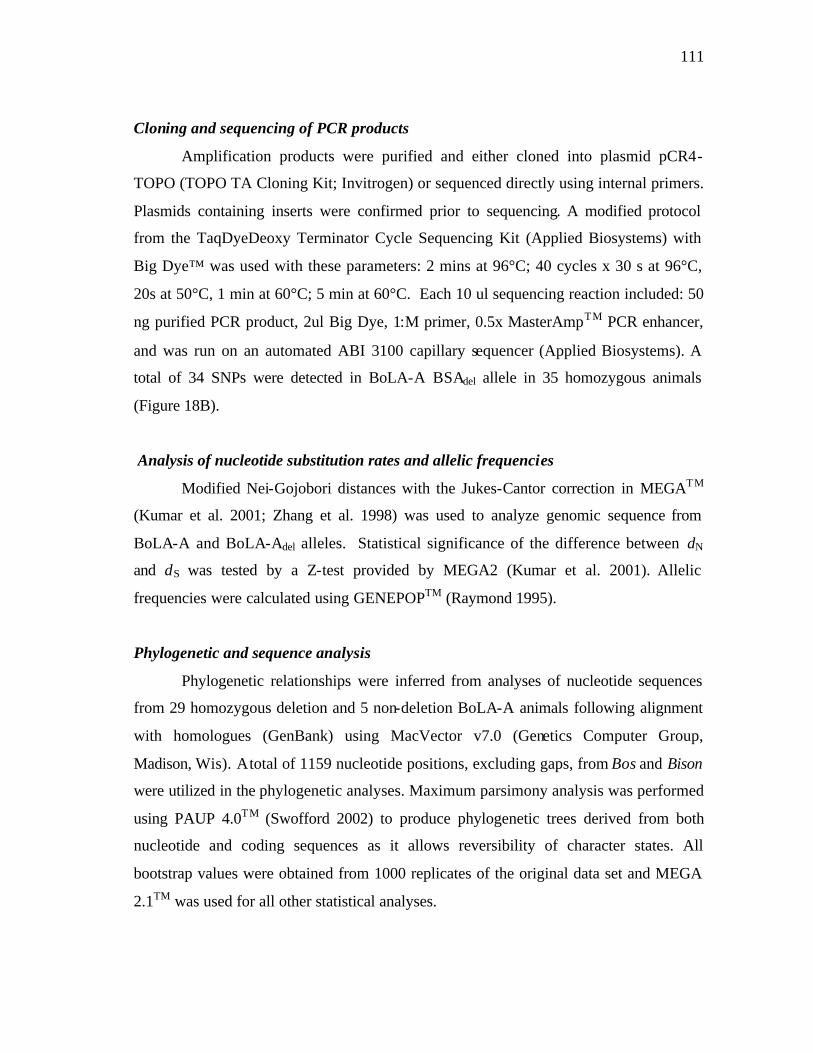
111
Cloning and sequencing of PCR products
Amplification products were purified and either cloned into plasmid pCR4-
TOPO (TOPO TA Cloning Kit; Invitrogen) or sequenced directly using internal primers.
Plasmids containing inserts were confirmed prior to sequencing. A modified protocol
from the TaqDyeDeoxy Terminator Cycle Sequencing Kit (Applied Biosystems) with
Big Dye™ was used with these parameters: 2 mins at 96°C; 40 cycles x 30 s at 96°C,
20s at 50°C, 1 min at 60°C; 5 min at 60°C. Each 10 ul sequencing reaction included: 50
ng purified PCR product, 2ul Big Dye, 1:M primer, 0.5x MasterAmpTM PCR enhancer,
and was run on an automated ABI 3100 capillary sequencer (Applied Biosystems). A
total of 34 SNPs were detected in BoLA-A BSAdel allele in 35 homozygous animals
(Figure 18B).
Analysis of nucleotide substitution rates and allelic frequencies
Modified Nei-Gojobori distances with the Jukes-Cantor correction in MEGATM
(Kumar et al. 2001; Zhang et al. 1998) was used to analyze genomic sequence from
BoLA-A and BoLA-Adel alleles. Statistical significance of the difference between dN
and dS was tested by a Z-test provided by MEGA2 (Kumar et al. 2001). Allelic
frequencies were calculated using GENEPOPTM (Raymond 1995).
Phylogenetic and sequence analysis
Phylogenetic relationships were inferred from analyses of nucleotide sequences
from 29 homozygous deletion and 5 non-deletion BoLA-A animals following alignment
with homologues (GenBank) using MacVector v7.0 (Genetics Computer Group,
Madison, Wis). A total of 1159 nucleotide positions, excluding gaps, from Bos and Bison
were utilized in the phylogenetic analyses. Maximum parsimony analysis was performed
using PAUP 4.0TM (Swofford 2002) to produce phylogenetic trees derived from both
nucleotide and coding sequences as it allows reversibility of character states. All
bootstrap values were obtained from 1000 replicates of the original data set and MEGA
2.1TM was used for all other statistical analyses.
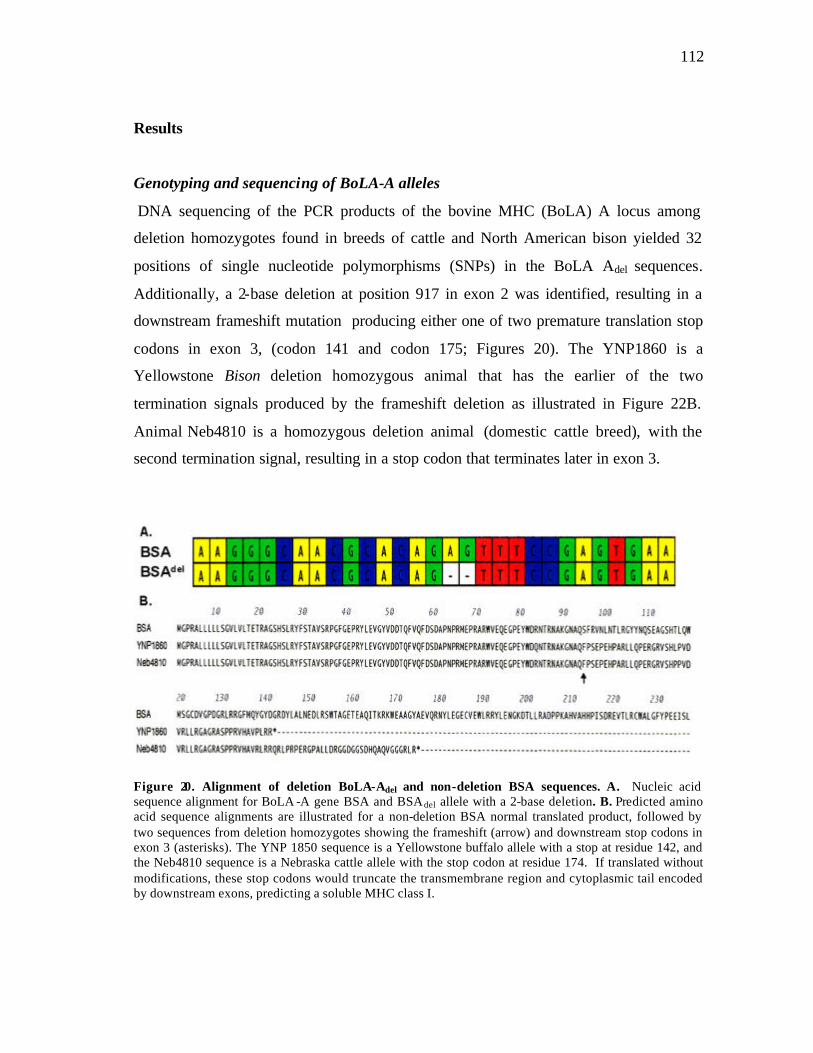
112
Results
Genotyping and sequencing of BoLA-A alleles
DNA sequencing of the PCR products of the bovine MHC (BoLA) A locus among
deletion homozygotes found in breeds of cattle and North American bison yielded 32
positions of single nucleotide polymorphisms (SNPs) in the BoLA Adel sequences.
Additionally, a 2-base deletion at position 917 in exon 2 was identified, resulting in a
downstream frameshift mutation producing either one of two premature translation stop
codons in exon 3, (codon 141 and codon 175; Figures 20). The YNP1860 is a
Yellowstone Bison deletion homozygous animal that has the earlier of the two
termination signals produced by the frameshift deletion as illustrated in Figure 22B.
Animal Neb4810 is a homozygous deletion animal (domestic cattle breed), with the
second termination signal, resulting in a stop codon that terminates later in exon 3.
Figure 20. Alignment of deletion BoLA-Adel and non-deletion BSA sequences. A. Nucleic acid sequence alignment for BoLA -A gene BSA and BSAdel allele with a 2-base deletion. B. Predicted amino acid sequence alignments are illustrated for a non-deletion BSA normal translated product, followed by two sequences from deletion homozygotes showing the frameshift (arrow) and downstream stop codons in exon 3 (asterisks). The YNP 1850 sequence is a Yellowstone buffalo allele with a stop at residue 142, and the Neb4810 sequence is a Nebraska cattle allele with the stop codon at residue 174. If translated without modifications, these stop codons would truncate the transmembrane region and cytoplasmic tail encoded by downstream exons, predicting a soluble MHC class I.
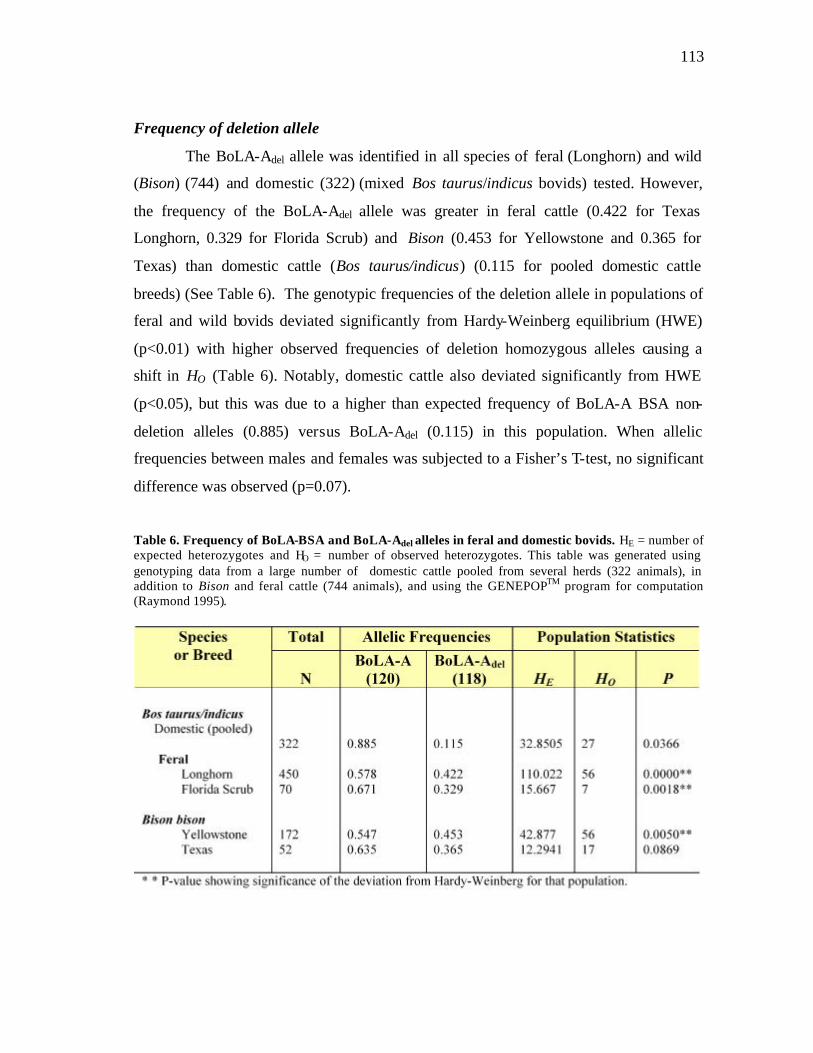
113
Frequency of deletion allele
The BoLA-Adel allele was identified in all species of feral (Longhorn) and wild
(Bison) (744) and domestic (322) (mixed Bos taurus/indicus bovids) tested. However,
the frequency of the BoLA-Adel allele was greater in feral cattle (0.422 for Texas
Longhorn, 0.329 for Florida Scrub) and Bison (0.453 for Yellowstone and 0.365 for
Texas) than domestic cattle (Bos taurus/indicus) (0.115 for pooled domestic cattle
breeds) (See Table 6). The genotypic frequencies of the deletion allele in populations of
feral and wild bovids deviated significantly from Hardy-Weinberg equilibrium (HWE)
(p<0.01) with higher observed frequencies of deletion homozygous alleles causing a
shift in HO (Table 6). Notably, domestic cattle also deviated significantly from HWE
(p<0.05), but this was due to a higher than expected frequency of BoLA-A BSA non-
deletion alleles (0.885) versus BoLA-Adel (0.115) in this population. When allelic
frequencies between males and females was subjected to a Fisher’s T-test, no significant
difference was observed (p=0.07).
Table 6. Frequency of BoLA-BSA and BoLA-Adel alleles in feral and domestic bovids. HE = number of expected heterozygotes and HO = number of observed heterozygotes. This table was generated using genotyping data from a large number of domestic cattle pooled from several herds (322 animals), in addition to Bison and feral cattle (744 animals), and using the GENEPOPTM program for computation (Raymond 1995).
114
Analysis of nucleotide substitutions indicates diversifying selection in ARS of BSA
allele and neutral selection in ARS of BSAdel
Within the non-ARS sites of exons 1, 2 and 3 of both the non-deletion BoLA-A
BSA allele and the BoLA-Adel allele, dN = dS, therefore ? = 1. However, ARS sites in the
non-deletion BSA allele, show significant evidence for overdominant selection (dN>dS,
?>1; p<0.01). Table 7 shows dN in the ARS region is lower in the BoLA-Adel allele (dN
= 1.00) compared to the non-deletion BoLA-A BSA (dN=14.27; p<0.01), providing
evidence that Adel may not be transcribed as a functional classical class I molecule.
Table 7. Analysis of 1200 bp of genomic sequence of BoLA-A locus deletion (BSAdel) and non-deletion (BSA) genes showing nucleotide distance (d) and proportion of non-synonymous (dN) and synonymous (dS) substitutions in 28 bovids . d = Kimura 2-parameter of average distances among sequences. Modified Nei-Gojobori distances with the Jukes-Cantor correction in MEGATM was used to calculate the following: dN and dS which are average non-synonymous and synonymous distances in the overall domain and within the non-antigen recognition sites or (non-peptide binding) and the antigen recognition sites (or peptide binding) within exons 1, 2 and 3 (Kumar et al. 2001; Zhang et al. 1998).
Phylogenetic analysis reveals Bison haplotypes of BoLA-A similar to, but distinct from
cattle
There were 16 haplotypes detected in the 32 BoLA BSA Adel homozygous
animals in this analysis as confirmed by ArlequinTM (Schneider 2000). The sequence of
a related BoLA class I gene, BSC (Accession # AF396752) was used as an outgroup in
this maximum parsimony analysis. Deletion alleles from Bison and Bos segregated into
similar, but distinct haplotype groups based on DNA sequence comparisons. An
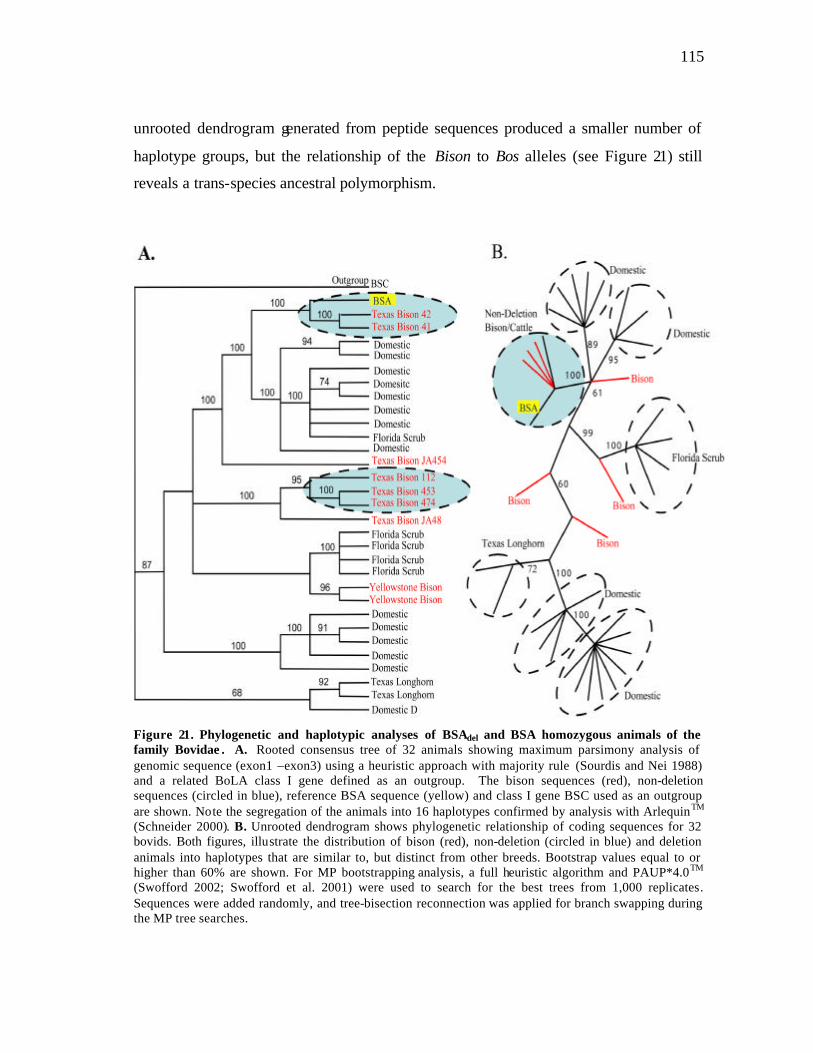
115
unrooted dendrogram generated from peptide sequences produced a smaller number of
haplotype groups, but the relationship of the Bison to Bos alleles (see Figure 21) still
reveals a trans-species ancestral polymorphism.
Figure 21. Phylogenetic and haplotypic analyses of BSAdel and BSA homozygous animals of the family Bovidae . A. Rooted consensus tree of 32 animals showing maximum parsimony analysis of genomic sequence (exon1 –exon3) using a heuristic approach with majority rule (Sourdis and Nei 1988) and a related BoLA class I gene defined as an outgroup. The bison sequences (red), non-deletion sequences (circled in blue), reference BSA sequence (yellow) and class I gene BSC used as an outgroup are shown. Note the segregation of the animals into 16 haplotypes confirmed by analysis with ArlequinTM (Schneider 2000). B. Unrooted dendrogram shows phylogenetic relationship of coding sequences for 32 bovids. Both figures, illustrate the distribution of bison (red), non-deletion (circled in blue) and deletion animals into haplotypes that are similar to, but distinct from other breeds. Bootstrap values equal to or higher than 60% are shown. For MP bootstrapping analysis, a full heuristic algorithm and PAUP*4.0TM
(Swofford 2002; Swofford et al. 2001) were used to search for the best trees from 1,000 replicates.
Sequences were added randomly, and tree-bisection reconnection was applied for branch swapping during the MP tree searches.
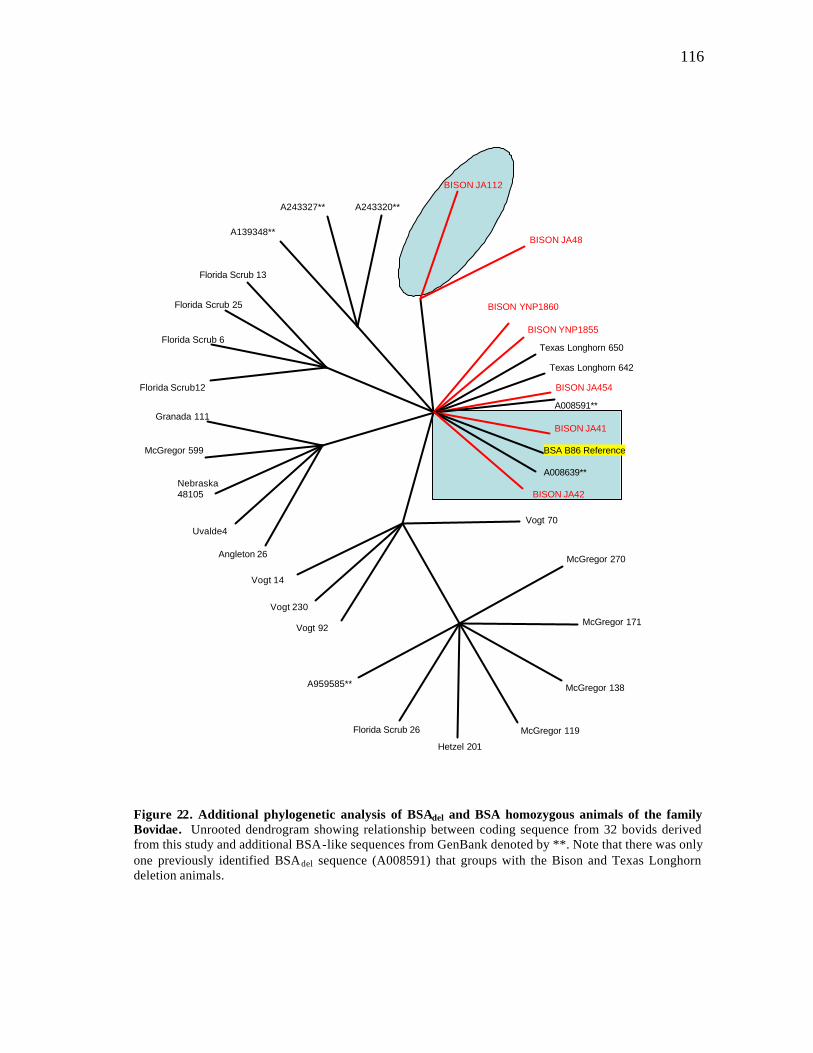
116
Figure 22. Additional phylogenetic analysis of BSAdel and BSA homozygous animals of the family Bovidae. Unrooted dendrogram showing relationship between coding sequence from 32 bovids derived from this study and additional BSA-like sequences from GenBank denoted by **. Note that there was only one previously identified BSAdel sequence (A008591) that groups with the Bison and Texas Longhorn deletion animals.
Vogt 70
McGregor 270
McGregor 171
McGregor 138
McGregor 119
Hetzel 201
Florida Scrub 26
A959585**
Vogt 92
Vogt 230
Vogt 14
Angleton 26
Uvalde4
Nebraska48105
McGregor 599
Granada 111
Florida Scrub12
Florida Scrub 6
Florida Scrub 25
Florida Scrub 13
A139348**
A243327** A243320**
BISON JA112
BISON JA48
BISON YNP1860
BISON YNP1855
Texas Longhorn 650
Texas Longhorn 642
BISON JA454
BISON JA42
BISON JA41
A008639**
A008591**
BSA B86 Reference
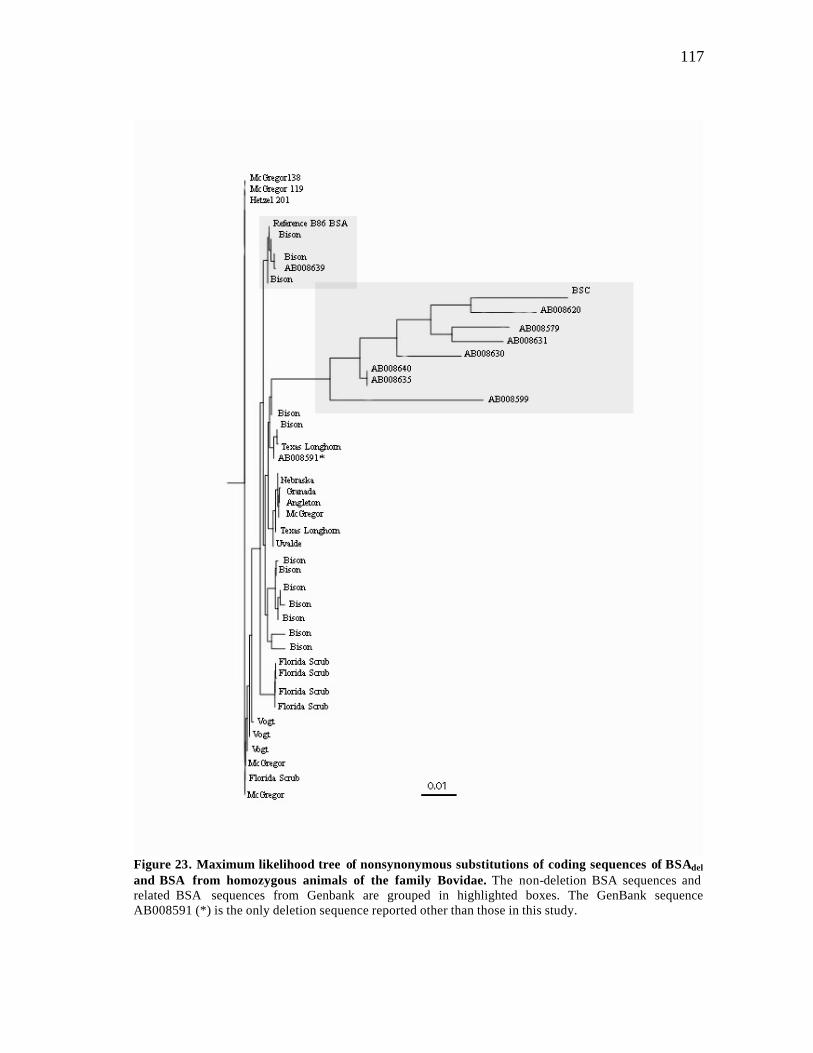
117
Figure 23. Maximum likelihood tree of nonsynonymous substitutions of coding sequences of BSAdel and BSA from homozygous animals of the family Bovidae. The non-deletion BSA sequences and related BSA sequences from Genbank are grouped in highlighted boxes. The GenBank sequence AB008591 (*) is the only deletion sequence reported other than those in this study.
118
When additional deletion sequences from the EST database and GenBank were
added (Accession numbers for ESTs: A9595858, A13934850, A24332712 and A008591
for GenBank deletion sequence; A008639 for non-deletion BSA-like sequence) Ab to
the analysis there was less resolution of some of the deletion sequences but nevertheless
the trans-species polymorphism was still evident (Figure 22). An additional analysis
using neighbour joining to elucidate the relationships of nonsynonymous substitutions
per site (disregarding the deletion as a character state) showed a similar haplotype
grouping (Figure 23), but branch lengths between the deletion sequences were very short
due to level of relatedness.
Discussion
In this article we describe a new allele, BoLA-Adel, detected during haplotype
analysis of feral, wild and domestic bovids, and identify 34 different polymorphic sites
in the BoLA Adel sequences. The 2-base deletion causes a stop codon in the putative
translated product that, if not subject to RNA decay or modification events, will produce
a soluble MHC molecule. Since the leader peptide encoded by exon 1, and the a1 and a2
domains of the antigen recognition sites encoded by exons 2 and 3 may be unaffected, it
is possible that the antigen recognition mechanism of the putative soluble molecule is
functional. However, since ?=1 for the ARS sites of the BSAdel allele, it may not
function as a classical class I molecule if translated, since classical class I alleles of all
species examined reveal a pattern of overdominant selection within the ARS (Hughes
and Nei 1989; Yuhki and O'Brien 1997). Analysis of all available BoLA class I
sequences revealed a very low number of Adel sequences amongst BoLA class I entries
which are mostly from domestic breeds of bovids (only one in GenBank and three in
EST databases). Coupled with analysis from this study, it can be concluded that the
deletion allele exists in low frequencies in domestic cattle. The prevalence of this allele
in feral cattle and Bison, predating the evolutionary split, may identify a genetic basis for
119
the anecdotal assertion that feral cattle and Bison differ from domestic cattle in response
to exposure of pathogens.
Serologically typed animals can express various combinations of four or more
class I genes (Ellis et al. 1999), but allelic versus locus assignment of expressed genes
remains a difficult task due to high gene conversion rates in the BoLA class I genes. The
low value of dS in the non-ARS codons of the BoLA-A BSA allele indicates a pattern of
nucleotide substitutions characteristic of a gene that has undergone homogenization
through gene conversion as documented for most MHC genes (Gregory et al. 2002). In
the ARS region of the non-deletion BoLA-A BSA gene, the ratio (?) of nonsynonymous
substations (dN) to synonymous substitutions (dS) is greater than 1, where positive
selection is identifiable when ? exceeds 1. This would indicate positive selection and
implies that there may be a fitness advantage to the nonsynonymous mutations in this
gene so that these are retained in the population at a higher rate than the synonymous
mutations.
The pattern of nucleotide substitution in nonclassical genes is different from that
in classical genes, as the rate of nonsynonymous substitution is higher in the ARS than
in other gene regions for classical genes. However, unlike the case of classical genes, the
nonsynonymous rate does not always exceed the synonymous rate in the antigen
recognition site. Nonclassical MHC class I proteins further differ from classical proteins
in having amino acid replacements in conserved antigen recognition site positions,
consistent with the hypothesis that nonclassical genes have originated from classical
genes but have lost classical class I function because of deleterious mutation (Hughes
and Yeager 1998a; Yeager and Hughes 1999). The BoLA-Adel allele may be
demonstrating such a mutation, and if functional could behave within the definition of a
nonclassical class I molecule with its limited polymorphism.
It is, however, important to recognise that within the allelic polymorphism at the
DNA level which seems endless, there are ancient lineages which predate speciation and
maintain themselves in closely related species. This is the basis of the trans-species
polymorphism theory proposed by Jan Klein and has found widespread support (Klein et

120
al. 1993c). Allelic lineages may be shared by related species, such as human and apes or
cattle and bison, having been found on a common ancestor.
There have been trans-species polymorphisms documented in bony fish
(Kruiswijk et al. 2002) (the ZE lineage) that have been maintained for up to 100 million
years and the unusual conservation of the peptide binding domains not only within
species, but also across species highlight the importance of their function. Although
these domains show an unusually high conservation at the amino acid level, each domain
exhibited a high degree of nucleotide diversity as shown by divergence time estimates
based on the level of synonymous substitutions. The conservation of the 1 and 2 domains
may relate to recognition of highly conserved molecular patterns derived from common
pathogens and the molecular structures might be the driving force to conserve the 1 and
2 domains in different species.
The trans-species polymorphism between the BoLA-A BSA and BSAdel alleles
seem to be ancient and related to a history of domestication. Although persistence of
MHC alleles after a speciation event could be maintained by overdominant selection in
response to pathogens (Klein 1987), it is unusual that the deletion allele is maintained in
both populations as evidence shows in analysis of its ARS dN/dS ratio (?= 1), it is a
neutral polymorphism. It may be maintained by linkage to a class I gene that is selected,
especially due to the close proximity of class I genes in BoLA. Alternatively, the non-
deletion allele may be subject to diversifying selection indirectly, due to linkage with
economically important traits that are heavily selected via human manipulation (e.g.
milk yield in Holstein) during domestication of the species independent of
environmental pathogens. The latter would explain the Hardy-Weinberg disequilibrium
(p<0.05) observed in domestic cattle, which had more non-deletion BoLA-A BSA
homozygous animals than any other population, tested (See Table 2). However, this is
probably not likely, as to date no quantitative trait loci of economic importance to the
dairy or beef industry has been linked to the MHC region.
Ongoing sequence analysis will provide more information to elucidate the
mechanisms of MHC class I expression at the BoLA A locus. Determining if BoLA-Adel

121
is transcribed and translated in its predicted form will help to relate sequence structure to
functional genomics within the MHC class I of bovids, and garner a better understanding
of the role of the bovine MHC in disease processes leading to the production of healthier
cattle.
122
CHAPTER V
CHARACTERIZATION OF AN ALLELIC VARIANT OF BOLA-A BSA (Adel)
WITH A FRAMESHIFT DELETION SHOWS TRANSCRIPTION OF SOLUBLE
GENE PRODUCT
The seeds of great discoveries are constantly floating around, but they only take root in minds well prepared to receive them. – Joseph Henry
Summary
Research into the immune systems of economically important species, such as
cattle, is largely focused on disease control strategies. Existing vaccine failures often
relate to poor induction of cellular immune responses, understanding of which requires
detailed analyses of MHC genes and their expression. BoLA class I genes have been
associated with disease susceptibility and resistance due to their role in antigen
presentation. Soluble MHC class I molecules are produced by alternative splicing and
proteolytic cleavage of both classical and non-classical class 1 gene products in several
mammalian species. This study describes the first soluble form of a MHC class I protein
that is allelic to a classical class I gene in any species. The BoLA BSA Adel product has a
frameshift deletion resulting in a truncated protein, and found in Bos and Bison with
higher frequencies than domestic cattle. Homozygous deletion animals do not show
differential expression of overall class I expression by flow cytometry or real- time RT-
PCR analysis. Models are suggested by which a soluble form of MHC class I gene, the
first described for the bovine MHC (BoLA), could provide immunoregulatory function.
Introduction
Products of genes within the MHC play critical roles in the immune response,
especially in immune recognition binding self and foreign peptide fragments for
123
presentation to T lymphocytes. A large amount of genetic diversity needs to be
generated within the MHC to deal with the constant evolution of pathogens to defeat its
defense responses. This diversity can be generated through overdominant selection
(heterozygote-advantage) or through preferential selection of rare genotypes that confer
benefits (negative frequency-dependent selection) or some combination of both (Hughes
and Nei 1988; Potts and Wakeland 1990).
This class I molecule is a heterodimer consisting of a heavy chain and a light
chain (beta-2 microglobulin). The heavy chain is anchored in the membrane. Class I
molecules play a central role in the immune system by presenting peptides derived from
the endoplasmic reticulum lumen. They are expressed in nearly all cells. The heavy
chain is approximately 45 kDa and its gene contains 8 exons. Exon one encodes the
leader peptide, exons 2 and 3 encode the a1 and a2 domains, which both bind the
peptide, exon 4 encodes the a3 domain, exon 5 encodes the transmembrane region, and
exons 6 and 7 encode the cytoplasmic tail. Polymorphisms within exon 2 and exon 3 are
responsible for the peptide binding specificity of each class I molecule as it changes
amino acids in the antigen recognition sites (ARS). Typing for these polymorphisms is
routinely done for bone marrow and kidney transplantation in humans, and to date 1,114
HLA class I alleles have been identified (Table 8).
HLA A, B and C genes are expressed by all individuals, but this is different in
cattle, where there is expression of a large number of class I genes and a variable number
of haplotypes (Table 8B). In humans, HLA-A and –B encode for protein products that
present peptides, while HLA-C encoded molecules interact with natural-killer-cytotoxic
T lymphocytes (NK-CTLs), which are a subset of CD8+ CTLs that express HLA (human
leukocyte antigen) class I-specific inhibitory receptors. HLA-E, F and G encoded
molecules are non-classical, demonstrating limited polymorphism, tissue restriction and
alternatively spliced forms producing soluble isoforms. HLA-E molecules
(CD94/NKG2A) are recognized by NK-CTLs and has the ability to bind peptides
derived from the leader sequence of various HLA class I alleles as well as from several
viral proteins (Moretta et al. 2003).
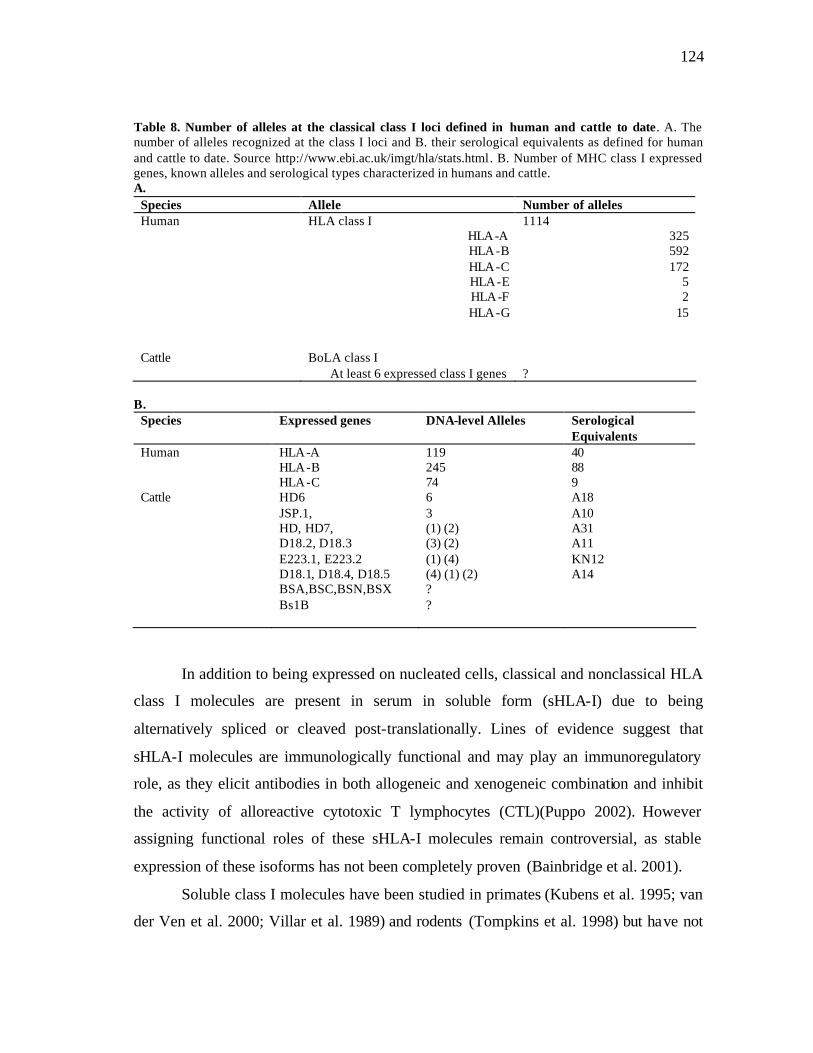
124
Table 8. Number of alleles at the classical class I loci defined in human and cattle to date. A. The number of alleles recognized at the class I loci and B. their serological equivalents as defined for human and cattle to date. Source http://www.ebi.ac.uk/imgt/hla/stats.html. B. Number of MHC class I expressed genes, known alleles and serological types characterized in humans and cattle. A.
Species Allele Number of alleles Human HLA class I
HLA-A HLA-B HLA-C HLA-E HLA-F HLA-G
1114 325 592 172
5 2
15
Cattle BoLA class I At least 6 expressed class I genes
?
B.
Species Expressed genes DNA-level Alleles Serological Equivalents
Human HLA-A 119 40 HLA-B 245 88 HLA-C 74 9 Cattle HD6
JSP.1, HD, HD7, D18.2, D18.3 E223.1, E223.2 D18.1, D18.4, D18.5 BSA,BSC,BSN,BSX Bs1B
6 3 (1) (2) (3) (2) (1) (4) (4) (1) (2) ? ?
A18 A10 A31 A11 KN12 A14
In addition to being expressed on nucleated cells, classical and nonclassical HLA
class I molecules are present in serum in soluble form (sHLA-I) due to being
alternatively spliced or cleaved post-translationally. Lines of evidence suggest that
sHLA-I molecules are immunologically functional and may play an immunoregulatory
role, as they elicit antibodies in both allogeneic and xenogeneic combination and inhibit
the activity of alloreactive cytotoxic T lymphocytes (CTL)(Puppo 2002). However
assigning functional roles of these sHLA-I molecules remain controversial, as stable
expression of these isoforms has not been completely proven (Bainbridge et al. 2001).
Soluble class I molecules have been studied in primates (Kubens et al. 1995; van
der Ven et al. 2000; Villar et al. 1989) and rodents (Tompkins et al. 1998) but have not
125
been characterized in the Artiodactyl family to date. HLA-G harbors several structural
characteristics, including the transcription of different membrane-bound and soluble
isoforms, a unique promoter region and a truncated cytoplasmic tail. HLA-G molecules
bind intracellular processed nonamer peptides (Diehl et al. 1996; Lee et al. 1995 and
Ishitani et al. 2003) and can serve as a restriction element for HCMV-derived peptides in
transgenic mice (Lenfant et al. 2003), suggesting that HLA-G may play a role in the
immune response against viral infections in the absence of classical MHC molecules.
HLA-G is also the ligand of several triggering or inhibitory receptors on natural killer
(NK) cells (Lanier 1999) that could protect trophoblast cells from maternal NK lysis
and/or also promote cytokine secretion important for the placentation (Croy et al. 2003).
The MHC class I chain-related molecules (MICs) have previously been shown to
be induced on most epithelial tumor cells. Engagement of MIC by the activa ting immune
receptor NKG2D triggers NK cells and augments antigen-specific CTL anti- tumor
immunity. The MIC-NKG2D system was proposed to participate in epithelial tumor
immune surveillance. Paradoxically, studies suggest that tumors may evade MIC-
NKG2D-mediated immunity by MIC shedding- induced impairment of effector cell
function. A significant correlation of MIC shedding and deficiency in NK cell function
with grade of disease in prostate cancer has been seen (Wu et al. 2004). The presence of
surface target MIC is counteracted by shedding, so that a significant increase in serum
levels of soluble MIC (sMIC) and a correlated deficiency in NK cell function as shown
in patients with advanced cancer (Wu et al. 2004).
There appears to be specific MHC class I molecules, including those with soluble
forms, which play a particular role in certain biological functions in many species,
including cattle. In humans, HLA-G is expressed specifically on invasive,
cytotrophoblast cells and may protect these cells from attack by CD4+ T lymphocytes
and/or natural killer (NK) cells (Ellis et al. 1986; Le Bouteiller et al. 1999; Bainbridge et
al. 2001; Park et al. 2004). In viviparous animals, regulation of expression of MHC
class I antigens by the trophoblast cells, which constitute the outermost layer of the
placenta, seems to be critical for maternal immunological acceptance of an allogeneic
126
fetus. Cattle are unusual in this regard, since the bovine trophoblast cells, in specific
regions of the uterine/placental interface, normally express MHC class I antigens during
the third trimester of gestation. This expression appears to be biologically relevant as
MHC class I compatibility between a cow and her fetus has been associated with an
increased incidence of placental retention. This suggests that maternal immunological
recognition of fetal MHC class I proteins triggers an immune/inflammatory response that
contributes to placental separation at parturition in cattle. Early in pregnancy, a complete
shutdown of MHC class I expression by trophoblast cells appears to be critical for
normal placental development and fetal survival (Park et al. 2004b).
Also, in a review of recent evidence of the evolutionary adaptation of HIV-1 to
the specific immune system in SIV-infected rhesus macaques, experiments show
unequivocally that amino acid replacements in CTL epitopes are the result of positive
selection and that these escape mutants have a lower class I MHC binding affinity or are
less likely to be recognized by CTLs than non-escape variants (da Silva 2003). These
analyses show that positive selection of MHC class I polymorphism may be related to
immunological function or susceptibility/resistance to a disease state, thus such
polymorphisms in MHC class I molecules seen in other species may be maintained due
to positive selection to some function or environmental pathogen.
Haplotype and phylogenetic analyses suggest there may be 6 or more cattle class
I genes that can be expressed and that individual haplotypes express between 1 and 3 of
these genes, in a number of different combinations (Di Palma et al. 2002; Ellis and
Ballingall 1999; Garber 1994; Holmes et al. 2003). Also in cattle, no single locus seems
to be consistently expressed.
The very high degree of polymorphism seen makes it possible for each individual
to possess a different set of MHC alleles, however, within this high level of allelic
polymorphism at the DNA level there are allelic lineages maintained within closely
related species. Some of these allelic lineages exhibit trans-species polymorphism and
are ancient lineages that predate speciation (Ayala et al. 1994; Klein et al. 1993c). This
127
is also especially seen in the MHC of primates (Anzai et al. 2003; Kulski et al. 2004;
Kulski et al. 2002b; Lawlor et al. 1988; Mayer et al. 1992)
Hughes and Yeager (1998b) suggests four independent lines of evidence to
support the hypothesis that MHC polymorphisms are selectively maintained: (a)
distribution of allelic frequencies does not fit the neutral expectation, (b) rate of
nonsynonymous nucleotide substitution significantly exceeds the rate of synonymous
substitution in the codons encoding the peptide-binding region of the molecule, (c)
polymorphisms have been maintained for long periods of time ("trans-species
polymorphism") and (d) introns have been homogenized relative to exons over
evolutionary time, suggesting that balancing selection acts to maintain diversity in the
latter, in contrast to the former.
BoLA has been estimated to contain at least 20 class I loci by southern blot
analysis with a human cDNA probe (Lindberg and Andersson 1988). Biochemical
techniques have also been used to detect class I protein from at least two loci in
immunoprecipitates and one dimensional isoelectric focusing (1D-IEF) and peptide
mapping also indicate a minimum of at least three class I loci expressed at the protein
level (al-Murrani et al. 1994; al-Murrani et al. 1993; Garber et al. 1994; Sawhney et al.
1995).
At least six classical class I genes, as well as several other non-classical class I
genes and pseudogenes, have been found by sequence and transcription analyses in the
pig MHC (or SLA) (Chardon et al. 1981; Chardon et al. 1999a; Renard et al. 2001;
Shigenari et al. 2004). In the equine MHC (ELA), 30 class I loci have been detected by
southern blot analysis, however only four of these are thought to be transcribed (Ellis et
al. 1995). Improved typing of classical MHC class I molecules is required to more
accurately define these molecules and to extend the number identified as an alternative
to serological assays. Also, defining classical MHC class I allelic polymorphism is
important in evaluating cytotoxic T lymphocyte (CTL) responses in many species. Like
cattle, horses sharing ELA-A haplotypes defined by serotyping do not always share
cDNA sequences, suggesting subhaplotypic variations within serologically defined
128
ELA-A haplotypes; as well, 13 horses in this study had two to five classical MHC class I
sequences, indicating that multiple loci code for these genes (Chung et al. 2003) similar
to the situation in cattle. Thus the situation in cattle is not unique as it is seen in rat,
mouse and horse where gene conversion plays an important role in MHC allelic lineages
(Amadou et al. 2003; Holmes et al. 2003; Hurt et al. 2004; Kulski et al. 2002a; Shiina et
al. 2004).
Intra- and inter-locus recombination in MHC class I genes have been observed in
the evolution of the MHC in several species, although the evolutionary mechanisms that
possibly generated this diversity has been controversial (Amadou et al. 1999; Amadou et
al. 2003; Andersson et al. 1991; Cadavid et al. 1997; Garber et al. 1994; Hughes 1991;
Hughes and Nei 1988; Hughes and Yeager 1997; Hughes and Yeager 1998a; Jones et al.
1999; Kumanovics et al. 2003; Pamer and Cresswell 1998; Takada et al. 2003).
The use of phylogenetic trees to test hypotheses of recombination and gene
conversion giving rise to inter-allelic recombination is useful as is estimating numbers of
nucleotide substitutions per site in a particular gene region (Hughes and Yeager 1998b;
Yeager and Hughes 1999; Yeager et al. 1997). However, it is difficult to assign a
sequence on the basis of allele versus loci using phylogenetics, especially in cattle MHC
analyses (Di Palma et al. 2002; Ellis et al. 1986; Holmes et al. 2003). Sequencing clones
from RT-PCR with classical MHC class I-specific primers should also be useful for
selection of haplotype matched and mismatched cattle for CTL or class I expression
studies, and could be useful in providing information needed to develop simpler and
more stringent typing procedures by determining DNA sequence.
The functional implications of variable class I haplotypes (including single class
I locus haplotypes) in cattle, in terms of individual and population fitness, are at present
unknown. BoLA class I genes may vary in terms of polymorphism, expression levels
and specific function. Recently, we described a frameshift deletion in a BoLA class I-
BSA allele in both feral cattle and bison, which if transcribed, would produce a putative
soluble class I molecule, of a 12kDa molecular weight and an isolectric point (pI) of 9.9,
without a transmembrane domain or cytoplasmic tail (Ramlachan 2004). This trans-
129
species polymorphism may have shared an alleleic lineage due to response to shared
environmental pathogens. Also, if translated, its soluble form could function as cleaved
sHLAs or alternatively spliced soluble MHC class I molecules and be secreted into the
cytosol. If translated as predicted by sequence analysis, this BoLA BSA-Adel allele
would be the first alleleic form of a soluble MHC class I molecule to be charactertized.
Cell lines were obtained from homozygous animals with and without the BoLA
BSA-Adel and characterization of this frameshift deletion mutant allele of BoLA Class I-
BSA was performed in this study through quantitative RT-PCR and flow cytometry
analysis to determine differential expression of MHC class I in deletion and non-deletion
homozygous animals. Also, attempts were made to determine the structure of the
putative soluble MHC class I predicted by the DNA analysis of the BoLA-Adel and use
this information in 1D-IEF and 2D gel analysis and peptide mapping to isolate the
peptide and/or amino acid sequence by mass spectrometry analysis.
Materials and Methods
DNA collection and cell culture
Blood samples from various domestic (Angus, Holstein, Hereford, Jersey,
Simmental) and feral (Texas Longhorn and Florida Scrub) cattle and bison breeds were
collected on WhatmanR (Clifton, New Jersey) FTATM cards at time of bleeding (125ul
per card) and stored at room temperature. A 1.2 mm disc was excised using a coring
device and DNA was prepared for downstream PCR according to the protocol
recommended by the manufacturer. Venous blood from the 100 Wichita Mountain
Refuge Texas Longhorns was also collected in sodium citrate CPT tubes (BD
Vacutainer, Franklin Lakes, NJ). CPT tubes were centrifuged as directed by the
manufacturer to obtain peripheral blood mononuclear cells (PBMC). Plasma was
removed for downstream analysis and PBMCs were either frozen at -80 ºC or cultured in
RPMI 1640 (Gibco BRL, Grand Island, N.Y.), supplemented with 10% heat inactivated
fetal bovine serum (FBS) (Atlas Biologicals, Fort Collins, CO), 50 ug/ml of gentamicin
130
(Gibco BRL, Grand Island, N.Y.), 5x 10⁻⁵ M 2-mercaptoethanol (Gibco BRL, Grand
Island, N.Y.), 2mM L-glutamine (Gibco BRL, Grand Island, N.Y.) and 100 units of
human recombinant IL-2 (Gibco BRL, Grand Island, N.Y.) per ml. Cells were grown at
36ºC in a humidified atmosphere of 5% CO2 and stimulated with concavalin A ( 5ug/ml)
(Sigma, St. Louis, MO) every three days then collected, washed with PBS, then frozen at
-80 ºC or stained for flow cytometry.
Genotyping, polymerase chain reaction (PCR) amplification and sequencing
This was done as described in Ramlachan et al. (2004). Briefly, locus A-specific
primers were designed to amplify BoLA BSA from genomic DNA for sequencing, then
this sequence was used to design internal primers used in genotyping. Genotyping was
performed via a nested PCR on 1.5ul of PCR product with a sequencing primer using a
standard labeled-primer protocol (Oetting et al. 1995), run on an automated ABI 3100
capillary sequencer (Applied Biosystems, Foster City, CA) and analyzed using
Genotyper 3.6TM. All genotyping products were run on a 1% agarose gel, excised, cloned
and sequenced as detailed below for confirmation.
Cloning and sequencing of PCR products
PCR was performed in 25µl with the following components: 1-2µl of cDNA or
genomic DNA, 1.5µM MgCl2, 1µM of each primer, 200µM of dNTPs, and 0.6U Taq
polymerase (Perkin Elmer). Amplification products were purified (QIAquick™ PCR
Purification kit, QIAGEN) and run on the ABI 3100 directly for genotyping analysis or
cloned into plasmid pCR4-TOPO™ (TOPO TA Cloning Kit; Invitrogen). Plasmids
containing inserts were confirmed prior to sequencing by restriction enzyme digestion
with SalI and/or HindIII and agarose gel electrophoresis. Clones (up to 12 per animal)
were selected and DNA was prepared from single colony isolates inoculated into 2 ml
cultures (with 2XLB broth) grown in 96-deep-well plates with appropriate antibiotic
(Kanamycin or Ampicillin) at 37ºC on a shaker at a 320 r.p.m. for 20-24 hours. A
Montage™ Plasmid Miniprep96 kit (Millipore, Bedford, MA) with a vaccum manifold
131
was used as per manufacturer’s instructions to prepare sequence-quality DNA templates
from clones.
Sequencing with internal primers in both orientations in a 96-well format was
done using a modified protocol from the TaqDyeDeoxy Terminator Cycle Sequencing
Kit (Applied Biosystems) with Big Dye™ and run on an automated ABI 3100 capillary
sequencer (Applied Biosystems) as described in Chapter II. Sequencing reactions were
subjected to a clean-up set prior to being run on the capillary sequencer to remove dye
terminators, salts, dNTPS, primers, buffers, and labeled nucleotides. Briefly, 40 ul of a
precipitation mix (624 ul of 3M sodium acetate (pH 5.2), 6 mls water, 26 mls 95%
ethanol) was added to each 10ul sequencing reaction in a 96-well plate, which was then
covered in foil, vortexed and left to incubate for 15 mins at room temperature. The plate
was then centrifuged at 3250 rpm at 4oC for 45-60 mins. Supernatants were removed
then 50 ul of chilled 70% ethanol was added to each well followed by an additional
centrifugation at 4000 rpm at 4oC for 5 mins. Plates were then shaken and spun upside-
down on a tissue at 250 rpm for 30-60 secs and allowed to dry before loading.
RT-PCR of MHC class I gene transcripts
Accurate analysis of in vivo gene expression might be complicated by unintended
ex vivo gene expression or degradation of gene transcripts. To reduce incidence of this,
we collected blood to be used for RNA extraction in a sampling system (PAXgeneTM
Blood RNA tubes; PreAnalytiX) that includes a stabilizing additive in the blood
collection tube (Rainen et al. 2002). Total RNA was extracted from animals genotyped
as homozygous or heterozygous for BoLA-A and BoLA Adel alleles using the
recommended protocols of the PAXgeneTM kit (PreAnalytiX, Qiagen, Valencia,
California). This was followed by reverse transcription PCR (RT-PCR) using a forward
and reverse primer specific for the 5' UTR (BSA 5': 5'-TGTCTCCCCAAGTTTCAC-3')
and the end of exon 3 (Blcon: 5'-GATACCTGGAGAACGGGAAGGA-3') regions of
BoLA-A BSA, respectively.
132
Generation of cDNA for use in Real-Time quantitative RT-PCR
To selectively enrich for the BoLA Adel cDNA, a deletion-specific reverse primer
was used in the RT reaction to produce source cDNA template to detect deletion
transcripts in downstream PCR from known homozygous or heterozygous animals. Two
forward primers were used in separate reactions with the same deletion specific reverse
primer to reduce amplification bias. Turbo DNA-freeTM (Ambion, Austin, TX) was used
remove residual genomic DNA before RT-PCR analysis. Anchored oligo (dT)23 or
specific primers were used with Enhanced Avian Reverse Transcriptase (Sigma, Saint
Louis, Missouri) to generate first strand cDNA. Briefly, 0.2- 5µg of purified RNA was
added to 1ul dNTP mix (500µM each) and 1 uM of either 3’ antisense specific primers
(BLCON for BoLA-BSA or 295DELREVPCR for BoLA-BSAdel) or anchored oligo
(dT)23 were used in 10µl reactions and incubated for 70ºC for 10 mins to denature RNA
secondary structure.
Following this, the reaction mix was placed on ice, centrifuged and the following
components were added to a 20 µl volume reaction: 2µl of 10x Buffer for AMV-RT, 1µl
of enhanced AMV-RT enzyme (1U/µl) and 1µl RNAse Inhibitor (20U/ul) and placed in
a GeneAmp® thermocyler at 63ºC for 50 mins. Subsequently, 1ul of this first-strand
cDNA was used in an Advantage-GC™ cDNA PCR kit in 50ul reactions containing
10ul 5X GC cDNA PCR Reaction Buffer, 10ul GC Melt (5M), 2ul primer mix (10µM
each), 1ul dNTP mix (10mM each) and 1ul of Advantage-GC cDNA polymerase Mix.
Primers specific for bovine glucose-6-phosphate dehydrogenase (GAPDH) were used as
a control. Amplification conditions was the same as for amplification from genomic
DNA or cDNA using Taq polymerase with only quantities of components differing
(94°C for 1 min; followed by 35 cycles of 30 s at 95°C, 30 s at 63°C, 1 min at 72°C, and
final extens ion at 72°C for 10 mins). Generated PCR products were resolved on 1%
agarose gels and visualized by ethidium bromide staining. Cloning and sequencing
confirmed the identity of products generated with different primer pairs.
133
Quantitative Real -Time PCR of BoLA BSA transcripts
Polymerase chain reaction (PCR) was performed using a GeneAmp 5700
Sequence Detector (Applied Biosystems) and SYBR Green (Molecular Probes, Eugene,
OR) as a double-stranded DNA-specific fluorescent dye. The PCR reaction mixture (25
µl) contained 0.625ul (10µM stock) of each primer and SYBR Green I Master Mix
(12.5ul) along with 0.5ul of cDNA (~0.1ug). Product identity was confirmed by
ethidium-bromide-stained 2% agarose gel electrophoresis. The PCR cycling parameters
were: initial denaturation for 4 min at 94 °C, 35 cycles of denaturation (94 °C, 1 min),
annealing (60°C s) and extension (72 °C, 2 min), followed by one cycle of final
extension (72 °C, 5 min). Fluorescent data were acquired at 85°C. The melting protocol
consisted of holding at 40°C for 60 sec and then heating from 50 to 94°C, holding at
each temperature for 5 sec while monitoring fluorescence. As negative controls, tubes
were always prepared in which template or reverse transcriptase was omitted during the
reverse transcription reaction.
The comparative CT method was used for quantification of expression levels
(ABI Prism Sequence Detection System User Bulletin No. 2, PE Applied Biosystems,
Foster City, CA). The quantification was normalized to the endogenous control bovine
GAPDH. Fluorescence was acquired in each cycle in order to determine the threshold
cycle or the cycle during the log-linear phase of the reaction at which fluorescence rose
above background for each sample. Within this region of the amplification curve, each
difference of one cycle is equivalent to a doubling of the amplified product of the PCR.
According to the comparative CT method, the ?CT value was determined by subtracting
the GAPDH CT value for each sample from the BoLA A or Adel CT value of the sample.
Calculation of ??CT involved using the highest sample ?CT value (i.e., the sample with
the lower target expression) as an arbitrary constant to subtract from all other ?CT
sample values. Relative mRNA expression of target was determined by using the
formula 2- ??CT (ABI Prism Sequence Detection System User Bulletin No. 2 [PE Applied
Biosystems]). Primer sequences, annealing temperature, the approximate sizes of the
amplified fragments, and the GenBank accession number are shown in Table 9.
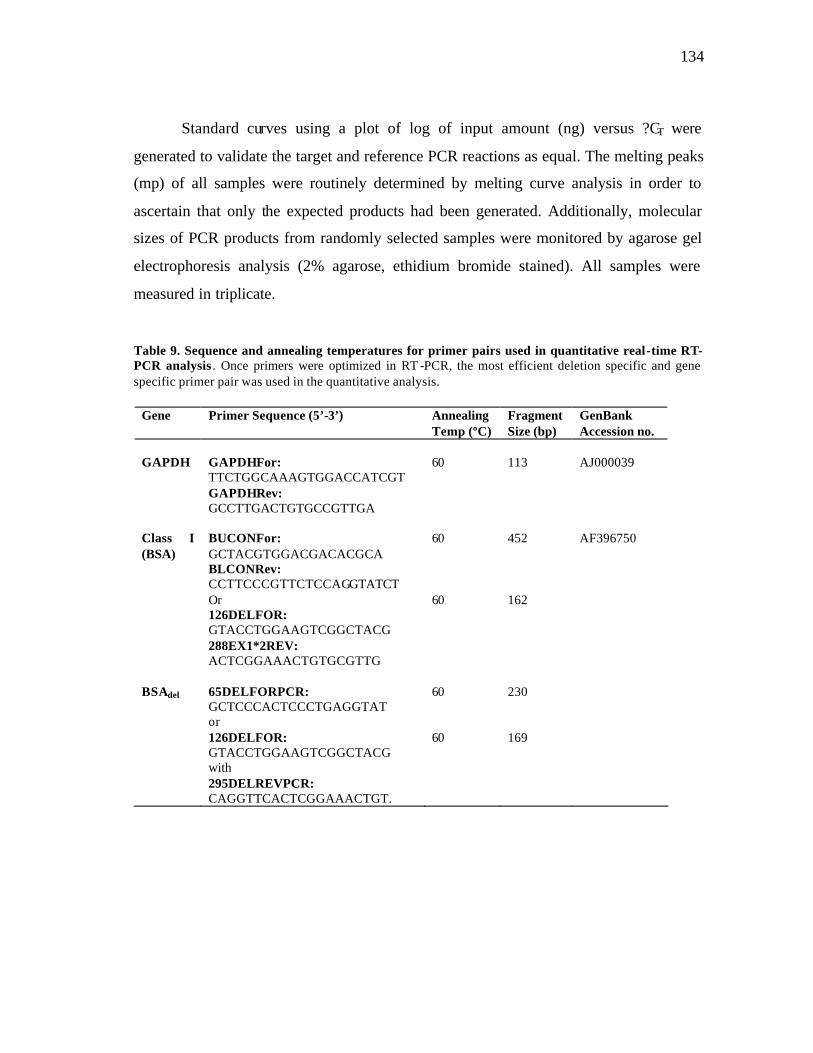
134
Standard curves using a plot of log of input amount (ng) versus ?CT were
generated to validate the target and reference PCR reactions as equal. The melting peaks
(mp) of all samples were routinely determined by melting curve analysis in order to
ascertain that only the expected products had been generated. Additionally, molecular
sizes of PCR products from randomly selected samples were monitored by agarose gel
electrophoresis analysis (2% agarose, ethidium bromide stained). All samples were
measured in triplicate.
Table 9. Sequence and annealing temperatures for primer pairs used in quantitative real-time RT-PCR analysis . Once primers were optimized in RT -PCR, the most efficient deletion specific and gene specific primer pair was used in the quantitative analysis.
Gene Primer Sequence (5’-3’) Annealing Temp (ºC)
Fragment Size (bp)
GenBank Accession no.
GAPDH
GAPDHFor: TTCTGGCAAAGTGGACCATCGT GAPDHRev: GCCTTGACTGTGCCGTTGA
60
113
AJ000039
Class I (BSA)
BUCONFor: GCTACGTGGACGACACGCA BLCONRev: CCTTCCCGTTCTCCAGGTATCT Or 126DELFOR: GTACCTGGAAGTCGGCTACG 288EX1*2REV: ACTCGGAAACTGTGCGTTG
60 60
452 162
AF396750
BSAdel
65DELFORPCR: GCTCCCACTCCCTGAGGTAT or 126DELFOR: GTACCTGGAAGTCGGCTACG with 295DELREVPCR: CAGGTTCACTCGGAAACTGT.
60 60
230 169
135
Flow cytometry
We used the QuantiBRITETM flow cytometry system (BD Biosciences, San Jose,
CA) which yields an absolute antigen expression value (antibodies bound per cell) useful
in standardizing surface antigen expression analysis. This system makes use of a highly
purified phycoerythrin (PE)- labelled antibody with a 1:1 fluorochrome to protein (F : P)
ratio, and multi- level calibrated beads with known absolute PE fluorescence. PBMCs
were collected by centrifugation and/or histopaque purification either fresh, or after 3, 6,
or 12 days of culture. Cells were washed twice in phosphate-buffered saline (PBS), then
class I surface expression was determined by flow cytometry on 1 x 10⁶ cells. The
following monoclonal antibodies, conjugated with phycoerythrin (PE) were used: mouse
anti-human HLA-ABC W6/32 (Catalog #MCA81PE, Serotec, Raleigh) and goat anti-
mouse IgG2a (Serotec, Raleigh) for labeling class I molecules and IgG2A as an isotype
control respectively. Following blocking with goat anti-IgG (2mg/ml) (Sigma, St. Louis,
MO), cultured cells were incubated on ice for 30 min with 10 µg/ml of the relevant
antibodies in PBS containing 1% FCS, 1 mmol/l EDTA and 0·1% NaN3, then washed
once with cold PBS-0.1% sodium azide and centrifuged at 1200rpm for 10 minutes.
Negative controls consisted of isotype-matched controls and unstained cells. After
washing, cells were fixed in 2% formaldehyde. All samples were analysed on a FACS
CaliburTM using the software CellQuestTM (BD Biosciences, San Jose, CA, USA). A
minimum of 10 000 gated events was counted. The PE fluorescence within the gates was
measured as specific geometric mean fluorescence intensity of the whole population of
cells and converted into antibodies bound per cell (ABC) and graphs produced with
Microsoft ExcelTM-spreadsheet. ABC values represent MHC class I expression for the
different cell populations.
136
Preparation of cell lysate and separation of membrane-bound and soluble fractions
Cultured PBMCs from genotypically defined animals were used for
immunoprecipitation of BoLA class I protein. Triton X-114 phase fractionation of
integral membrane surface proteins of the PBMCs was necessary to separate membrane-
bound from soluble BoLA class I protein and performed by using a modified protocol
from Garber et al. 1994. Approximately 5x10⁶ - 1x 10⁷ cells was solubilized in cold
lysis buffer (pre-condensed 5% Triton X-114, 150mM NaCl, 10 mM Tris pH 7.4, 1mM
EDTA, 0.2 mM sodium ortho-vanadate, protease inhibitor cocktail (Boehringer
Mannheim), 0.5% IGEPAL CA-630) and incubated on ice for 30 min. Cell debris was
removed by a 1.5 mins spin in a microfuge at 14,000rpm. The insoluble, membrane-
bound protein component was recovered in the supernatant, and then the extract was
warmed for 5 mins at 37ºC, and following several centrifugation steps the detergent
phase was recovered and used in downstream immunoprecipitation applications. The
aqueous phase was also kept and analyzed for presence of soluble MHC BoLA class I
protein. When used in immunoprecipitation with HC10 (a monoclonal antibody detected
denatured heavy chain), lysates were denatured by boiling in 1% SDS for 5 mins.
SDS-PAGE and Western blot analysis
Initially, SDS-PAGE was performed on approximately 50µg of protein per
sample in the NuPAGE Tris-Glycine system (Invitrogen, Carlsbad, CA) run at 125V for
90 minutes. Gels were stained with comassie blue and/or silver stain, and sometimes run
in parallel so as to ascertain the identity of protein bands excised for mass spectrometry
by western blot analysis. Immunoblotting was performed using a panel of monoclonal
antibodies (MAbs) directed against MHC class I/ ß2M complexes for detection (see
Table 9). The protein concentration of the lysates was determined using the Bradford or
BCA assay. Following denaturation, equal quantities of protein extracts were loaded on
to a 12% SDS-polyacrylamide gel. The proteins were transferred on to nitrocellulose 0.2
mM (Millipore) using the Invitrogen XCellTM Blot module (Invitrogen, Carlsbad, CA)
using transfer buffer (20 mM Tris-HCL pH 8.5, 150 mM glycine, 0.01% SDS, and 20%
137
methanol) at 200 V for 1 h at 4°C. The blot was subsequently blocked with 1× TBS
(0.25%Tween) containing 5% milk protein for 1 h at room temperature.
The hybridizations were carried out using a 1:1000 dilution of a monoclonal
MHC class I /ß2M complex specific antibody (PT85A or H58A, VMRD, Pullman
Washington; HC10, ß2M and or W6/32 from Dr. Michael Ed idin). The hybridized filters
were washed with TBS Tween (25 mM Tris-HCL pH 7.6, 150 mM NaCl, and 0.5%
Tween 20) followed by a final wash in milli-q H2O, then hybridized with polyclonal
donkey anti-mouse IgG (Santa Cruz, California) coupled with horseradish peroxidase
using a dilution of 1:10000 at room temperature for 1h. The proteins were detected by
enhanced chemiluminescence (1:1 luminol enhancer solution:stable peroxidase buffer
solution, Western LightningTM; Perkin-Elmer, Boston, MA) and exposed to film.
Immunoprecipitation of MHC class I BoLA A proteins and SDS-PAGE
Antibody-conjugated Protein G agarose beads (Sigma, St. Louis, MO) were used
to precipitate BoLA A MHC class I protein from the cell lysates as prepared above.
Unless specified all incubations were done in at 4ºC on a rotator. Pre-clearing by adding
50µl of Protein G:Agarose beads (Sigma, St. Louis, MO) to 500µl of PBMC cell lysate
(from 50 ul either denatured or undenatured detergent phase of the cell lysate dilute 1:2
in lysis buffer), incubated for 2 hrs followed by removal of agarose beads by
centrifugation. Monoclonal antibody was added at a ratio of 1:500 to total pre-cleared
lysate and incubated overnight. Next, 25µl of a 50% suspension Protein G Agarose
(Sigma) will be added to 500µl of total lysate:MAb and incubated overnight. The
precipitants were washed 3 times in 1x lysis buffer, twice more with autoclaved ddH2O
and either eluted with 50µl of 0.1 M Glycine, pH 2.5 or boiled 2 times with 25 ul
Laemmli 6x loading buffer for 5 mins. If being eluted, after 30 mins incubation, the
supernatant will be removed by centrifugation and used as the IP sample.
To neutralize the pH, 5µl of 1M Tris pH 8.0 will be added prior to adding 10µl of
5X concentrated electrophoresis Laemmli sample buffer (125mM Tris pH 6.8, 4% SDS,
10% Glycerol, 0.006% bromophenol blue, 2% β-mercaptoethanol) with iodoacetamide
(Sigma, St. Louis, MO) to each sample and boiled for 5 mins. Samples were used for
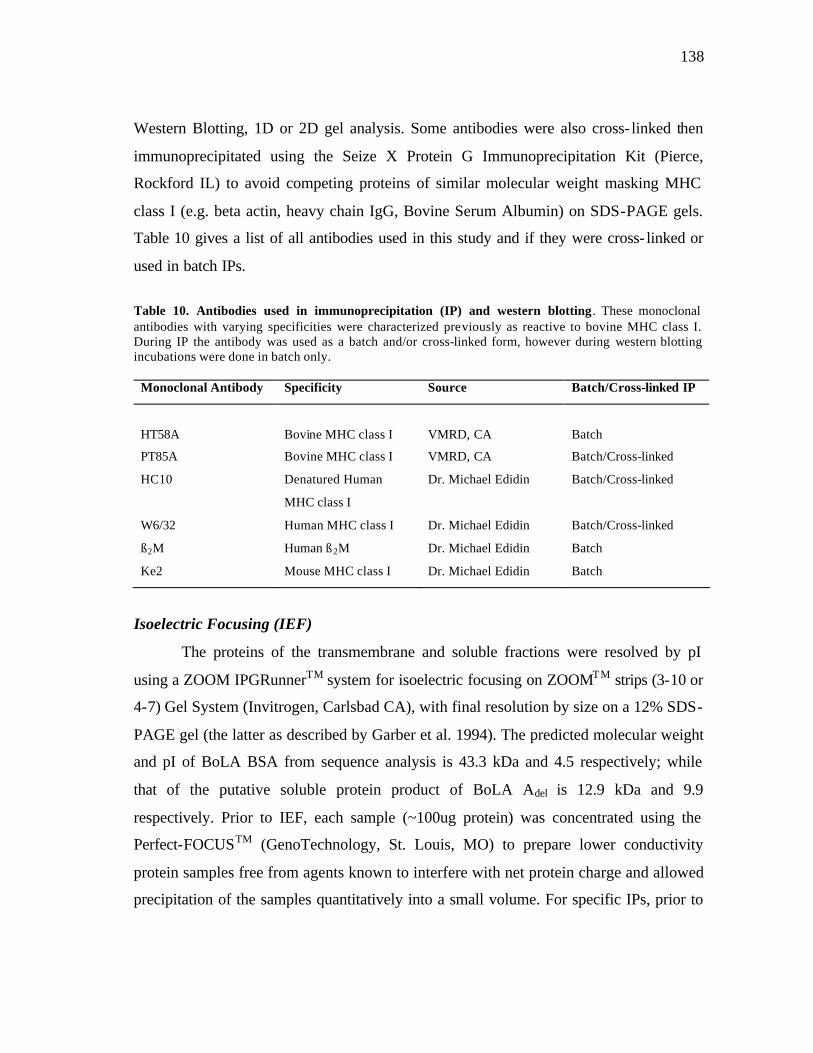
138
Western Blotting, 1D or 2D gel analysis. Some antibodies were also cross- linked then
immunoprecipitated using the Seize X Protein G Immunoprecipitation Kit (Pierce,
Rockford IL) to avoid competing proteins of similar molecular weight masking MHC
class I (e.g. beta actin, heavy chain IgG, Bovine Serum Albumin) on SDS-PAGE gels.
Table 10 gives a list of all antibodies used in this study and if they were cross- linked or
used in batch IPs.
Table 10. Antibodies used in immunoprecipitation (IP) and western blotting . These monoclonal antibodies with varying specificities were characterized previously as reactive to bovine MHC class I. During IP the antibody was used as a batch and/or cross-linked form, however during western blotting incubations were done in batch only.
Monoclonal Antibody Specificity Source Batch/Cross-linked IP
HT58A
Bovine MHC class I
VMRD, CA
Batch
PT85A Bovine MHC class I VMRD, CA Batch/Cross-linked
HC10 Denatured Human
MHC class I
Dr. Michael Edidin Batch/Cross-linked
W6/32 Human MHC class I Dr. Michael Edidin Batch/Cross-linked
ß2M Human ß2M Dr. Michael Edidin Batch
Ke2 Mouse MHC class I Dr. Michael Edidin Batch
Isoelectric Focusing (IEF)
The proteins of the transmembrane and soluble fractions were resolved by pI
using a ZOOM IPGRunnerTM system for isoelectric focusing on ZOOMTM strips (3-10 or
4-7) Gel System (Invitrogen, Carlsbad CA), with final resolution by size on a 12% SDS-
PAGE gel (the latter as described by Garber et al. 1994). The predicted molecular weight
and pI of BoLA BSA from sequence analysis is 43.3 kDa and 4.5 respectively; while
that of the putative soluble protein product of BoLA Adel is 12.9 kDa and 9.9
respectively. Prior to IEF, each sample (~100ug protein) was concentrated using the
Perfect-FOCUSTM (GenoTechnology, St. Louis, MO) to prepare lower conductivity
protein samples free from agents known to interfere with net protein charge and allowed
precipitation of the samples quantitatively into a small volume. For specific IPs, prior to

139
elution or boiling, beads were treated overnight at 37ºC with either 20ul of 20U/ml
neuraminidase (type VIII, Sigma, St. Louis, MO) in buffer (100mM Na acetate, 5mM
CaCl2, pH 5.5) or buffer alone as a negative control. A non- interfering Protein AssayTM
was then used to quantify protein prior to loading unto IEF gels.
Approximately 20µg of total protein was loaded unto a ZOOM™ Strip (pI 3-10
or 4-7 depending on sample’s predicted pI) and incubated for 16 hours for rehydration.
IEF was then performed as per manufacturer’s instructions in a step voltage protocol as
follows: 200 V for 20 mins, 450 V for 20 mins, 750 V for 20 mins 1500 V for 15 mins
and finally 2000V for 45 mins. Strips were then equilibrated in NuPAGE LDS Sample
buffer, followed by alkylation of the sulfhydryl groups of the proteins to reduce vertical
streaking in a second equilibration step using idodoacetamide. The equilibrated ZOOM
strip was then loaded unto a NuPAGE® Novex 4-12% Bis-Tris ZOOM® gel
immediately for the 2D SDS-PAGE gel analysis and run at 125V for 90 minutes in
MOPS SDS running buffer. The gels were either stained as per manufacturer’s
recommendations with zinc (GelCode E-zinc reversible stain, PIERCE), Commassie
blue (Sigma., St. Louis, MO) or silver (SilverQuestTM, Invitrogen, Carlsbad, CA). Bands
approximate in size to a either predicted pI on the IEF 1st dimension gels or kDa on the
2nd dimension were excised and used immediately (or frozen at -80ºC) for in-gel analysis
by mass spectrometry and peptide sequencing. A range of 42-48 kDa was used for gel
excision of the BoLA A product, and 10-15 kDa for the predicted soluble BoLA-Adel
product.
In-gel and MALDI-TOF mass spectrometry analysis
Proteins were isolated using polyacrylamide gels as described above. The protein
spot of interest was gel excised (or thawed), and washed repeatedly by alternating
solutions of ammonium bicarbonate and 70% acetonitrile in ammonium bicarbonate then
completely dehydrated under vacuum. The gel was rehydrated using a solution
containing a trypsin protease. Enough ammonium bicarbonate solution was added to
completely cover the gel piece and the sample incubated at 37ºC. After 3-12hrs, peptides
140
eluted from the gel were analyzed by mass spectrometry. The samples were prepared by
first coating the stainless steel target plate with a-cyano-4-hydroxycinnamic acid
(0.15M). Once the matrix dried, approximately 1µL of the peptide mixture was mixed
with 1µL of matrix and loaded on top of the matrix underlayer (Murphy et al. 1999). The
matrix/peptide crystals were washed twice with cold ddH2O to remove residual buffer
and salts.
Peptide mass mapping data was obtained using an Applied Biosystems Voyager
STR equipped with a MALDI source and delayed extraction, in order to obtain high
resolution and high mass accuracy (< 50ppm). The peptide mass fragment data collected
was analyzed using database-searching programs as described by Park and Russell,
2001. Identification of proteins using peptide mass fingerprints was done using
databases such as the non-redundant protein sequence data base maintained at the
European Bioinformatics Institute (EBI, Hinxton, UK; ftp://ftp.ebi.ac.uk/pub/data bases/
PeptideSearch).
When necessary, sequencing of the peptides was done using tandem MS.
Sequencing of peptides was completed on a PE-Sciex QSTAR Pulsar equipped with a
nanospray ion source. The QSTAR combines the ion selectivity of a quadrupole ion
guide with the high resolution and mass accuracy of a time-of- flight (TOF) mass
spectrometer. Initially all ions are allowed to pass through the quadrupoles into the TOF
portion of the mass spectrometer, where the intact masses are determined. In order to
sequence the peptides, the first quadrupole is tuned to filter out all but the target mass. A
buffer gas is introduced into the second quadrupole, which fragments peptides upon
collision, and then fragment ion masses are determined in the TOF region. Fragment
masses were then analyzed and the intact peptide sequence determined. This process
was repeated for all masses found in the mixture. The experimental sequence data was
then interrogated using a web based searching algorithms available, such as MASCOT
(http://www.matrixscience.com), PepSea (http://195.41.108.38/PepSeaIntro.html), or
Protein prospector (http://prospector.ucsf.edu/ ).
141
Modelling
Identification of function of a protein is possible by performing a CDD search
which uses a database of motifs to characterize ‘conserved-domains’ in a protein
sequence (Marchler-Bauer et al. 2002). A CDD search was performed with the standard
protein–protein search option against the consensus of the deletion allele translated
amino acid sequences to match its predicted structure with known structures. The
structure of the predicted alignment was visualized with the Cn3D program (Wang et al.
2000).
Statistical analysis
Statistical analysis was performed to determine the statistical significance of
differences between the two groups of animals (deletion homozygotes versus non-
deletion homozygotes). For the quantitative real-time RT-PCR samples of three different
animals were analyzed in duplicate, and data expressed as means ± standard deviation.
Because the data were not distributed normally in flow cytometry data analysis,
geometric means and medians were used to describe the distributions of continuous
variables. The nonparametric Mann–Whitney U test was used to determine the statistical
significance of differences in median values. The chi-square test was used to test the
association between categorical variables and the presence and absence of deletion.
Differences were considered significant if P < 0.05.
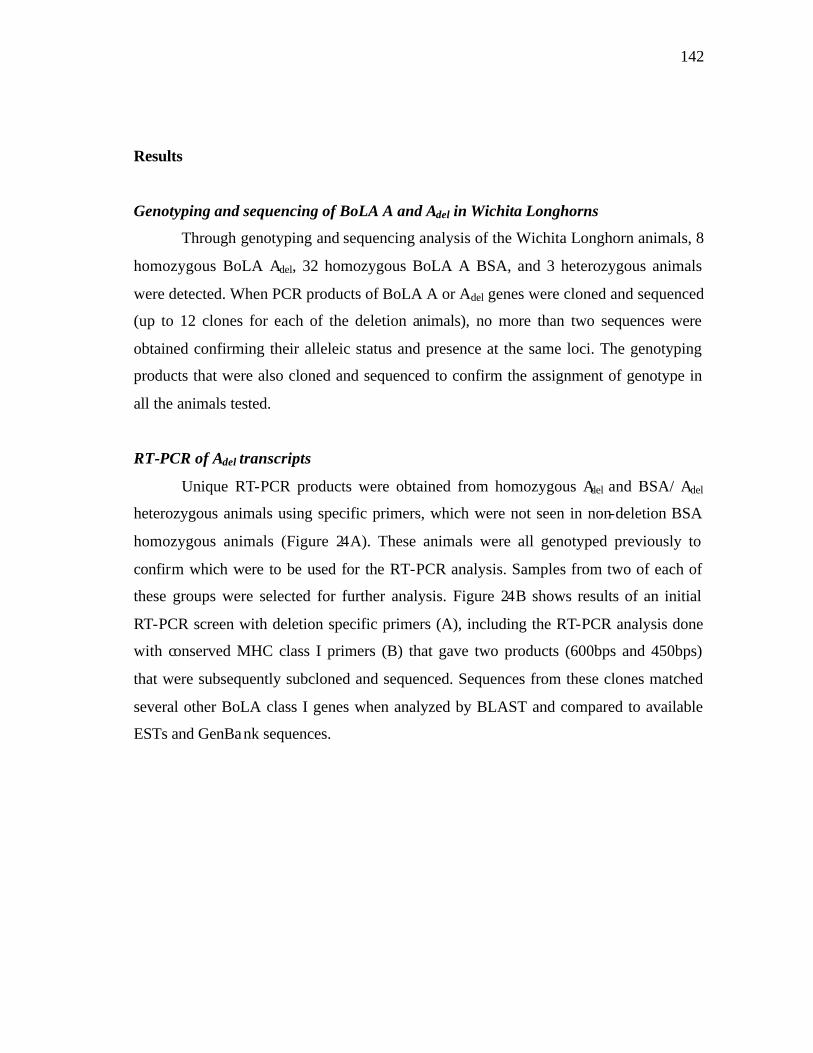
142
Results
Genotyping and sequencing of BoLA A and Adel in Wichita Longhorns
Through genotyping and sequencing analysis of the Wichita Longhorn animals, 8
homozygous BoLA Adel, 32 homozygous BoLA A BSA, and 3 heterozygous animals
were detected. When PCR products of BoLA A or Adel genes were cloned and sequenced
(up to 12 clones for each of the deletion animals), no more than two sequences were
obtained confirming their alleleic status and presence at the same loci. The genotyping
products that were also cloned and sequenced to confirm the assignment of genotype in
all the animals tested.
RT-PCR of Adel transcripts
Unique RT-PCR products were obtained from homozygous Adel and BSA/ Adel
heterozygous animals using specific primers, which were not seen in non-deletion BSA
homozygous animals (Figure 24A). These animals were all genotyped previously to
confirm which were to be used for the RT-PCR analysis. Samples from two of each of
these groups were selected for further analysis. Figure 24B shows results of an initial
RT-PCR screen with deletion specific primers (A), including the RT-PCR analysis done
with conserved MHC class I primers (B) that gave two products (600bps and 450bps)
that were subsequently subcloned and sequenced. Sequences from these clones matched
several other BoLA class I genes when analyzed by BLAST and compared to available
ESTs and GenBank sequences.
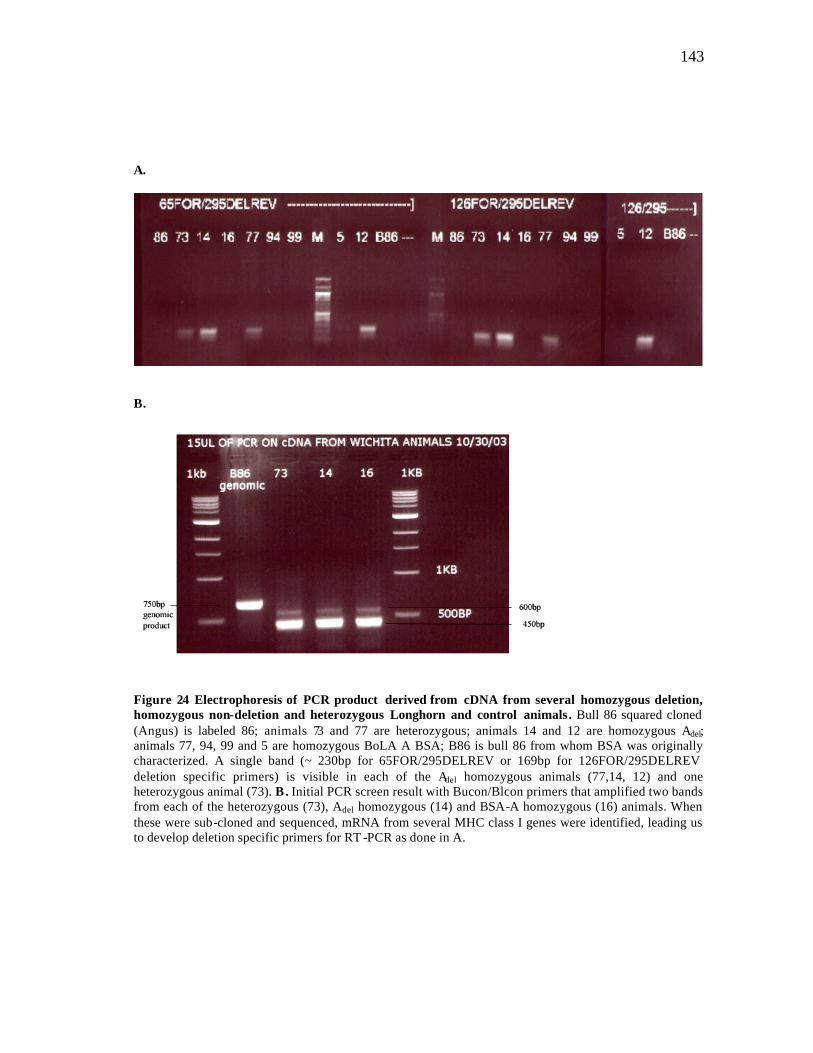
143
A.
B.
Figure 24 Electrophoresis of PCR product derived from cDNA from several homozygous deletion, homozygous non-deletion and heterozygous Longhorn and control animals. Bull 86 squared cloned (Angus) is labeled 86; animals 73 and 77 are heterozygous; animals 14 and 12 are homozygous Adel; animals 77, 94, 99 and 5 are homozygous BoLA A BSA; B86 is bull 86 from whom BSA was originally characterized. A single band (~ 230bp for 65FOR/295DELREV or 169bp for 126FOR/295DELREV deletion specific primers) is visible in each of the Adel homozygous animals (77,14, 12) and one heterozygous animal (73). B. Initial PCR screen result with Bucon/Blcon primers that amplified two bands from each of the heterozygous (73), Adel homozygous (14) and BSA-A homozygous (16) animals. When these were sub-cloned and sequenced, mRNA from several MHC class I genes were identified, leading us to develop deletion specific primers for RT -PCR as done in A.
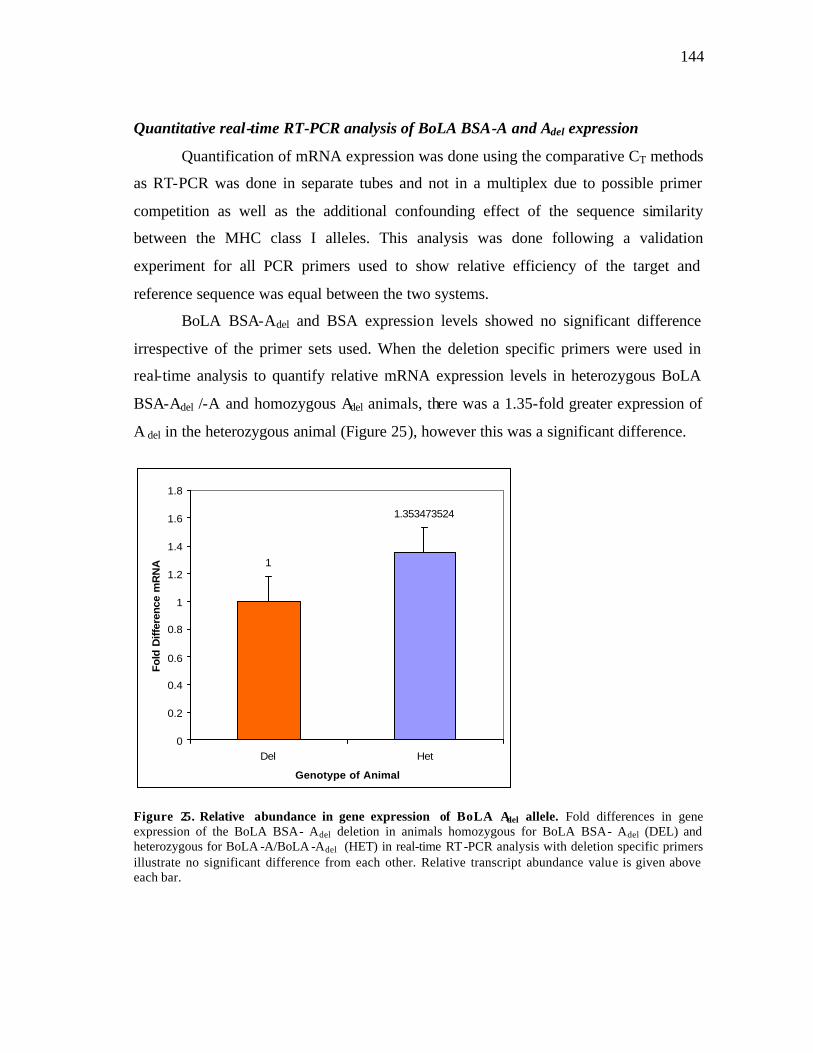
144
Quantitative real-time RT-PCR analysis of BoLA BSA-A and Adel expression
Quantification of mRNA expression was done using the comparative CT methods
as RT-PCR was done in separate tubes and not in a multiplex due to possible primer
competition as well as the additional confounding effect of the sequence similarity
between the MHC class I alleles. This analysis was done following a validation
experiment for all PCR primers used to show relative efficiency of the target and
reference sequence was equal between the two systems.
BoLA BSA-Adel and BSA expression levels showed no significant difference
irrespective of the primer sets used. When the deletion specific primers were used in
real-time analysis to quantify relative mRNA expression levels in heterozygous BoLA
BSA-Adel /-A and homozygous Adel animals, there was a 1.35-fold greater expression of
A del in the heterozygous animal (Figure 25), however this was a significant difference.
1
1.353473524
0
0.2
0.4
0.6
0.8
1
1.2
1.4
1.6
1.8
Del Het
Genotype of Animal
Fo
ld D
iffer
ence
mR
NA
Figure 25. Relative abundance in gene expression of BoLA Adel allele. Fold differences in gene expression of the BoLA BSA- Adel deletion in animals homozygous for BoLA BSA- Adel (DEL) and heterozygous for BoLA -A/BoLA -Adel (HET) in real-time RT -PCR analysis with deletion specific primers illustrate no significant difference from each other. Relative transcript abundance value is given above each bar.
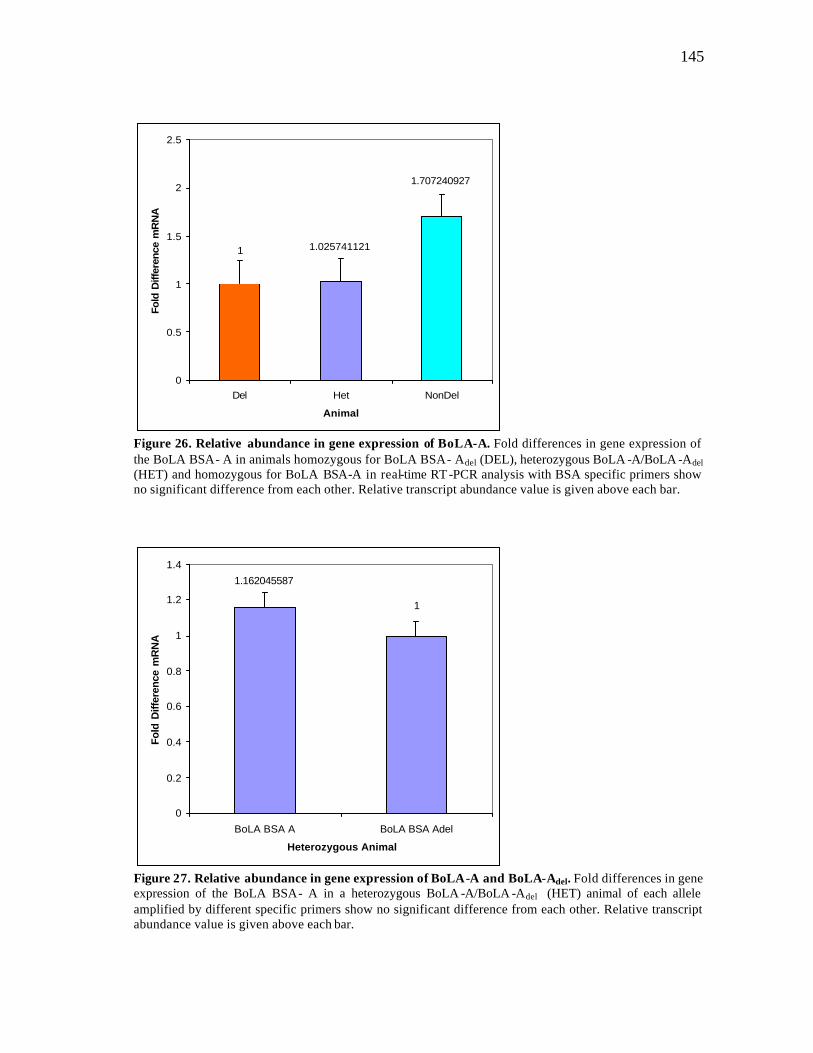
145
1.707240927
1.0257411211
0
0.5
1
1.5
2
2.5
Del Het NonDel
Animal
Fold
Diff
eren
ce m
RN
A
Figure 26. Relative abundance in gene expression of BoLA-A. Fold differences in gene expression of the BoLA BSA- A in animals homozygous for BoLA BSA- Adel (DEL), heterozygous BoLA -A/BoLA -Adel (HET) and homozygous for BoLA BSA-A in real-time RT -PCR analysis with BSA specific primers show no significant difference from each other. Relative transcript abundance value is given above each bar.
1
1.162045587
0
0.2
0.4
0.6
0.8
1
1.2
1.4
BoLA BSA A BoLA BSA Adel
Heterozygous Animal
Fold
Diff
eren
ce m
RN
A
Figure 27. Relative abundance in gene expression of BoLA-A and BoLA-Adel. Fold differences in gene expression of the BoLA BSA- A in a heterozygous BoLA -A/BoLA -Adel (HET) animal of each allele amplified by different specific primers show no significant difference from each other. Relative transcript abundance value is given above each bar.
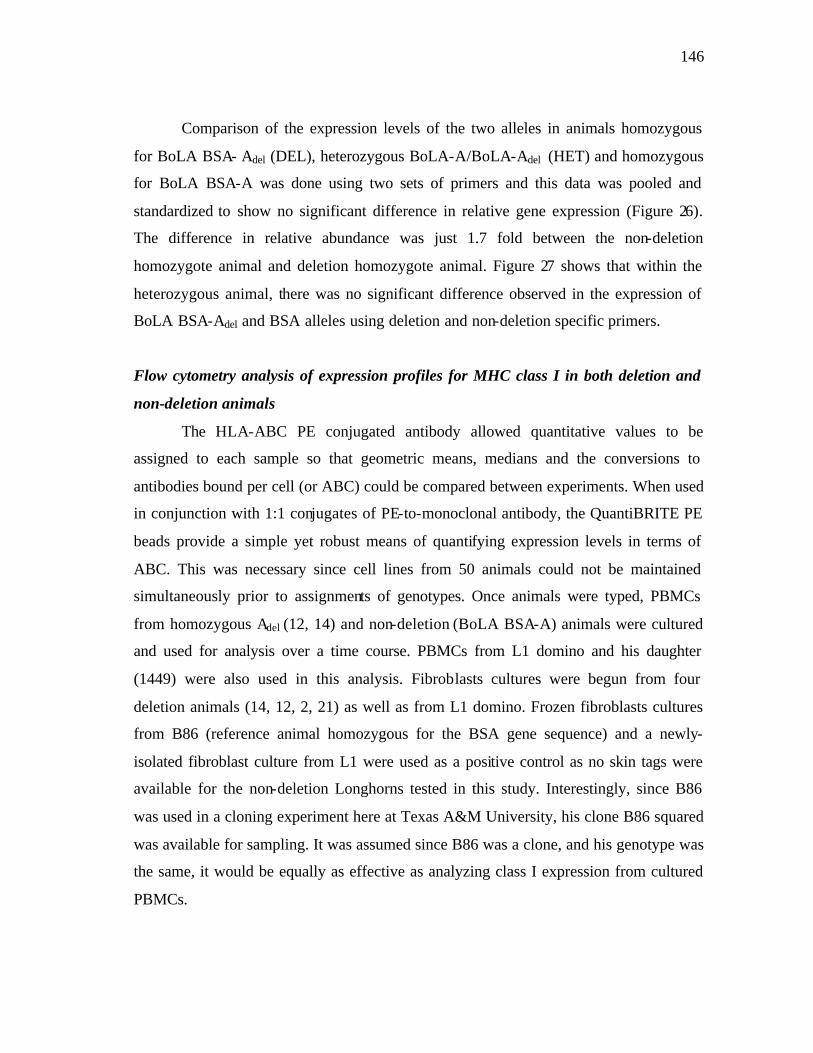
146
Comparison of the expression levels of the two alleles in animals homozygous
for BoLA BSA- Adel (DEL), heterozygous BoLA-A/BoLA-Adel (HET) and homozygous
for BoLA BSA-A was done using two sets of primers and this data was pooled and
standardized to show no significant difference in relative gene expression (Figure 26).
The difference in relative abundance was just 1.7 fold between the non-deletion
homozygote animal and deletion homozygote animal. Figure 27 shows that within the
heterozygous animal, there was no significant difference observed in the expression of
BoLA BSA-Adel and BSA alleles using deletion and non-deletion specific primers.
Flow cytometry analysis of expression profiles for MHC class I in both deletion and
non-deletion animals
The HLA-ABC PE conjugated antibody allowed quantitative values to be
assigned to each sample so that geometric means, medians and the conversions to
antibodies bound per cell (or ABC) could be compared between experiments. When used
in conjunction with 1:1 conjugates of PE-to-monoclonal antibody, the QuantiBRITE PE
beads provide a simple yet robust means of quantifying expression levels in terms of
ABC. This was necessary since cell lines from 50 animals could not be maintained
simultaneously prior to assignments of genotypes. Once animals were typed, PBMCs
from homozygous Adel (12, 14) and non-deletion (BoLA BSA-A) animals were cultured
and used for analysis over a time course. PBMCs from L1 domino and his daughter
(1449) were also used in this analysis. Fibroblasts cultures were begun from four
deletion animals (14, 12, 2, 21) as well as from L1 domino. Frozen fibroblasts cultures
from B86 (reference animal homozygous for the BSA gene sequence) and a newly-
isolated fibroblast culture from L1 were used as a positive control as no skin tags were
available for the non-deletion Longhorns tested in this study. Interestingly, since B86
was used in a cloning experiment here at Texas A&M University, his clone B86 squared
was available for sampling. It was assumed since B86 was a clone, and his genotype was
the same, it would be equally as effective as analyzing class I expression from cultured
PBMCs.
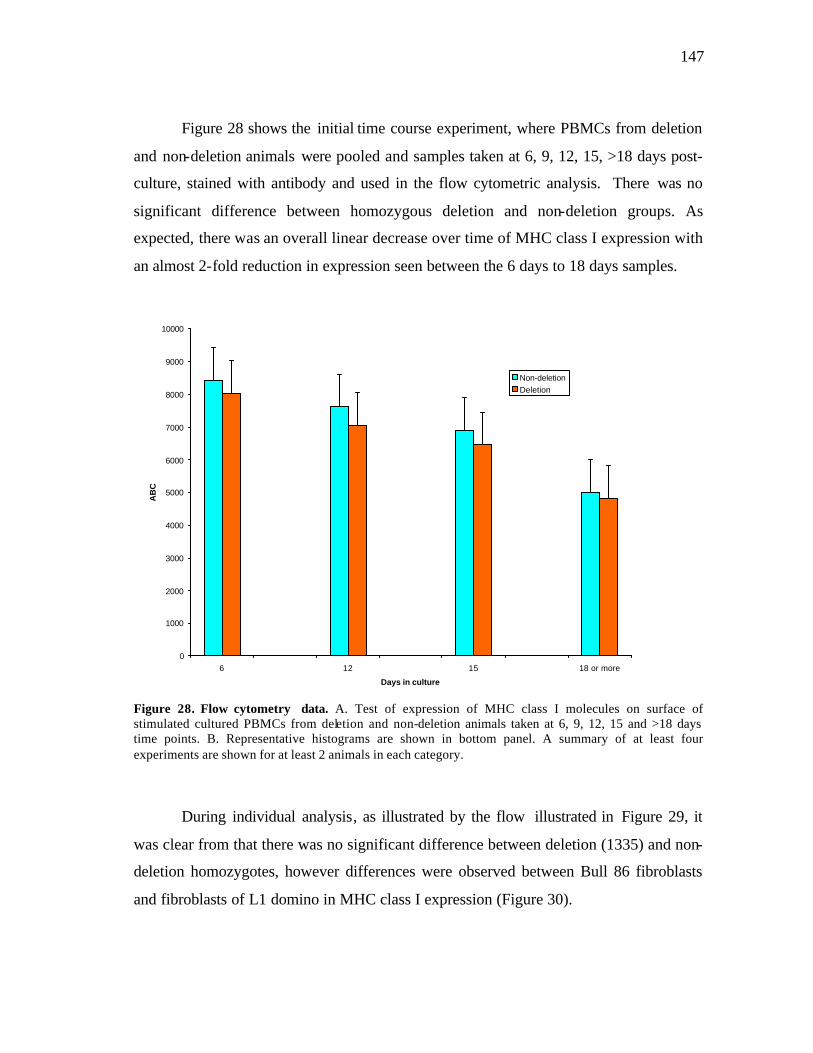
147
Figure 28 shows the initial time course experiment, where PBMCs from deletion
and non-deletion animals were pooled and samples taken at 6, 9, 12, 15, >18 days post-
culture, stained with antibody and used in the flow cytometric analysis. There was no
significant difference between homozygous deletion and non-deletion groups. As
expected, there was an overall linear decrease over time of MHC class I expression with
an almost 2-fold reduction in expression seen between the 6 days to 18 days samples.
0
1000
2000
3000
4000
5000
6000
7000
8000
9000
10000
6 12 15 18 or more
Days in culture
AB
C
Non-deletionDeletion
Figure 28. Flow cytometry data. A. Test of expression of MHC class I molecules on surface of stimulated cultured PBMCs from deletion and non-deletion animals taken at 6, 9, 12, 15 and >18 days time points. B. Representative histograms are shown in bottom panel. A summary of at least four experiments are shown for at least 2 animals in each category. During individual analysis, as illustrated by the flow illustrated in Figure 29, it
was clear from that there was no significant difference between deletion (1335) and non-
deletion homozygotes, however differences were observed between Bull 86 fibroblasts
and fibroblasts of L1 domino in MHC class I expression (Figure 30).
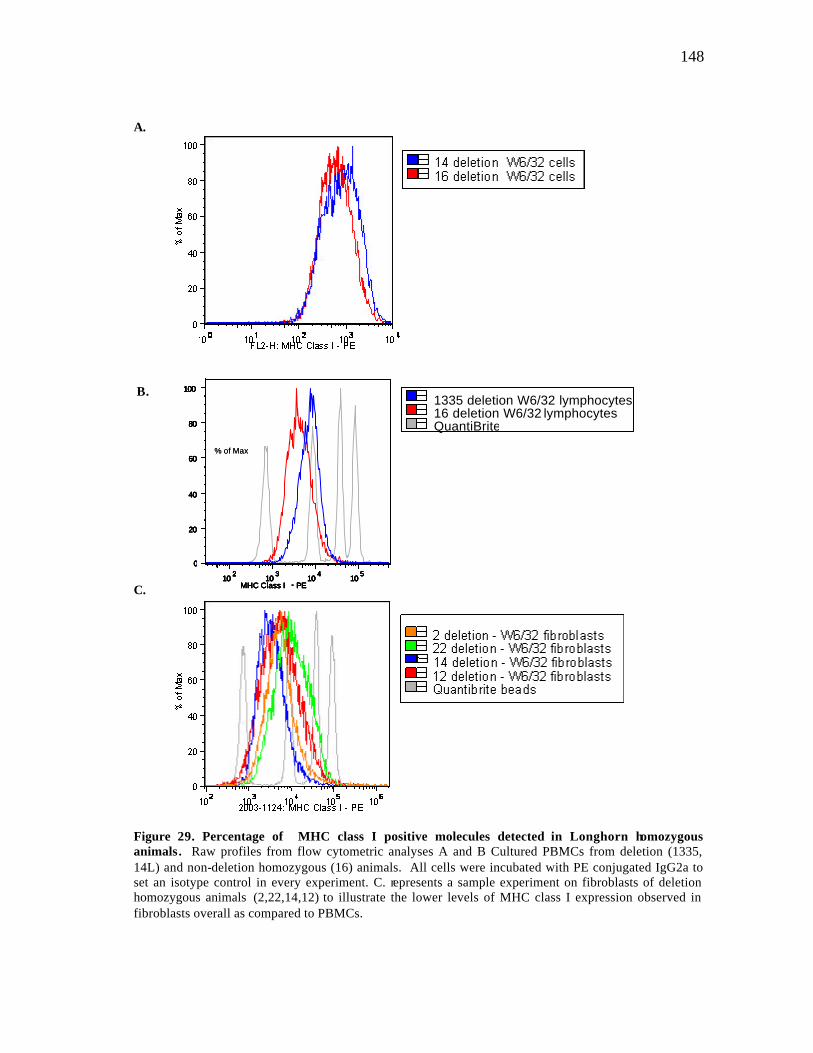
148
A.
B. C.
Figure 29. Percentage of MHC class I positive molecules detected in Longhorn homozygous animals. Raw profiles from flow cytometric analyses A and B Cultured PBMCs from deletion (1335, 14L) and non-deletion homozygous (16) animals. All cells were incubated with PE conjugated IgG2a to set an isotype control in every experiment. C. represents a sample experiment on fibroblasts of deletion homozygous animals (2,22,14,12) to illustrate the lower levels of MHC class I expression observed in fibroblasts overall as compared to PBMCs.
10 2 10 3 10 4 10 5 MHC Class I - PE
0
20
40
60
80
100
% of Max
QuantiBrite beads 16 deletion W6/32 lymphocytes 1335 deletion W6/32 lymphocytes
10 2 10 3 10 4 10 5 MHC Class I - PE
0
20
40
60
80
100
% of Max
10 2 10 3 10 4 10 5 MHC Class I - PE
0
20
40
60
80
100
% of Max
10 2 10 3 10 4 10 5 MHC Class I - PE 10 2 10 3 10 4 10 5 10 2 10 3 10 4 10 5 MHC Class I - PE
0
20
40
60
80
100
% of Max
0
20
40
60
80
100
0
20
40
60
80
100
% of Max QuantiBrite 16 deletion W6/32 lymphocytes 1335 deletion W6/32 lymphocytes
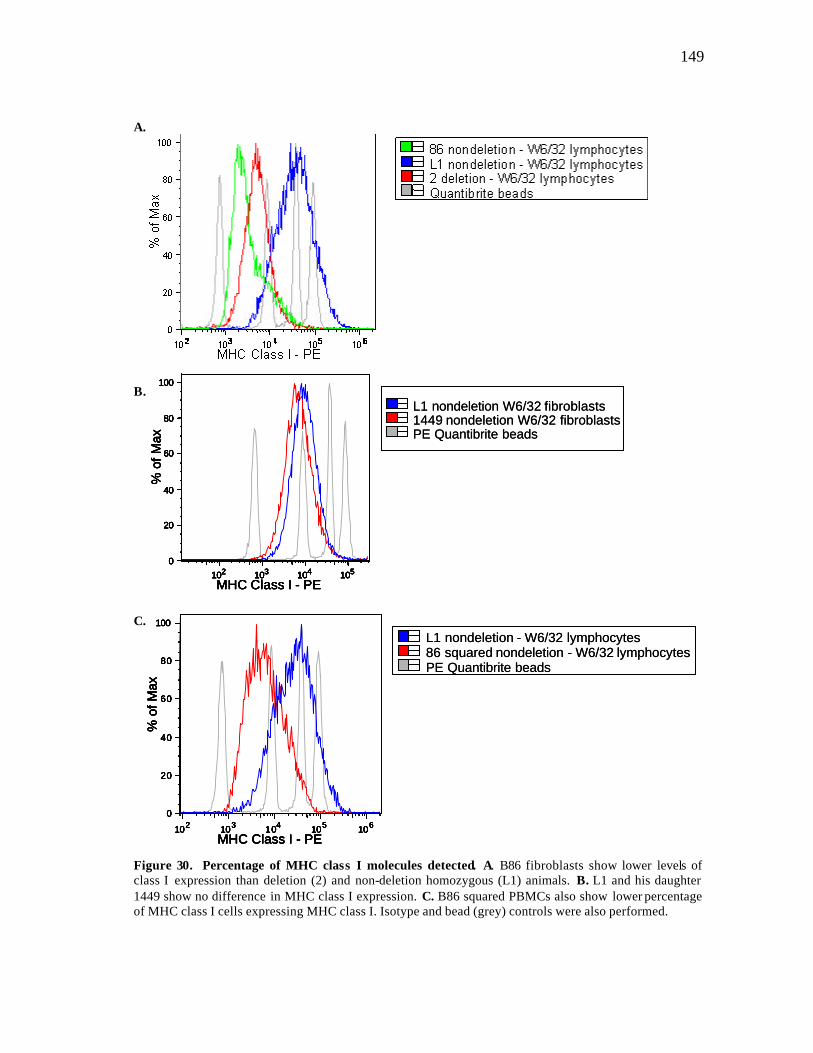
149
A.
B. C. Figure 30. Percentage of MHC class I molecules detected. A. B86 fibroblasts show lower levels of class I expression than deletion (2) and non-deletion homozygous (L1) animals. B. L1 and his daughter 1449 show no difference in MHC class I expression. C. B86 squared PBMCs also show lower percentage of MHC class I cells expressing MHC class I. Isotype and bead (grey) controls were also performed.
PE Quantibrite beads1449 nondeletion W6/32 fibroblastsL1 nondeletion W6/32 fibroblasts
102 103 104 105
MHC Class I - PE
0
20
40
60
80
100
% o
f Max PE Quantibrite beads
1449 nondeletion W6/32 fibroblastsL1 nondeletion W6/32 fibroblasts
PE Quantibrite beadsPE Quantibrite beads1449 nondeletion W6/32 fibroblasts1449 nondeletion W6/32 fibroblastsL1 nondeletion W6/32 fibroblastsL1 nondeletion W6/32 fibroblasts
102 103 104 105
MHC Class I - PE
0
20
40
60
80
100
% o
f Max
102 103 104 105
MHC Class I - PE
0
20
40
60
80
100
% o
f Max
102 103 104 105
MHC Class I - PE102 103 104 105102 103 104 105
MHC Class I - PE
0
20
40
60
80
100
% o
f Max
0
20
40
60
80
100
0
20
40
60
80
100
% o
f Max
PE Quantibrite beads86 squared nondeletion - W6/32 lymphocytesL1 nondeletion - W6/32 lymphocytes
102 103 104 105 106
MHC Class I - PE
0
20
40
60
80
100
% o
f Max
PE Quantibrite beadsPE Quantibrite beads86 squared nondeletion - W6/32 lymphocytes86 squared nondeletion - W6/32 lymphocytesL1 nondeletion - W6/32 lymphocytesL1 nondeletion - W6/32 lymphocytes
102 103 104 105 106
MHC Class I - PE
0
20
40
60
80
100
% o
f Max
102 103 104 105 106
MHC Class I - PE
0
20
40
60
80
100
% o
f Max
102 103 104 105 106
MHC Class I - PE102 103 104 105 106102 103 104 105 106
MHC Class I - PE
0
20
40
60
80
100
% o
f Max
0
20
40
60
80
100
0
20
40
60
80
100
% o
f Max
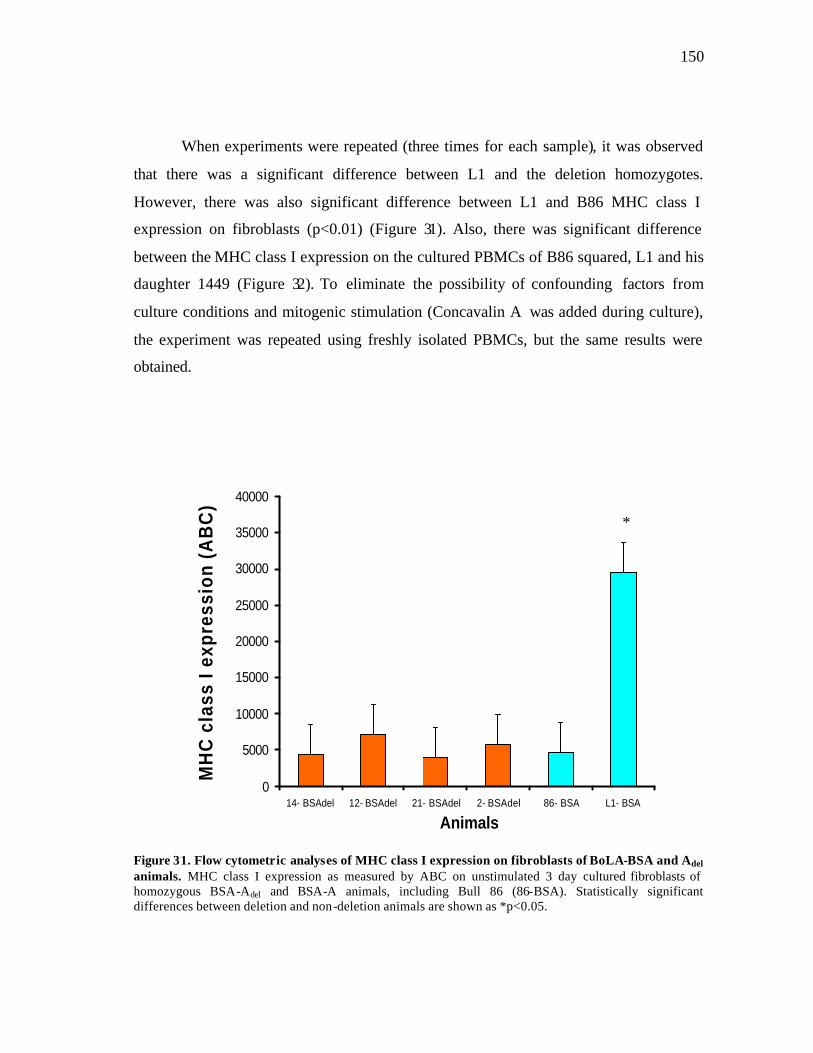
150
When experiments were repeated (three times for each sample), it was observed
that there was a significant difference between L1 and the deletion homozygotes.
However, there was also significant difference between L1 and B86 MHC class I
expression on fibroblasts (p<0.01) (Figure 31). Also, there was significant difference
between the MHC class I expression on the cultured PBMCs of B86 squared, L1 and his
daughter 1449 (Figure 32). To eliminate the possibility of confounding factors from
culture conditions and mitogenic stimulation (Concavalin A was added during culture),
the experiment was repeated using freshly isolated PBMCs, but the same results were
obtained.
0
5000
10000
15000
20000
25000
30000
35000
40000
14- BSAdel 12- BSAdel 21- BSAdel 2- BSAdel 86- BSA L1- BSA
Animals
MH
C c
lass
I ex
pres
sion
(A
BC
)
Figure 31. Flow cytometric analyses of MHC class I expression on fibroblasts of BoLA-BSA and Adel animals. MHC class I expression as measured by ABC on unstimulated 3 day cultured fibroblasts of homozygous BSA-Adel and BSA-A animals, including Bull 86 (86-BSA). Statistically significant differences between deletion and non-deletion animals are shown as *p<0.05.
*
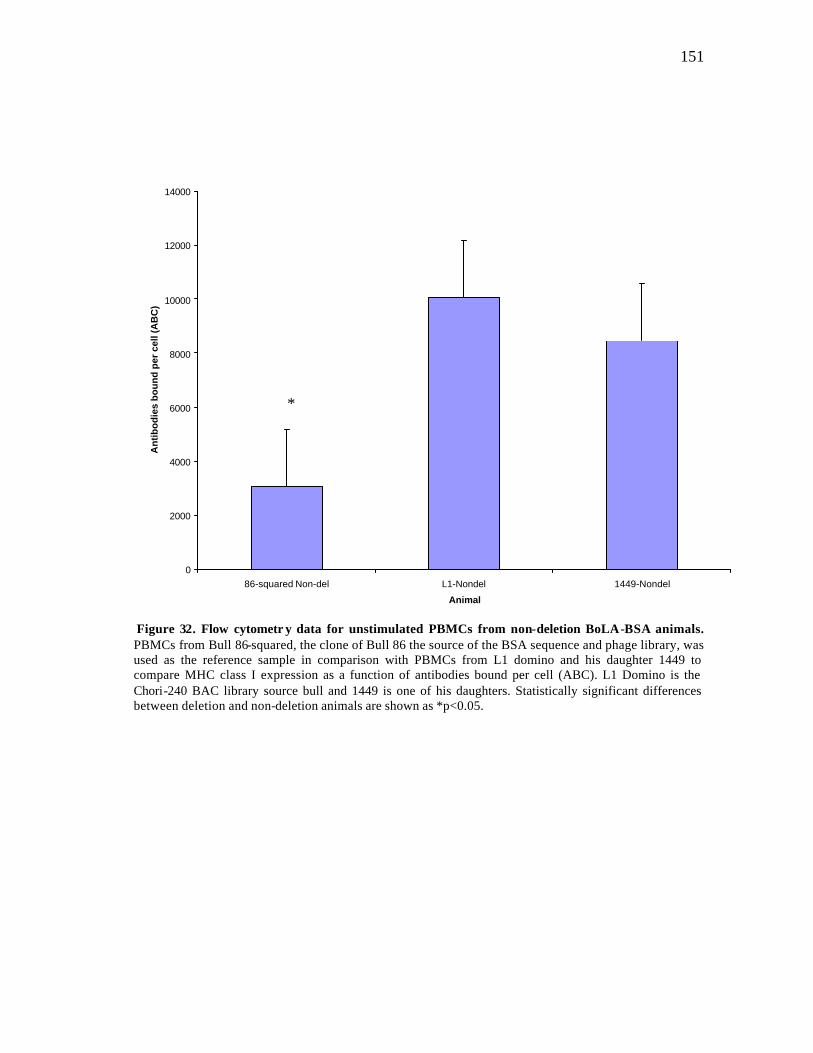
151
0
2000
4000
6000
8000
10000
12000
14000
86-squared Non-del L1-Nondel 1449-Nondel
Animal
An
tib
od
ies
bo
un
d p
er c
ell (
AB
C)
Figure 32. Flow cytometr y data for unstimulated PBMCs from non-deletion BoLA-BSA animals. PBMCs from Bull 86-squared, the clone of Bull 86 the source of the BSA sequence and phage library, was used as the reference sample in comparison with PBMCs from L1 domino and his daughter 1449 to compare MHC class I expression as a function of antibodies bound per cell (ABC). L1 Domino is the Chori-240 BAC library source bull and 1449 is one of his daughters. Statistically significant differences between deletion and non-deletion animals are shown as *p<0.05.
*
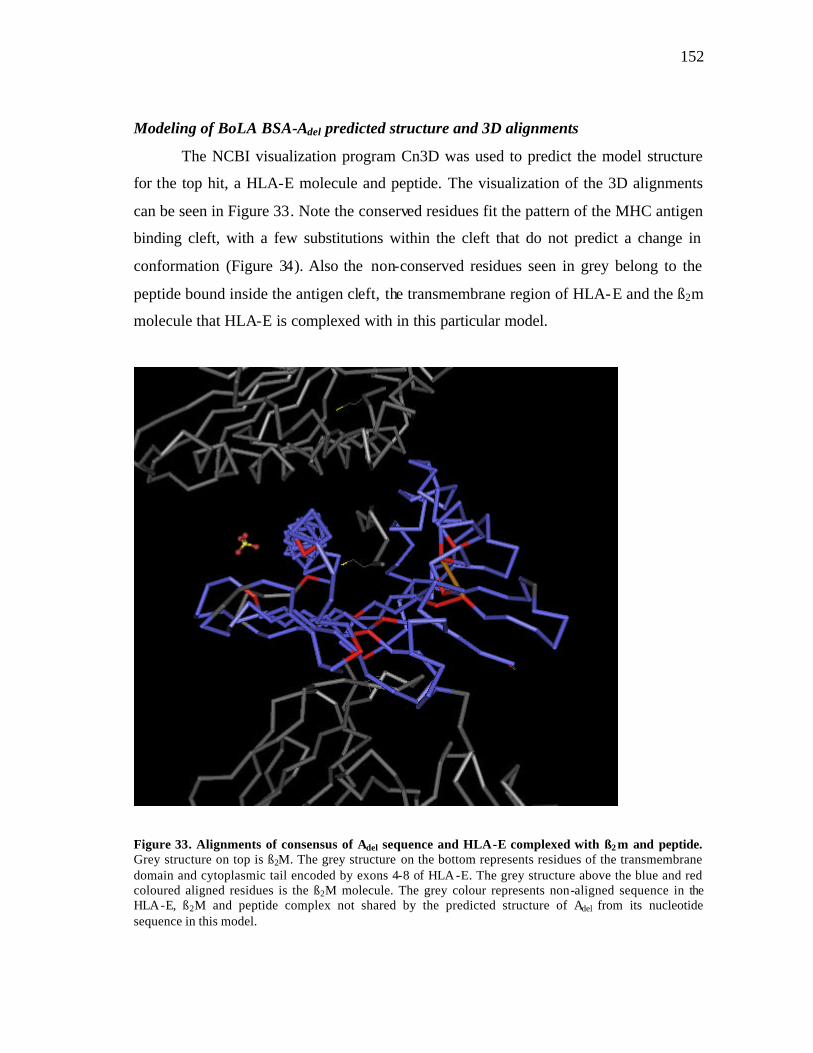
152
Modeling of BoLA BSA-Adel predicted structure and 3D alignments
The NCBI visualization program Cn3D was used to predict the model structure
for the top hit, a HLA-E molecule and peptide. The visualization of the 3D alignments
can be seen in Figure 33. Note the conserved residues fit the pattern of the MHC antigen
binding cleft, with a few substitutions within the cleft that do not predict a change in
conformation (Figure 34). Also the non-conserved residues seen in grey belong to the
peptide bound inside the antigen cleft, the transmembrane region of HLA-E and the ß2m
molecule that HLA-E is complexed with in this particular model.
Figure 33. Alignments of consensus of Adel sequence and HLA-E complexed with ß2 m and peptide. Grey structure on top is ß2M. The grey structure on the bottom represents residues of the transmembrane domain and cytoplasmic tail encoded by exons 4-8 of HLA -E. The grey structure above the blue and red coloured aligned residues is the ß2M molecule. The grey colour represents non-aligned sequence in the HLA-E, ß2M and peptide complex not shared by the predicted structure of Adel from its nucleotide sequence in this model.
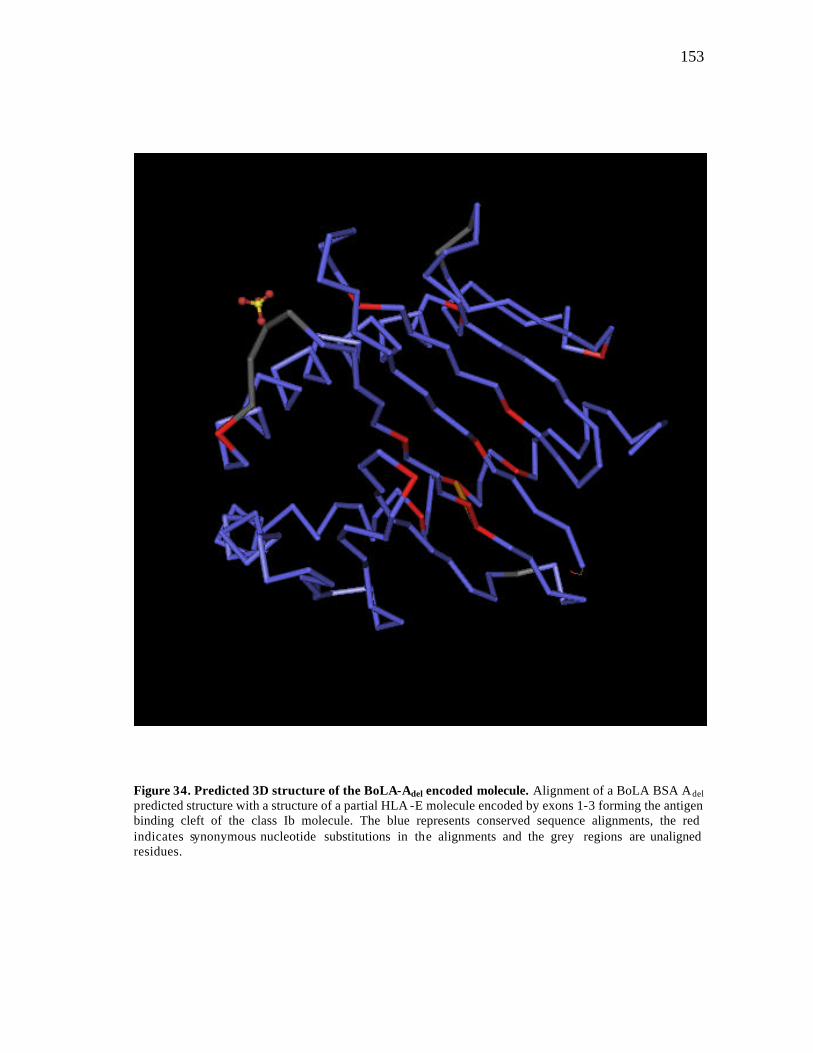
153
Figure 34. Predicted 3D structure of the BoLA-Adel encoded molecule. Alignment of a BoLA BSA Adel predicted structure with a structure of a partial HLA -E molecule encoded by exons 1-3 forming the antigen binding cleft of the class Ib molecule. The blue represents conserved sequence alignments, the red indicates synonymous nucleotide substitutions in the alignments and the grey regions are unaligned residues.
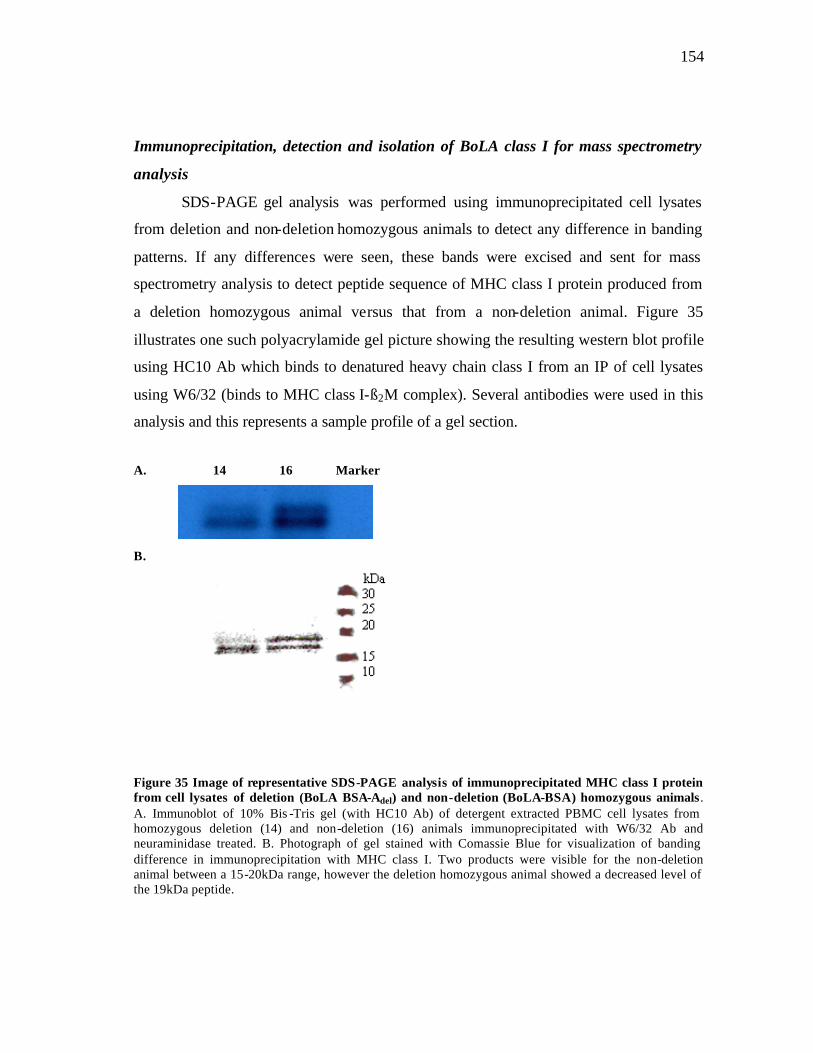
154
Immunoprecipitation, detection and isolation of BoLA class I for mass spectrometry
analysis
SDS-PAGE gel analysis was performed using immunoprecipitated cell lysates
from deletion and non-deletion homozygous animals to detect any difference in banding
patterns. If any differences were seen, these bands were excised and sent for mass
spectrometry analysis to detect peptide sequence of MHC class I protein produced from
a deletion homozygous animal versus that from a non-deletion animal. Figure 35
illustrates one such polyacrylamide gel picture showing the resulting western blot profile
using HC10 Ab which binds to denatured heavy chain class I from an IP of cell lysates
using W6/32 (binds to MHC class I-ß2M complex). Several antibodies were used in this
analysis and this represents a sample profile of a gel section.
A. 14 16 Marker
B.
Figure 35 Image of representative SDS-PAGE analysis of immunoprecipitated MHC class I protein from cell lysates of deletion (BoLA BSA-Adel) and non-deletion (BoLA-BSA) homozygous animals. A. Immunoblot of 10% Bis -Tris gel (with HC10 Ab) of detergent extracted PBMC cell lysates from homozygous deletion (14) and non-deletion (16) animals immunoprecipitated with W6/32 Ab and neuraminidase treated. B. Photograph of gel stained with Comassie Blue for visualization of banding difference in immunoprecipitation with MHC class I. Two products were visible for the non-deletion animal between a 15-20kDa range, however the deletion homozygous animal showed a decreased level of the 19kDa peptide.
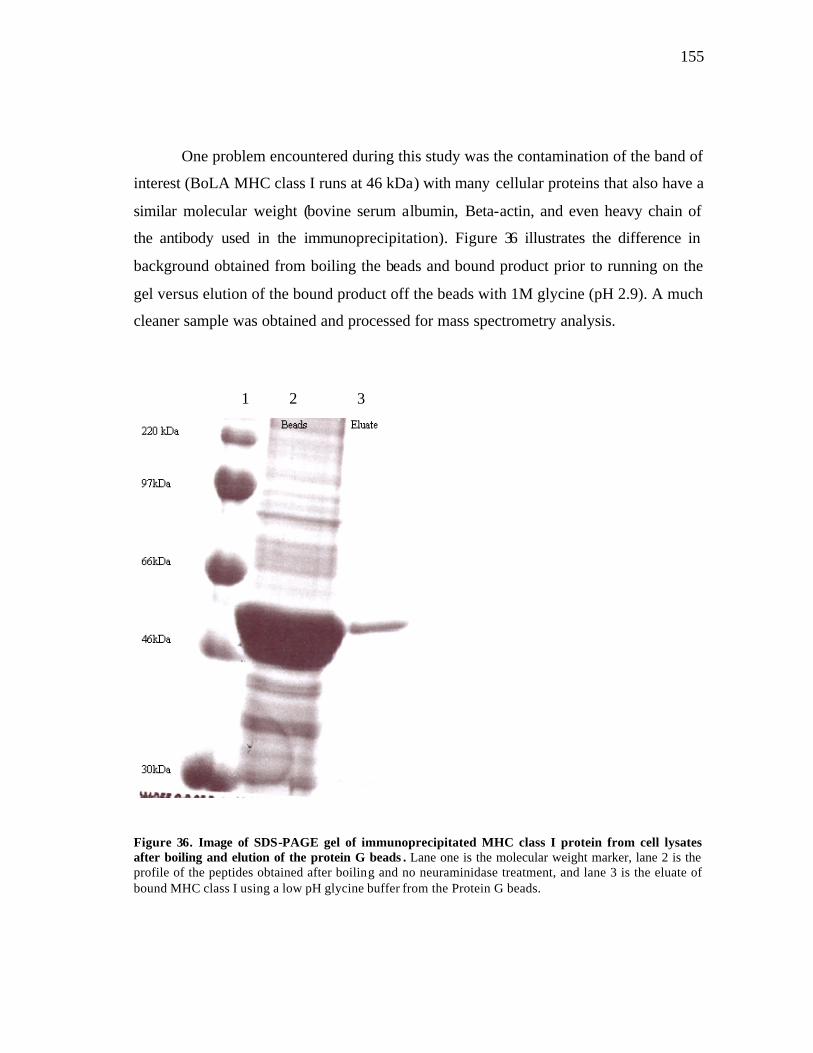
155
One problem encountered during this study was the contamination of the band of
interest (BoLA MHC class I runs at 46 kDa) with many cellular proteins that also have a
similar molecular weight (bovine serum albumin, Beta-actin, and even heavy chain of
the antibody used in the immunoprecipitation). Figure 36 illustrates the difference in
background obtained from boiling the beads and bound product prior to running on the
gel versus elution of the bound product off the beads with 1M glycine (pH 2.9). A much
cleaner sample was obtained and processed for mass spectrometry analysis.
1 2 3
Figure 36. Image of SDS-PAGE gel of immunoprecipitated MHC class I protein from cell lysates after boiling and elution of the protein G beads . Lane one is the molecular weight marker, lane 2 is the profile of the peptides obtained after boiling and no neuraminidase treatment, and lane 3 is the eluate of bound MHC class I using a low pH glycine buffer from the Protein G beads.
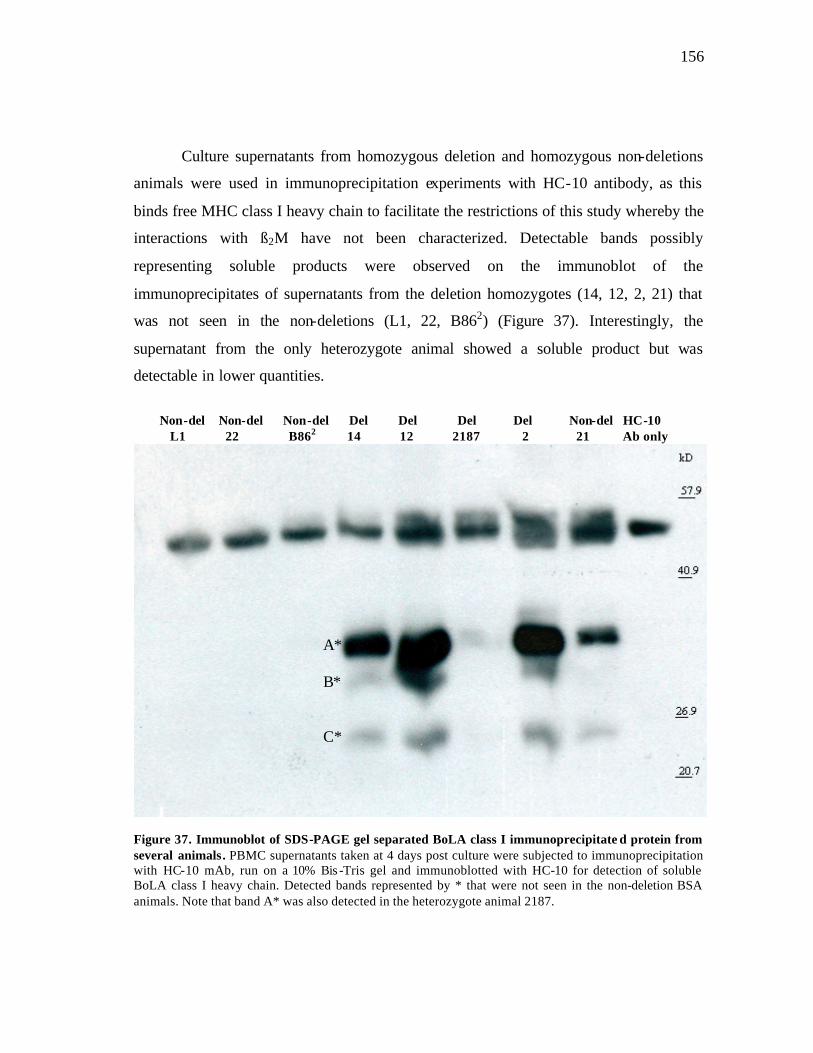
156
Culture supernatants from homozygous deletion and homozygous non-deletions
animals were used in immunoprecipitation experiments with HC-10 antibody, as this
binds free MHC class I heavy chain to facilitate the restrictions of this study whereby the
interactions with ß2M have not been characterized. Detectable bands possibly
representing soluble products were observed on the immunoblot of the
immunoprecipitates of supernatants from the deletion homozygotes (14, 12, 2, 21) that
was not seen in the non-deletions (L1, 22, B862) (Figure 37). Interestingly, the
supernatant from the only heterozygote animal showed a soluble product but was
detectable in lower quantities.
Non-del Non-del Non-del Del Del Del Del Non-del HC-10 L1 22 B862 14 12 2187 2 21 Ab only
Figure 37. Immunoblot of SDS-PAGE gel separated BoLA class I immunoprecipitate d protein from several animals. PBMC supernatants taken at 4 days post culture were subjected to immunoprecipitation with HC-10 mAb, run on a 10% Bis -Tris gel and immunoblotted with HC-10 for detection of soluble BoLA class I heavy chain. Detected bands represented by * that were not seen in the non-deletion BSA animals. Note that band A* was also detected in the heterozygote animal 2187.
A* B* C*
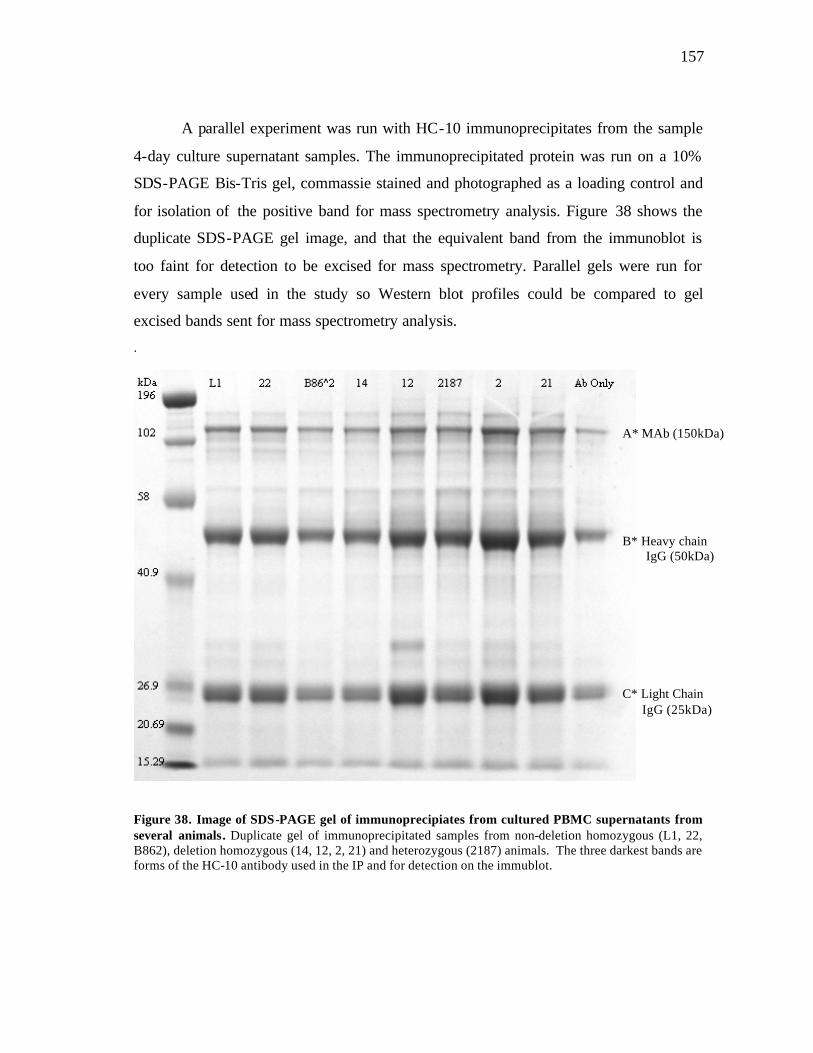
157
A parallel experiment was run with HC-10 immunoprecipitates from the sample
4-day culture supernatant samples. The immunoprecipitated protein was run on a 10%
SDS-PAGE Bis-Tris gel, commassie stained and photographed as a loading control and
for isolation of the positive band for mass spectrometry analysis. Figure 38 shows the
duplicate SDS-PAGE gel image, and that the equivalent band from the immunoblot is
too faint for detection to be excised for mass spectrometry. Parallel gels were run for
every sample used in the study so Western blot profiles could be compared to gel
excised bands sent for mass spectrometry analysis.
.
Figure 38. Image of SDS-PAGE gel of immunoprecipiates from cultured PBMC supernatants from several animals. Duplicate gel of immunoprecipitated samples from non-deletion homozygous (L1, 22, B862), deletion homozygous (14, 12, 2, 21) and heterozygous (2187) animals. The three darkest bands are forms of the HC-10 antibody used in the IP and for detection on the immublot.
A* MAb (150kDa) B* Heavy chain IgG (50kDa) C* Light Chain IgG (25kDa)
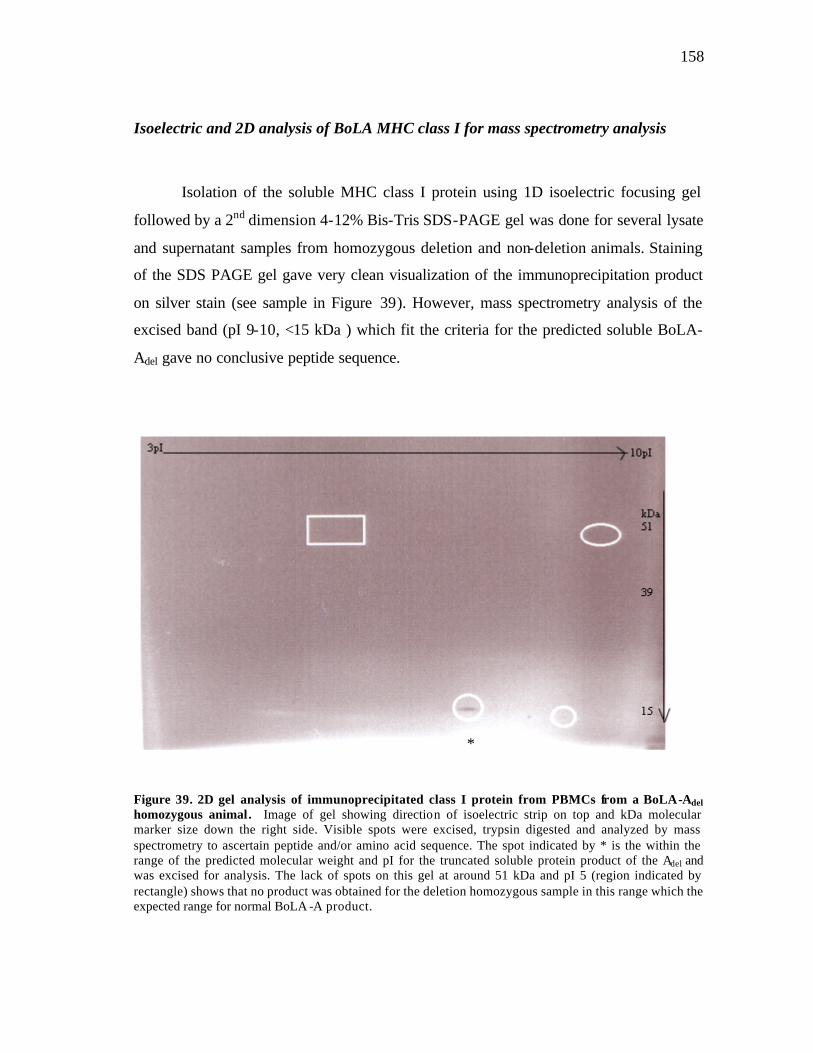
158
Isoelectric and 2D analysis of BoLA MHC class I for mass spectrometry analysis
Isolation of the soluble MHC class I protein using 1D isoelectric focusing gel
followed by a 2nd dimension 4-12% Bis-Tris SDS-PAGE gel was done for several lysate
and supernatant samples from homozygous deletion and non-deletion animals. Staining
of the SDS PAGE gel gave very clean visualization of the immunoprecipitation product
on silver stain (see sample in Figure 39). However, mass spectrometry analysis of the
excised band (pI 9-10, <15 kDa ) which fit the criteria for the predicted soluble BoLA-
Adel gave no conclusive peptide sequence.
Figure 39. 2D gel analysis of immunoprecipitated class I protein from PBMCs from a BoLA-Adel homozygous animal. Image of gel showing direction of isoelectric strip on top and kDa molecular marker size down the right side. Visible spots were excised, trypsin digested and analyzed by mass spectrometry to ascertain peptide and/or amino acid sequence. The spot indicated by * is the within the range of the predicted molecular weight and pI for the truncated soluble protein product of the Adel and was excised for analysis. The lack of spots on this gel at around 51 kDa and pI 5 (region indicated by rectangle) shows that no product was obtained for the deletion homozygous sample in this range which the expected range for normal BoLA -A product.
*
159
Discussion
In the previous chapter, a BoLA MHC class I frameshift allele BSA Adel was
isolated, cloned and described in several species of cattle (feral and domestic) and bison.
This chapter characterizes the transcription of a BoLA MHC class I allele BSA Adel,
common in wild and feral bovids, which may produce a soluble class I molecule. To
date, no allelic form of MHC class I in any species has been found that produces a
soluble class I molecule. Soluble MHC class I (sMHCs) defined to date, are produced by
proteolytic cleavage or by alternative splicing (Bouvier et al. 1998; Fournel et al. 2000;
Mallet et al. 1999). Characterization of the Adel product was attempted through a
rigorous analysis of expression encompassing a variety of transcription and translation
assays, including real-time RT-PR, flow cytometry, 1D and 2D gel analysis and mass
spectrometry analysis.
The real- time PCR methods which monitor accumulation of PCR products can be
adapted for the validation of differentially expressed genes as or as in this instance, to
detect alleleic differences. One of the major advantages of this method is that it enables
simple and rapid measurement of accumulation of PCR products during the log-linear
reaction phase. Thus, this procedure has the advantage of greater precision and more
objectivity than other quantification methods (like northern blots) and can be used cases
such as this, where there is only a 2-base deletion difference in both alleles being
quantified. Selection of quantitative RT-PCR primers that span an intron to reduce
genomic DNA contamination was not possible, due to need to design deletion specific
primers within a highly conserved region of a gene that is part of a large MHC gene
family. However, bias was avoided by using different primers to amplify both the
deletion and non-deletion alleles and standard curves were constructed to confirm the
relative efficiency of targets and reference PCR amplification. Also, performing the data
acquisition step at an elevated temperature was helpful in minimizing interference of
possible primer-dimers with the quantification. Thus, a robust method was used to
detect potential differences in expression of the BoLA BSA and Adel alleles, and no

160
significant difference was found between levels of expression in deletion and non-
deletion homozygous animals. Also, no significant difference was also observed
between alleles in the heterozygous animals (BSA-A/BSA-Adel).
The expression of MHC class I on the cell surface quantified during flow
cytometry analysis using the antibodies bound per cell (ABC) assuming a PE to mAb
ration of 1:1, also showed no significant difference between deletion and non-deletion
animals. There were significant differences between L1 and Bull 86 MHC class I
expression level in fibroblast culture, which was thought to be possibly erroneous since
Bull 86 frozen stocks were used. Since it is not possible to get fresh unstimulated
lymphocytes from Bull 86 (culled), these were obtained from Bull 86 squared (the viable
genetic clone of Bull 86) with the same genotypic profile. When unstimulated fresh
lymphocytes from L1, his daughter 1449 and Bull 86 squared were analyzed by flow
cytometry, there appeared to be significant differences in expression of MHC class I
between L1, 1449 and Bull 86 Squared. Possible discrepancies could be due to detection
with an antibody (HLA-ABC) quantifying overall MHC class I expression level by
measuring all BoLA class I molecules bound to antibody on the cell surface, which may
be different in these non-deletion animals. Expression levels of BoLA class I on
unstimulated fibroblasts were generally lower (2-fold) than expression in stimulated
lymphocytes for both non-deletion and deletion animals. Overall however, when
samples were pooled, there did not seem to be a significant difference in the MHC class
I expression of the deletion animals versus the non-deletion animals. The high
expression of L1 was negated by the low expression of B86 Squared in the non-deletion
homozygous animal group once samples were pooled for analysis, and there was no
detectable significant difference from the deletion homozygous animals.
Thus, the expression data taken from quantitative RT-PCR and flow cytometric
analysis does not show a significant difference in expression of BoLA BSA A and BSA
Adel alleles. Therefore, there is no evidence to suggest differential expression of the
putative soluble or membrane-bound alleles of the BoLA class I gene.
161
There were however, several confounding factors to be considered. The mAb
W6/32 recognizes only class I/ß2m complexes but not free class I heavy chains, whereas
the mAb HC10 recognizes free heavy chain. This was useful for discrimination of
protein bands when doing immunoprecipitations and western blotting of cell lysates and
supernatants. However, no specific antibody is available to the BoLA Adel protein, so
inferences were made that HC10 would bind at least an intact heavy chain encoded by
exons 1-3. The W6/32 mAb is a pan-MHC class I and therefore can detect all forms of
HLA-E, -F, and -C in addition to HLA-G, as well as BoLA class I that. Since there are
several BoLA class I genes expressed on PBMCs and fibroblasts, it cannot be excluded
that the staining of these different BoLA class I molecules may have masked the specific
labeling of BoLA Adel. Problems in detection of the soluble MHC class I, in addition to
generating quantities of protein necessary for detection by MALDI-TOF or tandem mass
spectrometry could not be solved by radioactive labeling as this affected the ability of
detection in mass spectrometry analysis of the final product. Also, cross-linking of
antibodies and elution of bound product to reduce contaminating cellular proteins in the
immunoprecipitations may have not been optimal, thereby restricting the amount of
protein obtained in eluates and in turn limiting the amount subject to trypsin digest and
mass spectrometry analysis.
Another limiting factor of this study was the limited supply of product, as the
genotyped Longhorns from which PBMCs and fibroblasts were obtained for this study
are at the Wichita Mountain Refuge in Oklahoma and only rounded up once per year,
then culled from the herd. Thus, obtaining uncultured PBMCs with which to do
comparative analyses from deletion and non-deletion homozygous animals is just not
possible. This is of particular concern as mitogenic stimulation of PBMCs may cause
induction of genes not induced in vivo, and primary cell cultures of PBMCs necessitates
addition of cytokine IL-2 and mitogen Concavalin A for cell growth/survival. There are
additional confounding factors in that there are different cleaved forms of soluble protein
observed, and without a specific antibody, it is not possible to confirm detection of the
specific BoLA Adel form by immunoblot with W6/32, HC10 or any of the other BoLA
162
class I monoclonal antibodies that recognize either any BoLA class I heavy chain
epitope that is free or in complex with ß2m.
The alignments of the predicted crystal structures of BoLA-Adel and HLA-E
showed some similarity in the a1 and a2 encoded domains, including conserved
substitutions in the ARS-specific binding sites. This may indicate a similar function, in
that BoLA-Adel may function as a soluble non-classical class I BoLA. The soluble form
of HLA-E fails to bind CD8 (Braud et al. 1999) however, secreted HLA-G5 can bind
CD8 and induces Fas/Fas ligand-mediated apoptosis in activated CD8+ lymphocytes
(Hofmeister 2003).
A role for soluble class I molecules has been defined in maternal/fetal
recognition and immune regulation and also allo-reactivity in organ transplantation
(Behrens et al. 2001 ; Pickl et al. 1996; Zavazava 1998; Zavazava and Kronke 1996;
Zavazava and Muller-Ruchholtz 1994). Recent studies have revealed that sHLA
molecules can induce antigen-specific apoptosis or anergy in autoimmune diseases
(Nicolle et al. 1994), suggesting that sHLA molecules might be used as a novel
therapeutic strategy for selective elimination of unwanted T-cell responses in
autoimmune disease (Casares et al. 2002). The serum level of sHLA-I molecules is
significantly increased in a variety of physiological and pathological conditions, such as
pregnancy, acute rejection episodes following organ allografts, acute graft-versus-host-
disease (GVHD) following bone marrow transplantation, autoimmune diseases, viral
infections, and malignant melanoma(Zavazava 1998; Zavazava and Kronke 1996).
In addition to their classical antigen-presenting role, HLA class I proteins are
recognised by members of the killer immunoglobulin receptor (KIR) and leukocyte
immunoglobulin- like receptor (LILR/ILT/LIR) families. Unusual properties of HLA-
B27 include an ability of free heavy chains (FHC) to reach the cell surface in the
absence of ß2m and to maintain their peptide-binding groove in vitro. The recognition of
HLA-B27 in both the classical ß2m- associated and ß2m- independent forms by members
of the KIR and LILR families could influence the function of cells from both innate and
163
adaptive immune systems, and may indicate a role for various leukocyte populations in
HLA-B27-associated inflammatory disease(Allen and Trowsdale 2004).
It is possible that this particular frameshift is being maintained as a trans-species
polymorphism due to a specific function of this deletion mutant MHC class I molecule
in responding to an ancient environmental pathogen under feral conditions in
homozygous bovids. However, it is equally likely that it is being lost in domesticated
bovids due to linkage to loci that are not economically important quantitative trait loci
(QTL).
Humans express killer cell immunoglobulin- like receptors (KIR) (functionally
equivalent to C-type lectin- like Ly49 receptors in mice) that interact with restricted
subsets of classical class I molecules, and to regulate natural killer (NK) cell function.
Cattle appear unusual in having putative functional KIR and Ly49 genes, (Ellis SA,
personal communication) which means the MHC class I specificity of NK receptors is
much broader in cattle possibly being facilitated by the presence of variable class I
haplotypes, such a haplotype expressing an allelic soluble BoLA class I.
Classical genes are apparently duplicated with a high frequency in the
evolutionary process, and many of the duplicated genes seem to degenerate into
nonclassical genes as a result of deleterious mutation (Hughes and Nei 1989). The
nonclassical class I Qa genes in the mouse, that encode soluble molecules, have
sequences homologous to regulatory sequences involved in the universal expression of
classical class I genes, but they have accumulated numerous nucleotide substitutions in
these sequences (Das et al. 2000; Vance et al. 1998; Yamauchi et al. 1981).
The cytoplasmic tail (CT) region of MHC class I possesses important structural
features related to functional capability of the molecule, for instance, specific sorting to
endolysosomal compartments is mediated by a highly conserved tyrosine motif within
the CT (Brode and Macary 2004). Also the transmembrane domain is important for
localization of the MHC class I molecule on the cell surface. Since both of these
structures are missing due to nucleotide deletions from the predicted molecular form the
164
BoLA Adel frameshift allele, an alternative function other than the classical cell-surface
antigen presentation is likely.
Another alternative is that the soluble form acts like MICA, allowing for
promiscuous receptor binding. NKG2D is an activating receptor that is expressed on
most NK cells, CD8 aß T cells, and ?d T cells. Among its ligands is MICA, which has
no function in antigen presentation but is induced by cellular stress. Moreover, NKG2D
stably interacted with surface molecules encoded by three newly identified cDNA
sequences (N2DL-1, -2, and -3), which are identical to the human ULBP proteins and
may represent homologs of the mouse retinoic acid-early inducible family of NKG2D
ligands (Steinle et al. 2001). Because of the substantial sequence divergence among
these molecules, these results indicated promiscuous modes of receptor binding.
Comparison of allelic variants of MICA revealed large differences in NKG2D binding
that were associated with a single amino acid substitution at position 129 in the alpha2
domain. Varying affinities of MICA alleles for NKG2D may affect thresholds of NK-
cell triggering and T-cell modulation (Steinle et al. 2001).
Also the role of shedding of soluble MICA has been defined as a potential
immune escape mechanism of human tumors in vivo In the case of MICA, reduction of
surface expression on tumor cells lowers the levels of NKG2DL capable of inducing a
cellular antitumor response by cytotoxic lymphocytes and may provide a mechanism for
the cells to escape local immune surveillance by limiting activating signals to the host
(Salih et al. 2003; Salih et al. 2002). Thus, there could be a similar role in tumour
surveillance for the gene product of the BoLA Adel. However, if the BoLA-Adel soluble
form is inhibiting CTL function, it would most likely be subject to purifying selection,
but this is not the case (Ramlachan 2004).
Evasion of host immune responses is well documented for viruses and may also
occur during tumor immunosurveillance. The mechanisms involve alterations in MHC
class I expression, Ag processing and presentation, chemokine and cytokine production,
and lymphocyte receptor expression. HCMV for instance expresses at least five proteins
that interfere with the MHC class I assembly pathways in a coordinated fashion. These

165
proteins inhibit the generation of HCMV-specific T-cell epitopes, block the transporter
associated with antigen presentation (TAP), retain MHC class I molecules in the
endoplasmic reticulum (ER), and redirect nascent class I heavy chains back to the
cytosol for subsequent degradation all of which inhibit lysis by T cells (Gewurz et al.
2001; Ploegh 1998).
In addition to T lymphocytes, NK cells play a pivotal role in the control of viral
replication. In humans, it has been reported that NK cell deficiency leads to an extreme
susceptibility to viral infections, however, HCMV has evolved strategies to inhibit NK
lysis (Biron et al. 1989; Ciccone et al. 1994; Lorenzo et al. 2001). However, HCMV
gpUS6 protein, which has been demonstrated to downregulate the expression of human
leukocyte antigen (HLA) class I and the presentation of cytotoxic T lymphocyte epitopes
by blocking transporter associated with antigen presentation (TAP function), does not
affect the ability of HLA-E to inhibit NK cell mediated lysis of K-562 cells by
interaction with CD94/NKG2A expressed on NK cells (Ulbrecht et al. 2003). Moreover,
it is possible that TAP dependence of HLA-E ligands varies between different cell types
as has been demonstrated for Qa-1, the mouse homologue of HLA-E (Bai et al. 2000).
In trophoblast cells, HLA-G mRNA is alternatively spliced into a variety of
forms which are predicted to encode a full- length membrane-bound form, three short
membrane-bound isoforms and two soluble isoforms but only full length HLA-G, but
not short HLA-G isoforms can be expressed on the surface of human cells while soluble
HLA-G is rapidly secreted (Bainbridge et al. 2000b). Thus, it is likely that the full- length
membrane-bound and soluble forms of HLA-G are the only biologically active forms to
which the mother is exposed during pregnancy.
Soluble forms of HLA-G produced by placental cells induce apoptosis of
activated CD8+ cells (Fournel et al. 2000). In mice, Qa2 also exists in a soluble form,
and has to capacity to activate alloreactive CTLs (Bainbridge et al. 2000a). RT1-E2 in
rats have been found both in placenta and neurospheres, which are in vitro cultures of
neural stem cells (McLaren et al. 2001; Park et al. 2002). It may be feasible to speculate
that the soluble BoLA Adel allele product has a role in maintaining tolerance and immune
166
response to viral infection during pregnancy at cells in the placental boundary. Such
functional analysis is beyond the limits of this study however, as this would require
defining expression levels in placental and cord tissue from homozygous and
heterozygous BoLA Adel animals which were not available for analysis.
It remains unanswered why mammalian cells generate soluble non-classical class
I gene products, like HLA-G (humans), RT1-E2 (rat) and H2-Qa2 (mouse), by dual
mechanisms: alternative splicing and proteolytic shedding. For example, biological
function of the HLA-G5 soluble protein that is an alternative splice variant compared to
soluble HLA-G1, is seemingly redundant. One possible explanation might be that the
proteolytic shedding of membrane-bound HLA-G1 is favored in pathological situations
in which mutations in HLA-G gene splicing sites are introduced. In this case, it was
believed that HLA-G evolved into proteolytic shedding as a backup to alternative
splicing to control specific immunomodulatory functions. Alternatively, soluble HLA-
G1 and HLA-G5 might be qualitatively different from each other in mediating immune
responses if they bind different spectra of peptides. Soluble HLA-G1 molecules
generated by the cleavage of membrane-bound HLA-G1 associate with beta2-
microglobulin and contain bound peptides that are stable at physiological conditions.
Also, soluble HLA-G1 is able to protect HLA class I-negative K562 cells from NK lysis,
suggesting that soluble HLA-G could act as an immunoregulator in NK cell recognition
and possibly in other immune responses (Park et al. 2004a)
One could postulate that it could act as a soluble BoLA class I immunomodulator
in a similar fashion to soluble HLA-G. Also, it could be that structural differences in the
soluble form allows it to be resistant to certain infection, similar as well to HLA-G,
which has evolved harboring a short cytoplasmic tail making it more resistant to HCMV
infection than other classical class I, including HLA-2 or -A3. This structural
characteristic probably delayed the time and efficiency of HLA-G down-modulation by
HCMV l compared to HLA-A2 (Pizzato et al. 2004; Sawai et al. 2004).
Thus BoLA BSA-Adel could be maintained due to trans-species polymorphism in
cattle and bison, because of an advantage in peptide presentation and resistance to
167
viral/pathogenic infection due to its soluble form and structural difference. It is possible
as well that this allele represents a redundant form of another alternatively spliced BoLA
class I that is soluble. This is seen in HLA-G, which has a large abundance of redundant
forms produced from alternative splicing and proteolytic cleavage as described
previously.
An alternative path is that the BoLA-Adel allele can process antigens via cross
presentation. It is now defined that ER–phagosome fusion defines a compartment for
proteasome- and TAP-dependent cross-presentation in phagosomes (Guermonprez et al.
2003). By doing so, antigen-presenting cells cope with the scarce number of exogenous
antigens gaining access to the proteasome for degradation, the low efficiency of
antigenic peptide generation by proteasomes and the short half- life of these antigenic
peptides in the cytosol (Reits et al. 2003; Rock 2002). By limiting the competition with
endogenous antigens, dendritic cells may focus all the cross-presentation machinery on
the antigens relevant for the initiation of most immune responses acquired by
phagocytosis (Gil-Torregrosa et al. 2004; Guermonprez et al. 2003).
The constant sampling of self and foreign molecules by the immune system is
part of a complex quality control process ensuring the recognition and clearance of
aberrant cell forms during development, tumorigenesis and infection by microbial
pathogens. What could be the biological importance of recovery of extracellular
peptides free from processing: recognition of microbial peptides; recognition of partially
proteolized autologous proteins in inflammation; or a component of auto- immunity?
Conventionally, MHC class I-restricted antigen processing requires the action of
the multimolecular peptide-loading complex within the ER. It has been shown that early
phagosomes from human dendritic cells contain the peptide- loading complex,
incorporating MHC class I, ß2m, transporter associated with Ag processing (TAP),
calreticulin, tapasin, and ERp57 (Ackerman and Cresswell 2004; Ackerman et al. 2003).
Antigenic peptides could be translocated into purified phagosomes by TAP and loaded
onto cognate class I molecules, inducing their specific dissociation from the loading
complex.
168
However it is known that certain soluble viral proteins, like cytomegalovirus
US6 and ICP47 (IE12) encoded by the herpes simplex virus, interfere with antigen
presentation via MHC class I molecules selecting TAP as target for immune evasion,
blocking TAP and retrotranslocation to the ER and import of peptides (Bauer and Tampe
2002; Hewitt et al. 2001; Kyritsis et al. 2001). Therefore it may be advantageous to have
soluble MHC class I, like the gene product of BoLA-Adel capable of binding such
peptides without restrictions of a transmembrane region or localizations signals found on
a cytoplasmic, and access ER and ER-like compartments to bind such free antigenic
peptides in the cytosol. Evidence for HLA polymorphism controlling the choice of
antigen presentation pathway can be seen in HLA-B, where a single amino acid
polymorphism that distinguishes HLA-B*4402 (Asp116) from B*4405 (Tyr116) permits
B*4405 to constitutively acquire peptides without any detectable incorporation into the
TAP-associated peptide loading complex (Zernich et al. 2004). This mode of peptide
capture gives the host an advantage as it is less susceptible to viral interference than the
conventional loading pathway used by HLA-B*4402 that involves assembly of class I
molecules within the peptide loading complex.
Therefore, a model is proposed where the soluble gene product of BoLA BSA
Adel is inhibitory acting in a TAP-independent manner to either 1) inhibit NK mediated
lysis as is the case of HLA-E inhibiting NK cell mediated lysis of K-562 cells by
interaction with CD94/NKG2A expressed on NK cells (Ulbrecht et al. 2003) or Qa-1 in
mice (Bai et al. 2000); 2) induce apoptosis of activated CD8+cells in immunopriviledged
sites like placenta and neural stem cells in immunoprivileged sites, to induce apoptosis
of activated CD8+ cells and induce tolerance during pregnancy like soluble HLA-G
(Fournel et al. 2000) and reduce autoimmune-like disease and killing of neural stem cells
like RT1-E in rats (Lau et al. 2003); or 3) activate immune response through cross-
presentation pathway without competing with endogenously-derived peptides in
dendritic cells. If functional, it is most likely not TAP-dependent, so the capability to
bind to an antigenic peptide shared by cattle and bison in an ancestral environment can
provides a means of antigenic presentation of viral peptides that possibly hijack the TAP
169
pathway like US16 in HCMV (Lorenzo et al. 2001) and confer the ability to circumvent
such pathogenic evasionary tactics. This last option would have the evolutionary trade-
off in selection for optimal HLA class I loading versus effective pathogen evasion as the
peptide loading complex may have been susceptible to viral interference during
evolution of the bovids, and a soluble allelic form in absence of an alternatively spliced
variant would have much needed immunomodulatory effects.
Many MHC non-classical and classical molecules that have alternatively spliced
forms and upregulation of expression in specific tissues or cell types have been the focus
of an ever- increasing amount of interest investigating the potential for multiple roles in
antigen presentation and immunoregulation. There is also a high degree of redundancy
seen in soluble MHC class I molecules through alternatively spliced variants and cleaved
forms being produced. This study represents the first study of an allelic variant of a
classical MHC class I gene that has a predicted soluble gene product. It provides
information with which functional studies can be performed to further define the
pathways, if any, by which BoLA soluble MHC class I molecules provide antigenic
response or suppression and/or tolerance in bovids. It also provides insight into the
maintenance of trans-species polymorphism between Bos Taurus and Bison, similar to
that seen for several MHC class I genes within other related species, like primates or
rodentia. There is great potential for future study to elucidate the functional role of
soluble BoLA class I, especially relating to a immunogenic shared function in both Bos
and Bison. Such studies will be of evolutionary, as well as economic importance, in
defining immune evasion strategies possibly used in an ancestral species that could assist
in selection and design of vaccines and disease reduction strategies in modern cattle
breeding practices.
170
CHAPTER VI
FINAL SUMMARY AND DISCUSSION
One does not discover new lands without consenting to lose sight of the shore for a very long time. – Andree Gide
The profitability of the cattle industry is deleteriously affected by the occurrence
of disease, causing millions of dollars in losses worldwide per year. Research using
molecular biology is critical to supplement traditional breeding programs to select
animals for disease-resistance and develop novel vaccines in the control of disease in
livestock populations. The role of genes within the MHC in antigen presentation and
characterization in mouse and human, make it a prime target for using comparative
genomics to gain a better understanding of genetics and function of the host immune
system in other species, like cattle.
Over 200 genes have been identified in the MHC region of humans of which
most has either a role in antigen presentation (class I and II) or are involved in the
processing of foreign antigens for immune recognition or involved in other immune
responses like inflammation or complement (class III). Most of these genes in the HLA
have been found to have orthologues and a general conserved gene framework and order
(classI, III, II) in other mammalian species, including those with already sequenced
MHCs like mouse, rat and swine. In cattle, the MHC has been mapped to BTA23 and
has a similar gene order, however there is a major division of class II and a translocation
of class IIb separating it by 20 Mb from class IIa, III and I. As well, there are some
orthologues not present (DP) and other genes that are shared only in cattle, sheep and
goats (DYA and DIB). It is possible that more of these differences are present, but until
complete sequencing and assembly is complete, this is not known.
Duplication of MHC genes has occurred many times during the process of
evolution and evidence of a “proto-MHC” can even be seen in early chordates. This is
171
especially apparent in the class I clusters which are seen in human (4 clusters), mouse (6
clusters), rat (7 clusters) and swine (2 clusters) which contain duplicated classical class I
genes, pseudogenes, fragments and non-classical class I genes. As discussed in Chapter
II, the BoLA class I region appears to have at least 3 and possibly 4 class I clusters that
share similarities with known MHCs of other mammalian species. For instance the first
class I cluster mapped in BoLA telomeric of class II is between BAT1 and POU5F1 is
equivalent to the ß block in humans, mouse, rat and swine. This is followed by one or
possibly two clusters between GNL (HSR1) and ZNF173 (Trim 26), which is present in
mouse, rat and human as two clusters, the first between GNL and FLJ22638, and the
second between RNF23 (Trim 39) and ZNF173 (Trim26). There is also one cluster
between the GNL and ZNF173 framework genes also present in the swine MHC.
Preliminary evidence from the horse MHC also shows class I genes in these two major
blocks (Gustafson et al. 2003). In BoLA however, there is evidence of another cluster of
MHC class I genes telomeric of MOG and GABBR1 within the olfactory region, which
is found in rat and mouse MHCs but not in human. It can be postulated that the extended
duplicated olfactory region was coupled with post-speciation class I gene duplications in
these species, and can be related to the increased role of olfactory genes in mate
selection.
The heterozygote advantage of the high polymorphism seen in the MHC genes,
helps to overcome the fallacies predicted by the Red Queen hypothesis as discussed in
Chapter I, by the fact that an offspring is unlikely to inherit the same allele from both
parents, and thus has double the MHC recognition capability for antigen detection from
pathogens regardless of the rate of a pathogen’s evolutionary evasion tactics. The large
number of MHC alleles documented in the human population (>1000 to date) would
contribute to overall population fitness as it is not likely that a single pathogen would
evade such diversity entirely, providing a barrier to pandemics of potential disease.
Generally “classical” class I genes like HLA-A, B and C are expressed in all
humans, and this seems shared by other primates like chimps and gorillas. However
closely related primates like orangatuns and rhesus monkeys have variable expression of
172
A, B and C orthologues, with C not even present in rhesus monkeys. This illustrates
variation in numbers and expression of MHC genes even in the more related species. In
ruminants like cattle and sheep, as well as in pig and horse, there seems to be a large
number of expressed class I genes and a variable number of haplotypes. The variability
seen in class I genes of cattle however, is unique since no class I locus is consistently
expressed, there are variable haplotypes with even single class I locus haplotypes, and
extensive class I interlocus recombination. This has made complete assembly of DNA
sequencing data from class I BACs within BoLA very difficult.
The fact that several animals have been used to date for assembly of BoLA and
no single haplotype has been used to provide a complete BoLA map provides additional
confounding factors. The presence of so many MHC class I & II alleles that are null, or
contain synonymous substitutions, also adds another problem so that the diversity of
MHC molecules that can be identified by antibodies serologically, is considerably fewer
than that by DNA sequencing. The presence of pseudogenes, gene fragments and non-
classical class I sequences spread liberally throughout class I clusters make it more
difficult to assign alleles to loci by DNA sequence analysis. For instance, Bull 86 was
thought to be heterozygous for BSA and BSC alleles thought to be at the same locus.
However, when molecular and serological data were aligned, it was realized that Bull 86
was heterozygous for BSC and homozygous for BSA; previous “alleles” which are now
known to be clearly not alleleic as BSC was formed from an interlocus recombination
event between BSA and another class I gene.
The FISH and fibre FISH analyses were very important in confirming the
overlapping BACs in the preliminary contigs and to map them to BTA23 q2.2. This was
especially needed when class I sequence and BACs were obtained from up to five
different animals, and DNA sequence analysis was not enough to order them.
The use of phylogenetic trees to test hypotheses of recombination and gene
conversion giving rise to inter-allelic recombination is useful as is estimating numbers of
nucleotide substitutions per site in a particular gene region (Hughes and Yeager 1998b;
Yeager and Hughes 1999; Yeager et al. 1997). However, it is difficult to assign a

173
sequence on the basis of allele versus loci using phylogenetics, especially in cattle MHC
analyses (Di Palma et al. 2002; Ellis et al. 1986; Holmes et al. 2003) due to the high
levels of gene conversion. It was possible to however, characterize the BoLA Adel as a
trans-species polymorphism seen in Bison and Bos predating speciation (Chapter IV).
The nested PCR primer pairs used for genotyping analysis of the BSA-A and
BSA-Adel alleles however were specific and consistent, as cloning and sequencing of
genotyping products matched predicted genotypes for all animals in the analysis. Also,
no more than two sequences were obtained from sequenced clones of BSA “locus-
specific” PCR products from each animal, indicating that they were allelic and not from
different loci.
The Adel allele of the BSA gene was consistently amplified by using the deletion
specific primers in several homozygous and heterozygous animals, including a large
number of Texas Longhorn animals used for expression analysis. In the experiments
described in Chapter V, flow cytometric and quantitative RT-PCR analysis showed no
significant difference in overall MHC class I expression between BoLA MHC class I
and Adel in homozygous deletion and non-deletion animals. Although 1D-IEF, 2D gel
analysis and western blotting showed several bands to be BoLA class I specific from
immunoprecipitations of homozygous deletion PBMCs, analysis by mass spectrometry
was not clear enough to determine the peptide sequence of these protein bands. This was
in part due to the lack of product obtained from cell lysates and supernatants during
these experiments. Since it was not possible to re-bleed the animals used in this study,
there was a limitation to the amount of material available dependent on the last
collection at Wichita Mountain Refuge in September 2003.
It is possible that functional data can be obtained using BoLA-Adel transfectants
(e.g.CHO cells) to produce larger quantities of class I protein which can also be used for
downstream mass spectrometry analysis and further functional assays. Also, production
of a monoclonal antibody specific for BoLA-Adel would also provide an invaluable tool,
as all antibodies used in this study were either developed for humans and reactive in
cattle, or developed for other cattle class I genes. The caveat in this study is that it is
174
unknown whether or not lack of confirmation of detection of a soluble product by mass
spectrometry is due to it not being translated, or because of failure to obtain enough of a
detectable product.
William of Ockham’s philosophical idea states that the best hypothesis to explain
a process is the one that requires the smallest number of assumptions. This may be the
most important technique in comparative genomics of the MHC, as it is important to not
make any more assumptions than absolutely necessary in analyzing genetic and
functional aspects of the BoLA class I region. Thus, in conclusion, there is no evidence
to suggest that BoLA class I Adel is differentially expressed from any other BoLA class I
gene, nor that the soluble product is non-functional. The BoLA class I region does share
some similarity in gene order, structure and duplicated clusters as detailed in this study,
with other mammalian species. Also, the maintenance of the Adel allele as a trans-species
polymorphism in feral and wild Bos and Bison could be 1) pure chance, or 2) be possibly
lost from certain highly genetically-manipulated domestic breeds as a by-product of
domestication and linkage to negatively selected loci, or alternatively, 3) serving a
functional purpose by recognizing an environmental pathogen common to both species
or providing immunological tolerance and thus facilitating either the initiation or
suppression of an immune response, respectively.
The molecular genetic structure of the MHC evolved possibly as a result of
selective pressure imposed by infectious microorganisms. Acquisition of complete and
accurate sequence data over polymorphic regions such as the BoLA using a BAC-based
approach, provides a definitive resource for the construction of informative genetic
maps, and avoids the limitation of chromosome regions that are refractory to PCR
amplification or difficult to sequence by other approaches. Construction of such genetic
maps, especially including haplotypic structure, has the potential of detecting variants
with high susceptibility or resistance to disease.
The present organisation of the MHC represents a snapshot in its evolution from
its ancestral form. Many of the molecular structures described above have been shown to
be targets in the various strategies devised by infectious organisms, in particular viruses,
175
to evade immune detection. Diverse evolutionary pressures may have directed the
evolution of the MHC differently in other organisms and further study of the
comparative genomic organisation of MHC genes in cattle, mouse, chicken, rat, teleosts
as well as more primitive members of the chordate family (eg. the lamprey), may help to
answer the riddle set by the genetic structure of the MHC as we see it today.
Also, further analysis of the BoLA class I region, including studies on defining a
functional role for the soluble allelic form of the BoLA BSA A-del gene product, would
allow for a greater understanding of the immunological role of BoLA MHC class I
genes. This is of prime importance in the development of vaccines, the design of animal
breeding programs to maximize resistance to pathogens, and to allow for evaluation and
optimization of a population’s immune response in one of the most economically
important species worldwide.
176
REFERENCES
Abi-Rached L, Gilles A, Shiina T, Pontarotti P, Inoko H (2002) Evidence of en bloc
duplication in vertebrate genomes. Nat Genet 31:100-105
Abi-Rached L, McDermott MF, Pontarotti P (1999) The MHC big bang. Immunol Rev
167:33-44
Ackerman AL, Cresswell P (2004) Cellular mechanisms governing cross-presentation of
exogenous antigens. Nat Immunol 5:678-684
Ackerman AL, Kyritsis C, Tampe R, Cresswell P (2003) Early phagosomes in dendritic
cells form a cellular compartment sufficient for cross presentation of exogenous
antigens. Proc Natl Acad Sci USA 100:12889-12894
Ada G (1994) Twenty years into the saga of MHC-restriction. Immunol Cell Biol
72:447-454
Adams EJ, Parham P (2001) Species-specific evolution of MHC class I genes in the
higher primates. Immunol Rev 183:41-64
Aguado B, Campbell, RD. (1998) Characterization of a human lysophosphatidic acid
acyltransfe rase that is encoded by a gene located in the class III region of the
human major histocompatibility complex. J Biol Chem 273:4096-4105
Aguilar A, Roemer G, Debenham S, Binns M, Garcelon D, Wayne RK (2004) High
MHC diversity maintained by balancing selection in an otherwise genetically
monomorphic mammal. Proc Natl Acad Sci USA 101:3490-3494
Albertella M, Campbell, RD. (1994) Characterization of a novel gene in the human
major histocompatibility complex that encodes a potential new member of the I
kappa B family of proteins. Hum Mol Genet 3:793-799
Alfonso C, Karlsson L (2000) Nonclassical MHC class II molecules. Annual Review of
Immunology 18:113-142
Allan DS, Colonna M, Lanier LL, Churakova TD, Abrams JS, Ellis SA, McMichael AJ,
Braud VM (1999) Tetrameric complexes of human histocompatibility leukocyte
177
antigen (HLA)-G bind to peripheral blood myelomonocytic cells. J Exp Med
189:1149-1156
Allan DS, Lepin EJ, Braud VM, O'Callaghan CA, McMichael AJ (2002) Tetrameric
complexes of HLA-E, HLA-F, and HLA-G. J Immunol Methods 268:43-50
Allen RL, Trowsdale J (2004) Recognition of Classical and Heavy Chain Forms of
HLA-B27 by Leukocyte Receptors. Curr Top Med Chem 4:59-65
al-Murrani SW, Glass EJ, Hopkins J (1994) BoLA class I charge heterogeneity reflects
the expression of more than two loci. Anim Genet 25:165-172
al-Murrani SW, Glass EJ, Williams JL, Oliver RA (1993) 1D-IEF analysis of BoLA
class I expression using allo-antisera reveals additional complexity. Anim Genet
24:427-431
Altschul SF, Gish W, Miller W, Myers EW, Lipman DJ (1990) Basic local alignment
search tool. J Mol Biol 215:403-410
Amadou C (1999) Evolution of the Mhc class I region: the framework hypothesis.
Immunogenetics 49:362-367
Amadou C, Kumanovics A, Jones EP, Lambracht-Washington D, Yoshino M, Lindahl
KF (1999) The mouse major histocompatibility complex: some assembly
required. Immunol Rev 167:211-221
Amadou C, Ribouchon MT, Mattei MG, Jenkins NA, Gilbert DJ, Copeland NG,
Avoustin P, Pontarotti P (1995) Localization of new genes and markers to the
distal part of the human major histocompatibility complex (MHC) region and
comparison with the mouse: new insights into the evolution of mammalian
genomes. Genomics 26:9-20
Amadou C, Younger RM, Sims S, Matthews LH, Rogers J, Kumanovics A, Ziegler A,
Beck S, Lindahl KF (2003) Co-duplication of olfactory receptor and MHC class I
genes in the mouse major histocompatibility complex. Hum Mol Genet 12:3025-
3040
Amills M, Ramiya V, Norimine J, Lewin HA (1998) The major histocompatibility
complex of ruminants. Rev Sci Tech 17:108-120
178
Andersson L, Lunden A, Sigurdardottir S, Davies CJ, Rask L (1988) Linkage
relationships in the bovine MHC region. High recombination frequency between
class II subregions. Immunogenetics 27:273-280
Andersson L, Rask L (1988) Characterization of the MHC class II region in cattle. The
number of DQ genes varies between haplotypes. Immunogenetics 27:110-120
Andersson L, Sigurdardottir S, Borsch C, Gustafsson K (1991) Evolution of MHC
polymorphism: extensive sharing of polymorphic sequence motifs between
human and bovine DRB alleles. Immunogenetics 33:188-193
Anzai T, Shiina T, Kimura N, Yanagiya K, Kohara S, Shigenari A, Yamagata T, Kulski
JK, Naruse TK, Fujimori Y, Fukuzumi Y, Yamazaki M, Tashiro H, Iwamoto C,
Umehara Y, Imanishi T, Meyer A, Ikeo K, Gojobori T, Bahram S, Inoko H
(2003) Comparative sequencing of human and chimpanzee MHC class I regions
unveils insertions/deletions as the major path to genomic divergence. Proc Natl
Acad Sci USA 100:7708-7713
Ayala FJ, Escalante A, O'hUigin C, Klein J (1994) Molecular genetics of speciation and
human origins. Proc Natl Acad Sci USA 91:6787-6794
Bai A, Aldrich CJ, Forman J (2000) Factors controlling the trafficking and processing of
a leader-derived peptide presented by Qa-1. J Immunol 165:7025-7034
Bainbridge D, Ellis S, Le Bouteiller P, Sargent I (2001) HLA-G remains a mystery.
Trends Immunol 22:548-552
Bainbridge DR, Ellis SA, Sargent IL (2000a) HLA-G suppresses proliferation of CD4(+)
T- lymphocytes. J Reprod Immunol 48:17-26
Bainbridge DR, Ellis SA, Sargent IL (2000b) The short forms of HLA-G are unlikely to
play a role in pregnancy because they are not expressed at the cell surface. J
Reprod Immunol 47:1-16
Ballingall K, MacHugh N, Taracha E,Mertens B, McKeever D (2001) Transcription of
the unique ruminant class II major histocompatibility complex-DYA and DIB
genes in dendritic cells. Eur J Immunol 31:82-86
179
Ballingall KT, Ellis SA, MacHugh ND, Archibald SD, McKeever DJ (2004a) The DY
genes of the cattle MHC: expression and comparative analysis of an unusual
class II MHC gene pair. Immunogenetics 55:748-755
Ballingall KT, Luyai A, Rowlands GJ, Sales J, Musoke AJ, Morzaria SP, McKeever DJ
(2004b) Bovine leukocyte antigen major histocompatibility complex class II
DRB3*2703 and DRB3*1501 alleles are associated with variation in levels of
protection against Theileria parva challenge following immunization with the
sporozoite p67 antigen. Infect. Immun. 72:2738-2741
Band M, Larson JH, Womack JE, Lewin HA (1998) A radiation hybrid map of BTA23:
identification of a chromosomal rearrangement leading to separation of the cattle
MHC class II subregions. Genomics 53:269-275
Band MR, Larson JH, Rebeiz M, Green CA, Heyen DW, Donovan J, Windish R,
Steining C, Mahyuddin P, Womack JE, Lewin HA (2000) An ordered
comparative map of the cattle and human genomes. Genome Res 10:1359-1368
Banghart LR, Chamberlain CW, Velarde J, Korobko IV, Ogg SL, Jack LJ, Vakharia VN,
Mather IH (1998) Butyrophilin is expressed in mammary epithelial cells from a
single-sized messenger RNA as a type I membrane glycoprotein. J Biol Chem
273:4171-4179
Barbis DP, Maher JK, Stanek J, Klaunberg BA, Antczak DF (1994) Horse cDNA clones
encoding two MHC class I genes. Immunogenetics 40:163
Barth R, Counce S, Smith P, Snell GD (1956) Strong and weak histocompatibility gene
differences in mice and their role in the rejection of homografts of tumors and
skin. Ann Surg 144:198-204
Baskaran N, Kandpal RP, Bhargava AK, Glynn MW, Bale A, Weissman SM (1996)
Uniform amplification of a mixture of deoxyribonucleic acids with varying GC
content. Genome Res 6:633-638
Bauer D, Tampe R (2002) Herpes viral proteins blocking the transporter associated with
antigen processing TAP--from genes to function and structure. Curr Top
Microbiol Immunol 269:87-99
180
Beck S, Trowsdale J (1999) Sequence organisation of the class II region of the human
MHC. Immunol Rev 167:201-210
Beck S, Trowsdale J (2000) The human major histocompatability complex: lessons from
the DNA sequence. Annu Rev Genomics Hum Genet 1:117-137
Beck TW, Menninger J, Voigt G, Newmann K, Nishigaki Y, Nash WG, Stephens RM,
Wang Y, de Jong PJ, O'Brien SJ, Yuhki N (2001) Comparative feline genomics:
a BAC/PAC contig map of the major histocompatibility complex class II region.
Genomics 71:282-295
Behrens D, Lange K, Fried A, Yoo-Ott KA, Richter K, Fandrich F, Kronke M, Zavazava
N (2001) Donor-derived soluble MHC antigens plus low-dose cyclosporine
induce transplantation unresponsiveness independent of the thymus by down-
regulating T cell-mediated alloresponses in a rat transplantation model.
Transplantation 72:1974-1982
Belov K, Lam MK, Hellman L, Colgan DJ (2003) Evolution of the major
histocompatibility complex: Isolation of class II beta cDNAs from two
monotremes, the platypus and the short-beaked echidna. Immunogenetics
55:402-411
Benacerraf B, McDevitt HO (1972) Histocompatibility- linked immune response genes.
Science 175:273-279
Biron CA, Byron KS, Sullivan JL (1989) Severe herpesvirus infections in an adolescent
without natural killer cells. N Engl J Med 320:1731-1735
Bluestone JA, Jameson S, Miller S, Dick R 2nd (1992) Peptide- induced conformational
changes in class I heavy chains alter major histocompatibility complex
recognition. J Exp Med. 176:1757-1761
Bodmer WF (1972) Evolutionary significance of the HL-A system. Nature 237:139-145
Bouvier M, Guo HC, Smith KJ, Wiley DC (1998) Crystal structures of HLA-A*0201
complexed with antigenic peptides with either the amino- or carboxyl- terminal
group substituted by a methyl group. Proteins 33:97-106
181
Braud VM, Allan DS, McMichael AJ (1999) Functions of nonclassical MHC and non-
MHC-encoded class I molecules. Current Opinion in Immunology 11:100-108
Braud VM, Allan DS, O'Callaghan CA, Soderstrom K, D'Andrea A, Ogg GS, Lazetic S,
Young NT, Bell JI, Phillips JH, Lanier LL, McMichael AJ (1998) HLA-E binds
to natural killer cell receptors CD94/NKG2A, B and C. Nature 391:795-799
Bresciani A, Pirozzi G, Spera M, Lombardi ML, Ambrosone L, Migliaresi S, Ferrone S,
Manzo C (1998) Increased level of serum HLA class I antigens in patients with
systemic lupus in patients with systemic lupus erythematosus. Correlation with
disease activity. Tissue Antigens 52:44-50
Brode S, Macary PA (2004) Cross-presentation: dendritic cells and macrophages bite off
more than they can chew! Immunology 112:345-351
Browne H, Smith G, Beck S, Minson T (1990) A complex between the MHC class I
homologue encoded by human cytomegalovirus and beta 2 microglobulin.
Nature 347:770-772
Cadavid LF, Shufflebotham C, Ruiz FJ, Yeager M, Hughes AL, Watkins DI (1997)
Evolutionary instability of the major histocompatibility complex class I loci in
New World primates. Proc Natl Acad Sci U S A 94:14536-14541
Cadavid LF, Watkins, D.I. (1997) The duplicative nature of the MHC class I genes: an
evolutionary perspective. Eur J Immunogenet. 24:313-322.
Cai L, Taylor JF, Wing RA, Gallagher DS, Woo SS, Davis SK (1995) Construction and
characterization of a bovine bacterial artificial chromosome library. Genomics
29:413-425
Carpenter S, Baker JM, Bacon SJ, Hopman T, Maher J, Ellis SA, Antczak DF (2001)
Molecular and functional characterization of genes encoding horse MHC class I
antigens. Immunogenetics 53:802-809
Carrington M, Bontrop RE (2002) Effects of MHC class I on HIV/SIV disease in
primates. Aids 16 Suppl 4:S105-114
182
Casares S, Hurtado A, McEvoy RC, Sarukhan A, von Boehmer H, Brumeanu TD (2002)
Down-regulation of diabetogenic CD4+ T cells by a soluble dimeric peptide-
MHC class II chimera. Nat Immunol 3:383-391
Cereb N, Hughes AL, Yang SY (1997) Locus-specific conservation of the HLA class I
introns by intra- locus homogenization. Immunogenetics 47:30-36
Chapman TL, Bjorkman PJ (1998) Characterization of a murine cytomegalovirus class I
major histocompatibility complex (MHC) homolog: comparison to MHC
molecules and to the human cytomegalovirus MHC homolog. J Virol 72:460-466
Chardon P, Renard, C., Vaiman, M. (1981) Characterization of class II
histocompatibility antigens in pigs. Anim Blood Groups Biochem Genet 12:59-
65
Chardon P, Renard, C., Vaiman, M. (1999a) The major histocompatibility complex in
swine. Immunol Rev 167:179-192
Chardon P, Rogel-Gaillard C,Peelman L,Yerle M,Velten FW, Renard C, Vaiman M.
(1999b) Physical organization of the pig major histocompatibility complex class
II region. Immunogenetics 50:344-348
Chardon P, Rogel-Gaillard C, Cattolico L, Duprat S, Vaiman M, Renard C. (2001)
Sequence of the swine major histocompatibility complex region containing all
non-classical class I genes. Tissue Antigens 57:55-65
Chen ZW, McAdam SN, Hughes AL, Dogon AL, Letvin NL, Watkins DI (1992)
Molecular cloning of orangutan and gibbon MHC class I cDNA. The HLA-A and
-B loci diverged over 30 million years ago. J Immunol 148:2547-2554
Chung C, Leib SR, Fraser DG, Ellis SA, McGuire TC (2003) Novel classical MHC class
I alleles identified in horses by sequencing clones of reverse transcription-PCR
products. Eur J Immunogenet 30:387-396
Ciccone E, Pende D, Vitale M, Nanni L, Di Donato C, Bottino C, Morelli L, Viale O,
Amoroso A, Moretta A (1994) Self class I molecules protect normal cells from
lysis mediated by autologous natural killer cells. Eur J Immunol 24:1003-1006
183
Clark MS, Shaw L, Kelly A, Snell P, Elgar G (2001) Characterization of the MHC class
I region of the Japanese pufferfish (Fugu rubripes). Immunogenetics 52:174-185
Collins RWM (2004) Human MHC class I chain related (MIC) genes: their biological
function and relevance to disease and transplantation. Eur J Immunogenet
31:105-114
Colonna M, Samaridis J, Cella M, Angman L, Allen RL, O'Callaghan CA, Dunbar R,
Ogg GS, Cerundolo V, Rolink A (1998) Human myelomonocytic cells express
an inhibitory receptor for classical and nonclassical MHC class I molecules. J
Immunol 160:3096-3100
Comiskey M, Goldstein CY, De Fazio SR, Mammolenti M, Newmark JA, Warner CM
(2003) Evidence that HLA-G is the functional homolog of mouse Qa-2, the Ped
gene product. Hum Immunol 64:999-1004
Contini P, Ghio M, Merlo A, Brenci S, Filaci G, Indiveri F, Puppo F (2000) Soluble
HLA class I/CD8 ligation triggers apoptosis in EBV-specific CD8+ cytotoxic T
lymphocytes by Fas/Fas- ligand interaction. Hum Immunol 61:1347-1351
Coquillard G, Lau M, Kletzel M, Rodriguez-Marino SG (2004) Identification of two
pseudogenes with sequence homology to human and gorilla MHC class IA
genes: ancestral haplotype in the Filipino population. Hum Immunol 65:665-673
Crabtree J, Wiltshire T, Brunk B, Zhao S, Schug J, Stoeckert CJ, Jr., Bucan M (2001)
High-Resolution BAC-Based Map of the Central Portion of Mouse Chromosome
5. Genome Res. 11:1746-1757
Cresswell P, Bangia N, Dick T, Diedrich G (1999) The nature of the MHC class I
peptide loading complex. Immunol Rev 172:21-28
Crooijmans RP DR, Veenendaal T, van der Poel JJ, Nicholls RD, Bovenhuis H, Groenen
MA. (2001) The gene orders on human chromosome 15 and chicken
chromosome 10 reveal multiple inter- and intrachromosomal rearrangements.
Mol Biol Evol. 18:2102-2109
Croy BA, Esadeg S, Chantakru S, van den Heuvel M, Paffaro VA, He H, Black GP,
Ashkar AA, Kiso Y, Zhang J (2003) Update on pathways regulating the
184
activation of uterine Natural Killer cells, their interactions with decidual spiral
arteries and homing of their precursors to the uterus. J Reprod Immunol 59:175-
191
da Mota AF, Martinez ML, Coutinho LL (2004) Genotyping BoLA-DRB3 alleles in
Brazilian Dairy Gir cattle (Bos indicus) by temperature-gradient gel
electrophoresis (TGGE) and direct sequencing. Eur J Immunogenet 31:31-35
da Silva J (2003) The evolutionary adaptation of HIV-1 to specific immunity. Curr HIV
Res 1:363-371
Danchin EG, Abi-Rached L, Gilles A, Pontarotti P (2003) Conservation of the MHC-like
region throughout evolution. Immunogenetics 55:141-148
Das G, Gould DS, Augustine MM, Fragoso G, Sciutto E, Stroynowski I, Van Kaer L,
Schust DJ, Ploegh H, Janeway CA, Jr., Scitto E (2000) Qa-2-dependent selection
of CD8alpha/alpha T cell receptor alpha/beta(+) cells in murine intestinal
intraepithelial lymphocytes. J Exp Med 192:1521-1528
Dausset J (1958) Demonstration of the Rh (D) antigen on leukocytes and platelets from
humans. C R Hebd Seances Acad Sci 246:2171-2173
Dausset J (1981) The major histocompatibility complex in man. Science 213:1469-1474
Dausset J, Degos L, Fellous M, Legrand L (1975) Formal genetics of the HL-A region.
Genetics 79 Suppl:251-262
Davies CJ, Andersson L, Joosten I, Mariani P, Gasbarre LC, Hensen EJ (1992)
Characterization of bovine MHC class II polymorphism using three typing
methods: serology, RFLP and IEF. Eur J Immunogenet 19:253-262
Davies CJ, Antczak DF (1991a) Mixed lymphocyte culture studies reveal complexity in
the bovine MHC not detected by class I serology. Anim Genet 22:31-44
Davies CJ, Antczak DF (1991b) Production and characterization of alloantisera specific
for bovine class II major histocompatibility complex antigens. Anim Genet
22:417-434
Davies CJ, Joosten I, Andersson L, Arriens MA, Bernoco D, Bissumbhar B, Byrns G,
van Eijk MJ, Kristensen B, Lewin HA (1994) Polymorphism of bovine MHC
185
class II genes. Joint report of the Fifth International Bovine Lymphocyte Antigen
(BoLA) Workshop, Interlaken, Switzerland, 1 August 1992. Eur J Immunogenet
21:259-289
Dawkins R, Leelayuwat C, Gaudieri S, Tay G, Hui J, Cattley S, Martinez P, Kulski J
(1999) Genomics of the major histocompatibility complex: haplotypes,
duplication, retroviruses and disease. Immunol Rev 167:275-304
De Boer RJ PA (1993) How diverse should the immune system be? Proc R Soc Lond B
Biol Sci. 252:171-175
de Groot NG, Otting N, Doxiadis GGM, Balla-Jhagjhoorsingh SS, Heeney JL, van Rood
JJ, Gagneux P, Bontrop RE (2002) Evidence for an ancient selective sweep in the
MHC class I gene repertoire of chimpanzees. PNAS 99:11748-11753
De Tomaso AW, Weissman AL (2004) Evolution of a protochordate allorecognition
locus. Science 303:977
Deverson E, Wright H, Watson S, Ballingall K, Huskisson N, Diamond AG, Howard JC.
(1991) Class II major histocompatibility complex genes of the sheep. Anim
Genet. 22:211-225
Di Palma F, Archibald SD, Young JR, Ellis SA (2002) A BAC contig of approximately
400 kb contains the classical class I major histocompatibility complex (MHC)
genes of cattle. Eur J Immunogene t 29:65-68
Diehl M, Munz C, Keilholz W, Stevanovic S, Holmes N, Loke YW, Rammensee HG
(1996) Nonclassical HLA-G molecules are classical peptide presenters. Curr Biol
6:305-314
Dimasi N, Moretta L, Biassoni R (2004) Structure of the ly49 family of natural killer
(NK) cell receptors and their interaction with MHC class I molecules. Immunol
Res. 30:95-104
Dresske B, Lin X, Huang D-S, Zhou X, Fandrich F (2002) Spontaneous tolerance:
experience with the rat liver transplant model. Human Immunology 63:853-861
Eggert F, Luszyk D, Haberkorn K, Wobst B, Vostrowsky O, Westphal E, Bestmann HJ,
Muller-Ruchholtz W, Ferstl R (1998a) The major histocompatibility complex
186
and the chemosensory signalling of individuality in humans. Genetica 104:265-
273
Eggert F, Muller-Ruchholtz W, Ferstl R (1998b) Olfactory cues associated with the
major histocompatibility complex. Genetica 104:191-197
Eijkelkamp EJ, Yapp TR, Powell LW (2000) HFE-associated hereditary
hemochromatosis. Can J Gastroenterol 14:121-125
Ellis JA, Baldwin CL, MacHugh ND, Bensaid A, Teale AJ, Goddeeris BM, Morrison
WI (1986) Characterization by a monoclonal antibody and functional analysis of
a subset of bovine T lymphocytes that express BoT8, a molecule analogous to
human CD8. Immunology 58:351-358
Ellis SA,Ballingall KT (1999) Cattle MHC: evolution in action? Immunol Rev 167:159-
168
Ellis SA, Holmes EC, Staines KA, Smith KB, Stear MJ, McKeever DJ, MacHugh ND,
Morrison WI (1999) Variation in the number of expressed MHC genes in
different cattle class I haplotypes. Immunogenetics 50:319-328
Ellis SA, Martin AJ, Holmes EC, Morrison WI (1995) At least four MHC class I genes
are transcribed in the horse: phylogenetic analysis suggests an unusual
evolutionary history for the MHC in this species. Eur J Immunogenet 22:249-260
Ellis SA, Staines KA, Stear MJ, Hensen EJ, Morrison WI (1998) DNA typing for BoLA
class I using sequence-specific primers (PCR-SSP). Eur J Immunogenet 25:365-
370
Engler FW, Hatfield J, Nelson W, Soderlund CA (2003) Locating sequence on FPC
maps and selecting a minimal tiling path. Genome Res 13:2152-2163
Ennis PD, Jackson AP, Parham P (1988) Molecular cloning of bovine class I MHC
cDNA. J Immunol 141:642-651
Escayg AP, Hickford JG, Bullock DW (1997) Association between alleles of the ovine
major histocompatibility complex and resistance to footrot. Res Vet Sci 63:283-
287
187
Fahnestock ML, Johnson JL, Feldman RM, Neveu JM, Lane WS, Bjorkman PJ (1995)
The MHC class I homolog encoded by human cytomegalovirus binds
endogenous peptides. Immunity 3:583-590
Fair T, Gutierrez-Adan A, Murphy M, Rizos D, Martin F, Boland MP, Lonergan P
(2004) Search for the bovine homolog of the murine ped gene and
characterization of its messenger RNA expression during bovine preimplantation
development. Biol Reprod 70:488-494
Fan W, Liu YC, Parimoo S, Weissman SM (1995) Olfactory receptor- like genes are
located in the human major histocompatibility complex. Genomics 27:119-123
Figueroa F, Gunther E, Klein J (1988) MHC polymorphism pre-dating speciation.
Nature 335:265-267
Figueroa F, O'hUigin C, Tichy H, Klein J (1994) The origin of the primate Mhc-DRB
genes and allelic lineages as deduced from the study of prosimians. J Immunol
152:4455-4465
Filaci G, Contini P, Brenci S, Gazzola P, Lanza L, Scudeletti M, Indiveri F, Mancardi
GL, Puppo F (1997) Soluble HLA class I and class II molecule levels in serum
and cerebrospinal fluid of multiple sclerosis patients. Hum Immunol 54:54-62
Filaci G, Contini P, Brenci S, Lanza L, Scudeletti M, Indiveri F, Puppo F (1995)
Increased serum concentration of soluble HLA-DR antigens in HIV infection and
following transplantation. Tissue Antigens 46:117-123
Fjell CD, Bosdet I, Schein JE, Jones SJM, Marra MA (2003) Internet contig explorer
(iCE)--a tool for visualizing clone fingerprint maps. Genome Res. 13:1244-1249
Flajnik MF, Kasahara M (2001) Comparative genomics of the MHC: glimpses into the
evolution of the adaptive immune system. Immunity 15:351-362
Flajnik MF, Ohta Y, Namikawa-Yamada C, Nonaka M (1999) Insight into the
primordial MHC from studies in ectothermic vertebrates. Immunol Rev 167:59-
67
188
Flores-Ramirez S, Urban-Ramirez J, Miller RD (2000) Major histocompatibility
complex class I loci from the gray whale (Eschrichtius robustus). J Hered
91:279-282
Flugge P, Fuchs E, Gunther E, Walter L (2002) MHC class I genes of the tree shrew
Tupaia belangeri. Immunogenetics 53:984-988
Fonteneau JF, Kavanagh DG, Lirvall M, Sanders C, Cover TL, Bhardwaj N, Larsson M
(2003) Characterization of the MHC class I cross-presentation pathway for cell-
associated antigens by human dendritic cells. Blood 102:4448-4455
Forbes SA, Trowsdale J (1999) The MHC quarterly report. Immunogenetics 50:152-159
Fournel S, Huc X, Aguerre-Girr M, Solier C, Legros M, Praud-Brethenou C, Moussa M,
Chaouat G, Berrebi A, Bensussan A, Lenfant F, Le Bouteiller P (2000)
Comparative reactivity of different HLA-G monoclonal antibodies to soluble
HLA-G molecules. Tissue Antigens 55:510-518
Friedman R, Hughes AL (2001) Gene duplication and the structure of eukaryotic
genomes. Genome Res 11:373-381
Fukagawa T, Sugaya K, Matsumoto K, Okumura K, Ando A, Inoko H, Ikemura T
(1995) A boundary of long-range G + C% mosaic domains in the human MHC
locus: pseudoautosomal boundary- like sequence exists near the boundary.
Genomics 25:184-191
Fust G, Arason GJ, Kramer J, Szalai C, Duba J, Yang Y, Chung EK, Zhou B, Blanchong
CA, Lokki ML, Bodvarsson S, Prohaszka Z, Karadi I, Vatay A, Kovacs M,
Romics L, Thorgeirsson G, Yu CY (2004) Genetic basis of tobacco smoking:
strong association of a specific major histocompatibility complex haplotype on
chromosome 6 with smoking behavior. Int Immunol
Gagnon E, Duclos S, Rondeau C, Chevet E, Cameron PH, Steele-Mortimer O, Paiement
J, Bergeron JJ, Desjardins M (2002) Endoplasmic reticulum-mediated
phagocytosis is a mechanism of entry into macrophages. Cell 110:119-131
Gallagher DS Jr, Basrur PK, Womack JE (1992) Identification of an autosome to X
chromosome translocation in the domestic cow. J Hered 83:451-453
189
Garber TL, Hughes AL, Letvin NL, Templeton JW, Watkins DI (1993) Sequence and
evolution of cattle MHC class I cDNAs: concerted evolution has not taken place
in cattle. Immunogenetics 38:11-20
Garber TL, Hughes AL, Watkins DI, Templeton JW (1994) Evidence for at least three
transcribed BoLA class I loci. Immunogenetics 39:257-265
Gelder CM, Lambkin R, Hart KW, Fleming D, Williams OM, Bunce M, Welsh KI,
Marshall SE, Oxford J (2002) Associations between human leukocyte antigens
and nonresponsiveness to influenza vaccine. J Infect Dis 185:114-117
Gelder CM, Williams OM, Hart KW, Wall S, Williams G, Ingrams D, Bull P, Bunce M,
Welsh K, Marshall SE, Borysiewicz L (2003) HLA class II polymorphisms and
susceptibility to recurrent respiratory papillomatosis. J Virol 77:1927-1939
Geraghty DE, Koller BH, Orr HT (1987) A human major histocompatibility complex
class I gene that encodes a protein with a shortened cytoplasmic segment. Proc
Natl Acad Sci USA 84:9145-9149
Geraghty DE, Koller BH, Pei J, Hansen JA (1992) Examination of four HLA class I
pseudogenes. Common events in the evolution of HLA genes and pseudogenes. J
Immunol 149:1947-1956
Geraghty DE, Wei XH, Orr HT, Koller BH (1990) Human leukocyte antigen F (HLA-F).
An expressed HLA gene composed of a class I coding sequence linked to a novel
transcribed repetitive element. J Exp Med 171:1-18
Gewurz BE, Gaudet R, Tortorella D, Wang EW, Ploegh HL, Wiley DC (2001) Antigen
presentation subverted: Structure of the human cytomegalovirus protein US2
bound to the class I molecule HLA-A2. Proc Natl Acad Sci U S A 98:6794-6799
Ghio M, Contini P, Mazzei C, Brenci S, Barberis G, Filaci G, Indiveri F, Puppo F (1999)
Soluble HLA class I, HLA class II, and Fas ligand in blood components: a
possible key to explain the immunomodulatory effects of allogeneic blood
transfusions. Blood 93:1770-1777
190
Ghio M, Contini P, Mazzei C, Brenci S, Filaci G, Indiveri F, Puppo F (2000) Soluble
HLA class I and Fas ligand molecules in blood components and their role in the
immunomodulatory effects of blood transfusions. Leuk Lymphoma 39:29-36
Gil-Torregrosa BC, Lennon-Dumenil AM, Kessler B, Guermonprez P, Ploegh HL, Fruci
D, van Endert P, Amigorena S (2004) Control of cross-presentation during
dendritic cell maturation. Eur J Immunol 34:398-407
Glass EJ, Oliver RA, Russell GC (2000) Duplicated DQ haplotypes increase the
complexity of restriction element usage in cattle. J Immunol 165:134-138
Go Y, Satta Y, Kawamoto Y, Rakotoarisoa G, Randrianjafy A, Koyama N, Hirai H
(2003) Frequent segmental sequence exchanges and rapid gene duplication
characterize the MHC class I genes in lemurs. Immunogenetics 55:450-461
Gongora R, Zaleska-Rutczynska Z, Takami K, Figueroa F, Klein J (1998) Linkage of
RXRB-like genes to class I and not to class II Mhc genes in the zebrafish.
Immunogenetics 48:141-143
Gorer PA (1937) The genetic and antigenic basis of tumour transplantation. J Pathol
Bacteriol 44:691-697
Goto T, Todo K, Miyamoto K, Akimoto S (2003) Bacterial artificial chromosome library
of Finegoldia magna ATCC 29328 for genetic mapping and comparative
genomics. Microbiol Immunol 47:1005-1016
Goulmy E, Schipper R, Pool J, Blokland E, Falkenburg F, Vossen J, Gratwohl A,
Vogelsang GB, van Houwelingen HC, van Rood JJ (1996) Mismatches of minor
histocompatibility antigens between HLA-identical donors and recipients and the
development of graft-versus-host disease after bone marrow transplantation. N
Engl J Med 334:281-285
Graser R, O'hUigin C, Vincek V, Meyer A, Klein J (1996) Trans-species polymorphism
of class II Mhc loci in danio fishes. Immunogenetics 44:36-48
Gregory SG, Sekhon M, Schein J, Zhao S, Osoegawa K, Scott CE, Evans RS, Burridge
PW, Cox TV, Fox CA, Hutton RD, Mullenger IR, Phillips KJ, Smith J, Stalker J,
Threadgold GJ, Birney E, Wylie K, Chinwalla A, Wallis J, Hillier L, Carter J,
191
Gaige T, Jaeger S, Kremitzki C, Layman D, Maas J, McGrane R, Mead K,
Walker R, Jones S, Smith M, Asano J, Bosdet I, Chan S, Chittaranjan S, Chiu R,
Fjell C, Fuhrmann D, Girn N, Gray C, Guin R, Hsiao L, Krzywinski M, Kutsche
R, Lee SS, Mathewson C, McLeavy C, Messervier S, Ness S, Pandoh P, Prabhu
A-L, Saeedi P, Smailus D, Spence L, Stott J, Taylor S, Terpstra W, Tsai M,
Vardy J, Wye N, Yang G, Shatsman S, Ayodeji B, Geer K, Tsegaye G,
Shvartsbeyn A, Gebregeorgis E, Krol M, Russell D, Overton L, Malek JA,
Holmes M, Heaney M, Shetty J, Feldblyum T, Nierman WC, Catanese JJ,
Hubbard T, Waterston RH, Rogers J, de Jong PJ, Fraser CM, Marra M,
McPherson JD, Bentley DR (2002) A physical map of the mouse genome. Nature
418:743-750
Grimsley C, Mather KA, Ober C (1998) HLA-H: a pseudogene with increased variation
due to balancing selection at neighboring loci. Mol Biol Evol 15:1581-1588
Gromme M, Neefjes J (2002) Antigen degradation or presentation by MHC class I
molecules via classical and non-classical pathways. Mol Immunol 39:181-202
Gruen JR, Weissman SM (1997) Evolving views of the major histocompatibility
complex. Blood 90:4252-4265
Gruen JR, Weissman SM (2001) Human MHC class III and IV genes and disease
associations. Front Biosci 6:D960-972
Guermonprez P, Saveanu L, Kleijmeer M, Davoust J, Van Endert P, Amigorena S
(2003) ER-phagosome fusion defines an MHC class I cross-presentation
compartment in dendritic cells. Nature 425:397-402
Gunther E, Walter L (2001) The major histocompatibility complex of the rat (Rattus
norvegicus). Immunogenetics 53:520-542
Gustafson AL, Tallmadge RL, Ramlachan N, Miller D, Bird H, Antczak DF, Raudsepp
T, Chowdhary BP, Skow LC (2003) An ordered BAC contig map of the equine
major histocompatibility complex. Cytogenet Genome Res 102:189-195
192
Gustafsson K, Andersson L (1994) Structure and polymorphism of horse MHC class II
DRB genes: convergent evolution in the antigen binding site. Immunogenetics
39:355-358
Gustafsson K, Germana S, Hirsch F, Pratt K, LeGuern C, Sachs DH (1990) Structure of
miniature swine class II DRB genes: conservation of hypervariable amino acid
residues between distantly related mammalian species. Proc Natl Acad Sci U S A
87:9798-9802
Han CS, Sutherland RD, Jewett PB, Campbell ML, Meincke LJ, Tesmer JG, Mundt MO,
Fawcett JJ, Kim UJ, Deaven LL, Doggett NA (2000) Construction of a BAC
contig map of chromosome 16q by two-dimensional overgo hybridization.
Genome Res 10:714-721
Hansen JD, Strassburger P, Thorgaard GH, Young WP, Du Pasquier L (1999)
Expression, linkage, and polymorphism of MHC-related genes in rainbow trout,
Oncorhynchus mykiss. J Immunol 163:774-786
Haring V, Gray JE, McClure BA, Anderson MA, Clarke AE (1990) Self- incompatibility:
a self-recognition system in plants. Science 250:937-941
Hedrick P (2004) Evolutionary genomics: foxy MHC selection story. Heredity 93:237-
238
Hedrick PW (2002) Pathogen resistance and genetic variation at MHC loci. Evolution
Int J Org Evolution. 56:1902-1908
Heiskanen M, Kallioniemi O, Palotie A (1996) Fiber-FISH: experiences and a refined
protocol. Genet Anal 12:179-184
Herberg JA, Beck S, Trowsdale J (1998) TAPASIN, DAXX, RGL2, HKE2 and four
new genes (BING 1, 3 to 5) form a dense cluster at the centromeric end of the
MHC. J Mol Biol 277:839-857
Hewitt EW, Gupta SS, Lehner PJ (2001) The human cytomegalovirus gene product US6
inhibits ATP binding by TAP. Embo J 20:387-396
Hickford JG, Ridgway HJ, Escayg AP (2000) Evolution of the ovine MHC DQA region.
Anim Genet 31:200-205
193
Hickford JG, Zhou H, Slow S, Fang Q (2004) Diversity of the ovine DQA2 gene. J
Anim Sci 82:1553-1563
Hill AV (1996) Genetic susceptibility to malaria and other infectious diseases: from the
MHC to the whole genome. Parasitology 112 Suppl:S75-84
Hirotsune S (2003) An expressed pseudogene regulates mRNA stability of its
homologous coding gene. Tanpakushitsu Kakusan Koso 48:1908-1912
Hiscock SJ, Kues U (1999) Cellular and molecular mechanisms of sexual
incompatibility in plants and fungi. Int Rev Cytol 193:165-295
Hiscock SJ, Kues U, Dickinson HG (1996) Molecular mechanisms of self-
incompatibility in flowering plants and fungi - different means to the same end.
Trends Cell Biol 6:421-428
Hofmeister V, Weiss EH (2003) HLA-G modulates immune responses by diverse
receptor interactions. Semin Cancer Biol. 13:317-323
Holmes EC, Roberts AF, Staines KA, Ellis SA (2003) Evolution of major
histocompatibility complex class I genes in Cetartiodactyls. Immunogenetics
55:193-202
Horton R, Niblett D, Milne S, Palmer S, Tubby B, Trowsdale J, Beck S (1998) Large-
scale sequence comparisons reveal unusually high levels of variation in the HLA-
DQB1 locus in the class II region of the human MHC. J Mol Biol 282:71-97
Houde M, Bertholet S, Gagnon E, Brunet S, Goyette G, Laplante A, Princiotta MF,
Thibault P, Sacks D, Desjardins M. (2003) Phagosomes are competent organelles
for antigen cross-presentation. Nature 425:402-406
Howcroft TK, Singer DS (2003) Expression of Nonclassical MHC class Ib genes:
comparison of regulatory elements. Immunol Res 27:1-30
Hu S (1996) Studies on Bovine MHC (BoLA) class I gene family: identification and
expression of BoLA class I genes. In VAPH (College Station, Texas A&M
University), pp. 121.
Hughes AL (1991) Testing for interlocus genetic exchange in the MHC: a reply to
Andersson and co-workers. Immunogenetics 33:243-246
194
Hughes AL (1995) Origin and evolution of HLA class I pseudogenes. Mol Biol Evol
12:247-258
Hughes AL, Nei M (1988) Pattern of nucleotide substitution at major histocompatibility
complex class I loci reveals overdominant selection. Nature 335:167-170
Hughes AL, Nei M (1989) Evolution of the major histocompatibility complex:
independent origin of nonclassical class I genes in different groups of mammals.
Mol Biol Evol 6:559-579
Hughes AL, Nei M (1993) Evolutionary relationships of the classes of major
histocompatibility complex genes. Immunogenetics 37:337-346
Hughes AL, Pontarotti P (2000) Gene duplication and MHC origins. Immunogenetics
51:982-983
Hughes AL, Verra F (2002) Extensive polymorphism and ancient origin of Plasmodium
falciparum. Trends in Parasitology 18:348-351
Hughes AL, Yeager M (1997) Molecular evolution of the vertebrate immune system.
Bioessays 19:777-786
Hughes AL, Yeager M (1998a) Natural selection and the evolutionary history of major
histocompatibility complex loci. Front Biosci 3:d509-516
Hughes AL, Yeager M (1998b) Natural selection at major histocompatibility complex
loci of vertebrates. Annu Rev Genet 32:415-435
Hurst JL, Payne CE, Nevison CM, Marie AD, Humphries RE, Robertson DH,
Cavaggioni A, Beynon RJ (2001) Individual recognition in mice mediated by
major urinary proteins. Nature 414:631-634
Hurt P, Walter L, Sudbrak R, Klages S, Muller I, Shiina T, Inoko H, Lehrach H, Gunther
E, Reinhardt R, Himmelbauer H (2004) The genomic sequence and comparative
analysis of the rat major histocompatibility complex. Genome Res 14:631-639
Iannuzzi L, Gallagher DS, Womack JE, Di Meo GP, Skow LC, Ferrara LC (1993)
Chromosomal localization of the major histocompatibility complex in cattle and
river buffalo by fluorescent in situ hybridization. Hereditas 118:187-190
IHGS Consortium (2001) A physical map of the human genome. Nature 409:934-941
195
Inoko H, Mizuki N, Shiina T, Ando A, Kimura M, Kikuchi YY, Kawata H, Sugaya K,
Fukagawa T, Matsumoto K, Nagata T, Taketo M, Okumura K, Kasahara M,
Ikemura T (1996) Cloning, sequencing and evolutionary analyses of the human
major histocompatibility complex (MHC) region. DNA Seq 7:31-32
Ishitani A, Sageshima N, Lee N, Dorofeeva N, Hatake K, Marquardt H, Geraghty DE
(2003) Protein expression and peptide binding suggest unique and interacting
functional roles for HLA-E, F, and G in maternal-placental immune recognition.
J Immunol 171:1376-1384
Jack LJ, Mather IH (1990) Cloning and analysis of cDNA encoding bovine butyrophilin,
an apical glycoprotein expressed in mammary tissue and secreted in association
with the milk-fat globule membrane during lactation. J Biol Chem 265:14481-
14486
Jarvi ST, Tarr CL, McIntosh CE, Atkinson CT, Fleischer RC. (2004) Natural selection
of the major histocompatibility complex (Mhc) in Hawaiian honeycreepers
(Drepanidinae). Mol Ecol. 13:2157-2168
Jones EP, Kumanovics A, Yoshino M, Fischer Lindahl K (1999) Mhc class I and non-
class I gene organization in the proximal H2-M region of the mouse.
Immunogenetics 49:183-195
Jonsson AK, Andersson L, Rask L (1989) Selection for polymorphism in the antigen
recognition site of major histocompatibility complex class II molecules. Scand J
Immunol 30:409-417
Kalmus H (1955) The discrimination by the nose of the dog of individual human odors
and in particular the odors of twins. Br J Animal Behavi 3:25
Kambayashi T, Kraft-Leavy JR, Dauner JG, Sullivan BA, Laur O, Jensen PE (2004) The
nonclassical MHC class I molecule Qa-1 forms unstable peptide complexes. J
Immunol 172:1661-1669
Kambayashi T, Michaelsson J, Fahlen L, Chambers BJ, Sentman CL, Karre K,
Ljunggren HG (2001) Purified MHC class I molecules inhibit activated NK cells
in a cell- free system in vitro. Eur J Immunol 31:869-875
196
Kasahara M (1997) New insights into the genomic organization and origin of the major
histocompatibility complex: role of chromosomal (genome) duplication in the
emergence of the adaptive immune system. Hereditas 127:59-65
Kaufman J (2000) The simple chicken major histocompatibility complex: life and death
in the face of pathogens and vaccines. Philos Trans R Soc Lond B Biol Sci
355:1077-1084
Kaufman J, Jacob J, Shaw I, Walker B, Milne S, Beck S, Salomonsen J (1999a) Gene
organisation determines evolution of function in the chicken MHC. Immunol Rev
167:101-117
Kaufman J, Milne S, Gobel TW, Walker BA, Jacob JP, Auffray C, Zoorob R, Beck S
(1999b) The chicken B locus is a minimal essential major histocompatibility
complex. Nature 401:923-925
Keet IP, Tang J, Klein MR, LeBlanc S, Enger C, Rivers C, Apple RJ, Mann D, Goedert
JJ, Miedema F, Kaslow RA (1999) Consistent associations of HLA class I and II
and transporter gene products with progression of human immunodeficiency
virus type 1 infection in homosexual men. J Infect Dis 180:299-309
Kim JS, Choi SE, Yun IH, Kim JY, Ahn C, Kim SJ, Ha J, Hwang ES, Cha CY,
Miyagawa S, Park CG (2004) Human cytomegalovirus UL18 alleviated human
NK-mediated swine endothelial cell lysis. Biochem Biophys Res Commun
315:144-150
Klein J (1987) Origin of major histocompatibility complex polymorphism: the trans-
species hypothesis. Hum Immunol 19:155-162
Klein J (1991) Of HLA, tryps, and selection: an essay on coevolution of MHC and
parasites. Hum Immunol 30:247-258
Klein J (1998) In an immunological twilight zone. Proc Natl Acad Sci USA 95:11504-
11505
Klein J, O'hUigin C (1993) Composite origin of major histocompatibility complex
genes. Curr Opin Genet Dev 3:923-930
197
Klein J, Ono H, Klein D, O’hUigin C (1993a) The accordion model of MHC evolution.
Prog Immunol 8:137-143
Klein J, Sato A (1998) Birth of the major histocompatibility complex. Scand J Immunol
47:199-209
Klein J, Sato A, O'hUigin C (1998) Evolution by gene duplication in the major
histocompatibility complex. Cytogenet Cell Genet 80:123-127
Klein J, Satta Y, O'hUigin C, Takahata N (1993b) The molecular descent of the major
histocompatibility complex. Annu Rev Immunol 11:269-295
Klein J, Satta Y, Takahata N, O'hUigin C (1993c) Trans-specific Mhc polymorphism
and the origin of species in primates. J Med Primatol 22:57-64
Koller BH, Geraghty DE, Shimizu Y, DeMars R, Orr HT (1988) HLA-E. A novel HLA
class I gene expressed in resting T lymphocytes. J Immunol 141:897-904
Kotzampasaki EM, Spyropoulou-Vlachou MS, Kalofoutis C, Vrani V, Kalofoutis A,
Stavropoulos-Giokas C (2004) Minor histocompatibility antigen HA-1 and HPA-
5 polymorphisms in HLA-identical related bone marrow transplantation.
Transplantation Proceedings 36:1735-1738
Kriener K, O'hUigin C, Klein J (2001) Independent origin of functional MHC class II
genes in humans and New World monkeys. Hum Immunol 62:1-14
Kriener K, O'hUigin C, Tichy H, Klein J (2000) Convergent evolution of major
histocompatibility complex molecules in humans and New World monkeys.
Immunogenetics 51:169-178
Kruiswijk CP, Hermsen TT, Westphal AH, Savelkoul HFJ, Stet RJM (2002) A novel
functional class I lineage in zebrafish (Danio rerio), carp (Cyprinus carpio), and
large barbus (Barbus intermedius) showing an unusual conservation of the
peptide binding domains. J Immunol 169:1936-1947
Krzywinski M, Bosdet I, Smailus D, Chiu R, Mathewson C, Wye N, Barber S, Brown-
John M, Chan S, Chand S, Cloutier A, Girn N, Lee D, Masson A, Mayo M,
Olson T, Pandoh P, Prabhu A-L, Schoenmakers E, Tsai M, Albertson D, Lam W,
Choy C-O, Osoegawa K, Zhao S, de Jong PJ, Schein J, Jones S, Marra MA
198
(2004a) A set of BAC clones spanning the human genome. Nucl. Acids. Res.
32:3651-3660
Krzywinski M, Wallis J, Gosele C, Bosdet I, Chiu R, Graves T, Hummel O, Layman D,
Mathewson C, Wye N, Zhu B, Albracht D, Asano J, Barber S, Brown-John M,
Chan S, Chand S, Cloutier A, Davito J, Fjell C, Gaige T, Ganten D, Girn N,
Guggenheimer K, Himmelbauer H, Kreitler T, Leach S, Lee D, Lehrach H, Mayo
M, Mead K, Olson T, Pandoh P, Prabhu A-L, Shin H, Tanzer S, Thompson J,
Tsai M, Walker J, Yang G, Sekhon M, Hillier L, Zimdahl H, Marziali A,
Osoegawa K, Zhao S, Siddiqui A, de Jong PJ, Warren W, Mardis E, McPherson
JD, Wilson R, Hubner N, Jones S, Marra M, Schein J (2004b) Integrated and
sequence-ordered BAC- and YAC-based physical maps for the rat genome.
Genome Res. 14:766-779
Kubens BS, Krumbacher K, Grosse-Wilde H (1995) Biochemical definition of DLA-A
and DLA-B gene products by one-dimensional isoelectric focusing and
immunoblotting. Eur J Immunogenet 22:199-207
Kuhner MK, Lawlor DA, Ennis PD, Parham P (1991) Gene conversion in the evolution
of the human and chimpanzee MHC class I loci. Tissue Antigens 38:152-164
Kulski JK, Anzai T, Shiina T, Inoko H (2004) Rhesus macaque class I duplicon
structures, organization and evolution within the alpha block of the major
histocompatibility complex. Mol Biol Evol 21:2079-2091
Kulski JK, Dawkins RL (1999a) The P5 multicopy gene family in the MHC is related in
sequence to human endogenous retroviruses HERV-L and HERV-16.
Immunogenetics 49:404-412
Kulski JK, Dunn DS, Gaudieri S, Shiina T, Inoko H (2001a) Genomic and phylogenetic
analysis of the human CD1 and HLA class I multicopy genes. J Mol Evol
53:642-650
Kulski JK, Dunn DS, Hui J, Martinez P, Romphruk AV, Leelayuwat C, Tay GK, Oka A,
Inoko H (2002a) Alu polymorphism within the MICB gene and association with
HLA-B alleles. Immunogenetics 53:975-979
199
Kulski JK, Gaudieri S, Bellgard M, Balmer L, Giles K, Inoko H, Dawkins RL (1997)
The evolution of MHC diversity by segmental duplication and transposition of
retroelements. J Mol Evol 45:599-609
Kulski JK, Gaudieri S, Inoko H, Dawkins RL (1999b) Comparison between two human
endogenous retrovirus (HERV)-rich regions within the major histocompatibility
complex. J Mol Evol 48:675-683
Kulski JK, Gaudieri S, Martin A, Dawkins RL (1999c) Coevolution of PERB11 (MIC)
and HLA class I genes with HERV-16 and retroelements by extended genomic
duplication. J Mol Evol 49:84-97
Kulski JK, Martinez P, Longman-Jacobsen N, Wang W, Williamson J, Dawkins RL,
Shiina T, Naruse T, Inoko H. (2001b) The association between HLA-A alleles
and an Alu dimorphism near HLA-G. J Mol Evol 53:114-123
Kulski JK, Shiina T, Anzai T, Kohara S, Inoko H (2002b) Comparative genomic
analysis of the MHC: the evolution of class I duplication blocks, diversity and
complexity from shark to man. Immunol Rev 190:95-122
Kumanovics A, Takada T, Lindahl KF (2003) Genomic organization of the mammalian
MHC. Annu Rev Immunol 21:629-657
Kumar S, Tamura K, Jakobsen IB, Nei M (2001) MEGA2: molecular evolutionary
genetics analysis software. Bioinformatics 17:1244-1245
Kuroda N, Figueroa F, O'hUigin C, Klein J (2002) Evidence that the separation of Mhc
class II from class I loci in the zebrafish, Danio rerio, occurred by translocation.
Immunogenetics 54:418-430
Kyritsis C, Gorbulev S, Hutschenreiter S, Pawlitschko K, Abele R, Tampe R (2001)
Molecular mechanism and structural aspects of transporter associated with
antigen processing inhibition by the cytomegalovirus protein US6. J Biol Chem
276:48031-48039
Lanier LL (1999) Natural killer cells fertile with receptors for HLA-G? Proc Natl Acad
Sci U S A 96:5343-5345
200
Lanier LL (2000) The origin and functions of natural killer cells. Clin Immunol 95:S14-
18
Lau P, Amadou C, Brun H, Rouillon V, McLaren F, Le Rolle AF, Graham M, Butcher
GW, Joly E (2003) Characterisation of RT1-E2, a multigenic family of highly
conserved rat non-classical MHC class I molecules initially identified in cells
from immunoprivileged sites. BMC Immunol 4:7
Lawlor DA, Ward FE, Ennis PD, Jackson AP, Parham P (1988) HLA-A and B
polymorphisms predate the divergence of humans and chimpanzees. Nature
335:268-271
Lawlor DA, Zemmour J, Ennis PD, Parham P (1990) Evolution of class-I MHC genes
and proteins: from natural selection to thymic selection. Annu Rev Immunol
8:23-63
Le Bouteiller P, Solier C, Proll J, Aguerre-Girr M, Fournel S, Lenfant F (1999) Placental
HLA-G protein expression in vivo: where and what for? Hum Reprod Update
5:223-233
Lee N, Malacko AR, Ishitani A, Chen MC, Bajorath J, Marquardt H, Geraghty DE
(1995) The membrane-bound and soluble forms of HLA-G bind identical sets of
endogenous peptides but differ with respect to TAP association. Immunity 3:591-
600
Lenfant F, Pizzato N, Liang S, Davrinche C, Le Bouteiller P, Horuzsko A (2003)
Induction of HLA-G-restricted human cytomegalovirus pp65 (UL83)-specific
cytotoxic T lymphocytes in HLA-G transgenic mice. J Gen Virol 84:307-317
Lepin EJ, Bastin JM, Allan DS, Roncador G, Braud VM, Mason DY, van der Merwe
PA, McMichael AJ, Bell JI, Powis SH, O'Callaghan CA (2000) Functional
characterization of HLA-F and binding of HLA-F tetramers to ILT2 and ILT4
receptors. Eur J Immunol 30:3552-3561
Leveziel HH (1984) Linkage in cattle between major histocompatibility complex
(BoLA) and the M blood group system. Genetic Selection and Evolution 16:405-
416
201
Lewin HA (1989) Disease resistance and immune response genes in cattle: strategies for
their detection and evidence of their existence. J Dairy Sci 72:1334-1348
Lewin HA, Russell GC, Glass EJ (1999) Comparative organization and function of the
major histocompatibility complex of domesticated cattle. Immunol Rev 167:145-
158
Li S, Kawata H, Katsuyama Y, Ota M, Morishima Y, Mano S, Kulski JK, Naruse T,
Inoko H (2004) Association of polymorphic MHC microsatellites with GVHD,
survival, and leukemia relapse in unrelated hematopoietic stem cell transplant
donor/recipient pairs matched at five HLA loci. Tissue Antigens 63:362-368
Lindberg PG, Andersson L (1988) Close association between DNA polymorphism of
bovine major histocompatibility complex class I genes and serological BoLA-A
specificities. Anim Genet 19:245-255
Linsley PS, Peach R, Gladstone P, Bajorath J (1994) Extending the B7 (CD80) gene
family. Protein Sci 3:1341-1343
Ljunggren HG, Karre K (1990) In search of the 'missing self': MHC molecules and NK
cell recognition. Immunol Today 11:237-244
Lopez-Botet, Miguel, Llano M, Navarro F,Bellon T (2000) NK cell recognition of non-
classical HLA class I molecules. Seminars in Immunology 12:109-119
Lorenzo ME, Ploegh HL, Tirabassi RS (2001) Viral immune evasion strategies and the
underlying cell biology. Semin Immunol 13:1-9
Lundberg AS, McDevitt HO (1992) Evolution of major histocompatibility complex class
II allelic diversity: direct descent in mice and humans. Proc Natl Acad Sci U S A
89:6545-6549
Mallal S, Nolan D, Witt C, Masel G, Martin AM, Moore C, Sayer D, Castley A,
Mamotte C, Maxwell D, James I, Christiansen FT (2002) Association between
presence of HLA-B*5701, HLA-DR7, and HLA-DQ3 and hypersensitivity to
HIV-1 reverse-transcriptase inhibitor abacavir. Lancet 359:727-732
202
Mallet V, Fournel S, Schmitt C, Campan A, Lenfant F, Le Bouteiller P (1999) Primary
cultured human thymic epithelial cells express both membrane-bound and
soluble HLA-G translated products. J Reprod Immunol 43:225-234
Mandelboim O, Reyburn HT, Sheu EG, Vales-Gomez M, Davis DM, Pazmany L,
Strominger JL (1997) The binding site of NK receptors on HLA-C molecules.
Immunity 6:341-350
Mann AJ, Abraham LJ, Cameron PU, Robinson W, Giphart MJ, Dawkins RL (1993)
The caprine MHC contains DYA genes. Immunogenetics 37:292-295
Marchler-Bauer A, Panchenko AR, Shoemaker BA, Thiessen PA, Geer LY, Bryant SH
(2002) CDD: a database of conserved domain alignments with links to domain
three-dimensional structure. Nucl. Acids. Res. 30:281-283
Marra MA, Kucaba TA, Dietrich NL, Green ED, Brownstein B, Wilson RK, McDonald
KM, Hillier LW, McPherson JD, Waterston RH (1997) High throughput
fingerprint analysis of large- insert clones. Genome Res 7:1072-1084
Matsunaga T, Rahman A (1998) What brought the adaptive immune system to
vertebrates?--The jaw hypothesis and the seahorse. Immunol Rev 166:177-186
Matsuo MY, Asakawa S, Shimizu N, Kimura H, Nonaka M (2002) Nucleotide sequence
of the MHC class I genomic region of a teleost, the medaka (Oryzias latipes).
Immunogenetics 53:930-940
Mayer WE, Klein J (2001) Is tapasin a modified Mhc class I molecule? Immunogenetics
53:719-723
Mayer WE, O'hUigin C, Zaleska-Rutczynska Z, Klein J (1992) Trans-species origin of
Mhc-DRB polymorphism in the chimpanzee. Immunogenetics 37:12-23
McDonald JC, Adamashvili I (1998) Soluble HLA: a review of the literature. Hum
Immunol 59:387-403
McLaren FH, Svendsen CN, Van der Meide P, Joly E (2001) Analysis of neural stem
cells by flow cytometry: cellular differentiation modifies patterns of MHC
expression. J Neuroimmunol 112:35-46
203
McShane RD (1998). Organization and expression of bovine MHC (BoLA) class I
genes. In VAPH (College Station, TAMU), pp. 160.
McShane RD, Gallagher DS, Jr., Newkirk H, Taylor JF, Burzlaff JD, Davis SK, Skow
LC (2001) Physical localization and order of genes in the class I region of the
bovine MHC. Anim Genet 32:235-239
Messer G, Zemmour J, Orr HT, Parham P, Weiss EH, Girdlestone J (1992) HLA-J, a
second inactivated class I HLA gene related to HLA-G and HLA-A. Implications
for the evolution of the HLA-A-related genes. J Immunol 148:4043-4053
MHC consortium (1999) Complete sequence and gene map of a human major
histocompatibility complex. Nature 401:921-923
Migliaresi S, Bresciani A, Ambrosone L, Spera M, Barbarulo D, Lombari V, Pirozzi G,
Borgia G, Lombardi ML, Tirri G, Manzo C (2000) Increased serum
concentrations of soluble HLA-class I antigens in hepatitis C virus related mixed
cryoglobulinaemia. Ann Rheum Dis 59:20-25
Mikko S, Roed K, Schmutz S, Andersson L (1999) Monomorphism and polymorphism
at Mhc DRB loci in domestic and wild ruminants. Immunol Rev 167:169-178
Milner CM, Campbell RD (2001) Genetic organization of the human MHC class III
region. Front Biosci 6:D914-926
Miska KB, Harrison GA, Hellman L, Miller RD (2002) The major histocompatibility
complex in monotremes: an analysis of the evolution of Mhc class I genes across
all three mammalian subclasses. Immunogenetics 54:381-393
Mizuki N, Ando H, Kimura M, Ohno S, Miyata S, Yamazaki M, Tashiro H, Watanabe
K, Ono A, Taguchi S, Sugawara C, Fukuzumi Y, Okumura K, Goto K, Ishihara
M, Nakamura S, Yonemoto J, Kikuti YY, Shiina T, Chen L, Ando A, Ikemura T,
Inoko H (1997) Nucleotide sequence analysis of the HLA class I region spanning
the 237-kb segment around the HLA-B and -C genes. Genomics 42:55-66
Momburg F, Hengel H (2002) Corking the bottleneck: the transporter associated with
antigen processing as a target for immune subversion by viruses. Curr Top
Microbiol Immunol 269:57-74
204
Moore CB, John M, James IR, Christiansen FT, Witt CS, Mallal SA (2002) Evidence of
HIV-1 adaptation to HLA-restricted immune responses at a population level.
Science 296:1439-1443
Moretta L, Romagnani C, Pietra G, Moretta A, Mingari MC (2003) NK-CTLs, a novel
HLA-E-restricted T-cell subset. Trends in Immunology 24:136-143
Moser JM, Gibbs J, Jensen PE, Lukacher AE (2002) CD94-NKG2A receptors regulate
antiviral CD8(+) T cell responses. Nat Immunol 3:189-195
Murray BW, Sultmann H, Klein J (1999) Analysis of a 26-kb region linked to the Mhc
in zebrafish: genomic organization of the proteasome component beta/transporter
associated with antigen processing-2 gene cluster and identification of five new
proteasome beta subunit genes. J Immunol 163:2657-2666
Mytelka DS, Chamberlin MJ (1996) Analysis and suppression of DNA polymerase
pauses associated with a trinucleotide consensus. Nucleic Acids Res 24:2774-
2781
Nei M, Gu X, Sitnikova T (1997) Evolution by the birth-and-death process in multigene
families of the vertebrate immune system. Proc Natl Acad Sci U S A 94:7799-
7806
Newkirk H (2000) Construction and analysis of two ordered BAC arrays spanning the
bovine major histocomptibility complex (BoLA). In Veterinary Anatomy and
Public Health, CVM (College Station, Texas A&M University), pp. 197.
Nicolle MW, Nag B, Sharma SD, Willcox N, Vincent A, Ferguson DJ,Newsom-Davis J
(1994) Specific tolerance to an acetylcholine receptor epitope induced in vitro in
myasthenia gravis CD4+ lymphocytes by soluble major histocompatibility
complex class II-peptide complexes. J Clin Invest 93:1361-1369
Niederkorn JY (2003) Mechanisms of immune privilege in the eye and hair follicle. J
Investig Dermatol Symp Proc 8:168-172
Nilsson PR, Schreuder GM, D'Amaro J, Joosten I, Buis RC, Davies CJ, van der Poel JJ
(1994) Serological definition of bovine MHC class II polymorphism in Holstein-
Friesians. Tissue Antigens 43:229-237
205
Norbury CC, Hewlett LJ, Prescott AR, Shastri N, Watts C (1995) Class I MHC
presentation of exogenous soluble antigen via macropinocytosis in bone marrow
macrophages. Immunity 3:783-791
Norbury CC, Princiotta MF, Bacik I, Brutkiewicz RR, Wood P, Elliott T, Bennink JR,
Yewdell JW (2001) Multiple antigen-specific processing pathways for activating
naive CD8+ T cells in vivo. J Immunol 166:4355-4362
O'Brien SJ, Yuhki N (1999) Comparative genome organization of the major
histocompatibility complex: lessons from the Felidae. Immunol Rev 167:133-144
O'Callaghan CA, Bell JI (1998) Structure and function of the human MHC class Ib
molecules HLA-E, HLA-F and HLA-G. Immunol Rev 163:129-138
O'Connor DH, Mothe BR, Weinfurter JT, Fuenger S, Rehrauer WM, Jing P, Rudersdorf
RR, Liebl ME, Krebs K, Vasquez J, Dodds E, Loffredo J, Martin S, McDermott
AB, Allen TM, Wang C, Doxiadis GG, Montefiori DC, Hughes A, Burton DR,
Allison DB, Wolinsky SM, Bontrop R, Picker LJ, Watkins DI (2003) Major
histocompatibility complex class I alleles associated with slow simian
immunodeficiency virus disease progression bind epitopes recognized by
dominant acute-phase cytotoxic-T-lymphocyte responses. J Virol 77:9029-9040
O'Connor KC, Bar-Or A, Hafler DA (2001) The neuroimmunology of multiple sclerosis:
possible roles of T and B lymphocytes in immunopathogenesis. J Clin Immunol
21:81-92
Oetting WS, Lee HK, Flanders DJ, Wiesner GL, Sellers TA, King RA (1995) Linkage
analysis with multiplexed short tandem repeat polymorphisms using infrared
fluorescence and M13 tailed primers. Genomics 30:450-458
Ohno S (1999) Gene duplication and the uniqueness of vertebrate genomes circa 1970-
1999. Semin Cell Dev Biol 10:517-522
Ohno S, Wolf U, Atkin NB (1968) Evolution from fish to mammals by gene duplication.
Hereditas 59:169-187
Ohta T (1998) On the pattern of polymorphisms at major histocompatibility complex
loci. J Mol Evol 46:633-638
206
Ohta Y, Okamura K, McKinney EC, Bartl S, Hashimoto K, Flajnik MF (2000) Primitive
synteny of vertebrate major histocompatibility complex class I and class II genes.
Proc Natl Acad Sci USA 97:4712-4717
O'hUigin C, Satta Y, Hausmann A, Dawkins RL, Klein J (2000) The implications of
intergenic polymorphism for major histocompatibility complex evolution.
Genetics 156:867-877
Oka A, Hayashi H, Tomizawa M, Okamoto K, Suyun L, Hui J, Kulski JK, Beilby J,
Tamiya G, Inoko H (2003) Localization of a non-melanoma skin cancer
susceptibility region within the major histocompatibility complex by association
analysis using microsatellite markers. Tissue Antigens 61:203-210
Oka A, Tamiya G, Tomizawa M, Ota M, Katsuyama Y, Makino S, Shiina T, Yoshitome
M, Iizuka M, Sasao Y, Iwashita K, Kawakubo Y, Sugai J, Ozawa A, Ohkido M,
Kimura M, Bahram S, Inoko H (1999) Association analysis using refined
microsatellite markers localizes a susceptibility locus for psoriasis vulgaris
within a 111 kb segment telomeric to the HLA-C gene. Hum Mol Genet 8:2165-
2170
Osoegawa K, Woon PY, Zhao B, Frengen E, Tateno M, Catanese JJ, de Jong PJ (1998)
An improved approach for construction of bacterial artificial chromosome
libraries. Genomics 52:1-8
Ota M, Katsuyama Y, Kimura A, Tsuchiya K, Kondo M, Naruse T, Mizuki N, Itoh K,
Sasazuki T, Inoko H (2001) A second susceptibility gene for developing
rheumatoid arthritis in the human MHC is localized within a 70-kb interval
telomeric of the TNF genes in the HLA class III region. Genomics 71:263-270
Ota M, Mizuki N, Katsuyama Y, Tamiya G, Shiina T, Oka A, Ando H, Kimura M,Goto
K, Ohno S, Inoko H (1999) The critical region for Behcet disease in the human
major histocompatibility complex is reduced to a 46-kb segment centromeric of
HLA-B, by association analysis using refined microsatellite mapping. Am J Hum
Genet 64:1406-1410
207
Ota T, Nei M (1994) Divergent evolution and evolution by the birth-and-death process
in the immunoglobulin VH gene family. Mol Biol Evol. 11:469-482.
Pagany M, Jagodic M, Bourquin C, Olsson T, Linington C (2003) Genetic variation in
myelin oligodendrocyte glycoprotein expression and susceptibility to
experimental autoimmune encephalomyelitis. Journal of Neuroimmunology
139:1-8
Pamer E, Cresswell P (1998) Mechanisms of MHC class I--restricted antigen processing.
Annu Rev Immunol 16:323-358
Pancer Z, Amemiya, C.T., Gotz, R.A.E., Ceitlin, J., Gartland, G.L., Cooper, M.D. (2004)
Somatic diversification of variable lymphocyte receptors in the agnathan sea
lamprey. Nature 430:174-180
Parham P (1989) MHC protein structure. Getting into the groove. Nature 342:617-618
Parham P (1995) Antigen presentation by class I major histocompatibility complex
molecules: a context for thinking about HLA-G. Am J Reprod Immunol 34:10-19
Park GM, Lee S, Park B, Kim E, Shin J, Cho K, Ahn K (2004a) Soluble HLA-G
generated by proteolytic shedding inhibits NK-mediated cell lysis. Biochemical
and Biophysical Research Communications 313:606-611
Park KI, Ourednik J, Ourednik V, Taylor RM, Aboody KS, Auguste KI, Lachyankar
MB, Redmond DE, Snyder EY (2002) Global gene and cell replacement
strategies via stem cells. Gene Ther 9:613-624
Park YH, Joo YS, Park JY, Moon JS, Kim SH, Kwon NH, Ahn JS, Davis WC, Davies
CJ (2004b) Characterization of lymphocyte subpopulations and major
histocompatibility complex haplotypes of mastitis-resistant and susceptible cows.
J Vet Sci 5:29-39
Pease LR, Horton RM, Pullen JK, Cai ZL (1991) Structure and diversity of class I
antigen presenting molecules in the mouse. Crit Rev Immunol 11:1-32
Pease LR, Horton RM, Pullen JK, Yun TJ (1993) Unusual mutation clusters provide
insight into class I gene conversion mechanisms. Mol Cell Biol 13:4374-4381
208
Penn D, Potts W (1999) The evolution of mating preferences and major
histocompatibility complex geens. Am Nat 153:145-164
Pennisi E (2001) Molecular evolution. Genome duplications: the stuff of evolution?
Science 294:2458-2460
Pham-Dinh D, Mattei MG, Nussbaum JL, Roussel G, Pontarotti P, Roeckel N, Mather
IH, Artzt K, Lindahl KF, Dautigny A (1993) Myelin/oligodendrocyte
glycoprotein is a member of a subset of the immunoglobulin superfamily
encoded within the major histocompatibility complex. Proc Natl Acad Sci U S A
90:7990-7994
Phillips RB, Zimmerman A, Noakes MA, Palti Y, Morasch MR, Eiben L, Ristow SS,
Thorgaard GH, Hansen JD (2003) Physical and genetic mapping of the rainbow
trout major histocompatibility regions: evidence for duplication of the class I
region. Immunogenetics 55:561-569
Piazza A, Torlone N, Valeri M, Poggi E, Monaco PI, Provenzani L, Tisone G, Adorno
D, Casciani CU (1993) Antidonor-HLA antibodies and soluble HLA antigens
after kidney transplant. Transplant Proc 25:3279-3280
Pickl WF, Holter W, Stockl J, Majdic O, Knapp W (1996) Expression of LA45 reactive
beta 2-microglobulin free HLA class I alpha-chains on activated T-cells is
regulated by internalization, constitutive and protein kinase C inducible release.
Tissue Antigens 48:15-21
Pinkel D, Segraves R, Sudar D, Clark S, Poole I, Kowbel D, Collins C, Kuo WL, Chen
C, Zhai Y, Dairkee SH, Ljung BM, Gray JW, Albertson DG (1998) High
resolution analysis of DNA copy number variation using comparative genomic
hybridization to microarrays. Nat Genet 20:207-211
Pizzato N, Garmy-Susini B, Le Bouteiller P, Lenfant F (2004) Differential down-
modulation of HLA-G and HLA-A2 or -A3 cell surface expression following
human cytomegalovirus infection. J Reprod Immunol 62:3-15
Ploegh HL (1998) Viral strategies of immune evasion. Science 280:248-253
209
Porcelli SA, Segelke BW, Sugita M, Wilson IA,Brenner MB (1998) The CD1 family of
lipid antigen-presenting molecules. Immunol Today 19:362-368
Potts WK (2002) Wisdom through immunogenetics. Nat Genet 30:130-131
Potts WK, Slev PR (1995) Pathogen-based models favoring MHC genetic diversity.
Immunol Rev 143:181-197
Potts WK, Wakeland EK (1990) The maintenance of MHC polymorphism. Immunol
Today 11:39-40
Poulsen TS, Johnsen HE (2004) BAC end sequencing. In: Zhao S, Stodolsky M (eds)
Bacterial artificial chromosomes volume 1: library construction, physical
mapping, and sequencing, Humana Press, Totowa, NJ, pp157-162
Princiotta MF, Finzi D, Qian SB, Gibbs J, Schuchmann S, Buttgereit F, Bennink JR,
Yewdell JW (2003) Quantitating protein synthesis, degradation, and endogenous
antigen processing. Immunity 18:343-354
Pullen JK, Horton RM, Cai ZL, Pease LR (1992) Structural diversity of the classical H-2
genes: K, D, and L. J Immunol 148:953-967
Puppo F, Contini P, Ghio M, Brenci S, Scudeletti M, Filaci G, Ferrone S, Indiveri F
(2000) Soluble human MHC class I molecules induce soluble Fas ligand
secretion and trigger apoptosis in activated CD8(+) Fas (CD95)(+) T
lymphocytes. Int Immunol 12:195-203
Puppo F, Ghio M, Contini P, Brenci S, Bignardi D, Filaci G, Scudeletti M, Indiveri F
(1998) Immunoregulatory role of soluble HLA molecules: a new skin for an old
subject? Arch Immunol Ther Exp (Warsz) 46:157-160
Puppo FCP, Ghio M, Indiveri F. (2002) Soluble HLA class I molecules/CD8 ligation
trigger apoptosis of CD8+ cells by Fas/Fas- ligand interaction. Sci World J
12:421-423
Quiniou SM, Wolters WR, Waldbiser GC (2003) Identification of a centromeric repeat
and verification of non-synteny of the MHC class I and II loci in channel catfish,
Ictalurus punctatus, using fluorescence in situ hybridization. Cytogenet Cell
Genet 102:359
210
Rada C, Lorenzi R, Powis SJ, van den Bogaerde J, Parham P, Howard JC (1990)
Concerted evolution of class I genes in the major histocompatibility complex of
murine rodents. Proc Natl Acad Sci USA 87:2167-2171
Radosavljevic M, Cuillerier B, Wilson MJ, Clement O, Wicker S, Gilfillan S, Beck S,
Trowsdale J, Bahram S (2002) A cluster of ten novel MHC class I related genes
on human chromosome 6q24.2-q25.3. Genomics 79:114-123
Rainen L, Oelmueller U, Jurgensen S, Wyrich R, Ballas C, Schram J, Herdman C,
Bankaitis-Davis D, Nicholls N, Trollinger D, Tryon V (2002) Stabilization of
mRNA expression in whole blood samples. Clin Chem 48:1883-1890
Ramlachan N, Womack JE, Skow LC (2004) Analyses of bovine major
histocompatibility (BoLA) class I loci reveal a novel frameshift mutation in a
BoLA-A allele prevalent in wild and feral bovids. In: Skamene E. (ed.)
Immunology 2004. Medimond Srl, Bologna, Italy, pp 51-62
Raudsepp T, Santani A, Wallner B, Kata SR, Ren C, Zhang HB, Womack JE, Skow LC,
Chowdhary BP (2004) A detailed physical map of the horse Y chromosome. Proc
Natl Acad Sci U S A 101:9321-9326
Raymond M, Rousset F (1995) GENEPOP (Version 1.2): population genetics software
for exact tests and ecumenicism. J. Hered. 86:123:143
Rees WA, Yager TD, Korte J, von Hippel PH (1993) Betaine can eliminate the base pair
composition dependence of DNA melting. Biochemistry 32:137-144
Reits E, Griekspoor A, Neijssen J, Groothuis T, Jalink K, van Veelen P, Janssen H,
Calafat J, Drijfhout JW, Neefjes J (2003) Peptide diffusion, protection, and
degradation in nuclear and cytoplasmic compartments before antigen
presentation by MHC Class I. Immunity 18:97-108
Renard C, Chardon P, Vaiman M (2003) The phylogenetic history of the MHC class I
gene families in pig, including a fossil gene predating mammalian radiation. J
Mol Evol 57:420-434
211
Renard C, Vaiman M, Chiannilkulchai N, Cattolico L, Robert C, Chardon P (2001)
Sequence of the pig major histocompatibility region containing the classical class
I genes. Immunogenetics 53:490-500
Reyburn H, Mandelboim O, Vales-Gomez M, Sheu EG, Pazmany L, Davis DM,
Strominger JL (1997a) Human NK cells: their ligands, receptors and functions.
Immunol Rev 155:119-125
Reyburn HT, Mandelboim O, Vales-Gomez M, Davis DM, Pazmany L, Strominger JL
(1997b) The class I MHC homologue of human cytomegalovirus inhibits attack
by natural killer cells. Nature 386:514-517
Rock K, York IA, Saric T, Goldberg AL (2002) Protein degradation and the generation
of MHC class I-presented peptides. Adv Immunol. 80:1-70
Rogers S, Shaw I, Ross N, Nair V, Rothwell L, Kaufman J, Kaiser P (2003) Analysis of
part of the chicken Rfp-Y region reveals two novel lectin genes, the first
complete genomic sequence of a class I alpha-chain gene, a truncated class II
beta-chain gene, and a large CR1 repeat. Immunogenetics 55:100-108
Rubio JP, Bahlo M, Butzkueven H, van Der Mei IA, Sale MM, Dickinson JL, Groom P,
Johnson LJ, Simmons RD, Tait B, Varney M, Taylor B, Dwyer T, Williamson R,
Gough NM, Kilpatrick TJ, Speed TP, Foote SJ (2002) Genetic dissection of the
human leukocyte antigen region by use of haplotypes of Tasmanians with
multiple sclerosis. Am J Hum Genet 70:1125-1137
Rubio JP, Bahlo M, Tubridy N, Stankovich J, Burfoot R, Butzkueven H, Chapman C,
Johnson L, Marriott M, Mraz G, Tait B, Wilkinson C, Taylor B, Speed TP, Foote
SJ, Kilpatrick TJ (2004) Extended haplotype analysis in the HLA complex
reveals an increased frequency of the HFE-C282Y mutation in individuals with
multiple sclerosis. Hum Genet 114:573-580
Safar J, Bartos J, Janda J, Bellec A, Kubalakova M, Valarik M, Pateyron S, Weiserova J,
Tuskova R, Cihalikova J, Vrana J, Simkova H, Faivre-Rampant P, Sourdille P,
Caboche M, Bernard M, Dolezel J, Chalhoub B (2004) Dissecting large and
212
complex genomes: flow sorting and BAC cloning of individual chromosomes
from bread wheat. Plant J 39:960-968
Salih HR, Antropius H, Gieseke F, Lutz SZ, Kanz L, Rammensee HG, Steinle A (2003)
Functional expression and release of ligands for the activating immunoreceptor
NKG2D in leukemia. Blood 102:1389-1396
Salih HR, Rammensee HG, Steinle A (2002) Cutting edge: down-regulation of MICA on
human tumors by proteolytic shedding. J Immunol 169:4098-4102
Salomonsen J, Dunon D, Skjodt K, Thorpe D, Vainio O, Kaufman J (1991) Chicken
major histocompatibility complex-encoded B-G antigens are found on many cell
types that are important for the immune system. Proc Natl Acad Sci U S A
88:1359-1363
Sambrook JG, Russell R, Umrania Y, Edwards YJ, Campbell RD, Elgar G, Clark MS
(2002) Fugu orthologues of human major histocompatibility complex genes: a
genome survey. Immunogenetics 54:367-380
Sato A, Figueroa F, Murray BW, Malaga-Trillo E, Zaleska-Rutczynska Z, Sultmann H,
Toyosawa S, Wedekind C, Steck N, Klein J (2000) Nonlinkage of major
histocompatibility complex class I and class II loci in bony fishes.
Immunogenetics 51:108-116
Sato A, Mayer WE, Tichy H, Grant PR, Grant BR, Klein J (2001) Evolution of Mhc
class II B genes in Darwin's finches and their closest relatives: birth of a new
gene. Immunogenetics 53:792-801
Sawai H, Kawamoto Y, Takahata N, Satta Y (2004) Evolutionary Relationships of
Major Histocompatibility Complex Class I Genes in Simian Primates. Genetics
166:1897-1907
Sawhney SM, Hasima NN, Glass EJ, al-Murrani SW, Nichani AK, Spooner RL,
Williams JL, Russell GC (1995) Transfection, expression, and DNA sequence of
a gene encoding a BoLA-A11 antigen. Immunogenetics 41:246-250
213
Sawhney SM, Taylor DW, Russell GC (2001) Polymorphism of bovine major
histocompatibility complex (MHC) class I genes revealed by polymerase chain
reaction (PCR) and restriction enzyme analysis. Anim Genet 32:27-31
Schat KA (1987) Marek's disease: a model for protection against herpesvirus- induced
tumours. Cancer Surv 6:1-37
Schat KA, Taylor RL Jr, Briles WE (1994) Resistance to Marek's disease in chickens
with recombinant haplotypes to the major histocompatibility (B) complex. Poult
Sci 73:502-508
Schein J, Kucaba T, Sekhon M, Smailus D, Waterston R, Marra M (2004) High-
throughput BAC fingerprinting. In: Zhao S, Stodolsky M (eds) Bacterial artificial
chromosomes volume 1: library construction, physical mapping, and sequencing,
Humana Press, Totowa, NJ, pp 143-156
Schibler L, Cribiu EP, Oustry-Vaiman A, Furet J-P,Vaiman D (2000) Fine mapping
suggests that the goat polled intersex syndrome and the human blepharophimosis
ptosis epicanthus syndrome map to a 100-kb homologous region. Genome Res.
10:311-318
Schibler L, Roig A, Mahe MF, Save JC, Gautier M, Taourit S, Boichard D, Eggen A,
Cribiu EP (2004) A first generation bovine BAC-based physical map. Genet Sel
Evol 36:105-122
Schmitz A, Herrgen H, Winkeler A, Herzog V (2000) Cholera toxin is exported from
microsomes by the Sec61p complex. J. Cell Biol. 148:1203-1212
Schneider SD, Roessli D, Excoffier, L (2000). Arlequin: A software for population
genetics data analysis Ver 2.000 (Geneva, University of Geneva).
Scofield VL, Schlumpberger JM, West LA,Weissman IL (1982) Protochordate
allorecognition is controlled by a MHC-like gene system. Nature 295:499-502
Scott PC, Maddox JF, Gogolin-Ewens KJ, Brandon MR (1991) The nucleotide sequence
and evolution of ovine MHC class II B genes: DQB and DRB. Immunogenetics
34:80-87
214
Sena L, Schneider MP, Brenig B, Honeycutt RL, Womack JE,Skow LC (2003)
Polymorphisms in MHC-DRA and -DRB alleles of water buffalo (Bubalus
bubalis) reveal different features from cattle DR alleles. Anim Genet 34:1-10
Sharif S, Mallard BA, Sargeant JM (2000) Presence of glutamine at position 74 of
pocket 4 in the BoLA-DR antigen binding groove is associated with occurrence
of clinical mastitis caused by Staphylococcus species. Vet Immunol
Immunopathol 76:231-238
Sharif S, Mallard BA, Wilkie BN, Sargeant JM, Scott HM, Dekkers JC, Leslie KE
(1998) Associations of the bovine major histocompatibility complex DRB3
(BoLA-DRB3) alleles with occurrence of disease and milk somatic cell score in
Canadian dairy cattle. Anim Genet 29:185-193
Sharif S, Mallard BA, Wilkie BN, Sargeant JM, Scott HM, Dekkers JC, Leslie KE
(1999) Associations of the bovine major histocompatibility complex DRB3
(BoLA-DRB3) with production traits in Canadian dairy cattle. Anim Genet
30:157-160
Shigenari A, Ando A, Renard C, Chardon P, Shiina T, Kulski JK, Yasue H, Inoko H
(2004) Nucleotide sequencing analysis of the swine 433-kb genomic segment
located between the non-classical and classical SLA class I gene clusters.
Immunogenetics 55:695-705
Shiina T, Kikkawa E, Saito W, Tamiya G, Oka A, Watanabe K, Yamazaki M, Tashiro
H, Okumura K, Ando A, Kimura M, Soeda E, Pontarotti P, Inoko H (1998)
Physical mapping between the S and HLA-E genes in the human MHC class I
region: construction of a BAC, PAC, and cosmid contig. Immunogenetics
48:402-407
Shiina T, Oka A, Imanishi T, Hanzawa K,Gojobori T,Watanabe S, Inoko H (1999a)
Multiple class I loci expressed by the quail Mhc. Immunogenetics 49:456-460
Shiina T, Shimizu S, Hosomichi K, Kohara S, Watanabe S, Hanzawa K, Beck S, Kulski
JK, Inoko H (2004) Comparative genomic analysis of two avian (quail and
chicken) MHC regions. J Immunol 172:6751-6763
215
Shiina T, Shimizu C, Oka A, Teraoka Y, Imanishi T, Gojobori T, Hanzawa K, Watanabe
S, Inoko H (1999b) Gene organization of the quail major histocompatibility
complex (MhcCoja) class I gene region. Immunogenetics 49:384-394
Shiina T, Tamiya G, Oka A, Takishima N, Inoko H (1999c) Genome sequencing
analysis of the 1.8 Mb entire human MHC class I region. Immunol Rev 167:193-
199
Shiina T, Tamiya G, Oka A, Takishima N, Yamagata T, Kikkawa E, Iwata K, Tomizawa
M, Okuaki N, Kuwano Y, Watanabe K, Fukuzumi Y, Itakura S, Sugawara C,
Ono A, Yamazaki M, Tashiro H, Ando A, Ikemura T, Soeda E, Kimura M,
Bahram S, Inoko H (1999d) Molecular dynamics of MHC genesis unraveled by
sequence ana lysis of the 1,796,938-bp HLA class I region. Proc Natl Acad Sci
USA 96:13282-13287
Shizuya H, Birren B., Kim UJ, MancinoV, Slepak T, TachiiriY, Simon M (1992)
Cloning and stable maintenance of 300-kilobase-pair fragments of human DNA
in Escherichia coli using an F-factor-based vector. Proc. Natl Acad. Sci. USA
89:8794-8797
Siebold C, Hansen BE, Wyer JR, Harlos K, Esnouf RE, Svejgaard A, Bell JI, Strominger
JL, Jones EY, Fugger L (2004) Crystal structure of HLA-DQ0602 that protects
against type 1 diabetes and confers strong susceptibility to narcolepsy. PNAS
101:1999-2004
Siegel AF, Trask B, Roach JC, Mahairas GG, Hood L, van den Engh G (1999) Analysis
of Sequence-Tagged-Connector Strategies for DNA Sequencing. Genome Res.
9:297-307
Skow LC, Snaples SN, Davis SK, Taylor JF, Huang B,Gallagher DH (1996)
Localization of bovine lymphocyte antigen (BoLA) DYA and class I loci to
different regions of chromosome 23. Mamm Genome 7:388-389
Skow LC, Womack JE, Petresh JM, Miller WL (1988) Synteny mapping of the genes for
21 steroid hydroxylase, alpha A crystallin, and class I bovine leukocyte antigen
in cattle. DNA 7:143-149
216
Smith TP, Rohrer GA, Alexander LJ, Troyer DL, Kirby-Dobbels KR, Janzen MA,
Cornwell DL, Louis CF, Schook LB, Beattie CW (1995) Directed integration of
the physical and genetic linkage maps of swine chromosome 7 reveals that the
SLA spans the centromere. Genome Res 5:259-271
Snell GD (1948) Methods for the study of histocompatibility genes. J. Genet. 49:87-108
Snell GD, Higgins GF (1951) Alleles at the histocompatibility-2 locus in the mouse as
determined by tumor transplantation. Genetics 36:306-310
Soderlund C, Humphray S, Dunham A,French L (2000) Contigs built with fingerprints,
markers, and FPC V4.7. Genome Res 10:1772-1787
Soderlund C, Longden I, Mott R (1997) FPC: a system for building contigs from
restriction fingerprinted clones. Comput Appl Biosci 13:523-535
Sourdis J, Nei M (1988) Relative efficiencies of the maximum parsimony and distance-
matrix methods in obtaining the correct phylogenetic tree. Mol Biol Evol 5:298-
311
Spooner RL, Leveziel H, Grosclaude F, Oliver RA,Vaiman M (1978) Evidence for a
possible major histocompatibility complex (BLA) in cattle. J Immunogenet
5:325-346
Sriwatanawongsa V, Davies HS, Calne RY (1995) The essential roles of parenchymal
tissues and passenger leukocytes in the tolerance induced by liver grafting in rats.
Nature Medicine 1:428-432
Steinle A, Li P, Morris DL, Groh V, Lanier LL, Strong RK, Spies T (2001) Interactions
of human NKG2D with its ligands MICA, MICB, and homologs of the mouse
RAE-1 protein family. Immunogenetics 53:279-287
Stephens R, Horton R, Humphray S, Rowen L, Trowsdale J, Beck S (1999) Gene
organisation, sequence variation and isochore structure at the centromeric
boundary of the human MHC. J Mol Biol 291:789-799
Stewart CA, Horton R, Allcock RJ, Ashurst JL, Atrazhev AM, Coggill P, Dunham I,
Forbes S, Halls K, Howson JM, Humphray SJ, Hunt S, Mungall AJ, Osoegawa
K, Palmer S, Roberts AN, Rogers J, Sims S, Wang Y, Wilming LG, Elliott JF, de
217
Jong PJ, Sawcer S, Todd JA, Trowsdale J, Beck S (2004) Complete MHC
haplotype sequencing for common disease gene mapping. Genome Res 14:1176-
1187
Stone RT, Muggli-Cockett NE (1990) Partial nucleotide sequence of a novel bovine
major histocompatibility complex class II beta-chain gene, BoLA-DIB. Anim
Genet 21:353-360
Sugita M, Moody DB, Jackman RM, Grant EP, Rosat JP, Behar SM, Peters PJ, Porcelli
SA, Brenner MB (1998) CD1--a new paradigm for antigen presentation and T
cell activation. Clin Immunol Immunopathol 87:8-14
Sulston J, Mallett F, Staden R, Durbin R, Horsnell T, Coulson A (1988) Software for
genome mapping by fingerprinting techniques. Comput Appl Biosci 4:125-132
Sultmann H, Sato A, Murray BW, Takezaki N, Geisler R, Rauch GJ, Klein J (2000)
Conservation of Mhc class III region synteny between zebrafish and human as
determined by radiation hybrid mapping. J Immunol 165:6984-6993
Swofford DL (2002). PAUP*. Phylogenetic analysis using parsimony (*and other
methods) version 4. Sinauer Assoc., Sunderland, MA
Swofford DL, Waddell PJ, Huelsenbeck JP, Foster PG, Lewis PO, Rogers JS (2001)
Bias in phylogenetic estimation and its relevance to the choice between
parsimony and likelihood methods. Syst Biol 50:525-539
Takada T, Kumanovics A, Amadou C, Yoshino M, Jones EP, Athanasiou M, Evans GA,
Fischer Lindahl K (2003) Species-specific class I gene expansions formed the
telomeric 1 mb of the mouse major histocompatibility complex. Genome Res
13:589-600
Takahata N, Nei M (1990) Allelic genealogy under overdominant and frequency-
dependent selection and polymorphism of major histocompatibility complex loci.
Genetics 124:967-978
Takahata N, Satta Y, Klein J (1992) Polymorphism and balancing selection at major
histocompatibility complex loci. Genetics 130:925-938
218
Takami K, Zaleska-Rutczynska Z, Figueroa F, Klein J (1997) Linkage of LMP, TAP,
and RING3 with Mhc class I rather than class II genes in the zebrafish. J
Immunol 159:6052-6060
Tatusova TA, Madden TL (1999) BLAST 2 Sequences, a new tool for comparing
protein and nucleotide sequences. FEMS Microbiol Lett 174:247-250
Tompkins SM, Kraft JR, Dao CT, Soloski MJ, Jensen PE (1998) Transporters associated
with antigen processing (TAP)- independent presentation of soluble insulin to
alpha/beta T cells by the class Ib gene product, Qa-1(b). J Exp Med 188:961-971
Totaro A, Grifa A, Carella M, Rommens JM, Valentino MA, Roetto A, Zelante L,
Gasparini P (1998) Cloning of a new gene (FB19) within HLA class I region.
Biochem Biophys Res Commun 250:555-557
Trachtulec Z, Hamvas RM, Forejt J, Lehrach HR, Vincek V, Klein J (1997) Linkage of
TATA-binding protein and proteasome subunit C5 genes in mice and humans
reveals synteny conserved between mammals and invertebrates. Genomics 44:1-
7
Trowsdale J (1995) "Both man & bird & beast": comparative organization of MHC
genes. Immunogenetics 41:1-17
Trowsdale J (2001) Genetic and functional relationships between MHC and NK receptor
genes. Immunity 15:363-374
Trowsdale J, Parham P (2004) Mini-review: defense strategies and immunity-related
genes. Eur J Immunol 34:7-17
Truedsson L, Sturfelt G, Johansen P, Nived O, Thuresson B (1995) Sharing of MHC
haplotypes among patients with systemic lupus erythematosus from unrelated
Caucasian multicase families: disease association with the extended haplotype
[HLA-B8, SC01, DR17]. J Rheumatol 22:1852-1861
Tsai WC, Chen CJ, Yen JH, Ou TT, Tsai JJ, Liu CS, Liu HW (2002) Free HLA class I
heavy chain-carrying monocytes--a potential role in the pathogenesis of
spondyloarthropathies. J Rheumatol 29:966-972
219
Ulbrecht M, Hofmeister V, Yuksekdag G, Ellwart JW, Hengel H, Momburg F,
Martinozzi S, Reboul M, Pla M, Weiss EH (2003) HCMV glycoprotein US6
mediated inhibition of TAP does not affect HLA-E dependent protection of K-
562 cells from NK cell lysis. Hum Immunol 64:231-237
Vales-Gomez M, Reyburn H, Strominger J (2000) Interaction between the human NK
receptors and their ligands. Crit Rev Immunol 20:223-244
Vallesi A, Giuli G, Bradshaw RA, Luporini P (1995) Autocrine mitogenic activity of
pheromones produced by the protozoan ciliate Euplotes raikovi. Nature 376:522-
524
Vallesi A, Giuli G, Ghiara P, Scapigliati G, Luporini P (1998) Structure-function
relationships of pheromones of the ciliate Euplotes raikovi with mammalian
growth factors: cross-reactivity between Er-1 and interleukin-2 systems. Exp Cell
Res 241:253-259
van der Meer A, Lukassen HGM, van Lierop MJC, Wijnands F, Mosselman S, Braat
DDM, Joosten I (2004) Membrane-bound HLA-G activates proliferation and
interferon-{gamma} production by uterine natural killer cells. Mol. Hum.
Reprod. 10:189-195
van der Poel JJ, Groenen MA, Dijkhof RJ, Ruyter D, Giphart MJ (1990) The nucleotide
sequence of the bovine MHC class II alpha genes: DRA, DOA, and DYA.
Immunogenetics 31:29-36
van der Ven K, Pfeiffer K, Skrablin S (2000) HLA-G polymorphisms and molecule
function--questions and more questions--a review. Placenta 21 Suppl A:S86-92
Vance RE, Kraft JR, Altman JD, Jensen PE, Raulet DH (1998) Mouse CD94/NKG2A is
a natural killer cell receptor for the nonclassical major histocompatibility
complex (MHC) class I molecule Qa-1(b). J Exp Med 188:1841-1848
Velten FW, Renard, C., Rogel-Gaillard, C., Vaiman, M., Chardon, P. (1999) Spatial
arrangement of pig MHC class I sequences. Immunogenetics 49:919-930
220
Vernet C, Boretto J, Mattei MG, Takahashi M, Jack LJ, Mather IH, Rouquier S,
Pontarotti P (1993) Evolutionary study of multigenic families mapping close to
the human MHC class I region. J Mol Evol 37:600-612
Vienne A, Shiina T, Abi-Rached L, Danchin E, Vitiello V, Cartault F, Inoko H,
Pontarotti P (2003) Evolution of the proto-MHC ancestral region: more evidence
for the plesiomorphic organisation of human chromosome 9q34 region.
Immunogenetics 55:429-436
Villar LM, Roy G, Lazaro I, Alvarez-Cermeno JC, Gonzalez M, Brieva JA, Del la Sen
ML, Leoro G, Bootello A, Gonzalez-Porque P (1989) Detection of soluble class I
molecules (non HLA-A or HLA-B) in serum, spleen membranes and
lymphocytes in culture. Eur J Immunol 19:1835-1839
Vogel TU, Evans DT, Urvater JA, O'Connor DH, Hughes AL, Watkins DI (1999) Major
histocompatibility complex class I genes in primates: co-evolution with
pathogens. Immunol Rev 167:327-337
Volik S ZS, Chin K, Brebner JH, Herndon DR, Tao Q, Kowbel D, Huang G, Lapuk A,
Kuo WL, Magrane G, De Jong P, Gray JW, Collins C. (2003) End-sequence
profiling: sequence-based analysis of aberrant genomes. Proc Natl Acad Sci U S
A. 100:7696-7701.
Wagner JL, Burnett RC, Storb R (1999) Organization of the canine major
histocompatibility complex: current perspectives. J Hered 90:35-38
Wagner JL, Sarmiento UM, Storb R (2002) Cellular, serological, and molecular
polymorphism of the class I and class II loci of the canine Major
Histocompatibility Complex. Tissue Antigens 59:205-210
Wang B, Norbury CC, Greenwood R, Bennink JR, Yewdell JW, Frelinger JA (2001)
Multiple paths for activation of naive CD8+ T cells: CD4-independent help. J
Immunol 167:1283-1289
Wang Y, Geer LY, Chappey C, Kans JA, Bryant SH (2000) Cn3D: sequence and
structure views for Entrez. Trends in Biochemical Sciences 25:300-302
221
Warner CM, Tyas DA, Goldstein C, Comiskey M, Cohen J, Brenner CA (2002)
Genotyping: the HLA system and embryo development. Reprod Biomed Online
4:133-139
Weissman IL, Saito Y, Rinkevich B (1990) Allorecognition histocompatibility in a
protochordate species: is the relationship to MHC somatic or structural?
Immunol Rev 113:227-241
Wiertz EJ, Jones TR, Sun L, Bogyo M, Geuze HJ, Ploegh HL (1996a) The human
cytomegalovirus US11 gene product dislocates MHC class I heavy chains from
the endoplasmic reticulum to the cytosol. Cell 84:769-779
Wiertz EJ, Tortorella D, Bogyo M, Yu J, Mothes W, Jones TR, Rapoport TA, Ploegh
HL (1996b) Sec61-mediated transfer of a membrane protein from the
endoplasmic reticulum to the proteasome for destruction. Nature 384:432-438
Williams F, Curran MD, Middleton D (1999) Characterisation of a novel HLA-A
pseudogene, HLA-BEL, with significant sequence identity with a gorilla MHC
class I gene. Tissue Antigens 54:360-369
Wilson IA, Bjorkman PJ (1998) Unusual MHC-like molecules: CD1, Fc receptor, the
hemochromatosis gene product, and viral homologs. Curr Opin Immunol 10:67-
73
Wolfe KH (2001) Yesterday's polyploids and the mystery of diploidization. Nat Rev
Genet 2:333-341
Wright H, Ballingall, K. T., Redmond, J. (1994) The DY sub-region of the sheep MHC
contains an A/B gene pair. Immunogenetics 40:230-234
Wu JD, Higgins LM, Steinle A, Cosman D, Haugk K, Plymate SR (2004) Prevalent
expression of the immunostimulatory MHC class I chain-related molecule is
counteracted by shedding in prostate cancer. J. Clin. Invest. 114:560-568
Xu A, van Eijk MJ, Park C, Lewin HA (1993) Polymorphism in BoLA-DRB3 exon 2
correlates with resistance to persistent lymphocytosis caused by bovine leukemia
virus. J Immunol 151:6977-6985
222
Yamauchi K, Murphy D, Cantor H, Gershon RK (1981) Analysis of an antigen-specific
H-2-restricted cell- free products(s) made by "I-J-" Ly-2 cells (Ly-2 TsF) that
suppresses Ly-2 cell-depleted spleen cell activity. Eur J Immunol 11:913-918
Yamazaki K, Beauchamp GK, Curran M, Bard J, Boyse EA (2000) Parent-progeny
recognition as a function of MHC odortype identity. Proc Natl Acad Sci U S A
97:10500-10502
Yano Y, Saito R, Yoshida N, Yoshiki A, Wynshaw-Boris A, Tomita M, Hirotsune S
(2004) A new role for expressed pseudogenes as ncRNA: regulation of mRNA
stability of its homologous coding gene. J Mol Med 82:414-422
Yeager M, Hughes AL (1999) Evolution of the mammalian MHC: natural selection,
recombination, and convergent evolution. Immunol Rev 167:45-58
Yeager M, Kumar S, Hughes AL (1997) Sequence convergence in the peptide-binding
region of primate and rodent MHC class Ib molecules. Mol Biol Evol 14:1035-
1041
Yewdell JW, Norbury CC, Bennink JR (1999) Mechanisms of exogenous antigen
presentation by MHC class I molecules in vitro and in vivo: implications for
generating CD8+ T cell responses to infectious agents, tumors, transplants, and
vaccines. Adv Immunol 73:1-77
Yoshino M, Xiao H, Jones EP, Kumanovics A, Amadou C, Fischer Lindahl K (1997)
Genomic evolution of the distal Mhc class I region on mouse Chr 17. Hereditas
127:141-148
Younger RM, Amadou C, Bethel G, Ehlers A, Lindahl KF, Forbes S, Horton R, Milne S,
Mungall AJ, Trowsdale J, Volz A, Ziegler A, Beck S (2001) Characterization of
clustered MHC-linked olfactory receptor genes in human and mouse. Genome
Res 11:519-530
Yu CY (1998) Molecular genetics of the human MHC complement gene cluster. Exp
Clin Immunogenet 15:213-230
223
Yuhki N, Beck T, Selway S, Stephens R, O'Brien SJ (2003a) Establishment of a 1.8 Mb
sequence draft of feline Mhc (FLA) class I region and comparative sequence
analysis of class I region between HLA and FLA. Human Immunology 64:S166
Yuhki N, Beck T, Stephens RM, Nishigaki Y, Newmann K, O'Brien SJ (2003b)
Comparative genome organization of human, murine, and feline MHC class II
region. Genome Res 13:1169-1179
Yuhki N, Heidecker GF, O'Brien SJ (1989) Characterization of MHC cDNA clones in
the domestic cat. Diversity and evolution of class I genes. J Immunol 142:3676-
3682
Yuhki N, O'Brien SJ (1997) Nature and origin of polymorphism in feline MHC class II
DRA and DRB genes. J Immunol 158:2822-2833
Yun TJ, Melvold RW, Pease LR (1997) A complex major histocompatibility complex D
locus variant generated by an unusual recombination mechanism in mice. Proc
Natl Acad Sci U S A 94:1384-1389
Zavazava N (1998) Soluble HLA class I molecules: biological significance and clinical
implications. Mol Med Today 4:116-121
Zavazava N, Kronke M (1996) Soluble HLA class I molecules induce apoptosis in
alloreactive cytotoxic T lymphocytes. Nat Med 2:1005-1010
Zavazava N, Muller-Ruchholtz W (1994) Quantitative and biochemical characterization
of soluble HLA class I antigens shed by cultured human cells. Hum Immunol
40:174-178
Zemmour J, Koller BH, Ennis PD, Geraghty DE, Lawlor DA, Orr HT, Parham P (1990)
HLA-AR, an inactivated antigen-presenting locus related to HLA-A.
Implications for the evolution of the MHC. J Immunol 144:3619-3629
Zernich D, Purcell AW, Macdonald WA, Kjer-Nielsen L, Ely LK, Laham N, Crockford
T, Mifsud NA, Bharadwaj M, Chang L, Tait BD, Holdsworth R, Brooks AG,
Bottomley SP, Beddoe T, Peh CA, Rossjohn J, McCluskey J (2004) Natural
HLA class I polymorphism controls the pathway of antigen presentation and
susceptibility to viral evasion. J. Exp. Med. 200:13-24
224
Zhang J, Rosenberg HF, Nei M (1998) Positive Darwinian selection after gene
duplication in primate ribonuclease genes. Proc Natl Acad Sci U S A 95:3708-
3713
Zhou H, Hickford JG (2004) Allelic polymorphism in the ovine DQA1 gene. J Anim
Sci. 82:8-16
Ziegler A, Dohr G, Uchanska-Ziegler B (2002) Possible roles for products of
polymorphic MHC and linked olfactory receptor genes during selection
processes in reproduction. Am J Reprod Immunol 48:34-42
225
VITA
Nicole Ramlachan
175 Hilda Ave., #615
Willowdale, ON., Canada M2M 1V8
Education
2003 Ph.D., Genetics
Texas A&M University, Department of Veterinary Integrative Biosciences
1995 M.Sc., Genetics
University of Guelph, Guelph, ON. Canada, College of Agriculture
1993 B.Agr., Animal Science
University of Guelph, Guelph, ON. Canada, College of Agriculture
University Fellow Honours
Publications
Gustafson, AL, Tallmadge, RL, Ramlachan, N, Miller, D, Bird, H, Antczak, DF, Raudsepp, T, Chowdhary, BP, and Skow, LC (2003) An ordered BAC contig map of the equine major histocompatibility complex. Cytogenet Genome Res 102: 189-95
Ramlachan, N, Womack, JE, Skow, LC (2004) Analyses of bovine major
histocompatibility (BoLA) class I loci reveal a novel frameshift mutation in a BoLA-A allele prevalent in wild and feral bovids. In: Skamene E (ed) Immunology 2004. Medimond Srl, Bologna, pp 51-62
Top Related
Copyright © 2022 FDOKUMEN

