


Bahasa
Halaman
Hukum


OIDA International Journal of Sustainable Development
Volume 09 Issue 04, 2016
The Journal of the Ontario International Development Agency ISSN 1923-6654 (print) ISSN 1923-6662 (online)
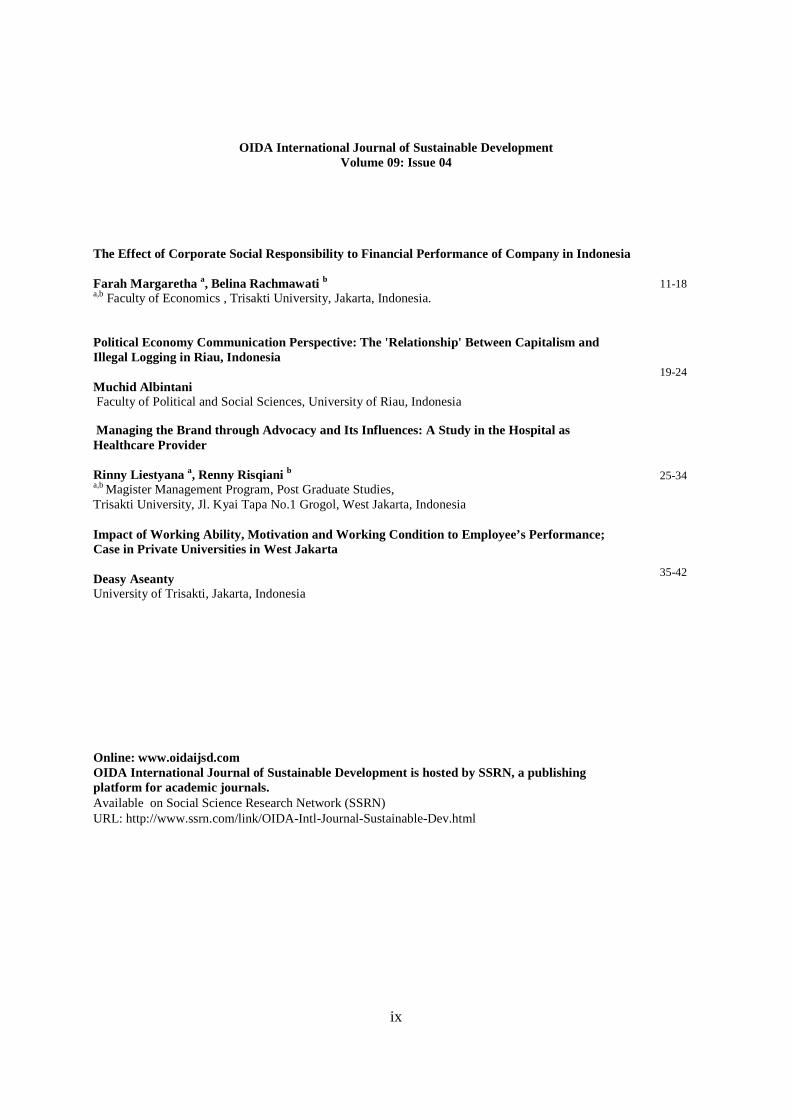
The Effect of Corporate Social Responsibility to Financial Performance of Company in Indonesia Farah Margaretha a, Belina Rachmawati b a,b Faculty of Economics , Trisakti University, Jakarta, Indonesia.
11-18
Political Economy Communication Perspective: The 'Relationship' Between Capitalism and Illegal Logging in Riau, Indonesia Muchid Albintani Faculty of Political and Social Sciences, University of Riau, Indonesia
19-24
Managing the Brand through Advocacy and Its Influences: A Study in the Hospital as Healthcare Provider Rinny Liestyana a, Renny Risqiani b
a,b Magister Management Program, Post Graduate Studies, Trisakti University, Jl. Kyai Tapa No.1 Grogol, West Jakarta, Indonesia
25-34
Impact of Working Ability, Motivation and Working C ondition to Employee’s Performance; Case in Private Universities in West Jakarta Deasy Aseanty University of Trisakti, Jakarta, Indonesia
35-42
Online: www.oidaijsd.com OIDA International Journal of Sustainable Development is hosted by SSRN, a publishing platform for academic journals. Available on Social Science Research Network (SSRN) URL: http://www.ssrn.com/link/OIDA-Intl-Journal-Sustainable-Dev.html

i
OIDA
International Journal of Sustainable Development
Volume 09, Issue 04
2016
Ontario International Development Agency Canada

ii

iii
OIDA International Journal of Sustainable Development
ISSN 1923 – 6654 (print) ISSN 1923 – 6662 (online)
The OIDA International Journal of Sustainable Development is a forum presenting high-quality research in both social and applied science to a broad audience of communities working in international development. The articles will appeal to social and applied scientists, both inside and outside academia, as well as non specialists. In addition, the OIDA International Journal of Sustainable Development publishes specially-commissioned feature articles and the proceedings of papers presented at its International Conference on Sustainable Development which focuses on the synthesis and integration of applied research and its application to future research agendas.

iv

v
The OIDA International Journal of Sustainable Development is published by the Ontario International Development Agency, Canada. Single issue (hard copy) can be purchased by contacting the Ontario International Development Agency. Open Access Journal OIDA Publications, OIDA International Development Agency, Ontario, Canada Copyright © Authours et al Printed in Canada. ISSN 1923 – 6654 (print) ISSN 1923 – 6662 (online) The OIDA International Journal of Sustainable Development is indexed in the SSRN e-library (Social Science Research Network). Back issues are also available in PDF format through online http://www.ssrn.com/link/OIDA-Intl-Journal-Sustainable-Dev.html All correspondence forward to: Managing Editor OIDA International Journal of Sustainable Development 364 Moffatt Pond Crt, Ottawa, Ontario, K2J 0C7 Canada. Tel: + 1 613 612 7615 e-mail: [email protected] For all photocopies and reproduction requests, contact OIDA Publications Ontario International Journal of Sustainable Development 364 Moffatt Pond Crt, Ottawa, Ontario, K2J 0C7 Canada. Tel: + 1 613 612 7615 Fax: + 1 613 823 7158 e-mail: [email protected] The opinions expressed herein are those of the respective authors and do not necessarily reflect the opinion of the Ontario International Development Agency. Cite as: OIDA-Intl-Journal-Sustainable-Dev.

vi
vii
OIDA International Journal of Sustainable Development
ISSN 1923 – 6654 (print) ISSN 1923 – 6662 (online)
Editorial Board
Dr. Henri R. Pallard, Ph.D. (Executive Editor / Editor-in-Chief) Director, International Centre for Interdisciplinary Research in Law Professor Law and Justice Laurentian University 935, Ramsey Lake Road, Sudbury Ontario, P3E 2C6 CANADA
Dr. Neville Hewage, Ph.D. (Managing Editor) Researcher International Centre for Interdisciplinary Research in Law (ICIRL) Laurentian University 935, Ramsey Lake Road, Sudbury Ontario, P3E 2C6 CANADA.
Dr. Christopher Isike, Ph.D. Head, Department of Politics and International Studies (POLIS), University of Zululand, SOUTH AFRICA
Dr. Kooi Guan (Steven) Cheah, Ph.D. Faculty, Economics Department, School of Business, Kwantlen Polytechnic University, Surrey, British Columbia, CANADA
Dr. Mohshin Habib, Ph.D. Senior Lecturer, Department of Leadership and Management & Director, Post Graduate Program in International Business, Faculty of Business and Enterprise Swinburne University of Technology PO Box 218 Hawthorn (Mail No. H23), Victoria 3122 AUSTRALIA.
Dr. Masudur Rahman, Ph.D. Associate Professor Faculty of Development and Economic Sociology University of Nordland NORWAY.
Dr. Stamatios Tzitzis, Ph.D Institute of Criminology, University of Paris II, FRANCE.
Dr. Manuel Juan Pelaez Albendea, Ph.D. University of Malaga, SPAIN.
Dr. Paulo Ferreira Da Cunha, Ph.D. University of Porto, PORTUGAL.
Dr. Maria Protopapa-Marneli, Ph.D. Academy of Athens, GREECE.

viii
ix
OIDA International Journal of Sustainable Development Volume 09: Issue 04
The Effect of Corporate Social Responsibility to Financial Performance of Company in Indonesia Farah Margaretha a, Belina Rachmawati b a,b Faculty of Economics , Trisakti University, Jakarta, Indonesia.
11-18
Political Economy Communication Perspective: The 'Relationship' Between Capitalism and Illegal Logging in Riau, Indonesia Muchid Albintani Faculty of Political and Social Sciences, University of Riau, Indonesia
19-24
Managing the Brand through Advocacy and Its Influences: A Study in the Hospital as Healthcare Provider Rinny Liestyana a, Renny Risqiani b
a,b Magister Management Program, Post Graduate Studies, Trisakti University, Jl. Kyai Tapa No.1 Grogol, West Jakarta, Indonesia
25-34
Impact of Working Ability, Motivation and Working C ondition to Employee’s Performance; Case in Private Universities in West Jakarta Deasy Aseanty University of Trisakti, Jakarta, Indonesia
35-42
Online: www.oidaijsd.com OIDA International Journal of Sustainable Development is hosted by SSRN, a publishing platform for academic journals. Available on Social Science Research Network (SSRN) URL: http://www.ssrn.com/link/OIDA-Intl-Journal-Sustainable-Dev.html
x
Determinants of Poverty: Panel Data Analysis in Asean-5; 1990 – 2013 Mona Adriana University of Trisakti, Jakarta, Indonesia
43-52
Designing Online Marketing For SME (Organic Food Case Study) Hasrini Sari a, Aditya Parama Setiaboedi b a, b Industrial Engineering Management, Institut Teknologi Bandung, Bandung, Indonesia.
53-62
Indoor Environmental Quality Credits in Green Buil dings in India Subodhika Vohra a, Meenakshi Mital b a,b Department of Resource Management and Design Application, Lady Irwin College, University of Delhi, India
63-80
OIDA Publications Ontario International Development Agency 364 Moffatt Pond Court Ottawa Ontario, K2J 0C7 Canada Published by Ontario International Development Agency, Canada.
The Effect of Corporate Social Responsibility to Financial Performance of Company in Indonesia
Farah Margaretha a, Belina Rachmawati b
a,b Faculty of Economics , Trisakti University, Jakarta, Indonesia. Corresponding authour: [email protected]
© Authour(s)
OIDA International Journal of Sustainable Development, Ontario International Development Agency, Canada ISSN 1923-6654 (print) ISSN 1923-6662 (online)
Available at http://www.ssrn.com/link/OIDA-Intl-Journal-Sustainable-Dev.html
Abstract: This study aims to determine the effect of corporate social responsibility (employee, environment, and community) to financial performance (ROA and Tobin 's Q). This study using a sample of 30 primary sector companies listed in Indonesia Stock Exchange for the period 2010-2013 which is choosen using purposive sampling method. The analysis used in this study is multiple regression analysis with the Statistical Package for the Social Science ( SPSS ) as its program. The results of this study indicate that CSR measured through indicators of employee has no significant effect on the company's financial performance as measured by ROA and Tobin 's Q. Environment has a significant effect on ROA but not against Tobin 's Q. Community has a significant effect both on ROA and Tobin 's Q. The results of this study can be used by managers for consideration to improve the financial performance by choosing environment and the community as a social activity.
Keywords: corporate social responsibility, financial performance, return on asset, Tobin’s Q
Introduction
lmost all of the companies in Indonesia both large and small have come to realize that implementing environmental concerns about the impact of their business activities are important . This is demonstrated by the many activities of corporate social responsibility ( CSR ) . Reinforced with the realization that as long as
this government , the Indonesian economy has been built on the foundation of the theory of growth that provide unlimited opportunities for large companies to exploit natural resources but little or not at all provide mutual benefits to the community in which the property was obtained ( Achda , 2006) .
Surrounding environment is not only the natural environment alone . Stakeholders , or rather those who have a direct impact on the business activities carried on by a company , becoming one of the priorities when discussing about CSR . Stakeholders can be divided into two types: primary and secondary ( Carroll , 2009) . Primary stakeholders are those directly related to the organization and the most influential , such as shareholders , employees and consumers . Secondary stakeholders are those who are not involved directly to the organization , but could be the most influential on the business . They are the government , the media , and competitors .
CSR activities by companies are not only intended as a responsibility to the environment . These activities are also conducted in order to attract investors to glance at a business that can maintain its business activities. With the CSR, the company expects an added value for having done a good thing in maintaining business continuity. This added value which can then raise the company's financial performance is obtained from the interests of stakeholders and shareholders. In an investor's perspective, CSR can be a thing that brings value-added enterprises, but also the one thing that is not useful. By doing social activities, a company means doing sustainable business. However, these social activities can also be a burden for the company; this means that there is a cash purse to be reduced.
Through the perspective of the consumer and public audiences, CSR is an excellent activity because it reflects the company of its responsibility towards society. With more and more conscious people will care about the environment, consumer behavior changes, too. This behavior can affect demand. The study revealed that 30 % of consumers are considering environmental issues to the products they buy ( Young et . Al . , 2010) . These perspectives into consideration strategies for companies . Strategies that should be considered in order not to be a financial burden to be incurred for social programs because of course that is not good news for investors or shareholders . But the strategy is also important to consider that the company's business continuity is not disrupted .
A
12 Margaretha and Rachmawati / OIDA International Journal of Sustainable Development 09:04 (2016)
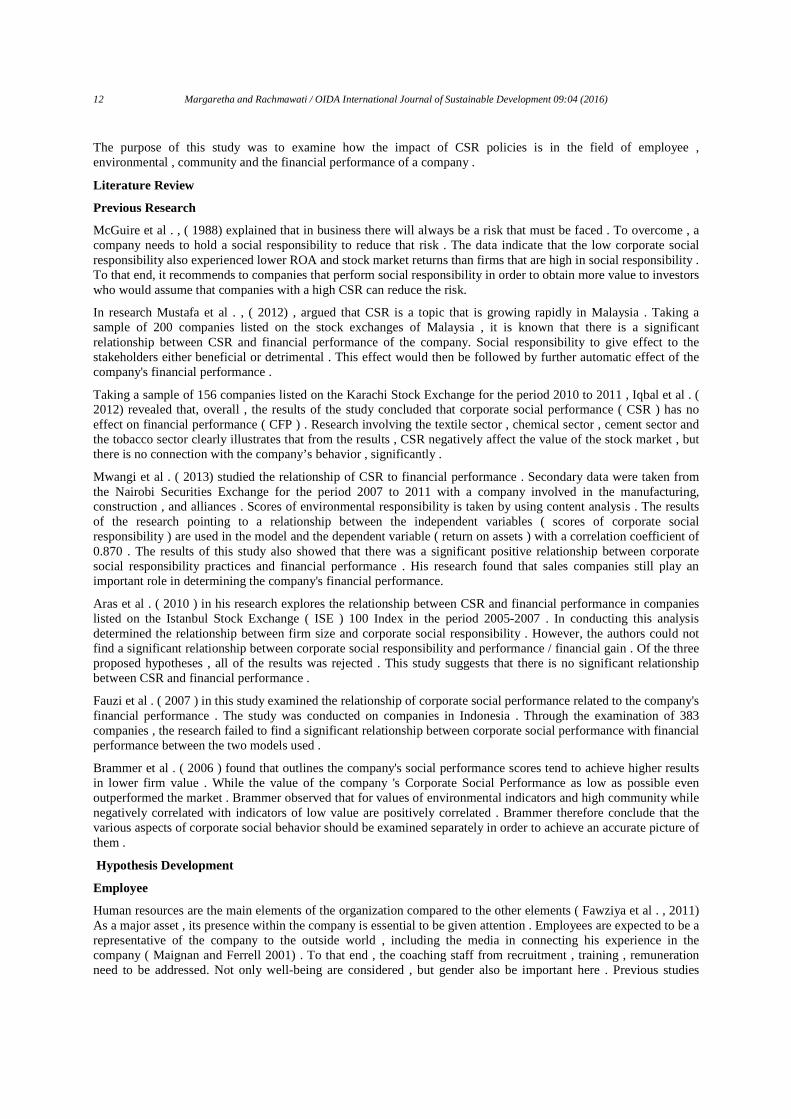
The purpose of this study was to examine how the impact of CSR policies is in the field of employee , environmental , community and the financial performance of a company .
Literature Review
Previous Research
McGuire et al . , ( 1988) explained that in business there will always be a risk that must be faced . To overcome , a company needs to hold a social responsibility to reduce that risk . The data indicate that the low corporate social responsibility also experienced lower ROA and stock market returns than firms that are high in social responsibility . To that end, it recommends to companies that perform social responsibility in order to obtain more value to investors who would assume that companies with a high CSR can reduce the risk.
In research Mustafa et al . , ( 2012) , argued that CSR is a topic that is growing rapidly in Malaysia . Taking a sample of 200 companies listed on the stock exchanges of Malaysia , it is known that there is a significant relationship between CSR and financial performance of the company. Social responsibility to give effect to the stakeholders either beneficial or detrimental . This effect would then be followed by further automatic effect of the company's financial performance .
Taking a sample of 156 companies listed on the Karachi Stock Exchange for the period 2010 to 2011 , Iqbal et al . ( 2012) revealed that, overall , the results of the study concluded that corporate social performance ( CSR ) has no effect on financial performance ( CFP ) . Research involving the textile sector , chemical sector , cement sector and the tobacco sector clearly illustrates that from the results , CSR negatively affect the value of the stock market , but there is no connection with the company’s behavior , significantly .
Mwangi et al . ( 2013) studied the relationship of CSR to financial performance . Secondary data were taken from the Nairobi Securities Exchange for the period 2007 to 2011 with a company involved in the manufacturing, construction , and alliances . Scores of environmental responsibility is taken by using content analysis . The results of the research pointing to a relationship between the independent variables ( scores of corporate social responsibility ) are used in the model and the dependent variable ( return on assets ) with a correlation coefficient of 0.870 . The results of this study also showed that there was a significant positive relationship between corporate social responsibility practices and financial performance . His research found that sales companies still play an important role in determining the company's financial performance.
Aras et al . ( 2010 ) in his research explores the relationship between CSR and financial performance in companies listed on the Istanbul Stock Exchange ( ISE ) 100 Index in the period 2005-2007 . In conducting this analysis determined the relationship between firm size and corporate social responsibility . However, the authors could not find a significant relationship between corporate social responsibility and performance / financial gain . Of the three proposed hypotheses , all of the results was rejected . This study suggests that there is no significant relationship between CSR and financial performance .
Fauzi et al . ( 2007 ) in this study examined the relationship of corporate social performance related to the company's financial performance . The study was conducted on companies in Indonesia . Through the examination of 383 companies , the research failed to find a significant relationship between corporate social performance with financial performance between the two models used .
Brammer et al . ( 2006 ) found that outlines the company's social performance scores tend to achieve higher results in lower firm value . While the value of the company 's Corporate Social Performance as low as possible even outperformed the market . Brammer observed that for values of environmental indicators and high community while negatively correlated with indicators of low value are positively correlated . Brammer therefore conclude that the various aspects of corporate social behavior should be examined separately in order to achieve an accurate picture of them .
Hypothesis Development
Employee
Human resources are the main elements of the organization compared to the other elements ( Fawziya et al . , 2011) As a major asset , its presence within the company is essential to be given attention . Employees are expected to be a representative of the company to the outside world , including the media in connecting his experience in the company ( Maignan and Ferrell 2001) . To that end , the coaching staff from recruitment , training , remuneration need to be addressed. Not only well-being are considered , but gender also be important here . Previous studies
Margaretha and Rachmawati / OIDA International Journal of Sustainable Development 09:04 (2016) 13
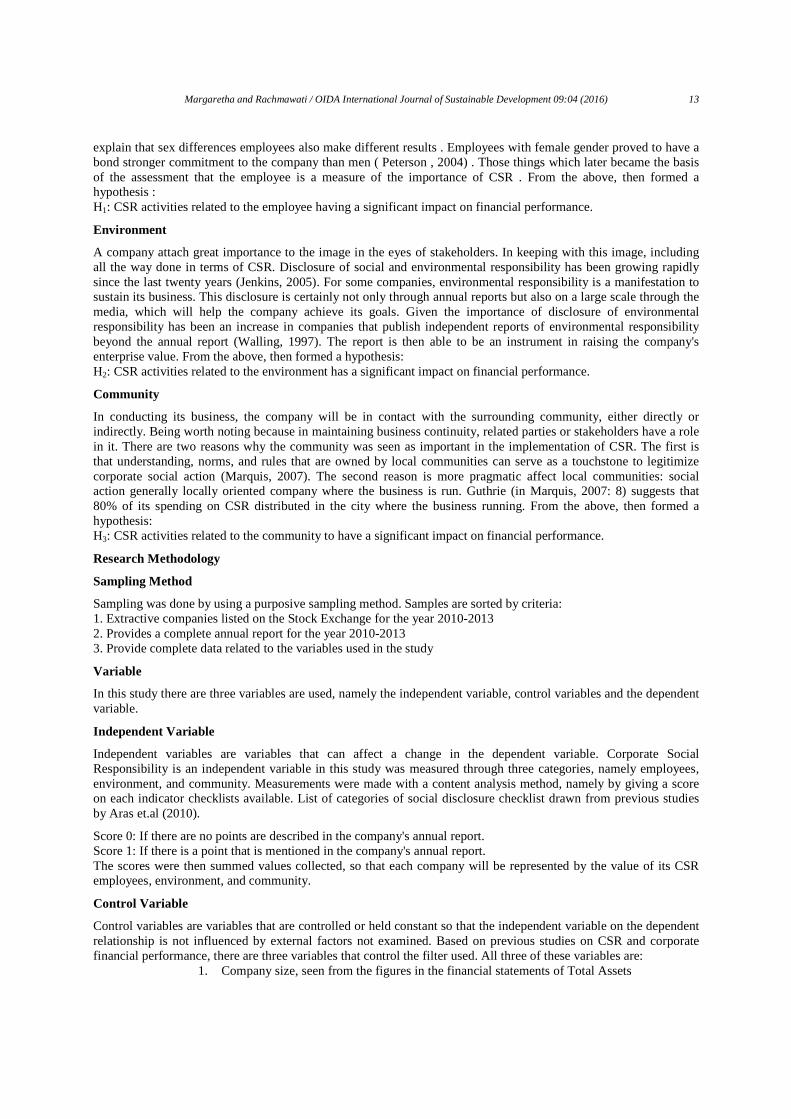
explain that sex differences employees also make different results . Employees with female gender proved to have a bond stronger commitment to the company than men ( Peterson , 2004) . Those things which later became the basis of the assessment that the employee is a measure of the importance of CSR . From the above, then formed a hypothesis : H1: CSR activities related to the employee having a significant impact on financial performance.
Environment
A company attach great importance to the image in the eyes of stakeholders. In keeping with this image, including all the way done in terms of CSR. Disclosure of social and environmental responsibility has been growing rapidly since the last twenty years (Jenkins, 2005). For some companies, environmental responsibility is a manifestation to sustain its business. This disclosure is certainly not only through annual reports but also on a large scale through the media, which will help the company achieve its goals. Given the importance of disclosure of environmental responsibility has been an increase in companies that publish independent reports of environmental responsibility beyond the annual report (Walling, 1997). The report is then able to be an instrument in raising the company's enterprise value. From the above, then formed a hypothesis: H2: CSR activities related to the environment has a significant impact on financial performance.
Community
In conducting its business, the company will be in contact with the surrounding community, either directly or indirectly. Being worth noting because in maintaining business continuity, related parties or stakeholders have a role in it. There are two reasons why the community was seen as important in the implementation of CSR. The first is that understanding, norms, and rules that are owned by local communities can serve as a touchstone to legitimize corporate social action (Marquis, 2007). The second reason is more pragmatic affect local communities: social action generally locally oriented company where the business is run. Guthrie (in Marquis, 2007: 8) suggests that 80% of its spending on CSR distributed in the city where the business running. From the above, then formed a hypothesis: H3: CSR activities related to the community to have a significant impact on financial performance.
Research Methodology
Sampling Method
Sampling was done by using a purposive sampling method. Samples are sorted by criteria: 1. Extractive companies listed on the Stock Exchange for the year 2010-2013 2. Provides a complete annual report for the year 2010-2013 3. Provide complete data related to the variables used in the study
Variable
In this study there are three variables are used, namely the independent variable, control variables and the dependent variable.
Independent Variable
Independent variables are variables that can affect a change in the dependent variable. Corporate Social Responsibility is an independent variable in this study was measured through three categories, namely employees, environment, and community. Measurements were made with a content analysis method, namely by giving a score on each indicator checklists available. List of categories of social disclosure checklist drawn from previous studies by Aras et.al (2010).
Score 0: If there are no points are described in the company's annual report. Score 1: If there is a point that is mentioned in the company's annual report. The scores were then summed values collected, so that each company will be represented by the value of its CSR employees, environment, and community.
Control Variable
Control variables are variables that are controlled or held constant so that the independent variable on the dependent relationship is not influenced by external factors not examined. Based on previous studies on CSR and corporate financial performance, there are three variables that control the filter used. All three of these variables are:
1. Company size, seen from the figures in the financial statements of Total Assets
14 Margaretha and Rachmawati / OIDA International Journal of Sustainable Development 09:04 (2016)
2. Sales of the company, seen from the figures in the financial statements Sales
3. EPS =
Dependent Variable Dependent Variable in this research is financial performance. Calculate through two indicators:
1. Return on Asset ROA is a measure of financial performance of the acquired company's financial statements.
2. Tobin’s Q Tobin's q is the ratio of the market value of the company's assets as measured by the market value of the number of shares outstanding and net asset value of the company's outstanding shares
Tobin’s Q =
(Hettiarachchi and Gunawardana, 2012)
Method Analysis
o answer the hypothesis, researchers using multiple regression method with correlation. Multiple Linear Regression analysis was used to measure the influence of more than one predictor variables (independent variables) on the dependent variable. In this study, researchers used two regression based on the dependent variables, respectively.
1. Multiple linear regression analysis with ROA as the dependent variable Y1 = α + β₁X₁ + β₂X₂ + β3X3 + β4X4 + β5X5 + β6X6 + e 2. Multiple linear regression analysis with Tobin’s Q as the dependent variable Y2 = α + β₁X₁ + β₂X₂ + β3X3 + β4X4 + β5X5 + β6X6 + e
Explanation Y1= ROA Y2= Tobin’s Q α =Constanta β₁ - β6=Coefficient Regression X₁= Employee X₂= Environment X3= Community X4= Total Aset X5= Sales X6= EPS The significance level used was 0,05 (α = 5%)
If the significance of t > 0.05, means Ho accepted or Ha rejected, and If the significance of t < 0.05, means Ho rejected or Ha accepted
Next page
Margaretha and Rachmawati / OIDA International Journal of Sustainable Development 09:04 (2016) 15
Results
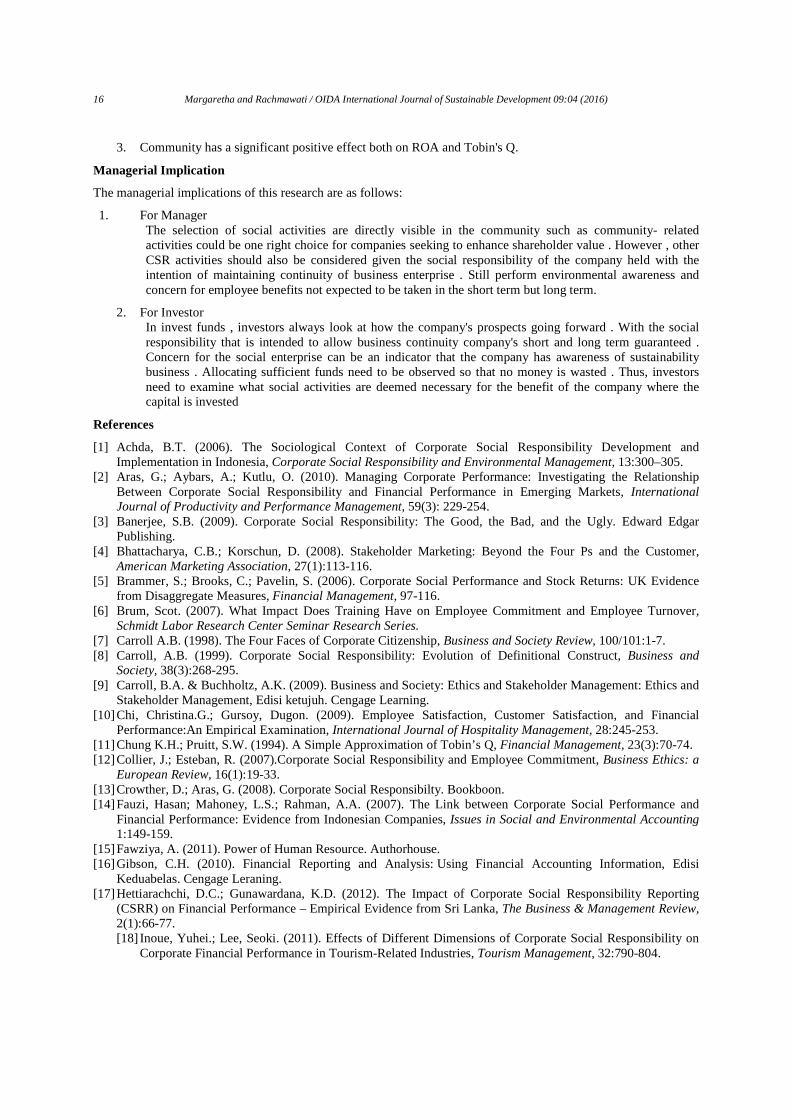
Table 1 t-Test Result
Variable name Constanta Coefficient Sig. Conclusion
Model 1 (y=ROA) -0,532
Employee Environment Community Total Asset Sales EPS
-0,003 -0,013 0,017 0,003 0,049
0,000412
0,136 0,002 0,005 0,877 0,001 0,001
Not Significance Significance Significance
Not Significance Significance Significance
Model 2 (y=Tobin’s Q) 894,173 Employee Environment Community Total Asset Sales EPS
-3,928 0,539 20,278 -50,00 -24,356 -0,014
0,079 0,888 0,001 0,003 0,068 0,716
Not Significance Not Significance
Significance Significance
Not Significance Not Significance
From the results of the T test table above, conclude:
1. Employees Based on calculations of data using SPSS results obtained for model 1, the regression coefficient of -0.003 employees (negative) with a significance value of 0.136> 0.05 level. This means that the employee does not have a significant effect on the financial performance as measured by return on assets. For model 2, the regression coefficient of -3.928 employees (negative) and significance value of 0.079> 0.05. This means that employees no significant effect on Tobin's Q
2. Environment Based on calculations of data using SPSS results obtained for model 1, the regression coefficient of -0.013 environment (negative) with a significance value of 0.002 <0.05. This means that the environment significantly influence financial performance as measured by return on assets. For model 2, the regression coefficient of 0.539 environment (positive) and significance value of 0.888> 0.05. This means that the environment does not significantly influence Tobin's Q
3. Community Based on calculations of data using SPSS results obtained for model 1, the regression coefficient of 0.017 community (positive) with a significance value of 0.005 <0.05. This means that communities have a significant effect on the financial performance as measured by return on assets. For model 2, the regression coefficient of community 20.278 (positive) and significance value of 0.001 <0.05. This means that communities have a significant effect on Tobin's Q
Conclusion
This study aimed to determine the effect of corporate social responsibility is measured using indicators of employees, the environment and the community that the company's financial performance is measured using ROA and Tobin's Q. This study used a sample of 30 companies listed on the primary sector Indonesia Stock Exchange for the period 2009-2012. Based on the description and analysis of the previous discussion, it can be concluded as follows:
1. Employee has no significance effect to ROA and Tobin’s Q 2. Environment has a significant negative effect on ROA but has no significant effect on Tobin's Q
16 Margaretha and Rachmawati / OIDA International Journal of Sustainable Development 09:04 (2016)
3. Community has a significant positive effect both on ROA and Tobin's Q.
Managerial Implication
The managerial implications of this research are as follows:
1. For Manager The selection of social activities are directly visible in the community such as community- related activities could be one right choice for companies seeking to enhance shareholder value . However , other CSR activities should also be considered given the social responsibility of the company held with the intention of maintaining continuity of business enterprise . Still perform environmental awareness and concern for employee benefits not expected to be taken in the short term but long term.
2. For Investor In invest funds , investors always look at how the company's prospects going forward . With the social responsibility that is intended to allow business continuity company's short and long term guaranteed . Concern for the social enterprise can be an indicator that the company has awareness of sustainability business . Allocating sufficient funds need to be observed so that no money is wasted . Thus, investors need to examine what social activities are deemed necessary for the benefit of the company where the capital is invested
References
[1] Achda, B.T. (2006). The Sociological Context of Corporate Social Responsibility Development and Implementation in Indonesia, Corporate Social Responsibility and Environmental Management, 13:300–305.
[2] Aras, G.; Aybars, A.; Kutlu, O. (2010). Managing Corporate Performance: Investigating the Relationship Between Corporate Social Responsibility and Financial Performance in Emerging Markets, International Journal of Productivity and Performance Management, 59(3): 229-254.
[3] Banerjee, S.B. (2009). Corporate Social Responsibility: The Good, the Bad, and the Ugly. Edward Edgar Publishing.
[4] Bhattacharya, C.B.; Korschun, D. (2008). Stakeholder Marketing: Beyond the Four Ps and the Customer, American Marketing Association, 27(1):113-116.
[5] Brammer, S.; Brooks, C.; Pavelin, S. (2006). Corporate Social Performance and Stock Returns: UK Evidence from Disaggregate Measures, Financial Management, 97-116.
[6] Brum, Scot. (2007). What Impact Does Training Have on Employee Commitment and Employee Turnover, Schmidt Labor Research Center Seminar Research Series.
[7] Carroll A.B. (1998). The Four Faces of Corporate Citizenship, Business and Society Review, 100/101:1-7. [8] Carroll, A.B. (1999). Corporate Social Responsibility: Evolution of Definitional Construct, Business and
Society, 38(3):268-295. [9] Carroll, B.A. & Buchholtz, A.K. (2009). Business and Society: Ethics and Stakeholder Management: Ethics and
Stakeholder Management, Edisi ketujuh. Cengage Learning. [10] Chi, Christina.G.; Gursoy, Dugon. (2009). Employee Satisfaction, Customer Satisfaction, and Financial
Performance:An Empirical Examination, International Journal of Hospitality Management, 28:245-253. [11] Chung K.H.; Pruitt, S.W. (1994). A Simple Approximation of Tobin’s Q, Financial Management, 23(3):70-74. [12] Collier, J.; Esteban, R. (2007).Corporate Social Responsibility and Employee Commitment, Business Ethics: a
European Review, 16(1):19-33. [13] Crowther, D.; Aras, G. (2008). Corporate Social Responsibilty. Bookboon. [14] Fauzi, Hasan; Mahoney, L.S.; Rahman, A.A. (2007). The Link between Corporate Social Performance and
Financial Performance: Evidence from Indonesian Companies, Issues in Social and Environmental Accounting 1:149-159.
[15] Fawziya, A. (2011). Power of Human Resource. Authorhouse. [16] Gibson, C.H. (2010). Financial Reporting and Analysis: Using Financial Accounting Information, Edisi
Keduabelas. Cengage Leraning. [17] Hettiarachchi, D.C.; Gunawardana, K.D. (2012). The Impact of Corporate Social Responsibility Reporting
(CSRR) on Financial Performance – Empirical Evidence from Sri Lanka, The Business & Management Review, 2(1):66-77. [18] Inoue, Yuhei.; Lee, Seoki. (2011). Effects of Different Dimensions of Corporate Social Responsibility on
Corporate Financial Performance in Tourism-Related Industries, Tourism Management, 32:790-804.
Margaretha and Rachmawati / OIDA International Journal of Sustainable Development 09:04 (2016) 17
[19] Iqbal, Nadeem; Ahmad, Naveed; Basheer, N.A.; Nadeem, Muhammad. (2012). Impact of Corporate Social Responsibility on Financial Performance of Corporations: Evidence from Pakistan, International Journal of Learning & Development, 2(6): 107-118.
[20] Jaworski, B.J.; Kohli A.K. (1993). Market Orientation: Antecedents and Consequences, Journal of Marketing, 57:53-70.
[21] Jenkins, H.; Yakovleva, N. (2005). Corporate Social Responsibility in the Mining Industry: Exploring Trends in Social and Environmental Disclosure, Journal of Cleaner Production, 14:271-284.
[22] Jones, J.P.; Heitger, D.L.; Mowen, M.M.; Hansen, D.R. (2011). Cornerston of Financial & Managerial Accounting (2nd ed). Cengage Learning.
[23] Maignan, I.; Ferrell, O.C.; Hult, G.T.M. (1999). Corporate Citizenship: Cultural Antecedents and Business Benefits, Journal of the Academy of Marketing Science, 27(4):455-469.
[24] Maignan, I; Ferrell, O.C. (2004). Corporate Social Responsibility and Marketing: An Integrative Framework, Journal of the Academy of Marketing Science, 32(1):3-19.
[25] Margaretha, Farah. (2011). Manajemen Keuangan untuk Manajer Non Keuangan. Jakarta: Erlangga. [26] Marquis, C.; Glynn, M.A.; Davis, G.F. (2007). Community Isomorphism and Corporate Social Action,
Acedemy of Management Review. [27] McGuire, J.B.; Sundgren, A.; Schneeweis, T. (1988). Corporate Social Responsibility and Firm Financial
Performance, The Academy of Management Journal, 31(4):854-872. [28] Mcwilliams, A.; Siegel, D. (2001). Corporate Social Responsibility: A Theory of the Firm Perspective, The
Academy of Management Review, 26(1):117-127. [29] Mehran, Hamid. (1995). Executive compensation structure, ownership, and firm performance, Journal of
Financial Economics, 38:163-184. [30] Mustafa, S.A.; Othmana A.R.; Perumal, S. (2012). Corporate Social Responsibility And Company Performance
In The Malaysian Context, Social and Behavioral Sciences, 65:897 – 905. [31] Mwangi, C.I. & Jerotich, O.J. (2013). The Relationship between Corporate Social Responsibility Practices and
Financial Performance of Firms in the Manufacturing Construction and Allied Sector of the Nairobi Securities Exchange, International Journal of Business, Humanities and Technology, 3(2): 81-90.
[32] Needles, B.E.; Powers, M.; Crosson S.V. (2010). Principles of Accounting (11th ed). Cengage Learning. [33] Ngambi, M.T.; Oloume, Frederic. (2013). Employee Share Ownership and Firm Performance: Evidence From
Sample of Cameroonian Firms, International Journal of Research in Social Sciences, 2:48-55. [34] Orlitzky, M.; SchmidtF.L.; Rynes, S.L. (2003). Corporate Social and Financial Performance: A Meta-analysis,
Organization Studies, 24(3): 403–441. [35] Peterson, D.K., (2004). The Relationship between Perceptions of Corporate Citizenship and Organizational
Commitment, Business & Society, 43(3):296-319. [36] Rakhiemah, A.N.; Agustia, Dian. (2012). Pengaruh Kinerja Lingkungan Terhadap Corporate Social
Responsibility (CSR) Disclosure dan Kinerja Finansial Perusahaan Manufaktur yang Terdaftar di Bursa Efek Indonesia.
[37] Saadullah, S.; Rezaee, Z. (2012). Do Satisfaied Employees Lead to Better Financial Performance, Research Journal of Economics, Business, and ICT, 5:13-20.
[38] Spurgeon, A.; Harrington, J.M; Cooper, C.L. (1997). Health and Safety Problems Associated with Long Working Hours: a Review of the Current Position, Occupation Environ Med, 54:367-375.
[39] Stancu, A.;Grigore, G.F.;Rosca, M.I. (2011). The Impact of Corporate Social Responsibility on Employees, International Conference on Information and Finance, 21:11-16.
[40] Strecker, N. (2009). Innovation Strategy and Firm Performance: An empirical study of publicly listed firms. Springer.
[41] Waddock, S.A. (1997). The Corporate Social Performance-Financial Performance Link, Strategic Management Journal, 184:303-319.
[42] Walling, P.D.; Batterman, S.A. (1997). Environmental Reporting by the Fortune 50 Firms, Journal of Environmental Management, 21(6):865–875.
[43] Wolfe, Joseph. (2003). The Tobin’s Q as a Company Performance Indicator, Developments in Business Simulation and Experiential Learning, 30:155-159.
[44] Young, W.; Hwang, K.; McDonald, S.; Oates, C.J. (2010). Sustainable Consumption: Green Consumer Behaviour when Purchasing Products, Sustainable Development, 18:20-31.

18 Margaretha and Rachmawati / OIDA International Journal of Sustainable Development 09:04 (2016)
Political Economy Communication Perspective: The 'Relationship' Between Capitalism and Illegal Logging in
Riau, Indonesia
Muchid Albintani Faculty of Political and Social Sciences, University of Riau, Indonesia
Coresponding author: [email protected]
© Authour(s) OIDA International Journal of Sustainable Development, Ontario International Development Agency, Canada
ISSN 1923-6654 (print) ISSN 1923-6662 (online) www.oidaijsd.com Also available at http://www.ssrn.com/link/OIDA-Intl-Journal-Sustainable-Dev.html
Abstract: This paper aims to explain the 'relationship' between capitalism and illegal logging in Riau. The relationship is built on the character of the essence of capitalism that 'greed'. The immediate implication of this character produces cultural issues of illegal logging. To examine and dissect this phenomenon is used Political Economy Communications perspective. This perspective is constructed by a shortage of Political Economy that cannot explain the phenomenon of communication actors policy makers and businessmen who support illegal logging. While the Political Communication can not understand economic phenomena [rentier or reward] relationship between the actors and the policy-makers cause of illegal logging. This paper uses a qualitative approach based on the study of documents. Data was analyzed using descriptive qualitative. Therefore, this paper is an analytical to provide input on the relationship between capitalism as an ideology and illegal logging as activity [behavior] actors involved in it. Results of the discussion paper indicates that: [i] Capitalism has a significant correlation and causality to damage the forest environment. The relationship is built on the character of the essence of capitalism that 'greed'. The immediate implication of this character generates a culture of illegal logging. Then the illegal logging that is what led to the emergence of the season in Riau. Among them, the flood season, smog and erratic weather and air temperature heats up the all representation of Riau future. [ii]. Philosophical statement 'Riau forest is our home’ as to support the efforts of law enforcement actors in Riau, so earnest muzzle of illegal logging. Spirit 'Riau forest is our home’ is a symbol of the struggle of law enforcement actors [police, Judiciary and Justice] suppress the crime of illegal logging in Riau simultaneously. The parable illegal logging is a common enemy lists society is another language in real fight 'Riau forest belongs to all'. The essence of this paper is to emphasize the importance of the perspective of Political-Economy-Communications in an attempt to understand the phenomenon of Capitalism and Illegal Logging relationship as brainstorming in reducing environmental damage forests in Riau.
Keywords: Communication, Capitalism, Economy, Illegal Logging and Politics
Introduction
nfortunately, forest damage in Indonesia is in critical condition. Indonesia lost at least 1,1 hectares or 2% of its forest every year. Meanwhile ministry of forestry said that today this country just has 130 million hectares and 42 million hectares among them were cut where illegal logging is one of the biggest threat of
natural forest existence in Indonesia (Walhi, 2007). This paper will review the argument, which produces proposition that capitalism has causative relationship on illegal logging culture in Riau.
Illegal logging can be defined a set of violation of regulation that causes forest resources exploitation beyond its limit. It started from wood production phase, for example cutting step, wood transporting and log wood as the product (raw material), till the phase of process and marketing. This includes using corrupt ways to get access to forestry and authority violations, such tax hindrances as a part of that illegal logging process. (Hariyadi, 2008). In addition, inconsistency policy in wood cutting management, the involvement of state actors and including the capital owners , different perspective between central government and local government as part of ugly face of illegal logging.
U
20 Albintani / OIDA International Journal of Sustainable Development 09:04 (2016)
Some problems appear in the relationship between capitalism and illegal logging in Riau. First, forestry sector cannot be separated from political tendency and was used as cash cow for ruling party. Secondly, forest is seen from aspect that how many trees can be cut. Third, Riau becomes the biggest exporter of CPO and pulp&paper in Indonesia. Next, government tends to let conflict happen and the decrease of environmental quality that trigger new problems. Fifth, the governor did not ever make statement so far to show his position in responding natural resources conflict in Riau and finally, decisions that made tend to be wrong caused by the failure of getting right information to make policy (SKEPI, 2007). Today, forest in Riau experiencing worst degradation especially in the area of peat forest meanwhile Indonesia was accused as the fastest forest destroyer country in the world (Walhi, 2007). This country was the third carbon emission contributor in the world while Riau has 56,1% of total peat swam forest in Indonesia (18,586 hectares) and it would justify phrase that solving Riau problems means solving Indonesia problems and indicated that Riau represented Indonesia. (Walhi, 2007). So, this paper would to analyze the relationship between capitalism and illegal logging in Riau as systemic and patterned ideology. Next, it would also analyze social communication on forest resources because of illegal logging.
Theoretical Framework
This theoretical background explains the relationship between capitalism and illegal logging and the perspective of political-economy-communication used to see this phenomenon in Riau.
Political Economy
Political Economy is effective perspective to handle encountered problems in this paper. This approach is understood to analyze political processes in relation with economy or political economy is the systematic study of about the relationship between economic process and political process [Didik Rachbini, 2006].
In the period of new order, Budiman in Didik Rachbini [2006] said that Soeharto’s rent seeking bureaucratic authoritarian country as Rent Seeking Bureaucratic Country. In this model, a group of businessmen is the winner. In one hand , State Elites using their bureaucratic power gave privilege to businessmen whether they were from private sector or sate owned firm’s directors. On the other hand, those elites asked fees for their efforts or rent seeking. The government elites those have bureaucratic authorities hired their positions to satisfy the interests of particular group of businessmen. They became production tools in producing capital accumulation for individual interests through rent seeking system.
In illegal logging, political economy is used as tool to analyze who gets profit and loss because of capitalism and forestry policy (logging). The profit and loss can be known from the revision of economic policy in political market, where in one hand legislative power together with executive power as producer and bureaucrats as the sellers. On the other hand, the activists who take benefits from forestry policy that use market to expand forestry business by exploiting natural resources deliberately [Didik Rachbini, 2006]. Based on this argument so political economy is used to understand economic profit if the logging gets the protection through forestry policy which successfully regulated. And then the actors individually or collectively earn profits from those policies.
Political Communication
Political communication is communication process that takes place in one political system. Therefore, political system is essential ingredient in democracy. Communication determines character and quality of democracy in one community [Eko Hari, 2010]. Next, in political communication creates relationship pattern of take and give that means how political elites used their power to society and in reverse the society responds and accept political elites interests. This relationship pattern depends on the ideology that underlying political system in a country. If the ideology is democratic so the communication would be democratic too [Dedy Mulyana, 2011].
Political communication explanation shows that phenomenon of capitalism as an ideology and illegal logging have causative relationship intensively. Nevertheless, this perspective does not yet portrays economic motive (rent seeking) as profits resulted from a product of forestry policy. The implication from intensive and causative relationship is not yet identified.
Political Economy Communication
Economy-Politic-Communication perspective used to answer capitalism and illegal logging phenomenon. This effort is the bridge to understand economy and communication phenomenon. This phenomenon is the answer in
Albintani / OIDA International Journal of Sustainable Development 09:04 (2016) 21
perspective between capitalism as economic based ideology and communication as interaction base among actors from forestry policy maker and policy user in illegal logging. And then economy-politic-communication perspective is needed to understand this relationship. This integrated perspective to solve the weakness on effort to understand capitalism and ideology phenomenon that merely viewed from separate perspective; political economy or political communication that cannot explain it optimally. Moreover, the reality supports this integrated perspective in order to understand the relationship between illegal logging and capitalism comprehensively.
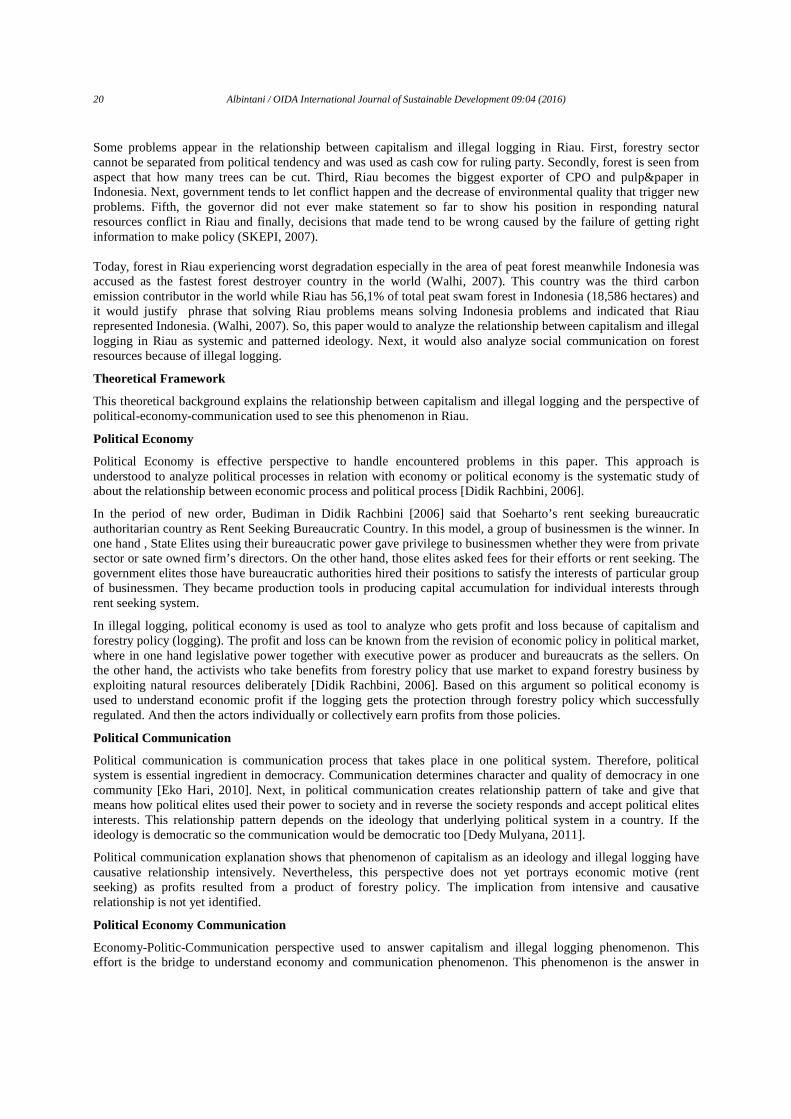
Concerning power structure, economy and communication development simultaneously, there is no difference between the era of new order and reform period in terms of centralized forestry policies. This study shows that policy still exist and the figure below will help to see the scheme of economy-politic-communication perspective.
CAPITALISM
ILLEGAL
LOGGING
GREEDY
MENTALITY
+
ILLEGAL
LOGGING
CULTURE
ENVIRONMENTAL
DEMAGE
POLITICAL
ECONOMY
POLITICAL
COMMUNICATION
RELATION
INTER
ACTOR
ECONOMY
RENT SEEKING
THEORITICAL EFFORT TO
UNDERSTAND THE RELATIONSHIP OF
CAPITALISM AND BEYOND THE
DESTRUCTIVE LOGGING OF
FORESTS [THE EFFECT OF
ILLEGAL LOGGING]
POLITICALECONOMY
COMMUNICATION
Figure 1: Relationship Political-Economic-Communication
Based on literature review, some issues are discussed to answers several things in this paper. First, capitalism and illegal logging is the phenomenon from interaction process between political economy and political communication. Secondly, integrated perspective is needed from political economy and political communication to understand this phenomenon. Next, limited scope of political economy perspective to understand capitalism and illegal logging phenomenon. And the fourth, this perspective is the alternative to bridge between normative and empirical discussion of new phenomenon as a character, ideology and culture that produce greed is the underlying element in a way of thinking that in turn causes ecological disaster in the future eventually.
Method
This study uses a qualitative approach based on the study of documents. While the study used qualitative paradigm to analyze the relationship between capitalism as an ideology and illegal logging as an activity of actor’s behavior involved inside based on descriptive qualitative research. Data was analyzed using descriptive qualitative.
Capitalism And Illegal Logging An Ambiguous
Ambiguous Capitalism
Fukuyama (2001) said that the history of capitalism still alive and exist despite history ends, which showing the victory of capitalism and liberal democracy while its ideological base is arrogant greed and capitalist is behind it. Meanwhile, Stiglitz (2011), said the essence of capitalism in the form of greed which support capital owner to keep destroying nature without considering the effect of ecological damage.
22 Albintani / OIDA International Journal of Sustainable Development 09:04 (2016)
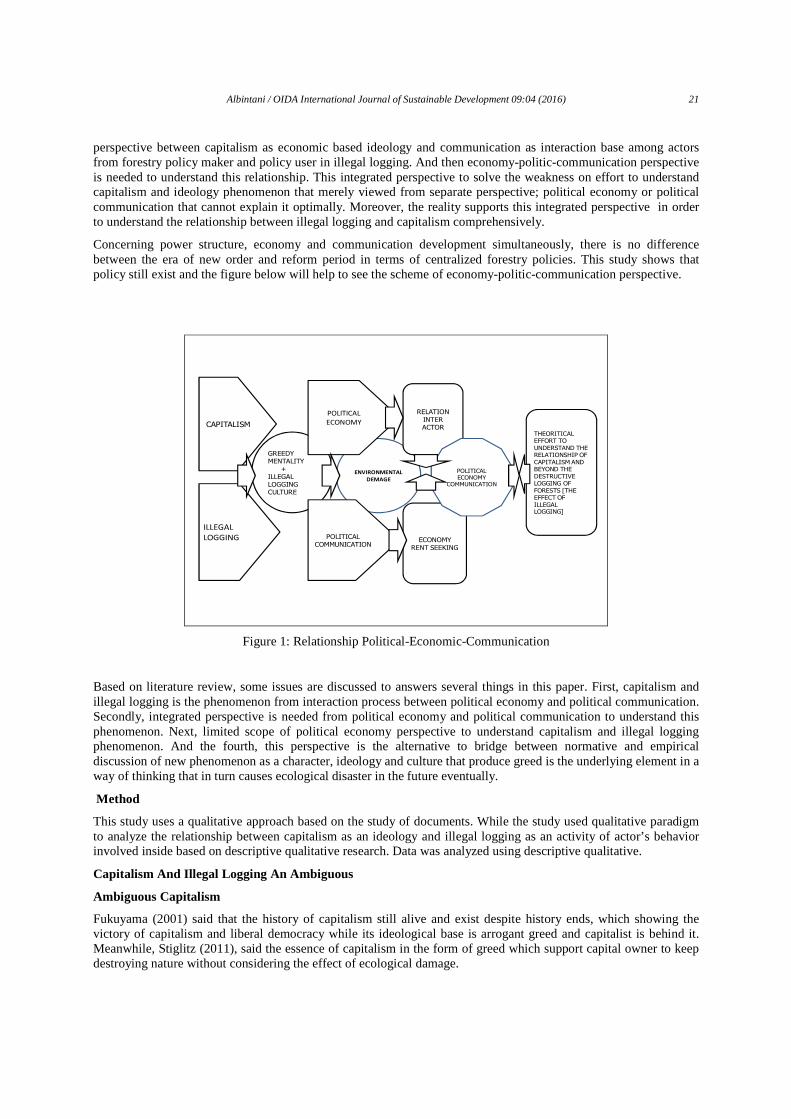
The victory of capitalist west is ambiguous character in relation with free market capitalism and the capitalism practice in Indonesia, including Riau. The collaboration between policy maker and rent seekers through decision letter that enable capital owner to exploit forest that shows on going ambiguous [paradox] process of capitalism. Next, the question is how big or none of profit that earned by big companies that operate in forest resources that also enjoyed by Riau people at the same time while negative implications due to illegal logging by those big companies always happen. Next, the figure below can help to understand the dialectical process of capitalism as thought that created greedy character. Marxism that as though contested with capitalism as two opposite pole
SERAKAHHGREEDY
INDIVIDUAL
MATERIALISTIC
SERAKAHHSERAKAH
COLLECTIVE
MATERIALISTIC
GREEDY
INDIVIDUAL
MARXISMCAPITALISM COMMUNICATION
ENVIRONMENTAL
DEMAGE
.
Figure 2: Dialectics Political-Economy-Communiction
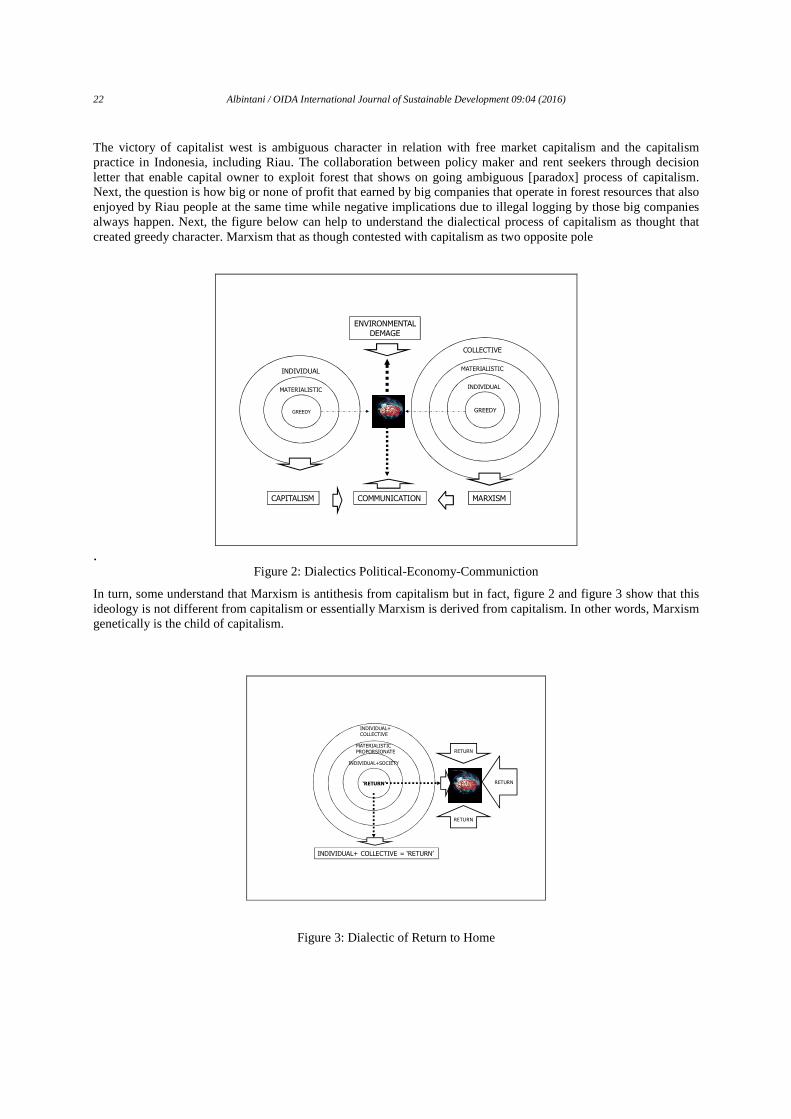
In turn, some understand that Marxism is antithesis from capitalism but in fact, figure 2 and figure 3 show that this ideology is not different from capitalism or essentially Marxism is derived from capitalism. In other words, Marxism genetically is the child of capitalism.
SERAKAHHSERAKAH
INDIVIDUAL+
COLLECTIVE
MATERIALISTIC
PROPORSIONATE
‘RETURN’
INDIVIDUAL+SOCIETY
INDIVIDUAL+ COLLECTIVE = ‘RETURN’
RETURN
RETURN
RETURN
Figure 3: Dialectic of Return to Home
Albintani / OIDA International Journal of Sustainable Development 09:04 (2016) 23
Consequently, the product from paradox ambiguous capitalism for Riau people is flood and smoke haze every year due to illegal logging. Ideally, it could be minimized because it threatens daily lives as negative product of capitalism. Riau people live in polluted environment while the wealth of forest resources cannot be enjoyed by them. Nevertheless, it also has negative correlation with the rent seekers those live in Riau, for instance, this capitalist make their holiday in Singapore and Malaysia for example, and the smoke haze will chase them. Consequently, the negative product of illegal logging also hit the capitalist.
Illegal Logging and Systemic Crimes
Learn from previous explanation to minimize bad effect from illegal logging. This crime can be viewed from systemic-structural approach. The forest damage has not happened just in Riau but Indonesia as whole and part of structural crime that has taken place for long time. Since new order era with centralistic authoritarian, the practice of illegal logging has been protected through illegal-formal policy. Ideally, reform order should be used by reformists to re arrange forest in Indonesia that has been destroyed by illegal logging.
Riau as province with endowment factor of forest resources has the same situation with other region in Indonesia due to destruction behavior in exploiting forest. Therefore, it is time to build awareness of society about the danger of illegal logging that lead to jeopardize human lives for the coming years, especially in Riau. This effort for example can be started by good intention from lawmakers to stop systemic-structural illegal logging
In the perspective systemic-structural, the power Regional Police of Riau [Polda Riau] as lawmakers is under control by National police (Polri), in other words regional police is dependent on national police. In this case, structural crime pattern that used power or position to produce decision letter that in turn enable illegal logging takes place is highly dependent on the support from the chief of national police (Kapolri) as the top leader from chief of regional police [Kapolda]. In fact, the support from chief of national police depends on the president’s commitment. So, mutual commitment from president and chief of national police is crucial to fight against illegal logging as part of systemic crime.
Communication and Environmental Policy: Forest is Our Home
It is important to involve society as social control to minimize the negative effect from illegal logging. Moreover, society is the party that has suffered more than others because of illegal logging. The level of forest damage in Riau should make us worried. It is estimated that with the speed of forest damage about 160 thousand hectares each year, the rest of forest in Riau will around 6% [Walhi, 2007].
Based on data from Ministry of forestry till 2006, there was 25% or 2,4 million hectares in critical condition and without efforts, Riau would not have forest. This situation also happened at national where 59 million hectares of 120 million hectares in hardly damage while other source said that 2,7 millions hectares have been owned by particular party and only 1,6 million hectares of forest have been permitted to be exploited [Walhi, 2007].
Meanwhile report from Greenpeace at the end of 2007 said that forest exploitation in Riau Province has considerably contributed on carbon dioxide emission from Indonesia. Most of Peat lands save the carbon while the land opened so the carbon dioxide went to the air that cause climate change [Walhi, 2007]. In reverse, “Forest is Ours Home” avoids society from experiencing four seasons; rainy, dry, flood and smoke haze as happened in the past that need to rearranged. The forest damage that has been happening in Peninsula of Kampar [ a region in Riau] as a case study that warn us how important “forest is ours home” to protect forest in Indonesia.
Conclusion
[Capitalism has significant and causative relationship with the forest damage. It was built by greed as the essence character of capitalism. It caused illegal logging as direct implication. And then the illegal logging produced flood, smoke haze, climate change and higher temperature and possibly these conditions becoming Riau portrays in the future. [ii]. Statement of forest is ours home is effort to support lawmakers to keep fighting illegal logging and simultaneously the spirit of this fight is the symbol for saving forest and put illegal logging is common enemy for all elements of society.
References
[1] Alfian. (1993). Komunikasi Politik dan Sistem Politik Indonesia. Jakarta: Gramedia. [2] Ahmad Zazali. (2008). Mengawal Revisi Rencana Tata Ruang Provinsi (RTRWP) Riau Untuk menyelamatkan
Hutan Alam Riau yang tersisa dari Ekspansi Perkebunan Besar Kelapa Sawit dan Akasia. Sustaibale Social [3] Development Partnership [SCALE UP].
24 Albintani / OIDA International Journal of Sustainable Development 09:04 (2016)
[4] Bachtiar Aly. (2010). Komunikasi Politik Sebagai Penjuru Penyelesaian Konflik dan Mengoptimalkan
Sinergis [5] Hubungan Pusat dan Daerah. Makalah Seminar Nasional di UMB Jakarta. 15 Mei 2010. [6] Billy Hindra. (2006). Potensi dan Kelembagaan Hutan Rakyat. Proseding Seminar Hasil LITBANG Hasil
Hutan: 14-23. [7] Bustanul Arifin dan Didik Junaidi Rachbini. (2001). Ekonomi Politik dan Kebijakan Publik. Jakarta:
Grasindo. [8] Deddy Mulyana. (2011). Mau Ke Mana Ilmu Komunikasi Kita? Pengantar Hal. 2-15 dalam Ilmu Komunika
Sekarang dan Tantangan Masa Depan. Jakarta: Kencana Pranada Media Group. [9] Didik J Rachbini. (2006). Ekonomi Politik Kebijakan dan Strategi Pembangunan. Jakarta: Granit. [10] Eko Harry Susanto. (2010). Komunikasi Manusia: Esensi dan Apalikasi dalam Dinamika Sosial Ekonomi [11] Politik . Jakarta: Mitra Wacana Media. [12] Fukuyama, F. (2005). Memperkuat Negara Tata Pemerintahan dan Tata Dunia Abad 21. Terj. A. Zaim Rofiqi [13] Jakarta: Preedom Institute dan Gramedia Pustaka Utama. [14] Fukuyama, F. (2001). Kemenangan kapitalisme dan demokrasi liberal. Terj. Muhammad Husein Amrullah. [15] Jokjakarta: Kalam. [16] Hutan Riau Habis Tahun (2015). Riau Mandiri, Selasa 20 Februari 2007. [17] Hariyadi. (2008). Politik Penebangan Kayu dan Kebijakan Pembalakan Liar [Studi Kasus Provinsi Jawa [18] Timur dan Jambi]. Kajian, Vol 14 No.2, Juni. [19] Ilmu Komunikasi Sekarang dan Tantangan Masa Depan. (2011). Eds. Farid Hamid dan Heri Budianto.
Jakarta: [20] Kencana Pedana Media Group. [21] Perkiraan Penggunaan Sumber Bahan Baku Industri Pulp & Paper. Studi Advokasi Indonesian Working
Group [22] on Forest Finance. Desember 2010. [23] Paper ICW: Mempersoalkan Penegakan Hukum dalam Penanganan Kasus Pembalakan Liar Jawaba [24] Pertanyaan RDPU-Komisi VII DPR-RI dengan PT. Riau Andalan Pulp and Paper dan PT. Indah Kiat Pulp
dan Paper Tbk. 2 Oktober 2007. [25] SKEPI. (2007). Press Release Refleksi Akhir Tahun 2007: Perusakan Hutan Gagal Dicegah dan Dikurangi. [26] Sekretariat Kerjasama Pelestarian Hutan Indonesia [SKEPI]. [27] Stiglitz, J. E. (2011). Dekade Keserakahan:Era '90-an dan Awal Mula Petaka Ekonomi Dunia. Terj. Suhaeni.
Serpong Tengerang Selatan: Marjin Kiri. [28] Susanto Kurniawan. (2004). Studi Kasus Kebijakan Gubernur Riau terhadap Pemberian Rencana Kerja
Tahuna [29] [KT] dan Bagan Kerja [BK] pada sejumlah Hutan Tanaman Industri Tahun 2004. JIKALAHARI Riau. [30] WALHI. (2007). Menyelesaikan Riau, Menyelesaikan Indonesia. Pekanbaru: Wahana Lingkungan Hidup
Indonesia Riau.
Managing the Brand through Advocacy and Its Influences: A Study in the Hospital as Healthcare
Provider
Rinny Liestyana a, Renny Risqiani b
a,b Magister Management Program, Post Graduate Studies, Trisakti University, Jl. Kyai Tapa No.1 Grogol, West Jakarta, Indonesia
Corresponding authour: [email protected]
© Authour(s) OIDA International Journal of Sustainable Development, Ontario International Development Agency, Canada
ISSN 1923-6654 (print) ISSN 1923-6662 (online) www.oidaijsd.com Also available at http://www.ssrn.com/link/OIDA-Intl-Journal-Sustainable-Dev.html
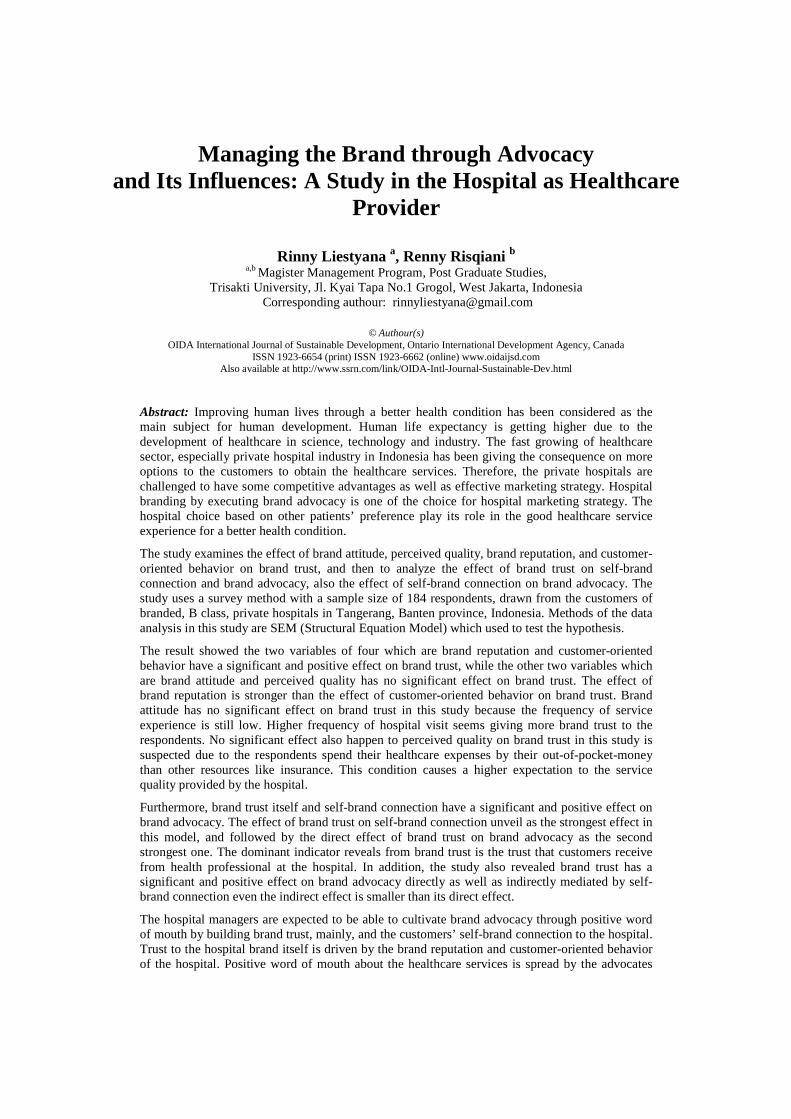
Abstract: Improving human lives through a better health condition has been considered as the main subject for human development. Human life expectancy is getting higher due to the development of healthcare in science, technology and industry. The fast growing of healthcare sector, especially private hospital industry in Indonesia has been giving the consequence on more options to the customers to obtain the healthcare services. Therefore, the private hospitals are challenged to have some competitive advantages as well as effective marketing strategy. Hospital branding by executing brand advocacy is one of the choice for hospital marketing strategy. The hospital choice based on other patients’ preference play its role in the good healthcare service experience for a better health condition.
The study examines the effect of brand attitude, perceived quality, brand reputation, and customer-oriented behavior on brand trust, and then to analyze the effect of brand trust on self-brand connection and brand advocacy, also the effect of self-brand connection on brand advocacy. The study uses a survey method with a sample size of 184 respondents, drawn from the customers of branded, B class, private hospitals in Tangerang, Banten province, Indonesia. Methods of the data analysis in this study are SEM (Structural Equation Model) which used to test the hypothesis.
The result showed the two variables of four which are brand reputation and customer-oriented behavior have a significant and positive effect on brand trust, while the other two variables which are brand attitude and perceived quality has no significant effect on brand trust. The effect of brand reputation is stronger than the effect of customer-oriented behavior on brand trust. Brand attitude has no significant effect on brand trust in this study because the frequency of service experience is still low. Higher frequency of hospital visit seems giving more brand trust to the respondents. No significant effect also happen to perceived quality on brand trust in this study is suspected due to the respondents spend their healthcare expenses by their out-of-pocket-money than other resources like insurance. This condition causes a higher expectation to the service quality provided by the hospital.
Furthermore, brand trust itself and self-brand connection have a significant and positive effect on brand advocacy. The effect of brand trust on self-brand connection unveil as the strongest effect in this model, and followed by the direct effect of brand trust on brand advocacy as the second strongest one. The dominant indicator reveals from brand trust is the trust that customers receive from health professional at the hospital. In addition, the study also revealed brand trust has a significant and positive effect on brand advocacy directly as well as indirectly mediated by self-brand connection even the indirect effect is smaller than its direct effect.
The hospital managers are expected to be able to cultivate brand advocacy through positive word of mouth by building brand trust, mainly, and the customers’ self-brand connection to the hospital. Trust to the hospital brand itself is driven by the brand reputation and customer-oriented behavior of the hospital. Positive word of mouth about the healthcare services is spread by the advocates
26 Liestyana and Risqiani / OIDA International Journal of Sustainable Development 09:04 (2016)
who are the satisfied previous customers, their family and friends having a good overall perception about the hospital. A good hospital reputation is constructed by a good service standard consistently for both functional service and medical service. Service standard has to focus on the customers’ interest so it is aiming for error reduced as well as patient safety. Even the hospital attains more customers, the service level is never under normal variation. Customer-oriented behavior of medical and non-medical staff is implemented by paying attention to every service contact point to the customers. Having detailed management on every service contact point will reduce the risk of customers’ disappointment and build brand trust. A hospital manager has to realize that the non-medical services are as much important as the core medical services, also giving the attention almost equally to the patients and their family and friends. Furthermore, self-brand connection is formed by conducting emotional bounding which comes from good service experiences in the past. Many hospitals only focus on the new customers without paying enough attention to the past customers or even loyal customers. Hospital has to be able to manage a customer-based data, and then facilitate a periodic gathering event or even one group community where the loyal customers become the advocates and sharing their past experiences in the hospital. The prospective customers will get a trusted testimonial while the past customers will be updated by full information on the current services. The hospital managers are challenged to create and maintain good memorable service experiences for continuous branding as well as sustainable good performances of healthcare providers and its role for higher life expectancy. Keywords: brand advocacy, brand trust, hospital branding, Indonesian healthcare sector, SEM (Structural Equation Model).
Introduction
mproving human lives through a better health condition has been considered as the main subject for human development, while the health standard of people and the health development in a country are influenced by its infrastructure. Both quantity and quality of healthcare providers in Indonesia contributed to the health standard
of people in Indonesia. Having a comparison to the population in Indonesia, the number of healthcare provider as well as its manpower is relatively unequal. This shows the size of healthcare business opportunity in Indonesia, hence it determines the development program targeted by government.
At the year 2013, hospital as one of provider type in the healthcare infrastructure is spreading in the amount of 2,228 units national-wide in Indonesia [1]. It consists of 1,562 public hospitals and 666 private hospitals. In term of growth, the private hospital has it much higher than the public hospital which in 2013 is as a result of 22.7% growth from 2012, and 72.4% growth in 2011. Hospital is also classified in class category based on the facility and its capability to provide healthcare services; those are Class A, Class B, Class C, and Class D. In 2013, 33% and 23% of the total hospital is Class C and Class D respectively, while 13% is Class B hospital. The market potential for healthcare provider in Indonesia can be seen from the bed ratio on 1,000 people, that is 1.12 in 2013. While Japan, Singapore, and Malaysia are having ratio between bed and population at 1:70, 1:320, and 1:500 respectively, the ratio for Indonesia is quite huge at 1:1,600 [2].
In 2014, Standard Chartered Equity Research estimated Indonesia’s health expenditure per capita has increased from USD 107 in 2013 to USD 229 in 2018 and USD 402 in 2023 [3]. This implies the acceleration to the health expenditure CAGR of 17% in 2013-2018 from 13% in 2008-2013. The hospital expenditure has been estimated to take share 63-68% of total health expenditure each year during 2013-2023. There are some factors influencing health sector growth such as the launch of National Health Insurance (JKN, Jaminan Kesehatan Nasional) managed by Badan Penyelenggara Jaminan Sosial (BPJS) with the target coverage of total population in 2019. JKN program will make upper middle class people switch to private hospitals due to fully-occupancy of service capacity in public hospitals. Increasing Ministry of Health budget for healthcare sector in 2014 is showing its boosting on government budget for JKN.
Additionally, the boosting of healthcare demand happens due to rising incomes and an expanding upper middle class as affordability and health awareness increase [3]. Macroeconomic improvement such as an increasing on buying power appears in upper middle class people. Upper middle class people particularly in big cities have been more educated and having higher health awareness including the importance of health prevention. They are willing to spend more for better quality of healthcare service. Hence, they are called as consuming class who are an economic
I
Liestyana and Risqiani / OIDA International Journal of Sustainable Development 09:04 (2016) 27
generator including for healthcare sector. Since 2010, it was estimated 45 million people in Indonesia included in consuming class who is predicted a double increase become 85 million in 2020 [4].
Although the healthcare industry is growing fast in Indonesia, it occurs tight competitive amongths healthcare providers in the country as well as with abroad healthcare providers where people looking for medical check-up and treatment is also increasing [5]. The reason for this phenomenon is not because healthcare services abroad is cheaper than within the country but people look for up-to-date technology and better service provided. This competitiveness should stimulate improvement in service performance. While the competition is ongoing in number of both core and support healthcare facilities as well as quality of service for patient safety and comfortness, at the same time hospital managers is challeged to have effective marketing strategy through its brand.
Many times managers face the fact that the conventional advertisement in healthcare industry is no longger giving an reasonable return of investment. One of the reason is due to decreasing in credibility of some medias where advertisement placed [6]. Patients trust in advocacy and recommendation from close friends and family to choose the brand of healthcare provider which usually through word-of-mouth (WOM). WOM is relevant to healthcare services because the service is very personnal, hence quality is the most important. The important role of brand advocacy in healthcare services is shown in a survey on Indonesia Hospital Customer Behaviour done by SWA in 2014 [5]. The survey discover the fact that friends and family is the main source of information elaborated by customers to choose a hospital with 88.3%. The figure is higher than the one of advertisement, hospital brochure, or other sources used by customer to get information.
Based on the above background this study attempts to assess the effect of brand attitude, perceived quality, brand reputation, and customer-oriented behavior on brand trust, and its influence on brand advocacy through self-brand connection.
Theoretical Background And Methods
Theoretical Background
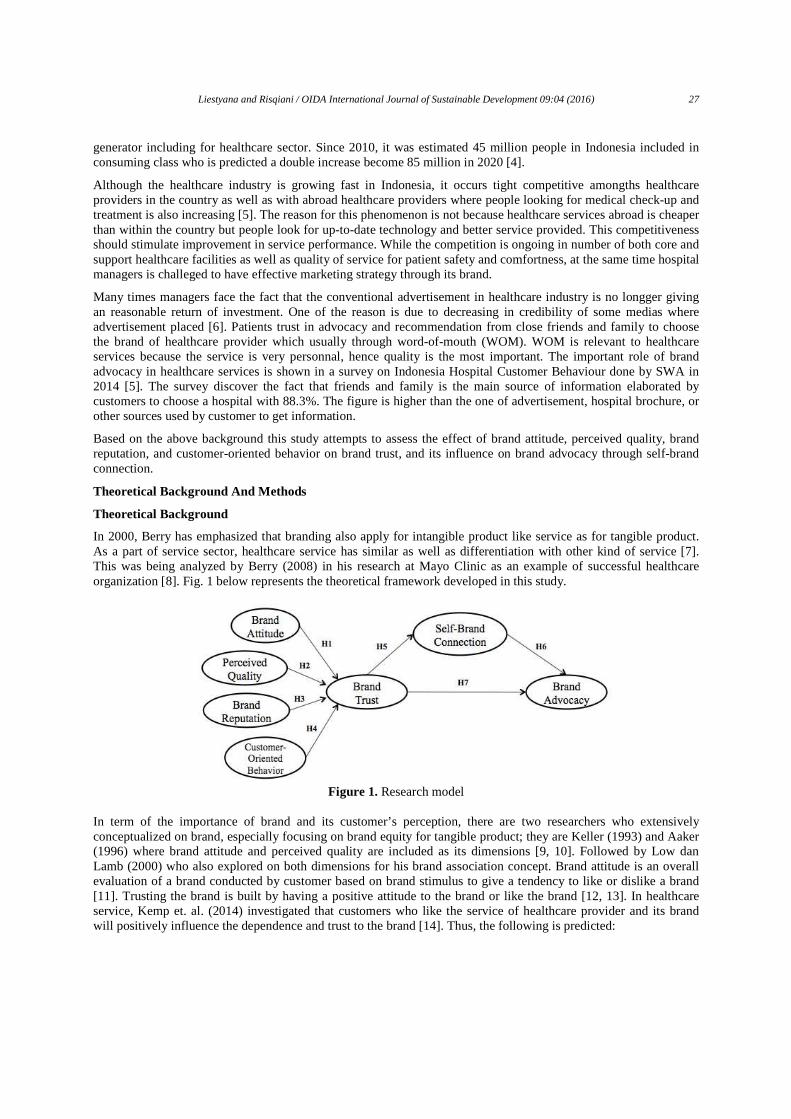
In 2000, Berry has emphasized that branding also apply for intangible product like service as for tangible product. As a part of service sector, healthcare service has similar as well as differentiation with other kind of service [7]. This was being analyzed by Berry (2008) in his research at Mayo Clinic as an example of successful healthcare organization [8]. Fig. 1 below represents the theoretical framework developed in this study.
Figure 1. Research model
In term of the importance of brand and its customer’s perception, there are two researchers who extensively conceptualized on brand, especially focusing on brand equity for tangible product; they are Keller (1993) and Aaker (1996) where brand attitude and perceived quality are included as its dimensions [9, 10]. Followed by Low dan Lamb (2000) who also explored on both dimensions for his brand association concept. Brand attitude is an overall evaluation of a brand conducted by customer based on brand stimulus to give a tendency to like or dislike a brand [11]. Trusting the brand is built by having a positive attitude to the brand or like the brand [12, 13]. In healthcare service, Kemp et. al. (2014) investigated that customers who like the service of healthcare provider and its brand will positively influence the dependence and trust to the brand [14]. Thus, the following is predicted:
28 Liestyana and Risqiani / OIDA International Journal of Sustainable Development 09:04 (2016)
H1. Brand attitude has an influence on brand trust
As for perceived quality, it has been proposed by Zeithaml (1988) and Aaker (1991), that is subjective judgment of overall quality and its superiority compared to its competitor [15, 16]. Resources invested for increasing perception on the quality is benefit for boosting trust on the brand [17]. So it also happens in the hospital branding [14]. Indeed, perceived quality has no direct effect on brand loyalty but it was mediated by brand trust [18]. Therefore, the following is hypothesized:
H2. Perceived quality has an influence on brand trust
In 1999, Lau and Lee constructed brand reputation as customers’ attitude to a brand when it comes as a good brand so the brand can be trusted as well [19]. Customers tend to trust the brand that has reputation of competent, honest, and pay attention to the customers’ interest [20]. Hence, this study is proposed the link of both variables for consumers and healthcare brands:
H3. Brand reputation has an influence on brand trust
Brady and Cronin (2001) who stated behavior of employee or service person becomes the most important factor in the customer-oriented organization due to the intangible characteristic of service as well as simultaneous between production and consumption of service [21]. Kim et. al. (2004) mentioned that customer-oriented behavior is the beliefs to put the customer’s interest first to create their satisfaction before other stakeholders for long-term profitable organization [22]. Brand association based on employee performance is the main factor to determine customers’ trust on the brand [23]. In healthcare service, the provider has to develop customer-oriented behavior among their employees both medical professionals and non-medical staff [14]. So it proceed to propose the following:
H4. Customer-oriented behavior has an influence on brand trust
Morgan and Hunt (1994) is well-known conceptualizing on a trust between parties in partnership [24]. Therefore, Chaudhuri dan Holbrook (2001) defined brand trust as a customer’s willingness to rely on the ability of the brand to function as stated so it reduces vulnerable situations and risk [25]. Since 1996, Escallas has conceptualized self-brand connection as a result of a process when customers utilize brands to create self-concept or self-image and to present these images to others or to themselves so their identity goals are achieved [26]. One study by Becerra and Badrinarayanan (2013) said that brand identification is shown when customers have ownership in their trusted brand [27]. In healthcare service, it was required an emotional bounding between healthcare provider brand and its customer so it was in accordance with customers’ self-concept or self-image [14]. Accordingly, the following is proposed:
H5. Brand trust has an influence on self-brand connection
Customers sometimes have no capability to assess the technical quality of a service performance. Amongst many kinds of products and services, there is a differentiation in difficulty grade to evaluate its quality. Service usually has either high experience quality that is characteristic being evaluated by customers after puschase, e.g. restaurant and barber service, or high credence quality that is characteristic hardly evaluated by customers even after consumption, e.g. law firm and medical service [28]. Kotler dan Keller (2012) mentioned that those characteristics determine some services rely more on word-of-mouth than advertisement. By focusing on brand value as a factor influenced identification between customer and the brand, customers are willing to give a positive word-of-mouth [29]. In healthcare service, only strong self-brand connection due to good service experience make customers willing to be an advocate for the related brand [14]. Hence this study propose the following:
H6. Self-brand connection has influence on brand advocacy
Effectively, competence and qualified service to the patient build trust to the healthcare provider brand, so in return the provider is more easily acquire some advocates to promote the brand [14]. Accordingly, we offer the following hypothesis:
H7. Brand trust has an influence on brand advocacy
Some previous researchers have discussed the variables mentioned above that affect brand trust, such as Kemp, et. al. (2012), Haefner et.al. (2011) who discussed the link between brand attitude and brand trust; Aurier and de Lanauze (2012), Chen and Chang (2013) who investigated the relation between perceived quality and brand trust; Jillapalli and Jillapalli (2014), Afzal et. al. (2010), Keh and Xie (2009) who examined the connection between brand
Liestyana and Risqiani / OIDA International Journal of Sustainable Development 09:04 (2016) 29
reputation and brand trust; Phan dan Ghantous (2013) who analyzed the effect of customer-oriented behavior to brand trust [12, 13, 17, 18, 20, 23, 30, 31]. As it is said that advocacy is a willingness to spread positive word-of-mouth about a product, service or organization, there some previous studies have investigated the link between brand advocacy, brand trust and self-brand connection such as Becerra and Badrinarayanan (2013) and Kemp et. al. (2014) [14, 27]. To be highlighted that the study which has been done by Kemp et. al. (2014) already included many variables but it was conducted in the context of hospital as a healthcare provider [14]. This is important to consider there are only few investigations performed in hospital branding. The connection between brand trust and self-brand connection is also studied by Kemp et. al. (2012) and Punjaisri (2013); the effect of self-brand connection and brand advocacy is also examined by Kwon dan Matilla (2015), Tuškej et. al. (2013), Badrinarayanan dan Laverie (2011), Stokburger-Sauera et. al. (2012), and Wallace et. al. (2012); finally the effect of brand trust to brand advocacy is also found in a study by Sicthmann (2007) [12, 29, 32, 33, 34, 35, 36, 37].
Method
In order to test the proposed hypotheses and the model represented in Figure 1, a survey for primary data was conducted. All constructs were measured using existing indicators adapted for this study. A total of 28 indicators are listed below using five-point Likert scale:
Brad attitude (Lichtenstein and Bearden, 1989 in Kemp et. al., 2014) [14] My overall attitude towards the hospital I currently attend is:
• Good/ bad (BAT1) • Pleasant/ unpleasant (BAT2) • Favorable/ unfavorable (BAT3) • Positive/ negative (BAT4)
Perceived quality (Keller and Aaker, 1992 in Kemp et. al., 2014) [14] The quality of care you receive at your hospital:
• Superior/ inferior (PQ1) • Quality/ low quality (PQ2) • Countable/ uncountable (PQ3)
Brand reputation (Lau dan Lee, 1999 in Afzal et. al., 2010) [31] • The hospital has a reputation for being good (BR1) • The hospital has a reputation for being reliable (BR2) • The hospital is reputed to perform well (BR3)
Customer-oriented behavior (Kim et al., 2004 in Kemp et. al., 2014) [14] • The staff at my hospital is always willing to help patients and/or their guardians (COB1) • The staff at my hospital is willing to cheer up patient when they are down (COB2) • The staff at my hospital is always willing to resolve patients’ complaint (COB3) • The staff at my hospital is willing to consider the things nor requested by patients and/or their guardians
(COB4)
Brand trust (Chaudhuri dan Holbrook, 2001 in Kemp et. al., 2014) [14] • I trust the care that I receive from healthcare professional at this hospital (BT1) • I rely on the care I receive from this hospital (BT2) • I feel save in my hospital (BT3)
Self-brand connection (Escalas dan Bettman, 2003 in Kemp et. al., 2014) [14] • My hospital reflects who I am (SBC1) • I can identify with my hospital (SBC2) • I feel a strong connection with my hospital (SBC3) • I use my hospital to communicate who I am to other people (SBC4) • I think my hospital help me become my condition now (SBC5) • When people respect the hospital, it reflects who I consider my self (SBC6) • My hospital suits me well (SBC7)
Brand advocacy (Escalas dan Bettman, 2003 in Kemp et. al., 2014) [14] • I try to get my family and friend to patronize my hospital (BA1)
30 Liestyana and Risqiani / OIDA International Journal of Sustainable Development 09:04 (2016)
• I seldom miss an opportunity to tell others good things about my hospital (BA2) • I would defend my hospital to others if heard someone speaking poorly about my hospital (BA3) • I would bring friends/family to my hospital if they needed care because I think they would like it (BA4)
A purposive sample was obtained consisting of customers of branded, Class B, private general hospitals in Tangerang. Here, customers can be patients or their family who do purchase decision and transaction as well as make an evaluation on the service experience. There are two criteria of the sample which are (1) at least the second visit when the survey was taken; (2) self or family of inpatient. Each sample is being asked his willingness to participate voluntary to fill in the questionnaire after finishing their hospitalization payment at the cashier and the respondents were promised anonymity. This study is cross-sectional study as data taken in a short period of time.
A total of 184 completed surveys were obtained; 60 percent of respondents were male and 40 percent were female. 92 percent of respondents live in Tangerang, Banten province, Indonesia; 86 percent were in the reproductive age between 20-49 years old. A total of 55 percent were private corporate employee; 46 percent were university graduates. 77 percent of respondents were family of the patient, 20 percent were patient himself, and the rest were friend of the patient. A total of 42% were the second visit and the rest were more than twice visiting the same hospital, while 76% of respondents have visited the hospital within the last 2 years. 30 % of funding source for healthcare expenditure comes from out-of-pocket money, followed by corporate assurance and private insurance.
Results and Discussion
According to Ghozali (2009), Confirmatory factor analysis (CFA) by KMO Bartlett’s and Anti-Image Matrices Correlation was used to purify and validate the scales used [39]. The validity of this study is constructed by the scale of KMO Bartlett’s and Anti-Image Matrices Correlation > 0,5 (KMO Bartlett’s ranging from 0.682 to 0.904; Anti-Image ranging from 0.632 to 0.936). While according to Sekaran (2013), the scale reliabilities of the study > 0.6 (Cronbach’s Alpha ranging from 0.816 to 0.923) suggest adequate scale reliability [40]. All measures are presented in Table 1.
The structural model and hypotheses were evaluated after attaining a validated measurement model. The model exhibited adequate fit GFI (0.809), RMR (0.023), NFI (0.850), CFI (0.927), PRATIO (0.892), PCFI (0.826), and RMSEA (0.066). The data were subjected to structural equation analysis in Structural Equation Model (SEM) by Analysis of Moment Structure (AMOS) version 8.0 software programs.
Table 1. Variable validity and scale reliability
Variable Validity Reliability
Conclusion KMO Anti Image Cronbach Alpha
BAT1 BAT2 BAT3 BAT4
0,823
0,868 0,868 0,785 0,820
0,908 Valid
& Reliable
PQ1 PQ2 PQ3
0,719 0,752 0,698 0,711
0,821 Valid
& Reliable
BR1 BR2 BR3
0,699 0,750 0,720 0,648
0,840 Valid
& Reliable
COB1 COB2 COB3 COB4
0,809
0,842 0,781 0,777 0,860
0,853 Valid
& Reliable
BT1 BT2 BT3
0,682 0,632 0,688 0,754
0,816 Valid
& Reliable
SBC1 SBC2 SBC3 SBC4 SBC5 SBC6 SBC7
0,904
0,866 0,864 0,936 0,933 0,925 0,898 0,924
0,923 Valid
& Reliable
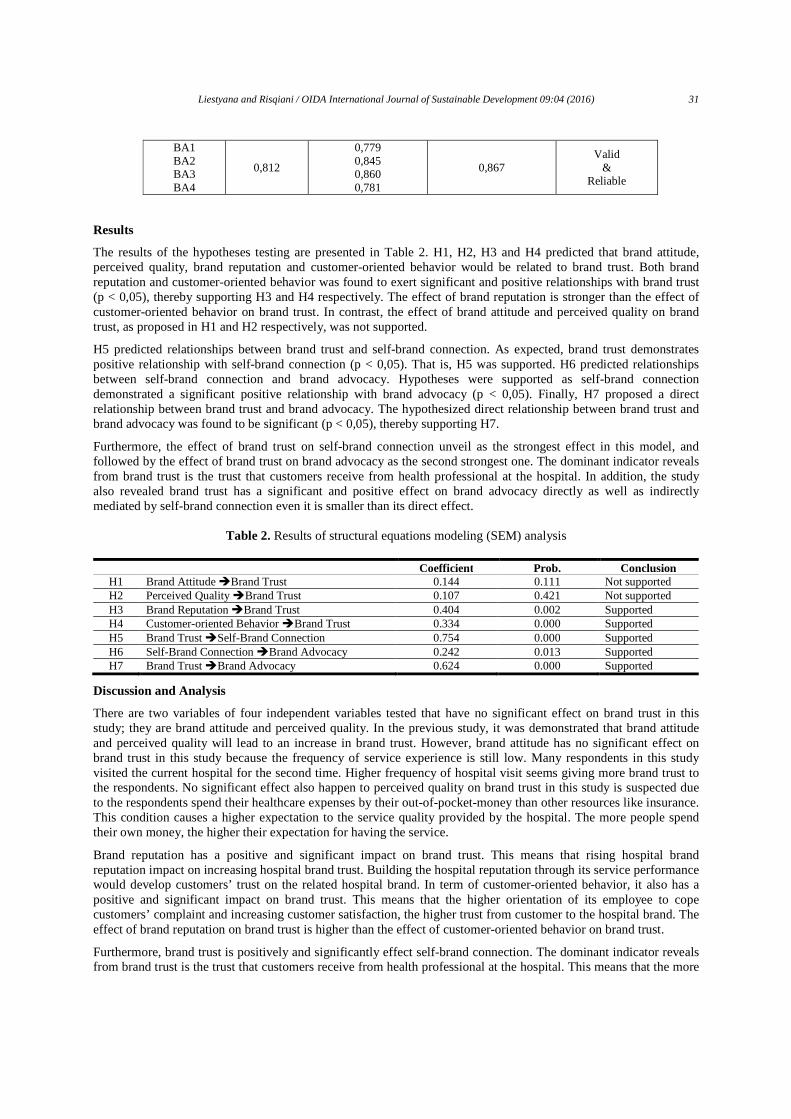
Liestyana and Risqiani / OIDA International Journal of Sustainable Development 09:04 (2016) 31
Results
The results of the hypotheses testing are presented in Table 2. H1, H2, H3 and H4 predicted that brand attitude, perceived quality, brand reputation and customer-oriented behavior would be related to brand trust. Both brand reputation and customer-oriented behavior was found to exert significant and positive relationships with brand trust (p < 0,05), thereby supporting H3 and H4 respectively. The effect of brand reputation is stronger than the effect of customer-oriented behavior on brand trust. In contrast, the effect of brand attitude and perceived quality on brand trust, as proposed in H1 and H2 respectively, was not supported.
H5 predicted relationships between brand trust and self-brand connection. As expected, brand trust demonstrates positive relationship with self-brand connection (p < 0,05). That is, H5 was supported. H6 predicted relationships between self-brand connection and brand advocacy. Hypotheses were supported as self-brand connection demonstrated a significant positive relationship with brand advocacy (p < 0,05). Finally, H7 proposed a direct relationship between brand trust and brand advocacy. The hypothesized direct relationship between brand trust and brand advocacy was found to be significant (p < 0,05), thereby supporting H7.
Furthermore, the effect of brand trust on self-brand connection unveil as the strongest effect in this model, and followed by the effect of brand trust on brand advocacy as the second strongest one. The dominant indicator reveals from brand trust is the trust that customers receive from health professional at the hospital. In addition, the study also revealed brand trust has a significant and positive effect on brand advocacy directly as well as indirectly mediated by self-brand connection even it is smaller than its direct effect.
Table 2. Results of structural equations modeling (SEM) analysis
Coefficient Prob. Conclusion
H1 Brand Attitude �Brand Trust 0.144 0.111 Not supported H2 Perceived Quality �Brand Trust 0.107 0.421 Not supported H3 Brand Reputation �Brand Trust 0.404 0.002 Supported H4 Customer-oriented Behavior �Brand Trust 0.334 0.000 Supported H5 Brand Trust �Self-Brand Connection 0.754 0.000 Supported H6 Self-Brand Connection �Brand Advocacy 0.242 0.013 Supported H7 Brand Trust �Brand Advocacy 0.624 0.000 Supported
Discussion and Analysis
There are two variables of four independent variables tested that have no significant effect on brand trust in this study; they are brand attitude and perceived quality. In the previous study, it was demonstrated that brand attitude and perceived quality will lead to an increase in brand trust. However, brand attitude has no significant effect on brand trust in this study because the frequency of service experience is still low. Many respondents in this study visited the current hospital for the second time. Higher frequency of hospital visit seems giving more brand trust to the respondents. No significant effect also happen to perceived quality on brand trust in this study is suspected due to the respondents spend their healthcare expenses by their out-of-pocket-money than other resources like insurance. This condition causes a higher expectation to the service quality provided by the hospital. The more people spend their own money, the higher their expectation for having the service.
Brand reputation has a positive and significant impact on brand trust. This means that rising hospital brand reputation impact on increasing hospital brand trust. Building the hospital reputation through its service performance would develop customers’ trust on the related hospital brand. In term of customer-oriented behavior, it also has a positive and significant impact on brand trust. This means that the higher orientation of its employee to cope customers’ complaint and increasing customer satisfaction, the higher trust from customer to the hospital brand. The effect of brand reputation on brand trust is higher than the effect of customer-oriented behavior on brand trust.
Furthermore, brand trust is positively and significantly effect self-brand connection. The dominant indicator reveals from brand trust is the trust that customers receive from health professional at the hospital. This means that the more
BA1 BA2 BA3 BA4
0,812
0,779 0,845 0,860 0,781
0,867 Valid
& Reliable
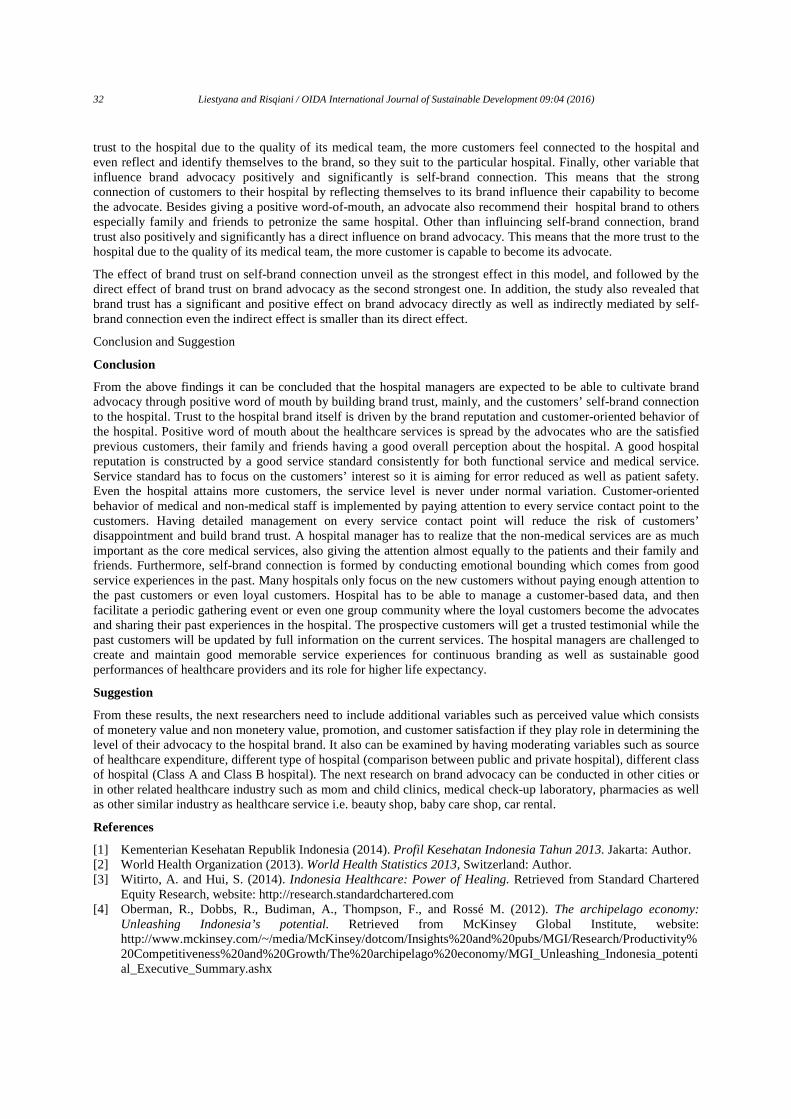
32 Liestyana and Risqiani / OIDA International Journal of Sustainable Development 09:04 (2016)
trust to the hospital due to the quality of its medical team, the more customers feel connected to the hospital and even reflect and identify themselves to the brand, so they suit to the particular hospital. Finally, other variable that influence brand advocacy positively and significantly is self-brand connection. This means that the strong connection of customers to their hospital by reflecting themselves to its brand influence their capability to become the advocate. Besides giving a positive word-of-mouth, an advocate also recommend their hospital brand to others especially family and friends to petronize the same hospital. Other than influincing self-brand connection, brand trust also positively and significantly has a direct influence on brand advocacy. This means that the more trust to the hospital due to the quality of its medical team, the more customer is capable to become its advocate.
The effect of brand trust on self-brand connection unveil as the strongest effect in this model, and followed by the direct effect of brand trust on brand advocacy as the second strongest one. In addition, the study also revealed that brand trust has a significant and positive effect on brand advocacy directly as well as indirectly mediated by self-brand connection even the indirect effect is smaller than its direct effect.
Conclusion and Suggestion
Conclusion
From the above findings it can be concluded that the hospital managers are expected to be able to cultivate brand advocacy through positive word of mouth by building brand trust, mainly, and the customers’ self-brand connection to the hospital. Trust to the hospital brand itself is driven by the brand reputation and customer-oriented behavior of the hospital. Positive word of mouth about the healthcare services is spread by the advocates who are the satisfied previous customers, their family and friends having a good overall perception about the hospital. A good hospital reputation is constructed by a good service standard consistently for both functional service and medical service. Service standard has to focus on the customers’ interest so it is aiming for error reduced as well as patient safety. Even the hospital attains more customers, the service level is never under normal variation. Customer-oriented behavior of medical and non-medical staff is implemented by paying attention to every service contact point to the customers. Having detailed management on every service contact point will reduce the risk of customers’ disappointment and build brand trust. A hospital manager has to realize that the non-medical services are as much important as the core medical services, also giving the attention almost equally to the patients and their family and friends. Furthermore, self-brand connection is formed by conducting emotional bounding which comes from good service experiences in the past. Many hospitals only focus on the new customers without paying enough attention to the past customers or even loyal customers. Hospital has to be able to manage a customer-based data, and then facilitate a periodic gathering event or even one group community where the loyal customers become the advocates and sharing their past experiences in the hospital. The prospective customers will get a trusted testimonial while the past customers will be updated by full information on the current services. The hospital managers are challenged to create and maintain good memorable service experiences for continuous branding as well as sustainable good performances of healthcare providers and its role for higher life expectancy.
Suggestion
From these results, the next researchers need to include additional variables such as perceived value which consists of monetery value and non monetery value, promotion, and customer satisfaction if they play role in determining the level of their advocacy to the hospital brand. It also can be examined by having moderating variables such as source of healthcare expenditure, different type of hospital (comparison between public and private hospital), different class of hospital (Class A and Class B hospital). The next research on brand advocacy can be conducted in other cities or in other related healthcare industry such as mom and child clinics, medical check-up laboratory, pharmacies as well as other similar industry as healthcare service i.e. beauty shop, baby care shop, car rental.
References
[1] Kementerian Kesehatan Republik Indonesia (2014). Profil Kesehatan Indonesia Tahun 2013. Jakarta: Author. [2] World Health Organization (2013). World Health Statistics 2013, Switzerland: Author. [3] Witirto, A. and Hui, S. (2014). Indonesia Healthcare: Power of Healing. Retrieved from Standard Chartered
Equity Research, website: http://research.standardchartered.com [4] Oberman, R., Dobbs, R., Budiman, A., Thompson, F., and Rossé M. (2012). The archipelago economy:
Unleashing Indonesia’s potential. Retrieved from McKinsey Global Institute, website: http://www.mckinsey.com/~/media/McKinsey/dotcom/Insights%20and%20pubs/MGI/Research/Productivity%20Competitiveness%20and%20Growth/The%20archipelago%20economy/MGI_Unleashing_Indonesia_potential_Executive_Summary.ashx
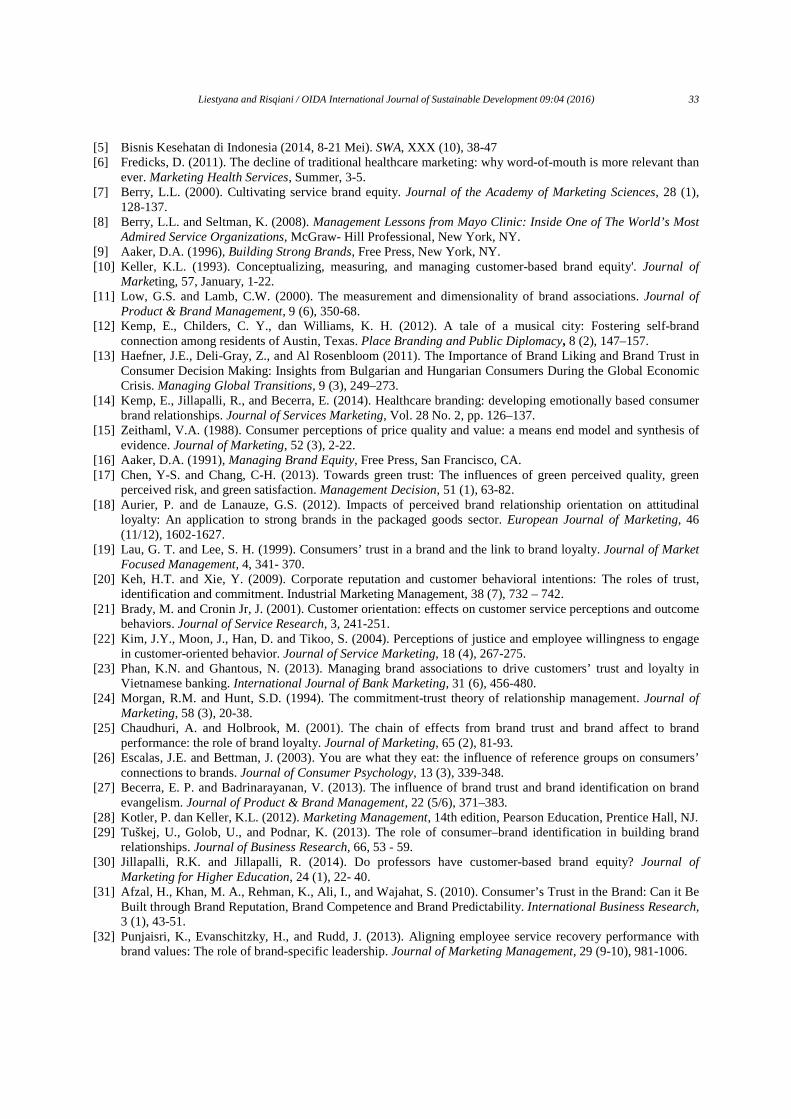
Liestyana and Risqiani / OIDA International Journal of Sustainable Development 09:04 (2016) 33
[5] Bisnis Kesehatan di Indonesia (2014, 8-21 Mei). SWA, XXX (10), 38-47 [6] Fredicks, D. (2011). The decline of traditional healthcare marketing: why word-of-mouth is more relevant than
ever. Marketing Health Services, Summer, 3-5. [7] Berry, L.L. (2000). Cultivating service brand equity. Journal of the Academy of Marketing Sciences, 28 (1),
128-137. [8] Berry, L.L. and Seltman, K. (2008). Management Lessons from Mayo Clinic: Inside One of The World’s Most
Admired Service Organizations, McGraw- Hill Professional, New York, NY. [9] Aaker, D.A. (1996), Building Strong Brands, Free Press, New York, NY. [10] Keller, K.L. (1993). Conceptualizing, measuring, and managing customer-based brand equity'. Journal of
Marketing, 57, January, 1-22. [11] Low, G.S. and Lamb, C.W. (2000). The measurement and dimensionality of brand associations. Journal of
Product & Brand Management, 9 (6), 350-68. [12] Kemp, E., Childers, C. Y., dan Williams, K. H. (2012). A tale of a musical city: Fostering self-brand
connection among residents of Austin, Texas. Place Branding and Public Diplomacy, 8 (2), 147–157. [13] Haefner, J.E., Deli-Gray, Z., and Al Rosenbloom (2011). The Importance of Brand Liking and Brand Trust in
Consumer Decision Making: Insights from Bulgarian and Hungarian Consumers During the Global Economic Crisis. Managing Global Transitions, 9 (3), 249–273.
[14] Kemp, E., Jillapalli, R., and Becerra, E. (2014). Healthcare branding: developing emotionally based consumer brand relationships. Journal of Services Marketing, Vol. 28 No. 2, pp. 126–137.
[15] Zeithaml, V.A. (1988). Consumer perceptions of price quality and value: a means end model and synthesis of evidence. Journal of Marketing, 52 (3), 2-22.
[16] Aaker, D.A. (1991), Managing Brand Equity, Free Press, San Francisco, CA. [17] Chen, Y-S. and Chang, C-H. (2013). Towards green trust: The influences of green perceived quality, green
perceived risk, and green satisfaction. Management Decision, 51 (1), 63-82. [18] Aurier, P. and de Lanauze, G.S. (2012). Impacts of perceived brand relationship orientation on attitudinal
loyalty: An application to strong brands in the packaged goods sector. European Journal of Marketing, 46 (11/12), 1602-1627.
[19] Lau, G. T. and Lee, S. H. (1999). Consumers’ trust in a brand and the link to brand loyalty. Journal of Market Focused Management, 4, 341- 370.
[20] Keh, H.T. and Xie, Y. (2009). Corporate reputation and customer behavioral intentions: The roles of trust, identification and commitment. Industrial Marketing Management, 38 (7), 732 – 742.
[21] Brady, M. and Cronin Jr, J. (2001). Customer orientation: effects on customer service perceptions and outcome behaviors. Journal of Service Research, 3, 241-251.
[22] Kim, J.Y., Moon, J., Han, D. and Tikoo, S. (2004). Perceptions of justice and employee willingness to engage in customer-oriented behavior. Journal of Service Marketing, 18 (4), 267-275.
[23] Phan, K.N. and Ghantous, N. (2013). Managing brand associations to drive customers’ trust and loyalty in Vietnamese banking. International Journal of Bank Marketing, 31 (6), 456-480.
[24] Morgan, R.M. and Hunt, S.D. (1994). The commitment-trust theory of relationship management. Journal of Marketing, 58 (3), 20-38.
[25] Chaudhuri, A. and Holbrook, M. (2001). The chain of effects from brand trust and brand affect to brand performance: the role of brand loyalty. Journal of Marketing, 65 (2), 81-93.
[26] Escalas, J.E. and Bettman, J. (2003). You are what they eat: the influence of reference groups on consumers’ connections to brands. Journal of Consumer Psychology, 13 (3), 339-348.
[27] Becerra, E. P. and Badrinarayanan, V. (2013). The influence of brand trust and brand identification on brand evangelism. Journal of Product & Brand Management, 22 (5/6), 371–383.
[28] Kotler, P. dan Keller, K.L. (2012). Marketing Management, 14th edition, Pearson Education, Prentice Hall, NJ. [29] Tuškej, U., Golob, U., and Podnar, K. (2013). The role of consumer–brand identification in building brand
relationships. Journal of Business Research, 66, 53 - 59. [30] Jillapalli, R.K. and Jillapalli, R. (2014). Do professors have customer-based brand equity? Journal of
Marketing for Higher Education, 24 (1), 22- 40. [31] Afzal, H., Khan, M. A., Rehman, K., Ali, I., and Wajahat, S. (2010). Consumer’s Trust in the Brand: Can it Be
Built through Brand Reputation, Brand Competence and Brand Predictability. International Business Research, 3 (1), 43-51.
[32] Punjaisri, K., Evanschitzky, H., and Rudd, J. (2013). Aligning employee service recovery performance with brand values: The role of brand-specific leadership. Journal of Marketing Management, 29 (9-10), 981-1006.
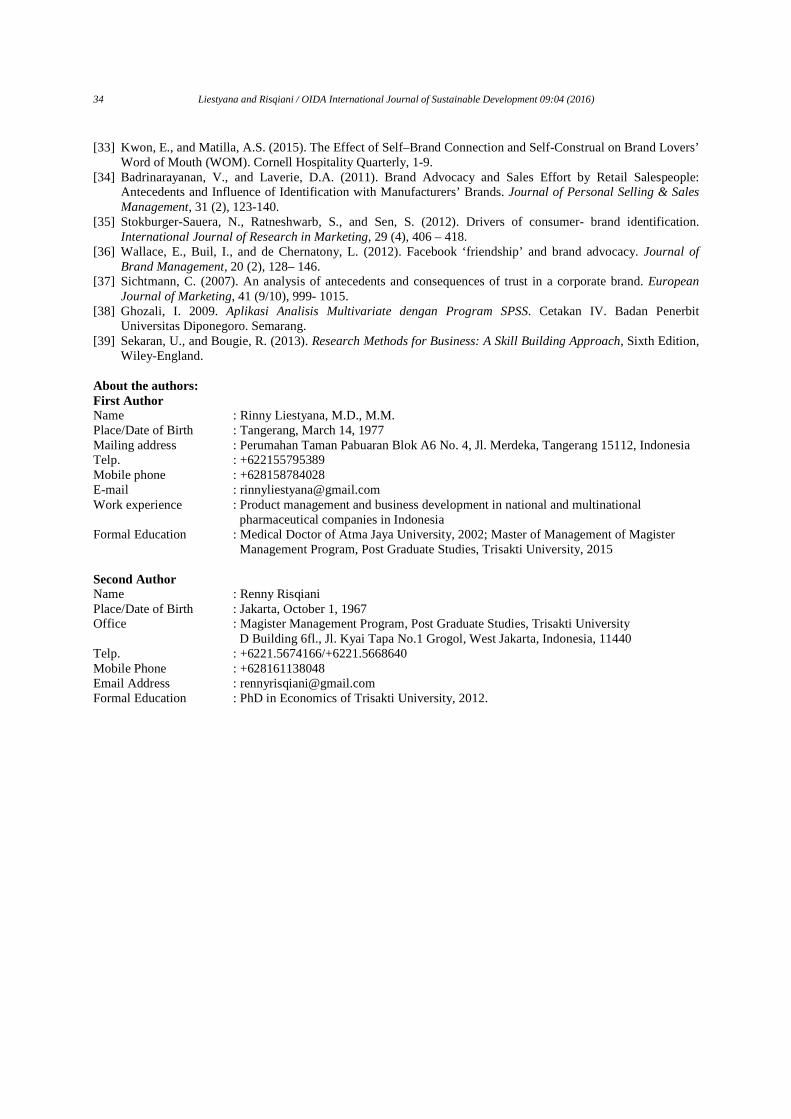
34 Liestyana and Risqiani / OIDA International Journal of Sustainable Development 09:04 (2016)
[33] Kwon, E., and Matilla, A.S. (2015). The Effect of Self–Brand Connection and Self-Construal on Brand Lovers’ Word of Mouth (WOM). Cornell Hospitality Quarterly, 1-9.
[34] Badrinarayanan, V., and Laverie, D.A. (2011). Brand Advocacy and Sales Effort by Retail Salespeople: Antecedents and Influence of Identification with Manufacturers’ Brands. Journal of Personal Selling & Sales Management, 31 (2), 123-140.
[35] Stokburger-Sauera, N., Ratneshwarb, S., and Sen, S. (2012). Drivers of consumer- brand identification. International Journal of Research in Marketing, 29 (4), 406 – 418.
[36] Wallace, E., Buil, I., and de Chernatony, L. (2012). Facebook ‘friendship’ and brand advocacy. Journal of Brand Management, 20 (2), 128– 146.
[37] Sichtmann, C. (2007). An analysis of antecedents and consequences of trust in a corporate brand. European Journal of Marketing, 41 (9/10), 999- 1015.
[38] Ghozali, I. 2009. Aplikasi Analisis Multivariate dengan Program SPSS. Cetakan IV. Badan Penerbit Universitas Diponegoro. Semarang.
[39] Sekaran, U., and Bougie, R. (2013). Research Methods for Business: A Skill Building Approach, Sixth Edition, Wiley-England.
About the authors: First Author Name : Rinny Liestyana, M.D., M.M. Place/Date of Birth : Tangerang, March 14, 1977 Mailing address : Perumahan Taman Pabuaran Blok A6 No. 4, Jl. Merdeka, Tangerang 15112, Indonesia Telp. : +622155795389 Mobile phone : +628158784028 E-mail : [email protected] Work experience : Product management and business development in national and multinational pharmaceutical companies in Indonesia Formal Education : Medical Doctor of Atma Jaya University, 2002; Master of Management of Magister Management Program, Post Graduate Studies, Trisakti University, 2015
Second Author Name : Renny Risqiani Place/Date of Birth : Jakarta, October 1, 1967 Office : Magister Management Program, Post Graduate Studies, Trisakti University D Building 6fl., Jl. Kyai Tapa No.1 Grogol, West Jakarta, Indonesia, 11440 Telp. : +6221.5674166/+6221.5668640 Mobile Phone : +628161138048 Email Address : [email protected] Formal Education : PhD in Economics of Trisakti University, 2012.
Impact of Working Ability, Motivation and Working Condition to Employee’s Performance; Case in Private
Universities in West Jakarta
Deasy Aseanty University of Trisakti, Jakarta, Indonesia
Correspondence Author: [email protected]
© Authour(s) OIDA International Journal of Sustainable Development, Ontario International Development Agency, Canada
ISSN 1923-6654 (print) ISSN 1923-6662 (online) www.oidaijsd.com Also available at http://www.ssrn.com/link/OIDA-Intl-Journal-Sustainable-Dev.html
Abstract: Employee is part of organization which has a significant role and impact to the performance of an organization. They have to run the operational process that led to organizational success. Therefore, it is important for us to know what factors that influence employee performance. It is also because the employee performance is a very significant factor affecting profitability of an organization. Inefficient job performance will bring about a tragedy to the organization as associated with lower productivity, profitability and overall organizational effectiveness. Measuring performance is an essential function in business management. Business owners usually have quantitative or qualitative analysis procedures to review their companies operations. Quantitative analysis uses mathematical calculations to measure the performance output. Qualitative analysis allows business owners, or also customers to make personal judgments or inferences from business information. Employee performance is a key cog of a company. Employees usually represent the largest expense for a company, and measuring performance is essential to the employee management process. So, it can be concluded that the employee performance is the core construct of today’s work place. The importance of employee is also way higher in service sectors, including education sectors.
The purpose of this study was to empirically prove the impact of working ability, working condition, and motivation on employee’s performance in private universities in West Jakarta. University of Bunda Mulia, University of Bina Nusantara, University of Krida Wacana, University of Tarumanegara, University of Trisakti and University of Esa Unggul are used to be the objects in this research. Those universities are the reputable universities with high number of students, and also followed by high number of employees also.
A questionnaire was designed and disseminated randomly to 160 staff among those six universities and multiple regression was used to generate the findings. The results shows that all those three variables; working ability, working conditions and motivation has positive and significant effect on employee performance.
Future study is still needed, regarding this issue. For further research, aspect individual attributes such as individual character can be included as part of variable working ability. Leadership aspect and financial aspect, also can be included on variable working conditions, since it is also an important factor that influence the employee’s performance. In the future studies, it can also be tested about the effect among each variable, not only the effect on job performance. And to enrich the results, it can also compare the situation between the private universities and public, or compare to another area.
Keywords: Motivation, Performace, Universities, Working Ability Working Condition
36 Aseanty / OIDA International Journal of Sustainable Development 09:04 (2016)
Introduction
mployees are the most valuable asset in any organization. A successful and highly productive business can be achieved by engaging them in improving their performance. Not all employees are equal in their working and they have different modes of working in that some have the highest capability regardless of the incentive
while others may have an occasional jump-start. If they are handled effectively, the result can be greater productivity and increased employee morale. Employees in a firm are required to generate a total commitment to desired standards of performance to achieve a competitive advantage and improved performance for sustaining that competitive advantage at least for a prolonged period of time, if not forever.
According to Judge & Ferris (1993), perhaps there is no human resources system more important in organizations other than performance evaluation and the ratings of employee’s performance represent critical decisions that highly influence a variety of subsequent human resources actions and outcomes. Performance is a multidimensional construct, the measurement of which varies depending on a variety of factors (Armstrong, 2000). A more comprehensive view of performance is achieved if it is defined as embracing both behavior and outcomes (Armstrong, 2000). Employees’ performance is an important factor that contributes to improve the outcomes, behavior and traits of the employees. It helps to improve the productivity of the organization. Performance is considered to be in relation with the concepts of ability, opportunity and motivation. Ability is a function of ability, education, experience and training. Good performance is resulted if the employee has the ability to support their activities at work. Opportunity refers to infrastructure and facilities needed to perform a job. Motivation is a psychological process that arousing, directing, and affecting the persistence a certain course of action to achieve a goal. That’s why it is important to know what factors affecting the employee’s performance. A lot of work already been done on performance management, but it is still limited study which use this variables as the predictors of employee’s performance, in the education sector.
Research Question
As a research question, the research seeks to answer what role does the working ability, motivation and working condition play in enhancing performance in organization, especially in education sector. This will be possible through analysis of information gathered from the employee from six private university in West Jakarta, Indonesia.
Objective of Study
This study aims to: • To give some more information about private universities in West Jakarta, Indonesia. • To find out the relationships between working ability and employee’s performance in private universities in
West Jakarta, Indonesia. • To find out the relationships between motivation and employee’s performance in private universities in
West Jakarta, Indonesia. • To find out the relationships between working condition and employee’s performance in private
universities in West Jakarta, Indonesia. • To provide recommendation and literature for the researchers and practitioners.
Limitation of this Study
Due to some constraints, the are still some limitation in this study. First, this study only uses the private universities as the objects, while there are also public universities. Second, the location we take is in West Jakarta only. And third, we didn’t put any financial aspect that we believe could impact to the employee’s performance, such as salary and bonus. It will be better for future research to combine these limitations so that the future finding will be much broader.
Theoretical Background
The literature begins with the vast correlation, hierarchical regression and moderated area of numerous factors that may affect the performance regression analysis were used to complete the statistical of employees in the working area.
Employee Performance
The objective of business owners is profitability. Your organization's success depends on your employees' performance; poor performance is detrimental to your company's success. Creating a well-rounded approach to
E
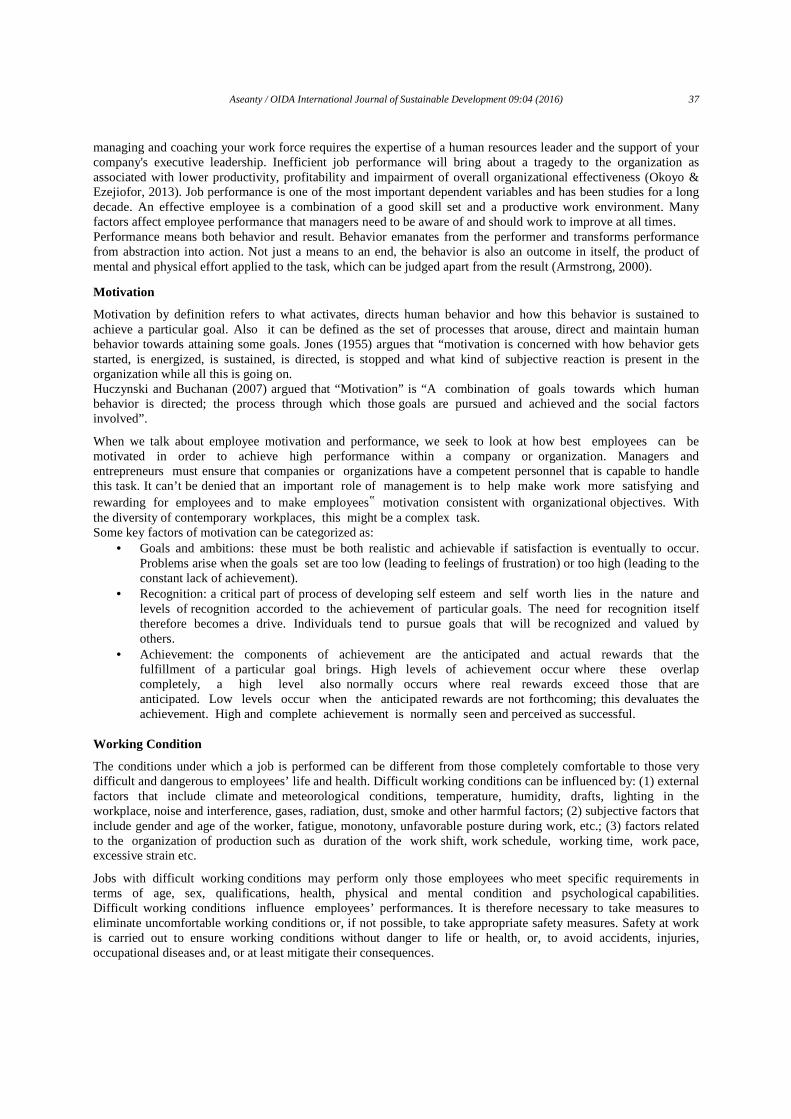
Aseanty / OIDA International Journal of Sustainable Development 09:04 (2016) 37
managing and coaching your work force requires the expertise of a human resources leader and the support of your company's executive leadership. Inefficient job performance will bring about a tragedy to the organization as associated with lower productivity, profitability and impairment of overall organizational effectiveness (Okoyo & Ezejiofor, 2013). Job performance is one of the most important dependent variables and has been studies for a long decade. An effective employee is a combination of a good skill set and a productive work environment. Many factors affect employee performance that managers need to be aware of and should work to improve at all times. Performance means both behavior and result. Behavior emanates from the performer and transforms performance from abstraction into action. Not just a means to an end, the behavior is also an outcome in itself, the product of mental and physical effort applied to the task, which can be judged apart from the result (Armstrong, 2000).
Motivation
Motivation by definition refers to what activates, directs human behavior and how this behavior is sustained to achieve a particular goal. Also it can be defined as the set of processes that arouse, direct and maintain human behavior towards attaining some goals. Jones (1955) argues that “motivation is concerned with how behavior gets started, is energized, is sustained, is directed, is stopped and what kind of subjective reaction is present in the organization while all this is going on. Huczynski and Buchanan (2007) argued that “Motivation” is “A combination of goals towards which human behavior is directed; the process through which those goals are pursued and achieved and the social factors involved”.
When we talk about employee motivation and performance, we seek to look at how best employees can be motivated in order to achieve high performance within a company or organization. Managers and entrepreneurs must ensure that companies or organizations have a competent personnel that is capable to handle this task. It can’t be denied that an important role of management is to help make work more satisfying and rewarding for employees and to make employees‟ motivation consistent with organizational objectives. With the diversity of contemporary workplaces, this might be a complex task. Some key factors of motivation can be categorized as:
• Goals and ambitions: these must be both realistic and achievable if satisfaction is eventually to occur. Problems arise when the goals set are too low (leading to feelings of frustration) or too high (leading to the constant lack of achievement).
• Recognition: a critical part of process of developing self esteem and self worth lies in the nature and levels of recognition accorded to the achievement of particular goals. The need for recognition itself therefore becomes a drive. Individuals tend to pursue goals that will be recognized and valued by others.
• Achievement: the components of achievement are the anticipated and actual rewards that the fulfillment of a particular goal brings. High levels of achievement occur where these overlap completely, a high level also normally occurs where real rewards exceed those that are anticipated. Low levels occur when the anticipated rewards are not forthcoming; this devaluates the achievement. High and complete achievement is normally seen and perceived as successful.
Working Condition
The conditions under which a job is performed can be different from those completely comfortable to those very difficult and dangerous to employees’ life and health. Difficult working conditions can be influenced by: (1) external factors that include climate and meteorological conditions, temperature, humidity, drafts, lighting in the workplace, noise and interference, gases, radiation, dust, smoke and other harmful factors; (2) subjective factors that include gender and age of the worker, fatigue, monotony, unfavorable posture during work, etc.; (3) factors related to the organization of production such as duration of the work shift, work schedule, working time, work pace, excessive strain etc.
Jobs with difficult working conditions may perform only those employees who meet specific requirements in terms of age, sex, qualifications, health, physical and mental condition and psychological capabilities. Difficult working conditions influence employees’ performances. It is therefore necessary to take measures to eliminate uncomfortable working conditions or, if not possible, to take appropriate safety measures. Safety at work is carried out to ensure working conditions without danger to life or health, or, to avoid accidents, injuries, occupational diseases and, or at least mitigate their consequences.
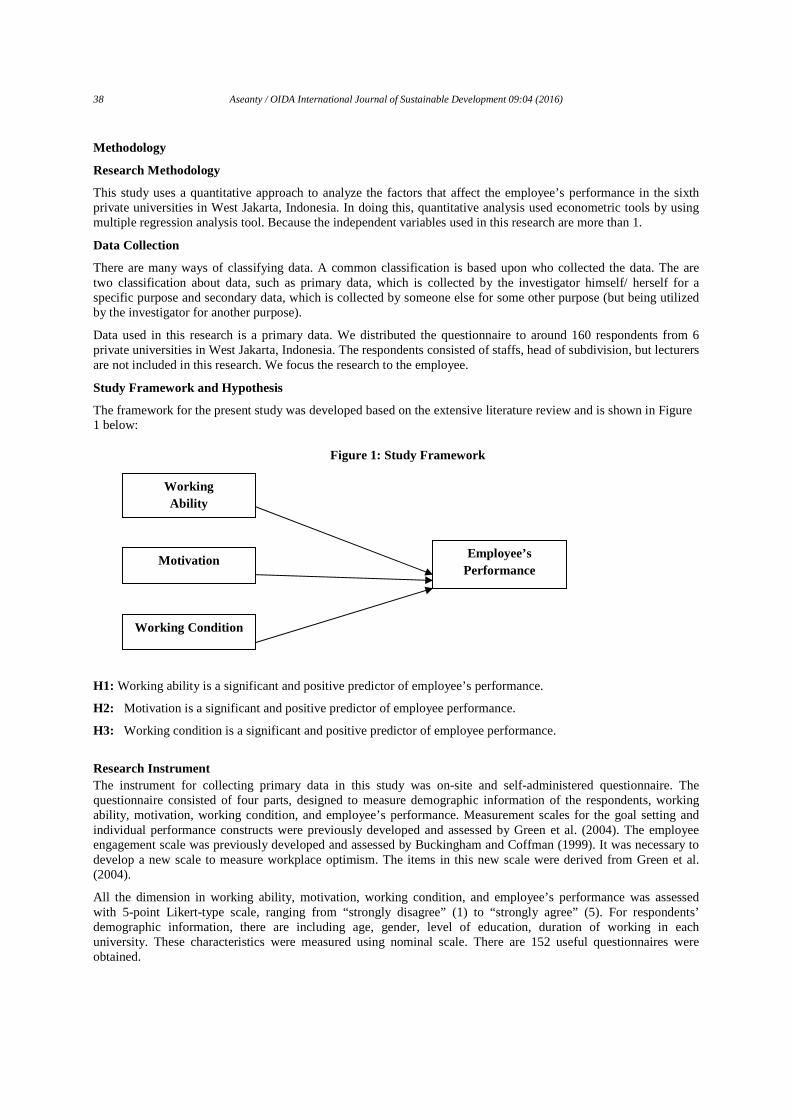
38 Aseanty / OIDA International Journal of Sustainable Development 09:04 (2016)
Methodology
Research Methodology
This study uses a quantitative approach to analyze the factors that affect the employee’s performance in the sixth private universities in West Jakarta, Indonesia. In doing this, quantitative analysis used econometric tools by using multiple regression analysis tool. Because the independent variables used in this research are more than 1.
Data Collection
There are many ways of classifying data. A common classification is based upon who collected the data. The are two classification about data, such as primary data, which is collected by the investigator himself/ herself for a specific purpose and secondary data, which is collected by someone else for some other purpose (but being utilized by the investigator for another purpose).
Data used in this research is a primary data. We distributed the questionnaire to around 160 respondents from 6 private universities in West Jakarta, Indonesia. The respondents consisted of staffs, head of subdivision, but lecturers are not included in this research. We focus the research to the employee.
Study Framework and Hypothesis
The framework for the present study was developed based on the extensive literature review and is shown in Figure 1 below:
Figure 1: Study Framework
H1: Working ability is a significant and positive predictor of employee’s performance.
H2: Motivation is a significant and positive predictor of employee performance.
H3: Working condition is a significant and positive predictor of employee performance.
Research Instrument The instrument for collecting primary data in this study was on-site and self-administered questionnaire. The questionnaire consisted of four parts, designed to measure demographic information of the respondents, working ability, motivation, working condition, and employee’s performance. Measurement scales for the goal setting and individual performance constructs were previously developed and assessed by Green et al. (2004). The employee engagement scale was previously developed and assessed by Buckingham and Coffman (1999). It was necessary to develop a new scale to measure workplace optimism. The items in this new scale were derived from Green et al. (2004).
All the dimension in working ability, motivation, working condition, and employee’s performance was assessed with 5-point Likert-type scale, ranging from “strongly disagree” (1) to “strongly agree” (5). For respondents’ demographic information, there are including age, gender, level of education, duration of working in each university. These characteristics were measured using nominal scale. There are 152 useful questionnaires were obtained.
Working Ability
Motivation
Working Condition
Employee’s Performance
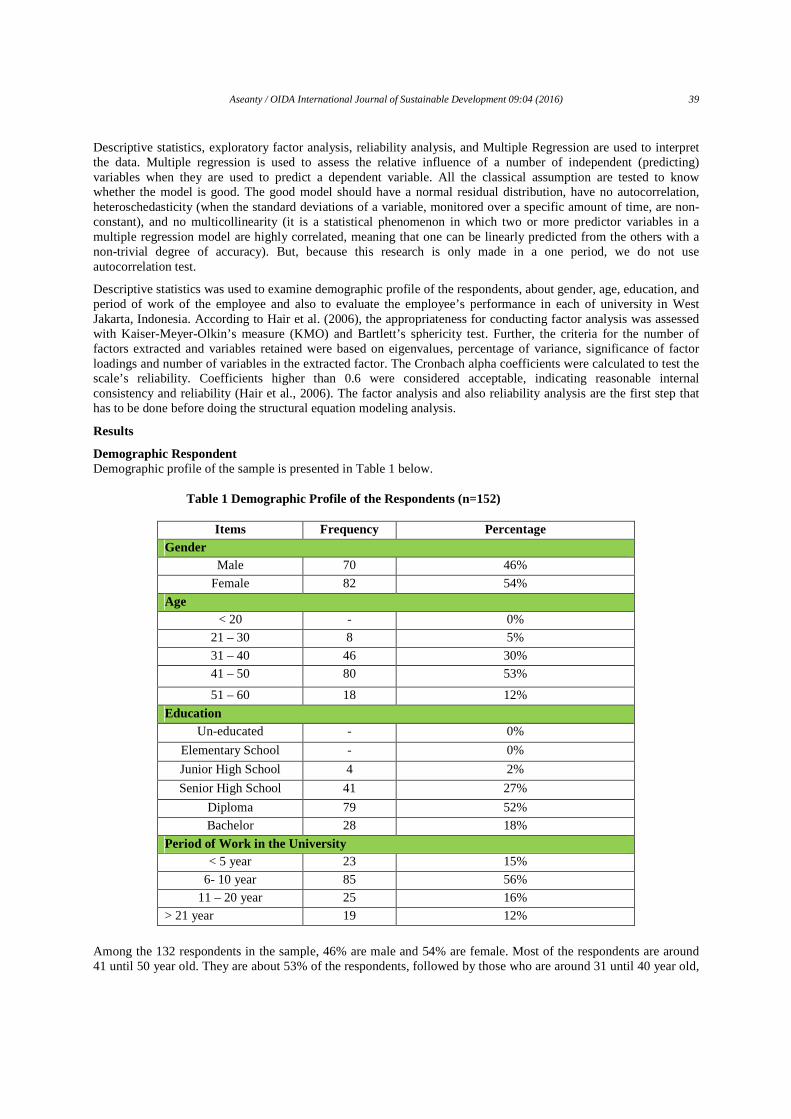
Aseanty / OIDA International Journal of Sustainable Development 09:04 (2016) 39
Descriptive statistics, exploratory factor analysis, reliability analysis, and Multiple Regression are used to interpret the data. Multiple regression is used to assess the relative influence of a number of independent (predicting) variables when they are used to predict a dependent variable. All the classical assumption are tested to know whether the model is good. The good model should have a normal residual distribution, have no autocorrelation, heteroschedasticity (when the standard deviations of a variable, monitored over a specific amount of time, are non-constant), and no multicollinearity (it is a statistical phenomenon in which two or more predictor variables in a multiple regression model are highly correlated, meaning that one can be linearly predicted from the others with a non-trivial degree of accuracy). But, because this research is only made in a one period, we do not use autocorrelation test.
Descriptive statistics was used to examine demographic profile of the respondents, about gender, age, education, and period of work of the employee and also to evaluate the employee’s performance in each of university in West Jakarta, Indonesia. According to Hair et al. (2006), the appropriateness for conducting factor analysis was assessed with Kaiser-Meyer-Olkin’s measure (KMO) and Bartlett’s sphericity test. Further, the criteria for the number of factors extracted and variables retained were based on eigenvalues, percentage of variance, significance of factor loadings and number of variables in the extracted factor. The Cronbach alpha coefficients were calculated to test the scale’s reliability. Coefficients higher than 0.6 were considered acceptable, indicating reasonable internal consistency and reliability (Hair et al., 2006). The factor analysis and also reliability analysis are the first step that has to be done before doing the structural equation modeling analysis.
Results
Demographic Respondent Demographic profile of the sample is presented in Table 1 below.
Table 1 Demographic Profile of the Respondents (n=152)
Items Frequency Percentage Gender
Male 70 46%
Female 82 54%
Age < 20 - 0%
21 – 30 8 5%
31 – 40 46 30%
41 – 50 80 53%
51 – 60 18 12%
Education Un-educated - 0%
Elementary School - 0%
Junior High School 4 2%
Senior High School 41 27%
Diploma 79 52%
Bachelor 28 18%
Period of Work in the University < 5 year 23 15%
6- 10 year 85 56%
11 – 20 year 25 16%
> 21 year 19 12%
Among the 132 respondents in the sample, 46% are male and 54% are female. Most of the respondents are around 41 until 50 year old. They are about 53% of the respondents, followed by those who are around 31 until 40 year old,
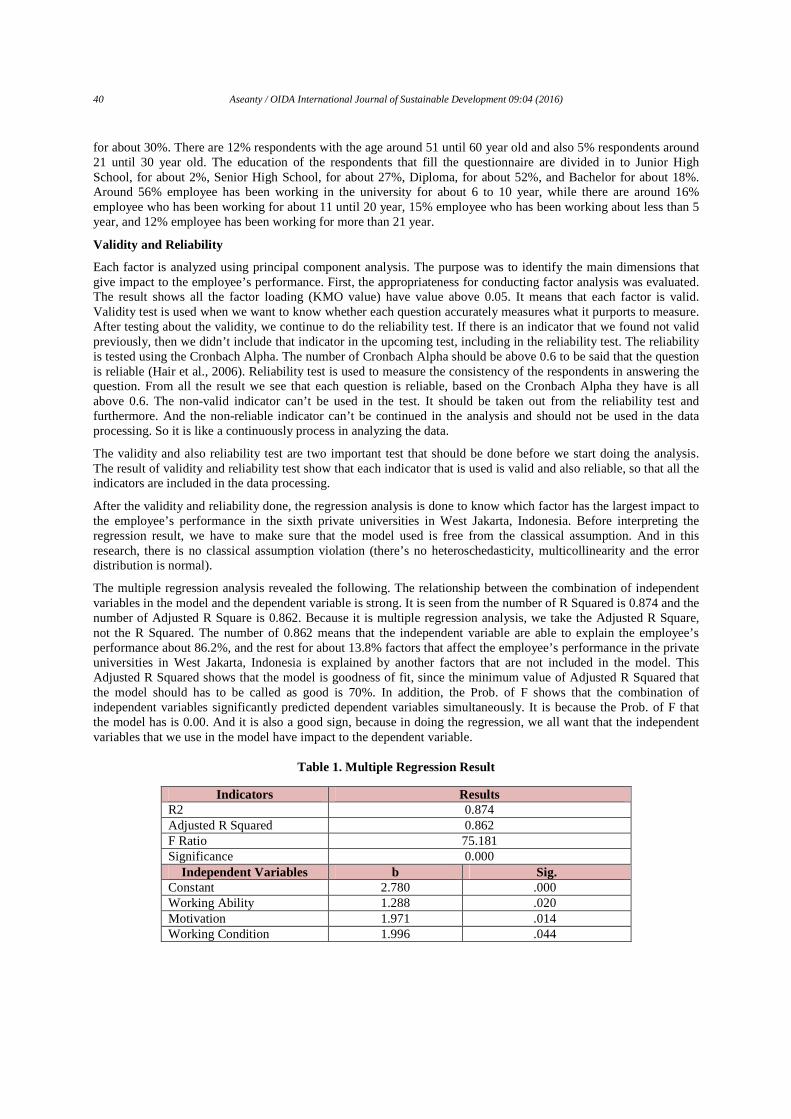
40 Aseanty / OIDA International Journal of Sustainable Development 09:04 (2016)
for about 30%. There are 12% respondents with the age around 51 until 60 year old and also 5% respondents around 21 until 30 year old. The education of the respondents that fill the questionnaire are divided in to Junior High School, for about 2%, Senior High School, for about 27%, Diploma, for about 52%, and Bachelor for about 18%. Around 56% employee has been working in the university for about 6 to 10 year, while there are around 16% employee who has been working for about 11 until 20 year, 15% employee who has been working about less than 5 year, and 12% employee has been working for more than 21 year.
Validity and Reliability
Each factor is analyzed using principal component analysis. The purpose was to identify the main dimensions that give impact to the employee’s performance. First, the appropriateness for conducting factor analysis was evaluated. The result shows all the factor loading (KMO value) have value above 0.05. It means that each factor is valid. Validity test is used when we want to know whether each question accurately measures what it purports to measure. After testing about the validity, we continue to do the reliability test. If there is an indicator that we found not valid previously, then we didn’t include that indicator in the upcoming test, including in the reliability test. The reliability is tested using the Cronbach Alpha. The number of Cronbach Alpha should be above 0.6 to be said that the question is reliable (Hair et al., 2006). Reliability test is used to measure the consistency of the respondents in answering the question. From all the result we see that each question is reliable, based on the Cronbach Alpha they have is all above 0.6. The non-valid indicator can’t be used in the test. It should be taken out from the reliability test and furthermore. And the non-reliable indicator can’t be continued in the analysis and should not be used in the data processing. So it is like a continuously process in analyzing the data.
The validity and also reliability test are two important test that should be done before we start doing the analysis. The result of validity and reliability test show that each indicator that is used is valid and also reliable, so that all the indicators are included in the data processing.
After the validity and reliability done, the regression analysis is done to know which factor has the largest impact to the employee’s performance in the sixth private universities in West Jakarta, Indonesia. Before interpreting the regression result, we have to make sure that the model used is free from the classical assumption. And in this research, there is no classical assumption violation (there’s no heteroschedasticity, multicollinearity and the error distribution is normal).
The multiple regression analysis revealed the following. The relationship between the combination of independent variables in the model and the dependent variable is strong. It is seen from the number of R Squared is 0.874 and the number of Adjusted R Square is 0.862. Because it is multiple regression analysis, we take the Adjusted R Square, not the R Squared. The number of 0.862 means that the independent variable are able to explain the employee’s performance about 86.2%, and the rest for about 13.8% factors that affect the employee’s performance in the private universities in West Jakarta, Indonesia is explained by another factors that are not included in the model. This Adjusted R Squared shows that the model is goodness of fit, since the minimum value of Adjusted R Squared that the model should has to be called as good is 70%. In addition, the Prob. of F shows that the combination of independent variables significantly predicted dependent variables simultaneously. It is because the Prob. of F that the model has is 0.00. And it is also a good sign, because in doing the regression, we all want that the independent variables that we use in the model have impact to the dependent variable.
Table 1. Multiple Regression Result
Indicators Results
R2 0.874 Adjusted R Squared 0.862 F Ratio 75.181 Significance 0.000
Independent Variables b Sig. Constant 2.780 .000 Working Ability 1.288 .020 Motivation 1.971 .014 Working Condition 1.996 .044
Aseanty / OIDA International Journal of Sustainable Development 09:04 (2016) 41
To assess the relative importance of each independent variable in determining the value of the dependent variable, the significant value of each dimension is provided. The data processing is using the 10% alpha. The factor is said to has a significant impact to the employee’s performance if they have the significant value less than 0.1. According to Table 1, it is seen that all those three independent variables significantly influenced the employee’s performance in those sixth university in West Jakarta, Indonesia, statistically.
Working condition has the highest impact to the employee’s performance. It is seen from the beta number. It has the highest number among all the other variable (1.996). Therefore, this is the most important independent variable. But we can see that the impact of motivation and working ability to employee performance has also great because the coefficient that is has is not too far differ from working condition.
Discussion and Conclusion
Through this research, we determine what factors that has the highest impact to the employee’s performance in six private university in West Jakarta, Indonesia. The findings of factor analysis revealed that the main dimensions of employee’s performance in those private universities are working condition, motivation and working ability.
Multiple regression analysis indicated that all those three variable are the important factors to the employee’s performance, since they have positive and significant impact to the employee’s performance in those private universities. The results revealed strong, positive and significant relationship between each variable to employee’s performance. It implies that the good determination of working condition, having a strong motivation and improving the employee’s ability lead to higher employee’s performance in those university. In addition, about 82% of variance in overall employee’s performance can be explained by these variables. Thus, the explanatory power of the tested model in the employee’s performance is satisfactory.
Working condition, as the most important predictor in the employee’s performance must be maintained well. The management should be able to prove a good working condition, for instance by giving a good supervision, by dividing the workload in an appropriate way among the employee. It is because we can’t deny that workload should be maintained, since it can lead to employee’s stress and cause a decreasing in employee’s performance.
Reference
[1] Armstrong , M. (2000), Performance Management, New York: Kogon Page Publisher. [2] Buckingham, M, Coffman, C. (1999). First, break all the rules; what great managers do differently.Simon &
Schuster, New York, NY. 1999 [3] Green, K., Medlin, B., and Whitten, D. (2004), “Developing optimism to improve performance: an approach for
the manufacturing sector”, Industrial Management and Data Systems, Vol. 104 No. 2, pp. 106-114. [4] Hair, J., Black, W., Babin, B., Anderson, R., & Tatham, R. (2006). Multivariate data analysis (6th ed.).
Uppersaddle River, N.J.: Pearson Prentice Hall. [5] Huczynski A, Buchanan D.(2007). Organisational Behaviour,An Introductory Text, Prentice Hall 6th Ed [6] Konrad, A. (2006), “Engaging employee through high-involvement work practices”, Ivey Business Journal,
March/April, pp. 1-6. [7] Latham, G. P. (2007).Work motivation: History, theory, research, and practice. Thousand Oaks, CA: Sage [8] Okoyo, P. V. C., & Ezejiofor, A. (2013). The effect of Human resource development on Organizational
Productivity. International Journal of Academic Research in Business and Social Sciences, 3(10), 250-268.

42 Aseanty / OIDA International Journal of Sustainable Development 09:04 (2016)
Determinants of Poverty: Panel Data Analysis in Asean-5; 1990 – 2013
Mona Adriana
University of Trisakti, Jakarta, Indonesia Corresponding author: [email protected]
© Authour(s)
OIDA International Journal of Sustainable Development, Ontario International Development Agency, Canada ISSN 1923-6654 (print) ISSN 1923-6662 (online) www.oidaijsd.com
Also available at http://www.ssrn.com/link/OIDA-Intl-Journal-Sustainable-Dev.html
Abstract: Poverty is a multi-faceted phenomenon which affects not only the ability to purchase goods, but also vulnerability towards various pressures that may prohibit an individual from enjoying life. This vulnerability may be gauged from living conditions such as employment, health, education, and housing. In short term, poverty can be concluded as one problem that really bothers every country around the world. Poverty is one of the issues being debated in the central and local governments in various regions including in ASEAN region. Since its establishment in 1967, ASEAN has been transforming in from five developing countries to a group consisting of 10 countries that are accounted in the international area. But still, they face the poverty problem up till now.
That’s why the analysis of determinants of poverty is essential for preparing strategies towards efficient intervention. This research aims to investigate the determinants of poverty in ASEAN-5. Indonesia, Thailand, Malaysia, Laos, and Vietnam are used as the object since the poverty rate in those five countries can be categorized as high since long time ago, and also the availability data of each country. Because for the rest of ASEAN countries, especially Myanmar and Cambodia, we still face lack of data that are publish freely in the internet. The variables used in this research consist of macroeconomics variables, such as inflation rate, the growth of gross domestic product, unemployment rate, and also social variables, such as total population and youth literacy rate. These variables are considered as the important factors that every country should have. And along with its development, ASEAN countries also have various condition about those factors. Also, it can be said that for some factors, there are some gap between the ASEAN countries.
Data used in this research is obtained from the World Bank Publication. The method used in this research is a quantitative method. By using panel data analysis and STATA 11 as the software, it is seen that generally, factors determine poverty rate in ASEAN-5 are the growth of GDP, inflation rate, unemployment rate, and youth illiteracy rate. Panel data or longitudinal data typically refer to data containing time series observations of a number of individuals. This research use the combination of time series and cross section, that’s why we can use the panel data analysis.
Future studies are still needed as a development of this study. We recommend to adding another factor that might be influence poverty, and if it is possible, to use all the ASEAN countries so that we can get broader depiction about the ASEAN countries.
Keywords: ASEAN, Illiteracy, Macroeconomics, Panel Data, Poverty Rate
Introduction
ational development is one of the efforts to create a just, prosperous, competitive, advanced and prosperous society. Different development activities have been carried out by each government in every countries, especially in developing countries, that are still lagging behind other regions to generalize the development
in various areas. The main indicators of a success development is the reduction in the number poor people. Effectiveness in decreasing the number of poor is the main growth in choosing a strategy or instrument development. This means that one of the main criteria for the selection of gravity or sector the leading sectors of national development are effective in decreasing the number of poor.
N
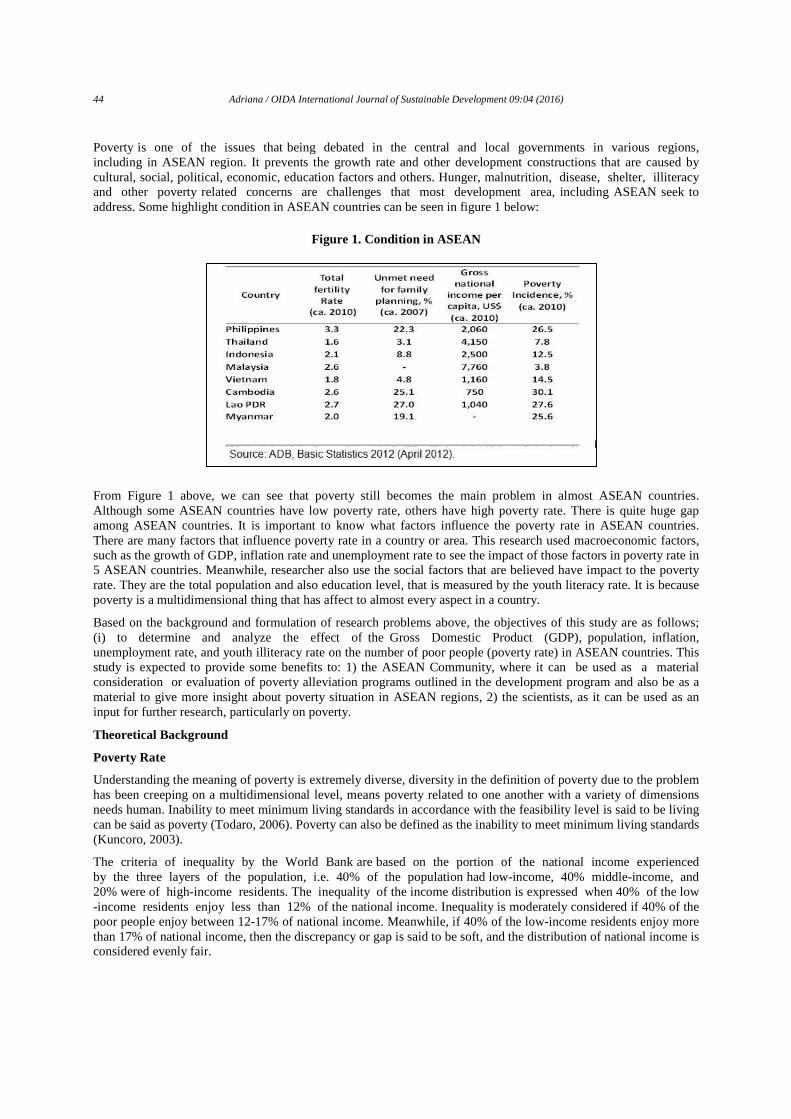
44 Adriana / OIDA International Journal of Sustainable Development 09:04 (2016)
Poverty is one of the issues that being debated in the central and local governments in various regions, including in ASEAN region. It prevents the growth rate and other development constructions that are caused by cultural, social, political, economic, education factors and others. Hunger, malnutrition, disease, shelter, illiteracy and other poverty related concerns are challenges that most development area, including ASEAN seek to address. Some highlight condition in ASEAN countries can be seen in figure 1 below:
Figure 1. Condition in ASEAN From Figure 1 above, we can see that poverty still becomes the main problem in almost ASEAN countries. Although some ASEAN countries have low poverty rate, others have high poverty rate. There is quite huge gap among ASEAN countries. It is important to know what factors influence the poverty rate in ASEAN countries. There are many factors that influence poverty rate in a country or area. This research used macroeconomic factors, such as the growth of GDP, inflation rate and unemployment rate to see the impact of those factors in poverty rate in 5 ASEAN countries. Meanwhile, researcher also use the social factors that are believed have impact to the poverty rate. They are the total population and also education level, that is measured by the youth literacy rate. It is because poverty is a multidimensional thing that has affect to almost every aspect in a country.
Based on the background and formulation of research problems above, the objectives of this study are as follows; (i) to determine and analyze the effect of the Gross Domestic Product (GDP), population, inflation, unemployment rate, and youth illiteracy rate on the number of poor people (poverty rate) in ASEAN countries. This study is expected to provide some benefits to: 1) the ASEAN Community, where it can be used as a material consideration or evaluation of poverty alleviation programs outlined in the development program and also be as a material to give more insight about poverty situation in ASEAN regions, 2) the scientists, as it can be used as an input for further research, particularly on poverty.
Theoretical Background
Poverty Rate
Understanding the meaning of poverty is extremely diverse, diversity in the definition of poverty due to the problem has been creeping on a multidimensional level, means poverty related to one another with a variety of dimensions needs human. Inability to meet minimum living standards in accordance with the feasibility level is said to be living can be said as poverty (Todaro, 2006). Poverty can also be defined as the inability to meet minimum living standards (Kuncoro, 2003).
The criteria of inequality by the World Bank are based on the portion of the national income experienced by the three layers of the population, i.e. 40% of the population had low-income, 40% middle-income, and 20% were of high-income residents. The inequality of the income distribution is expressed when 40% of the low -income residents enjoy less than 12% of the national income. Inequality is moderately considered if 40% of the poor people enjoy between 12-17% of national income. Meanwhile, if 40% of the low-income residents enjoy more than 17% of national income, then the discrepancy or gap is said to be soft, and the distribution of national income is considered evenly fair.
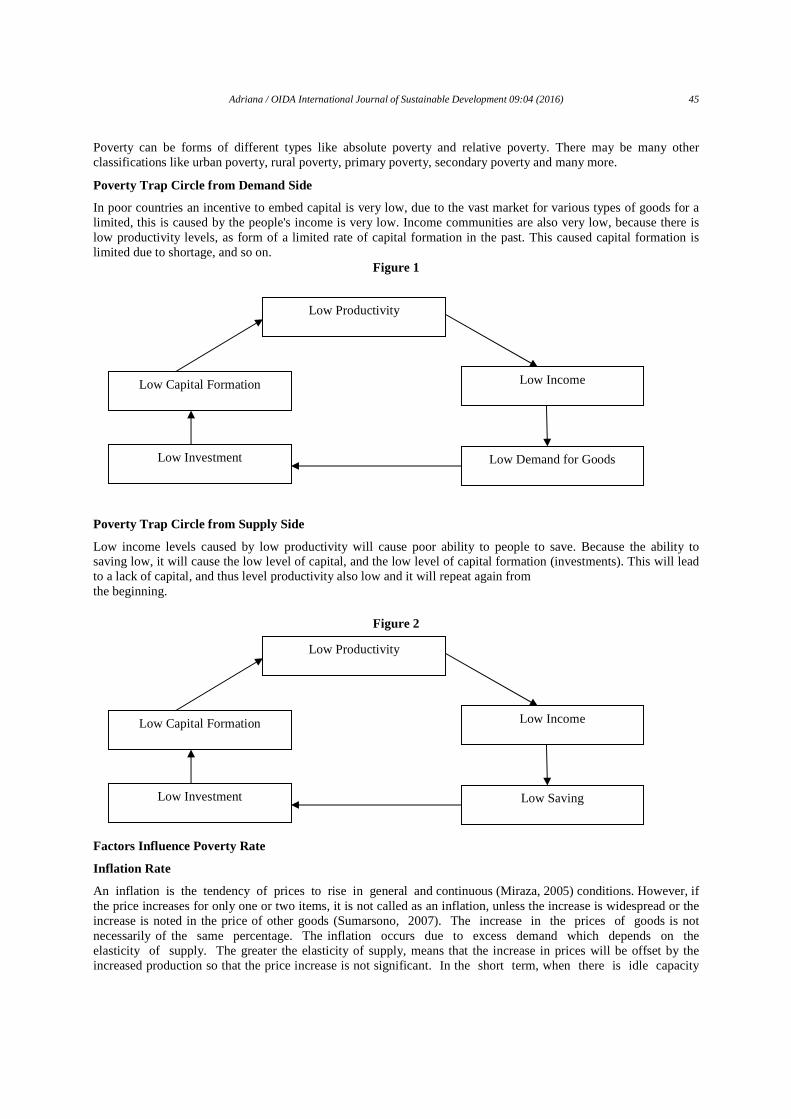
Adriana / OIDA International Journal of Sustainable Development 09:04 (2016) 45
Poverty can be forms of different types like absolute poverty and relative poverty. There may be many other classifications like urban poverty, rural poverty, primary poverty, secondary poverty and many more.
Poverty Trap Circle from Demand Side
In poor countries an incentive to embed capital is very low, due to the vast market for various types of goods for a limited, this is caused by the people's income is very low. Income communities are also very low, because there is low productivity levels, as form of a limited rate of capital formation in the past. This caused capital formation is limited due to shortage, and so on.
Figure 1
Picture 2 Poverty Trap Circle from Supply Side
Low income levels caused by low productivity will cause poor ability to people to save. Because the ability to saving low, it will cause the low level of capital, and the low level of capital formation (investments). This will lead to a lack of capital, and thus level productivity also low and it will repeat again from the beginning.
Figure 2 Factors Influence Poverty Rate
Inflation Rate
An inflation is the tendency of prices to rise in general and continuous (Miraza, 2005) conditions. However, if the price increases for only one or two items, it is not called as an inflation, unless the increase is widespread or the increase is noted in the price of other goods (Sumarsono, 2007). The increase in the prices of goods is not necessarily of the same percentage. The inflation occurs due to excess demand which depends on the elasticity of supply. The greater the elasticity of supply, means that the increase in prices will be offset by the increased production so that the price increase is not significant. In the short term, when there is idle capacity
Low Productivity
Low Income
Low Saving
Low Capital Formation
Low Investment
Low Productivity
Low Income
Low Demand for Goods
Low Capital Formation
Low Investment
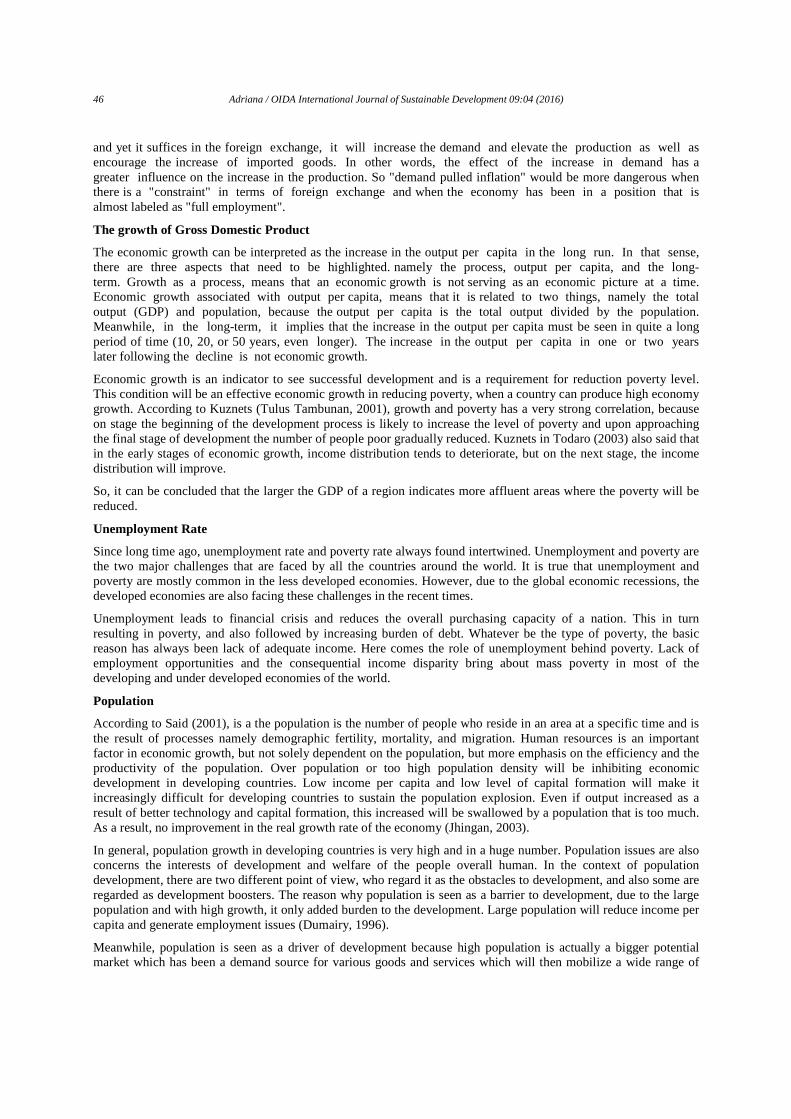
46 Adriana / OIDA International Journal of Sustainable Development 09:04 (2016)
and yet it suffices in the foreign exchange, it will increase the demand and elevate the production as well as encourage the increase of imported goods. In other words, the effect of the increase in demand has a greater influence on the increase in the production. So "demand pulled inflation" would be more dangerous when there is a "constraint" in terms of foreign exchange and when the economy has been in a position that is almost labeled as "full employment".
The growth of Gross Domestic Product
The economic growth can be interpreted as the increase in the output per capita in the long run. In that sense, there are three aspects that need to be highlighted. namely the process, output per capita, and the long-term. Growth as a process, means that an economic growth is not serving as an economic picture at a time. Economic growth associated with output per capita, means that it is related to two things, namely the total output (GDP) and population, because the output per capita is the total output divided by the population. Meanwhile, in the long-term, it implies that the increase in the output per capita must be seen in quite a long period of time (10, 20, or 50 years, even longer). The increase in the output per capita in one or two years later following the decline is not economic growth.
Economic growth is an indicator to see successful development and is a requirement for reduction poverty level. This condition will be an effective economic growth in reducing poverty, when a country can produce high economy growth. According to Kuznets (Tulus Tambunan, 2001), growth and poverty has a very strong correlation, because on stage the beginning of the development process is likely to increase the level of poverty and upon approaching the final stage of development the number of people poor gradually reduced. Kuznets in Todaro (2003) also said that in the early stages of economic growth, income distribution tends to deteriorate, but on the next stage, the income distribution will improve.
So, it can be concluded that the larger the GDP of a region indicates more affluent areas where the poverty will be reduced.
Unemployment Rate
Since long time ago, unemployment rate and poverty rate always found intertwined. Unemployment and poverty are the two major challenges that are faced by all the countries around the world. It is true that unemployment and poverty are mostly common in the less developed economies. However, due to the global economic recessions, the developed economies are also facing these challenges in the recent times.
Unemployment leads to financial crisis and reduces the overall purchasing capacity of a nation. This in turn resulting in poverty, and also followed by increasing burden of debt. Whatever be the type of poverty, the basic reason has always been lack of adequate income. Here comes the role of unemployment behind poverty. Lack of employment opportunities and the consequential income disparity bring about mass poverty in most of the developing and under developed economies of the world.
Population
According to Said (2001), is a the population is the number of people who reside in an area at a specific time and is the result of processes namely demographic fertility, mortality, and migration. Human resources is an important factor in economic growth, but not solely dependent on the population, but more emphasis on the efficiency and the productivity of the population. Over population or too high population density will be inhibiting economic development in developing countries. Low income per capita and low level of capital formation will make it increasingly difficult for developing countries to sustain the population explosion. Even if output increased as a result of better technology and capital formation, this increased will be swallowed by a population that is too much. As a result, no improvement in the real growth rate of the economy (Jhingan, 2003).
In general, population growth in developing countries is very high and in a huge number. Population issues are also concerns the interests of development and welfare of the people overall human. In the context of population development, there are two different point of view, who regard it as the obstacles to development, and also some are regarded as development boosters. The reason why population is seen as a barrier to development, due to the large population and with high growth, it only added burden to the development. Large population will reduce income per capita and generate employment issues (Dumairy, 1996).
Meanwhile, population is seen as a driver of development because high population is actually a bigger potential market which has been a demand source for various goods and services which will then mobilize a wide range of
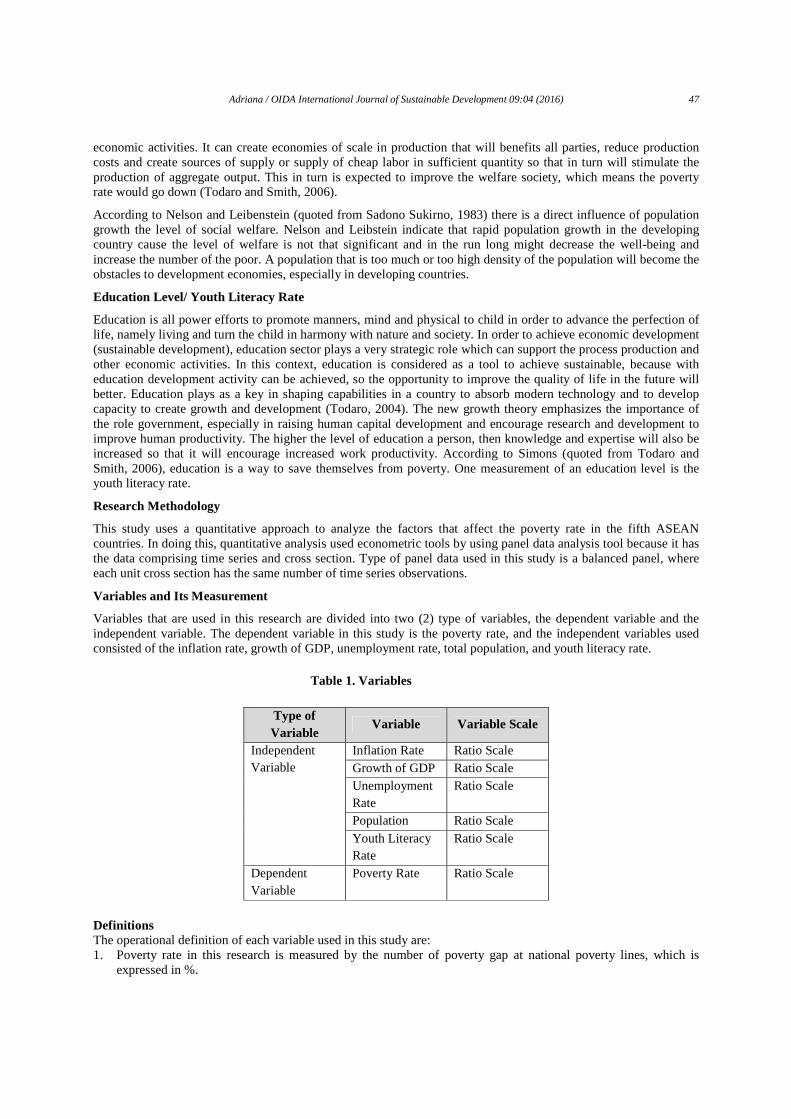
Adriana / OIDA International Journal of Sustainable Development 09:04 (2016) 47
economic activities. It can create economies of scale in production that will benefits all parties, reduce production costs and create sources of supply or supply of cheap labor in sufficient quantity so that in turn will stimulate the production of aggregate output. This in turn is expected to improve the welfare society, which means the poverty rate would go down (Todaro and Smith, 2006).
According to Nelson and Leibenstein (quoted from Sadono Sukirno, 1983) there is a direct influence of population growth the level of social welfare. Nelson and Leibstein indicate that rapid population growth in the developing country cause the level of welfare is not that significant and in the run long might decrease the well-being and increase the number of the poor. A population that is too much or too high density of the population will become the obstacles to development economies, especially in developing countries.
Education Level/ Youth Literacy Rate
Education is all power efforts to promote manners, mind and physical to child in order to advance the perfection of life, namely living and turn the child in harmony with nature and society. In order to achieve economic development (sustainable development), education sector plays a very strategic role which can support the process production and other economic activities. In this context, education is considered as a tool to achieve sustainable, because with education development activity can be achieved, so the opportunity to improve the quality of life in the future will better. Education plays as a key in shaping capabilities in a country to absorb modern technology and to develop capacity to create growth and development (Todaro, 2004). The new growth theory emphasizes the importance of the role government, especially in raising human capital development and encourage research and development to improve human productivity. The higher the level of education a person, then knowledge and expertise will also be increased so that it will encourage increased work productivity. According to Simons (quoted from Todaro and Smith, 2006), education is a way to save themselves from poverty. One measurement of an education level is the youth literacy rate.
Research Methodology
This study uses a quantitative approach to analyze the factors that affect the poverty rate in the fifth ASEAN countries. In doing this, quantitative analysis used econometric tools by using panel data analysis tool because it has the data comprising time series and cross section. Type of panel data used in this study is a balanced panel, where each unit cross section has the same number of time series observations.
Variables and Its Measurement
Variables that are used in this research are divided into two (2) type of variables, the dependent variable and the independent variable. The dependent variable in this study is the poverty rate, and the independent variables used consisted of the inflation rate, growth of GDP, unemployment rate, total population, and youth literacy rate.
Table 1. Variables
Type of Variable
Variable Variable Scale
Independent Variable
Inflation Rate Ratio Scale Growth of GDP Ratio Scale
Unemployment Rate
Ratio Scale
Population Ratio Scale
Youth Literacy Rate
Ratio Scale
Dependent Variable
Poverty Rate Ratio Scale
Definitions The operational definition of each variable used in this study are: 1. Poverty rate in this research is measured by the number of poverty gap at national poverty lines, which is
expressed in %.
48 Adriana / OIDA International Journal of Sustainable Development 09:04 (2016)
2. Inflation, the inflation rate as measured by the Consumer Price Index (CPI). This variable is expressed in terms of percent (%).
3. Unemployment rate is the total unemployment, as the percentage of labor force. 4. Growth of GDP, it is the growth of gross domestic product, in a country, which is expressed as%. To get the
number of its variable, we compare the GDP in current year with the previous year. 5. Total population is based on the de facto definition of population, which counts all residents regardless of legal
status or citizenship-except for refugees not permanently settled in the country of asylum, who are generally considered part of the population of their country of origin. In this research, the total population is measured by the growth of total population in the current year compared with the previous year, and is expressed in percentage.
6. Youth literacy rate is the literacy rates of 15-24 years old, men and women in a country, which is expressed in percentage.
Data Collection
The data used is secondary data from the World Bank, the International Monetary Fund (IMF), and the Asian Development Bank (ADB).
Model Formulation
The design of the model will be presented in a linear regression model with five independent variables, with the following model: Poverty Rate = α0 + α1 Inflation – α2 Growth of GDP + α3 Unemployment - α4 Education + α5 Population + e With α0= = constant α1, α2, α3, α4, α5 = coefficient e= residual
Analysis Tool
The analytical tool used in this research is panel analysis and using Eviews as its software. The panel data is a combination of cross section data with time series data. Panel data model that can be generated is a common effect, Fixed Effects and Random Effects.
Stationary Test
Before estimating panel models, the first thing to do is to test the stationary condition for each variable. Stationary test is done to avoid spurious regression. In this study, the stationary test was conducted by using Levin-Lin-Chu stationarity test to see stationarity condition among overall variables (common unit root) and also the Im-Pesaran-Shin stationary test to see the condition of the individual variables (individual unit root).
The hypothesis proposed: Ho: variables are not stationary. Ha: stationary variable. Decision making is Ha will be rejected if the value of Prob. > Alpha (0:05) and the statistical values of these variables is positive.
Chow Test
Chow test conducted to choose between Pooled Least Square model and Fixed Effect model. The hypothesis is as follows:
Ho: models Pooled Least Squared (PLS) is better. Ha: Fixed Effect models better. Proposed decision is if the result of Prob. > F is smaller than the value of α (5 percent), then Ho will be rejected and Ha accepted, and vice versa.
LM Test
This test is used to choose between Pooled Least Squared or Random Effect. The hypothesis is as follows: Ho: Pooled Least Squared model is better Ha: Random Effect models better Proposed decision is if the result of Prob. < α (0:05), then Ho will be rejected, and vice versa.
Adriana / OIDA International Journal of Sustainable Development 09:04 (2016) 49
Hausman Test
Hausman test is used to determine the best model among the models of Fixed Effects and Random Effects. The hypothesis is as follows:
Ho: Random Effect model is better Ha: Fixed Effect model is better
If the Probability of Chi-square> 0.05 then Ho is accepted and the model used is Random Effect. But if the Probability <0.05, the model used is the Fixed Effect.
Model Evaluation Method
After the results of data processing by using panel data analysis is done, we must evaluate the model. Estimation methods produced through the panel data analysis methods should be evaluated based on the following criteria:
Individual Test (T-Test)
Individual test is done by testing the significance of the coefficients of each variable. T-Test is used to determine whether the independent variable (X) is significant to the dependent variable (Y). This test is done by comparing the t-test or a t-statistic with a t-table at α significant level 10%.
F-Test
Simultaneously test is done to prove the existence of significant influence of the independent variables on the dependent variable overall.
Goodness of Fit Test
Goodness of Fit test aims to explain whether the change of independent variables in the model is quite able to explain the change of the dependent variable. The coefficient of determination is noted with R2. The value of R2 that is near to one is what a model needs to be categorized as good. If the value of R2 closes to zero, it means that the independent variables that exist in the method is not able to explain the change of dependent variable. So, the higher the value of R2, the better the model means Result
Stationarity Test Result
Results and discussion in this study is done based on the steps that have been described previously. The first step in conducting an econometric analysis to analyze the time series data is to do a test to see variable stationary or not. Stationarity test that is used is Levin-Lin-Chu stationary test and Im-Pesaran-Shin stationary test. Stationarity test results can be seen in Table 1 below. Based on test results obtained, it shows that all variables are stationary at a level so that the level of the test data is continued and there is no change in the model of the data used.
Next page
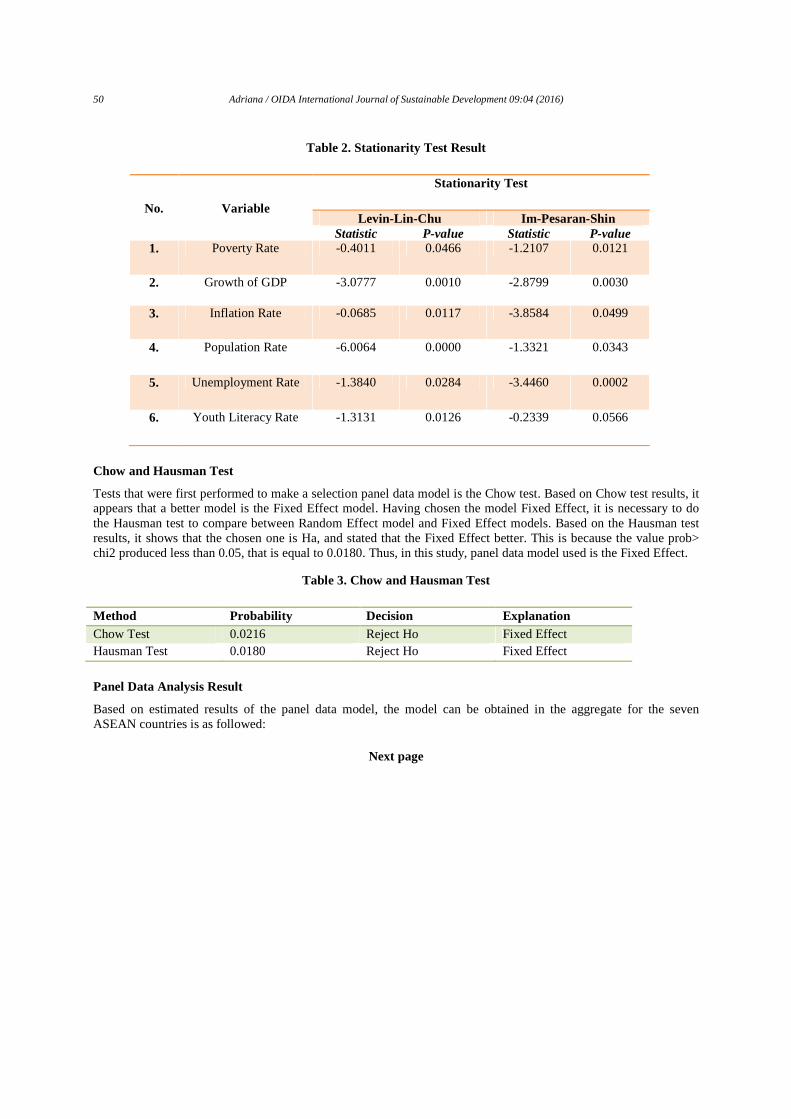
50 Adriana / OIDA International Journal of Sustainable Development 09:04 (2016)
Table 2. Stationarity Test Result
No. Variable
Stationarity Test
Levin-Lin-Chu Im-Pesaran-Shin Statistic P-value Statistic P-value
1. Poverty Rate -0.4011 0.0466 -1.2107 0.0121
2. Growth of GDP -3.0777 0.0010 -2.8799 0.0030
3. Inflation Rate -0.0685 0.0117 -3.8584 0.0499
4. Population Rate -6.0064 0.0000 -1.3321 0.0343
5. Unemployment Rate -1.3840 0.0284 -3.4460 0.0002
6. Youth Literacy Rate -1.3131 0.0126 -0.2339 0.0566
Chow and Hausman Test
Tests that were first performed to make a selection panel data model is the Chow test. Based on Chow test results, it appears that a better model is the Fixed Effect model. Having chosen the model Fixed Effect, it is necessary to do the Hausman test to compare between Random Effect model and Fixed Effect models. Based on the Hausman test results, it shows that the chosen one is Ha, and stated that the Fixed Effect better. This is because the value prob> chi2 produced less than 0.05, that is equal to 0.0180. Thus, in this study, panel data model used is the Fixed Effect.
Table 3. Chow and Hausman Test
Method Probability Decision Explanation Chow Test 0.0216 Reject Ho Fixed Effect Hausman Test 0.0180 Reject Ho Fixed Effect
Panel Data Analysis Result
Based on estimated results of the panel data model, the model can be obtained in the aggregate for the seven ASEAN countries is as followed:
Next page
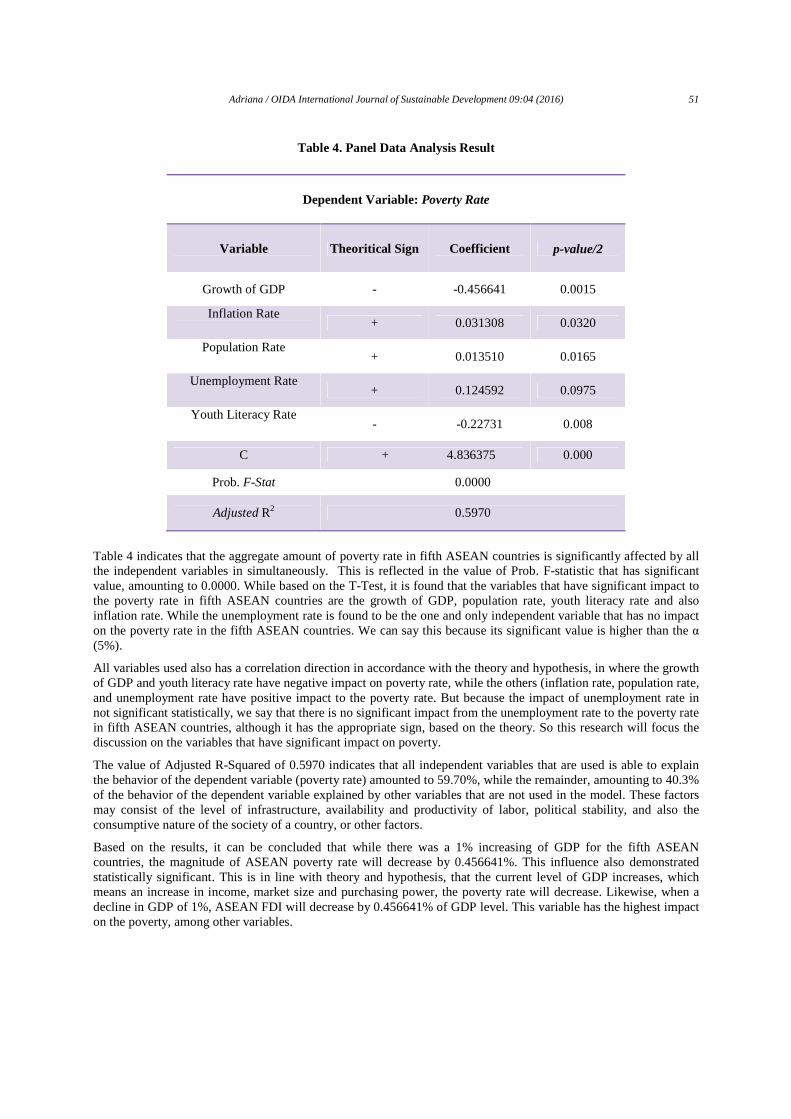
Adriana / OIDA International Journal of Sustainable Development 09:04 (2016) 51
Table 4. Panel Data Analysis Result
Dependent Variable: Poverty Rate
Variable Theoritical Sign Coefficient p-value/2
Growth of GDP - -0.456641 0.0015
Inflation Rate + 0.031308 0.0320
Population Rate + 0.013510 0.0165
Unemployment Rate + 0.124592 0.0975
Youth Literacy Rate - -0.22731 0.008
C + 4.836375 0.000
Prob. F-Stat 0.0000
Adjusted R2 0.5970
Table 4 indicates that the aggregate amount of poverty rate in fifth ASEAN countries is significantly affected by all the independent variables in simultaneously. This is reflected in the value of Prob. F-statistic that has significant value, amounting to 0.0000. While based on the T-Test, it is found that the variables that have significant impact to the poverty rate in fifth ASEAN countries are the growth of GDP, population rate, youth literacy rate and also inflation rate. While the unemployment rate is found to be the one and only independent variable that has no impact on the poverty rate in the fifth ASEAN countries. We can say this because its significant value is higher than the α (5%).
All variables used also has a correlation direction in accordance with the theory and hypothesis, in where the growth of GDP and youth literacy rate have negative impact on poverty rate, while the others (inflation rate, population rate, and unemployment rate have positive impact to the poverty rate. But because the impact of unemployment rate in not significant statistically, we say that there is no significant impact from the unemployment rate to the poverty rate in fifth ASEAN countries, although it has the appropriate sign, based on the theory. So this research will focus the discussion on the variables that have significant impact on poverty.
The value of Adjusted R-Squared of 0.5970 indicates that all independent variables that are used is able to explain the behavior of the dependent variable (poverty rate) amounted to 59.70%, while the remainder, amounting to 40.3% of the behavior of the dependent variable explained by other variables that are not used in the model. These factors may consist of the level of infrastructure, availability and productivity of labor, political stability, and also the consumptive nature of the society of a country, or other factors.
Based on the results, it can be concluded that while there was a 1% increasing of GDP for the fifth ASEAN countries, the magnitude of ASEAN poverty rate will decrease by 0.456641%. This influence also demonstrated statistically significant. This is in line with theory and hypothesis, that the current level of GDP increases, which means an increase in income, market size and purchasing power, the poverty rate will decrease. Likewise, when a decline in GDP of 1%, ASEAN FDI will decrease by 0.456641% of GDP level. This variable has the highest impact on the poverty, among other variables.
52 Adriana / OIDA International Journal of Sustainable Development 09:04 (2016)
The impact of education, measured by the youth literacy rate is significant. When there is a 1% increasing in youth increasing rate, the poverty rate will decrease about 0.22731%. This variable plays the second high role that impacts poverty rate in the fifth ASEAN countries. It can be understood because when an area has a good education means the quality of the resource humans in the area was also good. Education plays a key in forming a developing country's ability to absorb modern technology and to develop the capacity to create growth and sustainable development (Todaro, 2000). So, people who have the quality of higher education will be able to produce goods and services optimally so that it will acquire optimal income as well. If the high-income population, then all needs will be met and away from the cycle of poverty.
The impact of total population to poverty rate is positive. When there is a 1% increasing of total population in the fifth ASEAN countries, it means that the poverty rate will also increase about 0.013510%. There are several things that make residents as a driver of development and negatively affect the level poverty. Population as a driver of development for the population the greater is the potential market is the source of the request will be a wide variety of goods and services which will then move a wide range of economic activities that create economies of scale in production that benefit all parties, lowers costs production and create new sources of supply, or the supply of labor cheap in sufficient quantity so that in turn will stimulates the production of aggregate output or higher and on ultimately expected to improve the welfare of society, which means the level of poverty would down (Todaro and Smith, 2006). But this findings shows that for ASEAN countries, the impact of population rate to poverty is still positive. It might be because the increasing in the population is found as a burden for the development in ASEAN countries. And it might be also because there are many unproductive people in the country.
The inflation rate is found has a positive impact on poverty rate. When there is a 1% increasing on the inflation rate in the fifth ASEAN countries, then the poverty rate will also increase about 0.031308%, and vise versa. Inflation rate shows about the stability of economy in a country, it means that ASEAN countries should taken care more in their stability of economy to decrease the poverty rate.
Conclusion and Suggestion
The purpose in this research is to see the impact of inflation rate, the growth of GDP, the total population, youth literacy rate, unemployment rate in fifth ASEAN countries, during 1990 – 2013. Data used are the secondary data. The result shows that only the unemployment rate that has no impact to the poverty rate, while other variables have the significant impact to poverty rate in the fifth ASEAN countries. It means that ASEAN should take care each of these factors to maintain its poverty rate, especially the GDP and education level (youth literacy rate) that are the first and two factors that have high impact on poverty rate. The ASEAN region should be able to maintain their economy growth high and provide good and qualify education.
Reference
[1] Barro, R.J. (1996). Determinants of Economic Growth: A Cross -Country Empirical Study (Working Paper 5698). Cambridge, MA: National Bureau of Economic Research
[2] Dumairy. 1996.Perekonomian Indonesia.Jakarta: Erlangga [3] Jhingan, M.L. 2003.Ekonomi Pembangunan dan Perencanaan. Penerjemah: D.Guritno. Jakarta: PT Raja
Grafindo Persada [4] Kuncoro, Mudrajat. 2010.Masalah, Kebijakan, dan Politik: EkonomikaPembangunan.Yogyakarta: UPP
STIM YKPN [5] Mankiw, Gregory N. 2007.Makroekonomi. Jakarta: Penerbit Erlangga [6] Ravallion, M. (2003). The Debate on Globalization, Poverty and Inequality: Why Measurement Matters.
International Affairs, 79(4), 739-753 [7] Tambunan,T.H.(2001).Perekonomian Indonesia. Jakarta:Penerbit Ghalia Indonesia. [8] Tambunan, T.H.(2008). SME development, economic growth and government intervention in a
developing country: The Indonesian story.Journal of International Enterprise, 6, 147-167 [9] Todaro, Michael P. 2004.Pembangunan Ekonomi di Dunia Ketiga, Edisi 8.Jakarta: Erlangga [10] Todaro, M. P and S. C. Smith. 2006. Pembangunan Ekonomi . Jilid 1. Edisi 9. Alih Bahasa. Penerbit Erlangga.
Jakarta.
Designing Online Marketing For SME (Organic Food Case Study)
Hasrini Sari a, Aditya Parama Setiaboedi b
a, b Industrial Engineering Management, Institut Teknologi Bandung, Bandung, Indonesia. a Corresponding author: [email protected]
© Authour(s)
OIDA International Journal of Sustainable Development, Ontario International Development Agency, Canada ISSN 1923-6654 (print) ISSN 1923-6662 (online) www.oidaijsd.com
Also available at http://www.ssrn.com/link/OIDA-Intl-Journal-Sustainable-Dev.html
Abstract: Organic food consumption in the world tends to grow each year along with the increasing public awareness on health. This positive trend also happens in Indonesia. Nevertheless, many producers of organic food in Indonesia face problems in market their products. Most of them are SMEs so they have limited financial resources for conducting marketing activities. Therefore, they need kinds of marketing program that can be run at a low cost but reach a wide range of audience. Online marketing meets these requirements. Nowadays, the role of online commerce in increasing organizations’ profit is growing each year. Organizations spending on online marketing is also increasing as media buyers adjust to online world while other media advertisement spending keep falling or remain constant each year. Nevertheless, the online marketing effort should be designed in a way that will deliver value to both the organization and its customers. Several SMEs in Indonesia have adopted online marketing program but they do not enjoy its maximum benefit. Even worst, they just ignore or stop their online marketing activities. One form of online marketing is a website creation program. This study is intended to investigate the characteristics of online marketing activities and website that will enhance the customers’ intention to buy. Several steps are taken. First step, we identify characteristics of online buyers in general in Indonesia. Then, based on their similarities and differences, we group them into several segments. Second step, we identify potential segment suitable to be targeted by organic food producers. At the end, we identify the online marketing activities and the technical characteristics of website that match with the profile of the selected segment.
Total 686 valid data are collected out of 688 data gathered using an online questionnaire. The questionnaire’s URL is being spread through several online social media. Factor analysis is used to analyze the data and the result shows there are six factors that influence online purchase intention, namely ease-of-use, website integrity, customer communication, word-of-mouth, transaction security, and perceived usefulness. Then, cross tabulation and cluster analysis is conducted to obtain segments and their profiles. This study shows that potential online shoppers could be grouped into three segments based on behavioral variables (online buying frequency and spending, and payment method) and psychographic variables. For the organic products, the potential target is professional-shopaholic group,, the segment with buyers who have high frequency on online shopping and relatively large number of online financial transaction. These characteristics are then translated into technical characteristics of organic food online marketing activities and website in order to increase visitors’ intention to buy. At the end, this paper is also describes the implementation of the study result by analyzing an existing processed organic food producer.
Keywords: intention to buy, online marketing, online shoppers, organic products, website
Introduction
his study concentrates on organic foods, defined as foods cultivated in the country and nurtured organically without any artificial substance, including the foods processed from them [1]. This definition is chosen because the negative effects of non-organic food to human body are already proven in previous studies [2]. In T
54 Sari and Setiaboedi / OIDA International Journal of Sustainable Development 09:04 (2016)
addition, organic foods, especially agricultural products, are raw materials for other organic products such as cosmetics. Organic food consumption in the world tends to grow each year along with the increasing public awareness on health. This positive trend also happens in Indonesia. Nevertheless, many producers of organic food in Indonesia face problems in market their products. Most of them are SMEs so they have limited financial resources for conducting marketing activities.
Moreover, organic food has its own characteristics, which is a challenge in marketing the product. Two main factors that greatly weaken the positioning of organic products in comparison to non-organic products are price and lack of tangible benefits. Benefits of organic products, such as effect on health, are not attainable or immediately perceived by customers after consumption. The benefits only become effective over time. Hence, such benefits are often referred to as intangible benefits. Moreover, organic products in general have higher price tags than their non-organic competitors due to the higher price of raw materials and the more complicated processes involved. This combination of higher price and intangible benefits relegates green products to an inferior position compared to their competitors in the customer’s decision-making process [3].
Therefore, they need kinds of marketing program that can be run at a low cost but reach audience, which are numerous but in accordance with the target. Online marketing meets these requirements. Online marketing has the advantage of having a relatively low investment cost, ease of use, extensive network coverage, acceleration of dissemination and collection of information as well as search for potential business partners [4].
Nowadays, the role of online commerce in increasing organizations’ profit is growing each year. Online promotions has an influence on digital transactions significantly. Along with the increase of internet users of the facility, the number of online shoppers in Indonesia is increasing every year [5]. Organizations spending on online marketing is also increasing as media buyers adjust to online world while other media advertisement spending keep falling or remain constant each year. Nevertheless, the online marketing effort should be designed in a way that will deliver value to both the organization and its customers.
Many SMEs in Indonesia have adopted online marketing program, however, some of them are not yet optimally utilize online marketing. Even worst, they just ignore or stop their online marketing activities. One form of online marketing is a website creation program. According to [6], consumer decision on purchasing or consuming a certain product is made through several stages. They are introduction of needs, information search, and evaluation of alternatives, purchase decision and post-purchase behavior. Attractive web site content will help consumers in the stage information search and evaluation of alternatives which led to the decision of purchasing the product. [7] argue that the content displayed on a page promotion is a significant factor in affecting consumer buying decisions. Moreover, thorough information could enhance customers’ perception of green product benefit and its economic accessibility [8].
This study is intended to investigate the characteristics of a website that will enhance the customers’ intention to buy. Several steps are taken. First step, we identify characteristics of online buyers in general in Indonesia. Then, based on their similarities and differences, we group them into several segment. Second step, we identify potential segment suitable to be targeted by organic food produces. At the end, we identify the technical characteristics of website that match with the profile of the selected segment.
Research methodology
There are three elements that affect consumer behavior in the approach to the new consumer behavior (neobehaviouristic approach): S-O-R. S (Stimulus) represents stimulus received by consumers, O (Organism) describes the information processing performed by the respondent based on stimulus received to generate R (Response). The response can be either a decision to buy or not to buy a product [9]. Stimuli that have most influence on the decision to buy is the perception of consumers [10]. Therefore, this study discusses how to create a perception in the minds of consumers regarding organic products that can maximize purchasing intentions, especially the perception formed through online marketing.
At first, a company should be able to study the existing market and select the segments that will be the market base in competing with competitors and setting market position. In fact, a company cannot serve all customers in the market because consumers are varied. Market segmentation is an activity of grouping heterogeneous market into a more homogeneous market in terms of interests, purchasing power, geographical, purchasing behavior, and lifestyles [11]. Segmentation has an important role in the design of the company's strategy because it helps the company to be more focused in allocating resources. In addition, segmentation can also give an idea about the consumer characteristics that assist companies in fulfilling the needs and desires of consumers.
Sari and Setiaboedi / OIDA International Journal of Sustainable Development 09:04 (2016) 55
Market could be divided into several segment based on the following variables [11]: • Geographic Segmentation
Market is divided according to different geographical conditions, such as country, region, city, or region. • Demographic Segmentation
Market is divided according to different demographic variables such as gender, age, occupation, income, education and religion
• Psychographic Segmentation Market is divided according to different social class, lifestyle, or individual psychological characteristics.
• Behavioral Segmentation Market is divided according to different knowledge, behavioral, or response to a product.
After segmentation process, the next step is to evaluate these segments and decide which segment is the target market. In evaluating market segments, there are several factors to be considered, namely the growth of the segment, the segment size, the attractiveness of the market, the company's goals, and the resources of the company. Projections of growth of sales and the expected profit margin of each segment are also should be analyzed by the company. In addition, it should be considered also whether there are potentially unique characteristics of a segment. Another consideration is whether the investments made for the selected segment makes sense to consider in terms of the objectives and resources of the company.
Selected target market is a group of consumers with similar characteristics and becoming the focus of the company. There are several options in selecting target market, they are [11]: a. Undifferentiated Marketing In this strategy, the company ignores market segments that form and will design a marketing strategy for all existing customers. b. Differentiated Marketing The company chooses some market segments and designs a marketing strategy for each selected segment. c. Concentrated Marketing In this strategy, the company will choose the segment with the largest market share. This strategy is suitable if the company's resources are limited.
After the company decides its target market, the next step is called positioning. Positioning is consumers’ point of view about a brand or product and that what distinguishes it from its competitors [11]. In addition, the positioning is also used to build trust, confidence and competence of the company in the eyes of consumers. The position of the product can be determined based on the product attributes, time of use, the product benefits, comparison with competitor products or classes of product quality.
This study uses demographic, psychographic and behavioral variables for segmentation basis to obtain the advantages of each variable. The use of demographic and psychographic variables together in segmentation can increase the degree of model predictability [3]. Habits in shopping online can be classified into behavioral factors. Therefore, the behavioral variables will also be used to include the online shopping habits factors. While geographic variables is not included in this study because, according to [13], the characteristics of online shoppers do not vary significantly between regions in Indonesia and there are no indication of different preferences and special needs by region.
Demographic variables are operationalized into gender, education level, and occupation. Behavioral variables have five operational variables, namely the frequency of online shopping, goods purchased online, online transaction amount, types of online shopping sites most commonly used, and the method of payment. Psychographic variables are operationalized based on former researches. The dependent variable in this study is purchase intention. The complete variables of this study can be seen in the Table 1 below.
Next Page
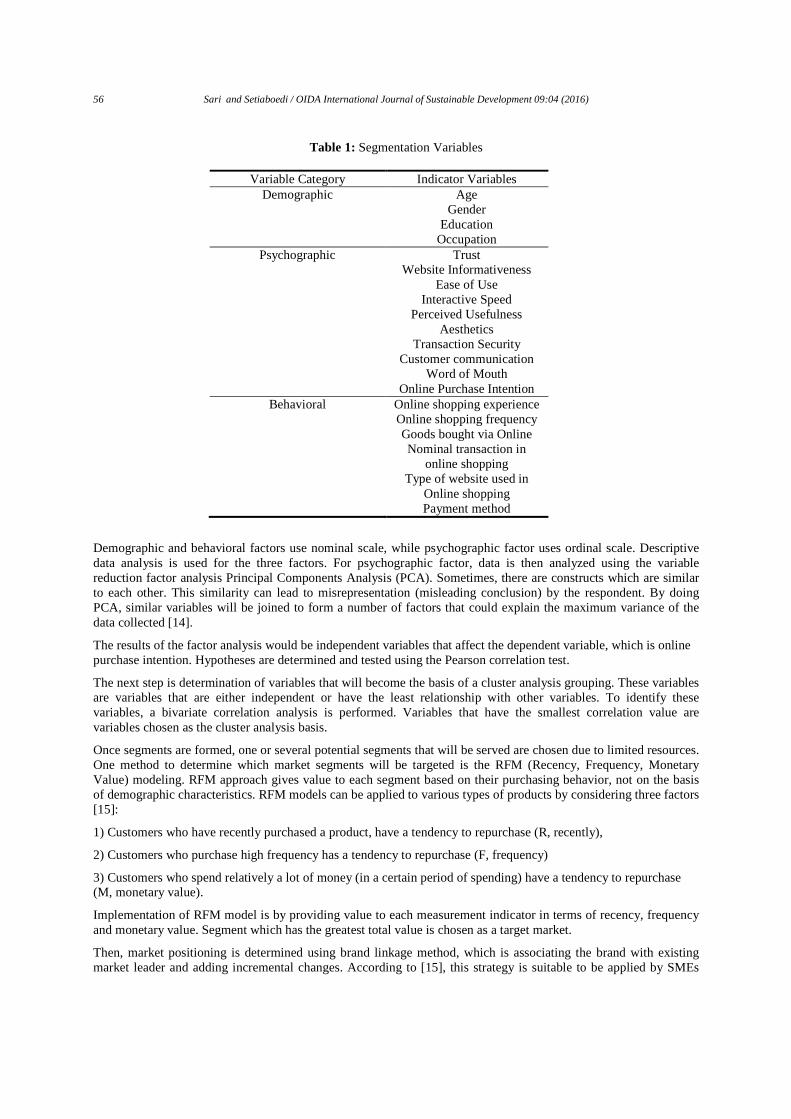
56 Sari and Setiaboedi / OIDA International Journal of Sustainable Development 09:04 (2016)
Table 1: Segmentation Variables
Variable Category Indicator Variables Demographic Age
Gender Education Occupation
Psychographic Trust Website Informativeness Ease of Use Interactive Speed Perceived Usefulness Aesthetics Transaction Security Customer communication Word of Mouth Online Purchase Intention
Behavioral Online shopping experience Online shopping frequency Goods bought via Online Nominal transaction in
online shopping Type of website used in
Online shopping Payment method
Demographic and behavioral factors use nominal scale, while psychographic factor uses ordinal scale. Descriptive data analysis is used for the three factors. For psychographic factor, data is then analyzed using the variable reduction factor analysis Principal Components Analysis (PCA). Sometimes, there are constructs which are similar to each other. This similarity can lead to misrepresentation (misleading conclusion) by the respondent. By doing PCA, similar variables will be joined to form a number of factors that could explain the maximum variance of the data collected [14].
The results of the factor analysis would be independent variables that affect the dependent variable, which is online purchase intention. Hypotheses are determined and tested using the Pearson correlation test.
The next step is determination of variables that will become the basis of a cluster analysis grouping. These variables are variables that are either independent or have the least relationship with other variables. To identify these variables, a bivariate correlation analysis is performed. Variables that have the smallest correlation value are variables chosen as the cluster analysis basis.
Once segments are formed, one or several potential segments that will be served are chosen due to limited resources. One method to determine which market segments will be targeted is the RFM (Recency, Frequency, Monetary Value) modeling. RFM approach gives value to each segment based on their purchasing behavior, not on the basis of demographic characteristics. RFM models can be applied to various types of products by considering three factors [15]:
1) Customers who have recently purchased a product, have a tendency to repurchase (R, recently),
2) Customers who purchase high frequency has a tendency to repurchase (F, frequency)
3) Customers who spend relatively a lot of money (in a certain period of spending) have a tendency to repurchase (M, monetary value).
Implementation of RFM model is by providing value to each measurement indicator in terms of recency, frequency and monetary value. Segment which has the greatest total value is chosen as a target market.
Then, market positioning is determined using brand linkage method, which is associating the brand with existing market leader and adding incremental changes. According to [15], this strategy is suitable to be applied by SMEs
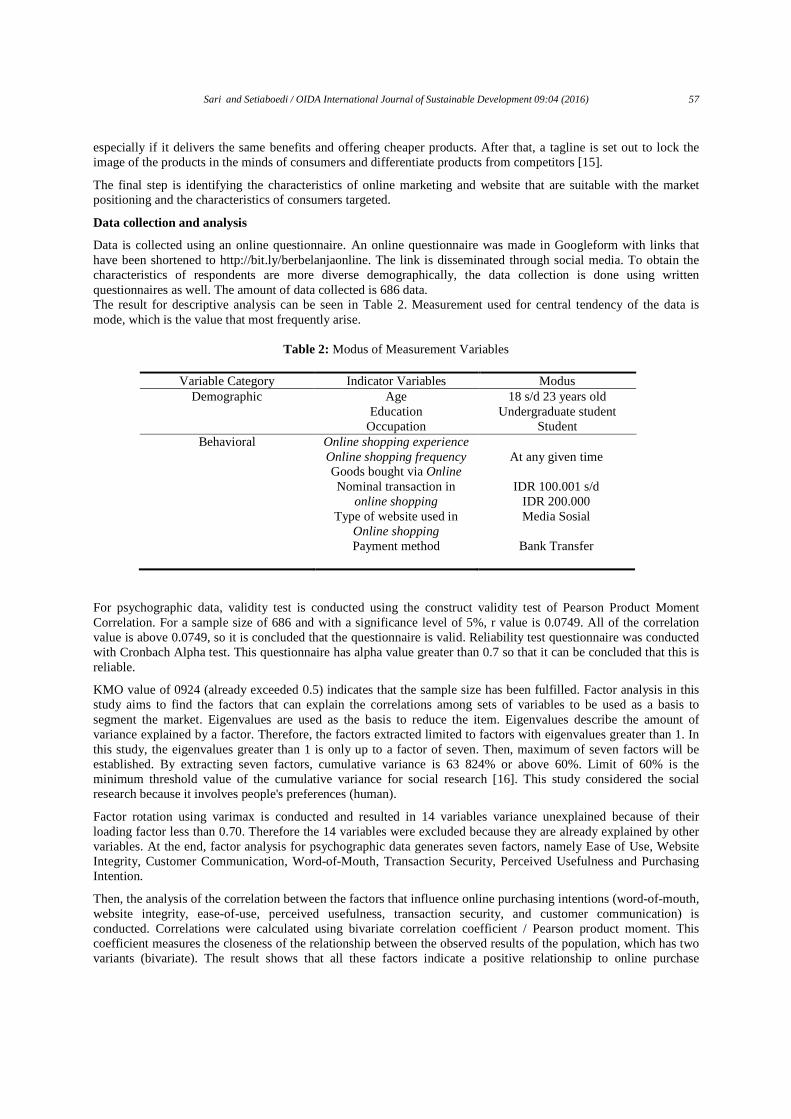
Sari and Setiaboedi / OIDA International Journal of Sustainable Development 09:04 (2016) 57
especially if it delivers the same benefits and offering cheaper products. After that, a tagline is set out to lock the image of the products in the minds of consumers and differentiate products from competitors [15].
The final step is identifying the characteristics of online marketing and website that are suitable with the market positioning and the characteristics of consumers targeted.
Data collection and analysis
Data is collected using an online questionnaire. An online questionnaire was made in Googleform with links that have been shortened to http://bit.ly/berbelanjaonline. The link is disseminated through social media. To obtain the characteristics of respondents are more diverse demographically, the data collection is done using written questionnaires as well. The amount of data collected is 686 data. The result for descriptive analysis can be seen in Table 2. Measurement used for central tendency of the data is mode, which is the value that most frequently arise.
Table 2: Modus of Measurement Variables
Variable Category Indicator Variables Modus Demographic Age 18 s/d 23 years old
Education Undergraduate student Occupation Student
Behavioral Online shopping experience Online shopping frequency At any given time Goods bought via Online Nominal transaction in
online shopping IDR 100.001 s/d
IDR 200.000 Type of website used in
Online shopping Media Sosial
Payment method Bank Transfer
For psychographic data, validity test is conducted using the construct validity test of Pearson Product Moment Correlation. For a sample size of 686 and with a significance level of 5%, r value is 0.0749. All of the correlation value is above 0.0749, so it is concluded that the questionnaire is valid. Reliability test questionnaire was conducted with Cronbach Alpha test. This questionnaire has alpha value greater than 0.7 so that it can be concluded that this is reliable.
KMO value of 0924 (already exceeded 0.5) indicates that the sample size has been fulfilled. Factor analysis in this study aims to find the factors that can explain the correlations among sets of variables to be used as a basis to segment the market. Eigenvalues are used as the basis to reduce the item. Eigenvalues describe the amount of variance explained by a factor. Therefore, the factors extracted limited to factors with eigenvalues greater than 1. In this study, the eigenvalues greater than 1 is only up to a factor of seven. Then, maximum of seven factors will be established. By extracting seven factors, cumulative variance is 63 824% or above 60%. Limit of 60% is the minimum threshold value of the cumulative variance for social research [16]. This study considered the social research because it involves people's preferences (human).
Factor rotation using varimax is conducted and resulted in 14 variables variance unexplained because of their loading factor less than 0.70. Therefore the 14 variables were excluded because they are already explained by other variables. At the end, factor analysis for psychographic data generates seven factors, namely Ease of Use, Website Integrity, Customer Communication, Word-of-Mouth, Transaction Security, Perceived Usefulness and Purchasing Intention.
Then, the analysis of the correlation between the factors that influence online purchasing intentions (word-of-mouth, website integrity, ease-of-use, perceived usefulness, transaction security, and customer communication) is conducted. Correlations were calculated using bivariate correlation coefficient / Pearson product moment. This coefficient measures the closeness of the relationship between the observed results of the population, which has two variants (bivariate). The result shows that all these factors indicate a positive relationship to online purchase
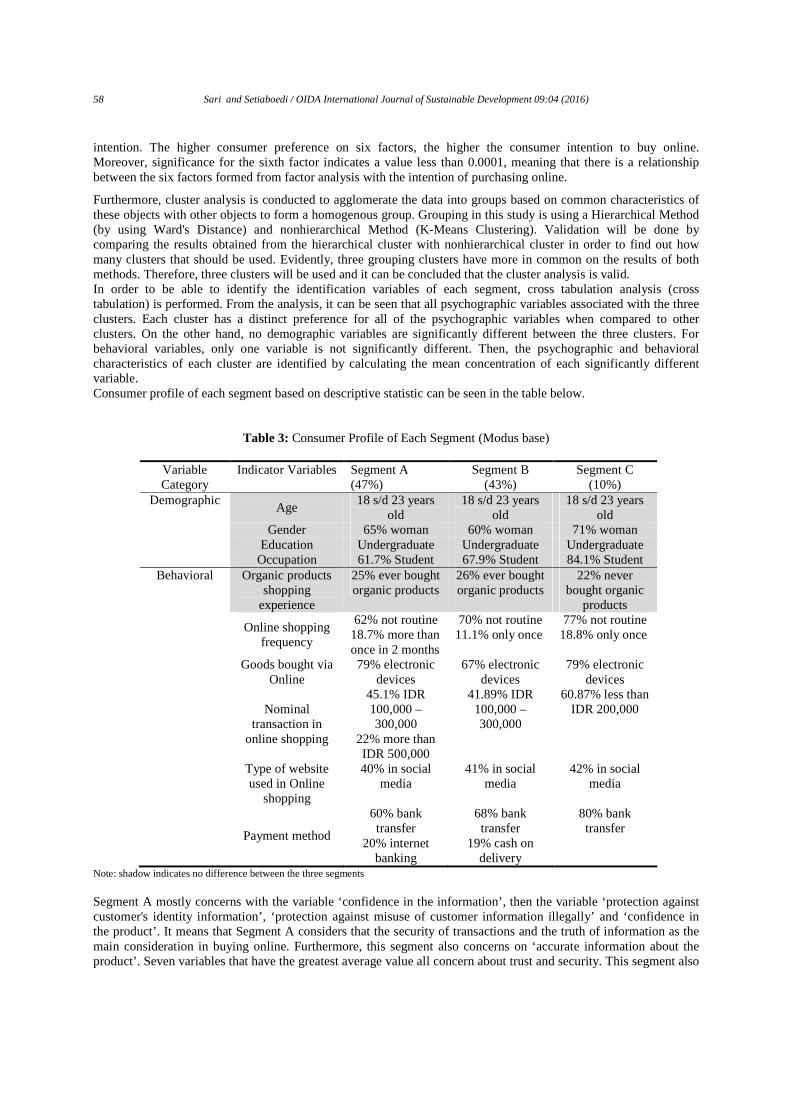
58 Sari and Setiaboedi / OIDA International Journal of Sustainable Development 09:04 (2016)
intention. The higher consumer preference on six factors, the higher the consumer intention to buy online. Moreover, significance for the sixth factor indicates a value less than 0.0001, meaning that there is a relationship between the six factors formed from factor analysis with the intention of purchasing online.
Furthermore, cluster analysis is conducted to agglomerate the data into groups based on common characteristics of these objects with other objects to form a homogenous group. Grouping in this study is using a Hierarchical Method (by using Ward's Distance) and nonhierarchical Method (K-Means Clustering). Validation will be done by comparing the results obtained from the hierarchical cluster with nonhierarchical cluster in order to find out how many clusters that should be used. Evidently, three grouping clusters have more in common on the results of both methods. Therefore, three clusters will be used and it can be concluded that the cluster analysis is valid. In order to be able to identify the identification variables of each segment, cross tabulation analysis (cross tabulation) is performed. From the analysis, it can be seen that all psychographic variables associated with the three clusters. Each cluster has a distinct preference for all of the psychographic variables when compared to other clusters. On the other hand, no demographic variables are significantly different between the three clusters. For behavioral variables, only one variable is not significantly different. Then, the psychographic and behavioral characteristics of each cluster are identified by calculating the mean concentration of each significantly different variable. Consumer profile of each segment based on descriptive statistic can be seen in the table below.
Table 3: Consumer Profile of Each Segment (Modus base)
Variable Category
Indicator Variables Segment A (47%)
Segment B (43%)
Segment C (10%)
Demographic Age
18 s/d 23 years old
18 s/d 23 years old
18 s/d 23 years old
Gender 65% woman 60% woman 71% woman Education Undergraduate Undergraduate Undergraduate Occupation 61.7% Student 67.9% Student 84.1% Student
Behavioral Organic products shopping
experience
25% ever bought organic products
26% ever bought organic products
22% never bought organic
products
Online shopping frequency
62% not routine 18.7% more than once in 2 months
70% not routine 11.1% only once
77% not routine 18.8% only once
Goods bought via Online
79% electronic devices
67% electronic devices
79% electronic devices
Nominal
transaction in online shopping
45.1% IDR 100,000 – 300,000
22% more than IDR 500,000
41.89% IDR 100,000 – 300,000
60.87% less than IDR 200,000
Type of website used in Online
shopping
40% in social media
41% in social media
42% in social media
Payment method
60% bank transfer
20% internet banking
68% bank transfer
19% cash on delivery
80% bank transfer
Note: shadow indicates no difference between the three segments Segment A mostly concerns with the variable ‘confidence in the information’, then the variable ‘protection against customer's identity information’, ‘protection against misuse of customer information illegally’ and ‘confidence in the product’. It means that Segment A considers that the security of transactions and the truth of information as the main consideration in buying online. Furthermore, this segment also concerns on ‘accurate information about the product’. Seven variables that have the greatest average value all concern about trust and security. This segment also
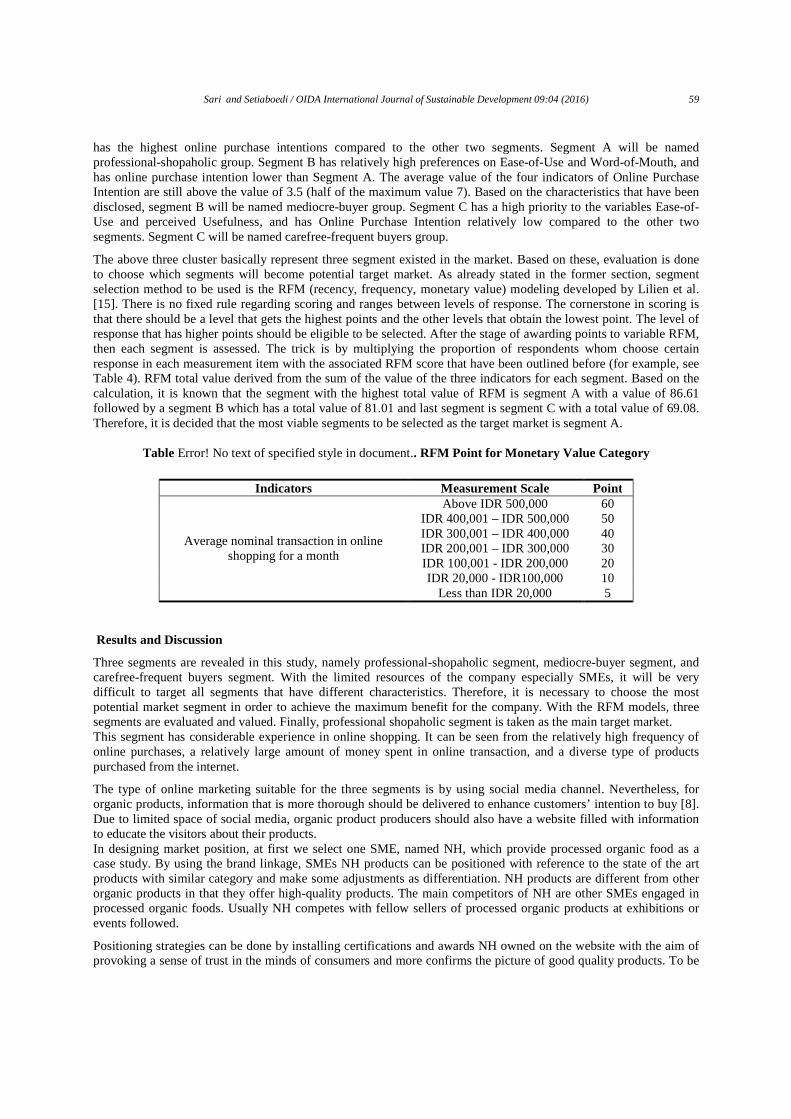
Sari and Setiaboedi / OIDA International Journal of Sustainable Development 09:04 (2016) 59
has the highest online purchase intentions compared to the other two segments. Segment A will be named professional-shopaholic group. Segment B has relatively high preferences on Ease-of-Use and Word-of-Mouth, and has online purchase intention lower than Segment A. The average value of the four indicators of Online Purchase Intention are still above the value of 3.5 (half of the maximum value 7). Based on the characteristics that have been disclosed, segment B will be named mediocre-buyer group. Segment C has a high priority to the variables Ease-of-Use and perceived Usefulness, and has Online Purchase Intention relatively low compared to the other two segments. Segment C will be named carefree-frequent buyers group.
The above three cluster basically represent three segment existed in the market. Based on these, evaluation is done to choose which segments will become potential target market. As already stated in the former section, segment selection method to be used is the RFM (recency, frequency, monetary value) modeling developed by Lilien et al. [15]. There is no fixed rule regarding scoring and ranges between levels of response. The cornerstone in scoring is that there should be a level that gets the highest points and the other levels that obtain the lowest point. The level of response that has higher points should be eligible to be selected. After the stage of awarding points to variable RFM, then each segment is assessed. The trick is by multiplying the proportion of respondents whom choose certain response in each measurement item with the associated RFM score that have been outlined before (for example, see Table 4). RFM total value derived from the sum of the value of the three indicators for each segment. Based on the calculation, it is known that the segment with the highest total value of RFM is segment A with a value of 86.61 followed by a segment B which has a total value of 81.01 and last segment is segment C with a total value of 69.08. Therefore, it is decided that the most viable segments to be selected as the target market is segment A.
Table Error! No text of specified style in document.. RFM Point for Monetary Value Category
Indicators Measurement Scale Point
Average nominal transaction in online shopping for a month
Above IDR 500,000 60 IDR 400,001 – IDR 500,000 50 IDR 300,001 – IDR 400,000 40 IDR 200,001 – IDR 300,000 30 IDR 100,001 - IDR 200,000 20 IDR 20,000 - IDR100,000 10
Less than IDR 20,000 5 Results and Discussion
Three segments are revealed in this study, namely professional-shopaholic segment, mediocre-buyer segment, and carefree-frequent buyers segment. With the limited resources of the company especially SMEs, it will be very difficult to target all segments that have different characteristics. Therefore, it is necessary to choose the most potential market segment in order to achieve the maximum benefit for the company. With the RFM models, three segments are evaluated and valued. Finally, professional shopaholic segment is taken as the main target market. This segment has considerable experience in online shopping. It can be seen from the relatively high frequency of online purchases, a relatively large amount of money spent in online transaction, and a diverse type of products purchased from the internet.
The type of online marketing suitable for the three segments is by using social media channel. Nevertheless, for organic products, information that is more thorough should be delivered to enhance customers’ intention to buy [8]. Due to limited space of social media, organic product producers should also have a website filled with information to educate the visitors about their products. In designing market position, at first we select one SME, named NH, which provide processed organic food as a case study. By using the brand linkage, SMEs NH products can be positioned with reference to the state of the art products with similar category and make some adjustments as differentiation. NH products are different from other organic products in that they offer high-quality products. The main competitors of NH are other SMEs engaged in processed organic foods. Usually NH competes with fellow sellers of processed organic products at exhibitions or events followed.
Positioning strategies can be done by installing certifications and awards NH owned on the website with the aim of provoking a sense of trust in the minds of consumers and more confirms the picture of good quality products. To be
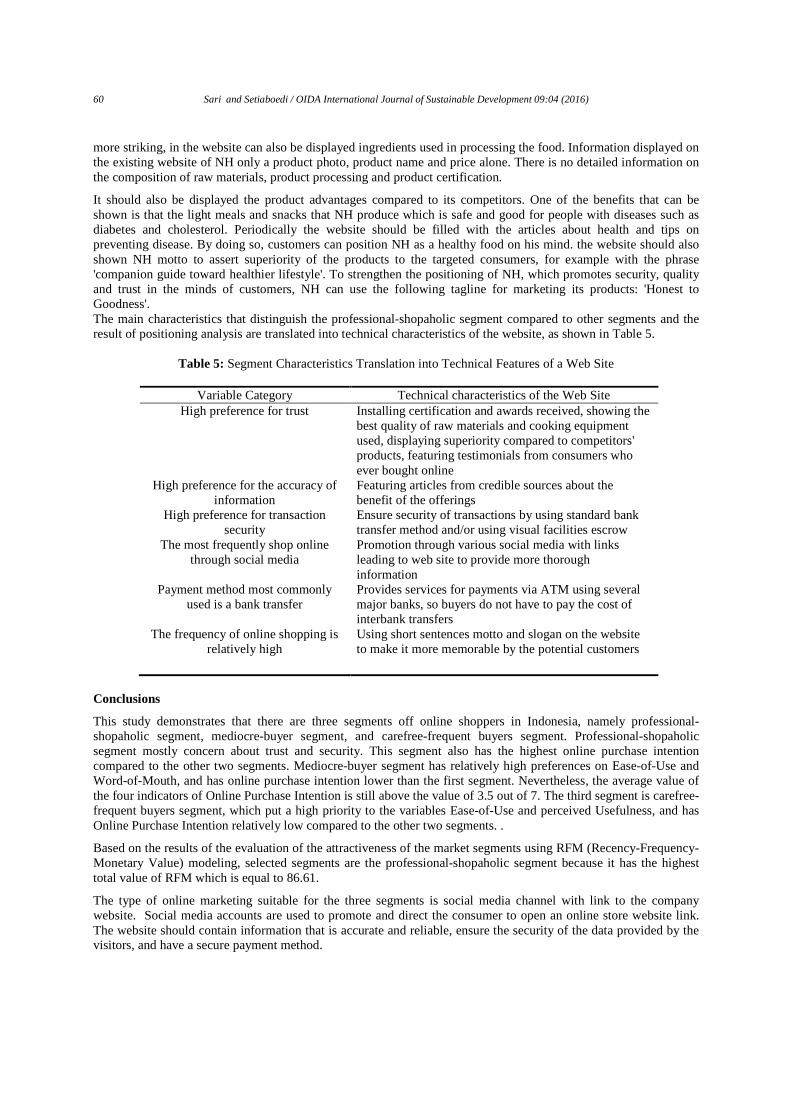
60 Sari and Setiaboedi / OIDA International Journal of Sustainable Development 09:04 (2016)
more striking, in the website can also be displayed ingredients used in processing the food. Information displayed on the existing website of NH only a product photo, product name and price alone. There is no detailed information on the composition of raw materials, product processing and product certification.
It should also be displayed the product advantages compared to its competitors. One of the benefits that can be shown is that the light meals and snacks that NH produce which is safe and good for people with diseases such as diabetes and cholesterol. Periodically the website should be filled with the articles about health and tips on preventing disease. By doing so, customers can position NH as a healthy food on his mind. the website should also shown NH motto to assert superiority of the products to the targeted consumers, for example with the phrase 'companion guide toward healthier lifestyle'. To strengthen the positioning of NH, which promotes security, quality and trust in the minds of customers, NH can use the following tagline for marketing its products: 'Honest to Goodness'. The main characteristics that distinguish the professional-shopaholic segment compared to other segments and the result of positioning analysis are translated into technical characteristics of the website, as shown in Table 5.
Table 5: Segment Characteristics Translation into Technical Features of a Web Site
Variable Category Technical characteristics of the Web Site High preference for trust Installing certification and awards received, showing the
best quality of raw materials and cooking equipment used, displaying superiority compared to competitors' products, featuring testimonials from consumers who ever bought online
High preference for the accuracy of information
Featuring articles from credible sources about the benefit of the offerings
High preference for transaction security
Ensure security of transactions by using standard bank transfer method and/or using visual facilities escrow
The most frequently shop online through social media
Promotion through various social media with links leading to web site to provide more thorough information
Payment method most commonly used is a bank transfer
Provides services for payments via ATM using several major banks, so buyers do not have to pay the cost of interbank transfers
The frequency of online shopping is relatively high
Using short sentences motto and slogan on the website to make it more memorable by the potential customers
Conclusions
This study demonstrates that there are three segments off online shoppers in Indonesia, namely professional-shopaholic segment, mediocre-buyer segment, and carefree-frequent buyers segment. Professional-shopaholic segment mostly concern about trust and security. This segment also has the highest online purchase intention compared to the other two segments. Mediocre-buyer segment has relatively high preferences on Ease-of-Use and Word-of-Mouth, and has online purchase intention lower than the first segment. Nevertheless, the average value of the four indicators of Online Purchase Intention is still above the value of 3.5 out of 7. The third segment is carefree-frequent buyers segment, which put a high priority to the variables Ease-of-Use and perceived Usefulness, and has Online Purchase Intention relatively low compared to the other two segments. .
Based on the results of the evaluation of the attractiveness of the market segments using RFM (Recency-Frequency-Monetary Value) modeling, selected segments are the professional-shopaholic segment because it has the highest total value of RFM which is equal to 86.61.
The type of online marketing suitable for the three segments is social media channel with link to the company website. Social media accounts are used to promote and direct the consumer to open an online store website link. The website should contain information that is accurate and reliable, ensure the security of the data provided by the visitors, and have a secure payment method.
Sari and Setiaboedi / OIDA International Journal of Sustainable Development 09:04 (2016) 61
Positioning strategy is done by displaying the certification and awards aiming of provoking a sense of trust in the minds of consumers and more confirm the picture of good quality products. To be more striking, website can also display ingredients, production tools, and processes.
Acknowledgement
This research was partly funded by JICA 2015.
References
[1] Tanner, C., & Kast, S.W. (2003). Promoting sustainable consumption: Determinants of green purchases by Swiss consumers. Psychology & Marketing, 20, 10, 883-893.
[2] Raloff, J. (1998). Picturing pesticides’ impacts on kids. Science News, 153, 23, 358. [3] Sari, H. & Firmanzah, (2011). Green Product Design: Identifying Determinant Factors That Influence
Customers’ Decision to Buy. Proceeding of IEEE Asia Pacific Industrial Engineering and Management System. [4] Akkeren, J. K., & Cavaye, A. M. (1999). Factors affecting entry‐level internet technology adoption by small
business in Australia ‐ evidence from three cases. Journal of Systems and Information Technology, 3 (2), 33-48. [5] Cadha, R. (2013). Indonesia Online: A Digital Economy Emerges, Fueled by Cheap Mobile Handsets.
EMarketer Inc Online Publication, March. [6] Boone, L.E. & Kurtz, D.L. (2008). Contemporary Marketing, Thomson South-Western, Mason OH 45040,
USA [7] Park, C., & Kim, Y. (2003). Identifying key factors affecting consumer purchase behavior in an online shopping
context. International Journal of Retail & Distribution Management, 31 (1), 16-29. [8] Sari, H. (2010). Product Design Process: Identifying and Designing Communication Strategy of Green Product
Benefits in Indonesia Context, Proceeding of Asia Pacific Business Innovation and Technology Management Society, Beijing, China.
[9] Rodiger, M., & Hamm, U. (2015). How are organic food prices affecting consumer behaviour? A review. Journal of Food Quality and Preference 43, 10-20.
[10] Lee, H.-J., & Yun, Z.-S. (2015). Consumer' perceptions of organic food attributes and cognitive and affective attitudes as deteminants of their purchase intention toward organic food. Journal of Food Quality and Preference, 39, 259-267.
[11] Kotler, P. & Keller, K.L. (2006). Marketing management, 12th Edition, Pearson Prantice Hall, Upper Saddle river, New Jersey, 07458 USA.
[12] Sun, S. (2009). An analysis on the conditions and methods of market segmentation. International Journal of Business Management, 4 (2), 63-70.
[13] APJII. (2012). Profil Pengguna Internet Indonesia 2012. Jakarta: Laporan Asosiasi Penyelenggara Jasa Internet Indonesia.
[14] Malhotra, N. K. (2010). Marketing Research: An Applied Orientation. Upper Saddle River, NJ: Prentice Hall. [15] Lilien, G. L., Rangaswamy, A., Buryn, D., & Arnaund. (2007). Principles of Marketing Engineering. Victoria,
BC: Trafford Publishing. [16] Hair, J. F., Black, W. C., Babin, B. J., & Anderson, R. E. (2010). Multivariate Data Analysis: A Globab
Perspective 7th Ed. Upper Saddle River, New Jersey: Pearson Education, Inc. About the authors: Name: Hasrini Sari Lecturer of Industrial Engineering Management, Faculty of Industrial Engineering, Bandung Institute of Technology e-mail : [email protected]

62 Sari and Setiaboedi / OIDA International Journal of Sustainable Development 09:04 (2016)
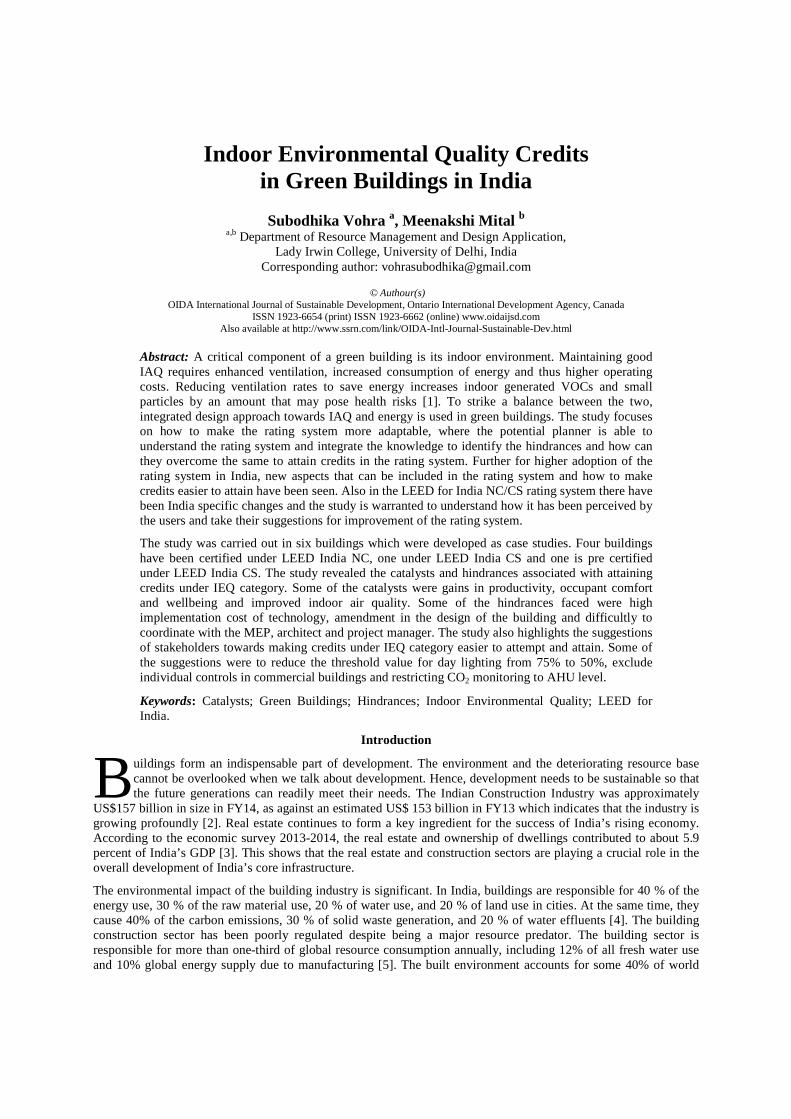
Indoor Environmental Quality Credits in Green Buildings in India
Subodhika Vohra a, Meenakshi Mital b
a,b Department of Resource Management and Design Application, Lady Irwin College, University of Delhi, India
Corresponding author: [email protected]
© Authour(s) OIDA International Journal of Sustainable Development, Ontario International Development Agency, Canada
ISSN 1923-6654 (print) ISSN 1923-6662 (online) www.oidaijsd.com Also available at http://www.ssrn.com/link/OIDA-Intl-Journal-Sustainable-Dev.html
Abstract: A critical component of a green building is its indoor environment. Maintaining good IAQ requires enhanced ventilation, increased consumption of energy and thus higher operating costs. Reducing ventilation rates to save energy increases indoor generated VOCs and small particles by an amount that may pose health risks [1]. To strike a balance between the two, integrated design approach towards IAQ and energy is used in green buildings. The study focuses on how to make the rating system more adaptable, where the potential planner is able to understand the rating system and integrate the knowledge to identify the hindrances and how can they overcome the same to attain credits in the rating system. Further for higher adoption of the rating system in India, new aspects that can be included in the rating system and how to make credits easier to attain have been seen. Also in the LEED for India NC/CS rating system there have been India specific changes and the study is warranted to understand how it has been perceived by the users and take their suggestions for improvement of the rating system.
The study was carried out in six buildings which were developed as case studies. Four buildings have been certified under LEED India NC, one under LEED India CS and one is pre certified under LEED India CS. The study revealed the catalysts and hindrances associated with attaining credits under IEQ category. Some of the catalysts were gains in productivity, occupant comfort and wellbeing and improved indoor air quality. Some of the hindrances faced were high implementation cost of technology, amendment in the design of the building and difficultly to coordinate with the MEP, architect and project manager. The study also highlights the suggestions of stakeholders towards making credits under IEQ category easier to attempt and attain. Some of the suggestions were to reduce the threshold value for day lighting from 75% to 50%, exclude individual controls in commercial buildings and restricting CO2 monitoring to AHU level.
Keywords: Catalysts; Green Buildings; Hindrances; Indoor Environmental Quality; LEED for India.
Introduction
uildings form an indispensable part of development. The environment and the deteriorating resource base cannot be overlooked when we talk about development. Hence, development needs to be sustainable so that the future generations can readily meet their needs. The Indian Construction Industry was approximately
US$157 billion in size in FY14, as against an estimated US$ 153 billion in FY13 which indicates that the industry is growing profoundly [2]. Real estate continues to form a key ingredient for the success of India’s rising economy. According to the economic survey 2013-2014, the real estate and ownership of dwellings contributed to about 5.9 percent of India’s GDP [3]. This shows that the real estate and construction sectors are playing a crucial role in the overall development of India’s core infrastructure.
The environmental impact of the building industry is significant. In India, buildings are responsible for 40 % of the energy use, 30 % of the raw material use, 20 % of water use, and 20 % of land use in cities. At the same time, they cause 40% of the carbon emissions, 30 % of solid waste generation, and 20 % of water effluents [4]. The building construction sector has been poorly regulated despite being a major resource predator. The building sector is responsible for more than one-third of global resource consumption annually, including 12% of all fresh water use and 10% global energy supply due to manufacturing [5]. The built environment accounts for some 40% of world
B
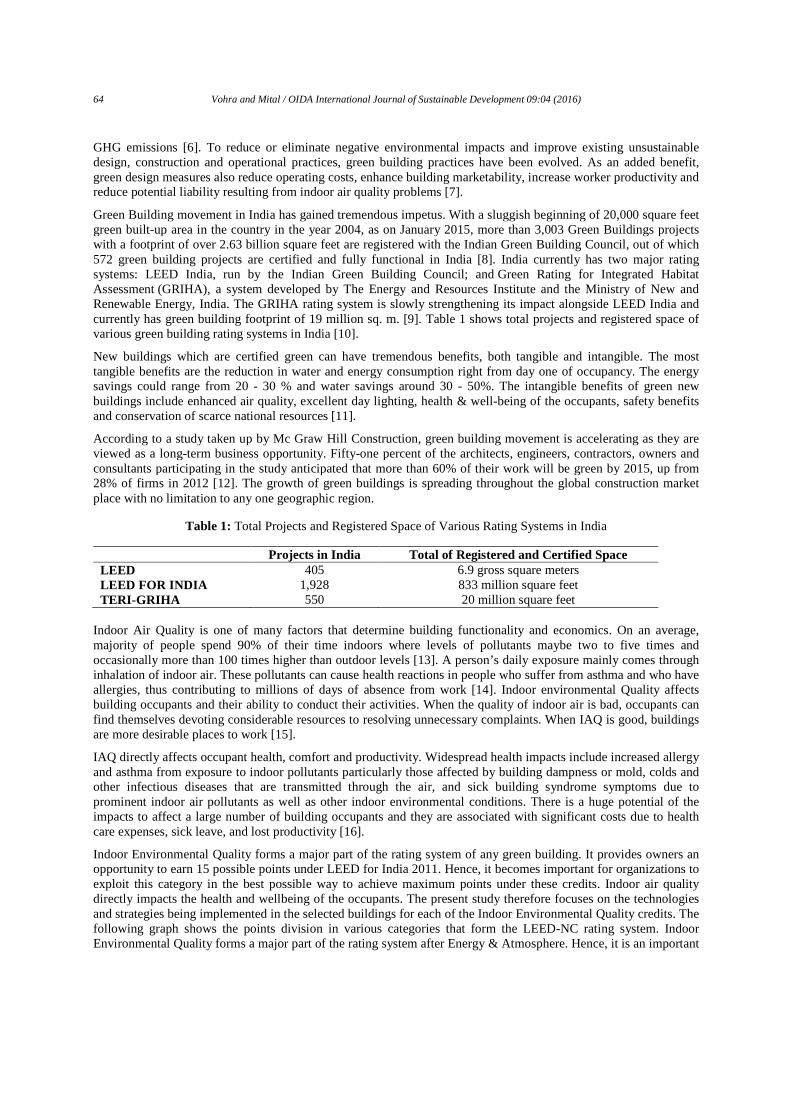
64 Vohra and Mital / OIDA International Journal of Sustainable Development 09:04 (2016)
GHG emissions [6]. To reduce or eliminate negative environmental impacts and improve existing unsustainable design, construction and operational practices, green building practices have been evolved. As an added benefit, green design measures also reduce operating costs, enhance building marketability, increase worker productivity and reduce potential liability resulting from indoor air quality problems [7].
Green Building movement in India has gained tremendous impetus. With a sluggish beginning of 20,000 square feet green built-up area in the country in the year 2004, as on January 2015, more than 3,003 Green Buildings projects with a footprint of over 2.63 billion square feet are registered with the Indian Green Building Council, out of which 572 green building projects are certified and fully functional in India [8]. India currently has two major rating systems: LEED India, run by the Indian Green Building Council; and Green Rating for Integrated Habitat Assessment (GRIHA), a system developed by The Energy and Resources Institute and the Ministry of New and Renewable Energy, India. The GRIHA rating system is slowly strengthening its impact alongside LEED India and currently has green building footprint of 19 million sq. m. [9]. Table 1 shows total projects and registered space of various green building rating systems in India [10].
New buildings which are certified green can have tremendous benefits, both tangible and intangible. The most tangible benefits are the reduction in water and energy consumption right from day one of occupancy. The energy savings could range from 20 - 30 % and water savings around 30 - 50%. The intangible benefits of green new buildings include enhanced air quality, excellent day lighting, health & well-being of the occupants, safety benefits and conservation of scarce national resources [11].
According to a study taken up by Mc Graw Hill Construction, green building movement is accelerating as they are viewed as a long-term business opportunity. Fifty-one percent of the architects, engineers, contractors, owners and consultants participating in the study anticipated that more than 60% of their work will be green by 2015, up from 28% of firms in 2012 [12]. The growth of green buildings is spreading throughout the global construction market place with no limitation to any one geographic region.
Table 1: Total Projects and Registered Space of Various Rating Systems in India
Projects in India Total of Registered and Certified Space LEED 405 6.9 gross square meters LEED FOR INDIA 1,928 833 million square feet TERI-GRIHA 550 20 million square feet
Indoor Air Quality is one of many factors that determine building functionality and economics. On an average, majority of people spend 90% of their time indoors where levels of pollutants maybe two to five times and occasionally more than 100 times higher than outdoor levels [13]. A person’s daily exposure mainly comes through inhalation of indoor air. These pollutants can cause health reactions in people who suffer from asthma and who have allergies, thus contributing to millions of days of absence from work [14]. Indoor environmental Quality affects building occupants and their ability to conduct their activities. When the quality of indoor air is bad, occupants can find themselves devoting considerable resources to resolving unnecessary complaints. When IAQ is good, buildings are more desirable places to work [15].
IAQ directly affects occupant health, comfort and productivity. Widespread health impacts include increased allergy and asthma from exposure to indoor pollutants particularly those affected by building dampness or mold, colds and other infectious diseases that are transmitted through the air, and sick building syndrome symptoms due to prominent indoor air pollutants as well as other indoor environmental conditions. There is a huge potential of the impacts to affect a large number of building occupants and they are associated with significant costs due to health care expenses, sick leave, and lost productivity [16].
Indoor Environmental Quality forms a major part of the rating system of any green building. It provides owners an opportunity to earn 15 possible points under LEED for India 2011. Hence, it becomes important for organizations to exploit this category in the best possible way to achieve maximum points under these credits. Indoor air quality directly impacts the health and wellbeing of the occupants. The present study therefore focuses on the technologies and strategies being implemented in the selected buildings for each of the Indoor Environmental Quality credits. The following graph shows the points division in various categories that form the LEED-NC rating system. Indoor Environmental Quality forms a major part of the rating system after Energy & Atmosphere. Hence, it is an important
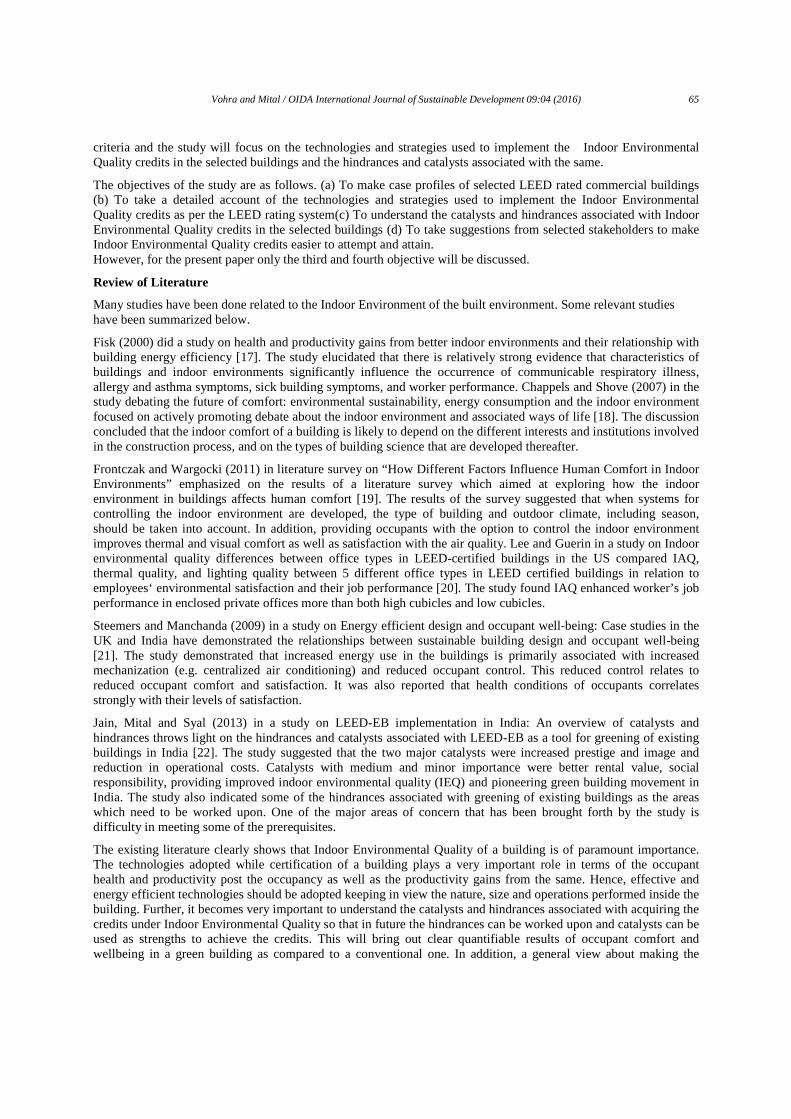
Vohra and Mital / OIDA International Journal of Sustainable Development 09:04 (2016) 65
criteria and the study will focus on the technologies and strategies used to implement the Indoor Environmental Quality credits in the selected buildings and the hindrances and catalysts associated with the same.
The objectives of the study are as follows. (a) To make case profiles of selected LEED rated commercial buildings (b) To take a detailed account of the technologies and strategies used to implement the Indoor Environmental Quality credits as per the LEED rating system(c) To understand the catalysts and hindrances associated with Indoor Environmental Quality credits in the selected buildings (d) To take suggestions from selected stakeholders to make Indoor Environmental Quality credits easier to attempt and attain. However, for the present paper only the third and fourth objective will be discussed.
Review of Literature
Many studies have been done related to the Indoor Environment of the built environment. Some relevant studies have been summarized below.
Fisk (2000) did a study on health and productivity gains from better indoor environments and their relationship with building energy efficiency [17]. The study elucidated that there is relatively strong evidence that characteristics of buildings and indoor environments significantly influence the occurrence of communicable respiratory illness, allergy and asthma symptoms, sick building symptoms, and worker performance. Chappels and Shove (2007) in the study debating the future of comfort: environmental sustainability, energy consumption and the indoor environment focused on actively promoting debate about the indoor environment and associated ways of life [18]. The discussion concluded that the indoor comfort of a building is likely to depend on the different interests and institutions involved in the construction process, and on the types of building science that are developed thereafter.
Frontczak and Wargocki (2011) in literature survey on “How Different Factors Influence Human Comfort in Indoor Environments” emphasized on the results of a literature survey which aimed at exploring how the indoor environment in buildings affects human comfort [19]. The results of the survey suggested that when systems for controlling the indoor environment are developed, the type of building and outdoor climate, including season, should be taken into account. In addition, providing occupants with the option to control the indoor environment improves thermal and visual comfort as well as satisfaction with the air quality. Lee and Guerin in a study on Indoor environmental quality differences between office types in LEED-certified buildings in the US compared IAQ, thermal quality, and lighting quality between 5 different office types in LEED certified buildings in relation to employees‘ environmental satisfaction and their job performance [20]. The study found IAQ enhanced worker’s job performance in enclosed private offices more than both high cubicles and low cubicles.
Steemers and Manchanda (2009) in a study on Energy efficient design and occupant well-being: Case studies in the UK and India have demonstrated the relationships between sustainable building design and occupant well-being [21]. The study demonstrated that increased energy use in the buildings is primarily associated with increased mechanization (e.g. centralized air conditioning) and reduced occupant control. This reduced control relates to reduced occupant comfort and satisfaction. It was also reported that health conditions of occupants correlates strongly with their levels of satisfaction.
Jain, Mital and Syal (2013) in a study on LEED-EB implementation in India: An overview of catalysts and hindrances throws light on the hindrances and catalysts associated with LEED-EB as a tool for greening of existing buildings in India [22]. The study suggested that the two major catalysts were increased prestige and image and reduction in operational costs. Catalysts with medium and minor importance were better rental value, social responsibility, providing improved indoor environmental quality (IEQ) and pioneering green building movement in India. The study also indicated some of the hindrances associated with greening of existing buildings as the areas which need to be worked upon. One of the major areas of concern that has been brought forth by the study is difficulty in meeting some of the prerequisites.
The existing literature clearly shows that Indoor Environmental Quality of a building is of paramount importance. The technologies adopted while certification of a building plays a very important role in terms of the occupant health and productivity post the occupancy as well as the productivity gains from the same. Hence, effective and energy efficient technologies should be adopted keeping in view the nature, size and operations performed inside the building. Further, it becomes very important to understand the catalysts and hindrances associated with acquiring the credits under Indoor Environmental Quality so that in future the hindrances can be worked upon and catalysts can be used as strengths to achieve the credits. This will bring out clear quantifiable results of occupant comfort and wellbeing in a green building as compared to a conventional one. In addition, a general view about making the
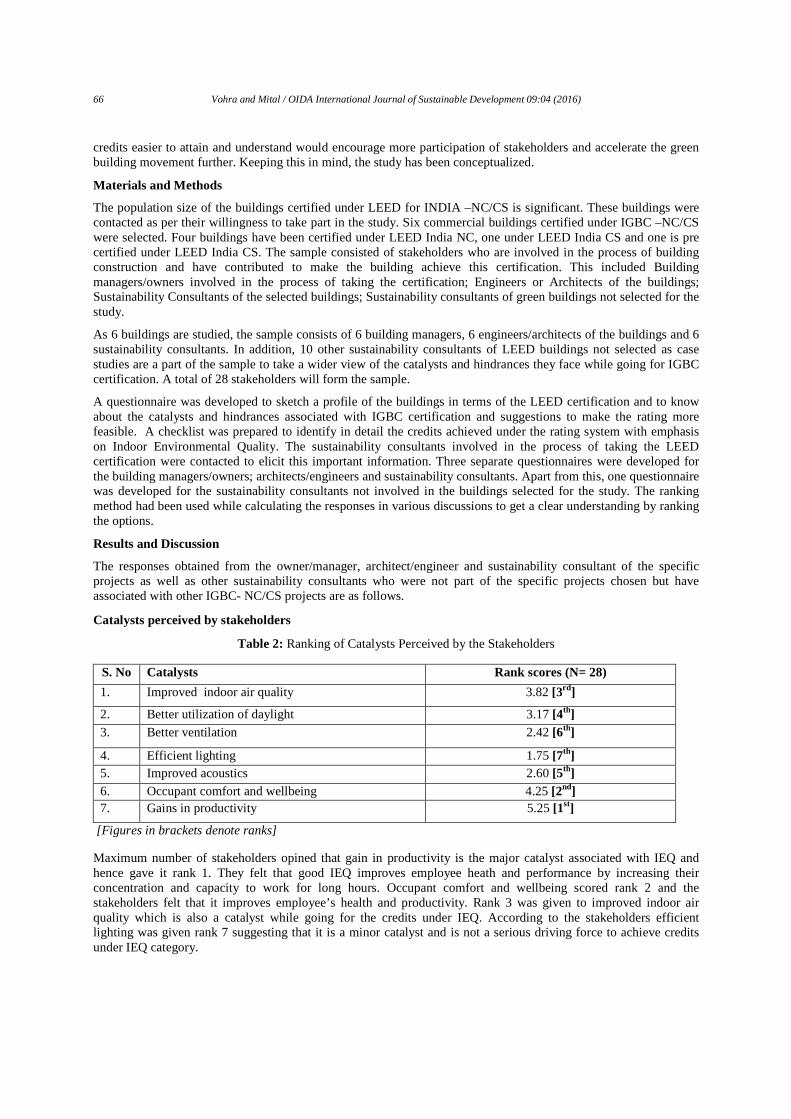
66 Vohra and Mital / OIDA International Journal of Sustainable Development 09:04 (2016)
credits easier to attain and understand would encourage more participation of stakeholders and accelerate the green building movement further. Keeping this in mind, the study has been conceptualized.
Materials and Methods
The population size of the buildings certified under LEED for INDIA –NC/CS is significant. These buildings were contacted as per their willingness to take part in the study. Six commercial buildings certified under IGBC –NC/CS were selected. Four buildings have been certified under LEED India NC, one under LEED India CS and one is pre certified under LEED India CS. The sample consisted of stakeholders who are involved in the process of building construction and have contributed to make the building achieve this certification. This included Building managers/owners involved in the process of taking the certification; Engineers or Architects of the buildings; Sustainability Consultants of the selected buildings; Sustainability consultants of green buildings not selected for the study.
As 6 buildings are studied, the sample consists of 6 building managers, 6 engineers/architects of the buildings and 6 sustainability consultants. In addition, 10 other sustainability consultants of LEED buildings not selected as case studies are a part of the sample to take a wider view of the catalysts and hindrances they face while going for IGBC certification. A total of 28 stakeholders will form the sample.
A questionnaire was developed to sketch a profile of the buildings in terms of the LEED certification and to know about the catalysts and hindrances associated with IGBC certification and suggestions to make the rating more feasible. A checklist was prepared to identify in detail the credits achieved under the rating system with emphasis on Indoor Environmental Quality. The sustainability consultants involved in the process of taking the LEED certification were contacted to elicit this important information. Three separate questionnaires were developed for the building managers/owners; architects/engineers and sustainability consultants. Apart from this, one questionnaire was developed for the sustainability consultants not involved in the buildings selected for the study. The ranking method had been used while calculating the responses in various discussions to get a clear understanding by ranking the options.
Results and Discussion
The responses obtained from the owner/manager, architect/engineer and sustainability consultant of the specific projects as well as other sustainability consultants who were not part of the specific projects chosen but have associated with other IGBC- NC/CS projects are as follows.
Catalysts perceived by stakeholders
Table 2: Ranking of Catalysts Perceived by the Stakeholders
S. No Catalysts Rank scores (N= 28)
1. Improved indoor air quality 3.82 [3rd]
2. Better utilization of daylight 3.17 [4th] 3. Better ventilation 2.42 [6th]
4. Efficient lighting 1.75 [7th] 5. Improved acoustics 2.60 [5th] 6. Occupant comfort and wellbeing 4.25 [2nd] 7. Gains in productivity 5.25 [1st]
[Figures in brackets denote ranks]
Maximum number of stakeholders opined that gain in productivity is the major catalyst associated with IEQ and hence gave it rank 1. They felt that good IEQ improves employee heath and performance by increasing their concentration and capacity to work for long hours. Occupant comfort and wellbeing scored rank 2 and the stakeholders felt that it improves employee’s health and productivity. Rank 3 was given to improved indoor air quality which is also a catalyst while going for the credits under IEQ. According to the stakeholders efficient lighting was given rank 7 suggesting that it is a minor catalyst and is not a serious driving force to achieve credits under IEQ category.
Vohra and Mital / OIDA International Journal of Sustainable Development 09:04 (2016) 67
Hindrances in relation with the credits
Figure 1: Credit/s under IEQ Posing a Hindrance to Achieve the Rating as Desired
Thirty eight percent of the respondents opined that the credit on controllability of the systems is the credit which in most cases is not approved by the council or the building team does not want to pursue the credit. This is because it was felt that individual controls of systems is not required in the building and leads to a heavy additional cost to the owner at shown in fig. 1
Twenty eight percent of the stakeholders felt that daylight and views posed a hindrance as no accurate simulation and modeling can be done for the building before it is constructed. Twenty five percent felt that IAQ during construction also posed a hindrance as the rating has not taken into account the Indian settings of a construction site whereby there is no air conditioning during the construction phase in the building. Hence, MERV 8 filters are of no use and the owner feels inappropriate to install the same. Nine percent of the stakeholders were of the opinion that it became difficult to convince the owners for using paints and adhesives which are prescribed as they come for a cost higher than the normal paints, adhesives and sealants.
Table 3: Ranking of Hindrances Perceived by Stakeholders
S. No Hindrances Rank scores (N= 28) 1. High implementation cost of technology 4.89 [1st]
2. Amendment in the design of the building 4.46 [2nd]
3. Acceptance of technology 2.39 [6th]
4. Training of the workers 2.67 [5th] 5 Difficult to coordinate with the MEP, architect and project
manager 3.67 [3rd]
6. Improper climatic, geographical and regional factors 2.85 [4th] [Figures in brackets denote ranks]
When asked about the hindrances faced by the stakeholders while going for IEQ credits, maximum respondents felt that high implementation cost of technology was the biggest hindrance they faced and gave it rank 1. As the technologies adopted for IEQ are energy efficient and come for a cost, this becomes a hindrance in achieving the rating as desired. CO2 sensors, MERV filters and low emitting materials are technologies which are new and comparatively more costly than the existing ones.
Amendment in the design of the building was ranked 2. There are various changes that happen over the period when the building is pre certified or if the design is on paper to the actual project construction. Rank 3 was given to difficulty in coordinating with the MEP, architect and project manager. As credits under IEQ category involve the input from all the departments of engineering that is mechanical, electrical, plumbing, the architect as well as the project manager, a lot of time is wasted as the coordination is difficult leading to delay in the project completion. According to the stakeholders, acceptance of technology was ranked 6 suggesting that it is a minor hindrance under
68 Vohra and Mital / OIDA International Journal of Sustainable Development 09:04 (2016)
IEQ category. Usually the technology employed in a building depends on the cost the owner is ready to invest in. Hence, once the technology is employed it does not take much time for the staff to accept the technology.
Aspects that can be included in the rating system
Figure 2: Responses of Stakeholders on Aspects to be Included in LEED for India Rating System
On analysis it was found that there are various aspects according to the stakeholders which need to be included in the rating system so that the rating becomes more authentic and easy to attain. Some of the aspects have already been addressed in the new ratings ahead of LEED for India 2011. Fig. 2 represents the responses of stakeholders to be included on the rating system.
One fourth of the consultants, 25% were of the opinion of including regular IAQ monitoring through a third party. They felt a need to regularize IAQ monitoring post occupancy as after certification the building might not follow the prescribed set of rules for the operations and maintenance of the building and hence compromise on the indoor environmental quality of the building. In line with this, 16% of the stakeholders opined that the former aspect will only be possible if there is IAQ management plan post occupancy. By doing this, the building will have set guidelines for the regular monitoring and hence will work towards its maintenance and upkeep.
Noise/ acoustics is the aspect which 12% of the stakeholders felt was necessary to be addressed in the rating system as a major part of indoor environmental quality comprises of noise reduction for productive gains. Twelve percent of the stakeholders also said that the use of indoor plants is extremely beneficial as they help improve the air circulation inside the building. Hence, forming a credit will bring this into practice.
Eight percent of the stakeholders were of the opinion to amend the HVAC design with respect to improved IAQ. After the building becomes operational, there are energy savings from the improved indoor air quality based on the credits of the rating system. Here, there can be amendments in the HVAC design with respect to lowering down the load initially calculated as per the standards as in practice the building might require a reduced load. Seven percent opined that there should be facilities for de-stressing for the disabled. There should be a separate entrance ramp for the disabled and facility of wheel chair, separate washrooms etc for them. Further, facilities such as a gymnasium; play room etc should be included for the employees. This aspect has already been addressed in the new rating system, IGBC for new buildings, 2014.
Other aspects such as carpeting, training of staff, and easy access to equipments, cleaning post occupancy were opined by 3% of the sustainable consultants each. These are aspects which need to be taken care of by individual facility managers of the building for a healthy environment within the enclosed space.
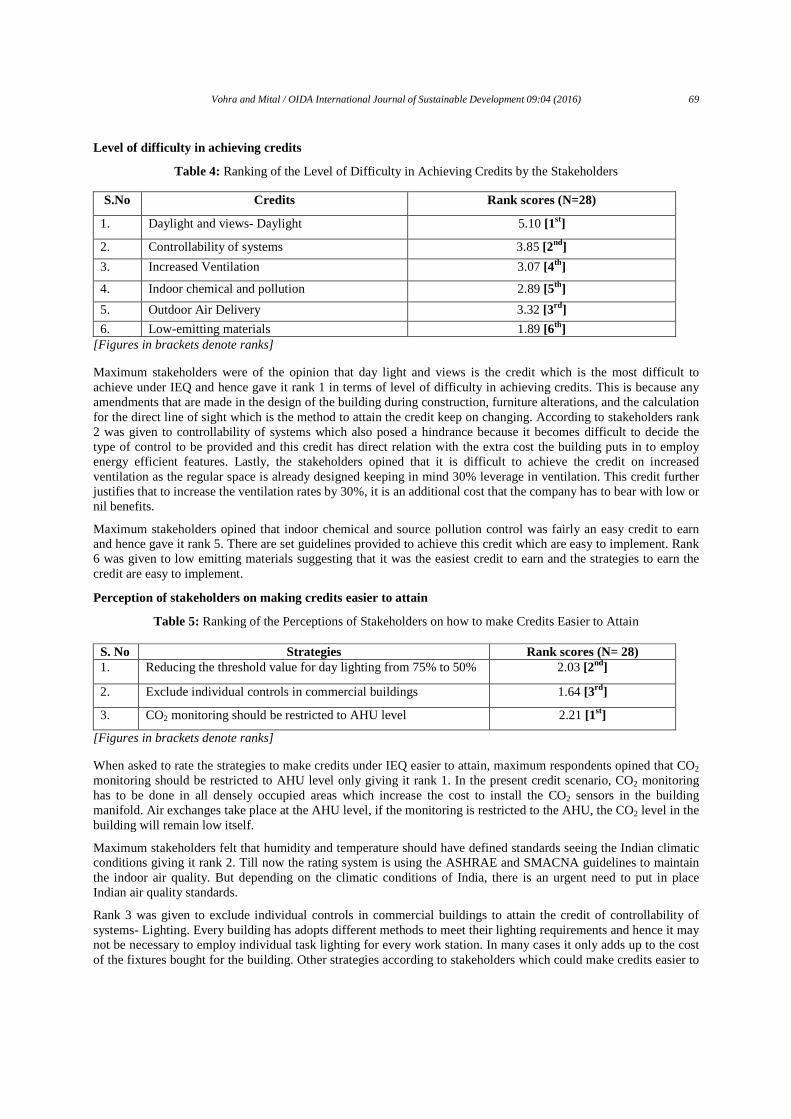
Vohra and Mital / OIDA International Journal of Sustainable Development 09:04 (2016) 69
Level of difficulty in achieving credits
Table 4: Ranking of the Level of Difficulty in Achieving Credits by the Stakeholders
S.No Credits Rank scores (N=28)
1. Daylight and views- Daylight 5.10 [1st]
2. Controllability of systems 3.85 [2nd]
3. Increased Ventilation 3.07 [4th]
4. Indoor chemical and pollution 2.89 [5th]
5. Outdoor Air Delivery 3.32 [3rd]
6. Low-emitting materials 1.89 [6th] [Figures in brackets denote ranks]
Maximum stakeholders were of the opinion that day light and views is the credit which is the most difficult to achieve under IEQ and hence gave it rank 1 in terms of level of difficulty in achieving credits. This is because any amendments that are made in the design of the building during construction, furniture alterations, and the calculation for the direct line of sight which is the method to attain the credit keep on changing. According to stakeholders rank 2 was given to controllability of systems which also posed a hindrance because it becomes difficult to decide the type of control to be provided and this credit has direct relation with the extra cost the building puts in to employ energy efficient features. Lastly, the stakeholders opined that it is difficult to achieve the credit on increased ventilation as the regular space is already designed keeping in mind 30% leverage in ventilation. This credit further justifies that to increase the ventilation rates by 30%, it is an additional cost that the company has to bear with low or nil benefits.
Maximum stakeholders opined that indoor chemical and source pollution control was fairly an easy credit to earn and hence gave it rank 5. There are set guidelines provided to achieve this credit which are easy to implement. Rank 6 was given to low emitting materials suggesting that it was the easiest credit to earn and the strategies to earn the credit are easy to implement.
Perception of stakeholders on making credits easier to attain
Table 5: Ranking of the Perceptions of Stakeholders on how to make Credits Easier to Attain
S. No Strategies Rank scores (N= 28) 1. Reducing the threshold value for day lighting from 75% to 50% 2.03 [2nd]
2. Exclude individual controls in commercial buildings 1.64 [3rd]
3. CO2 monitoring should be restricted to AHU level 2.21 [1st]
[Figures in brackets denote ranks]
When asked to rate the strategies to make credits under IEQ easier to attain, maximum respondents opined that CO2 monitoring should be restricted to AHU level only giving it rank 1. In the present credit scenario, CO2 monitoring has to be done in all densely occupied areas which increase the cost to install the CO2 sensors in the building manifold. Air exchanges take place at the AHU level, if the monitoring is restricted to the AHU, the CO2 level in the building will remain low itself.
Maximum stakeholders felt that humidity and temperature should have defined standards seeing the Indian climatic conditions giving it rank 2. Till now the rating system is using the ASHRAE and SMACNA guidelines to maintain the indoor air quality. But depending on the climatic conditions of India, there is an urgent need to put in place Indian air quality standards.
Rank 3 was given to exclude individual controls in commercial buildings to attain the credit of controllability of systems- Lighting. Every building has adopts different methods to meet their lighting requirements and hence it may not be necessary to employ individual task lighting for every work station. In many cases it only adds up to the cost of the fixtures bought for the building. Other strategies according to stakeholders which could make credits easier to
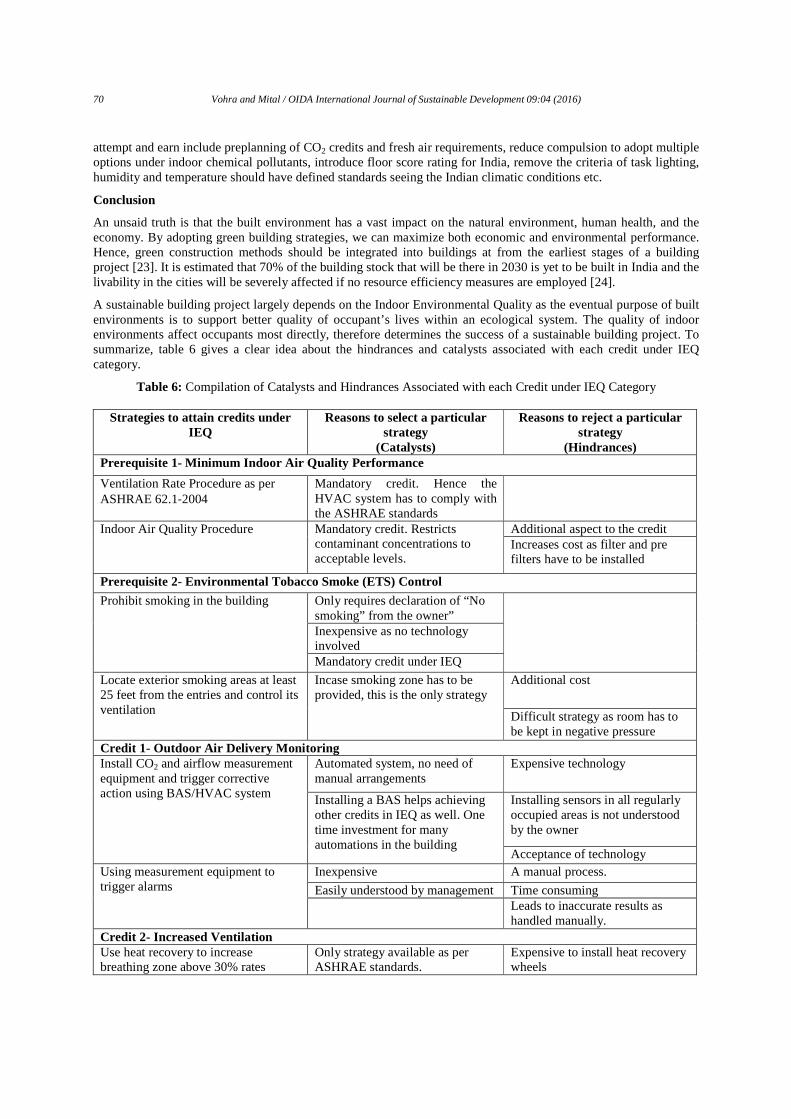
70 Vohra and Mital / OIDA International Journal of Sustainable Development 09:04 (2016)
attempt and earn include preplanning of CO2 credits and fresh air requirements, reduce compulsion to adopt multiple options under indoor chemical pollutants, introduce floor score rating for India, remove the criteria of task lighting, humidity and temperature should have defined standards seeing the Indian climatic conditions etc.
Conclusion
An unsaid truth is that the built environment has a vast impact on the natural environment, human health, and the economy. By adopting green building strategies, we can maximize both economic and environmental performance. Hence, green construction methods should be integrated into buildings at from the earliest stages of a building project [23]. It is estimated that 70% of the building stock that will be there in 2030 is yet to be built in India and the livability in the cities will be severely affected if no resource efficiency measures are employed [24].
A sustainable building project largely depends on the Indoor Environmental Quality as the eventual purpose of built environments is to support better quality of occupant’s lives within an ecological system. The quality of indoor environments affect occupants most directly, therefore determines the success of a sustainable building project. To summarize, table 6 gives a clear idea about the hindrances and catalysts associated with each credit under IEQ category.
Table 6: Compilation of Catalysts and Hindrances Associated with each Credit under IEQ Category
Strategies to attain credits under IEQ
Reasons to select a particular strategy
(Catalysts)
Reasons to reject a particular strategy
(Hindrances) Prerequisite 1- Minimum Indoor Air Quality Performa nce
Ventilation Rate Procedure as per ASHRAE 62.1‐2004
Mandatory credit. Hence the HVAC system has to comply with the ASHRAE standards
Indoor Air Quality Procedure Mandatory credit. Restricts contaminant concentrations to acceptable levels.
Additional aspect to the credit Increases cost as filter and pre filters have to be installed
Prerequisite 2- Environmental Tobacco Smoke (ETS) Control
Prohibit smoking in the building Only requires declaration of “No smoking” from the owner”
Inexpensive as no technology involved Mandatory credit under IEQ
Locate exterior smoking areas at least 25 feet from the entries and control its ventilation
Incase smoking zone has to be provided, this is the only strategy
Additional cost
Difficult strategy as room has to be kept in negative pressure
Credit 1- Outdoor Air Delivery Monitoring Install CO2 and airflow measurement equipment and trigger corrective action using BAS/HVAC system
Automated system, no need of manual arrangements
Expensive technology
Installing a BAS helps achieving other credits in IEQ as well. One time investment for many automations in the building
Installing sensors in all regularly occupied areas is not understood by the owner
Acceptance of technology Using measurement equipment to trigger alarms
Inexpensive A manual process.
Easily understood by management Time consuming Leads to inaccurate results as
handled manually. Credit 2- Increased Ventilation Use heat recovery to increase breathing zone above 30% rates
Only strategy available as per ASHRAE standards.
Expensive to install heat recovery wheels
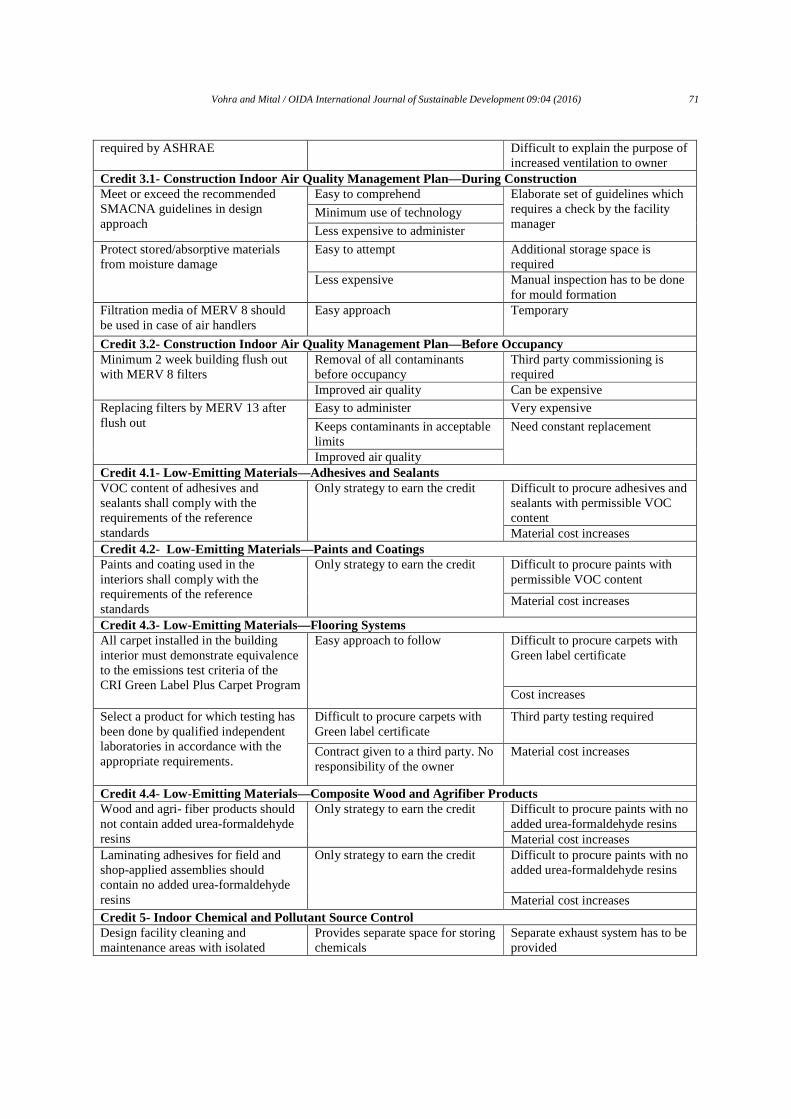
Vohra and Mital / OIDA International Journal of Sustainable Development 09:04 (2016) 71
required by ASHRAE Difficult to explain the purpose of increased ventilation to owner
Credit 3.1- Construction Indoor Air Quality Management Plan—During Construction Meet or exceed the recommended SMACNA guidelines in design approach
Easy to comprehend Elaborate set of guidelines which requires a check by the facility manager
Minimum use of technology
Less expensive to administer
Protect stored/absorptive materials from moisture damage
Easy to attempt Additional storage space is required
Less expensive Manual inspection has to be done for mould formation
Filtration media of MERV 8 should be used in case of air handlers
Easy approach Temporary
Credit 3.2- Construction Indoor Air Quality Management Plan—Before Occupancy Minimum 2 week building flush out with MERV 8 filters
Removal of all contaminants before occupancy
Third party commissioning is required
Improved air quality Can be expensive
Replacing filters by MERV 13 after flush out
Easy to administer Very expensive
Keeps contaminants in acceptable limits
Need constant replacement
Improved air quality Credit 4.1- Low-Emitting Materials—Adhesives and Sealants VOC content of adhesives and sealants shall comply with the requirements of the reference standards
Only strategy to earn the credit Difficult to procure adhesives and sealants with permissible VOC content Material cost increases
Credit 4.2- Low-Emitting Materials—Paints and Coatings Paints and coating used in the interiors shall comply with the requirements of the reference standards
Only strategy to earn the credit Difficult to procure paints with permissible VOC content
Material cost increases
Credit 4.3- Low-Emitting Materials—Flooring Systems All carpet installed in the building interior must demonstrate equivalence to the emissions test criteria of the CRI Green Label Plus Carpet Program
Easy approach to follow Difficult to procure carpets with Green label certificate
Cost increases
Select a product for which testing has been done by qualified independent laboratories in accordance with the appropriate requirements.
Difficult to procure carpets with Green label certificate
Third party testing required
Contract given to a third party. No responsibility of the owner
Material cost increases
Credit 4.4- Low-Emitting Materials—Composite Wood and Agrifiber Products Wood and agri- fiber products should not contain added urea-formaldehyde resins
Only strategy to earn the credit Difficult to procure paints with no added urea-formaldehyde resins Material cost increases
Laminating adhesives for field and shop-applied assemblies should contain no added urea-formaldehyde resins
Only strategy to earn the credit Difficult to procure paints with no added urea-formaldehyde resins
Material cost increases Credit 5- Indoor Chemical and Pollutant Source Control Design facility cleaning and maintenance areas with isolated
Provides separate space for storing chemicals
Separate exhaust system has to be provided
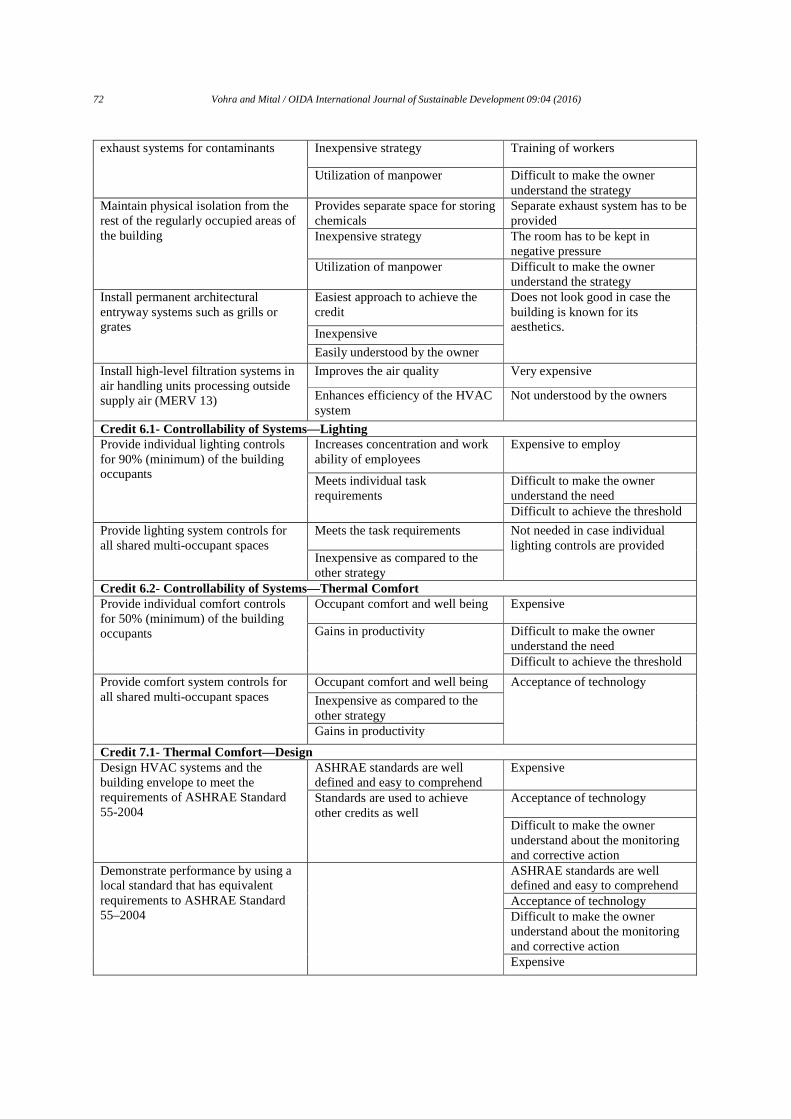
72 Vohra and Mital / OIDA International Journal of Sustainable Development 09:04 (2016)
exhaust systems for contaminants Inexpensive strategy Training of workers
Utilization of manpower Difficult to make the owner understand the strategy
Maintain physical isolation from the rest of the regularly occupied areas of the building
Provides separate space for storing chemicals
Separate exhaust system has to be provided
Inexpensive strategy The room has to be kept in negative pressure
Utilization of manpower Difficult to make the owner understand the strategy
Install permanent architectural entryway systems such as grills or grates
Easiest approach to achieve the credit
Does not look good in case the building is known for its aesthetics. Inexpensive
Easily understood by the owner
Install high-level filtration systems in air handling units processing outside supply air (MERV 13)
Improves the air quality Very expensive
Enhances efficiency of the HVAC system
Not understood by the owners
Credit 6.1- Controllability of Systems—Lighting Provide individual lighting controls for 90% (minimum) of the building occupants
Increases concentration and work ability of employees
Expensive to employ
Meets individual task requirements
Difficult to make the owner understand the need Difficult to achieve the threshold
Provide lighting system controls for all shared multi-occupant spaces
Meets the task requirements Not needed in case individual lighting controls are provided
Inexpensive as compared to the other strategy
Credit 6.2- Controllability of Systems—Thermal Comfort Provide individual comfort controls for 50% (minimum) of the building occupants
Occupant comfort and well being Expensive
Gains in productivity Difficult to make the owner understand the need Difficult to achieve the threshold
Provide comfort system controls for all shared multi-occupant spaces
Occupant comfort and well being Acceptance of technology
Inexpensive as compared to the other strategy Gains in productivity
Credit 7.1- Thermal Comfort—Design Design HVAC systems and the building envelope to meet the requirements of ASHRAE Standard 55-2004
ASHRAE standards are well defined and easy to comprehend
Expensive
Standards are used to achieve other credits as well
Acceptance of technology
Difficult to make the owner understand about the monitoring and corrective action
Demonstrate performance by using a local standard that has equivalent requirements to ASHRAE Standard 55–2004
ASHRAE standards are well defined and easy to comprehend Acceptance of technology Difficult to make the owner understand about the monitoring and corrective action Expensive
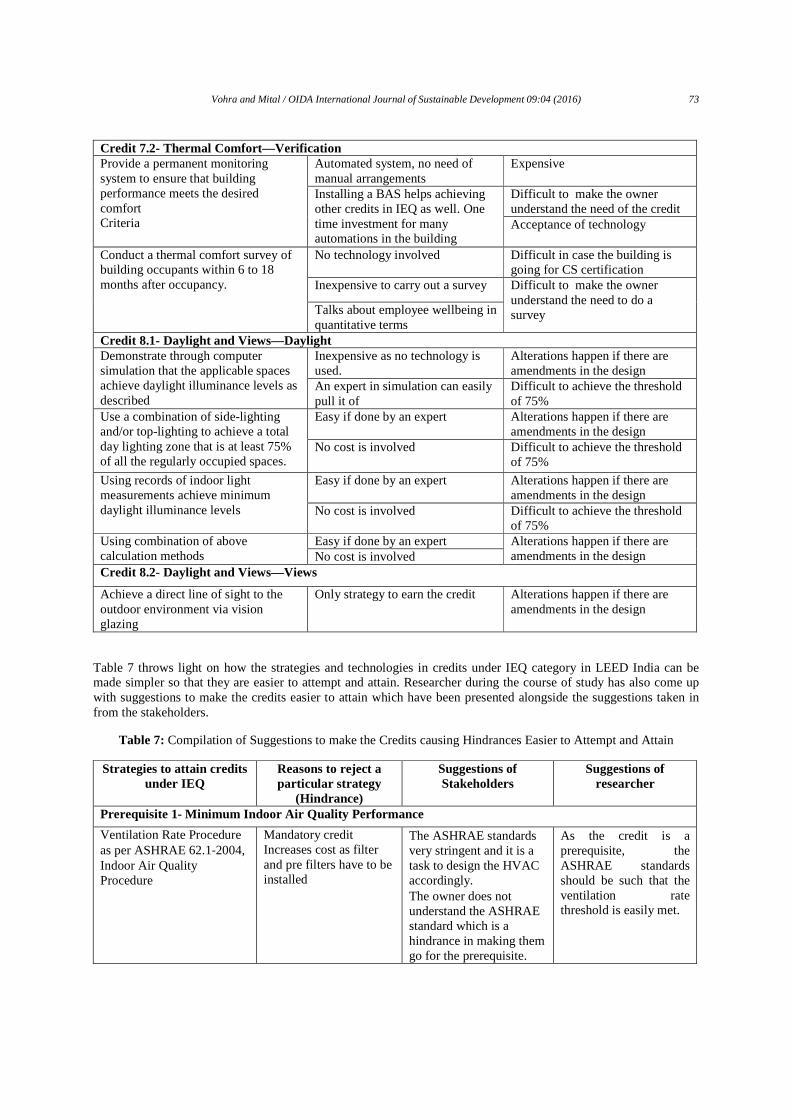
Vohra and Mital / OIDA International Journal of Sustainable Development 09:04 (2016) 73
Credit 7.2- Thermal Comfort—Verification Provide a permanent monitoring system to ensure that building performance meets the desired comfort Criteria
Automated system, no need of manual arrangements
Expensive
Installing a BAS helps achieving other credits in IEQ as well. One time investment for many automations in the building
Difficult to make the owner understand the need of the credit Acceptance of technology
Conduct a thermal comfort survey of building occupants within 6 to 18 months after occupancy.
No technology involved Difficult in case the building is going for CS certification
Inexpensive to carry out a survey Difficult to make the owner understand the need to do a survey Talks about employee wellbeing in
quantitative terms Credit 8.1- Daylight and Views—Daylight Demonstrate through computer simulation that the applicable spaces achieve daylight illuminance levels as described
Inexpensive as no technology is used.
Alterations happen if there are amendments in the design
An expert in simulation can easily pull it of
Difficult to achieve the threshold of 75%
Use a combination of side-lighting and/or top-lighting to achieve a total day lighting zone that is at least 75% of all the regularly occupied spaces.
Easy if done by an expert Alterations happen if there are amendments in the design
No cost is involved Difficult to achieve the threshold of 75%
Using records of indoor light measurements achieve minimum daylight illuminance levels
Easy if done by an expert Alterations happen if there are amendments in the design
No cost is involved Difficult to achieve the threshold of 75%
Using combination of above calculation methods
Easy if done by an expert Alterations happen if there are amendments in the design No cost is involved
Credit 8.2- Daylight and Views—Views
Achieve a direct line of sight to the outdoor environment via vision glazing
Only strategy to earn the credit Alterations happen if there are amendments in the design
Table 7 throws light on how the strategies and technologies in credits under IEQ category in LEED India can be made simpler so that they are easier to attempt and attain. Researcher during the course of study has also come up with suggestions to make the credits easier to attain which have been presented alongside the suggestions taken in from the stakeholders.
Table 7: Compilation of Suggestions to make the Credits causing Hindrances Easier to Attempt and Attain
Strategies to attain credits under IEQ
Reasons to reject a particular strategy
(Hindrance)
Suggestions of Stakeholders
Suggestions of researcher
Prerequisite 1- Minimum Indoor Air Quality Performa nce
Ventilation Rate Procedure as per ASHRAE 62.1‐2004, Indoor Air Quality Procedure
Mandatory credit Increases cost as filter and pre filters have to be installed
The ASHRAE standards very stringent and it is a task to design the HVAC accordingly.
The owner does not understand the ASHRAE standard which is a hindrance in making them go for the prerequisite.
As the credit is a prerequisite, the ASHRAE standards should be such that the ventilation rate threshold is easily met.
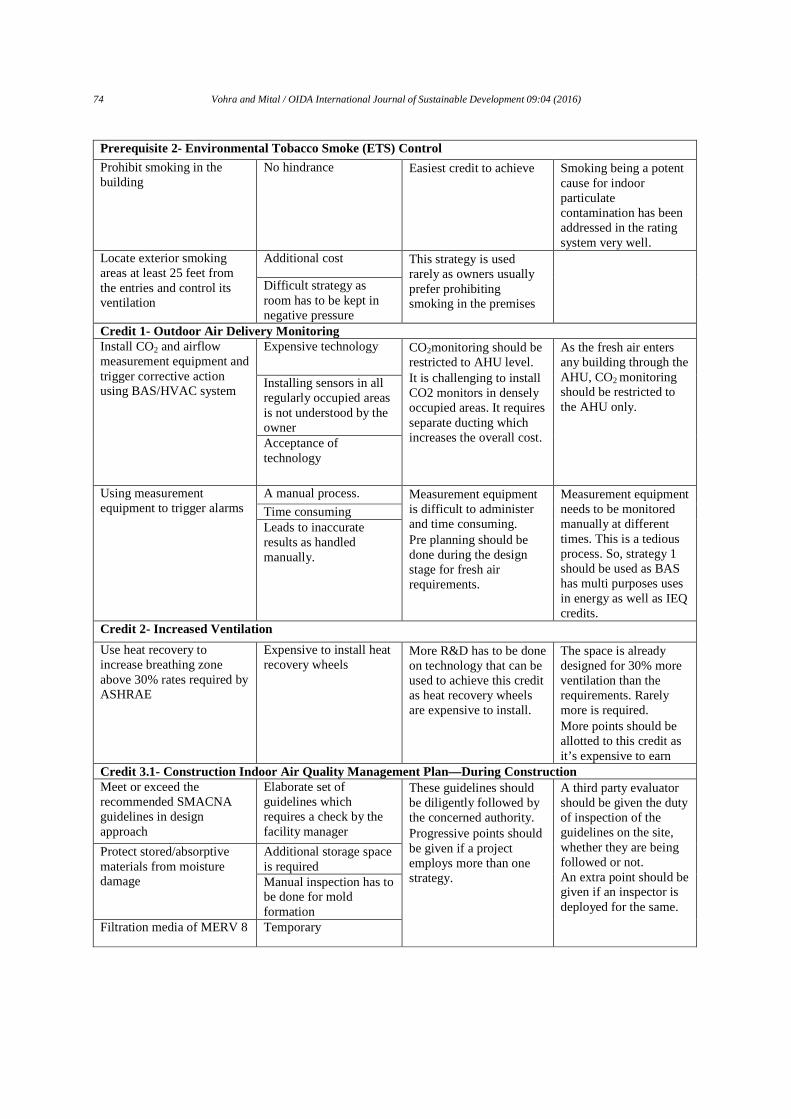
74 Vohra and Mital / OIDA International Journal of Sustainable Development 09:04 (2016)
Prerequisite 2- Environmental Tobacco Smoke (ETS) Control
Prohibit smoking in the building
No hindrance Easiest credit to achieve Smoking being a potent cause for indoor particulate contamination has been addressed in the rating system very well.
Locate exterior smoking areas at least 25 feet from the entries and control its ventilation
Additional cost This strategy is used rarely as owners usually prefer prohibiting smoking in the premises
Difficult strategy as room has to be kept in negative pressure
Credit 1- Outdoor Air Delivery Monitoring Install CO2 and airflow measurement equipment and trigger corrective action using BAS/HVAC system
Expensive technology CO2monitoring should be restricted to AHU level.
It is challenging to install CO2 monitors in densely occupied areas. It requires separate ducting which increases the overall cost.
As the fresh air enters any building through the AHU, CO2 monitoring should be restricted to the AHU only.
Installing sensors in all regularly occupied areas is not understood by the owner Acceptance of technology
Using measurement equipment to trigger alarms
A manual process. Measurement equipment is difficult to administer and time consuming.
Pre planning should be done during the design stage for fresh air requirements.
Measurement equipment needs to be monitored manually at different times. This is a tedious process. So, strategy 1 should be used as BAS has multi purposes uses in energy as well as IEQ credits.
Time consuming Leads to inaccurate results as handled manually.
Credit 2- Increased Ventilation
Use heat recovery to increase breathing zone above 30% rates required by ASHRAE
Expensive to install heat recovery wheels
More R&D has to be done on technology that can be used to achieve this credit as heat recovery wheels are expensive to install.
The space is already designed for 30% more ventilation than the requirements. Rarely more is required.
More points should be allotted to this credit as it’s expensive to earn
Credit 3.1- Construction Indoor Air Quality Management Plan—During Construction Meet or exceed the recommended SMACNA guidelines in design approach
Elaborate set of guidelines which requires a check by the facility manager
These guidelines should be diligently followed by the concerned authority.
Progressive points should be given if a project employs more than one strategy.
A third party evaluator should be given the duty of inspection of the guidelines on the site, whether they are being followed or not. An extra point should be given if an inspector is deployed for the same.
Protect stored/absorptive materials from moisture damage
Additional storage space is required Manual inspection has to be done for mold formation
Filtration media of MERV 8 Temporary
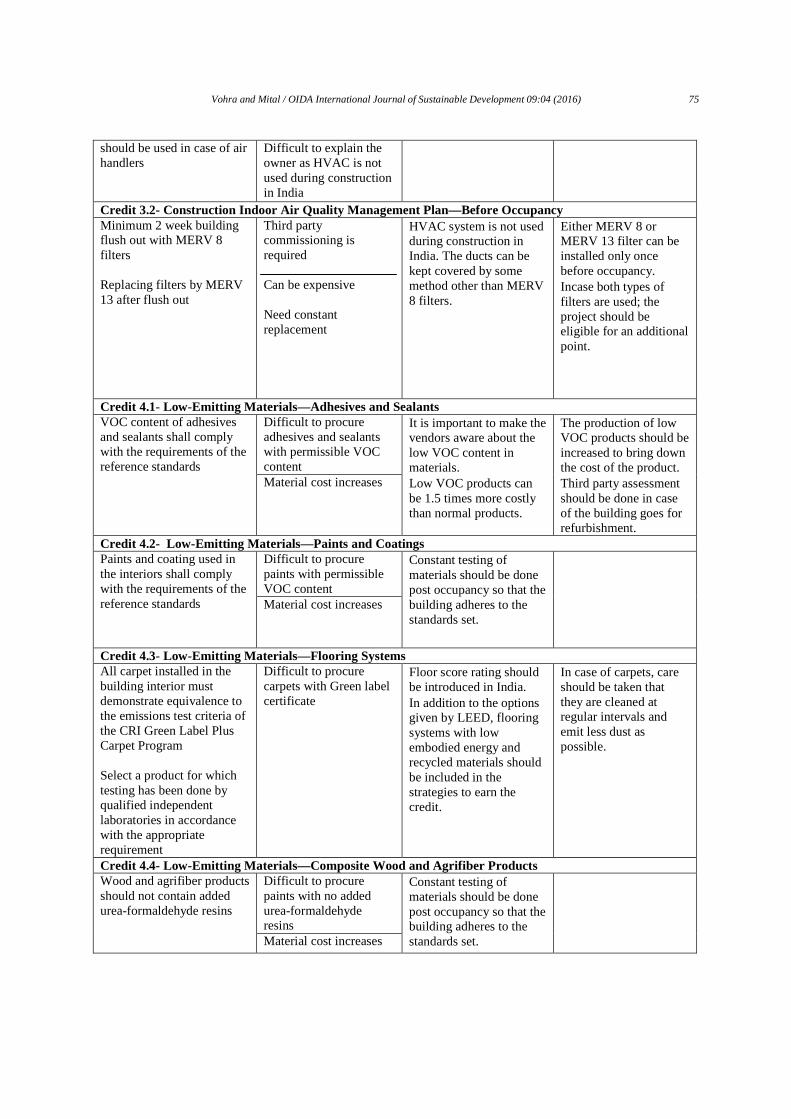
Vohra and Mital / OIDA International Journal of Sustainable Development 09:04 (2016) 75
should be used in case of air handlers
Difficult to explain the owner as HVAC is not used during construction in India
Credit 3.2- Construction Indoor Air Quality Management Plan—Before Occupancy Minimum 2 week building flush out with MERV 8 filters Replacing filters by MERV 13 after flush out
Third party commissioning is required Can be expensive Need constant replacement
HVAC system is not used during construction in India. The ducts can be kept covered by some method other than MERV 8 filters.
Either MERV 8 or MERV 13 filter can be installed only once before occupancy.
Incase both types of filters are used; the project should be eligible for an additional point.
Credit 4.1- Low-Emitting Materials—Adhesives and Sealants VOC content of adhesives and sealants shall comply with the requirements of the reference standards
Difficult to procure adhesives and sealants with permissible VOC content
It is important to make the vendors aware about the low VOC content in materials.
Low VOC products can be 1.5 times more costly than normal products.
The production of low VOC products should be increased to bring down the cost of the product.
Third party assessment should be done in case of the building goes for refurbishment.
Material cost increases
Credit 4.2- Low-Emitting Materials—Paints and Coatings Paints and coating used in the interiors shall comply with the requirements of the reference standards
Difficult to procure paints with permissible VOC content
Constant testing of materials should be done post occupancy so that the building adheres to the standards set.
Material cost increases
Credit 4.3- Low-Emitting Materials—Flooring Systems All carpet installed in the building interior must demonstrate equivalence to the emissions test criteria of the CRI Green Label Plus Carpet Program Select a product for which testing has been done by qualified independent laboratories in accordance with the appropriate requirement
Difficult to procure carpets with Green label certificate
Floor score rating should be introduced in India.
In addition to the options given by LEED, flooring systems with low embodied energy and recycled materials should be included in the strategies to earn the credit.
In case of carpets, care should be taken that they are cleaned at regular intervals and emit less dust as possible.
Credit 4.4- Low-Emitting Materials—Composite Wood and Agrifiber Products Wood and agrifiber products should not contain added urea-formaldehyde resins
Difficult to procure paints with no added urea-formaldehyde resins
Constant testing of materials should be done post occupancy so that the building adheres to the standards set.
Material cost increases
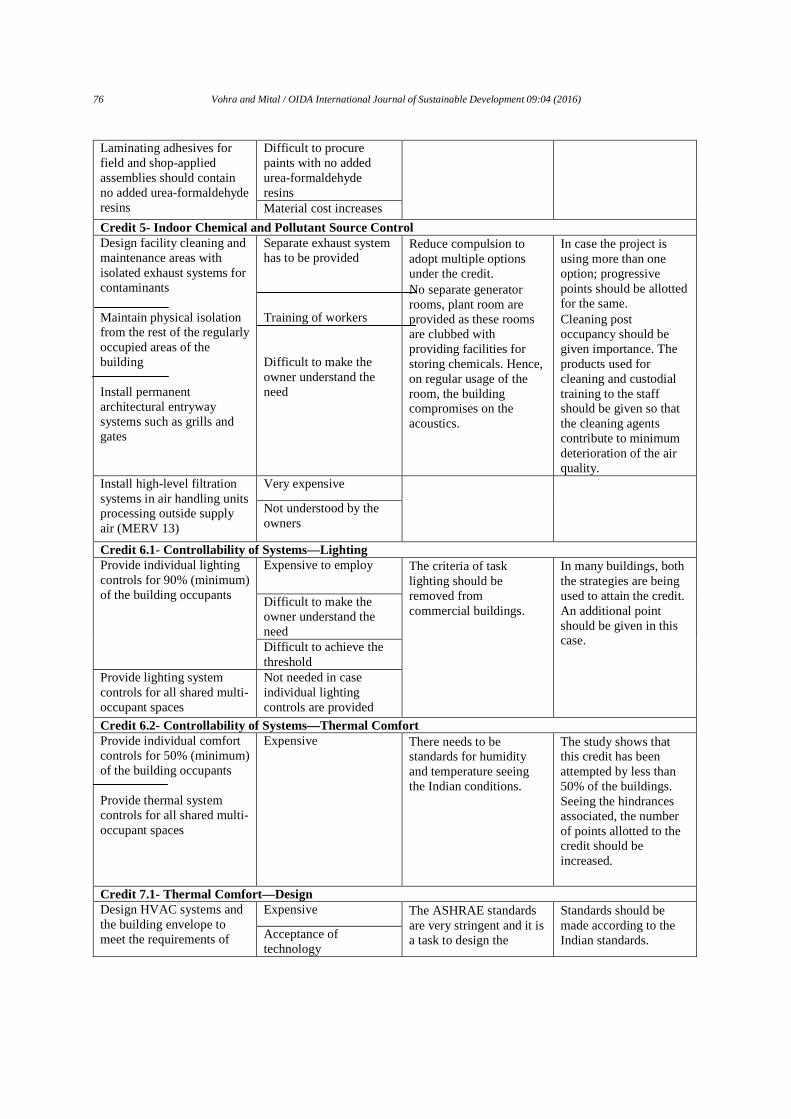
76 Vohra and Mital / OIDA International Journal of Sustainable Development 09:04 (2016)
Laminating adhesives for field and shop-applied assemblies should contain no added urea-formaldehyde resins
Difficult to procure paints with no added urea-formaldehyde resins Material cost increases
Credit 5- Indoor Chemical and Pollutant Source Control Design facility cleaning and maintenance areas with isolated exhaust systems for contaminants Maintain physical isolation from the rest of the regularly occupied areas of the building Install permanent architectural entryway systems such as grills and gates
Separate exhaust system has to be provided Training of workers Difficult to make the owner understand the need
Reduce compulsion to adopt multiple options under the credit.
No separate generator rooms, plant room are provided as these rooms are clubbed with providing facilities for storing chemicals. Hence, on regular usage of the room, the building compromises on the acoustics.
In case the project is using more than one option; progressive points should be allotted for the same.
Cleaning post occupancy should be given importance. The products used for cleaning and custodial training to the staff should be given so that the cleaning agents contribute to minimum deterioration of the air quality.
Install high-level filtration systems in air handling units processing outside supply air (MERV 13)
Very expensive
Not understood by the owners
Credit 6.1- Controllability of Systems—Lighting Provide individual lighting controls for 90% (minimum) of the building occupants
Expensive to employ The criteria of task lighting should be removed from commercial buildings.
In many buildings, both the strategies are being used to attain the credit. An additional point should be given in this case.
Difficult to make the owner understand the need Difficult to achieve the threshold
Provide lighting system controls for all shared multi-occupant spaces
Not needed in case individual lighting controls are provided
Credit 6.2- Controllability of Systems—Thermal Comfort Provide individual comfort controls for 50% (minimum) of the building occupants Provide thermal system controls for all shared multi-occupant spaces
Expensive There needs to be standards for humidity and temperature seeing the Indian conditions.
The study shows that this credit has been attempted by less than 50% of the buildings. Seeing the hindrances associated, the number of points allotted to the credit should be increased.
Credit 7.1- Thermal Comfort—Design Design HVAC systems and the building envelope to meet the requirements of
Expensive The ASHRAE standards are very stringent and it is a task to design the
Standards should be made according to the Indian standards. Acceptance of
technology
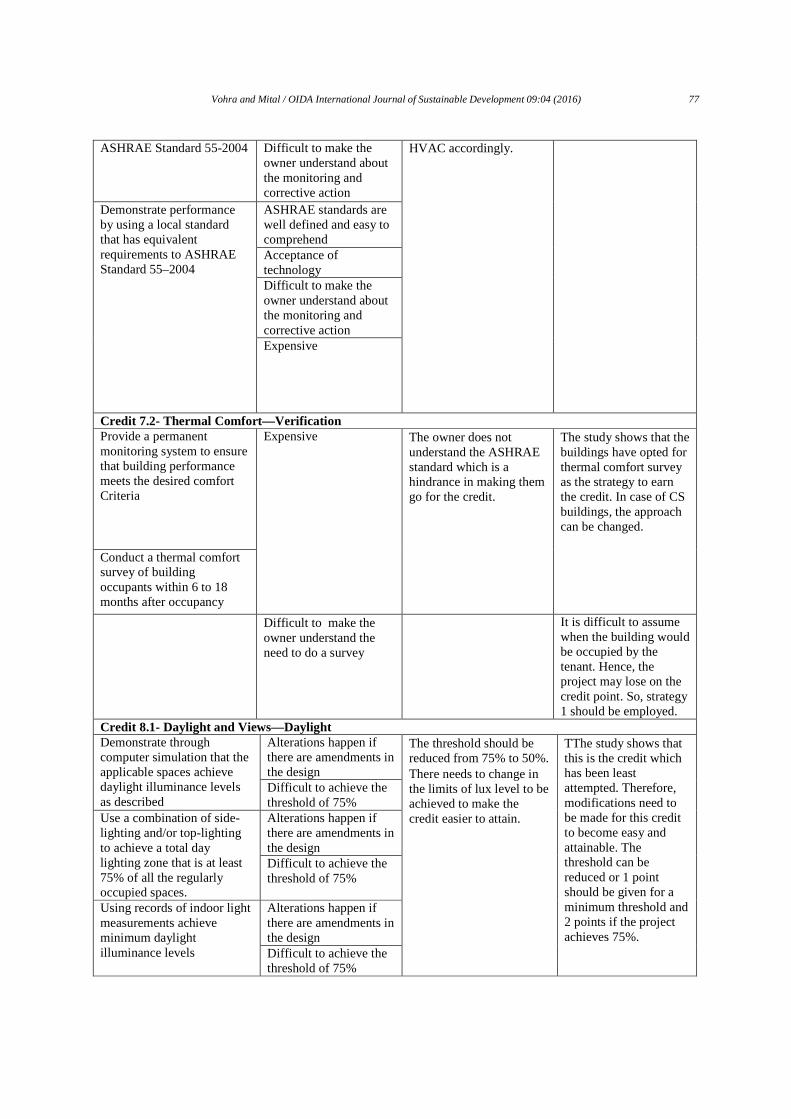
Vohra and Mital / OIDA International Journal of Sustainable Development 09:04 (2016) 77
ASHRAE Standard 55-2004 Difficult to make the owner understand about the monitoring and corrective action
HVAC accordingly.
Demonstrate performance by using a local standard that has equivalent requirements to ASHRAE Standard 55–2004
ASHRAE standards are well defined and easy to comprehend Acceptance of technology Difficult to make the owner understand about the monitoring and corrective action Expensive
Credit 7.2- Thermal Comfort—Verification Provide a permanent monitoring system to ensure that building performance meets the desired comfort Criteria
Expensive The owner does not understand the ASHRAE standard which is a hindrance in making them go for the credit.
The study shows that the buildings have opted for thermal comfort survey as the strategy to earn the credit. In case of CS buildings, the approach can be changed.
Conduct a thermal comfort survey of building occupants within 6 to 18 months after occupancy
Difficult to make the owner understand the need to do a survey
It is difficult to assume when the building would be occupied by the tenant. Hence, the project may lose on the credit point. So, strategy 1 should be employed.
Credit 8.1- Daylight and Views—Daylight Demonstrate through computer simulation that the applicable spaces achieve daylight illuminance levels as described
Alterations happen if there are amendments in the design
The threshold should be reduced from 75% to 50%.
There needs to change in the limits of lux level to be achieved to make the credit easier to attain.
TThe study shows that this is the credit which has been least attempted. Therefore, modifications need to be made for this credit to become easy and attainable. The threshold can be reduced or 1 point should be given for a minimum threshold and 2 points if the project achieves 75%.
Difficult to achieve the threshold of 75%
Use a combination of side-lighting and/or top-lighting to achieve a total day lighting zone that is at least 75% of all the regularly occupied spaces.
Alterations happen if there are amendments in the design Difficult to achieve the threshold of 75%
Using records of indoor light measurements achieve minimum daylight illuminance levels
Alterations happen if there are amendments in the design Difficult to achieve the threshold of 75%
78 Vohra and Mital / OIDA International Journal of Sustainable Development 09:04 (2016)
Using combination of above calculation methods
Alterations happen if there are amendments in the design
Credit 8.2- Daylight and Views—Views
Achieve a direct line of sight to the outdoor environment via vision glazing
Alterations happen if there are amendments in the design
Early planning during design stage should be done.
Minimum alterations should be done when the project is in the construction phase.
Overall, this study sees the catalysts and hindrances associated with LEED for India NC and CS. Apart from this, the study gives suggestions from stakeholders as well as of the researcher about overcoming the hindrances associated with IEQ credits and to make them easier to attempt and attain. Though modifications and revisions are done with new versions of the rating, this study gives a larger picture to overcome the hindrances and accelerate the growth of green buildings in India. References
[1] World Green Building Council. (2013). Green Building Rating Systems. Retrieved from http://www.worldgbc.org/green-building-councils/green-building-rating-tools
[2] Dmg India. (2015). Construction Market in India. Retrieved from https://www.thebig5constructindia.com/media/257069/Construction-Market-Report.pdf
[3] KPMG. (2013). Indian Real estate-Opening Doors. Retrieved from http://www.kpmg.com/IN/en/IssuesAndInsights/ArticlesPublications/Documents/Indian-real-estate-Opening-doors.pdf
[4] Centre for Science and Environment (2012). Sustainable Buildings, Lifestyle and Resource Use. Retrieved from www.cseindia.org/content/work-overview-3
[5] United Nations Environment Programme. (2011). Buildings: Investing in Energy and Resource Efficiency. Retrieved from http://www.unep.org/greeneconomy/Portals/88/documents/ger/GER_9_Buildings.pdf
[6] The Energy and Resource Institute. (2014). What is a green building?. Retrieved from http://www.grihaindia.org/index.php?option=com_content&task=view&id=14
[7] U.S. Green Building Council. (2011). Green Building Facts. Retrieved from http://www.usgbc.org/Docs/Archive/General/Docs18693.pdf
[8] Indian Green Building Council. (2015). IGBC Green New Building Rating System-3. Retrieved from https://igbc.in/igbc/html_pdfs/abridged/IGBC%20Green%20New%20Buildings%20v3.0%20-%20Third%20Addendum_April%202015.pdf
[9] Economic times. (2014). India’s Green Building Footprint. Retrieved from http://economictimes.indiatimes.com/topic/Green-building-footprint
[10] Indian Green Building Council. (2011). Green Building Rating System for New Construction & Major Renovation. LEED 2011 for India. Hyderabad, India: Anonymous.
[11] U.S. Green Building Council. (2009). USGBC New Construction; Version 3. California, United States of America: Anonymous
[12] Mc Graw Hill Construction (2012). McGraw-Hill Construction's World’s Green Building Trends: Business Imperative and Market Demand Driving Green Building Growth. New York: Mc Graw Hill Publication
[13] Roulet, C. (2001). Indoor Environmental Quality in Green Buildings and its Impact on outdoor Environment. Energy and Buildings, 33 (3), 183-191. Retrieved from https://scholar.google.co.in/citations?view_op=view_citation&hl=en&user=8b6ZZF4AAAAJ&citation_forview=8b6ZZF4AAAAJ:UebtZRa9Y70C
[14] World Health Organization. (2008). Children’s Health and Environment. Retrieved from http://www.who.int/ceh/capacity/Outdoor_air_pollution.pdf
[15] American Society of Heating, Refrigerating and Air-Conditioning engineers. (2011). ASHRAE Standards and Guidelines. Retrieved from http://www.ashrae.org/publications/page/158
Vohra and Mital / OIDA International Journal of Sustainable Development 09:04 (2016) 79
[16] United States Environmental Protection Agency. (2012). Reducing Greenhouse Gas Emissions. Retrieved from http://www.epa.gov/climatechange/reducing-emissions.html
[17] Fisk, W. (2000). Health and Productivity Gains from Better Indoor Environments and their Relationship with Building Energy Efficiency. Energy and Environment, 25(5), 37-66. Retrieved from www.annualreviews.org
[18] Chappels, H and Shove, E. (2007). Debating the Future of Comfort: Environmental Sustainability, Energy Consumption and the Indoor Environment. Building research and Information, 31(1), 32-40. Retrieved from http://dx.doi.org/10.1080/0961321042000322762
[19] Frontczak, M. and Wargocki, P. (2011). Literature Survey on how Different Factors Influence Human Comfort in Indoor Environments. Building and Environment, 46(5), 922-937. Retrieved from www.elsevier.com/locate/buildenv
[20] Lee, Y. (2013). Occupant Comfort and Satisfaction in Green Healthcare Environments: A Survey Study Focusing on Healthcare Staff. Journal of Sustainable Development, 8(1),156-173. Retrieved from http://scholars.opb.msu.edu/pubDetail.asp?t=pm&id=84924443886&n=YoungSook+Lee&u_id=1426&oe_id=&o_id=
[21] Jain, M., Mital, M., Syal, M. (2013). LEED-EB Implementation in India: An Overview of Catalysts and Hindrances. International Journal of Sustainable Development, 6(12). Retrieved from http://www.ssrn.com/link/OIDA-Intl-Journal-Sustainable-Dev.html Indian Green Building Council. (2011). Green Building Rating System for New Construction & Major Renovation. LEED 2011 for India. Hyderabad, India: Anonymous.
[22] Steemers, K and Manchanda, S. (2010). Energy efficient design and occupant well-being: Case studies in the UK and India. Building and Environment, 45(3), 270-278. Retrieved from www.elsevier.com/locate/buildenv
[23] United States Environmental Protection Agency. (2013). Carbon Pollution Standards for the Power Sector. Retrieved from http://www2.epa.gov/carbon-pollution-standards
[24] World Bank. (2014). GDP of India. Retrieved from http://data.worldbank.org/country/india#cp_gep About the Authors Name: Subodhika Vohra Email: [email protected] Name: Meenakshi Mital Email: [email protected]

80 Vohra and Mital / OIDA International Journal of Sustainable Development 09:04 (2016)

Determinants of Poverty: Panel Data Analysis in Asean-5; 1990 – 2013 Mona Adriana University of Trisakti, Jakarta, Indonesia
43-52
Designing Online Marketing For SME (Organic Food Case Study) Hasrini Sari a, Aditya Parama Setiaboedi b a, b Industrial Engineering Management, Institut Teknologi Bandung, Bandung, Indonesia.
53-62
Indoor Environmental Quality Credits in Green Buil dings in India Subodhika Vohra a, Meenakshi Mital b a,b Department of Resource Management and Design Application, Lady Irwin College, University of Delhi, India
63-80
OIDA Publications Ontario International Development Agency 364 Moffatt Pond Court Ottawa Ontario, K2J 0C7 Canada Published by Ontario International Development Agency, Canada.
Top Related
Copyright © 2022 FDOKUMEN

