


Bahasa
Halaman
Hukum


PNL-8534,Vol. 2UC "^i "^" "_^-vv _ uuI, J,_ l_,.}v
HANFORDENVIRONMENTALANALYTICALMETHODS(METHODSAS OF MARCH 1990)
c: :E,_:
APPENDIXAI-O AND APPENDIXAI-I __ _ :_ _ _'_s
S C Goheen __: _=-• • o __ _.o_ _ _M McCulloch _-__ _ _ -_ _'-• _,_ __-.--, _ _ _J L Daniel _ .....• . _._ __._
_ _ _'_ 0 _ _ _ _
May 1993 _ _= = _ -
o_ o__ B_._e
_,_ _ _ _1 _,, ''Preparedfor _ _ =_ -__-:_ __ G ,_ "_ I_ _ _ _
the U.S Departmentof Energy _._-__ _ _• ,_,-_ _ 8"_ c_,.,
under ContractDE-ACO6.-76RLO1830 _ _ _ ) _ .L__ _
_ _-_ _'o_
" _ _'_ _ e'_'_
PacificNorthwestLaboratoryRichland,Washington (}9352
_)tSTRIBUTIC..)h,I C-)FTHIS DOCUMENT IS UtXILIMITED
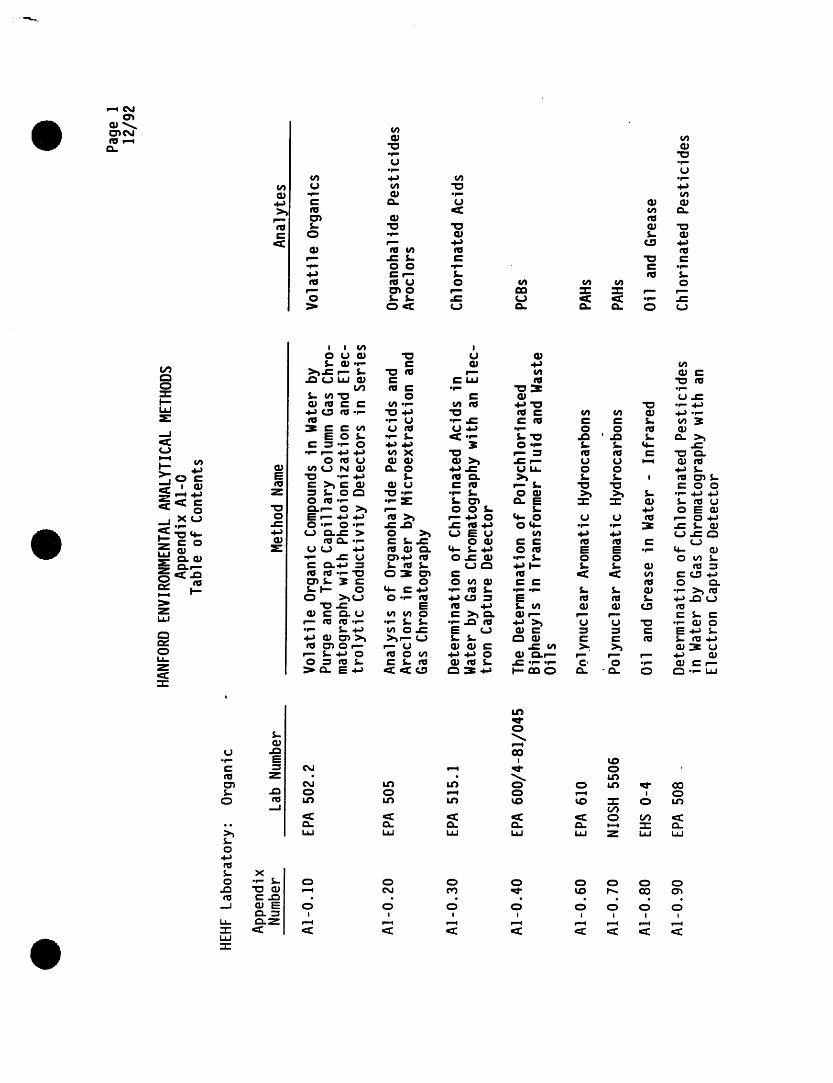
) METIlOO502.2. VOLATILE ORGANIC COMPOUNDS IN WATER BYPURGE P.::_TRAP CAPILLARYCOLUMN GAS CHROHATOGRAPHY
WITH PHOTOIONIZATIONAND ELECTROLYTIC j / . .CONDUCTIVITYDETECTORS IN SERIES
. t"
(September,1986)
1. SCOPEANDAPPLICATIONii i nml ulIlUll
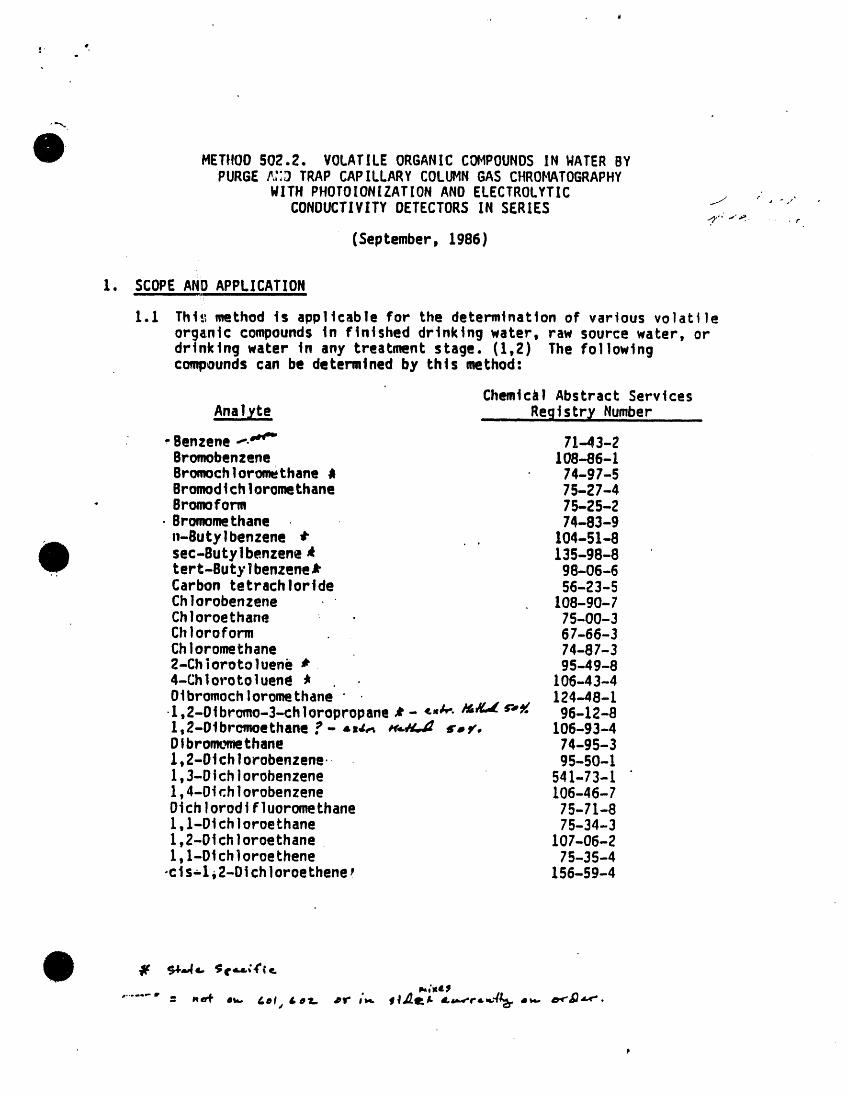
I.I Thls_method is applicablefor the determinationof various volatileorganic compounds in finisheddrinking water, raw source water, ordrinking water in any treatment stage. (1,2) The followingcompoundscan be determined by this method:
Chemical Abstract Services
AnaIj,te Reqlstr_ Number
.Benzene...,,w-- 71-43-2Bromobenzene 108-86-1Bromochlorom_thane_ 74-g7-5Bromodtch ]oromethane 75-27-4
- Bromoform 75-25-2• Bromomethane 74-83-9
n-Butylbenzene * . 104-51-8sec-Buty lbenzene _ 135-g8-8
.. t er t-Buty l benzene• 98-06-6Carbon tetrachIoride 56-23-5Chlorobenzene 108-90-7Chloroethane • 75-00-3ChI oro form 67-66-3ChIoromethane 74-87-32-Ch iorotoluene* gs-4g-84-Ch lorotoluen_ _ 106-43-4OtbromochIoromethane • 124-48-1•1,2-Otbromo-3-chloropropane ,- _,_'. _/L_ _'-_ 96-12-81,2-Otbremoethane ?- -_,_ _Y,.,C.d _r,¥, 106-93-4OIbrom_methane 74-95- 31,2-Otch lorobenzene. 95-50-11,3-D tchI orobenzene 541-73-11,4-Dt ch 1orobenzene 106-46-7DichlorodlfIuoromethane 75-71-81, l-Ot ch Ioroethane 75-34-31,2-0 t ch1oroe thane 107-06-21,1-Dt ch1oroe thene 75-35-4
•cis-l, 2-Dt chIoroethene _ 156-59-4
Chemical Abstract ServicesAnal_te .RegistryNumber
I
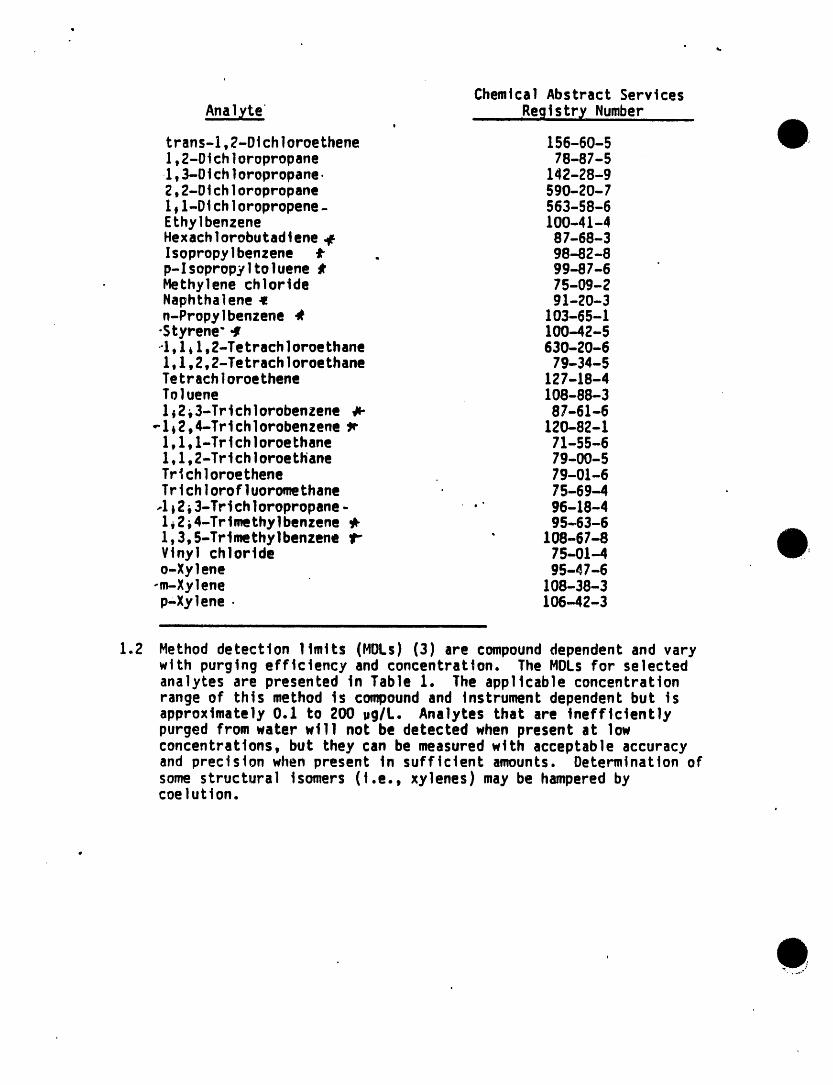
trans-1,2-Dichloroethene 156-60-51,2-Dtchloropropane 78-87-51,3-Dichloropropane. 142-28-92,2-Dtchloropropane 590-20-7ltl-Dichloropropene- 563-58-6Ethylbenzene 100-41-4Hexachlorobutadtene _ 87-68-3Isopropylbenzene _ . 98--82-8p-lsopropyltoluene ¢ 99-87-6Methylene chlortde 75-09-2Naphthalene _ 91-20-3n-Propylbenzene _ 103-65-1•Styrene" _ 100-42-5•l,l,l,2-Tetrachloroethane 630-20-6l,l,2,2-Tetrachloroethane 79-34-5Tetrachloroethene 127-18-4Toluene 108-88-3l_2_3-Trichlorobenzene _- 87-61-6
-1,2,4--Trtchlorobenzene _ 120-82-11,1,1-Trtchloroethane 71-55-61,1,2-Trichloroet_ane 7g-00-5Trtchloroethene 79-01-6Trtchlorofluoromethane 75-69-4
.l_2_3-Trichloropropane- " g6-18-41,2k4-Trtmethylbenzene_ 95-63-61,3,5-Trtmethylbenzene 11" " 108-67-8Vinyl chloride 75-01-4o-Xy]ene 95-47-6
-m-Xylene 108-38-3p-Xylene. 106-42-3
1.2 Method detection limits (MDLs) (3) are compounddependent and varywith purging efficiency and concentration. The MDLs for selectedana]ytes are presented in Table 1. lhe applicable concentrationrange of this method is compoundand instrument dependent but isapproximately 0.1 to 200 ,glL. Analytes that are inefficientlypurged from water wtll not be detected when present at lowconcentrations, but they can be measured with acceptable accuracyand precision when present in sufficient amounts. Determination ofsome structural isomers (i.e., xylenes) may be hampered bycoelutton.
e. *
e.
1.3 This method is recommendedfor use only by analysts experienced tnthe measurement of purgeable organtcs at the low .g/L level or byexperienced technicians under the close supervision of a qualifiedanalyst.
2. SUmmARYOF METHOD|l
2.1 Hfghly volatile organic compoundswith low water solubility areextracted (purged)from the samplematrix by bubbling an Inert gasthrough a 5 nd. aqueous sample. Purged sample conq_onentsaretrapped in a tube containing suitable sorbent materials. Whenpurging is complete, the sorbent tube ts heated and backf]ushedwith helium to desorb trapped san_31ecomponents onto a capillarygas chromatography (GC) column. The column ts temperatureprogrammedto separate the method analytes which are then detectedwith a photot0ntzation detector (PIP) and a halogen spectftcdetector placed in series.
2.2 Tentative Identifications are confirmed by analyzing standardsunder the sameconditions used for samples and comparing resultantGC retention times. Additional confirmatory information can begatned by co_)artng the relative response from the two detectors.Each tdent|f4ed component ts measured by relating the responseproduced for that comPoundto the response produced by a compoundthat ts used as an internal standard.
3. "INTERFERENCESi i
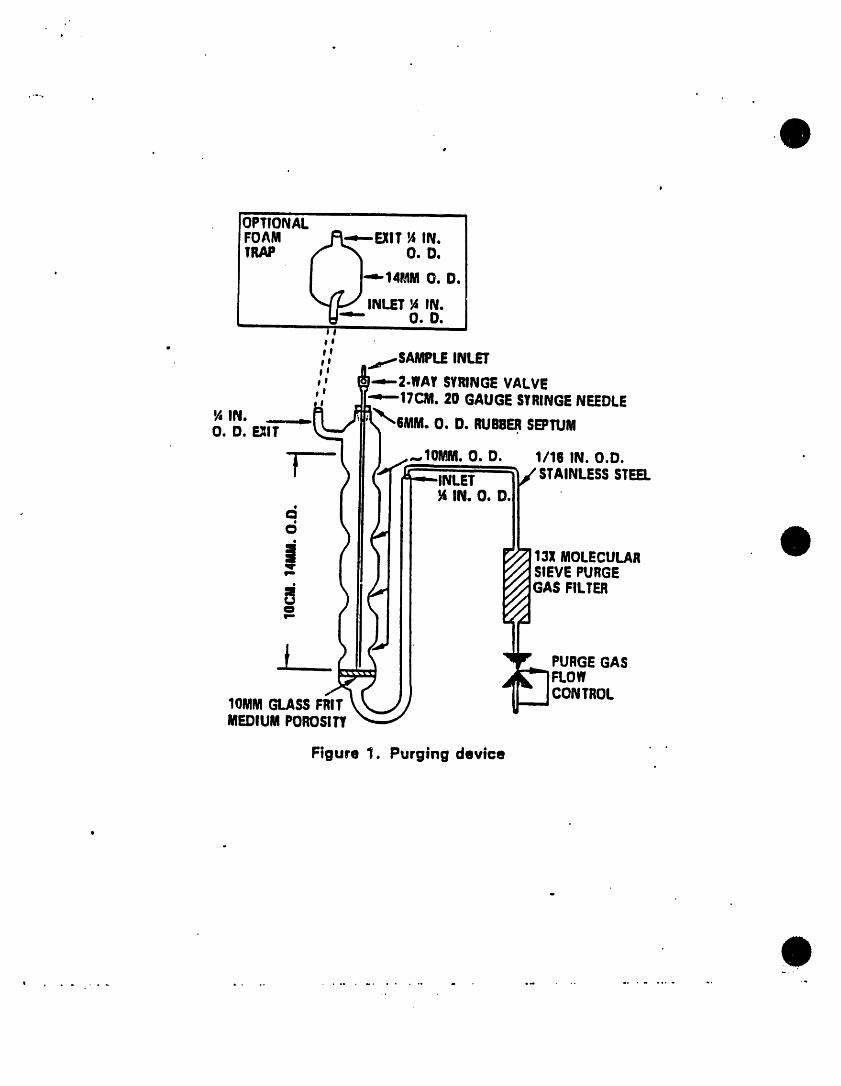
3.1 During anaiysts, major contaminant sources are volatile materialsin _he laboratory and impurities in the inert purging gas and inthe sorbent trap. The use of non-polytetrafiuoroethylene (PTFE)p]asttc tubing, non-PTFE thread sealants, or flow controllers withrubber components in the purging device should be avoided sincesuch materials out-gas organic compoundswhich will be concentratedin the trap dur|ng the purge operation. Analyses of laboratoryreagent blanks (Sect. 9.1.3) provide Information about the presenceof contaminants. When potential interfering peaks are noted tnlaboratory reagent b]anks, the ana]yst should change the purge gassource and regenerate the molecular sieve purge gas filter (Fig.1). Subtracting blank va]ues from sample results ts not permitted.
3.2 Interfering contamination may occur when a sample containing lowconcentrations of volatile organic compoundsis analyzedimmediately after a sample containing relatively highconcentrations of volati]e organic compounds. A preventivetechnique is between-sample rinsing of the purging apparatus andsample syringeswith two portionsof reagent water. After analysisof a sample containinghigh concentrationsof volatile organic
. compounds, one or more laboratory reagent blanks should be analyzedto check for cross contamination. For samples containing largeamounts of water soluble materials, suspended solids, high boilingcompoundsor high levels of compoundsbeing determined, it may be

necessary to wash out the purging device with a soap solutionrtnse tt. wtth reagent water, and then dry it in an oven at 105°C "between analyses.
3.3 Special precautions must be taken to analyze for methylenechloride. The analytical and sample storage area should beisolated from al1 atmospheric sources of methylene chloride,otherwise random background levels will result. Since methylenechloride wt]] permeate through PTFE tubing, all gas chromatograpllycarrier gas lines and purge gas plumbing should be constructed fromstainless steel or copper, tubing. Laboratory clothing worn by theanalyst should be clean since clothing previously exposed tomethylene chloride fumes during commonliquid/liquid extractionprocedures can contribute to sample contamination,
4. SAFETYi
4.1 The toxicity or carcinogen|city of chemicals used in this methodhas not been precisely defined; each chemical should be treated asa potential health hazard, and exposure to these chemicals shouldbe minimized. Each laboratory ts responsible for maintainingawareness of OSHAregulations regarding safe handling of chemicalsused in this method. Additional references to |aboratory safetyare available (4;6) for the information of the analyst.
4.2 The following method analytes have been tentatively classified asknown or suspected humanor mammalian carcinogens: benzene, carbontetrachlortde, 1,4-dtch]orobenzene, 1,2-dtchlorethane, hexachloro-butadtene, 1,1,2,2-tetrachloroethane, l;l,2-trtchloroethane,chlorofom, 1,2-dtbromoethane, tetrachloroethene, trtchloroethene,and vinyl chloride. Pure standard materials and stock standardsolutions of these compoundsshould be handled tn a hood. ANIOSH/MESA approved toxic gas respirator should be worn when theanalyst handles high concentrations of these toxic compounds.
5. APPARATUSAND E_UIPMENT
5.1 SAMPLE CONTAINERS- 40-mL to 120-mL screw cap vials (Pierce#13075or equivalent)each equippedwith a PTFE-faced silicone septum(Pierce #12/22 or equivalent). Prior to use, wash vials and septawith detergent and rinse with tap and distilled water. Allow thevials and sepia to air dry at room temperature,place in a Io5"coven for one hour, then remove and allow to cool in an area knownto be free of organics.
5.2 PURGE AND TRAP SYSTEM - The purge and trap system consists of threeseparatepieces of equipment: purging device, trap, and desorber.
. Systems are commerciallyavailablefrom several sources that meetall of the followingspecifications.

5.2.1 The all glass purging device (Fig• 1) must be designed toaccept 5-mL samples wtth a water column at least 5 cm deep.Gaseous volumes above the sample must be kept to a minimum(< 15 mC) to eliminate dead volume effects. A glass frttshould be Installed at the base of the sample chamber sothat the purge gas passes through the water column as finelydivided bubbles wtth a diameter of < 3 mmat the origin.Needle spargers may be used, however, the purge gas must beintroduced at a point < 5 mmfrom the base of the watercolumn.
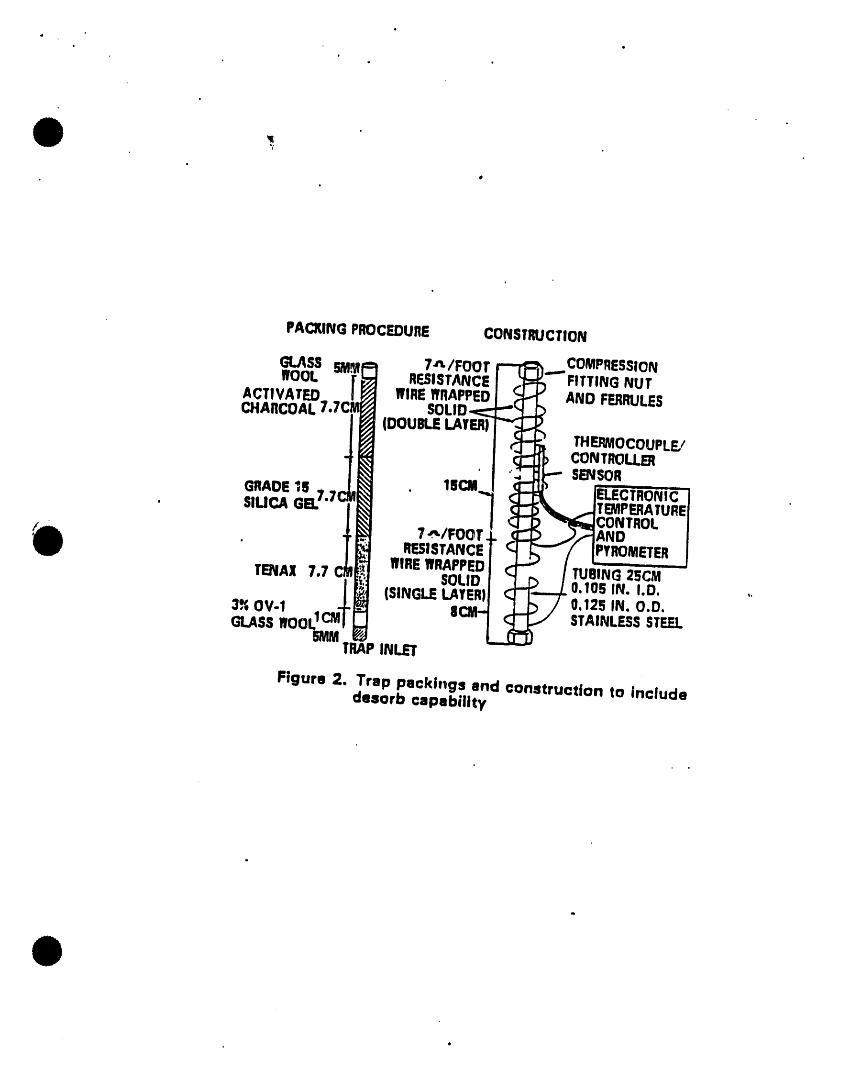
5.2.2 The trap (Fig. 2) must be at least 25 cm long and have aninside diameter of at least 0.105 tn. Starting from theinlet, the trap should contain 1.0 cm of methyl st l tconecoated packing and the following amounts of adsorbents: 1/3of 2,6-dtphenylene oxide polymer, 1/3 of silica gel, and 1/3of coconut charcoal. Before initial use, the trap should beconditioned overnight at 180"C by backflushtng wtth an inertgas flow of at least 6 ml./mtn. Vent the trap effluent to theroom, not to the analytical column. Prior to use, the trapshould be conditioned for 10 minutes at 180"C wtthbackflushtng. The trap may be vented to the analyticalcolumn during daily conditioning; however, the column mustbe run through the temperature program prior to analysis ofsamples.
5.2.3 The use of the methyl stltcone chafed packing tsrecommended, but not mandatory. The packing serves a dualpurpose of protecting the adsorbent from aerosols, and alsoof insuring that the adsorbent ts fully enclosed within theheated zone of the trap thus eliminating potential coldspots. Alternatively, stlantzed glass wool may be used as aspacer at the trap inlet.
5.2.4 The desorbermust be capable of rapidly heating the trap to180"C. The pol_Tnersectionof the trap should not be healedhigher than 200-C or the llfe expe,ctancyof the trap willdecrease. Trap failure Is characterizedby a pressuredroptn excess of 3 pounds per square tnch across the trap duringpurging or by poor bromofom sensitivities• The desorberdesign illustrated tn Ftg. 2 meets these criteria.
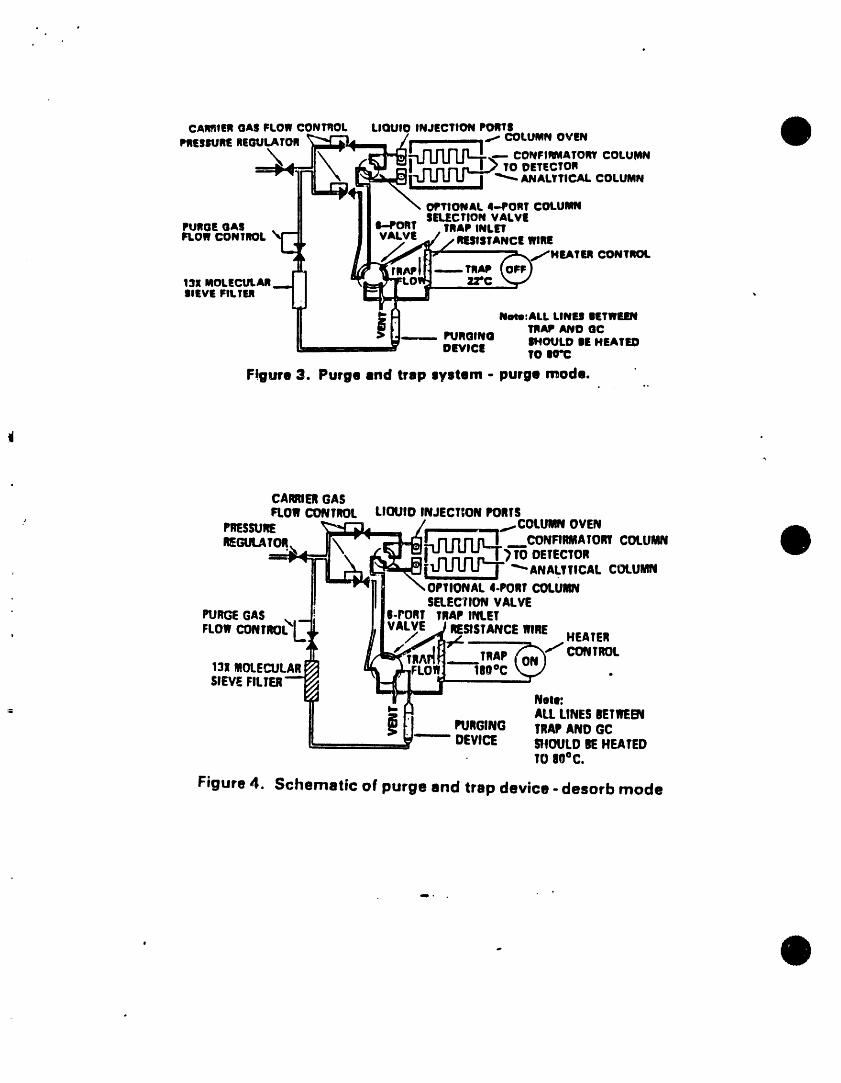
5.2.5 Figures 3 and 4 show typtcal flow patterns for thepurge-sorb and desorb modes.
5.3 GAS CHROMATOGRAPH
• 5.3.1 The GCmust be capable of temperature programming and shouldbe equipped wtth variable-constant differential flowcontrollersso that the column flow rate w111 remain
constant throughoutdesorptlon and temperatureprogram
operation, The column oven must be cooled to <10"C (Sect._ 5.3.2), therefore, a subambtent oven controller ts
required. The carrter gas flow ts augmented wtth anadditional 24 ml. of heltum flow before entering the photo-Ionization detector. Thts make-up gas ts necessary toensure opttmal response from both detectors. The photo-ionization and electroconducttvtty detector are connectedwttha short piece of uncoated capillary tubing, 0.32 -0.5mm lO.
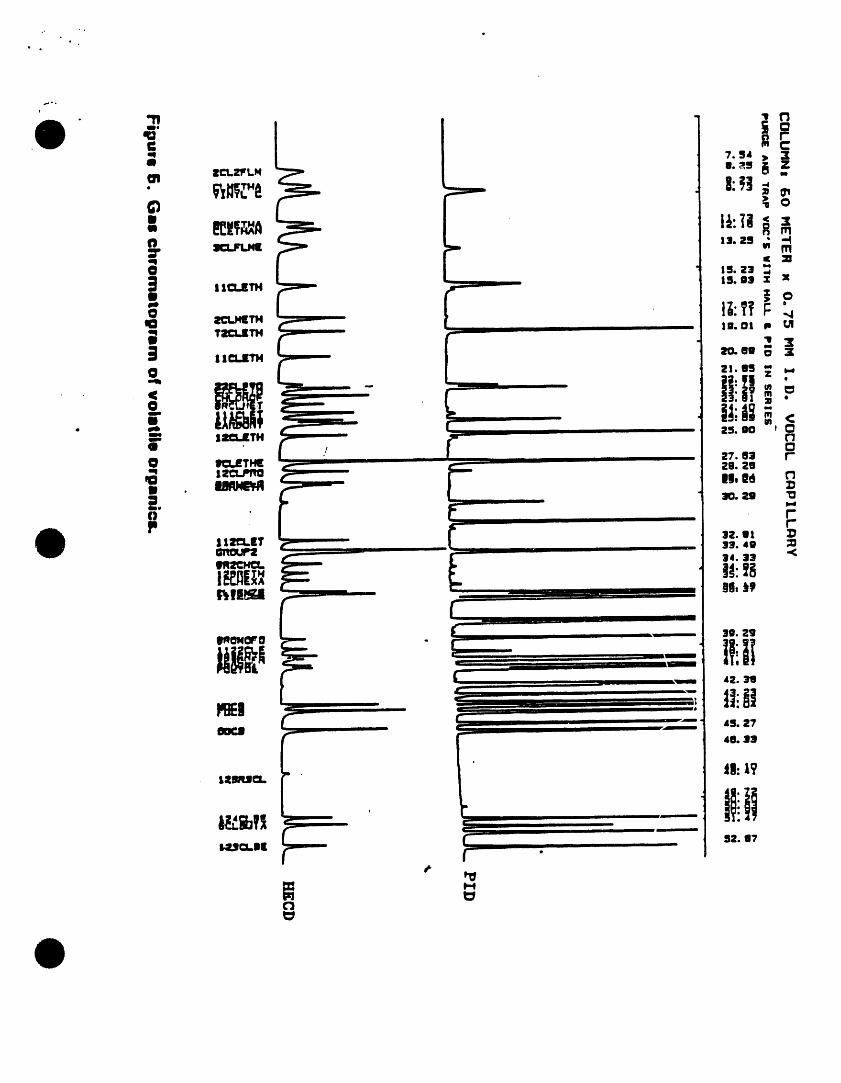
5.3.2 Gas Chromatographic Column- 60m long x 0.75mm ]D VOCOL(Supelco, Inc.) wide-bore capillary column wtth 1.5 um ftlmthickness, or equivalent. The flow rate of helium carriergas ts adjusted to about G mt.lmtn. The column temperaturets held for 8 mtnutes at 10"C, then programmed to 180"C at4"C/min, and held untt1 all expected compoundshave eluted.A sample chromatogram obtained wtth thts column ts presentedtn Fig. 5. This column was used to develop the method
•performance statements in Sect ton 12.
5.3.3 A htgh temperature phototontzation detector equipped with a10.2 eV lamp ts required (Tracor Model 703 or equivalent).
5.3.4 An electrolytic conductivity or microcoulometrtc detector tsrequired. These halogen-specific systems eliminatemisldenttftcattons due to non-organohaltdes whtch arecoextracted durtng the purge step. A Tracor Hall Model -700-A detector was used to gather the single laboratoryaccuracy and precision data. The operating conditions usedto collect these data are as follow:
Reactor tube: Nickel l/IG tn ODReactor temperature: 810"CReactor base temperature: 250"CElectrolyte: 100% n-propyl alcoholElectrolyte flow rate: 0.8 mL/mlnReaction gas: Hydrogen at 40 mL/minCarrier gas plus make-up gas: Helium at 30 ml./mln
5.4 SYRINGE AND SYRINGE VALVES
5.4.1 Two 5-ml.glass hypodermicsyringeswlth Luer-Lok tlp.
6.4.2 Three 2-_waysyringe valves with Luer ends.
5.4.3 One 25-uL micro syringewl'tha 2 in x 0.006 in ID, 22" bevelneedle (HamlIton #702N or equivalent).
5.4.4 Micro syrlnges - I0, I00 ,L.
5.4.5 Syrl,ges -0.5, 1.0, and 5-ml.,gas tight with shut-off valve.
• °j
5.5 H[SCELLANEOU5
5.5.1 Standard solution storage containers - 15-mL bottles withPTFE-I|ned screw caps.
6. REAGENTSANDCONSUHABLEHATERIALS
6.1 TRAPPACKINGHATERIALS
6.1.1 2,6-Otphenylene oxide polymer, 60/80 mesh, chromatographicgrade (Tenax GCor equivalent).
6.1.2 Hethyl silicone packing (optional) - OV-1 (3_) on Chromo-sorb W, 60/80 mesh, or equivalent.
6.1.3 St]tca gel - 35160 mesh, Davison, grade 15 or equivalent.
6.1.4 Coconut charcoal - Prepare from Barnebey Cheney, CA-580-26lot #M-264g by crushing through 26 mesh screen.
6.2 REAGENTS
6.2.1 Hethanol -Demonstrated to be free of analytes.
6.2.2 Reagent water - Prepare reagent water by passing tap ,aterthrough a filter bed containing about 0.5 kg of activatedcarbon, by using a water purification system, or by boilingdistilled water for 15 mtn followed by a 1-h purge wtthinert gas while the water temperature is held at gO-C.Store in clean, narrow-mouth bottles with PTFE-ltned septaand screw caps.
6.2.3 Hydrochloric acid (1+I) - Carefully add a measured volume ofconc. HC! to equal volume of reagent water.
6.2.4 Vtny] chloride - gg.g¢ pure vinyl chloride is available fromidea] Gas Products, inc., Edison, New Jersey and fromHatheson, East Rutherford, New Jersey. Certified mixturesof vinyl chloride in nitrogen at 1.0 and 10.0 ppm (v/v) areavailable from several sources.
6.3 STANOAROSTOCKSOLUT]ONS- These solutions may be purchased ascertified solutions or prepared from pure standard materials usingthe following procedures:
6.3.1 Place about 9.8 mt.of methanol into a lO-mL ground-glassstoppered volumetric flask. Allow the flask to stand,unstoppered, for about 10 mtn or until all alcohol-wettedsurfaces have dried and weigh to the nearest 0.1 mg.
6.3.2 If the analyte is a ]tqutd at room temperature, use a IO0-.L_" syringe and immediately add two or more drops of re_erence
standard to the flask. Be sure that the reference standardfalls directly into the alcohol without contacting the neckof the flask. If the analyte is a gas at room temperature,fill a 5-mL valved gas-tight syringe with the standard tothe 5.0-mL mark, lower the needle to 5 mm above the methanolmeniscus, and slowly inject the standard into the neck areaof the flask. The gas wtll rapidly dissolve in the methanol.
6.3.3 Rewetgh, dtlute to volume, stopper, then mix by invertingthe flask several ttm_s. Calculate the concentration inmicrograms per mtcroitter from the net gain in weight, Whencompound purity is certified at 96% or greater, the weightcan be used without correction to calculatetheconcentrationof the stock standard.
6.3.4 Store stock standard solutions in I)-ml.bottlesequippedwith PTFE-llnedscrew c_ps. Methanol solutionspreparedfrom liquid.anaiytesare stable for at least four weeks whenstored at 4 C. Methanol solutions prepared from gaseousanalytes are not stable for more than one week when storedat <O-C; at room temperature,they must be discarded afterone day.
6.4 SECONDARY DILUTIONSTANOAROS- Use standard stock solutionstoprepare secondarydilution standard solutionsthat contain theanalytes In methanol. The secondarydilution standardsshould beprepared at concentrationsthat can be easily diluted to prepareaqueous calibrationsolutions (Sect. B.1) that will bracket theworking concentrationrange. Store the secondarydilution standardsolutions with minimal headspaceand check frequentlyfor signs ofdeteriorationor evaporation,especially Just before preparingcalibrationsolutionsfrom them. Storage times describedfor stockstandard solutionsin Sect. 6.3.4 also apply to secondarydilutionstandard solutions.
6.5 INTERNAL STANDARD SPIKING SOLUTION-- Prepare a spiking solutioncontainingfluorobenzene,and 2-bromo-l-chloropropanein methanolusing the proceduresdescribed in Sect. 6.3 and 6.4. It Isrecommended that the secondarydilution standard be prepared at aconcentrationof 5 ,g/mL of each internalstandard compound. Theaddition of I0 uL of such a standard to 5.0 mL of sample orcalibration standardwould be equivalentto I0 ,g/L.
6.6 LABORATORYQUALITY CONTROL CHECK STANDARD CONCENTRATE- Usingstandard stock solutions,prepare a solution containingeach
. analyte of interestat a concentrationof I00 times the maximumcontaminant level (EL) or I pg/mL, whichever is smaller, inmethanol.

,¢reported effectiveness in the analysis of photogrs- Test Procedures given on page 33546 of the FederalFc Industry effluents. Although the direction given Register, Vol. 52, No. 171, September 3, 1987. ForVlethod 272.1 appears straightforward, caution - ,your convenience that entire footnote as given Is
s,,ould be exercised in Its use. It Is Important that the restated below:.sample is basic (pH _> 7) prior to the addition of theCNI reagent to eliminate the possible formation of smApproved methods for tt,,, ,_nalysis of silvervolatile hydrogen cyanide. Also, the CNI reagent should In Industrial wasteweter.,_ -t concentrations
of I mg/L and above are Inadequate wherebe added to the sample In an exhaust hood as aprecautionary measure. Once the sample or sample sllver exists as an Inorganic halide. Silveraliquot has been treated with the CNI reagent and halide such as the bromide and chloride arediluted per Instruction, the solution has a cyanide f relatively Insoluble In reagents such as nitric
sold but are readlly soluble In an aqueousconcentration of approximately 260 mg/L A solutlon ,; : • buffer of sodium thlosulfate and sodlumel that cyanide concentratlon must be consldered apotential hazardous waste and must be disposed of hydroxide to s pH of 12. Therefore, for levelsusing an approved safety plan In accordance with local .: , , of silver above 1 rag/L. 20 ml. of sampleauthority requirements. Until such time that a detailed . * should be diluted to 100 mL by _Jdding 40disposal plan can be fully documented and approved, mL each of 2 M I\let,,StOs and NoOH. Stand-the use of the CNI reagent should be avoided. For the erda should be prepared in the same manner.atomic absorption analysis of these samples where the ;. For levels of silver below 1 mg/L the approved"total metal" digestion Is not adequate, the use of an . method Is satisfactory.aqueous buffer of sodium thiosulfnte end sodium Comments concerning this recommendation arehydroxide should be substituted for the CNI procedure, welcome.Th_ conditions for the usa of the buffer are described (Theodore Martin, ITS: 684-7312: COMI.: 513-569-7312)in footnote 28 to Table 1B--List of Approved Inorganic ' ..
Sampling and Field Measurement Section
Intergovernmental Personnel Act (IPAJ Assignment
...,. Fred Kawalmra has completed a six-month IPA coated on glass beads. Using C-14 assay techniques,n,_signnlent with the National Bureau of Standards he explored the degree of silanlzation of glass beads(NBS), During this period Dr. Kawahara has Investi- using4-1mtno-butyldimeWI ethoxysllane. Antigens aregnted _arious techniques of coating glass beads using then ecylated on the Imlno groups for activation of thesilence to compliment the work of NBS In developing analytical method.an analytical method for aromatics with antigens (Joseph Roesler, FTS: 684-7286; COML: 513-569-7286)
iL _(Jl i_ Organic Analyses
Note on Preservation of Drinking Water Samples to be Analyzed for Volatile Organic Chemicals(VOCs) and 1445 Monitoring Compounds
Recipients and users of the September l g86 7.1 S_lmpleCollection"Methods lor the Determlnation of Organic Compounds 7.11.1 If the sample is expected to contain freein Finished Drinking Water and Raw Source Water'" or combined chlorine, add escorbic acid_hould note that a modification to the preservation (8) or sodium thlosulfate to the sample totechnique is being made. Continuing use and evalua- arrest formation of trihalomethanes orlion o! the methods has shown that chlorinated waters other chlorinated artifacts. Ascorbic acidmust be dechlorinated prior to acidification In order (25 mg/4OmL) or sodium thlosulfate (3to prevent the chlorination of certain method analytes/ mg/40 mL] sllould be added to the emptyaromatic compounds that may be present. The sample bottle prior to stripping to thedP,ctdorinelion stop must be added to Methods 502.1, sampling site.503.1, 524.1, arid 524.2. The methods now being Recent date on preservation ol volatiles has shown
for printing have been edited to read as follows: that thlosulfete cannot be used as e free-chlorine
4
7. SAMPLECOLLECTION1 PRESEEVATION1 ANDSTORAGE
7.1 SAMPLECOLLECTION
7.1.1 Collect al1 sampies in duplicate. Fill sample bottles tooverflowing. No air bubbles should pass through the sampleas the bottle is filled, or be trapped in the sample whenthe bottle is sealed.
7.1.2 When sampling from a water tap, open the tap and allow thesystem to flush until the water temperature has stabilized(usually about ]O mtn)_. Adjust the flow to about 5OOmLImtnand collect duplicate samples from the flowing stream.
7.1.3 When sampling from an Open body of water, fill a l-quartwide-mouth bottle or 1-liter beaker with sample from arepresentative area, and carefully fill duplicate samplebottles from the container.
7.2 SAMPLEPRESERVATION
7.2.1 Adjust the pH of the duplicate samples to <2 by carefullyadding one drop of 1:1 HCI for each 20 mLof samplevolume.(7) Seal the sample bottles, PFTE-face down, andshake vigorously for one minute.
7.2.2 The s_mples must be chilled to 4"C on the day of collection.- and maintained at that temperature until analysis. Field
samples that will not be received at the laboratory on theday of collection must be packaged for shipment withsufficient Ice to ensure that they will be at 4"C on arrivalat the laboratory.
7.3 SAMPLESTORAGE
7.3.1 Store samples at 4"C until analysis. The sample storagearea must be free of organic solvent vapors.
7.3.2 Analyze a]] samples w_thtn 14 days of col]ectton. Samplesnot analyzed within this period must be discarded andreplaced.
8. CALIBRATIONAND STANDARDIZATION
8.1 PREPARATIONOF CALIBRATIONSTANDARDS
8.1.1 A set of at least lftve calibration standards contatnt,g themethod analytes is needed. One calibration standard shoulrJcontain each analyte at a concentration approaching butgreater than the method detection limit (Table 1) for thatcompound; the other calibration standards should containanalytes at concentrations that define the range of themethod or the detect ton _ysteem.
8,1.2 To prepare a calibration standard, add an appropriate volumeof a secondary dilution standard solution to an aliquot ofreagentwater In a volumetricflask. Use a mlcrosyringeandrapidly inject the alcoholicstandard into the expanded areaof the filled volumetricflask. Remove the needle asquicklyas possible after injection. Mix by invertingtheflask three times only. Discard the contentscontained inthe neck of the flask. Aqueous standardsare not stable andshould be discarded after one hour unless sealed and storedas described in Sect. 7.2.
8.2 CALIBRATION
8.2.1 Analyze each calibration standard according to Sect. 10,adding IO ,L of internalstandard spiking solution directlyto the syringe. Tabulate area response versus theconcentrationfor each analyte and internalstandard.Calculateresponse factors (RF) for each analyteusingEquation I:
RF . (As)(Cls) Equation Ii
eAts) (Cs)
where:
As m Area for the analyte to be measured;AIs . Area for the internal standard;Cls - Concentrationof the internal standard,in ,glL.Cs . Concentration of the analyte to be measured, in
• ,glL.
The choice of which internal standard to use for an analyteis left to the analyst.
8.2.2 Prepare a calibrationcurve for each analyte.Alternatively, tf the RF for an analyte ts constant (lessthan 15%RSD) over the working range, the average RF can beused for that anaiyte.
8.2.3 The working calibration curve or average response factormust be verified on each working day by the measurementofone or more callbratlonstandards. If the area for anyanalyte varies from the response determined for thatstandardconcentrationfrom the calibrationcurve or averageRF establishedin Sect. 8.2.2 by more than *20%, repeatsteps 8.2.1 and 8.2.2.
8.2.4 Callbrationfor vinyl chlorlde using a certified gaseousmixture of vinyl chloride in nitrogen can be accomplishedbythe following steps. The procedure requires use of amodified purge vessel having a septum seal port in theexpanded part of the device.
8.2.4.1Ftll the purging device with 5.0mL of reagent waterr- or aqueous calibration standard, and add internal
standards.
8.Z.4.2 Start to purge the aqueous mixture, inject a knownvolume (between 100 and 2000 ,L) of the calibrationgas (at room temperature) directly into the purgingdevice with a gas tight syringe. Slowly inject thegaseous sample through a septum seal at the top ofthe purging device at 2000 uLImtn. Do not injectthe standard through the aqueous sample Inletneedle, inject the gaseous standard before five minof the 11-mtn purge time have elapsed.
8.2.4.3 Determine the aqueous equivalent concentration ofvinyl chloride standard injected in ,g/L, accordingto Equation 2:
S . 0.510 (C)(V) Equation 2
where S - Aqueous equivalent concentrationof vinyl chloride standard in ug/L;
C - Concentration of gaseous standard in ppm(v/v);
V . Volume of standard injected in milli-liters.
9. qUALITY CONTROL
9.1 Each laboratory that uses this method is required to operate aformal quality control program. The minimumrequirements of thisprogram consist of an initial demonstration of laboratory cap-ability and an ongoing analysis of spiked samples to evaluate anddocument data quality. The laboratory must maintain records todocument the quality of data that ts generated. Ongoing dataquality checks are compared with established performance criteriato determine if the results of analyses meet the performancecharacteristics of the method. A quality control check standardmust be analyzed to confirm that the measurements were performed inan in-control mode of operation.
9.1.1 The analyst must make an initial, one-time, demonstration ofthe ability to generate acceptable accuracy and precisionwith this method. This ability Is established as describedin Section 9.2.
9.1.2 In recognition of advances that are occurring in chromato-graphy, the analyst is permitted certain options (detailedin Section 10.1.1) to improve the separations or lower thecost of measurements. Each time such a modification is madeto the method, the analyst is required to repeat theprocedure in Section 9.2.
.Q
o •
9.1.3 Each day, the analyst must analyze a reagent water blank todemonstrate that interferences from the analytical systemare under control.
9.1.4 The laboratory must, on an ongoing basis, demonstratethrough the analyses of quality control check standards thatthe operation of the measurement system ts tn control. Thisprocedure ts described tn Section 9.3. The frequency of thecheck standard analyses ts equivalent to 10% of all samplesanalyzed but at least two samples per month.
9.1.5 On a weekly basis, the laboratory must demonstrate theabtltty to analyze low level samples. A procedure for lowlevel check samples ts described in Section 9.4.
9.1.6 The laboratory must matntatn performance records to documentthe quality of data that ts generated. Thts procedure tsdescribed tn Section 9.5.
9.2 To establish the ability to generate acceptable accuracy andprecision, the analyst must perform the follow|ng operations.
9.2.1 A qualtty control (QC) check sample concentrate ts requiredcontaining each regulated analyte, and any additionalanalyte which Is to be reported, at a concentration of 100times the MCLor [ uglmL, whichever ts smalier,.tnmethanol. The QC check sample must be prepared by the •laboratory using stock standards prepared independently fromthose used for calibration.
9.2.2 Analyze seven 5-ml. QC check samples at 115 HCLor 2 ug/L: according to the method beginning tn Sect. 10. Each sample
Is produced by Injecting 10 uL of qC check sample. concentrate into 5 mL of reagent water in a glass syringe
through the syringe valve.
9.2.3 Calculate the average recovery (_) in ug/L, and the standarddeviation of the recovery (s) tn ug/L for each analyte usingthe seven results, Calculate the MDL for each analyte asspecified in Ref. 2. The calculated MDLmust be less thanthe spike level.
9.2.4 For each analyte, (_) must be between 80% and 120% of thetrue value. Additionally,s must be < 30% of _. If s andfor all analytesmeet the criteria, tee system performanceIs acceptable and analysisof actual samplescan begin. Ifany s exceeds the precision IImit or any _ falls outside therange for accuracy, the system performanceIs unacceptablefor that analyte.
NOTE: The large number of analytes present a substantial"- probability that one or more will fall at least one of the
acceptance criteria when all analytes are determined.
9.2.5 Whenone or more of the analytes tested fail at least one ofthe acceptance criteria, the analyst must repeat the testaccording to Section 9.2.2 only for the analytes whichfailed the test.
9.3 The laboratory must demonstrate on a regular basis, as outlined inSect. 9.1.4, that the measurement system ts in control by analyzinga quality control sample for all analytes of Interest at the HCLor10 ,g/L, whichever is smaller.
9.3.1 Prepare a QC check standard by adding 50 ,L of QC checksample concentrate to 5 mL of regent water in a glasss_'tnge. •
9.3.2 Analyze the QCcheck according to Section 10, and calculatethe recovery for each analyte. The recovery must be between60% and 140% of the expected value.
9.3.3 If the recovery for any analyte falls outside the designatedrange, the analyte has failed the acceptance criteria. Acheck standard containing each failed analyte must bere-analyzed. "
,, 9.4 On a weekly basis, the laboratory must demonstrate the ability toanalyze low level samples.
9.4.1 Prepare a low level check sample by adding 10 uL of QC checksample concentrate to 5 mL of reagent water in a 5 mLsyringe. Analyze according to the method in Sect. 10.
9.4.2 For each analyte, the recovery must be between 60_ and 140%of the expected value.
9.4.3 Whenone or more analytes fat] the test, the analyst mustrepeat the test only for those analytes which failed to meetthe criteria. Repeated failure, however_ will confine ageneral problem with the measurement system. If thisoccurs, locate and correct the source of the problem andrepeat the test for all compoundsof interest beginning with9.4.1.
9.5 It is recomnended that the laboratory adopt additional qualityassurance practices for use with this method. The specificpractices that are most productive depend upon the needs of thelaboratory and the nature of the samples. Field duplicates may beanalyzed to assess the precision of the environmental measurements.Whenever possible, the laboratory should analyze standard referencematerials and participate tn relevant performance evaluationstudies.
.°
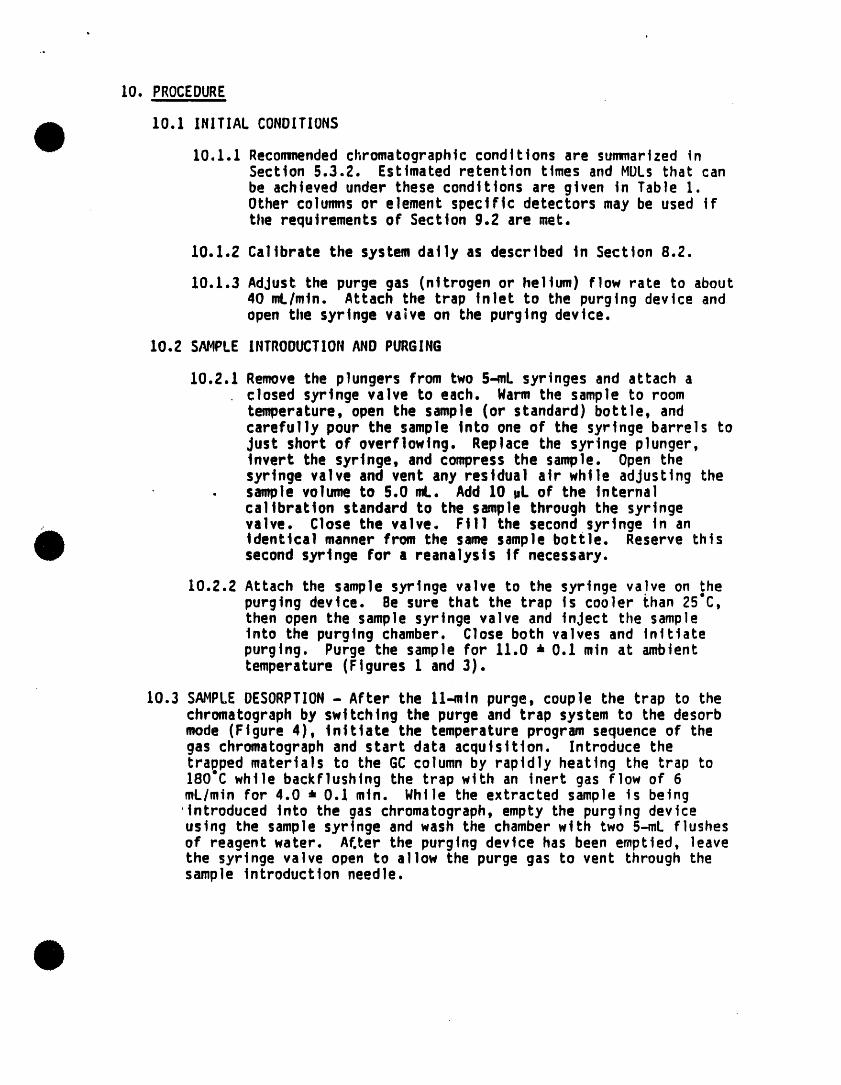
10. PROCEDURE
10.1 INITIAL CONDITIONS
10.1.1 Recommendedchromatographic conditions are summarized inSection 5.3.2, Estimated retention times and HULs that canbe achieved under these conditions are given tn Table 1.Other columns or element specific detectors may be used ifthe requirements of Section 9.2 are met.
10.1.2 Calibrate the system daily as described in Section 8.2.
10.1.3 AdJust the purge gas (nitrogen or helium) flow rate to about40 mL/mtn. Attach the trap Inlet to the purging device andopen the syringe valve on the purging device.
10.2 S/_J4PLEINTROOUCTIONAND PURGING
10.2.1 Removethe plungers from two 5-mL syrtnges and attach aclosed syringe valve to each. Warm the sample to roomtemperature, open the sample (or standard) bottle, andcarefully pour the sample Into one of the syringe barrels toJust short of overflowing. Replace the syringe plunger,invert the syringe, and compress the sample. Open thesyringe valve and vent any residual air while adJusting the
• sample volume to 5.0 ml.. Add 10 ,L of the Internalcalibration standard to the sample through the syringevalve. Close the valve, Fill the second syringe tn anIdentical manner from the same sample bottle. Reserve thissecond syringe for a reanalysis if necessary.
10.2.2 Attach the sample syringe valve to the syringe valve on thepurging device. Be sure that the trap ts cooler than 25"C,then open the sample syringe valve and inject the sampleinto the purging chamber. Close both valves and initiatepurging. Purge the sample for 11.0 * 0.1 rain at ambienttemperature (Figures 1 and 3).
10.3 SAHPLEOESORPTION- After the 11-rain purge, couple the trap to thechromatograph by switching the purge and trap system to the desorbmode (Figure 4), initiate the temperature program sequence of thegas chromatograph and start data acquisition. Introduce thetrapped materials to the GCcolumn by rapidly healing the trap to180"C while backflushing the trap with an inert gas flow of 6mL/min for 4.0 * 0.1 mtn, While the extracted sample is beingintroduced into the gas chromatograph, empty the purging deviceusing the sample syringe and wash the chamber with two 5-mL flushesof reagent water. Af.ter the purging device has been emptied, leavethe syringe valve open to allow the purge gas to vent through thesample introduction needle.
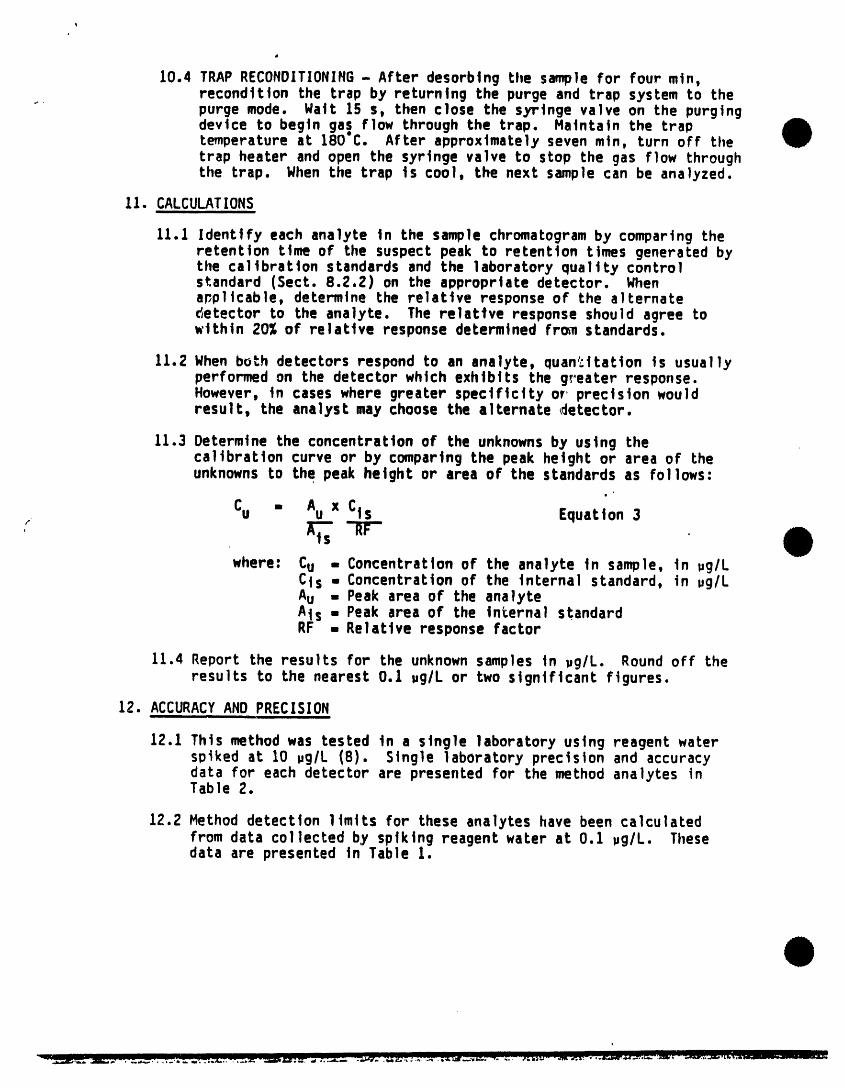
10.4 TRAPRECONDITIONING- After desorbtng the sample for four min,recondition the trap by returning the purge and trap system to thepurge mode. Wait 15 s, then close the syringe valve on the purgingdevice to begin gas flow through the trap. Maintatn the traptemperature at 180"C. After approximately seven mln, turn off thetrap heater and open the syringe valve to slop the gas flow throughthe trap. Whenthe trap is cool, the next sample can be analyzed.
11. CALCULATIONSi i
11.1 Identifyeach analyte in the sample chromatogramby comparingtheretentiontime of the suspectpeak to retentiontimes generatedbythe calibration standards and the laboratory quality controlstandard (Sect. 8.2.2) on the appropriate detector. Whenal_plicable, determine the relative response of the alternatet_etector to the analyte. The relattve response shou]d agree towithin 20% of relative response determined fr_ standards.
11.2 When both detectors respond to an analyte, quan_citatton is usuallyperformed on the detector which exhtbtts the greater response.However, in cases where greater specificity or' precision wouldresult, the analyst may choose the alternate _detector.
11.3 Determine the concentration of the unknownsby using thecalibration curve or by comparing the peak height or area of theunknowns to the peak height or area of the standards as follows:
Cu - Au x Cts Equation 3: tATs"liP-
where: Cu . Concentration of the analyte in sample, in uglLCts - Concentration of the internal standard, in ug/LAu -Peak area of the analyteAts . Peak area of the internal standardRF - Relative response factor
11.4 Report the results for the unknownsamples in ug/L. Round off theresults to the nearest 0.1 ug/L or two significant figures.
12. ACCURACYANDPRECISION
12.1 This method was tested in a single laboratory using reagent waterspiked at 10 .glL (B). Single laboratory precision and accuracydata for each detector are presented for the method analytes tnTable 2.
12.2 Method detection ]|miLs for these analytes have been calculatedfrom data collected by spiking reagent water at 0.1 ug/L. Thesedata are presented tn Table I.
!
13. REFERENCES
1. "The Determination of Halogenated Chemicals in Water by the Purge andTrap Method, Method 502.1," Environmental Protection Agency,Environmental Monitoring and Support Laboratory, Cincinnati, Ohio45Z68, April, 1981.
2. "Volatile Aromatic and Unsaturated Organic Compoundsin Water by Purgeand Trap Gas Chromatography, Method 503.1," Environmental ProtectionAgency, Environmental Monitoring and Support Laboratory, Cincinnati,Ohio, April, 1981.
3. Glaser, J.A., O.L. Foerst, G.D. McKee, S.A. Quave, and W.L. Budde," Environ° Sct Technol., 15, 1426, 1981"Trace Analyses for Wastewaters, . __. .
4, "Carcinogens-Working with Carctnogens," Department of Health, Education,and Welfare, Public Health Service, Center for Disease Control, NationalInstitute for Occupational Safety and Health, Publication No. 77-206,August, 1977.
5. "OSilA Safety and Health Standards, General Industry," (29CFRIglO),Occupational Safety and Health Administration, OSHA2206, (Revised,January, 1976).
6. "Safety in Academic Chemistry Laboratories," American Chemical SocietyPublication,. Committee on Chemical Safety, 3rd Edition, 1979.
7. Bellar, T.A. and J.J. Ltchtenberg, "The Oetermtnatton of SyntheticOrganic Compoundsin Water by Purge and Sequential Trapping CapillaryColumn Gas Chromatography," U.S. Environmental Protection Agency,Environmental Monitoring and Support Laboratory, Cincinnati, Ohio, 45268.
8. Ho. J.S. Method Performance Data for Method 502.2, Unpublished Report,September, 1986.
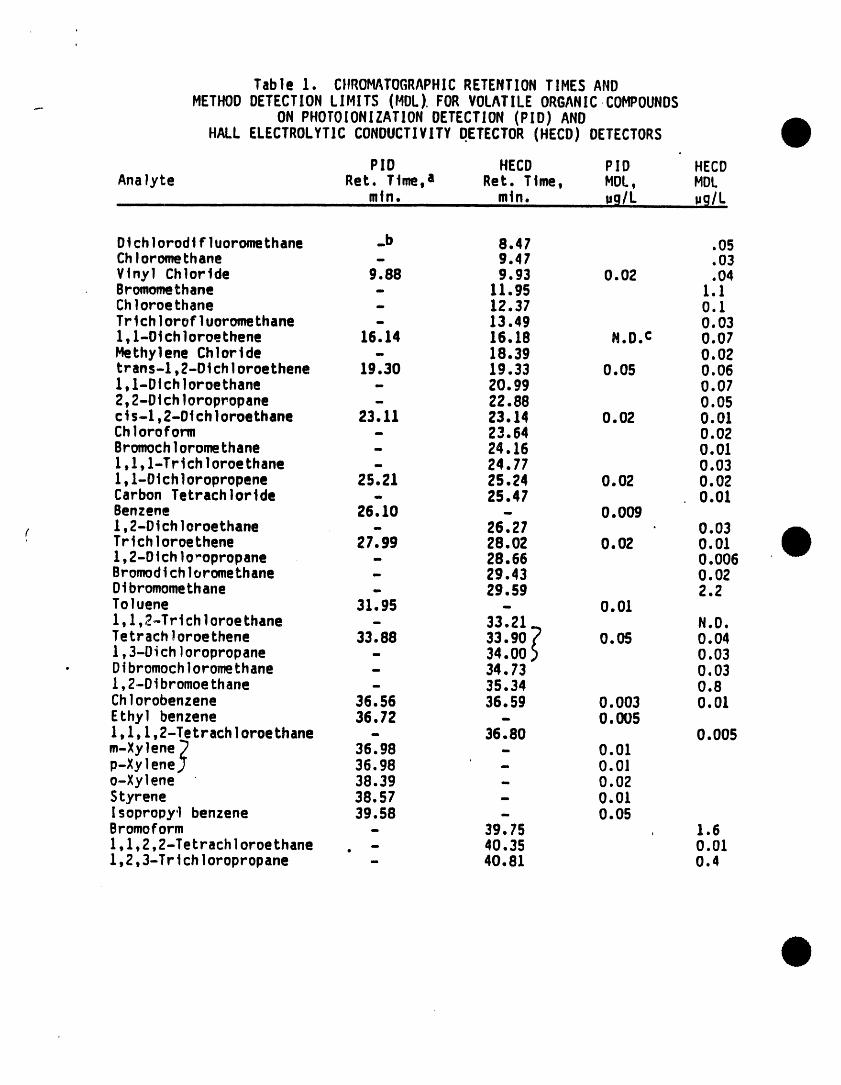
Table 1. CIIROHATOGRAPHICRETENTIONTIHES ANDHETHODDETECTIONLIHITS (HDL) FORVOLATILEORGANICCOHPOUNDS
ON PHOTOIONIZATIONDETECTION(PID) ANDHALL ELECTROLYTICCONDUCTIVITYDETECTOR(HECD) DETECTORS
PID HECD PID HECDAnalyte Ret. Time, a Ret. Time, HDL, HDL
mtn. mtn. ug/L ug/L
Dtchlorodt F]uoromethane _b 8.47 .05ChIoromethane - 9.4 7 .03Vinyl Chloride 9.88 9.93 0.02 .04Bromomethane - 11.95 1.1Chloroe thane - 12.37 O.1Tr tch1orof l uoromethane - 13.49 O.031, l-Otch]oroethene 16.14 16.18 N.O.C 0.07Hethylene Chloride - 18.39 0.02t r ans-1,2-D tchIoroe thene 19.30 19,33 0.05 0.061,1-DI chloroethane - 20.99 0.072,2-Dtch loropropane - 22.88 0.05ct s-1,2-Dt ch l oroethane 23.11 23.14 O.02 O.OlChloroform - 23.64 0.02Bromoch]oromethane - 24.16 0.011,1, l-Tri ch1oroe thane - 24.77 0.031, I-Dt chloropropene 25.21 25.24 O.02 O.02Carbon Tetrach Ioride - 25.47 0.01Benzene 26.10 - 0.009
r 1,2-Dt chI oroethane - 26.27 0.03Tr tchl oroe thene 27.99 28.02 O.02 O.01I, 2-D tch1o_opropane - 28.66 O.006Bromodt ch1oromethane - 29.43 O.02Dtbromomethane - 29.59 2.2To1uene 31,95 - 0.011,1,2-Trt ch1oroe thane - 33.21 N.D.Tetr ach !oroe thene 33.88 33.90 _ O.05 O.041,3-Di chIoropropane - 34.00 _ 0.03
• Dibromochloromethane - 34.73 0.031,2-Dt bromoethane - 35.34 0.8Ch!orobenzene 36.56 36.59 O.003 O.01Ethyl benzene 36.72 - O.0051,1,1,2-Tetrach ]oroethane - 36.80 0.005m-Xylene _ 36.98 - 0.01p-Xy]enej 36.98 - 0.0]o-Xylene 38.39 - 0.02Styrene 38.57 - O.OlI sopropy'| benzene 39.58 - 0.05Bromoform - 39.75 1.61,1,2,2-Tetrach ]oroethane . - 40.35 0.011,2,3-Trtch loropropane - 40.81 0.4
' i
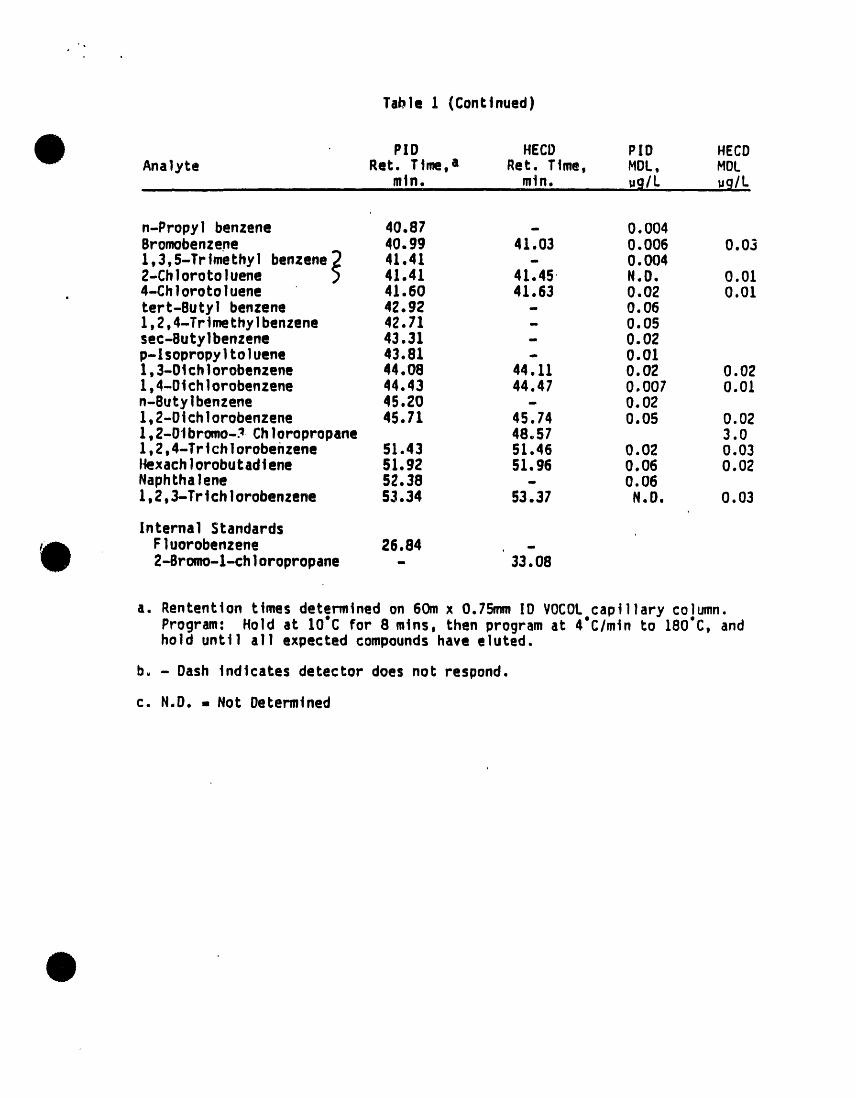
Tabl e I (Conttnued)
PID HECD P[D HECDAnalyte Ret. Time, a Ret. Time, blOL, blOC
etn. ....... mtn. ug/L ug/L
n-Propyl benzene 40°87 - 0.004Bromobenzene 40.99 41.03 0.006 0.031,3,5-Trlmethyl benzene_ 41.41 - 0.0042-Chlorotoluene _ 41.41 41.45 N.O. 0.014-Chlorotoluene 41.60 41.63 0.02 0.01tert-Butyl benzene 42.92 - 0.061,2,4-Trimethylbenzene 42.71 - 0.05sec-Sutylbenzene 43.31 - 0.02p-lsopropyltoluene 43.81 - 0.011,3-Olchlorobenzene 44.08 44.11 0.02 0.021,4-O|¢hlorobenzene 44.43 44.47 0.007 0.01n-Butylbenzene 45.20 - 0.021,2-Dtchlorobenzene 45.71 45.74 0.05 0.021,2-0tbromo-_ Chloropropane 48.57 3.01,2,4-Trtchlorobehzene 51.43 51.46 0.02 0.03t_xachlorobutadtene 51.92 51.96 0.06 0.02Naphthalene 52.38 - 0.061,2,3-Trtchlorobenzene 53.34 53.37 N.D. 0.03
[nterna] StandardsFluorobenzene 26.84 -2-Sromo-l-chloropropane - 33.08
a. Rententton times determined on 60m x 0.75mm ID VOCOLcapillary column.Program: Hold at 10"C for 8 mtns, then program at 4"C/mtn to 180"C, andhold unt] 1 al I expected compoundshave eluted.
b. - Dash indicates detector does not respond.
c. N.D. , Not Determined
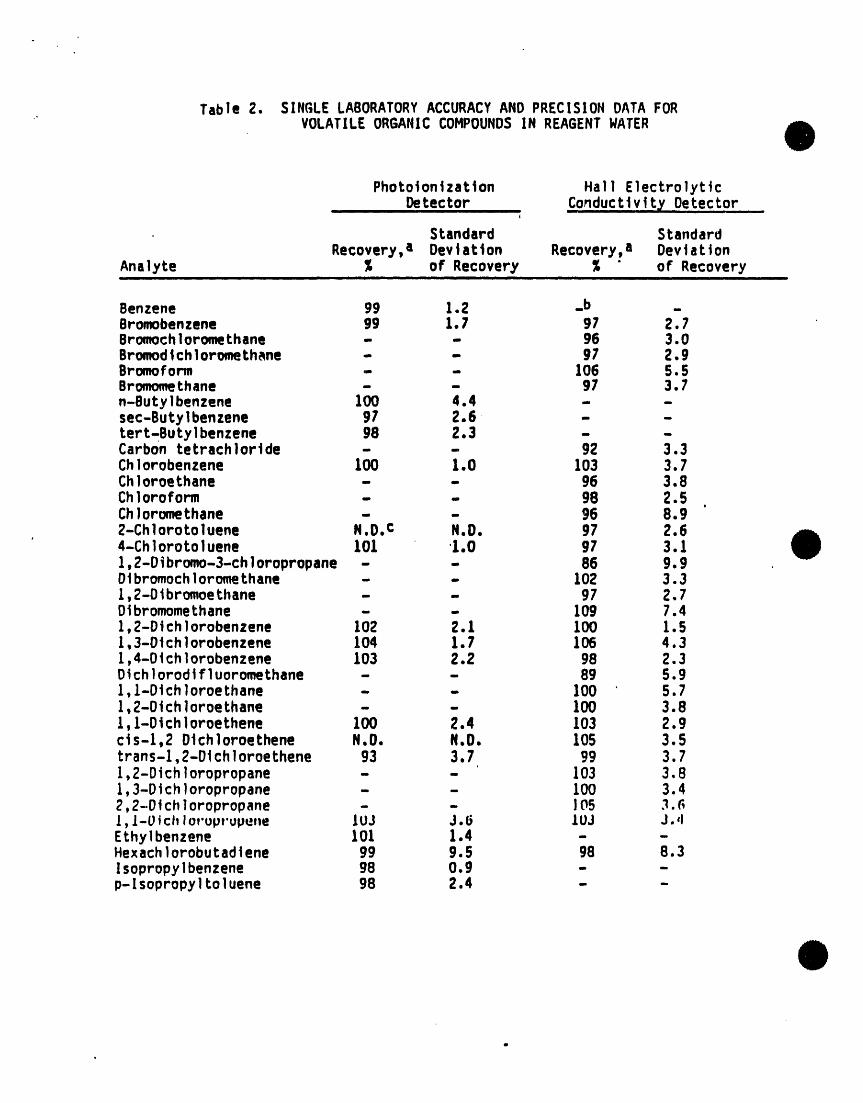
Table 2. SINGLE LABORATORYACCURACYANDPRECISIONDATAFORVOLATILEORGANICCOMPOUNDSIN REAGENTWATER
Photoionizat]on Hal] ElectrolyticDetector Conductlv!ty Detectori, i i ul ii i i am _ l| i |
I
Standard StandardRecovery,a Devtatton Recovery,a Deviation
Analyte % of Recovery % " of Recovery_ i i i i i i ii i i ii i i mlll ii
Benzene 99 1.2 _b _Bromobenzene g9 l.l g7 2.7Bromochloromethane - - 96 3.0BromodtchloromeLh_ne - - 97 2.9Bromoform - - 106 5.SBromomethane - - 97 3.7n-Butylbenzene 100 4.4 - -sec-ButyIbenzene 97 2.6 - -tert-Butylbenzene 98 2.3 - -Carbon tetrachlortde - - 92 3.3Chlorobenzene 100 1.0 103 3.7Chloroethane - - 96 3.8Ch]oroform - - g8 2.5
o
Chloromethane - - 96 8.9Z-Chlorotoluene N.D. c N.D. 97 2.6o
4-Chlorotoluene 101 1.0 g7 3.11,2-Dibromo-3-chloropropane - - 86 9.9Dibromochloromethane - - 102 3.31,2-Dlbromoethane - - 97 2.7Dibromomethane - - log 7.41,2-DtchIorobenzene 102 2.1 100 1.51,3-Dtchlorobenzene 104 1.7 106 4.31,4-D4chlorobenzene 103 2.2 98 2.3Dtchlorodtfluoromethane - - 89 5.9l,l-Dichloroethane - - 100 5.71,Z-OtchloroeLhane - - 100 3.8l,l-Otchioroethene 100 2.4 103 2.9cts-l,2 Dtchioroethene N.O. N.D. 105 3.5trans-l,Z-Dlchloroethene 93 3.7 99 3.71,2-Dichloropropane - - 103 3.81,3-Dichloropropane - - 100 3.42,2-Dichloropropane - - 105 3._I,/-Ptchloruprupene JUJ J.6 LOJ J.,lEthylbenzene 101 1.4 - -Hexachlorobutad_ene 99 9.5 98 8.3Isopropylbenzene 98 O.g - -p-Isopropyltoluene 98 2.4 - -
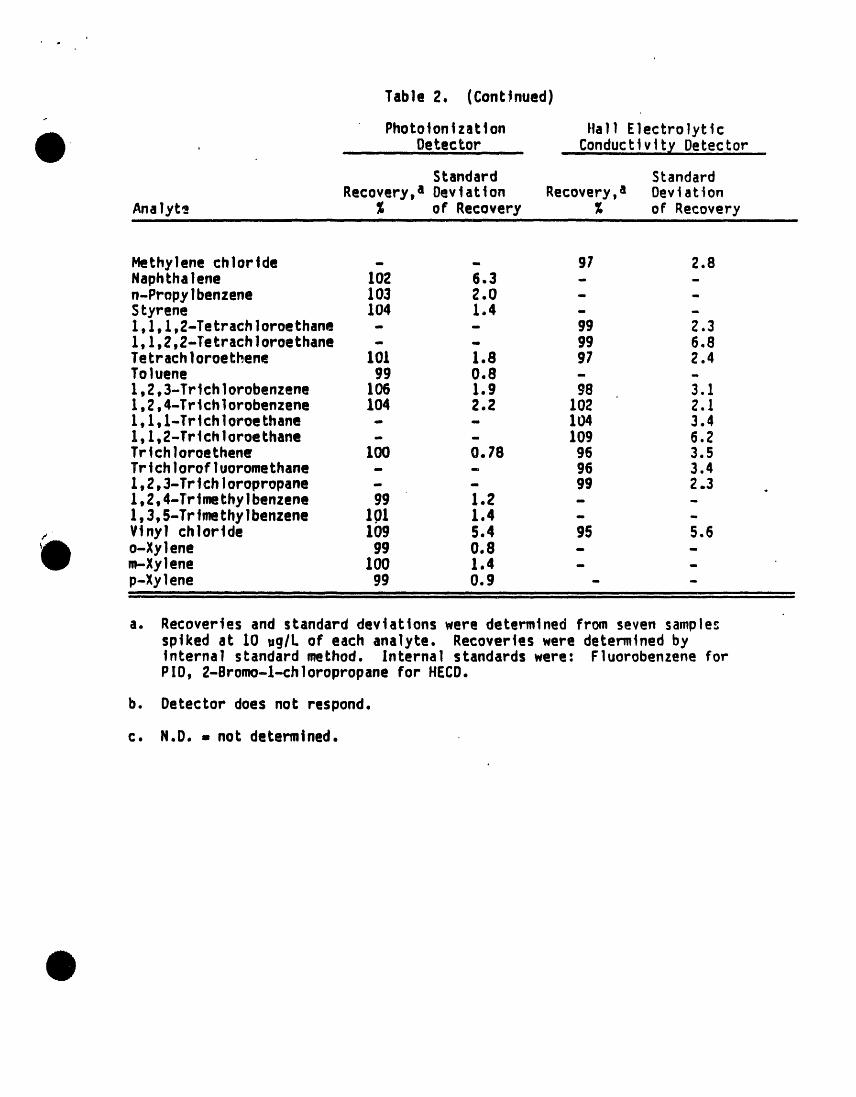
Table 2. (Continued)
Phototontzatton Hall Electrolytic, . Detector Conductlv!....t¥Detector
Standard StandardRecovery,a Deviation Recovery,a Deviation
Analyte % of Recovery % of RecoveryIII ill I I II II I i im
Methylenechloride - - 91 2.8Naphthalene 102 6.3 - -n-Propylbenzene 103 2.0 - -Styrene !04 Io4 - -1,1,1,2-Tetrach loroethane - - 99 2.31,I,2,2-Tetrachloroethane - - 99 6.8Tetrach 1oroe thene 101 1.8 97 2.4Toluene 99 0.8 - -1,2,3-Trtchlorobenzene 106 1.9 g8 3.11,2,4-Trichlorobenzene 104 2.2 102 2.1l,l,1-Trtchloroethane - - 104 3.41,1,2-Trtchloroethane - - 109 6.2Trichloroethene 100 0.78 96 3.5Trichlorofluoromethane - - 96 3.41,2,3-Tr]chloropropane - - gg 2.3 .1,2,4-Trtmethylbenzene 99 1.2 - -1,3,5-Trtmethylbenzene 101 1.4 - -Vinyl chlortde 109 S.4 95 5.6o-Xylene 99 0,8 - -m-Xylene 100 1.4 - -p-Xylene 99 0.9 - -
I I II i I I I IIII III I I IIIIII I I ii Wli ii ii i i i i iI Hill , i l I .... i u.
a. Recover]es and standard dev]ations were determ|ned from seven sample_sptked at 10 ,g/L of each analyte. Recoveries were determined byInternal standard method. Internal standards were: Fluorobenzene forPID, 2-Bromo-l-chloropropane for HECD.
b. Detector does not respond.
c. N.D. = not determined.
• .°-.
,P
4 •
PACXlNGPROCEDURE CONSTRUCTION
_, COMPRESSION
GLASS mMF 7_/FOOT _"-FITTING NUTwool "t_ _eslsT^.ceACTIVATED I_ WIREWRAPPED _" ANO FERRULESCHARCOAL7.7CM_ SOLID_ _
t.t (DOUBLELATER) _ THERMOCOUPLE/
CONTROLLER., --" SENSORGRADElS . • IELECTRO_IIC ISIUCA GEL7./ ISCM_. q_l[_ _..ITEMPERATORSl
_Lt"-,,,JCONTROLI. 7 .,._/FOOT .,),,_AND I
..ISTA.Cf / ITENAX 7.7 CM_i! ,IRE WRAPPED I TUBING'25CM
__ SOI'ID _ ' 0"10SIN" I'D. ,.
(SINGLELAYER) "0.128 IN. O.O.3_ OV-I I 8=- STAINLESSSTEELGLASSWookC_l_,
TRAPINLET
Figure 2. Trap packings and construction to includedesorb capability
i
CAImlER (]AS FLOW CONTROL LIQUIO INJECTION PORT|
_ES_Re ,eou_mn ,._r"_.. /. ,._ COLUMNOVeN\ Ii\ ,-..I-,_" r'! i"1r1 I'__.._=..,,.-CONFImATOIW COLUMN
_..-,l_..Jl\ _'_ NI %_,.,%u_._ ToOETtCVO,
l! | I \ O_"nONAL4-.PONTCOLUMN, _ : sm._=cTmHVALVE
eunoe (]As . II I I s...r__T TRAP_,L_r
13xMOLECtn.JUI...,.JI --_-_Lo zz-c
IIEVE FILT. U J_i,_im_II .;A N_,:ALLUNUtETWmII _ 51 ........ TPAP AND OCII ) -----.-- I_ROINO IHOULD tE HEATED
DEVICE TO IIO'C
Figure 3. Purge and trap system - purge mode.,.
CAREER GAS_Lo.CO.T.OLL,O.,o,.J_c.o..om
•_ P._ssu_ icoLu_ovmIEGUU TOR | I CONFIRMA TORt' COLUMNF_ o.ecTo.
_'_ r _ANALTTICAL COLUMN
_"l ,.,o,cotU_i s_Ec_,o_VALVEPunmOAS . /e.ronT TeAe_ETFLOW CONTROL"_ |VALVE _ RESISTANCE WIRE HEAT"R
SIEVF.
Note:_" ALL LINES IIETWIEB_I
PURGING TRAP AND GC
--'--- DEVICE SItOULDBEHEATEDTO 80Oc.
Figure 4. Schematic of purge and trap device- desorb mode
..
• b
" ' Draft Method 505- For Use in we023 Only
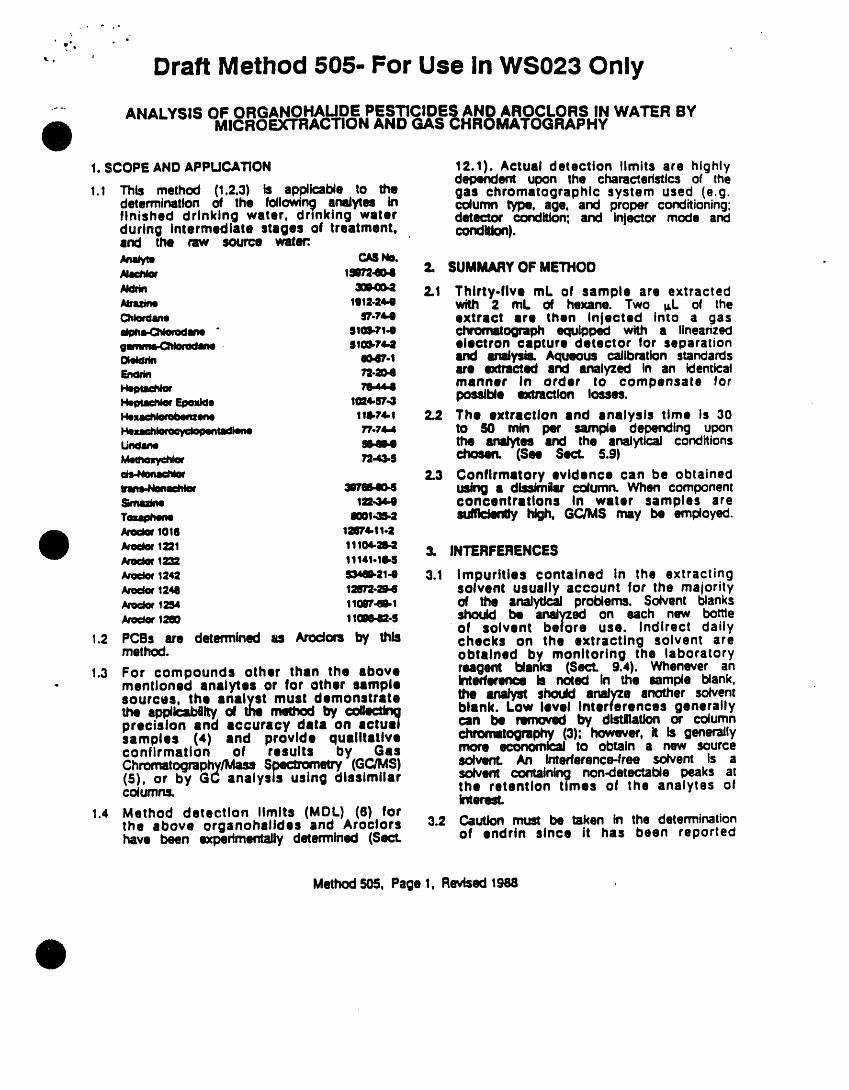
.... ANALYSIS OF ORGANOHALJDE PESTICIDES ANO AROCLORS IN WATER BYMICROEXTRACTION AND GAS CHROMATOGRAPHY
loSCOPEANDAPPLICAT1ON 12.1). Actual detection limits are highlydependent upon the charactedstlcs of the
1.1 This method (1.2.3) Is applicable to the gas chromatographic system used (e.g.determination of the followi.r_ arxdytes in column type. age. and proper conditioning:finished drinking water, drmking water detector condition; and Injector mode andduring Intermediate stages of treatment, condition).and trte raw source water:.
CASNo./,_w mort-e04 2. SUMMARY OF METHOD "
/_htn 3m.0o4 2.1 Thirty.five mL of sample are extractedARzine 101:!.24-0 with 2 mL of hexane. Two _L of theCh_e s'z.za.o extract are then Injected into a gas81_=,CNomdaM SIOS.7'I-O clvornatogmph equipped with a Ilnearizedgm_mtv(:hlomm,_ StO0.T*-,1 electron capture detector for separation00eic_n eo.4w-i and anaJ_ Aqueous caJibrutlon standards
72.a_1 are extracted and analyzed In an identicalm.,uve manner In order to compensate for
v_=tm,_xS_,d_o t0=4-Sx-,1 possible extraction losses.Hex=_xoeemone i'ual,,7'_v 2.2 The extraction and analysis time Is 30He,._hlm_eyQ*_m_le.e n'.T4.4 to 50 rain per sample depending uDon
_.,_.s chosen. (See Sect. 6.9)en.Nmm=_r 2.3 Confirmatory evidence can be obtainednns.Nsnemw 3mllS40-S tndng a dissimilar column. When component
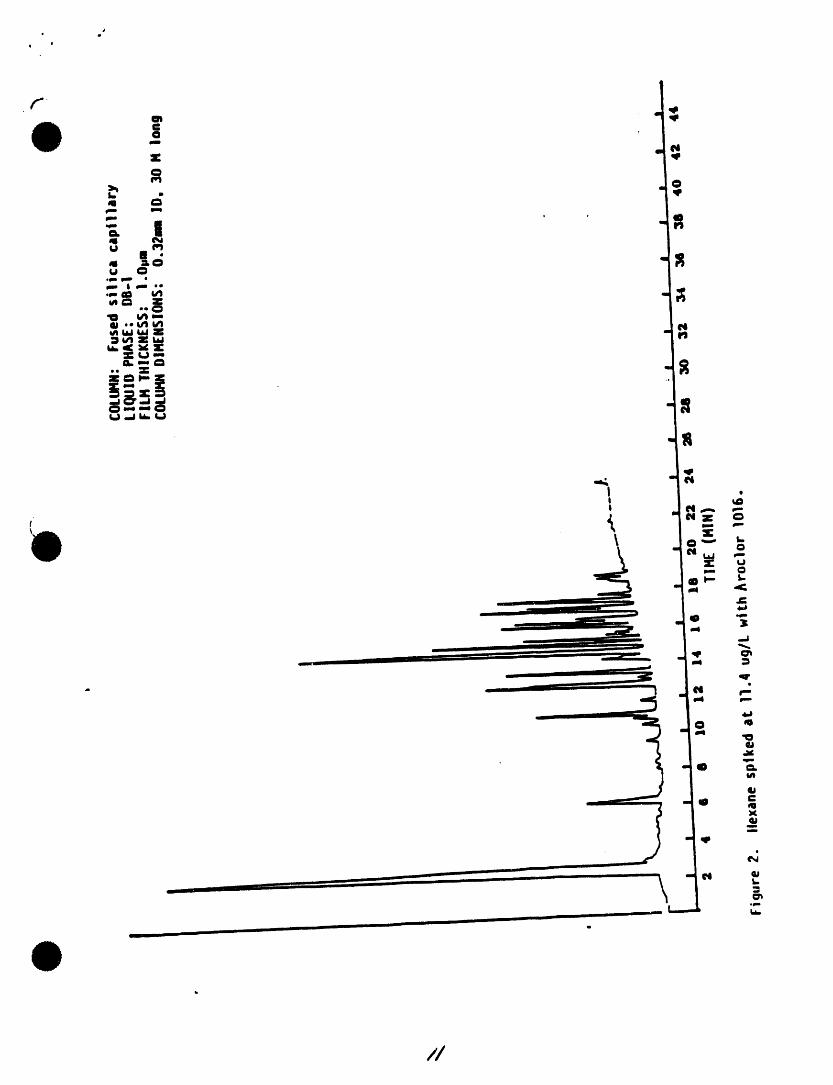
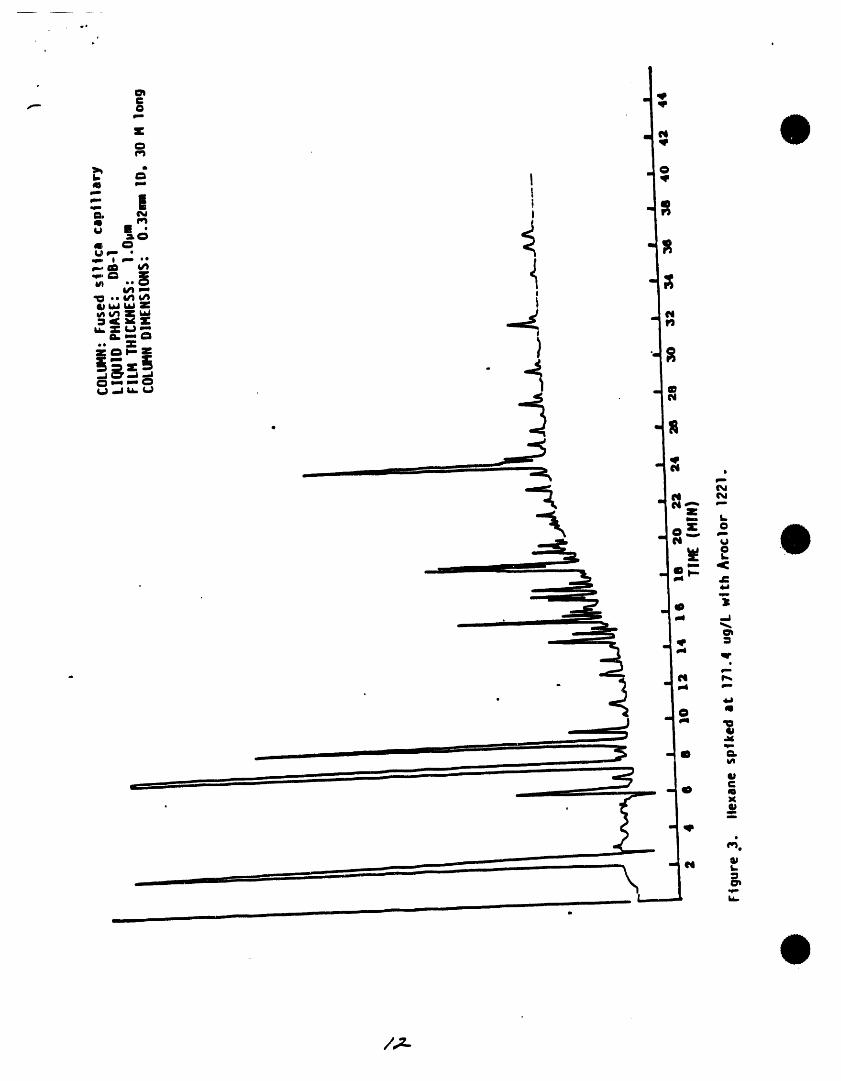
in-_Ik_4 concentrations In water samples areTo,,_=_,,= mo1.,_.= sufficW_y high, GC/MS ,nay be employed.kocw lOtS i;mlr4.li.;l
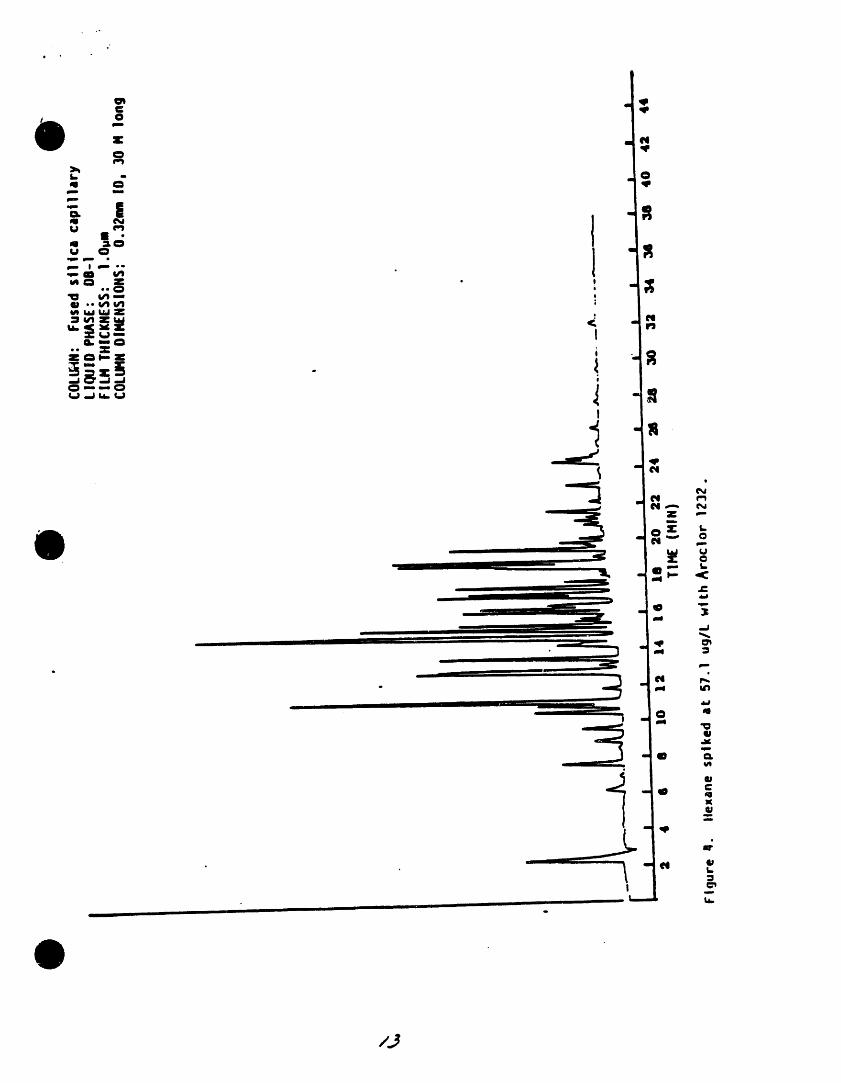
) k=cw I221 lilo,m._ 2. INTERFERENCESAmcW 1232 11141.16-5
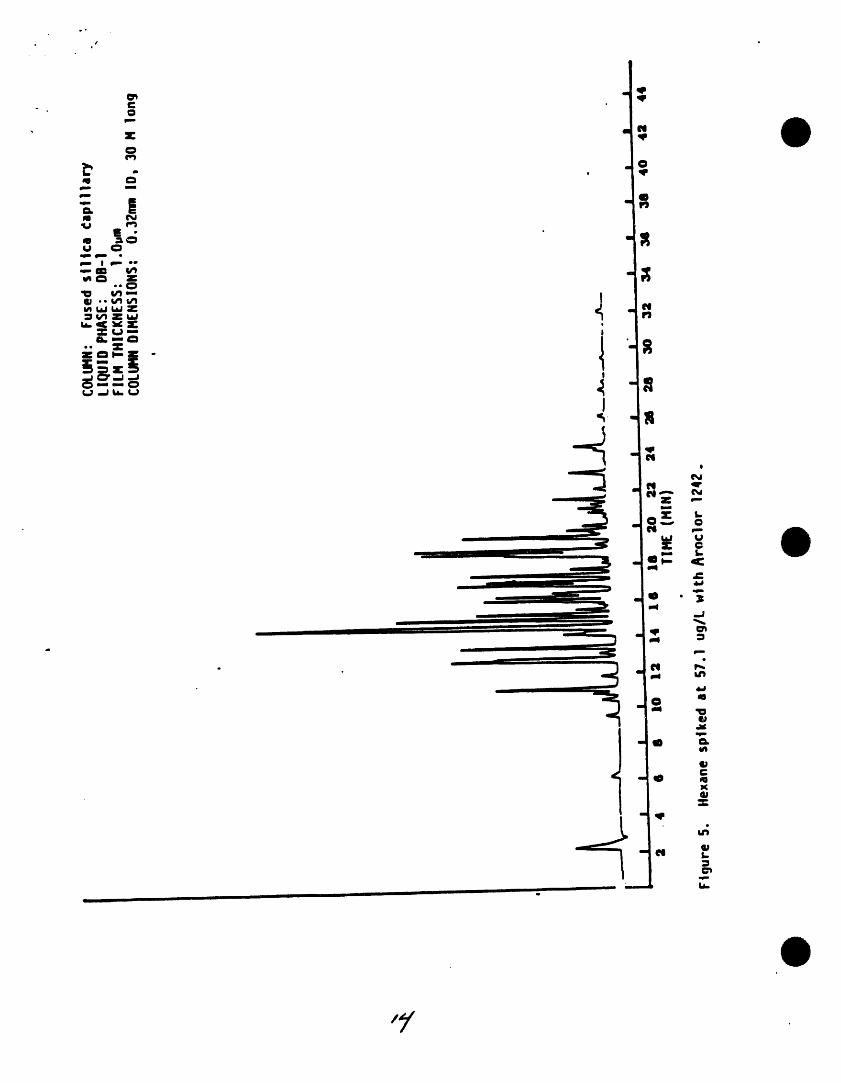
/vock_r1242 $34aB.21-0 3.1 Impurities contained In the extractingkscl=rl2,_ i_-;m-e solvent usually account for the ma)ority,Am¢i_i2S4 ilk-aS-! of the anaJytJcaJproblems. Solvent blanks
k_x_ori2eo l iaN_2.s should be -anal_od on each new botlleof solvent bei )re use. Indirect daily1.2 PCSs are determined as Arodom by this checks on the extracting solvent are
method, obtained by monitoring the laboratory1.3 For compounds other than the above reagent blanks (Sect. 9.4). Whenever an
- mentioned analytes or for other sample Interference Is r_ed In the sample I_ank.sources, the analyst must demonstrate the tea/yet should arudy'ze another solventthe al_k:abSlty a_ the _ by ¢otlectlr_ blank. Low level Interferences generallyprecision and accuracy data on actual can be removed by distllatlon or columnsamples (4) and provide qualitative chrametogrnphy (3); however, it Is generallyconfirmation of results by Gas more economical to obtain a new sourceChromatography/Masa Spectrometer (GC,_,tS) solvent. An interference4rH solvent is a(5). or by GC analysis using dissimilar sc_vent containlncj non.detectable peaks atthe retention times of the analytes ofc__ M.o_
1.4 Method detection limits (MDL) (6) forthe above organohalldas and Aroclors 3.2 Caution must be taken in the determinationhave been expedmentaJLy determined (Sect. of endrin since it has been reported
Method 606, Page 1, Revised 1988

' DRAFTDOCUMENT. INTERNALUSEONLY. 4/1S/Ca
that the splitless Injector may cause _ 1.8 mL, Vadsn #96.0(_og_00 orendrin degradation (7). The analyst should equMdem or any oL_r autosampier vialsbe alerted to this possible Interference no( requiring more than t.8 I_- sarape
- resulting in an ewatJc ms_ for endrtn volumes
3.3 Variable amounts of pesticidesand Archers 5.3 AUTO SAMPLER . Hevdett.Packard 7671A.from aqueous solutions adhere to ghsss or equivalent.surfaces. It is recommended that sampletransfers and glass surface contacts be 5.4 MICRO SYRINGES . 10 and 100 _L.mtnimLzed. 5.5 MICRO SYRINGE - 25 p.L with a 2.inch
3.4 Ndrtn and rnetho_or are rapidly oxk:llzed by 0,006-Inch needle - Hamilton 702Nby chlorine. Dechlorlnatlon with sodium or equNaJenLthiosulfate at time of coflectJonwill retard 5.6 PIPETTES . 2.0 and 5.0 mL transfer.further oxidation of them; compounds
5.7 VOLUMETRIC FLASKS . 10 and 100 mLmm stopm,.
4. SAFETY 5.8 STANDARD SOLUTICN STORAGE4.1 The toxicity and carcl_clty of chMfdclds CONTNNERS. 15-mL bottleswith PTFEJIned
used In this method have not been screw caps.
precisely defined; each chemlca0 should 5.9 GAS CHROMATOGRAPH- Amdytlcldsystembe u'eated u a p_mllJ J_im hGam, complem wRh GC suitable for use withand ex_ to these chemicals should capillarycolumnsand ,I reaulred acce.odesbe mlnlmC_ed.Each laboratoryis _lble Including ,.n,,h,syringes, k:alcolumns,gases.for maintaining awareness of OSHA detector and side" recorder A dataregulations regarding safe handling of system Is recommended for measuringchemicaJs used In this _. Additional peek Brims. Table 1 lists retention times
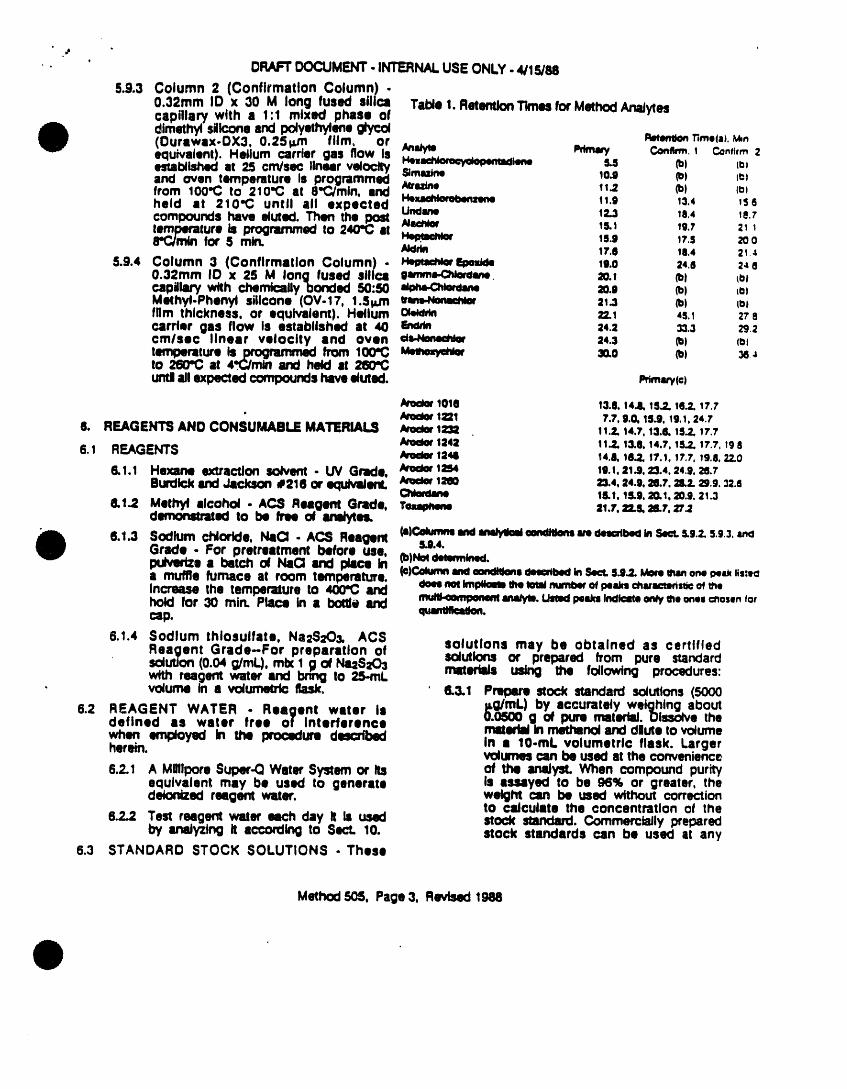
refemrces to laboraton/ ufeiP/ IMlilabte a_ analytes using theanalytical conditions descnl_ed4.2 The following organohalldes have been below.
tentativelyc_ssJflad as known or suspected 5.9.1 Thnm gaschromatographicco4urnnsarehuman or rnamrnaJlancarck_gens: elddn, recommended. Column 1 (SecL 5.9.2) _.Aroclors, chlordane, dieldrin, hept|chlor, shouldbe used as the pdmaryanal_caihexachlorobenzene, and toxaphene. Pure column unless routinely occurring ".
• standard materials and stock standard analyles ere not adequately resolvedsolutions of these ¢ompota_s should be VaJldatlondata presentedin this methodhandled in a hood or glovebox. A w_reobminedusingthtscoiumn.CoiumnsNIOSI-I/ MESA approved toxic gas r_or 2 and 3 am recommendedfor use asshould be worn when the iuWyst _ndles confirmatory columns when GC/MShigh concentrations of these toxic confirmationis not avaRable.Nternetivecompounds, columns may be used in accordance
with the provisionsdescribed in SecL5. APPARATUSAND EQUIPMENT g.3.
5.1 SAMPLE CONTAINERS - 40-mL screw 5.9.2. Column1 p_ Column) - 0.32 ramID x 30 M long fused silica capillary. cap vials (Pierce _13075 or equivalent)
_,_ _:l_---" L--'---", _ "fa'"-_ng2t_l_ w_ with ch,micaily bonded m.thylpolysloxanephase (DB-1, 1.0 film,or equivalent). Helium carder _ flow
a p_yethylene fll_ mdnaJon (Fisher is establishedat 25 ca/sac Ilnur velocity#02-883-3F or equivalent). Prior to use, end oven temperature is programmed
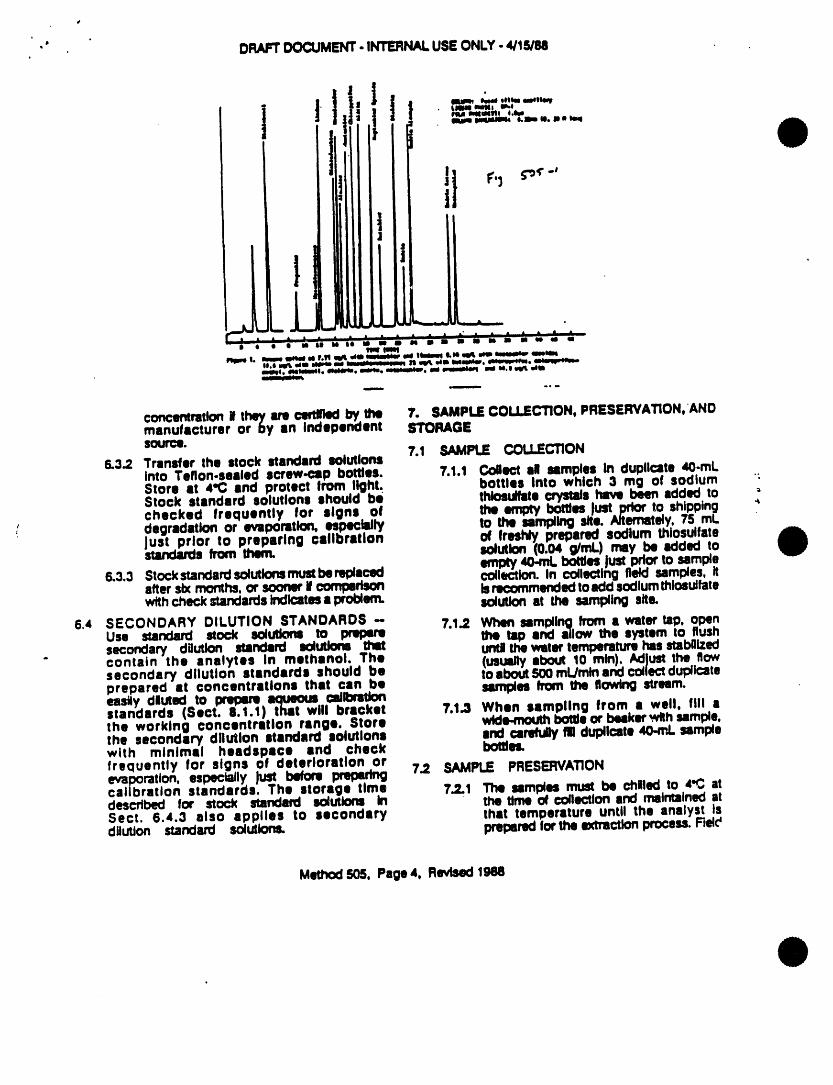
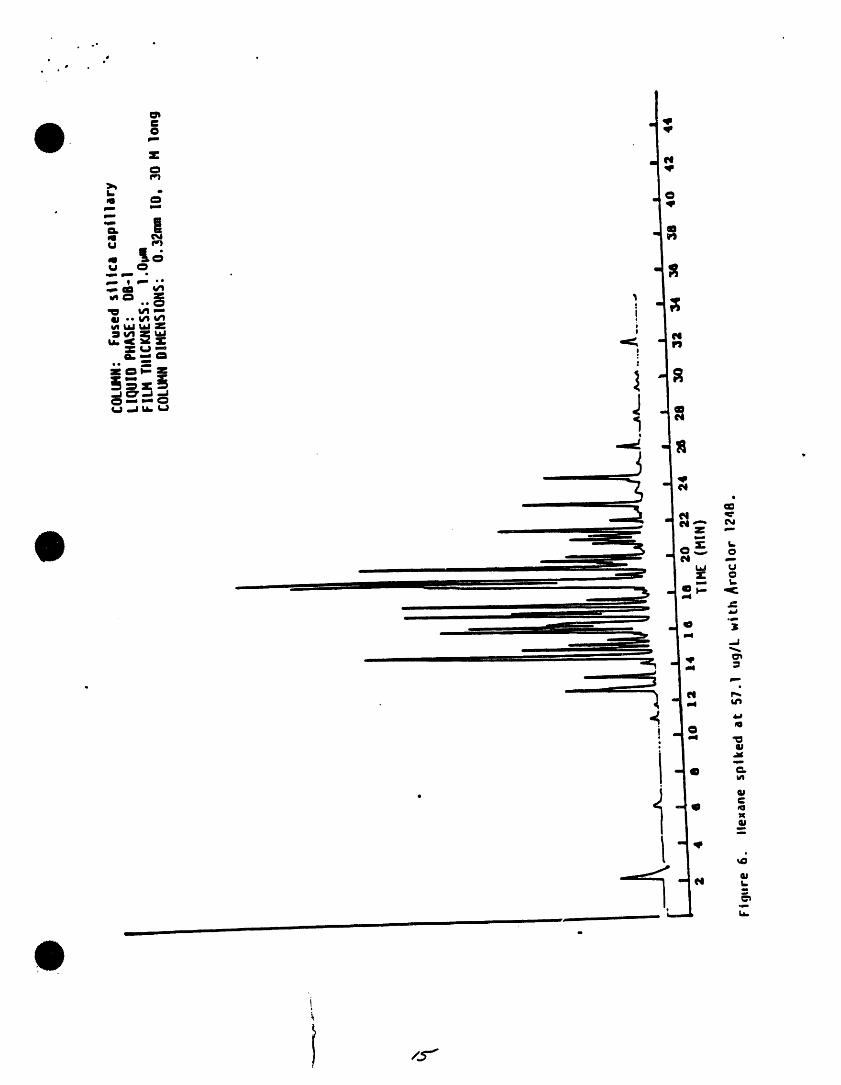
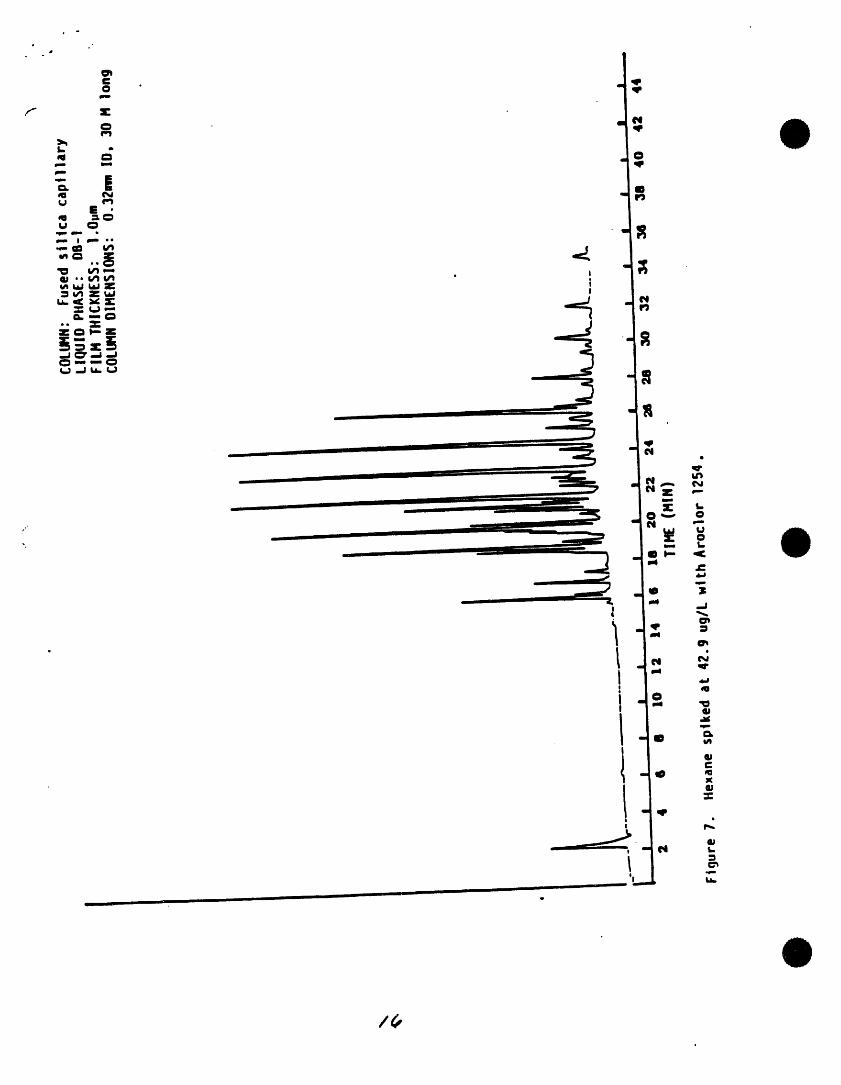
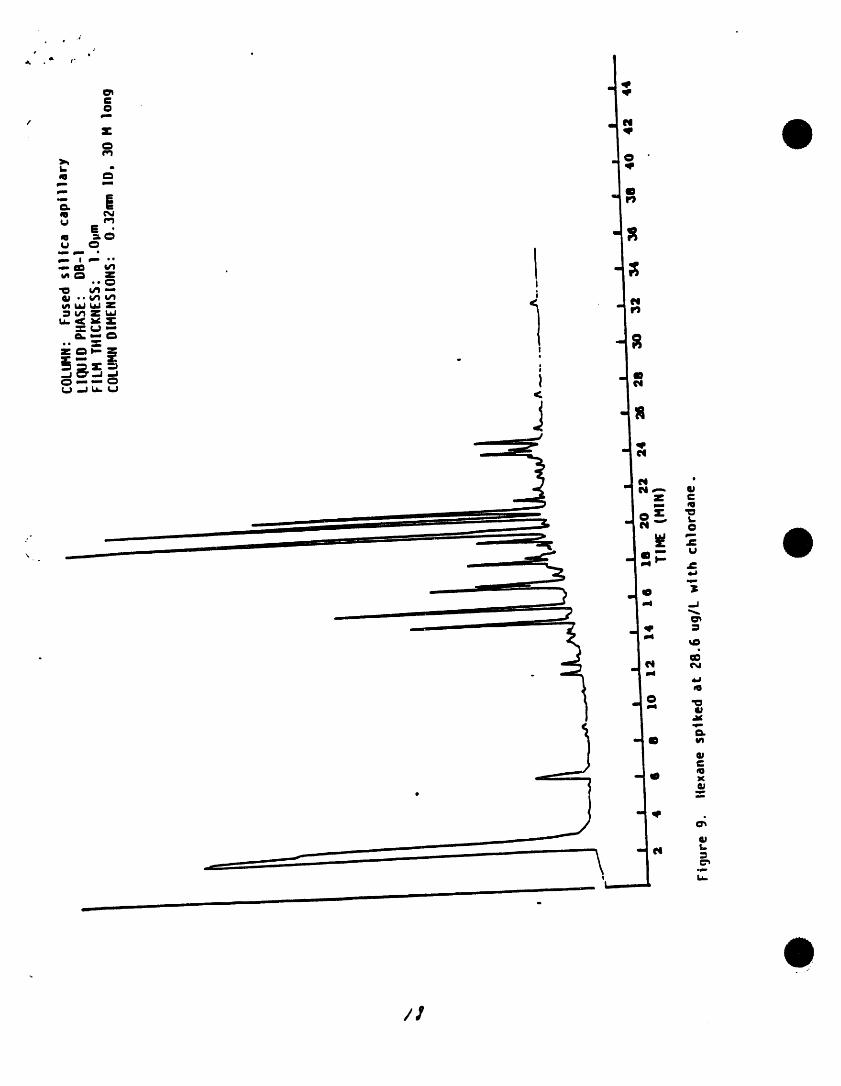
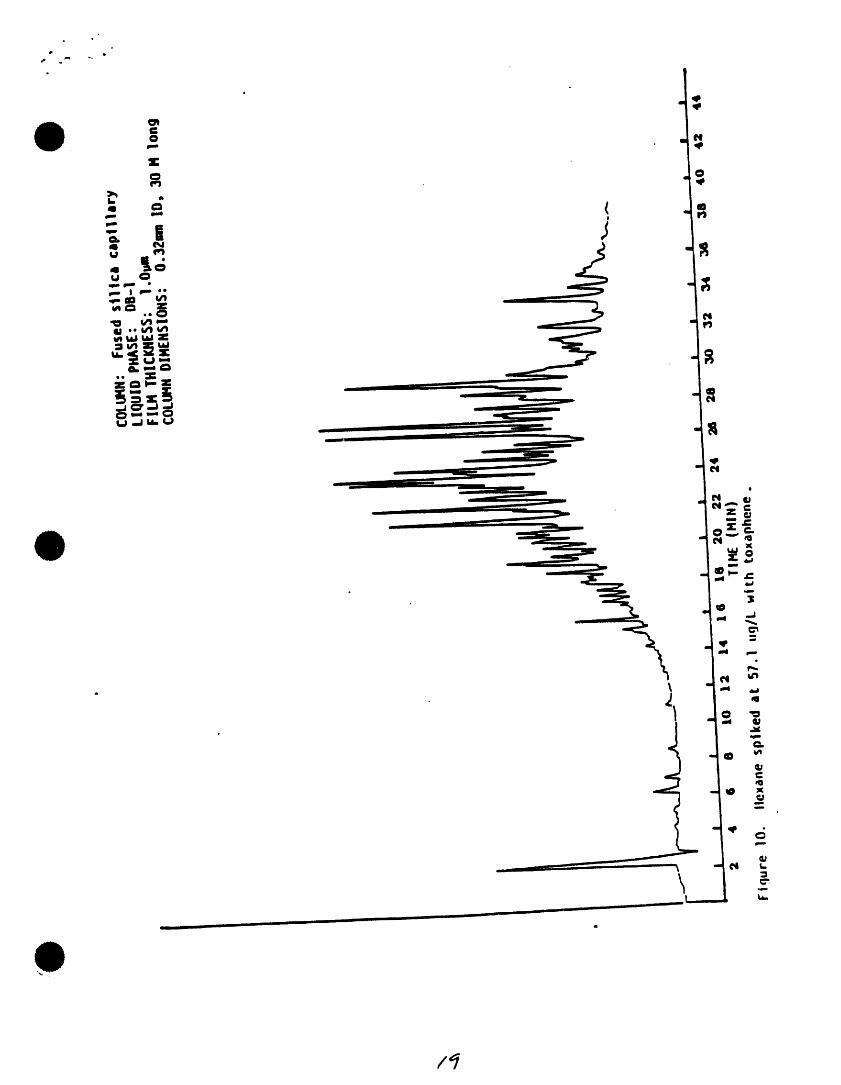
rinse water. Nlow held at 260"C until ell uxpectedthe v_s and sel:Xa to air dry at room compounds have eluted. A sampletemperature place t_ v_e in • 400"Coven for one hour, then remove and cl_omatogramfor selected pesticidesispresented In Figure 505-I.tdlaw to cool in an ame known to be Chromatograms of the Aroclors,free of organics. ' toxaphene,and technicalchlordaneare
5.2 VIALS - auto sampler, screw cap with presented In Figures 505-2 through505-I0.
Method505, Page2, Revised1988
Method505, Page3, Revised1988
DRAFTDOCUMENT- INTERNALUSE ONLY - ,I/lS/U
tj llI ----Plt J guuq01Qgnlnu 0._Ilam emcm_men e.llnm mom • Omq
F_ ;J_
i '_lo _ gDOtanl N IP.M mlR _m m aml I_ ql.m imR _ omwm_og _oam
IO.I _ _o _ m mlmIimuimlmpm n _ _m _. emqAw,m, nlmW_eem•_at. etetemil• 4eMei, u. me meelmidepo me lemMeq Big U.0 _ elm
concentrationI they am cmlffiedby the 7. SAMPLE COLLECTION,PRESERVATION,ANDmanufacturer or by an Independent STORAGEsource.
6.3.2 Transfer the stock standard sol,lens 7.1 SAMPLE COLLECTIONInto Teflon-sealed screw-cap bottles. 1'.I.1 Collect aN samples In duplicate 40.mLStore at 4"C and protect from light, bottles Into which 3 mg of sodiumStock standard solutions should be thiosulfatocrystalshave been added to ;checked frequently for signs of the empty bottlesjust prior to shipping
to the samplings#e. Ntemate(y. 75 mL,: degradation or evaporation, especiallyJust prior to preparing calibration of freshly prepared sodium thlosuIfatestandams from them. zofutlm (0.04 g/n'd.) may be Klded to
40q11LbottlesJUStpdo¢tO sample6.3.3 StockstandardsolutionsmusZbeMac_ collieries. In collectingfield samples, it
aftersix months,or soonerIfcompertson IsrecommendedtoaddsodiumthiosulfatewithcheckstandardsIndk::atesa prot_em, solutionat the sampling site.
6.4 SECONDARY DILUTION STANDARDS - 7.1.2 When sampling l_roma water lap. openUse starx:Lnrdstock 8(3tu1_ to pmpem tho tap and allow the system to flushsecondary dilution standard eok,'tJom that untJthewater temperatu_ hasstabilized
" contain the analytas In methanol. The (usuallyabout 10 sin), Adlustthe flowsecondary dilution standards should ba toabout500 murals and collectduplicateprepared at concentrations that can be samples Item _ flowing stream.easily dlUtEI tO prlpall _ calibrationstandards (Sect• 8.1.1) that will bracket 7.1.3 When sampling from a well, fill athe working concentration range. Store wM_h I:)offieor beaker.vdthsample,the secondary dilution standard solutions Ind carl_ fillduplicate 40.m.Lsarnplowith minimal hoadspaco and check boffios.frequently for signs of deterioration orevaporation, especially Just bofonl _ 7.2 SAMPLE PRESERVATIONcalibration standards• The storage time 7.2.1 The samplN _ be chlled to 4"C atdescribed for stock standard solutions In the Use of coflectJonand maintainedatSect. 6.4.3 also applies to secondary that temperature until the analyst IsdUutlon standard sotutlom, prep,rod forthe e_lnnctlonproces_ Field
MethodS06, Page4, Re_N_I IN8
,k# *t *
ORAFTOOCUMENT- INTERNALUSE ONLY.,Vls/ea
sambas that ell no( be receivedat the peekheightor area responseversusthelabonltoryon the day of collectk)nmum concimUmtlonIn the standard.Theresultsbe I:MCkagedfor shipmentw#h sufficient em tO be used tO prepare a calibrationIce to Im,urethat they wtl be _n4d curve for each compound by plotllngat 4'C until ardvaJat the laboratory, the peekheightor areasresDonseversus
the concentration. AltematNely, if the7.3 SAMPLE STORAGE ratio of resDonse to concentration
7.3.1 Store sambas and extractsat 4'C until (cldlbratlon factor) is a constant overextractionand anaW_L the working range (a relative standard
devfatk_n),llneadtyto the origincan be7.3.2 Extract all samplesas soonas possible Issumed and the average ratio or
after coUecUon.Resultsof holding time calibrationfactor can be used in placestudlessuggest lNut _ ana/ytes (aldrtn, of a calibrationcurve.dieldrin, endrtn, hoptachlor epoxlde,hexachlorobenzene, Ilndane, and the 8.1.4 The working calibration curve orarea:fore)with the possrolaexceptionof cadlbratlonfactor must be vedfied _nhe_tacNor may be extracted within 14 each workingday by the measuremef_tdays after collection. In general, of one or more csdibrattonstandards.Ifhel:Xachlorshowed Inconsislentresults, the restx)nsefor an analyte variesfromIf het_lChloristo bedatlmltned,sampleS, the predicted response by more thanmust be extracted within 7 days of =20%, the test must be repeatedusing¢odlectlon.Samplesfromwhich ana/ytes a freshcsdibratlonstandard.If theresultshave not been extracted within these still do not agree, generate a newdPrescrlbadperiods of time must be calibrationcurve or use a singleIscan:ledand mf:_lced, ca/ibrationstandardasdescribedin_o_!
8.1.S.
8. CALIBRATIONAND STANDARDIZATION 8.1.5 SIngtepokt calibrationis an acceptableIitornativeto a calibrationcurve.Prepare
e.1 CAUBFIATION sh'Rtepairtstandardsfromthesecondarydilution standard solutions. The single
8.1.1 AZleast three calibration standa_s are point calibration standard should beneeded.One shouldcontainanaiytesIt preparedata concentrationthatproducesa concentration near but gruter than a responsedose (=20%) to that of thethe method detection limit for aach unknowns.Do no( use less than 20 _.Lcompeted; the ofJ'm'two shouldbe at oftheseconda_fdlutlonstandardsolutionconcentrationsthat bracket the range to produce = single point calibrationexpected In samples. For example, If ammdmn:lIn reagent water.the MOL Is 0.01 _g/t., and a ampleexpec!ed to contain appmxirnateiy0.10 8.2 INSTRUMENT PERFORMANCE . Check the_g/L Isto bem_dyzed,aqueousstandards performance of the entire analytical systemshouldbe preDaredat concretions of daily using data gathered from analyses0.02 p.g/1, 0.10 /Lg/I.,,and 0.20 p.g/L, of reagent blanks, standards, duplicate
samples,and the laboratory control standard8.1.2 To prepare a calibrationstandard,_ (Sect. g.6).
an appropriatevolume of a secondarydilutionstandardto a 35-eL aJlquo(of 8.2..1 Significantpeak taring In excessof that
- reagentwarm'In a 40-eL bottle.Do no( shownfor the target compoundsin theadd less than 20 _ of an alcohoflc method chromatograms(Figures t-lO)
must be corrected.Tailingproblemsarestandard to the reagent water. Use a
25-1=Lmicrosydnge and rapk:lly,n!.ect _ICe_-dYun_Cea_eto acUvesitesor, thethe ad¢ohotlcstandan:linto the middle Impropercolumn Installation,point of the wnt_r volume.Remove the or the detector operatloRneedle as quickly as possible afterinjection. Mix by invertingand shaking 8.2.2 Check the precision between replicateanalyses. A property operating systemthe cappedbottleseveraltimes.Aqueous should performwAhan averagerelativestandarOsmust be pnq)aredfreshddy. standard deviation of less than 10%.
8.1.3 Starting with the standard of lowest Poor precisionIs generallytraceabletoconcentration, prepare, extract, and pneumaticleaks,especiallYatthe Injectionanalyze each calibration standard port. If the GC system Is apparentlybeginningwith Sect. 10.2 and tabulate performingaccel:ffablybutwithdecreased
Method505, Page S, Revisedlg68
. DRAFTDOCUMENT- INTERNAL.USE ONLY. 4/16/U,v
sensltlvlty,Itmaybenecuearyto generate costs, Each time such method modlflcetlons 'a new curveor set of callbratlorifactors are made, the snalyst must repeat theto verify the dm_mud _ proc_unm In _ 9.3
8.2.3 Observed relative area responses of 9.5 Assessing Laboratory Performanceendrln must meet the followingcriteria:endrin 50% of total anm. 9.5.1 Inltlal OC crlterla are established by
a_bo_the valuesfor X and S generated(Sect. 9,3) to establishupperand9, QUALITYCONTROL lower control limlts:
9.1 Minimum quality contr¢_ (QC) labmClU(oemWlts UPPER CONTROL LIMIT -, X + 3Sare initial demonstration of ratory LOWER CONTROL lIMIT --X . 3Scapability, analysis of method blanks,InstnJment QC solutlorl, labonltOry contn:l The laboratorymustanaJyzeat leastone
evaJr,rouen_l.'l:_ sarn_e$. extracted wlthln a 24.h period), Theeach
9.2 Method Blanks. Before processing any spikingconcentrationof analyte inthe laboratorycontrolsample shouldbesamples, the analyst must demonstratethat all glasswareand reagent interferences 10 times EDL Calculate accuracy asare under control. Each time a set of perc:ml recovery(XI). If the recoveryof
any analyte falls outside the controlsamples Is extracted or reagents are limits, that analyte Is judged out ofchanged, a method blank must be control,and the source of the pro_emanalyzed. If within the retention timewindow of any |neJyte the method b_nk must be Idm_ffiedand .motved beforecontinuinganalyses. The control limitsproduces a peak that Is 0.5 EDL for should be updated periodically. It isthat analyte, determine the source ofcontaminationend eliminate me Intaderence reconm_ecl that after each five to ten
new recovery measurements that newbefore Pr_ s_l_lu. . control limits be calculated using only
9.3 Initial D_ of C_Ry. the _ recent 20-30 dill points.
9.3.1 Select a representative spike 9.5.2 Eachquerierthe laboratorymustanalyze .¢¢_¢allCatk_1(about 10 _ MDI.) for OC check standards (ff available). Ifeach analyte. Prepare a LC sample crltede provided with the QC check ":'-concentrate (in methanol) containing standardam not met, correctiveaction -each analyta at 1000 t/mas selected should be taken and documented. -
• concentration. With s syringe, sdd 35 9.5.3 At leaM oncea year, the laboratorymust "_: I_L of the concentrate to each of at ImldyzeI pedorminca IMduatJonsample
least four 35-mL allquots of reagent (if available),and resultsfor each analytewater,andanalyzeeachadk:lu_according _ be within establishedacceptanceto proceduresbeglnnt_ in SecL 10. limits.
9.3.2 Calculate mean percent recovery (X), 9.6 Amdyte Confirmation . When doubt existsand standard deviation of percent about Identification of I GC peak,recovery (S). For each anahee, X mustfail In the range of 70-130% (or within _c_ttmltory techniquessuch as determinationR + 3RSD using the values for R and _ a mass s_er detector or a
- RSD for reagentwmer In Table 2)and different GC c_un_ must be used.S must be less than 30% (or _ than3 x RSD In reagent water in Table 2). 10. PROCEDUREIf the calculated X and S for everyanalyle meet the acceptance cdterfa, 10.1 SAMPLE PREPARATIONperformance is acceptable and sam_eanalysismay bog_, If amyX or S fails 10.1.1R_o_ samplesfrom storagem_dallowoutside Rs acceptance range, Initial _ to equilbrate to roomtemperature.demonstration procedues for that 10.1.2Remove the container caps. Withdrawcompound must be repmted. Ind discard a 5-mL volume using a
transfer pipet. Replace the container9.4 The analy__ iS parroted to modify GCto Clpl and weigh the containers withcolumns, GC conditions, or detectors
improve separations or lower analytical contentsto the nearest0.1 g and record
Method505, Page6. Revised1988
o
, . , DRAFTDOCUMENT- INTERNALUSE ONLY, 4/15/88
these weights for subsequent ump4e specific compound from chromatogramsvolume determlnaU(xu(Sect. 10.3). generated vvlth Individual standards. Select
me most seas#lye and mproducll_e peaks10.1.3Remove the container canoofofeach for calculation purposes.
ample, and add tSg NaG (Sect.6.1.3)to the sample I:x:_e.Recap_ dissolve 11.2 Use the calibration curve or calibrationthe NaCI by Invertingand shakingthe factor (Sect. 8.1.3) to directly calculateIx_es severaltimes (approx,20 sac). the u_ed concentration(Ca) of each
analyte tn the sample (e.g., calibration10.2 EXTRACTION AND ANALYSIS factor x response).
10.2.1Remove the cap, and using a transfer 11.3 Calculate the sample volume (Vs) asor automatic dispensing pipet, add 2.0 equal to the net sample weight:rnLofhexane.Recapandshakevlgorotmly
by hand for 1 mln. Invertthe I:x_e and t_re gross weight(Sect. 10.1.2) . bottleaJlowthe water and hexane pt'mu to (S4¢t. 10.3.2).separate.10.2.2Remove the cap and carefully transfer 11.4 Calculatethe ¢owwJ1edsample concentration
!¢proximatoly O.SmL of hexane layer u:IntoIm IutosamplerviaJusingI disposable
m
Concentmon,
10.2.3Transfer the remaining hexane _P_h_ 11.5 Report the results for the unknownsamples in _g/t.. Round off me resultsbeing careful no( to Includem_y to the nearest 0.1 _.g/1. or two significantwater pNtse, Intoa secondautosampler ngures,vial Reserve thissecond _d at 4"C foran ImmediatereanalysJsif necessary.
10.2.4Transfer the first sample vial to an 12. ACCURACYAND PRECISION
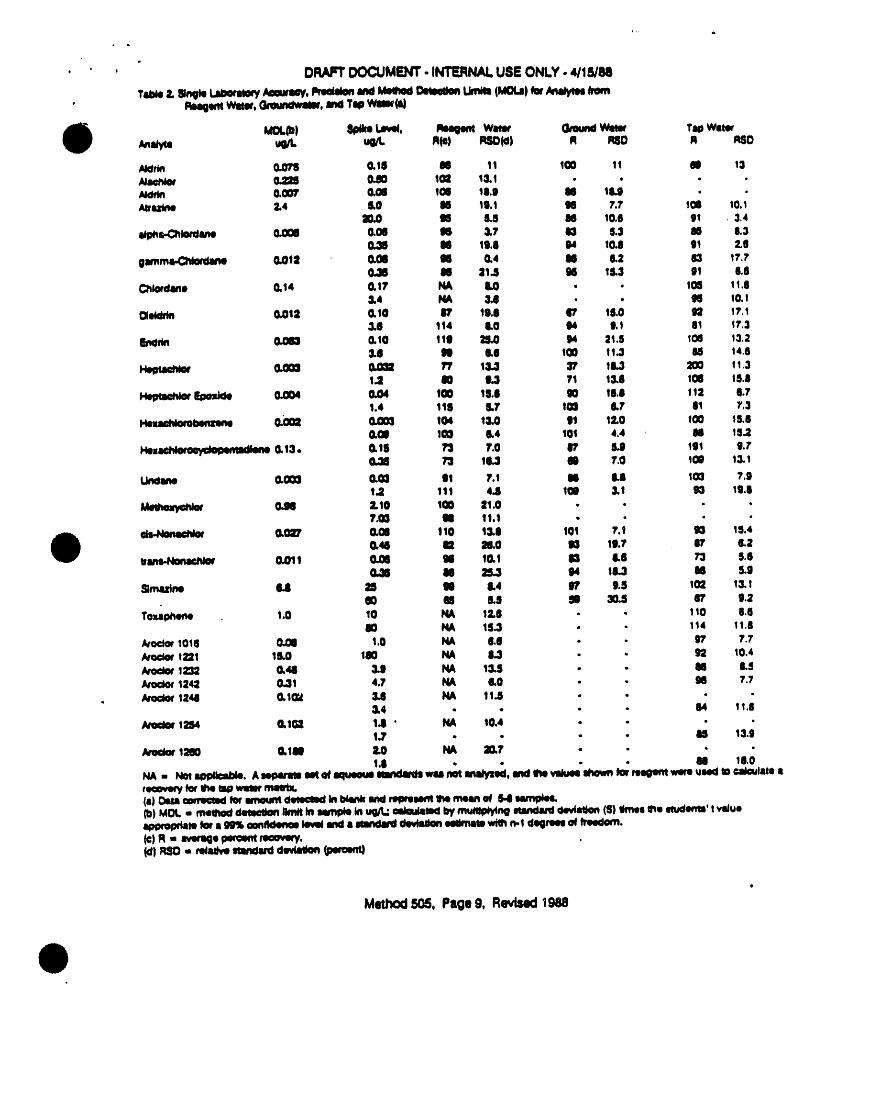
autosampler set up to Inject 1-2 mL 12.1 Single laborato_ (EMSL-ClncinnatJ)accuracyportionsinto the gas chromatograprlfor and precision at several concentrationsSect.5.9 foranalysis(See GCcondltJons). In reager¢ ground, and tap water matricesNtemat_y, 1-2 rnL portionsof sampleS,` are presented In Table 2.(1 1) Thesebiank¢ and standaf_ may be manuJly results were obtained from data generatedInjected, although an autosampler Is with 8 DB-1 column.stronglyrecornmsnded.
12.2 This method was tested by 10 laboratories10.3DETERMINATIONINBoI"rLES NoTOFcAuBRATEDSAMPLEVOLUME using reagent water and groundwater
spiked It three concentrationlevels. Single10.3.1Discard the remaining samplethexane operator precision, overall precision, and
mixture from the sample bottle. Shake method accuracy were found to beoff the remainingfew dropsusingshort, directly related to the concentration ofbrisk w_st movements, the analyte and virtually Independent of
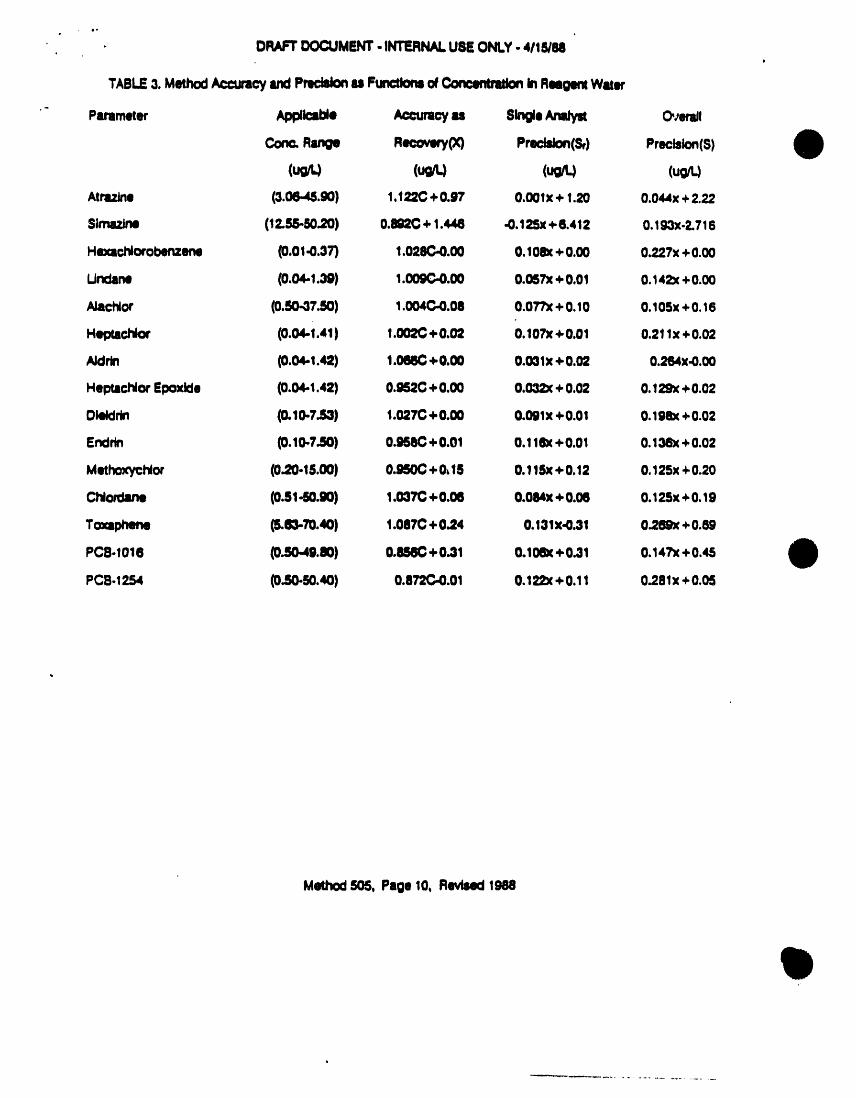
tile sample matrix. Linear equations to10.3.2Rewek_hthe_npty contatnerw#hork_naJ c_escrlbe the relationships are presented
cap and calculate the net weight of In Ta_e 3.(12)sample by differenceto the nearest0.1
Sect. 10.1.2 minus Section 10.3.2).is net wek3ht(In grams) is equivalent 13. REFERENCES
- to the volume(In mL.)of wuter extracted(Sect. 11.3). 1.Glaze,W.W.,LJn,C.C._Optimizationof LJquk:l-LJaukd
_EX_A_._)_3.(_, f_n__ OrganicsinWater'11. CALCULATIONS
11.1 Identify tl_ organohaJldes In tthehesample 2.Henderson, J.E., Peyton, G.R. and Glaze. W.H.rmentlon .(1976).In "Identificationand Analysisof Organicpo4.chrornatogram by corncflr_ lutants In Wate¢ (LH. Keitl_ed.), pp.\105-111. Anntime of the suspect peak to retentiontimes generated by the callbratlon standards ArborScLPubl.,AnnArbor,Michigan.and the laboratory cons'el standard. Identifythe multJcornlx)nentcompounds using allpeaks that are characteristic of the
Method.505,Page 7, Revised1988
.,i
. DRAFTDOCUMENT- INTERNAL.USE ONLY- 4/I_U
Determinationof In Water,* Jourhmi meritof Hidth, EducatForl,_ Welfnro,Pul:dlcHealthService,C4H1terfor DlsmuleControl.Natlon_ Instltute
4"HandbookforAne_k_.Oual_ContrdinWater_dWastewuterLabomtoHe¢ EPA-EIX]/4-_79-019,U.$, En:.vlronmental Protection Agency, Environmental 9.'OSHA Safety and Heelth $1andarda,GeneralIn.
45268, March 1979.
5.Budde,W.L, EIchelberger,J.W.,_'OrgantcAnaly_m 10. "Safety In Acedemlc Chemistry Laboratories,"Using(._asChrornatoQmp'hy_ __," Ann American_ $octe.tyPublication,v.,ommmeeonAroorS_ence, Ann/0t)or, MkcCdgan1979. ChemicalSefefy,3rd Edition,1979.
6.Glaser,J.A.e_aL."TraceAnalysesforWu_ewater¢" 11, WINk_, 1".,et_. "Anldystsof Organ0halldePes.En_ronmental Science and Techncdogy,15, 1426 tk:ddo4In DrinkingWater by MlcroeXtJlCtlonano Gas(IHI). Chromltogllphy." inptlpamtJoR
7.Ballar,T.A.,Stemmer,P., L.Ichtonber_J.J.,_'Evalul- 12.Multlabomto_/MethodValidationStucly#40, con-tion of CaDillarySystemsf_orthe __Antis of E/_M_ton- ClUC_Odby tl_ Oi.mJltyAssuranceurancn, EMSL-Cl.mentalExtracts,"EPA.6OOIS4.e4-O04,March1984. Rq:_rt Inprogress.
Method605, Page 8, Re_md 1988
MethodSOS.Psgeg, Revised1_!8
- DRAFTDOCUMENT- INTERNALUSEONLY- 4115/88
TABLE3. MethodAcctracy andPmcislonu Functionsof Con¢_ In R_ge_ W_er
"- Pammt_ App/Icsl_ Accumc? Is SingleAnalyst Overnfi
Corr. Range Recovery(X) PrecisJon(Sf) Precision(S)
(uo (u;'q (uo/t.)Atrazlns (3.06.._.90) 1.122C+ 0.97 0.001x + 1.20 0.044x+2.22
Simazine (12.55-50.20) 0.892C+ 1.446 -0.125x+6.412 0.193x-2.716
Hexachlorobenzene (0.01.0.37') 1.028C-0.00 0.10_c+0.00 0.227x+0.00
L,Jndllnil (0.04,,i.39) 1.009G.0.00 O.057x+0.01 O.142x+0.00
AJachlor (0.50.0730) 1.004C4).00 0.07"Px+0.10 0.105x+0.16
HeptllChlo¢ (0.04-1.41) 1.002C+0.02 0.107X+0.01 0.21lx +0.02
Aklrln (0.04-1.42) 1.066C+0.00 0.03lx +0.02 0.264x.0.00
HeptlcNor Epoxlde (0.04-1.42) 0.95,?.C+0.00 0.032x+0.02 0.129x+0.02
Ol_lrin (0.10.7.80) 1.027C+ 0.00 0.091x+0.01 0.198x+0.02
Sndrln (0.I0-7..S0) 0._8C +0.01 0.11ex+0.01 O.138x+0.02
MethoxycNor (0.20-15.00) 0.950C+0,15 0.115x+0.12 0,125x+0.20
Chlordane (0.81-50.90) 1.037C+0.06 0.084x+0.06 0.125x+0.19
Toxlphene (S.63-70.40) 1.087C+0.24 0.13Ix-0.31 0.269x+O.8g
PC8.I016 (0.50.49.80) 0.8S6C+ 0.31 0.106x+0.31 0.147x+0.45
PC8.125,4 (0.50-50.40) 0.872C.0.01 0.122( +0.11 0.281x+0.05
Method505, Page 10, Revised1988
* e
//
13
.o ,,
• eej
i
.... llll q,
J _IN_ Nm
,' E I... O_ 0
•, iN "G_ oa,. t._
,1=
--J O IB
N ,4
o
c
x
t
_...._.,m, N
I =• | ,_-
u i n • I nl n iimm n iN

• o*a
• Jt
4t . _ I" ,
/;
m
Draft Method 515.1- For Use in WS023 Only
DETERMINATION OF CHLORINATED ACIDS IN WATER BY GAS CHROMATOGRAPHYWITH AN ELECTRON CAPTURE DETECTOR
1. SCOPE AND APPLICATION acceptable results with this methocl usmgthe procedure described in Sect. 9,3.
1.1 This is a gas chromatographic (GC)method applicable to the determination 1.5 When this method Is used to analyzeof certain chlorinated acids In ground unfamiliar samples for any or all of thewater and flnlstled drinking water.(1) The analytes above, anaJyte identifications mus!following compounds can,be determined be confirmed by at least one additionalby this methcx_: '; ' '' ' ' quaJitatlve technk:lue. '
2, SUMMARY OF k;ETHOO
•_ta=_., 2sosT._so 2.1 A measured volume of sample of.Ot_r.smmm_ 13341o.4 approximately 1 L is adjusted to I:)H
v,",(r'_.'¢o_ _.nl.r 12 with 6 N sodium hydroxide and' ' ' ' shaken for 1 hour to hydro_yze derivatives.
I_LOQnV 7S-0IHI Extraneous organic material Is removedq2.'1-08 * 04.4=4 by a solvent wash. The sample is,OCPAmc_,_mm=_". (m) acidified, and the chlorinated acids are
.. Bcarnmn " .)le,,Oo,o extracted with ethyl ether by mechanical• 3.s.o_oed_,ea=_l_- sl.3e.s shaking In a separatory funnel or-:0k:NwW_" I:10._.S mechanical tumbling In a bottle. The
j,,/=_!J_ U.M,'I acids are converted to their methyl esters. S.Hycu_.mx_=amu.',"_F _m.so.;! using dMzomethane as the derivatizing
t¢o.o=._' agent. Excess derivatlztng reagent isyp,_ll,C_=q rt.u.s removed, and the esters are determinecl,,,.=., =no.r,.,.onc.o.,r,oe,e=o,,k,,.,_mm_W
q?tP..4._T""1 113,741,0
/7_F_" I_.t 2.2 The method provides a Florlsil cleanup(mtDCPAoaddanddlm:IdmetaboUtxlnclUdedlnmetl_d procedure to aid In the elimination el=¢0_; OCPAd0=¢,=meumome,=_ foqv_ m_lu. interferences that may be encountered.
1.2 This method may be applicable'to thedetermination of salts and esters of 3. INTERFERENCESanalyte acids. The form of each acidis not distinguished by this method. 3.1 Method Intederences may be caused byResults are calculated and reported for contaminants in soNents, reagents, glasswareeach listed analyte as the total free and other sample processing apparatusacid. that lead to discrete artifacts or elevated
1.3 This method has been validated In s baselines In gas cl_romatograms. Allsingle laboratory and es=lmated detection reagents and apparatus must be routinelylimits (EDLs) have been determined for demonstrated to be free from interferencesthe enelytes above (Sect.12). Observed under the conditions of the analysis bydetection limits may vary _qNm ground, running laboratory method blanks aswaters, depending upon the nature of described In Sect. 9.2.Interferences In the sample matrix and 3.1.1 Glassware must be scrupulouslythe specific Instrumentation used. cleaned.(2) Oean aJl glassware as soon
1.4 This method Is restricted to use by or aspossible after use by thoroughlyunder the SUl:)eP,'_on of anaJys_ exl_rienced dnslng with the last solvent used In i_.In the use of GC and In Lhe Inter_'etatlon F_low by washing with hot water andof gas chromatograms. Each analyst must detergent and thorough rinsing with diluteacid. tap and reagent water. Drain dry.demonstrate the ability to generate
MeU_d515.1. Page I, Revised 1988
DRAFTDOCUMENT- INTERNALUSE ONLY- 4/15/88
and hell In an oven or muffle _ associated equipment with MTBE canat 400"C for 1 hour. Do not heal minkn_e sample cross contamination. Aftervolumetric ware. Thermally stable analysis of a sample containing highmaterlaJssuch as PCBI might not be concentratk0cmof anatyte¢ one or moreeliminatedby this tm_ Thorough _ectJonl of MTBE should be made todnsingwith acetone may be substituted ensure that accurate vaJues are obtainedfor the huUng. Alter dryingand cooling, for the next sample.seal and store glassware In a cleanerM_to prm4mtany accumulation 3.6 Matrix Interferences may be caused byof dust or other contaminants. Store contaminants that are coextracted fro,nInvertedor capped with idun_Mjmfoil. the sample. The extant of matrix
Interferences wig vary considerably from3.1.2 The usa of high purity reagents and source to source, depending upon the
solventshelm to minimize Intederlm¢o ground water sampled. The cleanupproblems. Purification of solvents by procedures in Sect. 10 can be useddistillationIn idl-_ess systems may I:)e to overcome many of these Interferences.required. Positive ldentlfk:atlOnsshouJd be confirmed
3.2 The acid forms of the analytes are .___.L_nSlns_econfirmation column specified
5.10.2.strong organic acids which, rlmcZ redlywith _dkaJlnesubstances aria can be lostd_ng sam_e praparaUon. _ and 4. SAFETY
lass wool must be acid-rinsed with+9) hydmchlork: acid and the sodium 4.1 The toxicity or carclnogenlcity of each
sulfate must be acidified with sulfuric reagent used In thls method has notacid prior to use to avoid anaJyte losses been precisely defined: however, eachdue to adsorption, chemical compound must be treated as
a potential health hazard. From this3.3 Organic acids and phenols, especially viewpoint, exposure to these chemicals
chlorinated compounds, cause the most must be reduced to the lowest possib4edirect Imederence with the determlrmtlon. " level by whatever means available. TheAJkaJinel_bamls_clsand _ extraction laboratory is responsible for maintainingof the sample remove many a current awareness file of OSHAchlorinated hydrocarbons and phthalate regulations regarding the safe handling ofesters thM might otherwise Intsdmo with the chemicals specified In this method.the _ cal:xure onadys_ A reference file of material safety dati
sheets should also be made available3.4 Intldererces by phU'udateastor8 can pose• a major problem In pesticide analysis to all personnel Inv_ved In the chemical
when using tt'_ ECO. These cornl_J_S lu_.ym. AdditionaJ references to laboratorygenerally appear In the chromatogram as safety are available and have oeenlarge peaks. Common flexible plastics identified (5-7) for the Information Of thecontain varying amounts of phthalates, anady_that are easily extracted or leached 4.2. Olazomethane is a toxic carcinogen andduring laboratory operations. Cross can explode under certain conditions. ThecontaminaUon Of dean glass',+vue routinely following precautions must be followed:occurs when plastlca am handled duringext_cUon steps,especkdlywhen sofvent-weged 4.2.1 Use only s well ventilated hood - dosurfaces are handled. Interferences from not breath vapors.
•- phthalates can best be minimized byavoiding the use of plastics In the 4.2.2 Usa a salety screen.laboratory. Ex_uustlve ¢lomlz_ of roaglmts 4.2.3 Usa mochank:zdplpel_ aides.and glassware may be required toeliminate background phthalate 4.2.4 Do not heat above 90"C - EXPLOSIONcontmldnmlo_(3,4) ., may mull
3.5 Interfering contamination may occur when 4.2.6 Avoid grinding surfaces, _'ound glassa sample containing low concentrations Joints,sleevebearings, gtass stln'ers -of anaJytesIs anaJyzedImmed_ely .Iotlow(ng EXPLOSION may result.a sample contalnlng relatlvely hlgn 4.2.8 Store away from alkall metals -_concentratk=m of 8rudytes. Between-sample EXPLOSION may resutt.rinsing of the sample syringe and
Method616.1, Page2. Revised1988
t. ?,o_
ON_'r _MF_T - INTERNALUSEONLY- _15/U
4.2,7 Sdutlonl of dlazomMPanedecompou 5,2,,11.Snyder column, K.O - two,ball microrlptdly In the presence,of i_,ld ml,t_ (KonumK-S6B301-021gor equivalent).
4.2.8 The dlazorneUmnegenemtlon¢oparmusused In the esterlflcation procedures S.2,S Vials - glass, S. to 10-mL,Pal:_cCywith(Sect.10,4and10.S)pr0ducNmlcn:)molar TFE-fluo_ llfled screw Pal:),amounts of dlazomethaneto mInimize 5.2.9 Disposable pipets -- sterile pluggedsafetyhazards. ' bor0silcateglass,5.mL¢al_CCy(Comlnti
707S-_SNor eClUMd,nq.4.3 Ethyl ether la an extremely flammablesolvent. If a mechanical device _ used S.3 Separatory funnel shaker-. Capable offor samite exnc'Jon, me device should holdir_g
_ _ _xleX_te__--Pmof_ shaking te_ 24- saparat¢_/ funnels and}era with rocking motion to
elchlev thorough mixing of separatorydamage imcl _ury due to In exClolk_ funnel contents (available from Eberbach
.. Co. In Ann Arbor, MI).q
S. APPAFIATUSANDEQUIPMENT(AII -, S,4 Tumbler - Cal=able of holding 4 to 8specifications_ mqlgeMed. Catalog nlanblre tumbler bottles and tumbling themare Includedfor Hlumtion only.) :,, end-over-end at 30 turnelmln (Associatecl.... . :, Oeslgn _ Mfg. Co., Alexarclri¢ VA).
5.1 SAMPUNG EQUIPMENT ' 5.5 Boiling stones - Teflon. Chemware (NortonS.1.1 Grab sample horde - Borcailk:ate, 14. ' Performance _ No. 015021).
volume with graduations (Wheaten 5.6 Water bath -- Halted, capable ofMedia/Lab bottle 219820), fitted with temperature control (+_2"C). The bathICmw _ Ilnl¢l witll 'I'FE.II_ ' '; _ be ul41d In a nooo.
"+ clit_clas descdbml S.7 Bean= - Aralytical, Cal:a_e of accuratelyIn Sect. 3.1,1 before use to minimize weighing to the nearem 0.0001 g,
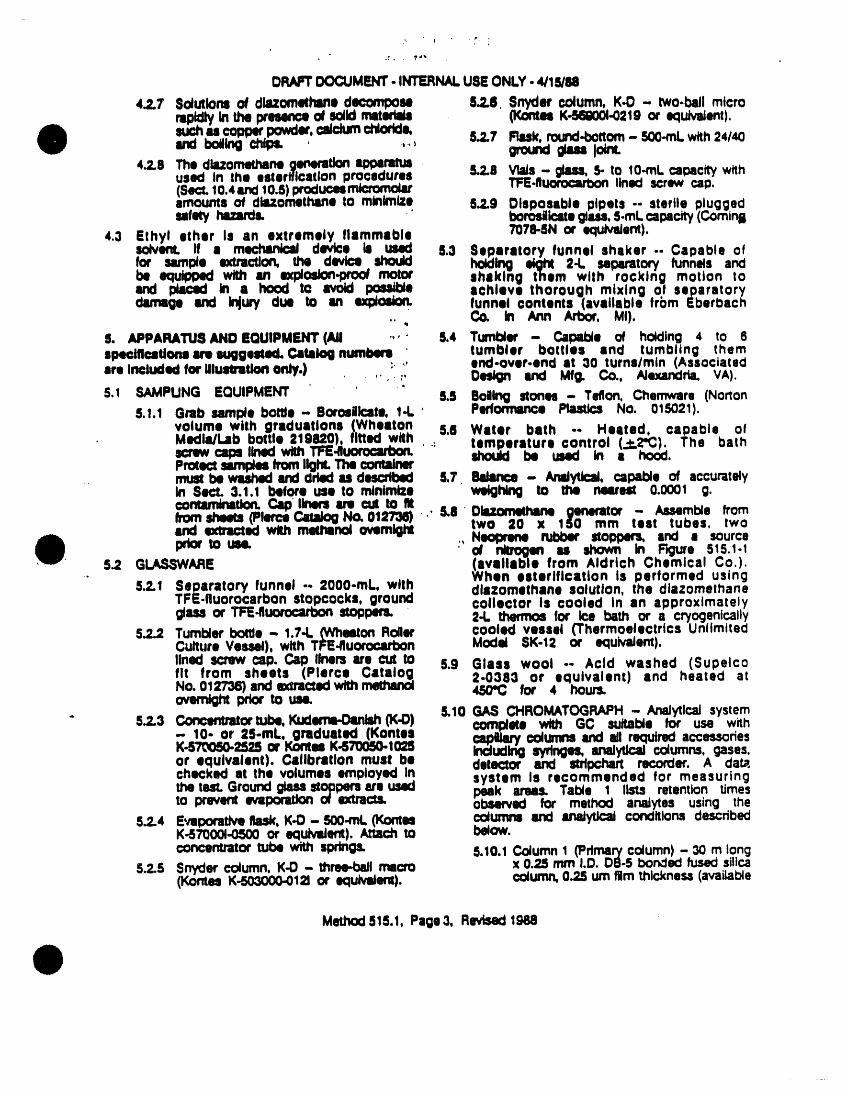
---'--'-- "-- "---- ---_ "-"_orn_*J°n'l_P_/cg_lck_O__m ." &ll ' O_ generator -Assemble from
u._.,u--'---""_with metllmnol two 20 x 150 mm test tubes, twoend ovemigfltNeoprlne _ stopl:m'J, and a source
prior to use. :'of n#mgm as shown in Figure 515.1-15.2 G_ARE (available from Aldrich Chemical Co.).
• When esterlflcatlon Is performed ustng5.2.1 Separatory funnel -- 2000-mL, with dlazomethane solution, the dlazometl_ane
TFE.fluorocarbon stopcocks, ground collector Is cooled In an approximatelygtass or TFE.Iluorocartx_ sf_31=por¢ 24. thormos for' Ice bath or a cryogenically
5.2.2 Tumbler bottle - 1.7-1,(Wh_on Roller cooled vessel (Thermoelectrics UnlimitedCulture Vessel), with TFE-Iluorocarbon Model SK-12 or equivalent).lined scrmv cap. Cap linersare cut to 5.g Glass wool -- Acid washed (Supelco
fltNo.01fr°m2736)sheetSandm_'actlKl(Plercewttll_ 460"C2"0383for°r4equivalent)hours.and heated atto5.10 GAS CHROMATOGRAPH- AnalytlcaJsystem
" 5.2.3 _ortube. Kml_Oanl_ (K.D) coml_e_a wire GC suitable tor use wi_h- 10- or 2S-mL, grlduated (Kontes c_ollllr/c:¢du1111_end Idl required accessoriesK-$70050-2525or Kontm K.S7005G.1025 sy_gu, _ul_ columns, gases.or equivalent). Calibration must be detector and strlpcha_ recorder. A da_checked at the volumes employed In system Is recommended for measuringthe test. Groundglasss_opper_are uxd peak arus. Table 1 lists retention timesto prevent _pomtlon o_a IJrac_ observed for metnoo anaJytes using tr_e
column= and imaJytlcaJconditions describedS.2.4 EvaporativeMsk, K-O- SO0-rnL(K_mK-67gO01..0500or equNaJe_). Atlac_ to below.concentratortube with ratings. 5.10.1Cdumn 1 (Pdmarycolumn) - 30 m long
5.2.5 5nyder column. K-O - three-bailmicro x 0.25 mm I.D. 130-5bonded fusedsilica(Kontn K-503000-0121or ecluMdenq, column,0.25 urnfilmthickness(availab(e
MethodS1S.1, Page3, Revised1988
m . .
Tabtal. RetenUonl'knuforMeffiodkrWytoe 6.1 _[ohe.., methanol, methylene chloride,;vv,m_nn.p_ Pmdk:Jda quJlry or KlUlVnJe_
6.2 Ethyl ether, unpreserved -. Nanograde,,_,_,m pmwy co_v_ rodlsUll_In gUU_s'V necessary. Must
C_uon , 3.4 4.? free of peroxides as Indicated by EM3,S.Ok:_W=_.__ ' t&e IT,? QUIre lUt strlpe (availa_e horn .Scientific4.N_w_ 1U 10.l Products Co., Cat. No. PI126 8, andoc_(,,,n_m) _.o 14.e other suPl_lers). Proc_ums recomme_edo0awvm,_ m.1 m.e for removal of peroxides are provided
2.4.O 2S.U _JO e.:) Sodium sulfate, granular, anhydrous, ACSOOOOkcm.) , u.s u.e grade -- Hoot treat In a shallow trayPCP , 21.3 17.0O_ormma_m as.? :U.l at 4S0"C for a minimum of 4 hours
tO remove Irllededng organic subsUlnces,Ld_.I"P lO.? . ILl lCk:lHy by adU_l 100 g sodium sulfate
30.0 , 10.? with enough ethyl ether to Just cover2.4.S.T 30.S 30.1 the solid. Add 0.1 el. concentrated3.4.00 32.2 33.3 RemoveCxno,w _4 _._ . sulfuric acid and mix thorougPdy.the ether under vacuum, Mix 1 g ofDemure aa..1 _.s the rNulting mid wlth 5 mL 04 reagent
'" water and measure the pH of the(ml___owxUommdemVx41n mixture. The _ must be below pH 4.
Sect.sJo._andI.m.¢ " . Store at 130"C.
from J&W). Helium carder gas flow I11 6.4 Sodium thlosulfata, granular, anhydrous,establishedat 30 ca/sac llmmrvelocity_ AC_ gradeand oven temperature is programmed 6.5 Sodium hydroxide (NIOH), pellets - ACSfrom 60'C to 300"Cel 4"C/min.VaJldltlon grade.data presented tn thls method wereobtainedusing this column. Alternative 6.5.1 NoaH, 6 N - Dissolve216 g NaOH incolumns may be used In accordance 900 nil rlagem waterwith the provtsionlldescribed in Se_cL', 6.8 Sulhjric acid (HISO4), concentrated, ACS9.2. erode- sp. Or. I.e4.
, 5.10.2 Column 2 (Conflrmotloncolumn) - 30,, along x 0.25 mm l.D.DB-1701
bondedfused Ilk= COllml. O.25
um filmthickness(wdable flfflf_ • ,J&W). Helium comer gas .'-'.--'is establishedat 30 cm/secllrmr "'='_ /
velocity and ov.n temperatur. ____JJ
is programmed from 80"C to300"G at 4"C/man. . ,., a
detector has proven __ In •" the analyals of spiked reagent ....
v,dtdaUondata pmsent_ in this ' .,method. NternaUvo detectors, -- ' " '_i_ 0 mass __,may be us_ Ina_ance _ ----
ducr = S,c "--" ""' •., .., ..
•I- '_ ._m ! _,m,i .,,*.._ae_m
. ,
,,'
MethodSIS.I, Page4 Revised1988
(
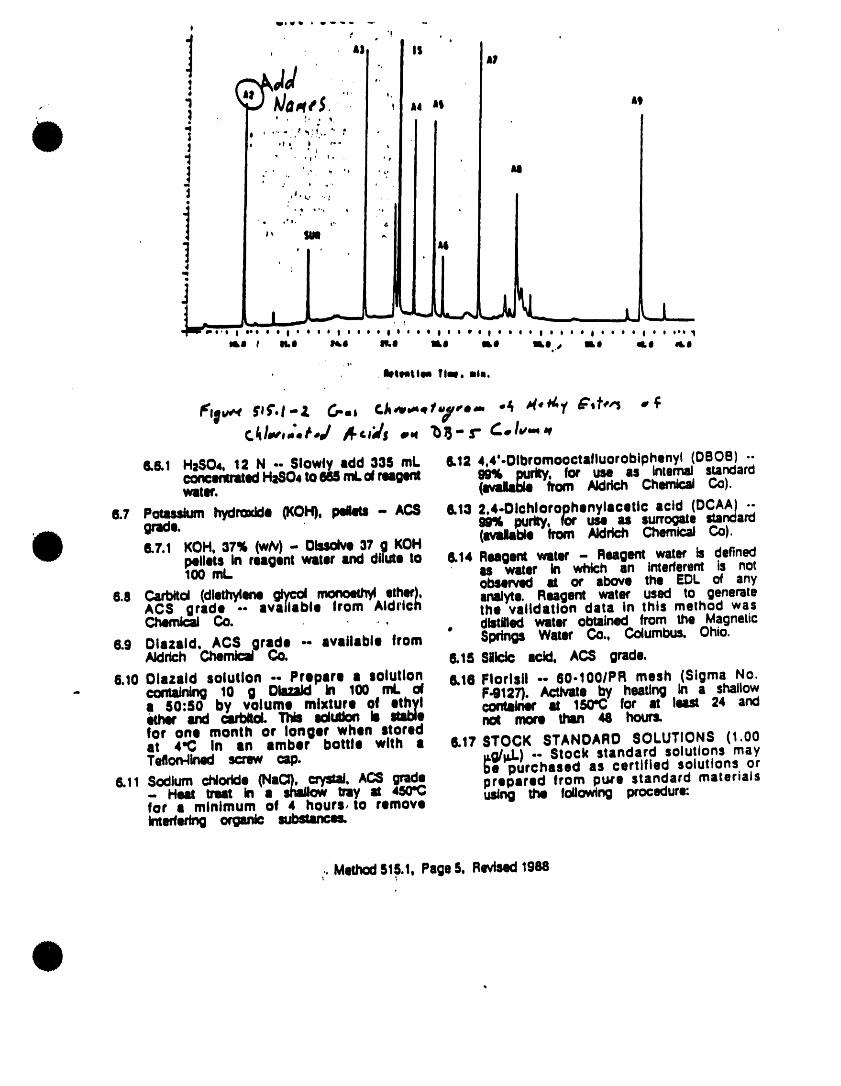
, - 13 IS
- + + , il II II+
I ,+, ,
j ,.' ' ,+ ." " '* "_, All
+ "•+Ii +,,,_ _ ,+
+_ SUII
I
• O I o e I o o • e I e • e i I o i o e I o • o , I o e o,,t 'I
Ukl I 11.41 /41,41 II, I Ikl ILl lLl.s ILl el, l Ol,l
' . llllllmthm llal. mlm.
FIp,,., rlf'.l-Z G., .,,.- .,I ,,,.,.. -+. o",y -+:
6.6.1 H|SC)4, 12 N -- Slowly add 335 mL 6.12 4,4'-Olbromooctafluoroblphenyl (DBC)B) -.¢oncemlted HlSC)4to 665mLoi reagefll 99% purity, for use as internal slan¢larclwater. (avzdlzbl,-_om Aldrich Chemlcai Co).
6.7 Pomsklm hydrmdde(KOH), AC,66.t:3 S_6 purity, for use as surreys star_ar_grade. - 2.4-Olchlorophenylacetlc acid (DCAA) ..
(wlLilable from AJdrich Chemical Co).6.7,1 KC)H,37% (w/_) - Obsoive37 g KC)H
pellets In reagent water and dilute to 6.14 Reagenl water - Reagent water Is defined100 ml.. ' as water in which an inlerterent is not
oblePvld at or above the EDL of any6.5 C,arbltd (dlethylene 91ycd _ etl ),
let',h analyte. Reagent wat_ used to generdZe_nk_ ads the validation data in melhod was
available from ,Iddllc,1141
thlsCo.' , dlstMIt_ water obtaimKI from me Magnetic
6.9 Olazald, ACS grade -- available from Spdngs Water Co., Columbus. Ohio.Aldrich Chernk_ Co. 6.1S Sik:d¢ acid, ACS grade.
6.10 Olazald solution -. Prepare a solution 6.16 Florlsil -- 60.10OlPR mesh (Sigma No,- torching 10 g Dllzakl In 100 nrd. o( F4127). Actinic by heating .in a shallow
aelher and csrblloL This eduUonI560:50 by volume mixture of _,/ notC°ntalrmrmorealU.an150"C48fOrhours.atleast 24 andfor one month or longer when storedat 4"C In In amber bottle with I 6.17 STOCK STANDARD SOLUTIONS (1.00Teflon-lined scntw cap. ,.g/l_.) "" Stock standard solutions may
be purchased as certified solutions or
6.11 _S°diUmHellc_loddelnmlin (NIII_I_I/C_;_ 4_ usingPreparedthefrom,,owlngpl.w'eprocedure:Standardmaterialsfor I minimum of 4 hours, to remove erfer*ngorga,'
, MeU_c1616.1,Page6, Revised1988
6.17.1 Prepare stock standard solutions by I_L of the 1,0 _g/l_. dinoseb stocksccuratelvwelohinOsl:H_t_0dnltly0.010Q iolulion to MTBE and diluting to volume
"mainly.Ollsolvethermiterll In s 10-mL vollxrmulc flask. To prepareof_m_ diuCeto_um. • s lO.mL me m_.r._ oc mrmrd, _d _o _L
/" v¢__ flask.LJugervolumesmay be ' of the diluted dlnoseb solution, 16 I_Lused at the c_ of the _ of the 4-nltrophenol stock solution, e _LIf compound purity IS certified at 96% of the 3,5®dlchlorobenzolc acid stockor greater, the weight may be used lolutlon, 50 I,L of the surrogate standarclwithout correction to calculate the . spiking solution, 25 _ of the Internalconcentration of the stock standard, standard spiking solution, and 250 _LCommerciallyprepared Itock stlndards , Of methlr_ to I $-mL volumetric flaskmay be used st any concentration If ' m_d dlute to volume with MTBE. Memylatethey are certIfied by the manufacturer sample as described in Sect. 10.4. Diluteor by In independent_ ' the simple to 10 mL In MTBE. Trar_'fer
the Instrument QC standard to a6.17.2 Transfer the stock stlndard solutlofts TFE.fluorocarbon-saaled screw cad botIle
into TFE-fiu_saeled screw cap lind store lit room temperature. Solutionvials. Store at room temperature and should be replaced when ohgolng QCpro(actfrom,ght. (Sacs.9) Indk=tesa prol_em.
6.17.3 Stock standard aolutlons should benm_:ed_er twomom_a' _ocnerIfcomparison wlth laboratory control ?. SAMPLECOUJ[CTION, PRESERVATION,ANDsmndaudsindicatesa Wooiem. " STORAGE ,
6.18 INTERNAL STANDARD SPIK)NO SOLUTION 7.1 (3rib samples must be collected in glass•- Prepare an Internal standard spiking contxkmPJ.Convlmtlorid sampling practicessolutionby sCCUlltelywetghMgIp__y (8) should be followed; however, the0.0010 of pure DBOB. Dissolve me bogle musl not be prertnsad with sampleDaOB Ign MTBE and dilute to volume before collection.in z lO-mL __ _ Trander theinternal standard spiking solution to I 7.2 SAMPLE PRESERVATION AND STORAGETFE.fiuorocarbon-eealed scrtw cap bogie 72.1 Add mercudc cNorlde to the sampleand sZom at room temperatIJm. Jiv:ldltlon bottle In amounts to produce aof 25 _ of the Intern/ _ spiking concentra_i of 10 rng/L Add lmL ofsolution a 10 _ Solutionof mercuricchlorideto 10 mL of sampla extractresults In a final Internal standard In water to the sample bottle at thecon_ of 0.2S la,O/_l-SdlJUon lltlOIjId sampling IAmor In the laboratorybeforebe replaced when ongalng (2(= (Sm:L g) shippingto the sampling site. A materIndicatN a protein. • .. dld_nwge of mercuricchlorideis mat
6.19 SURROGATESTANDARDSPIKING SOLUTION It Is | highly toxic chemical: mercuric' ct_oddI mum be handled with caution,- Prepare a surrogate standard spiking andsamplescontainingmercuricchloride_u,on by_c.rately_ m_0dm!ay m.szbedisposedof prope,y.0.0010 g of pure DCAA. Dissolve theDCAA in MTBE and dilute to volume 72.,2 If residual cNorlne Is present, add 80in s 10-mL voIummx_ Ilask. Transfer the mg of sodium thlosulfate per liter ofsurrooata standard sl_dng Imlutk_ tO a sample and mix well,
. TFE.iiuorocsrbon-selied icrew cap bottleand store at room tempwzUZn. Addition 7.2.3 Alterme sample Is colle_ed in the Ix)meof 50 i_1..of the surrogate standard containing preservxtMI, sell the bornespiking soluUon to a 1-L simple prior arid shake vlgolmul_ for 1 ran.to extraction results In surrogate 72.4 Them,mpleemumbe Icedor rl_erated.
_;,,-,,;m,_,i;;_- In I_ _ of It 4"C Iwiy from light from_the,meow
_ _._-Ind, assuming _ _ collection until exzraction.PreservationDCAA. a sun,ogate standan:lconcm'_'alJon study reresultsindicate that most of the
in the f_e ex_a(:;of 0..5_g/mL.Solu0on analyses(measuredastomacid)pre-_,ntreplaced when ongoing OCshould in Sil_lra iill sla_e for 14 days whenstored under these conditions.(1)(Sect.g) Indicatesa
6.20 INSTRUMENT OC STANDARD - Prepare However,analysestabiltymaybeaffecteda diuted dlnoseb sdubon by Iddlng 10 by the matrix; therefore, the analyst
Method515.1, Page6, Revised1988
DRAFT[X:X_MENT- INTERNALUSEONLY.4/1s/el
should verify that the preservation All -the peak area of the internal
. 8.2.3 GenenD a calibration curve of analyte7.:3 EXTRACT STORAGE relative response. RRL versus anaiyte
(:_lcanultJGi1 In the eamplo In ldl-7.3.1 Extracts should be meted at 4'C Iwly
from light. PreservaUon study results 8.2.4 The working calibration curve must beIndicate thlt that most Inldytu Ira stable verified on each working shift by thefor 28 days(l); however, the analyst mmsumment of one or more caJlbrattonshould verify appmprtlle extract holding standan:ls. If the response for any anaJytetimes a,opllcabte to the eamples under yules from the predicted response bystudy. .,, , , more than _.20%. the test must be
repeated us|nga fresh calibration" -, II,lmdan:l,AltemlUv_y, a new caJlbratlon
I. CALIBRATION ... • ¢ur_ must be prepared for that anaIyte.
8.1 Establish GC operating pw'amotlrs equtvJant 8.3 EXTERNAL STANDARD CALIBRATIONto thole Indicated In Sect. 5.10. The PROCEDUREGC system may be calibrated usingeither the Internal standard technique 8.3.1 Prepare calibration standards at a(Sect. 8.2) or the external ltandard minimum of five conclmtnlUon levels foreech analytl of Interllst lad surrogatetlc_ (Sect. 8.3). i compound by adding volumes of one
8.2 INTERNAL STANDARD CALIBRATION or more stockstandamsand 250 ;LPROCEDURE -- To use thll approach, _ to I volumetrk: _ it)lute tothe analyst must select one or more volume with kATEE. Estertfy acids witl_
. intemaJ s_lndan_l compllf_le In lrllJytJcaJ dlazomlthane as descrtl:)_:lin Sect. 10.4behavior to the compounds of Interest. or 10.5 One of the calibration standardsThe m_dyst must _ dqmmnsUate that ' should be repmsenUitlve of an analytethe meas_ of the Infernal standlnd " concentration near. but above, theIs not affected by method or matrix EDL.Tho other concentrations shouldInterferences, DOe0 hal been Identified corr_ to me range of concentrationsu a suitable _erral smndan/, expec!_lInthesampleconcentrates,or
IhouId define the woddng range of the8.2.1 Prepare calibration standards at a . detector.
of ave conconmuJo,levelaforhanldytaotbllrml_bYldd!ngvoflanm 8.3.2 Starting with the standard of lowestone or more stock standlrda to I concommtlon, analyze each caJlbratton
volumetric flask. To each caJlbratlon standard according to Sect. 10 andslarldlld, add a known (:otls_at amount tabulate peak height or area responseof oneor more lateral _ and versusmeconcemmtlonIn thestandard.250 I_ methand, and dlutl to velum! The results can be used to prepare awith MTBE. Estertfy acids with callbraUon curve for each compound.
. dlaz_ as described In Sect. 10.4 Altamatlv_ty, II the raUo of response toOr 10.5. One of the caJlbratlonstandan_ concentration (calibration factor) is ashould be repmunta_e of an zmlyte cormart overtheworkingrange(< 10%concentration near. but above, the relative standard deviation), llnearityEDLThe other concentraUons should through the origin can be assumed and
" correspond to the range of concanU'atlons the average ratio or calibration factor
detector. 8.3.3 Single point calibration Is a viable8.2.2 In_ect 2 _ c_ each calllxatlon _ itwnstJve to a caJlbratloncurve. Prepare
and tabulate the relative respome vOr Idnglepo(nt smndan:lsfrom the secondary
inch IrNdy1e (l:lRa) to an inte_i s_mdan:l IlutJonclsmndams In m_ar,=i. The sin_eusing the g_:l_ " point standan:la should be prepared at,,. a corlc41fllTaUonUlat produces a response
RP.m- Aa/AIs dose (..+.20%)to mmof me unknowns.whom: 8.3.4 The working cllibrltlon curve orA41 -the peak Iraa of _ anaJyte, and caJibraUon factor must be verified on
Me_'_xl616.1.Page7, Revleacl1988
DRAFTDOCUMENT.INTERNALUSEONLY,4/15/88
w_fklng day by the _ srmlyte meet the acceptance criteria.of one or morn cJlbr_lon •linden:is. If • perfommncs Is acceptable and sample
_u_e_ forany anah/tev_m from m_/m maybegin.If any x or S fails-- predictKI re•poem by mar• then outside Its acceptance range, initialthe tul mu_ be repe_KI using demonstration procedues for that
• hlsh cad_ slandan:l. If the results compoimd must be repeated.still do not agree, generate • newcallbraUon cta'wl or use • single poL_ 9.4 The anatyS! is permitted to modify G]cJibraUon st,sr¢lafd as dNcdbed In _ columlls, GC condlUons, or detectors ;o8.3.3. ', Improve separations or lower analytical
• ,.. corns. Each time such method modifications
+-. . re•de, _ Sectk'monaJyat9r_ust repeat the+.QUAUTYCONTROL +• procedures .
s._ MlrumumquW_ comrd (OC).mUmments 9.s _ S.m:_tt. Recovery.are Initial demonstration of laboratory 9.5.1 When surn0g_e recovery from a saml:lecapability, determination of surrogate or method blank Is <70% or 130%.compourcl mcovmlea In each •ample lad check (1) calculatlons to locate possibleblank, monitoring Internal standard peak errors, (2) splklng solutions for• re• or height In each sample and dIK_'adaUo_ (3)contaminaUon or otherblank (when Internal standard calibration _abnormalltles, and (4)instrumen(
_ ca_ of _ w_em, r__e thelaboratory control (LC) standards. QCsambas, a,d per_mwca .vz¢_ pE)ssrnples. 9.5.2 If a blank extract reanalysis fails the
70-130% criteria, the problem9.2 Method Blanks. Before processing any mu_ be _ and corrected before
samples, the analyst must demonstrate ¢on_that all gtauwam and reagentimerferoncasare under conUcL Each time • sIK of 9.5.3 if sample extract reanaJysls solves thesamples Is extracted or reagents are problem, report only data from the -changed. • method blank must be analysis with acceptable surrogate :analyzed. If within the retention time recovery. If sample extract reanalysiswindow of any analym the method blank dol no( solve the problem, report all "produces a peak that Is 0.S EDL for data for b'_ smnpie as suspect.that an•lyre, determine the source of 9.6 Ass_ the Int•mal S_contaffdmt_n and elinmate the _adenmc_before pfoclmstng samples. 9.8.1 For each sample and blank extract,
dlmmtWm If Imemal slanda_ peak area9.3 Initial _ of Capabllb/. or height deviates by 30% from the
9.3.1 Selects representative spike average measured during analysis ofconcenm_ (about 10 _ EDL_ for cadlbralloneach an•lyre. Prepare • LC sample
concentrate (in methanol) containing 9.6.2 ifped_30%deviation,ladini_°ptimize•secondinstrumentaJiqucteach anaJyte •t 1000 limos selected -b_e--of _ exlmcL If rolr_ected aJlquot
_tOsydnge'eac_add I mLwire producesamacceptableIntem_standard- of the conclmu_e of at Iom_ peak aros or height, report results for
four 1-4. aJkNorJ of reaoent WllM, and that Idk:lUOLIf not, assume that an erroranalyze each aliquot according to was made during addition of Internalproc_ums _ In ,SectionIO, mndmn:lto _ tx_act, Reax_ct mat
9.3.2 CaJcullte mmmporcemrocovery(X), .. sampleorblardc,andanaJyzemat extract.and standsrd deviation of percent 9.6.3 If 30% deviation continues, 8nalyze arecovery (S). For each.nWy_ X muse • cal_,,,,_ scar_ (Sect.e).fail in the range Of 70,,130% (or withinR .:!:.3RSD using I_1 values for R and 9.6.3.1 If I_ W4m-_ s|andard peak areaRSD for reagent wazor In Table 2) and or peak height fds to meet criteria, thenS must be less _an _ (or leas then rucaJibrate, and reanaJyze e_tmcts mat3 x RSD in reagen_ wamr In Tsl=ie 2). previously did not meet criteria. IfIf the calculated X •nd S for every sccopla_• area or height Is measured,
Method 516.1, Page 8, Rovtsld 1988
DRAFTDOCUMENT- INTERNALUSEONLY. 4/15/88
report results. If not, assume •n •bout identification of • GC peak,Interferencefrom me mudx is _eczlng coNImuofy techntcluessuch as decerrr.natlonthe Interml standard and me aternaJ " wlm • ma_ spec_aer dmecmr of 8c¢_ (See• 8). dlffemr_ GC cdumn musl be used.
9.8.3.2 If me Intmmt sm'_dan:;peekmof peakheightmeetsc_eda thenassume 10. PROCEDUREan Intederencefromthematrixis •fleeringthe Internal standard In your sarnpte 10.1 AUTOMATEDHYDROLYSIS, CLEANUP, ,ANDextract and use extam-aJ¢aJlbraUon. EXTI:LAC3"IONMETHOD - Validation dam
presmUd In this method were generatedg.7 Assessing Laboratory PII_ using me automated extraction procedure
g.7.1 Initial QC ¢rRerLI are esf41bllshedby with the mechanical separatory funnelthe values for X and $ gmr_ed shaker.
above (Sect. 9.3) to eala_ish _ and 10.1.1Add preservative to any samples notlower conU_ limits: prevt0uJy preserved (Sect. 7.2). Mark
the wilier meniscus on the side of theUPPER CONTROL UMIT = X + 3S earn_e bottle for later determinationofLOWER CONTROL LIMIT -X . 3S sample volume. Spike sample with 50
IAL of the surrogate standard spikingThe L_oratory mu_ anly_ at learnone solution. If the mechanical separatoryLC sam_a per sample eat (aJlsambas funnel shaker Is used, pour the entireextracted w_:hln • 24-h period). The " simile Into • 2-1,.sager•tory funnel. Ifst_ldngconClCllfatkgnof I_ _e In the m_nl_ tumbler Is used, pourthe laboratofy central sample shouldbe me enfJmsample Into a tumbler borne.10 times EDL Calculate accuracy as
recovery(X,'). If the recoveryof 10.t.2 Add 250 g NaC1 to the sample, seal,any •nalyte ilsfa outside the control and shake to dlssoNe saillimits, that •nalyte Is Judged out ofconud, and me source of the problem 10.1.3Add 17 mL of 6 N NaOH to'the sample.rnu_ be idenlffiedand msdvod bMom seal. and Shake. Check the pH of thecontinuing anaJysu. The ¢onsr_ limits sample with pH paper;, If the sample
have a pH greater thanrecammemledSh°uldbe updatedthlafterPeri°dically'_five tolttlmls dOeSequal_oOt12,adjust the pH by actdin°g
more 8 N NaOH. Shake sample for 1new recovery rmmummenls macnew hour using the appropriate me_hanicaJconUol limits be c:aJculafjdruIng m_me me.,=rm:em 20-30 da,= polm¢ m_xingdevice.
9.7.2 Eachquarterme lal:oralorymustanalyze 10.1.4Add 300 mL methylenechlorideto theOC check standards (if available). If samite boaleto rinsethe bottle,transfercriteria provided with the QC check me rneffiytenechlorideto the sap•rarefyslanda_ are not met, corrective_ funnelof tumbler baffle, seal and shakeshould be taken and doctunented, for 10 s, ventthg periodically. Repeat
shakingandventinguntilpressurereleaseg.7.3 At leas•once a year, me labof_ofy muse is not observed dudng venting. ReseaJ
anaJyze8 perfom'anco_m_ sample 8ndplacesarape containerinap0ropriate('_available),and _ for each •naiVe mechanical mixing device. Shake or
. must be within eaim_Lshed•ccel:xance tumble Itm samplefor 1 hour. CornpleteIimitL and tttoroughmixingot the organicand
KlUeOUSphasesshouldbe observedat9.8 A_sessing Instrument Performance -The least 2 men after starting the mixing
Instrumem OC _ _ e.12) mxddbe analyzed daily to monitor Instrumentperformance. Inability to demonstrate 10.1.5Removeme sample container from theacceptable insmJmentperformance indicates mixing device. If the tumbler is used.the needs to mevaJuate me GC sys=em, pour contents of tuml_er Ix)me into aIf laboratory EDIj differ from listed EDI..s 24.separatofy funnel.Nlow the organic
able 2), concentrations of Instrument layer to sap•rate from the water phasestandard compoun_ may be adjusted for a minimumof 10 man.If the emutsion
as needed. Interface between layers Is more thanone thln:lthe volurneof the so,ventlayer.
g.9 AnaJyte Confi_ - When doub( exisls
Method515.1. Pageg. Revisedlg88
DRAFT _ENT - INTERNAL USE ONLY - 4/15/88
the enelyst must employ mechanical 10.2.1 Add preservative to any samples nottechniques to complete the phase prm/tousiy preserved (Sect. 7.2). Markseparation. The optimum technique the water meniscus on the side of the
F depends upon the sample, but may sample borne for later determination ofInclude stirring, filtration through glass sample volume. Pour the entire samitewool, centrtfugatlon, or other physical into a 24. saparatory funnel. Spike samplemethods. Drain end discard the organic with 50 _ of the surrogate standardphase, ff the tumbler is used, return the sl_klng sOlUtion.aqueous phase to me tumbler bottle.
10.2.2 Add 250 g NeCI to the sample, seal.10.1.8 Add 17 mL of 12 N H2SO4 to the and shake to dissoNe sail
.samite., seal. and shake to mlx. Checkof me sample with pH paper;, if 10.2.3 Add 17 mL of 6 N NaOH to the sam_e.
themel:_sampledoes not have I pH less seal, end shake. Check the pH of thesample with pH paper; if the saml:iethan or equal to 2. adlust the pH by
adding more 12 N Pi2SO4. doeS_uualnot have s pH greater than ortO 12, adjust the DH by adding10.1.7 Add 300 mL ethyl ether to the sample, _e 6 N NaOH. Lot the sample sit at
seal, and shake for 10 s, venting room temperature Ior 1 hour, shakingperiodically. Repeat shaking end ver_ the separatory funnel and contentsuntil pressure rWeasa is not observed pedodicaJly.dt=ing venting. ResaaJand place samplecontainer In appropriate mechanical 10.2.4 Add 60 mL methylene chloride to themixing de_ca. Shake or tumble sample sarn_e bottle to rinse the bottle, transferfor 1 hour. Complete and thorough the rn_ene cNodde to the saparatory
funnel and extract the sample bymixing of the organic and aqueousphases shoutd be observed st least 2 vtgorotndy shaking the funnel for 2 manmin Idter starting me rn_ device, . with periodic venting to release excesspressure. Allow the organic layer to
10.1.8 Remove me sample contairm¢ from the separate from the water phase for amixing device. If the tumbler is used, minimum of 10 mtn. If the emulsionpour contents of tumbler boffie Into a Interface between layers is more than24. separatory funnel. Allow me on_ one third the volume of the solvent layer, :_
layer to separate 1fromtheOmln.ffwater pl-,asa ' the analyst must employ mechanicalfore minimum of the emulsion techniques to complete the phaselmorfaca between layers is more than separation. The optimum technique _one third me volume of the solvem layer, depends upon the sample, but maythe analyst must employ mechanical Include stirring, filtration through glasstechniques to complete the phase wool, centrlfugation, or other physicalseparation. The optimum technh:lUe rne_ Discard the methylene chloridedepends upon the sample, but may phase.in(dude sttmng, filtration through glasswool, centrlfugatlon, or other physical 10.2.5 Add a second 60-mLvotume of methylenemethods. Drain and discard the aqueous cNodde to the sample bottle and repeatphase. Collect the ixtract in a 5(X)-mL the exlracflon procedure a second time,round-bottom flask _ about 10 g dlscan:llng the methylene chloride layer.of acidified anhydrous sodium sulfate. Perform a third extraction in the samemanner.PedodicaJlyvigorousty shake the sample
" and drylng agent. Allow the m_ract to 10.2.8 Add 17 mL of 12 N H2SO4 to theremain In contact with b'_ sodium sulfa_ semple, seal, and shake to mix. Checkfor II_x_0dcnmmly 2 hour& the pH of the sample with pH paper;, if
the sample does not have ,o pH less10.1.9 Determine the odglnJ amlde volumeby refilling the sample bottle to the n_rk than or equal to 2, adiust the pH byand transferring the water to a 1000-mL adding mote 12 N H=SO4.graduated cylinder. Record the sample 10.2.7 Add 120 mL ethylether to the sample.volume to the neomst 5 mL seal, and ox_Jractthe sample by vigorously
10.2 MANUAL HYDROLYSIS, CLEANUP, AND shaking the funnedfor 2 min with pedodicEXTRACTION METHOD - Alternative ' venting to re(usa excess pressure. Allow
the organic layer to separate trom theprocedure, waf41rphase for a minimum of 10 man.
Method 515.1, Page 10, RevLsed1988
DRAFTDOCUMENT- INTERNAL.USEONLY- 4/15/88
If the emulsionInterfacebetweenlayers liquid reaches 1 ml., remove the K-0- Is more than one third the volume of ¢opamtusand aJlowit to drain and co(_
thesoMml:layer..thearedy=mu= employ for at Isest 10 men." _ t_ to compete me
phases_ Theopdmumt_e 10.3.4Remove the Snyder column and nnsedepends upon the sample, but may the flask and its lower joint Into theconcentrator tube with 1 to 2 mL ofinctude sZlrdng,fitratlon through glass ..wool, centrlfugatlon,or other physlcaJ _ ether. Add 2 mL of MTBE and amethods. Remove the aqueous phase . ' holingstone.Attacha micro-Snydercolumn to the concentrator tube andto a 2-L Edenmeyer flask and collect ....the ethyl ether phase In a 500-mL prewet the column by adding about0.5round.bottom flask containing mL of ethyl ether to the top. Place _eapproximately10g of acidifiedanhydrous . micro K-D apparatuson the water bathsodium sutfam. , so that the ¢oncmtor tube is partially
Immersed In the hot water. Adjust tl_e10.2.8Return the aqueous phase to the vertical position of the apparatus and
separatory funnel,add a 60.mL volume the water temperature as required toof ethyl etller to the santo, and nKleat complete concentrationIn 5 to 10 men.the ¢_'actlon procedurea sin:end time, When the apparent volume of liquidcombining the extracts In the 500-rnL reaches0.5 mL. remove the micro K-Dertanmeyer flask. Perform a third from the bath and =low it to drain andatnlctk)n with 60 mL of _ _ In cooLRemovethe micro Snydercolumnthe same manner.Periodicallyvlgo_ and add 250 _ of methanol If theshake the sample and drying agent, gaseousdiazomethaneprocedure(Sect.Allow the extract to remain in contact 10.4)isusedfores_eriflcatlonofpesticicles.withthe sodiumsulfatefor approximately rinse the walls of the concentratortube2 houri, while adJl._tlngthe volume to 5.0 mL
with MTBE. If the pesticides will be10.2.9Determine the original sample volume esterilledusingthedlazomethanesolution
by refillingthe sample bo_e to the mark (Sect. 10.5), rinse the walls of tl_eand transferringthe water to a 1000-mL concentrator tube while adjusting thegraduated cylinder.Record the sample volume to 4.5 mL with M'rBE..votume to the rmutm S mL
10.3 EXTRACT COITION : ' 10.4 ESTERIFICATIONOF ACIDS USINGGASEOUSDIAZOMETHANE -- Validation results10.3.1AssembleaK-Oconcet'_Worbyatlaching presented in this method were generated
a concentrator tube toe 500.mL pr_4_d_um.gas4mu8dlazomethan, derivattzat,on- iVllt_rattve Ilask. .... ;.. ,
10.3.2Pour the dded exlmct through a funnel 10.4.1Assambie the dlazomethane generatorplugged with acid washed glass wool, (Rgt_ 515.1-I) in a hood.and collect the extract In the K-D 10.4.2Add 5 mL of ethyl ether to Tube 1. Addconcentrator.Use a glass rod to crush 1 mL of etl_d ether, I mL of carbitol,any caked sodium sulfate dudng the 1.5 mL of 37% aqueous KOH, and 0.2transfer. Rinse the round.bottom flask grams DiazaJdto Tube 2. Immediatelyand funnel with 20 to 30 mL of ethy4 place the exit tube Into the concentratoretherto complete theClUantitatlvaIx'4r=fer. tubecontainingthe sampleextract.Ap_y
" 10.3.3Add 1 to 2 clean boling stones to the nitrogen flow (10 mL/mtn) to bubbleevaporaUveflask and attacha micro dlazomettmnethroughtheex_'actfor 1Snydercolumn.PmwltheSnydercoltltm rain. Remove _ sarnple. Rinsethe Upby adding about 1 mL ethyl ether to of the dlazomethar_generatorwith ethylthe top. Place _ K-D _ on a ether after _n of each sample.hot water bath, 60 to _'C, so that the Bubbledlazomethanethroughthe secondconcentrator tube Is pmllally Immersed sampleextract for I min. Dlazomethane.In the hot water, and the entlm lower reactlon mixture should be used torounded surface of the flask Is bathed es=edfyonly two samDlea:prepare newwith hot vapor. At the proper rate of reaction mixture In Tube 2 to ester_dlstillstlon the balls of the column will each two additional samples. Samplesactlvety chatter but the chambers will should turn yellow after addition ofno( flood.When the apparentvolume of d_ and remain yellow for at
',*, L J
Method515.1, Page11, Revised1988
DRAFTDOCUMENT• INTERNALUSEONLY- 4/15/88
least2 rain. Repeatmethytatlon__l 10.6.2AD_y s mL of 5 percent methanol inIf _. . MI"BEto the Flortsl. Allowthe liquidto
Jan_reach the top of the Florisil.In thisf 10.4.3Seal concentratortubes with moppers, subsequentsteps, allow the licluidStore at room tampemtur! In a hood levelto just reach the top of the Flodsdfor 3:} mln. beforeapplytngrite next dnse, howe,,,er.
10.4.4Destroyany t_rmcted dlazomethaneby do not allow the Flortsil to go dry.adding 0.1 to 0.2 grams dick: acid to .. Discard eluate.the cortcentraIortube¢ Nlow to standuntl the evolutionof nitrogengas has 10.6.3Apply 5 mL methyiated sample to the
Collec_eluate in K-D tube.(ap0um.,, v2o Re.s,l.v,nQ.li Ic In tubethe sample v_ume to 5.0 mL wire
10.5 ESTERIFICATION OF ACIDS USING 10.6,4Add 1 mL of 5 percent methanol inMTBE to the sample container, rinsingDIAZOMETHANE SOLUTION - Alternative walls. Transfer the rinse to the Rorisdprocedure. " • column leaving siliclc acid in the tube.10.5.1Aseaml:dethe diazomathane generator , Collect eluate in a K-D tube. Repeat
(Figure515.1) In a hood. The collection withl-mL and 3-mLaJiquotsof 5 percentvessel ts • 10- or 15-mL via/, equipped methart_ in MTBE, collectingeiualesInwith a Teflon-lined screw cap and K-D tube.fftalntalmKIat 0-5C. 10.6.5If necessary,dlute eluate to 10 mL with
10.5.2Add a sufficientamount of ethyl ether S percentmetttar_ In MTBE.Spikewithto tube 1 to cover the first Implnger. 25 _ of Internal standard solution.Add 5 mL of MTBE to the collection Thon__ghtymixsampleandplace aliquot
In a GC Vial for subsequent analysis._J¢lSetthe _iazall_dfl°w et 5"10mLLrnIn.2 mL solution (SecL 6..9) 10.6.6Slid the vial and store In a refrigeratorand 1.5 mL of 37% KOH solutk_ to the If fUllherprocosl_ will notbe II>edormedsecondImpinger.Connm=file tubingas Immedlate_. Analyze by GC-ECD.shown and allow the nitrogen flow topurgethedlaz_ Ifornthereactt0n 10.7 GAS CHROMATOGRAPHYvesselIntothe collec_n v_l for30 rain. _Cap the viii when ccdlecUonIs complete 10.7.1SecL5.10 summarizesthe recommended -_end maimaInet o-sc.whenstoredat condom form,,GC.ir.uded0-5C this dlazomethanesotutlanmay be 1 are retentiontJrn#.sobservedusa¢lover a period of 48 11.'" , using thls method. Other GC columns.
" chromatographiccondRIons,ordetectors10.5.3To each concentrator tube contaIning may be usedIf the requirementsof Sect.
sample or standard, add 0.5 mL 9.4 am met.diazomethaneso4utJa_Samples shouldturn yellow after addition of the 10.7.2 Calibratethe system dailyas describedIn Sect. 8. The stanclarclsand extractsdiazomethanesolutionand remainyellowfor at least 2 mln. Repeat methylaUon must be In MTBE._ura if necuea_. 10.7.3 Ir_ect 2 IJ- of the sampleextract.Record
10.5.4Seal concentrator tubes with stoppers. . the resultingpeak size in area units.Store at room temperature In a hood 10.7.4The width of the retention time window
. for 30 mtn. used to make identificationsshouldbebased upon measurements of actual
10.5.:.OesUoyany _ dlaz_ by retanUon time variations of standardsadding 0.1 to 02 grimm dick: acid tothe concentratortubes. Allowto _ ov_r the coume of a day. Three times• the standard deviation of a retentionuntl the wol_lon of nJUogengas hm
stopped (approxlrnately20 mln).k_u_ tlrnecanbe usedto calculatea suggestedthe sample vcdurneto 5.0 ml. with window size for a compound.However,the experience of the analyst should10.6 FLORISIL CLEANUP , ' weigh heavily in the interpretation of
10.6.1 Place a small plug of glass wool into chromatogmms.s 5-ml. die.sable glass I_Pet. Tare the 10.7.5 If the response for the peak exceedspipet, and measure 1 g of activated the woddngrange of the system,diluteFiortsl into the pipet, the extract and reanalyze.L
Method515.1, Page 12, Revised1988,
DRAFTDOCUMENT- INTERNALUSEONLY- 4/15/88
11 CALCULATIONS Monitoringand SupportLaboratory,Cincinnati,Ohio" 45268.
11.1 Calculate analyte concentrations In thesample from the response for the i_yt,eusing the calibration procedure dmmrcm] 2..ASTMAnnualBook of Standards,Part 11,Volume11.02,D'_94-82, "StandardPracticeforPreparationofin Sect. 8. Sample Containe_ and for Preservation',American
11.2 For samples processed as part of a SocteWfor Testingand MatenaJs,Philadelphia,PA,p.86,1986.set where the laboratow centred standar¢lrecovery fails outside of the control limitsIn Sect. 9, results for the effectea 3.Glare,C. S, ChantH. S., and Nef,G. S. "SensitiveanaJytea must be lab_ed as suspecL Method for Determinationof Phthalate Ester Ptas-
tlctzers In Open-Ocean Biota Samples,"
12. PRECISIONAND ACCURACY _ 47-2225 (1975).
12.1 In a slr_e labomtoW, InJyte recoveries 4.Glare,C. S.,andChan,H. S."Controlof Blanksinthefrom reagent water were determined at AnalvstsofPhthalatulnAIrandOceanBiotaSam_es.'five concentration levots. Results were U.S.NalJonaJBureauofStandardL SpeciaJPul_icazlonused to determine analyte EDLs and 442, pp.701.708,1976.demonstrate method range.(1) In caseswhere anatytes coeluted using primary 5.'Carctn(x.,lena-Workingwith Carcinogens."Depart-anaJ_ioaJcondRlona,resultsfrom conflffnalory meatof Hl_aJth,Education,andWelfare,PublicHeaJtl_GC conditionswere used. AnaJyterecoveries Ser_dce,Centerfor DiseaseControl,NaUonaJInstituteat one concentration and EDL results forOccupaUonalSafetyandHeaJ_,PubilcationNo.TZ-are given In Table 2. 206,AUg.1977.
12.2 In a single labor_ory, analy_ recoveriesfrom two artificial ground waters were 6"OSHA Safety and Health Standards, GeneraJIn.determined et one concentration level, dij._ry,'(2gCFR1910),OccuDa_ttonalSaferyandHealth
Admen, OSHA2206, (Revised,January1976).Resultswere used to demonstrateappilcabiltyof the method to different ground watermatrices.(1) Analyte rocoverles from the 7.'Safety In Academic Chemistry Laboratories."two Irtlflc_ rna_ric_ em given In Table Amerk_hChemlcWSoclt_Publlcatlon,Comm_on2. ChemicalSW_/, 3rd Zclitl_, 1979.
13. REFERENCES ILASTMAnnualBookof Standards,Part 11, Vo4ume. 11.01, D3370-82, "Standard Practice for Saml_ing
Water,"AmericanSocietyfor Testing and Materials,1.'Pestk:ideMeU'N_sEvaluation,"letter Report#33 for Phitadelpht¢PA,p. 130, 1986.EPAContractNo. 68.03-2697.AvailablefromU.S. En.vironmental Protection Agency, Environmental
Methcx:l515.1, Page 13, Revised1988
Prepared fort
John P.. OeKany "Oepu.i:yAssistantAdminis_rai:orforChemicalContro1
Office of Toxic Substancese
Prepared byI
_omas A. BellarJames J. Lichtenber3Physicaland ChemicalFlethodsBr_nchEnvironmentalNonitoringand SupportLab_ra:or:/
I
w
THE DETERMINATIONOF POLYCHLORINATEDBIPHENYLSINTRANSFORMERFLUID AND WASTE OILS
l. Scopei
1.1 This is the EPA preferredmethod for the determinationof
polychorinatedbiphenyls(PCBs) in waste oils accordingto PCB
regulations,l This gas chromatographic(GC) procedure is
applicableto the determinationof commercialmixtures of PCBs in
transformerfluids and certainother hydrocarbonbasedwaste oils.
The method can be used to analyzewaste oils for individualPCB
isomersor complexmixtures of chlorinatedbiphenylsfrom mono-
chlorobiphenylthroughdecachlorobiphenylonly if the isomershave
been previouslyidentifiedby othermethods2 or by knowledgeof
,- the sample history.
1.2 The detectionlimitsare dependentupon the _bmplexitT-o_ the
samplematrix and the abilityof the analystto properlymaintain
the analyticalsystem. Using a carefullyoptimizedinstrument,
this method has been shown to be useful for the determinationof
commercialPCB mixturesspiked into transformerfluidover a range
of 5.0 to 500 mg/Kg. Based upon a statisticalcalculationat 5
mg/Kg for a simpleoil matrix, the method detectionlimitfor
Aroclors 12Zl,12¢2, 1254, and 1260 is I mg/Kg. The method
detectionlimit (MDL.)is defined as the minimum concentrationof a
substancethat can be measured and reportedwith 99% confidence
that the value is above zero.
1.3 This method is restrictedto use by or under the supervisionof
analystsexperiencedin the use of gas chromatographyand in the
interpre:ationof gas chromatograms. Priorto sample analysis,
each analystmust demonstratethe abllltyto generateacceptable
resultswith this method by followingthe proceduresdescribedin
SectionlO.Z.
• 2_ Summary
2.1 The sample is dilutedon a weight/volumebasis so that the concen-
trationsof each PCB isomer is within capabilityof the GC system
(O.Olto lO ng/uL.).
2.Z The dilutedsample is then injectedinto a gas chromatographfor
separationof the PCB isomers. Measurementis accomplishedwith a
haIogenspecificdetectorwhich maximizesbaselinestabilityand
minimizesinterferencesnorma.llyencounteredwith other detectors.
The electroncaptur_ detectar(ECD)can normallybe substitutedfor
the halogenspecificdetectorwhen samplescontaindichlorothrough .
, decachlorobiphenylisomers(AroclorsI016, 1232, 12¢Z, 1248, 1254,•
12BO_-'l-26Zand IZBB),or when the samplematrix does not interfere
with the PCBs. Severalcleanup techniquesare providedfor samples
containinginterferences. A mass spectrometeroperatingin the
selectedion monitoringmode of data aquisitionmay also be used as
the GC detectorwhen PCB levelsare sufficientlyhigh and the PCB
m/z ranges are free from interference. Interferencesmay occur in
some wast_ oil sampleseven afterexhaustivecleanup.
2.3 The concentrationsof the PCBs are calculatedon a mg/Kg basis,
using commercialmixturesof PCBs as standards. The analysistime,
not includingdata reduction,is approximately35 min/sample.
3. Interferences, ,m,
3..I Qualitativemisidentificationsare alwaysa potentialproblem in GC
'analysis.The use of a halogen specificdetectorand the analyst's
skill in recognizingchromatographicpatternsof commercialPCB
' mixturesmlnlmlzesthis posslblllty.
3.Z Whenever analyzedsamplesdo not provldechromatographicpatterns
nearly Identlca]to the standardspreparedfrom commercialPCBs,
the analystmust confirmthe presenceof PCBs by one of threeways:
by analysisafter column cleanup;by analysison dissimilargas
chromatographiccolumns;or, by gas chromatography/massspectro-
metry (GC/MS).
3.3" During the development,and testingof this method, certainanaly'ci-
c_l parametersand equipmentdesignswere found to affectthe
validityof the anal_Yclcalresults. Proper use of the method
requiresthat such parametersor designsare'to be used as speci-r
'- " fJed.These items are identifiedin the text by the word "must.".,...,._ ,
Anyonewishing to deviatefrom the method in areas so identified,
. must demonstratethai:the deviationdoes not affect the validityof
the.dat_ and alternativetest procedureapprovalmust be obtainedo
throughthe EnvironmentalMonitoringand SupportLaboratory,26
West St. Clair Street,Cincinnati,Ohio 45268 Equivalency
Program.3 An experiencedanalystmay make modificationsto
parametersor equipmentidentifiedby the term "recon_ended." Each
time such modificationsare made to the method, the analystmust
repeatthe procedurein Section I0.2. In this case, formal
approvalis not required,but the documenteddata from SectionI0.2
must be on file as pari:of the overallquality assuranceprogram.
3.4 Sampleswhich are diluted at a ratio of lO0:l and are analyzedby
electroncaptureGC, consistentlyproduceresultsthat are lO to
3
o
F 20% lowerthan the true value {See Section IZ). This is due to
quenchingof the detectorresponseby high boilinghydrocarbons
coelutlngwith the PCBs. The degree of error is matrix dependent '
and is not predictablefor samplesof unknown origin. As the PCB
concentrationapproaches20% of a control level,for example,
50 mg/kg, the analystmust routl.nelyreanalyzea duplicatespiked
s_ple to determinethe actualrecovery.Spike the duplicateor
dilutedsampleat 2 times the electroncapture observedvalue and
reanalyzeaccordingto Section I0.2. Correct the resultsaccord-
Ingly.
4.. Apparatus
4.1 las Chromatograph-- The gas chromatographshouldbe equippedwith
on-columnI/4-1nchinjectors. The oven must be largeenough to.. D,_ °
accepta I/¢L 0D i!meter coiled glass.column.--If-h&Toge_specific
detectorsare used, then the columnoven shouldhave progran_ning
capabi1ities. • o
4.2 Gas ChromatographicDetector
¢.2.1 A h_logenspecificdetector is used to eliminateinter-
ferencescausingmlsldentlflcatlonsor false-posltivevalues
due to non-organohalIdes whlch COnTnonlycoelute with the
PCBs..
a. Electrolyticconductiv'itydetector-- the Hall
electrolyticconductivitydetector,Model 7OO-A (HED),
availablefrom Tracor, Inc. has been found to provide the
sensitivityand stabilityneeded for the curr_nt PCB
Regulations..l
b. Other halogenspecificdetectors,includingolder,_odel
,f
r electrolytic conductivity detectors and mtcrocoulometrtc
titration, may be used. However, the stability, sensi-
tivity, and response,time of these detectorsmay raise
the method detectionllmltand adverselyaffect peak
resolution. Each systemmust be shown to be operating
wlthln requlrementsof the PCB regulationsby collecting
singlelaboratoryaccuracyand precisiondata and method
detect ton limits on simple sptked samples as described in
Section IO.Z.
4.Z.Z Semi-specific detectors, such as ECD, may be substituted
wherrsampTachromatographicpatternscloselymatch those of
the standards. Actd cleanup (See Section 8.1) or Florisil
slurry cleanup(See Section8.7) shouldbe incorporated
routinelywhen the ECD is used.--SeeSection_3.4J_or
additionalqualitycontrolproceduresfor ECD.
• 4.2.3 QuantitativeGC/MS techniquescan be used and the recom-
mended approachis selectedion monitoring (SIM)but the
GC/MS data systemmust have a program that supportsthis
method of data acquisition. The programmust be capableof
monitoringa minimum of eight ions,and it is desirableFor
the system to have the abilityto change the ions monitored
as a functionof time. For PCB measurements,severalsets
of ions may be used dependingon the objectivesof the study
and the data systemcapabilities. The alternativesare as
follows:
51ngle ions for high 154, 188, 222,
sensitivity 256, 292, 326,
• 360, 394
i
Shortmass rangeswhich 154-156,188-192,
may give enhanced senst- 222-226, 256-250,
tivlty,dependingon the 290-295,322-32B,
data system capabilities 356-364,. 3gO-398 .
Single ions giving 190, 224, 250, 294,
decreased sensitivity 330, 362, 394
bu_:are selectivefor
1evels of .chlorination.(2)
-- i
Th_ data systemmust have the capabilityof integrating
artabundanceof the selectedions betweenspecified
limitsand relatingintegratedabundancesto concentra-
tions,,using the calibrationproceduresdescribed in this
method.
4.3 Gas Chromatographic Columns
4.3.l The GC columns and conditionslistedbelow are recommended
for the analysisof PCB _ixtures in oil. If these columns
and conditionsare not adequate,the analystmay vary the
columnparametersto improveseparations. The columns and
conditionsselectedmust be capableof adequatelyresolving
the PCBs in th8 variousAroclormixtures so that each
6
- Aroclor is identifiablethroughisomer patternrecognition.
(See Figures I through6 to establish this.) To prop.erly
.use the calculationproceduredescribed in Section 11.5,the
analyst must use the methyl silicone liquid phase column
- described in Sec_ton ¢.3.2. Capillary columns and their
associatedspecializedinjectiontechniquesare acceptable
alternatives;however,due to problemsassociatedwith the
use ofcapillary columns the analyst must demonstrate that
the entire systemwill produceacceptableresults by
performini_the operationsdescribedin Section lO.Z.
4.3.2 Reco_ended primary a.nalytic.alLcolumn:Glass, I'/¢in. O.D.
(Z mm I.D.)6 fi:(180 cm) long,packedwith Gas-ChromQ
lO0/I20mesh coatedwith 3% OV-l.
Carrier gas: 40 to 60 mL/min (helium,nitrogenor mixtures 0- .I,mm NI..--
o_"methane in argon as recommendedby the manufacturerof
the detector).
TemperatureProgram: 120°C isothermalfor 2 minutes,
6°/min to 220°C.and hold until all compoundselute.
Figure 8 shows a chromatogramof the PCB locatormixture
{see Section5.8) analyzedunder these conditions. Each PCB
peak has been identifiedby assigningthe same relative
retentiontimes determinP..din the isothermalruns Figures l
through6.
IsothermalOp.eratlon:Aroclor 1221, 1232, or ClI through
Cl¢ isomers-- recommendedrange 140 to 150°C
Aroclor lOIB,1242, 1254, 1260, 1262, 1268,or Cl3 through
Clio isomer_-- recommendedrange 170 to 200°C
7
.JI"
4..3.3 Recommendedconfirmatory column: Glass tubing 1/¢ in. O.D.,f
2 mm I.D. 6 ft (180 m) long,packed with Gas-ChromQ
lO0/IZOmesh coatedwith 1.5_ OV-17 + 1.95_OV-210.
Carriergas: 40 to 60 mL/min (helium,nitrogenor mixtur-.s
• of methane in argon as recommendedby the manufacturerof .
the detector). "
Column temperatures:Aroclor 1221, 1232,or ClI through
CI¢ isomersrecommendedrange -- 170 to lSO°C.
Aroclor lOl@, 1242,1248, 1254,.1260, 1262, 1268,or Cl3
throughClio isomers200°C..
4.4 Volumetricflasks-- I0, lO0, 200, and 250-mL.roll
4.5 Pipets-- O.lO, l.O, and 5.0 mL Mohr delivery(for viscousoils cut
off tip of pipet).
4.6 Micros_rringes -- lO.O uL.i
4.7 Sammlecontainers-- 20 mL or largerscrew cap bottleswith Teflon
faced cap liners. (Aluminumfoil cap linerscan be used for non
corrosivesamplee).
4.8 Chromato_amhic column-- Chromaflex,400 _ long x 19 mm ID
(KontesK-420540-gOllor equlvalsni:).
4.g Gel PermeationChromatograph--GPC Autoprep I002 or equivalent,
availablefrom AnalyticalBio ChemistryLaboratories,Inc.
4.10 Balance--Analyi:ical,capableof weighing99 grams with ao
sensitivityof +_O.O001 g.
4.11 Kuderna-Danish(K-O)EvaporativeConcentratorApparatus
4.lO.l Concentratortube-- lO-mL,graduated(KontesK-570050-I025
or equivalent). Calibrationmust be checked. Ground glass
• B
stopper(size lg/2Zjoint) is used to preventevaporationoff ".
so1vent.
4.11.2 Evaporative flask -- SO0_mL(Kontes K-S7001-OSO0or
equivalent). Attach to concentrator tube with springs
(Kontes K-6627SO-OOlZ or equivalent). .e
4.11.3 Snyder column -- Three ball macro (Kontes KS03000-0121 or
equivalent).
5. Reagents and Materials
5.1 Reagent safety precautions
S.l.1 The toxicity or" carcinogenicity of each reagent used in this
method has nat been precisely defined; however, each
chemicalcompoundshouldbe treatedas a potentialhealth
hazard._rom this viewpoint,exposureto these chemicals,,
must be reducedto the lowestpossible levelby whatever•.. m ._
means available. The laboratoryis responsiblefor main-
taininga currentawarenes_file of OSHA regulationsregard-
ing the safe handlingof the chemicalspecifiedin this
method. A referencefil_ of materialdata handlingsheets
should _.!sobe made availableto all personnelinvolvedinI.
the chemicalanalysis.
5.1.2 PCBs have been tentativelyclassifiedas known or suspected,
human or mammaliancarcinogens. Primarystandardsof these
toxic compoundsshouldbe prepared in a hood.o
S.l.3 Diethylether shouldbe monitored regularlyto determinethe
peroxidecontent. Under no circumstancesshoulddiethyi
ether be used with a peroxidecontent in excessof 50 ppm as
..s
d
an explosioncould result. Peroxidetest stripsmanufac-
tured by EM Laboratories(availablefrom ScientificProducts4
Co. Cat. No. PI126-8and other suppliers)are recommended
for th.istest. Proceduresfor removalof peroxidesfrom
diethyl ether are includedin the instructionssuppliedwith
the peroxidetest kit.
5.2 Hexane (mixedhexanes),isooctane,acetonitrile,methylene
chloride,cyclohexane,and diethylether of pesticidegrade.
5.3 RecommendedColumn Packings
5.3.1 Gas Chrom Q lO0/IZOmesh coated with 3",OV-l.
S.3.Z Gas Chrom Q I00/120mesh coatedwith 1.5,_ OV-17 + 1.95,"
OV-ZIO..
5.4. Standards ..
S.4.1 Aroclors lOl_, 1221, 1232, 1242.,_1248,1254, 1260, 1262,
126B. Primarydilution_of variousAroclorsare available
from U.$. EPA, EMSL-CincinnatiQualityAssuranceBranch, 26
W. St:.Clair Street,Cincinnati,Ohio 45268.
S.4.Z 2-Chlorobiphenyl,3-¢hlorobiphenyl,and decachlorobiphenyl
5.4.3 Pure individualPCBs as identifiedin the sample by mass
spectrometryor indicatedby retentiondata.
5".4..4Alumina (FisherAS40 or equivalent).
5.4.S Silica gel (DavisonGrad_950 or equivalent).
5.4.6 Florisil (PR grade or equivalent).
5.4.7 Sulfuric acid A.C.S.
"5.4.8 QualityControl Check Sample--Certified Samplesof PCBs in
oil matrices are availablefrom U.S. EPA, _4SL-Cincinnati,
10
QualityAssuranceBranch,Z5 W. St. Clair Street,
Cincinnati,Ohio 452B8.
5.5 StandardStock Solutions-- Prepareprimarydilutionsof each of
the Aroclorsor individualPCBs by weighingapproximatelyO.Ol g of
materialwithin ± O.O00l g. Dissolveand diluteto lO.O mL with
isooctaneor hexane. Calculatethe concentrationin ug/uL. Store
the primarydilutionsat 4°C in 10 to I5-mLnarrowmouth, screw
cap bottleswith Tefloncap liners. Primarydilutionsare stable
indefinitelyif the seals are maintained. The validityof Inhouse
generatedor stored primary and secondarydilutionsmust be veri-
fied on a quarterlybasis by analyzingEMSL-ClQualityControl
CheckSamplesor certifiedPCB standards.,,
5.6 WorkingStandards-- Prepare workingstandardssimilar in PcB
compositiorrand concentrationto the samplesby mixing and dilutingo,e_ ,me
the individualstandardstock solutions. Dilute the mixtureto
volumewith pesticidequality hexane. Calculatethe concentration
in ng/ul,as the individual_oclors {Section ll.4)or as the
individualPCBs {Sectionll.5). Store dilutionsat 4°C in lO to
15-mLnarrowmouth, screw cap bottleswith Tefloncap liners. If
the sealsare maintained,these secondarydilutionscan be stored
indefinitely. (See SectionS.5.)
5.7 Laboratorycontrolstandard (LCS) -- Prepare a LCS by spikinga PCB
free oil typicalof the matrix normally analyzed,such as a trans-
formeroil, at 50.0 mg/Kg with a PCB mixture typicalof those
normallyfound in the samples, such as Aroclor 1260 at 50.0 mg/Kg.
5.8 PCB LocatorMixture -- Prepare a PCB locatormixture containingO.l
ng/uL of 2-chlorobiphenyl,O.l ng/uL 3-chlorobiphenyl,0.5 ng/uL
1!
jJf
°..._
Aroclor 1242,0.5 ng/uL Aroclar 1260,and 0.2 ng/uL Aroclar126B in
hexane (0..Ing/ul,of decachlarobiphenylcan be substitutedfor
Aroclor 126(I).Use the chromatogramgeneratedby the PCB locator
mixture to help identifythe retentiontimes of the variousPCB
• isomerscommonlyfound in commercialPCB mixtures.
6. SamoleCollectionand Handlingiu, H I I Ill
6.1 Ean_lecontainersshouldhave a volume of 20 mL or more and have
Teflan or fa i 1 1tned"screw, caps.
6.2 Sample BottlePreparation
6.Z.l WaslTaIT sampTebottlesand seals in detergentsolution.
Rinse firstwith tapwater and then with distilledwater.
Allow the bottles.andseals to drain dry in a contaminant.,
.. fret area. Then rinse sealswith pesticidegrade hexane and
a11ow to air dry.
6.2.Z Heat sample bottles'to 400°C for IS to 20 minutes or rinse
with pesticidegrade acetoneor hexane and allow to air dry.
6.2.3 Stare the cleanbottles invertedor sealeduntil use.
6.2.4 Samplebottlescan be reused. Prior to reuse, rinse the
bottles and seals 3 times with hexane,allow to air dry, and
then proceed to Section6.2.1.
6.3 Sample Preservation--The samplesshould be stored in a cool, dry,
dark area until analysis. Storage times in excessof ¢ weeks are
not recommendedfor unknownor undefinedsamplematrices.
6.4 Sampl• Collection
6.4.1 Fill a largecontainersuch as a 500-mL beaker from a
representativearea of the sample source. If'practical,mix
the samplesourceprior to sampling.
12
I
I
.,°'_
f 6.4.2 FIll a minimum of two 20-mL sample bottles(Field Sample1
(FSI)and Field Sample2 (FS2))approximately80",full from
the samplingcontainer.
6.4.3 Repeat Sections6.4.1 and 6.4.2 if there is a need to
monitor samplingprecisionas described in Section10.6.
7. Proceduremlllll
7.1 The approximatePCB concentrationof the samplemay be determined
by X-ray fluorescence(totalhalogenmeasurement),microcoulometry
(totalhalogenmeasurement),densitymeasurements,or by analyzing
a very dilutemixture Of the sample (lO,O00:l)accordingi_oSection
7.4_
7.2 For'samplesin the 0 to I00 mg/Kg range, dilute at the rate of
lO0:l in hexane.
7.2.I Pipet l.O mL of sample into a iO0-mL v_lumetr.ic_f.laskusing
a l.O-mLMohr pipet. For viscoussamples,cut the capillary
- tip off the pipet. Dilute to volume with hexane. Stopper
and mix.
7.2.2 Using the same pipet as in Section7.2.I, deliver l.O mL of
sample into a tared lO-mLbeaker weighed to ._.001 g.
Reweigh the beaker to ± .001 g to determinethe weight of
sampleused in 7.2.1.
7.Z.3 As an alternativeto Sections7.2.1 and 7.2.2,weigh approxi-
mately l gram to ±.OOl g of sample in a lO0-mLvolumetric
flask and dilute to volumewith hexane.
7.2.4 Analyze the dilutedsample accordingto Section 7.4 or store
' the diluted sample in a narrowmouth bottlewith a Teflon
linedscrew cap.
13
7.3 For samplesabove lOO mg/Kg in concentration,dilute at a rate of
lO00:lin hexane.
7.3.1 Pipet 0.I0 mL of sampleinto a lO0-mLvolumetricflask using
a 0.I0 mL-Mohr pipet..Diluteto volumewith hexane,stopper
and mix.
7.3.Z Using the same pipet as in Section7.3.1, deliverO.lO mL of
sample Into a tared lO mL beaker to __.O001 g. Reweighthe
beaker to determine•theweight of sampleused in Section
7.3.1.
T.3.3 As an alternativeto Sections7.3.1 and 7.3.2,weigh approxi-
mately O.T gra_rto ±.OOOTg of sample and in a lOO mLe
• volumetricflask. Dilute to volumewith hexane.
7.3.¢ Analyze the dilutedsample accordingto Section 7.4 or store
the.dilutedsample in a narrowmouth bottlewith a Teflon.g.m
lined screw cap.
T._.5: If the concentrationof PCBs is still too high for the
chromatographicsystem,preparesecondarydilutionsfrom
Sections7.3.1 or_7.3.3,until acceptablelevelsare
obtained.
7.¢ Analyze the sampleby injectingthe hexanemixture into the gas
chromatographusing auto injectorsor the solventflush
technique.
7.4.1 Recommendedinjectionvolumes:Halogen specificdetector--
¢ to 5 uL, ECD 2 to 3 IJL. Sma]lervolumesmay be injected
when auto injectorsare used if the resultingmethod detec-
tion limitsare acceptable.
Note; When semi-specificdetectorsare used, cleanup techniques(see Section4.2.2) shouldbe routinely incorporat.=dinto theanalysisscheme prior to injection.
14
_'- 7.5 If the resulting,chromato.aramshows evidenceof columnfloodingor
nonlineardetectorresponses,furtherdilute the sampleaccording
to Section 7.3.5.
7.6 Determinewhether or not PCBs are present in the sampleby compar-
in_ the samplechromatogramto that of the PCB locatormixture
Se__tian S.8.
7.6.I If a series of peaks in the samplematch some of the reten-
tion times of PCBs in the PCB locatermixture, attemptto
identifythe sourceby comparingchromatogramsof each
standardpreparedfrom commercialmixtures of PCBs (see
SectionS.6).. Proceedto Section II.4 if the sourceof PCBs
is identified.
• Oa7 6.Z If the samplecontainsa complexmixture of PCBs, proc..dto
Section Il.S.,mm.m...
T._.3 ILla dilutionratio of lO00:l(Section7.3) or higherwas
analyzedand no measurablePCB peaks were detected, analyze
an _Tiquoi:of samplediluted to lO0:l.
7.6.4 If severalPCB interferenceproblemsare encounteredor if
PCB ratios do not match standards,proceedto Section8, use
alternatecolumns,or use GC/MS2 to verifywhether or not
th_ nonrepresentativepatternsare due to PCBs.
8. Cleanupi l ii
Severaltested cleanuptechniquesare described. Dependingupon the
complexityof the sample,one or all of the techniquesmay be required
to resolvethe PCBs from interferences.
8.1 Acid Cleanup
15
/._ 8.1.I Place5.0 mL of concentratedsulfuricacid into a 40-mL
narrowmouth screwcap bottle. Add lO.OmL of the diluted
san_31e.Seal the bottlewith a Teflon lined screwcap and
shakefor l minute.
8.1.Z AlTow the phasesto separate,transferthe sample (upper
phase)to a clean narrowmouth screwcap bottle. Seal with
a Teflon 1ined cap.
8.1'.3 Analyze according to Section 7.4.
8.1.¢ If the sample is hlghTycontaminated,a secondor third acid
cleanupmay be employed.
NOTE- This cleanuptechniquewas testedover a 6-month• periodof time using both electroncaptureand electrolytic
conductivitydetectors. Care was taken to exclude anysamplesthat formedan emulsionwith the acid. The samolewas withdrawnwell above the sample-acldinterface. Underthese conditions,no adverseeffects associatedwith columnperformanceand detectorsensitivityto PCBs were noted.This cleanuptechniquecould adversely--_ffect-_he-chromato-graphiccolumn performancefor samplescontaininganalytesother than PCBs.
8.Z FlorisilColumnCleanup
8.Z.I Variancesbetweenbatchesof Florisilmay affect the elution
volume of the variousPCBs. For this reason, the volumeof
solventrequiredto completelyelute all of the PCBs must be
verifiedby the analyst. The weight of Florisilcan then be
adjustedaccordingly.
8.Z.Z Plac_ a 20.0 g chargeof Florisil, activatedat 130°C,
into a _hromaflexcolumn. Settle the Florisilby tapping
the column. Add about l cm of anhydroussodiumsulfate to
the top of the Florisil. Pre-eiutethe columnwith 70 to 80
mL of hexane. Just before the exposureof the sodium
sulfatelayer to air, stop the flow. Discard the eluate.
16

f
/,
8.2.3 Add 2.0 mL of the undilutedsample to the columnwith af'.
2- mL Mohr pipet. For viscoussamples,cut the capillary
tip off the pipet. Add 22S ml.of hexane to the column.
Carefullywash down the innerwall of the columnwith a
small amountof the hexane prior to addingthe total volume.
Collectand discardthe first Z5.0 ml..
8.Z.¢ Collectexactly200 mL of hexane eluate in a ZO0-mL volu-
metric flask. All the PCBs must be in this fraction.
8.1.5 Using the same pipet as in Section 8.2.Z, deliver Z.O mL of
sample into a tared lO-mLBeaker weighed to ± O.OOl g.
Reweighthe beaker to determinethe weight of the sample
dilutedto 200 mL.
8.2.6 Analyzethe sample accordingto Section7.4.
8.3 AluminaColumnCleanup•row._ t -- __
8.3.I Adjust the activityof the aluminaby heatingto 200°C for
Z to Chours. When cool, add 3_.water (weight:weight)and
mix until uniform. Store in a tightly sealedbottle. Allow
the aluminato equilibrateat least30 minutes before use.
Adjustactivityweekly.
8.3.2 Variancesbetweenbatchesof aluminamay affectthe elution
volumeof the variousPCBs. For this reason,the volume of
solventrequiredto completelyelute all of the PCBs must be
verifiedby the analyst. The weight of Aluminacan then be
adjustedaccordingly.
8.3.3 Place a 50.0 g charge of alumina into a Chromaflexcolumn.
Settlethe aluminaby tapping. Add about l cm of anhydrous
sodiumsulfateto the top of the alumina. Pre-elutethe
17
f-" columnwith 70 to 80 mL of hexane. Just beforeexposingthe
sodiumsulfate layerto air, stop the flow. Discardthe
eluate.
8.3.¢ Add 2.5 mL of the undilutedsample to the columnwith a 5-mL
Mohr pipet. For viscoussamples,cut the capillaryend off
the pipet. Add 300 mL of hexane to the column. Carefully
'wash down the innerwalls of th_ column with a small volume
of hexane prior to addingthe total volume. Collectand
discardthe 0 to 50 mL fraction.
8.3.5 Collectexactly250 mL of the hexane in a 250-mL volumetric
flask. All the PCBs must be in this fraction.
8.3.6 Using the same pipet as in 8.3.4,deliver2.5 mL of samlole
into a tared lO-mLbeaker± O.OOl g. Reweighthe beaker to
determin_weight of sampledilutedto 250 mL..mmm=g ,ll
8.3.6 Analyzethe sample accordingto Section7.4,
8.4 Silica Gel ColumnCleanup.
8.4.1 Activatesilica gel at 135°Covernight.
8.4.Z Variancesbetweenbatchesof silica gel may affectthe
elutionvolumeof the variousPCBs. For this reason,the
volume of solventrequiredto completelyelute all of the
PCBs must be verifiedby the analyst. The weightof silica
gel can then be adjustedaccordingly.
8.4.3 Place a Z5 g charge of activatedsilicagel into a
Chromaflexcolumn. Settlethe silicagel by tappingthe
column. Add about l cm of anhydroussodiumsulfateto the
top of the silicagel.
IB
8.4.4 Preelute the column with about 70 to 80 mL of hexane. Just
beforeexposingthe sodium sulfatelayerto air, stop theb
flow. Discardthe eluate.
8.4.5 Add 2.0 mL of the undilutedsample to the columnwith a 2-mL
Mohr pipet, For viscous samples,cut the capi]larytip off
the pipet.i
8.4.6 Washdown the inner wall of the column with 5 mL of hexane.
8.4.7 Elute the PCBs with 195 mL Of 10% dlethyletherin hexane
voTume:vo1ume.
8.4.8 CollectexactlyZOO mL of the eluate in a 200-mL volumetric
• f_ask. A11 the Peas must be in this fraction.
8.4.9 Using the same pipet as in Section 8.4.5,deliver2.0 mL of
sample into a tared lO-mLbeaker(± O.OOl g). Reweigh to
determine the weight of sample diluted to 200 mL.
8.4.10 An=lyze the sample according to Section 7.4.
8.5 Gel PermeationCleanup
8.5.1 Set up and calibratethe gel permeationchromatographwith
an $X-3 column accordingto the instructionmanual. Use 15_
methylenechlorideIn cyclohexane.(volume:volume)as Ehe
mobil phase.
B.5.Z Place l.O mL of sample into a lO0-mLvolumetricflask, using
a l-mL Mohr pipet. For ¢iscoussamples,cut the capillary
tip off the pipet.
8.5.3 Dilute the sampleto volume,using 15_ methylenechloride in
cyclohexane (voIume:voIume).
B.5.4 Using the same pipet as in Section8.5.2 deliver l.O mL of
sample into a tared lO-mLbeaker ± O.OOl g. Reweigh the
Ig
/ •i beaker • 0.001 g to detmrmtne thin wmtght of samDle used in
r- Section 8.5.Z.
8,5.5 As an alternative to Sections 8,5.2 and 8.5.3 weigh approxi-
mately 1 gram ± 0,001 g of sample and dilute to 100.0 mL in
15¢ methylene chloride in cyclohexane (volume:volume).
8.5.5 Inject5.0 mL of the dlluted sampleInto the instrument.
Collect the fracti.oncontainingthe CII throughClIo
PCBs (see operator'smanual) in a K-O flask equippedwith a
10-mLampuI,
8.5.7 Concentratethe Section8.5.4 fractiondown to less than 5
mL, usingK-O evaporativeconcentrationtechniques.
8.5.B Dilute to 5.0 ml.with hexane,then analyzeaccordingto
Seci:ion7.4. Be sure to use lO0 ml.as the dilutionvolume
for the final calculation.ml_.
8.6 AcetonitrllePartition --
8.6.1 Place lO.OmL of the previouslydilutedsample into a 125-mLo,
separatoryfunnel. Add S.O mL of hexane. Extractthe
sample four timesby shakingvigorouslyfor one minute with
30 mL portionsof hexane-saturatedacetonitrile.
8._.P.Transferand combine the acetonitrilephases to a l-L
separatoryfunneland add 650 mL of distilledwater and
40 mL of saturatedsodiumchloridesolution. Mix thoroughly
for 30 to 35 seconds.Extractwith two lO0 mL portionsof
hexane by vigorouslyshakingabout 15 seconds.
8.5.3 Combinethe hexaneextracts in a l-L separatoryfunnel and
wash with two lO0 mL portionsof distilledwater. Discard
the water layerand pour the hexane layer througha
20

column (Section 4.8) packed with 3 to 4 inches of anhydrousf'"x
sodium sulfate . Drain the column into a 500-mL K-O flask
equipped with a lO-mL ampul. Rinse the separatory funnel
and column with three 10 mL portions of hexane.
8.8.4 Concentrate the extracts ta 6 to 10 mL in the K-O evaporator
in _ hot water bath, then adjust the volume to 10.0 mL. Be
" sur_ to use the correct dilution volume (see Section 8.5.1)
for the final calculation.
8.5.[ Analyze according to Section 7.4.
8.7 rlorisil Slurry Cleanup
8.7.1 Place 10 mL of the dtluted sample into a 20-mL narrow mouth
screw cap container. Add 0.2S g of Flortstl. Seal with a
Teflon lined screw cap and shake for I minute.
8.7.Z Allow the Flortstl to sett.le then. decant the treated solu-1,
ttorr into a second container. Analyze according to Section
g. Calibrationii.l
g.l SinglePoint'Calibrations-- Preparecalibrationstandardsfrom
• standardstock solutionsin hexanethat are close to the unknown in
compositionand in concentration. If when using an electrolytic
conductivitydetectorthe sampleresponseis in the low level
nonlineardetectionarea,the calibrationpointmust then be within
20",of the sample. The ECD must beoperated only within its linear
responserange.
9.2 As an alternativeto Sectiong.l, preparea calibrationcurve for
each Aroclor or PCB detected in the sample. The standardcurve
must containat least3 points,two of which must bracket the
21
_concentration. When using an electrolyticconductivity
detector,if the sampleresponseis in a low levelnonlineararea
of the calibrationcurve,two of the calibrationpointsmust be
within 20",of the unknown. The calibrationcurve must be checked
daily, usingthe LaboratoryControlStandardSection5.7. If the
calibrationcurve is not within 15% of the LaboratoryControl
Standard,recalibratethe instrument. If an electroncaptur_
detectoris used then it will be necessaryto correct the
LaboratoryControlStandardvaluefor recovery(see Section3.4).
Use the recoveryvalue determinedthe same day the calibration
curve was generated. The correctedvalue must be within 15%,of the
spike value,otherwisethe instrumentmust be recalibrated.
lO. Precision and Accurac),
lO.l Each laboratoryusing this method is requiredto operatea formal
- qualitycontrolprogram. The minimum requirenentsof this program
consistsof an initialdemonstrationof laboratorycapabilityand
the analysisof spiked samplesas a continuingcheck on perfor-
mance, l'helaboratory is requiredto maintain performance
records to definethe quality of data that is generated. After
January 1, 1982,ongoing performancechecks must be comparedwith
establishedperformancecriteriato determine if the results of
analysesare withir accuracyand precision limitsexpectedof the,m
method.
10.1.1Before performingany analyses;the analystmust demonstrate
the ability to generateacceptableaccuracyand precision
0
with this method. This ability is es_aolishedas described
in Section I0.2.
!

I0.I.2 In recognitionof the rapid advancesoccurringin chromato-
f- graphy,the analyst is permittedcertain optionsto improve
the separationsor lowerthe cost of measurements. Each
time such modificationsare made to the method,the analyst
is requiredto repeat the procedure in Section I0.2.
lO.l.3The.laboratorymust spike and analyzea minimum of lO_ of
all samplestq monitor continuinglaboratoryperformance.
This procedureis describedin Section I0.4.
I0.2 To establishthe ability to generateacceptableaccuracyand
precisionin the use of this method, the analystmust perform the
followingoperations.
lO.2.1For each commercialPCB mixture or individualPCB isomer
normallymeasured,select _ --jpikeconcentrationin the range
of 25 to 75 mg/kg. Using stock standards,prepare a spiking(i' --.1
concentratein isooctanelO00 timesmore concentratedthan
the seIectedconcentration.
° I0.2.2Using a microsyringe,add lO0 uL of the PCB concentrateto
each of a minimumof Four lO0 mL aliquotsof PCB _ o,re. oil.
A representativewaste oil may be used in place of the clean
ofl, but one or"more additionalaliquotsmust be analyzedto
determinebackgroundlevels,and the spike level must exceed
twice the backgroundlevel for the test to be valid.,m
Analyze the aliquotsaccordingto the method beginningin
Section 7.
I0.2.3Calculatethe averagepe_'centrecovery,(R), and the
relativestandarddeviation(s)of the concentrationfound.
23
Waste oil background corrections must be made before R
calculationsare performed.
10.2.4Using the appropriatedata from Tables 7, 8, and 9, deter-
mine the recoveryand singleoperatorprecisionexpectedfor
the method and comparethese results to the valuescalcu-
lated in SectionI0.Z.3. If the data are not comparable,
the analys_must review and remedy potentialproblem areas
and repeatthe test.
I0.2.5After January I, Ig82,the valuesfor R and s must meet
method performancecriteriaprovided by the U.S. EPA,
EnvironmentalMonitoringand SupportLaboratory,Cincinnati,
Ohio, before any samplesmay be _nalyzed.
IO.3 The analystmust calculatemethod performancecriteriaand define
the performanceof the laboratoryfor each s_tke_co.n.c.entrationand
. parameterbein_measured.
I0.3.1Calculateupper and lower control limitsfor method perfor-
mance:
Upper Contr_1Limit (UCL)= R . 3 s
LowerControlLimit (LCL)- R - 3 s
where R and s are calculatedas in Section I0.2.3.
¢The UCL.and LCL can be used to constructcontrolcharts
that are useful in observingtrends in performance. After
January I, 1982,the control limitsabovemust be replaced
by method performancecriteriaprovidedby the U.S.
EnvironmentalProtectionAgency.
10.3.2The laboratorymust developand maintain separateaccuracy
statementsof laboratoryperformancefor waste oil samples.
Jm ........ _.....
accuracystatementfor _he method is definedas R ± s.r.
The accuracystatement_houldbe developedby the analysis
of ¢ aliquotsof waste oil as describedin Section10.2.2,
followedby the calculation'ofR and s. Alternately,the
analystmay use four waste oil data pointsgatheredthrough
the r_uir=Jent for continuingquality control in Section
I0.4. The accuracystatementsshould be updatedregularly.
10.4 The laboratoryis requiredto collecta portionof their samples in
duplicateto monitor spikerecoveries. Tne frequencyof spiked
sample analysismust be at least I0% of all samplesor one sample
per month,whichever is greater. One aliquotof the samplemust be
spikedand analyzedas describedin Section I0.2.2at two times the
backgroundlevel. If the recoveryfor a particularparameterdoes ,.
not fall within the control limitsfor.method-perfo._ma.nc__the
resultlreportedfor the parameter in all samplesprocessedas part
.. of the same set must be qualifiedas described in Section ll.9.
The laboratoryshouldmonitoringthe frequencyof data so qualified
to ensurethat it remainsat or below 5",.
I0.5 Before processingany samp.les,the analystshould demonstrate
throughthe analysisof a PCB free oil sample,that all glassware
-, (_4_kand reaoentsare fr_. of interferences..Each time a set of samples
is analyzedor there is a change"in reagents,a laboratoryreagent
blank shouldbe processedas a safeguardagainstcontamination.
I0.6 It is reconTnendedthat the laboratoryadopt additionalquality
assurancepracticesfor use with this method. The most productive
specificpraci_i¢_sdependupon the needs of the laboratoryand the
nature of the samples. Field duplicatesmay be analyzedto monitor
25
the precisionof the samplingtechnique. When doubt exists
F--- r_._ar_Ingone 1_en_ifica_ionof a peak on the chroma_ogram,k
confirmatorytechniquessuch as GC with a dissimilarcolumn,
specificelementdetector,or MS must be used. Wheneverpossibl-_
the laboratoryshouldperform analysisof standardreference
materials and participatein relevantperformanceevaluation
studies.
I0.7Analjrzethe LaboratoryControlStandardSection5.7 daily before
any samplesare analyzed. Instrumentstatus checks,calibration
curve validationand long term precisionare obtainedFrom these
data. In addition,responsedata obtainedfrom the Laboratory
ControlStandardcan be used to estimatethe concentrationof the
unknowns. From this information,the appropriatestandardd'zlu-
tions can be determinedfor singlepoint calibrations.
10.8Analyzeon a quarterlyballs an EMSL-CincinnatiQuality Control
- Sample(Section5.4.0)of PCBs In oil or whenever new standard
dilutionsar_ prepared.
I0.8.1The resultsof the EMSL QualityControlSample should agr-_-e
within IS% of the true value. If they do not, the analyst
must check each step in the standardpreparationprocedure
to re.solvethe problem.
II.Calculationsi
ll.lLocate each PCB in the samplechromatogramby comoaringthe
retentiontime of the suspect_-'akto the retentiondata gatho.r_.=_
from analyzingstandardsand int6_rferencefree Quality Control
Samples. The width of the retentiontime window used to make
026
Ji__ identificationsshould be based upon measurementsof actualreten-
f" tion time variationsof standardsover the course of a day. Three
times the standarddeviationof a retentiontime for each PCB can
be used to calculatea suggestedwindow size; however,the exper-
ienceof the analystshouldweigh heavilyin the interpretationof
chromatograms.
If.2 If the responsefor any PCB peak exce-.dsthe workingrange of the
system, diluteaccordingto Section T.3.5..
ll.3 If accuratemeasurmentof the peaks in the PCB elution area of the
chromatogramis pre.ventedby the presenceof interferences,further
cleanup is required.
ll.¢ If the parentAroclorsor PCBs are identifiedin the sample,
calibrateaccordingto Section9. The concentrationof the PCBs in
the sampleare calculatedby comparingthe sum of the responsesform...j. ,__
each .PCBin the standardto the sum of all of the PCBs in the
sample. This is particularlyimportantas sample concentrations
approachwithin 20% of 50 mg/kg or any other ERA regulatedconcen-
" tration. If calculationsare based upon a singlePCB peak or upon
a smallpercentageof the total PCB peaks, seriouserrorsmay
result. Peaks comprisingless than 50% of the total can be dis-
regardedonly if l) interferenceproblemspersist after cleanup;
2) the sourceof PCBs is obvious;or 3) the concentrationof PCBs
are not within± 20% of an ERA controlledvalue such as 50 mg/kg.
If.4.1Measure the peak heightor peak area of each peak identified
as a PCB in Sectionll.l in both the sampleand the standard.
27
III I I
11.6.ZUse the ?ollowingformulato calculatethe concentrationof
PCBs in the sample:
Concentration mg/Kg = B x VtA 'x W
A Sum oi:standardPeak Heights (areas) = mmZng.= "" ng of-standardinjected i •
B = Sum of samplePeak Heiohts (areas) = n_n/uL...........Ul-ihjec_.ed
Vt- diTutlonvolume of sample in mL
W - weight of the sample In grams
ll.5 I? the parentAroclors or sourceof PCBs"isnot apparent,calculate
the concentrationaccordingto the procedureof Webb and McCall.6
The concentrationof the PCBs in each peak is determinedindivid-.
ually then added togetherto determinethe tota.lPCB contentof the
sample. Each PCB identi?iedin the samplemus_-be-}nc.ludedin
-. these calculations.
" ._ 11.5.1Sma]l variationsbetweenAroclor batchesmake it necessary
to obtainstandardspreparedFrom a specificsourceoF
Aroc]ors. Primary.dilutior,s of these referenceAroclors
will be availablein IgBl From the EnvironmentalMonitoring
and SupportLaboratory,QualityAssuranceBranch,
Cincinnati,Ohio 45268.
II.5.2Analyzea standardmixture of Aroclors 12=.2,1254 and 1260
underthe conditionsshown in Figures3, 5, and 6. Analyz:_
the sampleunder the same conditions..Compare the resulting
standardchromatogramsto those shown in Figures3, 5, and
6. Each PCB peak must be resolvedas well or better than
28
those shown in the figures. Determinethe relative
retentiontime (RRT) of each peak in the standardswith
respect to p,p'-DDEor assignthe RRT shown in the figures
to the correspondingpeak in the standard. Identifythe RRT
o? each PCB in the sample by_comparingthe samplechromato-
gram to the standardchromatograms.
II.5.3 Identifythe most likelyAroclors present in the sample,
using the IdentificationFlow Chart Figure 7.
II.5.4Analyzestandardsaccordingto Section g, using the appro-
priate.Aroclors.
II.5.5Determinethe instrumentresponsefactor (A) for each
indlvidualPCB, using the followingformula:
Peak Heilht (area)A ,_ NgI X mean weight
' ' 100 '
• Ngi - Ng of Aroclor standard injected• Obtain mean weight percent from Tables l
throughB.
"- II.5.6Calculate.the concentrationof each PCB in the sampleusing
the ?ollowingFormula:
Concentration mg/Kg - B x Vt _AxW
A = Responsefactor from II.5.5
B ". P.,eak...Height Car_as)of samole_mm/uLuL injected
Vt= dilutionvolume of sample in mL
W = weight of sample in grams
The concentrationof each PCB must be calculatedand added
togetherto obtain the total amountof PCBs present.
29
p
ll.6 Report all data in mg/Kg.
#_ ll.7 Round off all data to _.significantfigures.
ll.8 Add all Aroclorsand r_port what was used as the standard. For
example,57 mg/Kgmeasured as Aroclor 1260 or 57 mg/Kgmeasured as
Aroclors 1242 and 1260.
ll.g Data for the affectedparametersof samplesprocessedas part of
a set where the laboratoryspikedsamplerecoveryfalls outsideof
the control limits in Section I0.4 must be labeledas suspect.
ll.lODeterminethe actualrecoveryfor electroncapture analysesof
each sample in the uncorrected40 to 50 mg/kg concentrationrange
(se_ Section3.4). Reportthe correctedvalue and the recovery.
12. PrecisionandAccuracy
12.1 The single laboratorydatx shown in Tables 7 throughg were
generatedusing the recommendedproceduresdescribed in this•mb .,mmm
method to anal_e both spiked_d nonspikedoil samplesof varying
degrees of complexity. Data For both the HED and ECD are
present. These data were generatedby the Physicaland Chemical
Methods Branch,EnvironmentalMonitoringand SupportLaboratory,
CincinnP.ti,Ohio, 45268.
Referencss
I. FederalRegister,40 CFR, Part 761.2. Eichelberger,J. W., L.E. Harris and'W.L. Budde. Anal. Chem., ___6,227
(1974).3. FederalRegister,Vol. 41, No. 232, Wednesday,December l, 1976.4. White, L. D., et al., AIHA Journal,31, 22S, (1970).5. Handbookof AnalyticalIQuality Contr_ in Water and Wastewater
Laboratories. EPA-600/4-79-Olg,U.S. EnvironmentalMonitoringandSupportLaboratory,Cincinnati,Ohio ¢5268,March 197g.
6. Webb,R.G. and A.C. McCall. J. Chrom. Sci., l.._l,366 (1973).
• 3O
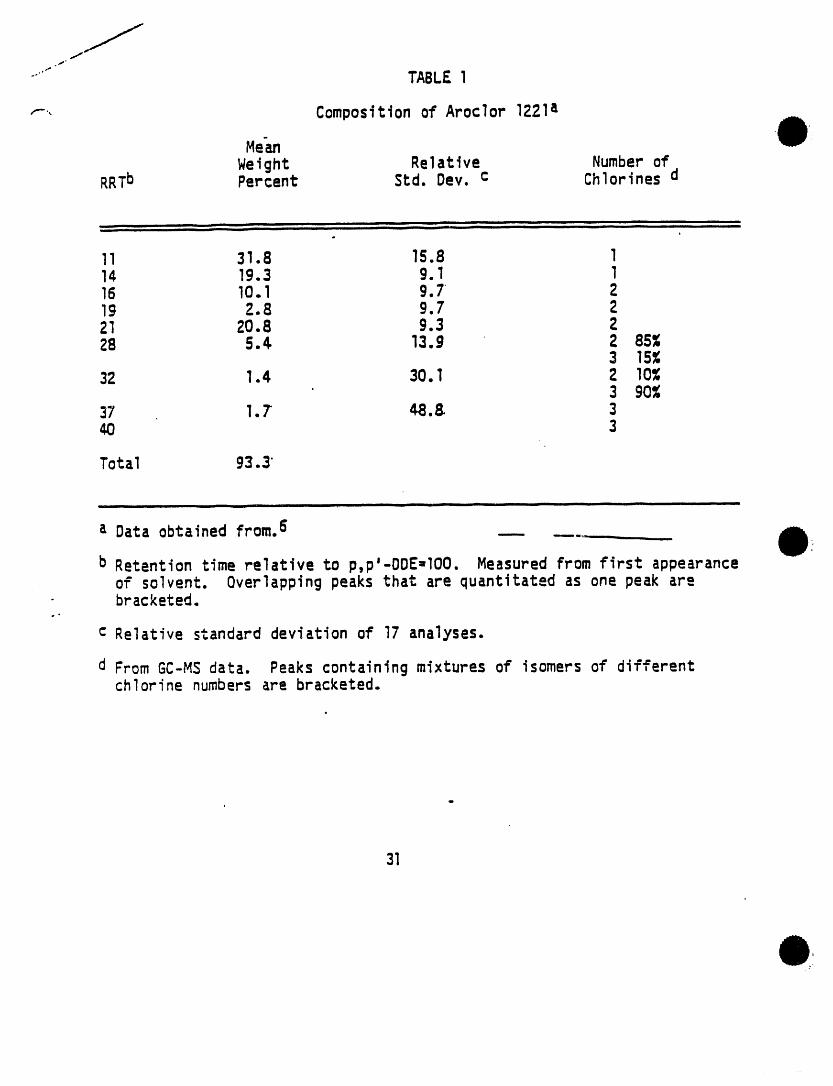
-" TABLE1
r, Composition of Aroclor 1221a
Me'am iWeight Relative Number of
RRTb Percent Std. Dev. c Chlorinesd
,n,. i n i i m i J l i nu nilnl ,uul i u
.
II 31.8 15.8 114 19.3 9.I 116 lO.l 9.7 219 2.8 9.7 221 20.8 9.3 228 5. ¢ 13.9 2 85%
3 15%32 1.4 30.1 2 10%
3 90%37 1.7 48.8. 340 3
Total 93.3"
iii i ii i iii i i1 ii i i1|1
a Data obtainedfrom.6 .....
b Retentiontime relativeto p,p'-DDE-IO0. Measured from first appearanceof solvent. Overlappingpeaks that are quantitatedas one peak arebracketed.
c Relativestandarddeviationof 17 analyses.
d From GC-MS data. Peaks containingmixturesof isomersof differentchlorinenumbers are bracketed.
31
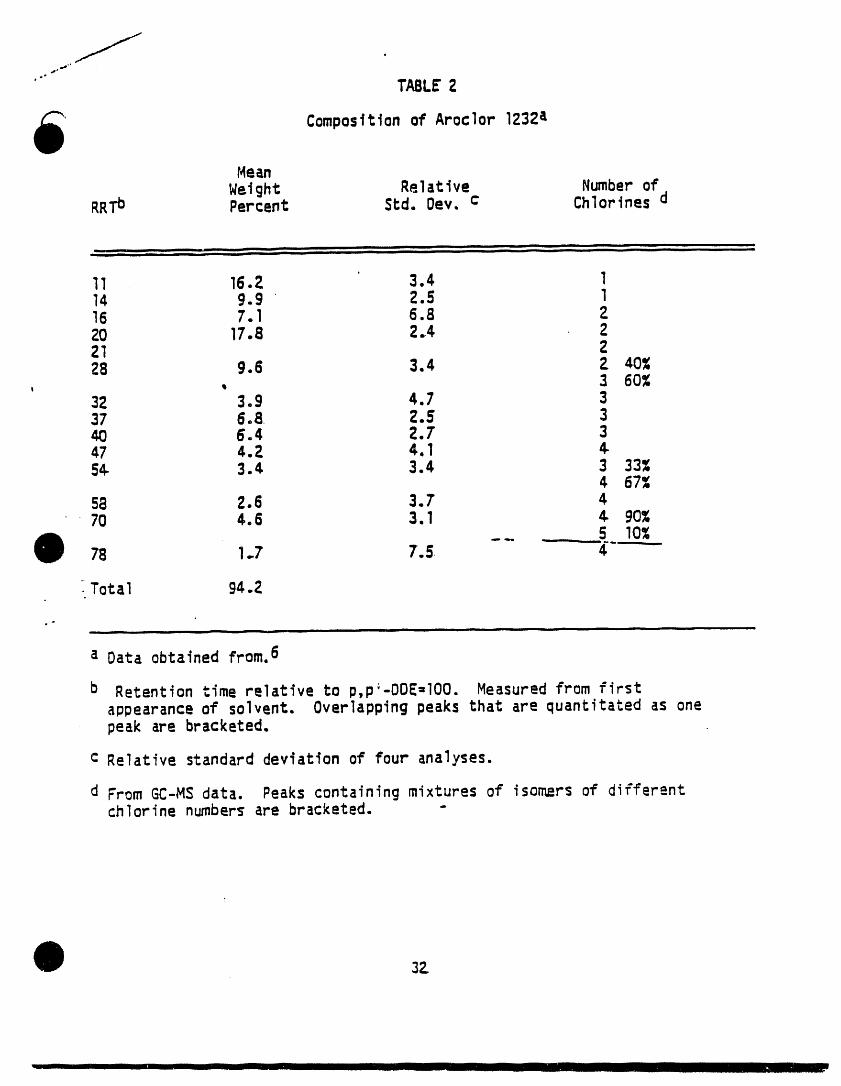
j ,
TABLE"2
Composition of Aroclor 1232a
MeanWeight Relative Number of
RRTb Percent Std. Dev, c Chlorinesd
i i i
........... I,,, ii i i i i iill I I,I
11 16.2 ' 3.4 114 g.g Z.5 116 7.1 6.8 220 17.8 2,4 221 228 9.6 3.4 Z 40%
, , 3 60%32 3.9 4.7 337 6°8. Z.5 340 6.4 2.7 347 4.2 4.1 4.St 3.¢ 3.4 3 33%
4 67%58 2.6 3.7 470 4.6 3.1 ¢ 90%
__ 5 10%7B 1.7 7.S 4_---'---
Total 94.2
.... ,,, i i
a Data obtainedfrom.6
b Retentiontime relativeto p,p_-DDE=lO0. Measuredfrom firstappearanceof solvent, Overlappingpeaks that are quantitatedas onepeak are bracketed,
c Relativestandarddeviationof four analyses.
d From GC-MSdata. Peaks containingmixturesof isomersof differentchlorinenumbersare bracketed.
3Z
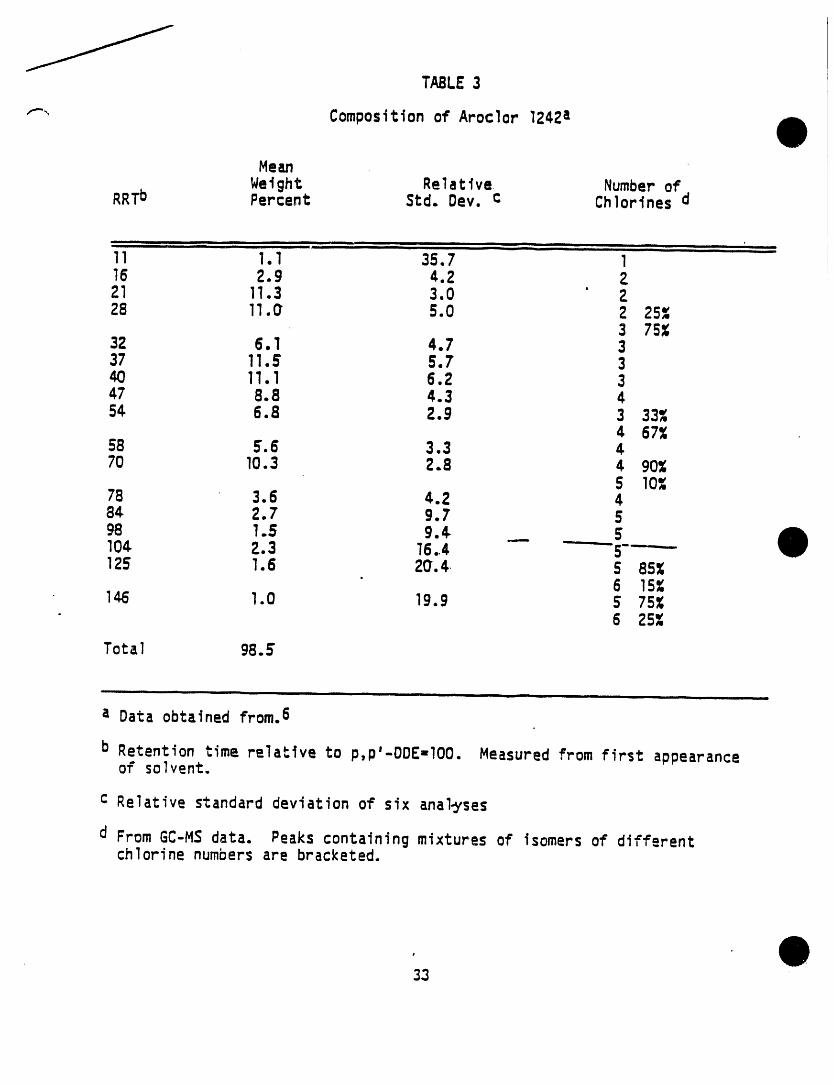
TABLE3
F-, Composition of Aroclor 1242a
Mean
Weight Relative Number ofRRTb Percent Std. Oev. c Chlorines d
.............. i iii iii ILIII -- I I ..... i i ill i I iiiiii ii ] _ _ _ __ .... I iii _ I ii I
11 1.1 35.7 116 2.9 4.2 221 11.3 3.0 " 2.28 11.O 5.0 2 25%
3 75_32 6.1 4.7 337 11.S 5.7 340 11.1 6.2 347 8.8 4.3 454 6.B 2.9 3 33%
4 67%58 5.6 3.3 470 10.3 2.8 4 90%
5 10%7B 3.6 4.2 484. Z.7 9.7 598 1.5 9.¢ __ s104. Z.3 16.4 -"---5---"-"125 1.6 20.4 5 85%
• 6 15%146 1.0 19.9 S 75%
6 25%
Total 98._
.... iIin i i1|1 i |11 , i
a Data obtainedfrom.6
b Retentiontime relatlveto p,p'-DDE=IO0. Measured from First appearanceof solvent.
c Relativestandarddeviationof six analwjses
d From GC-M5 data. Peaks containingmixtures of isomersof differentchlorinenumbersare bracketed.
#
33
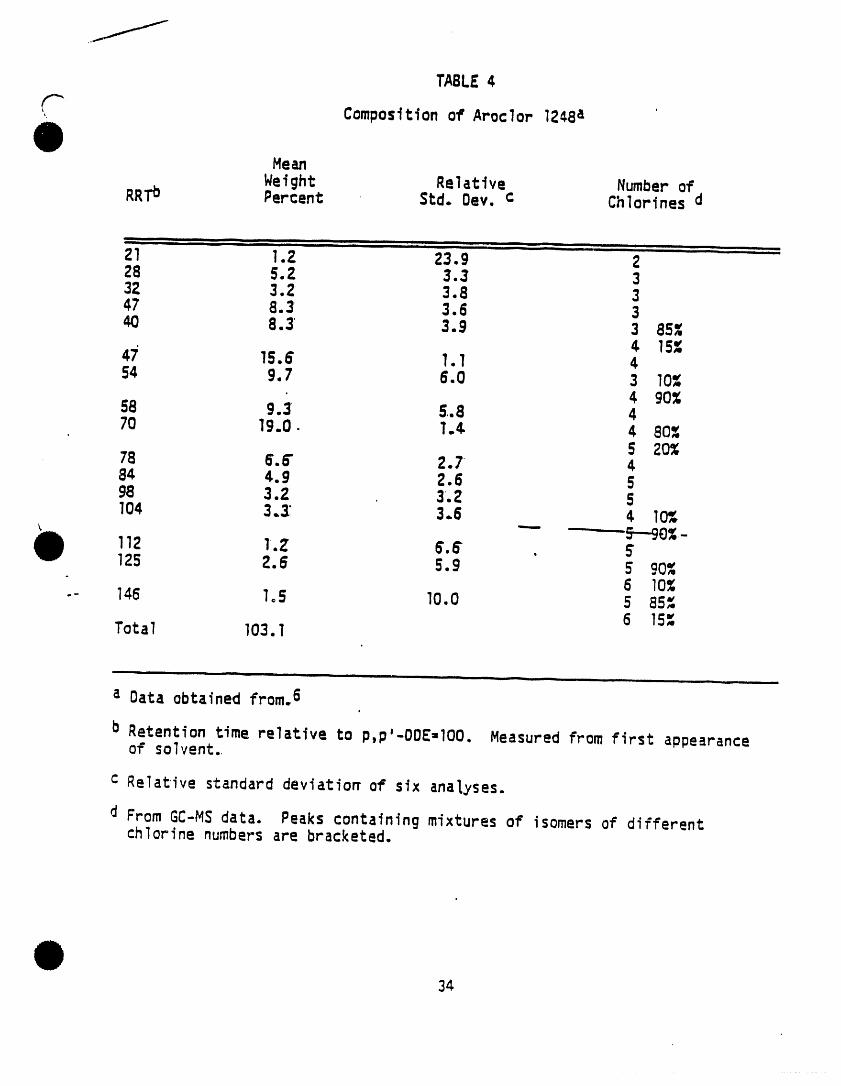
TABLE4
Composition of Aroclor 12¢8a '
Mean
Weight Relative Number ofRRTb Percent Std. Oev. c Chlorinesd
....... - ,, l l II-- Il ,i l I II II l I |I llll
..... ;I -- "_l' ...... l:ll _' Ill "' 23".9 221 1.228 5.2 3.3 332 3.2 3.8 347 8.3 3.6 340 8.3 3.9 3 85_
¢ lSg47: 15.6 1.1 4S4 9.7 6.0 3 log
¢ 90%58 9.3 5.8 470 19.0. 1.¢ 4 80%
S 20%78 6.6" 2.7 484 4.9 2.6 598 3.2 3.2 5104 3.3: 3.6 ¢ 10%
"-" 5--90%-112 I.Z 6e_' . _"
.,O,o125 2.6 5.9 5 o ,'6 10%
-- 146 1°5 I0.0 5 85",,6 15"
Total 103.1
a Data obtainedfrom.6
b Retentiontime relative to p,p'-DDE=IO0. Measuredfrom first appearanceof solvent.
: Relativestandarddeviationof six ana1.vses.
d From GC-MS data. Peaks containingmixturesof isomersof differentchlorinenumbersare bracketed.
34
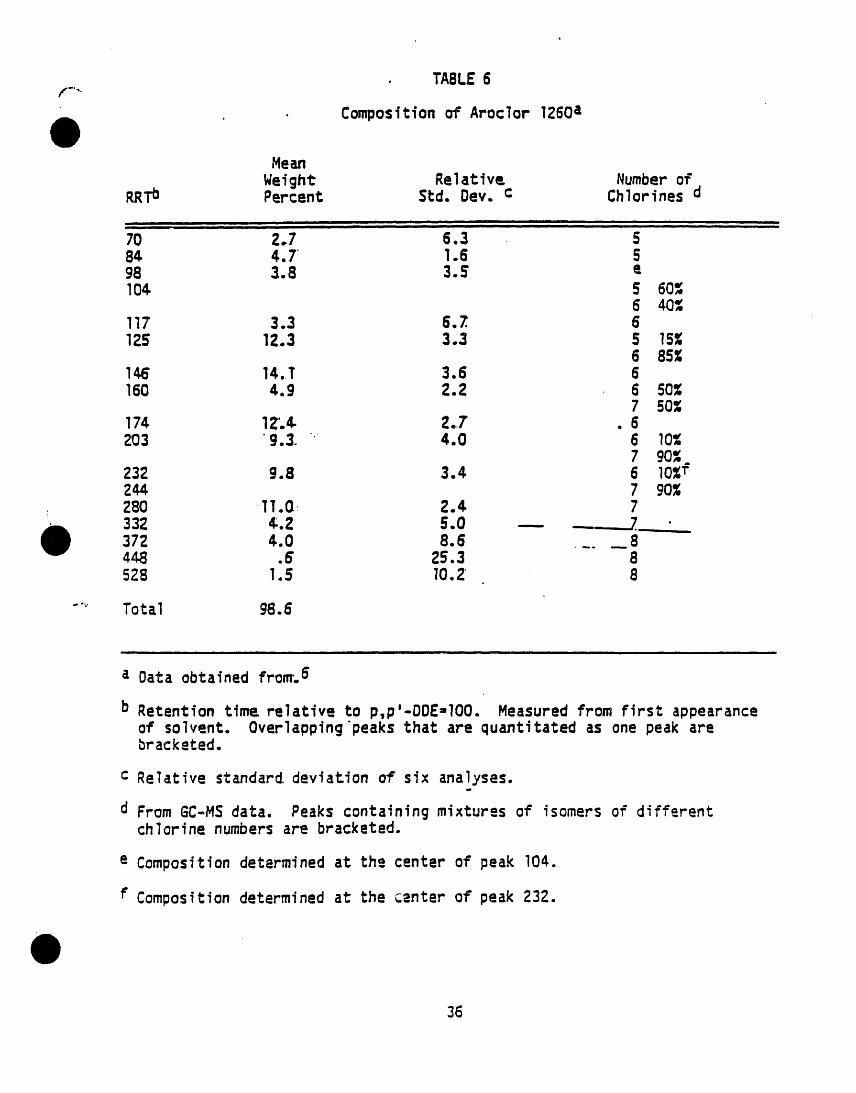
• TABLE6-,.,
. . Composition oF Aroclor 1260a
Mean
Weight Relative NumberofRRTb Percent Std. Oevo c Chlorines d
nimbi i n • UnnlI i,n InI iii ul n in I i n n, m,, m,i , I , n
70 2,7 6,3 584 4.7 1.6 59B 3.8 3.S e104. 5 60_
6 40_117 3.3 6.Z 6125 12.3 3.3 5 15%
6 85%146 14.T 3.6 6160 4.9 2.2 6 50%
7 50%174 12'.¢ 2o7 . 6203 "9.3. 4.0 6 10%
7 90%232 9.8 3.4 6 10%f244 7 9O%
; 280 II.0 2.4 7, 332 ¢.Z 5,0 --- -_- 7._ •
372 4.0 8.6 .... 84d.8 .6 25.3 8528 1.5 10.2 8
"" Total 98.6
in
a Oata obtainedfront.6
b Retentiontime relativeto p,p'-DDE=IO0. Measuredfrom first appearanceof solvent. Overlapping'peaksthat are quantitatedas one peak arebracketed.
c Relativestandarddeviationof six analyses.
d From GC-MSdata. Peaks containingmixturesof isomersof differentchlorinenumbersare bracketed.
e Compositiondeterminedat th=.centerof peak I04.
f Compositiondeterminedat the centerof peak 232.
36

F
o
• 6,-o_P
• TABLE 7ACCURACYAND PRECISIONUSING
,--.., SPIKEDMOTOR 0IL
Ave. (Precision)Conc. Rel. Std. (Accuracy) Nut
Dilution Method Spike Aroclor Found Deviation Percent GRatio Detector Clean up mg/Kg Spike mg/Kg % Recovered Di1
-- i II II iiI I _II III I • I II I Jll,
I00:1 HE'D None 30.3 1242 28.2 _,.2 93.1lO0:l ECO None 30.3 1242 26.7a 5.7 88.II00-T HEO None 31.1 1260 27.2 2.0 87.5lO0:l ECD None 31.1 1260 23.9 2.2 76.8lO0:l HED 8. I 30.3 1242 28.4 11.5 93.7lO0: 1 ECD 8. I 30.3 1242 25.4 a 6. I 83.8lO0:l HE'D 8.1' 31.1 1260 28. I 8.0 90.3lO0:l ECD 8.1 31.1 1260 24.3 7.8 78. IlO0:1 HED 8.2 30.3 1242 30.7 2.4 101I00:1 ECD 8.2 30.3 1242 27.3 a 10.2 90.1lO0:l HED 8.2 31.I 1260 30.9 3.6 99.4100: l ECD 8.2 31.1 1260 31.0 8.6 g9.7lO0:1 HED 8.3 30.3 1242 30.3 8.6 lO0lO0:1 ECD 8.3 30.3 1242 28.9 a 5.0 95.4lO0:1 HED 8.3 31. I 1260 29.8 4.7 95.8100:1 ECO 8.3 31.1 1260 . 30.8 6.5 99.0lO0:l HED 8.4. 30.3 1242 29. 4 _ l _ _ 97.0lO0:l ECD 8.4 " 30.3" .... 1747. 26.4 a 5.3 87. llO0:1 HE'D 8.4 31.I 1260 29.4 5.2 94.5lO0:l ECD 8.4 31.1 1250 23.6 4.5 75.9lO0:l HED 8.5 30.3 1242 31.9 8.5 105lO0:1 ECD 8.5 30.3 1247_ 23.4a 3.0 77.2lO0:l HE'D 8.5 31.1 1260 33.6 9.2 I08lO0:1 ECD 8.5 31. l 1260 30.g 5.5 g9.4I00"1 HED 8.6 30.3 1242 34.4 3.8 107I00:I ECD 8.6 31.1 1242 23.4a 4.4 77.2lO0:l HED 8.6 30.3 1260 29.1 4.2 g6.7lO0:1 ECD 8.6 31.1 1260 27.0 4.6 86.7
m
a Severe interferenceproblemsin elution area of 1242. Measurementbased upon only 3the lO normallyresolvedmajor peaks. Clean up technique,Sections8.1, 8.2, 8.3, 88.5, and 8.6 did not improvethe quality of the 1242 chromatogram. If this were anunknownsample, it would be impossibleto qualitativelyidentifythe presenceof Aro°1242 using ECD. The HED providedan interference= °,re. chromatogram.
37
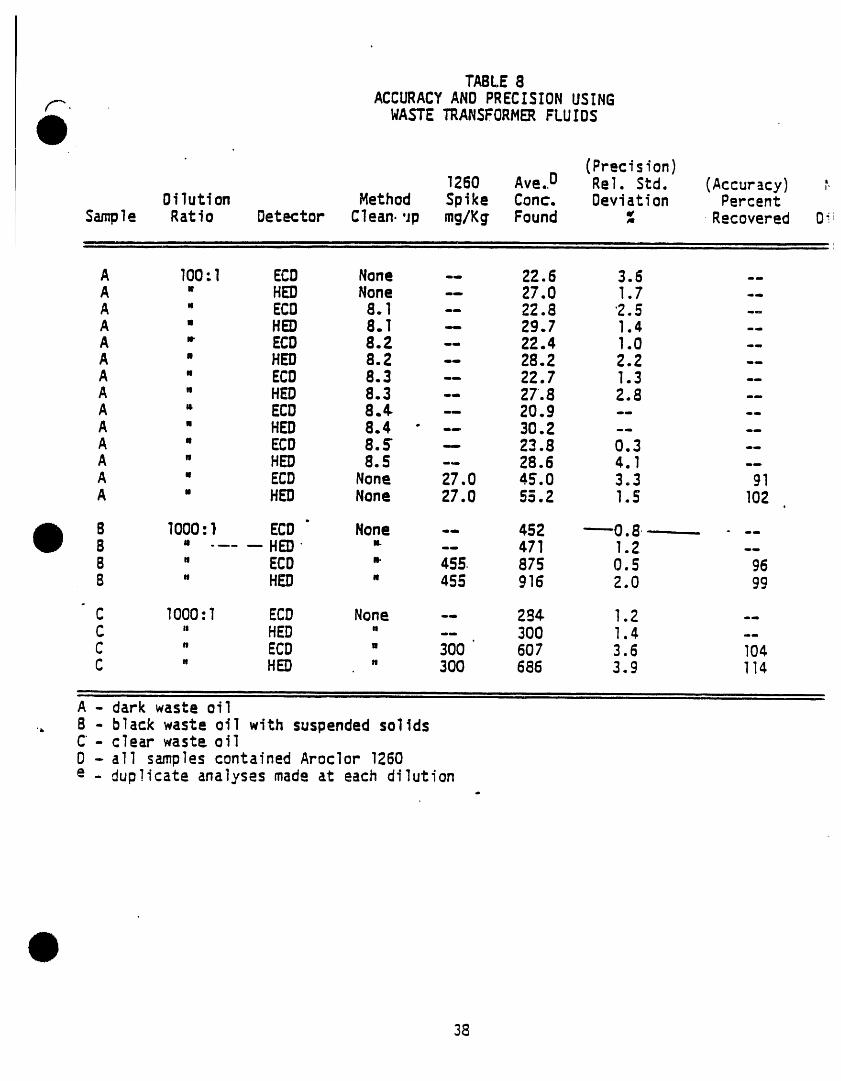
TABLE8
f,, ACCURACYAND PRECISIONUSINGWASTE TRANSFORMERFLUIDS
(Precision)1260 Ave..o Rel. Std. (Accuracy) _,
Dilution Method Spike Conc. Deviation PercentSan_le Ratio Detector Clean.'Jp mg/K_I Found % Recovered 0-
I , i
A lO0:I ECD None -- 22.6 3.6 --A " HED None -- 27.0 I.7 --A " ECD 8.1 -- 22.B "2.5 --A " HED 8.1 -- 29.7 1.4 --A " ECD 8.Z -- 22.4 1.0 --A • HED 8.2 -- 28.2 2.2 --A " ECD 8.3 -- 22.7 1.3 --A " HED 8.3 -- 27.8 2.8 --A • ECD 8. ¢ -- 20.9 ....A • HED 8.4 " -- 30.2 ....A • ECD 8. S" -- 23. B O.3 --A " HE[} 8.5 -- 28.6 4. l --A • ECD None 27.0 45.0 3.3 91A " HED None 27.0 55.2 1.5 102
B lO00: } ECD None -- 452 ----0. B -- - --B " .... HED " -- 471 1.2 --B " ECD " 455 875 O.5 96B " HED " 455 916 2,0 g9
°
C lO00:l ECD None -- 26¢ 1.2 --C " HED " -- 300 I.4 --C _ ECD " 300 607 3.6 I04C " HE]) M 300 686 3.9 I14
A - dark waste oil., B - blackwaste oil with suspendedsolids
C- clear waste oilD - all samplescontainedAroclor 1260e . duplicateanalysesmade at each dilution
38
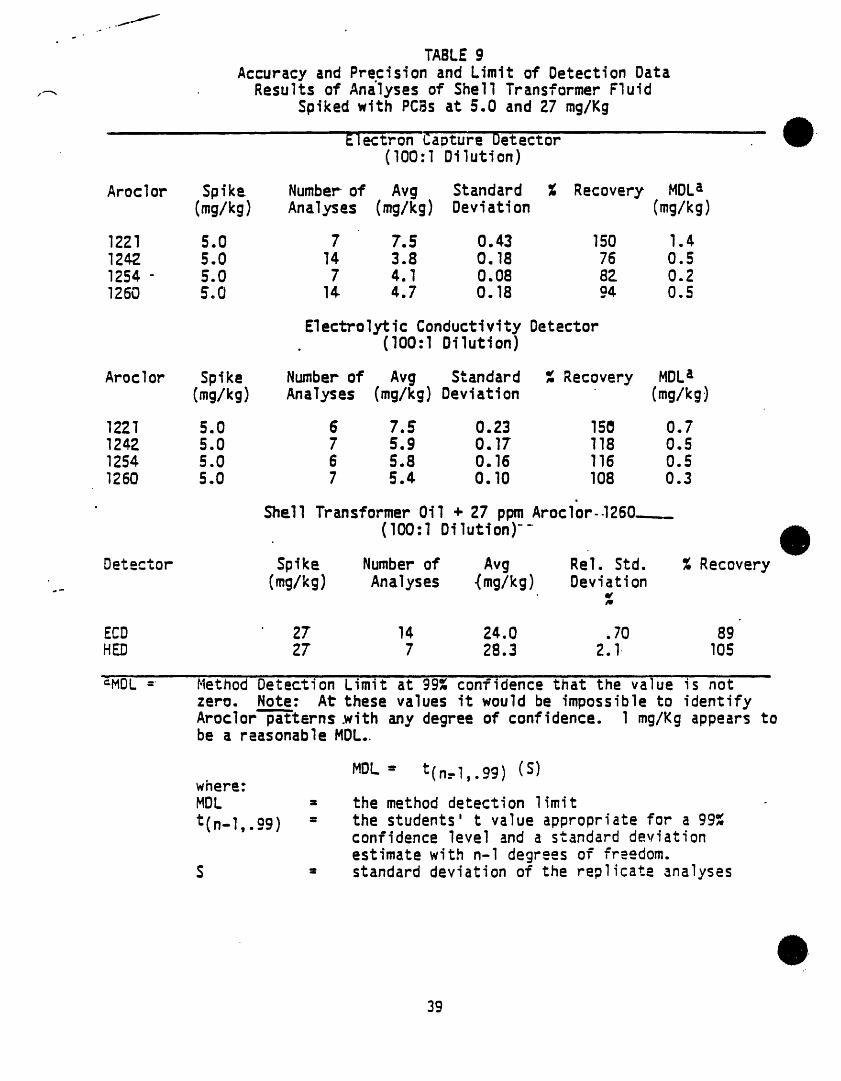
.lJ
TABLE 9Accuracy and Precisionand Limit of DetectionData
,_ Results of Ana'lysesof ShellTransformerFluidSpikedwith PCBs at 5.0 and 27 mg/Kg
' ElectronCaptt}'reDetector .....(lO0:lDilution)
Aroclor Spike Number-of Avg Standard % Recovery MDLa(mg/kg) Analyses (mg/kg) Deviation (mg/kg)
12Zl 5.0 7 7.5 0.43 150 1.4124_ 5.0 14 3.8 0.18 76 0.51254 - 5.0 7 4.1 0.08 82 0.21260 5.0 l& 4.7 O.18 9_, 0.5
E'lec'L'rolytic ConductivityDetector• {lO0:lDilution)
Aroclor Spike Numberof Avg Standard % Recovery MDLa(mg/kg) Analyses (mg/kg)Deviation (mg/kg)
IZZ1 5.0 6 7.5 0.23 150 0.71242 5.0 7 5.9 O.17 lib 0.51254 5.0 6 5.8 0.16 116 0.51260 S.0 7 5.4 0.10 108 0.3
• Sh_l 1 Transformer 041 + 27 ppmAroclor-.1260__._(lOC):l Dilution)--
Detector Spike Number of Avg Rel. Std. % Recovery,- (mg/kg) Analyses {mg/kg) Deviation
If
ECD ' 27 14 24.0 .70 89HED 27" 7 28.3 2.l I05
aMDL = Method DetectionLimit at 99_ confidencethat the value is notzero. Note: At these values it would be impossibleto identifyAroclor'-_terns.withany degreeof confidence, l mg/Kg appearstobe a reasonableMDL..
MDL = t(n_l,.99) (S)where:MDL = the method detectionlimit
t(n_l,.99) = the students't value appropriatefor a 99_confidenceleveland a standarddeviationestimatewith n-l degrees of freedom.
S :, standarddeviationof the replicateanalyses
39
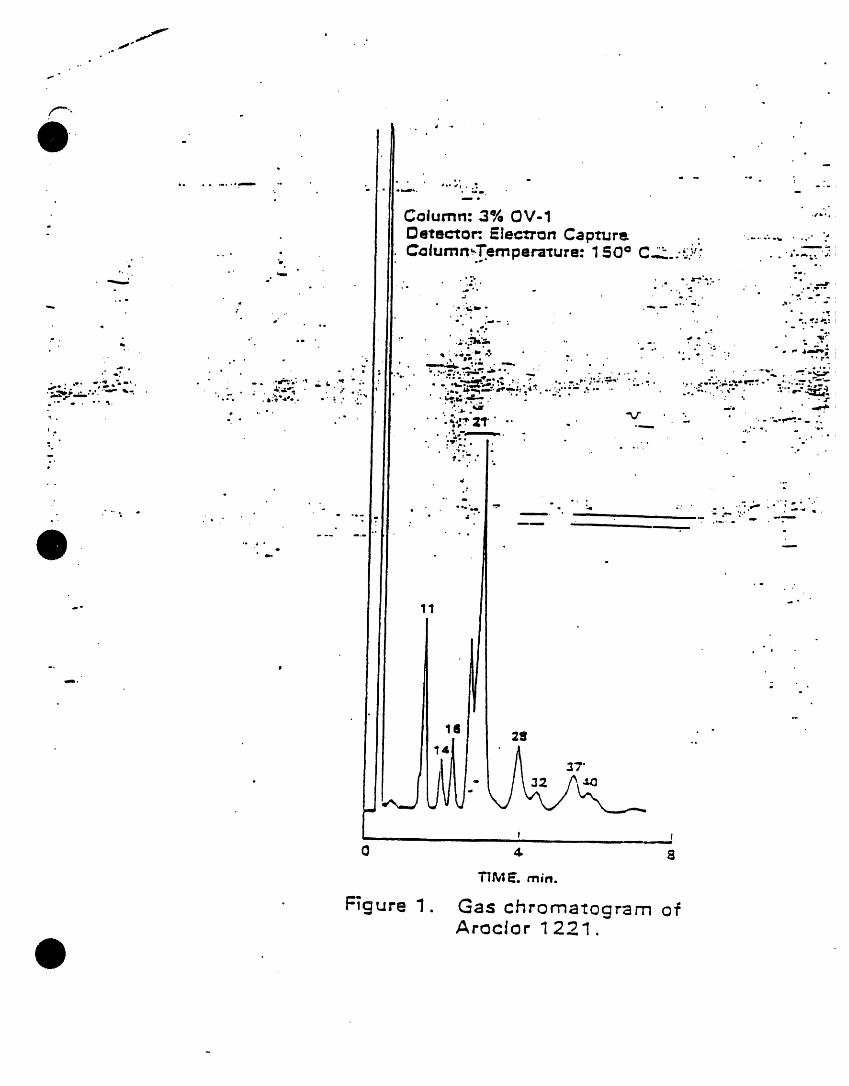
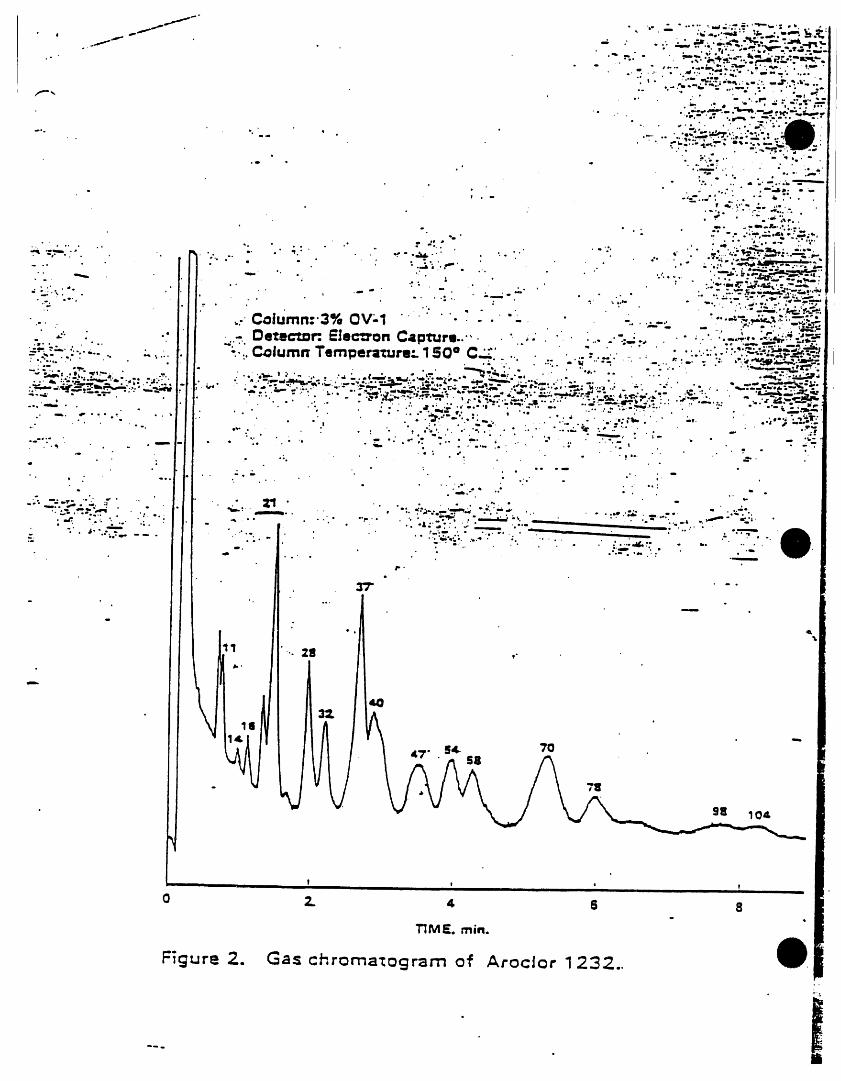
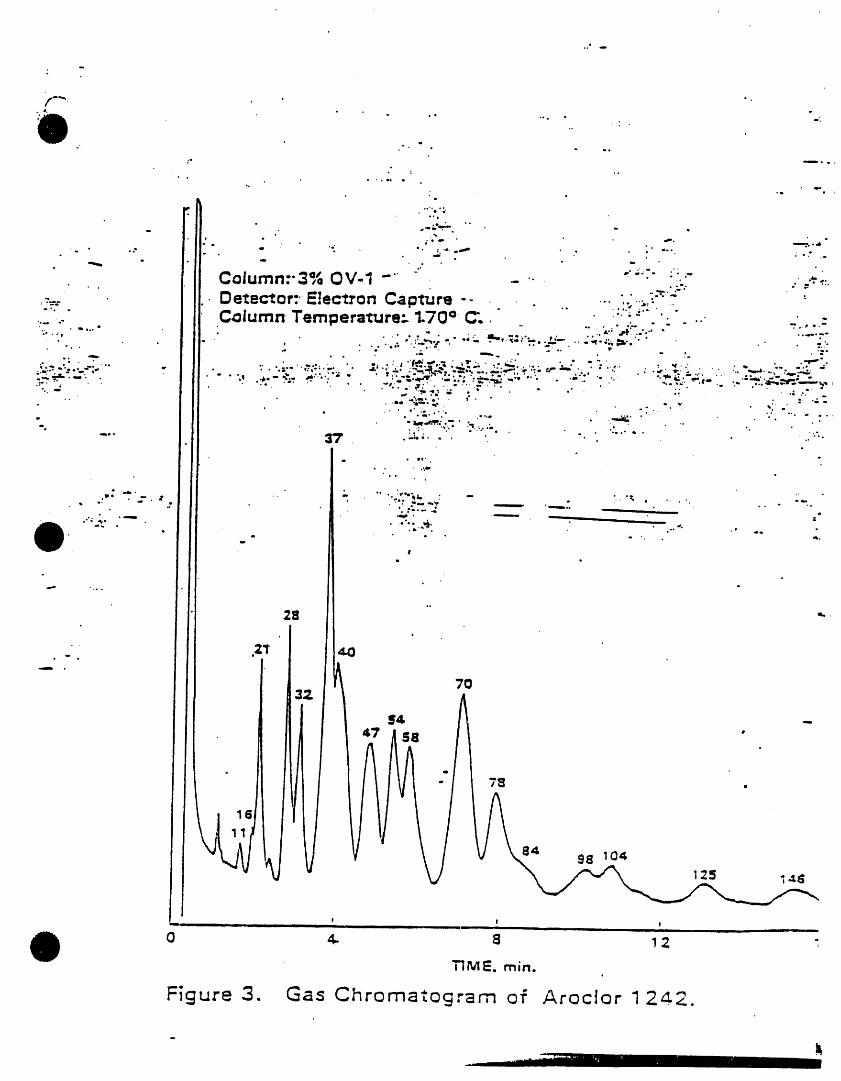
.. I
,/
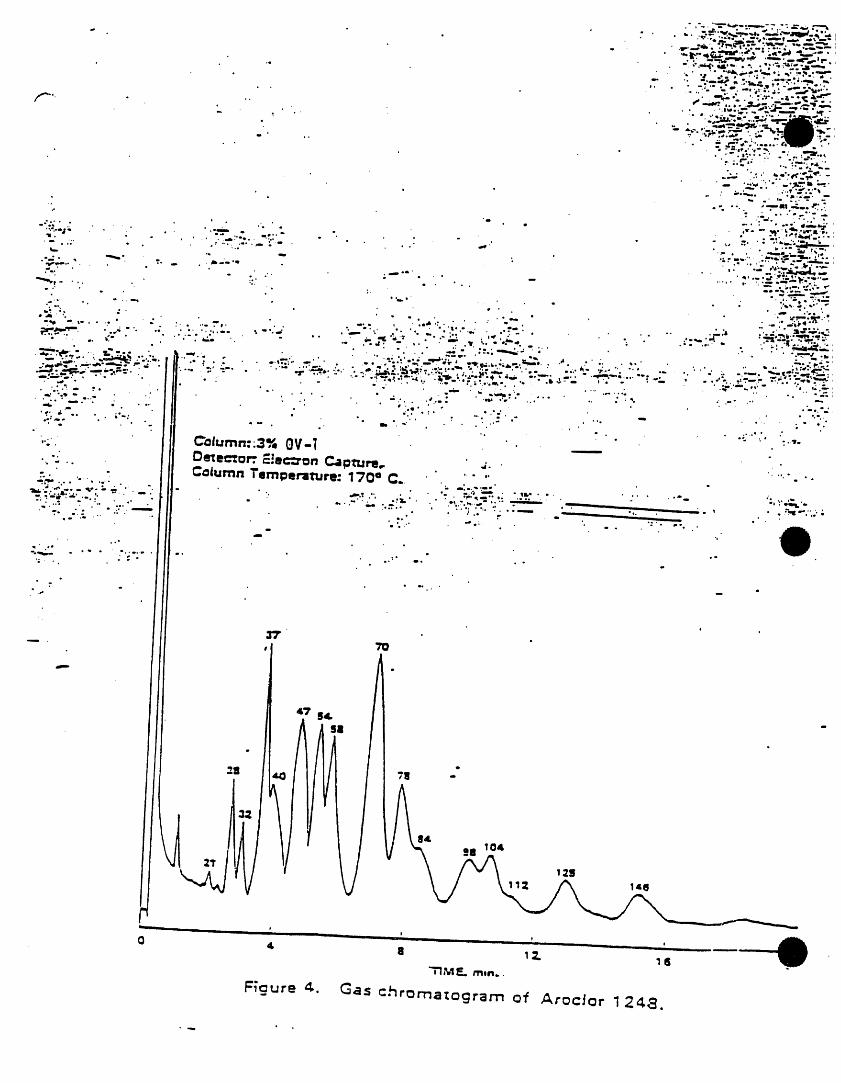
• q
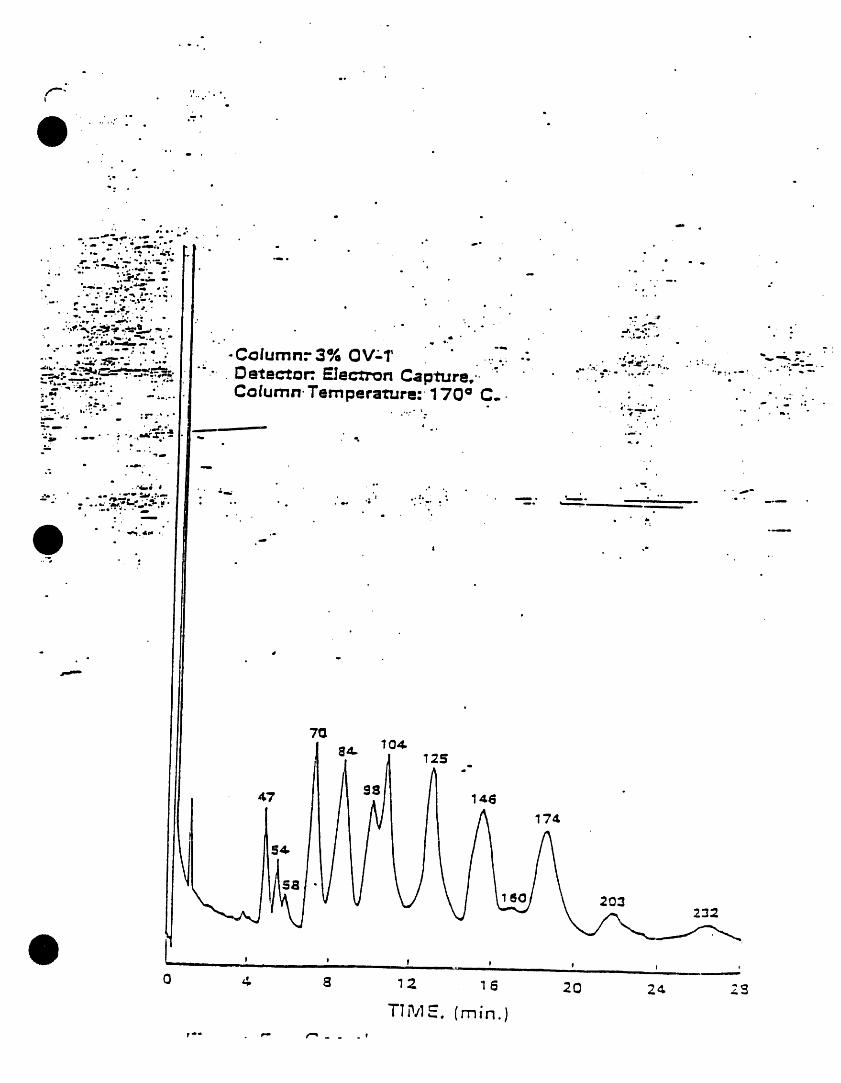
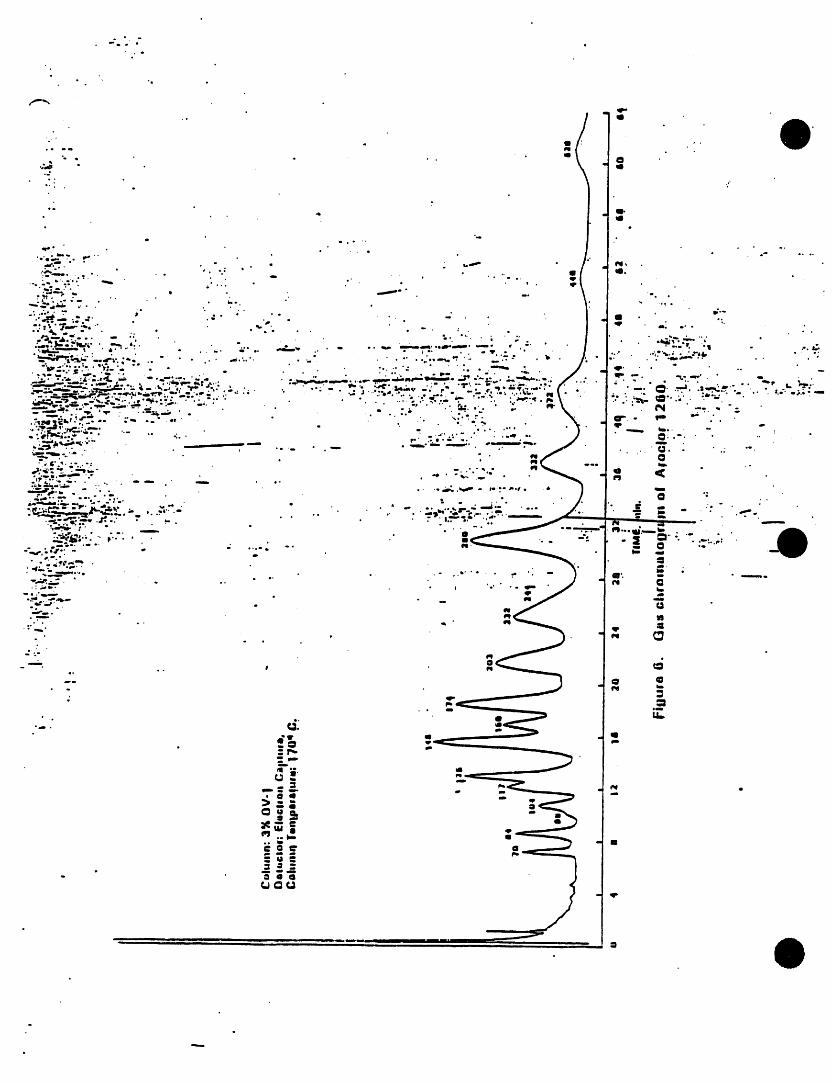
o
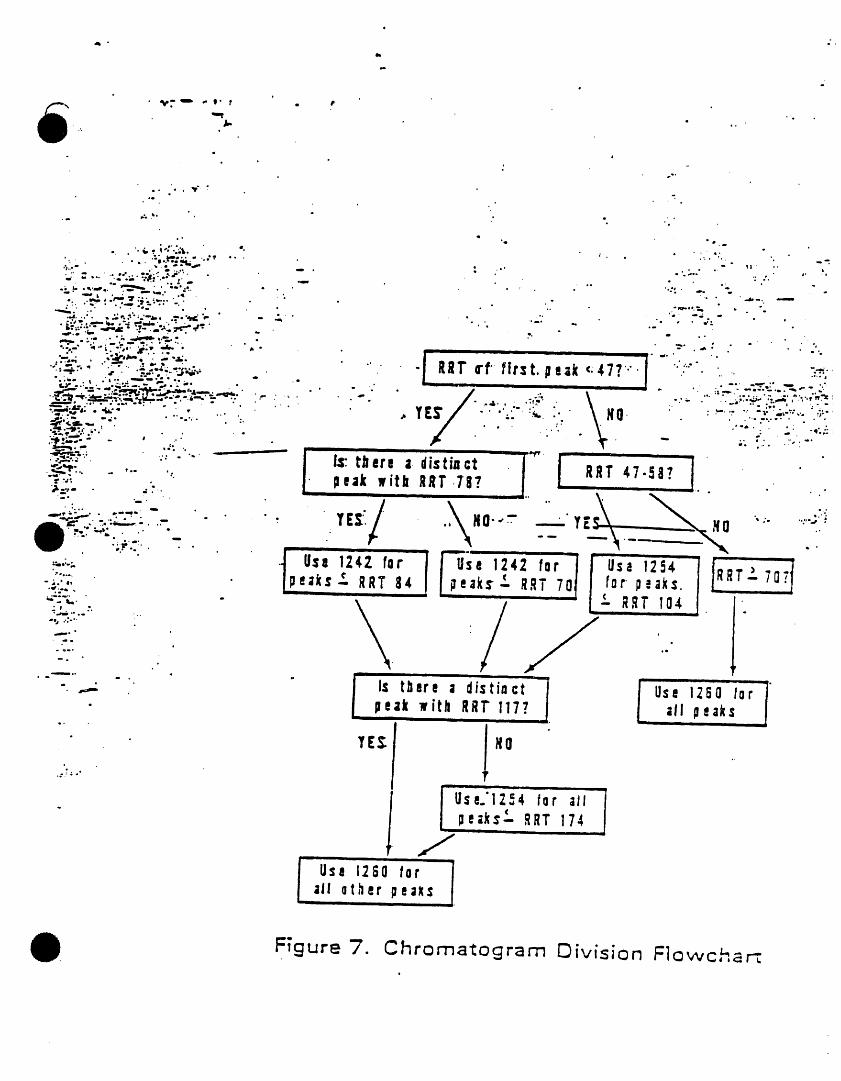
FTgureT. Chromatograrn Oivision Fl_wcha_
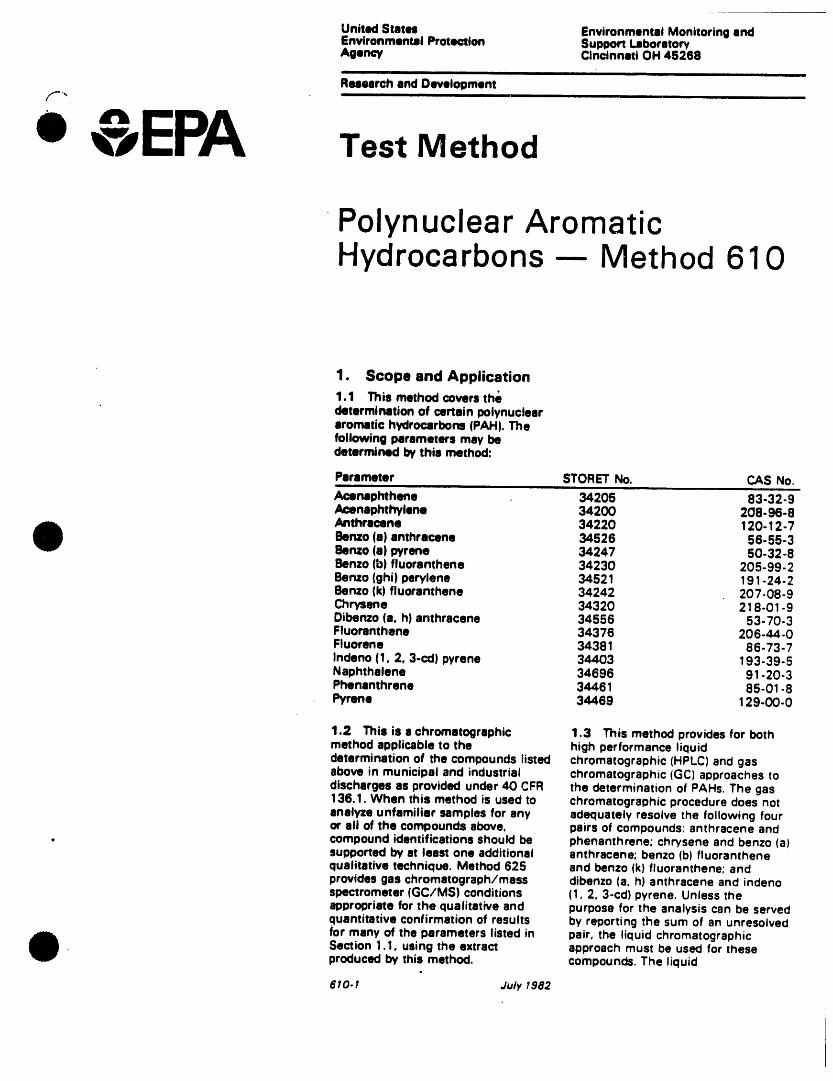
United States Environmental Monitoring andEnvironmental Protection Support LaboratoryAgency Cincinnati OH 45268
Research and Development
,EPA Test Method
Polynuclear AromaticHydrocarbons-- Method 610
1. Scope and Application
1.1 This method covers thedetermination of certain polynucleararomatic hydrocarbons(PAH). Thefollowing parameters may bedetermined by this method:
Parameter STORET No. CAS No,Acanaphthene 34205 83-32- 9Acenaphthylsne 34200 208-96-8Anthracene 34220 120-12-7Benzo(a) anthracene 34526 56- 55-38enzo (a) pyrene 34247 50-32-8Benzo(b) fluoranthene 34230 205- 99- 2Benzo(ghi) perylene 34521 191-24- 28enzo (k) fluoranthene 34242 207-08-9Chrysene 34320 218-01-9Dibenzo (a, h) anthracene 34556 53-70.3Fluoranthene 34376 206-44-0Fluorene 34381 86- 73- 7Indeno (1, 2, 3-cd) pyrene 34403 193-39-5Naphthalene 34696 91.20- 3Phenanthrene 34461 85-01-8Pyrene 34469 129-00-0
1.2 This is a chromatographic 1.3 This method providesfor bothmethod applicable to the high performance liquiddetermination of the compounds listed chromatographic (HPLC) and gasabove in municipal and industrial chromatographic (GC) approaches todischarges as provided under 40 CFR the determination of PAHs. The gas136.1. When this method is used to chromatographic procedure does notanalyze unfamiliar samples for any adequately resolve the following fouror all of the compounds above, pairs of compounds: anthracene and
• compound identifications should be phenanthrene; chrysene and benzo (a)supported by at least one additional anthracene; benzo (b) fluoranthenequalitative technique. Method 625 and benzo(k) fluoranthene; andprovides gas chromatograph/mass dibenzo (a, h) anthracene and indenospectrometer (GC/MS) conditions (1, 2, 3-cd) pyrene. Unless theappropriate for the qualitative and purpose for the analysis can be servedquantitative confirmation of results by reporting the sum of an unresolvedfor many of the parameters listed in pair, the liquid chromatographicSection 1.1. using the extract approach must be used for theseproduced by this method, compounds.The liquid
6t O.I July 1982
chro_',acographic method does described which permit the separation been fully assessed. Although theresolve all 16 of the PAHs listed, and measurement of the PAll HPLC conditions described allow for a
1.4 The method detection limit c°mp°unds_D" unique resolution of the specific PAH
,-" (MDL defined in Section 15) ''D for 2.2 A silica gel column cleanup compounds covered by this method,each parameter is listed in Table 1. procedure is provided to aid in the other PAH compounds may interfere.The MDL for a specific wastewater elimination of interferences that may 4. Safetymay differ depending upon the nature be encountered.of interferences in the sample matrix. 4.1 The toxicity or carcinogenicity of
each reagent used in this method1.5 The sample extraction and 3. Interferences has not been precisely defined:concentration steps in this method are 3.1 Method interferences may be however, each chemical compoundessentially the same as in methods caused by contaminants in solvents, should be treated as a potential health606, 608, 609, 611 and 612. reagents, glassware, and other hazard. From this viewpoint, exposureTherefore. a single sample may be sample processing hardware that lead to these chemicals must be reducedextracted to measure the parameters to discrete artifacts and/or elevated to the lowest possible level byincluded in the scope of each of these baselines in the chromatograms. All whatever means available. Themethods, provided the concentration of these materials must be routinely laboratow is responsible foris high enough to permit selecting demonstrated to be free from maintaining a current awareness filealiquots of the extract for cleanup, interferences under the conditions of of OSHA regulations regarding thewhen required. Selection of the the analysis by running laboratory safe handling of the chemicalsaliquots must be made prior to the reagent blanks as described in specified in this method. A referencesolvent exchange steps of this Section 8.5. file of material data handling sheetsmethod. The analyst is allowed the should also be made available to alllatitude, under Gas Chromatography 3.1.1f Glassware must be personnel involved in the chemical(Section 13), to select scrupulously cleaned (:D.Clean all analysis. Additional references tochromatographic conditions glassware as soon as possible after laboratory safety are available andappropriate for (he simultaneous use by rinsing with the last solvent have been identified t''4mfor the
measurement of combinations of used in iL This should be followed by information of the analyst.these parameters, detergent washing with hot water,
and rinses with tap water and distilled 4.2 The following paramenters1.6 Any modification of this method, water. It should then be drained dry, covered by this method have beenbeyond those expressly permitted, and heated in a muffle furnace at tentath_ly classified as known orshall be considered as major 40(_C for 15 to 30 minutes. Some suspected, human or mammalianmodifications subject to application thermally stable materials, such as carcinogens; benzo (a) anthracene, -and approval of alternate test PCBs, may not be eliminated by benzo (a) pyrene and dibenzo (a, h) "
- procedures under 40 CFR 136.4 this treetmenL Solvent rinses with anthracene.
and 136.5. acetone and pesticide quality hexane S. Apparatus and Materials1.7 This method is restricted to usa may be substituted for the muffleby or under the supervision of furnace heating. Volumetric ware 5.1 Sampling equipment, foranalysts experienced in the use of should not be heated in a muffle discrete or composite sampling.HPLC and GC and in the furnace. After drying and cooling, 5. I. I Grab sample bottle - Amberinterpretation of liquid end gas glassware should be sealed and glass, one-liter or one-quart volume,chromatograms. Each analyst must stored in a clean environment to fitted with screw caps lined withdemonstrate the ability to generate prevent any accumulation of dust or Teflon. Foil may be substituted foracceotable results with this method other contaminants. Store inverted Teflon if the sample is not corrosive,using the procedure described in or capped with aluminum foil. If amber bottles are not available.
Section 8.2. 3. 1.2 The use of high purity protect samples from light. The
2. Summary of Method reagents and solvents helps to container must be washed, rinsedminimize interference problems, with acetone or methylene chloride,
2.1 A measured volume of sa_nple, Purification of solvents by distillation and dried before use to minimizeapproximately one-liter, is solvent in oil-glass systems may be required. "contamination.
extracted with methylene chloride 3.2 Matrix interferences may be 5.1.2 Automatic sampler (optional) -using a separatow funnel. The Must incorporate glass samplemethylene chloride extract is dried caused by contaminants that are containers for the collection of aand concentrated to a volume of 10 coextracted from the sample. ThemL or less. The solvent is exchanged extent of matrix interferences will minimum of 250 mL. Sampleto cyclohexane prior to cleanup, vary considerably from source to source, containers must be kept refrigeratedFollowing cleanup, when using HPLC depending upon the nature and at 4"C and protected from light duringfor determination of the PAHs. the diversity of the industrial complex or compositing. If the sampler uses asolvent is exchanged to acetonitrile, municipality being sampled. The peristaltic pump, a minimum length ofUltraviolet (UV) and fluorescence cleanup procedure in Section 1 1 can compressible silicone rubber tubingdetectors are used with HPLC. When be used to overcome many of these may be used. Before use, however.the compressible tubin" :.,,ould becleanup is not remuired and when interferences, but unique samples thoroughly rinsed withmethanol,flame ionization detector GC is may require additional cleanup followed by repeated rinsings withapproaches to achieve the MDL listedused for determination, the distilled water to minimize thein Table 1.methylene chloride extract may be potential for contamination of theanalyzed directly. When clemnup is 3.3 The extent of interferences that sample. An integrating flow meter isrequired, the cyclohexane exchange may be encountered using liquid required to collect flow proportionalis made. Instrumental conditions are chromatographic tachnk:lues has not composites.
6 I0-2 July I982
i r,l | ii .i
5.2 Glassware (All specifications are 5.6.5 Strip-chart recorder mL volumetric flask. Larger volumessuggested. Catalog numbers are compatible with detectors. Use of a can be used at the convenience of theincluded for illustration only), data system for measuring peak areas analyst. If compound purity is certified
f... 5.2. I Separatow funnel - 2000-mL and retention times is recommended, at 96% or greater, the weight can bewith Teflon stopcock. E.7 Gas chromatograph - An used without correction to calculate
analytical system complete with ' the concentration of the stock5.2.2 Drying column - temperature programmable gas standard. Commercially preparedChromatographic column 400 mm chromatograph suitable for on-column stock standards can be used at anylong x 19 mm 10 with coarse frit. , injection or splitless injection and all concentration if they are certified by
the manufacturer or by an5.2.3 Concentrator tube, Kuderna- required accessories including independent source.Danish. l O-mL. graduated (Kontes syringes, "analytical columns, gases,K-570050-1025 or equivalent). , detector, and strip-chart recorder, 6.7.2 Transfer the stock standardCalibration must be checked at the .A data system is recommended for solutions into Teflon-sealed screw-capvolumes employed in the test. Ground measuring peak areas, bottles. Store at 4°C and protect from
light. Stock standard solutions shouldglass stopper is used to prevent . 5. 7. I Column - 1.8 m long x 2 mm be checked frequently for signs ofevaporation of extracts. , ID pyrex glass packed with 3% OVol 7 degradation or evaporation, especially5.2.4 Evaporative flask. Kuderna- on Chromosorb W-AW-DCMS just prior to preparing calibrationDanish - 500-mL (Kontes K-570001- (100/120 mesh) or equivalent. This standards from them. Quality control0500 or equivalent). Attach to column was used to develop the check standards that can be used to
retention time data in Table 2. determine the accuracy of calibrationconcentrator tube with springs. Guidelines for the use of alternate standards will be available from the5.2.5 Snyder column, Kuderna- column packings are provided in U.S. Environmental Protection
Danish. three-ball macro (Kontes Section 13. Agency, Environmental MonitoringK-503000-0121 or equivalent). 5.7.2 Detector - Flame ionization, and Support Laboratory, Cincinnati,
5.2.6 Snyder column, Kuderne- This detector has proven effective in Ohio 45268.Danish - two-bail micro (Kontes the analysis of wastewaters for the 6.7.3 Stock standard solutions mustK-569001-0219 or equivalent), compounds listed in the scope be replaced after six months, or
excluding the four pairs of unresolved sooner if comparison with check5.2.7 Vials - Amber glass, 10- to compounds listed in Section 1.3. standards indicate a probtem.15- mL capacity, with Teflon-lined Guidelines for the use of alternate
-screwcep. detectors are provided in Section 7. Calibration5.2.8 Chromatographic column - 12.2. 7.1 Establish liquid or gas
250 mm long x 10 mm 10 with coarse 6. Reagents chromatographic operatingfritted disc at bottom and Teflon parameters to produce resolution of
( stopcock. 6.1 Reagent water - Reagent water the parameters equivalent to that
• 5.3 Boiling chips - approximately is defined as a water in which an indicated in Tables 1 or 2. Theinterferent is not observed at the chromatographic system can be
•10/40 mesh. Heat to 4000C for 30 MDL of each parameter of interest, calibrated using the external standardminutes or Soxhlet extract with
methylene chloride. 6.2 Sodium thiosuifate - (ACS) technique (Section 7.2) or the internalGranular. standard technique (Section 73).
5.4 Water bath - Heated, with7.2 External standard calibration
concentric ring cover, capable of 6.3 Cyclohexane, methanol, acetone,temperature control (±2°C). The bath methylene chloride, and pentane - procedure:should be used in a hood. Pesticide quality or equivalent. 7.2. I Prepare calibration standards
5 5 Balance -- Analytical, capable of 6.4 Acetonitrile, high purity HPLC at a minimum of three concentration' levels for each parameter of interest
accurately weighing 0.O001g. quality, distilled in glass, by adding volumes of one or more5.6 High performance liquid 6.5 Sodium sulfate - (ACS) stock standards to a volumetric flaskchromatographic apparatus (modular): Granular, anhydrous. Purify by and diluting to volume with
heating at 400=C for four hours acetonitrile. One of the external5. 6.1 Gradient pumping system, in a shallow tray. standards should be at a
constant flow, 6.8 Silica get - Grade 923 (100/200 concentration near. but above, the5.6.2 Reverse phase column, 5 mesh) dessicant (Davison Chemical or MDL and the other concentrations
should correspond to the expectedmicron HC-ODS SiI-X, 250 mmx 2.6 equivalent). Before use, activate for atmm I0 (Perkin-Elmer No. 089-O716 or least 16 hours at 130°C in a shallow range of concentrations found in realequivalent), glass tray, loosely covered with foil. samples or should define the working
range of the detector.
5.6,3 Fluorescence detector, for 6,7 Stock standard solutions (1.00 7.2.2 Analyze each calibrationexcitation at 280 nm and emission pg/#L) - Stock standard solutions can standard (5 to 25 pL for HPLC and 2greater than 389 nm cutoff (Corning be prepared from pure standard3-75 or equivalent). Fluoromaters materials or purchased as certified to 5 pL for GC), and tabulate peakshould have dispersive optics for solutions, height or area responses against theexcitation and can utilize either filter mass injected. The results may be
6. 7.1 Prepare stock standard used to prepare a calibration curve foror dispersive optics at the emissiondetector, solutions by accurately weighing each compound. Alternatively, if the
about 0.0100 g of pure material, ratio of response to amount injected5.6,4 UV detector, 254 nm, coupled Dissolve the material in HPLC quality (calibration factor) is a constant over
• to fluorescence detector, acetonitrile, dilute to volume in a 10- the working range (< 10% relative
610.3 July 1982
n ii i
standard deviation, RSD), linesrity , be assumed to be invariant and the 8.2. I Select a representative spikethrough the origin can be assumed average RF can be used for calcula- concentration for each compound toand the average ratio or calibration tions. Alternatively, the results can be be measured. Using stock standards,factor can be used in place of s used to plot a calibration curve of prepare a quality control check sample
,."'" calibration curve, i'esponse ratios, Ae,/A_. vs. RF. concentrate in acetronitrile 1000times more concentrated than the
7.2.3 The working calibration curve 7.3.3 " The working calibration curve selected concentrations. Qualityor calibration factor must be verified or RF must be verified on each control check sample concentrates,on each working day by the working day by the measurement of appropriate for use with this method,measurement of one or more one or more calibration standards. If will be available from the U.S.
calibration standards. If the response the response for any parameter varies Environmental Protection Agency,for any parameter varies from the from the predicted response by more Environmental Monitoring andpredicted response by more than than 10%, the test must be repeated Support Laboratory, Cincinnati, Ohio__.10%, the test must be repeated using a fresh calibration standard. 45268.using a fresh calibration standard. Alternatively, a new calibration curveAlternatively, a new calibration curve must be prepared for that compound. 8.2.2 Using a pipet, add 1.00 mL ofor calibration factor must be prepared the check sample concentrate to eachfor that compound. 7.4 Before using any cleanup of a minimum of four 1000-mL
• procedure, the analyst must process a aliquots of reagent water. A7.3 Internal standard calibration series of calibration standards through representative wastewater may beprocedure. To use this approach, the the procedure to validate elution used in place of the reagent water,analyst must select one or more patterns and the absence of but one or more additional aliquotsinternal standards that are similar in interferences from the reagents, must be analyzed to determineanalytical behavior to the compoundsof interest. The analyst must further background levels, and the spike leveldemonstrate that the measurement of 8. Quality Control must exceed twice the background
level for the test to be valid. Analyzethe internal standard is not affected 8.1 Each laboratory that uses thisthe aliquots according to the method
by method or matrix interferences, method is required to operate a formal beginning in Section 10.Because of these limitations, no quality control program. The minimum
internal standard can be suggested requirements of this program consist 8.2.3 Calculate the average percentthat is applicable to all samples, of an initial demonstration of labors- recovery, (R), and the standard7.3. 1 Prepare calibration standards tory capability and the analysis of deviation of the percent recovery (s), --at a minimum of three concentration spiked samples as a continuing check for the results. Wastewaterlevels for each parameter of interest on performance. The laboratory is background corrections must bu made ":by adding volumes of one or more required to maintain performance before R and s calculations are
stock standards to a volumetric flask, records to define the quality of data performed.To each calibration standard, add a that is generated. Ongoing perform-
ance checks must be compared with 8.2.4 Using Table,3, note theknown constant amount of one orestablished performance criteria average recovery (X) and standardmore internal standards, and dilute to
volume with acetonitrile. One of the to determine if the results of deviation (p) expected for each methodstandards should be at a cancan- analyses are within accuracy and parameter. Compare these to thetration near, but above, the MDL precision limits expected of the calculated values for R and s. If s >and the other concentrations should method. 2p or IX-RI > 2p, review potential
problem areas and repeat the test.correspond to the expected range of 8. I. I Before performing anyconcentrations found in real samples analyses, the analyst must 8.2.$ The U.S. Environmentalor should define the working range of demonstrate the ability to generate Protection Agency plans to estab-the detector, acceptable accuracy and precision lish performance criteria for R and
• with this method. This ability is s based upon the results of inter-7.3.2 Analyze each calibrationstandard (5 to 25/JL for HPLC and 2 established as described in Section laboratory testing. When theyto 5/JL for GC) and tabulate peak 8.2. .; become available, these criteria mustheight or area responses against 8.1.2 In recognition of the rapid be met before any samples may beconcentration for each compound advances that are occurring in analyzed.and internal standard, and calculate chromatography, the analyst is 8.3 The analyst must calculateresponse factors (RF) for each permitted certain options to improve method performance criteria andcompound using Equation 1. the separations or lower the cost of define the performance of the
measurements. Each time such laboratory for each spikeEq. 1 RF = (A,Cm]/(A_ C.) modifications are made to the method, concentration and parameter
where: the analyst is required to repeat the being measured.
A, =Response for the parameter to procedure in Section 8.2. 8.3.1 Calculate upper and lower" be measured. 8.1.3 The laboratory must spike control limits for method performance:
A,, =Response for the internal and analyze a minimum of 10% ofstandard, all samples to monitor continuing Upper Control Limit (UCL) = R 4- 3 s
C,, =Concentration of the internal laboratory performance. This Lower Control Limit (LCL) = R -- 3 sstandard, (pg/L). procedure is described in Section 8.4. where R and s are calculated as in
C, =Concentration of the parameter Section 8.2.3.to be measured, (pg/L). 8.2 To establish the ability to
generate acceptable accuracy and The UCL and LCL can be used toIf the RF value over the working range precision, the analyst must perform construct control charts _7_that areis a constant (<_ 10% RSD), the RF can the following operations, useful in observing trends in parlor- .
610.4 July 1982
i
mance. The control limits above must laboratory should perform analysis of chloride extract in a 250-mLbe r_leced by method performance standard reference materials and Erlenmeyer flask.criteria as they become available from participate in relevant performancethe U.S. Environmental Protection evaluation studies. 10.3 Add a second 60-mL volume of
f"' Agency. methylene chloride to the sample9. Sample Collection, bottle, rinse and repeat the extraction
8.3.2 The laboratory must develoo Preservation, and Handling procedure a second time. combininnand maintain separate accuracy the extracts in the Erlenmeyer flask.statements of laboratory performance 9.1 Grab samples must be collected Perform a third extraction in the samefor wastewater samples. An accuracy in glass containers. Conventional manner.statement for the method is defined sampling practices fernshould be
as R ± s. The accuracy statement followed, except that the bottle must 10.4 Assemble a Kuderna-Danish
should be developed by the analysis not be prewashed with sample before (K-D) concentrator by attaching a lO-af four aliquots of wastewater as collection. Composite samples should mL concentrator tube to a 5OO-mLdescribed in Section 8.2.2, followed be collected in refrigerated glass evaporative flask. Other concentration
by the calculation of R and s. containers in accordance with the devices or techniques may be used inAlternately, the analyst may use four requirements of the program, place of the K-D if the requirementswastewater data points gathered Automatic sampling equipment must of Section 8,2 are met.through the requirement for be as free as possible of Tygon tubingcontinuing quality control in Section and other potential sources of 10.8 Pour the combined extract8.4. The accuracy statements should contamination• through a drying column containing
about 10 cm of anhydrous sodiumbe updated regularly _7_. 9.2 The samples must be iced or sulfate, and collect the extract in8.4 The laboratory is required to refrigerated at 4°C from the time of the K.D concentrator Rinse thecollect a portion of their samples in collection until extraction. PAHs are Erlenmeyer flask and column with 20duplicate to monitor spike recoveries, known to be light sensitive, therefore,The frequency of spiked sample samples, extracts and standards to 30 mL of methylene chloride toanalysis must be at least 10% of all should be stored in amber or foil complete the quantitative transfer.
samples or one sample per month, , wrapped bottles in order to minimize 10.6 Add one or two clean boilingwhichever is greater. One aliquot of photolytic decomposition. Fill the chips to the evaporative flask andthe sample must be spiked and sample bottle and, if residual chlorine attach a three-ball Snyder column.analyzed as described in Section is present, add 80 mg of sodium Prewar the Snyder column by adding
-- 8.2. If the recovery for a particular thiosulfate per liter of sample. U.S. about 1 mL methylene chloride to the• parameter does not fall within the Environmental Protection Agency top. Place the K-D apparatus on a hot
control limits for method performance, methods330•4 and 330.5 may be water bath (60 to 65°C) so thatthe results reported for that parameter used for measurement of residual the concentrator tube is partiallyin all samples processed as part of chlorine "D_.Field test kits are available immersed in the hot water, and thethe same set must be qualified as for this purpose, entire lower rounded surface of the
--described in Section 14.3. The 9.3 All samples must be extracted flask is bathed with hot vapor. Adjust- laboratory should monitor the within 7 days, and analysis completed the vertical position of the apparatus
frequency of data so qualified to within 40 days of extraction t:". and the water temperature asensure that it remains at or below 5%. required to complete the concen-
8.5 Before processing any samples, 10. Sample Extraction tration in 15 to 20 minutes. At thethe analyst should demonstrate 10.1 Mark the water meniscus on proper rate of distillation the ballsthrough the analysis of a one.liter ' the side of the sample bottle for later of the column will actively chatter butaliquot of reagent water, that all '" determination of sample volume. Pour the chambers will not flood withglassware and reagents interferences the entire sample into a two-liter condensed solvent. When theare under control. Each time a set of seperatory funnel, apparent volume of liquid reaches 1samples is extracted or there is a mL, remove the K-D apparatus andchange in reagents, a laboratory . 10.2 Add 60 mL methylene chloride allow it to drain and cool for at leastreagent blank should be processed as"" to the sample bottle, seal, and shake 10 minutes. Remove the Snydera safeguard against laboratory :, 30 seconds to rinse the inner surface, column and rinse the flask and itscontamination. ,, Transfer the solvent to the separatory lower joint into the concentrator tube
• _ funnel and extract the sample by with 1 to 2 mL of methylene chloride.8.8 It is recommended that the shaking the funnel for two minutes A 5-mL syringe is recommemded forlaboratory adopt additional quality with periodic venting to release this operation. Stopper theassurance practices for use with this • excess pressure. Allow the organic concentrator tube and store
method. The specific practices that layer to separate from the water refrigerated if further processing willare most productive depend upon the phase for a minimum of ten minutes, not be performed immediately. If theneeds of the laboratory and the nature If _e emulsion interface between extracts wil! be stored longer thanof the samples. Field,duplicates may layers is more than one-third the two days, they should be transferredbe analyzed to monitor the precision volume of the solvent layer, the to Teflon-sealed screw-cap bottlesof the sampling technique. When analyst must employ mechanical and protected from light.doubt exists over the identification , techniques to complete the phaseof a peak on the chromatogram, . separation. The optimum technique 10.7 Determine the original sampleconfirmatory techniques such as depends upon the sample, but may volume by refilling the sample bottlechromatography with a dissimilar include stirring, filtration of the to the mark and transferring the watercolumn or detector must be used. This emulsion through glass wool, to a lO00-mL graduated cylinder.may include the use of a mass centrifugation, or other physical Record the sample volume to _hespectrometer. Whenever possible, the methods. Collect the methylene nearest 5 mL.
610.6 July I962
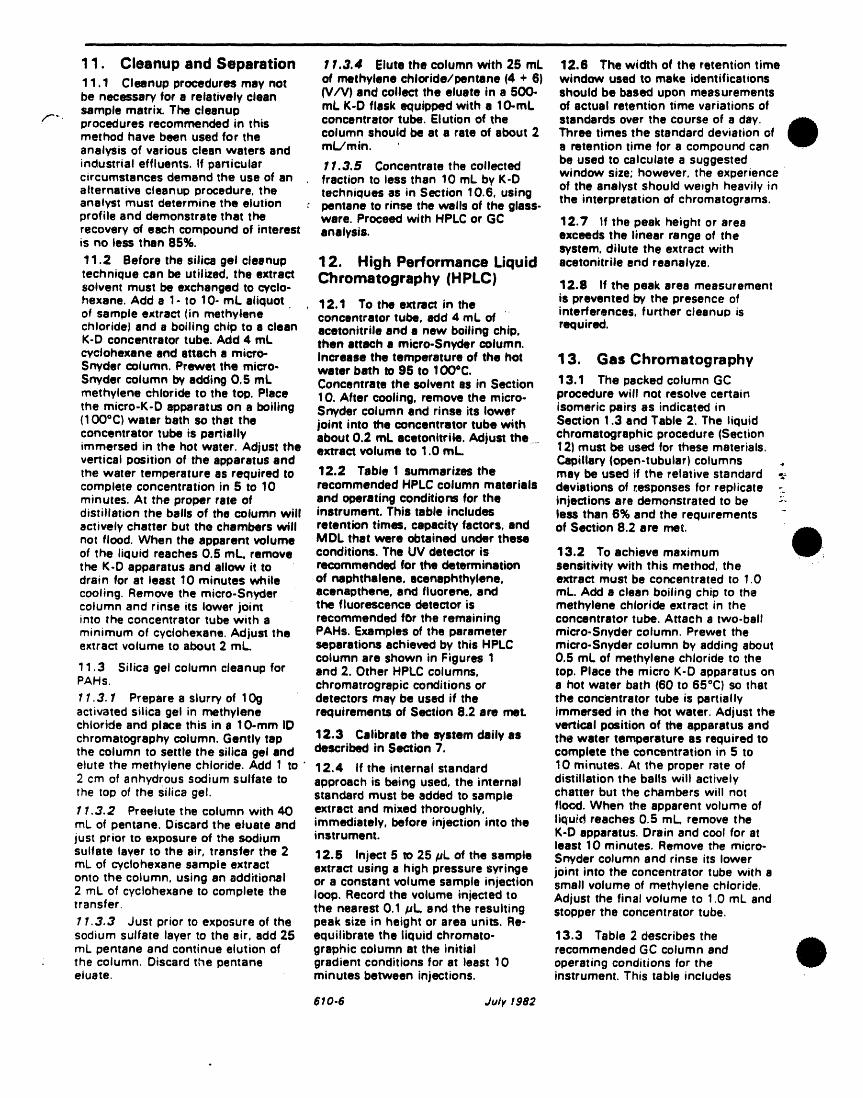
IN II III IlUl I In n I I Illll N
1 1. Cleanup and Separation 11.3.4 Elute the column with 25 mL 12,6 The width of the retention time
11.1 Cleanup procedures may not of methylene chloride/pentsne (4 + 6) window used to make identificationsbe necessary for a relatively clean (V/V) and collect the eluete in a 500- should be based upon measurementssample matrix. The cleanup mL K-D flask equipped with • lO-mL of actual retention time variations of
f'" procedures recommended in this concentrator tube, Elution of the standards over the course of a day.method have been used for the column should be at a rate of about 2 Three times the standard deviation of
analysis of various clean waters and mL/min, a retention time for a compound canindustrial effluents. If particular 11.3.5 Concentrate the collected be used to calculate a suggested
circumstances demand the use of an fraction to less than 10 mL by K-D window size; however, the experiencealternative cleanup procedure, the techniques as in Section 10.6, using of the analyst should weigh heavily inanalyst must determine the elution : pentane to rinse the walls of the glass- the interpretation of chromatograms.
profile and demonstrate that the ware. Proceed with HPLC or GC 12.7 If the peak height or arearecovery of each compound of interest analysis, exceeds the linear range of theis no tess than 85%. system, dilute the extract with11.2 Before the silica gel cleanup 12. High Performance Liquid acetonitrile and reanalyze.
technique can be utilized, the extract Chromatography (HPLC)solvent must be exchanged to cycle- 12.8 If the peak area measurement
hexane. Add a 1. to 10- mL aliquot , 12.1 To the extract in the is prevented by the presence ofof sample extract (in methylene concentrator tube, add 4 mL of ' interferences, further cleanup ischloride) and a boiling chip to s clean acetonitrile and a new boiling chip, required.K-D concentrator tube. Add 4 mL then attach a micro.Snyder column.
cyctohexene and attach a micro- Increase the temperature of the hot 1 3. Gas ChromatographySnyder column. Prewar the micro- water bath to 95 to 100°C.Snyder column by adding O.5 mL Concentrate the solvent as in Section 13.1 The packed column GC
methylene chloride to the top. Place 10. After cooling, remove the micro- procedure will not resolve certainthe micro-K-D apparatus on a boiling Snyder column and rinse its lower isomeric pairs as indicated in(100°C} water bath so that the joint into the concentrator tube with Section 1,3 and Table 2. The liquidconcentrator tube is partially about 0.2 mL acetonitrile. Adjust the .... chromatographic procedure (Sectionimmersed in the hot water. Adjust the extract volume to 1.0 mL 12) must be used for these materials.vertical position of the apparatus and Capillary (open-tubular) columns ,the water temperature as required to 12.2 Table 1 summarizes the may be used if the relative standardcomplete concentration in 5 to 10 recommended HPLC column materials deviations of r.esponses for replicate -_minutes. At the proper rate of and operating conditions for the injections are demonstrated to be _-distillation the balls of the column will instrument. This table includes less than 6% and the requ0rements -actively chatter but the chambers will retention times, capacity factors, and of Section 8.2 ere met.not flood. When the apparent volume MDL that were obtained under theseof the liquid reaches 0.5 mL. remove conditions, The UV detector is 13.2 To achieve maximumthe K.D apparatus and allow it to recommended for the determination sensitivity with this method, thedrain for at least 10 minutes while of naphthalene, ecenaphthylene, extract must be concentrated to 1.0cooling. Remove the micro-Snyder acenapthena, and fluorene, and mL. Add s clean boiling chip to thecolumn and rinse its lower joint the fluorescence detector is methylene chloride extract in theinto the concentrator tube with a recommended for the remaining concentrator tube. Attach a two.ball
minimum of cyciohexane. Adjust the PAHs. Examples of the parameter micro-Snyder column. Prewet theextract volume to about 2 mL. separations achieved by this HPLC micro-Snyder column by adding about
column are shown in Figures 1 0.5 mL of methylene chloride to the11.3 Silica gel column cleanup for and 2. Other HPLC columns, top, Place the micro K-D apparatus onPAHs. chromatrograpic conditions or a hot water bath (60 to 65°C) so that11.3. 1 Prepare a slurry of log detectors may be used if the the concentrator tube is partiallyactivated silica gel in methylene requirements of Seclion 8.2 are reel immersed in the hot water. Adjust thechloride and place this in a lO.mm ID vertical position of the apparatus andchromatography column. Gently tap 12.3 Calibrate the system daily as the water temperature as required tothe column to settle the silica gel and described in Section 7, complete the concentration in 5 toelute the methylene chloride. Add 1 to ' 12,4 If the internal standard 10 minutes. At the proper rate of
2 cm of anhydrous sodium sulfate to approach is being used, the internal distillation the balls will activelythe top of the Silica gel. standard must be added to sample chatter but the chambers will not1 1.3.2 Preelute the column with 40 extract and mixed thoroughly, flood. When the apparent volume ofmL of pentane. Discard the eluate and immediately, before injection into the liquid reaches 0.5 mL remove thejust prior to exposure of the sodium instrument. K-D apparatus. Drain and cool for atleast 10 minutes. Remove the micro-sulfate layer to the air, transfer the 2 12.5 Inject 5 to 25/JL of the sample Snyder column and rinse its lowermL of cyclohexane sample extract extract using a high pressure syringe joint into the concentrator tube with aonto the column, using an additional or a constant volume sample injection small volume of methylene chloride.2 mL of cyclohexane to complete the loop, Record the volume injected to Adjust the final volume to 1.0 mL andtransfer the nearest 0.1 /JL and the resulting stopper the concentrator tube,11.3.3 ,Just prior to exposure of the peak size in height or area units. Re-sodium sulfate layer to the air, add 25 equilibrate the liquid chromate- 13.3 Table 2 describes themL pentane and continue elution of graphic column at the initial recommended GC column and
; the column, Discard the pentane gradient conditions for at least 10 operating conditions for theeluate, minutes between injections, instrument. This table includes
610.6 Ju/y I982
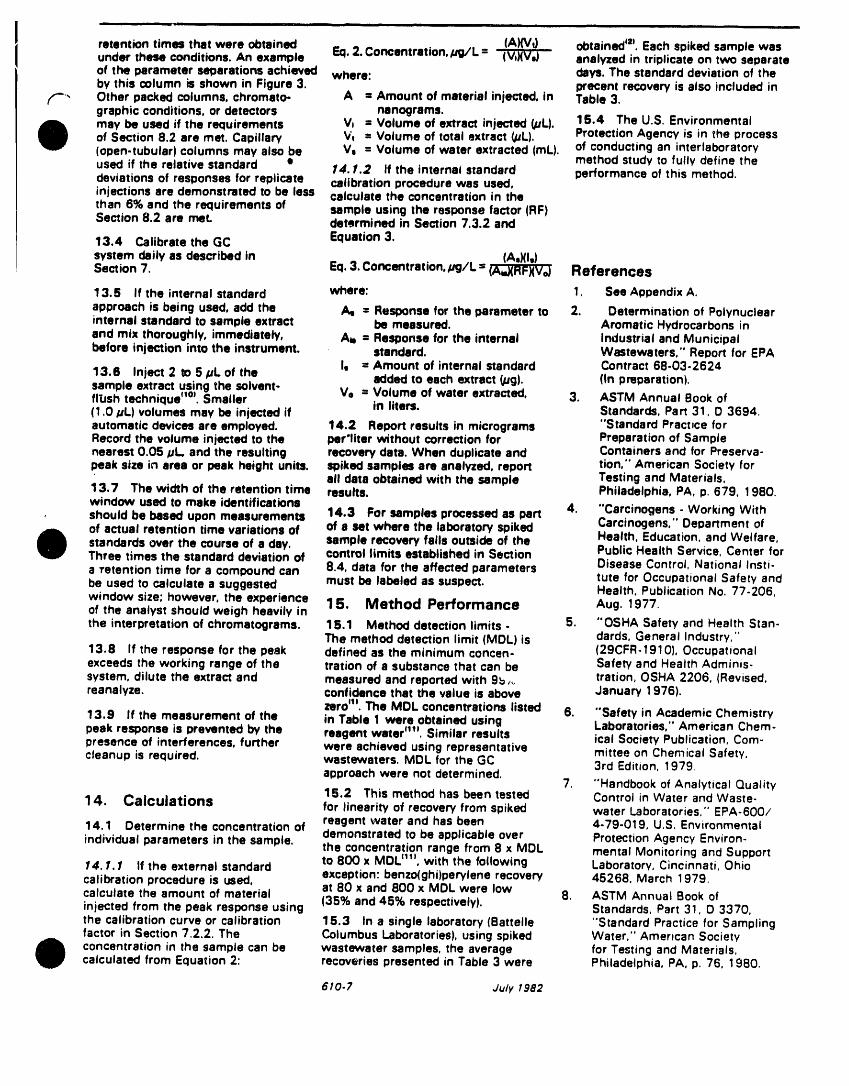
- ,i
retention times that were obtained (A)(Vt) obtained _a:.Each spiked sample wasunder these conditions. An example Eq. 2. Cortcentration,/Jg/L = (VoXV.) analyzed in triplicate on two separateof the parameter separations achieved where: days, The standard deviation of theby this column is shown in Figure 3, precent recovery is also included in
('-'. Other packed columns, chromato- A = Amount of material injected, in Table 3,graphic conditions, or detectors nanograms.may be used if the requirements V0 = Volume of extract injected _L). 15.4 The U.S, Environmentalof Section 8.2 are met. Capillary Vt = Volume of total extract (/JL). Protection Agency is in the process(open-tubular) columns may also be V. = Volume of water extracted (mL), of conducting an interlaboratory
method study to fully define theused if the relative standard • 14. 1.2 If the internal standard performance of this method,deviations of responses for replicate calibration procedure was used,injections are demonstrated to be less calculate the concentration in the
than 6% and the requirements of sample using the response factor (RF)Section 8.2 are rneL determined in Section 7.3.2 and
13.4 Calibrate the GC Equation 3.
system daily as described in (A,XI,)Section 7. Eq. 3. Concentration,,ug/L = _ References
13.5 If the internal standard where: 1. See Appendix A.
approach is being used, add the At = Response for the parameter to 2. Determination of Polynucleerinternal standard to sample extract be measured. Aromatic Hydrocarbons inand mix thoroughly, immediately, Aa, = Response for the internal Industrial and Municipalbefore injection into the instrument, standard. Wastewaters," Report for EPA
13.6 inject 2 to 5/JL of the I, = Amount of internal standard Contract 68-03-2624added to each extract (,up). (In preparation).
sample extract using the solvent- Vo = Volume of water extracted,fliJsh technique _1°:.Smaller 3. ASTM Annual Book of(1.0/_L) volumes may be injected if in liters. Standards, Pan 31, D 3694.automatic devices are employed. 14.2 Report results in micrograms "Standard Practice forRecord the volume injected to the per'liter without correction for Preparation of Samplenearest 0.05/JL and the resulting recovery data. When duplicate and Containers and for Preserva-peak size in area or peak height units, spiked samples are analyzed, report tion," American Society for
all data obtained with the sample Testing and Materials.13.7 The width of the retention time results. Philadelphia, PA, p. 679, 1980.
window used to make identifications 4. "Carcinogens - Working With, should be based upon measurements 14.3 For samples processed as part
of actual retention time variations of of a set where the laboratory spiked Carcinogens," Department ofstandards over the course of a day. sample recovery falls outside of the Health, Education, and Welfare,Three times the standard deviation of control limits established in Section Public Health Service, Center fora _'etention time for a compound can 8.4, data for the affected parameters Disease Control, National Insti-be used to calculate a suggested must be labeled as suspect, tute for Occupational Safety and
Health, Publication No. 77-206,window size; however, the experience 15. Method Performance Aug. 1977.of the analyst should weigh heavily inthe interpretation of chromatograms. 15.1 Method detection limits - 5. "OSHA Safety and Health Stan-
The method detection limit (MDL) is dards, General Industry,"13.8 If the response for the peak defined as the minimum cancan- (29CFR-1910), Occupationalexceeds the working range of the tration of a substance that can be Safety and Health Adminis.system, dilute the extract and measured and reported with 9b _,_ tration, OSHA 2206, (Revised,reanalyze, confidence that the value is above January 1976).
zero "_. The MDL concentrations listed 6. "Safety in Academic Chemistry13.9 If the measurement of the in Table 1 were obtained using Laboratories," American Chem-peak response is prevented by the reagent water "_. Similar results ical Society Publication, Cam-presence of interferences, further were achieved using representative mittee on Chemical Safety,cleanup is required, wastewaters. MDL for the GC 3rd Edition, 1979
approach were not determined.7, "Handbook of Analytical Quality
15.2 This method has been tested Control in Water and Waste.14. Calculations for linearity of recovery from spiked water Laboratories," EPA-600/14.1 Determine the concentration of reagent water and has been 4-79-019, U.S. Environmental
demonstrated to be applicable over Protection Agency Environ-individual parameters in the sample, the concentration range from 8 x MDL mental Monitoring and Support14.1.1 If the external standard to 800 x MDL "I:. with the following Laboratory, Cincinnati, Ohiocalibration procedure is used, exception: benzo(ghi)perylene recovery 45268, March 1979calculate the amount of material at 80 x and 800 x MDL were low
iniected from the peak response using (35% and 45% respectively). 8. ASTM Annual Book ofStandards, Part 31, D 3370.the calibration curve or calibration 15.3 In a single laboratory (Battelle "Standard Practice for Samplingfactor in Section 7.2.2, The Columbus Laboratories), using spiked Water," American Societyconcentration in the sample can be wastewater samples, the average for Testing and Materials,calculated from Equation 2: recoveries presented in Table 3 were Philadelphia, PA, p. 76, 1980.
610. 7 July 1982
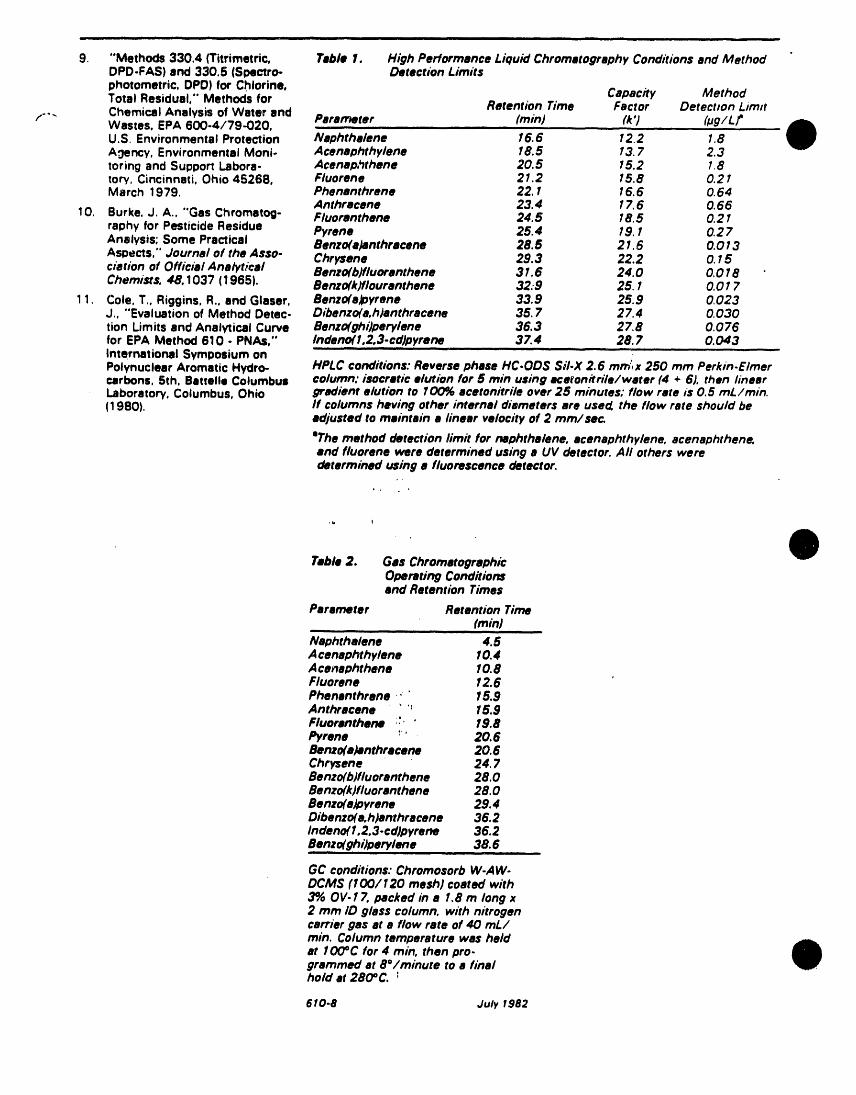
i iii ill i i i il i ii ii -- ii , ,i
9. "Methods 330,4 (Titrimetric, Table I. High Performance Liquid Chromatography Conditions and MethodDPD-FAS) and 330.5 (Spectro- Detection Limitsphotometric, DPD) for Chlorine,Total Residual," Methods for Capacity MethodRetention Time Factor Detection Limit
f... Chemical Analysis of Water andWastes. EPA 600-4/79-020, pars,meter (rain) (k') (IJg/L[U.S, Environmental Protection Naphthalene 16.6 12.2 1,8A0ency, Environmental Moni- Acenaphthylene 18.5 73, 7 2.3toring and Support Labors- Acenap,_thane 20.5 15.2 1,8tory, Cincinnati, Ohio 45268, Fluorene 21.2 15.8 0.21March 1979, Phenanthrene 22. 1 I6. 6 O.64
Anthracene 23. 4 17,6 O,6610. Burke, J. A., "Gas Chromatog- Fluoranthene 24.5 18,5 0.27
raphy for Pesticide Residue Pyrene 25.4 19. 1 0.27Analysis; Some Practical Benzo(a)anthrecene 28.5 21.6 0.013Aspects," Journal of the Asso- Chrysene 29.3 22.2 O,15clarion of Official Analytical Benzo(bjfluoranthene 31.6 24.0 0,018Chemists. 48.1037 (1965). Benzo(k)flouranthene 32..9 25. 1 0.017
11. Cote, T., Riggins, R., and Glaser, Benzo(a)pyrene 33.9 25.9 0,023J,, "'Evaluationof Method Detec- Dibenzo(a.h)anthracene 35. 7 27.4 0,030tion Limits and Analytical Curve Benzo(ghi)perylene 36.3 27.8 0,076for EPA Method 610 - PNAs," lndeno(l.2,3.cd)pyrene 37.4 28.7 0,043........ Hi
International SymposiumonPolynuclear Aromatic Hydro- HPLC conditions: Reverse phase HC.OD$ $iI-X 2. 6 m_",x 250 mm Perkin.E/mercarbons, 5th, Battelle Columbus column: isocratic elution for 5 rain using acetonitrile/water (4 + 6). then linearLaboratory, Columbus, Ohio gradient elution to 100% acetonitrile over 25 minutes; flow rate is 0,5 mL/rnin.(1980). If columns having other internal diameters are used the flow rate should be
adjusted to maintain a linear velocity of 2 mm/ se_
=Themethod detection limit for naphthalene, acenaphthy/ene, acenaphthene.end fluorene were determined using a UV detector. Aft others weredetermined using a fluorescence detector.
* i
Table 2. Gas ChromatographicOperating Conditionsand Retention Times
Parameter Retention Time(min)
Naphthalene 4.5Acanaphthylene 10.4Acanaphthene 10.8Fluorane 12.6 'Phenanthrena . " 15.9Anthracene " " 15.9Fluorenthene :_ " 19.8Pyrene :" 20.6Benzofe)anthrecene 20. 6Chrysene 24. 7Benzo(b)fluoranthene 28.0Benzo(k)fluoranthene 28. 0Benzo(a_oyrene 29.4Dibenzo(a.h)anthracene 36.2Indeno( l .2.3-cd)pyrene 36.28en,,zo(ghi)perylene 38.6
GC conditions: Chromosorb W-AW.DCMS {100/120 mesh) coated with3% OV- 17. packed in a 1,8 m long x2 mm ID glass column, with nitrogencarrier gas at a flow rate of 40 mL/rain. Column temperature was heldat 100°C for 4 rain. then pro.grammed at 8"/minute to a finalhold at 280°C. :
610.8 July I982
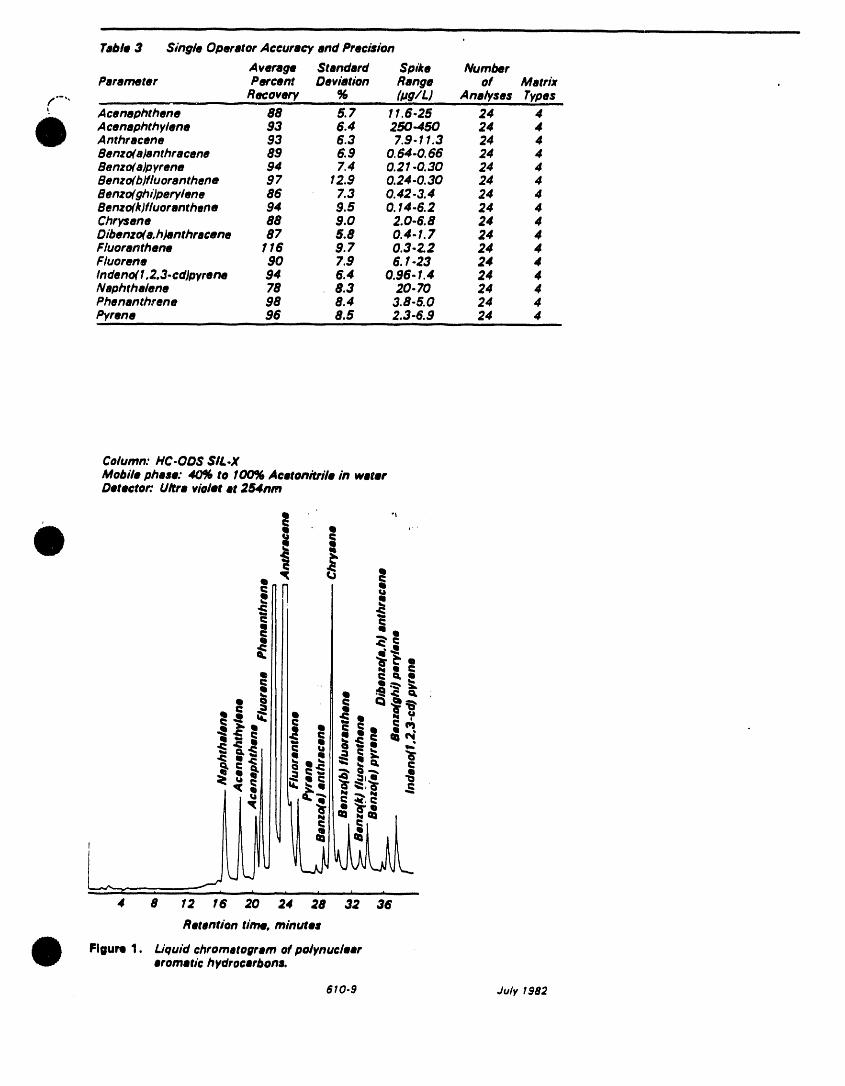
in i u I nn nlln nun n nnumul| J|l
i
Table 3 Single Operator Accuracy and Precision
Average Standard Spike NumberParameter Percent Deviation Range of Matrix
__ Recovery % (#g/L) Analyses Types'f..... Acenaphthene 88 5. 7 11.6.25 24 4
Acenaphthytene 93 6.4 250-450 24 4Anthracene 93 6.3 7.9-11.3 24 48enzo(a)anthracene 89 6.9 O.64.0. 66 24 48enzo(a)p yrene 94 7.4 O.21-0, 30 24 48enzo(b)fluoranthene 9 7 I2.9 0.24-0. 30 24 48enzo(ghi)peryiene 86 7.3 0,42-3.4 24 4Benzo(k)fluoranthene 94 9.5 O.14-6.2 24 4Chrysene 88 9.0 2.0-6.8 24 4Dibenzo(a,h)anthracene 87 5.8 0.4-1.7 24 4Fluoranthene 116 9.7 0.3-Z2 24 4Fluorene 90 7.9 6.1-23 24 4Indenc#1,2.3.cd/pyrene 94 6.4 0.96- I. 4 24 4Naphthalene 78 8.3 20.70 24 4Phenanthrene 98 8.4 3.8-5.0 24 4Pyrene 96 8.5 2.3-6.9 24 4i
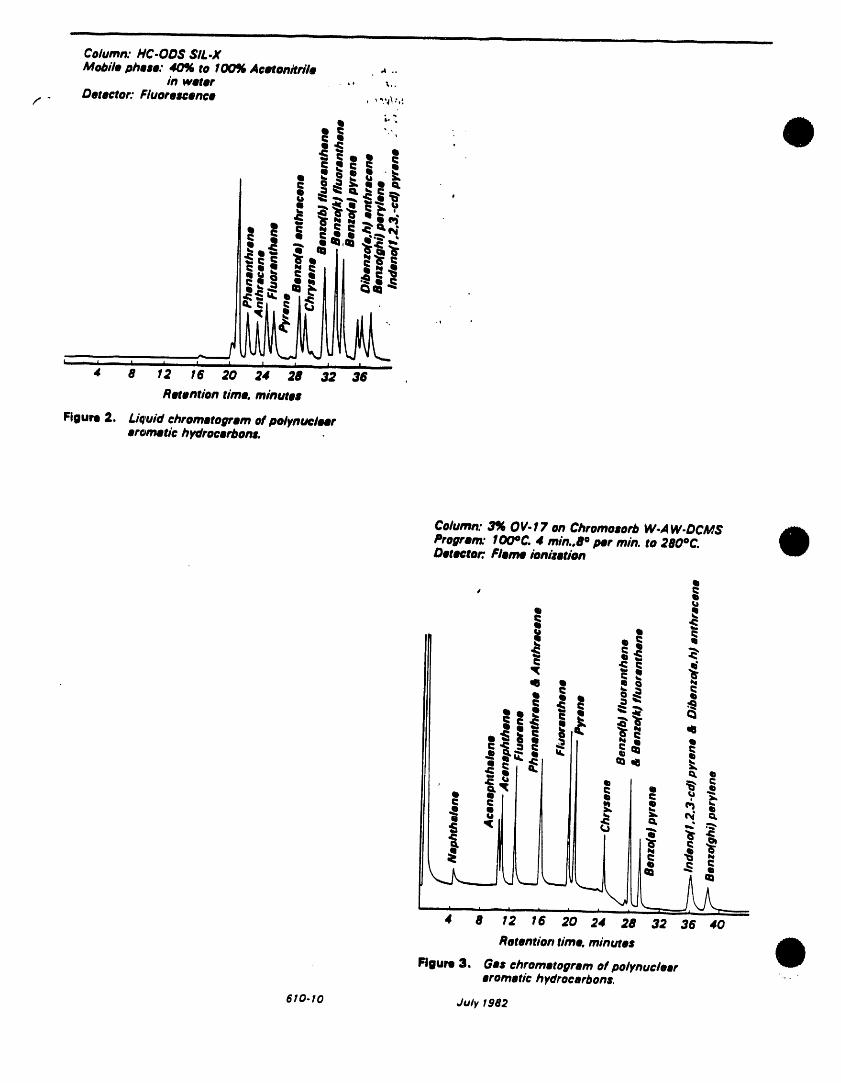
__ iiii iii i i i _ illi lai _ i i i iii iii i il
Column: HC-OD$ $1L.XMobile Dhe$e: 40% to 100% Acetoni_rile _ ..
in weter , ,, _,.Detector: Fluorescence , ,.,_.,:f-
t_,!_ '
Ill _ q
,, '" , , ; I'_'--, , I,,, , , •4 8 12 I6 20 24 28 32 36
Retention time. minutes
Figure 2. Liquid chrometogrem of polynucleererometic hydrocerbon¢
Column: 3% or. 17 on Chromoaorb W.AW.DCM$Progren_" 100°C. 4 rain.,8 ° per rain. to 280°C.Detector. Fleme ionizetion
Q
Q
i: t: Q
4 8 I2 16 20 24 28 32 36 40
Retentiontime,minutes
Figure 3, Gas chrometogrem of polynuclnr ..,,.orometic hydrocarbons.
610. I 0 July 1982
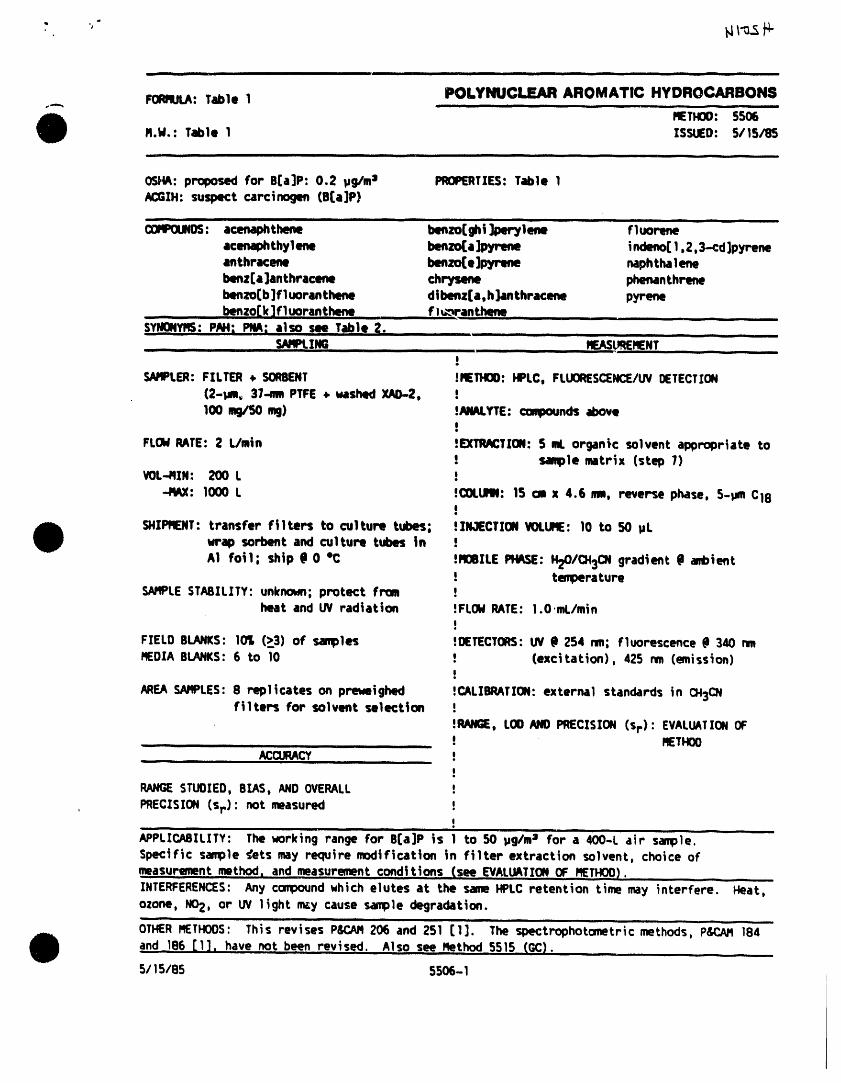
i i i.ii
FOmmJLA:Table 1 POLYNUCLEAR AROMATIC HYDROCARBONSPIETHO0: 5506
Iq.kl.: Table 1 %SSUED: 5/15/185
-- -- N I I IImla IIIII I I
OSHA:proposed for O[a]P: 0.2 pg/m_ PROPERTIES:Table 1ACGIH: suspect carcinogen (B(a]P)
os: 'ace,matrm' benzo( i]per lene fluore " Lecena_ thylene benzo(a ]pyrene indeno(1,2,3-cd ]pyreneanthrecL,ne benzo(e ]p,j_-mle naphtha1eriebenz(a ]anthracene chrysefle phenanthrenebenzo(b]fluoranthem) dibenz[a,h]anthracene pyrene
_ benzo[k ]fluorant hene. f V_ran thene ....SYIg_YHS: PAH; PNA; also m Table 2. ....
s t1.Q ....... me.e.T!
SNqPLER:FILTER • SCRBIENT !IqETHOD:HPLC, FLUORESCENCE/UVDETECTION(2-pro, 37-ramPTFE • washed XAI)-2, !100 mq/50 ,mS) .'ANALYTE:oumounds above
FLOblRATE: 2 L/rain !EXTRACTION:5 ml. organic solvent appropriate to! sample matrix (step 7)
VOL-JIIN: 200 L !
-/MX: 1000 L !COLUFII: 15 on x 4.G ram, reverse phase, 5-_m C18
SHIRqE]IT: transfer Filters to cultur_ tubes; !IN3ECTION VOLUI_: 10 to 50 pLvrap sorbent and culturl tubes tn !
AI foil; ship (I 0 "C !MOBILEPHASE:HgO/CH3CNgradient (I anl)ient! temperature
SNqPLESTABILITY: unknown; protect frm !heat and UV radiation !FLOMRATE: I.O.mL/min
O
FIELD 8tANKS: 109, (>3) of samples !0ETECTORS:UV (I 254 nm; fluorescence _l 340 nm_IEDIABLANKS:6 to 10 ! (excitation). 425 nm (mission)
!
AREASNqPLES:8 replicates on prewaighed !CALIgRATZON:external standards in CH3C_filters for solvent selection !
!RANGE, LOOANO PRECISION (st): EVALUATIONOF.... ! FIETH00_ ACOLRACY !
I
RANGESTUOIED, BIAS, ANDOVERALL !
, PRECISION (st): not measured II
APPLICABILITY: The _orking range for eCa]P is I to 50 pg/ma for a 400-L air sample.Specific sample _'ets may require modification in filter extraction solvent, choice of"measurement method, andmeasurement conditions (see EVALUATIONOF I_THOO).
INTERFERENCES:Any compoundwhich elutes at the sam HPLCretention time may interfere. Heat,ozone, NO2, or UV light m_y cause sample degradation.
OTHERMETHOOS: This revises PJ_AJq206 and 251 [l]. The spectrophotometric methods, PS_?.A/q184and 186 [1], have not been revised. Also see Iqethod 5515 (GC).
5/15/eS S506-1
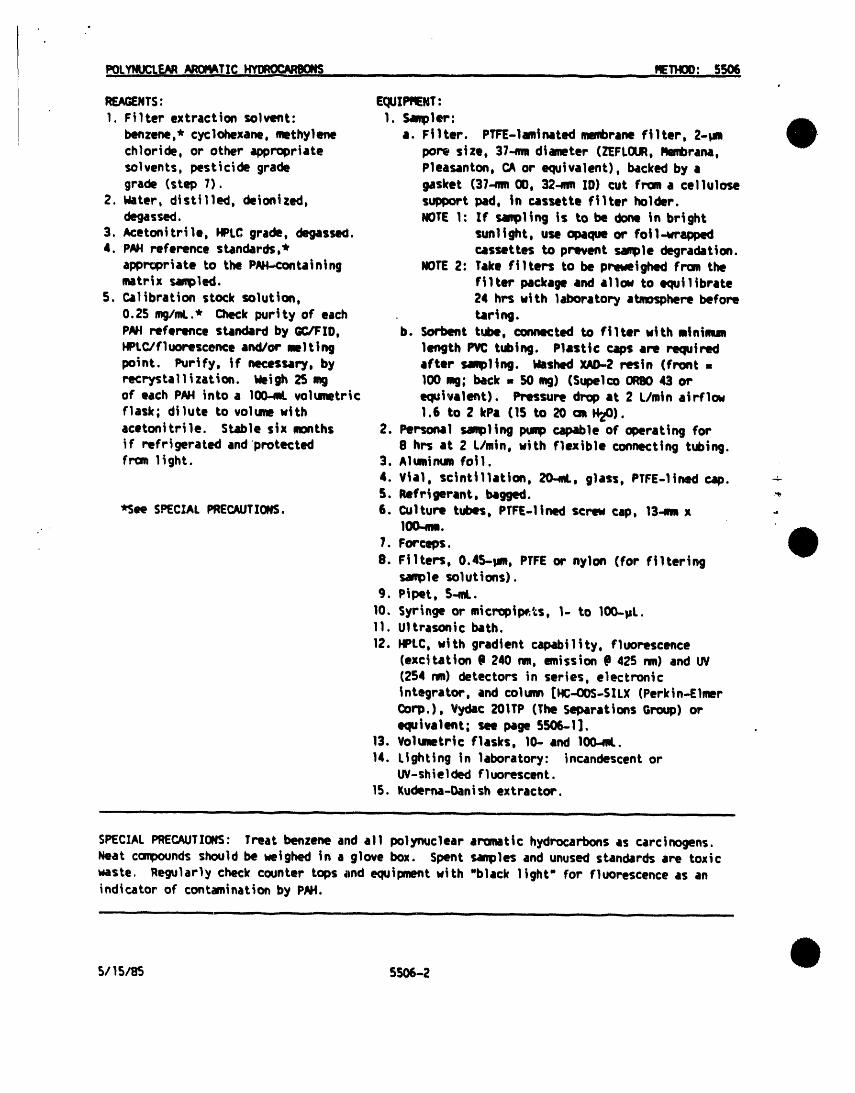
_POLYI_ICLE.IIR."._I_.TIC _ , ....... I'ETHOD: 5506
REA_NTS: EQJIPFlEHT:1. Filter extraction solvent: 1. Sampler:
benzene,* cyclohexane, methylene a. Filter. PTFE-lamtnated nwd)rane filter, 2-_chloride, or other appRq)riate pore size, 37-m diameter (ZEFLOUR,I_nbraml,solvents, pesticide grade Pleasanton, CAor equivalent), backed by agrade (step 7). gasket (37-,m 00, 32-ram ZD) cut fr_n a cellulose
2. Mater, distilled, deionized, support pad, in cassette f_lter holder.degassed. NOTE1: Zf samplin9 is to be done in bright
3. Acetonitr41e, HPLCgrade, degassea, sunlight, use opaque or fotl-wapped4. PAHreference standards,* cassettes to prevent sample degradation.
apprrmriate to the P_taining NOTE2: Take f|lters to be preveighed fr_ thematrix sampled, filter package and allow to equilibrate
5. Calibration stock solution, 24 hr_ v_th laborator_f atmosphere before0.25 nxJ/mL.* Check purity of" each taring.PNt reference standard by GC/FID, b. Sorbent tube, connected to f|lter vtth minimumHPLC/fluorescence and/or melting length PVC tubing. Plastic caps are r_lutredpoint. Purify, if necessary, by after sampling. Mashed _ res|n (front =vecrystallization. Meigh 25 m9 100 rag; back = 50 rag) (Supelco ORB043 orof each PNt into a 100._L volumetric equivalent). Pressure drop at 2 L/rain airflo_flask; dilute to volume vtth 1.6 to 2 kPa (15 to 29 am H20).acetonitrile. Stable six months 2. Personal sampling pump capable of operating forif refrigerated and protected 8 hrs at 2 Llmin, vith flexible connecting tubing.f_ light. 3. A1umiman fol I.
4. V_al, $c|ntillation, 20-mL, glass, PTFE-lined cap. -_5. Refrigerant, bagged. -_
*3ee SPECIALPRECAUTIONS. 6. Culture tubes, PTFE-ltned scrlv cap, 13-ramx -lOOm.
7. Forceps.
8. Ftlter_, 0.45-pro, PTFE or nylon (for filteringsample solutions).
9. Pipet, S-rot..10, Syringe or micr_pipe,_s, I- to lO0-pL.11. Ultrasonic bath,
12. HPLC, with gradient capability, fluorescence(excitation (I 240 nm, emission (I 425 nm) and UV(254 rim) detectors in series, electrx_nic_ntegrator, and column [HC-OOS-SILX (Perkin-ElmerCorp.), Vydac 291TP (The Separations Group) orequivalent; see page 550_-I].
13. Volumetric flasks, 10-and 100-_.14. Lighting in laboratory: incandescent or
UV-shiel dad fluorescent.15. Kuderna-Oanish extractor.
i iii ii -- IIlll i IIIIIII I] --
SPECIALPRECAUTIONS: Treat benzene and all polynuclear ar_nmtic hydrocarbons as carcinogens.Neat compoundsshould be _eighed in a glove box. Spent saeq)les and unused standards are toxicwaste. Regularly check counter tops and equipment with "black light" for fluorescence as anindicator of contamination by PN4.
5/1 S/85 55O6-2
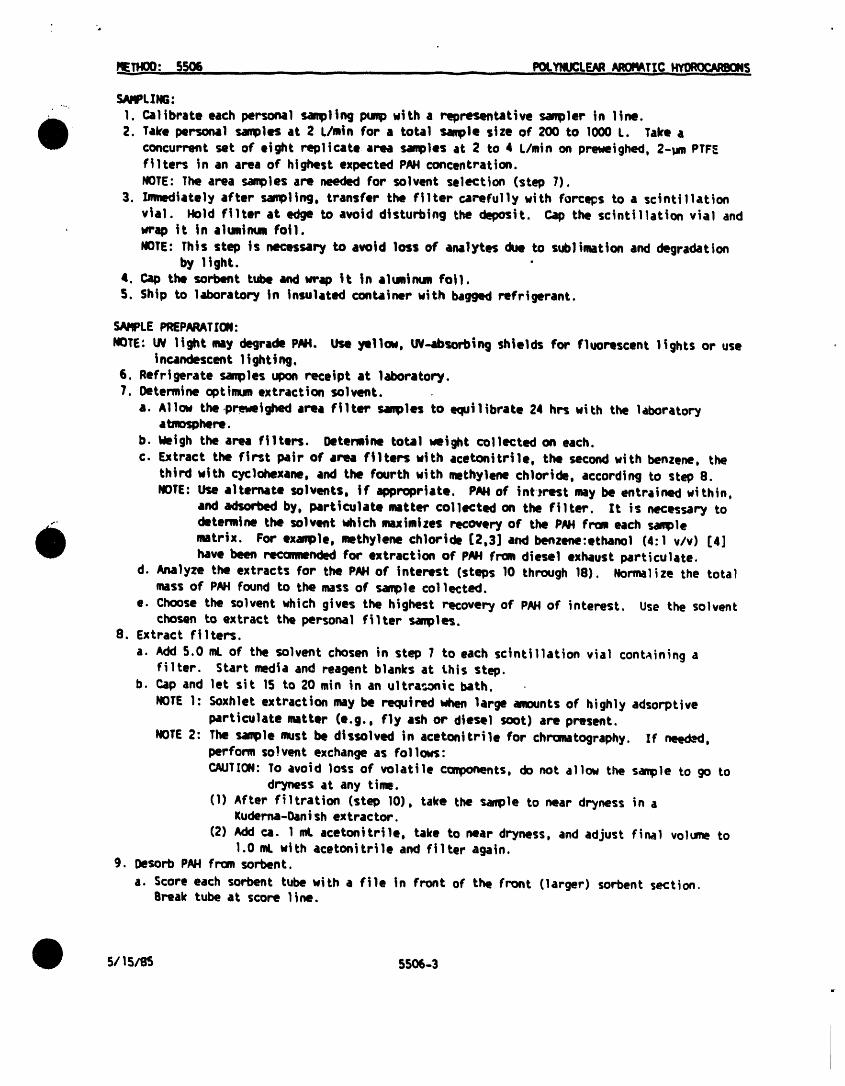
REl1400:5506 ...... _ _ ,. I_..YI_.LF.AR AROMATICHYI_S
SARPLING:
I. Calibrate each personal sampling pumpwith a r_presentative sampler in line.2. Take personal samles at 2 L/mln for a total sample size of 200 to 1000 L. Take a
concurrent set of eight replicate area samples at 2 to 4 L/min on preweighecl, 2-_ PTFEfilters in an area of highest expected PAHconcentration.NOTE: The area samples are needed For solvent selection (step 7).
3. Inmediately after sampling, transfer the filter carefully with forceps to a scintillationv|al. Hold f|lter at edge to avoid disturbing the deposit. Cap the scintillation vial andwrap tt tn aluminum foil.
NOTE: This step is necessary to avoid loss of 4nalytes due to sub)imat|on and degradationby l|ght.
4. Cap the sorbent tube and m'ap tt in al_inum foil.5. Ship to laboratory in insulated container with bagged refrigerant.
SAMPLEPREPARATION:
NOTE: LN light my degrade PNa. Use yellow, UV-absorbing shields for fltmrescent lights or useincandescent 1ighting.
6. Refrigerate samples upon receipt at laboratory.7. 0etemtne optimum extraction solvent.
a. A1low the ,preveighed area fi lter samples to equi 1 |brate 24 hrs wi th the laborator_Jatemsphere.
b. Weigh the area filters. 0etemine total weight collected on each.c. Extract the f|rst pair of am f|lters with acetonitrJle, the second with benzene, the
third with cyclohexane, and the fourth with methylene chloride, according to step 8.NOTE: Use alternate solvents, if appr_riate. PAHof int.,rest may be entrained within,
and adsorbed by, particulate matter collected on the filter. It is necessary to. detemine the solvent which maximizes recove_ of the PAH from each sample
matrix. For example, methylene chloride (2,3] and benzene:ethanol (4:1 v/v) [4]have been recamwndod for extraction of PAH from diesel exhaust particulate.
d. Analyze the extracts For the PAl4of interest (steps 10 through 18). Normalize the totalmass of PAH found to the mass of sample col letted.
e. Choose the solvent which gives the highest recovery of PNt of interest. Use the solventchosen to extract the personal fi Iter samples.
8. Extract filters.
a. Add S.O mi. of the solvent chosen in step 1 to each scintillation vial containing afilter. Start media and reagent blanks at this step.
b. Cap and let sit 15 to 20 rain in an ultra-_nic bath.
NOTE1: Soxhlet extraction may be required when large amounts of highly adsorptiveparticulate matter (e.g., fly ash or d|esel soot) are present.
NOTE2: The sample must be d|ssolved in acetonjtrile For chromatography. Zf neecL_l,perfom so)vent exchange as follov_:
CAUTION:To avoid loss of volatile components, do not allow the sample to go todryness at any tim.
(1) After filtrat|on (step 10), take the _mple to near dryness in aKuderna-OanJsh extractor.
(2) Add ca. 1 mt acetonJtrile, take to near dryness, and adjust final volume to1.0 mL with acetonjtr|le and filter again.
9. Oesorb PAH from sorbent.
a. Score each sorbent tube with a file in Front of the Front (larger) sorbent section.Break tube at score line.
5/15/85 5506-3
m,ucL NnATICH ZOCNm0m..... .ET.OO:SS06
b. Transfer glass woul plug and front sorbent section to a culture tube. Discard the foamplug. Transfer back sorbent section to • second culture tube.
c. Add S.O mL acetonttrile to each culture tube. Cap the culture tubes.d. Allow samles to sit for 30 rain. Swirl OCCaSiOMI1y.
10. Filtar all sample extracts through an 0.4S-_m membrane f|lter.
CALIBRATIONANOQUALITYCONTROL:
I1. Calib_ate daily with at least five working standards.a. Dilute aliquots of calibration stock solution with acetonitrile in lO-mL volumtric
flasks (e.g.. to 2.5. 0.5. 0.1. 0.02. and 0.002 pg/mL).b. Intersperse working standards •nd samples in the measuremmts.c. Prepare calibration graphs (peak area vs. lag of each PN4 per sample).
12. Recovery and desorptton efficiency.a. DetemJne recovery (R) from filters and desorption efficiency (DE) from sorbent tubes at
least once for each lot of filterq; and sorbent tubes used in the range of |nterest.(1) F|lters. Us|ng • microltter syringe or micrt)pipette, spike four filters at each of
five concentration levels vith a mixture of the •nglytes. AIIou the f|lters to dryin the dark overnight. Analyze the filters (steps 8. 10, and 14 through 16.Prepare graphs of R vs. amounts found.
NOTE: This step my not be used for sam highly adsorptive particulate mtrices forvhich calibration by the method of standard additions may be more accurate.
(2) Sorbent tubes. Transfer an unused front sorbent section to a culture tube. Pr_,parea total of 24 culture tubes in order to insure DE at five concentration levels plusblanks |n quadruplicate. Using a microliter syringe or micropipette, add -calibration stock soTution directly to sorbent. Cap culture tubes and allow tostand overnight. Analyze (steps g, 10, and 14 through 16). Prepare graphs of DE _"
/" vs. mounts found.
', b. Check R and 0E at two levels for each sample set, in duplicate. Repeat detemination ofR and DE graphs if checks do not agree to within +_S_of DE graph.
13. Analyze at least three field blanks for each sample radium.
I_.ASUREIqENT:
14. Set HPLCaccording to manufacturer's recommndations and to conditions on page 5506-1.Equilibrate column at 60_ CN3CN/40&1420at 1.0 mL/min for 15 rain before injecting firstsample.
15. Inject sample aliquot, start mobile phase gradient:a. Linear gradient 601, CH3CNto 1001, CH301, 20 rain.b. Hold at 100_ Q43CNfor 20 rain.
NOTE: Hold longer if necessary to prevent carryover of background, e.g., from co41 dust.c. Linear gradient to initial condition, S rain.
15. Iqeasure peak areas.NOTE1" Approximate retention times appear in Table 3.
NOTE2: If peak area is above the calibration range, dilute with appropriate solvent,reanalyze, and apply dilution factor in calculations.
NOTE3: If sample has many interferences, add|tional Saml)le cleanup may be necessary. Ranycleanup procedures have been published. Liquid-liquid partitioning beU_.,encyclohexane and nitr_methane [5,6] is widely used, but other techniques may be moreappropriate for .r_,_ific samples.
S/15/85 5506-4
CALCULATIONS:
"'° 17. P_acl the mass, ug (corrected for R or DE) of each analyte found on the filter (W) andfront sor4_at (_) and back sorbent (Wb) sections, and on the average media blankf_lter (B) and f_'ont sor4_mt (Bf) and beck sortN_t (Ob) sections fron the calibrationgraphs. "_
18. r,al_late ¢onct_tration, C (l_g/mz), in air as the sumof the particulate concentrationand the vapor concerti.ration using the actual air volum sampled, V (L).
c r_-a+_r-%-nf-_)-IO'.- --_ ,, ,, pg/m_.V
NOTE: Mf .and Wb |n¢lude analyte originally collected on the fitter as particulate, thenvolat|ltzed during sanpling. This can be a significant fraction for many PN4 (e.g.,fluoranthane, naphthalene, fluortme, anthracene, phenanthrene),
_/ALUAT[QNOF flETHO0: ' - ..........The fluoramcence detector used in this method is both sensitive and selectivt. The detectorcan "see" as l_ttle as 50 pg of many PNI injected _n the colum. L00s for the 17 analytesrange frml SO to 350 ng per sample. [t does not respond to non-fluorescent molecules such asaliphatics. The method is, therefore, most aaenable to determination of trace amounts of PAFIin mixtures of altphatic comounds. Successful applications include: aluminum reductionfacilities, asphalt fume, coal gasification plants, coal liquefaction plants, coal tar pitch,coke oven emissions, creosote treatmmt fac|ltties, diesel exhaust, graphite electrode
_ manufacturing, petroleum pitch, and roofing tearoff operations.
This method has been evaluated by analyz|ng spiked filtcq-s, spikQd sorbent tubes, and completespiked samplin9 trains through ut_ich wire dram 500 L of air (7]. Each of the three groups uas
.. spiked uith each analyte at t_o concentrat|on levQIs in sextuplicate. Particular note shouldbe made that the effect of particulate mutter has not been evaluated, and every sampling matrixis unique. The data on the follouing page uet't obtained on spiked samplers stored refrigeratedin the dark for three months follomd b_f measuremLmtwith HPLC.
5/15/8S 5506-5
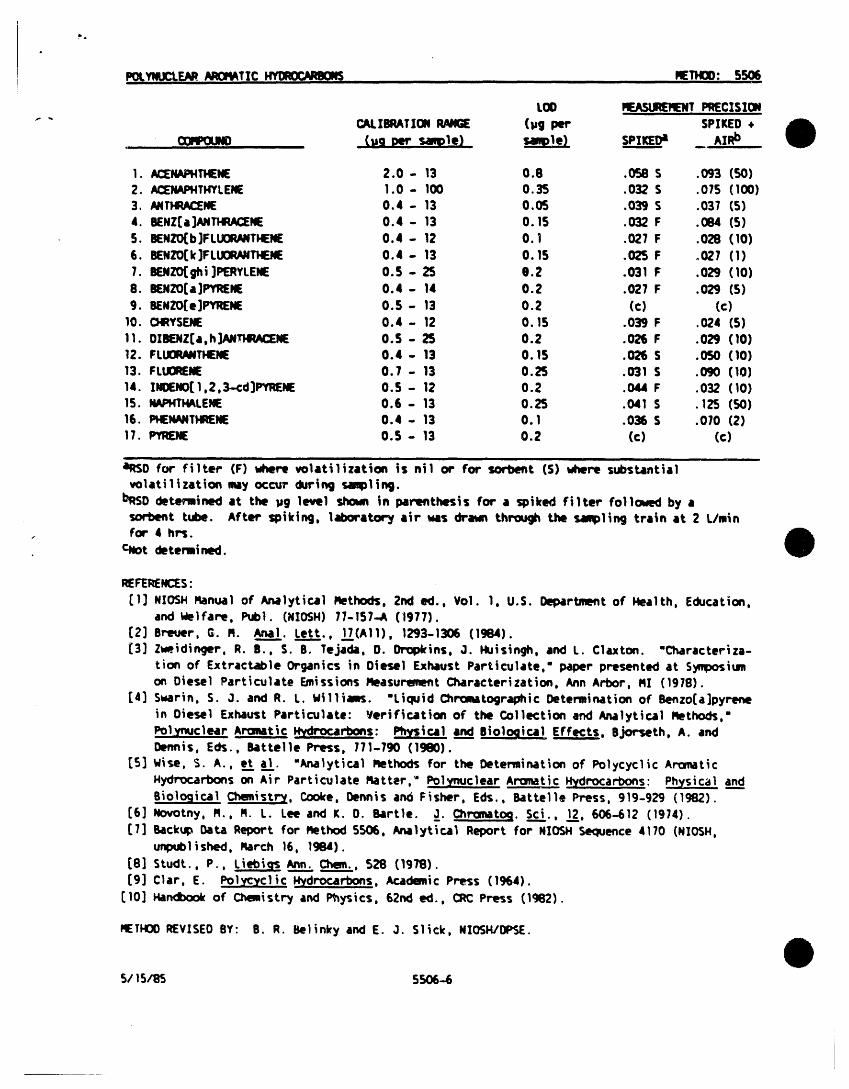
PotmJCLE_N_mTIC m_R0C_Em _mm: 55o6
LOD MEASURERENTPRECISION
" " CALIBRATIONRNIGE (lJg per SPIKED •OONK)UNO (_g per sample) samle) SPIKEDi AZRb
1. J_ENNF_TI.IENE 2.0- 13 0.8 .0rj_ S .093 (SO)2. ACL_IAPNTHYLENE 1.0- 100 0.35 .032 S .075 (100)3, ANTISM_NE 0.4- 13 0.05 .039 S .037 iS)4. BENZ[a]ANTHRACEIE 0.4- 13 0.15 .032 F .(_4 (5)5. BENZO[b]FLUORANTHEN[ 0.4- 12 0.1 .027 F .028 (10)6. BENZO[k]FLUORANTHENE 0.4- 13 0.15 .025 F .027 (I)
7. BIEMZO(ghi]PERYLENE 0.5- 2S e.2 .031 F .029 (10)8. BENZO[a]PYRENE 0.4- 14 0.2 .027 F .029 (5)9. BENZO(e]PYRENE 0.5- 13 0.2 (c) (c)
10. CHRYSENE 0.4- 12 0.15 .039 F .024 i5)I1. 0IBIENZ[a,h]AN!_4tACTcJE 0.5 - 2S 0.2 .026 F .029 il0)12. FLUORNITISENE 0.4- 13 0.15 .026 S .050 (10)13. FLUORENE 0.7- 13 0.35 .031 S .090 (10)14. I_1,2,3-¢d]_NE 0.5- 12 0.2 .044 F .032 (10)15. NAPHTHALENE 0.6- 13 0.35 .O41 5 .125 (50)16. I_IENANTHRENE 0.4- 13 0.1 .036 S .070 i2)17. PYRENE 0.5- 13 0.2 (c) (c)
al_l) for filter iF) vhere volatil|zat_on is nil or for sorb_t (S) where subst,lntialvolatilization may occur ckn-ing sampl|n9.
bRSDdetermined at the pg level shorn in pawmthesis for • spiked Filter folloved by •sorbent Lube. After spiking. 1•bin-•tory air winsdr•tin through the samplin9 train •t 2 t/rainfor 4 hrs.
r-Uot determined.
REFE_EHC_S-
[1] NIOSH Kanual of Analytical Iqethods, 2nd ed., Vol. 1, U.S. Depsrtment of Health, Educaticm,and Welfare, Publ. (NIOSH) 77-157-A (1977).
[2] Breuer, G. Iq. Anal. Left., 17(AI1), 1293-1306 (19G4).(3] Z_eidirKjer, R. B., S. B. Tejada, 0. I)ropkins, 3. Huisingh, and L. Claxton. "Characteriza-
tion of Extractable Organics in Diesel Exhaust Particulate," paper presented at Symposiumon Diesel Particulate Emissions /qeasur_ment Chsracterization, Ann Arbor, PI! (1978).
[4] Svarin, S. 3. and R. L. Williams. "LiClUJd Chromatographic Determination of Bemzo[a]pyrenein Diesel Exhaust P•rticulate: Verification of the Collection and Analytical Plethods."PolymJclear Ar_nat_c I_.arbons- Physical and Biological Effects, S_)rseth, A. andDermis, Ects., Bsttelle Press, 771-790 (1900).
IS] w_se, $. A., e._tal. "Analytical Piethods for the Determination of Polycyclic An:re•ticHydrocarbons on Air Particulate Iqstter, _ Po13_uclear A_tic Hydrocarbons" Physical andBiological Chem_st_j, Cooke, Dennis and Fisher, Eds., Battelle Press, 919-929 (1982).
[6] Novotny, M., fq. t. Lee and K. 0. Battle. 3_. Chr_matcx]. Sc__i_i.,1_22,606-612 (1974).(7] Backup Oa_ Report for _ttMo<lS_. _lytical Relx)rtfor NI_ Sequence 4170 (NIGH,
un_blished, Rarch 16, lCJ_l).
(8] $tudt., P., liebigs Ann__Chem._.._._,528 (1978).[9] Clar. E. Polyc_cl!c H_drocartx)ns, Academic Press (1964).
[10] Hanexx_ of Ct_mistr_i and Physics, 62nd ed., C_ Press (1962).
IqETNO0R[VISEO BY" g. R. Belinky and E. 3. $1i¢k, NIOSN/OPSE.
5/15/85 55O6-6
Hethod I_. EH$ 0-4 i ulll i in i i|ii i i
Title; 0t1 and Grease.In Hater- Infraredi m i i i i i i i ii i i
DaLe Issued: ....1-2-86 Approved by: HK Hamflto,d_J_-_...... ° . ..
t4rtl;Len by: IIK Hamiltoni i u i i i i • ii i lil|l i
Supersedes Hethod No. EH5 0-2 | i, ,,mi, i i
Oa,,,Le . Ilevlewe,d 07 , DaLe . Revised ,B7 ,
'........
t i i i
| i i i i HE II I • I
i illl ii i i i iili i l i i ii ill
i i : c • , ,, -- , fill
i i ii • ill if i i al i
i, ,|,m i el i | m ii _ , ,if ill ii |
ii i i i i i| li i i
i ii • lU j ilia i ii i i a| if
Replaced by HeLhod IIo. DaLe;| i i , i • I
EHS 0-4- !8-10-89
PIL ANOGREASEIN WATER- INFRARED
_efe_ence
1. Standard Method_ for the _xamination of Water and Wastewater, 16th Ed.,lg85, pp. 496-49g.
Principle_
Dissolved or emulsified oil and grease are extracted from water using organicsolvents. Since various solvents differ in their abtllty to extract otl andgrease, it is important to be consistent in the solvents used. ],],2-trichlorotrifluoroethane was chose to conform with the procedure used by theEnvironmental Protection Agency. After the otl and grease have been extracted,the amount present is quantified using infrared spectroscopy at 2930 cm'-.
Limit, ation_
Low boiling fractions such as kerosene and gasoline can be determined reliablyby this method as can other oil and grease fractions. This must be taken intoaccount when comparing results obtained by this method to those obtainedgravimetrically as that method does not detect low boiling fractions. Since noorganic solvent is known to selectively dtssolve only otl and grease, otherorganic substances present may b@ dissolved as Well. Only those showing in-frared absorption in the 2930 cm"_ hydrocarbon region will cause interferences.To aid in breaking up saponified oil and grease, samples should be acidified toabout pH ]. The addition of saturated sodium chloride may also be helpful.
Eauioment
I. l-liter separatory funnels with teflon stopcocks.
2. Recording infrared (IR) spectrophotometerfor use in the 3200 to 2700cm'- range.
3. I cm IR cell (quartz windows).
4. 25, 50 & 100 mL volumetric flasks.
5. Whatman IPS phase separating paper.
Reaqent (Stock}
1. I,I,2-Trichlorotrlfluorethane(TCTFE) -spec quality.
2. Sodium chloride - NaCI.
3. Sulfuric acid conc. -H2SO 4.
4. Isooctane
5. Hexadecane,.
6. Benzene- CLASS.!HUMAN CARCINOGEN
EHS 0-4-2
l_eaqents (Prepared)
I. Saturated NaCl - add NaCI to delonlzed H20 with stirring until no moreNaCl will dissolve and a slight excess remains (approximatelylOOg/250mL).Prepare _nnualIy.
Stan.dards
I. Stock Standard - Pipet 250 /_Lbenzene, 375 #L isooctane and 375 #L hexa-decane into a tightly sealed ! mL vlal. This represents a reference oilof density - 0.77 mg//JL. Refrigerate and prepare monthly.
2. Working Standards - Prepare three working standards monthly as Follows:
a. Pipet I0 /_Lof stock standard reference oil to 50 mL of TCTFE.! ml.- ]54 /Jgol] and grease. (Working standard "A" )
b. Pipet 3.5 mL of working standard "a" (]54 /Jg/mL) to a 50 mLvolumetric and dilute to volume with 7CTFE. ] mL - 10.8 #g oil andgrease.
c. Pipet 10.0 mL of working standard "a" (]54 /_g/mL) to a 50 mL: volumetric and dilute to volume with TCTFE. ! mL - 30.8 /_goli &
grease.
Also prepare a zero standard by filling a 25 mL volumetric flask withTCTFE.
Procedure
A. Sample collection
1. Preclean l-liter glass sample bottles with 1:I HNO3 and de_onlzedH20.
2. Collect approximately I llter of sample, acidify with 2.5 mL conc.H2SO4 within 6 hours of collection and refrigerate.
3. Analyze within 24 hours of collectlon.
B. Analysis
1. If the sample has not been acidified, add 2.5 mL conc. H2SO4 perliter.
2. Transfer the sample to a l-liter separatory funnel.
3. Rinse the sample container with 15 mL ],],2-trichlorotrIFluoroethane(TCTFE) and add this to the separatory funnel along with anadditional 25 mL TCTFE.
4. Shake the separatory funnel vigorously for 2 minutes and allow thelayers to separate. If an emulsion forms add 10 mL saturated NaClsolution and mix gently to break the emulsion.
EHS0-4-3
5. Draw off the lower TCTFE layer through Whatman IPS filter paper into-. a dry ]00 mL volumetric flask.
6. Rinse the original sample container wtth 15 mL TCTFE and add this to °the separatory funnel along with an additional 25 mL TCTFE.
7. Shake the separatory funnel vigorously for 2 mtnutes as before andallow the layers to separate.
8. Draw off the lower TCTFE layer and add it to the 100 mL volumetriccontaining the first TCTFE extract, again, filtering through WhatmanIPS filter paper.
9. Drain the upper aqueous phase into a 1000 mL graduated cylinder andrecord the volume iv).
• 10. Rinse the separatory funnel with 20 mL TCTFE and add this washing tothe ]00 mL volumetric, filtering as above.
II. Prepare a blank by filtering 10-20 mL TCTFE into a stoppered flask.
12. Set up the IR spectrophotometer according to the manufacturer'sinstructions. Zero the instrument and run a styrene spectrum to besure the instrument is operating properly.
13. FilI a ] cm IR cell with the zero standard and scan from 3200-2700Cm"".
14. Rinse the cell with each successive standard and sample and scan thesame wavelength region.
15. Clean the IR cell with TCTFE and acetone, dry and return it to adesiccator for storage.
Calcu!ation_
1. Measure the absorbance of the standards and samples by constructing astraight baseline over t_e scan range and measuring the absorbance of thepeak maximum at 2930 cm"_ and subtracting the baseline absorbance at thatpoint.
2. Using the standards data, prepare a calibration curve by plott|ng /_g/mLoil and grease vs absorbance.
3. Use the callbratlon curve to determine the oil and grease concentration ofthe sample TCTFE extracts.
4. Calculate the original sample ell and grease concentration as follows:
mg/L ell and grease - A X _00v
A - pg/mL oil and grease in TCTFE extract
100 - mL of TCTFE
V - mL of H20 extracted
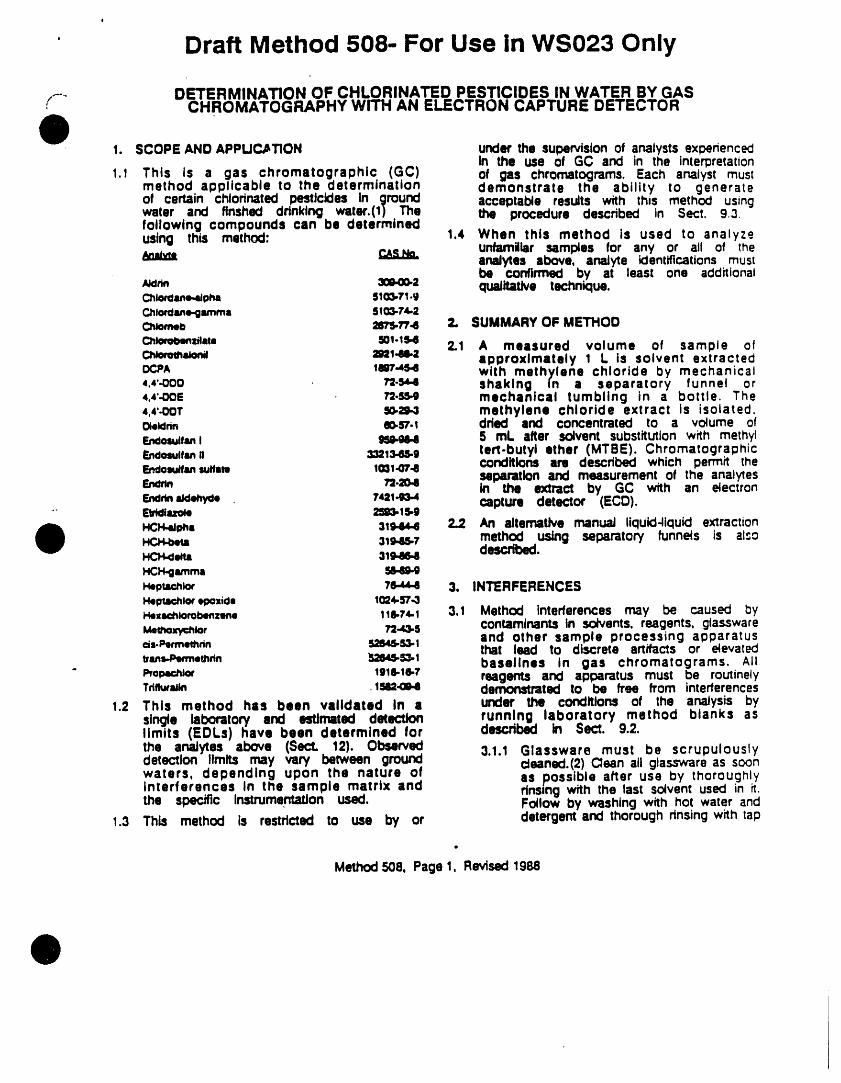
e
' Draft Method 508- For Use in WS023 Only
DETERMINATION OF CHLORINATED PESTICIDES IN WATER BY GAS,f'" CHROMATOGRAPHY WITH AN ELECTRON CAPTURE DETECTOR
1. SCOPEAND APPLICATION underthe supe_1slonof analystsexperiencedIn the use of GC and in the Intemretation
1.1 This is a gas chromatographic (GC) of gas chromatograms. Each analyst mustmethod applicable to the determination demonstrate the ability to generateof certain chlorinated pesticides in ground acceptable results with this methcx::lusingwater and flnshed ddnktng water.(1) The the procedure described in Sect. 9.3.following compounds can be determinedusing this method: 1.4 When this method is used to analyze
unfamiliar samples for any or all of the_ analytes above, analyte identificationsmust
be confirmed by at least one additional,NcI_ 3:o.00.;! qualitative technique.Chlorclane.._pha 5103-71.gCllloqclline-glmma SI03-T4-2Crooned 2lTs.:r't4 2. SUMMARYOF METHOD
C_Woeermlat. SOt.tS.4 2.1 A measured volume of sample ofCtCommlaonJ 2921..61.2 approximately I L is solvent extractedOC,PA Im't.as.e with methylene chloride by mechanical4.,r.OOO _.Sa.4 shaking in a separatory funnel or4,4'-00E T2-55.0 mechanical tumbling in a bottle. The4.4'.OOT gO.ES4 methylene chloride extract is isolated.Oiet_rin eo,sT.t dded and concentrated to a volume ofr_N:to=u_t_t _ 5 mL after solvent substitutionwith methyl[ndosu,=n _213.M.o tert.butyl ether (MTBE). ChromatographicEr_o=u_fansutfat= tmt.o't.e conditions am described which permit the
separationand measurement of the anal_esF._ _.2o4 in the extract by GC ,with an electronF.eeaeaJ,_myd, 74=140.4 capture detector (ECD).
•" Etddtazoie 2503.15-9
HCH._, 3'19,_ 2.2 An alternative manual liquid-liquid extraction_ta 31_,0S,7 method using separatory funne(s is al_o_t.ee_ta algae.4 described.HCH.glu'nma M-Og-gHer_ucJ_ 7e,,u-e 3. INTERFERENCESHeptachtoqol=o=iclo 1024,.5'7.0Ho=zc_iomb_zzn, t le.74-t 3.1 Method Interferences may be caused byMemoxyc_k=r 72-¢1-s contaminantsIn sc_vents,reagents, glassware
and other sample processing apparatus¢i=._==nm_hrm s2m4s.s3.t that lead to discrete artifacts or elevatednn_m_tm_n _sts.s_.t baselines In gas chromatograms. All
" I_op4m.hlor 1918-16.7 reagents and apparatus must be routinelyTdlk=rzaM .lZ_12-0_41 demort,Cd'atedto be free from interferences
1.2 This method has been validated In a under the conditions of the analysis bysingle laboratory and estimated detection running laboratory method blanks aslimits (EDLs) have been determined for described In Sect. 9.2.the analytes above (Sect. 12). Observed 3.1.1 Glassware must be scrupulouslydetection limits may vary between ground ¢_eaned.(2)C_eanall glasswareas soonwaters, depending upon the nature of as possible after use by thoroughlyinterferences In the sample matrix and flnsmgwith the last solventused in it.the specific Instrumentation used. Follow by washing with hot water and
1.3 This method Is restricted to use by or detergentand thoroughdnsingwith tap
Method508, Page1, Revised1988
DRAFTDOCUMENT. INTERNALUSE ONLY. 4/15/88
and reagent water. Drain dry, and heat 4. SAFETYin an oven or muffle furnace at 400"(::
.. -. for 1 hour.Do not heat volumetricware. 4.1 The toxicity or carcJnogentctty of eachThermallystable materialssuchas PCBs reagent used In this method has notmightnot be eliminatedby thistreatment, been precisely defined; however, eachThorough rinsing with acetone may be chemical compound must be treated assubstitutedfor the heating. Alter drying a potential health hazard. From thisand coo_ing,seal and store glassware viewpoint, exposure to these chemicalsIn a clean environmentto preventany must be reduced to the lowest possibleaccumulation of dust or other level by whatever means available. Thecontaminants.Store Inverted or capl:)ed laboratory Is responsible for maintainingwith aluminumfoil. a current awareness file of OSHA
regutatlons regarding the safe handling of3.1.2 The use of high purity reagents and the chemicals specified in this metl_od.
solvents helps to minimize interference A reference file of material safety dataproblems. Purification of solvents by sheets should also be made availabledistillation in all-glass systeJ_5 may to all personnel involved in the chemicalrequired, analysis. Additional references to laboratory
::3.2 Interferencesby phthalate esters can pose safety are available and have beena major problem in pesticide analysis identif'md (5-7) for the information of thewhen using the electron capture detector, analyst.These compounds generally appear in thechromatogram as large peaks. Common S. APPARATUSAND EQUIPMENT (Allflexible plastics contain varying amountsof phthalates that are easily extracted speciflcaUonsare suggested. Catalog numbersor leached ,during laboratory operations, ere included for illustration only.)Cross contamination of clean glasswareroutinely occurs when I_asttcs are handled 5.1 SAMPLING EQUIPMENTduring extra_:tlon steps, especially when 5.1.1 Grab sample bottle - Borosilicate, I-Lsolvent.wetted surfaces are handled, vol.ume with graduations (WheatenInterferences from phthalates can best be Media/Lab borne #219820), fitted with -minimize_'tby avoiding the use of I_astics screw caps lined withTFE-fluorocarbon.in the laboratory. -Exhaustive cleanup of Protectsamplesfromlight.Thecontainerreagents and glassware may be required mustbe washedand dried as describedto eliminate background phthalate in Sect. 3.1.1 before use to minimizecontaminatlon.(3,4) contamination.Cap linersare cut to fit
3.:3 Interfering contamlnatlon may occur when from sheets (Plerce #012736) anda sample containing low concentrations extractedwith methano_overnight priorof anaiytes Is analyzed Immediatelyfollowing to use.a saml:)ie containing relatively high 5.2 GLASSWAREconcentrations of anaJytes. Between.sam_erinsinQ of the sample syringe and 5.2.1 Separatory funnel -- 2000-mL, withassocIated equipment with MTBE can TFE4uorocarbonstopcock,groundglassminimize sample cross contamination. After or TFE.Nuorocarbonstopper.analysis of a sample containing high 5.2.2 Tumbler boWe- 1.7.L (Wheaten Rollerconcentrations of anaJytes, one or more Culture Vessel), with TFE-fluorocarboniniections of MTBE stK)uld be made to lined screw cap. Cap liners are cut toensure that accurate values are ol:Xained fit from sheets (Pierce #012736)andfor the nexz sample, extracted with methanol overnight prior
:3.4 Matrix Interferences may be caused by to use.contaminants that are coextracted from 5.2.3 Rask, Edenmeyer- 500.mLthe sample. The extent of matrixinterferences will vary considerably from 5.2.4 Concentratortube,Kudema.Danish(K-D)source to source, depending upon the 10- or 25-mL, graduated (Kontesground water sampled. Cleanup of sample K.570050-1025 or K-570050-2525 orextracts may be necessary. Positive equivalent).C.,aJibrationmust be checkedidentifications must be confirmed using at the volumes employed in the test.the confirmation column specified in Sect. Ground glass stoppers are used to5.8.2. prevent evaporationof extracts.
Method508, Page2, Revised1988
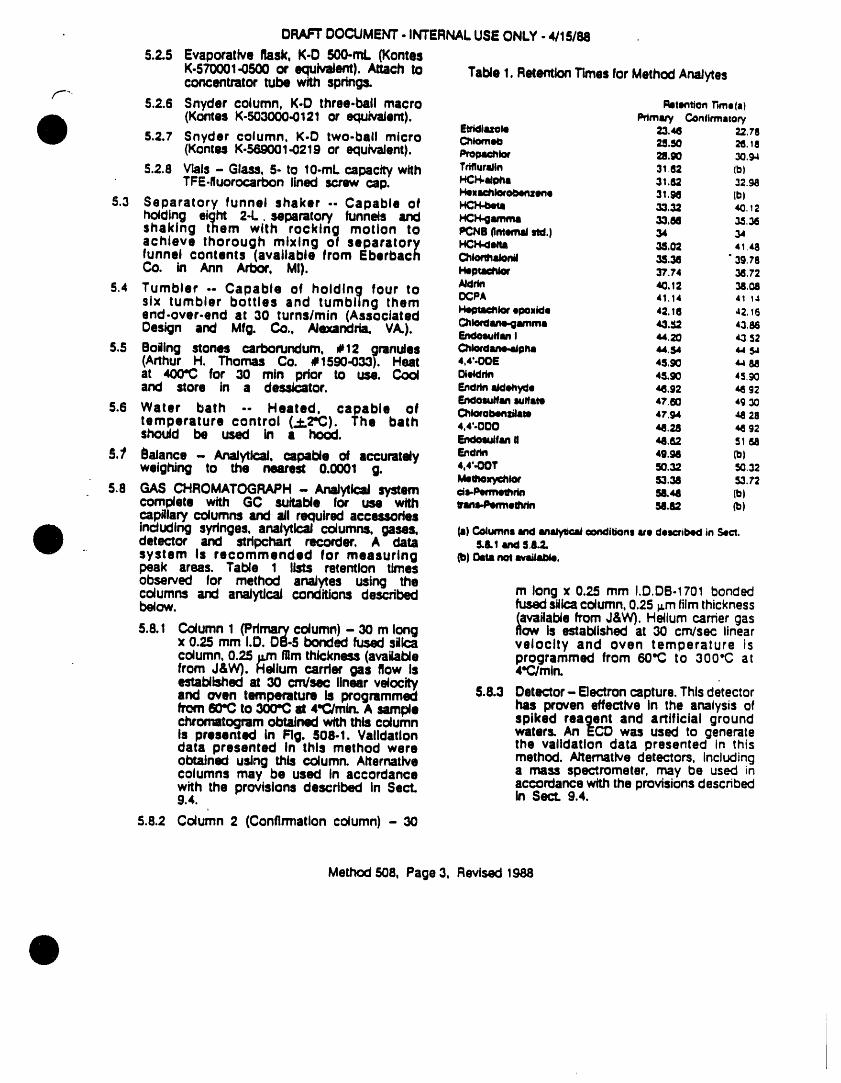
DRAFTDOCUMENT. INTERNAL.USEONLY- 4/15/88
5.2.5 Evaporative Cask,K-D 500-mL (Kontea
K.570001-0500or ec_.tvatent).Alzachto Tal:de1. RetentionTimesforMethodAnaJytesconcentratortube with spdngs`
5.2.6 Snyder column. K-D three-ball macro _tontmnT'_ue(=)(KontesK-503000.0121or equivalent). I_mary Conflrmatonf
EU_dia=ok= :_.,,_ _2.ze5.2.7 Snyder column, K-D two-bell micro C_Jomee =s.so _.le
(KontesK-56gO01-0219or equivalent). Pmm=c_w =8.go 3o._5.2.8 Vials - Glass, 5- to 10-mLcapacitywith Tritium/In 31.(52 (hi
TFE-fluorocarbon lined screw cap. HCH.,JnN= 31._ _2._1'4e=tmhkseoOenzene 31.N (b)
5.3 Seloaratory funnel shaker .. Capable of HCH.6e= 3.1.32 4o_2holding eight 2-L, sel:aratory funnels and HCH-g=mm= 30.88 3S_5shaking them with rocking motion to PCNOPntemslstd.) 34achieve thorough mixing of separatory J.4CH.=o_ 3,5.O2 ,_1.4afunnel contents (available from Eberbach C_JormsJon¢ _.35 "397eCo. in Ann Arbor, MI). Heputmw 37.74 _.z2
5.4 Tumbler .. Capable of holding four to ._lr_ 40.12 38.08six tumbler bottles and tumbling them oCPA 41.14 41 14end-over.end at 30 turns/rain (Associated _B:_kxo_o,6de 42.Is _._6Design and Mfg. Co,, Alexandria. VA.). _k,_m.gHnma 40.32 43.e_Etclom,dfim I 44,20 43 52
5.5 Boiling stones carborundum, #12 granules OactrdJm,=pn= 44._ _(Arthur H. Thomas Co. #1590-033). Heat 4,4"-OOE 4S.SO 4.488at 400"C for 30 min pdor to use. Cool I_e*drm 4s,go 4s._oand store In a dessJcator. _¢J,n=¢do_W, _5.g2 ,_ g=
SttCJOIMJ/llftIKJlflltl 47,e0 49 305.6 Water bath -- Heated, capable of ¢_woew_za,to 47_ q 28
temperature control (.:1:.2"C). The bath 4,4'.000 ,_.=s _592should be used in a hood. _f_n, ,q.s2 s_sa
_._ 0stance - AnaJytlcal,capable of accurately Sndr_ 4e._ (hiweighing to the nearest 0.0001 g. 4.4'.oo1' so.32 so32
M,mezyctlle_ S3._ 53.?25.8 GAS CHROMATOGRAPH-Analytical system c_=-puw,mm ss.,_ (t=l
complete with GC =Jitable for use with _=_=_ =I._ _)capillarycolumns and all requiredaccessoriesincdudlngsyringes,analytical columns` gases, (-)C_umna _ emMy=r..=d¢on¢lition= &re deaa=becl in Sect.detector and stdpchart recorder. A data S,8._dS.8_
" system Is recommended for measuring Co)Oetan_t_,_u=e.peak areas. Ta_e 1 lists retention timesobserved for method analytes using thecolumns and analytlcaJconditions described m long x 0.25 mm I.D.DB-1701 bondedbelow, fusedsilicacolumn,0.25 p.mfilmthickness
(availableh'om J&W). Heliumcareergas5.8.1 Cc_umn1 primary column)- 30 m long flow Is establishedat 30 cm/sec linear
x 0.25 mm I.D. DB-5 bonded fusedsilica velocity and oven temperature iscolumn,0.25 filmthickness(available programmed from 60"C to 300°C atfrom J&W). H_lum carrl_ gas flow Is 4*Clmln.establishedat 30 cm/sec linearvelocityand oven tomperatum Is programmed 5.8.:3 Detector-Bectron capture.Thisdetectorfrom60"C to 300"C8t 4"C/mln.A sarape has proven effectNe In the analysis ofchromatogramobtainedw#hthis cdumn spiked reagent and artificial groundis presented in Rg. 508-1. Validation waters. An EGO was used to generatedata presented In this method were the validation data presented tn thisobtained using this cotumn. Alternative method. Alternativedetectors, Includingcolumns may be used In accordance a mass st:)ectrometer,may be used inwith the provisionsdescflbed In Sect. accon:lancewiththe provisionsdescnbed9.4. In Soc't.9.4.
5.8.2 Cotumn 2 (Confirmationcolumn) - 30
Method508, Page3, Revised1988
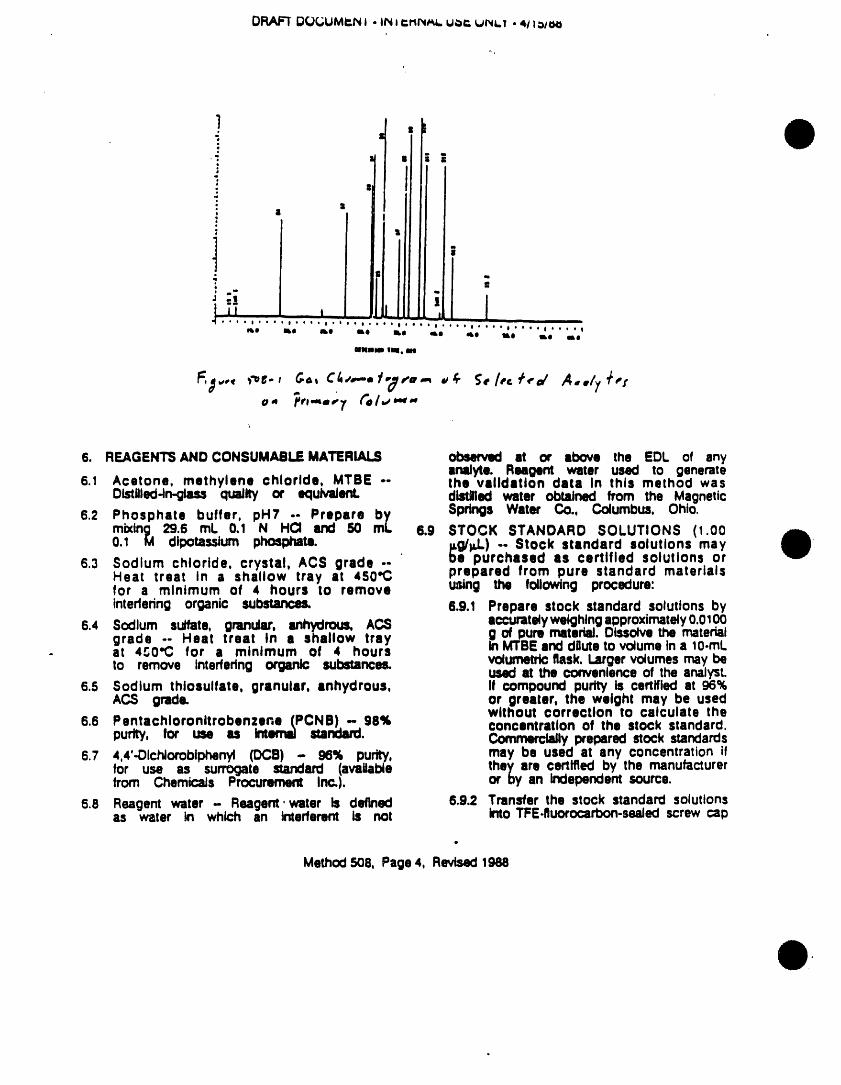
I• I
o
1 'q el' t
1 .-I Jt iT J l i,, _i.i
tl ° ' t ° O t ° i I i ' I * t * I ° e ' ° e ° I ° ° I O ' * ° ° t * * ° ° l * ° e e t ° • i I
,_1 It II II II all Ill tl ILl II
IIIIIII Ilill • III
c4,.-, t.8¢o.. ,, +..dAo./ t,tre/.,..,-
6. REAGENTSANDCONSUMABLEMATERIALS observed at or above the EDL of anyamdyte. Reagent water used to generate
6.1 Acetone, methylene chloride, MTBE -- the validation data in this method wasDistgled-in._ptassquaJlty or equlvaienL distilled water obtained from the Magnetic
6.2 Phosphate buffer, ,,pH7H Prepare b_f,,,,. Springs Water Co., Columbus, Ohio.mixing. 29.6 mL 0.1 _ and 50 6.9 STOCK STANDARD SOLUTIONS (1.000.1 M dipotassium phosphate. p.g/pJ.).. Stock standard solutions may
6.3 Sodium chloride, crystal, ACS grade -- be purchased as certified solutions orHeat treat In a shallow tray at 450"C prepared from pure standard materialsfor a minimum of 4 hours to remove t_sing the following procedure:interfering organic substances. 6.9.1 Prepare stock standard solutions by
6.4 Sodium sulfate, granular, anhydrous, ACS acc_atelywetghlngal:)proximately0.01.00grade -- Heat treat In a shallow tray g of pure material.Dissolvethe materialin MTBEand dguteto volumeina 10.mL- at 4_0"C for a minimum of 4 hoursto remove interfering organic substances, volurnetricflask.Largervolumesmay beused at the convenienceof tim analyst.
6.5 Sodium thlosulfate, granular, anhydrous, If compound purity is certified at 96%ACS grade, or greater, the weight may be used
without correction to calculate the6.6 Pentachloronltrobenzen (PCNB) -- 98% concentration of the stock standard.
purfty, for use as Intema stanm_ Commerciallypreparedstock standards6.7 4,4'-Dlcl'dorobiphenyl(DCa) - 96% purity, may be used at any concentration if
for use as surrogate standard (avallal:de they are certified by the manufacturerfrom ChemicaJs Procummem Inc.). or oy an independentsource.
6.8 Reagent water - Reagent.water Is defined 6.9.2 Transfer the stock standand solutionsas water in which an interferent is not into TFE.fluorocarbon-seaiedscrew cap
Method508, Page4, Revised1988
DRAFTDOCUMENT- INTERNALUSEONLY. 4/15/8_
vials. Store at room temperature and 7, SAMPLECOLLECTION,PRESERVATION,'ANDprotectfrom light. STORAGE
6.9,3 Stock standard solutions should be 7,1 Grab samples must be co4_ectedin glassf" replaced after two monthsor sooner If containers, Conventlo_d r4mpllng practices' comparison with laboratory control (S) should be followed: however, the
standards indicates a problem, baffle must not be prednsed with sample8.10 INTERNAL STANDARD SPIKING SOLUTION before collection.
-- Prepare an Internal standard spikingsolutionby accuratelyweighing approxirnat_y 7,2 SAMPLE PRESERVATION0.0010 of pure PCN8. Dissolve the 7.2.1 Add mercuric chloride to the samDlePCNB tng bottle In amounts to produce aMTBE and dilute to volumein a 10-mL volumetric flask. Transfer the concentrationof 10 mg/L Add 1mE ofinternal standard spiking solution to a a 10 mg/mlº so4utlonof mercuricchlor_eTFE.fluorocarbon-sealed screw cap bottle In reagentwater to the sample bot_leatand store at room temperature. Addition the sampling site or in the lal=orato_of 5 _L of the interred standard spiking before shipping to the sampling site, Asolution to 5 ml. of sample extract majordlsaclvantageof mercuricchtorK:leresults In a final Internal standard Is that it is a highly toxic chemical;concentration of 0.1 _g/mL Solutlon should mercuricchloridemust be hanclleclw,thbe replaced when ongolng OC (Sect. 9) caution,andsam_escontainingmercuncindicates a problem, r..tdoddemust be disposed of prol:)erty
6.11 SURROGATESTANDARDSPIKINGSOLUTION 7.2.2 If reldduldchlorine is present, add 80-- Prepare a surrogate standard spiking mg of sodium thlosulfate per liter ofsolutionby accurately weighingapproxirnat_y sample and mix we41.0.0050 g of pure 0C8. Dissolve theDC8 In MTBE and dilute to volun_ In 7.2.3 After adding the sample to the bottlea 10-ml. volumetric flask. Transfer the containingpreservative,seaJthe saml:)le
bottle and shake vigorousJyfor 1 man.su_n'ogatestandard spiking solution tO aTFE-fluorocarbon-seaied screw cap bottle 7.2.4 Samples must be Iced or refrigerate_atand store at room temperature. Addltlon 4"C from the time of collection untilof 50 p.[. Of the surrogate standard extraction. Preservation stucly resultsspiking solution to a 1-l. sample prior Indicate that most of the target anal_es
to extraction resultSinln a surrogate present in the samplesare stablefor 14standard concentration the sample of days when stored under these25 conditions.(1)However, analyle stab_lrry_.g_. and, assuming quantltatJv_recoveryof TDBP, a surrogate standard concentration may be affectedby the matrix;therefore.in the final extract of 5.0 _g/mL Solution the analyst should verify that theshould be replaced when ongoing QC " preservationtechnique is applical=leto(Sect. 9) Indicates a problem, the samples under study,
6.12 INSTRUMENT QC STANDARD -- Prepare 7.3 EXTRACT STORAGEinstrument QC standard stock solutionsby accurately weighing 0.0010 g each 7.3.1 Sample extractsshouldbe storedat 4"Cof chlorothaJonil,chlorpyr_fos, DCPA, and away from light. A 14-day maximumHCH-detta. Dissolve each anaJyta In MTBE extract storage time is recommended.and dilute to volume In Individual 10-mL However,analytestabiltt',/maybeaffectecl
by the matrix; therefore the analystvolumetric flasks. Combine 2 .I. of the
chloropyrlfos stock solution, '5-0 _ of shouldverifyappropriate extract holdingthe DCPA stock solution, 50 ..L.t.. the times applicable to the sambas unclerchlorothalonll stock solution, _ind 40 _ study.of the HCH-delta stock solution to a100.ml. volumetric flask and dilute tovolume with MTBF.. Transfer the Instrument 8. CALIBRATION
OC standard solution to a 8.1 Establish GC operating parameters ecluNalentTFE.fluorocarbon-sealed screw cap bogle to those Indicated Jn Sect. 5,8. The GCand store at room temperature. Solution system may be calibrated using eithershould be replaced when ongoing QC the Internal standan:l technique (Sect. 8.2)(Sect. 9) indicates a problem.
Method 508, Page5, Revised1988
DRAFTDOCUMENT- INTERNALUSE ONLY- 4/15188
or the ixternal standard technique (SecL compound bY adding volumes of one8.3). or mote stock standardsto a volumetric
flask. Dlute to volume with MTBE. One8.2 INTERNAL STANDARD CALIBRATION of the calibration standards shoulcSbe
_." PROCEDURE -- To use this approach, representattveofananalyteconcentratton' !he analyst mull select one or more near, but above, the EDL,The other
Internal standards compaUble in anaJytlcal concentratlonsshould correspondto thebehavior to the compounds of Interest. range of concentrationsexpected in meThe anaJyst must further demonstram that sample concentrates, or should definethe measurement of the inten'ml Itandard the working range of the detector.Is not affected by method or matrixInterferences. PCNB hal been Identified 8.3.2 Sta_lng with the standard of lowestas a suitable tnterneJ statvCln:l, concentration,analyze each calibration
standard according to Sect. 10 anO8.2.1 Prepare calibration Itandardl lit a tab4J_te peak height or area response
minimum of five concentrationIfvqdsfor versusthe concentrationin the star=lard,eachaneJyteofinterestbyaddingvolumes The resultl can be used to prepare aof one or more stock standards to a calibration curve for each compound,volumetric flask. To each calibration Nternettvely, If the ratio of responsetostandard, add a knownconstantamount concentration (calibration factor)is aof one or more Internalstandards,and constantoverthe workingrange (< 10%dilute to volume with MTBE. One of the relative l_tandard deviation), linearitycalibration standards should be throughthe origin can be assumedandrepresentatMIofan arm, s concentration the average ratio or calibration factornear, but above, the EDL.The other can be used In place of a calibrationconcentrationsshould correspondto the curve.range of concentrationsexpectedin thesample concentrates, or should define 8.3.3 Single point calibration is a viablethe working range of the detacmr, alternativetoa caJibratloncurve.Prepare
sln_e pointstandardsfromthe secondary8.2.2 In_ect2 _L of each caJlbraUonItandard dilutionstandardsinmethanol,Thesingle
and tabulate the ratline response for point standards should be preparedateachanaiyte(liRa)to In internldmarclard a concentrationthat producesa response -,using the equation: (dose(.!:.20%)to that of the unknowns. .:
RRa -- A_AII 8.3.4 The working calibration curve or -where: calibration factor must be verified onAll -the peak area of the shame, and each workingclay by the measurementAll --the peak area of the internal of one or more calibrationstandards.II
starv_rd, the responsefor any analytevariesfromthe predicted response by more than
8.2.3 Generate a calibrationcurve of anaJyte ..1:.20%,the test must be repeated usingrelaUveresponse, RRa, versus anaJyte e freshcaJlbrattonstandard, If lhe resultsconcentrationin the samplein idl.. Dab still do not agree, generate a newpresentedin Sect. 12.2 were generated calibration curve or use a single pointusingTPP for quintfficatJoncalculaUons, callbr'_lonsumdardas describedin Sect.
8.2.4 The working calibrationcurve must be 8.3.3,verified on each working shift by themeasurementof one or more caJibratJon 9. QUALITYCONTROLstandards,If the responsefor any anaJytevariesfrom the Ixedlcted response by 9.1 Mlrdmum quldlty control (QC). requirementsmore than ..t.20%, the test must be are Inltlal demonstration or laboratoryrepeated uslnga fresh callbratlon capablllty, determinatlon of surrogatestar,dard..aJtematlvely,a new callbrallon compouno recoveries In each sample andcurve mustbe preparedfor that anaJyte, blank, monitoring Internal standard peak
8.3 EXTERNAL STANDARD CALIBRATION area or height in each sample andblank (when internal standard calibration
PROCEDURE procedures ara being employed), analysis8.:3,1 Prepare calibration standards at a of method blanks, instrument OC solution,
minimumof five concentration levetsfor laboratory control (LC) standards, C)Ceach analyle of interest and surrogate
Method508, Page6, Revised1988
t
O_ DOCUMENT• INTERNALUSE ONLY- 4/16/88
sarnples, and perfomaJce tvaluaUon (PE) 9.5.2 If a blank extract reanatysis fails thesamples. 70-130% recoverycriteria, the problem
mu_ be identified_ correctedbefore/-" 9.2 Method Blanks. Before processing any continuing.
samples, the analyst must demonstratethat Idl glassware and reagent Interferences 9.6.3 If sample extract reanalysessolves tl_eire under control, Each time a sa_ of problem, rec)ort only data from thesamples Is extracted or reage,ts are analysis with acceptable surrogatechanged, a method blank must be recovery. If sample extract reanaJysisanalyzed. If within the retention time does not sane the problem, re_x:)nallwindow of any analyte the method blank data for that sample as susl:_ct.produces a peak that Is 0.5 EOL forthat analyte, determine the source of 9.6 Assessing the IntemaJ Standardcontaminationand elimlnate the Interference 9.6.1 For each samDle and blank extract,before processk_ samples, determineif internal_tandard leak area
9.3 Initial Demonstration of Capability. or height deviates by 30% from theaverage measured during analysis of
9.3.1 Select a representative spike calibrationstandards.concentration(about 10 times EDI.) foreach analyte. Prepare a LC sample 9.6.2 If 30% deviation, optimize instrumentconcentrate (In methanol) containing performanceand inlect a second aliquoteach analyte at 1000 times selected of U_lt extract. If the reinlected aliquotconcentration.With a syringe,add 1 mL prooucesan acceptableinternalstandarclof the concentrate to each of at least peak area or height, report results for
that allquoLIf not, assumethat an errorfour 1-1.ali(lUOtsof reagent water, andanalyze each aliquot according to was made dudng addition of internalproceduresbeginningIn Section 10. standard to that extract. Reextractthatsample¢,rblank,and analyzethatextract.
9.3.2 Calculate mean percent recovery 0(), 9.6.3 If 30% deviation continues, analyze aand standard deviation of percentrecovery (S). For each anaJyte,X must caJibraUonstandard (Sect. e).fail In the ran_e of 70-130% (or within 9.6.3.1 If the Internalstandard peak areaR ..+.3RSD using the values for R and or leak heightfailsto meet crTteria,thenRSO for reagent water In Table 2)and recaJibrate,and reanalyze extracts thatS mtm be less thin 30% (or less than previously did not meet criteria. If3 x RSD In reagert wat_ In Table 2), acceptaolearea or height is measured,If the calculated X and S for every report results. If not, assume ananalyte meet the acceptance crlteda, interferencefrom the matrix is affectingperformance is acceptable and sample the Internal standard and use externalanalysismay begin. If any X or S falls calibration(Sect. 8).outside Its acceptance range, initialdemonstration procedues for that 9.8.3.2 If the Internalstandard I=eakareacompound must be repeated, orpeak heightmeetscriteriathenassume
an interferencefrom thematrixisaffecting9.4 The analyst Is permitted to modify GC the Internal standard In your sample
columns, GC conditions, or detectors to ex/zact and use extemaJcalibration.improve separations or lower analyticalcosts. Each time such method rnodiflcallons 9.7 Assessing Laboratory Performanceare made, the analyst must repeat the 9.7.1 Initial CC criteria are established byprucedurea in SectJcm 9.3 usingthe valuesfor X and S generated
above (Sect. 9.3) to estai_ishupper and9.5 Assessing Sunogate Recovery. lower control limits:
9.5.1 When surrogaterecoveryfrom a sampleor method blank Is <70% or 130%, UPPER CONTROL LIMIT = X + 3Scheck (1) caJcutaUonsto locate possible LOWER CONTROL LIMIT -X - 3Serrors, (2) spiking solutions fordegradation, (3) contaminationor other The laboratorymustanalyze at least oneobviousabnormalities,and (4)Instrument LC sam_e per sarape set (all sam_esperfomvmce.If thosestepsdo not reveaJ extracted within a 24-h period). Thethe cause Of the problem, _yze the spikingconcentrationof each analyte in
• extract, the laboratorycontrc4samp4eshouldbe
Method508, Page7, Revised1988
DRAFTDOCUMENT- INTERNALUSE ONLY. 4/15/88
10 tlmes EDL Calculate accuracy as 10,1.2Adjust sample to pH 7 by adding 50rnL of _te buffer.percent recovery ('XI). If the reco_ry of
any analyte falls outside the control"" limits, that analyte is red out ofJudge 10,1.3Add 100 g'NaCI to the sample, seal.
control, and the source of the problem and shako to dissolvesailmust be identifiedlind resolved before 10.1,4Acid300 mL methylenechlodde to thecontinuing analyses.The control limits sample borne, seaJ,and shake 30 s toshould be updated periodically. It Is dnsethe innerwalls.Transferthe solventrecommendedthat after each fiveto ten to the samplecontainedIn theseparatorynew recovery measurements that new funnelor tumblerbottle,seal,and shakecontrol limits be calculated using only for 10 s, venting periodically. Repeatthe most recent 20-30 dam points. shakingand ventinguntilpressurerelease
9.7.2 Eachquarterthe laboratorymustanalyze Is not observed during venting. ResealQC check standards (if available). If andplace samite containerinaDprop_tecriteria provided with the OC check mechanical mixing device (separatorystanclardare not met, correctiveaction funnel shaker or tumbler). Shake orshouldbe taken and documented, tumble the samplefor 1 hour. Compete
and thoroughmixingof the organicand9.7.3 At leastonces year, the laboratorymust aqueous phasesshouldbe observedat
analyzea performanceevaluationsample least 2 man after starting the mixing(ifavailable),and resultsfor each analyte device.must be within establishedacceptancelimits. 10.1.5Rernova the sample container from the
mixing device• If the tumbler is used.9.8 Assessing Instrument Performance - The pour contents of tumbler bottle into a
instrument QC standard (Sect. 6.12) should 2-L seDaratoryfunnel,Nlow the organicbe analyzed daily to monitor instrument layer to saparate from the water phaseperformance. Inablllty to demonstrate for a minimumof 10 rain. If the emulsionacceptable Instrument petite tndk:ates Interface between layers Is more lhanthe needs to reevaluate the GC.NPD onethird the volumeof the solventlayer, •system. If laboratory EDLI differ from the analyst must employ mechanicalIlsled EDLs (Table 2)° concentrations of techniques to complete the phaseinstrument QC standard compounds may separation. The optimum techniquebe adjusted as needed, depends upon the sample, but may
Inctude stirring, filtrationthrough glass9.9 Analyte Confirmation . _ doubt exists wool, centrtfugation,or other physical ""
about Identification of a GC peak, methods. Collect the methylenechlorideconfirmatorytechniquessuch as determination extract In a 500-mL Erlenmeyer flaskwith a mass spectrometer detector or a containingappn:_Jmately5 g anhydrousdifferent GC column must be used. sodk.,rnsutlate.Swtrlflasktodryextract;
allow flask to sit for 15 rain.
10. PROCEDURE 10.1.6Determine the odglnal sample volumeby refillingthe sample bottleto the ma_;k
10.1 AUTOMATEDEXTRACTIONMETHODValidation and transferringthe water to a 1000.mLdata presented In this method were graduated cylinder. Record the samplegenerated using the automated e04mctJon volume to the nearest 5 mLprocedure with the mechanioai saparatoryfunnel shaker. 10.2 MANUAL EXTRACTION METHOD Alternative
I0.I.1 Add preservative to any samples not procedure.previously preserved (Sect. 7.2). Mark 10.2.1Add preservative to any samples notthe water meniscus on the side of the previously preserved (Sect. 7.2). Marksample bottle for later detorminaUonof the water meniscuson the side of thesample volume. Spike sample with 50 sample bo_e for later determinationof
of the surrogate standard spiking sample volume. Spike the sample withsolution. If the mechanical separatory 50 _L of the surrogatestandardspikingfunnel shaker is used. pour the entire solutlon. Pour the entire saml_e into asamite into a 2-1. sep4ratory funnet. If 2-L sapamtory funMI.the mechanical tumbler Is used, pourthe entire sample into l tumbler bottle. 10•2.2Adjust sample to pH 7 by adding 50
mL of phosphate buffer.
Method508, Page8, Revised1988
I
DRAFTDOCUMENT- INTERNALUSE ONLY- 4/15/88
10.2.3Add 100g NaCl to the sample, seal, concentration in 15 to 20 rain. At theand shake-to dissdve sac proper rate of dlstglatlonthe ballsof the
/"" 10.2.4Add 60 mL methylene chloride to the column will actively chatter, but thechambers will not flood. When thesample bottle, seal, and shake 30 s to apparentvolumeof IlclUidreaches2 eL,dnsethe innerwailS:Transferthe solvent rwnove the K.O apparatus and allow itto the saparatoryfunneland extract the to drain and co_ for at least 10 rain.sam_e by vigorouslyshakingthe funmdfor 2 min with pedodicventingto re_ease 10.3.3Remove the Snyder column and dnseexcesspressure.Allowthe organiclayer the flask and Its lower Joint into theto separate from the water phase for a concentrator tube with 1 to 2 mL ofminimum of 10 mtn. If the emulsion MTBE.Add 10 mL of MTBE and a freshInterface between layers is more than be!ling stone, Attach a micro-Snyderonethirdthe volumeof the solventlayer, column to the concentrator tube andthe analyst must employ mechanical prewarthe co4umnby adding alx)ut0,5techniques to complete the phase at. of M'I"BEto _ top. Placethe microseparation. The optimum technique K.Oapparatuson the water bath sothatdepends upon the sample, but may theconcentratortubeispartiallyimmerseclinclude stirring, filtrationthrough_n glass in the hot water, Adjust the verticalwool, centrtfugatlon,or other physical positionof the aPDaratusand the watermett_xIs.C.,4:_ectthe methylenechloride temperature as required to coml:)teteextract In a 500-eL Erlenmeyer flask concontrat_nin 5 to 10 rain, When thecontainingapproximately5 g anhydrous apparentvolumeof Ik:lUidreaches2 eL.sodium sulfate, remove the micro K-D from the bath
and allow it to drain and co_. Add 1010.2.5Adda second60.mLvolumeof methylene mL MTBE and a boiling stone to the
chlorideto the sam;deboBleand repeat micro K-D and reconcantrateto 2 eL.the extractionprocedureI secondtime, Remove the micro K-D from the bathcombiningthe extractsinthe Edenmeyer and allow it to drain and cool. Removeflask. Perform a third exlnlctlon in the the micro Snydercotumn,and rinsethesame manner.Swld flaskto dry moract; walls of the concentrator tube whileallow flask to sit for 15 mln. adjusting the volume to 5.0 mL with
10.2.8 Determine the origlmd sample volume M'rBE.by refillingthe samplebo_e to the mark 10.3.4Add 5 ILL of IntemaJ standard spikingand tmnsforflngthe water to a 100e-eL solul_ to the sample extract, seal, andgraduated cylinder. RIx:on:lthe samplo shaketo dlstributothe intemaJstandard.volume to the nearesZ5 eL. Transferexuact to an apl:)ropnate-sized
• 10.3 EXTRACT CONCENTRATION TFE-fluorocarbon-seaJedscrew.cap vialand store, refrlgerated at 4"C, until
10.3.1Assemblea K.Dconcentratorbyattaching anaJysisby GC-ECD.a 25-eL concentratortube to a 50e-eLevaporative flask. Decant methylene 10.4 GAS CHROMATOGRAPHYchlorkle extract Into K-() concentrator, 10,4.1SecL 5.8 summarizesthe recommencledRinseremainingsodiumsulfatewithtwo operating conditions for the gas25.mL portions of methylene chloride chromatograph.Inctuded In Table 1 areand decant rinses Into the K-O retention times observed using this
• concentrator, method. Other GC columns,10.3.2Add 1 to 2 dun b01ing stones to the chromatographicconditions,ordetectors
evaporative flask end attach a macro may be used ifthe requirementsof Secl.
to the top. Race the K-D apparatuson 10.4.2CaJibratethe system daily as describedIn SecL 8. The standards and extractsa hot water bath, 65 to 70"C, so that must be in M'rBE.theconcentratortubeispartiallyImmersedin the h(X water, and the entire lower 10.4.3 Inject2 p.Lof the sampleextract. Recordrounded surface of the flask is bathed the resultingpeak sizes in area units.with hotval:x:)r.Adjustthe vealk:=dposition 10.4.4The width of the retentiontime windowof the apparatus and the watertemperatureas requiredto completethe used to make Identificationsshould toebased upon measurements of actual
Method508, Page9. Revised1988
DRAFTDOCUMENT. INTERNALUSE ONLY- 4/15/88retention time variations Of standards 2.ovw tl_ course of a clay.Tl_reeUmes
," the standard deviation of a retentiontimecanbeusedto calculatea suggested 13. REFERENCESw_dow size for • compound. However,the exl3edence of the analyst should 1. BattidieJNPSMethod2weigh heavily In the Interpretation ofchromatograms. 2.ASTMAnnuaJBook of Standards.Part 11. Volume
10.4.5If the responsefor a peak exceeds the 11.02,.D3_:82,..stanclard P_ctlce for Preparationofworkingrange of the system,dilute the _arnple t.;ontaJrl_rSert¢l for I_reservatlon'', AmericanextraCZ_ rmlnldyza. 86,S°cltt_ffor1966,Tesltngand Materials,PhilacletDhia.PA,D
t 1. CALCULATIONS 3.Glare. C. S., Chan, H. S.. and Nef. G. S. "SensitiveMethod for Determinationof Phthalate Ester Piss.
11.1 Calculate an•lyre concentrations In the tlcizers in Open-Ocean Biota Samples."Analyticalsample horn the res_ for the anldyte C1_mb;t_,47. 2225 (1975).
_me carnation procedure descrU:.,:l4.G_, C. S.. and l_un. H. $. "_'oI of Blanks m the
11.2 For samples processed as part of a Anatyslsof PhthaJatesinAIrand OceanBlotaSamp(es,-set where laboratory control standard U.S.NatlonaJBureauof Standards.SpeclaJPublication
bl/I outside of the contrc_ 44,2.pp.701.701L1976.limits in Sect. g, data for the affected
an•lyres mug= be labeled u suspect. 5.'C_, ens. Workingwith Carcinogens"Depart.rnemof Health.Education.and We4fare.Punic HealthSire/co. Centerfor DiseaseControl.NationalInstitute
12. PRECISION AND ACCURACY forOccupationalSaletyandHealth.PublicationNo. 77.12.1 In • single laboratory, arudyte recovodos 206. Aug. 1977.
from reagent water were determined atfive concentration levels. Results were 8."OSHA Safety and Health Standards General In.used to determine an•lyre EDLs and d,,ugly/.t"(29CFR1910).Occul__tlonidSaf;;tyanclHealthdemonstrate method range.(1) An•lyres .qO_tJon, OSHA2206, (Revised.January1975).were divided into two spiking groups for
recovery studies. Analyte recoveries at 7.'Safety In Academic Chemistry Laboratories."one concentration and EDL data are _A_. n Chemlcal$octet'yPubllcatron.Comm_eeon IPrgiven in Table 2. _mucal =alely.3rd Edllk_n,1979.
12.2 In • single laboratory, imaJyte recoveriesfrom two artificial ground waters were 8.ASI"MAnnualBook of Standards.Part 11, Volumedetermined at one concentration level. 11.01. D3370-82, "Standard Practice for S_,mp!ingResultswere u_ed to demonstrateappllcabiity _Water,"AmericanSocJotyfor Testingand Materials.
Phladoll=t_a,PA,p. 130, 1906.of the mettx_ to different ground watermatrices.(1) An•lyre recoveries from thetwo artJficl_ msut:u ate given in Table
Q
#
Method508, Page I0, Revised1988
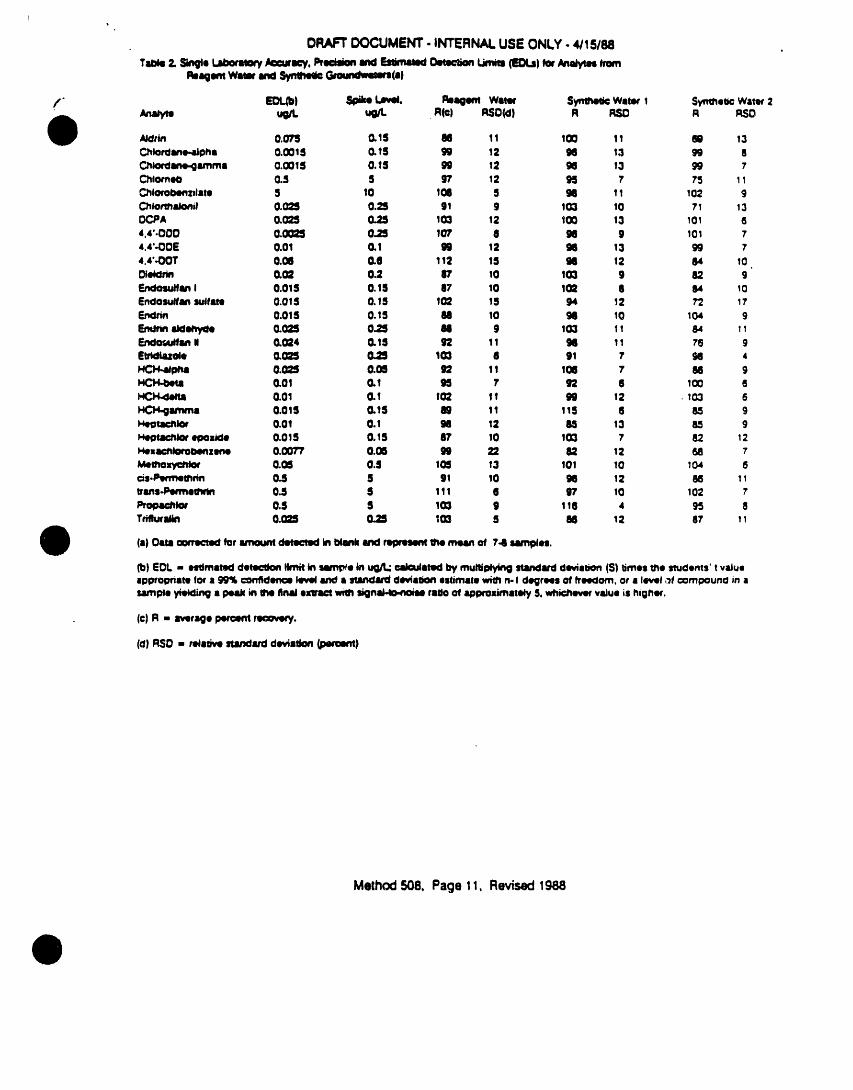
Method 508, Page 11, Revised 1988
Method No. EHS G-1i i i i
Tit]e: ORGANIC WASTE CHARACTERIZATIONUSING DIRECT GC/MS INJECTION
Date Issued: I-9-90 Approved by: M.K. Hamiltqp,'CI_i
Written by: M.K. Ham.ilton,CIH
Supersedes Method No. New
.........Date ...... Reviewed By ..........Da..te Revlsed By ......
.,. , ii i .i, ,i | ,, , ,,
Replaced by Method No. Date: i
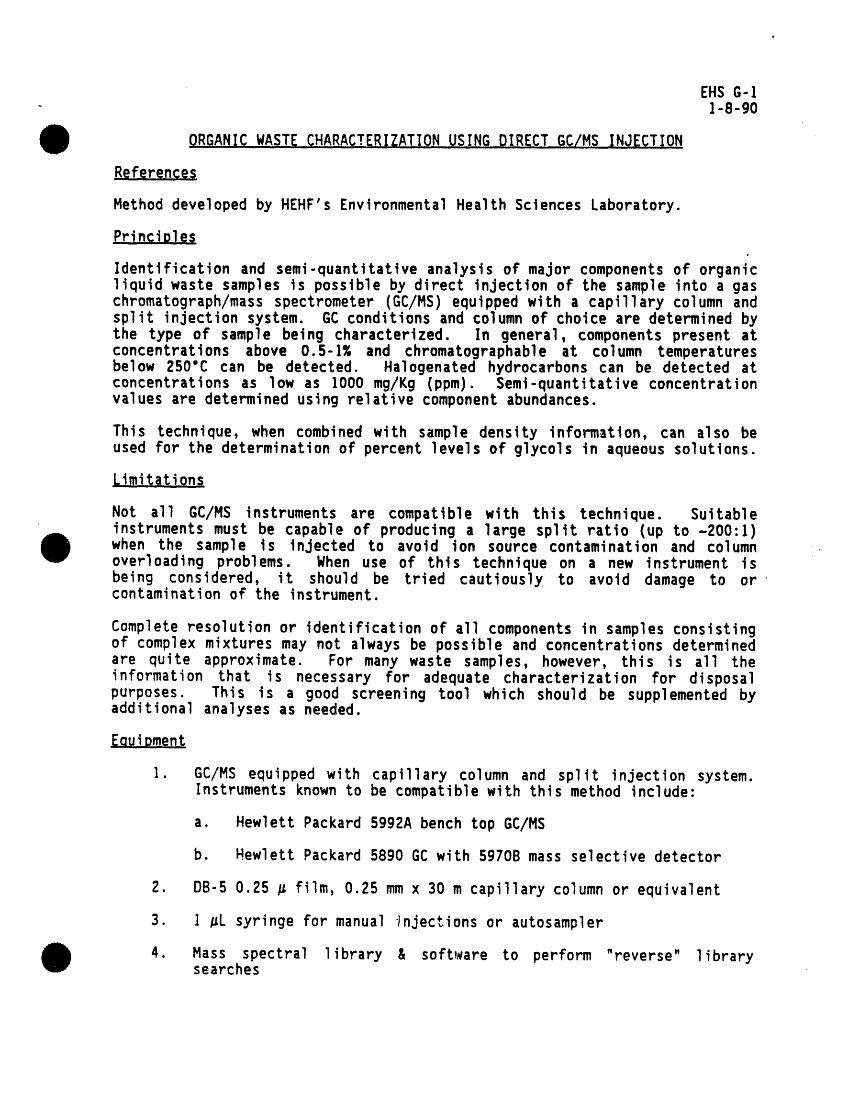
EHS G-11-8-90
ORGANICWASTECHARACTERIZATIONUSING DIRECT GC/MS INJECTION
Reference_
Method developed by HEHF's Environmental Health Sciences Laboratory.
Principles
Identification and semi-quantitative analysis of major components of organicliquid waste samples is possible by direct injection of the sample into a gaschromatograph/mass spectrometer (GC/MS) equipped with a capillary column andsplit injection system. GCconditions and column of choice are determined bythe type of sample being characterized. In general, components present atconcentrations above 0.5-1% and chromatographable at column temperaturesbelow 250"C can be detected. Halogenated hydrocarbons can be detected atconcentrations as low as 1000 mg/Kg (ppm). Semi-quantitative concentrationvalues are determined using relative component abundances.
This technique, when combined with sample density inform3tton, can also beused for the determination of percent levels of glycols in aqueous solutions.
_imitations
Not all GC/MS instruments are compatible with this technique. Suitableinstruments must be capable of producing a large split ratio (up to -200"1)when the sample is injected to avoid ion source contamination and columnoverloading problems. When use of this technique on a new instrument isbeing considered, it should be tried cautiously to avoid damage to orcontamination of the instrument.
Complete resolution or identification of all components in samples consistingof complex mixtures may not always be possible and concentrations determinedare quite approximate. For many waste samples, however, this is all theinformation that is necessary for adequate characterization for disposalpurposes. This is a good screening tool which should be supplemented byadditional analyses as needed.
Eouipment
1. GC/MS equipped with capillary column and split injection system.Instruments known to be compatible with this method include:
a. Hewlett Packard 5gg2A bench top GC/MS
b. Hewlett Packard 5890 GCwith 5970B mass selective detector
2. DB-5 0.25 _ film, 0.25 mm x 30 m capillary column or equivalent
3. ! _L syringe for manual _njections or autosampler
4. Mass spectral library & software to perform "reverse" librarysearches
Page Z EHS G-Il-8-go
Reaqent_
Isooctane, acetone and deionized water or other appropriate solvents forsyringe rinsing.
Procedur@
]. Autotune the GC/MS and make sure the instrument is functioningproperly.
2. Select an appropriate temperature program. The fo]lowing programshave been found satisfactorywhen using the DB-5 capillary co]umn:
a. HPsggzA--30"C initial, 10"C/min. ramp, 250"C final, run time45 minutes
b. HP58go/sg70B--30"C initial, 10"C/min. ramp, 300"C final, runtime 35 minutes
3. Establish the appropriate split ratio of -15:1 for the HPsgg2A or-150:1 for the HPB8go/Bg70B.
4. Inject the sample and collect the chromatographic and mass spectraldata. Data collection parameters should be set to yield a TotalIon Chromatogram containing approximately ]00 peaks in a complexoil sample.
a. HPBgg2A - manually inject 0.1 #L using a I #L syringe.
b. HPSBgO/sg70B - manually or with an autosampler inject I #Lusing a 10 #L syringe (viscous samples must be injectedmanually).
5. Produce a printout of the sample chromatogram and the mass spectrafor each chromatographic peak.
6. Identify the sample constituents by comparing sample spectra'tomass spectra of known compounds. The following mass spectral databases are available:
a. NIH/EPA Mass Spectral Data Base, NSRDS-NBS 63, 1983, 6 volumeshard copy.
b. Chemical Information Systems, Inc. Mass Spectral Search Systemfor searching the NIH/EPA/MSDC Mass Spectral Data Base andWiley Mass Spectral Search System For searching the 1982Registry of Mass Spectral Data From John Wiley & Sons, Inc.(See Lab Operating Procedure L-8.IO for accessing thesecomputer data bases.)
c. NBS-Rev.F Mass Spectral Library, resident on the HP58go/sg70BGC/MS. (Instrument has capability of automatically searchingall spectra in a sample against this library.)
Kage _ _no u-_]-B-g0
Ca!culation_
Approximate concentrations of sample components are determined bysumming the abundances of all components and dividing that sum into theabundance of the component of interest. This assumes equivalentresponses for all compounds, which is not true; however, the informationobtained is adequate for the gross characterizations provided by thismethod.
The following guidelines are used when characterizing organic liquids,especially oil matrices:
1. Aliphatic hydrocarbons are grouped as to those with molecularweights less than or equal to ]0 and those greater than ]0. (Decanehas a flash point of-60"C, the critical temperature for flammableor nonflammable waste designation.)
Z. Low molecular weight solvents (ketones, alcohols, benzene, toluene,xylene, etc.) are characterized and reported individually whenpossible.
3. Halogenated solvents and other halogenated materials are identifiedand reported separately as much as possible.
4. Aromatic compounds heavier than xylene are grouped as substitutedbenzenes, subs. naphthalenes, subs. phenols, etc. If polynucleararomatics with three or more rings are found, they are identifiedseparately as much as possible. At a minimum they are grouped bythe number of rings present.
The following procedure is used to determine ethylene and propyleneglycols in water when no other major components are present"
I. Identify the glycol or glycols present.
2. Determine the sample density.
3. Using charts of density versus percent glycol or solution of twoequations with two unknowns, determine the amount of glycolpresent.
Example: Sample identified as ethylene glycol and water.density = 1.065
A+B=I
A = % water/]00B = % ethylene glycol/t00
1.000A + 1.113B = ].065I.O00 = approximate density of waterI.]13 = density of ethylene glycol]:065 = measured density of the sample
solution: A = 0.42 = 42% water
B = 0.58 = 58% ethylene glycol " I_p/_
Method Ho, EHS P-2i •
Tttle: PIIENOLSIN WATER- CBLOROFORHEXTP,ACTION_ i i i i
DaLe Issued: BeFore 12182 Approved by: M K HamlILonr(_ I;_f-Wrttten by: M K Hamtlton
i
Supersedes HeLhod No,iiiiim'li i i l
DaLe ,,Revtewed B_ DaLe , Rev]sed ,B_,
_/_J/1_ _#_I ...... _/14 __¢-;q -y_ ..../- jO-Y_ . _ ii i
i " ii i ii i
i i io
ii i
i, i
umni ilnl |
ii i
p
Replaced by Method No, ' DaLe:
II IIII
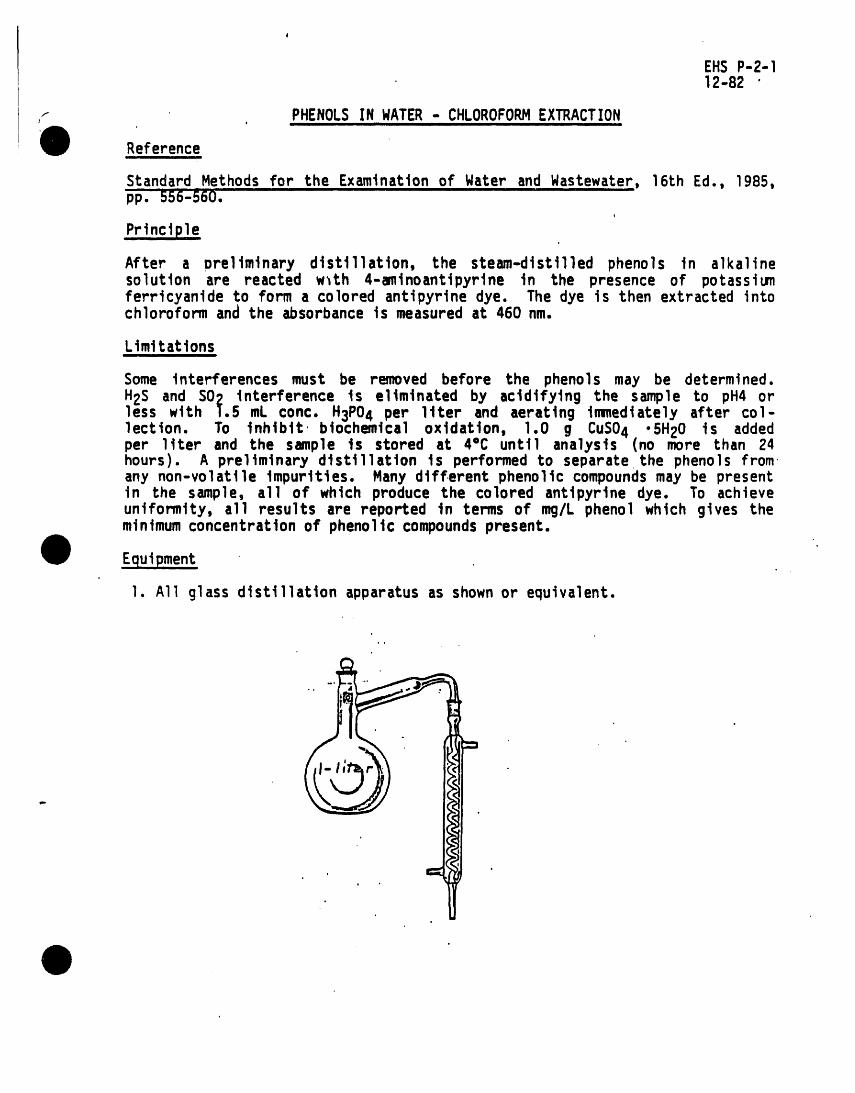
EHSP-2-I, 12-82 '
PHENOLS IN WATER - CHLOROFORM EXTRACTION/ f III I I i II I IIII i II iii III
Referencei
Standard Methods for the Examination of Water and Wastewater, 16th Ed., 1985,s56 ..................pp. - ,
Principle
After a preliminary distillation, the steam-distilled phenols in alkalinesolution are reacted w_th 4-aminoantipyrine in the presence of potassiumferricyanideto form a colored antipyrine dye. The dye is then extracted intochloroform and the absorbance is measured at 460 nm.
Limitationsi
Some interferences must be removed before the phenols may be determined.
HZS1essandwithSO_. interference is eliminated by acidifying the s_le afterto pH4 orl5 mL conc. H3PO4 per 11ter and aerating immediately co -lection. To inhibit biochemical oxidation, 1.0 g CuSO4 .5H20 is addedper liter and the sample is stored at 4°C until analysis (no more than 24hours). A preliminary distillation is performed to separate the phenols fromany non-volatile impurities. Many different phenolic compounds may be presentin the sample, a11 of which produce the colored antipyrine dye. To achieveuniformity, a11 results are reported in terms of ,_j/Lphenol which gives theminimum concentrationof phenolic compounds present.
Equipment
I. All glass distillationapparatus as shown or equivalent.
° .
EHSP-2-2
2. 500 mL graduated cylinders
3. Spectrophotometer for use at 460 nmwith 1.0 cmcells
4. ghatman #41 filter paper- 11cm
S. Long-stemmedglass funnels
6. pH meter
7. 1-ltter separatory funnels
Reagents(Stock)
1. Phosphoric acid- cone. 85%H3PO4
2. Cupric sulfate pentahydrate - CuSO4 ,5H20
3. Reagent grade phenol
4, Ammoniumchlortde - NH4C1
5. Ammontumhydroxide -conc, NH40H,o
6. 4-amtnoanttpyrtne
7. Potassium ferrtcyantde - K3Fe(CN)5
8. Chloroform - CHC13- CLASS2 susPECT HUMANCARCINOGEN
Reagents(PrePared)
i. Ammonium chloride solution - Dissolve 25g NH4CI in deionizedH20 anddiluteto 500 mL. Prepareannually.
2. Aminoantipyrinesolution- Dissolve2.0 g of 4-aminoantipyrinein deioniz-ed H2O and diluteto 100mL. Preparefreshdaily.
3. Potassiumferricyanidesolution- Dissolve 8.0 g K3Fe(CN)5in deioniz-ed H20 and diluteto 100mL. Filterif necessary. Preparefreshweekly.
Standardsill Jl ii i i
" I. Stock phenol solution- Dissolve1.00 g reagentgrade phenol in freshlyboiled and cooled deionized H20 and dilute to l-liter. (If extremeaccuracyis desired,see StandardMethods,page 559, for standardization.)im ,,,-
I mL - 1.0 mg phenol. Prepareweekly.
2. Standardphenol solution- Dilute 1.0 mL of the stock phenol to 100 mLwith freshlydeionizedH20. Preparefreshdaily, l mL = 10.0 ug phenol.
EHS P-2-3
"- Procedureill II I ill
I. Transfer a 500 mL aliquot of sample that has been acidified and treatedwith CuSO4 .5H20 to the distillatlon flask and begin dlstilling intoa SO0 mL graduated cyllnder. (Also carry a standard containing 10 Ugphenol/500 mL and a reagent blank through the distillation.)
2. When about 450 mL has been distilled, stop the distillation. After boil-ing ceases, add 50 mL of deionized H20 to the distillation flask andcontinue distilling until 500 mL has been collected. Transfer thedlstillate to a 1-Llter separatory funnel.
3. In l-liter separatory funnels, prepare a 500 mL delonlzed H20 blank anda series of standards containing I, 5, I0, and 20 Ug phenol in 500 mL.(0.I, O.S, 1.0 and 2.0 mL of I0 _/mL phenol standard.) Carry all samplesand standards through the remainderof the procedure.
4. Add lO mL NH4CI solution and adjust to pH lO.O+_0.2 using cone. NH4OH.
5. Add 3.0 mL of amtnoantipyrine solution and mix well.
6. Add 3.0 mL of K3Fe(CN)6 solution, mix well and allow pale yellow colorto develop for three minute.
7. Extract immediately with 25 mL of CHC13. Shake separatory funnel atleast 10 times, let phases separate and shake again. NOTE: ALL WORKWITHCHLOROFORMSHOULDBE DONEWITH GLOVESIN A HOOD_ .......
lill i i i i I llll
8. After the phases separate, filter the CHCI3 extract through IPS filterpaper to remove any H20.
g. Measure absorbance of samples and standards at 450 nm, using chloroform asa reference.
lO. Discard CHCl3 solutions in waste can marked for organic carcinogens.
Calculationi
I. Plot ,g phenol in 500 mL vs. absorbance.
2. DetermineIJgphenol in the samples from the curve.
D
mg/L phenol - aliquot ug pheno!500 mL sample
Use the standard carried through the distillationto determine % recovery.Make necessary correction in results if recovery is less than I00%.
Hethod No, EHS V-2IIIIIII I IIIII I IIII II II IIII I II
_ Tttle: Volattle Oraantc Chemtcal Ana,l..ys_sb.y.,.PuPae & Tra.,pGC ......v II
Date Issued: 8-15-88 Approved by: M.K. Hamtl toni I i IIII I I IIIII II IIiiii i i i
Written by: T.j. Gtlfotl-_ 1111 II I I I I I III I II I III Bill II I l I II IIIII II
Supersedes Hethod No, ............I II I II ii I I
Date Rev4ewed By Date Rev|sed By -._I I IIIII _ IIIIlI II I I I -- " -- III II III II 4P
i i1| i I IIII I . II III II I " II I II II I I i
.1111 i I II [ I I I I II __ I I I I II I III I I IIII _
_11 I I I I I IIii I • - i I
II I __ I II II IIIIII III II -- I I I III II iiiiiiiii Ii I
G
,I
I | I I II III- II
unllll ill Ill II IIIIII I __ II1| II I nl
t__
n mill I I n i I i __ iii i n I nm i in i i i. i ..,
ilml i jll j iI -..hill I | I i
,,p
in ill Ul li I I il i __ Inl II - ill i
II ii I __ II I II I i iii
IIII Illl I • I u
.... inl I II u i In
i i _1 -- :-- i1 I i i ,i
Replaced by Hethod No. Date:I iii ii llll i i iiiiii ii el i llll
8-15-88
VOLATILE ORI._NIC CHEMICAL(VO(_I ANALYSIS,.-- BY PURGEAND TRAP GCWITH
PHOTOIONIZATIONAND ELECTROLYTICCONDUCTIVITYDETECTORSIN SERIES
1.0 SCOPEANDAPPLICATION
1.1 This method is applicable to the determination of at least 58 VOC's infinished drinking water, raw source water, or drinking water in anytreatment stage. A list of the determinable compounds is given inReference 1 and show in Attachment A,
1,2 Method detection ltmtts are very compound dependent and are variable.Each analyst as part of the qualtty control associated with this methodmust determine the precision of his or her own technique and thereby apersonalized set of detection limits.
The analytical range of this method is currently defined by the equipmentwe are using to perform it. The span of the data processing equipmentand the spans of the two detectors used combine to effectively limit theworking range to approximately 0.2 to 20 _g/L.
Co-elutton of some compounds effectively prohibits their directdetermination by this method; meta and para xylene, 1,2,3-trtchloropropane and I,],2,2-tetrachloroethane are the two problem pairson the column system used in this method. The identities of all otherco-eluting compounds can be distinguished by the particular detectorresponding to them; i.e., in all other cases each of the co-eluttngcompoundsonly responds on one detector.
1.3 It is highly recommended that thts method only be used by analystsexperienced in the measurement of purgeable organics at low _g/Lconcentrations. As mentioned above, part of the quality control for thismethod tncludes a demonstration of analyst performance. Beforeproceeding further it is mandatory that the analyst read Reference 1thoroughly.
2. METHODPRINCIPLES
2.1 Volattle organic compoundswith low water solubility are removed (purged)from a 5 ml volume of the aqueous sample contained in a spargtng cell bypassing heltum through the sample. The purged compoundsare carried withthe gas through a stainless steel tube packed with several adsorbent
- materials, on which the compounds are trapped. After completion ofsample purging the sorbent tube is heated and backflushed with helium.The trapped compoundsare carried onto a megabore fused silica captl]arycolumn which is held at subambtent temperatures. The column is thentemperature programmed to separate the method analytes which are thendetected by the phototontzatton detector (PID) and the electrolyticconductivity detector (ELCD) in series.
• i llmlml
p. 2 EHSV-Z8-15-88
F"' 2.2 Tentative identifications are based on retention time comparison betweeuLsample peaks and standard peaks as well as a comparison of response fr_each detector if the compoundresponds on both. Internal standav_Fcalibration is used to enhance the precision of the technique and toprovide "reference"peaks which can then be used to more ioositivelyidentifythe analytepeaks by adjustingthe identificationwindowstoaccountfor minor fluctuationsin predictedretentiontimes.
3. INTERFERENCES
3.1 The primary interferences for this method are commonlaboratory solventssuch as methylene chloride and Freon 113 which are used in our facility.Isolating,as much as possible,the area in which any work relatedto VOCanalysis is to be performed is the ultimate solution.
3.2 There are several compoundswhich are known to be chromatographicinterferences. Those which are known at this time are: 1-chlorohexaneand chl orobenzene, Freon 113 and 1,1-dichl oroethyl ene,trtchlorobromomethane and one of the middle eluttng chlorinatedcompounds,and a dtchlorotoluene coelutes with one of the later eluttngaromatics. As can be seen, identification is far from foolproof so greatcare needs to be exercised.
3.3 Carryover from a high to a low sample may also be a source ofcontamination, but with the use of the ALS-IO it is more important thatthe spargtng cells be thoroughly cleaned after each use to prevent any
_ carryover problems.
4. METHO0PITFALLS
4.1 Analyte volatilityrepresents the major source of both sample andcalibrationstandardinstabilICy.
As regards samples, any air space above aqueous samples renders theminvalid. Samplesmust also be kept cold (ca. 4 "C) from the time ofcollectionto the time of analyslsand they must be analyzedwithin 14days of collection to avoid losses of volatile components.
Calibration standards also suffer from stability problems. Methanoltcworking standard solutions last about 1 week during normal usage; a dropin response, especially in the gaseous compoundsindicates standarddecomposition. Working standards must be replaced when the response
- observeddiffersfrom that of the initialcalibrationcurveby 20% ormore (see Section II., QualityControl). It is highlyrecommendedthatstock and working standardsolutionsbe stored after preparationin anumberof smallautosamplervials to maximizethe amountof time that abatch of standardswill last. Minimizingthe amountof time a standardspends at room temperatureis also highly advised. Stock standardsolutionslast approximatelyone monthif storedin a freezer.
A final problem arising from analyte volatilityinvolves sample andstandardstorage. Samplesshouldbe storedrefrigerated,with a holdintblank,in a refrigeratorfree of volatilecontaminants.Standardsshoulbe storedin a freezer. This will minimizethe amountof cross
p.3 EHSV-28-15-88
r contamlnatlon that wlll occur. An addltlonal precautlon that can betaken to prevent contamlnatlon Is storage of standards and/or samples inclosed containers wlth actlvated carbon to adsorb any atmospherlccontaminants.
B, SAFETY
S.l A number of the analytes dealt with in tht.- method have toxic and/orcarcinogenic properties which mandates that all standards be prepared ina fume hood and that proper protective equipment be utilized. Forfurther information the analyst is referred to the safety referencescited in Reference I. Also refer to EHS Lab Operating Procedure L-4.10,"Laboratory Policy Guide - Use of Carcinogens."
6. APPARATUSAND EQUIPMENT
6.1 SAMPLECONTAINERS-- 40 ml glass screw cap vials equtpped with PTFE-facedstltcone septa: (I-them # S-3360040 or equivalent). IF I-thempre-cleaned bottles will not be used, wash vtmls and septm with detergentand rinse with tap and detontzed water.
Allow vials and septa to air dry at room temperature, place in a GCovenat 105 "C for one hour, allow to cool in the GC lab and replace caps andsepta. Vtals should be prepared as close to their usage as possible toprevent any contamination durtng storage.
6.2 PURGEANDTRAP SYSTEM-- The basic operating principles of the Tekmar LSC2 and the ALS-IO units, utilized by EHS, are covered in their respectiveoperating manuals (Reference ;I & 3. It is highly recommendedthat thesebe read thoroughly before beginning any work with this equipment. Ofspecial concern are the flow patterns utilized in the system. Thisequipment satisfies the criteria of EPA method 502.2 and other EPAmethods involving purge and trap equipment.
There are minimal problems with this equipment, and routine maintenanceconsists of cleaning the spargtng cells and periodically (perhapsmonthly) pressure checking the ALS-IO sparging positions for leaks, as isdetailed tn the Tekmar manual for the ALS-IO. Sparging cells are cleanedafter" each use by sucking a weak detergent solution through the cells ina reverse direction to the normal flow, followed by a thorough rinsingwith deiontzed water and baking at 110 "C in a GC oven until dry.Periodic flow checks are also required and flows must be verified
" whenever a new trap is installed. Appropriate flows are a purge flow of40 cc/min. (at the sparge cell inlet), and a desorb (column carriergas) flow rate of approximately6 cc/mln. Helium is the gasutilized.
The trap utilized for this method is the one specified in Section 5.2.2of EPA method 502.2 (Tekmar #142366-003 or equivalent). The trap cyclelisted below is a modificationof the EPA recommended purge cycle. It isone recommended by Lowell Wright of OI corporation as one which willminimize ELCD signal suppression and premature catalytic tube failure dueto desorbed water.
p.4 EHSV-28-15-88
: Purge time ts 11 mtn., purge temperature ts 30 "C or less (tndeference to the room temperature). Desorb preheat temperature is ]"C, desorb time and temperature are 2 man. and 180 "C respectively (tomintmize water deposition onto the column). Bake time and temperaturesare 11 mtn. and 180 "C. Prtor to ustng a new trap or ustng one which hasbeen tdle for an extended period, tt should be conditioned by subjectingtt to at least one bake cycle and more tf necessary. The traps aresusceptible to premature failure if any sample foams and is carried intothe tubtng beyond the sparge cell. It is also advisable not to bake thetrap unless tt is being sparged wtth helium (wtth the ALS-]O this meansasparge cell must be tn place) stnce this does seemto shorten the life ofthe trap.
Trap life is highlyvariable;some indicatorsof a failingtrap are anincreasednumber of artifact peaks in the PID chromatogram,perhapsadecrease In bromofom sensitivity(but there are many causes for thisphenomena),an increasein back pressurerequiredto malntalnflow acrossthe trap, and perhaps also problemswith sensitivityof the gaseouscompounds especially vinyl chloride since this compound is barelyretainedon the trap.
6.3 GAS CHROMATOGRAPHICSYSTEM -- The basic requirements of the gaschromatographic system are detailed sufficiently in Reference 4 so nofurther discussion wtll be made here of general requirements. Rather,the spectftc conditions under whtch our particular system has been foundto operate best are given.
Gas Chromatograph: HP 5880Column: a & W Scientific DB-624, 0.53mmi.d.ColumnLength: 30 m.Ftlm Thickness: Approx. 3 pm.Start Temp-Ttme: -15 "C, 1 mtn.Program Rate: 3 "C / mtn.End Temp-Ttme: 140 "C, 5 min.Post Temp-Ttme: 175 "C, 2 min.Det l-Type & Temp: PID, 180 °C, Range- 100.Det Z-Type & Temp: ELCD, 180 "C, "S" Mode.PID Lamp: 10.2 ev.ELCDTube Temp& H2 Flow: 900 "C, 100 +/- 10 cc/mtn.ELCDFlow and Eluent: 50 #l/mtn, n-Propanol.ELCDPumpSetting: 3-4 turns (10 turn pot.)
. CarrierFlow & Gas: 6 cc/mlnHe @ 140C.Make-UpGas-Flow: He, 24 cc/min.
}oecialNotes
PID Intensityshouldbe set at-30%. The two detectorsare connectedinserieswith a short piece of deactivated,uncoated,0.53 mm i.d. fusedsilicatube.
A copy of a correctprintoutof the variousconditions,run tables,the shortkeystrokeprogramwhichneedsto be enteredin orderto operatethe instrumentfrom the 5880 terminalsis containedin AttachmentB, Acurrentcopy of this is also kept in the GC laboratory. Understandingthis informationis criticalto successfuloperationof this instrument.
p.5 EHSV-28-15-88
/r TM .
A listing of each of the methods used on the Hewlett-Packard (HP) d_system are also contained in Attachment B. The analyst is referred _.Reference 7 for detailed instructions on the use of the data system.
The instrument utilizes liquid nitrogen (LN2) cryogenics as the meanstolower the column oven temperature to -15 *C. Two25 L dewar flasks of LN2are used to fill the instrument dewar, which is then pressurized to 20pst with nitrogen. It ts important to rememberwhen using the ALS-IO tomake a clock table entry such that after the last run of a series theoven temperature is raised above 50 "C so that the cryogenic cooling isnot activated unnecessarily for an extended period.
A troubleshooting guide which has more specific information about what todo when things go wrong ts kept in the Laboratory Operating ProceduresManual (see Proc. #L-8.1]).
6.4 MISCELLANEOUSEQUIPMENT--A number of small items will be required toperform,thismethod;a varietyof microlitersyringesfor dilutionsetc.,as well as a 5 ml gas tightsyringewith a luer lock valve for loadingofstandards and samples into the 5 ml sparging cells.
7. REAGENTS
7.1 METHANOL--Methanol which is free from any analyte contaminants must beused to prepare standard solutions. Burdick and Jackson Purge and Trapgrade methanol (product #232) ts highly recommended. :.
7.2 n-Propanol--The n-propanol used as eluent tn the ELCDcell must be a highpurity glass distilled type (Burdtck and Jackson product # 322 orequivalent).
7.3 Gases--Three gases are used to perform this analysis; helium, hydrogen,and LN2. Ultra high purity helium and hydrogen are required for theproperoperationof the ELCD. The LN2 used for the cryogenicsystemisobtainedfrom Battelle'stank outsidethe wholebody counter. Its purityis reallyan unknownbut it also has no bearingon the performanceof themethod.
7.4 REAGENT WATER-- Analyte-freereagent water is prepared by passingdeionizedwater through two Milliporeactivatedcarbonorganic removalcartridges(Milllpore#CC1512000)using a vacuumflask apparatus(Rainin#38-181). This water Is then sparged in a large impingerwith high
" purity nitrogenfor 1/2 hr and stored in a closedcontainerin the GCIaboratory.
7.5 SAMPLE PRESERVATIVE--Hydrochloricacid (I+I) is prepared using ACSreagentgrade HCL and the reagentwaterpreparedabove.
7.6 STANDARDSTOCKSOLUTIONS--These solutionsare preparedfromcommerciallyavailablestock solutions(Supelco)or from ampulatedstock solutionsprovidedby the EPA QualityAssuranceMaterialsBank (QAMB). The sto-solutions can also be prepared from neat materials following t,.directionsIn Sections 6.3.1-6.3.4in Reference I. Typicallystocksolutionsare at concentrationsof 1000 to 10,000ug/mL. Referto
p.6 EHSV-2
8-15-88Section 4.1 for storage conditions and shelf life of these solutions.
7.7 WORKINGSTANDARDSOLUTION-- The working standard solution isprepared from the commercial stock solutions by additions ofappropriate microltter volumes of the stock solutions to methanol. Theworking solution concentration is 5 ug/mL of each analyte. Additions ofI _L to 20 _L of this solution to 5 ml of reagent water in a 5 ml glasssyringe yield calibration standard concentrations of 1-20 _g/L in theaqueous solution. Refer to Section 4.1 for storage conditions andstandard shelf life.
7.8 INTERNAL STANDARD WORKING SOLUTION--The internal standard workingsolution is prepared from EPA stock solutions by dilution into methanol.The two internal standards are fluorobenzene (PID) and 1,4-Oichlorobutane(ELCD). 2-Bromo-l-chloropropane is not used because it cannot beseparated from another analyte on the D8-624 column or on the VOCOLcolumn recommended in Reference 1. The internal standard in EPA method302.1 is 1,4-dichlorobutane and this compound was adopted for thismethodology. The internal standard working solution is prepared at aconcentration of 10 #g/mL of each standard compound by dilution of thestock solutions. Addition of 5 #L of this solution to 5 mL of aqueoussample or reagent water in a 5 mL glass syringe to yields a final aqueousconcentration of 10 #g/L.
7.g SURROGATEWORKINGSOLUTION-- Surrogate compoundsare added to each sampleto yield recovery information on each sample. The two surrogates use(one for each detector) are 2-chlorobutane and p-dtfluorobenzene. Stocsurrogate spiking solutions are prepared from either neat material as perSections 6.3.1-6.3.4 of EPA method 302.2 (2-chlorobutane) or fromavailable EPA standard solutions (p-difluorobenzene). The surrogateworking solution is prepared at a concentration of 10 _g/mL. Thissolution is used for calibration and for sample spiking. Calibrationstandards are prepared by addition of 1, 2, 5, lO and 20 #L of thisworking solution to 5 mL of reagent water in a glass syringe to which theinternal standard and calibration standard solutions have already beenadded. This results in aqueous concentration levels of 2, 4, 10, 20, and40 #g/L. A 5 #L aliquot of the surrogate working solution is used tospike the samples at a 10 Fg/L level.
7.10 LABORATORYQC CHECKSOLUTIONS-- Two different kinds of qC check solutionsare prepared in our laboratory. A check solution is currently being made
. from EPA standard solution mixes to check the comparability of ourstandards to those of the EPA. This EPA QC Check solutton does notcontain all of the analytes covered by method 502.2 but it does contain asubstantial number of them. EPA currently does not have a standardsolution mix or even several standard solution mixtures which have all ofthe analytes covered under method 502.2. Currently we are using this EPAsolution to function as the "Laboratory Quality Control Check Standard"referred to in method 502.2.
A source of standard solution mixes different from that used to prepthe calibration standards has been found (Ultra Scientific) From whichsecond QC check solution will be prepared to cover all of the analytes.The EPA QC check solution will continue to be analyzed Jn addition to the
p.7 EHSV-28-15-88
normal QC check solution In order to validate comparabilitywith EPAstandards. More wlll be said on thls subjectlater in SectionII.
B. SAMPLECOLLECTION,PRESERVATION,STORAGE
B.I SAMPLE COLLECTION--Theanalyst is referredto ReferenceI for adequatedetails concerningsample collection. All samples are collected induplicate. If samplesare to be composltedit must be done accordingtothe guidelinescontainedin Reference8.
8.2 SAMPLEPRESERVATION--Samplesare held at 4 "C from the time of collectionto receipt at the laboratoryby the use of blomailersand cold packs.Upon receiptat the laboratorylowerthe samplepH to <2 by additionof200 #L of I:l HCl (see Section 7.3) to the sample through the septumusinga syringeequippedwith a narrowgaugeneedle.
S.3 SAMPLESTORAGE--Storesamplesin a refrigeratorfree of organicsolventvapors (see Section4.1) at 4 "C until analysis. All samplesmust beanalyzedwithin 14 days of collection. Samplesnot analyzedwithinthistime periodmust be discardedand replaced.
g. CALIBRATIONAND STANDARDIZATION
g.l CALIBRATIONSTANDARD PREPARATION--CaIIbratlonstandards areprepared by adding 5 mL of reagentwater to a 5 mL glass gas-tightsyringe. Five mlcrolltersof internalstandardworkingsolutionare thenadded quickly through the luer valve to the syringe. Then theappropriatevolumes of surrogateworking solutionand the calibrationstandardworkingsolutionare addedin the same fashion. The contentsofthe syringeare then loadedinto a spargecell and analyzedaccordingtoSection12.
Calibrationstandardsare"preparedat concentrationsof I, 2, 5, I0, and
20 pg/L by additionof I 2, 5, I0, and 20 _L of the 5 uq/ml standardworkingsolution. Surrogat,levelsare twicethls concentrationbecausethe same volumesare addedbut the concentrationof the surrogateworkingsolutionIs I0 #g/mL.
g.2 INTERNALSTANDARDINSTRUMENTCALIBRATION--Theinternalstandardmethodofcalibrationis used. Responsefactorsare calculatedand a calibrationcurvegeneratedusingthe ExtrachromII Data system. For a discussionofhow this Is performedand the pertinentequationsused the analyst is
" referred to Reference 7. A first order (linear) or second order(quadratic)fit must be used to generatethe calibrationcurve,the oneyieldingthe highestcorrelationcoefficientshouldnormallybe chosen.The % RSD of the responsefactorsmust be less th_n 20% for all of theanalytesor anothercalibrationcurvemust be prepared.
10. METHODPERFORMANCEDEMONSTRATION
IO.IMETHOD PERFORMANCEAND MDL DETERMINATION--Inorder to demonstrateacceptablemethod performanceand to determine the method detectionlimits (MDL) each analyst is requiredto analyze seven samplesat aconcentrationof 0.5 #g/L. These samplesare preparedusingthe
.,
p.8 EHSV-28-15-88
laboratory QCcheck solution.
For each analyte the mean recovery must be between 80% and 120%06 thetrue value and the relative standard deviation of the values must be< 30%. If either of these tests fail, system performance is unacceptableand corrective action must be taken. Corrective action can be a repeatof the test, preparation of fresh QCcheck solution, recaltbratton of theinstrument or other means. The method detection limit at the gg%confidence level is determined as 3.143 x s where s is the standarddeviation of the concentrations observed above.
11. QUALITYCONTROL
11.1 DAILY METHODBLANKS--Eachday before any standards or samples areanalyzed a methodblank consisting of 5 mL of reagent water containing5 /_Lof internalstandardworkingsolution,and 5 pL of surrogateworkingsolutionmust be analyzedand foundto containless than the MDL of anyof the 502.2 analytes. If any compoundsare found above the MDLcorrective action must be taken. Corrective action could includepreparation of fresh reagent water, re-cleaning of the sparging cells,replacement of the trap, and replacement of the purge gas hydrocarbontraps, or all of the above.
11.2 DAILY STANDARDVALIDATION--Eachday after analysis of the method blanktwo standard check solutions must be analyzed. First, a calibrationstandard solution must be analyzed and the concentrations obtained mube within 20%of their true values. Standard concentration levelsshould alternate to cover all standard levels over a period of severadays. Standards should be run at the end of each sample batch as well,if possible. Second, a solution prepared to be 5 pg/L using theLaboratoryQC CheckSolutionmust be analyzedand the recoveriesobtainedmust be within 40% of their expected values. If either of'thesesolutions fails the test for no obviousreason,then correctiveactionmust be taken in the form of freshstandardsor a recalibrationof theinstrument.
IT.3DAILY EPA QC STANDARD CHECK--Eachday of analysis a solutionprepared to be S to 20 pg/L using the EPA QC check solution must beanalyzed and the recovery must be within 40% of the expected value.Correctiveactionfor a failureof this test must be takenin the form06fresh standardsor a recallbrationof the instrument.
- 11.4 SURROGATERECOVERYCHECK--Surrogatesare added to each sampleand blankto yield a concentrationof 10 #g/L. Surrogaterecoverymust be within80-120%.
11.5 INTERNALSTANDARDAREACHECK--Internal standard areas must be recordedand each day must be within 50% of the areas observed for the dailycalibration standards and within 50%of the prior day's daily calibrationstandard values. Failure of this test invalidatesall samples itaffects. Correctiveactionmay includereplacementof internalstandasolution,a repairof a particulardetector,or a recalibratlonof tinstrument.
p.9 EHS V-28-15-88
f_11.6 WEEKLYLOW LEVEL STANDARDCHECK--At least once each week a
calibration standard at the 0.5 pg/L must be analyzed and the analy_recovery must be within 40% of the expected value. If thts test isfailed, corrective action must be taken. Corrective measures mighttnclude a simple repetition of the test, preparation of fresh standards,instrument repair, or recaltbratton of the instrument.
11.7 WEEKLYEPA PE SAHPLEANALYSiS--Performance Evaluation (PE) samples areavailable from EPA EHSL-Ctnctnnatt and one of these must be analyzed atleast once each week at a concentration that ts within the range of thecalibration curve. The analyte concentration values must be within 20%Of those provided by EPA EHSL-Ctnctnnatt or within the acceptance limitsprovided, whichever ts app]tcable.
11.8 SAHPLE DUPLICATE ANALYSIS--Any samples tn which a positive result tsobtained for any analytes other than trthalomethanes must be analyzed induplicate, duplicate analyses should agree to within 40¢.
11.9 RESPONSEFACTORCHECK--Whenanalytes are found tn the samples For whichresponses are observed on both detectors the analyte concentrationsobtained on both detectors should be within 40% of each other.
12. SAHPLEANALYSIS
12.1 INSTRUHENTALCONDITIONS--The Instrumental conditions to be used atdescribed fully in Sections 6.2 and 6.3. Approximate retention times anuexample chromatograms are contained tn Attachment B.
12.2 QUANTITATION--The ana]yte concentrations are calculated by the internalstandard method by comparison of the response factors observed in thesamples with those of the calibration standards. Hore information onthe calculation methods used ts contained in Reference 7. Results arereported tn #g/L and rounded off to two significant figures or 0.1 _g/L.
13. DOCUHENTATION
13.1 QUALITY CONTROL--Quality control results are recorded to verifyacceptable method performance on a series of forms prepared For thispurpose, copies of these forms are contained tn Attachment C.
° 13.2 QUANTITAIION--The analytical quantitative results obtained from analysisof the samples are recorded on a form established for thts purpose, acopy of thts form ts contained tn Attachment C.
14. REFERENCES
1. Volatile Organic Compounds in Water by Purge and Trap Capillary ColumnGas Chromatography with Photoiontzation and Electrolytic ConductivityDetectors tn Series, Hethod 502.2, EPA, as shown in 52 CFR 12879 (April17, 1987).
I III _ I , _ __
p.lO EHSV-28-15-88
f, 2. Tekmar Company Liquid Sample Concentrator Hodel LSC-2 operatingmanual.
3. Tel_nar CompanyAutomatic LtquJd Sampler Hodel ALS-IO operating manual.
4. Hewlett-Packard Gas ChromatographHodel 5880 operating manual.
5. HNUPhototonJzatJon Detector (PID) Hodel PI-52 operating manual.
6. Ol Corporation Electrolytic Conduct|vJty Detector (ELCD) Hodel 44Z0operating manual.
7. Extrachrom II Data System Operators manual.
8. Federal Register, Vol. 52, No. 130, WednesdayJuly 8, 1987.

ATTACHMENT A
._.w,.- _ .., , .
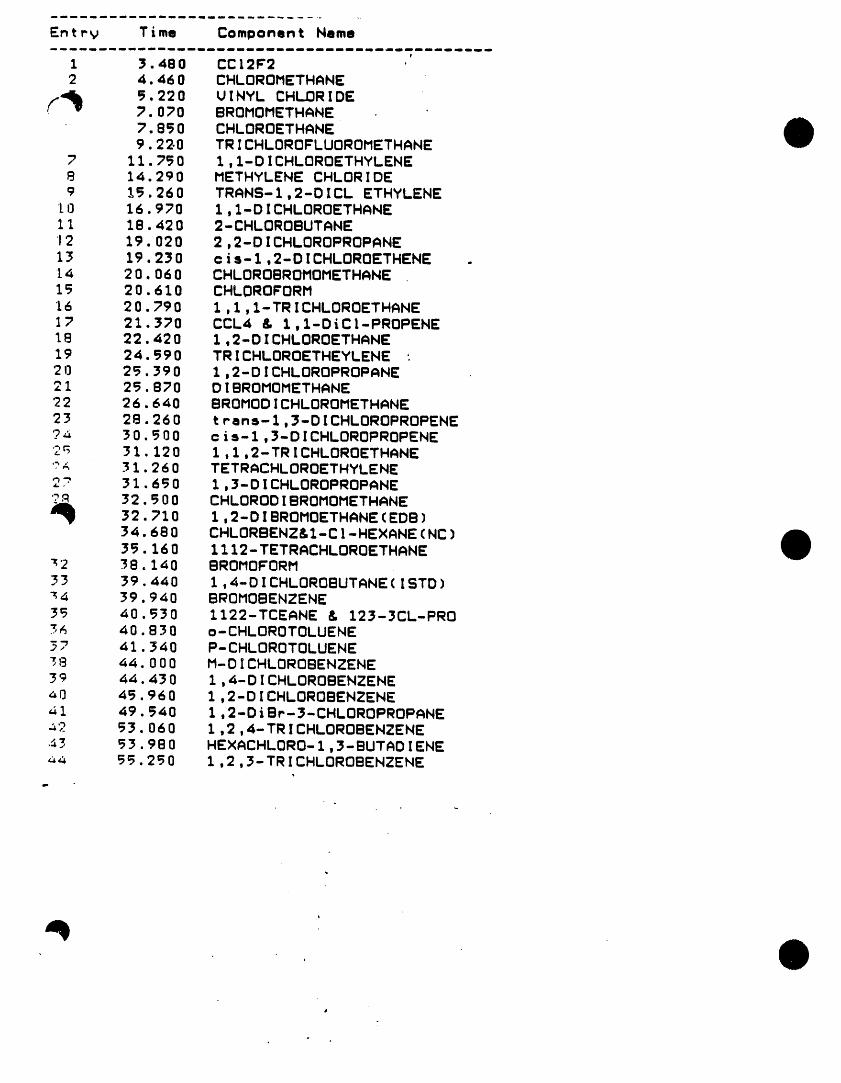
Entry Time Component Name
1 3.480 CC12F22 4.460 CHLOROMETHANE
_.220 UINYL CHLORIDE7.0_0 BROMOMETHANE• 7.8_0 CHLOROETHANE
9.220 TRICHLOROFLUOROMETHANE
7 11.7_0 I,%IOICHLOROETHYLENE8 14.290 METHYLENE CHLORIDE9 %_.260 TRANS-1,21DICL ETHYLENE
t0 16. 970 1,1-D ICHLOROETHANE11 1 B. 420 2- CHLOROBUTANE12 19o 020 2,2-DICHLOROPROPANE13 19. 230 c isI1,2IDICHLOROETHENE .14 20.060 CHLOROBROMOMETHANE15 20.610 CHLOROFORM16 20.7?0 1,1,%-TRICHLOROETHANE17 21.370 CCL4 & 1,%-DiCI-PROPENE18 22.420 1,2-DICHLOROETHANE19 24._90 TRICHLOROETHEYLENE '20 2_.390 1,2-DICHLOROPROPANE21 25.870 DIBROMOMETHANE22 26.640 BROMOOICHLOROMETHANE
23 28.260 transI1,3IDICHLOROPROPENE?_ 30.500 ciSll,3-OICHLOROPROPENE2_ 31.120 1,1,2-TRICHLOROETHANE'_ 31.260 TETRACHLOROETHYLENE2? 31.650 1,3-OICHLOROPROPANE_ 32.500 CHLORODISROMOMETHANE
Jl_ 32.710 1,2-OIBROMOETHANE(ED8)34.680 CHLORBENZ&I-CI-HEXANE(NC)35.160 1112-TETRACHLOROETHANE
_2 _8.140 8ROMOFORM33 _9.440 1,4-DICHLOROBUTANE(ISTD)_ _9.940 BROMOBENZENE35 40.530 1122-TCEANE & 123I_CLIpRO3_ 40.830 oICHLOROTOLUENE_7 41._40 P-CHLOROTOLUENE_8 44.000 M-DICHLOROBENZENE39 44.4_0 1,4-OICHLOROBENZENE40 45.960 1,2-DICHLOROBENZENE_1 49._40 t,21DiBpI_-CHLOROPROPANE_,_
53.060 1,2,4-TRICHLOROBENZENE13 53.980 HEXACHLORO-1,3-BUTADIENE_ 55.250 I ,2,3-TR ICHLOROBEHZENE
,
o
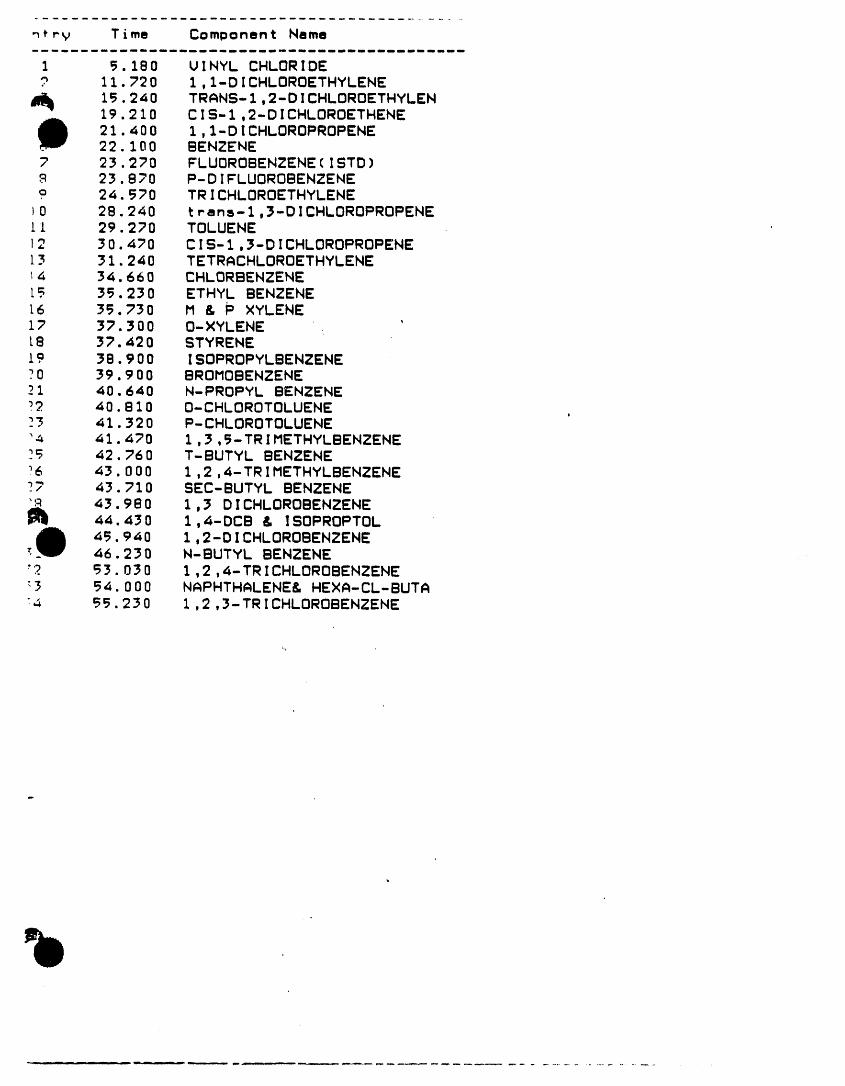
_r v Time Component Namem I Im mimliImmmmmu m m m el
I 5.1B0 UINYL CHLORIDE? 11. 720 1 oI-DICHLOROETHYLENE
15.240 TRANS- 1,2- D !CHLOROETHYLEN19. 210 C IS-1,2-DICHLOROETHENE21.400 1,1-DICHLOROPROPENE22.100 BENZENE
7 23.270 FLUOROBENZENE(ISTD)23.870 P-DIFLUOROBENZENE
a 24.570 TRICHLOROETHYLENE)0 28.240 trens-I,_-DICHLOROPROPENEIi 29.270 TOLUENE12 30.470 CIS-I,_-DICHLOROPROPENE13 31.240 TETRACHLOROETHYLENE_4 34.660 CHLORBENZENEl_ 35.230 ETHYL BENZENE16 35.730 M & P XYLENE17 _7._00 O-XYLENE , 'L8 37.420 STYRENE19 _8.900 ISOPROPYLBENZENE?0 39.900 BROMOBENZENE31 40.640 N-PROPYL BENZENE_2 40.810 O-CHLOROTOLUENE #
33 41._20 P-CHLOROTOLUENE'_ 41. 470 I ,_ ,5-TR IMETHYLBENZENE_ 42. 760 T-BUTYL BENZENE
76 43. 000 1 ,2,4-TRIMETHYLBENZENE_7 43.710 SEC-BUTYL BENZENE
"_ 43.980 1,_ DICHLOROBENZENE44.430 1,4-DCB & ISOPROPTOL45.940 1,2-DICHLOROBENZENE46.230 N-BUTYL BENZENE
'? 53.030 1,2,4-TRICHLOROBENZENE:3 _4.000 NAPHTHALENE& HE×A-CL-BUTA"_ _5.230 1,2,3-TRICHLOROBENZENE
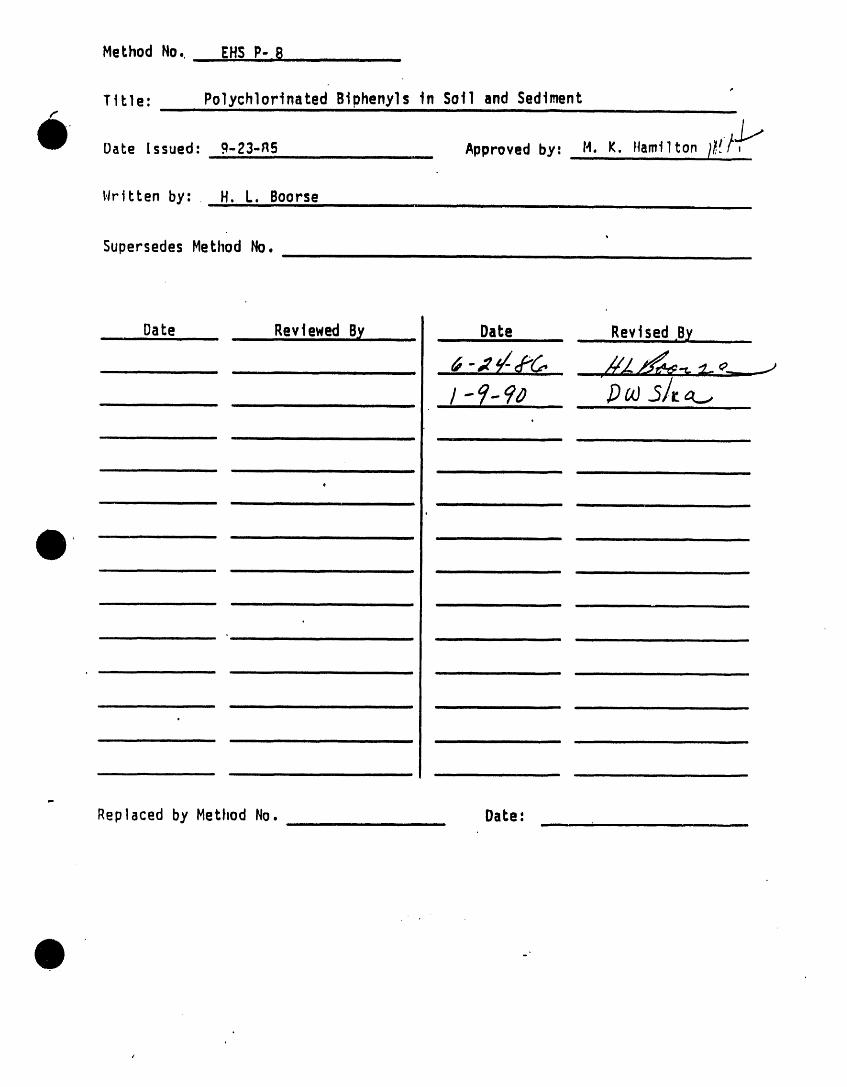
Method No, EHSP-8i iii i
Title: Polychlorlnated Bim)henylsin 8o11 and SedimentIN Ill I mill I I I I I I l I Ill I Bill I,,..
Date Issued: gr23=_1,5..... _ Approvedby: H. K. HamiltonI_! imllmi
t./ritten by: H.L. Boorsei iiiii i i ii i
SupersedesMethod No.IN INmiNim till I I
, Date , ,Reviewed,By ...... DaLe , RevlsedBy ,,
i-i- .....Dw .51a...il i i i i ,i
ii i ii i ii i
l
nl i m lln Ill • I -- n i nl
i n n• I ml I n m I In ii,=
iiii llll i iii iim
Replacedby MethodNo. DaLe:,11, i i
o
l
EHSP-B-I01-09-90
POLYCHLORINATEDBIPHENYLSIN SOILAND SEDIMENT
I. R_ferences
A. "TestMethodsfor EvaluatingSolidWaste,_ EPA SW 846 Methods3540,3660,and 8080.
B. 'Determination of Pesticides and PCB's in Sediments (GasChromatographicMethod)," Region 10 LaboratorySurveill'anceandAnalysis DivisionU.S. EnvironmentalProtectionAgency, Seattle,Washington.
C. The analyticalchemistry of PCBs, M. D. Erickson, ButterworthPublishers, Boston, 1986.
II. Princiole# and Limitations
The dried soil is extracted with acetone/hexane in a Soxhlet extractor.The extract is evaporated to a low volume and then solvent exchangedinto isooctane. The resulting solution is treated by a cleanupprocedure(routinely:acid wash/florisilslurry)to remove interferingsubstances. Analysis is by capillary gas chromatographyusing anelectroncapture (EC) detector. The method is made qualitativeandquantitativeby comparingpeak patterns, area counts, and retentiontimes of the samplechromatogramwith chromatogramsof known quantityand type of aroclor standards,obtained under the same conditions.Resultscan be confirmedby runningthe samplesand standardsusing aseconddissimilarcolumn.
Occasionally,sample chromatogramsindicate the presence of PCBs;however,no arocloror mixtureof aroclorsare indicatedby the pattern.This is often the case with weatheredor otherwisedegraded aroclormixturesor when a non-aroclormaterialis the PCB source. In thesecases the Dry Color ManufacturesAssociations'(DCMA)method for PCBidentificationis employed,(see SectionIV.F "Non-aroclorand partialaroclorPCB mixture').
Electron capture detectors respond to chlorine containingcompoundsotherthan PCBs and to certainotherelectrophilicmaterialscontainingotherhalogens,nitrogen,oxygen,and sulfur. Most commoninterferences
- can be removed by sulfuric acid washing. The chromatogramof eachanalyzed sample should be carefully compared with those of thestandards. The responseof an EC detectorto PCBs is reducedby highboilinghydrocarbonsthat co-elutewith the PCBs. This suppressioncanbe compensatedfor by running spiked samplesto determinethe actualrecovery.
Residualoxygen in carrierand makeupgas can react with componentsofsamplesto give oxidationproductsto which EC detectorswill respond.Purityof thesegasesshouldbe assured.
EHSP-8- Z01-09-90
. III. Materi_als
A. Equipment:
I. Extractionapparatus,Soxhlet,AllihnCondenser(250mL flask,40mm I.D.ext. tube,73mmHt siphontube)
2. Controlled heating mantle
3. Extraction thimbles (Whatmancellulose 35mmx 80ram)
4. i x 12 cmscrew cap tubes
S. Teflon lined caps
6. 10 mL repipetors for solvent and acid measurementand transfer
7. O.S mL, 1 mL, and 2 mL Class A or better glass pipets
8. Volumetric flasks, tsooctane washedQ
9. Analytical balance with 0.1 mg sensitivity
10. Ana]yttca] ba]ance with 0.1 g sensitivity
11. SE-54 or DB-5 fused silica capillary column 30 meter length,0.250ramI.D., 0.25 /_mfilm thickness
12. DB1-30mmegabore column 30 meter length, 0.53mm I.D., 1.5 #mfilm thickness
13. Gas chromatograph fitted for capillary column and equippedwith electron capture detector and auto sampler
14. Vortex
]5. Centrifuge
16. PasteurPipets
17. Autosamplervialswith tefloncaps
18. Mechanii:alrotaryextractor
Ig. Threeball SnyderColumn •
20. Oven capableof maintainingtemperatureof 50-55"C
21. Carborundumboilingchips,soxhletextracted
22. Aluminumfoil
EHS P-8-301-og-go
23. Lambdapipets
B, Reagents:
1. Pesticide grade 2,2,4-trimethylpentane (isooctane)
2. Pesticide grade hexane
3. Pesticide grade acetone
4. Reagent grade (conc.) Sulfuric Acid
5. Activated Floristl, 60/100 mesh, reagent grade, suitable forpesticide-residue analysis. Available from Floridin Companyand treated per AOAC(lg80) 2g.002 before use
6. EPA standards (1000 to 5000 ppm) of aroclors 1016, 1221, 1232,1242, 1248, 1254, 1260, 1262, 1268
7. Hexabromobenzene (PCB surrogate)
8. Ultra high purity helium
9. 90 percent argon--lO percent methane (PIO) or g5 percentargon--5 percent methane (PS)
10. Tetrabutylammonium hydrogen sulfate, reagent grade
11. Sodium sulfite, reagent grade
12. Ethanol, USP 95%
13. Potassium hydroxide, anhydrous pellets
14. Dry Color Manufactures Association mixture of PCB isomers inhexane. Available from Ultra scientific.
15. Sodium sulfate, anhydrous, certified A.C.S.
16. 2-propanol, reagent grade
- C. Standards & Prepared Reagents:
Note: All glassware should be dedicated for the preparation ofaroclor standards.
I. Stock Aroclor solutions. EPA Aroclor standards range from5000 #g/mL to 1000 /_g/mL and are received in I mL glassampules. The appropriate amount of standard is volumetricallytransferred to a 25 or 50 mL volumetric flask and diluted inisooctane so that a 10 to 20 /_g/mLsolution is produced.
EHSP-8-4Ol-Og-gO
/" Transfer the Stock solution to a brown glass bottle fitted
with a teflon lined cap. Transfer remaining EPA standardmaterial to a I mL auto sampler vial. The stock solution andthe EPA standard are stable indefinitely if their seals aremaintained and they are stored at or below O'C.
2. Working standards - (0.5, 0.], 0.05, 0.01 #g/mL). Addappropriate amount of stock standard (depending on stockstandard concentration) to _crew cap test tubes and make"upwith isooctane so that a 0.5 #g/mL solution results. Seriallydilute the 0.5 /_g/mLto make up the remaining standards (0.01,0.05, and 0.1 /_g/mL). Total volume of each working standardshould be approximately 10 mL. Prepare monthly or as needed.
3. DCMA mixture, stock and serial dilutions. The DCMA mixtureampule is opened and an aliquot diluted 100 fold. Serialdilutions of 2, IO, and ZO fold are made up of this solution.The remaining original DCMA mixture is transferred to an autosailer vial, sealed with a teflon backed cap and stored at orbelow O'C.
4. Hexabromobenzene (HBB) surrogate-workingstandard. The neatHBB standard is removed from the freezer and a 10 mg aliquotvolumetrically made up into ]00 mL of isooctane. Theresulting 100 /_g/mL solution, the HBB working standard, issubdivided into 10 mL vials, secured with a teflon lined screwcap. These materials are stable indefinitely if their sealsare maintained and they are stored at or below O*C.
5. 1:I acetone/hexane extraction solution-mix equal volumes ofhexane and acetone. Use the same "batch" of extractionsolvent for a given set of samples, spikes and controls.
IV. Methods
Note: This procedure is intended to qualitatively andquantitatively analyze samples for the nine specific aroclorslisted on page 3. This method is not adequate for qualitativeand/or quantitative analysis of partial aroclors or individualcongeners which may result from aroclor degradation or by productsof chemical reactions. For non-aroclor samples see Section IV.F
. for the analysis of these partial or non-aroclor containingsamples.
A. Extraction: (Soxhlet extraction, based on: "Test Methods ForEvaluating Solid Waste," EPA SW 846 Method 3540.
I. Empty the majority of the sample from its container on to asheet of aluminum foil. Pick through the sample and removelarger stones, roots and other non-homogeneous material.Place I0 g of cleaned, homogeneous material into a cellulosethimble. Add 10 g of sodium sulfate and mix.
EHS P-8-501-og-go
Alternately,place approximately100 g of soil sample in a 250mL beaker and place in an oven to dry at 50-55"C for 6-8hours. Cool to room temperature. Sieve soil throu£_h20 mesh,Standard Sieve (A.S.T.M. Designation Ell). Weigh 10 g ofsieved sample into a cellulose extraction thimble. Do not addsodium sulfate. This is the preferred method when workingwith exceptionally wet materials (i.e. sludges with standingIiquid phase).
2. Prepare blank, spike and other QC samples in accordance withSection IV.C.
3. Spike every sample, sample duplicate, sample spike, EPA QC,and blank with 100 /_Lof the HBB surrogate.
4. Place 150 mL of 1:1 acetone/hexane solution into the 250 mLround-bottom flask containing several carborundum boilingchips. Attach the flask to the soxhlet extractor, and extractthe sample for 18 hours.
5. Allow the extract to cool after the extraction is completed.Rinse the condenser with the extraction solvent and drain theSoxhlet apparatus into the collecting round-bottom flask.
6. Attach three-ball Snyder column to the flask and reducesolvent to a volume of approximately25 mL.
7. Rinse down Synder column with isooctane and add an additional25 mL isooctane to sample flask. Add a new boiling chip andreduce solution volume to approximately 10 mL. It may benecessary to wrap the Snyder column in aluminum foil to speedevaporation.
8. Allow the extract to cool. Rinse down the Snyder column withisooctane and quantitatively transfer extract to a 50 mLvolumetric flask and adjust to volume with isooctane.
g. Transfer 10 ,nLoF the extract to a screw cap tube.
B. Cleanup techniques
. I. Acid wash/florisil cleanup (Primary procedure)
a. Add 3 mL concentrated sulfuric acid to each of the 10 mLsample aliquots, includingblanks, QC samples, etc.
b. Shake by hand for 30 seconds and Vortex for 30 seconds.
c. Transfer all test tubes containing samples, blanks,quality control and spiked samples to the rotaryextractor. Run extractor for I hour.
d. Label test tubes for'each sample, blank, quality controland spiked sample being run. Add-0.2 g florisil to eachempty test tube.
EHS P-8-601-og-go
e. Remove sample test tubes from the extractor andcentrifuge for approximately 5 minutes at 3000 rpm.Transfer each isooctane layer to its correspondingflorisil-containingtest tube.
f. Place sample test tubes in extractor for I hour.
g. If the isooctane extract appears colored or cloudyadditional/alternative cleanup procedures may benecessary, ntherwise the extract is ready for analysis(Section IV.D.).
2. Sulfur removal (Based on EPA SW 846 Method 3660)
This procedure is used routinely with sediment and sludgesamples or when _,u]furinterference is indicated on thechromatogram.
a. Prepare TBA-sul rite reagent: Dissolve 3.3g gtetrabutylammontu_ hydrogen sulfate in 100 mL oFdeionized water. Extract 3 times with 20 mL portions ofisooctane. Discard the isooctane extracts and add 25 gof sodium sulfite to the water solution. Resultingsolution is saturatedwith respect to sodium sulfite andis stable for I month at room temperature.
b. Transfer 2 ml. of extract from Sectio_ IV.B.I.g (Acidwash/florisil cleanup) to a new test tube.
c. Add I mL of TBA-sulfite reagent and I mL 2-propanol tothe test tube. Shake test tube for at least i minute andlook for clear crystals from precipitation of sodiumsulfite. If crystals are not present, add crystallinesodium sulfite in 100 mg portions until solid materialremains (one portion is usually enough).
d. Add 5 mL of deioniz_,dwater and shake for at least iminute. Let stand for 5 minutes for phase separation.Collect top, isoocta_e, layer in an auto sampler vial.The extract is ready for analysis (Section IV.D.).
3. Ethanol/potassiumhydroxide cleanup
This procedure is used when hydroxyl containing species- such as pentach]orophenol and glycols are present.
Additionally, fats are made more water soluble throughsaponification. Certain chlorinated pesticides undergodehydrochlorination.
a. Prepare 2% potassium hydroxide/ethanolsolution:Dissolve2 g KOH into 100 mL of 95% ethanol.
b. Prepare 50% ethanol/water solution: add equal volumes oFethanol and deionized water.
EHS P-8-701-09-90
c. Pipet up to 4 mL of extract from Section IV.B.1.g. (Acidwash/florisil cleanup) into a pyrex test tube and reduceto dryness under N2.
d. Add 2 mL of ethanol/KOH reagent and ] boiling chip.
e. Reflux test tube contents over boiling water bath for 20minutes. During first 5 minutes the test tube should beimmersed only in the steam of the water bath. Thisgentle refluxing is to prevent the loss of analytes alongwith the solvent stream. The steam refluxing shouldreduce the sample to near dryness. Continue refluxing
• with the tube immersed in the water bath for theremaining 15 minutes.
f. Remove test tube from water bath. Following cooling add2 mL of ethanol/water solution. Note: if a precipitateforms during the refluxing step it should be dissolvedbefore adding the ethanol/water solution. To dissolvethe precipitate,reheat the test tube and add a few dropsof the ethanol/KOH reagent. Swirl, to dissolve theprecipitate and then add the 2 mL of ethanol/water.
g. Add isooctane in a I to I ratio of the amount of extractused in step "c" above and shake for I minute.
h. If a clear separation of isooctanefrom the ethanol/waterphase is achieved, the extract is-ready for analysis,otherwise a second iteration of the acid'wash/florisilslurry cleanup is recommended.
C. Analyte Recovery and quality control
I. Preparationof spiked samples
a. In order to determine the effect of matrix suppressiononthe electron capture"detector every IOth sample is spikedwith aroclor material. If a given sample set contains avariety of widely different matrixes, each type should bespiked.
b. Samples to be spiked are cut in duplicate. A smallamount (1.0 to 0.5 mL) of aroclor stock solution (10 to20 /_g/mL) is added to the sample in the extractionthimble. The resulting concentrationof the added spikedsample after extraction is in the range of 0.1 to 0.5/_g/mL.
c. The sample spike is handled as any other sample beginningwith Step 4 of the extraction procedure, IV.A.
2. Preparation of quality control samples
EHS P-8-801-09-90
F ..,
a. There are currently no PCB containing sediments or solavailable from the EPA.
3. Preparation of blank sample
a. Pl_ce 10 g of sodium sulfate in a cellulose extractionthimble and handle as any other sample beginning with Step 4of the extraction procedure, IV.A.
D. Gas chromatography analysis (splitless mode)
I. instrument parameters:
H.P. B880A InitialOven Temperature IBO'CInitialTime O.S minuteTemperature Profile:
Rate 10"C/minuteFinal Temperature 225"CFinal Time 1 0 minutesRate 2 8"CFinal temperature 2 260"CFinal time 2 15 minutesPost temperature 300"CPost time 1 minute
Injector Temperature 250"C, Detector Temperature 300"C• Detector Electron Capture
Chart Speed I cm/minuteAttenuation 3Threshold 2Peak Width 0.04F1ows:
Capillary Column (He) I mL/minuteSeptum Purge 2 mL/minuteSplit Vent 65-70 mL/minuteMake Up Gas 30-40 mL/minute(90% Argon ]0% Methane)
Split valve opens: 0.5 rain
2. Operation
- a. Transfer aliquots of samples to auto sampler vials and loadthem into 7672A auto sampler tray while entering autosamplervial data into "sample table."
b. Run interspersedsets of standards and controls with samples.Also include isooctane washes on a regular basis. Averageset of runs should contain 40 percent analytical standards,controls, spikes, and blanks to 60 percent samples.
c. Start resident program: "PCBs". This program provides Forsumming of peak areas occurring between discrete timewindows. These windows correspond to the major peaks ofspecific aroclors. Program also provides For selectingindividual vials for double injection. See Appendix I For
EHS P-8-901-09-90
d. Double inject all quality control samples, all spikes, atleast one analytical standard from each set of a givenaroclor, and isooctane washes that follow a highconcentration injection.
e. Inspect the results of the initial run of samples andassess the following:
1. the need for further dilutions and or cleaning,
2. the identity of the aroclor contaminant(s), (ifpresent at all), and
3. the correct selection of aroclor standards to runalong with the samples. (Standards must be of thesame aroclor type as the samples and the standards'area counts must bracket the samples' area counts).
f. If there is doubt as to the aroclor identity or there areother reasons for needing confirmation of the results,the analysis can be repeated using the DBI-30m megaborecolumn, or other dissimilar columns.
g. When necessary, dilute samples, perform any additionalcleanup, or reselect appropriate aroclor formulations forstandards. Then return to Section IV.D.2.a. forreanalysls. When a sample is subjected to additionalcleanup, a spiked sample must also be similarly treated.
E. Calculations
I. Single Aroclor Samples
PCB concentrations in single aroclor samples are calculated bysumming the total area of all the peaks due to that aroclorand comparing to the total area of those same peaks found inthe standards.
a. Dete"_ine which aroclor is present in the sample bycomparing retention times and peak patterns of the sampleto those of the standards.
b. Plot concentration versus area count for the aroclorstandards. Using the method of least squares, calculatethe regression equation for the best line, using theanalytical standards data. Calculate the correlationcoefficient (must be O.9gg or better). Regressionanalysis may be done using a hand calculator such as theHP11C or a computer program such as LOTUS 123.
c. Determine the concentration of aroclor present in thesample from the calibration curves.
,
I EHS P-B-I001-09-90
F
d. Use the spikedsample(s)to determinepercentrecoveryofPCB materialin the sample(s). If a sampleset is large,and of similar matrix, then the recovery data can beaveraged. Check the qualitycontrol charts to confirmthat this level of recovery is within the acceptablerange. (SeeSectionV on qualitycontrol.)
e. Use the EPA controlsample(s)to confirmthat the methodis undercontrol. Use the area countsof the analyticalstandardsto confirm that the instrumentis operatingcorrectly.
f. Use the HBB surrogatedata to determinepercentrecoveryon all non aroclor spiked samples.
g. Calculation: ppm PCB in 011 = - C X DR X W
where:C the observedPBC concentrationin /Jg/mLD the dilutionratioof the sampleR the recoverycorrectionfactoras determinedby
spikesor surrogatesW the weightof the samplealiquotin g
h. Round off all data to 2 significantfiguresand reporta11 data in ppm on a #g/g ratioin the soil/sediment.
2. Mixedaroclorsamples
PCB concentrationsin mixed aroclor samples are calculatedfrom individualcongenerpeak areas or peak grouping sums.These peaks are chosen from non-overlappingregionsof thechromatogram.Theseareasare comparedwith the same areasonthe chromatograms of the analytical standards. Aconcentrationis determinedfor each aroclor present and atotalconcentratiuncalculated.
a. Look at the sample'schromatogramand also at those ofaroclor standardsto determinewhich aroclorscomprisethe mixture. Determinewhich peaks from each aroclorhave the least contributionfrom the other aroclors
- present.
b. Using the area of the selected non-overlappingpeaksdeterminethe concentrationof each aroclorby standardratios:
Calculation: X-(A x c)/a
where:X concentrationof aroclor"X"A area of selectedpeaksin samplea areaof selectedpeaksin standardc concentrationof standardin /_g/mL
EHS P-8-1101-09-g0
.o
c. The total PCB concentration is determined by thesummation of each of the individual aroclorconcentrations. This value is substitutedinto "theobservedPCB concentrationin /_g/mL"in step "g" of theabovesection.
d. See Appendix 2 for an example of a calculationfor• determiningtotal PCB concentrationin a mixed aroclor
sample.
F. Analysisof non-aroclor and partialaroclorPCB mixtures
Samplesthat contain PCBs from non-aroclorformulationsor fromaroclors that have been altered through chemical or biologicalaction are best analyzed using the Dry Color ManufacturersAssociation(DCMA)method.
Essentially,this method dividesthe distributionof PCB congenerpeaks into 10 regions. Each region is centered around theretention time of each PCB homologous series (i.e.pentachlorobiphenyl,hexachlorobiphenyl,etc.). In each homologousseriesone congenerhas been selectedthat has an averageresponsefactor for that series. These 10 congeners are prepared atdifferentconcentrationsand run on the GC as outlinedabove inSectionIV.D.(note"finaltime 2" may have to extendedin ordertosee decachlorobiphenyl).Regressionequationsare calculatedforeach of the 10 congenersas describedin SectionIV.E.].B. Samplesare cleaned up as needed and run as describedin Sections IV.Athrough IV.D. Sample peaks are summed for each PCB congenerregion. Sample data for each region is compared against theappropriate DCMA regional standards to determine individualcongenerconcentrations.
Total PCB concentrationin a given sampleis determinedby summingthe individualregional/congenerconcentrations.
V. .DualityControl
Qualitycontroldata relatingto PCBs are kept on the followingmatrixtypes" aqueous,solid, surface,air, and non-aqueousfluids. Qualitycontroldata relatingto samplesanalyzedusingthis methodare recorded
- under the category"Wastes"in our QC records. Since thereare no PCBcontainingsoils or sedimentsavailablefrom the EPA, qualitycontroldata for this matrix consistsof spike and surrogaterecoverydata.Results of the analyses of the quantitation standards are alsomaintained. See the recordcategories"Environmental"and "IndustrialHygiene"for otherPCB QC records.
EHS P-8-1201-09-g0
fr
A. The followingdata are recordedfor each sampleset:
I. The spikingaroclor,its concentration,the amountspiked,andthe dilutionfactor.
2. The date of analysisand run number.
3. The calculated true value of the spiked sample and theobserved value (s).
4. The percent recovery of the observed value as comparedto thecalculated true value. This is plotted for an estimate ofmethod accuracy.
5. The percent difference between the low and high observedvalues. This is plotted for an estimate of instrumentprecision.
• Currently,this data is enteredinto a LOTUS 123 spreadsheetwhichdeterminesmeans and standarddeviationsand plotsresultsagainstthesedescriptivestatistics.
B. The area counts of the aroclor standards are monitored as anestimate of detector sensitivity. Likewise the HBBpeak is used todetermine theoretical plate height as an indicator of degradationin chromatography.
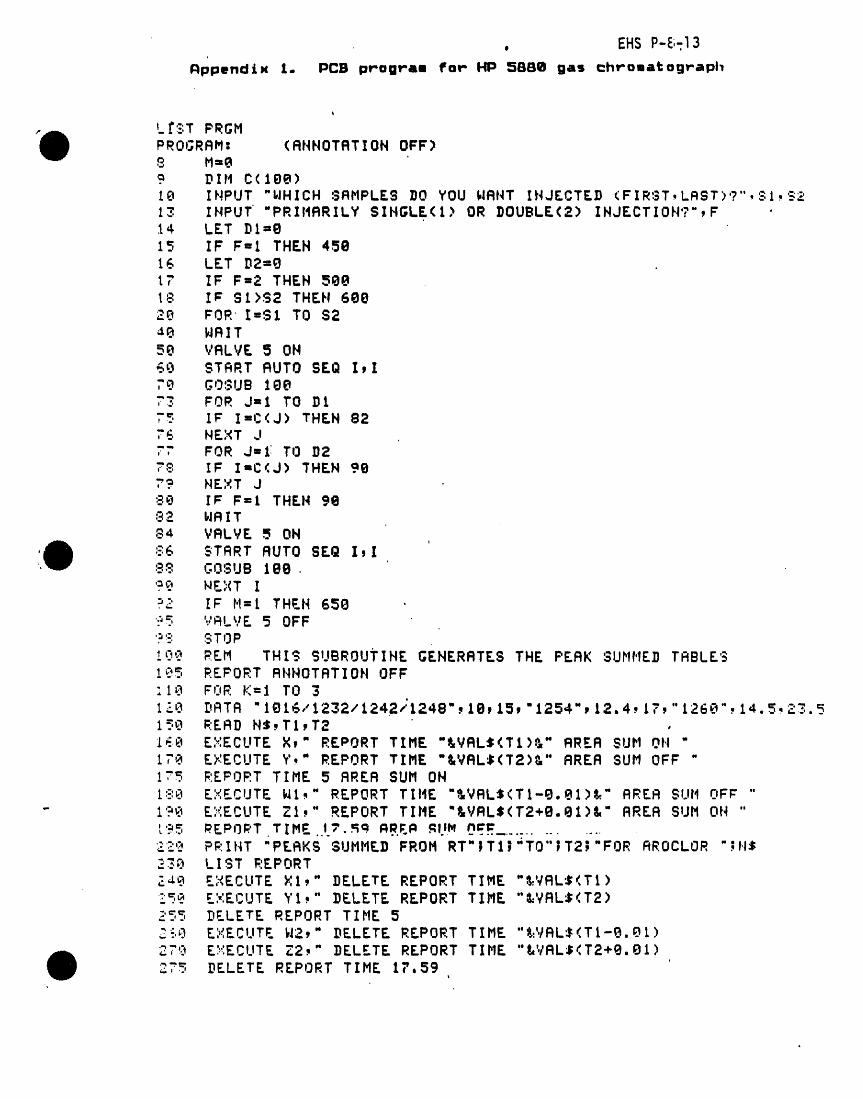
. EHS P-E;-I3
Appendiw 1. PCB program for lip 5880 gas chromatograph
t
L l'?:T PRGMPROGRRM: (RHHOTRTION OFF)8 M=e
DIM C(18@)10 IHPUT "WHICH SRMPLES DO YOU IJRHT IHJECTED (FIR'3T,LAST)'?",,:,I," '5213 INPUT "PRIMRRILY SIHGLE(1) OR DOUBLE(2) IHJECTIOH'?',F •14 LET D1=015 IF F=I THEN 45016 LET D2=017 IF F=2 THEN 500t8 I_ SI>$2 THEH 60020 FOR' I=S1 TO S248 WRIT50 VRLVE 5 OH_.9 $TRRT RUTO SEQ I,I7_ GOLRUB1gO7..": FOR J=l TO Dt75 IF I=C(J) THEN 82TE, NEXT J77 FOR J=1; TO D278 IF I,,C(J) THEN 907.°. HEXT J8e I_ F=t THEH 9082 WRIT84 VRLVE 5 OH
=
:SG STRRT RUTO SEg I_l38 GOSUB 100.'.=g NEXT I?l;_ IF t,I=1 THEN 650 •':_5 ',.,'SLVE5 OFF'.:'": 3T0P;0_? P.EM THIS SIJBROUYIHE GEHERRTE$ THE PERK SUHI'IED TRBLE'51_':.=.,REPORT RHHOTRTIOH OFF:18 FnR I",=ITO 3
t.SL._. DRTR "1016/1232/1242/'124B',10,15,'1254",12. .4,17,"126A'.14.. , .5.':'.:..5,_"1_.'_ ;:ERD MS, T 1, T21E_O E:_:ECUTE X," REPORT TIME "&VRL$,',TI)_" RRER $UH OH "t78 EY.ECUTE Y:" REPORT TIME "&VRL'.I;(T2)&" RRER SUM OFF "1-_ REPORT TIME 5 RRER SUM OHI:.:',E'_EXECUTE Wt,,," REPORT TIME "&VRL$(TI-O.O1)&." RRER SUM OFR "
" I'.:'E_ E_'.:ECUTEZl.," REPORT TIME "&VRLS(T2+B.O1)&" RRER SUM OH "_':,=" PEPOPT TIME 17 Rq RI_EP RI,_ n¢'¢.. ,.I . ,,.. " .... -- .o ...,-.,D.-.- .........
'.S';"._PRIHT "PERKS SUMHE]} FROM RT"ITI;"TO"IT2;'FOR RROCLOR ";H$_....,,.J _ IST REPORT"."J._ EXECUTE _.:1," DELETE REPORT TIME ",$VRL$,',Tt):-_ E:,:ECUTE Yt," DELETE REPORT TIME "&VRL$(T2)255 DELETE REPORT TIME 5C._._) E,V,ECUTE W2.,," DELETE REPORT TIME "&:',/RL$(Tt-O.Ot)27r_ E'.":ECUTEZ2," DELETE REPORT TIHE "&VRL$(T2+0.01)275 DELETE REPORT TIME 1;'.59
' EHS P-8-14
f
3_e H_XT K3_ REPORT RNNOTRTION 0143X5 R_STORE32e RETURN45e LET DI'e4_e INPUT "HOW HRNY DO YOU MRNT DOUBLE INJECTEDq",DI_6[ FOR H-t TO 2e463 HEXT H47_ IF 9t=0 THEH 16475 FOR L=I TO gl4ee IHPUT "WHICH 9RMPLE?" tC_L)485 NEXT L49e GOTO 16_e LET D2"05[e IHPUT "HOW MRHY DO YOU WANT SINGLE INJECTEg?',D252e IF D2=0 THEN tg525 FOR L-t TO D253e IHPUT "WHICH SRHPLE?'fC(L)535 N_XT L54e. GOTO 18see S3"S261e $2=99SZe H=I
• 63e GOTO 20650 SIll_6_ _2=$3-_6_'. PI=_6:_e GOTO 20
-- t
!
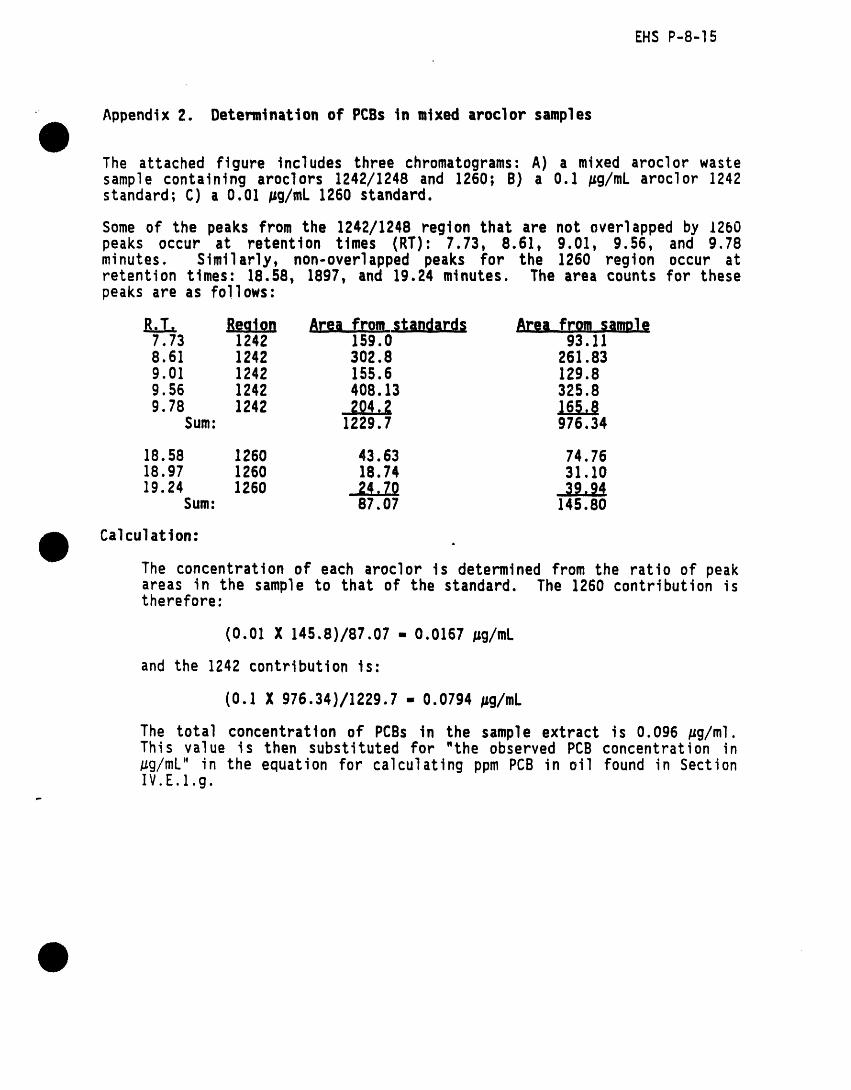
EHS P-8-15
Appendix 2. Determination of PCBs tn mtxed aroclor samples
The attached figure tncludes three chromatograms: A) a mixed aroclor wastesample containing aroclors 1242/1248 and 1260; B) a 0.1 pg/mL aroclor 1242standard; C) a 0.01 pg/mL 1260 standard.
Some of the peaks from the 1242/1248 regton that are not overlapped by i260peaks occur at retention times (RT): 7.73, 8.61, 9.01, 9.56, and 9.78minutes. Similarly, non-overlapped peaks for the 1260 region occur atretention times: 18.58, 1897, and 19.24 minutes. The area counts for thesepeaks are as follows:
]]_T.= Reaton Area from standards Area from sanmle7.73 1242 159.0 93.118.61 1242 302.8 261.839.01 1242 155.6 129.89.56 1242 408.13 325.89.78 1242 _ 165.8
Sum: 1229.7 976.34
18.58 1260 43.63 74.7618.97 1260 18.74 31.1019.24 1260 _ 39.94
Sum: 87.07 145.80
Calculation:
The concentration of each aroclor is determined from the ratio of peakareas in the sample to that of the standard. The 1260 contribution istherefore:
(0.01X 145.8)/87.07- 0.0167 pg/mL
and the 1242 contributionis:
(0.1X 976.34)/1229.7 - 0.0794 pg/mL
The total concentration of PCBs in the sample extract is 0.096 pg/ml.This value is then substituted for "the observed PCB concentration in
#g/mL" in the equation for calculating ppm PCB in oil found in SectionIV.E.I.g.
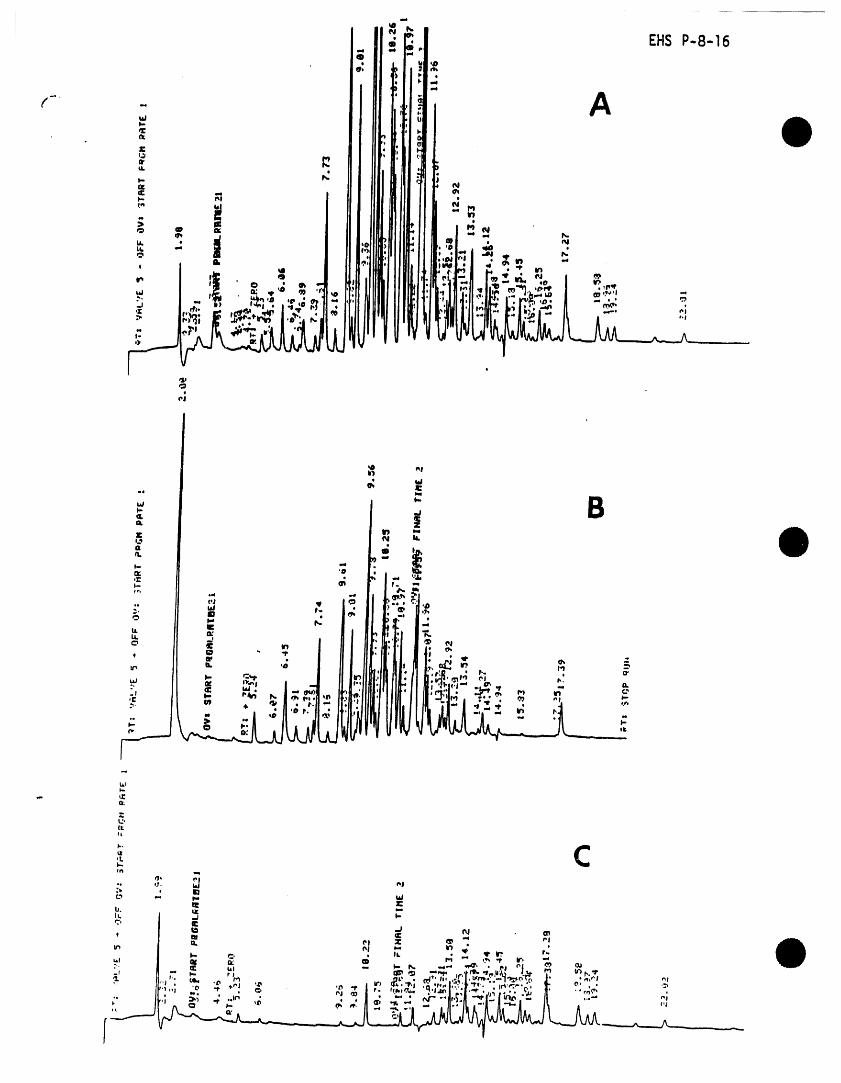
Ill
(l;
I.:,llli
tl,L
:.: ,_, _l, I_l
li. ..i I=.
"J _ mli. el :1: @ _ nl
_1 _' Vi ._ .
:" _ ill I-- I% ,..i" w_', • _ r'l _ I_l
,,; ,_ _ ."1 '"_ '0 -r I. I-_ ___,_-r,i /il._._l,.:'l_.i.. "'lri'_-_, _, _.' ,,_' '_,
[ _ J_-"_---_Llt_____ _ "_ _:,_ '_ _- ____J__" _ _ "' - .... _ _"_
Method No. EHS P-9iiii i iiiii Biiiiii i iiiiii
f- Title: _ Pol_chlorJnated Btphen_,ls in, Oil and Waste Ltauids)
Date Issued: 9-23-B5 ....... Approved by: 1;1.K. Hamtlton_JV
(m'Written by: H. L. Boorse
i i i ii i liB III |1 Ill _
Supersedes Method No.ii i i iii iii i iiii ii.
Date , Reviewed,,B_, Date _ Revised By
ii i i
II I Ill I
ii ii iiiii illl i i ii i i I imlll I II
t
ii i ii i i i i i iii i --
i iiii i i i i.
i
iI.
Replaced by Method No. Date:__ =i liH

,..., EHS P-g- 101-09-90
POLYCHLORINATEDBIPHENYLSIN OIL AND WASTELIQUIDS
I. R.eferenc_
A. "EPA (Environmental Protection Agency) Method Study 2B, PCB's" Versar, Inc , Springfield VA.(Polychlorinated Biphenyls) in Oil, . ,
Prepared for Environmental Monitoring and Support Lab.-Cincinnati, OHOctober 1984.
B. "Analysis of Polychlorinated Biphenyls in Mineral Insulating Oilsby Gas Chromatography," ASTM D405g-83. Vol. 10.03 ElectricalInsulation Liquids, Gases, Protective Equipment.
C. "The Determination of Polychlorinated Biphenyls in TransformerFluid and Waste Oils", EPA-60014-81-045,T. A. Bellar and J. J.Lichtenberg. EnvironmentalMonitoring and Support Laboratory.
D. The analytical chemistry of PCBs, M. D. Erickson, ButterworthPublishers, Boston, 1986.
E. "Test Methods for Evaluating Solid Waste," EPA SW 846, Methods 3660& 8080.
II. Principles and Limitation_
The sample is diluted with isooctane and the resulting solution istreated by a cleanup procedure (routinely:acid wash/florisil slurry) toremove interfering substances. Analysis is by capillary gaschromatography using an electron capture (EC) detector. The method ismade qualitative and quantitative by comparing peak patterns, areacounts, and retention times of the sample chromatogram withchromatograms of known quantity and type of aroclor standards, obtainedunder the same conditions. Results can be confirmed by running thesamples and standards using a second dissimilar column.
Occasionally, sample chromatograms indicate the presence of PCBs;however, no aroclor or mixture of aroclors are indicated by the pattern.This is often the case with weathered or otherwise degraded aroclormixtures or when a non-aroclor material is the PCB source. In thesecases the Dry Color Manufactures Associations' (DCMA) method for PCB
- identification is employed. (See Section IV.F "Non-aroclorand partialaroclor PCB mixture.")
Electron capture detectors respond to chlorine-containing compoundsother than PCBs anJ to cert&in other electrophilic materials containingother halogens, nitrogen, oxygen, and sulfur. Most common interferencescan ue removed by sulfuric acid washing. The chromatogram of eachanalyzed sample should be carefully compared with those of thestandards. The response of an EC detector to PCBs is reduced by highboiling hydrocarbons that co-elute with the PCBs. This suppression canbe compensated for by running spiked samples to determine the actualrecovery.
EHS P-9-2f 01-09-90
Residual oxygen in carrier and makeup gas can react with components ofsamples to give oxidation products to which EC detectors will respond.Purity of these gases should be assured.
Ill. Materials
A. Equipment:
I. I x 12 cm screw cap tubes
2.. Teflon lined caps
3. 10 mL repipetors forsolvent and acid measurement and transfer
4. 0.5 mL, I mL, and 2 mL Class A or better glass pipets
5. Volumetric flasks, isooctanewashed
6. Analytical balance with 0.1 mg sensitivity
7. $E-54 or DB-5 fused silica capillary column 30 meter length,0.250ram I.D.,0.25 #m film thickness
8. DBI-30m megabore column 30 meter length, O.53mm I.D., 1.5 /_m( film thickness
g. Gas chromatograph fitted for capillary column and equippedwith an electron capture detector and auto sampler
10. Vortex
11. Centrifuge
12. Pasteur Pipets
13. Autosampler vials with teflon caps
14. Mechanical rotary extractor
15. Lambda pipets as needed
16. Carborundum boiler chips
B. Reagents:
I Pesticide grade Z,Z,4-trimethylpent:ne(isooctane) :.---_:-,-_
2. Reagent grade (conc.) Sulfuric Acid
'=' ---- - .I..-,r, ¢.11] _111 / L._
EHS P-9-301-0g-g0
3. Activated Florisll, 60/100 mesh, reagent grade, suitable forpesticide-residue analysis. Available from Floridin Companyand treated per AOAC (1980) 29.002 before use.
4. EPA standards (I000 to 5000 ppm) of aroclors 1016, 1221, 1232,1242, 1248, 1254, 1260, 1262, 1268
5. EPA controls of aroclors in oils (transformer,hydraulic, andcapacitor)
6. Hexabromobenzene (PCB surrogate standard)I
7. Ultra high purity helium
8. gO percent argon--lO percent methane (PIO) or 95 percentargon--5 percent methane (P-S)
9. Tetrabutylammoniumhydrogen sulfate, reagent grade
I0. Sodium sulfite, reagent grade
11. Ethanol, USP 95%
12. Potassium hydroxide, anhydrous pellets
13. Dry Color Manufactures Association mixture of PCB isomers inhexane. Available from Ultra scientific.
14. 2-propanol, reagent grade
C. Standards & Prepared Reagents:
Note: All glassware should be dedicated for the preparation ofaroclor standards.
I. Stock Aroclor solutions. EPA Aroclor standards range from1000 to 5000 /Jg/mLand are received in 1 mL glass ampules.The appropriate amount of standard is volumetricallytransferred to a 25 or 50 mL volumetric flask and diluted inisooctane so that a 10 to 20 /_g/mL solution is produced.Transfer the stock solution to a brown glass bottle fitted
- with a teflon lined cap. Transfer remaining EPA standardmaterial to a I mL auto sampler vial. The stock solution andthe EPA standards are stable indefinitely if their seals aremaintained and they are stored at or below O°C.
2. Working standards--(O.5, 0.1, 0.05, 0.01 /Jg/mL). Addappropriate amount of stock standard (depending on stockstandard concentration) to screw cap test tubes and make upwith isooctane so that a 0.5 /_g/mLsolution results. Seriallydilute the 0.5 /Jg/mLto make up the remaining standards (0.01,0.05, and 0.I /Jg/mL). Total volume of each working standardshould be approximately 10 mL. Prepare monthly or as needed.
EHSP-9-4" 01-09-90
3. DCMAmixture, stock and serial dilutions. The DCMAmixtureampule is opened and an aliquot diluted 100 fold. Serialdilutions of Z, 10, and 20 fold are made up of this solution.The remainingoriginalDCMA mixtureis transferredto an autosamplervial,sealedwith a teflonbackedcap and storedat orbelowO'C.
4. Hexabromobenzene(HBB) surrogate-workingstandard. The neatHBB standardis removedfrom the freezerand a I0 mg aliquotvolumetricallymade up into I00 mL of isooctane. Theresultingsolution,the HBB working standard,is subdividedinto 10 mL vials, secured with a teflon lined screw cap.These materials are stable indefinitelyif their seals aremaintainedand they are storedat or belowO'C.
IV. Methods
Note" This procedureis intendedto qualitativelyand quantitativelyanalyzesamplesfor the nine.specificaroclorslistedon Page 3. Thismethod is not adequatefor qualitativeand/orquantitativeanalysisofpartialaroclorsor individualcongenerswhich may resultfrom aroclordegradationor by products of chemical reactions. For non-aroclorsamples see Section IV.F for the analysisof these partial or non-aroclorcontainingsamples.
f A. Dilution:
I. Pipetapproximately0.10 g sampleusinga pasteurpipetinto ataredscrewtop test tube.
2. Reweighthe test tube to +_0.0001g and recordthe weightofthe sample.
3. Prepareblank,spike,and otherQC samplesin accordancewithSectionIV.C.
4. Diluteto 10 mL with isooctaneand mix well.
5. Spike every sample,sample duplicate,sample spike,EPA QC,and blankwith 2 #L of the HBB surrogate.
- B. Cleanuptechniques
I. Acid wash/florisilcleanup(Primaryprocedure)This procedure is used for all samples received at theIaboratory.
a. Add 3 mL concentratedsulfuric acid to each of thesamples,includingblanks,QC samples,etc.
b. Shakeby hand for 30 secondsand VortexFor 30 seconds.
EHS P-9-5Ol-Og-go
c. Transfer all test tubes containing samples, duplicatesamples, blanks, quality controls and spiked samples tothe rotary extractor. Run extractor for I hour.
d. Label test tubes for each sample, blank, quality controland spiked sample being run. Add -0.2 g florisil to eachempty test tube.
e. Remove sample test tubes from the extractor andcentrifuge for approximately 5 minutes at 3000 rpm.Transfer each isooctane layer to its correspondingflorisil-containingtest tube.
f. Place sample test tubes in extractor for I hour.
g. If the isooctane extract appears colored or cloudy,additional/alternative cleanup procedures may benecessary; otherwise the extract is ready for analysis.(Section IV.D.)
2. Sulfur removal (Based on EPA SI0846 Method 3660)
This procedure is used routinely with sediment and sludgesamples or when sulfur interference is indicated on thechromatogram.
a. Prepare TBA-sulfite reagent: Dissolve 3.39 gtetrabutylammonium hydrogen sulfate in 100 mL ofdeionized water. Extract 3 times with 20 mL portions ofisooctane. Discard the isooctane extracts and add 25 gof sodium sulfite to the water solution. Solution issaturated with respect to sodium sulfite and is stable Imonth at room temperature.
b. Transfer 2 mL of extract from Section IV.B.I.g. ("Acidwash/florisil cleanup") to a new test tube.
c. Add I mL of TBA-sulfite reagent and I mL 2-propanol tothe test tube. Shake test tube for at least I minute andlook for clear crystals from precipitation of sodiumsulfite. If crystals are not present, add crystalline
- sodium sulfite in 100 mg portions until solid materialremains (one portion is usually enough).
d. Add 5 mL of deionized water and shake for at least Iminute. Let stand for 5 4nutes for phase separation.Collect top, isooctane, l_jer in an auto sampler vial.The extract is ready for analysis (Section IV.D).
EHSP- 9-6
f. 01-0g-90
3. Ethanol/potassium hydroxide cleanup
This procedure is used when hydroxyl-containing species suchas pentachlorophenol and glycols are present. Additionally,fats are made more water soluble through saponification.Certain chlorinated pesticides undergo dehydrochlorination.
a. Prepare 2% potassium hydroxideethanol solution: Dissolve2 g KOHinto 100 mL of g5% ethanol.
b. Prepare 50% ethanol/water solution: add equal volumes ofethanol and deionized water.
c. Pipet up to 4 mL of extract from Section IV.B.I.g ("Acidwash/florisil cleanup") into a pyrex test tube and reduceto dryness under N2.
d. Add 2 mL of ethanol/KOH reagent and 1 botling chip.
e. Reflux test tube contents over boiling water bath for 20minutes. During first 5 minutes the test tube should beimmersed only in the steam of the water bath. Thisgentle refluxing is to prevent the loss of analytes alongwith the solvent stream. The steam refluxing should
,. reduce the sample to near dryness. Continue refluxing', with the tube immersed in the water bath for the
remaining 15 minutes.
f. Remove test tube from water bath, cool and add 2 mL ofethanol/water solution. Note: if a precipitate Formsduring the refluxing step it should be dissolved beforeadding the ethanol/water solution. To dissolve theprecipitate,reheat the test tube and add a few drops ofthe ethanol/KOH reagent. Swirl, to dissolve theprecipitate and then add the 2 mL of ethanol/water.
g. Add isooctane in a I to 1 ratio of the amount of extractused in Step "c" above and shake for ] minute.
h. If a clear separation of isooctane from the ethanol/waterphase is achieved, the extract is ready For analysis,
- otherwise a second iteration of the acid wash/florisilslurry cleanup is recommended.
C. Analyte Recovery and quality control
I. Preparation of spiked samples
a. In order to determine the effect of matrix suppressiononthe electron capture detector, every 10th sample isspiked with aroclor material. If a given sample setcontains a variety of widely different matrixes, eachtype should be spiked.
EHS P-9-7_ 01-09-90
b. Samples to be spiked are cut in duplicate. A smallamount (0.1 to 0.2 mL) of aroclor stock solution (10 to20 #g/mL) is added to one of the sample aliquots. Thesample aliquot with added aroclor material is made up to10 mL in isooctane and shaken. The resultingconcentration of the added spiked sample is in the rangeof 0.1 to 0.5 /Jg/mL.
c. The sample spike is handled as any other sample beginningwith the acid wash/florisiI slurry cleanup.
2. Preparationof quality control samples
a. Available from the EPA are PCBs in transformer,hydraulic, and capacitor oils. They are available atapproximately 10, 50, and 500 ppm concentrations. Atypical oil would be identified as: "Aroclor 1260transformer oil, concentration I, WP# 683." Startingwith an approximately0.1 g aliquot, quality control oilsare treated as any sample.
3. Preparationof blank sample
a. Dispense 10 mL of isooctane into a screw top test tubeand treat as any sample extract.
D. Gas chromatography_alysis (splitlessmode)
I. Instrument parameters:
H.P. 5880A InitialOven Temperature 150"CInitialTime 0.5 minuteTemperature Profile:
Rate 10"C/minuteFinal Temperature 225"CFinal Time I 0 minutesRate 2 8"CFinal temperature 2 260"CFinal time 2 15 minutesPost temperature 300'CPost time I minute
- Injector Temperature 250,CDetector Temperature 300"CDetector Electron CaptureChart Speed I cm/minuteAttenuation 3Threshold 2Peak Width 0.4Flows:
Capillary Column (He) I mL/minuteSeptum Purge 2 r,iL/minuteSplit Vent 65-70 mL/minuteMake Up Gas 30-40 mL/minute(90% Argon 10% Methane)
Split valve opens: 0.5 minute
EHS P-9-8OI-og-go
f .-,q,
2. Operation
a. Transfer allquots of sample extracts to autosampler vialsand load them into 7672A auto sampler tray while enteringauto sampler vial data into "run table."
b. Run interspersed sets of standards and controls w!thsamples. Also include isooctane washes on a regularbasis. Average set of runs should contain 40 percentanalytical standards, controls, spikes, and blanks to 60percent samples.
c. Start resident program "PCBs." This program provides forsumming of peak areas occurring between discrete timewindows. These windows correspond to the major peaks ofspecific aroclors. Program also provides for selectingindividual vials for double injection. See Appendix Ifor listing of program.
d. Double inject all quality control samples, all spikes, atleast one analytical standard from each set of a givenaroclor, and isooctane washes that follow a highconcentration injection.
e. Inspect the results of the initial run of samples and_ assess the following: (1) the need for further dilutions
and or cleaning, (2) the identity of the aroclorcontaminant(s), (if present at all), and (3) the correctselection of aroclor standards to run along with thesamples. (Standardsmust be of the same aroclor-type asthe samples and the standards' area counts must bracketthe samples' area counts.)
f. If there is doubt as to the aroclor identity or there areother reasons for needing confirmation of the results,the analysis can be repeated using the DBI-30m megaborecolumn, or other dissimilar columns.
g. When necessary, dilute samples, perform any additionalcleanup, or reinject with appropriate aroclorformulations for standards. Then return to Part "a"
- above for reanalysis. When a sample is subjected toadditional cleanup, a spiked sample must also besimilarly treated.
E. Calculations
I. Single Aroclor Samples
PCB concentrationsin single aroclor samples are calculated bysumming the total area of all the peaks due to that aroclorand comparing to the total area of those same peaks found inthe standards.
EHS P-g-901-Og-gO
a. Determine which aroclor is present in the sample bycomparing retentiontimes and peak patterns of the sampleto those of the standards.
b. Plot concentration versus area count for the aroclorstandards. Using the method of least squares, calculatethe regression equation for the best line using theanalytical standards data. Calculate the correlationcoefficient (must be o.ggg or better). Regressionanalysis may be done using a hand calculator such as theHP11C or a computer program such as LOTUS 123.
c. Determine the concentrationof the aroclor present in thesample from the calibration curves.
d. Use the spiked sample(s) to determine percent recovery ofPCB material in the sample(s). If an sample set islarge, and of similar matrix, then the recovery data canbe averaged. Check the quality control charts to confirmthat this level of recovery is within the acceptablerange. (See Section V on quality control.)
e. Use the EPA control sample(s) to confirm that the methodis under control. Use the area counts of the analyticalstandards to confirm that the instrument is operatingcorrectly.
f. Use the HBB surrogate data to determine percent recoveryon all non-aroclorspiked samples.
g. Calculation:
ppm PCB in Oil - C X DRXW
where:
C the observed PBC concentration in /_g/mLD the dilution ratio of the sampleR the recovery correction factor as determined by
spikes or surrogatesW the weight of the sample aliquot in g
h. Round off all data to 2 significant figures and reportall data in ppm on a /_g/gratio in the oil.
2. Mixed aroclor samples
PCB concentrations in mixed aroclor samples are calculatedfrom individual congener peak areas or peak grouping sums.These peaks are chosen from non-overlapping regions of thechromatogram. These areas are compared with the same areas onthe chromatograms of the analytical standards. Aconcentration is determined for each aroclor present and atotal concentration calculated.
l

EHS P-g-I0Ol-og-go
a. Look at the sample's chromatogram and also at those ofaroclor standardsto determinewhich aroclors comprisethe mixture. Determinewhich peaks from each aroclorhave the least contributionfrom the other aroclorspresent.
b. Using the area of the selected non-overlappingpeaksdeterminethe concentrationof each aroclorby standardratios:
Calculation: X-(A x c)/a
where:X concentrationof aroclor"X"A area of selectedpeaksin samplea areaof selectedpeaksin standardc concentrationof standardin /_g/mL
c. The total PCB concentration is determined by thesummation of each of the individual aroclorconcentrations. This value is substitutedinto "theobservedPCB concentrationin pg/mL" in Step "g" of theabove section.
_ d. See Appendix Z for an example of a calculationfordeterminingtotal PCB concentrationin a mixed aroclorsample.
F. Analysisof non-aroclorand partialaroclorPCB mixtures
Samples that contain PCBs from non-aroclorformulationsor fromaroclors that have been altered through chemical or biologicalaction are analyzedusing the Dry ColorManufacturersAssociation(DCMA)method.
Essentiallythis method dividesthe distributionof PCB congenerpeaks into 10 regions. Each region is centered around theretention time of each PCB homologous series (e.g.pentachlorobiphenyl,hexachlorobiphenyl,etc.). In each homologousseriesone congenerhas been selectedthat has an averageresponsefactor for that series. These 10 congeners are prepared at
- differentconcentrationsand run on the GC as outlinedabove inSectionIV.D (note"finaltime 2" may have to be extendedin orderto see decachlorobiphenyl).Regressionequationsare calculatedfor each of the IO congenersas described in Section IV.E.I.b.Samplesare cleanedup as neededand run as describedin SectionsIV.A through IV.D. Samplepeaksare summedfor each PCB congenerregion. Sample data for each region is compared against theappropriate DCMA regional standards to determine individualcongenerconcentrations.
Total PCB concentrationin a given sampleis determinedby summingthe individualregional/congenerconcentration.
EHS P-g-ll_--. OI-Og-gO
V. Quality Control
Quality control data relating to PCBs are kept on the following matrixtypes: aqueous, solid, surface, air, and non-aqueous fluids. Qualitycontrol data relating to samples analyzed using this method are recordedunder the category "Wastes" in our QC records. Results of the analysesof the EPA oils, surrogate data, and the quantitation standards aremaintained. See the record categories "Environmental" and "IndustrialHygiene" for other PCB QC records.
A. The following data are recorded for each sample set:
I. The EPA QC oil's type, concentration and WP number, amountweighed, and dilution factor.
2. The date of analysis and run number.
3. The calculated true value of the QC sample and the observedvalue(s).
4. The percent recovery of the observed value as compared to thecalculated true value. This is plotted for an estimate ofinstrument precision.
Currently, this data is entered into a LOTUS 123 spreadsheet whichdetermines means, standard deviations, and plots results againstthese descriptive statistics.
B. The area counts of the aroclor standards are monitored as anestimate of detector sensitivity. Likewise the HBB peak is used todetermine theoretical plate height as an indicator of degradationin chromatography.
p
i
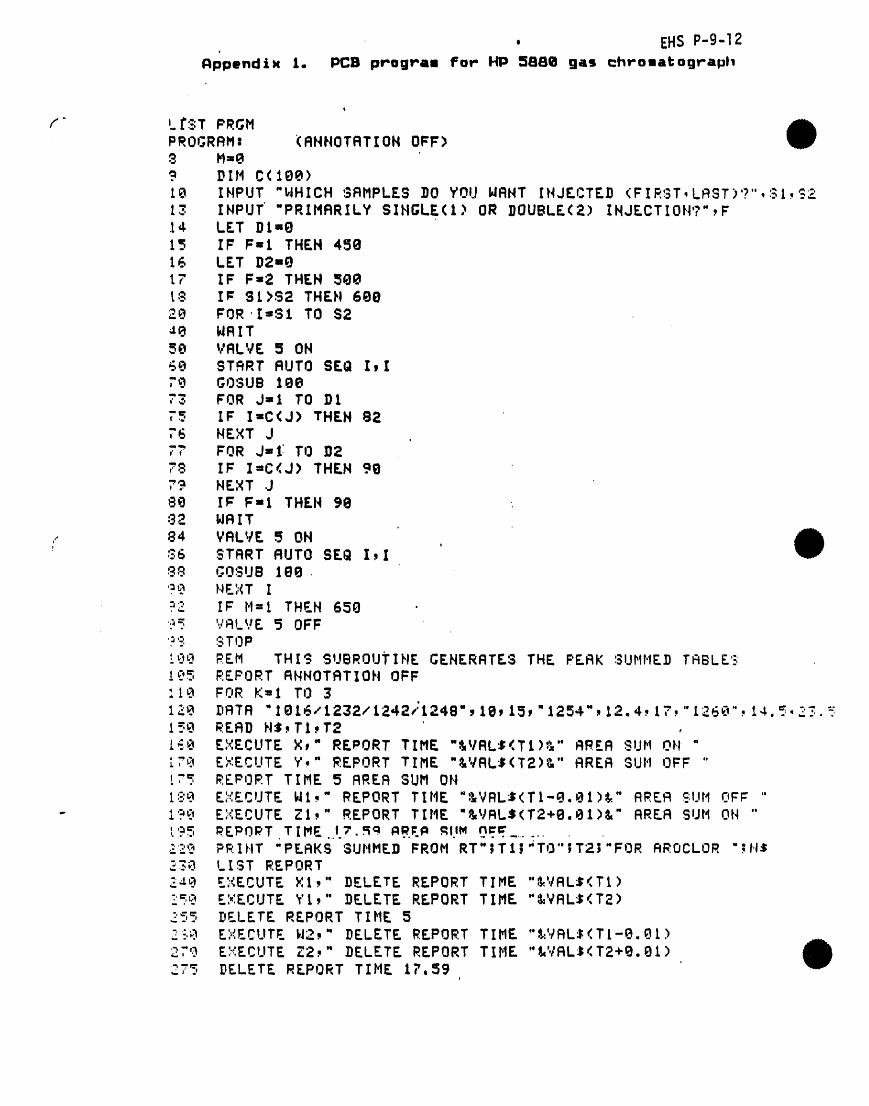
. EHS P-9-12
Appendtw 1. PCB program for' liP 5880 gas chromatograph
K" LI":'sTPRGMPROGRRM; (RHtlOTRTION OFF)8 H=,O? DIH C(190)10 IHPUT "WHICH 'BRI'IPLESI)OYOU WRNT IHJECTED (FIRST,LRST)'?",:._I:S213 INPUT" "PRIMRRILY SII'IGLE(1)OR I)OUBLE(2) IHJECTIOH?",F14 LET Il t =E)15 IF F=t THEH 45016 LET D2mOt? IF F=2 THEN 500t:_ I_ S1>$2 THEH 60029 FOR°I=St TO S24A. WRIT50 VRLVE 5 ON_._ STRRT RUTO SEQ I,I._ GOSUB 1007._ FOR J=l TO D1T5 IF I=C(J) THEN 82T6 NEXT JT7 FOR J=l: TO g278 IF l=C(J) THEN 9077 NEXT J90 IF: F=t THEI4 9092 WRIT
,, 84 VRLVE 5 OHt
! ,..
b6 STRRT RUTO SEQ I,I"" e598 ,.;O.=UB180 ,
'._ NEXT I?.'-: I_"M=I THEH 650 •"?=., ':.'ALVE '5 OFF'.:''". 3T0P"00 REM THIS SUBROUTIHE GENERRTES THE PEAK 3UHHE]) TFtBLE'.::tEo5 REPORT RHHOTRTIOH OFFII_._FOR K=I TO 31_. DRTR "lE)I6/1232/t242;t248"_10,15,'1254",. 12.4,. 17,"126n".. ,14. =.,,=.'3.'-."I_:@ RERD NS.,YI.,T2LEO EY'.ECUTE×," REPORT TIHE "&VRL_(Tt)'_" RRER SUH OH "t.c_ E_:ECUTE Y," REPORT TIRE "&VRL$(T2)&" RRER 3UH OFF "t-_ REPORT TIME 5 RRER SUM ONL::.:E_E::.':ECUTEWt," REPORT TIME "&VRL$(TI-Q..gt)&" RRER ¢.:IJMC,F_ "
- 1'.:,E_E::'.:ECUTEZI.," REPORT TIME "&VRLS(T2+B.OI)&" RRER SUM ON "_'?S _EROPT TIME.I.7._q n.REt=.RItMn='.='........:-Z"._PRIHT "PERKS SUMMED FROM RT"IT1;"TO"IT2I"FOR RROCLOR ";H$2.'.,_ LIST REPORT•_J.@ E'..'(ECUTE}_:t_" I)ELETE REPORT TIME "&VRL:;(Tt):_=..L?E:,:ECUTE YI," I)ELETE REPORT TIME "&VRL_(T2):,.:"-5 DELETE REPORT TIRE 52".0 E'/.ECUTE W2.," DELETE REPORT TIME "_'./RL$(TI,-Q..Q.t)279 E;'..':ECUTEZ2.," DELETE REPORT TIME "&VRLJ;<[email protected])•. -.. :2,_ DELETE REPORT TItlE I;',59
i
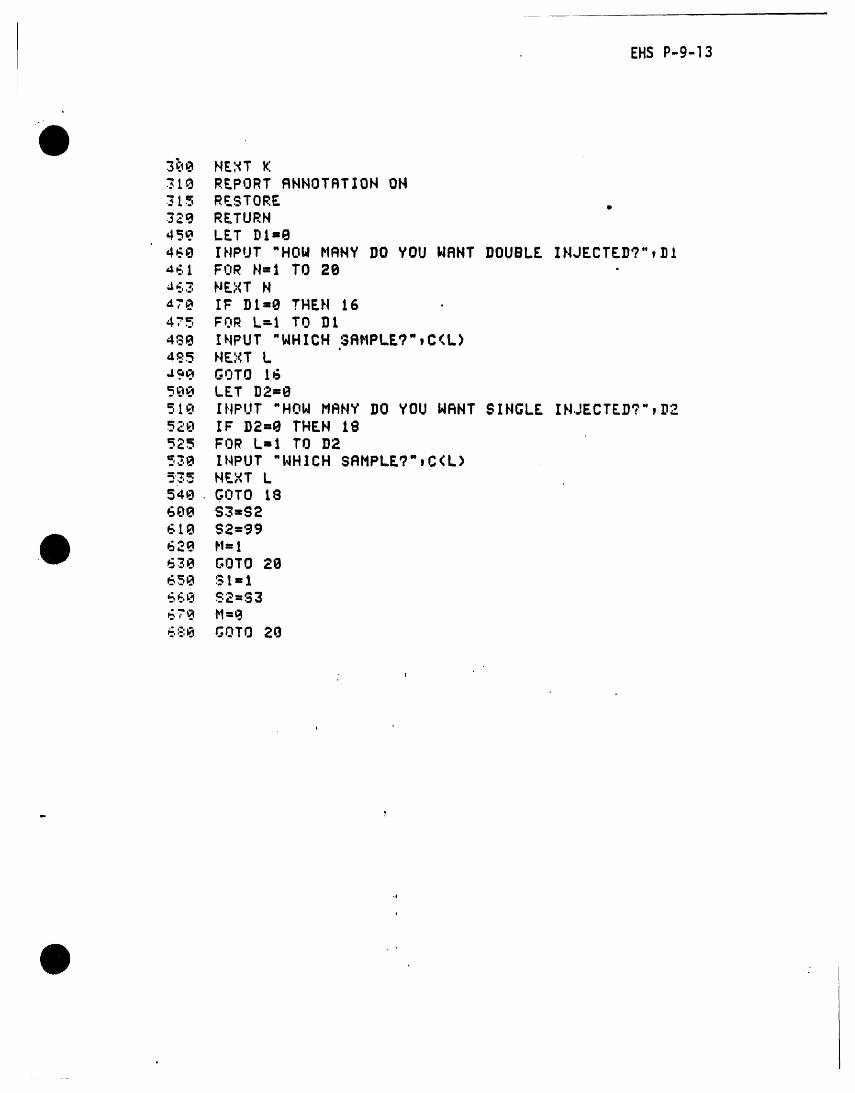
I , EHS P-9-13
3;10 HE:,{TKSt_ REPORT RHHOTRTIOH OH3 t 5 RESTORE .320 RETURH45_.'_ LET Dl=e460 IHPUT "HOW MRHY gO YOU WRHT DOUBLE IHJECTEI)?",DI•tE,I FOR H=I TO 20•_&_ NEXT H47._ IF'Dt=O THEH 16475 FOR L=I TO Dt480 IHPUT "WHICH :_RHPLE?',CKL),t_5 HE:'.<TL_gm. GOTO 16505 LET 92=951Et IHPUT "HOW MRHY DO YOU WRHT SIHGLE IH.JECTEDq',D2520 IF D2=0 THEH 18525 FOR L=I TO 9253,8 INPUT "WHICH SRHPLE.?'tC(L)5$5 HEXT L540, GOTO 18690 S3=$261.9 S2=99629 H=I65:.,,0 C,OTO 20659 SI=1
_,'9 H:OE,:':0 GOTO 20
' I
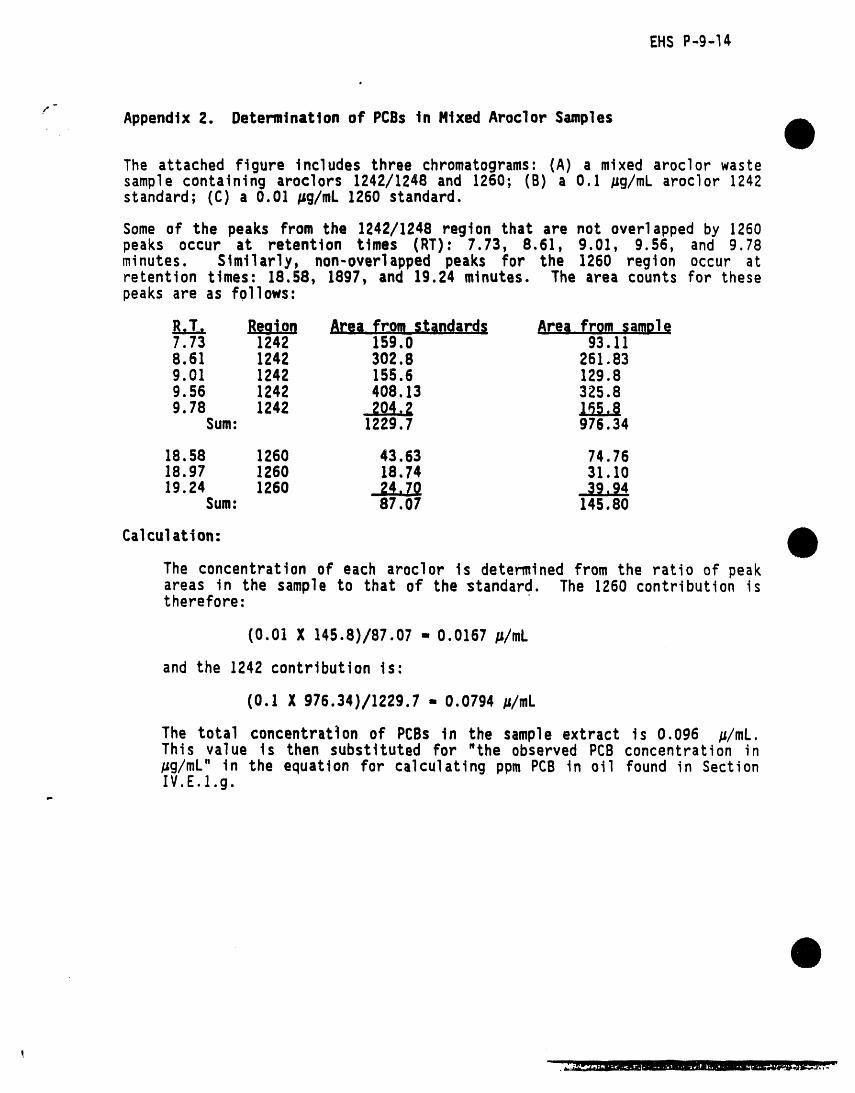
EHSP-9-14
4'
t--
Appendix 2. Determination of PCBstn Ntxed Aroclor Samples
The attachedfigureincludesthree chromatograms:(A) a mixed aroclorwastesamplecontainingaroclors1242/1248and 1260; (B) a 0.1 #g/mL aroclor1242standard;(C) a 0.01pg/mL 1260 standard.
Some of the peaks from the 1242/1248regionthat are not overlappedby 1260peaks occur at retention times (RT): 7.73, 8.61, 9.01, 9.56, and 9.78minutes. Similarly,non-overlappedpeaks for the 1260 region occur atretentiontimes: 18.58,1897,and 19.24minutes. The area countsfor thesepeaksare as follows:
Reqiog Area fro_ standards Area fr_m_amDle7.73 1242 159.0 93.118.61 1242 302.8 261.839.01 1242 155.6 129.89.56 1242 408.13 325.89.78 1242 _ 165.8
Sum: 1229.7 976.34
18.58 1260 43.63 74.7618.97 1260 18.74 31.1019.24 1260 _ 39,94
Sum: 87.07 145.80
Calculation:
The concentration of each aroclor is determined from the ratio of peakareas in the sample to that of the standard. The 1260 contribution istherefore:
(0.01 X 145.8)/87.07 - 0.0167 p/mL
and the 1242 contribution is:
(0.1 X 976.34)/1229.7 - 0.0794 p/mL
The total concentration of PCBs in the sample extract is 0.096 p/mL.This value is then substituted for "the observed PCBconcentration in#g/mL" in the equation for calculating ppmPCB in oil found in SectionIV.E.1.g.
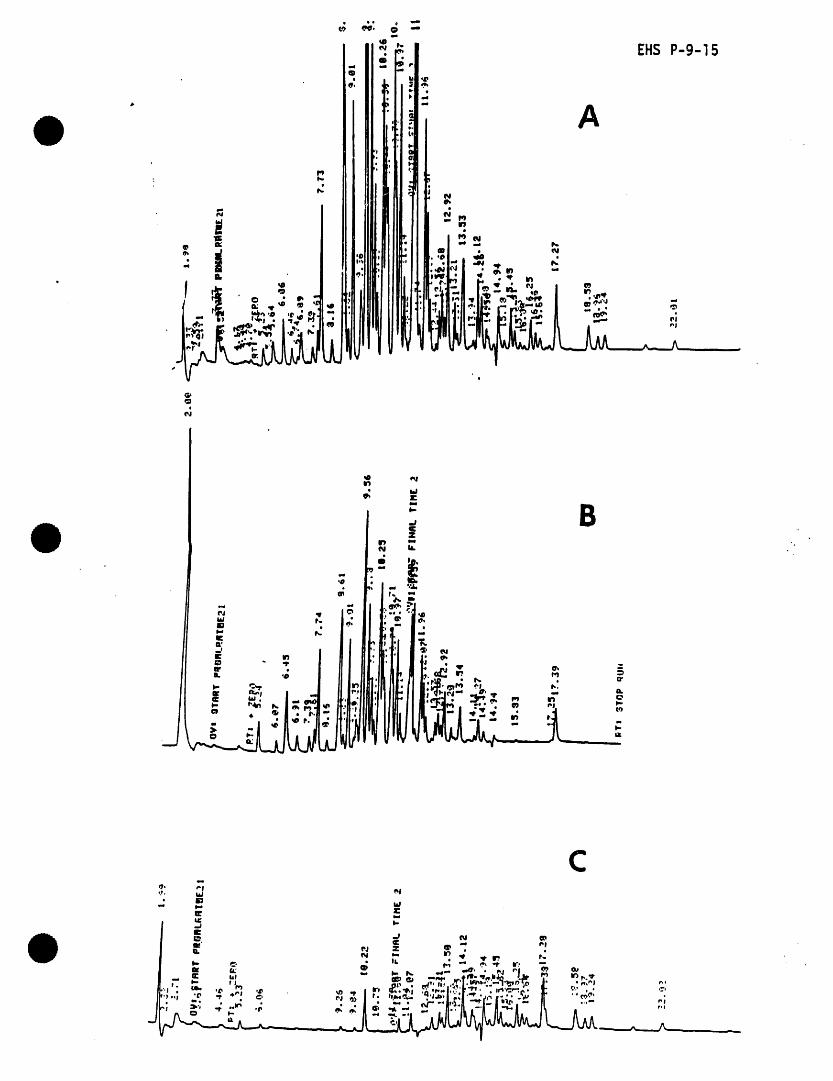
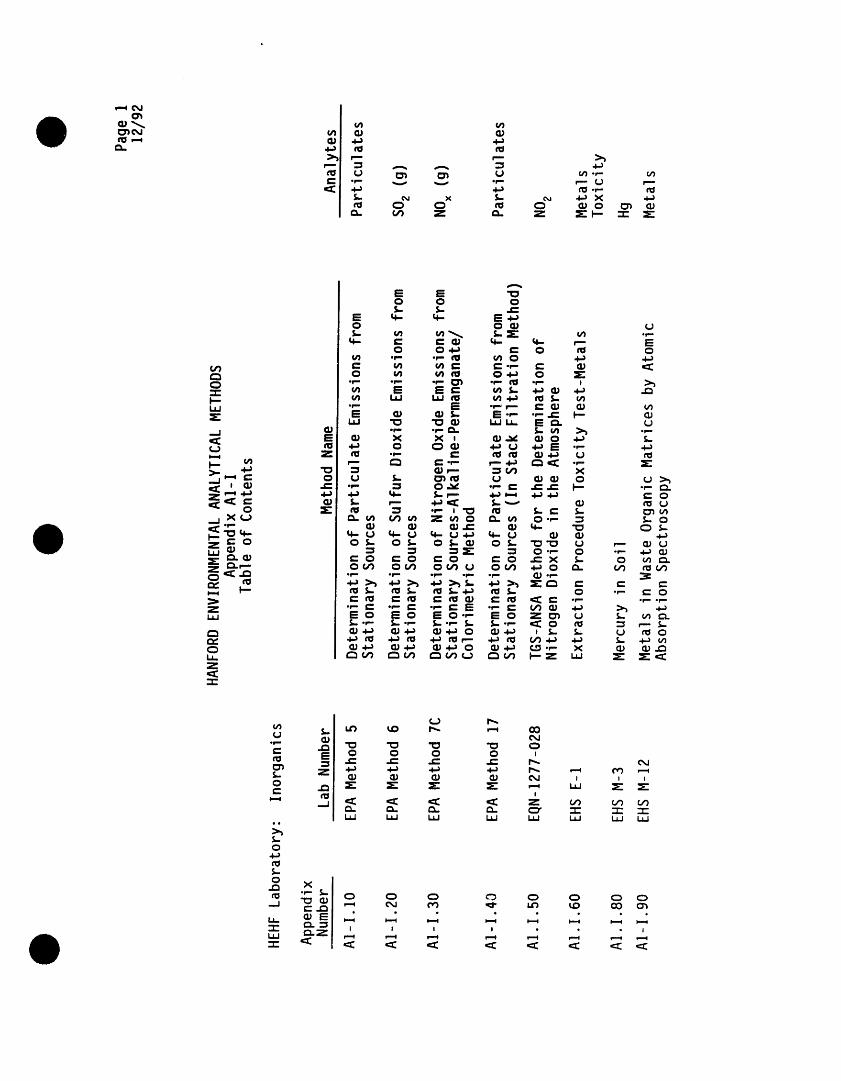

(M {_.1
I.i. (..) (,_Z
>'i 0p. _ d,. ,, Zc ¢=3 (.,IZ ,.
*" 4=_,,,= =_)N t'_ _E:: a.
0
m I= v') I='I_
= ,- ! C3'q: :E:: ,,:{:U. l-- -I-" _ (.J L_. ', U.. Z U')
P'_ ro
I-- .O
_-- S- o us.. s-
o:I:: m "_- 12.
_'_ E
Z cO U O C_,,:E ,_: I= o,-r--- e"- ,r=,
o L_. c S- g. o _-_ O1X U ! G,) m *r- .,-- _ m ¢=
, U O1 c:l: cE: _ I= .,..C:_ .r-l-- "O_- E I= _ S- O_ "O "-- c_Z I= O m O I= O "O "O _= 0 EaJ Z S.. I= I=: I:=: r- .T.- f,.l=l.J "I=" "
C2.P-. l.k=
Z :E C{ =I= (J :_= _ m E: _ =I=:J_" (._
.p S- m ",- E -_" S... 0 U= E c.n = :3 S- .,.-- U E O_(_ 0 _ S- .r- _ -,-- S. _.- .13
Z _ _ _ O E E: .,-- .,..) "_
'-!- ::_ =_¢Z: r-- ,:E:m r.z3 ._ (_U -I_ o s.- _ _" E E S.. e-
I=: I=: _- _ E (.3 U _:_ _ -,-- "'" *p 0
I_ m m m E m I::: c.- o O _ * X ._
O1 G) _ Or- _) _ C::.E P- p- C._.,-- _ S..S.. =IE _" I.--u. :2:: (..) _U _.. u_ I-- _"_ (_1---E
., le_J .__ I I I I I
:_j _ (.J (.3 u.. u.. 2[
"_ .-I- -'P- .-r- "r" "r- _ "r" -'r- :Z=i,, i=l.J l=l.J iii i=l.J i,i LI.J i,i i=l.J
f,..
.._ Xc_
L_. ¢_ E
I I I I I I IL._ Z _ ,..4 ,..i _ ,..4 ,--.* _ ,--I _= ,=Z: _ c=:: <::: '::E _ =:E ,=:Z: ,:Z: ,_
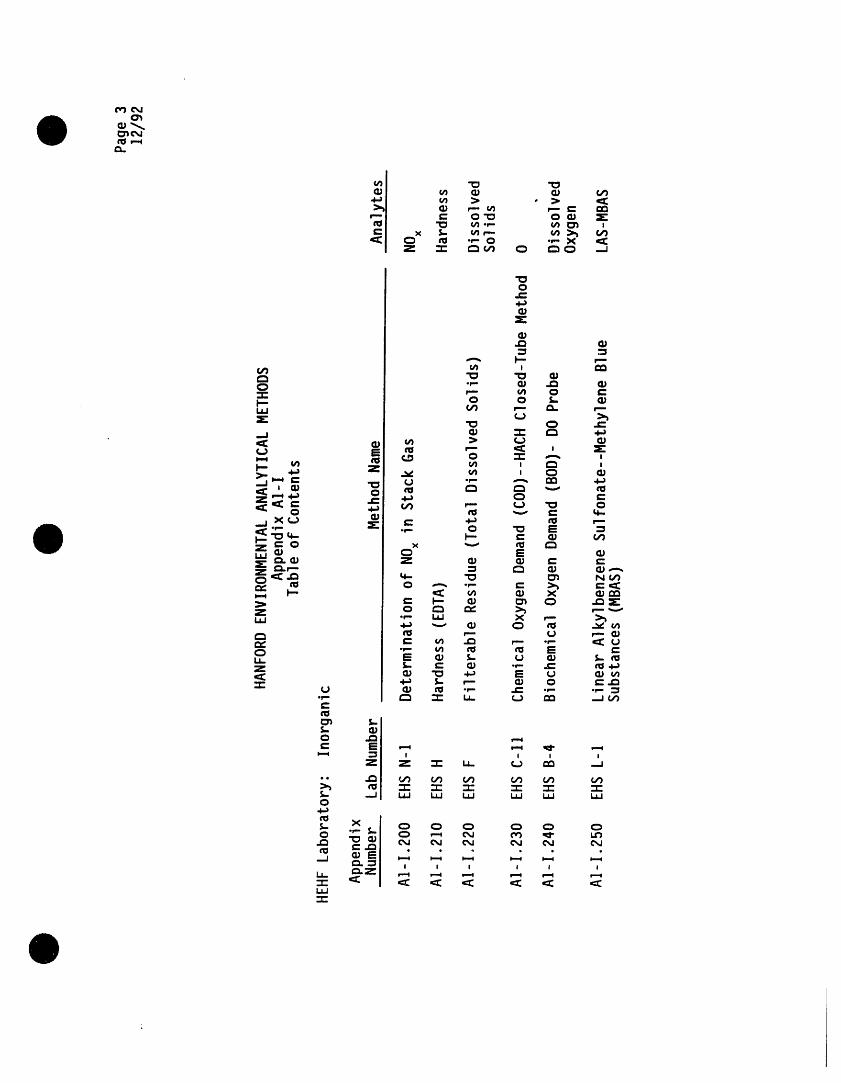
_c__=_
il + +v) > . • ,_(I) r== vl r- l:: l:OC 0"I_ 0 (I) _-=I_ u1.,- vl I_ s
x _ v)f-.=, v) >,jm "f- 0 *,'=X "::C
"0o
(I)
_'_ I.-. rm
(_ -r- (1) ._ (1)r-- ul O C
I'-- 0 0 S,,.I.I=I U") r== _ r==
_.) >.j
.=I _ "I- _
i== m r=- ":C I =E:
im _ _ _ r_>" I-.-0 _" 0 .r.- _ 02..J "_
Z _=__=_ 0
.=j X _=_ _ _ r=-
I.,="_ q-- *'- I--- I= _ (/)Z _ 0 x v _I
O,cl: e_ q= "_ _ NI/)
•r.. _ X r.--r'_ _ r-.. _.) r.=-rv" _" v) _ r=- .,- c:C
-,-- v) _'0 c_ EU-Z _-. _: G) .,- _" cO ._
-r- (3 (1) _ -,'- ..1=: .,-- -,-- =1e_
I=c_
° ile-!
-r- "r- :2= "I- -.I- .-l-
U. _.Z _ _ _ _
U.J
[Appendix A, Melhod SJ
,.27-87 I_tehed by1141[8t_ OF NAnog_u. AFF_IqS, INC. Wg_ql_n, O.C. 20037 20S

FEDERAL REGULATIONS..... , , iii i lJ i i |1 i ii i lU i iiii i, m ,i,,,, ,,,,,
TJMPERATURE SENHR
p_ IMPINOER TRAIN OPTIONAL. MAY OE REPLACEDBY AN EOUIVALENT CONOENSER
¢ )
' HE OMETER "f", ' _,_" --7 TEMPERATURE_ SENSOR CHECK
PI_OT TUllE I FILTER HOLOER VALVE
PROBE STACK -- -- --WALL
"':_ ...... ' _ _ 360
[A_teedlx k Method S]
! !-27-87 F_M_htd by THE BUREAUOF I_TtQNAL AFFAIPt__ WelhMgto_ D._ :IO_T 207
L_lqmendlxA, Method l|
'o .... EndmmnenqRm_ter 2O8
I ' ! ¢
el, ' 'l ".,t,: * _ .... _" '
• * * 9 ""* lib
• . !.k.lt , s.-
(Appendix A, Method !|
11-_747 Psd)ii_edbyTHE llUIq_u OF NATIONALAFFAII_ iNC., WlWdn_m_ D.C. 20037 269
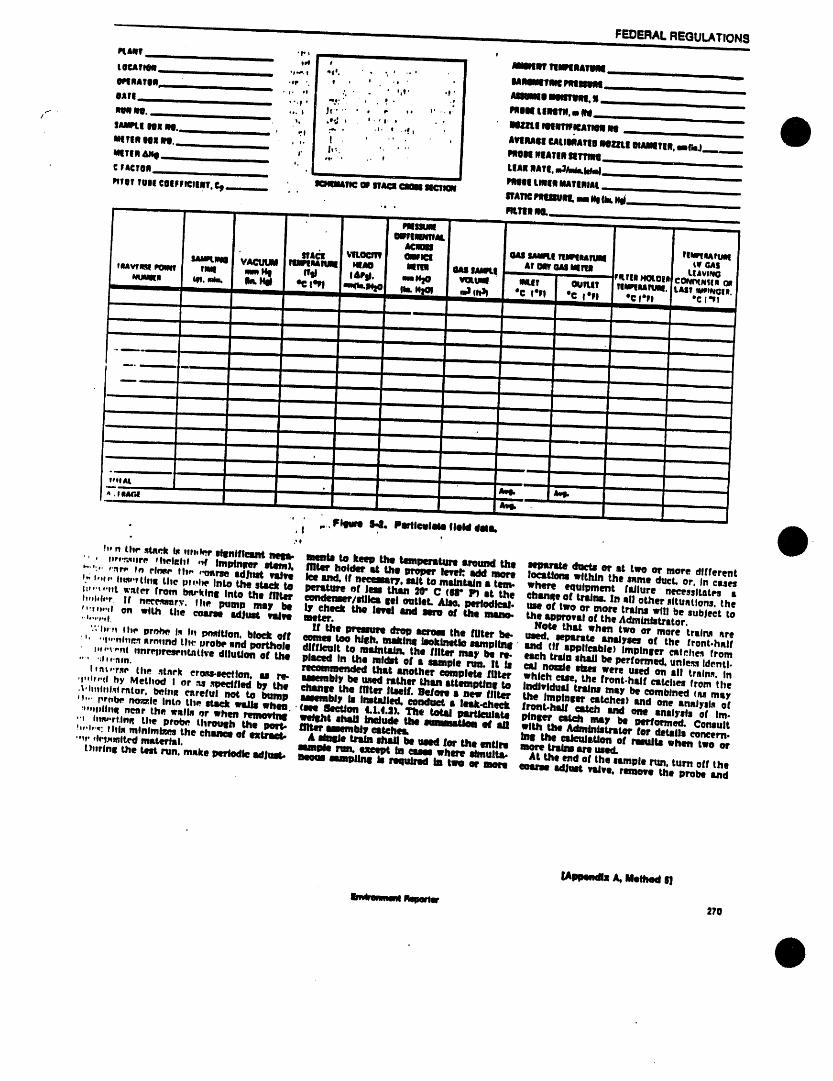
FEDERAL REGULATIONS,, ,, i i i i i n ii iii n . i i L I I
!
FtJmT , , .t-, ' imsln' Irlulq[nlTMlS_ C in ___
tOCArlen .... .,.,, ,,0. " ..... UltOlaOVtl_INNUlM .,• 11' ".
01_llUIT011r _ ....... . ,. ,, . . ' ,,1, .t' llllOllTIIlll.S ........OXrl ,, ,.,w. -':' ' . ;" : ilmlNtlll1111i,mN ,
... I Jt ..... ' ' " 0. i' .. q,
. ;eWelet , _, .,.j , , •_,..... . MZ/I,I IMBTIPlICAIrfllIIH ....t . ' " ' AVlRAll ULIilA1111 tNl_'tl MTIII, mm(hLI , .
mqTIllllltNt ...... '_'" I,,. .. ' " I_IilHIATllIKTlllHI ........r
tHtTlR4Jqp .... "_ " '" f LIAItlfltfl, m3A_aJeke_........c_,.cvol ,,. , , - 0,M.Lmn_vtmL ....mowrue,co,a,.cltmr._ .. mv_ mnJu:naoaaaw=.m s'irA_n,mSul,.,,,0ool_._ --
., • flt1111nO,......... - ....
' ..... muUmOINlllllPllI/il,
l|maxvumdams GASIail_t TUlMtlIUll8 Lit_s
_li_l vll,acnT aUpla A!OinOMmlU LIaw__lJi0 VACUUM _lHUaPlluln_ o4110 lall_ OAJIMg_t , , FN.ItNH0t0in COl_r_Nt(tl On
p6uImRgt m. ml_ kHlil e_:lOll ,am_iil_Oi lqi. _ n_ltla._ "C l°ft °C I °Pt °C l'fl "C(*Plil Hi I I I II I I I I II IN
i u i i i i i • i
li iii m i Hi inn
nmu i lUll I u I I I mn i el
......i I I
imp,,,. . .... i li I I n I i [ InUlll
I I n lie n nlm • II n ii i i in i[ i
i I n I • m nil I nun null
u J I ] In I m I nil • i
• i |l ul i I i i I i I , i,nm i
ill II NI I I n n I il • i i
I ......I I u
un U nl I i ii]11 I ii I i =, ,
t'el AL I . , ,i ' . ,, ' " -
_,._ _"
" ' ,,.,FqNm I._. Pmtlculmio flokl dalai.
!. rl Lhl"sUt_?kLq0llo0k_l"8hlnJ||l_lnlt _ mlmlHIto keep the hnnnporst41re8rmmd the aepm'a_ ducts m' _ two or mote different', , .r,,_'.,.jr_ ,heteltl nf Jmptnser it,e_), Jilt,or hoJdor i_ thl _ leve_ lldd more IocsUom within the s_mt duct. or, Jn tit.see,-':,. ,._ 0, rl,e_, th,. ,.o_rse edhu_ vldve ke 8rid, If new.tory. 88Jrto madnUdns Lens- whene eqult_ent fadture ne_sslt,,t_ •0,_o,,,,. I_'etl,_ Lh_ p,,t_r Into the stack to pera_ure o( Jel tJ_m 30" C (08" 1_ ill the ahamtleof mdns. in Jill o_her sttuntlons, theI':,,._,..t u_ter from Ix_'klnll Into the Jilter o=ndeller/llllJel let outlet. _ I=ortodh_d. uae of two or more tndns wttl be subject Wh,hi0.r Jf m_L't.mlar_', file pump rely be LY ehe_ tho llmd amd nero of the ms_o. the a_l_rovslof theAdmlnlstrstor._,,v,,,.d on _,IUs ti_e eoeJrwsdJus&vsi_m meter. No_ thl_ when two or more trtln_ _re,,,.,,.,.,t. It the tmmtml dit_pa_s_a the Ntor be. uaed. eelP_rstenmdysesof the front.heir
'.:'h.. el., probe I._ t. po_lUon, block off _mnus too hiE11,maldnll hlokbletlo IlmplUt8 ' lind (if sPpll¢lble) Implnlel' elitr.h_ from, o, ',l-'.hsF.,'tltrnllnd Lilt.'urobeendporthole difflm]lt to madnUdn,the litter my b_ ro. euh txaJuIhaLLIbeperformed._mle._Identl.
,.,'__nt .nr_)ros_.LnLivedllufJoelor the pls_d In the midst of t emmpleruts.It 11 _ nozzlem were u_edo. ill Lrelnn.In..... :_,.n,n. recommendedthat imother (_mplebafUtetr which ea_, the front-hidf cst_lj_ from ti_e
t ,n_,,ra_, tl_e atnrk eroM4ection, u re. MMmbly be LIMd rlthqff thlm IttmlpUng to indlvlduld trldns rosy be combined tu may,l,,i.*d hy Metttod I or M .,weclfiedby the Idsllnlethe flltey Itlell. 9e/oul • new filter Use implnlor cliches) lind one &nAlylisOf._,lmllll.,tlrlttor, bell_ff _reful not to blimp liembl_ II Initialled, eoodll_ I Illll.e, heck IrorlL.hldl _ lind Olle Iflllylll of Ira-'),,. probe no_,le Into the Ital_k mdlm whalsa.• (IN _l_Jon 4.1.4,:1). The toted pl_d(:adlte pttnlor eaHl_it may bo performed. Consult:-,idl,_ n_ar the wlll_ or wh_m_ amSht _ Is_t_ie UM immmi41m mrii! with the Administ_tor for dletsllaconcern.
,', It_,rt, lnft Lhe proUn Lltroulh the _ IIItqff mid/_et_helk Illl the t_l_tlllUoO Of ruUIU when two Or_,,,I,._: thl_mlnlmlxea thechDneeoflmtZllddr,- Aatnslemdnmadtbeugedfortheentlre moretndmmua_'._. ,h'1_mttrdmsterlsl. NalINe rim. mt_'_IptIn ONe wheS_admulto_ At the endof the msmplerun, turn off the
L).rlnll the teat ram, make p_todf_ Idluli_ lllmi llmpllnl II _ In tWO Or _ mlnm ildJtlmtvldve, rlsslove the probe lind
tAp_nx A,Memedel
Ib_ Ropm_r 2?0
• LAppemtlx A, Method s]
! 1-27-87 In.laNd by TNE IURE_U _ 14ATIONA_.AlPlZAII_IN_ WmNnOlc_ O.C.20_7 271
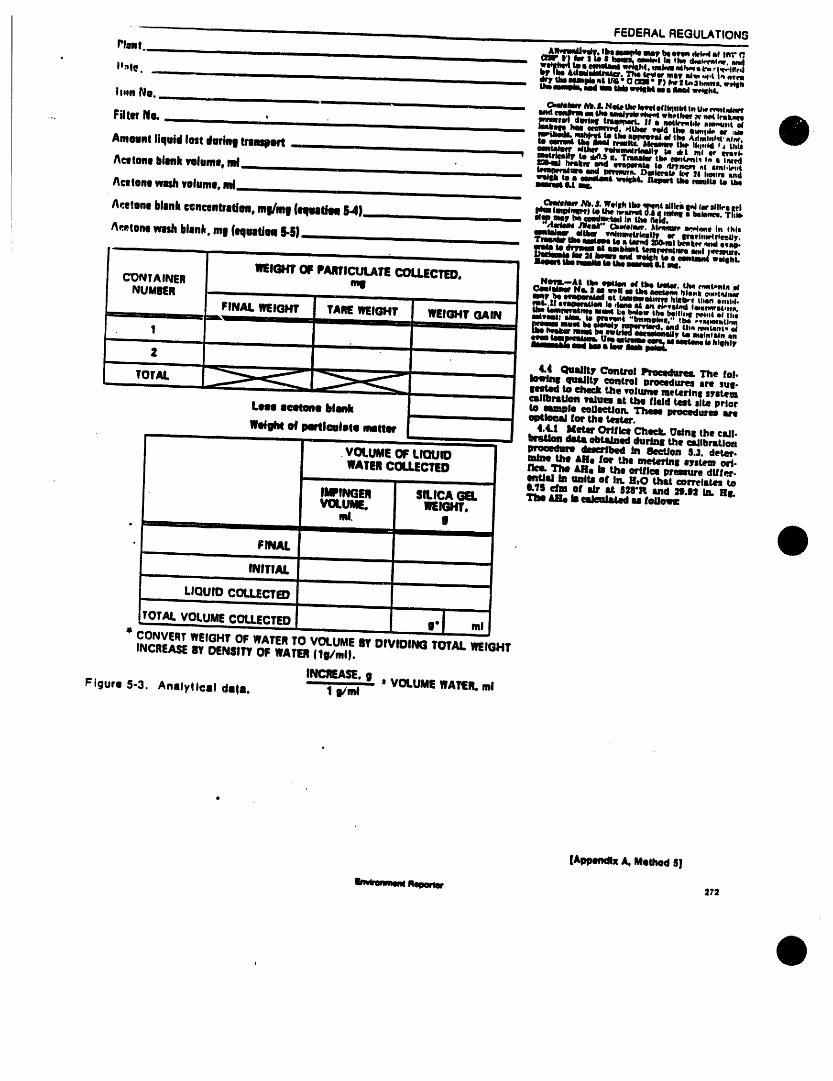
FEDERAL REGULATIONS• i nil u n | ,n,
PIInt. _ r) i_ si. i _ a,,,_,o.inoMd,..h_o.,r.• bf lh AdIdl_lM_tta. _ lie_w mlW Id_ .f,t i'_ 4win
l'ml_, drrmelmpu st ins"0 rise- r) i,w:t,,:,,mns,,r_n' _i_ Iimtide_M I mIbmlm.qk¢.
I IIIII NU. . , CeMellrNil.Jl.NqAetim1o914ollkl.MInthe_tt nmef'' '" ' " •ridegldkrmoiltheimldyaktg4w*4whq,th_ _w_4,Ir•k_emmlllluI dlmml _ II • netk's'_bk, nm.,unt o4
Filter No. ' ., k,_m. _, oct. ,,row ._4 tM ,,..0_',w _..
Amount liquid last dal_ I transport ..... _ n,_knl_ u, _.s .. 1muir tu. eo.u.ni,,- • m,,_lx_l,,t end esmm'm to 4nne_ nt luml,t_t,
^.to. .lure,, ......... ¢mlnlQ M ml,
^¢stuna wish volulnl. ISd ........... Imam.,,Jw'...f.w.,_ti., ,,p_iailk_¢,,!c,._l_..._dI+_I _ the + OJ I 0mq I kbm. Tisi.
^reruns blankcen_nflatiou, rag/rag(equthm _41 ,,n mr m m,,._i ,, m mid. . ....Im_M_ V_ __I_ _, _I,_¢_Uy.
/_tunu wash blank, ml (equation _.§) _rnI_ u _ u,• m _.i b_t,, _.do,,.+.' • ' ' enite _ ill _i_t tempmumre _l lm_u_e,II |1 m end mdlls to • emtmnt s.eillst,,
........ m•.m .,. ,.,... _..,.,m,_ ..t .,..
WEIGHTOF PARTICULATE COLLECTED. mon,.-_¢ tu. ,m_n ,_ thew,w. the,_w,,, ,,CONTAINER q _*W Ne.J,- _,i u _ _ _J..k _.,t_,W
_l_ I_ _ _lw t._ _III,_ _.l ol theFINAL _lO_ TARE WEIGHT WEIGHT (_ ill: M +mmt "hlm_.." th ,g.twiUm
.... "' ' -- ' " ' • II I Illl ' III ,,, _ _ _ _ m_ _Y tmmltnl_fl afttllllmllllmb Um eIi _ M_ _ hllhlY
1 _iilllli J ii i
,i 2 ........ ¢4 _IIY Con_l _ The for
TOIAL _ .___ _ aelKmlto checkthe vo|turll metelrtn, lylLem.. _llruriUon smluu I_ the field tat site prtor
Lm u_I bl_ , ! _ I_ _fl_o_ _ procedures m
W_41ht el gltlulutt mittm' brsUon4"_ldIt41MI4LIrobtlJnIdOIlfl_IdurlnlChIrJl"meO84nladlbuIUoflthecIdl-
........ © - m,.,,,,,m- k,o,• _ _ IHe lot' the _a i_utem _-WATERCQLLECTED Ik,¢. 'Fill _Fle II UIII orUl_ _ dU/,.J'.
imtlsl In/M of In. H,O _t¢ correlates to' ' _TS dm of ilr M III'R Ind _I.ll kI. HI.
IMPINGEII SILICA GEL The _1. IJ_ ,., IoUcnn_I_0LUII. WEIGHT,
rid. g,irli m n ,, ,n m •
• FINALii i i Jl ii i ii i ii i
INITIALi i i i i n i l I I
LIQUID COLLECTED, Ill I II _I I I
I
tOT,,,.VOLUm+¢O Cm .. +'I ml'+ CONVERTWEIGHT OF WATERTO VOLUME 81' DIVIDING TOTAL WEIGHT
INCREASEire DENSITY OF WATER(lg/ml).
INCREASE.,g t VOLUME WATER.mlFigure 5-3. Analytical dill. 1 I/ml
(Al_lmdix A, Melhod l]
Rqloltw 272
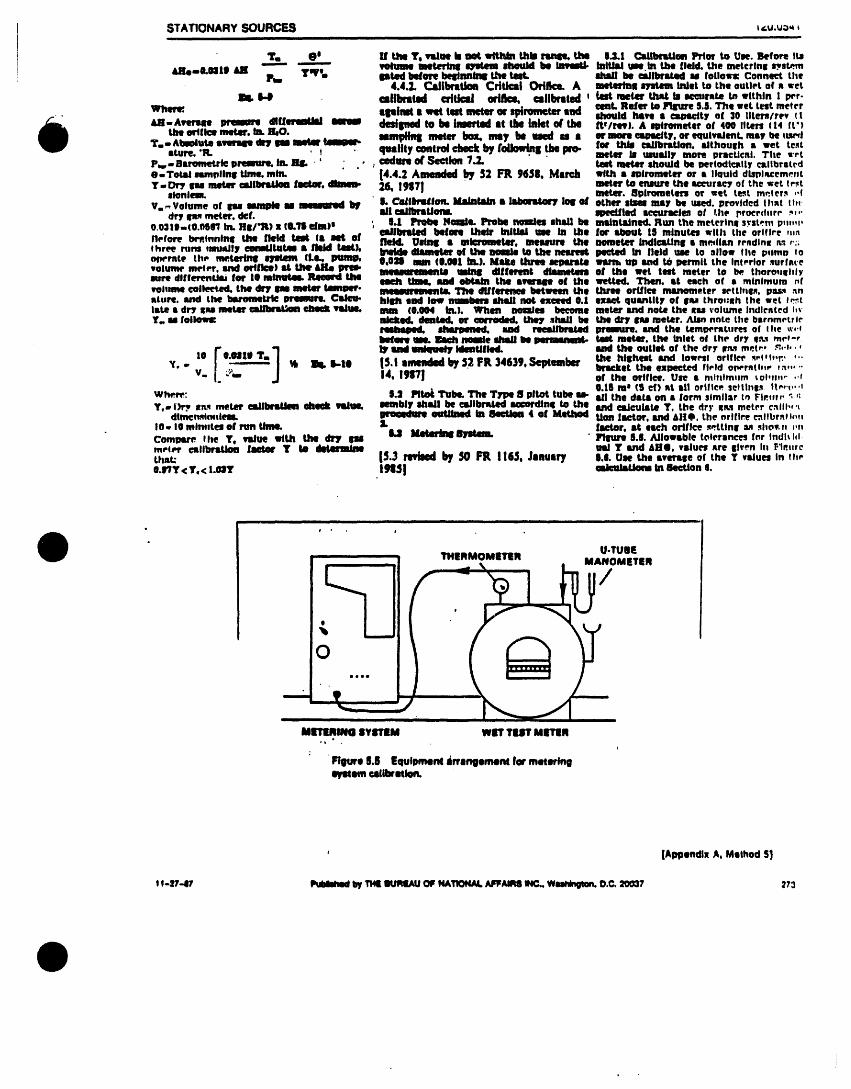
t , t,t
U-TUBETHERMOMETER MANOMETER
/
0**0 ! ]
METRING 8YaTIEM wire Tltl_ MrllR
Flgtwe 8.6 Equlment irysngement far •metingIp/_tem _lllmmkm.
' [Appendix A, Method S|
ss-_-i_ _ lw 11_ _ OF m_110_ k,_,Ui_l _ Wmmlngten.O.r. =o0=7 _3
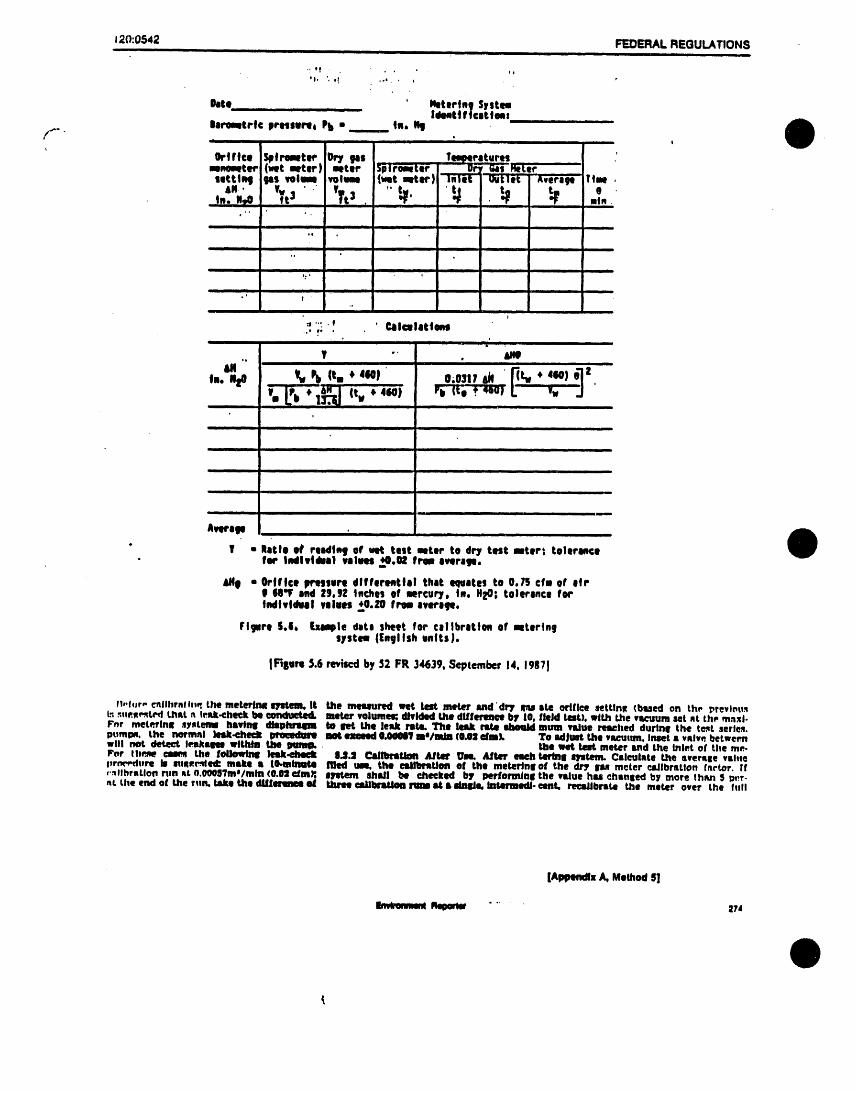
120:0542 FEDERAL REGULATIONSi i l i ii
• _
'1. "..* .,,, . , P
Date ' lletertn9 Systm' ' Ideott flee•terns
f... Illromtrlc prMaurt, Pb • .... tu, 1111 . ' ................ I
ortftco 5pfrwmtor Or7 gas Tmratvresrename•or (we meter) meter spirea•or or _ s_b Hater
or•let "Averag;I Tim
set•louD_All,gas velum, volume (vie,. meter) .l_Ot.in. 1190 '_t 3 ' ,_t $ , _.. _ _ e.......... mtn ... o
i i i i • ,, .....,e
i i io,
i i i ii ,
u i i i ii mill
.o
!
= .... _ ' C4ilculatlomJ.,* t'; .
• I * i | . IR. °
lr "' alW• , •
...., nmnlm_ i
II I • i nil
lal i i • u n
I n n
nul nn n
"" m i
A_aga ..............
• V • Ratio of TINing of vet test motor to dr7 test meter; tolerance• for Individual volm _.M from ovoralm.
drill - Orifice prHsore dlffer_tlol that equates to 0,_ cfm or lipII M'F _ |9.9Z Inches of mercury, tno HzO; tolerance fortndlvl/kgol valves 40.ZO from avoragQ.
Irlgure S.8, r_mple data sheet for calibration or mtertngSyStm ([ngl Ish vnlts 1.
[R8um $.6 reviscclby $2 FR .14639,Seplc:mbcf14, 1987!
ft-hjr_ cnllhrnfg,_,the meterfmt r_tem, It the memmredwet test meter Md'dr7 opusshe orlfl_ settlnt_ (bued on th_ _revlmk5L_,':tm._! LI3_L._InstiL-checkbe conducted, meter volumes;dividedthe dlffertm_ by 10,field test),with Useva_-uumsat at th_ mnxl.For meteylnlt syxLemmhmdnll ettapmmi to treethe leJdtrlJte.The lee&_ 8houidmum vllue re_hed durtnl the tcqt series.pumDlq, the normnl Jesk-4:hect 0raeedo_ Bet exNed 0.04OiJlmaim (LOBdmJ. To 8dNet the vscuttm. Inset • valw. betweenwill not detect let•know within Use m the wet tat meter and the ini_.tof tile me.Par t l_ cam the folJowfn8 leak_tut_t 8_J_1 CsJlbrst4a_ JUtes' UBe. After ese_ tedn8 totem. C•lculnte the sver_ee vtlueI_rrR'_'tJtlre fl mllCP.t_detJt:make • •0-minute ftl_d me, the adlt_mUon of the meterJn8of the dry Six reeler r_Jibrntton (nr_or. Ifr.sllt_rntlonr,n _t o.00_S7mJ/mln(0.rJelmS, Intent ahldl be rJle_k_l by parietal•if the value hu chuueedby more thnn Sarr-_LLiaeendof the r11_t,•Jr,,othe dlffm _ _ ell]]_ _ _ • dlllde, latermedj, cent, re_lJibritLethe meter over the frill
IAPl_mdlx,4,Method81
llm_nxwm__ .... 274
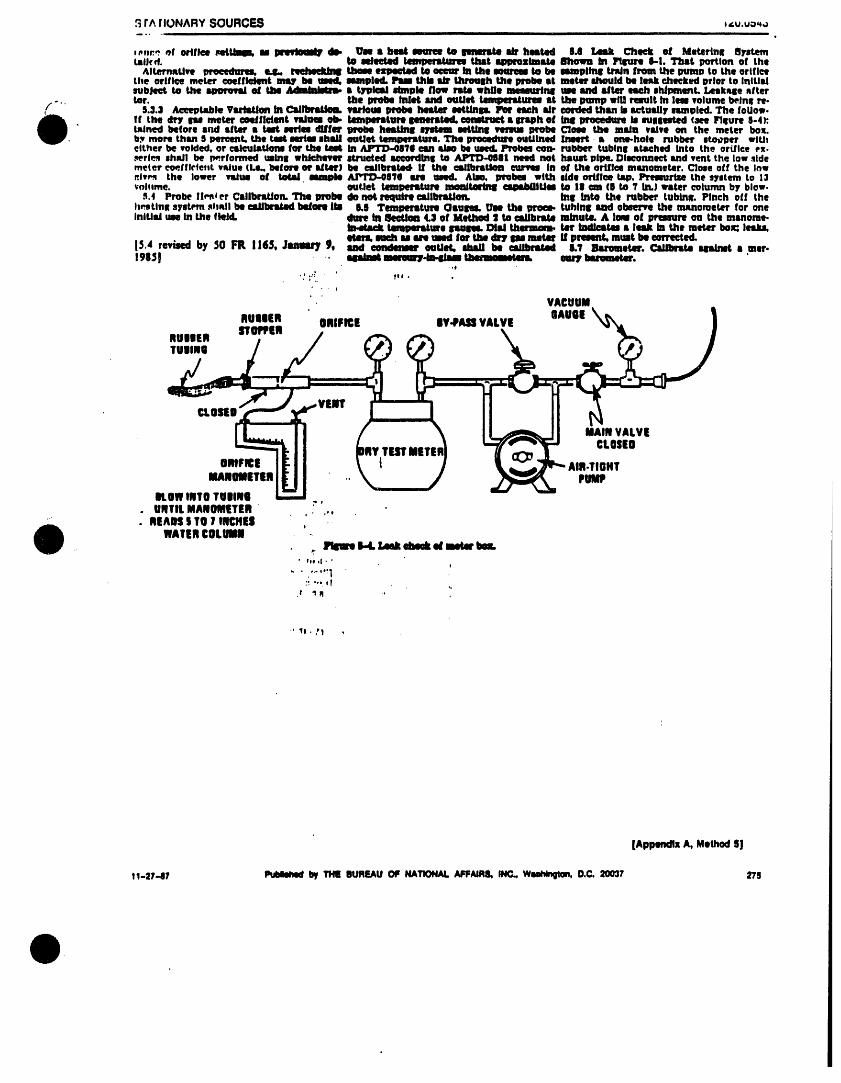
MAIN VALVE
TUT lilT! CLOSEOORIFICE _ AIR.TI6HT
MANOMETER ,. PUMP
ROW INT0 TUBINg• ._ P
• UNTIL MANOMETER . , .,," . READS| TO1 INCHES •I
WATERCOLUMN -... _ FIIml 1.4, lask eblek ol merit Ilol.
' f14; +l " *
• ,1 I ,,
.r +'I +!_
(Applndll A, Mllhod |]
11-_7-07 PubiJelmdby THEBUREAUOF NAllONAI.AFFAJ_ IN(=.Wmm_gtem,D.C.20037 279
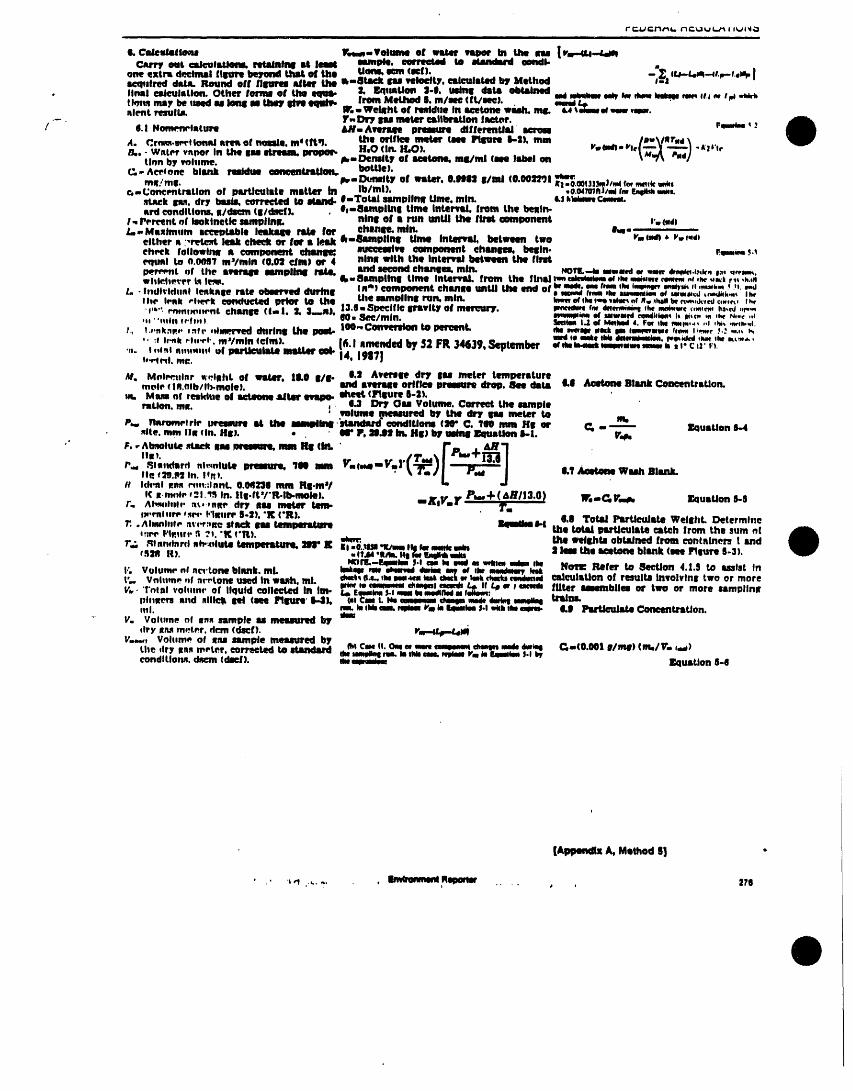
i i
ILCa/nla|to_ Ir,_nmVolumm ot _ sntoo¢ In the m |vm-_--_.mmout _f_ _ MI_ mmm. _ to _ _k
one extrm decimal fllm_ tleTond that of the Uons. ecru (gel). -:._l (I.,.-l.e_....41.p-l.+Jq,JilOqllJred dltlJi, llotlnd off' fJSu_l Hlor the Ik-8lack 8u veJoefW, cmlculstod by Method• final calculation. Othelr rorml or the e(_ 2, r,qtutUon 2-|, IIIl_ll dlltll obtained
from Method g, mll_ (ft/ee_). ad ,,k,mm m_ k, _ _ um "e m I_lieu my be treed u kmll IW_ _ _ II'.-, Welllht of mddtte in •cetone wauth, ml_ _l_mt_ .tw ,t_nltmt r,.,sul_
-- T-D_ m me_ etJllmm.ttonfmetor./ 4.I HmmmHatm _- A_ p_ ,**ffemU_ _ Fqw,,_m,_ ;
4. ,,of ..,...'m,. the .,. I-., .. ,,,,.H,O (1_ _).O,. - Wntrr v_por In _ 8u eCrmlm, m llkmDemltY of INUmO. roland (m Ill)el on _,,_ Pad/Urm by _rlilllne._,,_Ae_lone blink nmldoe ooneeatllUo_ boule).
real/all. /_-I_nwlty of muir. 0.1t111:18/Inl (0.00:1201-+we.ll.0.0013]l_. J/m4rmm_tk mkse,-I_onctmtraUon of ImurUeulste matter In Ib/ml). ,0.0_m+nJ/,drmFm_m,,.
.st_ek IrM. dry Ixu_k eorroe(_-,d to _and+ l-Total umplfml Ume. rain. tJhV_mCmmLard eondltlor_ II/dsem (ll/dnel). , e0-Smpllnll Ume InCer_l+ from the bellln-
I-_r_nt of mklnetk _lln_ nl_ of • run un_ _ l_ c_m_nent I'm(nd)
_,.Max_.m __ I_ rub_ for chiton, rain. I,m .....either n : _ lak cheek or for • _ &mSnmpllml Um In_ _twm two vm_ + v. ,.wehq,_k followinff It compone_ _ eueeet_vt eompmttnt ehlml_k begin. _m,m,.._.'tequsl to o00157 m+/min (O.Ot _m) or 4 nlnff with the IntlmmJ bttwun the flrmt
wh_.h_er LqI_. k-Smpll_ tlmo In_ from the 111111m_ _ _ awe _m ._ ,_r.,_,_ r- ,_._+. l,,+i,.im,.i,.ka_e.. o_md d.m_ c.'__._.t +ha...m U. ,_ or,*_ _...'_'m",',- ----"'---- ," -_" mmm M mmat_d .m_dkkm_ I_
Ule IImDllnll rim. mill. mo(ih41tqvll_of Rwakl4111lapnell:led cm,l_.aliarlhr ll_Itk rhel'k eoflducted prkl_ to thll |3.11.Slx, cifle llmvlty o! Intregry. urn,elm rm dnm,,mi.l _lwmi_w_ +..m,+,.l,z._ ._..'P*'" _nlmt+nt ch_ (I-1. 2, _+1, 80. _/mln. mmd mwmN m+m_ I++++. +. ,_ m.+ ,.
*01"I_IilR fl'fltl! _l_llm I.Z _ k4klqkOd 4. Fol tilt ml_'_ .l _Iti_ ,t_0h+ql.l,, !.-nkam. lair 0dxuprved _Irlnl IJhlt poM,- lO0_,Convellton to pqq'eent,, m mill lll_k llm tmllllle fern l'mr ._..+ ,.,0, I_
" :l hmk Pl,'rl'. m*/mJfl (efml. m oeme tkb mmmlmmlm.I+_,mlcd.i_ 01_,,m_,,16.I amendedby_2FR 34639.September ._m,k.mnmum m m. _.c,_"++,.. I0,a.!n...o._ .1 mwUeulmnmtJ+roo4-14,19171Io+-t t_i. el:.
M. Mol_,tnlnr w-,IRht of _, 18.0 8/8- 0.:I Averll_ dry m meter tem_rsturemolP (IR,Olb/ll)-mole). _ •t_ll_le oflf_ p_ _, b _ LI _ 9181111_mn_Uon.
m. Mm of residue el mctlmml 41Jltlr _ llhee4, (_lllUro 6-:11.• 1.3 DI_ Ou Volume. C_ the mmmpie
mile. mm fill tin. HI). * . ' t8" P, :11J:l In. HI) by IIIh18 bUon I-l. Pep,
"" F, ,-Absolute miJ_-k,. mr_mmr_ mm HII ,II_ ' -T.-r _1Item. P_,,+ "
IP Ith_l mnmr_m:;InnL 0._O mm Hl-m'!
1¢_..._1_ +21,_,_In. lll.ft'/'R.l_mo_l. "-XtV,,F Pw.F(AH/I3.0) Yr,mG, P,,_, Ir_usUon S-S/". Ah_ltltlll' ,'t_,,,flliL'tP dr7 IIU _ _ ' _r'm
fp,rlllllrP +.qpt,_'lltllrP §-2)0 "K ('R). 0.8 ToUd Pm_leulm WellhL DetermineT..Ahemlllle .'t+'rr._ltOSlltck lU teml_rltAl_ IdlmlbSl-I the total Imrtlculst_ _teh from the sum nl
+;.'PPt;'i_llltr .q ?_. "I_ f'Irt), w4m_. _lhll mlllhla oblaJm_d from contnlners t madT_ Rtnmtnrd eh.:dUUI tmnl_mlCuru. _ le li.0.)llMl+lr,_nmlllbgmnkmdll
. NOIT.--Eeamim _l.t am Im mml as mille I INI,'. Volun_ nl nc_'to_ blnnk, mL _,m m _ my _ ,_ _ _ N_ Refer to _le_Jon 4.1.5 to _lst Int-- Vnittm_, .f nrrLone used in wuh, _. am_ p._.,0h_m_m _ anckm_ _ rm_ad _ullUon of resul_ _volvlnl +wo or more
.__m mmmma_ml _ 14 If _ m _mmmb ffl_r _bUe_ or two or more 8|mpllnxV,,+ T'ntsl VOhllnr of liquid collected In Im- _ emlmS-immlm_natmrelknn:ltilllte_ xold allh:_ 811 (m Plllurl' I-,11. 0..c_9. I. I_ emaWOmmm m _ m t4L'ldlBI,1111. Iml. Ii llm elm,_Ym 181lllamlmlP-I_Ib llm_ ILl _ Coo¢'e_ItllUon.
"" V. Yolttme .f Inn s|tmple u m_ by dm(try l,'t.qm.trr, dr:m (dscf). t'm.--4JLp.-Le_
V.N+! Volum_ of X:w rumple meswred bythe dry lea tarter, corr_:tod to Mand_ Iht Cme It. Om. m m _ made _q _i(O.O01 _)
(A_ k MethodS]
' .' _,1 ....... _ Rell_ , 270i .... i
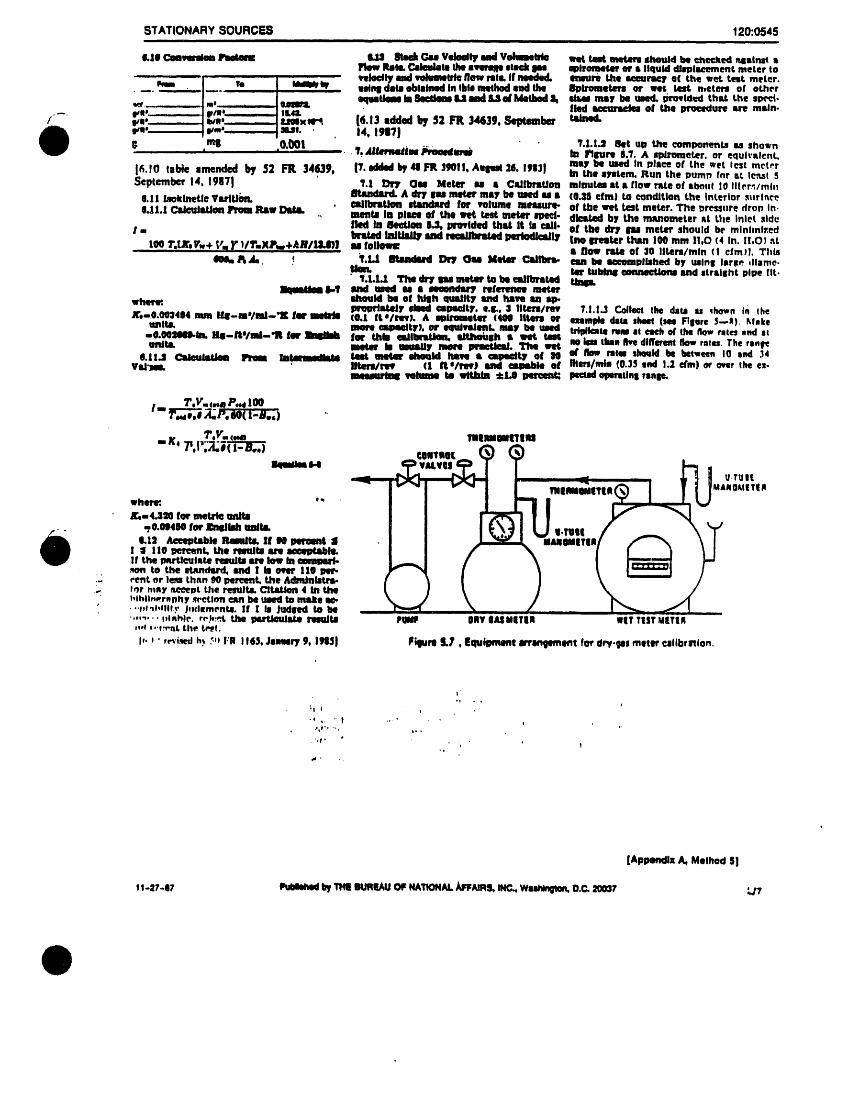
I• , . o
;I ( ,
• i _. .. _ . , t ,.
',l' " i ' I
[Appendlz A, Method S]
t t-=7-e7 Pueeee_ by 11418tmeNJ o_ NATtON.6,t.kFFAmS, iNC., WmmlngU_S.C. 2tm7 Lt7
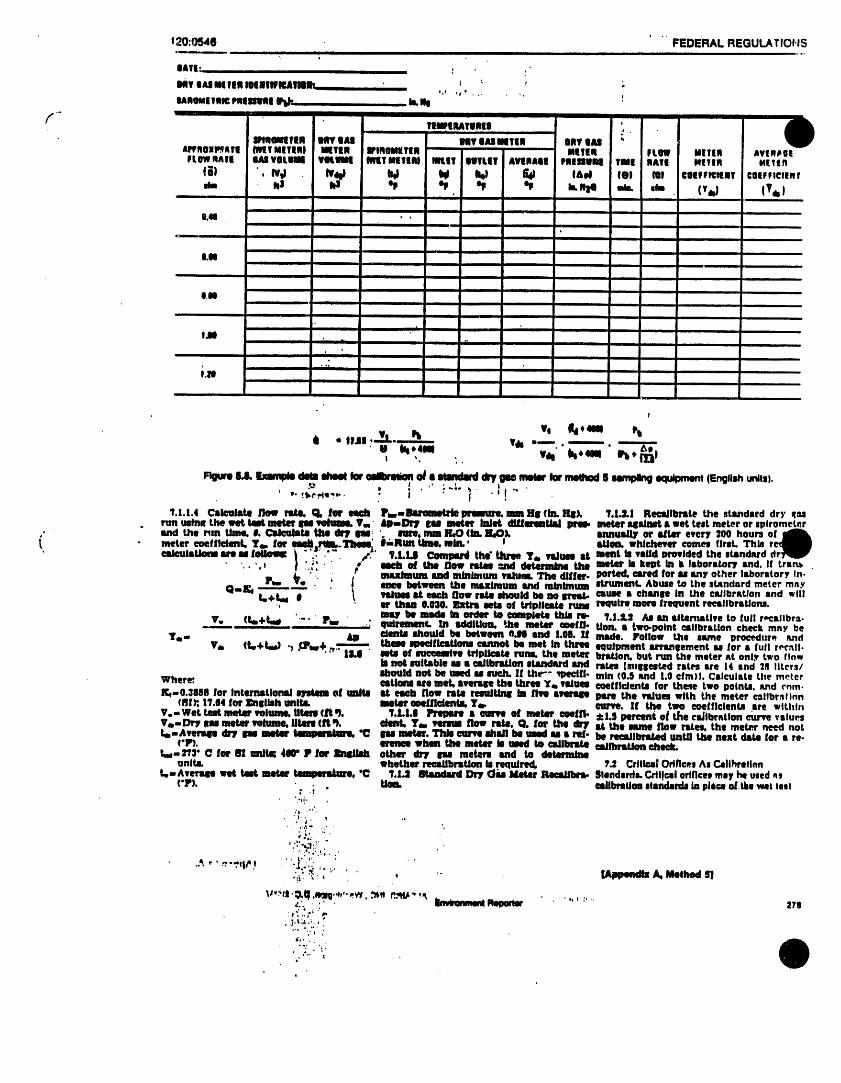
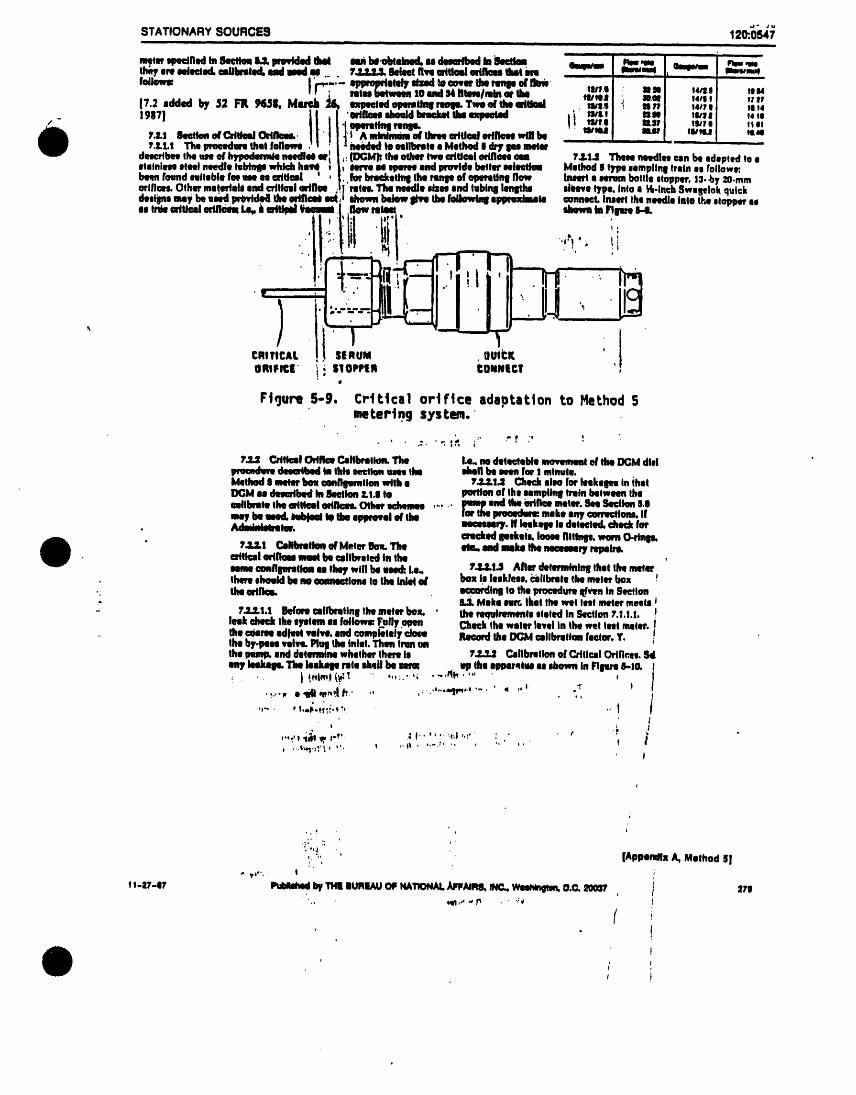
'. '_,1
,. _.' ' • [AppondlxA_MethodI]_ *
•" _po". | !
Vl-I7-1J7 Ptdalad_J. by 'rill It, IRK _ NIA_ _J_AlPtS, INC. Wi_ O.C, _0_ , / 270',_ _,,, -,_ " ,'v i
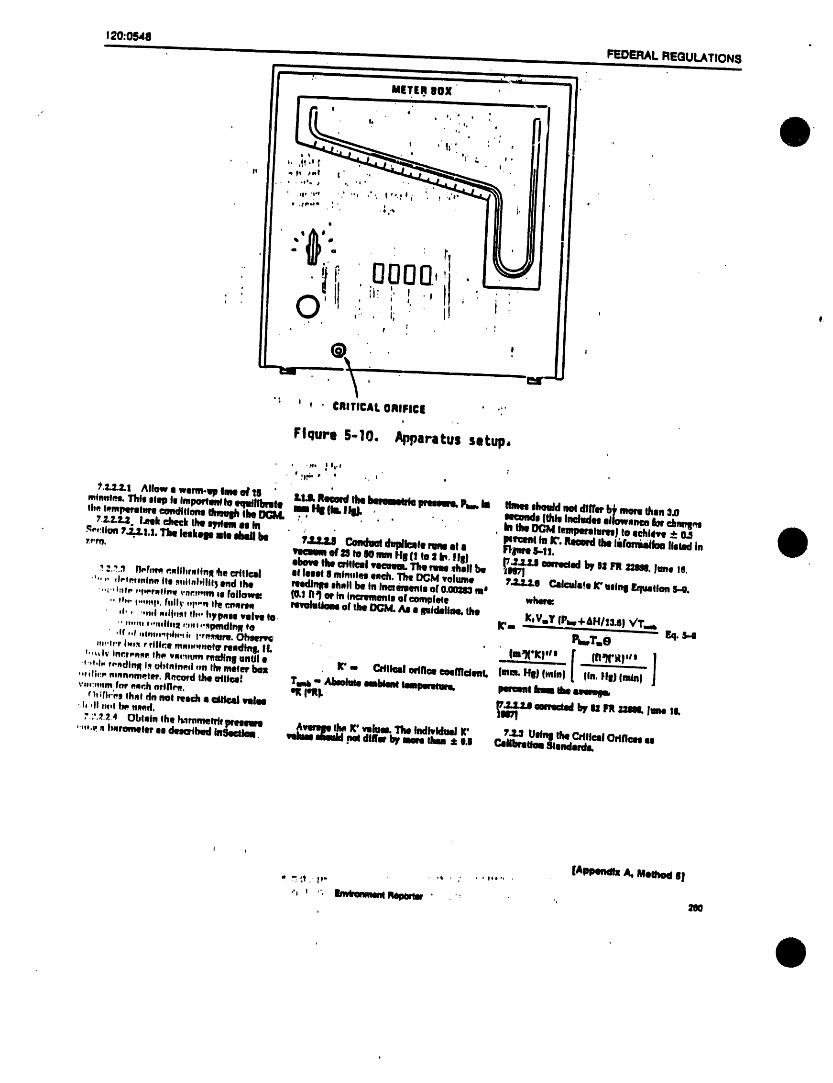
' ' [AppendlzA, MemN II, .i ' , . Itl't ,
" _'I, It"
.',' '. lndrmmmlAepam_ ' _ ',
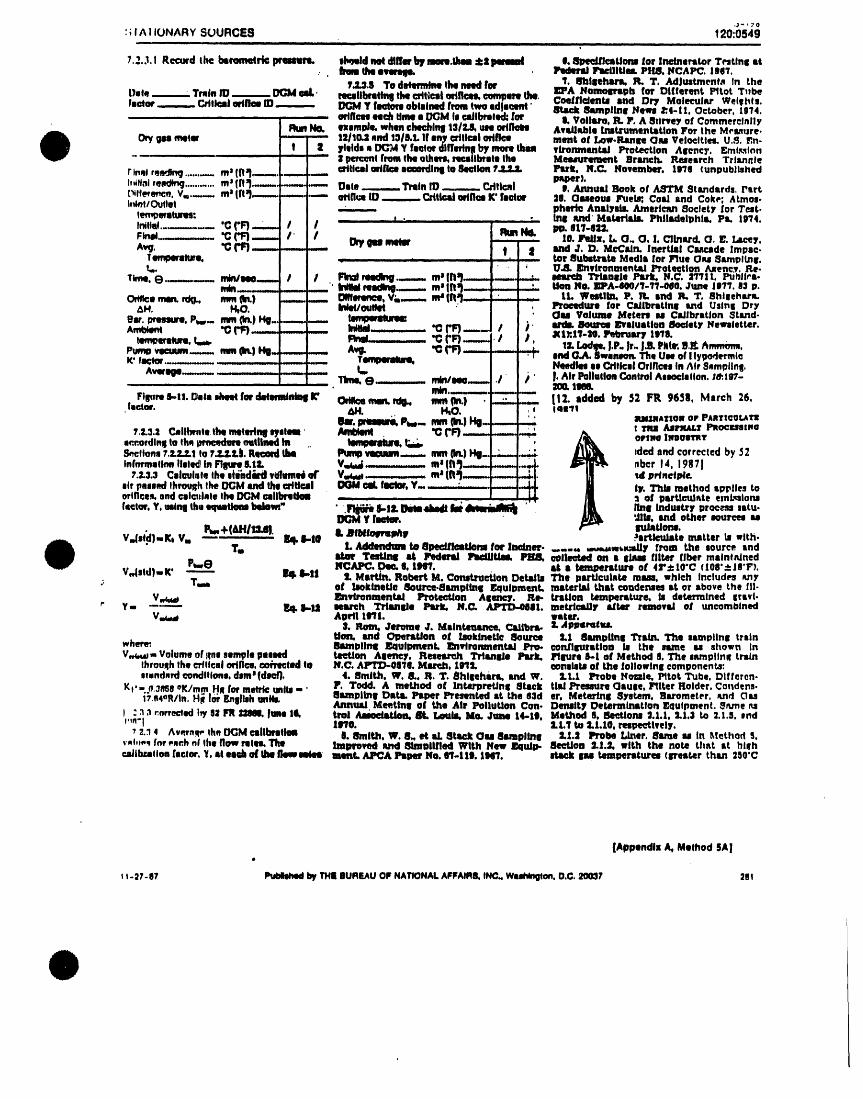
:; ! A 1 lUNAR Y SUURCES 120:0549iii i i iiii ii
7.._..1.I Reouwd tl_ beirmn_l_ _ iIwJmld_ {lille by iiiiMl.lbll :_ll _ I. _111_llcllLIolll |or |llli_bllrltor Testlnl st. lmm Ihel_wMlL _ FlelllU_ PllB, NCAPC. 11161.
f_L3.11 1'o d_ tins_ rer 1. BhlllhlWlk I_ T. MJumLmenM In theDA Nom_reph Ira"Different Pltot T,be
I)lle Train lid _ tel.. nmllllmlthq ! the critical orlllelm, uompm the. Coefficients iIId OIl, Molecular Wetlhts,rectal' ....... Ctllkml ortnmID DGM Y hmto_ oblulnml h_nl two edlnmml" Black 8smpllBI J_eml 1:.4-11. October. 1g74.
................ wlllcll licit tlnll e I)GM II clllbrllld: fee L Volllum, lqL F. A 811trey or CommeretnllyRun No. IrxumplL whim chechlnll lS/].S, u_ orll1_e Avldl_ble InltrumentaUon For the MPIsure.
On/gu mltll meet of Low-Ranle Ou Velocities. U.S, r,n.-- l , 12110._nnd 1OlB.LIf any =filial oHll_yields a DG_ Y fxtor dllTIHnll by moll then vlrenmentld Protection Alellc]'. Emt_,,dnn
-- | pefclmt from the oth_ mcMIbrete the Mmmmmlent gr_eh, Research Trlsmnlefloat readlm] ....... mj |_=t.... attirali afilicl IiN:mlJlnI to 8mltlOII?JI.].l. PII'L N.C. Ho_mber, 1i70 (unpublished"-- pspelr).tt,lfnl rel_ltng........... m)(ll_ ...... Oils l"fllll ID ._._._. CrltlcNI |. Annuld ]Book Of _ Stlmdlrds. Part(_lfe_e_:., Y..__ mJlrt_ ...... :;-_ -- arlnue lid , Crltlr.ld orlrlw K' fscdc_ 30. Oueool P%lel_,Cold and Coke; Atmos.I,dmlOutie! ; phelrt_ Aullyldl. Amerlcnn So¢tetY for Test-
tem_evstunm: 'G I. ...... _ I111 mid' MstmtsAk Philldelphlt, PL 1974.Iml,e_, ('F) .... t I Run N_ p_ sll-e_Fined.___..__ "C ('1:1-- I" I 10. lqdlx, b. O. O. f. CllnntcL O. I_. la_ey.AW. "C {'F),_._----, -- I_y girl _ t | ind J. D. MeCldn. Inertlll CM_de Impsc.
Tempelalmlk - , .... , tot 8ullt_t_ Media for 1qua aM 8ampilJnl.t... i' ' UJL l_rlvlronmentAJ Protection AJ_enc_,Re-
TltlolJe Plrlt. N,C. 3"1'711,_bJl_l-mM _ _, __'" Ildtlll fllldlnt.._.., m sII1_--.-. m m _ Itc_ _PA-400/1-71-0tt0. June 11117.113p.
Odflcemen, rd_ mm (In.) _ Olffm_e_-'l, Vm,__,, ma|fi_l.......m._...,... U. Westtln. P. I1, and It. T. Jqhilehsrn,AH. H_O, bdeUoullet ' , l_roemlure for Cldlbrstlnl tad Uslnl Dry
Bit, I_lssurl, Pw-- mm (In.)Hg ............. _ Ou Volume Meterl sl Cldlbrstlon 5tsmd-Arrd0k_ "1__ .... IllltlM* ;: _ _ - "C ('1=).,,.--. I )' _ IlmlW_ L_rIIUItIOll 8c_ety NewMetter.
I_m_emlum, _ _ "C pF).._.. I 1, ,1KI):IT-IO. l_srlr 11711.p_ _ { _ _ ) _ _ : 1 _ -- -- Avg. '_ ('F) __ t:t. Ladle. i,P. Jr. IJB.Pitte,,0,1¢ ,_m,.em_,K' lector...... ...... Tlmpllill, _ _ aM G.A. Swann_ The U_ of I lypoderml_
-- t,, Needle ae Critical Orifices In/_if Snmpllna.Avlwuge....... : :: Tint, _ ....... mining__ .I / ' I. Air Pollution Control ^slm¢iallon. _.l_-
:m. tim.
Fil..I-tt. Dated_mlfw_lml_ll{' Odlk__ ='_)_-:. _" _ !12. sddml by $2 FR 96_11, March 25,{Ictor. J_'l. 1410. -- _ IOl_fi
_11. _ Pt_-- _ _11.1Hi........ _ llllLIIAllOIl OWPAIIlrlCOLAlrlt _ AJ;a'xMJrIPstoca_emo7,].3,3 C_lll_nle the mt_lq eyetml • knnldonl "_ ('F1 ..,..,- --er_oedlnl to the pn_mdmmoltlleml hi _, _ , owls llloomml_cilon, 7=tto,_.JL&lI.R--ibl " P_qlvlluum__ mm(M.)Hi. --..44 ,ded,ndcorrected by ,2
.......:: | _) _'t_ ,bcr 14, 1987 Iinfnnlllilno IJlled in Irllpn &tl. V ma I1 ..... ..
?.2.3.3 C81culnle tl_ siehdird v_'lum_ or V,,_ _ m_ (flff__..... _1 prlnel_¢sir paled Ihro_h the DGM _ theertllt_ll _ (NIL fll_'t_, Y.. +..... : .... ii I'_i]] I_. _ method applies tooflflce_, and cll_dlle the DGM _ilbml_m ......... [ |J _ of plrtlm_l_te emLqlon_lector. Y. umlnI the lmpUltlmUlbldowl" ' lel_ 8'11. 0111411all II_ _ "' hal industry process sate.
Y futee. 'Jib, ted other _ourees u
-- lublUorm.V._sl'.dJmK,V,, Rm+(MII11_81. IMI. I.-t@ IL JIIMIolWIM1 PertleuJsta matter k with.
11'. L kddendmu to 8pedf1_tlom tar lneJn_. _,,,, ,,,,_,u,.,dly from me .saree andTmltJnl M Pedlmd lqldUUt. PIlB, _lleetod on • eJaai filter fiber meintedned
P_,,e NC.q,1_. _ |. tllrY. _ • teml_lm o! 4r:t:10"C (108"±le'F).V,,Istd)-K' -- IN, I-It 51.Martin, Robert M. Comtl_l_Jon Detldk The plurtlcutste msem. which Includes _ny
:, T,m of IsoklneUe 8ource-81mpllnl Equipment, msterlAI that coudemes st or above the Ill.V_ _n_,_nmenfad I_rot_.eUon Aleney. Re- _rsUon tempemteure. 1_ determined Itsvl-
" Y- ---- lhl. I-It laugh Trhmale PIIll. N.C, ,4,PTD-0HI. metrteldJr _ttm, removld of uncombinedV,._,,, April L111. water.
I. Ram, Jerome J. Mldntlmtam,_ Clllbm- ].,lppelrltuahUon. and OpemUon of lsokfnef, lc 8aurae 1.1 8umuttne "l_rsln. The _mplln11 train
wherl_, _lJrnpltml Equipment, EnWronmentld Pro- cordllurstlon k the _me u shown InV_._- Volume of line sample gilled _Oll Alerlcy. Reselzeh Trtanlde PmrL FlluN 0-1 of Method 9. The snmpllnll train
Ihrouqh the CTftieal orifice, cold,lid le N.C. AP'FD-0870. Msr_. L11& eonaLste of the followtn| components:tmadnrd conditions, dime(die.f). 4. Bmlth, W, 8. R. T, 8hllehtrl. 8rid W. 2.1.1 Probe Ironic. Pttot Tube, Dlfferen.
Kt'- 0.3R68OK/mm HA for metrk: until - ' 1p. Todd. A method of IntemreUn8 Stack tlsl Pressure (]sale, Pitier Holder, Co.dens.{Ts4OR/In. H_ 10fF,.ilbh uni_ 8ampitnl I:)StL Psper Presented st the (13d er, Materiel 8_tem, Barometer, n.qd Ou
•_muld Meetlnll of the Air PolluUon Con. Density Determination E(lulpment. an.meI : _ 3 _mrected I_/0,1 FR _ lime 10, trol AamJeMdou. EL/,mull Me, June 14-10. Method S, BeeUorm ].1.1. ].1.3 to 2.1,S. end"'n'l 1110. &L.7 to &I.10, respe_lvely.
? 2._ 4 Avernqe the I:_M clllhrllltlNl II. i_laiU1. W. 8. et st 8tlr..k Ou 81mpllnlf ].1._ Probe Ir_ner. 8nme u in Method 5._'nl.e_ for each of the flow rile. The huplm_Bd _ 81mDIlfled With New ]r4ull)- 8ecUon :1.1.3, with the note tlmt st highcaJibuJllon {lClOe. Y, el ee_ll of the Jlemm4et ulent` ,_IP_A Pule' No. trl-lll. 11)41"/. id_ek |u talnperelurel(Irrester than 260'C
[Appendix A, Method SA]
_-_7-87 _ by THli BUREAUOF NATIONAl.AFFAIRS,INC., Wuhin_ton, O.G.2013_7 201

*40 CFR 60, July i, 1978 I
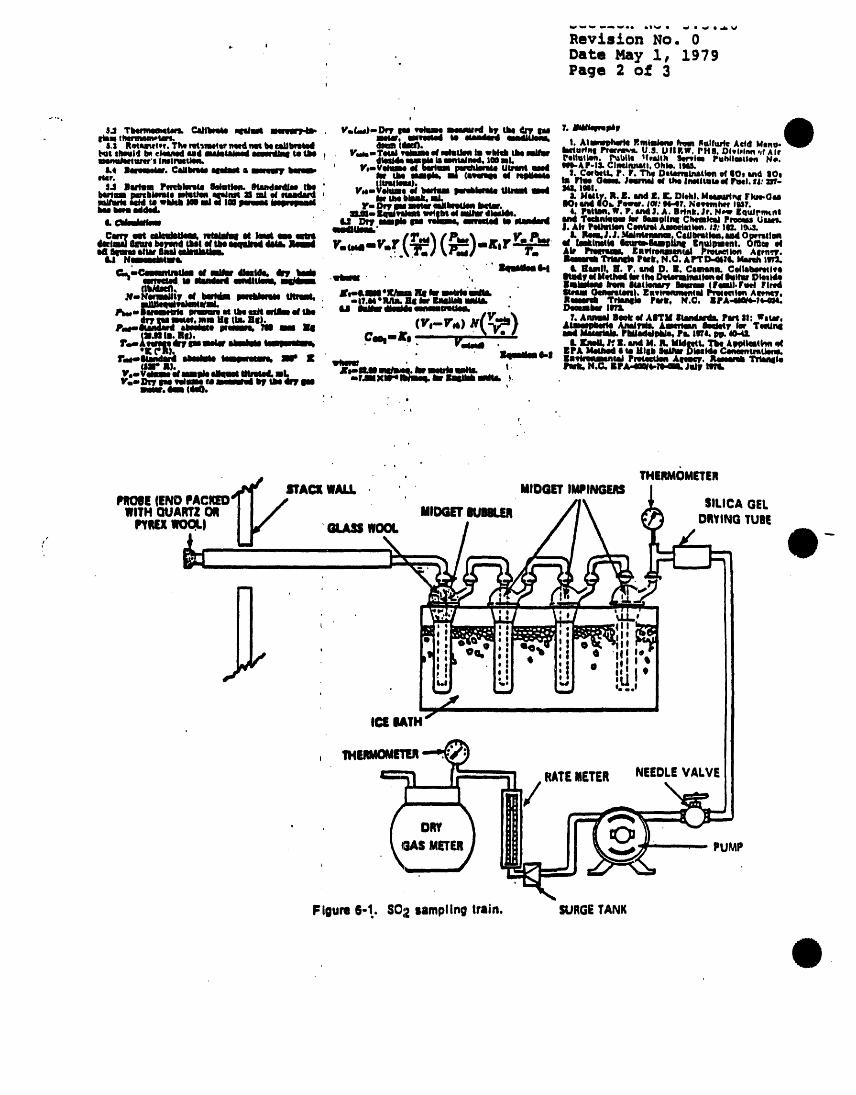
t
IC_liATH
1HmAO_E1LqRATEMETER NEEDLEVALVE
/• , DRY
GAS METER PUMP
Figure6-1. 502 samplingtrain. SURGETANK
*Federal Register, Vol. 43, No. S7-March 23, 1978
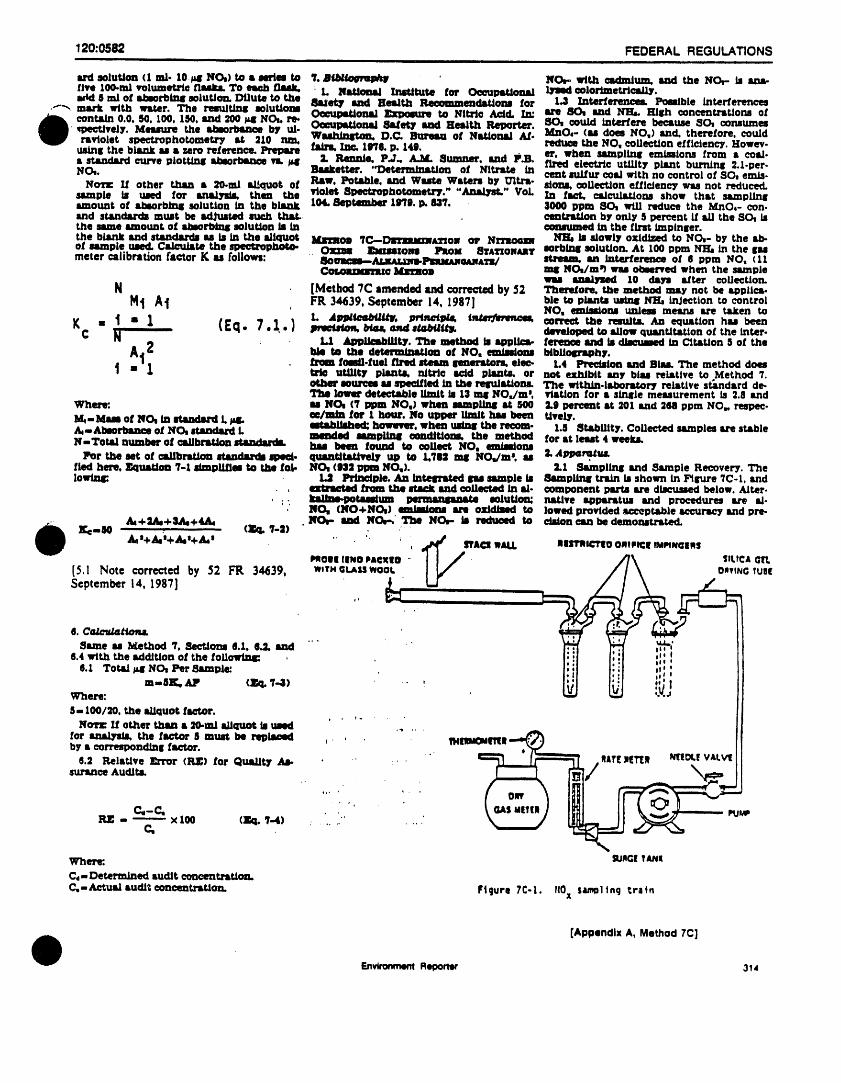
[Appendix A, Method 7C]
EnvironmentReport_ 314
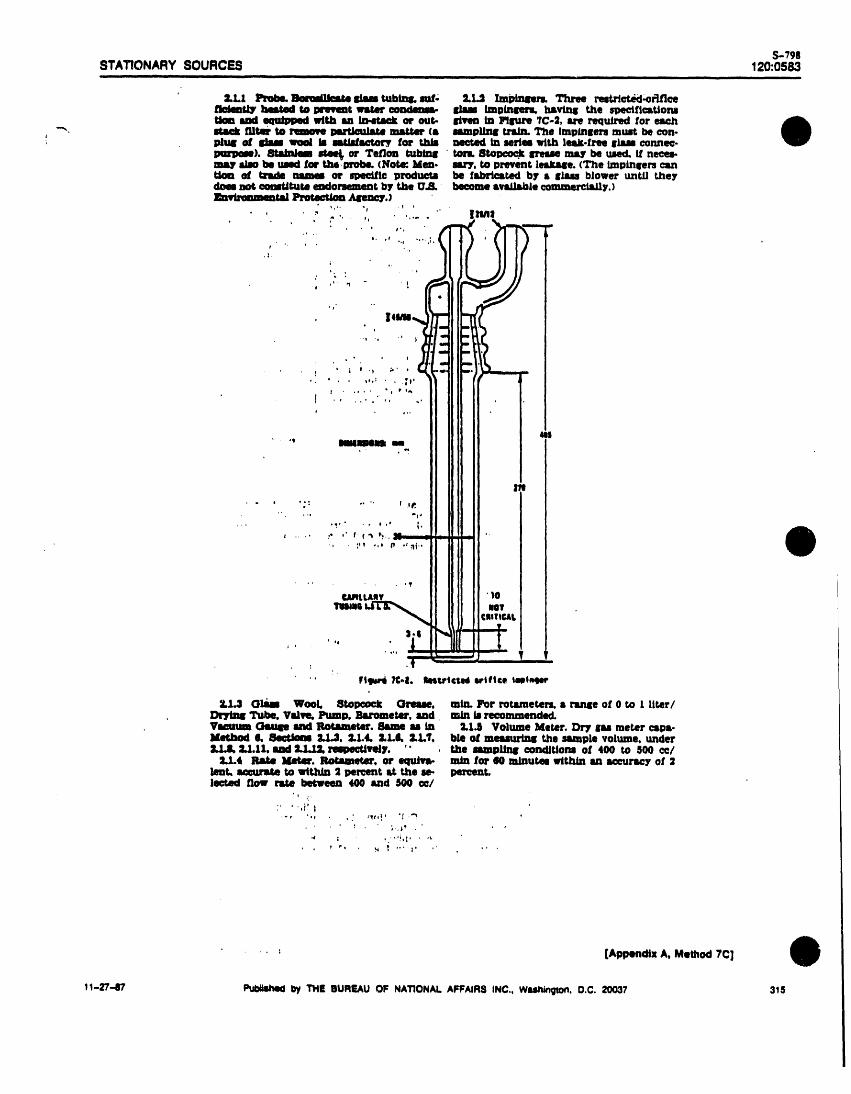
!
* " ": o."" r OR,. • ,., ,,.,ii,+,
., :,v .,. _ .,_+.,
. ,?
URttallY • )0
'rglllllll _ lilt_:BIIIC£L
; .... I _) •' ,.i pi
o_!,
• Fl_ 71:,,I,. Ikjsli.rl¢t, ld Irtftce t+t_qleg"
31.1.3 Olaas WooL, 8topoo_ Ormme, rain. Por rotsmeter_. • rtnle of 0 CoI Liter/Drj_nl Tube. Vsive, Pump, Bsrome_r. and rain 1_recommend_LVm G_uu 8rid Rolame_er. 8sine u in =.1.11Volume Meter. Dry lU meter csps,Method 0. 8ecUmu 2.1.3. :1.1.4, :t.L_ :I.LT, hie of masurin8 tho sample volume, under:LIJk 2.1.11, and :L1.LI.rmoectivel_. " the mmpUn8 eondJtiorw of 400 to S00 ce/
2.L4 ]itJdr4_. ItolraJIn_Ms'.o1"equbrs- ndn fOF gO Im_ut4m_lth_ axl sccurlcy of 2lent, xeeura_ to wtthLn 2 _ent at the ae. percent.loeted flow rsta between 400 snd 500 ce/
o! .:+
"' ,_'_I,-r ',, , , ' _lt,!' "_ "'"
• . ;._, . ,
' ' _ _' ."+ _ "" I' " ' ' '
• ' ; [Al:1_mdixA, Method 7C]
11-27-87 1%lt3MIhed tly THE BUREAU OF NATIONAL AFFAIRS INC., WIJthingtort. D.C. 20037 315
[Appe_¢llx.A, Method 7C]
"_',- Envemm_m Reportsr 316
S-798STATIONARY SOURCES 120:0585i i i i ,i | m i ii
flow _ be chocJLedu alwvo prior to emr,h loot can be _ from the dffferemce simple mmpeetedto have the hlghe_ NOr.test. between inltia/and final solution levels, and eoncentmUon, and add I ml of the spikinl
4.L4 8mnple CoUeetion. Record the inJ. this VldUe can then be mJedto correct the solution to these allquota. U the spike recov.thLt EX)M resdin8 and bezometrte preseure. 8madyticsl remdL, qusfltltstlveLy trsn_er ery or column efficiency (see 4.2.1) is below
f_ Determine the mmpUng point or point8 _ the contend to a l.Uter volumetric fhudt` 98 percent, prepare a new column, an_Jan,cording to the spproprta_ relul_ouJ, e.g., sad dilute to volume, repo_ the cscimlumreduction].Section 00.40(e) of 40 CI_ Part 80. Pesltlma Take a 100.ml aliquot of the sample and 4.4 _mple Analysis. PSpotte 10 mlthe Up of the probe st the Jamplinlr point, bisz_ (_ K.MJ10,/NsOH) solution& sample Into • culture tube. (NonL.-8om_ m"connect the probe to the first Impinger, add and tru_er to 400-mr. beakers containing test tubes give a hlSh blank NOr- value butstart the pump. Adjust the smnple flow to a magneUe 8tilTing bars. Usin8 s pH meter, culture tubes do not,) Pipette In 10 all ofvalue between 400 and 500 ce/min. CAU- add coneen_ H,80, with stirring until a sulfanilamide soluUon and 1.4 md of NEDA"/'ION: HIGHER FLOW R_T]I:8 WILL pH of 0.7 is obtained. ,_low the solutions to solution. Cover the culture tube with Dt_.-PRODUCE LOW RENULTS. Once adjusted, stand for 16 minute_ Cover the beakers film. and mix the solution. Prepare a blankmalntadrt a constant flow rate during the with watch ghum_ and bring the tempera- in the same manner usin| the sample fromentire sampUnl run. Sample for 60 minute& lure of the solution8 to 80 "C.Kcep the tmn. tresLment of the unexposed KMnO,/N&OHFor relative 8_'uru_ (RA) I_ltlng of cenUll- I_.stan_ below 00 "CDJmolve 4.8 • of oxafle solution (3.1.2). Also. prepare a caUbraUonuou8 emission monitora, the minimum Jsm. acid in • minimum volume of wa_r. ap- standard to check the slope of the calibra-piing time is I hour. nmpiing _0 minutu a_ proxtm_ady SOmL _ room tempor_ure. Do lion curve. After a I0-minuto color develop-each traverse point. I_ox_--Whm the 80, not he_ the soluUon. Add this solution ment interval, measure the abeorbance stconcenU_JoD _ _ thnm 1200 PDm. the Jdowly, in inerementL until the K:M,nO, so- S40 nm m41trujt water. RHd _ NOr-/mlmmsplin8 time may have to be reduced to 30 luUon becomm celorlms. If the color is not from the calibration curve. If the ahsor.minutes to eliminate PluaTin8 of the ira- completely removed, prepare some more of bance is aTester than that of the hilhestpinger orifice with MnO,. For R_ testawith the aboveoxldlc acidsolution, and add unUl esJlbratJonstandard, pipette lessth_n 10 mlSO, I_t_er _ 1200 plxn. sample for I0 • coloriem solution is obtadned. Add an of sample and enoulh water to make the
exeem Of ox&Lk__ by dissolvtnl L4 g o! total ssmple volume 10 mL and repeat theminutes (10 minutm 8_ each point)). Record oxalic anid In 60 ml of meter, and add 4 mi analys_. Determine the No, concentrationthe DGM tempet_um, and cheer tt_ flow of _ soluthm to the celorimm solution. If usin8 the calibration curve obtained In See.r_e a_ least every S minute_ At th, eonelu- _ maU_ la presem, add concert- lion S.3.8don of each run, turn off the pump. remove _ _e_qO, until s clear solution is o1_.probe from the stack, and record the filud teJned. 4.5 Audit ,4J_llmis. This is the same u mrmldJng_.Divide the rumple volume by the Allow the Nmpla to cool to near room Method 7. _eetion 4.4.ssmpUnlr time to determine the average tempor_ul'_ bean8 sure _ the MmpLes 5. Ca/_bratton.flow _ Conduct a le_k.ehec_ aa in _ m _ elem,. &dJugl;the pH to 11.7 to 12.0 S.l Dry Ou Metering System (DGM).Uon 4.1.2. If a lee/t is found, void the te_ with 10 N NsOIL Qmmtitatlvely trm_er 5.1.1 1nJtial CallbraUon. Same u tnrun, or uae procedures acceDtable to the Ad- the mixture to s _ funnel eontoininz Method 6. Section 5.1.1. For detailed ln-mlnistrator to adJuJt the somple volume for OlP/C rotor piper. 8rodfilter the preetpitol_e, structlorm on exa-rying out this calibration.the lealu_re, lPllt_ the mb_m into a 500-mi filtering it is suggested that _ctlon 3.5.2 of Citation
4.1,5 CO, Mesmlrement_ Durtn8 rim- flwdr. Wmlh the solid _ four Uml 4 In the bibiosr_hy be consulted.piing, mvemure the CO, content of the stact with warm,. When flltraUon is complete. $.1.2 Peet_Test Calibration Cheek. Samepa near the mmpUn8 point uain8Metltod 3. mlab the Teflon tubinir, qusntit&tlvely Imin Method 0, _,ction 6.1.2.The staBle.point stab samplin8 procedure is muter the fll_ to • 000.ml vol_sdemm_ provided the m_W aru flt_dr_end dliu_ to volume. The mmpla aru fJ_ Thermometers for DGM and Barome-made 8_ _ Uzrue Umse--ne_r the am_r_ now rem_ for mdmlum _ Pipette a ter. _nne u in Method 6. Sec_ionJ S._ andmidul_r, and before the end of S run and _ aiklUOt of the mmpJe Into • l_F0-ml _.4. respeeUvely. Athe average CO, concentraUon hJcom_ted, beak, s'. and add a m84_etle 8tlrrtnl bar. Pt. 0.3 Calibration Curve for 8pectropho_The Orsat or Fyrtte _ m_y be used porte tn L0 nd of 4J_ percent EITrA solu- meter. Dtlute S.0 ml of the NaNO, stan_for th_ anal3m_ •
4.2 Sample Recovery. Disconnect the tnt- _ and mUL solution to 200 m/with w_er. This solution _rptnlers. Pour the contents of the imp_ Determine the correct stoDcock setting to nominally contains 25 ),11NOr-/ml. Use thisinto a filter polyethylene bettie usin_ a establh_l a flow rate of ? to 9 ml/min of solution to prepare calibra_lon standards tofunnel and s st_rrtng rod (or other means) column rinse solution thromlh the cadmhun cover the mnse of 0.25 to 3.00 _z NOr-/mLto prevent spillage. Complete the qmmtit_- reduction celumn. Use a S0-mi 8radtta_d Prepare • minimum of three standards eachWe trarufer by rinsin8 the Lmpingers and c_Under to coUect and mesmare the solution for the linear and slightly nonlinear (de-conn_ tulx_ with water untU the _ volume. After the lut of the rinse soluUon scribed below) range o! the curve. Use pl-tn, thai; are clear to light pink. and _ld the I_s passed from the funnel Into the burette, pottes for all addltion_rinsings to the bottle. Mix the sample, and but before air entrapment can occur, start Run standards and a water blank nm In-mark the solution leveL Seal and identify addin_ the sample, and collect It In a 250-mi structed in Section 4.4. Plot the net aUsor-the sample container. 8raduated cytinder. Complete the qmmtit_ bance wJ _,sNOt-/mL Draw s smooth curve
4.3 Sample PreDaraUon for Analysis. Pre- five tranafer of the sample to the column in throu_ the points. The curve should bepare a cadmium reduction column u for the sample pintoes throush the column, linear up to an nd_orbanceof approximatelylows: Pill the burette (2.2.12) with u_Mer. After the lut of the sample bsa pomed from 1.2with a slope of a_proximstely 0.53 abser-Add freshly prep_'ed em:lmlumslowly with the funflel Into the burette. 8tsFt _ 00 baJ_e unlLii/_ NOr-/mL The curve shouldta_inlr until no further settlJng occurs.The ml of column rlme solution, and celle_ the pore through the origin. The curve is sltlht-height of the cedmium column should be 31t rbmmsolution unUl the solution Just dise_ ly _ from an sbeortxmee of 1.2 to
When not in use, store the column pears from the tunnel QuantitsUvely trar_ 1.8.under rinse solution (3.2.7). (NOTL--The fer the sample to a 200-mi volumetrecolumn should not contain any band8 of (250-mr may be required), and dilute tocadmium fine_ Thts may occur if resenera_- volume. The samples are now ready for 6. Calc,zlatto,ued column 1_ uaed and will IreaUy reduce NOr-4- analysis. (NoTL-- Both the sample . Carry out calculations, retaining at leucthe column lifetime.) and blank should go through tJ_J proee- one extra decimal figure beyond that of _he
Note the level of liquid In the sample con- duve. Additlomdly. two spiked samples acquired data. Round off figures after firm/t.tiner, and determine whether any sample should be run with every group of 8&mpies cslcu_tion.wu 1_ durtn8 shipment, If a not_%q_ble _umed thl_ulrh the column. To do thl_ pre- 4.1 Sample volume, dry baals, corrected toamount of ieak_e l_s occurred, the volume pare two acldlUonal S_-mi allquotm of the standard concUtlonL
[Appendix A, Method 7_]
1_-27--87 Ptd_iSttedI_yTHE BUREAUOF NATIONALAFFAIRSINC.. Wsshington.D.C. 20037 317
[Appendix A, Method 70]
"-. • ' ..... ' EnvVonmnmmtRopoctor _16
3. MailS•On, J.H.."|.F,. KnolL and DLR. of premure apgeare to be nesiisiblt, " k determined mvlmetrladly deer removalMldptt. A Manuel Method for TR$ In method 8, 2SO" P is established us • of uncombined water.Determination. Dre(! 8veilsbJe from the nomineJ reference temperature. Thud, 1.3 Applicability. This method applies toauthors. Source Brenr_ Quslity Amn_ whm Method S hi sips:filed in auraappflable the detorminsUon of parUcuJste emLssloruiDivision. U_. Environmental ProtecUoa rdbpsrt of the standards, particular4 msttm' from stsUonar7 sources for determinin|
.._Agency, Research TriansJe Perk, North ia deflued with rupee_ to temperature. In compUanee with new source performance: "._,aroltna 27711. order to maintain • collection temperature standards, only when specifically provided
of _JJ0" PP,Method il employs • heated |lure for In am applicable subpsrt o( the stand., sample probe and • heatA,d fUter holder. _ This method Is not applicable to stack,5
This equipment is somewhat eumbenmme that eontaln liquid droplets or are saturated
METHOD 17--DrrZltMlWAYlOlq OF PARTICITLA1M and requir_ care in lea operation. There- with water vapor. In addition, this methodEMtSStOlqS I_ROM8"_A'FIonJutY 80UlaM (111- Fore. where particulate matter concentre- shall not be used u written It the projectedsTacx I_LntaTXON Mrrxoo} alone (over the normal ran|e of temperature cross-sectional ares of the probe extension-
ussoc/ated ruth • spas/fled source catelrory) filter holder assembly covers more than Sare known to be Independent of tempera- percent of the 8tuct cross-_.ctlonal ares (see
ethod t7 corrected by 52 FR 34039. Sap(am- tufa, It is desirable to elJmJnste the |lu8 8eeUon 4,1.3).r 14. 1987}probe trod he•tin8 try_ems, add usmp|t 8_stoat temperature.
Introdue_lo,t This method de•at/be8 in to-steak sam-Plurtleuiste mattes" is not an absolute pllnl _ sad mmpilnlr proeeduru foruJe In such sues. It is Intended to be used 2. ,Ipparu_w.
quantity; rather. It is • function or tempers, only when spas|fled by an applicable sub.ture and premure. Therefore. to prevent part of the standards, and ordy within thevariability In particulate matter emission applicable temperature limit,, (U specified), 2.1 Sempllnl Train. A schematic of therelrulstlons and/or, ussoelated test methods, or when otllerwise approved by the AdDflD- 8ampiin| train used tn this method is shownthe temperature sad presmlre st wnleh par- IMitator. . In FIIrure 17-t. Construction details forUculste matter is to be me•mired must be many. but not all. of the train comvonenUcarefully defined, Of the two vat/able• (Le., 1. Pr/nc/p_ e_f Ap_fcob/fltW. are liven in APT1D-0881 (Citation 3 In 8ec.temperature and premuro}, temperature him 1.1 Prine/pla. PsrtJeula_ ula£ter 18 with. Uon _):, for ehsmses from the AP'TD-0S81the Irrester effect upon the mount of par- drawn isoirJneUcsUy from the amuree and document and for sUowsble modificationstieulate matter In an effluent 8us 8tzes_ In collected on • IJll fiber filter saints/ned to Flruure 17-1. con•u Jr with the AdmlnLstra.most aUtO|artery •aurae cats•aries, the e/feet st stack temperature. The parUculs_ msm tar.
i
[Appendix A, Method 17]
Rego_er 122
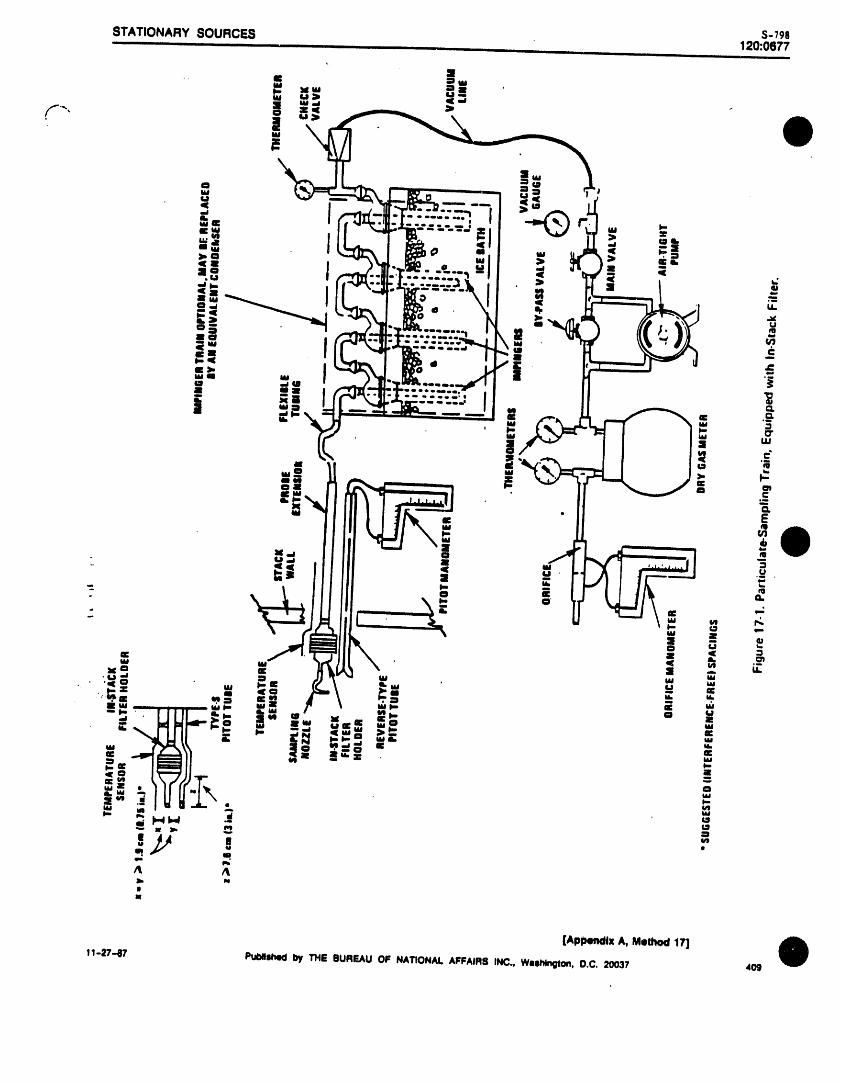
[Ap_lz A, Me_ 17]
11-2747 PuOlletl_ by THE BUREAU OF NATIONAL AFFAIRS INC., Wuhlngton, D.C. 20037 409
120:0878 FEDERAL REGULATIONSi
The operatlnl and msJn_ prose, may be used: however, the pilot tube coeffl, descr/bed In Method 3.dures for many of the samplln8 tndn com- dents of sueh 8memblles ahan be deter. The temperature sensor shall be attachedrepents are deser/bed In APTI2-0876 (Clta. mined b)' eaUbraUon, mdnl methods lubJe¢'¢ to either the pltot tube or to the probe ex.
on 3 in Section 7). Since correct tum4re is to the approval of the Administrator. tension. In s fixed conJIIruratlon. If the tern.....oortant In obtalnInl valid results, all 2.1J 12ffferentlal Pressure Oaul¢ In- perature sensor is attached in the field: the
.-sshould read the APTI)-0878 document eUned manometer or equivalent devtce sensor shall be placed In an interference.adopt the operatinl and uudn_ (two), u dem:Hbed in Section 2.2 of Method free srranlrement with respect to the Type.,dulls outlined in IL unJm otherwtes :L One manometer shall be used for velocity B pilot tube openlnlm (8.5 shown In l_gure
specified he.rein. The 8amplinl t4,alD con. tread (£p) resdJngl, and the other, for or/- 17-1 or In ]PIIrUre 2-7 of Method 2). AJterna.sis_ of the followinlr components: flee dHferentlal premure resdInll, tlvely, the tempol-_ture sensor need not be
2.1.1 Probe Nm=Je. Stainless steel (31(1) 2.1.(I Condenser. It Is recommended that attached to either the probe extension oror llg.ss, with sharl_, tapered leading edlle, the imp/pier system desm'ibed in Method § pilot tube durtnlr sgntpling, provided that a'the anlrle of taper shall be 30" and the be used to determine the moisture content difference of not more than l percent In thetaper sht41 be on the outside to preserve a of the 8task Irma. Alternatively. an), system sverale velocity meuurement la Introduced.constant tnternal diameter. The probe that tJlows meuurement of both the water This LltemaUve ts subject to the approvtJno_Je shall be of the button-hook or elbow oD,nd.eneed and the moisture leaving the con- of the Adm/nistrMar.des|lrn, unless otherwise specified by the Ad. denN¢, ev, h to w/thin I mi or I 8, may be 2.2 _unple Recovery.mlnistrator. If mgde of sta/rdesa steel, the used. The moisture leaving the condense1' 2.=.1 Probe Nozzle Brush. Nylon bristleno¢TJe shall be constructed from seamless can be mesmn'ed either by:. (1) monitoring brush w/th 8taL-des8 steel wire handle. Thetubinl. Other mater/ale of construction may the temperstm am/premurs st the exit of brush shall be properly sized and shaped tobe IJlaed subject to the Kppl'OV_ of the _ the condenser sad usinl Dalton's law of brush out the probe nozzle.mlntstrator. Imrtlai premure¢ or (2) pua/n_ the sample 2.2.2 Wuh Bottles--Two. Glass wash
A ranlre of s/ass suitable for Isoktnetle Imp strelun through a silica gel ira4) with bottles are recommended: polyethylenesampling should be avs/la_le, e.g, 0.32 to exit m kept below 20" C (88" 1p) sad do- wuh bottles may be used at the option of1.2"t cm (V, to _ In}--or larlrer II higher retaining the we/|ht lain. the tester. It la recommended that acetonevolume samvllnlr trains are used.-Ins/de dl. FlexJbie tubinlr may be used between the not be stored (n polyethylene bottles forameter (LD) nobles In Increments of 0.111m probe eltormion and condenNr. If means longer than a month.(_o In). F.ach no_Je shall be eaUbrated me- :L2.3 Oimm 8arnl)le Storage Containers.cordinl to the procedures outlined in 8era- othm" fJ_n 8/Ucs Irsl are used to dletermtnetion 5.1. the amount of moisture IcavInf the con- ChemleLUy resistant, borosllicate llu tot.
2.1.2 Ftlter Holder, The In.stack filter denser, tt is recommended that. silica Irel sUII ties, for acetone wuhes, 500 ml or 1000 ml.holder shall be constructed of borosil/cate be used between the condenser system and 5crew cap liners shall either be rubber.or quartz |la_. or staJ_ess steel: if a iruket pump to prevent moisture condenutlon In backed Teflon or shall be constructed so asb used. It shall be made of dllcone rubber, the pump sad meter/hi dev/ces and to avoid to be le_k-free and resistant to chemicalTeflon. or stainless steel Other holder and the need to make correeUons for moisturt stt4_c' by acetone. (Narrow mouth 81sss bof|a.sket material.5 may be used subject to the In the metered volume, ties have been found to be les.5 prone tonVproval of the Administrator. The filter 2.1.7 Metorinlr System, Vacuum PUle. leskm4e.} Alternatively. polyethylene bottlesholder shall be desilmed to provide s poe/- leak-free pump. thermometers capable of my be used,Live seal ags3nst lesJrJ_e from the ou_Ide or memmlldn8 temperature to w/thln 3" C (5.4" 2,2.4 PetH Dishes. For filter samples;around the filter. IF}. dry 8u meter cspeble of memaurin8 |laura or polyethylene, unless otherwise svec.
2.1.3 Probe Extension. Any suitable rtldd volume to within 2 percent, and related [fled by the Administrator.probe extenmlon mmkybe used alter the LUta' equipment, 8Mmshown In IPlIRIr_ 17-I. Other 2.2.S Graduated Cylinder and/or Bal-holder, me4_rinl 83mtelmm cal_Jble of maintaining iknce. To meagre condensed water to within
2.1.4 P1tot Tube. Type 8, Im deecr/bed In Immplin| raLes w/thin 10 percent ot isoklne- I mJ or I 8. Graduated cylinders shall have:ectlon 2.1 of Method 2, or other device alp tie and of determininlr sample volumes to subdivisions no Irrest_r than = mL Most lab.
•wed by the Admirdstrator, the pilot tube w/t.h/n I percent may be used, subject to the oratory balances are capable of welshing tobe sttached to the probe extension to approval of the Administrator. When the the neare_ 0.5 g or less. Any of these hal.
, constant monitoHn8 of the stack Imp mererln| system is used In conjunction w/th ances is suitable for tune here and In Sectionvelocity (see F11rure 17-t). The impact (hlrh a pltot tube, the atom shaft enable eheclr, g 2.3.4._res3ure) ovenln| plane of the pltot tube of isokinetle rates. 2.3.8 PIMtIc Storage Containers. Airtllht containers to store silica gel.shall be even with or above the noz_e enM7 8smvlinl tralrm utUlzlnl metertnlr sys- 2.2,'/ Punnel and Rubber Policeman. Toplane dur/n8 samDlinlr (see Method 2. terns desllrned for higher flow rate= themPlfure 2-(1b). It is recommended: (1) that that deser/bed in _(1(11 or AP'TI_.0878 sJd In transfer of silica lel to container;, notnecessary if silica gel is weighed in the field.the pilot tube have t known baseline coeffl- may be used provided that the specUic_. 2.2.8 Funnel. OIua or polyethylene, tocient, determined M outlined In _'ctlon 4 of Uons of this method L"e met.Method 2: and (2) that this known coeffl- =.1.8 Barometer. Mercury, aneroid, or aid In sample recovery.cient be preserved by plsctn| the pltot tube other barometer capable of meuuldng at-' 2.3 Analysis.In xn Interference.free arrangement w/th re- mosvher/e pressure to within 2.5 rnm HI 2.3.1 Glass Wetghinl Dishes.spect to the sarnvllnf nozrJe, filter holder. (0.1 in. H|). In many cases, the barometric 2.3.2 Desiccator.and temperature sensor (see FIirure 11-1). readinl may be obtained from s nearby ns- 2.3.3 Analytical Balance. To meuure toHole that the 1.9 cm (0.75 in) free.space be- tional weather service station, In which case w/thin 0.1 ml.t_'een the nozrJe and pltot tube shown In the Itstlon value (which is the absolute bgur- 2.3.4 Balgmce. To meuure to within 0.5Figure I%1, Is based on s 1.3 cm (0.0 In) DD ometJr/e premure) 8hall be requested and in ml.nozzle. If the sampling train la desllrned for adjustment for elation dUfere_'es be- 2.3.S Beakers. 250 mLsampling at hllher flow rst_J than that de- Sweep the weather slat/on and 8srnpttnlr =.3.(I Hylrrometer. To meuure the tess.scribed In A_581. thus nmltatinl poInt shaft be applied st s rate of minus 2.5 tire hunddlty of the laboratory environ.the use of lar_er sized norzJes, the free- mm HI (0.1 in. HI) per 30 m (100 It) slew- ment.space shall be 1.9 cm (0.'/5 In} with the larl- lion Increase or vies venm for elevation de- 2.3.'/ TemOerature Oauge. To rues.sureeat sized nozzle In place, creue, the temperature of the labora_ry environ.
Source-sampling Lsaemblles that do not 2.1.9 Ou Density Determination Equip- merit.meet the m/nlmum sVactng requdrements of -merit. Temperature sensor and pressureFiqure 1'/-1 (or the equivalent of these re- laUle, u described In 8ectlous 2.3 and 2.4 of 3. ReauenM.qulrements, e.¢., Ftlure 2-'/ of Method 3) Method 2, and 8u anaLy_r, ff necessary, u 3.1 Sampling.
[Appendix A, Method 17]
Re0o_er 410
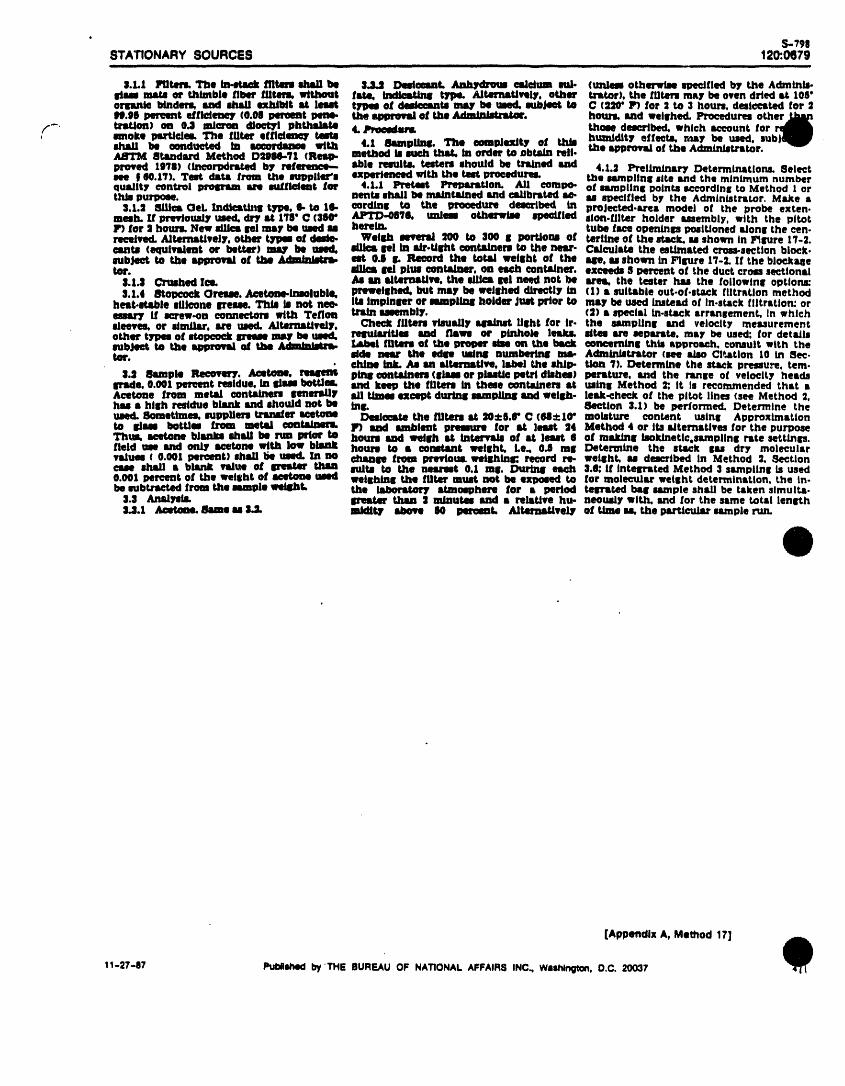
S-798STATIONARY SOURCES 120:.0679
i i ii i|ll ii ii
|.1.1 Fur451. Tile In-wtmt tlltenl she11be $.:1,1 Deslessnt. _ e:ddum 8111- (tndem otherwise m_,_'Jfledby the AdmLnis-irism mats or thimble fiber flltom, without fate, _ type. AJt4nT_UJveLy,other t_tor), the tilters my be oven dried st 106'ormmte binders, sad shall exhibit st lmmt t71_mof desteamta may be treed,mmjeet to C (3,10"lfl for = to 3 houri, deslccsted for 309.90 permmt effh:len_7 (0.00 pm_emt pens. the Sl_lWOVaJof the Ad_. hmu8. sad welshed. Plrocedum other
f- tnstJon) on 0,3 mlcs_n dJoelWlphthsinto 4.Plmegdm them desmrlbed,which account for, emote peJrtieles. The tutor efflcdemqr teats
8hJiJJ be conducted in •caas_Jmaoe with 4.1 8mmplinlf. The compleddty of thbi humidity effe,_k rm_y be used.8t4ndsrd Method D:1911_71(ResO- method Is mWJtlths_ in order to nbtoin rail. the sppromt4of the Administ4"stor.
proved 1078) (IneorpSmtmi by ref_ Id)le rsmdtak testers should be trldrted luld 4.1.3 Prelimins17 Determirultlons. Selectmm J00.17). Test dmt& from the amlpplles'| expmt_ with the tam p__ the munplln8 site emd the minimum numberqtmllty control prosrsm m 8uLfl_emt for 4.1.1 Pretest Pl_asmUon. AU compo- of 8smpilnf aointa sccordinll to Method I ortlt_ purpose, nemblshall be mslnta4ned sad csJLtbrstedsa- ,u, 8Declfled by the Adminlstrttor. Make a
$.1.3 BflJesGeL Inditer1,8 t_pe, e- to 10- eordin¢ to the proemture des_ribed in project,,d-lure& model of the probe exten.mesh- U pr_nousLy used,dry st 170' C (360" APTID-087L unJe_ othorwiN speeUled alon.flltor holder Msembly. with the paterlfl for 3 hounJ.New stilesIml rnsy be used_,, herein, tube fs_ openinlmposlUonedtJonll the c_n.received. ,4Jterns_vely. other tYlPmof desdo. Welldtl esvm'sJ :tO0 to 300 8 portJona of terllne of the st_L u shown in PIImre 17-3.santa (equivalent or bet4m') may be umld, _ Iml II1sJr-Ulrht eouteblers to the near- Cslc_lJate the esUmsted cTesa-sectionblock.ambJeet to the s4pprovadof tJw AdaninJU_ mt O.fl 8. ]record the toLId wet|hi of the Use u shown in Fllrure 17-2. If the blocks,astot'. _ lad plus container, on _ contsimur, excteds S peroent of the duet crmi8 sectlonat
$.t.3 C_'u_ed Ice. Ai am adtemsUve, the _ nl need not be ares, the tester hu the followin8 options:3.1.4 8topo0_ Oreue. ,4L,etosae.imoluble, prevei|hod, ina_nmy be welshed db11=tly in (1) • suitable out.of.st_ck filtration method
hest-amlbie sflioone Irreue. This Is not nee- Ibi Impinlrer or mmpline holder Just prior to may be used Instead of In-st_ck filtration: oresmix7 Lf im'ew-ou connectors with Teflott tradn uesmbly. (3) a special in.stack arramlrement, In whichlleeves, or 8fndlsr. lure u_ Aitel_VeJYo Cheek flltors vtnsdly J_rs_ lilht for Jr- the ssmpUn¢ sad velocity meuurementother t71pes of 8topco_ 8reue mmy be uimd. re81Jhizlties 8uld f_w8 or pinhole lesJrJ, idtamare Npsmsto. may be used: for detidlasubject to the I_ Of _ .iLd_inJJtzl_ Idi4wdfllltmmof the prolNw IdN on the bm:k eot1_erninll thIs approach, consult with thetot. Male near the edlm uslnll numberin8 nnm. Admin_Jtrstor (m 8deeCitation 10 in 8ec.
3.I 8staple Re,..ovm_. Acetone, resems ehlne _ As amsltomsUve, lsbed the ship. tlon 7). Detemine the st_k prmmu_e,tern.pin8 eonte4ners (Sins or pluUo pet_tdishes) persture, sad the rsnlle of velocity headsirnlde. 0.001 per,.,ent residue, in IrJm bottJes, amd keep the fllt4ml in theme eontsJners st ualn| Method 2:. it Is recommended that sAcetone from metal contoinen 8eneradly adl Uses ezcep¢ durra8 esmpflnlr imd Wellrb- le•k._heek of the pltot lines (see Method 3,hams hJlfh residue blamk sad should not be lair. Section 3.1) be performed. Determine theused. 8ometimes, sulmUm tzsrt_ seetoua Desie=sto the filters st :10:t:6.1rC (08=t=10"moIsture content uslne Approximationto 81am bottles from metal corlte4nm_ IF) add ambient premmm for st least :14 Method 4 or Its alternatives for the purpose'rhtm, smstoneblsnlm sh-it be run prior to houri _ _l|h st intel'vads Of at le_m e of mW_n_ Isoldnetlc,ssmplln8 rate settinlls.field tree amd only I_etono with low blau_ houri to • constamt Weflhf, Lt, 0J ml Determine the stack 8u dry molecularwines ( 0.001 percent) shslJ be used. In no (d_aare from prevtou_ welshinr, re_rd re- weleht, ,,, des_ribed in Method 3. Sectionease shaJl • bbu_ vadue of iPrml4or tham andte to the ueszest 0.1 me. Dwtn8 _ 3.(J:if intefr•ted Method 3 ssxnpilnlr Is used0.001 per_mt of the wellrht of e_tone uesd weiebin| the filter mu_ not be expend to for moleeulaur weisht determination, the tri-be anubtnlcted from the immple _bL, the _ stmoelphere for s period t4_rr_r_d I_lr 8aunpie shad] be taken slmuit_.
3.3 In ht _ _ 3 __ _ • rel&tJve hu- neomdy with. amd for the same total lenirth_L3.t J_f3ze. Bam_ Iw I.,1. midtW Ibovo 80 _t, ,4JternadJveLy of fJin_ u, the paxticuisr sample run.
[Appendix A, Method 17]
11-27-87 I_ji_is_ld byTHE SURF.AUOF NATIONALAFFAIRSINC.. Washington.D.C. 20037
120:0680 FEDERAL REGULATIONS-- II iii i |1 i i i i )1 ii illl ii i i iii
STACKWALL
TEMPERATURESENSOR : ,
ISAMPLINGNOULE
I
ITYPE.S
PITOTTUBE
IN-STACKFILTER. IPROBEEXTENSIONASSEMBLY
ESTIMATEO rSHAOEDAREA_oLOCKAa,• LBeeTARIA--JX _00Im
• Figure 17-2. Projected.area model of cross-section blockage (approximate average fora sample traverse) caused by an in-stack filter holder-probe extension assembly.
(ApptndlxA,Method17l
Env4ronmontRolport_r 412
S-798STATIONARY SOURCES 120:0681i
lllll i i i i i ii lll l i| ,
8elect • nouaJo me bsoed on the rn_ of weighed flltor in the flltor holder. Be sure dusted immediately before the change Isvoiooft7 hmp.ds,such that It is not _ that the rotor 0t properly nntored and the made. _rte lest-check shall be done accord.to _mse the nonJe adN tn order to main- imdte_ properly plan_ so sunnot to allow the ing to the procedure outlined in 8ectJontaln bolrJnetJoImpJine rstze. During the is•pie m atrotm to chant•vane the tutor. 4.1.4.1 above,except that It shall be doneJIk_
_. run, do not chtml_ the nomJe Idse.]_ssure C'he_J_fllbn' for tam i_tor ratably is eom- • voouum equal to or grester than the mRt that the proper differeuthd premuro flu. pleted. MIrk the probe exterlon _tth hm mum value recordedup to that point in
b choson for the rufla_ of voloeft7 heedsen- resltant tape or by some other method to test. If the lesksn rate is found to becountered (see8e_Jon :t.,1of Method 2). denoto the proper diatazt_ Into the eta_k or STnt_ than 0,00067 m J/•ln (0,03 cfm) or 4
8eleet a probe extemdon length suob that duet for es_h mlmplin8 point, pereent o! the average umplln8 rateall tl_verso point• esn be munpled. Por Isrve, Asoemblethe train u In lqgure 17-1, usIng (whlehever is less), the results are accept•.stacks, conMder immpUng from oppo_te • verT Ught eOst of s/Ucone Irroue on all hie, and no correction will need to be ap.Mdes of the 8tack to reduoe the length of irround lira JoInt• and greulng only the plied to Lhe total volumeof dr? iru metered:probes, i
, outer portJoD (zee _870)to •void Iz04- If, however, s higher leakage rate Is oh.8elect • toteJ sompllnlr Ume 8renter than _bfllty of oonlnlna_Jon by the dUcone talned, the tester shall either record the
or equal to the minimum total re•pUn8 : argue. Plsee on•bed Joe around the tm- iesksle rate and pl•n to correct the samplef.tme meclfled in the test proeedunm for the Pin• volmue am shown in Section (I.3 of this8petrie JnduMJ7such that (I) the Samplinl 4.1.4 14sk Cheok Proeedurm. method, or 8hall void the sampling run.time per point is not lem than S minutes (or ' 4.1.4.1 Prttmt Lesk.Cheok. A pretest Immediately Lfter _mponent chanles,some 8rnter time interval IJr_ by leak-oh•de / r_ommended, but not re- leak_?heckaare optional: if such leak.cheeksthe AdmMistrstor), imd (3) the rumple qulred. U the tam, opts to conduct the pro. are done. the procedure outlined In ,.qeetlonvolmue taken (eorreetod to st_mdardeondl, test lealt.eheek, the foUowtnl prosed• 4.1.4.1aboveshallbeusecLtlonl) wlU exceed the required mb_mtlm _ be uNd. 4.1,4,3 Post.Test L_ak.Check, A lesk.total gu 81mple volume. The lattel' Is bend _ Mtm' the rumpling tl_dn luta been mmem. cheek is mandatory it the conclusion ofotl an approximate ever_ tm..nplJnlrate.
It IJ recemmertded that the numtNn' of bled. plug the lndetto the probe nowJe with esoh rumpling run. The leak-check shill be• material _ will be •blt to wi_ the done In eecerdlmce with the procedures out.
mluutmlmmspledat emehpoint be an Inteq_ 8to_ tomper_llro, lmmrt the rotor holder lined In 8ecUon 4.1.4.1, except that It shallto°ravoidanIntewortlmekcel_inlPlUmone-hafterrml.minute,in ot_ Into the a_ and walt approximately 8 be conducted st a vacuum equal to or great.
In some otrcmlal_ e.8.. I_ oyeles, mJnuta (or Ionsor. If no_) to allow er than the maximum value retched duringIt may be ne_ to Nmple tor shorter the 8yu14m to come to equilibrium wtth the the sampling run. If the leakage rate istimes st the traverse points amd to obtain, tompor_uro of the stoelt irma8tromu. Turn found to be no Irrester than 0.0005; m'/mtnsmaller 8musample volumze. In these eases, on the pump sad draw s viBuum of st leeat (0.0:1 of•) or 4 percent, of the aver•so sam.the Adn_sistrstor's approvad must flrna be :180 mm HI (111 in. HI);, note that s lover puns rote (whichever Is learn),the resulU areobtained, vssuum maw be mmd,provided that It is not _'ceptable. and no correction need be ap-
4.1.3 Prep_on of CoUectlon Train. o._0eodod during the test. I_J_e the plied to the total volume of dry |am metered.During prepa_on and _bly of tho Ioakalro rot4. A lesk841wrate In ex_ of 4 U. however, s higher leskqe rate Ls ob.88•piing train, keep all openknlmwhere oon- _t of the svere4t so•piing rote or te_ed, the tester she. either record thetaminstlon cart o_.ur coverod until h_t ' 0.0001j7 me/•in. (0.01 ofm), wbiebevor is leUaee rote and correct the ample vol.meprior to uesmbly or unt.UmmpLb_ is _ _ is mMmzeptable, u shown In Section (L3 o! this method, orto beqtn, shall void the sampling run.
The foltowine leak-check Instru_Jons for 4.l.fJ Psu_culate. TreJn Operation,If Impinnm m uaed to oondome stad_ the mmplkn8 train dem=lbedIn APTD-0670 During the sampling run, maintain • sam.
m moisture, prepare them u foflog_ pl•_ 8rodAPT1)-41J81nuky be helpful. 8tort the piing rate such that saunplln¢ is within100 nd of water in eeeh of the first m In_ pump with by.pus valvo fully open and per_nt of true isokinetlc, unlm otherwlpingers, leave the third Imp•aim" empty, eOmle adjust yldvo emupletely _Jooed. Par. specified by the Administrator.
i and tnmsfer approximately :NO to :1908 of thd]y open the ooenm adjust voJve and Por each run. record the data requiredpreweighed stiles gel from Its eoutainor to slowly cloee the by.pare valve until the de- the example data sheet shown In Figure 17-the fourth ImpInger. More stiles iml rosy be idred V_mlum is rce_ed. Do not reverse dl. 3. Be suro to record the Initial dry fu meterused, but ears should be taken to ensu_ rectlon of by.pus valve. U' the desired reading. Record the dry gu meter reedlnlmthat It is not entrained and carried out from vacuum Is exceeded, either )'esk-check at at the beginning and end or each samplingThe impinger during Immplinl. Piece the this higher vacuum or end the leak-check u time Increment. when changes in flow ratescontainer In a clean place for later use In shown below trodstart over. are made, before and after each leak check,the sample recovery. Alternatively, the and when nmplln8 Is halted. Take otherweight of the silica 8el plus Impinger my When the leak-check is completed, first re•dins• required b? Figure 17-3 st loutbe determined to the nearest 0JI | amd ro- slowly remove the plug from the Inlet to the once at eseh sample point during each timecorded, probe nm_le and Immediately turn off the increment and additional readinlm when st|.
vueuum pump. This prevents water !rom hi!leant changes (20 perceni variation In ve-Il some means other than Implngeru is being forged backward and keep8 sflJcagel loeity head reading) necessitate additional
used to condense moisture, prepeze the con- from being entrained backward, adjustments In flow rate. Level and zero th_denser (and, if appropriate, ndlles 8el tot' 4.1.4.3 Leak-Cheeks During Sample Run. manometer. Because the manometer levelcondenser outlet)for use. If, during the munplLns run, a component and zero ms? drift due to vlbrallons and
Using s tweezer or clesn dispomtblo mini1- (e.g.. rotor 8membly or tmpinger) chsmp be. tomneruture chsnlres, make periodic checUcal gloves, place • libeled (Identified) sad eomu ne_, • luk,,cheek shall be _on- durtnll the trsverle.
i
1
[Appendix A, Method 17]
11-27-87 Pu_411dlodby THE BUREAUOF NATIONALAFFAIRSINC., WsshlnQton,D.C. 20037 413
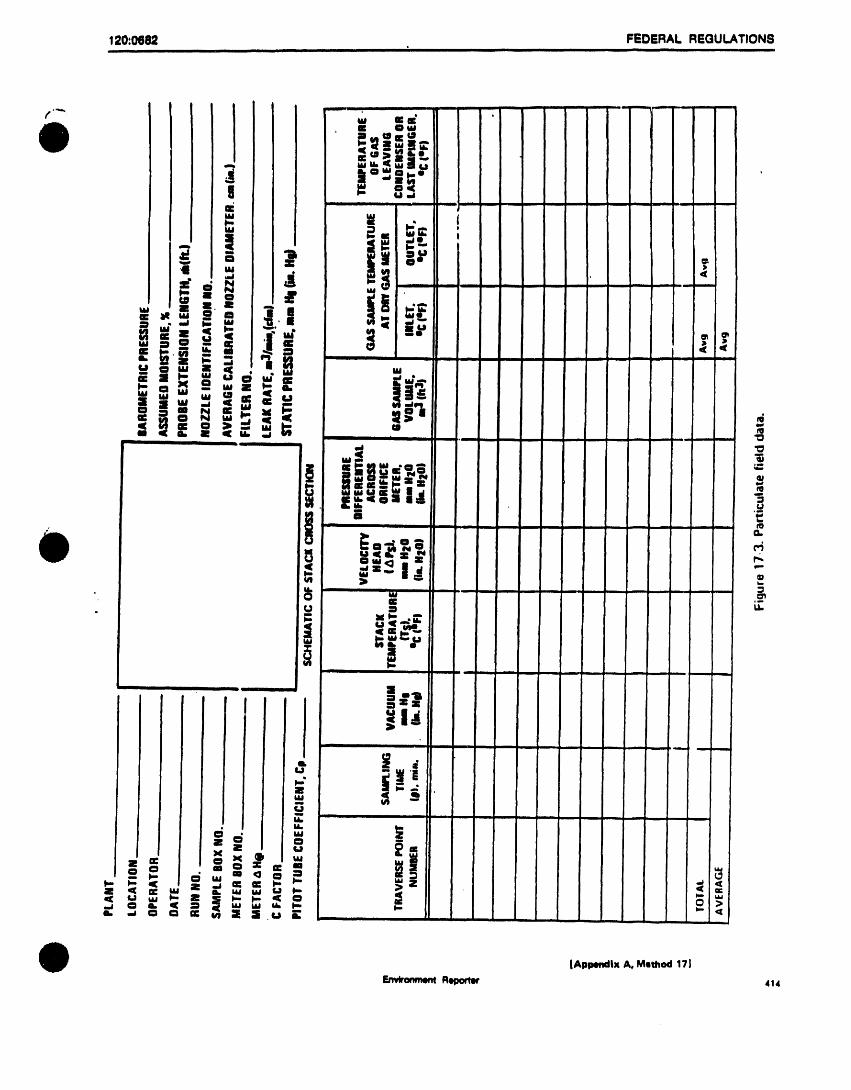
120:0682 FEDERALREGULATIONSii i imm i i I I i I i I i I ii, i I ill I i i -- -- i llll
[Aplxmdlx A, M_thod 17i
Envirm'mlenl Repor_r 414
. S-+911STATIONARY SOURCES 120:0683
.-- II -- I _ I Illll j I I I I I II I Ill I II -- Ill I Illl I iiill -- ii iiii I Ill I
C1et_i the portholco prior to the test rim oheek, in ordm' to ssdid•iWthe veioeILybeid Ciu_f_lly rsTnove the probe nm=le trodto minimise the ohm of mimpiinI the de. dito. _eiul the inside Imrfsee by rlrminl with •c.posited nuitinrtiLl,TO begin mimpiinS, IqmOV, 4.1,8 CSJmlllUon ot Per•mr llmkL,setJa, clone Ire• a wuh bottle and br_lhlnl with
the no•de cap Mid verify th&t the pttot t_lbe Celt•late pemmt bloklnet_ (m 8eo/Jon i NYlon bmtle bnish. Brtmh until sc_tontsad proN extlmldon Ire properly pol. 4,11) to dot4tlnine whethmr another test run rtnlle Ihoqrs no visible particles, after/""' Uoned. PotdUonthe noa/I It the/lilt trll. ahmild be made. If these bl dlfll_tlty ill m&ke a fineJ rmee of the inside Iurftce,. verse point with the tip pointin_ dlre_T mldntoJninll IsoldrteUa rM4t due to sour,._ k'cLone.
Into the ImpItllqUu. ImmediateLy imirt the condltlonlk consult with the Administrator Brtmh lad rtnse with re:cLonethe Insidepump and ed|tmt.tho flow to Isoklnotl@con. /or polible _ on Use isotinetlc mtm. p&rtoof the flttin8 in • similar wn). until nodlUonR, ]qomolfflipha aft avaihlbie, which _:1 8ample Recovery, Propel' cilmnup visible particles re•tin. A funnel (lira orlid I11the ripld idJttetment to the llmkmeUo .procedure boldP.Jim soon u Uie Probe ex. polyethylene) may be used to aid In trans.immpllnir ate without emcosstvepc•puLl. _rision Idmembly is removed Ire• the stuk /erltnir liquid wuhes to the container. Rinsetion& TI,ese nomotmlptmare desllmed for st the end of the eimpiinil period. AJ]owthe the brush with acetone and quantitativelytin when the T_me8 pttot tube coefflcJes_t llembly to coo|, collect three wuhlnn In the sample fen.b 0,86=:0.0:t,Imd the irtack Ilia eqtlJvllent When the luIefablF w be 81delYhi•died, t•inel'. Between Intrnpllnl runs, keepdenMty (dr7 molecular wet|hi) II equld to wipe oil idl exf,_ ptrtlcultto mlttey neap brtmhm olesm Ind proUl_t¢,dIre• contsml.:,1±4. APFD*OllTOdof,ldlJ the proaduro for the tip el the probe noale Imd pil_ i asp tuition.IlsinI the nommrrsphi. U C, Imd )44lureout. over it to pnmmt Iosinlr or Imininl IXlrticu. After emmrinI that all Joints Ire wipedilde the abovQ8IsLedMIU. do pot Im the lille matter. Do not _ off the probe Up _elul of Illlcone 8ferule(11applicable), ele_nnomotmtpM I1nlesr &Dproprtlte _ time UshUy while the mmplinlr treJlt la cooUnl the Inside of the front half of the filterCitation I In 8cation ?) m t•klut to ecru- dowa id thbl would create • tl_UUlu In the holder by rubbtnl the surf•cos _'ith a Nylonpeuimtefor the devt•tlonl, flltes, hold•',/Ol5_1 condense wsl4s,Imolt. brisUe bruatl sad rtnslnl with ieetone.
When the _ is trader idlmlflasnt _ _ RJam es_h surface three times or more IfLive prumur_ (hetRht of Impinlror Item), Before moqnI the munple trldn to the needed to remove visible ptrtlculate, MaKetUe fire to _oee the c_mm _Ljust wive eiuaup site, dils_nne_t the tilts' holder, fired rJmm of the brush 8rod filter holder.bereft imm'tinlr the psmbeextorIioU _ llfObe Ie IiiImbty from the probe a. A/tof IdJ aimtone WIUlhinII Mid plu,ti_liatebly into the _tek to pros•at wetof from retreat: am the am• InSet of the probe u. m_ter ire ('oJl_tod in the ample contain.being f_ tmcltwurd. If neeemmT, the _ Be e_reful not to lace tiny eonden, ft. Uehton the lid on the sample containerPump my be turned cm with the eoenm ate, Jf prment. Remove the umbtlksd cord so that Nit, one will not lexk out when i¢ tsedJuatqlJveclQoed, from the condenser outlet imd imp the shipped to the IsbOrlitory. )4irk the hellht
When the plebe Is In poeltlm_ blodt Oil outlet. If i flexible line kJuIed betwmm the of the fluid level to determine whether orthe openinp around the probe imdporthole _ Inlplnser (or sondetMmf)Imd the probe not leskmle o_,curt_l during trsmsport.to prevent mmmpre_ntltJve dilution of thl nil•lion, _ the Ikne i& the probe Label the conUUner to clearly Identify illI--imam. eztomioa end let Lay condensed ester or contonlL
Tnlyersm the _ msII Im_tlon, Ii re. liquid dl'lin into the InspmIost or (,u_KlelnI. Conbsinln"N_ a. if idllts Irel Is treedIn theq_tlred by Method 1 or II JINl_qed by _ Or.Dtlmonmmtthe probe ex¢4t_ion from the _ndensor system for moslture content de.Admlnbltrator, beinil (_mful not to bump condislMmr,_p the probe eXtelMdonOUtlet. to•sin•Lion, note the color of the eel to de.the probe noule into the _ llqdhlWhelm JUror WIPN Off the idllcone _ asp off Lorraine If It hu b_n completely spent:Immpllnl nef the wtllI or when removin8 the ooedenm_InSet.Ground IliUm Jtoppenk mUe • no_tton of its condition. Trensferor Imertinqr the probe extomdon thrOUl_ plut_ _sp_ or serum (_pe (wbiohI_or Ire the •ill_ tel _ to its oril_lnal containerthe portholes, to minimise c_um of a- •pproprUl_) my be _ to c_ee these Mid _ A funnel may mUe It eater totre_ln8 dep_lted mstorUd, oponinl_ pour the Mllas lel without 8pllllnl. a,d s
Durinlr the tat run. take 8pp_ Treader both the fl]tmr holder.probe rubber poLice•in may be used u _n aid instein (e.l, sddini crushed lee to the bn- nmie llembLy sad the condelmor to the remowinf the Idll_i sol. It Is not necessaryto_...Plnl_er I_ beth) to mIdnUdn • tel_ oieIaUp m ThlI _ ohould be oJein I_d I_mmm the ImIJI mount of dust pnrtlri_Ikof lal thln :_ C (08" IF) st the condenior protected from the wind io _ the _ thl_ may Idhm to the wails Mid tre dlff_ouUet; this will Prevent ncoIIJ_l moiItu_ of oontemJnlt_l or _ the iImple WIU otdtto _mtove. 81neethe gain in weiRht Is to'Ill w1prom.Alto, pe_odicIUy _ the kind Ind be _ betied for moIsture csle.lstlona, do not luesere of the mm_ametey. 8•wJ s porUolt of the I_-etone uNd for Miy _mter or other liquids to trat_sfcr tim
If the pr_tr_ drop _ the flltel, be- olee,nup M I blink. Take 200 mJ of this I_- silica get. if • ball•co Is Iviilible In thecomes too hflh, m_Jcinff Isoklnetl_ IImplin8 clone directJy from the wuh bottle betn8 fielct, follow the procedure for Containerdifficult to m_lntaln, the filter my be re. lied and pls_e tt in • 8him sample conteJnor No. 3 under "Analysis,"
_placod In the midst of I simple run. St'is labeled "acetone bit•It" Condoner Water. Treat the condenser orrecommended Lhlt Miother complete filter Irmpe_ the tndn prior to Ind durtnlr dis. Implnlrer water u follows: mike I notationholder Imsembly be Imed richer than at,. uiembly Ind note Imy ibnormld condlUonL of In), color or film In the llquld catch. Me_.tempttnlr to chortle the lilies' Itself, Before I _ the •unDies u follo_l: sure the liquid volume to within ± t ml bynew filter holder Is InstaJ]ed. conduct • in.c Con_imrr No. :. Carefully remove the u_inl I irredusted cylinder or. If s balnnce Ischeck, u outlined In Section 4.1.4.2. The filter from the filter holder m_d pla_e It in Ivailtmle. determine the liquid wetrJ_t totntIU psrticolate weilht shIdl Include the ltI identllled petrl dbh container. Use t pslr within __.0.SI. Record the total vet,tree orlulnnlitlon of liJl filter IaIembly eite.heI, of twe_Iira Indlor clesut dlIponble 8urlieJU weilht of Uquid present. Tiffs Information Is
A Ilnl|le treJn shall be 9Bed for the entire IlOVm to hsnctle the filter. It it hi ne_us_y r_uil_d to clLIcul&_ thr moisture contentssntple run, exc'_t in _ues where sLmult_, to fold the filter, do so •1oh that the ptrt_- of the effluent I_. Dts,_rd the liq_tid afterne_ua Immplinl hi requllr_ In two or I_ore ulsto eske Is blldo the fold.Clumfully triM- meuurinI and recordinI the volume orIeplu'ste ducUI of M tWOOf Nl_t d_fet'Im$ • felr to the p41t_ dud1 iny _Ulto Inlttor wellht.JOclLIonIwithin the Imnte duct, or, In _ iuld/of rULer tibet1 which adhere to the 4.3 Antlfllbl, Record the d_tta required onwh_re equipment fsdlure necemttatoe • rULer holder Imsket, by usinl a dry Nylon the exmple eh_t shown In Flxure 17-4.chsnle of treins. In all other sltuattonL the bristle brush _md/or • shsrp-4_ed blade. Hsndle e•cll s_npie contsiner u follo_.s:use of two or more trldlMI will be lubje,,*t to 8eLl the contldner. Container No. J. Leave the contents In thethe ipprovli of the Adndnlstrstor. Note C_afmrr No. 2. TId_inl at_e to smsthat Ih|pplnl cont&ineror trsn.q/er the filter andthat when two or more trslrm m used, I dust Oll the ouUdde o! the probe no_le or imy loosepmrtic_liite frnm the sample con-sop&rate tnalylis of the ooi|ected pIrtlmt, other exterior surfscen does not let into the talner to I _red IIS,ss welllllinl dish, Destc.la_e from etch tndn sh_dl be performed, emuple, quantitatively recover psu_J_'_late o_ts for _4 hours In a destc_'_tor oont_inln|unless identicsd no_Je sizes were uud on tU nu_,t_r or Miy condenu_e from _he probe ILnhYdroulcalcium sulfate, We!oh to _ _r)n.trelliS, In which sue the ptrtir,'ud&tocatches nou'Je, fltUnX, and fronL half of the filler stint welsht and rrport the result5 to thefrom the IndlvlduaJ trsJnamay be combined holder by miahlnl these components with nearest 0,1 ml, For purposnsof this Re:Lion,imd a slni|Je_nalYslsperformed, acetone imd plm:in8 the wMh In 8 Bind•con. 4.3, the term *'corutlmt wetxht'* meansa dlf.
At the end of the sample run, turn off the tldner. DIstilled water my be uned If•teed ferenaeof no more than 0.5 mf or I percentpump,remove the probe extension imaembly of tcetone when approved by the Adminis. of tot&i weteitt lesstare wci#ht, whtehe_'eri.5from the stscl(. Imd record the final dry Ires trator Mid 8hldl be used when specified by iff_aLer, between two consecutiveweil_hinxs.meter r_sdin|. Perform a leak.check, u ont. the Administrator: In these cases, slice a with no Ira than 6 hours of desiccationlined In Section 4.1.4.3.ALso,leak.check the water bleak Imd follow &dminiatretor°s dl. time betweetteel|hints.pltot line• u described In Section 3.1 of rectlorm on Im_i_is. Perform the acetone Aiternttively, the ssmnle may he ov,nZ,lethod 2; the lines must pl tills lea_. _ u follows: dried at the Ivermle stick temperaL_|re or
[Appendix A, Method 17 I
! 1-2747 Publlsh_Klby THE BUREAUOF NATIONAl.AFFAIRSINC., Wishlngton,D.C. 20037 415
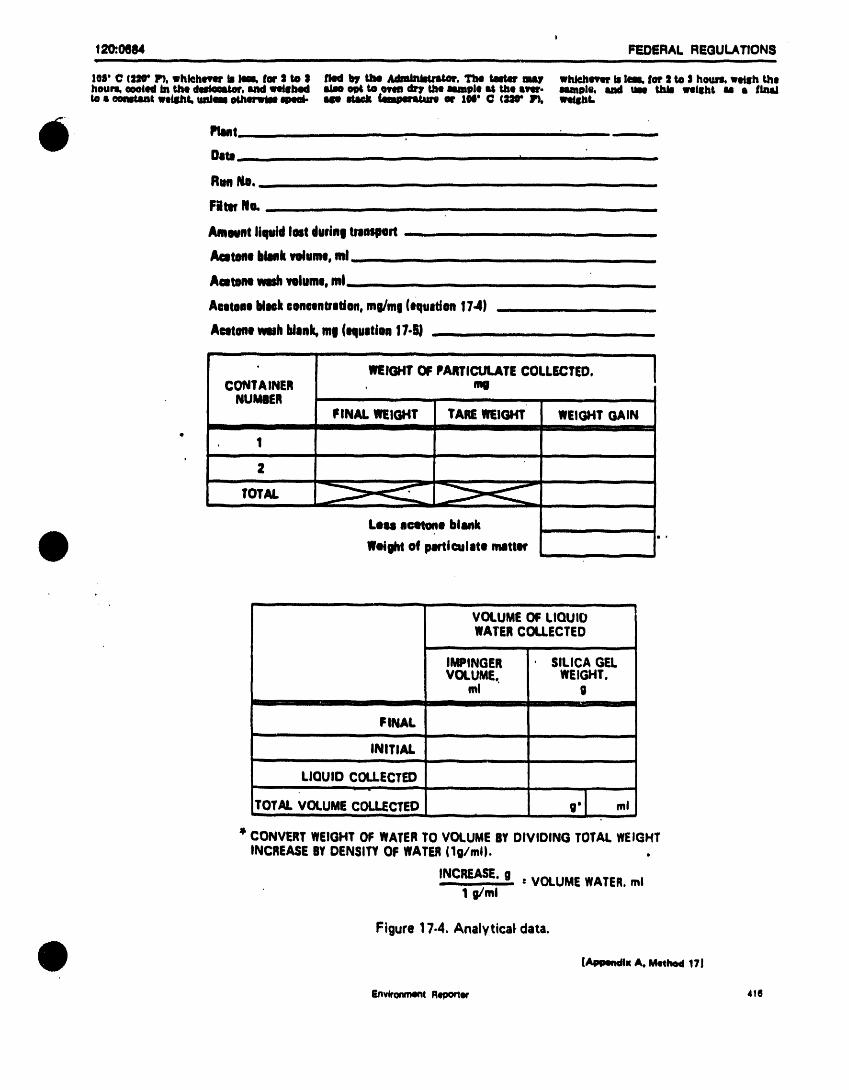
!
120.0684 FEDERAL REGULATIONS- i i i i,ii i i i __ -- i i,i |ll i i __ i i i, ii i
I0S"O (lit IP}.whtehewn'Islees,tar :1to | fled by the _. The toMm ass), whiehewn'Isle_ los'2 to $hours,welshthehours,eDDiedin the dulaM_. Iutdmltilbed Skidoptto area cllr3rtheImplo st the stir. ample, tad tm this mflllht sa s ILmldtos oomUm¢weight,u.Jm o_m m samsu_ fam_ ar foe' C (:ulO"]P), wellbt.
Plant. i ill Ill II I in i i ill
Oats- i i i i ii . J 1 iii
RunNO.................
Fire h. .........................
Amovnt liquid lostduringtnnsport - .........
Autone blankvolume,ml .......................
AuteN washvolume,ml .......................
AcetoneblNk eeneonUmtton,rag/rot (equation174) .......
Acmtonewish blank,ml (equation17-6) - ........, ,,
• W_IGHT OF PARTICULATECOLLECTED,CONTAINER , mg
NUMBER ..........FINAL _T.IGHT TANS WEIGHT WEIGHT GAIN
i I i i I II Jill in ' '" "l
. 1ii ill i nl i ill ill • I I
2i nllll inn , nn n II I
TOTAL , ,iii ,ii
Loss ecotone blank 1.
JP
Weightof pmtculato matter ,
......... ml
VOLUME OF LIQUIDWATERCOt.LECTED
• q| i | i
II_INGER SILICA GELVOLUME, WEIGHT,
ml gI r
FINALI il • II
INITIALi Ul H el lull i
LIQUID COLLECTED--I
TOTAL VOLUME COI_CTED ,, , o'1 m,
" CONVERT WEIGHTOF WATERTO VOLUME BY DIVIDING TOTALWEIGHTINCREASEBYDENSITYOF WATER(1g/roll.
INCREASE'g = VOLUME WATER.ml1 g/ml
Figure 17-4, AnalyticaF data.
(AppemilxA.Method171
EnvironmentReporter 410
' [Appeedix A, Molhod 171
11-2747 Publishedby THE BUREAUOF NATIONALAFFAIRSINC., Washington,O.C, 20037 417
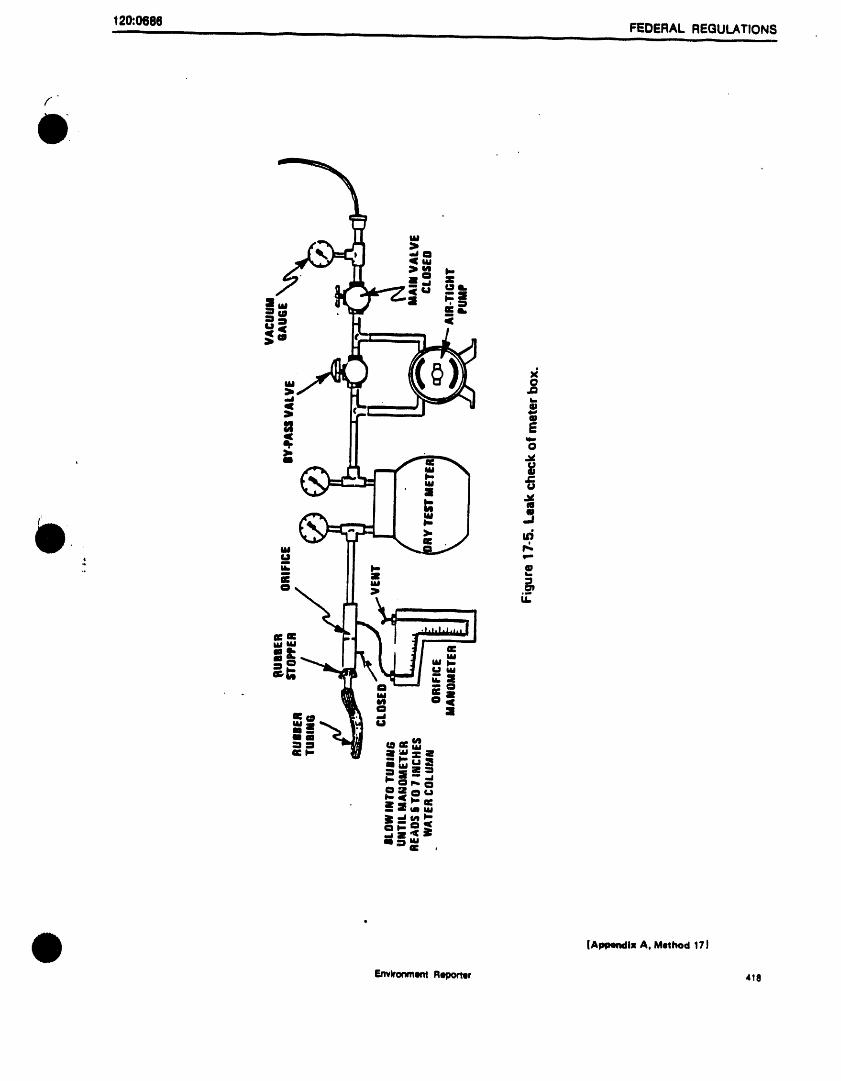
120:.0686 FB_DERAL REGULATIONRiiiii iiii iiii
f
[ApqNndlx A. Method 17l
Envbonment Reporter 418
120:0688 FEDERAL REGULATIONS"
I. Addendum to 8pecfflc_Uons for Inctner- those found In bulldlnl air _nd fullUve riodlcally mmalyztnl bl_nks that consist olslur Testlnl at P'oderaJ lqu.'tllUel. PIES, emissionsources, hydrocarbon.free Mdror nltroten.NCJ_=C.December S. tg(1"/. Thbl method wlU not determine corn- Sample cro_-contJunlnatlon that occurs
2. Martin. Robert M., ConstrucUon DetaJM poundsthat (1) are pol_nerle (hlch molecu- when htch-level Lad tow-level samples orof Isoktnetlc 8ource-Smanplln¢Equipment lar wel|ht), (2) can polymerL_ebefore amaly, standards _ mnaly-,.edalternately, is best
.. Environmental ProtectJon Alency. Re- _ or (3) have very low vapor presxuresst deldt with by thoroulh pursinl of the GCsearch Trt_n|le Park, N.C. AJF_I"D-05(11.s*_M_l¢or instrument condlUon¢ saunoleloop betweensamples.
April, 1971. |.2 Principle. The major orsanic ¢ompo- To assure consistent detector rest)onse,3. Rom, Jerome J.. MKIntenLnce. CaJIbra-,ion. sad Operation of ]soklnetle Source. nenU ot"a gas mixture are separated by calibration gases are contained in dry _irS_mpllnl Equipment E41vlronmentaJPro- BILlchromatography (GC)and individual- To adjust gaseous organic concentrationstecUon Al|ency. Reseau-ehTHnmlle Pmrlr.. ly quantified by flame ionization, pho- when water vapor is present in the sample,N.C. APT"D-0510. March, 1912. '
4. Smith. W. S.. R. T. Shllleh_ and W, toionization, electron capture, or other ap- water vapor concentrations are determinedF. Todd. A Method of Interpretlnlr SLtcI¢ propriate detection principles, for thosesamples°and a correction factor isSamplln¢ Data. Pager Pre_ented at the 83rdAnnual Meetln¢ of the Air Pollution Con. [I.2 revised by 52 FR 5106, February 19, applied.trol AuoclaMon. SL Louis, Mo. June 14--t9, 1987] [4. amended by 52 FR 5106, February 19,19"/0. The retention Umes of e_h sepmted 1987]
5, Smith, W. S., eLat., 8Lack Ou Ssmpiin| component are coml_tred with those ofImproved and Simplified with New F.,qUllP known compounds under Identical condl. 5. Pres=rvey=nd PresurvepS=mpiin_meat. APCA Paver No. 8'/-119. 19S'/. Lions. Therefore, the smdyst confirms the Perform a presurvey for each source to
8. SpeclflcsUons for Incinerator Testlnl _ IdentJty and sOproxlmaCeconcentJ'sUonsof be tested, Refer to Figure 18-I. Some ofFederal Paetlltles. PE[8. NCAPC. 1987. the orlanie emission components before- the information can be collected from lit-
7. Shllreh_ra, R. T.. AdJustments In the hand. With thL_ lntorrnation, the -naiystEPA Nomolr_Vh for Different Pttot Tube then prepare or pu_hues commercJIJly erature surveys and source personnel.Cot-Coefflc/enta and Dry Molecular Weilhtl. avslllJ=iestandlu'd mixtures to calibrate the I¢ct Bagsamples that can be analyzed toStack Samplln¢ News 2:4-11. October. 1914. OC under condlUorm ldenUcai to those o! confirm the identities and approximate
8, Vollt.ro, R. P., A Survey of Commerc/sJ- the samples. The analyst also determines concentrations ol" the organic emissions.ly Available InstrumentaUon for the Mess- the need for sample dilution to avoid detec-urement of Low-RLnle Usa VeloclUes. U.8. torssturatlon. Imxstream filtration to ellml- it. revised by 52 FR 5106, February 19,EnvtroRrnental Protection Acency. EmL_lon rmte i:_JrtJeulatematter, and prevenUon o! 1987]Mes.surement Branch. ReseaJrchTrianlde mot=turecondenmt./on.P_rk, N.C. November, 19"/(! (unpublLshed _.1 Apparatus. This apparatus list alsopaper). 2. R_nfe =,=dSe_udtl_tV applies to Sections 6 and 7.
9. Annual ]Bookof AS'I"M 8taJrtdmJrds.PsJrt 2.1 Rattle. The rmnle of this method is [5.1 revised by 52 FR 5106, February 19,26. OMeou_ l_eL_:, Coal sad Coke; Atmoe- from rod)outt part per mUilon (ppm) to thepheric Analys/s. AmeHcumSociety for Test.In¢ _Jld MKt.ertaL_ Philadelphia, Ps. tiff4, upper limit Ioverned by OC detector satura- 1997]pp. 81'/-822. Uon or column overloadinl. The upper limit 5.1.1 Teflon Tubln¢. (MenLlon of trade
can be extended by d"utl_l the stack cMes names or spectflc products does not constl-10. Voilaro. R. P., Recommended Proce. with sn Inert Ima or by md_| m_Uler m tute endorsement by the U.S. Envlronmen.dure for S_nple Trsverses In Duct., _]maJJer
than t2 Inches In DIx_neter. U._. Bnviron. umplJnl loops, tad Protection Agency.) Diameter _ndmental Protection Alency. Emisxlon Mesa- 2.2 8enMMvlty. The senxitJvlty limit for s lenlth determined by connection require.urement Branch. ReseaJrchTHLn¢Ie Park. compound bl defined u the ndnlmum de- menta of cylinder rel_Jlators and the GC.N.C. November, 19'/(!. _le concentration of that compound, or Additional tubin¢ is necessary to connect
the concentration that producesa sllmsl.to, the OC sample loop tothe sample.nolse ratio of three to one. The m/n/mum 5.1.2 O_s Chromatol|rapi_. GC with suit.
IET|IOD |8 -- MEASUREMENT OF detectable conce:,trstlon is determined able detector, columns, temperature.con.GASEOUS ORGANIC COMPOUND durtn¢ the pre_Jr_ey mdlbrsUon for etch trolled sample loop and valve _._embly. andEMISSIONS BY GAS CHROMATO- compound, temperature prolram_.ble oven, If necessary.
The GC shall achieve sensitivity require-(;RAPIIY 3. Pree/=_oaand Accurm_ men_ for the compoundsunder _tudy.[Method 18 added by 48 FR 48335, Octo- Ou ehJromatolraphie techniques typically 5.1.3 Pump. C;_pableof pumping I00 ml/her 18. 198J: amended by 49 FR 22606, provide a precision of 5 to tO percent rela- rain. Pot flushing saznvle loop.May 30, 1984; 52 FR 5106, February 19, tire standard deviation (RSD), but art expe- 5.1.4 Flowmeters. To measure flow1987] rlenced OC operator with a reliable Instru. rates.
ment can readily achieve 5 percent R_D.r.ntrod_ct.ion, tThis method should not be Por this method, the foilowtnl combined [5.1.4 revised by 52 FR 5]06, Februarys¢,Lempt.edby persons unfamiliar with the OC/operttor values,re required. 19, 1987]performance characteristics of la._ chroma- (a) Precision. Duplicate analyses are 5.1.8 Relrulators. Used on gsa cylinderstosraphy, nor by those persons who are un- within 5 percent of their mean value, for (3C trod for cylinder standards.tamlllm- with source samplln|. Particular (b) Accuracy. AnaJyslxresults of prepared 5.1.8 Recorder, Recorder with Ilnettr stripcare should be exerc/sed In the ares of audit sample,, are wlth/n 10 percent, of prelP ehs."t is minimum acceptable. Intetratorsafety concernlnl choice of equipment and aratlon vsJue_ (optional) is recommended.
operation In potenti,dly explosive at_oo- 4. lnt_-jre_me_ 5.1.7 Syringes. 0.-_ mi, 1.0- and 10-pheres.] ResoluMon Interferences that may occur microliter sizes, calibrated, maximum ac-1.Applicability and PHnctpie _ be eliminated by _pproprt&te GC
t.t App!lczbillty. This method applies to column sJnddetector choice or by shlftln| curacy (gas tight), for preparing calibra-the snalysls of &pproxlmately 90 percent of t,he retention t,lmes t.hroulh ¢hanfes In the |ion standards. Other appropriate sizesthe total gs.seousorl_anlcsemitted from an column flow rate and the use o( tempera, can be used.industrial source. It does not Include tech- t,ure prolrammin¢.ntques to Identify and measure trace The tnsJytlc=d system is demonstrated to 5.1.'/ revised by 52 FR 5106, Februaryamount_ of orlanlc compound',, such u be essentlmJl7lree from contammaJutsby pc- 19, 1987]
[Appendix A, Method 18]
F.n_onmontReporte_ 58
_.-_._, TGS-ANSA METHOD FOR THE
"_: DETERMINATIONOF NITROGENDIOXIDE IN THE ATMOSPHERE
.-_ EPA Designated Equivalent Method;_: No. EQN-1277-028" • ,L.. "_. •
-..Q .
'-'i _'l-._._.:
.
o..
"i.i• , b •
.:_f•
t" k_ .
C*
t.
•.t'- •
' " 1 l
,-°.. ,,_
.--!': ,'i..:." U S Environmental Protection Agency' :a • •
" EnvironmentalMonitoring and Support Laboratory., - Research Triangle Park, North Carolina 27711.':?;'..__,"
December 1977
mm i I
oIw
TGS-ANSA METHOD FOR THE DETERMINATION
• OF NITROGEN DIOXIDE IN THE ATMOSPHERE
EPA Designated Equivalent Method No. EQN-1277-028
I. Principleand App1!cability
i l.l Ambient nitrogen dioxide (NO2) is collected by bubbling air
througha solution of triethanolamlne,o-methoxyphenol, and sodium
metabisulfite.(I'2) The concentrationof nitrite ion (NO2) produced
duringsampling is determined colorimetricallyby reacting the nitrite
ionwith sulfanilamideand 8-anilino-l-naphthalenesulfonicacid ammonium
salt and measuring the absorbance of the highly colored azo dye at 550
INn,
1.2 The method is applicable to 24-hour integrated sampling of NO2
in ambientair. Collectedsamples are transferred to a laboratory forI
,man al analysis., , , ,
1.3 Agencies desiring to use this method in a network operation#
may find it necessary to develop and use additional operation and quality
assuranceprocedures not provided in the method description. Information@
regardingquality assurance procedures can be found in reference 3.
2. Ranqe and Lower Detectable Limit
• 2.l The nominal range of the method is 15 to 750 ug NO2/m3 (0.008
to 0.4 ppm).(2) The range of the analysis is 0.025 to 4.0 ug NO2/ml,
followingBeer's law throughout this range (0 to 2.0 absorbance units).
U:lder the specified conditions of 50 m! of absorbing reagent, a sampling
r- r_ce of 200 cm3/min for 24 hours, and a sampling efficiency of 0.93, the
runge of the method is therefore 5 to 750 ug NO2/m3 (0.003 to 0.4 ppm).
2.2 Based on results from a co]laboratlve study, the lower detectable
limit of the method is estimated to be 15 ug NO2/m3 (0.008 ppm). (4)
3. Interferences
3.1 At a NO2 concentration of 100 ,g/m 3 the following pollutants,
at the levels indicated, do not interfere: ammonia, 205 _g/m3 (0.29
ppm); carbon monoxide, 154,000 ,g/m 3 (134 ppm); formaldehyde, 750 _g/m3
(0.61 ppm); nitric oxide, 734 pg/m3 (0.60 ppm); phenol, 150 ug/m3 (0.04
ppm); ozone, 400 ,g/m 3 (0.20 ppm); and sulfur dioxide, 439 ,g/m 3 (0.17
ppm).11)
4. Precision, Accuracy, and S..Labiltty
4.1 Based on results from a collaborative study, the within laboratory
standard deviation is 7 ug/m3 (0.004 ppm) and the between laboratory
standard deviation ts 12 ,g/m 3 (0.006 ppm) over the range of 50 to 300
_g NO2/m3 (0.027 to 0.16 ppm).(4) Based on resu]ts from the Subpart C
consistentrelationship test (see Appendix), the within laboratoryF
standarddeviation is g pg/m3 (0.005 ppm) over the range of 120 to 540o
NO2/m3 (0.062 to 0.29 ppm).bg
4.2 Based on results .froma collaborative study, the method has an
averagebias of -5% over the range of 50 to 300 pg NO2/sm3 (0.027 toI J
0
_.I__).(4) Based on results from the Subpart C consistent relationship
test(seeAppendix), the method has an average bias of +2% over the
,.a,geof 120 to 540 ug NOz/m3 (0.062 to 0.29 ppm).
4.3 Collected samples are stable for at least 3 weeks at room
temperature.Stored samples should be tightly sealed to prevent absorption
of NO2 from the atmosphere.Q
5. ApparatusI
5.1 Sampling. A diagram of a suggested sampling system is shown
in FigureI.®
B.l.l Sample Inlet. Teflon or glass tube with an inverted
lefion _ or glass funnel at the sampling point to prevent entrance of
precipitation.
5.1.2 Absorber. Po]ypropylene tube, 164 mm long x 32 mm
diameter, equipped with a polyprowlene two-port c]osure (see Figure 1).
_Rubber stoppers cause high and variable blank va]ues and should not be
u_ed.) The closure must be fitted with an 8 mmO.D., 6 mm I.D. glass
tube approximate]y 152 tam'long having the end drawn out to form an
orifice with an I.D. of 0.3-0.6 ram. This tube must be positioned to
allow a c]earance of 6 mm from the orifice to the bottom of the absorber.
The closure and ports must be free of leaks.
5.].3 Moisture Trap. Po]ypropylene tube similar to absorber.
The entrance port of the closure is fitted with tubing that extends to
the bottom of the trap. The unit is ]oose]y packed with glass wool or
silica ge] to trap moisture to protect the flow control device. The
t_'ap must be repacked with fresh g]ass wool or silica gel before the
start of each sampling period.
3
• 5.1,4 MembraneFt1ter. Of 0,8 to 2,0 micron porostty and
r 3 cmdiameter, Be sure the filter does.not leak, The ftlter must be
replacedafter collecting 10 samples,
5.1.5 Flow ControlDevice. Any devicecapableof maintaining
constantflow throughthe samplingsolutionbetween180 and 220
cm3/min.A convenientflow controldeviceis a 27 gaugehypodermic
needle,(5)I0 mm (3/8 inch)long,used as a criticalorifice. (Most27
gaugeneedleswill give flow ratesin this range.)
5.1.5 Air Pump. Capableof maintaininga vacuumof at
least0.6atmosphere(450 tort)acrossthe flow controldevice. [This
valueis basedon the Criticalpressuredifferential,0.53 atmosphere
(400tort)(5),plus a safe1:yfactorto a11ow for variationsin atmospheric
pressureand minorvariationsin pump performance.]
5.1.7 Flowmeter. Properlycalibratedflowmeterfor measuring
airflowratesin the rangeof 150-250cm3/min. The use of a mass
flo_neteris particularlyconvenientsinceno correctionsare requiredf
wllenusedundertemperatureand pressureconditionsthatdifferfrom the
conditionsunderwhich it is calibrated(see I0.I).
5.1.8 Flow MeasurementStandard. Precisionwet testmeter
(Iliter/revolution),bubbleflowmeter,or otherreliablestandard.
5.2 Analysis
5.2.1 VolumetricFlasks. I00, 200, 250, l,O00-ml.
5.2.2 Pipets. I, 2, 5, I0, 15, 20, 50-m1volumetric;l,
3-mi,graduatedin l/lO-mlintervals.
5.2.3 Test Tubes. Approximately150 nw,long x 20 mm
diameter.
5.2.4 Spectrophotometer.Capableof measuringabsorbance
at550nm; equippedwith I cm opticalpath lengthcells.
6. Reaqents All reagents should confom to ACSspecifications for
reJ_L,nt gradematerials unless otherwise specified.
6.1 Sampling
6.1.1 OistilledWater. Must be reagentwateras defined
by ASTMprocedure1193-66part 6.3 (Consumptionof potassiumpermanganate
P
6.1.2 Triethanolamlne.
6.1.3 o-Methoxyphenol.Also knownby its trivialname,
guJiaco1.Meltingpoint,Z7-28°C. CAUTION: Technicalgradematerial
wi I I not meet this specification and should not be used.
6.1.4 SodiumMetablsulflte.
6.1.5 AbsorbingReagent: OlssolveZO g of triethanoIamine,
3.5g of o-methoxyphenol,and 0.250g of sodiummetabisulfiteconsecutively
I, 500ml of distilledwater. Dlluteto 1000ml with distilledwater.
4ixthoroughly.The solutionshouldbe colorless. This solutionIs
;t_blefor3 weeksif protectedfrom light.
6 2 Analysis' I
6.2.1 Sulfanilamide,meltingpoint165-167°C.
5.2.2 8-Anilino-l-naphthalenesulfonicAcid AmmoniumSalt
{ANSA).Molecularweight= 316.38. The ANSA must have a molarabsorptlvity
(()of 19,000to 19,300li_ter/mole-cmas givenby:
, Q
A¢ " bxc (1)
dlere:A = Absorbancemeasuredat a wavelengthof 264 nm
b = Ce]l length,cm
c = Concentration,mole/literon a dry basis,in waterat
• pH 7.0 ± 0.2
t,ote: ANSAusually has a moisture content of 2 to 3%.
f
t,ote: EastmanChemical Co. ANSA,mtntmumanalysis g8%, has been found
to n_eetthe above specifications. (a)
6.2.3 HydrogenPeroxide, 30%.
6.2.4 Methanol, absolute..
6.2.5 Hydrochloric Acid, concentrated.4
: 6.2.6 Sulfanilamide Solution: Add 2.0 g of sulfanilamide
to d lO0-ml volumetric flask containing approximately 50 ml of distilled
wdter. Thenslowly add 33 ml of concentrated HC1and dilute to lO0 ml
with distilled water. Mtx thoroughly. This solution can be used for 4
,eeks whenstored under normal laboratow conditions.
6.2.7 ANSASolution: Dtssolve 0.1 g of ANSAin 50 ml of
" a_soiute methanol. Dilute to 100 ml wtth absolute methanol in a volumetric
flJsk. Mix thoroughly. Keepstoppered, when not in use, to minimize
evaporative losses. This solution can_be used for 3 weeks when stored
u,der normal laboratory conditions. The solution will develop some
co]or under these conditions, but this color does not affect subsequent
a,alyses.(If thiscolor formationis objectionableto the analyst,thel
solutioncan be storedin the dark to minimizecolor fomation.) Exposure
toelevatedtemperatureshouldbe avoided, Solutionsexposedto temperatures
of 30_Cor higherfor 8 hoursor more shouldbe discarded.
6.2.8 HydrogenPeroxideSolution: Dilute0.2 ml of 30%
hydrogenperoxideto 250 ml with distilledwater. This solutionmay be
usedforone month,if refrigeratedand protectedfrom light.
aHentionof commercialproductsdoes not constituteendorsementof the
productby the U. S. Government.
6
6.3 Calibratlon
6.3.1 SodiumNitrite,assayof g7% NaNO2 or greater.
6.3.;! Sodium Nitrite Stock Solution (500 .g NO_/ml):
:lssolve an accurately weighed (to nearest 0.1 rag) amountof desiccated
iudiumnitrite in distilled water and dilute to 1.O00 ml such that a
_olution containing 500 ,g NO_/ml is obtained. The amountof NaNO2 to
,,e is calculated as follows:.|
|
1. 500G - "X-- x 50 (2)
wt_ere: G - Amountof NaNO2, grams
1.500 • Gravtmetrtc conversion factor
A • Assay, percent (should be 97 or greater)
Tt,is stock solutton can be stored for 6 weeks, if refrigerated.
6.3.3 SodiumNitriteWorkingStandard(I0 ug NO21ml):
PipetS ml of the stocksolutionintoa 250-mlvolumetricflaskandi
_iluteto volumewith absorbingreagent. Preparefreshdaily.
'. CaIIbration
7.1 Flowmeter.Callbratethe flowmeteragainsta calibratedflow
_asurementstandard,suchas a wet testmeter,bubbleflowmeter,orI
therreliablevolumemeasurementstandard. Calibratein unitsof
ta,dardcm3/min(i.e.,correctedto 25°C and 760 torr).
7.2 Absorber. Calibratethe polypropyleneabsorber(see5.1.2)by
ipeting50 ml of wateror absorbingreagentinto the absorber. Scribe
7_ _ ............... -- ...... , i i ml
•.4 Q ""t, " ..... -- --. --
the level of the meniscuswtth a sharp object, mark over the area wtth a
f.. f_,lt-tip marking pen, and rub off the excess.
7.3 Spectrophotometer
7,3.1 Prepare calibration standards by dtlutton of the
sodiumnitrtte worktng standard (see 6.3.3) as Indicated below. Use
absorbing reagent for all dilutions.
Volumeot_ worktng Ftnal Concentrationstandard_ ml volumeeml _g NO_/ml
0.0 100 0.01.0 100 O.12.0 100 0.25.0 100 0.5
IO.O tO0 I .015.0 100 1.520.0 100 2.0
(0;_t iona1) 25.0 1O0 2.5(0_'t i ona1) 30.0 1O0 3.0(Ort i ona1) 40.0 1O0 4.0
7.3.2 In accordancewlth the analytlcal procedure glven Jn 8.2,
,_asure and record the absorbance for each callbratlon standard (0.1,
0.2, 0.5, 1.0, 1.5, and 2.0 _g NO_/ml)_ ti
7.3.3 Plot absorbance (y-axts) versus the corresponding
:o,centration tn ,g NO2/ml (x-axis). Drawor computethe straight 1the
)est fitting the data to obtatn the calibration curve. A straight 11ne
_ith a slope of 0.50 + 0.02 absorbance untts/pg NO_/mland a y-Intercept
jf approxinmtely 0.01 absorbanceuntts should be obtained. The absorbance
s linear up to a concentration of 4.0 pg NO2/ml. Therefore, if samples
:xceedthe absorbance ot: the htghest calibration standard and the aboveI
bsorbance is within the range of the spectrophotometer, the calibrationl
urve can be extended by, including the htgher concentration standards.
f a higher absorbance range ts not available, samples must be dtluted
itn unexposedabsorbing reagent until the absorbance is wtthin thet I
angeof the highest standard.
I
8
6 Procedure
J.I $ample Collectlon
8.1.1 Assemble the sampling apparatus (Figure 1) at the
$j::.;_ling site, Componentsbpstream from the absorber may be connected,
bilL,re required,with Teflon®'tublng;,glass tubing with dry ball Joints;
or glass tubingwith butt-to-buttJoints with Tygon®, Teflon®, or poly-
pr_py l e,e.
8.1.2 Add'exactly 50 ml of absorbing reagent to the calibratedt
absorber.
8.1,3 Disconnect the funnel, connect the calibrated flowmeter,
m_jsurethe flow rate before sampllng and record as FI. If the flow
rate before sampling is not between 180 and 220 cm3/min, replace the
flow control device and/or check the system for leaks. Start samplingI
o.ly after obtainingan initial flow rate in this range.
8.1.4 Sample for 24 hours. Record the exact sampling time
i. minutesas t s.I
0.1.5 Measure the flow rate after the sampling period and
recordas Ff.
8.1.6 Seal the collected samples and transport to theI I
la_oratory for analysis.
_1.2 Analysis
8.2.1 Replace any water lost by evaporation during sampling
)y addingdistilledwater up to the calibration mark on the absorber.#
4i._thoroughly.
8.2.2 Pipet _ ml of the collected sample into a test tube.
'ii_etin 0.5 ml of hydrogen peroxide solution and mix vigorously foro
pproximately15 seconds. Add 2.7 ml of sulfanilamide solution and mix
9
vl:lorously for about 30 seconds. Then pipet 3 ml of the ANSAsolution
_,,j ,,_ixvigorously for about 30 seconds. CAUTION: The ANSAmust be
4uu_clwithin 6 minutes after adding the sulfanilamide solution. Longer
tlr_ i,tervals will result in lower absorbance values.
8.2.3 Prepare a blank in the samemannerusing 5 ml of
u,e_posedabsorbing reagent.
8.2.4 Measureand record the absorbance of each sample and
• tsle blank at 550 nmagainst distilled water. The absorbance measurement
ca, be n_deanytimefrom I to 40 minutesafteradditionof the ANSA.
TheaDsorbanceof the blankshouldbe approximatelythe same as the y-
intercept tn the calibration curve (see 7.3.3).
8.2.5 Determine .g NOz/ml from the calibration curve (see
7.3.3).
8.2.6 IVhenusing a spectrophotometer wtth an absorbance
ra,ge of 0 to l, samples'with an absorbance greater than 1.0 must be
rea,alyzed after diluting an aliquot of the collected sample witht , I
b
une_pusedabsorbing reagent. ' ,I
8.2.7 A randomly selected 5-10% of the samples should be
rea,alyzed as part of an Internal qualtty assurance program.#
8.2.8 After u_e, the spectrophotometer cells must be
ri,sedthoroughlywlthdlstl11_ waterand acetone,and dried;otherwisee
a film will build up on the cell walls.
I I
). S_amplinqE.ffJcienc_ The overall average efficiency is 93%from 20
_o 750ug NOz/m3(0.01to 0_4 ppm).(3)
lO
I0, C__iCulations.
10.1 Air Volume. Cal'culate the volume of air sampled as follows:
Fi +Ff%' " _ I_ -- X t s X 10 .6 (3)
, m3.hL,re: V Volumeof air sample,
Ft • Air flow rate before sampling, cm3/mtn
: Ff - Air flow rate after sampling, cm3/min
t • Sampling time, mtns
10.6 • Conversionof cm3 to. m3
If the temperature and pressure conditions at the time of the tntttal
JnJ fi,a! air flow rate measurementsare substantially different from
thL.conditions under which the flowneter was calibrated, appropriate
:orrections to the flow rate measurementsmay be madeto improve the.
_c_,'Jcy of the resultant NO2 concentration measurement. The mathematicali'ot_; of! tllese corrections dependson the type of flowmeter used; consult
tn appropriate reference for guidance.
10.2 HO2 Concentration in Analyzed Sample. Determine ug HO2/ml
irJp, ically from the calibration curve or computefrom the slope and
intercept values (see 7.3.3).
10.3_402 Concentrationin Air Sample. Calculateas ug of NO2 per
,Kallddrdcubicmeterof air as follows:
" ug NO2/mlx 50"g NO2/m3 = '" V x 0.93.... x D (4)
II
,:,ere: _g XOz/ml = NO_concentration in analyzed sample
r 50 • Volumeof absorbing reagent used in sampllng, ml
V - Volumeof air sample, m3
o.g3 - 5ampllng efficiency
D - Dllutlon factor (D - 1 for no dilutlon; D = 2 for
I:1 dilution; etc,)
)0.4 The NO2 concentration may be calculated as ppmusing:
ppmNO2 - (ug NO2/m3)x 5.32 x 10.4 (5)
, !
, t
O
12ii
ill i i I I I I
1i. Re_e,'ence$.
I. ujl,k. J. O. et al. "Development and Optimization of 24-Hour,ua,ual Mechods-'fo'_ the Collection and Colorimetric Analysis of_t;:_sp,,eric NO_." International Journal of' Environmental AnalxticalC.h___, 3_, 333-348 (1 974
2. f_erst, R. G. and Margeson, J. H. "An Evaluation of the TGS-ANSAr,-ocedure for Determination of Nitrogen Dioxide in Ambient Air."/.rA Report No. 650/4-74-047, November ]974.
'e
J "Q_ality Assurance Handbook for Air Pollution Heasur_ment Systems."EPArublication No. EPA-600/9-76-O05, January 1976.
4. C._n_tant, P. C., Jr. et al. "A Collaborative Test of the TGS-ANSAM_,tr_odfor Determinat_n_f Nitrogen Dioxide in Ambient Air." EPAC.,ntractNo. 68-02-1363. EPA Report No. 650/4-74-046, Septemberi._74.
i. Lod_le, J. P., Jr., et al. "The Use of Hypodermic Needles as CriticalOrifices in Air Samp-Ti_." J.A.P.C.A., 1.66,197-200 (1966).
6. ASTMStandards (Water;Atmospheric Analysis), Part 23. October1_6_. (p. 225).
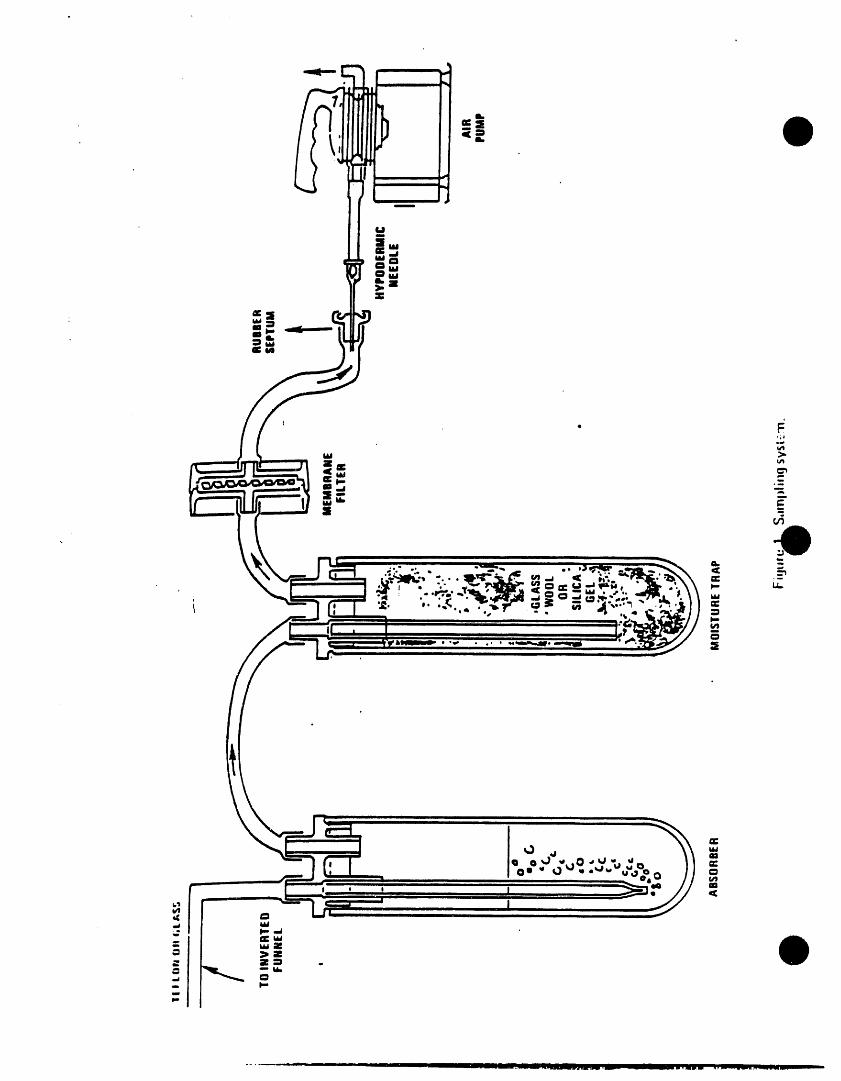
APPENDIX
I, ; I I
I
i
........ __ -- I -"_"_ I IlIIt ilil
t
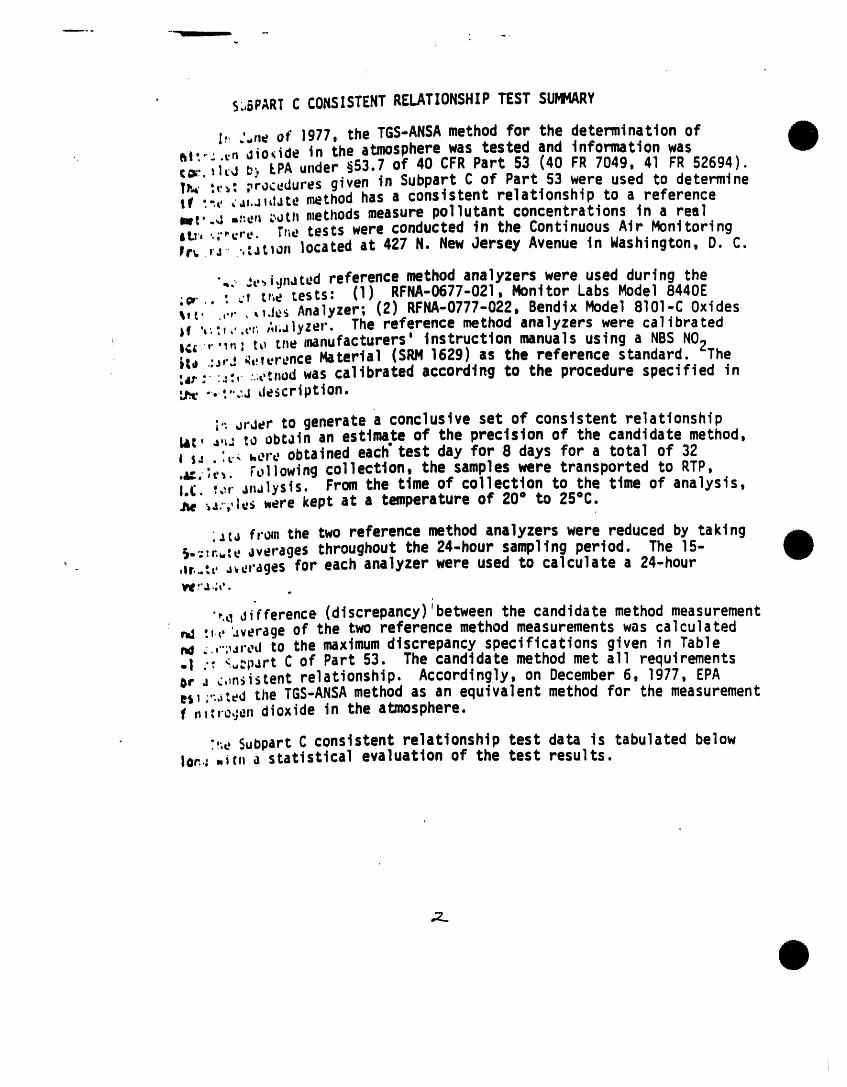
/o.
• S,,6PARTC CONSISTENTRELATIONSHIPTEST SUt,l_RY
Z:' ".,he of 1977, the TGS-ANSAmethod for the determination ofhit," ._.ndioxide in the atmosphere was tested and information was¢_.. _i_.j _:, LPAu,der §53.7 of 40 CFR Part 53 (40 FR 7049, 41 FR 52694).TP_'t,:_:proceduresgiven in Subpart C of Part 53 were used to determineIf "-.L.,'as.J1datemethod has a consistentrelationshipto a referencem_{..u=':e,aL'0_tt_methodsmeasurepollutantconcentrationsin a tea]_t_.,..;.,_,'e.Tr_etestswere conducted in the ContinuousAir MonitoringFr_,'J"..,'Jt_o,]ocatedat 427 N. New Jersey Avenue in Washington,D. C.
",....,t._i,jnJtedreferencemethod ana]yzerswere used during the;_,...: ,.tt,;etests: (I) RFNA-0677-021.Monitor Labs Mode] 8440El,t..,.,',,,.lesAnalyzer;(2) RFNA-0777-022.Bendix Model 8101-C Oxidesjf ,,...,_.,_._;A_;J1yzer.The referencemethod analyzerswere caTibrated
re{ ,"_,: t_ the manufacturers' instruction manuals using a NBS.NO2Theit, 'J,'J _,:vurence Material (SRM 1629) as the reference standard:4r : :-:,' :.:_,:,udwas calibrated according to the procedure specified in:j_... :,....j description.
i,- u,-der to generate a conclusive set of consistent relationship14c, a,_J to obtain an estimate of the precision of the candidate method,I s-, . :_.. were obtained each"test day for 8 days for a total of 32.ac,;t,_. FL,ilowing collection, the samples were transported to RTP,I.e. '.,'," j,.,Iysis. From the time of collection to the time of analysis,J_e ;_..,,l_s _ere kept at a temperature of 20* to 25"C.
•_{a from the two reference method analyzers were reduced by takingS.:_r.,:e averages throughout the 24-hour sa_ling period. The 15-
'- ,Ir..'_, a_e,'ages for each ana]yzer were used to calculate a 24-hour'#1_:'.t .;d.
",._ difference (discrepancy);between the candidate method measurementnd :,_, '_verage of the two reference method measurements was calculatedn_ .,..._,-ed to the maximumdiscrepancy specifications given in Table.I "" <._cpart C of Part 53. The candidate method met all requirements_e j c,,nsistent relationship. Accordingly, on December 6, 1977, EPAe$, ;.:._:ed the TGS-ANSAmethod as an equivalent method for the measurementf ,_:ro,je, dioxide in the atmosphere.
;:;e Su_part C consistent relationship test data is tabulated be]owler.._ ._,, a statistical evaluation of the test results.
;2_
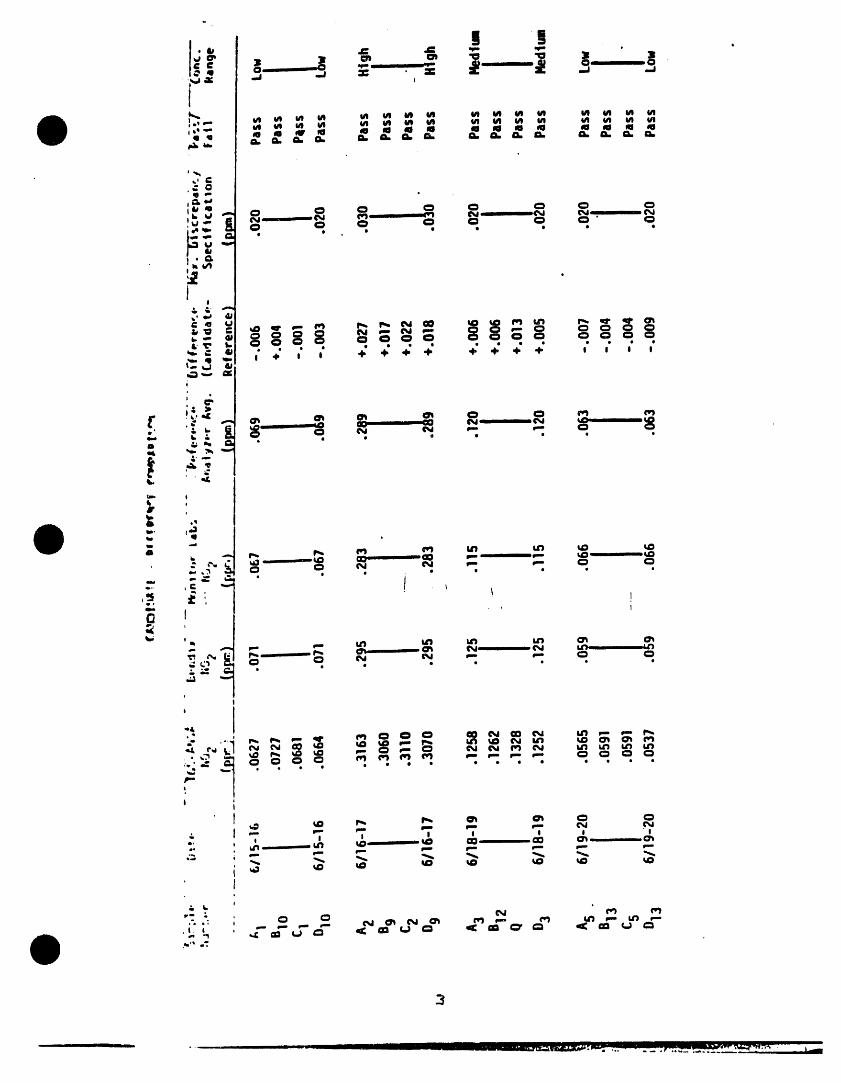
II ---- • I 4 . Ill II _. II Ill n I I _ _ . .--. . I _--_,_,-,-V... _.... JL_l-_'_r_" -_-_r ,'_'_I''-]" ,.. - - _ ;_T,_-_-_ _ _. '_'-" _ l
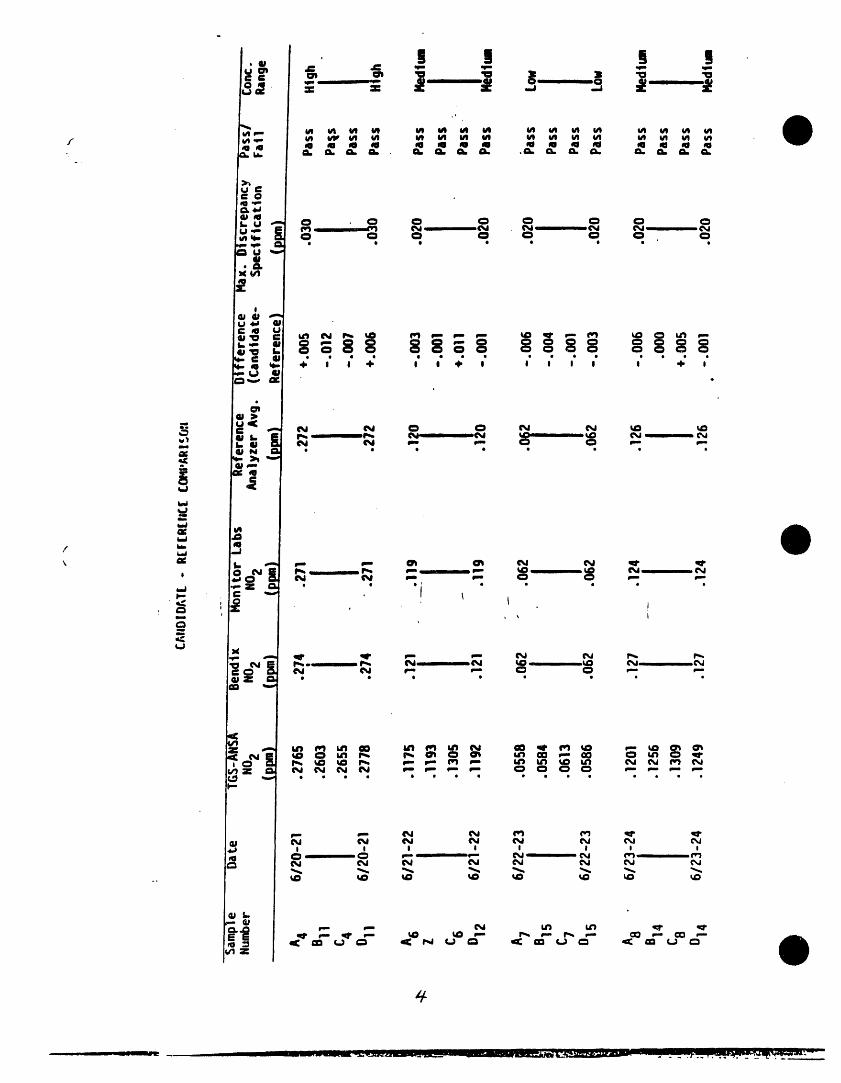
• • • • • • • • • • • • • • • •
LW
,.== _ ,..- tO 14) ,.== P,_ ,.=. I'_ ,..= ¢=Q ,..=. GO
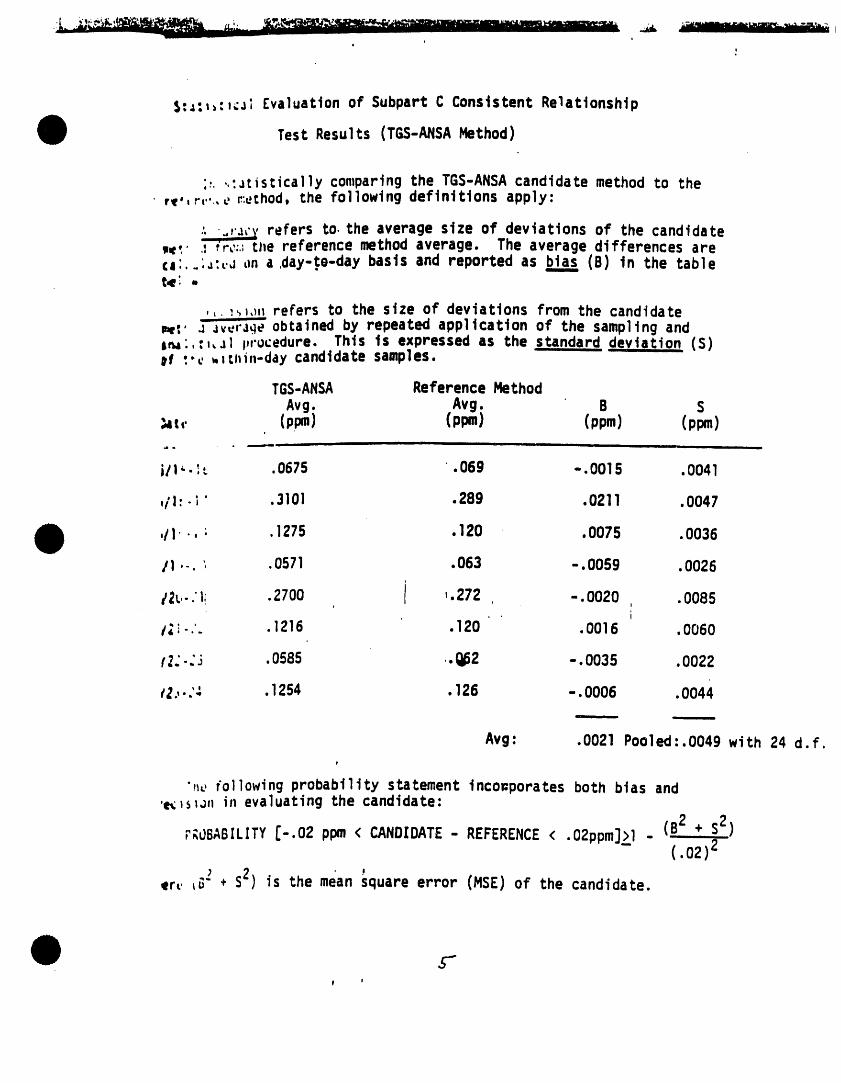
S:;:_:_cJ; [valuation of 5ubpart C Consistent Relationship
Test Results (TGS-AHSAMethod)
;..,.:Jtisticallycomparingthe TGS-ANSAcandidatemethod to theri,,r,.',er:ethod,the followingdefinitionsapply:
_0 refers to.the average size of deviations of the candidatew,:' .::r::;t)lereferencemethod average. The average differencesare(4:,-:_:_.JLm a .day-)e-daybasis and reported as bla_ (B) in the tablet4i .
,,.,_,), refers to the size of deviations from the candidate_,, j-_v_r_qe' obtained by repeated application of the sampling and¢n_'.:_, ,1 procedure. This ts expressed as the .Standard deviation (S))f .. _,w, tl_i.-day candidate samples.
TGS-ANSA Reference MethodAvg. Avg. B S
_t,' (ppm) (ppm) (ppm) (ppm)__ m im
i/! "- _" .0675 .069 -.0015 .0041
,/1: -; ' .3101 .289 .0211 .0047
,/I ', .1275 .120 .0075 .0036
it .-.. .0571 .063 -.0059 .0025
t2L,- "ii .2700 i ,.272 , -.0020 .0085I
t;i- ' .1216 .120 .0016 .0060
f2:-: J .0585 ._2 -.0035 .0022
t2., " 1254... . .126 -. 0006 .0044• i ,ml i
Avg" .0021 Pooled:.O049 with 24 d.f.
"_L, following probability statement inco=porates both bias and,_sIJ, in evaluating the candidate:
(B2 + S2)pROBABILITY[-.02 ppm < CANDIDATE- REFERENCE < .02ppm]_>l-
(.02)2
2er_,_ + S ) is the mean '"" square error (MSE) of the candidate.
5-
' @asedon the data, the following statement appltes:
f __. The probabilityof the candidatebeingwithin±.02ppmof the_-(erenceis greaterthan .g3. Anotherway of statingthis is that ifO0analyseswere made,7 of thesewouldbe expectedto differbyha,cealoneby ,rarethan ±.02ppmfromthe reference.
#
#-. °. L immlm I
Method No, EH$ E-!i i iiiii i i i
Tttle: , Extraction Procedure Toxtctty Test - I_talsi ii lllll iii iii ii r i iiii ii i iiii iii i ii i i i i
DaLe Issued: Before 2-83 .... Approved by: LI,HK Ham!,lto .............
Wrtt.ten by: HK Hamtlton .... . ...... . .............
Supersedes Hethod No. i i iiiiiiJ, |1 ii |1 ii , i imi i iiii i ii
,,,Oat,e, Revtewed By . DaLe , Revtsed,.By • .
.....................!-/5_yo , i!
iii i ill i ill l fill i i • i i li i i i l i l
Illl I I I II I I I I II I I I I I
I II II II I 'I liiII I I I I Ill -- Ill Illl I I
i ,HI,I i i i i i m i | ill i i i i i i i, |1
,11 i ,i
[ i i i i - ii ill __ i • i i
illl i i iill ii ili ill i
Replaced by Method No. DaLe: ii ii ii ill ili
EHS E-I-I1-15-90
EP TOXICITY EXTRACTION PROCEbURE--METALS
REFERENCES
I. Test Methods for EvaluatingSolid Waste: Physical and Chemical Methods.,Method 1310 & appropriate7000 series methods, USEPA SW-846 3rd Edition,1986.
2. Hazardous Waste Testing Manual, MllliporeCorp., pp. I08+.
3. April Z1. 1982 Memorandum from J. Knudson, Washington State Departmentof Ecology,on the use of buffer for EP-ToxicityTest.
PRINCIPLES
Solid samples are extracted in a pH 5 acetic acid buffer to determine thecharacteristicof EP toxicity due to the eight heavy metals arsenic, barium,cadmium, chromium, lead, mercury, selenium and silver.
LIMITATIONS
This procedure does not recover the analytes of interest quantitatively,itis a simulation of the leaching process that might occur in a landfill. Allanalyte recovery studies( i.e. spikes) should be performed after theextraction process.
DEFINITIONS
I. EP Toxi{ Metal_; These metals are arsenic, barium, cadmium, chromium,lead, mercury, selenium and silver. For liquid samples EP-TOXconcentration equals total metals concentration; for solids it is theconcentrationof the extract resulting from the EP toxicity extractionprocedure.
Z. Total Me_als: The metals concentrationdetermined using a mineral aciddigestionwithout filtrationor centrifugationof the digestate.
3. Laboratory CQntrQl Sample ('LCS); A sample containing known quantitiesof the analytes of interest (preferably certified) in the matrix ofinterest, prepared using the appropriatep_eparationmethod. The LCS isused to monitor the analyte recovery value of the sample preparationmethod employed.
4. PreparatiOn Blank: An aliquot of the analytical solvent ( DI water,acetic acid buffer, etc.) preparedby the appropriatesample preparationmethod. The preparation blank is used to monitor for contaminationintroducedby the sample preparationmethod.
5. Matrix Soike: A sample to which known quantities of analyte have beenadded before sample preparation.The matrix spike is used to monitoranalyte recovery for a particularmatrix/preparationmethod combination.
EHSE-1-21-15-90
6. Post Preoaration SDt_e: A sample to which known quantities of analytehave been added after sample preparation. The post preparation spike isused to monitor analyte loss due to a particular matrix/interferenceindependent of the sample preparation method.
7. Duolicate: A second identical preparation of a sample or spike.Oupltcates are used to monitor method precision.
8. Method of Standard Additions (MSA): The use of multiple additions ofanalyte to equal portions of sample to create a calibration curve anddetermine concentration. MSA is used to compensate for alteredsensitivity created by certain matrix effects, especially in theanalysts of organic matrices.
1. Nucleopore filtration chamber and stand
2. NBS rotating extractor
3. Polyethylene bottles compatible with extractor
4. Preftlters and ftlter membranes(Nucleopore PSO, PlO0, and P300)
S. Wide mouth funnel
6. Graduated cylinders
. 7. pH meter
8. 50 ml buret
9. Forceps. rubber policeman
10. Nitrogen tank, regulator, tubing, fittings
REAGENTS& STANDARDS
A. REAGENTS (STOCK..)
I. Milli-Q Plus deionizedwater
2. Glacial acetic acid
3. Sodium acetate
4. Sodium hydroxide
5. Materials for metal standardsas listed in EHS M-I, M-4 & M-tO

EHSE-1-31-15-90
B. REAGENTS(PREPARED)
1. 0.1 M Sodium acetate buffer: Dissolve 13.6 g sodtumacetate and5.75 ml glacial acetic actd in Mtllt-q deionJzed water and dtluteto 1 l tter ustng Mtll t-Q water. Thts solutton can be stored for upto six months.
2. 5.0 N Sodiumhydroxide solution: Dissolve 200 g sodiumhydroxide indeionized water. This solution can be stored for up to one year.
3. 0.5 N Acetic acid dtlute 28.74 ml of glacial acetic acid to 1 literwith deiontzed water, this solution can be stored for up to oneyear.
C. St_ndards
1. ]000 _Kj/Lstock metal standards - See EHSM-l, M-4 & M-lO
PROCEDURE
A. Initialfiltrationis oftenrequiredto separatesolidphasefromliquidphase portions of the sample. Initialfiltrationis performedasfollows:
I. Place3 filtersonto the teflonsupportscreenin increasingporesize usingforceps( P80, PIO0,P300).
2. Assemblethe filtrationsystem.Placethe chamberover the filterpad carefullyand tighten the 3 bolts. Place a funnel in theopeningat the top of the chamberand a suitablefiltratecollectorunderneaththe filtrationassembly.
3. Transfera portionof the samplevia the funnelintothe filtrationassembly. Securethe lid on the chamberand attachthe nitrogensupply. Closethegas supplyand pressurereleasevalves. Turn onthe nitrogen regulatorand adjust so that a small amount ofpressureis indicated(-I0psi).Slowlyopen the gas supplyvalve.Liquidshouldbeginto flow.Increasethe pressureslowly(maximumpressure75 psi) untilall of the liquidhas been expelledandgasbreaksthrough.
4. Close the nitrogentank valveand dial the pressuredown to zero.Open the pressurereleasevalveand vent the filtrationassembly.Removethe threeboltsand take the chamberoff the filterpad.
5. Remove the filterpad from the filtrationassembly.Removesolidfromthe filterpad and weighan aliquotintoan extractionvessel.Discardthe filterpad.
6. Cleanall apparatusimmediatelyto preventcorrosion.
EHSE-I-41-15-90
I_. Samole Extraction
I. Transfer IZ.S g of solid to a SO0 mLpolyethylene bottle.
2. Add 200 mL 0.1 M acetate/acetic acid buffer to the bottle.
3. Adjust the pH with 0.5 N acetic acid or 5.0 N sodium hydroxide to5.0+0.2 units.
4. Start the extractor and repeat step B.3 every hour or until the pHchange is less than 0.5 units.
5, Run the extractor overnight and check the pH in the morning. If thepH is 5.0+0.2 units after 24 hours, stop the extraction. If the pHis not within this range adjust and extract for 4 more hours.
C. Second Filtration
1. Following the procedure for the first filtration,transfer all of "the liquid from the extractionto the filtrationapparatus.
2. Filter the extract,collecting it in a 250 mL volumetric flask.
3. Otlute to volume with acetate buffer solution.
4. Transfer the extract to a polyethylene bottle (optional).
D. ANALYSIS;
I. Analyze the final extract for the eight metals using flame,graphite furnace or cold vapor atomic absorption spectroscopy(AAS).
a. Analyze for mercury by cold vapor AAS as described in EHS M-4,using 2.0 mL of sample.
b. Analyze for arsenic and selenium by graphite furnace AAS asdescribed in EHS M-]0, using the followingstandards:
O. 0.005, 0.01, 0.03, 0.05, 0.10 mg/L As & Se
c. Analyze for barium, cadmium, chromium, lead and silver byflame AAS as described in EHS M-I, using the followingstandards.
O, 0.04, 0.10, 0.20, 0.60, 1.0, 2.0 mg/L Cd, Cr & Ag0, 0.2, 0.5, 1.0, 3.0, 5.0, I0.0 mg/L Pb0, 0.2, 0.5, 1.0, 3.0, 5.0, 10.0 mg/L Ba (1000 mg/L K
added to all Ba samples and standards)
EHS E-I-51-15-90
2. If the extract is cloudy or otherwise presents problems for directanalysis, digest the extract as described in EHS M-11 and thenproceedwith the AAS analysisas described above.
3. Report all EP-TOX concentrations as mg/L metal in the finalextract.
OUALITYCONTROL
The quality control measures required to assure that the sample preparationprocedures presented here are adequate are discussed below. Other qualitycontrolmeasures associatedwith the atomic absorption spectroscopicanalysisof samples are presented in those methods.
LABORATORY CONTROL SAMPLE: A Laboratory control sample should beprepared by spiking a volume of the extraction solution with knownquantities of all analytes of interest in the concentration ranges ofinterest.The use of spiking solutions that are reference materials ispreferred.
PREPARATIONBLANK: A volume of extraction solution should be analyzedwith eacllbatch of samples as a preparationblank.
POST PREPARATION SPIKE AND POST pRI_PARATIONDUPLICATE SPIKI_: Twoidenticalpost preparation spikes should be prepared with each batch of
, samples.
.s ).-_I.P'J ._ j-- '! / )
///
HeLhod fto. Ells H-3_ i i i
Tttle: tlercur.v tn 5otl
VaLe Issued: Before 11-8_ Approved by: HK Hamtlton;_ ,_-b . .
Hrttten by: HK Hamtltoni i H i • i iii i i
Supersedes Hethod tlo. ill i i i ii
DaLe ....... Reviewed B_ .......... DaLe. _ Revtsed By
/
I-/o - qo., , t;.7z. ......
i i |,,, i|,, i || i i i
Replaced by t.leLhod rio. DaLe:
• °o
EHS M 3-I
). II-B2" MERCURY IN SOILS
l i,lllii lllll ii i i i i
Reference
Perkin-E1mer,Anal),tic.alMethods for Atomic Absorption Spectrophotometre,March 1971, Method GC 2 (Reference - Hatch and Ott, Anal. Chem_ 40, 2085(1968)).
Principles
Mercury is extracted from soil by the addition of nitric acid and hydrogenperoxide. The peroxide prevents the mercury from being reduced to theelemental state and lost by volatilization. The amount of mercury extractedis determined by the flameless atomic absorption technique described in EHSProcedure M-4.
Limitations#
Oxidizing conditions must be maintained during the extraction to prevent lossi of mercury. This method is suitable for the analysis of mercury pesticide
residues in most soils. If the soil is a potentially hazardous waste, see EPToxicity Procedure (EHS E-I).
Equipment
I. 250 mL glass-stopperederlenmyer flasks
2. lO0 mL glass-stopperedgraduated cylinders
3. Atomic absorption spectrophotometerand recorder
4. Absorption cell and reduction apparatus shown in EHS Procedure M-4
Reagents (stock)
I. Mercuric chloride - HgCl2
2. Stannous chloride - SnCl2 .2H20
3. Conc. nitric acid - HNO3
4. 30% hydrogen peroxide - H202
5. Potassium permanganate - KMnO4
6. Tributyl phosphate- TBP
7. Conc. hydrochloric acid - HCf
8. Magnesium perchlorate - Mg(Cl04)2
EHS M 3-2
Reagents (Prepared)- See EHS ProcedureM-4.
Standards - See EHS Procedure M-4.
Procedure
I. Rinse all glasswarewith l:l HN03, and deionized H20 before using.
2. Weigh out 5.0 g soil samples and place in 250 mL glass-stopperederIenmeyers.
3. Prepare standardsby adding 0.5, l.O, 3.0, and 5.0 mL of O.l ug/mL Hgstandard to 5.0 g portions of a representativesoil sample.
4. Add 25 mL conc. HNO3 and one mL 30% H202 to each sample andstandard. Stopper the flasks and allow to stand overnight.
5. Add an additional one mL 30% H202 to each solution.
6. Transfer samples (includingsoil) to lO0 mL glass-stopperedcylinders and. dilute to volume with deionized H20.
7. Allow the soil to settle and transfer a 50 mL aliquot (less if the soil isknown to be contaminated)to a mercury reductionflask and add deionized
, H20 to give a total volume of 75 mL.
8. Analyze accordingto EHS ProcedureM-4 beginning with ProcedureStep 7.
Calculations
I. Plot absorbance vs. ug Hg added to the spiked soil. Use the absorbanceofthe unspiked soil as 0 ug Hg added.
2. Back extrapolatethe calibrationcurve to 0 absorbance to determinetheamount of Hg present in the original soil.
3. Use this calibrationcurve to determine the amount of Hg present in theremainingsoil samples.
4. Determine the soil Hg concentrationas follows:
soil ppm Hg = A x BCxD
A = ug Hg foundB - lO0 mL initial volume
C = aliquot used in determination(usually 50 mL)D = 5.0 g sample weight
(Note: Average Hg level in untreated soil - 0.07 ppm. Reference ElvaldoKothny, Trace Elements in the Environment,ACS, 1973, p. 60.)
Method No. EHSM-]2__ , ii ill
• Title: Me.ta.,IsilflWaste OrganicMatricesby Atomic AbsorptionSpectroscopy
Date Issued: 1,10-90 Approved by: ......M...K. Hamilton t/_/
Wrltt._by: M.L. ZabelNil i , llilli ii i
SupersedesMethod No. New
.... DaLe , Reviewed By.. __ Date Revtsed By .-."
" ',... ,, , i m
|, =,
i,i
Replacedby Method No. DaLe:
• EHS M-121-I0-g0
METALS IN WAS!E-ORGANICMATRICESBY ATOMIC ABSORPTION SPECTRO_CQPY
REFERENCES
1. Test Me_hod_.forEvaluat.inaSQIjd Waste: .physiCaland Chemical Methods,Methods 3040, 3050, and 7000, Section 8.7, and 7060, SW-846 3rd Edition,1986, USEPA.
_RINCIPLES
The metals cadmium, chromium, and lead are determined in organic liquidmatrices by dissolution in methyl isobutyl ketone (MIBK) or xylene followedby flame atomic absorption analysis. Matrix effects make the use of themethod of standard additions mandatory. This method is also applicable tobarium, silver, and other metal species.
Arsenic is determined in organic matrices using a sub-boiling nitricacid/hydrogenperoxide digestion for sample preparation,followed by analysisby graphite furnace atomic absorption spectroscopy.Digestion of samples isnecessary to provide an aqueousmatrix for graphite furnace atomic absorptionanalysis.
LIMITATIONS\
This method does not apply to solid organic matrices or to organic materialswhich are water miscible. This method may not be adequate for organic liquidswith high suspended solids content if determinationof total metal content isdesired. Due to the instability of diluted samples and organometallicstandards, samples should be run as soon after dilution as possible•
The acid digestion method for arsenicmay not completely destroy the organicmatrix of many samples. A possible consequence of incomplete matrixdestruction is incomplete recovery of analyte. The use of method controlsamples, preparation blanks, matrix spikes, duplicates,and post-preparationspikes is necessary to assure the applicabilityof this procedure to a givensample matrix.
DEFINITIONS
I. EP Toxic Metals: The heavy metals arsenic, barium, cadmium, chromium,lead, mercury, selenium, and silver. For liquid samples equal to totalmetals concentrations; for solids the concentrationdetermined usingthe EP toxicity extraction procedure.
2. LaboratoryControl Sample (LCS):A sample containing known quantitiesofthe analytes of interest (preferably certified) in the matrix ofinterest, prepared using the appropriatepreparationmethod. The LCS isused to monitor the analyte recovery value of the sample preparationmethod employed.
EHS M-12-2f- 01-10-90
3. prepara)lon Blank: An aliquot of the analytical solvent ( DI water,MIBK, Etc.) prepared by the appropriatesample preparationmethod. Thepreparationblank is used to monitor for contaminationintroducedby thesample preparationmethod.
4. M)trix SDike: A sample to which known quantities of analyte have beenadded before sample preparation. The matrix spike is used to monitoranalyterecovery for a particularmatrix/preparatlonmethod combination.
5. Post Pre_aratlon Spike: A sample to which known quantities of analytehave been added after sample preparation.The post preparation spike isused to monitor analyte loss due to a particular matrix/interferenceindependentof the sample preparationmethod.
6. Duplicate: A second identical preparation of a sample or spike.Duplicates are used to monitor method precision.
7. Instrument callbratlqn verlf!¢atlon/continuinqCallbratipn verifiCation"sample (ICV/CCV):A sample, prepared from standard reference materials,used to verify the initial accuracy and the continuing accuracy of thecalibration.The ICV/CCV should have a concentrationnear the center ofthe calibrationrange.
8. Instrument calibration blank/continuinq,call.brat.ionblank (ICB/CCB)" AF" blank used to verify the initial and continuing accuracy of the
calibration.
g. Method detection limit (MDL): The minimum concentration-ofanalyte thatcan be measured and reportedwith gg% confidence that its concentrationcan be reported as greater than zero. The MDL is determined fromanalysis of a sample in a given matrix processed using the appropriatepreparationprocedure.
10. Instrument dete_tion limit (IDL)"The concentration equivalent to ,,signal, due to the analyte, which is equal to three times the standat'ddeviation of a series of at least seven replicatesof the reagent blanksignal at the analytewavelength.
EOUIPMENT
A. Flame metals analysis
I. Atomic absorption spectrophotometer,equipped with deuterium arcbackgroundcorrection
2. Hollow cathode lamps (HCLs) for the elements of interest
3. Volumetric Flasks and pipets
4. Disposable volumetric pipets
EHS M-12-301-I0-g0
• ,
5. 13 x 125 mm test tubes with threadedtops and teflon lined caps
6. Test tube racks
7. Analytical balance with 0.1 mg sensitivity
B. Graphite Furnace Analysis
1. Atomic absorption spectrophotometer,equipped with deuterium arcbackground correction,graphite furnace and autosampler
2, Electrodlessdischarge lamp (EDL) for arsenic, and EDL power supply(other lamps as needed)
3. 100 mL Griffin beakers
4. Ribbed watch glasses
5. Hot plate
6. Centrifuge and centrifugetubes
7. Volumetric flasks with stoppers,volumetric pipets
8. Analytical balance with 0.1 mg sensitivity
REAG[NTS
A. Flame Mel;.a_ls Analvsis--Stock
1. Methyl isobutyl ketone (MIBK)
2. Xylene
3. Organometallicstandards (see Standard@for details)
B. Graohite FurnaceAnalYsis--Stock
1. Concentrated,distilled nitric acid
2. Milli-Q finished deionizedwater
3. Hydrogen peroxide 30%
4. Nickel metal--Class2 Suspect Human Carcinogen
5. Arsenic Trioxide--ClassI Human Carcinogen
C. Reaaents (prepared)-.-.Graph.i..te.Furnace.Analysis
EHSM-12,4" 01-10-90
1. 0.5% (V/V) nitric acid: Transfer approximately 1800 mL Mill t-Qfinished detonized water to a 2000 mL volumetric flask. TransferlO.O ml. concentrated re-distilled nitric acid to the flask and fillto the mark with Mtlli-Q finished deionized water. Transfer thesolution to an acid rinsed polyethylene container.
2. 1000 mcj/L nickel solution: Prepared as indicated in EHSM-IO.
STANDARDS
A. Flame Metals Analys!_
1. Organometallic standards, 5000 mg/Kg (available from the ConostanDivision, Conoco Specialty Products Inc., Ponca City OK).
2. Organometalltc Reference Materials (available from the NationalInstitute of Standards and Technology).
3. Standard Addition Solution: Weigh approximately 0.100 g of 5000mg/Kg lead standard, 0.050 g of 5000 mg/Kg chromium standard and0.020 g of 5000 mg/Kg cadmium standard to a lO0 mL volumetricflask. Record the weights added for each standard. Fill the flaskto the mark with solvent (MIBK or xylene), stopper, and shake todissolve the standards. Calculate and record the standard
/ concentrations of each metal in the solution using the formulashown below:
SW (g) X 5000 (#g/g) / I00 (mL) = Std. Conc. (mg/L)Where: SW = Standard Weight.
ApproximateConc. - S mg/L Pb, 2.5 mg/L Cr, I mg/L Cd
B. Graoh!te FurnaceAnalysis
I. Arsenic stock solution 1000 mg/L: Prepared as indicatedin EHS M-]0.
2. NIST SRM 3103 Arsenic Solution 10 g/L
3. Arsenic intermediatesolution 10.0 mg/L: Transfer 1.0 mL 1000 mg/Larsenic stock solution to a ]00 mL volumetric Flask and dilute tothe mark with 0.5% (v/v) nitric acid. Transfer to an acid rinsedpolyethylenebottle. This solution should be replaced monthly.
4. Prepare standards by transferringthe following amounts of arsenicintermediatesolution to ]00 mL volumetric flasks and diluting tothe mark with 0.5% (v/v) nitric acid.
EHSM-12-501-10-90
_tandard Concentration ma/L uL As Intermediate Added
O, 100 1000
0.050 500
0.030 300
0.010 100
0.005 50
Use the 0.5% (v/v) nitric acid as the calibration blank. Transferthe standard solutions to acid rinsed, labeled polyethylenebottles. Standardsshould be prepared daily.
5. ICV/CCV stock solution: Transfer 100 /JLNIST SRM 3103 (As 10 g/L) .to a 100 mL volumetric and dilute to the mark with 0.5% (v/v)nitric acid. Transfer this solution to an acid rinsed, labeledpolyethylene bottle. This solution is 10.0 mg/L. Prepare thissolution monthly.
6. ICV/CCVsolution:Transfer I00 /_LICV/CCV stock solution to a 25 mLvolumetric flask and dilute to the mark with 5% (v/v) nitric acid.This solution is 0.040 mg/L As. Prepare this solutiondaily. .-
PROCEDURE
A. Flame Metals AnaIysis--Pb_(;d.Cr
I. Weigh between 1.0 and 5.0 grams of sample into a 25 mL volumetricflask.
2. Dilute to the mark with MIBK. If the sample is insoluble in MIBK,use xylene. Samples Insoluble in both MIBK or xylene are notamenable to analysis by this method..
3. Label 4 test tubes with the sample number and +0, +1, +2, and +3.
4. Transfer a 5 mL aliquot from the sample flask to each of the 4 testtubes placed in the test tube rack. Transfer the remaining sampleto a labeled test tube. Cap the test tube and save the sample.
5. Add 1.0 mL standard addition solution to the tube labeled +I, 2.0mL to the tube labeled +2, and 3.0 mL to the tube labeled +3.
6. Bring the total volume added to each tube to 10 mL with solvent(5.0 mL For the +0 tube, 4.0 mL for the +1 tube, 3.0 mL for the +2tube and 2.0 mL for the +3 tube).
EHS M-12-601-10-90
7. Cap the test tubes and shake vigorously.The samples are ready foranalysis.
8. Set up the atomic absorption spectrophotometer according to themanufacturer's instructions for flame operation with organicsolvents for the analyte of interest. The use of backgroundcorrection is mandatory for wavelengths below 300 nm.
9. Analyze the samples using the following steps:
a. Aspirate solvent and zero the instrument.
b. Take duplicate absorbance measurements of each sample andsample addition. Aspirate solvent continuously between samplereadings.
c. Check the absorbances of the four sample solutions. If theconcentration/absorbance relationshipdeviates significantlyfrom linear behavior or the absorbance of the +2 standardaddition is not at least twice that of the +0 standardaddition, repeat the standard addition analysis with a smallerinitialsample a11quot or with a dilute sample.
10. Clean the sample introduction system of the AA spectrophotometerand remove and clean the sample drain trap. Discard the solventportion of the waste generated and the sample solutions in the"Waste Solvent" container.
B. Graohit_ F_rnace Analvsl
I. Transfer a 5.00 mL aliquot of sample to a 100 mL Griffin beaker.
2. Slowly add 5 mL of 50 % nitric acid to the sample and cover with aribbed watch glass. Heat the sample so that it refluxes withoutboilincl.Reflux for one hour or until the digestate volume is -5mL. whichever is shorter.
3. VerY,_lowl.yadd 5 mL concentrated,redistilled nitric acid to thesample. Continue heating the sample so that It refluxes witho,,utboiling until the digestate volume is -5 mL. Allow the sample tocool.
4. Repeat step 3 until oxidation is complete. For matrices containingorganic compounds this may take many iterations. Oxidation isconsidered complete when addition of acid ceases to generatebrownish red fumes and the sample ceases to change in appearance.
EHS M-12-7,'" 01-I0-90
5. After step 4 has been completed and the sample has cooled,carefully add 2 mL 30% hydrogen peroxide. Return the coveredsample to the hot plate. Watch the sample carefully as vigorouseffervescence may cause it to overflow. Heat until theeffervescence subsides and cool the sample.
6. Continue to add hydrogen peroxide in 2 mL aliquots with warminguntil effervescence is minimal or until the general sah;pleappearance does not change. Add a maximum of I0 mL of hydrogenperoxide.
7. Continue to reflux sample until the volume has been reduced to -5mL. Transfer the sample to a 25 mL volumetric flask and dilute tovolume with Milli-Q/delonlzed water. The sample should becentrifuged if particulate residue is present and organic residuefloating at the top of the sample should be withdrawn with apasteur pipet. The sample is ready for analysis.
8. Set up the graphite furnace atomic absorption instrument for theanalysis of arsenic according to the manufacturer's instructions.Conditions for a Perkin Elmer 2380/HGA-400are listed below:
Wave lenghth: 193,7 nmSilt width: 0.7 nm
)r Peak height modeIntegration time: 5 secBackground correction: onDry: Temp: 160 C Ramp: 5 sec Hold: 30 secAsh: Temp: 1050 C Ramp: S sec Hold: 25 secAtomize: Temp: 2500 C Ramp: 0 sec Hold: 5 secClean: Temp: 2600 C Ramp: i sec Hold: 3 secCool: Temp: 30 C Ramp: I sec Hold: 5 secSample volume: 20 /JLMatrix modifier: Nickel Nitrate, 1000 mg/L, 20 _LTube type: Pyrolyticallycoated Lvov platform type with platforms.
9. Make replicateanalyses of all standardsand samples.
CALCULATIONS
A. Flame Metal_ Analysis
I. Calculate the /Jganalyte added for each standard addition:
#g added = CONC STD ADD (#g/mL)x ADD VOL (mL)
2. Prepare a calibration curve plotting standard additionconcentration (in #g) in the horizontal (x) axis versus absorbance(peak height) in the vertical (y) axis using curvilinearregression.
EHSM-12-801-10-90
3. Sample aliquot concentration (in /Jg) is the absolute value of x atpoint where the calibration curve intercepts the horizontal (x)axts. (See Appendtx 1.)
4. Calculate the sample concentration tn mg/Kg:
CONC(mg/Kg)- ALIQ. CONC(#g)/AW(g)
AW(g)- Aliquot Weight m SW(g) X AV(mL)/DV(mL)
SW- Sample Weight, AV - Aliquot Volume, DV - Dilution Volume
B. _;raDhtte Eurnace All_l vst
1. Generate a calibration curve and regression equation by plottingstandard concentration in the horizontal (x) axis versus peakheight in the vertical (y) axis and using curvtltnear regression.
2. From the caltbratton curve determine sample analyticalconcentrations, AC (#g/mL) using the regression equation generatedin Step I.
3. Using dtlutton factors, sample weights, and dilution volumes,._ calculate the original sample concentrations (mg/Kg).
C(mg/Kg) - AC(/Jg/mL) x OF x DV(mL) / SW(g)
Where DF - Dilution factor, DV -Dilution volume (mL), and SW -Sample weight (g).
QUALITYCONTROL
A. Elaine Metall; Analv_;i_;
1. Solvents must be free from impurities. Solvents containingimpuritiesmay be suitable for use after distillation.
2. Standard referencematerials should be analyzed with each batch ofsamples.
3. Duplicates should be analyzed in each batch of samples
4. NIST Standard referencematerials diluted to the concentrationsofanalysis should be analyzed with each batch of samples to verifyinstrumentperformanceand method accuracy.
EHS M-12,901-I0-90
B. Graphite FurnaceAnalysis
I. An ICV/CCV and a ICB/CCB must be analyzed after the initialcalibration and after every fifth sample to verify the continuingaccuracy of the calibration.
2. A method,control sample and preparationblank must be prepared andanalyzed with each sample batch.
3. For 10% of all samples, or at least once per batch of samples, amatrix spike and duplicate matrix spike shall be prepared andanalyzed.
4. A post preparationspike and duplicate post preparationspike mustbe analyzed in cases where matrix spike recovery and/or matrixspike duplicationerror are not satisfactory.
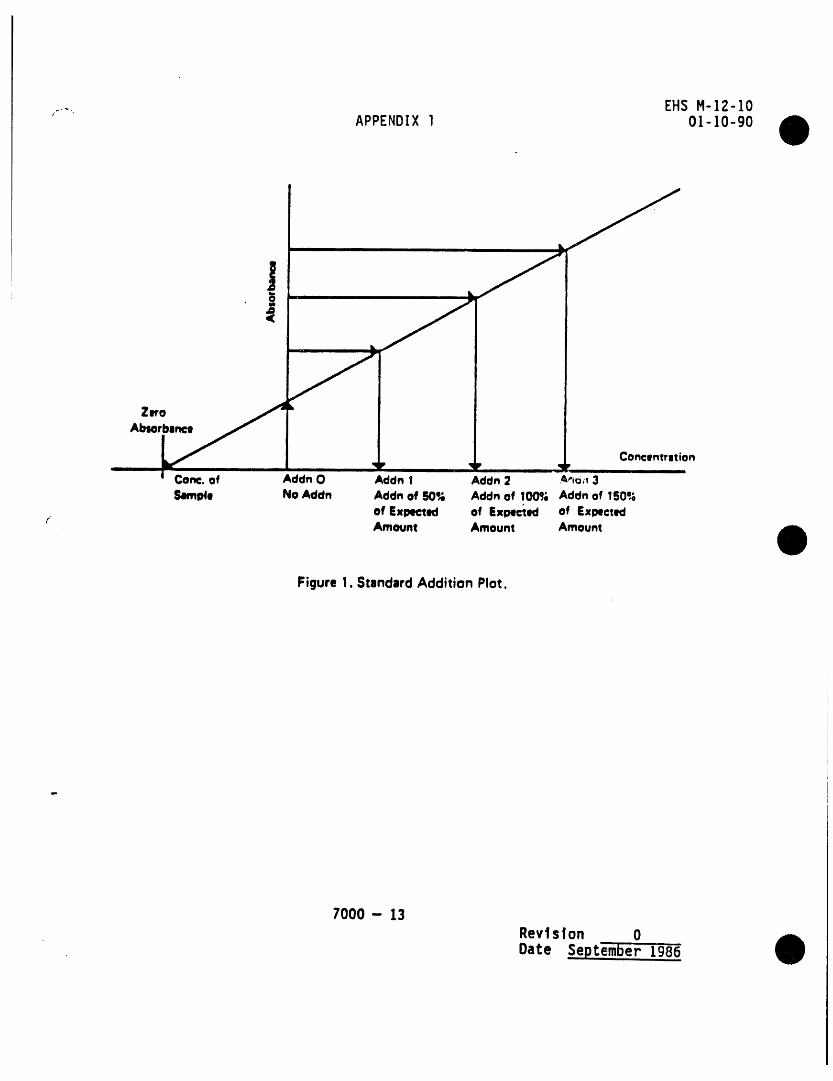
EHSM-12-10'+ APPENDIX 1 01-lO-gO
i
, ii i i
Z_o
Conc. of Addn O Addn I Addn 2 A"fU++13
,_lfnpll No Addn Addn of 50% Addn of 100% Addn of 150%
of Expected of Ex_ of Exl_ctedi
' Amount Amount Amount
Figure 1. StandardAdditionPlot.
7000- 13RevtsIon 0Date September 1§86
Her.hod No. ' El-ISIT,.1 ii i
• TtLle: Hetals In IIzO - Atomic Absorotton - FlameAq, .a, ¢&, t;r, CUo he, i!n, r_l°mml'llZn
DaLe Issued: Before 12-82 Approved by: _IKItamtIton
WrtLLen by: MK XamtlLon,l ii ii , i ....
Supersedes Method No.iiii i i ,1,
Date Revtewed By DaLe Rev|sed BY ....
. .,....../-)/.9o _ /o-/-,_-5" /_i,_77 ....
m -- - I
e
i , -- . ii ,i
,nl n nn ,unn m nn I I nlll nln.
. n, ,n,
'., , .I I I| ,I I
Replaced by MeLhodNo. Date:ii

EHSM 1-110-01-85
METALS IN H20 - ATOMIC ABSORPTION - FLAMEAg, Bat .(_at..crt cut Fe, M_p' IMnlZn
References
1. Standard Methods for the Examinationof Water and Wastewater, 16th Ed.,1985, pp. ISI-160, 16Z-164. •.....
Z. AnalyticalMethods for Atomic AbsorptionAnalyses,Perkin-Elmer,1971.
P.rincipies
When a solution containingmetals is aspiratedinto a flame, some of the atomsw111 be dissociated from their chemlcal bonds and placed in an unexcitedunionized ground state. If a beam of llght from a source lamp whose cathodeis composed of the element of interest is directed into the flame, the groundstate atoms of that element will absorb llght at a characteristicwavelength.The amount of 11ght absorbed can be measured and is directly proportionaltothe concentrationof the element in the sample.
Limitationsu i
It is important to use the proper flame conditions to ensuremaximum dissocia-tion of the element of interest in order to obtain adequate sensitivity. Insome cases, sensitivitywill be decreased by the presence of interferingsub-
" stances (phosphateinterferenceof Ca and Mg) or by an excess degree of ioni-zation of the desired element. These interferencescan often be overcome bythe addition of a cation that undergoes the undesired reaction more readilythan the element of interest (La added in Ca and Mg determination). Whenextremely diluted solutions are encountered, it may be possible to increasethe sensitivity of the analysis by using graphite furnace techniques(EHS M-IO).
Equipment
I. Atomic absorptionspectrophotometerand recorder
2. 14ollowcathode laml_sfor metals of interest
3. lO0 mL volumetricFlasks
4. 2S0 mL volumetricflasks
S. 1-11ter beakers
Reagents (stockl
I. Nitric acid, conc. 70% HNO3 - redistilled
2. Hydrochloric_cid, conc. 37-38% HCI
3. Barium chloride,BaCI2
EHS M I-2
• 4. Potassiumchloride,KCI
5. Calciumcarbonate, CaCO3
6. Copper,powder99.gg+%
7. Ironoxide, 9g.gg+% - Fe203
8. Zlnc powder, g9.gg+%
9. Manganesedioxide, MnO2
10. Silver nitrate,AgNO3
11. Potassiumdichromate,primary standard K2Cr207
12. Magnesiummetal
13. Lanthanumnitrate, La(N03)3 .6H20
14. Hydrogenperioxide, H202
Reagents IPrepared)
I. Lanthanum solutlon (20,000 ug/mL La) - dissolve 62.3 g La(N03)3•6H20 in dilute HN03 and dilute to I llter with deionlzed water.
' Prepareannually.
2. Potassiumsolution (20,000ug/mL K) dissolve 38.13g KCI in deionized waterand dilute to I Liter. Store in polyethylene. Prepare annually.
Standards
A. S'cockSolutions (prepareevery 6 months)
I. Barium stock solution - dissolve l.Sl6g oven dried BaCl_ in deionlz-ed H20, add 10 mL conc. HNO3 and dilute to I Liter wlth deionizedH20. I mL - lO00 ug Ba. Prepare every 6 months.
2. Calclum stock solution - dlssolve 2.4972 oven dried CaC03 in a mini-mum volume of HCf and dilute to l liter with delonized H20.I mL - 1000ug Ca. Prepareevery 6 months.
3. Chromium stock solutlon - dissolve 2.828 g oven dried K2Cr207 indeionizedwater to give a final volume of 1 liter, l mL = 1000 ug Cr.•Prepareevery 6 months.
4. Copper stock solution - dissolve l.O00 g Cu powder in a minimum volumeof l:l HNO3. Add an additional lO mL of conc. HNO3 and dilute toI liter with deionized H20. I mL - lO00 ug Cu. Prepare every 6months.
f
EHS M I-3
" 5. Iron stock solution - dissolve 1.430 g oven dried Fe203 in 50 mLof I'I HCf and dilute to I liter with deionized H20. l mL = I000 ugFe. Prepareevery G months.
G. Magnesium stock solution- dissolve l.O00 g Mg metal in l'l HCf, addan additional I0 mL conc. HCl and dilute to 1 liter with deionizedwater. I mL - I000 ug Mg. Prepare every G months.
7. Manganese stock solution - dissolve 1.5823 g MnO2 in a minimumvolume of l'l HCf. Add H202 as needed to complete dissolution.Add an additional lO mL of conc. HCl and dilute to l liter withdeionizedwater, l mL = lO00 ug Mn. Prepareevery G months.
8. Silver stock solution - dissolve 1.575 g oven dried AgNO3 indelonized water, add I0 mL conc. HNOI and _ilute to 1 liter withdeionlzedwater. Store away from llght-ln a brown glass bottle.1 mL - I000 ug Ag. Prepareevery G months.
g. Zlnc stock solutlon - dlssolve 1.000 g Zn powder in a minimum volumeof l:l HCf. Add an additional I0 mL of conc. HCf and dilute to l
liter with deionized H20. 1 mL - I000 ug Zn. Prepare every 6months.
B. Workin9 Standards.
I. Composite Cu, Fe, Mn, Zn standards - pipet 1.0 mL Cu stock, 0.5 mL Festock, O.l mL Mn stock, and 3.0 mL Zn stock into a I00 mL volumetricflask, add I mL conc. HNO3 and and dilute to volume with deionizedwater.
l mL - lO ug Cu1 mL = 5 ug Fel mL - 1 ug Mnl mL = 30 ug Zn
Prepare working standards by pipeting the following amounts of thecomposite standard into I00 mL volumetric flasks, adding 0.5 mL conc.HN03, and diluting to volume with deionlzed water. Prepare freshweekly.
Conc. Pg/mLm.LCompositeStandard CLt__. Fe M__n Z..n.n
0 0 0 0 0l.O O.l 0.05 O.Ol 0.32.0 0.2 O.l 0.02 0.65.0 0.5 0.25 0.05 1.58.0 0.8 0.4 0.08 2.4lO.O l.O 0.5 0.I0 3.0
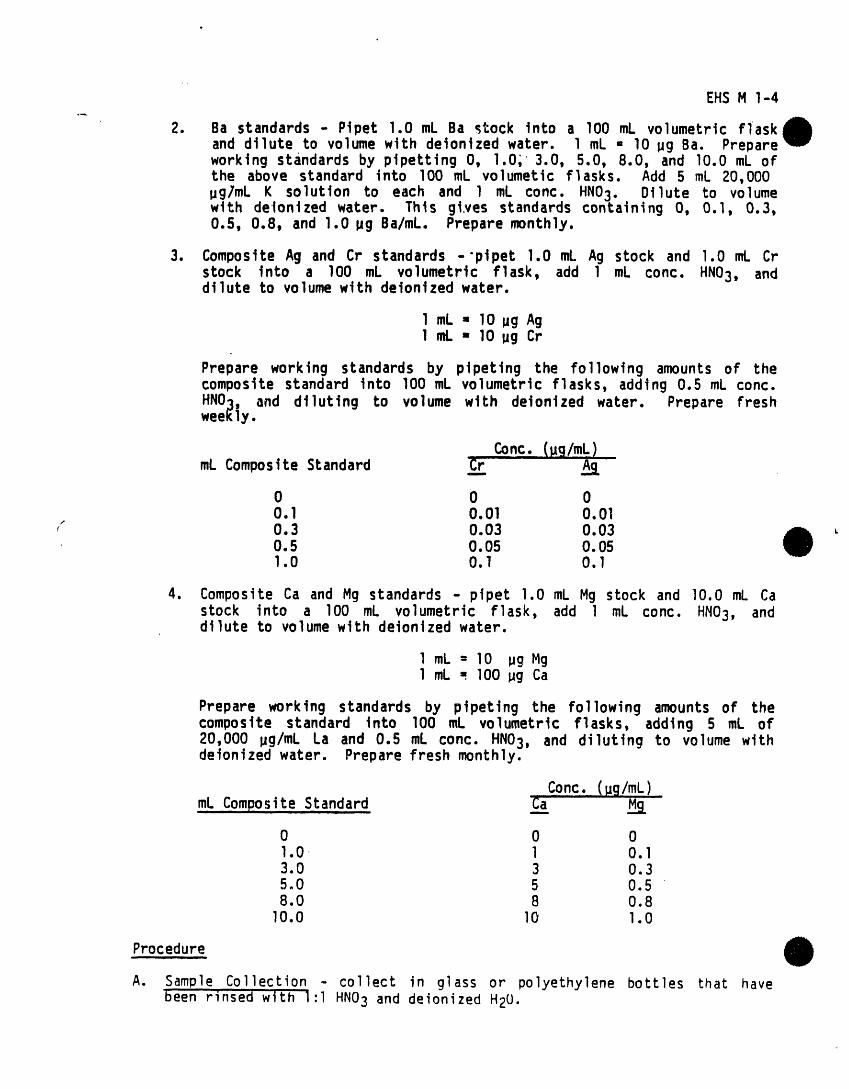
EHS M I-4o.,._
2. Ba standards - Pipet 1.0 mL Ba stock into a lO0 mL volumetric fiaskand dilute to volume with deionlzed water, l mL - lO IJgBa. Prepareworking standards by pipettlng O, 1.0, 3.0, 5.0, 8.0, and I0.0 mL ofthe above standard into lO0 mL volumetic flasks. Add S mL 20,000ug/mL K solution to each and l mL conc. HNO3. Dilute to volumewith delonlzed water. This gives standardscontaining O, O.l, 0.3,0.5, 0.8, and 1.0 ug Ba/mL. Preparemonthly.
3. Composite Ag and Cr standards -'pipet 1.0 mL Ag stock and 1.0 mL Crstock into a 100 ml volumetric flask, add I mL conc. HN03, anddilute to volume with deionlzedwater.
l mL - 10 ug Ag1 mL - 10 ug Cr
Prepare working standards by plpetlng the following amounts of thecomposite standard into 100 mL volumetric flasks, adding 0.5 mL conc.HNO_ and dilutlng to volume with deionized water. Prepare freshwee_iy.
Conc. (_ig/mL)mL Composite Standard Cr A_
0 0 00.1 O.Ol 0.01
/ 0.3 0.03 0.030.5 0.05 0.051.0 O.l 0.1
4. Composite Ca and Mg standards - pipet l.O mL Mg stock and lO.O mL Castock into a lO0 mL volumetric flask, add l mL conc. HN03, anddilute to volumewith deionlzedwater.
l mL --lO _g Mgl mL : I00 ug Ca
Prepare working standards by plpeting the following amounts of thecomposite standard into I00 mL volumetric flasks, adding S mL of20,000 pg/mL La and 0.5 mL conc. HN03, and diluting to volume withdeionizedwater. Preparefresh monthly.
Conc. (pglmL)mL CompositeStandard Ca M__
0 0 01.0 l O.l3.0 3 0.35.0 5 0.58.0 8 0.8I0.0 lO 1.0
Procedure
A. Sample Collection - collect in glass or polyethylene bottles that havebeen rinsed with I:1 HNO3 and deionizedH20.
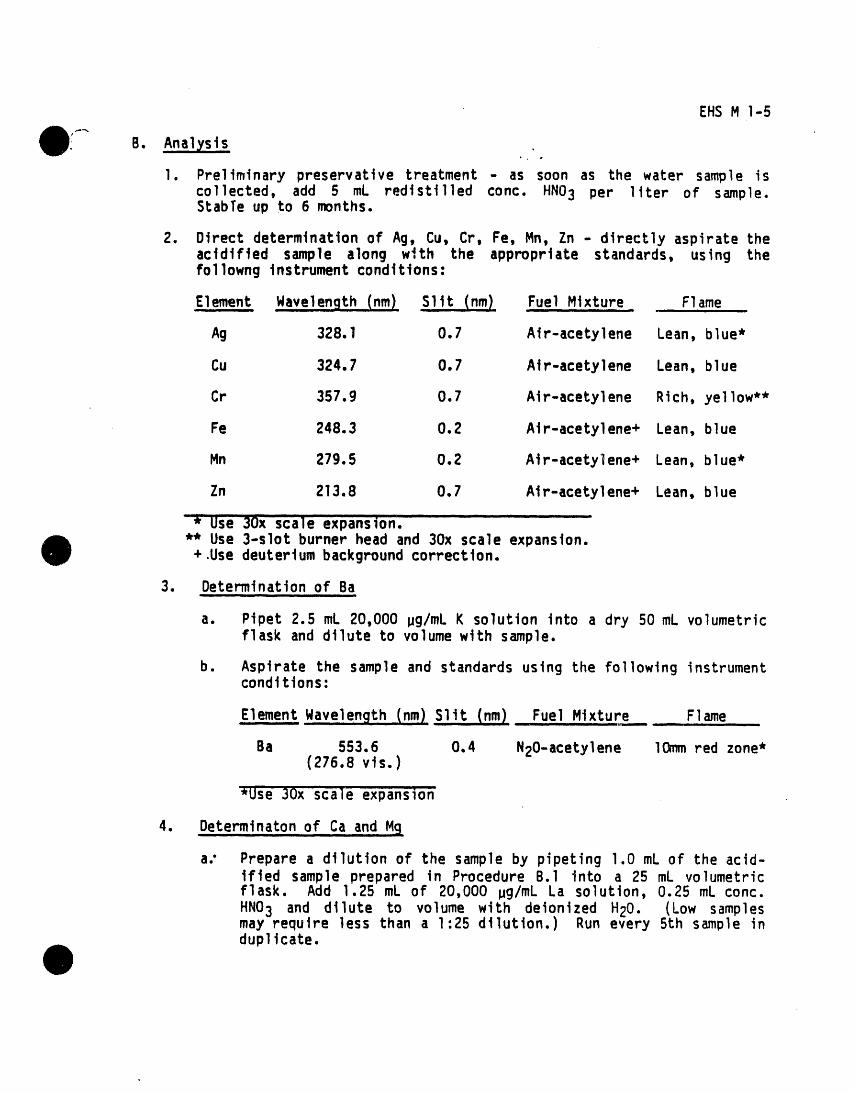
EHS M I-5• .
B. Anal_si,s,
I. Preliminary preservative treatment - as soon as the water sample iscollected, add 5 mL redistilled conc. HNO3 per liter of sample.StabTe up to 6 months.
2. Direct determinationof Ag, Cu, Cr, Fe, Mn, Zn - directly aspirate theacidified sample along with the appropriate standards, using thefollowng instrumentconditions:
Element Wavelength (nm) $1it (nm_ Fuel Mixture Flame
Ag 328.I 0.7 Air-acetylene Lean, blue*
Cu 324.7 0.7 Air-acetylene Lean, blue
Cr 357.g 0.7 Air-acetylene Rich, yellow**
Fe 248.3 0.2 Air-acetylene+ Lean, blue
Mn 279.5 0.2 Air-acetylene+ Lean, blue*
Zn 213.8 O.l Air-acetylene+ Lean, blue
_'Use 30x scale expansion."** Use 3-slot burner head and 30x scale expansion.+.Use deuteriumbackgroundcorrection.
3. Determinationof BaIll lll,l
a. Pipet 2.5 mL 20,000 IJg/mLK solution into a dry 50 mL volumetricflask and dilute to volume with sample.
b. Aspirate the sample and standardsusing the following instrumentconditions"
Element.Wavelength (nm) Silt (nm) FueI Mixture _ Flame
Ba 553.6 0.4 N20-acetylene lOmm red zone*(276.8 vis.)
*use 30x scale expansion
4. Determinatonof Ca and Mg
a." Prepare a dilution of the sample by pipeting l.O mL of the acid-ified sample prepared in Procedure B.l into a 25 mL volumetricflask. Add 1.25 mL of 20,000 ug/mL La solution, 0.25 mL conc.HNO3 and dilute to volume with deionized H20. (Low samplesmay require less than a 1:25 dilution.) Run every 5th sample induplicate.
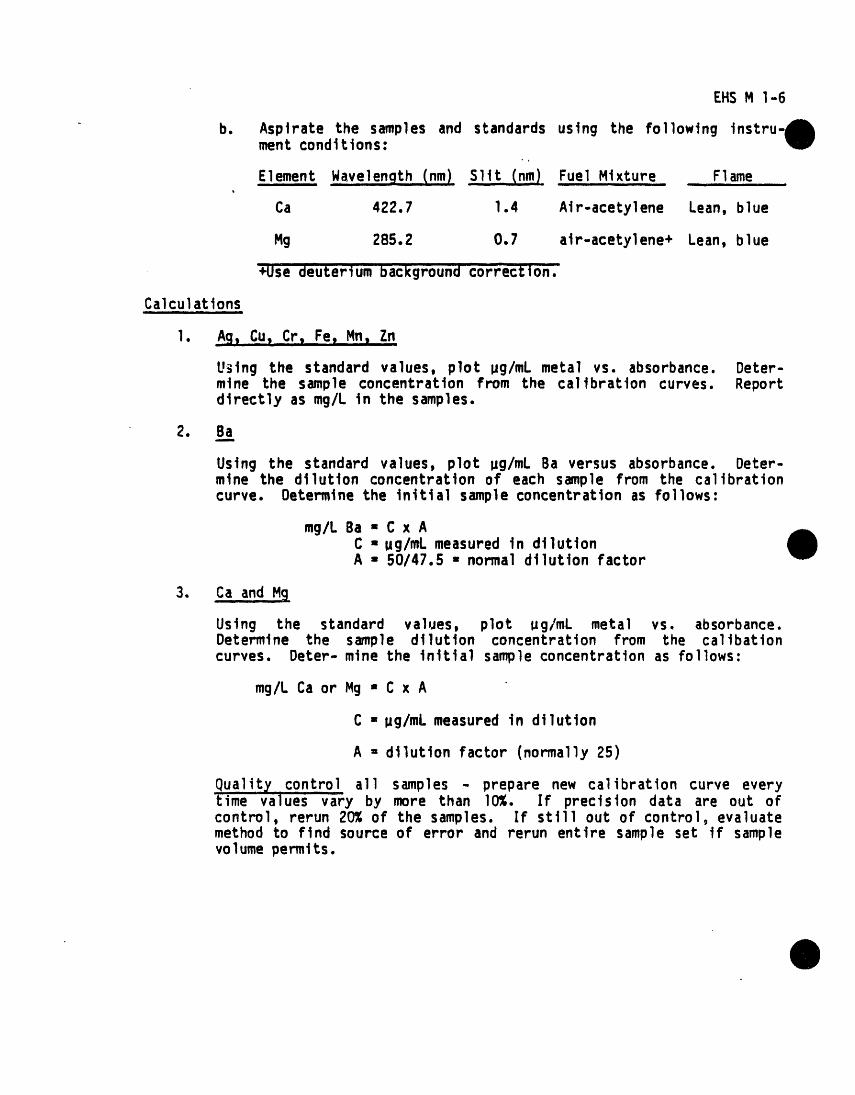
EHS M 1-6
" b. Asplrate the samples and standards using the following Instment conditions:
Element. Wavelenqth.(nm) _ Fuel M.ixture _Flame .....
Ca 422.7 1.4 AIr-acetylene Lean, blue
Mg 285.2 0.7 air-acetylene+ Lean, blue
_Jse deuteriumbackground (:or_"ect|on.
Calculationsinlnul u n
I. Aq, Cu, Cr_ Fee Mn, Zn
Using the standard values, plot IJg/mL metal vs. absorbance. Deter-mine the sample concentration from the calibration curves. Reportdirectly as mg/L in the samples.
2. Ba
Using the standard values, plot ug/mL Ba versus absorbance. Deter-mine the dilution concentrationof each sample from the calibrationcurve. Determinethe Initialsample concentrationas follows:
mg/L Ba - C x AC -ug/mL measured in dilutionA - 50/47.5 - normal dilution factor
3. Ca_and Mg
Using the standard values, plot ug/mL metal vs. absorbance.Determine the sample dilution concentration from the callbationcurves. Deter-mine the inltlalsamle concentrationas follows:
mg/L Ca or Mg - C x A
C - ,g/mL measured in dilution
A = dilution factor (normally25)
Quality,control a11 samples - prepare new calibration curve everytime values vary by more than 10%. If precision data are out ofcontrol, rerun 20% of the samples. If still out of controlo evaluatemethod to flnd source of error and rerun entire sample set if samplevolume permits.

EHSM 1-7
Accuracy % PrecisionMetal Recovery _jngll Range (rag/L)
Ag. 98.9 0.001 0.01-0.1
Fe 106.9 0.010 0.02-1.0
Mn 99.3 O.002 O.01-0.5
Cu 109.3 0.037 0.01-0.45
Zn lOB,1 0.006 0.01-I.0
Ba 94.3 0.014 0.05-1.0
Cr 102.1 O.003 O.08-0.4
Ca 97,0 0,15 0.5-10
Mg II0.0 O.14 0.05-I.0
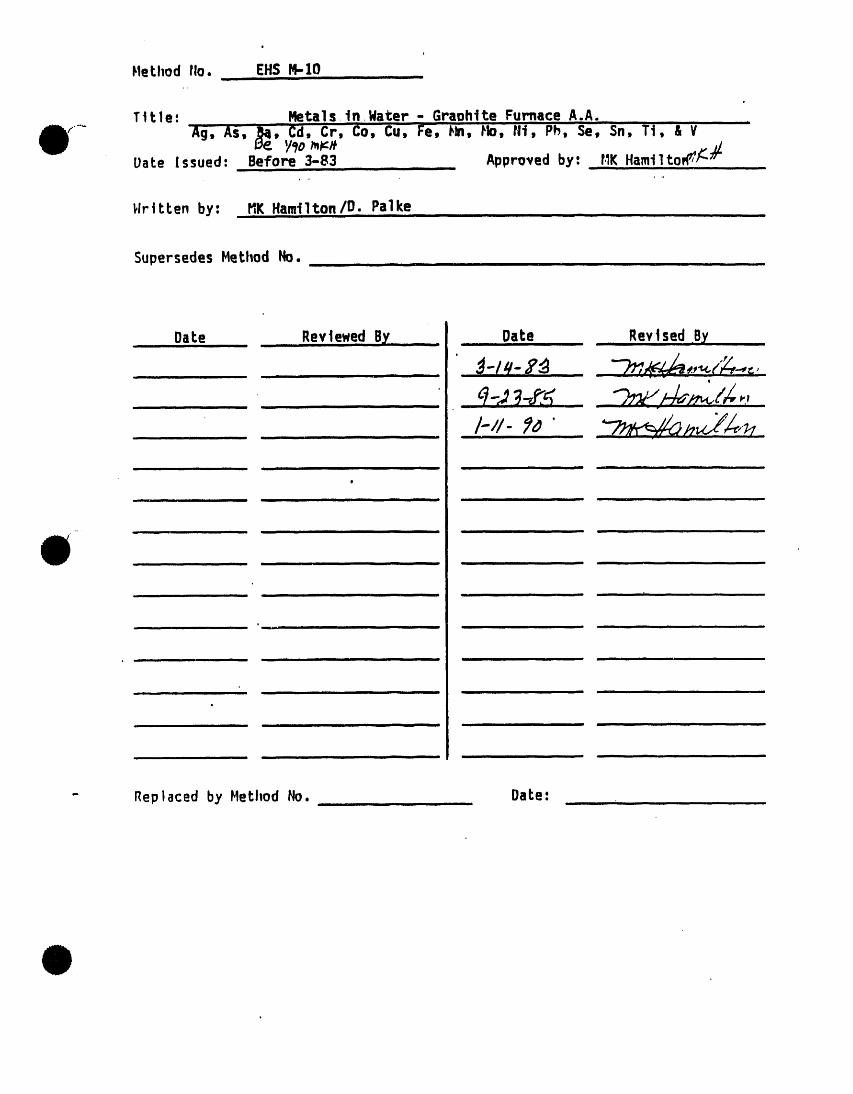
Hethod rio. EHSR-IOi ii iii iiii --
Tttle: Hetals.tn,Xater - Graoh!te Furnace A.A.., , ,.....
Ag, AS, _, Cd, Cr, Co, Cu, "Fe, I_, _, fit, Pb, se, sn, Tt, & VUoLe Issued: Before 3-83 Approved by: t,IKHamiltofl_mill
• .., ,.
;IrtLLen by: HK Hamtlton/D. Palke ........
Supersedes Hethod No, .....................
Date , R,ev|ewedBy ..... , .... Date ........ ... R.evtsed By.
,,, _ ,_-/_-8_ _ "_,,_,,_/_,t
ii i nnml .... .
.....
, ,,. illul i n i i i -- . n , ,
i inn ii lull II l II II
- Replaced by Hethod No. , .... DaLe: __ n' .........
EHS M-lO-I01-11-90
o,
METALS IN WATER -_GRAPHITEFURNACE A..A.Ag. A_;LB_. C_. Cr, CO. CuL_Fe.Mn, Mo, Ni, pb, Se. Sn. Ti, V
References
I. Methods fq_Chemi{al Analysis Qf_ater al1_lWastes, EPA-600/4-79-020,1983,Section 200.
2. AnaIytica]_Method# for FurnB(;e_AtomicAb#orotign Soectr_cooy, PerkinElmer, Corporation,1980.
3. Standard Methods for the Evaluation of Water and Wastewa.t_, 17th. Ed.,1989, Sections 3000 & 3113.
4. USEPA TestMethods for Evaluatina Solld Waste. SW-846, 3rd. Ed., 1986,7000 Series methods.
P_InciDles
In furnace atomic absorption spectroscopy,a sample is thermallyatomized intounionized, unexcited atoms in their ground states without the use of a flame.A light beam from a hollow cathodelamp, which is composed of the element to bedetermined, is directed through the atomizationarea and onto a detector thatmeasures the amount of light absorbed. Absorptiondepends upon the presence offree unexcitedground state atoms in the furnace. Since the wavelength of thelight beam is characteristic of only the metal being determined, the lightenergy absorbed is a measureof the concentrationof that metal in the sample.
t
Limitations
Background absorption of light from the source beam due to volatilized oratomized matrix material is the major source of interferencein furnace atomicabsorption. This problem can be alleviated in a number of ways. The additionof a matrix modifier to the sample which increasesthe volatilityof the matrixor decreases the volatility of the analyte allows for separation of thecomponents and achievementof more accurate results. Reduction of the samplesize or use of a deuterium backgroundcorrectorwill also help to reduce back-ground absorption. (For sampleswith complex matrices,the method of standardadditions may be needed to completely overcome matrix problems.) The use ofproper drying, ashing, and atomizing parameters is also necessary for good
. results.
Equipment
i. Atomic absorptionspectrophotometer
2. Hollow cathode or electrodelessdischargelamps for metals of interest
3. Strip chart recorder & printeri
4. HGA 400 graphite furnaceplus autosampler
5. Pyrolyticallycoated graphite tubes, with and without platform
EHS M-10-201-II-90
_..
6. Deuteriumbackgroundcorrector
7. EDL power source
B. Various volumetricflasks and pipets
Reaqents (Stock)
I. Hydrogen peroxide,30% H202
2. Nitric acid, conc. HNO3, redistilled
3. Ammonium phosphate,dibasic, (NH4)2HP04
4. Lanthanumnitrate, LA(N03)3 • 6H20
5. Nickel powder--{LASS2 SUSPECTHUMAN CARCINOGEN
6. Cadmiummetal--CLASS2 SUSPECTHUMAN qARCIBOBEN
7. Potassiumdichromate,K2Cr207
8. Copper powder
9. Lead nitrate, Pb(N03)2
10. Silver nitrate, AgNO3
11. Arsenic trioxide,As203--CLASSI SUSPECT HUMAN CARCINOGEN
12. Sodium hydroxide,NaOH
13. Seleniummetal
14. Berylliummetal--CLA_$2 SUSPECTHUMAN CARCINOGEN
15. Manganese dioxide, MnO2
16. Iron oxide, Fe203
17. Hydrochloric acid, conc. HCl
- 18. Cobalt metal
19. Ammonium molybdate--(NH4)BMo7024" 4H20
20. Titanium dioxide--TiO2
21. Vanadyl sulfate--VOSO4 ' 2H20
22. Potassium antimonytartrate--K(SbO)C4H406' I/2 H20
23. Tin metal
EHS M-I0-301-11-90_
h_ 24. Ammoniumhydroxide--NH40H
25. Ammoniumsulfate (NH4)2 SO4
25. Sulfuric acld, conc. H2SO4
Reaaents (Preoared)
I. 40% (NH4)2HPO4 dissolve 40 g (NH4)2HPO4 in 100 mL volumetric flask anddilute to volume with deionizedwater. Prepare annually.
2. Lanthanum solution (50,000 /_g/mLLa)--dissolve77.9 g La(N03)3 • 6H 0 indilute HNO3 and dilute to 500 mL with deionizedwater. Prepare annually.
3. Ti dissolving solution--DissolveBOg (NH4)2SO4 in 200 mL conc. H 2 S 0 4 .Prepare annually.
Standard_
A. Stock Solutions--Prepareevery 6 months
I. Antimony stock solution--Dissolve0.6855g K(SbO)C4H406.1/2H_O indeionized water and dilute to 250 mL. DO NOT add acid. I mL--1000#g/Sb.
2. Arsenic stock solutionDissolve 0.3302 g arsenic trioxide As203, in25 mL deionized water containing I g NaOH and dilute to 250 mL withdeionizedwater. I mL--1000 /JgAs.
3. Beryllium stock solution--Dissolve0.250 g Be metal in 15 mL 1:1 HCI,add an additional 2.5 mL conc. HCI and dilute to 250 mL withdeionizedwater. I mL - 1000 #g Be.
4. Cadmium stock solution--DissolVe0.250 g cadmium metal in a minimumvolume of 1:1 HNO3. Add an additional2.5 mL conc. HNO3 and diluteto 250 mL with deionizedwater. I mL - 1000 #g Cd.
5. Chromium stock solution--Dissolve0.707 g oven dried K2Cr207 indeionizedwater to give a final volume of 250 mL. I mL - 1000 /JgCr.
6. Cobalt stock solution--Dissolve0.250 g cobaltmetal in a minimumvolume of 1:1 HNO3. Add an additional2.5 mL conc. HNO3 and dilute
- to 250 mL with deionizedwater. I mL= 1000 #g Co.
7. Copper stock solution--Dissolve0.250 g copper powder in a minimum
volume of I:I HNO3. Add an additional120.050mL conc. HNO3 and diluteto 250 mL with demonizedwater. I mL - /_gCu.
8. Iron stock solution--dissolve0.3575 g oven dried Fe203 in 15 mL of1:1 HCl and dilute to 250 mL with deionized water, i mL - 1000 #gFe,
9. Lead stock solution--Dissolve0.3995 g oven dried Pb(N03)2" inb1:IpHNO3 and dilute to 250 mL with deionizedwater. I mL I000 #g
EHSM-10-4/.. 01-11-90
10. Manganese stock solution--Dissolve 0.3956 g MnO2 in a minimum volumeof 1:1 HCI. Add H202 as needed to complete (Jissolution. Add anadditional 2.5 mL of cone. HCl and dilute to 250 mL with deionized
- water. 1 mL m 1000 pg Mn.
11. Molybdenum stock solution--Dissolve 0.433 g dried (NH4)6M07024 in 1%NH40Hand dilute to 250 mL with deiontzed water. 1 mL - 1000 pg Mo.
12. Ni solution (1 mL - 1000 #g Nt)--Dtssolve 0.250 g Ni powder in aminimumvolume of 1:1 HNO3. Add an additional 2.5 mL conc. HNO3 anddilute to 250 mL with deionized water.
13. Selenium stock solution--Dissolve 0.250 g selenium metal in 2 mLconc. HNO3. Wam until reaction is complete Cautiously evaporatejust to dryness and dilute to 250 mL with de'ionized water. 1 mL -1000 pg Se.
14. Silver stock solution--Dissolve 0.3938 g oven dried AgNO3 in deion-tzed water. Add 2.5 mL conc. HNO3 and dilute to 250 mL with deion-tzed water. Store away from light in a brown glass bottle. 1 mL -1000 pg Ag.
15. Tin stock solution--Dissolve 0.250 g Sn metal in -15 mL conc. HCI(not dilute). Dilute to 250 mL with deionized water, adding more HCI
, if necessary to keep tin tn solution. 1 mL - 1000 pg Sn.
16. Titanium stock solution--Dissolve 0.417 g TiO2 in 25 mL ofHzSO4/(NH4)2 SO4 dissolving solution and dilute to 250 mL withdeionized water. 1 mL - 1000 pg Ti.
17. Vanadium stock solution--Oissolve 0.9768 g VOSO4"2H20 in deionizedwater and dilute to 250 mL. 1 mL- 1000 pg V.
B. Workinq Standards
Mote: Prepare all intermediate and working standards using MiII i-Qdelonlzed water.
I. Ag, As, Cd, Cr, Pb, Sb, and Se working standards
a. Intermediate Cd & Ag--pipet 1.0 mL Cd stock and 2.0 mL Ag stock- into a I0 mL volumetric flask and dilute to volume with
deionlzed water. I mL - I00 /_g Cd & 200 pg Ag. Preparemonthly.
b. CompositeAg, As, Cd, Cr, Pb, Sb and Se standard
Pipet 0.5 mL Cr stock, i.0 mL each of the As, Pb, Sb, and Sestock solutions and 1.0 mL of the Cd/Ag intermediatesolutioninto a I000 mL volumetric flask, add 5 mL conc. HNO3, and diluteto volumewith deionlzedwater. Prepareweekly.
I mL - I /_gAs, Pb, Sb, Sem 0.5 _g Cr
- 0.2 #g Ag-0.I #g Cd
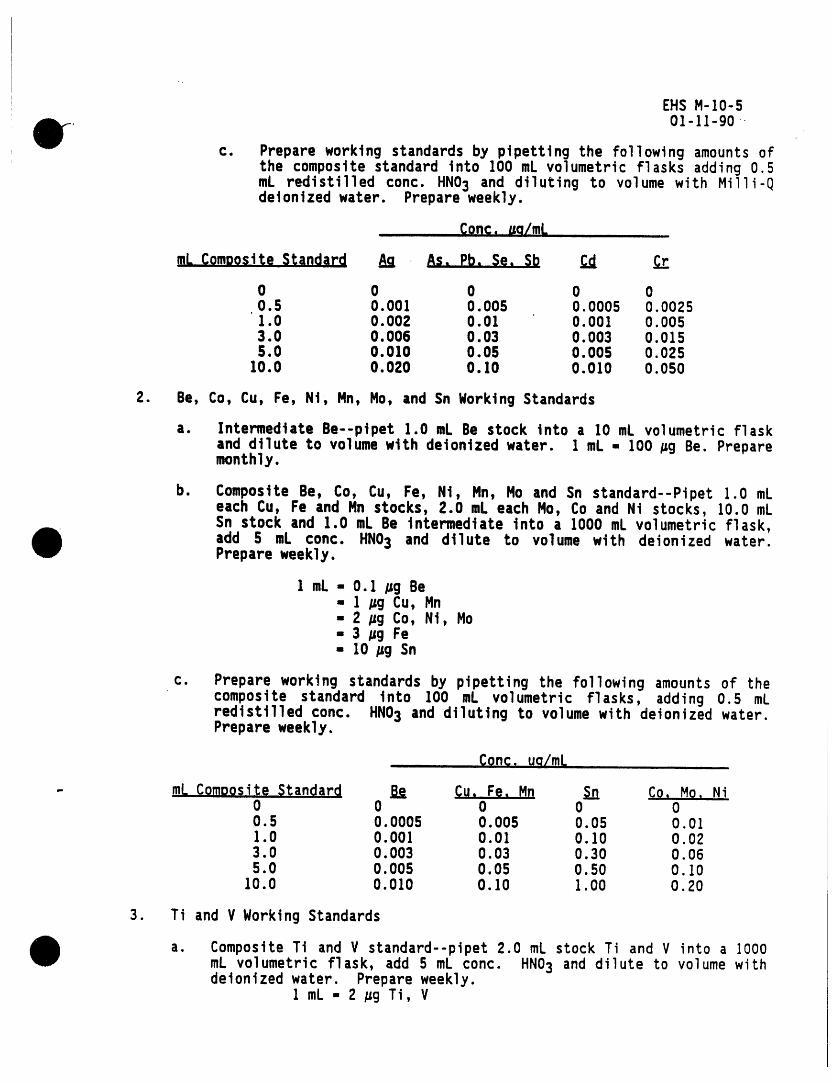
EHS M-I0-5Ol-ll-gO
c. Prepareworking standardsby plpettlngthe following amountsofthe compositestandard into I00 mL volumetric flasks adding 0.5mL redistilled conc. HNO3 and diluting to volume with Milli-Qdelonlzedwater. Prepareweekly.
Conc.uq/ml.
mL Composite Standard Aa As. Pb. Se. Sl_ Ccl Cr
0 0 0 0 00.5 0.001 0.005 0.0005 0.00251.0 0.002 0.01 0.001 0.0053.0 O.006 O.03 O.003 O.0155.0 0.010 0.05 0.005 0.025
10.0 0.020 0.10 0.010 0.050
2. Be, Co, Cu, Fe, Nt, Mn, No, and Sn Working Standards
a. Intermediate Be--pipet 1.0 mL Be stock into a 10 mL volumetric flaskand dilute to volume with deiontzed water. 1 mL - 100 #g Be. Preparemonthly.
b. Composite Be, Co, Cu, Fe, Nt, Mn, Mo and Sn standard--Pipet 1.0 mLeach Cu, Fe and Mn stocks, 2.0 mL each No, Co and Ni stocks, 10.0 mLSn stock and 1.0 mL Be intermediate into a 1000 mL volumetric flask,add 5 mL cone. HNO3 and dilute to volume with deionized water.Prepare weekly.
1 mL m O. 1 /_g Be
- 1 /Jg Cu, Mnm 2 /_g Co, NI, Mo-3 #g Fe- 10 #g Sn
c. Prepare working standards by pipetting the following amounts of thecomposite standard into 100 mL volumetric flasks, adding 0.5 mLredistilledconc. HNO3 and diluting to volume with deionizedwater.Prepareweekly.
qQn¢, uq/ml,
- mL Compo$itqStanqlard Be Cu. Fe. Mn Sn Co, Mo, Ni0 0 0 0 0O.5 O.0005 O.005 O.05 O.O11.0 0.001 0.01 0.10 0.023.0 O.003 O.03 O.30 O.065.0 0.005 0.05 0.50 O. 10I0.0 0.010 0.I0 1.00 0.20
3. Ti and V Working Standards
a. CompositeTI and g standard--pipet2.0 mL stock Ti and V into a I000mL volumetric flask, add 5 mL conc. HNO3 and dilute to volume withdeionizedwater. Prepareweekly.
I mL - 2 /_gTi, V
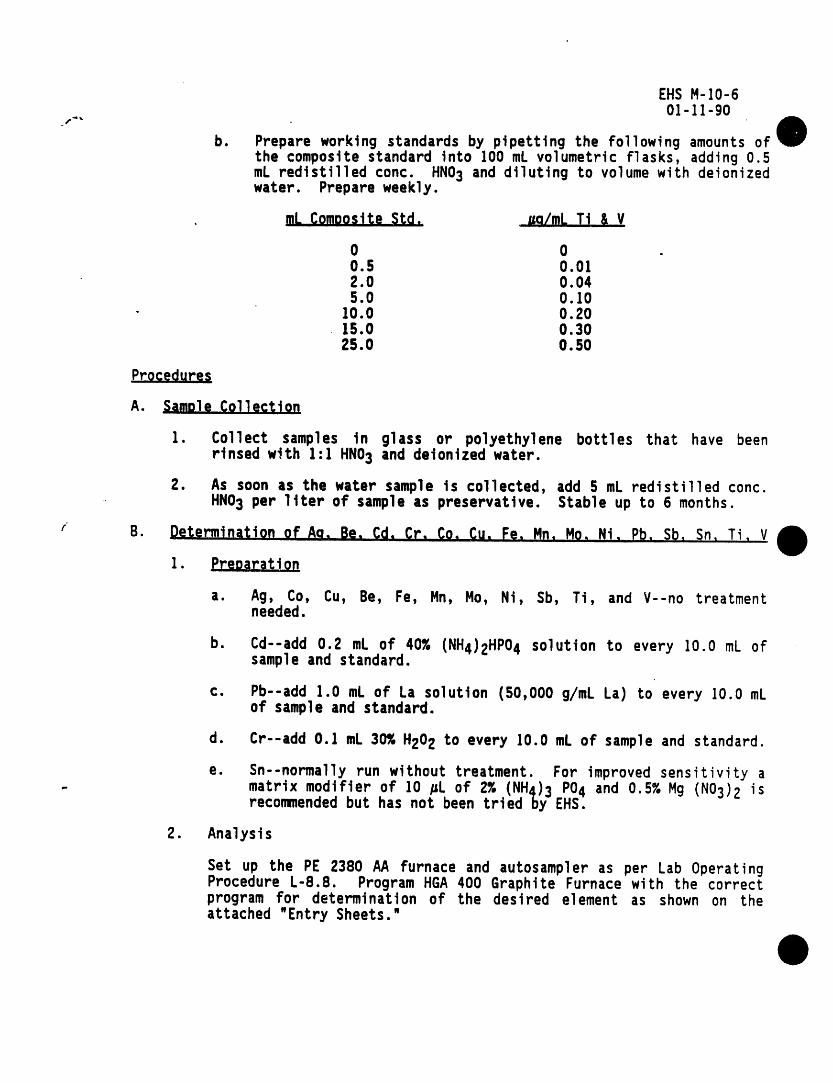
EHSH-10-601-11-90
j,'ml
b. Prepare working standards by pipetting the following amounts ofthe composite standard into 100 mL volumetric flasks, adding 0.5mL redtstilled conc. HNO3 and diluting to volume with deionizedwater. Prepare weekly.
• mL Comoostte _1;_, _o/mL Tt & V
0 0 .0.5 0.012.0 0.045.0 0.10
• 10.0 0.2015.0 0.3025.0 0.50
Procedures
A. Samole Collect, lOt1
1. Collect samples in glass or polyethylene bottles that have beenrinsed with 1:1 HNO3 and deiontzed water.
2. As soon as the water sample is collected, add 5 mL redistilled conc.HNO3 per liter of sample as preservative. Stable up to 6 months.
r B. Determination of Aa. Be. Cd. Cr. Co. Cu. F_, Hn, Mo. Ni, Pb, Sb, Sn, Ti, V
I. Preoar_tion
a. Ag, Co, Cu, Be, Fe, Mn, Mo, Ni, Sb, Ti, and V--no treatmentneeded.
b. Cd--add 0.2 mL of 40% (NH4)2HPO4 solution to every 10.0 mL ofsample and standard.
c. Pb--add 1.0 mL of La solution (50,000 g/mL La) to every 10.0 mLof sample and standard.
d. Cr--add 0.1 mL 30% H202 to every lO.O mL of sample and standard.
e. Sn--normally run without treatment. For improved sensitivity a- matrix modifier of 10 /JLof 2% (NH4)3 PO4 and 0.5% Mg (NO3)2 is
recommendedbut has not been triedby EHS.
2. Analysis
Set up the PE 2380 AA furnace and autosampleras per Lab OperatingProcedure L-8.8. Program HGA 400 Graphite Furnace with the correctprogram for determination of the desired element as shown on theattached "Entry Sheets."
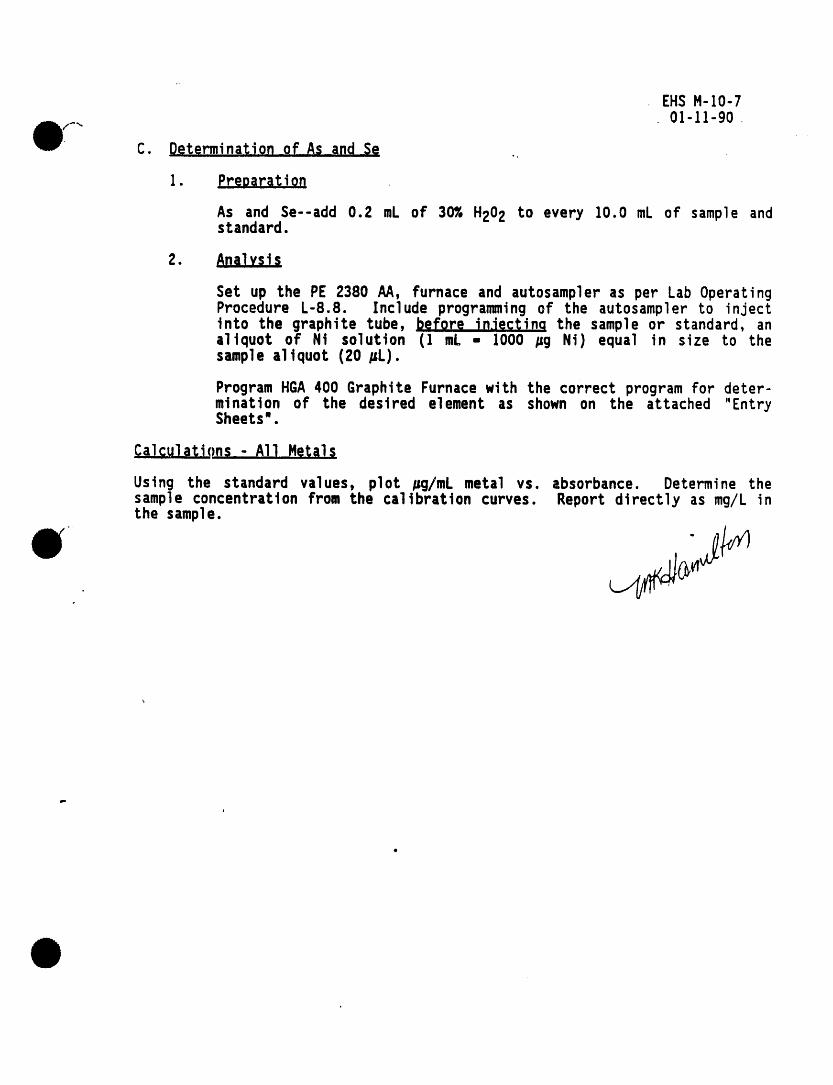
EHS M-I0-701-11-g0
C. Determinai_ionof A_ and Se .,
I. PreDaration
As and Se--add 0.2 mL of 30% H202 to every 10.0 mL of sample andstandard.
2. Analysis
Set up the PE 2380 AA, furnace and autosampler as per Lab OperatingProcedure L-8.8. Include programming of the autosampler to injectinto the graphite tube, before inJectinq the sample or standard, analiquot of Ni solution (1 mL - 1000 #g Ni) equal in size to thesample aliquot (20 /LL).
Program HGA400 Graphite Furnace with the correct program For deter-mination of the desired element as shown on the attached "EntrySheets'.
Calculal_ions - All Metals
Using the standard values, plot /_g/mL metal vs. absorbance. Determine thesample concentration from the calibration curves. Report directly as mg/L inthe sample.
g,.
i
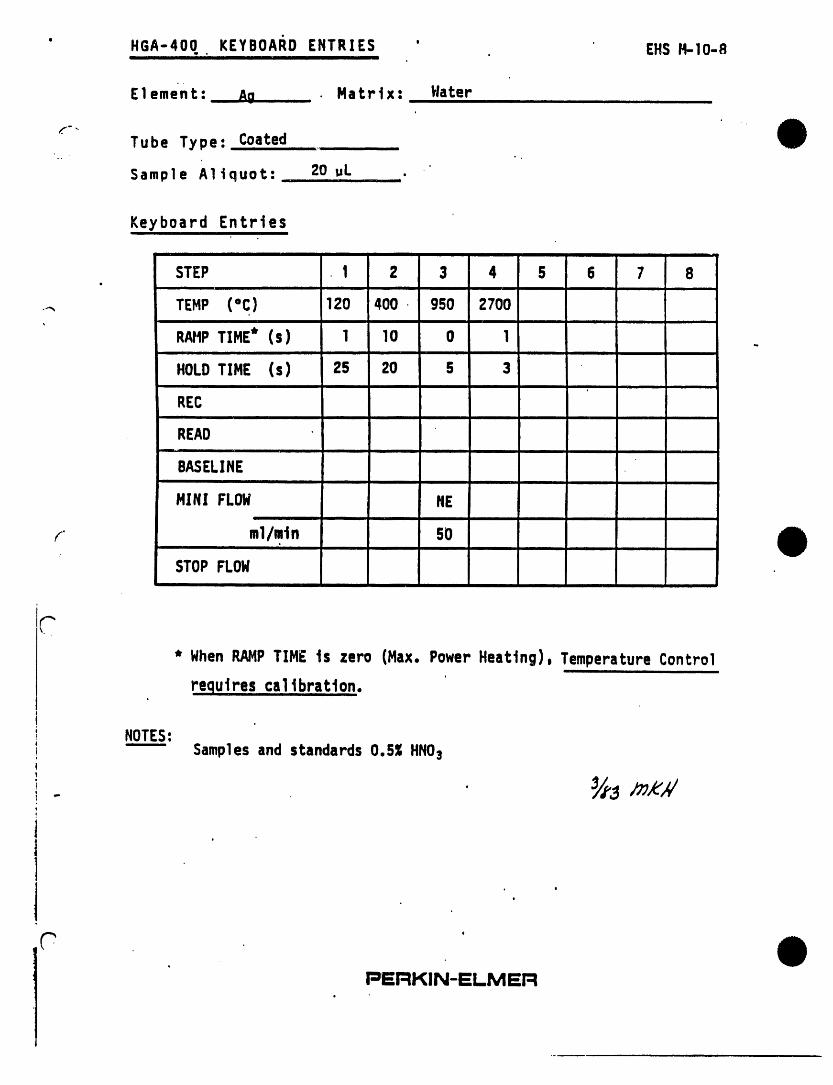
• HGA-400.. KEYBOAI_DENTRIES ' . EHSH-10-8I I III
Element: An Matrtx: Hater
Tube Type: Coated
Sample Aliquot:_ 20 ul.i i . ii i
Keyboard Entrtesmill
, ,
STEP 1 2 3 4 5 6 7 8ii
._ TEMP (°C) 120 400 , 950 2700i
RAMPTIME* (s) 1 10 0 1
HOLDTIME (s) 25 20 5 3
REC
READi i
BASELINEii i I
MZNZFLOW HE
r' ml/mtn SO
STOPFLOW
* WhenRAHPTIME ts zero (Max. PowerHeating), Temperature Control
requtres calibration.I
NOTES:Samplesand standards 0.53 HN03
I
]
< .
Pi=I=IKIN-IELMI=FI
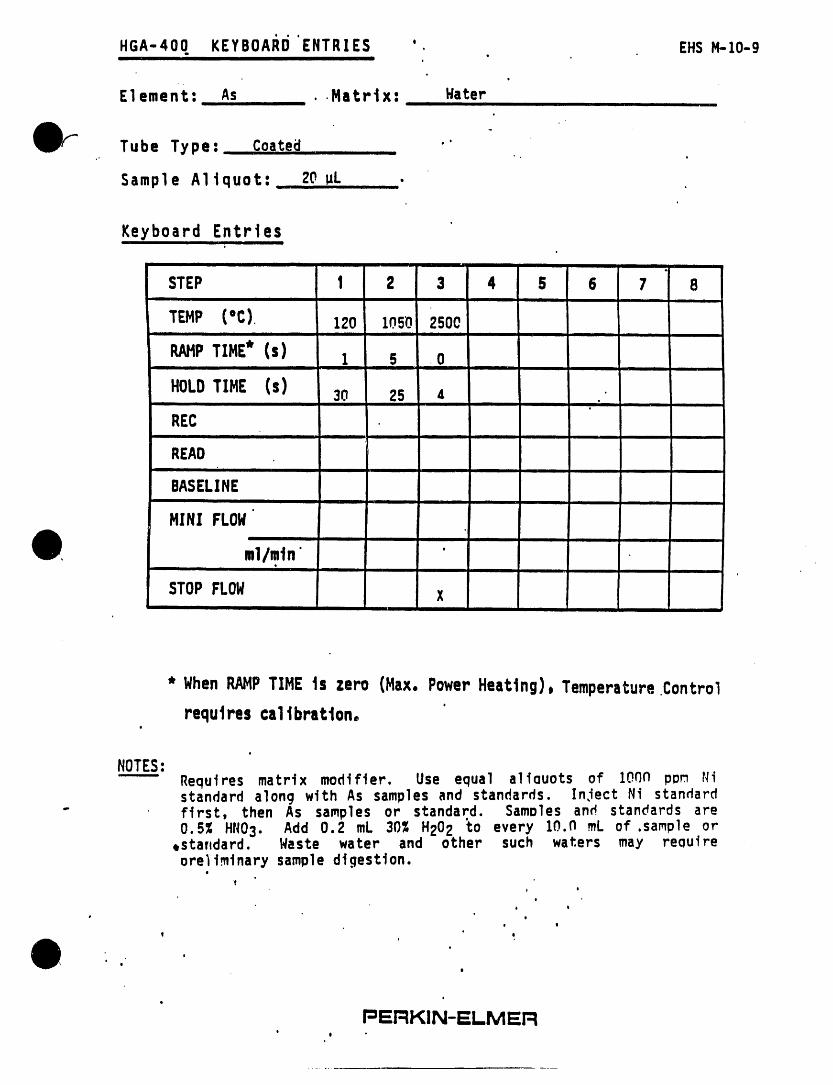
HGA-400 KEYBOAI_I)'ENTRIES '. EHS1_-10-9i •
+
Element: As . .Matrix: Haterii i i
..
Tube Type: Coated •'• . ,
Sample Altquot: ZOuL •
Keyboard Entrfesi
STEP 1 2 3 4 5 6 7 8,,.. ......
TEMP (°C). 120 lOBn. 2500
RAHPTIME* (s) 1 S .0I
HOLDTIME (s) 30 25 4i ] i iii
RECi
READ
BASELINE
MINI FLOWi i i
ml/mtn'
STOPFLOW xiii
* WhenRAMPTIME ts zero (Max. PowerHeating), Temperature.Controlrequtres cal tbratton.
NOTES:Requires matrix modifier• Use equal allouots of lOr)ll ppm Nistandardalon9with As samplesand standards•InjectNi standard
" first, then As samplesor standard. Samolesand standardsare0•5% HNO3. Add 0.2 mL 30% H202 to every lO.n mL of .sampleor+standard• Naste water and other such waters may reauireore_Imlnarysampledigestion.
-fI i
o
I ,
, o
! ' t+ .
io
o
PEFIKIN-ELMEFIi
0 '
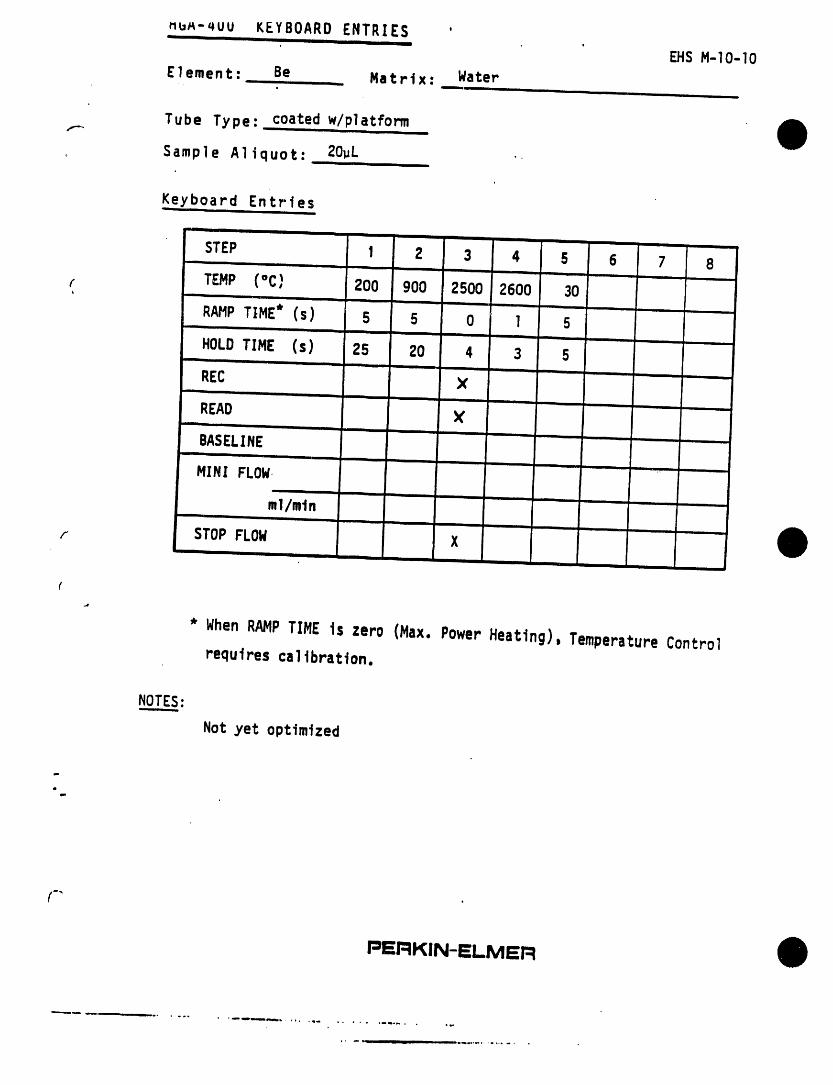
.u_-quu KEYBOARD ENTRIES
.............. • EHSM-IO-]O
Element: Be Matrix: Water-- i i i i . i . , i i
Tube Type: coatedw/platformuu n n II
Sample Aliquot: 20uL
Keyboard Entries
STEP 1 2 3 4 5 6 7 8,i iiii , i ,i i ,i
r TEMP (°C) 200 900 2500 2600 30• n in nil II In
RAMPTIME* (s) 5 5 0 l 5I m U Ul null I I I ,,
HOLDTIME (s) 25 20 4 3 5-- i nn i ii ii i lu i • i i i
REC Xi i i i i ,i i i . ...
READ Xii iiii n ii j i i illl
BASELINE- i i i , i i i i .. • _ .1 "
MINI FLOW.i i i i ,
ml/mln.... n i m • ,,ii n i ,
r STOPFLOW XHi , ,, , ,.,, , .. .........
(
.4
* When RAMP TIME is zero (Max.Power Heating),TemperatureControl
requirescal Ibration.
NOTES:
Not yet optimized
4u"
rJErJIKIN-ELMEFI
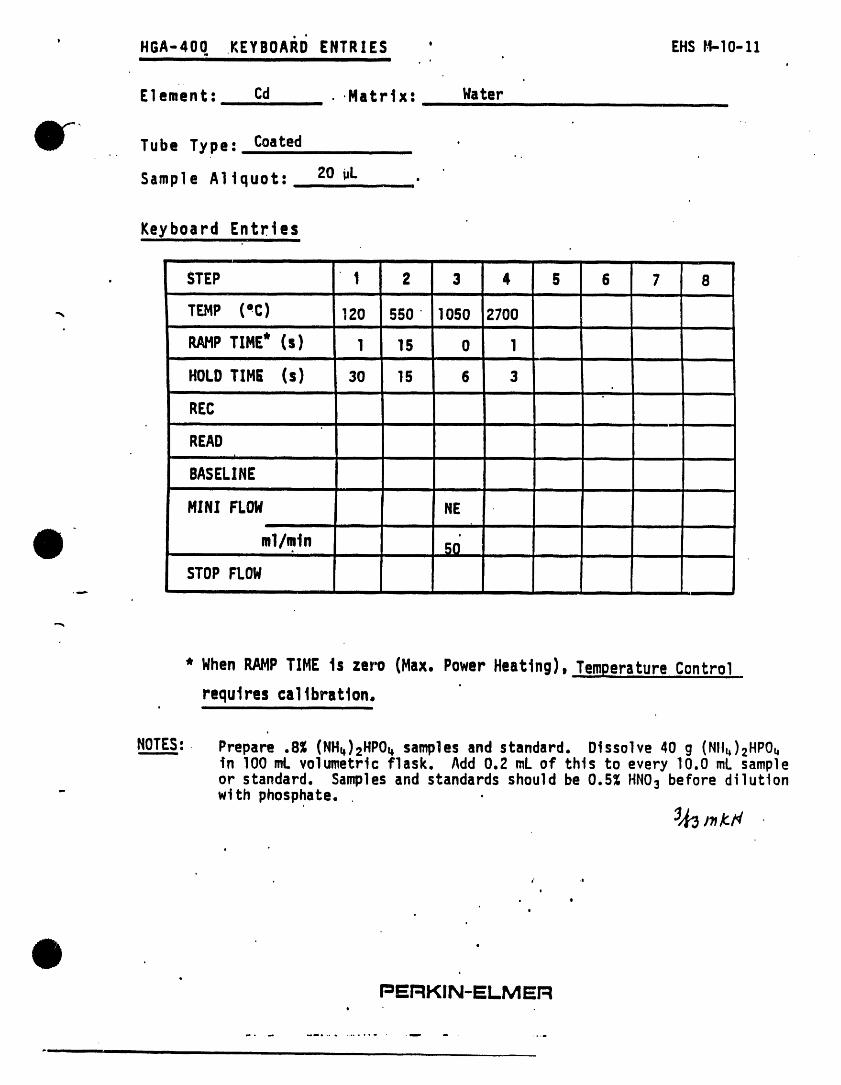
' HGA-400. KEYBOAI_li ENTRIES ' EHSH-10-11HI I
I
..
Element: Cd • .Hatrtx: Hateri i
..
Tube Type: Coated
Sample Altquot: 20 ,L .
Keyboard Entries...... ,
• STEP 1 2 3 4 6 6 7 8i i •
TEMP (:C) 120 550 1050 2700i ii
RAMPTIME* (s) 1 15 0 1i i
HOLDTIME (s) 30 15 6 3
RECi i i
READi i
BASELINEi ii
MZN!FLOW NEf ii
ml/m.tn 50i illl i
STOP FLOW• ,u_. ......
* Hhen RAMPTIHE ts zero (Hax. Power Heating), Temperature Control
requtres calibration.
NOTES: Prepare .8¢ (NH_)2HPO_ samplesand standard. Dtssolve 40 g (NII_)2HPO _fn 100 mLvolumetric f]ask. Add0.2 mLof thts to every 10.0 mLsampleor standard. Samp]esand standards should be 0.5% HNO3 before diluL4on
" wtth phosphate. •
I
e' .e
o
• o
I'JEFIKIN-E:LM EFIi
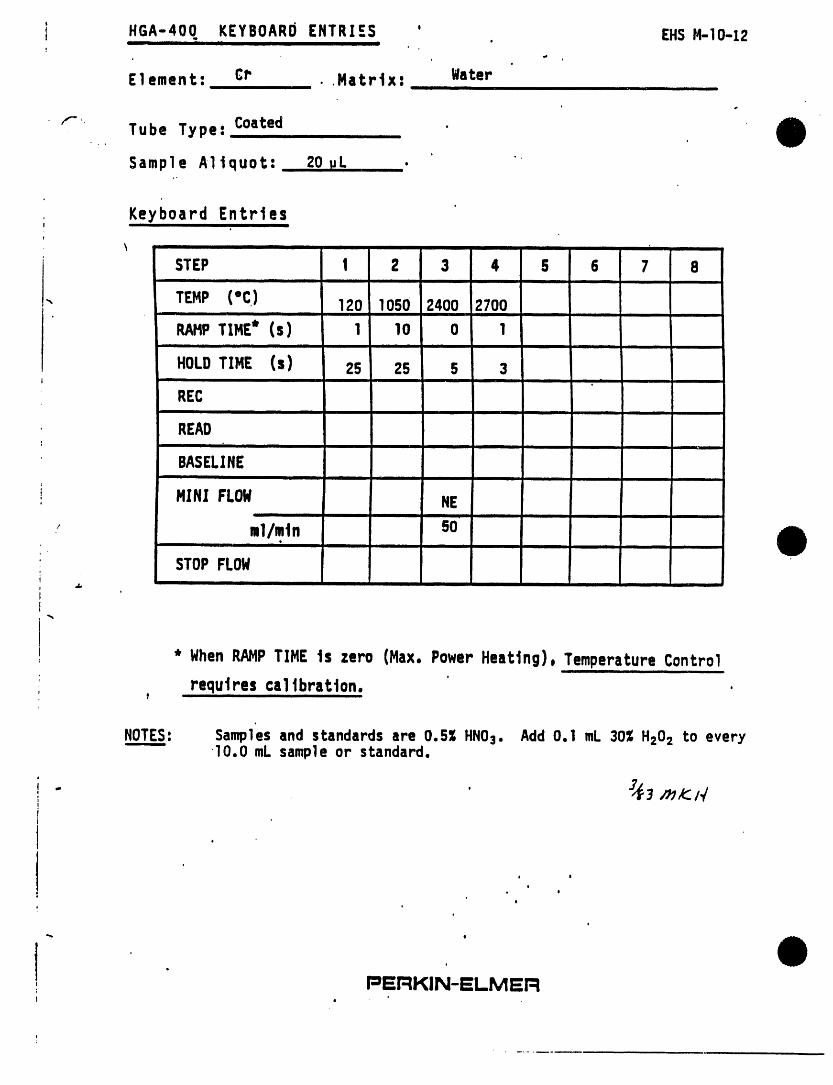
i HGA-400. KEYBOARDENTRIES ' EHSr4-10-12| |li I I •
!
Element: C.r • .Hatrtx: Waterii i iii ii
r Tube Type: CoaLed, .
Sample Altquot: 201+L _'
; KeYboard Entriesf
i STEP 1 2 3 4 6 6 7 8TEMP (°C) 120 1050 2400 2700ill u i
RAMPTIME* (s) 1 10 0 1
HOLDTIHE Is) 25 25 5 3i i |11
RECi i
READT i i
BASELINEi
1
! MINI FLOW NEI
ml/mtn 50Q
i i i i i
STOPFLOW
* WhenRAMPTIME ts zero (Max. PowerHeaLing), Temperature ConLrol
. requtres ca1tbraLton. '• ill i
NOTES: Samplesand standards are 0.5% HN03. Add0.1 mL 30%H202 to every10.0 mLsampleor standard.
. .
i |
o. e
oe
o
",, e
l • ', I_I=FIKIN-E:LMIEFiI
I •
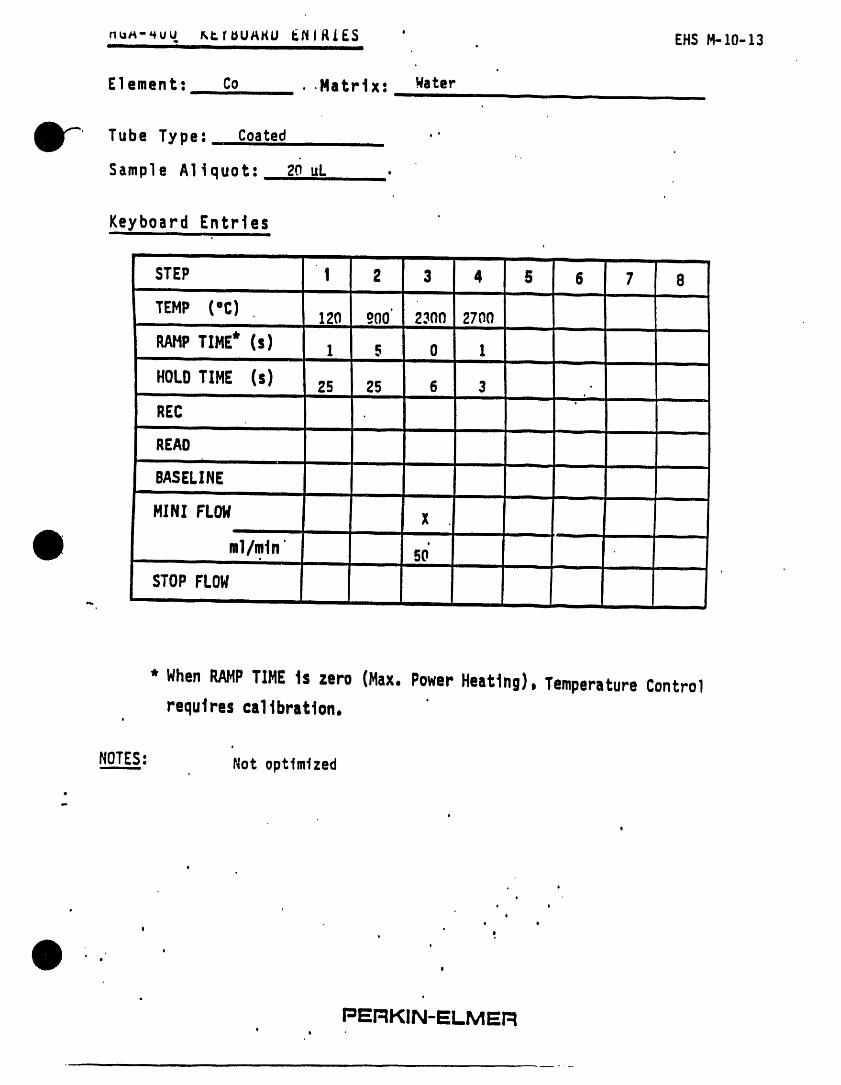
.u_-_uu _.TUU_kHU 6.tliRLE$ ' EHS )4-10-13,D •m •
Element: Co ..Matrix: Wateri , i iii ii i
Tube Type:. Coated ..... "
Sample Allquot: 20 uL .
Keyboard Entriesi m ii
STEP 1 2 3 4 6 6 7 8i i i
TEMP ('C) 120 .°00' 2300 2700i i iii i i
RAHPTIHE* (s) 1 5 0 1-- M i i m Ill I I I
HOLDTIHE (s) 25 25 6 3 ..i i I I -- i ii
RECI mnl • nmlln _ )
READ111 n ii
BASELINEf iiiii i ii
HINI FLOW XmR i ii
ml/m.tn' so'ii i i ! i i ii
STOPFLOWil ,,, ....
o
* WhenRAHPTIME Is zero (Hax, PowerHeating), TemperatureControli
requires caltbratton.e
o
NOTES: Not optimized
e
o
PEFIKIN-ELMERi
t
, ._ , i

', HGA-400 KEYBOAI_DENTRIES ' . EHSM-10-14I l , ,
Element: Cu _ . .Hatr|x: , Hater
C""
Tube Type: Coated ....... '
Sample Aliquot: 20 uL •
Keyboard EntriesI
STEP 1 2 3 4 5 6 7 8Ill II I IIlll
., TEHP (°I_) 120 1000. 2450 2700in ilnm
RAHPTIHE* (s) 1 1 0 1i liB ilU ii
HOLDTIHE (s) 20 10 10 3L I II
REC• i am
READii i
BASELINE
HZNZFLOH NE,f
ml/mtn 60It
STOPFLOH,v
* HhenRAMPTZHEts zero (Hax. PowerHeating), TemperatureControl||
requtres cal|bratlon.J
HOTE$:. Sables and standards are 0.5% HNO3,
.e
• i,' , o
_ e
o
I 'i
I=EFIKIN-ELMEFIi
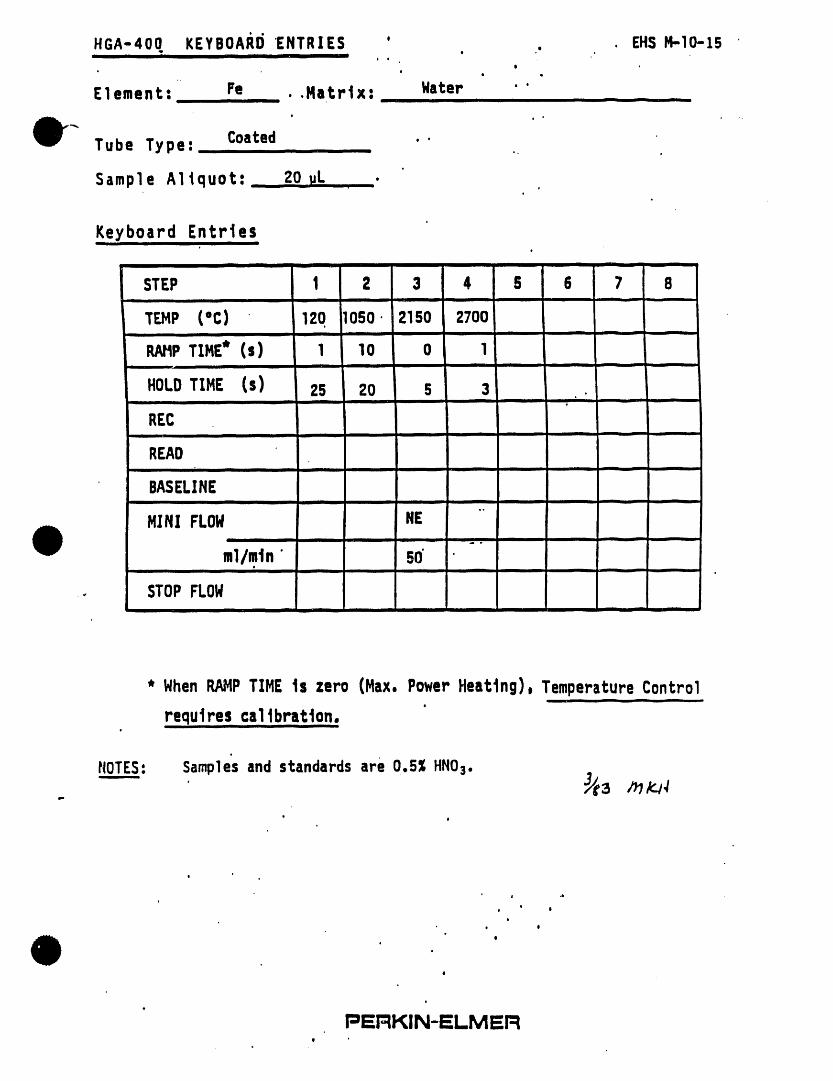
HGA-400. KEYBOAI_I}"ENTRIES ' . . EHS/4-10-15_ • , ,i_ I i e o
o
Element.: Fe . .Matrtx: Water • 'iiiii ilii i -- - • i
Tube Type: Coated ..i o.
Sample Aliquot: 201JL ,
Keyboard Entriesm,,
STEP 1 2 3 4 5 6 7 8in i
TEHP (De) 120 1050' 2150 2700I In I ii
RAttPTIME* ($) 1 10 0 1i ii
HOLDTIME (s) 25 20 5 3i ii i
RECi iii i
READiii iii iiii
BASELINEii ii ii ii
MINI FLOW HEii ii i Hi-- o
ml/min " 50' 'ei , i ii --
. STOPFLOWi ii • -
* WhenRAMPTIME is zero (Max, PowerHeating), TemperatureControl
requires calibration.i
rlOTES: Samplesand standards are 0,5% HNO3,
• j
e
m .o
,o o
e
• e
oo
e
l
PEFIKIN-ELMEr-II

HGA-400 .KEYBOAI_I)ENTRIES ' EHSH-10-16ill i li II Jill I I I III •
Element: 14n • .Hatrtx: Haternllll I • II I I
,'-- CoatedTube Type: ..... '
Sample Al,lquot: 20,,,.L •
Keyboard Entr,les.... ,, ,.,
STEP ,l 2 3 4 6 6 7 8m,. i
TEHP (°C). 120 1000 2100 2700
TI'HE* ..............RAMP (S) 1 10 0 1i i i l ii ii
HOLDTIHE (s) 26 20 6 3I iii ii i•
RECi ill ii l illlll
READi i Ii i i i ii I i i ii i
BASELINEI liB i
HINI FLOW HEi li il i ii
ml/m'ln SOi it i t,
- STOPFLOWi
,ml.
* WhenRAHPTIME fs zero (Max. Power Heating), Temperature Controli i ii ii
.,requirescallbratton.
HOES: Samplesand standards are 0,5Z HHOs,
....... _ pl_g-
, t
• t
! •
i
I=EFIKIN-ELMEFII
ii i i . |1
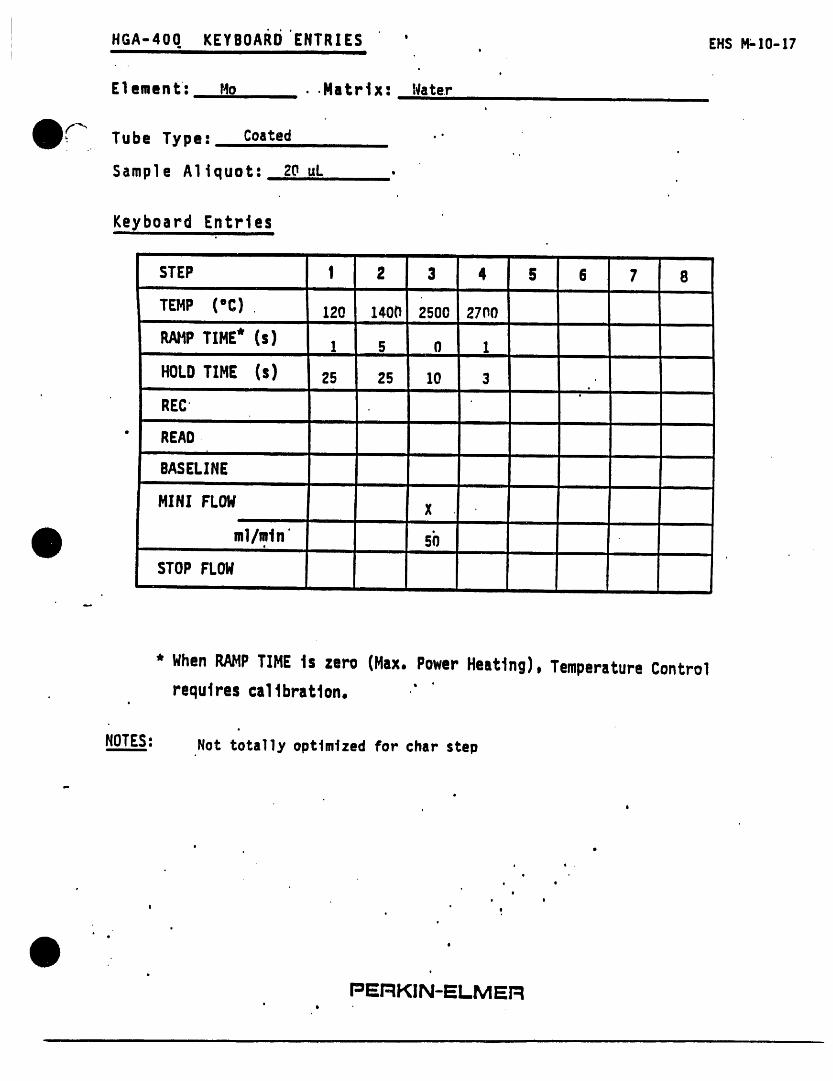
HGA-400. KEYBOARD'ENTRIES ' EHS1_-10-17l •
• ,
+
Element: Ho • .Matrix; t_ate.r+
f',_. Tube Type: Coated ..
• .
Sample Altquot: 20 uL
Keyboard Entrtes+
I
STEP | 2 3 4 6 6 7 8i
TEMP ('el , 120 140{1 2500 27110I i i
RAHPTIME* (s) 1 5 0 1i
HOLDTIME (s) 2s 25 10 3iii, +
RECii
" READ.| i|
BASELINEi
MINI FLOW Xi i i
ml/m.tn' So
STOPFLOWI
* WhenRAMPTIME ts zero (Max, Power Heating), Temperature Controlrequtres calibration. ." '
NOTES: Not totally opttmfzed for char step
I+
e e .
+ •
o• e
! • e• .
o
oQ
I'_EFIKIN-IELM ERI

HGA-400 KEYBOAI_i)"ENTRZES+ ' . EHS_10-18I
Element: Nt . .Hatrtx: Hateri nlml
tube Type : Coated ""
Sample Altquot: 2fl pL •.
Keyboard Entriesi
STEP . | 2 3 4 5 6 7 8i
TEMP (°C) 12n lOOi] 2400 27('10ml
RAHPTIHE* (s) 1 S o 1i
HOLDTIHE (s) Z5 ZO 6 3
REC ' Ii
READi
BASELINE
HZN!FLOW Xi i
ml/mtn' S'O.i i
, STOPFLOWii i
I
* WhenRAZ4PTIHE ts zero (Hax. PowerHeating), TemperatureControl
requires cal tbratton.
+
NOTES:
, e
o
+ o
• o
I I
I
e
PERKIN-ELMIERI
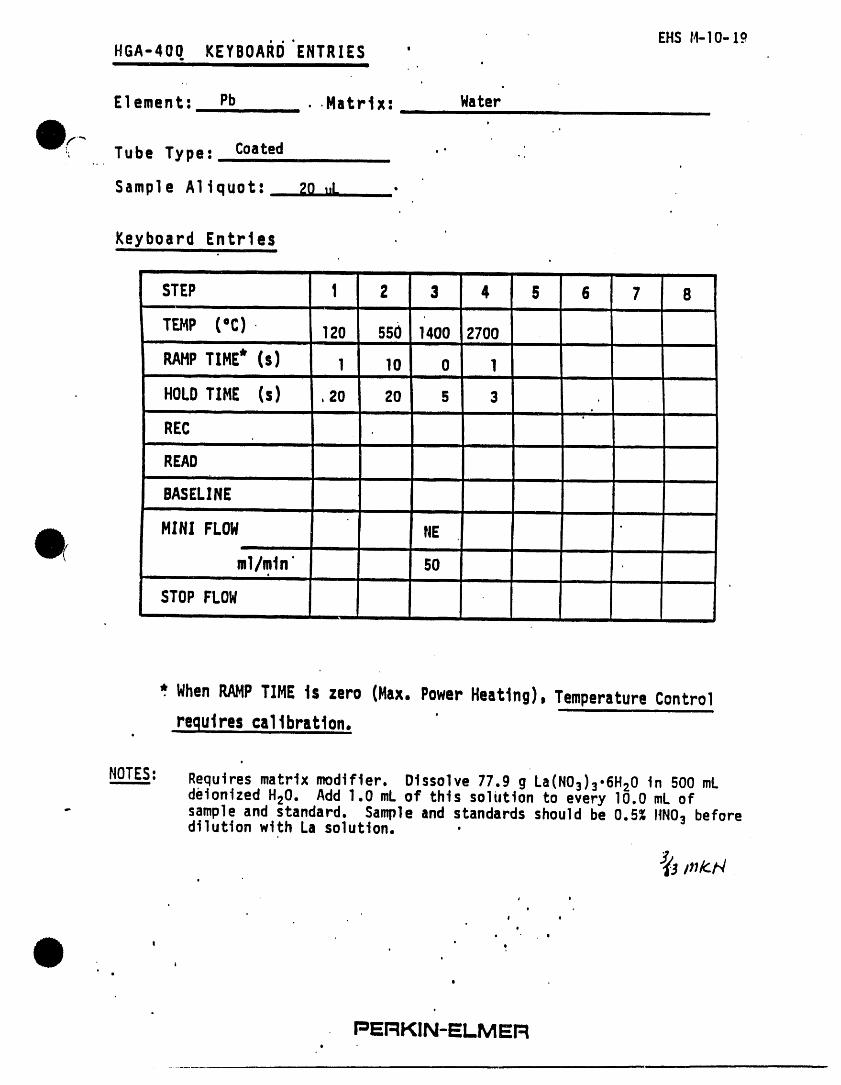
EHSH-IO-19HGA-400 KEYBOAI_I]•ENTRIES '
,m •i
• . I
Element:,., Pb . .Matrtxt. Water ,B
_ Tube Type: Coated ." ..i o,..
Sample A1tquot: ZO uL _.
Keyboard Entriesii i IN
STEP | 2 3 4 6 6 7 8I I i Hi i
TEMP lee) 120 550 1400 2700ii II i
RAHPTIME* (s) 1 10 0 1i i '1 i |
HOLDTIME (s) ,2o 20 s 3I
i i P o
RECi nl i i
READii • i ii
BASELINEi ii i i I pl
MINI FLOW tiE .]
ml/mtn' 50o
i ] i i i ] Jl ii
STOPFLOW
*. WhenRAMPTIME is zero (Max, PowerHeating), TemperatureControliii iiiiiii , i
requires c,alt..bratton.
NOTES: Requiresmatrixmodifier.Dissolve77.9g La(NOs)3.6H20in 500mLdeionized H20. Add 1.0 mLof this solution to every lO.O mLof
- sampleand standard. Sampleand standards should be 0.5% IIN03 beforedilutionwith La solution.
i
e I
i
0 e
e
_ e
I • e
i
ii
o
I_ERKIN-ELMER
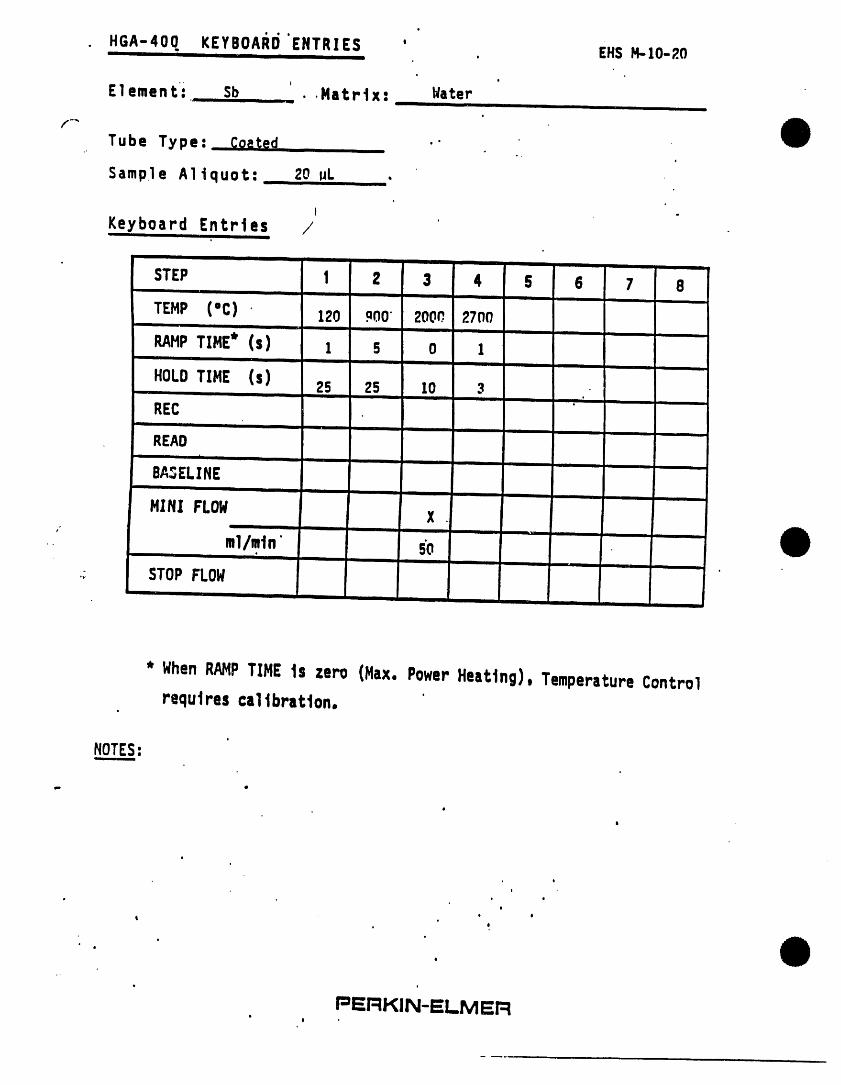
. HGA-400 KEYBOAI_I)•ENTRIES ' EHSH-.10-20e _ ,,ii i i ii i i
Element: Sb ' • .Xatrtx: ldater, i IllI I a, I I
Tube Type: Coeted " ..
Sample Altquot: 20 wL .,
I "
K_eyboard En_tr!.es /..................... i,
STEP 1 2 3 4 6 6 7 8i i i fill i i m ,
TEMP ('C) 120 ?00' 200P..2700i i I i i i ,
RAHPTIME* (s) 1 5 0 1iii ii iii ii i ii ii ,i
HOLDTIME (s) 25 25 lo 3ii i ii i ii i i i i iii iio
RECi L I II I i
REAOi ii i iiii Ull ii i ii i
BASELINEiil Ji j i i in i|
MINI FLOg X .ii i i ,
.. ml/mtn gOi i Ul iiii i | i
- STOPFLOWi i , , , ,
* WhenRN_PTIME ts zero (Max. PowerHeating), Temperature Controli
requt res ca1t bratt on.
NOTES:
I
, t
i
• ¢
• m
• I
t ° eo ,
i
e
..o
PERKIN-ELMERI
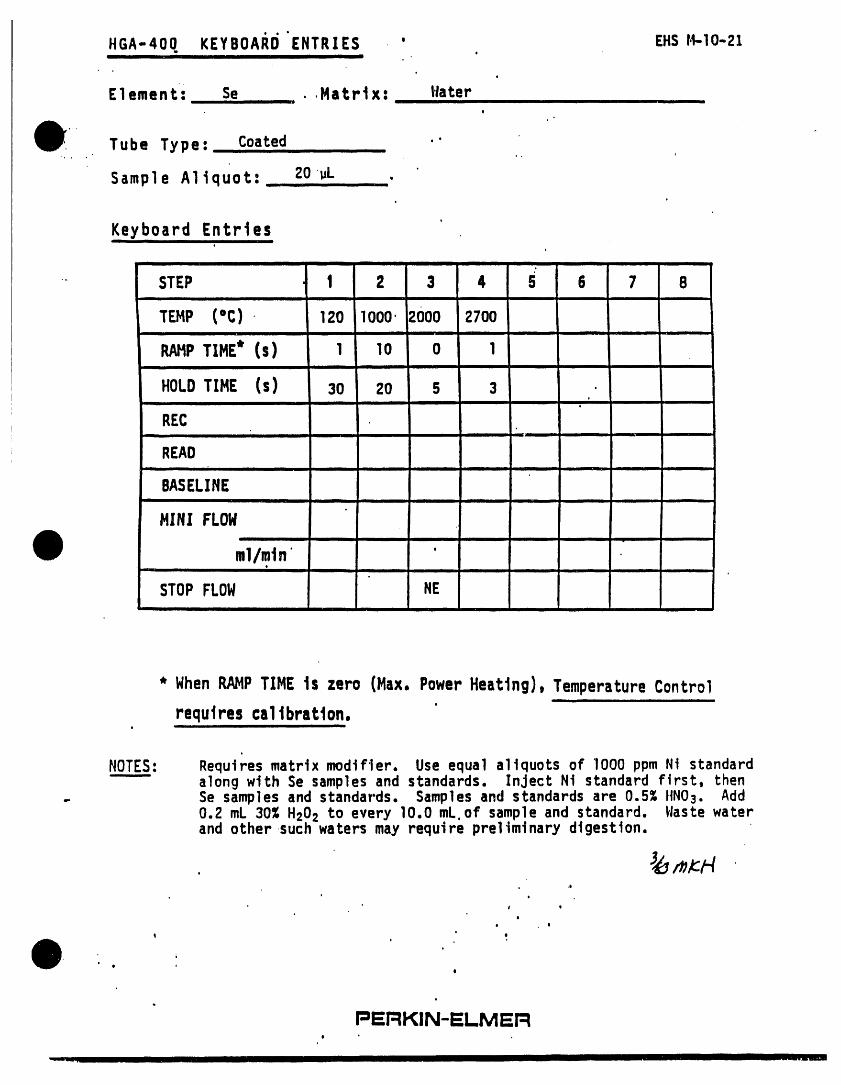
HGA-400. KEYBOAIll)"ENTRIES ' . EHSr1-1o-21lil l i -
o
Element: Se • .Matrtx: Haterj i I i ii
z
. .
Tube Type: Coated ."., o . ,
Sample Altquot: 20 uL . 'iii i ilillll
Keyboard EntriesIll I I
" STEP 1 2 3 4 5 6 7 8iN i I
TEMP (°C) 120 1000 2000 2700ii I I
RAMPTIME* (s) 1 10 0 1i i i
HOLDTIME (s) 30 20 5 3i ,
RECi F _l
READJill i
BASELINE• iii iN imI
MINI FLOgi
ml/mtn" 't
i I
STOPFLOW NE
* WhenRAMPTIMEts zero (Max,PowerHeating), TemperatureControlrequtrescalIbratlon.
i i
NOTES: Requiresmatrixmodifier.Use equalallquotsof lO00 ppm Ni standardalong with Se samples and standards. Inject Ni standard first, then
. Se samplesand standards. Samplesand standards are 0.5% ttN03. Add0.2mL 30% H202 to everyI0.0mL.of sampleand standard. Wastewaterandothersuch watersmay requirepreliminarydigestion.
.' i
j e
e
e eo
.
e
I
PEi=IKIN-ELMEFII
lln Ill II-_.l---
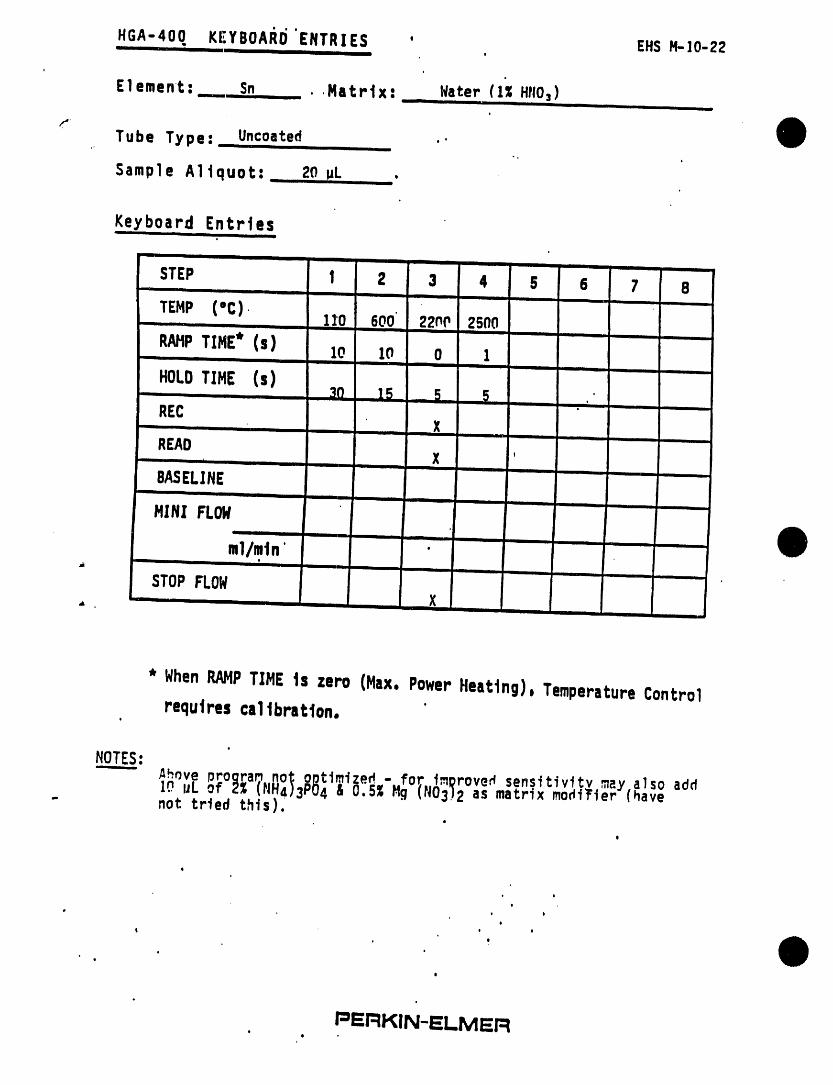
HGA-400 K£YBOAI_I}"ENTRIES ' EHSH-]0-22I I .... _ " I I i l III
Element: Sn • .Matrtx: Hater (1% HtI03)i ii | i ii ii i i i i ii_lmml II --
f,
• Tube Type: Uncoated , , .'
Sample Altquot: ,, 20 uL •
Keyboard Entriesill, iiii
STEP 1 2 3 4 6 6 7 8el I I I III I I I ]1 I ii I el ii i
TEMP (=C)' 11'0 600,' 22r_P 2500i i i iii i • i iiii i i iii iii IL I
RAHPTIME* (s) lO 1o 0 1el I ii i i
HOLDTIME (s) ... 30. te 5 5 .... .'
REC Xi i ii ii ii
READ X 'ii i l ii ii iii I i ii
BASELINEI II i i i i i
MINI FLOWi i i ii i i i •
ml/mtn'!
l I II in I I l II
STOPFLOW X , ,., . ., . , .,,
ak
* WhenRAMPTIME is zero (Max. Power HeBttng), Temperature Control
requtres calibration.i
I
NOTES:
Ahr_ve _'_ _1_1. 3P04 & 0:5%Hg (N03)2 as ma_:r'lxmodtTt (have- not. triedthis).
q
I=ERKIN-ELMEFIe
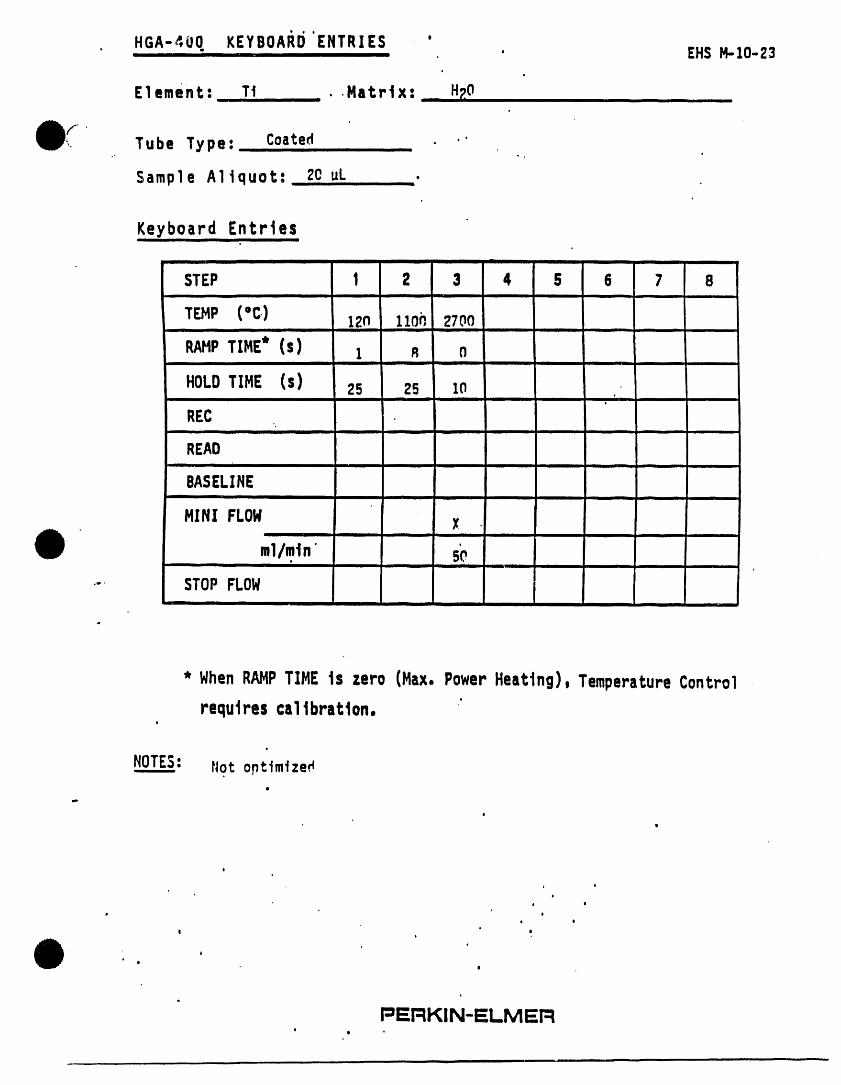
HGA-4UO KEYBOAI_I)'ENTRIES '' , .... , EHS.- Z0-23o
Element: Tt , • .Matrix: Hp,O iii iiiiii ii
,
1_ Tube Type: Coated .'
Sample Aliquot: 20 uL ......... •
Keyboard Entries.... ,,
STEP 1 2 3 4 S 6 7 8i ill 1 i i i
TEMP (°C.) 12n 110h 2700iii
RAMPTIME* (s) 1 _ nlille II i ii
HOLD TIME (s) 25 Z5 Io Iiii i
RECII III III
READi
BASELINEIll III Ili
MINI FLOW xi i ii ii
ml/mtn" BOii i i
•- STOPFLOWi =11 i ,.
,r
* WhenRAMPTIMEis zero(Max.PowerHeating),TemperatureControli
requires caltbratton.t
NOTES: rlotoptimized
I
e
e
i e
• ee e
eI e
= .
$
e
I=IERKIN-ELMER• I ,
.
,i
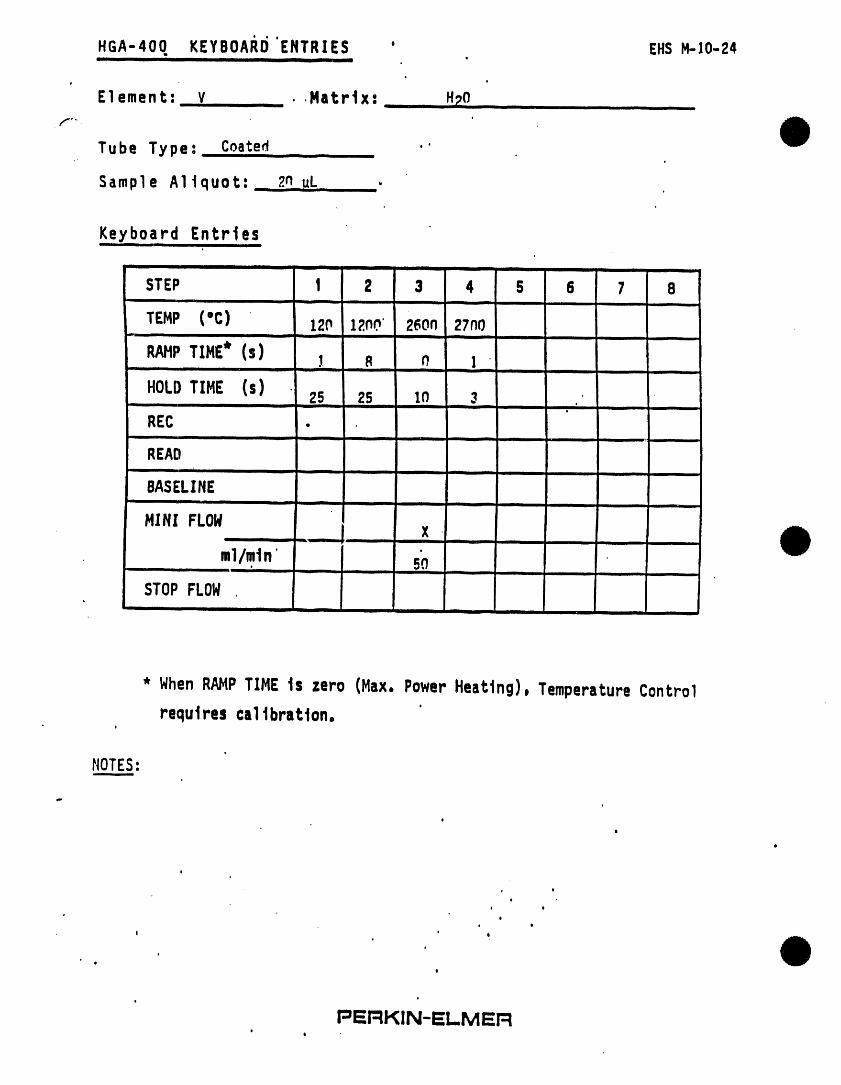
HGA-400. KEYBOAI_I)'ENTRIES ' EHSH-]0-24i iii I II _ I
. o
Element: V _..Hatrtx: H?O
Tube Type: Coated .'
Sample Aliquot:_ 2n uL...
Keyboa,,rd ,Entries
" ' i i i i
STEP 1 2 3 4 6 6 7 8i i i i
TEMP (°C) 120 1200' 260n 27n0,,
RAHPT1ME* (s) .I, e n l,i i
HOLDTIME (s) . zs, zs in 3 ,,li i
REC, , ,, ......
READii i i iii
BASELINE,|m i •
MINI FLOW X_ .... iii ii ,
_ m]/mtn' s'nii li ,,,,, .,.
STOPFLON
* WhenRAHPTIME ts zero (Max. Power Heating). Temperature Controlo
requires cal tbratton,o
NOTES:
i
|
PEFIKIN-ELMEFI
Method No. EHSM-4
TOTAL MERCURY (ORGANICAND INORGANIC)IN WATER BY FLAHELESSAAi Title: ,
M K llamltrollI__''/Date Issued:. Before 3/83 Approvedby:
Written by; M K llamilton • ,,,, • , i ,,, i i |
SupersedesMethod No. EHS M-2
Date ReviewedBy _ Date Revised,By
_ I,IO .._o IZJ_.. - .
_.
o
.... , --
Replaced by Method No. Date:
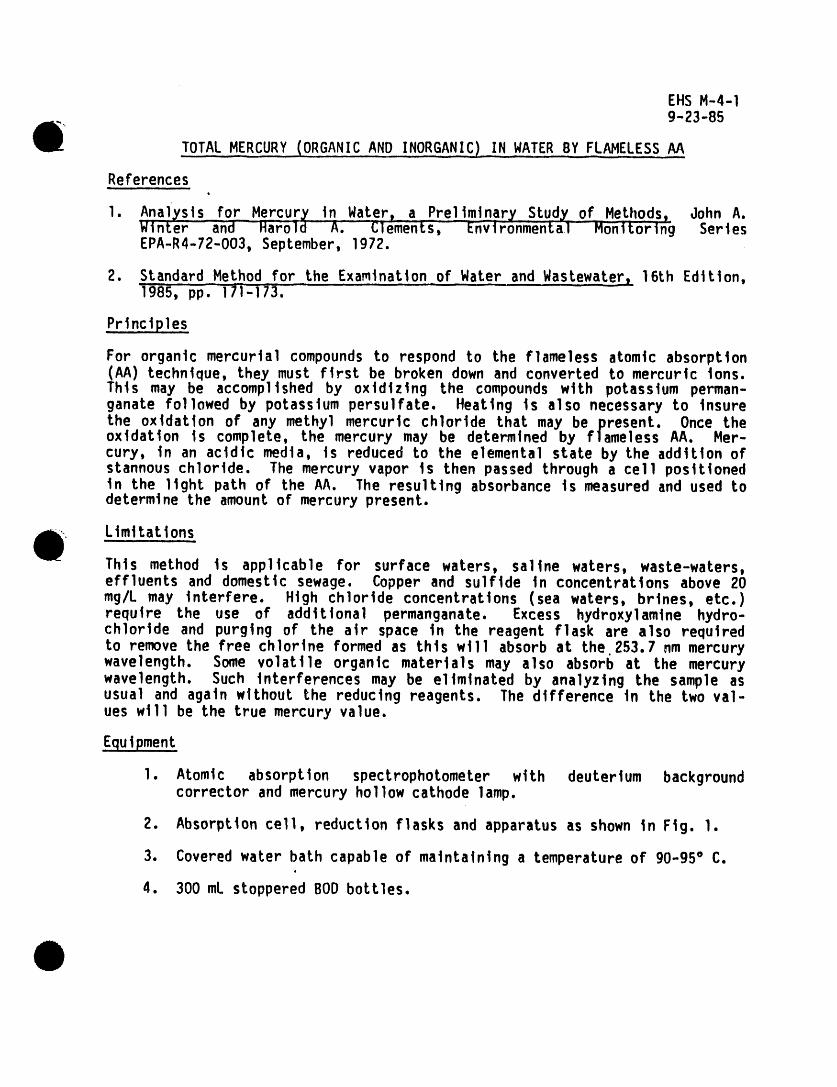
EHS M-4-I9-23-85
TOTAL MERCURY (ORGANICAND INORGANIC1 IN WATER BY FLAMELESSAA
References
I. Analysls for Mercury in Water_ a Prel|m|nar_ Study of Methods, John A.Winter and" Haroid A. C1emefitS, Environmental Mdnltorlng SeriesEPA-R4-72-O03,September, 1972.
2. Standard Method for the Examinationof Water and Wastewater._16th Edltlon,1985, pp. 17-1-i 73.
Principles
For organic mercurial compoundsto respond to the flameless atomic absorption(AA) technique, they must first be broken down and converted to mercuric ions.This may be accomplished by oxidizing the compounds with potassium perman-ganate followed by potassium persulfate. HeaLing is also necessary to insurethe oxtdat|on of any methyl mercuric chloride that may be present. Once theoxidation is complete, the mercury may be determined by flameless AA. Mer-cury, in an acidic media, is reduced to the elemental stale by the add]Lton ofstannous chloride. The mercury vapor is then passed through a cell pos4ttonedin the llght path of the AA. The resultlngabsorbance is measured and used todetermine the amount of mercury present.
Limitations
This method is applicable for surface waters, saline waters, waste-waters,effluents and domestic sewage. Copper and sulfide In concentrationsabove 20mg/L may interfere. High chlor|de concentrations(sea waters, brlnes, etc.)require the use of addltional permanganate. Excess hydroxylamlne hydro-chlorIde and purging of the air space in the reagent flask are also requiredto remove the free chlorlne formed as this will absorb at the 253.7 nm mercurywavelength. Some volatile organic materlals may also absorb at the mercurywavelength. Such Interferencesmay be ellmInated by analyzlng the sample asusual and again w|thouL the reducing reagents. The difference in the two val-ues will be the true mercury value.
Equipment
I. Atomic absorptlon spectrophotometer with deuterium backgroundcorrectorand mercury hollow cathode lamp.
2. Absorption cell, reductionflasks and apparatusas shown in Fig. I.
3. Coveredwater bath capable of maintaininga temperatureof 90-g5° C.
4. 300 mL stopperedBOD bottles.
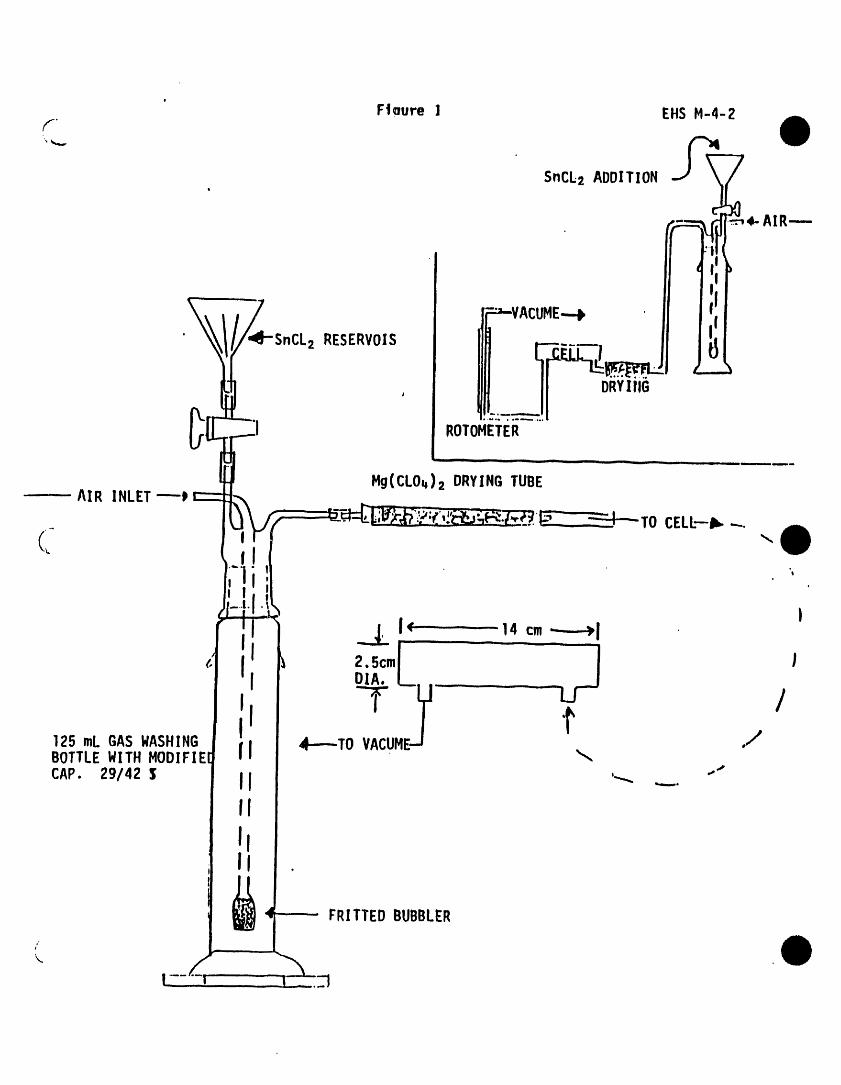
i
Ffoure ] EHSM-4-2f.",, _
SnCL2 ADDITION 7
,- .... ,6-AIR-.---
"ill
EHS M-4-3
Reagents (stock)
I. Mercuric chloride - HgCL2
2. Sulfuric acid, conc. H2SO4
3. Nitric acid, conc. - HN03
4. Potassiumpermanganate- KMnO4
5. Potassiumpersulfate - K2S?O8
6. Stannous chlorlde - SnCL2 • 2H20
7. Sodium chloride - NaCl
8. Hydrochlorlcacid, conc. - HCI
g. Hydroxylamlnehydrochlorlde- NH2OH-HCl
10. Magnesium perchlorate- Mg(CI04)2
Reagents (prepared)
I. KMnO4 - 5% w/v solution - dissolve 25g KMn04 in deion|zed water anddilute to 500 mL. Prepareevery 6 months.
2. K2S208 - 5% w/v solution - dlssolve 12.5g K2S208 in deionlzedwater and dilute to 250 mL. Prepareevery 6 months.
3. NaCl - hydroxylamine hydrochlorlde - dlssolve 30g NaCl and 25g hydroxyl-amine hydrochloride in delonlzed water and dilute to 250 mL. Prepareevery 6 months.
4. SnCL2 - 20% w/v in 10% HCl - add 25 mL conc. HCI to about 150 mL deion-ized water and mlx. Add 50g SnCL2 • 2H20, mix well and dilute to250 mL with delonlzed water. (Solution will be milky). Prepare every 6months.
Standards
1. Stock Hg solut|on - 1000 ug/mL - dlssolve 1.3535g HgCI2 in delonizedwater, add I g K2S208 and dilute to one Liter with delonlzed water.Prepare every 6 months. Discard in inorganic heavy metal and carcinogenwaste container.
2. IntermediateHg standard - 10 ,g/mL - pipet 1.0 mL stock Hg solution intoa I00 mL volumetric flask, add I mL conc. HN03 and dilute to volume withdelon|zedwater. Preparemonthly.
3. Working Hg standard - 0.I ,g/mL - pipet 1.0 mL IntermedlateHg standardinto a 100 mL volumetric flask, add I mL conc. HNO3 and dilute to volumewith delonlzedwater. Prepareda|ly.
EHS M-4-4
f- Procedure_'
"- A. Sample Collection - co]le_ in glass bottles that have been rinsed withI :I HNO3 and"deionJzedwater.
i
B.
I. Preserve a11 samples by adding I g K2S208/L or by acidifying topH2 or less with HNO3 immediately after collection. Samples stablefor 2 weeks if refrigerated.
2. Rinse a11 glasswarewith 1"I HN03, and.delonizedwater prior to use.
3. Check Mg(CI04)2 drying tube and refill if caked or wet.
4. Fill covered water bath and heat to 90-95°C.
5. Prepare standardsby plpetting O, 0.5, 1.0, 3.0, and 5.OraL of 0.1pg/mL Hg standard into a series of BOD flasks. Add enough deionlzedwater to each to give a total volume of 75 mL. Prepareduplicatesofal I standards.
6. Transfer a 75 mL aliquot of sample or a smaller amount diluted to 75nil.,.;Ithdelon|zed water to another BOD flask. Run every lOth samplein duplicate. Spike one sample with 1.0 mL of O.l lJg/mLHg standard.
_ l. Add 5 mL conc. H2SO4 and 2.5 mL conc. HNO3 to each flask.
8. Add 15 mL KMnO4 solution to each sample and standard and a11ow tostand untll the purple color persists for at least 15 minutes. Addmore KMnO4 If necessary.
9. Add 8 mL persulfate solution to each flask, stopper, and heat for twohours in the water bath at 90-g5°C. Record bath temperature onanalystworksheet.
10. Cooi the flask and add 6 ml. sodium chloride-hydroxylamlnehydro-chlorlde solutlon to each. Swirl untll the KMnO4 color Is com-pletely removed giving a colorlesssolutionwith no black precipitate.
11. Set up the spectrophotometerand measure the absorbanceof each solu-tlon as follows:
a. Mount the absorption cell on top of the atomic absorption burn-er. Use the following instrumentparameters (P.E. 306).
wavelength - 253.7 nmSilt - 4 (7A°)mode - absorbancewith backgroundcorrection

EHSM-4-5
b. Connect the reduction apparatus, minus reduction flask, to thecell. Adjust vacuum to give an air flow of 0.5 Lpm (10 onrotameter).
c.. Place 3 mL SnCL2 reducing solut|on in funnel reservoir.
d. Transfer sample or standard to reduction flask under reservoir.Add SnCL2 and immediately connect flask to reduction appara-tus, thus sweepingHg into absorptioncell.
e. Record absorbanceat peak and disconnectflask.
12. Repeat steps c -e for remaining samples and standards making allmeasurements in the same reduction flask. Run entire standard curveat the beginning and at the end of the analysis.
Calculations
Plot average absorbance vs ug Hg present in standards. Use this calibra-tion curve to determinepg Hg present In the sample allquots.
ug/L Hg = l_gfound x lO00mL sample -
Accuracy: 93.4% recoveryPrecision: O.0006 mg/L
Method .No. EIIS C-2-I
Tttle: Hexavalent Chromium- Water and Atri
Date Issued: 2-73 Approved by: MKHamtlton _/_,, ;: ,III '.o .......
Nrttten by: MKHamilton
SupersedesHethod NO. i
Date Reviewed By Date Revtsed ,By
/
/_-__-_.._ ,_,_--- •,/,,/¢_ O,/,r- , •
i
ii iii i
i
i
W
Replaced by Method No. DaLe:
EHS No. C-2-I10-I-85
HEXAVALENTCHROMIUM- WATER AND AIR
References
I. Standard Methods for the Examination of Water and Wastewater, 16th Ed.,i
1985, pp. 201-204.2. NIOSH Manual of AnalyticalMethods, 3rd Ed., Method 7600, 1984.
Principle
Hexavalent chromium reacts with diphenylcarbazidein acidic solutions to pro-duce a reddish-purplecolor with maximum absorbanceat 540 nm.
Limitations
This method is intended for use with potable water samples or personal airsan_les collected from an occupationalenvironment. Mercury, iron, copper,molybdenum,nickel, and vanadium interferewith the color developmentbut notin the concentrationsnormally found in these types of samples. Water samplesshould be analyzed within 24 hours of collection. For waste samples or otherwater sanq_lesthat may have high concentrationsof interferingmetals, referto ReferenceI for pretreatmentprocedures.
,Equipment
I! I. Spectrophotometerfor use at 540 nm with 1.0 cm sipperce11.
2. BO mL graduatedcylinderswith ground glass stoppers.
3. 50 n_.side arm test tubes.
4. 37 mm Buchner funnel.
5. Personal san_lingpumps.
6. Styrenecassettes.
7. PVC filters and cellulosebackup pads.
8. Screw cap vials.
. 9. pH meter.
lO. lO0 mL beakers.
If. Hotplate
12. Water glasses
Reagents (stock)
I. Acetone.
2. l, 5-diphenylcarbazide
• EHS C-2-2
_- 3. Sulfurlc acid, conc. H2SO4.
4. Potassiumdichromate,KECr207.
5. Sodium hydroxide,NaOH
6. Sodium carbonate,NazCO3
7. High purity nitrogen
Reaqents (prepared):
A. Water Anal_,sis
I. Dllute HzSO4 solution (0.2N)50 s1.owlyadd 2.8 mL conc. H2SO4to detontzed H20 and dtlute to 0 mL Prepare annually.
2. Diphenylcarbohydraztde reagent -dtssolve 250 mg 1,5-dtphenyl-carbaztde in 50 mL acetone. Reagent stable for one month if storedin brown bottle and refrigerated. (Discard if solutton becomesdt scolored. )
B. Air Analysisi
l. 0.25 M H2SO4..- add 14 mL conc. H2S04 to about 500 mL deioniz-ed H20 and dilute to I liter with detontzed H20. Prepare every 6months,
2. 6N H2SO4 - slowly add 84 _ of conc. H2SO4 to deionizedH20, cool and dilute to 500 _. Prepareannually.
3. Diphenylcarbazidereagent -dissolve 0.25g 1,5-diphenylcarbazidein50 nL acetone plus 50 _ deionized H20. Store in amber bottle inrefrigerator. Preparemonthly.
•. 4. Filter extract solution - Dissolve 5g NaOH plus 7.5g Na2CO3 indeionlzed H20 and dilute to 250 n_.. Prepareevery 6 months.
Standardsi ii
I. Stock chromium solution - dissolve 2.828g dried anhydrous K2Cr207 indelonized H20 and dilute to one liter, l.O _ - lO00 ,g Cr+6. Pre-
. pare every 6 months.,
2. Intermediatechromium solution - dilute 5.0 mL of stock chromium solution(lO00 ,g/_) to lO0 mL with deionized H20. 1.0 _ - 50 ug Cr+6-Preparemonthly.
3. Standard chromium solution - dilute 2.0 mL of intermediate chromiumsolution (50 Ijg/mL)to lO0 mL with deionized H20. l.O mL = l.O ugCr+6. Preparedaily.
,o
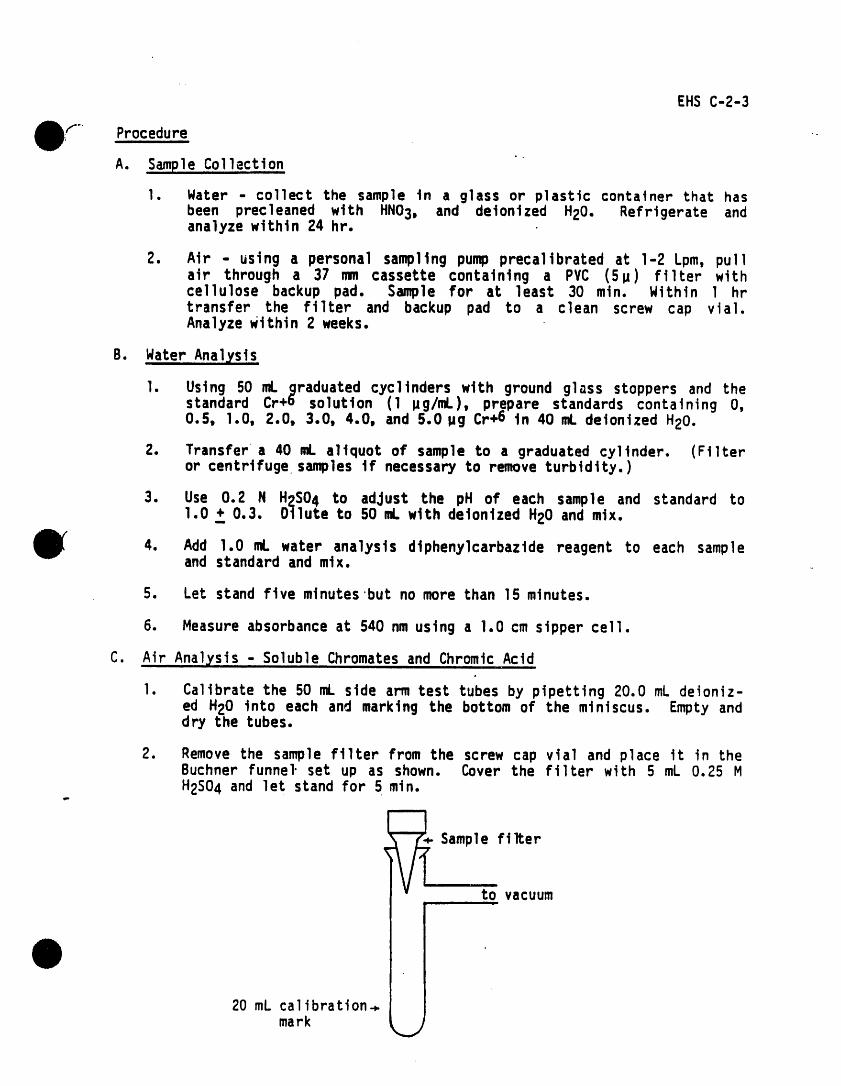
EHS C-2-3
r Procedure
A. Sample Collection
l. Water - collect the sample in a glass or p]astic container that hasbeen precleaned with HN03, and deionized H20. Refrigerate andanalyzewithin 24 hr.
2. Air - using a persona] samp]ing pump preca]ibratedat 1-2 Lpm, pullair through a 37 mm cassette containing a PVC (5U) filter withcellulose backup pad. S_]e for at least 30 min. Within I hrtransfer the filter and backup pad to a clean screw cap via].AnalyzeWithin 2 weeks.
B. Water Analysis
I. Using 50 nd.graduated cyc]inders with ground glass stoppers and thestandard Cr+6 solution (1 IJg/nW.),prepare standards containing O,
Cr+O In 40 mLdeloni0.5, l.O, 2.0, 3.0, 4.0, and 5.01Jg zed H20.
2. Transfera 40 nW.aliquotof san_=leto a graduatedcylinder. (Filteror centrifugesamplesIf necessaryto remove turbidity.)
3. Use 0.2 N H2SO4 to adjust the pH of each sample and standard to1.0_+ 0.3. Dilute to 50 mL with delonizedH20 and mix.
4. Add 1.0 mL water analysis diphenylcarbazidereagent to each sampleand standardand mix.
5. Let stand five minutes but no more than 15 minutes.
6. Measure absorbanceat 540 nm using a ].0 cm sipper cell.
C. Air Anal_,sis- Soluble Chromatesand ChromicAcid
I. Calibratethe 50 n_.side arm test tubes by pipetting20.0 mL deioniz-ed H20 into each and marking the bottom of the miniscus. En_ty anddry the tubes.
2. Remove the san_le filter from the screw cap vial and place it in theBuchner funnel,set up as shown. Cover the filter with 5 mL 0.25 MH2SO4 and let stand for 5 rain.
I,-
.x_Sample,filterto vacuum
20 mL calibration_mark
EHSC-2-4
-- 3. Using the vacuum, pull the H2SO4 through the ftlter tnto thetube. Rinse the ftlter and vtal twice wtth small amounts of 0.25 HH2SO4 and adjust the sanq_le volume to the 20 mL mark with addi-tfonal H2SO4 as needed.
4. Prepare a spike by ptpetttng 20 ML of the 50 Mg/mL Cr+6 standardonto a PVC ftlter place tn a Buchner funnel. Proceed as tn Steps 2and 3.
5. Prepare standards by ptpetttn9 10, 20, 50, 100, and 200 uL of the50 ug/mL Cr+6 standard tnto calibrated tubes and dtluttng to the20 mL mark wtth 0.25 H H2S04. Thts gives standards containing0.5, 1.0, 2.5, 5, and 10 lagCr+O.
6. Add 0.5 _ air ana]ysts dtphenylcarbaztde reagent to each sample andstandard and mtx.
7. Within 5-15 mtn measure the absorbance at 540 nm using 1 cm sippercell.
O. Air Analysts - Insoluble chromates and all Cr+6 tn the presence of ironor other reducing agents.
1. Calibrate the 50 aW. stde arm test tubes as for soluble chromateanalys t s (Sect ton C.1).
2. Remove the sanqole filter from the screw cap vtal and place tt in a100 mLbeaker.
• 3. Rinse the vial with 5 nd.of filter extract solutlon and add this tothe beaker.
4. Prepare a spike by plpettlng 20 um of the 60 14g/mLCr+6 standardonto a PYC filter placed In a lO0 nl.beaker. Add 5 mL of filterextract solutionand proceed as wlth the samples.
5. Purge the head space above the solutionswith nitrogen and repeat thepurge 2-3 times during the extraction.
6. Cover the beakers wlth watchglassesand heat to near boiling on a hotplate. Continue heat_g, with occasional swirling and purging, for30-45 minutes, DO_NOl;=allowthe solution to evaporate to dryness asCr+6 may be 16st. A brown colored PVC filter Is an indication ofm-
such loss.
7. Cool the solutions and filter through a 51JPVC filter using a Buchnerfunnel and precallbrated 50 mL side arm test tube. Rinse the filterand beaker with deJonized H20, keeping the final volume below 18 mL.
8. Add 1.g mL of 6N HzSO4 to each sample and swirl carefully to mix,Let the samples stt for several minutes, until the vigorous gasevolution ceases. Occasional swirling will help speed up the gasremoval.
• EHSC-Z-5
i:/--- g. ghen gas evolution ceases dilute the solution volumesto ZOmL.
10. Prepare standards and proceed with color developmentas for salublechromates (Section C, Steps 5-7).
Calculation
1. Plat IR/Cr+6 vs absorbance.
2. Detemtne _/Cr+6 Jn the samplefrom the calibration curve.
3. Calculate air or water concentrations as follows:
Cr+6At_.._r rag/m3Cr+6 • I_ aI r,
gater _/L Cr+6 ; ug Cr+6, 40 mLH20.
i
o
r.lethod No, EHSC-3i i
.-4 TtLle: c_antde - Celortmetr]c Hater & Atr ....
DaLe issued: ....Before 2,17-R3 Approvledb_.: .....HK Ham_lton_,_.fT_
Hr ! t,l:en by: MK Ham11tonii i i
Supersedes HeLhod Ho.i ii i i i
Date Revlew_ B_ DaLe . Revtsed ,B]
/ _-Z--6, --_# " _-/__ /z,,__i ii i i
i
ii i ,
iiiiii ii iii
i i
• iiiiiii |iiii i iii
ii i ,ii
oii, i i i i
iii
i
- Replaced by MeLhod No. DaLe:
i
EHS C-3-I/
2-17-83
CYANIDE - COLORIMETRIC - WATER& AIR,,, ii i ii ii i ii i iiii i
Reference
I. Manual of Methodsfor ChemicalAnalysis of Water & Wastes,EP/_'600-14,-79-020U.S."Envir6nmentalProtection Agency, 107g, Method335.1.
2. Analytical Chemistry, Vo1. 44, No. 11, 1972, pp. 1845-46,"Determinationof Nanogram Quantit.l.esof Simple & Complex C_an.!desinWat.er,"P. D. Goulden,et. al.
3. N.IOSH.Manual of.Analytical.Met.hod.s,2nd Ed., Vo1. 3, S250, 1977.
Principle
Cyanides in the aqueoussolution are converted to hydrogen cyanide bydistillationwith acid and are absorbed in NaOH solution. Air samplesare collectedon membrane filters (partlculate)plus O.IN NaOH absorbingsolution (HCN). The CN'-in the distillate, absorbingsolution or de-sorbed filter is converted to cyanogen chloride, CNCI, by reacting withchloramine-Tat a pH less than eight. CNCl forms a colored dye on addi-tion of pyridinebarbituricacid, the absorbanceof which is measured at578 nm.
Limitations
Becausemost cyanides are highly reactive and unstable,water samplesshould be made alkaline immediatelyafter collectionby adding 4 mL of 6NNaOH per Liter. The cyanide analysis should be performedwithin 24 hoursof collection. Preliminarytreatmentmay be necessaryto remove inter-ferences from sulfides and oxidizing agents. The distillationis impor-tant not only for removing interferencesfrom varying salt concentra-tions, but also for converting any complex cyanides to simple CN-.
- Only the cobalticyanidecomplex is not convertedby this procedure.Filters from air sampling should be desorbed as soon as possible aftersampling. Samples should be analyzedwithin 2 hours of desorption.
Equipment
I. Distillationapparatusshown on next,page Or equivalent(aqueous)
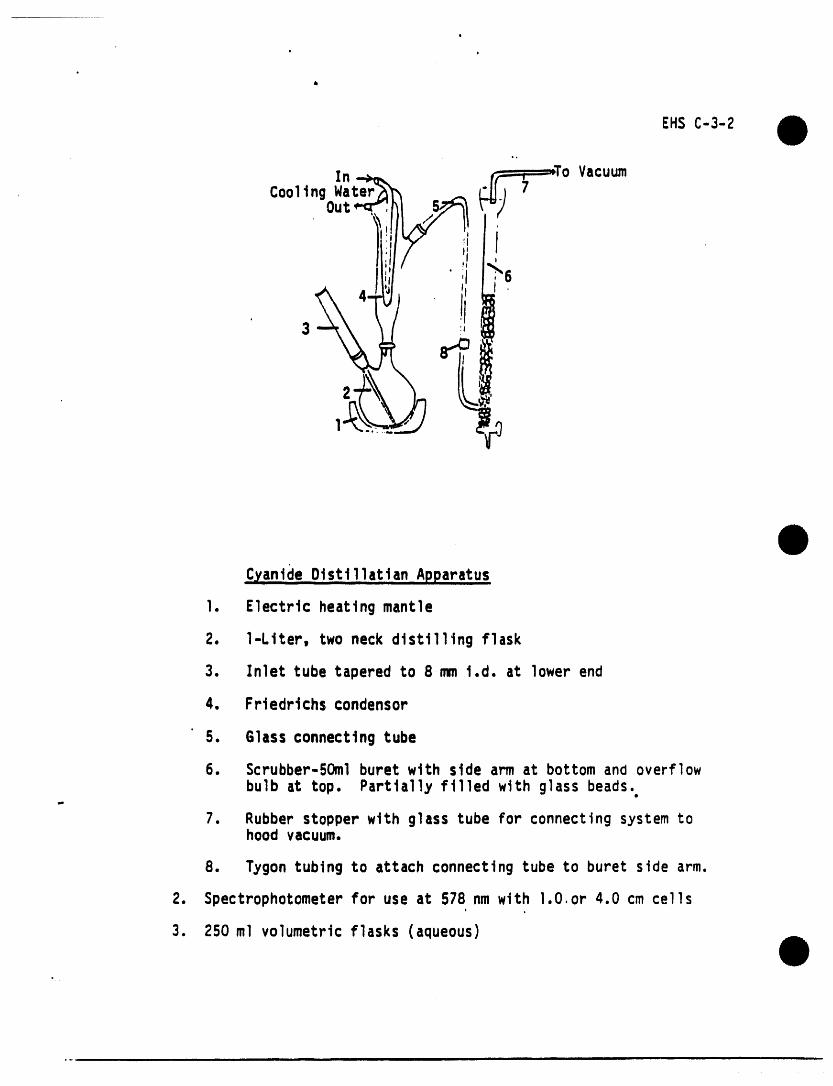
EHSC-3-2
Cyanide Otsttllat!an Apparatus
1. Electric heating mantle
2. 1-Liter, two neck distilling flask
3. Inlet tube tapered to 8 mmt.d. at lower end
4. Friedrtchs condensor
5. Glass connecting tube
6. Scrubber-5Omlburet with side arm at bottom and overflowbulb at top. Partiallyfilledwith glassbeads.
7. Rubberstopperwith glasstube for connectingsystemtohood vacuum.
8. Tygontubingto attachconnectingtube to buretside arm.
2. $pectrophotometerfor use at 578 nm with l.O.or4.0 cm cells
3. 250 ml volumetricflasks(aqueous)
o
e
EHS C-3-3
# 4. 100 mL voIumetrlc flasks
5. Whatman#41 filter paper (aqueous)
6. Long-stemmedfunnels (aqueous)
7. GF/A glass fiber filter paper (aqueous)
8. Personal sampling pumps (air)e
9. Styrene cassettes (air)
10. Midget in_Jngers (air)
11. 0.8u cellulose acetate filters and cellulose backup pads (air)
12. Large test tubes (air)
Reagents (Stock)
1. Starch
2. Potassium iodide, K!
3. Lead acetate, Pb(C2H302)2 " 3H20.,
4. Lead carbonate, PbCO3
5. AscorbJc actd
6. Sodium hydroxide, NaOH
7. Cuprous ch]orJde, Cu2Cl2
8. Sulfuric acid, con. H2SO4
g. Hydrochloric actd, conc., HC1
10. Sodium dJhydrogen phosphate, NaH2PO4 . H20
ll. Potassium cyanide, KCN
12. Potassium hydrc)xJde, KOH
13. ChloramJne-T
14. PyrtdJne0,
i
EHS C-3-4
I- 15. Barblturic acid,,
16. Silver nitrate, AgNO3
17. Paradimethylamlnobenzalrhodanine [5-(p-Olmethylaminobenzylldene) rhodamine]
18, Acetone
Reaqents (Prepared) ,
A. water Ana1_sis
1. Starch-lodlde paper - Stir 5 g of starch into 100 mL of deion-ized H20, boll and add 0.5 g KI. Impregnatestrips of Whatman#41 filter paper with this solutlon,dry and store in glassbottle,
2. Lead acetate paper - Prepare a saturated solutionof leadacetate in detontzed HE0 (-45 g Pb(CzH302)2 •3H20/I00 ml). I,q_regnatestrips of Whatman #41 filter paperwith this solution, dry and store in glass bottle.
3. 1 N NaOH- Dtssolve 40,0 g NaOH in detontzed H20 and dilute to1 Ltter, Prepare annually.
4, Cuprous chloride reagent - Weight 20 g Cu2Cl2 into an 800 mLbeaker. Wash twice, by decantation, with 250 mL portions of di-lute (1+49) H2SO4 and twice with deionized H20. AdO about250 mL detontzed H20,fo]lowed by small additiorls of conc. HC1until the Cu2C12 dissolves. (At this point the so]utionshould be c]ear and pale green. Brown or dark discoloration in-dicates presence of cupric salts and solution must be dis-carded.) Dilute to I Liter with deionized H20 adding conc.HCI as needed to keep the Cu2C12 in solution. Store in atightly stoppered bottle containing a few lengths of pure copperwire extending from the bottom to the mouth of the bottle.Prepare fresh when solution darkens.
B. Air or Water Analysis
" I. Sodium dihydrogenphosphate (IM) - Dissolve 13.8 g NaH2PO4• H20 in deionizedwater and dilute to I00 mL, Store inrefrigerator. Prepare every 6 months.
2. Chloramine-Tsolution - Dissolve 1.0 g chloramine-Tin deionizedH20 and dilute to I00 mL. Store in refrigerator. Prepareweekly. . . '
3. Pyridine-barbituricacid reagent - Place 15 g barbituric acid ina 250 mL volumetricflask and add Just enough deionized H20 towash down the sides of the flask and wet the barblturic acid.
EHSC-3-5/B -
Add 75 mL pyrtdtne, mix, add 15 mLconc. HC1, mix until dis-solved, cool and dilute to volume with detontzed H20. (Disso-lution complete only after adding H20). Store in dark. Pre-pare weekly.
4. CN- Rhodanine indicator- dissolve 0.02 g paradimethyl-aminobenzal-rhodaninein acetone and dilute to lO0 mL. Prepareannually.
C. Air Analysis
I. O.l N NaOH - Dissolve 4.0 g NaOH in delonizedH20 and diluteto I Llter. Prepare annually.
Standardsiiii i i iiiii Hill
1. Standard AgNO3 (O,O141N) - Dissolve 2.395 g AgNO3 in deion-tzed H20 and dilute to 1 Liter. Store in brown bottle° Stan-dardize monthly against standard NaC1 as in EHS C-5.
2. Stock cyanide solution - Dissolve 2.51 g KCN end 2 g KOH indetonized H20, dilute to 1 Liter end standardize as follows:
Pipet 10.0 mL of KCNsolution into a 250 mLcontca] beaker. Add100 mL detontzed H20 and adjust pH to l l or above with 1 N
', NaOH. Add 0.5 _ CN indicatorand tltratewith standarized
AgNO3 solution to first color change from canary yellow to asalmon hue. Also titrate a reagent blank.
Ag+ + 2CN:4-Ag(CN)2
mg/_ CN" . (mL AgNO,)(N AgN03) X 52.02 mg CN/mL• ]O.O'mLCN ] N CN
• (mL AgNO3)(N AgNo3) X 5,202
Stock CN- solution must be restandardized weekly.
2. Intermediate cyanide solution - Dilute 5.0 mL of stock cyanidesolution (or the amount necessary to contain 5000 pg CN-) t_
" lO0 mL with deiontzed H20. 1 mL • 50 _g CN-. Prepare f,-eshdaily.
3. Working cyanide solution - Dilute 2.0 mL of intermediatecyanidesolution to lO0 mL with deionizedH20. l mL- l _g CN'.Prepare fresh daily.
0
EHS C-3-6
Procedure
A. Water Analysis
I. Collectioni iiiiii i
I. Collect the sample in glass or plastic containers.
2. Add 4mL of 6 N NaOH per Liter of sample and refrigerate.Analyze within 24 hours.
II. Pretreatmentand Distillation
Carry an alkaline CN standard (-0.02 mg/l.)through the entireprocedureto determinerecovery.
I. Sulfide removal- place a drop of sample on a strip of leadacetatetest paper. If the test is negative (no darken-ing), skip to Step 2 for oxidizing agent removal. If thetest Is positive (dark color), add small incrementsofPbCO3 to 502 mL of the alkaline sample. Repeat until nomore blank PbS forms. Avoid excess PbCO3 or long periodof contact. Filter through GF/A filter paper into a]-Litertwo neck distilling flask, rinse precipitatewithlO mL delonizedH20 and add washings to the filtrate.
2. Oxidizingagent removal - check the filtrate from sulfideremovalwith starch-iodidepaper..If test is positive(blue-blackcolor), add ascorbic acid crystals until anegative test (no color) is obtained. Add an additional0.3 g ascorbic acid to each sample.
3. Set up distillationapparatus in a well ventilatedhood.
4. Add 30 mL of I N NaOH to the 50 mL buret scrubber.
5. Connectthe flask containing the sample (502 mL) to thedistillationapparatus and adJut the vacuum so that airenters at a rate of about 2-3 bubbles per second. (Thisshould be fast enough to prevent sample backup in the
- delivery tube.)
6. Slowly add 25 mL conc. H2SO4 throughthe air inlettube, rinse the tube with deionizedH20 and allow airflowto mix the flask contents for 3 minutes.
7. Add lO mL CuzCl2 reagent through the air inlet tube andagain rinse with deionized H20.
8. Heat to rapid boiling but do not flood the condensor.Watch the air flow rate closely as the solution begins to
, boil and adjust it if necessaryto prevent sample backup inthe inlet tube. Reflux for one hour, then turn off heatbut continue air flow for 15 minutes.
EHS C-3-7
g. Transfer the l N NaOB scrubber solutionto a 250 mL volu-metric fla._k.Rinse the buret'andthe connecting tube fromcondensorto buret and add the rinsings to the volumetricflask. Dilute to 250 mL with deionizedH20.
If stable complex cyanides are present, repeat the distil-lation.
III. ColorimetricDeterminationi iiii
I. Prepare a series of standardsby pipeting O, 0.5, l.O, 3.0,and S.O mL of the l ,g/mL CN- standard into lO0 mL volu-metric flasks. Acld6 mL of I N NaOH to each flask plusenough deionizedH20 to give SO mL of solution. Thisgives standardscontaining O. 0.5, 1.0, 3.0, and 5.0 g CN.
2. Pipet a SO mL aliquot of sample distillate into a lO0 mLvolumetricflask.
3. To each sample and standard add IS mL NaH2PO4 solutionand 2.0 mL chloramine-Tand mix.
4. Immediatelyadd S.O mL pyridine-barbituricacid reagent,mix, dilute to volume with deionized H20 and mix again.
S. After 8 minutes, but before 15 minutes, measure the absorb-ance of the solution at 578 nm using l.O or 4.0cm cells anddeionized H20 as reference.
B. Air Analysis
I. Collection
I. Using a personal sampling pump precalibratedat 0.5 - l Lpmpull air througha sampling train consisting of a 37mmcassette containing an 0.8 celluloseacetate filterfollowed by a midget impingercontaining 15 mL of O.l NNaOH. Sample for at least 30 minutes.
2. Place the membrane filter in a small jar or tube and desorbwith 25 mL of O.l N NaOH. Stir occasionallyfor 30 minutes
" to complete the dissolution. Analyze the solution within 2hours.
3. PrepareBlank and spiked filters and desorb in a similarmanner.
II. Colorimetricdetermination •
I. Pipet S.O mL of absorbingsolution from each desorbedfilter and impingerinto a large test tube.
EHS Co3-8
2. Prepare a series of standardsby pipetti.ngO, 50, lO0, 300& 500 uL of the I ug/mL CN standard into large test tubesand diluting to 5.0 mL with O.IN NaOH. This gives stan-dards containingO, 0.05, O.l, 0.3, and 0.5 g CN.
3. To each sa_le and standard add 1.5 mL NaHzPO4 solu-tion and O.Z nW.chloramlne - T and mix.
4. Immediatelyadd 0.5 mL pyridine-barbituricacid reagent andmix.
5. Add Z.8 mL deionizedHE(]and mix again.
6. After 8 minutes but before 15 minutes measure the absor-
bence of the samples and standards at 578 nm using l.O or4.0 cm cells and deionized H20 as reference.
Calculation:
A. Water
1. Plot _g CN- present in the 50 mL aliquot vs. absorbance.
2. Determineug CN- present in the san_}lealiquotsfrom theabove curve.
Z50 mL
mg/L CN" = aliquotug CN" 50 mL500 ml.
• aliquotug CN/lO0
Use the standard carriedthrough the distillationto determine % recoveryand correct results for this if less than 100%.
B. Air
I. Plotug CN present in the 5 mL aliquot versus absorbance
2. Determineug CN present in each samplealiquot from the above curve.
Particulate CN
mg/m3CN= (aliqug CNI(A}B XV
a
) °
EHSC-3-9
A- mL O,1 N NaOHused to desorb filter. (25 mL)B - Sample aliquot (SmL)V • m3 air sampled
Gaseous HCN
mg/m3CN- (altq. pgCN)(A)BXV
ABv,-• _a_rS_mplemLO.1NsampledalNaOHiquottmpinger(5 mL) absorbing soln. (15 mL)_j J/_._ /_Z" /_-- __p.
Hethod No. EHSA-7
Title: InorganicAnions in Water Using Ion Chromatography
•"Date Issued: I-9-90 Approvedby: M.K.Hamilto -,/1"
Written by: P.A. Thurmani
Supersedes-Method No. New
Date ReviewedB,V Date Revised B)' . "
w,,
Replacedby Method No. Date:
EHSA-7-101-09-90
' INORGANICANIONSIN WATERUSING ION CHROMATOGRAPHY
Reference
1. EPA Methods for Chemical Analysts of Water and Wastes, Method 300.0,EPA-600/4-84-017, March ]984.
2. Standard Methods for the Analysis of Water and Wastewater, ]7th Ed.,]989, pp 4-2 through 4-6, Section 4110.
3. Nelson Analytical Model 4660X Operators Manual, 1986, pp 1-1 -> 13-8.
4. Dionex System 2010i Operator's Manual.
Princiol_#
Use of ion chromatography provides a rapid simultaneous analyses of manycommon anions, with fluoride, chloride, nitrate, nitrite, phosphate, andsulfate being the most common. The method can also be used for other anionssuch as sulftte.
The sample is injected into a carbonate/bicarbonate eluent stream and passedthrough a series of ion exchangers. The anions are separated by a stronglybasic anion exchanger (separator or guard column) and then converted to theirhighly conductive acidic form by an acidic cation exchanger (suppressor
, column). The separated acidified anions are measured by conductivity.
Limitations
This method is not approved for the analysis of fluoride in drinking watersamples. That analysis must be done by specific ion electrode (EHS F-2).
Substances which have retention times coinciding with any of the anions ofinterest will interfere, such as, low molecular weight organic acids in highconcentrations. Due to small sample volumes used, contamination from dirtyand/or turbid samples must be avoided. All samples are filtered through aMillex-HV 0.45# filter unit when injected to prevent column plugging.
EauiDment
1. Ion Chromatograph (Dionex 2010i) connected via analog to digital- converterto a data station (HewlettPackardModel 300, Series 9000).
2. Anion separator column, with styrene divenylbenzene-basedlow-capacitypellicularanion exchange resin (HPIC-AS4A).
3. Guard column, same as separatorcolumn except 4 x 50 mm HPIC-AG4A.
4. Micro Membrane Suppressor.
5. Auto regen accessoryfor suppressorcolumn.
EHS A-7-2- 01-09-g0
,,
6. High pressure in-linefilter to protectguard column.
7. Deionizedwater finishingsystem--MilliporeMilliQ-Plus.
8. Syringes, 10cc leur slip tip.
9. Sample filters (MilliporeMillex HV 0.45 _m).
10. 100 mL volumetricflasks,misc pipets, etc.
Reaqents (stock)
1. Sodium Bicarbonate (NaHCO3)
2. Sodium Carbonate (Na2CO3)
3. Sulfuric Acid, conc.--(H2SO 4)
4. Sodium Sulfate (NazSO4)
5. PotassiumNitrate (KN03),99.g9+%
6. Sodium Chloride (NaCl),99.99+%..
• 7. Sodium Fluoride (NaF),99.99+%
8. PotassiumPhosphate,Monobasic (KH2P04),99.99+%
g. PotassiumSulfate (K2S04),gg.g9+%
10. Sodium Nitrite (NAN02),99.99+%
11. Nitrogen
REaqent@--Preoaredi
1. Eluant solution: 1.7mM NaHC03--1.8 mMNa2CO3
Dissolve 0.5712g NaHCO3 and 0.7632g Na2CO3 in deionized water and diluteto 4 liters with Milliporewater.
2. Regenerant solution: 0.025 N H2SO4
Dilute 0.7 mL conc. H2SO4 to I literswith deionizedwater.
3. Column Cleaning Solution--O.IMNa2CO3
Dissolve I0.6g Na2CO3 in deionizedwater and dilute to I liter. Preparefresh when needed.
EHS A-7-3K- Ol-Og-go
4. Column cleaning solution O.IM Na2SO4--Dissolve 14.2g Ndae2dS?4indeionizedwater and dilute to I liter. Prepare fresh when ne
Standards
I. Stock standards (prepareall wlth Mlllipore finisheddeionizedwater)
a. Nitrate, I00 /Jg/mLNO3-N or 445 /;g/mLNO3. Dissolve 0.361g driedKNO3 In deionized water and dilute to 500 mL. (Stable for sixmonths).
b. Chloride, 500 /_g/mL. Dissolve 0.412g dried NaCl in deionizedwaterand dilute to 500 mL. (Stablefor 6 months)
c. Fluoride--t000#g/mL. Dissolve 1.1106gNaF in deionized Water anddilute to 500 mL. Store in polyethylene. (Stablefor six months.)
d. Phosphate--500#g/mL. Dissolve O.3582g KH2PO4 in deionized waterand dilute to 500 mL. Store in polyethylene. (Stable for threemonths.)
e. Sulfate--lO00 #g/mL. Dissolve 0.4517g of 100.4 percent K2SO4 indeionized water and dilute to 250 mL. Store in polyethylene...
i( (Stablefor six months.)
f. Nitrite--lO00/;g/mLNOZ or 305 #g/mL NOz-N. Dissolve 0.750g driedNaNOZ in deionized water and dilute to 500 m.L (Stable for threemonths.)
2. Intermediate Standards (Prepare with Millipore finished deionizedwater.)
a. To a I00 mL volumetricflask add:
20.0 mL of 500 ppm Cl - I00 #g/mLg 0 mL of 445 ppm NO3 - 40 /;g/mL2010 mL of 1000 ppm SO4 - 200 /Jg/mL20 mL of 500 ppm PO4 - I00 /_g/mL4.0 mL of 1000 ppm NO2 - 40 /;g/mL
w.
Dilute to volume with deionizedwater
b. In a separate 100 mL volumetric flask pipet, 2 mL of I000 ppm F.Dilute to 100 mL with deionized water (20 /;g/mL). Prepareintermediatestandardsmonthly.
EHS A-7-4
F__ Ol-Og-90
3. Working Standards "
Pipet the following amounts of the appropriate intermediatestandardsinto 100 mL volumetric flasks and dilute to 100 mL with Milliporefinisheddeionizedwater. (Prepareweekly.)
mL Intermediate Conc. /;g/mLStandard F _.I _ P04 SO4 NO2
0 0 0 0 0 0 0
0.5 too low 0.5 0.2 0.5 1.0 0.2
1.0 0.2 1.0 0.4 1.0 2.0 0.4
2.0 (2.5 Fluoride) 0.5 2.0 0.8 2.0 4.0 0.8
5.0 1.0 5.0 2.0 5.0 10.0 2.0
20.0 (25 Fluoride) 5.0 20.0 8.0 20.0 40.0 8.0
Procedur@
I. InstrumentStart-up
See Laboratory Operating Guides L-8.4 for instrument start-upinstructions.
2. InstrumentCalibration
Run standards first to establish the initial calibration curve. SeeAppendix I to set-up calibrationcurve on the data station.
a. It is not always necessary to recalibratethe instrumenteach dayit is run. Check the existing calibration by running 2 or 3standards and calculating their values using the existingcalibrationcurve-lf the true values are within ten percent of thecalculated values, the calibrationcurve is still valid and may beused. If calculatedvalues are not within ten percent of the truevalues, rerun standardsand make a new calibrationcurve.
lu.
3. Sample injections: All samples and standards are filtered throughMillex HV 0.45/_filters. For data acquisition set-up see LaboratoryOperating Guide L-8.4, SectionC.
a. Turn auto offset-on.
b. Fill a 10 mL leur tip syringewith standar_or sample.
c. Attach syringe to the sample port.

EHSA-7-5
)".... 01-0g-90..
d. Inject 1-2 mL of the sample.
e. Press the load-inject button to inject. At the sametime start thecomputer by pushing the start button on the A/D box 707.
4. SampleProtocol
a. Runevery tenth sample in duplicate. (At least one samplemust berun if there are less than ten samples.)
b. Spike at least one sampleor one for every ten samples run.
c. Runa standard after every fifth sample to validate the calibrationcurves.
d. Dilute as necessary samples with concentrations outside thecaltbration range,
e. Ruh 2-3 standards at the end of the run to validate the calibrationcurves.
Calculatlon_
Sampleconcentrationsare normallycalculatedby the computerand printedoutat the end of each samplerun. Manuallycheckthe calculatedsamplevaluesagainst the callbratloncurve. Verify that any dilution factors arecalculatedin the result. Also checkvalidityof all QC and standardcheckdata.

' EHSA-7-601-09-90
Appendix [
F" Preparing a calibration curve using the "Metgen" program (method generatiprogram).
1. Run each standard in duplicate. Record' and average the heights for eachcomponent at each concentration level.
2. Proceed to the "Metgen" program by pressing the F1 key.
3. Enter the "Method File Name" (2010IC2 is currently being used).
4. Select the menu by pressing the key corresponding to "Metgen Menu" on themenu bar. ,
5. Select "Quant. Opts" by presstng the F5 key.
6. Select "Review Opts" by pressing the F1 key.
7. Select "Comp. Names" by pressing the F4 key.
8. Select "Cal. PUnt. List" by presstng the F5 key.
9. Enter the averaged heights for each component at each concentration level asfollows.
a. Position the cursor in the height column by pressing "Return."
(. b. Enter the averaged height for the component at the current level.
c. Move to the next level by pressing 'Return" until the cursor is in theappropriate height column.
d. Press "Return" after the last height is entered.
e. Select "Cal. Amt. List" by pressing the F5 key.
f. Repeat Step g until all heights have been entered For all components.
10. Select the key corresponding to "Quant Menu" on the menu bar.
11. Select the key corresponding to "Metgen Menu" on the mend bar.
12. Select "Store Hethod" by pressing the F7 key.
- a. Press "Return" when the nameof the method (20101C2) is displayed.
b. Press "Return" at the "Overwrite this File" prompt. (Method is nowsaved.)
13. Press the key corresponding to "New Program" on the menu bar.
14. Press "Return" at the next prompt. (XTRA CHROM[I--Core program menu willappear.)
15. Precede to the "Acquire" program.
Method No. EH$ F-2-1i iiiiii [i i i iiii ii
Tttle: Fluortde- Soectftc Ion Electrodei i I Ill Ill IllIllll I II I IIII
.,
Date Issued: ,, Fehruar_v !97 3 ............. Approved by: , M.,,,,K.,.,,,Ham,tlton/_/_
Nrttten by: M.K. Hamtltoni i i i iiii i i iiii iii i i i r
Supersedes Method No.i iiH Kill I I II i
0ate .... RevtewedBy Date __ Revtsed B_ ,, ,-.-
//I.C,"/ _/-/i iiiiii ,..,,,
/
Jol - iiiiiiitii i i
....... .........e
UINII i i i i i
i i i in i
ill ill i II Ul iii
Replaced by Method No. Date:
. EHSF-2-I10-I-85
if'" FLUORIDE- SPECIFIC ION ELECTRODEIIIIII fill IIIIII I I II II II Jill Illllll I
,o
Referencesfl[ll II I
1. Standard Methods for the Examination of Ware_....and klastewater, 16thE'(Jll:ion, 1985, pp. 357-359.
2. Instruction Manua! - pHtlon Heter, 135 CornJng, 1979.
3. Instruction Manual -Fluortde Electrode Model 94-09, Orion Research,incorporated, .......1970. ..............
Prtncip..les
A fluoride ion actJvtty electrode wtth a laser-type doped single lanthanumfluroide crystal is used with a saturated calomel reference electrode tomeasure fluoride concentration. Thts is done by measuring the potentialestablished across the electrode crystal in the presence of fluoride ions.
LimitationsIII II I Ill
Polyvalent cations such as A1 (III), Fe (Ill), and St (IV) complex fluortdetons. In alkallne solutions, the hydroxyl ton also interferes with theelectrode response to fluortde tons. Variations tn the total tontc strengthof the solutions betng measured cause fluctuations tn results. All of theseproblems can be overcome by diluting 1:1 with TISAB (Total Ionic StrengthAdJustment Buffer).
Equipment
1. pH/SpectfJc ion meter - CornJng 135 or equivalent.
2. Stngle junctton sleeve-type reference electrode.
3. F]uoride spectftc ion electrode.
4. Magnettc sttrrer and small stirring bars.
5. 100 mL plastic beakers.
Reagents (stock)
1. Anhydrous sodium fluoride, NaF.
2. Glacial acetic acid.
3. Sodtum chloride, NaC1.
4. Sodtum citrate dthydrate, Na3C6H507 '2H20.
5. Sodium hydroxide, NaOH.
6. Reference electrode ft11|ng solution.
. I II I I II III II III I II

EHSF-2-2
_/" Reagents (prepared)1. 6N NaOH - dtssolve 120g NaOH tn detontzed H20 and dtlute to 500 mL.
Prepare annually.
" 2. TISAB buffer solutton - add the following to approximately 500 mLdetontzed H20 tn a 1-Ltter beaker:
57 mL glactal acettc actd58g NaC112g sodtumcttrate (Na3C6HsO7 .2H20)
Sttr to dissolve. Use a pH meter NaOHpellets and 6N NaOHto adjust thepH to 5.0-5.5, Cool and dtlute to one Ltter. Prepare every 6 months.
Standardsi ii i
1. Stock fluortde solutton -dtssolve 1.105g anhydrous NaF tn detontzed H20and dtlute to 500 el.. I ml. = 1000 ,g F. Prepare every 6 months.
2. Intemedtate fluortde dJlutton - dtlute 1.0 ml. of stock fluortde solutionto 100 mL with deJonJzed H20, 1 mL = 10 ug F. Prepare monthly.
3. Worktng fluortde standards- ptpet 0.5, 2.5, 5.0, 25.0, and 50.0 mL oftntemedtate fluortde dJlutton tnto 1OO mL volumetric flasks. Add 50 mLTISAB solutton and dtlute to volume wtth detontzed H20 Store tnpolyethylene bottles, These are equivalent to 0.1, 0.5, 1:0, 5.0, and
10.0 Mg/mLF standards before addttton of TISAB. Prepare monthly., Procedureiiiii i ii
A. Sample COll,llect,,ton
Collect tn polyethylene bottles whtch have been rtnsed with deionizedH20. Store at 4°C up to 7 days. No preservative.
B. Analysts
1. Set Corntng 135 meter to "activity" mode and reset. Be sure thetemperature probe ts in place.
2. Rinse electrodes and blot dry with soft tissue, being careful not toscratch the LaF crystal.
3. Calibrate the meter as follows, using plastic beakers for allfluoride measurements:
a) Enter 5 0 for "Ca1 1" 0.1 for "Blank" and 0.5 for "Ca1 2"• • | • •
Also enter the slope value of -60.000.
b) Immerse the electrodes and temperature probe in the 5.0 ug/mL Fstandard. Sttr for 3 mtnutes and then press "Cal.1" whenstabt 11zed.
EH$ F-2-3
-_ c) Rinse and dry the electrodes and get readings on the 0.1 and +0.5 ,g/mL F standards after stirring each for 3 minutes. Press"Blank" after the 0.1 ug/mL standard stabilizes and "Cal. 2"after the 0.5 ug/mL standard.
d. Read and record the new slope which should be near - 60mY.
e. Take readings on all ftve standards (0.1 to 10.0 ug/mL F).
4. Prepare samples by ptpetttng lO.O mL of sample plus lO.O mL TISABsolution tnto a plastic beaker. Run every lOth sample in duplicate.
5. Measure the fluortde concentration by immersing the electrodes in thebuffered solution, stirring three minutes and recording the meterreading. Check instrument calibration by running a standard afterevery 5th sample. Rerun the entire calibration curve at the end ofthe analysts.
Calculation
1. Prepare a calibration curve by plotting wg/mL F vs meter reading on 2cycle log paper.
2. Determine the sample concentration in ,cj/mL (rag/L) from the calibrationcurve.
Precision
in the EHS laboratory ustng dr_,nktng water samples at concentrations of 0.2 to9.0 ug/mL F, the standard deviation was 2%of the average (+ 0.04 to + 0.15).Precision of a stngle determination at g5:i confidence level ts-+5_; atconcentrations of 0.2 to g.o ,g/mL F.
Accurac_
In the EHS laboratory using drinking water samples at concentrations of 0.822and 8.50 i_g/mL F, recoveries were 99.3 (+ 1.2%) and 100.1% (+ 1%) respectively.
Hethod No. EHS F-8i
p-
Ti t I e: F]ashpo_nt Determination
Date Issued: 8-81 Approved by: HI( Hamilton '
Written by: Susan Kinse_,
Supersedes'Hethod No. .i ml H llml nml nil i
Date Reviewed By Date Revised 8_,
-- / • /I
• /
Replaced by Hethod No. Date:

EHS F-8-16-89
bf,, FLASH POINT DETERMINATION
Reference
I. HazardousWaste Tes_inq Manqal,Millipore,pp. 63-86 (includesASTM Dg3-79 Method on pp. 74+).
2. Test Methods for Evaluatinq Solid Wastes: Phvstcal and Chemical Methods5W-846 3rd Ed, USEPA, 1986, _o]ume 1C, chapter 8, Methods 1010 (ASTMD93-85) and 1020 (ASTMD3278-82).
Princiol_
These methods, prepared by the AmericanSociety for Testing and Materials(ASTM),are designed for the determinationof flash point, using either thePensky-MartensClosed Cup Tester or the SetaflashClosed Cup Tester. Theflash point of an organicmaterial is defined as the temperature,(undercontrolled conditions),at which the concentrationof the material in thevapor phase has reachedthe lower explosivelimit. In such a flammableatmospherethe introductionof a spark will ignite the vapor. This ignitionresults in a flame that instantaneouslypropagates itself across the surfaceof the sample. Vapor pressure is a fundamentalphysicalproperty of anychemical,determinedlargely by intermolecularattractions. Vapor pressureis also affected by the equilibriumstate of the system. Consequently,inthis analysisvolume, temperature,and time are importantvariables.
For the purposes of Department of Transportation(DOT) compliance,liquidswith a flash point below 100 "F (37.8 "C) are regulated as flammable. UnderRCRA regulationsfor ignitability,substancesare consideredhazardouswhenthe flash point is below 60"C. When testingsampleswith unknown flashpoints, the test flame must be appliedat regular intervals,from the initialtemperatureto 100 "C or until the flash point is reached.
Limi_atiQns
These proceduresare specificallydesigned for fuel oils, lube oils,solvents,greases, some solids,suspensionsof solids,and liquidsthat tendto form a surface film under test conditions.
Exact reproducibility of the flash point testers, and their comparability hasnot been proven at thispoint.
EHSF-8-26-89
Setaflash Closed Cup Tester ..
This method requires 2 mL of sample material. It is best used when there is.little sample material,a rapid analysis time is desired, trace crosscontaminationmust be avoided, and an accuracyof 5 "C intervalsisacceptable. Accuracy comparableto that of the Pensky-Martensmethodrequires iterativeanalysis (see section on finite testing). This is theprocedurerouti,elyused by the EHS laboratory.
I. SetaflashClosed Cup Tester2. 2 mL glass syringe3. tissue wipes, acetone4. cooling block (kept in freezer)
Procedure-finlteflash ooint (PrlmarvMeth9d)
1. This procedure is used to determine the exact flash point of a testmaterial. The ASTMmethod calls for an iterative approach where theflash point is first approximatedand then the analysis is repeated withthe temperatureadjusted to just below that of the first observed flash.In our laboratorywe have modified this approachmore closely to that ofthe Pensky-Martensmethod described above. This is a valid
/ approximation if the sample chamber is heated at such a rate so thatthere is time for vapor and liquid phases to reach equilibrium. Forsamples of low voltttltty and low volume (<70 mL), use the iterativeapproach.
2. Begin the test with the sample chamber at, or, by using the coolingblock, below ambient temperature. Sample material is introduced intothe sample chamber via the 2 mL glass syringe. For viscous or solidsamples the Z mL volume may have to be estimated using other means.
3. The temperature dial is set to somevalue that produces a 5 "C/minuteincrease. Additio_la] adjustments may be necessary as the tester reachesthe set value and begins to cycle on and off. The pilot and ignitionflames are set as described above but are not shut down afteradjustment. The temperature of the sample cup is monitored and thesample tested for flashpoint at every 5 *C increase. After the flash
. has been observed,the temperaturedial is reset to the beginningvalue,the lid of the sample chamber opened,and excess material wiped from thetestercup. Use acetoneas necessaryto remove remainingresidues,ifany. To cool the sample cup down to ambient temperatures,the aluminumblock is removed from the freezer and fitted into the sample cup. Whenthe sample cup has returnedto ambienttemperature,the next sample canb_ te_ted.

EHS-F-8-36-8g
' Prgcedur_-flash/no fl ash (A! ternativQ Procedure)
1. This method is for testing a material at a predetermined temperature.i
2. Basic procedure--the power switch of the tester is turned on and thetemperature dtal set to the value corresponding to the desiredtemperature. The coarse and fine knobs allow adjustment to within 1 "C.The temperature of the tester cup is indicated on the built-inthermometer. While the tester cup is heating, light and adjust thepilot and ignition flames. Use the pinch clamp to shut off gas withoutchanging flow rates. When the temperature has stabilized at the desiredsetting the indicator light will cycle on and off. Fill the syringewith 2 mL of sample material and dispense through injection port in lidof tester chamber. Start the 1 minute timer. Release the pinch clampand ltght the gas streams. Whenthe timer tones, trip the release leverand observe for the flash/no-flash condition. Shut off gas flow, turntemperature dial back to its original setting, and clean the sample cupas described above.
3. Multtple analyses--the temperature dtal is not reset after an analysis,rather the tester cup ts cleaned, the lid shut and the cup allowed toagain reach themal equilibrium. The steps outltned under the basicprocedure are repeated. If a temperature other than that currently inequilibrium is desired the temperature dial is set accordingly. Fortemperatures less than the current setting, the cooltng block can beused.
Pensky-Martens Closed Cup Tester
This method is employed when low volatile samples are encountered (i.e. tar,heavy oils), where greater accuracy (flash point to within 2 "C) is desiredand trace cross contamination is not a problem. This method requires 70 mLof organicmaterial.
EouiDmen_
1. Pensky-Martens Closed Cup Tester2. Motorized stirrerwith flexiblebelt3. Thermometers
. 4. Z beakers, ! large enough to hold brass sample cup5. Materials to clean brass sample cup: tissue wipes, detergent
solution,small nylon bottle brush, acetone.
Procedur@
I. Fill clean, dry brass cup to mark with sample;place cup in well andsecure cover apparatusby tighteningattachmentscrews; adjustthermometerin provided port so that stirringmechanismdoes not strikeit; check all gas connectionsand adjust larger needle valve for gas
EHSF-8-46-89
Flow; connect belt; turn gas on, light pil,ot flame, and adjust smalle_needle valve for test flame; turn sttrcer on. (Stop stirring when applytest flame.)
2. Basic procedure--adjustthe Ful-Kontroldial for a temperatureincreaseof 5-6"C/min.(approximately70 increasingto gO by the end of test); setthe belt on the smallerpulley to achive a stirring rate ofapproximately115 rpm. Test the sample at 2"C intervalsbeginning 17-28"C below expected flash point (lowertest flame in 0.5 sec., hold Isec., raise quickly); if flash point is unknown, test in similarmanner,except start at ambienttemperature. Record the flash point as thetemperatureat which there is a disti.nctflash in the cup (theremay bea bluish halo present in the readingprecedingthe flash).
3. Multiple analyses--afterthe flash has been observed perform thefollowing:shut off gas, shut off stirrer, disconnectbelt, removecover, remove sample cup from well and place in water bath (waterfilled beaker), turn Ful-Kontrolknob back to start position. Forroutine samples the test cup should be placed in the water bathimmediately after the end of the test. The sample cup is cleanedas follows: return remaining sample to original container, usenylon brush to scrub cup with detergent solution, rinse first withwater then with acetone, use tissue to dry sample cup. The samplecup is then refilled with the next sample and placed in the tester.The Ful-Kontro] is reset to 70 and the sample tested in thew manner
r" already described.
4. Notes--sampleswith low flash points can be tested by cooling thesample cup in a freezer prior to analysis. A second sample cup isuseful in this situation;one can be kept in the freezerwhile theother is in use.
An importantconsiderationin disassemblingthe tester: Place the testcup in the water immediatelyafter the test is completed. IF this isnot done, the samplewill continue to receive heat from the cup andsample well, consequently,the sample may superheatonce the stirrerhasbeen disconnected. In this situation,samplematerial can be violentlyejected from the cup. This is especially the case with aqueous/organicmixed samples. Such samples should be analyzed only in the Setaflashtester.
. Quality control
Quality control records for the flash point analysis are maintained in the"Waste"volume of qualitycontrol data. There are separatesections for thePensky-Martensand for the Setaflashmethods. Compoundsof known purity andflashpointare used to check the accuracyof the tester and analyst.Currentlyundecane,with a flash point of 65 "C is used as our referencestandard. The observed flashpointof the standard,the date oF the test, theanalyst's initials,and the customer order number of the associatedsampleset are recorded.
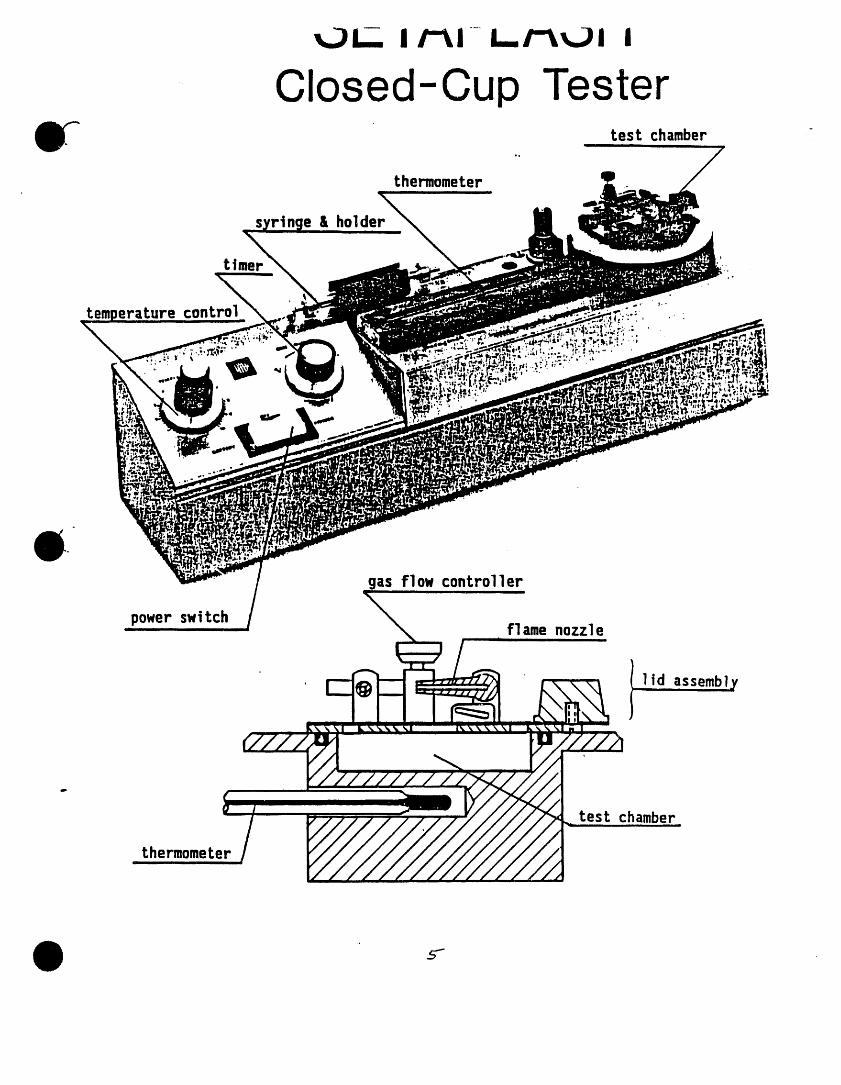
_3L.V. I/'_1 .....I_,F1_,11 I
- Closed-Cup Testertest chamber
o.
thermometer
s re & holder
L.
gas flow controller
power swi tchflame nozzle
,I id,'assembly
p
Lest chamber
thermometer
5-
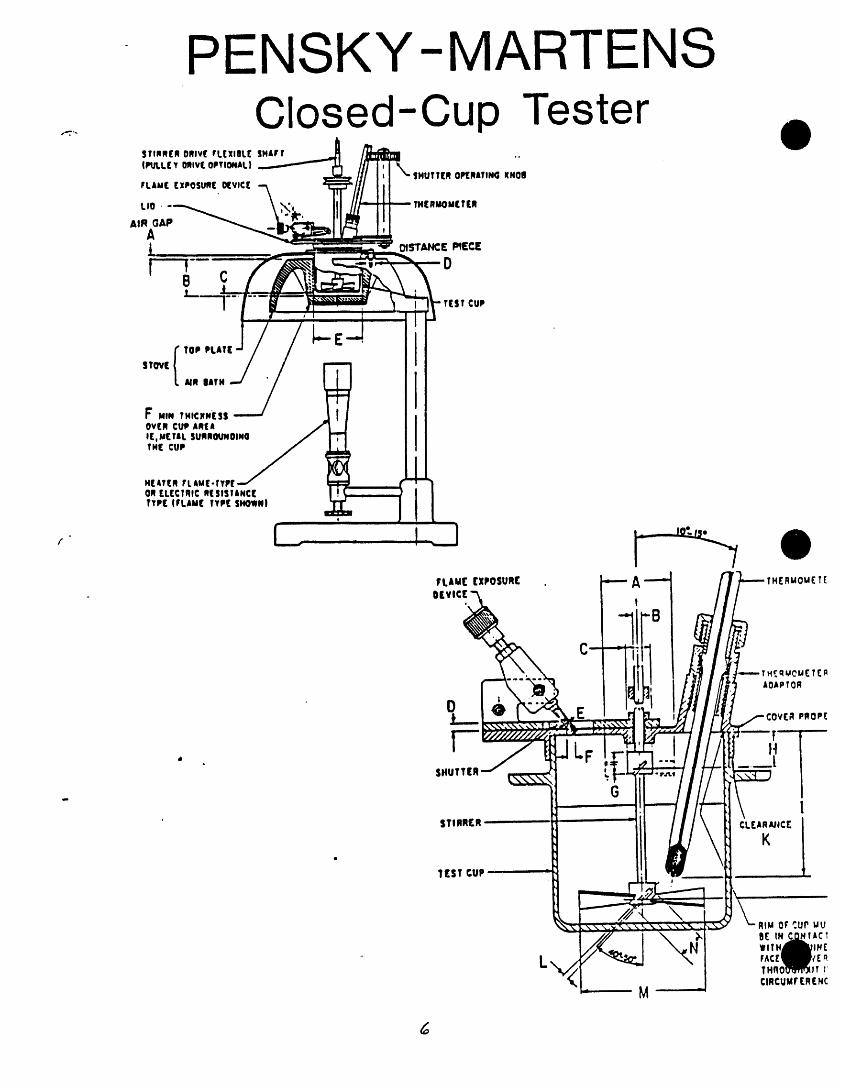
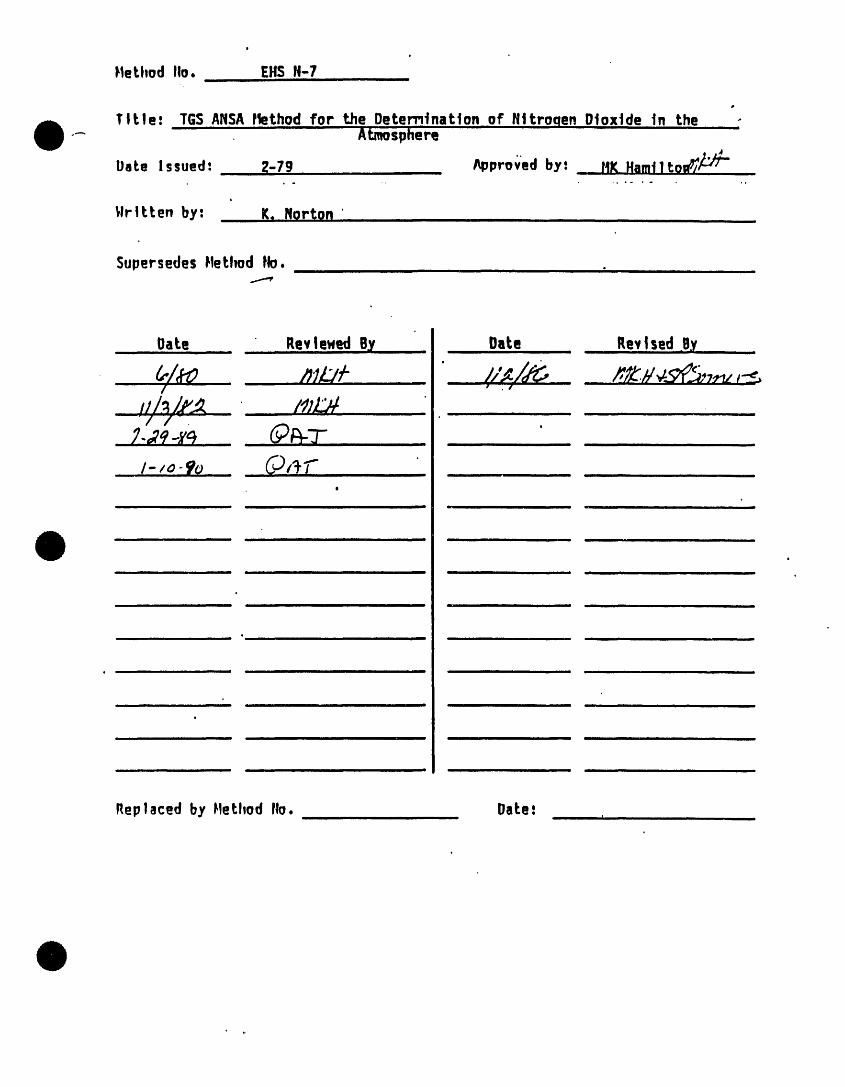
F1eLhodIio, Ells X-7j i
,i
TILIe. TGSArlSArlethod for the Detemtnatlon...of Nltro.qen Dioxide |n the ;--- Atmosphere
IlaLe Issued: 2-79 /_pproved by; _ IlK tlam|]tol_"• ..... ,. , . .o
_lrtLLen by: K,..INQrtQrl ' ,
Supersedes Xethod IIo. , . ....
DaLe I_evlewed By DaLe . p.evlsed ,Bw
_/_ ,_J_/- • //_//_ _f_#,___._,,_,_/ • , J
_/l_/_, mL_ .............-//-
iii
, /-,,o-fo .. @4-/" ....o
I I I II -- i -- __ i I
Ill IL I I I I .... II
I I I I I II I I II II
I I
_i ii
i i ii i ii iii i ii i i
Replaced by MeLhod |to. Date;
EHSN-7-18-19-89
.
TG$ ANSAMETHODFOR THE DETERMINATIONOF.NITROGEN
, Rqferences '
I. TGS ANSA Method fqr t_he O@terminatlon of Nitroqen l_ioxide in th_Atmosphere, EPA Designated EquivalentMethod No. EQN-1277-028.
Principles
Ambient nitrogen dioxide (NO_) is collected by bubbling air through a 50 mLsolution of trlethanolam_ne, o-methoxyphenol (Gualacol), and sodiummetablsulflte in a two port polypropylenetube. The inlet port is fitted withan 8 mm O.D., 6 mm I.D. glass tube with the end drawn out to form an orificewith an I.D. of 0.3 - 0.6 ram.
The concentrationof nitrite ion (NO2) produced during sampling is determinedcolorimetricallyby reacting the nltrlte ion with sulfanilamideand 8-anllino-l-napthalenesulfontc acid ammonium salt and measuring the absorbance of thehighly colored AZO dye at 550 nm.
The method is applicable to 2_-hour integrated sampling of NO2 in ambient airwith a sampling rate of 200 cmO/mtn.
Limitations
At an NO2 concentration of 100 #g/m3 (0.05 ppm) the folio.wing pollutants, atthe levels indicated, _o not interfere: ammonia, 205 /_g/nl._ (0.29 ppm); carbonmonoxide, 154,00_0 /Jg/m_ (]34 ppm); formaldehyde_, 750 /_g/mJ (0.61 ppm); nttri_oxide, 734 /4g/m_ (0.60 ppm); phenol, ]_0 /_g/m_ (0.04 ppm); ozone, 400 /Jg/m_(.020 ppm); and sulfur dioxide, 439 /_g/m_ (0.17 ppm).
EauiDment
I. Two port polypropylenetubes (164 mmx.32 ram).
2. Approximately ]52 mm long bubbler tubes (8 mm O.D., 6 mm I.D. with anorifice of I.D. 0.3 - 0.6 ram).
3. Test tubes (150 mm long X 20 mm diameter).
4. RAC 24-hour sequential samplers.
5. Spectrophotometercapable for measuring absorbance at 550 nm using I cm.optical path length cells or sipper cell and/or autosampler.
6. Autosampler tubes.
Reaaents (Stock)
I. Triethanolamlne
2. o-methoxyphenol (guaiacol)- reagantgrade
3. Sodium Metabisulfire
EHSN-7-24. Sul fan] lamide
S. 8-aniltno-l-napthalenesulfonic acid ammoniumsalt (ANSA)
6. Hydrogen peroxide, 30%
7. Absolute Methanol
8. Hydrochloric Acid, concentrated (HC1)
9. Sodium Nitrite - NaNO2
Reaaents (Preoared) Reagents should be prepared in amounts which will be usedwithin the holding times. This is in keeping with waste reduction efforts.
I. Absorbing Solution - Dissolve 90 mL of trtethanolamtne, 2.25 mLof o-methoxyphenol (guaiacol) and 1.25 g of sodium metabtsulftteconsecutively in 3L of detonized water. Dilute to 5L with detontzedwater. Stable for 3 weeks if protected from light.
2. Sulfanilamide Solution - Add 20g of sulfanilamide to 1,000 mL volumetricflask containing approximately 500 mL of deionized water. Slowly add 330ml. of concentrated HCI and dilute to 1,000 mL with detonized water.Stab]e for 4 weeks under normal laboratory conditions.
3. ANSASolution - Dissolve l.O g of ANSA in 500 mL of absolute methanol.Dilute to 1,000 mL wtth absolute methanol in a volumetric Flask. Mix
' thoroughly. Stable For 3 weeks when stoppered and stored under normallaboratory conditions. Should not be exposed to temperatures of 30'C orhigher for 8 hours or more.
4. Hydrogen Peroxide Solution - Dilute 0.2 mL of 30% hydrogen peroxide to 250mL with detonized water, Stable for ] month if refrigerated and protectedfrom Iight.
Standards
]. Sodium Nitrite Stock Solution - (500 /_g NOz/mL) Dissolve 0.7732 g ofoven dried NaNO) in detontzed water and dilute to 1L with deionized water.Can be stored f_r 6 weeks, if refrigerated.
2. Sodium Nitrite Working Solution - (lO pg NO2/mL) Pipet 5 0 mLof thestock solution into a 250 mL volumetric flask and dilute t'o volume withabsorbing solution. Prepare fresh daily.
3. Working Standards - Transfer O, 1.0, 3.0, 5.0, 8.0, and I0.0 mL of thesodium nitrite working solution to 100 mL volumetric Flasks and dilute tovolume wtth absorbing solution. This yields standards of O, O.I, 0.3,0.5, 0.8, and 1.0 pg NO2/mL.
EHSN.7.3
f- Proce_lure
A. Samole collecttor!
1. Place 50 mL absorbing solution into a polypropylene tube, 164 mmlongx 32 mmdiameter. The tube is fitted with a polypropylene two-portclosure equipped with an 8 mm O.D., 6 mm I.D. glass tube having anend drawn out to form the specified orifice.
I. Draw air through the bubbler using a convenient f'lowcontrol device,such as a crltical orifice and RAC sequential sampler. The devicemust be capable of malntainlng,a constant flow through the samplingsolution between 180 and 210 cmJ/mln. Sample for 24 hours and recordthe volume of air samples based on the actual calibration samplingrate.
B. Analv)is
1. Replace any water lost by evaporation during sampllng by addingdetontzed water up to 50 mL calibrationmark.
2. Pipet S mL of each standard and collected sample into a test tube.
3. Add 0.5 mL of hydrogen peroxide solution and mix for approximately15seconds.
/ 4. Add 2.7 mL of sulfanilamidesolution and mix vigorously for about 30seconds.
5. Add 3.0 mL of ANSA solution and mix vigorously for about 30 seconds(the ANSA must be added within 6 minutes after adding thesulfanilamide solution. Longer time intervalswill result in lowerabsorbance values. )
6. Transfer altquots of the samples and standards to autosampler tubes.If not using autosampler,use sipper cell.
7. Measure and record the absorbance of the blank and each standard andsample at 550 nm, using the autosampler (see Lab Operating ProcedureL-8.2 for set up instructions). The absorbance measurement can bemade anytime from ] to 40 minutes after the addition of the ANSA.
(_alcul at_igns
1. Use the standard values to plot absorbance vs. /_g/NO2/mLabsorbingsolution.
2. Use the calibration curve to determine /Jg NO2 present in the sampleal iquot.
3. CalculateNO2 in air as follows:
/Jg NO2/m3- /Jgmi NO_ /mL x 50 mL x DV (M3) x 0.93
EHSN-7-4
_- Where:
ug NOz/mL - NO2 concentration tn analyzed sample "
, 50 - volume oF absorbing reagent used tn sampling
V - volume of atr sample (m3)
0.93 = Sampllng efficiency
D -Dtlutton factor - for no dtluttor_-2 for 1:1 dtlut')on
4. The NO2 concentration may be calculaLed as ppm using:
ppmNOg - (pgNOg/m3) x 5.32 x ]0-4
NOTE: Calculations may also be performed wtth an IBH-PC using Lotus ]-2-3and the program wrttten by S. R. Somers (Appendix [).
EHSN-7-5APPENDIXI
f,-.t
' COMPUTER INSTRUCTIONSFOR LOTUS NO2 PROGRAM
INTRODUCTIONi i . i i ill
t
The following instructionsa]low the user to manipulate data generated fromthe weekly NO2 air surveillanceprogram on the IBM PC using the LOTUS ]-2-3software. All calculationsare programmed so all the user has to do is enterthe appropriatemeasurements In the designated 1ocatlon and the program willconvert absorption to ppm NO2.
STARTUPi ii |
Turn the computer on using the multiple outlet switch.
Insert the LOTUS I-2-3 diskette Into the left drive, which w111 be referred toas drive A. Close the A drive door. Wail a few moments while the computerloads (boots)LOTUS. When the red 11ght is on, this indicatesthe computer isobtaining information from the diskette or manlpulatlng information. DO NOTREMOVE THE DISKETTEWHEN THIS LIGHT IS ON.
Insert the data diskette labeled (NO2 CALCULATIONS) into the right drive ordrive B. Close the door.
If the computer Is already on, and not In use, there will be an A prompt (A)f In the upper left corner of the screen. When the /_> appears It is ready to
accept commands. Simply type: LOTUS, return (-_J)and the software willautomatically boot.
When LOTUS is activated, follow the instructionsfor date and time, strikingthe return (.mJ)key after each entry. Make sure that the date is enteredcorrectly because It will be used later in the program, i.e., mn-day-yr(5-01-85).
LOTUSwill now list a menu. This menu shows the user different options withinthe LOTUS network. Use the 1-2-3--LOTUS spreadsheetprogram. Strike returnwhen the highlighted commandcursor ts centered on 1-2-3.
Next a copyrightw111 appear,strike any key to continue.
If the appropriate diskette is placed in drive B, the program wil]automatica]ly load the NO2 spreadsheet and generate a ].ist of commandsneeded to utilize the program.
The spreadsheet program is now loaded; letters should appear in the vertica]direction (rows) and numbers in horizontal (columns). Notice that the ]etLersand numbersmake up a matrix so the user can identifyeach cell.
The beginning of the program appears and is ready to be manipulated. Noticethe greenish and white areas. Data can only be entered to the cells thatappear greenish or those that have been designated for data input; a]l othercells are internallyprotected and will not acceptentries.

6
• EHSN-7-6
r IMPORTANT: Striking the _[_] keys simultaneouslycauses a menu directlyrelating to the NO2 sprea_h-_t to appear. This menu lists most of thecommands needed to manipulate the spreadsheet..The commands are set up so theuser can move from one end to another (down the line) to complete theobjective. The menu should appear as follows:
EXIT DATE INPUT LAB NO PRINT FILE SAVE QUIT
DATING THE WORKSHEETi ii
By striking [_E)[]_ keys and selecting DATE, the cursor will automaticallymove to ce11_a-nd wait untll the user enters the weekly date. The dateshould be entered as shown here: 1/28 - 2/05; followed by a return (,_I).The easiest way to change the date Is by striking the F-2 key (edit),makingthe necessarychanges and erasingwlth the cleletekey.
DATA ENTRYi
To start the input mode, go to menu __l), select INPUT, (not'iceanothermenu appears). Select INPUT again and the-_-_ser automaticallymoves to enterthe standard absorptioncurve for Run 1 and Run 2; manipulatethe cursor usingthe keys located to the right of the key board (primarily_, down). This inessence will give you the fundamental rudiments of latter calculationsderiving ppm from absorption./.
To enter the data for each respected site, locate the site and its informationcells as shownbelow.
ABS. CONC. LAB NO
{SSO nm) (ppm/NO) E85-OI-
SITE:DATE:PUMPNO:ORIFICE NO:FLOW(co/m) :AIR VOLUME:CAL. DATE:
DUP:AVG:
Check all pertinent information in the first column to make sure all pumpcharacteristicsare correct and current (especiallyflow and air volume). AllABS enteries will then be placed under the ABS column. Continue to enter theabsorption for each site using the cursor movement keys to advance thespreadsheet. After all absorption entries are entered, to break the programloop strike I-_'_i'J (.Break)simultaneously.
EHS N-7-7
f-. CALCULATI NGt.
After all data has been entered and the pump characteristics checked, theentries need to be calculated. Simply recall the menu, select INPUT, followedby CALCULATE.
LABORATORYNUMBERSYSTEMii i
The lab number identifies each sample and is responsible for the integrity of
quallty assurance __ the laboratory numbers in chronological order,re.trievethe menu "( and enter command LAB NO.
To operate, the program will ask the user to enter the address (site) to goto. Type in the appropriatesite (Ale, 200W, IOOB, fOOD, 615C, AB, Wye, FFTF,or SB). Enter the starting lab no., strike return (,tJ),and the program willsupply the log numbers for the rest of the cell. Again, the program will askthe cell address. Type the next site on which data was collected (4J) andthe lab no. (-_). Repeat until all sites are accounted for. NOTE: If onlyfive samples were collected,then your worksheet should representthis; hence,the ABS columns and the laboratorynumber must coincide. To break the programstrike LC,JLEjJ _ simultaneously. IMPORTANT: A cross check against thelog book will determine if the processwas done correctly.
PRINTINGWEEKLY REPORT
When all data entries are finished a weekly printout is essential, and must be
_" done before the FILE and SAVE commands. This printout will be placed in theNO2 notebook for future reference. Before printing make sure the printer ison, paper loaded, and ready to accept information. The ON-LINE light must belit. The printer settings should be the following:
MARGINS
Left: 7 Top: 0 Page Length: 64o' Date: @Right: 136 Bottom: 2 Footer:,,
IMPORTANT: Before sending information to the printer, the paper must firstbe aligned so that the top perforation "lines-up" with the printer head.This will allow for a weekly report that is bondable, legible,and neat.
To print the data sheet, recall the menu and select PRINT. After this iscomplete, remove the printout from the printer and store in the notebook.Record data in the log and QC books.
FILE
After the absorbance numbers have been converted to parts per million NO2,the data needs to be stored in a calendar matrix for future manipulatlons.
Recall the menu ([_Z_I_) and select FILE, the cursor will automaticallymoveto RS and ask the user to "align cursor at appropriate date". Strike return(-_bJ)to continue. Using the cursor movement keys or page down, move thecursor accordingly. Once the starting date is located,position the cursor incolumn R (ALE) and strike return (,mJ). The data will be automaticallyplacedin the matrix for the remainingsites, and a range is set for later use.
EHS N-7-8
f SAVING WEEKLY ENTERIES
After all data has been entered, printed, anclfiled the last operation is tostore the results In a calendar matrix for yearly summations. To do this, goto the menb (_ [_ ) and select SAVE (q.l). The computer will then performthis command and presents anothermenu:
EXIT FILE SAVE QUIT
Select FILE (iJ), notice the same calendar appears as in the previousspreadsheet. The comment "Align cursor at appropriateDate" appears. Strikereturn (ia) and move the cursor accordingly. When the cursor is properlyaligned in the 'C' (ALE) column, strike return (-_) and the weekly resultsarecoe_oined,but not saved. After the data is combined, select SAVE (,mwJ)toprotect and con_lete the process. Selecting Quit will exit the user from thespread sheet.
RETURN TO FILEi i i i
The con_uter will then present the beginning menu. Strike EXIT, followed by aself check (Y/N). Strike Yes if you want to leave the LOTUS Access System.The flnal result w111 be an A . Retrieve the diskettes from drives A and B,place in protective wrappers, and store in respective location. Turn thecomputer off using the multlple outlet switch.
( PROTECTIONSYSTEM
The protection status minimizes the chance that unlntentional harm will bedone to the spreadsheet. Baslcally, those areas which appear greenish areunprotected and the rest (white) are internally protected. To break theinternal protection, which would be needed to change pump characteristics,simply strike Slash (/), Worksheet (W), Global (G), Protection (P), Disable(D), and make corrections. It is wise to turn the protection back on afterthe necessary corrections are entered to protect the integrity of thespreadsheet. To turn the protectionsystem back on, strike /WGPE.
ERASING
This operation will be used to delete characters that change within the weekstime. To do this, strike slash (/), Range (R), Erase (E), color in range tobe erased, return (-_J),and continue. The deleted material is not losteduntil the spreadsheetis saved.
OTHER IMPORTANTKEYS AND INDICATORSIN LOTUS
Keys
Controlbreak: Allows the user to escape from an internalprogram ("Loop").F-l: Help key
ESC: Escape, allows the user to back-out and exit the command.
Indicators
Upper left corner of screen identifies the current locationwithin the spreadsheet, I.e., E31.
Upper right corner of the screen indicates the command mode (ready, wait,command,error, etc.).
Method No, EHS$-6 , , i
1
_-, Tttle: SOz In Atr and Stack Samples Ustnq Barium Perchlorate Titration
IJaLe Issued: 4-71] Approved by: MK HamilLon
t
t Wr|Lten by: MKHamflLon ..?
i 5upers.edes Method No.ii!II
I
; I]ate Revtewed B,v ....... Date ...... Revtsed..B},...
i I /I
, /......cP,er i ,,i
4I "
I
i
i ill
iii i i i
i
i
ii i ml i |l i i |1 • ill i
i
m , i i ii i
" Replaced by Method No. Date:
I!
4;)
EHSS-6-18-10-8g
SO2 IN AIR AND STACK SAMPLESUSING BARIUM PERCHLORATETITRATION
Reference_
I. _ulfqr Dioxide in Air, NIOSH AnalyticalMethod P&CAM 163.
Z. Tentative Te_t Method for Sulfur Dioxid_ in WorkplaCe Atmospheres(.BariumPerchIQrateM_thod), ASTM DesignationD3449-lBT.
3. EPA Method 6: Determinationof Sulfur Dioxide Emissions frQm StationarySources, 40 CFR Part 60.
Princiol_
Sulfur dioxide in the air ts absorbed in 0.3N H202 (3 percent H202 if stack)and oxidized to sulfate. After the pH of the solution has been adjusted withperchlortc acid, the resulting su]fate is titrated with barium perch]orateusing thorin as the indicator.
Llmltati_n_
Particu]ate sulfates, sulfuric acid and SO3 will all cause erroneouslyhighSO2 values. This problem can be eliminated by placing a 0.8# membraneprefilter ahead of the ]mplnger for ambient sampling or by using an initialscrub of 80 percent isopropanol, as is the case when stack sampling. Metalion and phosphate ion interferencesare also eliminated by using a prefilter.Oxidizing material trapped on the prefiltercould cause erroneously low SO2 -results but is not often a problem.
EauiDment
I. 125 mL erlenmeyerflasks
Z. I0 and 50 mL graduatedburettes
3. Stack samplingtrain as described in EPA Method 6, or
4. Midget impingers, O.8p membrane filters and cassettes, and personalsampling pump
5. pH meter
- Reaqents (Stock)
I. Barium perchlorate- Ba(CIO4)2.3H20
2. Isopropylalcohol (isopropanol)
3. PerchloricAcid, conc. - HCIO4
4. Sulfuric Acid, conc. - H2SO4
I
°.
EHS S-6-2
/- 5. Thorln indicator
6. Hydrogen peroxide,30 percent - H202 "'
7. Sodium hydroxide - NaOHJ
8. Potassium acid phthalate (KHP), primary standard
g. Phenolphthaletn indicator
10. Ethyl alcohol (ethanol)
Reaoent (Preoared)_
1. Hydrogen peroxide absorbing solution (0.3N) - dilute 17 mL of 30percent HzO2 to 1 liter using detonized H20. Prepare daily.
2. 80 percent tsopropanol (stack sampling only) - dilute 800 mL isopropanolto 1 liter with detontzed H20. Prepare annually.
3. Perchloric acid (1.8%) - dilute 25 mL cone. HCIO4 to 1 literwith detontzed H20. Prepare annually.
4. Thortn indicator solution - dissolve 0.1-0.2g thortn in 100 mL detontzedH20. Prepare annually.
(" 5. Phenolphthaletn indicator -dtssolve O.Olg phenolphthaletn in 50 mLethanol + 50 mL detontzed water. Prepare annually.
6. Hydrogen peroxide absorbing solution (3%) -dtlute 100 mL of 30 percentH20Z to 1 liter with delontzed H20. Prepare daily. (Stack samplingonly)
Standard_
I. Oo0100N KHP - Dissolve 0.2042g oven dried potassium hydrogen phthalatein detontzed H20 and dilute to 100 mL. Prepare monthly.
2. -0.01N NaOH - dissolve 0.4g NaOH in detonized H20 and dilute to 1liter. Standardize every three months as follows: Pipet two 25.0 mLaltquots of O.0100N KHP into 125 mL erlenmeyer flasks. Prepare a blankfrom 25 mL deiontzed H20. Add 2-4 drops phenolphthaletn to each andtttrate with the NaOHto a pink end point.
NNaOH - mL N_KHP x KHP
mLNaOH
mLNaOH m (mL to tltrateKHP) - (mL to tltrate Blk)
r i
EHS S-6-3
3. -O.01N H2SO4 - Add 0.3 mL conc. H2S04 to de'Ionized H20 and dilute to 1liter. Standardize every three months against the standardized NaOHasfollows: Pipet two Z5.O mL allquots..of-0.01 N H2SO4 into 125 mL "erlenmeyer flasks. Prepare a blank from 25 mL deionizedH20. Add 2-4drops phenolphthalelnto each flask and titrate with the standardized
' NaOHto a pink end point.
N mL xN
H2SO - NaOH NaOH• 4 mLH SO2 4
mLNaOH - (mL to titrateHzS04) - (mL to titrate blank)
4. -O.01N Ba(CI04)2_.Dissolve 1.95g Ba (CI04)2_ . 3H20 in 200 mL deionizedH_C'. Add 80OraL Isopropanol,mlx wel. =,,.adjust the pH to -3.5 withd11ute HCIO4. Standardize every three months as follows: Pipet two10.0 mL aliquotsof standardizedH2SO4 into 125 mL erlenmeyer flasks andadd 40 mL isopropanol. Prepare a-blank from 10.0 mL deionizedH20 + 40mL isopropanol. Adjust the pH of the solutions to -3.5 uslng diluteHCIO4 and add 4-6 drops thorln to each. Titrate with the Ba(CI04)2 toan end point color change from yellow to pink.
N mL NBa)CIO ) - H SO x H SO
•. 42 2 4 _ 4mL
Ba(CIO )42
mLBa(ClO ) - (mL to titrate H2S04) - (mL to titrate Blk)
42
Procedure
I. Sampling
A. Stacks - see EPA Method 6
B. Ambient - Plac_ 15 mL O.3N peroxide absorbing solution in a midgetimpinger and sample at 1.0 Lpm for a minimum of 100 min. Use aO.8/Jmembrane prefilterwhen necessary.
a,,
2. Analysis
A. Transfer the samples to volumetric flasks (25 mL for ambientsamples, 500 mL for stack samples) and dilute to volume withdeionizedH20.
\
1 EHS-S-6-4
B. Pipet a 10.0 mL altquot to a 125 mL erlenmeyer Flask and add 40 mL_f tsopropanol plus 4-6 drops thorin. Prepare a blank using 10.0 mL
of appropriate absorbing solution in place of the sample aliquot. °Adjust pH to -3.5 using dilute HCIO4.
C. Tttrate to pink end point using standardized Ba(CI04) 2.
l;alcul atjon_
1. Stack samples - see EPA Method 6 or computer program written byB. K. Grogan.
Z. Ambient Samples
mg/m3 SO = mL x M x I_ x FZ B B SO
i ii _ ,
V
t mLB = mL Ba(C]04) 2 to titrate sple minus amount to titrate B1k
MB = Molarity Ba (C104)2 = 1/2 normality
MW = toolecul ar wt SO2 = 64.06SO
2
, F = dilution factor = total sol. vo_aliquot vol.
V = m3 air sampled+
i ppm SOZ = mg/m3 SO2 x 0.382i t
0.382 = 24.45 mL/m mole64.06 mg/mmole
-.Jll +-_ -__+ ..... _ I IIII ilI III •
t
HeLhod Xo. EXS N-1 i
s
TILIe: Detemtnatton of NOv IN SLack Gis-_- . i ii
Da_e Issued: 5-25-74 ' Approved by: IIK Hamtltofl_:_iZlll i . . ii i
,.. .. . ,. ..... . . , ,o
WrltLen by: HK,HamtTton,s ,
f ,
Supersedes HeLhod No.• i i 1 ii i
DaLe Reviewed By ...... DaLe _-- Revtsed .B;y
I "' / ,/ -- '
/ / ........i
i|1
,l|l , i
,f i __ i i
ii i i
ii i _ ii i,
i _ iiii ii ,i
• ii
i ii i ill i
-- _ i
- Replaced by HeLhod No. ...... DaLe: _ , _
- EHSN-1-11-2-86
,(--, .D.ETERM!.NATION OF NOX IN STACK GAS
References "i
I. FederalRegister,Vol. 42, No. 160, August 18, 1977, pp. 41784-41786.
2. EPA Method 7, Determinationof Nitrogen Oxide Emissions from StationarySources,October4, 1982.
3. EnvironmentalSciences& Technologyg (10), g7g-g81,October 1975.
Principles
A grab sample of air is collected in an evacuated flask containing a diluteH2SO4-H202 absorbing solution. Nitrogen oxides except nitrous oxide,are collected in this solutionwhich is treatedwith'phenoldisulfonicacid andneutralizedwith NH40H to give a yellow color, the absorbance of which ismeasured at 405 nm. Results are reportedas ppm NO2,
Limitations
This method is applicable for the determination of nitrogen oxides, exceptnitrous oxide, from stationary sources at concentrationsgreater than 10 ppmNO2.
Equ.ipment
I. I liter evacuable round bottom flasks (500 mL and 2000 ml.flasks may alsobe used).
2. Pyrex glass sampllng probe
3. Vacuum pump and manometer
4. Steam bath
S. I00 mL beakers
6. Red or neutral lltmus paper
7. I00 mL volumetricflasks
- 8. Spectrophotometerfor use at 405 nm with 1.0 cm cells or sipper cell
Reagents (stock)
I. Sulfuricacid, conc. -H2SO 4
2. Hydrogenperoxide,30% - H202
3. Sodium hydroxide- NaOH
4. Phenoldisulfonicacid
5. Ammoniumhydroxide,conc. - NH40H
l EHSN-I-2
6. Potassiumnitrate,analyzed reagent- KNO3f
_Reagents(prepared) .
I. Absorbing solution - add 2.8 mL conc. H2SO4 to ] liter delonized H20and mix well. Add 0.6 mL 30% H202 to 5.4 mL delonized H20 and mlx.Add the H202 solution to the H2SO4 solution and mix. Store awayfrom extremeheat or direct sunlight. Prepareweekly.
2. I N NaOH - dissolve 40g NaOH in delenlzedH20 and dilute to I liter.
Standardsl
I. Stock NO2 solution (l mL - 250 wg NO2) - dissolve 0.2748g oven driedKNO3 in delonizedH20 and dilute to 500 mL. Preparemonthly.
2. IntermediateNO2 dilution (1 ml. - 25 _ NO2) - tranfer lO.O mL stockNO2 solution to a 100 mL volumetric fl and dilute to volume with de-ionlzedH20. Prepareweekly.
Procedure
A. Sample collectlon
I. Fill the collectlon flask completely wlth HpO and measure the vol-ume of water used. This gives the volume of tile flask at room temp.
/,.''
2. Place 25 ml.absorbingsolution In the flask and evacuate to at least3 inches of Hg. Measure the negative pressure (vacuum) just before
using the flask and record (PI).
3. Purge the sample probe, then open the flask for about 15 seconds tocollecta sample.
4. Close the flask and shake for 5 minutes. Al]ow to stand at least 16hours.
5. Shake the flask for 2 minutes and measure the flask pressure (PF)at room temperature.
B. Analysis
. I. Transfer the 25 mL absorbing solution from the sampling flask to alO0 mL beaker. Rinse the flask twice with lO mL a]iquots of deion-Ized H20 and add rinsingsto beaker.
• 2. Prepare standardsby pipetting O, l.O, 3.0, 6.0, 10.0, 15.0 and 20.0mL intermediateNO2 standard (25 Ijg/mL)into 100 mL beakers Add25 mL absorbing so]ution and enough deionized H20 to give a volumeof about 45 mL. NOTE: If analyst is new to the procedure, standardsshould be carrie_rough the entire procedure before starting sam-ples to be sure techniquesare mastered and procedure Is working.
• EHSN-1-3
3. Neutralize samples and standards to lttmus using 1 N NaOH. Be care-if- ful not to add excess NaOHas it will cause low results.
4. Evaporate all solutions to dryness on steam bath. (Avoid over-bakingthe samples once dryness is reached),
5, Add 2 mL phenoldisulfonic acid and use a plastic rod to crush and wetthe residue thoroughly.
G. Add 1 mL delonized H20 (use to rinse plastic rod) and 4 drops conc,H2S04.
7. Heat on steam bath for 3 minutes with occasionalstirringand cool.
8. Add 20 mL deionlzed HE0, mix, and add 15 mL conc. NH4OH. (Ayellow color should develop tnthe presence of NO2).
g. Transfer the solutions to 100 mi. volumetrlc flasks and dilute tovolume with deionized H20. If the sample color is darker than thehighest standard,dilute as needed.
10. Measure absorbance of samples and standards at 405 nm using 1.0 cmcells and deionized H20 reference Sipper cell may also be used.(Color ts stable for several hours, i
Calculations "
/I_ I. From the standardvalues plot absorbancevs l_gN02/IO0mL.
2. Using this calibrationcurve determinethe |IgNO2 present in the samples.
3. Determineppm NO2 in the alr samplesas follows:
ppm NO2 , .A(jjgN02/lO0mi.)x O.532vl
A - dilution factor
V1 - liter air sampled
. P2V2Pl
el
PI " 760 mm standardpressure - 29.9 in. Hg
P2" measured flask pressure (Pinitial-Pfinal)as in. Hg
V2 - (mL flask volume - 25 mL absorbingsolution)/lO00- L air sampled
0.532 = factor to convertwg/L to uL/L (ppm) at 25°C
.244_o.um IJg
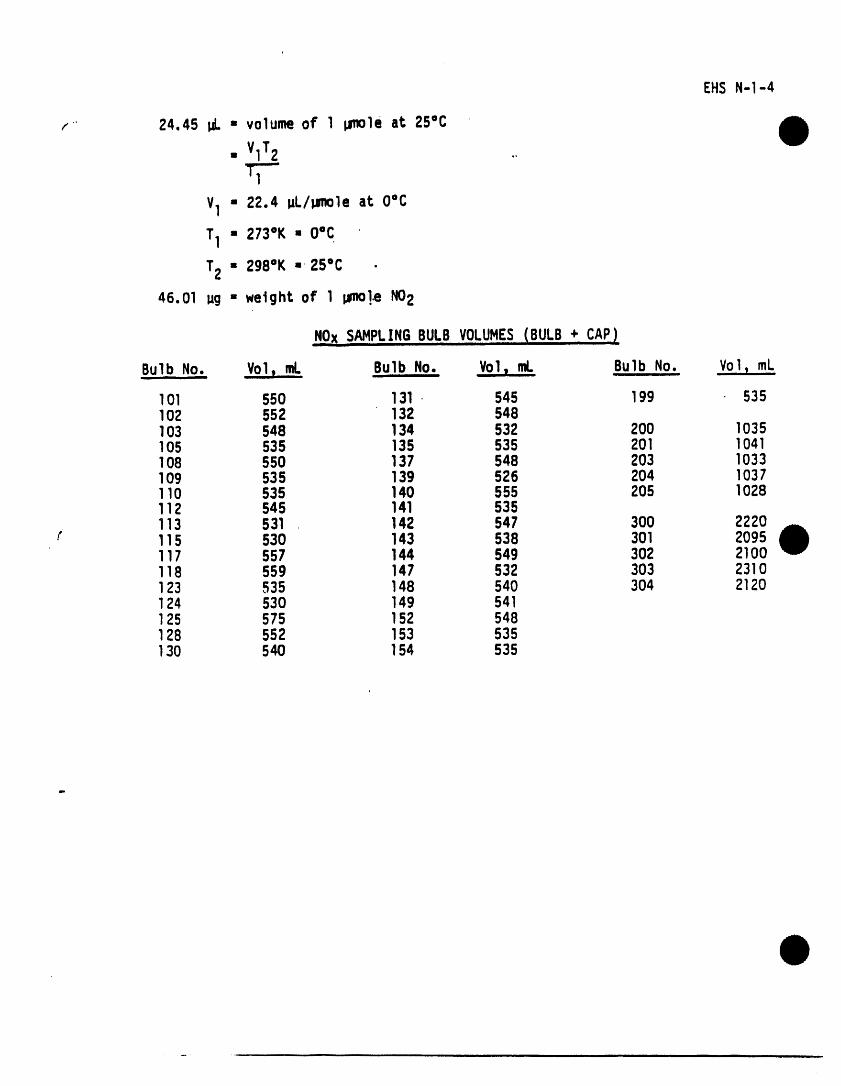
EHSN-1-4
_, 24.45 _ = volume of 1 pmole at 25°C
• V1T2 ..
V1 = 22.4 ML/l.lmoleat O°C
T1 • 273OK• OoC
T2 = 298oK., 25oC
46.01 ug = weight of 1 I_m0!.eNO2
NOxSAHPLINGBULBVOLUHES(BULB+,.,,CAp)
Bu1b NO:, Vo11,mL BuI b No. Vo1n,mL BuI b No,.;,, Vo...1_,mL
101 550 131 • 545 199 535102 552 132 548103 548 134 532 200 ]035105 535 135 535 201 1041108 550 137 548 203 1033109 535 139 526 204 1037110 535 140 555 205 1028112 545 141 535113 531 142 547 300 2220
f 115 530 143 538 301 2095117 557 144 549 302 21O0118 559 147 532 303 2310123 535 148 540 304 2120124 530 149 541125 575 152 548128 552 153 535130 540 154 535
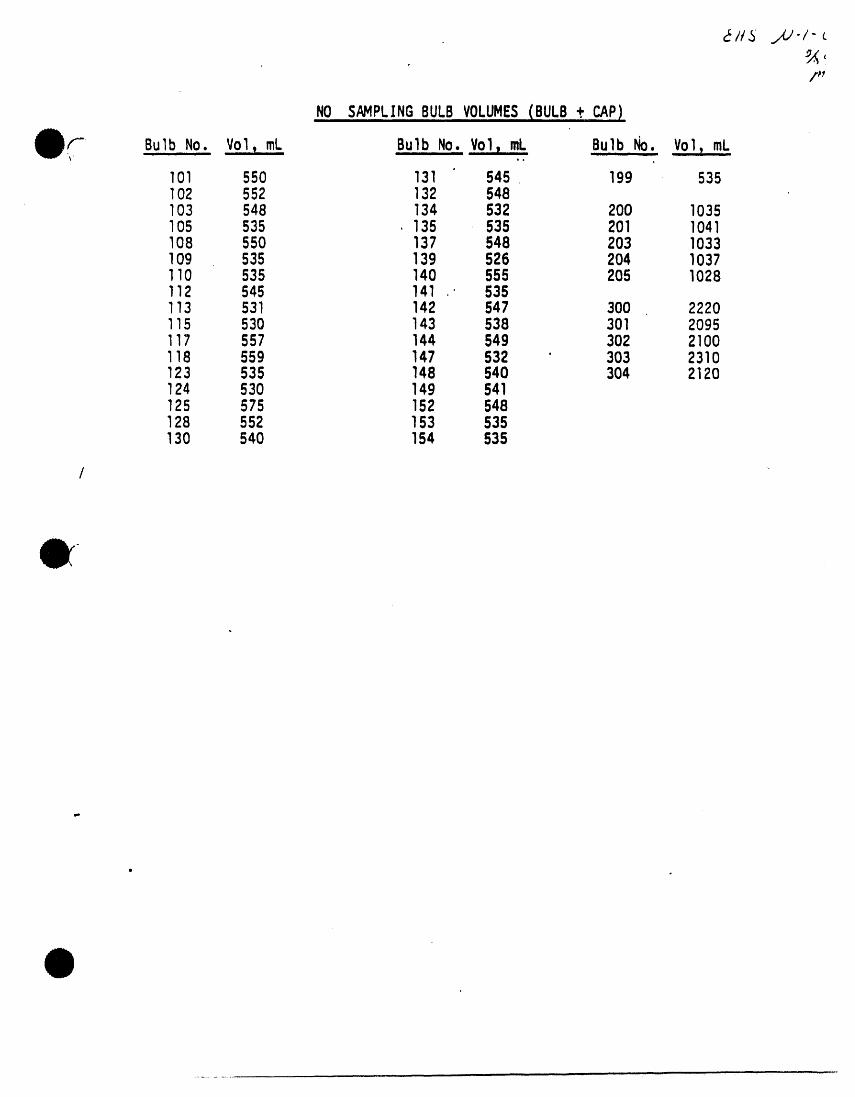
E/t3 .,,u-/-_
f_
NoS LXNGsULBVOLUMES(BULB+f'- Bulb,No. VOI_,mL. Bulb NO. Vol, mL Bulb No. Vol_ mL_' _.
101 550 131 545 199 535102 552 132 548103 548 134 532 200 1035105 535 , 135 535 201 1041108 550 137 548 203 1033109 535 139 526 204 1037110 535 140 555 205 1028112 545 141 .' 535113 531 142 547 300 2220115 530 143 538 301 2095117 557 144 549 302 2100118 559 147 532 ' 303 2310123 535 148 540 304 2120124 530 149 541125 575 152 548128 552 153 535130 540 154 535
/
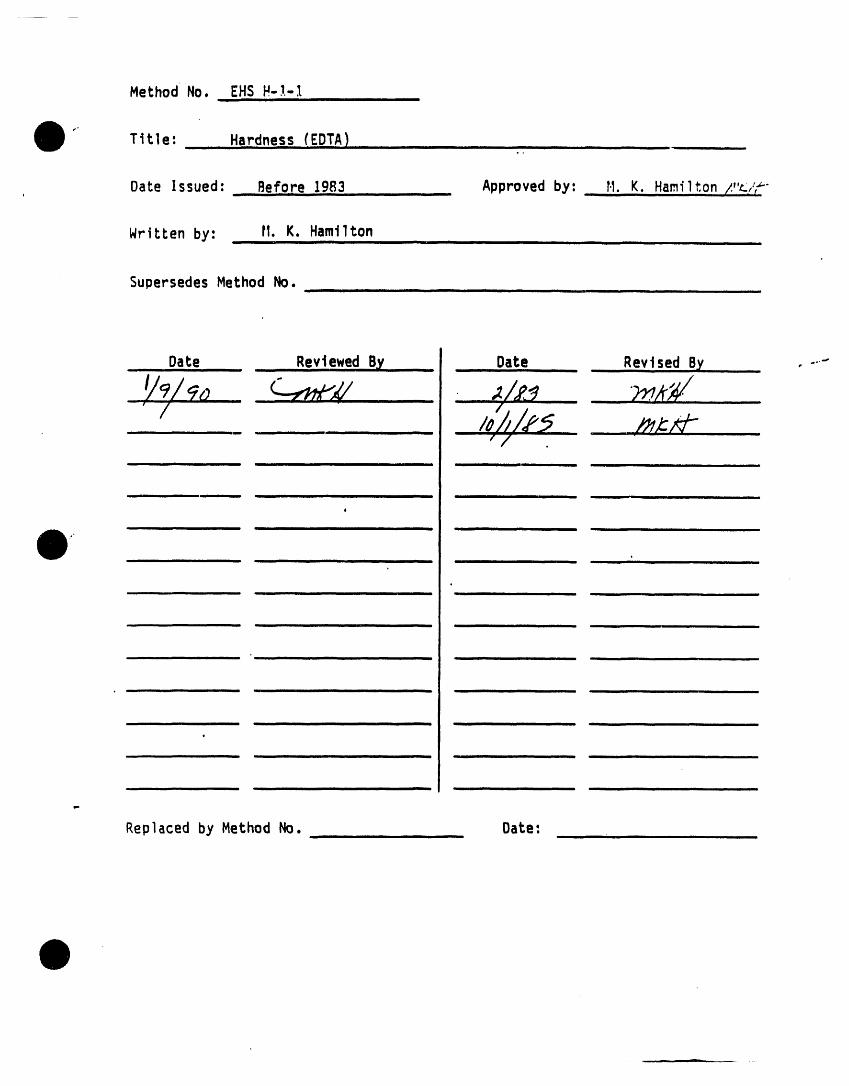
MethodNo. EHS H-.I.-Imliii ii i
r-
Title: Hardness (EDTA) ............. _ ,.• .
, Date issued: _ Bef,o,re 1983 , Approved by: H.K. Hamilton /."%,'_J'
Written by: it. K. Hamiltonii i i i i
SupersedesMethod No. i ii ii i u l ill i ii
Date ReviewedBy ..... Date ,, Revised B_ ,-..-
•i ,..............I I
,,,,..,ii - ,,,,,, . i immlI iii -- i ii i .
i i1, , i ii -,,,u ,, ,n
e
u ii m i n III I Ill _ I
i ininnnnninn I i I i II nn n n i
,, ..,... ,, _ u nl --
nlnn Ilnln II II I iimi, I nil
ii I IIInm
n
Replacedby Method No. Date:iii m H ill
EHS H-I-I
i_- 01-09-90 .HARDNESS (EDTA),.
Re.ference
I. _tandard Methqds for the Examination of Water and Wastewater, 17thEdition, 1989, pp. 2-52 -> 2-57.
Principles
Calcium and magnesium, when present in an aqueous solution at pH 10, willproduce a wine-red color in the presence of the dye EriochromeBlack T. Theaddition of ethylenediaminetetraaceticacid (EDTA)will complex the calciumand magnesium. When the complexationis complete, the solutionwill changefrom wine-red to blue. If the EDTA has been standardized with a knownconcentration of calcium carbonate, the results of the EDTA hardnesstitrationwill be reportedas mg/L CaCO3.
Limitations
Magnesium ions must be present to yield a satisfactoryendpoint in the titra-tion. To meet this requirement,a small amount of complexometricallyneutralmagnesium salt of EDTA is added to the buffer. An indistinctor fading end-point may result from the presence of metal ions such as Fe, Cu, Co, Al, Ni,etc. This problem may be overcome by the addition of an inhibitor such ashydroxylamine hydrochloride. Barium, and strontium, if present, will alsotitrate as EDTA hardness. Suspended or colloidal organic matter may alsointerferewith the endpoint. This can be overcome by evaporatingthe sampleto dryness, heating at B50"C, dissolving the residue in IN HCl andneutralizingwith IN NaOH.
EQuipment
I. 10 mL buret
2. 250 mL erlenmeyerflasks
3. Magnetic stirrerand stirringbars
Reagents (stock)
I. Disodium ethylenediaminetetraacetatedihydrate (EDTA)--alsocalled- disodium (Ethylenedinitrilo)tetraacetate--analyzedreagent grade.
2. Ammonium chloride--NH4Cl
3. Ammonium hydroxide, conc.--NH40H
4. (Ethylenedinitrilo)tetraaceticacid, magnesiumsalt
EHS H-I-Z
f. Ol-O9-gO
5. Eriochrome Black T dye (sodium salt of 1-(l-hydroxy-Z-naphthylazo)-5-nitro-Z-naphthol-4-sulfonicacid). "
6. Triethanolamine
7. Anhydrouscalcium carbonate--CaCO3--primarystandardor ACS reagentgrade.
8. Hydrochloricacid, conc.--HCl
g. Methyl orange
Reaaents (Preoared)
I. Buffer--dissolve6.75g NH4Cl in 57.2 mL conc. NH4OH, add O.5g magnesiumsalt of EDTA and dilute to 100 mL with deionized water. Store in a
" polyethylene bottle, kept tightly closed when not in use. Preparemonthly.
Z. Indicator--dissolve0.5 g Eriochrome Black T in 100g triethanolamine.Prepare annually.
3. EDTA titrant--dissolve3.723 g disodium EDIA in deionized water anddilute to one liter. Standardize monthly against a standard calciumsolution,followingthe sample procedurebelow. Store in a polyethylene
l bottle. Prepare annually.
4. 3N NH4OH--dilute50 mL conc. NH40H to 250 mL with deionizedwater.Prepare annually.
Standards
1. Standard calcium solution--1.0 mL = 1.0 mg CaCO3 -weigh 1.000 ganhydrousCaCO3 into a 500 mL erlenmeyerand add 1:1HCI graduallyuntilthe CaCO3 dissolves. Add 200 mL deionizedwater and boil a few minutes.Cool, add a few drops methyl orange and adjust to the intermediateorange endpoint with 3N NH40H or 1:1 HCf. Transfer quantitativelyto al-Liter volumetric flask and dilute to volume with deionized water.Prepareevery six months.
Procedure
I. Transfer a sample aliquot, requiringless than 10 mL EDTA titrant, to a250 mL erlenmeyer flask and dilute to 100 mL, if necessary,with deion-ized water.
2. Add two mL buffer and 4-5 drops of indicatorsolution.
EHSH-1-301-09-90
3. Begin stirring and titrate immediately wi.th EDTAuntil the last reddishtinge disappears from the solution. (If the endpoint color change isnot sharp, the indicator may have deteriorated, or a different inhibitormay be needed. See StandarclM_thods, for a list of additionalindicators•)
4. Titrate a blank, using 100 mL deionizedwater insteadof sample.
Calculation
I. Standardizationof EDTA solution:
BxCA - D
A m mg CaCO3 equivalent to 1.0 mL EDTA
B - mL standard CaCO3 solution titrated
C - 1.0 mg/mL concentration of CaCO3 solution
D- mL EDTAneeded in titration (mLstd - mLblk)
2. Calculation of EDTA hardness:
A. Hardness as mg/L CaCO3 A x B x _000" C
A - mg CaCO3 equivalent to 1.0 mL EDTA
B -mL EDTA to titrate sample (mLsple - mLblk)
I000 - mL/L
C -mL sample titrated
B Hardness as grains/gal- ma\L CaCO• 17.1
" EPA Quality criteria for water hardness:
0 - 75 mg/L - soft
75 - 150 gm/L - mod. hard
150 - 300 mg/L - hard
300 mg/L - very hard
o''
Method No. F-1-1 i
"- Tttle: Filtrable Residue (Total Dissolved Soltds)i ul i i ii i
; Date Issued: Feh_ary 1973 , Approved by: ...... II. _:. Hanilton /_/P
Written by: M.K. Hamilton i u|ll
Supersedes Method No. i i iiii ii ii i i
1
i
] Date Rev|ewed By Date Revtsed B_ .-.I ---- iii i i i i i im i
: /j/_/_ /4_/ ,'" ,,/
,?,,/,,o, O, r " ,, ' ....i , ill i n ill
o
IIII II II I I
II ii II
---- i I I II i I
nnll ii
I I I Ill I I
nllll I I II • ii
ii i i
,1"
Replaced by Method No. Date: , ..,,
i
It
tI
, i u
EHSF-1-1 '10-1-85
FIL ABLERESIDUE(TOTAL D..ISSOLVEDSOLIDS.)
Referenceii
I. Standard Methods for the Examination of Water and Wastewater, 16thEdition,1985, pp 95-96.
Pri..ncipIe
The sample is filtered and the filtrate is evaporatedon a steam bath. Theresidue remainingafter evaporation,dried to a constant weight, is equal tothe filtrableresidue.
Limltations.,, i i
Because of the many variables due to the chemical and physical nature of thesample which affect filtration, the filtrable residue value obtained is notsubject to the usual criteria for accuracy. The drying ten_)eraturealsoaffectsthe results. At 180"C, some water of crystallizationmay remain, andthe organic matter may be reduced by volatilization;however, the resultsagree more closely with those obtained by summing the individuallydeterminedmineral salts than residue valuesobtained by drying at a lower temperature.
Equipment "._',
I. Oven for drying sanq_lesat 179-181°C.
2. 9 cm Porcelainfilteringfunnel
3. g cm WhatmanGF/C or equivalentglass fiber filters.
4. I50-mLporcelainevaporatingdishes
5. 250 or 500 mL suctionflasks
6. Hot plate or steam bath
Procedure.m
. I. Dry the evaporatingdishes in an oven at 180"C, cooi in a desiccator,andweigh.
2. Assemb'iefiltering apparatus. Rinse a glass fiber filter with about 50 mLof the water sample and discardthe rinse.
3. Filter about 150 mL of the water samplet,,ough the glass fiber filter.
4. Place a lO0 mL aliquot of the filtered sample In a dried and weighedevaporatingdish. Evaporateto drynesson a steam bath or low temperaturehot plate, being careful to avoid splattering.
i i| iii
EH5 F-l-2
_.-- 5, After the water is completely evaporated, place the dish in an oven at180°C for at least one hour, Cool in desiccator and weigh. Repeat dryingstep until a constant weight is obtained. 'Record the temperature at whichthe dishes were dried on the analyst worksheet.
i
Calculationi i i i
For lO0 mL allquot:
mg/L filtrableresidue= mg residuex lO
Report results as:
mg/L filtrable residue on drying at 180°C
/
(
Method No. EHSC-11ii iii ii
_.-. TitIe: ,,, CHEMICAL,OXYGENDEMAND (COD)--HACHCLOSED-TUBEMETHOD,
Date Issued: l-ll-90 Approved by" MK Hamilton,C__.I
Written by" ,,.P.,,.A.Thurman
SupersedesMethod No. EHS C-B
Date ReviewedBy Date Revised By ,-.
i
o
ii ii ii ii
f,, i|l i
t
, ,i i im_J
, _,, , , i iii i
i
Replacedby MetilodNo. Date:
EHS C-11-IOl-Og-go
f-
CHEMICALOXYGEN DEMAND (COD)--HACHCLOSED TUBE METHOD
References
I. Hach COD ReactorModel 16500 InstructionManual.
2. Standar(;lMethod_ for l;he Examinatiqn of Water and Wastewater, 17thEdition, Ig8g, Section 5220C, pp 5-14 & 15.
Principles
Chemical Oxygen Demand (COD) is a measure of the oxygen equivalent of thematerial present in the sample subject to oxidation by a strong chemicaloxidant, namely dichromate. The sample is refluxed in a closed tube with aknown amount of potassium dichromate and sulfuric acid to oxidize mostorganic matter present. The excess dichromate is titrated with standardferrous ammonium sulfate. The amount of oxidizableorganicmatter present isproportionalto the amount of dichromateconsumed.
Limitation_
Volatile straight chain aliphatic hydrocarbons and pyridine and relatedmaterials may not be significantly oxidized by this procedure. Samplescontainingmore than 2000 mg/L chloride cannot be analyzed by this procedure.The presence of significant amounts of reduced inorganic species such as
' ferroils iron and sulfide may produce high results as they will also beoxidized by the dichromate. This method uses reagent vials for 2concentrationranges approvedby EPA"
0-150 mg/L COD (Hach Catalog #21258) 0-1500 mg/L COD (Hach catalog #21259)
EauiDment
1. Hach COD reactor, Model 16500
2. Buret--t0mL
3. stirring bars, teflon-coated(I0 mm x 3 ram)
4. magnetic stirrer
- 5. small test tube rack
6. water purificationsystem Millipore--Milli-Q-Plus
Reaqents (stock)
I. Potassiumdichromate,primary standardgrade--KECr207
2. Sulfamic acid
EHSC-11-2f 01-09-90
3. Ferrous ammoniumsulfate-hexahydrate--Fe(NH4)2(S04) 2 • 6H20
4. 1,10-phenanthroline monohydrateg
5. Ferrous sulfate heptahydrate--FeSO 4 • 7H20
6. Potassium acid phthalate, primary standard grade
7. Sulfuric acid conc.--H2SO4
Reaaents (PreDated)
1. Ferroin indicator solution
Dissolve 1.485 g 1,10-phenanthroline monohydrate and 0.695 g Fe2S_47HoO in deionJzed/Mllll-Q water and dilute to 100 mL Use a ludiTution of this for 0-150 mg/L range.
2. Ferrous AmmoniumSulfate 0.125 N
Dissolve 12.25 g Fe (NH4)2(SO4)2.6H20 in deionized/Milli-Q water. Add 1mL conc. H2S04 and dilute to 250 mL with detontzed/Milli-Q water.Standardize with each use.
/ 3. Ferrous AmmoniumSulfate--O.O125N
Dtsso!ve 1.225 g Ferrous Ammoniumsulfate in deionized/Milli-Q water.Add 1 mL concentrated sulfuric acid and dilute to 250 mL withdeionized/Milli-Q water. Must be standardized with each use.
4. Potassium Dichromate--0.25 N
Dissolve 1 226 g primary standard K2Cr207, previously dried for 2 hoursat 100-105;C in deionized/Milli-Q water. Add 12 mg sulfamic acid anddilute to 100 mL with deionized Milli-Q water. Prepare every 6 months.'
5. Potassium Dichromate--O.025 N
Dissolve 0.1226 g dried primary standard K2Cr_O7 in deionized/Milli-Qwater. Add 12 mg sulfamic acid and d11ute to 100 mL withdeionized/Milli-Qwater. Prepareevery 6 months.
6. Potassiumacid phthalate (KHP) standard,500 mg/L COD equivalent
Dissolve 0.4251 g oven dried primary standard KHP in deionized/Milli-Qwater and dilute to I liter. Prepare fresh when needed.
7. Hach vials with COD digestion solution for 0-150 mg/L (#21258) and 0-1500 mg/L (#21259).
0
EHS C-11-301-09-90
prQcedure ""
A. Sample collectionand preservation
I. Collect samples in glass containers that have been rinsed withsulfuricacid and Milli-Q deionizedwater.
2. If samples cannot be run immediately,acidifyto pH <2 using conc.HESO_ (-2 mL/L sample) and refrigerateat 4"C. Cooled, acidifiedsamples are stable for 7-2B days.
3. Homogenize samples containing solid material just prior toanalysis.
B. Digestion
I. Turn on Hach COD reactor and preheat to reach a temperature of150"C for 30 minutes.
2. Slowly pipet 2.0 mL of sample into a Hach digestionvial containingreagents for the desired COD range. Do not use any vials whichhave had reagents spilled from them. Caution: Vials containconcentrated sulfuric acid, dichromate, and mercuric sulfate--handle carefully.p"
3. Replacevial cap tlghtly and holdingvial by the cap, gently severethe vial until contents are well mixed. These vials become hot--donot grab the vial itself!
4. Prepare a reagent blank using 2.0 mL of Milli-Q water instead ofsample. Also prepare a standard in the proper range using the KHP500 mg/L COD equivalentstandard.
5. Place vials in the preheatedreactor.
6. Heat vials for 2 hours at 150"C. Turn off reactor and allow vialsto cool in place to 120" or less. This takes approximately20minutes.
7. While still warm, invert each vial several times. Place in a test- tube rack and allow to cool completely. If a pure green color is
obtained in the reactor sample, the sample concentration is toohigh for the range of the vials (150 mg/L [low range] or 1500 mg/L[high range]). If the low range is exceeded, rerun a dilutedsample or use the high range vials. If the high range is exceeded,rerun using a diluted sample. (Do not directly pipet less than 1mL of sample of a greater dilution is needed, make dilution inanother flask and pipet Z mL cf the dilution into the reactionvial.)
EHSC-11-401-09-g0
..
/
C. Titration Procedure 0-150 mg/L CODrange
1. Removecap and rinse the inside walls of the digestion vial withless than 1 mL of Mtll t-Q detontzed water.
2. Add a small stirring bar and one drop of the dtluted Ferroinindicator to the vtal. If the color changes to brown at thispotnt, the COD ts greater than 150 mg/L. Rerun with 2 mL of adt luted sample.
3. Place vial on the magnetic stirrer and begin stirring.
4. Tttrate with 0.0125 N ferrous ammoniumsulfate to the color changefrom greenish-blue to orange-brown.
5. Record the volume in mL of the ferrous ammoniumsulfate used.
6. Standardize the ferrous ammoniumsulfate (0.0125) as follows:
a. Pipet 2.0 mL of 0.025 N Standard Potassium Dichromate into aclean via.
b. Add 3 mL conc. sulfurtc actd and swtrl to mtx. Allow to cooluntt 1 comfortable to touch.
t"
c. Add a sttrrtng bar and one drop of the dtluted FerroinIndicator.
d. Place on a magnetic stirrer and titrate with 0.0125N ferrousammoniumsulfate to the color change greenish-blue to orange-brown.
e. Record the volume in mL of ferrous ammoniumsulfate used forstandardization.
7. Dispose of waste in the Inorganic waste container.
D. Titration Procedure 0-1500 mg/L range
1. Remove cap and rinse the inside walls of the digestion vial with- less than I mL of Milli-Q deionizedwater.
2. Add a stirringbar and one drop of ferroin indicator. If the colorof the sample changes to brown at this point, the COD is greaterthan 1500 mg/L. Rerun using a diluted sample. (Use 2 mL of adilution of the sample rather than using less than I mL of theoriginal sample.)
.i Place vial on the magnetic stirrerand beo_, ,+_--'--
• EHSC-11-501-09-90
f-
4. Titrate with 0.125 N ferrous ammoniumsulfate until color changesfrom greenish-blue to orange-brown. ..
5. Record the volume in mL of the ferrous ammoniumsulfate used.
6. If the volume of ferrous ammoniumsulfate used by the sample iswithin 0.2 mL of the volume used for the blank, the sample is toolow for accurate analysis using high range reagents. Rerun sampleusing the low range vtals.
7. Standardize the 0.0125 N ferrous ammoniumsulfate as follows:
a. Pipet 2.0 mL of 0.25 N standard potassium dichromate into aclean vtal.
b. Add 3 mLconc. sulfuric acid and swirl to mix, Allow to cooluntil comfortable to touch.
c. Add a stirring bar and one drop ferroin indicator.
d. Place on a magnetic stirrer and titrate with 0.125 N ferrousammoniumsulfate to a color change of greenish-blue to orange-brown.
_ e. Record the volume in mL of the ferrous ammoniumsulfate usedfor standardization.
B. Discard waste in the inorganic waste container.
Calculation
A. O-150 mg/L range:
(A-B) x 200 , mg/L CODC
A - mL titrant used for blankB- mL titrant used for sampleC -mL tttrant used to standardize the 0.0125 N ferrous
ammoniumsul fate
. 0-1500 mg/L range:
(A-B) x _- mg/L CODC
A - mL titrant used for blankB- mL titrantused for sampleC - mL titrant used to standardizethe 0.125 N ferrous
ammonium sulfate
EHSB-4Method No. ,i i i
' Title: BIOCHEMICALOXYGEN DEMAND (BOD) - DO PROBEi ii i i i i l i
Date Issued: Before 5/80 Approved by: M K Hamilt_TlC,_i ii iii i .....
I"
Written by: P A Swobodai in i i i i i
EHS B-ISupersedes Method No. Hi,
Date Reviewed By , ,,Date ,, Revised By
/ f
i Hlu I|1 I II
Replaced by Method No. Date: ,,
EHSB-4-101-12-90
BIOCHEMICALOXYGEN_MAND (BOD),-DO PROBE
1. St..andard Methods fqe the ExamtnattQn 9f Wal;ec _r_d Wa_tewater, 17thEdition, 1989, Section 5210, pp. 5-2 through 5-10.
2. YSI Dissolved Oxygen Meter--Instruction Manual.
3. Introduction to Biological Oxygen Demand, Technical Information Series--Booklet No. 7, Hach, 1989.
P_rinciDIe_
The biochemicaloxygen demand is an empiricaltest to determine the relativeoxygen requirementsof waste waters, effluents,and polluted waters. This isdone by determiningthe dissolved oxygen (DO) present initially and after afive-day incubation at 20"C. The difference in these two values equals theBOD. The amount of dissolved oxygen present is determined using the YSIModel 58 Dissolved Oxygen MeteP. Dissolved oxygen measurements are takenusing the membrane covered probe. This membrane allows oxygen and certainother gases to pass through so that when a polarizing voltage is appliedacross the sensor, oxygen that has passed through reacts at the cathodecausing a current. This is read on the scale as ppm dissolvedoxygen.
Limitation_
The BOD values obtained cannot be compared with other BOD results unless theywere obtained under identical test conditions. Any oxidizing or reducingmaterials which are present could cause interferences in the DO analysis.Residual chlorine,which may be present, is destroyedby adding an equivalentamount of sodium sulfite. If the samples are supersaturatedwith DO, theyshould be reduced to saturationby aerating with compressed air to preventloss of oxygen during incubation.
EQuipment
I. YSI Model 58 dissolvedoxygen meter
2. YSI Model 5720A BOD bottle probe
3. Air incubatorthermostaticallycontrolledat 20'C _+I"C
- 4. Flared mouth BOD bottles,300 mL
5. Various size graduated cylinders
6. 11-1iterglass container
7. Tubing for siphons
8. Deionizedwater finishingsystem--MilliporeMilli-Q Plus
Reaclents(Stock)
I. Sodium hydroxide (NaOH)
EHS B-4-2;"_ 01-12-90
2. Sodium sulfite (Na2S03)
3. DPD free chlorine reagent
4. SulfuricAcid, Cond. (H2S04)
5. Glucose
6. Glutamic acid
7. Nutrient buffer pillows (Hach #14861-98)
Reaaents (Preo_red)
1. 1N NaOH--dissolve 40.0 g NaOH in deionized water and dilute to one1iter. Prepare annual ly_
• 2. 1N H2SO4--add 28 mL conc. HE$O4 to deionized water and dilute to one1iter. Prepare annual ly.
3. BOD dilution water--place the necessary amount of Milli-Q deionizedwater into a large glass container. For every 3 liters of water, addone Hach 3-11ter nutrient buffer pillow. Mix well to assure complete
:: dissolution of the reagents (some residue may remain with some pillows).Saturate with DO by aerating with compressed air. The temperatureshould be 20"C + I"C. Prepare dilution water the day of use.
;: 4. Glucose-Glutamicacid control solution--dissolve0.150 g dried glucoseand 0.150 g dried glutamic acid in deionizedwater and dilute to I literwith Milli-Q deionizedwater. Prepareas needed.
Procedure
A. _)ilutionPreparation
I. Check the pH of the samples and adjust to pH 6.5 - 7.5, using INHzSO4 or IN NaOH.
2. Add a DPD free chlorine reagent pillow to 5 mL of sample to checkfor residualchlorine. If the test is positive (pink color), add a
- small amount of NazSO3 to the original sample. Mix (DO NOT SHAKE)Allow to sit.a few minutes, then repeat procedure until the testshows no pink color change upon additionof DPD reagent.
EHS B-4-301-12-90
3. Make several dilutions of the sample. (See Standard Methods ifseeding is necessary.) Suggesteddilu'tionranges for samples are:
, 0.I - I_0% strongtrade waste
I - 5% raw and settled sewage
5 - 25% oxidizedeffluents
25 - 100% pollutedriver water
Makethe diIutions as follows:
Siphon BOD dilution water into a 1000 mL graduated cylinder untilthe cylinder is about half full. Siphon the desired amount ofmixed sample into an appropriategraduated cylinder and carefullyadd it to the cylinderof dilution water. Adjust volume to 1000 mLwith dilution water and mix well with a glass rod. IMPORTANT:DURING THE ENTIRE DILUTION PROCESS, BE CAREFUL TO AVOID TRAPPINGAIR IN THE SOLUTIONS.
4. Siphon each of the mixed dilutions into one BOD bottle and stoppertightly, covering the seal with solution. Read the initial DO,then incubate sample bottle for flve days at 20"C. Replace anylost solution with dilution water as needed to maintain the waterseal.
5. Fill a BOD bottle with dilution water for a blank and treat as asample.
6. Prepare a control by carefully pipetting 20.0 mL of the glucose-glutamic acid solution into a 1000 mL volumetricflask and dilutingto volume with Milli-Q deionized water. Fill a BOD bottle andproceedingas with a sample.
7. After five days, determinethe final DO of the incubatedsamples.
B. Determinationof DO
I. Preparationof probe and meter:
- a) See Appendix I for fillingprobe with electrolyteand membraneplacement. Membrane should be replaced every month or soonerif bubbles and discolorationappear under the membrane or ifthe meter cannot be calibrated.
b) Allow 15 minutes for instrument warm up and probestabilizationbefore calibrating. This isdone with the meterturned to the 0.01 mg/L range. Steps b and c must beperformed whenever the instrument has been off or the probehas been disconnected.
EHS B-4-4__f 01-12-90
c) Switch the meter to the zero position and adjust the 02 zerocontrol knob to give a meter readingof 00.0.
Z. Calibration--AirCalibration--FreshWater
a) The probe is kept stored in a partially filled BOD bottle.This provides moist air necessary for the calibration andprevents dehydrationof the electrolyte.
b) Switch the meter to the temperature position and note thetemperature. Refer to Table I and determine the dissolvedoxygen calibrationvalue.
c) Determinethe atmosphericcorrection factor using Table 2.
d) Multiply the calibrationvalue from Table I by the correctionfactor from Table 2 (correctionfactor for Tri-Cities area -0.98).
_: At a temperature of 22"C (from Table I) thecalibration value is 8.8 ppm. 8.8 X 0.98(correctionfactor) - 8.6Z.
e) Switch to the 0.01 _/L range and adjust the calibrateknob sothat the meter reads the correctedcalibrationvalue from Step
: d. Walt 2 minutes to verify stability. Readjust, ifnecessary.
3. Dissolvedoxygen measurement
a) Place the probe in the sample BOD bottle, being careful not totrap air bubbles, and turn on probe stirrer.
b) Allow sufficient time for probe to stabilize to sampletemperatureand dissolvedoxygen (approximately2-3 min.).
c) Read dissolvedoxygen in mg/L from the meter.
Calculations
. mg/L BOD - [(DI'Dz) " Blk]P
DI -DO of initialdiluted sample
D2 - DO of diluted sample after incubation
P - dilution factor - mL sample usedI000 mL
Blk - (DOBlkl- DOBlk2) - P(DOBIkl - DOBlk2)
EHSB-4-501-12-90
Example"
20 mL of sample diluted to 1000 mL
D1 - 8.15 _2 " 4.25 P -'0.02 (20/1000)
DOBlkl - 8.20 DOBlk2 - 8.05
mg/L- (8.]L5 - 4,251 -r(e.zo ,- e.o5} - o.o_(s.2o- 8.,OS)l0.02
. _._o- (o.]5 - o.oo3) . 1880.02
Qualitv Control
Routine quality control for this procedure includes monitoring resultsobtained for the blank and glucose-glutamicacid control solution. Uptake ofunseeded blanks should not exceed 0.2 mg/L DO. The control solution shouldgive a BOD equivalent of 198 mg/L +_30. If these conditions are not met,evaluate the procedurefor possible interferenceor contaminationproblems.
i
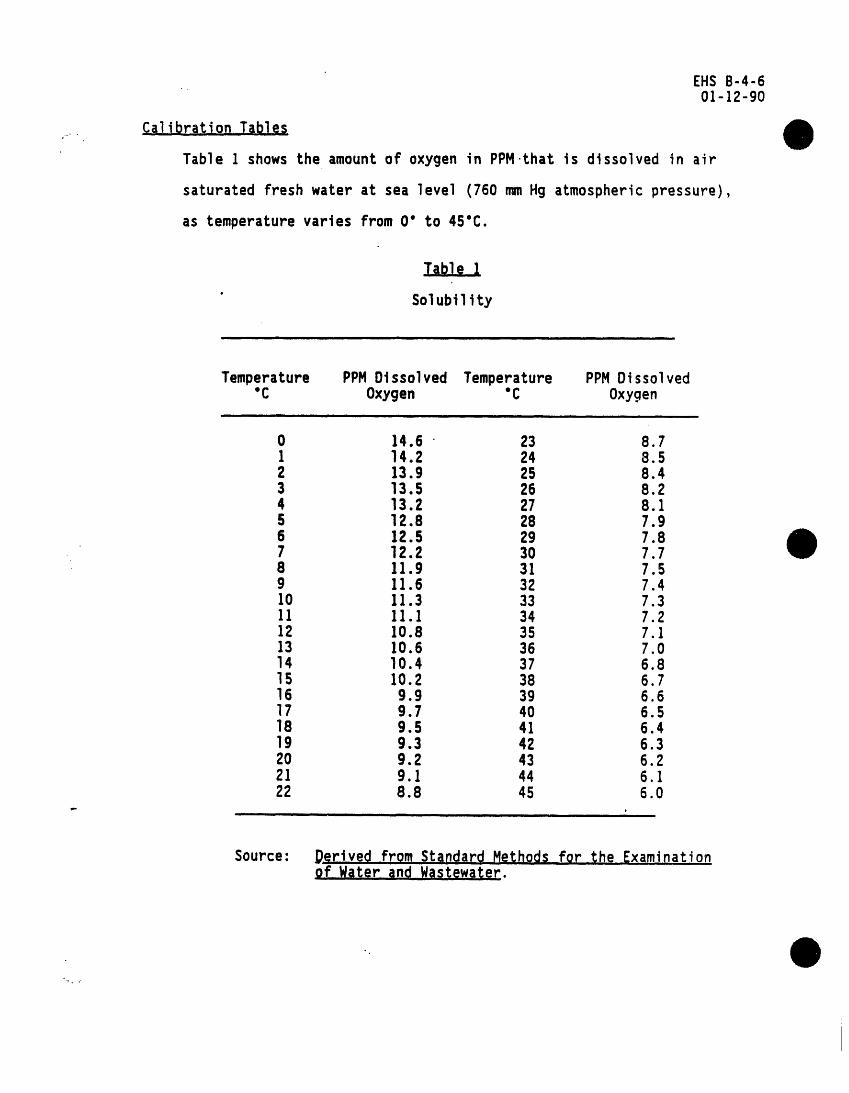
EHS B-4-601-12-90
Cali..brationTableso., .
Table I shows the amount of oxygen in PPM.that is dissolved in air
saturatedfresh water at sea level (760 mm Hg atmosphericpressure),
as temperaturevaries from O" to 45"C.
Tab]e I
• Solubility
Temperature PPMDissolved Temperature PPMDissolved"C Oxygen "C Oxygen
0 14.6 23 8.71 14.2 24 8.52 13.9 25 8.43 13.5 26 8.24 13.2 27 8.15 12.8 28 7.96 12.5 29 7.87 12.2 30 7.78 11.9 31 7.5g 11.6 32 7.410 11.3 33 7.311 11.1 34 7.212 10.8 35 7.113 10.6 36 7.014 10.4 37 6.815 10.2 38 6.716 9.9 39 6.617 9.7 40 6.518 9.5 41 6.419 9.3 42 6.320 9.2 43 6.221 9.1 44 6.122 8.8 45 6.0
o........ i i
Source: D.erivedfrom Standard..Method_for i_he_xaminationof Water,_IndWastewater.
,o
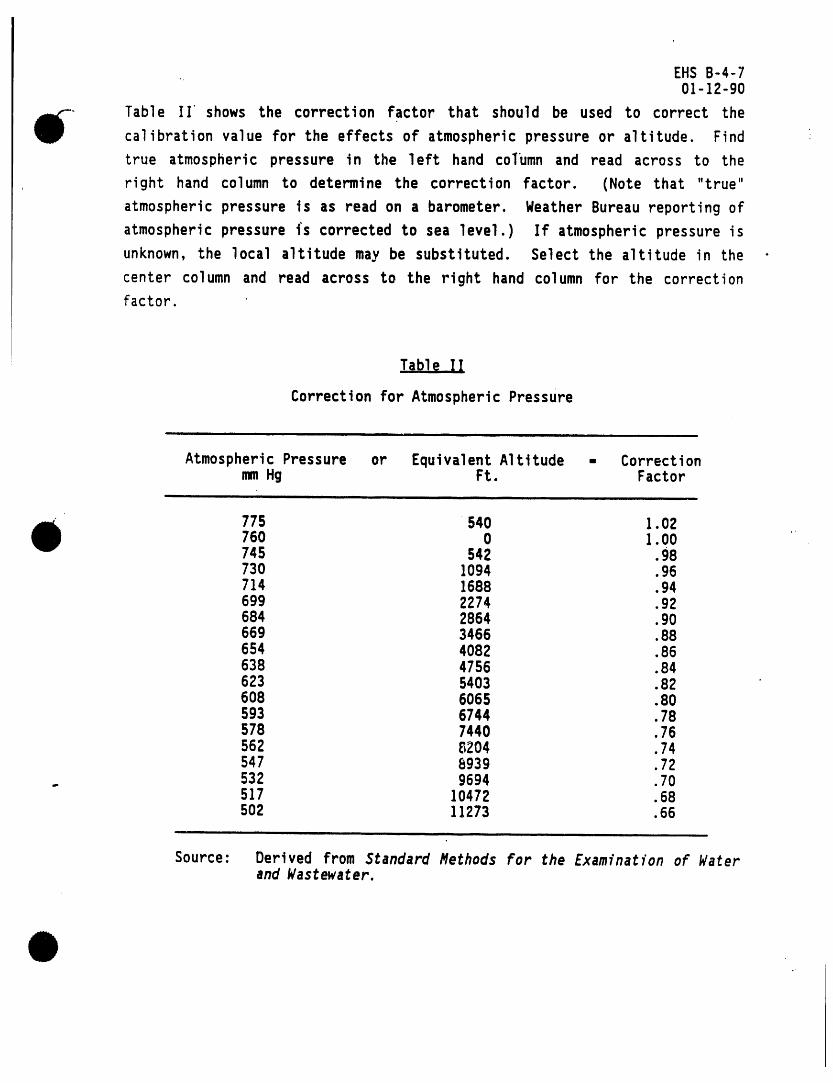
EHSB-4- 7..
01-12-90
Table II shows the correction factor that should be used to correct the
calibration value for the effects of atmospheric pressure or altitude. Find
true atmospheric pressure in the left hand col'umn and read across to the
right hand column to determine the correction factor. (Note that "true"
atmosphericpressure is as read on a barometer. Weather Bureau reportingof
atmosphericpressure i'scorrectedto sea level.) If atmosphericpressure is
unknown, the local altitude may be substituted. Select the altitude in the -
center column and read across to the right hand column for the correction
factor.
Table II
Correctionfor AtmosphericPressure
i ,|,,,
AtmosphericPressure or EquivalentAltitude = Correctionmm Hg Ft. Factor
i i
775 540 1.02760 0 1.00745 542 .98730 1094 .96714 1688 .94699 2274 .92684 2864 .90669 3466 .88654 4082 .86638 4756 .84623 5403 .826O8 6065 .80593 6744 .78578 7440 .76562 8204 .74547 8939 .72
° 532 9694 .70517 10472 .685O2 11273 .66
Source: Derived from Standard Methods for the Examination of Waterand Wastewater.
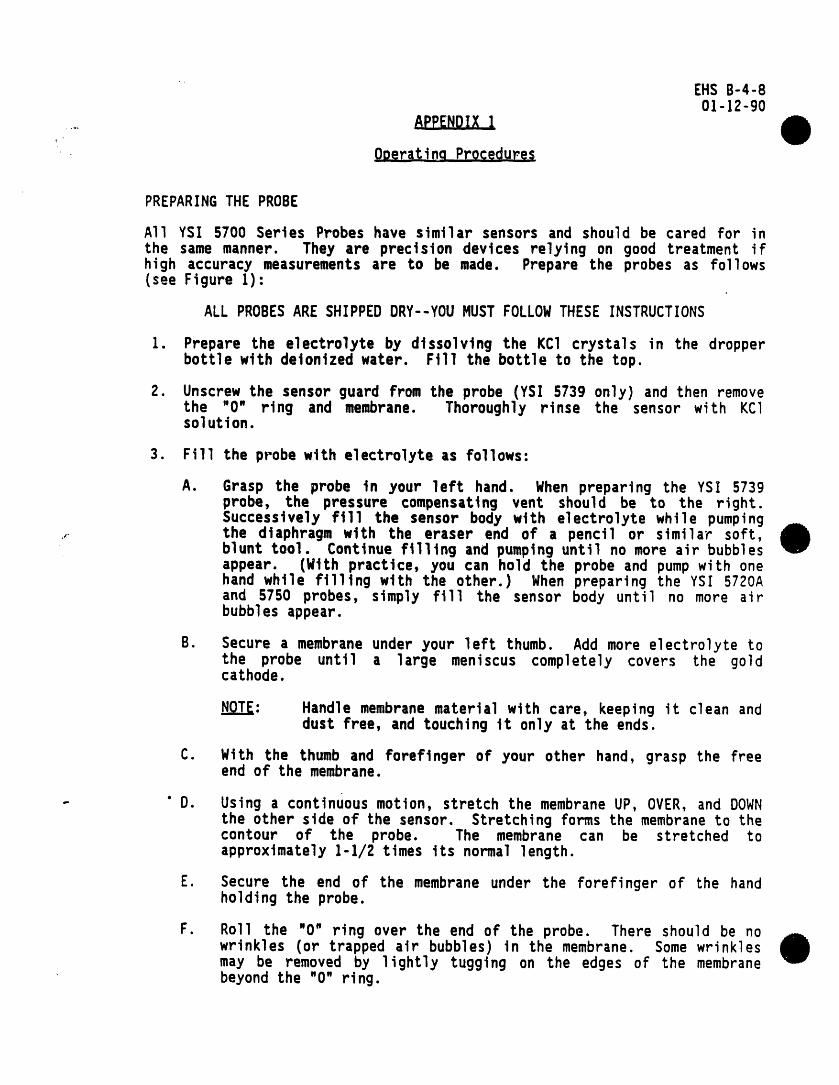
EHS B-4-B01-12-g0
APPENDIX I
ODer_ina Procedur_
PREPARINGTHE PROBE
All YSI 5700 Series Probes have similar sensors and should be cared for inthe same manner. They are precision devices relying on good treatment ifhigh accuracy measurements are to be made. Prepare the probes as follows(see Figure I):
ALL PROBESARE SHIPPEDDRY--YOU MUST FOLLOW THESE INSTRUCTIONS
I. Prepare the electrolyte by dissolving the KCI crystals in the dropperbottle with deionizedwater. Fill the bottle to the top.
2. Unscrew the sensor guard from the probe (YSI 5739 only) and then removethe "0" ring and membrane. Thoroughly rinse the sensor with KCIsolution.
3. Fill the probe with electrolyteas follows:
A. Grasp the probe in your left hand. When preparing the YSI 573gprobe, the pressure compensating vent should be to the right.Successively fill the sensor body wlth electrolyte while pumping
, the diaphragm with the eraser end of a pencil or similar soft,blunt tool. Continue fillingand pumping until no more air bubblesappear. (With practice, you can hold the probe and pump with onehand while filling with the other.) When preparing the YSI 5720Aand 5750 probes, simply fill the sensor body until no more airbubbles appear.
B. Secure a membrane under your left thumb. Add more electrolytetothe probe until a large meniscus completely covers the goldcathode.
NOTE: Handle membrane material with care, keeping it clean anddust free, and touching it only at the ends.
C. With the thumb and forefinger of your other hand, grasp the freeend of the membrane.
- " D. Using a continuousmotion, stretchthe membrane UP, OVER, and DOWNthe other side of the sensor. Stretchingforms the membrane to thecontour of the probe. The membrane can be stretched toapproximately1-1/2 times its normal length.
E. Secure the end of the membrane under the forefinger of the handholding the probe.
F. Roll the '0" ring over the end of the probe. There should be nowrinkles (or trapped air bubbles) in the membrane. Some wrinklesmay be removed by lightly tugging on the edges of the membranebeyond the "0" ring.
EHSB-4-901-12-90
G. Trim off excess membranewith scissors or sharp knife. Check thatthe stainless steel temperature sensor is not covered by excessmembrane.
.o
4. Shake off excess KC1 and reinstall the sensor guard.
5. The YSI 5720A and 5750 probes can be stored in a B.O.D. bottlecontaining about 1 inch of water.
6. Membraneswill last indefinitely, depending on usage. Average replace-ment is 2-4 weeks. However, should the electrolyte be allowed toevaporate and an excessive amount of bubbles form under the membrane, orthe membranebecomedamaged, thoroughly flush the reservoir with KC1 andinstall a new membrane.
7. Also, replace the membrane tf erratic readings are observed orcalibration ts not stable.
8. "Homebrew" electrolyte can be prepared by making a saturated solutionof reagent grade KCl and detontzed water, and then diluting the solutionto half strength with deiontzed water. Adding 2 drops of Kodak PhotoFlo per 100 mL of solutton assures good wetting of the sensor, but isnot absolutely essential.
9. The gold cathode should always be bright and untarnished. To clean,wipe with a clean lint-free cloth or hard paper. NEVERUSEANY FORMOFABRASIVEOR CHEMICAL. Rtnse the sensor several times with KC1, refill,and install a new membrane.
10. Some gasses contaminate the sensor, evidenced by discoloration of thegold. If the tarnish cannot be removed by vigorous wiping with a softcloth, lab wipe, or hard paper, return the probe to the factory forservice.
11. Oxides of nitrogen and sulphur, halides, and H2S are known interferinggases. Helium and Neon are reported to interfere with the oxygenreaction at the cathode. If you suspect erroneous readings, it may benecessaryto determineif these are the cause.
12. If the probe has been operated for extended periods with a loose orwrinkled membrane, the gold cathode may become plated with silver. Inthis event, return the probe to the factory for refinishing.

EHSB-4-1001-12-90
APPENDIX2r ALTERNATEDILUTION WATER PREPARATION
As an alternativeto using the Hach nutrient 6uffer pillows to prepare thedilutionwater, the followingmethod may be used:
Reaaents (Stock)
1. Potassium dihydrogen phosphate (KH2P04).
2. Dipotassium hydrogen phosphate (K2HP04)
3. Disodium hydrogen phosphate (Na2HPO4 • 7H20)
4. Ammoniumchloride (NH4Cl)
5. Magnesium sulfate (MgSO4 • 7H20 or Mg$04)
6. Calcium chloride (CaC12)
7. Ferric chloride (FeC13 • 7H20}
ReaQents (Pr_Dar@d)
1. Phosphate buffer--pH 7.2--dissolve 4,25 g KH2PO4, 10.9 g K2HP04. 16 7 gNa2HPO4 • 7H20, and 0.85 g NH4C1 in Milli-Q deionized water and diiuteto 500 mL. Frepare annually or when Blank values exceed 0.2 mg/L.
2. Magnesium sulfate solution--dissolve 11.2 g MgSO4 • 7H20 (5.3 g MgS04)in Milli-Q deionized water and dilute to 500 mL. Prepare annually orwhen Blank values exceed 0,2 mg/L.
3. Calcium chloride solution--dissolve 13.75 g CaC12 in Milli-Q deionizedwater and dilute to 500 mL. Prepare annually or when Blank valuesexceed 0.2 mg/L.
4. Ferric chloride solution--dissolve 0.125 g FeC13 • 6H20 in Milli-_deionized water and dilute to 500 mL. Prepare annually or when Blankvalues exceed 0.2 mg/L.
Dilution Water Pr_oar_tion
Place the necessary amount of Milli-Q deionized water in a large glass- container. Saturate the water with DO by aerating with compressed air. The
temperatureof the water should be 20" _+I"C. For each liter of water, addI mL each of the phosphate buffer, magnesium sulfate solution, calciumchloride solution and ferric chloride solution. Prepare the dilution waterthe day of use.
)
FleLhodNo. EHSL-I,|, ii ii ,,, ,
TILle: Linear Alkyoenzene Sulfonate- Methylene Blue Acttve Substances - (tIBAS), i.i -- .. i i i . ,.
IJaLe Issued: Before. 3-83 . Approved by: MKHamtlton_'_'/_• .
Hr'tLLen by: _ Hamiltoni r,, ., i i,, i i i .,i
Supersedes MeLhodHo.-- • ii n n nn an
.... DaLe Reviewed O,y DaLe Revised By
/ / '
/- ,,,,-";o _
li iiiii I II I i-- -- iii
i -- u -- " i m,
,,. , ,,u
__ -- 1,1, ,, i ,i i _ i ,i
ml 1 ,i i i
Replaced by t.lethod rio. OaLd:_ . , , ,,.
o.
EHS L-I-Ig-23-85
LINEAR ALKYBENZENESULFONATE, i --
- METHYLENEBLUE ACTIVE SUBSTANCES- (MBAS)4, •
Reference
I. Standard Methods for the Examination of Water and Wastewater, 16thEdition, 1985, pages 581-585. ....
Principles
Anionic surfactants such as LAS react with methylene blue to form a coloredsalt. This salt is extractable into chloroformwhere the absorbanceat 652 nmcan be measured.
NOTE: CHLOROFORM IS LISTED AS A CLASS 2 SUSPECT HUMAN CARCINOGEN. REFERTO"-'LABORATORYPOLICY GUIDE - USE OF CARCINOGENS (L-H.IO) FOR PROPERHANDLING OF THIS MATERIAL.
Limitations,,,.i |
The method is limited to water of "drinkingquality" and not wastes or sew-ages. The method is subject to positive interferencesfrom the followingcon_)ounds: organic sulfates, sulfonates, carboxylates, phosphates, phenols,inorganiccyanates, chlorides, nitrates, and thlocyanates. Negative interfer-ences can be caused by amines. (With the exception of chlorides, interfer-ences from the above con_)oundscan be generally ignoredunless the confound ispresent in "unusuallyhigh" quantities.)
Minimum detectable amount: lO ,g LAS
Equipment
I. 250 mL separatory funnelswith Teflon stopcorks.
2. I00 mL Volumetricflasks.
3. Spectrophotometerfor use at 652 nm providing a light path of one cm orlonger.
Reagents (Stock)
I. Linear AlkybenzeneSulfonate,LAS
2. Phenolphthaleinindicatorsolution.
3. Sodium Hydroxide,Reagent grade, NaOH.
4. Sulfuric Acid, conc., H2SO4
EHS L-I-2
,'"" 5. Chloroform,CHCI3 - CLASS 2 - SUSPECT HUMAN CARCINOGEN.o
6. Methylene81ue (EastmanNo. P573 or equivalent)
7. MonosodiumdihydrogenphosphatemonohydrateNaH2PO4 • H20
..Reagents(Prepared)
I. Methylene Blue Reagent - Dissolve 100 mg of methylene blue in lO0 mLdelonizedwater. Transfer 3OraLto a one liter flask, add 500 mL of deion-ized water, 6.8 mL of conc. sulfuric acid, and 50 grams of NaH2PO4 •H20. Shake until dissolvedand dilute to one liter. Prepareannually.
2, Wash solutlon - Add 6.8 ml.of conc. suIfuric acid to SO0 mL of deionlzed
water in one 11ter flask. Add 50.0 grams of NaH2PO4 • H20, shakeuntil dissolved and dilute to one liter. Prepare annually.
3. Sodium Hydroxide, IN - Dissolve 40 grams NaOH in one liter of water.Prepareannually.
4. Sulfuric Acid, IN -Dilute 28 ad.of conc. H2SO4 to one liter. Prepareannually.
Standardsii
I. Stock LAS - Weigh an a_unt of the referencematerlal equal to l.O00 grams_, LAS on a 100% active basis. Dissolve in delonizedwater and dilute to one
liter. 1.00 ml.- 1.00 mg LAS. Store in a refrigerator. Prepareweekly.
2. Working standard LAS - Dilute 10.00 ml.stock LAS to one liter with deion-ized water, l.O0 mL = lO.Oug LAS. Preparedaily.
Procedures
Standard Curve: Pipet l.O0, 3.00, 5.00, 7.00, and 10.00 mL of the LAS workingstandard into separatoryfunnels and dilute each to 100 mL. This gives stan-dards equalling 10, 30 50, 70 and 100 Mg LAS. Treat as per the followingprocedure.
I. Add lO0 mL of the sample to a separatoryfunnel. (This may vary dependingon the concentrationof LAS.)
2. Add one or two drops of phenolphthaleln.
3. Add IN NaOH dropwise until alkallne and then add IN H2SO4 until pinkcolor disappears.
4. Add lO mL of chloroform and 25 mL of methylene blue reagent and rockvigorously for 30 seconds. (N_O0NO.__Tagitate vigorously because emulsionmay form.) A11ow the phase to separate.

EHSL-l-3. NOTE: ALL CHLOROFORMWORK SHALL BE DONE IN A HOOD WHILE WEARING GLOVES.
5. Swirl the san_le gently, let settle and draw off lower phase into asecondary funnel. If sample CHCI3 layer "is lighter than low standard,stop here and report less than value of O.l mg/L. See end of procedurefor disposalof chloroformsolutions.
6. Repeat the extractionthree times, using 10 mL of chloroform.
Note: If the blue color in the water phase becomes faint and disappears,discard the san_le and start over, using a smaller sample size.
7. Combine all extracts in the second separatory funnel. Add 50 mL of washsolution, shake vigorously for 30 seconds and a11ow to settle. (No emul-sions should form.)
8. Draw off the chloroform layer through IPS phase separating paper into a100 mL volumetrickflask.
9. Wash the aqueous solution from step seven twice with lO mL of chloroform,collecti_gthe chloroform in the 100 mL flask.
10. Rinse the phase separatingpaper with chloroform,collecting the rinse inthe flask. Dilute to 100 mL mark with chloroform.
If. Measure the absorbance at 652 nm with one cm cells against a chloroformblank.
• ..
.
Disposal All chloroform solutions shall be disposed of in the organic solventand carcinogenwaste container.
Calculation
Plot a curve of standardconcentrationin Ug LAS extractedversus absorbance.
Read the value of LAS from the curve and calculateas follows:
ug LASliters Of sample extracted - mg/liter LAS
Report as "MethyleneBlue Active Substances".


Top Related
Copyright © 2022 FDOKUMEN

