


Bahasa
Halaman
Hukum

ORIGINAL ARTICLE
Numerical modeling of splashing and air entrapmentin high-pressure die casting
P. Homayonifar & R. Babaei & E. Attar & S. Shahinfar &
P. Davami
Received: 10 February 2007 /Accepted: 17 August 2007 /Published online: 19 September 2007# Springer-Verlag London Limited 2007
Abstract High-pressure die casting (HPDC) is one of themost important manufacturing processes. Air porosity inHPDC parts has many serious effects upon the casting quality.A 3D single-phase code based on the SOLA-VOF algorithmis used for the continuous phase advection duringmold filling.In this research, a computational model based on concentra-tion transport equation is used for calculation of air porositydistribution and a mixed VOF-Lagrange algorithm is devel-oped in order to model splashing in HPDC. Finally, Schmid’sexperimental tests are used to verify the modelling results andthe comparison between the experimental data and simulationresults has shown a good agreement.
Keywords High-pressure die casting (HPDC) . Splashing .
Air porosity . VOF-Lagrange
NomenclatureA Front area of free surface cellCD Drag factord Droplet diameterD Mass diffusivity
F Forcef Volume of fluidg Gravity accelerationm MassMF Mass fractionOh Ohnesorge numberP PressureRe Reynolds numbert timeu Velocity in x directionv Velocity in y directionV Velocity vectorw Velocity in z directionWe Weber numberX Spatial vector
Greekɛ Turbulent kinetic energy dissipationk Turbulent kinetic energyμ Dynamic viscosityν Kinematic viscosityρ Fluid densityσ Surface tensionσk Turbulence Prandtl number of ks" Turbulence Prandtl number of ɛ
Subscriptsair Air entrapmentcell Celldrop DropletD Drag forceg Gravity forcei Inward directionn Normal direction
Int J Adv Manuf Technol (2008) 39:219–228DOI 10.1007/s00170-007-1214-6
P. Homayonifar (*)Department of Mechanical Engineering,Sharif University of Technology,Tehran, Iran P.O. Box 11365-9567e-mail: [email protected]
R. Babaei : E. Attar : S. ShahinfarRazi Metallurgical Research Center,Tehran, Iran
P. DavamiDepartment of Material Science and Engineering,Sharif University of Technology,Tehran, Iran
o Outward directionP Pressure difference forceS Surface tension forcet Turbulentx In x directiony In y directionz In z direction
1 Introduction
High-pressure die casting (HPDC) is an important processfor manufacturing high-volume and low-cost components.In this process, molten metal is injected at high speed (50 to100 m/s) and under high pressures through complex gatesand runner systems into the die. The geometric complexityof dies leads to strong 3D fluid flow with significant freesurface fragmentation and splashing. Crucial forminghomogeneous cast components with minimal entrappedvoids is the order in which the various parts of the die filland the positioning of the air vents. This is determined bygating system design and die geometry. Both productquality and process productivity improvements can bebrought about through improved die design. These includedeveloping more effective control of die filling and diethermal performance. Numerical simulation offers a pow-erful and cost-effective way to study the effectiveness ofdifferent die designs and filling processes [1].
When a liquid jet is subjected to high aerodynamicforces, it disintegrates into relative small droplets [2]. Notonly have these forces depended mainly on the relativevelocity between the jet and the gas at the gate discharge,but also on the density of the gas. If the velocity ofinjection is maintained high enough for aerodynamic forcesbeing the cause of atomization, higher values in the gasdensity will promote smaller droplet diameters.
The break-up process takes place when a dropletbecomes unstable due to the force produced by thedifference between the droplet and the gas velocities. Thecarrier gas imposes drag force on the droplets and distortsthem from being spherical. If the distortion is large enough,the droplets will break up into smaller drops [2].
2 Droplet formation model
Within a fluid, the intermolecular forces of attraction arebalanced in all directions. However, for the fluid moleculesat or near the surface, the cohesive forces are unbalanceddue to discontinuity of the fluid properties at the interface.If forces on the free surface can predominate on the surfacetension force, droplets will then be released with the surface
rupture. In common methods, to find out how dropletsgenerate on the free surface, computation of surfacecurvature in 3D, which is time-consuming and complex,is essential.
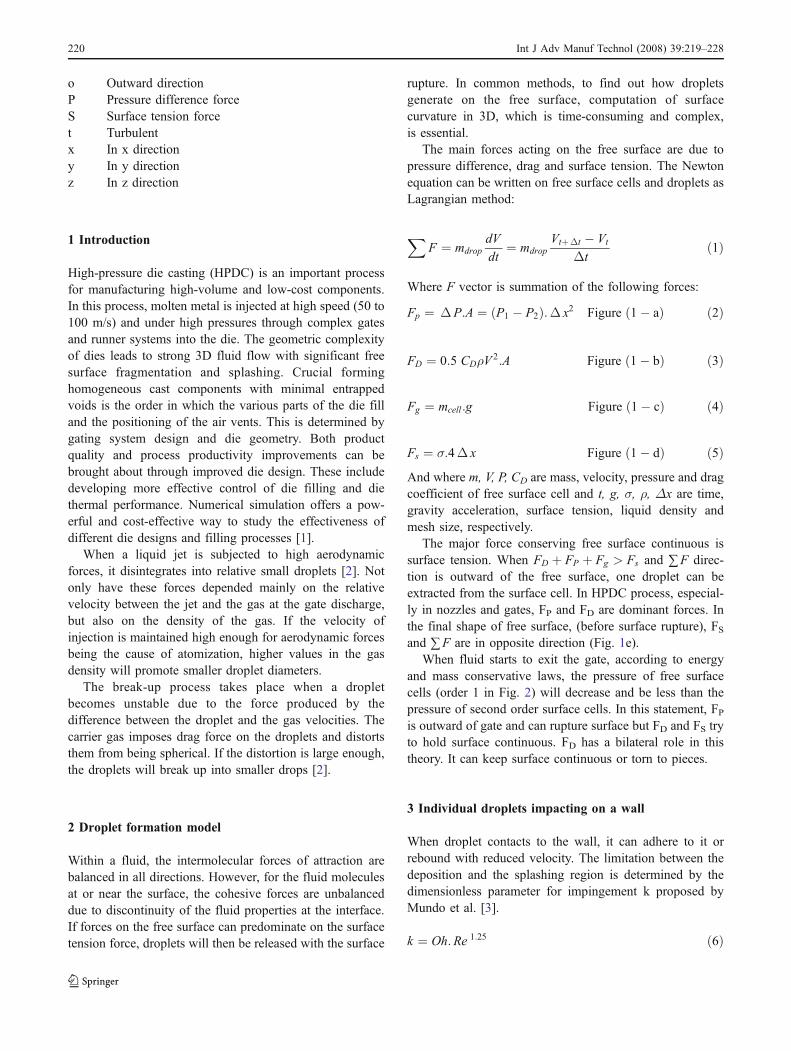
The main forces acting on the free surface are due topressure difference, drag and surface tension. The Newtonequation can be written on free surface cells and droplets asLagrangian method:
XF ¼ mdrop
dV
dt¼ mdrop
VtþΔt � Vt
Δtð1Þ
Where F vector is summation of the following forces:
Fp ¼ ΔP:A ¼ P1 � P2ð Þ:Δ x2 Figure ð1� aÞ ð2Þ
FD ¼ 0:5 CDρV2:A Figure ð1� bÞ ð3Þ
Fg ¼ mcell:g Figure ð1� cÞ ð4Þ
Fs ¼ σ:4Δ x Figure ð1� dÞ ð5ÞAnd where m, V, P, CD are mass, velocity, pressure and dragcoefficient of free surface cell and t, g, σ, ρ, Δx are time,gravity acceleration, surface tension, liquid density andmesh size, respectively.
The major force conserving free surface continuous issurface tension. When FD þ FP þ Fg > Fs and ∑F direc-tion is outward of the free surface, one droplet can beextracted from the surface cell. In HPDC process, especial-ly in nozzles and gates, FP and FD are dominant forces. Inthe final shape of free surface, (before surface rupture), FSand ∑F are in opposite direction (Fig. 1e).
When fluid starts to exit the gate, according to energyand mass conservative laws, the pressure of free surfacecells (order 1 in Fig. 2) will decrease and be less than thepressure of second order surface cells. In this statement, FPis outward of gate and can rupture surface but FD and FS tryto hold surface continuous. FD has a bilateral role in thistheory. It can keep surface continuous or torn to pieces.
3 Individual droplets impacting on a wall
When droplet contacts to the wall, it can adhere to it orrebound with reduced velocity. The limitation between thedeposition and the splashing region is determined by thedimensionless parameter for impingement k proposed byMundo et al. [3].
k ¼ Oh:Re 1:25 ð6Þ
220 Int J Adv Manuf Technol (2008) 39:219–228
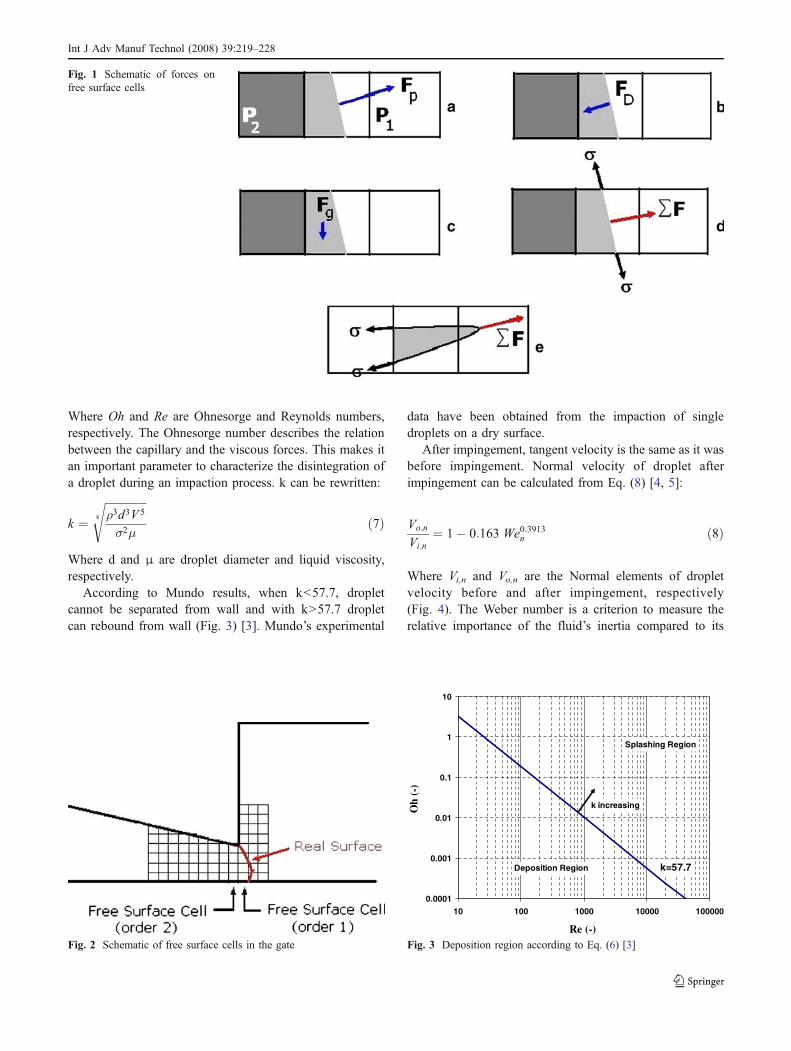
Where Oh and Re are Ohnesorge and Reynolds numbers,respectively. The Ohnesorge number describes the relationbetween the capillary and the viscous forces. This makes itan important parameter to characterize the disintegration ofa droplet during an impaction process. k can be rewritten:
k ¼ffiffiffiffiffiffiffiffiffiffiffiffiffiffiffiρ3d3V 5
σ2μ4
sð7Þ
Where d and μ are droplet diameter and liquid viscosity,respectively.
According to Mundo results, when k<57.7, dropletcannot be separated from wall and with k>57.7 dropletcan rebound from wall (Fig. 3) [3]. Mundo’s experimental
data have been obtained from the impaction of singledroplets on a dry surface.
After impingement, tangent velocity is the same as it wasbefore impingement. Normal velocity of droplet afterimpingement can be calculated from Eq. (8) [4, 5]:
Vo;n
Vi;n¼ 1� 0:163 We0:3913n ð8Þ
Where Vi,n and Vo,n are the Normal elements of dropletvelocity before and after impingement, respectively(Fig. 4). The Weber number is a criterion to measure therelative importance of the fluid’s inertia compared to its
Fig. 1 Schematic of forces onfree surface cells
Fig. 2 Schematic of free surface cells in the gate
0.0001
0.001
0.01
0.1
1
10
10 100 1000 10000 100000
Re (-)
Oh
(-)
k=57.7
k increasing
Splashing Region
Deposition Region
Fig. 3 Deposition region according to Eq. (6) [3]
Int J Adv Manuf Technol (2008) 39:219–228
surface tension and Weber number according to normalvelocity (Vn) is:
Wen ¼ r:V 2n :d
sð9Þ
4 Air entrapment
The main defect in HPDC is the presence of porosities inthe components. Attar et al. developed a computationalmodel in order to calculate the air pressure during the moldfilling [6]. Ideal gas assumption, conservation of massequation and Bernoulli law were used for calculation of airpressure. This algorithm is convenient for gravity and low-pressure die casting where the number of air cavities andbubbles are limited and the majority of them are in themacro scale during the mold filling. In HPDC, however,there are many micro bubbles whose volume are less than acomputational mesh volume and distinguishing the bound-ary of solved air in the molten metal cells is difficult [7].
In the present simulation, a concentration transportequation is used to predict the location and the probabilityof porosities in the molten metal. The main reason thatmakes this suggestion acceptable is that trapped air in themolten metal is distributed in micro scale volume [7]. Evenif one macro bubble is trapped in the liquid phase, thisequation shows air porosities enter to the molten metalaccording to the concentration gradient on the surface;
@MFair
@t¼ D
r@2MFair
@x2þ @2MFair
@y2þ @2MFair
@z2
� �
� Vx@MFair
@x
� �� Vy
@MFair
@y
� �
� Vz@MFair
@z
� �ð10Þ
Where MFair is the mass fraction of air. According to thevelocities in HPDC process, it is assumed that diffusion
effect in advection of trapped air is negligible compared toconvection term of concentration transport equation. Itshould be mentioned that the gate velocity in HPDC isusually around 10 to 100 m/s and under the pressure greaterthan 100 bar. Therefore, the movement of dominant phase(liquid) causes to transfer and change the air concentrationin the molten metal domain. The discretization of concen-tration transport equation used in the modeling is:
MFair x;y;zð Þ;tþΔtð Þ�MFair x;y;zð Þ;tð ÞΔt ¼�Vx
MFair xþΔx;y;z;tð Þ�MFair x;y;z;tð ÞΔx
� ��Vy
MFair x;yþΔy;z;tð Þ�MFair x;y;z;tð ÞΔy
� ��Vz
MFair x;y;zþΔz;tð Þ�MFair x;y;z;tð ÞΔz
� �ð11Þ
This equation is used for continuous phase only; itmeans that the air trapped between droplets is notconsidered. When droplets join together, the advectionalgorithm switches from Newton law (Lagrangian method)to VOF method (Eulerian method) then concentrationtransport equation is used to predict porosity again.
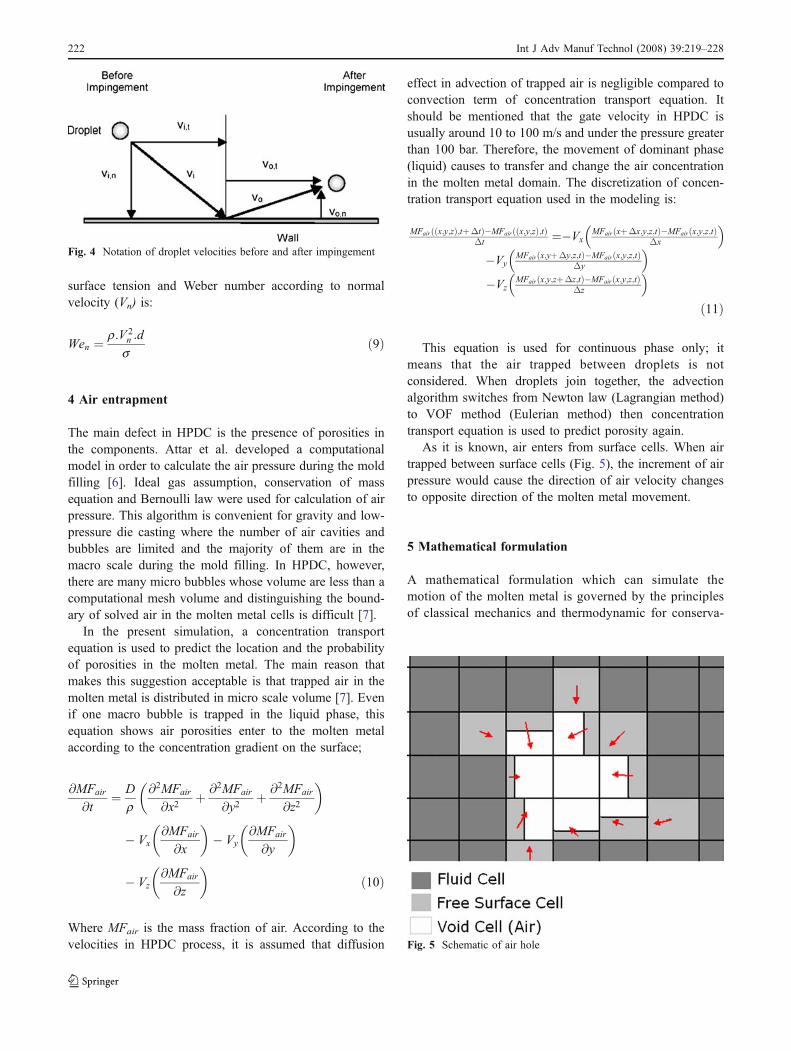
As it is known, air enters from surface cells. When airtrapped between surface cells (Fig. 5), the increment of airpressure would cause the direction of air velocity changesto opposite direction of the molten metal movement.
5 Mathematical formulation
A mathematical formulation which can simulate themotion of the molten metal is governed by the principlesof classical mechanics and thermodynamic for conserva-
Fig. 4 Notation of droplet velocities before and after impingement
Fig. 5 Schematic of air hole
222 Int J Adv Manuf Technol (2008) 39:219–228
tion of mass, momentum (Navier-Stokes), energy andconcentration [8, 9].
A typical approach to the analysis of two-phase flows isto use mixture equations. That is, the individual fluidphases are assumed to behave as a flowing mixturedescribed in terms of a mixture properties.
Because the properties of fluid in governing equationsdepend on the air mass fraction in each element and thedensity of air is negligible in comparison to the moltenmetal density, the properties of fluid is set to molten metalproperties.
Development and evolution of the free surface is aninherent factor of mold filling. In this research, for moldfilling modeling, a single-phase approach was chosen. Freesurface is modeled with both simple line interface calcula-tion (SLIC) and piecewise linear interface calculation(PLIC) reconstruction methods.
The SLIC method approximates interfaces as a piece-wise constant, where interfaces within each cell areassumed to be planes (or lines in two dimensions) alignedwith one of the logical mesh coordinates. Whereas thepiecewise linear approximation in PLIC allows the recon-struction to align naturally with the interface [9, 10].
The liquid metal domain is modeled directly and airtreats as a medium exerting pressure on the free surface.The volume of fluid (VOF) [11, 12] has been chosen tokeep track of the free surface.
The VOF function ( f ), which is defined as a ratio of themetal volume to the total element volume, is governed withthe kinematics equation.
@f
@tþr:fV ¼ 0 ð12Þ
Conceptually, VOF is easily extendable to the 3D cases. Analgorithm in the spirit of the SOLA (solution algorithm)[13] has been chosen as solution scheme. The main steps ofthe algorithm are shown as follow:
– Calculating of the coefficients of momentum FDE(finite difference equations);
– Solving the momentum equations in predictor step byexplicit method;
– Imposing pressure boundary conditions at the threesurfaces;
– Calculating the pressure correction coefficient;– Solving of the pressure correction equation (reformu-
lated continuity);– Updating the pressure and velocities;– Imposing velocity boundary conditions at the free
surface;– Solving the energy equation;– Solving of the VOF equation;
– Proceeding back to first step (next time step) orfinishing calculation.
In this modeling, Babaei et al. modified VOF is used toincrease the accuracy of fluid advection [14].
For turbulence modeling, the k-ɛ standard model wasused. In order to achieve an accurate model, computationaldomain was discreted to three regions includes: laminar sublayer, boundary layer, and internal region.
The two-equation model is introduced to define thevalue of νt for the region far from walls. In the standard k-ɛmodel, the following transport equations are used forturbulence kinetic energy k and rate of dissipation per unitmass ɛ [15]:
@k
@tþr: Vkð Þ ¼ r:
n þ ntsk
rk
� �þ G� " ð13Þ
@"
@tþr: V"ð Þ ¼ r:
n þ ntsk
r"
� �þ C"1:
"
k:G
� C"2:"2
kð14Þ
where
G ¼ νt 2@u
@x
� �2
þ 2@v
@y
� �2
þ 2@w
@z
� �2
þ @u
@yþ @v
@x
� �2
þ @u
@zþ @w
@x
� �2
þ @v
@zþ @w
@y
� �2" #
ð15Þ
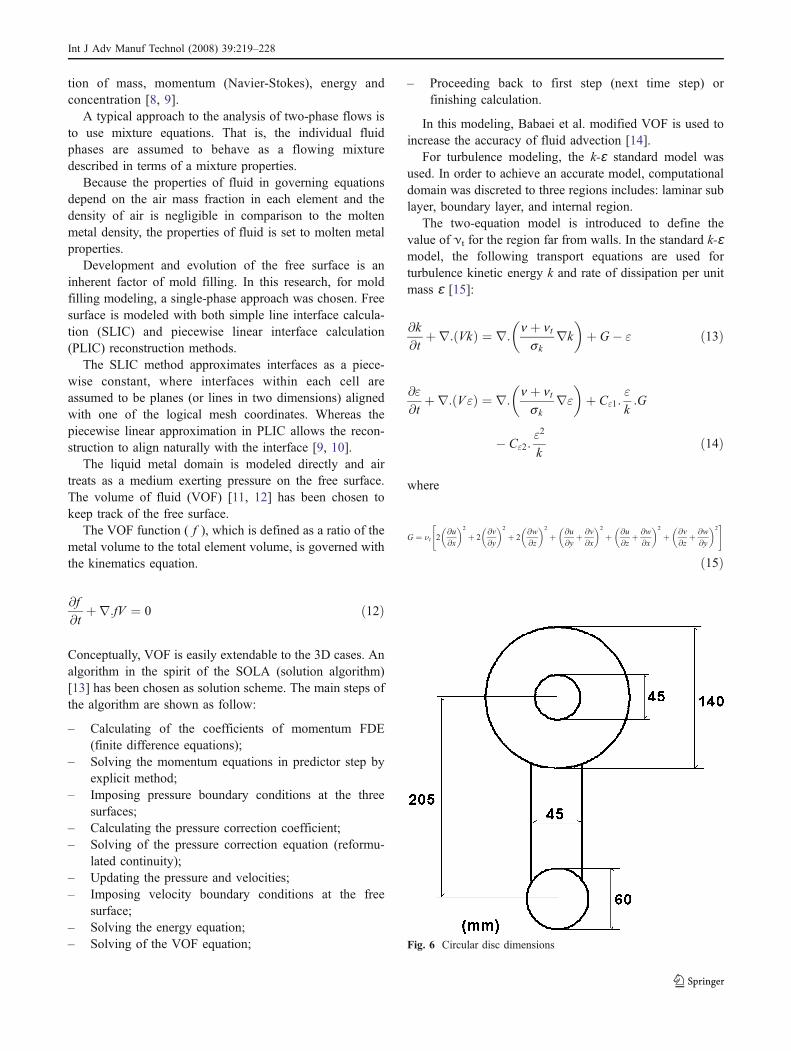
Fig. 6 Circular disc dimensions
Int J Adv Manuf Technol (2008) 39:219–228
and finally, the kinematic turbulent viscosity can beobtained from:
nt ¼ Cmk2
"ð16Þ
In this work, the following values for Cm, C"1, C"2, s"
and σk were used. [16]:
Cm ¼ 0:09;C"1 ¼ 1:44;C"2 ¼ 1:92; s" ¼ 1:3; sk ¼ 1:0
When the droplet being extracted from the surface, itexits from continuous phase domain and will be tracked inLagrangian method. Initial velocity of droplet sets asprevious velocity of the cell in continues phase. Thevelocity (V) and location (X) of droplets in the next timesteps will be calculated from the following equations:
VtþΔt ¼ Vt þ Δt
mcell
XF ð17Þ
XtþΔt ¼ Xt þ Vt:Δt ð18ÞAccording to the velocities in HPDC and the volume of
molds, it can be assumed that the change of droplet velocityin the air is negligible until it contacts to the wall or freesurface in another location. If droplets collide together andthe total of volume fractions is greater than one, advectionalgorithm alters to VOF algorithm again.
6 Validation
Validation of the flows predicted by numerical simulationsfor HPDC is essential before they are used reliably forindustrial optimization or die design. As a part of thisvalidation process, the results of new methods simulationsfor two dies have been compared with the experimentaldata of Schmid and Klein [17]. In both cases, experimentswere carried out using water at room temperature. Theseresults were used in the validation because they areamongst the best and clearest available for comparison.
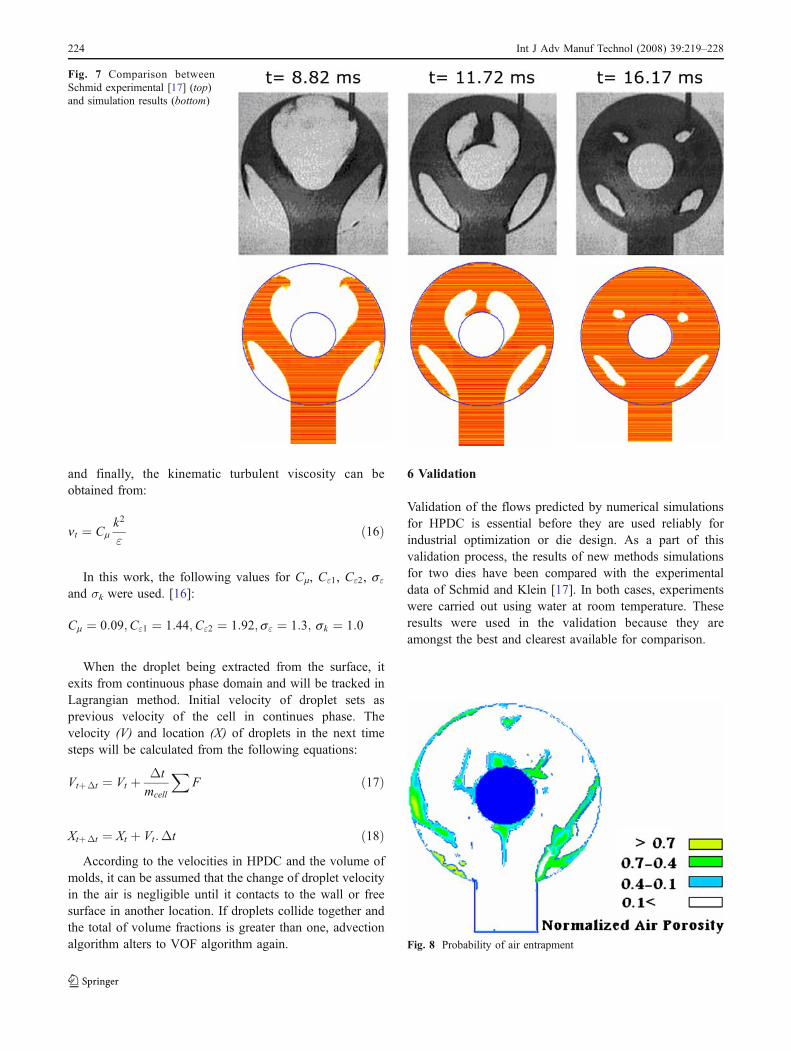
Fig. 8 Probability of air entrapment
Fig. 7 Comparison betweenSchmid experimental [17] (top)and simulation results (bottom)
224 Int J Adv Manuf Technol (2008) 39:219–228
6.1 Circular disc with core
Figure 6 shows that the geometry of the first die has acircular cross section and a circular core [17]. The thicknessof the die is 2 mm and the gate velocity is 18.0 m/s.Comparison of these VOF-Lagrange simulations with thecorresponding experimental results of Schmid and Klein atthree specific times is shown in Fig. 7.
The VOF-Lagrange simulation captures the fine detailsof the flow well. The jet enters the die, strikes the core andsplits into two jets. These strike the outside of the die andeach splits into two smaller jets, traveling in each directionaround the outside of the die.
The first frame shows the flow when the two branches ofthe fluid near the top are approaching each other. The VOF-Lagrange simulation captures the smooth edges of theincoming jet and of the two branches after splitting atthe core. The VOF-Lagrange solution is able to capture theshape of the four sub-branches traveling around the outsideof the die. In both the upper and lower pair of branches, theleading edges of the jets have reached similar points on theoutside of the die and they have similar thicknesses.
At 16.17 ms, the filling is almost completed. The VOF-Lagrange simulation is able to predict the presence of voidsand gives shapes that are similar to those found in theexperiment. Figure 8 shows the air entrapment distributionin the filled casting. It is observed that the regions of airporosities are compatible with the last locations of air voidsin the experimental results. Fig. 10 S-shaped dimensions
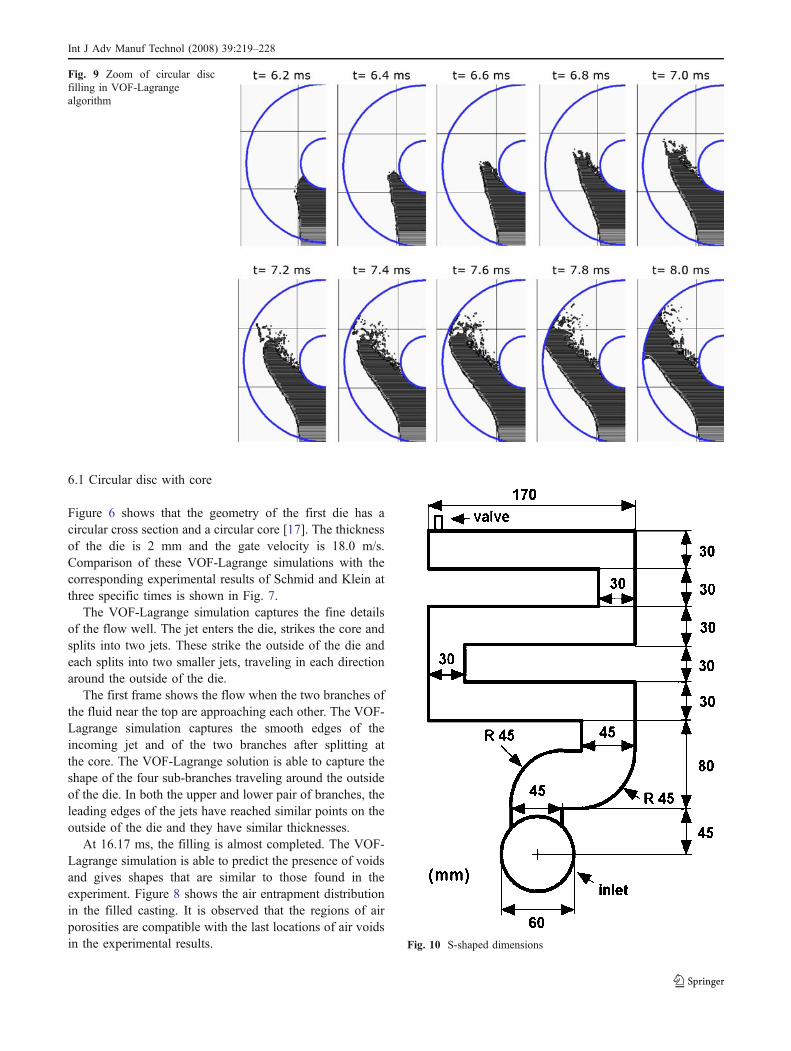
Fig. 9 Zoom of circular discfilling in VOF-Lagrangealgorithm
Int J Adv Manuf Technol (2008) 39:219–228
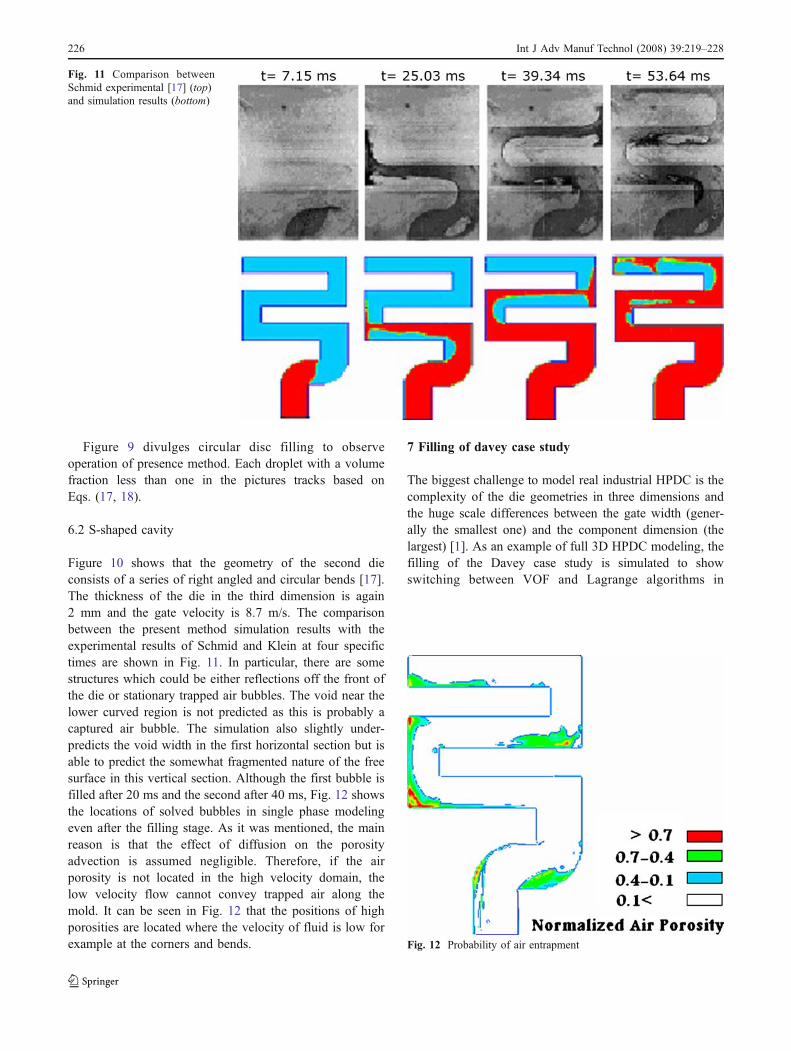
Figure 9 divulges circular disc filling to observeoperation of presence method. Each droplet with a volumefraction less than one in the pictures tracks based onEqs. (17, 18).
6.2 S-shaped cavity
Figure 10 shows that the geometry of the second dieconsists of a series of right angled and circular bends [17].The thickness of the die in the third dimension is again2 mm and the gate velocity is 8.7 m/s. The comparisonbetween the present method simulation results with theexperimental results of Schmid and Klein at four specifictimes are shown in Fig. 11. In particular, there are somestructures which could be either reflections off the front ofthe die or stationary trapped air bubbles. The void near thelower curved region is not predicted as this is probably acaptured air bubble. The simulation also slightly under-predicts the void width in the first horizontal section but isable to predict the somewhat fragmented nature of the freesurface in this vertical section. Although the first bubble isfilled after 20 ms and the second after 40 ms, Fig. 12 showsthe locations of solved bubbles in single phase modelingeven after the filling stage. As it was mentioned, the mainreason is that the effect of diffusion on the porosityadvection is assumed negligible. Therefore, if the airporosity is not located in the high velocity domain, thelow velocity flow cannot convey trapped air along themold. It can be seen in Fig. 12 that the positions of highporosities are located where the velocity of fluid is low forexample at the corners and bends.
7 Filling of davey case study
The biggest challenge to model real industrial HPDC is thecomplexity of the die geometries in three dimensions andthe huge scale differences between the gate width (gener-ally the smallest one) and the component dimension (thelargest) [1]. As an example of full 3D HPDC modeling, thefilling of the Davey case study is simulated to showswitching between VOF and Lagrange algorithms in
Fig. 12 Probability of air entrapment
Fig. 11 Comparison betweenSchmid experimental [17] (top)and simulation results (bottom)
226 Int J Adv Manuf Technol (2008) 39:219–228
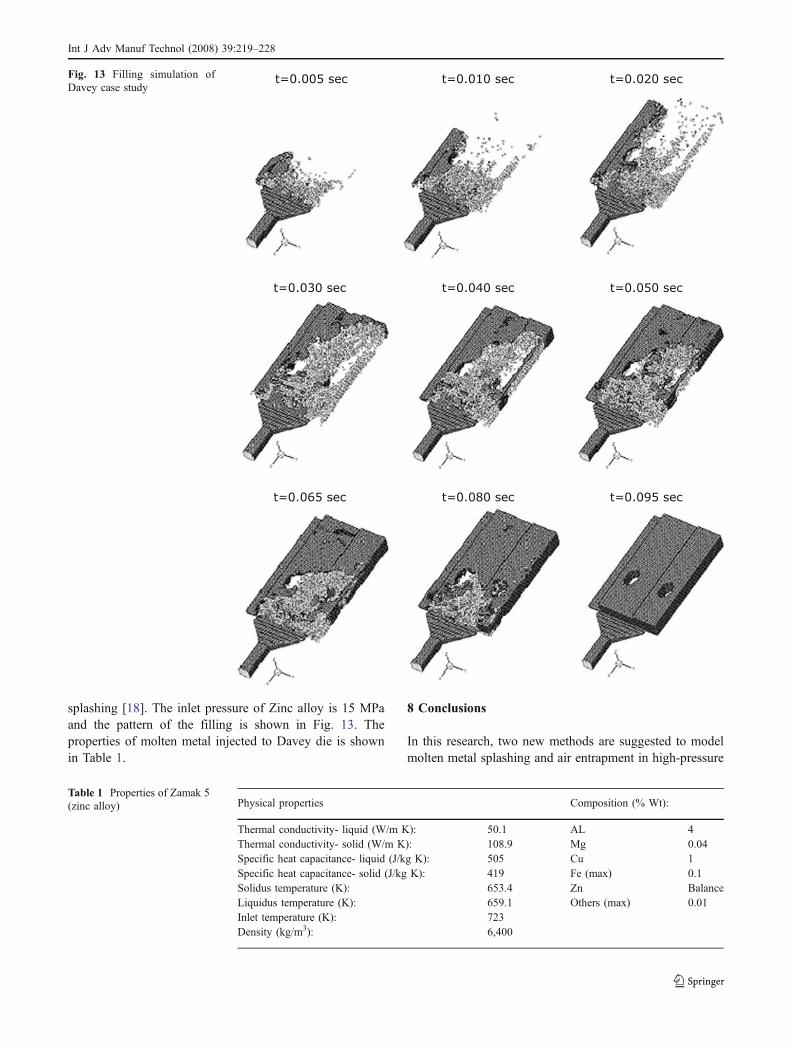
splashing [18]. The inlet pressure of Zinc alloy is 15 MPaand the pattern of the filling is shown in Fig. 13. Theproperties of molten metal injected to Davey die is shownin Table 1.
8 Conclusions
In this research, two new methods are suggested to modelmolten metal splashing and air entrapment in high-pressure
t=0.005 sec t=0.010 sec t=0.020 sec
t=0.030 sec t=0.040 sec t=0.050 sec
t=0.065 sec t=0.080 sec t=0.095 sec
Fig. 13 Filling simulation ofDavey case study
Table 1 Properties of Zamak 5(zinc alloy) Physical properties Composition (% Wt):
Thermal conductivity- liquid (W/m K): 50.1 AL 4Thermal conductivity- solid (W/m K): 108.9 Mg 0.04Specific heat capacitance- liquid (J/kg K): 505 Cu 1Specific heat capacitance- solid (J/kg K): 419 Fe (max) 0.1Solidus temperature (K): 653.4 Zn BalanceLiquidus temperature (K): 659.1 Others (max) 0.01Inlet temperature (K): 723Density (kg/m3): 6,400
Int J Adv Manuf Technol (2008) 39:219–228
die casting. Much research has been done on molten metalsplashing, but the majority of it has focused on impinge-ment of one droplet to the wall. This paper presents a newmodel included VOF method for continuous-phase andLagrangian tracking for the droplets movement. In thismethodology, when droplets contact together the advectionmethod switches to VOF again.
As it is known, the main defect in the parts made byHPDC is the air porosities. Simulation of air porosity in thedie casting parts has been investigated in the second sectionof this research. In the fact, the air porosity volume is inmicro scale and the interface boundary of two phases cannot be specified easily. So two-phase modeling or mixturemodeling is a time-consuming and complicated approach.Although the single-phase modeling cannot track macrobubbles, concentration transport equation helps to specifythe porosity distribution in the part during filling stage.
It should be emphasized that it is difficult to trace themolten metal movement in the high-pressure die castingand the experimental data are not available. ThereforeSchmid’s experiences in low-pressure die casting are usedto validate the new ideas. Comparison between theexperimental data and simulation results has shown goodagreement. In many geometries, the single-phase modelcannot predict air bubbles, but the air porosity algorithmcan predict this phenomenon.
References
1. Cleary PW, Ha J, Prakash M, Nguyen T (2006) 3D SPHflow predictions and validation for high-pressure die castingof automotive components. Appl Math Model 30(11):1406–1427
2. Schmehl R, Maier G, Wittig S (2000) CFD analysis of fuelatomization, secondary droplet breakup and spray dispersion inthe premix duct of a LPP combustor. Eighth InternationalConference on Liquid Atomization and Spray Systems, ICLASS2000, Pasadena, CA, USA, July
3. Mundo C, SomerfeldM (1995) Droplet-wall collisions, experimentalstudies of the deformation and breakup process. Int J MultiphaseFlow 21:151–173
4. Karl A, Rieber M, Schelkle M, Anders K, Frohn A (1996)Comparison of new numerical results for droplet wall interactionswith experimental results. Proceedings of the ASME FluidsEngineering Summer Meeting, FED-236:201–206
5. Issa RJ (2003) Numerical modeling of the dynamics and heattransfer of impacting sprays for a wide range of pressures. PhDDissertation, University of Pittsburgh
6. Attar E, Homayonifar P, Babaei R, Davami P (2005) Modeling ofair pressure effects in casting molds. Model Sim Mater Sci Eng13:903–917
7. Lee SG, Gokhale AM, Patel GR, Evans M (2006) Effect of processparameters on porosity distributions in high-pressure die-cast AM50Mg-alloy. Mater Sci Eng A 427:99–111
8. Kim SW, Turng LS (2004) Developments of three-dimensionalcomputer-aided engineering simulation for injection moulding.Model Sim Mater Sci Eng 12:S151–S173
9. Tavakoli R, Babaei R, Varahram N, Davami P (2006) Numericalsimulation of liquid/gas phase flow during mold filling. ComputMethods Appl Mech Eng 196:697–713
10. Rider WJ, Kothey DB (1998) Reconstructing volume tracking. JComput Phys 141:112–152
11. Nichols BD, Hirt CW, Hotchkiss, RS (1980) SOLA-VOF: asolution algorithm for transient fluid flows with multiple freeboundaries. Tech Rep LA 8355, Los Alamos, Scientific library ofUniversity of California
12. Duff ES (1999) Fluid flow aspect of solidification modeling:simulation of low pressure die casting. PhD Thesis, Department ofMining & Metallurgical Engineering, University of Queensland
13. Sicilian JM, Hirt CW (1985) HYDR-3D: a solution algorithm fortransient 3D flows, Rep. FSI-84-00-3, Flow Science Int., Los Alamos
14. Babaei R, Abdollahi J, Homayonifar P, Varahram N, Davami P(2006) Improved advection algorithm of computational modelingof free surface flow using structured grids. Comput Methods ApplMech Eng 195(7/8):775–795
15. Shahinfar S, Babaei R, Davami P (2005) 3-D simulation of moldfilling with k-ɛ turbulence modeling 14th IASTED Int. Conf onApplied Simulation and Modeling, June
16. Launder BE, Spalding DB (1974) The numerical computation ofturbulent flow. Comput Methods Appl Mech Eng 3:269–289
17. Schmid M, Klein F (1995) Fluid flow in die cavities -experimental and numerical simulation. Proc North AmericanDie Casting Assoc Conf, Indianapolis, IN, pp 93–99
18. Rosindale I, Davey K (1998) Steady-state thermal model for thehot chamber injection system in the pressure die casting process. JMater Process Technol 83:27–45
228 Int J Adv Manuf Technol (2008) 39:219–228
Top Related
Copyright © 2022 FDOKUMEN

