


Bahasa
Halaman
Hukum


NISTIR 7880-29
NIST Micronutrients Measurement Quality Assurance Program
Winter, Spring, and Fall 1995 Comparability Studies
Results for Round Robins XXXIII, XXXIV, and XXXV Fat-Soluble Vitamins and Carotenoids in Human Serum
and Round Robins 7 and 8 Ascorbic Acid in Human Serum
David L. Duewer Margaret C. Kline
Sam A. Margolis (Retired) Katherine E. Sharpless
Jeanice B. Thomas
http://dx.doi.org/10.6028/NIST.IR.7880-29


NISTIR 7880-29
NIST Micronutrients Measurement Quality Assurance Program
Winter, Spring, and Fall 1995 Comparability Studies
Results for Round Robins XXXIII, XXXIV, and XXXVFat-Soluble Vitamins and Carotenoids in Human Serum
and Round Robins 7 and 8 Ascorbic Acid in Human Serum
David L. Duewer Sam A. Margolis (Retired)
Katherine E. Sharpless Jeanice B. Thomas
Chemical Sciences Division Materials Measurement Laboratory
Margaret C. Kline Biomolecular Measurement Division
Materials Measurement Laboratory
http://dx.doi.org/10.6028/NIST.IR.7880-29
April 2014
U.S. Department of Commerce Penny Pritzker, Secretary
National Institute of Standards and Technology Patrick D. Gallagher, Under Secretary of Commerce for Standards and Technology and Director
(This page intentionally blank)
ii

Abstract
The National Institute of Standards and Technology coordinates the Micronutrients Measurement Quality Assurance Program (MMQAP) for laboratories that measure fat- and water-soluble vitamins and carotenoids in human serum and plasma. This report describes the design of and results for the Winter, Spring and Fall 1995 MMQAP measurement comparability improvement studies: 1) Round Robin XXXIII Fat-Soluble Vitamins and Carotenoids in Human Serum, 2) Round Robin XXXIV Fat-Soluble Vitamins and Carotenoids in Human Serum, 3) Round Robin XXXV Fat-Soluble Vitamins and Carotenoids in Human Serum, 4) Round Robin 7 Ascorbic Acid in Human Serum, and 5) Round Robin 8 Ascorbic Acid in Human Serum. The materials for Round Robin XXXIII were shipped to participants in January 1995; participants were requested to provide their measurement results by March 20, 1995. The materials for Round Robin XXXIV were shipped to participants in April 1995; participants were requested to provide their measurement results by July 24, 1995. The materials for Round Robin XXXV were shipped to participants in July 1995; participants were requested to provide their measurement results by September 15, 1995. The sample materials for Round Robin 7 were distributed in January 1995 with results due by late May 1995. The sample materials for Round Robin 8 were distributed in October 1995 with results due by December 18, 1995.
Keywords
Human Serum Retinol, α-Tocopherol, γ-Tocopherol, Total and Trans-β-Carotene
Ascorbic Acid
iii
Table of Contents
Abstract............................................................................................................................................... iiiKeywords ............................................................................................................................................ iiiTable of Contents ............................................................................................................................... ivIntroduction......................................................................................................................................... 1Round Robin XXXIII: Fat-Soluble Vitamins and Carotenoids in Human Serum...................... 1Round Robin XXXIV: Fat-Soluble Vitamins and Carotenoids in Human Serum ...................... 2Round Robin XXXV: Fat-Soluble Vitamins and Carotenoids in Human Serum ....................... 2Round Robin 7: Vitamin C in Human Serum................................................................................. 3Round Robin 8: Vitamin C in Human Serum................................................................................. 3References ............................................................................................................................................ 4
Appendix A. Shipping Package Inserts for RR33........................................................................ A1Appendix B. Final Report for RR33 .............................................................................................. B1 Appendix C. “All-Lab Report” for RR33 ...................................................................................... C1Appendix D. “Individualized Report” for RR33 ......................................................................... D1 Appendix E. Shipping Package Inserts for RR34 ......................................................................... E1 Appendix F. Final Report for RR34............................................................................................... F1 Appendix G. “All-Lab Report” for RR34...................................................................................... G1 Appendix H. “Individualized Report” for RR34 .......................................................................... H1 Appendix I. Shipping Package Inserts for RR35 ........................................................................... I1Appendix J. Final Report for RR35 ................................................................................................ J1Appendix K. “All-Lab Report” for RR35..................................................................................... K1 Appendix L. “Individualized Report” for RR35........................................................................... L1Appendix M. Shipping Package Inserts for RR07 ....................................................................... M1 Appendix N. Final Report for RR06 and RR07 ........................................................................... N1 Appendix O. “All Lab Report” for RR07 ..................................................................................... O1 Appendix P. Shipping Package Inserts for RR08 ......................................................................... P1 Appendix Q. “All Lab Report” for RR08 ..................................................................................... Q1
iv
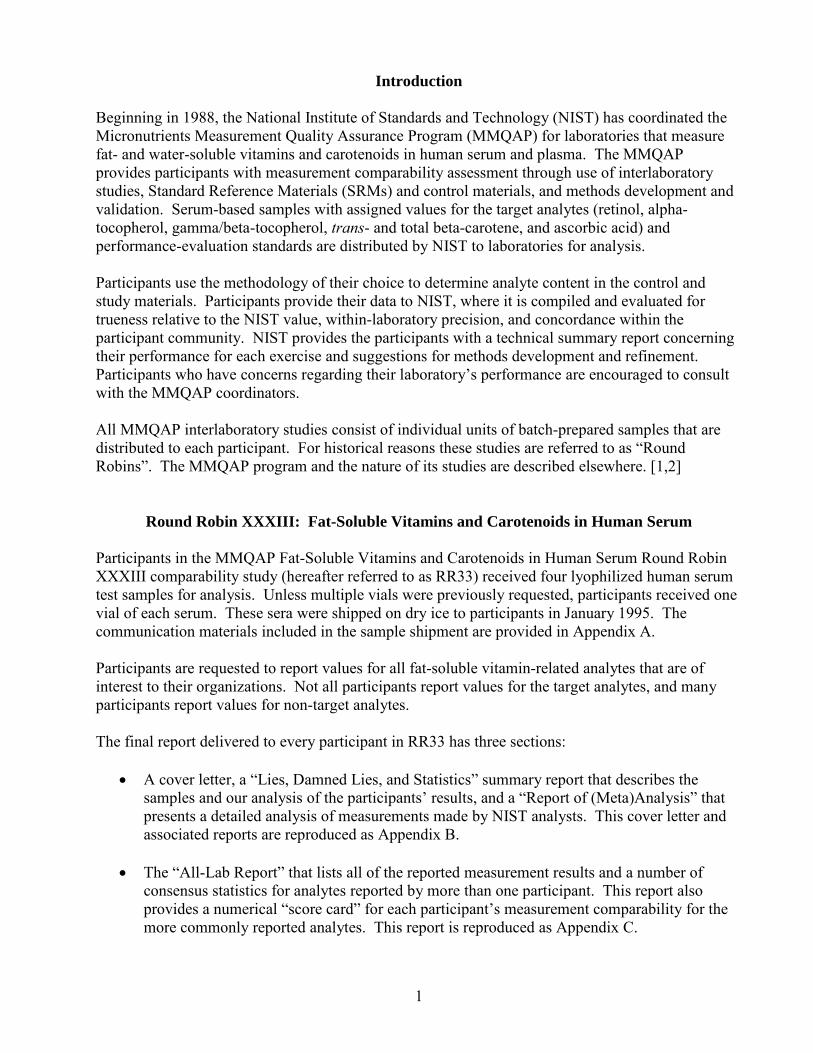
Introduction
Beginning in 1988, the National Institute of Standards and Technology (NIST) has coordinated the Micronutrients Measurement Quality Assurance Program (MMQAP) for laboratories that measure fat- and water-soluble vitamins and carotenoids in human serum and plasma. The MMQAP provides participants with measurement comparability assessment through use of interlaboratory studies, Standard Reference Materials (SRMs) and control materials, and methods development and validation. Serum-based samples with assigned values for the target analytes (retinol, alpha-tocopherol, gamma/beta-tocopherol, trans- and total beta-carotene, and ascorbic acid) and performance-evaluation standards are distributed by NIST to laboratories for analysis.
Participants use the methodology of their choice to determine analyte content in the control and study materials. Participants provide their data to NIST, where it is compiled and evaluated for trueness relative to the NIST value, within-laboratory precision, and concordance within the participant community. NIST provides the participants with a technical summary report concerning their performance for each exercise and suggestions for methods development and refinement. Participants who have concerns regarding their laboratory’s performance are encouraged to consult with the MMQAP coordinators.
All MMQAP interlaboratory studies consist of individual units of batch-prepared samples that are distributed to each participant. For historical reasons these studies are referred to as “Round Robins”. The MMQAP program and the nature of its studies are described elsewhere. [1,2]
Round Robin XXXIII: Fat-Soluble Vitamins and Carotenoids in Human Serum
Participants in the MMQAP Fat-Soluble Vitamins and Carotenoids in Human Serum Round Robin XXXIII comparability study (hereafter referred to as RR33) received four lyophilized human serum test samples for analysis. Unless multiple vials were previously requested, participants received one vial of each serum. These sera were shipped on dry ice to participants in January 1995. The communication materials included in the sample shipment are provided in Appendix A.
Participants are requested to report values for all fat-soluble vitamin-related analytes that are of interest to their organizations. Not all participants report values for the target analytes, and many participants report values for non-target analytes.
The final report delivered to every participant in RR33 has three sections:
• A cover letter, a “Lies, Damned Lies, and Statistics” summary report that describes the samples and our analysis of the participants’ results, and a “Report of (Meta)Analysis” that presents a detailed analysis of measurements made by NIST analysts. This cover letter and associated reports are reproduced as Appendix B.
• The “All-Lab Report” that lists all of the reported measurement results and a number of consensus statistics for analytes reported by more than one participant. This report also provides a numerical “score card” for each participant’s measurement comparability for the more commonly reported analytes. This report is reproduced as Appendix C.
1

• An “Individualized Report” that graphically analyzes each participant’s results for selected analytes. This report also provides a graphical summary of their measurement comparability. The graphical tools used in this report are described in detail elsewhere [3]. An example “Individualized Report” is reproduced as Appendix D.
Round Robin XXXIV: Fat-Soluble Vitamins and Carotenoids in Human Serum
Participants in the MMQAP Fat-Soluble Vitamins and Carotenoids in Human Serum Round Robin XXXIV comparability study (hereafter referred to as RR34) received four lyophilized human serum test samples for analysis. Unless multiple vials were previously requested, participants received one vial of each material. These sample materials were shipped on dry ice to participants in April 1995. The communication materials included in the sample shipment are provided in Appendix E.
Participants are requested to report values for all fat-soluble vitamin-related analytes that are of interest to their organizations. Not all participants report values for the target analytes, and many participants report values for non-target analytes.
The final report delivered to every participant in RR34 has three sections:
• A cover letter, a “Lies, Damned Lies, and Statistics” summary report that describes the samples and our analysis of the participants’ results, and a “Report of (Meta)Analysis” that presents a detailed analysis of measurements made by NIST analysts. This cover letter and associated reports are reproduced as Appendix F.
• The “All-Lab Report” that lists all of the reported measurement results and a number of consensus statistics for analytes reported by more than one participant. This report also provides a numerical “score card” for each participant’s measurement comparability for the more commonly reported analytes. This report is reproduced as Appendix G.
• An “Individualized Report” that graphically analyzes each participant’s results for selected analytes. This report also provides a graphical summary of their measurement comparability. The graphical tools used in this report are described in detail elsewhere [3]. An example “Individualized Report” is reproduced as Appendix H.
Round Robin XXXV: Fat-Soluble Vitamins and Carotenoids in Human Serum
Participants in the MMQAP Fat-Soluble Vitamins and Carotenoids in Human Serum Round Robin XXXV comparability study (hereafter referred to as RR35) received four lyophilized human serum test samples for analysis. Unless multiple vials were previously requested, participants received one vial of each material. These sample materials were shipped on dry ice to participants in July 1995. The communication materials included in the sample shipment are provided in Appendix I.
Participants are requested to report values for all fat-soluble vitamin-related analytes that are of interest to their organizations. Not all participants report values for the target analytes, and many participants report values for non-target analytes.
The final report delivered to every participant in RR35 has three sections:
2

• A cover letter, a “Lies, Damned Lies, and Statistics” summary report that describes the samples and our analysis of the participants’ results, and a “Report of (Meta)Analysis” that presents a detailed analysis of measurements made by NIST analysts. This cover letter and associated reports are reproduced as Appendix J.
• The “All-Lab Report” that lists all of the reported measurement results and a number of consensus statistics for analytes reported by more than one participant. This report also provides a numerical “score card” for each participant’s measurement comparability for the more commonly reported analytes. This report is reproduced as Appendix K.
• An “Individualized Report” that graphically analyzes each participant’s results for selected analytes. This report also provides a graphical summary of their measurement comparability. The graphical tools used in this report are described in detail elsewhere [3]. An example “Individualized Report” is reproduced as Appendix L.
Round Robin 7: Vitamin C in Human Serum
Participants in the MMQAP Vitamin C in Human Serum Round Robin 7 comparability study (hereafter referred to as RR07) received four frozen serum test samples and a frozen serum control material for analysis. These materials were shipped on dry ice to participants in January 1995. The available communication materials included in the sample shipment are provided in Appendix M.
The test and control materials were prepared by adding equal volumes of 10 % metaphosphoric acid (MPA) to human serum that had been spiked with ascorbic acid. Participants were asked to provide two results for each vial.
The final report delivered to all participants in RR06 and RR07 consists of a cover letter and a series of Tables and Figures that summarize the results of the study. This report is reproduced as Appendix N.
While not distributed to the participants in RR07, Appendix O is a modified “All Lab Report” that lists the results for the test materials transformed into units of µmol/mL sample.
No “Individualized Report” was provided to the participants in RR07.
Round Robin 8: Vitamin C in Human Serum
Participants in the MMQAP Vitamin C in Human Serum Round Robin 8 comparability study (hereafter referred to as RR08) received four frozen serum test samples and a frozen serum control material for analysis. These sample materials were shipped on dry ice to participants in October 1995. The communication materials included in the sample shipment are provided in Appendix P.
The test and control materials were prepared by adding equal volumes of 10 % metaphosphoric acid (MPA) to human serum that had been spiked with ascorbic acid. Participants were asked to provide two results for each vial.
3

As described in NISTIR 7880-28, the data and results for RR08 were reported November 1996 in combination with the data and results for RR09.
While not distributed to the participants in RR08, Appendix Q is a modified “All Lab Report” that lists the results for the test materials transformed into units of µmol/mL sample.
No “Individualized Report” was provided to the participants in RR08.
References
1 Duewer DL, Brown Thomas J, Kline MC, MacCrehan WA, Schaffer R, Sharpless KE, May WE, Crowell JA. NIST/NCI Micronutrients Measurement Quality Assurance Program: Measurement Repeatabilities and Reproducibilities for Fat-Soluble Vitamin-Related Compounds in Human Sera. Anal Chem 1995;69(7):1406-1413.
2 Margolis SA, Duewer DL. Measurement Of Ascorbic Acid in Human Plasma and Serum: Stability, Intralaboratory Repeatability, and Interlaboratory Reproducibility. Clin Chem 1995;42(8):1257-1262.
3 Duewer DL, Kline MC, Sharpless KE, Brown Thomas J, Gary KT, Sowell AL. Micronutrients Measurement Quality Assurance Program: Helping Participants Use Interlaboratory Comparison Exercise Results to Improve Their Long-Term Measurement Performance. Anal Chem 1999;71(9):1870-1878.
4
Appendix A. Shipping Package Inserts for RR33
The following two items were included in each package shipped to RR33 participants: • Cover letter • Datasheet
The cover letter and datasheet were enclosed in a sealed waterproof bag along with the samples themselves.
A1
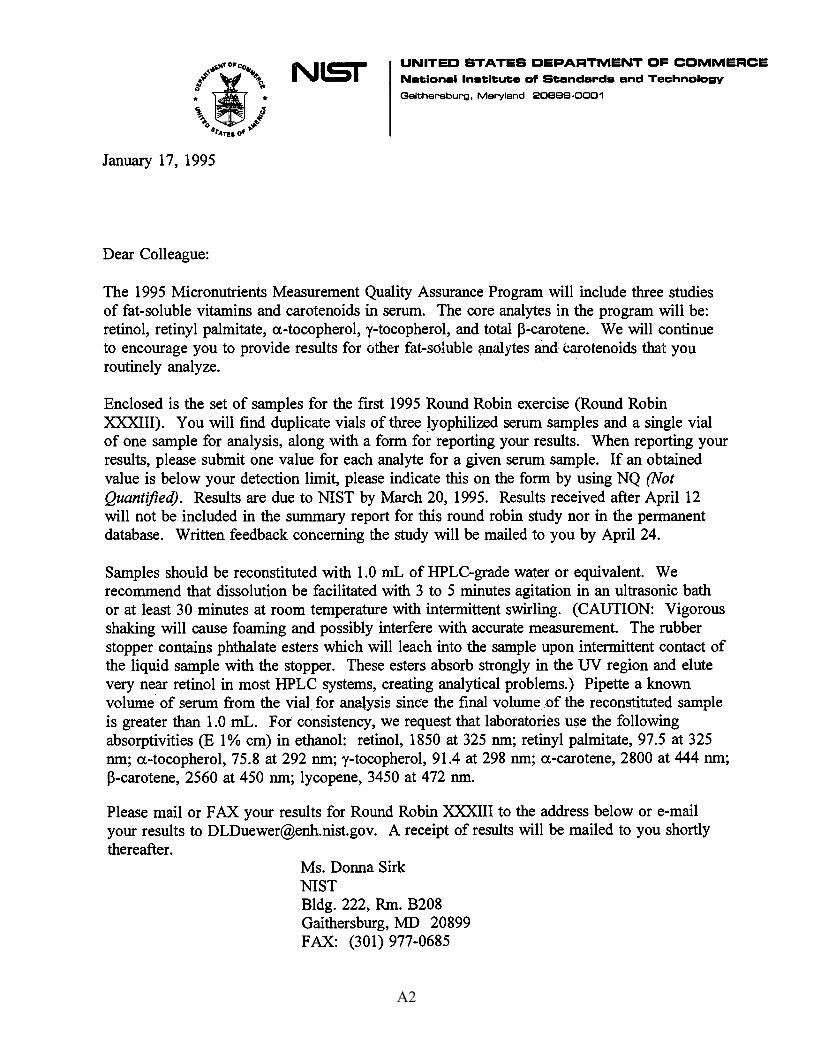
January 17, 1995
Dear Colleague:
NI.Sr UNITED STATES DEPARTMENT DF COMMERCE National Institute of Standards and Technology
Gaithersburg, Maryland 20899-0001
The 1995 Micronutrients Measurement Quality Assurance Program will include three studies of fat-soluble vitamins and carotenoids in serum. The core analytes in the program will be: retinol, retinyl palmitate, a.-tocopherol, y-tocopherol, and total P-carotene. We will continue to encourage you to provide results for other fat-soluble ~alytes and· carotenoids that you routinely analyze. ·
Enclosed is the set of samples for the first 1995 Round Robin exercise (Round Robin XXXIII). You will find duplicate vials of three lyophilized serum samples and a single vial of one sample for analysis, along with a form for reporting your results. When reporting your results, please submit one value for each analyte for a given serum sample. If an obtained value is below your detection limit, please indicate this on the form by using NQ (Not Quantified). Results are due to NIST by March 20, 1995. Results received after April 12 will not be included in the summary report for this round robin study nor in the permanent database. Written feedback concerning the study will be mailed to you by April 24.
Samples should be reconstituted with 1.0 mL of HPLC-grade water or equivalent. We recommend that dissolution be facilitated with 3 to 5 minutes agitation in an ultrasonic bath or at least 30 minutes at room temperature with intermittent swirling. (CAUTION: Vigorous shaking will cause foaming and possibly interfere with accurate measurement. The rubber stopper contains phthalate esters which will leach into the sample upon intermittent contact of the liquid sample with the stopper. These esters absorb strongly in the UV region and elute very near retinol in most HPLC systems, creating analytical problems.) Pipette a known volume. of serum from the vial for analysis sinc·e the final volume .-Of the recons:tituted sample is greater than 1.0 mL. For consistency, we request that laboratories u~e the following absorptivities (E 1 % cm) in ethanol: retinol, 1850 at 325 nm; retinyl palmitate, 97 .5 at 325 nm; a.-tocopherol, 75.8 at 292 nm; y-tocopherol, 91.4 at 298 nm; a-carotene, 2800 at 444 nm; P-carotene, 2560 at 450 nm; lycopene, 3450 at 472 nm.
Please mail or FAX your results for Round Robin XXXIII to the address below or e-mail your results to [email protected]. A receipt of results will be mailed to you shortly thereafter.
Ms. Donna Sirk NIST Bldg. 222, Rm. B208 Gaithersburg, MD 20899 FAX: (301) 977-0685
A2

If you have questions regarding this round robin exercise, please call me at (301) 975-3120 or mail/FAX queries to the above address.
· ce Brown Thomas Research Chemist Analytical Chemistry Division Chemical Science and Technology Laboratory
Attachment
cc: w. May S. Wise
A3
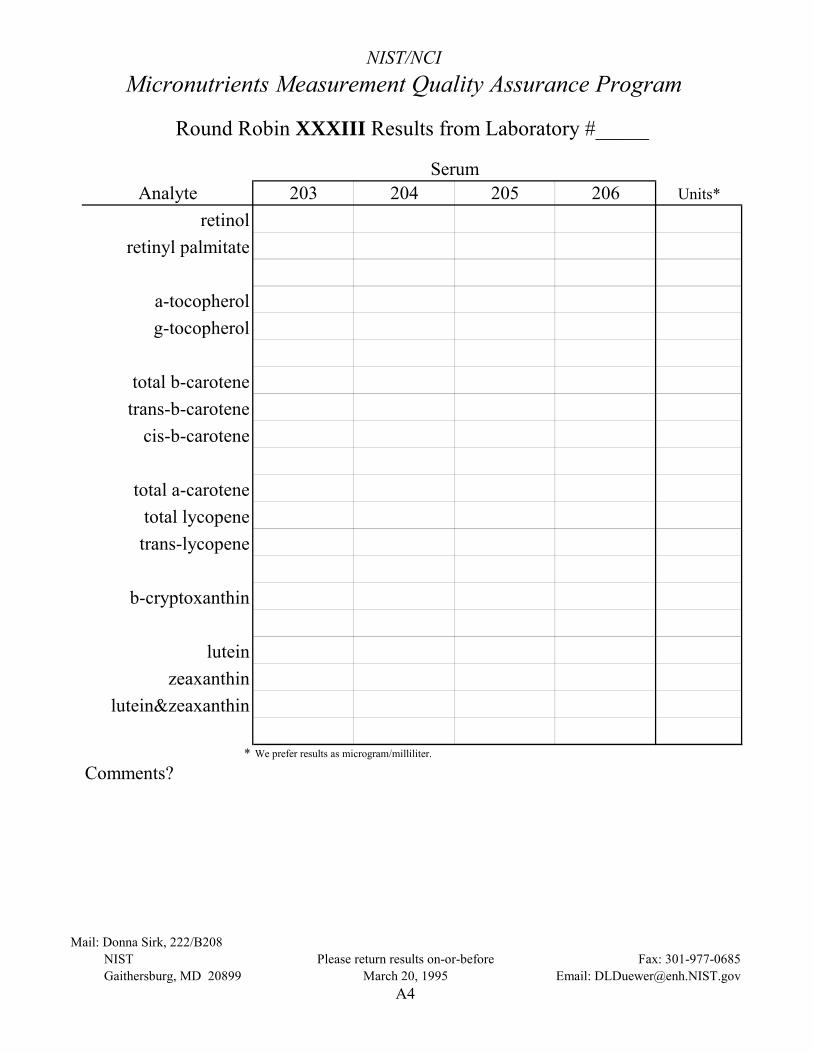
NIST/NCI Micronutrients Measurement Quality Assurance Program
Round Robin XXXIII Results from Laboratory #_____
Serum Analyte 203 204 205 206 Units*
retinol retinyl palmitate
a-tocopherol g-tocopherol
total b-carotene trans-b-carotene
cis-b-carotene
total a-carotene total lycopene trans-lycopene
b-cryptoxanthin
lutein zeaxanthin
lutein&zeaxanthin
* We prefer results as microgram/milliliter.
Comments?
Mail: Donna Sirk, 222/B208 NIST Please return results on-or-before Fax: 301-977-0685 Gaithersburg, MD 20899 March 20, 1995 Email: [email protected]
A4
Appendix B. Final Report for RR33
The following 11 pages are the final report for RR33 as provided to all participants: • Cover letter • A discussion entitled “Lies, Damn Lies, and Statistics” that:
o describes the nature of the test samples and details any previous distributions o summarizes aspects of the study that we believe may be of interest to the
participants • A “Report of (Meta)Analysis” that details the analysis of NIST measurements
B1
April 24, 1995
Dear Colleague:
UNITED STATES DEPARTMENT OF COMMERCE National Institute of Standards and Technology Gaithersburg, Maryland 20899-
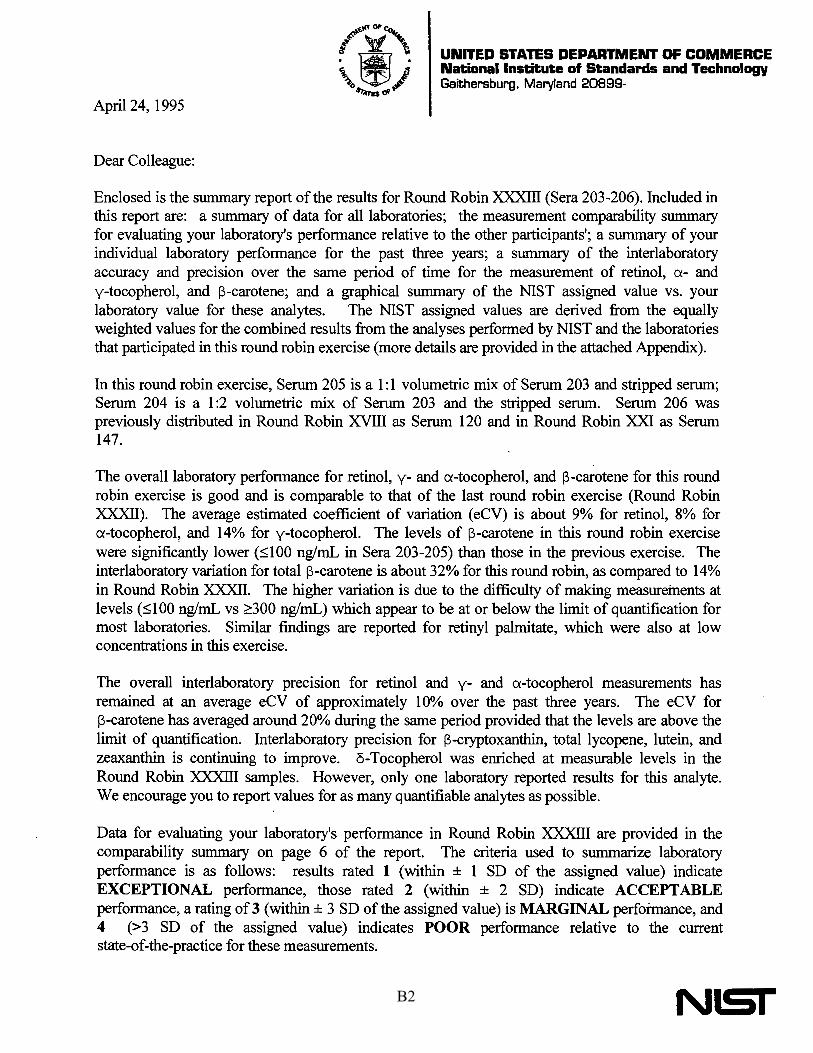
Enclosed is the summary report of the results for Round Robin XXXIII (Sera 203-206). Included in this report are: a summary of data for all laboratories; the measurement comparability summary for evaluating your laboratory's performance relative to the other participants'; a summary of your individual laboratory performance for the past three years; a summary of the interlaboratory accuracy and precision over the same period of time for the measurement of retinol, ex- and y-tocopherol, and !)-carotene; and a graphical summary of the NIST assigned value vs. your laboratory value for these analytes. The NIST assigned values are derived from the equally weighted values for the combined results from the analyses performed by NIST and the laboratories that participated in this round robin exercise (more details are provided in the attached Appendix).
In this round robin exercise, Serum 205 is a 1: 1 volumetric mix of Serum 203 and stripped serum; Serum 204 is a 1 :2 volumetric mix of Serum 203 and the stripped serum. Serum 206 was previously distributed in Round Robin XVID as Serum 120 and in Round Robin XXI as Serum 147.
The overall laboratory performance for retinol, y- and cx-tocopherol, and !)-carotene for this round robin exercise is good and is comparable to that of the last round robin exercise (Round Robin XXXII). The average estimated coefficient of variation ( eCV) is about 9% for retinol, 8% for cx-tocopherol, and 14% for y-tocopherol. The levels of !)-carotene in this round robin exercise were significantly lower (:s:;IOO ng/mL in Sera 203-205) than those in the previous exercise. The interlaboratory variation for total !)-carotene is about 32% for this round robin, as compared to 14% in Round Robin XXXII. The higher variation is due to the difficulty of making measureinents at levels (:s:;IOO ng/mL vs ~:300 ng/mL) which appear to be at or below the limit of quantification for most laboratories. Similar findings are reported for retinyl palmitate, which were also at low concentrations in this exercise.
The overall interlaboratory precision for retinol and y- and cx-tocopherol measurements has remained at an average eCV of approximately 10% over the past three years. The eCV for !)-carotene has averaged around 20% during the same period provided that the levels are above the limit of quantification. Interlaboratory precision for 13-cryptoxanthin, total lycopene, lutein, and zeaxanthin is continuing to improve. o-Tocopherol was enriched at measurable levels in the Round Robin XXXIII samples. However, only one laboratory reported results for this analyte. We encourage you to report values for as many quantifiable analytes as possible.
Data for evaluating your laboratory's performance in Round Robin XXXIII are provided in the comparability summary on page 6 of the report. The criteria used to summarize laboratory performance is as follows: results rated 1 (within ± 1 SD of the assigned value) indicate EXCEPTIONAL performance, those rated 2 (within ± 2 SD) indicate ACCEPT ABLE performance, a rating of 3 (within ± 3 SD of the assigned value) is MARGINAL performance, and 4 (> 3 SD of the assigned value) indicates POOR performance relative to the current state-of-the-practice for these measurements.
NISI B2

As you are probably aware, Standard Reference Material (SRM) 968a (Fat-Soluble Vitamins in Human Serum), which we recommend that you use to validate your methods, is sold out. The renewal material, SRM 968b, is not yet available for purchase. If your laboratory is out of SRM 968a, we suggest that you use for method validation control materials that are available in your laboratory or previously distributed (~1 year ago) round robin samples. If you do not have access to either of these options, please give me a call.
If you still have some SRM 968a and have concerns regarding your performance, or are a lab whose performance would be rated "POOR" based on the convention stated above, we suggest that you analyze all three levels of the SRM. If with minor method modifications, your measured values do not agree with the certified values, please contact us for consultation.
Samples for the food round robin (shipped only to those labs that requested these samples) and for Round Robin XXXIV were shipped during the last week of April. Results are due June 16 and feedback to labs is expected by July 24. We will attempt to follow this schedule as closely as possible.
The methods manual, Methods for Analysis of Cancer Chemopreventive Agents in Human Serum, is now available and has been distributed to all QA participants. If you have not received a copy, please notify Ms. Donna Sirk at 301/975-3174 or FAX: 301/977-0685. If you have further questions or concerns, please contact me at 301/975-3120.
· ce Brown Thomas Research Chemist Analytical Chemistry Division Chemical Science and Technology Laboratory
B3

"Lies, Damned Lies, and Statistics" Mark Twain
Well, we've done it again ... the attached Round Robin XXXIII Report incorporates a
major change in the NIST/NCI Micronutrients Measurement Quality Assurance Program
(NNMMQAP - spreadsheets just don't do N2M2QAP). Most of the Tables look much the
same, but we now value- and uncertainty-assign many serum analytes. We'll explain how
this is done in the Appendix, but the bottom line is that we provide you with something
approaching "true" concentration values - and we make more emphatic statements about
your measurement performance.
As before, the Report includes a fairly exhaustive analysis of your results (the
"Individualized" report) and a complete listing of everyone's results (the "All Lab" report).
Your "Individualized" has the following elements:
Pa e Contents
1 Your values, our assigned values, and the %bias between us.
2 %Bias barchart for retinol for your last 3 years' results
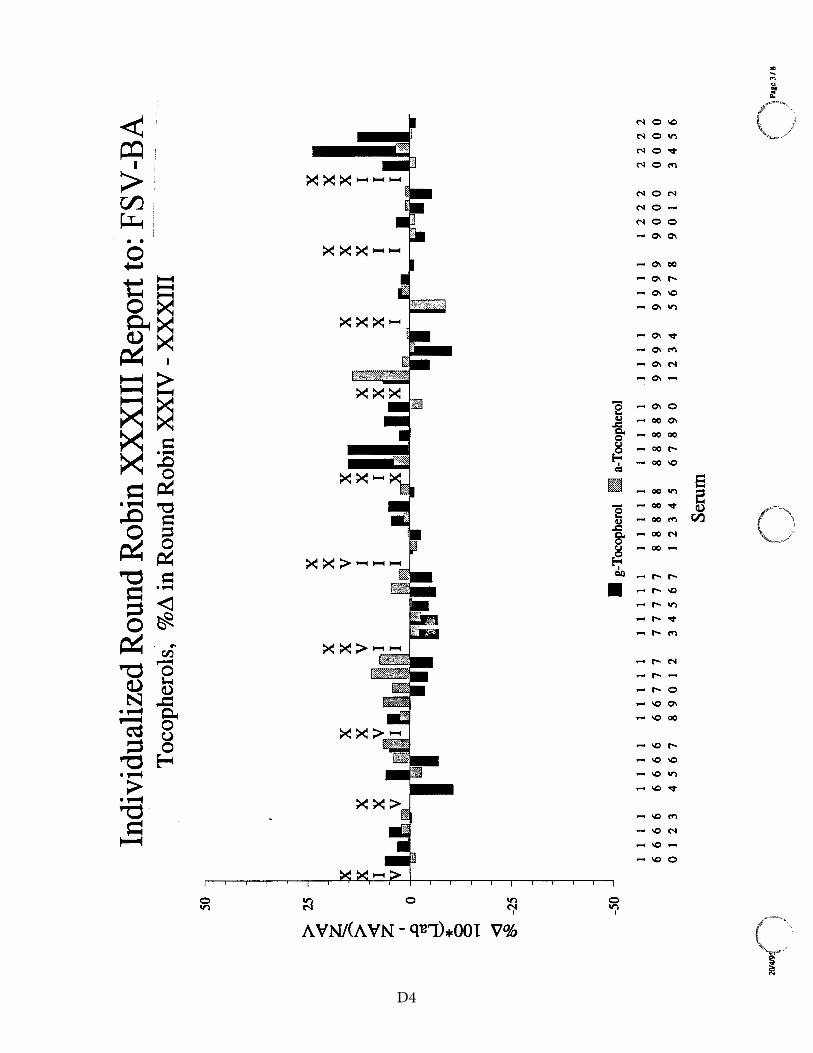
3 %Bias barchart for a- and y-tocopherol for your last 3 years' results
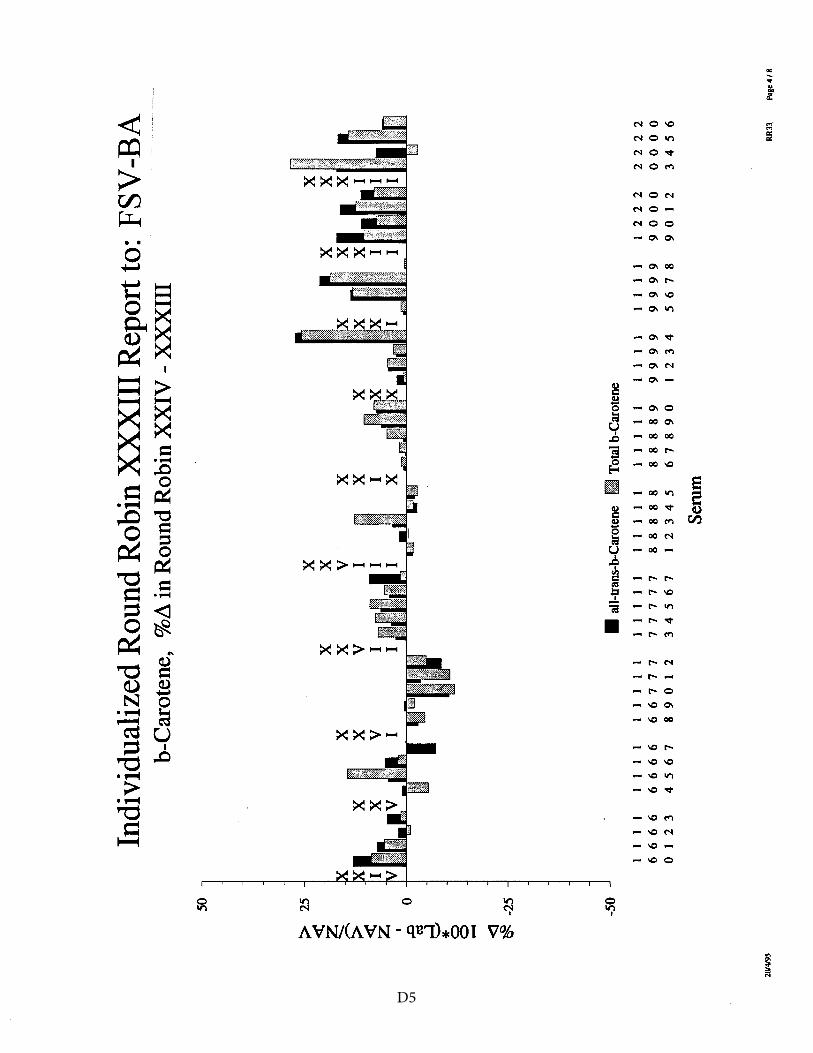
4 %Bias barchart for total and trans-P-carotene for your last 3 years' results
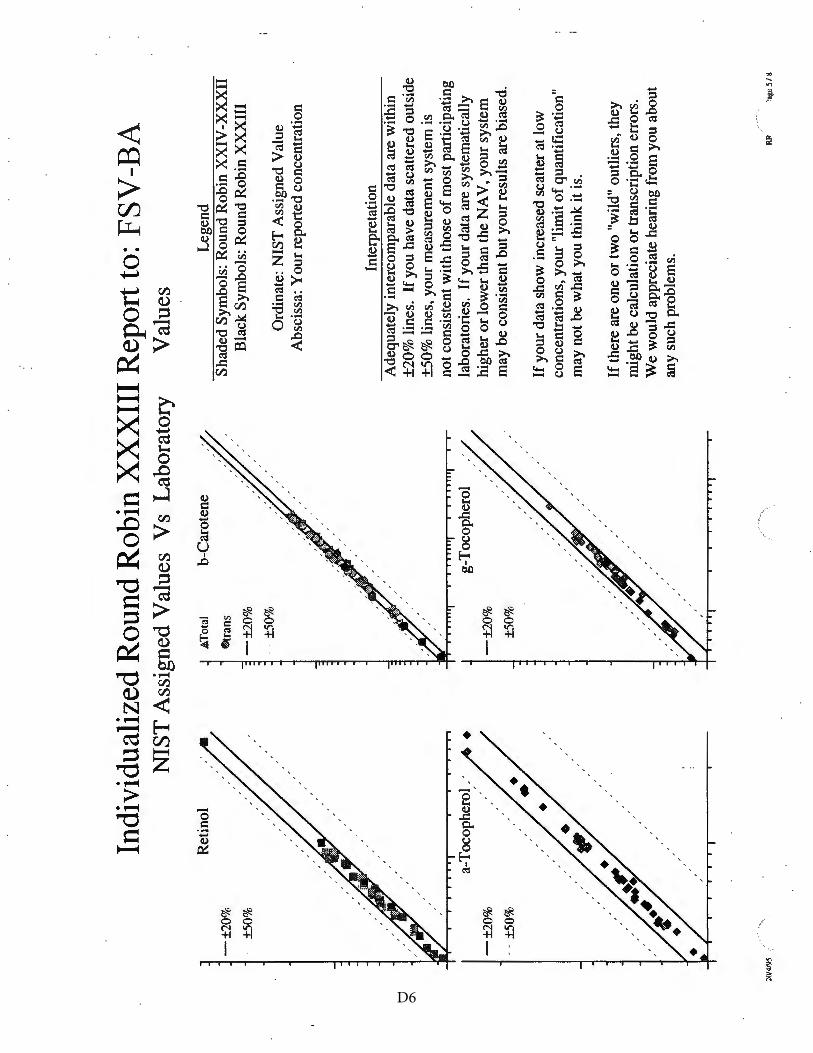
5 Our assigned value vs. your value scatterplots for retinol, a- and ytocopherol, total and trans-p-carotene, again for your last 3 years' results
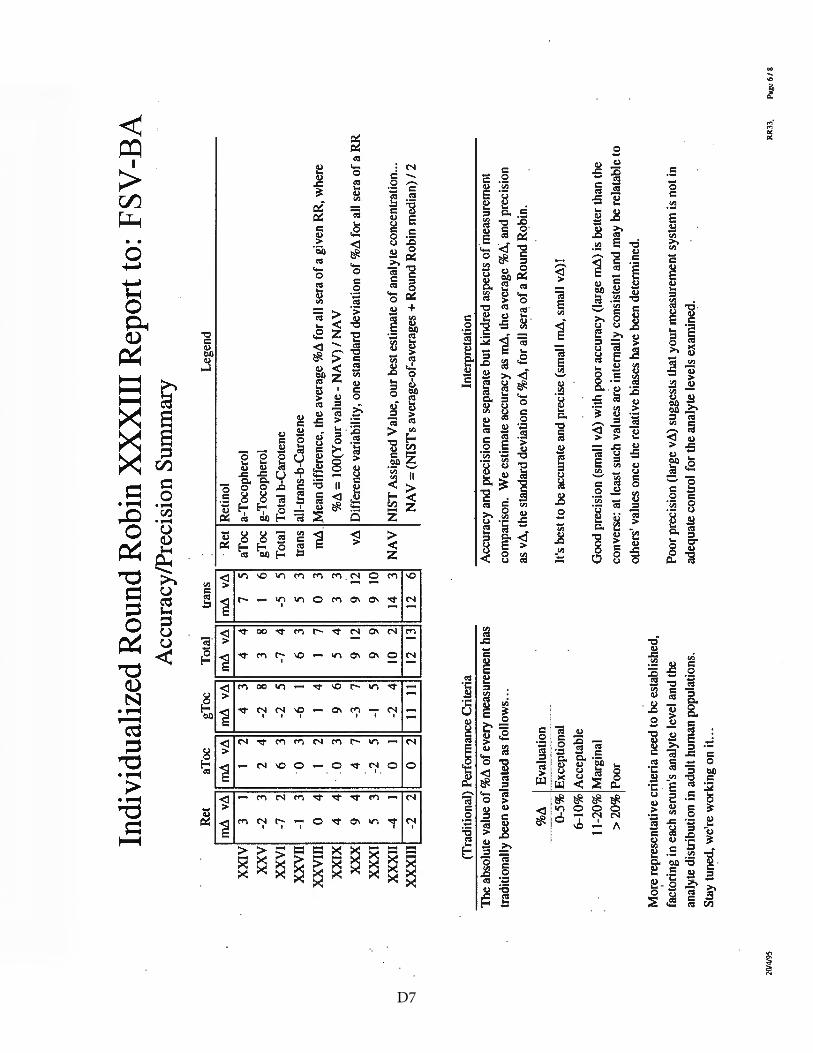
6 Accuracy/Precision Summary, yet again for your last 3 years' results. Note: this replaces the "(Provisional) Performance Summary" page!
7 Comparison-to-Known-Relationship plots for retinol, total a-carotene, total and trans-p-carotene, and a- and y- tocopherol
8 Comparison-to-Known-Relationship plots for total lycopene, p-cryptoxanthin, lutein, zeaxanthin, and lutein & zeaxanthin
The Comparison-to-Known-Relationship plots on pages 7 and 8 show your individual
results and a box-plot summary of the group's results, plotted against either historical
results or known dilution ratios. In detail:
Serum #206 was #120 in Round Robin XVIII and #147 in Round Robin XXI. The "true value" line is the average of the three Round Robin results.
Sera #203-205 are a dilution series. Serum #205 is a 1: 1 mixture of serum #203 and a delipidized serum diluent. Serum #204 is a 1 :2 mixture of serum #203 and the diluent. The "true value" has the slope of the designed-in ratios, and is pegged at the average (dilution corrected) assigned value over the three sera.
B4

Lies, Damn Lies, and Statistics
The "All Lab" report has the following elements:
Pa e Contents
1-4 A complete listing of all results provided by every laboratory and both NIST analysts, plus essential summary statistics.
5 A Legend for the above.
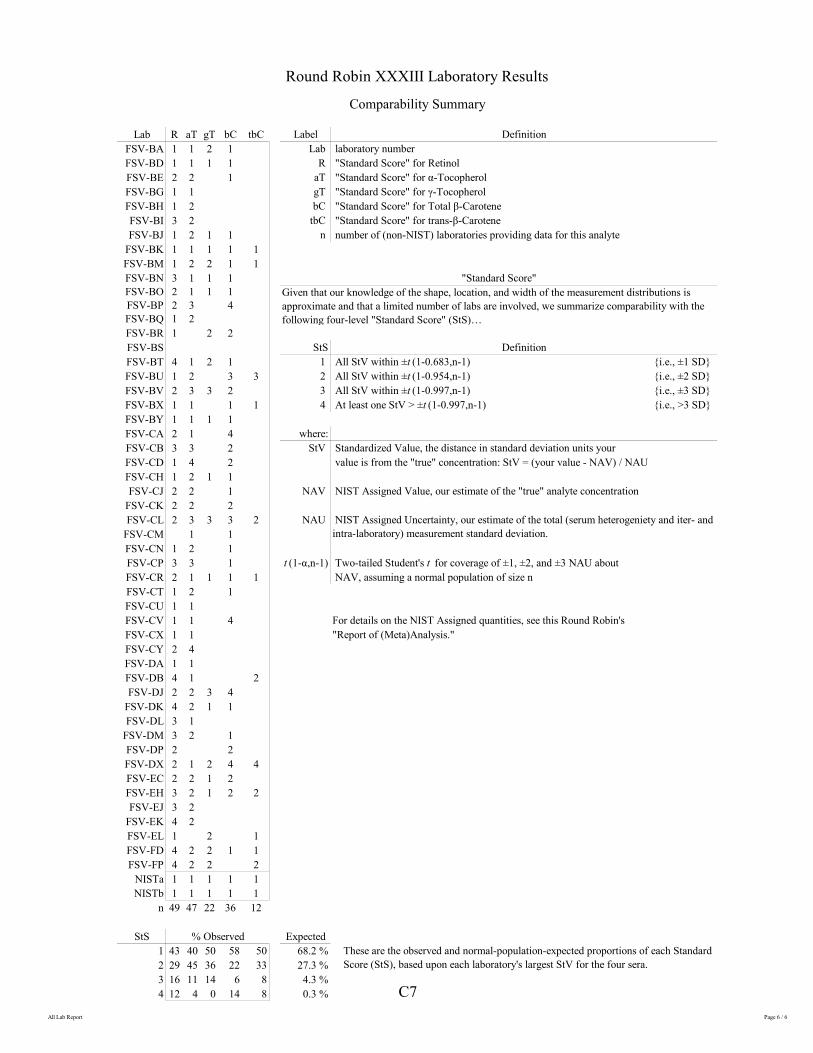
6 The "Measurement Comparability Summary"
Page2
The "Measurement Comparability Summary" (i,p<;>pularly? known as the "Score Card")
provides a four-level score for each laboratory for retinol, ex- and y-tocopherol, and total and
trans-J3-carotene. The score is based upon the worst-case differences between your
reported values and our assigned values, after scaling the values by the total measurement
uncertainty for each serum. Details of the calculations are provided along side the scores;
for those of you who don't want to dig through the details, note the following two points:
1) The NIST Assigned Value (NAV) is calculated as:
(the average of all NIST analyses)+ (the median from this Round Robin) 2
As the two summary values are equally weighted, our biases (who, us?) don't dominate the evaluation.
2) The NIST Assigned Uncertainty (NAU) is calculated as the maximum of:
a) 5% of NA V (this experience-based lower bound prevents too-low estimates)
b) the combined repeatability and material heterogeneity standard deviation estimated from NIST replicate analysis of multiple samples
c) the total estimated standard deviation from this Round Robin, estimated as before: eSD = 0.74(IQR), where IQR is the "InterQuartile Range" or central 50% span of all non-NIST values
This insures that NAU is at least as large as the observed interlaboratory estimate used last year, and (since we give ourselves worst-case samples) that any sample heterogeneity is fully accounted for.
The attached Appendix details the value and uncertainty assignments for all analytes
determined by either of the NIST analysts. As patience and time are limited, our promised
approach to documenting measurement consistency over time will (hopefully!) be part of
Round Robin XXXIV' s Report.
B5
Lies, Damn Lies, and Staristics
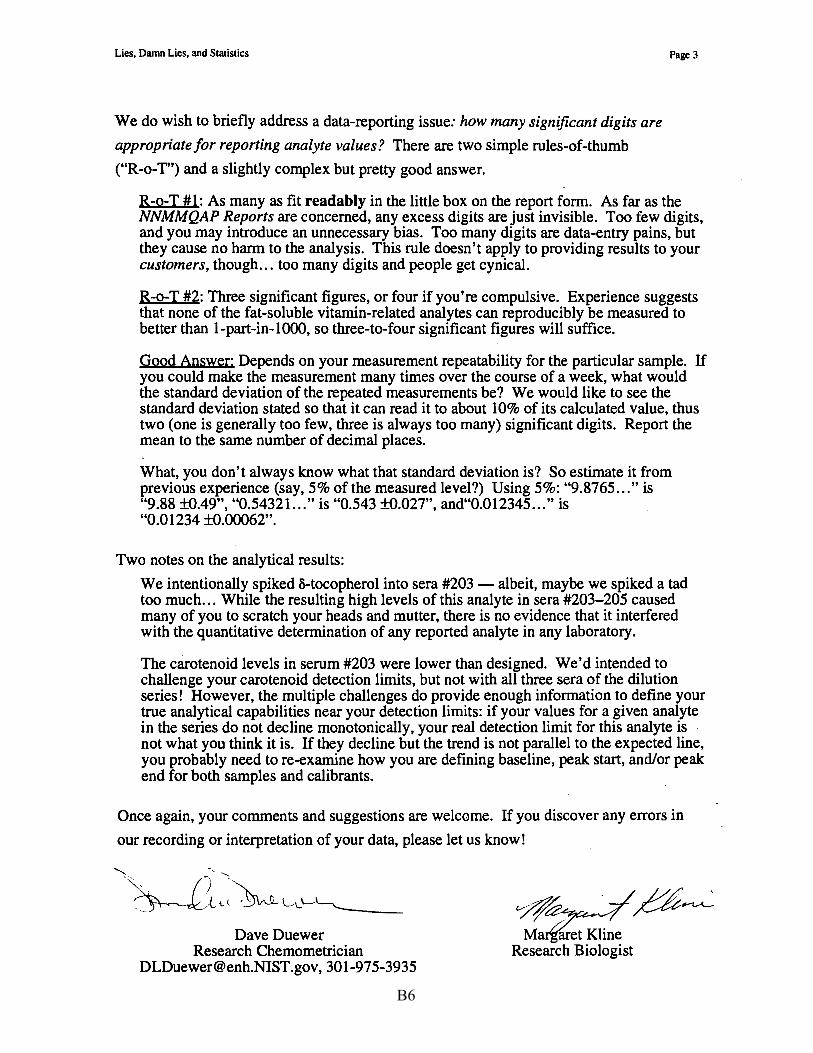
We do wish to briefly address a data-reporting issue: how many significant digits are
appropriate for reporting analyte values? There are tWo simple rules-of-thumb
("R-o-T') and a slightly complex but pretty good answer.
Page 3
R-o-T #1: As many as fit readably in the little box on the report form. As far as the NNMMQAP Reports are concerned, any excess digits are just invisible. Too few digits, and you may introduce an unnecessary bias. Too many digits are data-entry pains, but they cause no harm to the analysis. This rule doesn't apply to providing results to your customers, though ... too many digits and people get cynical.
R-o-T #2: Three significant figures, or four if you're compulsive. Experience suggests that none of the fat-soluble vitamin-related analytes can reproducibly be measured to better than 1-part-in-1000, so three-to-four significant figures will suffice.
Good Answer: Depends on your measurement repeatability for the particular sample. If you could make the measurement many times over the course of a week, what would the standard deviation of the repeated measurements be? We would like to see the standard deviation stated so that it can read it to about 10% of its calculated value, thus two (one is generally too few, three is always too many) significant digits. Report the mean to the same number of decimal places.
What, you don't always know what that standard deviation is? So estimate it from previous experience (say, 5% of the measured level?) Using 5%: "9.8765 ... " is "9 .88 ±0.49", "0.54321 ... " is "0.543 ±0.027", and"O.O 12345 ... " is "0.01234 ±0.00062".
Two notes on the analytical results:
We intentionally spiked S-tocopherol into sera #203 - albeit, maybe we spiked a tad too much ... While the resulting high levels of this analyte in sera #203-205 caused many of you to scratch your heads and mutter, there is no evidence that it interfered with the quantitative determination of any reported analyte in any laboratory.
The carotenoid levels in serum #203 were lower than designed. We'd intended to challenge your carotenoid detection limits, but not with all three sera of the dilution series! However, the multiple challenges do provide enough information to define your true analytical capabilities near your detection limits: if your values for a given analyte in the series do not decline monotonically, your real detection limit for this analyte is not what you think it is. If they decline but the trend is not parallel to the expected line, you probably need to re-examine how you are defining baseline, peak start, and/or peak end for both samples and calibrants.
Once again, your comments and suggestions are welcome. If you discover any errors in
our recording or interpretation of your data, please let us know!
.....,__ -, -
,~;L~~~~LL\--~ Dave Duewer
Research Chemometrician [email protected], 301-975-3935
~~~~ M~~-Kli~e
Research Biologist
B6
Lies, Damn Lies, and Statistics Page Al
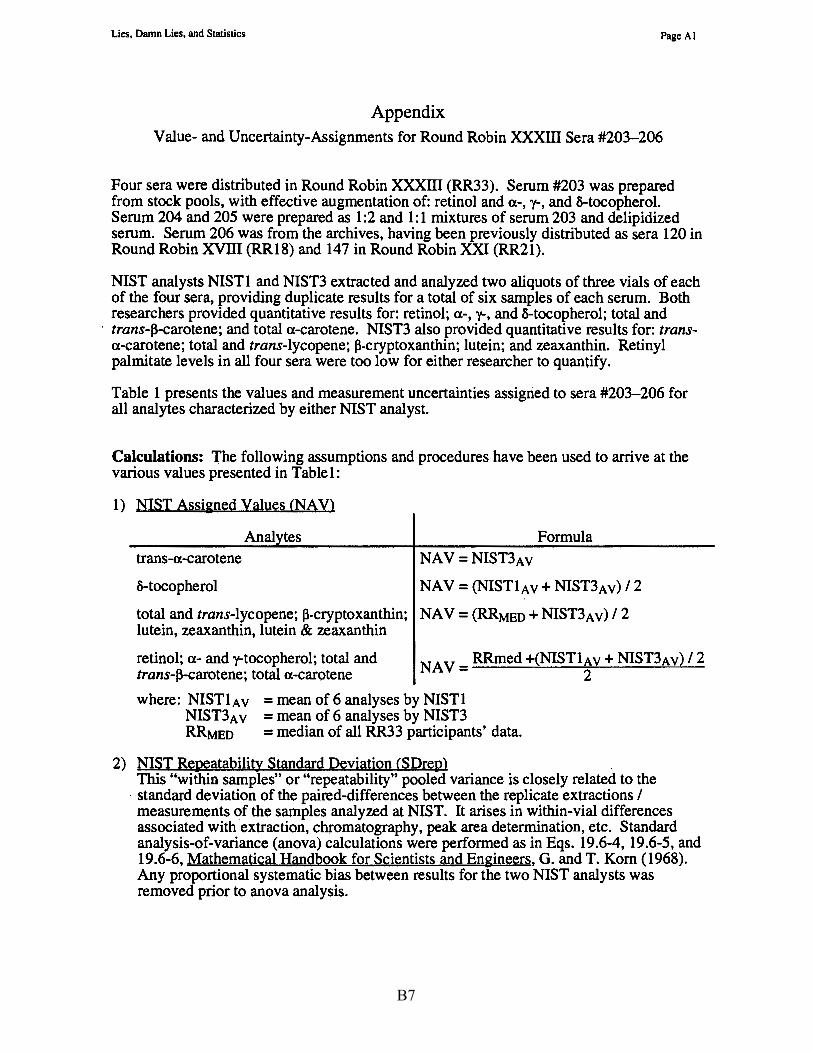
Appendix Value- and Uncertainty-Assignments for Round Robin XXXIII Sera #203-206
Four sera were distributed in Round Robin XXXIII (RR33). Serum #203 was prepared from stock pools, with effective augmentation of: retinol and a-, y-, and 0-tocopherol. Serum 204 and 205 were prepared as 1 :2 and 1: 1 mixtures of serum 203 and delipidized serum. Serum 206 was from the archives, having been previously distributed as sera 120 in Round Robin XVIII (RR18) and 147 in Round Robin XXI (RR21).
NIST analysts NISTl and NIST3 extracted and analyzed two aliquots of three vials of each of the four sera, providing duplicate results for a total of six samples of each serum. Both researchers provided quantitative results for: retinol; a-, y-, and 0-tocopherol; total and
· trans-13-carotene; and total a-carotene. NIST3 also provided quantitative results for: transa-carotene; total and trans-lycopene; 13-cryptoxanthin; lutein; and zeaxanthin. Retinyl palmitate levels in all four sera were too low for either researcher to quantify.
Table 1 presents the values and measurement uncertainties assigned to sera #203-206 for all analytes characterized by either NIST analyst.
Calculations: The following assumptions and procedures have been used to arrive at the various values presented in Tablet:
1) NIST Assi~ned Values CNAV)
Anal tes trans-a-carotene
Formula
NAV=NIST3Av
0-tocopherol NAV = (NISTlAv + NIST3Av) / 2
total and trans-lycopene; 13-cryptoxanthin; NAV = (RRMED + NIST3Av) / 2 lutein, zeaxanthin, lutein & zeaxanthin
retinol; a- and y-tocopherol; total and trans-13-carotene; total a-carotene
NAV = RRmed +(NISTl~v + NIST3Av) / 2
where: NISTlAv =mean of 6 analyses by NISTl NIST3 Av = mean of 6 analyses by NIST3 RRMED =median of all RR33 participants' data.
2) NIST Repeatability Standard Deviation CSDrep) . This "within samples" or "repeatability" pooled variance is closely related to the
· standard deviation of the paired-differences between the replicate extractions I measurements of the samples analyzed at NIST. It arises in within-vial differences associated with extraction, chromatography. peak area determination, etc. Standard analysis-of-variance (anova) calculations were performed as in Eqs. 19.6-4, 19.6-5, and 19.6-6, Mathematical Handbook for Scientists and Engineers, G. and T. Korn (1968). Any proportional systematic bias between results for the two NIST analysts was removed prior to anova analysis.
B7
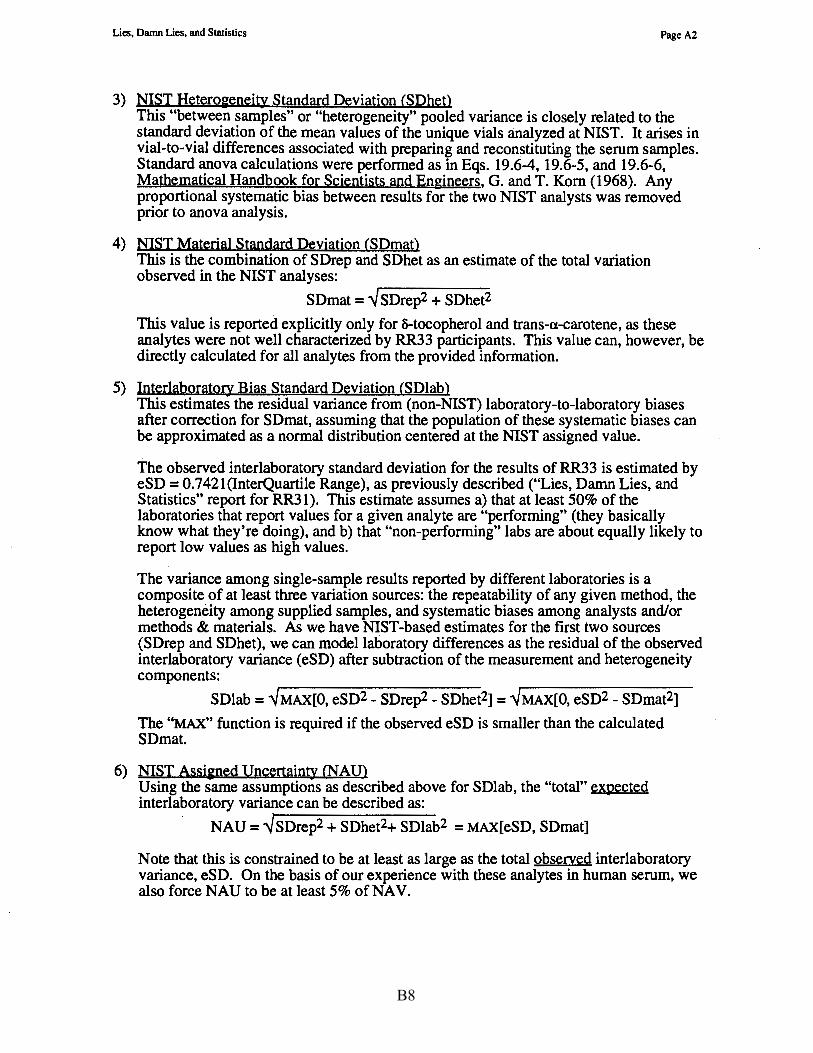
Lies, Damn Lies, and Statistics Page A2
3) NIST Heterogeneity Standard Deviation CSDhet) This "between samples" or "heterogeneity" pooled variance is closely related to the standard deviation of the mean values of the unique vials analyzed at NIST. It arises in vial-to-vial differences associated with preparing and reconstituting the serum samples. Standard anova calculations were performed as in Eqs. 19.6-4, 19.6-5, and 19.6-6, Mathematical Handbook for Scientists and Engineers, G. and T. Korn (1968). Any proportional systematic bias between results for the two NIST analysts was removed prior to anova analysis.
4) NIST Material Standard Deviation CSDmat) This is the combination of SDrep and SDhet as an estimate of the total variation observed in the NIST analyses:
SDmat = -..J SDrep2 + SDhet2
This value is reported explicitly only for S-tocopherol and trans-a-carotene, as these analytes were not well characterized by RR33 participants. This value can, however, be directly calculated for all analytes from the provided information.
5) Interlaboratoty Bias Standard Deviation CSDlab) This estimates the residual variance from (non-NIST) laboratory-to-laboratory biases after correction for SDmat, assuming that the population of these systematic biases can be approximated as a normal distribution centered at the NIST assigned value.
The observed interlaboratory standard deviation for the results of RR33 is estimated by eSD = 0.7421(InterQuartile Range), as previously described ("Lies, Damn Lies, and Statistics" report for RR31). This estimate assumes a) that at least 50% of the laboratories that report values for a given analyte are "performing" (they basically know what they're doing), and b) that "non-performing" labs are about equally likely to report low values as high values.
The variance among single-sample results reported by different laboratories is a composite of at least three variation sources: the repeatability of any given method, the heterogeneity among supplied samples, and systematic biases among analysts and/or methods & materials. As we have NIST-based estimates for the first two sources (SDrep and SDhet), we can model laboratory differences as the residual of the observed interlaboratory variance (eSD) after subtraction of the measurement and heterogeneity components:
SDlab = "1MAX[0, eSD2 - SDrep2 - SDhet2] = "1MAX[0, eSD2 - SDmat2]
The ''MAX" function is required if the observed eSD is smaller than the calculated SDmat.
6) NIST Assigned Uncertainty CNAUl Using the same assumptions as described above for SDlab, the "total" expected interlaboratory variance can be described as:
NAU= ..Jsorep2 + SDhet2+ SDlab2 = MAX[eSD, SDmat]
Note that this is constrained to be at least as large as the total observed interlaboratory variance, eSD. On the basis of our experience with these analytes in human serum, we also force NAU to be at least 5% of NA V.
B8
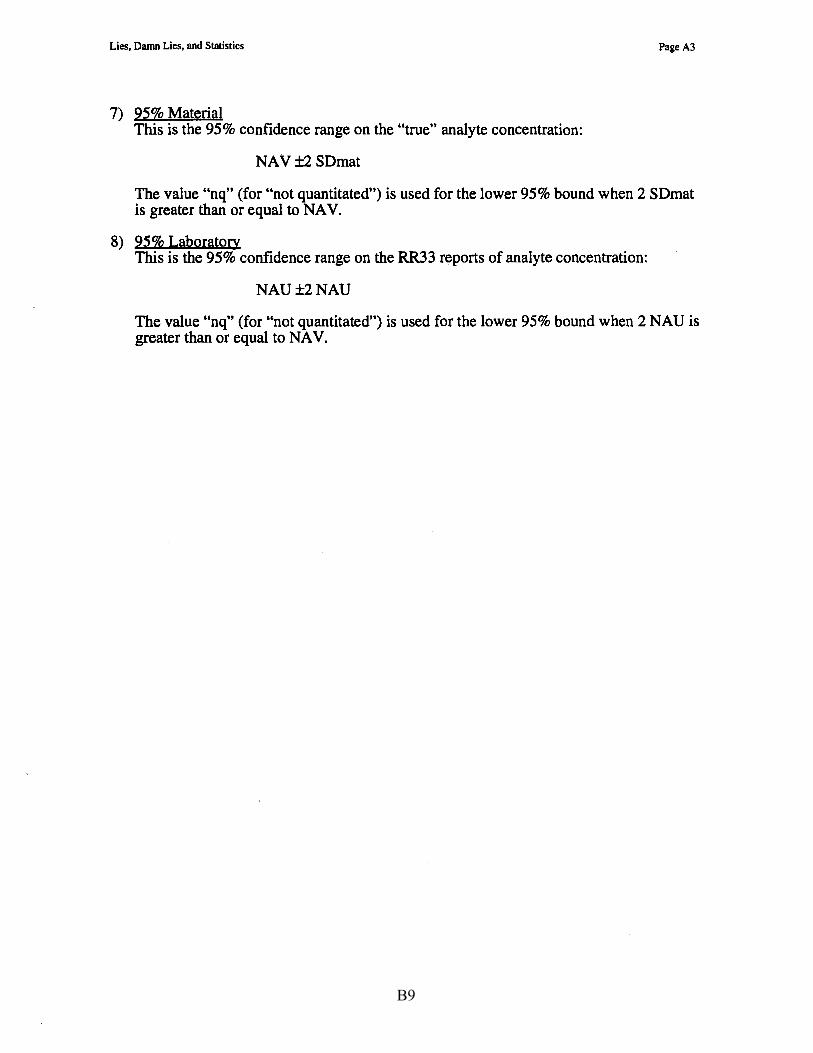
Lies, Damn Lies, and Statistics Page A3
7) 95% Material This is the 95% confidence range on the "true" analyte concentration:
NAV±2SDmat
The value "nq" (for "not quantitated") is used for the lower 95% bound when 2 SDmat is greater than or equal to NAV.
8) 95% Laboratoiy This is the 95% confidence range on the RR33 reports of analyte concentration:
NAU±2NAU
The value "nq" (for "not quantitated") is used for the lower 95% bound when 2 NAU is greater than or equal to NAV.
B9
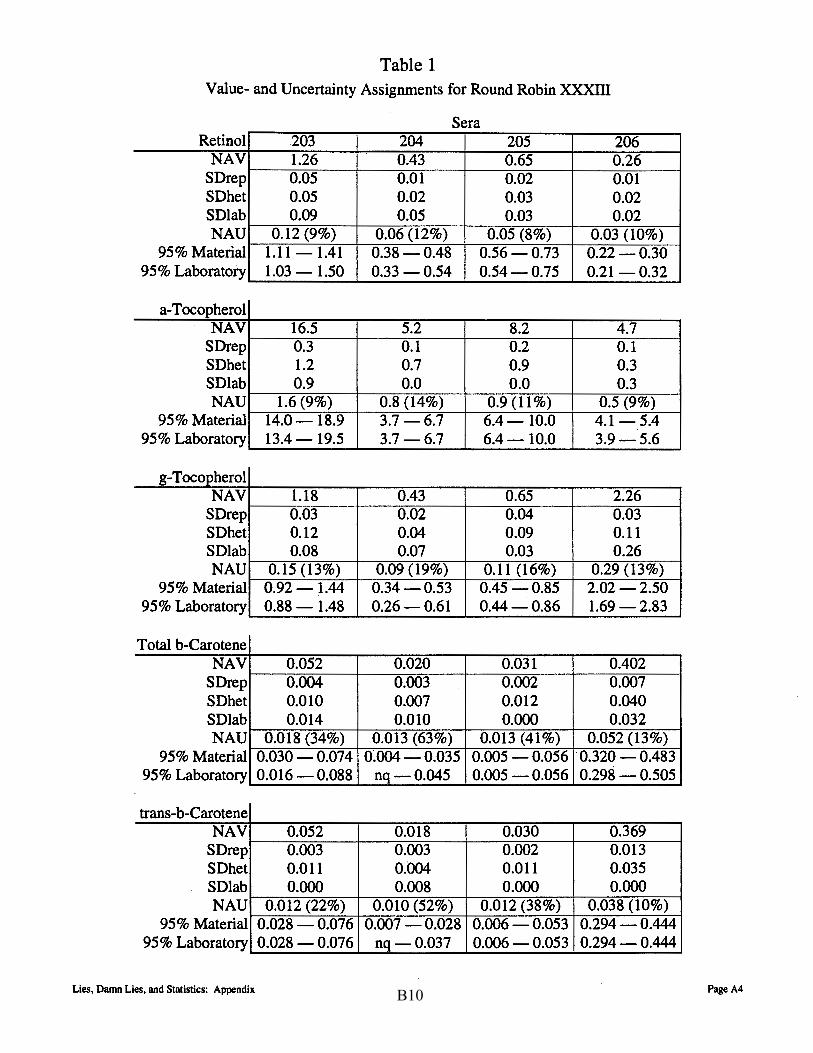
Table 1 Value- and Uncertainty Assignments for Round Robin XXXIII
Sera Retinol 203 204 205 206
NAV 1.26 0.43 0.65 0.26 SDrep 0.05 0.01 0.02 0.01 SDhet 0.05 0.02 0.03 0.02 SD lab 0.09 0.05 0.03 0.02 NAU 0.12 (9%) 0.06 (12%) 0.05 (8%) 0.03 (10%)
95% Material 1.11 - 1.41 0.38-0.48 0.56-0.73 0.22-0.30 95% Laboratory 1.03-1.50 0.33-0.54 0.54-0.75 0.21-0.32
a-Tocopherol NAV 16.5 5.2 8.2 4.7
SDrep 0.3 0.1 0.2 0.1 SD bet 1.2 0.7 0.9 0.3 SD lab 0.9 0.0 0.0 0.3 NAU 1.6 (9%) 0.8 (14%) 0.9 (11%) 0.5 (9%)
95% Material 14.0-18.9 3.7-6.7 6.4-10.0 4.1-5.4 95% Laboratory 13.4-19.5 3.7-6.7 6.4-10.0 3.9-5.6
g-Tocopherol NAV 1.18 0.43 0.65 2.26
SDrep 0.03 0.02 0.04 0.03 SDhet 0.12 0.04 0.09 0.11 SD lab 0.08 0.07 0.03 0.26 NAU 0.15 (13%) 0.09 (19%) 0.11 (16%) 0.29 (13%)
95% Material 0.92-1.44 0.34-0.53 0.45 - 0.85 2.02-2.50 95% Laboratory 0.88-1.48 0.26-0.61 0.44-0.86 1.69-2.83
Total b-Carotene NAV 0.052 0.020 0.031 0.402
SDrep 0.004 0.003 0.002 0.007 SDhet 0.010 0.007 0.012 0.040 SD lab 0.014 0.010 0.000 0.032 NAU 0.018 (34%) 0.013 (63%) 0.013 (41%) 0.052 (13%)
95% Material 0.030 - 0.074 0.004 - 0.035 0.005 - 0.056 0.320 - 0.483 95% Laboratory 0.016 - 0.088 nq-0.045 0.005 - 0.056 0.298 - 0.505
trans-b-Carotene NAV 0.052 0.018 0.030 0.369
SDrep 0.003 0.003 0.002 0.013 SDhet 0.011 0.004 0.011 0.035 SD lab 0.000 0.008 0.000 0.000 NAU 0.012 (22%) 0.010 (52%) 0.012 (38%) 0.038 (10%)
95% Material 0.028 - 0.076 0.007 - 0.028 0.006 - 0.053 0.294 - 0.444 95% Laboratory 0.028 - 0.076 nq-0.037 0.006 - 0.053 0.294 - 0.444
Lies, Damn Lies, and Statistics: Appendix Page A4 B10
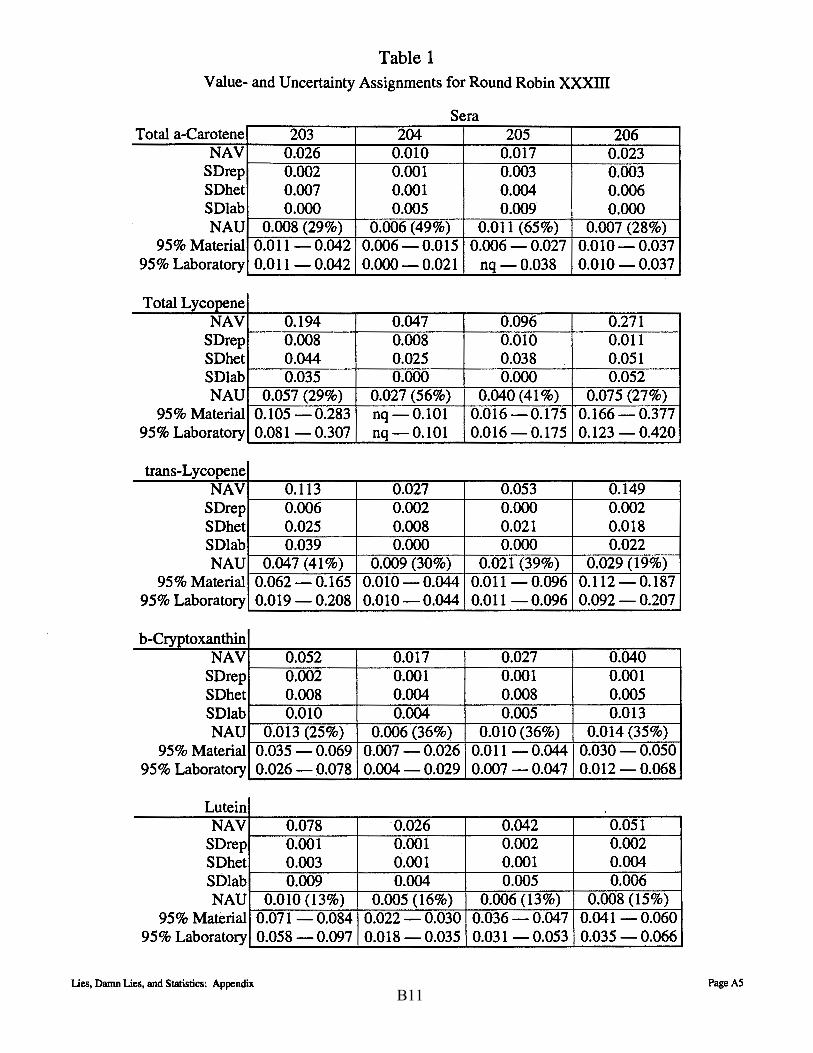
Table 1 Value- and Uncertainty Assignments for Round Robin :xxxm
Sera Total a-Carotene 203 204 205 206
NAV 0.026 0.010 0.017 0.023 SDrep 0.002 0.001 0.003 0.003 SDhet 0.007 0.001 0.004 0.006 SD lab 0.000 0.005 0.009 0.000 NAU 0.008 (29%) 0.006 (49%) 0.011 (65%) 0.007 (28%)
95% Material 0.011-0.042 0.006-0.015 0.006 - 0.027 0.010 - 0.037 95% Laboratory 0.011 - 0.042 0.000 - 0.021 nq-0.038 0.010 - 0.037
Total Lycopene NAV 0.194 0.047 0.096 0.271
SDrep 0.008 0.008 0.010 0.011 SDhet 0.044 0.025 0.038 0.051 SD lab 0.035 0.000 0.000 0.052 NAU 0.057 (29%) 0.027 (56%) 0.040 (41 %) 0.075 (27%)
95% Material 0.105 - 0.283 nq-0.101 0.016-0.175 0.166 - 0.377 95% Laboratory 0.081 - 0.307 nq-0.101 0.016-0.175 0.123 - 0.420
trans-Lycopene NAV 0.113 0.027 0.053 0.149
SDrep 0.006 0.002 0.000 0.002 SD bet 0.025 0.008 0.021 0.018 SD lab 0.039 0.000 0.000 0.022 NAU 0.047 (41%) 0.009 (30%) 0.021 (39%) 0.029 (19%)
95% Material 0.062 - 0.165 0.010 - 0.044 0.011 - 0.096 0.112-0.187 95% Laboratory 0.019 - 0.208 0.010- 0.044 0.011 - 0.096 0.092 - 0.207
b-Cryptoxanthin NAV 0.052 0.017 0.027 0.040
SDrep 0.002 0.001 0.001 0.001 SDhet 0.008 0.004 0.008 0.005 SD lab 0.010 0.004 0.005 0.013 NAU 0.013 (25%) 0.006 (36%) 0.010 (36%) 0.014 (35%)
95% Material 0.035 - 0.069 0.007 - 0.026 0.011 - 0.044 0.030 - 0.050 95% Laboratory 0.026 - 0.078 0.004 - 0.029 0.007 - 0.047 0.012 - 0.068
Lute in NAV 0.078 0.026 0.042 0.051
SDrep 0.001 0.001 0.002 0.002 SD bet 0.003 0.001 0.001 0.004 SD lab 0.009 0.004 0.005 0.006 NAU 0.010 (13%) 0.005 (16%) 0.006 (13%) 0.008 (15%)
95% Material 0.071 - 0.084 0.022 - 0.030 0.036 - 0.047 0.041 - 0.060 95% Laboratory 0.058 - 0.097 0.018 - 0.035 0.031 - 0.053 0.035 - 0.066
Lies, Damn Lies, and Statistics: Appendix Page A5 B11
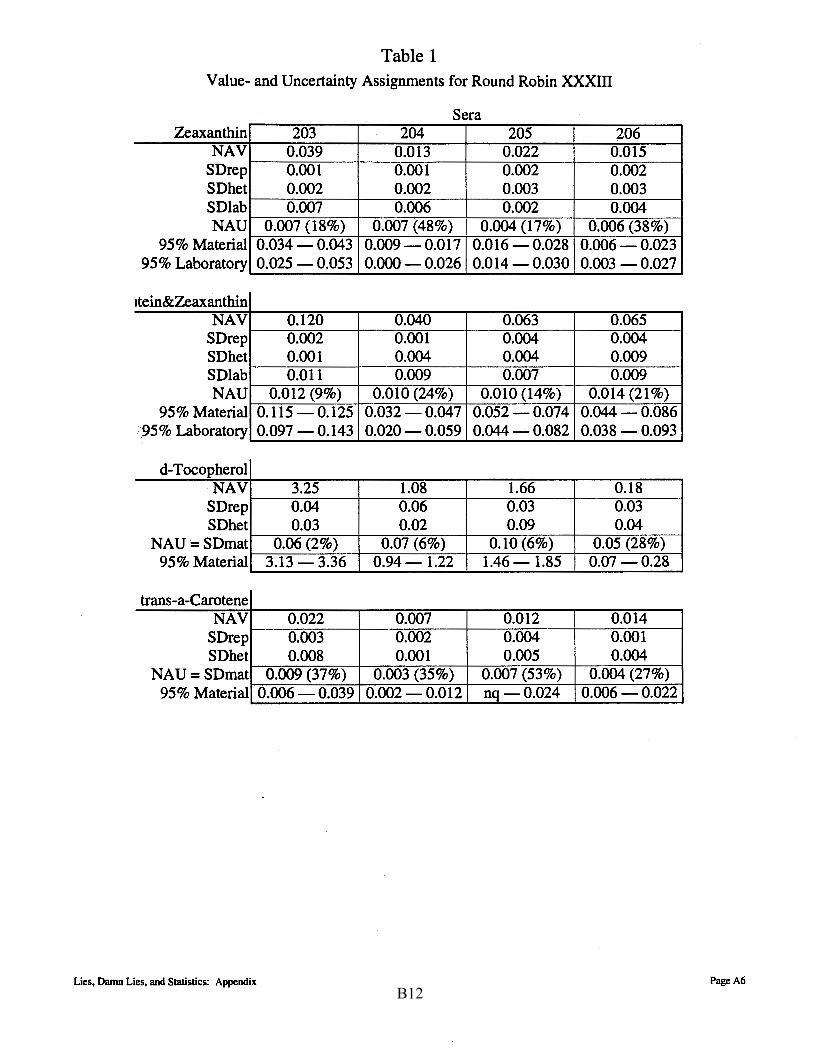
Table 1 Value- and Uncertainty Assignments for Round Robin XXXIII
Sera Zeaxanthin 203 204 205 206
NAV 0.039 0.013 0.022 0.015 SDrep 0.001 0.001 0.002 0.002 SDhet 0.002 0.002 0.003 0.003 SD lab 0.007 0.006 0.002 0.004 NAU 0.007 (18%) 0.007 (48%) 0.004 (17%) 0.006 (38%)
95% Material 0.034 - 0.043 0.009 - 0.017 0.016 - 0.028 0.006 - 0.023 95% Laboratory 0.025 - 0.053 0.000 - 0.026 0.014- 0.030 0.003 - 0.027
1tein&Zeaxanthin NAV 0.120 0.040 0.063 0.065
SDrep 0.002 0.001 0.004 0.004 SDhet 0.001 0.004 0.004 0.009 SD lab 0.011 0.009 0.007 0.009 NAU 0.012 (9%) 0.010 (24%) 0.010 (14%) 0.014 (21%)
95% Material 0.115-0.125 0.032 - 0.047 0.052 - 0.074 0.044 - 0.086 i95% Laboratory 0.097-0.143 0.020 - 0.059 0.044 - 0.082 0.038 - 0.093
d-Tocopherol NAV 3.25 1.08 1.66 0.18
SDrep 0.04 0.06 0.03 0.03 SDhet 0.03 0.02 0.09 0.04
NAU= SDrnat 0.06 (2%) 0.07 (6%) 0.10 (6%) 0.05 (28%) 95% Material 3.13-3.36 0.94-1.22 1.46-1.85 0.07-0.28
trans-a-Carotene NAV 0.022 0.007 0.012 0.014
SDrep 0.003 0.002 0.004 0.001 SDhet 0.008 0.001 0.005 0.004
NAU = SDrnat 0.009 (37%) 0.003 (35%) 0.007 (53%) 0.004 (27%) 95% Material 0.006 - 0.039 0.002 - 0.012 nq - 0.024 0.006 - 0.022
Lies, Damn Lies, and Statistics: Appendix Page A6 B12

Appendix C. “All-Lab Report” for RR33
The following 6 pages are the “All-Lab Report” as provided to all participants, with two exceptions: • the participant identifiers (Lab) have been altered. • the order in which the participant results are listed has been altered.
The data summary in the “All-Lab Report” has been altered to ensure confidentiality of identification codes assigned to laboratories. The only attributed results are those reported by NIST. The NIST results are not used in the assessment of the consensus summary results of the study.
C1

Round Robin XXXIII Laboratory Results Values in µg/mL
Retinol Retinyl Palmitate α-Tocopherol γ-Tocopherol 203 204 205 206Lab
FSV-BA FSV-BD FSV-BE FSV-BG FSV-BH FSV-BI FSV-BJ
FSV-BK FSV-BM FSV-BN FSV-BO FSV-BP FSV-BQ FSV-BR FSV-BS FSV-BT FSV-BU FSV-BV FSV-BX FSV-BY FSV-CA FSV-CB FSV-CD FSV-CH FSV-CJ
FSV-CK FSV-CL
FSV-CM FSV-CN FSV-CP FSV-CR FSV-CT FSV-CU FSV-CV FSV-CX FSV-CY FSV-DA FSV-DB FSV-DJ
FSV-DK FSV-DL
FSV-DM FSV-DP FSV-DX FSV-EC FSV-EH FSV-EJ
FSV-EK FSV-EL FSV-FD FSV-FP
1.23 0.414 0.632 0.267 1.31 0.426 0.636 0.270 1.29 0.512 0.632 0.275 1.20 0.400 0.590 0.250 1.19 0.415 0.617 0.261 1.05 0.352 0.492 0.186 1.27 0.418 0.610 0.269 1.34 0.423 0.636 0.263 1.25 0.425 0.645 0.266 1.34 0.455 0.654 0.329 1.18 0.352 0.550 0.227 1.35 0.478 0.716 0.308 1.29 0.450 0.650 0.270 1.29 0.445 0.674 0.283
1.19 0.725 0.653 0.271 1.36 0.434 0.652 0.286 1.25 0.405 0.706 0.228 1.36 0.456 0.654 0.283 1.20 0.404 0.623 0.269 1.20 0.380 0.620 0.260 1.57 0.518 0.770 0.327 1.37 0.461 0.684 0.259 1.33 0.428 0.608 0.249 1.40 0.435 0.611 0.254 1.15 0.353 0.586 0.244 1.14 0.431 0.586 0.310
1.19 0.388 0.613 0.276 0.99 0.321 0.519 0.209 1.48 0.480 0.730 0.300 1.28 0.426 0.642 0.246 1.18 0.416 0.611 0.259 1.24 0.443 0.661 0.263 1.22 0.470 0.660 0.270 1.27 0.375 0.649 0.270 1.21 0.470 0.680 0.280 1.29 0.511 0.667 0.648 1.24 0.440 0.730 0.290 1.17 0.300 0.440 0.196 1.29 0.318 0.695 0.299 1.13 0.367 0.493 0.248 1.19 0.404 0.586 0.242 1.03 0.398 0.563 0.258 1.32 0.491 0.701 0.299 1.44 0.558 0.756 0.303 1.31 0.553 0.718 0.253 1.50 0.653 0.909 0.454 1.32 0.410 0.640 0.290 1.71 0.507 0.713 0.291 0.81 0.446 0.829 0.272
203 204 205 206 0.129 0.073 0.118 0.059
0.066 0.045 0.080 nq nq nq nq nq
0.114 0.042 0.123 nd 0.131 0.086 0.117 nq
0.068 0.072 0.066
0.084 0.079 0.091 nd nq nq nq nq
0.172 0.049 0.085 nd
nq 0.027 0.022 0.035
0.137 0.018 0.028 0.080
0.170 0.040 0.030 0.030
nd nd nd nd
203 204 205 206 16.2 5.37 8.16 4.76 16.0 5.43 8.27 4.84 17.6 6.36 8.56 5.03 16.7 5.48 8.25 4.74 18.1 6.22 9.18 5.28 18.3 6.02 9.25 4.88 17.5 6.98 9.70 5.16 16.7 5.47 8.04 4.31 18.2 5.80 8.80 5.30 18.0 5.16 8.95 4.57 17.7 5.87 8.00 4.92 19.4 7.14 10.67 6.08 18.1 4.10 9.30 5.40
15.5 5.35 8.02 4.43 16.1 4.73 8.05 4.15 17.5 6.07 10.14 5.25 17.3 5.55 8.47 4.91 16.8 4.83 8.38 4.84 17.1 5.74 8.75 4.64 20.0 7.28 10.19 6.38 21.7 7.02 10.35 5.58 19.4 5.90 8.54 4.81 16.8 5.76 7.80 5.66 14.7 5.25 7.79 4.60 15.3 6.27 8.36 5.89 17.1 5.60 8.90 5.10 17.4 5.48 9.50 4.78 11.7 3.81 5.98 3.28 16.8 5.90 8.80 5.10 17.0 5.69 8.32 5.32 15.5 4.87 7.51 4.72 17.2 5.32 8.80 4.75 15.5 5.96 8.49 4.81 22.1 5.30 8.84 4.82 16.6 5.71 8.87 4.75 15.6 5.59 8.42 4.99 17.0 6.60 8.80 5.20 18.3 6.72 9.20 5.30 17.1 5.10 8.66 5.16 18.7 5.56 8.30 5.20
15.2 5.17 8.10 4.60 13.5 5.04 7.20 4.12 19.6 6.63 10.02 5.49 18.8 5.80 9.18 5.17 19.0 5.34 9.14 4.40
16.4 5.95 9.22 4.49 17.3 6.77 8.61 5.26
203 204 205 206 1.26 0.54 0.73 2.23
1.22 0.49 0.63 2.48
1.04 0.37 0.55 1.95 1.34 0.52 0.69 2.47 1.45 0.62 0.80 2.61
0.96 0.18 0.52 2.13
1.17 0.45 0.59 2.06 1.09 0.32 0.50 2.06 1.31 0.50 0.77 2.53 1.21 0.48 0.62 2.27 1.54 0.45 0.74 2.30
1.07 0.37 0.54 2.03 1.23 0.41 0.55 2.29
1.11 0.48 0.66 2.49
1.09 0.22 0.43 2.02 1.19 0.26 1.26
1.05 0.62 0.57 2.83 1.13 0.39 0.61 2.39
1.23 0.45 0.67 2.22
1.52 0.45 0.66 2.45
1.45 0.65 0.93 2.68
1.33 0.46 0.67 2.33 n 49 49 49 49 9 9 10 5 47 47 47 47 22 21 22 22
Min 0.81 0.300 0.440 0.186 0.066 0.018 0.022 0.030 11.7 3.81 5.98 3.28 0.96 0.18 0.26 1.26 Median 1.27 0.428 0.645 0.270 0.129 0.045 0.083 0.059 17.1 5.69 8.66 4.91 1.22 0.45 0.63 2.30
Max 1.71 0.725 0.909 0.648 0.172 0.086 0.123 0.080 22.1 7.28 10.67 6.38 1.54 0.65 0.93 2.83 eSD 0.11 0.044 0.052 0.025 0.061 0.027 0.052 0.031 1.5 0.55 0.74 0.43 0.17 0.09 0.11 0.28 eCV 8 10 8 9 47 59 63 53 9 10 9 9 14 20 18 12
1.22 0.415 0.611 0.254 nq nq nq nq 16.4 4.94 8.08 4.77 1.08 0.42 0.70 2.21 1.29 0.460 0.688 0.265 nq nd nd nd 15.2 4.63 7.62 4.50 1.23 0.40 0.63 2.25
1.26 0.433 0.647 0.265 16.5 5.24 8.26 4.77 1.19 0.43 0.65 2.26 0.12 0.049 0.059 0.029 1.6 0.87 0.92 0.51 0.17 0.11 0.11 0.30
NISTaNISTb
NAVNAU
C2All Lab Report Page 1 / 6

Round Robin XXXIII Laboratory Results Values in µg/mL
δ-Tocopherol Total β-Carotene trans-β-Carotene Total cis-β-Carotene Lab 203 204 205 206
FSV-BA FSV-BD FSV-BE FSV-BG FSV-BH FSV-BI FSV-BJ
FSV-BK FSV-BM FSV-BN FSV-BO FSV-BP FSV-BQ FSV-BR FSV-BS FSV-BT FSV-BU FSV-BV FSV-BX FSV-BY FSV-CA FSV-CB FSV-CD FSV-CH FSV-CJ
FSV-CK FSV-CL
FSV-CM FSV-CN FSV-CP FSV-CR FSV-CT FSV-CU FSV-CV FSV-CX FSV-CY FSV-DA 2.70 0.910 1.400 0.130 FSV-DB FSV-DJ
FSV-DKFSV-DL
FSV-DMFSV-DPFSV-DXFSV-ECFSV-EHFSV-EJ
FSV-EKFSV-ELFSV-FDFSV-FP
203 204 205 206 0.067 0.019 0.035 0.425
0.040 0.013 0.027 0.383 0.055 0.024 0.030 0.398 0.060 0.021 0.033 0.405 0.062 0.022 0.033 0.408 0.075 0.031 0.037 0.432
0.095 0.043 0.042 0.455 0.050 0.017 0.026 0.352 0.044 0.025 0.037 0.325 0.140 0.070 0.070 0.450
0.068 0.027 0.037 0.420 0.059 0.019 0.031 0.362 0.069 0.099 0.037 0.400
>0.044 >0.018 >0.031 >0.377 0.037 0.018 0.029 0.358 0.058 nd 0.028 0.411
0.040 0.010 0.018 0.045 0.016 0.027 0.336 0.055 0.016 0.024 0.345
0.049 0.022 0.031 0.427 0.069 0.035 0.042 0.360
>0.030 nd nd >0.321 0.043 0.013 0.019 0.268
0.063 0.019 0.027 0.341 0.110 0.037 0.048 0.497 0.066 0.010 0.020 0.380 0.050 0.020 0.030 0.410 0.042 0.117 0.138 0.339 0.068 0.032 0.038 0.441 0.021 nq nq 0.426
0.061 0.013 0.030 0.412 0.042 0.009 0.024 0.314
>0.046 >0.008 >0.025 >0.309 0.045 0.022 0.033 0.413 0.056 0.025 0.031 0.403 0.162 0.121 0.126 3.016
nd 0.120 0.398
0.047 0.018 0.029 0.440 0.042 0.031 0.057 0.415
203 204 205 206 0.061 0.019 0.035 0.392
0.060 0.021 0.033 0.379
0.077 0.026 0.042 0.410
0.056 0.018 0.029 0.338 nq 0.083 nq 0.384
0.044 0.018 0.031 0.377
0.030 nd nd 0.321
0.098 0.037 0.038 0.394
0.064 0.030 0.034 0.396
0.055 0.011 0.026 0.390
0.046 0.008 0.025 0.309
0.056 0.025 0.031 0.366
203 204 205 206 0.006 nd nd 0.033
nq nq nq 0.026
0.037 0.017 0.020 0.081
0.003 0.001 0.001 0.025 nq 0.018 nq 0.016
0.012 0.000 0.010 0.103
0.004 0.002 0.004 0.045
0.006 0.002 0.004 0.022
nq nq nq 0.014
nd nd nd nd
n Min
Median Max eSD eCV
NISTa NISTb
NAV NAU
1
3.24 3.26
1
1.07 1.09
1
1.63 1.69
1
0.18 0.17
35 0.021 0.056 0.162 0.017
31
0.047 0.044
0.051 0.018
33 0.009 0.022 0.121 0.009
40
0.023 0.012
0.020 0.011
35 0.018 0.031 0.138 0.009
29
0.038 0.018
0.030 0.016
35 0.268 0.405 3.016 0.040
10
0.450 0.351
0.403 0.076
11 11 10 12 0.030 0.008 0.025 0.309 0.056 0.021 0.032 0.382 0.098 0.083 0.042 0.410 0.012 0.007 0.004 0.020
21 35 14 5
0.043 0.017 0.035 0.384 0.044 0.012 0.018 0.313
0.050 0.018 0.029 0.365 0.013 0.009 0.014 0.063
6 0.003 0.006 0.037 0.004
59
0.004 0.000
0.004 0.005
6 0.000 0.002 0.018 0.002
100
0.006 0.000
0.002 0.009
5 0.001 0.004 0.020 0.004
96
0.004 0.000
0.003 0.005
9 0.014 0.026 0.103 0.015
59
0.066 0.039
0.039 0.029
C3 All Lab Report Page 2 / 6

Lab
FSV-BA FSV-BD FSV-BE FSV-BG FSV-BH FSV-BI FSV-BJ
FSV-BK FSV-BM FSV-BN FSV-BO FSV-BP FSV-BQ FSV-BR FSV-BS FSV-BT FSV-BU FSV-BV FSV-BX FSV-BY FSV-CA FSV-CB FSV-CD FSV-CH FSV-CJ
FSV-CK FSV-CL
FSV-CM FSV-CN FSV-CP FSV-CR FSV-CT FSV-CU FSV-CV FSV-CX FSV-CY FSV-DA FSV-DB FSV-DJ
FSV-DK FSV-DL
FSV-DM FSV-DP FSV-DX FSV-EC FSV-EH FSV-EJ
FSV-EK FSV-EL FSV-FD FSV-FP
n Min
Median Max eSD eCV
NISTa NISTb
Round Robin XXXIII Laboratory Results Values in µg/mL
Total α-Carotene Total Lycopene trans-Lycopene β-Cryptoxanthin 203 204 205 206
0.031 0.010 0.014 0.023
0.028 0.013 0.014 0.023
203 204 205 206 203 204 205 206 203 204 205 206
0.234 0.082 0.106 0.326
0.114 0.042 0.057 0.159 0.071 0.033 0.040 0.050
0.029 0.010 0.015 0.020 0.203 0.064 0.102 0.293 0.083 0.027 0.041 0.052 0.028 0.009 0.018 0.019 0.052 0.025 0.033 0.034
0.144 0.037 0.074 0.190 0.132 0.038 0.065 0.184
0.077 0.026 0.040 0.045
0.046 0.017 0.029 0.024 0.262 0.062 0.151 0.415 0.232 0.030 0.103 0.227 0.050 0.023 0.046 0.055 0.026 0.009 0.013 0.015 0.197 0.060 0.088 0.279 0.059 0.021 0.030 0.036 0.024 0.011 0.017 0.020 0.086 0.038 0.063 0.150 0.051 0.022 0.031 0.035
0.024 0.012 0.017 0.016 0.120 0.040 0.010 0.140 0.042 0.020 0.051 0.074 0.030 0.014 0.019 0.021 0.167 0.051 0.094 0.232 0.135 0.044 0.077 0.187 0.069 0.027 0.034 0.040 0.025 0.016 0.016 0.016 0.219 0.055 0.092 0.263 nq nq nq nq 0.055 0.012 0.029 0.038 0.036 0.014 0.024 0.028 0.314 0.102 0.184 0.450 0.038 0.016 0.025 0.029 0.082 0.019 0.031 0.033 0.172 0.052 0.079 0.207 0.110 0.043 0.059 0.058 0.024 nd 0.013 0.018 0.139 0.043 0.071 0.310 0.060 0.018 0.031 0.043
0.019 0.005 0.008 0.095 0.013 0.033 0.041 0.013 0.021 0.020 0.008 0.012 0.014 0.028 0.010 0.012 0.013
0.161 0.053 0.078 0.223 0.199 0.037 0.076 0.234
0.043 0.015 0.020 0.025
0.030 0.014 0.018 0.017 0.209 0.032 0.105 0.304 0.064 0.016 0.033 0.045 0.033 0.012 0.019 0.026 0.225 0.063 0.106 0.368 0.067 0.022 0.032 0.067 0.047 0.033 0.036 0.038
nd nd nd nd
0.330 0.178 0.209 0.392
0.205 nd nd 0.182
0.119 0.069 0.082 0.088
0.022 0.009 0.014 0.015 0.172 0.052 0.077 0.214 0.063 0.022 0.034 0.036
0.215 0.046 0.095 0.271 0.030 0.010 0.020 0.020 0.230 0.070 0.120 0.350 0.060 0.020 0.030 0.040
0.027 0.013 0.018 0.024 0.168 0.042 0.070 0.255 0.088 0.023 0.040 0.139 0.039 0.014 0.022 0.032
0.032 0.007 0.015 0.021
0.014 0.003 0.009 0.013
0.208 0.040 0.090 0.304
0.151 0.043 0.075 0.246
0.104 0.027 0.046 0.062
0.020 0.012 0.012 0.015 0.105 0.054 0.064 0.091
0.020 0.015 0.028 0.014
0.191 0.063 0.100 0.267 0.262 0.163 0.175 0.394
0.504
0.093 0.061 0.087 0.193
0.102 0.037 0.055 0.145 0.054 0.015 0.023 0.033
28 27 28 27 29 28 28 29 5 5 5 5 22 22 22 21 0.014 0.003 0.008 0.013 0.086 0.013 0.010 0.140 0.088 0.023 0.040 0.139 0.038 0.012 0.020 0.025 0.028 0.012 0.017 0.020 0.197 0.052 0.089 0.267 0.114 0.037 0.057 0.159 0.060 0.021 0.033 0.043 0.105 0.054 0.064 0.091 0.330 0.178 0.209 0.504 0.232 0.044 0.103 0.227 0.119 0.069 0.082 0.088 0.006 0.004 0.005 0.006 0.050 0.017 0.023 0.087 0.031 0.010 0.025 0.030 0.016 0.008 0.011 0.013
21 37 31 30 25 32 26 33 27 27 44 19 26 38 34 31
NAV NAU
C4
0.025 0.010 0.019 0.030 0.022 0.007 0.012 0.022 0.192 0.043 0.104 0.272 0.084 0.020 0.037 0.121 0.041 0.011 0.021 0.032
0.026 0.010 0.016 0.023 0.194 0.048 0.096 0.269 0.099 0.028 0.047 0.140 0.050 0.016 0.027 0.038 0.009 0.005 0.006 0.009 0.052 0.021 0.031 0.083 0.039 0.017 0.023 0.051 0.021 0.011 0.013 0.016
All Lab Report Page 3 / 6

Round Robin XXXIII Laboratory Results Values in µg/mL
Lutein Zeaxanthin Lutein&Zeaxanthin Lab 203 204 205 206 203 204 205 206 203 204 205 206
FSV-BA 0.148 0.074 0.092 0.088 FSV-BD FSV-BE FSV-BG FSV-BH 0.079 0.031 0.042 0.052 0.038 nq 0.028 0.011 0.117 0.031 0.070 0.063 FSV-BI 0.078 0.027 0.038 0.045 0.042 0.012 0.020 0.015 0.122 0.039 0.056 0.057 FSV-BJ
FSV-BK FSV-BM FSV-BN 0.054 0.014 0.022 0.038 0.036 0.007 0.016 0.008 0.090 0.021 0.038 0.046 FSV-BO 0.090 0.032 0.047 0.056 FSV-BP FSV-BQ FSV-BR FSV-BS FSV-BT 0.089 0.056 0.050 0.054 0.023 0.019 0.020 0.010 0.113 0.075 0.070 0.064 FSV-BU nq nq nq nq nq nq nq nq 0.126 0.032 0.055 0.064 FSV-BV 0.096 0.035 0.061 0.061 FSV-BX 0.084 0.033 0.044 0.045 0.032 0.013 0.017 0.012 0.116 0.033 0.061 0.057 FSV-BY 0.090 0.027 0.045 0.057 0.024 0.008 0.012 0.020 0.114 0.035 0.057 0.077 FSV-CA FSV-CB 0.120 0.044 0.061 FSV-CD 0.167 0.057 0.080 0.089 FSV-CH FSV-CJ 0.148 0.049 0.064 0.073
FSV-CK 0.133 0.042 0.066 0.081 FSV-CL 0.129 0.047 0.064 0.088
FSV-CM FSV-CN FSV-CP 0.113 0.047 0.068 0.060 FSV-CR FSV-CT FSV-CU FSV-CV FSV-CX 0.120 0.040 0.060 0.070 FSV-CY FSV-DA 0.069 0.026 0.038 0.053 0.033 0.019 0.022 0.023 0.102 0.045 0.060 0.076 FSV-DB FSV-DJ
FSV-DK FSV-DL 0.139 0.034 0.071 0.080
FSV-DM FSV-DP FSV-DX 0.099 0.035 0.052 0.061 FSV-EC FSV-EH 0.069 0.026 0.037 0.047 0.046 0.017 0.023 0.021 0.115 0.042 0.060 0.068 FSV-EJ
FSV-EK 0.092 FSV-EL FSV-FD FSV-FP
n 8 8 8 9 8 7 8 8 21 21 21 20 Min 0.054 0.014 0.022 0.038 0.023 0.007 0.012 0.008 0.090 0.021 0.038 0.046
Median 0.079 0.027 0.040 0.052 0.035 0.013 0.020 0.014 0.117 0.040 0.061 0.066 Max 0.090 0.056 0.050 0.092 0.046 0.019 0.028 0.023 0.167 0.075 0.092 0.089 eSD 0.014 0.004 0.006 0.007 0.008 0.007 0.004 0.007 0.018 0.010 0.007 0.013 eCV 18 15 14 14 24 57 22 49 15 25 12 20
NISTa NISTb 0.076 0.026 0.042 0.049 0.044 0.014 0.024 0.018 0.120 0.040 0.065 0.067
0.077 0.026 0.041 0.051 0.020 0.009 0.012 0.014
0.039 0.013 0.022 0.016 0.012 0.006 0.007 0.008
0.119 0.027
0.040 0.012
0.063 0.016
0.066 0.017
NAV NAU
C5 All Lab Report Page 4 / 6

Termn
Min Median
Max
eSD
eCV
NAV NAU
nd nq >x
italics
Round Robin XXXIII Laboratory Results
Analytes Reported By One LaboratoryValues in µg/mL
Analyte trans-α-Carotene
Code 203 204 205 206 NISTb 0.022 0.007 0.012 0.014
Legend
Definition Number of (non-NIST) quantitative values reported for this analyte
Minimum (non-NIST) quantitative value reported Median (non-NIST) quantitative value reported Maximum (non-NIST) quantitative value reported
Estimated standard deviation, calculated from the median absolute deviation from the median of the non-NIST results Coefficient of Variation for (non-NIST) results: 100*eSD/Median
NIST Assigned Value, our estimate of the "true" analyte concentration NIST Assigned Uncertainty, our estimate of the total (serum hetergeniety and inter- and intra-laboratory) standard deviation For details on how we assign these quantities, see the "Analysis of Results."
Not detected (i.e., no detectable peak for analyte) Detected but not quantitatively determined Concentration greater than or equal to x
Not explicitly reported but calculated by NIST from reported values
C6All Lab Report Page 5 / 6
Lab FSV-BA FSV-BD FSV-BE FSV-BG FSV-BH FSV-BI FSV-BJ
FSV-BK FSV-BM FSV-BN FSV-BO FSV-BP FSV-BQ FSV-BR FSV-BS FSV-BT FSV-BU FSV-BV FSV-BX FSV-BY FSV-CA FSV-CB FSV-CD FSV-CH FSV-CJ
FSV-CK FSV-CL
FSV-CM FSV-CN FSV-CP FSV-CR FSV-CT FSV-CU FSV-CV FSV-CX FSV-CY FSV-DA FSV-DB FSV-DJ
FSV-DKFSV-DL
FSV-DMFSV-DPFSV-DXFSV-ECFSV-EHFSV-EJ
FSV-EKFSV-ELFSV-FDFSV-FP
NISTa NISTb
n 49 47 22 36 12
StS % Observed Expected 1 43 40 50 58 50 68.2 % 2 29 45 36 22 33 27.3 % 3 16 11 14 6 8 4.3 % 4 12 4 0 14 8 0.3 %
Round Robin XXXIII Laboratory Results
R aT gT bC tbC Label Lab
1 1 1 1 1 1 2 1
R 2 2 1 aT 1 1 gT 1 2 bC 3 2 tbC 1 2 1 1 n 1 1 1 1 1 1 2 2 1 1 3 1 1 1
Comparability Summary
Definition laboratory number "Standard Score" for Retinol "Standard Score" for α-Tocopherol "Standard Score" for γ-Tocopherol "Standard Score" for Total β-Carotene "Standard Score" for trans-β-Carotene number of (non-NIST) laboratories providing data for this analyte
"Standard Score" 2 1 1 1 Given that our knowledge of the shape, location, and width of the measurement distributions is 2 3 4 approximate and that a limited number of labs are involved, we summarize comparability with the 1 2 following four-level "Standard Score" (StS)… 1 2 2
StS 4 1 2 1 1 1 2 3 3 2 2 3 3 2 3 1 1 1 1 4 1 1 1 1 2 1 4 where: 3 3 2 StV 1 4 2 1 2 1 1 2 2 1 NAV 2 2 2 2 3 3 3 2 NAU
1 1 1 2 1 3 3 1 t (1-α,n-1)2 1 1 1 1 1 2 1 1 1 1 1 4 1 1 2 4 1 1 4 1 2 2 2 3 4 4 2 1 1 3 1 3 2 1 2 2 2 1 2 4 4 2 2 1 2 3 2 1 2 2 3 2 4 2 1 2 1 4 2 2 1 1 4 2 2 2 1 1 1 1 1 1 1 1 1 1
DefinitionAll StV within ±t (1-0.683,n-1) {i.e., ±1 SD} All StV within ±t (1-0.954,n-1) {i.e., ±2 SD} All StV within ±t (1-0.997,n-1) {i.e., ±3 SD} At least one StV > ±t (1-0.997,n-1) {i.e., >3 SD}
Standardized Value, the distance in standard deviation units your value is from the "true" concentration: StV = (your value - NAV) / NAU
NIST Assigned Value, our estimate of the "true" analyte concentration
NIST Assigned Uncertainty, our estimate of the total (serum heterogeniety and iter- and intra-laboratory) measurement standard deviation.
Two-tailed Student's t for coverage of ±1, ±2, and ±3 NAU about NAV, assuming a normal population of size n
For details on the NIST Assigned quantities, see this Round Robin's "Report of (Meta)Analysis."
These are the observed and normal-population-expected proportions of each Standard Score (StS), based upon each laboratory's largest StV for the four sera.
C7 All Lab Report Page 6 / 6
Appendix D. Representative “Individualized Report” for RR33
Each participant in RR33 received an “Individualized Report” reflecting their reported results. Each report included a detailed analysis of the results they reported for some or all of the following analytes: • Retinol • Retinol palmitate • α-Tocopherol • γ-Tocopherol • Total β-Carotene • trans-β-Carotene • Total α-Carotene • Total Lycopene • β-Cryptoxanthin • Lutein • Zeaxanthin • Lutein & Zeaxanthin
The following 8 pages are the “Individualized Report” for the analytes evaluated by participant FSV-BA.
D1

20/4
195
Indi
vidu
aliz
ed R
ound
Rob
in X
XX
III
Rep
ort t
o: F
SV
-BA
Y
our
Dat
a, N
IST
Ass
igne
d V
alue
s, a
nd %
Dif
fere
nces
Ser
um20
3 Se
rum
204
Se
rum
205
Se
rum
206
A
naly
te
You
N
AV
%
L\
n I Y
ou
NA
V
%L\
n
II You
N
AV
%
L\
n II Y
ou
NA
V
%L\
n I
Ret
inol
1.
23
1.26
-3
44
.4
1 .4
3 -4
44
.6
3 .6
5 -2
44
.2
7 .2
6 1
44
Ret
inyl
Pal
mita
te
.129
9
.073
8
.118
9
.059
4
a-T
ocop
hero
l 16
.23
16.4
7 -1
42
5.
37
5.19
3
42
8.16
8.
20
0 42
4.
76
4.75
0
42
g-T
ocop
hero
l 1.
26
1.18
7
19
.54
.43
24
17
.73
.65
13
18
2.23
2.
26
-1
19
Tot
al b
-Car
oten
e .0
67
.052
29
32
.0
19
.020
-3
31
.0
35
.031
14
33
.4
25
.402
6
32
tran
s-b-
Car
oten
e .0
61
.052
17
8
.019
.0
18
8 9
.035
.0
30
17
8 .3
92
.369
6
9 T
otal
cis
-b-C
arot
ene
.006
4
nd
3
nd
3
.033
7
Tot
al a
-Car
oten
e .0
31
.026
18
25
.0
10
.010
-4
24
.0
14
.017
-1
5 25
.0
23
.023
-1
24
tr
ans-
Lyc
open
e .1
14
.113
1
4 .0
42
.027
55
4
.057
.0
53
7 4
.159
.1
49
6 4
b-C
rypt
oxan
thin
.0
71
.052
37
19
.0
33
.017
99
19
.0
40
.027
47
19
.0
50
.040
26
18
L
utei
n &
Zea
xant
hin
.148
.1
20
23
18
.074
.0
40
87
18
.092
.0
63
You
: Y
our
repo
rted
val
ues
for
the
list
ed a
naly
tes
(mic
rogr
ams/
mil
lili
ter)
NA
V :
NIS
T A
ssig
ned
Val
ues,
equ
al t
o (N
IST
s av
erag
e-of
-ave
rage
s+ th
is R
ound
Rob
in's
med
ian
)/ 2
%a
: P
erce
nt d
iffe
renc
e be
twee
n yo
ur v
alue
and
the
NA
V
· n
: N
umbe
r o
f non
-NIS
T la
bora
tori
es r
epor
ting
qua
ntit
ativ
e va
lues
for
this
ana
lyte
in th
is s
erum
nd
:
Not
det
ecte
d
Plea
se c
heck
our
reco
rded
val
ues
agai
nst y
our r
ecor
ds.
46
18
.088
Send
cor
rect
ions
to:
NN
MM
QA
P, 2
22/B
208,
NIS
T, G
aith
ersb
urg,
MD
208
99
fax:
301
-977
-068
5
.065
35
17
1/8
D2

50
> 2
5 <
~
...- > <
z I ~
0
d * 0 0 - <I ~ -25
-50
20/4
195
x x I
Indi
vidu
aliz
ed R
ound
Rob
in X
XX
III
Rep
ort t
o: F
SV
-BA
R
etin
ol, %~ i
n R
ound
Rob
in X
XIV
-X
XX
III
x x
x x
x x
x x
v x
x x
x x
x v
I x
I x
v I
I ,,.
~1~L ~ ...
1,)
I ii
V~
_mr
oV
I I
11
WM""
"'_x
ill®I.,
. I m
rnm
= ...•
.. Rl'm
I
I ~
~·
·
11
11
1
11
1
11
11
1
11
11
1
11
11
1
6 6
6 6
6 6
6 6
6 6
7 7
7 7
7 7
7 7
8 8
8 8
8 0
1 2
3 4
5 6
7 8
9 0
1 2
3 4
5 6
7 1
2 3
4 5
Ser
um 1
11
11
1
11
1
11
11
8
8 8
8 9
9 9
9 9
9 9
9 9
6 7
8 9
0 1
2 3
4 5
6 7
8
I 2
2 2
2 2
2 2
9 0
0 0
0 0
0 0
9 0
1 2
3 4
5 6
RR
33.
Plg
e 2
/ 8
D3
50
> 2
5 <
~
,..... >
< z I
Indi
vidu
aliz
ed R
ound
Rob
in X
XX
III
Rep
ort t
o:. F
SV
-BA
T
ocop
hero
ls, %~ i
n R
ound
Rob
in X
XIV
-X
XX
IIl
~
0 I
1 !1 !h-
.•'"'
..I»
' •
111/!,i
illr•·
w
•m m
J!!ia"
'.i."ii
ii"
""'"
'*~'
".,.,Jii'.iii'
"""lliii7
us;
-.ii
i" •w
'-.•
• '!'!
'!.
•na 1
ii"u
rnii
' a
d_
_,,
,__
..
'!'!' i
ii'w
II/
! •m
• 8
. •·•
,,,
.. ,
* 8 - <l ~ -25
-50
2W~n
., ,
/
• g-
Toc
ophe
rol
IJ a-
Toc
ophe
rol
11
11
1
11
1
11
11
1
11
11
1
11
11
1
11
11
1
11
11
1
11
1
12
22
2
22
2
6 6
6 6
6 6
6 6
6 6
7 7
7 7
7 7
7 7
8 8
8 8
8 8
8 8
8 9
9 9
9 9
9 9
9 9
9 0
0 0
0 0
0 0
0 I
2 3
4 5
6 7
8 9
0 I
2 3
4 5
6 7
1 2
3 4
5 6
7 8
9 0
1 2
3 4
5 6
7 8
9 0
I 2
3 4
5 6
Ser
um
ni
'~
_,.,.
()P
age3/8
'-~,
,!
D4
50
> 2
5 <
~
,.-.,.
>
< z I ~
0
8 * 8 - -<I ~
-25
-50
20/4
195
Indi
vidu
aliz
ed R
ound
Rob
in X
XX
III
Rep
ort t
o: F
SV
-BA
b-
Car
oten
e,
%A
in R
ound
Rob
in X
XIV
-X
XX
III
• al
l-tra
ns-b
-Car
oten
e m
l Tot
al b
-Car
oten
e
11
11
1
11
1
11
11
1
11
11
1
11
11
1
11
11
1
11
11
1
11
1
12
22
2
22
2
6 6
6 6
6 6
6 6
6 6
7 7
7 7
7 7
7 7
8 8
8 8
8 8
8 8
8 9
9 9
9 9
9 9
9 9
9 0
0 0
0 0
0 0
0 1
2 3
4 5
6 7
8 9
0 1
2 3
4 5
6 7
1 2
3 4
5 6
7 8
9 0
1 2
3 4
5 6
7 8
9 0
1 2
3 4
5 6
Ser
um
RR
33.
Page
4 /
8
D5
-±2
0%
±50%
-±2
0%
--±
50%
Indi
vidu
aliz
ed R
ound
Rob
in X
XX
III
Rep
ort t
o: F
SV
-BA
Ret
inol
a-T
ocop
hero
l,,, N
IST
Ass
igne
d V
alue
s V
s L
abor
ator
y
A.T
otal
®tra
ns
-±
50%
-±2
0%
±50
%
b-C
arot
ene
g-T
ocop
hero
l
~,., ....
r.,...,
_""'
Val
ues
Leg
end
Sha
ded
Sym
bols
: R
ound
Rob
in X
XIV
-XX
XII
B
lack
Sym
bols
: R
ound
Rob
in X
XX
III
Ord
inat
e: N
IST
Ass
igne
d V
alue
A
bsci
ssa:
Yo
ur
repo
rted
con
cent
rati
on
Inte
rpre
tati
on
Ade
quat
ely
inte
rcom
para
ble
data
are
wit
hin
±20
% l
ines
. If
you
hav
e da
ta s
catt
ered
out
side
±
50%
line
s, y
our
mea
sure
men
t sy
stem
is
not c
onsi
sten
t w
ith
thos
e o
f m
ost
part
icip
atin
g la
bora
tori
es. If
you
r da
ta a
re s
yste
mat
ical
ly
high
er o
r lo
wer
than
the
NA
V,
your
sys
tem
m
ay b
e co
nsis
tent
but
you
r re
sult
s ar
e bi
ased
.
If y
our
data
sho
w i
ncre
ased
sca
tter
at
low
co
ncen
trat
ions
, you
r "l
imit
of q
uant
ific
atio
n"
may
not
be
wha
t you
thin
k it
is.
If th
ere
are
one
or
two
"wil
d" o
utli
ers,
the
y m
ight
be
calc
ulat
ion
or
tran
scri
ptio
n er
rors
. W
e w
ould
app
reci
ate
hear
ing
from
you
abo
ut
any
such
pro
blem
s.
/
RP
··,a
ge 5
/ 8
D6
2&41
9S
Indi
vidu
aliz
ed R
ound
Rob
in X
XX
III
Rep
ort t
o: F
SV
-BA
A
ccur
acy /
Pre
cisi
on S
umm
ary
Ret
a T
oe
gToc
T
otal
mA
vl
l. m
A
vll.
mA
vl
l. m
A
vll.
3 1
1 2
4 3
4 4
-2
3 2
4 -2
8
3 8
-7
2 6
3 -2
5
-7
4
-1
3 0
3 -6
1
6 3
0 4
1 2
1 4
1 7
4 4
0 3
9 6
5 4
XX
IV
xxv
XX
VI
XX
VII
X
XV
III
XX
IX
xxx
XX
XI
XX
XII
XX
XII
I
9 4
4 7
-3
7 9
12
5 3
-2
5 -1
5
9 9
-4
1 0
1 -2
4
10
2
-2
2 0
2 11
11
12
13
(Tra
diti
onal
) P
erfo
rman
ce C
rite
ria
The
abs
olut
e va
lue
of
%fl.
of e
very
mea
sure
men
t ha
s
trad
itio
nall
y be
en e
valu
ated
as
foll
ows .
..
%fl.
I E
valu
atio
n
0-5%
Exc
epti
onal
6-10
% A
ccep
tabl
e
11-2
0% M
argi
nal
>2
0%
Poo
r
Mor
e re
pres
enta
tive
cri
teri
a ne
ed to
be
esta
blis
hed,
fact
orin
g in
eac
h se
rum
's a
naly
te l
evel
and
the
anal
yte
dist
ribu
tion
in
adul
t hu
man
pop
ulat
ions
.
Sta
y tu
ned,
we'
re w
orki
ng o
n it.
..
tran
s
mA
vl
l.
7 5
1 6
-5
5
5 3
0 3
3 3
9 12
9 10
14
3
12
6
Leg
end
Ret
R
etin
ol
a Toe
a-
Toc
ophe
rol
gToc
g-
Toc
ophe
rol
Tot
al
Tot
al b
-Car
oten
e
tran
s al
l-tr
ans-
b-C
arot
ene
mA
M
ean
diff
eren
ce,
the
aver
age
%fl.
for
all
sera
of a
giv
en R
R,
whe
re
%fl.
= 1 O
O(Y
our
valu
e -
NA
V)
I N
A V
vll.
Dif
fere
nce
vari
abil
ity,
one
sta
ndar
d de
viat
ion
of
%fl.
for
all
sera
of
a R
NA
Y
NIS
T A
ssig
ned
Val
ue,
our
best
est
imat
e o
f ana
lyte
con
cent
rati
on ...
NA
V =
(NIS
Ts
aver
age-
of-a
vera
ges
+ R
ound
Rob
in m
edia
n)/
2
Inte
rpre
tati
on
Acc
urac
y an
d pr
ecis
ion
are
sepa
rate
but
kin
dred
asp
ects
of
mea
sure
men
t
com
pari
son.
We
esti
mat
e ac
cura
cy a
s m
A, t
he a
vera
ge %
fl.,
and
prec
isio
n
as v
A,
the
stan
dard
dev
iati
on o
f %
fl.,
for
all
sera
of
a R
ound
Rob
in.
It's
bes
t to
be a
ccur
ate
and
prec
ise
(sm
all
mA
, sm
all
vll.)
!
Goo
d pr
ecis
ion
(sm
all
vll.)
wit
h po
or a
ccur
acy
(lar
ge m
A)
is b
ette
r th
an t
he
conv
erse
: at
lea
st s
uch
valu
es a
re i
nter
nall
y co
nsis
tent
and
may
be
rela
tabl
e to
othe
rs' v
alue
s on
ce t
he r
elat
ive
bias
es h
ave
been
det
erm
ined
.
Poo
r pr
ecis
ion
(lar
ge v
ll.)
sugg
ests
tha
t you
r m
easu
rem
ent s
yste
m is
not
in
adeq
uate
con
trol
for
the
ana
lyte
lev
els
exam
ined
.
R
RR
33.
Page
6 /
8
D7
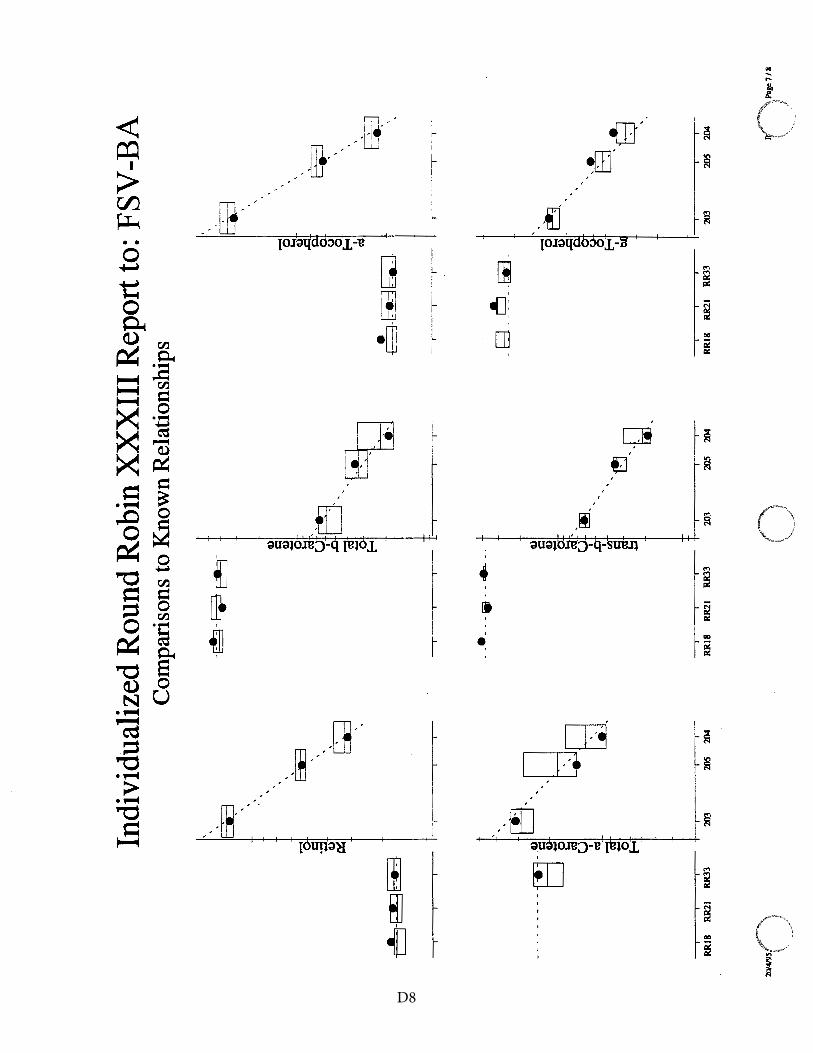
~-~~
RR
l8
RR
21
RR
33
2W~So
Indi
vidu
aliz
ed R
ound
Rob
in X
XX
III
Rep
ort t
o: F
SV
-BA
C
ompa
riso
ns to
Kno
wn
Rel
atio
nshi
ps
- c: ·.o ~ ~
--,--
203
E1i::3
~
205
204
-~-qp E
!:J- Q
) c B ~-·
~E
l_~tl
--,-
-,---
1 .-
--
--•
---~ -
-+-
-
-~-
't!I
El
--~
RR
l8
RR
21
RR
33
203
205
204
0
EE
]._
$
[~ l t
-:iJ i
;;;:
i. Ei
J
i-.-
--1-
-r
····-
--,-
----
r
_i;;i_
6 __ ~
_ 81~
Q)
'
-~~
RR
l8
RR
21
RR
33
203
205
204
()
Plge
7/8
-........ _
·'
D8
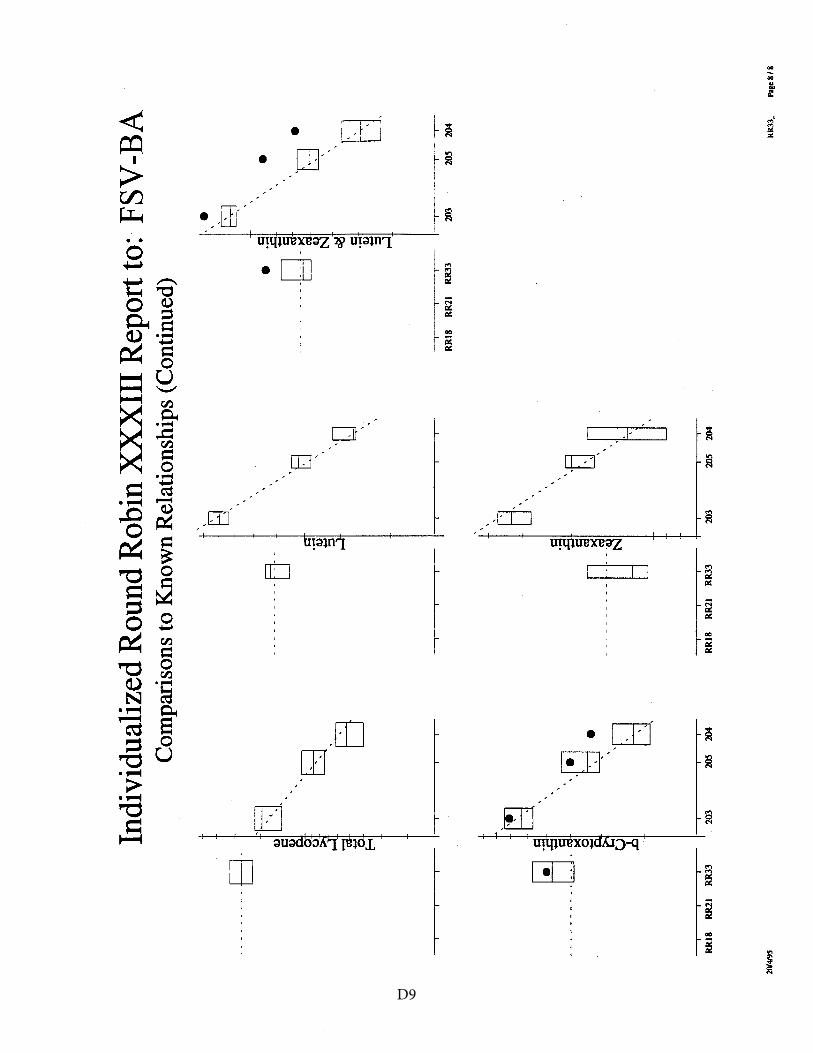
Indi
vidu
aliz
ed R
ound
Rob
in X
XX
III
Rep
ort t
o: F
SV-B
A
Com
pari
sons
to
Kno
wn
Rel
atio
nshi
ps (
Con
tinue
d)
~ ~ ,-,
·a B
I I
t;i
c::I
--•
:s \
--___ J~
l ~
' ~ .
-"B
u I ,0
r-·
-r
I-,
1 1
RR
18
RR
21
RR
33
203
20S
204
21W
419S
----
---El
-
1-·
----
-,--
-,
c::
' tl ' ' 8'"
'E3 'O -
·1
fa "~
-u ~
--~ r-
----
-
RR
18
RR
21
RR
33
203
205
204
• .5
-s -~ls
~
cld .s.
~ ...:l ,. 8
• 'El
• [,I_
,-,-
·--·
·--·-
,---
RR
18
RR
21
RR
33
203
205
204
RR
33_
Page
8 /
8
D9

Appendix E. Shipping Package Inserts for RR34
The following two items were included in each package shipped to RR34 participants: • Cover letter • Datasheet
The cover letter and datasheet were enclosed in a sealed waterproof bag along with the samples themselves.
E1

UNITED STATES DEPARTMENT OF COMMERCE National Institute of Standards and Technology Gaithersburg, Maryland 20899-
April 13, 1995
Dear Colleague:
Enclosed is the set of samples for the second round robin exercise (Round Robin XXXIV). You will find one vial of four lyophilized sera samples for analysis along with a form for reporting your results. When reporting your results, please submit one value for each analyte for a given serum sample. If an obtained value is below the detection limit, please indicate this result on the form by using ND (Not Detected). For values not obtained, please leave a blank for the given analyte. Results will be due to NIST by June 16, 1995. Results received two weeks after the due date will not be included in the summary report for this round robin study. Written feedback concerning the study will be provided to you by July 24, 1994.
Samples should be reconstituted with LO mL ofHPLC-Grade water or equivalent. We rec_ommend that dissolution be facilitated with 3 to 5 minutes agitation in an ultrasonic bath or at least 30 min at room temperature with intermittent swirling. (CAUTION: Vigorous shaking will cause foaming and possibly interfere with accurate measurement. The rubber stopper contains phthalate esters which will leach into the sample upon intermittent contact of the liquid sample with the stopper. These esters absorb strongly in the UV region and elute very near retinol in most HPLC systems creating analytical problems.) Pipette a known volume of serum from the vial for analysis since the final volume of the reconstituted sample is greater than 1.0 mL. For consistency, we request that laboratories use the following absorptivities (E 1 % cm) in ethanol: retinol, 1850 at 325 nm; retinyl palmitate, 975 at 325 nm; a:-tocopherol, 75.8 at 292 nm; y-tocopherol, 91.4 at 298 nm; a:-carotene, 2800 at 444 nm; j3-carotene, 2560 at 450 nm; lycopene, 3450 at 472 nm.
Please mail or FAX your results for Round Robin XXXIV to: · Micronutrients Measurement Quality Assurance Program
NIST Bldg.222,Rm.B208 Gaithersburg, MD 20899 FAX: (301) 977-0685
If you have questions regarding this round robin exercise, please call me at (301) 975-3120 or mail/FAX queries to the above address.
(
-~~n· Ct_
ice Brown Tho esearch Chemist
Analytical Chemistry Division Chemical Science and Technology Laboratory
Attachment
cc: W.May S. Wise N•Si E2

NIST/NCI Micronutrients Measurement Quality Assurance Program
Round Robin XXXIV Results from Laboratory #_____
Serum Analyte 207 208 209 210 Units*
retinol retinyl palmitate
a-tocopherol g-tocopherol
total b-carotene trans-b-carotene
total cis-b-carotene total a-carotene
total lycopene trans-lycopene
b-cryptoxanthin lutein
zeaxanthin lutein&zeaxanthin
Other Analytes?
* We prefer results as microgram/milliliter.
Comments?
Mail: NNMMQAP, 222/B208 NIST Please return results on-or-before Fax: 301-977-0685 Gaithersburg, MD 20899 June 16, 1995 Email: [email protected]
E3

Appendix F. Final Report for RR34
The following 13 pages are the final report for RR34 as provided to all participants: • Cover letter • A discussion entitled “Lies, Damn Lies, and Statistics” that:
o describes the nature of the test samples and details any previous distributions o summarizes aspects of the study that we believe may be of interest to the
participants • A “Report of (Meta)Analysis” that details the analysis of NIST measurements
F1

July 28, 1995
Dear Colleague:
UNITED STATES DEPARTMENT OF COMMERCE National Institute of Standards and Technology Gaithersburg. Maryland 20899-
Enclosed is the summary report of the results for Round Robin XXXIV (Sera 207-210). Included in this report are: a summary of data for all laboratories; a summary of your individual laboratory performance for the past three years; a summary of the interlaboratory accuracy and precision over the same period of time for the measurement of retinol, a- and y-tocopherol, and B-carotene; a graphical summary of the NIST assigned value vs. your laboratory value for these analytes; and the measurement comparability summary for evaluating your laboratory's performance relative to the other participants'. The NIST assigned values (described in the attached Appendix) are derived from the equally weighted values for the combined results from the analyses performed by NIST and the laboratories that participated in this round robin exercise.
In this round robin exercise, Serum 207, 209, and 210 were previously distributed in Round Robin XXXII as sera 200, 201, and 202, respectively. These serum samples are also the low, medium, and high levels of SRM 968b. Serum 208 (identified as "Control B" during the initial stages of the QA program), was previously distributed as serum 81 in Round Robin XII, serum 94 in Round Robin XIII, and serum 112 in Round Robin XVI.
The overall interlaboratory performance for retinol, y- and a-tocopherol, and B-carotene for Round Robin XXXIV is comparable to that of Round Robin XXXII. The average estimated coefficient of variation (eCV) is about 8.5% for retinol, 10% for a-tocopherol, 9% for y-tocopherol, and about 17% for B-carotene. The eCV for B-carotene was about 14% in round robin XXXII. The median values obtained in this round robin exercise are also in agreement with those from the previous round robin exercises and the NIST-assigned values. The results for retinol, retinyl palmitate, y- and a-tocopherol, total and trans-B-carotene, total a-carotene, and lutein in this round robin exercise are comparable to the proposed certified values in SRM 968b (See Figure 1 in Appendix).
The overall interlaboratory measurement comparability for B-cryptoxanthin, total lycopene, and zeaxanthin continues to improve. Laboratories are beginning to report additional values for new analyte(s) of interest (i.e., one laboratory has reported values for co-enzyme QlO). We encourage you to continue to report values for as many quantifiable analytes as possible.
Data for evaluating your laboratory's performance in Round Robin XXXIV are provided in the comparability summary on page 6 of the report. The criteria used to summarize laboratory performance are as follows: results rated 1 (within ± 1 SD of the assigned value) indicate EXCEPTIONAL performance, those rated 2 (within ± 2 SD) indicate ACCEPTABLE performance, a rating of 3 (within± 3 SD of the assigned value) is MARGINAL performance, and 4 (>3 SD of the assigned value) indicates POOR performance relative to the current state-ofthe-practice for these measurements.
N•Si F2
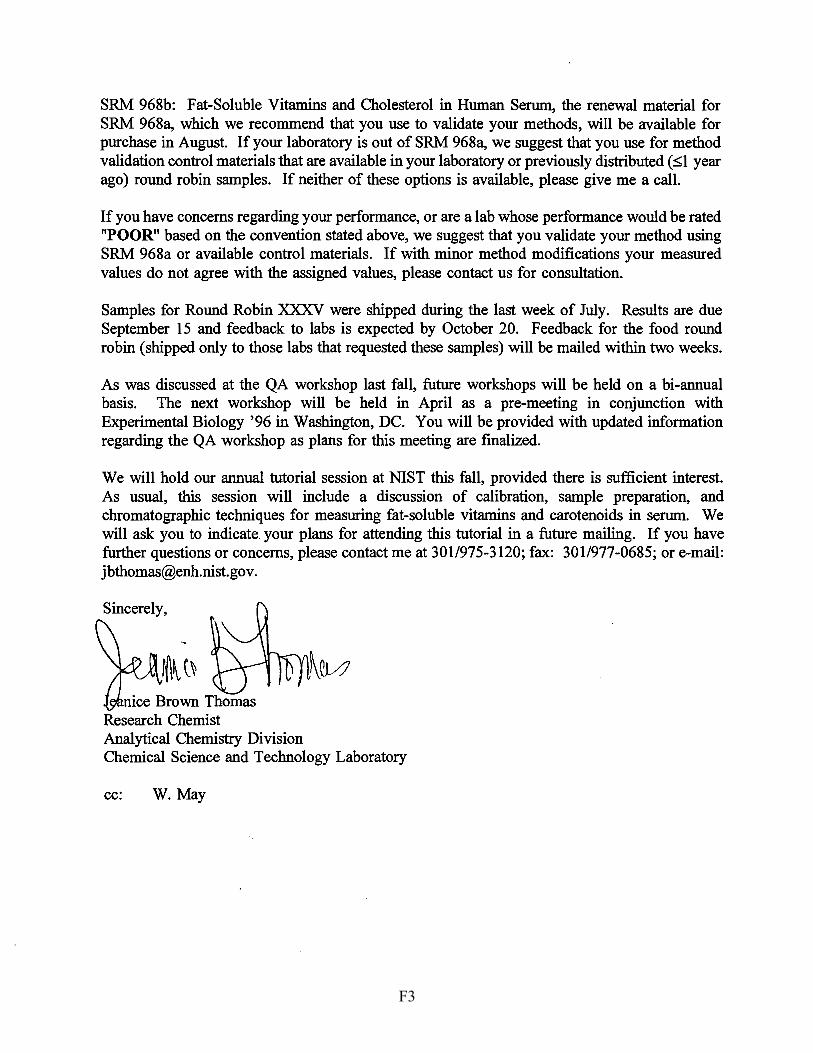
SRM 968b: Fat-Soluble Vitamins and Cholesterol in Human Serum, the renewal material for SRM 968a, which we recommend that you use to validate your methods, will be available for purchase in August. If your laboratory is out of SRM 968a, we suggest that you use for method validation control materials that are available in your laboratory or previously distributed (~1 year ago) round robin samples. If neither of these options is available, please give me a call.
If you have concerns regarding your performance, or are a lab whose performance would be rated "POOR" based on the convention stated above, we suggest that you validate your method using SRM 968a or available control materials. If with minor method modifications your measured values do not agree with the assigned values, please contact us for consultation.
Samples for Round Robin :XXXV were shipped during the last week of July. Results are due September 15 and feedback to labs is expected by October 20. Feedback for the food round robin (shipped only to those labs that requested these samples) will be mailed within two weeks.
As was discussed at the QA workshop last fall, future workshops will be held on a bi-annual basis. The next workshop will be held in April as a pre-meeting in conjunction with Experimental Biology '96 in Washington, DC. You will be provided with updated information regarding the QA workshop as plans for this meeting are finalized.
We will hold our annual tutorial session at NIST this fall, provided there is sufficient interest. As usual, this session will include a discussion of calibration, sample preparation, and chromatographic techniques for measuring fat-soluble vitamins and carotenoids in serum. We will ask you to indicate. your plans for attending this tutorial in a future mailing. If you have further questions or concerns, please contact me at 301/975-3120; fax: 301/977-0685; or e-mail: [email protected].
Sincerely,
· ce Brown Thomas Research Chemist Analytical Chemistry Division Chemical Science and Technology Laboratory
cc: W. May
F3
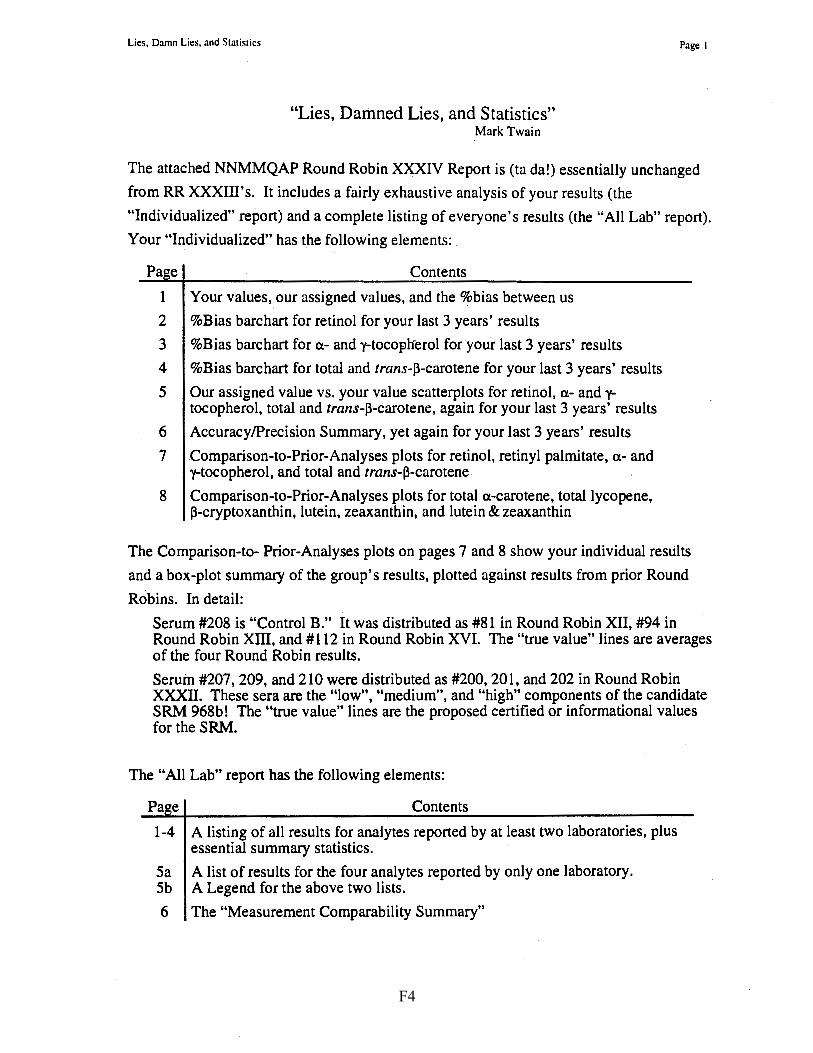
Lies, Damn Lies, and Statistics
"Lies, Damned Lies, and Statistics" Mark Twain
Page I
The attached NNMMQAP Round Robin XXXIV Report is (ta da!) essentially unchanged
from RR XXXIII's. It includes a fairly exhaustive analysis of your results (the
"Individualized" report) and a complete listing of everyone's results (the "All Lab" report).
Your "Individualized" has the following elements:
Pa e Contents
1 Your values, our assigned values, and the %bias between us
2 %Bias barchart for retinol for your last 3 years' results
3 %Bias barchart for ex- and y-tocof)lferol for your last 3 years' results
4 %Bias barchart for total and trans-~-carotene for your last 3 years' results
S Our assigned value vs. your value scatterplots for retinol, ex- and ytocopherol, total and trans-~-carotene, again for your last 3 years' results
6 Accuracy/Precision Summary, yet again for your last 3 years' results
7 Comparison-to-Prior-Analyses plots for retinol, retinyl palmitate, ex- and y-tocopherol, and total and trans-~-carotene
8 Comparison-to-Prior-Analyses plots for total ex-carotene, total lycopene, ~-cryptoxanthin, lutein, zeaxanthin, and lutein & zeaxanthin
The Comparison-to- Prior-Analyses plots on pages 7 and 8 show your individual results
and a box-plot summary of the group's results, plotted against results from prior Round
Robins. In detail:
Serum #208 is "Control B." It was distributed as #81 in Round Robin XII, #94 in Round Robin Xill, and #112 in Round Robin XVI. The "true value" lines are averages of the four Round Robin results.
Seruin #207, 209, and 210 were distributed as #200, 201, and 202 in Round Robin XXXII. These sera are the "low", "medium'', and "high" components of the candidate SRM 968b ! The "true value" lines are the proposed certified or informational values for the SRM.
The "All Lab" report has the following elements:
Pa e Contents
1-4 A listing of all results for analytes reported by at least two laboratories, plus essential summary statistics.
Sa A list of results for the four analytes reported by only one laboratory. Sb A Legend for the above two lists.
6 The "Measurement Comparability Summary"
F4
Lies. Damn Lies. and Statistics Page 2
The "Measurement Comparability Summary" (the "score card") provides a four-level score
for each laboratory for: retinal, a- and y-tocopherol, and total and trans-j3-carotene. The
score is based upon the worst-case differences between your reported values and our
assigned values, after scaling the values by the total measurement uncertainty. The
attached Appendix details our value and uncertainty assignment methods.
If you dig through the Appendix, you may note that we intend to certify values for retinal,
retinyl palmitate, a- and y-tocopherol, total and trans-13-carotene, total a-carotene, and
lutein (also cholesterol, 9-cis-, 15-cis-, and 13- & 15-cis-13-carotene) in SRM 968b. We
will also provide non-certified values for: o-tocopherol, trans-a-carotene, total and trans
lycopene, 13-cryptoxanthin, and zeaxanthin_ What's the difference between "certified" and
"non-certified" analytes? Well ...
In addition to your Round Robin results, we analyze SRM-to-be samples using three
separate and distinct methodologies. We believe that our "normal method" results for total
and trans-lycopen~. zeaxanthin, and probably 13-cryptoxanthin are confounded with one-or
more co-eluting compounds. (Results for o-tocopherol and trans-a-carotene are mostly
detector-sensitivity limited.) Judging from the high-bias discord between the Round Robin
and our best-guess non-certified values, many of you who report these analytes also are
plagued with co-eluting compounds .. .
We recognize that the levels of these and other analytes in the lyophilized sera are too low
to be reliably measured. Resources permitting (it's not so much the$ cost, but the -0.3L
plasma/sample set that's the hassle), we still hope to eventually obtain more interesting
"natural" sera. But to really nail down what's going on, we need methods for augmenting
plasma with known analytes and their potential co-eluters. Ideas?
Your comments and suggestions are welcome. If you discover any errors in our recording
or interpretation of your data, please let us know!
Dave Duewer Research Chemometrician
-
~~77~ Margaret Kline
Research Biologist [email protected]
F5
Reportof(Meta)Analysisfor RR XXXIV Sera: 207-210
From: David Duewer Date: July 22, 1995
To: Jeanice Brown Thomas, Margaret Kline, Willie E. May, Katherine E. Sharpless cc: Laurie Locascio, Dennis J. Reeder, Stephen A. Wise
Re: Value Assignment and Analysis of Variance for RR XXXIV Sera: 207 -210
Purpose: We now compare individual laboratory values to a NIST value-assigned analyte concentration rather than to the interlaboratory median. Analysts NISTl and NIST3 provide replicate measurements on sufficient samples to permit confident value-assignment. This reports the statistical I chemometrical analysis of their analytical results for the sera distributed in Round Robin XXXIV (RR34 ).
Background: Four sera were distributed in &R34. Sera 207, 209, and 210 were distributed as sera 200, 201, and 202, respectively, in RR32 (i.e., the low, medium, and high components of SRM 968b). Serum 208 is "Control B" from the archives, having been previously distributed as sera 81 (RR12), 94 (RR13), and 112 (RR16).
NIST I and NIST3 analyzed all sera using their normal procedures. Both researchers extracted and analyzed two aliquots of three vials, providing dllplicate results for a total of six samples of each~serum. NISTl provided quantitative results for: retinol, a-, and y-tocopherol, total and trans-~-carotene, and total a-carotene. NIST3 provided quantitative results for these analytes, plus: retinyl palmitate, 0-tocopherol, trans-a-carotene, total and trans-Iycopene, ~-cryptoxanthin, lutein, and zeaxanthin.
Results: Table 1 presents the values and uncertainties assigned to sera 207 - 210. Table 2 compares average results for the two NIST analysts in RR34, the median results from RR34, and the median results from previous RRs. Table 3 lists the linear bias models between the NISTl and NIST3 data.
The following assumptions and definitions have been used in calculating the various statistics:
1) NIST Assigned Value (NAV): (RR+ (Nl + N3) / 2) / 2 (RR+ N3) / 2 (N3)
where: NI= mean of NISTl 's data, N3 =mean ofNIST3's data, and RR = median of all RR34 participants' data.
(Both NIST analysts, ~2 RR labs) (One NIST analyst, ~ RR labs) (One· NIST analyst)
2) NIST Repeatability Standard Deviation (SDrep): "measurement" standard deviation (sd), within-vial differences associated with extraction, chromatography, peak area determination, etc. This "within samples" pooled sd is closely related to the sd of the paired-differences between the replicate extractions I measurements of the samples analyzed at NIST. For the analytes reported by both NIST analyt'es, any proportional systematic bias between results for the two analysts was removed as part of the combined-data ANOV A. These bias models are listed in Table 3.
3) NIST Heterogeneity Standard Deviation (SDhet): "heterogeneity" sd, vial-to-vial differences associated with preparing and reconstituting the serum samples. This "between samples" pooled sd is closely related to the sd of the mean values of the unique vials analyzed at NIST.
F6

Report of (Meta)AMlysisfor RR XXXIV Sera: 207-210
For the analytes reported by both NIST analysts, any systematic proportional bias between results for the two analysts was removed as part of the combined-data ANOV A. These bias models are listed in Table 3. See Eqs. 19.6-4, 19.6-5, and 19.6-6, Mathematical Handbook for Scientists and Engineers, G. and T. Korn ( 1968), for details of the ANOV A calculations.
4) Interlaboratory Bias Standard Deviation (SDlab): "Laboratory bias" sd, the residual sd from (non-NIST) laboratory-to-laboratory biases after correction for SDrep and SDhet. This assumes that the population of these systematic biases can be approximated as a normal distribution centered at the NAV.
The observed interlaboratory sd for the results of RR34 is estimated as eSD = MAX(0.7421 *InterQuartile Range, 0.05*NAV),
as previously described ("Lies, Damn Lies, and Statistics" report for RR3 l ). This estimate assumes a) that at least 50% of the laboratories that report values for a given analyte are "performing" (they basically know what they're doing), b) that "non-performing" labs are about equally likely to report low values as-high values, and c) that standard deviations less than 5 % of NA V are unrealistically low.
The sd among single-sample results reported by different laboratories is a composite of at least three variation sources: the repeatability of any given method, the heterogeneity among supplied samples, and systematic biases among analysts and/or methods and materials. As we have NIST-based estimates for the first two sources (SDrep and SDhet), we can model laboratory differences as the residual of the observed interlaboratory sd (eSD) after subtraction of the measurement and heterogeneity components:
SDlab = MAX(VeSD2 - SDrep2 - SDhet2 , 0). The "MAX" function is required if eSD is smaller than ~.-S-D-re_p_2_+_S_D-he_t_2 •
5) NIST Assigned Uncertainty (NAU) Using the same assumptions as described above for SDlab, the "total" expected interlaboratory sd can be described as:
NAU = 4t/.-S-D-re_p_2 _+_S_D-he-t2_+_S_D_l-ab-2 .
Note that this is constrained to be at least as large as the observed interlaboratory sd, eSD.
6) 95% Material, the 95% confidence range on the "true" analyte concentration:
NA V ±2 ~SDrep2 + SDhet2 •
The value "nq" (for "not quantitative") is used if the uncertainty is large relative to the value.
7) 95% Laboratory, the 95% confidence range on the RR34 reports of analyte concentration: NAV±2NAU.
The value "nq" (for "not quantitative") is used if the uncertainty is large relative to the value.
Conclusions: The RR34 median values agree well with the NIST-analyst values and with the median values from recent Round Robin exercises (Table 2). The retinol, a-tocopherol, total and trans-~-carotene RR 34 values for serum 208 ("Control B") are remarkably unchanged from the RR12, RR13, and RR16 (1988- 1989) results.
F7
Report of ( Meta)Analysis for RR XXXIV Sera: 207-2 IO
Figure 1 compares the NA Vs and NAUs for sera 207, 209, and 210 to the proposed values for SRM 968b. RR34 results for analytes with certified values in SRM 968b agree very well with the proposed certified values and material uncertainty regions (top segment of Figure 1). For all levels of all these analytes: 1) the RR34 NA Vs are within the certified 95% confidence region and 2) the RR34 95% interlaboratory uncertainty region is slightly larger than the (NISTanalysis-based) certified 95% confidence region.
Note: The two 95% confidence region definitions reflect philosophical differences between the SRM and QA programs. SRM value/uncertainty statements reflect NIST's state-ofknowledge of the composition of the "stuff in the vials". The NAV/NAU in this report reflect the QA community's ability to measure the "stuff in the vials".
RR34 results for analytes with non-certified values in SRM 968b are biased and generally have large NAUs (bottom segment of Figure 1). While there is qualitative agreement between the "informational" SRM and RR-assigned values, the putative 95% confidence ranges for 8-tocopherol, trans-a-carotene, and zeaxanthin do not overlap for some/all levels. The current routine methods for these analytes do not yet provide adequately quantitative information.
The systematic biases between the Nl and N3 data (Table 3) continue to be intriguing. As we now have at least three data sets to intercompare, it may be possible to separate intrinsic differences between the two methods from "accidental" differences between the analyses. Should we invest the resources?
This~rnemo will be attached as the Appendix to RR34's "Lies, Damn Lies, and Statistics" report.
David Lee Duewer Research Chemist
F8
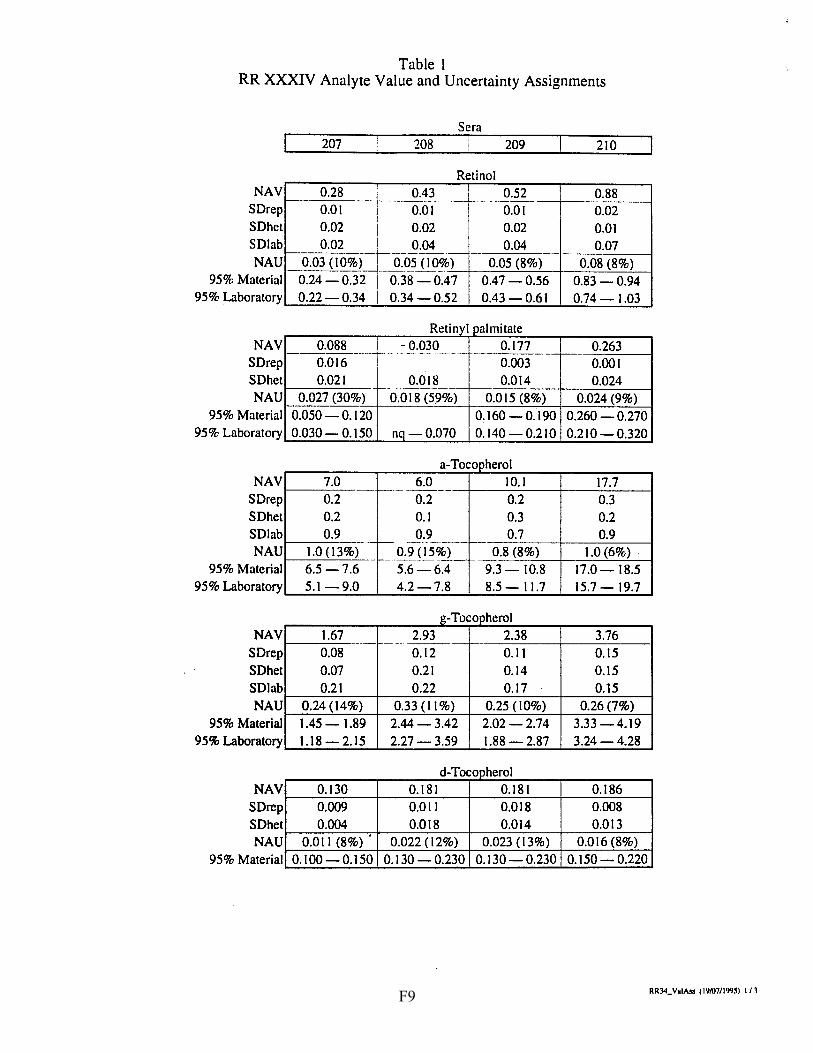
Table l RR XXXIV Analyte Value and Uncertainty Assignments
NAV SDrep SDhet SDI ab NAU
95% Material 95% Laboratory
NAV SD rep SDhet NAU
95% Material 95% Laboratory
NAV SDrep SDhet SDI ab
I NAU
95% Materia 95% Laboratory
NAV SDrep SDhe SD lab
t
I NAU
95% Materia 95% Laboratory
NAV SDrep SDhet NAU
95% Material
Sera 207 208 209
Retinal 0.28 0.43 I 0.52 ----~----·--
T ----
0.01 0.01 0.01 0.02 0.02 0.02 0.02 0.04 0.04
>---------r--------··-- --0.03 (10%) --~Q? (I 0_%) 0.05 (8%) 0.24-0.32 0.38-0.47 0.47-0.56 0.22-0.34 0.34-0.52 0.43-0.61
R . I I . etiny pa m1tate 0.088 - 0.030 0.177 -----·---1-- -- - - ~- ---- --·-- ·----0.016 0.003 0.021 0.018 0.014
~-
0.027 (30%) 0.018 (59%) 0.015 (8%) 0.050 - 0.120 0.160-0.190 0.030 - 0.150 nq-0.070 0.140-0.210
a-T h ocop ero 7.0 6.0 IO.I
t---·-- ---
0.2 0.2 0.2 0.2 0.1 0.3 0.9 0.9 0.7 ----t-- -------t---
1.0 (13%) __ O.~J!~~J- - -0.8 (8%)
6.5-7.6 5.6-6.4 9.3-10.8 5.1-9.0 4.2-7.8 8.5-11.7
g-T h ocop ero 1.67 2.93 2.38 ----1----
0.08 0.12 0.11 0.07 0.21 0.14 0.21 0.22 0.17
0.24 (14%) 0.33 (11%) 0.25 (10%) 1.45-1.89 2.44-3.42 2.02-2.74 1.18-2.15 2.27-3.59 1.88-2.87
dT h I - ocop ero 0.130 0.181 0.181 0.009 0.011 0.018 0.004 0.018 0.014
0.011 (8%) 0.022 (12%) 0.023 (13%) 0.100-0.150 0.130 - 0.230 0.130 - 0.230
210
0.88 0.02 0.01 0.07
0.08 (8%) 0.83-0.94 0.74-1.03
0.263 f----
0.001 0.024
0.024 (9%) 0.260 - 0.270 0.210 - 0.320
17.7 0.3 0.2 0.9
1.0 (6%) 17.0-18.5 15.7-19.7
3.76 0.15 0.15 0.15
0.26 (7%) 3.33-4.19 3.24-4.28
0.186 0.008 0.013
0.016 (8%) 0.150- 0.220
RR34_Va1Ass (19/0711995) I/ 3 F9

Table l RR XXXIV Analyte Value and Uncertainty Assignments
NAV SDrep SDhet SD lab
NAU 95% Material
95% Laboratory
NAY SDrep SDhet SD lab
NAU 95% Material
· 95% Laboratory
NAY SDrep SDhet SD lab NAU
95% Material 95% Laboratory
NAV SDrep SDhet
NAU 95% Material
NAY SDrep
SDhet SD lab
NAU 95% Material
95% Laboratory
Sera 207 208 I 209
Total b-Carotene 0.252 0.194 0.635 -- - ---0.013 0.017 I 0.024 0.015 0.018 0.011 0.050 0.033 0.099 -·-- --- ·-· -- ----
0.054 (21%) 0.042 (2 J_~) 0.103 ( 16%) 0.213 - o.~92 0.144 - 0.244 0.582 - 0.687 0.145 - 0.360 0.111-0.277 0.430 - 0.840
trans-b-Carotene 0.241 - 0. 175 0.584
-- -- .. - ---- --.. ···---0.012 0.018 0.023 O.Dl5 0.015 0.012 0.009 0.014 0.045 ---- - -------·--- ·-· - -
0.022 (9%) 0.028 (16%) 0.052 (9%) -- ---··- ··· ··---- --0.202 - 0.279 0. 127 - 0.222 0.532 - 0.636 0.197 - 0.284 0.120 - 0.230 0.479 - 0.688
Total a-Carotene 0.022 0.017 0.034 --------- -0.003 0.005 0.003
0.005 0.006 0.006 0.000 0.000 0.009
0.006 (26%) Q_'.008 (43%) 0.012 (34%) 0.010-0.034 0.002 - 0.033 0.020 - 0.049 0.0 I 0 - 0.034 0.002 - 0.033 0.011 - 0.058
trans-a-Carotene 0.022 0.017 0.040 ----·-0.003 0.002 0.003
0.002 0.002 0.002 0.004 (15%) 0.003 (17%) 0.004 (8%)
0.0 I 5 - 0.030 0.0 I 0 - 0.023 0.033 - 0.048
Ola .ycopene T IL 0.201 0.229 0.301
0.034 0.017 0.012
0.018 0.017 0:026
0.033 0.042 0.052 0.05 I (25%) ' 0.049 (21%) 0.060 (20%)
0.124 - 0.278 0.181-0.278 0.243 - 0.359
0.100 - 0.302 0.131 - 0.327 0.182 - 0.420
210
1.239 0.058 0.038 0.147
0.163 (13%)
1.099 - 1.378 0.913 - 1.564
1.165 0.039 0.034 0.048
0.071 (6%)
1.061 -1.268 1.023 - 1.306
0.047 0.006 0.002 0.012
0.014 (29%)
0.034 - 0.059 0.019 - 0.075
0.039 0.003 0.002
0.004 (8%)
0.032 - 0.046
0.345 0.027 0.008 0.078
0.084 (24%)
0.287 - 0.402 0.178-0.511
RR34_ Va1Ass (19~7/1995) 213 F10
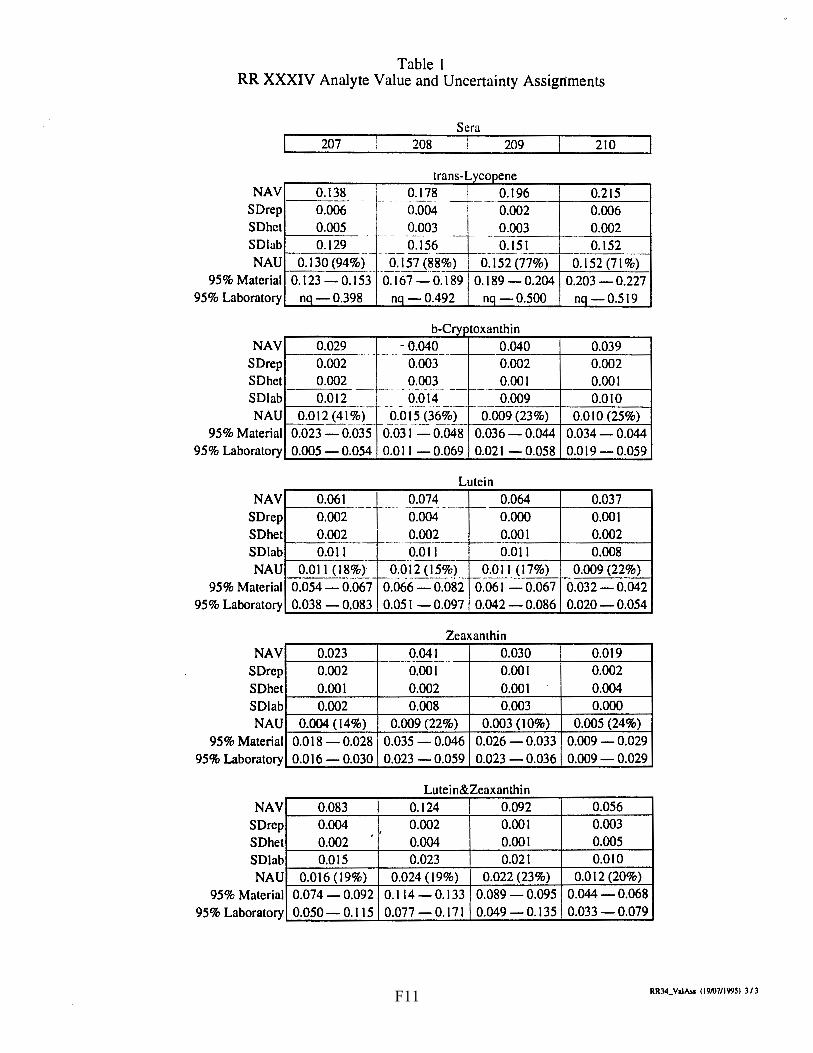
Table 1 RR XXXIV Analyte Value and Uncertainty Assignments
NAV SD rep SDhet SDI ab NAU
95% Material 95% Laboratory
NAV SD rep SDhet SDI ab NAU
95% Material 95% Laboratory
NAV SDrep SDhet SDI ab NAU
95% Material 95% Laboratory
NAV SDrep SDhet SDI ab NAU
95% Material 95% Laboratory
NAV SD rep SDhet SD lab NAU
95% Material 95% Laboratory
Sera 207 208 209
L trans- .ycopene 0.138 0.178 0.196 -· . ---·- - - - · -- · 0.006 0.004 0.002 0.005 0.003 0.003 - - - - - ···- - - - - --0.129 0.156 0. 151
·- - -- ------ - ----0.130(94%) .. . -9.:~.?J8~%) 0.152 (77%)
0.123-0.153 0.167-0.189 0.189 - 0.204 nq-,.0.398 nq-0.492 nq-0.500
b c h" - :ryptoxant m 0.029 - 0.040 0.040 ----- -- - - --0.002 0.003 0.002 0.002 0.003 0.001 - r-- ·- -- ·- - - ----- - - r--
0.012 0.014 0.009 ---- - -- - --·-- ··- ---- --0.012 (41%) 0.015 (36%) 0.009 (23%)
··-- ,__ ___ - -- · --0.023 - 0.035 0.031 - 0.048 0.036 - 0.044 0.005 - 0.054 0.011 - 0.069 0.021 - 0.058
Lutein 0.061 0.074 0.064 --- - -·--- - - - --· 0.002 0.004 0.000 0.002 0.002 0.001 - - - · 0.011 0.011 0.011 ..
0.011 (18%) ~_:_0_12 (15%_L _ Q.011 (17%) 0.054 - 0.067 0.066 - 0.082 0.061 - 0.067 0.038 - 0.083 0.051 - 0.097 0.042 - 0.086
Zeaxanthin 0.023 0.041 0.030 ----·---- ·-
0.002 0.001 0.001 0.001 0.002 0.001 0.002 0.008 0.003
0.004 (14%) 0.009 (22%) 0.003 (10%)
0.018 - 0.028 0.035 - 0.046 0.026 - 0.033 0.016-0.030 0.023 - 0.059 0.023 - 0.036
Lutein&Zeaxanthin 0.083 0.124 0.092 0.004 0.002 0.001
' 0.002 0.004 0.001 0.015 0.023 0.02J
0.016 (19%) 0.024 (19%) 0.022 (23%)
0.074 - 0.092 0.114-0. 133 0.089 - 0.095
0.050-0.115 0.077-0.171 0.049 - 0.135
210
0.215 0.006 0.002 0.152 --
0.152 (71%) 0.203 - 0.227 nq-0.519
0.039 0.002 0.001 0.010
0.010 (25%) 0.034 - 0.044 0.019 - 0.059
0.037 0.001 0.002 0.008
0.009 (22%) 0.032 - 0.042 0.020 - 0.054
0.019 0.002 0.004 0.000
0.005 (24%) 0.009 - 0.029 0.009 - 0.029
0.056 0.003 0.005 0.010
0.012 (20%) 0.044 - 0.068 0.033 - 0.079
RR:l4_ ValAs& (19/07/199') 3 / 3 F11
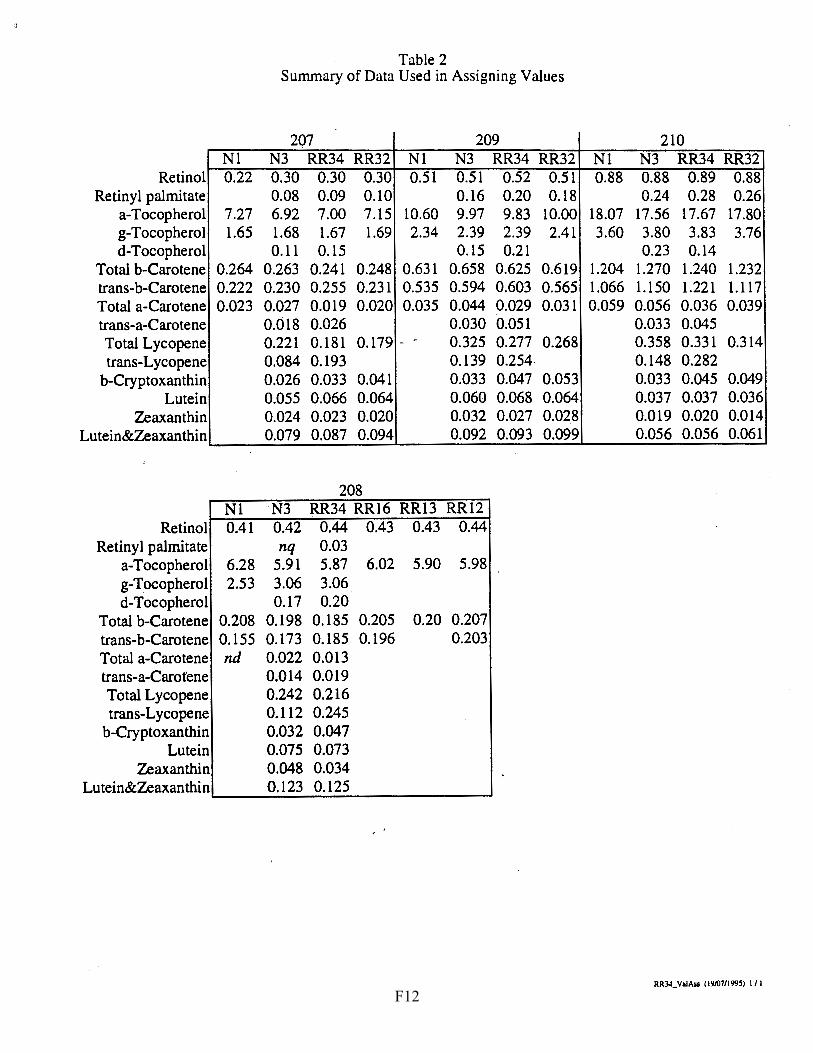
Retinol Retinyl palmitate
a-Tocopherol g-Tocopherol d-Tocopherol
Total b-Carotene trans-b-Carotene Total a-Carotene trans-a-Carotene Total Lycopene trans-Lycopene
b-Cryptoxanthin Lutein
Zeaxanthin Lutein&Zeaxanthin
Retinol Retinyl palmitate
a-Tocopherol g-Tocopherol d-Tocopherol
Total b-Carotene trans-b-Carotene Total a-Carotene trans-a-Carotene Total Lycopene trans-Lycopene
b-Cryptoxanthin Lutein
Zeaxanthin Lutein&Zeaxanthin
NI 0.22
7.27 1.65
0.264 0.222 0.023
Nl 0.41
6.28 2.53
0.208 0.155 nd
Table 2 Summary of Data Used in Assigning Values
207 209 N3 RR34 RR32 NI N3 RR34 RR32 0.30 0.30 0.30 0.51 0.51 0.52 0.51 0.08 0.09 0.IO O.I6 0.20 0.18 6.92 7.00 7.15 10.60 9.97 9.83 10.00 1.68 1.67 1.69 2.34 2.39 2.39 2.41 O. I I 0.15 0.15 0.2I
0.263 0.241 0.248 0.631 Q.658 0.625 0.619 0.230 0.255 0.231 0.535 0.594 0.603 0.565 0.027 0.019 0.020 0.035 0.044 0.029 0.031 0.018 0.026 0.030 0.051 0.221 0.181 0.179 - 0.325 0.277 0.268 0.084 0.193 0.139 0.254. 0.026 0.033 0.041 0.033 0.047 0.053 0.055 0.066 0.064 0.060 0.068 0.064 0.024 0.023 0.020 0.032 0.027 0.028 0.079 0.087 0.094 0.092 0.093 0.099
208 N3 RR34 RRI6 RR13 RR12 0.42 0.44 0.43 0.43 0.44 nq 0.03
5.91 5.87 6.02 5.90 5.98 3.06 3.06 0.17 0.20
0.198 0.185 0.205 0.20 0.207 0.173 0.185 0.196 0.203 0.022 0.013 0.014 0.019 0.242 0.216 0.112 0.245 0.032 0.047 0.075 0.073 0.048 0.034 0.123 0.125
210 NI N3 RR34 RR32 0.88 0.88 0.89 0.88
0.24 0.28 0.26 18.07 17.56 17.67 I7.80 3.60 3.80 3.83 3.76
0.23 O.I4 1.204 I.270 1.240 1.232 1.066 1.150 1.221 1.117 0.059 0.056 0.036 0.039
0.033 0.045 0.358 0.331 0.314 0.148 0.282 0.033 0.045 0.049 0.037 0.037 0.036 0.019 0.020 0.014 0~056 0.056 0.061
RR34_ Va1As.s (19/0711995) U I
F12
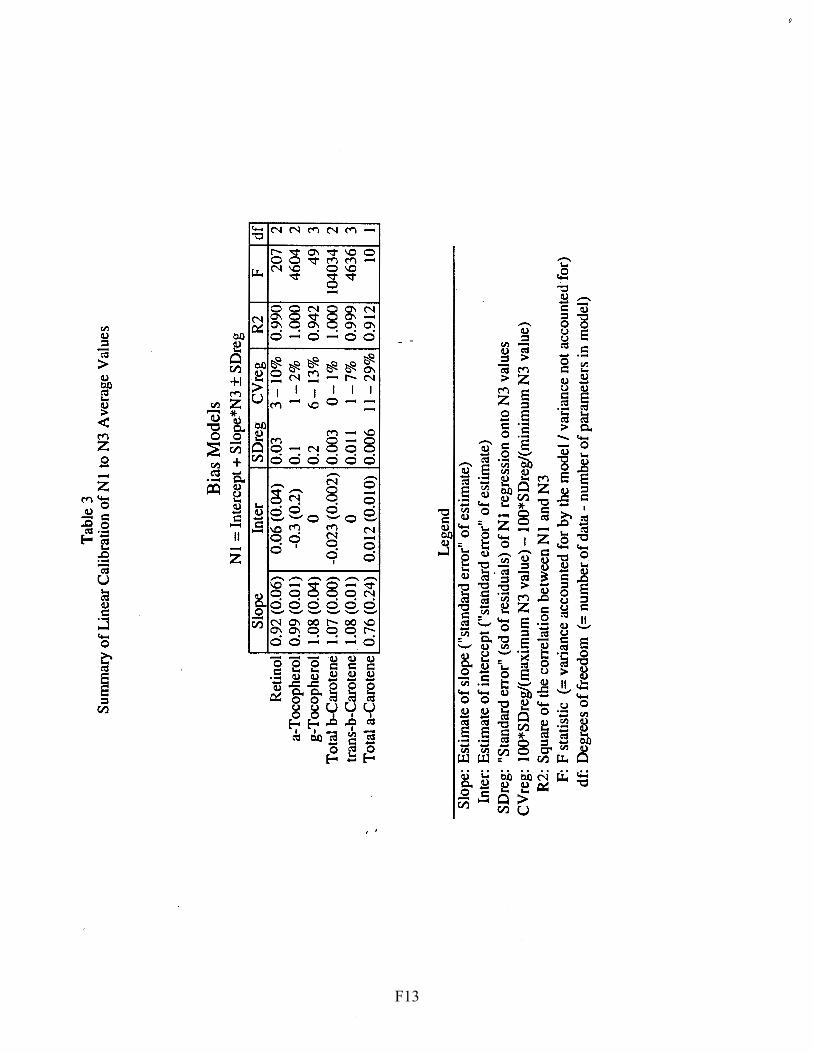
Tab
le 3
S
umm
ary
of L
inea
r Cal
ibra
tion
of N
l to
N3
Ave
rage
Val
ues
Bia
s M
odel
s N
l =
Int
erce
pt +
Slo
pe.*
N3
± S
Dre
g
Ret
inol
a-
Toc
ophe
rol
g-T
ocop
hero
l T
otal
b-C
arot
ene
tran
s-b-
Car
oten
e T
otal
a-C
arot
ene
Slo
pe
0.92
(0.
06)
0.99
(0.
01)
l.08
(0.
04)
1.07
(0.
00)
l.08
(0.
01)
0.76
(0.
24)
Inte
r 0.
06 (0
.04)
-0
.3 (
0.2)
0
-0.0
23 (
0.00
2)
0 0.
012
(0.0
10)
Leg
end
SD
reg
0.03
0.
1 0.
2 0.
003
0.01
1 0
.006
Slop
e: E
stim
ate
of s
lope
("s
tand
ard
erro
r" o
f est
imat
e)
Inte
r: E
stim
ate
of i
nter
cept
("s
tand
ard
erro
r" o
f est
imat
e)
CV
reg
R2
3-1
0%
0.
990
1-2
%
l.00
0 6
-13
%
0.94
2 0
-1%
1.
000
1-7
%
0.99
9 11
-2
9%
0.
912
SD
reg:
"S
tand
ard
erro
r" (
sd o
f res
idua
ls)
of N
l re
gres
sion
ont
o N
3 va
lues
C
Vre
g: l
OO
*SD
reg/
(max
imum
N3
val
ue)
-lO
O*S
Dre
g/{m
inim
um N
3 va
lue)
R
2: S
quar
e o
f the
cor
rela
tion
bet
wee
n N
I an
d N
3
F 20
7 46
04
49
1040
34
4636
10
F: F
sta
tist
ic (
=va
rian
ce a
ccou
nted
for
by
the
mod
el I
vari
ance
not
acc
ount
ed f
or)
df:
Deg
rees
of f
reed
om (
= nu
mbe
r of d
ata
-nu
mbe
r of p
aram
eter
s in
mod
el)
df 2 2 3 2 3 l
F13

c:: ·-..c ~ ] = ~
10
1
0.1
0.01
Figure 1 Comparison of SRM 968b to RR34 Results
SRM 968b Certified Values R retinol r retinyl palmitate a cx-tocopherol y y-tocopherol ~ total ~-carotene B · trans-~-carotene a total a-carotene I lutein
/ 95%RR34
-f '\ 95% SRM 968b
0.1 1
SRM 968b Information Values 5 5-tocopherol ex trans-a-carotene L total lycopene I trans-lycopene ~ ~-cryptoxanthin z zeaxanthin
' '
' '
0.01 0.1
Proposed SRM 968b Values
10
F14
Appendix G. “All-Lab Report” for RR34
The following six pages are the “All-Lab Report” as provided to all participants, with two exceptions: • the participant identifiers (Lab) have been altered. • the order in which the participant results are listed has been altered.
The data summary in the “All-Lab Report” has been altered to ensure confidentiality of identification codes assigned to laboratories. The only attributed results are those reported by NIST. The NIST results are not used in the assessment of the consensus summary results of the study.
G1
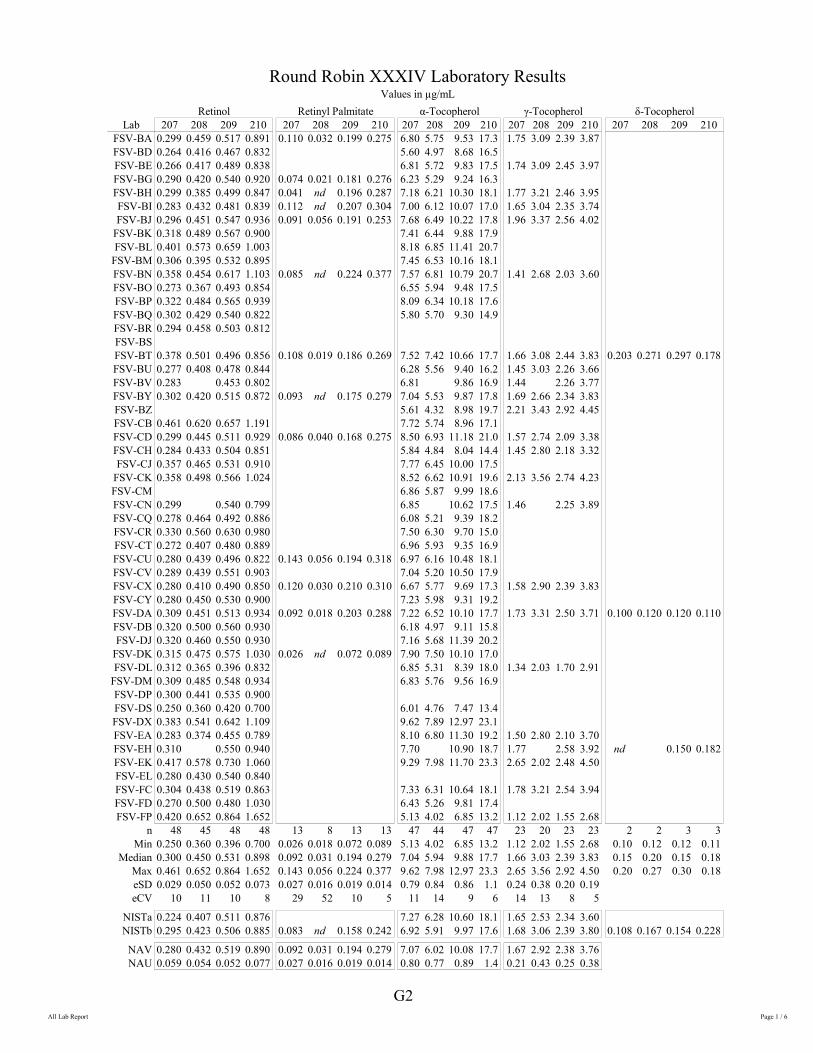
Round Robin XXXIV Laboratory Results Values in µg/mL
Retinol Retinyl Palmitate α-Tocopherol γ-Tocopherol δ-Tocopherol 207 208 209 210Lab
FSV-BA FSV-BD FSV-BE FSV-BG FSV-BH FSV-BI FSV-BJ
FSV-BK FSV-BL
FSV-BM FSV-BN FSV-BO FSV-BP FSV-BQ FSV-BR FSV-BS FSV-BT FSV-BU FSV-BV FSV-BY FSV-BZ FSV-CB FSV-CD FSV-CH FSV-CJ
FSV-CK FSV-CM FSV-CN FSV-CQ FSV-CR FSV-CT FSV-CU FSV-CV FSV-CX FSV-CY FSV-DA FSV-DB FSV-DJ
FSV-DK FSV-DL
FSV-DM FSV-DP FSV-DS FSV-DX FSV-EA FSV-EH FSV-EK FSV-EL FSV-FC FSV-FD FSV-FP
0.299 0.459 0.517 0.891 0.264 0.416 0.467 0.832 0.266 0.417 0.489 0.838 0.290 0.420 0.540 0.920 0.299 0.385 0.499 0.847 0.283 0.432 0.481 0.839 0.296 0.451 0.547 0.936 0.318 0.489 0.567 0.900 0.401 0.573 0.659 1.003 0.306 0.395 0.532 0.895 0.358 0.454 0.617 1.103 0.273 0.367 0.493 0.854 0.322 0.484 0.565 0.939 0.302 0.429 0.540 0.822 0.294 0.458 0.503 0.812
0.378 0.501 0.496 0.856 0.277 0.408 0.478 0.844 0.283 0.453 0.802 0.302 0.420 0.515 0.872
0.461 0.620 0.657 1.191 0.299 0.445 0.511 0.929 0.284 0.433 0.504 0.851 0.357 0.465 0.531 0.910 0.358 0.498 0.566 1.024
0.299 0.540 0.799 0.278 0.464 0.492 0.886 0.330 0.560 0.630 0.980 0.272 0.407 0.480 0.889 0.280 0.439 0.496 0.822 0.289 0.439 0.551 0.903 0.280 0.410 0.490 0.850 0.280 0.450 0.530 0.900 0.309 0.451 0.513 0.934 0.320 0.500 0.560 0.930 0.320 0.460 0.550 0.930 0.315 0.475 0.575 1.030 0.312 0.365 0.396 0.832 0.309 0.485 0.548 0.934 0.300 0.441 0.535 0.900 0.250 0.360 0.420 0.700 0.383 0.541 0.642 1.109 0.283 0.374 0.455 0.789 0.310 0.550 0.940 0.417 0.578 0.730 1.060 0.280 0.430 0.540 0.840 0.304 0.438 0.519 0.863 0.270 0.500 0.480 1.030 0.420 0.652 0.864 1.652
207 208 209 210 0.110 0.032 0.199 0.275
0.074 0.021 0.181 0.276 0.041 nd 0.196 0.287 0.112 nd 0.207 0.304 0.091 0.056 0.191 0.253
0.085 nd 0.224 0.377
0.108 0.019 0.186 0.269
0.093 nd 0.175 0.279
0.086 0.040 0.168 0.275
0.143 0.056 0.194 0.318
0.120 0.030 0.210 0.310
0.092 0.018 0.203 0.288
0.026 nd 0.072 0.089
207 208 209 210 6.80 5.75 9.53 17.3 5.60 4.97 8.68 16.5 6.81 5.72 9.83 17.5 6.23 5.29 9.24 16.3 7.18 6.21 10.30 18.1 7.00 6.12 10.07 17.0 7.68 6.49 10.22 17.8 7.41 6.44 9.88 17.9 8.18 6.85 11.41 20.7 7.45 6.53 10.16 18.1 7.57 6.81 10.79 20.7 6.55 5.94 9.48 17.5 8.09 6.34 10.18 17.6 5.80 5.70 9.30 14.9
7.52 7.42 10.66 17.7 6.28 5.56 9.40 16.2 6.81 9.86 16.9 7.04 5.53 9.87 17.8 5.61 4.32 8.98 19.7 7.72 5.74 8.96 17.1 8.50 6.93 11.18 21.0 5.84 4.84 8.04 14.4 7.77 6.45 10.00 17.5 8.52 6.62 10.91 19.6 6.86 5.87 9.99 18.6 6.85 10.62 17.5 6.08 5.21 9.39 18.2 7.50 6.30 9.70 15.0 6.96 5.93 9.35 16.9 6.97 6.16 10.48 18.1 7.04 5.20 10.50 17.9 6.67 5.77 9.69 17.3 7.23 5.98 9.31 19.2 7.22 6.52 10.10 17.7 6.18 4.97 9.11 15.8 7.16 5.68 11.39 20.2 7.90 7.50 10.10 17.0 6.85 5.31 8.39 18.0 6.83 5.76 9.56 16.9
6.01 4.76 7.47 13.4 9.62 7.89 12.97 23.1 8.10 6.80 11.30 19.2 7.70 10.90 18.7 9.29 7.98 11.70 23.3
7.33 6.31 10.64 18.1 6.43 5.26 9.81 17.4 5.13 4.02 6.85 13.2
207 208 209 210 1.75 3.09 2.39 3.87
1.74 3.09 2.45 3.97
1.77 3.21 2.46 3.95 1.65 3.04 2.35 3.74 1.96 3.37 2.56 4.02
1.41 2.68 2.03 3.60
1.66 3.08 2.44 3.83 1.45 3.03 2.26 3.66 1.44 2.26 3.77 1.69 2.66 2.34 3.83 2.21 3.43 2.92 4.45
1.57 2.74 2.09 3.38 1.45 2.80 2.18 3.32
2.13 3.56 2.74 4.23
1.46 2.25 3.89
1.58 2.90 2.39 3.83
1.73 3.31 2.50 3.71
1.34 2.03 1.70 2.91
1.50 2.80 2.10 3.70 1.77 2.58 3.92 2.65 2.02 2.48 4.50
1.78 3.21 2.54 3.94
1.12 2.02 1.55 2.68
207 208 209 210
0.203
0.100
nd
0.271 0.297 0.178
0.120 0.120 0.110
0.150 0.182
n 48 45 48 48 Min 0.250 0.360 0.396 0.700
Median 0.300 0.450 0.531 0.898 Max 0.461 0.652 0.864 1.652 eSD 0.029 0.050 0.052 0.073 eCV 10 11 10 8
13 8 13 13 0.026 0.018 0.072 0.089 0.092 0.031 0.194 0.279 0.143 0.056 0.224 0.377 0.027 0.016 0.019 0.014
29 52 10 5
47 44 47 47 23 20 23 23 5.13 4.02 6.85 13.2 1.12 2.02 1.55 2.68 7.04 5.94 9.88 17.7 1.66 3.03 2.39 3.83 9.62 7.98 12.97 23.3 2.65 3.56 2.92 4.50 0.79 0.84 0.86 1.1 0.24 0.38 0.20 0.19
11 14 9 6 14 13 8 5
2 0.10 0.15 0.20
2 0.12 0.20 0.27
3 0.12 0.15 0.30
3 0.11 0.18 0.18
NISTa NISTb
0.224 0.407 0.511 0.876 0.295 0.423 0.506 0.885 0.083 nd 0.158 0.242
7.27 6.28 10.60 18.1 6.92 5.91 9.97 17.6
1.65 2.53 2.34 3.60 1.68 3.06 2.39 3.80 0.108 0.167 0.154 0.228
NAV NAU
0.280 0.432 0.519 0.890 0.059 0.054 0.052 0.077
0.092 0.031 0.194 0.279 0.027 0.016 0.019 0.014
7.07 6.02 10.08 17.7 1.67 2.92 2.38 3.76 0.80 0.77 0.89 1.4 0.21 0.43 0.25 0.38
G2All Lab Report Page 1 / 6

Round Robin XXXIV Laboratory Results Values in µg/mL
Total β-Carotene trans-β-Carotene Total cis-β-Carotene Lab 207 208 209 210 207 208 209 210 207 208 209 210
FSV-BA 0.267 0.213 0.66 1.29 0.252 0.200 0.634 1.24 0.015 0.013 0.025 0.050 FSV-BD FSV-BE 0.243 0.194 0.70 1.42 FSV-BG 0.226 0.164 0.57 1.17 FSV-BH 0.234 0.194 0.65 1.31 0.221 0.183 0.606 1.22 0.013 0.011 0.041 0.082 FSV-BI 0.232 0.182 0.61 1.15 FSV-BJ 0.291 0.206 0.72 1.31
FSV-BK FSV-BL
FSV-BM FSV-BN 0.279 0.190 0.63 1.16 0.239 0.175 0.540 1.03 0.101 0.077 0.142 0.186 FSV-BO 0.222 0.154 0.50 0.97 FSV-BP 0.168 0.115 0.46 0.90 FSV-BQ 0.316 0.254 0.77 1.51 FSV-BR FSV-BS 0.291 0.187 0.64 1.29 0.258 0.169 0.582 1.22 0.032 0.018 0.057 0.069 FSV-BT 0.259 0.196 0.64 1.25 0.242 0.185 0.599 1.16 0.017 0.011 0.041 0.090 FSV-BU 0.212 0.155 0.70 1.06 FSV-BV >0.22 >0.66 >1.077 0.220 0.660 1.08 FSV-BY 0.264 0.172 0.62 1.21 FSV-BZ 0.241 0.146 0.24 0.42 FSV-CB FSV-CD 0.234 0.170 0.55 1.17 FSV-CH 0.193 0.161 0.54 1.03 FSV-CJ 0.189 0.161 0.56 1.12
FSV-CK 0.203 0.233 0.74 1.49 FSV-CM FSV-CN >0.238 >0.636 >1.164 0.238 0.636 1.16 FSV-CQ 0.338 0.262 0.85 1.48 FSV-CR FSV-CT 0.232 0.165 0.61 1.22 FSV-CU 0.314 0.222 0.65 1.29 0.263 0.185 0.599 1.22 0.051 0.037 0.046 0.069 FSV-CV 0.226 0.131 0.57 1.05 FSV-CX 0.230 0.160 0.52 1.04 FSV-CY 0.220 0.180 0.61 1.24 FSV-DA 0.292 0.251 0.79 1.54 0.272 0.233 0.727 1.41 0.020 0.018 0.058 0.130 FSV-DB 0.140 0.130 0.55 1.24 FSV-DJ
FSV-DK 0.326 0.144 0.44 FSV-DL 0.193 0.125 0.44 1.04
FSV-DM 0.320 0.232 0.85 1.60 FSV-DP FSV-DS 0.216 0.209 0.57 1.14 FSV-DX >0.337 >0.24 >0.869 >1.714 0.337 0.240 0.869 1.71 FSV-EA 0.262 0.178 0.61 1.20 0.237 0.166 0.581 1.16 0.025 0.012 0.029 0.041 FSV-EH 0.262 0.64 1.21 0.236 0.573 1.09 FSV-EK 0.248 0.179 0.68 1.43 FSV-EL FSV-FC 0.236 0.185 0.70 1.34 FSV-FD 0.210 0.140 0.59 1.06 FSV-FP 0.342 0.234 0.82 1.80
n 37 36 37 36 12 9 12 12 8 8 8 8 Min 0.140 0.115 0.24 0.42 0.220 0.166 0.540 1.03 0.013 0.011 0.025 0.041
Median 0.236 0.180 0.62 1.22 0.241 0.185 0.603 1.19 0.023 0.016 0.044 0.076 Max 0.342 0.262 0.85 1.80 0.337 0.240 0.869 1.71 0.101 0.077 0.142 0.186 eSD 0.039 0.037 0.10 0.16 0.022 0.022 0.045 0.06 0.013 0.006 0.021 0.030 eCV 16 20 16 13 9 12 8 5 56 38 48 39
NISTa NISTb
0.264 0.208 0.263 0.198
0.63 0.66
1.20 1.27
0.222 0.230
0.155 0.173
0.535 0.594
1.07 1.15
0.042 0.033
0.053 0.025
0.097 0.064
0.138 0.120
0.249 0.191 0.051 0.039
0.63 0.11
1.23 0.17
0.239 0.034
0.175 0.029
0.582 0.067
1.16 0.14
0.030 0.019
0.027 0.026
0.062 0.039
0.103 0.046
NAV NAU
G3 All Lab Report Page 2 / 6

Lab
FSV-BA FSV-BD FSV-BE FSV-BG FSV-BH FSV-BI FSV-BJ
FSV-BK FSV-BL
FSV-BM FSV-BN FSV-BO FSV-BP FSV-BQ FSV-BR FSV-BS FSV-BT FSV-BU FSV-BV FSV-BY FSV-BZ FSV-CB FSV-CD FSV-CH FSV-CJ
FSV-CK FSV-CM FSV-CN FSV-CQ FSV-CR FSV-CT FSV-CU FSV-CV FSV-CX FSV-CY FSV-DA FSV-DB FSV-DJ
FSV-DK FSV-DL
FSV-DM FSV-DP FSV-DS FSV-DX FSV-EA FSV-EH FSV-EK FSV-EL FSV-FC FSV-FD FSV-FP
n Min
Median Max eSD eCV
NISTa NISTb
NAV NAU
Total α-Carotene 207 208 209 210
0.025 0.013 0.036 0.047
0.015 0.010 0.025 0.034 0.018 0.011 0.032 0.048 0.022 0.013 0.030 0.035 0.034 0.026 0.057 0.079
0.047 0.019 0.050 0.059 0.017 0.009 0.022 0.032
0.155 0.157 0.160 0.130 0.020 0.015 0.030 0.037 0.013 0.009 0.026 0.035 0.029 0.046 0.051 0.019 0.010 0.043 0.044 0.020 0.030 0.020 0.017
0.020 0.009 0.026 0.039 0.011 0.011 0.021 0.032 0.016 0.012 0.029 0.035 0.021 0.023 0.054 0.073
nd nd nd
0.020 0.010 0.010 0.020
0.018 0.006 0.018 0.042
0.010 0.003 0.020 0.027 0.013 0.035 0.057 0.015 0.016 0.027 0.035
0.017 0.015 0.021 0.026 23 22 23 22
0.010 0.003 0.010 0.017 0.020 0.013 0.029 0.038 0.155 0.157 0.160 0.130 0.006 0.004 0.012 0.011
30 35 41 30
0.023 nd 0.035 0.059 0.027 0.022 0.044 0.056
0.022 0.017 0.034 0.047 0.008 0.010 0.014 0.018
Round Robin XXXIV Laboratory Results Values in µg/mL
trans-α-Carotene Total Lycopene trans-Lycopene 207 208 209 210
0.026 0.019 0.051 0.045
0.018 0.029 0.038
207 208 209 210
0.200 0.213 0.294 0.357 0.181 0.252 0.304 0.344 0.117 0.163 0.191 0.208 0.141 0.190 0.232 0.240
0.217 0.246 0.314 0.348 0.190 0.252 0.336 0.432 0.143 0.088 0.149 0.153
0.623 0.788 0.906 1.355 0.186 0.216 0.277 0.308 0.166 0.214 0.265 0.280 0.280 nd 0.347 0.180 0.185 0.276 0.311
0.160 0.200 0.239 0.286 0.118 0.183 0.215 0.231 0.168 0.231 0.299 0.345 0.191 0.349 0.460 0.587
0.160 nd 0.337
0.150 0.190 0.240 0.260
0.183 0.224 0.215 0.331
0.166 0.156 0.238 0.319 0.145 0.199 0.252 0.267
0.214 0.246 0.344 0.378 0.219 0.255 0.316 0.373 0.195 0.282 0.303
0.240 0.330 0.430 0.470
0.111 0.115 0.159 0.188
207 208 209 210 0.113 0.159 0.177 0.188
0.108 0.139 0.152 0.171
0.504 0.620 0.613 0.644 0.144 0.178 0.216 0.241
0.096 0.127 0.113 0.168
0.099 0.148 0.160
2 1 2 2 26 23 24 26 6 5 6 6 0.02 0.03 0.04 0.111 0.088 0.149 0.153 0.096 0.127 0.113 0.160 0.02 0.02 0.04 0.04 0.181 0.214 0.276 0.325 0.111 0.159 0.165 0.180 0.03 0.05 0.05 0.623 0.788 0.906 1.355 0.504 0.620 0.613 0.644
0.038 0.047 0.058 0.069 0.019 0.030 0.050 0.023 21 22 21 21 17 19 30 13
0.018 0.014 0.030 0.033 0.221 0.242 0.325 0.358 0.084 0.112 0.139 0.148
0.201 0.228 0.301 0.339 0.098 0.136 0.158 0.168 0.055 0.058 0.075 0.080 0.034 0.046 0.054 0.059
G4
β-Cryptoxanthin 207 208 209 210
0.040 0.054 0.049 0.048
0.038 0.052 0.052 0.050 0.032 0.047 0.040 0.038
0.047 0.060 0.050 0.056 0.024 0.033 0.034 0.031 0.010 0.023 0.019 0.016
nd nd nd nd 0.034 0.044 0.043 0.043 0.021 0.028 0.038 0.022 0.018 0.038 0.021 0.041 0.050 0.050 0.051
0.017 0.022 0.022 0.022
0.033 0.047 0.051 0.057 0.043 0.065 0.065 0.078
0.020 0.030 0.030 0.040
0.030 0.036 0.047 0.045
0.024 0.026 0.028 0.032
0.026 0.033 0.028
17 15 17 17 0.010 0.022 0.019 0.016 0.030 0.044 0.040 0.040 0.047 0.065 0.065 0.078 0.013 0.015 0.015 0.016
43 35 37 41
0.026 0.032 0.033 0.033
0.029 0.038 0.038 0.038 0.013 0.018 0.015 0.016
All Lab Report Page 3 / 6

Round Robin XXXIV Laboratory Results Values in µg/mL
Lutein Zeaxanthin Lutein&Zeaxanthin Lab 207 208 209 210 207 208 209 210 207 208 209 210
FSV-BA 0.112 0.162 0.111 0.064 FSV-BD FSV-BE FSV-BG FSV-BH 0.057 0.058 0.054 0.030 nd 0.029 nd nd 0.057 0.087 0.054 0.030 FSV-BI 0.053 0.070 0.056 0.031 0.020 0.042 0.029 0.020 0.083 0.126 0.086 0.052 FSV-BJ
FSV-BK FSV-BL
FSV-BM FSV-BN 0.048 0.065 0.056 0.034 0.029 0.035 0.027 0.015 0.080 0.103 0.089 0.051 FSV-BO FSV-BP FSV-BQ FSV-BR FSV-BS 0.068 0.061 0.095 0.171 FSV-BT 0.075 0.103 0.069 0.037 0.023 0.034 0.022 0.020 0.098 0.137 0.092 0.057 FSV-BU 0.080 0.110 0.046 0.026 FSV-BV 0.060 0.083 0.042 FSV-BY 0.065 0.083 0.067 0.037 0.022 0.019 0.027 0.022 0.087 0.102 0.094 0.059 FSV-BZ 0.090 0.075 0.070 0.040 FSV-CB FSV-CD 0.120 0.158 0.135 0.071 FSV-CH FSV-CJ 0.105 0.124 0.096 0.056
FSV-CK 0.114 0.146 0.112 0.071 FSV-CM FSV-CN FSV-CQ FSV-CR FSV-CT 0.058 0.075 0.061 0.036 FSV-CU FSV-CV FSV-CX 0.060 0.090 0.070 0.040 FSV-CY FSV-DA 0.069 0.077 0.072 0.057 0.025 0.054 0.033 0.020 0.094 0.131 0.105 0.077 FSV-DB FSV-DJ
FSV-DK FSV-DL 0.080 0.089 0.065 0.067
FSV-DM 0.087 0.130 0.107 0.055 FSV-DP FSV-DS FSV-DX 0.102 0.134 0.096 0.070 FSV-EA FSV-EH 0.053 0.055 0.029 0.027 0.025 0.010 0.084 0.081 0.042 FSV-EK FSV-EL FSV-FC FSV-FD FSV-FP
n 10 9 10 10 6 6 6 6 17 15 17 17 Min 0.048 0.058 0.054 0.029 0.020 0.019 0.022 0.010 0.057 0.087 0.046 0.026
Median 0.062 0.075 0.064 0.037 0.024 0.034 0.027 0.020 0.087 0.126 0.092 0.056 Max 0.090 0.103 0.095 0.171 0.029 0.054 0.033 0.022 0.120 0.162 0.135 0.077 eSD 0.012 0.012 0.012 0.007 0.004 0.010 0.003 0.002 0.016 0.030 0.020 0.021 eCV 19 16 19 18 16 28 11 9 18 24 22 37
NISTa NISTb 0.055 0.075 0.060 0.037 0.024 0.048 0.032 0.019 0.079 0.123 0.092 0.056
0.060 0.075 0.063 0.037 0.016 0.017 0.016 0.008
0.023 0.041 0.030 0.019 0.007 0.014 0.009 0.006
0.083 0.020
0.124 0.027
0.093 0.021
0.056 0.013
NAV NAU
G5 All Lab Report Page 4 / 6

Termn
Min Median
Max
eSD
eCV
NAV NAU
nd >x
italics
Round Robin XXXIV Laboratory Results
Analytes Reported By One LaboratoryValues in µg/mL
Analyte cis-Lutein&Zeaxanthin
Coenzyme Q10 Total Carotenoids α-Cryptoxanthin
Code 207 208 209 210 FSV-BT 0.053 0.058 0.072 0.066 FSV-CH 0.751 1.718 1.243 0.682 FSV-BT 0.748 0.767 1.252 1.852 FSV-BT 0.020 0.032 0.023 0.016
Legend
Definition Number of (non-NIST) quantitative values reported for this analyte
Minimum (non-NIST) quantitative value reported Median (non-NIST) quantitative value reported Maximum (non-NIST) quantitative value reported
Estimated standard deviation, calculated from the median absolute deviation from the median of the non-NIST results Coefficient of Variation for (non-NIST) results: 100*eSD/Median
NIST Assigned Value, our estimate of the "true" analyte concentration NIST Assigned Uncertainty, our estimate of the total (serum hetergeniety and inter- and intra-laboratory) standard deviation For details on how we assign these quantities, see the "Analysis of Results."
Not detected (i.e., no detectable peak for analyte) Concentration greater than or equal to x
Not explicitly reported but calculated by NIST from reported values
G6All Lab Report Page 5 / 6

Round Robin XXXIV Laboratory Results
Comparability Summary
Lab FSV-BAFSV-BDFSV-BEFSV-BGFSV-BHFSV-BIFSV-BJ
FSV-BKFSV-BL
FSV-BMFSV-BNFSV-BOFSV-BPFSV-BQFSV-BRFSV-BSFSV-BTFSV-BUFSV-BVFSV-BYFSV-BZFSV-CBFSV-CDFSV-CHFSV-CJ
FSV-CK FSV-CM FSV-CN FSV-CQ FSV-CR FSV-CT FSV-CU FSV-CV FSV-CX FSV-CY FSV-DA FSV-DB FSV-DJ
FSV-DK FSV-DL
FSV-DM FSV-DP FSV-DS FSV-DX FSV-EA FSV-EH FSV-EK FSV-EL FSV-FC FSV-FD FSV-FP
NISTa NISTb
R aT gT bC tbC 1 1 1 1 1 2 1 1 1 1 1 1 2 2 1 1 1 1 3 1 1 1 2 2 1 1 1 1 3 3 1 1 1 1 1 3 2 3 3 3 4 2 1 1 1 2 1 2 1 2 1
2 2 2 1 2 2 1 2 1 3 2 1 1 2 2
3 3 4 2 2 1 1 1 3 1 2 1 3 2 1 2 2 2 2 1 1
1 1 1 2 1 1 1 2 2 3 2 1 1 1 1 1 1 1 1 1 1 1 2 1 1 2 1 2 1 1 2 2 1 2 4 2 2 4 2 3 2 2 1 1 1 2 1 2 3 3 3 3 4 2 1 2 2 3 4 1 1 1 2 2 4 4 1 1 1 2 2 2 1 1 1 1 4 4 1 1 1 1 1 1 1 1 1 1 1 1
n 48 47 23 37 12
StS 1 58 45 48 46 75 2 23 36 30 41 17 3 13 13 17 8 0 4 6 6 4 5 8
% Observed
Label Lab
R aT gT bC
tbC n
Definition laboratory number "Standard Score" for Retinol "Standard Score" for α-Tocopherol "Standard Score" for γ-Tocopherol "Standard Score" for Total β-Carotene "Standard Score" for trans-β-Carotene number of (non-NIST) laboratories providing data for this analyte
"Standard Score" Given that our knowledge of the shape, location, and width of the measurement distributions is approximate and that a limited number of labs are involved, we summarize comparability with the following four-level "Standard Score" (StS)…
StS 1 2 3 4
where: StV
NAV
NAU
t (1-α,n-1)
Expected 68.2 % 27.3 %
4.3 % 0.3 %
Definition All StV within ±t (1-0.683,n-1) {i.e., ±1 SD} All StV within ±t (1-0.954,n-1) {i.e., ±2 SD} All StV within ±t (1-0.997,n-1) {i.e., ±3 SD} At least one StV > ±t (1-0.997,n-1) {i.e., >3 SD}
Standardized Value, the distance in standard deviation units your value is from the "true" concentration: StV = (your value - NAV) / NAU
NIST Assigned Value, our estimate of the "true" analyte concentration
NIST Assigned Uncertainty, our estimate of the total (serum heterogeniety and iter- and intra-laboratory) measurement standard deviation.
Two-tailed Student's t for coverage of ±1, ±2, and ±3 NAU about NAV, assuming a normal population of size n
For details on the NIST Assigned quantities, see this Round Robin's "Report of (Meta)Analysis."
These are the observed and normal-population-expected proportions of each Standard Score (StS), based upon each laboratory's largest StV for the four sera.
G7 All Lab Report Page 6 / 6

Appendix H. Representative “Individualized Report” for RR34
Each participant in RR34 received an “Individualized Report” reflecting their reported results. Each report included a detailed analysis of the results they reported for some or all of the following analytes: • Retinol • Retinol palmitate • α-Tocopherol • γ-Tocopherol • Total β-Carotene • trans-β-Carotene • Total α-Carotene • Total Lycopene • β-Cryptoxanthin • Lutein • Zeaxanthin • Lutein & Zeaxanthin
The following 8 pages are the “Individualized Report” for the analytes evaluated by participant FSV-BA.
H1
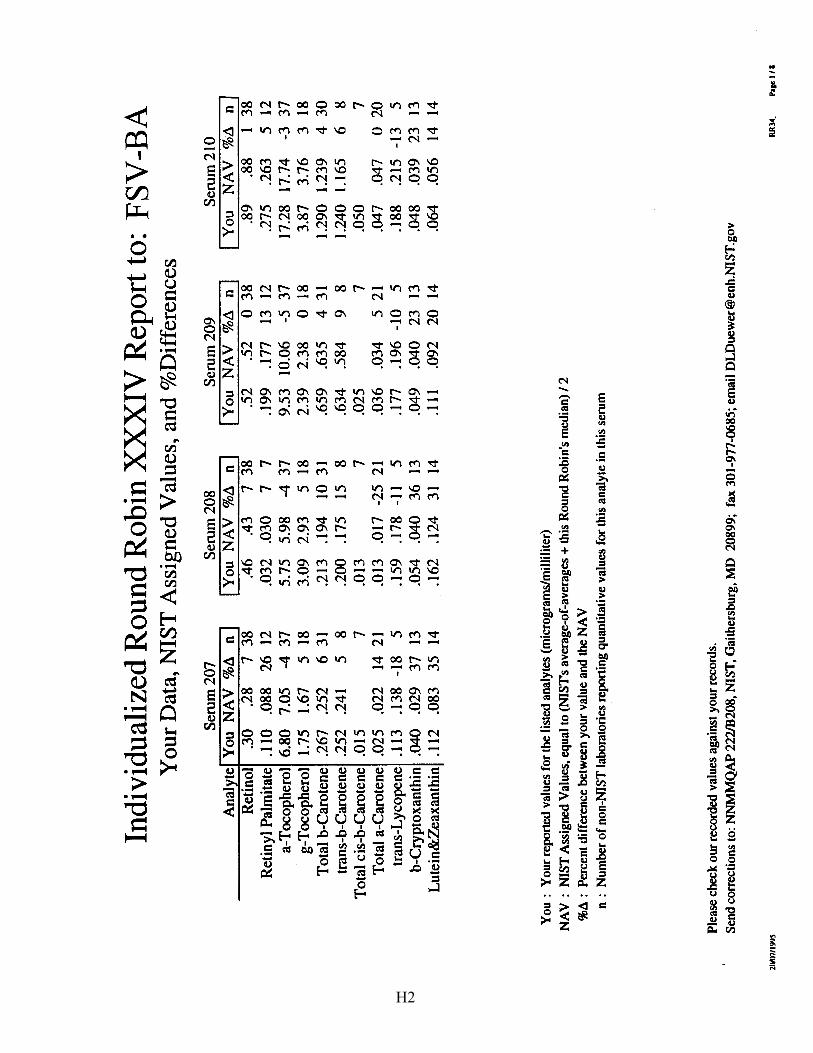
2CW
7/19
95
Indi
vidu
aliz
ed R
ound
Rob
in X
XX
IV R
epor
t to:
FS
V-B
A
You
r D
ata,
NIS
T A
ssig
ned
Val
ues,
and
%D
iffe
renc
es
Seru
m 2
07
Ser
um 2
08
Seru
m 2
09
Ana
l te
Y
ou
NA
V
%A
n
I You
N
A V
%A
n I
I You
N
AV
%
A
n I
Ret
inal
.3
0 .2
8 7
38
.46
.43
7 38
.5
2 .5
2 0
38
Ret
inyl
Pal
mita
te
.110
.0
88
26
12
.032
.0
30
7 7
.199
.1
77
13
12
a-T
ocop
hero
l 6.
80
7.05
-4
37
5.
75
5.98
-4
37
9.
53
10.0
6 -5
37
g-
Toc
ophe
rol
1.75
1.
67
5 18
3.
09
2.93
5
18
2.39
2.
38
0 18
T
otal
b-C
arot
ene
.267
.2
52
6 31
.2
13
.194
10
31
.659
.6
35
4 31
tr
ans-
b-C
arot
ene
.252
.2
41
5 8
.200
.1
75
15
8 .6
34
.584
9
8 T
otal
cis
-b-C
arot
ene
.015
7
.013
7
.025
7
Tot
al a
-Car
oten
e .0
25
.022
14
21
.0
13
.017
-2
5 21
.0
36
.034
5
21
tran
s-L
ycop
ene
.113
.1
38
-18
5 .1
59
.178
-1
1 5
.177
.1
96
-10
5 b-
Cry
ptox
anth
in
.040
.0
29
37
13
.054
.0
40
36
13
.049
.0
40
23
13
Lut
ein&
Zea
xant
hin
.112
.0
83
35
14
.162
.1
24
31
14
.ll l
.0
92
20
14
You
: Y
our
repo
rted
val
ues
for
the
list
ed a
naly
tes
(mic
rogr
ams/
mil
lili
ter)
NA
Y :
NIS
T A
ssig
ned
Val
ues,
equ
al t
o (N
IST
's a
vera
ge-o
f-av
erag
es+
this
Rou
nd R
obin
's m
edia
n)/
2
%.d
: P
erce
nt d
iffe
renc
e be
twee
n yo
ur v
alue
and
the
NA
V
n :
Num
ber o
f non
-NIS
T la
bora
tori
es r
epor
ting
qua
ntit
ativ
e va
lues
for
thi
s an
alyt
e in
thi
s se
rum
Ple
ase
chec
k ou
r rec
orde
d va
lues
aga
inst
you
r rec
ords
.
Seru
m 2
10
I You
N
AV
%
A
nl
.89
.88
1 38
. 2
75
.263
5
12
17.2
8 17
.74
-3
37
3.87
3.
76
3 18
1.
290
1.23
9 4
30
1.24
0 1.
165
6 8
.050
7
.047
.0
47
0 20
.1
88
.215
-1
3 5
.048
.0
39
23
13
.064
.0
56
14
14
Sen
d co
rrec
tion
s to
: N
NM
MQ
AP
222
/B20
8, N
IST
, Gai
ther
sbur
g, M
D 2
0899
; fa
x 30
1-97
7-06
85; e
mai
l DL
Due
wer
@en
h.N
IST
.gov
RR
34;
Pose
1/8
H2
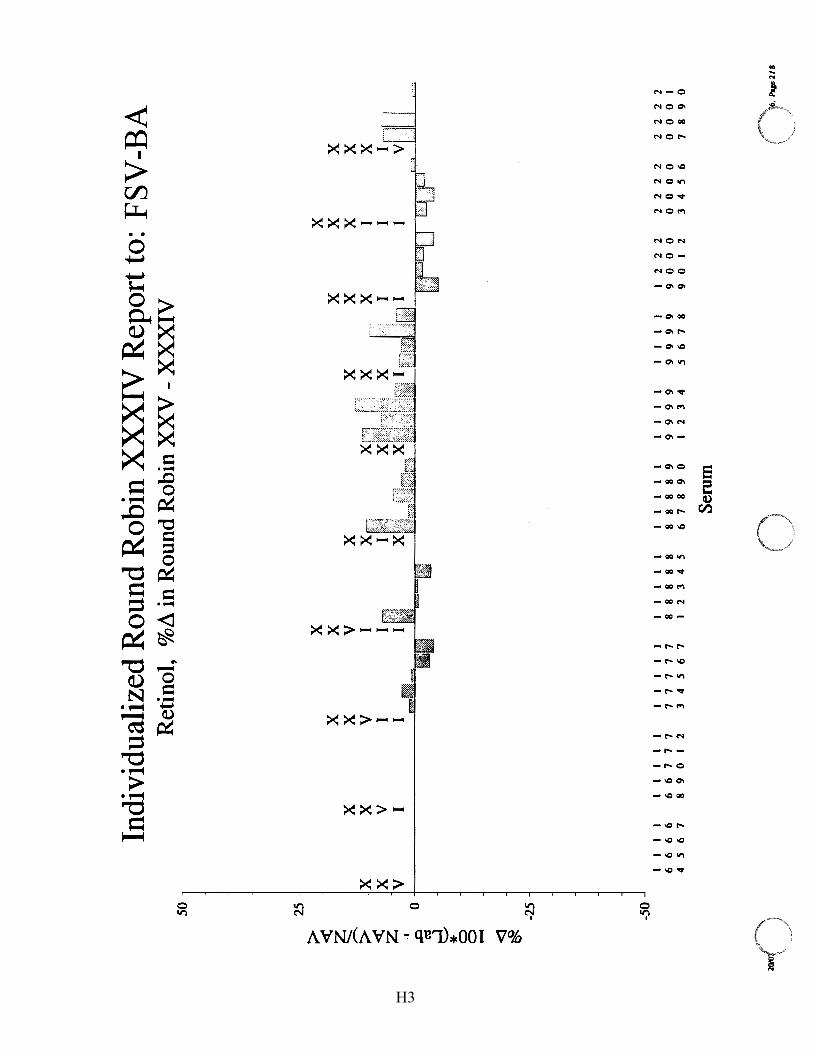
50
25
> <
~
-. >
x <
x
z v
~
0
d * 0 0 - <I ~
-25
-50
Indi
vidu
aliz
ed R
ound
Rob
in X
XX
IV R
epor
t to
: F
SV-B
A
Ret
inol
, %
Li in
Rou
nd R
obin
XX
V -
XX
XIV
I I
I I
6 6
6 6
4 5
6 7
x x v I
I I
I I
I 6
6 7
7 7
8 9
0 I
2
x x v I I
I I
I I
I 7
7 7
7 7
3 4
5 6
7
·::f!.S
· --
I I
I I
I 8
8 8
8 8
I 2
3 4
5
x
I I
I I
I 8
8 8
8 9
6 7
8 9
0
Seru
m
0
I I
I I
9 9
9 9
I 2
3 4
x x x I
I I
I I
9 9
9 9
5 6
7 8
x x x I I
I 2
2 2
9 0
0 0
9 0
I 2
x x x I I I
2 2
2 2
0 0
0 0
3 4
5 6
x x x Ir 11
.vl··
l1
2 2
2 2
0 0
0 I
7 8
9 0
,6.
Paa
cl/ 8
CG,.
,, ~ .
.. /
H3

50 -
25
>
< ~
..........
>
<
z v
.0
cd
0
d * 0 0 - <J ~
-25
-50
J
2tw
7/1!
195
Indi
vidu
aliz
ed R
ound
Rob
in X
XX
IV R
epor
t to:
: FS
V-B
A
Toc
ophe
rols
, %
.1 i
n R
ound
Rob
in X
XV
-X
XX
IV
x x
x x
x x
x x
x x
x v
x I
x v
I I
I I
I I
I I
v~,i~~
~Iii
L..J
• g-
Toc
ophe
rol
ml a
-Toc
ophe
rol
I I
I I
I I
I I
I I
I I
I I
I I
I I
I I
I I
I I
I I
I I
I I
I I
I 2
2 2
2 2
2 2
2 2
2 2
6 6
6 6
6 6
7 7
7 7
7 7
7 7
8 8
8 8
8 8
8 8
8 9
9 9
9 9
9 9
9 9
9 0
0 0
0 0
0 0
0 0
0 I
4 5
6 7
8 9
0 I
2 3
4 5
6 7
I 2
3 4
5 6
7 8
9 0
I 2
3 4
5 6
7 8
9 0
I 2
3 4
5 6
7 8
9 0
Ser
um
RR
:W_
Pq
e ) /I
H4
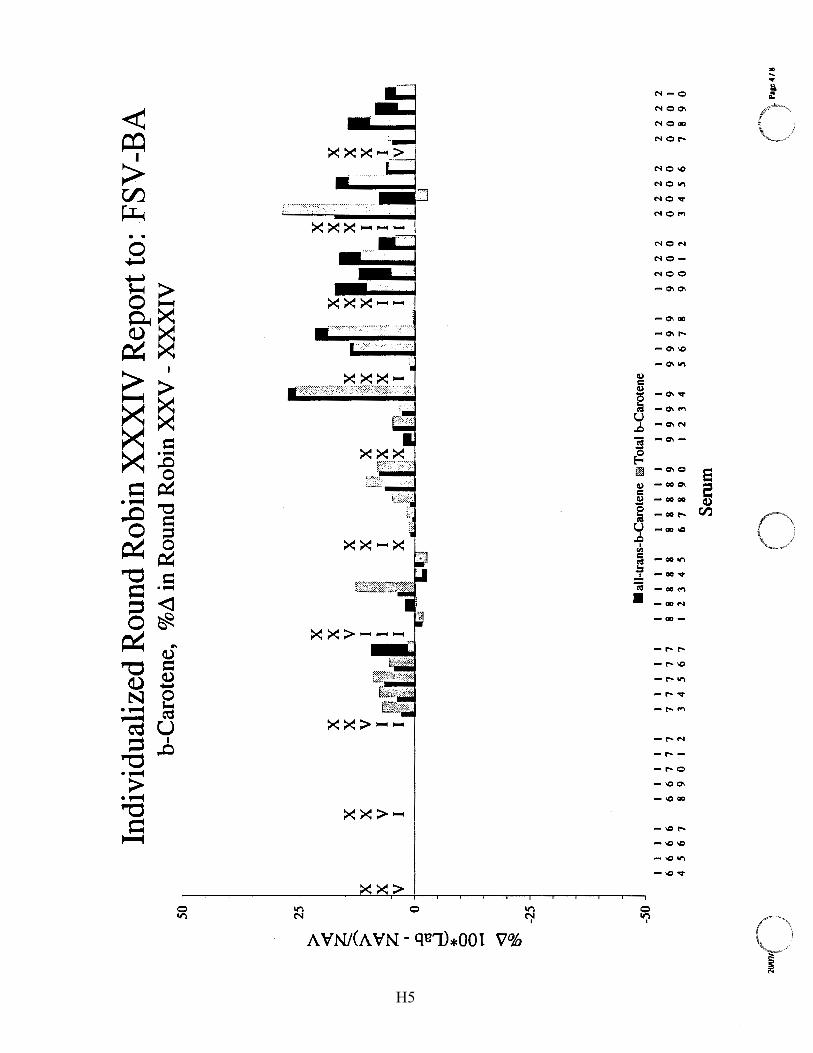
50
25
>
<
~ ~
-.. >
<
z ..c
0 c:s
d * 0 0 - <
I ~
-25
-50
j
2Mnl(,_
) '\
, -·
~'""
Indi
vidu
aliz
ed R
ound
Rob
in X
XX
IV R
epor
t to:
FS
V-B
A
b-C
arot
ene,
%
A in
Rou
nd R
obin
XX
V -
XX
XIV
x x
x x
v v
I I
I
• al
l-tr
ans-
b-C
amte
ne m
i Tot
al b
-Car
oten
e I
I I
I I
I I
I I
I I
I I
I I
I I
I I
I I
I I
I I
I I
I I
I I
I I
2 2
2 2
2 2
2 2
2 2
2 6
6 6
6 6
6 7
7 7
7 7
7 7
7 8
8 8
8 8
8 8
8 8
9 9
9 9
9 9
9 9
9 9
0 0
0 0
0 0
0 0
0 0
I 4
5 6
7 8
9 0
I 2
3 4
5 6
7 I
2 3
4 5
6 7
8 9
0 I
2 3
4 5
6 7
8 9
0 I
2 3
4 5
6 7
8 9
0
Ser
um
0 P
lp:4
/8
H5
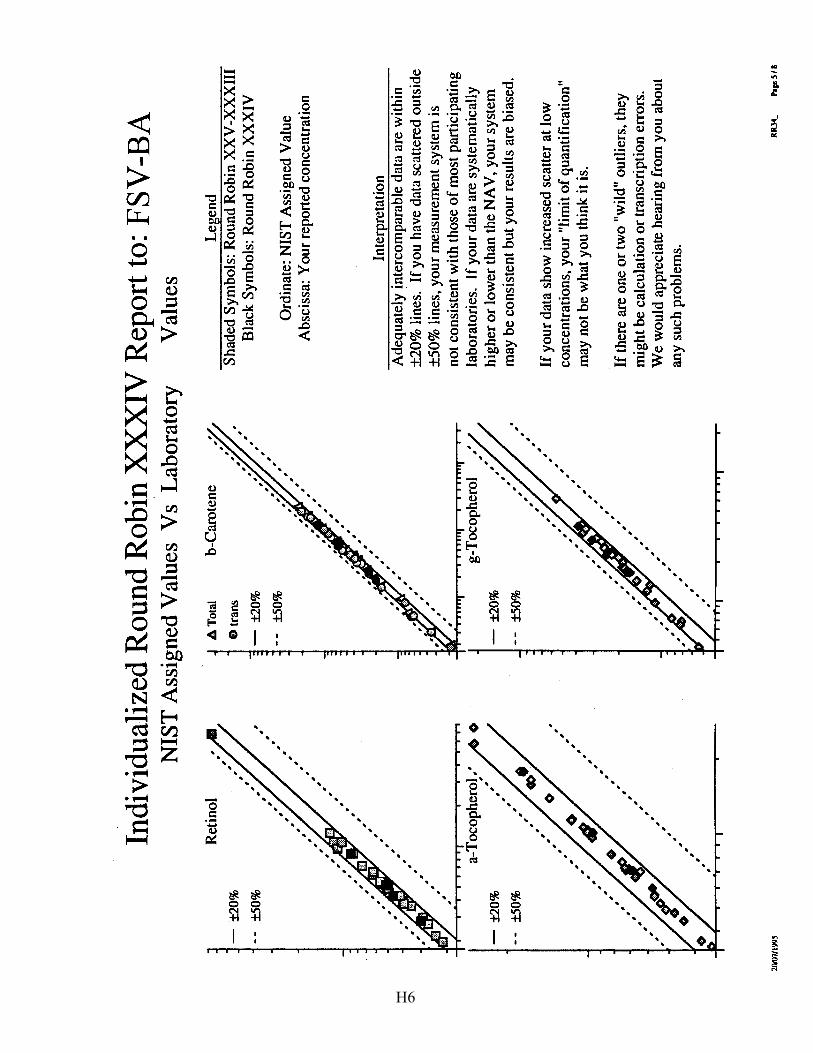
-±2
0%
--±
50%
. . . . . .
-±
20%
--±
50%
21W
7/19
9S
Indi
vidu
aliz
ed R
ound
Rob
in X
XX
IV R
epor
t to:
FS
V-B
A
NIS
T A
ssig
ned
Val
ues
Vs
Lab
orat
ory
Val
ues
Ret
inol
. • • • . .
. . . . . . . .
. . . . . .
. . . . . . . . . .
. . . . . . .
•
• • • . .
a-T
ocop
hero
l. •
,
. . . . . . . .
. • • . . . . ,
. • . , . . . . • .
• . . . . . . .
. . . . . . , • ,
A T
otal
e tr
ans
--±
50%
-±
20%
--±
50%
. . . . . . .
b-C
arot
ene
g-T
ocop
hero
l • •
. . .
. . . . . . .
. .
• , • . .
. . . . . • . . . . . . , .
. • • . . . . . ,
Leg
end
Sha
ded
Sym
bols
: R
ound
Rob
in X
XV
-XX
XII
I B
lack
Sym
bols
: R
ound
Rob
in X
XX
IV
Ord
inat
e: N
IST
Ass
igne
d V
alue
A
bsci
ssa:
You
r re
port
ed c
once
ntra
tion
Inte
rpre
tati
on
Ade
quat
ely
inte
rcom
para
ble
data
are
with
in
±20
% l
ines
. If
you
hav
e da
ta s
catt
ered
out
side
±
50%
lin
es, y
our
mea
sure
men
t sy
stem
is
not c
onsi
sten
t w
ith
thos
e o
f m
ost
part
icip
atin
g la
bora
tori
es.
If y
our
data
are
sys
tem
atic
ally
hi
gher
or
low
er t
han
the
NA
V, y
our
syst
em
may
be
cons
iste
nt b
ut y
our
resu
lts
are
bias
ed .
If y
our d
ata
show
inc
reas
ed s
catt
er a
t lo
w
conc
entr
atio
ns, y
our
"lim
it o
f qua
ntif
icat
ion"
m
ay n
ot b
e w
hat y
ou t
hink
it is
.
If th
ere
are
one
or tw
o "w
ild"
outl
iers
, th
ey
mig
ht b
e ca
lcul
atio
n or
tran
scri
ptio
n er
rors
. W
e w
ould
app
reci
ate
hear
ing
from
you
abo
ut
any
such
pro
blem
s .
RR
34_
Paa
cS/&
H6
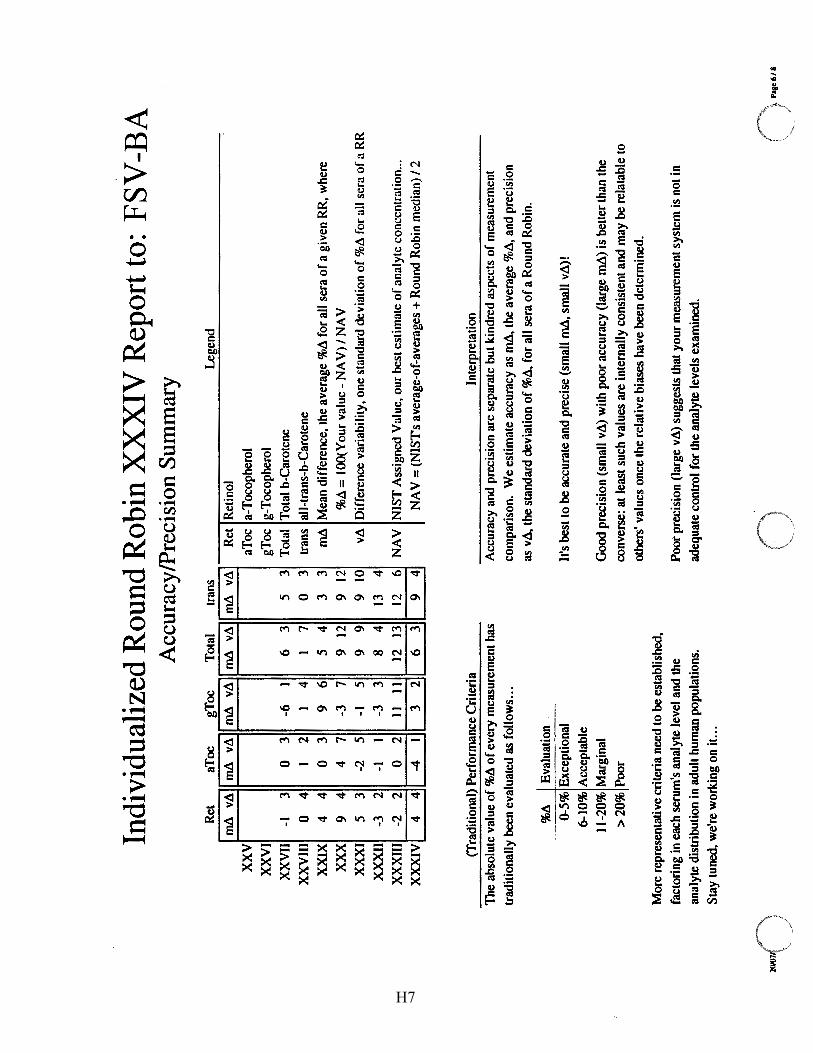
2!W7/(
¢")
·. )
Indi
vidu
aliz
ed R
ound
Rob
in X
XX
IV R
epor
t to:
FS
V-B
A
Acc
urac
y /P
reci
sion
Sum
mar
y
Rel
a T
oe
gToc
T
otal
-
l1ll\
vl
l l1
ll\
vll
l1ll\
vl
l rn
.ll
vll
-1
3 0
3 -6
1
6 3
0 4
I 2
I 4
I 7
4 4
0 3
9 6
5 4
xxv
XX
VI
XX
VII
X
XV
III
XX
IX
xxx
XX
XI
XX
XII
X
XX
III
XX
XIV
9 4
4 7
-3
7 9
12
5 3
-2
5 -1
5
9 9
-3
2 -1
I
-3
3 8
4
-2
2 0
2 11
11
12
13
4 4
-4
1 3
2 6
3
(Tra
diti
onal
) P
erfo
rman
ce C
rite
ria
1lle
abs
olut
e va
lue
of
%/l.
of e
very
mea
sure
men
t ha
s
trad
itio
nall
y be
en e
valu
ated
as
foll
ows .
..
%A
E
valu
atio
n
0-5%
Exc
epti
onal
6-10
% A
ccep
tabl
e
11-2
0% M
argi
nal
>20
% P
oor
Mor
e re
pres
enta
tive
cri
teri
a ne
ed l
o be
est
abli
shed
,
fact
orin
g in
eac
h se
rum
's a
naly
te le
vel
and
the
anal
yte
dist
ribu
tion
in a
dult
hum
an p
opul
atio
ns.
Sta
y tu
ned,
we'
re w
orki
ng o
n it
. ..
tran
s
l1ll\
vl
l
5 3
0 3
3 3
9 12
9 10
13
4
12
6 9
4
Leg
end
-
Rel
R
etin
ol
a Toe
a-
Toc
ophe
rol
gToc
g-
Toc
ophe
rol
Tot
al
Tot
al b
-Car
oten
e
tran
s al
1-t
rans
-b-C
arot
ene
l1ll\
M
ean
diff
eren
ce,
Jhe
aver
age
%A
for
all
sera
of
a gi
ven
RR
, w
here
%!l
= 1
OO
(You
r va
lue
-N
A V
) I
NA
V
v!l.
Dif
fere
nce
vari
abil
ity,
one
sta
ndar
d de
viat
ion
of
%ll
for
all
sera
of a
RR
NA
V
NIS
T A
ssig
ned
Val
ue,
our
best
est
imat
e o
f an
alyt
e co
ncen
trat
ion
...
NA
V =
(NIS
Ts
aver
age-
of-a
vera
ges
+ R
ound
Rob
in m
edia
n) I
2
Inte
rpre
tati
on
Acc
urac
y an
d pr
ecis
ion
are
sepa
rate
but
kin
dred
asp
ects
of
mea
sure
men
t
com
pari
son.
W
e es
tim
ate
accu
racy
as
llll\,
the
ave
rage
%ll
, and
pre
cisi
on
as v
!l., t
he s
tand
ard
devi
atio
n o
f %
A, f
or a
ll s
era
of
a R
ound
Rob
in.
It's
bes
t to
be
accu
rate
and
pre
cise
(sm
all
rn.ll
, sm
all
v!l.)
!
Goo
d pr
ecis
ion
(sm
all
vll)
wit
h po
or a
ccur
acy
(lar
ge r
n.ll)
is
bett
er th
an t
he
conv
erse
: at
leas
t suc
h va
lues
are
int
erna
lly
cons
iste
nt a
nd m
ay b
e re
lata
ble
to
othe
rs' v
alue
s on
ce th
e re
lati
ve b
iase
s ha
ve b
een
dete
rmin
ed.
Poo
r pr
ecis
ion
(lar
ge v
ll)
sugg
ests
tha
t you
r m
easu
rem
ent s
yste
m is
not
in
adeq
uate
con
trol
for
the
ana
lyte
lev
els
exam
ined
.
()
'· -·
Paac6
/I
H7

]l g~
l!J
81
94
112
208
~i ------
--~
81
94
11
2 20
8
2CW
7/19
'.IS
Indi
vidu
aliz
ed R
ound
Rob
in X
XX
IV R
epor
t to
: F
SV-B
A
Com
pari
sons
to
Prio
r A
naly
ses
iiJ!J
c:
::::::
ca:I
I ~f:!l
Q)
-c:
e Q
)
Q)
~I a~
~
0 fit
&J
u ~
8 I
..0
E-ca
, . .....
.. tU
g~@
fI{!
l 0 E-
El 8-~t
J i!l~
lt
El
II
r--.
,--
-·1
r r
r -
. I
I "1
I
-1
I I
I I
I I
I I
I I
I I
200
207
201
2()1
) 20
2 21
0 81
94
11
2 20
8 20
0 20
7 20
1 20
9 20
2 21
0 81
94
11
2 20
8 20
0 20
7 20
1 20
9 20
2 21
0
_ a_~_
1 ~~-
I -~_I! _
-~-~
-gl
-------~
••
-e--
--Q
)
-~-a
-.ru
.......
-~~
~ u I
1 -B
ij ~t~
-!-~-
~.
---~-I-
II
r--1
r--1
I 8
1 94
11
2 20
8 r--1
,-
--,
r-1
t
r-.-.--,
,---
, ,--
--,
r--.
20
0 20
7 20
1 21
19
202
210
200
207
201
209
202
210
81
94
112
208
200
207
201
2119
20
2 21
0
RR
34
l'a&C
7 I
8
H8
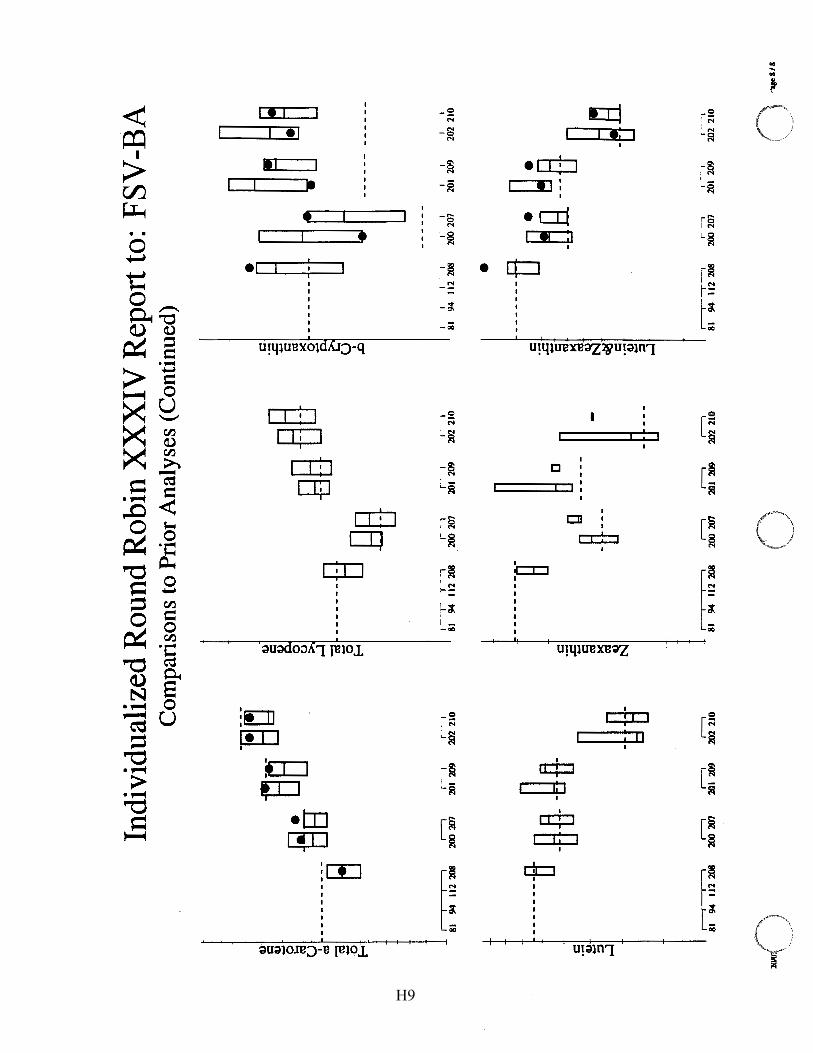
Indi
vidu
aliz
ed R
ound
Rob
in X
XX
IV R
epor
t to:
FSV
-BA
C
ompa
riso
ns t
o Pr
ior
Ana
lyse
s (C
ontin
ued)
~ • E
a-13 ~
-i
----
----
[j -§
a .
~ D
~}---
----8
BB BB
~5
11
r-
1 r-
·--
1 ,-
-r
l ·
·-1
,-l
r--I
I I
81
94
112
208
200
1.(J
/ 20
1 2(
)1)
202
210
81
94
112
208
200
207
201
2()1
) 20
2 21
0
------
--~ -H
~-_gB
-
~l -~~-
----
----
8-
~ D c:
·- '5 -~-
~---
----
a -
~ ~
-- -
-
II
r--1
,--,
r--1
,--,
,--,
81
94
112
208
200
1.(J
J 20
I 20
0 20
2 21
0 81
94
11
2 20
8 20
0 20
7 20
1 20
9 20
2 21
0
200.()
"-··
-'"-
-··"
''/
n , _____ /
c: :s c: ell ><
•
0 ~ -
--
--
--
_._
~ ~~
- u I ,D
----
--I
~I ;4
1:
2 2~
I
I I
I I
I 20
0 20
7 20
1 20
9 20
2 2I
O
• '
c: ---
----ft
B. g.
·-..c: -
fl ---
t} - §
-~Ji
>< ell. ~
ad
c:
"i) -::s ...l
.----i-
---r-·1
r
·--i
r--i
r -
1
81
94
112
208
200
207
201
20
')
202
210
()
··8
/8
,_
H9

Appendix I. Shipping Package Inserts for RR35
The following two items were included in each package shipped to RR35 participants: • Cover letter • Datasheet
The cover letter and datasheet were enclosed in a sealed waterproof bag along with the samples themselves.
I1
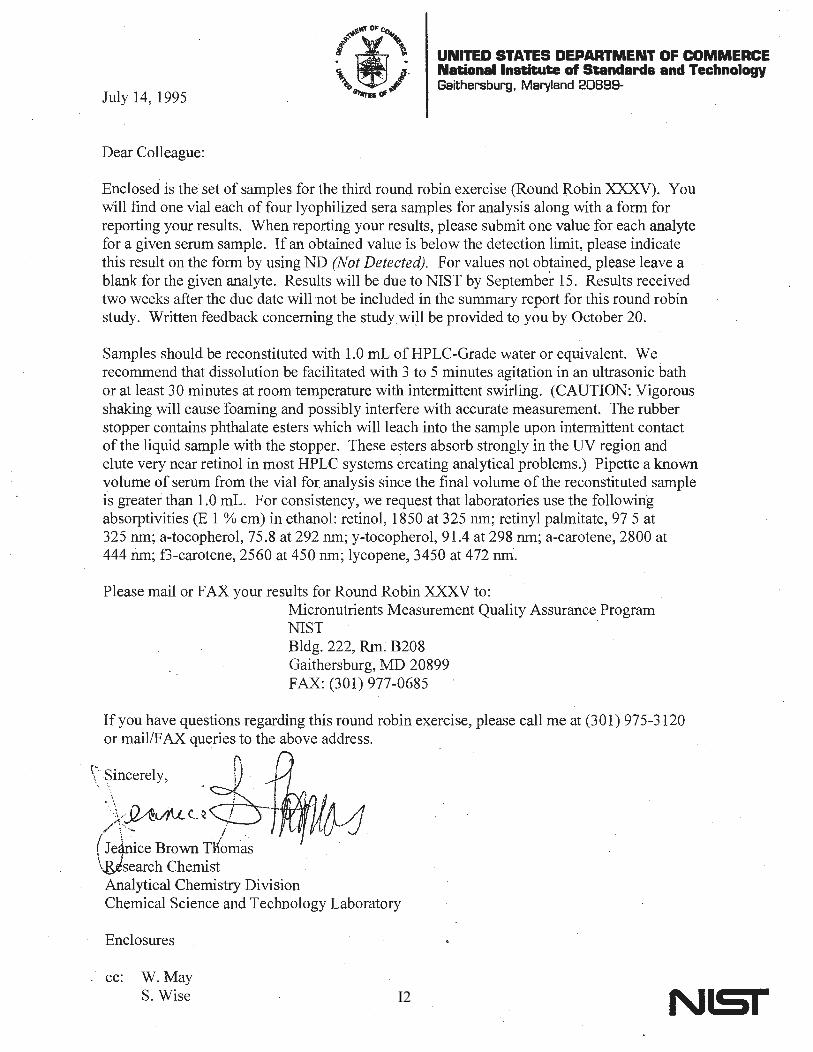
July 14, 1995
UNITED STATES DEPARTMENT OF COMMERCE National Institute of Standards and Technology Gaithersburg, Maryland 20899-
Dear Colleague:
Enclosed is the set of samples for the third round robin exercise (Round Robin XXXV). You will find one vial each of four lyophilized sera samples for analysis along with a form for reporting your results. When reporting your results, please submit one value for each analyte for a given serum sample. If an obtained value is below the detection limit, please indicate this result on the form by using ND (Not Detected). For values not ob~ained, please leave a blank for the given analyte. Results will be due to NIST by September 15. Results received two weeks after the due date will not be included in the summary report for this round robin study. Written feedback concerning the study will be provided to you by October 20.
Samples should be reconstituted with 1.0 mL of HPLC-Grade water or equivalent. We recommend that dissolution be facilitated with 3 to 5 minutes agitation in an ultrasonic bath or at least 30 minutes at room temperature with intermittent swirling. (CAUTION: Vigorous shaking will cause foaming and possibly interfere with accurate measurement. The rubber stopper contains phthalate esters which will leach into the sample upon intermittent contact of the liquid sample with the stopper. These esters absorb strongly in the UV region and elute very near retinal in most HPLC systems creating analytical problems.) Pipette a known volume of serum from the vial for analysis since the final volume of the reconstituted sample is greater than 1.0 mL. For consistency, we request that laboratories use the following absorptivities (E 1 % cm) in ethanol: retinal, 1850 at 325 nm; retinyl palmitate, 97 5 at 325 nm; a-tocopherol, 75.8 at 292 nm; y-tocopherol, 91.4 at 298 nm; a-carotene, 2800 at 444 rim; f3-carotene, 2560 at 450 nm; lycopene, 3450 at 472 nm.
Please mail or FAX your results for Round Robin XXXV to: Micronutrients Measurement Quality Assurance Program NIST Bldg.222, Rm.B208 Gaithersburg; MD 20899 FAX: (301) 977-0685
If you have questions regarding this round robin exercise, please call me at (301) 975-3120 or mail/FAX queries to the above address.
\~~ ~incerely, . ~: · ·. '
·.\ t>A>. .: --· .~ ·:·:.Jb'~IAll. ( _ ~ /
~\Je~~~ce Brown T~mas ~search Chemist Analytical Chemistry Division Chemical Science and Technology Laboratory
Enclosures
cc: W. May S. Wise N•Si I2
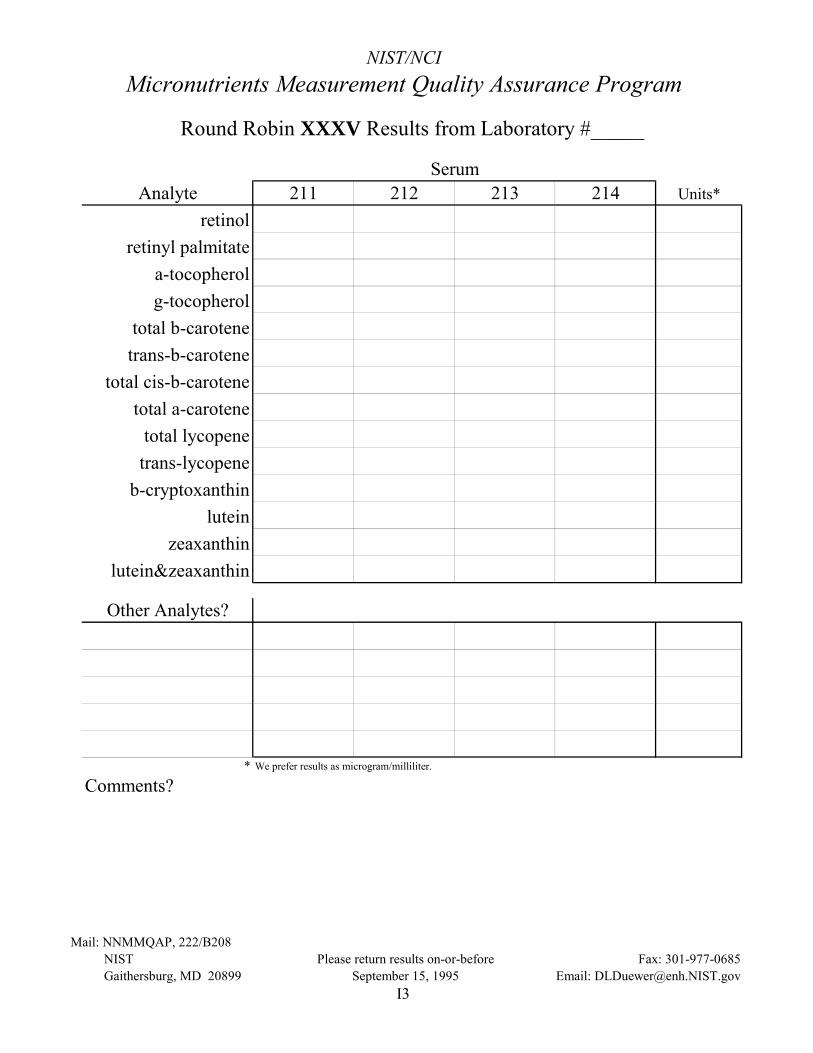
NIST/NCI Micronutrients Measurement Quality Assurance Program
Round Robin XXXV Results from Laboratory #_____
Serum Analyte 211 212 213 214 Units*
retinol retinyl palmitate
a-tocopherol g-tocopherol
total b-carotene trans-b-carotene
total cis-b-carotene total a-carotene
total lycopene trans-lycopene
b-cryptoxanthin lutein
zeaxanthin lutein&zeaxanthin
Other Analytes?
* We prefer results as microgram/milliliter.
Comments?
Mail: NNMMQAP, 222/B208 NIST Please return results on-or-before Fax: 301-977-0685 Gaithersburg, MD 20899 September 15, 1995 Email: [email protected]
I3
Appendix J. Final Report for RR35
The following 19 pages are the final report for RR35 as provided to all participants: • Cover letter • A discussion entitled “Lies, Damn Lies, and Statistics” that:
o describes the nature of the test samples and details any previous distributions o summarizes aspects of the study that we believe may be of interest to the
participants • A “Report of (Meta)Analysis” that details the analysis of NIST measurements
J1

November 3, 1995
Dear Colleague:
UNITED STATES DEPARTMENT OF COMMERCE National Institute of Standards and Technology Gaithersburg. Maryland 20899-
Enclosed is the summary report of the results for Round Robin XXXV. This report summarizes both overall and individual laboratory performance for the three round robin exercises conducted during 1995. Included in this report are: tabular summaries of data for Round Robins XXXIII, XXXIV, and XXXV; a graphical summary of the interlaboratory median vs. individualized laboratory data for retinol, a.- and y-tocopherol, and total and transP-carotene; percent bias charts for retinol, a.- and y-tocopherol, and trans- and total Pcarotene; and a summary of individual laboratory performance for the past three years. Tabular data only are provided for a-carotene, P-cryptoxanthin, lutein, lycopene, retinyl palmitate, and zeaxanthin.
The overall interlaboratory precision of retinol and a.-tocopherol measurements has remained at an average estimated coefficient of variation ( eCV) of approximately 10% over the past three years, and around 21 % for P-carotene during the same period of time. The eCV for ytocopherol has remained at about 10% over the past 18 months.
Round Robin XXXIII (Sera 203-206) consisted of a dilution series where Serum 205 was a 1: 1 volumetric mix of Serum 203 and stripped serum; Serum 204 was a 1 :2 volumetric mix of Serum 203 and the stripped serum. Serum 206 was previously distributed in Round Robin XVIII as Serum 120 and in Round Robin XXI as Serum 147. The results from this exercise indicate that the measurement capability for retinol, a.- and y-tocopherol, and P-carotene is adequate.
Round Robin XXXIV consisted of Sera 207-210 where Sera 207, 209, and 210 were previously distributed as Sera 200, 201, and 202 , respectively in Round Robin XXXII and are the three concentration levels of SRM 968b. Serum 208 (also identified as Control B in earlier studies) was previously distributed as Serum 81 in Round Robin XII, Serum 94 in Round Robin XIII, and Serum 112 in Round Robin XVI. In this study, the average eCV for retinol and a.- and y-tocopherol was 9-10% and 17% for P-carotene. Results from this study demonstrated that the interlaboratory measurement reproducibility over the past 18 months has improved.
Round Robin XXXV (Sera 211-214) consisted of a replicate dilution series. Sera 211, 212, and 214 were previously distributed in Round Robin XXXI as Sera 197, 198, and 195, respectively. Serum 213 was distributed in Round Robin XXX as Serum 191. Sera 195, 197, and 198 are a dilution series. Serum 198 was blended from native sera that was high in Pcarotene. Serum 195 is a 1: 1 blend of Serum 198 and stripped serum. Serum 197 is a 1 :3 blend of Serum 198 and stripped serum. Serum 191 is a blend of native serum that was supplemented with a high level of retinol.
N•Si
The tabular summaries for Round Robins XXXIII and XXXIV mentioned below are provided in previous Appendices of this document and are not repeated here.
J2

EXCEPTIONAL performance, those rated 2 (within± 2 SD) indicate ACCEPTABLE performance, a rating of 3 (within± 3 SD of the assigned value) is MARGINAL performance, and 4 (>3 SD of the assigned value) indicates POOR performance relative to the current state-of-the-practice for these measurements.
If you have concerns regarding your laboratory performance or were rated "POOR" based on the criteria stated above, we suggest that you obtain a unit of SRM 968b, Fat-Soluble Vitamins and Cholesterol in Human Serum, and analyze all three levels. If with minor method modifications, your measured values do not agree with the certified values, we suggest that you contact us for consultation.
As last year, the fees for non-NCI funded laboratories will be $300 for US labs and $600 for non-US labs. An invoice to that effect will be mailed in January.
The 1996 QA Program will consist of three round robin exercises for the analysis of fat-soluble vitamins and carotenoids in serum, two studies for the analysis of ascorbic acid in serum, and two exercises for the analysis of fat-soluble vitamins and carotenoids in food. The FY96 program thrusts will continue to include methods development for the measurement of difluoromethylomithine, 4-hydroxyphenylretinamide, and selenomethionine in serum. Attention will also be focused on agents that are currently in preclinical efficacy and toxicity trials ( e.g.,epigallocatechin gallate, phenethyl isothiocyanate, indole-3-carbinol, dimethyl fumarate, and curcumin).
The first set of samples for the fat-soluble vitamins in serum analysis will be distributed the week of January 22. Results are due by March 15; written feedback will be provided to labs by April 12. The second set of samples will be shipped the week of April 29 with results due by June 14 and feedback to labs by July 26. The third set of samples will be shipped the week of July 29. Results will be due by September 20. Feedback will be provided to the laboratories by October 25.
The round robin studies for the analysis of fat-soluble vitamins and carotenoids in food will also be scheduled in April and July to coincide with the second and third serum round robin studies. The coordinator of these exercises is Dr. Katherine Sharpless (301/975-3121).
The first set of samples for the analysis of ascorbic acid in serum will be distributed in February. The second set will be distributed in May. These round robin studies are being coordinated by Dr. Sam Margolis (301/975-3137).
The next QA workshop will be held Saturday, April 13 as a pre-meeting in conjunction with Experimental Biology '96 in Washington, DC. Details of the workshop will be provided as plans are finalized.
J3

(
Certificates of participation in the FY95 QA Program will be distributed again in January. If you have suggestions regarding improvements to the certificates, please contact us. We are also in the process of developing a home page through the Internet for the QA program. You will be updated as to when it becomes available.
Sincerely,
anice Brown Thomas Research Chemist Analytical Chemistry Division Chemical Science and Technology Laboratory
cc: W. May
J4
Lies, Damn Lies, and Statistics
"Lies, Damned Lies, and Statistics" Marie Twain
Page 1
The attached N2M2QAP Round Robin XXXV Report is identical (!)in form to RR XXXIV's. It
includes an exhaustive analysis of your results (the "Individualized" report), a complete listing of
everyone's results (the "All Lab" report), and the details of the NIST value and uncertainty
assignments (the "Report of (Meta)Analysis for RR XXXV Sera: 211-214").
Your "Individualized" report has the following elements:
Pa e Contents
1 Your values, our assigned values, and the %bias between you and us
2 %Bias barchart for retinol for your last 3 years' results
3 %Bias barchart for a- and y-tocopherol for your last 3 years' results
4 %Bias barchart for total and trans-~-carotene for your last 3 years' results
5 Our assigned value vs. your value scatterplots for retinol, a- and ytocopherol, and total and trans-~-carotene, again for your last 3 years' results
6 Accuracy/Precision Summary, yet again for your last 3 years' results
7 Comparison-to-Prior-Analyses plots for retinol, retinyl palmitate, a- and y-tocopherol, and total and trans-~-carotene
8 Comparison-to-Prior-Analyses plots for cis-~-carotene, total a-carotene, total lycopene, ~-cryptoxanthin, lutein, and lutein & zeaxanthin
The Comparison-to-Prior-Analyses plots on pages 7 and 8 show your individual results and a
box-plot summary of the group's results, plotted against results from prior Round Robins:
Serum #213 was distributed as #191 in Round Robin XXX. This serum was prepared to have high levels of the retinoids, tocopherols, and trans-~-carotene. (It has a very high level of retinol, one representative of extreme retinol poisoning.) The "true value" line is the average of the assigned values for the two Round Robins.
Serum #211, 212, and 214 were distributed as #197, 198, and 195, respectively, in Round Robin XXXI. These sera were prepared as a concentration series by dilution of a blended native serum with delipidized serum. The level of analytes in serum 214 is 50% of that in serum 212 and the level in serum 211is25% of that in 212. There are thus two sets of "true value" lines: the horizontal lines are the average of the assigned values for the two Round Robins. The sloping lines represent the expected dilution relationship.
The "All Lab" report has the following elements:
Pa e Contents
1-4 A listing of all results for analytes reported by at least two laboratories, plus essential summary statistics.
5a A list ofresults for the four analytes reported by only one laboratory. Sb A Legend for the above two lists.
6 The "Measurement Comparability Summary" (or "Score card")
J5
Lies, Damn Lies, and Statistics Page2
The Legend for the data summary lists all the "flag codes" we currently use. Two new codes
have been added: "?" and "*". The "?" indicates non-quantitative values resulting from the
analyte level being above the limit of quantification of the routine calibration curve. The "*"
indicates non-quantitative values resulting from a miscellany of causes: broken vial, instrument
malfunction, etc. These codes have been introduced to insure that values you report as somehow
suspect are not included in the statistical and "Score card" calculations. We want to keep as
accurate a record of measurement results as possible, but do not wish to in any way "punish"
anyone for honest reporting of results recognized as non-quantitative.
The "?" code for non-quantitative high values was suggested by Laboratory 70. They recognized
that the value from the routine analysis was beyond the range of their calibration, but were
unable to rerun a properly diluted sample. We believe that "?" is a better code for such
extrapolated values than is the upper-limit of quantification code ''>x". We believe that
differentiating extrapolation-related from other sources of non-quantitative values is important,
as the recognition of "toxic high level!" is the critical aspect of the retinol in serum 213.
Note that the dilution series ( [212], [214] = [212]/2, [211] = [212]/4) enables you to estimate
your effective limits of quantification ("LOQ"s) for some of the analytes in these lyophilized
sera. For example, as described in the "Report of (Meta)Analysis", the NIST LOQs are below
the serum 211 levels for retinol, a- and y-tocopherol, total and trans-~-carotene, and lutein. The
LOQs are between the serum 212 and 211 levels for retinyl palmitate, total and trans-a-carotene,
total and trans-lycopene, ~-cryptoxanthin, and zeaxanthin. The LOQ for 0.tocopherol is at least
as high as the serum 214 level. The Comparison-to-Prior-Analyses plots present all the values
required for you to make your own LOQ determinations. We encourage you to report "<X"
(where x is your LOQ) for values below your LOQ; "nq" is acceptable, but is less informative.
Please reserve "ntf' (or "0") for situations where you find no evidence forthe analyte's presence
in the sample.
The interlaboratory medians for nearly all analytes reported in this Round Robin are very similar
to those reported previously, and the observed distribution of values among reporting
laboratories is generally tighter. Thus, we believe that interlaboratory measurement performance
for most analytes is again improving. (We're still working on methods to more quantitatively
document such trends ... ) However, the lutein and especially the zeaxanthin values are suspect.
The poorer performance for lutein and zeaxanthin is not surprising, as some of you measure a
combined "lutein and zeaxanthin" peak, others measure lutein and zeaxanthin independently,
some just estimate lutein, and a few laboratories differentiate all-trans- and cis-isomers. Our
separation system may provide resolved peaks for trans-lutein and trans-zeaxanthin, but we have
J6
Lies, Damn Lies, and Statistics Page3
thus far not determined whether any of the cis-isomers are included under these dominant peaks.
There are many peaks eluting in this region; most of them remain to be i~ntified.
The retinol level in serum 213, while about that of an actual polar-bear-liver poisoning case,
represents an extreme "Challenge Sample." We promise not to distribute it again for a few
years ... As we should have freeze-dryer capability again soon, we anticipate introducing a
number of new and "more interesting" samples in '96. We intend to explore the expected high
levels for many of the carotenoids. The attached Table summarizes the analyte distributions we
have gleaned from recent literature.
Your comments and suggestions are welcome. If you discover any errors in our recording or
interpretation of your data, please let us know!
DaveDuewer Research Chemometrician [email protected]
Margaret Kline Research Biologist
J7
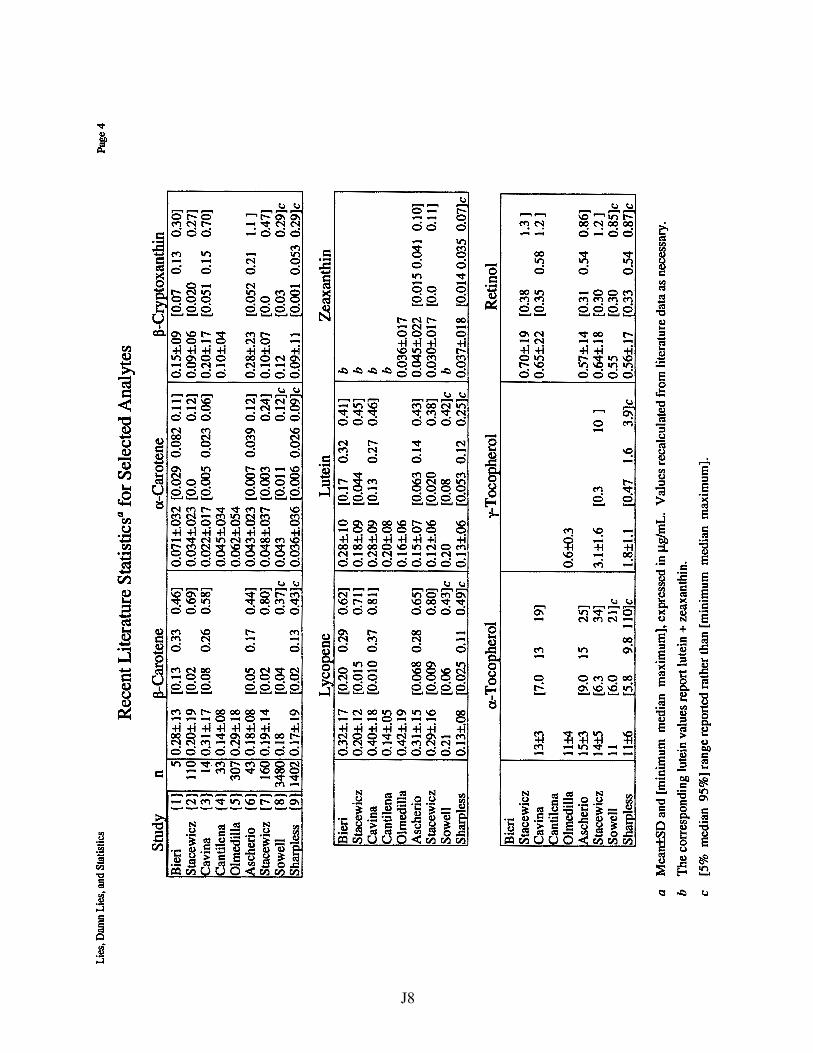
Lies
, Dam
n Li
es, a
nd S
tatis
tics
Pag
e4
Rec
ent L
iter
atur
e S
tati
stic
s0 fo
r S
elec
ted
Ana
lyte
s
Stud
n
-Car
oten
e a-
Car
oten
e 13
-C
toxa
nthi
n B
ieri
{ 1
} 5
0.28
±.13
[0
.13
0.33
0.
46]
0.07
1±.0
32 [
0.02
9 0.
082
0.11
] 0.
15±.
09
[0.0
7 0.
13
0.30
] St
acew
icz
{ 2}
110
0.20
±.19
[0
.02
0.69
] 0.
034±
.023
[0.
0 0.
12]
0.09
±.06
[0
.020
0.
27]
,Cav
ina
{3}
14 0
.31±
.17
[0.0
8 0.
26
0.58
] 0.
022±
.017
[0.
005
0.02
3 0.
06]
0.20
±.17
[0
.051
0.
15
0.70
] 'C
antil
ena
{4}
33 0
.14±
.08
0.04
5±.0
34
0.10
±.04
O
lmed
illa
{5}
307
0.29
±.18
0.
062±
.054
IA
sche
rio
{6}
43 0
.18±
.08
[0.0
5 0.
17
0.44
] 0.
043±
.023
[0.
007
0.03
9 0.
12]
0.28
±.23
[0
.052
0.
21
1.1
1 St
acew
icz
{ 7}
160
0.19
±.14
[0
.02
0.80
] 0.
048±
.037
[0.
003
0.24
] 0.
10±.
07
[0.0
0.
47]
Sow
ell
{8}
3480
0.1
8 [0
.04
0.37
]c
0.04
3 [0
.011
0.
12]c
0.
12
[0.0
3 0.
29]c
Sh
arol
ess
f 91
1402
0.1
7±.1
9 0.
02
0.13
0.
43 c
0.
036±
.036
0.
006
0.02
6 0.
09 c
0.
09±.
11
0.00
1 0.
053
0.29
lc
L c
o ne
L
ute i
n Z
eaxa
nthi
n B
ieri
0.
32±.
17
[0.2
0 0.
29
0.62
] 0.
28±.
10
[0.1
7 0.
32
0.41
] b
Stac
ewic
z 0.
20±.
12
[0.0
15
0.71
] 0.
18±.
09
[0.0
44
0.45
] b
Cav
ina
0.40
±.18
[0
.010
0.
37
0.81
] 0.
28±.
09
[0.1
3 0.
27
0.46
] b
'Can
tilen
a 0.
14±.
05
0.20
±.08
b
Olm
edill
a 0.
42±.
19
0.16
±.06
0.
036±
.017
A
sche
rio
0.31
±.15
[0
.068
0.
28
0.65
] 0.
15±.
07
[0.0
63
0.14
0.
43]
0.04
5±.0
22
[0.0
15 0
.041
0.
10]
Stac
ewic
z 0.
29±.
16
[0.0
09
0.80
] 0.
12±.
06
[0.0
20
0.38
] 0.
030±
.017
[0
.0
0.11
] So
wel
l 0.
21
[0.0
6 0.
43]c
0.
20
[0.0
8 0.
42]c
b
Shar
oles
s 0.
13±.
08
ro.0
25
0.11
0.
49 c
0.
13±.
06
0.05
3 0.
12
0.25
c
0.03
7±.0
18
0.01
4 0.
035
0.07
1c
a-T
ocop
hero
l y-
Toc
oohe
rol
Ret
inol
'
Bie
ri
Stac
ewic
z ,0
.70±
.19
[0.3
8 1.
3 1
Cav
ina
13±3
[7
.0
13
19]
0.65
±.22
[0
.35
0.58
1.
21
Can
tilen
a O
lmed
illa
11±4
0.
6±0.
3 A
sche
rio
15±3
[9
.0
15
25]
0.57
±.14
[0
.31
0.54
0.
86]
Stac
ewic
z 14
±5
[6.3
34
] 3.
1±1.
6 [0
.3
10 1
0.
64±.
18
(0.3
0 1.
21
Sow
ell
11
[6.0
21
]c
0.55
[0
.30
0.85
]c
Shar
oles
s 11
±6
5.8
9.8
110
c 1.
8±1.
1 0.
47
1.6
3.9
c 0.
56±.
17
0.33
0.
54
0.87
c
a M
ean±
SD a
nd [
min
imum
med
ian
max
imum
], ex
pres
sed
in µ
g/m
L.
Val
ues
reca
lcul
ated
fro
m l
itera
ture
dat
a as
nec
essa
ry.
b T
he c
orre
spon
ding
lute
in v
alue
s re
port
lute
in +
zea
xant
hin.
c [5
%
med
ian
95%
] ra
nge
repo
rted
rat
her
than
[m
inim
um m
edia
n m
axim
um).
J8

Lies, Damn Lies, and Statistics
References
1 Bieri JG, Brown ED, Smith JC Jr. 1985. Determination of Individual Carotenoids in Human Plasma by High Performance Liquid Chromatography. Journal of Liquid Chromatography 8(3) 473-484.
2 Stacewicz-Sapuntzakis M, Bowen PE, Kikendall JW, Burgess M. 1987. Simultaneous Determination of Serum Retinol and Various Carotenoids: Their Distribution in Middle-aged Men and Women. Journal of Micronutrient Analysis 3 27-45.
3 Cavina G, Gallinella B, Pomi R, Pecora P, Suraci C. 1988. Carotenoids, Retinoids, and alpha-Tocopherol in Human Serum: Identification and Determination by Reversed-phase HPLC. Journal of Pharmaceutical and Biomedical Analysis 6 259-269.
4 Cantilena LR, Nierenberg DW. 1989. Simultaneous Analysis of Five Carotenoids in Human Plasma by Isocratic High Performance Liquid Chromatography. Journal of Micronutrient Analysis 6 127-145.
5 Olmedilla B, Granado F, Blanco I, Rojas-Hidalgo E. 1992. Determination of Nine Carotenoids, Retinol, Retinyl Palmitate, and cx-Tocopherol in Control Human Serum Using Two Internal Standards. Food Chemistry 45 205-213.
6 Ascherio A, Stampfer MI, Colditz GA, Rimm EB, Litin L, Willett WC. 1992. Correlations of Vitamin A and E Intakes with the Plasma Concentrations of Carotenoids and Tocopherols among American Men and Women. Journal of Nutrition 122 1792-1801.
7 Stacewicz-Sapuntzakis M, Bowen PE, Mares-Perlman, IA. 1993. Serum Reference Values for Lutein and Zeaxanthin Using a Rapid Separation Technique. Carotenoids in Human Health. Eds: Canfield LM, Krinsky NI, Olson IA. Annals of the New York Academy of Sciences, Vol. 691: 207-209.
8 Sowell AL, Huff DL, Yeager PR, Caudill SP, Gunter EW. 1994. Retinol, cx-Tocopherol, Lutein/Zeaxanthin, 13-Cryptoxanthin, Lycopene, ex-Carotene, trans-j3-Carotene, and Four Retinyl Esters in Serum Determined Simultaneously by Reversed-Phase HPLC with Multiwavelength Detection. Clinical Chemistry 40 411-416.
9 Sharpless KS, Duewer DL. 1995. Population Distributions and lntralaboratory Reproducibility for Fat-Soluble Vitamin-related Compounds in Human Serum. Analytical Chemistry, scheduled for publication Dec 1, 1995.
Page 5
J9
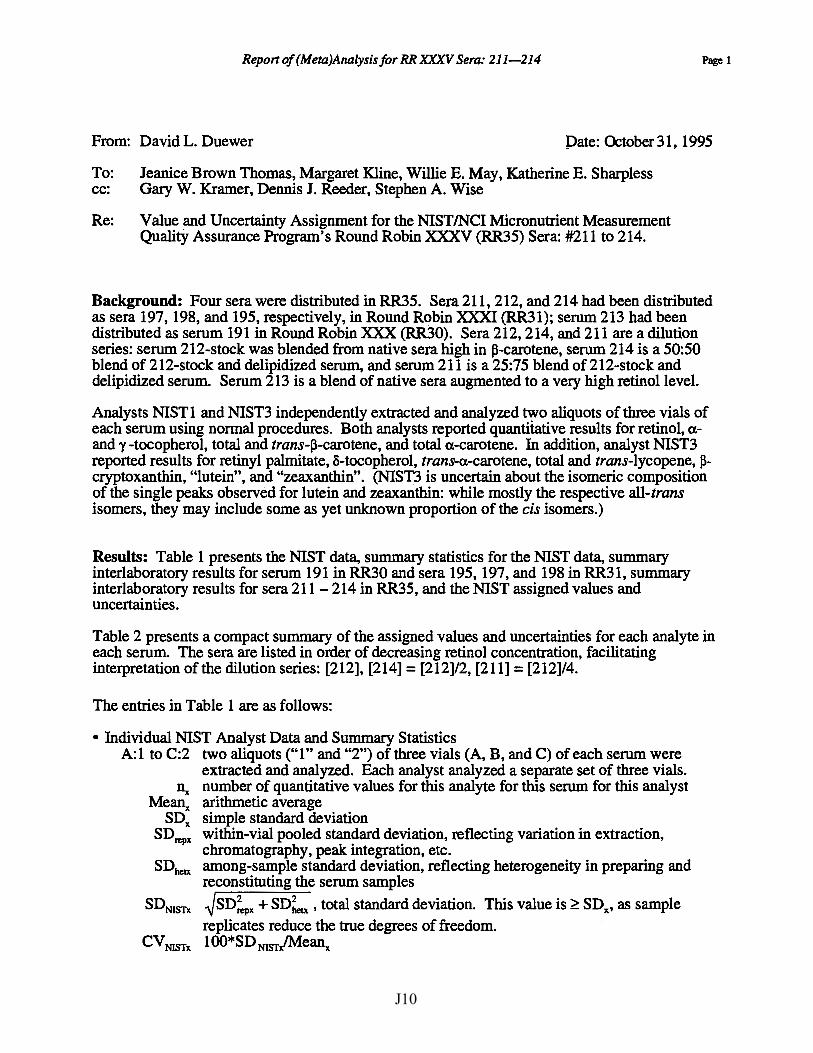
Report of (Meta)Analysisfor RR XXXV Sera: 211-214 Page I
From: David L. Duewer Pate: October 31, 1995
To: Jeanice Brown Thomas, Margaret Kline, Willie E. May, Katherine E. Sharpless cc: Gary W. Kramer, Dennis J. Reeder, Stephen A. Wise
Re: Value and Uncertainty Assignment for the NIST/NCI Micronutrient Measurement Quality Assurance Program's Round Robin XXXV (RR35) Sera: #211to214.
Background: Four sera were distributed in RR35. Sera 211, 212, and 214 had been distributed as sera 197, 198, and 195, respectively, in Round Robin XXXI (RR31); serum 213 had been distributed as serum 191 in Round Robin XXX (RR30). Seta 212, 214, and 211 are a dilution series: serum 212-stock was blended from native sera high in J3-carotene, serum 214 is a 50:50 blend of 212-stock and delipidized serum, and serum 211 is a 25:75 blend of 212-stock and delipidized serum. Serum 213 is a blend of native sera augmented to a very high retinol level.
Analysts NISTl and NIST3 independently extracted and analyzed two aliquots of three vials of each serum using normal procedures. Both analysts reported quantitative results for retinol, aand y -tocopherol, total and trans-J3-carotene, and total a-carotene. In addition, analyst NIST3 reported results for retinyl palmitate, S-tocopherol, trans-a-carotene, total and trans-lycopene, 13-cryptoxanthin, "lutein", and "zeaxanthin". (NIST3 is uncertain about the isomeric composition of the single peaks observed for lutein and zeaxanthin: while mostly the respective all-trans isomers, they may include some as yet unknown proportion of the cis isomers.)
Results: Table 1 presents the NIST data, summary statistics for the NIST data, summary interlaboratory results for serum 191 in RR30 and sera 195, 197, and 198 in RR31, summary interlaboratory results for sera 211 - 214 in RR35, and the NIST assigned values and uncertainties.
Table 2 presents a compact summary of the assigned values and uncertainties for each analyte in each serum. The sera are listed in order of decreasing retinol concentration, facilitating interpretation of the dilution series: [212], [214] = [212]/2, [211] = [212]/4.
The entries in Table 1 are as follows:
• Individual NIST Analyst Data and Summary Statistics A: 1 to C:2 two aliquots ("1" and "2") of three vials (A, B, and C) of each serum were
extracted and analyzed. Each analyst analyzed a separate set of three vials. °x number of quantitative values for this analyte for this serum for this analyst
Me~ arithmetic average SDx simple standard deviation
SDrepx within-vial pooled standard deviation, reflecting variation in extraction, chromatography, peak integration, etc.
SD1ie111 among-sample standard deviation, reflecting heterogeneity in preparing and reconstituting the serum samples
SDNISTx ~SD~x +SD~ , total standard deviation. This value is~ SDx, as sample replicates reduce the true degrees of freedom.
CV NISTx 1 OO*SD Nisr/Meanx
J10
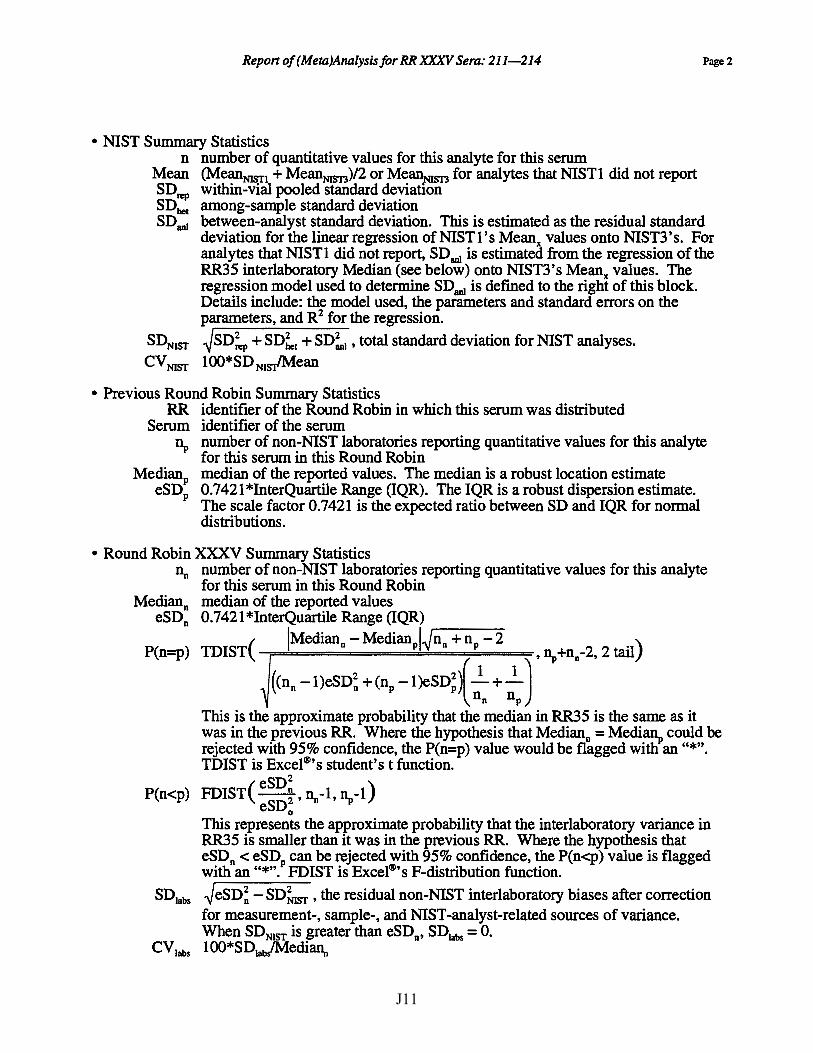
Report of (Meta)Analysisfor RR XXXV Sera: 211-214
• NIST Summary Statistics n number of quantitative values for this analyte for this serum
Mean (MeanNISTl + MeanNIST3)/2 or MeanNIST3 for analytes that NISTl did not report SDrep within-vial pooled standard deviation SD1ie1 among-sample standard deviation
Page2
SDan1 between-analyst standard deviation. This is estimated as the residual standard deviation for the linear regression of NISTl 's Meanx values onto NIST3's. For analytes that NISTl did not report, SD8111 is estimated from the regression of the RR35 interlaboratory Median (see below) onto NIST3's Meanx values. The regression model used to determine SDan1 is defined to the right of this block. Details include: the model used, the parameters and standard errors on the parameters, and R2 for the regression.
SDNIST ~SD~ + SD~1 + SD~1 • total standard deviation for NIST analyses.
CV NIST 100*SDN1s/Mean
• Previous Round Robin Summary Statistics RR identifier of the Round Robin in which this serum was distributed
Serum identifier of the serum ~ number of non-NIST laboratories reporting quantitative values for this analyte
for this serum in this Round Robin MedianP median of the reported values. The median is a robust location estimate
eSDP 0.7421 *InterQuartile Range (IQR). The IQR is a robust dispersion estimate. The scale factor 0.7421 is the expected ratio between SD and IQR for normal distributions.
• Round Robin XXXV Summary Statistics ~ number of non-NIST laboratories reporting quantitative values for this analyte
for this serum in this Round Robin Median0 median of the reported values
eSD0 0.7421 *InterQuartile Range (IQR)
( !Median0 - MedianPl~.--n0_+_n_P ___ 2 . ) P(n=p) TDIST , ~+n0-2, 2 tail
{ (n0 -1 )eSD~ + (nP -1 )eSD! )(_!_ + _!_] nn np
This is the approximate probability that the median in RR35 is the same as it was in the previous RR. Where the hypothesis that Median0 = Medi~ could be rejected with 95% confidence, the P(n=p) value would be flagged with an"*". TDIST is Excel®'s student's t function.
P( ) FDIST( eSD~ n -1 n -1) n<p eSD! • ";! ' -,,
This represents the approximate probability that the interlaboratory variance in RR35 is smaller than it was in the previous RR. Where the hypothesis that eSD0 < eSDP can be rejected with 95% confidence, the P(n<p) value is flagged with an "*". FOIST is Excel®' s F-distribution function.
SD1abs ~eSD~ -SD~ST, the residual non-NIST interlaboratory biases after correction for measurement-, sample-, and NIST-analyst-related sources of variance. When SDNIST is greater than eSD0 , SDlabs = 0.
CV1abs 100*SD1ab/Medi~
J11

Report of (Meta)Analysisfor RR XXXV Sera: 211-214
• NIST Assigned Values and Uncertainties NA V (Mean + Mediann) / 2, our best guess of the "true" analyte level
NAU Maximum( 0.05*NA V, ~SD~+ SD~ ), our best guess for the "true" interlaboratory standard deviation characterizing measurement, sample heterogeneity, inter-analyst, and interlaboratory sources of variation. When SDJabs could not be determined, NAU is estimated as
Max.imum(O.lO*NAV, ~2 SD~T ). CV lOO*NAU/NAV
Page 3
Conclusions: The retinol, ex- and y-tocopherol, total and trans-j3-carotene, and "lutein" values are fully compatible with the known dilution series ((214] = (212]/2, (211] = [212]/4); NIST's limits of quantification (LOQ) for these analytes are below the levels of serum 211. The retinyl palmitate, total and trans-ex-carotene, total and trans-lycopene, j3-cryptoxanthin, and "zeaxanthin" values are compatible with the dilution series for sera 214 and 212, but the serum 211 values are higher than expected; NIST's LOQ for these analytes are therefore somewhere between the levels of sera 214 and 211. The 5-tocopherol values are not compatible with the dilution series; NIST's LOQ for this analyte is at least as high as the level in serum 212.
All median values from RR35 (Media:I\i) are statistically indistinguishable at the 95% confidence level from the corresponding values (Media.I\,) determined in RR30 and RR3 l. Nearly all of the interlaboratory standard deviations from RR35 (eSD0 ) are smaller than the corresponding previous values ( eSDp). Most of the few increases can be accounted for by insufficient or contradictory data in me earlier RR: only the ex- and y-tocopherol eSD0 values for serum 212 may have actually increased (9.9 vs. 7.0% and 8.5 vs. 5.3%, respectively). Therefore: 1) none of the sera degraded during storage and 2) the interlaboratory reproducibility has improved somewhat over the past 12 to 18 months.
Systematic constant and/or proportional biases are again apparent between the NISTl and NIST3 analyses for many analytes. These biases are statistically significant when the standard errors for the intercept "a" and/or slope "b" regression parameters are small relative to the differences between the observed and expected 0.0 (intercept) and 1.0 (slope) values.
To better account for the NIST versus non-NIST sources of variation, the standard estimate of error for the regression has been included into the total NIST standard deviation. In general, this "analyst" or "method" component is greater than or equal to the analytical repeatability and sample heterogeneity components. For low levels of all analytes, it is the dominant component. For total ex-carotene and r -tocopherol in these sera, the NIST analyses are now revealed as being at least as variable as the interlaboratory values. For ex-carotene, this probably just reflects the quantification limit: we need sera with higher native "minor" carotenoid levels and/or methods for selectively augmenting their levels. For y-tocopherol, it is another indication that we need to re-evaluate our methodologies. This modification of the analysis of variance does NOT affect either the NIST assigned value (NAV) or the NIST assigned uncertainty (NAU); it only redistributes part of what was previously attributed to interlaboratory biases onto NIST. The SDNIST can be interpreted as defining NIST's "true" measurement uncertainty.
This memo will be attached as the Appendix to RR35' s "Lies, Damn Lies, and Statistics" report.
J12
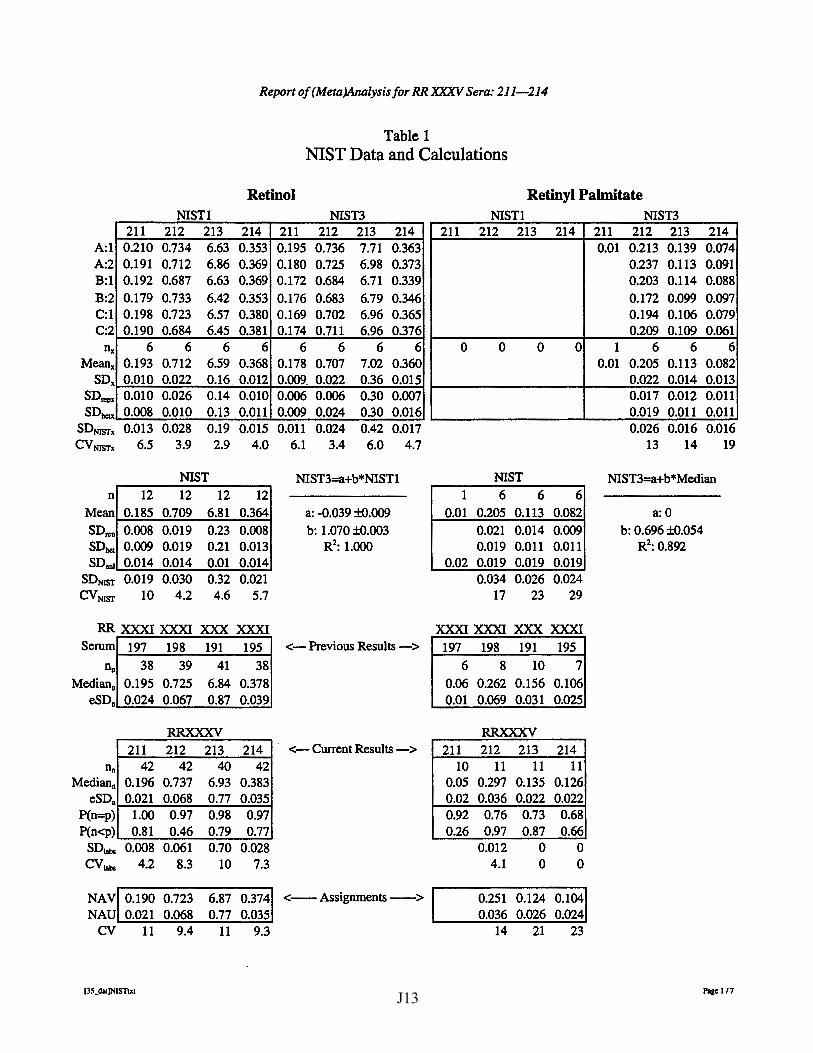
Report of (Meta)Analysis for RR XXXV Sera: 211-214
Table 1 NIST Data and Calculations
Retinol Retinyl Palmitate
A:l A:2 B:l B:2 C:l C:2
n, Mean,
so. SDreox SDbetx
NISTl 211 212 213 214
0.210 0.734 6.63 0.353 0.191 0.712 6.86 0.369 0.192 0.687 6.63 0.369 0.179 0.733 6.42 0.353 0.198 0.723 6.57 0.380 0.190 0.684 6.45 0.381
6 6 6 6 0.193 0.712 6.59 0.368 0.010 0.022 0.16 0.012 0.010 0.026 0.14 0.010 0.008 0.010 0.13 0.011
NIST3 211 212 213 214 0.195 0.736 7.71 0.363 0.180 0.725 6.98 0.373 0.172 0.684 6.71 0.339 0.176 0.683 6.79 0.346 0.169 0.702 6.96 0.365 0.174 0.711 6.96 0.376
6 6 6 6 0.178 0.707 7.02 0.360 0.009 0.022 0.36 O.D15 0.006 0.006 0.30 0.007 0.009 0.024 0.30 0.016
SDmsr. 0.013 0.028 0.19 O.oI5 0.011 0.024 0.42 0.017 CYmsrx 6.5 3.9 2.9 4.0 6.1 3.4 6.0 4.7
n
Mean
SDrcn SD bet
SDan1
NIST 12 12 12
0.185 0.709 6.81 0.008 0.019 0.23 0.009 0.019 0.21 0.014 0.014 O.Ql
12 0.364 0.008 0.013 0.014
SDNIST 0.019 0.030 0.32 0.021 CVNIST 10 4.2 4.6 5.7
RR XXXI XXXI XXX XXXI Serum
Do
Median0
eSD0
n. Median.
eSD0
P(n=p) P(n<p)
197 198 191 195 38 39 41 38
0.195 0.725 6.84 0.378 0.024 0.067 0.87 0.039
RRXXXV 211 212 213 214
42 42 40 42 0.196 0.737 6.93 0.383 0.021 0.068 0.77 0.035
1.00 0.97 0.98 0.97 0.81 0.46 0.79 0.77
SDlabs 0.008 0.061 0.70 0.028 cv1abs 4.2 8.3 10 7.3
NIST3=a+b*NIST1
a: -0.039 ±0.009 b: 1.070 ±0.003
R2: 1.000
<- Previous Results ->
<- Current Results ->
NAY 0.190 0.723 6.87 0.374 <-Assignments-> NAU 0.021 0.068 0.77 0.035
CV 11 9.4 11 9.3
13S_dalJNISTtxt
NISTl 211 212 213 214
0 0 0 0
NIST 1 6 6 6
0.01 0.205 0.113 0.082 0.021 0.014 0.009 0.019 0.011 0.011
0.02 O.D19 0.019 0.019 0.034 0.026 0.024
17 23 29
XXXI XXXI XXX XXXI 197 198 191 195
6 8 10 7 0.06 0.262 0.156 0.106 0.01 0.069 0.031 0.025
RRXXXV 211 212 213 214
10 11 11 11 0.05 0.297 0.135 0.126 0.02 0.036 0.022 0.022 0.92 0.26
0.76 0.97
0.012 4.1
0.73 0.87
0 0
0.68 0.66
0 0
0.251 0.124 0.104 0.036 0.026 0.024
14 21 23
NIST3 211 212 213 214 0.01 0.213 0.139 0.074
0.237 0.113 0.091 0.203 0.114 0.088 0.172 0.099 0.097 0.194 0.106 0.079 0.209 0.109 0.061
1 6 6 6 0.01 0.205 0.113 0.082
0.022 0.014 0.013 0.017 0.012 0.011 0.019 0.011 0.011 0.026 0.016 0.016
13 14 19
NIST3=a+b*Median
a:O b: 0.696 ±0.054
R2: 0.892
Paae I /7 J13
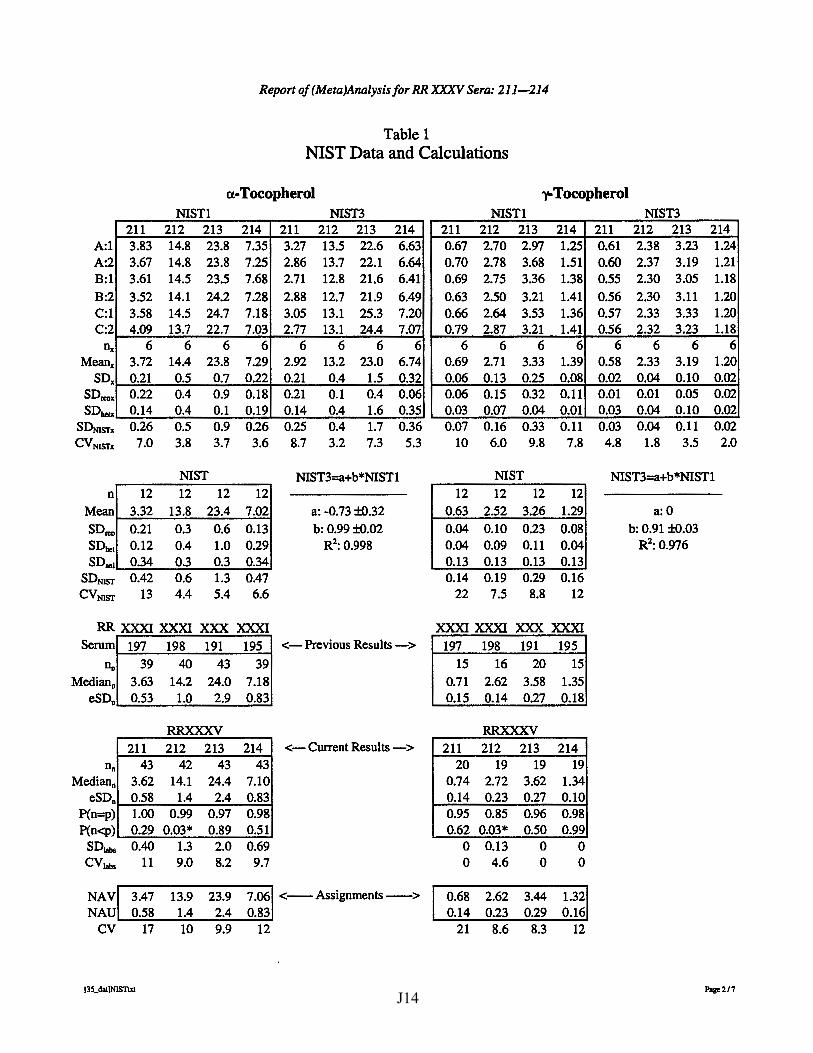
A:l A:2 B:l B:2 C:l C:2
Dx
Meanx so.
SDr.ox SD11e1x
211 3.83 3.67 3.61 3.52 3.58 4.09
6 3.72 0.21 0.22 0.14
Report of(Meta)Analysisfor RR XXXV Sera: 211-214
Table 1 NIST Data and Calculations
a-Tocopherol y-Tocopherol NISTl NIST3 NISTl
212 213 214 211 212 213 214 211 212 213 214 211 14.8 23.8 7.35 3.27 13.5 22.6 6.63 0.67 2.70 2.97 1.25 0.61 14.8 23.8 7.25 2.86 13.7 22.1 6.64 0.70 2.78 3.68 1.51 0.60 14.5 23.5 7.68 2.71 12.8 21.6 6.41 0.69 2.75 3.36 1.38 0.55 14.1 24.2 7.28 2.88 12.7 21.9 6.49 0.63 2.50 3.21 1.41 0.56 14.5 24.7 7.18 3.05 13.1 25.3 7.20 0.66 2.64 3.53 1.36 0.57 13.7 22.7 7.03 2.77 13.1 24.4 7.07 0.79 2.87 3.21 1.41 0.56
6 6 6 6 6 6 6 6 6 6 6 6 14.4 23.8 7.29 2.92 13.2 23.0 6.74 0.69 2.71 3.33 1.39 0.58 0.5 0.7 0.22 0.21 0.4 1.5 0.32 0.06 0.13 0.25 0.08 0.02 0.4 0.9 0.18 0.21 0.1 0.4 0.06 0.06 0.15 0.32 0.11 0.01 0.4 0.1 0.19 0.14 0.4 1.6 0.35 0.03 0.07 0.04 0.01 0.03
NIST3 212 213 214 2.38 3.23 1.24 2.37 3.19 1.21 2.30 3.05 1.18 2.30 3.11 1.20 2.33 3.33 1.20 2.32 3.23 1.18
6 6 6 2.33 3.19 1.20 0.04 0.10 0.02 0.01 0.05 0.02 0.04 0.10 0.02
SDNJsrx 0.26 0.5 0.9 0.26 0.25 0.4 1.7 0.36 0.07 0.16 0.33 0.11 0.03 0.04 0.11 0.02 CVNJsrx 7.0 3.8 3.7 3.6 8.7 3.2 7.3 5.3 10 6.0 9.8 7.8 4.8 1.8 3.5 2.0
n Mean
SD'"" SDi,.. SDID I
12 3.32 0.21 0.12 0.34
NIST 12 12 12
13.8 23.4 7.02 0.3 0.6 0.13 0.4 1.0 0.29 0.3 0.3 0.34
SDNIST 0.42 0.6 1.3 0.47 CV NIST 13 4.4 5.4 6.6
RR XXXI XXXI XXX XXXI Serum
Do
Median0
eSD0
n. Median.
eSD0
P(n=p) P(n<p)
197 39
3.63 0.53
211 43
3.62 0.58 1.00 0.29
198 191 195 40 43 39
14.2 24.0 7.18 1.0 2.9 0.83
RRXXXV 212 213 214
42 43 43 14.1 24.4 7.10
1.4 2.4 0.83 0.99 0.97 0.98
0.03* 0.89 0.51 SDlabs 0.40 1.3 2.0 0.69 cvlabs 11 9.o 8.2 9.7
NIST3=a+b*NIST1
a: -0.73 ±0.32 b: 0.99 ±0.02
R2: 0.998
<-Previous Results ->
<-Current Results ->
NA V 3.47 13.9 NAU 0.58 1.4
23.9 7.06 <-Assignments-> 2.4 0.83
CV 17 IO 9.9 12
J3S_dalJNISTtxt
NIST 12 12 12 12
0.63 2.52 3.26 1.29 0.04 0.10 0.23 0.08 0.04 0.09 0.11 0.04 0.13 0.13 0.13 0.13 0.14 0.19 0.29 0.16
22 7.5 8.8 12
XXXI XXXI XXX XXXI 197 198 191
15 16 20 0.71 2.62 3.58 0.15 0.14 0.27
RRXXXV 211 212
20 19 0.74 2.72 0.14 0.23 0.95 0.85 0.62 0.03*
0 0.13 0 4.6
213 19
3.62 0.27 0.96 0.50
0 0
195 15
1.35 0.18
214 19
1.34 0.10 0.98 0.99
0 0
0.68 2.62 3.44 1.32 0.14 0.23 0.29 0.16
21 8.6 8.3 12
NIST3=a+b*NIST1
a:O b: 0.91 ±0.03
R2: 0.976
Page2/7 J14
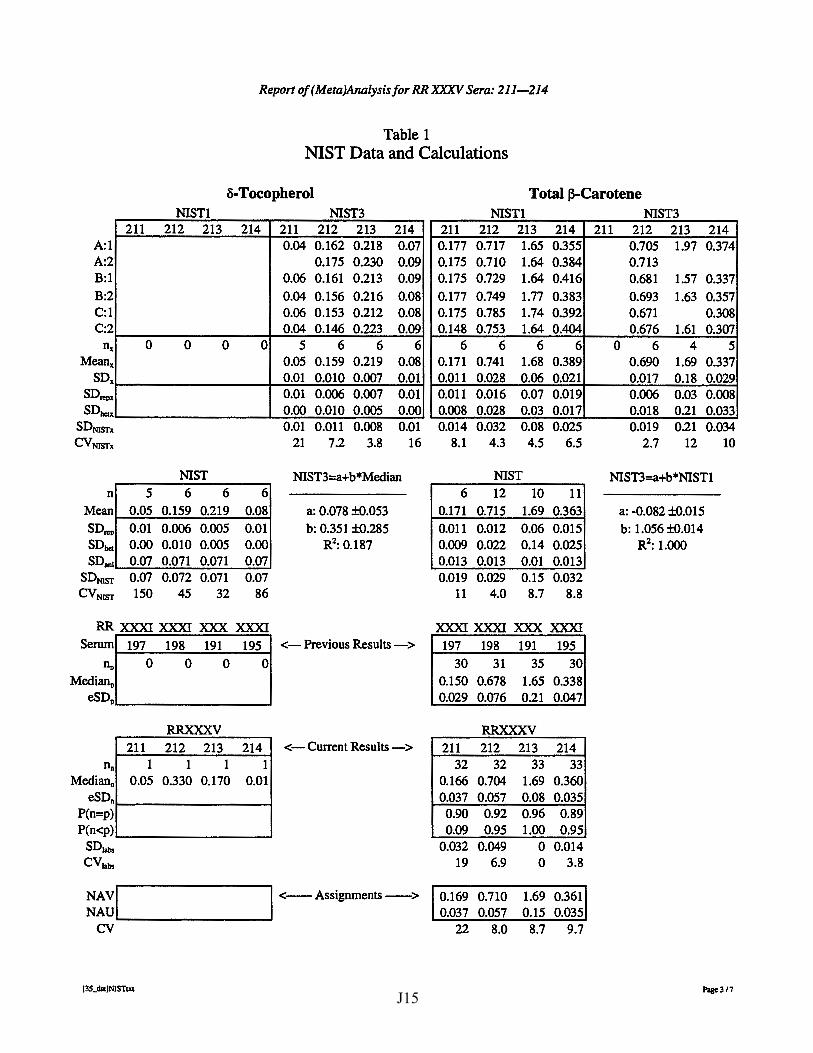
Report of(Meta)Analysisfor RR XX.XV Sera: 211-214
Table 1 NIST Data and Calculations
0-Tocopherol Total 13-Carotene NISTl NIST3 NIST! NIST3
A:l A:2 B:l B:2 C:l C:2
n, Mean,
so. SDreox SDbcu
SDNISTx CVNis-rx
n Mean
SD"'1> SDbet SDan1
SD NIST CVNIST
211 212 213 214
0 0 0 0
NIST 5 6 6 6
0.05 0.159 0.219 0.08 0.01 0.006 0.005 0.01 0.00 0.010 0.005 0.00 0.07 0.071 0.071 0.07 0.07 0.072 0.071 0.07 150 45 32 86
RR XXXI XXXI XXX XXXI Serum
Do
Median0
eSD0
Dn
Median. eSD.
P(n=p) P(n<p)
SD!abs cvlabs
197 0
211 1
0.05
198 191 195 0 0 0
RRXXXV 212 213 214
1 1 1 0.330 0.170 0.01
211 212 213 214 211 212 213 214 0.04 0.162 0.218 0.07 0.177 0.717 1.65 0.355
0.175 0.230 0.09 0.175 0.710 1.64 0.384 0.06 0.161 0.213 0.09 0.175 0.729 1.64 0.416 0.04 0.156 0.216 0.08 0.177 0.749 1.77 0.383 0.06 0.153 0.212 0.08 0.175 0.785 1.74 0.392 0.04 0.146 0.223 0.09 0.148 0.753 1.64 0.404
5 6 6 6 6 6 6 6 0.05 0.159 0.219 0.08 0.171 0.741 1.68 0.389 O.ot 0.010 0.007 0.01 0.011 0.028 0.06 0.021 0.01 0.006 0.007 0.01 0.011 0.016 0.07 0.019 0.00 0.010 0.005 0.00 0.008 0.028 0.03 0.017 O.Ql 0.011 0.008 0.01 0.014 0.032 0.08 0.025
21 7.2 3.8 16 8.1 4.3 4.5 6.5
NIST3=a+b*Median NIST 6 12 10 11
a: 0.078 ±0.053 0.171 0.715 1.69 0.363 b: 0.351 ±0.285 0.011 0.012 0.06 O.Q15
R2: 0.187 0.009 0.022 0.14 0.025 0.013 0.013 0.01 0.013 0.019 0.029 0.15 0.032
11 4.0 8.7 8.8
XXXI XXXI XXX XXXI <-Previous Results -> 197 198 191 195
30 31 35 30 0.150 0.678 1.65 0.338 0.029 0.076 0.21 0.047
RRXXXV <-Current Results -> 211 212 213 214
32 32 33 33 0.166 0.704 1.69 0.360 0.037 0.057 0.08 0.035 0.90 0.92 0.96 0.89 0.09 0.95 1.00 0.95
0.032 0.049 0 0.014 19 6.9 0 3.8
I <-Assignments-> NAVI NAU
""'-~~~~~~~~
0.169 0.037
0.710 1.69 0.361 0.057 0.15 0.035
CV 22 8.0 8.7 9.7
(lS_dat)NISnxt
211 212 213 214 0.705 1.97 0.374 0.713 0.681 1.57 0.337 0.693 1.63 0.357 0.671 0.308 0.676 1.61 0.307
0 6 4 5 0.690 1.69 0.337 0.017 0.18 0.029 0.006 0.03 0.008 0.018 0.21 0.033 0.019 0.21 0.034
2.7 12 10
NIST3=a+b*NIST1
a: -0.082 ±0.015 b: 1.056 ±0.014
R2: 1.000
Plael/7 J15
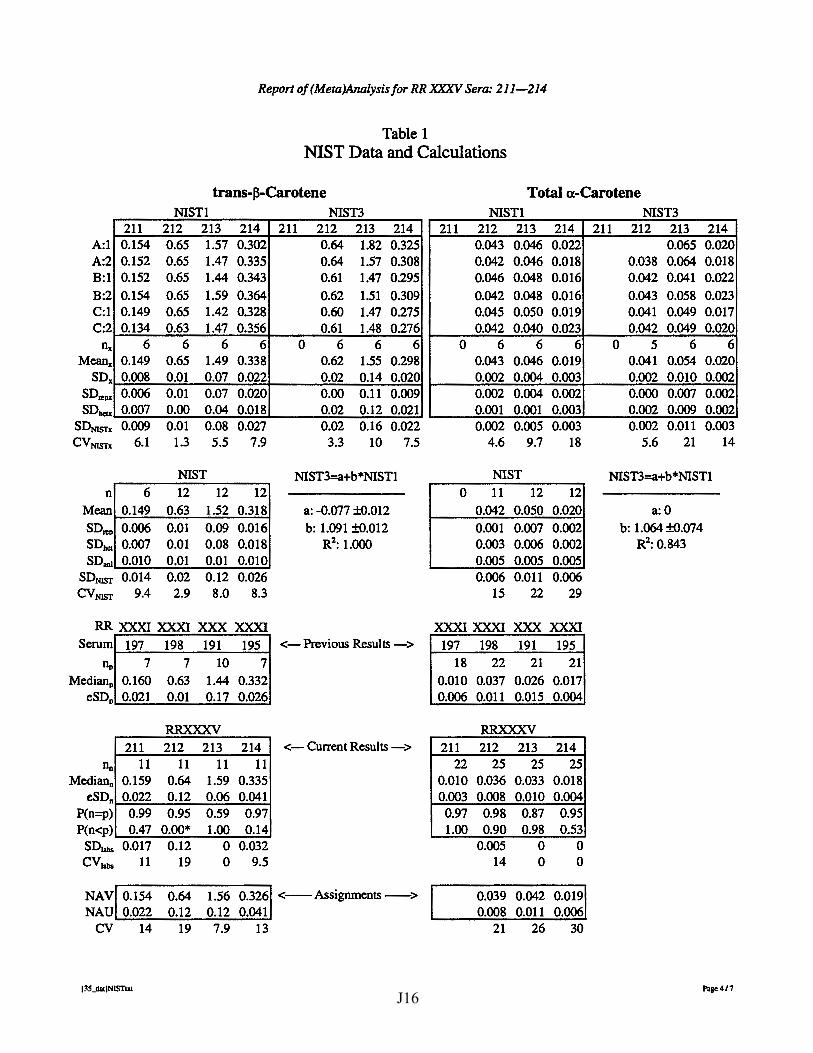
Report of (Meta)Analysisfor RR XXXV Sera: 211-214
Table I NIST Data and Calculations
trans-~-Carotene
NISTI NIST3
A:l A:2 B:l B:2 C:l C:2
n, Mean,
so. SDreox SDbcU
211 0.154 0.152 0.152 0.154 0.149 0.134
6 0.149 0.008 0.006 0.007
212 0.65 0.65 0.65 0.65 0.65 0.63
6 0.65 0.01 0.01 0.00
213 214 1.57 0.302 1.47 0.335 1.44 0.343 1.59 0.364 1.42 0.328 1.47 0.356
6 6 1.49 0.338 0.07 0.022 0.07 0.020 0.04 O.Ql8
SI>msr, 0.009 0.01 0.08 0.027 CVNISTx 6.1 1.3 5.5 7.9
NIST n
Mean
SDreo SDbet SDan1
6 0.149 0.006 0.007 0.010
12 0.63 0.01 0.01 0.01
12 12 1.52 0.318 0.09 0.016 0.08 0.018 0.01 0.010
SDNIST 0.014 0.02 0.12 0.026 CVNIST 9.4 2.9 8.0 8.3
RR XXXI XXXI XXX XXXI Serum 197 198 191 195
Op 7 7 10 7 Median0 0.160 0.63 1.44 0.332
eSD0 0.021 O.ot 0.17 0.026
RRXXXV
n. Median0
eSD0
P(n=p) P(n<p)
211 11
0.159 0.022 0.99 0.47
212 11
0.64 0.12 0.95
0.00* SDlabs 0.017 0.12 CV1abs 11 19
213 214 11 11
1.59 0.335 0.06 0.041 0.59 0.97 1.00 0.14
0 0.032 0 9.5
211 212 213 214 0.64 1.82 0.325 0.64 1.57 0.308 0.61 1.47 0.295 0.62 1.51 0.309 0.60 1.47 0.275 0.61 1.48 0.276
0 6 6 6 0.62 1.55 0.298 0.02 0.14 0.020 0.00 0.11 0.009 0.02 0.12 0.021 0.02 0.16 0.022
3.3 10 7.5
NIST3=a+b*NIST1
a: -0.077 ±0.012 b: 1.091 ±0.012
R2: 1.000
<-Previous Results->
<- Current Results - >
NAY 0.154 0.64 1.56 0.326 <-Assignments - > NAU 0.022 0.12 0.12 0.041
CV 14 19 7.9 13
(3S_dalJNISTlxt
Total a-Carotene NISTl NIST3
211 212 213 214 211 212 213 214 0.043 0.046 0.022 0.065 0.020 0.042 0.046 O.ot8 0.038 0.064 0.018 0.046 0.048 0.016 0.042 0.041 0.022 0.042 0.048 0.016 0.043 0.058 0.023 0.045 0.050 0.019 0.041 0.049 0.017 0.042 0.040 0.023 0.042 0.049 0.020
0 6 6 6 0 5 6 6 0.043 0.046 0.019 0.041 0.054 0.020 0.002 0.004 0.003 0.002 0.010 0.002 0.002 0.004 0.002 0.000 0.007 0.002 0.001 0.001 0.003 0.002 0.009 0.002 0.002 0.005 0.003 0.002 0.011 0.003
4.6 9.7 18 5.6 21 14
NIST NIST3=a+b*NIST1 0 11 12 12
0.042 0.050 0.020 a:O 0.001 0.007 0.002 b: 1.064 ±0.074 0.003 0.006 0.002 R2: 0.843 0.005 0.005 0.005 0.006 0.011 0.006
15 22 29
XXXI XXXI XXX XXXI 197 198 191 195
18 22 21 21 0.010 0.037 0.026 0.017 0.006 0.011 O.ot5 0.004
RRXXXV
211 212 213 214 22 25 25 25
0.010 0.036 0.033 0.018 0.003 0.008 0.010 0.004 0.97 0.98 0.87 0.95 1.00 0.90 0.98 0.53
0.005 0 0 14 0 0
0.039 0.042 0.019 0.008 0.01 1 0.006
21 26 30
Page4 /7
J16
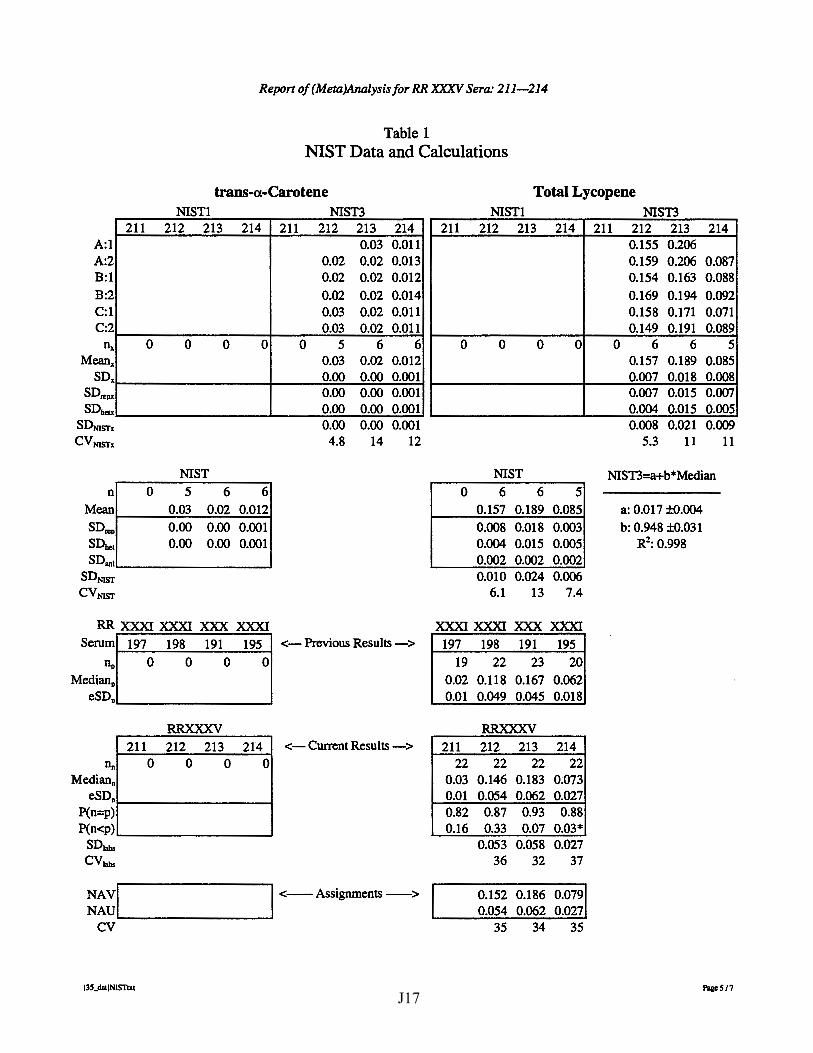
Report of (Meta)Analysis for RR XXXV Sera: 211-214
Table 1 NIST Data and Calculations
trans-a-Carotene NISTl NIST3
A:l A:2 B:l B:2 C:l C:2
n, Mean1
so. SDm>x SD11etx
SDmsrx CVmsrx
n
211
0
0
212 213 214
0 0 0
NIST 5 6 6
Mean 0.03 0.02 0.012 1-----------l SDICP 0.00 0.00 0.001 SD11e1 0.00 0.00 0.001 SDw.__ _______ _,
SDNIST CVNIST
RR XXXI XXXI XXX XXXI
211 212 213 214 0.03 O.Qll
0.02 0.02 0.013 0.02 0.02 0.012 0.02 0.02 0.014 0.03 0.02 0.011 0.03 0.02 0.011
0 5 6 6 0.03 0.02 0.012 0.00 0.00 0.001 0.00 0.00 0.001 0.00 0.00 0.001 0.00 0.00 0.001 4.8 14 12
Serum 197 198 191 0 0 0 0 0
195 <-Previous Results ->
0 Median0
eSD0.__ _______ _,
n. Median.
eSD0
P(n=p) P(n<p)
SD1abs cvlabs
211 0
RRXXXV 212 213 214
0 0 0 <-Current Results ->
~~~l .... _______ __.I <-Assignments->
CV
J3S_dallNISTtxt
211
0
0
Total Lycopene NISTl NIST3
212 213 214
0 0 0
NIST 6 6 5
0.157 0.189 0.085 0.008 O.Q18 0.003 0.004 O.Q15 0.005 0.002 0.002 0.002 0.010 0.024 0.006
6.1 13 7.4
211 212 213 214 0.155 0.206 0.159 0.206 0.087 0.154 0.163 0.088 0.169 0.194 0.092 0.158 0.171 0.071 0.149 0.191 0.089
0 6 6 5 0.157 0.189 0.085 0.007 O.ot8 0.008 0.007 O.Q15 0.007 0.004 0.015 0.005 0.008 0.021 0.009
5.3 11 11
NIST3=a+b*Median
a: 0.017 ±0.004 b: 0.948 ±0.031
R2: 0.998
XXXI XXXI XXX XXXI 197
19 0.02 O.Ql
211 22
0.03 O.Ql 0.82 0.16
198 191 195 22 23 20
0.118 0.167 0.062 0.049 0.045 O.Q18
RRXXXV 212 213 214
22 22 22 0.146 0.183 0.073 0.054 0.062 0.027 0.87 0.93 0.88 0.33 0.07 0.03*
0.053 0.058 0.027 36 32 37
0.152 0.186 0.079 0.054 0.062 0.027
35 34 35
PageS/7
J17

Report of (Meta)Analysis for RR XXXV Sera: 211-214
Table 1 NIST Data and Calculations
trans-Lycopene NISTl NIST3
A:l A:2 B:l B:2 C:l C:2
n, Mean.
so. SD..,px SD11etx
SDNISTx CVNISTx
n Mean
SD..,p SD11et SD1111
SDNJST CVNJST
211
0
0
212 213 214
0 0 0
NIST
6 6 5 0.061 0.082 0.030
0.002 0.004 0.000 0.002 0.004 0.001 0.004 0.004 0.004 0.004 0.007 0.004
7.2 8.3 13
RR XXXI XXXI XXX XXXI Serum
np
Medianp eSDP
n. Median.
eSD0
P(n=p) P(n<p)
SDlabs cvlabs
NAV NAU
197
1
0.02
211 6
0.02 0.01
198 191 195
1 1
0.070 0.041
RRXXXV 212 213 214
6 6 6 0.087 0.107 0.046 0.017 0.013 0.004
0.016 O.otl 0.002 19 11 4.6
0.074 0.094 0.038 0.017 0.013 0.004
'--~~~~~~~ ....... CV 23 14 12
f3S_dal]NISTtxt
211 212 213 214 0.060 0.091 0.064 0.081 0.031 0.061 0.077 0.031
0.062 0.080 0.031 0.058 0.082 0.027 0.060 0.081 0.031
0 6 6 5 0.061 0.082 0.030 0.002 0.005 0.002 0.002 0.004 0.002 0.002 0.004 0.001 0.002 0.006 0.002
4.0 6.9 7.5
NIST3=a+b*Median
a: -0.009 ±0.007
b: 0.838 ±0.083 R2: 0.981
<-Previous Results ->
<-Current Results ->
<--Assignments-->
~-Cryptoxanthin
NISTl NIST3 211 212 213 214
0 0 0 0
NIST
0 6 6 5 0.016 0.039 0.007
0.001 0.002 0.000 0.002 0.005 0.002 0.001 0.001 0.001 0.002 0.006 0.002
15 15 31
XXXI XXXI XXX XXXI 197 198 191 195
12 15 18 13
0.008 0.024 0.050 0.013 0.003 0.008 0.008 0.007
RRXXXV 211 212 213 214
11 15 15 14 0.010 0.026 0.053 0.014 0.004 0.007 0.008 0.005
0.77 0.92 0.91 0.95 0.32 0.65 0.42 0.94
0.007 0.005 0.004 26 10 30
0.021 0.046 0.011 0.007 0.008 0.005
34 18 44
211 212 213 214 0.019 0.047 0.018 0.041 0.010 0.017 0.038 0.006
0.017 0.039 0.007 0.014 0.033 0.007 0.013 0.034 0.006
0 6 6 5 0.016 0.039 0.007 0.002 0.005 0.002 0.001 0.002 0.000 0.002 0.005 0.002 0.002 0.006 0.002
15 15 30
NIST3=a+b*Median
a: -0.005 ±0.001
b: 0.817 ±0.024 R2: 0.998
Paac6/7 J18
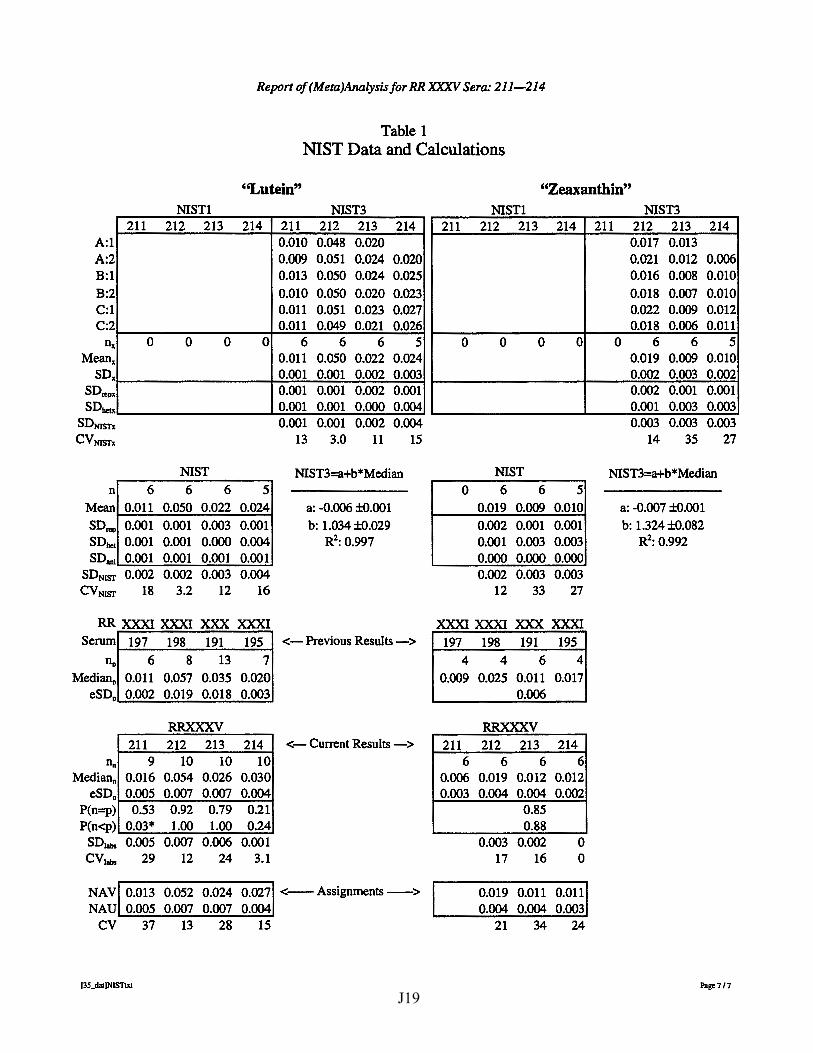
Report of (Meta)Analysisfor RR XXXV Sera: 211-214
Table 1 NIST Data and Calculations
''Lutein" "Zeaxanthin"
A:l A:2 B:l B:2 C:l C:2
n, Mean,
SD, SDreox SDbeu
SDNISl"x CVmSTx
n
Mean
SDreo SDbcl SDan1
211
0
6 O.Qll
0.001 0.001 0.001
NISTl 212 213 214
0 0 0
NIST 6 6 5
0.050 0.022 0.024 0.001 0.003 0.001 0.001 0.000 0.004 0.001 0.001 0.001
SDNIST 0.002 CVNIST 18
0.002 0.003 0.004 3.2 12 16
RR XXXI XXXI XXX XXXI Serum
Do
Median0
eSD0
n. Median.
eSD0
P(n=p) P(n<p)
SD labs
cvlabs
197 198 191 195 6 8 13 7
0.011 0.057 0.035 0.020 0.002 0.019 0.018 0.003
RRXXXV 211 212 213 214
9 10 10 10 0.016 0.054 0.026 0.030 0.005 0.007 0.007 0.004
0.53 0.92 0.79 0.21 0.03* 1.00 1.00 0.24 0.005 0.007 0.006 0.001
29 12 24 3.1
NIST3 211 212 213 214 0.010 0.048 0.020 0.009 0.051 0.024 0.020 0.013 0.050 0.024 0.025 0.010 0.050 0.020 0.023 0.011 0.051 0.023 0.027 0.011 0.049 0.021 0.026
6 6 6 5 O.Qll 0.050 0.022 0.024 0.001 0.001 0.002 0.003 0.001 0.001 0.002 0.001 0.001 0.001 0.000 0.004 0.001 0.001 0.002 0.004
13 3.0 11 15
NIST3=a+b*Median
a: -0.006 ±0.001 b: 1.034 ±0.029
R2: 0.997
<-Previous Results->
<- Current Results - >
NA V 0.013 0.052 0.024 0.027 <--Assignments-> NAU 0.005 0.007 0.007 0.004
CV 37 13 28 15
13S_dal)NISTuu
NISTl 211 212 213 214
0 0 0 0
NIST 0 6 6 5
0.019 0.009 0.010 0.002 0.001 0.001 0.001 0.003 0.003 0.000 0.000 0.000 0.002 0.003 0.003
12 33 27
XXXI XXXI XXX XXXI 197
4 0.009
211 6
0.006 0.003
198 191 195 4 6 4
0.025 0.011 0.017 0.006
RRXXXV 212 213 214
6 6 6 0.019 0.012 0.012 0.004 0.004 0.002
0.85 0.88
0.003 0.002 17 16
0 0
0.019 0.011 0.011 0.004 0.004 0.003
21 34 24
NIST3 211 212 213 214
0.017 0.013 0.021 0.012 0.006 0.016 0.008 0.010 0.018 0.007 0.010 0.022 0.009 0.012 0.018 0.006 0.011
0 6 6 5 0.019 0.009 0.010 0.002 0.003 0.002 0.002 0.001 0.001 0.001 0.003 0.003 0.003 0.003 0.003
14 35 27
NIST3=a+b*Median
a: -0.007 ±0.001 b: 1.324 ±0.082
R2: 0.992
Paae 717
J19

Rep
ort o
f (M
eta)
Ana
lysi
sfor
RR
XX
XV
Ser
a: 2
11
-21
4
Tab
le 2
S
umm
ary
of N
IST
Ass
igne
d V
alue
s an
d U
ncer
tain
ties
213
212
214
211
Ana
lyte
N
AV
N
AU
CV
N
AV
N
AU
C
V
NA
V
NA
U C
V
NA
V
NA
U
CV
R
etin
ol
6.87
0.
77
11
0.72
3 0.
068
9.4
0.37
4 0.
035
9.3
0.19
0 0.
021
11
Ret
inyl
Pal
mit
ate
0.12
4 0.
025
20
0.25
1 0.
036
14
0.10
2 0.
027
26
0.03
a-
Toc
ophe
rol
23.9
2.
4 9.
9 13
.9
1.4
10
7.06
0.
83
12
3.47
0.
58
17
y-T
ocop
hero
l 3.
44
0.29
8.3
2.
62
0.23
8.
6 1.
32
0.16
12
0.
68
0.14
21
a-
Toc
ophe
rol
0.19
4 0.
100
52
0.24
5 0.
101
41
0.05
0.
10 2
10
0.05
0.
10 2
10
Tot
al (}
-Car
oten
e 1.
69
0.15
8.7
0.
710
0.05
7 8.
0 0.
361
0.03
5 9.
7 0.
169
0.03
7 22
tr
ans-
p-C
arot
ene
1.56
0.
12 7
.9
0.64
0.
12
19
0.32
6 0.
041
13
0.15
4 0.
022
14
Tot
al a
-Car
oten
e 0.
042
0.01
1 26
0.
039
0.00
8 21
0.
019
0.00
6 30
tr
ans-
a-C
arot
ene
0.02
0.
03
0.01
2 T
otal
Lyc
open
e 0.
186
0.06
2 34
0.
152
0.05
4 35
0.
079
0.02
7 35
tr
ans-
Lyc
open
e 0.
094
0.01
3 14
0.
074
0.01
7 23
0.
038
0.00
4 12
p-
Cry
ptox
anth
in
0.04
6 0.
008
18
0.02
1 0.
007
34
0.01
1 0.
005
44
"Lut
ein"
0.
024
0.00
7 28
0.
052
0.00
7 13
0.
027
0.00
4 15
0.
013
0.00
5 37
"Z
eaxa
nthi
n"
0.01
1 0.
004
34
0.01
9 0.
004
21
0.01
1 0.
003
24
f)S
_dal
)Sum
muy
Txt
Page
I I
I
J20
Appendix K. “All-Lab Report” for RR35
The following six pages are the “All-Lab Report” as provided to all participants, with two exceptions: • the participant identifiers (Lab) have been altered. • the order in which the participant results are listed has been altered.
The data summary in the “All-Lab Report” has been altered to ensure confidentiality of identification codes assigned to laboratories. The only attributed results are those reported by NIST. The NIST results are not used in the assessment of the consensus summary results of the study.
K1
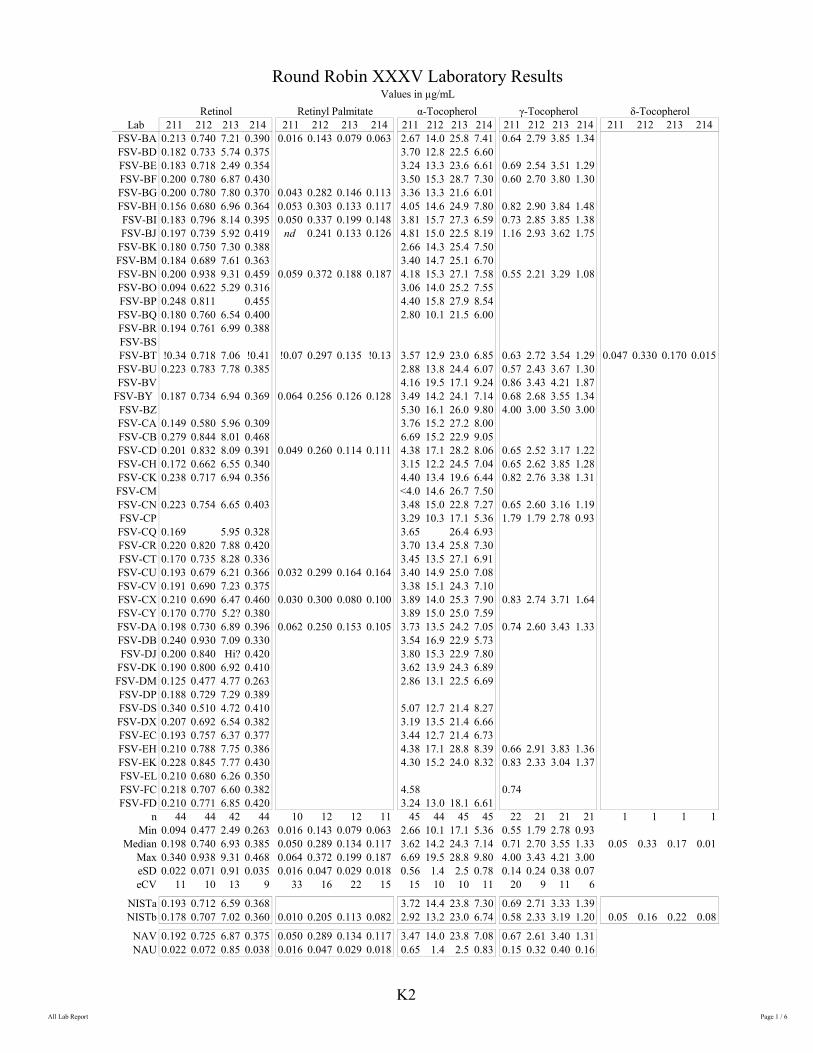
Round Robin XXXV Laboratory Results Values in µg/mL
Retinol Retinyl Palmitate α-Tocopherol γ-Tocopherol δ-Tocopherol 211 212 213 214Lab
FSV-BA FSV-BD FSV-BE FSV-BF FSV-BG FSV-BH FSV-BI FSV-BJ
FSV-BK FSV-BM FSV-BN FSV-BO FSV-BP FSV-BQ FSV-BR FSV-BS FSV-BT FSV-BU FSV-BV
FSV-BY FSV-BZ FSV-CA FSV-CB FSV-CD FSV-CH FSV-CK FSV-CM FSV-CN FSV-CP FSV-CQ FSV-CR FSV-CT FSV-CU FSV-CV FSV-CX FSV-CY FSV-DA FSV-DB FSV-DJ
FSV-DK FSV-DM FSV-DP FSV-DS FSV-DX FSV-EC FSV-EH FSV-EK FSV-EL FSV-FC FSV-FD
0.213 0.740 7.21 0.390 0.182 0.733 5.74 0.375 0.183 0.718 2.49 0.354 0.200 0.780 6.87 0.430 0.200 0.780 7.80 0.370 0.156 0.680 6.96 0.364 0.183 0.796 8.14 0.395 0.197 0.739 5.92 0.419 0.180 0.750 7.30 0.388 0.184 0.689 7.61 0.363 0.200 0.938 9.31 0.459 0.094 0.622 5.29 0.316 0.248 0.811 0.455 0.180 0.760 6.54 0.400 0.194 0.761 6.99 0.388
!0.34 0.718 7.06 !0.41 0.223 0.783 7.78 0.385
0.187 0.734 6.94 0.369
0.149 0.580 5.96 0.309 0.279 0.844 8.01 0.468 0.201 0.832 8.09 0.391 0.172 0.662 6.55 0.340 0.238 0.717 6.94 0.356
0.223 0.754 6.65 0.403
0.169 5.95 0.328 0.220 0.820 7.88 0.420 0.170 0.735 8.28 0.336 0.193 0.679 6.21 0.366 0.191 0.690 7.23 0.375 0.210 0.690 6.47 0.460 0.170 0.770 5.2? 0.380 0.198 0.730 6.89 0.396 0.240 0.930 7.09 0.330 0.200 0.840 Hi? 0.420 0.190 0.800 6.92 0.410 0.125 0.477 4.77 0.263 0.188 0.729 7.29 0.389 0.340 0.510 4.72 0.410 0.207 0.692 6.54 0.382 0.193 0.757 6.37 0.377 0.210 0.788 7.75 0.386 0.228 0.845 7.77 0.430 0.210 0.680 6.26 0.350 0.218 0.707 6.60 0.382 0.210 0.771 6.85 0.420
211 212 213 214 0.016 0.143 0.079 0.063
0.043 0.282 0.146 0.113 0.053 0.303 0.133 0.117 0.050 0.337 0.199 0.148
nd 0.241 0.133 0.126
0.059 0.372 0.188 0.187
!0.07 0.297 0.135 !0.13
0.064 0.256 0.126 0.128
0.049 0.260 0.114 0.111
0.032 0.299 0.164 0.164
0.030 0.300 0.080 0.100
0.062 0.250 0.153 0.105
211 212 213 214 2.67 14.0 25.8 7.41 3.70 12.8 22.5 6.60 3.24 13.3 23.6 6.61 3.50 15.3 28.7 7.30 3.36 13.3 21.6 6.01 4.05 14.6 24.9 7.80 3.81 15.7 27.3 6.59 4.81 15.0 22.5 8.19 2.66 14.3 25.4 7.50 3.40 14.7 25.1 6.70 4.18 15.3 27.1 7.58 3.06 14.0 25.2 7.55 4.40 15.8 27.9 8.54 2.80 10.1 21.5 6.00
3.57 12.9 23.0 6.85 2.88 13.8 24.4 6.07 4.16 19.5 17.1 9.24 3.49 14.2 24.1 7.14 5.30 16.1 26.0 9.80 3.76 15.2 27.2 8.00 6.69 15.2 22.9 9.05 4.38 17.1 28.2 8.06 3.15 12.2 24.5 7.04 4.40 13.4 19.6 6.44 <4.0 14.6 26.7 7.50 3.48 15.0 22.8 7.27 3.29 10.3 17.1 5.36 3.65 26.4 6.93 3.70 13.4 25.8 7.30 3.45 13.5 27.1 6.91 3.40 14.9 25.0 7.08 3.38 15.1 24.3 7.10 3.89 14.0 25.3 7.90 3.89 15.0 25.0 7.59 3.73 13.5 24.2 7.05 3.54 16.9 22.9 5.73 3.80 15.3 22.9 7.80 3.62 13.9 24.3 6.89 2.86 13.1 22.5 6.69
5.07 12.7 21.4 8.27 3.19 13.5 21.4 6.66 3.44 12.7 21.4 6.73 4.38 17.1 28.8 8.39 4.30 15.2 24.0 8.32
4.58 3.24 13.0 18.1 6.61
211 212 213 214 0.64 2.79 3.85 1.34
0.69 2.54 3.51 1.29 0.60 2.70 3.80 1.30
0.82 2.90 3.84 1.48 0.73 2.85 3.85 1.38 1.16 2.93 3.62 1.75
0.55 2.21 3.29 1.08
0.63 2.72 3.54 1.29 0.57 2.43 3.67 1.30 0.86 3.43 4.21 1.87 0.68 2.68 3.55 1.34 4.00 3.00 3.50 3.00
0.65 2.52 3.17 1.22 0.65 2.62 3.85 1.28 0.82 2.76 3.38 1.31
0.65 2.60 3.16 1.19 1.79 1.79 2.78 0.93
0.83 2.74 3.71 1.64
0.74 2.60 3.43 1.33
0.66 2.91 3.83 1.36 0.83 2.33 3.04 1.37
0.74
211 212 213 214
0.047 0.330 0.170 0.015
n 44 44 42 44 10 12 12 11 45 44 45 45 22 21 21 21 1 1 1 1 Min 0.094 0.477 2.49 0.263 0.016 0.143 0.079 0.063 2.66 10.1 17.1 5.36 0.55 1.79 2.78 0.93
Median 0.198 0.740 6.93 0.385 0.050 0.289 0.134 0.117 3.62 14.2 24.3 7.14 0.71 2.70 3.55 1.33 0.05 0.33 0.17 0.01 Max 0.340 0.938 9.31 0.468 0.064 0.372 0.199 0.187 6.69 19.5 28.8 9.80 4.00 3.43 4.21 3.00 eSD 0.022 0.071 0.91 0.035 0.016 0.047 0.029 0.018 0.56 1.4 2.5 0.78 0.14 0.24 0.38 0.07 eCV 11 10 13 9 33 16 22 15 15 10 10 11 20 9 11 6
NISTa 0.193 0.712 6.59 0.368 3.72 14.4 23.8 7.30 0.69 2.71 3.33 1.39NISTb0.178 0.707 7.02 0.360 0.010 0.205 0.113 0.082 2.92 13.2 23.0 6.74 0.58 2.33 3.19 1.20 0.05 0.16 0.22 0.08
NAV 0.192 0.725 6.87 0.375 0.050 0.289 0.134 0.117 3.47 14.0 23.8 7.08 0.67 2.61 3.40 1.31NAU0.022 0.072 0.85 0.038 0.016 0.047 0.029 0.018 0.65 1.4 2.5 0.83 0.15 0.32 0.40 0.16
K2 All Lab Report Page 1 / 6

Round Robin XXXV Laboratory Results Values in µg/mL
Total β-Carotene trans-β-Carotene Total cis-β-Carotene Lab 211 212 213 214 211 212 213 214 211 212 213 214
FSV-BA 0.168 0.704 1.69 0.386 0.159 0.671 1.62 0.361 0.009 0.033 0.068 0.025 FSV-BD FSV-BE 0.129 0.759 1.88 0.361 FSV-BF 0.237 0.672 1.70 0.399 FSV-BG 0.212 0.712 1.67 0.374 FSV-BH 0.150 0.689 1.60 0.341 0.140 0.642 1.50 0.315 0.010 0.047 0.097 0.026 FSV-BI 0.147 0.740 1.75 0.360 FSV-BJ 0.176 0.746 1.72 0.385
FSV-BK FSV-BM FSV-BN 0.213 0.818 1.68 0.411 0.159 0.690 1.53 0.335 0.054 0.124 0.150 0.076 FSV-BO 0.131 0.656 1.69 0.358 FSV-BP 0.120 0.518 1.29 0.377 FSV-BQ 0.190 1.120 2.63 0.500 FSV-BR FSV-BS 0.225 0.477 2.04 0.284 0.203 0.451 2.02 0.264 0.022 0.026 0.022 0.020 FSV-BT 0.167 0.686 1.70 0.356 0.153 0.641 1.59 0.333 0.013 0.045 0.108 0.024 FSV-BU 0.132 0.681 1.41 0.298 FSV-BV >0.179 >0.779 >1.639 >0.409 0.179 0.779 1.64 0.409
FSV-BY 0.159 0.655 1.63 0.330 FSV-BZ >0.225 >0.423 >1.78 >0.466 0.225 0.423 1.78 0.466 0.034 0.073 0.140 0.060 FSV-CA FSV-CB FSV-CD 0.177 0.634 1.36 0.360 FSV-CH 0.118 0.606 1.41 0.270 FSV-CK 0.070 0.663 1.53 0.334 FSV-CM FSV-CN >0.152 >0.603 >1.698 >0.342 0.152 0.603 1.70 0.342 FSV-CP 0.155 0.572 1.67 0.373 FSV-CQ 0.060 3.11 0.294 FSV-CR FSV-CT 0.155 0.692 1.72 0.334 FSV-CU 0.195 0.704 1.62 0.365 0.182 0.660 1.57 0.339 0.013 0.044 0.045 0.026 FSV-CV 0.181 0.730 1.63 0.369 FSV-CX 0.180 0.920 2.15 0.440 FSV-CY 0.790 1.80 0.250 FSV-DA 0.176 0.662 1.74 0.288 0.148 0.597 1.61 0.249 0.028 0.065 0.130 0.039 FSV-DB 0.150 0.850 1.86 0.340 FSV-DJ
FSV-DK 0.198 0.722 1.73 0.381 FSV-DM 0.099 0.647 1.52 0.317 FSV-DP FSV-DS 0.206 0.671 0.15 0.360 FSV-DX >0.126 >0.546 >1.046 >0.286 0.126 0.546 1.05 0.286 FSV-EC 0.166 0.745 1.63 0.328 FSV-EH 0.202 0.756 1.72 0.395 0.177 0.680 1.58 0.351 0.025 0.076 0.143 0.044 FSV-EK 0.196 0.682 1.67 0.369 FSV-EL FSV-FC 0.144 0.724 1.73 0.369 FSV-FD 0.170 0.720 1.68 0.330
n 34 34 35 35 12 12 12 12 9 9 9 9 Min 0.060 0.477 0.15 0.250 0.126 0.423 1.05 0.249 0.009 0.026 0.022 0.020
Median 0.167 0.698 1.69 0.360 0.159 0.642 1.60 0.337 0.022 0.047 0.108 0.026 Max 0.237 1.120 3.11 0.500 0.225 0.779 2.02 0.466 0.054 0.124 0.150 0.076 eSD 0.038 0.062 0.09 0.039 0.027 0.062 0.08 0.034 0.013 0.027 0.052 0.009 eCV 23 9 5 11 17 10 5 10 61 57 48 33
NISTa NISTb
0.171 nq
0.741 0.690
1.68 1.70
0.389 0.337
0.149 0.646 1.49 0.338 nq 0.620 1.56 0.298
0.022 nq
0.095 0.070
0.186 0.140
0.051 0.039
0.169 0.036
0.707 0.095
1.69 0.21
0.363 0.053
0.154 0.637 1.56 0.328 0.022 0.066 0.16 0.040
0.022 0.011
0.064 0.039
0.133 0.087
0.036 0.024
NAV NAU
K3 All Lab Report Page 2 / 6

Round Robin XXXV Laboratory Results Values in µg/mL
Total α-Carotene Total Lycopene trans-Lycopene β-Cryptoxanthin Lab
FSV-BA FSV-BD FSV-BE FSV-BF FSV-BG FSV-BH FSV-BI FSV-BJ
FSV-BK FSV-BM FSV-BN FSV-BO FSV-BP FSV-BQ FSV-BR FSV-BS FSV-BT FSV-BU FSV-BV
FSV-BY FSV-BZ FSV-CA FSV-CB FSV-CD FSV-CH FSV-CK FSV-CM FSV-CN FSV-CP FSV-CQ FSV-CR FSV-CT FSV-CU FSV-CV FSV-CX FSV-CY FSV-DA FSV-DB FSV-DJ
FSV-DK FSV-DM FSV-DP FSV-DS FSV-DX FSV-EC FSV-EH FSV-EK FSV-EL FSV-FC FSV-FD
n 23 26 26 26 23 24 24 23 6 6 6 6 12 16 16 15 Min 0.004 0.013 0.016 0.010 0.016 0.014 0.087 0.042 0.015 0.066 0.096 0.025 0.003 0.012 0.018 0.006
Median 0.009 0.036 0.032 0.018 0.030 0.142 0.176 0.073 0.024 0.087 0.107 0.046 0.009 0.026 0.052 0.014 Max 0.032 0.060 0.088 0.047 0.079 0.292 0.378 0.201 0.044 0.138 0.125 0.083 0.075 0.039 0.617 0.051 eSD 0.003 0.007 0.010 0.005 0.009 0.043 0.062 0.028 0.012 0.017 0.013 0.005 0.005 0.008 0.011 0.006 eCV 33 19 33 27 30 30 35 39 49 20 12 12 54 32 21 42
211 212 213 214 211 212 213 214 211 212 213 214 211 212 213 214 0.009 0.040 0.036 0.019 0.015 0.074 0.100 0.045 0.075 0.031 0.073 0.051
0.015 0.049 0.040 0.020 0.029 0.203 0.253 0.092 0.014 0.036 0.038 0.018 0.033 0.164 0.174 0.072 0.007 0.038 0.029 0.018 0.029 0.144 0.172 0.070 nd 0.024 0.052 nd 0.007 0.039 0.035 0.018 0.021 0.096 0.120 0.048 0.008 0.025 0.052 0.011 0.032 0.059 0.048 0.038 0.068 0.228 0.264 0.124
0.011 0.060 0.048 0.047 0.066 0.229 0.218 0.104 0.031 0.097 0.096 0.047 0.032 0.055 0.032 0.006 0.031 0.033 0.014 0.029 0.148 0.214 0.074 nd 0.015 0.033 0.009 0.010 0.036 0.034 0.025 0.041 0.200 0.228 0.116 0.003 0.029 0.061 0.014
0.026 0.045 0.088 0.029 0.073 0.051 0.087 0.042 0.057 0.027 0.063 0.027 0.007 0.027 0.030 0.013 0.028 0.140 0.154 0.073 0.021 0.098 0.123 0.051 0.011 0.033 0.057 0.019
0.016 0.120 0.150 0.050 0.009 0.039 0.026 0.020 0.079 0.292 0.303 0.142 0.013 0.020 0.018 0.018 0.010 0.039 0.040 0.019 0.028 0.124 0.168 0.062 0.007 0.026 0.038 0.013 0.022 0.013 0.033 0.034 0.026 0.014 0.323 0.201
0.007 0.033 0.020 0.017 0.032 0.122 0.134 0.066 0.003 0.012 0.030 0.006 nd 0.026 0.024 0.012 0.019 0.099 0.120 0.053
0.005 0.049 0.050 0.023 0.022 0.250 0.378 0.131 0.003 0.039 0.053 0.016
nd nd nd nd nd 0.106 0.177 nd 0.008 0.028 0.026 0.018 0.039 0.122 0.173 0.073 0.006 0.021 0.046 0.013
<0.01 0.020 0.020 0.010 0.030 0.150 0.170 0.070 0.010 0.020 0.050 0.010
0.011 0.037 0.037 0.017 0.031 0.137 0.356 0.051 0.015 0.066 0.107 0.025 0.010 0.017 0.617 0.014
nd 0.032 0.020 0.018 0.004 0.020 0.020 0.011 0.027 0.138 0.161 0.070
0.010 0.025 0.016 0.012 0.044 0.138 0.125 0.083
0.007 0.034 0.027 0.016 0.049 0.153 0.191 0.083 0.027 0.077 0.106 0.044 nd 0.028 0.054 0.012
0.005 0.032 0.025 0.015 0.036 0.180 0.223 0.091 0.010 0.038 0.016 0.014
NISTa NISTb
nd nq
0.043 0.046 0.019 0.041 0.054 0.020 nq 0.157 0.189 0.085 nq 0.061 0.082 0.030 nq 0.016 0.039 0.007
0.039 0.041 0.019 0.150 0.182 0.079 0.074 0.094 0.038 0.021 0.046 0.011 0.012 0.017 0.006 0.048 0.056 0.027 0.026 0.028 0.015 0.010 0.017 0.007
NAV NAU
K4 All Lab Report Page 3 / 6

Round Robin XXXV Laboratory Results Values in µg/mL
Lutein Zeaxanthin Lutein&Zeaxanthin Lab 211 212 213 214 211 212 213 214 211 212 213 214
FSV-BA FSV-BD FSV-BE FSV-BF FSV-BG FSV-BH nd 0.035 0.025 0.031 nd nd nd nd nd 0.035 0.025 0.031 FSV-BI 0.014 0.054 0.026 0.026 0.004 0.023 0.017 0.014 0.021 0.077 0.046 0.040 FSV-BJ
FSV-BK FSV-BM FSV-BN 0.017 0.048 0.026 0.028 0.013 0.031 0.013 0.010 0.030 0.078 0.039 0.038 FSV-BO 0.014 0.048 0.025 0.027 FSV-BP FSV-BQ FSV-BR FSV-BS 0.078 0.053 0.186 0.222 FSV-BT 0.022 0.059 0.029 0.031 0.009 0.017 0.030 0.012 0.030 0.076 0.059 0.043 FSV-BU FSV-BV 0.020 0.086 0.016 0.044
FSV-BY 0.011 0.045 0.026 0.023 0.005 0.017 0.011 0.009 0.016 0.062 0.037 0.032 FSV-BZ 0.032 0.055 0.040 0.040 FSV-CA FSV-CB FSV-CD 0.028 0.101 0.056 0.056 FSV-CH FSV-CK 0.028 0.087 0.045 0.047 FSV-CM FSV-CN FSV-CP 0.021 0.072 0.046 0.046 FSV-CQ FSV-CR FSV-CT 0.015 0.048 0.037 0.025 FSV-CU FSV-CV FSV-CX 0.020 0.070 0.040 0.040 FSV-CY FSV-DA 0.016 0.064 0.024 0.032 0.007 0.021 0.011 0.013 0.023 0.085 0.035 0.045 FSV-DB FSV-DJ
FSV-DK FSV-DM 0.018 0.063 0.034 0.037 FSV-DP FSV-DS FSV-DX 0.014 0.054 0.015 0.026 FSV-EC FSV-EH 0.015 0.058 0.026 0.028 0.004 0.018 0.012 0.039 0.019 0.076 0.037 0.067 FSV-EK FSV-EL FSV-FC FSV-FD 0.016 0.064 0.034 0.033
n 9 10 10 10 6 6 6 6 15 16 16 16 Min 0.011 0.035 0.024 0.023 0.004 0.017 0.011 0.009 0.014 0.035 0.015 0.026
Median 0.016 0.054 0.026 0.030 0.006 0.019 0.012 0.012 0.020 0.074 0.037 0.040 Max 0.078 0.064 0.186 0.222 0.013 0.031 0.030 0.039 0.030 0.101 0.059 0.067 eSD 0.003 0.008 0.002 0.004 0.003 0.004 0.002 0.003 0.006 0.016 0.012 0.009 eCV 19 15 9 15 52 18 15 24 30 22 33 23
NISTa NISTb 0.011 0.050 0.022 0.024 nq 0.019 0.009 0.010 >0.011 0.069 0.031 0.034
0.013 0.052 0.024 0.027 0.006 0.012 0.007 0.008
0.019 0.011 0.011 0.006 0.005 0.005
0.016 0.009
0.071 0.016
0.034 0.011
0.036 0.011
NAV NAU
K5 All Lab Report Page 4 / 6
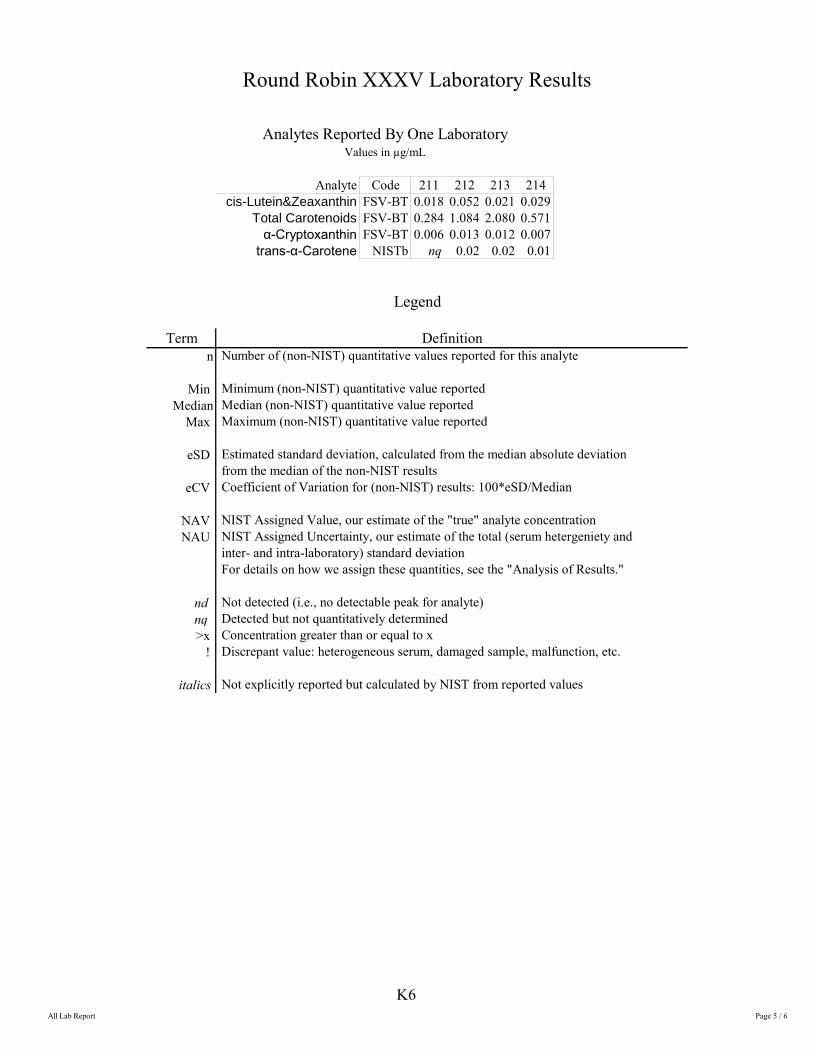
Termn
Min Median
Max
eSD
eCV
NAV NAU
nd nq >x
!
italics
Round Robin XXXV Laboratory Results
Analytes Reported By One LaboratoryValues in µg/mL
Analyte cis-Lutein&Zeaxanthin
Total Carotenoids α-Cryptoxanthin trans-α-Carotene
Code FSV-BT FSV-BT FSV-BT
NISTb
211 212 213 214 0.018 0.052 0.021 0.029 0.284 1.084 2.080 0.571 0.006 0.013 0.012 0.007
nq 0.02 0.02 0.01
Legend
Definition Number of (non-NIST) quantitative values reported for this analyte
Minimum (non-NIST) quantitative value reportedMedian (non-NIST) quantitative value reportedMaximum (non-NIST) quantitative value reported
Estimated standard deviation, calculated from the median absolute deviationfrom the median of the non-NIST resultsCoefficient of Variation for (non-NIST) results: 100*eSD/Median
NIST Assigned Value, our estimate of the "true" analyte concentrationNIST Assigned Uncertainty, our estimate of the total (serum hetergeniety andinter- and intra-laboratory) standard deviationFor details on how we assign these quantities, see the "Analysis of Results."
Not detected (i.e., no detectable peak for analyte)Detected but not quantitatively determinedConcentration greater than or equal to xDiscrepant value: heterogeneous serum, damaged sample, malfunction, etc.
Not explicitly reported but calculated by NIST from reported values
K6All Lab Report Page 5 / 6
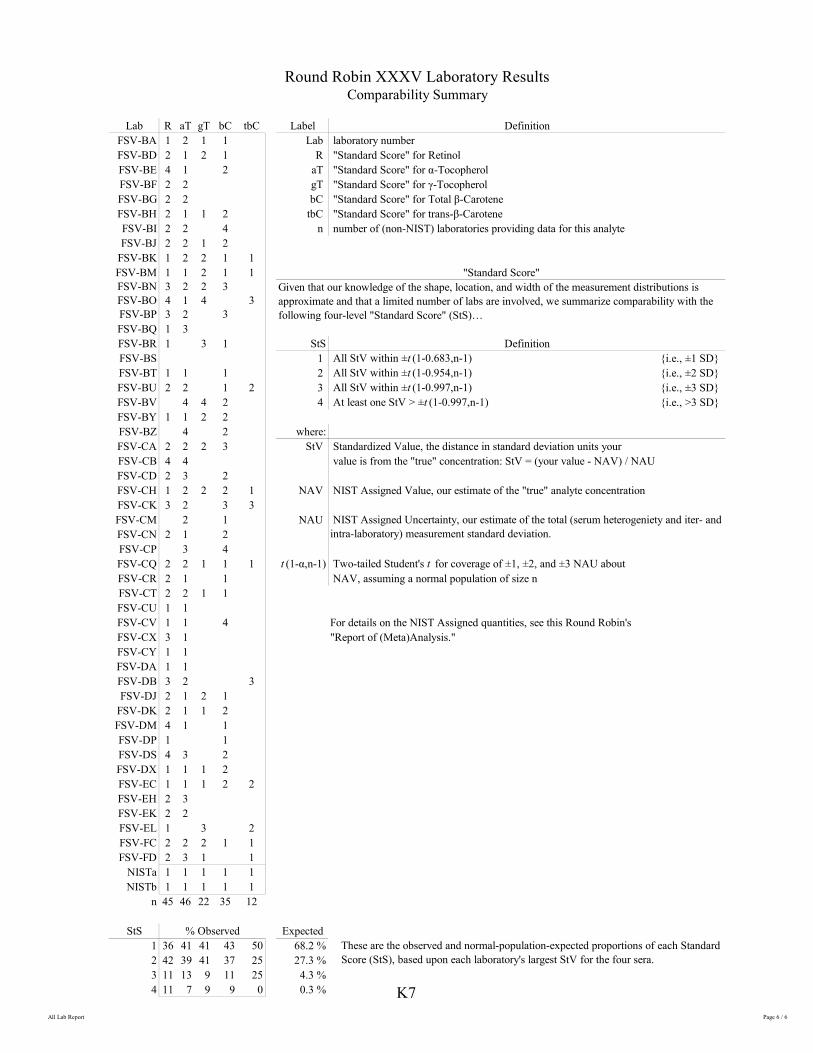
Round Robin XXXV Laboratory Results
Comparability Summary
Lab FSV-BA FSV-BD FSV-BE FSV-BF FSV-BG FSV-BH FSV-BI FSV-BJ
FSV-BK FSV-BM FSV-BN FSV-BO FSV-BP FSV-BQ FSV-BR FSV-BS FSV-BT FSV-BU FSV-BV FSV-BY FSV-BZ FSV-CA FSV-CB FSV-CD FSV-CH FSV-CK FSV-CMFSV-CNFSV-CPFSV-CQFSV-CRFSV-CTFSV-CUFSV-CVFSV-CXFSV-CYFSV-DAFSV-DBFSV-DJ
FSV-DKFSV-DMFSV-DPFSV-DSFSV-DXFSV-ECFSV-EHFSV-EKFSV-ELFSV-FCFSV-FD
NISTaNISTb
R aT gT bC tbC 1 2 1 1 2 1 2 1 4 1 2 2 2 2 2 2 1 1 2 2 2 4 2 2 1 2 1 2 2 1 1 1 1 2 1 1 3 2 2 3 4 1 4 3 3 2 3 1 3 1 3 1
1 1 1 2 2 1 2
4 4 2 1 1 2 2
4 2 2 2 2 3 4 4 2 3 2 1 2 2 2 1 3 2 3 3
2 1 2 1 2
3 4 2 2 1 1 1 2 1 1 2 2 1 1 1 1 1 1 4 3 1 1 1 1 1 3 2 3 2 1 2 1 2 1 1 2 4 1 1 1 1 4 3 2 1 1 1 2 1 1 1 2 2 2 3 2 2 1 3 2 2 2 2 1 1 2 3 1 1 1 1 1 1 1 1 1 1 1 1
n 45 46 22 35 12
StS 1 36 41 41 43 50 2 42 39 41 37 25 3 11 13 9 11 25 4 11 7 9 9 0
% Observed
Label Lab
R aT gT bC
tbC n
Definition laboratory number "Standard Score" for Retinol "Standard Score" for α-Tocopherol "Standard Score" for γ-Tocopherol "Standard Score" for Total β-Carotene "Standard Score" for trans-β-Carotene number of (non-NIST) laboratories providing data for this analyte
"Standard Score" Given that our knowledge of the shape, location, and width of the measurement distributions is approximate and that a limited number of labs are involved, we summarize comparability with the following four-level "Standard Score" (StS)…
StS1 2 3 4
where: StV
NAV
NAU
t (1-α,n-1)
Expected 68.2 % 27.3 % 4.3 % 0.3 %
Definition All StV within ±t (1-0.683,n-1) {i.e., ±1 SD} All StV within ±t (1-0.954,n-1) {i.e., ±2 SD} All StV within ±t (1-0.997,n-1) {i.e., ±3 SD} At least one StV > ±t (1-0.997,n-1) {i.e., >3 SD}
Standardized Value, the distance in standard deviation units your value is from the "true" concentration: StV = (your value - NAV) / NAU
NIST Assigned Value, our estimate of the "true" analyte concentration
NIST Assigned Uncertainty, our estimate of the total (serum heterogeniety and iter- and intra-laboratory) measurement standard deviation.
Two-tailed Student's t for coverage of ±1, ±2, and ±3 NAU about NAV, assuming a normal population of size n
For details on the NIST Assigned quantities, see this Round Robin's "Report of (Meta)Analysis."
These are the observed and normal-population-expected proportions of each Standard Score (StS), based upon each laboratory's largest StV for the four sera.
K7 All Lab Report Page 6 / 6

Appendix L. Representative “Individualized Report” for RR35
Each participant in RR35 received an “Individualized Report” reflecting their reported results. Each report included a detailed analysis of the results they reported for some or all of the following analytes: • Retinol • Retinol palmitate • α-Tocopherol • γ-Tocopherol • Total β-Carotene • trans-β-Carotene • Total α-Carotene • Total Lycopene • β-Cryptoxanthin • Lutein • Zeaxanthin • Lutein & Zeaxanthin
The following 8 pages are the “Individualized Report” for the analytes evaluated by participant FSV-BA.
L1
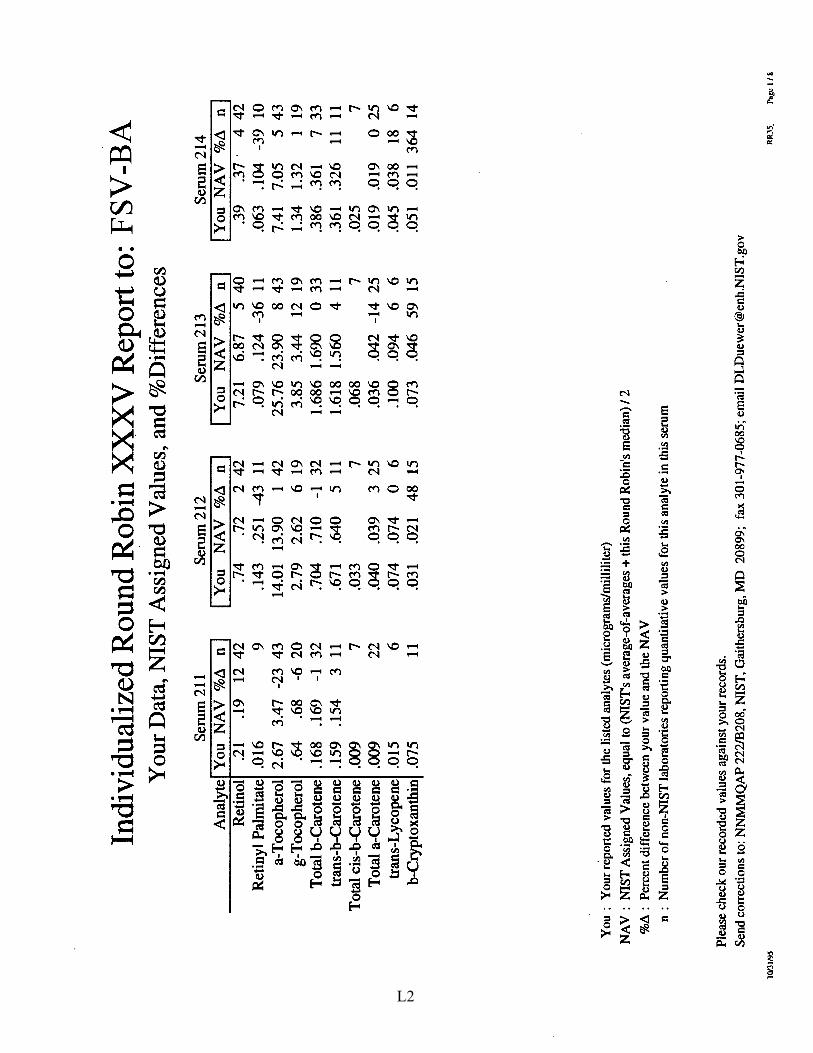
10/3
1195
Indi
vidu
aliz
ed R
ound
Rob
in :X
XX
V R
epor
t to:
FS
V-B
A
You
r D
ata,
NIS
T A
ssig
ned
Val
ues,
and
%D
iffe
renc
es
Seru
m 2
11
Seru
m 2
12
Seru
m 2
13
Ana
lyte
Y
ou
NA
V
%Li
n
I You
N
AV
%
Li
n I
I You
N
AV
%
Li
n I
Ret
inol
.2
1 .1
9 12
42
.7
4 .7
2 2
42
7.21
6.
87
5 40
R
etin
yl P
alm
itate
.0
16
9 .1
43
.251
-4
3 11
.0
79
.124
-3
6 11
a-
Toc
ophe
rol
2.67
3.
47
-23
43
14.0
1 13
.90
1 42
25
.76
23.9
0 8
43
g-T
ocop
hero
l .6
4 .6
8 -6
20
2.
79
2.62
6
19
3.85
3.
44
12
19
Tot
al b
-Car
oten
e .1
68
.169
-1
32
.7
04
.710
-1
32
1.
686
1.69
0 0
33
tran
s-b-
Car
oten
e .1
59
.154
3
11
.671
.6
40
5 11
1.
618
1.56
0 4
11
Tot
al c
is-b
-Car
oten
e .0
09
7 .0
33
7 .0
68
7 T
otal
a-C
arot
ene
.009
22
.0
40
.039
3
25
.036
.0
42
-14
25
tran
s-L
ycop
ene
.015
6
.074
.0
74
0 6
.100
.0
94
6 6
b-C
rypt
oxan
thin
.0
75
11
.031
.0
21
48
15
.073
.0
46
59
15
You
: Y
our
repo
rted
val
ues
for
the
list
ed a
naly
tes
(mic
rogr
ams/
mil
lili
ter)
NA
V :
NIS
T A
ssig
ned
Val
ues,
equ
al t
o (N
IST
s av
erag
e-of
-ave
rage
s+ th
is R
ound
Rob
in's
med
ian)
/ 2
%a
: P
erce
nt d
iffe
renc
e be
twee
n yo
ur v
alue
and
the
NA
V
n :
Num
ber
of n
on-N
IST
labo
rato
ries
rep
orti
ng q
uant
itat
ive
valu
es f
or t
his
anal
yte
in t
his
seru
m
Ple
ase
chec
k ou
r re
cord
ed v
alue
s ag
ains
t you
r re
cord
s.
Seru
m 2
14
I You
N
A V
%
Li
n I
.39
.37
. 4
42
.063
.1
04
-39
10
7.41
7.
05
5 43
1.
34
1.32
1
19
.386
.3
61
7 33
.3
61
.326
11
11
.0
25
7 .0
19
.019
0
25
.045
.0
38
18
6 .0
51
.011
36
4 14
Sen
d co
rrec
tion
s to
: N
NM
MQ
AP
222
/B20
8, N
IST
, Gai
ther
sbur
g, M
D 2
0899
; fa
x 30
1-97
7-06
85; e
mai
l DL
Due
wer
@en
h.N
IST
.gov
RR
J5_
Pag
e I/
8
L2
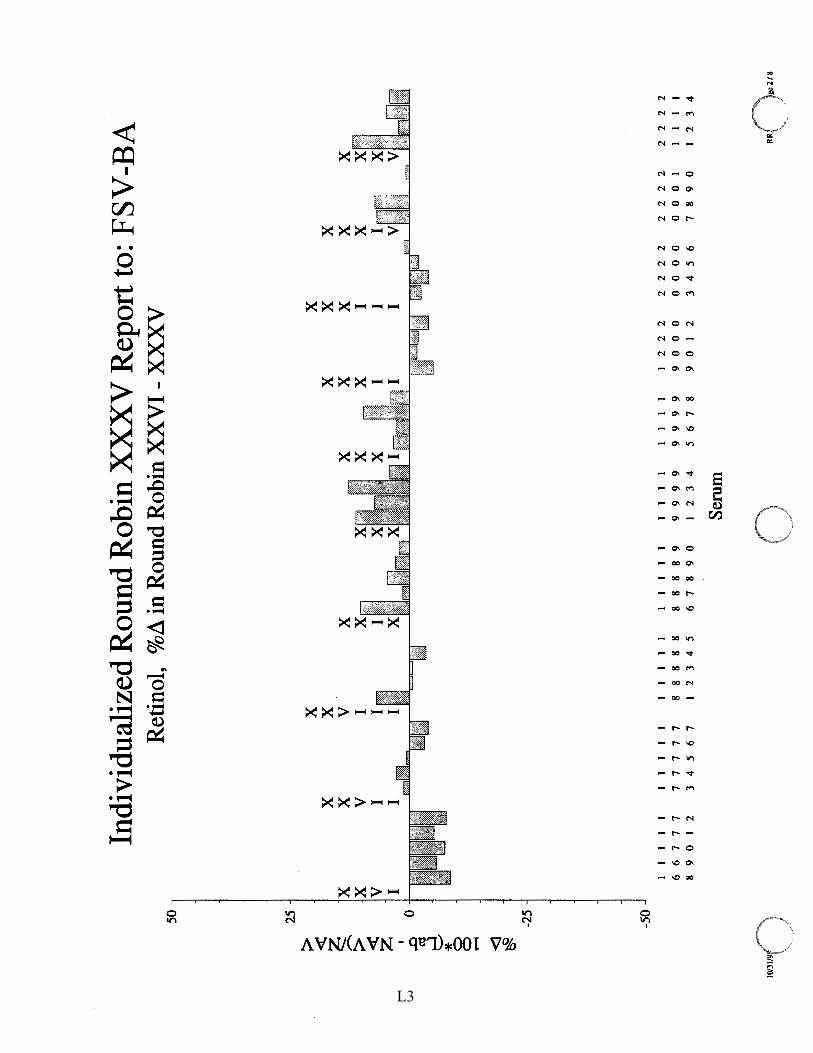
50
25
>
<
~
,-...
>
< z ~
0
8 * 8 - <l ~ -25
-50
llll31/9n · .
... ./
x x v I
Indi
vidu
aliz
ed R
ound
Rob
in X
XX
V R
epor
t to:
FSV
-BA
R
etin
ol,
%L\
in R
ound
Rob
in X
XV
I -
XX
XV
x x v I I &
$ill
I I
I I
I I
I I
I I
6 6
7 7
7 7
7 7
7 7
8 9
0 I
2 3
4 5
6 7
x x v I Ill
I ~l
I I
I I
I 8
8 8
8 8
I 2
3 4
5
x x I x x I x
I x
I I
I I
I I
I I
I 8
8 8
8 9
9 9
9 9
6 7
8 9
0 I
2 3
4
Ser
um
0
x x
x x
x x
x I
x I
~ Wllr
El l11~
~ I I
I I
I I
I 2
2 2
2 2
2 2
2 2
2 2
2 2
2 2
9 9
9 9
9 0
0 0
00
00
0
00
1
11
11
5
6 7
8 9
0 I
2 3
45
6
78
90
1
23
4
RR
Og
e2/8
L3
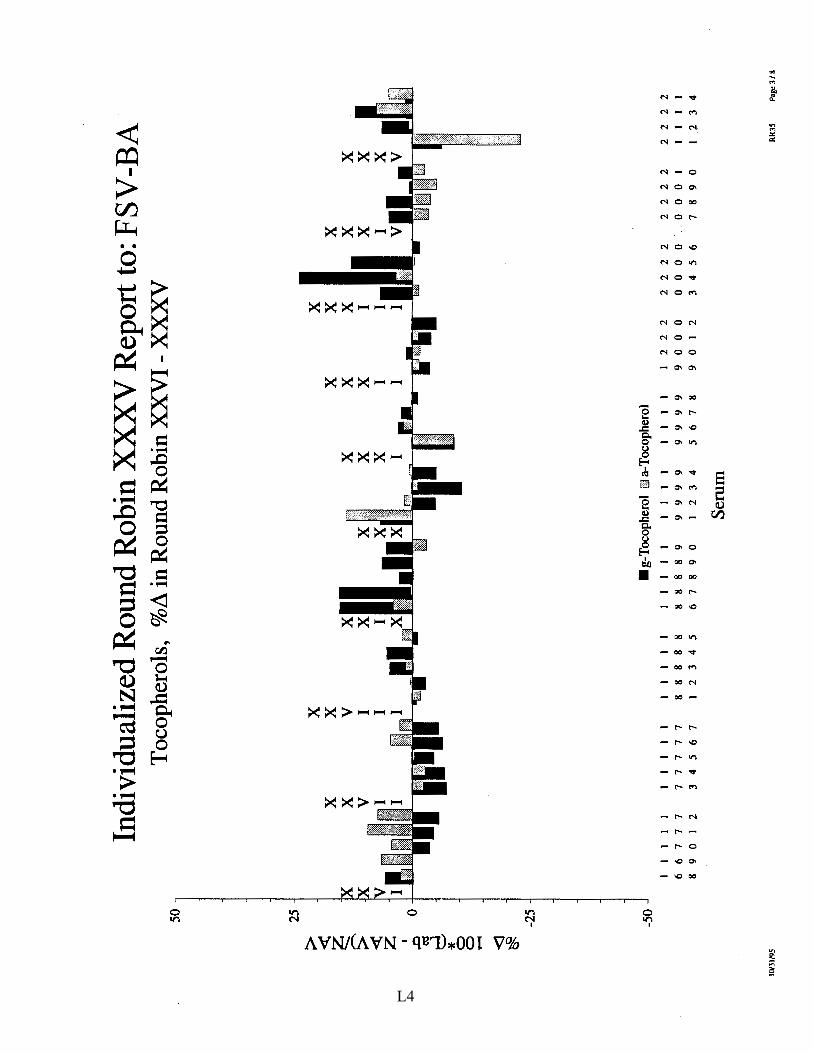
50
25
> <
~
...-... > ~ I
,.0
0
c.;s 8 * 0 0 - <l
1 ~
-25
-50
J
llW31
/95
Indi
vidu
aliz
ed R
ound
Rob
in X
XX
V R
epor
t to:
FS
V-B
A
Toc
ophe
rols
, %
L\ i
n R
ound
Rob
in X
XV
I -
XX
XV
• g-
Toc
ophe
rol
E3 a
-Toc
ophe
rol
I I
I I
I I
I I
I I
I I
I I
I I
I I
I I
I I
I I
I I
I I
I 2
2 2
2 2
2 2
2 2
2 2
2 2
2 2
6 6
7 7
7 7
7 7
7 7
8 8
8 8
8 8
8 8
8 9
9 9
9 9
9 9
9 9
9 0
0 0
0 0
0 0
. 0
0 0
I I
I I
I 8
9 0
I 2
3 4
5 6
7 I
2 3
4 5
6 7
8 9
0 I
2 3
4 5
6 7
8 9
0 I
2 3
4 5
6 7
8 9
0 I
.2
3 4
Ser
um
RR
35
Page
3 /
8
L4
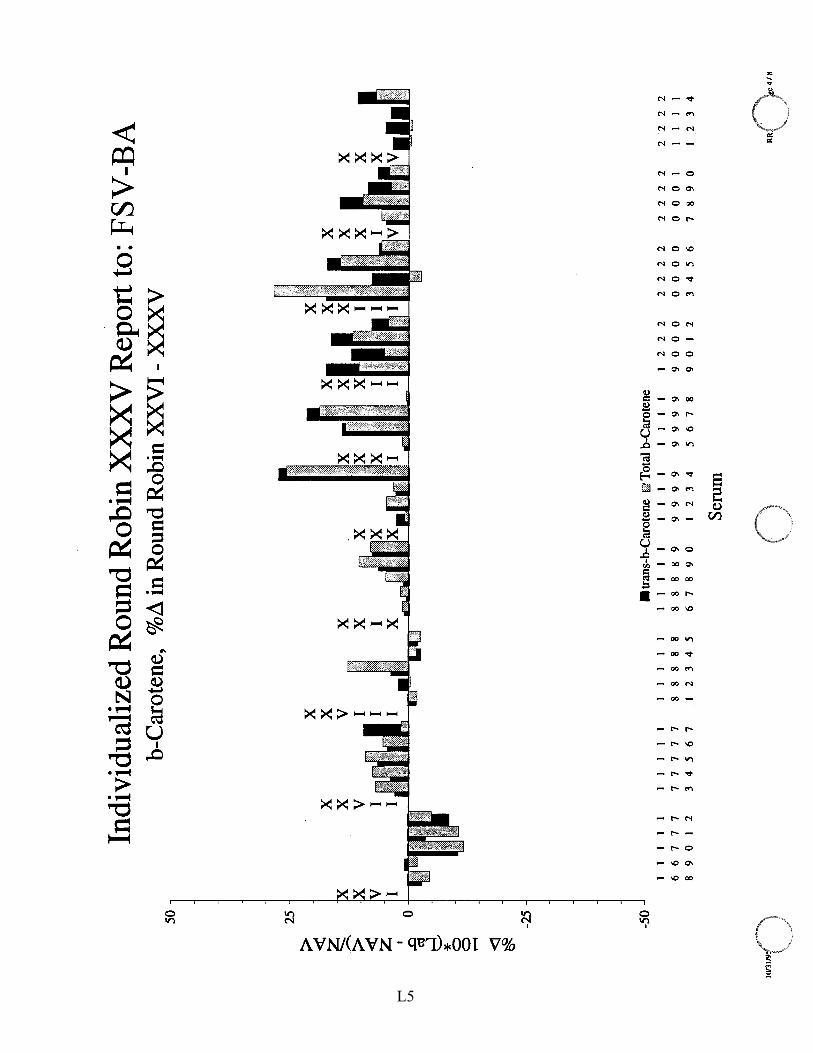
50
Indi
vidu
aliz
ed R
ound
Rob
in X
XX
V R
epor
t to:
FS
V-B
A
b-C
arot
ene,
%
1'.\ i
n R
ound
Rob
in X
XV
I -
XX
XV
25
>
x x
<
x x
xi
x ~
x v
. x
x x
x
Z
1 I
1.s;.·.I
1
J. x
~ lrx
n 1
R 1
,11I
,, !!! ~ 1
>
V
I X
2#(
X
X
.
Xv,··~~
I ~
I I
I i·'>
''"'
X
X
• I
w
'~ I
)~ -
-~JH
l1 -•
iht!B
II.
"' %
.JI
~
~~
• %
4
..0
0 ~
d * 0 0 .......
<I ~
-25
-50
10/3
1/9r\
\.~ ___
_ )
I I
I I
I 6
6 7
7 7
8 9
0 I
2
I I
I I
I 7
7 7
7 7
3 4
5 6
7
I I
I I
I
8 8
8 8
8 I
2 3
4 5
• tr
ans-
b-C
arot
ene
till T
otal
b-C
arot
ene
I I
I I
I 8
8 8
8 9
6 7
8 9
0
I I
I I
9 9
9 9
I 2
3 4
Ser
um
0
I I
I I
9 9
9 9
5 6
7 8
I 2
2 2
9 0
0 0
9 0
I 2
2 2
2 2
0 0
0 0
3 4
5 6
2 2
2 2
0 0
0 I
7 8
9 0
2 2
2 2
I I
I 2
3 4
RROe4/8
L5
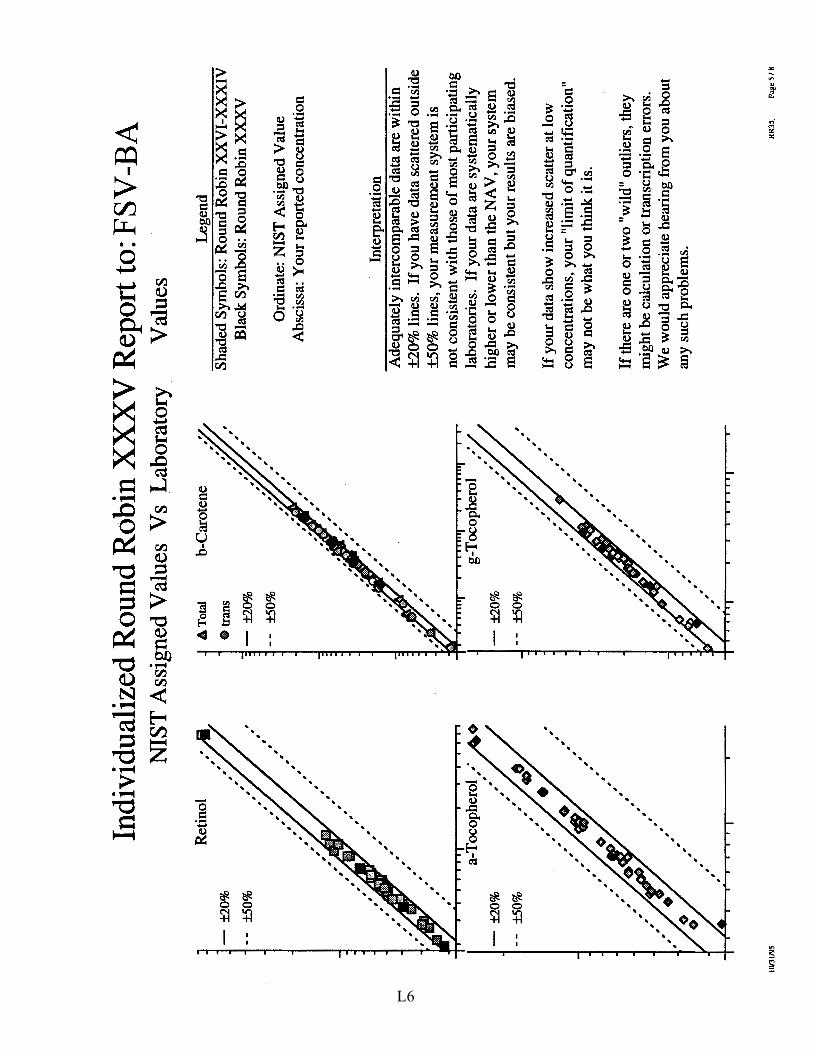
Indi
vidu
aliz
ed R
ound
Rob
in X
XX
V R
epor
t to:
FS
V-B
A
NIS
T A
ssig
ned
Val
ues
Vs
Lab
orat
ory
Val
ues
Ret
inol
-±
20%
--±
50%
. • . , , , ,
,
• , . • • .
• , , , ,
, . . , , ,
. , • . , , , , ,
, , . , , • , ,
, , . . ,
a-T
ocop
hero
l /
-±
20%
--±
50%
,
10/3
1/95
, , , ,
, , , ,
, ,
, ,
, , , , , , , ,
, , ,
, , , ,
A T
otal
8 tr
ans
--±
50%
-±
20%
--±
50%
, , ,
, , , ,
b-C
arot
ene
g-T
ocop
hero
l ,·
, , , ,
, ,
,
, , , ,
, ,
, , , , . , , , ,
, , , , ,
, , , ,
, , ,
Leg
end
Sha
ded
Sym
bols
: R
ound
Rob
in X
XV
I-X
XX
IV
Bla
ck S
ymbo
ls:
Rou
nd R
obin
XX
XV
Ord
inat
e: N
IST
Ass
igne
d V
alue
A
bsci
ssa:
You
r re
port
ed c
once
ntra
tion
Inte
rpre
tati
on
Ade
quat
ely
inte
rcom
para
ble
data
are
wit
hin
±20
% li
nes.
If y
ou h
ave
data
sca
tter
ed o
utsi
de
±50
% li
nes,
yo
ur
mea
sure
men
t sys
tem
is
not c
onsi
sten
t wit
h th
ose
of m
ost p
arti
cipa
ting
la
bora
tori
es. If
yo
ur
data
are
sys
tem
atic
ally
hi
gher
or
low
er th
an t
he N
A V
, you
r sy
stem
m
ay b
e co
nsis
tent
but
you
r re
sult
s ar
e bi
ased
.
If y
our d
ata
show
inc
reas
ed s
catt
er a
t low
co
ncen
trat
ions
, you
r "l
imit
of q
uant
ific
atio
n"
may
not
be
wha
t yo
u th
ink
it is
.
If th
ere
are
one
or
two
"wil
d" o
utli
ers,
they
m
ight
be
calc
ulat
ion
or
tran
scri
ptio
n er
rors
. W
e w
ould
app
reci
ate
hear
ing
from
you
abo
ut
any
such
pro
blem
s.
RR
35.
Pag
d /
8
L6

ltl/Jl/9n '·
,"~.
..../I
Indi
vidu
aliz
ed R
ound
:Rob
in X
XX
V R
epor
t to:
FS
V-B
A
Acc
urac
y/P
reci
sion
Sum
mar
y
Ret
a T
oe
gToc
T
otal
-
ml
v!:J.
ml
v!:J.
ml
v!:J.
ml
v!:J.
-7
2 6
3 -2
5
-7
4
-1
3 0
3 -6
1
6 3
0 4
1 2
1 4
1 7
4 4
0 3
9 6
5 4
XX
VI
XX
VII
xxvm
X
XIX
xxx
XX
XI
XX
XII
X
XX
III
XX
XN
xxxv
9 4
4 7
-3
7 9
12
5 3
-2
5 -1
5
9 9
-3
2 -1
1
-3
3 8
4
-2
2 0
2 11
11
12
13
4 4
-4
1 3
2 6
3
6 4
-2
14
3 8
1 4
(Tra
ditio
nal)
Per
form
ance
Cri
teri
a
The
abs
olut
e va
lue
of %
/:J. o
f eve
ry m
easu
rem
ent h
as
trad
ition
ally
bee
n ev
alua
ted
as f
ollo
ws .
..
%/:J
. I E
valu
atio
n
0-5%
Exc
eptio
nal
6-10
% A
ccep
tabl
e
11-2
0% M
argi
nal
>20
% P
oor
Mor
e re
pres
enta
tive
crite
ria
need
to b
e es
tabl
ishe
d,
fact
orin
g in
eac
h se
rum
's an
alyt
e le
vel a
nd th
e
anal
yte
dist
ribu
tion
in a
dult
hum
an p
opul
atio
ns.
Stay
tun
ed,
we'
re w
orki
ng o
n it.
..
tran
s
ml
v!:J.
-5
5 5
3
0 3
3 3
9 12
9 10
13
4
12
6
9 4
6 3
Leg
end
Ret
R
etin
ol
a Toe
a-
Toc
ophe
rol
gToc
g-
Toc
ophe
rol
Tot
al
Tot
al b
-Car
oten
e
tran
s al
l-tr
ans-
b-C
arot
ene
ml
IMea
n di
ffer
ence
, the
ave
rage
%/:J
. for
all
sera
of a
giv
en R
R, w
here
%/:J
. = 1 O
O(Y
our
valu
e -
NA
V)
I NA
V
v!:J.
I Dif
fere
nce
vari
abili
ty, o
ne s
tand
ard
devi
atio
n o
f %a
for
all
sera
of a
RR
NA
V I
NIS
T A
ssig
ned
Val
ue, o
ur b
est e
stim
ate
of a
naly
te c
once
ntra
tion .
..
NA
V =
(NIS
Ts
aver
age-
of-a
vera
ges
+R
ound
Rob
in m
edia
n) /
2
Inte
rpre
tatio
n
Acc
urac
y an
d pr
ecis
ion
are
sepa
rate
but
kin
dred
asp
ects
of m
easu
rem
ent
com
pari
son.
We
estim
ate
accu
racy
as
ml,
the
aver
age
%.:1
, and
pre
cisi
on
as v
!:J.,
the
stan
dard
dev
iatio
n of
%.:1
, for
all
sera
of a
Rou
nd R
obin
.
It's
best
to b
e ac
cura
te a
nd p
reci
se (
smal
l m
l, s
mal
l v!
:J.)!
Goo
d pr
ecis
ion
(sm
all
v.:1)
with
poo
r ac
cura
cy (
larg
e m
l) is
bet
ter
than
the
conv
erse
: at
lea
st s
uch
valu
es a
re i
nter
nally
con
sist
ent a
nd m
ay b
e re
lata
ble
to
othe
rs' v
alue
s on
ce th
e re
lativ
e bi
ases
hav
e be
en d
eter
min
ed.
Poor
pre
cisi
on (
larg
e v!:
J.) s
ugge
sts
that
you
r m
easu
rem
ent s
yste
m is
not
in
adeq
uate
con
trol
for
the
ana
lyte
lev
els
exam
ined
.
0 RR
ogc
6/H
L7
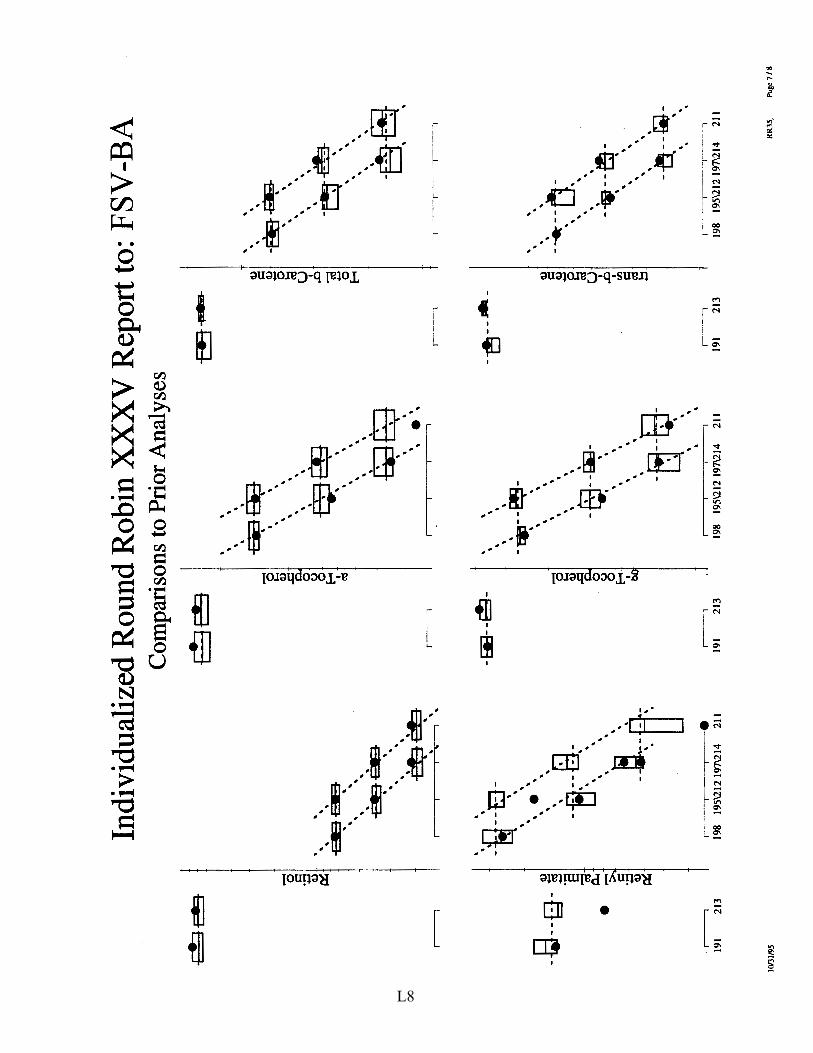
~es
,-----
----,
0 c:: ·..:i ~
-S--a
-·I ~
ti.
• >
c ~
,----
----
-, 19
1 21
3
llWJJ
/95
Indi
vidu
aliz
ed R
ound
Rob
in :X
XX
V R
epor
t to:
FSV
-BA
C
ompa
riso
ns to
Pri
or A
naly
ses
' '
' '
.9EJ~
' '
' '
' '
' '
-EE
Q3
'
' '
' '
' '
'
~·~-~·
E;J-~~
' ' '
\ ' '
\ '
" ...
" '@
--B
·~ --
~ .-'
' '
' ' '
'
·~~-A,
--W
. LJ
.
.--~·-i-•
198
195\
212
197\
214
211
9~
.--.
-E93--~-
,--
, 19
1 21
3
e i ~ els
' '
~Bi?
'
' '
~fH
' ' '
~s
' '
" . "
' \
' \
' ' '
-1*i--~-
\ '
\ '
' ' ' '
' '
' '
_!i::J
__ ~_
~
' ' ' '
' '
'
-15--e- •
' ' ~--
,
198
195\
212
197\
214
211
-ffi"~
,---
-,
-~--·-
.--·-··-.
191
213
Q) c:: i u I
.0
~
....... 0 E-<
Q) c B ~ u I
.0
I VJ c:: ~
' '
-ffi~
' ' '
' \
-6~ '
-~S
' '
.---
-,-
--.
---
,
' '
-:..
.--~
'
Li.
' '
' --¥
--t!i-
' '
\ ' ' '
' '
--1!1-
-ftil -
' '
' '
,---
--,--
--,-
---·
-. 19
8 19
5\21
2 19
7\21
4 21
1
RR
35.
Pug
e 11
K
L8
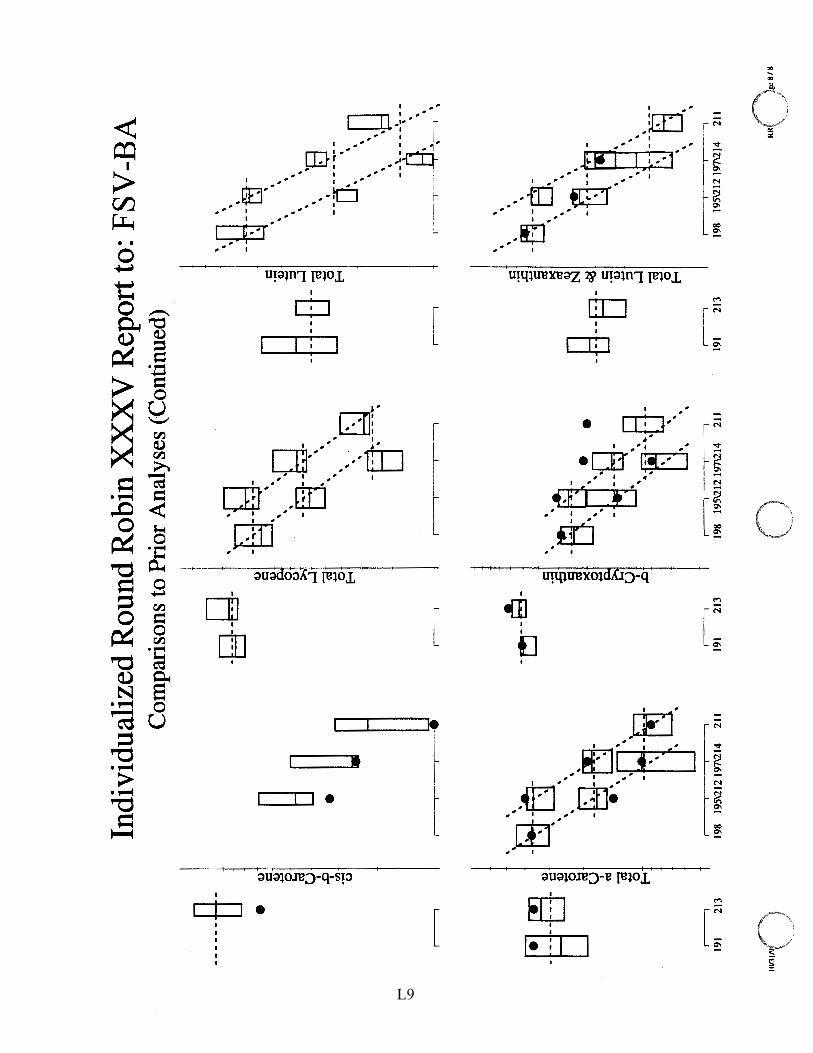
Indi
vidu
aliz
ed R
ound
Rob
in X
XX
V R
epor
t to:
FS
V-B
A
Com
pari
sons
to P
rior
Ana
lyse
s (C
onti
nued
)
------
B- . ~ ~ ~
,----
----
-,
~ ~ (.(
-9
VJ .....
u
r---.-
8 [3
:g:~-
~ '
LJ,
----
--c:
' '
-~
' '
~ --@-~-
~ ... B
.. 3
.. --·
~-0
-E-<
'.
'
' '
,----
----
-, I
191
213
198
195\
212
197\
214
211
1001~0
... _/
-9-b
J-:aJ
;~:
6.
·~
.----i
-~--~-
.---
--.
191
213
....J
';! ..... ~
u I .0
' '
-l-1--
<
' '
·. ·o
' '
' .
. .
' '
E1--
----
~ -L
J'
~~~~~-~~---,
t(g· :.. .
. --
__ g_
'. ~-~· .. §
-..
-.
• •
• .
. . '
' '
.----.-
---
-.--
--.
198
195\
212
197\
214
21 I
0
. .
·g ..
-.. --e
-•
• . ~
.5
" "
~
. .
'E
" '-i:
:::i
....J
" l!.
J -
--8-~
--a.:--
\ ~
.---
-.
c: .....
'5 ~ ~
-8--~l
i ....J ~ E-<
.---
-.
191
213
. •
• •
• •
• •
. • _g __ '!,. _
--
-·,
--
• . .
. r--
---,
-~
--
,
• •
•
. -t
i--~
.-.
LJ.
•
• "o ..
--
fc-
.. -
-r '
-~~.r-~-
. LJ
, •
.-----
--i-
-..-
----•
19
8 19
5\21
2 19
7\2)
4 21
1
RR(}
gc8
/8
~~ ....
..
L9

Appendix M. Shipping Package Inserts for RR07
Three items were included in each package shipped to a RR07 participant: • Cover letter • Methodology questionnaire • Report of Analysis datasheet for the analysis of the Control and Serum Samples
The cover letter, questionnaire, and datasheet were enclosed in a sealed waterproof bag along with the samples themselves.
Dr. Margolis’s records did not preserve these materials. By inference, the cover letter was similar to that for RR08 (see Appendix Q) with the addition of information and instructions relating to the questionnaire. The questionnaire and Report of Analysis have been recreated from the preserved participant responses.
M1
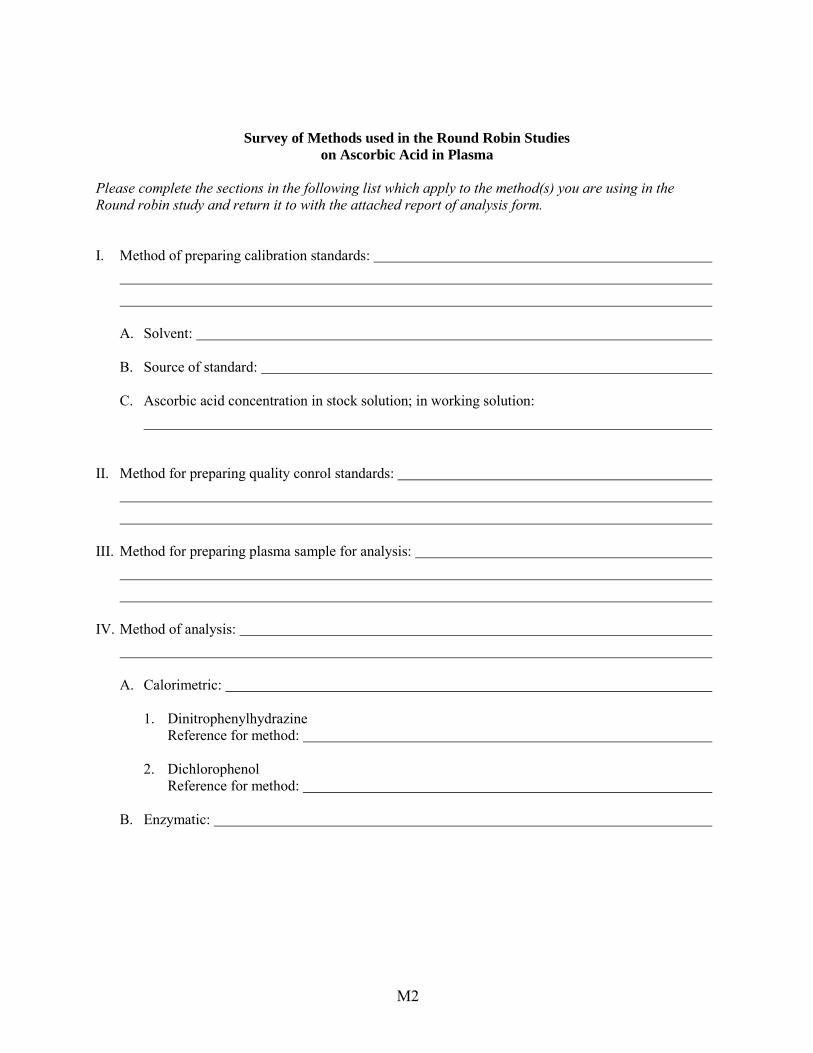
Survey of Methods used in the Round Robin Studies on Ascorbic Acid in Plasma
Please complete the sections in the following list which apply to the method(s) you are using in the Round robin study and return it to with the attached report of analysis form.
I. Method of preparing calibration standards:
A. Solvent:
B. Source of standard:
C. Ascorbic acid concentration in stock solution; in working solution:
II. Method for preparing quality conrol standards:
III. Method for preparing plasma sample for analysis:
IV. Method of analysis:
A. Calorimetric:
1. Dinitrophenylhydrazine Reference for method:
2. Dichlorophenol Reference for method:
B. Enzymatic:
M2
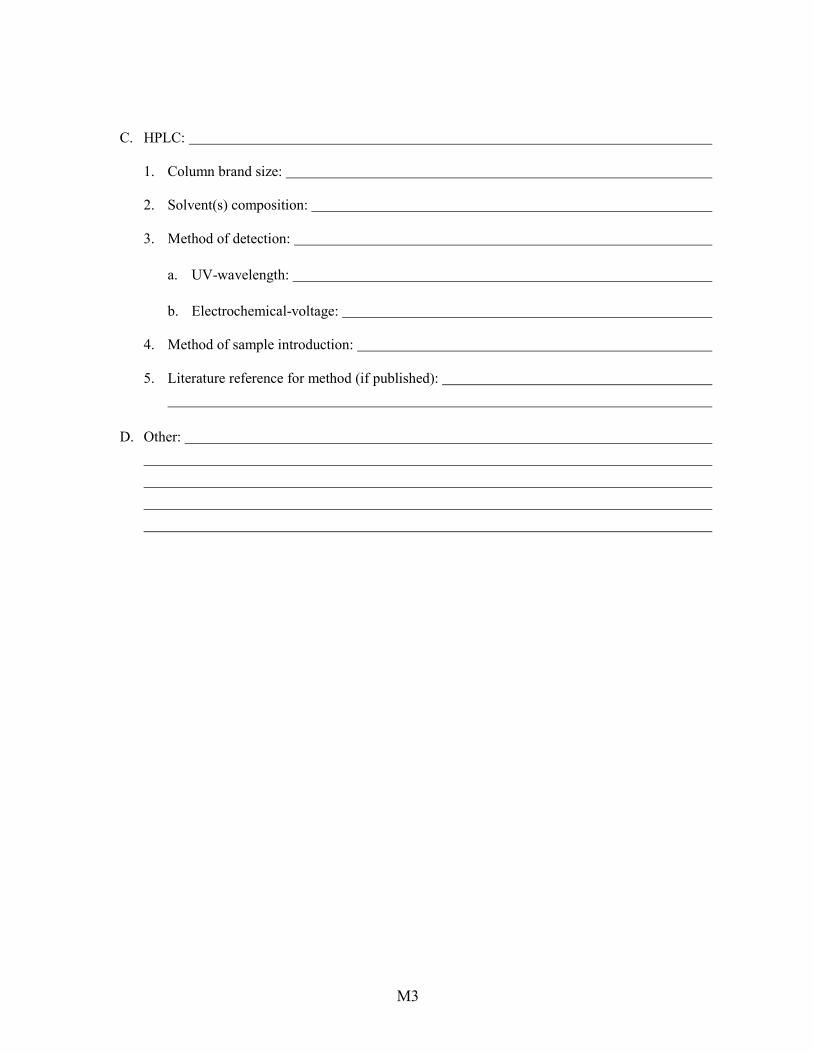
C. HPLC:
1. Column brand size:
2. Solvent(s) composition:
3. Method of detection:
a. UV-wavelength:
b. Electrochemical-voltage:
4. Method of sample introduction:
5. Literature reference for method (if published):
D. Other:
M3
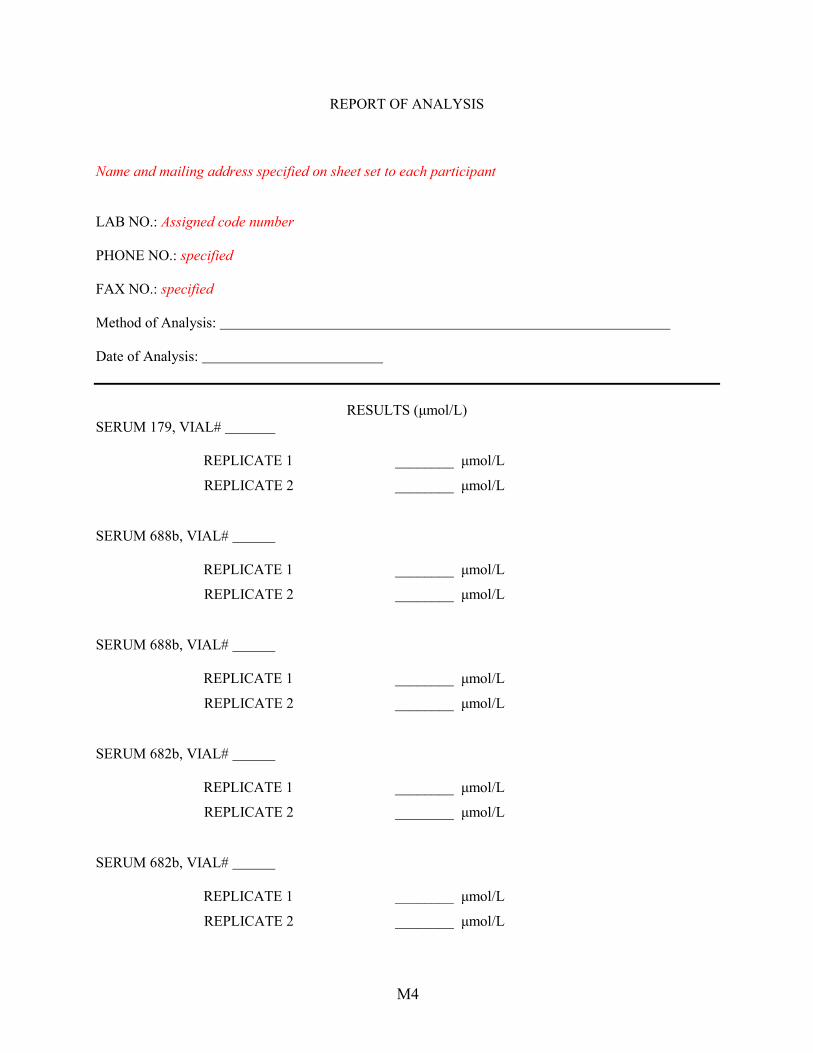
REPORT OF ANALYSIS
Name and mailing address specified on sheet set to each participant
LAB NO.: Assigned code number
PHONE NO.: specified
FAX NO.: specified
Method of Analysis:
Date of Analysis:
SERUM 179, VIAL#
REPLICATE 1
REPLICATE 2
RESULTS (μmol/L)
________ μmol/L
________ μmol/L
SERUM 688b, VIAL#
REPLICATE 1
REPLICATE 2
________ μmol/L
________ μmol/L
SERUM 688b, VIAL#
REPLICATE 1
REPLICATE 2
________ μmol/L
________ μmol/L
SERUM 682b, VIAL#
REPLICATE 1
REPLICATE 2
________ μmol/L
________ μmol/L
SERUM 682b, VIAL#
REPLICATE 1
REPLICATE 2
________ μmol/L
________ μmol/L
M4
Appendix N. Final Report for RR07
The following 13 pages are the final report for RR07 and for Round Robin 6 (RR06); the samples for RR06 were distributed in August 1994 and are described in NISTIR 7880-30. This report was provided to all participants in either study.
This report contains: • Cover letter and analysis of results. • Table 1 “Results of Round Robin RR06 Measurement of Ascorbic Acid in Human
Plasma”. • Table 2 “Results of Round Robin RR07 Measurement of Ascorbic Acid in Human
Plasma”. • Table 3 “NIST Results of Measurement AA in Human Plasma”. • Figure 1 “Box Plot of the Round Robin RR06 Results” • Figure 2 “Box Plot of the Round Robin RR07 Results” • Figure 3. “Box Plot Comparing the Results of Round Robins RR04, RR05 and
RR06”. • Figure 4. “Distribution of Round Robin RR06 Results for Lot 179”. • Figure 5. “Distribution of Round Robin RR06 Results for Lot 180”. • Figure 6. “Distribution of Round Robin RR07 Results for Lots 179 and 688b”. • Figure 7. “Distribution of Round Robin RR07 Results for Lot 682b”.
A number of the results reported in the Tables were later revised to correct for miscommunication of the reporting units. Since the listed results do not necessarily represent measurement performance, the Lab identifiers used by Dr. Margolis have been redacted from these Tables rather than re-coded. The reporting unit confusion impacts some of the conclusions discussed in the cover letter. However, the results discussed in the Dr. Margolis’s text have not been updated or corrected.
The “All Lab Report” in Appendix O lists the corrected results and provides more extensive statistical summaries.
N1
August 22, 1995
Title- First- LastCompanyAddress-
Dear Title- Last-:
This report describes both the overall-group and your laboratory's performance in Round Robin VI and Round Robin VII for the measurement of ascorbic acid in human plasma. The studies involve the duplicate analysis of four unknown samples (two each from lots 179 and 180 and two each from lots 688b and 682b ). Round Robin VII also contained two vials of lot 179 which served as a control material. Specifically, your package contains tabular presentations of all data submitted for ascorbic acid for Round Robins VI and VIL Your results are designated Lab No.- in the tables and figures.
Tables 1 and 2 provide a summary of the data submitted by the participating laboratories (the NIST data were not included in the statistical analysis). Two laboratories submitted two sets of measurements, each done by a different method. As shown in Tables 1 and 2, the percent Relative Standard Deviation (RSD) for both lots ranged from 18.0 - 24.8. The intralaboratory %RSD ranged from 0.3 - 4.0 with three exception in Round robin VII indicating that the major source of variation was the interlaboratory variation. The box plots in Figures 1 and 2 graphically summarize the results. The highest and lowest 10% of the measurements for each lot are plotted as small open circles, the two simple lines each span the next 15% intervals and the center box contains the values from the remaining data sets. The NIST mean value for ascorbic acid (AA) + dehydro-AA is represented by a solid circle and the NIST mean for reduced AA is represented by a solid square. The horizontal line in the 50% boxes represents the median interlaboratory values which are slightly different from the NIST values. Finally, the results of the previous round robins are compared to the results of this round robin and show a similar distribution of results (Figure 3).
The basis of the distribution of the majority of the LC measurements below the NIST mean requires further evaluation along with the large variation in the results (%RSD = 18-24.8%). In Round Robin VII we added in a control material to help you evaluate the capability of your method to measure the AA in a sample of known concentration. Three laboratories were between 12.5 and 14% lower and one 11 % higher than the stated value of the control sample. The results of remaining laboratories were in agreement with the stated value. The assay done by the DNPH method was also high as would be expected from the previous round robin studies. Further examination of the data indicates that three laboratories, which were
N2

able to measure AA in the control material, varied quite widely from the values established for the unknown samples. The fact that all of the gravimetrically added AA was accounted for (Table 3) also supports the need to continue these round robins in order to reduce the measurement variation. We would appreciate it if each of you, whose results deviated widely from the assigned values, would reexamine your methods for possible systematic errors. The distribution of the results of each laboratory are graphically illustrated in figures 4-7.
The next set of samples, Round Robin VIII, will be shipped around September 25, 1995. If you have any questions concerning Round Robin VI and VII please indicate it on the enclose sheet and return it to us via mail (Donna Sirk, NIST, Chemistry B208, Gaithersburg, MD 20899) or FAX (301/977-0685), or contact me at 301/975-3137.
Sincerely,
Sam A Margolis, Ph.D. Research Chemist Analytical Chemistry Division Chemical Science and Technology Laboratory
Enclosures
N3
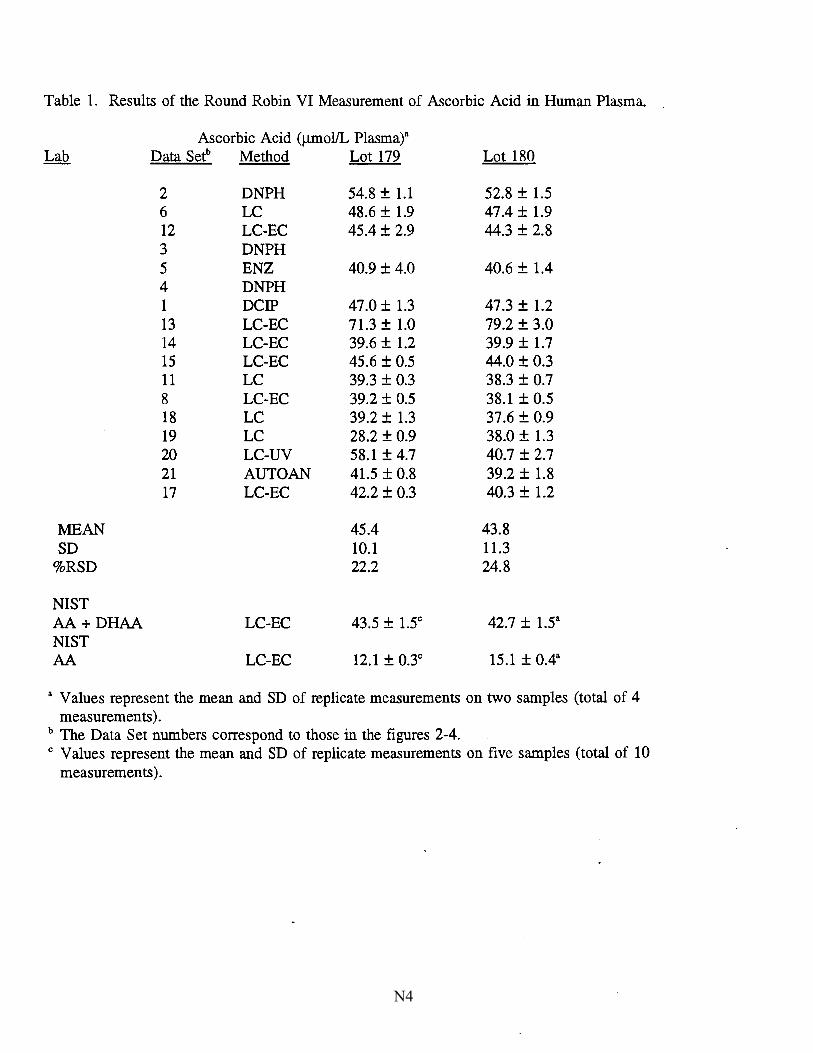
Table 1. Results of the Round Robin VI Measurement of Ascorbic Acid in Human Plasma.
Ascorbic Acid (µmol/L Plasma)a Lab Data Seth Method Lot 179 Lot 180
2 DNPH 54.8 ± 1.1 52.8 ± 1.5 6 LC 48.6 ± 1.9 47.4 ± 1.9 12 LC-EC 45.4 ± 2.9 44.3 ± 2.8 3 DNPH 5 ENZ 40.9 ± 4.0 40.6 ± 1.4 4 DNPH 1 DCIP 47.0 ± 1.3 47.3 ± 1.2 13 LC-EC 71.3 ± 1.0 79.2 ± 3.0 14 LC-EC 39.6 ± 1.2 39.9 ± 1.7 15 LC-EC 45.6 ± 0.5 44.0 ± 0.3 11 LC 39.3 ± 0.3 38.3 ± 0.7 8 LC-EC 39.2 ± 0.5 38.1±0.5 18 LC 39.2 ± 1.3 37.6 ± 0.9 19 LC 28.2 ± 0.9 38.0 ± 1.3 20 LC-UV 58.l ± 4.7 40.7 ± 2.7 21 AUTO AN 41.5 ± 0.8 39.2 ± 1.8 17 LC-EC 42.2 ± 0.3 40.3 ± 1.2
MEAN 45.4 43.8 SD 10.1 11.3
%RSD 22.2 24.8
NIST AA+DHAA LC-EC 43.5 ± l.5c 42.7 ± 1.53
NIST AA LC-EC 12.l ± 0.3c 15.1 ± 0.43
a Values represent the mean and SD of replicate measurements on two samples (total of 4 measurements).
b The Data Set numbers correspond to those in the figures 2-4. c Values represent the mean and SD of replicate measurements on five samples (total of 10
measurements).
N4

Table 2. Results of the Round Robin VII Measurement of Ascorbic Acid in Human Plasma.
Ascorbic Acid (µmol/L Plasmat Lab Data Seth Method Lot 179 Lot 688b Lot 682b
2 DNPH 50.3 ± 0.1 ~5.5 ± 0.9 122.2 ± 4.0 6 LC 48.6 ± 0.7 6.0 ± 3.7 122.5 ± 5.2 12 LC-EC 41.7 ± 2.1 63.1 ± 19.8 111.8 ± 6.2 3 LC-UV 37.7 ± 0.9 31.3 ± 3.5 105.9 ± 3.3 5 ENZ 41.0 ± 1.4 55.5 ± 6.2 127.3 ± 12.0 4 DNPH 54.D 60.5 ± 0.6 124.3 ± 0.5
13 46.7 ± 5.2 72.2 ± 0.6 141.2 ± 1.5 14 LC-EC 42.5 ± 0.7 55.0 ± 2.0 122.8 ± 3.1
11 LC 40.1 ± 0.4 50.4 ± 1.0 110.5 ± 1.8 8 LC-EC 41.8 ± 1.7 56.5 ± 3.1 122.4 ± 2.4 18 LC 37.9 ± 0.1 52.9 ± 0.3 128.9 ± 16.1 19 LC 46.0 ± 2.3 52.2 ± 1.8 119.3 ± 5.0 20 LC-UV 41.4 ± 7.5 33.1 ± 2.0 55.7 ± 29.l 21 AUTO AN 42.0 ± 0.2 54.7 ± 0.3 118.1 ± 0.9 22 LC-EC 40.9 ± 0.2 55.7 ± 0.5 118.7 ± 1.3 23 LC-EC 42.7 ± 1.1 50.1 ± 0.5 105.2 ± 0.2 24 LC-OPD 38.5 ± 0.7 39.3 ± 1.2 74.7 ± 2.1
MEAN 43.2 53.2 113.6 SD 4.5 10.6 20.5 %RSD 10.4 19.9 18.0
NIST AA+DHAA LC-EC 43.5 ± 1.5c 56.4 ± l.6a 115.4 ± 2.7 NIST AA LC-EC 12.1 ± 0.3c 43.2 ± 3.3a 100.1 ± 1.4
a Values represent the mean and SD of replicate measurements on two samples (total of 4 measurements).
b The Data Set numbers correspond to those in the figures 2-4. c Values represent the mean and SD of replicate measurements on five samples (total of 10
measurements).
N5

Table 3. NIST Results of Measurement of AA in Human Plasma.
Ascorbic Acid (µmol/L) without DTT with DTT Supplemented
Lot No. (AA) (AA+DHAA) Amount
Plasma 1 5.1 ± I.I (4t 11.5 ± 0.2 (4) 178 10.2 ± 0.4 (4) 27.0 ± 0.5 (4) 15.8 179 12.1 ± 3.9 (10) 43.5 ± 1.5 (10) 32.1 180 15.1 ± 0.4 (4) 42.7 ± 0.3 (4) 31.6
Plasma 2 18.9 ± 6.5 (4) 52.2 ± 1.6 (4) 179B 67 .2 ± 26.4 (5) 154.4 ± 1.1 (10) 101.3
a The value in parentheses is the number of measurements made.
N6

Figure 1. Box Plot of the Round Robin VI Results. Figure 2. Box Plot of the Round Robin VII Results. Figure 3. Box Plot Comparing the Results of Round Robins IV, V and VI. Figure 4. Distribution of Round Robin VI Results for Lot 179. Figure 5. Distribution of Round Robin VI Results for Lot 180. Figure 6. Distribution of Round Robin VII Results for Lots 179 and 688b. Figure 7. Distribution of Round Robin VII Results for Lot 682b.
Key for Figures 1 and 2:
The small open circles represent the highest and low.est 10% of the measurements, the two simple lines each span the next 15% intervals and the center box contains the values from the remaining data sets. The NIST mean value for ascorbic acid (AA) + dehydro-AA is represented by a solid circle and the NIST mean for reduced AA is represented by a solid square. The horizontal line in the 50% boxes represents the median interlaboratory values which are slightly different from the NIST values.
Key for Figure 3:
The highest and lowest 10% of the measurements are not represented in this figure, the two simple lines each span the next 15% intervals and the center box contains the values from the remaining data sets. The horizontal line in the 50% boxes represents the median interlaboratory values. The dashed lines represent the 95% confidence range of the NIST values for total AA.
Key for Figures 4, 5 and 7:
• First Vial; First Measurement + Second Vial; First Measurement D First Vial; Second Measurement 0 Second Vial; Second Measurement
Key for Figure 6:
• First Vial; First Measurement Lot 179 D First Vial; Second Measurement Lot 179 + First Vial; First Measurement Lot 688b 0 First Vial; Second Measurement Lot 688b • Second Vial; First Measurement Lot 688b 0 Second Vial; Second Measurement Lot 688b
N7
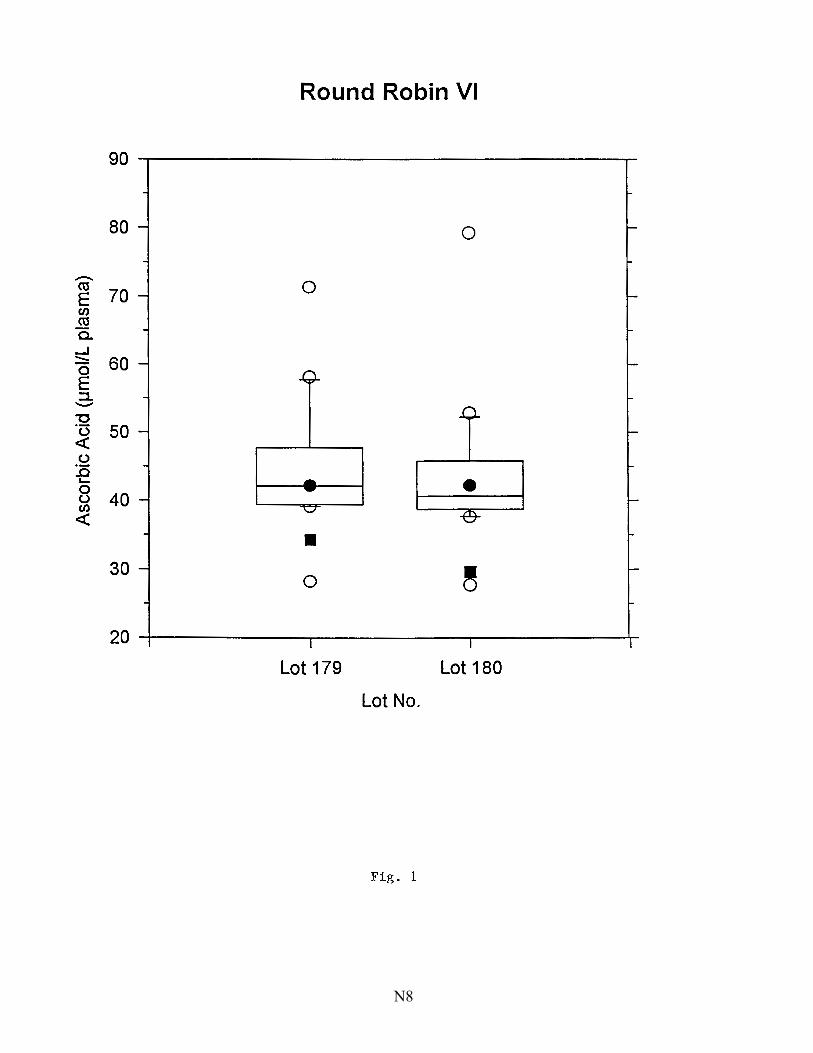
Round Robin VI
80 0
- 0 ro 70 E CJ) ro c.. ~ :::::: 60 0 E ::::i.. -"O ·5 50 <( (.)
.c I.... • 0 (.) 40 CJ)
<(
• 30
0
Lot179 Lot 180
Lot No.
Fig . 1
N8
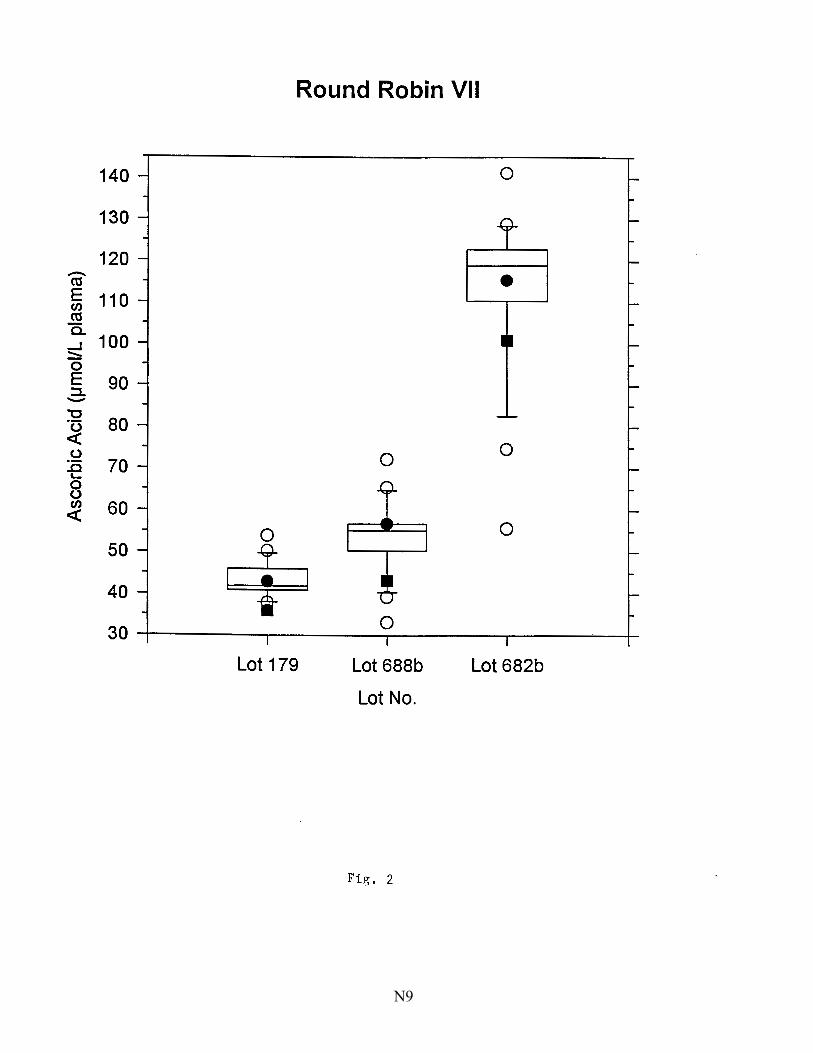
Round Robin VII
140 0
130
120 ......... • ro E 110 CJ)
ro a. 100 ...J
::::::: 0 E 90 ::l. -"C
80 ·u <(
0 .2 0 .c 70 L.-
0 (.) CJ) 60 <(
0 0 50
~ 40
0 30
Lot 179 Lot 688b Lot 682b
Lot No.
Fi8. 2
N9

,,_ ~ 100 - 90 0 8 80 ::i. '-'
'"O 70 . -(.)
60 < (.)
-Q ·--€ 50 0 (.) --~-- --r.I)
< 40 ---- -- --Cd ...... 0 ~ 30
--- - -
20
Round Robin IV V All IV VI All V VI All IV
Lot 178 180 179 179b
Fig. 3
N10

en
"" ""'" -0 ..J
0 co
Ill ~
a
cm <>•
•
I •
1-.:i
• a
41 <>a
a<>•
•<> •
• <> a • • +a<>
D•+
0 0 0 <.O I.!) """'"
(111owrl) P!!>V' :>!qJO!>SV'
Fig. 4
e::a
a
~
--
--
-
0 N
I.!) N
0 N
I.!) ....-
0 ....-
I.!)
0
0 z ~ 0 -e 0 .c n:s ..J
N11
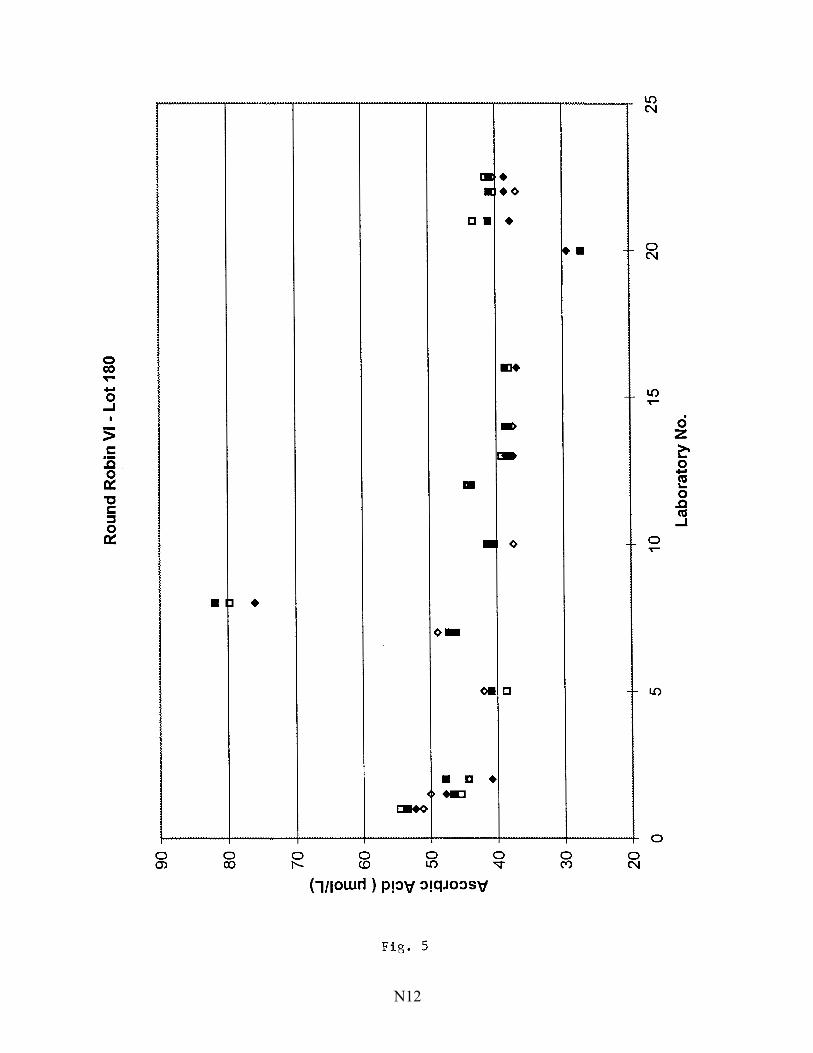
0 CIO ..... -0 ...J
0 (J')
• IJ
0 ro
•
m • • •<>
a• •
Ill+
-19
Ill
• <>
<>•
<>m a
• a • o~
cm+<>
0 0 0 0 I'-- <D L{) "<;f"
(111owrl ) P!=>'V :>!qJo:>s'Q'
Fig. 5
•• ,...
-
--
-
0 N
L{) N
0 N
L{) ..--
0 ..--
L{)
0
0 z ~ 0 -C'IS .... 0 .c C'IS ...J
N12
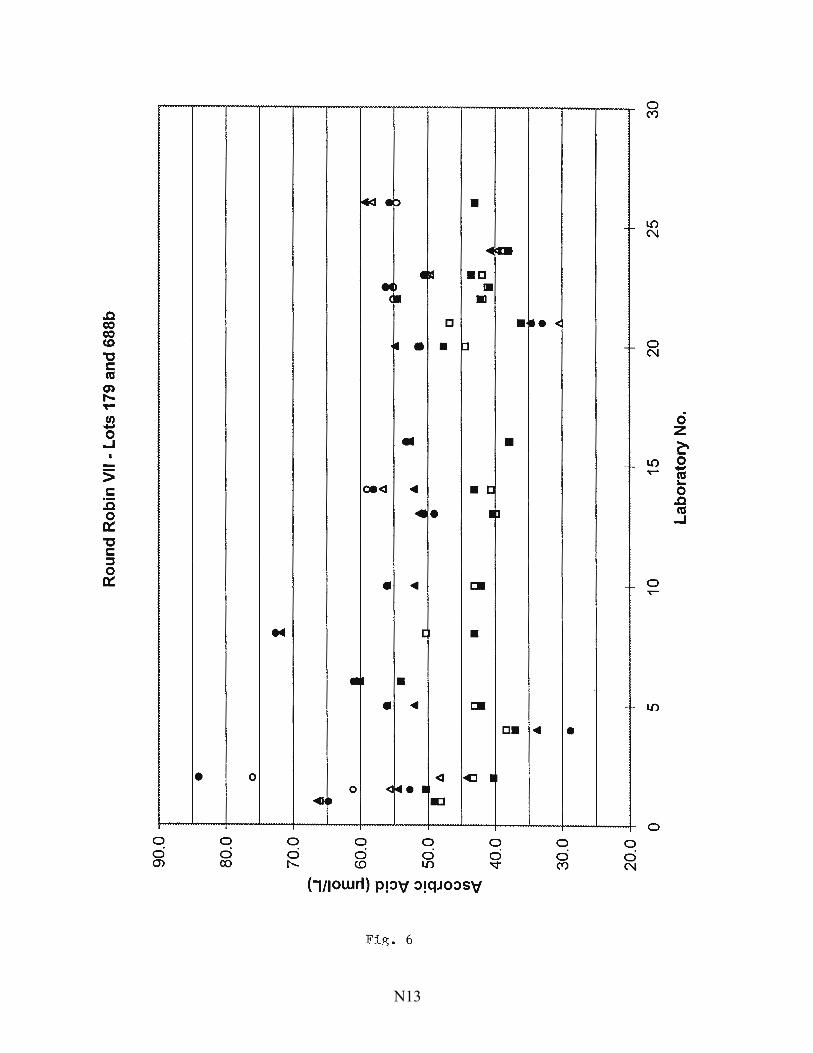
.c co co CD "O c ca en ,.... "'"" !? 0
...J
> c :c 0
a:= "O c ::l 0
a:=
0 ci CJ)
•
0 0 co
"
0
I+:! t 1:> • ... lnl
IDJ •a eo • <• Ill
a • II • • b
• • 094 ~ • Cl
41 • ID
• ~ CJm
[ •
•• • • ~ CJm
a•
4 <l I 0 <Ii.. e I
41111 E
0 0 0 0 ci ci ci ci I'- <D I.{) ~
(111owri) P!=>'V =>!qJo:>s-v
Fip; . 6
•• <C
~ •
0 ci {"')
- -
-~
~
._
-~
0 0 N
0 {"')
I.{) N
0 N
0 z ~
~ .s ~
I.{)
0
0 .c ca
...J
N13

15
0.0
14
0.0
13
0.0
• •
<>
-_. :::: ~
12
0.0
:l
.
I ca
a • -
$ - •
-'"
rj
"'C
t-'·
(JQ
~
11
0.0
.
a •
'-I
(.)
• .c
•
i...
8 1
00
.0
ti)
<(
90
.0
80
.0
70
.0 -
"T
0 5
• . .
<> a • - T
10
Ro
un
d R
ob
in V
II -
Lo
t 68
2b
•
a ~
• ~ •
I 15
Lab
ora
tory
No
.
• • a <>
I 20
~
~A
• a 3
•
n • <>
• i ' T
25
30
N14
Appendix O. “All-Lab Report” for VC-RR07
The following is a single page “All-Lab Report” that contains the same information as originally provided to all participants, with the following exceptions: • the participant identifiers (Lab) have been altered to ensure confidentiality of
identification codes assigned to laboratories.. • the order in which the participant results are listed has been altered. • results for the Serum Samples have been corrected and transformed to have units
of µmol/mL sample. • results for the Control and Serum Samples have been consolidated. • additional summary statistics have been included.
O1

Vitamin C Round Robin 7
Control 688B, [AA] mmol/mL 682B, [AA] mmol/mL
Lab Method VC-MA VC-MB VC-MC VC-MD VC-ME VC-MF VC-ML VC-MQ VC-MV VC-MX VC-MZ VC-NA VC-NB VC-NC VC-ND VC-NR VC-NU
NIST
24DNPH AO
AO-OPD HPLC-EC HPLC-EC HPLC-EC HPLC-EC HPLC-UV 24DNPH 24DNPH
HPLC-UV HPLC-EC HPLC-EC HPLC-EC HPLC-UV HPLC-UV AutoAnal
HPLC-EC
Min Median
Max eSD eCV
N 17 18.8 20.9 27.0
1.3 6
0.1 0.7 2.8
0.0 0.4 3.8
0.0 0.7 2.8
0.0 0.6 3.8
17 15.7 27.2 31.6 3.0 11
0.0 0.7
11.9
0.0 0.4 2.6
0.0 0.4
11.8
0.0 0.9
12.0
17 27.8 59.3 64.4 6.1 10
0.0 0.9
16.6
0.0 0.6 6.4
0.0 1.1
16.0
0.0 1.6
17.2
AO AutoAnal 24DNPH
EC HPLC OPD
UV
Ascorbate oxidase Auto Analyzer 2,4-Dinitrophenylhydrazine Electrochemical detector Liquid chromatography Orthophenlyenediamine Ultraviolet absorbance
179, [AA] mmol/mL Av Sdup Srep Shet Stot
20.0 20.5 22.3 24.3 21.1 20.6 20.7 23.3 21.3 18.9 20.9 23.0 21.4 27.0 19.3 20.9 18.8
2.8 1.1 0.2 0.1
0.2 0.7 0.4 0.1 0.1 0.4 3.8 2.6 0.4 0.0 0.8 1.1 0.6 0.0 0.4 1.1 0.5
2.8 1.1 0.2 0.0
0.2 0.7 2.8 1.1 0.2 0.4 3.8 2.6 0.4 0.0 0.8 1.1 0.6 0.0 0.4 1.1 0.5
21.8 0.1
Av Sdup Srep Shet Stot
25.2 27.8 31.4 27.2 27.3 27.8 16.6 18.1 27.5 26.4 28.2 26.1 25.1 30.3 19.6 31.6 15.7
0.5 2.8 2.0 1.0 0.1 0.0 0.4 0.1 0.7 0.2 1.5 0.7 0.1 0.0 0.7
11.9 1.8
0.4 2.6 0.6 1.7 0.1 0.3 1.2 0.0 1.0 0.1 1.1 0.9 0.3 0.4 0.3 2.2 0.0
0.4 2.2 2.0 0.5 0.0 0.0 0.0
0.0 0.2 1.3 0.3
0.0 0.6
11.8 1.8
0.5 3.4 2.0 1.8 0.1 0.3 1.2 0.0 1.0 0.2 1.7 0.9 0.3 0.4 0.7
12.0 1.8
28.2 0.1
Av Sdup Srep Shet Stot
55.2 63.6 62.2 63.6 59.1 59.3 27.8 35.3 61.4 64.4 61.2 59.6 52.6 62.1 37.3 55.9 53.0
0.9 5.1 2.2 4.4 0.0 0.6
16.6 0.4 0.5 9.9 0.7 0.0 0.1 0.2 1.2 2.7 1.6
0.5 5.3 0.8 4.7 0.6 0.5 6.4 0.0 1.8 0.1 1.3 3.0 0.0 0.3 0.6 2.7 0.0
0.8 3.5 2.2 3.7 0.0 0.5
16.0
0.0 9.9 0.0 0.0
0.0 1.1 1.8 1.6
1.0 6.3 2.3 5.9 0.6 0.7
17.2 0.0 1.8 9.9 1.3 3.0 0.0 0.3 1.2 3.3 1.6
57.7 1.4
8/13/2013 O2 1 / 1

Appendix M. Shipping Package Inserts for RR08
The following two items were included in each package shipped to a RR08 participant: • Cover letter and instructions for preparing the Control Sample • Report of Analysis datasheets for the preparation of the Control Sample and for
the analysis of the Control and Serum Samples
The cover letter and datasheets were enclosed in a sealed waterproof bag along with the samples themselves.
P1
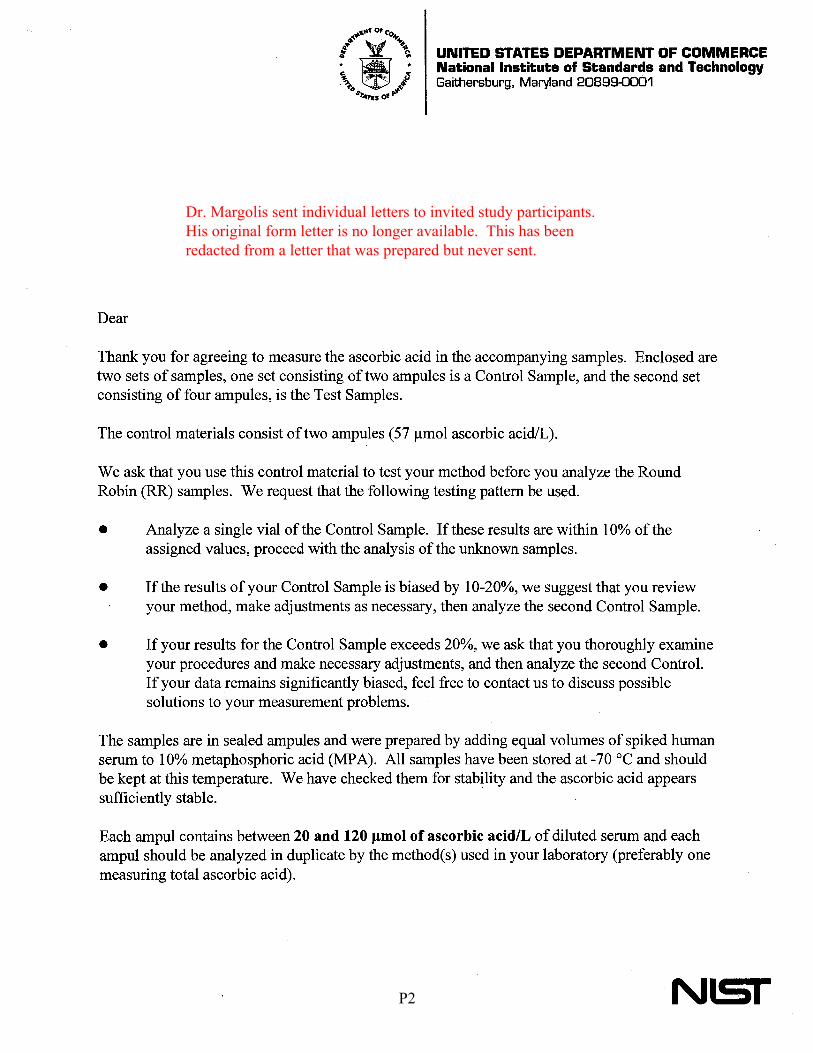
UNITED STATES DEPARTMENT OF COMMERCE National Institute of Standards and Technology Gaithersburg, Maryland 20899-0001
Dear
Thank you for agreeing to measure the ascorbic acid in the accompanying samples. Enclosed are two sets of samples, one set consisting of two ampules is a Control Sample, and the second set consisting of four ampules, is the Test Samples.
The control materials consist of two ampules (57 µmol ascorbic acid/L).
We ask that you use this control material to test your method before you analyze the Round Robin (RR) samples. We request that the following testing pattern be used.
• Analyze a single vial of the Control Sample. If these results are within 10% of the assigned values, proceed with the analysis of the unknown samples.
• If the results of your Control Sample is biased by 10-20%, we suggest that you review your method, make adjustments as necessary, then analyze the second Control Sample.
• If your results for the Control Sample exceeds 20%, we ask that you thoroughly examine your procedures and make necessary adjustments, and then analyze the second Control. If your data remains significantly biased, feel free to contact us to discuss possible solutions to your measurement problems.
The samples are in sealed ampules and were prepared by adding equal volumes of spiked human serum to 10% metaphosphoric acid (MP A). All samples have been stored at -70 °C and should be kept at this temperature. We have checked them for stability and the ascorbic acid appears sufficiently stable.
Each ampul contains between 20 and 120 µ,mol of ascorbic acid/L of diluted serum and each ampul should be analyzed in duplicate by the method(s) used in your laboratory (preferably one measuring total ascorbic acid).
NISI
Dr. Margolis sent individual letters to invited study participants. His original form letter is no longer available. This has been redacted from a letter that was prepared but never sent.
P2

The Samples should be defrosted by warming at 20 °C for not more than 10 min, otherwise some oxidation of ascorbic acid may occur.
A report form is attached and we would appreciate it if you would make your measurements and return your report to me by December 18, 1995. We also request that you send us a representative chromatogram for each lot and indicate whether you used the peak area or the peak height for calculating the concentration of ascorbic acid in your samples. Your results will be kept confidential. We will use these results in a study to demonstrate the comparative accuracy and precision of the laboratories currently measuring ascorbic acid. However, values will not be assigned to individual labs. If you wish to fax your results to me. The fax number is: (301) 977-0685. If you have any questions I can be reached at (301) 975-3137.
Thank you for your participation is this exercise.
Sincerely,
Sam A. Margolis, Ph. D. Research Chemist Analytical Chemistry Division Chemical Science and Technology Laboratory
Enclosures
P3
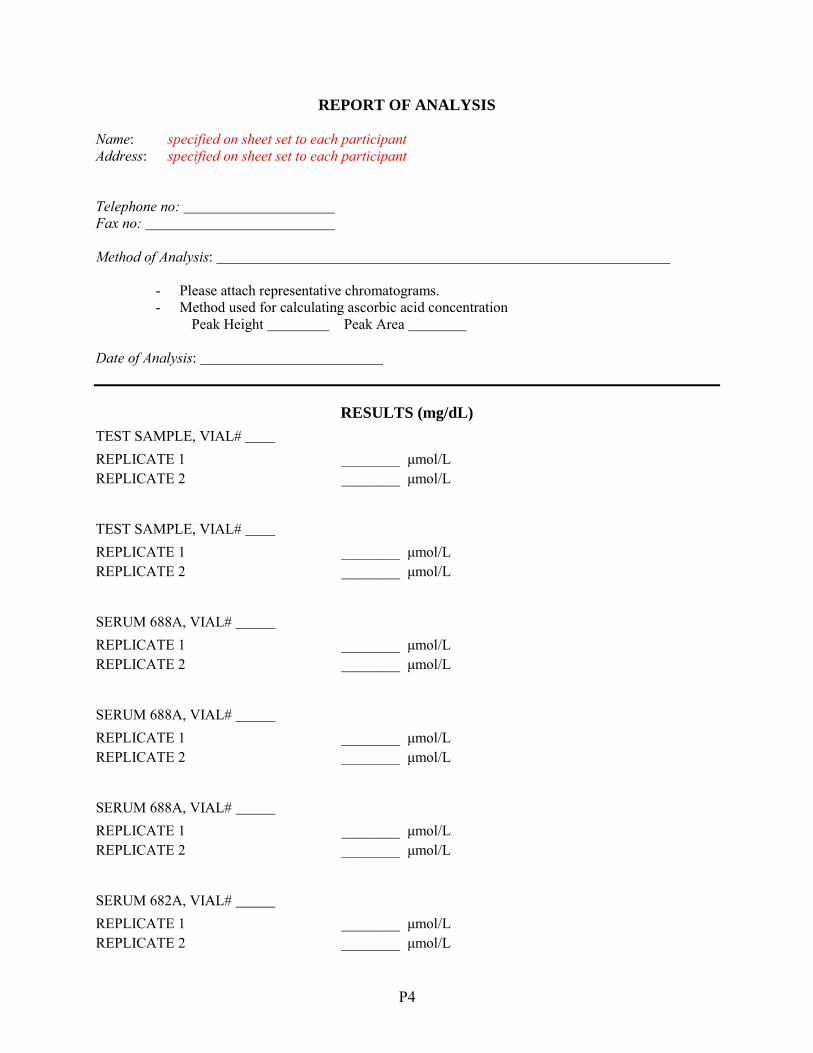
REPORT OF ANALYSIS
Name: specified on sheet set to each participant Address: specified on sheet set to each participant
Telephone no: Fax no:
Method of Analysis:
- Please attach representative chromatograms. - Method used for calculating ascorbic acid concentration
Peak Height Peak Area
Date of Analysis:
RESULTS (mg/dL) TEST SAMPLE, VIAL# REPLICATE 1 ________ μmol/L REPLICATE 2 ________ μmol/L
TEST SAMPLE, VIAL# REPLICATE 1 ________ μmol/L REPLICATE 2 ________ μmol/L
SERUM 688A, VIAL# REPLICATE 1 ________ μmol/L REPLICATE 2 ________ μmol/L
SERUM 688A, VIAL# REPLICATE 1 ________ μmol/L REPLICATE 2 ________ μmol/L
SERUM 688A, VIAL# REPLICATE 1 ________ μmol/L REPLICATE 2 ________ μmol/L
SERUM 682A, VIAL# REPLICATE 1 ________ μmol/L REPLICATE 2 ________ μmol/L
P4

Appendix Q. “All-Lab Report” for VC-RR08
The following is a single page “All-Lab Report” that contains the same information as originally provided to all participants, with the following exceptions: • the participant identifiers (Lab) have been altered to ensure confidentiality of
identification codes assigned to laboratories.. • the order in which the participant results are listed has been altered. • results for the Serum Samples have been corrected and transformed to have units
of µmol/mL sample. • results for the Control and Serum Samples have been consolidated. • additional summary statistics have been included.
Q1

Vitamin C Round Robin 8
Control 688A, [AA] mmol/mL 682A, [AA] mmol/mL
Lab Method VC-MB VC-MC VC-MD VC-ME VC-MF VC-MQ VC-MV VC-MX VC-MZ VC-NA VC-NB VC-NC VC-ND VC-NG VC-NL
NIST
AO AO-OPD
HPLC-EC 24DNPH
HPLC-EC HPLC-EC 24DNPH 24DNPH
HPLC-UV HPLC-UV HPLC-EC HPLC-UV AutoAnal
HPLC-UV HPLC-EC HPLC-EC
N Min
Median Max eSD eCV
15 16.9 28.7 31.1
1.2 4
0.1 0.5 1.4
0.0 0.4 1.3
0.0 0.3 1.4
0.1 0.8 1.4
15 6.7
13.6 17.1 1.2
8
0.0 0.6 2.3
0.0 0.3 1.4
0.0 0.4 2.3
0.0 0.6 2.4
15 24.8 44.8 49.3 3.7
8
0.1 0.4 3.2
0.1 0.6 4.1
0.0 0.3 3.2
0.2 0.8 4.1
AO AutoAnal 24DNPH
EC HPLC OPD
UV
Ascorbate oxidase Auto Analyzer 2,4-Dinitrophenylhydrazine Electrochemical detector Liquid chromatography Orthophenlyenediamine Ultraviolet absorbance
688B, [AA] mmol/mL Av Sdup Srep Shet Stot
30.4 28.6 28.9 29.5 27.1 28.7 30.8 26.6 28.7 29.1 16.9 31.1 28.5 28.4 25.8
0.4 1.4 0.8 0.1 0.2 1.1 0.2 0.1 0.3 0.9 0.2 0.8
0.9 0.6
0.4 0.3 1.3 1.0 0.0
1.2 0.0 0.2 0.4
0.0 0.4 0.7
0.3 1.4 0.0 0.0 0.2 1.1 0.0 0.1 0.3 0.8 0.2 0.8
0.7 0.6
0.5 1.4 1.3 1.0 0.2 1.1 1.2 0.1 0.3 0.9 0.2 0.8 0.5 1.0 0.6
27.7 0.8
Av Sdup Srep Shet Stot
15.8 13.4 14.0 14.4 13.6 17.1 17.1 13.3 14.7 12.9 10.9 16.0 13.5
6.7 13.1
0.2 0.4 0.6 0.7 0.0 1.0 0.7 0.0 0.1 0.6
0.1 1.4 2.3 0.6
0.0 0.4 1.2 0.3 0.0 0.8 0.2 0.0 0.3 0.4
0.1 1.4 0.4
0.2 0.3 0.1 0.7 0.0 0.8 0.7 0.0 0.0 0.5
0.1 1.0 2.3 0.6
0.2 0.5 1.2 0.7 0.0 1.1 0.7 0.0 0.3 0.7
0.1 1.8 2.4 0.6
14.0 1.6
Av Sdup Srep Shet Stot
45.9 45.9 46.4 43.7 42.1 47.3 49.3 41.2 44.8 45.0 34.1 46.0 39.0 24.8 40.9
0.2 0.8 0.8 1.5 0.1 2.3 0.3 0.5 0.4 0.8
0.1 0.2 3.2 0.3
0.3 0.8 0.8 1.0 0.4 4.1 0.8 0.1 0.4 0.6
0.1 0.8 0.5
0.0 0.7 0.6 1.3 0.0 0.0 0.0 0.5 0.2 0.7
0.1 0.0 3.2 0.3
0.3 1.0 1.0 1.6 0.4 4.1 0.8 0.5 0.5 1.0
0.2 0.8 3.3 0.3
41.6 2.8
Q28/13/2013 1 / 1
Top Related
Copyright © 2022 FDOKUMEN

