


Bahasa
Halaman
Hukum

New precision measurements of free neutron betadecay with cold neutrons
S Baeßler1,2, J D Bowman2, S Penttilä2, D Počanić11 University of Virginia, Charlottesville, VA 22904, U.S.A.2 Oak Ridge National Laboratory, Oak Ridge, TN 37831, U.S.A
E-mail: [email protected]
Abstract. Precision measurements in free neutron beta decay serve to determinethe coupling constants of beta decay, and offer several stringent tests of the StandardModel. This paper describes the free neutron beta decay program planned forthe Fundamental Physics Beamline at the Spallation Neutron Source at Oak RidgeNational Laboratory, and puts it into the context of other recent and plannedmeasurements of neutron beta decay observables.
PACS numbers: 23.40.Bw,13.30.Ce,12.15.Hh
Submitted to: J. Phys. G: Nucl. Part. Phys.
arX
iv:1
408.
4737
v1 [
nucl
-ex]
20
Aug
201
4

New precision measurements of free neutron beta decay with cold neutrons 2
1. Introduction
Measurement of observables in free neutron beta decay falls within the broader field ofstudy of the fundamental properties and symmetries of the electroweak interaction atlow energies. Although successful without parallel, the present Standard Model (SM) ofelementary particles and their interactions, based on the SU(3)C×SU(2)L×U(1)Y gaugesymmetries, is known to be incomplete. Additional particles and phenomena must exist.Questions regarding possible extensions of the SM are being simultaneously addressedat the high energy frontier, using particle colliders, and at the precision frontier at lowand intermediate energies. Precision measurements in neutron beta decay belong inthe latter category, and seek to illuminate questions related to the number of quarkgenerations (through exploring quark-lepton universality via the Cabibbo-Kobayashi-Maskawa, or CKM matrix), non-SM forms of weak interaction (i.e., scalar, pseudoscalarand tensor), as well as trace evidence of supersymmetry. The redundancy inherent inthe SM description of the neutron beta decay process allows uniquely sensitive checksof the model’s validity and limits [1–7], with strong implications in astrophysics [8].
In this work we discuss active and recent free neutron beta decay experiments. Werestrict ourselves to experiments that have either obtained results in the last decade, orare poised to do so, and which use cold neutrons. Neutrons are considered cold if they areextracted in a beam from a cold source in which their kinetic energy is in approximateequilibrium with matter at a low temperature (usually about 40K); the neutron’saverage kinetic energy is about 5meV. Our main emphasis is on the description of theexperiments that are under construction for the Fundamental Physics Beamline (FNPB)of the Spallation Neutron Source (SNS) at Oak Ridge National Laboratory. This paper ispart of a focus issue on precision semileptonic weak interaction physics. The theoreticalmotivation and relevance of the various experiments to contemporary particle / nucleartheory is summarized in [7] in this issue. Neutron beta decay experiments that useultracold neutrons (neutrons with an average energy about 100neV that can be storedin material or magnetic bottles) are discussed in [9] in this issue. Experiments thatprobe time-reversal (T ) invariance are discussed in [10] in this issue, along with betadecay experiments involving nuclei. Recent reviews of neutron beta decay that includemore of the history have been given in [11–13].
Most past and proposed neutron beta decay experiments focus on determining oneor more of the correlation coefficients defined by Jackson et al [14], who parametrizedthe differential decay rate to leading order as
d3Γ
dEedΩedΩν
∝ peEe (E0 − Ee)2 ξ ·
(1 + a
~pe · ~pνEeEν
+ bme
Ee
+~σn ·[A~peEe
+B~pνEν
]), (1)
where pe, pν , Ee, Eν , are the relativistic momenta and energies of decay electronand neutrino, and E0 is the endpoint energy of the electron. The quantity σndenotes the neutron spin. In the SM, we have ξ = G2
FV2ud(1 + 3λ2). The Fermi
constant, GF, best measured in muon decay, was recently determined to be GF =
1.1663787(6)× 10−5GeV−2 by the MuLan collaboration [15]. Vud is the relevant element
New precision measurements of free neutron beta decay with cold neutrons 3
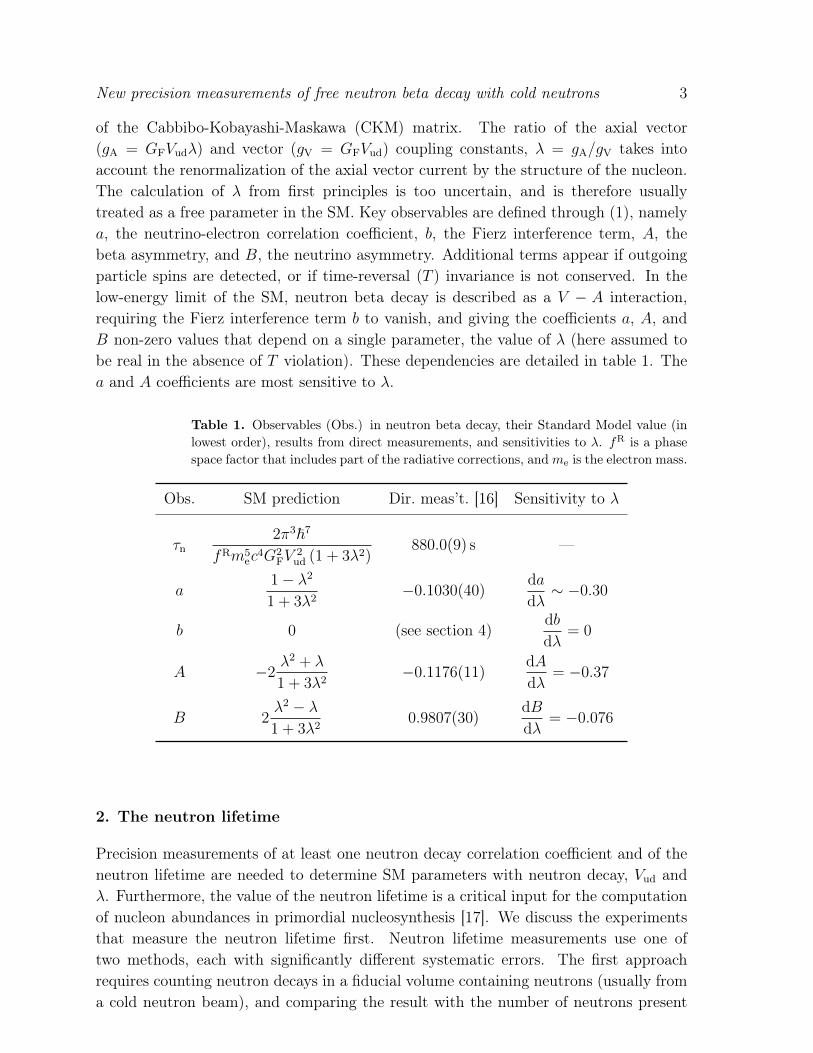
of the Cabbibo-Kobayashi-Maskawa (CKM) matrix. The ratio of the axial vector(gA = GFVudλ) and vector (gV = GFVud) coupling constants, λ = gA/gV takes intoaccount the renormalization of the axial vector current by the structure of the nucleon.The calculation of λ from first principles is too uncertain, and is therefore usuallytreated as a free parameter in the SM. Key observables are defined through (1), namelya, the neutrino-electron correlation coefficient, b, the Fierz interference term, A, thebeta asymmetry, and B, the neutrino asymmetry. Additional terms appear if outgoingparticle spins are detected, or if time-reversal (T ) invariance is not conserved. In thelow-energy limit of the SM, neutron beta decay is described as a V − A interaction,requiring the Fierz interference term b to vanish, and giving the coefficients a, A, andB non-zero values that depend on a single parameter, the value of λ (here assumed tobe real in the absence of T violation). These dependencies are detailed in table 1. Thea and A coefficients are most sensitive to λ.
Table 1. Observables (Obs.) in neutron beta decay, their Standard Model value (inlowest order), results from direct measurements, and sensitivities to λ. fR is a phasespace factor that includes part of the radiative corrections, andme is the electron mass.
Obs. SM prediction Dir. meas’t. [16] Sensitivity to λ
τn2π3~7
fRm5ec
4G2FV
2ud (1 + 3λ2)
880.0(9) s —
a1− λ2
1 + 3λ2−0.1030(40)
da
dλ∼ −0.30
b 0 (see section 4)db
dλ= 0
A −2λ2 + λ
1 + 3λ2−0.1176(11)
dA
dλ= −0.37
B 2λ2 − λ1 + 3λ2
0.9807(30)dB
dλ= −0.076
2. The neutron lifetime
Precision measurements of at least one neutron decay correlation coefficient and of theneutron lifetime are needed to determine SM parameters with neutron decay, Vud andλ. Furthermore, the value of the neutron lifetime is a critical input for the computationof nucleon abundances in primordial nucleosynthesis [17]. We discuss the experimentsthat measure the neutron lifetime first. Neutron lifetime measurements use one oftwo methods, each with significantly different systematic errors. The first approachrequires counting neutron decays in a fiducial volume containing neutrons (usually froma cold neutron beam), and comparing the result with the number of neutrons present

New precision measurements of free neutron beta decay with cold neutrons 4
in that same volume (the “beam method”). Alternatively, one stores ultracold neutronsin a bottle, and observes the decay of the number of neutrons with time (the “storagemethod”). In the beam method, the neutron lifetime is measured as τn = N/r, where Nis the number of neutrons present in the fiducial volume at any time, and r is the rate ofthe detected decays. In the storage method, the number of neutrons in a bottle decreaseswith time t through N(t) = N0 exp (−t/τn,storage). For the storage method to work, theefficiency of the neutron detection does not have to be precisely known. The main issuein the storage method is to estimate the loss rate of neutrons through processes otherthan beta decay, e.g., through capture or upscattering when bouncing off the bottlewall. This is complicated by the fact that the loss mechanisms are not all understoodfrom first principles; see [18–20] for recent discussions. The rate of wall losses appearsnot to be constant over the neutron phase space, which causes the phase space densityto evolve with time, which, in turn, causes the effective wall loss rate and/or detectionefficiency of the neutrons to change with time. Only ultracold neutrons, can be storedin a bottle. This paper discusses experiments with cold neutrons; we direct the readerto Young et al [9] for a discussion of neutron lifetime experiments that use the “storagemethod”, or to Wietfeldt et al [21].
B = 4.6 Tprotondetector
neutron beam
yellow: trapelectrodes(ground)
red: mirrorelectrodes(+800 V)
green: doorelectrodes
(ground / +800 V)
6Li
deposit
precisionaperture
alpha / tritondetector
Figure 1. Setup of the most recent neutron lifetime experiment at the cold neutronbeamline NG-6 at NCNR [22].
Recent measurements of the neutron lifetime with the beam method have beenperformed at the NG-6 beamline at the National Institute for Standard and Technology(NIST) Center of Neutron Research (NCNR) [22]. Figure 1 depicts a recent NCNRapparatus, similar to the one built earlier by Byrne et al [23, 24]. In the NCNRexperiment, a cold neutron beam is directed through a strong axial magnetic field. Astack of cylindrical electrodes, aligned axially, is used to create an electrostatic potentialthat is uniform in a central region, and has a positive voltage higher than required bythe proton endpoint at its ends, labeled as “mirror electrodes” and “door electrodes” inthe figure. The central region is the fiducial volume where a number of neutron beamparticles decay in flight. Protons from these neutron decays are trapped, radially bythe magnetic fields, and axially by the electric field; the electromagnetic field setup is
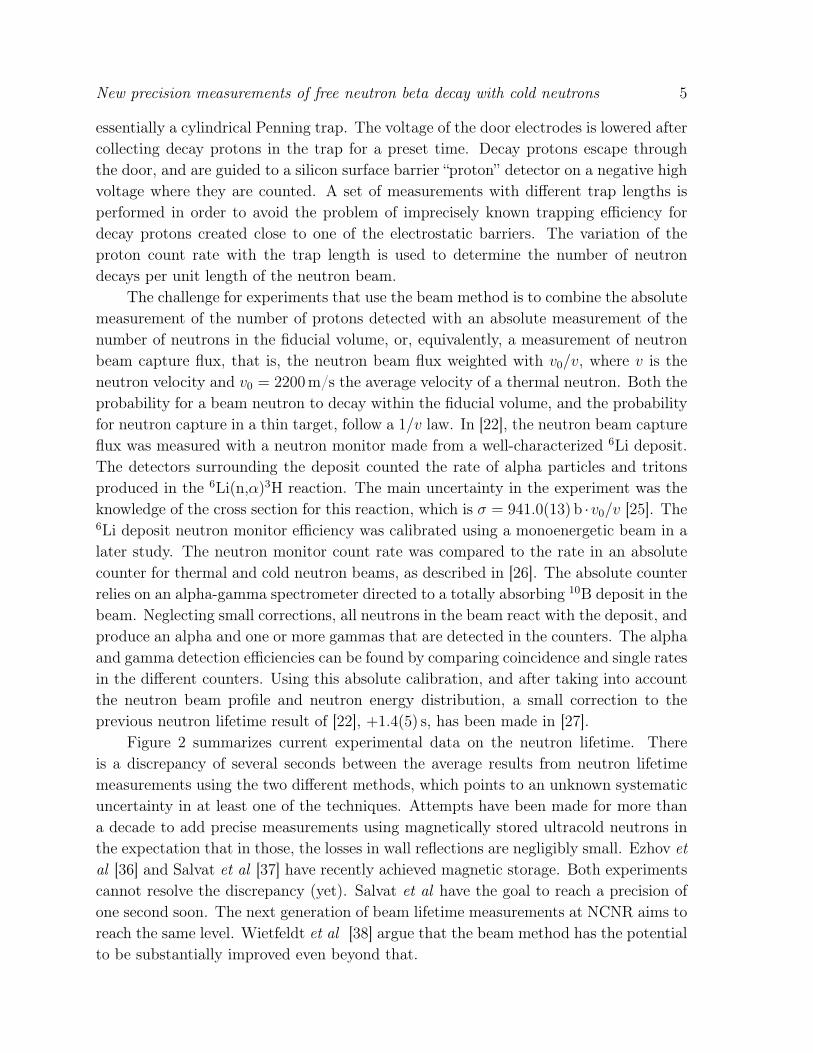
New precision measurements of free neutron beta decay with cold neutrons 5
essentially a cylindrical Penning trap. The voltage of the door electrodes is lowered aftercollecting decay protons in the trap for a preset time. Decay protons escape throughthe door, and are guided to a silicon surface barrier “proton” detector on a negative highvoltage where they are counted. A set of measurements with different trap lengths isperformed in order to avoid the problem of imprecisely known trapping efficiency fordecay protons created close to one of the electrostatic barriers. The variation of theproton count rate with the trap length is used to determine the number of neutrondecays per unit length of the neutron beam.
The challenge for experiments that use the beam method is to combine the absolutemeasurement of the number of protons detected with an absolute measurement of thenumber of neutrons in the fiducial volume, or, equivalently, a measurement of neutronbeam capture flux, that is, the neutron beam flux weighted with v0/v, where v is theneutron velocity and v0 = 2200m/s the average velocity of a thermal neutron. Both theprobability for a beam neutron to decay within the fiducial volume, and the probabilityfor neutron capture in a thin target, follow a 1/v law. In [22], the neutron beam captureflux was measured with a neutron monitor made from a well-characterized 6Li deposit.The detectors surrounding the deposit counted the rate of alpha particles and tritonsproduced in the 6Li(n,α)3H reaction. The main uncertainty in the experiment was theknowledge of the cross section for this reaction, which is σ = 941.0(13)b ·v0/v [25]. The6Li deposit neutron monitor efficiency was calibrated using a monoenergetic beam in alater study. The neutron monitor count rate was compared to the rate in an absolutecounter for thermal and cold neutron beams, as described in [26]. The absolute counterrelies on an alpha-gamma spectrometer directed to a totally absorbing 10B deposit in thebeam. Neglecting small corrections, all neutrons in the beam react with the deposit, andproduce an alpha and one or more gammas that are detected in the counters. The alphaand gamma detection efficiencies can be found by comparing coincidence and single ratesin the different counters. Using this absolute calibration, and after taking into accountthe neutron beam profile and neutron energy distribution, a small correction to theprevious neutron lifetime result of [22], +1.4(5) s, has been made in [27].
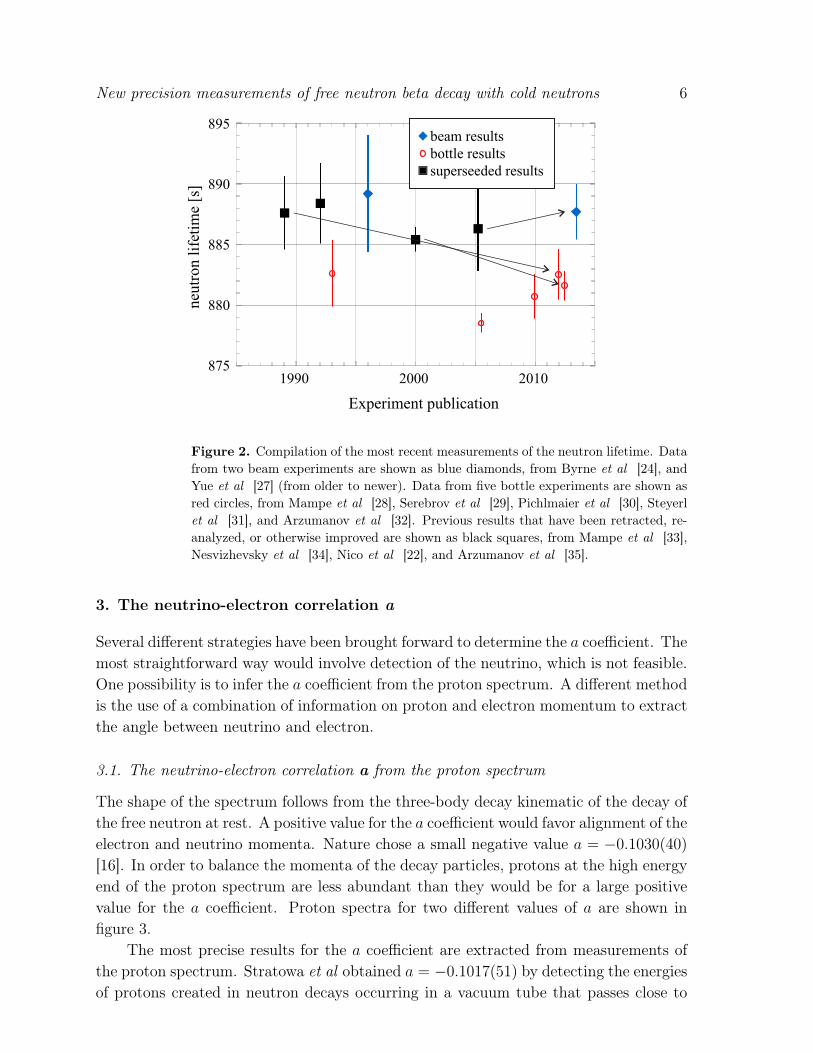
Figure 2 summarizes current experimental data on the neutron lifetime. Thereis a discrepancy of several seconds between the average results from neutron lifetimemeasurements using the two different methods, which points to an unknown systematicuncertainty in at least one of the techniques. Attempts have been made for more thana decade to add precise measurements using magnetically stored ultracold neutrons inthe expectation that in those, the losses in wall reflections are negligibly small. Ezhov etal [36] and Salvat et al [37] have recently achieved magnetic storage. Both experimentscannot resolve the discrepancy (yet). Salvat et al have the goal to reach a precision ofone second soon. The next generation of beam lifetime measurements at NCNR aims toreach the same level. Wietfeldt et al [38] argue that the beam method has the potentialto be substantially improved even beyond that.
New precision measurements of free neutron beta decay with cold neutrons 6
875
880
885
890
895
Experiment publication
neut
ron
life
tim
e [s
]
beam results
superseeded resultsbottle results
1990 2000 2010
Figure 2. Compilation of the most recent measurements of the neutron lifetime. Datafrom two beam experiments are shown as blue diamonds, from Byrne et al [24], andYue et al [27] (from older to newer). Data from five bottle experiments are shown asred circles, from Mampe et al [28], Serebrov et al [29], Pichlmaier et al [30], Steyerlet al [31], and Arzumanov et al [32]. Previous results that have been retracted, re-analyzed, or otherwise improved are shown as black squares, from Mampe et al [33],Nesvizhevsky et al [34], Nico et al [22], and Arzumanov et al [35].
3. The neutrino-electron correlation a
Several different strategies have been brought forward to determine the a coefficient. Themost straightforward way would involve detection of the neutrino, which is not feasible.One possibility is to infer the a coefficient from the proton spectrum. A different methodis the use of a combination of information on proton and electron momentum to extractthe angle between neutrino and electron.
3.1. The neutrino-electron correlation a from the proton spectrum
The shape of the spectrum follows from the three-body decay kinematic of the decay ofthe free neutron at rest. A positive value for the a coefficient would favor alignment of theelectron and neutrino momenta. Nature chose a small negative value a = −0.1030(40)
[16]. In order to balance the momenta of the decay particles, protons at the high energyend of the proton spectrum are less abundant than they would be for a large positivevalue for the a coefficient. Proton spectra for two different values of a are shown infigure 3.
The most precise results for the a coefficient are extracted from measurements ofthe proton spectrum. Stratowa et al obtained a = −0.1017(51) by detecting the energiesof protons created in neutron decays occurring in a vacuum tube that passes close to

New precision measurements of free neutron beta decay with cold neutrons 7
Proton kinetic energy [eV]
Yie
ld
Transm
ission
60040000%
100%
200
pp
pe
pν
pe
pp
pν
proton spectrum for a = -0.103
proton spectrum for a = 0
response function @ U = 375 V
p ↑↑ pe ν
p ↑↓ pe ν
Figure 3. Proton spectrum in free neutron beta decay for the experimentally observedvalue of the a coefficient (red solid line), and for a vanishing a coefficient (dashed blackline). The blue dashed dotted curve is plotted in reference to the right axis, and isexplained in the discussion of the aSPECT experiment.
the core of a nuclear reactor [39].Byrne et al and the newer experiment aSPECT use variants of a retardation
spectrometer. The former experiment is finished, and reported a = −0.1054(55) [40].The aSPECT experiment was proposed in [41] and its design was further explainedin [42]. The configuration and the principle of operation of the aSPECT spectrometerare illustrated in figure 4. Unpolarized cold neutrons are directed through the sensitivevolume of a magnetic spectrometer. About one of 108 neutrons decays in the fiducialvolume. The recoil protons from the decay are gyrating around the magnetic field lines.Protons emitted downward are reflected by an electrostatic mirror, so all decay protonsmove upward at some point, towards the analyzing plane and the proton detector.A variable retardation voltage is applied at the analyzing plane. Only protons withsufficient kinetic energy can pass, and those are accelerated by a high voltage of about-15 kV and magnetically focused onto a proton detector that counts the number ofarriving protons.
A silicon drift detector (SDD) is used to detect the protons [43]. An SDD is asemiconductor detector based on the principle of sidewards depletion which allows thefull depletion of a large detector volume with a very small readout node. The smallness ofthe readout electrode leads to an improved noise performance compared to a PIN diodewith the same dimensions. The price to pay is the long drift path, mostly sideways, ofthe secondary electrons, with drift times of the order of microseconds. This can be usedto achieve position resolution if the time of impact of the incoming particle is known,but otherwise limits the accuracy in the determination of the impact time. The SDDsused in the aSPECT spectrometer have been manufactured by PNSensor GmbH [44].One SDD chip contains a row of three square pads with a side length of 1 cm. Each padhas a thickness of 450µm, and is covered by a aluminum layer of 30 nm thickness for
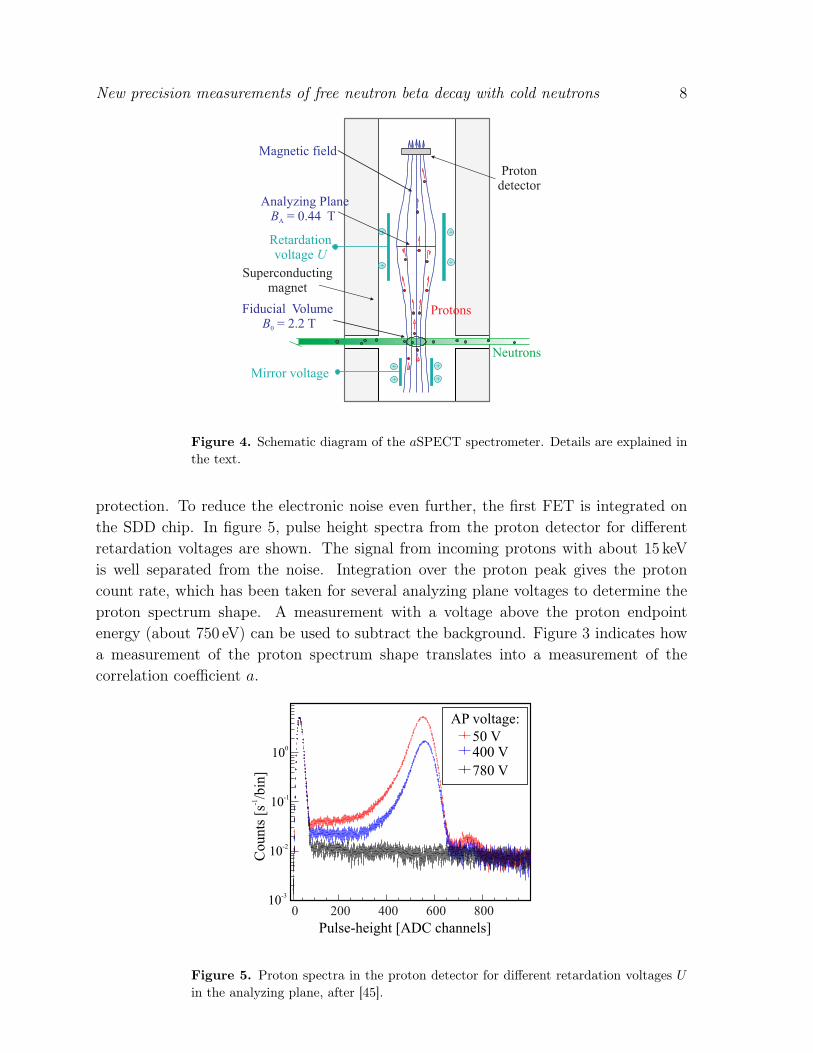
New precision measurements of free neutron beta decay with cold neutrons 8
Superconductingmagnet
Magnetic field
Retardationvoltage U
Mirror voltage
Neutrons
Protons
+
+
+
+
+
+
+
+
Protondetector
Analyzing PlaneBA = 0.44 T
Fiducial VolumeB = 2.2 T0
Figure 4. Schematic diagram of the aSPECT spectrometer. Details are explained inthe text.
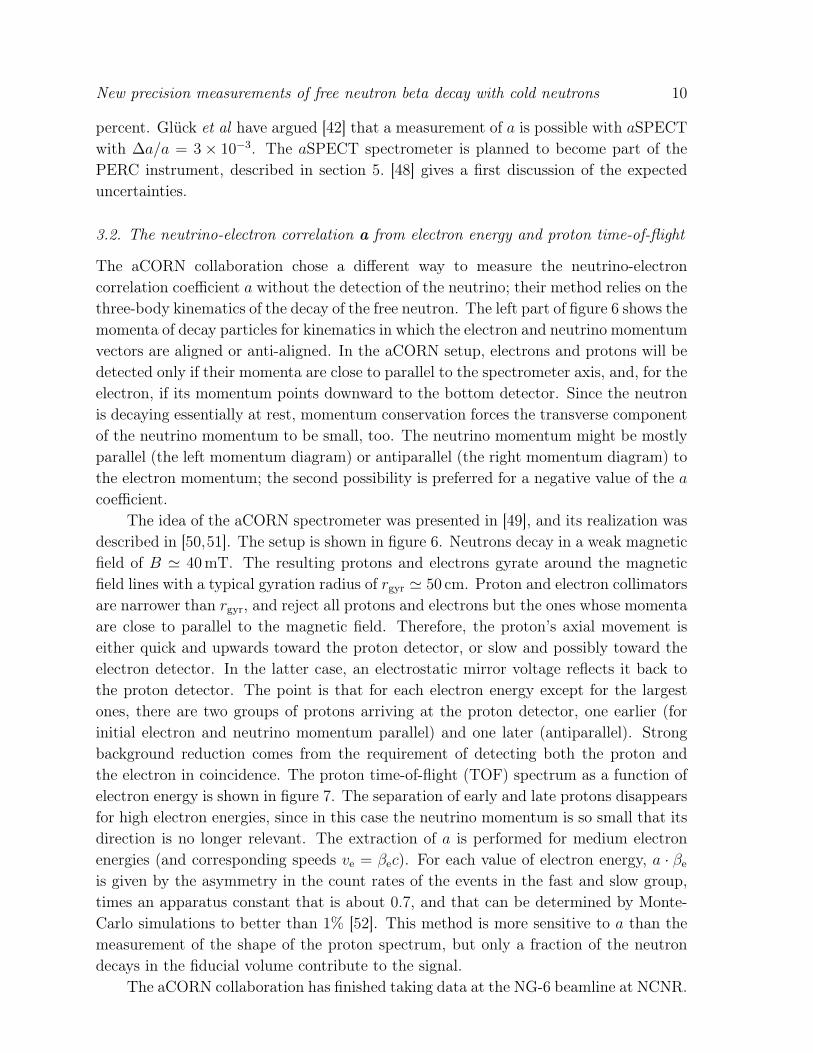
protection. To reduce the electronic noise even further, the first FET is integrated onthe SDD chip. In figure 5, pulse height spectra from the proton detector for differentretardation voltages are shown. The signal from incoming protons with about 15 keVis well separated from the noise. Integration over the proton peak gives the protoncount rate, which has been taken for several analyzing plane voltages to determine theproton spectrum shape. A measurement with a voltage above the proton endpointenergy (about 750 eV) can be used to subtract the background. Figure 3 indicates howa measurement of the proton spectrum shape translates into a measurement of thecorrelation coefficient a.
Pulse-height [ADC channels]
-1C
ount
s [s
/bin
]
-310
-210
-110
010
AP voltage:50 V400 V
780 V
0 200 400 600 800
Figure 5. Proton spectra in the proton detector for different retardation voltages Uin the analyzing plane, after [45].

New precision measurements of free neutron beta decay with cold neutrons 9
The analysis has to take into account the gyration of the protons, that is, thefact that the proton orbit is a combination of circular motion around the field linesand axial motion along them. The protons experience a decreasing magnetic field onthe path towards the analyzing plane, which causes their momenta to align with themagnetic field lines. The transmission function describes the probability for protonsto traverse the electrostatic potential in the analyzing plane; they pass if their energyin the axial motion is above eU . For a typical setting of the retardation voltage, thetransmission function vanishes for proton energies below eU . It reaches 100% at highproton energies, where we have sufficient kinetic energy in the axial motion to pass theanalyzing plane. In an intermediate range of proton energies, only a fraction of protonscan pass, i.e., the ones whose momenta are most aligned with the magnetic field. Thetransmission function can be analytically calculated in the adiabatic approximation; andthe input parameters needed are the electrostatic potential and magnetic field values inboth fiducial volume and analyzing plane. As an example, the transmission function forU = 375V is shown as the dashed dotted line in figure 3. A detailed field map is onlyneeded to ensure that the field is sufficiently smooth for the adiabatic approximationto be valid. The analysis has to take into account the gyration of the protons, that is,the fact that the proton orbit is a combination of circular motion around the field linesand axial motion along them. The protons experience a decreasing magnetic field onthe path towards the analyzing plane, which causes their momenta to align with themagnetic field lines. The transmission function describes the probability for protonsto traverse the electrostatic potential in the analyzing plane; they pass if their energyin the axial motion is above eU . For a typical setting of the retardation voltage, thetransmission function vanishes for proton energies below eU . It reaches 100% at highproton energies, where we have sufficient kinetic energy in the axial motion to pass theanalyzing plane. In an intermediate range of proton energies, only a fraction of protonscan pass, i.e., the ones whose momenta are most aligned with the magnetic field. Thetransmission function can be analytically calculated in the adiabatic approximation, andthe input parameters needed are the electrostatic potential and magnetic field values inboth fiducial volume and analyzing plane. As an example, the transmission function forU = 375V is shown as the dashed dotted line in figure 3. A detailed field map is onlyneeded to ensure that the field is sufficiently smooth for the adiabatic approximation tobe valid.
Only protons are detected in the aSPECT spectrometer, while electrons are treatedas background. This has the advantage that a precise determination of the electrondetection efficiency is not needed, but also the disadvantage that little information aboutother sources of background is directly available. The background subtraction procedureworks well for background sources outside the spectrometer. The main problem turnedout to be the background generated from trapped particles (electrons or ions) in thePenning-like traps in the center of the spectrometer [46,47].
The goal for the analysis of the data taken in the recent beam time with aSPECTin summer 2013 is to get a first physics result for a with accuracy in the order of a few
New precision measurements of free neutron beta decay with cold neutrons 10
percent. Glück et al have argued [42] that a measurement of a is possible with aSPECTwith ∆a/a = 3× 10⁻³. The aSPECT spectrometer is planned to become part of thePERC instrument, described in section 5. [48] gives a first discussion of the expecteduncertainties.
3.2. The neutrino-electron correlation a from electron energy and proton time-of-flight
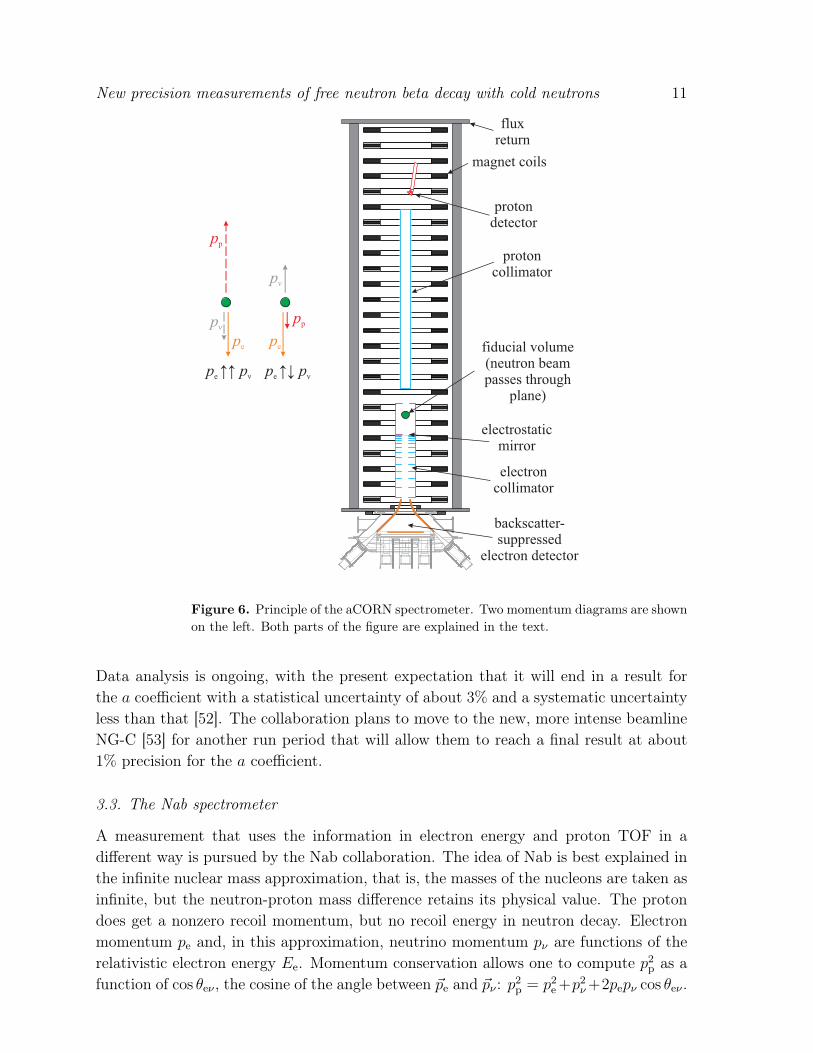
The aCORN collaboration chose a different way to measure the neutrino-electroncorrelation coefficient a without the detection of the neutrino; their method relies on thethree-body kinematics of the decay of the free neutron. The left part of figure 6 shows themomenta of decay particles for kinematics in which the electron and neutrino momentumvectors are aligned or anti-aligned. In the aCORN setup, electrons and protons will bedetected only if their momenta are close to parallel to the spectrometer axis, and, for theelectron, if its momentum points downward to the bottom detector. Since the neutronis decaying essentially at rest, momentum conservation forces the transverse componentof the neutrino momentum to be small, too. The neutrino momentum might be mostlyparallel (the left momentum diagram) or antiparallel (the right momentum diagram) tothe electron momentum; the second possibility is preferred for a negative value of the acoefficient.
The idea of the aCORN spectrometer was presented in [49], and its realization wasdescribed in [50,51]. The setup is shown in figure 6. Neutrons decay in a weak magneticfield of B ' 40mT. The resulting protons and electrons gyrate around the magneticfield lines with a typical gyration radius of rgyr ' 50 cm. Proton and electron collimatorsare narrower than rgyr, and reject all protons and electrons but the ones whose momentaare close to parallel to the magnetic field. Therefore, the proton’s axial movement iseither quick and upwards toward the proton detector, or slow and possibly toward theelectron detector. In the latter case, an electrostatic mirror voltage reflects it back tothe proton detector. The point is that for each electron energy except for the largestones, there are two groups of protons arriving at the proton detector, one earlier (forinitial electron and neutrino momentum parallel) and one later (antiparallel). Strongbackground reduction comes from the requirement of detecting both the proton andthe electron in coincidence. The proton time-of-flight (TOF) spectrum as a function ofelectron energy is shown in figure 7. The separation of early and late protons disappearsfor high electron energies, since in this case the neutrino momentum is so small that itsdirection is no longer relevant. The extraction of a is performed for medium electronenergies (and corresponding speeds ve = βec). For each value of electron energy, a · βeis given by the asymmetry in the count rates of the events in the fast and slow group,times an apparatus constant that is about 0.7, and that can be determined by Monte-Carlo simulations to better than 1% [52]. This method is more sensitive to a than themeasurement of the shape of the proton spectrum, but only a fraction of the neutrondecays in the fiducial volume contribute to the signal.
The aCORN collaboration has finished taking data at the NG-6 beamline at NCNR.
New precision measurements of free neutron beta decay with cold neutrons 11
p ↑↑ pe ν p ↑↓ pe ν
pν
pe
pp
pp
pe
pν
backscatter-suppressed
electron detector
electroncollimator
protoncollimator
protondetector
fluxreturn
magnet coils
electrostaticmirror
fiducial volume(neutron beampasses through
plane)
Figure 6. Principle of the aCORN spectrometer. Two momentum diagrams are shownon the left. Both parts of the figure are explained in the text.
Data analysis is ongoing, with the present expectation that it will end in a result forthe a coefficient with a statistical uncertainty of about 3% and a systematic uncertaintyless than that [52]. The collaboration plans to move to the new, more intense beamlineNG-C [53] for another run period that will allow them to reach a final result at about1% precision for the a coefficient.
3.3. The Nab spectrometer
A measurement that uses the information in electron energy and proton TOF in adifferent way is pursued by the Nab collaboration. The idea of Nab is best explained inthe infinite nuclear mass approximation, that is, the masses of the nucleons are taken asinfinite, but the neutron-proton mass difference retains its physical value. The protondoes get a nonzero recoil momentum, but no recoil energy in neutron decay. Electronmomentum pe and, in this approximation, neutrino momentum pν are functions of therelativistic electron energy Ee. Momentum conservation allows one to compute p2p as afunction of cos θeν , the cosine of the angle between ~pe and ~pν : p2p = p2e +p2ν+2pepν cos θeν .
New precision measurements of free neutron beta decay with cold neutrons 12
late protons
early protons
6
5
4
3
2
prot
on T
OF
(μ
s)
8006004002000beta kinetic energy (keV)
Figure 7. Proton TOF spectra, after background subtraction, as a function of electronenergy, from [52]. The blue bins show a positive count rate, which is higher where theblue is darker. The red bins contain a negative count rate. Most events are in a fasterand are slower group. Good separation between the groups is achieved for low andmedium electron energy.
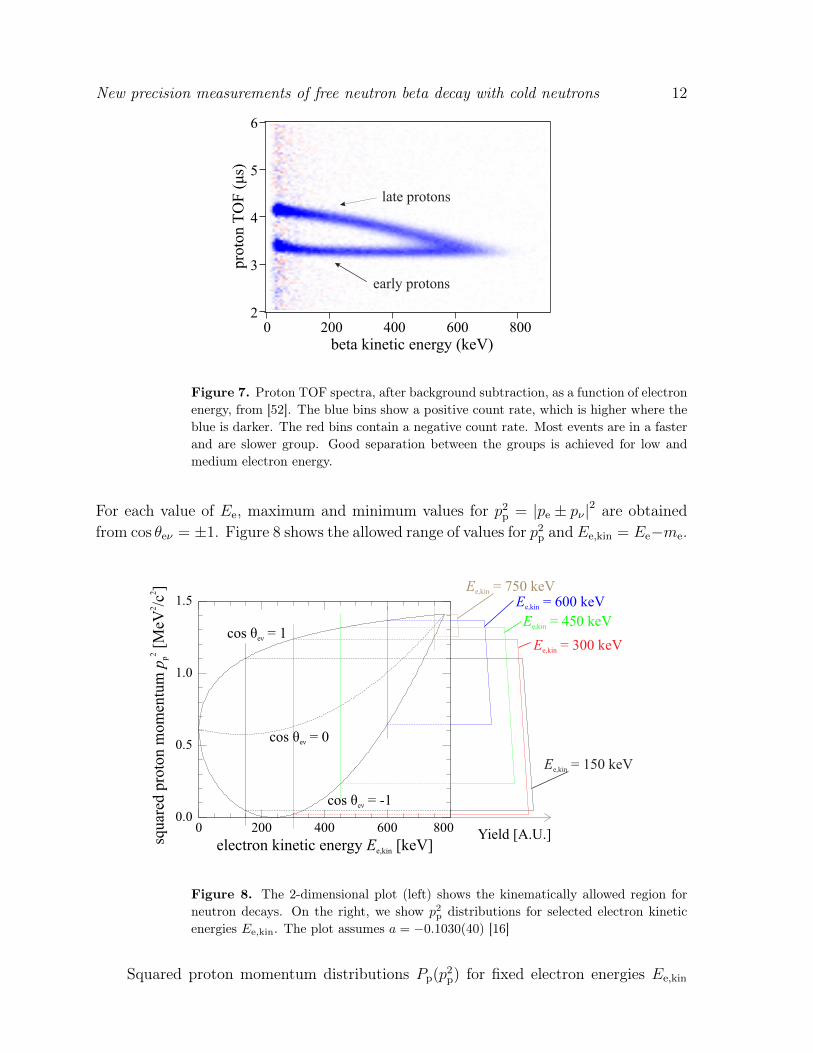
For each value of Ee, maximum and minimum values for p2p = |pe ± pν |2 are obtainedfrom cos θeν = ±1. Figure 8 shows the allowed range of values for p2p and Ee,kin = Ee−me.
electron kinetic energy E [keV]e,kin
E = 750 keVe,kin
E = 150 keVe,kin
22
2sq
uare
d pr
oton
mom
entu
m p
[M
eV/c
]p
cos θ = -1eν
cos θ = 0eν
Yield [A.U.]
E = 300 keVe,kin
E = 450 keVe,kin
E = 600 keVe,kin
cos θ = 1eν
0 200 400 600 8000.0
0.5
1.0
1.5
Figure 8. The 2-dimensional plot (left) shows the kinematically allowed region forneutron decays. On the right, we show p2p distributions for selected electron kineticenergies Ee,kin. The plot assumes a = −0.1030(40) [16]
Squared proton momentum distributions Pp(p2p) for fixed electron energies Ee,kin

New precision measurements of free neutron beta decay with cold neutrons 13
are shown to the right in figure 8. These distributions are given by:
Pp(p2p) ∝
(1 + a pe
Ee
p2p−p2e−p2ν2pepν
)if − 1 ≤ p2p−p2e−p2ν
2pepν≤ 1
0 otherwise(2)
The edges of the Pp(p2p) histograms are sharply defined. Values of Ee,kin and p2p aredetermined for each neutron decay in the Nab experiment, and histograms of squaredproton momentum distributions for fixed electron energies are created. The a coefficientis determined from the slope of these histograms.
The original idea of the Nab spectrometer is described in [54, 55]. The Nabspectrometer was originally planned to have two identical arms at opposite sides ofthe neutron beam (the symmetric design). Since then, the Nab collaboration hasidentified a superior strategy; here we report on the final, asymmetric variant of theNab spectrometer. The asymmetric configuration of the Nab spectrometer is shownconceptually in figure 9. This version, presently under construction, works as follows:Cold neutrons from the FNPB at the SNS pass through the spectrometer. A smallpercentage of them decay in the fiducial volume, which is in a region of moderatemagnetic field, about 1.7T. Decay protons have to pass through a field pinch (the filterregion) above the fiducial volume to be detected in the upper detector, the only detectorthat detects protons. All electrons, but only upward-going decay protons are accepted.The measured proton time of flight gives an estimate of the squared proton momentum.
SegmentedSi detector
TOF region
Upper HV
Lower HV
magneticfilter
spinflipper
fiducialvolume
neutron beam
4 m flight path omitted
1 m flight path omitted
Figure 9. Principle of the Nab spectrometer in the vertical orientation. Magneticfield lines (shown in blue) electrodes (light green boxes), and coils (not shown) possesscylindrical symmetry around the vertical axis. The neutron beam is unpolarized forNab, but can be polarized for later experiments.
The Si detectors measure the electron energy with keV-level resolution. Energylosses due to backscattering of electrons are reduced because the magnetic guide field
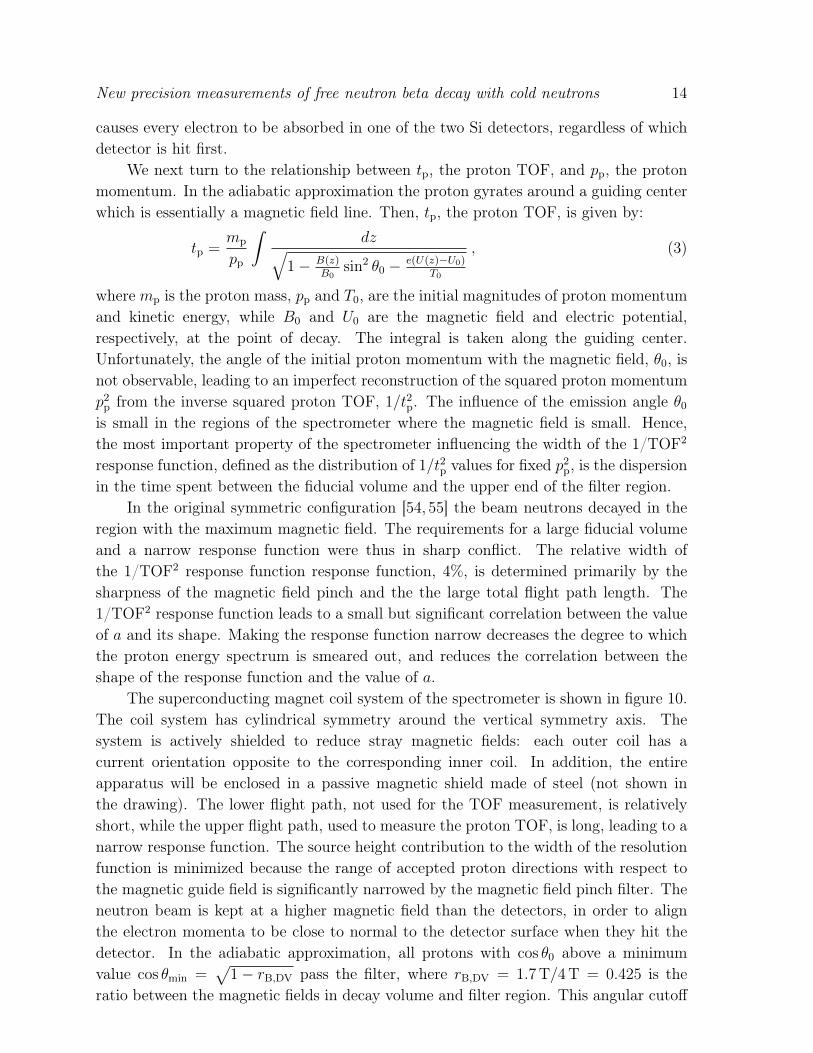
New precision measurements of free neutron beta decay with cold neutrons 14
causes every electron to be absorbed in one of the two Si detectors, regardless of whichdetector is hit first.
We next turn to the relationship between tp, the proton TOF, and pp, the protonmomentum. In the adiabatic approximation the proton gyrates around a guiding centerwhich is essentially a magnetic field line. Then, tp, the proton TOF, is given by:
tp =mp
pp
∫dz√
1− B(z)B0
sin2 θ0 − e(U(z)−U0)T0
, (3)
where mp is the proton mass, pp and T0, are the initial magnitudes of proton momentumand kinetic energy, while B0 and U0 are the magnetic field and electric potential,respectively, at the point of decay. The integral is taken along the guiding center.Unfortunately, the angle of the initial proton momentum with the magnetic field, θ0, isnot observable, leading to an imperfect reconstruction of the squared proton momentump2p from the inverse squared proton TOF, 1/t2p. The influence of the emission angle θ0is small in the regions of the spectrometer where the magnetic field is small. Hence,the most important property of the spectrometer influencing the width of the 1/TOF2
response function, defined as the distribution of 1/t2p values for fixed p2p, is the dispersionin the time spent between the fiducial volume and the upper end of the filter region.
In the original symmetric configuration [54, 55] the beam neutrons decayed in theregion with the maximum magnetic field. The requirements for a large fiducial volumeand a narrow response function were thus in sharp conflict. The relative width ofthe 1/TOF2 response function response function, 4%, is determined primarily by thesharpness of the magnetic field pinch and the the large total flight path length. The1/TOF2 response function leads to a small but significant correlation between the valueof a and its shape. Making the response function narrow decreases the degree to whichthe proton energy spectrum is smeared out, and reduces the correlation between theshape of the response function and the value of a.
The superconducting magnet coil system of the spectrometer is shown in figure 10.The coil system has cylindrical symmetry around the vertical symmetry axis. Thesystem is actively shielded to reduce stray magnetic fields: each outer coil has acurrent orientation opposite to the corresponding inner coil. In addition, the entireapparatus will be enclosed in a passive magnetic shield made of steel (not shown inthe drawing). The lower flight path, not used for the TOF measurement, is relativelyshort, while the upper flight path, used to measure the proton TOF, is long, leading to anarrow response function. The source height contribution to the width of the resolutionfunction is minimized because the range of accepted proton directions with respect tothe magnetic guide field is significantly narrowed by the magnetic field pinch filter. Theneutron beam is kept at a higher magnetic field than the detectors, in order to alignthe electron momenta to be close to normal to the detector surface when they hit thedetector. In the adiabatic approximation, all protons with cos θ0 above a minimumvalue cos θmin =
√1− rB,DV pass the filter, where rB,DV = 1.7T/4T = 0.425 is the
ratio between the magnetic fields in decay volume and filter region. This angular cutoff
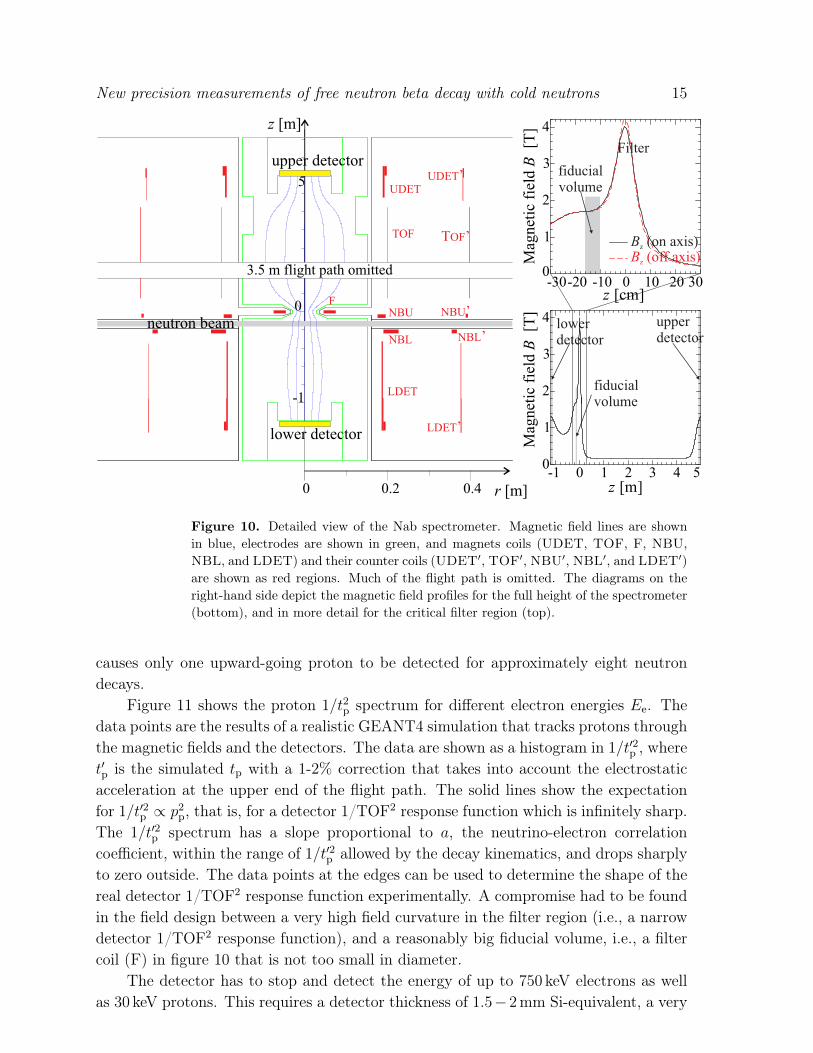
New precision measurements of free neutron beta decay with cold neutrons 15
upper detector
lower detector
NBL
NBUF
TOF TOF’
NBU’
NBL’
UDET’UDET
LDET
LDET’
neutron beam
z [m]
r [m]
0
0 0.2 0.4
5
-1
3.5 m flight path omitted
z [cm]
Mag
neti
c fi
eld
B
[T]
0
1
2
3
4
fiducialvolume
B (on axis)z
B (off axis)z
Filter
-30-20 -10 0 10 20 30
Mag
neti
c fi
eld
B
[T]
0
1
2
3
4
-1 0 1 2 3 4 5
fiducialvolume
lowerdetector
upperdetector
z [m]
Figure 10. Detailed view of the Nab spectrometer. Magnetic field lines are shownin blue, electrodes are shown in green, and magnets coils (UDET, TOF, F, NBU,NBL, and LDET) and their counter coils (UDET′, TOF′, NBU′, NBL′, and LDET′)are shown as red regions. Much of the flight path is omitted. The diagrams on theright-hand side depict the magnetic field profiles for the full height of the spectrometer(bottom), and in more detail for the critical filter region (top).
causes only one upward-going proton to be detected for approximately eight neutrondecays.
Figure 11 shows the proton 1/t2p spectrum for different electron energies Ee. Thedata points are the results of a realistic GEANT4 simulation that tracks protons throughthe magnetic fields and the detectors. The data are shown as a histogram in 1/t′2p , wheret′p is the simulated tp with a 1-2% correction that takes into account the electrostaticacceleration at the upper end of the flight path. The solid lines show the expectationfor 1/t′2p ∝ p2p, that is, for a detector 1/TOF2 response function which is infinitely sharp.The 1/t′2p spectrum has a slope proportional to a, the neutrino-electron correlationcoefficient, within the range of 1/t′2p allowed by the decay kinematics, and drops sharplyto zero outside. The data points at the edges can be used to determine the shape of thereal detector 1/TOF2 response function experimentally. A compromise had to be foundin the field design between a very high field curvature in the filter region (i.e., a narrowdetector 1/TOF2 response function), and a reasonably big fiducial volume, i.e., a filtercoil (F) in figure 10 that is not too small in diameter.
The detector has to stop and detect the energy of up to 750 keV electrons as wellas 30 keV protons. This requires a detector thickness of 1.5−2mm Si-equivalent, a very

New precision measurements of free neutron beta decay with cold neutrons 16
2 2Inverse squared proton TOF 1/t ’ [1/μs ]p
0 0.002 0.004 0.006 0.008
E = 150 keVe,kin
E = 300 keVe,kin
E = 450 keVe,kin
E = 600 keVe,kin
E = 750 keVe,kin
Sim
ulat
ed e
vent
s
0
100
200
300
400
500
600
700
Figure 11. Proton 1/t′2p spectrum for different values of fixed electron kinetic energyEe,kin. The proton TOF has been corrected for the effect of the acceleration region.The solid lines show the expected infinitely sharp 1/TOF2 response function for anideal detector.
thin window technology, and a very low energy threshold for detecting signals down toabout 10 keV. The very thin window, or dead layer, must be uniform over a large areaof '100 cm2. The detector has to be segmented into 127 elements, in order to keepthe individual element small enough to avoid excessive electronic noise, and to allowfor rejection of accidental background through the requirement of spatial coincidencebetween electron and proton hit. The segmentation has been applied on the back sideto keep the irradiated front side homogeneous. The detector segmentation has to becombined with pulse processing electronics allowing for real-time signal recording witha resolution at the level of several ns. The low energy threshold is required for goodenergy resolution, at the level of a few keV for the relevant energy range of electronsand protons.
Detector prototypes have been procured from Micron Semiconductor Ltd. [56]. Theprototypes can be operated at a temperature of about 100K to reduce electronic noise.Charged particles enter the detector through the junction side, which is uniform apartfrom a very thin aluminum grid deposited on it with areal coverage of 0.4%. Electriccharge liberated by the ionizing particles is collected on the ohmic side, which has 127individual readout electrodes in the shape of regular hexagons, with area Ad = 70mm2.The readout electrodes fill the circular area of the detector efficiently, and match theimage of the fiducial volume well. Only three hexagons meet at a single vertex, thusreducing the maximum number of elements involved in a charge-sharing event. Thereare no dead spaces between the detector elements.
The performance of prototype Si detectors for low-energy proton detection has beentested, and is described in [57].
Fitting the data to (2) assumes a perfect determination electron energy Ee in the Si

New precision measurements of free neutron beta decay with cold neutrons 17
detected electron energy [keV]
Yie
ld
0
1
10
100
1000
10000
100 200 300
Figure 12. Detector response to an incoming electron with a kinetic energy of 300 keV,as simulated by GEANT4. The thin red line shows the result if only the lower detectoris used. Its long low-energy tail is mainly due to backscattering. The thick black lineshows the reconstructed energy in the detector setup as planned in Nab. The algorithmused to reconstruct the energy is explained in the text.
detectors. Figure 12 shows the simulated electron detector response for monoenergeticincoming electrons. The thin red line shows the response if only the lower detector isused, and backscattering is not suppressed. The thick black line shows the reconstructedenergy in a scenario which poses the least demands on the detector readout electronics.Most of the events are contained in a sharp peak at the correct electron energy, reflectingthe good energy resolution of a silicon detector. The low-energy tail is mainly caused byelectron bremsstrahlung in the detector, with a small additional contribution throughenergy losses at the dead layer and grid on the detector entrance. Reconstruction of theelectron energy requires some care for electrons that bounce multiple times, in orderto take into account the different electrostatic potentials on upper and lower detector.Assuming that individual detector hits are not resolved, and that the threshold can beset to 10 keV at the upper, and to 40 keV at the lower detector, the black line showsreconstructed electron energy using an algorithm that adds the energies in the detectorsif they are above threshold, and adds 30 keV (due to the high voltage of the upperdetector) if the latest detected hit is on the upper detector.
It is planned to suppress proton reflections from the lower detector, e.g., througha −1 kV voltage at the lower detector. This is necessary, as otherwise too many [58]downward-going protons would bounce off the lower detector undetected, and reachthe upper detector within the time window for upwardgoing protons. Together withthe 30 kV at the upper detector, and the magnetic field lines connecting the two, thespectrometer constitutes a Penning trap. Experience gained in the commissioning ofthe aSPECT [47] and KATRIN [59] spectrometers indicates different ways to deal withbackground and HV problems through electrode design, good vacuum, or via the removal

New precision measurements of free neutron beta decay with cold neutrons 18
of trapped particles by means of electric fields or by mechanical means.Uncertainties in the determination of a: The neutrino-electron correlation
coefficient a is determined in a χ2-fit to the histograms shown in figure 11. Thefitting parameters are: a, N , the number of decays, b, the Fierz interference term,and eventually additional parameters which characterize spectrometer properties. Theknowledge of the spectrometer properties, as determined from auxiliary measurements,is converted into a prediction of the shape of the the detector 1/TOF2 response function.The fit will be performed twice. First, the full data set is used. In this step, there are twoadditional fit parameters, the average value of the detector 1/TOF2 response function(parametrized as flight path length L), and an electron energy calibration factor (Ecal).In a second step, the additional parameters are fixed, and the data set is reduced bytaking only the inner 70% of the data for each given electron energy. This proceduremakes use of the fact that the edges of 1/TOF2 distribution are primarily sensitive to theshape of the detector 1/TOF2 response function, and the inner part is mainly sensitive tothe neutrino-electron correlation coefficient a. The second step reduces the sensitivity ofthe extracted value of a to imperfections in the reconstruction of the detector function.The decision to use only the inner 70% of the data sample in the second fit reduces thestatistical sensitivity by 65%, which is offset by considerably relaxed tolerances for anumber of false effects (sources of systematic uncertainty).
Table 2. Statistical uncertainty in the determination of a, and the influence of differentcuts. N is the number of neutron decays in the fiducial volume for which the protongoes into the upper detector.
lower Ee,kin cutoff: none 100 keV 100 keV 300 keVupper tp cutoff: none none 40µs 40µs
σa 2.4/√N 2.5/
√N 2.5/
√N 2.6/
√N
σa (Ecal, l variable) 2.5/√N 2.6/
√N 2.6/
√N 2.7/
√N
σa (inner 70% of data) 4.1/√N 4.1/
√N 4.1/
√N 4.1/
√N
The statistical uncertainty is shown in table 2 for several possible threshold valuesfor the electron kinetic energy (Ee,kin,min), and tp,max, a high proton TOF cutoff due toaccidental coincidences. Expected settings are Ee,kin,min = 100 keV and tp,max = 40µs. Atotal of 1.6× 10⁹ detected protons are required to determine a with a relative statisticaluncertainty of 10−3. Using the measured beam flux at the SNS [60], the prediction is thata few months of data taking are needed for a single run, without extra measurementsdevoted to systematic checks. Setting b ≡ 0 for a fit within the Standard Model, wouldnot significantly improve the uncertainty in a.
We turn now to the discussion of the most prominent systematic uncertainties inthe determination of a with the Nab spectrometer. A more complete discussion is
New precision measurements of free neutron beta decay with cold neutrons 19
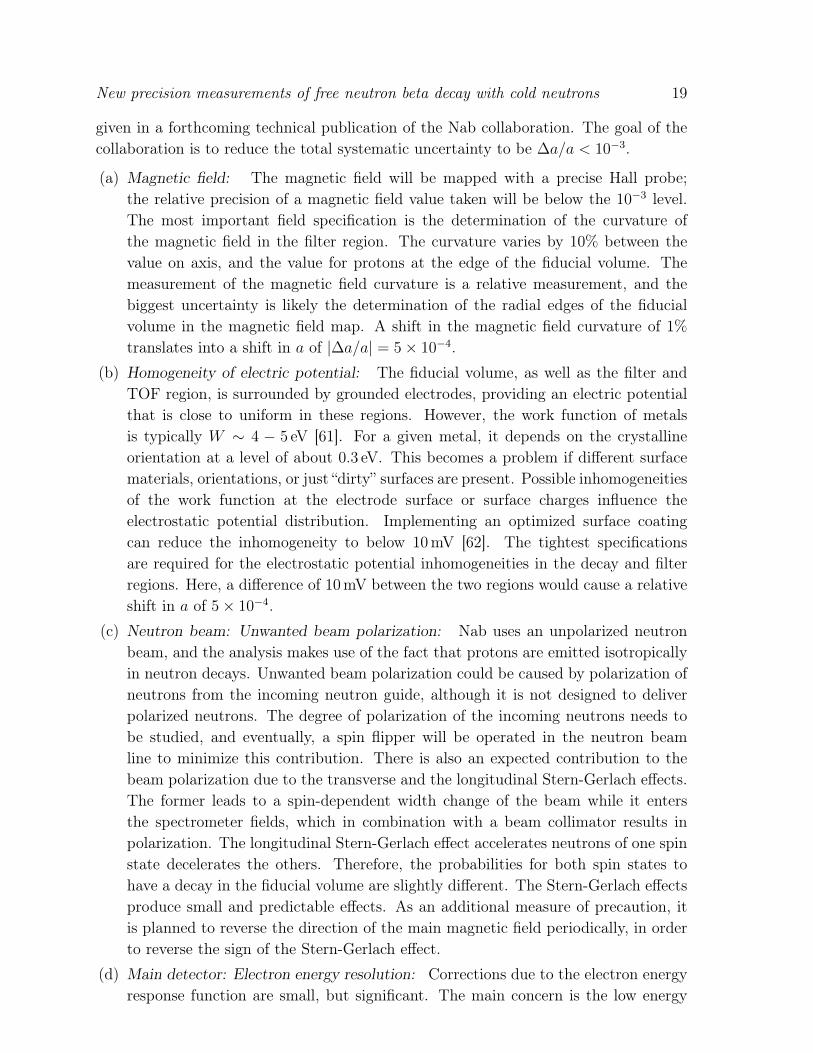
given in a forthcoming technical publication of the Nab collaboration. The goal of thecollaboration is to reduce the total systematic uncertainty to be ∆a/a < 10−3.
(a) Magnetic field: The magnetic field will be mapped with a precise Hall probe;the relative precision of a magnetic field value taken will be below the 10−3 level.The most important field specification is the determination of the curvature ofthe magnetic field in the filter region. The curvature varies by 10% between thevalue on axis, and the value for protons at the edge of the fiducial volume. Themeasurement of the magnetic field curvature is a relative measurement, and thebiggest uncertainty is likely the determination of the radial edges of the fiducialvolume in the magnetic field map. A shift in the magnetic field curvature of 1%translates into a shift in a of |∆a/a| = 5× 10⁻⁴.
(b) Homogeneity of electric potential: The fiducial volume, as well as the filter andTOF region, is surrounded by grounded electrodes, providing an electric potentialthat is close to uniform in these regions. However, the work function of metalsis typically W ∼ 4 − 5 eV [61]. For a given metal, it depends on the crystallineorientation at a level of about 0.3 eV. This becomes a problem if different surfacematerials, orientations, or just “dirty” surfaces are present. Possible inhomogeneitiesof the work function at the electrode surface or surface charges influence theelectrostatic potential distribution. Implementing an optimized surface coatingcan reduce the inhomogeneity to below 10mV [62]. The tightest specificationsare required for the electrostatic potential inhomogeneities in the decay and filterregions. Here, a difference of 10mV between the two regions would cause a relativeshift in a of 5× 10⁻⁴.
(c) Neutron beam: Unwanted beam polarization: Nab uses an unpolarized neutronbeam, and the analysis makes use of the fact that protons are emitted isotropicallyin neutron decays. Unwanted beam polarization could be caused by polarization ofneutrons from the incoming neutron guide, although it is not designed to deliverpolarized neutrons. The degree of polarization of the incoming neutrons needs tobe studied, and eventually, a spin flipper will be operated in the neutron beamline to minimize this contribution. There is also an expected contribution to thebeam polarization due to the transverse and the longitudinal Stern-Gerlach effects.The former leads to a spin-dependent width change of the beam while it entersthe spectrometer fields, which in combination with a beam collimator results inpolarization. The longitudinal Stern-Gerlach effect accelerates neutrons of one spinstate decelerates the others. Therefore, the probabilities for both spin states tohave a decay in the fiducial volume are slightly different. The Stern-Gerlach effectsproduce small and predictable effects. As an additional measure of precaution, itis planned to reverse the direction of the main magnetic field periodically, in orderto reverse the sign of the Stern-Gerlach effect.
(d) Main detector: Electron energy resolution: Corrections due to the electron energyresponse function are small, but significant. The main concern is the low energy

New precision measurements of free neutron beta decay with cold neutrons 20
tail of the electron energy response function, caused by electrons that createbremsstrahlung in the detector, by electron energy losses in dead layer at theentrance of the detector, and by imperfect energy reconstructions due to energydeposition below threshold in case of backscattered electron events that hit multipledetectors and/or pixels. Several percent of the electrons will have a reconstructedenergy which is in this tail. The shape of the tail has to be calibrated to anuncertainty of 1% in order to reach |∆a/a| = 5× 10⁻⁴.
A cross-check and possible improvement of this analysis will be achieved by areconstruction of the shape, and not only the average position, of the detector 1/TOF2
response function from the edges of the measured 1/TOF2 distribution. This approachintroduces more free parameters and uses the previously described analysis method toprovide good starting values for the parameters. The choice of the parameters and theirfunctional relationship to the detector response function are discussed in [63].
4. Measurement of the Fierz term b in neutron beta decay
The Fierz interference term vanishes in the Standard Model in lowest order. A non-zerovalue would show as an additional factor in the electron energy spectrum dependenton the electron energy Ee. Beyond the Standard Model, the Fierz term bF in Fermidecays depends linearly on the scalar coupling. Its non-observation in superallowedbeta decays leads to a very stringent limit of bF = −0.0022(26) [64]. This limit is setby the fact that for larger values of bF, an additional contribution to the lifetime of thenuclei under study would appear, depending on the beta endpoint energy, which hasnot been observed experimentally. The Fierz term bGT in Gamow Teller decays is lesstightly bound [5, 11]. In neutron beta decay, a measurement of the Fierz term b wouldbe a measurement of a linear combination of bF and bGT [14]; given the tight limit onbF, this is essentially a measurement of bGT and a search for tensor couplings. A firstlimit on b from electron energy spectra in neutron beta decays has been reported withultracold neutrons recently [65]; indirect limits from the influence of a non-zero b onother neutron decay observables were available earlier [4, 66, 67]. Neutron decays cancompete with radiative pion decays [68] in their sensitivity to tensor couplings if theyreach or surpass a precision of ∆b . 10−3 [5].
Measuring the Fierz term b with the Nab spectrometer amounts to a precisedetermination of the shape of the electron spectrum and its deviation from the b = 0
shape predicted by the Standard Model (1). Any such deviation will be far morepronounced for low electron momenta than for high momenta. Accurate understandingof background rates, which usually increases with decreasing pulse size, is crucial. Thecoincidence method, i.e., detection of both electrons and proton, will help to reduce thebackground rates. The main contribution to the background is expected to be due toaccidental coincidences; the amount and spectral dependence can be determined withthe method of delayed coincidences. For this measurement, the lower detector will beput on a high negative potential of −30 kV. The region between the magnetic filter
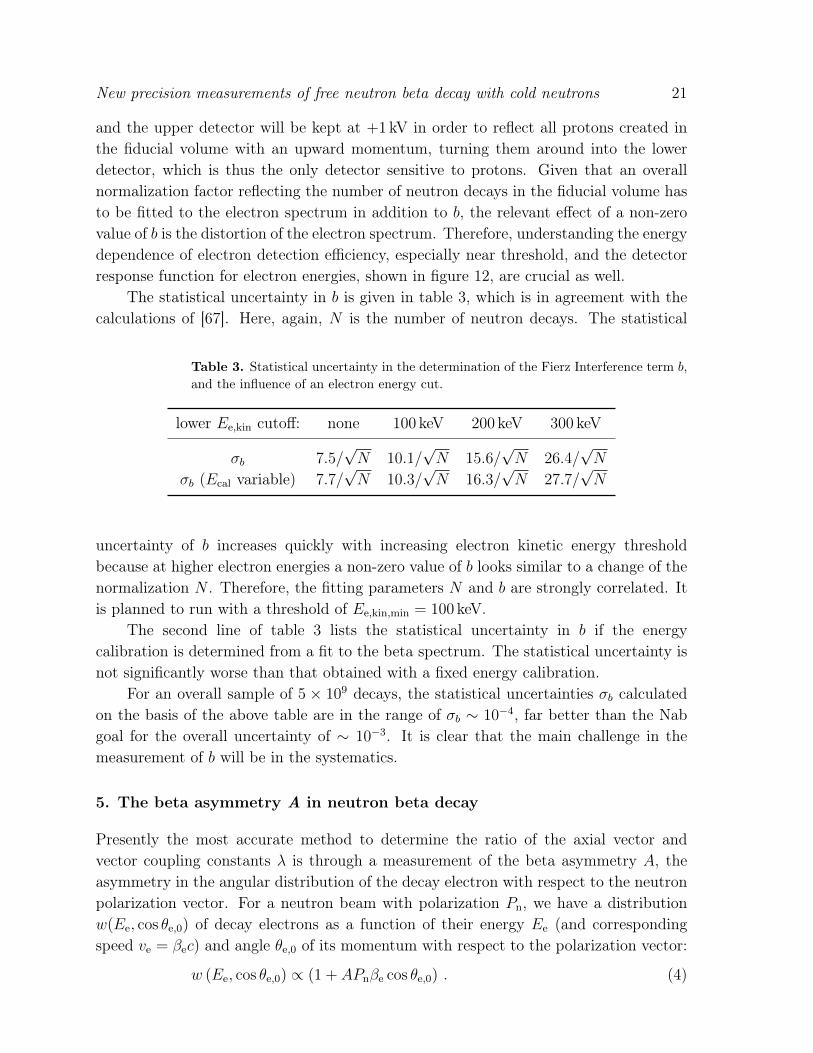
New precision measurements of free neutron beta decay with cold neutrons 21
and the upper detector will be kept at +1 kV in order to reflect all protons created inthe fiducial volume with an upward momentum, turning them around into the lowerdetector, which is thus the only detector sensitive to protons. Given that an overallnormalization factor reflecting the number of neutron decays in the fiducial volume hasto be fitted to the electron spectrum in addition to b, the relevant effect of a non-zerovalue of b is the distortion of the electron spectrum. Therefore, understanding the energydependence of electron detection efficiency, especially near threshold, and the detectorresponse function for electron energies, shown in figure 12, are crucial as well.
The statistical uncertainty in b is given in table 3, which is in agreement with thecalculations of [67]. Here, again, N is the number of neutron decays. The statistical
Table 3. Statistical uncertainty in the determination of the Fierz Interference term b,and the influence of an electron energy cut.
lower Ee,kin cutoff: none 100 keV 200 keV 300 keV
σb 7.5/√N 10.1/
√N 15.6/
√N 26.4/
√N
σb (Ecal variable) 7.7/√N 10.3/
√N 16.3/
√N 27.7/
√N
uncertainty of b increases quickly with increasing electron kinetic energy thresholdbecause at higher electron energies a non-zero value of b looks similar to a change of thenormalization N . Therefore, the fitting parameters N and b are strongly correlated. Itis planned to run with a threshold of Ee,kin,min = 100 keV.
The second line of table 3 lists the statistical uncertainty in b if the energycalibration is determined from a fit to the beta spectrum. The statistical uncertainty isnot significantly worse than that obtained with a fixed energy calibration.
For an overall sample of 5 × 10⁹ decays, the statistical uncertainties σb calculatedon the basis of the above table are in the range of σb ∼ 10−4, far better than the Nabgoal for the overall uncertainty of ∼ 10−3. It is clear that the main challenge in themeasurement of b will be in the systematics.
5. The beta asymmetry A in neutron beta decay
Presently the most accurate method to determine the ratio of the axial vector andvector coupling constants λ is through a measurement of the beta asymmetry A, theasymmetry in the angular distribution of the decay electron with respect to the neutronpolarization vector. For a neutron beam with polarization Pn, we have a distributionw(Ee, cos θe,0) of decay electrons as a function of their energy Ee (and correspondingspeed ve = βec) and angle θe,0 of its momentum with respect to the polarization vector:
w (Ee, cos θe,0) ∝ (1 + APnβe cos θe,0) . (4)
New precision measurements of free neutron beta decay with cold neutrons 22
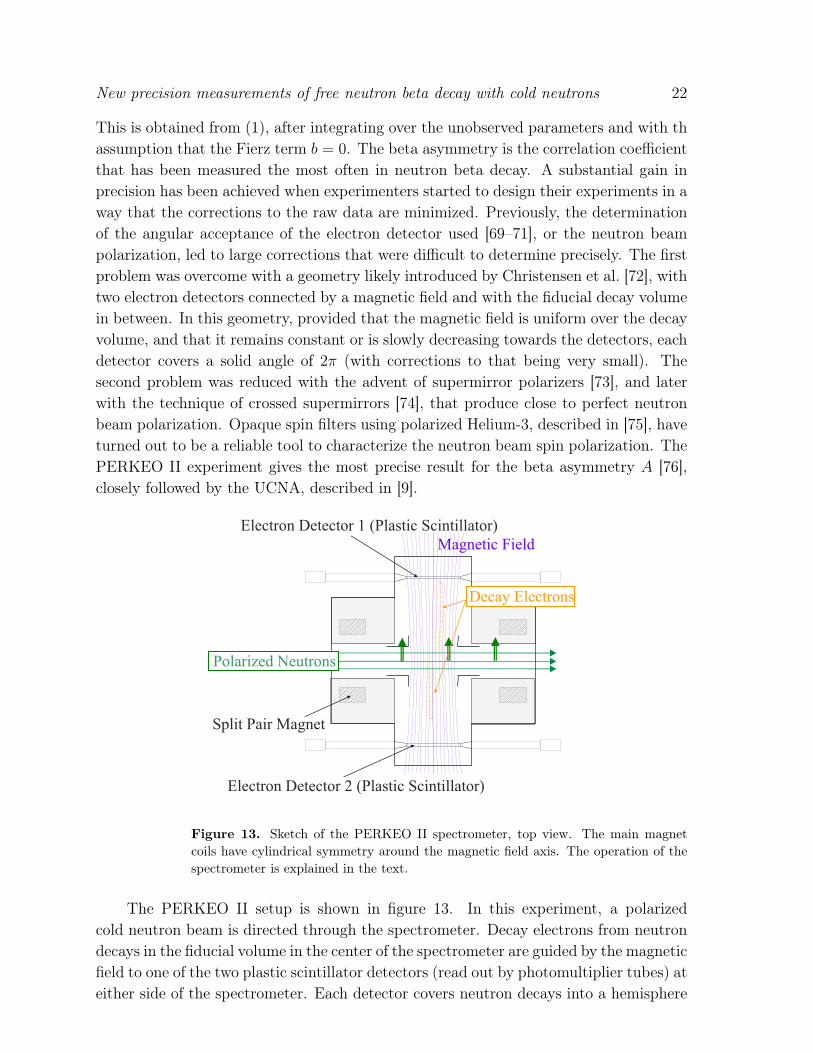
This is obtained from (1), after integrating over the unobserved parameters and with thassumption that the Fierz term b = 0. The beta asymmetry is the correlation coefficientthat has been measured the most often in neutron beta decay. A substantial gain inprecision has been achieved when experimenters started to design their experiments in away that the corrections to the raw data are minimized. Previously, the determinationof the angular acceptance of the electron detector used [69–71], or the neutron beampolarization, led to large corrections that were difficult to determine precisely. The firstproblem was overcome with a geometry likely introduced by Christensen et al. [72], withtwo electron detectors connected by a magnetic field and with the fiducial decay volumein between. In this geometry, provided that the magnetic field is uniform over the decayvolume, and that it remains constant or is slowly decreasing towards the detectors, eachdetector covers a solid angle of 2π (with corrections to that being very small). Thesecond problem was reduced with the advent of supermirror polarizers [73], and laterwith the technique of crossed supermirrors [74], that produce close to perfect neutronbeam polarization. Opaque spin filters using polarized Helium-3, described in [75], haveturned out to be a reliable tool to characterize the neutron beam spin polarization. ThePERKEO II experiment gives the most precise result for the beta asymmetry A [76],closely followed by the UCNA, described in [9].
Electron Detector 1 (Plastic Scintillator)
Polarized Neutrons
Split Pair Magnet
Magnetic Field
Electron Detector 2 (Plastic Scintillator)
Decay Electrons
Figure 13. Sketch of the PERKEO II spectrometer, top view. The main magnetcoils have cylindrical symmetry around the magnetic field axis. The operation of thespectrometer is explained in the text.
The PERKEO II setup is shown in figure 13. In this experiment, a polarizedcold neutron beam is directed through the spectrometer. Decay electrons from neutrondecays in the fiducial volume in the center of the spectrometer are guided by the magneticfield to one of the two plastic scintillator detectors (read out by photomultiplier tubes) ateither side of the spectrometer. Each detector covers neutron decays into a hemisphere

New precision measurements of free neutron beta decay with cold neutrons 23
along the neutron spin quantization axis. As a result, each detector measures a countrate asymmetry with respect to the direction of polarization, given by ±APnβe/2, wherethe factor ±1/2 comes from the averaging over the electron directions (cos θe,0) in eachhemisphere. The results are shown in figure 14.
0.02
0
0 200 400 600
0.04
0.06
-0.06
-0.04
-0.02
Detector 2
Detector 1
Electron kinetic energy [keV]
coun
t ra
te a
sym
met
ry
Figure 14. Count rate asymmetry with respect to the direction of the neutron spinfor both detectors, adapted from [76]. The region between the dashed lines is the leastsensitive to systematic uncertainties, and is used to extract the result for the betaasymmetry A.
The largest uncertainties are in the knowledge of the detector response and itsspatial dependence, in the estimation of the beam-related background, and in thedegree of polarization. The detector response function of the PERKEO II detectorshas been calibrated with several conversion electron sources (109Cd, 113Sn, 137Cs, and207Bi). A non-linearity in the gain was found, but could be neglected in the fit region.The position dependence of the detector response has been mapped with some of thecalibration sources; in the end an overall gain factor was determined with a fit tothe count rate difference between both neutron polarization states, which is taken asbackground-free. In order to evaluate the measured asymmetry in the count rates,the measured rates are corrected for environmental background by subtracting countrates taken with the neutron beam blocked by a shutter in front of the experiment.This first step of background correction is the largest, but it misses the beam-relatedbackground produced by the neutron beam further downstream. An elaborate neutronbeam collimation system reduced the amount of beam-related background to give acount rate of less than 1/1700 of the signal count rate in the fit region, despite thefact that only about one in 107 neutrons decays in the fiducial volume. The size of thisbackground component has been estimated from auxiliary measurements. A decade ago,neutron beam polarization was thought to be the limiting factor in a measurement ofthe beta asymmetry with cold neutrons. However, crossed supermirrors have made it
New precision measurements of free neutron beta decay with cold neutrons 24
possible to achieve a very high degree of cold neutron beam polarization, Pn = 99.7(1)%.
-1.28
-1.275
-1.27
-1.265
-1.26
-1.255
1980 1990 2000 2010
λ =
g/g
AV
Experiment publication
Stratowa
Byrne
Mostovoi
PERKEO I
PERKEO IIPERKEO II
PERKEO II
Yerozolimski
Liaud
UCNA
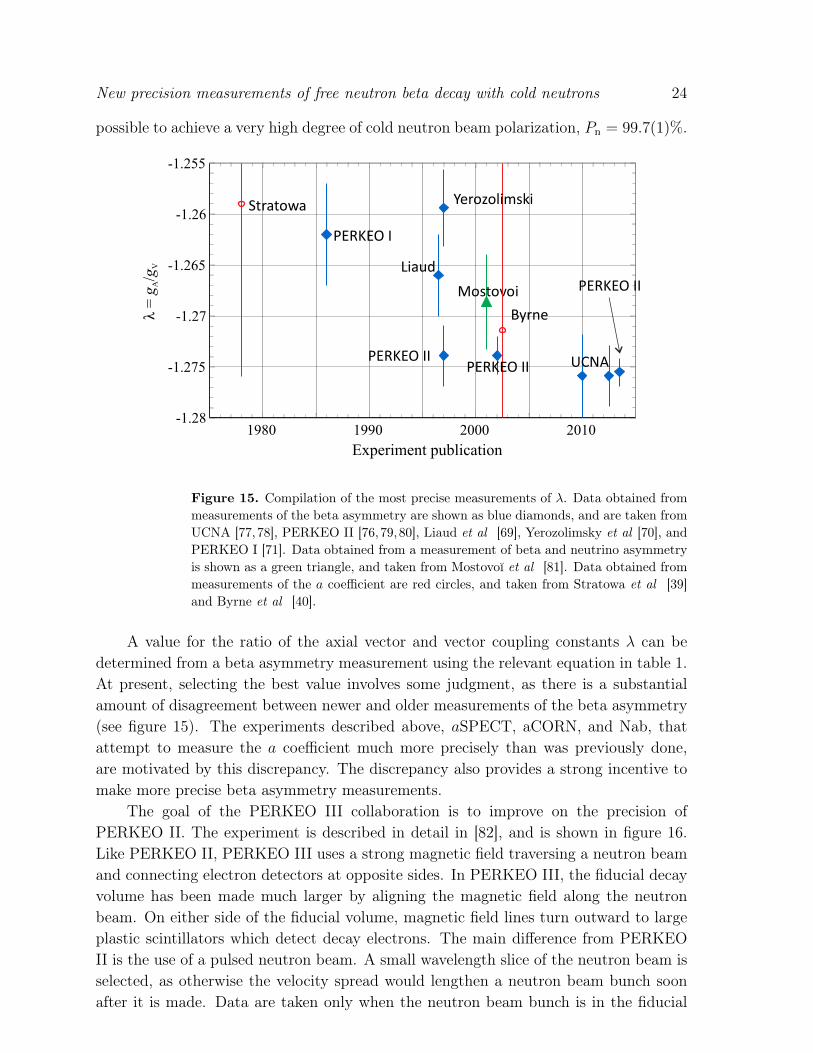
Figure 15. Compilation of the most precise measurements of λ. Data obtained frommeasurements of the beta asymmetry are shown as blue diamonds, and are taken fromUCNA [77,78], PERKEO II [76,79,80], Liaud et al [69], Yerozolimsky et al [70], andPERKEO I [71]. Data obtained from a measurement of beta and neutrino asymmetryis shown as a green triangle, and taken from Mostovoı et al [81]. Data obtained frommeasurements of the a coefficient are red circles, and taken from Stratowa et al [39]and Byrne et al [40].
A value for the ratio of the axial vector and vector coupling constants λ can bedetermined from a beta asymmetry measurement using the relevant equation in table 1.At present, selecting the best value involves some judgment, as there is a substantialamount of disagreement between newer and older measurements of the beta asymmetry(see figure 15). The experiments described above, aSPECT, aCORN, and Nab, thatattempt to measure the a coefficient much more precisely than was previously done,are motivated by this discrepancy. The discrepancy also provides a strong incentive tomake more precise beta asymmetry measurements.
The goal of the PERKEO III collaboration is to improve on the precision ofPERKEO II. The experiment is described in detail in [82], and is shown in figure 16.Like PERKEO II, PERKEO III uses a strong magnetic field traversing a neutron beamand connecting electron detectors at opposite sides. In PERKEO III, the fiducial decayvolume has been made much larger by aligning the magnetic field along the neutronbeam. On either side of the fiducial volume, magnetic field lines turn outward to largeplastic scintillators which detect decay electrons. The main difference from PERKEOII is the use of a pulsed neutron beam. A small wavelength slice of the neutron beam isselected, as otherwise the velocity spread would lengthen a neutron beam bunch soonafter it is made. Data are taken only when the neutron beam bunch is in the fiducial

New precision measurements of free neutron beta decay with cold neutrons 25
collimators
magnetic fielddownstream detector
upstream detector
beam dumpcentral solenoidchopper
fiducial volume
neutrons from left(Beamline H113 at ILL)
velocityselector
polarizer spin flipper
Figure 16. Sketch of the PERKEO III spectrometer, taken from [83]. Magnetic fieldlines are the blue lines that connect fiducial volume and detectors. The neutron beamis pulsed due to the operation of velocity selector and chopper in the incoming neutronbeam. Data for the analysis is only taken while a neutron beam pulse is contained inthe fiducial volume.
volume of the spectrometer. Besides having a much higher decay rate than in thePERKEO II setup, there are several advantages in the systematics: For one, the relativeamount of neutron beam-related background is strongly reduced, as nominally noneutrons hit collimators or the beam stop during data taking. In addition, the neutronbeam polarization can be measured more precisely if the wavelength spread of neutronsbeam is reduced. Finally, edge effects and the magnetic mirror effect are reduced.The electron detectors are still plastic scintillators read out by photomultipliers. ThePERKEO III collaboration has finished data taking, and is finalizing their analysis.
Looking into the future, construction of the PERC instrument has started at thebeam facility MEPHISTO of the Forschungs-Neutronenquelle Heinz Maier-Leibnitz. Incontrast to existing neutron decay spectrometers, PERC is a user instrument whichdelivers, in addition to the neutrons, an intense beam of decay electrons and protons,under well-defined conditions. The setup is shown in figure 17. In PERC, the fiducial
neutron decay channel(neutron guide, length: 8m)
in longitudinal magnetic field: 2T
magnetic filter(about 8 T)
transport solenoid(about 0.5 T)
electron / proton beamto detectorchopper
neutron bunch
transportneutron guide
polarizer /spin flipper
end ofcold neutron
beamline
wavelength(velocity)selector
Figure 17. Sketch of the PERC neutron decay channel setup. Polarizer, spin flipper,wavelength selector, and chopper are optional, and will be used if the neutron beam isdesired to be polarized and / or bunched. Adapted from [85].
decay volume is essentially an 8m long section of neutron guide with a strong magnetic
New precision measurements of free neutron beta decay with cold neutrons 26
field along the guide. At the end of it, neutrons are directed into a beam stop. Chargeddecay particles from neutron decays in the 8 m long neutron decay channel follow themagnetic field lines adiabatically, and are guided through a magnetic filter to a detector.This magnetic filter is probably the most important improvement over PERKEO II andIII; it was first proposed by Serebrov et al [84]. One mode to use this instrument is tooperate it with a highly polarized bunched neutron beam. Due to the magnetic mirroreffect, only decay particles that have their momentum close to parallel to the magneticfield at the decay point can pass the magnetic filter, with the angular cutoff given bythe ratio between the magnetic field in the magnetic filter and the magnetic field atthe neutron decay point (see appendix). For a wide range of field ratios, the statisticaldisadvantages of rejecting many decay particles is outweighed by the fact that the decayparticles that make it through the filter have the highest asymmetry in their countrate with respect to the neutron spin direction. Coincidence between decay electronsand decay protons is not planned to be used as a method of background rejection, ascount rates will be so high that the number of accidentals would be overwhelming. Asin PERKEO III, the amount of beam-related background is suppressed in the data bynot recording decay particles when the neutron beam bunch hits the beam stop. Anumber of systematic effects inherent in the method have been analyzed and found tobe sufficiently small, as reported in [85]. The apparatus needs to be connected to adetector which is specific to the measured observable, e.g., an electron detector for ameasurement of the beta asymmetry A, or a proton detector for a proton asymmetry.It is possible to use a large plastic scintillator as in the PERKEO experiments. A moreinnovative proposal has been made by Wang et al [86] who describe the use of an R×Bspectrometer. Here, magnetic field coils form half of a torus that contains a magneticfield in a semicircle. In this magnetic field, a substantial drift motion along ~R × ~B,where ~R is the curvature of the magnetic field lines, is superimposed on the particlegyration around a field line as a guiding center. The drift velocity along ~R× ~B dependson the particle momentum, and therefore the arrival position of a particle on a detectorcontains information about its momentum.
Measurements of the degree of polarization in a cold neutron beam well below thepresent level of 0.1% appear feasible [87]. The main limitation is the inhomogeneity inthe degree of polarization in different parts of the phase space of the neutron beam.A very high degree of polarization is desirable, as it sets a hard limit on the possibleinhomogeneity.
Looking further in the future, C. Klauser et al [88] describe an upgrade path,that is, the count rate advantage for the case that the possibilities at MEPHISTO areexhausted and the PERC spectrometer is moved to a planned cold neutron beamline atthe European Spallation Source.

New precision measurements of free neutron beta decay with cold neutrons 27
6. The neutrino asymmetry B in neutron beta decay
The neutrino asymmetry B describes the asymmetry of the neutrino emission withrespect to the neutron spin. While it is not feasible to detect the neutrino with ameaningful efficiency, the value of the neutrino asymmetry can be inferred from theelectron and proton momenta. Glück et al [67] discuss the two most recently usedmethods: (1) measurement of the count rate asymmetry for events in which the decayelectron and proton are emitted into the same hemisphere relative to the neutron spin– momentum conservation then restricts the neutrino to the opposite direction, and (2)measurement of the proton asymmetry with respect to the neutron spin. The latteris sensitive to the values of the beta and neutrino asymmetries; however, the betaasymmetry A is known well enough that in practice, a proton asymmetry measurementdetermines the B coefficient. B is not very sensitive to the value of λ, and therefore itis measured to search for non-Standard Model physics, e.g., for right-handed currentsor scalar and tensor interactions [4, 6, 7, 67].
The most precise determinations of the neutrino asymmetry were performed bySerebrov et al [89], and by the PERKEO II collaboration [90]. The PERKEO IIcollaboration modified their instrument that was used for a measurement of the betaasymmetry, as shown in figure 13 and described above: The main change is the additionof thin carbon foils between the fiducial volume and each of the plastic scintillators; thecarbon foils are kept on a high negative potential. The idea is that protons that traversethe foil produce a few secondary electrons; these secondary electrons are detected in theplastic scintillators used for electron detection. Electrons that traverse the thin foil arenot very much affected. In this way, the plastic scintillators function as detectors forboth electrons and protons. Many sources of background that were a problem for thebeta asymmetry measurement were made less significant with a coincidence condition.Electron and proton signals are indistinguishable, creating additional background whenone of them is accidentally mistaken for the other. The modified PERKEO II apparatus,with the carbon foils inserted, was used in a dedicated beam time. The apparatus is mostsensitive to the neutrino asymmetry B in a mode counting both electrons and protonsin the same detector (see [67]). Results for the asymmetry in the count rate of this classof events with respect to the neutron spin direction from one of the detectors (the betterone of the two) are shown in figure 18. The fit region is chosen for optimum precision: athigher electron energies the corrections due to magnetic mirror effects become large, andat lower energies, high voltage induced background and electron detector imperfectionsgenerate a large uncertainty.
The data recorded with the PERKEO II apparatus just described were additionallyused to determine the proton asymmetry with respect to the neutron spin (see [91]). Thismeasurement provides the presently most precise measurement of the proton asymmetry,and has confirmed an earlier result with the same apparatus [92], as well as the expecteddependence of the proton asymmetry on the electron energy. However, the uncertainty inB is considerably higher than with the previous method. The analysis in [91] relies partly

New precision measurements of free neutron beta decay with cold neutrons 28
Electron kinetic energy [keV]
ep-A
sym
met
ry B
exp
0.55
0.60
0.65
0.70
0.752χ = 1.23, P = 20 %r
200 400 600
Figure 18. Asymmetry with respect to the direction of the neutron spin for the countrate of events in which both decay electron and proton are detected by detector 2 inthe PERKEO II experiment [90] as a function of the electron kinetic energy. The solidline indicates the fit region that is used to extract the neutrino asymmetry B; it ischosen to have the least sensitivity to systematic uncertainties. The dashed lines showsthe extension of the fitting curve outside the fit region.
on the same data as the one in [90], and is therefore not an independent determinationof the B coefficient.
Finally we note that Mostovoı et al [81] measured the neutrino and the electronasymmetries in the same device at the same time. In both measurements, the neutronbeam polarization Pn was not assumed to be known, and therefore, these measurementsgive a result for APn and BPn. The ratio of these asymmetries is independent of theneutron beam polarization, and it is used to determine λ in a different way than others(see figure 15).
7. Measurement of the beta and the proton asymmetries with the Nabspectrometer
Use of the Nab spectrometer in experiments with polarized neutrons is not plannedfor the near term, and we would not discuss it here were it not for the fact thatthese experiments use the Nab spectrometer with minimal modifications. Previously,independent measurements of the electron and proton asymmetry at the FnPB/SNSwere proposed by the abBA [93–95] and PANDA [96] collaborations. Both proposedinstruments use symmetric magnetic spectrometer designs, with identical flight pathstoward the two detectors. The planned abBA spectrometer had a design with similaritiesto the PERKEO II instrument. The main differences concerned the type of the neutronbeam polarizer (a polarized 3He spin filter) and detectors that allow for proton andelectron detection in coincidence (the Nab silicon detectors, described in section 3.3, wereoriginally developed for abBA). With the Nab spectrometer already under construction,the collaborations joined forces; here we discuss the electron and proton asymmetrymeasurements that are possible with the Nab spectrometer. The basic setup shown infigure 9 will remain the same, but now with a neutron beam polarizing system installed
New precision measurements of free neutron beta decay with cold neutrons 29
in front of the spectrometer. For a measurement of the electron asymmetry it is plannedto use a configuration with the electrostatic voltages set in such a way that all protons aredetected in the lower detector. The coincidence between electrons and protons from thesame neutron decay is preserved, along with its strong suppression of background-relateduncertainties. The proton asymmetry will be measured with the upper detector servingas the proton detector, as in the measurement of a, the neutrino-electron correlation.
For discussion of the uncertainties, we need to consider an asymmetry of the type
differential decay rate ∝ (1 + α cos θ0) , (5)
where θ0 is the initial angle of electron (or proton) momentum relative to the neutronbeam polarization (i.e., the magnetic field) at the moment of the neutron decay, while αdesignates the size of the asymmetry, as follows. For the beta asymmetry, the differentialdecay rate is usually taken as a function of the electron energy, with α = A·βe. Equation(5) defines the proton asymmetry C through α = 2C if energy dependencies are notrecorded. We note that it is feasible to measure the proton count rate asymmetry asa function of the electron energy. In this case α becomes a function of A, B and theelectron energy, as given in [97], and can be used to make a precise determination of theneutrino asymmetry B.
The most important sources for uncertainties in a measurement of the electron orproton asymmetry using the Nab spectrometer are as follows:
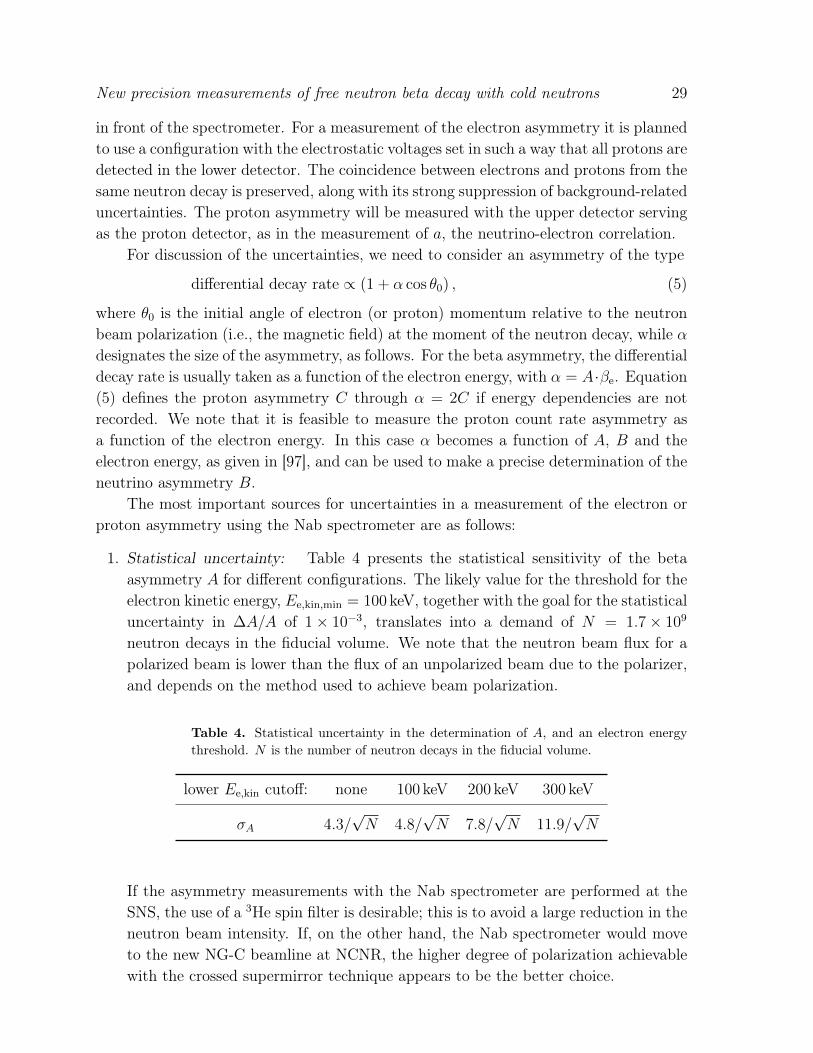
1. Statistical uncertainty: Table 4 presents the statistical sensitivity of the betaasymmetry A for different configurations. The likely value for the threshold for theelectron kinetic energy, Ee,kin,min = 100 keV, together with the goal for the statisticaluncertainty in ∆A/A of 1× 10⁻³, translates into a demand of N = 1.7× 10⁹
neutron decays in the fiducial volume. We note that the neutron beam flux for apolarized beam is lower than the flux of an unpolarized beam due to the polarizer,and depends on the method used to achieve beam polarization.
Table 4. Statistical uncertainty in the determination of A, and an electron energythreshold. N is the number of neutron decays in the fiducial volume.
lower Ee,kin cutoff: none 100 keV 200 keV 300 keV
σA 4.3/√N 4.8/
√N 7.8/
√N 11.9/
√N
If the asymmetry measurements with the Nab spectrometer are performed at theSNS, the use of a 3He spin filter is desirable; this is to avoid a large reduction in theneutron beam intensity. If, on the other hand, the Nab spectrometer would moveto the new NG-C beamline at NCNR, the higher degree of polarization achievablewith the crossed supermirror technique appears to be the better choice.
New precision measurements of free neutron beta decay with cold neutrons 30
2. Solid angle: In a symmetric spectrometer, such as PERKEO II, abBA, orPANDA, the measurement precision relies on the fact that the accepted solidangle of each detector is a hemisphere, and the average angle of electron (proton)momentum with the neutron spin is given as cos θ0 ∼ 1/2 with a correction dueto the magnetic mirror effect. The asymmetric spectrometer design eliminates theunwanted magnetic mirror effect, and replaces it by the requirement to determinethe solid angle of the upper detector. The measured electron asymmetries in bothdetectors can be combined in such a way that the angle cutoff of each detectordrops out in leading order, or in a different way that allows us to extract thesolid angle of the upper detector in situ from the beta asymmetries in bothdetectors, e.g., for subsequent use in a proton asymmetry measurement. Thecutoff angle for each detector depends on the magnetic field at the position ofneutron decay. Nevertheless, we show in the appendix (A.15) that the magnetic fieldinhomogeneities can be neglected for the Nab setup. Therefore, no high precisionmagnetic field measurements are needed, and the systematic uncertainty due tothe solid angle (as well as the the uncertainty due to the imperfect knowledge ofthe neutron beam position) is small. We note that the usual arrangement withtwo identical detectors used for electron and proton asymmetry measurementsis replaced by two different detectors, but with a difference which is preciselyunderstood.
3. Neutron beam polarization: A common systematic to all experiments that measurean asymmetry with respect to the spin direction is the measurement of the beampolarization Pn. We have argued above in the description of the PERC spectrometerthat the uncertainty in the beam polarization will be below 0.1% for a cold neutronbeam polarized with supermirrors, the level that was already achieved by thePERKEO II collaboration. The same argument is made in [96] for a 3He spin filter.We note that if a 3He spin filter is used, the neutron beam polarization depends onthe neutron wavelength in a known way. For an experiment at a spallation source,this translates into a time-dependence of the degree of polarization which in itselfcan provide an in-situ measurement, or at least an in-situ monitor, of the neutronbeam polarization [98].
4. Electron energy calibration: It is planned to use the same detector as inthe unpolarized experiments described previously. Its simulated electron energyresponse has been shown and discussed in figure 12. Its width is substantiallysmaller than with a plastic scintillator detector. To determine the detector responsefunction, and to establish the linearity of the energy-channel-relationship, a set ofradioactive calibration sources will be used. The sources are backed by very thin(e.g., 10µg/cm2) carbon foils, and are movable within the fiducial volume so asto reach every point in the detector. Six possible candidates for such calibrationsources have been used in ref. [79]. For the electron asymmetry, an uncertaintyof 0.1% in the slope of the energy channel relation would cause an uncertainty of∆A/A = 2× 10⁻⁴ for a reasonable choice of the fitting region.
New precision measurements of free neutron beta decay with cold neutrons 31
5. Electric field homogeneity: The proton asymmetry is very sensitive to electricpotential inhomogeneities; the beta asymmetry is not, as electron energies are muchhigher. Demands on the absence of shallow electric field minima in symmetricspectrometers like PERKEO II, abBA, or PANDA, are tight. However, thesensitivity to electric potential traps is practically absent in a proton asymmetrymeasurement using the asymmetric Nab spectrometer. A trapped electron or protonneeds to come from a decay event in this trap. If its kinetic energy is above a low-energy cutoff, it is trapped only because its momentum is close to perpendicularto the magnetic field. Such electrons or protons would not make it through themagnetic filter even in the absence of a trap. The leading contribution to the list ofuncertainties is an (unwanted) electric potential difference between the filter regionand the fiducial volume. A filter–fiducial volume potential difference as large as500mV changes the proton asymmetry by less than 0.04% for rB,DV ∼ 0.5.
The asymmetric Nab spectrometer design allows for a beta and proton asymmetrymeasurement at an uncertainty level of 10−3 or better.
8. Summary
The experiments at the Spallation Neutron Source and the planned measurementswith the PERC instrument promise a series of precision measurements of correlationcoefficients in neutron beta decay at the level of 0.1% or better in the near future. Thesemeasurements of beta asymmetry and neutrino–electron correlation coefficient, alongwith a corresponding improvement in the knowledge of the neutron lifetime, will makepossible a test of the unitarity of the CKM matrix with an accuracy comparable to theone using superallowed beta decays, but without the nuclear uncertainties. In addition,the search for scalar and tensor interactions in neutron decays, which contribute mainlyto the Fierz term and the neutrino asymmetry, will explore new physics with a sensitivitythat is at or beyond the level of searches at the LHC. The intention of this review hasbeen to present the experiments that are planned to achieve these goals.
Acknowledgments
We thank the members of the Nab collaboration, and H. Abele, B. Märkisch, J. Nico, T.Soldner, and F. Wietfeldt, for help in the preparation of the manuscript. We gratefullyacknowledge support from the Office of Nuclear Physics in the Office of Science of theDepartment of Energy, and the National Science Foundation, through NSF grants PHY-0653356, -0855610, -0970013, -1205833 and -1307328.

New precision measurements of free neutron beta decay with cold neutrons 32
Appendix: Sensitivity of count rate asymmetry to inhomogeneities in themagnetic field
The measured asymmetry for a decay rate as in (5) is
αexp =N↑ −N↓
N↑ +N↓= α cos θ0 . (A.1)
We denote the count rates in the upper detector as N↑ and N↓ for the different neutronspin states. In the adiabatic approximation, decay particles are detected in the upperdetector if their emission angle fulfills the condition cos θ0 > cos θmin =
√1− rB,DV,
where rB,DV ∼ 0.425 is the ratio between the magnetic fields in decay volume andfilter region. Given that cos θ0 is uniformly distributed, the average emission angle, forparticle that go to the upper detector, is:
cos θ0,U =1
2
(1 +
√1− rB,DV
). (A.2)
In the same way, we determine the average emission angle for particles that go to thelower detector to be
cos θ0,D = −1
2
(1−
√1− rB,DV
). (A.3)
If both detectors are used to evaluate asymmetries, one can choose a combinationindependent of rB,DV. We add the subscripts “U” and “D” for count rates andasymmetries in upper and lower detector, and make use of the fact that the two detectorssee opposite solid angles.
αexp,U − αexp,D =N↑U −N
↓U
N↑U +N↓U− N↑D −N
↓D
N↑D +N↓D≡ α . (A.4)
The sensitivity of this expression to α is about the same as (A.1).Furthermore, one can determine the average emission angle for both detectors
through
cos θ0,U =
(1− αexp,D
αexp,U
)−1(A.5)
cos θ0,D = cos θ0,U − 1 . (A.6)
The determination of the average emission angles is best done with electrons, as αexp,D
for protons is very sensitive to systematic uncertainties (traps due to a electrostaticpotential minima).
Equations (A.4) and (A.5) are strictly valid only if the magnetic field ratio rB,DV
does not depend on the position of the neutron decay. We next turn to the errorassociated with this simplification: n(~x) is the normalized density of neutron decays, andα is the asymmetry, which may be the electron or the proton asymmetry, corrected forthe kinematic factors and degree of polarization. We note that now rB,DV(~x) depends onthe position. We write rB,DV(~x) = rB,DV + δrB,DV(~x) with δrB,DV(~x) = 0. The averagingis understood to be performed over the fiducial volume weighted by the density of

New precision measurements of free neutron beta decay with cold neutrons 33
neutron decays. The count rate N↑U in the upper detector for neutron-spin pointingupwards is given as:
N↑U =N0
2
∫d3x · n(~x) ·
1∫√
1−rB,DV(~x)
(1 + α cos θ0 d cos θ0) . (A.7)
Carrying out the integration, we obtain
N↑U =N0
2
[(1−
√1− rB,DV(~x)
)+α
21− (1− rB,DV(~x))
]
=N0
2
1−√
1− rB,DV
√1− δrB,DV
1− rB,DV
+α
2rB,DV
(A.8)
' N0
2
[1−
√1− rB,DV
(1− var(rB,DV)
8 (1− rB,DV)2
)+α
2rB,DV
]. (A.9)
Analogously, we find for the count rate in the spin-down state of the neutron
N↓U =N0
2
[(1−
√1− rB,DV(~x)
)− α
21− (1− rB,DV(~x))
]' N0
2
[1−
√1− rB,DV
(1− var(rB,DV)
8 (1− rB,DV)2
)− α
2rB,DV
]. (A.10)
For the asymmetry in the upper detector αU, we expect:
αexp,U =N↑U −N
↓U
N↑U +N↓U=
α · rB,DV
2(
1−√
1− rB,DV
)' α · rB,DV
2(1−
√1− rB,DV
) (1− var(rB,DV) (1− rB,DV)−3/2
8(1−
√1− rB,DV
) )
'α ·(1 +
√1− rB,DV
)2
(1− var(rB,DV) (1− rB,DV)−3/2
8(1−
√1− rB,DV
) ). (A.11)
For the lower detector, we find
N↓D =N0
2
[(1 +
√1− rB,DV
)+α
2rB,DV
], and (A.12)
N↑D =N0
2
[(1 +
√1− rB,DV
)− α
2rB,DV
]. (A.13)
Finally, for the asymmetry αD, we obtain
αexp,D =N↑D −N
↓D
N↑D +N↓D= − α · rB,DV
2(
1−√
1 + rB,DV
)' − α · rB,DV
2(1 +
√1− rB,DV
) (1 +var(rB,DV) (1− rB,DV)−3/2
8(1 +
√1− rB,DV
) )
' −α ·(1−
√1− rB,DV
)2
(1 +
var(rB,DV) (1− rB,DV)−3/2
8(1 +
√1− rB,DV
) ).(A.14)

New precision measurements of free neutron beta decay with cold neutrons 34
These asymmetries have to be subtracted, as shown in (A.4), yielding
αexp,U − αexp,D =α · rB,DV
2(
1−√
1− rB,DV
) +α · rB,DV
2(
1 +√
1− rB,DV
)=
α · rB,DV
1−(√
1− rB,DV
)2=
α · rB,DV
1− (1− rB,DV)√
1− δrB,DV
1−rB,DV
2
' α
(1 +
var(rB,DV)
4rB,DV (1− rB,DV)
). (A.15)
The equation gives a correction to (A.4) for an inhomogeneous field, which is well below10−3 for the geometry used in the Nab spectrometer.
Finally, we compute the average emission angle cos θ0,U as follows:
cos θ0,U =
[1− αexp,D
αexp,U
]−1
=
1 +α · rB,DV
2(
1−√
1 + rB,DV
) α · rB,DV
2(
1−√
1− rB,DV
)−1−1
=1 +
√1− rB,DV
2
' 1
2
(1 +
√1− rB,DV
)− var(rB,DV) (1− rB,DV)−3/2
16. (A.16)
Again, for the geometry of the Nab spectrometer, the second term constitutes acorrection well below 10−3, which can be neglected.
References
[1] Dubbers D 1991 Prog. Part. Nucl. Phys. 26 173[2] Byrne J 1995 Neutrons, Nuclei and Matter Inst. Phys. Publ., Bristol[3] Profumo S, Ramsey-Musolf M J, Tulin S, 2007 Phys. Rev. D 75 075017[4] Konrad G, Heil W, Baeßler, Počanić D, Glück F, Proceedings of the 5th International BEYOND
2010 Conference, Cape Town, South Africa, World Scientific, 2010 Preprint 1007.3027[5] Bhattacharya T, Cirigliano V, Cohen S D, Filipuzzi A, González-Alonso M, Graesser M L, Gupta
R, Lin H-W 2012 Phys. Rev. D 85 054512[6] Cirigliano V, Gardner S, Holstein B, 2013 Prog. Part. Nucl. Phys. 71 93[7] Holstein B, this focus issue of J. Phys. G: Nucl. Part. Phys. (citation will be filled in by editor)[8] Dubbers D, Schmidt M G, 2011 Rev. Mod. Phys. 83 1111[9] Young A, this focus issue of J. Phys. G: Nucl. Part. Phys. (citation will be filled in by editor)[10] Severijns N, this focus issue of J. Phys. G: Nucl. Part. Phys. (citation will be filled in by editor)[11] Severijns N, Beck M, Naviliat-Cuncic O, 2006 Rev. Mod. Phys. 78 991[12] Abele H 2008 Prog. Part. Nucl. Phys. 60 1[13] Nico J, 2009 J. Phys. G: Nucl. Part. Phys. 36 104001[14] Jackson J D, Treiman S B, Wyld Jr. H W, 1957 Phys. Rev. 106 517
New precision measurements of free neutron beta decay with cold neutrons 35
[15] Tishchenko V et al , 2013 Phys. Rev. D 87 052003[16] Beringer J et al (Particle Data Group), 2012 Phys. Rev. D 86 010001 and 2013 partial update for
the 2014 edition (http://pdg.lbl.gov)[17] Beringer J et al (Particle Data Group), Review “Big-Bang Nucleosynthesis”, 2012 Phys. Rev. D
86 010001, and 2013 partial update for the 2014 edition.[18] Pokotilovski Yu N, 1999 Phys. Lett. A 255 173[19] Lamoreaux S K, Golub R, 2002 Phys. Rev. C 66 044309[20] Nesvizhevsky V V, Voronin A Yu, Lambrecht A, Reynaud S, Lychagin E V, Muzychka A Yu,
Strelko A V, 2013 Cryst. Rep. 58 743[21] Wietfeldt F E, Greene G L, 2011 Rev. Mod. Phys. 83 1173[22] Nico J S et al , 2005 Phys. Rev. C 71 055502[23] Byrne J et al , 1990 Phys. Rev. Lett. 65 289[24] Byrne J, Dawber P G, Habeck C G, Smidt S J, Spain J A, Williams A P, 1996 Europ. Phys. Lett.
33 187[25] Carlson A D, Poenitz W P, Hale G M, Peelle R W, Doddler D C, Fu C Y, Mannhart W, 1993
NIST Interagency Report No. 5177[26] Gilliam D M, Greene G L, Lamaze G P, 1989 Nucl. Inst. Meth A 284 220[27] Yue A T, Dewey M S, Gilliam D M, Greene G L, Laptev, Nico J S, Snow W M, Wietfeldt F E,
2013 Phys. Rev. Lett. 111 222501[28] Mampe W, Bondarenko L N, Morozov V I, Panin Yu N, Fomin A I, 1993 Journ. Exp. Theor. Phys.
Lett. 57 82[29] Serebrov A et al , 2005 Phys. Lett. B 605 72[30] Pichlmaier A, Varlamov V, Schreckenbach K, Geltenbort P, 2010 Phys. Lett. B 693 221[31] Steyerl A, Pendlebury J M, Kaufman C, Malik S S, Desai A M, 2012 Phys. Rev. C 85 065503[32] Arzumanov S S, Bondarenko L N, Morozov V I, Panin Yu N, Chernyavsky S M, 2012 Journ. Exp.
Theor. Phys. Lett. 95 22[33] Mampe W, Ageron P, Bates C, Pendlebury J M, Steyerl A, 1989 Phys. Rev. Lett. 63 593[34] Nesvizhevsky V V, Serebrov A P, Taldaev R R, Kharitonov A G, Alfimenkov V P, Strelkov A V,
Shvetsov V N, 1992 Soviet Physics JETP 75 405[35] Arzumanov S, Bondarenko L, Chernavsky S, Fomin A, Morozov V, Panin Y, Drexel W,
Schreckenbach K, Geltenbort P, Pendlebury M, 2000 Phys. Lett. B 483 15[36] Ezhov V F et al , 2005 J. Res. Natl. Inst. Stand. Technol. 110 345[37] Salvat D J et al , 2014 Phys. Rev. C 89 052501(R)[38] Wietfeldt F E, Darius G, Dewey M S, Fomin N, Greene G L, Mulholland J, Snow W M, Yue A
T, 2014 Phys. Proc. 51 54[39] Stratowa C, Dobrozemsky R, Weinzierl P, 1978 Phys. Rev. D 18 3970[40] Byrne J, Dawber P G, v.d. Grinten M G D, Habeck C G, Shaikh F, Spain J A, Scott R D, Baker
C A, Green K, Zimmer O, 2002 J. Phys. G: Nucl. Part. Phys. 28 1325[41] Zimmer O, Byrne J, v.d. Grinten M G D, Heil W, Glück F, 2000 Nucl. Inst. Meth A 440 548[42] Glück F, Baeßler S, Byrne J, van der Grinten M G D, Hartmann F J, Heil W, Konorov I, Petzoldt
G, Sobolev Yu, Zimmer O, 2005 Europ. Phys. Journ. A 23 135[43] Gatti E, Rehak P, 1984 Nucl. Inst. Meth A 225 608[44] PNSensor GmbH, München, Germany[45] Simson M, 2010 Ph.D. thesis, Technische Universität München[46] Baeßler S et al , 2008 Europ. Phys. Journ. A 38 17[47] Simson M et al , 2009 Nucl. Inst. Meth A 611 203[48] Konrad G et al , 2012 Journ. of Phys.: Conf. Ser. 340 012048[49] Balashov S, Mostovoy Yu, Russian Research Center, Kurchatov Institute, Preprint IAE-5718/2,
Moscow (1994)[50] Wietfeldt F E et al , 2005 Nucl. Inst. Meth A 545 181[51] Wietfeldt F E et al , 2009 Nucl. Inst. Meth A 611 207

New precision measurements of free neutron beta decay with cold neutrons 36
[52] Wietfeldt F, personal communication.[53] Cook J C, 2009 Rev. Sci. Instr. 80 023101[54] Bowman J D, 2005 J. Res. Natl. Inst. Stand. Technol. 110 407[55] Počanić D et al , 2009 Nucl. Inst. Meth A 611 211[56] Micron Semiconductor Ltd., Lancing, Sussex, UK[57] Salas-Bacci A et al , 2014 Nucl. Inst. Meth A 735 408[58] Eckstein W, Verbeek H, 1978 Journ. Nucl. Mat. 76& 77 365[59] Beck M et al , 2010 Europ. Phys. Journ. A 44 499[60] Fomin N, Greene G L, Allen R, Cianciolo V, Crawford C, Huffman P, Iverson E, Mahurin R, Snow
M, to be published.[61] CRC Handbook of Chemistry and Physics, Section 12.[62] Robertson N A, Blackwood J R, Buchman S, Byer R L, Camp J, Gill D, Hanson J, Williams S,
Zhou P, 2006 Class. Quantum Grav. 23 2665[63] R. Alarcon et al , Nab proposal update, Jan 2010,
http://nab.phys.virginia.edu/nab_doe_fund_prop.pdf.[64] Hardy J C, Towner I S, 2009 Phys. Rev. C 79 055502[65] Hickerson K, 2013 Ph.D. thesis, California Institute of Technology[66] Pattie Jr. R W, Hickerson K P, Young A R, 2013 Phys. Rev. C 88 048501[67] Glück F, Joó I, Last J, 1995 Nucl. Phys. A 593 125[68] Bychkov M et al 2009 Phys. Rev. Lett. 103 051802[69] Liaud P, Schreckenbach K, Kossakowski R, Nastoll H, Bussière A, Guillaud J P, Beck L, 1997
Nucl. Phys. A 612 53[70] Erozolimsky B, Kuznetsov I, Stepanenko I, Mostovoı Yu A, 1997 Phys. Lett. B 412 240[71] Bopp P, Dubbers D, Hornig L, Klemt E, Last J, Schütze H, Freedman S J, Schärpf O, 1986 Phys.
Rev. Lett. 56 919[72] Christensen C Z, Nielsen A, Bahnsen A, Brown W K, Rustad B M, 1972 Phys. Rev. D 5 1628[73] Schärpf O, Stuüsser N, 1989 Nucl. Inst. Meth A 284 208[74] Kreuz M, Nesvizhevsky V, Petoukhov A, Soldner T, 2005 Nucl. Inst. Meth A 547 583[75] Zimmer O, Müller T M, Hautle P, Heil W, Humblot H, 1999 Phys. Lett. B 455 62[76] Mund D, Märkisch B, Deissenroth M, Krempel J, Schumann M, Abele H, 2013 Phys. Rev. Lett.
110 172502[77] Liu J et al , 2010 Phys. Rev. Lett. 105 181803[78] Mendenhall M P et al , 2013 Phys. Rev. C 87 032501(R)[79] Abele H, Astruc Hoffmann M, Baeßler S, Dubbers D, Glück F, Müller U, Nesvizhevsky V, Reich
J, Zimmer O, 2002 Phys. Rev. Lett. 88 211801[80] Abele H, et al , 1997 Phys. Lett. B 407 212[81] Mostovoi Yu A et al , 2001 Phys. Atom. Nucl. 64 1955[82] Maerkisch B, Abele H, Dubbers D, Friedl F, Kaplan A, Mest H, Schumann M, Soldner T, Wilkin
D, 2009 Nucl. Inst. Meth A 611 216[83] Mest H, 2011 Ph.D. thesis, Ruprecht-Karls Universität Heidelberg[84] Serebrov A et al , 2005 Nucl. Inst. Meth A 545 344[85] Dubbers D, Abele H, Baeßler S, Märkisch B, Schumann M, Soldner T, Zimmer O, 2008 Nucl. Inst.
Meth A 596 238[86] Wang X, Konrad G, Abele H, 2013 Nucl. Inst. Meth A 701 254[87] Soldner T, personal communication.[88] Klauser Ch, Abele H, Soldner T, 2014 Phys. Proc. 51 46[89] Serebrov A P et al , 1998 Journ. Exp. Theor. Phys. 86 1074[90] Schumann M, Soldner T, Deissenroth M, Glück F, Krempel J, Kreuz M, Märkisch B, Mund D,
Petoukhov A, Abele H, 2007 Phys. Rev. Lett. 99 191803[91] Schumann M, Kreuz M, Deissenroth M, Glück F, Krempel J, Märkisch B, Mund D, Petoukhov A,
Soldner T, Abele H, 2008 Phys. Rev. Lett. 100 151801
New precision measurements of free neutron beta decay with cold neutrons 37
[92] Abele H, Baeßler S, Deissenroth M, Glück F, Krempel J, Kreuz M, Märkisch B, Mund D, SchumannM, Soldner T, 2005 J. Res. Natl. Inst. Stand. Technol. 110 377
[93] Wilburn W S et al , 2005 J. Res. Natl. Inst. Stand. Technol. 110 389[94] R. Alarcon et al , experiment proposal submitted in November 2007, available at
http://nab.phys.virginia.edu/ABBA_proposal_2007.pdf[95] Barrón-Palos L et al , 2010 Journ. of Phys.: Conf. Ser. 239 012013[96] R. Alarcon et al , experiment proposal, available at
http://research.physics.lsa.umich.edu/chupp/panda/[email protected][97] Glück F, 1998 Phys. Lett. B 436 25[98] Penttila S I, Bowman J D, 2005 J. Res. Natl. Inst. Stand. Technol. 110 309
Top Related
Copyright © 2022 FDOKUMEN

