


Bahasa
Halaman
Hukum


ORIGINAL ARTICLE
Neuroanatomical consequences of very preterm birthin middle childhood
Ilyse D. Lax • Emma G. Duerden • Sarah Y. Lin •
M. Mallar Chakravarty • Elizabeth J. Donner •
Jason P. Lerch • Margot J. Taylor
Received: 23 October 2011 / Accepted: 7 April 2012 / Published online: 11 May 2012
� Springer-Verlag 2012
Abstract Individuals born preterm can demonstrate
reductions in brain volume, cortical surface area and
thickness. However, the extent of these neuroanatomical
deficits and the relation among these measures in middle
childhood, a critical developmental period, have not been
determined. We assessed differences in brain structure
by acquiring high-resolution T1-weighted scans in 25
children born very preterm (\32 weeks gestational age)
without significant post-natal neurological sequelae and
32 age-matched term-born children (7–10 years). Children
born very preterm had decreased brain volume, surface
area and cortical thickness compared to term-born chil-
dren. Furthermore, children born preterm did not display
the robust relation between total brain volume and basal
ganglia and thalamic volume apparent in the term-born
children. Cortical thickness analyses revealed that the
cortex was thinner for children born preterm than term-
born children in the anterior cingulate cortex/supplemen-
tary motor area, isthmus of the cingulate gyrus, right
superior temporal sulcus, right anterior insula, postcentral
gyrus and precuneus. Follow-up analyses revealed that
right precuneus thickness was correlated with gestational
age. Thus, even without significant postnatal medical
sequelae, very preterm-born children showed atypical
brain structure and developmental patterns in areas related
to higher cognitive function. Disruptions of the typical
neurodevelopmental trajectory in the third trimester of
pregnancy likely underlie these differences persisting into
middle childhood.
Keywords Preterm � Brain structure � Cortical thickness �Volume � Surface area � Children
Introduction
Premature birth is a significant social and health issue
globally in terms of both associated mortality and long-
term morbidity, as well as financial implications for
health, education and social service sectors. Close to
10 % of all births worldwide were preterm (\37 weeks of
gestation) in 2005 with the highest rates occurring in
Africa and North America, with 11.9 and 10.6 % of
I. D. Lax � E. G. Duerden � S. Y. Lin � M. J. Taylor (&)
Department of Diagnostic Imaging, Hospital for Sick Children,
555 University Avenue, Toronto, ON M5G 1X8, Canada
e-mail: [email protected]
E. G. Duerden � M. Mallar Chakravarty �J. P. Lerch � M. J. Taylor
Department of Neuroscience and Mental Health, Research
Institute, Hospital for Sick Children, Toronto, Canada
S. Y. Lin � J. P. Lerch
Mouse Imaging Centre, Hospital for Sick Children,
Toronto, Canada
M. Mallar Chakravarty
Kimel Family Translational Imaging-Genetics Research
Laboratory, Research Imaging Centre, Centre for Addiction
and Mental Health, Toronto, Canada
E. J. Donner � M. J. Taylor
Department of Neurology, Hospital for Sick Children,
Toronto, Canada
J. P. Lerch
Department of Medical Biophysics, University of Toronto,
Toronto, Canada
M. J. Taylor
Department of Psychology, University of Toronto,
Toronto, Canada
123
Brain Struct Funct (2013) 218:575–585
DOI 10.1007/s00429-012-0417-2
Author's personal copy
births, respectively (Beck et al. 2010). These rates have
dramatically increased over the past 20 years in devel-
oped countries such as the United States, the United
Kingdom, Canada and Scandinavian countries (Pennell
et al. 2007). Although the mortality of very preterm
(\32 weeks of gestation) infants has decreased over
recent years, morbidity has not. Even 50–60 % of healthy
preterm children, whose neonatal period was not marked
by medical complications and who had normal or near-
normal head ultrasounds, are reported to have cognitive
deficits once they enter school (Bohm et al. 2002; Breslau
et al. 2000; Frisk and Whyte 1994; Pharoah et al. 2003;
Taylor et al. 2000). This is not a maturational lag as
children born very preterm continue to experience diffi-
culties as they develop through adolescence (Isaacs et al.
2004; O’Brien et al. 2004). These infants are born in the
third trimester when rapid neurodevelopmental events
take place and are thus vulnerable to primary injury and
secondary maturational disturbances (Volpe 2009).
Recent research using magnetic resonance imaging
(MRI) has demonstrated cerebral volumetric deficits in
preterm infants persisting throughout childhood, adoles-
cence and adulthood (Allin et al. 2004; Fearon et al.
2004; Gimenez et al. 2006; Isaacs et al. 2000; Marti-
nussen et al. 2009; Nosarti et al. 2002, 2004, 2008; Pet-
erson et al. 2000; Taylor et al. 2011). At term equivalent
age, manifestations of brain insults include white matter
abnormalities, reductions in white and gray matter vol-
umes and ventricular enlargement (Inder et al. 2003,
2005; Limperopoulos et al. 2005; Peterson et al. 2003;
Srinivasan et al. 2007; Thompson et al. 2007). MRI
studies of brain volume in childhood, adolescence and
young adulthood reveal similar abnormalities. A study by
Nosarti et al. (2008) found that adolescents (14–15 years
of age) born preterm exhibited reduced gray matter (GM)
volume in the temporal, frontal and occipital cortices and
cerebellum. Additionally, areas of the frontal and tem-
poral lobes have increased GM volume compared to
controls, indicating early overgrowth of these regions or
that typical selective pruning may not be occurring at the
same rate in adolescents born preterm. Reductions in
white matter (WM) were concentrated in the brainstem,
internal capsule, temporal and frontal regions while tem-
poral, parietal and frontal regions showed increased WM
volume. Those with neonatal ultrasound evidence of peri-
ventricular haemorrhage and ventricular dilatation exhib-
ited the greatest GM and WM abnormalities. Additionally,
several areas where very preterm individuals demonstrated
decreased GM and WM volume were associated with ges-
tational age (GA) at birth and may have mediated cognitive
impairment.
More recently, longitudinal MRI investigations have
outlined the development of cortical thickness and its
relation with cognitive functioning across age and clinical
groups (Jones et al. 2000; Shaw et al. 2006, 2007, 2008).
Other studies have specifically examined cortical thick-
ness in adolescents born preterm or with very low birth
weight (VLBW). Martinussen et al. (2005) examined
cortical thickness, surface area and brain volume in
15-year-old adolescents with VLBW or small for gesta-
tional age. Regional thinning was found in the parietal,
temporal and occipital lobes in the VLBW group com-
pared to controls. However, regional thickening was
found in the frontal and occipital lobes. Similarly, Nagy
et al. (2011) found that the cortex was significantly
thinner in adolescents born preterm in focal regions of the
temporal and parietal cortices. Both studies found that
differences in cortical thickness were most pronounced
for those born at the shortest gestation or with the lowest
birthweight.
MRI studies have not examined cortical thickness in
very preterm-born children at school age, a vital period of
development when the cognitive delays associated with
preterm birth are most frequently identified. Previous
volumetric MRI studies have identified differences in
cortical GM and WM volumes as well as subcortical
structures of preterm-born adolescents (Allin et al. 2004;
Gimenez et al. 2006; Nosarti et al. 2008; Martinussen
et al. 2009; Taylor et al. 2011). Thus, the aim of the
present study was to determine whether school-age chil-
dren born very preterm without significant medical
sequelae at birth display structural abnormalities in cor-
tical and subcortical regions. Also, as frontal–striatal
dysfunction is implicated in the cognitive deficits seen
in this population (e.g., Nosarti et al. 2009), we also
measured striatal volumes to determine if there were
anatomical atypicalities of the striatum. In accordance
with the literature, we hypothesised that children born
very preterm would exhibit neuroanatomical differences,
including reduced cortical and subcortical volume, corti-
cal surface area and thickness, particularly in temporal
and parietal regions. During early development efferent
projections from the thalamus connect with migrating
neurons that terminate in the cortical plate (Rakic 1988)
that permit direct neuronal connections between cortical
GM and thalamus. This relation would indicate a strong
volumetric connection between the cortex and the thala-
mus. Thus, we were interested to determine whether
children born preterm would have compensatory changes
in subcortical volume relative to the volume of the whole
brain. Also, thinner cortical regions were expected to be
correlated with GA and birthweight such that those born
earlier and/or with lower birthweight would have more
profound deficits. Similarly, areas of thinner cortex in the
preterm group were hypothesised to be correlated with IQ
and parent ratings of executive function.
576 Brain Struct Funct (2013) 218:575–585
123
Author's personal copy
Materials and methods
Participants
The participants were 57 children. Twenty-five, 15 boys
and 10 girls, were born very preterm (mean age = 8.72
years, range 6.92–9.89 years; mean GA = 27.4 weeks,
range 24–31 weeks) and 32 were typically developing
control children, 15 boys and 17 girls (mean age = 8.41,
range 7.06–9.86). The groups did not differ significantly in
terms of age (t = 1.4, p = 0.6) or sex (v2 = 0.97,
p = 0.425). The typically developing children were
recruited through fliers at the Hospital for Sick Children
and announcements in the hospital newsletter, as well as
fliers at public schools in Toronto. All were term-born
without a neurological or psychiatric history or scholastic
difficulties.
The children born very preterm were recruited from the
Neonatology Follow-up Clinics at the Hospital for Sick
Children, and were those who did not experience serious
neurological sequelae during the post-natal period. We
did not include children with periventricular leukomalacia
(PVL) or severe intraventricular haemorrhage (IVH),
grade 3 or 4. Fifteen of these children had normal head
ultrasounds at birth. Four children had grade 1 IVH, two
children had grade 2 IVH, and four children had sube-
pendymal haemorrhage, identified by cranial ultrasound at
birth.
During a recruitment interview, all participants, preterm
and term-born children, were screened for: (1) a medical
history of neurological or developmental disease, (2)
inability to tolerate the MRI environment and (3) having
standard contra-indications for MRI such as metallic or
electronic implants in the body. The Hospital for Sick
Children research ethics board approved the study protocol.
Written informed consent was obtained from parents and
informed assent from the children.
Behavioural assessments
IQ was measured using the 2-subtest Wechsler Abbreviated
Scale of Intelligence [WASI (Wechsler 2003)] for all 25 of
the participants born very preterm, and the majority
(n = 29) of the typically developing controls; participants
had IQs[88. The parents completed the Behaviour Rating
Inventory of Executive Function (BRIEF) which docu-
ments difficulties with executive function of the children
in everyday life. This questionnaire has high internal
consistency (alphas = 0.8–0.98), test–retest reliability
(rs = 0.82) and convergent validity established with a
variety of other measures of executive function (Gioia
et al. 2000).
Imaging parameters
MRI was performed with a 1.5-T whole-body scanner (GE
Excite) using a product 8-channel head coil. An anatomical
scan was obtained for each child using a 3D FSPGR (fast
spoiled gradient recalled) sequence (axial, FOV = 256 cm,
voxel size = 0.93 9 0.93 9 1.5 mm).
Image processing
Anatomical MRI images were analysed with the Cortico-
metric Iterative Vertex-based Estimation of Thickness
(CIVET) image-processing environment, an automated
pipeline (Lerch and Evans 2005). The T1-weighted images
were corrected for MR non-uniformity artefacts (Sled et al.
1998), skull stripped (Smith 2002) and aligned to stereo-
taxic space (Collins et al. 1994). The brain was then tissue
classified into WM, GM and cerebrospinal fluid (CSF)
using a neural net classifier (Zijdenbos et al. 2002; Tohka
et al. 2004). Partial volume effect classification was used to
extract the inner and outer cortical surfaces with 81,924
vertices each. Cortical thickness was then calculated in
native space using the linked distance between the outer
and pial surfaces at each vertex (Lerch and Evans 2005).
Images were smoothed using a 20-mm surface-based dif-
fusion kernel (Chung and Taylor 2006) and non-linearly
registered towards a template surface (Boucher et al. 2009;
Lyttelton et al. 2007). In addition to the measures of cor-
tical thickness calculated at 81,924 vertices across the
cortex for each image, WM, GM and CSF volumes and
surface area were calculated for the whole brain and each
cortical lobe. These estimates were obtained by non-line-
arly warping each T1 image towards a segmented atlas
(Collins et al. 1994; Chakravarty et al. 2008). Subcortical
volumes (striatum, globus pallidus and thalamus) were
obtained by customising a high-resolution subcortical atlas
derived from serial histological data (Chakravarty et al.
2006) using a region-of-interest nonlinear registration
procedure (Chakravarty et al. 2009). These basal ganglia
and thalamus segmentations had been validated using
manual gold-standard segmentations, against other auto-
mated segmentation techniques, and intraoperative elec-
trophysiological recordings in humans during stereotactic
neurosurgery (Chakravarty et al. 2008, 2009).
Statistical analyses
Statistical analyses were performed on the brain volume,
cortical surface area and cortical thickness data. Global
differences in brain volume, including CSF, GM, WM and
total brain volume, were compared by use of MANCOVA
using sex as a covariate. Differences in GM and WM
Brain Struct Funct (2013) 218:575–585 577
123
Author's personal copy
volumes as a proportion of total brain volume were cal-
culated and were subsequently tested for between-group
differences using a MANOVA. A similar MANCOVA was
used to investigate between-group differences in basal
ganglia and thalamus volumes and the relation between
total brain volume and subcortical volumes. Global dif-
ferences in cortical surface area and cortical thickness were
also calculated for each hemisphere as well as for the entire
brain. Between-group differences in surface area and cor-
tical thickness at a lobular level were investigated using a
MANCOVA. The anatomical delineations of the lobes
were as follows: the frontal lobe region on the lateral
surface of the brain extended from the frontal pole poste-
riorly to the central sulcus and inferiorly to the lateral fis-
sure; medially the frontal lobe region extended posteriorly
to the central sulcus and inferiorly to the callosal sulcus.
The parietal lobe region on the lateral and medial surfaces
of the brain extended from the central sulcus posteriorly to
the parieto-occipital fissure and on the lateral surface
inferiorly to the lateral fissure. The temporal lobe region
extended from the anterior temporal pole posteriorly to the
preoccipital notch with the superior border being the lateral
fissure and inferior border the inferior temporal sulcus. The
occipital lobe region on the lateral surface of the hemi-
sphere extended from the preoccipital notch posteriorly to
the occipital pole. In the medial surface of the hemisphere
the occipital lobe region included the territory of the
cuneus and the posterior portion of the lingual gyrus.
At a regional level, vertex-based cortical thickness
analyses were conducted to examine group differences
using Surfstat software (Worsley et al. 2009) and thres-
holded for statistical significance using random field theory
(Worsley et al. 1999). The cluster-forming threshold was
set at p \ 0.001. Correlations between average cortical
thickness for significant clusters, from the between-group
cortical thickness analysis, and GA, birthweight, IQ and
BRIEF scores were examined.
Results
Behavioural results
Children born very preterm had significantly lower 2-sub-
test IQ scores (n = 25, M = 101.12, SE = 2.70) than the
subset of term-born children with IQ scores (n = 29,
M = 117.48, SE = 2.60), t(52) = 4.36, p \ 0.001. Also,
the subset of children born very preterm with BRIEF
reports (n = 20, M = 53.40, SE = 2.00) had significantly
higher scores on this measure than the subset of term-born
children with BRIEF reports (n = 28, M = 47.93,
SE = 1.22), t(32.59) = 2.33, p \ 0.05, indicating that the
preterm-born children had poorer behavioural regulation
and metacognition (knowledge and awareness of one’s own
cognitive processes) than the term-born children.
Imaging results
Brain volume
Total brain volume was significantly lower in the very
preterm group than in the control group, F(1, 54) = 16.04,
p \ 0.001, partial g2 = 0.23. WM volume also differed
between groups, with children born preterm showing
decreased volume compared to controls, F(1, 54) = 15.67,
p \ 0.001, partial g2 = 0.23. Similarly, GM volume was
significantly lower in the very preterm group compared to
the control group, F(1, 54) = 8.14, p = 0.005, partial
g2 = 0.13. However, these results were not maintained
when adjusting for total brain volume [WM: F(1,54) =
2.11, p = 0.15, partial g2 = 0.03; GM: F(1,54) = 2.67,
p = 11 partial g2 = 0.05]. CSF volume did not differ
between the two groups, F(1,54) = 0.82, ns (not signifi-
cant; see Table 1a).
Cortical WM, as a proportion of total brain volume,
tended to be higher in the term-born (mean = 0.58,
SD = 0.02) than the preterm-born group (M = 0.57,
SD = 0.03), F(1, 55) = 2.85, ns. Conversely, cortical GM,
as a proportion of total brain volume tended to be higher in
the preterm-born group (mean = 0.396, SD = 0.02) than
the term-born group (mean = 0.389, SD = 0.017), F(1,
55) = 3.60, ns.
Subcortical volumes
Children born preterm had smaller basal ganglia and tha-
lamic volumes than term-born children. The preterm chil-
dren had significantly smaller striatum volumes, F(1,54) =
4.39, p \ 0.05, partial g2 = 0.08, and globus pallidus
volumes, F(1,54) = 11.32, p \ 0.005, partial g2 = 0.17,
than controls. A similar pattern was found for thalamic
volume; children born preterm showed significantly smal-
ler thalamic volumes than control children, F(1,54) =
20.86, p \ 0.001, partial g2 = 0.28 (see Table 1b).
To examine the relation between total brain volume and
subcortical volume within the two groups, Pearson corre-
lations between total brain, basal ganglia (striatum and
globus pallidus segmentations) and thalamic volumes were
examined using a bootstrapping procedure. In the term-
born group, total brain volume was significantly positively
correlated with the striatum (r = 0.65, p \ 0.001), globus
pallidus (r = 0.64, p \ 0.001), and thalamus volumes
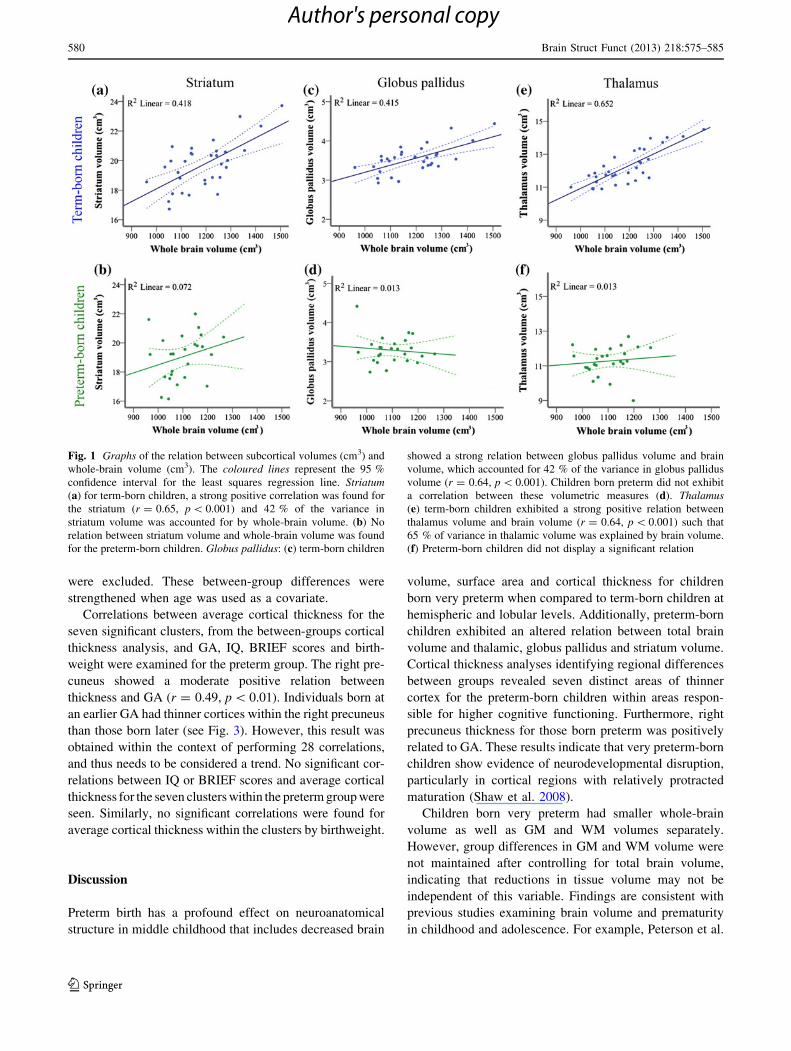
(r = 0.81, p \ 0.001) (see Fig. 1a, c, e). These results were
maintained when residualizing out the effects of age (stri-
atum: r = 0.65, p \ 0.001; globus pallidus r = 0.65,
p \ 0.001; thalamus: r = 0.8, p \ 0.001). In contrast, total
578 Brain Struct Funct (2013) 218:575–585
123
Author's personal copy

brain volume and striatum (r = 0.27, ns), globus pallidus
(r = -0.11, ns) and thalamus volumes (r = 0.11, ns), were
not correlated in the preterm-born group (see Fig. 1b, d, f).
These findings were also maintained when controlling
for age (striatum: r = 0.27, p = 0.2; globus pallidus:
r = -0.12, p = 0.58; thalamus: r = 0.1, p = 0.61). The
lack of a significant relation between total brain volume
and subcortical volumes, illustrate that the basal ganglia
and thalamus may not develop proportionately with the
whole brain in children born very preterm.
Cortical surface area
Children born preterm had significantly less surface area for
the entire cortex than term-born children, F(1,54) = 14.06,
p \ 0.001, partial g2 = 0.21 (see Table 1c); this was
also the case for the right and left hemispheres separately,
right: F(1, 54) = 14.38, p \ 0.001, partial g2 = 0.21, left:
F(1,54) = 13.42, p \ 0.005, partial g2 = 0.20. At a lobar
level, when averaged across hemispheres, children born
preterm showed reduced surface area in the frontal,
F(1,54) = 6.00, p \ 0.05; temporal, F(1,54) = 10.82,
p \ 0.005; parietal, F(1,54) = 6.09, p \ 0.05; and occipital
lobes, F(1,54) = 16.35, p \ 0.001 (see Table 1c). Group
accounted for 10 % of the variance in frontal and parietal
lobe surface areas, 17 % of the variance in temporal lobe
surface area, and 23 % of occipital lobe surface area (partial
g2 = 0.10, 0.10, 0.17 and 0.23, respectively).
Cortical thickness
Children born preterm showed significantly lower mean
cortical thickness for the entire cortex than term-born
children, F(1,54) = 5.13, p \ 0.05, partial g2 = 0.09 (see
Table 1d). The same pattern was also seen in right and left
hemispheres separately, right: F(1,54) = 4.20, p \ 0.05,
partial g2 = 0.07, left: F(1,54) = 8.08, p \ 0.01, partial
g2 = 0.13.
When examining group differences in cortical thickness
at a lobar level, children born preterm showed decreased
mean cortical thickness in the frontal, F(1,54) = 4.07,
p \ 0.05, temporal, F(1,54) = 5.90, p \ 0.05, and parietal
lobes, F(1,54) = 4.39, p \ 0.05, when averaged across
hemispheres. Group accounted for 8 % of the variance in
parietal lobe cortical thickness, 7 % of the variance in
frontal lobe cortical thickness and 10 % of temporal lobe
cortical thickness (partial g2 = 0.08, 0.07 and 0.10,
respectively). No significant difference in cortical thickness
was found between groups in the occipital lobes,
F(1,54) = 0.74, ns (see Table 1d).
A whole-brain, vertex-based approach was used to
identify the focal regions of reduced cortical thickness. The
cortex was significantly thinner for children born very
preterm in seven distinct clusters. The right anterior cin-
gulate cortex/supplementary motor area (corrected for
multiple comparisons, p \ 0.001), left isthmus of the cin-
gulate gyrus (corrected p \ 0.005), right superior temporal
sulcus (corrected p \ 0.05), right anterior insula (corrected
p \ 0.05), right postcentral gyrus (corrected p \ 0.05) and
precuneus bilaterally (corrected p \ 0.05) were signifi-
cantly thinner in the preterm-born group relative to controls
(see Fig. 2; Table 2). Between-group differences were
similar when IQ was included as a covariate and also when
children with brain abnormalities at birth on ultrasound
Table 1 Group differences in average brain volumes, cortical surface
area and thickness
Preterm-born Term-born F-value
Mean Standard
deviation
Mean Standard
deviation
(a) Brain volume (cm3)
Total brain 1,098.5 77.7 1,188.2 121.4 16.04***
WM 626.4 56.4 689.4 73.5 15.67***
GM 435.1 36.5 460.0 55.0 8.14**
CSF 36.9 9.2 38.8 8.7 0.82
(b) Subcortical volumes (cm3)
Striatum 19.0 1.6 19.7 1.6 4.39*
Globus
pallidus
2.8 0.3 3.0 0.3 11.32**
Thalamus 11.3 0.8 12.2 1.0 20.86***
(c) Cortical surface area (cm2)
Entire
cortex
926.0 60.4 985.7 77.1 14.06***
Frontal
lobes
324.7 22.7 339.7 28.5 6.00*
Temporal
lobes
191.7 17.0 205.9 19.2 10.82**
Parietal
lobes
202.2 18.6 212.4 18.1 6.09*
Occipital
lobes
107.6 9.8 119.1 14.0 16.35***
(d) Cortical thickness (mm)
Entire
cortex
3.59 0.2 3.7 0.16 5.13*
Frontal
lobes
3.79 0.24 3.9 0.18 4.07*
Temporal
lobes
3.79 0.22 3.91 0.15 5.90*
Parietal
lobes
3.42 0.18 3.51 0.15 4.39*
Occipital
lobes
3.28 0.2 3.31 0.2 0.74
Between-group comparisons of average brain volume (a), subcortical
volumes (b), cortical surface area (c) and thickness (d) by use of
MANCOVA with gender as a covariate
Significant differences between groups are indicated by asterisks
(*** p \ 0.001, ** p \ 0.005, * p \ 0.05)
Brain Struct Funct (2013) 218:575–585 579
123
Author's personal copy
were excluded. These between-group differences were
strengthened when age was used as a covariate.
Correlations between average cortical thickness for the
seven significant clusters, from the between-groups cortical
thickness analysis, and GA, IQ, BRIEF scores and birth-
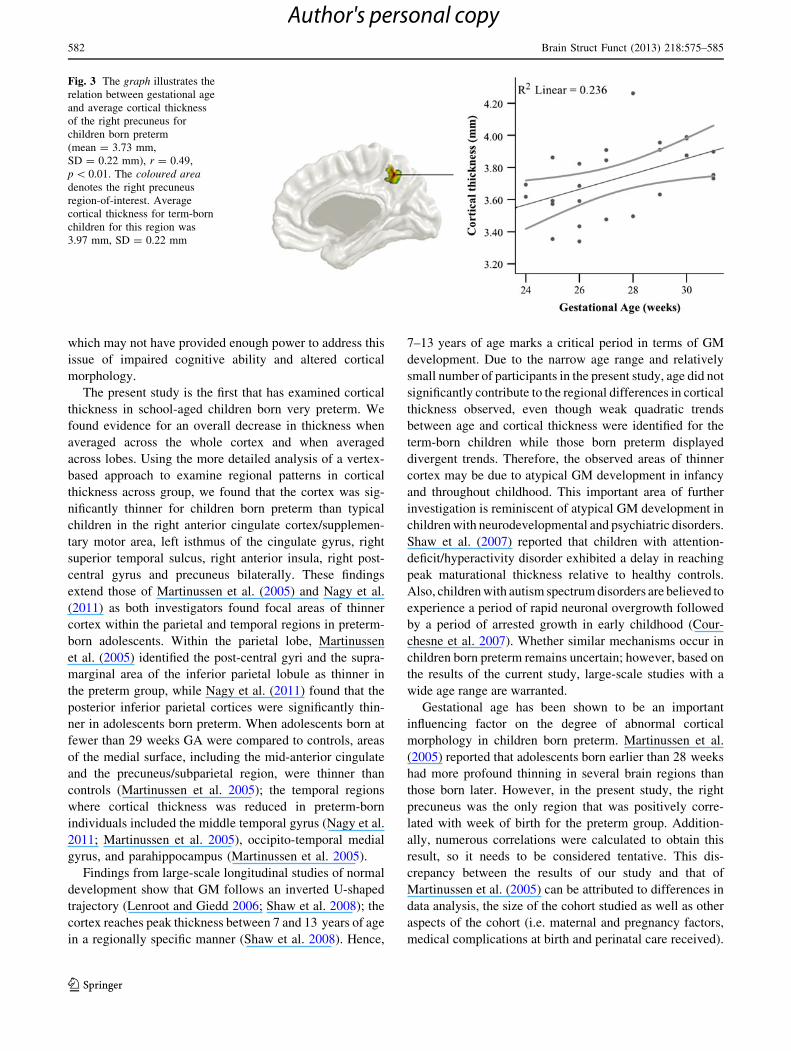
weight were examined for the preterm group. The right pre-
cuneus showed a moderate positive relation between
thickness and GA (r = 0.49, p \ 0.01). Individuals born at
an earlier GA had thinner cortices within the right precuneus
than those born later (see Fig. 3). However, this result was
obtained within the context of performing 28 correlations,
and thus needs to be considered a trend. No significant cor-
relations between IQ or BRIEF scores and average cortical
thickness for the seven clusters within the preterm group were
seen. Similarly, no significant correlations were found for
average cortical thickness within the clusters by birthweight.
Discussion
Preterm birth has a profound effect on neuroanatomical
structure in middle childhood that includes decreased brain
volume, surface area and cortical thickness for children
born very preterm when compared to term-born children at
hemispheric and lobular levels. Additionally, preterm-born
children exhibited an altered relation between total brain
volume and thalamic, globus pallidus and striatum volume.
Cortical thickness analyses identifying regional differences
between groups revealed seven distinct areas of thinner
cortex for the preterm-born children within areas respon-
sible for higher cognitive functioning. Furthermore, right
precuneus thickness for those born preterm was positively
related to GA. These results indicate that very preterm-born
children show evidence of neurodevelopmental disruption,
particularly in cortical regions with relatively protracted
maturation (Shaw et al. 2008).
Children born very preterm had smaller whole-brain
volume as well as GM and WM volumes separately.
However, group differences in GM and WM volume were
not maintained after controlling for total brain volume,
indicating that reductions in tissue volume may not be
independent of this variable. Findings are consistent with
previous studies examining brain volume and prematurity
in childhood and adolescence. For example, Peterson et al.
Fig. 1 Graphs of the relation between subcortical volumes (cm3) and
whole-brain volume (cm3). The coloured lines represent the 95 %
confidence interval for the least squares regression line. Striatum(a) for term-born children, a strong positive correlation was found for
the striatum (r = 0.65, p \ 0.001) and 42 % of the variance in
striatum volume was accounted for by whole-brain volume. (b) No
relation between striatum volume and whole-brain volume was found
for the preterm-born children. Globus pallidus: (c) term-born children
showed a strong relation between globus pallidus volume and brain
volume, which accounted for 42 % of the variance in globus pallidus
volume (r = 0.64, p \ 0.001). Children born preterm did not exhibit
a correlation between these volumetric measures (d). Thalamus(e) term-born children exhibited a strong positive relation between
thalamus volume and brain volume (r = 0.64, p \ 0.001) such that
65 % of variance in thalamic volume was explained by brain volume.
(f) Preterm-born children did not display a significant relation
580 Brain Struct Funct (2013) 218:575–585
123
Author's personal copy
(2000) found reduced cortical volume in children born
preterm at 8 years of age, although they did not distinguish
GM from WM tissue volumes. Martinussen et al. (2005),
Nagy et al. (2009) and Nosarti et al. (2002) demonstrated
similar results in terms of smaller whole brain, GM and
WM volumes in adolescents born preterm or with very low
birthweight. WM damage accompanied by GM involve-
ment is commonly observed in individuals born preterm
(Inder et al. 2005), when tested in infancy. This finding
illustrates that premature birth may impact myelination,
dendritic connections and corticogenesis through childhood
and adolescence. However, impaired cortical development
may also be associated with low birthweight as this is
likely to influence cortical development. While we did not
find any correlations between low birthweight and altered
cortical morphology in the current study, it is difficult to
dissociate this variable from age of preterm birth.
The children born very preterm exhibited smaller sub-
cortical GM volumes than controls in the present study.
This finding is generally consistent with the existing liter-
ature on subcortical GM and prematurity as the basal
ganglia and thalamus are commonly affected subcortical
GM regions in preterm-born children and adolescents
(Kesler et al. 2008; Nosarti et al. 2008; Sie et al. 2000;
Taylor et al. 2011). Most interestingly, the relation between
subcortical GM volume and total brain volume differed
between groups in the current study. Whole-brain volume
of term-born children was strongly correlated with basal
ganglia and thalamic volume. In contrast, whole-brain
volume of children born preterm was not correlated with
basal ganglia and thalamic volume. Thus, in addition to the
reduced subcortical volumes in children born very preterm,
these children did not demonstrate the robust relation
between whole-brain volume and subcortical volume
exhibited by term-born children. This novel finding sug-
gests that subcortical and cortical regions develop differ-
ently after early exposure to the extrauterine environment
(Volpe 2009).
In the current study, average cortical surface area was
relatively decreased in children born preterm and was
maintained at the lobular level, concordant with the few
studies in this area (Ajayi-Obe et al. 2000; Kapellou et al.
2006; Martinussen et al. 2005). In previous studies, it was
shown that preterm birth and low birthweight were related
to reduced cortical surface area and impairments in cog-
nitive abilities (Kapellou et al. 2006). In the present work
we did not find an association between IQ or BRIEF scores
and surface area; however, more specific deficits in exec-
utive functioning that were not measured in this sample
may be shown to be affected in future studies. An addi-
tional consideration is that our sample was relatively small,
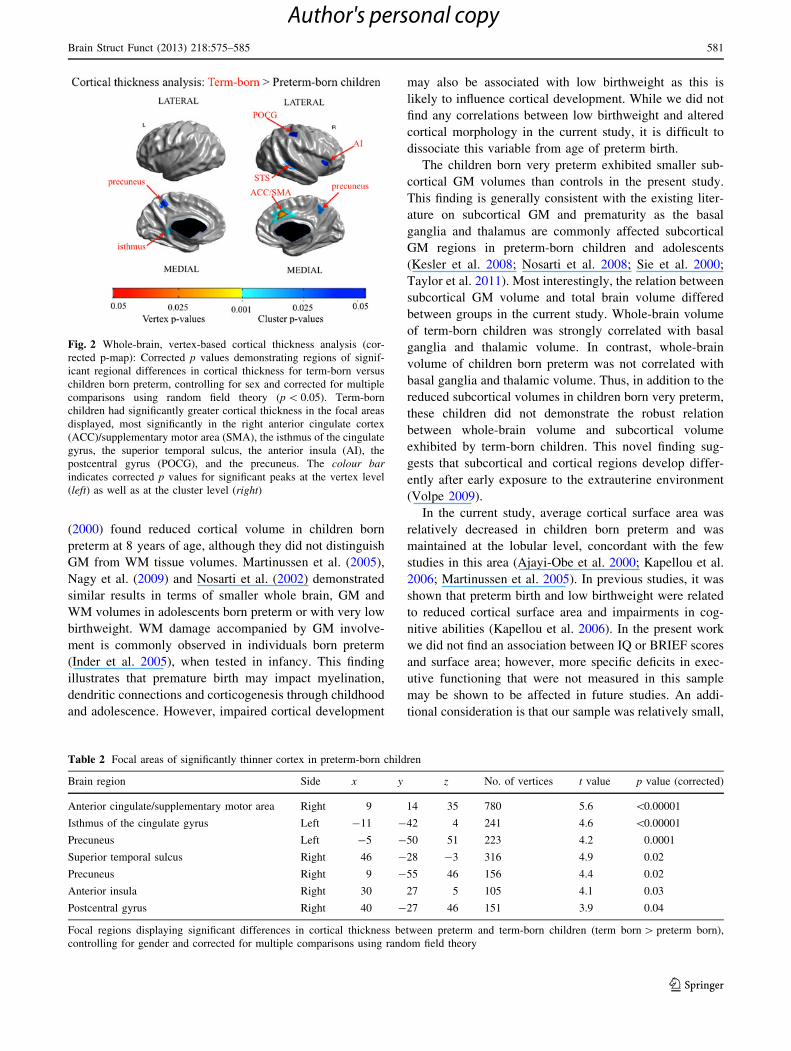
Fig. 2 Whole-brain, vertex-based cortical thickness analysis (cor-
rected p-map): Corrected p values demonstrating regions of signif-
icant regional differences in cortical thickness for term-born versus
children born preterm, controlling for sex and corrected for multiple
comparisons using random field theory (p \ 0.05). Term-born
children had significantly greater cortical thickness in the focal areas
displayed, most significantly in the right anterior cingulate cortex
(ACC)/supplementary motor area (SMA), the isthmus of the cingulate
gyrus, the superior temporal sulcus, the anterior insula (AI), the
postcentral gyrus (POCG), and the precuneus. The colour barindicates corrected p values for significant peaks at the vertex level
(left) as well as at the cluster level (right)
Table 2 Focal areas of significantly thinner cortex in preterm-born children
Brain region Side x y z No. of vertices t value p value (corrected)
Anterior cingulate/supplementary motor area Right 9 14 35 780 5.6 \0.00001
Isthmus of the cingulate gyrus Left -11 -42 4 241 4.6 \0.00001
Precuneus Left -5 -50 51 223 4.2 0.0001
Superior temporal sulcus Right 46 -28 -3 316 4.9 0.02
Precuneus Right 9 -55 46 156 4.4 0.02
Anterior insula Right 30 27 5 105 4.1 0.03
Postcentral gyrus Right 40 -27 46 151 3.9 0.04
Focal regions displaying significant differences in cortical thickness between preterm and term-born children (term born [ preterm born),
controlling for gender and corrected for multiple comparisons using random field theory
Brain Struct Funct (2013) 218:575–585 581
123
Author's personal copy
which may not have provided enough power to address this
issue of impaired cognitive ability and altered cortical
morphology.
The present study is the first that has examined cortical
thickness in school-aged children born very preterm. We
found evidence for an overall decrease in thickness when
averaged across the whole cortex and when averaged
across lobes. Using the more detailed analysis of a vertex-
based approach to examine regional patterns in cortical
thickness across group, we found that the cortex was sig-
nificantly thinner for children born preterm than typical
children in the right anterior cingulate cortex/supplemen-
tary motor area, left isthmus of the cingulate gyrus, right
superior temporal sulcus, right anterior insula, right post-
central gyrus and precuneus bilaterally. These findings
extend those of Martinussen et al. (2005) and Nagy et al.
(2011) as both investigators found focal areas of thinner
cortex within the parietal and temporal regions in preterm-
born adolescents. Within the parietal lobe, Martinussen
et al. (2005) identified the post-central gyri and the supra-
marginal area of the inferior parietal lobule as thinner in
the preterm group, while Nagy et al. (2011) found that the
posterior inferior parietal cortices were significantly thin-
ner in adolescents born preterm. When adolescents born at
fewer than 29 weeks GA were compared to controls, areas
of the medial surface, including the mid-anterior cingulate
and the precuneus/subparietal region, were thinner than
controls (Martinussen et al. 2005); the temporal regions
where cortical thickness was reduced in preterm-born
individuals included the middle temporal gyrus (Nagy et al.
2011; Martinussen et al. 2005), occipito-temporal medial
gyrus, and parahippocampus (Martinussen et al. 2005).
Findings from large-scale longitudinal studies of normal
development show that GM follows an inverted U-shaped
trajectory (Lenroot and Giedd 2006; Shaw et al. 2008); the
cortex reaches peak thickness between 7 and 13 years of age
in a regionally specific manner (Shaw et al. 2008). Hence,
7–13 years of age marks a critical period in terms of GM
development. Due to the narrow age range and relatively
small number of participants in the present study, age did not
significantly contribute to the regional differences in cortical
thickness observed, even though weak quadratic trends
between age and cortical thickness were identified for the
term-born children while those born preterm displayed
divergent trends. Therefore, the observed areas of thinner
cortex may be due to atypical GM development in infancy
and throughout childhood. This important area of further
investigation is reminiscent of atypical GM development in
children with neurodevelopmental and psychiatric disorders.
Shaw et al. (2007) reported that children with attention-
deficit/hyperactivity disorder exhibited a delay in reaching
peak maturational thickness relative to healthy controls.
Also, children with autism spectrum disorders are believed to
experience a period of rapid neuronal overgrowth followed
by a period of arrested growth in early childhood (Cour-
chesne et al. 2007). Whether similar mechanisms occur in
children born preterm remains uncertain; however, based on
the results of the current study, large-scale studies with a
wide age range are warranted.
Gestational age has been shown to be an important
influencing factor on the degree of abnormal cortical
morphology in children born preterm. Martinussen et al.
(2005) reported that adolescents born earlier than 28 weeks
had more profound thinning in several brain regions than
those born later. However, in the present study, the right
precuneus was the only region that was positively corre-
lated with week of birth for the preterm group. Addition-
ally, numerous correlations were calculated to obtain this
result, so it needs to be considered tentative. This dis-
crepancy between the results of our study and that of
Martinussen et al. (2005) can be attributed to differences in
data analysis, the size of the cohort studied as well as other
aspects of the cohort (i.e. maternal and pregnancy factors,
medical complications at birth and perinatal care received).
Fig. 3 The graph illustrates the
relation between gestational age
and average cortical thickness
of the right precuneus for
children born preterm
(mean = 3.73 mm,
SD = 0.22 mm), r = 0.49,
p \ 0.01. The coloured areadenotes the right precuneus
region-of-interest. Average
cortical thickness for term-born
children for this region was
3.97 mm, SD = 0.22 mm
582 Brain Struct Funct (2013) 218:575–585
123
Author's personal copy

The exact mechanism underlying the reduction in cortical
thickness, volume and surface area in those born very pre-
term cannot be determined from the current study, although it
is likely that disruptions of the typical neurodevelopmental
trajectory in the third trimester of pregnancy underlie these
differences. During this period the thalamocortical axons
exit the subplate and enter the cortex forming connections in
the deep cortical plate (Kostovic and Jovanov-Milosevic
2006) leading to a substantial increase in volume from
28–40 weeks (Huppi et al. 1998; Kostovic and Judas 2002;
Kapellou et al. 2006). GABAergic cortical neuronal prolif-
eration occurs during this period as well as migration critical
for the expansion of the superficial cortical layers that
underlie an increase in cortical surface area (Volpe 2009). It
is possible that the extrauterine environment of the preterm-
born babies adversely affects these processes and, in turn,
brain structure.
One important aspect of this study pertains to the medical
history of the children included in our sample. The very
preterm-born infants are routinely screened for PVL or severe
IVH using cranial ultrasound and those with PVL, grade 3 or 4
IVH, or other neurological or severe perinatal findings were
not included in the present cohort. Therefore, significant
differences in brain structure between term-born and very
preterm-born children exist even when only those without
serious neurological or medical conditions are considered.
Another strength of the current study is that the same research
team, using the same facilities and scanner, without any
hardware changes, scanned all participants. This standardised
environment is important in reducing unwanted measurement
error, which may increase the sensitivity of analyses.
Future projects should be conducted on cohorts of very
preterm-born children cared for in other health care set-
tings, as multiple studies must be considered together. This
is especially important in this population as outcome can
depend on the neonatal care received (Murphy et al. 2001;
Gressens et al. 2002; Als et al. 2004) and practices can
differ greatly across sites (Van Reempts et al. 2007). To
gain a greater understanding of the related biological
mechanisms across development, longitudinal studies fol-
lowing preterm infants through childhood are essential.
Acknowledgments This work was supported by the Canadian
Institutes of Health Research [Grant Number MOP-81161 to MJT].
The authors thank Wayne Lee for MRI technical and analysis support
and the staff at the Neonatology Follow-Up Clinics, Hospital for Sick
Children. We also sincerely thank the children and their families who
participated in this study.
References
Ajayi-Obe M, Saeed N, Cowan FM, Rutherford MA, Edwards AD
(2000) Reduced development of cerebral cortex in extremely
preterm infants. Lancet 356(9236):1162–1163
Allin M, Henderson M, Suckling J, Nosarti C, Rushe T, Fearon P,
Stewart AL, Bullmore ET, Rifkin L, Murray R (2004) Effects of
very low birthweight on brain structure in adulthood. Dev Med
Child Neurol 46(1):46–53
Als H, Duffy FH, McAnulty GB, Rivkin MJ, Vajapeyam S, Mulkern
RV, Warfield SK, Huppi PS, Butler SC, Conneman N, Fischer C,
Eichenwald EC (2004) Early experience alters brain function
and structure. Pediatrics 113(4):846–857
Beck S, Wojdyla D, Say L, Betran AP, Merialdi M, Requejo JH,
Rubens C, Menon R, Van Look PF (2010) The worldwide
incidence of preterm birth: a systematic review of maternal
mortality and morbidity. Bull World Health Organ 88(1):31–38
Bohm B, Katz-Salamon M, Institute K, Smedler AC, Lagercrantz H,
Forssberg H (2002) Developmental risks and protective factors
for influencing cognitive outcome at 5 1/2 years of age in very-
low-birthweight children. Dev Med Child Neurol 44(8):508–516
Boucher M, Whitesides S, Evans A (2009) Depth potential function
for folding pattern representation, registration and analysis. Med
Image Anal 13(2):203–214
Breslau N, Chilcoat HD, Johnson EO, Andreski P, Lucia VC (2000)
Neurologic soft signs and low birthweight: their association and
neuropsychiatric implications. Biol Psychiatry 47(1):71–79
Chakravarty MM, Bertrand G, Hodge CP, Sadikot AF, Collins DL
(2006) The creation of a brain atlas for image guided neurosur-
gery using serial histological data. NeuroImage 30(2):359–376
Chakravarty MM, Sadikot AF, Germann J, Bertrand G, Collins DL
(2008) Towards a validation of atlas warping techniques. Med
Image Anal 12(6):713–726
Chakravarty MM, Sadikot AF, Germann J, Hellier P, Bertrand G,
Collins DL (2009) Comparison of piece-wise linear, linear, and
nonlinear atlas-to-patient warping techniques: analysis of the
labeling of subcortical nuclei for functional neurosurgical
applications. Hum Brain Mapp 30(11):3574–3595
Chung MK, Taylor J (2006) Diffusion smoothing on brain surface via
infinite element method. In: Proceedings of Biomedical Imaging:
Macro to Nano, IEEE International Symposium, pp 432–435
Collins DL, Neelin P, Peters TM, Evans AC (1994) Automatic 3D
intersubject registration of MR volumetric data in standardized
Talairach space. J Comput Assist Tomogr 18(2):192–205
Courchesne E, Pierce K, Schumann CM, Redcay E, Buckwalter JA,
Kennedy DP, Morgan J (2007) Mapping early brain development
in autism. Neuron 56(2):399–413
Fearon P, O’Connell P, Frangou S, Aquino P, Nosarti C, Allin M,
Taylor M, Stewart A, Rifkin L, Murray R (2004) Brain volumes
in adult survivors of very low birth weight: a sibling-controlled
study. Pediatrics 114(2):367–371
Frisk V, Whyte H (1994) The long-term consequences of periven-
tricular brain damage on language and verbal memory. Dev
Neuropsych 10:313–333
Gimenez M, Junque C, Narberhaus A, Bargallo N, Botet F, Mercader
JM (2006) White matter volume and concentration reductions in
adolescents with history of very preterm birth: a voxel-based
morphometry study. NeuroImage 32(4):1485–1498
Gioia GA, Isquith PK, Guy SC, Kenworthy L (2000) Behavior rating
inventory of executive function. Child Neuropsychol 6(3):235–238
Gressens P, Rogido M, Paindaveine B, Sola A (2002) The impact of
neonatal intensive care practices on the developing brain.
J Pediatr 140(6):646–653
Huppi PS, Maier SE, Peled S, Zientara GP, Barnes PD, Jolesz FA,
Volpe JJ (1998) Microstructural development of human newborn
cerebral white matter assessed in vivo by diffusion tensor
magnetic resonance imaging. Pediatr Res 44(4):584–590
Inder TE, Wells SJ, Mogridge NB, Spencer C, Volpe JJ (2003)
Defining the nature of the cerebral abnormalities in the
premature infant: a qualitative magnetic resonance imaging
study. J Pediatr 143(2):171–179
Brain Struct Funct (2013) 218:575–585 583
123
Author's personal copy
Inder TE, Warfield SK, Wang H, Huppi PS, Volpe JJ (2005)
Abnormal cerebral structure is present at term in premature
infants. Pediatrics 115(2):286–294
Isaacs EB, Lucas A, Chong WK, Wood SJ, Johnson CL, Marshall C,
Vargha-Khadem F, Gadian DG (2000) Hippocampal volume and
everyday memory in children of very low birth weight. Pediatr
Res 47(6):713–720
Isaacs EB, Edmonds CJ, Chong WK, Lucas A, Morley R, Gadian DG
(2004) Brain morphometry and IQ measurements in preterm
children. Brain 127(Pt 12):2595–2607
Jones SE, Buchbinder BR, Aharon I (2000) Three-dimensional
mapping of cortical thickness using Laplace’s equation. Hum
Brain Mapp 11(1):12–32
Kapellou O, Counsell SJ et al (2006) Abnormal cortical development
after premature birth shown by altered allometric scaling of
brain growth. PLoS Med 3(8):e265. doi:10.1371/journal.pmed.
0030265
Kesler SR, Reiss AL, Vohr B, Watson C, Schneider KC, Katz KH,
Maller-Kesselman J, Silbereis J, Constable RT, Makuch RW,
Ment LR (2008) Brain volume reductions within multiple
cognitive systems in male preterm children at age twelve.
J Pediatr 152(4):513–520
Kostovic I, Jovanov-Milosevic N (2006) The development of cerebral
connections during the first 20–45 weeks’ gestation. Semin Fetal
Neonatal Med 11(6):415–422
Kostovic I, Judas M (2002) Correlation between the sequential
ingrowth of afferents and transient patterns of cortical lamination
in preterm infants. Anat Rec 267(1):1–6
Lenroot RK, Giedd JN (2006) Brain development in children and
adolescents: insights from anatomical magnetic resonance
imaging. Neurosci Biobehav Rev 30(6):718–772
Lerch JP, Evans AC (2005) Cortical thickness analysis examined
through power analysis and a population simulation. NeuroIm-
age 24(1):163–173
Limperopoulos C, Soul JS, Haidar H, Huppi PS, Bassan H, Warfield
SK, Robertson RL, Moore M, Akins P, Volpe JJ, du Plessis AJ
(2005) Impaired trophic interactions between the cerebellum and
the cerebrum among preterm infants. Pediatrics 116(4):844–850
Lyttelton O, Boucher M, Robbins S, Evans A (2007) An unbiased
iterative group registration template for cortical surface analysis.
NeuroImage 34(4):1535–1544
Martinussen M, Fischl B, Larsson HB, Skranes J, Kulseng S,
Vangberg TR, Vik T, Brubakk AM, Haraldseth O, Dale AM
(2005) Cerebral cortex thickness in 15-year-old adolescents with
low birth weight measured by an automated MRI-based method.
Brain 128(Pt 11):2588–2596
Martinussen M, Flanders DW, Fischl B, Busa E, Lohaugen GC,
Skranes J, Vangberg TR, Brubakk AM, Haraldseth O, Dale AM
(2009) Segmental brain volumes and cognitive and perceptual
correlates in 15-year-old adolescents with low birth weight.
J Pediatric 155(6):848–853
Murphy BP, Inder TE, Huppi PS, Warfield S, Zientara GP, Kikinis R,
Jolesz FA, Volpe JJ (2001) Impaired cerebral cortical gray
matter growth after treatment with dexamethasone for neonatal
chronic lung disease. Pediatrics 107(2):217–221
Nagy Z, Ashburner J, Andersson J, Jbabdi S, Draganski B, Skare S,
Bohm B, Smedler AC, Forssberg H, Lagercrantz H (2009)
Structural correlates of preterm birth in the adolescent brain.
Pediatrics 124(5):e964–e972
Nagy Z, Lagercrantz H, Hutton C (2011) Effects of preterm birth on
cortical thickness measured in adolescence. Cereb Cortex
21(2):300–306
Nosarti C, Al-Asady MH, Frangou S, Stewart AL, Rifkin L, Murray
RM (2002) Adolescents who were born very preterm have
decreased brain volumes. Brain 125(Pt 7):1616–1623
Nosarti C, Rushe TM, Woodruff PW, Stewart AL, Rifkin L, Murray
RM (2004) Corpus callosum size and very preterm birth:
relationship to neuropsychological outcome. Brain 127(Pt
9):2080–2089
Nosarti C, Giouroukou E, Healy E, Rifkin L, Walshe M, Reichenberg
A, Chitnis X, Williams SC, Murray RM (2008) Grey and white
matter distribution in very preterm adolescents mediates neuro-
developmental outcome. Brain 131(Pt 1):205–217
Nosarti C, Shergill SS, Allin MP, Walshe M, Rifkin L, Murray RM,
McGuire PK (2009) Neural substrates of letter fluency process-
ing in young adults who were born very preterm: alterations in
frontal and striatal regions. NeuroImage 47(4):1904–1913
O’Brien F, Roth S, Stewart A, Rifkin L, Rushe T, Wyatt J (2004) The
neurodevelopmental progress of infants less than 33 weeks into
adolescence. Arch Dis Child 89(3):207–211
Pennell CE, Jacobsson B, Williams SM, Buus RM, Muglia LJ, Dolan
SM, Morken NH, Ozcelik H, Lye SJ, Relton C (2007) Genetic
epidemiologic studies of preterm birth: guidelines for research.
Am J Obstet Gynecol 196(2):107–118
Peterson BS, Vohr B, Staib LH, Cannistraci CJ, Dolberg A, Schneider
KC, Katz KH, Westerveld M, Sparrow S, Anderson AW,
Duncan CC, Makuch RW, Gore JC, Ment LR (2000) Regional
brain volume abnormalities and long-term cognitive outcome in
preterm infants. JAMA 284(15):1939–1947
Peterson BS, Anderson AW, Ehrenkranz R, Staib LH, Tageldin M,
Colson E, Gore JC, Duncan CC, Makuch R, Ment LR (2003)
Regional brain volumes and their later neurodevelopmental
correlates in term and preterm infants. Pediatrics 111(5 Pt 1):
939–948
Pharoah PO, Stevenson CJ, West CR (2003) General certificate of
secondary education performance in very low birthweight
infants. Arch Dis Child 88(4):295–298
Rakic P (1988) Specification of cerebral cortical areas. Science
241(4862):170–176
Shaw P, Greenstein D, Lerch J, Clasen L, Lenroot R, Gogtay N,
Evans A, Rapoport J, Giedd J (2006) Intellectual ability and
cortical development in children and adolescents. Nature
440(7084):676–679
Shaw P, Eckstrand K, Sharp W, Blumenthal J, Lerch JP, Greenstein
D, Clasen L, Evans A, Giedd J, Rapoport JL (2007) Attention-
deficit/hyperactivity disorder is characterized by a delay in
cortical maturation. PNAS 104(49):19649–19654
Shaw P, Kabani NJ, Lerch JP, Eckstrand K, Lenroot R, Gogtay N,
Greenstein D, Clasen L, Evans A, Rapoport JL, Giedd JN, Wise
SP (2008) Neurodevelopmental trajectories of the human
cerebral cortex. J Neurosci 28(14):3586–3594
Sie LT, van der Knaap MS, Oosting J, de Vries LS, Lafeber HN, Valk
J (2000) MR patterns of hypoxic-ischemic brain damage after
prenatal, perinatal or postnatal asphyxia. Neuropediatrics 31(3):
128–136
Sled JG, Zijdenbos AP, Evans AC (1998) A nonparametric method
for automatic correction of intensity nonuniformity in MRI data.
IEEE Trans Med Imaging 17(1):87–97
Smith SM (2002) Fast robust automated brain extraction. Hum Brain
Mapp 17(3):143–155
Srinivasan L, Dutta R, Counsell SJ, Allsop JM, Boardman JP,
Rutherford MA, Edwards AD (2007) Quantification of deep gray
matter in preterm infants at term-equivalent age using manual
volumetry of 3-tesla magnetic resonance images. Pediatrics
119(4):759–765
Taylor HG, Klein N, Minich NM, Hack M (2000) Middle-school-age
outcomes in children with very low birthweight. Child Dev
71(6):1495–1511
Taylor HG, Filipek PA, Juranek J, Bangert B, Minich N, Hack M
(2011) Brain volumes in adolescents with very low birth weight:
584 Brain Struct Funct (2013) 218:575–585
123
Author's personal copy

effects on brain structure and associations with neuropsycho-
logical outcomes. Dev Neuropsychol 36(1):96–117
Thompson DK, Warfield SK, Carlin JB, Pavlovic M, Wang HX, Bear
M, Kean MJ, Doyle LW, Egan GF, Inder TE (2007) Perinatal
risk factors altering regional brain structure in the preterm infant.
Brain 130(Pt 3):667–677
Tohka J, Zijdenbos A, Evans A (2004) Fast and robust parameter
estimation for statistical partial volume models in brain MRI.
NeuroImage 23(1):84–97
Van Reempts P, Gortner L, Milligan D, Cuttini M, Petrou S, Agostino
R, Field D, den Ouden L, Borch K, Mazela J, Carrapato M,
Zeitlin J (2007) Characteristics of neonatal units that care for
very preterm infants in Europe: results from the MOSAIC study.
Pediatrics 120(4):e815–e825
Volpe JJ (2009) Brain injury in premature infants: a complex
amalgam of destructive and developmental disturbances. Lancet
Neurol 8(1):110–124
Wechsler D (2003) Wechsler Intelligence Scale for Children, 4th edn.
Psychological Corporation, San Antonio, TX
Worsley KJ, Andermann M, Koulis T, MacDonald D, Evans AC
(1999) Detecting changes in nonisotropic images. Hum Brain
Mapp 8(2–3):98–101
Worsley KJ, Taylor JE, Carbonell F, Chung MK, Duerden E,
Bernhardt B, Lyttelton O, Boucher M, Evans AC (2009)
SurfStat: A Matlab toolbox for the statistical analysis of
univariate and multivariate surface and volumetric data using
linear mixed effects models and random field theory. NeuroIm-
age 47 (S102)
Zijdenbos AP, Forghani R, Evans AC (2002) Automatic ‘‘pipeline’’
analysis of 3-D MRI data for clinical trials: application to
multiple sclerosis. IEEE Trans Med Imaging 21(10):1280–1291
Brain Struct Funct (2013) 218:575–585 585
123
Author's personal copy
Top Related
Copyright © 2022 FDOKUMEN

