


Bahasa
Halaman
Hukum

Electronic copy available at: http://ssrn.com/abstract=2521012
Nanotechnology Research and Innovation in Russia:
A Bibliometric Analysis
Project on Emerging Technologies, Trajectories and Implications of Next Generation
Innovation Systems Development in China and Russia
October 2014
Maria Karaulova1
Oliver Shackleton1
Abdullah Gök1
Maxim Kotsemir2
Philip Shapira1
1Manchester Institute of Innovation Research
Manchester Business School, University of Manchester
http://research.mbs.ac.uk/innovation/
2Institute for Statistical Studies and Economics of Knowledge
National Research University Higher School of Economics
http://issek.hse.ru/

Electronic copy available at: http://ssrn.com/abstract=2521012
Nanotechnology Research and Innovation in Russia: A Bibliometric Analysis
2 Manchester Institute of Innovation Research
This work was supported by the Economic and Social Research Council [grant number
ES/J012785/1] as part of the project Emerging Technologies, Trajectories and Implications of
Next Generation Innovation Systems Development in China and Russia.
The project addresses research, management and policy issues related to advanced
technological development in driving the growth of Rising Powers, with a focus on
nanotechnology in China and Russia and associated issues of institutional development,
governance and global impact.
See http://www.risingpowers.net/projects/innovationsystems/ for further information about
the project, including other outputs
The authors appreciate the assistance of Weishu Liu in database development and Marianne
Sensier in editing.
Any opinions, findings, and conclusions or recommendations expressed in this material are
those of the authors and do not necessarily reflect the views of the project sponsors or authors’
institutions.
Recommended Citation
Maria Karaulova, Oliver Shackleton, Abdullah Gök, Maxim Kotsemir and Philip Shapira, Nanotechnology Research and
Innovation in Russia: A Bibliometric Analysis. Working Paper, Project on Emerging Technologies, Trajectories and
Implications of Next Generation Innovation Systems Development in China and Russia, Manchester Institute of
Innovation Research, University of Manchester, Manchester, 2014 (October).

Nanotechnology Research and Innovation in Russia: A Bibliometric Analysis
3 Manchester Institute of Innovation Research
Table of Content
Table of Figures ................................................................................................................................................................. 4
List of Tables ....................................................................................................................................................................... 5
Abstract ................................................................................................................................................................................ 7
1 Introduction .............................................................................................................................................................. 8
2 Data Sources and Methods .................................................................................................................................. 9
3 Analyses ................................................................................................................................................................... 10
3.1 Patterns of Russian nanotechnology publication activity ....................................................... 10
3.1.1 Growth of publications...................................................................................................................... 10
3.1.2 Publications Language ...................................................................................................................... 10
3.1.3 Publication Journals ........................................................................................................................... 11
3.1.4 Leading Russian Institutions Publishing in Nanotechnology ........................................... 13
3.1.5 Researchers ........................................................................................................................................... 15
3.1.6 Organisational Structure of Russian Nanotechnology Research Publishing .............. 20
3.1.8 Institutional Collaborations ............................................................................................................ 22
3.1.9 Subject Areas ......................................................................................................................................... 23
3.1.10 The Russian Academy of Sciences (RAS) ............................................................................. 26
3.1.11 Leading Institutions for International Collaboration ...................................................... 35
3.1.12 Top-collaborating countries ...................................................................................................... 35
3.1.13 International co-authorship patterns by Region .............................................................. 37
3.1.14 Leading International Partners, Russian Nanotechnology Publications ................ 37
3.1.15 International Collaboration by the Type of Organisation ............................................. 39
3.2 Funding Trends ......................................................................................................................................... 40
3.2.1 Main Russian Funders ....................................................................................................................... 40
3.2.2 Leading Foreign Funders ................................................................................................................. 43
3.2.3 Recent Developments in Funding................................................................................................. 45
3.2.4 Funding distribution across the subject areas ........................................................................ 47
3.3 Indicators of Research Performance ................................................................................................ 50
3.3.1 Research Performance Analysis Based on Publications Data ........................................... 50
3.4 Patenting Patterns.................................................................................................................................... 52
3.4.1 Proportion of Domestic/Collaborated Patenting ................................................................... 54
3.4.2 Top Russian Nanotechnology Patent Assignees ..................................................................... 54
4 Summary of Findings.......................................................................................................................................... 56
5 Appendix.................................................................................................................................................................. 57
5.1 Publication Database .............................................................................................................................. 57

Nanotechnology Research and Innovation in Russia: A Bibliometric Analysis
4 Manchester Institute of Innovation Research
5.1.1 Cleaning of Fields ................................................................................................................................ 57
5.1.2 Domestic (NCP) and International (ICP) ................................................................................... 57
5.1.3 Affiliations .............................................................................................................................................. 57
5.1.4 Funding Information. ......................................................................................................................... 58
5.2 Patent Database ........................................................................................................................................ 59
5.3 Limitations .................................................................................................................................................. 59
Table of Figures
Figure 1. Annual Publication Growth, Russian Nanotechnology ............................................................... 10
Figure 2. Domestic and International (Foreign) Publications – Percentage Growth Rates, 1990-
2012 .................................................................................................................................................................................... 10
Figure 3. Yearly Russian Nanotechnology Publication Output, Russian-language ............................ 11
Figure 4. Annual Growth of English Language Publications in Russian and Non-Russian Journals
............................................................................................................................................................................................... 13
Figure 5. Russian Nanotechnology Publications by Journal Type and Organisation, 1990-2012 13
Figure 6. Domestic Publications by Sector .......................................................................................................... 20
Figure 7. PRO and Corporate Publications Outputs, Russian Nanotechnology Publications, 1990-
2012 .................................................................................................................................................................................... 21
Figure 8. Leading PRO publishers in Russian Nanotechnology, 1990-2012 ......................................... 21
Figure 9. University and PRO Collaborations, Russian Nanotechnology Publications, 1990-2012
............................................................................................................................................................................................... 22
Figure 10 Corporate and RAS Collaborations, Russian Nanotechology Publications, 1990-2012
............................................................................................................................................................................................... 22
Figure 11. Russian Nanotechnology Publications, Subject Area Map according to WOS categories
............................................................................................................................................................................................... 23
Figure 12. Subject Areas for Russian Academies of Science and University Publications .............. 24
Figure 13. Subject Areas for PRO and Corporate Publications ................................................................... 24
Figure 14. Russian Nanotechnology Publications by Selected Subject Areas and Organisational
Type ..................................................................................................................................................................................... 25
Figure 15. RAS Nanotechnology Publications, 1990-2012........................................................................... 27
Figure 16. Contribution of RAS to All Russian Nanotechnology Papers (Annual).............................. 27
Figure 17. Ioffe Institute and MSU Annual Publication Outputs ................................................................ 29
Figure 18. 5-Year Average Nanotechnology Publication Growth of Selected RAS Institutes (Rank
2-10) ................................................................................................................................................................................... 30
Figure 19. 5-Year Average Nanotechnology Publication Growth of Selected RAS Institutes (Rank
11-20) ................................................................................................................................................................................. 30
Figure 20. Distribution of Variance of Collaboration for leading RAS Nanotechnology Publishing
Institutes ........................................................................................................................................................................... 31
Figure 21. Time Series Data on Regional Nanotechnology Publishing in RAS ..................................... 34

Nanotechnology Research and Innovation in Russia: A Bibliometric Analysis
5 Manchester Institute of Innovation Research
Figure 22. Time Series Data on the Top-6 Collaborating Countries, Russian Nanotechnology
Publications ..................................................................................................................................................................... 36
Figure 23. International Co-Authorship Patterns by Region, Russian Nanotechnology
Publications ..................................................................................................................................................................... 37
Figure 24. 5-Year Average Time Series Data for the Top 7 Foreign Collaborating Organisations39
Figure 25. Foreign Organisations by Type, Internationally Collaborated Russian Nanotechnology
Publications ..................................................................................................................................................................... 39
Figure 26. Percentage Cover of Top 20 Funders (Domestic) ...................................................................... 42
Figure 27. Top 20 Funders (International) of Russian Nanotechnology Publications, mid-2008-
2012 .................................................................................................................................................................................... 44
Figure 28 Funding Sectors of Russian Nanotechnology Publications mid-2008-2012 .................... 46
Figure 29. Funding Sectors in Records of Nanotechnology Publications 1990-2012 (without
Public Funders) .............................................................................................................................................................. 46
Figure 30. Top 10 Subject Areas for Public Funding, Russian Nanotechnology Publications, mid-
2008-2012 ........................................................................................................................................................................ 47
Figure 31. Top 10 Subject Areas for Public Research Organisation Funders, Russian
Nanotechnology Publications, mid-2008-2012 ................................................................................................ 47
Figure 32. Top 10 Subject Areas for University Funders, Russian Nanotechnology Publications,
mid-2008-2012 .............................................................................................................................................................. 48
Figure 33. Top 10 Subject Areas for Corporate Funders, Russian Nanotechnology Publications,
mid-2008-2012 .............................................................................................................................................................. 49
Figure 34. The Growth of Nano Patent Applications 1990-2012 .............................................................. 52
Figure 35. Growth of Nanotechnology Patent Applications by Russia and Great Britain, 1990-
2012 .................................................................................................................................................................................... 53
Figure 36. Domestic Russian Nanotechnology Patent Applications by Type of Organisation ...... 54
List of Tables
Table 1. Top-20 Journals – Nanotechnology Papers by Russian Authors, 1990-2012 ..................... 12
Table 2. Leading Institutions, Russian nanotechnology papers, 1990-2012 ........................................ 14
Table 3. Top 20 Most Productive Authors, Russian Nanotechnology Papers, 1990-2012 ............. 16
Table 4. Highly Cited Authors, Russian Nanotechnology publications, 1990-2012 .......................... 18
Table 5. Top 10 Most Cited Subject Areas, Russian Nanotechnology Publications, 1990-2012 ... 26
Table 6. Top-20 Institutions of RAS by Nanotechnology Publications, 1990-2012 ........................... 28
Table 7. Top-10 Contributing RAS Authors in Nanotechnology ................................................................ 28
Table 8. Non-RAS Collaborations of the leading RAS Institutes, Nanotechnology Publications... 32
Table 9. Regional Distribution of RAS Nanotechnology Publications ...................................................... 33
Table 10. Regional Distribution of RAS Publications Across Federal Districts .................................... 34
Table 11. Internationally Collaborating Russian Organisations, Nanotechnology Publications,
1990-2012 ........................................................................................................................................................................ 35
Table 12. Top Collaborating Countries, Russian Nanotechnology Papers, 1990-2012 .................... 36
Table 13. Leading International Partners ........................................................................................................... 38
Table 14. Top 20 Domestic Funding Sponsors of Russian Nanotechnology Publications, mid-
2008-2012 ........................................................................................................................................................................ 43
Nanotechnology Research and Innovation in Russia: A Bibliometric Analysis
6 Manchester Institute of Innovation Research
Table 15. Top 20 (Foreign) Sources of Research Sponsorship, mid-2008-2012 ................................ 45
Table 16. Average Number of Citations in Internationally Collaborated Russian publications by
Country .............................................................................................................................................................................. 50
Table 17. Average Number of Citations in Internationally Collaborated Russian Publications by
Region ................................................................................................................................................................................. 51
Table 18. Top 20 Russian Nanotechnology Patent Assignees (Domestic) 1990-2012 ..................... 55
Nanotechnology Research and Innovation in Russia: A Bibliometric Analysis
7 Manchester Institute of Innovation Research
Abstract
This working paper presents findings from analyses of Russian nanotechnology outputs in
publications and patents focusing on developments over the period 1990 through to 2012. The
investigation draws on bibliometric datasets of scientific journal publications and patents and
on available secondary English-language and Russian sources.
The document provides both an overview and detailed analyses of nanotechnology research
and innovation in Russia. The examination of publications highlights sectoral trends, leading
authors and organizations, and acknowledgements to funding sources. The analysis of patents
adds further evidence about patterns of invention and ownership of intellectual property
emanating from research and development in Russian nanotechnology.
The analyses in this paper have been undertaken to provide an information base for further
research on the current state and trajectory of nanotechnology in Russia and on the broader
development of Russia’s innovation system. Comparisons with Chinese publication and patent
outputs can be seen in a parallel report on Nanotechnology Research and Innovation in China
(2014).1
1 Maria Karaulova and Mikhail Gershman. Nanotechnology Research and Innovation in China. Project on Emerging
Technologies, Trajectories and Implications of Next Generation Innovation Systems Development in China and
Russia, Manchester Institute of Innovation Research, Manchester, 2014.
Nanotechnology Research and Innovation in Russia: A Bibliometric Analysis
8 Manchester Institute of Innovation Research
1 Introduction
This paper presents findings from analyses of Russian Nanotechnology outputs in publications
and patents focusing on developments over the period 1990 through to 2012. The investigation
draws on bibliometric datasets of scientific journal publications and patents and on available
secondary English-language and Russian sources. The analyses have been undertaken to
provide an information base for further research on the current state and trajectory of
nanotechnology in Russia and on the broader development of Russia’s innovation system.
The existing literature on nanotechnology research and innovation Russia is less prodigious
than analogous analyses of China and other “Rising Powers” countries (such as Brazil and
India). However, there have been several studies that have profiled nanotechnology
developments in Russia or included Russia as a benchmark country.2 The present study seeks to
provide an updated bibliometric analysis that presents a systematic view of the structure and
trends in the development of nanotechnology in Russia. We also examine aspects (such as
funding acknowledgements) where novel data is now available. The following key topics are
examined:
� Nanotechnology publication patterns – the structure and regional distribution of publishing,
specialisations of Russian researchers, and main actors and leading institutions of
publishing activity;
� Dynamics of international collaboration in nanotechnology by Russian (and Soviet)
researchers over time;
� Funding trends in nanotechnology by Russian and foreign research sponsors – using
funding acknowledgements data where available in publication records, including
comparative analysis of domestic and foreign funding, and the impact on the research
outputs;
� Research performance of Russian nanotechnology researchers;
� Nanotechnology patenting patterns of Russian inventors, including main actors and leading
institutions of the patenting activity.
� Dynamics of international collaboration of Russian nanotechnology patenting.
2 See, for example, Terekhov, A.I., "Nanotechnologies and Nanomaterials in the Modern World." Herald of the Russian
Academy of Sciences, October 2009, 79, 5, pp 412-419; Xuan L., Zhang, P., Li, X., Chen, H., Dang, Y., Larson, C., Roco,
M.C., Wang, X. "Trends for nanotechnology development in China, Russia, and India," Journal of Nanoparticle Research,
Nov 2009, 11(8): 1845–1866; Karasev, O., Rudnik, P., Sokolov, A. "Emerging technology-related markets in Russia:
The Case of nanotechnology." Journal of East-West Business, 2011, 17, 2-3, pp. 101-119; and Gokhberg L., Fursov K.,
Karasev O. "Nanotechnology development and regulatory framework: The case of Russia." Technovation, 2012, 32, 3–
4, pp. 161–162.
Nanotechnology Research and Innovation in Russia: A Bibliometric Analysis
9 Manchester Institute of Innovation Research
2 Data Sources and Methods
The bibliometric analysis draws on datasets of nanotechnology publications and patents
developed by researchers at Georgia Institute of Technology and the Manchester Institute of
Innovation Research. Two data sources are used: the Web of Science (scientific publications)
and Derwent Innovations (patents). Both data sources are published and made available in the
Web of Knowledge by ThomsonReuters.
Nanotechnology records in these databases are identified using the two-stage search strategy
detailed in Porter et al., 2008,3 and updated in Arora et al., 2012.4 A keyword search based on a
Boolean query is applied. Unrelated records are then removed by using a series of exclusion
terms. Further data cleaning to remove duplicates and consolidate organisational and author
names is undertaken using VantagePoint text mining software. Search and data cleaning
processes were completed in mid-2013. The resulting database covered the period from 1990
through to 2012, from the breakup of the Soviet Union until the last full year available to us.
The defining characteristic that we used to identify Russian publications was that at least one
author of each included publication had to have a Russian affiliation address (Soviet Union in
1990-1992). The primary language of publications in the dataset is English, but specialised
editions that include translated articles originally published in Russian are included as well. In
total, 33,538 Russian nanotechnology publication records were identified (1990-2012).
Nanotechnology patent records were identified using the same search strategy. Russian patents
were defined as those patents listing Russia as the patent priority country. In total, 3,350
Russian nanotechnology patent families were identified (1990-2012).
Both publication and patent databases required cleaning of the records to reduce duplicate
entries. We further grouped the data according to country, region, and type of affiliation. Our
analysis mostly examines these groupings to develop an understanding of broader themes and
trends of in Russian nanotechnology research. Further descriptions of the cleaning and
grouping strategies can be found in Appendixes 1 and 2 for publications and patents
respectively.
3 Porter, A., Youtie, J., Shapira, P., Schoeneck, D., “Refining Search Terms for Nanotechnology,” Journal of Nanoparticle
Research, 2008, 10(5), 715-728. 4 Arora, S., Porter, A.L., Youtie, J., and Shapira, P. “Capturing new developments in an emerging technology: An
updated search strategy for identifying nanotechnology research outputs.” Scientometrics, 2013 (April), 95, 1, 351-
370.
Nanotechnology Research and Innovation in Russia: A Bibliometric Analysis
10 Manchester Institute of Innovation Research
0
500
1000
1500
2000
2500
3000
3500
4000
4500
5000
Domestic Foreign
3 Analyses
3.1 Patterns of Russian nanotechnology publication activity
3.1.1 Growth of publications
The output of Russian nanotechnology publications recorded in the Web of Science (WoS)
steadily increased between 1990 and 2012. The total number of publications was 33,538 over
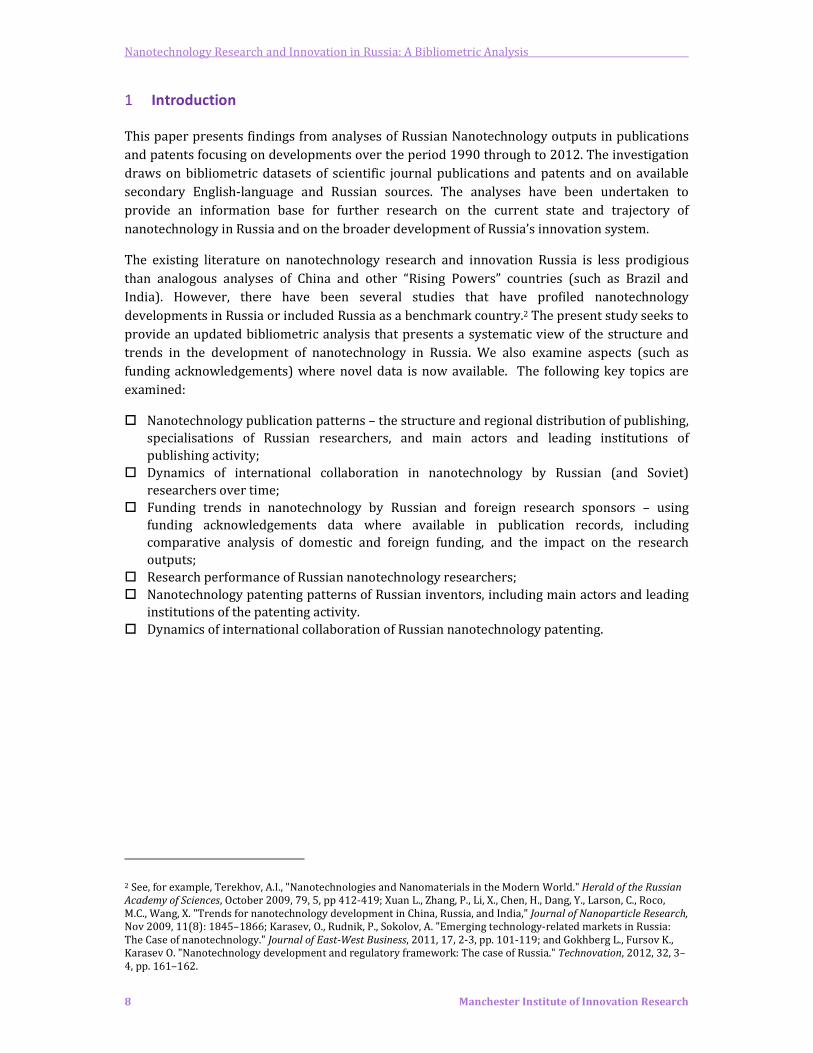
the full time period, with nearly 3,500 papers published in 2012. In 1998, there was a
considerable jump in the number of publications; this probably reflects the fresh inclusion of a
series of Russian journals within the WoS (Figure 1).
Figure 1. Annual Publication Growth, Russian Nanotechnology
Figure 2. Domestic and International (Foreign) Publications – Percentage Growth Rates, 1990-2012
Russian Web of Science nanotechnology publications, 1990-2012 (N=33.5K).
Russian internationally collaborated nanotechnology publications (with one or more authors
located outside of Russia) also grew over the study time period (Figure 1, internationally
collaborated publications denoted as “foreign”). Significantly, domestic publications (all authors
located in Russia) grew faster than the internationally collaborated papers over the total period.
However, from 1999 until 2012 growth rates for domestic and international publications are
almost identical at about 1.1% per year on average.
3.1.2 Publications Language
Russian nanotechnology papers listed in WoS are published in seven languages. Papers in
English comprise 98% of publications. Papers in Russian comprise 1.83% of publications, with
0
0.5
1
1.5
2
2.5
3
3.5
4
19
91
19
93
19
95
19
97
19
99
20
01
20
03
20
05
20
07
20
09
20
11
Domestic
Foreign

Nanotechnology Research and Innovation in Russia: A Bibliometric Analysis
11 Manchester Institute of Innovation Research
the other five languages being an insignificant minority. Over the study period, the growth in
Russian WoS nanotechnology publications is almost entirely due to English-language
publications. The number of Russian-language WoS publications grew until 1999, but since
then has demonstrated a sharp decline (see Figure 3).
Figure 3. Yearly Russian Nanotechnology Publication Output, Russian-language
Russian Web of Science nanotechnology publications, 1990-2012.
The peak of WoS publishing in Russian was during the period 1998-2000. This is also the peak
for annual publications produced by the Ioffe Physics Institute of the Russian Academy of
Sciences in St Petersburg and of the most productive Russian scientists publishing WOS papers
in Russian, according to our dataset. It should be noted that changes in WoS Russian-language
publications are influenced by the specific journals that the Web of Science includes in its
database. While Russian nanotechnology scientists have increased their English-language WoS
publications, they also continue to publish in Russian-language journals that are not indexed in
the Web of Science. Additionally, Russian scientists have other channels to publish their
research in English: there are a number of English Language translations of the leading journals
in Russian available internationally (see further discussion in next section).
3.1.3 Publication Journals
Field data for the journal source is available for 32,844 (or 97%) of our total database of
Russian WoS papers. The majority of Russian publications in English were published in
translated journals. Out of the top twenty journals with the greatest number of Russian
publications, 14 were translated versions of Russian journals (Table 1).5 About 35% of all
5 Translated versions of Russian journals are identified not by the publishing body (the rights to publish in most
cases are owned by Springer), but by the contents of the journal and the editorial board of the journal. For example,
The Physics of the Solid State (No2 in Table 1) is published by Springer. The description says “The journal Physics of the Solid State presents the latest results from Russia’s leading researchers in condensed matter physics at the
Russian Academy of Sciences and other prestigious institutions.
(http://www.springer.com/materials/journal/11451) However the analogous journal, called Phyzika Tvyordogo Tela
(The Physics of the Solid State) is published in Russian by the Ioffe Institute in St.Petersburg
(http://journals.ioffe.ru/ftt/). The Chief Editor of both journals is A.A. Kaplyanskii, and the editorial board matches
the one listed on the Springer website. Tables of contents of several recent issues match as well. From this
information we made the conclusion that The Physics of the Solid State is a translated version of Phyzika Tvyordogo
Tela, and the ‘publishing body’ is therefore an Institute within the Russian Academy of Science (the publishing body
of the original), not Springer (the publishing body of the translated version).
0
20
40
60
80
100
120
19
90
19
91
19
92
19
93
19
94
19
95
19
96
19
97
19
98
19
99
20
00
20
01
20
02
20
03
20
04
20
05
20
06
20
07
20
08
20
09
20
10
20
11
20
12

Nanotechnology Research and Innovation in Russia: A Bibliometric Analysis
12 Manchester Institute of Innovation Research
publications were published in the top twenty journals, with papers in translated Russian
journals included into the top-20 sources constituting about one quarter of these papers.
Table 1. Top-20 Journals – Nanotechnology Papers by Russian Authors, 1990-2012
Papers Journal Publishing Body Share*
1 1595 Phys. Rev. B APS 4.86%
2 1412 Phys. Solid State RAS 4.30%
3 1255 Semiconductors RAS 3.82%
4 848 Tech. Phys. Lett. RAS 2.58%
5 828 Jetp Lett. RAS 2.52%
6 511 Inorg. Mater. RAS 1.56%
7 510 Appl. Phys. Lett. American Institute of Physics 1.55%
8 505 J. Appl. Phys. AIP Publishing 1.54%
9 490 J. Exp. Theor. Phys. RAS 1.49%
10 411 Russ. Chem. Bull. RAS 1.25%
11 403 Tech. Phys. RAS 1.23%
12 348 Russ. J. Appl. Chem. RAS 1.06%
13 342 Phys. Rev. Lett. APS 1.04%
14 337 Phys. Metals Metallogr. RAS 1.03%
15 315 Fuller. Nanotub. Carbon
Nanostruct.
Taylor and Francis 0.96%
16 305 Opt. Spectrosc. RAS 0.93%
17 305 Thin Solid Films Elsevier 0.93%
18 296 J. Surf. Ingestig.-X-Ray
Synchro.
RAS 0.90%
19 293 Glass Phys. Chem. RAS 0.89%
20 288 Russ. J. Phys. Chem. A RAS 0.88% *Share of total Russian Web of Science nanotechnology publications with journal data (N=32,844), 1990-2012.
RAS = Russian Academy of Sciences (translated English-language journal).
It is common for a paper to be first published in a Russian peer-reviewed journal, and
subsequently translated and published in the English version of that journal. As a side note, if
our database had a large number of publications in Russian, it would mean a large number of
duplicated papers; however, this is not the case.
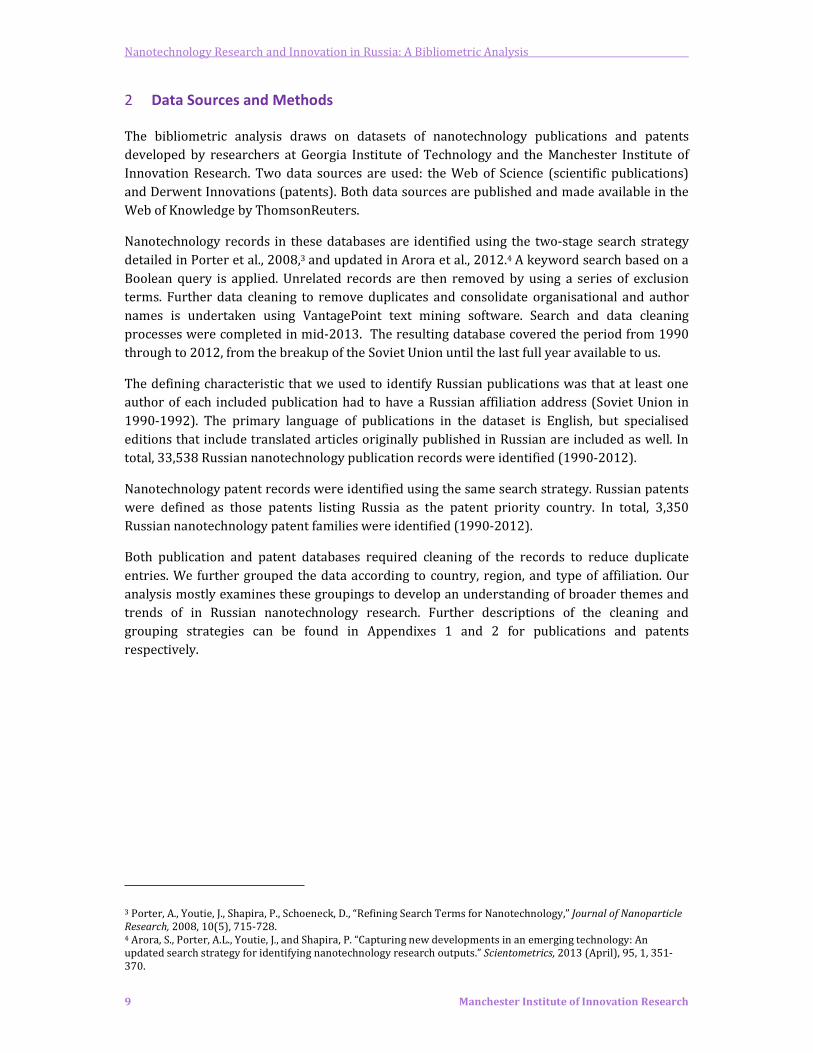
The annual growth of publications in English is much more rapid in journals translated from
Russian rather than in international journals initially published in English (Figure 4). Russian
scientists prefer to publish in domestic journals, and the domestic science structure remains
inward-oriented.
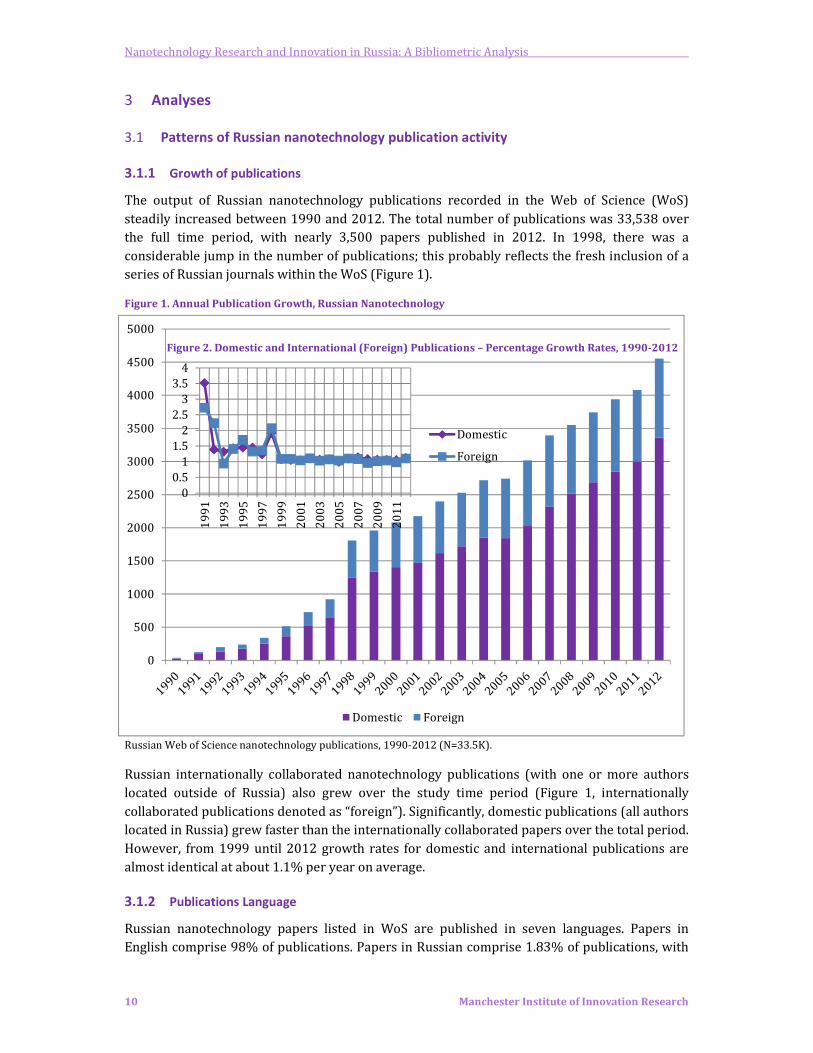
In absolute numbers there is a prevalence of publications in translated versions of domestic
journals from institutes of the Russian Academy of Sciences and universities, with some
representation from public research organisations (PROs) and corporate actors (Figure 5).
However, there are minor sectoral differences: researchers from the Russian Academy of
Sciences and public research organisations publish relatively more in non-Russian journals,
whereas university researchers are more likely to publish in English-language translations of
Russian journals.
Nanotechnology Research and Innovation in Russia: A Bibliometric Analysis
13 Manchester Institute of Innovation Research
Figure 4. Annual Growth of English Language Publications in Russian and Non-Russian Journals
Russian Web of Science nanotechnology English language publications, 1990-2012. RU_translated = papers published
first in Russian, then in translated English-Language journals. Non-RU = papers first published in English-language
international journals.
Figure 5. Russian Nanotechnology Publications by Journal Type and Organisation, 1990-2012
Russian Web of Science nanotechnology publications, 1990-2012.
RU_translated = papers published first in Russian, then in translated English-Language journals.
Non-RU = papers first published in English-language international journals.
3.1.4 Leading Russian Institutions Publishing in Nanotechnology
There is a high concentration of Russian publishing activity in nanotechnology within a few
major organisations. In our study period, the top-twenty leading Russian institutions publishing
in nanotechnology comprised the Russian Academy of Sciences (RAS), 15 universities and four
State Research Institutes (Table 2). Although these organisations all are state-owned they differ
in structure and methods of funding. Among the top-20 domestic publishers 68% of
publications are produced by the Russian Academy of Sciences and another 12% by the Moscow
State University (MSU). The top-20 organisations together produced 87.4% of all Russian
nanotechnology publications in 1990-2012. The top three organisations – RAS, MSU and St
Petersburg State University (SPSU) – produced 78% of all Russian nanotechnology publications
0
200
400
600
800
1000
1200
1 9478 RU_translated
2 3572 Non-RU

Nanotechnology Research and Innovation in Russia: A Bibliometric Analysis
14 Manchester Institute of Innovation Research
over the study period. (The RAS has more than 500 institutes. The distribution of RAS
nanotechnology publications by individual RAS institutes is discussed in Section 3.1.9.2.)
Table 2. Leading Institutions, Russian nanotechnology papers, 1990-2012 Organisation name Records Share of
the total
1 RAS 22794 68.12%
2 Moscow MV Lomonosov State Univ 4007 11.98%
3 St Petersburg State Univ 1208 3.61%
4 RRC Kurchatov Inst 613 1.83%
5 Nizhnii Novgorod State Univ 496 1.48%
6 Natl Univ Sci & Technol MISIS 484 1.45%
7 Novosibirsk State Univ 429 1.28%
8 Dubna Joint Nucl Res Inst 427 1.28%
9 St Petersburg Tech Univ State Inst Technol 405 1.21%
10 Russian Res Ctr Vavilov Opt Inst 390 1.17%
11 Ural Fed Univ 359 1.07%
12 Ufa State Aviat Tech Univ 325 0.97%
13 Karpov Inst Phys Chem 294 0.88%
14 Kazan Fed Univ 288 0.86%
15 St Petersburg State Univ Informat Technol Mech
& Opt
286 0.85%
16 Moscow Engn Phys Inst State Univ 284 0.85%
17 Voronezh Tech Univ 283 0.85%
18 St Petersburg State Polytech Univ 274 0.82%
19 Moscow Inst Phys & Technol MFTI 233 0.70%
20 Medeleev Univ Chem Technol 218 0.65% Russian Web of Science nanotechnology publications, 1990-2012 (N=33.5K). Total sums to over 100% due to
institutional co-authorships.
It is apparent that three organisations (RAS, MSU and SPSU) dominate Russian nanotechnology
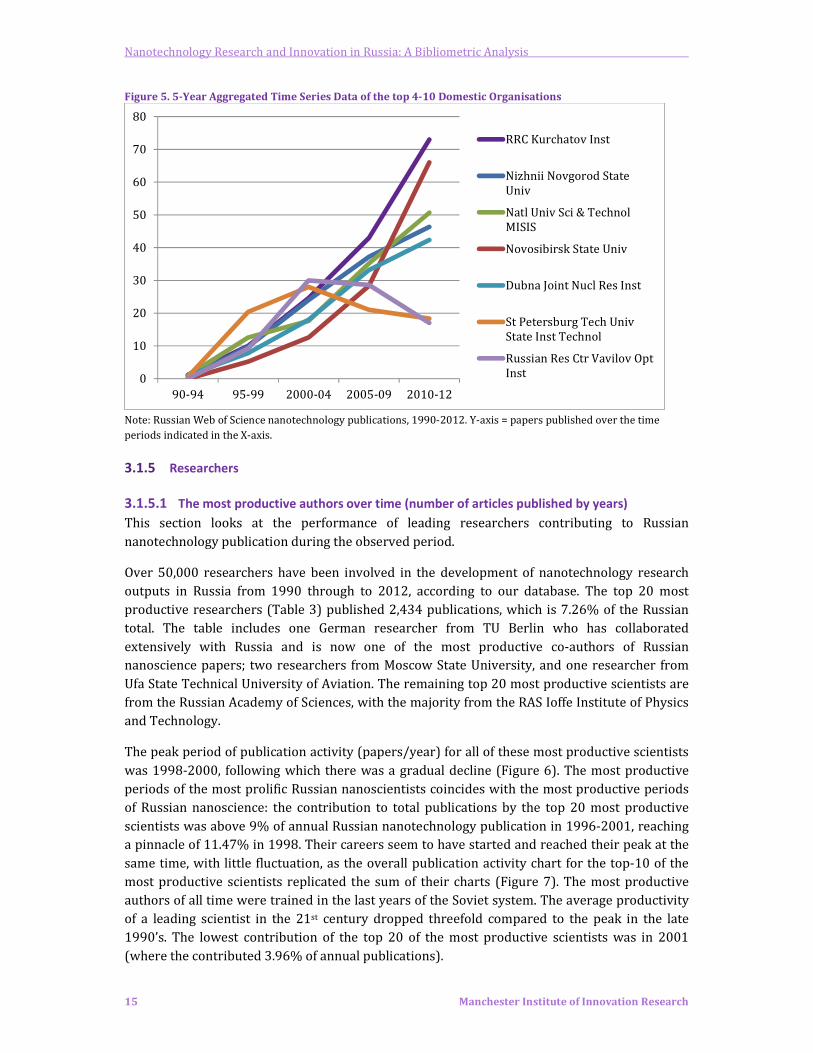
publishing by the volume of papers produced. Nonetheless, the next tier of organisations
(ranked 4 through 20) contributed more than one-fifth of Russian nanotechnology papers in the
period 1990-2012. Looking at the ten organisations in the next tier ranked from 4 through to
11, there are two organisations that have grown rapidly by nanotechnology paper output: the
All Russian Science Centre Kurchatov Institute and Novosibirsk State University. Other
organisations show less rapid growth, while two organisations (the All Russia State Science
Centre Optics Institute and the St Petersburg Institute of Technology) show a declining trend
since the early 2000s. (Figure 5.)
Nanotechnology Research and Innovation in Russia: A Bibliometric Analysis
15 Manchester Institute of Innovation Research
Figure 5. 5-Year Aggregated Time Series Data of the top 4-10 Domestic Organisations
Note: Russian Web of Science nanotechnology publications, 1990-2012. Y-axis = papers published over the time
periods indicated in the X-axis.
3.1.5 Researchers
3.1.5.1 The most productive authors over time (number of articles published by years)
This section looks at the performance of leading researchers contributing to Russian
nanotechnology publication during the observed period.
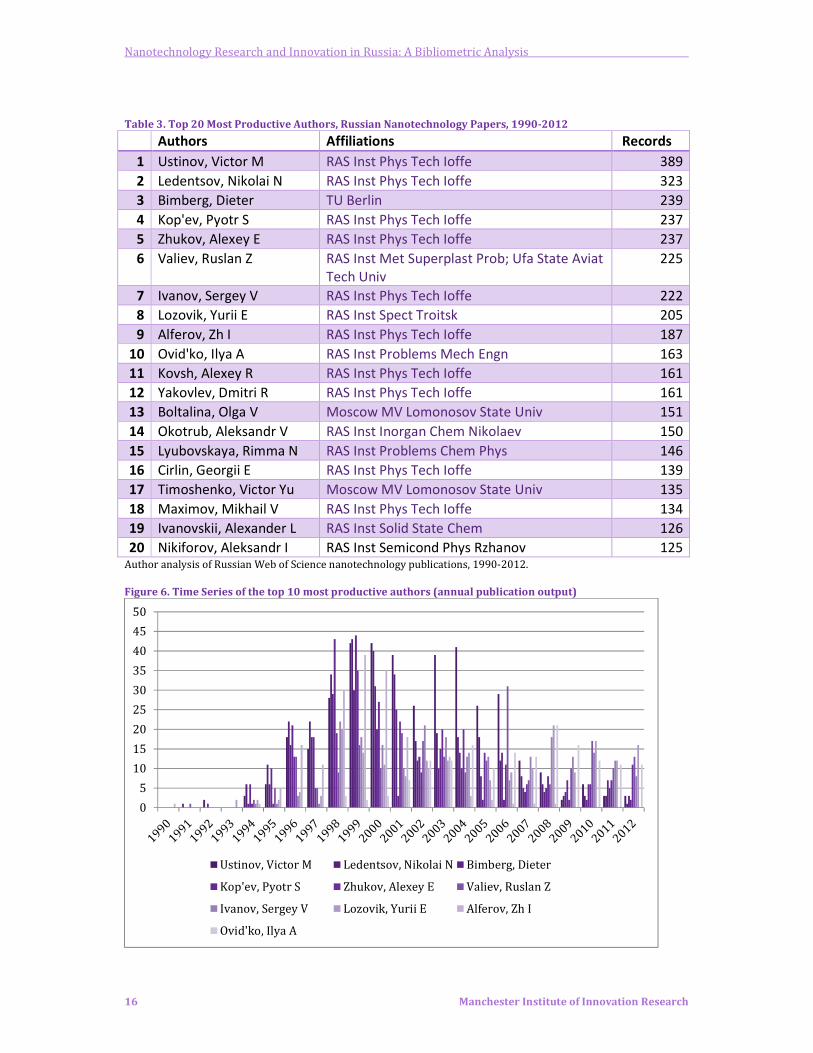
Over 50,000 researchers have been involved in the development of nanotechnology research
outputs in Russia from 1990 through to 2012, according to our database. The top 20 most
productive researchers (Table 3) published 2,434 publications, which is 7.26% of the Russian
total. The table includes one German researcher from TU Berlin who has collaborated
extensively with Russia and is now one of the most productive co-authors of Russian
nanoscience papers; two researchers from Moscow State University, and one researcher from
Ufa State Technical University of Aviation. The remaining top 20 most productive scientists are
from the Russian Academy of Sciences, with the majority from the RAS Ioffe Institute of Physics
and Technology.
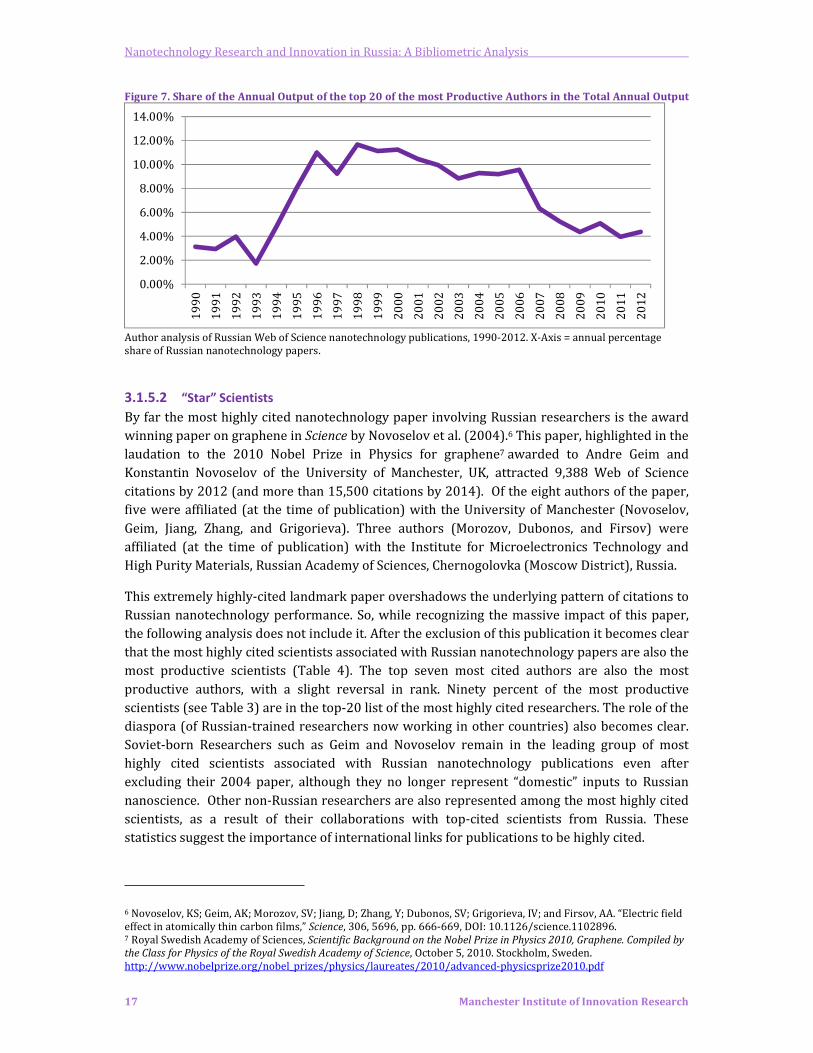
The peak period of publication activity (papers/year) for all of these most productive scientists
was 1998-2000, following which there was a gradual decline (Figure 6). The most productive
periods of the most prolific Russian nanoscientists coincides with the most productive periods
of Russian nanoscience: the contribution to total publications by the top 20 most productive
scientists was above 9% of annual Russian nanotechnology publication in 1996-2001, reaching
a pinnacle of 11.47% in 1998. Their careers seem to have started and reached their peak at the
same time, with little fluctuation, as the overall publication activity chart for the top-10 of the
most productive scientists replicated the sum of their charts (Figure 7). The most productive
authors of all time were trained in the last years of the Soviet system. The average productivity
of a leading scientist in the 21st century dropped threefold compared to the peak in the late
1990’s. The lowest contribution of the top 20 of the most productive scientists was in 2001
(where the contributed 3.96% of annual publications).
0
10
20
30
40
50
60
70
80
90-94 95-99 2000-04 2005-09 2010-12
RRC Kurchatov Inst
Nizhnii Novgorod State
Univ
Natl Univ Sci & Technol
MISIS
Novosibirsk State Univ
Dubna Joint Nucl Res Inst
St Petersburg Tech Univ
State Inst Technol
Russian Res Ctr Vavilov Opt
Inst
Nanotechnology Research and Innovation in Russia: A Bibliometric Analysis
16 Manchester Institute of Innovation Research
Table 3. Top 20 Most Productive Authors, Russian Nanotechnology Papers, 1990-2012
Authors Affiliations Records
1 Ustinov, Victor M RAS Inst Phys Tech Ioffe 389
2 Ledentsov, Nikolai N RAS Inst Phys Tech Ioffe 323
3 Bimberg, Dieter TU Berlin 239
4 Kop'ev, Pyotr S RAS Inst Phys Tech Ioffe 237
5 Zhukov, Alexey E RAS Inst Phys Tech Ioffe 237
6 Valiev, Ruslan Z RAS Inst Met Superplast Prob; Ufa State Aviat
Tech Univ
225
7 Ivanov, Sergey V RAS Inst Phys Tech Ioffe 222
8 Lozovik, Yurii E RAS Inst Spect Troitsk 205
9 Alferov, Zh I RAS Inst Phys Tech Ioffe 187
10 Ovid'ko, Ilya A RAS Inst Problems Mech Engn 163
11 Kovsh, Alexey R RAS Inst Phys Tech Ioffe 161
12 Yakovlev, Dmitri R RAS Inst Phys Tech Ioffe 161
13 Boltalina, Olga V Moscow MV Lomonosov State Univ 151
14 Okotrub, Aleksandr V RAS Inst Inorgan Chem Nikolaev 150
15 Lyubovskaya, Rimma N RAS Inst Problems Chem Phys 146
16 Cirlin, Georgii E RAS Inst Phys Tech Ioffe 139
17 Timoshenko, Victor Yu Moscow MV Lomonosov State Univ 135
18 Maximov, Mikhail V RAS Inst Phys Tech Ioffe 134
19 Ivanovskii, Alexander L RAS Inst Solid State Chem 126
20 Nikiforov, Aleksandr I RAS Inst Semicond Phys Rzhanov 125 Author analysis of Russian Web of Science nanotechnology publications, 1990-2012.
Figure 6. Time Series of the top 10 most productive authors (annual publication output)
0
5
10
15
20
25
30
35
40
45
50
Ustinov, Victor M Ledentsov, Nikolai N Bimberg, Dieter
Kop'ev, Pyotr S Zhukov, Alexey E Valiev, Ruslan Z
Ivanov, Sergey V Lozovik, Yurii E Alferov, Zh I
Ovid'ko, Ilya A
Nanotechnology Research and Innovation in Russia: A Bibliometric Analysis
17 Manchester Institute of Innovation Research
Figure 7. Share of the Annual Output of the top 20 of the most Productive Authors in the Total Annual Output
Author analysis of Russian Web of Science nanotechnology publications, 1990-2012. X-Axis = annual percentage
share of Russian nanotechnology papers.
3.1.5.2 “Star” Scientists
By far the most highly cited nanotechnology paper involving Russian researchers is the award
winning paper on graphene in Science by Novoselov et al. (2004).6 This paper, highlighted in the
laudation to the 2010 Nobel Prize in Physics for graphene7 awarded to Andre Geim and
Konstantin Novoselov of the University of Manchester, UK, attracted 9,388 Web of Science
citations by 2012 (and more than 15,500 citations by 2014). Of the eight authors of the paper,
five were affiliated (at the time of publication) with the University of Manchester (Novoselov,
Geim, Jiang, Zhang, and Grigorieva). Three authors (Morozov, Dubonos, and Firsov) were
affiliated (at the time of publication) with the Institute for Microelectronics Technology and
High Purity Materials, Russian Academy of Sciences, Chernogolovka (Moscow District), Russia.
This extremely highly-cited landmark paper overshadows the underlying pattern of citations to
Russian nanotechnology performance. So, while recognizing the massive impact of this paper,
the following analysis does not include it. After the exclusion of this publication it becomes clear
that the most highly cited scientists associated with Russian nanotechnology papers are also the
most productive scientists (Table 4). The top seven most cited authors are also the most
productive authors, with a slight reversal in rank. Ninety percent of the most productive
scientists (see Table 3) are in the top-20 list of the most highly cited researchers. The role of the
diaspora (of Russian-trained researchers now working in other countries) also becomes clear.
Soviet-born Researchers such as Geim and Novoselov remain in the leading group of most
highly cited scientists associated with Russian nanotechnology publications even after
excluding their 2004 paper, although they no longer represent “domestic” inputs to Russian
nanoscience. Other non-Russian researchers are also represented among the most highly cited
scientists, as a result of their collaborations with top-cited scientists from Russia. These
statistics suggest the importance of international links for publications to be highly cited.
6 Novoselov, KS; Geim, AK; Morozov, SV; Jiang, D; Zhang, Y; Dubonos, SV; Grigorieva, IV; and Firsov, AA. “Electric field
effect in atomically thin carbon films,” Science, 306, 5696, pp. 666-669, DOI: 10.1126/science.1102896. 7 Royal Swedish Academy of Sciences, Scientific Background on the Nobel Prize in Physics 2010, Graphene. Compiled by
the Class for Physics of the Royal Swedish Academy of Science, October 5, 2010. Stockholm, Sweden.
http://www.nobelprize.org/nobel_prizes/physics/laureates/2010/advanced-physicsprize2010.pdf
0.00%
2.00%
4.00%
6.00%
8.00%
10.00%
12.00%
14.00%
19
90
19
91
19
92
19
93
19
94
19
95
19
96
19
97
19
98
19
99
20
00
20
01
20
02
20
03
20
04
20
05
20
06
20
07
20
08
20
09
20
10
20
11
20
12

Nanotechnology Research and Innovation in Russia: A Bibliometric Analysis
18 Manchester Institute of Innovation Research
Additionally, it is notable that RAS dominates Russian nanotechnology research in terms of both
volume, journal placement, and citation impact. A portion of the research produced in RAS is
world class and the most productive and highly cited people in Russian nanoscience are
concentrated within the Russian Academy of Sciences.
Table 4. Highly Cited Authors, Russian Nanotechnology publications, 1990-2012
Rank Author Name Affiliations Times
Cited
1 Ledentsov, Nikolai N RAS Inst Phys Tech Ioffe 6033
2 Ustinov, Victor M RAS Inst Phys Tech Ioffe 5559
3 Bimberg, Dieter TU Berlin 5451
4 Alferov, Zh I RAS Inst Phys Tech Ioffe 5108
5 Kop'ev, Pyotr S RAS Inst Phys Tech Ioffe 5052
6 Zhukov, Alexey E RAS Inst Phys Tech Ioffe 3504
7 Valiev, Ruslan Z RAS Inst Met Superplast Prob; Ufa State Aviat
Tech Univ
3428
8 Egorov, Anton Yu RAS Inst Phys Tech Ioffe 2788
9 Grundmann, M TU Berlin; Max-Plank Inst 2545
10 Geim, A K Univ Manchester; Radbound Univ Nijmegen 2382
11 Morozov, S V RAS Inst Phys Microelect Technol & High Pur
Mat
2323
12 Novoselov, K S Univ Manchester; Radbound Univ Nijmegen 2292
13 Werner, P Max-Plank Inst 2246
14 Katsnelson, M I Radbound Univ Nijmegen 2166
15 Gosele, U Max-Plank Inst 1975
16 Maximov, Mikhail V RAS Inst Phys Tech Ioffe 1909
17 Heydenreich, J Max-Plank Inst 1846
18 Ruvimov, S S RAS Inst Phys Tech Ioffe 1812
19 Kovsh, Alexey R RAS Inst Phys Tech Ioffe 1757
20 Pertsev, N A RAS Inst Phys Tech Ioffe 1681 Citation analysis of Russian Web of Science nanotechnology publications, 1990-2012. Excludes Novoselov et al., 2004,
(see discussion in text).
3.1.5.3 Newcomer Researchers
Well-established researchers tend to dominate lists of most productive and most cited
researchers. However, it is important to also identify the extent to which new researchers are
entering the research system. Newcomers may include new early career researchers and
research students, but also established researchers who shift into the nanotechnology domain,
new collaborators, and other entrants into the Russian nanotechnology research system. In our
analysis of Russian nanotechnology papers, we identify newcomer researchers as those who
publish for the first time by year of first publication in any year during our study period. These
include Russian and non-Russian authors associated with Russian nanotechnology papers. We
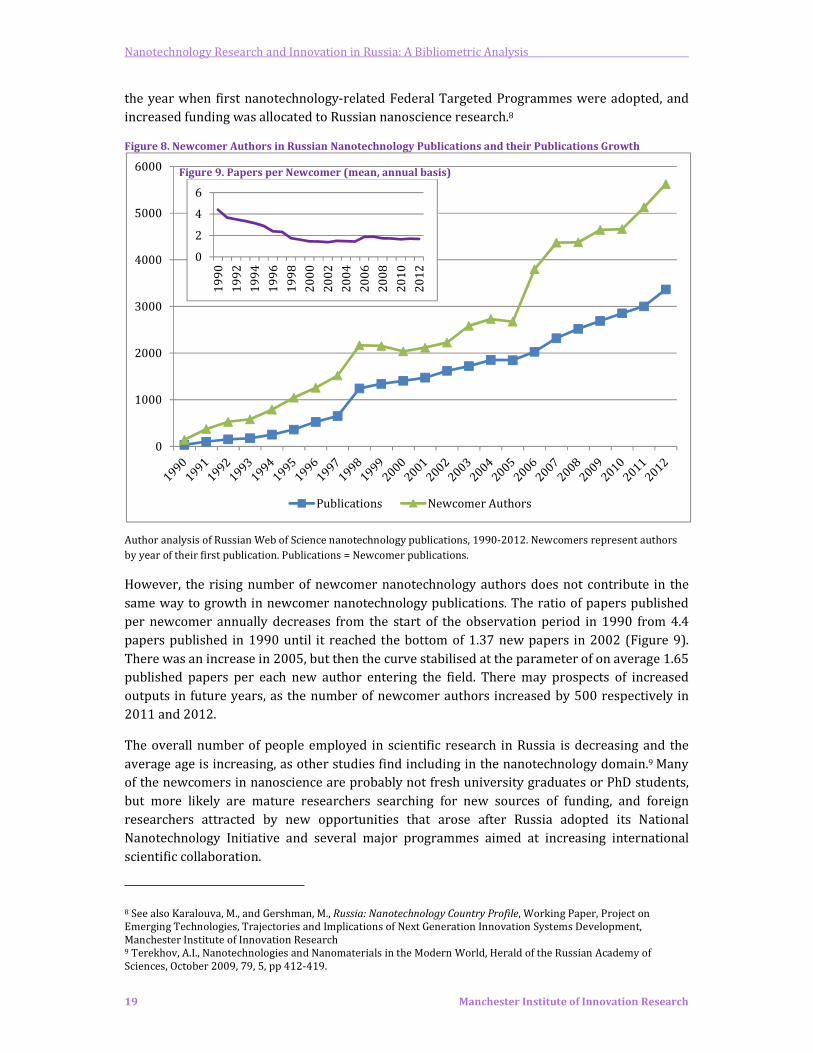
find that there is a curve, which reflects an increase in the number of newcomer researchers
each year (Figure 8). There is a hike in 1997-98, with another noticeable escalation in the
number of newcomers starting in 2005. The second jump may be explained by policy: 2005 is
Nanotechnology Research and Innovation in Russia: A Bibliometric Analysis
19 Manchester Institute of Innovation Research
0
1000
2000
3000
4000
5000
6000
Publications Newcomer Authors
the year when first nanotechnology-related Federal Targeted Programmes were adopted, and
increased funding was allocated to Russian nanoscience research.8
Figure 8. Newcomer Authors in Russian Nanotechnology Publications and their Publications Growth
Figure 9. Papers per Newcomer (mean, annual basis)
Author analysis of Russian Web of Science nanotechnology publications, 1990-2012. Newcomers represent authors
by year of their first publication. Publications = Newcomer publications.
However, the rising number of newcomer nanotechnology authors does not contribute in the
same way to growth in newcomer nanotechnology publications. The ratio of papers published
per newcomer annually decreases from the start of the observation period in 1990 from 4.4
papers published in 1990 until it reached the bottom of 1.37 new papers in 2002 (Figure 9).
There was an increase in 2005, but then the curve stabilised at the parameter of on average 1.65
published papers per each new author entering the field. There may prospects of increased
outputs in future years, as the number of newcomer authors increased by 500 respectively in
2011 and 2012.
The overall number of people employed in scientific research in Russia is decreasing and the
average age is increasing, as other studies find including in the nanotechnology domain.9 Many
of the newcomers in nanoscience are probably not fresh university graduates or PhD students,
but more likely are mature researchers searching for new sources of funding, and foreign
researchers attracted by new opportunities that arose after Russia adopted its National
Nanotechnology Initiative and several major programmes aimed at increasing international
scientific collaboration.
8 See also Karalouva, M., and Gershman, M., Russia: Nanotechnology Country Profile, Working Paper, Project on
Emerging Technologies, Trajectories and Implications of Next Generation Innovation Systems Development,
Manchester Institute of Innovation Research 9 Terekhov, A.I., Nanotechnologies and Nanomaterials in the Modern World, Herald of the Russian Academy of
Sciences, October 2009, 79, 5, pp 412-419.
0
2
4
6
19
90
19
92
19
94
19
96
19
98
20
00
20
02
20
04
20
06
20
08
20
10
20
12
Nanotechnology Research and Innovation in Russia: A Bibliometric Analysis
20 Manchester Institute of Innovation Research
0
500
1000
1500
2000
2500
19
90
19
91
19
92
19
93
19
94
19
95
19
96
19
97
19
98
19
99
20
00
20
01
20
02
20
03
20
04
20
05
20
06
20
07
20
08
20
09
20
10
20
11
20
12
Acad Sci
Univ
PRO
Corporate
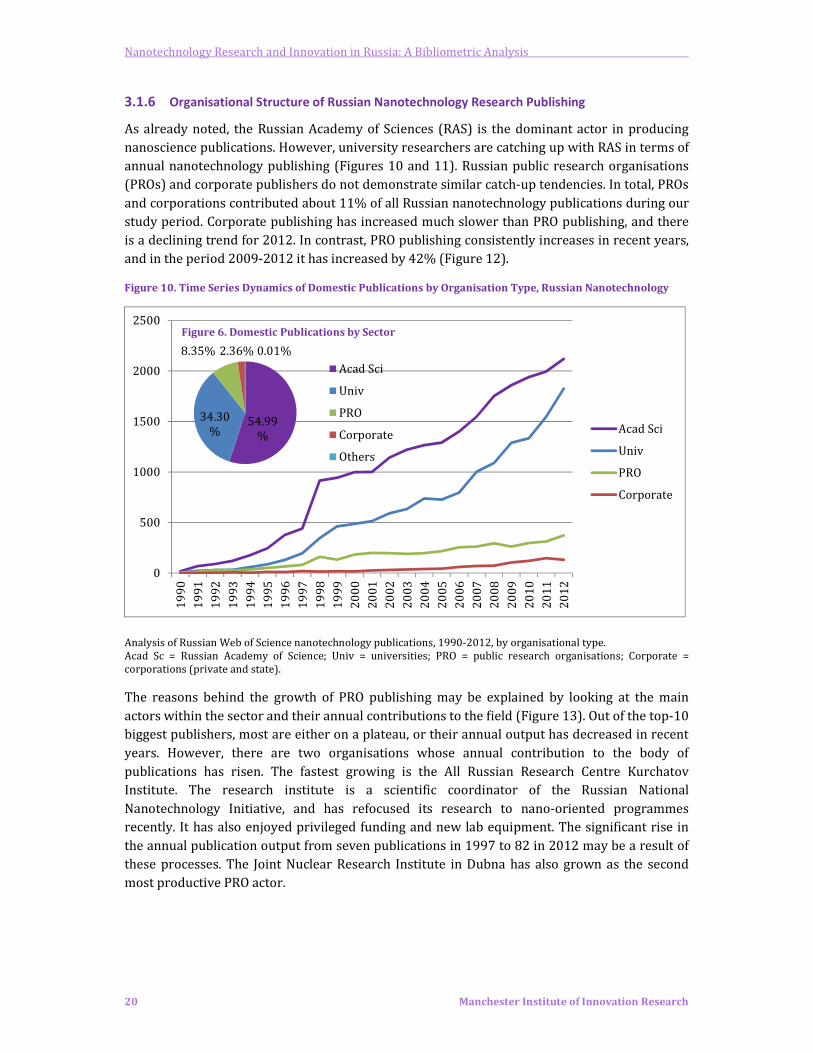
3.1.6 Organisational Structure of Russian Nanotechnology Research Publishing
As already noted, the Russian Academy of Sciences (RAS) is the dominant actor in producing
nanoscience publications. However, university researchers are catching up with RAS in terms of
annual nanotechnology publishing (Figures 10 and 11). Russian public research organisations
(PROs) and corporate publishers do not demonstrate similar catch-up tendencies. In total, PROs
and corporations contributed about 11% of all Russian nanotechnology publications during our
study period. Corporate publishing has increased much slower than PRO publishing, and there
is a declining trend for 2012. In contrast, PRO publishing consistently increases in recent years,
and in the period 2009-2012 it has increased by 42% (Figure 12).
Figure 10. Time Series Dynamics of Domestic Publications by Organisation Type, Russian Nanotechnology
Figure 6. Domestic Publications by Sector
Analysis of Russian Web of Science nanotechnology publications, 1990-2012, by organisational type.
Acad Sc = Russian Academy of Science; Univ = universities; PRO = public research organisations; Corporate =
corporations (private and state).
The reasons behind the growth of PRO publishing may be explained by looking at the main
actors within the sector and their annual contributions to the field (Figure 13). Out of the top-10
biggest publishers, most are either on a plateau, or their annual output has decreased in recent
years. However, there are two organisations whose annual contribution to the body of
publications has risen. The fastest growing is the All Russian Research Centre Kurchatov
Institute. The research institute is a scientific coordinator of the Russian National
Nanotechnology Initiative, and has refocused its research to nano-oriented programmes
recently. It has also enjoyed privileged funding and new lab equipment. The significant rise in
the annual publication output from seven publications in 1997 to 82 in 2012 may be a result of
these processes. The Joint Nuclear Research Institute in Dubna has also grown as the second
most productive PRO actor.
54.99
%
34.30
%
8.35% 2.36% 0.01%
Acad Sci
Univ
PRO
Corporate
Others

Nanotechnology Research and Innovation in Russia: A Bibliometric Analysis
21 Manchester Institute of Innovation Research
Figure 7. PRO and Corporate Publications Outputs, Russian Nanotechnology Publications, 1990-2012
Analysis of Russian Web of Science nanotechnology publications, 1990-2012, by organisational type. Y-axis shows
annual publications.
Figure 8. Leading PRO publishers in Russian Nanotechnology, 1990-2012
Analysis of Russian Web of Science nanotechnology publications, 1990-2012, by organisational type. Y-axis shows
publications by indicated time period on X-axis.
0
50
100
150
200
250
300
350
400
19
90
19
91
19
92
19
93
19
94
19
95
19
96
19
97
19
98
19
99
20
00
20
01
20
02
20
03
20
04
20
05
20
06
20
07
20
08
20
09
20
10
20
11
20
12
PRO
Corporate
0
10
20
30
40
50
60
70
80
1990-94 1995-99 2000-04 2005-09 2010-12
RRC Kurchatov Inst
Dubna Joint Nucl Res Inst
Russian Res Ctr Vavilov Opt
Inst
Karpov Inst Phys Chem
Inst Rare Mat
Technol Inst Superhard &
New Carbon Mat
NIOPIK Russian State Sci Ctr
Inst Automat & Control Proc
Vladivostok
Nanotechnology Research and Innovation in Russia: A Bibliometric Analysis
22 Manchester Institute of Innovation Research
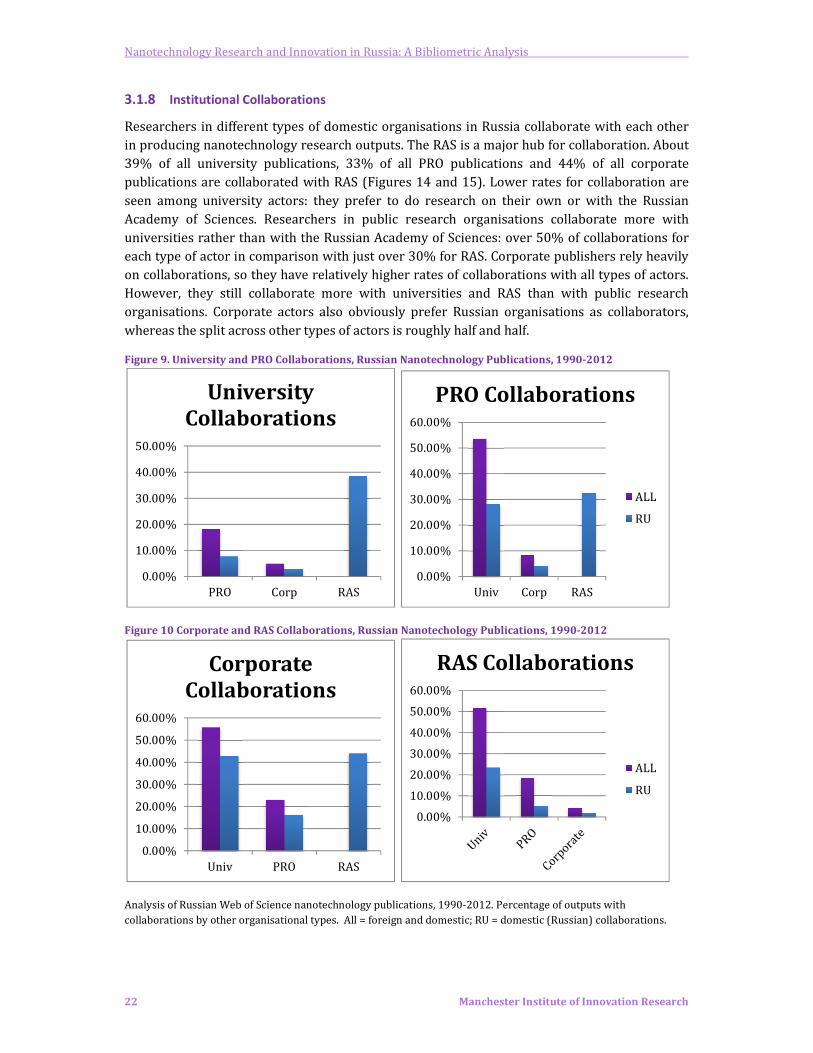
3.1.8 Institutional Collaborations
Researchers in different types of domestic organisations in Russia collaborate with each other
in producing nanotechnology research outputs. The RAS is a major hub for collaboration. About
39% of all university publications, 33% of all PRO publications and 44% of all corporate
publications are collaborated with RAS (Figures 14 and 15). Lower rates for collaboration are
seen among university actors: they prefer to do research on their own or with the Russian
Academy of Sciences. Researchers in public research organisations collaborate more with
universities rather than with the Russian Academy of Sciences: over 50% of collaborations for
each type of actor in comparison with just over 30% for RAS. Corporate publishers rely heavily
on collaborations, so they have relatively higher rates of collaborations with all types of actors.
However, they still collaborate more with universities and RAS than with public research
organisations. Corporate actors also obviously prefer Russian organisations as collaborators,
whereas the split across other types of actors is roughly half and half.
Figure 9. University and PRO Collaborations, Russian Nanotechnology Publications, 1990-2012
Figure 10 Corporate and RAS Collaborations, Russian Nanotechology Publications, 1990-2012
Analysis of Russian Web of Science nanotechnology publications, 1990-2012. Percentage of outputs with
collaborations by other organisational types. All = foreign and domestic; RU = domestic (Russian) collaborations.
0.00%
10.00%
20.00%
30.00%
40.00%
50.00%
PRO Corp RAS
University
Collaborations
0.00%
10.00%
20.00%
30.00%
40.00%
50.00%
60.00%
Univ Corp RAS
PRO Collaborations
ALL
RU
0.00%
10.00%
20.00%
30.00%
40.00%
50.00%
60.00%
Univ PRO RAS
Corporate
Collaborations
0.00%
10.00%
20.00%
30.00%
40.00%
50.00%
60.00%
RAS Collaborations
ALL
RU
Nanotechnology Research and Innovation in Russia: A Bibliometric Analysis
23 Manchester Institute of Innovation Research
The Russian Academy of Sciences prefers to work with universities: 51% of its publications are
collaborated with this type of organisations. Almost a half of those universities are Russian
universities, the balance is comprised of foreign university collaborations. Only 18% of RAS
publications are collaborated with public research organisations, and 4.4% of its collaborations
include a corporate actor. Out of the 18% of PRO collaborations, only a third are Russian public
research organisations. Here, the RAS more frequently collaborates with foreign PROs than with
domestic PROS, compared with its higher collaboration rates with Russian universities and
corporate actors.
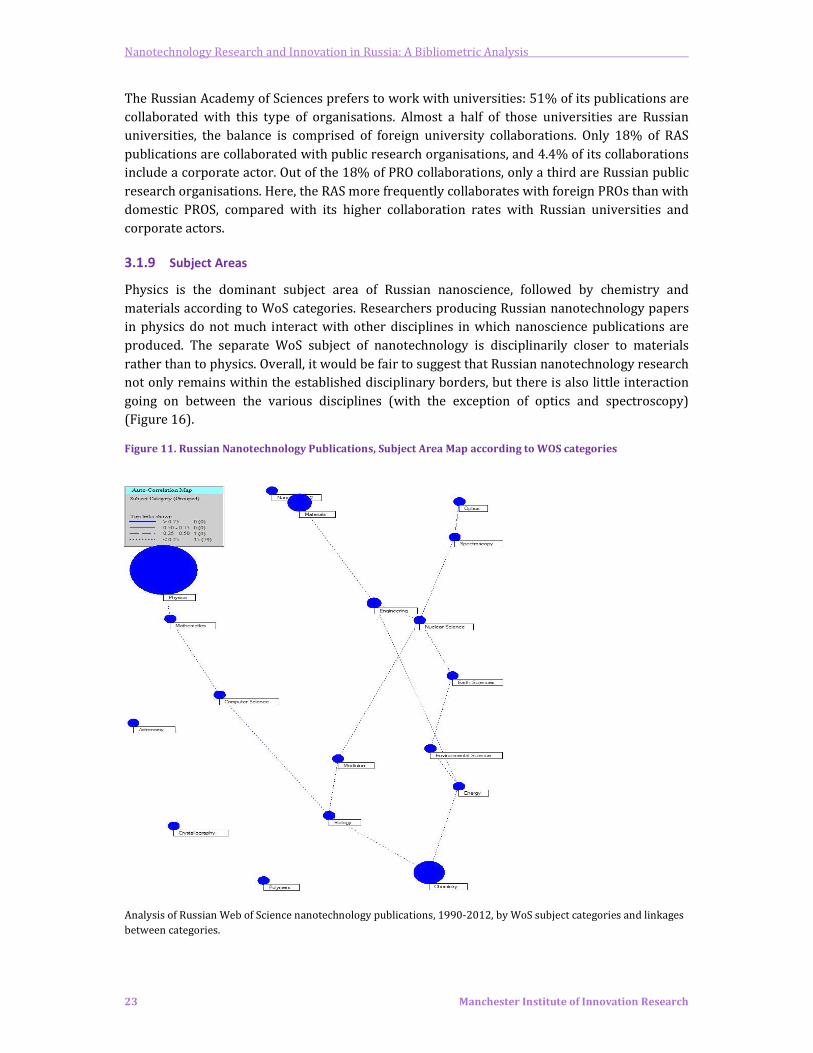
3.1.9 Subject Areas
Physics is the dominant subject area of Russian nanoscience, followed by chemistry and
materials according to WoS categories. Researchers producing Russian nanotechnology papers
in physics do not much interact with other disciplines in which nanoscience publications are
produced. The separate WoS subject of nanotechnology is disciplinarily closer to materials
rather than to physics. Overall, it would be fair to suggest that Russian nanotechnology research
not only remains within the established disciplinary borders, but there is also little interaction
going on between the various disciplines (with the exception of optics and spectroscopy)
(Figure 16).
Figure 11. Russian Nanotechnology Publications, Subject Area Map according to WOS categories
Analysis of Russian Web of Science nanotechnology publications, 1990-2012, by WoS subject categories and linkages
between categories.

Nanotechnology Research and Innovation in Russia: A Bibliometric Analysis
24 Manchester Institute of Innovation Research
An analysis of publications by organisations in WoS subject categories shows some difference in
specialisations (Figures 17 and 18). The RAS predominantly specializes in physics (more than
twice as many publications as in chemistry, which is the following category). University type
organisations mimic the specialisation distribution of RAS on a smaller scale: the proportion of
physics publications of RAS/University is 0.55, and the proportion interval (0.5; 0.6) sustains
over the other subject areas. Other types of research organizations also specialise in physics, but
there is less disparity in publication area. Chemistry also loses its place as the second most
important subject area for public research organisations and corporate publishers, and is
replaced by materials.
Figure 12. Subject Areas for Russian Academies of Science and University Publications
Figure 13. Subject Areas for PRO and Corporate Publications
Analysis of Russian Web of Science nanotechnology publications, 1990-2012, by WoS subject categories and
organisational types. Y-axis = cumulative number of publications.
0
2000
4000
6000
8000
10000
12000
14000
Ph
ysi
cs
Ch
em
istr
y
Ma
teri
als
En
gin
ee
rin
g
Op
tics
Po
lym
ers
Na
no
scie
nce
#
En
erg
y
Bio
log
y
Ea
rth
Sci
en
ces
Me
dic
ine
Co
mp
ute
r S
cie
nce
Acad Sci
0
1000
2000
3000
4000
5000
6000
7000
8000
Ph
ysi
cs
Ch
em
istr
y
Ma
teri
als
En
gin
ee
rin
g
Op
tics
Po
lym
ers
Na
no
scie
nce
#
En
erg
y
Bio
log
y
Ea
rth
Sci
en
ces
Me
dic
ine
Co
mp
ute
r S
cie
nce
Univ
0
500
1000
1500
2000
2500
Ph
ysi
cs
Ch
em
istr
y
Ma
teri
als
En
gin
ee
rin
g
Op
tics
Po
lym
ers
Na
no
scie
nce
#
En
erg
y
Bio
log
y
Ea
rth
Sci
en
ces
Me
dic
ine
Co
mp
ute
r S
cie
nce
PRO
050
100150200250300350400450500
Ph
ysi
cs
Ch
em
istr
y
Ma
teri
als
En
gin
ee
rin
g
Op
tics
Po
lym
ers
Na
no
scie
nce
#
En
erg
y
Bio
log
y
Ea
rth
Sci
en
ces
Me
dic
ine
Co
mp
ute
r S
cie
nce
Corporate
Nanotechnology Research and Innovation in Russia: A Bibliometric Analysis
25 Manchester Institute of Innovation Research
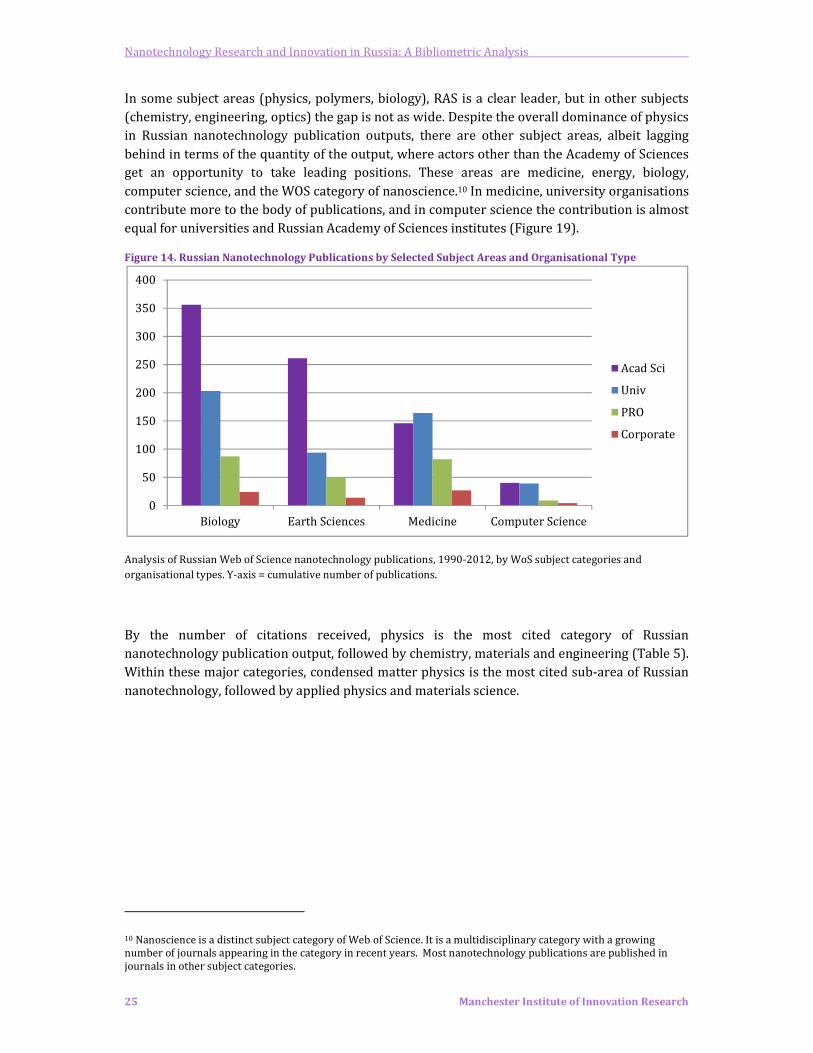
In some subject areas (physics, polymers, biology), RAS is a clear leader, but in other subjects
(chemistry, engineering, optics) the gap is not as wide. Despite the overall dominance of physics
in Russian nanotechnology publication outputs, there are other subject areas, albeit lagging
behind in terms of the quantity of the output, where actors other than the Academy of Sciences
get an opportunity to take leading positions. These areas are medicine, energy, biology,
computer science, and the WOS category of nanoscience.10 In medicine, university organisations
contribute more to the body of publications, and in computer science the contribution is almost
equal for universities and Russian Academy of Sciences institutes (Figure 19).
Figure 14. Russian Nanotechnology Publications by Selected Subject Areas and Organisational Type
Analysis of Russian Web of Science nanotechnology publications, 1990-2012, by WoS subject categories and
organisational types. Y-axis = cumulative number of publications.
By the number of citations received, physics is the most cited category of Russian
nanotechnology publication output, followed by chemistry, materials and engineering (Table 5).
Within these major categories, condensed matter physics is the most cited sub-area of Russian
nanotechnology, followed by applied physics and materials science.
10 Nanoscience is a distinct subject category of Web of Science. It is a multidisciplinary category with a growing
number of journals appearing in the category in recent years. Most nanotechnology publications are published in
journals in other subject categories.
0
50
100
150
200
250
300
350
400
Biology Earth Sciences Medicine Computer Science
Acad Sci
Univ
PRO
Corporate
Nanotechnology Research and Innovation in Russia: A Bibliometric Analysis
26 Manchester Institute of Innovation Research
Table 5. Top 10 Most Cited Subject Areas, Russian Nanotechnology Publications, 1990-2012
Subject Area Total Citations
Physics 87713
Chemistry 32270
Materials 26621
Engineering 13253
Optics 5932
Polymers 6440
Nanoscience 2472
Energy 1666
Biology 2559
Earth Sciences 1187
Medicine 1427
Mathematics 265
Computer Science 161 Citation analysis of Russian Web of Science nanotechnology publications, 1990-2012, by WoS subject categories.
The following section focuses on the nanotechnology publication outputs of the Russian
Academy of Sciences (RAS).
3.1.10 The Russian Academy of Sciences (RAS)
The Russian Academy of Sciences (RAS) is a public research body that occupies a special place
within the Russian Science and Technology system. It has a wide regional network of research
institutes stretching across all disciplines of sciences and humanities. The RAS has long
dominated Russian research publishing and to work in the Academy was regarded as the peak
of an academic career during the Soviet Union. In the present day its hegemony is increasingly
under challenge, and Russian science is becoming more polycentric. In the field of nanoscience
and nanotechnology, however, the RAS contributes to the majority of scientific outputs, and is
still a prevailing player.
3.1.10.1 RAS - Growth of Nanotechnology Paper Outputs
There is a steady growth pattern in the nanotechnology publication output of the Russian
Academy of Science, with a recognizable leap in 1997/98 (Figure 20). The annual publication
production rate exceeded 2000 in 2011. The publication output of the Russian Academy of
Sciences has generally been in line with the overall publication growth rates, with the exception
of two time periods (Figure 21). During the period 1990-1993 the annual contribution of RAS to
the body of publications rose from 50% to 70%. RAS has been contributing on average 70% of
all Russian nanoscience publications annually from 1993 until 2009. Since 2009 a declining
trend in the annual nanoscience output can be observed, with almost a 10% loss in the share by
2012.

Nanotechnology Research and Innovation in Russia: A Bibliometric Analysis
27 Manchester Institute of Innovation Research
0
500
1000
1500
2000
2500
Figure 15. RAS Nanotechnology Publications, 1990-2012
Figure 16. Contribution of RAS to All Russian Nanotechnology Papers (Annual)
Analysis of Russian Web of Science nanotechnology publications, 1990-2012.
3.1.10.2 RAS - Leading Institutions
The Russian Academy of Sciences has about 500 constituent institutes. Publication activity
within the RAS in nanotechnology is concentrated in a smaller number of these institutes. The
top 20 institutes of RAS produced more than 72% of all RAS nanotechnology publications in the
period 1990-2012 (Table 6).
One RAS institute – the Ioffe Physics and Technology Institute in St Petersburg – produced over
20% of RAS nanotechnology publications (1990-2012). The top three RAS institutes produced
just over 30% of RAS nanotechnology publications. The regional distribution is not extensive,
especially given the large geographical area of Russia. Twelve of the top 20 RAS nanotechnology
publishing institutes, by volume of papers, are in Moscow or the Moscow Region (including
Troitsk and Chernogolovka). The “science city” of Novosibirsk emerges as a regional centre (3
top 20 RAS nanotechnology institutes), with two institutes in St Petersburg. The cities of
Ekaterinburg, Kazan, and Nizhnii Novgorod each host one of the top 20 RAS nanotechnology
institutes. Except for Novosibirsk, all the other cities with leading RAS nanotechnology institutes
are in European Russia (which hosts more than three-quarters of the Russian population).
The RAS also houses the most productive Russian nanotechnology researchers. Eight of the 10
most productive Russian nanotechnology research authors are affiliated with the RAS – mostly
at the Ioffe Institute of Physics and Technology (see Table 4). The most productive RAS
researchers in nanotechnology are indicated in Table 7. The Ioffe institute is again well
represented.
0.00%
20.00%
40.00%
60.00%
80.00%

Nanotechnology Research and Innovation in Russia: A Bibliometric Analysis
28 Manchester Institute of Innovation Research
Table 6. Top-20 Institutions of RAS by Nanotechnology Publications, 1990-2012
RAS Institute Number of Pubs % of Total Location
RAS Inst Phys Tech Ioffe 4696 20.67% St Petersburg
RAS Inst Problems Chem Phys 1208 5.32% Moscow
RAS Inst Semicond Phys Rzhanov 1203 5.30% Novosibirsk
RAS Inst Gen Phys Prokhorov 1023 4.50% Moscow
RAS Inst Solid State Phys 926 4.08% Moscow Region
RAS Inst Phys Lebedev 885 3.90% Moscow
RAS Inst Catalysis Boreskov 823 3.62% Novosibirsk
RAS Inst Crystallog Shubnikov 777 3.42% Moscow
RAS Inst Chem Phys Semenov 727 3.20% Moscow
RAS Inst Organoelement Cpds Nesmeyanov 655 2.88% Moscow
RAS Inst Phys Chem & Elektrochem Frumkin 616 2.71% Moscow
RAS Inst Met Phys 580 2.55% Ekaterinburg
RAS Inst Inorgan Chem Nikolaev 548 2.41% Novosibirsk
RAS Inst Spect 547 2.41% Moscow Region
RAS Inst Gen & Inorgan Chem Kurnakov 505 2.22% Moscow
RAS Inst Phys Microstruct 498 2.19% Nizhnii Novgorod
RAS Inst Macromol Cpds 474 2.09% St Petersburg
RAS Inst Radio Engn & Elect Kotelnikov 470 2.07% Moscow
RAS Ctr Sci Kazan 438 1.93% Kazan
RAS Inst Microelect Technol & High Pur Mat 373 1.64% Moscow Region
Analysis of Russian Web of Science nanotechnology publications, Russian Academy of Sciences, 1990-2012
(N=22,794)
Table 7. Top-10 Contributing RAS Authors in Nanotechnology
Name Total Number of Pubs Affiliated with Ioffe Inst
Ustinov, V M 387 383
Ledentsov, N N 318 315
Zhukov, A E 235 227
Bimberg, D 226 215
Ivanov, S V 219 219
Valiev, R Z 200 2
Alferov, Z I 185 183
Kop'ev, P S 179 179
Ovid'ko, I A 161 9
Kovsh, A R 159 157
Author analysis of Russian Web of Science nanotechnology publications, Russian Academy of Sciences, 1990-2012
(N=22,794)
Our analyses highlight that the Ioffe Institute is not only a key organisation in RAS
nanotechnology research but also occupies a key position in Russian nanotechnology research
in general, having published more than any other organization, and having hosted the most
prominent scientists during the observed period. However, in recent years the output
productivity of the Ioffe Institute has plateaued. For example, in Figure 22, the annual
nanotechnology publication output of Ioffe is compared with the leading non-RAS organisation,

Nanotechnology Research and Innovation in Russia: A Bibliometric Analysis
29 Manchester Institute of Innovation Research
Moscow State University (MSU). In recent years (2008 onwards) MSU overtook the Ioffe
Institute in yearly publication growth. The peak of the Ioffe Institute’s publication activities
came during 1998-2000, which was also the peak of publishing activities for its star scientists.
Since then, the Ioffe Institute has seen a relative diminishment in its leadership position. Ioffe’s
relative importance within the nanotechnology research activities of the RAS has declined as
well: the share of Ioffe’s nanotechnology publications as a percentage of all RAS nanotechnology
outputs fell below 20% in 2002 and has further declined since then, going below 10% in 2012.
Figure 17. Ioffe Institute and MSU Annual Publication Outputs
Analysis of Russian Web of Science nanotechnology publications, 1990-2012.
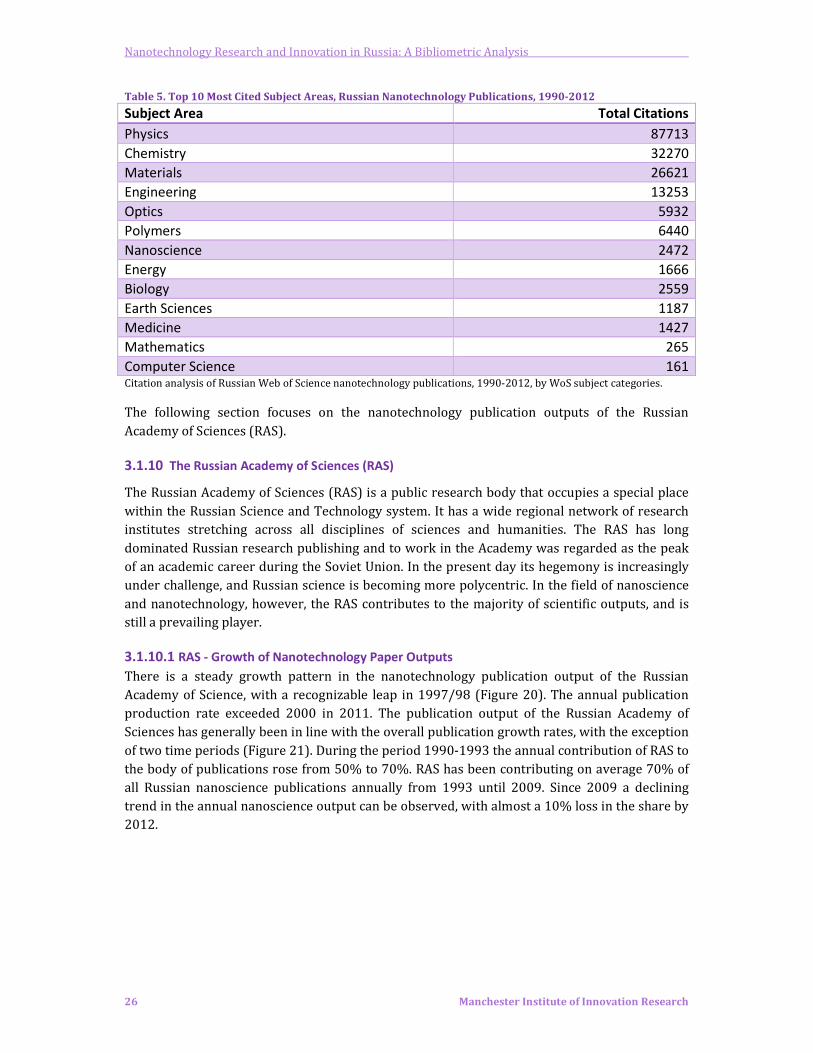
After the Ioffe Institute, the next set of RAS institutes in the top 20 for nanotechnology
publishing contributes at lower but comparable orders of magnitude. Based on 5-year
aggregations, three groups can be distinguished among the 9 institutes that follow Ioffe Institute
(Figure 23). The first group comprises of two Institutes from Moscow (Institute of Problems of
Chemistry and Physics) and two Institutes from Novosibirsk (Institute of Semiconductor Physics
and the Institute of Catalysis). All four institutes have demonstrated stable growth over the
period and have been publishing 80-100 publications annually in 2010-2012 yrs. The second
group includes the Institute of Physics N.A Lebedev in Moscow and the Institute of Solid State
Physics in Chernogolovka, Moscow Region. These two institutes were keeping up with the first
four in terms of publication growth in the first half of the observed period, but lost pace and fell
behind by the end of the observed period producing 60-70 publications p/a in 2010-12. Finally,
the last group consists of three other Moscow Institutes: the Institute of Crystallogy, Institute of
Chemistry and Physics N.A. Semenov, and the Institute of Organoelement Compounds. They have
maintained slower pace of growth than that of the other institutes in the top 10, and ended up
producing 40-60 publications p/a in 2010-2012.
0
50
100
150
200
250
300
350
400
450
Moscow MV Lomonosov
State Univ
RAS Inst Phys Tech Ioffe, St
Petersburg
Nanotechnology Research and Innovation in Russia: A Bibliometric Analysis
30 Manchester Institute of Innovation Research
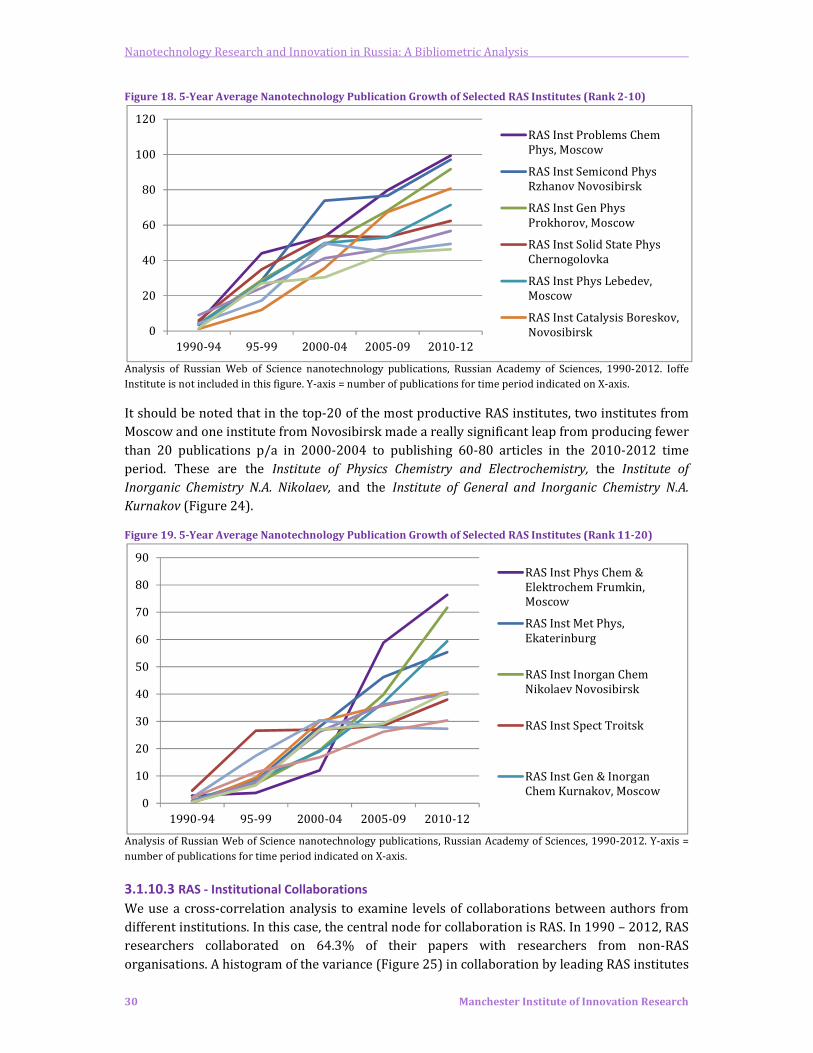
Figure 18. 5-Year Average Nanotechnology Publication Growth of Selected RAS Institutes (Rank 2-10)
Analysis of Russian Web of Science nanotechnology publications, Russian Academy of Sciences, 1990-2012. Ioffe
Institute is not included in this figure. Y-axis = number of publications for time period indicated on X-axis.
It should be noted that in the top-20 of the most productive RAS institutes, two institutes from
Moscow and one institute from Novosibirsk made a really significant leap from producing fewer
than 20 publications p/a in 2000-2004 to publishing 60-80 articles in the 2010-2012 time
period. These are the Institute of Physics Chemistry and Electrochemistry, the Institute of
Inorganic Chemistry N.A. Nikolaev, and the Institute of General and Inorganic Chemistry N.A.
Kurnakov (Figure 24).
Figure 19. 5-Year Average Nanotechnology Publication Growth of Selected RAS Institutes (Rank 11-20)
Analysis of Russian Web of Science nanotechnology publications, Russian Academy of Sciences, 1990-2012. Y-axis =
number of publications for time period indicated on X-axis.
3.1.10.3 RAS - Institutional Collaborations
We use a cross-correlation analysis to examine levels of collaborations between authors from
different institutions. In this case, the central node for collaboration is RAS. In 1990 – 2012, RAS
researchers collaborated on 64.3% of their papers with researchers from non-RAS
organisations. A histogram of the variance (Figure 25) in collaboration by leading RAS institutes
0
20
40
60
80
100
120
1990-94 95-99 2000-04 2005-09 2010-12
RAS Inst Problems Chem
Phys, Moscow
RAS Inst Semicond Phys
Rzhanov Novosibirsk
RAS Inst Gen Phys
Prokhorov, Moscow
RAS Inst Solid State Phys
Chernogolovka
RAS Inst Phys Lebedev,
Moscow
RAS Inst Catalysis Boreskov,
Novosibirsk
0
10
20
30
40
50
60
70
80
90
1990-94 95-99 2000-04 2005-09 2010-12
RAS Inst Phys Chem &
Elektrochem Frumkin,
Moscow
RAS Inst Met Phys,
Ekaterinburg
RAS Inst Inorgan Chem
Nikolaev Novosibirsk
RAS Inst Spect Troitsk
RAS Inst Gen & Inorgan
Chem Kurnakov, Moscow
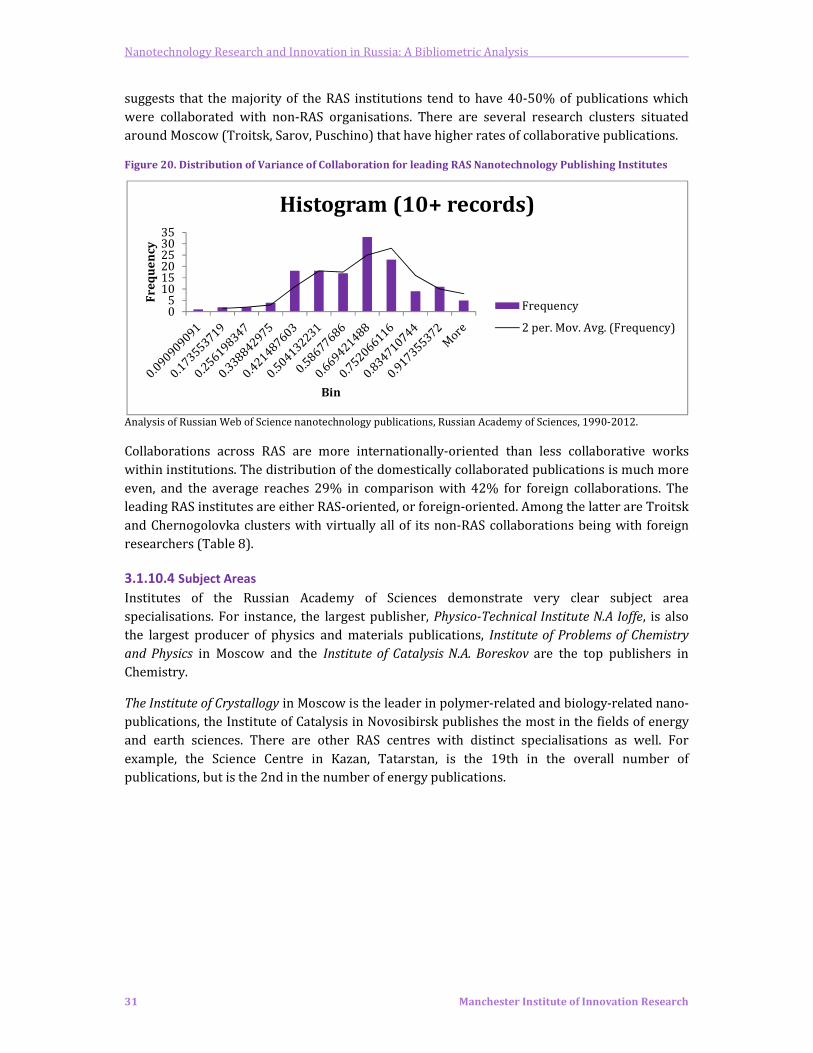
Nanotechnology Research and Innovation in Russia: A Bibliometric Analysis
31 Manchester Institute of Innovation Research
suggests that the majority of the RAS institutions tend to have 40-50% of publications which
were collaborated with non-RAS organisations. There are several research clusters situated
around Moscow (Troitsk, Sarov, Puschino) that have higher rates of collaborative publications.
Figure 20. Distribution of Variance of Collaboration for leading RAS Nanotechnology Publishing Institutes
Analysis of Russian Web of Science nanotechnology publications, Russian Academy of Sciences, 1990-2012.
Collaborations across RAS are more internationally-oriented than less collaborative works
within institutions. The distribution of the domestically collaborated publications is much more
even, and the average reaches 29% in comparison with 42% for foreign collaborations. The
leading RAS institutes are either RAS-oriented, or foreign-oriented. Among the latter are Troitsk
and Chernogolovka clusters with virtually all of its non-RAS collaborations being with foreign
researchers (Table 8).
3.1.10.4 Subject Areas
Institutes of the Russian Academy of Sciences demonstrate very clear subject area
specialisations. For instance, the largest publisher, Physico-Technical Institute N.A Ioffe, is also
the largest producer of physics and materials publications, Institute of Problems of Chemistry
and Physics in Moscow and the Institute of Catalysis N.A. Boreskov are the top publishers in
Chemistry.
The Institute of Crystallogy in Moscow is the leader in polymer-related and biology-related nano-
publications, the Institute of Catalysis in Novosibirsk publishes the most in the fields of energy
and earth sciences. There are other RAS centres with distinct specialisations as well. For
example, the Science Centre in Kazan, Tatarstan, is the 19th in the overall number of
publications, but is the 2nd in the number of energy publications.
05
101520253035
Fr
eq
ue
nc
y
Bin
Histogram (10+ records)
Frequency
2 per. Mov. Avg. (Frequency)
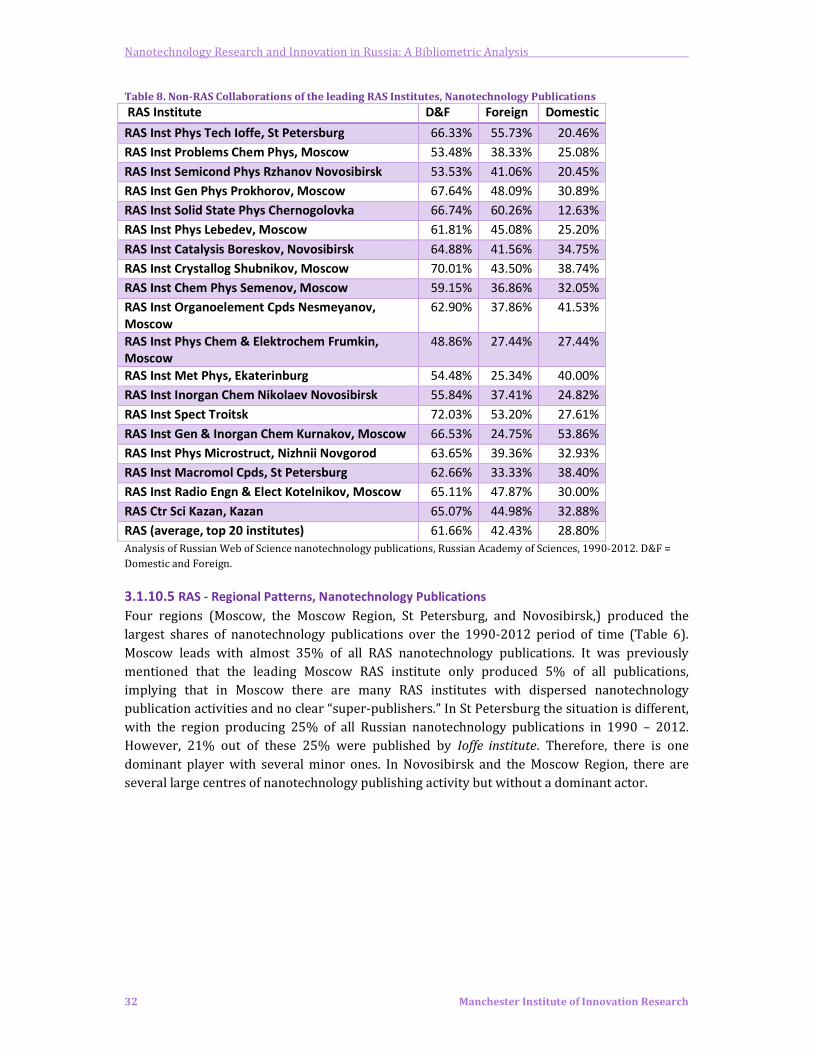
Nanotechnology Research and Innovation in Russia: A Bibliometric Analysis
32 Manchester Institute of Innovation Research
Table 8. Non-RAS Collaborations of the leading RAS Institutes, Nanotechnology Publications
RAS Institute D&F Foreign Domestic
RAS Inst Phys Tech Ioffe, St Petersburg 66.33% 55.73% 20.46%
RAS Inst Problems Chem Phys, Moscow 53.48% 38.33% 25.08%
RAS Inst Semicond Phys Rzhanov Novosibirsk 53.53% 41.06% 20.45%
RAS Inst Gen Phys Prokhorov, Moscow 67.64% 48.09% 30.89%
RAS Inst Solid State Phys Chernogolovka 66.74% 60.26% 12.63%
RAS Inst Phys Lebedev, Moscow 61.81% 45.08% 25.20%
RAS Inst Catalysis Boreskov, Novosibirsk 64.88% 41.56% 34.75%
RAS Inst Crystallog Shubnikov, Moscow 70.01% 43.50% 38.74%
RAS Inst Chem Phys Semenov, Moscow 59.15% 36.86% 32.05%
RAS Inst Organoelement Cpds Nesmeyanov,
Moscow
62.90% 37.86% 41.53%
RAS Inst Phys Chem & Elektrochem Frumkin,
Moscow
48.86% 27.44% 27.44%
RAS Inst Met Phys, Ekaterinburg 54.48% 25.34% 40.00%
RAS Inst Inorgan Chem Nikolaev Novosibirsk 55.84% 37.41% 24.82%
RAS Inst Spect Troitsk 72.03% 53.20% 27.61%
RAS Inst Gen & Inorgan Chem Kurnakov, Moscow 66.53% 24.75% 53.86%
RAS Inst Phys Microstruct, Nizhnii Novgorod 63.65% 39.36% 32.93%
RAS Inst Macromol Cpds, St Petersburg 62.66% 33.33% 38.40%
RAS Inst Radio Engn & Elect Kotelnikov, Moscow 65.11% 47.87% 30.00%
RAS Ctr Sci Kazan, Kazan 65.07% 44.98% 32.88%
RAS (average, top 20 institutes) 61.66% 42.43% 28.80%
Analysis of Russian Web of Science nanotechnology publications, Russian Academy of Sciences, 1990-2012. D&F =
Domestic and Foreign.
3.1.10.5 RAS - Regional Patterns, Nanotechnology Publications
Four regions (Moscow, the Moscow Region, St Petersburg, and Novosibirsk,) produced the
largest shares of nanotechnology publications over the 1990-2012 period of time (Table 6).
Moscow leads with almost 35% of all RAS nanotechnology publications. It was previously
mentioned that the leading Moscow RAS institute only produced 5% of all publications,
implying that in Moscow there are many RAS institutes with dispersed nanotechnology
publication activities and no clear “super-publishers.” In St Petersburg the situation is different,
with the region producing 25% of all Russian nanotechnology publications in 1990 – 2012.
However, 21% out of these 25% were published by Ioffe institute. Therefore, there is one
dominant player with several minor ones. In Novosibirsk and the Moscow Region, there are
several large centres of nanotechnology publishing activity but without a dominant actor.
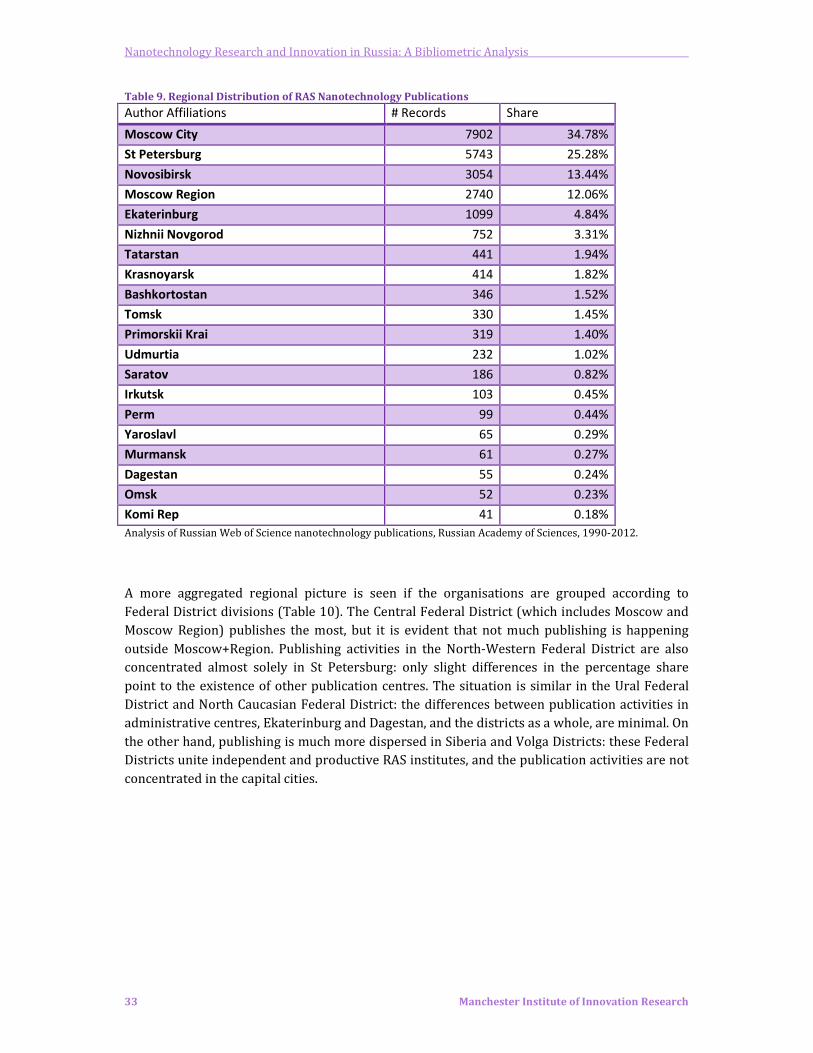
Nanotechnology Research and Innovation in Russia: A Bibliometric Analysis
33 Manchester Institute of Innovation Research
Table 9. Regional Distribution of RAS Nanotechnology Publications
Author Affiliations # Records Share
Moscow City 7902 34.78%
St Petersburg 5743 25.28%
Novosibirsk 3054 13.44%
Moscow Region 2740 12.06%
Ekaterinburg 1099 4.84%
Nizhnii Novgorod 752 3.31%
Tatarstan 441 1.94%
Krasnoyarsk 414 1.82%
Bashkortostan 346 1.52%
Tomsk 330 1.45%
Primorskii Krai 319 1.40%
Udmurtia 232 1.02%
Saratov 186 0.82%
Irkutsk 103 0.45%
Perm 99 0.44%
Yaroslavl 65 0.29%
Murmansk 61 0.27%
Dagestan 55 0.24%
Omsk 52 0.23%
Komi Rep 41 0.18%
Analysis of Russian Web of Science nanotechnology publications, Russian Academy of Sciences, 1990-2012.
A more aggregated regional picture is seen if the organisations are grouped according to
Federal District divisions (Table 10). The Central Federal District (which includes Moscow and
Moscow Region) publishes the most, but it is evident that not much publishing is happening
outside Moscow+Region. Publishing activities in the North-Western Federal District are also
concentrated almost solely in St Petersburg: only slight differences in the percentage share
point to the existence of other publication centres. The situation is similar in the Ural Federal
District and North Caucasian Federal District: the differences between publication activities in
administrative centres, Ekaterinburg and Dagestan, and the districts as a whole, are minimal. On
the other hand, publishing is much more dispersed in Siberia and Volga Districts: these Federal
Districts unite independent and productive RAS institutes, and the publication activities are not
concentrated in the capital cities.

Nanotechnology Research and Innovation in Russia: A Bibliometric Analysis
34 Manchester Institute of Innovation Research
Table 10. Regional Distribution of RAS Publications Across Federal Districts
RAS Author Affiliations by Russian
Federal Districts
# Records Share
Central FD 10327 45.46%
NW FD 5882 25.89%
Siberian FD 3887 17.11%
Volga FD 2069 9.11%
Ural FD 1106 4.87%
Far E FD 374 1.65%
N Caucasian FD 68 0.30%
Southern FD 36 0.16%
Analysis of Russian Web of Science nanotechnology publications, Russian Academy of Sciences, 1990-2012.
Figure 26 illustrates the regional patterns of nanotechnology publications for RAS Institutes.
Although Moscow clearly dominates in the overall publishing, it was publishing as much as the
St Petersburg region annually until the early 2000s, and the annual publication growth
increased rapidly after that. At around the same time Novosibirsk overtook Moscow Region in
the annual publication growth as well. The early 2000s seem to be a turning point for several
regional RAS divisions.
Figure 21. Time Series Data on Regional Nanotechnology Publishing in RAS
Analysis of Russian Web of Science nanotechnology publications, Russian Academy of Sciences, 1990-2012.
0
100
200
300
400
500
600
700
800
19
90
19
91
19
92
19
93
19
94
19
95
19
96
19
97
19
98
19
99
20
00
20
01
20
02
20
03
20
04
20
05
20
06
20
07
20
08
20
09
20
10
20
11
20
12
Moscow
St Petersburg
Novosibirsk
Moscow Region
Ekaterinburg
Nizhnii Novgorod
Tatarstan
Krasnoyarsk
Bashkortostan
Tomsk
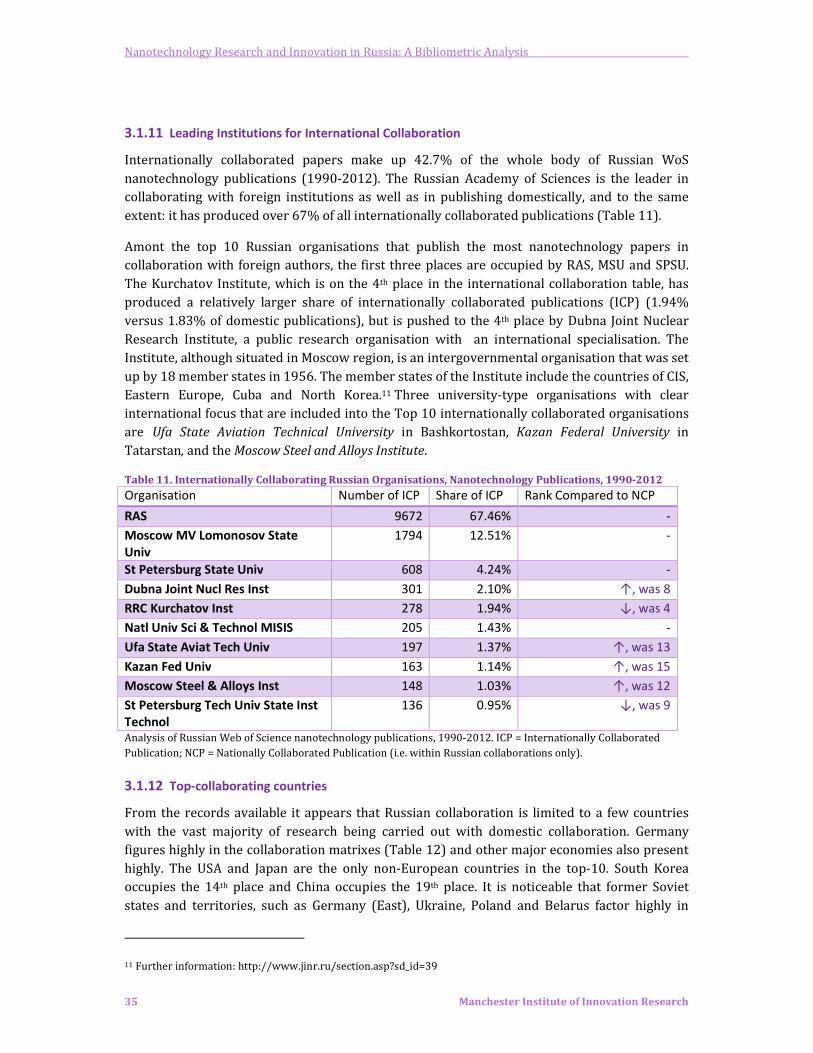
Nanotechnology Research and Innovation in Russia: A Bibliometric Analysis
35 Manchester Institute of Innovation Research
3.1.11 Leading Institutions for International Collaboration
Internationally collaborated papers make up 42.7% of the whole body of Russian WoS
nanotechnology publications (1990-2012). The Russian Academy of Sciences is the leader in
collaborating with foreign institutions as well as in publishing domestically, and to the same
extent: it has produced over 67% of all internationally collaborated publications (Table 11).
Amont the top 10 Russian organisations that publish the most nanotechnology papers in
collaboration with foreign authors, the first three places are occupied by RAS, MSU and SPSU.
The Kurchatov Institute, which is on the 4th place in the international collaboration table, has
produced a relatively larger share of internationally collaborated publications (ICP) (1.94%
versus 1.83% of domestic publications), but is pushed to the 4th place by Dubna Joint Nuclear
Research Institute, a public research organisation with an international specialisation. The
Institute, although situated in Moscow region, is an intergovernmental organisation that was set
up by 18 member states in 1956. The member states of the Institute include the countries of CIS,
Eastern Europe, Cuba and North Korea.11 Three university-type organisations with clear
international focus that are included into the Top 10 internationally collaborated organisations
are Ufa State Aviation Technical University in Bashkortostan, Kazan Federal University in
Tatarstan, and the Moscow Steel and Alloys Institute.
Table 11. Internationally Collaborating Russian Organisations, Nanotechnology Publications, 1990-2012
Organisation Number of ICP Share of ICP Rank Compared to NCP
RAS 9672 67.46% -
Moscow MV Lomonosov State
Univ
1794 12.51% -
St Petersburg State Univ 608 4.24% -
Dubna Joint Nucl Res Inst 301 2.10% ↑, was 8
RRC Kurchatov Inst 278 1.94% ↓, was 4
Natl Univ Sci & Technol MISIS 205 1.43% -
Ufa State Aviat Tech Univ 197 1.37% ↑, was 13
Kazan Fed Univ 163 1.14% ↑, was 15
Moscow Steel & Alloys Inst 148 1.03% ↑, was 12
St Petersburg Tech Univ State Inst
Technol
136 0.95% ↓, was 9
Analysis of Russian Web of Science nanotechnology publications, 1990-2012. ICP = Internationally Collaborated
Publication; NCP = Nationally Collaborated Publication (i.e. within Russian collaborations only).
3.1.12 Top-collaborating countries
From the records available it appears that Russian collaboration is limited to a few countries
with the vast majority of research being carried out with domestic collaboration. Germany
figures highly in the collaboration matrixes (Table 12) and other major economies also present
highly. The USA and Japan are the only non-European countries in the top-10. South Korea
occupies the 14th place and China occupies the 19th place. It is noticeable that former Soviet
states and territories, such as Germany (East), Ukraine, Poland and Belarus factor highly in
11 Further information: http://www.jinr.ru/section.asp?sd_id=39

Nanotechnology Research and Innovation in Russia: A Bibliometric Analysis
36 Manchester Institute of Innovation Research
collaborative research with Russia. It implies that older research networks continue to be
maintained at least at some level. Overall, Russian international collaborations in
nanotechnology are strongly oriented towards selected European countries, the US, and Japan,
with greatest growth in these collaborations in the late 1990s to mid-2000s (Figure 27).
Table 12. Top Collaborating Countries, Russian Nanotechnology Papers, 1990-2012
Rank Collaborating
Countries
Russia % of Total
Pubs
1 Germany 4123 12.29
2 USA 2736 8.16
3 France 1689 5.04
4 UK 1157 3.45
5 Japan 978 2.92
6 Sweden 699 2.08
7 Italy 657 1.96
8 Ukraine 597 1.78
9 Poland 497 1.48
10 Spain 495 1.48
11 Netherlands 483 1.44
12 Belarus 423 1.26
13 Finland 390 1.16
14 South Korea 324 0.97
15 Israel 300 0.89
16 Switzerland 296 0.88
17 Belgium 290 0.86
18 China 267 0.80
19 Canada 261 0.78
Analysis of Russian Web of Science nanotechnology publications, 1990-2012.
Figure 22. Time Series Data on the Top-6 Collaborating Countries, Russian Nanotechnology Publications
Analysis of Russian Web of Science nanotechnology publications, 1990-2012.
0
50
100
150
200
250
300
350
19
90
19
91
19
92
19
93
19
94
19
95
19
96
19
97
19
98
19
99
20
00
20
01
20
02
20
03
20
04
20
05
20
06
20
07
20
08
20
09
20
10
20
11
20
12
Germany
USA
France
UK
Japan
Sweden

Nanotechnology Research and Innovation in Russia: A Bibliometric Analysis
37 Manchester Institute of Innovation Research
3.1.13 International co-authorship patterns by Region
Russia’s European orientation in international collaboration is asserted when the international
partners are grouped according to larger regions. Russian scientists predominantly collaborate
with European Union member states: the share of all publications together amounts to 69% of
all international collaborations (Figure 28). In the chart the North American contribution is
predominantly the USA, which constitute 92% of all North American collaborations. In Asia 40%
of all collaborations are made with Japanese participation, but such countries as South Korea,
China and Taiwan have almost equal share of contributions following Japan, each amounting to
8-10%. In recent years there has been an increase in Russian nanotechnology research
involving Asia. The CIS is a group uniting the countries of the former Soviet Union; Ukraine and
Belarus are the primary collaborators there, with 50% and 35% of all CIS collaborations.
Figure 23. International Co-Authorship Patterns by Region, Russian Nanotechnology Publications
Analysis of Russian Web of Science nanotechnology publications, 1990-2012, co-authorship by regional blocs.
3.1.14 Leading International Partners, Russian Nanotechnology Publications
Russian nanotechnology scientists collaborate with a range of international partners, although
the top 20 international partners are all in Europe (see Table 13). The first three leading
organisation make up 11% of all internationally collaborated papers. These are the Max Planck
Society, a German umbrella research organisation; the French CNRS that has analogous
structure; and the Ukrainian Academy of Sciences, which used to be a branch of the Soviet
Academy of Sciences. Together the Top 20 International Partners make up just over 28% of all
internationally collaborated publications.
There are organisations from 8 countries represented in the table of the top 20 International
partners, half of which are based in Germany. Three partner organisations are located in
Sweden, with two in Belarus. By type of the organisation 11 of the top 20 international partner
0
2000
4000
6000
8000
10000
12000
Europe EU-28 North
America
Asia CIS BRICSK South
America
Oceania Africa

Nanotechnology Research and Innovation in Russia: A Bibliometric Analysis
38 Manchester Institute of Innovation Research
organisations are universities, 4 are the Academy of Sciences type organisations (Ukraine,
Belarus, Poland, and Czech Republic), and 5 are public research organisations.
Table 13. Leading International Partners
Organisation name Number of Records Share of total
International records
Max Planck Inst GER 644 4.49%
CNRS FR 635 4.43%
NAS Ukraine 356 2.48%
TU Berlin GER 310 2.16%
Polish Acad Sci 275 1.92%
Chalmers Tech Univ SWE 228 1.59%
Univ Wurzburg GER 193 1.35%
Tech Univ Dresden GER 185 1.29%
Forschungszentrum Karlsruhe GER 178 1.24%
NAS Belarus 173 1.21%
Belarusian State Univ 150 1.05%
Helmholtz Zentrum GER 139 0.97%
Leibniz Inst Solid State & Mat Res Dresden GER 139 0.97%
Univ Nottingham UK 139 0.97%
Humboldt Univ GER 137 0.96%
Univ Ulm GER 134 0.93%
Linkoping Univ SWE 131 0.91%
Acad Sci Czech Republic 126 0.88%
Lund Univ SWE 124 0.86%
Tech Univ Munich GER 124 0.86%
Analysis of Russian Web of Science nanotechnology publications, 1990-2012, co-authorship by affiliated institutions
of international co-authors.
The leading three foreign organisations that publish nanotechnology research in collaboration
with Russia form a distinctive cohort, not only in the all-time contributions, but also in the time-
series perspective. Although the all-time shares place Max Planck Society Institutes in first
place, the time series data (Figure 29) demonstrates the decline of the contribution of this
research organisation in collaboration with Russian authors. The French CNRS became the
leader in the annual publishing in 2006, and the Ukrainian Academy of Sciences overtook the
Max Planck Society, pushing it into third place in terms of the annual publication output. The
Technical University of Berlin also featured strongly in the 1990s in terms of the annual
publications output, but then its collaborations with Russia declined substantially throughout
the 2000s.
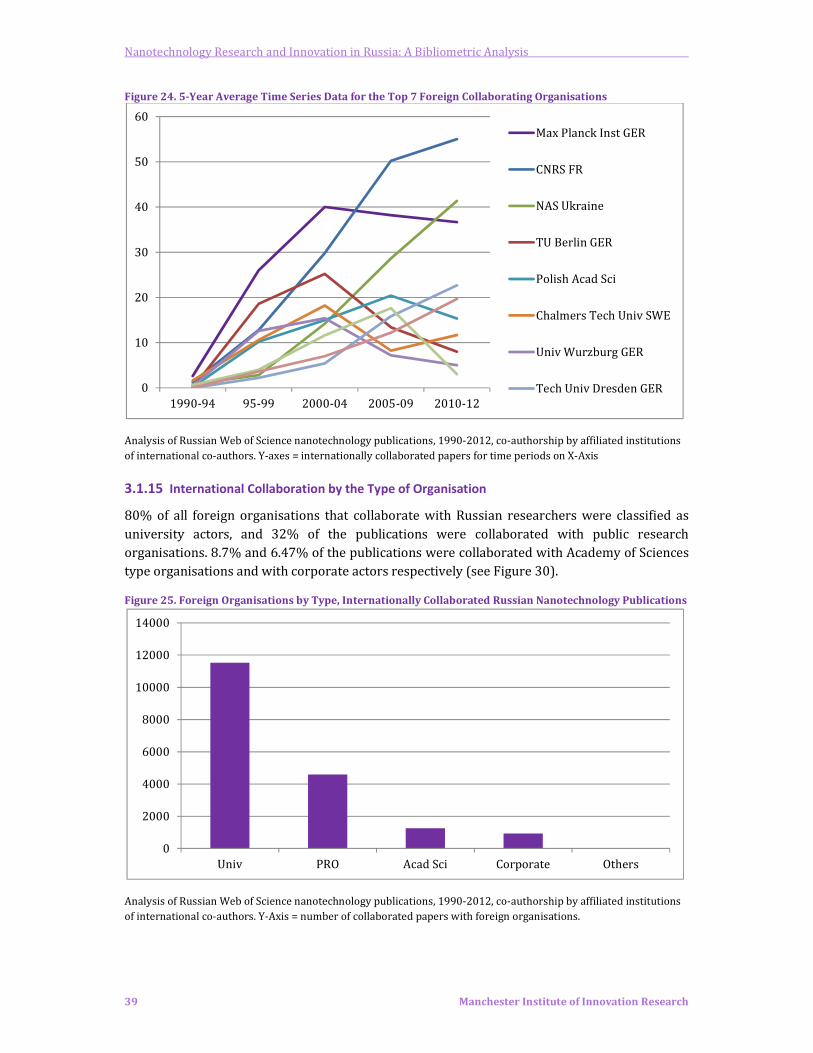
Nanotechnology Research and Innovation in Russia: A Bibliometric Analysis
39 Manchester Institute of Innovation Research
Figure 24. 5-Year Average Time Series Data for the Top 7 Foreign Collaborating Organisations
Analysis of Russian Web of Science nanotechnology publications, 1990-2012, co-authorship by affiliated institutions
of international co-authors. Y-axes = internationally collaborated papers for time periods on X-Axis
3.1.15 International Collaboration by the Type of Organisation
80% of all foreign organisations that collaborate with Russian researchers were classified as
university actors, and 32% of the publications were collaborated with public research
organisations. 8.7% and 6.47% of the publications were collaborated with Academy of Sciences
type organisations and with corporate actors respectively (see Figure 30).
Figure 25. Foreign Organisations by Type, Internationally Collaborated Russian Nanotechnology Publications
Analysis of Russian Web of Science nanotechnology publications, 1990-2012, co-authorship by affiliated institutions
of international co-authors. Y-Axis = number of collaborated papers with foreign organisations.
0
10
20
30
40
50
60
1990-94 95-99 2000-04 2005-09 2010-12
Max Planck Inst GER
CNRS FR
NAS Ukraine
TU Berlin GER
Polish Acad Sci
Chalmers Tech Univ SWE
Univ Wurzburg GER
Tech Univ Dresden GER
0
2000
4000
6000
8000
10000
12000
14000
Univ PRO Acad Sci Corporate Others
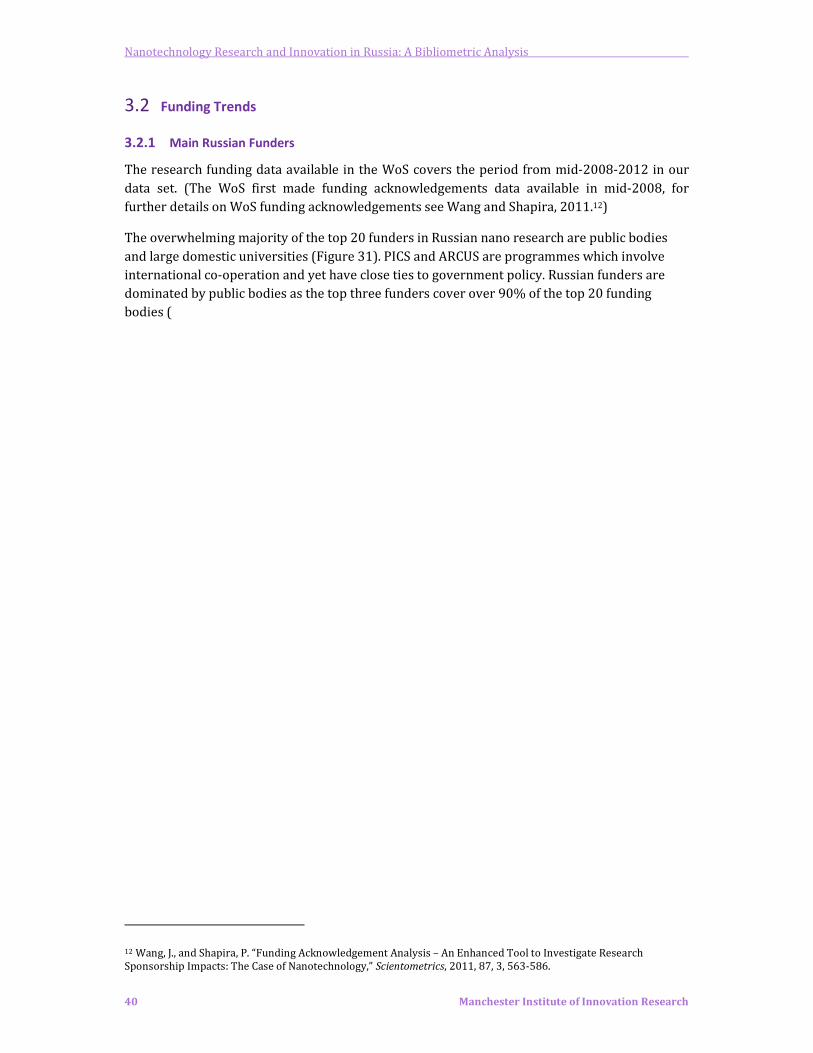
Nanotechnology Research and Innovation in Russia: A Bibliometric Analysis
40 Manchester Institute of Innovation Research
3.2 Funding Trends
3.2.1 Main Russian Funders
The research funding data available in the WoS covers the period from mid-2008-2012 in our
data set. (The WoS first made funding acknowledgements data available in mid-2008, for
further details on WoS funding acknowledgements see Wang and Shapira, 2011.12)
The overwhelming majority of the top 20 funders in Russian nano research are public bodies
and large domestic universities (Figure 31). PICS and ARCUS are programmes which involve
international co-operation and yet have close ties to government policy. Russian funders are
dominated by public bodies as the top three funders cover over 90% of the top 20 funding
bodies (
12 Wang, J., and Shapira, P. “Funding Acknowledgement Analysis – An Enhanced Tool to Investigate Research
Sponsorship Impacts: The Case of Nanotechnology,” Scientometrics, 2011, 87, 3, 563-586.
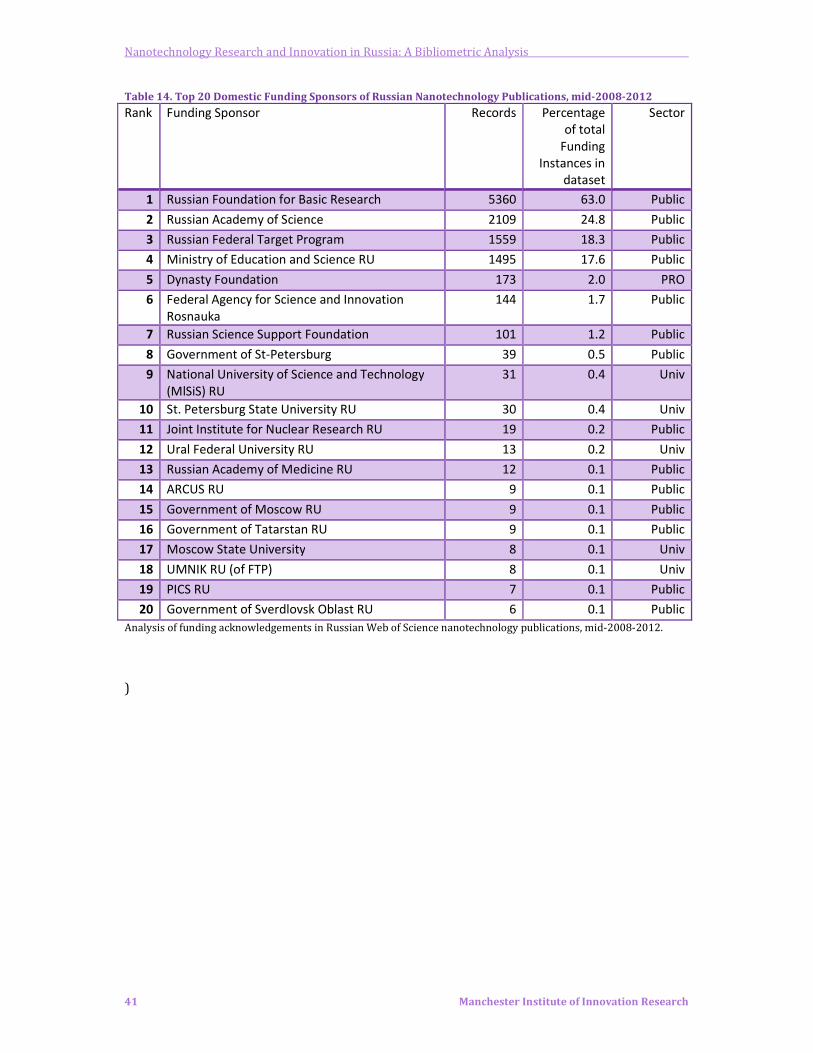
Nanotechnology Research and Innovation in Russia: A Bibliometric Analysis
41 Manchester Institute of Innovation Research
Table 14. Top 20 Domestic Funding Sponsors of Russian Nanotechnology Publications, mid-2008-2012
Rank Funding Sponsor Records Percentage
of total
Funding
Instances in
dataset
Sector
1 Russian Foundation for Basic Research 5360 63.0 Public
2 Russian Academy of Science 2109 24.8 Public
3 Russian Federal Target Program 1559 18.3 Public
4 Ministry of Education and Science RU 1495 17.6 Public
5 Dynasty Foundation 173 2.0 PRO
6 Federal Agency for Science and Innovation
Rosnauka
144 1.7 Public
7 Russian Science Support Foundation 101 1.2 Public
8 Government of St-Petersburg 39 0.5 Public
9 National University of Science and Technology
(MlSiS) RU
31 0.4 Univ
10 St. Petersburg State University RU 30 0.4 Univ
11 Joint Institute for Nuclear Research RU 19 0.2 Public
12 Ural Federal University RU 13 0.2 Univ
13 Russian Academy of Medicine RU 12 0.1 Public
14 ARCUS RU 9 0.1 Public
15 Government of Moscow RU 9 0.1 Public
16 Government of Tatarstan RU 9 0.1 Public
17 Moscow State University 8 0.1 Univ
18 UMNIK RU (of FTP) 8 0.1 Univ
19 PICS RU 7 0.1 Public
20 Government of Sverdlovsk Oblast RU 6 0.1 Public
Analysis of funding acknowledgements in Russian Web of Science nanotechnology publications, mid-2008-2012.
)
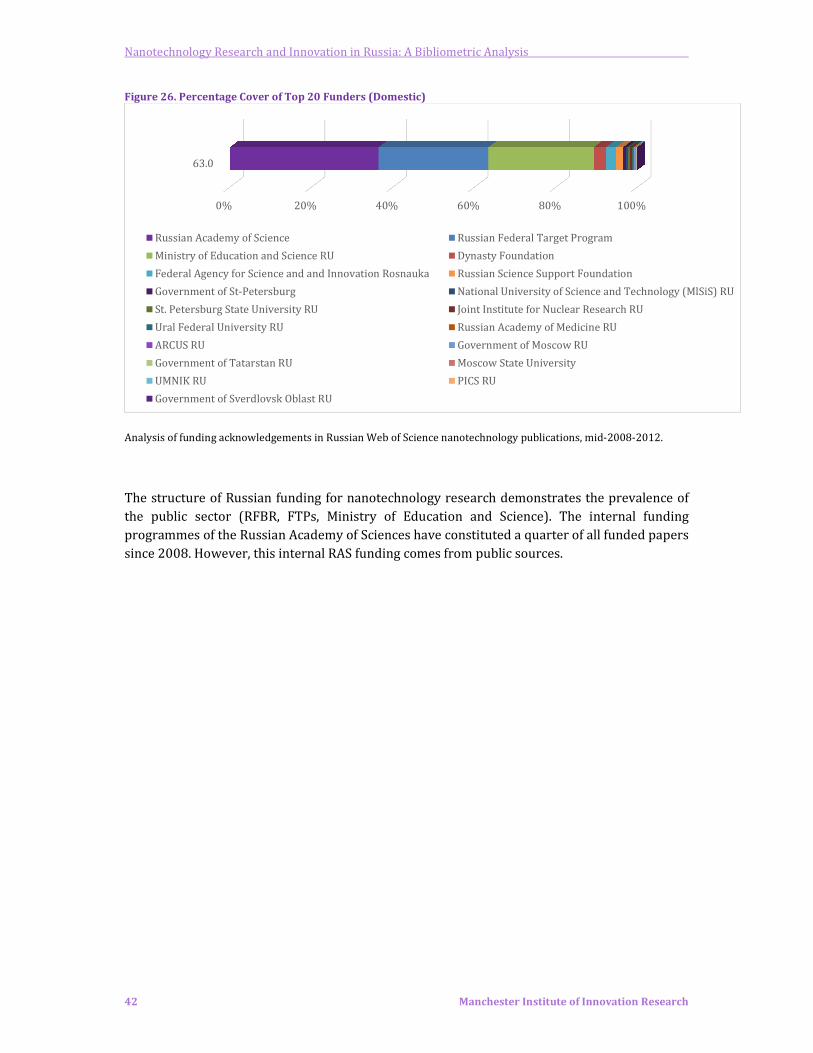
Nanotechnology Research and Innovation in Russia: A Bibliometric Analysis
42 Manchester Institute of Innovation Research
Figure 26. Percentage Cover of Top 20 Funders (Domestic)
Analysis of funding acknowledgements in Russian Web of Science nanotechnology publications, mid-2008-2012.
The structure of Russian funding for nanotechnology research demonstrates the prevalence of
the public sector (RFBR, FTPs, Ministry of Education and Science). The internal funding
programmes of the Russian Academy of Sciences have constituted a quarter of all funded papers
since 2008. However, this internal RAS funding comes from public sources.
0% 20% 40% 60% 80% 100%
63.0
Russian Academy of Science Russian Federal Target Program
Ministry of Education and Science RU Dynasty Foundation
Federal Agency for Science and and Innovation Rosnauka Russian Science Support Foundation
Government of St-Petersburg National University of Science and Technology (MlSiS) RU
St. Petersburg State University RU Joint Institute for Nuclear Research RU
Ural Federal University RU Russian Academy of Medicine RU
ARCUS RU Government of Moscow RU
Government of Tatarstan RU Moscow State University
UMNIK RU PICS RU
Government of Sverdlovsk Oblast RU

Nanotechnology Research and Innovation in Russia: A Bibliometric Analysis
43 Manchester Institute of Innovation Research
Table 14. Top 20 Domestic Funding Sponsors of Russian Nanotechnology Publications, mid-2008-2012
Rank Funding Sponsor Records Percentage
of total
Funding
Instances in
dataset
Sector
1 Russian Foundation for Basic Research 5360 63.0 Public
2 Russian Academy of Science 2109 24.8 Public
3 Russian Federal Target Program 1559 18.3 Public
4 Ministry of Education and Science RU 1495 17.6 Public
5 Dynasty Foundation 173 2.0 PRO
6 Federal Agency for Science and Innovation
Rosnauka
144 1.7 Public
7 Russian Science Support Foundation 101 1.2 Public
8 Government of St-Petersburg 39 0.5 Public
9 National University of Science and Technology
(MlSiS) RU
31 0.4 Univ
10 St. Petersburg State University RU 30 0.4 Univ
11 Joint Institute for Nuclear Research RU 19 0.2 Public
12 Ural Federal University RU 13 0.2 Univ
13 Russian Academy of Medicine RU 12 0.1 Public
14 ARCUS RU 9 0.1 Public
15 Government of Moscow RU 9 0.1 Public
16 Government of Tatarstan RU 9 0.1 Public
17 Moscow State University 8 0.1 Univ
18 UMNIK RU (of FTP) 8 0.1 Univ
19 PICS RU 7 0.1 Public
20 Government of Sverdlovsk Oblast RU 6 0.1 Public
Analysis of funding acknowledgements in Russian Web of Science nanotechnology publications, mid-2008-2012.
3.2.2 Leading Foreign Funders
The foreign funding element of the database is more distributed between groups compared to
the domestic funding structure. Once again, the majority of funders appear to be large national
public bodies or quasi-independent funders. The European Union (EU) represents the largest
single foreign funder (Figure 27) covering 20% of the papers supported by the top 20 funders.
The nature of the EU may render funding to larger projects with many different affiliations
easier and more likely to occur.
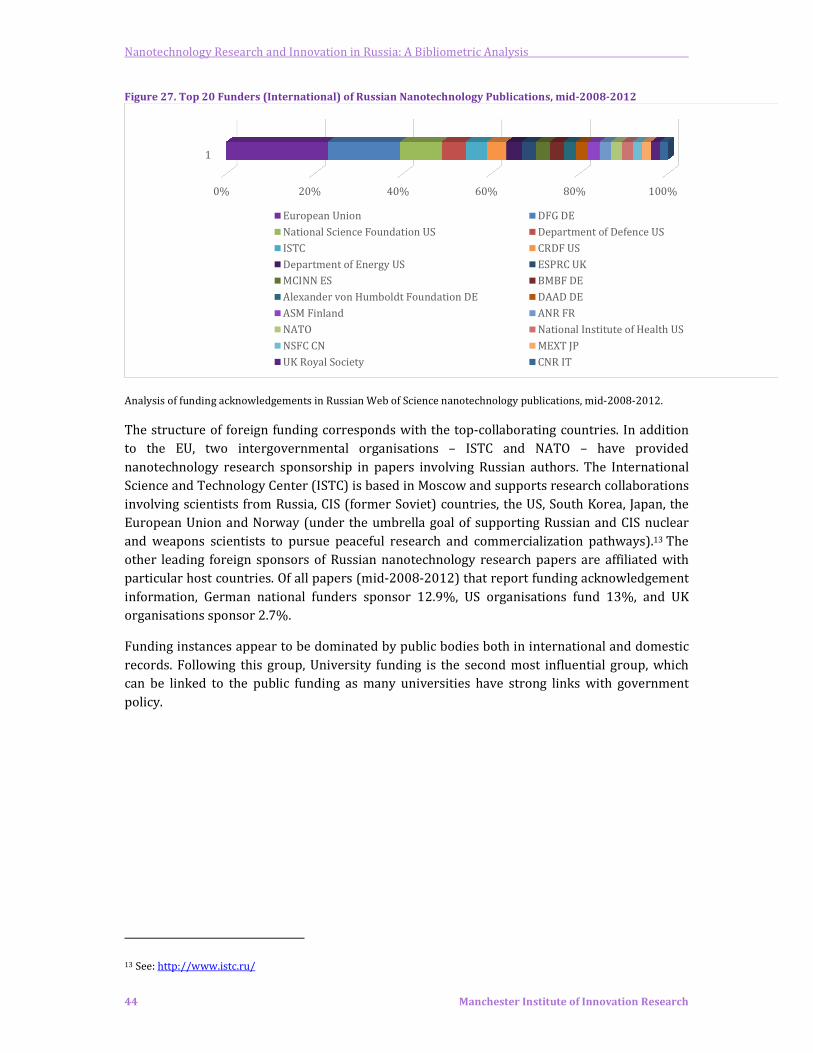
Nanotechnology Research and Innovation in Russia: A Bibliometric Analysis
44 Manchester Institute of Innovation Research
Figure 27. Top 20 Funders (International) of Russian Nanotechnology Publications, mid-2008-2012
Analysis of funding acknowledgements in Russian Web of Science nanotechnology publications, mid-2008-2012.
The structure of foreign funding corresponds with the top-collaborating countries. In addition
to the EU, two intergovernmental organisations – ISTC and NATO – have provided
nanotechnology research sponsorship in papers involving Russian authors. The International
Science and Technology Center (ISTC) is based in Moscow and supports research collaborations
involving scientists from Russia, CIS (former Soviet) countries, the US, South Korea, Japan, the
European Union and Norway (under the umbrella goal of supporting Russian and CIS nuclear
and weapons scientists to pursue peaceful research and commercialization pathways).13 The
other leading foreign sponsors of Russian nanotechnology research papers are affiliated with
particular host countries. Of all papers (mid-2008-2012) that report funding acknowledgement
information, German national funders sponsor 12.9%, US organisations fund 13%, and UK
organisations sponsor 2.7%.
Funding instances appear to be dominated by public bodies both in international and domestic
records. Following this group, University funding is the second most influential group, which
can be linked to the public funding as many universities have strong links with government
policy.
13 See: http://www.istc.ru/
0% 20% 40% 60% 80% 100%
1
European Union DFG DE
National Science Foundation US Department of Defence US
ISTC CRDF US
Department of Energy US ESPRC UK
MCINN ES BMBF DE
Alexander von Humboldt Foundation DE DAAD DE
ASM Finland ANR FR
NATO National Institute of Health US
NSFC CN MEXT JP
UK Royal Society CNR IT
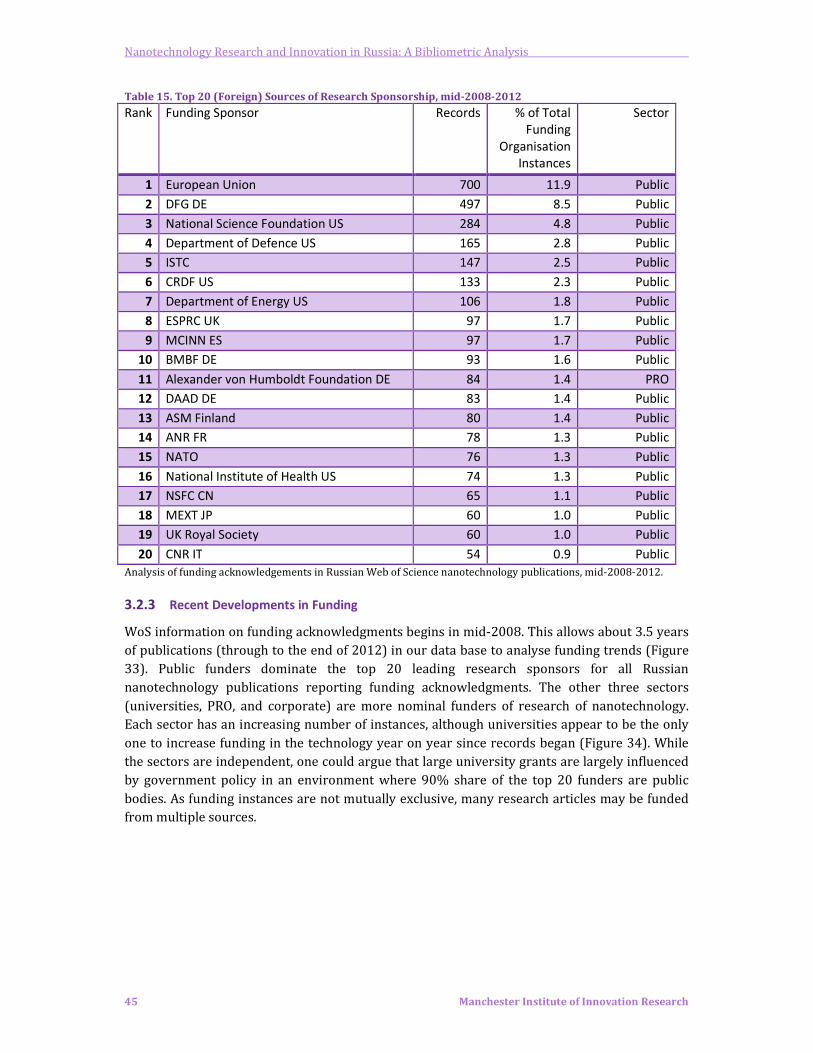
Nanotechnology Research and Innovation in Russia: A Bibliometric Analysis
45 Manchester Institute of Innovation Research
Table 15. Top 20 (Foreign) Sources of Research Sponsorship, mid-2008-2012
Rank Funding Sponsor Records % of Total
Funding
Organisation
Instances
Sector
1 European Union 700 11.9 Public
2 DFG DE 497 8.5 Public
3 National Science Foundation US 284 4.8 Public
4 Department of Defence US 165 2.8 Public
5 ISTC 147 2.5 Public
6 CRDF US 133 2.3 Public
7 Department of Energy US 106 1.8 Public
8 ESPRC UK 97 1.7 Public
9 MCINN ES 97 1.7 Public
10 BMBF DE 93 1.6 Public
11 Alexander von Humboldt Foundation DE 84 1.4 PRO
12 DAAD DE 83 1.4 Public
13 ASM Finland 80 1.4 Public
14 ANR FR 78 1.3 Public
15 NATO 76 1.3 Public
16 National Institute of Health US 74 1.3 Public
17 NSFC CN 65 1.1 Public
18 MEXT JP 60 1.0 Public
19 UK Royal Society 60 1.0 Public
20 CNR IT 54 0.9 Public
Analysis of funding acknowledgements in Russian Web of Science nanotechnology publications, mid-2008-2012.
3.2.3 Recent Developments in Funding
WoS information on funding acknowledgments begins in mid-2008. This allows about 3.5 years
of publications (through to the end of 2012) in our data base to analyse funding trends (Figure
33). Public funders dominate the top 20 leading research sponsors for all Russian
nanotechnology publications reporting funding acknowledgments. The other three sectors
(universities, PRO, and corporate) are more nominal funders of research of nanotechnology.
Each sector has an increasing number of instances, although universities appear to be the only
one to increase funding in the technology year on year since records began (Figure 34). While
the sectors are independent, one could argue that large university grants are largely influenced
by government policy in an environment where 90% share of the top 20 funders are public
bodies. As funding instances are not mutually exclusive, many research articles may be funded
from multiple sources.

Nanotechnology Research and Innovation in Russia: A Bibliometric Analysis
46 Manchester Institute of Innovation Research
Figure 28 Funding Sectors of Russian Nanotechnology Publications mid-2008-2012
Analysis of funding acknowledgements in Russian Web of Science nanotechnology publications, mid-2008-2012.
Looking closer at the three minor funders, it is noticeable that corporate and PRO funding have
been on a plateau since the beginning of the observation period, whereas the university funding
shows an increasing trend (Figure 34). This may be a consequence of a recent policy introduced
by the Russian Government to facilitate university research. Federal Universities that enjoy
privileged funding were established in 2006-2009, and National Research University system
was introduced in 2008.
Figure 29. Funding Sectors in Records of Nanotechnology Publications 1990-2012 (without Public Funders)
Analysis of funding acknowledgements in Russian Web of Science nanotechnology publications, mid-2008-2012.

Nanotechnology Research and Innovation in Russia: A Bibliometric Analysis
47 Manchester Institute of Innovation Research
3.2.4 Funding distribution across the subject areas
Top 10 subject categories of the publications in different sectors offer some insight into the
funding influences of different sectors. Three out of four of the sectors have the largest
percentage in Physics. Corporate funding provides the largest funding in Science & Technology-
Other Topics.
The majority of top 10 subject categories are similar. Public and Non-Governmental funders
(Figure 30, Figure 31) have the most distributed funding types, whereas University and
Corporate funders especially are more targeted, with over 75% of the top 10 taken up by four
publication subject categories (Figure 32 and Figure 33).
Figure 30. Top 10 Subject Areas for Public Funding, Russian Nanotechnology Publications, mid-2008-2012
Figure 31. Top 10 Subject Areas for Public Research Organisation Funders, Russian Nanotechnology
Publications, mid-2008-2012
Physics Chemistry
Materials Science Science & Technology - Other Topics
Physics, Condensed Matter Physics, Applied
Optics Engineering
Metallurgy & Metallurgical Engineering Materials Science, Multidisciplinary
Physics Chemistry
Materials Science Science & Technology - Other Topics
Physics, Condensed Matter Physics, Applied
Optics Materials Science, Multidisciplinary
Chemistry, Physical Nanoscience & Nanotechnology

Nanotechnology Research and Innovation in Russia: A Bibliometric Analysis
48 Manchester Institute of Innovation Research
Figure 32. Top 10 Subject Areas for University Funders, Russian Nanotechnology Publications, mid-2008-
2012
Analysis of funding acknowledgements in Russian Web of Science nanotechnology publications, mid-2008-2012.
The subject categories of research appear to show a leaning towards particular topics in
research. Within these subject categories there are many different research areas. Corporate
research appears to be the most focussed on the top 10 subject categories, implying that that
the market influence is less varied and the application of research is more closed when involved
in the corporate sector. Public funding appears to offer the most distributed view of research
across its top 10 research subjects. Whereas the state has larger financial assets and no explicit
shareholders to appease, the research may be more distributed since short term “profits” are
exchanged for longer term goals of national research agendas.
Three out of four categories show Physics and Chemistry as covering approximately 50% of the
Top 10 subject categories through all sectors (Figure 30, Figure 31, Figure 32, and Figure 33).
Physics Chemistry
Materials Science Science & Technology - Other Topics
Optics Metallurgy & Metallurgical Engineering
Materials Science, Multidisciplinary Physics, Condensed Matter
Physics, Applied Nanoscience & Nanotechnology
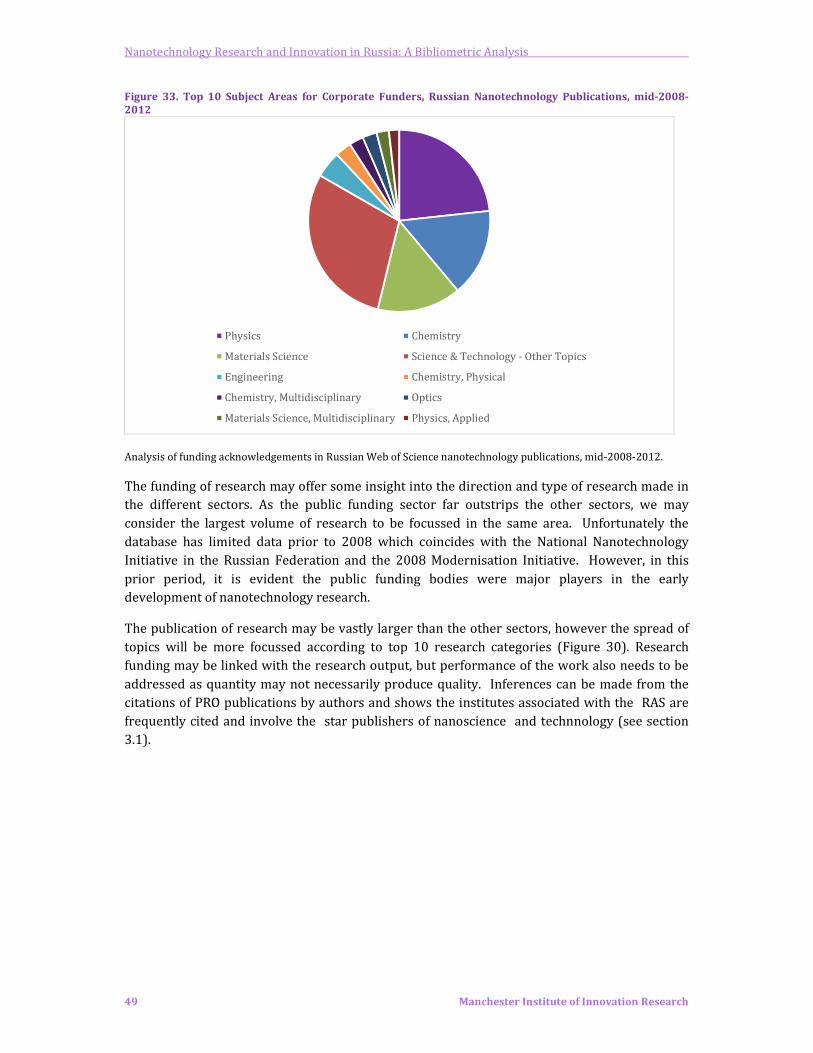
Nanotechnology Research and Innovation in Russia: A Bibliometric Analysis
49 Manchester Institute of Innovation Research
Figure 33. Top 10 Subject Areas for Corporate Funders, Russian Nanotechnology Publications, mid-2008-
2012
Analysis of funding acknowledgements in Russian Web of Science nanotechnology publications, mid-2008-2012.
The funding of research may offer some insight into the direction and type of research made in
the different sectors. As the public funding sector far outstrips the other sectors, we may
consider the largest volume of research to be focussed in the same area. Unfortunately the
database has limited data prior to 2008 which coincides with the National Nanotechnology
Initiative in the Russian Federation and the 2008 Modernisation Initiative. However, in this
prior period, it is evident the public funding bodies were major players in the early
development of nanotechnology research.
The publication of research may be vastly larger than the other sectors, however the spread of
topics will be more focussed according to top 10 research categories (Figure 30). Research
funding may be linked with the research output, but performance of the work also needs to be
addressed as quantity may not necessarily produce quality. Inferences can be made from the
citations of PRO publications by authors and shows the institutes associated with the RAS are
frequently cited and involve the star publishers of nanoscience and technnology (see section
3.1).
Physics Chemistry
Materials Science Science & Technology - Other Topics
Engineering Chemistry, Physical
Chemistry, Multidisciplinary Optics
Materials Science, Multidisciplinary Physics, Applied
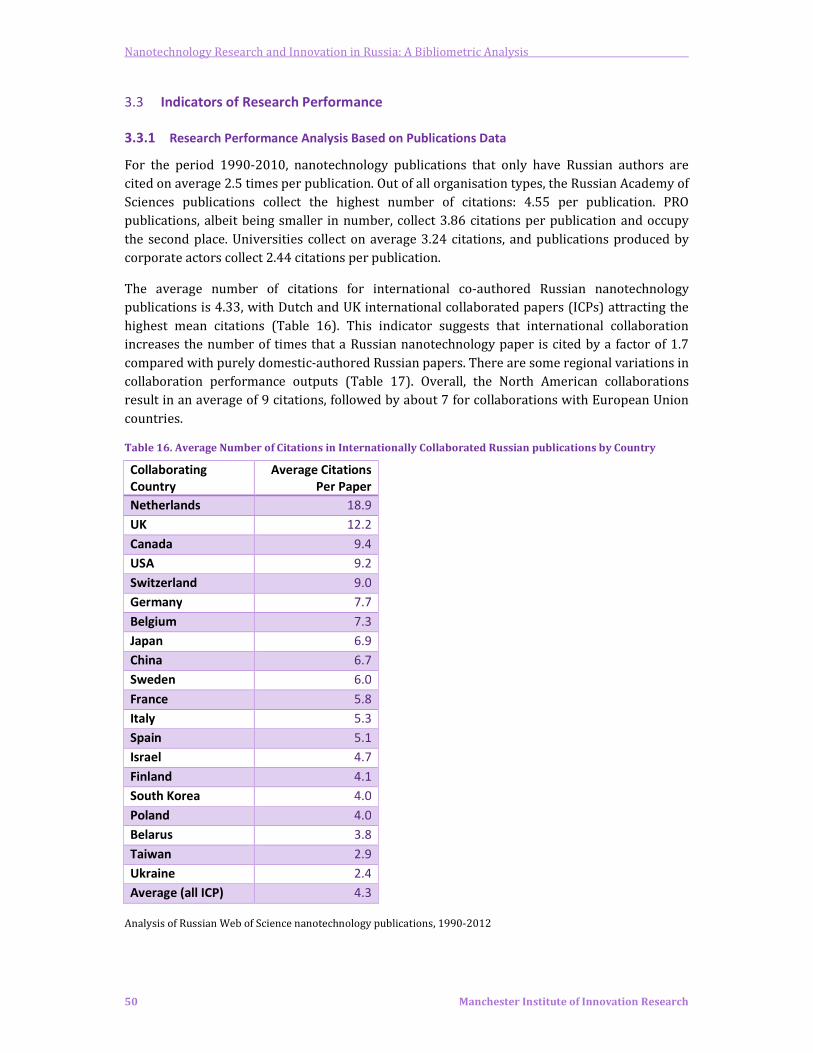
Nanotechnology Research and Innovation in Russia: A Bibliometric Analysis
50 Manchester Institute of Innovation Research
3.3 Indicators of Research Performance
3.3.1 Research Performance Analysis Based on Publications Data
For the period 1990-2010, nanotechnology publications that only have Russian authors are
cited on average 2.5 times per publication. Out of all organisation types, the Russian Academy of
Sciences publications collect the highest number of citations: 4.55 per publication. PRO
publications, albeit being smaller in number, collect 3.86 citations per publication and occupy
the second place. Universities collect on average 3.24 citations, and publications produced by
corporate actors collect 2.44 citations per publication.
The average number of citations for international co-authored Russian nanotechnology
publications is 4.33, with Dutch and UK international collaborated papers (ICPs) attracting the
highest mean citations (Table 16). This indicator suggests that international collaboration
increases the number of times that a Russian nanotechnology paper is cited by a factor of 1.7
compared with purely domestic-authored Russian papers. There are some regional variations in
collaboration performance outputs (Table 17). Overall, the North American collaborations
result in an average of 9 citations, followed by about 7 for collaborations with European Union
countries.
Table 16. Average Number of Citations in Internationally Collaborated Russian publications by Country
Analysis of Russian Web of Science nanotechnology publications, 1990-2012
Collaborating
Country
Average Citations
Per Paper
Netherlands 18.9
UK 12.2
Canada 9.4
USA 9.2
Switzerland 9.0
Germany 7.7
Belgium 7.3
Japan 6.9
China 6.7
Sweden 6.0
France 5.8
Italy 5.3
Spain 5.1
Israel 4.7
Finland 4.1
South Korea 4.0
Poland 4.0
Belarus 3.8
Taiwan 2.9
Ukraine 2.4
Average (all ICP) 4.3
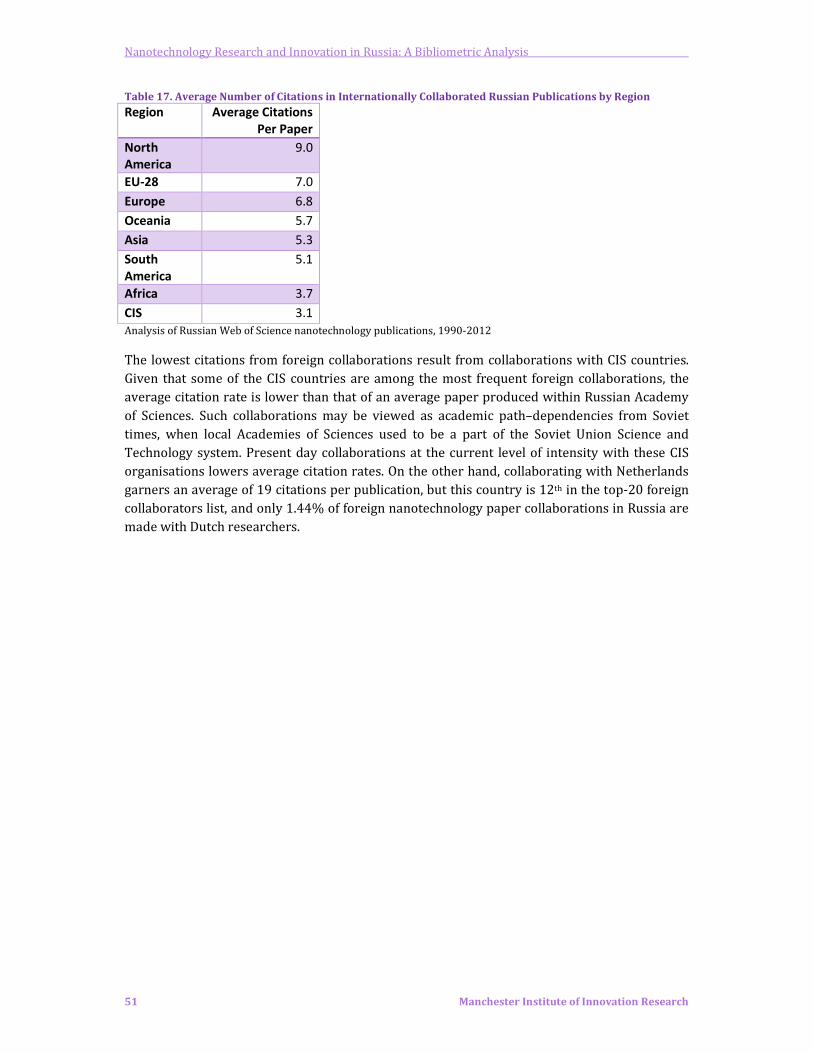
Nanotechnology Research and Innovation in Russia: A Bibliometric Analysis
51 Manchester Institute of Innovation Research
Table 17. Average Number of Citations in Internationally Collaborated Russian Publications by Region
Region Average Citations
Per Paper
North
America
9.0
EU-28 7.0
Europe 6.8
Oceania 5.7
Asia 5.3
South
America
5.1
Africa 3.7
CIS 3.1
Analysis of Russian Web of Science nanotechnology publications, 1990-2012
The lowest citations from foreign collaborations result from collaborations with CIS countries.
Given that some of the CIS countries are among the most frequent foreign collaborations, the
average citation rate is lower than that of an average paper produced within Russian Academy
of Sciences. Such collaborations may be viewed as academic path–dependencies from Soviet
times, when local Academies of Sciences used to be a part of the Soviet Union Science and
Technology system. Present day collaborations at the current level of intensity with these CIS
organisations lowers average citation rates. On the other hand, collaborating with Netherlands
garners an average of 19 citations per publication, but this country is 12th in the top-20 foreign
collaborators list, and only 1.44% of foreign nanotechnology paper collaborations in Russia are
made with Dutch researchers.
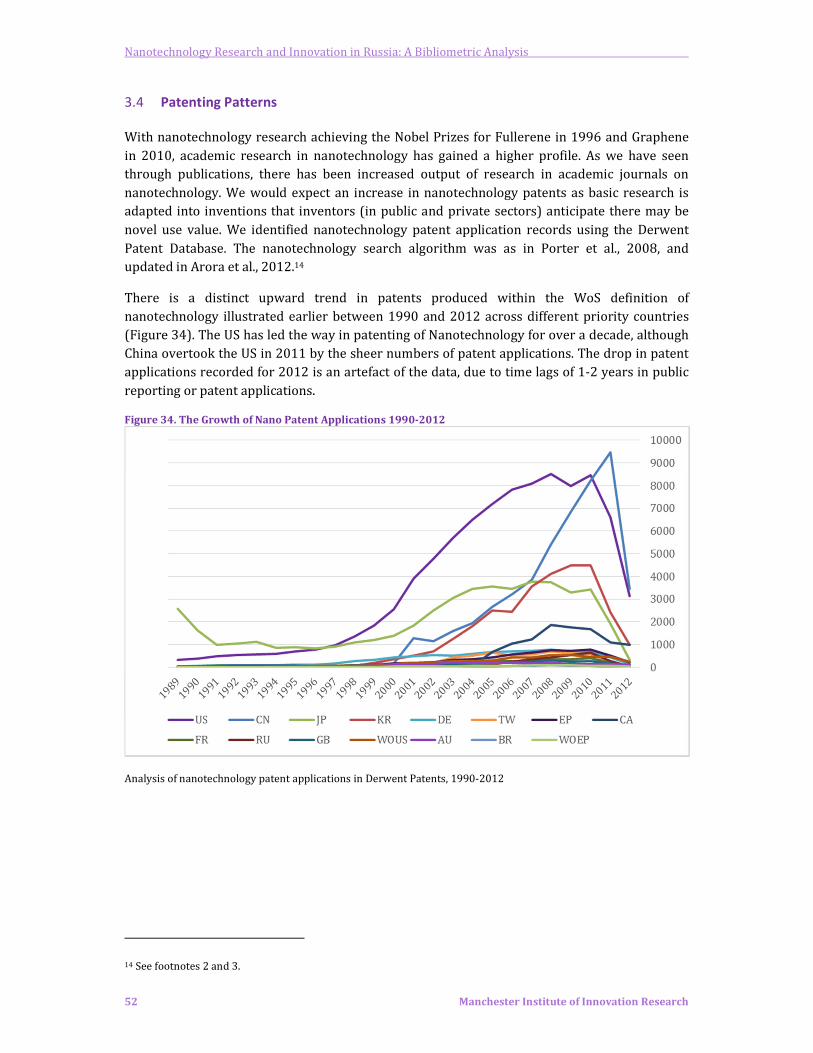
Nanotechnology Research and Innovation in Russia: A Bibliometric Analysis
52 Manchester Institute of Innovation Research
3.4 Patenting Patterns
With nanotechnology research achieving the Nobel Prizes for Fullerene in 1996 and Graphene
in 2010, academic research in nanotechnology has gained a higher profile. As we have seen
through publications, there has been increased output of research in academic journals on
nanotechnology. We would expect an increase in nanotechnology patents as basic research is
adapted into inventions that inventors (in public and private sectors) anticipate there may be
novel use value. We identified nanotechnology patent application records using the Derwent
Patent Database. The nanotechnology search algorithm was as in Porter et al., 2008, and
updated in Arora et al., 2012.14
There is a distinct upward trend in patents produced within the WoS definition of
nanotechnology illustrated earlier between 1990 and 2012 across different priority countries
(Figure 34). The US has led the way in patenting of Nanotechnology for over a decade, although
China overtook the US in 2011 by the sheer numbers of patent applications. The drop in patent
applications recorded for 2012 is an artefact of the data, due to time lags of 1-2 years in public
reporting or patent applications.
Figure 34. The Growth of Nano Patent Applications 1990-2012
Analysis of nanotechnology patent applications in Derwent Patents, 1990-2012
14 See footnotes 2 and 3.
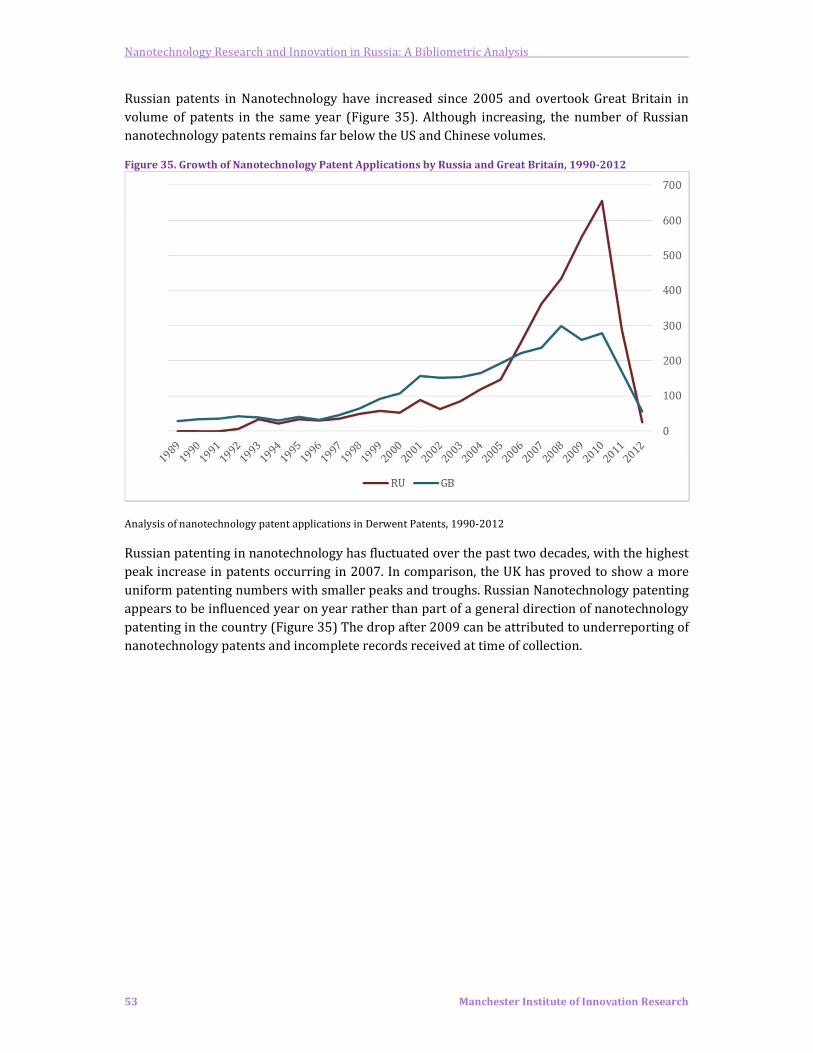
Nanotechnology Research and Innovation in Russia: A Bibliometric Analysis
53 Manchester Institute of Innovation Research
Russian patents in Nanotechnology have increased since 2005 and overtook Great Britain in
volume of patents in the same year (Figure 35). Although increasing, the number of Russian
nanotechnology patents remains far below the US and Chinese volumes.
Figure 35. Growth of Nanotechnology Patent Applications by Russia and Great Britain, 1990-2012
Analysis of nanotechnology patent applications in Derwent Patents, 1990-2012
Russian patenting in nanotechnology has fluctuated over the past two decades, with the highest
peak increase in patents occurring in 2007. In comparison, the UK has proved to show a more
uniform patenting numbers with smaller peaks and troughs. Russian Nanotechnology patenting
appears to be influenced year on year rather than part of a general direction of nanotechnology
patenting in the country (Figure 35) The drop after 2009 can be attributed to underreporting of
nanotechnology patents and incomplete records received at time of collection.
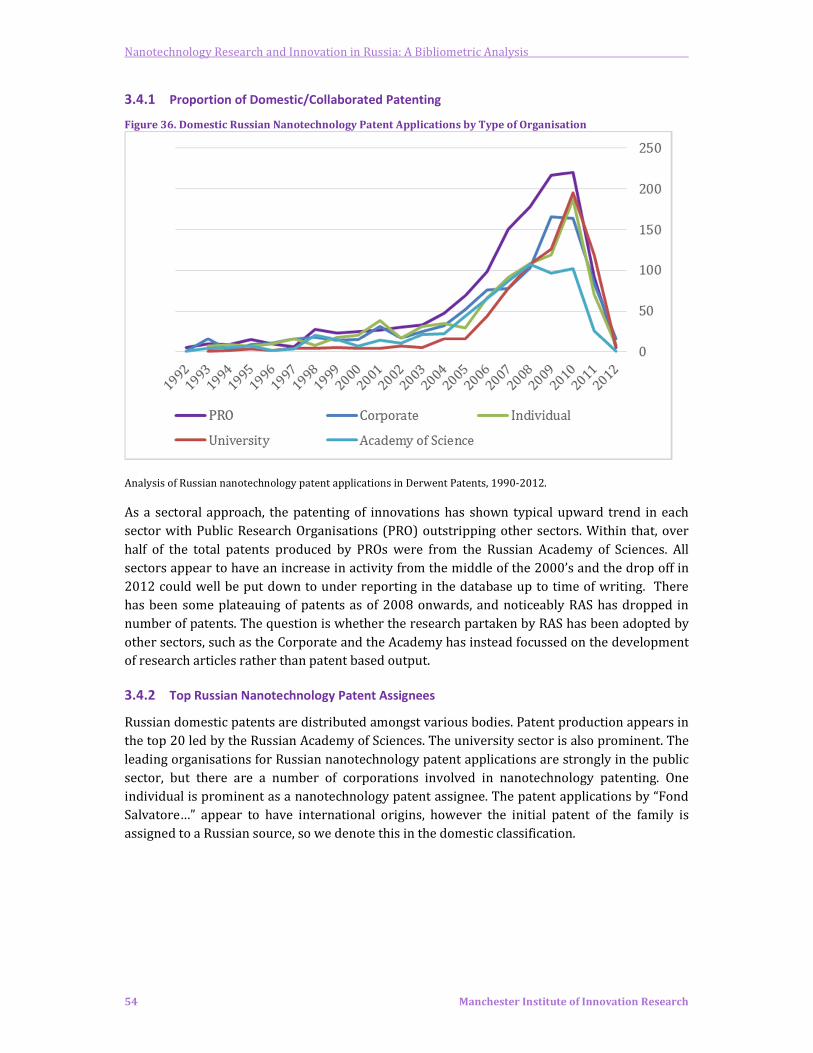
Nanotechnology Research and Innovation in Russia: A Bibliometric Analysis
54 Manchester Institute of Innovation Research
3.4.1 Proportion of Domestic/Collaborated Patenting
Figure 36. Domestic Russian Nanotechnology Patent Applications by Type of Organisation
Analysis of Russian nanotechnology patent applications in Derwent Patents, 1990-2012.
As a sectoral approach, the patenting of innovations has shown typical upward trend in each
sector with Public Research Organisations (PRO) outstripping other sectors. Within that, over
half of the total patents produced by PROs were from the Russian Academy of Sciences. All
sectors appear to have an increase in activity from the middle of the 2000’s and the drop off in
2012 could well be put down to under reporting in the database up to time of writing. There
has been some plateauing of patents as of 2008 onwards, and noticeably RAS has dropped in
number of patents. The question is whether the research partaken by RAS has been adopted by
other sectors, such as the Corporate and the Academy has instead focussed on the development
of research articles rather than patent based output.
3.4.2 Top Russian Nanotechnology Patent Assignees
Russian domestic patents are distributed amongst various bodies. Patent production appears in
the top 20 led by the Russian Academy of Sciences. The university sector is also prominent. The
leading organisations for Russian nanotechnology patent applications are strongly in the public
sector, but there are a number of corporations involved in nanotechnology patenting. One
individual is prominent as a nanotechnology patent assignee. The patent applications by “Fond
Salvatore…” appear to have international origins, however the initial patent of the family is
assigned to a Russian source, so we denote this in the domestic classification.
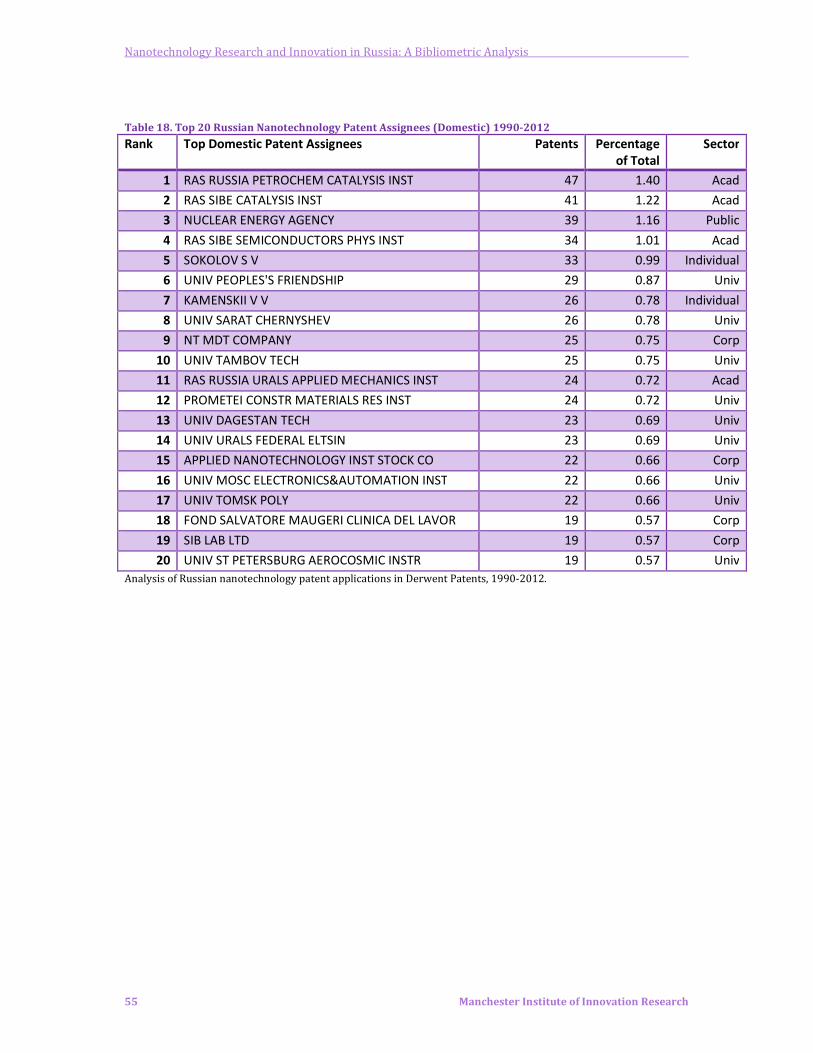
Nanotechnology Research and Innovation in Russia: A Bibliometric Analysis
55 Manchester Institute of Innovation Research
Table 18. Top 20 Russian Nanotechnology Patent Assignees (Domestic) 1990-2012
Rank Top Domestic Patent Assignees Patents Percentage
of Total
Sector
1 RAS RUSSIA PETROCHEM CATALYSIS INST 47 1.40 Acad
2 RAS SIBE CATALYSIS INST 41 1.22 Acad
3 NUCLEAR ENERGY AGENCY 39 1.16 Public
4 RAS SIBE SEMICONDUCTORS PHYS INST 34 1.01 Acad
5 SOKOLOV S V 33 0.99 Individual
6 UNIV PEOPLES'S FRIENDSHIP 29 0.87 Univ
7 KAMENSKII V V 26 0.78 Individual
8 UNIV SARAT CHERNYSHEV 26 0.78 Univ
9 NT MDT COMPANY 25 0.75 Corp
10 UNIV TAMBOV TECH 25 0.75 Univ
11 RAS RUSSIA URALS APPLIED MECHANICS INST 24 0.72 Acad
12 PROMETEI CONSTR MATERIALS RES INST 24 0.72 Univ
13 UNIV DAGESTAN TECH 23 0.69 Univ
14 UNIV URALS FEDERAL ELTSIN 23 0.69 Univ
15 APPLIED NANOTECHNOLOGY INST STOCK CO 22 0.66 Corp
16 UNIV MOSC ELECTRONICS&AUTOMATION INST 22 0.66 Univ
17 UNIV TOMSK POLY 22 0.66 Univ
18 FOND SALVATORE MAUGERI CLINICA DEL LAVOR 19 0.57 Corp
19 SIB LAB LTD 19 0.57 Corp
20 UNIV ST PETERSBURG AEROCOSMIC INSTR 19 0.57 Univ
Analysis of Russian nanotechnology patent applications in Derwent Patents, 1990-2012.

Nanotechnology Research and Innovation in Russia: A Bibliometric Analysis
56 Manchester Institute of Innovation Research
4 Summary of Findings
From a selection of observations and findings from this preliminary analysis we can note the
following.
• There is an upward trend of research paper outputs in Russian nanotechnology. The
publishing activity is highly concentrated. The Russian Academy of Sciences (RAS)
dominates publishing in nanotechnology, although there is a tendency of decline of the
annual contribution of RAS, and a transition away from monocentrism in nanoscience
publishing. RAS still has the biggest regional structure of all research organisations.
• In the WoS database, English is the predominant language for Russian nanotechnology
publications, and rate of publishing in Russian decreases. However, there is a prevalence
of publications in translated versions of domestic journals rather than in international
journals for all types of publishing entities.
• The most productive researchers in nanotechnology increased outputs during the key
formative years in the development of nanoscience, aided by domestic policies to
encourage development in nanotechnology. More recently, productivity among this
research group is declining: peak productivity for current “star scientists” is over.
• The leading international collaborations for Russian nanotechnology researchers are
with Western Europe and the former Soviet Union republics, and the USA. Collaboration
rates with Asian countries are low, with the exception of Japan.
• Russian nanoscientists co-author with a diversity of international organisations. Russian
university nanotechnology authors are relatively more likely to collaborate with foreign
organisations that for the Russian Academy of Science or other Russian research actors.
• Corporate Research appears to collaborate with universities and RAS to a higher degree
than other types of publishers, and also shows leaning towards collaborating
domestically.
• The RAS dominates nanotechnology research in the subject areas of physics and
chemistry. Other types of actors contribute to other subject areas relatively more than
found in the RAS. There is a clear specialisation according to the traditional subject
areas within RAS institutes, inhibiting multidisciplinary research within institutes.
• RAS publications are the most highly cited among domestic publications. Internationally
collaborated Russian nanotechnology publications garner the highest number of
citations on average.
• The distribution of research funding for nanotechnology in Russia is overwhelmingly
dominated by the public sector. International research appears to be most linked with
funding coming from large national public bodies or quasi-independent funders, as well
as international sponsors.
• Russian nanotechnology patenting is increasing year on year, although Russia ranks
significantly below China and the USA for patenting activity.
• Russian nanotechnology patent production is led by the Russian Academy of Science,
with a strong role from the university sector. Russian corporate patenting of
nanotechnology is represented but at relatively lower levels.
Nanotechnology Research and Innovation in Russia: A Bibliometric Analysis
57 Manchester Institute of Innovation Research
5 Appendix
The following sections provide additional methodological notes and explanation.
5.1 Publication Database
Publication data is drawn from the Web of Science (SCI), using the nanotechnology search
algorithm in Porter et al., 2008, and updated in Arora et al., 2012.15 VantagePoint text mining
software was used to aid data cleaning, management, and analysis. 33,538 Russian
nanotechnology publication records were identified (1990-2012).
5.1.1 Cleaning of Fields
The data in affiliations and funding fields were cleaned to combine duplicate records and deal
with misspellings and variations in the raw data. The cleaning was first run through an
algorithm and then reviewed in person to pick up on records which were missed by the
programme.
5.1.2 Domestic (NCP) and International (ICP)
Russian publications were identified if they had at least one author with a Russian institutional
affiliation. Domestic (NCP) publications ought to have had all authors affiliated with Russian
organisations. International (ICP) publications ought to have at least one author with foreign
affiliation. The two types of publications are mutually exclusive. The Soviet Union in the early
publications (1990-1992) is classified as belonging to “Domestic” publications, although the
affiliations belonging to the countries of the former Soviet Union (including Belarus and
Kazakhstan that have formed a confederation entity with Russia) were then classified as
“International”.
This classification grouping was applied to the affiliation and funding categories to show the
spread of NCP and ICP in both of these categories.
5.1.3 Affiliations
Affiliation data in the dataset is available for 100% of the data and includes 4065 separate
Russian and international affiliations. The basic grouping of the affiliations was based on 5
categories that are mutually exclusive:
• Academy of Science organisations – specific research entities that have wide
government affiliations and heavily rely on government funding, that have a wide
regional structure and hierarchical administrative division;
• Universities – without distinguishing into private and public;
• Public Research Organisations – private and state-owned research institutes that are
neither academy of science institutions, nor universities. These also include research
foundations and ministries;
• Corporate – privately and state-owned company affiliations. Organisations were usually
labelled as “corporate” actors if they had a distinctive property type word in their names
(LLC, Ltd, GmbH, ZAO etc.);
15 See footnotes 2 and 3.
Nanotechnology Research and Innovation in Russia: A Bibliometric Analysis
58 Manchester Institute of Innovation Research
• Other – all other organisations that cannot be attributed to any other category (such are
high schools, vet clinics etc.).
In the domestic regional mapping only Universities, PROs and corporate actors were counted, as
the academy of science groupings were aggregate of all academy organisations in all regions.
The grouping of Russian organisation by regions was carried out in the accordance with the
administrative division of Russia into 83 federal subjects (21 republics, 9 krais, 46 oblasts, 2
federal cities, 1 autonomous region). The current administrative division is valid from 2008,
publications from the time previous to 2008 were classified according to the modern dividing
lines. The bigger picture is provided by aggregating the 83 federal subjects into 8 Federal
Districts. They were set up by the President of Russia in 2000, and each includes the federal
districts with similar economic and demographic conditions. As an anomaly, since July 2013
Troitsk was adjoined with Moscow. The dataset precedes this, therefore Troitsk is classified as a
Moscow Region unit.
Internationally Collaborated Publications are grouped in accordance with the established
regional classifications: North America, EU-28, the rest of Europe, Asia, Oceania, and BRICSK.
Russia is excluded from BRICSK, South Korea is added. Also, CIS as a distinct group of states that
used to be included into the Soviet Science System is separated from their usual Europe/Asian
classification categories.
These groupings have given an insight into the sectoral approach of innovation in the Nano
sector. There are grey areas with each of these grouping. For example, such as joint stock
companies and other state-owned enterprises, which are notable in Post-Soviet Russia and
comprise government corporate influences. Many of such corporate actors were established as
spin-offs of State Research Centres, so in the late Soviet Union era, and never quite got detached
from their state-owned mother organisations. They are obviously different in structure,
organising principles and the purposes of functioning from more conventional (especially
Western) corporate actors, and there may be doubts as whether these should be grouped and
studied separately. This hypothesis is a subject to further investigation.
There were no notable civil society actors, such as NGOs or charities, in the dataset, so the
separate grouping was not created. The phenomenon may be attributed to the lack of civil
society concerns regarding research in Russia, and the lack of specialised NGOs, including
Russian branches of international NGOs. This is yet another point of inquiry for further
research.
5.1.4 Funding Information.
The funding data available covers the period mid-2008-2012. A total of 8512 records with
funding sources were identified.
The Domestic (NCP) and Foreign (ICP) groupings were applied to the funding sponsors, which
showed the overall spread. All records had at least 1 Russian author, however foreign links were
found in 5872 articles.
A secondary grouping was created to show the sectoral make-up of the funding organisations
involved in nanotechnology research. The groupings were the following.
• Universities – both private and public;

Nanotechnology Research and Innovation in Russia: A Bibliometric Analysis
59 Manchester Institute of Innovation Research
• Public Funders – National and local government bodies as well as national target
programmes;
• Public Research Organisations – Research institutes that were neither Universities nor
Government Ministries. They include Research Foundations formed from charities and
businesses;16
• Corporate – privately and state-owned company affiliations. Organisations were usually
group as ‘corporate’ actors if they had a distinctive property type word in their names
(LLC, Ltd, GmbH, ZAO etc).
5.2 Patent Database
The source of the patent data is the ThomsonReuter Web of Knowledge Derwent Patent
Database. The nanotechnology search algorithm was as in Porter et al., 2008, and updated in
Arora et al., 2012.17 VantagePoint text mining software was used to aid data cleaning,
management, and analysis. Russian patents were identified as those patents listing Russia as the
patent priority country. In total, 3,350 Russian nanotechnology patent families were identified
(1990-2012).
After cleaning the dataset was grouped into Domestic (NCP) and International (ICP) categories.
“Domestic” implies a patent priority registered only in Russia. “International” denotes at least
one international link in priority countries of the patent.
Similar to the publication database, patent assignees were grouped into sectors covering
• Universities - National and Private Higher Education bodies;
• Public Research Organisations – private and state-owned research institutes that were
neither academy of science institutions, nor universities. They also include research
foundations and ministries;
• Academy of Science – This covers Russian Academy of Sciences assignees from different
regions of the Russian Federation. This grouping is a subset of of the PRO category as
this is a particularly common occurrence in the database;
• Corporate – privately and state-owned company affiliations. Organisations were usually
group as ‘corporate’ actors if they had a distinctive property type word in their names
(LLC, Ltd, GmbH, ZAO etc);
• Individual- Patent assignees with for individuals.
5.3 Limitations
Publications used in the analysis were collected from the Web of Science Database. Therefore,
there is a database bias in the data. One of the effects of this bias shows in the overall growth of
publications: it is a ‘jump’ in the annual publication output in 1998, which also features in
graphs and tables further along the text. Second, it is the language of publications. Although the
majority of publications are in English, there is a small portion of publications in Russian. A
small percentage of inflation may be expected regarding that, as the majority of publications in
Russian are then translated into the English version of the peer-reviewed journal. The third
16 This grouping is distinct from “Universities” and diverges from the OECD definition of PRO/ PRI as we felt that the
category could limit analysis of some intermediate bodies such as Foundations and charities which may have some
similar characteristics but different goals and management approaches. 17 See footnotes 2 and 3.
Nanotechnology Research and Innovation in Russia: A Bibliometric Analysis
60 Manchester Institute of Innovation Research
limitation of the database is that information on funders is only available starting from 2008.
Finally, the Web of Science only recently started to associate each author with their affiliation,
opening some more advanced opportunities for research, but the too recent opening made it
impossible to carry out further analysis on this topic in the report.
Russia has a publication database eLIBRARY.ru that contains over 15 million records in Russian
and English covering all areas of science. Possible overlaps or complementarities between the
records in the WoS and eLIBRARY remain to be investigated.
1 Manchester Institute of Innovation Research
Manchester Institute of Innovation Research
The Manchester Institute of Innovation Research (MIoIR) is the research centre of excellence in the
Manchester Business School (MBS) and The University of Manchester in the field of innovation and
science studies. With more than 50 full members and a range of associated academics from across the
University, MIoIR is Europe’s largest and one of the World’s leading research centres in this field.
The Institute’s key strengths lie in the linkage and cross-fertilisation of economics, management and
policy around innovation and science. Building on forty years of tradition in innovation and science
studies, the Institute’s philosophy is to combine academic rigour with concrete practical relevance for
policy and management. This includes broad engagement with and research for policy makers and
societal and industrial stakeholders in the Manchester City Region, across the UK and internationally.
MIoIR is also firmly committed to a range of teaching activities within and beyond MBS and integrates a
strong and successful PhD programme into its research activities. The Institute has a visitor programme
for academics and management and policy practitioners and provides a range of popular and high level
executive education courses on evaluation, foresight and S&T Policy.
For more information please visit http://research.mbs.ac.uk/innovation
Top Related
Copyright © 2022 FDOKUMEN

