


Bahasa
Halaman
Hukum

Multiscale anisotropy controlled by folding: the example
of the Chaudrons fold (Corbieres, France)
Laurent Louis a,b,*, Philippe Robion a, Christian David a, Dominique Frizon de Lamotte a
a Universite de Cergy-Pontoise, Departement des Sciences de la Terre et de l’Environnement, UMR CNRS 7072,
Batiment Neuville 3.1, 5 mail Gay Lussac, F-95031 Cergy-Pontoise, Franceb Stony Brook University, Department of Geosciences, Stony Brook, NY 11794-2100, USA
Received 21 August 2005; received in revised form 16 January 2006; accepted 20 January 2006
Available online 10 March 2006
Abstract
In this paper, anisotropies developed in silicoclastic continental deposits during the building of the Chaudrons anticline (Corbieres, France) are
studied. A microstructural analysis of the deformational features in three different panels within the fold (crest, hinge, and forelimb, respectively)
is reported and compared with early field observations (distribution and orientation of cleavage) and laboratory measurements (estimation of
magnetic and acoustic anisotropies). The main finding of this investigation is the preservation of unwelded joints between grains of calcite
promoted by the presence of quartz grains. These joints, which appear as discontinuities in a matrix of calcite, are analyzed in orientation and
composition. In the three panels of the fold that are investigated, a range of dip angles is observed with at least two major generations of joints, the
average orientation of which is found to be consistent with both macroscopic cleavage and magnetic and acoustic fabrics. To account for the
multimodal distribution of the joints orientation, we suggest an original scenario in which they are successively generated by sets. Two processes
have operated simultaneously during the development of the fold: (1) horizontal rock mass compaction inducing pressure solution and twinning in
calcite; (2) preservation of unwelded calcite/calcite grain joints due to stress heterogeneities associated with quartz inclusions. From these results,
we suggest that microstructural processes are the same before and during folding, ruling out a passive shearing of cleavage plane formed during a
first step of layer parallel shortening.
q 2006 Elsevier Ltd. All rights reserved.
Keywords: Anisotropy; Magnetic susceptibility; P-wave velocity; Pressure solution; Cleavage
1. Introduction
Studies of regional structures have often considered that
microstructures were not taking on a significant part of plastic
strain during folding, arguing that if affected they would be so
mostly during early pre-folding stages like burial related
compaction or layer parallel shortening (LPS). In the Barclay
fold, Thorbjornsen and Dunne (1997) observed that original
microstructures had not been significantly disturbed during
folding, while other studies revealed some strain-related
textures that were attributed to LPS only: see the example of
the Lagrasse fold (Corbieres, France) (Averbuch et al., 1992;
Frizon de Lamotte et al., 1997), or the work of Tavarnelli (1997)
in the Apennines (Italy). Still, it was shown in a few examples
that microstructures were at least partly sin-folding: in the
0191-8141/$ - see front matter q 2006 Elsevier Ltd. All rights reserved.
doi:10.1016/j.jsg.2006.01.002
* Corresponding author. Tel.: C1 631 632 8302; fax: C1 631 632 8240.
E-mail address: [email protected] (L. Louis).
Tadighoust anticline (High Atlas, Morocco) (Saint-Bezar et al.,
2002), in the Oupia anticline (Corbieres, France) (Grelaud
et al., 2000), or in the Lost River Range (Idaho, USA) (Anastasio
et al., 1997). In order to understand better the relationships
between micro-/mesoscopic deformation patterns and the
kinematic or mechanical evolution of a fold, more case studies
are required.
The Chaudrons anticline (Corbieres, France) provides a
good opportunity for such a work mainly for two reasons: first,
due to a weak (even naught) compaction, meso-scale tectonic
features (fractures, cleavage) are particularly well expressed
(Ellenberger, 1967; Cluzel, 1977; Averbuch et al., 1992; Frizon
de Lamotte et al., 2002; Tavani et al., 2004); second, the
orientation of these features with respect to the bedding depend
on their location in the fold and are consequently folding-
related (Tavani et al., 2004).
The purpose of this study is to understand how and at which
scale strain was accommodated during the construction of
the Chaudrons fold, with a particular emphasis on the role
of microstructures. This work was largely motivated by
Journal of Structural Geology 28 (2006) 549–560
www.elsevier.com/locate/jsg
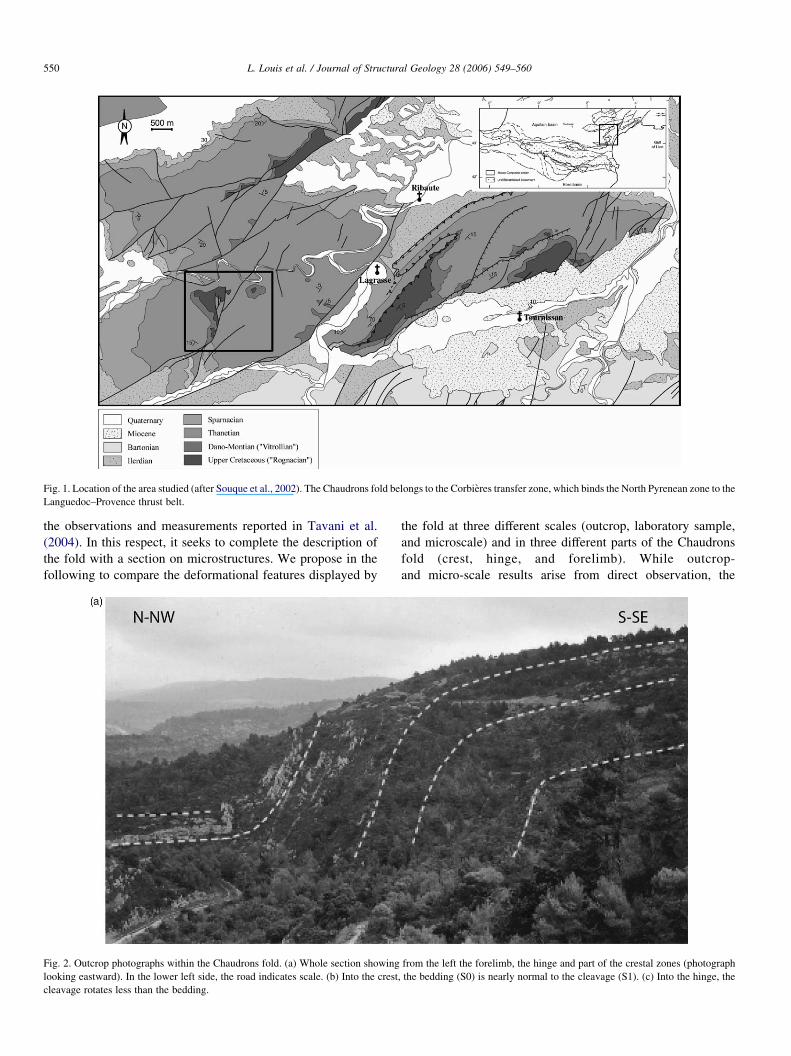
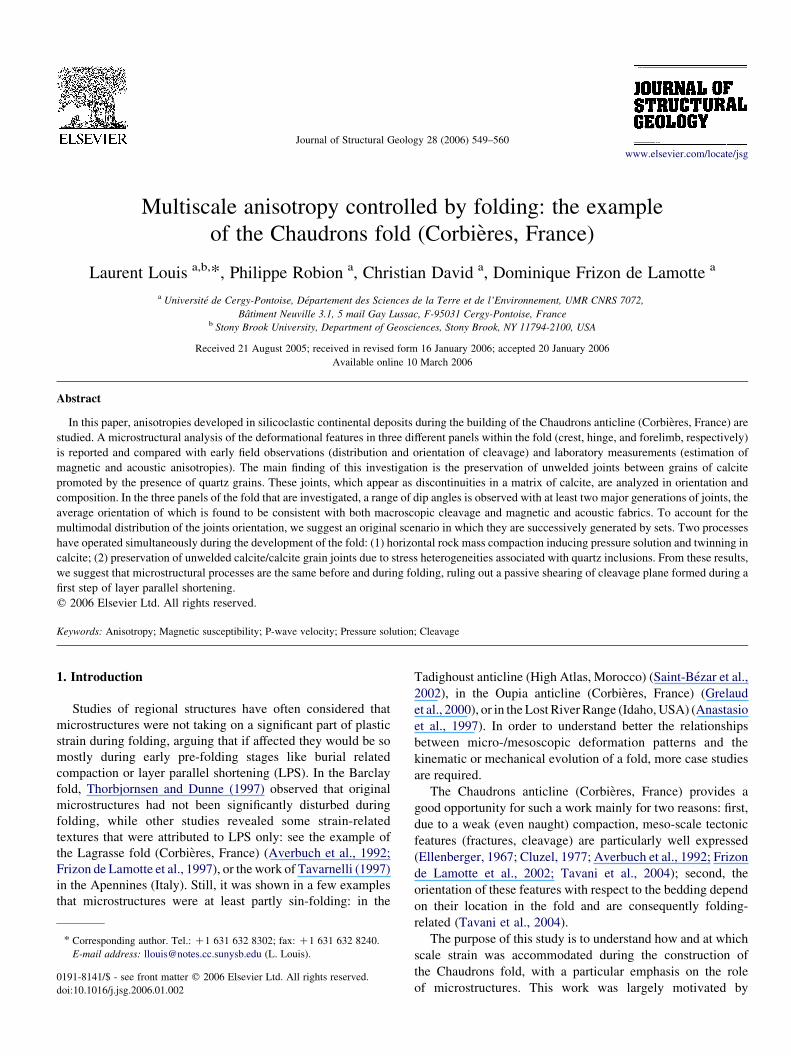
Fig. 1. Location of the area studied (after Souque et al., 2002). The Chaudrons fold belongs to the Corbieres transfer zone, which binds the North Pyrenean zone to the
Languedoc–Provence thrust belt.
L. Louis et al. / Journal of Structural Geology 28 (2006) 549–560550
the observations and measurements reported in Tavani et al.
(2004). In this respect, it seeks to complete the description of
the fold with a section on microstructures. We propose in the
following to compare the deformational features displayed by
Fig. 2. Outcrop photographs within the Chaudrons fold. (a) Whole section showing
looking eastward). In the lower left side, the road indicates scale. (b) Into the crest
cleavage rotates less than the bedding.
the fold at three different scales (outcrop, laboratory sample,
and microscale) and in three different parts of the Chaudrons
fold (crest, hinge, and forelimb). While outcrop-
and micro-scale results arise from direct observation, the
from the left the forelimb, the hinge and part of the crestal zones (photograph
, the bedding (S0) is nearly normal to the cleavage (S1). (c) Into the hinge, the
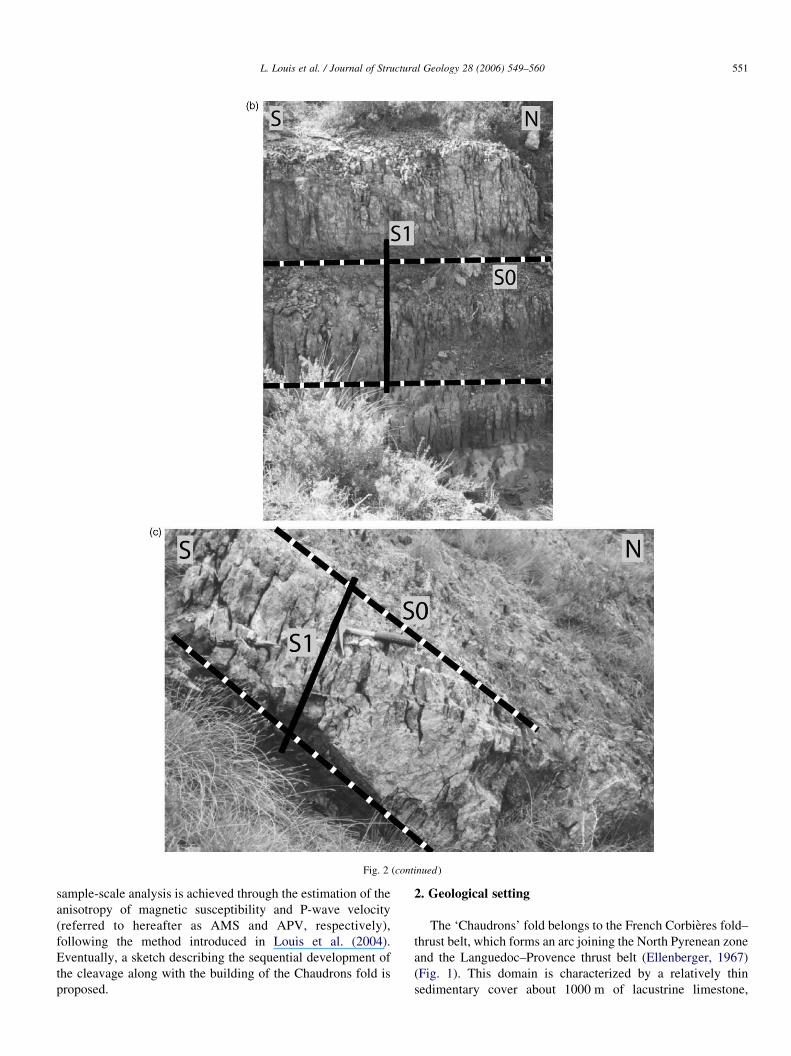
Fig. 2 (continued)
L. Louis et al. / Journal of Structural Geology 28 (2006) 549–560 551
sample-scale analysis is achieved through the estimation of the
anisotropy of magnetic susceptibility and P-wave velocity
(referred to hereafter as AMS and APV, respectively),
following the method introduced in Louis et al. (2004).
Eventually, a sketch describing the sequential development of
the cleavage along with the building of the Chaudrons fold is
proposed.
2. Geological setting
The ‘Chaudrons’ fold belongs to the French Corbieres fold–
thrust belt, which forms an arc joining the North Pyrenean zone
and the Languedoc–Provence thrust belt (Ellenberger, 1967)
(Fig. 1). This domain is characterized by a relatively thin
sedimentary cover about 1000 m of lacustrine limestone,
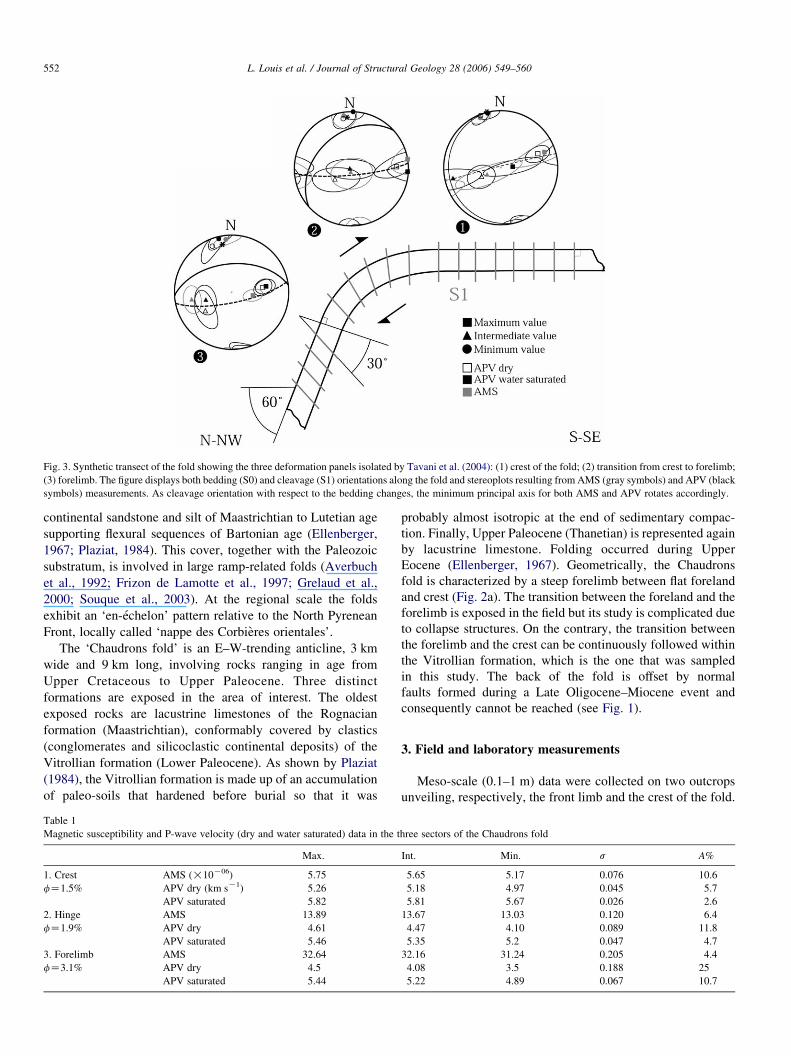
Fig. 3. Synthetic transect of the fold showing the three deformation panels isolated by Tavani et al. (2004): (1) crest of the fold; (2) transition from crest to forelimb;
(3) forelimb. The figure displays both bedding (S0) and cleavage (S1) orientations along the fold and stereoplots resulting from AMS (gray symbols) and APV (black
symbols) measurements. As cleavage orientation with respect to the bedding changes, the minimum principal axis for both AMS and APV rotates accordingly.
L. Louis et al. / Journal of Structural Geology 28 (2006) 549–560552
continental sandstone and silt of Maastrichtian to Lutetian age
supporting flexural sequences of Bartonian age (Ellenberger,
1967; Plaziat, 1984). This cover, together with the Paleozoic
substratum, is involved in large ramp-related folds (Averbuch
et al., 1992; Frizon de Lamotte et al., 1997; Grelaud et al.,
2000; Souque et al., 2003). At the regional scale the folds
exhibit an ‘en-echelon’ pattern relative to the North Pyrenean
Front, locally called ‘nappe des Corbieres orientales’.
The ‘Chaudrons fold’ is an E–W-trending anticline, 3 km
wide and 9 km long, involving rocks ranging in age from
Upper Cretaceous to Upper Paleocene. Three distinct
formations are exposed in the area of interest. The oldest
exposed rocks are lacustrine limestones of the Rognacian
formation (Maastrichtian), conformably covered by clastics
(conglomerates and silicoclastic continental deposits) of the
Vitrollian formation (Lower Paleocene). As shown by Plaziat
(1984), the Vitrollian formation is made up of an accumulation
of paleo-soils that hardened before burial so that it was
Table 1
Magnetic susceptibility and P-wave velocity (dry and water saturated) data in the t
Max.
1. Crest AMS (!10K06) 5.75
fZ1.5% APV dry (km sK1) 5.26
APV saturated 5.82
2. Hinge AMS 13.89
fZ1.9% APV dry 4.61
APV saturated 5.46
3. Forelimb AMS 32.64
fZ3.1% APV dry 4.5
APV saturated 5.44
probably almost isotropic at the end of sedimentary compac-
tion. Finally, Upper Paleocene (Thanetian) is represented again
by lacustrine limestone. Folding occurred during Upper
Eocene (Ellenberger, 1967). Geometrically, the Chaudrons
fold is characterized by a steep forelimb between flat foreland
and crest (Fig. 2a). The transition between the foreland and the
forelimb is exposed in the field but its study is complicated due
to collapse structures. On the contrary, the transition between
the forelimb and the crest can be continuously followed within
the Vitrollian formation, which is the one that was sampled
in this study. The back of the fold is offset by normal
faults formed during a Late Oligocene–Miocene event and
consequently cannot be reached (see Fig. 1).
3. Field and laboratory measurements
Meso-scale (0.1–1 m) data were collected on two outcrops
unveiling, respectively, the front limb and the crest of the fold.
hree sectors of the Chaudrons fold
Int. Min. s A%
5.65 5.17 0.076 10.6
5.18 4.97 0.045 5.7
5.81 5.67 0.026 2.6
13.67 13.03 0.120 6.4
4.47 4.10 0.089 11.8
5.35 5.2 0.047 4.7
32.16 31.24 0.205 4.4
4.08 3.5 0.188 25
5.22 4.89 0.067 10.7
Fig. 4. (a) Microphotograph of a polished section obtained under natural light. The observation plane is vertical and contains the direction of shortening (NNW). On
the orientation patch, the letter V stands for ‘vertical’. Surface is mostly occupied by grains of microcodium that are embedded in a fine grained clayish matrix. (b)
Network formed by the matrix after image threshold. At this scale, no anisotropic pattern emerges.
L. Louis et al. / Journal of Structural Geology 28 (2006) 549–560 553
Both outcrops include a part of the hinge, so that they form
together a continuous profile of the Chaudrons fold, backlimb
excepted. In the following, we display all results on one unified
transect showing the three different panels isolated in Tavani
et al. (2004): the crest of the fold, the transition from crest to
forelimb (hinge) and the forelimb. The results obtained at
sample (cm) scale from AMS and APV measurements are
quoted from this former work. The analysis of the microstruc-
tures (mm–cm), which provides our new data set, has been
performed on polished sections of chips cut from blocks
sampled at various locations along the transect. These chips
were observed at different magnifications using optical
microscopy (reflected light mode) and SEM. In order to infer
the composition of the rock in selected zones, X-ray analyses
were also conducted.
Fig. 5. (a) and (b) Microphotographs of a polished section obtained under
reflected light. Three phases, calcite, quartz and ferruginous filling are
identified. Quartz grains are inlaid in calcite and the ferruginous matrix that
underlines the boundaries between microcodiums also concentrates around
quartz inclusions. Inside the microcodiums, many calcite grains are twinned.
3.1. Outcrop and sample-scale measurements
The results obtained from outcrop data and AMS/APV
estimations were presented in Tavani et al. (2004) and will only
be briefly summarized here (Fig. 3 and Table 1). It should be
noted, however, that while APV data obtained in samples
saturated with water were used in this former work, both dry and
saturated results are displayed in the present study. In Tavani
et al. (2004), the deformation associated with the development
of the Chaudrons anticline was described at two different scales.
At the outcrop scale, a very well defined pervasive solution
cleavage was observed continuously on the profile (Fig. 2b
and c). Using factors such as cleavage spacing, cleavage height
over spacing ratio and shape factor of the microlithons, the fold
was divided into three sectors in which the relationship between
bedding and cleavage varies. In the crest (zone 1 in Figs. 2b
and 3), the bedding is nearly horizontal and the cleavage
foliation is perpendicular to it. In the hinge (zone 2 in Figs. 2c
and 3), the bedding dip progressively increases up to 608, while
the cleavage foliation rotates by 308 only. In the forelimb (zone 3
in Fig. 3), bedding and cleavage dip remain constant. In each of
the three panels, AMS and APVmeasurements displayed rather
planar fabrics with the minimum axes parallel to the cleavage
pole for both properties, even in zone 2where an apparent ‘top to
crest’ shearing was observed (Fig. 3). For P-wave velocity
measurements, data obtained in dry andwater saturated samples
show that the increase in stiffness associated with the filling of
Fig. 6. Scanning electron microscope images (BSE) of a contacting zone between several grains of microcodium. (a) Microcodiums and quartz/clay matrix. (b) Zoom
at the transition from calcite to the matrix. An inlaid quartz grain seems to promote the dismantlement of a microcodium.
L. Louis et al. / Journal of Structural Geology 28 (2006) 549–560554
the pore space does not modify significantly the result in terms
of principal directions.
Tavani et al. (2004) suggested that the similarity between
AMS and APV was due to solution planes parallel to the
macroscopic cleavage that would provide the same kind of
anisotropy, despite the fundamentally different origin of the
two physical properties. Nevertheless this was not demon-
strated in that paper. The authors eventually proposed that the
Chaudrons fold had developed in two steps in which macro-
and micro-cleavage would have behaved similarly: (1) pre-
folding LPS, visible in the crest zone, shaping a set of
subvertical solution planes anastomosed at the observation
scale, and (2) flexural slip associated with persistent LPS
during folding. That interpretation was suggested after the
authors had observed an increase in deformation intensity in
the forelimb, which was accounted for with persistent layer
parallel shortening. Doing so their scenario modified a previous
one proposed by Averbuch et al. (1992) in the nearby Lagrasse
fold, where cleavage formed during a first step of layer parallel
shortening was just passively sheared during folding due to
flexural slip.
3.2. Quantitative analysis of the microstructure
The microstructure was analyzed on polished sections cut
along a vertical plane parallel to the tectonic transport direction
(this plane is the one exhibiting the largest anisotropy for both
physical properties and contains the pole to cleavage drawn in
Fig. 3). At low magnification (Fig. 4), an observation under
natural light of a chip sampled in the forelimb of the fold
reveals numerous microcodiums (sets of calcite-rich prisms
of organic origin; Bignot, 1994) embedded in an iron- and
clay-rich matrix containing dispersed detrital quartz grains.
This aggregate, typical in composition of the Vitrollian
Formation in the region (Cluzel, 1977; Averbuch et al.,
1992), is representative of the intra-microlithon structure, i.e.
enclosed between two major cleavage surfaces visible on the
outcrops. It is well sorted with low intergranular porosity filled
by fine particles. At this scale, no obvious anisotropic pattern
that could account for our AMS and APV results is observed.
Moreover, statistical investigation such as image autocorrela-
tion (Louis et al., 2005) is made difficult due to a lack of
homogeneity (note in Fig. 4 the slight increase in the amount of
filling toward the bottom right-hand side of the image).
Under higher magnification, the relationship between
microcodiums and quartz grains displays interesting features
(Fig. 5). Calcite is clearly the dominating component and
quartz grains of less than 50 microns in diameter appear
sometimes almost totally embedded. The ferruginous clayish
matrix underlines calcite/quartz and calcite/calcite joints.
Thickness of the joints seems to vary depending on their
type. In calcite, one can still distinguish the aligned prisms
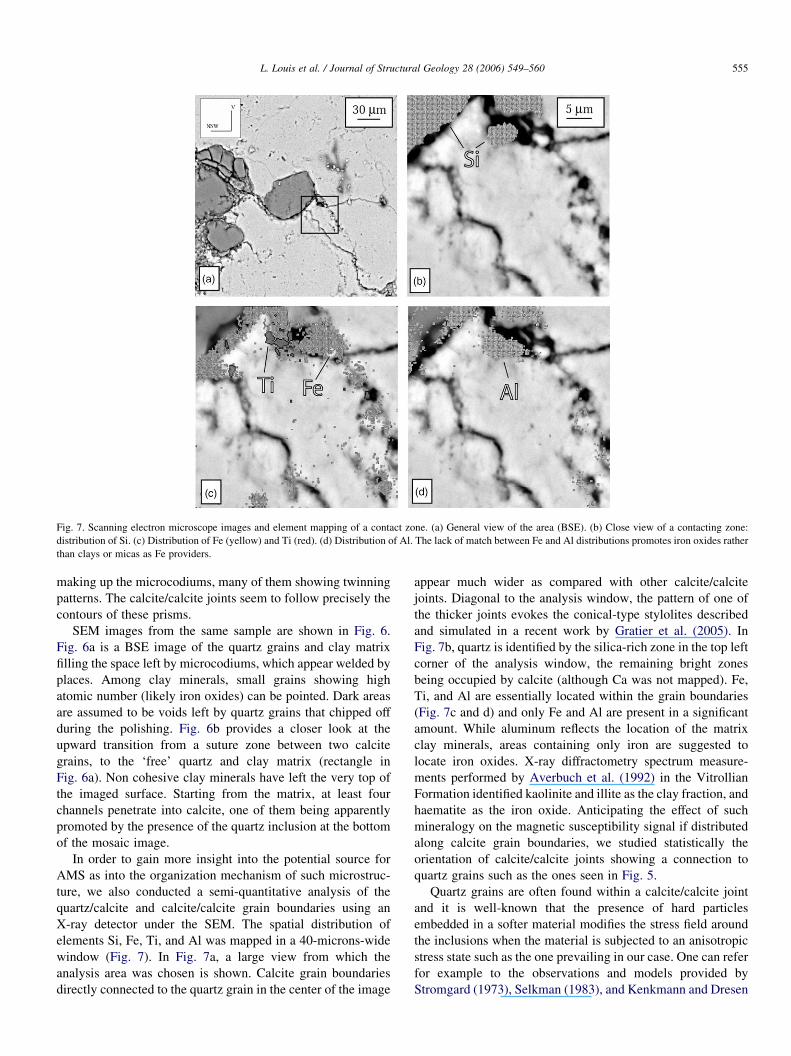
Fig. 7. Scanning electron microscope images and element mapping of a contact zone. (a) General view of the area (BSE). (b) Close view of a contacting zone:
distribution of Si. (c) Distribution of Fe (yellow) and Ti (red). (d) Distribution of Al. The lack of match between Fe and Al distributions promotes iron oxides rather
than clays or micas as Fe providers.
L. Louis et al. / Journal of Structural Geology 28 (2006) 549–560 555
making up the microcodiums, many of them showing twinning
patterns. The calcite/calcite joints seem to follow precisely the
contours of these prisms.
SEM images from the same sample are shown in Fig. 6.
Fig. 6a is a BSE image of the quartz grains and clay matrix
filling the space left by microcodiums, which appear welded by
places. Among clay minerals, small grains showing high
atomic number (likely iron oxides) can be pointed. Dark areas
are assumed to be voids left by quartz grains that chipped off
during the polishing. Fig. 6b provides a closer look at the
upward transition from a suture zone between two calcite
grains, to the ‘free’ quartz and clay matrix (rectangle in
Fig. 6a). Non cohesive clay minerals have left the very top of
the imaged surface. Starting from the matrix, at least four
channels penetrate into calcite, one of them being apparently
promoted by the presence of the quartz inclusion at the bottom
of the mosaic image.
In order to gain more insight into the potential source for
AMS as into the organization mechanism of such microstruc-
ture, we also conducted a semi-quantitative analysis of the
quartz/calcite and calcite/calcite grain boundaries using an
X-ray detector under the SEM. The spatial distribution of
elements Si, Fe, Ti, and Al was mapped in a 40-microns-wide
window (Fig. 7). In Fig. 7a, a large view from which the
analysis area was chosen is shown. Calcite grain boundaries
directly connected to the quartz grain in the center of the image
appear much wider as compared with other calcite/calcite
joints. Diagonal to the analysis window, the pattern of one of
the thicker joints evokes the conical-type stylolites described
and simulated in a recent work by Gratier et al. (2005). In
Fig. 7b, quartz is identified by the silica-rich zone in the top left
corner of the analysis window, the remaining bright zones
being occupied by calcite (although Ca was not mapped). Fe,
Ti, and Al are essentially located within the grain boundaries
(Fig. 7c and d) and only Fe and Al are present in a significant
amount. While aluminum reflects the location of the matrix
clay minerals, areas containing only iron are suggested to
locate iron oxides. X-ray diffractometry spectrum measure-
ments performed by Averbuch et al. (1992) in the Vitrollian
Formation identified kaolinite and illite as the clay fraction, and
haematite as the iron oxide. Anticipating the effect of such
mineralogy on the magnetic susceptibility signal if distributed
along calcite grain boundaries, we studied statistically the
orientation of calcite/calcite joints showing a connection to
quartz grains such as the ones seen in Fig. 5.
Quartz grains are often found within a calcite/calcite joint
and it is well-known that the presence of hard particles
embedded in a softer material modifies the stress field around
the inclusions when the material is subjected to an anisotropic
stress state such as the one prevailing in our case. One can refer
for example to the observations and models provided by
Stromgard (1973), Selkman (1983), and Kenkmann and Dresen
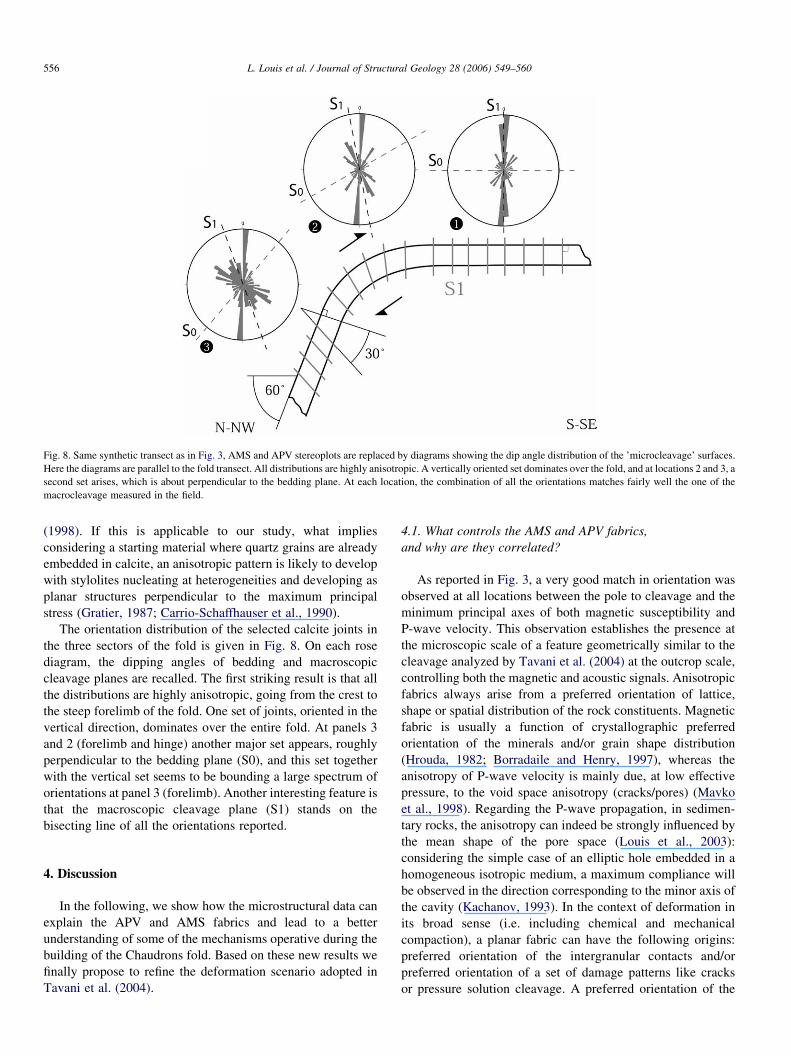
Fig. 8. Same synthetic transect as in Fig. 3, AMS and APV stereoplots are replaced by diagrams showing the dip angle distribution of the ’microcleavage’ surfaces.
Here the diagrams are parallel to the fold transect. All distributions are highly anisotropic. A vertically oriented set dominates over the fold, and at locations 2 and 3, a
second set arises, which is about perpendicular to the bedding plane. At each location, the combination of all the orientations matches fairly well the one of the
macrocleavage measured in the field.
L. Louis et al. / Journal of Structural Geology 28 (2006) 549–560556
(1998). If this is applicable to our study, what implies
considering a starting material where quartz grains are already
embedded in calcite, an anisotropic pattern is likely to develop
with stylolites nucleating at heterogeneities and developing as
planar structures perpendicular to the maximum principal
stress (Gratier, 1987; Carrio-Schaffhauser et al., 1990).
The orientation distribution of the selected calcite joints in
the three sectors of the fold is given in Fig. 8. On each rose
diagram, the dipping angles of bedding and macroscopic
cleavage planes are recalled. The first striking result is that all
the distributions are highly anisotropic, going from the crest to
the steep forelimb of the fold. One set of joints, oriented in the
vertical direction, dominates over the entire fold. At panels 3
and 2 (forelimb and hinge) another major set appears, roughly
perpendicular to the bedding plane (S0), and this set together
with the vertical set seems to be bounding a large spectrum of
orientations at panel 3 (forelimb). Another interesting feature is
that the macroscopic cleavage plane (S1) stands on the
bisecting line of all the orientations reported.
4. Discussion
In the following, we show how the microstructural data can
explain the APV and AMS fabrics and lead to a better
understanding of some of the mechanisms operative during the
building of the Chaudrons fold. Based on these new results we
finally propose to refine the deformation scenario adopted in
Tavani et al. (2004).
4.1. What controls the AMS and APV fabrics,
and why are they correlated?
As reported in Fig. 3, a very good match in orientation was
observed at all locations between the pole to cleavage and the
minimum principal axes of both magnetic susceptibility and
P-wave velocity. This observation establishes the presence at
the microscopic scale of a feature geometrically similar to the
cleavage analyzed by Tavani et al. (2004) at the outcrop scale,
controlling both the magnetic and acoustic signals. Anisotropic
fabrics always arise from a preferred orientation of lattice,
shape or spatial distribution of the rock constituents. Magnetic
fabric is usually a function of crystallographic preferred
orientation of the minerals and/or grain shape distribution
(Hrouda, 1982; Borradaile and Henry, 1997), whereas the
anisotropy of P-wave velocity is mainly due, at low effective
pressure, to the void space anisotropy (cracks/pores) (Mavko
et al., 1998). Regarding the P-wave propagation, in sedimen-
tary rocks, the anisotropy can indeed be strongly influenced by
the mean shape of the pore space (Louis et al., 2003):
considering the simple case of an elliptic hole embedded in a
homogeneous isotropic medium, a maximum compliance will
be observed in the direction corresponding to the minor axis of
the cavity (Kachanov, 1993). In the context of deformation in
its broad sense (i.e. including chemical and mechanical
compaction), a planar fabric can have the following origins:
preferred orientation of the intergranular contacts and/or
preferred orientation of a set of damage patterns like cracks
or pressure solution cleavage. A preferred orientation of the
L. Louis et al. / Journal of Structural Geology 28 (2006) 549–560 557
intergranular contacts results, for elastic properties, in a larger
stiffness in a direction perpendicular to this preferred
orientation (this is the case for the Rothbach sandstone, see
Louis et al., 2005). The development of oriented damage
features like cracks or solution cleavage under compression
can also be easily captured by P-wave velocity measurements.
For a set of parallel penny-shaped cracks as well as in the case
of cleavage planes, P-wave velocity is greatly reduced along
the normal direction while it remains almost unchanged for in-
plane propagation. The sensitivity of AMS to void space
anisotropy is not straightforward, and basically the only
possibility to get it is when oxides or clay minerals crystallize
along discontinuities or coat the pore space. For example, this
is the case when clay minerals seal the remaining voids along
irregular contacts, or when pressure solution operates in
limestone, resulting in concentrating ferromagnetic minerals
and paramagnetic clays on solution surfaces (Borradaile and
Tarling, 1981). The anisotropic shape of the pores will usually
have no influence for AMSmeasurements unless the pore walls
are coated with magnetic minerals (Pfleiderer and Kissel,
1994).
Our microstructural study revealed a significant anisotropy
in the orientation distribution of calcite/calcite joints filled with
clay and iron oxide (Fig. 8). While trying to discriminate
between paramagnetic clays (kaolinite, illite) and haematite to
find the major contributor to AMS in the Vitrollian formation,
Averbuch et al. (1992) showed that both were significantly
influencing the signal. Both phyllosilicates and haematite also
bear crystallographic anisotropy resulting in normal-type
magnetic fabrics as defined by Rochette et al. (1992):
crystallographic control on both susceptibility and grain
shape results in maximum (minimum) susceptibility along
the long (short) dimension of the particles. Thus, estimation of
the exact proportion of the magnetic signal, respectively
carried by para- and ferro-magnetic minerals (following, for
example, the method proposed by Hrouda, 1994), is not critical
here since both species are expected to behave similarly during
deformation.
Let us consider any single joint. Although all magnetic
minerals are obviously not contained in such a location since
matrix aggregates are also often observed at the junction of
more than two microcodiums (Fig. 4), the preferred joint
orientation together with its probable tectonic origin makes it a
very suitable feature to give account for both magnetic and
acoustic anisotropies. Given its flat shape and knowing that it
may have formed perpendicular to the maximum principal
stress, the effect of spatial distribution and rotation of the para-
and ferro-magnetic grains perpendicular to the flattening
direction are expected to produce a planar AMS fabric with a
minimum axis perpendicular to the joint. Our microstructural
study highlighted more than one set of such joints, and the way
signals arising from each single joint sum up to give the
observed fabric deserves comment. Analytical and experimen-
tal studies of the composition of two elemental fabrics of
magnetic susceptibility, which is known to be well described
by a second rank tensor (Daly, 1970; Housen et al., 1993;
Louis, 2003), established a few important results:
(i) The composition of two elemental fabrics perpendicu-
lar to each other conserves the same pair of principal
axes as the original fabrics.
(ii) The composition of two identical (same intensity and
anisotropy) elemental fabrics at an angle !908 to each
other has a maximum intensity axis oriented along the
angle bisecting the two original maximum intensity
axes.
(iii) When the two elemental fabrics have random orien-
tation and different values of intensity and anisotropy,
the orientation of the composition is a simple function
of these three parameters.
An acceptable assumption in the case we are studying is to
attribute the same intensity and anisotropy to each identified
joint. Doing so, the composition of elemental AMS fabrics that
builds the stereoplots shown in Fig. 3 can be explained with the
same simple argument as that used for the orientation of the
macroscopic cleavage, placing the maximum susceptibility
axis along the mean of the distribution of all orientations.
For the acoustic properties, the anisotropy of P-wave velocity
has to be linked to compliance anisotropy of the rock through its
composition and the distribution of its constituents. The joints
that we observed can be assimilated to crack-like features filled
with a low cohesion material, acting as planes of weakness with
respect to the elastic properties. In such a situation, considering
that no other source of elastic anisotropy is present, this set of
discontinuities is expected to act with respect to P-wave
velocities in the same way as a set of cracks parallel to each
other. In the P-wave tensor approximation proposed by Louis et
al. (2004), this will lead to a planar fabric with a minimum
velocity axis perpendicular to the average joint orientation.
Following the same argument as for AMS results, we can finally
suggest that the preferred orientation of the analyzed joints is a
good candidate for the origin of both the P-wave velocity and
magnetic susceptibility anisotropies observed in our samples,
and that these microstructural observations provide a satisfac-
tory explanation for the excellent correlation between magnetic
and elastic fabrics.
As far as AMS is concerned, other potential sources of
magnetic susceptibility could have been suggested such as
ferroan calcite or ferromagnetic minerals embedded in calcite. In
the first case, however, ferroan calcite was recognized to exhibit
inverse fabrics with a maximum susceptibility axis tending to
cluster around the flattening axis (Rochette et al., 1992), which
would not have been consistent with the fabric observed in the
Chaudrons fold. Concerning the presence offerromagnetic grains
embedded in calcite, their passive concentration and/or neo-
crystallization along the solution surfaces (Evans et al., 2003) is
expected to override the signal that could be arising from a
preferred orientation inside the crystal.
4.2. What is the formation mechanism of the preferentially
oriented joints in calcite?
Pressure solution was clearly operative during the formation
of the fold. Evidence can be found in the geometrical
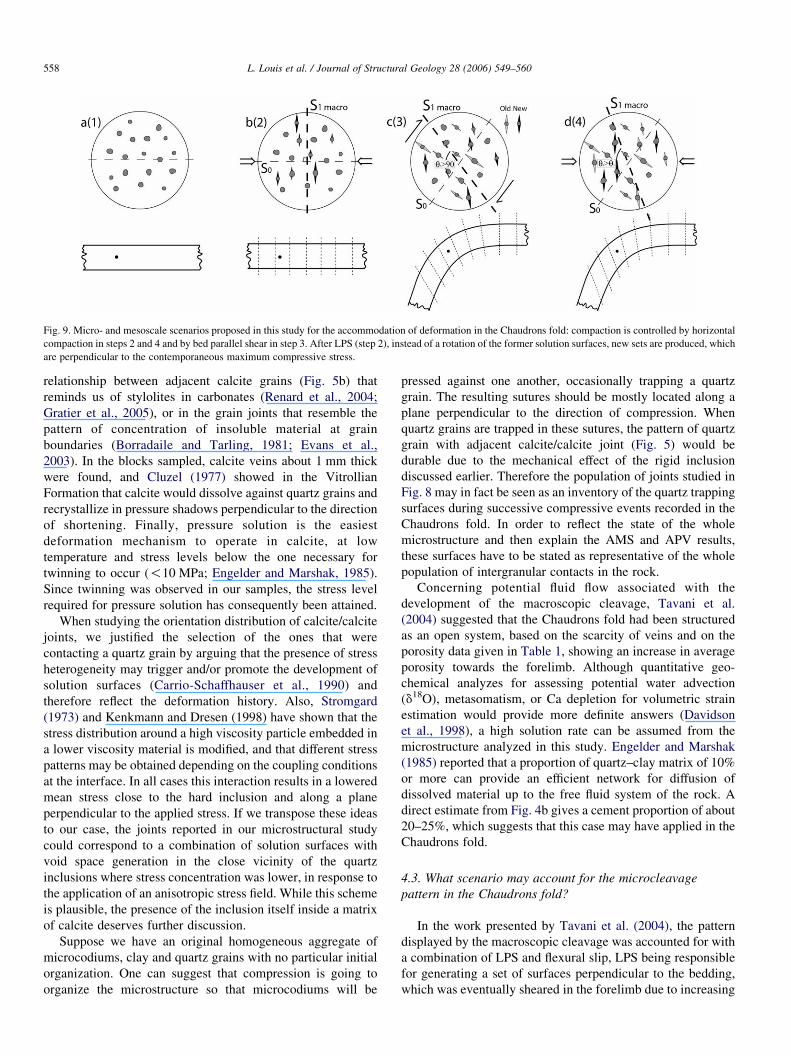
Fig. 9. Micro- and mesoscale scenarios proposed in this study for the accommodation of deformation in the Chaudrons fold: compaction is controlled by horizontal
compaction in steps 2 and 4 and by bed parallel shear in step 3. After LPS (step 2), instead of a rotation of the former solution surfaces, new sets are produced, which
are perpendicular to the contemporaneous maximum compressive stress.
L. Louis et al. / Journal of Structural Geology 28 (2006) 549–560558
relationship between adjacent calcite grains (Fig. 5b) that
reminds us of stylolites in carbonates (Renard et al., 2004;
Gratier et al., 2005), or in the grain joints that resemble the
pattern of concentration of insoluble material at grain
boundaries (Borradaile and Tarling, 1981; Evans et al.,
2003). In the blocks sampled, calcite veins about 1 mm thick
were found, and Cluzel (1977) showed in the Vitrollian
Formation that calcite would dissolve against quartz grains and
recrystallize in pressure shadows perpendicular to the direction
of shortening. Finally, pressure solution is the easiest
deformation mechanism to operate in calcite, at low
temperature and stress levels below the one necessary for
twinning to occur (!10 MPa; Engelder and Marshak, 1985).
Since twinning was observed in our samples, the stress level
required for pressure solution has consequently been attained.
When studying the orientation distribution of calcite/calcite
joints, we justified the selection of the ones that were
contacting a quartz grain by arguing that the presence of stress
heterogeneity may trigger and/or promote the development of
solution surfaces (Carrio-Schaffhauser et al., 1990) and
therefore reflect the deformation history. Also, Stromgard
(1973) and Kenkmann and Dresen (1998) have shown that the
stress distribution around a high viscosity particle embedded in
a lower viscosity material is modified, and that different stress
patterns may be obtained depending on the coupling conditions
at the interface. In all cases this interaction results in a lowered
mean stress close to the hard inclusion and along a plane
perpendicular to the applied stress. If we transpose these ideas
to our case, the joints reported in our microstructural study
could correspond to a combination of solution surfaces with
void space generation in the close vicinity of the quartz
inclusions where stress concentration was lower, in response to
the application of an anisotropic stress field. While this scheme
is plausible, the presence of the inclusion itself inside a matrix
of calcite deserves further discussion.
Suppose we have an original homogeneous aggregate of
microcodiums, clay and quartz grains with no particular initial
organization. One can suggest that compression is going to
organize the microstructure so that microcodiums will be
pressed against one another, occasionally trapping a quartz
grain. The resulting sutures should be mostly located along a
plane perpendicular to the direction of compression. When
quartz grains are trapped in these sutures, the pattern of quartz
grain with adjacent calcite/calcite joint (Fig. 5) would be
durable due to the mechanical effect of the rigid inclusion
discussed earlier. Therefore the population of joints studied in
Fig. 8 may in fact be seen as an inventory of the quartz trapping
surfaces during successive compressive events recorded in the
Chaudrons fold. In order to reflect the state of the whole
microstructure and then explain the AMS and APV results,
these surfaces have to be stated as representative of the whole
population of intergranular contacts in the rock.
Concerning potential fluid flow associated with the
development of the macroscopic cleavage, Tavani et al.
(2004) suggested that the Chaudrons fold had been structured
as an open system, based on the scarcity of veins and on the
porosity data given in Table 1, showing an increase in average
porosity towards the forelimb. Although quantitative geo-
chemical analyzes for assessing potential water advection
(d18O), metasomatism, or Ca depletion for volumetric strain
estimation would provide more definite answers (Davidson
et al., 1998), a high solution rate can be assumed from the
microstructure analyzed in this study. Engelder and Marshak
(1985) reported that a proportion of quartz–clay matrix of 10%
or more can provide an efficient network for diffusion of
dissolved material up to the free fluid system of the rock. A
direct estimate from Fig. 4b gives a cement proportion of about
20–25%, which suggests that this case may have applied in the
Chaudrons fold.
4.3. What scenario may account for the microcleavage
pattern in the Chaudrons fold?
In the work presented by Tavani et al. (2004), the pattern
displayed by the macroscopic cleavage was accounted for with
a combination of LPS and flexural slip, LPS being responsible
for generating a set of surfaces perpendicular to the bedding,
which was eventually sheared in the forelimb due to increasing
L. Louis et al. / Journal of Structural Geology 28 (2006) 549–560 559
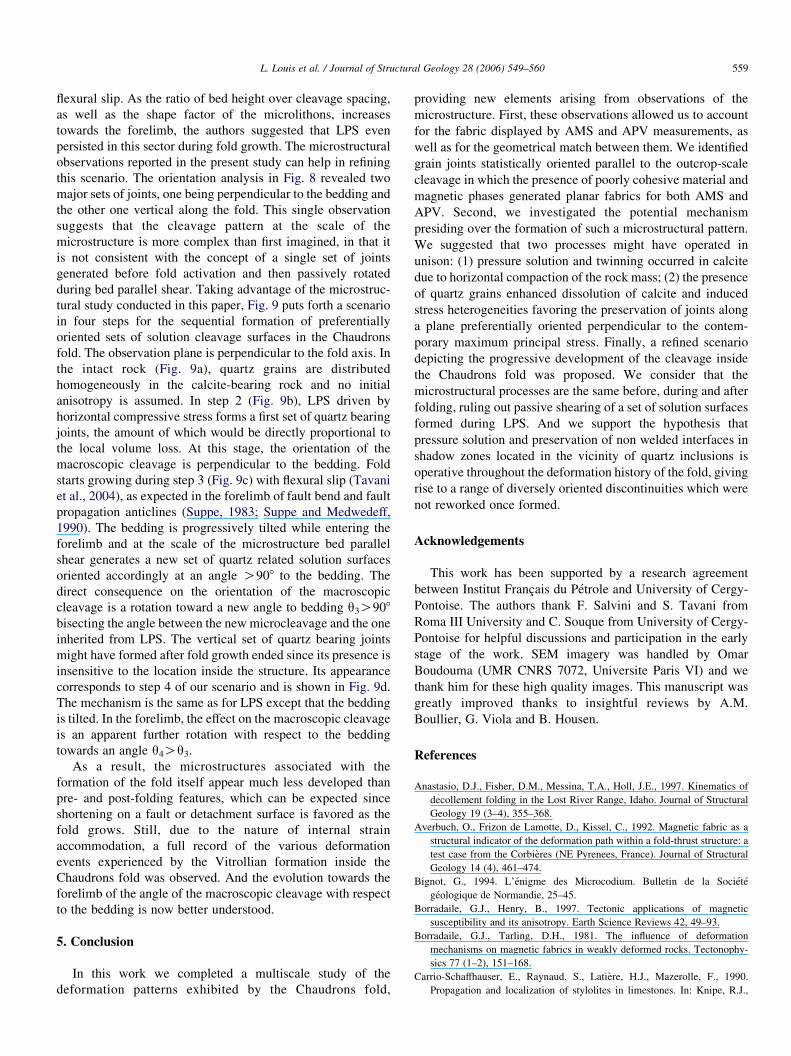
flexural slip. As the ratio of bed height over cleavage spacing,
as well as the shape factor of the microlithons, increases
towards the forelimb, the authors suggested that LPS even
persisted in this sector during fold growth. The microstructural
observations reported in the present study can help in refining
this scenario. The orientation analysis in Fig. 8 revealed two
major sets of joints, one being perpendicular to the bedding and
the other one vertical along the fold. This single observation
suggests that the cleavage pattern at the scale of the
microstructure is more complex than first imagined, in that it
is not consistent with the concept of a single set of joints
generated before fold activation and then passively rotated
during bed parallel shear. Taking advantage of the microstruc-
tural study conducted in this paper, Fig. 9 puts forth a scenario
in four steps for the sequential formation of preferentially
oriented sets of solution cleavage surfaces in the Chaudrons
fold. The observation plane is perpendicular to the fold axis. In
the intact rock (Fig. 9a), quartz grains are distributed
homogeneously in the calcite-bearing rock and no initial
anisotropy is assumed. In step 2 (Fig. 9b), LPS driven by
horizontal compressive stress forms a first set of quartz bearing
joints, the amount of which would be directly proportional to
the local volume loss. At this stage, the orientation of the
macroscopic cleavage is perpendicular to the bedding. Fold
starts growing during step 3 (Fig. 9c) with flexural slip (Tavani
et al., 2004), as expected in the forelimb of fault bend and fault
propagation anticlines (Suppe, 1983; Suppe and Medwedeff,
1990). The bedding is progressively tilted while entering the
forelimb and at the scale of the microstructure bed parallel
shear generates a new set of quartz related solution surfaces
oriented accordingly at an angle O908 to the bedding. The
direct consequence on the orientation of the macroscopic
cleavage is a rotation toward a new angle to bedding q3O908
bisecting the angle between the new microcleavage and the one
inherited from LPS. The vertical set of quartz bearing joints
might have formed after fold growth ended since its presence is
insensitive to the location inside the structure. Its appearance
corresponds to step 4 of our scenario and is shown in Fig. 9d.
The mechanism is the same as for LPS except that the bedding
is tilted. In the forelimb, the effect on the macroscopic cleavage
is an apparent further rotation with respect to the bedding
towards an angle q4Oq3.As a result, the microstructures associated with the
formation of the fold itself appear much less developed than
pre- and post-folding features, which can be expected since
shortening on a fault or detachment surface is favored as the
fold grows. Still, due to the nature of internal strain
accommodation, a full record of the various deformation
events experienced by the Vitrollian formation inside the
Chaudrons fold was observed. And the evolution towards the
forelimb of the angle of the macroscopic cleavage with respect
to the bedding is now better understood.
5. Conclusion
In this work we completed a multiscale study of the
deformation patterns exhibited by the Chaudrons fold,
providing new elements arising from observations of the
microstructure. First, these observations allowed us to account
for the fabric displayed by AMS and APV measurements, as
well as for the geometrical match between them. We identified
grain joints statistically oriented parallel to the outcrop-scale
cleavage in which the presence of poorly cohesive material and
magnetic phases generated planar fabrics for both AMS and
APV. Second, we investigated the potential mechanism
presiding over the formation of such a microstructural pattern.
We suggested that two processes might have operated in
unison: (1) pressure solution and twinning occurred in calcite
due to horizontal compaction of the rock mass; (2) the presence
of quartz grains enhanced dissolution of calcite and induced
stress heterogeneities favoring the preservation of joints along
a plane preferentially oriented perpendicular to the contem-
porary maximum principal stress. Finally, a refined scenario
depicting the progressive development of the cleavage inside
the Chaudrons fold was proposed. We consider that the
microstructural processes are the same before, during and after
folding, ruling out passive shearing of a set of solution surfaces
formed during LPS. And we support the hypothesis that
pressure solution and preservation of non welded interfaces in
shadow zones located in the vicinity of quartz inclusions is
operative throughout the deformation history of the fold, giving
rise to a range of diversely oriented discontinuities which were
not reworked once formed.
Acknowledgements
This work has been supported by a research agreement
between Institut Francais du Petrole and University of Cergy-
Pontoise. The authors thank F. Salvini and S. Tavani from
Roma III University and C. Souque from University of Cergy-
Pontoise for helpful discussions and participation in the early
stage of the work. SEM imagery was handled by Omar
Boudouma (UMR CNRS 7072, Universite Paris VI) and we
thank him for these high quality images. This manuscript was
greatly improved thanks to insightful reviews by A.M.
Boullier, G. Viola and B. Housen.
References
Anastasio, D.J., Fisher, D.M., Messina, T.A., Holl, J.E., 1997. Kinematics of
decollement folding in the Lost River Range, Idaho. Journal of Structural
Geology 19 (3–4), 355–368.
Averbuch, O., Frizon de Lamotte, D., Kissel, C., 1992. Magnetic fabric as a
structural indicator of the deformation path within a fold-thrust structure: a
test case from the Corbieres (NE Pyrenees, France). Journal of Structural
Geology 14 (4), 461–474.
Bignot, G., 1994. L’enigme des Microcodium. Bulletin de la Societe
geologique de Normandie, 25–45.
Borradaile, G.J., Henry, B., 1997. Tectonic applications of magnetic
susceptibility and its anisotropy. Earth Science Reviews 42, 49–93.
Borradaile, G.J., Tarling, D.H., 1981. The influence of deformation
mechanisms on magnetic fabrics in weakly deformed rocks. Tectonophy-
sics 77 (1–2), 151–168.
Carrio-Schaffhauser, E., Raynaud, S., Latiere, H.J., Mazerolle, F., 1990.
Propagation and localization of stylolites in limestones. In: Knipe, R.J.,
L. Louis et al. / Journal of Structural Geology 28 (2006) 549–560560
Rutter, E.H. (Eds.), Deformation Mechanisms, Rheology and Tectonics
Journal of the Geological Society of London Special Publications 54,
pp. 193–199.
Cluzel, D., 1977. Etude microtectonique de l’avant-pays de la nappe des
Corbieres orientales (Aude-France). Unpublished PhD thesis, Universite
Paris-Sud.
Daly, L., 1970. Etude des proprietes magnetiques des roches metamorphiques
ou simplement tectonisees. Nature de leur aimantation naturelle.
Determination de leur anisotropie magnetique et application a l’analyse
structurale. PhD thesis, Universite Pierre et Marie Curie (Paris VI).
Davidson, S.G., Anastasio, D.J., Bebout, G.E., Holl, J.E., Hedlund, C.A., 1998.
Volume loss and metasomatism during cleavage formation in carbonate
rocks. Journal of Structural Geology 20 (6), 707–726.
Ellenberger, F., 1967. Les interferences de l’erosion et de la tectonique
tangentielle tertiaire dans le Bas-Languedoc: note sur les charriages
cisaillants. Revue de Geologie Dynamique et de Geographie Physique 9,
87–142.
Engelder, T., Marshak, S., 1985. Disjunctive cleavage formed at shallow depths
in sedimentary rocks. Journal of Structural Geology 7 (3–4), 327–343.
Evans, M.A., Lewchuk, M.T., Elmore, R.D., 2003. Strain partitioning of
deformation mechanisms in limestones: examining the relationship of
strain and anisotropy of magnetic susceptibility (AMS). Journal of
Structural Geology 25 (9), 1525–1549.
Frizon de Lamotte, D., Mercier, E., Dupre la Tour, A., Robion, P.,
Averbuch, O., 1997. Cinematique du plissement et deformation interne
des roches. L’exemple du pli de Lagrasse (Aude, France). Comptes-rendus
de l’Academie des Sciences 324 (IIa), 591–598.
Frizon de Lamotte, D., Souque, C., Grelaud, S., Robion, P., 2002. Early record
of tectonic magnetic fabric during inversion of a sedimentary basin. Short
review and examples from the Corbieres transfer zone (France). Bulletin de
la Societe Geologique de France 173 (5), 461–469.
Gratier, J.-P., 1987. Pressure solution deposition creep and associated chemical
differentiation in sedimentary rocks. In: Jones, M.E., Preston, R.M.F.
(Eds.), Deformation Mechanisms in Sediments and Sedimentary Rocks
Journal of the Geological Society of London Special Publications 29,
pp. 25–38.
Gratier, J.-P., Muquet, L., Hassani, R., Renard, F., 2005. Experimental
microstylolites in quartz and modeled application to natural stylolitic
structures. Journal of Structural Geology 27, 89–100.
Grelaud, S., Buil, D., Hardy, S., Frizon de Lamotte, D., 2000. Trishear
kinematic model of fault-propagation folding and sequential development
of minor structures: the Oupia anticline (NE Pyrenees, France) case study.
Bulletin de la Societe Geologique de France 171 (4), 441–449.
Housen, B.A., Richter, C., van der Pluijm, B.A., 1993. Composite magnetic
anisotropy fabrics: experiments, numerical models and implications for the
quantification of rock fabrics. Tectonophysics 220, 1–12.
Hrouda, F., 1982. Magnetic anisotropy of rocks and its application in geology
and geophysics. Geophysical Surveys 5, 37–82.
Hrouda, F., 1994. A technique for the measurement of thermal changes of
magnetic susceptibility of weakly magnetic rocks by the CS-2 apparatus
and KLY-2 Kappabridge. Geophysical Journal International 118, 604–612.
Kachanov, M., 1993. Elastic Solids with Many Cracks and Related Problems
Advances in Applied Mechanics, vol. 30. Academic Press, Boston, MA,
pp. 259–445.
Kenkmann, T., Dresen, G., 1998. Stress gradients around porphyroclasts:
palaeopiezometric estimates and numerical modelling. Journal of Structural
Geology 20 (2–3), 163–173.
Louis, L., 2003. Anisotropies microstructurales composites dans les roches
reservoir: Consequences sur les proprietes elastiques et relation a la
deformation. PhD thesis, Universite de Cergy-Pontoise, France.
Louis, L., David, C., Robion, P., 2003. Comparison of the anisotropic
behaviour of undeformed sandstones under dry and saturated conditions.
Tectonophysics 370 (1–4), 193–212.
Louis, L., Robion, P., David, C., 2004. A single method for the inversion of
anisotropic data sets with application to structural studies. Journal of
Structural Geology 26, 2065–2072.
Louis, L., David, C., Metz, V., Robion, P., Menendez, B., Kissel, C., 2005.
Microstructural control on the anisotropy of elastic and transport properties
in undeformed sandstones. International Journal of Rock Mechanics and
Mining Science 42 (7–8), 911–923.
Mavko, G., Mukerji, T., Dvorkin, J., 1998. The Rock Physics Handbook—
Tools for Seismic Analysis in Porous Media. Cambridge University Press,
Cambridge.
Pfleiderer, S., Kissel, C., 1994. Variation of pore fabric across a fold–thrust
structure. Geophysical Research Letters 21 (19), 2147–2150.
Plaziat, J.C., 1984. Le domaine pyreneen de la fin du Cretace a la fin de
l’Eocene. Stratigraphie, paleo-environnements et evolution paleo-geogra-
phique. These de doctorat, Universite Paris Sud Orsay (Paris XI).
Renard, F., Schmittbuhl, J., Gratier, J.-P., Meakin, P., Merino, E., 2004. Three-
dimensional roughness of stylolites in limestones. Journal of Geophysical
Research 109, B03209. doi:10.1029/2003JB002555.
Rochette, P., Jackson, M.J., Aubourg, C., 1992. Rock magnetism and the
interpretation of anisotropy of magnetic susceptibility. Reviews of
Geophysics 30, 209–226.
Saint-Bezar, B., Hebert, R.L., Aubourg, C., Robion, P., Swennen, R., Frizon de
Lamotte, D., 2002. Magnetic fabric and petrographic investigation
of hematite-bearing sandstones within ramp-related folds: examples
from the South-Atlas Front (Morocco). Journal of Structural Geology 24,
1507–1520.
Selkman, S., 1983. Stress and displacement distributions around pyrite grains.
Journal of Structural Geology 5 (1), 47–52.
Souque, C., Robion, P., Frizon de Lamotte, D., 2002. Cryptic magnetic fabric of
tectonic origin revealed by heating of sedimentary samples from the
Corbieres, France. Physics and Chemistry of the Earth (A) 27, 1253–1262.
Souque, C., Frizon de Lamotte, D., Leturmy, P., Robion, P., 2003. Duplex at the
lateral tip of a thrust fault: the “La Cagaliere” example (NE Pyrenees,
France). Geodinamica Acta 16 (2–6), 89–98.
Stromgard, K.E., 1973. Stress distribution during formation of boudinage and
pressure shadows. Tectonophysics 16, 215–248.
Suppe, J., 1983. Geometry and kinematics of fault-bend folding. American
Journal of Science 283, 684–721.
Suppe, J., Medwedeff, D.A., 1990. Geometry and kinematics of fault-
propagation folding. Eclogae Geologicae Helvetiae 83, 409–454.
Tavani, S., Louis, L., Souque, C., Robion, P., Salvini, F., Frizon de Lamotte, D.,
2004. Folding related fracture pattern and physical properties of rocks in the
Chaudrons ramp-related anticline (Corbieres, France). In: Swennen, R.,
Roure, F., Granath, J. (Eds.), Deformation, Fluid Flow and Reservoir
Appraisal in Foreland Fold and Thrust Belts. AAPG Hedberg series no. 1.
Tavarnelli, E., 1997. Structural evolution of a foreland fold-and-thrust belt: the
Umbria–Marche Apennines, Italy. Journal of Structural Geology 19 (3–4),
523–534.
Thorbjornsen, K., Dunne, W.M., 1997. Origin of a thrust-related fold:
geometric vs. kinematic tests. Journal of Structural Geology 19 (3–4),
303–319.
Top Related
Copyright © 2022 FDOKUMEN

