


Bahasa
Halaman
Hukum

Journal of Ecology
2007
95
, 27–40
© 2006 The AuthorsJournal compilation© 2006 British Ecological Society
Blackwell Publishing Ltd
Mortality and tree-size distributions in natural mixed-age forests
DAVID A. COOMES*† and ROBERT B. ALLEN†
*
Conservation and Community Ecology Group, Department of Plant Sciences, University of Cambridge, Downing Street, Cambridge CB2 3EA, UK, and,
†
Landcare Research, PO Box 69, Lincoln 8152, New Zealand
Summary
1
Tree-size distributions are changing in many natural forests around the world, and itis important to understand the underlying processes that are causing these changes.Here we use a classic conceptual framework – the shifting mosaic of patches model –to explore the ways in which competitive thinning and disturbance influence tree-sizedistributions, and to consider the effects of temporal variability in disturbancefrequency on the size structure of forests.
2
We monitored 250 stands of
Nothofagus solandri
var.
cliffortiodes
(mountainbeech), randomly distributed over 9000 hectares, for 19 years. Mountain beech is alight-demanding species that forms monospecific forests in New Zealand mountains.For the purposes of our model, we assumed that each stand functions as an even-agedpopulation: it is initiated by a pulse of recruitment, undergoes competitive thinning asit matures, and is eventually destroyed by a disturbance event. The tree-size distributionof the whole forest is driven partly by the frequency and temporal patchiness of disturbanceevents and partly by competitive processes within the constituent stands.
3
Temporal changes in stem density and mean tree size were observed to be remarkablysimilar in all young stands, indicating that a consistent packing rule operates duringthis phase of stand development. A popular idea in the self-thinning literature is thatthe maintenance of constant leaf area index (LAI) provides the mechanism for thispacking rule, but our analyses suggest that LAI increased by about 30% during thethinning phase. We use leaf economic theory to develop a new packing rule based onlight interception, and argue that LAI increases with stand age because of changes incanopy organisation.
4
Smaller trees were significantly more likely to die than larger trees within the youngstands. Tree-diameter distributions within young stands were left skewed but those ofolder populations were normally distributed. These observations are consistent withasymmetric competition winnowing out small, suppressed trees from young stands buthaving less effect in older stands.
5
Large-scale disturbances created gaps of sufficient size to allow mass recruitment ofseedlings in about 0.8% of stands each year. Older stands were most susceptible to suchlarge-scale disturbance, but the trend was weak.
6
The diameter-distribution of the whole
Nothofagus
forest was found to beapproximately exponential in form. Simulation models only produced realisticdiameter distributions when competitive packing rules and disturbance were included.Therefore, the shifting mosaic model provides a general framework for understand theways in which these mortality processes determine forest size structure.
7
The diameter distribution of the forest was not in equilibrium over the 19-year study.Using simulation models, we show that temporal variability in disturbance frequencycan generate enormous deviations in tree-diameter distributions away from thelong-term mean, leading us to conclude that modern-day disequilibrium in naturalforests may be the legacy of past disturbance events.
Correspondence: David Coomes (tel. +1223 333911; fax +1223 332418; e-mail [email protected]).
28
D. A. Coomes & R. B. Allen
© 2006 The AuthorsJournal compilation © 2006 British Ecological Society,
Journal of Ecology
95
, 27–40
Key-words
: asymmetric competition, density dependence, forest dynamics, leaf economicspectrum, scaling relationships, size frequency distribution, WBE metabolic scalingtheory, Weibull function
Journal of Ecology
(2007)
95
, 27–40doi: 10.1111/j.1365-2745.2006.01179.x
Introduction
The tree-size distribution for a natural forest is a prop-erty that emerges from the demographics of individualsand therefore should be predictable from tree growth,mortality and recruitment processes. However, manyfactors influence these demographic processes, and it isdifficult to decide on the level of complexity to includein predictive models. Enquist & Niklas (2001) predictedthat the relationship between tree size and stem densityin natural forests is given by an invariant scaling relation-ship, basing their calculation on an assumption thatcompetition for space is the only determinant of mor-tality within stands. In fact, the tree-size distributionsseldom follow this pattern, because large trees die at amuch greater rate than predicted by competition alone,probably because of disturbance and senescence (Coomes
et al
. 2003; Muller-Landau
et al
. 2006). Indeed, many studieshave shown that disturbance has a profound influenceon forest structure, particularly in the later stages of standdevelopment (e.g. Parker
et al
. 1985; Lorimer 1989;Oliver & Larson 1996; Runkle 2000; Miura
et al
. 2001).Therefore, general models for tree-size distributionsneed to take disturbance and competition into account(see Goff & West 1975; Shugart 1984; Harcombe 1987;Kohyama 1987; Clark 1991; Coomes
et al
. 2003).This paper seeks to derive a general theory of tree-
size structure for natural forests by taking into accountthe effects of both disturbance and competitive thinningon demographic processes. Our premise is that a forestdevelops as a shifting mosaic of patches (Fig. 1a,e; Watt1947; Franklin
et al
. 2002). This conceptual model viewsa forest as being comprised of populations (= patches)that establish as a result of asynchronous disturbanceevents. Each population is regarded as functioning asan even-aged stand. The populations go through a seriesof developmental phases; there is a seedling recruit-ment phase, followed by a phase in which the canopy isclosed and competitive thinning takes place. Later, thestands become mature and disturbance plays an increas-ingly important role in killing trees, gaps are opened thatdo not refill by lateral branch spread, and the openingsprovide opportunities for seedlings to establish, whencethe cycle starts again (Fig. 1a; Franklin
et al
. 2002).This model allows three aspects of demography to beidentified and quantified that together shape the tree-size structure of the forest (i.e. the diameter distributionof the metapopulation DDM).
The first aspect is the diameter size distribution oftrees within each population (DDP; Fig. 1b). Research
in plantations indicates that tree cohorts initially havediameter distributions that are highly skewed at the timeof canopy closure, a pattern that can be reproducedmathematically by allowing seedlings to differ in relativegrowth rates or starting sizes (Westoby 1984). After canopyclosure, relatively small trees are hugely disadvantagedin the battle to intercept light, which slows their growthrate and increases their likelihood of death (Weiner 1990;Adler 1996; Reynolds & Ford 2005). This ‘hierarchy ofdominance and suppression’ has two effects: variationin growth broadens the distribution, while the loss of smallertrees reduces its skewness (Fig. 1c; Mohler
et al
. 1978;Hara 1984; Weiner & Thomas 1986; Knox
et al
. 1989).We hypothesize that many natural forests may functionsimilarly, particularly where most seedlings recruit withina narrow time frame after canopy disturbance. We alsoexpect this in any forest where light limitation leads toa dominance hierarchy, even in mixed-age populations.
The second aspect shaping size structure concernscompetition for light as the mechanism behind loss ofstems during competitive thinning. Long & Smith (1984)argued that mortality within densely packed standsoccurs because individuals increase their leaf area asthey grow but the total leaf area of the population iscapped (i.e. the leaf area index or ‘LAI’ is capped). Atree’s leaf area is directly proportional to its basal area,so it follows that LAI scales approximately with
N
×
BA
m
, where
BA
m
is the mean basal area of the trees withina stand and
N
is the number of stems, and this in turnleads to log(
N
)
∝
−
log(
BA
m
). A cap on LAI provides anexplanation for self-thinning relationships, which areobserved to control development in even-aged plantations(Midgley 2001). We test the hypothesis that constantLAI limits stem densities in young natural-forest stands(Long & Smith 1984; Franco & Kelly 1998), because atthis stage the trees are densely packed and so competi-tion is particularly important (White & Harper 1970;Westoby 1984; Enquist
et al
. 2000).The final aspect defining size structure is disturbance.
Whilst it is generally recognized that stands becomeincreasingly susceptible to senescence and disturbanceas they age (Runkle 1982, 1985, 2000; King 1986; Dahir& Lorimer 1996; Canham
et al
. 2001; Lorimer
et al
.2001), it is equally recognized that disturbance is highlyunpredictable and spatially patchy (Runkle 1982, 1990;Pickett & White 1985; Clark 1991; Oliver & Larson 1996;Allen
et al
. 1999). Here we use simulation modelling toexplore the effects of disturbance on the size distributionof trees in forests. Disturbances often produce a shiftingmosaic of patches of varying age at the landscape level,
29
Tree size distributions
© 2006 The AuthorsJournal compilation © 2006 British Ecological Society,
Journal of Ecology
95
, 27–40
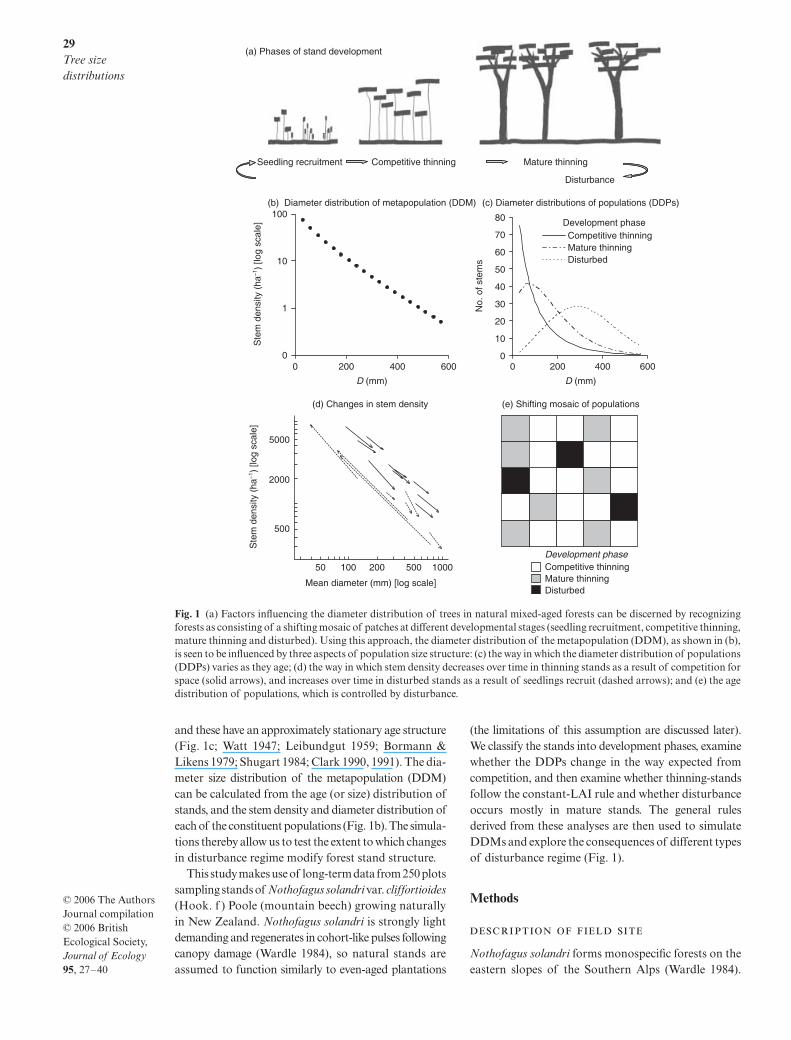
and these have an approximately stationary age structure(Fig. 1c; Watt 1947; Leibundgut 1959; Bormann &Likens 1979; Shugart 1984; Clark 1990, 1991). The dia-meter size distribution of the metapopulation (DDM)can be calculated from the age (or size) distribution ofstands, and the stem density and diameter distribution ofeach of the constituent populations (Fig. 1b). The simula-tions thereby allow us to test the extent to which changesin disturbance regime modify forest stand structure.
This study makes use of long-term data from 250 plotssampling stands of
Nothofagus solandri
var.
cliffortioides
(Hook. f ) Poole (mountain beech) growing naturallyin New Zealand.
Nothofagus solandri
is strongly lightdemanding and regenerates in cohort-like pulses followingcanopy damage (Wardle 1984), so natural stands areassumed to function similarly to even-aged plantations
(the limitations of this assumption are discussed later).We classify the stands into development phases, examinewhether the DDPs change in the way expected fromcompetition, and then examine whether thinning-standsfollow the constant-LAI rule and whether disturbanceoccurs mostly in mature stands. The general rulesderived from these analyses are then used to simulateDDMs and explore the consequences of different typesof disturbance regime (Fig. 1).
Methods
Nothofagus solandri
forms monospecific forests on theeastern slopes of the Southern Alps (Wardle 1984).
Fig. 1 (a) Factors influencing the diameter distribution of trees in natural mixed-aged forests can be discerned by recognizingforests as consisting of a shifting mosaic of patches at different developmental stages (seedling recruitment, competitive thinning,mature thinning and disturbed). Using this approach, the diameter distribution of the metapopulation (DDM), as shown in (b),is seen to be influenced by three aspects of population size structure: (c) the way in which the diameter distribution of populations(DDPs) varies as they age; (d) the way in which stem density decreases over time in thinning stands as a result of competition forspace (solid arrows), and increases over time in disturbed stands as a result of seedlings recruit (dashed arrows); and (e) the agedistribution of populations, which is controlled by disturbance.
30
D. A. Coomes & R. B. Allen
© 2006 The AuthorsJournal compilation © 2006 British Ecological Society,
Journal of Ecology
95
, 27–40
Seedlings of
Nothofagus solandri
can persist for manyyears in the semi-shade, but the species is widely recog-nized as a light-demander that requires large gaps toregenerate successfully, and produces cohort-like popu-lations (Wardle 1984). The data set from these forestsconsists of 20 330 trees situated in 250 permanentlymarked plots that randomly sample 9000 ha of forests.The plots were established systematically along 98compass lines over the austral summers of 1970/71 and1972/73 with line origins located randomly along streamchannels (30–1000 m apart), and aligned along a randomcompass direction. Plots were then located at 200-mintervals along each line until the tree line was reached,giving rise to lines containing between one and eightplots (mean = 2.6). Each plot was 0.04 ha (20
×
20 m),and in the austral summer of 1974/75 all stems withinthe plots > 30 mm diameter at breast height were tagged,and diameters at breast height recorded. New recruitswere tagged in subsequent measurements and deathswere recorded. The plots were re-measured during theaustral summers of 1983/84 and 1993/94.
Windstorms and snowstorms in 1968 caused extensivedamage to the forests, which had previously consistedlargely of mature stands (Wardle & Allen 1983). In thewinter of 1973, a further moist heavy snowfall damagedtrees in 30% of stands; there was branch breakage inlarge trees, and stem snapping of smaller trees (Wardle& Allen 1983; Harcombe
et al
. 1998). Populations ofpinhole beetles (
Platypus
spp., Platypodidae, Coleoptera),and associated pathogens, built up on the woody debristhat accumulated after these storms and the beetlesthen attacked live trees, resulting in ongoing mortalityand a decline in stem biomass through to 1987. Thisresulted in a pattern of dispersed, low-intensity distur-bance (Harcombe
et al
. 1998).
Stands were classified into developmental phases (Fig. 1a)based on whether they were gaining or losing stems overtime, and whether mortality was focused particularlyon small stems. A gain in stem number over 19 years,associated with a decrease in mean tree size, was theresult of multiple tree deaths within a stand followed bya pulse of seedling recruitment, and stands showing thispattern were classified as ‘disturbed’. Stands in whicha net loss of individuals had occurred over 19 years,accompanied by an increase in the mean tree size, weredefined as ‘thinning’ stands, and these were furtherdivided into those in which mortality was greatest amongsmaller trees (‘competitive thinning stands’), vs. theremainder in which no such size discrimination wasobserved (‘mature thinning stands’). This was done bynoting which of the 10–650 trees present on plots in1974 were dead in 1993, and then using generalizedlinear models to test whether the probability of dyingvaried with initial stem diameter. The function logit(
p
D
)=
a
+
bD
was fitted, where
p
D
is the probability of deathand
D
is initial stem size, using the
GLM
routine in R
v 2.1.0 (R Foundation 2005), with a binomial errorstructure. Stands for which
b
was significantly less thanzero (
P =
0.05) were classified as competitive thinning(Fig. 1a).
-
We used various statistics to describe the tree-diameterdistribution of each stand (DDP). The mean stem basalarea (
BA
m
) and mean stem diameter (
D
m
) were calcu-lated for each measurement for each plot. Size inequalitywithin stands was characterized by coefficient of vari-ation in stem diameter (CV = standard deviation/mean)and deviation from normality was quantified usingskewness. Note that Gini coefficients provide an alter-native measure of inequality (Knox
et al
. 1989), but arenot presented here because they were very closelycorrelated with CV (
r =
0.96). Foresters commonly usea two-parameter Weibull function to describe the sizestructure of a forest stand; it has the probability densityfunction
f
(
D
) =
c
/
d
(
D
/
d
)
c
−
1
exp(–(
D
/
d
)
c
), where
c
and
d
are the shape and scale parameters, respectively, and
D
is the stem diameter. Two-parameter Weibull functionswere fitted to the diameter distributions from each ofthe 250 stands in 1974 and in 1993, using the
fit.distr
function in the
MASS
library of R. The ways in which
c
and
d
varied with
D
m
were assessed by least-squareslinear regression, using the
lm
function of R.Finally, we explored the way in which mortality varied
with tree size within each of the development phases.For each category, the total number of deaths within eachof 30 diameter-size classes was calculated, and com-pared with the total number of stems initially present,using a cumulative-interest-rate formula to calculateannual mortality rates. The size-class boundaries wereselected so that each class contained the same numberof stems (obtained using the
quantile
function in R),and the mean stem diameter
D
i
within each bin wasused in plots of mortality against size.
Thinning relationships were quantified by examiningthe temporal trajectories in population density (
N
)and mean basal area (
BA
M
) of trees within each stand.Temporal trajectories were visualized by plottingvectors of changes in log
N
and log
BA
m
over 19 yearsfor stands in each development phase. The thinningslopes were calculated for each stand as (log
N
1999
–log
N
1974
)/(log
BA
1993
– log
BA
1974
) and the averageslope calculated among stands from these (Roderick &Barnes 2004). If the slope is
−
1 this suggests that LAIremains constant during stand development, providedthat a tree’s leaf area scales isometrically with its basalarea, which appears to be the case for
Nothofagus solandri
trees (
M
L
∝
BA
0.99
, where
M
L
is mass of leaves, calcu-lated from data in Osawa & Allen (1993) using SMAregression).
31
Tree size distributions
© 2006 The AuthorsJournal compilation © 2006 British Ecological Society,
Journal of Ecology
95
, 27–40
A less powerful approach than following temporalchanges is to compare stands at different developmentalstages using only a single enumeration (see Weller 1990),and we also explored the data in this way. The self-thinningrule does not apply in even-aged stands in which thereis incomplete canopy cover (Westoby 1984; Begon
et al
.1996), so it is usually deemed necessary to quantify thethinning process by fitting an upper boundary to therelationship between log(
N
) and log(
BA
M
) (Osawa &Allen 1993). Quantile regression was used to fit these‘upper boundary’ lines (the
rq
function in the
quantreg
library of R, setting tau at 0.95) to the data from 1974and 1993, and standard errors were estimated by the‘xy’ bootstrapping method (Cade & Guo 2000). Forthe 1993 data, we had information on which of thestands belonged to which developmental phase basedon their dynamics during the previous 19 years, andfitted regression lines though the centre of the data set.Scaling relationships were fitted using RMA regression,using the
slopes.s
function in R.
The diameter distribution of the metapopulation (DDM)was obtained by assigning each of the 20 330 stems toa diameter class (bin widths = 30 mm), and totallingthe number of stems within each size-class bin. Scalingand exponential functions were fitted to the DDM usinglinear regression and we tested which function was moststrongly supported, using the Akaike InformationCriterion. Simulation modelling allowed us to identifywhich processes have the greatest influence on the DDM.The models are based on an assumption that the DDPsand density of stems change in predictable ways overthe course of stand development (according to functionsdefined from field data), and asynchronous destructionof individual stands gives rise to a shifting mosaic ofpatches across the landscape. All our functions werederived at the whole-stand level, rather than attemptingto keep track of individual trees.
One thousand stands were simulated, each of whichwas given an initial age of 20 years. At the end of eachtime step (1 year) a percentage of the stands weredestroyed, and were replaced by stands of zero age. Thechoice of which stands were destroyed was made byrandom draws from a probability density function thatdepended upon stand age. This process was repeatedfor 5000 years, by which stage the age structure wasindependent of starting conditions. The mean stemdiameter of each stand was then estimated from its age.We used non-linear regression modelling to fit thefollowing relationship between mean stem diameter in1974 and 1993,
D
m
, 1974
= ( + 19
λ
)–θ; and then usedthe parameter estimates (λ and θ) in the following rela-tionship between size and time since recruitment intothe 30-mm size class (t), Dm,t = (30θ + λ t)–θ; this modelassumes that growth is a power function of size, and isobtained by integrating the power function (see Muller-
Landau et al. 2006). Next, the number of stems perstand, N, was estimated using the thinning scalingfunction obtained by RMA regression; then the diam-eter distribution within each stand was obtained, bydrawing N stems from a Weibull distribution (using therweibull function in R) with shape and scale parametersappropriate for the mean stem diameter of trees inthe stand. Finally, the DDM of the 1000 populationswas constructed by assigning the individual stems intodiameter-size classes (bin width = 30 mm), and totallingthe number of stems within each size class bin.
The simulated distribution was compared with theactual DDM. We explored the way in which intensityof disturbance affects the size structure by varying thenumber of plots destroyed each year. The effects oftemporal variability in disturbance were explored byallowing the frequency to vary among years, whilemaintaining a constant long-term average; the numberof plots destroyed each year was sampled from a neg-ative binomial distribution (using the rnbinom functionin R). This may result in considerable variation amongyears, depending on the size parameter c (e.g. whenc = 0.05, mortality occurs in only 30% of years).
Results
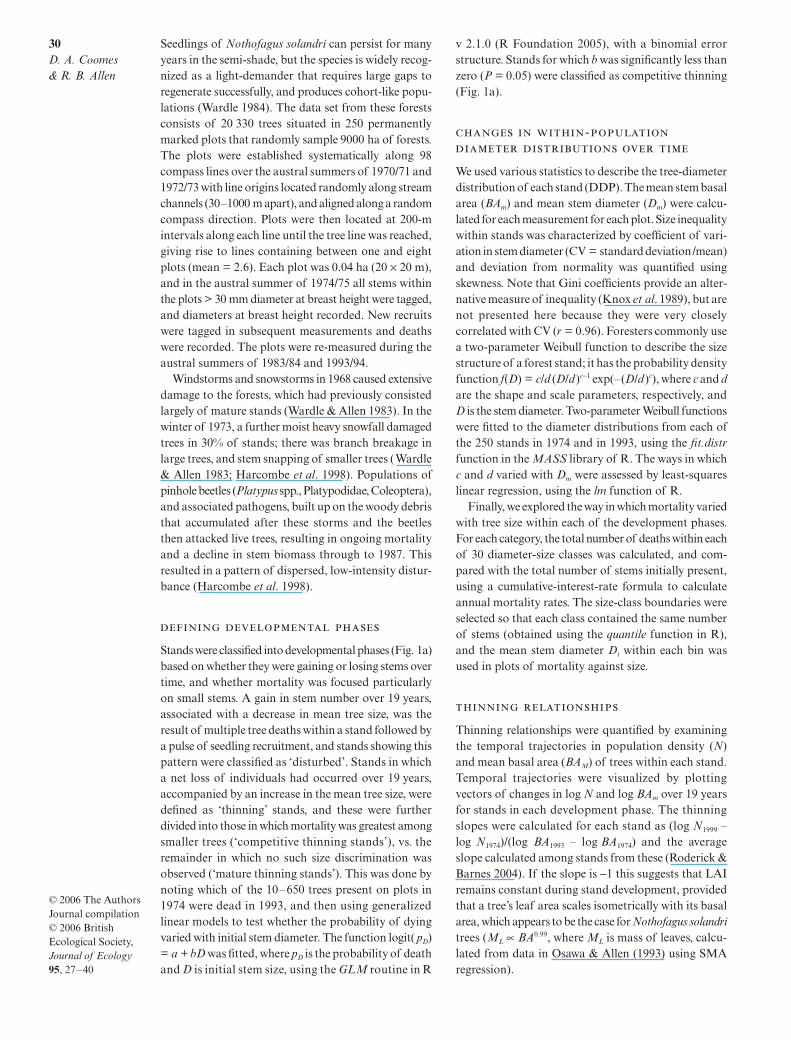
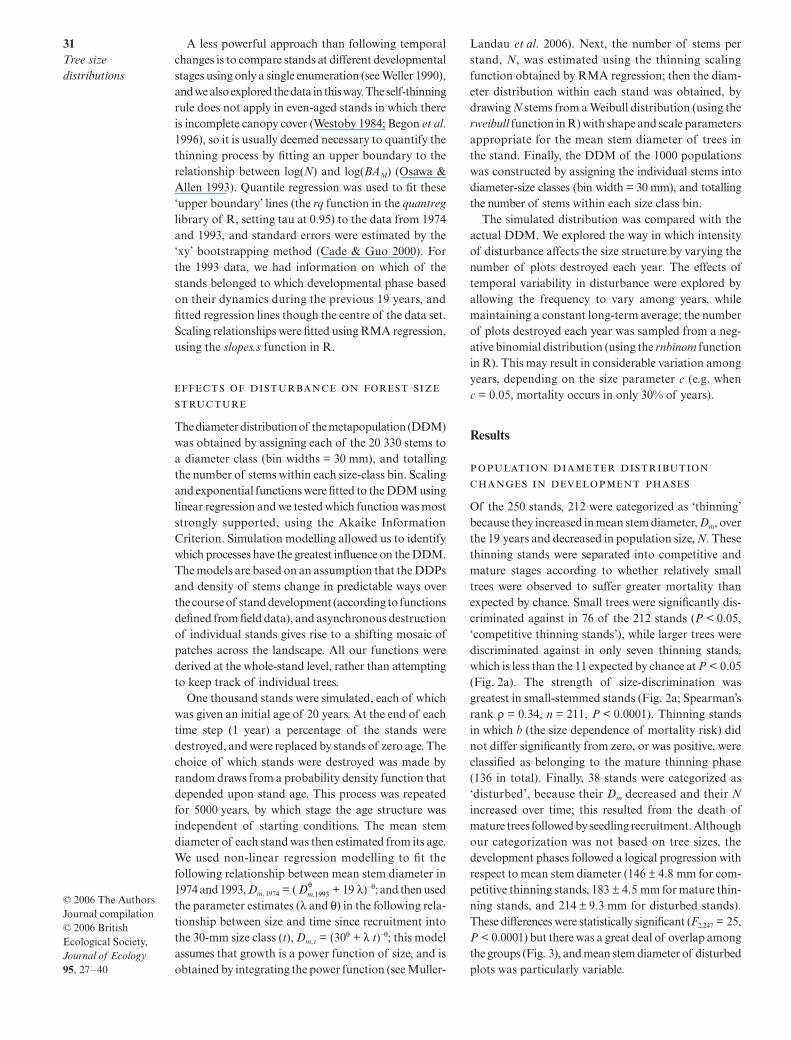
Of the 250 stands, 212 were categorized as ‘thinning’because they increased in mean stem diameter, Dm, overthe 19 years and decreased in population size, N. Thesethinning stands were separated into competitive andmature stages according to whether relatively smalltrees were observed to suffer greater mortality thanexpected by chance. Small trees were significantly dis-criminated against in 76 of the 212 stands (P < 0.05,‘competitive thinning stands’), while larger trees werediscriminated against in only seven thinning stands,which is less than the 11 expected by chance at P < 0.05(Fig. 2a). The strength of size-discrimination wasgreatest in small-stemmed stands (Fig. 2a; Spearman’srank ρ = 0.34, n = 211, P < 0.0001). Thinning standsin which b (the size dependence of mortality risk) didnot differ significantly from zero, or was positive, wereclassified as belonging to the mature thinning phase(136 in total). Finally, 38 stands were categorized as‘disturbed’, because their Dm decreased and their Nincreased over time; this resulted from the death ofmature trees followed by seedling recruitment. Althoughour categorization was not based on tree sizes, thedevelopment phases followed a logical progression withrespect to mean stem diameter (146 ± 4.8 mm for com-petitive thinning stands, 183 ± 4.5 mm for mature thin-ning stands, and 214 ± 9.3 mm for disturbed stands).These differences were statistically significant (F2,247 = 25,P < 0.0001) but there was a great deal of overlap amongthe groups (Fig. 3), and mean stem diameter of disturbedplots was particularly variable.
Dm,1993θ
32D. A. Coomes & R. B. Allen
© 2006 The AuthorsJournal compilation © 2006 British Ecological Society, Journal of Ecology 95, 27–40
( )
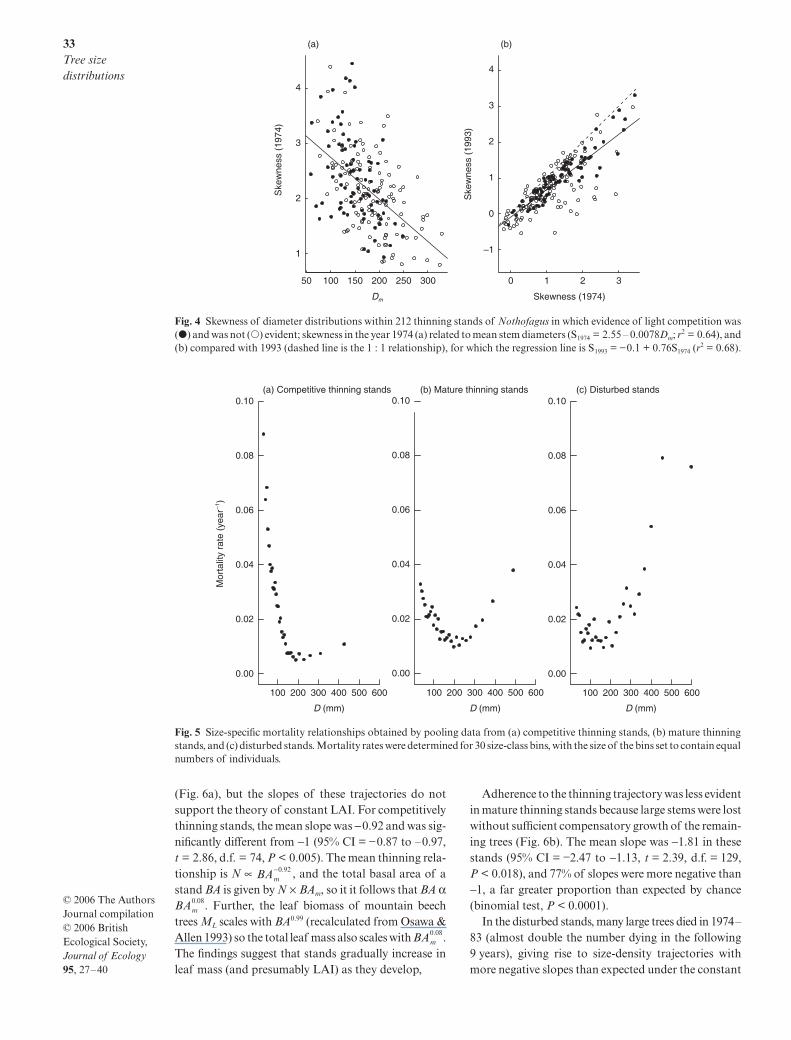
The DDPs were positively skewed in 200 of the 212thinning stands, the skew being greatest in the youngstands of small stems, and decreasing as stands aged(Figs 3 and 4b). Skewness also decreased with increas-ing Dm (Fig. 4a, F1,207 = 82.1, P < 0.00001). Similarly,coefficients of variation (CV) decreased over time (CV1993
= 0.049 (± 0.011) + 0.76 (± 0.017) CV1974, F1,211 = 2070,
P < 0.00001) and with increasing mean stem diameter(CV1974 = 0.97 (± 0.043) − 0.0022 (± 0.00024) Dm, F1,210 =84.1, P < 0.00001). Weibull functions provided the sortof flexibility required to model such size distributions.The scale parameter was found to be closely related tothe mean stem diameter of the individuals in the stand(scale = 1.118 (± 0.00138) Dm, r2 = 0.99), while the shapeparameter, which is inversely correlated with CV, increasedsignificantly with mean stem diameter (shape = 0.825(± 0.152) + 0.00715 (± 0.00085) Dm, r2 = 0.25).
The 38 disturbed populations functioned differentlyto thinning populations. Within each stand it was therelatively large trees that tended to die, perhaps becausethey were especially exposed to wind or snow damage;the logistic regression of mortality against size gave riseto b-values that were significantly greater than zero in13 of the 38 plots (Fig. 2b), and the mean b-value wasgreater than zero (0.0087 ± 0.0042; t = 2.0, d.f. = 37,P = 0.048). Seedling recruitment resulted in huge changesin CV and skewness over time, to the extent that the val-ues in 1974 were completely uncorrelated with those in1993 (Pearson correlation, r = 0.25, P > 0.10; skewnessr = 0.11, P > 0.50).
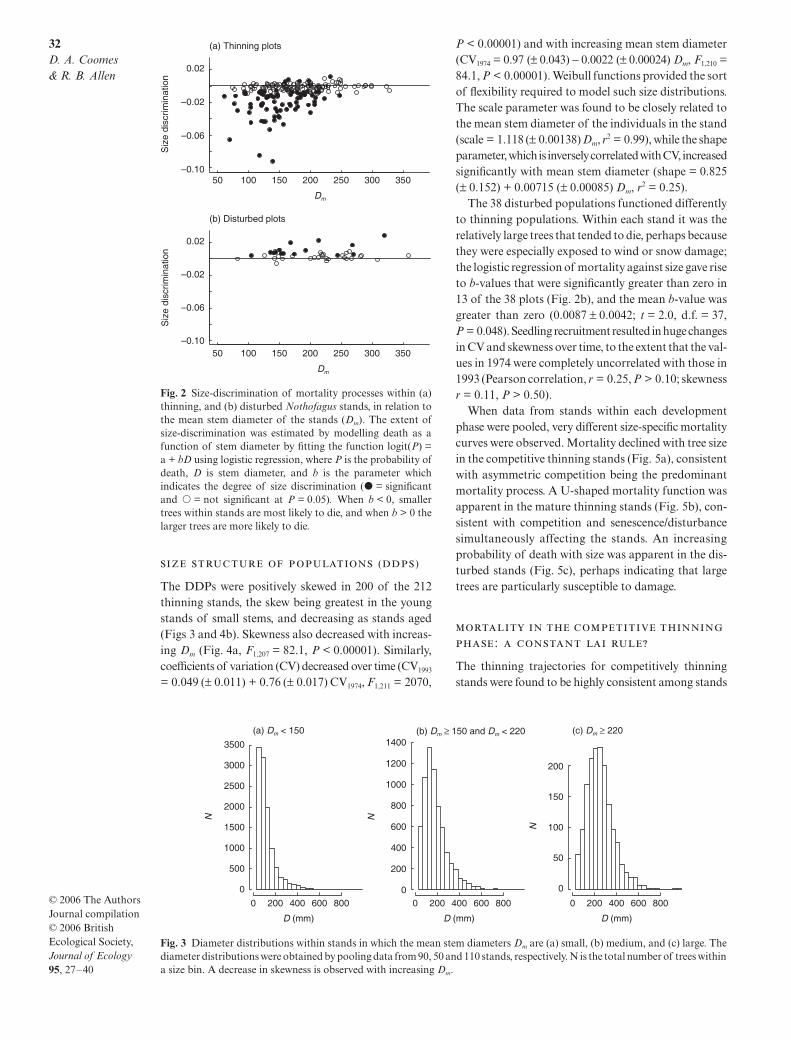
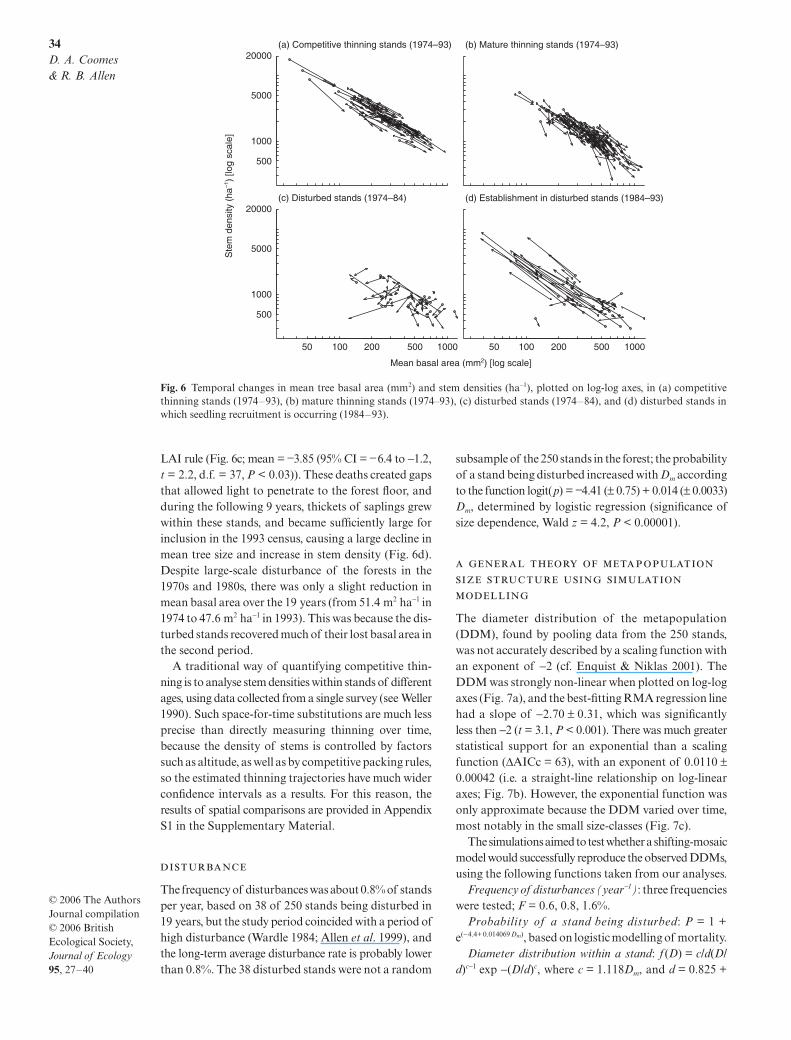
When data from stands within each developmentphase were pooled, very different size-specific mortalitycurves were observed. Mortality declined with tree sizein the competitive thinning stands (Fig. 5a), consistentwith asymmetric competition being the predominantmortality process. A U-shaped mortality function wasapparent in the mature thinning stands (Fig. 5b), con-sistent with competition and senescence/disturbancesimultaneously affecting the stands. An increasingprobability of death with size was apparent in the dis-turbed stands (Fig. 5c), perhaps indicating that largetrees are particularly susceptible to damage.
:
The thinning trajectories for competitively thinningstands were found to be highly consistent among stands
Fig. 2 Size-discrimination of mortality processes within (a)thinning, and (b) disturbed Nothofagus stands, in relation tothe mean stem diameter of the stands (Dm). The extent ofsize-discrimination was estimated by modelling death as afunction of stem diameter by fitting the function logit(P) =a + bD using logistic regression, where P is the probability ofdeath, D is stem diameter, and b is the parameter whichindicates the degree of size discrimination (� = significantand � = not significant at P = 0.05). When b < 0, smallertrees within stands are most likely to die, and when b > 0 thelarger trees are more likely to die.
Fig. 3 Diameter distributions within stands in which the mean stem diameters Dm are (a) small, (b) medium, and (c) large. Thediameter distributions were obtained by pooling data from 90, 50 and 110 stands, respectively. N is the total number of trees withina size bin. A decrease in skewness is observed with increasing Dm.
33Tree size distributions
© 2006 The AuthorsJournal compilation © 2006 British Ecological Society, Journal of Ecology 95, 27–40
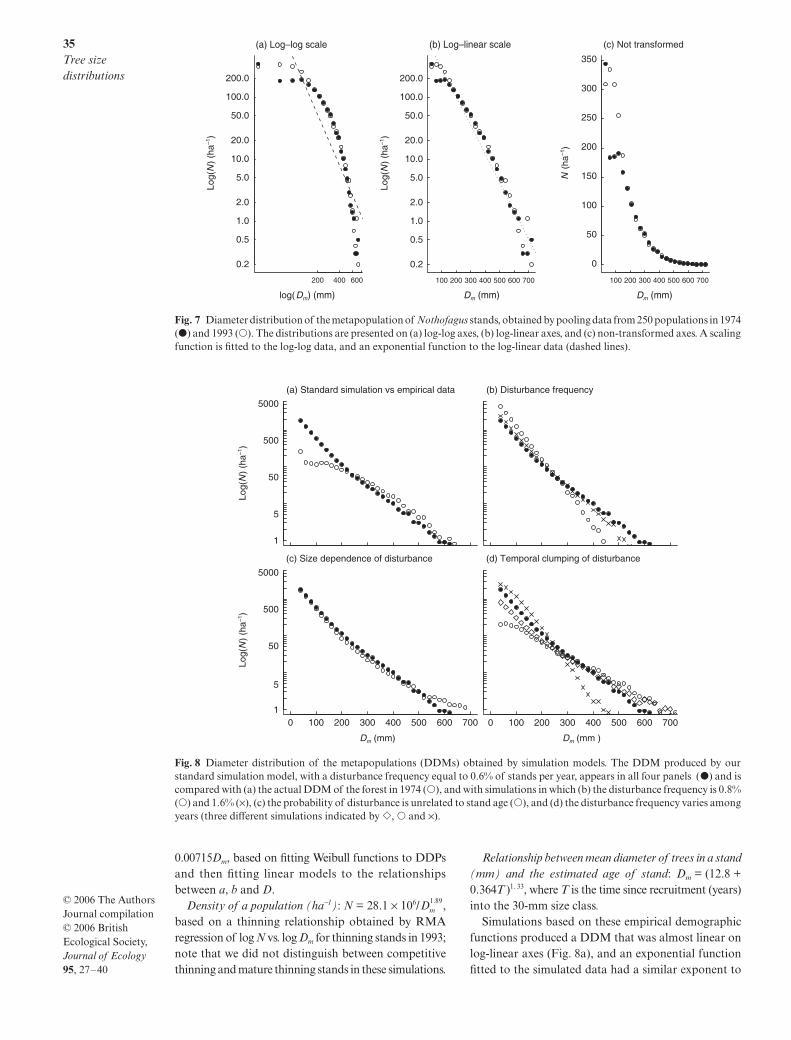
(Fig. 6a), but the slopes of these trajectories do notsupport the theory of constant LAI. For competitivelythinning stands, the mean slope was −0.92 and was sig-nificantly different from −1 (95% CI = −0.87 to –0.97,t = 2.86, d.f. = 74, P < 0.005). The mean thinning rela-tionship is N ∝ , and the total basal area of astand BA is given by N × BAm, so it it follows that BA α
. Further, the leaf biomass of mountain beechtrees ML scales with BA0.99 (recalculated from Osawa &Allen 1993) so the total leaf mass also scales with .The findings suggest that stands gradually increase inleaf mass (and presumably LAI) as they develop,
Adherence to the thinning trajectory was less evidentin mature thinning stands because large stems were lostwithout sufficient compensatory growth of the remain-ing trees (Fig. 6b). The mean slope was −1.81 in thesestands (95% CI = −2.47 to −1.13, t = 2.39, d.f. = 129,P < 0.018), and 77% of slopes were more negative than−1, a far greater proportion than expected by chance(binomial test, P < 0.0001).
In the disturbed stands, many large trees died in 1974–83 (almost double the number dying in the following9 years), giving rise to size-density trajectories withmore negative slopes than expected under the constant
Fig. 4 Skewness of diameter distributions within 212 thinning stands of Nothofagus in which evidence of light competition was(�) and was not (�) evident; skewness in the year 1974 (a) related to mean stem diameters (S1974 = 2.55 – 0.0078Dm; r2 = 0.64), and(b) compared with 1993 (dashed line is the 1 : 1 relationship), for which the regression line is S1993 = −0.1 + 0.76S1974 (r
2 = 0.68).
Fig. 5 Size-specific mortality relationships obtained by pooling data from (a) competitive thinning stands, (b) mature thinningstands, and (c) disturbed stands. Mortality rates were determined for 30 size-class bins, with the size of the bins set to contain equalnumbers of individuals.
BAm−0 92.
BAm0 08.
BAm0 08.
34D. A. Coomes & R. B. Allen
© 2006 The AuthorsJournal compilation © 2006 British Ecological Society, Journal of Ecology 95, 27–40
LAI rule (Fig. 6c; mean = −3.85 (95% CI = −6.4 to −1.2,t = 2.2, d.f. = 37, P < 0.03)). These deaths created gapsthat allowed light to penetrate to the forest floor, andduring the following 9 years, thickets of saplings grewwithin these stands, and became sufficiently large forinclusion in the 1993 census, causing a large decline inmean tree size and increase in stem density (Fig. 6d).Despite large-scale disturbance of the forests in the1970s and 1980s, there was only a slight reduction inmean basal area over the 19 years (from 51.4 m2 ha−1 in1974 to 47.6 m2 ha−1 in 1993). This was because the dis-turbed stands recovered much of their lost basal area inthe second period.
A traditional way of quantifying competitive thin-ning is to analyse stem densities within stands of differentages, using data collected from a single survey (see Weller1990). Such space-for-time substitutions are much lessprecise than directly measuring thinning over time,because the density of stems is controlled by factorssuch as altitude, as well as by competitive packing rules,so the estimated thinning trajectories have much widerconfidence intervals as a results. For this reason, theresults of spatial comparisons are provided in AppendixS1 in the Supplementary Material.
The frequency of disturbances was about 0.8% of standsper year, based on 38 of 250 stands being disturbed in19 years, but the study period coincided with a period ofhigh disturbance (Wardle 1984; Allen et al. 1999), andthe long-term average disturbance rate is probably lowerthan 0.8%. The 38 disturbed stands were not a random
subsample of the 250 stands in the forest; the probabilityof a stand being disturbed increased with Dm accordingto the function logit(p) = −4.41 (± 0.75) + 0.014 (± 0.0033)Dm, determined by logistic regression (significance ofsize dependence, Wald z = 4.2, P < 0.00001).
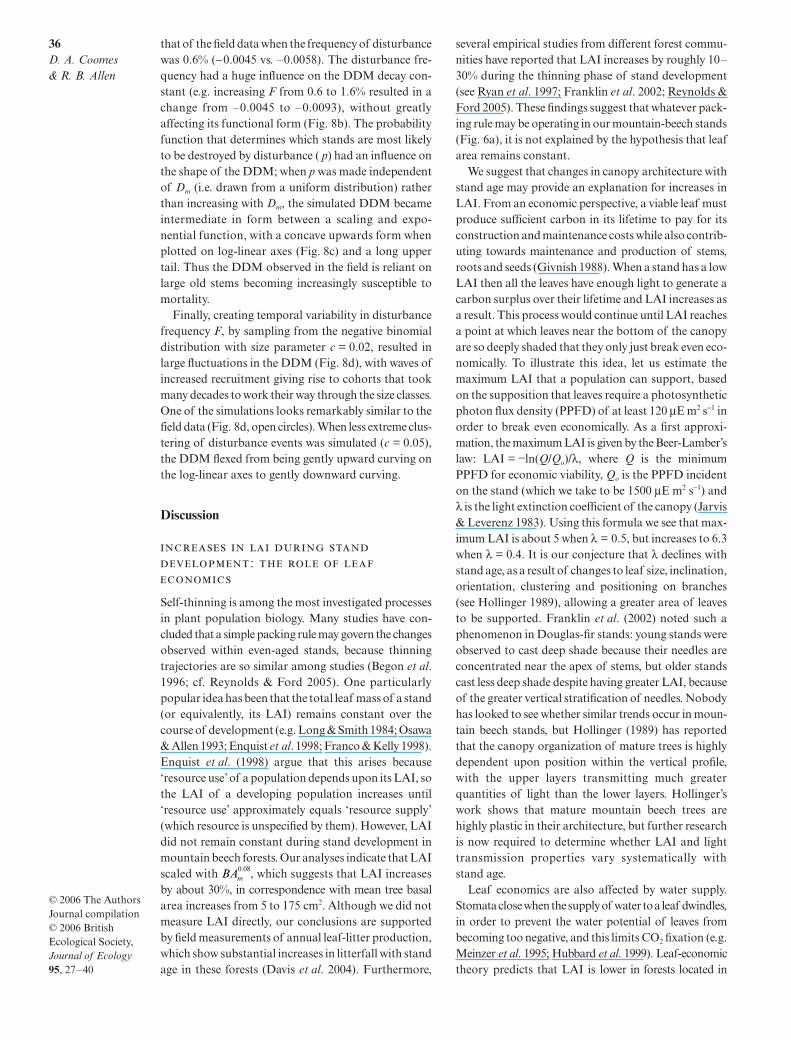
The diameter distribution of the metapopulation(DDM), found by pooling data from the 250 stands,was not accurately described by a scaling function withan exponent of −2 (cf. Enquist & Niklas 2001). TheDDM was strongly non-linear when plotted on log-logaxes (Fig. 7a), and the best-fitting RMA regression linehad a slope of −2.70 ± 0.31, which was significantlyless then −2 (t = 3.1, P < 0.001). There was much greaterstatistical support for an exponential than a scalingfunction (∆AICc = 63), with an exponent of 0.0110 ±0.00042 (i.e. a straight-line relationship on log-linearaxes; Fig. 7b). However, the exponential function wasonly approximate because the DDM varied over time,most notably in the small size-classes (Fig. 7c).
The simulations aimed to test whether a shifting-mosaicmodel would successfully reproduce the observed DDMs,using the following functions taken from our analyses.
Frequency of disturbances (year−1): three frequencieswere tested; F = 0.6, 0.8, 1.6%.
Probability of a stand being disturbed: P = 1 +e(−4.4+ 0.014069 Dm), based on logistic modelling of mortality.
Diameter distribution within a stand: f (D) = c/d(D/d)c−1 exp −(D/d)c, where c = 1.118Dm, and d = 0.825 +
Fig. 6 Temporal changes in mean tree basal area (mm2) and stem densities (ha−1), plotted on log-log axes, in (a) competitivethinning stands (1974–93), (b) mature thinning stands (1974–93), (c) disturbed stands (1974–84), and (d) disturbed stands inwhich seedling recruitment is occurring (1984–93).
35Tree size distributions
© 2006 The AuthorsJournal compilation © 2006 British Ecological Society, Journal of Ecology 95, 27–40
0.00715Dm, based on fitting Weibull functions to DDPsand then fitting linear models to the relationshipsbetween a, b and D.
Density of a population (ha−1): N = 28.1 × 10⁶/ ,based on a thinning relationship obtained by RMAregression of log N vs. log Dm for thinning stands in 1993;note that we did not distinguish between competitivethinning and mature thinning stands in these simulations.
Relationship between mean diameter of trees in a stand(mm) and the estimated age of stand: Dm = (12.8 +0.364T )1. 33, where T is the time since recruitment (years)into the 30-mm size class.
Simulations based on these empirical demographicfunctions produced a DDM that was almost linear onlog-linear axes (Fig. 8a), and an exponential functionfitted to the simulated data had a similar exponent to
Fig. 7 Diameter distribution of the metapopulation of Nothofagus stands, obtained by pooling data from 250 populations in 1974(�) and 1993 (�). The distributions are presented on (a) log-log axes, (b) log-linear axes, and (c) non-transformed axes. A scalingfunction is fitted to the log-log data, and an exponential function to the log-linear data (dashed lines).
Fig. 8 Diameter distribution of the metapopulations (DDMs) obtained by simulation models. The DDM produced by ourstandard simulation model, with a disturbance frequency equal to 0.6% of stands per year, appears in all four panels (�) and iscompared with (a) the actual DDM of the forest in 1974 (�), and with simulations in which (b) the disturbance frequency is 0.8%(�) and 1.6% (×), (c) the probability of disturbance is unrelated to stand age (�), and (d) the disturbance frequency varies amongyears (three different simulations indicated by �, � and ×).
Dm1 89.
36D. A. Coomes & R. B. Allen
© 2006 The AuthorsJournal compilation © 2006 British Ecological Society, Journal of Ecology 95, 27–40
that of the field data when the frequency of disturbancewas 0.6% (−0.0045 vs. –0.0058). The disturbance fre-quency had a huge influence on the DDM decay con-stant (e.g. increasing F from 0.6 to 1.6% resulted in achange from –0.0045 to –0.0093), without greatlyaffecting its functional form (Fig. 8b). The probabilityfunction that determines which stands are most likelyto be destroyed by disturbance ( p) had an influence onthe shape of the DDM; when p was made independentof Dm (i.e. drawn from a uniform distribution) ratherthan increasing with Dm, the simulated DDM becameintermediate in form between a scaling and expo-nential function, with a concave upwards form whenplotted on log-linear axes (Fig. 8c) and a long uppertail. Thus the DDM observed in the field is reliant onlarge old stems becoming increasingly susceptible tomortality.
Finally, creating temporal variability in disturbancefrequency F, by sampling from the negative binomialdistribution with size parameter c = 0.02, resulted inlarge fluctuations in the DDM (Fig. 8d), with waves ofincreased recruitment giving rise to cohorts that tookmany decades to work their way through the size classes.One of the simulations looks remarkably similar to thefield data (Fig. 8d, open circles). When less extreme clus-tering of disturbance events was simulated (c = 0.05),the DDM flexed from being gently upward curving onthe log-linear axes to gently downward curving.
Discussion
:
Self-thinning is among the most investigated processesin plant population biology. Many studies have con-cluded that a simple packing rule may govern the changesobserved within even-aged stands, because thinningtrajectories are so similar among studies (Begon et al.1996; cf. Reynolds & Ford 2005). One particularlypopular idea has been that the total leaf mass of a stand(or equivalently, its LAI) remains constant over thecourse of development (e.g. Long & Smith 1984; Osawa& Allen 1993; Enquist et al. 1998; Franco & Kelly 1998).Enquist et al. (1998) argue that this arises because‘resource use’ of a population depends upon its LAI, sothe LAI of a developing population increases until‘resource use’ approximately equals ‘resource supply’(which resource is unspecified by them). However, LAIdid not remain constant during stand development inmountain beech forests. Our analyses indicate that LAIscaled with , which suggests that LAI increasesby about 30%, in correspondence with mean tree basalarea increases from 5 to 175 cm2. Although we did notmeasure LAI directly, our conclusions are supportedby field measurements of annual leaf-litter production,which show substantial increases in litterfall with standage in these forests (Davis et al. 2004). Furthermore,
several empirical studies from different forest commu-nities have reported that LAI increases by roughly 10–30% during the thinning phase of stand development(see Ryan et al. 1997; Franklin et al. 2002; Reynolds &Ford 2005). These findings suggest that whatever pack-ing rule may be operating in our mountain-beech stands(Fig. 6a), it is not explained by the hypothesis that leafarea remains constant.
We suggest that changes in canopy architecture withstand age may provide an explanation for increases inLAI. From an economic perspective, a viable leaf mustproduce sufficient carbon in its lifetime to pay for itsconstruction and maintenance costs while also contrib-uting towards maintenance and production of stems,roots and seeds (Givnish 1988). When a stand has a lowLAI then all the leaves have enough light to generate acarbon surplus over their lifetime and LAI increases asa result. This process would continue until LAI reachesa point at which leaves near the bottom of the canopyare so deeply shaded that they only just break even eco-nomically. To illustrate this idea, let us estimate themaximum LAI that a population can support, basedon the supposition that leaves require a photosyntheticphoton flux density (PPFD) of at least 120 µE m2 s−1 inorder to break even economically. As a first approxi-mation, the maximum LAI is given by the Beer-Lamber’slaw: LAI = −ln(Q/Qo)/λ, where Q is the minimumPPFD for economic viability, Qo is the PPFD incidenton the stand (which we take to be 1500 µE m2 s−1) andλ is the light extinction coefficient of the canopy (Jarvis& Leverenz 1983). Using this formula we see that max-imum LAI is about 5 when λ = 0.5, but increases to 6.3when λ = 0.4. It is our conjecture that λ declines withstand age, as a result of changes to leaf size, inclination,orientation, clustering and positioning on branches(see Hollinger 1989), allowing a greater area of leavesto be supported. Franklin et al. (2002) noted such aphenomenon in Douglas-fir stands: young stands wereobserved to cast deep shade because their needles areconcentrated near the apex of stems, but older standscast less deep shade despite having greater LAI, becauseof the greater vertical stratification of needles. Nobodyhas looked to see whether similar trends occur in moun-tain beech stands, but Hollinger (1989) has reportedthat the canopy organization of mature trees is highlydependent upon position within the vertical profile,with the upper layers transmitting much greaterquantities of light than the lower layers. Hollinger’swork shows that mature mountain beech trees arehighly plastic in their architecture, but further researchis now required to determine whether LAI and lighttransmission properties vary systematically withstand age.
Leaf economics are also affected by water supply.Stomata close when the supply of water to a leaf dwindles,in order to prevent the water potential of leaves frombecoming too negative, and this limits CO2 fixation (e.g.Meinzer et al. 1995; Hubbard et al. 1999). Leaf-economictheory predicts that LAI is lower in forests located in
BAm0 08.
37Tree size distributions
© 2006 The AuthorsJournal compilation © 2006 British Ecological Society, Journal of Ecology 95, 27–40
regions of low rainfall, because leaves at the bottom of acanopy can endure less shade if their lifetime carbongain is curtailed. Such declines in LAI are commonlyobserved along rainfall gradients (Coomes & Grubb2000). By a similar logic, it might be anticipated thatLAI should decline with tree size, because tall treesmust transport water through long pipes, incurring highresistance to flow (Mencuccini 2003). However, our datacontradict this idea, because LAI increases rather thandeclines with tree size. The metabolic theory proposedby West, Brown and Enquist (WBE) provides an ingen-ious explanation for why LAI does not decrease duringstand development: it suggests that trees can preventhydraulic resistance (per unit leaf area) from increasingas they grow taller, if vessels in their trunks have largerdiameters than those in their peripheral branches(West et al. 1997; Enquist et al. 2000; Enquist 2002).This pattern of vascular design is indeed observedin mountain beech trees (Coomes et al., in press), andmight allow them to grow tall without substantiallyincreasing resistance to hydraulic flow.
LAI is a population-level property that is driven byleaf-level economics, but it is important not to losesight of the fact that competition among individualtrees gives rise to the observed patterns. For plants thatare competing for light, shorter trees produce many oftheir leaves in the shade of taller neighbours, resultingin slow growth and eventual death (Givnish 1988; Adler1996; Begon et al. 1996). Such asymmetric competitionfor light provides the simplest explanation for greatermortality among small trees in Nothofagus stands (Adler1996) and for the reduction in skewness of size distri-butions observed over time (Mohler et al. 1978; Hara1984; Weiner & Thomas 1986; Knox et al. 1989). Ourstudy provides support for general packing rules thatare equally applicable to self-thinning plantations andnatural mixed-aged forests.
The U-shaped mortality curve observed in maturethinning stands indicates that large trees are dying ingreater numbers than can be explained by competitivethinning (Fig. 5b). Similar patterns are observed in manyother forests (Lorimer et al. 2001). Large trees may beparticularly susceptible to windthrow (King 1986;Canham et al. 2001), or less able to ward off pathogenssuch as Armillaria (Lorimer et al. 2001), and their deathscreate gaps in the canopy that are not immediatelyrefilled through recruitment. However, many of themature stands continued to follow a similar thinningtrajectory to that observed in competitive thinning stands(Fig. 6b), although some had slopes < −1, which indi-cates mortality without compensatory growth. In addi-
tion, a −1 slope is evident in spatial analyses of datafrom 1993 (Fig. 7b). The apparent persistence of the−1 thinning trajectories might result from increasedgrowth of surviving trees in response to the death ofneighbours, which eventually compensates for the lossin large trees (D. A. Coomes & R. B. Allen, unpub-lished data). The surviving trees fill in single tree-fallgaps by lateral branch growth (Franklin et al. 2002), andalthough there might be a flush of regeneration inresponse to the opening up of the canopy, the seedlinglayer is then suppressed so the opening does not lead toan increase in stem density (R. B. Allen, unpublisheddata). This contrasts with our ‘disturbed’ stands, inwhich the openings created by multiple tree deaths weretoo large for compensatory lateral growth, resulting insuccessful regeneration of a profusion of seedlings.
The diameter distribution of the Nothofagus forest didnot resemble a scaling function (Fig. 7), and changedsubstantially over time (Figs 4 and 7, and Fig. S1 inAppendix S1). Thus, size structure was not adequatelypredicted by an invariant scaling function as metabolictheory predicts (Enquist & Niklas 2001). The inade-quacy of the theory for predicting size distributions inthese monospecific Nothofagus forests and in naturalmixed-species forests throughout tropical and temper-ate regions (Coomes et al. 2003; Muller-Landau et al.2006) is the consequence of its narrow focus on com-petition as the cause of mortality in forest stands,and its failure to consider the effects of disturbance(Parker et al. 1985; Harcombe 1987; Lorimer 1989;Clark 1991; Oliver & Larson 1996; Runkle 2000;Miura et al. 2001).
Our simulations suggest that the increasing proba-bility of mortality with stand age is important indefining metapopulation structure (Clark 1989, 1990).Models in which disturbance probability did not varywith stand age produced a DDM that resembled scal-ing functions (Fig. 8c), and only when more realisticdisturbance probabilities were introduced did the DDMtake on its near-exponential form. Several other studiesshow that the probability of stand-scale disturbanceincreases with the time since the last such event (Kohyama1987; Suzuki & Tsukahara 1987; Foster 1988), as doesthe probability of fire (Clark 1989). The influences ofthese processes on size structure, as well as non-randommortality within stands, are profound.
Even though the Nothofagus forest was sampled overan extensive area (c. 9000 ha) it was clear that the DDMwas non-stationary, and changed substantially over the19 years of study (Fig. 7c). Historical records speak ofthe study area being dominated by mature forests untilthe 1960s (Wardle 1984), after which there was a seriesof disturbance episodes (Wardle & Allen 1983; Allenet al. 1999). These disturbances are causing ongoingchanges to the forest size structure, with a 30% increase
38D. A. Coomes & R. B. Allen
© 2006 The AuthorsJournal compilation © 2006 British Ecological Society, Journal of Ecology 95, 27–40
in small stems since the 1994 census (R. B. Allen, unpub-lished data). Simulations show that concentratingdisturbance events into 10% of years results in majorperturbations of diameter distribution from that pre-dicted when disturbance rate is constant (Fig. 8d), andonly when temporal variability was introduced did sim-ulations produce realistic looking DDMs. Few naturalforests are in equilibrium, because changes in the climate,fragmentation, disease outbreaks, earthquakes andintroduced herbivores all influence size structure(Bormann & Likens 1979; Phillips & Gentry 1994; Wellset al. 2001; Coomes et al. 2003; Lewis et al. 2004) anddisturbances are sporadic in most systems (e.g. Foster1988). Hence, the diameter-distributions of naturalforests are unlikely to be invariant (Muller-Landauet al. 2006) and the predictive ability of general modelsis limited.
Demographic equilibrium modelling is the simplestmethod for predicting size distributions from demo-graphic process data (Kohyama 1991; Coomes et al.2003; Muller-Landau et al. 2006). We previously foundthat the size structure of large trees in New Zealand’sforests was accurately predicted by this approach, butnumbers of small trees were massively overestimated(Coomes et al. 2003). Similarly, Muller-Landau et al.(2006) found that the general shape of size distributionswas predicted accurately, but not the precise numbersof stems in size classes. The limitations of the approachare that it assumes that forests are in dynamic equilibrium,that mortality rates are constant over time, and thatvariation in growth and mortality due to local compe-tition are negligible: this imposes limitations on thepredictive ability of this approach.
Our model assumes that forests function as a shiftingmosaic of discrete patches (Fig. 1) and provides a moreeffective tool for understanding the ways in which com-petition and disturbance interplay to structure forests.Nevertheless, some aspects of the model are simplistic.For example, the assumption that trees within a standare all of similar age may be reasonable as a first approxi-mation, but disturbances sometimes result in theincomplete destruction of mature stands, so it is notuncommon to find a few old trees nestled among ayounger cohort. In addition, seedling establishmentmay initiate new stands, but suppressed saplings mayalso take advantages of gaps, so recruits may be ofvarious ages rather than consisting of a tight cohort.Individual-based simulation models, which track theperformance of every tree, have the potential to includeall the demographic processes that influence size struc-ture (Dubé et al. 2001; Reynolds & Ford 2005), andshould in theory be capable of simulating the develop-ment of within-population size structure seen in Fig. 2.An important next step will be to develop such modelsfor the Nothofagus forests.
-
Nothofagus solandri is a light-demanding species thathas cohort-like regeneration patterns, and this allowedus to draw analogies with even-aged, self-thinning stands.However, mixed-species forests function differentlybecause succession from light-demanding to shade-tolerant species occurs over time (e.g. Franklin et al.2002). DDPs may retain a ‘reverse J’ form throughoutstand development (e.g. Niklas et al. 2003), if late-successional species continue to recruit after the waveof early successional trees has established (e.g. the‘additive basal area model’ of Ogden & Stewart 1995).The form of the DDM will depend greatly upon theextent to which the early successional trees are effectiveat suppressing further recruitment (Clark 1991; Franklinet al. 2002). Secondly, shade-tolerant species tend tosupport a greater leaf area than light-demandingspecies of similar size (Coomes & Grubb 2000), sosuccession from light-demanding to shade-tolerantspecies might lead to large increases in LAI, and abreaking of the near-constant LAI rule of thinning.Further, development of a general theory for mixed-species forests will require individual-based modellingof plants’ responses to their competitive environment(Adler 1996; Kobe 1996; Dubé et al. 2001; Reynolds &Ford 2005), rather than the mean-field approach adoptedin this paper.
Greater generality will also require the effects ofenvironment to be modelled. For instance, we used asingle relationship between stand age and mean treesize in our simulations, but know that trees take muchlonger to reach a given size at higher altitudes: our resultsmay be contingent on unaccounted variation of this sort.It is also known that Nothofagus forests increase in basalarea with increasing altitude (Harcombe et al. 1998),but nobody has yet investigated the demographic changesthat underpin this trend. A need to include environmentalvariation is suggested from comparison of Figs 6 and 7.Traditionally, upper boundary relationships are usedto quantify self-thinning (Fig. 7), because populationsthat lie beneath the boundary are not fully packed andshould increase in BAm without any loss in density(Westoby 1984; Begon et al. 1996). What is actuallyobserved is that all of the competitive thinning standsfollowed trajectories that ran parallel to the boundaryline (Fig. 6a), irrespective of their initial distance fromit. One explanation for this discrepancy is that the LAIof forests depends on environmental conditions, butthat the ‘constant leaf area rule’ nevertheless applies todevelopment within any one stand.
Conclusions
During the competitive thinning phase of stand devel-opment, changes in size structure and stem density weresimilar in natural mixed-age forest to those reported in
39Tree size distributions
© 2006 The AuthorsJournal compilation © 2006 British Ecological Society, Journal of Ecology 95, 27–40
even-aged plantations. We argue that these similaritiesreflect a common set of physiological processes thatregulate leaf-level carbon economics in both types offorest. Senescence and disturbance became increas-ingly important as stands matured, and exerted stronginfluences on metapopulation size structure. By show-ing that DDMs derived from our simulations provide abetter description of observed field data than simplescaling theory relationships, we demonstrate an improvedgeneral theory for the size structure of tree populationsin a natural forest.
Acknowledgements
We are indebted to John Wardle for establishing theNothofagus plots and to Larry Burrows and KevinPlatt, among many others, for their involvement withcollecting, checking and archiving the data set. PeterGrubb, Georges Kunstler, Sabrina Russo and EmmaSayer provided helpful comments on the manuscript.Discussions at an ARC-NZ workshop on vegetationfunction contributed to the development of concepts inthis paper. Research was supported by the New ZealandFoundation for Research, Science and Technology andthe British NERC.
References
Adler, F.R. (1996) A model of self-thinning through localcompetition. Proceedings of the National Academy of Sciences,93, 9980–9984.
Allen, R.B., Bellingham, P.J. & Wiser, S.W. (1999) Immediatedamage by an earthquake to a temperate montane forest.Ecology, 80, 708–714.
Begon, M.B., Harper, J.L. & Townsend, C.R. (1996) Ecology:Individuals, Populations and Communities, 3rd edn. Black-well Science, Oxford.
Bormann, F.H. & Likens, G.E. (1979) Pattern and Process inForested Ecosystems. Springer-Verlag, New York.
Cade, B.S. & Guo, Q.F. (2000) Estimating effects of constraintson plant performance with regression quantiles. Oikos, 91,245–254.
Canham, C.D., Papaik, M.J. & Latty, E.F. (2001) Interspecificvariation in susceptibility to windthrow as a function of treesize and storm severity for northern temperate tree species.Canadian Journal of Forest Research, 31, 1–10.
Clark, J.S. (1989) Ecological disturbance as a renewal process– theory and application to fire history. Oikos, 56, 17–30.
Clark, J.S. (1990) Integration of ecological levels: individualplant growth, population mortality and ecosystem processes.Journal of Ecology, 78, 275–299.
Clark, J.S. (1991) Disturbance and population-structure onthe shifting mosaic landscape. Ecology, 72, 1119–1137.
Coomes, D.A., Jenkins, K.L. & Cole, L.E.S. (in press) Scalingof tree vascular transport systems along gradients of nutri-ent supply and altitude. Biology Letters.
Coomes, D.A., Duncan, R.P., Allen, R.B. & Truscott, J.(2003) Disturbances prevent stem size-density distributionsin natural forests from following scaling relationships.Ecology Letters, 6, 980–989.
Coomes, D.A. & Grubb, P.J. (2000) Impacts of root competi-tion in forests and woodlands: a theoretical frameworkand review of experiments. Ecological Monographs, 70,171–207.
Dahir, S.E. & Lorimer, C.G. (1996) Variation in canopy gap
formation among developmental stages of northern hard-woodstands. Canadian Journal of Forest Research, 26, 1875–1892.
Davis, M.R., Allen, R.B. & Clinton, P.W. (2004) The influenceof N addition on nutrient content, leaf carbon isotope ratio, andproductivity in a Nothofagus forest during stand development.Canadian Journal of Forest Research, 34, 2037–2048.
Dubé, P., Fortin, M.-J., Canham, C.D. & Marceau, D.J. (2001)Quantifying gap dynamics at the stand mosaic level using aspatially-explicit model of a northern hardwood forestecosystem. Ecological Modelling, 142, 39–60.
Enquist, B.J. (2002) Universal scaling in vascular plants: towardsa general quantitative theory for linking plant processesfrom leaves to ecosystems. Tree Physiology, 22, 1045–1064.
Enquist, B.J., Brown, J.H. & West, G.B. (1998) Allometricscaling of plant energetics and population density. Nature,395, 163–165.
Enquist, B.J. & Niklas, K.J. (2001) Invariant scaling relationsacross tree-dominated communities. Nature, 410, 655–660.
Enquist, B.J., West, G.B. & Brown, J.H. (2000) Quarter-powerallometric scaling in vascular plants: functional basis andecological consequences. Scaling in Biology (eds J.H. Brown& G.B. West). Oxford University Press, Oxford.
Foster, D.R. (1988) Species and stand responses to catastrophicwind in central New England, USA. Journal of Ecology, 76,135–151.
Franco, M. & Kelly, C.K. (1998) The interspecific mass–densityrelationship and plant geometry. Proceedings of the NationalAcademy of Sciences, 95, 7830–7835.
Franklin, J.F., Spies, T.A., Van Pelt, R., Carey, A.B.,Thornburgh, D.A., Berg, D.R. et al. (2002) Disturbancesand structural development of natural forest ecosystems withsilvicultural implications, using Douglas-fir forests as anexample. Forest Ecology and Management, 155, 399–423.
Givnish, T.J. (1988) Adaptation to sun and shade: a whole-plantperspective. Australian Journal of Plant Physiology, 15, 63–91.
Goff, F.G. & West, D.C. (1975) Canopy–understory interactioneffect on forest population structure. Forest Science, 21,98–108.
Hara, T. (1984) A stochastic model and the moment dynamicsof the growth and size distribution in plant popsulations.Journal of Theoretical Biology, 109, 173–190.
Harcombe, P.A. (1987) Tree life tables. Bioscience, 37, 557–568.Harcombe, P.A., Allen, R.B., Wardle, J.A. & Platt, K.H. (1998)
Spatial and temporal patterns in stand structure, biomass,growth and mortality in a monospecific Nothofagus solandrivar. cliffortioides (Hook. F.) Poole forest in New Zealand.Journal of Sustainable Forestry, 6, 313–345.
Hollinger, D.Y. (1989) Canopy organization and foliagephotosynthetic capacity in a broad-leaved evergreen montaneforest. Functional Ecology, 3, 53–62.
Hubbard, R.M., Bond, B.J. & Ryan, M.G. (1999) Evidencethat hydraulic conductance limits photosynthesis in oldPinus ponderosa trees. Tree Physiology, 19, 165–172.
Jarvis, P.G. & Leverenz, J.W. (1983) Productivity of temperate,deciduous and evergreen forests. Physiological Plant Ecology.IV. Ecosystem Processes Encyclopedia of Plant Physiology,New Series, Volume 12D (eds O.L. Lang, P.S. Nobel, C.B.Osmond & H. Zielgler), pp. 243–280. Springer-Verlag, Berlin.
King, D.A. (1986) Tree form, height growth, and susceptibilityto wind damage in Acer saccharum. Ecology, 67, 980–990.
Knox, R.G., Peet, R.K. & Christensen, N. (1989) Populationdynamics in loblolly pine stands: changes in skewness andsize inequality. Ecology, 70, 1153–1166.
Kobe, R.K. (1996) Intraspecific variation in sapling mortalityand growth predicts geographic variation in forest compo-sition. Ecological Monographs, 66, 181–201.
Kohyama, T. (1987) Stand dynamics in a primary warm-temperate rain forest analysed by the diffusion equation.Botanical Magazine (Tokyo), 100, 305–317.
Kohyama, T. (1991) Simulating stationary size distribution oftrees in rainforests. Annals of Botany, 68, 173–180.
40D. A. Coomes & R. B. Allen
© 2006 The AuthorsJournal compilation © 2006 British Ecological Society, Journal of Ecology 95, 27–40
Leibundgut, H. (1959) Über Zweck und Methodik derStruktur- and Zuwächsanalyse von Urwäldern. Schweizer.Zeitschrift für Forstwesen, 110, 111–124.
Lewis, S.L. (and 17 others) (2004) Concerted changes in trop-ical forest structure and dynamics: evidence from 50 SouthAmerican long-term plots. Philosophical Transactions ofthe Royal Society B, 359, 421–436.
Long, J.N. & Smith, F.W. (1984) Relation between size anddensity in developing stands: a description and possiblemechanisms. Forest Ecology and Management, 7, 191–206.
Lorimer, C.G. (1989) Relative effects of small and large dis-turbances on temperate hardwood forest structure. Ecology,70, 565–567.
Lorimer, C.G., Dahir, S.E. & Nordheim, E.V. (2001) Treemortality rates and longevity in mature and old-growthhemlock-hardwood forests. Journal of Ecology, 89, 960–971.
Meinzer, F.C., Goldstein, G., Jackson, P., Holbrook, N.M.,Gutierrez, M.V. & Cavelier, J. (1995) Environmental andphysiological regulation of transpiration in tropical forestgap species: the influence of boundary layer and hydraulicproperties. Oecologia, 101, 514–522.
Mencuccini, M. (2003) The ecological significance of long-distance water transport: short-term regulation, long-termacclimation and the hydraulic costs of stature across plantlife forms. Plant, Cell and Environment, 26, 163–182.
Midgley, J.J. (2001) Do mixed-species mixed-size indigenousforests also follow the self-thinning line? Trends in Ecologyand Evolution, 16, 661–662.
Miura, M., Manabe, T., Nishimura, N. et al. (2001) Forestcanopy and community dynamics in a temperate old-growthevergreen broad-leaved forest, south-western Japan: a 7-yearstudy of a 4-ha plot. Journal of Ecology, 89, 841–849.
Mohler, C.L., Marks, P.L. & Sprugel, D.G. (1978) Standstructure and allometry of trees during self-thinning of purestands. Journal of Ecology, 66, 519–614.
Muller-Landau, H.C. (and 43 others) (2006) Comparingtropical forest tree size distributions with the predictions ofmetabolic ecology and equilibrium models. Ecology Letters,9, 589–602.
Niklas, K.J., Midgley, J.J. & Rand, R.H. (2003) Tree sizefrequency distributions, plant density, age and communitydisturbance. Ecology Letters, 6, 405–411.
Ogden, J. & Stewart, G.H. (1995) Community dynamics of theNew Zealand conifers. Ecology of Southern Conifers (edsN.J. Enright & R.S. Hill), pp. 81–119. Melbourne Univer-sity Press, Australia.
Oliver, C.D. & Larson, B.C. (1996) Forest Stand DynamicsJohn Wiley, New York.
Osawa, A. & Allen, R.B. (1993) Allometric theory explainsself-thinning relationships of mountain beech and red pine.Ecology, 74, 1020–1032.
Parker, G.R., Leopold, D.J. & Eichenberger, J.K. (1985) Treedynamics in an old-growth, deciduous forest. Forest Ecologyand Management, 11, 31–57.
Phillips, O.L. & Gentry, A.H. (1994) Increasing turnoverthrough time in tropical forests. Science, 264, 954–958.
Pickett, S.T.A. & White, P.S. (1985) Stand dynamics: a synthesis.The Ecology of Natural Disturbance and Stand Dynamics(eds S.T.A. Pickett & P.S. White), pp. 371–384. AcademicPress, Orlando, Florida.
R Foundaton (2005) http://www.r-project.org/.Reynolds, J.H. & Ford, E.D. (2005) Improving competition
representation in theoretical models of self-thinning: a criticalreview. Journal of Ecology, 93, 362–372.
Roderick, M.L. & Barnes, B. (2004) Self-thinning of plantpopulations from a dynamic viewpoint. Functional Ecology,18, 197–203.
Runkle, J.R. (1982) Patterns of disturbance in some old-growth
mesic forests of eastern North America. Ecology, 63, 1533–1546.
Runkle, J.R. (1985) Disturbance regimes in temperate forests.The Ecology of Natural Disturbance and Stand Dynamics(eds S.T.A. Pickett & P.S. White). Academic Press, Orlando,Florida.
Runkle, J.R. (1990) Gap dynamics of an Ohio Acer–Fagusforest and speculations on the geography of disturbance.Canadian Journal of Forestry Research, 20, 632–641.
Runkle, J.R. (2000) Canopy tree turnover in old-growth mesicforests of eastern North America. Ecology, 81, 554–567.
Ryan, M.G., Binkley, D. & Fownes, J.H. (1997) Age-relateddecline in forest productivity: pattern and process. Advancesin Ecological Research, 27, 214–262.
Shugart, H.H. (1984) A Theory of Forest Dynamics. SpringerVerlag, New York.
Suzuki, E. & Tsukahara, J. (1987) Age structure and regener-ation of old growth Cryptomeria japonica forests on YakushimaIsland. Botanical Magazine (Tokyo), 100, 223–241.
Wardle, J.A. (1984) The New Zealand Beeches: Ecology, Uti-lisation and Management. New Zealand Forest Service,Caxton Press, Christchurch, New Zealand.
Wardle, J.A. & Allen, R.B. (1983) Dieback in New ZealandNothofagus forests. Pacific Science, 37, 397–404.
Watt, A.S. (1947) Pattern and process in the plant community.Journal of Ecology, 35, 1–22.
Weiner, J. (1990) Asymmetric competition in plant populations.Trends in Ecology and Evolution, 5, 360–364.
Weiner, J. & Thomas, S.C. (1986) Size variability and compe-tition in plant monocultures. Oikos, 47, 211–222.
Weller, D.E. (1990) Will the real self-thinning rule please standup? A reply to Osawa and Sugita. Ecology, 71, 1204–1207.
Wells, A., Duncan, R.P. & Stewart, G.H. (2001) Forest dynamicsin Westland, New Zealand: the importance of large, infre-quent earthquake-induced disturbance. Journal of Ecology,89, 1006–1018.
West, G.B., Brown, J.H. & Enquist, B.J. (1997) A generalmodel for the origin of allometric scaling laws in biology.Science, 276, 122–126.
Westoby, M. (1984) The self-thinning rule. Advances inEcological Research, 14, 167–225.
White, J. & Harper, J.L. (1970) Correlated changes in plantsize and number in plant populations. Journal of Ecology,58, 467–485.
Received 31 March 2006 revision accepted 24 August 2006 Handling Editor: Frank Gilliam
Supplementary Material
The following supplementary material is available forthis article:
Appendix S1 Thinning relationships deduced fromspatial variation in stem density and size.
This material is available as part of the online articlefrom: http://www.blackwell-synergy.com/doi/full/10.1111/j.1365-2745.2006.01179.x
Please note: Blackwell Publishing is not responsiblefor the content or functionality of any supplementarymaterials supplied by the authors. Any queries (otherthan missing material) should be directed to the corre-sponding author for the article.
Top Related
Copyright © 2022 FDOKUMEN

