Surface Fire Intensity Influences Simulated Crown Fire Behavior in Lodgepole Pine Forests with...
10
Surface Fire Intensity Influences Simulated Crown Fire Behavior in Lodgepole Pine Forests with Recent Mountain Pine Beetle-Caused Tree Mortality Chad M. Hoffman, Penelope Morgan, William Mell, Russell Parsons, Eva Strand, and Steve Cook Abstract: Recent bark beetle outbreaks have had a significant impact on forests throughout western North America and have generated concerns about interactions and feedbacks between beetle attacks and fire. However, research has been hindered by a lack of experimental studies and the use of fire behavior models incapable of accounting for the heterogeneous fuel complexes. We populated the Wildland-Urban Interface Fire Dynamics Simulator with data from 11 field sites to investigate the effect of mountain pine beetle (MPB)-caused tree mortality on simulated crown fire behavior across a range of surface fire intensities. Simulations addressed fire behavior during a 1- to 2-year period after the initiation of the outbreak in which some proportion of the trees have been killed but no foliage has yet fallen. The effect of MPB-caused tree mortality on simulated crown fire behavior significantly changed as a function of surface fire intensity. The largest effects of mortality on crown fire behavior occurred at moderate levels of surface fire intensity, whereas diminished effects occurred at low and high levels of surface fire intensities. Our results suggest that increased crown fire potential immediately after bark beetle infestations is dependent on the fire intensity generated by the preoutbreak surface fuels complex. FOR.SCI. 59(4):390 –399. Keywords: fire hazard, computational fluid dynamics, spatial heterogeneity W IDESPREAD MORTALITY OF LODGEPOLE PINE (Pi- nus contorta Dougl. Ex Loud.) caused by drought and mountain pine beetle (MPB) (Den- droctonus ponderosae Hopkins) has raised concern about potential increases in crown fire hazard in stands dominated by lodgepole pine (Kaufmann et al. 2008). Although his- torical fire regimes within lodgepole pine ecosystems in- cluded high-severity crown fires (Brown 1975, Arno 1980, Lotan et al. 1985), increased crown fire behavior in these systems poses a challenge for fire suppression operations. Crown fires burn with high intensity and spread rapidly, with increased potential for long-distance spotting and a high risk for losses to people and homes (Cohen and Butler 1998, Scott and Reinhardt 2001). Understanding and pre- dicting crown fire behavior is challenging (Van Wagner 1977) due in part to the interactions between the surface fuel, canopy fuel, environment, and topography, all of which influence combustion. In MPB-infested forests, there are additional challenges and factors to consider in predict- ing and understanding crown fires as a result of changes in the fuels complex across spatial and temporal scales. MPB-caused tree mortality is thought to influence po- tential fire behavior both directly and indirectly (Page and Jenkins 2007, Jenkins et al. 2008, Klutsch et al. 2011, Simard et al. 2011). Direct influences occur primarily through changes in the arrangement and composition of the fuels complex, whereas indirect changes occur through al- terations to the within-stand environmental conditions such as increased wind flow and incoming solar radiation. Direct changes to the fuels complex and the associated indirect effects on within-stand environmental conditions vary through time and emerge as four distinct stages after MPB outbreaks, each with a different fuels complex (Jenkins et al. 2008, Simard et al. 2011). These stages are known as (1) the green stage (preoutbreak fuels), (2) the red stage (immediately after the outbreak), (3) the gray stage (several years after bark beetle-caused tree mortality), and (4) the old stage (several years to decades after tree mortality). These stages are used to classify the transient nature of the fuels complex after MPB outbreaks that has been de- scribed for lodgepole pine-dominated ecosystems (Brown 1975, Romme et al. 1986, Jenkins et al. 2008, Klutsch et al. 2009, 2011, Simard et al. 2011). However, effects of alterations to the fuels complex after MPB outbreaks on fire behavior have been challenging to quantify because of a lack of empirical field studies and Manuscript received September 1, 2011; accepted July 10, 2012; published online July 26, 2012; http://dx.doi.org/10.5849/forsci.11-114. Chad M. Hoffman ([email protected]), Colorado State University, Forest and Rangeland Stewardship, Fort Collins, CO. Penelope Morgan, Wildland Fire Program, College of Natural Resources, University of Idaho, Moscow, ID. William Mell, USDA Forest Service, Pacific Wildland Fire Sciences Laboratory, Seattle, WA. Russell Parsons, USDA Forest Service, Missoula Fire Sciences Laboratory, Missoula, MT. Eva Strand, Wildland Fire Program, College of Natural Resources, University of Idaho, Moscow, ID. Steve Cook, Department of Plant, Soils and Entomological Sciences. College of Agriculture and Life Sciences, University of Idaho, Moscow, ID. Acknowledgments: This research was supported in part by funds provided by Forest Health Protection Special Technology Development, USDA Forest Service, US Department of Agriculture. We appreciate the assistance of Erin Berryman and Harold Osborne in collecting all field data and Helen Maffei, Eric Pfeiffer, and the rest of the staff at the Deschutes and Salmon-Challis National Forests for help in identifying field locations and thank three reviewers and the associate editor for comments that helped improve this manuscript. Copyright © 2013 by the Society of American Foresters. 390 Forest Science 59(4) 2013
-
Upload
independent -
Category
Documents
-
view
1 -
download
0
Transcript of Surface Fire Intensity Influences Simulated Crown Fire Behavior in Lodgepole Pine Forests with...

Surface Fire Intensity Influences Simulated Crown Fire Behavior inLodgepole Pine Forests with Recent Mountain Pine Beetle-CausedTree Mortality
Chad M. Hoffman, Penelope Morgan, William Mell, Russell Parsons, Eva Strand, andSteve Cook
Abstract: Recent bark beetle outbreaks have had a significant impact on forests throughout western NorthAmerica and have generated concerns about interactions and feedbacks between beetle attacks and fire.However, research has been hindered by a lack of experimental studies and the use of fire behavior modelsincapable of accounting for the heterogeneous fuel complexes. We populated the Wildland-Urban Interface FireDynamics Simulator with data from 11 field sites to investigate the effect of mountain pine beetle (MPB)-causedtree mortality on simulated crown fire behavior across a range of surface fire intensities. Simulations addressedfire behavior during a 1- to 2-year period after the initiation of the outbreak in which some proportion of the treeshave been killed but no foliage has yet fallen. The effect of MPB-caused tree mortality on simulated crown firebehavior significantly changed as a function of surface fire intensity. The largest effects of mortality on crownfire behavior occurred at moderate levels of surface fire intensity, whereas diminished effects occurred at lowand high levels of surface fire intensities. Our results suggest that increased crown fire potential immediatelyafter bark beetle infestations is dependent on the fire intensity generated by the preoutbreak surface fuelscomplex. FOR. SCI. 59(4):390–399.
Keywords: fire hazard, computational fluid dynamics, spatial heterogeneity
WIDESPREAD MORTALITY OF LODGEPOLE PINE (Pi-nus contorta Dougl. Ex Loud.) caused bydrought and mountain pine beetle (MPB) (Den-
droctonus ponderosae Hopkins) has raised concern aboutpotential increases in crown fire hazard in stands dominatedby lodgepole pine (Kaufmann et al. 2008). Although his-torical fire regimes within lodgepole pine ecosystems in-cluded high-severity crown fires (Brown 1975, Arno 1980,Lotan et al. 1985), increased crown fire behavior in thesesystems poses a challenge for fire suppression operations.Crown fires burn with high intensity and spread rapidly,with increased potential for long-distance spotting and ahigh risk for losses to people and homes (Cohen and Butler1998, Scott and Reinhardt 2001). Understanding and pre-dicting crown fire behavior is challenging (Van Wagner1977) due in part to the interactions between the surfacefuel, canopy fuel, environment, and topography, all ofwhich influence combustion. In MPB-infested forests, thereare additional challenges and factors to consider in predict-ing and understanding crown fires as a result of changes inthe fuels complex across spatial and temporal scales.
MPB-caused tree mortality is thought to influence po-tential fire behavior both directly and indirectly (Page and
Jenkins 2007, Jenkins et al. 2008, Klutsch et al. 2011,Simard et al. 2011). Direct influences occur primarilythrough changes in the arrangement and composition of thefuels complex, whereas indirect changes occur through al-terations to the within-stand environmental conditions suchas increased wind flow and incoming solar radiation. Directchanges to the fuels complex and the associated indirecteffects on within-stand environmental conditions varythrough time and emerge as four distinct stages after MPBoutbreaks, each with a different fuels complex (Jenkins etal. 2008, Simard et al. 2011). These stages are known as(1) the green stage (preoutbreak fuels), (2) the red stage(immediately after the outbreak), (3) the gray stage (severalyears after bark beetle-caused tree mortality), and (4) theold stage (several years to decades after tree mortality).These stages are used to classify the transient nature ofthe fuels complex after MPB outbreaks that has been de-scribed for lodgepole pine-dominated ecosystems (Brown1975, Romme et al. 1986, Jenkins et al. 2008, Klutsch et al.2009, 2011, Simard et al. 2011).
However, effects of alterations to the fuels complex afterMPB outbreaks on fire behavior have been challenging toquantify because of a lack of empirical field studies and
Manuscript received September 1, 2011; accepted July 10, 2012; published online July 26, 2012; http://dx.doi.org/10.5849/forsci.11-114.
Chad M. Hoffman ([email protected]), Colorado State University, Forest and Rangeland Stewardship, Fort Collins, CO. Penelope Morgan, WildlandFire Program, College of Natural Resources, University of Idaho, Moscow, ID. William Mell, USDA Forest Service, Pacific Wildland Fire SciencesLaboratory, Seattle, WA. Russell Parsons, USDA Forest Service, Missoula Fire Sciences Laboratory, Missoula, MT. Eva Strand, Wildland Fire Program,College of Natural Resources, University of Idaho, Moscow, ID. Steve Cook, Department of Plant, Soils and Entomological Sciences. College of Agricultureand Life Sciences, University of Idaho, Moscow, ID.
Acknowledgments: This research was supported in part by funds provided by Forest Health Protection Special Technology Development, USDA ForestService, US Department of Agriculture. We appreciate the assistance of Erin Berryman and Harold Osborne in collecting all field data and Helen Maffei,Eric Pfeiffer, and the rest of the staff at the Deschutes and Salmon-Challis National Forests for help in identifying field locations and thank three reviewersand the associate editor for comments that helped improve this manuscript.
Copyright © 2013 by the Society of American Foresters.
390 Forest Science 59(4) 2013

limitations in many of the modeling approaches used. Firebehavior modeling systems used operationally in the UnitedStates, such as Fire and Fuels Extension-Forest VegetationSimulator (Reinhardt and Crookston 2003), Nexus (Scottand Reinhardt 2001), and BehavePlus (Andrews et al. 2008)are based on the integration of Rothermel’s (1972, 1991)surface and crown fire spread models with Van Wagner’s(1977) crown fire transition and propagation models. Thesemodeling systems are based on the assumptions that surfacefuels are spatially homogeneous and continuous and thatcrown fuels are a homogeneous layer at uniform heightabove the ground, with uniform bulk density, depth, andfoliar moisture content. Neither differences in heat transfermechanisms nor transient fire behavior is predicted by thesemodels (Parsons et al. 2011). The inability of these sys-tems to address fuel heterogeneity or the interactions ofdifferent heat transfer mechanisms significantly limits theirapplication in evaluations of fire behavior after MPB out-breaks (Jolly et al. 2012). Despite these limitations, re-searchers have used these systems to examine fire behaviorin beetle-killed stands, often with conflicting results. Forexample, using the modeling systems described above,Page and Jenkins (2007) and Jenkins et al. (2008) found thatbark beetle-induced fuels changes probably increase crownfire intensity during the red stage, whereas Simard et al.(2011) found decreases in crown fire behavior during thered stage. Using similar modeling methodologies, Klutschet al. (2011) found decreased potential for active crownfire spread, but no differences in the potential for torch-ing, between the green stage and 7 years after the start ofa bark beetle outbreak in Colorado. In contrast, Hoffman etal. (2012) used the Wildland-Urban Interface Fire Dynam-ics Simulator (WFDS) (Mell et al. 2007, 2009), a physics-based fire model, to investigate the effect of different lev-els of MPB-caused tree mortality on simulated crown firebehavior across a range of stand compositions, levels oftree mortality, and spatial arrangements during the redstage. They concluded that the level of tree mortality, alongwith stand characteristics and the spatial arrangement oftrees, influenced the amount of crown fuel consumptionand the intensity of crown fires and that there were signif-icant increases in crown fire behavior during the red stagewhen at least 10% of the susceptible trees were killed byMPB.
Hoffman et al. (2012) only considered variations in theoverstory fuels complex, because they held surface firebehavior, including intensity, heat release rate, and rate ofspread, constant across the 11 sites they simulated. Thus,they only considered alterations in the canopy fuels com-plex, and they did not consider the potential effect thatdifferent preoutbreak surface fire intensities might have hadon crown fire behavior. Here, we expand the work ofHoffman et al. (2012) to investigate how MPB-caused treemortality influences simulated crown fire behavior across arange of surface fire intensities and mortality levels. Byaltering surface fire intensity as a proxy for surface fuelchanges we were able to further investigate the role thatMPB-caused morality has on crown fire behavior.
Objectives
Our overall objective was to use a physics-based firemodel, WFDS, to examine the interaction of fire intensityand different levels of beetle-killed mortality for the 11 sitesdescribed in Hoffman et al. (2012). Our consideration of thebeetle attack is constrained to the early attack stage in whichsome proportion of trees has been killed, but no trees haveyet lost their needles. The period of time simulated in thisstudy probably only represents a 1- to 2-year window afterthe initiation of an outbreak; however, few published datathat quantify the temporal progression of needle drop afteran outbreak exist. We investigated two main questions inthis study: How does the effect of increasing MPB-causedtree mortality on simulated canopy fuel consumption andcrown fire intensity vary depending on the surface fireintensity? and Are there thresholds of MPB-caused mortal-ity at which there is increased crown fire intensity andcanopy fuel consumption compared with the no mortalitysimulations and how do these thresholds vary as a result ofdifferent surface fire intensities?
WFDS Description
WFDS is a computational fluid dynamics model forsimulating fire spread through vegetative fuels or a mixtureof vegetative (i.e., trees, shrubs, and grass) and structuralfuels (i.e., houses or other buildings). It is an extension ofthe Fire Dynamics Simulator (FDS) (McGrattan et al.2010a) developed by the National Institute of Standards andTechnology in cooperation with VTT Technical ResearchCentre of Finland, Industry, and Academics. WFDS numer-ically solves the Navier-Stokes equations appropriate forlow Mach number flow, and models subgrid turbulent dis-sipation using a large-eddy simulation approach (McGrattanet al. 2010a). This approach results in both a space- andtime-dependent prediction of fire behavior characterizedby transient heat flux (radiative and convective), whichconsiders heterogeneous fuel complexes and fuel- and fire-atmosphere interactions. Verification and validation studiesfor FDS, the parent model of WFDS, have been describedby McGrattan et al. (2010a) and McDermott et al. (2010),whereas validation for WFDS was reported by Mell et al.(2007, 2009). McGrattan et al. (2010b) and Mell et al.(2009) described the mathematical formulation of WFDSmore completely.
Methods
We sampled 11 sites that were predominately lodgepolepine on the Deschutes National Forest in central Oregon andon the Salmon-Challis National Forest in central Idaho(Table 1). Sampling locations were chosen in consultationwith US Forest Service personnel to represent a wide rangeof typical stand structures in terms of tree density, speciescomposition, and the size and number of canopy layersfound in lodgepole pine-dominated stands on each NationalForest. All sites sampled had recently experienced MPB-caused tree mortality and were similar in tree compositionand structure to nearby stands with high levels of treemortality from bark beetles.
Forest Science 59(4) 2013 391

As described by Hoffman et al. (2012), within each site,four fixed-radius 0.04-ha plots were sampled in a clustereddesign. Within each cluster, we measured dbh (1.37 mabove the ground), total height, height to lowest branch withfoliage (live or dead), tree status (live or dead), canopyposition (dominant, codominant, intermediate, or suppressed),and crown width for all trees with a dbh of at least 5 cm. Foreach of the 11 sites, all tree data recorded on each of the4 subplots within a cluster were combined to produce asingle tree list representing that site for fire simulations withthe WFDS model.
The 11 sites sampled varied in both tree composition andforest structure (Table 1). Three sites were composed en-tirely of lodgepole pine, and 8 sites were composed of a mixof other tree species dominated by lodgepole pine (Table 1).The mixed lodgepole pine sites included grand fir (Abiesgrandis [Douglas ex D. Don] Lindl.), mountain hemlock(Tsuga mertensiana [Bong.] Carrier), subalpine fir (Abieslasiocarpa [Hook.] Nutt.), Engelmann spruce (Picea engel-mannii Parry ex Engelm.), whitebark pine (Pinus albicaulisEngelm.) and/or Douglas-fir (Pseudotsuga menziesii [Mirb.]Franco).
Simulation Experiment
We used a completely randomized experimental designin which five levels of MPB-caused tree mortality (0, 25,55, 70, and 100%) were the treatments and three levels ofsurface fire intensity (Table 2) were used as a covariate; the11 sites acted as replications of each level of MPB-causedtree mortality and surface fire intensity. This resulted in atotal of 165 simulations (11 sites � 5 levels of MPB-causedtree mortality � 3 surface fire intensities). These experi-ments were developed to represent a wide range of over-story fuel complexes and surface fire intensities. Observed
tree mortality levels after MPB outbreaks have been re-ported to range from 5.5 to 100% across a 1- to 7-year timeframe (Klutsch et al. 2009). Although our range of treemortality covers the spectrum reported in the literature, it isnot clear at what rate these levels of mortality occur acrossspatial scales. Thus, our simulated levels of mortality maynot be realistic at all spatial scales of concern to fire man-agers, particularly when the rate of mortality is low andoccurs over extended time frames. The variations in surfacefire intensity simulated in these experiments could havebeen caused by a number of interacting factors such as fuelloading, distribution of fuel loading by size class, fuelmoisture, and packing ratio. Regardless of the specificmechanism driving the change in surface fire intensityamong the different scenarios, the altered surface fire inten-sities resulted in different levels of heat flux exposure forthe overstory trees.
The simulated spatial domain was identical for all sim-ulations, measuring 120 m � 48 m � 35 m in the x, y, andz dimensions, respectively, and discretized as 0.5-m cubicalcells. All simulations ran for a total of 1,250 s (�20.4 min)of simulated time, with a time step of 0.1 s. The domainconsisted of five parts (Figure 1): a wind entry field alongthe left-hand side of the domain, an exiting wind field alongthe right-hand side of the domain, a fire development zone(zone A), a zone representing the experimental section(zone B), and the preoutflow boundary (zone C). Theboundary conditions along the top and bottom (x � 0, y �0–48 and x � 120, y � 0–48, respectively) were simulatedas an open domain, which acts as a passive boundary,allowing air to enter and exit without obstruction, whereasthe boundaries along the sides (x � 0–120, y � 0 and x �0–120, y � 48, respectively) were simulated as “mirrors”that act essentially as free-slip, no-flux boundaries.
Table 1. Mean stand-level characteristics of lodgepole pine sites used in WFDS simulations.
Site no. Trees ha�1 BA (m2 ha�1) QMD (cm) Height (m) CBH (m) Species composition*
1 997 26.6 18.2 10.8 3.8 LPP 100%2 775 28.6 21.4 11.6 3.5 LPP 80%, GF 20%3 2825 42.3 13.6 9.5 3.7 LPP 100%4 1118 33.7 19.4 14.0 6.0 LPP 74%, MH 15%, SF 11%5 1137 27.7 17.4 10.3 2.7 LPP 100%6 751 34.7 24.1 14.8 4.1 LPP 52%, SF 47%, ES 1%7 1647 33.1 15.8 12.1 5.5 LPP 91%, SF 9%8 1378 38.0 18.5 14.2 6.2 LPP 91%, SF 9%9 1442 47.7 20.3 13.6 5.9 LPP 93%, SF 4%, ES 3%10 1112 28.0 17.7 10.5 3.4 LPP 58%, WBP 28%, SF 14%11 1406 36.5 17.9 14.0 5.8 LPP 60%, DF 31%, ES 6%, SF 2%
Measurements include stand density (trees ha�1), basal area (BA), quadratic mean diameter (QMD), mean tree height (Height), height to base of live crown(CBH), and species composition as the percent of tree stems by species. LPP, lodgepole pine, GF, grand fir, MH, mountain hemlock, SF, subalpine fir, ES,Engelmann spruce, WBP, whitebark pine, DF, Douglas-fir.
Table 2. Summary of surface fire properties used to investigate the influence of surface fire intensity on the relationship betweenthe level of mortality and fire behavior properties in WFDS simulation experiments.
Rate of spread(m s�1)
Heat releaseper unit area(kW m�2)
Surface firelineintensity
(kW m�1)Residencetime (s)
Flamedepth (m)
Low surface fire intensity 0.1 125 313 25 2.5Moderate surface fire intensity 0.1 250 625 25 2.5High surface fire intensity 0.1 500 1250 25 2.5
392 Forest Science 59(4) 2013

For all simulations, the wind entering the domain at x �0 m varied with height above the ground after a verticalpower-law profile (Morvan and Dupuy 2001, 2004) with aconstant speed of 2 m s�1 at 6.1 m above the ground. Thepower law is of the form
Ux � Ur�Zx /Zr��,
where Ux is the wind speed at height Zx, Ur is a known windspeed at height Zr, Zx is the height at which wind speedUx will be predicted, and � is a constant value of 1⁄7. Theentering windflow was allowed to interact with the fuels for60 s before ignition, which allowed for a predevelopedwindflow before surface fire ignition.
We modeled the surface fire as a steady-state fire with aknown spread rate, heat release rate, and residence time.The surface fire spread radially from a point ignition at (x �1, y � 24) and burned through the entire domain. Thus,instead of relying on WFDS to predict the surface firebehavior from a given surface fuel complex, we assumedthat the surface fire behavior was known and that the firepropagated as a steady-state fire with homogeneous prop-erties through both time and space. This modeling simpli-fies the dynamic nature of surface and crown fire interactioninto a one-way interaction, in which crown fires are affectedby the surface fire, but surface fire behavior is not influ-enced by the combustion of crown fuels. Although thisassumption simplifies fire dynamics, it provides a concep-tual framework for testing our hypotheses. By eliminatingfeedbacks from the crown fire on the surface fire, weensured that differences in fire behavior between simula-tions were due to changes in surface fire intensities and thecanopy fuels complex (caused by differences in sites, pointpatterns of tree locations, and level of MPB-caused treemortality).
We simulated three different surface fire intensities (Ta-ble 2). The rate of spread and residence time were heldconstant for all three surface fires at 0.1 m s�1 and 25 s,
respectively, and heat release rate was set at 125, 250, or500 kW m�2. The change in heat release rate resulted inthree different levels of surface fire intensity hereafter re-ferred to as low (313 kW m�1), moderate (625 kW m�1),and high (1,250 kW m�1) intensity scenarios. The heatrelease rates and surface fire line intensities used in thisstudy would result from 0.14, 0.28, and 0.57 kg m�2 of fuelcombusting in the flaming front over the 25-s residence timewe used for the low, moderate, and high surface fire inten-sity scenarios, respectively. According to the fire character-istics chart (Andrews and Rothermel 1982), both the mod-erate and high surface fire intensity values are higher thancould be suppressed directly by firefighters using handtools, whereas a fire burning at the low surface fire intensitycould be suppressed by firefighters using hand tools. Wechose these three scenarios to represent the wide range ofpotential surface fire intensities that might be encounteredin lodgepole pine forests.
Individual tree crowns were modeled with crown fuelsconstrained to a cone with the height, crown width, andcrown base height measured for each tree in the field. Fuelswithin the cone were represented as a homogeneous, ther-mally thin fuel with surface area/volume ratio of 6470 m2
m�3 (Brown 1970) and bulk density of 0.7 kg m�3. Wesimulated five levels of MPB-caused tree mortality (0, 25,55, 70, and 100%) in the domain following Hoffman et al.(2012). In our simulations, we assumed that MPB-causedtree mortality was limited to susceptible tree species (lodge-pole pine and whitebark pine) and to trees with a dbh of atleast 10 cm. This method resulted in a clumpy pattern of treemortality within stands. Because our focus here was on asingle point in time rather than on a sequence over time, weassumed that tree mortality occurred as a synchronousevent, which is a reasonable assumption considering thespatial extent of the simulations (0.2 ha) (zone B in Figure1). This assumption resulted in our simulated forests havinggreater canopy fuel loadings, and horizontal and vertical
Figure 1. WFDS simulation layout showing the overall spatial domain measuring 120 � 48 � 35 m, witha predeveloped wind field entering the domain along the left-hand side, the ignition point, a fire develop-ment zone (zone A), the simulation experiments (zone B), the preoutflow boundary zone (zone C), and theexiting wind field along the right-hand side.
Forest Science 59(4) 2013 393

canopy fuel continuity and lower mean canopy fuel mois-tures compared with the assumption of a nonsynchronousmortality event. Thus, our simulations represent a worst-case scenario in terms of canopy fuel hazard as indicated bycanopy bulk density, total canopy biomass, and dead canopybiomass.
The level of tree mortality was measured as the percent-age of MPB-susceptible trees killed rather than the percent-age of all stems in the stand. Thus, even in the 100%mortality scenario, total stand mortality may have been lessthan 100% if nonsusceptible species and/or smaller (�10cm dbh) trees were present. Live canopy fuels were set witha moisture content equal to 100% of dry weight. Keyes(2006) recommended this value for living trees as a pru-dently conservative value. The dead foliage within crownsof trees killed by MPB was represented with a foliar mois-ture content of 10% of dry weight; this is within the rangeof measured values by Jolly et al. (2011). The individualtrees and the spatial arrangement of those trees in zones Aand C were selected randomly from a master tree list con-sisting of all trees from each of the 11 sites such that thestand density was equal to 800 trees ha�1. The trees in zoneB consisted of the specific measured trees from each site.The overstory tree structure within zones A and C were heldconstant between simulations to ensure that the wind flowthat entered zone B and the drag imposed by the downwindvegetation on air entrainment were consistent for all simu-lations. All tree spatial locations were simulated by gener-ating random x and y locations using SpPack (Perry 2004).The simulated spatial patterns resulted in a random pointpattern of tree locations in the domain.
We used two model outputs to quantify crown fire be-havior. First, we used the mass loss of crown fuels, a globalquantity tracked at each 0.1-s time step, that describes theconsumption of total canopy fuel over time. We calculatedthe mean percent consumption for each simulation by thefollowing equation:
Percent canopy fuel consumption
� �Canopy biomasstend
Canopy biomasst0� � 100,
where Canopy biomasstend is the biomass in kg remainingat the end of the simulation and Canopy biomasst0 is thebiomass in kg at the start of the simulation. Both the startand end canopy biomass were directly output from WFDS.
Second, we calculated the mean crown fire intensity. Thecrown fire intensity provides a measure of the energy outputper unit time per unit length of fire front regardless of thedepth and is commonly reported as kW m�1 (Byram 1959).We calculated the mean crown fire intensity as the averagecrown fire intensity for the period of time in which the firewas in zone B using the following equation:
Mean crown fire intensity ��n�400
n�850 ��Qn � Qfn�/FLn�
450,
where Qn is the total heat release rate per unit area at timen (kW), Qfn is the heat release rate of the surface fire at timen (kW), FLn is the length of fire line at time n (m), and 450
is the total time for which there was a fire within zone B inseconds.
The total heat release (Qn) is estimated in WFDS by
Qn � �Mc � Hc� � Qfn,
where Qn is the total heat release rate at time n (kW), Mc isthe rate of gas fuel consumed due to canopy fuel gas (kgs�1), Hc is the heat of combustion (kJ kg�1), and Qfn is theheat release rate due to the surface fire.
We tested the effect of the level of tree mortality onpercent canopy fuel consumption and crown fire intensityacross a range of surface fire intensities using an analysis ofcovariance with the five levels of tree mortality as theindependent variable and the three levels of surface fireintensity as covariates. We then looked for differences ofslope and intercept between surface fire intensity classesusing Tukey’s least significant difference multiple compar-ison procedure. We identified differences in percent canopyfuel consumption and crown fire intensity across percenttree mortality classes using a one-way analysis of varianceand a Dunnett’s test with the no tree mortality group as acontrol within each level of surface fire intensity. We usedBartlett’s test and a Lillifors test to ensure that assumptionsof homogeneous variance and normality were met beforeanalyses were conducted.
Results
The effect of MPB-caused tree mortality on the percentcanopy fuel consumption was significantly (P � 0.05) af-fected by the surface fire line intensity (Figure 2). The slopeof the regression between the percent canopy fuel consump-tion and the level of MPB-caused tree mortality was greatestfor the moderate surface fire intensity with the smallestslopes in the high surface fire intensity simulations. For a10% increase in the level of tree mortality, there was a 1.4,7.6, and 5.5% increase in the percent canopy fuel consump-tion for the high, moderate, and low levels of surface fireline intensity, respectively. There were also significant dif-ferences (P � 0.05) in the intercepts of the regressionequations with near-zero percent fuel consumption in the notree mortality category for both moderate and low surfacefire intensities and �80% fuel consumption for the highsurface fire intensity (Figure 2). The proportion of MPB-caused tree mortality explained a large amount of the pre-dicted canopy fuel consumption, as measured by the R2
statistic. At moderate surface fire intensities, the proportionof MPB-caused mortality accounted for 84% of the totalvariation in the percent canopy fuel consumption (Figure 2).At low surface fire intensities, the level of MPB-caused treemortality explained approximately 49% of the variation incanopy fuel consumption, whereas at high surface fire in-tensities it only explained 22% of the variation (Figure 2).
At low surface fire intensity, the three highest tree mor-tality classes (55, 70, and 100% of susceptible trees) showeda significant increase in the percent canopy fuel consumedcompared with the no tree mortality simulations (P � 0.05)(Table 3). For moderate surface fire intensities, all simu-lated stands with at least 25% MPB-caused tree mortalityhad significantly higher (P � 0.010) levels of canopy fuel
394 Forest Science 59(4) 2013

consumption compared with the same stands with no treemortality (Table 3). At high surface fire intensities, allsimulated stands with MPB-caused tree mortality greaterthan 70% experienced significantly higher canopy fuel con-sumption compared with the same stands with no treemortality (Table 3). Overall, 20 and 65% less canopy fuelwas consumed, respectively, with low surface fire intensitycompared with the same stand conditions with moderate andhigh surface fire intensity, whereas those burned with mod-erate surface fire intensity had approximately 45% lesscanopy consumption compared with simulations with highsurface fire intensity.
The influence of MPB-caused tree mortality on meancrown fire intensity was also significantly affected by sur-face fire intensity (Figure 3). There were significant differ-ences in the slope of the regression between the high surfacefire line intensity and both the moderate and low surface fireline intensity (P � 0.05) (Figure 3). However, no significantdifferences in slope were found between the low and mod-
erate levels of surface fire intensity (P � 0.437) (Figure 3).An increase of 10% in bark beetle-caused tree mortalityresulted in an average increase of 3, 25, and 36% in thecrown fire intensity for the high, moderate, and low surfacefire line intensity scenarios, respectively. The intercepts ofthe regression equations for each of the three levels ofsurface fire intensity decreased significantly (P � 0.05)from high to low surface fire intensity (Figure 3). The levelof MPB-caused mortality was a significant (� � 0.05)explanatory variable for crown fire intensity for both thelow and moderate surface fire intensities with R2 valuesof 0.38 and 0.56, respectively (Figure 3). At high levels ofsurface fire intensity, the level of MPB-caused mortalitywas not a significant explanatory variable for predictedcrown fire intensity.
At low surface fire intensities, there were no significantdifferences between the predicted crown fire intensity forno mortality and all levels of tree mortality less than 100%of susceptible trees (Table 3). At moderate levels of
Figure 2. Simulated percent tree canopy fuel consumed as a function of the percent tree mortality forthree different surface fire intensities. The mean canopy fuel consumed (lines) and 95% confidenceintervals (vertical bars) are shown. The regression equation and parameters for each surface fire intensityare given in the table; parameter estimates followed by a different letter in a column are significantlydifferent (� � 0.05).
Table 3. Threshold values for the level of MPB-caused tree mortality at which significant (� � 0.05) increases in the percentcanopy fuel consumption and crown fire intensity were found compared with the no tree mortality scenario for three differentsurface fire intensities.
Surface fireline intensity
Threshold values of tree mortality required for an increase in fire behaviorcompared with the no mortality simulations
Percent canopy fuel consumed Crown fireline intensity
High surface fireline intensity 70% mortality No significant differencesModerate surface fireline intensity 25% mortality 55% mortalityLow surface fireline intensity 55% mortality 100% mortality
Level of mortality is expressed as a percentage of susceptible trees killed, not as a percentage of total stems killed.
Forest Science 59(4) 2013 395
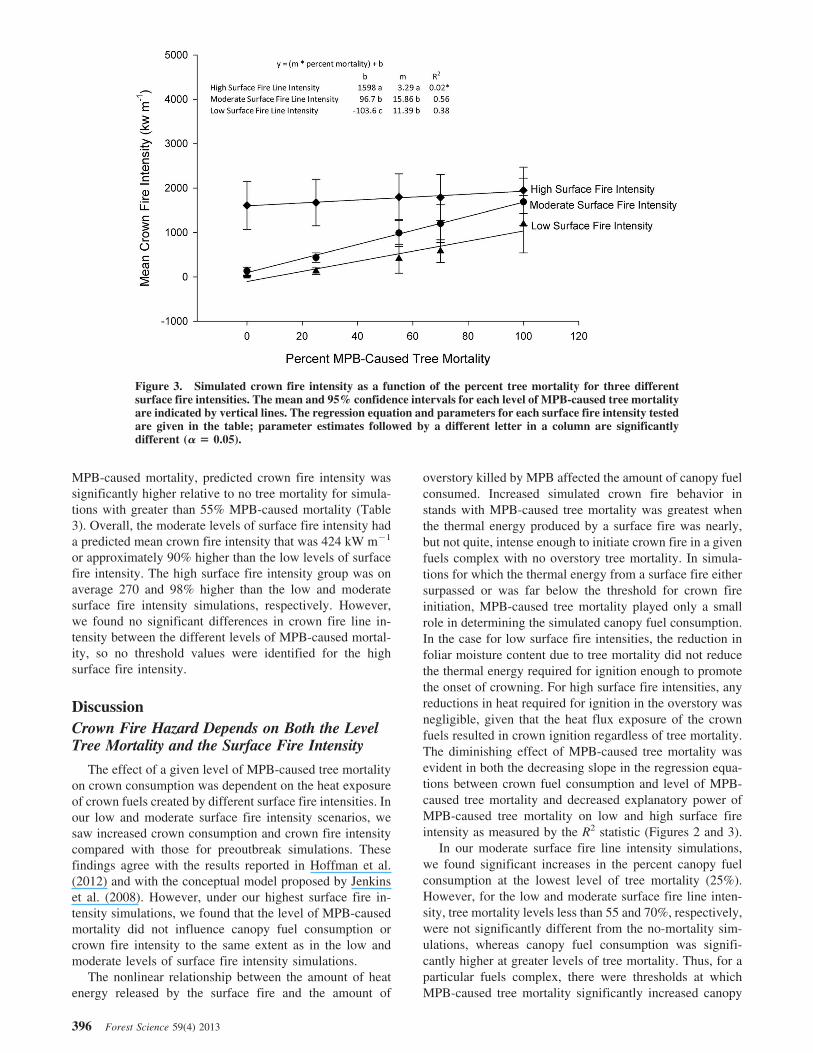
MPB-caused mortality, predicted crown fire intensity wassignificantly higher relative to no tree mortality for simula-tions with greater than 55% MPB-caused mortality (Table3). Overall, the moderate levels of surface fire intensity hada predicted mean crown fire intensity that was 424 kW m�1
or approximately 90% higher than the low levels of surfacefire intensity. The high surface fire intensity group was onaverage 270 and 98% higher than the low and moderatesurface fire intensity simulations, respectively. However,we found no significant differences in crown fire line in-tensity between the different levels of MPB-caused mortal-ity, so no threshold values were identified for the highsurface fire intensity.
DiscussionCrown Fire Hazard Depends on Both the LevelTree Mortality and the Surface Fire Intensity
The effect of a given level of MPB-caused tree mortalityon crown consumption was dependent on the heat exposureof crown fuels created by different surface fire intensities. Inour low and moderate surface fire intensity scenarios, wesaw increased crown consumption and crown fire intensitycompared with those for preoutbreak simulations. Thesefindings agree with the results reported in Hoffman et al.(2012) and with the conceptual model proposed by Jenkinset al. (2008). However, under our highest surface fire in-tensity simulations, we found that the level of MPB-causedmortality did not influence canopy fuel consumption orcrown fire intensity to the same extent as in the low andmoderate levels of surface fire intensity simulations.
The nonlinear relationship between the amount of heatenergy released by the surface fire and the amount of
overstory killed by MPB affected the amount of canopy fuelconsumed. Increased simulated crown fire behavior instands with MPB-caused tree mortality was greatest whenthe thermal energy produced by a surface fire was nearly,but not quite, intense enough to initiate crown fire in a givenfuels complex with no overstory tree mortality. In simula-tions for which the thermal energy from a surface fire eithersurpassed or was far below the threshold for crown fireinitiation, MPB-caused tree mortality played only a smallrole in determining the simulated canopy fuel consumption.In the case for low surface fire intensities, the reduction infoliar moisture content due to tree mortality did not reducethe thermal energy required for ignition enough to promotethe onset of crowning. For high surface fire intensities, anyreductions in heat required for ignition in the overstory wasnegligible, given that the heat flux exposure of the crownfuels resulted in crown ignition regardless of tree mortality.The diminishing effect of MPB-caused tree mortality wasevident in both the decreasing slope in the regression equa-tions between crown fuel consumption and level of MPB-caused tree mortality and decreased explanatory power ofMPB-caused tree mortality on low and high surface fireintensity as measured by the R2 statistic (Figures 2 and 3).
In our moderate surface fire line intensity simulations,we found significant increases in the percent canopy fuelconsumption at the lowest level of tree mortality (25%).However, for the low and moderate surface fire line inten-sity, tree mortality levels less than 55 and 70%, respectively,were not significantly different from the no-mortality sim-ulations, whereas canopy fuel consumption was signifi-cantly higher at greater levels of tree mortality. Thus, for aparticular fuels complex, there were thresholds at whichMPB-caused tree mortality significantly increased canopy
Figure 3. Simulated crown fire intensity as a function of the percent tree mortality for three differentsurface fire intensities. The mean and 95% confidence intervals for each level of MPB-caused tree mortalityare indicated by vertical lines. The regression equation and parameters for each surface fire intensity testedare given in the table; parameter estimates followed by a different letter in a column are significantlydifferent (� � 0.05).
396 Forest Science 59(4) 2013

fuel consumption. In terms of simulated crown fire inten-sity, tree mortality level had to be at least 100 and 55% forthe low and moderate surface fire intensities before signif-icant increases were detected compared with the no mortal-ity scenario. Further, we found that, regardless of tree mor-tality level, there was no significant increase in crown fireintensity for the high surface fire intensity scenario. Atlarger spatial extents than those simulated here (0.2 ha),high levels of tree mortality during the red stage may not bea common occurrence. Thus, some of our identified thresh-olds may be limited to small spatial scales for which theseconditions could exist. These findings suggest that in-creased fire behavior was not necessarily an outcome im-mediately after MPB outbreaks.
The potential effects of bark beetle mortality on subse-quent fire behavior have been debated recently in the sci-entific literature with several authors suggesting that barkbeetle outbreaks will lead to catastrophic wildfires (Brown1975, Geiszler et al. 1980), whereas others have suggestedthat such increases may only occur during the red stage(Gara et al. 1985, Romme et al. 2006). Although studiesinvestigating the effect of bark beetle outbreaks on subse-quent fire behavior are still few, there is a growing body ofboth retrospective (i.e., Kulakowski and Veblen 2007, Bondet al. 2009) and modeling studies (Page and Jenkins 2007,Jenkins et al. 2008, DeRose and Long 2009, Simard et al.2011). However, a clear picture of bark beetle-caused mor-tality effects on fire behavior immediately after an outbreakhas yet to emerge (Hicke et al. 2012). Kulakowski andVeblen (2007), Bond et al. (2009), and Simard et al. (2011)reported no significant change in subsequent wildfire be-havior during the red stage compared with that in forests notaffected by bark beetles, whereas Page and Jenkins (2007),Jenkins et al. (2008), and Hoffman et al. (2012) havesuggested that there is an increase in fire behavior duringthe red stage. The dependence of red stage fire behavior onthe relationship between the level of mortality and thesurface fire intensity may provide some explanation as towhy such discrepancies may exist between studies. Futurestudies that evaluate the effects of bark beetle mortality onsubsequent fire behavior should include descriptions ofthe level of tree mortality and adequate information regard-ing the stand conditions and fire behavior such that cross-experimental comparisons can be made.
Assumptions and Limitations of the ModelingApproach Used
Our fire behavior was not modeled in a fully coupled fireenvironment. We assumed that the rate of spread and inten-sity of the surface fire were constant and not influenced byradiative heat transfer or convective flow induced by thecombustion of canopy fuel. Thus, we were unable to assessany effects that crown fire activity may have had on surfacefire behavior. The assumption of a steady-state surface firedecoupled from the crown fire resulted in a constant inten-sity and arrival time of the surface fire through space. Thisassumption also probably dampened the range of outcomesthat could have occurred in a fully coupled approach byeliminating far-field entrainment effects due to crown fuel
combustion and radiative heat transfer effects from thecanopy. The implications of this assumption on simulationresults need to be further explored.
The main focus of this study was to explore interactionsamong different levels of mortality and surface fire intensityfor the simple case in which there is a mix of red- andgreen-stage trees in the stand. We did not intend in thisstudy to capture the full range of fuel changes that occur ina beetle-attacked stand over time, and our simplificationsmay not accurately represent fuel conditions in beetle-attacked stands in which the outbreak unfolded over severalyears, leaving a stand comprised of a mix of green-stage,red-attacked, and gray-stage trees. In scenarios in whichmortality occurred over several years, resulting in a mix ofgreen-, red-, and gray-stage trees, our assumption of syn-chronous mortality would have resulted in increased canopyfuel biomass, canopy bulk density, horizontal and verticalfuel continuity, and decreased mean canopy fuel moisturecontents compared with a nonsynchronous simulation.Thus, our assumption represented a limiting worst-casescenario in terms of crown fuel hazard. Because crown firebehavior is generally thought to increase as canopy bulkdensity, canopy fuel loadings, and crown fuel continuityincrease and as canopy fuel moisture decreases we wouldexpect that that our simulations probably overestimatedrates of canopy fuel consumption and crown fire intensitiesand that our threshold estimates are conservative comparedwith simulations that included a nonsynchronous represen-tation of bark beetle mortality that resulted in a mix ofgreen-, red-, and gray-stage trees. However, more studiesare needed to better understand the effects of the canopy andsurface fuels when there are mixes of green-, red-, andgray-stage trees and the effects of these distributions on firebehavior. Future studies investigating this topic should con-sider the spatial variability in overstory tree patterns, thespatial alterations to surface fuels, and the spatial relation-ship between the surface and canopy fuels.
Along with further investigation of the assumptions wemade in this study, studies are needed in other forest typesthat have also had bark beetle-caused tree mortality. Inves-tigations at larger spatial scales are also needed. The thresh-olds we identified in this study were simulated with arelatively small spatial extent (0.2 ha) and may not be acommon occurrence at larger spatial scales. Future studiesusing physics-based models to investigate postoutbreaktime periods across a range of environmental and topo-graphical conditions could help identify fuel and weatherconditions in which MPB-caused tree mortality influencescrown fire behavior. Simulations that account for a range oftopographical and environmental conditions may revealconditions under which operational and physics-based mod-els differ. In addition, both laboratory and field experimentsare needed to help validate the results from physics-basedsimulations such as those performed here.
Conclusions
Surface fire behavior played a significant role in deter-mining the effect of MPB-caused tree mortality on simu-lated crown fire behavior by altering the heat flux exposure
Forest Science 59(4) 2013 397

of the canopy fuels. When simulated surface fire intensitywas high, the degree of tree mortality did not affect crownfire intensity or consumption, but with moderate and lowsurface fire intensity, simulated canopy fuel consumptionand crown fire intensity increased as the percentage ofMPB-caused tree mortality increased. For a given surfacefire intensity, there are thresholds in the level of MPB-caused tree mortality during the early red stage over whichincreased crown fire hazards exist compared with the samestands with no mortality. Our study demonstrated thatmountain pine beetle-caused tree mortality increased crownfire and crown consumption, with the greatest effects shownat moderate, rather than very low or very high, levels ofsurface fire intensities. This work highlights the importanceof the interaction between surface fire intensity and canopyfuels on crown fire behavior and provides a possible mech-anism for disparate results of previous studies investigatingMPB-caused mortality effects on fire behavior.
Literature CitedARNO, S.F. 1980. Forest fire history in the Northern Rockies.
J. For. 78:460–465.ANDREWS, P.L., AND R.C. ROTHERMEL. 1982. Charts for inter-
preting wildland fire behavior characteristics. USDA For.Serv., Gen. Tech. Rep. INT-GTR-131. 21 p.
ANDREWS, P.L., C.D. BEVINS, AND R.C. SELI. 2008. BehavePlusfire modeling system, version 4.0: User’s guide. USDA For.Serv., Gen. Tech. Rep. RMRS-GTR-106. 116 p.
BOND, M.L., D.E. LEE, C.M. BRADLEY, AND C.T. HANSON. 2009.Influence of pre-fire tree mortality on fire severity in coniferforests of the San Bernardino Mountains, California. Open For.Sci. J. 2:41–47.
BROWN, J.K. 1970. Ratios of surface area to volume for commonfine fuels. For. Sci. 16(1):101–105.
BROWN, J.K. 1975. Fire cycles and community dynamics in lodge-pole pine forests. P. 429–456 in Management of lodgepole pineecosystems, Baumgartner, D.M. (ed.). Washington State Uni-versity Press, Cooperative Extension Service, Pullman, WA.
BYRAM, G.M. 1959. Combustion of forest fuels. P. 61–89 inForest fires: Control and use, K.P. Davis (ed.). McGraw-Hill,New York.
COHEN, J.D., AND B.W. BUTLER. 1998. Modeling potential struc-ture ignition from flame radiation exposure with implicationsfor wildland/urban interface fire management. P. 81–86 in the13th conference on fire and forest meteorology. InternationalAssociation of Wildland Fire, Lourne, VIC, Australia.
DEROSE, R.J., AND J.N. LONG. 2009. Wildfire and spruce beetleoutbreak: Simulation of interacting disturbances in the centralRocky Mountains. EcoScience 16:28–38.
GARA, R.I., W.R. LITTKE., J.K. AGEE, D.R. GEISZLER, J.D. STU-ART, AND C.H. DRIVER. 1985. Influence of fires, fungi andmountain pine beetles on development of a lodgepole pineforest in south-central Oregon. P. 153–162 in Lodgepole pinethe species and its management, Baumgartner, D., R. Krebill, J.Arnott, and G. Weetman (eds.). Washington State University,Office of Conferences and Institutes, Pullman, WA.
GEISZLER, D.R., R.I. GARA, C.H. DRIVER, V.F. GALLUCCI, AND
R.E. MARTIN. 1980. Fire, fungi and beetle influence on alodgepole pine ecosystem of south-central Oregon. Oecologia46:239–243.
HICKE, J.A., M.C. JOHNSON, J.L. HAYES, AND H.K. PREISLER.2012. Effects of bark beetle-caused tree mortality on wildfire.For. Ecol. Manage. 271:81–90.
HOFFMAN, C.M., P. MORGAN, W. MELL, R. PARSONS, E. STRAND,AND S. COOK. 2012. Numerical simulation of crown fire hazardfollowing bark beetle-caused mortality in lodgepole pine for-ests. For. Sci. 58(2):178–188.
JENKINS, M.J., E. HEBERTSON, W. PAGE, AND C.A. JORGENSEN.2008. Bark beetles, fuels, fires and implications for forestmanagement in the Intermountain West. For. Ecol. Manage.254:16–34.
JOLLY, W.M., R. PARSONS, A.M. HADLOW, AND G. COHEN. 2011.Relationship between foliar moisture, leaf chemistry and ignit-ability of Pinus contorta needles during the early stages onmountain pine beetle attack (Abstract). In Program of theInterior west fire ecology conference: Challenges & opportu-nities in a changing world. Association for Fire Ecology,Snowbird, UT. 87 p.
JOLLY, W.M., R. PARSONS, J.M. VARNER, B.W. BUTLER, K.C.RYAN, AND C.L. GUCKER. 2012. Do mountain pine beetleoutbreaks change the probability of active crown fire in lodge-pole pine forests? Comment. Ecology 93:941–945.
KAUFMANN, M.R., G.H. APLET, M. BABLER, W.L. BAKER, B.BENTZ, M. HARRINGTON, B.C. HAWKES, ET AL. 2008. Thestatus of our scientific understanding of lodgepole pine andmountain pine beetles—A focus on forest ecology and firebehavior. Nature Conservancy, GFI Tech. Rep. 2008-2. 22 p.
KEYES, C.R. 2006. Role of foliar moisture content in the silvicul-tural management of forest fuels. West. J. Appl. For. 21:228–231.
KLUTSCH, J.G., M.A. BATTAGLIA, D.R. WEST, S.L. COSTELLO,AND J.F. NEGRON. 2011. Evaluating potential fire behavior inlodgepole pine-dominated forests after a mountain pine beetleepidemic in north-central Colorado. West. J. Appl. For.26(3):101–109.
KLUTSCH, J.G., J.F. NEGRUN, S.L. COSTELLO, C.C. RHOADES, D.R.WEST, J. POPP, AND R. CAISSIE. 2009. Stand characteristics anddowned woody debris accumulations associated with a moun-tain pine beetle (Dendroctonus ponderosae Hopkins) outbreakin Colorado. For. Ecol. Manage. 258:641–649.
KULAKOWSKI, D., AND T.T. VEBLEN. 2007. Effects of prior dis-turbance on the extent and severity of wildfire in Coloradosubalpine forests. Ecology 88:759–769.
LOTAN, J.E., J.K. BROWN, AND L.F. NEUENSCHWANDER. 1985.Role of fire in lodgepole pine ecosystems. P. 132–152 inLodgepole pine: The species and its management, Baumgart-ner, D., R. Krebill, J. Arnott, and G. Weetman (eds.), Wash-ington State University, Office of Conferences and Institutes,Pullman, WA.
MCDERMOTT, R., K.B. MCGRATTAN, S. HOSTIKKA, AND J. FLOYD.2010. Fire dynamics simulator (version 5) technical referenceguide, verification, vol. 2. NIST, Spec. Publ. 1018-5. 87 p.
MCGRATTAN K.B., H. BAUM, R. REHM, W. MELL, R. MCDER-MOTT, S. HOSTIKKA, AND J. FLOYD. 2010a. Fire dynamicssimulator (version 5) technical reference guide, mathematicalmodel, vol. 1. NIST, Spec. Publ. 1018-5. 124 p.
MCGRATTAN, K.B., S. HOSTIKKA, J. FLOYD, AND R. MCDERMOTT.2010b. Fire dynamics simulator (version 5) technical referenceguide, validation, vol. 3. NIST, Spec. Publ. 1018-5. 316 p.
MELL, W., M.A. JENKINS, J. GOULD, AND P. CHENEY. 2007. Aphysics-based approach to modeling grassland fires. Intl. J.Wildl. Fire. 16(1):1–22.
MELL, W., A. MARANGHIDES, R. MCDERMOTT, AND S.L. MAN-ZELLO. 2009. Numerical simulation and experiments of burningDouglas-fir trees. Combust. Flame. 156(10):2023–2041.
MORVAN, D., AND J.L. DUPUY. 2001. Modeling fire spread througha forest fuel bed using a multiphase formulation. Combust.Flame. 127:1981–1984.
398 Forest Science 59(4) 2013

MORVAN, D., AND J.L. DUPUY. 2004. Modeling the propagation ofa wildfire through a Mediterranean shrub using a multiphaseformulation. Combust. Flame. 138:199–210.
PAGE, W., AND M.J. JENKINS. 2007. Predicted fire behavior inselected mountain pine beetle-infested lodgepole pine. For. Sci.53(6):662–674.
PARSONS, R.A., W.E. MELL, AND P. MCCAULEY. 2011. Linking3D spatial models of fuels and fire: Effects of spatial hetero-geneity on fire behavior. Ecol. Model. 222:679–691.
PERRY, G.L.W. 2004. SpPack: Spatial point pattern analysis inExcel using Visual Basic for Applications (VBA). Environ.Model. Softw. 19:559–569.
REINHARDT, E.D., AND N.L. CROOKSTON. 2003. The fire and fuelsextension to the forest vegetation simulator. USDA For. Serv.,Gen. Tech. Rep. RMRS_GTR-116. 209 p.
ROMME, W.H., D.H. KNIGHT, AND J. FEDDERS. 1986. Mountainpine beetle outbreaks in the Rocky Mountains: Effects on fuelsand fire in lodgepole pine forests (Abstract). In Program of theannual meeting of the Ecological Society of America, SyracuseUniv., Syracuse, NY.
ROMME, W.H., J. CLEMENT, J. HICKE, D. KULAKOWSKI, L.H.MACDONALD, T.L. SHOENNAGEL, AND T.T. VEBLEN. 2006.Recent forest insect outbreaks and fire risk in Colorado forests:A brief synthesis of relevant research. Colorado State Univ.,Fort Collins, CO. 24 p.
ROTHERMEL, R.C. 1972. A mathematical model for predicting firespread in wildland fuels. USDA For. Serv., Res. Paper INT-RP-115. 40 p.
ROTHERMEL, R.C. 1991. Predicting behavior and size of crownfires in the Northern Rocky Mountains. USDA For. Serv., Res.Paper INT-RP-438. 46 p.
SCOTT, J.H., AND E.D. REINHARDT. 2001. Assessing crown firepotential by linking models of surface and crown fire behavior.USDA For. Serv., Res. Paper RMRS-RP-29. 59 p.
SIMARD, M., W.H. ROMME, J.M. GRIFFIN, AND M.G. TURNER.2011. Do mountain pine beetle outbreaks change the probabil-ity of active crown fire in lodgepole pine forests? Ecol.Monogr. 81:3–24.
VAN WAGNER, C.E. 1977. Conditions for the start and spread ofcrown fire. Can. J. For. Res. 7:23–34.
Forest Science 59(4) 2013 399