


Bahasa
Halaman
Hukum

Morphological, thermal, rheological, and mechanical propertiesof polypropylene-nanoclay composites preparedfrom masterbatch in a twin screw extruder
Achmad Chafidz • Mohammad Al-haj Ali •
Rabeh Elleithy
Received: 22 February 2011 / Accepted: 16 April 2011 / Published online: 3 May 2011
� Springer Science+Business Media, LLC 2011
Abstract A commercial homopolymer polypropylene
was melt blended with commercial nanoclay masterbatch
at different concentrations of nanoclay using twin screw
extruder (TSE). The influence of three different concen-
trations (5, 10, and 15 wt%) of the nanoclay on the mor-
phological, thermal, rheological, and mechanical properties
was investigated. The morphology of the nanocomposites
was characterized using Scanning Electron Microscope
(SEM), whereas, the thermal behavior (e.g., melting and
crystallization) was characterized using Differential Scan-
ning Calorimetry (DSC). The melt rheology and dynamic
mechanical properties were analyzed using a torsional
rheometer. Additionally, the tensile properties were char-
acterized as well. The morphological analysis showed that
the nanoclay was well distributed in the PP matrix as
indicated by the SEM micrographs. The DSC results
showed that the presence of nanoclay in the PP matrix
increased the degree of crystallinity of PP-nanoclay com-
posites, which reached a maximum at 5 wt% of nanoclay
concentration. However, the melting temperature of the
PP-nanoclay composites was not affected by the presence
of nanoclay particles. In addition, rheological analysis
showed that the melt response gradually changed from
pseudo-liquid like to pseudo-solid like as the nanoclay
concentration increased. Moreover, the storage modulus
(G0) increased by increasing nanoclay content. Further-
more, tensile test results showed that the addition of
nanoclay leads to a significant enhancement in the
mechanical properties of the PP nanocomposites.
Introduction
Reinforcement of polymers using fillers is generally carried
out in the production of high performance plastics. It has
been many years since the manufacturer has filled polymer
with particles/fillers (polymer composites) in order to
enhance the properties of polymer materials. However,
although conventionally filled polymeric materials are
vastly used, generally this addition of fillers sometimes
causes disadvantages to the resulting composite materials
like brittleness, because there is no or only little interaction
at the interface between the two mixed components. Gen-
erally, macro-sized reinforcing fillers usually give imper-
fections especially in the resulted material’s structure,
which also affects other properties like ductility and
toughness [1–3].
A radical alternative to the conventional polymer com-
posites is provided by polymer nanocomposites (PNCs), a
promising new class of composite materials. PNCs consist
of a polymeric material (e.g., thermoplastics, thermosets, or
elastomers) and a reinforcing nano-sized material (nano-
material). The dispersed nanomaterial has at least one
dimension in nanometer scale. Because the nanomaterials
are so small, limited amounts are sufficient to greatly
enhance the polymer properties. Thus, the use of such
materials has no effect on polymer density and process-
ability compared to their traditional composites. This fea-
ture counterbalanced the negative effect of high cost of
nanofillers [1, 3, 4].
The unique characteristic of polymer nanocomposites is
caused by the fundamental nanoscale dimensions which
A. Chafidz � M. A. Ali
Department of Chemical Engineering, King Saud University,
Riyadh, Saudi Arabia
R. Elleithy (&)
SABIC Polymer Research Center, King Saud University,
Riyadh, Saudi Arabia
e-mail: [email protected]
123
J Mater Sci (2011) 46:6075–6086
DOI 10.1007/s10853-011-5570-0
dominate the morphology and properties of polymer
nanocomposites material. The uniform dispersion of nano-
sized particles (nanofillers e.g., nanoclays, nanofibers,
nanotubes) can lead to an extremely large interfacial area
and even high aspect ratio (largest dimension/smallest
dimensions of nanofiller). Thus, increasing the interaction
between polymer matrix and nanofiller leads to properties
enhancement of polymer nanocomposites [4–6]. Polymer
nanocomposites offer the possibility to develop new
materials with their own different-structure property rela-
tionships compared to the micron and macro scale com-
posites. Polymer nanocomposites (PNCs) exhibit improved
tensile strength and moduli [1, 5], improved thermal deg-
radation [7], decreased gas permeability [8, 9], and reduced
flammability [10–13].
Among the potential nanomaterials used in polymer
nanocomposites, nanoclay (layered silicate) has been
widely investigated primarily because of remarkable
improvement in properties. Furthermore, clay materials are
easily available, environmentally friendly, and their inter-
calation chemistry has been investigated for a long time.
These make nanoclay one of the most widely accepted and
effective nano-reinforcements [1, 4, 14–16].
Several methods have been considered to prepare
polymer—layered silicate nanocomposites, exfoliation—
adsorption, in situ intercalative polymerization, template
synthesis, and direct melt intercalation using a polymer
mixer or extruder. For the development of most important
polymer, both in situ polymerization and exfoliation—
adsorption is limited because neither a suitable monomer
nor a compatible polymer—silicate system is always
available. Moreover, they are not always compatible with
current polymer processing techniques. The remaining
option that has attracted great interest among researchers
and thus particularly will be used in this study is melt
intercalation method. This method is compatible with
current industrial processes as extrusion and injection
molding. Besides, it is environmental friendly because no
solvent is used. Using melt intercalation, suitable nanoclay
can be blended with PP to produce nanocomposites [1, 17–
19]. Nanoclay is a hydrophilic material, whereas PP is one
of the most hydrophobic polymers. This fact makes nano-
clay difficult to exfoliate or intercalate in the polypropylene
matrix. In order to render its surface more hydrophobic
which improves the compatibility with PP, surface treat-
ment of nanoclay (organoclay) is necessary [4, 17, 19, 20].
PP-nanoclay composites have been widely investigated
by numerous researchers [3, 4, 15–18, 20–24]. Recently,
commercial nano-material masterbatches have been
already manufactured. Using commercial masterbatch
becomes a promising alternative in the production of
polymer nanocomposites compared with using bulk nano-
materials. Besides dust free, masterbatch also has less
healthy and safety risks. Another advantage of masterbatch
is the elimination of difficulty in dispersion process and
also easy handling because the nano-materials are bounded
inside the polymer matrix. Therefore, the use of master-
batch in producing polymer nanocomposites is considered
to be one of the simplest and most economical methods in
processing of polymer-nanocomposites. However, litera-
ture survey revealed that the investigation reports which
studied polypropylene nanocomposites using masterbatch
are limited compared to direct incorporation of nano-
material into polypropylene that makes it an attractive area
for research [25].
The aim of this study is to evaluate the effectiveness of
nanoclay concentration, added as a masterbatch, on mor-
phological, thermal, rheological, and mechanical properties
of PP-nanoclay composites. This study demonstrated the
successful preparation of PP nanoclay composites using
commercial masterbatch.
Experimental
Materials
Commercial homopolymer polypropylene was used as
matrix polymer for the nanocomposites which were
investigated in this study. The polypropylene was acquired
from a local manufacturer in the Saudi market. Table 1
shows some properties of the polypropylene according to
the manufacturer’s datasheet. As for the nano-filler, com-
mercial nanoclay masterbatch materials, NanoMax, with
50 wt% concentration of nanoclay and PP as carrier were
supplied by Nanocor, USA. According to the product
information from the supplier, the nanoclay is organoph-
illic montmorillonite (MMT), which has been modified
with dimethyl-dihydrogenated tallow ammonium and it is
believed that the masterbatch contains maleic anhydride
(MA) as a compatibilizer.
Table 1 Some properties of polypropylene homopolymer according
to the manufacturer
Property Unit Value Test method
Melt flow rate
(2.16 kg and 230 �C)
g/10 min 8 ASTM D-1238
Tensile strength at yield MPa 32 ASTM D-638
Tensile elongation at yield % 11 ASTM D-638
Flexural modulus (1% secant) MPa 1630 ASTM D-256
Heat distortion temperature �C 100 ASTM D-648
Vicat softening temperature �C 155 ASTM D-1525B
6076 J Mater Sci (2011) 46:6075–6086
123

Preparation of PP-nanoclay composites
PP-nanoclay composites (PPNCs) were prepared by dilut-
ing highly concentrated nanoclay masterbatch pellets in
polypropylene matrix using melt blending technique. First,
polypropylene was manually pre-mixed with different
concentration of masterbatch (10, 20, and 30 wt%), which
effectively is 5,10, and 15 wt% of nanoclay. Prior to the
melt blending in a twin screw extruder (TSE), the mixed
materials (PP and nanoclay masterbatch) were dried in an
conventional oven at 55 �C for 24 h to reduce the moisture
content. It is known that high moisture content inside the
blend/mixture could produce bubbles during the processing
step.
Afterward, the pre-mix was compounded using co-
rotating twin screw extruder, Farrell FTX-20. The screw
diameter is 26 mm and the L/D ratio 35. The TSE has
distributive and dispersive mixing elements. The extrudate
from the die was cooled in water bath (at about 20 �C), air
dried, and pelletized for further use. Details about the
processing conditions of TSE are listed in Table 2. The
nanocomposite samples will be referred to as NC-5,
NC-10, NC-15 for nanoclay concentration of 5, 10, and
15 wt%, respectively. The same extrusion procedure was
used on neat PP (referred to as NC-0) to compare pure
material with its nanocomposites.
The prepared pellets from TSE were dried as mentioned
before, then were further used to make a set of molded
samples for testing. An injection molding machine, Super
Master Series SM 120, made by Asian Plastic Machinery
Co. was used to prepare a set of ASTM standard samples
(e.g., tensile and flexural). The injection molding condi-
tions are listed in Table 3.
Note that we used different masterbatch concentrations
in this study; some of them could be seen as high con-
centrations, to investigate the optimum concentration of
nanoclay. We tried to balance the gained benefits of using
the masterbatch with the added cost that comes with them.
Samples characterization
Morphological analysis
Scanning electron microscopy (SEM) images were
obtained using a JEOL JSM-6360A, Japan. Molded sam-
ples were cryogenically fractured in order to maintain the
originality of the sample’s morphology. Afterward, the
fractured samples were coated with a thin layer of gold
(good conductive metal) in order to minimize samples
electronic charging and overheating. In addition, the
coating can also increase the signal and surface resolution.
All the samples were examined by the SEM at 15 kV using
different magnifications that vary from 200 to 20,0009.
Thermal analysis
A differential scanning calorimeter (DSC), model DSC-60
from Shimadzu—Japan, was used to study the melting and
crystallization behavior of the nanocomposites. DSC tem-
perature scale was calibrated from the melting character-
istics of indium. Nanocomposite samples of about 5–7 mg
each were accurately weighted and then analyzed via DSC.
The samples were heated at constant rate of 10 �C/min
from ambient temperature up to 200 �C (approx. 30 �C
higher than the melting temperature of PP) in air envi-
ronment. They were held for 5 min at 200 �C to erase their
thermal history. Subsequently, samples were cooled down
to 30 �C at a cooling rate of 10 �C/min to study the crys-
tallization process. Finally, samples were heated again for
the second time (2nd heating scan) at a constant rate of
10 �C/min up to 350 �C. The corresponding thermograms
were recorded. All DSC curves were normalized to the unit
weight of the sample.
The melting temperature, Tm was taken as the peak
temperature of the transition endothermic curve from the
2nd heating scan whereas, the crystallization temperature,
Tc, was taken as the peak temperature of the transition
exothermic curve during the cooling scan. The crystallinity
of the specimen was calculated from the experimental heat
of fusion DHm and the literature value of 100% crystalline
polymer material, DH0m. Literature indicates that DH0
m for
PP is 207 J/g [26]. The following equation was used to
estimate the percentage of crystallinity (Xc) [27]:
Xc ¼DHm
DH0m
� 100½%� ð1Þ
Rheological/viscoelastic characterization
The melt rheological measurements were performed using
a Rheometer instrument model AR G2 made by TA
Instruments, USA. The complex viscosity of neat PP and
its nanocomposites were measured under torsion mode
using frequency sweep scheme in parallel plates fixture
with diameter equal to 25 mm and a constant 2 mm gap.
Stress sweep tests were also performed on representative
samples to determine their linear viscoelastic region. Prior,
frequency sweep tests were performed at a constant tem-
perature, of 260 �C. Oscillation stress was kept constant at
Table 2 Processing conditions of twin screw extruder (TSE)
Barrel temp. (�C) Screw speed (rpm) Melt press. (bar)
Zone 1 Zone 2–6
230 240 17 12
J Mater Sci (2011) 46:6075–6086 6077
123

500 Pa. This value is within the range of linear viscoelastic
region of each nanocomposites, which was determined
based on the oscillation stress vs. % (shear) strain curve
generated from stress sweep test. The data generated from
this frequency sweep test were storage modulus (G0), loss
modulus (G00), and complex viscosity (g*) versus angular
frequency in frequency range between 0.1 and 628.3 rad/s.
Disk-like samples with diameter 25 mm and thickness
approximately 3 mm obtained from injection molding were
used for this test. Excess of polymer melts were cleaned
prior to the test.
Dynamic mechanical analysis (DMA) was performed to
characterize the viscoelastic behavior of the solid material
at different temperatures. DMA was carried out by using
the same apparatus, Rheometer-AR G2. The analysis was
carried under torsion mode using temperature sweep
scheme. The angular frequency was 1 rad/s, and the strain
was 1%. This strain was in the linear viscoelasticity region
of PP and the nanoclay composites. The temperature sweep
was between 30 and 140 �C with 3 �C increment. Rect-
angular samples, with dimensions of 3.25 mm thick 9
12.70 mm width 9 63.5 mm length obtained from injec-
tion molding machine were used for this test.
Mechanical properties
Tensile tests were performed on dumbbell-shape tensile
bars (tensile sample prepared by injection molding
machine) by using LYOD tensile test machine at room
temperature and a cross-head speed of 500 mm/min.
ASTM D-638 was used as our guidelines. Displacement
was measured from the cross-head position. The stress–
strain curves and the mechanical properties e.g., estimated
tensile modulus (E), maximum stress, tensile energy to
break (or toughness), and strain at break were calculated.
The values were taken from the median of three runs for
each of nanocomposites.
Results and discussion
Morphology
Scanning electron micrographs of cryo-fractured surface of
PP-nanoclay composite samples at different concentration
(5 and 15 wt%) are presented in Fig. 1. The study of the
SEM micrographs revealed that all the samples show good
distribution of nanoclay particles. Nanoclay is indicated by
the white needle-like nanoclay in dark area of the PP
matrix. Even at high nanoclay concentration (15 wt%), the
distribution of nanoclay particles in PP matrix was still
good. Relatively small size of the nanoclay particles are
scattered uniformly in PP matrix (Fig. 1d). This good
distribution of nanoclay could be attributed to the high
shear stress that the polymer melt was exposed to during
processing which was induced by the twin screw geometry
and temperature in the barrel. Uniform distribution is an
important aspect that needs to be considered because if the
resulted nanocomposites consist of aggregates of nanoclay
particles, the stress in the aggregate’s area will be high,
resulting in crack initiation and propagation, and conse-
quent premature failure [16].
Using a commercial software, Sigma Scan (Systat Soft-
ware Inc. from US), SEM images (Fig. 1) were further ana-
lyzed. In this study, we performed the distribution of particles
area. Figure 2a and b show the distribution of nanoclay par-
ticles area of NC-5 and NC-15 nanocomposite samples,
respectively. The distribution of particles area on this SEM
image analysis only covered nanoclay particles with area
approximately C0.3 lm2. Smaller particles were not analyzed
here due to the limitations of the SEM apparatus.
In addition, both of NC-5 and NC-15 nanocomposite
samples showed comparative trend of nanoparticles area
distribution. However, NC-15 had some particles bigger than
3 lm2. As noticed in both Fig. 2a and b, the highest popu-
lation number of nanoclay particles had an area less or equal
to 1 lm2. This means that the well distribution or even dis-
persion of nanoclay particles in PP matrix was considerably
assisted by intercalants. Therefore, surface modification for
nanoclay is a very crucial aspect to improve the affinity or
compatibility between nanoclay and the polymer matrix and
to avoid the agglomeration [4]. Several research studies on
PLS nanocomposites have shown a significant change in the
viscoelastic property depending on their microstructure and
the interfacial characteristics between polymer and layered
silicate (intercalation or exfoliation) [22, 27, 28].
Both of SEM image analyses (NC-5 and NC-15)
revealed that the area of nanoclay in PP matrix was far
below 5% of total area of SEM image. Thus, it could be
assumed that the ‘‘undetected nanoclay particles’’ were in
nanometer scale, which can only be observed using dif-
ferent microscopic techniques such as TEM.
Table 3 Processing conditions of injection molding machine
Screw speed (rpm) Temperature (�C) Injection pressure (bar) Cooling time (s) Cycle time (s)
200 T 1 T 2 T 3 Feed zone 500 30 35
220 240 240 170
6078 J Mater Sci (2011) 46:6075–6086
123

Fig. 1 SEM images of NC-5 (left) and NC-15 (right) at different magnification, a and b (10,0009); c and d (20,0009). Dashed circles show
some of nanoclay particles
Fig. 2 a Distribution of nanoclay particles area in NC-5 nanocomposite sample (scan image analysis result of Fig. 1c). b Distribution of
nanoclay particles area in NC-15 nanocomposite sample (scan image analysis result of Fig. 1d)
J Mater Sci (2011) 46:6075–6086 6079
123

Thermal behavior (non-isothermal crystallization)
Figure 3 shows the DSC melting curves of PP-nanoclay
composites prepared using twin screw extruder. The transi-
tion DSC melting curves were chosen from the 2nd heating
scan to eliminate the influence from the thermo mechanical
history of the samples. The thermal analysis results in terms
of melting temperature (Tm), heat of fusion (DH), and the
percentage of crystallinity (Xc) were determined from the
thermograms (Fig. 3) and are summarized in Table 4.
The DSC measurement showed that the melting tem-
peratures of PP-nanoclay composites were not significantly
affected by the changes in the nanoclay concentration.
Similar result was also observed by Zhou et al. [29]. In
addition, the degree of crystallinity, Xc of PP-nanoclay
composites slightly increased as compared to that of neat
PP as shown in Table 4. The increase of Xc could be
attributed to the presence of the dispersed nanoclay plate-
lets, which enhanced the nucleation process of PP by acting
as heterogeneous nuclei during the crystallization process
[23]. However, Xc reached a maximum of 51.2% at 5 wt%
nanoclay concentration. Thereafter, Xc decreased at higher
concentrations (15 wt%) (Fig. 3 and Table 4). The
decrease of Xc could be explained by the presence of an
excessive number of nanoclay platelets which could hinder
the motion of the polymer chain segments and thus, retard
crystal growth [30]. There are two mutually opposite
effects of nanoclay on the crystallization behavior; nucle-
ating ability and growth retardation. Both of them are
related to the type, content, and dispersion state of the
nanoclay [15]. The combination of a large amount of
nucleation sites and limited crystal growth is expected to
produce crystal of fine grain size. It is inferred that the
addition of organoclay increased the number and decreased
the size of spherulites formed in polypropylene. Similar
case was reported by Ma et al. [31] and Xu et al. [32].
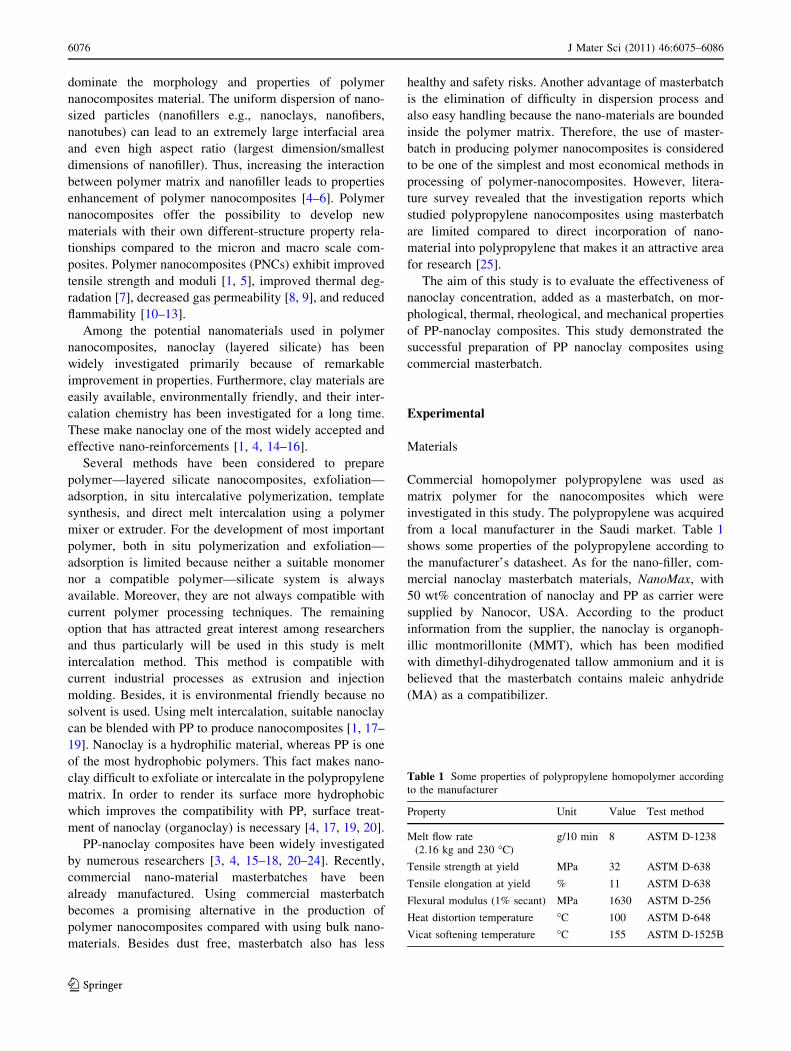
To investigate the effect of different nanoclay concen-
trations on the crystallization behavior, DSC cooling
curves of different mixtures of PP-nanoclay composites are
shown in Fig. 4. Crystallization temperature (Tc), and the T
onset crystallization (Toc) were determined from the ther-
mograms and summarized in Table 4. As noticed from the
figure, crystallization process of PP-nanoclay composite
for all nanoclay concentrations has two peaks as compared
to the neat PP which has a single crystallization peak. In
this study, it is suggested that the first crystallization peak
at lower temperature, Tc1, was attributed to the homoge-
neous crystallization of neat PP. The second crystallization
peak at higher temperature, Tc2, was attributed to the
crystallization process induced by the heterogeneous
nucleation resulting from the presence of nanoclay, that
was confirmed by comparing the crystallization peak (Tc)
of the nanoclay masterbatch to that of neat PP. The
nanoclay masterbatch had Tc of 126 �C close to Tc2, as
compared to neat PP which had Tc of 113 �C, close to Tc1.
The presence of nanoclays in the mixtures increased the
crystallization temperature, Tc significantly, from 113 �C
(PP) to approximately 126 �C. It indicates that the presence
of nanoclay altered the overall crystallization process of PP
matrix by acting as nucleating agent. Many research studies
have shown a nucleating effect of nanoclay particles [4, 31,
33]. Lei et al. reported that the presence of nanoclays in the
PP-nanoclay composites increased the Tc from 107 �C (PP)
to about 115 �C [4].
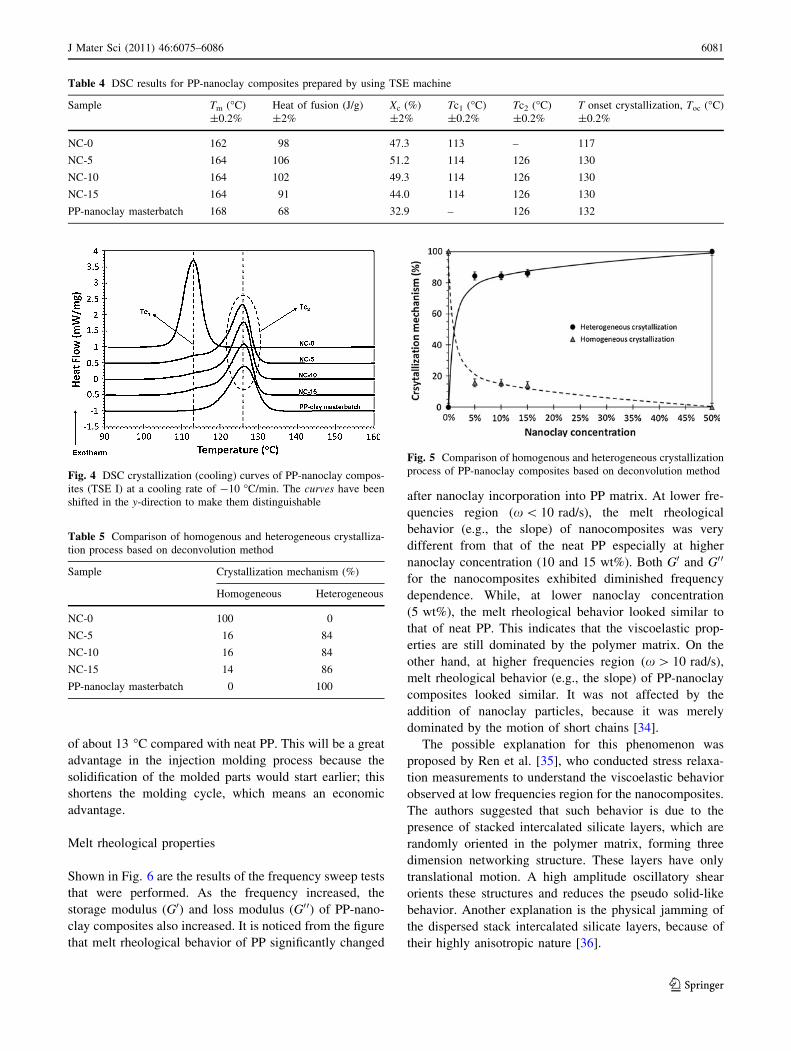
The contribution of heterogeneous and homogeneous
portion in overall crystallization process could be estimated
by comparing the area of each peak (heterogeneous and
homogeneous). Using commercial software, ‘‘Peak Fit’’
made by Systat Software Inc.-USA, each exothermic curve
was deconvoluted/separated into two peaks which represent
heterogeneous and homogeneous crystallization peaks, and
then the area of each peak was calculated. The results in the
form of a percentage of each area can be seen in Table 5. As
shown in Table 5, by adding nanoclay, heterogeneous
crystallization mechanism took over the crystallization
process. This phenomenon could be seen clearly in Fig. 5, as
noticed, the nanoclay acted effectively as nucleating agent.
Note that for PP-nanoclay masterbatch, concentration was
50 wt%. In addition, the ratio of hetero- to homo-crystalli-
zation was almost independent of the nanoclay percentage
used here. This topic is currently under further investigation.
Moreover, from Table 4 another advantage of nanoclay
addition into PP matrix could be derived. As noticed, there
was a significant difference in the onset crystallization
temperature, Toc where Toc of PP-nanoclay composites
experienced a shift to higher temperatures with difference
Fig. 3 DSC melting curves (2nd heating scan) of PP-nanoclay
composites. The curves have been shifted in the y-direction to make
them distinguishable
6080 J Mater Sci (2011) 46:6075–6086
123
of about 13 �C compared with neat PP. This will be a great
advantage in the injection molding process because the
solidification of the molded parts would start earlier; this
shortens the molding cycle, which means an economic
advantage.
Melt rheological properties
Shown in Fig. 6 are the results of the frequency sweep tests
that were performed. As the frequency increased, the
storage modulus (G0) and loss modulus (G00) of PP-nano-
clay composites also increased. It is noticed from the figure
that melt rheological behavior of PP significantly changed
after nanoclay incorporation into PP matrix. At lower fre-
quencies region (x\ 10 rad/s), the melt rheological
behavior (e.g., the slope) of nanocomposites was very
different from that of the neat PP especially at higher
nanoclay concentration (10 and 15 wt%). Both G0 and G00
for the nanocomposites exhibited diminished frequency
dependence. While, at lower nanoclay concentration
(5 wt%), the melt rheological behavior looked similar to
that of neat PP. This indicates that the viscoelastic prop-
erties are still dominated by the polymer matrix. On the
other hand, at higher frequencies region (x [ 10 rad/s),
melt rheological behavior (e.g., the slope) of PP-nanoclay
composites looked similar. It was not affected by the
addition of nanoclay particles, because it was merely
dominated by the motion of short chains [34].
The possible explanation for this phenomenon was
proposed by Ren et al. [35], who conducted stress relaxa-
tion measurements to understand the viscoelastic behavior
observed at low frequencies region for the nanocomposites.
The authors suggested that such behavior is due to the
presence of stacked intercalated silicate layers, which are
randomly oriented in the polymer matrix, forming three
dimension networking structure. These layers have only
translational motion. A high amplitude oscillatory shear
orients these structures and reduces the pseudo solid-like
behavior. Another explanation is the physical jamming of
the dispersed stack intercalated silicate layers, because of
their highly anisotropic nature [36].
Table 4 DSC results for PP-nanoclay composites prepared by using TSE machine
Sample Tm (�C) Heat of fusion (J/g) Xc (%) Tc1 (�C) Tc2 (�C) T onset crystallization, Toc (�C)
±0.2% ±2% ±2% ±0.2% ±0.2% ±0.2%
NC-0 162 98 47.3 113 – 117
NC-5 164 106 51.2 114 126 130
NC-10 164 102 49.3 114 126 130
NC-15 164 91 44.0 114 126 130
PP-nanoclay masterbatch 168 68 32.9 – 126 132
Fig. 4 DSC crystallization (cooling) curves of PP-nanoclay compos-
ites (TSE I) at a cooling rate of -10 �C/min. The curves have been
shifted in the y-direction to make them distinguishable
Table 5 Comparison of homogenous and heterogeneous crystalliza-
tion process based on deconvolution method
Sample Crystallization mechanism (%)
Homogeneous Heterogeneous
NC-0 100 0
NC-5 16 84
NC-10 16 84
NC-15 14 86
PP-nanoclay masterbatch 0 100
Fig. 5 Comparison of homogenous and heterogeneous crystallization
process of PP-nanoclay composites based on deconvolution method
J Mater Sci (2011) 46:6075–6086 6081
123

In addition, at lower frequencies region (x \ 10 rad/s),
as nanoclay concentration in the PP matrix increased,
viscoelastic response of the nanocomposites gradually
changed from pseudo-liquid like (G0\ G00) to pseudo-solid
like (G0[ G00). In fact, for PP-nanoclay composites with
highest nanoclay concentration (NC-15), G0 was not very
sensitive to the increase of angular frequency at lower
frequencies region as compared to the neat PP. The G0 of
NC-15 exceeded its G00 at frequency lower than 0.1 rad/s;
which means that characteristic of the material exhibiting a
pseudo-solid like behavior. Similar results have been
observed by Koo et al. [22]. It is suggested that the polymer
chains could not relax completely, due to the interaction
between polymer and nanoclay. Interfacial characteristics
between nanoclay particles and polymer matrix as well as
the microstructural difference gave a strong relationship
between morphological and rheological properties, which
manifested in the change of the viscoelastic properties [22,
27, 28, 37].
If Figs. 6a and b (storage and loss modulus) were
overlapped, there will be an intersection between the two
moduli. The storage modulus gradually exceeded the loss
modulus, which indicated a shift from pseudo liquid-like
behavior to pseudo solid-like behavior. Along with the
increasing of nanoclay concentration, there was a trend,
where the intersection shifts toward lower frequency. The
intersections were at 251.2, 158.5, and 100 rad/s for PP,
NC-5, and NC-10, respectively while at NC-15, the inter-
section is at lower frequency, outside the boundary of our
range of the test. In addition, Fig. 6a shows that G0 of neat
PP increased about 10,000 times from 0.1 to 100 rad/s,
whereas G0 of NC-15 increased only about 10 times for the
same frequency range. This could be attributed to the
molecular mobility that was restricted for NC-15 while it
was not for neat PP.
Figure 7 shows the effect of nanoclay concentration on
the dynamic complex viscosity g�j j of nanoclay composites.
From the figure, it is noticed that the dynamic complex
viscosity increased substantially with increased nanoclay
content. This increase was attributed to the interaction and
dispersion of nanoclay in the polymer matrix that appeared
to provide the flow restriction of polymer chain in the molten
state. In addition, at lower frequency region (x \ 1 rad/s),
neat PP exhibit some Newtonian-like behavior indicated by
the plateau regime. As the nanoclay concentration increased,
the Newtonian-like behavior dependency diminished. The
Newtonian plateau is an indication of the cooperative
interaction of the molecules. As the interaction increased,
the plateau ‘‘length’’ decreased. For the NC-15, the nanoclay
helped the interaction between the molecules; hence the
plateau ended at lower frequency and got shortened. In
addition, all nanoclay composites exhibited an increased
shear thinning behavior, which is attributed to the orienta-
tion of the nanoclay layers under shear. Similar result was
also reported by Kim et al. [21]; Sinha Ray and Okamoto
[38] and Koo et al. [22].
Dynamic mechanical properties
The effect of nanoclay concentration on the temperature
dependencies of the dynamic storage modulus, G0 which is
analogous to the stiffness of neat PP and PP-nanoclay
composites is presented in Fig. 8. As noticed from Fig. 8,
the storage moduli of nanocomposites are higher when
compared with that of neat PP. The storage modulus of the
samples increased by adding the nanoclay, which resulted
in a considerable improvement in stiffness. This phenom-
enon could be attributed to the restricted mobility of PP
Fig. 6 Storage modulus (a) and loss modulus (b) versus angular
frequency, and (c) cross-over points of PP-nanoclay composites at
temperature 260 �C
6082 J Mater Sci (2011) 46:6075–6086
123

chains as a result of the interaction between nanoclay and
PP matrix. There are several factors that affect this inter-
action; however, this interaction strongly depends on the
interfacial area shared between PP and the nanoclay. As the
concentration of nanoclay increased, the interaction area
also increased. This explains the improvement of the
storage modulus of the nanocomposites by increasing the
level of the nanoclay concentrations [22, 39].
Figure 8 shows that all curves have the same trend,
which is the sharp decrease of the storage modulus at
higher temperatures. This is due to the molecular mobility
which is less restricted at high temperature [20]. The
curves in Fig. 8 could be divided into two regions; flat
region and steep region. The flat region determines the
‘‘usage temperatures’’ of each material. From these curves,
the ‘‘softening temperatures’’ could also be determined and
are listed in Table 6. The ‘‘softening temperature’’ is
defined as the temperature where the storage modulus starts
to decline sharply, which is taken as the intersection of the
flat and steep regions tangents. The softening temperature
is considered as the maximum usage temperature of the
material. As noticed from Table 6, the ‘‘softening tem-
perature’’ of the nanocomposites was relatively higher than
that of the neat PP. Hence, the addition of nanoclay wid-
ened the usage-temperature range of the nanocomposites as
compared to neat PP.
To get more insight into the effect of nanoclay in
enhancing the stiffness of PP material, the representative
values of the storage modulus of PP-nanoclay composites
TSE I at temperature of 30, 60, 100, and 130 �C are listed
in Table 6. For example, at 100 �C, there are improve-
ments in storage modulus values of nanocomposite samples
as compared to the neat PP. The increasing of storage
modulus (stiffness) of PP-nanoclay composites as com-
pared to neat PP are about 56, 82, and 121% for 5, 10, and
15 wt% of nanoclay concentration, respectively.
Such significant enhancements look interesting from
industrial applications point of view. As an example, let us
assume that the design criterion for a certain part dictates a
minimum modulus of 160 MPa. By using neat PP, this
limit value is reached at 60 �C while using nanocomposites
material the limit is reached at higher temperature of
100 �C. This 40 �C temperature difference shows that the
incorporation of nanoclay particles into PP matrix greatly
enhanced the thermal stability of the matrix and hence
widened its ‘‘usage temperature’’.
The relationship between storage modulus, percentage
of nanoclay concentration (%), and temperature (T) was
modeled using the following exponential equation, Eq. 2.
Fig. 7 Dynamic complex viscosity g�j j as function of angular
frequency (x) for PP-nanoclay composites at 260 �C
Fig. 8 Temperature dependencies of storage modulus (G0) of PP-
nanoclay composites at angular frequency 1 rad/s and constant 0.1%
strain
Table 6 The representative values of storage modulus, G0 at several temperatures for PP-nanoclay composites prepared using TSE
Sample G0 (Pa) at temperature Softening
30 �C 60 �C 100 �C 130 �C Temperature (�C)
NC-0 3.9E ? 08 1.6E ? 08 7.7E ? 07 3.7E ? 07 145
NC-5 5.7E ? 08 2.5E ? 08 1.2E ? 08 6.1E ? 07 149
NC-10 6.8E ? 08 2.9E ? 08 1.4E ? 08 7.0E ? 07 150
NC-15 7.6E ? 08 3.8E ? 08 1.7E ? 08 8.2E ? 07 151
J Mater Sci (2011) 46:6075–6086 6083
123

G0 ¼ AeBðTÞ ð2Þ
where G0 is storage modulus as a function of nanoclay
loading in wt%, the type of nanoclay, and temperature.
Parameters A and B are to be determined from the fitting of
the experimental data, which is presented in Table 6. It is
worth mentioning that the fitting data were only applied for
‘‘the flat region’’ or usage temperature (30–130 �C). Our
model showed that parameter A (MPa) was a function of
the concentration of the nanoclay as described by Eq. 3.
A ¼ 4:91E7 � wt%ð Þ þ 7:47E8 ð3Þ
Parameter B (1/K) was found to be independent of the
nanoclay concentration; for the nanocomposite studied in
this study, it has a value of -0.0221. This parameter is
expected to change if different nanoclay is used. Eq. 2
described the nanocomposites satisfactorily; however, it
did not model the neat PP very well.
In order to clarify the significant effect of nanoclay
addition in enhancing PP properties, the relative storage
modulus of PP-nanoclay composites to those of PP are
plotted in Fig. 9. The relative storage moduli of PP-nano-
clay composites were higher than those of the respective
PP matrix at all temperature range. As could be seen in the
figure, the relative storage modulus of PP-nanoclay com-
posites increased as nanoclay concentration increased
In addition, the storage modulus of NC-15 (15 wt% of
nanoclay) considerably increased up to the peak tops at
approximately 50–70 �C and then slightly decreased, as
described as hump-like curve. This ‘‘peak’’ could be
attributed to the development of nanoclay network that
resisted the applied stress. This network resistance
increased as the concentration of nanoclay increased as
shown by the size of the peak. For example, the peak of
NC-15 was bigger than that of NC-5. As the temperature
increased, mobility of the network increased and the
network structure collapsed causing the modulus to
decrease. Similar result was also observed by Hasegawa,
et al. [40]. They found that relative storage modulus of PP-
nanoclay hybrids (PPCHs) drastically increased up to the
peak tops at about 60–70 �C and then decreased. In gen-
eral, the improvements of the storage modulus were about
1.5–2.2 fold times as compared to that of neat PP. Similar
results were also observed in several research investiga-
tions [4, 18, 40, 41].
Moreover, the relative storage moduli of all nanocom-
posites were gradually increased; starting at 120 �C and
reached the top peak at 155 �C as indicated by hump-like
curves. This ‘‘peak’’ phenomenon could be related to the
DSC melting curves. As seen in the Fig. 3, melting process
for all samples started at about 120 �C and completely
melted at about 164 �C. Apparently, the ‘‘peak’’ phenom-
enon has emerged in this range of temperature. As nano-
clay concentration increased, the ‘‘peak’’ tendency
becomes bigger and bigger. It is suggested that the struc-
ture of nanocomposites during the melting process was
different than that of neat PP. The structure changes as
nanoclay concentration increased. The presence of nano-
clay particles hindered the motion of polymer chains,
resulted in different storage modulus response than that of
neat PP. However, this phenomenon needs further
investigation.
Mechanical properties
Figure 10 shows the results of tensile stress–strain curve as
function of nanoclay concentration level. As shown in this
figure, there was an increase in tensile modulus, E, and
yield stress. As the concentration of nanoclay increased, so
did the tensile modulus. This improvement could be seen in
Table 7, which shows some of mechanical properties (e.g.,
tensile modulus, yield stress, toughness, and strain at
Fig. 9 Temperature dependencies of relative storage modulus (G0) of
PP-nanoclay composites as compared to neat PP at angular frequency
1 rad/s
Fig. 10 Stress–strain curves of neat PP and its nanocomposites at
cross-head speed of 500 mm/min
6084 J Mater Sci (2011) 46:6075–6086
123

break) that generated from Fig. 10. The data were taken as
mean of three runs. The tensile modulus increased by 38,
49, and 79% on the addition of nanoclay at 5, 10, and
15 wt%, respectively (see Fig. 11).
The increasing of tensile modulus, E, is analogous to the
increasing of storage modulus, G0, due to the restricted
motion of the polymer chains, which resulted from the
strong interaction between the PP matrix and nanoclay [21,
22]. Tensile modulus enhancements were also reported in
other research investigation with different use of polymer
matrix [21, 38, 41]. Another important tensile property is
the yield stress. The yield stress (here taken as the peak
stress) of nanoclay composites are presented in Fig. 11.
From the figure, we can see that the yield stress of PP
material has been enhanced by the incorporation of nano-
clay in PP matrix. However, as noticed in Table 6, the
toughness of PP-nanoclay composites decreased as nano-
clay concentration increased. This could be explained by
the presence of the nanoclay which could act as a stress
concentrator that will decrease the toughness of the com-
posites. Toughness was more sensitive to strain rather than
the yield stress. Figure 12 shows the toughness and strain
at break (ultimate strain) of the nanocomposites as function
of nanoclay concentration. As noticed from the figure, the
toughness and strain at break (ultimate strain) decreased
about 67 and 60%, respectively (for NC-15) as compared to
that of neat PP. It is an indication of a less mobility of the
polymer chains caused by interaction between PP matrix
and nanoclay particles.
Conclusions
Melt-blended PP-nanoclay composites with different
nanoclay concentration were successfully prepared from
commercial masterbatch. The effect of nanoclay concen-
tration on morphological, thermal, rheological, and
mechanical properties of the prepared nanocomposites has
been studied. These results suggested that the optimum
loading is 5%. Morphological study revealed that all the
samples showed good distribution and dispersion of
nanoclay particles in PP matrix at all concentrations. This
could be attributed to the high shear stressed of the polymer
melt during processing and surface modification of nano-
clay particles. Thus, using masterbatch yielded good dis-
tribution of nanoclay in the composite. DSC results
revealed that introducing nanoclay particles in PP matrix
enhanced the degree of crystallinity at certain nanoclay
concentration, namely 5%. Nanoclay particles acted as
nucleating agent, thus promoting heterogeneous crystalli-
zation process, and hence enhancing the degree of crys-
tallinity. Two crystallization mechanisms existed which
resulted into two crystallization peaks that were attributed
to the homogeneous and heterogeneous crystallization
temperatures. The nanocomposites experienced a shift to a
higher temperature of crystallization, which could be
translated as money savings in polymer processing like
injection molding process. In rheological behavior,
the nanocomposites showed higher storage modulus, loss
modulus, and complex viscosity than the neat PP. Evi-
dence of changes from pseudo-liquid like (G0\ G00) to
Table 7 Mechanical properties of neat PP and PP-nanoclay composites at different nanoclay concentration
Sample Tensile modulus, E (MPa) Yield stress (MPa) Strain at break (%) Toughness (MJ/m3)
NC-0 1560 37.4 13.1 4.0
NC-5 2154 41.0 9.6 2.7
NC-10 2330 41.1 6.8 1.8
NC-15 2787 41.8 5.4 1.3
Fig. 11 Modulus elasticity, E, and yield stress of PP-nanoclay
composites with different nanoclay concentration at cross-head speed
of 500 mm/min
Fig. 12 Toughness and ultimate strain of PP-nanoclay composites with
different nanoclay concentration at cross-head speed of 500 mm/min
J Mater Sci (2011) 46:6075–6086 6085
123

pseudo-solid like (G0[ G00) appeared as the nanoclay
concentration increased which showed an intense rela-
tionship with their morphologies. Dynamic mechanical
analysis (DMA) results showed that the addition of nano-
clay into PP matrix resulted in a significant improvement of
storage modulus of the nanocomposites; the increase was
proportional to the concentration of the nanoclay. The
improvements of the storage modulus of the nanocom-
posites at 30 �C were 1.5–2.2 fold times as compared to
that of neat PP. The reinforced effect in storage modulus by
incorporating nanoclay was most effective, especially in
the higher temperature range rather that the lower tem-
perature ranges. It was also found that the addition of
nanoclay increased the thermal stability of the nanocom-
posites, which makes it possible to use PP-nanoclay com-
posites at higher temperature than the neat PP. Mechanical
test results showed that the addition of nanoclay in PP
matrix leads to a significant enhancement in the stiffness of
PNC, while the yield stress was only enhanced at certain
level, and further loading of the nanoclay had less effect on
the yield stress. In contrary, the toughness of PP-nanoclay
composites decreased as nanoclay concentration increased.
Acknowledgements The authors are grateful to SABIC Polymer
Research Center (SPRC) at King Saud University for allowing us to
use their equipments and to the Engineering Research Center for their
financial support. We would also like to thank the Deanship of
Scientific Research and Research Center-College of Engineering at
King Saud University.
References
1. Alexandre M, Dubois P (2000) Mater Sci Eng 28(1–2):1
2. Fischer H (2003) Mater Sci Eng 23(6–8):763
3. Modesti M, Lorenzetti A, Bon D, Besco S (2005) Polymer
46(23):10237
4. Lei SG, Hoa SV, Ton-That MT (2006) Compos Sci Technol
66(10):1274
5. Kannan M, Bhagawan SS, Jose T (2010) J Mater Sci 45:1078.
doi:10.1007/s10853-009-4046-y
6. Nath DC, Bandyopadhyay S, Yu A, Zeng Q, Das T, Blackburn D,
White C (2009) J Mater Sci 44:6078. doi:10.1007/s10973-
009-0408-6
7. Ganguly A, Bhowmick A (2009) J Mater Sci 44:903. doi:
10.1007/s10853-008-3183-z
8. Yano K, Usuki A, Okada A, Kurauchi T, Kamigaito O (1993)
J Polym Sci 31(10):2493
9. Messersmith PB, Giannelis EP (1995) J Polym Sci 33(7):1047
10. Gilman JW, Kashiwagi T, Brown JET, Lomakin SP (1998) In:
Proceeding of 43rd international SAMPE symposium and exhi-
bition—materials and process affordability keys to the future,
Book1, vol 43, 31 May–4 June 1998, Anaheim, CA
11. Gilman JW (1999) Appl Clay Sci 15(1–2):31
12. Gilman JW, Jackson CL, Morgan AB, Harris R Jr (2000) Chem
Mater 12(7):1866
13. Kashiwagi T, Du F, Douglas JF, Karen IW, Harris R Jr, Shields
JR (2005) Nat Mater 4(12):928
14. Mai YW, Yu ZZ (2006) Polymer nanocomposites. Woodhead
Publishing Ltd., Cambridge
15. Yuan Q, Awate S, Misra RDK (2006) Eur Polym J 42(9):1994
16. Yuan Q, Misra RDK (2006) Polymer 47(12):4421
17. Modesti M, Lorenzetti A, Bon D, Besco S (2006) Polym Degrad
Stab 91(4):672
18. Hasegawa N, Kawasumi M, Kato M, Usuki A, Okada A (1998) J
Appl Polym Sci 67(1):87
19. Lertwimolnun W, Vergnes B (2005) Polymer 46(10):3462
20. Rohlmann CO, Failla MD, Quinzani LM (2006) Polymer
47(22):7795
21. Kim DH, Fasulo PD, Rodgers WR, Paul DR (2007) Polymer
48(18):5308
22. Koo CM, Kim MJ, Choi MH, Kim SO, Cheung IJ (2003) J Appl
Polym Sci 88(6):1526
23. Sharma SK, Nayak SK (2009) Polym Degrad Stab 94(1):132
24. Boucard S, Duchet J, Gerard JF, Prele P, Gonzales S (2003)
Macromol Symp 194(1):241
25. Prashantha K, Soulestin J, Lacrampe MF, Krawczak P, Dupin G,
Claes M (2008) Compos Sci Technol 69(11–12):1756
26. Ehrenstein GW, Riedel G, Trawiel P (2004) Thermal analysis of
plastic: theory and practice. Carl Hanser Verlag, Munich
27. Kim HB, Choi JS, Lee CH, Lim ST, Jhon MS, Choi HJ (2005)
Eur Polym J 41(4):679
28. Lim YT, Park OO (2001) Rheol Acta 40(3):220
29. Zhou Y, Rangari V, Mahfuz H, Jeelani S, Mallick PK (2005)
Mater Sci Eng 402(1–2):109
30. Kontou E, Niaounakis M (2006) Polymer 47(4):1267
31. Ma J, Zhang S, Qi Z, Li G, Hu Y (2002) J Appl Polym Sci
83(9):1978
32. Xu Y, Shang S, Huang J (2010) Polym Test 29:1007–1013
33. Kodgire P, Kalgaonkar R, Hambir S, Bulakh N, Jog JP (2001) J
Appl Polym Sci 81(7):1786
34. Ferry JD (1980) Viscoelastic properties of polymer. Wiley, New
York, p 358
35. Ren J, Silva AS, Krishnamoorti R (2000) Macromolecules
33(10):3739
36. Ray SS (2006) J Ind Eng Chem 12(6):811
37. Ray SS, Okamoto M (2003) Prog Polym Sci 28(11):1539
38. Ray SS, Okamoto M (2003) Macromol Mater Eng 288(12):936
39. Nwabunma D, Kyu T (2008) Polyolefin composites. Wiley-
Interscience, New Jersey
40. Hasegawa N, Okamoto H, Kato M, Usuki A (2000) J Appl Polym
Sci 78(11):1918
41. Kim JH, Koo CM, Choi YS, Wang KH, Chuung IJ (2004)
Polymer 45:7719
6086 J Mater Sci (2011) 46:6075–6086
123
Top Related
Copyright © 2022 FDOKUMEN

