


Bahasa
Halaman
Hukum


Military Power and Food Security:A Cross-National Analysis of
Less-Developed Countries, 1970–1990
Stephen J. Scanlan and J. Craig Jenkins
The Ohio State University
Addressing the long-standing debate over the social impact of militarypower and recent discussions of military-induced famine, we conduct apanel analysis of aggregate food supply and child hunger rates in 75–79less-developed countries ~LDCs!. Distinguishing between militarization,as the growth of military resources, and militarism, as the use of militaryforce to handle political conflicts, we show that militarization is bothbeneficial and detrimental to food security, whereas militarism is con-sistently detrimental. Arms imports and associated increased militaryspending plus praetorianism and military repression reduce food secu-rity, whereas increased military participation and arms production boostfood security. Increased food supply reduces child hunger and is largelyconfined to the more developed of the LDCs. These military powereffects show net economic growth, which “trickles down” to improvefood supply and reduce child hunger among the more developed LDCs,reflecting the growth of global economic inequality. Contrary to viewsthat see militarization as a single unified process, use of armed force isnot strongly rooted in either praetorianism or militarization.
Food security is the most fundamental of human needs and is central to generaldiscussions of human rights and development policy ~Sen, 1981, 1995; Drèze andSen, 1989; Kutzner, 1991; Brandt, 1986; Drèze, Sen, and Hussain, 1995; FAO,1996a!. Despite the “green revolution” and increased international food tradeand improved food security in most less-developed countries ~LDCs!, almost halfof the LDCs experienced a loss in aggregate food supply and over a quarter anincrease in child hunger between 1970 and 1990 ~Bongaarts, 1996; FAO, 1996a,1996b; Foster and Leathers, 1999:75–92!. In the mid-1990s, an estimated 840million people lacked sufficient food to meet basic nutritional needs ~UNFPA,1999! and over 200 million children suffered from severe undernutrition ~UNICEF,1998!. As proponents of the “entitlement” approach to hunger contend ~Sen,1981; Drèze and Sen, 1989; Drèze et al., 1995!, global hunger is not a problemof aggregate food supply but of distribution. Globally there is sufficient food to
Authors’ note: Correspondence concerning this paper should be directed to Stephen J. Scanlan, The Ohio StateUniversity, Department of Sociology, 300 Bricker Hall, 190 N. Oval Mall, Columbus OH 43210-1353. We shareequally in the authorship of this paper. We benefited from the advice of Edward Crenshaw, Edward Kick, LowellHargens, David Jacobs, Katherine Meyer, members of the Comparative Social Change Seminar at The Ohio StateUniversity, and anonymous reviewers, as well as from the financial support of the National Science Foundation~# SBR-9710958!, the Mershon Center for International Security, The Ohio State University, and a DissertationFellowship for Stephen Scanlan from the Graduate School, The Ohio State University.
International Studies Quarterly ~2001! 45, 159–187.
© 2001 International Studies Association.Published by Blackwell Publishers, 350 Main Street, Malden, MA 02148, USA, and 108 Cowley Road, Oxford OX4 1JF, UK.

meet all human nutritional needs, but many LDCs and particular groups insidethese countries lack secure access to food.
We examine the impact of military power on food security. The long-standingdebate over the social impact of military power has largely been framed in termsof the question as to whether military spending improves, undermines, or isirrelevant to economic growth ~for recent reviews, see Chan, 1985, 1995!. Somecontend that, despite a short-term trade-off, military spending boosts long-termgrowth by creating human capital, work discipline and social integration, tech-nological spin-offs, mild inflation, and market stimulus ~e.g. Andreski, 1968;Benoit, 1973, 1978; Janowitz, 1977; Weede, 1983, 1986; Ward, Davis, and Chan,1993; Ward, Penubarti, Cohen, and Lofdahl, 1995; Cohen, Mintz, Stevenson, andWard, 1996!. In contrast, others argue that military spending crowds out privateinvestment, diverts human capital from productive efforts, and has few spin-offsand multiplier effects ~e.g. Kaldor, 1976; Dumas, 1988; Harris, Kelly, and Pra-nowo, 1988; Kick, Nasser, Davis, and Bean, 1990; Kick, Davis, Kiefer, and Burns,1997!. This debate, however, has largely neglected social welfare outcomes. AsChan ~1985:422! argues, “we need to disaggregate the dependent variable interms of measures that are more directly relevant to the lives of particular groupsof people.” We focus on food security as the most basic of human needs and asthus central to social welfare. Food security is especially problematic in many ofthe poorer LDCs, where military power has been most prominent and is centralto recent policy discussions of military-induced famine, including the argumentthat food aid is often diverted by bandit armies and guerrillas, who use it tostrengthen their power, thus creating protracted political instability and greaterhunger ~Cheatham, 1994; Macrae and Zwi, 1994; Prendergast, 1996; Messer,Cohen, and D’Costa, 1998; Uvin, 1998; de Soysa and Gleditsch, 1999!.
Research on the social impact of military power has largely focused on militaryspending, neglecting other aspects of military power and behavior. We distinguishbetween militarization, defined as increased military control over social and eco-nomic resources, and militarism, treated as the use of military force to handle po-litical conflicts ~Ross, 1987; Vantuyll, 1994!. Several studies have found that militaryparticipation ~i.e., the ratio of troops to labor force! is distinct from military spend-ing and improves infant mortality, literacy, and secondary schooling ~Dixon andMoon, 1986; Kick and Sharda, 1987; Bullock and Firebaugh, 1990; Kick et al., 1990;Kick et al., 1997!. Some have refined the spending argument by claiming that theroot problem is international arms races that spur international arms purchases andlocal arms production at the expense of health, nutrition, and education programsand socially beneficial economic development ~McKinlay and Mughan, 1984; Brzoskaand Ohlson, 1987; Thomas, 1994!. There is also the question of military conduct,especially praetorianism and the use of military force to control internal oppo-nents and challenge international competitors ~Huntington, 1968; Janowitz, 1977!.Some contend that militarization gives the military more resources and thus en-courages praetorianism, political repression, and interstate wars that underminesocial welfare ~Wolpin, 1981, 1983; Sivard, 1991; Tilly, 1992!. This raises the addi-tional question as to whether militarization and militarism are strongly interrelated.
We examine the impact of military power on two measures of food security:food supply and child hunger.1 By food supply, we mean the aggregate per capita
1 This parallels Tweeten’s ~1997! distinction between food availability ~the aggregate supply of foodstuffs in acountry! and food access ~secure possession by individuals, households, and specific groups of the means to acquirefood for consumption!. We argue, however, that both are actually measures of food access at different levels ofaggregation. Thus a country’s food availability per capita captures a country’s access to the global “bread basket,”whereas child hunger as indicated by the prevalence of undernutrition captures individual access to that country’sbasket. Tweeten also distinguishes utilization, defined as nutrition derived from the metabolization of consumedfood, which we do not address.
160 Military Power and Food Security

availability of foodstuffs in a country regardless of where it was produced.2 Itincludes both internal food production ~both marketed and nonmarketed! aswell as food imports and assistance. Given the global food surplus, it captures theaccess of a country to the global “bread basket.” The child hunger rate capturesthe internal or intracountry distributional component of food security. Sincechildren are the most vulnerable and child hunger is typically associated with thehunger of other vulnerable groups ~Kelly, 1992; Foster and Leathers, 1999:47–52!,it serves as a proxy for broader hunger problems. In the regression analysis ofchild hunger rates below, we control first for increased food supply, thus tappinghunger net of increased food supply. We use a lagged panel design, which is lessvulnerable to reciprocal causation and specification bias ~Finkel, 1995:13–22;Hannan, 1979!.
We begin by discussing the meaning of food security and its relevance to thelong-standing debate over the social impact of military power and the questionof military-induced famine. We then clarify the distinction between militarization~resources! and militarism ~conduct!, finding only modest relationships betweenthem. Using a lagged panel model to analyze change in food supply and childhunger, we show that arms imports and associated military spending along withpraetorianism and internal repression create a military burden but that increasedmilitary participation and an arms industry improve food security. In general,factors that improve ~or reduce! food supply also improve ~or reduce! childhunger rates.
What Is Food Security?
The idea of food security has been pioneered by the United Nations ~U.N.General Assembly, 1949; FAO, 1996a, 1996b! and proponents of an “entitlement”approach to food security ~Sen, 1981, 1995; Drèze and Sen, 1989; Foster andLeathers, 1999! to underscore the importance of food as the most basic ofhuman needs. Recently the United Nations Development Programme ~UNDP!has included food security in its broader concept of “human security” ~1994:22–46!.In the words of the UNDP ~1994:22!, “a feeling of insecurity arises more fromworries about daily life than the dread of a cataclysmic world event.” In place ofCold War concerns about the superpower rivalry and impending nuclear destruc-tion, security discussions should focus on threats to ordinary citizens and theirquality of life. Put simply, food security means that
@a#ll people at all times have both physical and economic access to basic food.This requires not just enough food to go around. It requires that people haveready access to food—that they have an “entitlement” to food, by growing it forthemselves, by buying it or by taking advantage of a public food distributionsystem. ~UNDP, 1994:22!3
Food security is thus a fundamental aspect of human development in LDCs andis associated with reductions in absolute poverty and improvements in publichealth ~Sen, 1981; Drèze and Sen, 1989! and the physical quality of life ~Morris,1979!. Food is the foundation of social welfare and thus should be central todiscussions of development policy and theory.
The central distinction between food supply and hunger is more than a simplemeasurement question. It raises the fundamental question as to whether increase
2 Past work has misleadingly referred to food supply as “food consumption” or “nutrition” ~Bullock and Fire-baugh, 1990; Wimberly and Bello, 1992; Firebaugh and Beck, 1994!, but in fact it is a measure of aggregateavailability and thus distinct from hunger and nutritious consumption.
3 The above use of “entitlement” should be understood in a normative sense, as distinct from the empirical usein the “entitlement” theory of food security ~Sen, 1981!.
Stephen J. Scanlan and J. Craig Jenkins 161

~or decline! in aggregate food supply “trickles down” to individuals, households,and disadvantaged groups. Does increased food supply automatically improvechild hunger? A country’s food supply is an aggregate bread basket of foodavailable to a defined population but says nothing directly about how this foodis distributed. The prevalence of child hunger in the presence of adequate foodsupply is a strong indication of serious internal access problems. As Sen ~1981!and Drèze and Sen ~1989! have shown, famines often occur in the midst of foodsurplus, selectively affecting those who lack the economic means to acquiresustenance and where the political will in the country to secure the basic needsof the population is lacking. Past cross-national research ~e.g., Bullock and Fire-baugh, 1990; Wimberley and Bello, 1992; Firebaugh and Beck, 1994! has exam-ined supply but neglected hunger.
Table 1 charts the trends in food supply and child hunger rates between197001975 and 1990 for all LDCs that had a population of 1 million or more in1970. To capture food supply, we use the five-year means for per capita dailycaloric and protein supply for 1968–1972 and 1988–1992 to eliminate annualvolatility. These are derived from the food balance sheets of the Food andAgriculture Organization ~FAO, 1972, 1974, 1992, 1994!, which include estimatesof marketed and nonmarketed food from all domestic and international sources~including self-production and aid!. This is the most reliable food security indi-cator available, based on field reports cross-checked by satellite imagery, and hasbroader temporal and country coverage than any other available cross-nationalindicator ~Quinn and Kennedy, 1994; Foster and Leathers, 1999:66–73!. To cap-ture hunger, we use the percentage of children under five years of age whosebody weight is below two standard deviations from the median weight-for-age ofthe country’s population. Children are typically the most vulnerable populationin LDCs, and child hunger is associated with hunger for other vulnerable groups~Kelly, 1992!. This weight-for-age method, also known as the “Gomez system”~Foster and Leathers, 1999:62–63!, taps only those who are severely undernour-ished. These data are compiled by the United Nations Sub-Committee on Nutri-tion and are supplemented by household and community surveys conducted byMacro International’s Demographic Health Survey Project. Field studies showthis is the most reliable gauge of preschool children who are at risk for primaryundernutrition ~i.e., insufficient calories! and secondary undernutrition ~i.e.,diarrheal infection that depletes nutrients!. It normalizes for the physical char-acteristics of the country’s population and is broadly available for LDCs begin-ning in 1975 from country surveys conducted by the World Health Organization~UNDP, 1994; FAO, 1996b!. Because it is unavailable on an annual basis, we focuson the change from 1975 to 1990, the longest time period currently available.
The overall trend in the data examined is toward improved LDC food security.Between 1970 and 1990, mean daily caloric supply per capita in LDCs increasedby 7.63% and, for protein supply, by 5.71%. Child hunger rates dropped byalmost 20%, from 28.9 to 23.4% of all children. Progress, however, has beenregionally uneven. Improvements were greatest in North Africa and the MiddleEast, with caloric supply rising by 27.4% and protein by 12.5%, were moderate inAsia0Oceania ~12.0 and 10.2%!, with slight improvement in Latin America ~5.8and 2.2%!, and a drop in sub-Saharan Africa ~2.16 and 22.4%!. The fightagainst child hunger showed greater progress, with a mean 41.2% decline inNorth Africa and the Middle East, a 26.9% decline in Latin America, a 17.4%decline in Asia0Oceania, and a 13.6% decline in sub-Saharan Africa.4 Despiteimprovement, over a third of all children remain hungry in Asia0Oceania, near
4 Experts disagree as to whether the greater incidence of underweight children in Asia0Oceania is due towater-borne disease in a monsoonal climate ~UNDP, 1994:27! or constitutes a genuine access problem ~FAO,1996b:79!, but our lagged panel design controls for serial correlation of errors and thus minimizes this issue.
162 Military Power and Food Security

Table 1. Trends in LDC Aggregate Food Supply and Child Hunger, 1970–1990
Means (Standard Deviations)for Caloric Supply per Capita
Means (Standard Deviations)for Protein Grams per Capita
Means (Standard Deviations)for Prevalence of Child Hunger
Circa 1970 Circa 1990 Circa 1970 Circa 1990 Circa 1975 Circa 1990
All Less-Developed Countries~N 5 88!
2227.47 ~299.12! 2397.43 ~416.82! 57.62 ~12.97! 60.91 ~14.47! 28.88 ~15.34! 23.42 ~13.81!
Caloric Availability Models~N 5 79!
2243.01 ~309.14! 2412.30 ~428.87!
Protein Availability Models~N 5 79!
57.85 ~12.91! 61.18 ~14.77!
Percentage of UndernourishedChildren Models ~N 5 75!
28.57 ~15.58! 23.19 ~14.11!
Asia and Oceania 2208.76 ~310.01! 2452.09 ~406.73! 54.88 ~11.72! 60.95 ~14.36! 46.07 ~16.63! 38.27 ~14.12!Latin America 2364.75 ~345.77! 2501.20 ~310.96! 61.84 ~14.55! 63.22 ~11.83! 15.71 ~7.19! 11.48 ~6.74!North Africa and
the Middle East2357.65 ~290.45! 3004.76 ~316.66! 64.13 ~12.12! 81.18 ~9.96! 18.20 ~4.76! 10.70 ~2.83!
Sub-Saharan Africa 2135.16 ~253.05! 2110.28 ~260.78! 54.45 ~10.50! 52.54 ~4.31! 32.11 ~10.48! 27.97 ~8.97!
Countries with Substantial Decreases in Food Security
Caloric Supply ~n 5 25!: Afghanistan, Angola, Argentina, Burundi, Cambodia, Cameroon, Central African Republic, Chad, Chile, Guinea, Haiti, Kenya,Madagascar, Malawi, Mozambique, Paraguay, Peru, Rwanda, Senegal, Sierra Leone, Sri Lanka, Togo, Sudan, Uruguay, Zambia
Protein Supply ~n 5 27!: Afghanistan, Angola, Argentina, Burundi, Cameroon, Central African Republic, Chad, Ethiopia, Ghana, Jamaica, Kenya,Liberia, Madagascar, Malawi, Mongolia, Mozambique, Namibia, Nicaragua, Paraguay, Peru, Rwanda, Somalia, Uganda,Uruguay, Zaire, Zambia, Zimbabwe
Prevalence of Child Hunger~n 5 12!:
Afghanistan, Angola, Burundi, Madagascar, Malawi, Mozambique, Nigeria, Senegal, Sierra Leone, Uruguay, Zaire, Zambia

30% in sub-Saharan Africa and a little over 10% in the other regions. Overall,improvement in child hunger was greater in the more developed regions, par-alleling studies indicating an increase in international economic inequality ~Pea-cock, Hoover, and Killian, 1988; Homer-Dixon, 1995; Korzeniewicz and Moran,1997!.
At the bottom of Table 1, we identify all LDCs with significant negative changesin food security over the period studied. For food supply, we list all that lost 100or more mean daily calories per capita and three or more grams of daily proteinper capita and, for child hunger, all with an increase of 1% or more. Sub-Saharan Africa and Asia0Oceania experienced the greatest losses in food secu-rity, with 20 and 17 out of 35 countries in sub-Saharan Africa suffering a declinein caloric and protein supply, respectively, and, in Asia0Oceania, 6 out of 22countries. In general, levels of child hunger improved everywhere except in 10countries in sub-Saharan Africa, civil war–torn Afghanistan, and Uruguay.
Dimensions of Military Power
The debate over the social impact of military power has been confused by thefailure to distinguish clearly between different aspects of military power. Somehave treated militarization ~or, alternatively, militarism, which is often used syn-onymously! as a single unified process, assuming that an increase in militaryresources leads to or is mutually reinforced by praetorianism and the use ofmilitary force ~Wolpin, 1981, 1983; Sivard, 1991; Bucholz, 1999; Mayer, 1999!.Thus the Stockholm International Peace Research Institute ~1982:393! defines“militarization” broadly in terms of “a steady growth in the military potential ofstates. Such growth is usually accompanied by an increasing role for militaryinstitutions both in national affairs, including the economic, social and politicalspheres, and in international affairs.” 5 The extent to which different militaryresources are integrated and encourage the use of military force is an empiricalquestion, however. Below we show that some aspects of military resources aremoderately correlated with one another but that most aspects are distinct andthat military resources are not strongly correlated with use of military force. Thisundermines the idea of a single unidimensional process called “militarization” or“militarism” and points to the need to evaluate the impact of distinct dimensionsof military power.
In discussing military power, we draw on Ross’s ~1987! distinction betweenmilitarization, defined in terms of military resources, and militarism, treated interms of praetorianism and the use of military force to regulate political conflict.Each in turn has multiple aspects that may potentially have a distinctive impacton social welfare. We use this distinction to organize the discussion of the socialimpact of military power.
Past research on military power has focused almost entirely on military spend-ing, typically treated in terms of a governmental budget trade-off. The classicstatement was that of Benoit ~1973, 1978!, who argued that military spendingmight appear wasteful and create a short-term trade-off in terms of governmentspending on health and education, but, in the long run, it creates humancapital, economic infrastructure, better work discipline, technology spin-offs,national security, and market stimulation, thus contributing to economic growth.Subsequent studies, however, have found highly mixed effects, including reduc-tions in social and health spending, the crowding of private capital markets,minimal technology and infrastructure spin-offs, weak multiplier effects, andsignificant opportunity costs in terms of foregone alternative investments ~Chan,
5 Others ~e.g. Vagts, 1959; Bucholz, 1999; Mayer, 1999! have used “militarism” as equivalent to “militarization,”contributing to this confusion.
164 Military Power and Food Security

1985, 1995; Ward and Davis, 1992; Payne, Sahu, and Ward, 1994!. Critical ques-tions are, first, whether any economic growth created by military spending “trick-les down” to social welfare and, second, whether military spending should betreated as a narrower budget trade-off or as a broader societal burden.
Several studies have shown that two aspects of military spending should bedistinguished: purchases of arms and equipment and personnel ~or militaryparticipation!. Drawing on Andreski ~1968!, military participation has been shownto improve food supply, decrease infant mortality, and increase literacy andphysical quality of life ~PQLI! as well as spurring economic growth ~Weede, 1983,1992; Dixon and Moon, 1986; Davis, Kick, and Kiefer, 1989; Kick et al., 1990;Bullock and Firebaugh, 1990; Looney, 1990; Kick et al., 1997!. Weede ~1992!,however, found that it did not affect income inequality, and Bowman ~1996!observed that it reduced democratization in Latin America between 1973 and1986. In analyses controlling for both military participation and spending, mili-tary spending normed over gross national product ~GNP! has either a negativeeffect on PQLI ~Dixon and Moon, 1987! or an insignificant effect on the abovesocial welfare indicators ~Bullock and Firebaugh, 1990; Looney, 1990!, whereasmilitary participation is socially beneficial. This suggests the need to distinguishbetween military spending on personnel that improves social welfare and spend-ing on weapons and supplies that may be detrimental to it.
A related discussion has focused on international arms imports. Several con-tend that arms imports create a budget trade-off in terms of reduced education,nutrition, and health spending, thus reducing social welfare ~Senghaas, 1977;McKinlay and Mughan, 1984; Thomas, 1994!. Others point to destabilizing con-sequences of arms imports, arguing that they set off regional arms races that leadto international war and increase the violence of internal conflicts ~Brzoska andOhlson, 1987; Pearson, 1994!. Lappé, Collins, and Rosset ~1998:138!, for exam-ple, argue that Cold War regional arms races destabilized Somalia, precipitatinga civil war that created widespread famine. Wolpin ~1981, 1983! contends thatarms imports promote other socially harmful economic policies, such as encour-agement of foreign investment and the export of cash crops, fosters internalrepression, and cements international alliances with foreign powers ~includingforeign investors and banks! that create distorted growth and reduce socialwelfare ~Wolpin, 1981, 1983!. Several studies have found that arms imports reduceeconomic growth and political rights as well as increasing infant mortality ~Kicket al., 1990; Kick et al., 1997!.
A fourth aspect of militarization is arms production, which was central tonineteenth-century state-led industrialization ~Gerschenkron, 1962; Kennedy, 1974!.Arms production should create human capital and technology spin-offs, stimu-late market demand, and strengthen the international power of the state. Armsproduction should also be associated with arms exports, which increased nearlyfourfold in the 1970s and 1980s and shifted from mainly security to more com-mercial purposes ~Brzoska, 1989; Krause, 1992; Pearson, 1994!. Exporting coun-tries are likely to be producers of more sophisticated and higher-value arms,which should have greater economic benefits and strengthen the state inter-nationally, thus allowing it to further improve food security. Although a fewstudies have found that arms production boosts economic growth ~Kick andSharda, 1986; Looney, 1989! and increases income inequality ~Looney, 1989!,arms exporting has not been examined, and neither has been used to explainsocial welfare outcomes.
Following our above discussion, militarism centers on the behavior or conductof the military. A classic argument focuses on the benefits and risks of praeto-rianism, that is, military rule and coups. Whereas a few have argued that militaryrulers are agents of modernization with managerial and technical skills and amodern social vision ~ Johnson, 1962; Trimberger, 1978!, most contend that mil-
Stephen J. Scanlan and J. Craig Jenkins 165

itary leaders lack the political skills to sustain legitimacy and are prone to useviolence to resolve political disputes and that such violence spurs generalizedpolitical instability ~Huntington, 1968; Janowitz, 1977; Tilly, 1992!. Military rulerswho have acquired power through violent means are likely to use force tocontrol opponents, including resorting to genocide and politicide to eliminateinternal political enemies ~Gurr, 1989; Harff and Gurr, 1993! and using militaryforce against international rivals, thus leading to wars and foreign military inter-ventions. Several studies have shown that democracies are unlikely to go to waragainst other democracies ~Russett, 1993; Mousseau, 1998!, but the war propen-sity of military regimes is unclear. Ethnic minorities should be especially vulner-able to military repression and thus to food insecurity, as the recent “food wars”in Ethiopia, Afghanistan, Sierra Leone, Myanmar ~Burma! and the Congo testify.Military rule may also indirectly reduce food security by diverting governmentspending from social programs toward weapons purchases and reinforcing thepower of metropolitan elites and foreign investors at the expense of the ruralpopulation and the poor ~Wolpin, 1981, 1983; Bates, 1981; Berg-Schlosser, 1984!.
A recent twist on these arguments is the idea of “military famine” ~Cheatham,1994; Macrae and Zwi, 1994; Uvin, 1998!. Responding to underlying subsistencecrises, bandit armies and guerrilla groups use broadly distributed humanitarianfood aid to consolidate their territorial control, thus perpetuating the chaos andcollapsed states that have contributed to widespread hunger ~Prendergast, 1996;de Soysa and Gleditsch, 1999!. Messer et al. ~1998! show that military repressionand internal war have been a major source of food scarcity in several LDCs,pointing to the need for peace-building as a basis for restoring food security.
These arguments, especially those about military force, have received littlecross-national analysis. Jackman ~1976! found no significant difference in eco-nomic growth between military and civilian regimes, and Dixon and Moon ~1986!uncovered no impact of the duration of military rule on PQLI. Kick et al. ~1990!,however, found that the longer the duration of military rule in a country, thelower its economic growth and the higher its rate of infant mortality. We extendthis to food security as well as to addressing the link between praetorianism andthe use of military force both internally and internationally.
Insofar as some of these aspects of military power are distinct, it is possiblethat some ~e.g., military participation! improve social welfare whereas others~e.g., military spending! reduce it. Most studies have focused on only one or twodimensions of military power ~typically spending and military participation!, andthere has been little attention to the relationship between militarization ~resourc-es! and militarism ~conduct!. We first examine the relationship among the vari-ous aspects of military power and then evaluate how these affect food security.
Method and Measurement
Our primary focus is change in food security between 1970 and 1990.6 As notedearlier, this was a period of generally improving food security, with a significantnumber of LDCs, however, losing food security. It also witnessed significantincreases in military power, making this an opportune time to evaluate theimpact of military power on food security. We use ordinary least-squares regres-sion in a lagged panel design ~i.e., controlling for the lagged endogenous termfor 197001975!. This is a conservative design, which is preferable to a static orcross-sectional design because it reduces the risk of bias associated with recipro-cal causality and serial correlation of errors, thus strengthening confidence in
6 Updated measures for child hunger after 1990 are not available, but supplementary analysis of food supplychange to 1996 produced results identical to those for the caloric models, indicating that Cold War patterns havepersisted into the 1990s.
166 Military Power and Food Security

our results ~Hannan, 1979!. It is also superior to predicting a change score,which is more vulnerable to heteroskedasticity and specification bias ~Bohrn-stedt, 1968; Hannan, 1979; Finkel, 1995:13–22!.7 Some of the military powervariables discussed below are best considered as change scores ~e.g., increasedmilitary spending!, whereas others are underlying static features ~e.g., militaryrule!. Residual plots and the Breusch-Pagan test ~Breusch and Pagan, 1979;Judge, Griffiths, Hill, Lütkepohl, and Lee, 1985; McClendon, 1994:179–184!indicate no heteroskedasticity in any of our models. We also introduce controlsfor economic growth ~1970–1990!, the initial development level, and the inter-action of growth with the initial development level to evaluate whether there isa trickle down from growth that mediates any military power effects. To test forspecification bias, we introduced regional dummies in full models, which indi-cated no problems.8 Exhaustive tests of final models for influential cases usingstandard methods ~Bollen and Jackman, 1985! revealed no problems.9
We examine LDCs with a population of 1 million or more in 1970 and astanding military by 1990. We include two countries ~Mongolia, Lesotho! that didnot have a standing military in 1970 but did by 1990 as well as one country ~CostaRica! that had no military spending in 1970 but did by 1990. Because of missingvalues, the food supply analysis is based on 79 cases and the child hunger on75.10 Table 2 summarizes the measurement of all our independent variables,which we discuss below.
Capturing Food Security
To capture change in food supply, we use the five-year means for daily caloricand protein supply for 1968–1972 and 1988–1992 as outlined above and, tocapture change in child hunger, the weight-to-height measures of undernutri-tion for 1975 and 1990 discussed earlier. These data have broad coverage andhigh reliability, tapping distinct aspects of food security.
Assessing change also has a substantive advantage in analyzing food supply.Discussions often treat food supply as if it were an absolute, but anthropometric
7 We test equations using a cross-sectional ~simple panel! design predicting levels of caloric and protein supplyin 1990 and the level of child hunger in 1990 using both static and change scores for military spending andparticipation. The results were identical with stronger t-tests, as expected with such an approach, thus underscoringthe point that a lagged panel design is a more conservative method for evaluating hypotheses in that it reduces thechance for inflated t-values.
8 In the food supply equations, two different dummy variables—one for sub-Saharan Africa, the other forNorth Africa and the Middle East—were significant, with the former being negative and washing out the effects ofarms imports and military spending, whereas the latter was positive and washed out the effects of developmentlevel. They did not alter any other effect, indicating that these factors are associated with the underlying nature ofrespective regions. This should not be surprising, given that North Africa and the Middle East contain the highestlevels of economic development, whereas Africa exhibits the largest regional changes during the period understudy in the spending burden and arms imports. Dummy variables for Latin America and Asia were not significantin the supply models and had no effects on the final equations. None of the regional dummy variables weresignificant in the child hunger models.
9 India is an outlier, but removing it indicates that it is not influential in the caloric supply models. Similarly,Afghanistan is an outlier in the child hunger models but not influential.
10 A total of 82 countries were included in one or both analyses. The caloric and protein analyses include sevencountries for which there are no child hunger data ~Benin, Burkina Faso, Côte d’Ivoire, Israel, North Korea, SouthKorea, and Singapore! and the child hunger analysis includes three countries not included in the caloric andprotein analysis ~China, Ghana, Papua New Guinea!. The other countries included are Afghanistan, Algeria,Angola, Argentina, Bangladesh, Bolivia, Brazil, Burma, Cambodia, Cameroon, Central African Republic, Chad,Chile, Colombia, Congo, Costa Rica, Cuba, Dominican Republic, Ecuador, Egypt, El Salvador, Ethiopia, Guatemala,Haiti, Honduras, India, Indonesia, Iran, Iraq, Jamaica, Jordan, Kenya, Laos, Lebanon, Lesotho, Liberia, Libya,Madagascar, Malawi, Malaysia, Mali, Mauritania, Mexico, Morocco, Mozambique, Nepal, Nicaragua, Niger, Nigeria,Pakistan, Panama, Paraguay, Peru, Philippines, Rwanda, Saudi Arabia, Senegal, Sierra Leone, Somalia, Sri Lanka,Sudan, Syria, Tanzania, Thailand, Togo, Tunisia, Uganda, Uruguay, Venezuela, Zaire ~Democratic Republic ofCongo!, Zambia, and Zimbabwe.
Stephen J. Scanlan and J. Craig Jenkins 167

Table 2. Measurement
Variable Definition and Source
Dependent VariablesFood Supply Five-year average for daily caloric supply per capita and daily
protein supply per capita, 1988–1992 ~FAO, 1994, 1992, 1972!
Child Hunger Prevalence of child nutritional well-being as indicated by thepercentage of children under age 5 who are of healthy weight,1990 ~UNDP, 1994!
Independent VariablesLevel of Economic
DevelopmentLevel of economic development based on real ~1980 U.S. dollars!gross domestic product per capita, 1970, 1975 ~Summers andHeston, 1991!
Economic Growth Average annual percentage change in real ~1980 U.S. dollars!gross domestic product per capita, 1970~75!–1990 ~Summers andHeston, 1991!
Military Participation First-difference change in armed forces personnel per thousandin the population aged 16–65, 1970~75!–1990 ~U.S. Arms Controland Disarmament Agency, 1975, 1985, 1994!
Military Spending: Budget First-difference change in military expenditure as a percentage ofcentral government expenditure 1970~75!–1990 ~U.S. ArmsControl and Disarmament Agency, 1979, 1997!
Military Spending: Societal~GNP!
First-difference change in military expenditures over GNP,1970~75!–1990 ~U.S. Arms Control and Disarmament Agency,1975, 1985, 1994; World Bank, 1994!
Military Rule Intensity of military rule based on number of years in whichmilitary or mixed regimes held power divided by total number ofyears from 1970 to 1985 ~Gurr, 1989!
Military Repression Dummy variable for the presence of military repression codedyes 5 1, no 5 0, 1980s ~Kidron and Smith, 1983, 1991!
Military Instability Likelihood of military coups and military loyalty, coded utterlyunreliable 5 4, unreliable 5 3, barely reliable 5 2, not whollyreliable 5 1, reliable 5 0, 1980s ~Kidron and Smith, 1983;Morrison et al., 1989!
Arms Producer Dummy variable for arms producers coded yes 5 1, no 5 0,1970–1985 ~Brzoska, 1989; Kidron and Smith, 1983!
Arms Exporter Dummy variable for arms exporter states coded yes 5 1, no 5 0,1970–1985 ~Brzoska, 1989; Kidron and Smith, 1983!
Arms Imports Average annual percentage change in the value of arms transfersper real GNP, 1970–1985 ~Brzoska and Ohlson, 1987!
Presence of Interstate War Dummy variable for the presence of interstate war, yes 5 1,no 5 0, 1970–1990 ~Kidron and Smith, 1983, 1991; Singer andSmall, 1993!
Presence of Civil War Dummy variable for the presence of civil war, yes 5 1, no 5 0,1970–1990 ~Kidron and Smith, 1983, 1991; Singer and Small,1993!
Presence of Genocideor Politicide
Dummy variable for the presence of genocide or politicide,coded yes 5 1, no 5 0 ~Fein, 1993; Harff and Gurr, 1989!
Ethnic PoliticalDiscrimination
Intensity of ethnic political discrimination based on summedproportion of minorities experiencing political discrimination inthe form of neglect, social ostracism, and political exclusion orrepression, with high values meaning higher discriminationagainst larger minority populations, 1970–1985 ~Gurr, 1993!
168 Military Power and Food Security

research shows that there is no simple caloric0protein level at which food short-age leads to malnutrition. As noted above, this is partially a question of distri-bution, but it is also a question of human adaptability. Human caloric0proteinand nutrient requirements are based on an accustomed activity level, climate,culture, population age structure, sex composition, and body size ~Foster, 1992:77–83; FAO, 1996b:128–142!. Although there is a physiological minimum for thebasic health of any specific population, this variable is based on accustomedlevels and is thus in part culturally relative. Hence the most important issue fora cross-national aggregate analysis is change in caloric0protein supply. A drop of300 daily calories in a country that has traditionally consumed 3,100 calories percapita has greater malnutrition impact than a decline of 100 daily calories in acountry that has traditionally consumed 1,900 per capita. For example, NorthKorea, which had 2,867 daily calories per capita in 1990, is five years laterexperiencing famine with a drop of only 507 daily calories per capita despite thefact that average daily caloric supply is considerably higher than that of almost allof the countries in sub-Saharan Africa ~FAO, 1998!.
In analyzing child hunger rates, we also control for the effects of change infood supply over the same period ~1975–1990!. This allows us to test the argu-ment that hunger is deeply embedded in social structure and largely indepen-dent of changes in aggregate food supply ~Drèze and Sen, 1989!. It also providesa conservative test of arguments about the impact of military power on hunger.
Capturing Military Power
The discussion of military power focuses on both changes and the level ofvarious aspects. Change can be gauged in different ways: the first-differencechange scores ~Yt2 2 Yt1!; the percentage change @~Yt2 2 Yt1!0Yt1# 3 100; and theannual average rate of change $@~Yt2 2 Yt1!0Yt1#0number of years% 3 100. Thefirst is relevant when we are speaking of a general structural trend, the secondwhen addressing the extent of change relative to a starting point value, and thelast when tapping the simple linear rate of change. In the following discussion,we discuss the theoretical reasons for the particular change metric used.
Most attention by academics and scholars ~e.g., Chan, 1985; Bullock and Fire-baugh, 1990; Benoit, 1973, 1978! has focused on military spending. We use twomeasures: the change in military expenditures in constant U.S. dollars normedagainst central government expenditures ~U. S. Arms Control and DisarmamentAgency, 1979, 1997! and the change in military expenditures normed againstreal GNP ~U.S. Arms Control and Disarmament Agency, 1975, 1985, 1994; Sum-mers and Heston, 1991!.11 Benoit ~1973, 1978! used the first to evaluate theimpact of a budget trade-off between military and nonmilitary expenditure. Ifincreased military spending is forcing the government to reduce social spendingand thus creating hunger, this measure should be negative. If, however, it isstimulating economic growth and reducing insecurity, it should be positive.Between 1970 and 1990, the mean military spending in LDCs increased from15.32% of central government budget to 17.22%, with the Sudan, Argentina,Saudi Arabia, Syria, and Panama exhibiting the greatest levels of growth. Thesecond taps the possible societal benefit or burden that military spending mightimpose by affecting human and physical capital, technological spin-offs, andinflation. Military spending relative to the whole economy increased from 11.35%
11 We compared these Arms Control and Development Agency ~ACDA! arms transfer and military spendingestimates with those of the Stockholm International Peace Research Institute ~SIPRI! ~1982, 1994! but found nosignificant differences. ACDA and SIPRI estimates are correlated between .88 and .97, and SIPRI estimates pro-duced the same results in the regression equations though with fewer cases. Hence despite questions about thepro-Western bias of ACDA, we found no evidence that this affected our results ~for a fuller discussion, see Happeand Wakeman-Linn, 1994!. ACDA has fuller country coverage, so we use it.
Stephen J. Scanlan and J. Craig Jenkins 169

to 13.50% of GNP between 1970 and 1990. On this measure Iraq had the largestgrowth, with Saudi Arabia, Ethiopia, Afghanistan, and Angola as the other topmilitary spenders. We use a first-difference change for both, since the questionis whether there is a trend toward greater or less spending.
Military participation is based on the number of troops in the armed forcesdivided by a country’s labor force. We use troop estimates of the U.S. ArmsControl and Disarmament Agency ~1975, 1985, 1994!. To gauge labor force, weuse the population between ages 16 and 65. This is superior to norming by totalpopulation because it taps the economically productive sector of the population.Because larger militaries are likely to recruit from a broader cross-section of thepopulation and to be more socially embedded in different regions and sub-groups, military participation should create social integration and cohesivenessacross regional and ethnic differences in LDCs ~see Andreski, 1968; Bullock andFirebaugh, 1990!.12 Between 1970 and 1990, mean military participation in LDCsgrew from 11.35 troops per thousand population to 13.5. Iraq experienced thegreatest increase on this term as well, with Syria, Mongolia, North Korea, andLibya the other leading militarizing states. Participation is correlated with spend-ing in that personnel costs constitute on average 50% of total military budgets inLDCs ~Harris et al., 1988!. In the regression analysis, we controlled simulta-neously for both spending and military participation, allowing us to disentanglethe distinct effects of personnel and nonpersonnel spending. To further checkthis, we also used two-staged least squares to see if increased spending has thesame effect on the residuals left after controlling for military participation, andvice versa. This produced the same results as the additive regression equations.Ideally we would use budget figures broken down into personnel costs, invest-ment in equipment, and arms purchases, but detailed military budget data arenot available for sufficient countries to be analyzed cross-nationally.
Arms production is coded as a dummy variable for significant arms produc-tion capacity in the 1970s and 1980s ~1 5 yes; 0 5 no! derived from Brzoska~1989! and Kidron and Smith ~1983, 1991!. Although crude, our assumption isthat the simple presence of such capability is the critical issue. The value addedfrom arms production over gross domestic product ~GDP! would be better but isunavailable for enough LDCs to be usefully analyzed. A second measure is armsexporting, treated as a dummy variable ~1 5 yes; 0 5 no, derived from Brzoska,1989; Kidron and Smith, 1983!. Most LDC arms producers are also involved inarms exporting, especially those capable of producing more sophisticated weap-ons. This should further boost or detract from their food security. Assuming thatexporting has a greater market value than simple production, this may be morerelevant. Although precise estimates of arms export value are not available, themere presence of arms export capacity should capture its effects on a country’sfood security.
Many argue that arms imports constitute a social drain. Because the issue isthe rate of increase in this potential burden, we use the average annual rate ofchange between 1970 and 1985 in the total value of international weaponspurchased in constant U.S. dollars normed over real GNP ~Brzoska and Ohlson,1987!. An arms import burden may also be associated with increased militaryspending.
We also examine the political role of the military in terms of praetorianism.We use two measures: ~1! the intensity of military rule, based on the proportionof years between 1970 and 1985 in which a military or a mixed military-civilian
12 Military participation ratio ~MPR! and a measure of ethnic homogeneity, which we derive from Sullivan~1991!, are only mildly correlated at r 5 .16, which is not statistically significant. In fact case-by-case evidence revealsseveral examples of states’ high MPR and low ethnic homogeneity levels relative to other LDCs, indicating apotential cohesiveness function, including Angola, Jordan, Laos, Malaysia, and Mauritania, among others.
170 Military Power and Food Security

regime held power ~based on Polity II @Gurr, 1989#!;13 and ~2! military instability,based on the loyalty of militaries and the propensity for coups and threatenedpolitical interventions. Kidron and Smith ~1983! use multiple sources ~e.g., pressreports, the International Institute for Strategic Studies! to construct this scale.We supplement it with the frequency of coups and coup attempts in sub-SaharanAfrica ~Morrison, Mitchell, Paden, and Stevenson, 1989!. A related measure ismilitary repression, based on assigning the military chief responsibility for inter-nal security and reports of military involvement in torture, imprisonment, andhuman rights violations from Amnesty International, press reports and the like~Kidron and Smith, 1983, 1991!. If the military is responsible for internal polic-ing, it is more likely to repress the political enemies of the regime.
The “military famine” thesis traces food insecurity to armed conflicts. Internalwars and interstate wars should disrupt food production and markets and hinderdistribution and may also interact with military regimes, regional arms races, andrelated military spending growth. Thus there may be direct effects of armedconflicts as well as effects linked with these other aspects of military power. Wegauge both of these with a dummy variable ~1 5 presence; 0 5 no presence!,based on wars reported by the Correlates of War project ~Singer and Small,1993!, cross-checked with Kidron and Smith, 1983, 1991, and Project Plough-shares, 1994. Simple presence or absence of these measures are useful in that theeffects of war on food security linger beyond the specific official duration of theconflict, including deaths directly and indirectly related to it ~Messer et al.,1998!. To test the argument that it is not the form of war but rather the inci-dence of armed warfare per se, we also use a general war indicator that sums thetwo.
Internal political enemies are often ethnic minorities subjected to politicaldiscrimination. We therefore also tap the intensity of ethnic political discrimi-nation by the percentage of country population represented by minority groupssubjected to the most intense political discrimination ~Gurr, 1993! and a dummyvariable representing the presence of genocide or politicide in a country between1970 and 1990 ~Harff and Gurr, 1989; Fein, 1993!. Wars make the militaryfunctionally important and thus strengthen military power. Thus we test theinteraction between military rule and armed conflicts.
In general, broad militarization measures should have more impact on eco-nomic growth and thus aggregate food supply, whereas militarism, especially thattied to the repression of internal enemies, should affect internal food access andthus child hunger.
Control Variables
We also examine the trickle down from economic growth. Neoclassical econom-ics and modernization theory argue that economic growth benefits disadvan-taged populations and thus should improve food supply and reduce hunger.These benefits may also be more linked to the more developed of the LDCs.Thus we test for both the average annual percentage of economic growth andthe interaction between growth and the level of economic development. Eco-nomic growth rate is measured as the average annual percentage growth in realU.S. dollars of real gross domestic product ~RGDP! per capita between 1970 and1990 ~Summers and Heston, 1991!. Economic growth may also be tied up withmilitary spending and participation. We therefore test this by comparing equa-tions including and excluding economic growth to see if spending mediates or isbehind any growth benefits. We also control for the starting-point ~1970! level of
13 We also used the simple presence of a military regime during this period, testing the idea that simply havinga military regime would have detrimental effects. It was never significant.
Stephen J. Scanlan and J. Craig Jenkins 171

economic development ~or RGDP per capita! to reduce possible specificationbias and control for any “floor” effect of starting at a lower level of development~i.e., indicating that LDCs have more room for improvement!. If RGDP is posi-tive, this indicates that more-developed countries were more economically andsocially integrated and thus better able to improve food security, which is com-patible with modernization arguments. We begin by examining the dimension-ality of military power to see if there is strong overlap among the various militarypower measures, then turn to the analysis of food security.
Results
Table 3 shows the correlation matrix and the descriptive statistics for the militarypower measures. The change in military spending and military participation arestrongly related, suggesting that they might comprise an underlying resourcedimension. However, we are also interested in distinguishing among differenttypes of spending. We thus control for both simultaneously in the regressionanalysis and compare this against simpler equations to see if spending on per-sonnel can be distinguished from that on weapons and equipment. As notedearlier, we confirm this using a two-staged least-squares procedure. Arms pro-ducers are also correlated with arms exporters, confirming our earlier discussionof the overlap. However, none of the other resource measures, including militaryspending and arms imports, are strongly correlated. This indicates that thesemilitary resource aspects are quite distinct, except for military spending andparticipation.
Several of the militarism measures are moderately correlated: ~1! militaryrepression with internal war, ~2! military rule with general war and geno-0politicide, and ~3! internal and general war with geno-0politicide. The link betweenmilitary rule and general war and geno-0politicide supports the idea that militaryregimes contribute to armed conflicts. Military instability, however, is unrelatedto any other measures, except negatively to arms production and exporting.Significantly, there are only two positive correlations between the militarizationmeasures and any militarism measure. Arms exporters are more likely to expe-rience interstate wars, possibly because export activities embroil them in regionalconflicts. Neither military spending nor participation are strongly related to anyof the militarism measures, undermining the contention that military powerconstitutes a single unified process. In fact, arms producers0exporters are signif-icantly less likely to experience military instability. Thus, it appears that overallthese are distinct aspects of military power, with some overlap between spendingand participation and among the various armed conflict and repression measures.
We next turn to the analysis of food supply ~Table 4!. We present results forcaloric supply because it is more central to overall food security than proteinsupply. ~We did analyze protein supply as well, but the results were virtuallyidentical, so we simply discuss the few discrepancies.! Economic growth, thestarting-point development level, and growth in the more developed of the LDCs~i.e., the interactive combination of these! contribute to improved food supply~equation 1 in the table!. The more developed of the LDCs experience greaterimprovement in food supply, indicating increasing global inequality in the foodsupply of LDCs over time. Economic growth also improves food supply and, inaddition, economic growth has a greater benefit in these more developed coun-tries among the LDCs.14 Protein supply was identical, except that economicgrowth per se was not significant, whereas the interaction of growth with thestarting-point development level was. This supports the modernization argument
14 These results are not due to multicollinearity. We tested each of these measures separately in all possiblecombinations, producing identical findings.
172 Military Power and Food Security

Table 3. Pearson Correlations, Means, and Standard Deviations for Military Power Measures
(1) (2) (3) (4) (5) (6) (7) (8) (9) (10) (11) (12) (13) (14)
~1! Military Participation Ratio 1.0~2! Military Spending: Budget .42* 1.0~3! Military Spending: GNP .53* .52* 1.0~4! Arms Imports .08 .13 .07 1.0~5! Arms Producers 2.14 2.01 2.15 2.28* 1.0~6! Arms Exporters .10 .03 2.07 2.18 .45* 1.0~7! Military Rule .16 2.07 .11 2.12 .07 2.01 1.0~8! Military Instability .04 2.02 .09 .06 2.40* 2.34* .13 1.0~9! Military Repression 2.12 .20 .02 .20 .04 .04 .06 .06 1.0
~10! Internal War 2.00 .07 .12 .26* 2.20 2.01 .03 .16 .39* 1.0~11! Interstate War .13 .15 .01 .11 2.07 .33* .07 2.02 .30* .27* 1.0~12! General War .06 .13 .03 .16 2.10 .26* .20 2.02 .37* .56* .42* 1.0~13! Ethnic Discrimination .01 2.18 2.08 2.01 2.02 .11 .04 .05 2.09 .07 2.01 .08 1.0~14! Geno-0Politicide .07 .10 .00 2.13 .09 .17 .33* .02 .21* .48* .10 .44* .13 1.0
Mean 3.06 2.43 .01 30.66 .47 .30 4.11 1.36 .53 .34 .42 .51 .14 .29
Standard Deviation 17.75 13.06 .07 84.08 .50 .46 5.52 1.07 .50 .48 .50 .50 .20 .46
*significant at p 5 .05 or higher, two-tailed.

Table 4. Lagged Panel Analysis ~OLS! of Military Power on Caloric Supply, 1970–1990
Variable
Eq. 1b
(t-value)
Eq. 2b
(t-value)
Eq. 3b
(t-value)
Eq. 4b
(t-value)
Eq. 5b
(t-value)
Eq. 6b
(t-value)
Eq. 7b
(t-value)
Caloric Supply, circa 1970 .54**** .49**** .48**** .41*** .40*** .58**** .56****~3.73! ~3.41! ~3.44! ~3.10! ~3.15! ~5.29! ~4.99!
Development Level, 1970 .14*** .14*** .13*** .10** .09** .09**~3.20! ~3.23! ~3.08! ~2.49! ~2.28! ~2.37!
Economic Growth 1.21** 1.26** 1.14** .74 .72 1.18**~2.26! ~2.43! ~2.23! ~1.51! ~1.46! ~2.37!
Development Level 3 Economic Growth .02** .02** .01** .01 .01~2.17! ~2.26! ~2.16! ~1.51! ~1.33!
Change in Military Participation 6.40*** 6.38*** 5.20** 4.94** 6.53*** 7.21***~2.74! ~2.81! ~2.41! ~2.36! ~3.12! ~3.31!
Change in Military Spending0GNP 21333.93** 21131.48* 2963.03* 2840.40 2764.15 2583.62~22.20! ~21.90! ~21.72! ~21.55! ~21.40! ~21.08!
Average Annual Percentage Changein Arms Imports0GNP
2.95** 2.83** 2.73* 2.89** 21.04***~22.34! ~22.19! ~21.94! ~22.24! ~22.81!
Arms Exporters 269.63*** 240.77*** 257.20***~3.27! ~2.99! ~3.11!
Military Repression 2110.36* 51.07~21.71! ~.56!
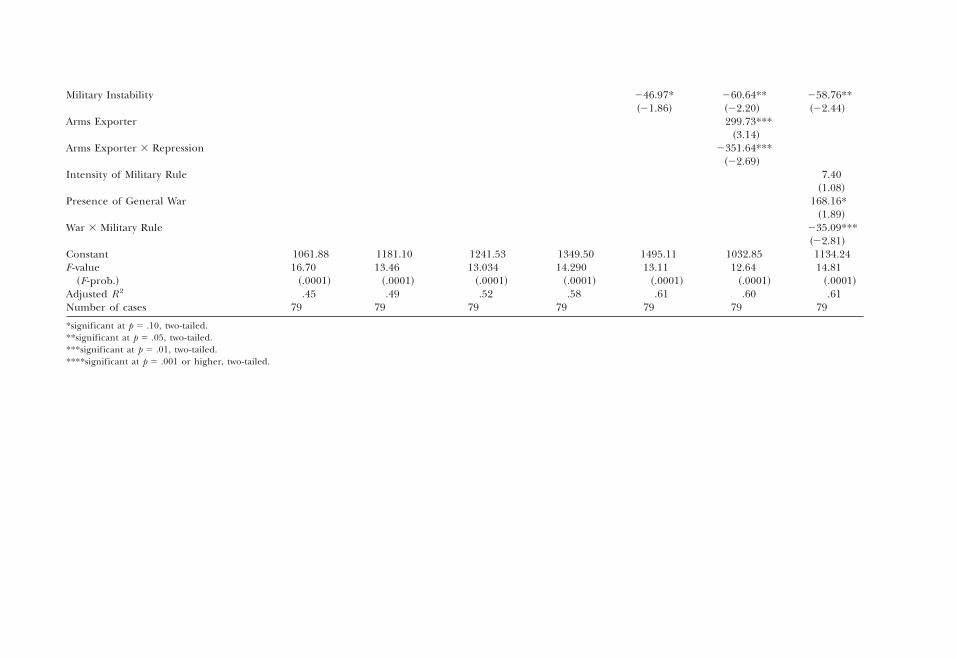
Military Instability 246.97* 260.64** 258.76**~21.86! ~22.20! ~22.44!
Arms Exporter 299.73***~3.14!
Arms Exporter 3 Repression 2351.64***~22.69!
Intensity of Military Rule 7.40~1.08!
Presence of General War 168.16*~1.89!
War 3 Military Rule 235.09***~22.81!
Constant 1061.88 1181.10 1241.53 1349.50 1495.11 1032.85 1134.24F -value
~F -prob.!16.70 13.46 13.034 14.290 13.11 12.64 14.81
~.0001! ~.0001! ~.0001! ~.0001! ~.0001! ~.0001! ~.0001!Adjusted R2 .45 .49 .52 .58 .61 .60 .61Number of cases 79 79 79 79 79 79 79
*significant at p 5 .10, two-tailed.**significant at p 5 .05, two-tailed.***significant at p 5 .01, two-tailed.****significant at p 5 .001 or higher, two-tailed.

that more developed LDCs have the social infrastructure to reap more socialbenefits from economic growth. This “growth dividend” to food supply shouldnot, however, be construed automatically as a trickle-down effect, which is moreclearly relevant to the distributional component of child hunger we examinebelow. What it does suggest is an increase in global food inequality, with themore developed among the LDCs benefiting more in terms of aggregate foodsupply. Such findings support claims ~Peacock et al., 1988; Homer-Dixon, 1995;Korzeniewicz and Moran, 1997! of a widening gap in social welfare among LDCs,with the poorer countries falling further behind in terms of human capital andtechnology.
Next we show that increased military spending relative to GNP constitutes asocial burden by reducing caloric supply whereas military participation improvesit ~equation 2!.15 Introducing these variables separately produces identical find-ings and did not significantly change the strength of the t-statistics, indicating nomulticollinearity problems. This allows us to distinguish between military spend-ing directed at personnel, which helps food supply, versus weapons and equip-ment, which is detrimental to it. The spending burden normed against centralgovernment expenditures was never significant, indicating that the burden is nota budget trade-off problem. We also tested the budget trade-off idea by usingeducation and health spending normed over central government spending, butthese measures were never significant. Although the number of countries withavailable budgetary data is limited ~N 5 49 for education and N 5 34 for health!and therefore problematic, we were unable to find evidence of a budget trade-off. Thus, the military spending problem is that of a burden on the total econ-omy and not just government constraints. Increased purchases of weapons andother equipment crowds out investment and diverts resources from beneficialeconomic development. Economic growth is weakly correlated negatively withboth increased military spending and military participation ~r 5 2.12 and 2.11,respectively!, and removing it and the growth0level of development interactionand level of development terms does not significantly alter these militarizationeffects. Thus the impact of military participation is not due to boosting growth.
To confirm the opposing spending burden and military participation effects,we also used a two-staged least-squares approach. Regressing the societal spend-ing burden on the residuals from predicting caloric supply with MPR was nega-tive and significant ~b 5 2934.6933, t 5 21.858!, whereas regressing MPR on theresiduals from predicting caloric supply with the societal spending burden waspositive and significant ~b 5 4.136, t 5 2.101!. Thus, increased spending on armsand equipment is negative net of controls for increased personnel spending, andincreased personnel spending is positive and significant net of increased spend-ing. Results of the analysis of protein supply differ only in that the spendingburden is negative but not significant.
We next turn to problem of arms importing, which reduces caloric supply~equation 3!. This supports the critics of the international arms bazaar whocontend that international arms purchases come at the expense of social needs.This weakens the effect of military spending, suggesting that part of the spend-ing burden problem is tied up with arms imports. Again, this appears to be aproduct of diverting economic resources from more beneficial societal endeav-ors rather than a governmental budget trade-off. Removing the controls for
15 Because there is a possibility that the MPR effects occur only among the more developed or economicallyprosperous of the LDCs, we test for its interaction with both the economic growth– and economic development–level terms. It is not significant in either basic or combined equations, indicating that the MPR effect is not acondition of either richer or poorer LDCs or of those experiencing more rapid economic growth. Furthermore,because it does not alter other components of the equation, such as economic growth or the growth–developmentlevel interaction, we can be confident that it is not tied up with these items.
176 Military Power and Food Security

military spending and the economic growth0development–level terms did notalter this effect. The results of the protein supply analysis were identical.
Arms production and exporting both improve caloric supply, with exportingexerting the stronger influence. These two terms are multicollinear. Thus weshow the stronger of the two, which is exporting ~equation 4!. In this equation,economic growth and the development level0growth interaction lose signifi-cance, indicating that arms exporters were major beneficiaries of economicgrowth and thus central to the growth dividend in terms of food supply. Theincreased spending burden also loses significance, suggesting that arms export-ing offsets this burden. Substituting arms production for exporting in this equa-tion reveals the same result but, if both are used simultaneously, only armsexporting is significant ~not shown but available from the authors!. This suggeststhat arms production is beneficial but that the more advantaged exporting coun-tries are the best off. All but 4 of the 27 arms exporters in the analysis are alsoproducers, but there are an additional 20 producers that do not export, produc-ing arms solely for internal use. Since exporters are likely to produce moreadvanced weapons, we suspect this is due to the international trade benefits ofarms exporting. Analysis of protein supply again produced identical results.
We next turn to the problem of praetorianism, finding that repressive andunstable militaries reduce food supply ~equation 5!. Military rule does not showsignificance in either this or simpler models, so we show only the significantinstability terms. All other terms remain significant, but the t-test for the spend-ing burden drops from 21.951 to 21.694, indicating that the effects of repres-sive and coup-prone militaries are partially tied up with the spending burden.Military participation is unaffected. Thus, it appears that unstable militaries aremore likely to boost their spending but not on personnel. The t-tests for devel-opment level and the interaction with economic growth similarly drop. We alsoentered these factors separately, producing identical results. Results of the analy-sis of protein supply followed the same pattern except that the spending burdenwas not significant.
These findings indicate that the institutionalization of the military is critical tofood supply. A military with low morale and a propensity to seize governmentalpower and to repress political opponents constitutes a significant threat to basicneeds. We also tested interactions combining military rule with repression andmilitary instability, but neither were significant. The weak correlations betweenmilitary rule and the other armed-conflict measures militate against critics whoclaim military regimes are responsible for repression and internal violence. Prae-torian rule per se does not appear to be that critical to this aspect of food securityor to internal instability. The effects in the analysis of protein supply were identical.
Equation 6 shows that arms producers whose militaries were simultaneouslyinvolved in domestic repression suffered reduced food supply. The base term forarms production remains significant, but military repression loses significance,indicating that the repression problem is tied up with states that produce theirown arms. These “low-tech” arms producers are producing weapons that arethen used to repress domestic opponents and thereby reduce caloric supply.Examining the cases exhibiting both arms production and domestic repressionreveals that food-troubled states such as Ethiopia, Sri Lanka, and the Sudanscore highly on this value but are also joined by more food-secure states likeIsrael, Singapore, and Syria. This effect does not show up for arms exporting,reinforcing the argument that the key question is arms production for internalrepressive use. Because the interaction between economic growth and starting-point development level remains insignificant and does not alter these findings,we do not show it in this equation. These repressive arms producers seem to alsobe the more developed of the LDCs, where economic growth was beneficial.Findings of the analysis of protein supply were again identical.
Stephen J. Scanlan and J. Craig Jenkins 177

Finally, we examine the interactive effects of general war, which combines thepresence of civil and interstate wars, and the intensity of military rule. Militaryrule per se is not significant and war is beneficial but, when these are combined,food supply is lowered ~equation 7!. International war often mobilizes the pop-ulation socially and politically and may thus improve food supply but the inter-action is negative, suggesting that military regimes are less able to mobilize thesesentiments. Notable cases such as in Afghanistan, Cambodia, Chad, and Peru fitthis pattern of detrimental military rule combined with interstate war. In simplerequations, neither military rule nor war are significant, indicating that this is aspecial effect of the combination.
Overall, these results support both sides of the traditional debate over militarypower. There is a negative spending burden on the economy stemming fromarms imports and related military spending. Unstable and repressive militariesand military regimes engaged in interstate wars do impose costs on food supply.At the same time, military participation, arms production, and arms exportingdo boost food supply, as do arms producers involved in repressing internalenemies. These effects operate largely independently of positive benefits fromeconomic growth and the level of development, adding roughly 15% to theexplained variance in these equations. In a highly conservative lagged paneldesign, this is a respectable increment. The impact on protein supply was iden-tical, except that military spending did not reduce protein supply, and there isno benefit from economic growth.
We next turn to analyzing child hunger rates. We begin by controlling for thechange in caloric supply over the same period. This strengthens our confidencethat we are tapping the hunger problem and allows us to evaluate the entitle-ment theory thesis ~Sen, 1981; Drèze and Sen, 1989! that hunger is not due tofood scarcity per se but to the internal distribution of food. Table 5 examines thechange in healthy-weight children, beginning first with the lagged control for1970 and the 1970–1990 first-difference change in caloric supply ~equation 1!.We score this so that positive signs indicate an improvement in child hungerrates ~i.e., a reduction in hunger!. LDCs with increased food supply did experi-ence greater progress in child hunger. This militates against a simple version ofthe entitlement thesis that food supply is irrelevant to levels of hunger. However,equation 2 shows that this benefit is largely due to economic growth. In thisequation, caloric change loses significance and only the starting-point develop-ment level and the interaction of growth with development level are significant.We also introduced growth and development level separately but they were neversignificant and did not influence the effects of change in food supply. Thus, atrickle down from economic growth to disadvantaged groups exists but is limitedto the more developed of the LDCs. At the same time, growth in the poorercountries, such as Ethiopia and India, does not trickle down. This suggests thatthese poorer countries have strongly entrenched social inequalities and barriersthat prevent economic growth and increased food supply from reducing childhunger. Controls for the change in protein in place of food supply producedidentical effects. Because food supply is never significant in the remaining equa-tions and its inclusion does not alter any of the other effects discussed below, wedrop it from the rest of the equations.
Paralleling our findings for food supply, increased military spending relativeto GNP contributes to hunger, whereas military participation reduces it ~equa-tion 3!.16 As with the food supply models, there is no support for the budget
16 We once again test the interactions of military participation with development level and economic growth, find-ing these to be insignificant as in the food supply equations. Furthermore, unlike the interaction between economicgrowth and development level, the term is in the negative direction, indicating that if significant, the benefits ofmilitary participation on child hunger rates would more likely occur in poor countries with less economic growth.
178 Military Power and Food Security

Table 5. Lagged Panel Analysis ~OLS! of Military Power on Child Hunger, 1975–1990
Variable
Eq. 1b
(t-value)
Eq. 2b
(t-value)
Eq. 3b
(t-value)
Eq. 4b
(t-value)
Eq. 5b
(t-value)
Eq. 6b
(t-value)
Percentage of Children of Healthy Weight, 1975 .78**** .72**** .69**** .67**** .67**** .67****~15.87! ~13.49! ~13.11! ~12.85! ~8.14! ~8.09!
Change in Caloric Supply, 1970–1990 .005 .003~2.42! ~1.49!
Development Level, 1975 .003*** .004**** .003*** .003**** .004****~2.82! ~3.55! ~3.13! ~3.46! ~3.57!
Economic Growth, 1975–1990 .02 .03 .05 .03 .02~.68! ~.98! ~1.46! ~1.02! ~.64!
Development 3 Economic Growth .001** .001** .001* .001** .001**~2.24! ~2.30! ~1.92! ~2.19! ~2.35!
Change in Military Participation .15** .17** .17*** .19***~2.22! ~2.52! ~2.75! ~3.09!
Change in Military Spending0GNP 238.34** 235.84** 236.17** 239.50***~22.28! ~22.18! ~22.33! ~22.62!
Presence of Internal War 23.54** 21.32~22.14! ~2.76!
Presence of Geno-0Politicide 24.76*** 26.02****~22.95! ~24.15!
Military Instability 1.04~1.55!
Intensity of Ethnic Political Discrimination 11.81~1.63!
Military Instability 3 Ethnic Discrimination 29.45***~22.68!
Constant 20.01 23.17 24.74 27.46 28.84 27.72
F -value~F -prob.!
133.12 59.54 52.27 47.81 47.71 41.65~.0001! ~.0001! ~.0001! ~.0001! ~.0001! ~.0001!
Adjusted R2 .78 .80 .81 .82 .83 .85
Number of cases 75 75 75 75 75 75
*significant at p 5 .10, two-tailed.**significant at p 5 .05, two-tailed.***significant at p 5 .01, two-tailed.****significant at p 5 .001 or higher, two-tailed.

trade-off thesis, indicating that the problem with military spending has to dowith diverting economic resources from beneficial development at the societallevel. There is also a trickle down from economic growth, but this is confined tothe more developed countries, as before.17 Adding the change in food supply~both caloric and protein! does not alter these results and they remain insigni-ficant, indicating that any benefits from increased food supply are wrapped upwith the trickle down from economic growth that is confined to the more devel-oped among the LDCs.
Next we turn to the question of militarism. In equation 4, internal wars createhunger and, in equation 5, geno-0politicides wash out this internal war effect,indicating that the major problem is severe internal repression. The militaryspending burden and the benefits of military participation persist with strength-ened t-tests, indicating that these are separate. Equation 6 looks at a potentialroot cause of geno-0politicides—ethnic political discrimination—and combines itwith unreliable militaries. This interaction reduces child hunger and increasesthe t-tests for geno-0politicides and internal wars, indicating that these are dis-tinct sources of hunger problems. Thus, countries such as Afghanistan, theDemocratic Republic of Congo, and Sierra Leone that exhibit this combinationof intense ethnic discrimination and military instability are particularly prone tochild hunger problems. Together, these support the military famine thesis thatfood distribution problems are due to severe internal repression, internal war,and underlying ethnic discrimination in countries with unstable militaries.
This analysis does not, however, support arguments that militarism constitutesan integrated complex rooted in military rule or resources. The militarizationeffects are quite distinct from the militarism effects. We also tested for militaryrule and all theoretically meaningful interactions of military rule with repressionand the increase in military resources, but none of these was significant in eithersimple or more complex equations. As we pointed out above in the discussion ofmilitary power, military rule is only modestly correlated with general war andgeno-0politicide. Armed conflicts do contribute to increased child hunger, butmilitary regimes do not appear to be the controlling agents behind these conflicts.
Overall, these results show that militarization is both positive and negative withregard to child hunger, whereas militarism is again negative. Increased militaryspending is a societal burden in that it increases hunger by diverting economicresources from more beneficial endeavors. At the same time, increased militaryparticipation reduces hunger. These results parallel those for food supply, withthe major difference being the greater relevance of internal repression directedat ethnic minorities primarily in the form of geno-0politicide and the combina-tion of unstable militaries with the presence of ethnic discrimination.
We also find a modest trickle down from economic growth and increased foodsupply. This benefit, however, is largely confined among the more developed ofthe LDCs. Thus economic growth does help those at greatest risk where there isgreater social infrastructure and social integration. For the poorer countries,however, growth itself is not a panacea. Thus the Drèze and Sen ~1989! argumentabout famine in the midst of adequate supply needs to be qualified as beingmost relevant to the poorer LDCs. Increased food supply does reduce hunger,but only because it is linked to the successful economic growth occurring amongthe more developed of the LDCs. This supports arguments about growing inter-national inequality leading to hunger and famine in the poorest countries.
17 To confirm that the spending burden and military participation are indeed separate effects, we again usedtwo-staged least squares. We residualize change in healthy-weight children against military participation and thenregress the spending burden on the residual. We also check the change in healthy-weight children against thespending burden and regress military participation on its residual. Once again an increased spending burden wasnegative and significant ~b 5 220.565, t 5 21.702!, whereas military participation was positive ~b 5 .081, t 5 1.668!.
180 Military Power and Food Security

Conclusions
Three problems have limited past research on the social impact of militarypower. First, the focus has largely been on economic growth, which does havesome beneficial effects on food security, but this is largely confined to the moredeveloped among the LDCs. Many of the poorer LDCs have experienced nega-tive growth, and what growth has occurred has had little impact on food securityin these countries. As de Soysa and Gleditsch ~1999! argue, the population inmany of the poorer LDCs is confronting a subsistence crisis, which has given riseto banditry, support for guerrilla movements, ethnic war, and state collapse. Inthis context, militarized conflicts have further undercut the food security of thepopulation. Thus analyses need to be extended to the more central question ofwhether military power is improving or undermining social welfare and suchfundamentals as food security. We have focused on food security because it isarguably the most fundamental of human needs and is thus central to under-standing the well-being of the least advantaged groups and the poorest LDCs.
Second, there has been an overreliance on static cross-sectional models. Sev-eral aspects of militarization are best considered as structural features of coun-tries but others, such as the spending burden or military participation, are bestconsidered as processes. Treating these as change scores also strengthens ourability to make causal inferences about the processes at work ~Finkel, 1995!. Weuse a lagged panel design because it is less vulnerable to heteroskedasticity andspecification bias. However, we obtained similar results from a simple cross-sectional design, indicating that the errors in these data and equations are notthat great. This supports the results of past cross-sectional analyses.
Third, there has also been an overreliance on military spending power and theassumption that militarization ~or militarism! constitutes a single unified process.As we have seen, military power is made up of a variety of distinct factors.Military spending and arms imports do undermine food security, but increasedmilitary participation and arms production0exporting are beneficial. The use ofmilitary force against internal enemies, especially ethnic minorities, creates hun-ger. Moreover, there are few strong relationships between military resources,praetorian rule, and the use of military force. Thus, instead of assuming thatmilitary power is a single unified factor that is detrimental ~or beneficial!, itwould seem better to specify different aspects of military power. In this, we buildon the earlier work ~Weede, 1983, 1986; Kick and Sharda, 1986; Dixon andMoon, 1986; Bullock and Firebaugh, 1990; Kick et al., 1990; Kick et al., 1997!showing that military spending is detrimental but military participation sociallybeneficial. We expand this by analyzing arms imports, arms production andexporting, military instability, and the use of military force against domestic andexternal political enemies. Although spending and military participation arecentral to any assessment of military power, any comprehensive assessment needsto include these other aspects. Moreover, it needs to recognize that militaryresources and regimes are not the major architects of armed conflicts. Althoughwe have not examined the specifics of these conflicts in terms of how theyemerged or the actors involved, it is clear that more is involved than the simplegrowth of military resources and praetorianism.
A key finding has been support for the idea that military force contributes tofood scarcity and hunger. Thus critics of unconditional humanitarian disasterassistance ~Macrae and Zwi, 1994; Prendergast, 1996; Uvin, 1998! are supportedinsofar as internal wars, state repression, ethnic discrimination and geno-0politicides disrupt food supply and create hunger. We have not examined theimpact of food assistance or the policies that regulate access. Hence we cannotevaluate the full argument about military famines or the extent to which food aidhas been diverted to create protracted internal wars and collapsed states. But our
Stephen J. Scanlan and J. Craig Jenkins 181

evidence does show quite clearly that armed conflict, especially repression tar-geted at minority groups and political enemies of the state, creates hunger.
Both sides in the traditional debate over military power receive support. Grow-ing military spending and arms imports are detrimental. At the same time,growing military participation creates human capital and social integration andimproves food security. The question is what activities are purchased with mili-tary spending. If it is arms and weaponry, spending undermines food security. Ifit is boosting troop strength, providing more training, then it is beneficial. Ingeneral, the military power factors that improve food supply also reduce hunger.Armed conflict and repression do have greater impact on hunger, but there isconsiderable consistency between the two food security outcomes.
This analysis undermines several popular theories. The spending burden the-sis is often advanced as a government budget trade-off, with political elitesdeciding to invest in either “guns” or “butter.” At least for food security, this doesnot appear to be the case. Instead, the spending burden is centered on increasesin military spending relative to the total economy. In other words, the spendingburden is a long-term investment of human, technological, and economic resources.At the same time, spending tied to increased military personnel works to boostfood security, indicating that the burden is centered in arms purchases andmaterial supplies.
The question of military rule is more complex. Both modernization ~Hunting-ton, 1968; Janowitz, 1977! and more critical perspectives ~Cardoso and Faletto,1979; Wolpin, 1983! have argued that praetorian rule encourages repression andinternal instability and reduces social well-being. The proponents of the militaryfamine thesis ~Cheatham, 1994; Macrae and Zwi, 1994; Prendergast, 1996; Messeret al., 1998! likewise argue that military rule is central to recent famines and theuse of food as weapon in numerous armed conflicts. We did not find support forthe direct harm of military regimes. At most, military rule during wartime reducesfood supply, but it does not seem to have the broad negative impact oftenascribed to it. At the same time, military rule is tied to general wars and geno-0politicides. In this sense, it may indirectly facilitate reductions in food security.Further research is needed to assess different types of military regimes that maydiffer in their social welfare impact. Such research, especially at the case level,can contribute to a more thorough understanding of the relationship betweenmilitary rule and food security than we are able to establish here. For example,some argue that large-scale war makes ruling elites more dependent on theirtroops and thus forces them to engage in political bargaining and concessions~Downing, 1992; Tilly, 1992!. At least in terms of food security, this “war benefit”appears to hold only for civilian regimes. Military rulers seem less vulnerable tothis pressure, which may explain the disadvantage of war-bound military regimes.
More significant are military instability and internal repression, which createboth food scarcity and hunger. This supports the various analysts who contendthat military coups and the political repression of internal enemies are disruptiveof social development. Praetorian rule per se does not appear to be primarilyresponsible for these problems but the social harm from coups and repressionare quite evident.
The military famine perspective ~Cheatham, 1994; Macrae and Zwi, 1994;Prendergast, 1996; Messer et al., 1998; de Soysa and Gleditsch, 1999! provides aprovocative insight about the origins of contemporary hunger and famine. War,repression, and geno-0politicide along with arms buildups and military instabilitycreate great food security problems, especially when considering the distribu-tional component of child hunger. In this regard, claims that civil unrest hasexacerbating food security consequences that outlive the duration of actual con-f lict itself is supported. Thus, one should not be surprised that countries such asAfghanistan, Angola, Cambodia, Chad, Ethiopia, Mozambique, Somalia, Sri Lanka,
182 Military Power and Food Security

and the Sudan, which have experienced protracted civil wars and state collapses,are among the countries experiencing the worst food security problems. Many ofthese countries confront a subsistence crisis in which normal mechanisms forsecurity of adequate nutrition have been disrupted by war, geno-0politicide, andmilitary repression. Peace-building is thus a precondition for restoring viableeconomies, much less creating economic growth.
Our results also speak to general development theory and theories of famine.Neoclassical economics and modernization theory argue that economic growthtrickles down to improve social welfare. We found that economic growth amongthe more developed of the LDCs does improve both food supply and reducehunger. Moreover, we found that improved food supply does reduce hunger,thus putting into doubt a strong version of the entitlement thesis that famine isunaffected by food supply ~Sen, 1981; Drèze and Sen, 1989!. At the same time,this beneficial economic growth and the related improvement in food supply arelargely confined to the more developed among the LDCs. Growth and its ben-efits have largely bypassed the poorer LDCs, leaving them without access toaggregate food supply and displaying persistent hunger. This points to growingglobal inequality and the emergence of a “Fourth World.” Future research shouldexamine what factors might benefit this Fourth World by focused case compar-ison and policy assessment.
Food security should be at the center of ongoing discussions about socialwelfare in LDCs. Although distinct from the PQLI ~Morris, 1979! and the HumanDevelopment Index ~UNDP, 1990!, which have received far more attention, foodsecurity is among the most fundamental of human needs and, as such, should beviewed as a basic human right ~Committee on World Food Security, 1996; Kutzner,1991; Brandt, 1986!. Without adequate food, populations are at risk of debilitat-ing disease and are severely hindered in maintaining elementary economic activ-ity. As Sen ~1981, 1995! and others ~Drèze and Sen, 1989; Drèze et al., 1995! haveargued, people do not suddenly perish in famines. Rather, persistent food insecur-ity gradually erodes their physical well-being, leaving them vulnerable to diseaseand unable to lead active lives. In the abstract, the food problem is not simply asupply problem. There is sufficient global supply to meet all human needs. In-stead the problem is one of distribution, both at the aggregate country level andinternal to specific countries. Discussions of food security should thus focus ondistribution as well as supply and treat food as a critical index of social welfare.
In addition, the problems of distribution and supply of food are important fortheir continued links to the potential for future conflicts. Food security has beenthe source of social unrest in the past ~Walton and Ragin, 1990; Walton andSeddon, 1994! and coupled with environmental scarcity has the potential forcreating a subsistence crisis that may be explosive in the future ~Homer-Dixon,1995, 1999; Homer-Dixon and Blitt, 1998; Lappé et al., 1998!. In this regard, notonly does conflict exacerbate food security in the form of increased hunger, thiscould result in further conflict that reinforces and intensifies food securityproblems, thus creating a circular pattern that could prove difficult to reverse~Messer et al., 1998!. Thus, because poverty and associated food insecurity aremost likely to befall rural populations in LDCs, strengthening the agriculturalsector is beneficial not only for the marketing spin-offs discussed by Bongaarts~1996! but equally importantly for the peace and prosperity outcomes presentedby de Soysa and Gleditsch ~1999!, who contrast the relative development successof India with the many failures in sub-Saharan Africa. Trickle down from growthmust therefore spread to outlying sectors in the poorer of the LDCs for agricul-tural policies aimed at improving distribution to be successful.
Finally, although militarization is rarely discussed as a tool of developmentpolicy, it does have important implications. The mobilization of personnel andtheir training in the military may create greater social integration and mobility—as
Stephen J. Scanlan and J. Craig Jenkins 183

well as creating human capital and social discipline—and thus contribute tosocial welfare. Arms production also boosts food supply. At the same time, thereare major social costs imposed by arms purchases and growing spending bur-dens. Thus policymakers need to be wary of the claim that military spending willstimulate development and ask what types of military spending are involved.They should also adopt measures to institutionalize the military by promotingprofessionalization and barring military involvement in domestic policing andpolitical control.
References
Andreski, S. ~1968! Military Organization and Society, 2nd ed. Berkeley and Los Angeles: University ofCalifornia Press.
Bates, R. ~1981! Markets and States in Tropical Africa. Berkeley and Los Angeles: University of Cali-fornia Press.
Benoit, E. ~1973! Defense and Economic Growth in Developing Countries. Lexington, MA: D.C. Health.Benoit, E. ~1978! Growth and Defense in Developing Countries. Economic Development and Cultural
Change 34:361–372.Berg-Schlosser, D. ~1984! African Political Systems: Typology and Performance. Comparative Political
Studies 17:121–151.Bohrnstedt, G. ~1968! “Observations on the Measurement of Change.” In Sociological Methodology
1969, edited by E. Borgatta, pp. 113–133. San Francisco: Jossey-Bass.Bollen, K., and R. W. Jackman ~1985! Regression Diagnostics: An Expository Treatment of Outliers
and Influential Cases. Sociological Methods and Research 13:510–542.Bongaarts, J. ~1996! Population Pressure and the Food Supply System in the Developing World.
Population and Development Review 22:483–503.Bowman, K. S. ~1996! Taming the Tiger: Militarization and Democracy in Latin America. Journal of
Peace Research 33:289–308.Brandt, W. ~1986! World Armament and World Hunger: A Call for Action. London: Victor Gollancz.Breusch, T., and A. Pagan ~1979! A Simple Test for Heteroskedasticity and Random Coefficient
Variation. Econometrica 47:1287–1294.Brzoska, M. ~1989! The Impact of Arms Production in the Third World. Armed Forces and Society
15:507–530.Brzoska, M., and T. Ohlson ~1987! Arms Transfers to the Third World. New York: Oxford University
Press.Bucholz, A. ~1999! “Militarism.” In Encyclopedia of Violence, Peace and Conflict, edited by Lester Kurtz,
pp. 423–432. New York: Academic Press.Bullock, B., and G. Firebaugh ~1990! Guns and Butter? The Effect of Militarization on Economic
and Social Development in the Third World. Journal of Political and Military Sociology 18:231–266.Cardoso, F. H., and E. Faletto ~1979!. Dependency and Development in Latin America. Berkeley and Los
Angeles: University of California Press.Chan, S. ~1985! The Impact of Defense Spending on Economic Performance: A Survey of Evidence
and Problems. Orbis 29:403–434.Chan, S. ~1995! Grasping the Peace Dividend: Some Propositions on the Conversion of Swords into
Plowshares. Mershon International Studies Review 39:53–95.Cheatham, M. ~1994! “War, Military Spending, and Food Security in Africa.” In Seeking Security and
Development, edited by N. Graham, pp. 229–253. Boulder, CO: Lynne Rienner.Cohen, J. S., A. Mintz, R. Stevenson, and M. D. Ward ~1996! Defense Expenditure and Economic
Growth in Israel: The Indirect Link. Journal of Peace Research 33:341–352.Committee on World Food Security ~1996! Rome Declaration on World Food Security and World Food
Summit Plan of Action. Rome: Food and Agriculture Organization of the United Nations.Davis, B., E. Kick, and D. Kiefer ~1989! “The World-System, Militarization and National Develop-
ment.” In War in the World-System, edited by R. Schaeffer, pp. 27–45. Greenwich, CT: Greenwood.de Soysa, I., and N. P. Gleditsch ~1999! To Cultivate Peace: Agriculture in a World of Conflict. Oslo,
Norway: International Peace Research Institute Oslo ~PRIO!.Dixon, W. J., and B. E. Moon ~1986! The Military Burden and Basic Human Needs. Journal of Conflict
Resolution 30:660–684.Downing, B. ~1992! The Military Revolution and Political Change. Princeton, NJ: Princeton University
Press.
184 Military Power and Food Security

Drèze, J., and A. Sen ~1989! Hunger and Public Action. Oxford, U.K.: Clarendon.Drèze, J., A. Sen, and A. Hussain, eds. ~1995! The Political Economy of Hunger: Selected Essays. New York:
Oxford University Press.Dumas, L. ~1988! Military Research and Development and Economic Progress. Bulletin of Peace Pro-
posals 19:293–303.Fein, H. ~1993! Accounting for Genocide after 1945: Theories and Some Findings. International
Journal on Group Rights 1:79–106.Finkel, S. ~1995! Causal Analysis with Panel Data. Newbury Park, CA: Sage.Firebaugh, G., and F. Beck ~1994! Does Economic Growth Benefit the Masses? Growth, Dependence
and Welfare in the Third World. American Sociological Review 59:631–653.Food and Agriculture Organization (FAO) ~1972! FAO Yearbook 1992: Production. Rome: FAO.Food and Agriculture Organization (FAO) ~1974! FAO Yearbook 1974: Production. Rome: FAO.Food and Agriculture Organization (FAO) ~1992! FAO Yearbook 1992: Production. Rome: FAO.Food and Agriculture Organization (FAO) ~1994! FAO Yearbook 1994: Production. Rome: FAO.Food and Agriculture Organization (FAO) ~1996a! World Food Summit: Synthesis of the Technical
Background Documents. Rome: FAO.Food and Agriculture Organization (FAO) ~1996b! The Sixth World Food Survey. Rome: FAO.Food and Agriculture Organization (FAO) ~1998! FAOSTAT Database @http:00apps.FAO.org0
default.htm#. Rome: FAO @producer and distributor#.Foster, P. ~1992! The World Food Problem. Boulder, CO: Lynne Rienner.Foster, P., and H. Leathers ~1999! The World Food Problem, 2nd ed. Boulder, CO: Lynne Rienner.Gerschenkron, A. ~1962! Economic Backwardness in Historical Perspective. Cambridge, MA: Belknap Press.Gurr, T. R. ~1989! Polity II: Political Structures and Regime Change, 1800–1986 @computer file#. Boulder,
CO: Center for Comparative Politics @producer#. ~1990! Ann Arbor, MI: Inter-university Con-sortium for Political and Social Research @distributor#.
Gurr, T. R. ~1993! Minorities at Risk Phase I Data set @computer file#. College Park, MD: University ofMaryland Center for International Development and Conflict Management @producer anddistributor#.
Hannan, M. ~1979! “Issues in Panel Analysis of National Development: A Methodological Overview.”In National Development and the World System, edited by J. Meyer and M. Hannan, pp. 17–33.Chicago: University of Chicago Press.
Happe, N., and J. Wakeman-Linn ~1994! Military Expenditure and Arms Trade: Alternative DataSources, Part I. Peace Economics, Peace Science and Public Policy 1:3–38.
Harff, B., and T. R. Gurr ~1989! Victims of the State: Genocides, Politicides and Group Repressionsince 1945. International Review of Victimology 1:23–41.
Harris, G., M. Kelly, and Pranowo ~1988! Tradeoffs between Defense and Education0Health Expen-ditures in Developing Countries. Journal of Peace Research 25:165–177.
Homer-Dixon, T. ~1995! The Ingenuity Gap: Can Poor Counties Adapt to Resource Scarcity? Popu-lation and Development Review 20:587–612.
Homer-Dixon, T. ~1999! Environment, Scarcity, and Violence. Princeton, NJ: Princeton University Press.Homer-Dixon, T., and J. Blitt, eds. ~1998! Ecoviolence: Links among Environment, Population, and
Security. Lanham, MD: Rowman and Littlefield.Huntington, S. ~1968! Political Order and Changing Societies. New Haven, CT: Yale University Press.Jackman, R. W. ~1976! Politicians in Uniform: Military Governments and Social Change in the Third
World. American Political Science Review 70:1078–1097.Janowitz, M. ~1977! Military Institutions and Coercion in the Developing Nations. Chicago: University of
Chicago Press.Johnson, J. ~1962! The Role of the Military in Less Developed Countries. Princeton, NJ: Princeton Uni-
versity Press.Judge, G., W. E. Griffiths, R. Hill, H. Lütkepohl, and T.-C. Lee ~1985! The Theory and Practice of
Econometrics, 2nd ed. New York: Wiley.Kaldor, M. ~1976! The Military in Development. World Development 4:459–482.Kelly, M. ~1992! Anthropometry as an Indicator of Access to Food in Populations Prone to Famine.
Food Policy 17:443–454.Kennedy, G. ~1974! The Military in the Third World. London: Duckworth.Kick, E., B. Davis, D. Kiefer, and T. Burns ~1997! “A Cross-National Analysis of Militarization and
Well-Being Relationships in Developing Countries.” Unpublished manuscript. Department ofSociology, University of Utah.
Kick, E., R. Nasser, B. Davis, and L. Bean ~1990! Militarization and Infant Mortality in the ThirdWorld. Journal of Political and Military Sociology 18:285–305.
Stephen J. Scanlan and J. Craig Jenkins 185

Kick, E., and B. D. Sharda ~1986! Third World Militarization and Development. Journal of DevelopingSocieties 2:49–67.
Kidron, M., and D. Smith ~1983! The War Atlas. New York: Simon and Schuster.Kidron, M., and D. Smith ~1991! The New State of War and Peace: An International Atlas. New York:
Simon and Schuster.Korzeniewicz, R., and T. P. Moran ~1997! World-Economic Trends in the Distribution of Income,
1965–1992. American Journal of Sociology 102:1000–1039.Krause, K. ~1992! Arms and the State: Patterns of Military Production and Trade. New York: Cambridge
University Press.Kutzner, P. ~1991! World Hunger: A Reference Handbook. Santa Barbara, CA: ABC-CLIO.Lappé, F. M., J. Collins, and P. Rosset ~1998! World Hunger: Twelve Myths, 2nd ed. New York: Grove.Looney, R. ~1989! The Impact of Arms Production on Income Distribution and Growth in the Third
World. Economic Development and Cultural Change 38:145–153.Looney, R. ~1990! Militarization, Military Regimes and the General Quality of Life in the Third
World. Armed Forces & Society 17:127–139.Macrae, J., and A. Zwi, eds. ~1994! War and Hunger. London: Zed.Mayer, P. ~1999! “Militarism and Development in Underdeveloped Societies.” In Encyclopedia of
Violence, Peace and Conflict, edited by L. Kurtz, pp. 433–445. New York: Academic.McClendon, M. ~1994! “Detection and Correction of Heteroskedasticity.” In Multiple Regression and
Causal Analysis, pp. 174–195. Itasca, IL: F.E. PeacockMcKinlay, R., and A. Mughan ~1984! Aid and Arms to the Third World: An Analysis of the Distribution
and Impact of U.S. Official Transfers. London: Pinter.Messer, E., M. Cohen, and J. D’Costa ~1998! Food from Peace: Breaking the Links between Conflict and
Hunger. Washington, DC: International Food Policy Research Institute.Morris, M. ~1979! Measuring the Condition of the World’s Poor: The Physical Quality of Life Index. New
York: Pergamon Press.Morrison, D., R. Mitchell, J. Paden, and H. M. Stevenson, eds. ~1989! Black Africa: A Comparative
Handbook, 2nd ed. Irvington, NY: Irvington.Mousseau, M. ~1998! Democracy and Compromise in Militarized Interstate Conflicts 1816–1992.
Journal of Conflict Resolution 42:210–230.Payne, J. E., A. P. Sahu, and M. Ward ~1994! Defense Spending and Economic Growth. International
Studies Quarterly 38:315–317.Peacock, W. G., G. Hoover, and C. Killian ~1988! Divergence and Convergence in International
Development. American Sociological Review 53:838–852.Pearson, F. ~1994! The Global Spread of Arms. Boulder, CO: Westview.Prendergast, J. ~1996! Frontline Diplomacy: Humanitarian Aid and Conflict in Africa. Boulder, CO:
Lynne Rienner.Project Ploughshares ~1994! Armed Conflicts Report 1993. Waterloo, Ontario, Canada: Project
Ploughshares.Quinn, V., and E. Kennedy ~1994! Food Security and Nutrition Monitoring Systems in Africa. Food
Policy 19:234–254.Ross, A. ~1987! Dimensions of Militarization in the Third World. Armed Forces and Society 13:561–578.Russett, B. ~1993! Grasping the Democratic Peace. Princeton: Princeton University Press.Sen, A. ~1981! Poverty and Famines: An Essay on Entitlement and Deprivation. New York: Oxford Univer-
sity Press.Sen, A. ~1995! “Food, Economics, and Entitlement.” In The Political Economy of Hunger, edited by J.
Drèze, A. Sen, and A. Hussain, pp. 50–68. New York: Oxford University Press.Senghaas, D. ~1977! Militarism Dynamics and the Contemporary Context of Peripheral Capitalism.
Bulletin of Peace Proposals 8:103–109.Singer, J. D., and M. Small ~1993! The Correlates of War Project: International and Civil War Data,
1816–1992 @computer file#. Ann Arbor, MI: Inter-university Consortium for Political and SocialResearch @producer and distributor#.
Sivard, R. L. ~1991! World Military and Social Expenditures 1991. Washington, DC: World Priorities.Stockholm International Peace Research Institute ~1982! World Armaments and Disarmament:
SIPRI Yearbook 1982. London: Taylor and Francis.Stockholm International Peace Research Institute ~1994! SIPRI Yearbook 1994. New York: Oxford
University Press.Sullivan, M. J. ~1991! Measuring Global Values: The Ranking of 162 Countries. New York: Greenwood.Summers, R., and A. Heston ~1991! The Penn World Table ~Mark 5!: An Expanded Set of Inter-
national Comparisons, 1950–1988. Quarterly Journal of Economics 106:327–368.
186 Military Power and Food Security

Thomas, A., ed. ~1994! Third World Atlas, 2nd ed. Washington, DC: Taylor and Francis.Tilly, C. ~1992! Coercion, Capital, and European States. Cambridge, MA: Blackwell.Trimberger, E. K. ~1978! Revolution from Above: Military Bureaucrats in Japan, Turkey, Egypt, and Peru.
New Brunswick, NJ: Transaction Books.Tweeten, L. ~1997! “Food Security.” In Promoting Third World Development and Food Security, edited by
L. Tweeten and D. McClelland, pp. 225–256. Westport, CT: Praeger.United Nations Children’s Fund (UNICEF) ~1998! The State of the World’s Children 1998. New York:
Oxford University Press.United Nations Development Programme (UNDP) ~1990! Human Development Report 1990. New
York: Oxford University Press.United Nations Development Programme (UNDP) ~1994! Human Development Report 1994. New
York: Oxford University Press.United Nations General Assembly ~1949! Universal Declaration of Human Rights. New York: United
Nations Department of Public Information.United Nations Population Fund (UNFPA) ~1999! Food for the Future: Women, Population, and Food
Security. New York: United Nations.U.S. Arms Control and Disarmament Agency ~1975! World Military Expenditures and Arms Transfers,
1966–1975 @computer file#. Washington, DC: USACDA @producer#. ~1977! Ann Arbor, MI: Inter-university Consortium for Political and Social Research @distributor#.
U.S. Arms Control and Disarmament Agency ~1979! World Military Expenditures and Arms Transfers,1969–1978. Washington, DC: USACDA.
U.S. Arms Control and Disarmament Agency ~1985! World Military Expenditures and Arms Transfers,1973–1983 @computer file#. Washington, DC: USACDA @producer#. ~1985! Ann Arbor, MI: Inter-university Consortium for Political and Social Research @distributor#.
U.S. Arms Control and Disarmament Agency ~1994! World Military Expenditures and Arms Transfers,1982–1992. Washington, DC: USACDA.
U.S. Arms Control and Disarmament Agency ~1997! World Military Expenditures and Arms Transfers,1996. Washington, DC: USACDA.
Uvin, P. ~1998! Aiding Violence: The Development Enterprise in Rwanda. West Hartford, CT: Kumarian.Vagts, A. ~1959! A History of Militarism. New York: Free Press.Vantuyll, H. P. ~1994! Militarism, the United States and the Cold War. Armed Forces and Society
24:519–530.Walton, J., and C. Ragin ~1990! Global and National Sources of Political Protest: Third World
Responses to the Debt Crisis. American Sociological Review 55:876–890.Walton, J., and D. Seddon ~1994! Free Markets and Food Riots. Cambridge, MA: Blackwell.Ward, M., and D. Davis ~1992! Sizing up the Peace Dividend: Economic Growth and Military
Spending in the United States. American Political Science Review 86:748–755.Ward, M., D. Davis, and S. Chan ~1993! Military Spending and Economic Growth in Taiwan. Armed
Forces and Society 19:533–550.Ward, M., M. Penubarti, J. Cohen, and C. Lofdahl ~1995! Guns and Growth around the Globe.
International Interactions 21:181–201.Weede, E. ~1983! Military Participation Ratios, Human Capital Formation, and Economic Growth: A
Cross-National Analysis. Journal of Political and Military Sociology 11:11–19.Weede, E. ~1986! Rent-Seeking, Military Participation, and Economic Performance in LDCs. Journal
of Conflict Resolution 30:291–314.Weede, E. ~1992! “Military Participation, Economic Growth, and Income Inequality: A Cross-National
Study.” In Defense, Welfare, and Growth: Perspectives and Evidence, edited by S. Chan and A. Mintz,pp. 211–230. London: Routledge.
Wimberley, D., and R. Bello ~1992! Effects of Foreign Investments, Exports and Economic Growthon Third World Food Consumption. Social Forces 70:895–922.
Wolpin, M. ~1981! Militarism and Social Revolution in the Third World. Totowa, NJ: Allanheld Osmun.Wolpin, M. ~1983! Comparative Perspectives on Militarization, Repression, and Social Welfare. Jour-
nal of Peace Research 20:129–155.World Bank ~1994! World Data 1994 @CD-ROM#. Washington, DC: World Bank @producer and dis-
tributor#.
Stephen J. Scanlan and J. Craig Jenkins 187
Top Related
Copyright © 2022 FDOKUMEN

