


Bahasa
Halaman
Hukum

MicroRNA Expression Profile in Human Macrophages inResponse to Leishmania major InfectionJulien Lemaire1., Ghada Mkannez2,3., Fatma Z. Guerfali2,3, Cindy Gustin1, Hanene Attia2,3,
Rabiaa M. Sghaier2,3, Sysco-Consortium`, Koussay Dellagi2,3,4, Dhafer Laouini2,3"*, Patricia Renard1"*
1 Laboratory of Biochemistry and Cellular Biology (URBC), NARILIS-University of Namur, Namur, Belgium, 2 Institut Pasteur de Tunis, LR11IPT02, Laboratory of
Transmission, Control and Immunobiology of Infections (LTCII), Tunis-Belvedere, Tunisia, 3 Universite Tunis El Manar, Tunis, Tunisia, 4 Institut de Recherche pour le
Developpement (IRD) et Centre de Recherche et de Veille sur les Maladies Emergentes dans l’Ocean Indien (CRVOI), Sainte Clotilde, Reunion Island, France
Abstract
Background: Leishmania (L.) are intracellular protozoan parasites able to survive and replicate in the hostile phagolysosomalenvironment of infected macrophages. They cause leishmaniasis, a heterogeneous group of worldwide-distributedaffections, representing a paradigm of neglected diseases that are mainly embedded in impoverished populations. Toestablish successful infection and ensure their own survival, Leishmania have developed sophisticated strategies to subvertthe host macrophage responses. Despite a wealth of gained crucial information, these strategies still remain poorlyunderstood. MicroRNAs (miRNAs), an evolutionarily conserved class of endogenous 22-nucleotide non-coding RNAs, aredescribed to participate in the regulation of almost every cellular process investigated so far. They regulate the expressionof target genes both at the levels of mRNA stability and translation; changes in their expression have a profound effect ontheir target transcripts.
Methodology/Principal Findings: We report in this study a comprehensive analysis of miRNA expression profiles in L.major-infected human primary macrophages of three healthy donors assessed at different time-points post-infection (threeto 24 h). We show that expression of 64 out of 365 analyzed miRNAs was consistently deregulated upon infection with thesame trends in all donors. Among these, several are known to be induced by TLR-dependent responses. GO enrichmentanalysis of experimentally validated miRNA-targeted genes revealed that several pathways and molecular functions weredisturbed upon parasite infection. Finally, following parasite infection, miR-210 abundance was enhanced in HIF-1a-dependent manner, though it did not contribute to inhibiting anti-apoptotic pathways through pro-apoptotic caspase-3regulation.
Conclusions/Significance: Our data suggest that alteration in miRNA levels likely plays an important role in regulatingmacrophage functions following L. major infection. These results could contribute to better understanding of the dynamicsof gene expression in host cells during leishmaniasis.
Citation: Lemaire J, Mkannez G, Guerfali FZ, Gustin C, Attia H, et al. (2013) MicroRNA Expression Profile in Human Macrophages in Response to Leishmania majorInfection. PLoS Negl Trop Dis 7(10): e2478. doi:10.1371/journal.pntd.0002478
Editor: Jesus G. Valenzuela, National Institute of Allergy and Infectious Diseases, United States of America
Received January 7, 2013; Accepted August 30, 2013; Published October 3, 2013
Copyright: � 2013 Lemaire et al. This is an open-access article distributed under the terms of the Creative Commons Attribution License, which permitsunrestricted use, distribution, and reproduction in any medium, provided the original author and source are credited.
Funding: This work was funded by the European Union under its 6th Framework Programme (LSHG-CT-2006-037231) and partially supported by an NIH/NIAID/DMID Grant Number 5P50AI074178 for DL. The funders had no role in study design, data collection and analysis, decision to publish, or preparation of themanuscript.
Competing Interests: The authors have declared that no competing interests exist.
* E-mail: [email protected], [email protected] (DL); [email protected] (PR)
. These authors contributed equally to this work.
" These authors co-directed this study.
` Membership of the Sysco-Consortium is provided in the Acknowledgments.
Introduction
The protozoan parasite Leishmania (L.) causes a heterogeneous
group of tropical and subtropical neglected diseases known as
leishmaniasis, with symptoms ranging from cutaneous lesions to
fatal visceral leishmaniasis [1].
Leishmania parasites are obligate intracellular pathogens of
their mammalian hosts. To establish infection, the flagellated
metacyclic promastigote form is inoculated into host tissue
through the bite of a female sandfly. It then electively invades
macrophages where it differentiates into the highly replicative
amastigote form whilst avoiding and/or subverting anti-para-
sitic responses [2,3].
As dual actors (i.e., being the host cells that allow parasite
replication as well as the effector cells that are responsible for
parasite killing), macrophages play, beside neutrophils, a central
role for host resistance or susceptibility to Leishmania infection
[4,5].
As successful intracellular parasites, Leishmania have developed a
range of sophisticated strategies to subvert and/or suppress
leishmanicidal activities of macrophages and overcome the host
innate immunity. Indeed, Leishmania parasites inhibit, upon
PLOS Neglected Tropical Diseases | www.plosntds.org 1 October 2013 | Volume 7 | Issue 10 | e2478
infection, antigen presentation [6], alter expression of co-
stimulatory molecules [7], disturb signaling pathways and tran-
scription factors activities [3,8,9,10], affect cytokine [11] and
chemokine [12] profiles and modulate metabolic pathways [13].
To safely ensure their differentiation into amastigotes, the
replicative intracellular form of the parasite, Leishmania inhibit
macrophage apoptosis [14] through complete remodeling of host
apoptotic and anti-apoptotic transcripts [15] and more specifically,
through the repression of mitochondrial release of cytochrome c
[16] or activation of PI3K/Akt signaling [17].
An exciting pattern of gene regulation in plants and animals has
recently emerged with the discovery of mammalian microRNAs
(miRNAs), which are a class of endogenous non-coding small
RNAs that regulate target mRNAs. Corresponding to approxi-
mately 1–2% of the known eukaryotic genomes, miRNAs are now
considered as master regulators of gene expression for at least 30%
of human genes [18]. In addition, computational predictions
suggest that each miRNA can target 100 or more transcripts and
that a single mRNA may be regulated by multiple miRNA species
[19,20]. Functional studies indicate that miRNAs take part in the
regulation of every cellular process investigated so far and are
involved in many pathologic processes and diseases.
During infection, changes in the host cell miRNA profile may
either indicate a cell defense mechanism or a subversion strategy
developed by the pathogen. Several classes of pathogens including
viruses [21,22], bacteria [23,24] and apicomplexan parasites [25]
like the intracellular protozoan parasite Toxoplasma gondii [26] can
manipulate the miRNA network of infected host cells. Hence, we
hypothesized that Leishmania might also alter macrophage host
miRNA expression profile to convert the harsh phagolysosomal
environment to a state suitable for its own survival and persistence.
We investigated whether L. major, the causative agent of
zoonotic cutaneous leishmaniasis, drives changes in the miRNA-
levels upon macrophage infection. For that purpose, we profiled a
set of 365 miRNAs at time points 3, 6, 12, and 24 h post-infection
and showed that L. major infection of human primary macrophages
modifies the expression of about 20% of them. Interestingly,
several of these differentially expressed regulatory molecules are
known to be LPS- and/or TLR ligand-induced miRNAs [27]. As
far as we know, this is the first study providing a valuable
framework on human macrophage miRNA profile upon L. major
infection that might be useful to identify new targets for anti-
parasitic therapy.
Materials and Methods
Ethics statementThe study protocol, consent forms and procedures were
reviewed and approved by the Institut Pasteur de Tunis Ethical
Review Board of. Healthy volunteer individuals provided written
informed consent for the collection of blood and subsequent
analysis.
Macrophage differentiation and infectionHealthy volunteer blood donors were selected as negative for
any recent infection and had no history of leishmaniasis. Their
peripheral blood mononuclear cells (PBMC) did not proliferate in
vitro on exposure to Soluble Leishmania Antigens and they were not
taking any medication at the time of the study.
PBMC were isolated from cytapheresis leukopacks using Ficoll-
Paque (Pharmacia, Uppsala, Sweden) density gradient centrifuga-
tion. Cells were washed and incubated at 107 cells/mL in RPMI
1640 medium supplemented with 2 mM L-glutamine, 100 U/mL
penicillin, 100 mg/mL streptomycin and 5% heat inactivated fetal
calf serum. Monocytes were purified by fibronectin-mediated
adhesion using gelatin (Sigma) and autologous heat inactivated
serum substratum [28]. Cell purity was assessed by flow cytometry
(FACSVantage; Becton Dickinson, Sunnyvale, CA) using directly
conjugated anti-CD3, anti-CD19 and anti-CD14 antibodies
(Becton-Dickinson, San Jose, CA) and was routinely greater than
85% of CD14+ cells. Macrophages were derived from monocytes
cultured for 8 days in 6- or 24-well tissue-culture plates, at 37uC,
5% CO2 in endotoxin-free RPMI 1640 medium supplemented
with 5% heat-inactivated normal human AB serum and 10% heat-
inactivated fetal calf serum (HyClone Laboratories, Logan, UT),
100 U/mL penicillin, 100 mg/mL streptomycin, 2 mM L-gluta-
mine at 26106 cells/mL.
Macrophages Derived Monocytes (MDM) were then exposed to
metacyclic promastigotes of L. major (MHOM/TN/95/GLC94
strain). Parasites at their infective stage were collected by density
gradient centrifugation from stationary culture (6–7 days old) [29].
MDM infection was conducted at a ratio of 5 parasites per cell for
3, 6, 12 and 24 hours (IF: infected) and then harvested for analysis.
When available, MDM were also cultured in the presence of the
same ratio of latex beads as phagocytosis control (Sigma, St. Louis,
MO). Non-infected MDM were collected at the same time points
and used as controls (NI: non infected).
Macrophage transfectionMDM were transfected twice by using the HiPerFect Trans-
fection Reagent (Qiagen), following the procedure described by
Hulten [30]. As a single transfection protocol gave low efficiency
(Lemaire, personal communication), a double transfection, as
recommended by the manufacturer and other studies, was used to
improve knockdown efficiency. Briefly, 20 mM of siRNA were
mixed with 12 ml of HiPerFect reagent and incubated for 10 min
at room temperature. The mix was resuspended in 200 ml of
endotoxin-free RPMI 1640 medium with antibiotics (100 U/mL
penicillin, 100 mg/mL streptomycin) and added to the cells,
previously washed twice with PBS. Cells were incubated at 37uC
Author Summary
Leishmania parasites belong to different species, each onecharacterized by specific vectors and reservoirs, and causescutaneous or visceral disease(s) of variable clinical presen-tation and severity. In its mammalian host, the parasite isan obligate intracellular pathogen infecting the monocyte/macrophage lineage. Leishmania have developed ambig-uous relationships with macrophages. Indeed, these cellsare the shelter of invading parasites, where they will growand eventually will reside in a silent state for life. Butmacrophages are also the cells that participate, throughthe induction of several pro-inflammatory mediators andantigen presentation, to shape the host immune responseand ultimately kill the invader. To subvert these anti-parasite responses, Leishmania manipulate the host ma-chinery for their own differentiation and survival. Weaimed to evaluate the impact of L. major (the causativeagent of zoonotic cutaneous leishmaniasis) infection onderegulation of non-coding miRNAs, a class of importantregulators of gene expression. Our results revealed theimplication of several miRNAs on macrophage fate uponparasite infection through regulation of different path-ways, including cell death. Our findings provided a newinsight for understanding mechanisms governing thismiRNA deregulation by parasite infection and will helpto provide clues for the development of control strategiesfor this disease.
Leishmania-Infected Macrophage MiRNA Deregulation
PLOS Neglected Tropical Diseases | www.plosntds.org 2 October 2013 | Volume 7 | Issue 10 | e2478
for 6 h before adding 500 ml of RPMI 1640 medium with
antibiotics supplemented with 10% heat-inactivated fetal calf
serum. Cells were incubated at 37uC and the transfection
performed once again after the 24 h of incubation. The siRNA
used are anti-miR-210 miRNA inhibitor (AM10516, Ambion),
anti-HIF-1a siRNA (SI04249308, Qiagen) or negative control
siRNA (1027280, Qiagen). In order to verify that transfected
macrophages were not activated by siRNA and remain at rest,
TNF-a, IL-6, IL-8 and iNOS mRNA and/or protein levels but
also nitric oxide amounts [31] were assessed. This was done using
real-time RT-PCR, ELISA and Griess assays respectively, in
control siRNA transfected cells, compared to non transfected cells.
RNA isolation and quantitative reverse transcription-PCRanalysis
RNA isolation. Cells were collected by centrifugation at the
indicated time points by centrifugation, washed to remove
extracellular parasites, homogenized by Trizol reagent (Gibco
BRL) and frozen at 280uC until RNA extraction. The RNA from
each time point was extracted using miRNA Qiagen kit according
the manufacturer’s instructions. RNA were quantified using
NanoDrop ND-1000 micro-spectrophotometer, their integrity
assessed using Agilent-2100 Bioanalyzer and stored at 280uC.
MiRNA expression profiling. The expression of 365 human
miRNA species was analyzed by real-time PCR using microfluidic
cards (TaqMan Human MicroRNA Array v1.0, Applied Biosys-
tem) following the recommendations of the manufacturer. The
abundance of each miRNA was normalized to the geometric
average of the 2 endogenous controls, RNU44 and RNU48,
according to [32], generating DCt values. DDCt were calculated as
the difference between infected and non-infected DCt. The results
are expressed in fold change, corresponding to 22DDCt. Values
below the background or undetectable are indicated as ND (not
detectable).
Real-time PCR for miRNA array validation and
chemokine transcript expression. RNA contained in 10 to
50 ng (depending on the targeted miRNA) was reverse transcribed
using Taqman microRNA reverse transcription kit (Applied
Biosystems, Foster City, CA, USA) and specific primers for each
miRNA (miRBase, Applied Biosystems), following the recommen-
dations of the manufacturer. Amplification reaction assays were
performed with Taqman Universal PCR Master mix (Applied
Biosystems) with specific primers (Applied Biosystems). RNU44
was used as the endogenous control for normalization and miRNA
expression level was quantified using the 22DDCt method.
Chemokine mRNA measurements on material obtained from
the same three initial donors were performed using SYBR Green I
Universal PCR MasterMix (PE Applied Biosystems). Chemokine
specific and housekeeping gene (b2-M, HPRT1 and GADPH)
primers were obtained from SABiosciences. Results were ex-
pressed using the 22DDCt method.
Western blotTotal protein extraction. At indicated times, MDM were
washed in cold PBS (2 mL/well) by centrifuging the culture plates
at 450 g, 10 min, 4uC and cells were scrapped in cold PBS
(500 mL/well) and transferred to microtubes. An additional
volume of cold PBS (500 mL/well) was used to harvest cells
remaining in the wells and was added to the same micro-tubes. To
pellet cells, micro-tubes were centrifuged at 220 g, (10 min, 4uC).
After removing supernatant, an additional 3–5 min centrifugation
step was used to completely dry the pellet. 100 mL of freshly
thawed lysis buffer (Urea 7 M, Thiourea 2 M, CHAPS 2%, Tris
HCl pH 8.8 30 mM, Protease Inhibitor 4%) was added to each
pellet and tubes were kept at 280uC until use. Protein
concentration was assayed using the Bradford protein assay (Bio-
Rad).
Western blot. Equal amounts of total proteins (10 mg) were
separated by SDS-PAGE on 10% acrylamide gels and transferred
to a PVDF membrane. After blocking in TBS containing 0,1%
Tween 20 and 2% milk (GE Healthcare Biosciences), the blots
were probed with anti-caspase 3 antibody (#9662, Cell Signaling;
dilution 1:1,000). Chemiluminescent detection was performed
using horseradish peroxidase-conjugated secondary antibodies and
membranes were revealed with ECL (GE Healthcare Biosciences).
Loading controls were checked using an antibody to HSP27 (sc-
1048, Santa Cruz; dilution 1:5,000). The first lane of the blot
contained 10 mg of Leishmania lysate, to ensure that the antibodies
used in the experiment did not cross-react with Leishmania proteins.
Data shown are representative of three independent experiments
conducted on MDM derived from three different healthy donors.
Bioinformatics analysesAnalysis of miRNA differentially regulated after L. major
infection was carried out for each experimental time point
separately using the MultiExperiment Viewer (MeV) v4.7.1 from
the TM4 software package [33] available as open-source software
at http://www.tm4.org/mev.html.
Hierarchical Clustering was performed using the Euclidean
distance metric with complete linkage option.
For miRNA target identification, we used the miRWalk
comprehensive database that provides information on human
miRNAs experimentally validated binding sites target genes [34]
updated on 15th March 2011.
InnateDB database [35] was used to classify all miRNA targets
according to their associated GO terms using the hyper-geometric
test and the Benjamini Hochberg correction method (default
parameters). An enrichment analysis was performed using the
BINGO plugIn [36] of Cytoscape [37] v2.8.3 [38], based on the
GO terms revealed by the up- or down-regulated miRNA targets
at each time point. We used the hyper-geometric test and the
Benjamini Hochberg FDR correction method, and a 0.001
significance level due to the high proportion of associated GO
terms. We finally used TransmiR database (updated on 19th
March 2012) for transcription factors (TFs) regulating miRNA
transcription [39] to identify experimentally validated TFs that are
upstream of deregulated miRNAs.
Statistical analysesThe statistical significance of the quantitative differences
between the different sample groups was determined by applica-
tion of Student’s two-tailed t test. P values of ,0.05 were
considered statistically significant.
Results
Profiling miRNA expression during L. major infection timecourse
To identify miRNAs for which expression is altered upon L.
major infection of human macrophages, we incubated MDM from
3 healthy donors with metacyclic parasites. Macrophages were
infected for 3, 6, 12 or 24 h and their RNA extracted for miRNA
array assay. Percentage of infected cells and parasite load in all
donors were microscopically assessed and showed consistent rates
of infection (57% and 82% of infected cells; 5,6 and 6,2 parasites/
infected cell at 12 and 24 h post-infection respectively).
RNA of non-infected MDM extracted at same time points were
used as controls. Among the 365 human miRNAs assessed by
Leishmania-Infected Macrophage MiRNA Deregulation
PLOS Neglected Tropical Diseases | www.plosntds.org 3 October 2013 | Volume 7 | Issue 10 | e2478

Taqman real-time PCR (Table S1), 214 were either undetectable
or below the background (ND); expression of the 151 remaining
miRNAs was further analyzed further. Expecting a large inter-
individual variability in miRNA expression as previously reported
[40,41,42], we only selected miRNAs that showed consistent
trends of deregulation (either up- or down-regulated) in the three
donors with fixed cut-off values. According to this criterion, only
64 miRNAs had levels consistently modified by L. major infection
(Table S1) and showed, using Principal Component Analysis
observable on 3D graphs (Figure S1), the closest relationship and
vicinity between the three donors compared to what was observed
for the whole miRNA tested set.
Hierarchical clustering of these 64 differentially regulated
miRNAs is shown in Figure 1 and Figure S2 for the whole time-
course and independent time-point course infection respectively.
Figure 1 indicates that the proportion of up- or down-modulated
miRNA is different for each time point. Hence, at 3 h post-
infection, 31 miRNAs were up-regulated but only three were
down-regulated. In contrast, at 6 h post-infection only five
miRNAs were up-regulated and seven were down-regulated.
Longer infection time showed eight and seven miRNAs up-
modulated at 12 and 24 h respectively whereas three and 11
miRNAs were down-modulated at these time points. Finally,
among the 64 miRNAs, four (miR-28, miR-331, miR-486 and
miR-502) were differently deregulated at, at least, two different
time points of infection. Control experiments using phagocytosis of
inert beads did not generate similar alteration in miRNA
expression Hence, the 64 miRNA, which levels were consistently
modified by L. major infection are likely induced by parasite
infection and unlikely reflecting only the early non-specific steps of
phagocytic internalization (Table S1).
QRT-PCR array validationTo validate the accuracy of array-generated data, a qRT-PCR
validation study was carried out on nine selected miRNAs (miR-
let7a, 26a, 26b, 130b, 132, 133b, 155, 199 and 210). This set was
randomly selected from the 64 deregulated miRNAs and the
number of qRT-PCR tested miRNAs was chosen merely
proportionally to the deregulated numbers at each time point
post-infection. In general, both data, generated by PCR-array or
by qRT-PCR showed consistent results (up- or down-regulation)
for most tested miRNAs in the three donors’ MDM, though the
magnitude of the response measured by the two approaches was
different (Figure S3). The correlation coefficient between the mean
values of the three donors (excepting two outliers values from the
same donor measured by array PCR) for each miRNA measured
by the two approaches was statistically significant (r = 0.78;
p = 0.003).
Identification and GO enrichment of differentiallyregulated miRNA targets
Since human miRNAs are able to regulate transcripts having
only few nucleotides of complementarity, their potential to
regulate large numbers of targets is obvious and amplifies the
quantitative and qualitative consequences of miRNA modulation
by L. major infection. In order to identify the transcripts that might
be targeted by differentially regulated miRNA in infected
macrophages, we used the validated module of miRWalk
database, containing experimentally verified miR interaction
information. The list of these targets is provided in Table S2.
According to this approach, genes belonging to critical cellular
pathways were identified. Several noteworthy transcripts virtually
targeted by deregulated miRNAs over the infection time course
were highlighted. These highly targeted genes included AKT1
(v-akt murine thymoma viral oncogene homolog 1), BCL1 (B-cell
CLL/lymphoma 1), BCL2, BCL2L11 (BCL2-like 11), EGFR
(epidermal growth factor receptor), Jun, MCL1 (myeloid cell
leukemia sequence 1), MYC (v-myc myelocytomatosis viral
oncogene homolog), p53 and PTEN (phosphatase and tensin
homolog), that belong to pro-, anti-apoptotic and proliferation
pathways; IL-1b, IL-6, p50 NF-kB, p65 NF-kB, TLR-4 belonging
to innate immune response pathways; NPC1 (Niemann-Pick
disease, type C1) involved in intracellular cholesterol trafficking;
PI3 (peptidase inhibitor 3) an anti-microbial peptide, Dicer1 and
DROSHA involved in miRNA expression and CCND1 (cyclin
D1) involved in the cell cycle.
The target lists identified at each time point were then
subjected to pathway analysis using the Cytoscape Plug-In
BINGO after GO enrichment focusing on molecular functions,
cellular components and biological processes. Several pathways
have been highlighted during the infection time course.
Assuming that there is theoretically a negative correlation
between expression levels of miRNAs and their targets, we
noticed several pathways and processes that could be either up-
or down-regulated. Figure 2 shows affected up- and down-
regulated biological processes of pathways targeted respectively
by down- or up-modulated miRNAs in infected macrophages at
3 h. Other results (biological processes at other time points of
infection and cellular components and molecular functions
affected by parasite infection between 3 and 24 h) are
represented in figures S4–S10.
Our results show that at 3 h post-infection several targets of up-
modulated miRNAs are located in the plasma membrane of the
infected macrophage whereas catalytic and enzyme regulator
activities seem to be inhibited. Interestingly, several biological
processes including cell communication and mitochondrion
organization were also down-modulated early upon infection.
GO enrichment also suggests that parasite infected macrophages
down-regulate several processes including cellular movement,
secretion, enzyme production or gene expression naturally
induced through an abiotic stimulus.
At 6 h post-infection, our results predict an increase of catalytic
and protein-binding activities associated with a more dynamic cell
communication process. This continues at later times of course
infection (12 and 24 h). Interestingly, this analysis predicted an
inhibition of lipid binding molecular function, probably occurring
within cytoplasmic membrane-bound vesicles concomitantly with
an increase of enzyme regulator and receptor binding activities.
Finally, at time when parasite infection appears to be well
established (i.e., 24 h post-infection), symbiotic biological processes
in response to stimulus seems inhibited. This might indicate either
a shutdown of macrophage anti-parasitic responses or down-
regulation of Leishmania key virulence gene activity, as a
consequence of an already differentiated parasite invasion.
Interestingly, several genes coding for parasite virulence factors
are related to this biological process. Indeed, L. major inhibitor of
serine peptidase 2 and 3 (ISP2 and ISP3), lipophosphoglycan 2
(LPG2) and leishmanolysin (gp63) are known as modulators of host
immune response via regulation of its complement system,
phagocytosis process and protein kinase-mediated and nitric
oxide-mediated signal transduction. The expression of up to 27
human genes related to this process is known to be regulated by
miRNAs. Interestingly, these genes include Natural resistance-
associated macrophage protein 1 (SLC11A1), transportin 1
(TNPO1) and Transferrin receptor protein 1 (TFRC), among
others.
We also predicted an enhanced activity in extracellular space
and in signal transducers at 24 h.
Leishmania-Infected Macrophage MiRNA Deregulation
PLOS Neglected Tropical Diseases | www.plosntds.org 4 October 2013 | Volume 7 | Issue 10 | e2478

It is worth noting that even if the identified pathways were
either inhibited or enhanced in the same way at a given time point
of infection, the number of involved targeted genes belonging to
the same GO category might be different from one node to
another.
Taken at the level of regulatory networks, this might reflect
affected cellular processes and molecular functions in macrophages
infected with L. major parasites following miRNA deregulation
during the time course of infection.
Negative correlation of expression between microRNAsand their mRNA targets
MiRNAs are known to regulate the expression of target genes
both at the levels of mRNA translation and mRNA stability,
Figure 1. Hierarchical cluster analysis of deregulated miRNA expression in L. major-infected human primary macrophages. ThemiRNA expression values are presented using a red-white-blue color scheme, with red data points indicating higher expression than median values,white indicating expression equal to the median, and blue indicating lower expression than the median. MiRNAs were analyzed based on theirexpression before and at different time points, post-infection (3, 6, 12 and 24 h) of primary human macrophages from three healthy donors (D1, D2and D3).doi:10.1371/journal.pntd.0002478.g001
Leishmania-Infected Macrophage MiRNA Deregulation
PLOS Neglected Tropical Diseases | www.plosntds.org 5 October 2013 | Volume 7 | Issue 10 | e2478

leading to a negative correlation between expression levels of these
master regulators and their target mRNAs. It was interesting to
note that among the experimentally validated targeted transcripts
of up-regulated miRNAs at 3 h, 6 h and 12 h (Table S2), several
belong to the chemokine family (e.g., CCL2, CCL5, CXCL10,
CXCL11 and CXCL12). These molecules might be inhibited by
different miRNAs that were up-regulated upon L. major macro-
phage infection.
In order to check if the mRNA expression of these chemokines
was negatively correlated with the up-regulation of all the
corresponding targeting miRNAs (i.e., let-7a, miR-25, miR-23b,
miR-26a, miR-132, miR-140, miR-146a, miR-146b, miR-155
and miR-210) identified in Table S2, we measured their levels
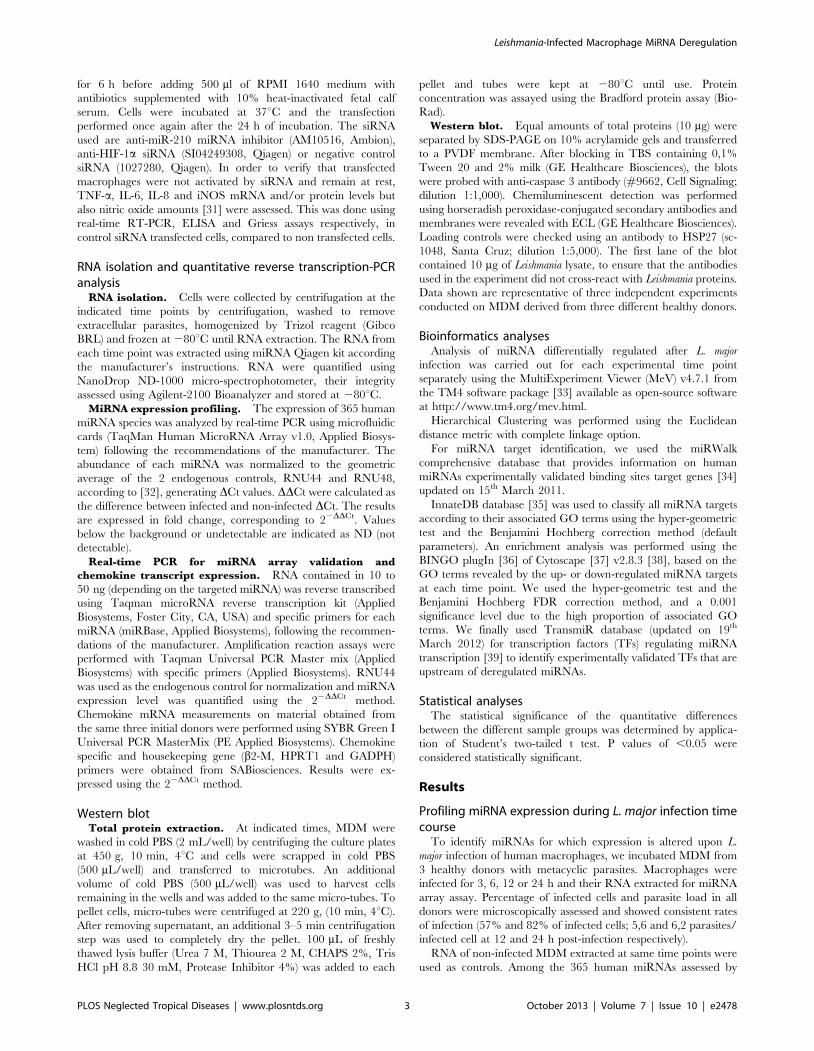
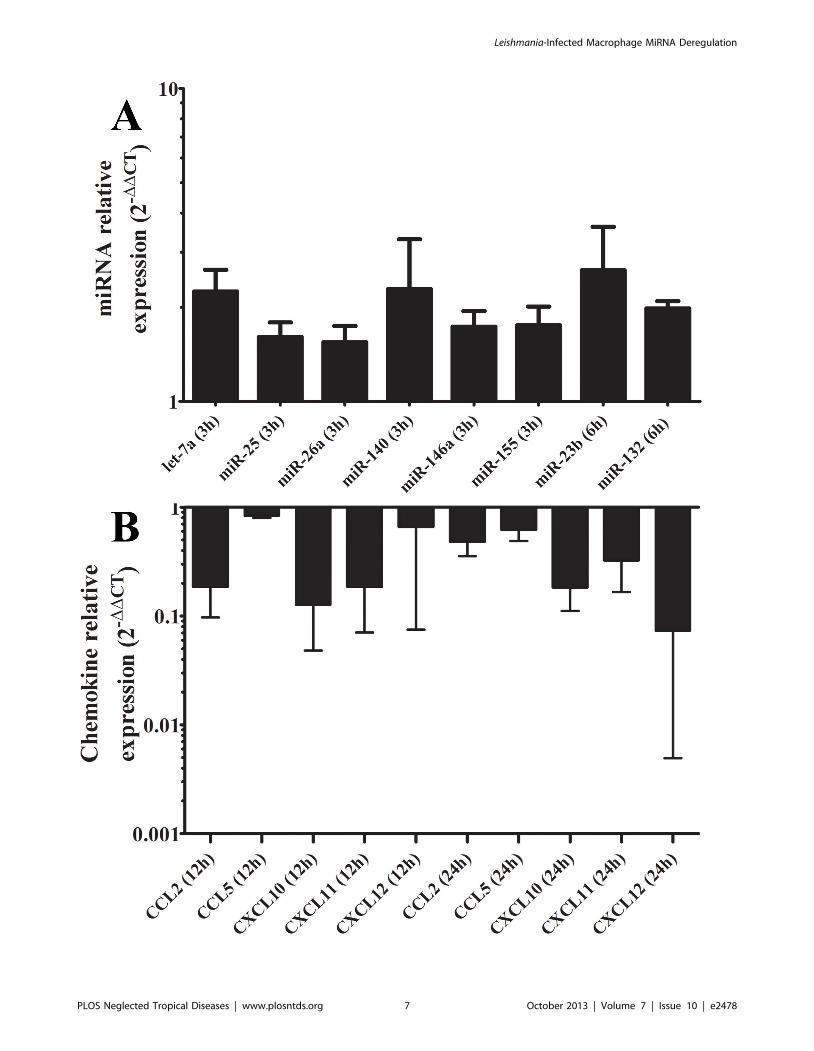
using qRT-PCR. Figure 3 shows the relative expression levels of
let-7a, miR-25, miR-26a, miR-132, miR-140, miR-146a and miR-
155 at 3 and 6 h (panel A), and of five chemokines of their
predicted targets at 12 and 24 h (panel B).
Taken as a whole, and despite some individual variability in the
measured levels between one donor to another as described
elsewhere [40,41,42], these results clearly indicate that there is a
statistically significant negative correlation (r = 20.27; p = 0.04)
between expression levels of the selected up-regulated set of
miRNAs and their corresponding chemokine targets (Figure S11).
This negative correlation should be experimentally validated to
indicate that the inhibition of chemokines-transcript levels is the
direct result of regulation through expression of their targeting
miRNAs.
Identification of transcription factors regulating miRNAtranscription
It is well known that the expression of miRNAs can be activated
or repressed by TFs, which can serve as upstream regulators of
miRNA expression. In order to indirectly identify TFs that are
inhibited or activated by L. major infection, we used the TransmiR
database listing experimentally validated TFs that are upstream
regulators of miRNA expression (Table S3). Interestingly, several
miRNAs were shown to be virtually activated, repressed or
regulated by master transcription factors e.g., p50 NF-kB, EGR1,
MYC, E2F1, PU.1, CREB-1, HIF-1a or p53. Among these TFs,
at least CREB [43], HIF-1a [44] and p50 NF-kB [45] were
previously shown to be modulated upon Leishmania infection.
MiR -210 is partially controlled by HIF-1a activation but isnot involved in down-regulation of pro-caspase-3 inparasite infected macrophages
Among the miRNAs for which levels were modulated during L.
major infection, several were described as playing a possible role in
apoptosis e.g., miR-210, [46] miR-22, miR-155 and miR-133b
[47].
For this study, we focused on the role of one of these
deregulated miRNA in infected macrophages, namely miR-210.
Expression of miR-210 was monitored by real-time PCR during
the time course of in vitro L. major infection in MDM from three
new donors. Results indicate that miR-210 was crescendo up-
regulated since 6 h post-infection in parasite infected macrophages
(Fig. 4, panel A). This up-regulation was statistically significant at
12 and 24 h.
MiR-210 expression has been described to be mainly transcrip-
tionally controlled by hypoxia-induced factor-1 alpha (HIF-1a)
(reviewed in [48]). This TF was shown by us (Tiffin and Sysco
Consortium, submitted paper) and by others [44,49] to be
activated in macrophages infected with Leishmania, probably
through a hypoxia-independent pathway [44,49]. In order to
check if the observed up-regulation of miR-210 was specifically
under HIF-1a control, we used siRNA to silence this TF before
infection (HIF-1a silencing leads to a 90% decrease in HIF-1aprotein abundance; Tiffin and Sysco Consortium, submitted
paper). Levels of miR-210 were then monitored in macrophages
incubated for 24 h with L. major parasites. In cells transfected with
control siRNA, and as expected, miRNA-210 was overexpressed
Figure 2. Biological processes deduced from analysis of deregulated miRNA-targets in L. major-infected human macrophages at 3 hpost-infection. Yellow color gradient intensity correlates with up- or down-regulation levels. White nodes are not significantly overrepresented. Thearea of each node is proportional to the number of genes in the set annotated to the corresponding GO category. Interactions were visualized as anetwork using Cytoscape and BINGO plugin.doi:10.1371/journal.pntd.0002478.g002
Leishmania-Infected Macrophage MiRNA Deregulation
PLOS Neglected Tropical Diseases | www.plosntds.org 6 October 2013 | Volume 7 | Issue 10 | e2478
Leishmania-Infected Macrophage MiRNA Deregulation
PLOS Neglected Tropical Diseases | www.plosntds.org 7 October 2013 | Volume 7 | Issue 10 | e2478

Figure 3. Negative correlation between expressions of an up-regulated set of miRNAs and their targeted chemokine transcripts.Expression means of let-7a, miR-25, miR-26a, miR-140, miR-146a and miR-155 at 3 h and miR-23b and miR-132 at 6 h post-infection of three healthydonors (D1, D2 and D3; panel A) is negatively correlated with CCL2, CCL5, CXCL10, CXCL11 and CXCL12 mRNA mean levels at 12 and 24 h post-infection (panel B) in L. major-infected human macrophages. Results were expressed using the 22DDCt method.doi:10.1371/journal.pntd.0002478.g003
Figure 4. Time course of miRNA-210 and procaspase-3 expression levels in L. major infected human primary macrophages. MiR-210expression at 3, 6, 12, and 24 h in infected cells relatively to non-infected cells (panel A), after siRNA-control or HIF-1a-silencing transfections in non-infected and infected cells (panel B). Results were expressed using the 22DDCt method. Stars (*) are indicated when results are statistically significantfrom control. One star indicates a p value ,0.05; two stars indicate a p value ,0.01 and three stars indicate a p value ,0.001. Panel C representsabundance of pro-caspase-3 protein levels in time course parasite-infected macrophages of healthy donors revealed by western blot analysis. HSP27was used as loading control. Ten mg of L. major lysate (latest lane) was used a negative control to ensure that anti-procaspase-3 antibody does notcross-react with parasite proteins. Data are representative of three independent experiments conducted on MDM derived from two to three differenthealthy donors. NI indicates non-infected cells and IF indicates infected cells.doi:10.1371/journal.pntd.0002478.g004
Leishmania-Infected Macrophage MiRNA Deregulation
PLOS Neglected Tropical Diseases | www.plosntds.org 8 October 2013 | Volume 7 | Issue 10 | e2478

in infected cells in comparison to non-infected ones. (p = 0.001).
HIF-1a silencing leads to a reduction by about 40% of miR-210
expression in non-infected cells (p = 0.001) and up to 60% in
infected cells (p = 0.00002), indicating that induction of miR-210 is
largely dependent on parasite-induced HIF-1a activation (Fig. 4,
panel B). Noteworthy, the parasite load in HIF-1a silenced cells
was drastically reduced, when compared to controls (Tiffin and
Sysco Consortium, submitted paper). This is unlikely to be the
result of any potential side effect activation by transfection agents,
since the expression levels of several macrophage activation
markers (TNF-a, IL-6, IL-8, iNOS and NO) were not significantly
different between non transfected and transfected cells (data not
shown).
Caspase-3 is considered as a key actor of apoptosis triggered by
both the intrinsic and extrinsic pathways [46]. It is however well
known that Leishmania spp. inhibit macrophage apoptosis [14] to
ensure their intracellular differentiation and survival. To investi-
gate if miR-210 up-regulation in infected macrophages might
contribute to the anti-apoptotic behavior of Leishmania-infected
macrophages through caspase-3 inhibition, we first measured pro-
caspase 3 abundance in infected cells compared to non infected
cells and then monitored the potential effect of miR-210 silencing
on expression of this pro-apoptotic molecule. Figure 4, panel C
shows a decreased abundance of pro-caspase-3 in macrophages
infected with the parasite at 6, 12 and 24 h, strongly supporting
the anti-apoptotic effect of L. major infection. However, miR-210
silencing did not affect the abundance of procaspase-3 (data not
shown). This absence of effect could be attributed either to the
partial effect of miR-210 silencing on its expression (46%, data not
shown) although statistically significant (p = 0.0014), or to specific
regulation of caspase-3 in MDM that differs from that observed in
HeLa cells [46].
Discussion
How host cells react to infection and how pathogens adapt to
host cell microenvironment remain largely unsolved issues, though
they are crucial for better understanding of host-pathogen
interactions in order to set up efficient therapies. Leishmania
parasites are among those pathogens that intriguingly contradict
immune response dogma. When injected into skin, Leishmania
promastigotes first interact with resident cells, i.e. PMN, dermal
macrophages, keratinocytes, and Langerhans cells. Promastigotes
are then rapidly phagocytized by PMN and macrophages and
metamorphose to amastigotes. Ideally, ingested promastigotes are
internalized in phagosomes that fuse with lysosomes, digest
invaders and present their antigens to T cells to initiate adaptive
responses. However, Leishmania parasites have evolved several
escape mechanisms to subvert the innate immune responses and
prevent the development of an efficient anti-parasitic response.
Despite several studies that have been conducted on Leishmania-
macrophage interaction, one should acknowledge that our
understanding of the mechanisms deployed by Leishmania parasites
to modulate the host cell’s response to infection is still incomplete.
Several pathogens have been shown to modify cellular responses
of their host through miRNAs, molecules now recognized as
master regulators of major cellular processes. We therefore
hypothesized that L. major parasites could alter the miRNA profile
of infected macrophages during the first 24 h of their encounter.
Our study shows that about 20% of the tested miRNAs were
specifically deregulated at different time points upon infection
course, while their expression was unchanged in cells cultured in
presence of inert latex beads. Several molecules that were
differentially up-regulated at 3 and 6 h post-L. major infection,
i.e., miR9, miR132, miR-146a, miR-155 and miR-187, are well
known to control TLR-receptor signaling in monocytes
[27,50,51]. Indeed, miR146a over-expression in human macro-
phages was reported to be noticeable as soon as 2 h after LPS
treatment (acting through TLR4) [52]. A TLR5 agonist induced in
these cells the same effect on miR-146a; in contrast agonists to
TLR3, TLR7, and TLR9 had no effect.. In turn, miR-146a
targets transcripts of TNF receptor-associated family (TRAF) 6
and IL-1 receptor-associated kinase (IRAK) 1, suggesting that
miR-146a is a negative regulator of the fine-tuned inflammatory
responses.
Induction of miR-155 is also a robust feature of the mammalian
inflammatory responses in human [52] and murine [53] macro-
phage cell lines in response to LPS and other TLR ligands [54].
Interestingly, the two parallel TLR4-dependant cascades (Myd88
and TRIF) both contain miR-155-targets. Assisted by miR-155-
regulated TAB2 [55], the MyD88 branch induces nuclear NF-kB
translocation and AP-1 activation through IKK and MAPK,
respectively. Although these observations suggest that miR-146
and miR-155 are most likely co- regulated, several studies have
indicated that they might control the inflammatory response at
different levels [56]. Inflammatory cytokines and/or TLR-
responsive miRNA also include miR-132 [57] and miR-9; the
latter directly targets the NF-kB1 providing a rapid and efficient
negative feedback loop on NF-kB dependent pathways [50].
Although the entry mechanism of Leishmania is not fully
elucidated, the up-regulation of several TLRs has been reported
upon macrophage infection by parasites [58] with contradictory
evidences in humans depending on the infecting Leishmania spp.
Indeed, it was shown that L. (Viannia) panamensis infection results
in up-regulation of TLR1, TLR2, TLR3, and TLR4 expression
[59], inducing activation of infected macrophages, whereas
infection with L. donovani suppresses the TLR2–NF-kB–mediat-
ed pro-inflammatory cytokine response [60]. In our hands,
profiling of up-regulated and TLR-related miRNAs indicates
that L. major infection preferentially induces activation of several
TLR-dependent pathways (IRAK, TRAF-6, p50 NF-kB), in
order to inhibit macrophage inflammatory responses. Altogeth-
er, several reports converge towards a model in which Leishmania
parasites have developed different mechanisms to counteract the
NF-kB-dependent inflammatory responses of infected macro-
phages (reviewed in [61]), as suggested by the absence of a
broad range of cytokine and chemokine secretion accompanying
the phagocytosis of Leishmania [62]. Among these mechanisms,
one can cite i) the up-regulation of the A20 de-ubiquiting
enzyme that counteracts the L. donovani-induced TRAF6
activation [60], ii) the Leishmania spp-induced specific cleavage
of the p65 NF-kB subunit [63,64] that we confirmed experi-
mentally in L. major-infected human primary macrophages (data
not shown), iii) the specific inhibition of p65 NF-kB subunit by
L. major parasites [65], iv) the activation of the repressive p50
NF-kB homodimer by L. amazonensis [45], and v) the up-
regulation of several miRNAs targeting the TLR-dependent
pathway shown in this paper.
The experimentally validated identification of differentially
expressed miRNAs targets highlighted several key molecules
belonging to several pathways that play critical roles during the
time course of infection. Besides TLR-2, TLR-4 and TLR-5
described above, TLR-related IL-1b, IL-6 and p50 NF-kB as well
as pro-apoptotic targets have been identified as targets of up-
regulated miRNA. This result is in keeping with our and others’
early observations showing that transcripts of several apoptotic
actors were down-modulated upon L. major infection of human
macrophages [15].
Leishmania-Infected Macrophage MiRNA Deregulation
PLOS Neglected Tropical Diseases | www.plosntds.org 9 October 2013 | Volume 7 | Issue 10 | e2478
Among other potential miRNA targets, we focused on selected
chemokines transcripts. Indeed, although base pairing is not
perfect in vertebrates, it is well known that miRNAs mainly act
through degradation of their mRNA targets [66,67,68]. Based on
the observation that five chemokines (CCL2, CCL5, CXCL10,
CXCL11 and CXCL12) are targeted by L. major-regulated
miRNAs i.e., Let-7a, miR-25, miR-26a, miR-132, miR-140,
miR-146a and miR-155, we show a negative correlation of
transcript abundance with their corresponding miRNAs. This
result corroborates our early observation showing that expression
levels of CCR2, CCL5 and CXCL10 mRNAs were drastically
inhibited upon L. major infection of human macrophages [15].
It has been reported that tissue lesions of human cutaneous
leishmaniasis due to L. tropica express high levels of intralesional
iNOS and CCL2, indicating that NO likely promotes parasite
killing by macrophages via CCL-2-mediated stimulation [69].
This result corroborates earlier observations showing that CCL2
acts synergistically with IFN-c to antagonize IL-4 action, stimulate
macrophage parasite-killing and promote healing [70]. Similarly,
CCL2 enhances nitric oxide production and leishmanicidal
activity of L. infantum infected macrophages [71]. These results
suggest that inhibition of CCL2 (as a consequence of miRNA up-
regulation reported in the present paper) might be a parasite-
induced strategy to escape killing by macrophages. Our result
showing inhibition of CXCL10 transcripts, however, contradicts
earlier reports on the expression of high levels of this chemokine in
CD14+ L. braziliensis infected-monocytes [72]. This discrepancy
might be related to differences in Leishmania spp. or to cutaneous
disease type [73].
This well-orchestrated mechanism is probably not the unique
way for L. major parasites to escape killing by macrophages.
Indeed, GO enrichment of deregulated miRNA potential targets
showed several differences during time course infection in
molecular functions, cellular components and biological processes.
Several miRNAs have been associated to regulation of apoptotic
and anti-apoptotic pathways. Hence, miR-210 when inhibited
increases the level of apoptosis in HeLa cells [46]; miR-22
promotes cell survival in UV irradiated cells through a tumor
suppressor gene down-regulation [74]; down-regulation of miR-25
in ovarian cancer cells induces apoptosis [75]; miR-155 was
described as having anti-apoptotic effects in murine macrophages
during Helicobacter pylori infection [76]; and miR-133b is known to
inhibit pro-survival molecules MCL-1 and Bcl-w proteins, two
members of the BCL-2 family [47].
Being particularly interested in putative regulators of apoptotic
and anti-apoptotic pathways (Tiffin and Sysco Consortium,
submitted paper), we identified one particular microRNA, miR-
210, that could possibly affect the abundance of apoptotic proteins
like procaspase-3, a key actor of apoptosis triggered by both
intrinsic and extrinsic pathways.
MiR-210 levels progressively and robustly increase through the
time course of infection. Silencing experiments showed that its
transcription is largely controlled by HIF-1a, a transcription factor
directly related to hypoxia.
Although HIF-1a stabilization did not play any role in L.
donovani entry in macrophages, its overexpression is beneficial to
the parasite survival at the post-infective stage [44,49], and its
silencing reduces parasite load (Tiffin and Sysco Consortium,
submitted paper). Interestingly, HIF-1a stabilization was not due
to depletion of cellular oxygen levels and was unlikely a hypoxia-
dependent phenomenon [44,49]. It is however interesting to note
that several miRNAs in addition to miRNA-210 i.e., miR-23,
miR-24, miR-26a, miR-26b, miR-29a and miR-107 up-regulated
through time course infection in our study were described as
hypoxia-related [77,78], negatively regulating HIF-1a through
factor inhibiting-HIF-1a (FIH) [79] or induced by this TF [80].
To our knowledge, our study is the first one showing miR-210
induction in response to a pathogen; further investigation is
warranted in order to clarify the biological significance of this up-
regulation in response to L. major infection.
It has been well known for almost two decades that Leishmania
infection inhibits macrophage apoptosis [14]. The parasite-
induced anti-apoptotic effect is associated with a significant
reduction of caspase-3 activity in L. major- or L. mexicana-infected
PMN [81] or monocyte-derived dendritic cells [82]. In addition, L.
infantum infection affected the apoptosis of U-937 human
monocytic cell line via a mechanism involving inhibition of
caspase-3 activation [83]. Conversely, it was also shown that
silencing of miR-210 in HeLa cells induced caspase-3 activity [46].
We hence hypothesized that pro-caspase3 could be targeted by
miR-210 in infected human MDM, thereby inhibiting their
apoptosis. Although silencing miR-210 in infected macrophages
did not reverse the L. major-induced pro-caspase-3 inhibition, we
cannot exclude that this anti-apoptotic function of miR-210 takes
place through the targeting of other pro-apoptotic molecules.
Indeed, miR-210 has been shown to promote cell survival by
targeting caspase-8-associated protein 2 in rat mesenchymal stem
cells [84], E2F3 transcription factor in human pulmonary artery
smooth muscle cell [85] and apoptosis-inducing factor, mitochon-
drion-associated, 3 (AIFM3) in hypoxic human hepatoma cells
[86]. However, the biological significance of L. major-induced miR-
210 may lie in non-apoptotic biological processes, as miR-210 has
been recently described to down-regulate NF-kB1 (the p105
precursor of p50 NF-kB subunit) [87].
When reporting our results, a recent study has elegantly shown
that L. donovani infection down-regulates expression of miR-122
and genes involved in cholesterol biosynthesis in infected mouse
livers. This deregulation was conducted through Leishmania
metalloprotease gp63, which inhibits Dicer1-mediated pre-miR-
122 processing upon Dicer1 degradation in infected cells [88].
Leishmania virulence factors or other parasite exosome components
involved in cell-cell contact might also be involved in mir-210 up-
regulation in human macrophage upon L. major infection.
ConclusionIn conclusion, we report for the first time that within the first
24 h of infection by L. major the miRNA profile of human primary
macrophages is strongly and rapidly modified.
Alterations in miRNA levels likely reflect the remarkable
capacity of parasites to modify the host responses to ensure their
intracellular differentiation and multiplication.
Supporting Information
Figure S1 Principal component analysis of miRNAexpression profiles raised with the whole 365 miRNAsset (upper panel) or with only deregulated sets (lowerpanel). These figures show similarities of miRNA profiles
between the three donors at different time points upon infection
(panels A and E: 3 h post infection; panels B and F: 6 h post
infection; panels C and G: 12 h post infection and panels D and
H: 24 h post infection).
(TIF)
Figure S2 Hierarchical cluster analyses of deregulatedmiRNA expression in L. major-infected human primarymacrophages at different time points upon infection.The miRNA expression values are presented using a red-white-
blue color scheme, with red data points indicating higher
Leishmania-Infected Macrophage MiRNA Deregulation
PLOS Neglected Tropical Diseases | www.plosntds.org 10 October 2013 | Volume 7 | Issue 10 | e2478
expression than median values, white indicating expression equal
to the median, and blue indicating lower expression than the
median. MiRNAs were analyzed independently based on their
expression before and upon infection at different time points (3, 6,
12 and 24 h) of primary human macrophages from three healthy
donors (D1, D2 and D3).
(TIF)
Figure S3 Individual PCR validation of a selected set ofderegulated miRNAs in L. major-infected human mac-rophages. Scatter plot analysis shows correlation between mean
expression levels of nine miRNAs measured by array analysis
(PCR array) and mean expression levels tested using individual
qRT-PCR (Individual PCR) in three donors. Correlation
coefficient r and statistical p values are indicated. Results were
expressed using the 22DDCt method.
(TIFF)
Figure S4 Molecular functions and cellular componentsof L. major-infected human primary macrophagemiRNA-targets at 3 h post-infection. Regulatory network
was obtained after GO enrichment deduced from analysis of up-
or down-regulated miRNA-targets. Yellow color gradient intensity
correlates with up- or down-regulation levels. White nodes are not
significantly overrepresented. The area of each node is propor-
tional to the number of genes in the set annotated to the
corresponding GO category. Interactions were visualized as a
network using Cytoscape and BINGO plugin.
(TIF)
Figure S5 Molecular functions and cellular componentsof L. major-infected human primary macrophagemiRNA-targets at 6 h post-infection. Regulatory network
was obtained after GO enrichment deduced from analysis of up-
or down-regulated miRNA-targets. Yellow color gradient intensity
correlates with up- or down-regulation levels. White nodes are not
significantly overrepresented. The area of each node is propor-
tional to the number of genes in the set annotated to the
corresponding GO category. Interactions were visualized as a
network using Cytoscape and BINGO plugin.
(TIF)
Figure S6 Molecular functions and cellular componentsof L. major-infected human primary macrophagemiRNA-targets at 12 h post-infection. Regulatory network
was obtained after GO enrichment deduced from analysis of up-
or down-regulated miRNA-targets. Yellow color gradient intensity
correlates with up- or down-regulation levels. White nodes are not
significantly overrepresented. The area of each node is propor-
tional to the number of genes in the set annotated to the
corresponding GO category. Interactions were visualized as a
network using Cytoscape and BINGO plugin.
(TIF)
Figure S7 Molecular functions and cellular componentsof L. major-infected human primary macrophagemiRNA-targets at 24 h post-infection. Regulatory network
was obtained after GO enrichment deduced from analysis of
up- or down-regulated miRNA-targets. Yellow color gradient
intensity correlates with up- or down-regulation levels. White
nodes are not significantly overrepresented. The area of each
node is proportional to the number of genes in the set
annotated to the corresponding GO category. Interactions
were visualized as a network using Cytoscape and BINGO
plugin.
(TIF)
Figure S8 Biological processes deduced from analysisof deregulated miRNA-targets in L. major-infectedhuman macrophages at 6 h post-infection. Yellow color
gradient intensity correlates with up- or down-regulation levels.
White nodes are not significantly overrepresented. The area of
each node is proportional to the number of genes in the set
annotated to the corresponding GO category. Interactions were
visualized as a network using Cytoscape and BINGO plugin.
(TIF)
Figure S9 Biological processes deduced from analysisof deregulated miRNA-targets in L. major-infectedhuman macrophages at 12 h post-infection. Yellow color
gradient intensity correlates with up- or down-regulation levels.
White nodes are not significantly overrepresented. The area of
each node is proportional to the number of genes in the set
annotated to the corresponding GO category. Interactions were
visualized as a network using Cytoscape and BINGO plugin.
(TIF)
Figure S10 Biological processes deduced from analysisof deregulated miRNA-targets in L. major-infectedhuman macrophages at 24 h post-infection. Yellow color
gradient intensity correlates with up- or down-regulation levels.
White nodes are not significantly overrepresented. The area of
each node is proportional to the number of genes in the set
annotated to the corresponding GO category. Interactions were
visualized as a network using Cytoscape and BINGO plugin.
(TIF)
Figure S11 Scatter plot analysis showing a negativecorrelation between expressions of an up-regulated setof miRNAs and their targeted chemokine transcripts.Expression of let-7a, miR-25, miR-26a, miR-140, miR-146a and
miR-155 at 3 h and miR-23b and miR-132 at 6 h post-infection of
three healthy donors (D1, D2 and D3) is negatively correlated with
CCL2, CCL5, CXCL10, CXCL11 and CXCL12 mRNA levels at
12 and 24 h post-infection in L. major-infected human macro-
phages. Correlation coefficient r and statistical p values are
indicated. Results were expressed using the 22DDCt method.
(TIFF)
Table S1 Expression levels of 365 human miRNAs in L.major-infected and latex beads-incubated human pri-mary macrophages. Results are obtained at different time
points (3, 6, 12 and 24 h) in macrophages from three healthy
donors (D1, D2 and D3). Analysis was assessed by qRT-PCR and
results were expressed using the 22DDCt method. When signals are
either undetectable or below the background, they are indicated as
(ND).
(XLS)
Table S2 Identification of differentially regulated-miRNA targets. Different lists were generated using miRWalk
database using miRNAs identified as differentially up- or down-
regulated at 3, 6, 12 and 24 h post-infection in L. major-infected
primary human macrophages. Tables indicate the miRNA name,
gene name, entrez ID and Pubmed ID experimental validation of
their targets.
(XLS)
Table S3 Identification of differentially regulated-miR-NAs up-stream regulating transcription factors. Different
lists were generated using TransmiR database using miRNAs
identified as differentially up- or down-regulated at 3, 6, 12 and
24 h post-infection in L. major-infected primary human macro-
phages. Tables indicate the transcription factor/signaling compo-
Leishmania-Infected Macrophage MiRNA Deregulation
PLOS Neglected Tropical Diseases | www.plosntds.org 11 October 2013 | Volume 7 | Issue 10 | e2478

nent, its entrez ID and type of activity on miRNA, miRNA name
and Pubmed ID experimental validation of indicated up-stream
regulation.
(XLS)
Acknowledgments
We thank the volunteers for their participation in these studies. We are
grateful to Dr. M. Maamar, Ms. R. Dridi and Mr. A. Fatnassi from the
Centre National de Transfusion Sanguine (Tunisia) for their valuable help
collecting the cytapheresis blood samples. We thank Dr. Lambermont (Red
Cross, Belgium), for providing the opportunity to use blood samples from
healthy donors.
Sysco Consortium Collaborators
Slimane Ben Miled1,2, Alia Benkahla1,2, Rym Ben-Othman1,2, Roman
Bruno3, Pierre-Andre Cazenave4, Elena Checkmeneva5, Adriani Daska-
laki5, Razif Gabdoulline5, Kais Ghedira1,2, Lamia Guzani-Tabbane1,2,
Ralf Herwig6, Winston Hide7,8, Oliver Hofmann7,8, Klaus Hornischer5,
Ruy Jauregui5, Alexander Kel10, Ilya Kiselev10, Fedor Kolpakov10, Yuriy
Kondrakhin10, Elena Kutumova10, Sigrid Land5, Ines Liebich5, Laurent
Manchon3, Volker Matys5, Holger Michael5, Florian Noguier3, Fabien
Pierrat3, David Piquemal3, Imen Rabhi1,2, Sameh Rabhi1,2, Axel Rasche6,
Beatrice Regnault9, Anna Ryabova10, Frank Schacherer5, Ruslan
Sharipov10, Philip Stegmaier5, Nicki Tiffin7, Nikita Tolstykh10, Bernadette
Trentin3, Tagir Valeev10, Nico Voss5, Christoph Wierling6, Ivan
Yevshin10.
1 Institut Pasteur de Tunis, LR11IPT06, Laboratory of Medical
Parasitology, Biotechnologies et Biomolecules, Tunis-Belvedere, 1002,
Tunisia.
2 Universite Tunis El Manar, Tunis, 1068, Tunisia.
3 Skuldtech, 1682, rue de la Valsiere - Cap Delta - CS 77394 - 34184
Montpellier Cedex 04 - France.
4 Laboratoire Jacques-Louis Lions, B.C. 187, Universite Pierre et Marie
Curie, 4, place Jussieu, 75252, PARIS CEDEX 05 France.
5 BIOBASE GmbH, Halchtersche Straße 33, D-38304 Wolfenbuttel,
Germany.
6 Max Planck Institute for Molecular Genetics, Ihnestr. 63-73, 14195
Berlin, Germany.
7 South African National Bioinformatics Institute/MRC Unit for
Bioinformatics Capacity Development, University of the Western Cape,
Cape Town, South Africa.
8 Harvard School of Public Health, Department of Biostatistics, 655
Huntington Ave, 02115 Boston, MA, USA.
9 Genopole. Institut Pasteur de Paris, 28 rue du Dr Roux. 75724 Paris
Cedex 15. France.
10 Institute of Systems Biology, Ltd. Krasina street, 54, office 901,
Novosibirsk, Russian Federation.
Author Contributions
Conceived and designed the experiments: KD DL PR. Performed the
experiments: GM JL CG FZG HA RMS DL. Analyzed the data: JL GM
CG FZG DL PR. Wrote the paper: JL GM FZG KD DL PR.
References
1. Murray HW, Berman JD, Davies CR, Saravia NG (2005) Advances in
leishmaniasis. Lancet 366: 1561–1577.
2. Duclos S, Desjardins M (2000) Subversion of a young phagosome: the survivalstrategies of intracellular pathogens. Cell Microbiol 2: 365–377.
3. Olivier M, Gregory DJ, Forget G (2005) Subversion mechanisms by whichLeishmania parasites can escape the host immune response: a signaling point of
view. Clin Microbiol Rev 18: 293–305.
4. Peters NC, Sacks DL (2009) The impact of vector-mediated neutrophilrecruitment on cutaneous leishmaniasis. Cell Microbiol 11: 1290–1296.
5. Moreno I, Dominguez M, Cabanes D, Aizpurua C, Torano A (2010) Kinetic
analysis of ex vivo human blood infection by Leishmania. PLoS Negl Trop Dis4: e743.
6. Reiner NE, Ng W, McMaster WR (1987) Parasite-accessory cell interactions inmurine leishmaniasis. II. Leishmania donovani suppresses macrophage expres-
sion of class I and class II major histocompatibility complex gene products.
J Immunol 138: 1926–1932.
7. Kaye PM, Rogers NJ, Curry AJ, Scott JC (1994) Deficient expression of co-
stimulatory molecules on Leishmania-infected macrophages. Eur J Immunol 24:
2850–2854.
8. Bhardwaj S, Srivastava N, Sudan R, Saha B (2010) Leishmania interferes with
host cell signaling to devise a survival strategy. J Biomed Biotechnol 2010:
109189.
9. Shadab M, Ali N (2011) Evasion of Host Defence by Leishmania donovani:
Subversion of Signaling Pathways. Mol Biol Int 2011: 343961.
10. Shio MT, Hassani K, Isnard A, Ralph B, Contreras I, et al. (2012) Host cell
signalling and leishmania mechanisms of evasion. J Trop Med 2012: 819512.
11. Bogdan C (2008) Mechanisms and consequences of persistence of intracellularpathogens: leishmaniasis as an example. Cell Microbiol 10: 1221–1234.
12. Teixeira MJ, Teixeira CR, Andrade BB, Barral-Netto M, Barral A (2006)
Chemokines in host-parasite interactions in leishmaniasis. Trends Parasitol 22:32–40.
13. McConville MJ, Naderer T (2011) Metabolic pathways required for theintracellular survival of Leishmania. Annu Rev Microbiol 65: 543–561.
14. Moore KJ, Matlashewski G (1994) Intracellular infection by Leishmania
donovani inhibits macrophage apoptosis. J Immunol 152: 2930–2937.
15. Guerfali FZ, Laouini D, Guizani-Tabbane L, Ottones F, Ben-Aissa K, et al.
(2008) Simultaneous gene expression profiling in human macrophages infected
with Leishmania major parasites using SAGE. BMC Genomics 9: 238.
16. Akarid K, Arnoult D, Micic-Polianski J, Sif J, Estaquier J, et al. (2004)
Leishmania major-mediated prevention of programmed cell death induction ininfected macrophages is associated with the repression of mitochondrial release
of cytochrome c. J Leukoc Biol 76: 95–103.
17. Ruhland A, Leal N, Kima PE (2007) Leishmania promastigotes activate PI3K/Akt signalling to confer host cell resistance to apoptosis. Cell Microbiol 9: 84–96.
18. Barbato C, Arisi I, Frizzo ME, Brandi R, Da Sacco L, et al. (2009)
Computational challenges in miRNA target predictions: to be or not to be atrue target? J Biomed Biotechnol 2009: 803069.
19. Krek A, Grun D, Poy MN, Wolf R, Rosenberg L, et al. (2005) Combinatorial
microRNA target predictions. Nat Genet 37: 495–500.
20. Lewis BP, Burge CB, Bartel DP (2005) Conserved seed pairing, often flanked by
adenosines, indicates that thousands of human genes are microRNA targets. Cell
120: 15–20.
21. Scaria V, Hariharan M, Maiti S, Pillai B, Brahmachari SK (2006) Host-virusinteraction: a new role for microRNAs. Retrovirology 3: 68.
22. Skalsky RL, Cullen BR (2010) Viruses, microRNAs, and host interactions. Annu
Rev Microbiol 64: 123–141.
23. Katiyar-Agarwal S, Jin H (2010) Role of small RNAs in host-microbeinteractions. Annu Rev Phytopathol 48: 225–246.
24. Eulalio A, Schulte L, Vogel J (2012) The mammalian microRNA response to
bacterial infections. RNA Biol 9: 742–750.
25. Hakimi MA, Cannella D (2011) Apicomplexan parasites and subversion of thehost cell microRNA pathway. Trends Parasitol 27: 481–486.
26. Zeiner GM, Norman KL, Thomson JM, Hammond SM, Boothroyd JC (2010)
Toxoplasma gondii infection specifically increases the levels of key host
microRNAs. PLoS One 5: e8742.
27. Nahid MA, Satoh M, Chan EK (2011) MicroRNA in TLR signaling and
endotoxin tolerance. Cell Mol Immunol 8: 388–403.
28. Liu Y, Kao WJ (2002) Human macrophage adhesion on fibronectin: the role of
substratum and intracellular signalling kinases. Cell Signal 14: 145–152.
29. Spath GF, Beverley SM (2001) A lipophosphoglycan-independent method for
isolation of infective Leishmania metacyclic promastigotes by density gradient
centrifugation. Exp Parasitol 99: 97–103.
30. Hulten LM, Olson FJ, Aberg H, Carlsson J, Karlstrom L, et al. (2010)
15-Lipoxygenase-2 is expressed in macrophages in human carotid plaquesand regulated by hypoxia-inducible factor-1alpha. Eur J Clin Invest 40:
11–17.
31. Daigneault M, Preston JA, Marriott HM, Whyte MK, Dockrell DH (2010) The
identification of markers of macrophage differentiation in PMA-stimulated
THP-1 cells and monocyte-derived macrophages. PLoS One 5: e8668.
32. Vandesompele J, De Preter K, Pattyn F, Poppe B, Van Roy N, et al. (2002)
Accurate normalization of real-time quantitative RT-PCR data by geometric
averaging of multiple internal control genes. Genome Biol 3: RE-
SEARCH0034.
33. Saeed AI, Sharov V, White J, Li J, Liang W, et al. (2003) TM4: a free, open-
source system for microarray data management and analysis. Biotechniques 34:
374–378.
34. Dweep H, Sticht C, Pandey P, Gretz N (2011) miRWalk–database: prediction of
possible miRNA binding sites by ‘‘walking’’ the genes of three genomes. J BiomedInform 44: 839–847.
35. Lynn DJ, Winsor GL, Chan C, Richard N, Laird MR, et al. (2008) InnateDB:
facilitating systems-level analyses of the mammalian innate immune response.
Mol Syst Biol 4: 218.
36. Maere S, Heymans K, Kuiper M (2005) BiNGO: a Cytoscape plugin to assess
overrepresentation of gene ontology categories in biological networks. Bioinfor-
matics 21: 3448–3449.
37. Shannon P, Markiel A, Ozier O, Baliga NS, Wang JT, et al. (2003) Cytoscape: a
software environment for integrated models of biomolecular interaction
networks. Genome Res 13: 2498–2504.
Leishmania-Infected Macrophage MiRNA Deregulation
PLOS Neglected Tropical Diseases | www.plosntds.org 12 October 2013 | Volume 7 | Issue 10 | e2478
38. Smoot ME, Ono K, Ruscheinski J, Wang PL, Ideker T (2011) Cytoscape 2.8:
new features for data integration and network visualization. Bioinformatics 27:
431–432.
39. Wang J, Lu M, Qiu C, Cui Q (2010) TransmiR: a transcription factor-
microRNA regulation database. Nucleic Acids Res 38: D119–122.
40. Whitney AR, Diehn M, Popper SJ, Alizadeh AA, Boldrick JC, et al. (2003)
Individuality and variation in gene expression patterns in human blood. Proc
Natl Acad Sci U S A 100: 1896–1901.
41. Turan N, Katari S, Coutifaris C, Sapienza C (2010) Explaining inter-individual
variability in phenotype: is epigenetics up to the challenge? Epigenetics 5: 16–19.
42. Stratz C, Nuhrenberg TG, Binder H, Valina CM, Trenk D, et al. (2012) Micro-
array profiling exhibits remarkable intra-individual stability of human platelet
micro-RNA. Thromb Haemost 107: 634–641.
43. Nandan D, Camargo de Oliveira C, Moeenrezakhanlou A, Lopez M, Silverman
JM, et al. (2012) Myeloid cell IL-10 production in response to leishmania
involves inactivation of glycogen synthase kinase-3beta downstream of
phosphatidylinositol-3 kinase. J Immunol 188: 367–378.
44. Singh AK, Mukhopadhyay C, Biswas S, Singh VK, Mukhopadhyay CK (2012)
Intracellular pathogen Leishmania donovani activates hypoxia inducible factor-1
by dual mechanism for survival advantage within macrophage. PLoS One 7:
e38489.
45. Calegari-Silva TC, Pereira RM, De-Melo LD, Saraiva EM, Soares DC, et al.
(2009) NF-kappaB-mediated repression of iNOS expression in Leishmania
amazonensis macrophage infection. Immunol Lett 127: 19–26.
46. Cheng AM, Byrom MW, Shelton J, Ford LP (2005) Antisense inhibition of
human miRNAs and indications for an involvement of miRNA in cell growth
and apoptosis. Nucleic Acids Res 33: 1290–1297.
47. Crawford M, Batte K, Yu L, Wu X, Nuovo GJ, et al. (2009) MicroRNA 133B
targets pro-survival molecules MCL-1 and BCL2L2 in lung cancer. Biochem
Biophys Res Commun 388: 483–489.
48. Chan YC, Banerjee J, Choi SY, Sen CK (2012) miR-210: the master hypoxamir.
Microcirculation 19: 215–223.
49. Degrossoli A, Bosetto MC, Lima CB, Giorgio S (2007) Expression of hypoxia-
inducible factor 1alpha in mononuclear phagocytes infected with Leishmania
amazonensis. Immunol Lett 114: 119–125.
50. Bazzoni F, Rossato M, Fabbri M, Gaudiosi D, Mirolo M, et al. (2009) Induction
and regulatory function of miR-9 in human monocytes and neutrophils exposed
to proinflammatory signals. Proc Natl Acad Sci U S A 106: 5282–5287.
51. Quinn SR, O’Neill LA (2011) A trio of microRNAs that control Toll-like
receptor signalling. Int Immunol 23: 421–425.
52. Taganov KD, Boldin MP, Chang KJ, Baltimore D (2006) NF-kappaB-
dependent induction of microRNA miR-146, an inhibitor targeted to signaling
proteins of innate immune responses. Proc Natl Acad Sci U S A 103: 12481–
12486.
53. Tili E, Michaille JJ, Cimino A, Costinean S, Dumitru CD, et al. (2007)
Modulation of miR-155 and miR-125b levels following lipopolysaccharide/
TNF-alpha stimulation and their possible roles in regulating the response to
endotoxin shock. J Immunol 179: 5082–5089.
54. O’Connell RM, Taganov KD, Boldin MP, Cheng G, Baltimore D (2007)
MicroRNA-155 is induced during the macrophage inflammatory response. Proc
Natl Acad Sci U S A 104: 1604–1609.
55. Ceppi M, Pereira PM, Dunand-Sauthier I, Barras E, Reith W, et al. (2009)
MicroRNA-155 modulates the interleukin-1 signaling pathway in activated
human monocyte-derived dendritic cells. Proc Natl Acad Sci U S A 106: 2735–
2740.
56. Schulte LN, Westermann AJ, Vogel J (2012) Differential activation and
functional specialization of miR-146 and miR-155 in innate immune sensing.
Nucleic Acids Res 41: 542–553.
57. Wanet A, Tacheny A, Arnould T, Renard P (2012) miR-212/132 expression
and functions: within and beyond the neuronal compartment. Nucleic Acids Res
40: 4742–4753.
58. Faria MS, Reis FC, Lima AP (2012) Toll-like receptors in leishmania infections:
guardians or promoters? J Parasitol Res 2012: 930257.
59. Gallego C, Golenbock D, Gomez MA, Saravia NG (2011) Toll-like receptors
participate in macrophage activation and intracellular control of Leishmania
(Viannia) panamensis. Infect Immun 79: 2871–2879.
60. Srivastav S, Kar S, Chande AG, Mukhopadhyaya R, Das PK (2012) Leishmania
donovani exploits host deubiquitinating enzyme A20, a negative regulator of
TLR signaling, to subvert host immune response. J Immunol 189: 924–934.
61. Reinhard K, Huber M, Lohoff M, Visekruna A (2012) The role of NF-kappaB
activation during protection against Leishmania infection. Int J Med Microbiol
302: 230–235.
62. Ji J, Sun J, Soong L (2003) Impaired expression of inflammatory cytokines and
chemokines at early stages of infection with Leishmania amazonensis. Infect
Immun 71: 4278–4288.
63. Gregory DJ, Godbout M, Contreras I, Forget G, Olivier M (2008) A novel form
of NF-kappaB is induced by Leishmania infection: involvement in macrophagegene expression. Eur J Immunol 38: 1071–1081.
64. Neves BM, Silvestre R, Resende M, Ouaissi A, Cunha J, et al. (2010) Activation
of phosphatidylinositol 3-kinase/Akt and impairment of nuclear factor-kappaB:molecular mechanisms behind the arrested maturation/activation state of
Leishmania infantum-infected dendritic cells. Am J Pathol 177: 2898–2911.65. Guizani-Tabbane L, Ben-Aissa K, Belghith M, Sassi A, Dellagi K (2004)
Leishmania major amastigotes induce p50/c-Rel NF-kappa B transcription
factor in human macrophages: involvement in cytokine synthesis. Infect Immun72: 2582–2589.
66. Filipowicz W, Bhattacharyya SN, Sonenberg N (2008) Mechanisms of post-transcriptional regulation by microRNAs: are the answers in sight? Nat Rev
Genet 9: 102–114.67. Guo H, Ingolia NT, Weissman JS, Bartel DP (2010) Mammalian microRNAs
predominantly act to decrease target mRNA levels. Nature 466: 835–840.
68. Huntzinger E, Izaurralde E (2011) Gene silencing by microRNAs: contributionsof translational repression and mRNA decay. Nat Rev Genet 12: 99–110.
69. Kumar R, Bumb RA, Salotra P (2010) Evaluation of localized and systemicimmune responses in cutaneous leishmaniasis caused by Leishmania tropica:
interleukin-8, monocyte chemotactic protein-1 and nitric oxide are major
regulatory factors. Immunology 130: 193–201.70. Ritter U, Moll H (2000) Monocyte chemotactic protein-1 stimulates the killing of
leishmania major by human monocytes, acts synergistically with IFN-gammaand is antagonized by IL-4. Eur J Immunol 30: 3111–3120.
71. Brandonisio O, Panaro MA, Fumarola I, Sisto M, Leogrande D, et al. (2002)Macrophage chemotactic protein-1 and macrophage inflammatory protein-1
alpha induce nitric oxide release and enhance parasite killing in Leishmania
infantum-infected human macrophages. Clin Exp Med 2: 125–129.72. Vargas-Inchaustegui DA, Hogg AE, Tulliano G, Llanos-Cuentas A, Arevalo J, et
al. (2010) CXCL10 production by human monocytes in response to Leishmaniabraziliensis infection. Infect Immun 78: 301–308.
73. Ritter U, Korner H (2002) Divergent expression of inflammatory dermal
chemokines in cutaneous leishmaniasis. Parasite Immunol 24: 295–301.74. Tan G, Shi Y, Wu ZH (2012) MicroRNA-22 promotes cell survival upon UV
radiation by repressing PTEN. Biochem Biophys Res Commun 417: 546–551.75. Zhang H, Zuo Z, Lu X, Wang L, Wang H, et al. (2012) MiR-25 regulates
apoptosis by targeting Bim in human ovarian cancer. Oncol Rep 27: 594–598.76. Koch M, Mollenkopf HJ, Klemm U, Meyer TF (2012) Induction of microRNA-
155 is TLR- and type IV secretion system-dependent in macrophages and
inhibits DNA-damage induced apoptosis. Proc Natl Acad Sci U S A 109:E1153–1162.
77. Kulshreshtha R, Ferracin M, Wojcik SE, Garzon R, Alder H, et al. (2007) AmicroRNA signature of hypoxia. Mol Cell Biol 27: 1859–1867.
78. Yang Z, Wu L, Zhu X, Xu J, Jin R, et al. (2013) MiR-29a modulates the
angiogenic properties of human endothelial cells. Biochem Biophys ResCommun 434: 143–149.
79. Peng H, Hamanaka RB, Katsnelson J, Hao LL, Yang W, et al. (2012)MicroRNA-31 targets FIH-1 to positively regulate corneal epithelial glycogen
metabolism. FASEB J 26: 3140–3147.80. Babar IA, Czochor J, Steinmetz A, Weidhaas JB, Glazer PM, et al. (2011)
Inhibition of hypoxia-induced miR-155 radiosensitizes hypoxic lung cancer cells.
Cancer Biol Ther 12: 908–914.81. Aga E, Katschinski DM, van Zandbergen G, Laufs H, Hansen B, et al. (2002)
Inhibition of the spontaneous apoptosis of neutrophil granulocytes by theintracellular parasite Leishmania major. J Immunol 169: 898–905.
82. Valdes-Reyes L, Argueta J, Moran J, Salaiza N, Hernandez J, et al. (2009)
Leishmania mexicana: inhibition of camptothecin-induced apoptosis ofmonocyte-derived dendritic cells. Exp Parasitol 121: 199–207.
83. Lisi S, Sisto M, Acquafredda A, Spinelli R, Schiavone M, et al. (2005) Infectionwith Leishmania infantum Inhibits actinomycin D-induced apoptosis of human
monocytic cell line U-937. J Eukaryot Microbiol 52: 211–217.
84. Kim HW, Haider HK, Jiang S, Ashraf M (2009) Ischemic preconditioningaugments survival of stem cells via miR-210 expression by targeting caspase-8-
associated protein 2. J Biol Chem 284: 33161–33168.85. Gou D, Ramchandran R, Peng X, Yao L, Kang K, et al. (2012) miR-210 has an
anti-apoptotic effect in pulmonary artery smooth muscle cells during hypoxia.Am J Physiol Lung Cell Mol Physiol.
86. Yang W, Sun T, Cao J, Liu F, Tian Y, et al. (2012) Downregulation of miR-210
expression inhibits proliferation, induces apoptosis and enhances radiosensitivityin hypoxic human hepatoma cells in vitro. Exp Cell Res 318: 944–954.
87. Qi J, Qiao Y, Wang P, Li S, Zhao W, et al. (2012) microRNA-210 negativelyregulates LPS-induced production of proinflammatory cytokines by targeting
NF-kappaB1 in murine macrophages. FEBS Lett 586: 1201–1207.
88. Ghosh J, Bose M, Roy S, Bhattacharyya SN (2013) Leishmania donovani targetsDicer1 to downregulate miR-122, lower serum cholesterol, and facilitate murine
liver infection. Cell Host Microbe 13: 277–288.
Leishmania-Infected Macrophage MiRNA Deregulation
PLOS Neglected Tropical Diseases | www.plosntds.org 13 October 2013 | Volume 7 | Issue 10 | e2478
Top Related
Copyright © 2022 FDOKUMEN

