


Bahasa
Halaman
Hukum


Edited by
Robert C. DicksonMichael D. Mendenhall
SignalTransduction
ProtocolsSECOND EDITION
Volume 284
METHODS IN MOLECULAR BIOLOGYTMMETHODS IN MOLECULAR BIOLOGYTM
Edited by
Robert C. DicksonMichael D. Mendenhall
SECOND EDITION
SignalTransduction
Protocols
Index
1. Making Protein Immunoprecipitates
Elaine A. Elion and Yunmei Wang
2. Signal Transduction Inhibitors in Cellular Function
Maofu Fu, Chenguang Wang, Xueping Zhang, and Richard G. Pestell
3. Two-Dimensional Gel Electrophoresis for the Identification of
Signaling Targets
Yukihito Kabuyama, Kirsi K. Polvinen, Katheryn A. Resing, and Natalie
G. Ahn
4. A High-Throughput Mammalian Cell-Based Transient Transfection
Assay
Daniel J. Noonan, Kenneth Henry, and Michelle L. Twaroski
5. Determining Protein Half-Lives
Pengbo Zhou
6. Assaying Protein Kinase Activity
Jan Brábek and Steven K. Hanks
7. Comparative Phosphorylation Site Mapping From Gel-Derived
Proteins Using a Multidimensional ES/MS-Based Approach
Francesca Zappacosta, Michael J. Huddleston, and Roland S. Annan
8. Studies of Calmodulin-Dependent Regulation
Paul C. Brandt and Thomas C. Vanaman
9. Measurement of Protein–DNA Interactions In Vivo by Chromatin
Immunoprecipitation
Hogune Im, Jeffrey A. Grass, Kirby D. Johnson, Meghan E. Boyer, Jing
Wu, and Emery H. Bresnick
10. Characterization of Protein–DNA Association In Vivo by Chromatin
Immunoprecipitation
Laurent Kuras

11. Nonradioactive Methods for Detecting Activation of Ras-Related
Small G Proteins
Douglas A. Andres
12. Nucleocytoplasmic Glycosylation, O-GlcNAc Identification and Site
Mapping
Natasha Elizabeth Zachara, Win Den Cheung, and Gerald Warren Hart
13. Techniques in Protein Methylation
Jaeho Lee, Donghang Cheng, and Mark T. Bedford
14. Assaying Lipid Phosphate Phosphatase Activities
Gil-Soo Han and George M. Carman
15. Assaying Phosphoinositide Phosphatases
Gregory S. Taylor and Jack E. Dixon
16. Assaying Phospholipase A2 Activity
Christina C. Leslie and Michael H. Gelb
17. Measurement and Immunofluorescence of Cellular Phosphoinositides
Hiroko Hama, Javad Torabinejad, Glenn D. Prestwich, and Daryll B.
DeWald
18. Measuring Dynamic Changes in cAMP Using Fluorescence Resonance
Energy Transfer
Sandrine Evellin, Marco Mongillo, Anna Terrin, Valentina Lissandron,
and Manuela Zaccolo
19. In Vivo Detection of Protein–Protein Interaction in Plant Cells Using
BRET
Chitra Subramanian, Yao Xu, Carl Hirschie Johnson, and Albrecht G.
von Arnim
20. Revealing Protein Dynamics by Photobleaching Techniques
Frank van Drogen and Matthias Peter
21. Assaying Cytochrome c Translocation During Apoptosis
Nigel J. Waterhouse, Rohan Steel, Ruth Kluck, and Joseph A. Trapani
1
Making Protein Immunoprecipitates
Elaine A. Elion and Yunmei Wang
SummaryA wide variety of methods used in the study of signal transduction in eukaryotes rely on the
ability to precipitate proteins from whole cell extracts. Immunoprecipitation and related methodsof affinity purification are routinely used to assess binding partner interactions and enzyme ac-tivity in addition to the size of a protein, rates of protein synthesis and turnover, and protein abun-dance, thus making it a mainstay of a wide variety of protocols. This chapter will provide start-ing-point methods for immunoprecipitation of proteins under denaturing and nondenaturingconditions and the detection of protein-protein interactions by co-precipitation. The Notes sec-tion gives recommendations on how to troubleshoot potential problems that can arise while doingthese methodologies.
Key Words: Immunoprecipitation; precipitation; co-immunoprecipitation; co-precipitation;immune complex; affinity purification; affinity matrix; whole-cell extracts; Saccharomycescerevisiae.
1. IntroductionProtein precipitation involves the formation of protein aggregates out of so-
lution followed by their recovery by centrifugation. A variety of methods canbe used to make proteins aggregate out of aqueous solution, including nonspe-cific methods such as salt and trichloroacetic acid, and specific methods directedagainst a particular protein, such as antibodies or other affinity matrixes. Whenantibodies are used, the method is termed immunoprecipitation; when otheraffinity-based methods are used, the method is termed precipitation. This
From: Methods in Molecular Biology, vol. 284:Signal Transduction Protocols
Edited by: R. C. Dickson © Humana Press Inc., Totowa, NJ
1
methodology is often used to detect or confirm physical interactions betweentwo proteins. When the method is for detecting physical associations, it is re-ferred to as co-immunoprecipitation.
There are three major reasons to incorporate immunoprecipitation of proteinsinto analysis. First, it is a simple and rapid method of affinity purification. Sec-ond, it is adaptable and can be done on either small or large scales. Third, it isamenable for the detection of both strong and weak physical interactions be-tween proteins that may or may not withstand the rigors of purification meth-ods involving substantial dilution of the initial cell extract.
Many protocols are available for immunoprecipitation and co-precipitation. Allimmunoprecipitation protocols follow a common series of ordered steps: (1)lysing cells and preparing cell extracts, (2) binding the antibody to protein througha specific antigen on the protein that is recognized by the antibody, (3) precipi-tating the antibody-antigen complex, and (4) washing the precipitate to removenonspecific proteins. An immunoprecipitation can be done under native condi-tions that preserve enzyme activity and associations with other proteins or it canbe done under more stringent conditions that are likely to reduce nonspecific in-teractions with the protein in question, but may abolish enzyme activity and pro-tein complexes. This chapter will provide a basic methodology that can be ad-justed to be more or less stringent depending on the experimental considerations.
Once an immunoprecipitate has been isolated, it can be used directly in anenzyme assay or after the protein has been dissociated from the antibodythrough a solution-based method or by gel electrophoresis. After gel elec-trophoresis, the protein is detected typically either by virtue of its being radio-labeled prior to cell lysis or by immunoblot analysis with either the same ordifferent antibody. A candidate associated-protein is typically detected by im-munoblot analysis in analytical studies. When immunoprecipitation is done ona large enough scale, it is possible to detect the immunoprecipitated protein andpotential binding partners by silver staining or Coommassie Blue staining ofpolyacrylamide gels. The resolution of detection of an average-sized protein isapprox 1–10 ng/band for silver stain detection and approx 0.1–1 lg/band forCoommassie Blue detection.
Of the many strategies possible, this section will describe: (1) optionsavailable for detecting proteins, (2) basic protocol for making whole-cell ex-tracts, (3) basic protocol for immunoprecipitation under native conditions, (4)immunoprecipitation under more stringent conditions, (5) co-immunoprecip-itation, (6) controls to test specificity of interaction, and (7) notes for trou-bleshooting. For an in-depth discussion on the generation and use of anti-bodies, see Harlow and Lane (1,2). For an in-depth review of co-precipitation
2 Elion and Wang
and other approaches to detect protein-protein interactions, see Phizicky andFields (3).
1.1. Detecting the Protein(s) in Question
How well an immunoprecipitation will work depends on a variety of factors,the most important being the affinity of the antibody to the antigenic site on theprotein. Antibody affinity can vary over a wide range, but for an immunoprecip-tiation to work efficiently the affinity of the antibody to the antigen should be atleast 107 mol�1 to 109 mol�1 (1). The simplest way to improve the detection ofan antibody-antigen complex is to increase the concentration of the antibody andthe antigen. This will only be effective under conditions in which the antibody isnot saturating, which must be empirically determined by doing a titration of theamount of antibody for a given amount of antigen in a given reaction volume.When the quantity of antibody is limited, it is easiest to reduce the reactionvolume. When an epitope-tag is used, it is also possible to improve detection byinserting multiple copies of the tag onto the protein to allow for multivalent bind-ing by the antibody. To determine the amount of antibody in your preparation, runsome of it on a sodium dodecyl sulfate (SDS)-polyacrylamide gel and comparethe intensity of the heavy and light chains to standard controls. If the antibody ispure, then one can determine its concentration by its absorbance at 280 nm usingthe relationship 1 OD � approx 0.75 mg/mL purified antibody.
The first step is to generate an antibody to the protein in question. Informa-tion for generating antibodies can be found in Harlow and Lane (1,2). Alterna-tively, a protein can be tagged in a variety of ways to allow their detection withcommercially available antibodies against the epitope tag or other affinityreagents. The tagged proteins are then introduced into the host organism usingexpression vectors. All tagged proteins must be assessed for function in vivo. Afrequently-used option is to add a short peptide or eptiope that is recognized bya commercially available high-affinity monoclonal antibody (MAb). The epi-tope is added typically at the amino or carboxyl terminus, although internal po-sitions that do not disrupt function can also be used. Two frequently-utilizedepitopes are derived from the influenza hemagglutinin protein (HA) and humanc-Myc; both are recognized by high-affinity MAbs 12CA5 and 9E10, respec-tively (4). However, others such as the leader peptide of gene 10, product ofbacteriophage T7 (FLAG 5,6) are also available (BioSupplyNet Source Book).The choice of the epitope may be dictated by its amino-acid composition. It isoften useful to insert tandem copies of the epitope in order to increase sen-sitivity. The number of tandem copies can range widely from one (7) to several(e.g., 3,8) to many (e.g., 9).
Immunoprecipitation Methods 3
Proteins can also be fused to small proteins or peptides that have high affinityto small molecules that can be attached to solid support. This is a particularlyvaluable approach when the protein to be precipitated co-migrates with im-munoglobulin heavy or light chains in a SDS-polyacrylamide gel. Such alter-native tagging methods include fusion to glutathione-S-transferase (GST) toallow purification by a glutathione affinity matrix or fusion to maltose bindingprotein (MBP) to allow purification by a maltose affinity matrix. An excellentreference for identifying sources of commercially available antibodies and ap-proaches to tagging proteins can be found in the BiosupplyNet Source Book. TheAmerican Type Culture Collection and European Collection of Cell Culturescan also be resources for hybridoma cell lines.
The second step to a successful co-precipitation is generating whole-cell ex-tracts in which the yield and activity of the proteins you wish to analyze is op-timal, using lysis buffer conditions that permit recognition of the proteins by theantibody or affinity matrix. In general, the lysis buffer conditions are not verydifferent from the immunoprecipitation conditions. The yield of total protein ina whole cell extract is not always a reliable indicator of the relative yield andactivity of specific proteins, so it is wise to verify both parameters at the onsetof an experiment before proceeding on to the immunoprecipitation. Once theextracts are prepared, the co-precipitation can be done within 3–4 h and beready to load on a gel for immunoblot analysis.
1.2. Basic Protocol for Making Whole-Cell Extracts
Yield and activity can be affected by a number of factors. Small variations inthe relative amounts of salt and detergents in the lysis buffer can have large ef-fects on yield and activity, as can the speed and efficiency of cell breakage. Bothfactors are particularly important for less soluble proteins that associate withmacromolecular structures such as membranes or cytoskeleton. In addition,global inhibition of proteolysis through the inclusion of multiple classes of pro-tease inhibitors may be essential. It is recommended that the investigator beginby comparing a series of small-scale extract preparations that vary the amount ofsalt and nonionic detergent. As a starting point, a basic lysis buffer might containa buffering agent (such as 25–50 mM Tris-HCl, pH 7.5), a small amount of non-ionic detergent (such as 0.1% Triton X-100), some salt (such as 100–250 mMNaCl), a reducing agent (such as 1 mM dithiothreitol [DTT] and 5–10% glycerolas a stabilizer. The lysis buffer should also contain protease inhibitors. Proteaseinhibitor cocktails are also commercially available. A reasonable starting pointwould be to include 5 lg/mL each chymostatin, pepstatin A, leupeptin, and anti-pain as well as 1 mM phenylmethylsulfonylfluoride and 2 mM benzamidine.Ethylene glycol-bis (beta-aminoethyl-ether)-N,N,N',N'-tetraacetic (EGTA) isalso commonly included (at approx 15 mM) to chelate divalent metal ions that
4 Elion and Wang
are essential for metalloproteases. Because EGTA will also inhibit other metal-dependent enzymes, it may be omitted, or combined with the addition of aneeded metal ion to the lysis buffer and/or substituted with ethylenediaminetetracetate (EDTA). If the phosphorylation state of the proteins in question is im-portant, a mixture of phosphatase inhibitors should also be included in the lysisbuffer. A starting mixture could be 0.5 mM vanadate (0.25 mM each meta- andortho-vanadate or 0.5 mM sodium vanadate, pH 7.4), 10 mM sodium fluoride(NaF), 10 mM b-glycerol phosphate. Simple modifications of this initial bufferinclude varying the amount of NaCl (from 0 to 500 mM) and the amount of Tri-ton X-100 (from 0 to 1%).
Total protein concentration in the whole-cell extract generally is assayedusing the Bio-Rad protein assay and calculating protein concentration. Extractsshould be tested for the amount of each specific protein by immunoblot analy-sis, analyzing 25–100 lg of total protein. In general, it is best to test for the pres-ence of a second protein (such as a housekeeping enzyme, cytoskeletal, or ribo-somal protein or a previously defined component in the pathway being studied)for a positive control of the immunoblot and normalization. The amount of spe-cific protein in the whole-cell extract is then compared to the amount that is re-covered by precipitation with an affinity matrix.
A general small-scale glass-bead breakage protocol for preparing a basicwhole-cell extract is described below as a starting point, with suggested rangesof salt and nonionic detergent concentrations for initial variations of this proto-col. It is recommended that the investigator compare several combinations ofsalts and nonionic detergent. This method can be scaled up and used with an au-tomated bead beater. The investigator may choose to compare the glass-beadbreakage method described below to the liquid nitrogen-grinding method,which keeps the cells colder and may break the cells more efficiently (10).
2. Materials2.1. Cell-Free Extract Preparation
All solutions used for extract preparation and immunoprecipitation are eitherfilter sterilized or autoclaved.
1. Yeast cells.2. Ice bath.3. Dry ice/ethanol bath or liquid nitrogen bath.4. Autoclaved ice-cold water.5. Acid-washed glass beads.6. Ice-cold lysis buffer.7. 50-mL conical plastic disposable tubes.8. 15-mL conical plastic disposable tubes.
Immunoprecipitation Methods 5
9. Vortexer.10. Timer.11. Microcentrifuge tubes and centrifuge.12. Acid washed glass beads: soak 0.25–0.600 microns glass beads (Sigma
G-8772) for 3 h in concentrated nitric acid. Wash beads thoroughly withlarge amounts of water, test pH of the wash water, and continue washinguntil pH is neutral. If necessary, wash several times with 2 M Tris-HCl,pH 8.0, or with 50X TE to raise the pH, then wash again several times withwater to remove the buffer. Glass-distilled or deionized water should beused in the final washes. Bake beads for 4 h in a baking oven until dry.Acid-washed beads are also available from Sigma.
13. Lysis buffer pre-chilled in an ice bath (see Note 1): 25 mM Tris-HCl,pH 7.5, 15 mM EGTA, 1 mM EDTA, 150 mM NaCl (or in the range of50–250 mM NaCl), 0.1% Triton X-100 (or in the range of 0.1–1.0% TritonX-100), 10% glycerol, 1 mM NaN3, 1 mM DTT, 1X protease inhibitor mix,1 mM phenylmethylsulfonyl fluoride (PMSF), 2 mM benzamidine, phos-phatase inhibitors. Add the protease inhibitor mix, benzamidine, PMSF,DTT, and phosphatase inhibitors from concentrated stock solutions prior touse. PMSF is labile in aqueous solution and should be added immediatelybefore use.
14. Phosphatase inhibitors: The phosphorylation state of the proteins in ques-tion is frequently important, therefore, a mixture of phosphatase inhibitorsshould be included in the lysis buffer. A good starting mixture is 1 mMsodium vanadate (from equal amounts of meta and ortho forms of vana-date), 10 mM NaF, 10 mM b-glycerol phosphate. Okadaic acid can also beadded if needed.
15. 1000X Protease inhibitor mix: 5 mg/mL chymostatin, 5 mg/mL pepstatinA, 5 mg/mL leupeptin, 5 mg/mL antipain. Dissolve protease inhibitors indimethyl sulfoxide (DMSO) and store in aliquots at �20°C. Premade mix-tures of protease inhibitors are also available commercially.
16. 250X PMSF: 0.25 M PMSF in 95% ethanol. Make fresh.17. Bio-Rad DC Protein Assay Reagent (Bio-Rad Laboratories, Hercules, CA).
2.2. Immunoprecipitation of Proteins
1. Antibody specific to the protein of interest. Polyclonal antisera, ascitesfluid, and culture supernatant of a hybridoma that secretes a MAb can allbe used for immunoprecipitation. Use approx 1 lg of antibody per im-munoprecipitation. Increase this amount several-fold for antibodies withlow affinity to antigen. This has to be determined empirically. Antibodysuppliers can be located in the BiosupplyNet Source Book (www.biosup-plynet.com) published yearly in collaboration with Cold Spring Harbor
6 Elion and Wang
Laboratories. For information on its contents, telephone 516-349-5595, orfax 516-349-5598, or E-mail: [email protected].
2. Protein A Sepharose and/or Protein G Sepharose. Recipe can be scaled up ordown. Hydrate 1.5 g of protein A or G Sepharose beads in 30 mL of 50 mMTris-HCl, pH 7.5, for 1–2 h on ice. Pellet beads by gravity or very gentle cen-trifugation (1 min at 1000 g) and then wash four times with immunoprecipi-tation buffer that lacks (the expensive) protease inhibitor mix and contains1 mM sodium azide. Resuspend the beads in 15 mL of this same buffer toyield a final slurry concentration of approx 100 mg/mL (approx 50% of totalvolume are the beads). The slurry is stable for months when stored at 4°C.
3. Lysis buffer (see Subheading 2.1.) with protease and phosphatase in-hibitors but without glycerol or NaCl.
4. 5 M NaCl.5. 80% glycerol.6. Microfuge tubes.7. 2X loading buffer for SDS-PAGE: 125 mM Tris-HCl, pH 6.8, 140 mM
SDS, 20% (v/v) glycerol, 2% (v/v) b-mercaptoethanol, 10 lg/mL bromphe-nol blue.
8. Refrigerated centrifuge.9. Ice bucket.
10. Chilled buffers and centrifuge tubes.
2.3. Immunoprecipitating Proteins Under Stringent Conditions
1. Radio immunoprecipitation assay (RIPA) buffer: 150 mM NaCl, 1.0% Triton-X-100, 0.5% sodium deoxycholate, 0.1% SDS, 50 mM Tris-HCl, pH 8.0.
3. Methods3.1. Growth and Harvesting of Cells
1. Cells should be grown under optimal conditions for the proteins understudy. In the absence of specific information, it is advisable to harvest log-arithmically-growing cells.
2. Grow yeast cells to an A600 of 0.5–1.3 in a volume of medium that will yield100 A600 Un of cells using appropriate media, temperature, and aeration.
3. Pellet cells by 5 min centrifugation at 5000 g in a centrifuge and rotorchilled to 4°C.
4. Wash cells once in 30 mL of ice water. Place pellet cells in a 50-mL sterileplastic conical tube that has been pre-chilled in an ice bucket.
5. Drain liquid rapidly and thoroughly from the pellet and immediatelyimmerse the tube into a dry ice/ethanol, or in liquid nitrogen bath.
6. Store frozen pellets at �80°C or immediately make cell-free extracts.
Immunoprecipitation Methods 7
3.2. Preparation of Cell-Free Extracts
Speed and maintenance of ice-cold conditions are key components of goodextract preparation. Extract preparation is done using an ice bucket either atroom temperature or in the cold room if the proteins are particularly labile.
1. Label one 15-mL conical tube and four microfuge tubes per sample.Prechill all tubes in an ice bath.
2. Thaw pellets in an ice bath. Begin extract preparation while pellets are stillpartially frozen (see Note 2).
3. Add 1 mL lysis buffer and transfer-cell suspension to 15-mL conicalplastic tube. Add chilled glass beads to just below the meniscus (seeNote 3).
4. Strongly vortex cells for five 30-s pulses, chilling on ice between pulses.Keep vortexer on the highest setting. When multiple samples are beingprocessed, use two vortexers.
5. Add 0.25 mL more lysis buffer. Vortex sample for 30 s. Check cells undermicroscope for complete or nearly complete lysis (see Note 4). Vortexagain if necessary.
6. Centrifuge sample 5 min at 5000g in a centrifuge chilled to 4°C.7. Transfer supernatant to a new microfuge tube and do not be concerned if a
few beads are carried along. The supernatant fluid will be turbid if the pro-tein concentration is high.
8. Centrifuge supernatant in a microfuge chilled to 4°C at the fastest speed for10 min.
9. Transfer supernatant to a new microfuge tube. Cap tube and invert gentlyto mix contents. Distribute sample into three microfuge tubes. Reserve 5 lLon ice to quantify the protein concentration.
10. Freeze samples at –80°C either directly or after prefreezing in a dryice/ethanol bath or process immediately for immunoprecipitation.
11. Assay total protein of reserved extract using the Bio-Rad protein assay andcalculate protein concentration using bovine serum albumin (BSA) to gen-erate a standard curve. The total protein yield is generally 5–10 mg.
12. Analyze 25–100 lg of protein by immunoblotting to determine if the pro-tein in question is present and readily detected.
3.3. Immunoprecipitation
3.3.1. Immunoprecipitating Proteins Under Native Conditions
In this method, the antibody is added to the whole-cell extracts on ice andthen the antibody-antigen complex is precipitated out of solution using proteinA or protein G coupled to Sepharose. Protein A and protein G are bacterial cell-
8 Elion and Wang
wall proteins that bind tightly to a region of the Fc domain in antibodies. Theinteraction is sensitive to pH and is reduced under conditions of low pH. Pro-tein A and protein G bind with different affinities to antibody subtypes from dif-ferent animals. Check Harlow and Lane (1) for a listing of their relative affini-ties. If in doubt, use an equal mixture of Protein A and Protein G Sepharose.Protein A Sepharose and Protein G Sepharose can be purchased separately or asmixture.
The amount of antibody and whole-cell extracts in the immunoprecipitationcan vary widely, depending on the expression level of the protein and the affin-ity of the antibody, and needs to be determined empirically. A starting point isto use 0.25–1 mg whole-cell extract with approx 1–3 lg antibody. In general,1 lg antibody is approx 0.5–1 lL of a polyclonal antiserum, approx 50 lL of ahybridoma culture supernatant or approx 0.5 mL of ascites fluid that contains asingle MAb (1).
1. Prepare samples in microfuge tubes on ice: Mix 0.25–1 mg of the whole-cell extract with 1 lg of antibody in a final volume of 0.5 mL, using thelysis buffer without NaCl to bring up the final volume to 0.5 mL. AdjustNaCl concentration to 100 mM NaCl and glycerol concentration to 5%. Ad-just lysis buffer by adding divalent cation or removing EGTA if necessaryfor activity of the protein in question (see Note 5).
2. Invert tube gently several times and incubate on ice for 90 min with occa-sional tube inversion to allow antibody to bind to antigen.
3. Centrifuge in a chilled microfuge for 10 min to pellet nonspecific aggre-gates (see Note 6).
4. Transfer supernatant to a new chilled microfuge tube.5. Add 30 lL of the protein A or G-Sepharose slurry. Be sure to evenly sus-
pend the slurry before distributing it to the samples.6. Rotate tube gently at 4°C for 60–90 min to allow the antigen-antibody com-
plex to bind to the protein A or G Sepharose beads (see Note 7).7. Gently pellet protein A/G sepharose by spinning 30 s at 2000 g in a chilled
centrifuge (see Note 8).8. Wash pellet twice with 1 mL lysis buffer that has the same amount of NaCl
as the immunoprecipitation, then wash twice with lysis buffer that lacksNaCl. For each wash, gently invert tube three times before pelleting. Care-fully remove supernatant without disturbing the beads. It is not necessaryto have protease inhibitors present in the lysis buffer during the washes (seeNote 9).
9. After the last wash, aspirate away as much liquid as possible without touch-ing the beads. Use the beads directly in an enzyme assay or run the sampleon a SDS polyacrylamide gel, or add an equal volume of 2X loading buffer
Immunoprecipitation Methods 9
(approx 25 lL). Samples can be frozen at �80°C or loaded immediately ona SDS-PAGE gel as follows: boil samples for 5 min (or incubate samplesfor 10 min in a 100°C heating block). Vortex the boiled sample and thencentrifuge it briefly in a microfuge to pellet beads before loading onto theSDS-PAGE gel (see Note 10).
3.3.2. Immunoprecipitating Proteins Under Stringent Conditions
In instances of a great deal of nonspecific background or in cases when theantibody does not recognize a nondenatured epitope, it may be necessary to usemore stringent or denaturing conditions. This is accomplished by using RIPAbuffer. Follow the previously-outlined protocols for making extracts and im-munoprecipitation but use RIPA whenever lysis buffer is needed.
3.3.3. Co-Immunoprecipitating Proteins
Co-immunoprecipitation (Co-IP) is a simple and useful method to detect aninteraction between two or more proteins (1–4). Under gentle enough condi-tions, it is possible to co-immunoprecipitate one or more proteins with the pro-tein that is recognized by an antibody. The standard immunoprecipitation con-ditions presented can be used along with specific antibodies for each of theproteins in question. Follow the previously-outlined methods and perform theCo-IP in duplicate; run the samples on an SDS-PAGE gel along with whole-cellextracts, and probe by immunoblot analysis for the presence of associated pro-teins with appropriate antibodies.
3.3.3.1. CO-IP CONTROLS
Controls are essential to verify that the antibody is specific and that a poten-tial protein-protein interaction is specific. For Co-IP experiments, it is impor-tant to immunoprecipitate each protein in the absence of the other to determinewhether their presence in an immune complex is owing to specific interactionswith the protein being bound by antibody or to nonspecific binding to the beads.Additional controls to confirm specificity of the antibody are also needed. Thesecontrols are the simplest to set up when proteins are tagged, because one cancompare extracts from cells that do not express the tagged protein.
If antibodies to native proteins are being used in a genetically tractable or-ganism, then one can compare extracts made from strains harboring deletionsof the proteins in question (obviously only possible if the deletions do not causeinviability) to test for the specificity of the antibody and the interaction. If dele-tion mutations are not possible, a commonly used approach is to show that thepre-immune serum or an antibody not known to be specific to either of the pro-teins in question, does not co-precipitate them in a parallel experiment. How-
10 Elion and Wang
ever, the latter control does not rule out the possibility that the antibody is pre-cipitating the protein in question through an indirect association.
In Co-IP, it is also essential to compare the amount of protein co-precipitatedwith the amounts of the proteins in question in the whole-cell extract. This al-lows one to determine whether apparent differences in the ability of two proteinsto co-precipitate from sample to sample is owing to differences in abundance ofthe proteins in the whole-cell extracts. This control is particularly importantwhen an interaction has been established and the investigator wishes to searchfor regulatory changes in association apart from changes in abundance.
3.3.3.2. TROUBLESHOOTING
In the absence of detecting an interaction, it is worthwhile to try less-strin-gent conditions or fewer washes after the immunoprecipitation. In addition, itmay be necessary to avoid any dilution of the whole-cell extract, by adding theprotein A/G-Sepharose directly after an initial clarification centrifugation andusing smaller wash volumes. When performing a co-precipitation, it is impor-tant to precipitate from both directions (i.e., individually precipitating Protein 1and Protein 2, and testing for the presence of Protein 2 and Protein 1, respec-tively), because it is possible the interaction will only be detected in one direc-tion. An inability to detect an interaction in one direction could be owing to avariety of factors, including obstruction of an interaction by the binding of theantibody, or other affinity agent, or differences in pool size representation ofeach protein. For example, Protein 1 may bind to many proteins besides Protein2, whereas most of Protein 2 binds to Protein 1. In this scenario, detection oftheir association may be most efficient when Protein 2 is precipitated.
In addition, it may be necessary to increase the expression levels of the proteinsin question to be able to readily detect them in a co-precipitation. A range of ex-pression levels is recommended, because too high a level of expression of proteinscan lead to unregulated interactions. Alternatively, one can scale up the Co-IP anduse more than 0.5–1 mg of whole-cell extract. Larger-scale extract preparationsmay be necessary to generate more concentrated extracts. In cases of failure owingto low abundance of the proteins in the host organism, one can overexpress one ofthe two proteins in another host (such as Escherichia coli), concentrate this proteinby pre-immobilization on the appropriate affinity matrix, and then incubate the af-fixed protein with extracts from the host organism (see Note 11).
4. Notes1. The EGTA is added to chelate divalent cations that are essential for metallo-
proteases. The 15 mM concentration of EGTA has been found to be optimalfor studies involving mitogen-activated protein kinase (MAPK). However,
Immunoprecipitation Methods 11

because EGTA will also inhibit other metal-dependent enzymes it may beomitted, used at a lower concentration (e.g., 1 mM), or combined with theaddition of a needed metal ion to the lysis buffer.
2. The yield can sometimes improve if the thawed sample is refrozen in liq-uid nitrogen and then rethawed prior to extract preparation.
3. Predetermine the amount of glass beads to add for the given volume, markthat amount on a microfuge tube, and use this tube to scoop equal amountsof beads into each sample.
4. This back-extraction step can be skipped for more concentrated extracts.5. Greater variability in pipetting occurs with small volumes. When preparing
multiple samples, predilute the antibody in immunoprecipitation buffer so thata bigger volume can be added to each sample to ensure equal distribution.
6. This step can decrease the presence of nonspecific background and is par-ticularly important in instances when the immunoprecipitate is being usedfor an enzyme assay. If background is not a problem, this step can beskipped.
7. Samples can be gently rocked instead of rotated; however, we find this tobe a less efficient way to recover the antigen-antibody complex. The 60-minincubation step can be lengthened to several hours to increase the amountof antigen captured. Increasing the length of time can be a tradeoff owingto the potential for sample degradation.
8. Save the supernatant in order to determine the efficiency of immunopre-cipitation of the protein in question.
9. This is a variable part of the protocol that depends on the affinity of theantibody-antigen complex. The stringency of the washes can be increasedby adding more salt or by having a fixed amount of salt present in a greaternumber of washes. It is helpful to do a final wash without added NaCl priorto running samples on a SDS-polyacrylamide gel.
10. Include aliquots of the initial whole-cell extract and the supernatant from theimmunoprecipitation for comparison to determine what fraction of the totalprotein is immunoprecipitated and as a positive control for the immunoblot.
11. The most important objective is to generate as great a signal to noise ratioand avoid problems of background. A variety of parameters can be changedto enhance immunoprecipitation. Optimization of the precipitating anti-body is one possibility. Protein A-sepharose and Protein G-sepharoseshould give results comparable to coupling the antibody to sepharose.However, direct coupling of the antibody to sepharose may lead to lessbackground and more quantitative precipitation. In addition, varying theratio of antibody to whole-cell extract and the total amount of whole-cellextract utilized is suggested to determine the optimal amount of antibodythat gives the most precipitation with the least amount of background.
12 Elion and Wang
Affinity purification of the antibody may be necessary if the antibodyimmunoprecipitates additional cross-reacting proteins. Additional ap-proaches can be taken to minimize background. First, the amount of saltand detergent can be increased in both the co-precipitation and the washesto reduce nonspecific binding. Second, increasing the number of washesmay also help, although it may reduce the amount of specific protein thatremains associated. Third, the whole-cell extract can be preincubated withprotein A/G sepharose to remove nonspecific proteins that bind to the solidsupport. Fourth, both the lysis buffer and the co-precipitation buffer can besupplemented with 1% BSAto reduce the amount of nonspecific binding tothe affinity matrix. Finally, one can increase the expression levels of theproteins in question to generate a stronger signal that is above the back-ground binding.
It may be possible to produce a whole-cell extract that is enriched forthe proteins in question, such as preparing a nuclear extract if the proteinsare known to be in the nucleus. Better clarification of the cell extract canbe done by precentrifugation at 100,000 g and the extracts can be directlyused for co-precipitation without an intervening freezing step, which canincrease the amount of protein precipitation. In instances where one of theproteins binds nonspecifically to sepharose, the substitution of an agarose-based affinity matrix may solve the problem. In this instance, it may benecessary to generate a different set of reagents to precipitate the proteinsin question (i.e., different antibodies and/or protein tags).
References1. Harlow, E. and Lane, D. (1988) Antibodies: A Laboratory Manual. Cold Spring
Harbor Laboratory Press, Cold Spring Harbor, NY.2. Harlow, E. and Lane, D. (1998) Using Antibodies: A Laboratory Manual. Cold
Spring Harbor Laboratory Press, Cold Spring Harbor, NY.3. Phizicky, E. M. and Fields, S. (1995) Protein-protein interactions: methods for de-
tection and analysis. Microbiolog. Rev. 59, 94–123.4. Kolodziej, P. A. and Young, R. A. (1991) Epitope Tagging and Protein Surveillance,
in Methods in Enzymology, vol. 194 Academic Press, San Diego, CA, pp. 508–519.5. Witzgall, R., O’Leary, E., Bonventure, J.V. (1994) A mammalian expression vector
for the expression of GAL4 fusion proteins with an epitope tag and histidine tail.Anal. Biochem. 2, 291–298.
6. Knappik, A. and Pluckthun, A. (1994) An improved affinity tag based on the FLAGpeptide for the detection and purification of recombinant antibody fragments.Biotechniques 17, 754–761.
7. Field, J., Nikawa, J., Broek, D., et al. (1988) Purification of a Ras-responsiveadenylyl cyclase complex from Saccharomyces cerevisiae by use of an epitope ad-dition method. Mol. Cell Biol. 8, 2159–2165.
Immunoprecipitation Methods 13

8. Tyers, M., Tokiwa, G., and Futcher, A.B. (1993) Comparison of the Saccharomycescerevisiae G1 cyclins: Cln3 may be an upstream activator of Cln1, Cln2, and othercyclins. EMBO J. 11, 1773–1784.
9. Feng, Y., Song, L.Y., Kincaid, E., et al. (1998) Functional binding between Gbetaand the LIM domain of Ste5 is required to activate the MEKK Ste11. Curr. Biol. 8,267–278.
10. Sorger, P. K. and Pelham, H. R. (1987) Purification and characterization of a heat-shock element binding protein from yeast. EMBO J. 6, 3035–3041.
14 Elion and Wang
2
Signal Transduction Inhibitors in Cellular Function
Maofu Fu, Chenguang Wang, Xueping Zhang, and Richard G. Pestell
SummarySignal transduction pathways mediate cell–cell interactions and integrate signals from the ex-
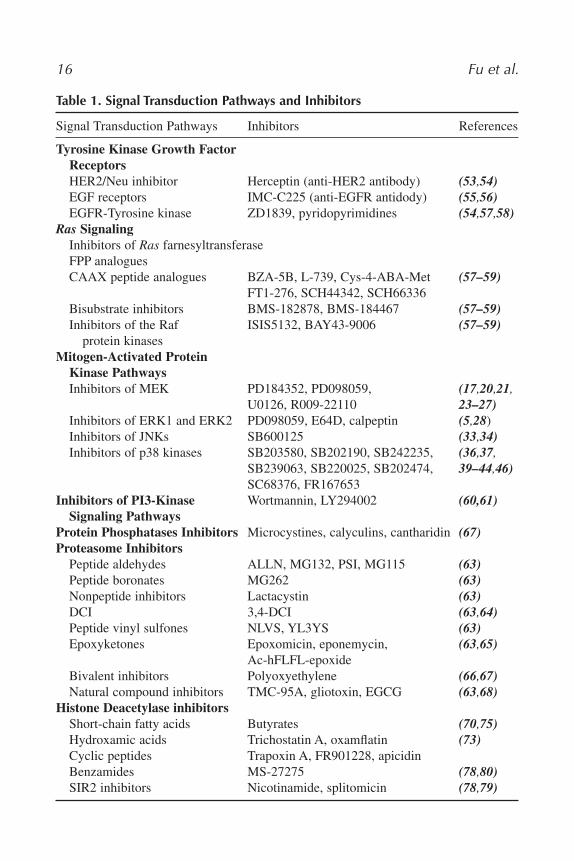
tracellular environment through specific receptors at the cell membrane. They play a pivotal rolein regulating cellular growth and differentiation and in mediating many physiological and patho-logical processes, such as apoptosis, inflammation, and tumor development. The mitogen-activated protein kinases (MAPKs) constitute a cascade of phosphorylation events that transmitextracellular growth signals through membrane-bound Ras to the nucleus of the cell. In this chap-ter, detailed protocols for analyzing the kinase activities of the key components of the MAPKspathway—MEK1, ERK1, JNK, and p38 MAPK—are described. A brief introduction to the chem-ical inhibitors to the MAPKs pathway is provided in the method section of each kinase assay. In-hibitors of other signaling pathways are summarized in Table 1. The reporter assay of Cyclin D1,a key downstream target gene of MAPKs pathway, is also described in detail.
Key Words: Signal transduction; MAPKs; chemical inhibitors; in vitro kinase assay.
1. Introduction
In multicellular organisms, gene expression is tightly controlled within thecell. Extracellular molecules, such as hormones, growth factors, and cytokines,communicate with the nuclear gene regulatory machinery through the interac-tion with receptors on the cell membrane and initiate intracellular signaling cas-cades. Signal transduction can occur between cells and within a single cell. Incancer cells, the integrity of signal transduction cascades is often disrupted by
From: Methods in Molecular Biology, vol. 284:Signal Transduction Protocols
Edited by: R. C. Dickson © Humana Press Inc., Totowa, NJ
15
16 Fu et al.
Table 1. Signal Transduction Pathways and Inhibitors
Signal Transduction Pathways Inhibitors References
Tyrosine Kinase Growth Factor ReceptorsHER2/Neu inhibitor Herceptin (anti-HER2 antibody) (53,54)EGF receptors IMC-C225 (anti-EGFR antidody) (55,56)EGFR-Tyrosine kinase ZD1839, pyridopyrimidines (54,57,58)
Ras SignalingInhibitors of Ras farnesyltransferaseFPP analoguesCAAX peptide analogues BZA-5B, L-739, Cys-4-ABA-Met (57–59)
FT1-276, SCH44342, SCH66336Bisubstrate inhibitors BMS-182878, BMS-184467 (57–59)Inhibitors of the Raf ISIS5132, BAY43-9006 (57–59)
protein kinasesMitogen-Activated Protein
Kinase PathwaysInhibitors of MEK PD184352, PD098059, (17,20,21,
U0126, R009-22110 23–27)Inhibitors of ERK1 and ERK2 PD098059, E64D, calpeptin (5,28)Inhibitors of JNKs SB600125 (33,34)Inhibitors of p38 kinases SB203580, SB202190, SB242235, (36,37,
SB239063, SB220025, SB202474, 39–44,46)SC68376, FR167653
Inhibitors of PI3-Kinase Wortmannin, LY294002 (60,61)Signaling Pathways
Protein Phosphatases Inhibitors Microcystines, calyculins, cantharidin (67)Proteasome Inhibitors
Peptide aldehydes ALLN, MG132, PSI, MG115 (63)Peptide boronates MG262 (63)Nonpeptide inhibitors Lactacystin (63)DCI 3,4-DCI (63,64)Peptide vinyl sulfones NLVS, YL3YS (63)Epoxyketones Epoxomicin, eponemycin, (63,65)
Ac-hFLFL-epoxideBivalent inhibitors Polyoxyethylene (66,67)Natural compound inhibitors TMC-95A, gliotoxin, EGCG (63,68)
Histone Deacetylase inhibitorsShort-chain fatty acids Butyrates (70,75)Hydroxamic acids Trichostatin A, oxamflatin (73)Cyclic peptides Trapoxin A, FR901228, apicidinBenzamides MS-27275 (78,80)SIR2 inhibitors Nicotinamide, splitomicin (78,79)
gene mutations or altered gene expression. Constitutive activation of signalingcascades contributes to uncontrolled cellular growth (1,2).
The elucidation of signal-transduction pathways in cancer cells, both at theproteomic and the genomic level, has provided the basis of rational screeningfor chemical inhibitors and targeted drug design. New therapeutics act at spe-cific steps of the signal transduction cascade. The inhibitor may interfere withsignaling processes by blocking binding of a ligand to a cell-surface receptor,by inhibiting the receptor tyrosine kinase (RTK) activity of a receptor or by in-hibiting downstream components of a signaling pathway (3).
Protein kinases are enzymes that covalently attach phosphate to the sidechain of serine, threonine, or tyrosine of specific proteins inside cells. Mitogen-activated protein kinases (MAPKs) are a family of protein kinases whose func-tion and regulation have been conserved during evolution from unicellular or-ganisms to complex organisms, including humans. Multicellular organismshave three subfamilies of MAPKs, namely ERK, JNK, and p38 protein Kinases,which control a vast array of physiological processes (4). The extracellular sig-nal-regulated kinases (ERKs) are involved in the control of cell proliferationand division. The c-Jun amino-terminal kinases (JNKs) are critical regulators ofapoptosis and gene transcription. The p38 MAPKs are activated by inflamma-tory cytokines and environmental stresses (5–7).
Signal transduction inhibitors have been developed to diverse signalingpathways. Limitations of using such inhibitors have been the temporal and spa-tial control of drug delivery. More recently approaches have been developed totarget inhibitors to discrete subcellular compartments, or to activate compoundsat a single-cell level using chemical “caging” (8). For example, it has been pos-sible to screen for compounds that are selectively taken up by mitochondria andinhibit growth of tumor cell targets, in part owing to the altered mitochondrialmembrane potential of malignant cells (9). Chemical “caging” of small mole-cules (e.g., ATP, NO, etc.), peptides and proteins, has been useful to define tem-poral relationships in biochemically mediated processes and to delineate therole of individual proteins in biological phenomena.
The recent application of caging ligands to regulate gene expression will pro-vide important new insights into the mechanisms governing signal transductionin vivo (8). Using light to activate caged molecules at the single-cell level willallow the dissection of intracrine and paracrine signaling at an organismal level.Future development in signal transduction research will integrate microarraytechnology at a genome-wide level to identify novel signal-transduction in-hibitors and, therefore, provide better chemotherapeutic approaches in the treat-ment of human diseases (8,10).
Here we briefly outline the MAPK signaling pathways and inhibitors thathave proven useful for studying such pathways. Stepwise protocols for im-munoprecipitating MEK1, ERK1, JNK, and p38 MAP Kinase are described,
Signal Transduction Inhibitors 17
along with assays for kinase activity. Because Cyclin D1 is a key downstreamtarget of the MAPK pathways, the utility of Cyclin D1 promoter reporter assaysto examine proliferative signaling pathways is also described.
2. Materials2.1. Measuring MEK1 Kinase Activity (11,12)
1. Cell lysis buffer: 50 mM HEPES, pH 7.5, 150 mM NaCl, 0.5% deoxy-cholate, 1% Triton X-100, 1% NP-40, 50 mM sodium fluoride (NaF), 1 mMsodium orthovanadate (Na3VO4), 0.01% aprotinin, 4 lg/lL pepstatin A,10 lg/lL leupeptin, 1 mM phenylmethanesulfonyl fluoride (PMSF), 1 mMdithiothreitol DTT. Add proteinase inhibitors immediately before use andkeep solution on ice.
2. Phosphate-Buffered saline (PBS): For preparation of 10 L 1X PBS, dis-solve 80 g NaCl, 2 g KCl, 14.2 g Na2HPO4, and 2.4 g KH2PO4 in double-distilled H2O. The pH should be between 7.28 and 7.60.
3. Anti-MEK1 antibody and Protein A-agarose (Santa Cruz Biotechnology,Santa Cruz, CA).
4. MAPK 2/Erk2, (inactive) (Upstate Biotechnology, Lake Placid, NY, cat.no. 14–198.)
5. Nonradioactive adenosine triphosphate (ATP) cocktail: 30 mM b-glycerolphosphate, 60 mM HEPES, pH 7.3, 4 mM EGTA, 1.5 mM DTT, 0.45 mMNa3VO4, 30 mM MgCl2, 0.3 mM ATP, and 0.3 mg/mL BSA.
6. Radioactive ATP cocktail: 2 lCi (γ-32P)-ATP, 10 lg of myelin basic protein(MBP), 30 mM glycerophosphate, 60 mM HEPES, pH 7.3, 4 mM EGTA,1.5 mM DTT, 0.45 mM Na3VO4, 30 mM MgCl2, and 6 lg of BSA.
7. Myelin basic protein (MBP) (Research Diagnostics, Flanders, NJ, cat. no.RDI-TRK8M79).
8. Cell lines and cell-culture supplies.9. Disposable cell lifter (Fisher Scientific, Pittsburg, PA).
10. PD-98059 stock (50 mM) in dimethyl sulfoxide (DMSO), store at �20°C(Calbiochem-Novabiochem, La Jolla, CA).
11. Bio-Rad Protein Assay Reagent (Bio-Rad Laboratories).12. Phosphorimager screen and phosphorimaging scanner (Strom, Amersham
Biosciences, Piscataway, NJ).13. Protein sample loading buffer: 50 mM Tris-HCl, pH 6.8, 10% glycerol, 1%
sodium docecyl sulfate (SDS), 1% 2-mercaptoethanol.
2.2. In Vitro ERK1 Kinase Assay (12,13)
1. Cell lysis buffer: 50 mM HEPES, pH 7.5, 0.5% deoxycholate, 1% TritonX-100, 1% NP-40, 150 mM NaCl, 50 mM NaF, 1 mM Na3VO4, 0.01% apro-tinin, 4 lg/lLpepstatin A, 10 lg/lLleupeptin, 1 mM PMSF, 1 mM DTT. Addproteinase inhibitors immediately before use and keep solution on ice.
18 Fu et al.
2. Anti-ERK1 antibody (Santa Cruz Biotechnology, cat. no. SC-94).3. Protein A-agarose and Protein G-agarose (Santa Cruz Biotechnology).4. Myelin basic protein.5. Kinase reaction buffer: 10 lCi (γ-32P)-ATP, 50 lM ATP, 20 mM HEPES,
pH 8.0, 10 mM MgCl2, 1 mM DTT, 1 mM benzamidine.
2.3. In Vitro JNK Kinase Assay (14)
1. Cell lysis buffer: 20 mM Tris-HCl, pH 7.5, 150 mM NaCl, 1% TritonX-100, 2.5 mM sodium pyrophosphate, 1 mM EDTA, 1 mM EGTA, 1 mMNa3VO4, 1 mM b-glycerol phosphate, 1 mM PMSF, and 1 lg/mL leupeptin.
2. Anti-JNK antibody (Cell Signaling Technology).3. Protein A-agarose and Protein G-agarose (Santa Cruz Biotechnology).4. ATF2 fusion protein (Cell Signaling Technology).5. Kinase buffer: 25 mM Tris-HCl, pH 7.5, 5 mM b-glycerol phosphate, 2 mM
DTT, 0.1 mM Na3VO4, 10 mM MgCl2 and 100 lM ATP.6. 6X SDS sample buffer: For 100 mL, add 35 mL 1 M Tris-HCl (pH 6.8),
10.28 g SDS, 36 mL Glycerin, 9.2 g DTT, 12 mg Bromophenol Blue, ad-just volume with dd H2O to 100 mL. Store in aliquots at –20°C.
7. Potter Elvehjem tissue grinder.
2.4. In Vitro p38 MAPK Assay (15)
1. Cell lysis buffer: 50 mM HEPES, pH 7.6, 150 mM NaCl, 10% glycerol(v/v), 1% Triton X-100 (v/v), 30 mM Na4P2O7, 10 mM NaF, 1 mM EDTA,1 mM PMSF, 1 mM benzamidine, 1 mM Na3VO4, 1 mM DDT, and 100 nMokadaic acid.
2. Anti-p38 MAP kinase antibody (Santa Cruz Biotechnology).3. Protein A- and Protein G-agarose.4. ATF2 fusion protein (Cell Signaling Technology) or ATF-2 peptide (New
England BioLabs, Beverly, MA).5. Kinase buffer: 50 mM Tris-HCl, pH 7.5, 10 mM MgCl2, and 1 mM dithio-
threitol and 100 lM ATP.6. Whatman P81 phosphocellulose filter (Whatman, cat. no. 3698-023).7. 175 mM phosphoric acid.8. Potter Elvehjem tissue grinder.9. Polyvinylidene flouride (PVDF) membrane.
2.5. Cyclin D1 Reporter Assay
1. Cell line: Breast cancer cell line MCF-7. Cells are maintained in Dul-becco’s Modified Eagle’s Medium (DMEM) supplemented with 10% fetalbovine serum (FBS) and 1% Penicillin-streptomycin at 37°C in the pres-ence of 5% CO2.
Signal Transduction Inhibitors 19
2. Plasmid DNA: Mammalian expression vector pSV2, pSV2Neu-T, and lucifer-ase reporter constructs 1745D1-LUC, Cyclin A-LUC and c-fos-LUC (16).
3. Transfection reagents: SuperFect reagent (Qiagen, cat. no. 301305, 1.2 mL).Store at 4°C.
4. MEK inhibitor: PD098059 (2-amino-3-methoxyflavone) (Calbiochem, cat.no. 513000, 5 mg, M.W. 267.3) Stock Solution: 10 mM in DMSO. (Dis-solve 5 mg PD098059 in 1.87 mL DMSO, aliquot into 100 lL/tube andstore at �20°C.)
5. 0.5 M Glycylglycine (Glygly) buffer: dissolve 33.05 g in 500 mL distilledwater, adjust pH to 7.8 with KOH, store at 4°C.
6. 100 mM Potassium phosphate (K-Phos): Mix 90.8 mL of 1 M K2HPO4 with9.2 mL 1 M KH2PO4, adjust volume to 1 L with distilled water and deter-mine if pH is 7.8.
7. 1 M DTT in distilled water, stored at �20°C in 1-mL aliquots.8. 200 mM ATP in distilled water, store at �20ºC in 400 lL aliquots.9. 1 mM Luciferin substrate (Molecular Probes, cat. no. L-2911, 25 mg). Dis-
solve in 78.51 mL distilled water, store at �20°C in 1-mL aliquots. Protectfrom light using aluminum foil.
10. 1 M MgSO4, store at room temperature.11. GME buffer: 25 mM Glygly, 15 mM MgSO4, 4 mM EGTA, 5 mL 0.5 M
glygly, 1.5 mL 1 M Mg MgSO4, 0.8 mL 0.5 M EGTA, adjust volume to100 mL with distilled water, store at 4°C.
12. Extraction buffer: 1% (w/v) Triton X-100 and 1 mM DTT in GME buffer.To prepare, add 0.5 mL Triton X-100 to 50 mL GME buffer, mix well, andthen add 50 lL of 1 M DTT. Prepare freshly before use.
13. ATP assay buffer: For each assay point, mix 300 lL GME buffer with 60 lL100 mM K Phos buffer, 0.4 lL 1 M DTT, and 4 lL 200 mM ATP. Preparefreshly before use.
14. Luciferin solution: Prepare 100 lL per assay. A 5 mL preparation will beenough for 40 samples (1 mL of 1 mM Luciferin, 4 mL GME buffer, and50 lL of 1 M DTT). Make fresh and protect from light by wrapping thetubes with aluminum foil. Leave on ice before use.
15. Luciferase assay tubes (Becton Dickinson Labwares, cat. no. 352008).16. Luminometer (i.e., Autolumat, Model LB953, Berthold).
3. Methods3.1. Measuring MEK1 Kinase Activity
Ras interacts with and activates Raf1, which in turn phosphorylates andactivates the dual-specificity kinase MEK1 (MAP kinase kinase) on two dis-tinct serine residues. Activated MEK1 catalyzes the phosphorylation ofp44MAPK (ERK1) and p42MAPK (ERK2) on a tyrosine and a threonine
20 Fu et al.
residue (Y183 and T185). These MAP kinases can phosphorylate a varietyof substrates, including transcription factors and cell-cycle control genes. Thesmall-molecule inhibitor of MEK, PD184352, directly inhibits MEK1 with a50% inhibitory concentration (IC50) of 17 nM. PD184352 produces a dose-dependent block in the G1 phase of the cell cycle in colon cancer cells. Thecell-culture and in vivo efficacy studies indicate colon tumors are especiallysensitive to MEK inhibition (17). When human multiple myeloma or leukemiacell lines are exposed to the MEK/MAPK inhibitor PD184352 and the cell-cycle checkpoint inhibitor UCN-01 the cells show dramatic mitochondrialdamage and apoptosis (18,19).
PD098059 is a synthetic inhibitor that selectively blocks the activation ofMEK-1 and, to a lesser extent, the activation of MEK-2 (20). The inhibition ofMEK-1 activation prevents activation of the MAPKs ERK-1/2 and subsequentphosphorylation of MAPK substrates both in vitro and in intact cells. PD098059reversed the transformed phenotype of Ras-transformed mouse fibroblasts andrat kidney cells and blocked induction of Cyclin D1 and cell-cycle progression(21–24). PD098059 does not inhibit JNK/SAPK and the p38 pathways at theconcentrations that inhibit ERK activity, demonstrating its specificity for theERK pathway (25).
U0126 is a newly discovered potent inhibitor of the dual-specificity kinasesMEK1 and MEK2 (26). Like PD98059, U0126 is a noncompetitive inhibitor ofMEK1/2. U0126 displays significantly higher affinity for all forms of MEKthan PD098059. U0126 inhibits phosphorylation of MEK1/2 and ERK1/2, in-hibits the invasion of human A375 melanoma cells, and decreases c-Jun expres-sion, a major component of the transcription factor AP-1 (27). U0126 inhibitsT-cell proliferation in response to antigenic stimulation and cross-linked anti-CD3 plus anti-CD28 antibodies. U0126 has an inhibitory concentration (IC50)of 50–70 nmol/L, whereas PD098059 has an IC50 of 5 lmol/L. Ro 09-2210, an-other inhibitor of MEK-1 and MEK-2, also inhibits other dual-specificitykinases such as MKK-4, MKK-6, and MKK-7, albeit at 4 to 10-fold higher IC50concentrations compared with its effect on MEK-1(25).
1. After treatment of the cells with proper kinase inhibitors, such as 5 lMPD098059 for 24 h, aspirate the culture medium from the tissue-cultureplates.
2. Wash the cells twice with 15 mL ice-cold PBS.3. Put the culture plates on ice, add 300–500 lL cell lysis buffer. Scrape the
cells from the culture plates using a disposable cell lifter. Transfer the celllysate to an ice-cold 1.5-mL Eppendorf tube.
4. Freeze-thaw twice using liquid nitrogen or a dry ice-ethanol mix.5. Vortex for 30 s and centrifuge at 14,000 rpm in a microcentrifuge at 4°C
for 10 min.
Signal Transduction Inhibitors 21
6. Transfer the supernatant to a 1.5-mL Eppendorf tube.7. Measure the protein concentration by using the Bio-Rad Protein Assay
Reagent.8. Dilute 300–600 lg cell lysate in 400 lL cell lysis buffer; add 10 lL anti-
MEK1 antibody. Incubate for 1 h at 4°C, rotating to thoroughly mix thesample.
9. Add 20 lL of Protein A-agarose bead slurry, washed according to the man-ufacture’s instruction, and incubate for 2 h at 4°C with constant rotation toimmunoprecipitate the kinase.
10. Pellet the agarose by centrifuging for 15 s at 14,000 rpm in a micro-centrifuge.
11. Remove the supernatant fraction and wash the protein A agarose beadstwice with 800 lL ice-cold lysis buffer and 800 lL once with ice-cold PBS.
12. Add 5 lL of inactive ERK2 (250 lg/mL) and 10 lL of nonradioactive ATPcocktail and incubate for 10 min at 30°C on a shaking incubator to mix thesample thoroughly.
13. Add 20 lL of the (γ-32P)-ATP mixture and incubate for an additional 10 min(see Note 1).
14. Stop the reaction by adding 40 lL sample buffer and boil at 95°C for 5 minin heat block, then cool on ice for 2 min (see Note 2 and 3).
15. Vortex vigorously for 30 s, and centrifuge at 14,000 rpm at room tempera-ture for 5 min.
16. Electrophorese 15 lL of the supernatant fluid on an 15% SDS-polyacry-lamide gel (PAGE) gel.
17. Transfer proteins from the SDS-PAGE onto a nitrocellulose membrane anddetermine the amount of radiolabeled ERK2 by phosphor imager analysis.
3.2. In Vitro ERK1 Kinase Assay (12,13)
ERK1 and ERK2 are widely expressed and are involved in the regulation ofmeiosis, mitosis, and postmitotic functions in differentiated cells (5). ERKs 1and 2 are both components of a three-kinase phosphorylation module that in-cludes the MKKK c-Raf1, B-Raf, or A-Raf, which can be activated by theproto-oncogene Ras. Oncogenic Ras persistently activates the ERK1 and ERK2pathways, which contributes to the increased proliferative rate of tumor cells(5). PD098059 specifically inhibits the ERK pathway (25). Interestingly, inhi-bition of cysteine proteinases by either E64D or calpeptin leads to a dramaticinhibition of ERK activity (28).
1. Aspirate the culture medium from the tissue culture plates.2. Wash the cells twice with 15 mL ice-cold PBS.3. Put the cell-culture plates on ice and add 0.5 mL ice-cold cell lysis buffer.
Scrape the cells from the culture plates using a disposable cell lifter.
22 Fu et al.
Transfer the cell lysate to a 1.5-mL Eppendorf tube and incubate on ice for30 min (see Notes 4 and 5)
4. Freeze-thaw twice using liquid nitrogen or a dry ice ethanol mix.5. Vortex 30 s and centrifuge at 14,000 rpm in a microcentrifuge at 4°C for
10 min.6. Transfer the supernatant to a new 1.5-mL Eppendorf microcentrifuge tube.7. Measure the protein concentration Bio-Rad Protein Assay Reagent.8. Dilute 500 lg of cell lysate in 500 lL cell lysis buffer, and incubate with
2 lg ERK1 anti-antibody for 2 h at 4°C, rotating to thoroughly mix thesample.
9. Add 30 lL of washed Protein A Plus-agarose bead slurry and incubate foranother 2 h at 4°C to immunoprecipitate the kinase, rotating thoroughly tomix the sample.
10. Pellet the agarose beads by centrifugation in a microcentrifuge at 14,000 rpmfor 15 s.
11. Remove the supernatant and wash the pellet twice with 800 lL ice-coldlysis buffer and twice with 100 mM NaCl in 50 mM HEPES buffer, pH 8.0.
12. Incubate the immunoprecipitated complexes with 0.3 mg/mL MBP at 37°Cfor 15 min in kinase reaction buffer. Use a shaking incubator to thoroughlymix the sample.
13. Stop the reaction by adding 40 lL sample buffer, boil at 95°C for 5 min,then cool on ice for 2 min (see Note 3).
14. Vortex vigorously for 30 s, and centrifuge at 14,000 rpm at room tempera-ture for 5 min to pellet the beads.
15. Electrophorese 15 lL of the supernatant fraction on to an 15% SDS-PAGE gel.
16. Transfer proteins from the SDS-PAGE onto a nitrocellulose membraneand determine the amount of radiolabeled MBP by phosphorimageranalysis.
3.3. In Vitro JNK Kinase Assay (14)
The JNKs are stress-activated protein kinases (29,30). The JNKs bind andphosphorylate c-Jun, a component of the AP-1 transcription complex, and in-crease its transcriptional activity (7,31,32). AP-1 is involved in regulation ofmany cytokine genes and is activated in response to environmental stress, radi-ation, and growth factors, all stimuli that activate JNKs. The inhibition of JNKsenhances chemotherapy-induced inhibition of tumor cell growth, suggestingthat JNKs may provide a molecular target for the treatment of cancer. JNK in-hibitors have shown promise inhibiting tumor cell growth and in the treatmentof rheumatoid arthritis (5).
Signal Transduction Inhibitors 23
SP600125 is a JNK inhibitor that completely blocks IL-1-induced expressionof c-Jun and collagenase mRNAs. The inhibitor suppressed IL-1-induced accu-mulation of phosphorylated-c-Jun in synoviocytes (33,34).
Bioactive cell-permeable peptide inhibitors of JNK were engineered by link-ing the minimal 20-amino acid inhibitory domains of the IB proteins (the islet-brain [IB] 1 and 2 proteins, which inhibit JNK signaling) to the 10-amino acidHIV-TAT sequence that rapidly translocates peptides into cells. Addition of thepeptides to the insulin-secreting betaTC-3 cell line resulted in a marked inhibi-tion of interleukin-1 (IL-1)-induced c-jun and c-fos expression, indicating inhi-bition of JNK signaling (35).
1. Wash the treated cells twice with 10 mL of ice-cold PBS. Aspirate PBScompletely after the second wash (see Note 4).
2. Add 0.5 mL of lysis buffer to the cells and incubate on ice for 20 min withoccasional swirling.
3. Scrape cell lysate gently off the plate with a cell lifter and transfer the lysateto a sterile ice-cold 1.5-mL microcentrifuge tube. Disrupt cell lysate in a2-mL Potter Elvehjem tissue grinder submerged in ice by using twenty upand down strokes (see Note 5).
4. Vortex 30 s and centrifuge in a microcentrifuge at 14,000 rpm at 4°C for10 min.
5. Transfer the supernatant to a new ice-cold 1.5-mL Eppendorf tube and de-termine the protein concentration.
6. Adjust 300–600 lg of cell lysate in 500 lL of total lysis buffer.7. Add 2 lg anti-JNK antibody and incubate at 4°C for 1 h on a rotating
navigator.8. Add 25 lL Protein-A agarose slurry and continue incubation at 4°C for 2 h
or overnight on a navigator.9. Pellet agarose beads for 10 min at 4°C by centrifugation in a microfuge at
1500g.10. Remove supernatant and wash twice with 0.8 mL of ice-cold lysis buffer
and twice with 0.5 mL cold kinase buffer.11. Pellet agarose beads by centrifugation at 4°C for 10 min at 1500g in a
microcentrifuge.12. Remove the supernatant and suspend the pellets in 30 lL kinase buffer con-
taining 200 lM ATP and 2 lg of ATF2 fusion protein.13. Incubate for 30 min at 30°C on a shaking incubator.14. Repeat step 10.15. Wash the pellet three times with 0.8 mL of ice-cold cell lysis buffer.16. Add 30 lL cell lysis buffer, 6 lL 6X protein loading buffer, boil at 95°C
for 5 min, then cool on ice for 2 min (see Note 3).
24 Fu et al.
17. Centrifuge at 14,000 rpm for 5 min in a microcentrifuge to collect the beads.18. Electrophorese the supernatant fraction on to a 7% SDS-PAGE gel.19. Transfer proteins from the gel onto nitrocellulose membrane. Detect the
phospho-ATF2 signal by Western blotting using the phospho-ATF2 anti-bodies (see Notes 6–10).
3.4. In Vitro p38 MAPK Assay (15)
The p38 MAPKs are activated by inflammatory cytokines as well as by manyother stimuli, including hormones, ligands for G protein-coupled receptors,stresses, and during activation of the immune response. Because the p38MAPKs are key regulators of inflammatory cytokine expression, they appear tobe involved in human diseases such as asthma and autoimmunity (5). Many in-hibitors targeting p38 kinase have been developed, including SB203580,SB202190, SB242235, SB239063, SB220025, SB202474, SC68376, andFR167653 (36–44).
SB203580, a pyridinylimidazole compound, is a selective inhibitor of p38MAP kinase that acts by competitive binding in the ATP-binding pocket. Thep38 MAP kinase inhibitors are efficacious in several disease models, includinginflammation, arthritis, septic shock, and myocardial injury (45). p38 MAPK isactivated significantly in nitric oxide (NO)- or peroxynitrite-induced cell deathin a time-dependent manner. Cell death and caspase-3 activation are markedlyinhibited by SB203580 (46).
1. Same as in Subheading 3.3.2. Add 0.3 mL of ice-cold cell lysis buffer to the 10 cm cell-culture dish (add
0.6 mL for 15 cm dishes) and incubate for 20 min on ice with occasionalswirling.
3. Same as in Subheading 3.3.4. Same as in Subheading 3.3.5. Same as in Subheading 3.3.6. Same as in Subheading 3.3.7. Add anti-p38 MAP kinase antibody (2 lg/reaction) precoupled to a 20 lL
mixture of Protein A- and Protein G-agarose beads and incubate at 4°C for2–3 h with constant rotation. Antibody-coupled beads are washed twicewith ice-cold PBS and once with ice-cold lysis buffer before use.
8. Pellet agarose beads for 10 min at 4°C at 1500 g in a microcentrifuge.9. Remove supernatant and wash beads four times with 1 mL of wash buffer
and twice with 1 mL of kinase buffer.10. Pellet agarose beads for 10 min at 4°C at 1500 g in a microcentrifuge.11. Remove the supernatant and suspend the pellets in 30 lL of reaction mix-
ture (kinase buffer containing 5 lM ATP, 2 lCi of (d-32P)-ATP).
Signal Transduction Inhibitors 25
12. Incubate the reaction with 2 lg of ATF-2 fusion protein for 30 min at 30°Cwith constant agitation.
13. Pellet agarose beads for 10 min at 4°C at 1500 g in a microcentrifuge.14. Transfer 30 lL of the supernatant onto a 2.1-cm diameter Whatman P81
cellulose phosphate filter circles.15. Wash circles four times for 10 min with 3 mL of 175 mM phosphoric acid
and once with 3 mL distilled water for 5 min.16. Air-dry filters and then measure radioactivity in a liquid scintillation
counter (see Note 11–15).
3.5. Cyclin D1 Reporter Assay (16)
The Cyclin D1 gene encodes a labile growth factor and oncogene-inducibleregulatory subunit of the holoenzyme that phosphorylates and inactivates thepRb protein. The abundance of Cyclin D1 is rate-limiting in the induction ofDNA synthesis by diverse mitogenic stimulus (47). The Cyclin D1 gene is tran-scriptionally induced by mitogenic stimuli, including Ras, Src, ErbB2, and ac-tivated ERK, suggesting that the Cyclin D1 promoter is a useful reporter ofmitogenic intracellular signaling activity (16–50).
3.5.1. Preparation of Cells for Transient Transfection
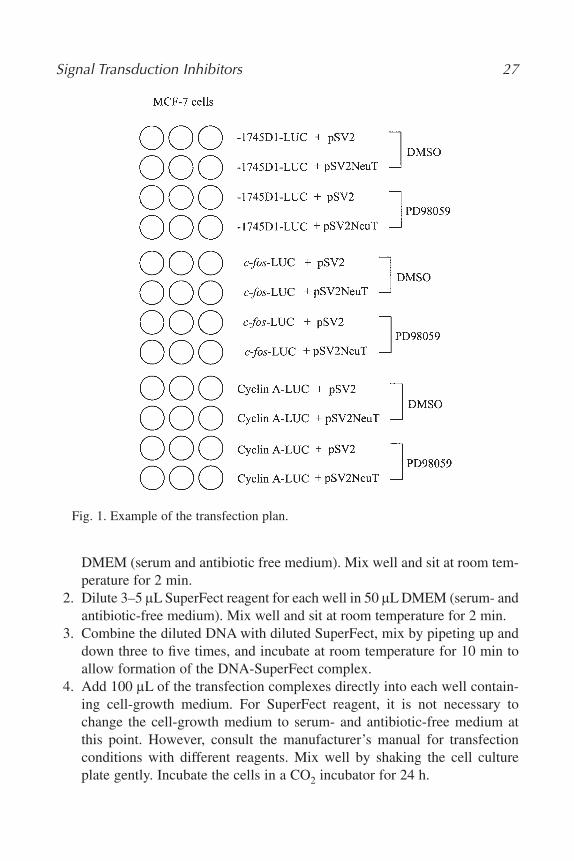
1. Plan the transfection experiment. For example, in this experiment, we willexamine the effect of Her2/Neu signaling on the Cyclin D1 transcription inMCF-7 breast cancer cells. We also want to know if Her2/Neu regulates Cy-clin D1 through a MAPK pathway and will examine this possibility byusing the MEK inhibitor, PD098059 (see Note 16). In this protocol, we willuse a reporter assay to address these questions. Cells will be transientlytransfected with the mammalian expression vector of NeuT with Cyclin D1reporter construct, -1745 cyclin D1-LUC. c-fos-LUC will be used as a pos-itive reporter control because it is known that Her2/Neu signaling upregu-lates c-fos expression (51). Cyclin A-LUC will be used as a negative con-trol. All transfections will be done in triplicate. The transfection plan isshown Fig. 1 (see Notes 17–19).
2. Subculture MCF-7 cells for transfection. A day before transfection, seed0.4 � 105 MCF-7 cells per well in 400 lL DMEM supplemented with 10%FBS into 24-well plates. By the time of transfection, the cells should reach50–70% confluence (see Note 20).
3.5.2. Transient Transfection
1. For each well, dilute 1.2 lg reporter plasmid DNA along with either pSV2control vector (75 ng) or expression vector pSV2-NeuT (100 ng) in 50 lL
26 Fu et al.
DMEM (serum and antibiotic free medium). Mix well and sit at room tem-perature for 2 min.
2. Dilute 3–5 lL SuperFect reagent for each well in 50 lL DMEM (serum- andantibiotic-free medium). Mix well and sit at room temperature for 2 min.
3. Combine the diluted DNA with diluted SuperFect, mix by pipeting up anddown three to five times, and incubate at room temperature for 10 min toallow formation of the DNA-SuperFect complex.
4. Add 100 lL of the transfection complexes directly into each well contain-ing cell-growth medium. For SuperFect reagent, it is not necessary tochange the cell-growth medium to serum- and antibiotic-free medium atthis point. However, consult the manufacturer’s manual for transfectionconditions with different reagents. Mix well by shaking the cell cultureplate gently. Incubate the cells in a CO2 incubator for 24 h.
Signal Transduction Inhibitors 27
Fig. 1. Example of the transfection plan.
3.5.3. Treatment of the Cells With PD98059
Twenty-four hours after transfection, replace the medium with 500 lL freshculture medium containing either DMSO (negative control) or 10 lM PD98059.Incubate the cells for another 24 h (see Note 21–23).
3.5.4. Luciferase Assay
1. Lyse cells by aspirating the medium from the culture plate and adding100 lL of cell-extraction buffer. Rotate or shake the cells on a shaking plat-form at room temperature for 5–10 min.
2. For each sample, add 300 lL of ATP assay buffer into luciferase assaytubes. Prepare six extra tubes as blank controls.
3. Transfer 100 lL of cell lysate into the tube containing the ATP assay bufferand mix.
4. Load the samples onto the luminometer and put the substrate injector intothe luciferin container (protected from light with aluminum foil). Makesure that the injector is submerged into the luciferin solution.
5. Measure the integrated light output for 10–60 s. At the end, wash the tub-ing of the luminometer with distilled water. (If renillar luciferin is used asan internal control, wash the tubing with 70% ethanol six times with sixwash tubes and then repeat wash again with distilled water [52]).
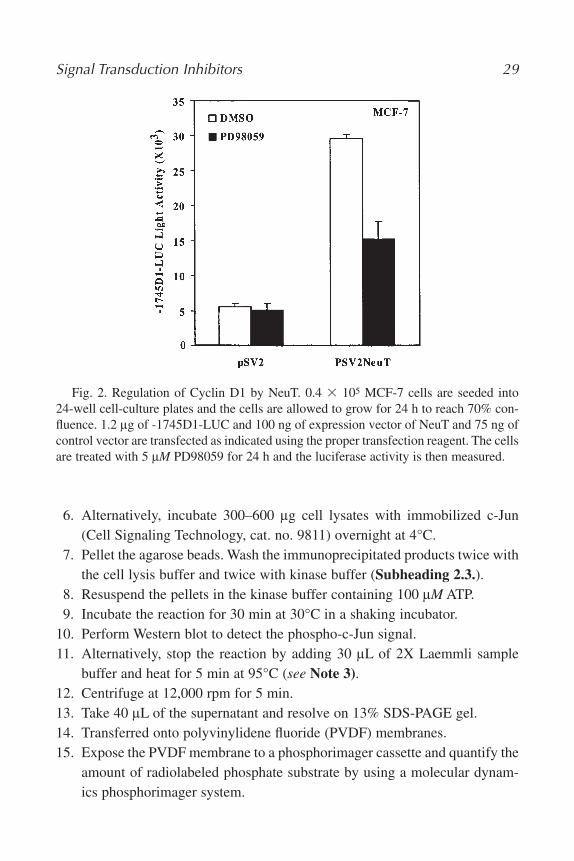
6. Analyze the data statistically and graph as shown in Fig. 2.
4. Notes
1. Safety warnings and precautions: Because the experiments described hereinvolve the use of radioactive (γ-32P)-ATP, be sure to follow your institu-tional regulations relating to the handling, usage, storage and disposal ofsuch materials. Always use protective barriers.
2. Alternatively, stop the reaction by adding 20 lL of 100 mM EDTA, pH 7.5,centrifuge briefly, and spot 40 lL of each supernatant onto phosphocellu-lar paper. The papers are then washed six times (5–10 min each) in 10%phosphoric acid, soaked briefly in 100% ethanol, and air-dried beforeanalysis in a liquid scintillation counter (11).
3. When heating samples on the heating block, make sure that the microcen-trifuge tubes are closed tightly. Place another heating block on top of thetubes will prevent the tops from popping open.
4. When harvesting the cell lysate, be sure to aspirate the PBS buffer com-pletely from the plates. Residual PBS will dilute the concentration of theprotein inhibitors in the cell lysis buffer.
5. Keep reconstituted lysis buffer on ice at all times.
28 Fu et al.
6. Alternatively, incubate 300–600 lg cell lysates with immobilized c-Jun(Cell Signaling Technology, cat. no. 9811) overnight at 4°C.
7. Pellet the agarose beads. Wash the immunoprecipitated products twice withthe cell lysis buffer and twice with kinase buffer (Subheading 2.3.).
8. Resuspend the pellets in the kinase buffer containing 100 lM ATP.9. Incubate the reaction for 30 min at 30°C in a shaking incubator.
10. Perform Western blot to detect the phospho-c-Jun signal.11. Alternatively, stop the reaction by adding 30 lL of 2X Laemmli sample
buffer and heat for 5 min at 95°C (see Note 3).12. Centrifuge at 12,000 rpm for 5 min.13. Take 40 lL of the supernatant and resolve on 13% SDS-PAGE gel.14. Transferred onto polyvinylidene fluoride (PVDF) membranes.15. Expose the PVDF membrane to a phosphorimager cassette and quantify the
amount of radiolabeled phosphate substrate by using a molecular dynam-ics phosphorimager system.
Signal Transduction Inhibitors 29
Fig. 2. Regulation of Cyclin D1 by NeuT. 0.4 � 105 MCF-7 cells are seeded into24-well cell-culture plates and the cells are allowed to grow for 24 h to reach 70% con-fluence. 1.2 lg of -1745D1-LUC and 100 ng of expression vector of NeuT and 75 ng ofcontrol vector are transfected as indicated using the proper transfection reagent. The cellsare treated with 5 lM PD98059 for 24 h and the luciferase activity is then measured.
16. Table 1 summarizes the various inhibitors for different signaling pathways.Consult the literature for a more extensive list of inhibitors available for aparticular pathway (5,28,33,34,36,37,39–44,46,53–79).
17. Different cell types may have a different genetic background. This is par-ticularly true for the cancer cell lines. Careful selection of the cell type forstudying a particular signal pathway is very important. For example, tostudy the effect of a signal pathway on the regulation of p53 expression,consider whether the p53 gene is expressed in the cell type you have cho-sen and whether or not the p53 gene is mutated. Also, consider whether thestatus of the particular pathway you are studying is altered (defective orconstitutively active) in your chosen cells.
18. Transfection efficiency varies with cell types and different transfectionreagents. Several internal control plasmids have been described, but thesecontrols may independently affect activity of the promoter being assessed(52). We suggest using a green flourescent protein (GFP)-expressing vec-tor as a monitor of transfection efficiency.
19. If different cell types are used, a reporter control such as renillar luciferase(or b-galactosidase) should be included in order to adjust the data and makecomparisons between different cell types.
20. Because the size of different cell types varies, the number of the cells to beseeded for transfection also varies. In general, the cells should reach50–80% confluence by the time of transfection. Check the manufacture’smanual for special requirements.
21. PD98059 is dissolved in DMSO or methanol. We use DMSO to make a10 mM stock solution and store in small aliquot at �20°C. PD98059 shouldbe protected from light. Always include the vehicle used to dissolve the in-hibitor as a control.
22. For experiments where the ligand of hormone receptors, such as dihy-drotestosterone (DHT) or estradiol are used, phenol-free medium andcharcoal-stripped serum should be used when the cells are treated withhormones.
23. Treatment usually occurs after 24 h of transfection. The duration of thetreatment varies depending on the reagents used and the targeted proteinsor signaling pathways. Time-course and dose curves might be necessary.
AcknowledgmentsWe apologize to the investigators whose work was not cited owing to space
limitations. This work was supported in part by awards from the Susan G.Komen Breast Cancer Foundation; Breast Cancer Alliance Inc., and researchgrants R01CA70896, R01CA75503, R01CA86072, R01CA86071 from NIH(R.G.P.), and 1 R21 DK065220-01 from NIDDK (M.F.).
30 Fu et al.
References1. Hanahan, D. and Weinberg, R. A. (2000) The hallmarks of cancer. Cell 100, 57–70.2. Heldin, C. H. (2001) Signal transduction: multiple pathways, multiple options for
therapy. Stem Cells 19, 295–303.3. Lobbezoo, M. W., Giaccone, G., and Van Kalken, C. (2003) Signal transduction
modulators for cancer therapy: from promise to practice? Oncologist 8, 210–213.4. Kyriakis, J. M. (1999) Making the connection: coupling of stress-activated
ERK/MAPK (extracellular-signal-regulated kinase/mitogen-activated protein ki-nase) core signalling modules to extracellular stimuli and biological responses.Biochem. Soc. Symp. 64, 29–48.
5. Johnson, G. L. and Lapadat, R. (2002) Mitogen-activated protein kinase pathwaysmediated by ERK, JNK, and p38 protein kinases. Science 298, 1911–1912.
6. Pestell, R. G., Albanese, C., Watanabe, G., et al. (1995) Epidermal growth factorand c-Jun act via a common DNA regulatory element to stimulate transcription ofthe ovine P-450 cholesterol side chain cleavage (CYP11A1) promoter. J. Bio.Chem. 270, 18,301–18,308.
7. Pestell, R. G., Hollenberg, A. N., Albanese, C., and Jameson, J. L. (1994) c-Junrepresses transcription of the human chorionic gonadotropin alpha and beta genesthrough distinct types of CREs. J. Bio. Chem. 269, 31,090–31,096.
8. Lin, W., Albanese, C., Pestell, R. G., and Lawrence, D. S. (2002) Spatially discrete,light-driven protein expression. Chem. Biol. 9, 1347–1353.
9. Fantin, V. R., Berardi, M. J., Scorrano, L., et al. (2002) A novel mitochondriotoxicsmall molecule that selectively inhibits tumor cell growth. Cancer Cell 2, 29–42.
10. Golub, T. R. (2003) Mining the genome for combination therapies. Nat. Med. 9,510–511.
11. Wu, W., Graves, L. M., Jaspers, I., et. al. (1999) Activation of the EGF receptor sig-naling pathway in human airway epithelial cells exposed to metals. Am. J. Physiol.277, L924–L931.
12. Samarakoon, R. and Higgins, P. J. (2002) MEK/ERK pathway mediates cell-shape-dependent plasminogen activator inhibitor type 1 gene expression upon drug-induced disruption of the microfilament and microtubule networks. J. Cell Sci. 115,3093–3103.
13. Marques, S. A., Dy, L. C., Southall, M. D., et al. (2002) The platelet-activating factorreceptor activates the extracellular signal-regulated kinase mitogen-activatedprotein kinase and induces proliferation of epidermal cells through an epider-mal growth factor-receptor-dependent pathway. J. Pharmacol. Exp. Ther. 300,1026–1035.
14. Hayakawa, J., Depatie, C., Ohmichi, M., and Mercola, D. (2003) The activation ofc-Jun NH2-terminal kinase (JNK) by DNA-damaging agents serves to promotedrug resistance via activating transcription factor 2 (ATF2)-dependent enhancedDNA repair. J. Biol. Chem. 278, 20,582–20,592.
15. Sweeney, G., Somwar, R., Ramlal, T., et al. (1999) An inhibitor of p38 mitogen-ac-tivated protein kinase prevents insulin-stimulated glucose transport but not glucosetransporter translocation in 3T3-L1 adipocytes and L6 myotubes. J. Biol. Chem.274, 10,071–10,078.
Signal Transduction Inhibitors 31
16. Lee, R. J., Albanese, C., Fu, M., et al. (2000) Cyclin D1 is required for transfor-mation by activated Neu and is induced through an E2F-dependent signaling path-way. Mol. Cell Biol. 20, 672–683.
17. Sebolt-Leopold, J. S., Dudley, D. T., Herrera, R., et al. (1999) Blockade of the MAPkinase pathway suppresses growth of colon tumors in vivo. Nat. Med. 5, 810–816.
18. Dai, Y., Yu, C., Singh, V., Tang, L., et al. (2001) Pharmacological inhibitors of themitogen-activated protein kinase (MAPK) kinase/MAPK cascade interact syner-gistically with UCN-01 to induce mitochondrial dysfunction and apoptosis inhuman leukemia cells. Cancer Res. 61, 5106–5115.
19. Dai, Y., Landowski, T. H., Rosen, S. T., et al. (2002) Combined treatment with thecheckpoint abrogator UCN-01 and MEK1/2 inhibitors potently induces apoptosisin drug-sensitive and -resistant myeloma cells through an IL-6-independent mech-anism. Blood 100, 3333–3343.
20. Alessi, D. R., Cuenda, A., Cohen, P., et al. (1995) PD 098059 is a specific inhibitorof the activation of mitogen-activated protein kinase kinase in vitro and in vivo. J.Biol. Chem. 270, 27,489–27,494.
21. Dudley, D. T., Pang, L., Decker, S. J., et al. (1995) A synthetic inhibitor of the mi-togen-activated protein kinase cascade. Proc. Natl. Acad. Sci. USA 92, 7686–7689.
22. Watanabe, G., Howe, A., Lee, R. J., et al. (1996) Induction of cyclin D1 by simianvirus 40 small tumor antigen. Proc. Natl. Acad. Sci. USA 93, 12,861–12,866.
23. Watanabe, G., Lee, R. J., Albanese, C., et al. (1996) Angiotensin II activation of cy-clin D1-dependent kinase activity. J. Biol. Chem. 271, 22,570–22,577.
24. Watanabe, G., Pena, P., Albanese, C., et al. (1997) Adrenocorticotropin inductionof stress-activated protein kinase in the adrenal cortex in vivo. J. Biol. Chem. 272,20,063–20,069.
25. Reuter, C. W., Morgan, M. A., and Bergmann, L. (2000) Targeting the Ras signal-ing pathway: a rational, mechanism-based treatment for hematologic malignancies?Blood 96, 1655–1669.
26. Duncia, J. V., Santella, J. B., 3rd, Higley, C. A., et al. (1998) MEK inhibitors: thechemistry and biological activity of U0126, its analogs, and cyclization products.Bioorg. Med. Chem. Lett. 8, 2839–2844.
27. Ge, X., Fu, Y. M., and Meadows, G. G. (2002) U0126, a mitogen-activated proteinkinase kinase inhibitor, inhibits the invasion of human A375 melanoma cells. Can-cer Lett. 179, 133–140.
28. Torres, C., Li, M., Walter, R., and Sierra, F. (2000) Modulation of the ERK pathwayof signal transduction by cysteine proteinase inhibitors. J. Cell. Biochem. 80, 11–23.
29. Force, T., Pombo, C. M., Avruch, J. A., et al. (1996) Stress-activated protein kinasesin cardiovascular disease. Circ. Res. 78, 947–953.
30. Kyriakis, J. M. and Avruch, J. (1996) Protein kinase cascades activated by stressand inflammatory cytokines. Bioessays 18, 567–577.
31. Albanese, C., Johnson, J., Watanabe, G., et al. (1995) Transforming p21ras mutantsand c-Ets-2 activate the cyclin D1 promoter through distinguishable regions. J.Biol. Chem. 270, 23,589–23,597.
32 Fu et al.
32. Albanese, C., D’Amico, M., Reutens, A. T., et al. (1999) Activation of the cyclinD1 gene by the E1A-associated protein p300 through AP-1 inhibits cellular apop-tosis. J. Biol. Chem. 274, 34,186–34,195.
33. Vincenti, M. P. and Brinckerhoff, C. E. (2001) The potential of signal transductioninhibitors for the treatment of arthritis: Is it all just JNK? J. Clin. Invest. 108,181–183.
34. Han, Z., Boyle, D. L., Chang, L., et al. (2001) c-Jun N-terminal kinase is requiredfor metalloproteinase expression and joint destruction in inflammatory arthritis. J.Clin. Invest. 108, 73–81.
35. Bonny, C., Oberson, A., Negri, S., et al. (2001) Cell-permeable peptide inhibitorsof JNK: novel blockers of beta-cell death. Diabetes 50, 77–82.
36. Lahti, A., Kankaanranta, H., and Moilanen, E. (2002) P38 mitogen-activated pro-tein kinase inhibitor SB203580 has a bi-directional effect on iNOS expression andNO production. Eur. J. Pharmacol. 454, 115–123.
37. Nishikori, T., Irie, K., Suganuma, T., et al. (2002) Anti-inflammatory potency ofFR167653, a p38 mitogen-activated protein kinase inhibitor, in mouse models ofacute inflammation. Eur. J. Pharmacol. 451, 327–333.
38. Ward, K. W., Proksch, J. W., Azzarano, L. M., et al. (2001) SB-239063, a potentand selective inhibitor of p38 map kinase: preclinical pharmacokinetics andspecies-specific reversible isomerization. Pharmacol. Res. 18, 1336–1344.
39. Barone, F. C., Irving, E. A., Ray, A. M., et al. (2001) SB 239063, a second-generation p38 mitogen-activated protein kinase inhibitor, reduces brain injury andneurological deficits in cerebral focal ischemia. J. Pharmacol. Exp. Ther. 296,312–321.
40. Jackson, J. R., Bolognese, B., Hillegass, L., et al. (1998) Pharmacological effectsof SB 220025, a selective inhibitor of P38 mitogen-activated protein kinase, in an-giogenesis and chronic inflammatory disease models. J. Pharmacol. Exp. Ther. 284,687–692.
41. Badger, A. M., Roshak, A. K., Cook, M. N., et al. (2000) Differential effects ofSB 242235, a selective p38 mitogen-activated protein kinase inhibitor, on IL-1treated bovine and human cartilage/chondrocyte cultures. Osteoarthritis Carti-lage 8, 434–443.
42. Badger, A. M., Griswold, D. E., Kapadia, R., et al. (2000) Disease-modifying ac-tivity of SB 242235, a selective inhibitor of p38 mitogen-activated protein kinase,in rat adjuvant-induced arthritis. Arthritis Rheum. 43, 175–183.
43. Karahashi, H., Nagata, K., Ishii, K., and Amano, F. (2000) A selective inhibitor ofp38 MAP kinase, SB202190, induced apoptotic cell death of a lipopolysaccharide-treated macrophage-like cell line, J774.1. Biochim. Biophys. Acta 1502, 207–223.
44. Wadsworth, S. A., Cavender, D. E., Beers, S. A., et al. (1999) RWJ 67657, a potent,orally active inhibitor of p38 mitogen-activated protein kinase. J. Pharmacol. Exp.Ther. 291, 680–687.
45. Lee, J. C., Kassis, S., Kumar, S., et al. (1999) p38 mitogen-activated protein ki-nase inhibitors: mechanisms and therapeutic potentials. Pharmacol. Ther. 82,389–397.
Signal Transduction Inhibitors 33
46. Sarker, K. P., Nakata, M., Kitajima, I., et al. (2000) Inhibition of caspase-3 activa-tion by SB 203580, p38 mitogen-activated protein kinase inhibitor in nitric oxide-induced apoptosis of PC-12 cells. J. Mol. Neurosci. 15, 243–50.
47. Brown, J. R., Nigh, E., Lee, R. J., et al. (1998) Fos family members induce cellcycle entry by activating cyclin D1. Mol. Cell Biol. 18, 5609–5619.
48. Hulit, J., Lee, R. J., Russell, R. G., and Pestell, R. G. (2002) ErbB-2-induced mam-mary tumor growth: the role of cyclin D1 and p27Kip1. Biochem. Pharmacol. 64,827–836.
49. D’Amico, M., Hulit, J., Amanatullah, D. F., et al. (2000) The integrin-linkedkinase regulates the cyclin D1 gene through glycogen synthase kinase 3beta andcAMP-responsive element-binding protein-dependent pathways. J. Biol. Chem.275, 32,649–32,657.
50. Watanabe, G., Albanese, C., Lee, R. J., et al. (1998) Inhibition of cyclin D1 kinaseactivity is associated with E2F-mediated inhibition of cyclin D1 promoter activitythrough E2F and Sp1. Mol. Cell Biol. 18, 3212–3222.
51. Sistonen, L., Holtta, E., Lehvaslaiho, H., et al. (1989) Activation of the neu tyro-sine kinase induces the fos/jun transcription factor complex, the glucose transporterand ornithine decarboxylase. J. Cell Biol. 109, 1911–1919.
52. Amanatullah, D. F., Zafonte, B. T., Albanese, C., et al. (2001) Ras regulation ofcyclin D1 promoter. Methods Enzymol. 333, 116–127.
53. Baselga, J. (2000) New therapeutic agents targeting the epidermal growth factorreceptor. J. Clin. Oncol. 18, 54S–59S.
54. Baselga, J. (2000) Current and planned clinical trials with trastuzumab (Herceptin).Semin. Oncol. 27, 27–32.
55. Kim, E. S., Khuri, F. R., and Herbst, R. S. (2001) Epidermal growth factor recep-tor biology (IMC-C225). Curr. Opin. Oncol. 13, 506–513.
56. Overholser, J. P., Prewett, M. C., Hooper, A. T., et al. (2000) Epidermal growth fac-tor receptor blockade by antibody IMC-C225 inhibits growth of a human pancre-atic carcinoma xenograft in nude mice. Cancer 89, 74–82.
57. Normanno, N., Maiello, M. R., and De Luca, A. (2003) Epidermal growth factorreceptor tyrosine kinase inhibitors (EGFR-TKIs): simple drugs with a complexmechanism of action? J. Cell Physiol. 194, 13–19.
58. Moasser, M. M., Basso, A., Averbuch, S. D., and Rosen, N. (2001) The tyrosinekinase inhibitor ZD1839 (“Iressa”) inhibits HER2-driven signaling and suppressesthe growth of HER2-overexpressing tumor cells. Cancer Res. 61, 7184–7188.
59. Monia, B. P., Sasmor, H., Johnston, J. F., et al. (1996) Sequence-specific antitumoractivity of a phosphorothioate oligodeoxyribonucleotide targeted to human C-rafkinase supports an antisense mechanism of action in vivo. Proc. Natl. Acad. Sci.USA 93, 15,481–15,484.
60. Hilger, R. A., Scheulen, M. E., and Strumberg, D. (2002) The Ras-Raf-MEK-ERKpathway in the treatment of cancer. Onkologie 25, 511–518.
61. Strumberg, D., Voliotis, D., Moeller, J. G., et al. (2002) Results of phase I pharma-cokinetic and pharmacodynamic studies of the Raf kinase inhibitor BAY 43-9006in patients with solid tumors. Int. J. Clin. Pharmacol. Ther. 40, 580–581.
34 Fu et al.
62. El-Kholy, W., Macdonald, P. E., Lin, J. H., et al. (2003) The phosphatidylinositol3-kinase inhibitor LY294002 potently blocks K(V) currents via a direct mechanism.Faseb. J. 17, 720–722.
63. Vanhaesebroeck, B. and Waterfield, M. D. (1999) Signaling by distinct classes ofphosphoinositide 3-kinases. Exp. Cell Res. 253, 239–254.
64. Sakoff, J. A., Ackland, S. P., Baldwin, M. L., et al. (2002) Anticancer activity andprotein phosphatase 1 and 2A inhibition of a new generation of cantharidin ana-logues. Invest. New Drugs 20, 1–11.
65. Kisselev, A. F. and Goldberg, A. L. (2001) Proteasome inhibitors: from researchtools to drug candidates. Chem. Biol. 8, 739–758.
66. Rusbridge, N. M. and Beynon, R. J. (1990) 3,4-Dichloroisocoumarin, a serine pro-tease inhibitor, inactivates glycogen phosphorylase b. FEBS Lett. 268, 133–136.
67. Elofsson, M., Splittgerber, U., Myung, J., et al. (1999) Towards subunit-specificproteasome inhibitors: synthesis and evaluation of peptide alpha’, beta’-epoxyke-tones. Chem. Biol. 6, 811–822.
68. Loidl, G., Musiol, H. J., Groll, M., et al. (2000) Synthesis of bivalent inhibitors ofeucaryotic proteasomes. J. Pept. Sci. 6, 36–46.
69. Lu, Y. P., Lou, Y. R., Xie, J. G., et al. (2002) Topical applications of caffeine or (-)-epigallocatechin gallate (EGCG) inhibit carcinogenesis and selectively increaseapoptosis in UVB-induced skin tumors in mice. Proc. Natl. Acad. Sci. USA 99,12,455–12,460.
70. Marks, P. A., Richon, V. M., Breslow, R., and Rifkind, R. A. (2001) Histonedeacetylase inhibitors as new cancer drugs. Curr. Opin. Oncol. 13, 477–483.
71. Richon, V. M., Zhou, X., Rifkind, R. A., and Marks, P. A. (2001) Histone deacety-lase inhibitors: development of suberoylanilide hydroxamic acid (SAHA) for thetreatment of cancers. Blood Cells. Mol. Dis. 27, 260–264.
72. Henderson, C., Mizzau, M., Paroni, G., et al. (2003) Role of caspases, Bid, and p53 in the apoptotic response triggered by histone deacetylase inhibitorstrichostatin-A (TSA) and suberoylanilide hydroxamic acid (SAHA). J. Biol.Chem. 278, 12,579–12,589.
73. Ailenberg, M. and Silverman, M. (2003) Differential effects of trichostatin A ongelatinase A expression in 3T3 fibroblasts and HT-1080 fibrosarcoma cells: impli-cations for use of TSA in cancer therapy. Biochem. Biophys. Res. Commun. 302,181–185.
74. Klisovic, M. I., Maghraby, E. A., Parthun, M. R., et al. (2003) Depsipeptide(FR901228) promotes histone acetylation, gene transcription, apoptosis and its ac-tivity is enhanced by DNA methyltransferase inhibitors in AML1/ETO-positiveleukemic cells. Leukemia 17, 350–358.
75. Jung, M. (2001) Inhibitors of histone deacetylase as new anticancer agents. Curr.Med. Chem. 8, 1505–1511.
76. Lee, B. I., Park, S. H., Kim, J. W., et al. (2001) MS-275, a histone deacetylase in-hibitor, selectively induces transforming growth factor beta type II receptor ex-pression in human breast cancer cells. Cancer Res. 61, 931–934.
Signal Transduction Inhibitors 35

77. Jaboin, J., Wild, J., Hamidi, H., et al. (2002) MS-27-275, an inhibitor of histonedeacetylase, has marked in vitro and in vivo antitumor activity against pediatricsolid tumors. Cancer Res. 62, 6108–6115.
78. Bitterman, K. J., Anderson, R. M., Cohen, H. Y., et al. (2002) Inhibition of silenc-ing and accelerated aging by nicotinamide, a putative negative regulator of yeastsir2 and human SIRT1. J. Biol. Chem. 277, 45,099–45,107.
79. Bedalov, A., Gatbonton, T., Irvine, W. P., et al. (2001) Identification of a small mol-ecule inhibitor of Sir2p. Proc. Natl. Acad. Sci. USA 98, 15,113–15,118.
80. Lee, Y. J., Kim, J. H., Chen, J., and Song, J. J. (2002) Enhancement of metabolicoxidative stress-induced cytotoxicity by the thioredoxin inhibitor 1-methylpropyl2-imidazolyl disulfide is mediated through the ASK1-SEK1-JNK1 pathway. Mol.Pharmacol. 62, 1409–1417.
36 Fu et al.
3
Two-Dimensional Gel Electrophoresis for the Identification of Signaling Targets
Yukihito Kabuyama, Kirsi K. Polvinen, Katheryn A. Resing, and Natalie G. Ahn
SummaryTwo-dimensional electrophoresis (2-DE) is a powerful technique to differentially display pat-
terns of protein expression and posttranslational modifications, providing a good strategy to mon-itor molecular responses induced by the activation or inactivation of specific signaling pathways.In this chapter, optimized protocols for 2-DE using extracts from tissue culture are provided. Pro-tocols for in-gel digestion of gel-resolved proteins, which allow protein identification by massspectrometry are also discussed.
Key Words: Two-dimensional electrophoresis; signal transduction.
1. IntroductionTwo-dimensional electrophoresis (2-DE) is a powerful technique for re-
solving complex protein mixtures. This method provides the ability to separateand quantify up to 9000 protein forms from unfractionated cell lysates (1).Many parameters and experimental conditions affect the quality of protein res-olution on 2-DE, such as temperature, voltage, quality of reagents, and instru-mentation, causing variability in quantitative analysis of gel-resolved proteins.However, introduction of immobilized pH gradients for isoelectric focusing(IEF) has led to significant improvements in resolution and reproducibility of
From: Methods in Molecular Biology, vol. 284:Signal Transduction Protocols
Edited by: R. C. Dickson © Humana Press Inc., Totowa, NJ
37
protein separation, allowing researchers greater accessibility to 2-DE for pro-tein expression profiling. Furthermore, improvements in methods for in-gel di-gestion, combined with database search algorithms that enable peptide massfingerprinting and sequencing, allow rapid identification of gel resolved pro-teins by mass spectrometry (MS).
The ability of 2-DE to differentially display patterns of protein expressionand posttranslational modifications provides a good strategy to monitor molec-ular responses induced by the activation or inhibition of specific signalingpathways. Applications of this method include the analysis of cellular targetsdownstream of mitogen activated protein kinase (MAPK) (2), transforminggrowth factor (TGF-b) (3), endothelin 1 (4), Fas (5), and PhoP/Q two compo-nent (6) signaling pathways. Each of these examples successfully identifiednovel signaling targets and revealed new functions of each pathways, clearlydemonstrating the utility of 2-DE for protein profiling. However, careful meth-ods are required to obtain resolution on 2-DE in order to yield satisfactory pro-tein profiling.
This chapter will describe optimized protocols for 2-DE in ranges of pIfrom 4 to 7 and 6 to 11, which have been modified from the methods ofGorg et al. (7) and Hoving et al. (8). The WM35 human melanoma cell lineis used as an example. Protocols for in-gel digestion of gel-resolved proteinsare also described.
2. Materials2.1. Equipment
1. Horizontal electrophoresis apparatus with electrode tray (Multiphor II,Amersham-Pharmacia, Piscataway, NJ).
2. Immobiline drystrip tray (Amersham-Pharmacia).3. Immobiline drystrip reswelling tray (Amersham-Pharmacia).4. Thermostatic circulator (e.g., VWR Heated/Refrigerated Circulators).5. Vertical electrophoresis units (e.g., Protean II xi cell, Bio-Rad).6. Power supply (EPS3500XL, Amersham-Pharmacia).7. Slab gel electrophoresis unit (e.g., Bio-Rad Protean II xi).8. Gradient maker (e.g., Hoeffer SG30 and peristaltic pump (e.g., Rainin
Dynamax Model RP-1).
2.2. Reagents
1. Cell lysis buffer A: 7 M urea, 2 M thiourea, 4% (3-[3-cholamidopropyl)dimethylammonio]-1-propane-sulfonate) (CHAPS), 1% IPG buffer (pH4.0–7.0, Amersham-Pharmacia), 1 mM benzamidine, 25 lg/mL leupeptin,20 lg/mL pepstatin-A, 20 lg/mL aprotinin, 1 mM sodium vanadate, 1 lM
38 Kabuyama et al.
microcystin-LR, 20 mM dithiothreitol (DTT). This buffer can be stored at�80°C up to 3 mo. DTT should be added to a final concentration of 20 mMjust before use.
2. Cell lysis buffer B: 7 M urea, 2 M thiourea, 4 % CHAPS, 2 % IPG buffer(pH 6.0–11.0, Amersham-Pharmacia), 1 mM benzamidine, 25 lg/mL leu-peptin, 20 lg/mL pepstatin-A, 20 lg/mL aprotinin, 1 mM sodium vanadate,1 lM microcystin-LR, 20 mM DTT. This buffer can be stored at �80°C upto 3 mo. DTT should be added to 20 mM just before use.
3. Rehydration buffer A: 7 M urea, 2 M thiourea, 4 % CHAPS, 3 % IPG buffer(pH 4.0–7.0, Amersham-Pharmacia), 20 mM DTT, 10 lg/mL of bromo-phenol blue. This buffer can be stored at �80°C up to 3 mo. DTT shouldbe added to 20 mM before use.
4. Rehydration buffer B: 7 M urea, 2 M thiourea, 4% CHAPS, 2% IPG bufferpH 6.0–11.0, Amersham-Pharmacia, 160 mM DTT, 10% isopropanol, 5%glycerol, 10 lg/mL bromophenol blue. This buffer can be stored at �80°Cup to 3 mo.
5. Rehydration buffer C: Rehydration buffer B with 230 mM DTT (instead of160 mM DTT). This buffer can be stored at �80°C up to 3 mo.
6. Equilibration solution A (reduction): 6 M urea, 30% glycerol, 2% sodiumdodecyl sulfate (SDS), 0.05 M Tris-HCl buffer, pH 6.8, 60 mM DTT.
7. Equilibration solution B (alkylation): 6 M urea, 30% glycerol, 2% SDS,0.05 M Tris-HCl buffer, pH 6.8, 2% iodoacetamide.
8. Immobiline drystrip pH 4.0–7.0, 18 cm (Amersham-Pharmacia). Thisshould be stored at �20°C and thawed immediately before use.
9. Immobiline drystrip pH 6.0–11.0, 18 cm (Amersham-Pharmacia). Thisshould be stored at �80°C and thawed immediately before use.
10. Light mineral oil (Fisher, Piscataway, NJ, cat. no. 0121-1).11. Light acrylamide solution: 8% acrylamide, 0.21% bisacrylamide, 0.38 M
Tris-HCl, pH 8.8, 0.03% ammonium persulfate, 0.3% N,N,N',N'-tetram-ethyl-ethylenediamine (TEMED) (added just before use).
12. Heavy acrylamide solution: 18% acrylamide, 0.48% bisacrylamide, 0.38 MTris-HCl, pH 8.8, 0.03% ammonium persulfate, 0.3% TEMED (added justbefore use).
13. Gel running buffer: 0.1% SDS, 25 mM Tris base, 190 mM glycine, pH 8.3.14. Gel fixation solution: 40% ethanol, 12% acetic acid, 0.02% formaldehyde.15. Sensitivity enhancing solution: 0.02% sodium thiosulfate.16. Silver-stain solution: 0.2% silver nitrate, 0.03% formaldehyde.17. Development solution: 6% sodium carbonate, 0.02% formaldehyde,
0.0004% sodium thiosulfate.18. Phosphate-buffered saline (PBS): 8 g NaCl, 0.2 g KCl, 1.15 g Na2HPO4·7H2O,
0.2 g KH2PO4 per liter, pH approx 7.3.
2-D Electrophoresis for Signaling Analysis 39
3. Method3.1. Sample Preparation
1. Plate 106 cells in 10-cm2 cell-culture dishes with RPMI-1640 medium con-taining 10% fetal bovine serum, (FBS) and incubate at 37°C for 48 h.
2. Perturb specific signaling pathways by various methods (e.g., by expressingconstitutively active mutants of signaling effector molecules, or by treatingcells with reagents that specifically activate or inactivate signaling molecules).
3. Wash cells twice with ice cold PBS, and remove residual PBS. To each dishadd 0.7 mL of lysis buffer A (for pI 4–7 separations) or lysis buffer B (forpI 6–11. separations).
4. Harvest each cell lysate by scraping, transfer to a 1.5-mL microcentrifugetube, and incubate at room temperature for 1 h, with occasional vortex mix-ing. Centrifuge (200,000 g) at 21°C for 1 h to remove insoluble material.
5. Determine protein concentration by Bradford assay (PIERCE, Rockford,IL). Before assay, the lysate should be diluted with five volumes of deion-ized water to prevent interfering effects of lysis buffer components.
3.2. Immobilized pH Gradient First Dimension
3.2.1. Isoelectric Focusing for pI 4–7 Range (see Note 1)
1. In a 1.5-mL microcentrifuge tube, mix the protein sample (150 lg) withlysis buffer A to a final volume of 175 lL.
2. Add 175 lL of rehydration buffer A and incubate at room temperature for20 min.
3. Pipet the sample mixture into one channel of the drystrip reswelling tray.4. Remove an Immobiline drystrip pH 4.0–7.0 gel from the freezer and peel
off the plastic backing.5. Gently lay the drystrip gel (gel side facing down) on the sample mixture in
each slot.6. Using forceps, gently lift and lower the pointed end (anodic or low pI end) of
the gel strip and slide it back and forth along the surface of the sample mix-ture, in order to remove bubbles and evenly spread the sample under the strip.
7. Repeat step 6, lifting the flat end (cathodic end) of the gel strip.8. Repeat step 6, lifting the pointed end.9. Overlay each strip with 2 mL light mineral oil.
10. Repeat steps 3–9 for each sample.11. Place the reswelling tray in a chamber at 25°C (e.g., onto the Multiphor
flatbed apparatus) and allow the gel strips to hydrate for 16 h.12. Prepare the Multiphor II apparatus by preequilibratring to 10°C with a cir-
culating water bath. Have ready the electrode tray, the electrodes, the plas-tic strip aligner, two sheets (15 � 30 cm) of Whatman 3MM paper, two IEF
40 Kabuyama et al.
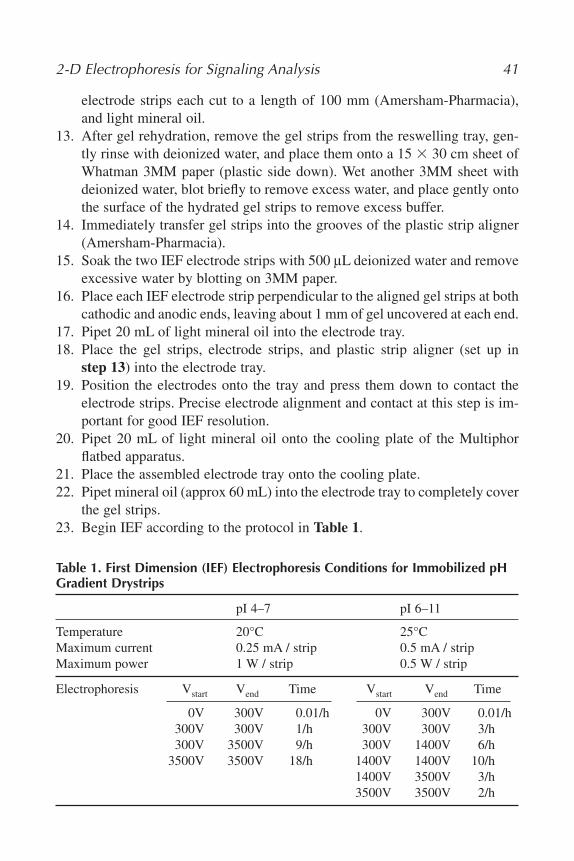
2-D Electrophoresis for Signaling Analysis 41
electrode strips each cut to a length of 100 mm (Amersham-Pharmacia),and light mineral oil.
13. After gel rehydration, remove the gel strips from the reswelling tray, gen-tly rinse with deionized water, and place them onto a 15 � 30 cm sheet ofWhatman 3MM paper (plastic side down). Wet another 3MM sheet withdeionized water, blot briefly to remove excess water, and place gently ontothe surface of the hydrated gel strips to remove excess buffer.
14. Immediately transfer gel strips into the grooves of the plastic strip aligner(Amersham-Pharmacia).
15. Soak the two IEF electrode strips with 500 lL deionized water and removeexcessive water by blotting on 3MM paper.
16. Place each IEF electrode strip perpendicular to the aligned gel strips at bothcathodic and anodic ends, leaving about 1 mm of gel uncovered at each end.
17. Pipet 20 mL of light mineral oil into the electrode tray.18. Place the gel strips, electrode strips, and plastic strip aligner (set up in
step 13) into the electrode tray.19. Position the electrodes onto the tray and press them down to contact the
electrode strips. Precise electrode alignment and contact at this step is im-portant for good IEF resolution.
20. Pipet 20 mL of light mineral oil onto the cooling plate of the Multiphorflatbed apparatus.
21. Place the assembled electrode tray onto the cooling plate.22. Pipet mineral oil (approx 60 mL) into the electrode tray to completely cover
the gel strips.23. Begin IEF according to the protocol in Table 1.
Table 1. First Dimension (IEF) Electrophoresis Conditions for Immobilized pHGradient Drystrips
pI 4–7 pI 6–11
Temperature 20°C 25°CMaximum current 0.25 mA / strip 0.5 mA / stripMaximum power 1 W / strip 0.5 W / strip
Electrophoresis Vstart Vend Time Vstart Vend Time
0V 300V 0.01/h 0V 300V 0.01/h300V 300V 1/h 300V 300V 3/h300V 3500V 9/h 300V 1400V 6/h
3500V 3500V 18/h 1400V 1400V 10/h1400V 3500V 3/h3500V 3500V 2/h
24. At the end of IEF, remove the gel strips from the tray, wrap them betweenfolded sheets of Saran Wrap, and store in a paper envelope at �80°C untilequilibration for the second-dimension step.
3.2.2. Isoelectric Focusing for pI 6–11 Range (see Note 2)
1. Pipet 350 lL of rehydration buffer B into each channel of the Immobilinedrystrip reswelling tray.
2. Remove an Immobiline drystrip pH 6.0–11.0 gel from the freezer and peeloff the plastic backing.
3. Gently lay the drystrip gel (gel facing down) onto the rehydration buffer ineach slot.
4. Using forceps, gently lift and lower the pointed end of the strip and slide itback and forth along the surface of the sample mixture to remove bubbles.
5. Repeat step 4, lifting the flat end of the strip.6. Repeat step 4, lifting the pointed end.7. Overlay each strip with 2 mL light mineral oil.8. Repeat steps 1–7 for each sample.9. Place the drystrip reswelling tray at 30°C (e.g., onto the Multiphor flatbed
apparatus) and allow the gel strips to hydrate for 16 h.10. Prepare the Multiphor II apparatus by preequilibrating to 10°C with a cir-
culating water bath. Have ready the samples, the electrode tray, the plasticstrip aligner, two sheets (15 � 30 cm) of Whatman 3MM paper; IEF elec-trode strips cut to lengths of 25, 50, and 100 mm (Amersham-Pharmacia),and light mineral oil.
11. After gel rehydration, remove the gel strips from the reswelling tray, gen-tly rinse with deionized water, and place them on a 3MM sheet. Wet anothersheet with deionized water, blot briefly to remove excessive water, andplace gently onto the surface of the hydrated gel strips to remove excessivebuffer.
12. Immediately transfer the gel strips into the grooves of the plastic stripaligner.
13. Cut two IEF electrode strips into 25 mm and 50 mm long pieces, and trimthem at one end to form an arrowhead (Fig. 1). Soak the 50 mm piece with250 lL of rehydration buffer C, and place them onto an aligned gel stripsat the (square) cathodic ends (basic side). Repeat for each sample.
14. Mix the protein sample (100 lg) with lysis buffer B to a final volume of100 lL.
15. Soak the 25 mm pieces with each protein sample mixture and place themon the (pointed) anodic ends (acidic side) of each aligned gel strip (Fig. 1).Repeat for each sample.
42 Kabuyama et al.
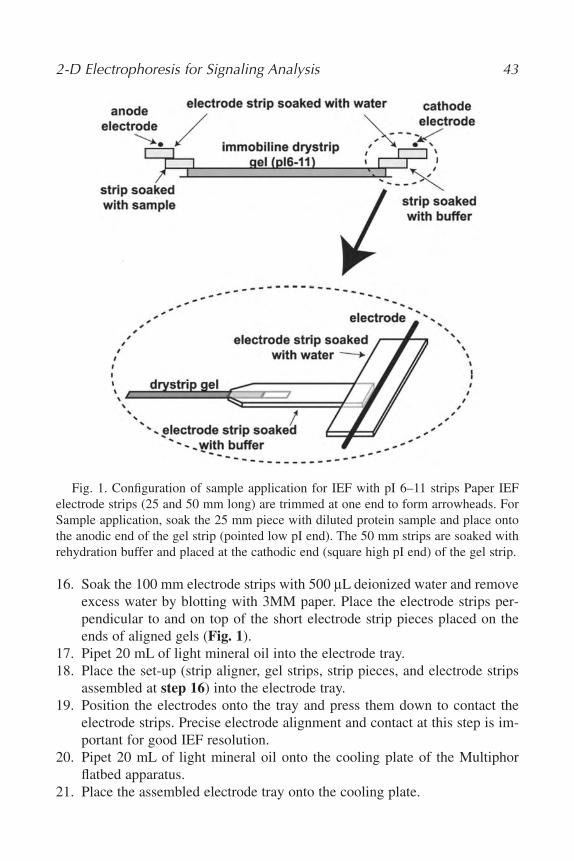
16. Soak the 100 mm electrode strips with 500 lL deionized water and removeexcess water by blotting with 3MM paper. Place the electrode strips per-pendicular to and on top of the short electrode strip pieces placed on theends of aligned gels (Fig. 1).
17. Pipet 20 mL of light mineral oil into the electrode tray.18. Place the set-up (strip aligner, gel strips, strip pieces, and electrode strips
assembled at step 16) into the electrode tray.19. Position the electrodes onto the tray and press them down to contact the
electrode strips. Precise electrode alignment and contact at this step is im-portant for good IEF resolution.
20. Pipet 20 mL of light mineral oil onto the cooling plate of the Multiphorflatbed apparatus.
21. Place the assembled electrode tray onto the cooling plate.
2-D Electrophoresis for Signaling Analysis 43
Fig. 1. Configuration of sample application for IEF with pI 6–11 strips Paper IEFelectrode strips (25 and 50 mm long) are trimmed at one end to form arrowheads. ForSample application, soak the 25 mm piece with diluted protein sample and place ontothe anodic end of the gel strip (pointed low pI end). The 50 mm strips are soaked withrehydration buffer and placed at the cathodic end (square high pI end) of the gel strip.
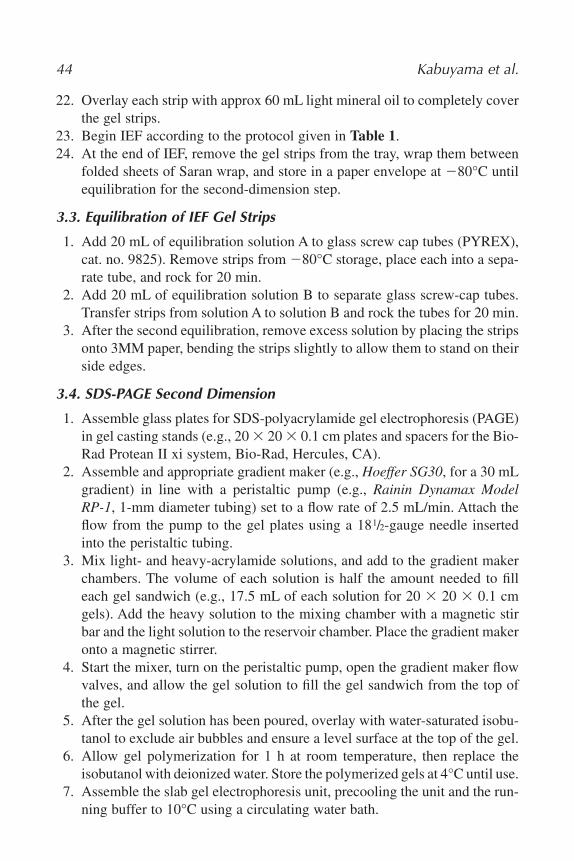
22. Overlay each strip with approx 60 mL light mineral oil to completely coverthe gel strips.
23. Begin IEF according to the protocol given in Table 1.24. At the end of IEF, remove the gel strips from the tray, wrap them between
folded sheets of Saran Wrap, and store in a paper envelope at �80°C untilequilibration for the second-dimension step.
3.3. Equilibration of IEF Gel Strips
1. Add 20 mL of equilibration solution A to glass screw cap tubes (PYREX),cat. no. 9825). Remove strips from �80°C storage, place each into a sepa-rate tube, and rock for 20 min.
2. Add 20 mL of equilibration solution B to separate glass screw-cap tubes.Transfer strips from solution A to solution B and rock the tubes for 20 min.
3. After the second equilibration, remove excess solution by placing the stripsonto 3MM paper, bending the strips slightly to allow them to stand on theirside edges.
3.4. SDS-PAGE Second Dimension
1. Assemble glass plates for SDS-polyacrylamide gel electrophoresis (PAGE)in gel casting stands (e.g., 20 � 20 � 0.1 cm plates and spacers for the Bio-Rad Protean II xi system, Bio-Rad, Hercules, CA).
2. Assemble and appropriate gradient maker (e.g., Hoeffer SG30, for a 30 mLgradient) in line with a peristaltic pump (e.g., Rainin Dynamax ModelRP-1, 1-mm diameter tubing) set to a flow rate of 2.5 mL/min. Attach theflow from the pump to the gel plates using a 181/2-gauge needle insertedinto the peristaltic tubing.
3. Mix light- and heavy-acrylamide solutions, and add to the gradient makerchambers. The volume of each solution is half the amount needed to filleach gel sandwich (e.g., 17.5 mL of each solution for 20 � 20 � 0.1 cmgels). Add the heavy solution to the mixing chamber with a magnetic stirbar and the light solution to the reservoir chamber. Place the gradient makeronto a magnetic stirrer.
4. Start the mixer, turn on the peristaltic pump, open the gradient maker flowvalves, and allow the gel solution to fill the gel sandwich from the top ofthe gel.
5. After the gel solution has been poured, overlay with water-saturated isobu-tanol to exclude air bubbles and ensure a level surface at the top of the gel.
6. Allow gel polymerization for 1 h at room temperature, then replace theisobutanol with deionized water. Store the polymerized gels at 4°C until use.
7. Assemble the slab gel electrophoresis unit, precooling the unit and the run-ning buffer to 10°C using a circulating water bath.
44 Kabuyama et al.

8. Replace the deionized water overlay with SDS-PAGE running buffer, andequilibrate for 10 min.
9. Remove the running buffer from the top of the gels, and blot the excessbuffer with 3MM paper.
10. Immediately transfer the IPG gel strip equilibrated in equilibration bufferB onto the top of the gel. Use a flat plastic edge (e.g., a thin plastic ruler)to remove air bubbles from underneath the gel strip. Overlay the strip with2–3 mL of melted 0.5% agarose solution (dissolved in running buffer) tak-ing care to avoid bubbles.
11. Assemble the gels into the electrophoresis chamber and begin electrophore-sis, running at constant current of 7mA/gel, and constant temperature of10°C. The total running time for 20 cm � 20 cm gels is approx 18 h.
3.5. Silver Staining (see Note 3)
All steps are carried out at room temperature with gentle agitation on a rotat-ing platform.
1. After the second-dimension electrophoresis, remove each gel from theglass plates and incubate overnight in 150 mL of gel fixation solution.
2. Rinse gels with 150 mL of 50% ethanol in water for 2 � 10 min.3. Rinse gels with 150 mL of 30% ethanol in water for 10 min.4. Soak gels in 100 mL of sensitivity enhancing solution for 1 min.5. Rinse gels with 200 mL of deionized water for 1 min. Repeat the rinse.6. Impregnate gels in 150 mL of silver-stain solution for 20 min.7. Rinse gels with water for 10 s. Rinse again for 10 s.8. Develop stained proteins with 100 mL of development solution. It takes
approx 2–4 min until spot intensities reach maximal levels.9. Stop development by adding 40% ethanol, 12% acetic acid and incubating
for 10 min.10. Rinse gels with at least four changes of deionized water over 2 h.11. Scan gel images and analyze spot changes using appropriate computer soft-
ware. Vendors include GeneBio (Melanie, GeneBio, Geneva, Switzerland),Compugen (Z3, Jamesburg, NJ), Bio-Rad (PDQuest, Hercules, CA), Proge-nesis (Phoretix, Durham, NC). We have found software programs that allowanalysis by image flickering (8,9) (e.g., Melanie) to be particularily useful.
12. Stained gels can be stored in water at 4°C until excision and in gel diges-tion of protein spots.
3.6. Preparation of Samples for Mass Spectrometry
3.6.1. Proteolytic Digestion of Gel-Resolved Proteins
All steps are carried out in a clean hood using gloves to minimize con-tamination from hands and dust. High-performance liquid chromatography
2-D Electrophoresis for Signaling Analysis 45
(HPLC)-grade reagents should be used to make all solutions and bags of plas-tic tubes and pipet tips should be handled to minimize dust contamination.
1. Precisely excise protein spots from gels and transfer to 1.5-mL microcen-trifuge tubes (see Note 4).
2. Add 500 lL of 50 mM sodium thiosulfate, 15 mM potassium ferricyanideto gel slices. Incubate for 2 min at room temperature by vortex mixing.Continue until the brown protein staining disappears.
3. Rinse with 1.5 mL water for 5 min. Repeat twice.4. Add 500 lL of 100 mM ammonium bicarbonate and incubate at room tem-
perature for 30 min by vortex mixing.5. Remove the buffer and add 500 lL of 50% acetonitrile, and 50 mM am-
monium bicarbonate. Incubate at room temperature for 30 min by vortexmixing.
6. Transfer gel pieces into a clean 0.65-mL microcentrifuge tube and removeas much buffer as possible using a micropipettor.
7. Add 50 lL of 100% acetonitrile and incubate at room temperature for10 min to shrink gel pieces.
8. Remove the acetonitrile solution from the gel pieces by drying to comple-tion in a clean speedvac concentrator (e.g., for 20 min).
9. Dilute concentrated trypsin solution (e.g., Promega Modified PorcineTrypsin; Princeton Separations Endopeptidase Modified Porcine Trypsin)with 25 mM ammonium bicarbonate to a final concentration of 20 lg/mL.
10. Reswell dehydrated gel pieces with 20 lg/mL Trypsin by adding solutiondirectly onto gel pieces in 3–5 lL aliquots, waiting 10 min between eachaddition. Continue until gel pieces are fully hydrated (typically approx10 lL).
11. After gel pieces are hydrated, add 25 mM ammonium bicarbonate to coverthe gel pieces (approx 20 lL). Incubate at room temperature for 20 min.
12. When fully swelled, add 25 mM ammonium bicarbonate until gel pieces arecovered at the top by approx 1 mm of buffer.
13. Incubate gel pieces at 37°C for 24 h with gentle agitation.14. After digestion, add 1 lL of 88% formic acid to quench trypsinization and
sonicate in a bath sonicator for 20 min.15. Transfer the supernatant to new 0.65 lL microcentrifuge tube and reduce
the volume to 5–10 lL with a speedvac concentrator. Do not Speed-Vac thesample to dryness.
3.6.2. Peptide Concentration and Purification
Concentrate the peptide digest and remove salts and contaminants using a re-versed phase resin (e.g., Millipore Zip Tip l-C18 columns). This step is critical
46 Kabuyama et al.
for successful matrix-assisted laser desorption/ionization-time-of-flight massspectrometry (MALDI-TOF MS).
1. Using a micropipetor, wet the ZipTip resin with 4 � 10 lL passes of 100%methanol. (One pass is equivalent to drawing the solvent up into the ZipTip, then expelling it completely.)
2. Rinse the resin with 4 � 10 lL passes of 1% (v/v) trifluoroacetic acid(TFA).
3. Adsorb peptides to the resin with 15–20 passes of the peptide digest solution.4. Wash the resin with 4 � 10 lL passes of 1% formic acid.5. Aliquot 2 lL of 60% acetonitrile, 1% formic acid to a second 0.65-mL
microcentrifuge tube. Elute the peptides from the resin with 20 passes ofthe acetonitrile solution into the second tube. This eluate is ready forMALDI-TOF MS analysis. For liquid chromatography based MS, the pu-rified sample must be dried by Speed-Vac centrifugation and resuspendedin 0.1% formic acid.
4. Notes1. The protocol described here represents a modification of the in-gel rehy-
dration method described by Gorg et al. (6). Modifications include the tem-perature regulation during gel rehydration and the electrophoresis condi-tions for protein focusing. In our experience, resolution and reproducibilityof protein separation were significantly improved by rehydrating at a con-stant temperature of 25°C, and by extending the focusing time to approx80,000v/h.
2. The protocol described here represents a modification of the paper-bridgeapplication method described by Hoving et al. (7). The main modification isthe regulation of temperature at gel-rehydration step, where in our experi-ence, the penetration of proteins into the gel strip is improved by rehydratingthe strips at a constant temperature of 30°C prior to sample application.
3. This protocol was originally reported by Blum et al. (11), where we haveincorporated several modifications. This method provides high sensitivityof detection, allowing approx 5000 protein spots to be visualized uponcombining pI 4–7 with pI 6–11 2-DE gels (Fig. 2). However, the methodleads to high fixation of proteins which precludes efficient peptide recov-ery. Therefore, we often visualize protein changes using the high-fixationmethod, but recover proteins from replicate gels stained with lower fixationsilver-staining protocol described by Shevchenko et al. (12).
4. Protein spots can be cut manually using P1000 pipet tips cut with a razor bladeto the appropriate diameter, then beveled using an X-acto knife to create asharp edge at the tip. Insert the sharpened pipet tip onto a plastic transfer pipet
2-D Electrophoresis for Signaling Analysis 47
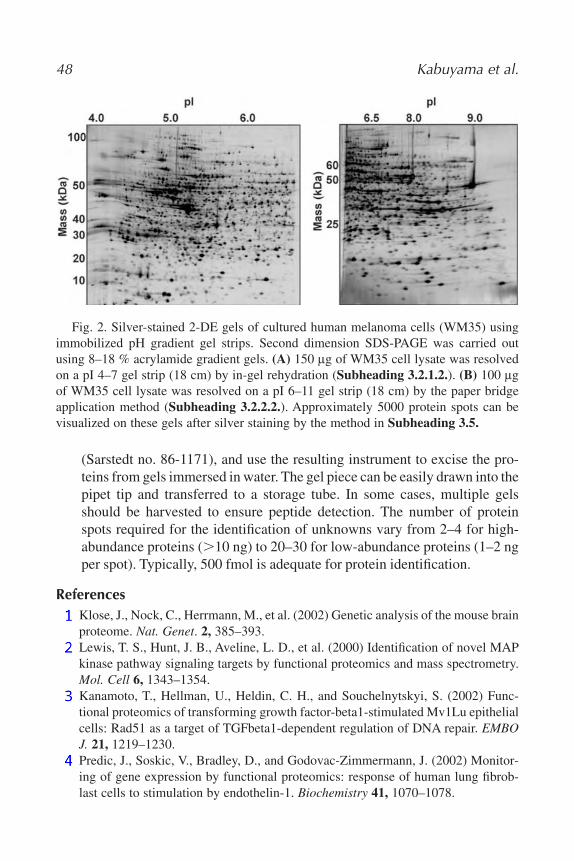
(Sarstedt no. 86-1171), and use the resulting instrument to excise the pro-teins from gels immersed in water. The gel piece can be easily drawn into thepipet tip and transferred to a storage tube. In some cases, multiple gelsshould be harvested to ensure peptide detection. The number of proteinspots required for the identification of unknowns vary from 2–4 for high-abundance proteins (�10 ng) to 20–30 for low-abundance proteins (1–2 ngper spot). Typically, 500 fmol is adequate for protein identification.
References1. Klose, J., Nock, C., Herrmann, M., et al. (2002) Genetic analysis of the mouse brain
proteome. Nat. Genet. 2, 385–393.2. Lewis, T. S., Hunt, J. B., Aveline, L. D., et al. (2000) Identification of novel MAP
kinase pathway signaling targets by functional proteomics and mass spectrometry.Mol. Cell 6, 1343–1354.
3. Kanamoto, T., Hellman, U., Heldin, C. H., and Souchelnytskyi, S. (2002) Func-tional proteomics of transforming growth factor-beta1-stimulated Mv1Lu epithelialcells: Rad51 as a target of TGFbeta1-dependent regulation of DNA repair. EMBOJ. 21, 1219–1230.
4. Predic, J., Soskic, V., Bradley, D., and Godovac-Zimmermann, J. (2002) Monitor-ing of gene expression by functional proteomics: response of human lung fibrob-last cells to stimulation by endothelin-1. Biochemistry 41, 1070–1078.
48 Kabuyama et al.
Fig. 2. Silver-stained 2-DE gels of cultured human melanoma cells (WM35) usingimmobilized pH gradient gel strips. Second dimension SDS-PAGE was carried outusing 8–18 % acrylamide gradient gels. (A) 150 lg of WM35 cell lysate was resolvedon a pI 4–7 gel strip (18 cm) by in-gel rehydration (Subheading 3.2.1.2.). (B) 100 lgof WM35 cell lysate was resolved on a pI 6–11 gel strip (18 cm) by the paper bridgeapplication method (Subheading 3.2.2.2.). Approximately 5000 protein spots can bevisualized on these gels after silver staining by the method in Subheading 3.5.
5. Gerner, C., Frohwein, U., Gotzmann, J., et al. (2000) The Fas-induced apoptosis an-alyzed by high throughput proteome analysis. J. Biol. Chem. 275, 39,018–39,026.
6. Adams, P., Fowler, R., Howell, G., et al. (1999) Defining protease specificity withproteomics: a protease with a dibasic amino acid recognition motif is regulated bya two-component signal transduction system in Salmonella. Electrophoresis 11,2241–2247.
7. Gorg, A., Obermaier, C., Boguth, G., et al. (2000) The current state of two-dimen-sional electrophoresis with immobilized pH gradient. Electrophoresis 21, 1037–1053.
8. Hoving, S., Gerrits, B., Voshol, H., et al. (2002) Preparative two-dimensional gelelectrophoresis at alkaline pH using narrow range immobilized pH gradients. Pro-teomics 2, 127–134.
9. Lemkin, P. F. (1999) Comparing 2-D electrophoresis gels across internet databases.Methods Mol. Biol. 112, 393–410.
10. Appeal, R. D. and Hochstrasser, D. F. (1999) Computer analysis of 2-D images.Methods Mol. Biol. 112, 363–381.
11. Blum, H., Beier, H., and Gross, H. J. (1987) Improved silver staining of plant pro-teins, RNA and DNA in polyacrylamide gels. Electrophoresis 8, 93–99.
12. Shevchenko, A., Wilm, M., Vorm, O., and Mann, M. (1996) Mass spectrometricsequencing of proteins from silver -stained polyacrylamide gels. Anal. Chem. 68,850–858.
2-D Electrophoresis for Signaling Analysis 49
4
A High-Throughput Mammalian Cell-Based TransientTransfection Assay
Daniel J. Noonan, Kenneth Henry, and Michelle L. Twaroski
SummaryIn eukaryotic organisms gene expression is regulated through a variety of upstream transact-
ing factors (transcription factors) whose primary function appears to be the targeting of coregu-latory protein complexes, which interact with basal transcription machinery to define the relativerate of transcription for a specific gene. Understanding the regulatory forces mediating transcrip-tion factor activity has been the focus of both academic and industrial research efforts over thepast 15 yr, and in this time frame a variety of methodologies have been developed for reconsti-tuting and assaying transcription factor activities in mammalian cell environments. Presented hereis a high-throughput version of one of these methodologies that can be readily adapted to thescreening of a variety of transcription factors. This technology utilizes co-transfection of mam-malian expression and luciferase reporter plasmids to reconstitute transcription events in a mam-malian host cell. Included is a detailed protocol for the use of a 96-well plate format, along witha variety of cost-effective measures that can be implemented to facilitate the use of the technol-ogy in the average low budget academic laboratory.
Key Words: Nuclear receptor; luciferase reporter; CaPO4 precipitation; 96-well plate; plate-reading luminometer.
1. Introduction
In eukaryotic cells, a class of transcription regulatory proteins known asupstream-transcription factors function to regulate gene expression through
From: Methods in Molecular Biology, vol. 284:Signal Transduction Protocols
Edited by: R. C. Dickson © Humana Press Inc., Totowa, NJ
51
binding-specific DNA sequences in the regulatory regions (promoters) of thegenes whose activity they are to modulate (1). The primary purpose of thisevent appears to be targeting specific coregulatory complexes to the promoterregion, which in turn facilitates or inhibits the transcriptional activities me-diated by the RNA polymerase complex (1). The activity of many of theseupstream-transcription factors is directly or indirectly linked to a signalingpathway initiated by some ligand-receptor interaction, and many of the lig-and receptor interactions have been linked to vital metabolic functions anddisease processes. The simplest example of this would be the steroid/nuclearreceptor family of proteins, wherein the intracellular receptors for suchlipophilic compounds as estrogens, androgens, corticosteroids and prosta-glandins are receptor proteins converted into upstream transcription factorsupon binding their ligand (2–5). These compounds and their receptors regu-late metabolic activities and eukaryotic development in response to a vari-ety of internal and external signals. Furthermore, misregulation of their func-tion has been associated with a variety of diseases and cancer (6). For thisreason many of these receptors have been the targets for large drug-discoveryefforts in a variety of pharmaceutical companies. In this regard, methods forreconstituting transcription factor activity in mammalian cell culture systemshave been developed and perfected over the past two decades (7,8). Thistechnology has proven to be a valuable tool for defining structure and func-tion relationships between transcription factors, the signaling pathways thatactivate them, and their mechanism for modulating gene expression. Com-mercially, these assays have also proven to be valuable tools for screeningfor small-molecule agonists and antagonists of transcription-factor activity(7,8). Over the past decade a variety of high throughput screens have beendeveloped that function through the reconstitution of the transcription factoractivity in some foreign host cell. Two basic screening approaches have beendeveloped. One attempts to identify modulators of ligand receptor-mediatedevents (7), and the other attempts to identify modulators of transcription fac-tor–coregulatory complex interactions (9). In this methods article, we willpresent a modified approach to high-throughput screening first developed backin the early 1990s for the screening of small molecule agonists and antago-nists of steroid receptor-mediated transcription events. This technology uti-lizes mammalian expression and luciferase reporter plasmids to reconstitutesteroid and nuclear receptor-mediated transcription events in a host cell. Fur-thermore, it converts a cumbersome 10-cm plate assay into an assay that isperformed in 96-well plates. Although this technology was originally devel-oped for high throughput screening in a pharmaceutical company environ-ment, we have found it to be both cost effective and highly utile in our ac-ademic pursuits.
52 Noonan et al.
2. MaterialsIn this section we have listed the reagents and reagent preparations necessary
to implement the co-transfection assay we utilize in our laboratory, and the onedetailed in the Methods section. Generic laboratory chemicals (e.g., NaCl, MgCl2,KH2PO4, K2H2PO4, NaHPO4, NaH2PO4, Tris-HCl, EGTA, glycerol, BSA, etc.)are standardly purchased at their highest reagent grade from a reputable distribu-tor such as Sigma or Fisher. Many variations and sources can also apply to sev-eral of the specialty reagents used in this protocol, but we will list our sources ofthese specialty reagents, and where applicable, we will also attempt to amplify onpossible alternatives. Transient transfection assays are not cheap to run, but thereare places that one can economize the assay substantially. Using the “home brew”approach outlined here, it can be estimated that, for disposable materials alone,the assay ranges from $5 to $7 per 96-well plate. Depending on the kit used, thiscould prove to be a substantial savings over the available “kit science” ap-proaches, which can range anywhere from $30 to $80/plate. Beyond the reagentsand luminometer listed here, two other fairly nonstandard laboratory purchasesthat are basic necessities in the high throughput technology are a good multi-channel pipettor and disposable reagent reservoirs. These items can be purchasedfrom any of the major distributors of scientific equipment and supplies.
Unless otherwise indicated, all reagents should be prepared with the highestquality double-distilled water (ddH2O) available. We have been more detailedin describing the preparation of some of these reagents, owing both to their im-portance and in hopes that this will facilitate the process for the reader.
1. 0.2 M Phenylmethanesulfonyl fluoride (PMSF) solution: Dissolve 0.348 gPMSF in 10 mL isopropyl alcohol. Caution: PMSF is toxic. Use gloves anda mask when weighing.
2. Ligand base: Into 80 mL of ddH2O add 0.851 g Trizma phosphate, 1.0 gbovine serum albumin (BSA), 0.152 g EGTA, 2.0 g CHAPS (Amresco,cat. no. 0465; see Note 1), 1.0 g L-Lecithin (Sigma, St. Louis, MO, cat. no.P-9671), 15 mL glycerol. Adjust pH 7.8 ���.02, QS to 100 mL filter-ster-ilize and store at 4°C.
3. 2X HBS Buffer: Into 950 mL ddH2O add 10 g HEPES and 16 g NaCl. Ad-just the pH to 7.10 ��� 05 (see Note 2), QS to 1 L, filter-sterilize, and storeat room temperature.
4. 100X Phosphate: Into 95 mL of ddH2O dissolve 0.994 g Na2HPO4 and0.966 g NaH2PO4�H2O. QS to 100 mL, filter-sterilize, and store at roomtemperature.
5. 2 M CaCl2: Into 95 mL of ddH2O dissolve 36.61 g CaCl2�4H2O (EM Sci-ences, Fort Washington, PA, cat. no. 2384-2). QS to 100 mL, filter-sterilize,and store at room temperature.
Luciferase Reporter Assay 53
6. Phosphate-buffered ATP Solution (KHPO4-ATP): Into 80 mL of ddH2Odissolve 0.116 g KH2PO4 and 1.59 g K2HPO4. Adjust pH to 7.80 ��� .05.Add 0.221 g ATP (disodium salt, Sigma cat. no. A5394). Adjust pH to 7.80��� .05, QS to 100 mL, filter-sterilize, divide into 25-mL aliquots andstore at �20°C. Good for 6 mo.
7. 0.1 M Potassium phosphate buffer: Into 900 mL of ddH2O dissolve 1.16 gKH2PO4 and 15.9 g K2HPO4. Adjust pH to 7.8 ���.05, QS to 1 L, fil-ter–sterilize, and store at room temperature.
8. 10X Luciferin stock solution: Dissolve 100 mg of D-Luciferin (Promega,Madison, WI, cat. no. PBI 1300B; see Note 3) in 33.1 mL 0.1 M potassiumphosphate buffer, pH 7.8 (see step 7). Divide into 5-mL aliquots, cover in-dividual aliquots with aluminum foil and store at �20°C. Dilute to 1X in0.1 M potassium phosphate buffer, pH 7.8, just prior to use. Keep shieldedfrom light at all times.
9. 1M MgCl2-50 mM Tris-HCl: Into 80 mL of ddH2O, dissolve 20.33 g MgCl2,053 g Tris-HCl, and 0.20 g Tris base. Adjust pH to 7.8 ���.1, filter steril-ize, and store at room temperature.
10. O-Nitrophenyl D-Galactopyranoside (ONPG) solution (see Note 4): Into80 mL of ddH2O, dissolve 0.2 g ONPG (Sigma cat. no. N-1127), 0.117 gNaH2PO4�H2O and 1.30 g Na2HPO4. Adjust pH to 7.8 ��� .05, QS to100 mL, filter-sterilize, divide into 50 mL aliquots and store at �20°C.Good for 6 mo.
11. Dithiothreitol (DTT) 0.10 M: Into 10 mL of ddH2O, dissolve 0.155 g ofDTT. Divide into 0.5-mL aliquots and freeze at �20°C. Good for 1 yr.
3. Methods3.1. Choosing an Expression Vector
One of the first and often overlooked considerations when instituting the tran-sient transfection assay is choice of vector system to be used. Almost every man-ufacturer of molecular biology reagents has its own mammalian expression sys-tem and most have multiple permutations of their system. There are far too manyto mention, which is not the object of this review, so we will simply overviewsome of the considerations one needs to reflect on when choosing a vector.
Perhaps the most important consideration is the promoter system drivingyour gene or transcription factor of interest. As with latex gloves, these gener-ally come in small, medium, and large. This of course refers to the level of ex-pression generated by the specific promoter elements. Most often researcherswant high levels of transcription-factor expression. This generally is to in-crease sensitivity and to overcome shortfalls in transfection efficiency. Oneneeds to be cautious about choosing an extremely high level of expression
54 Noonan et al.
vector, especially when attempting to investigate some question of physiolog-ical relevance with respect to the transcription factor being studied. On theother hand, if one is screening chemical compounds for transcription-factor ac-tivation, sensitivity may be of great importance. Perhaps the most popular andmost active of these expression vectors are the cytomegalovirus (CMV)-drivenexpression systems. Less active but sometimes more uniform in their expres-sion profiles are the Rous sarcoma virus (RSV) and simian virus (SV-40)-driven promoters.
A second concern that we, and others, have encountered serendipitouslywith the various mammalian expression vectors used in these studies is thepresence of cryptic enhancers and transcription factor-binding sites (10–12).This appears to be especially true for many of the CMV-driven vectors andsome reporter vectors. It is therefore judicious to run a vector-only control withevery assay, and, if examining the effects of some other expression constructon the activity of your transcription factor, make sure it is not the vector pro-ducing the effects.
3.2. Choosing a Reporter Vector
Here again there are a variety of systems to choose from. Firefly luciferasehas been our reporter of choice simply because of its sensitivity and the avail-ability of its substrate. A variety of other luminescent enzymes have been clonedmore recently along with their available substrates (13–15). In addition thereare a variety of fluorescing proteins that have been, or can be, adapted to func-tion as reporters (15–17). Use of these in high-throughput assays will require aplate-reading fluorimeter, but might be worth the investment if one wishes todevelop scenarios that incorporate some form of fluorescence energy transfer(FRET) into their readout (9,17). Finally, there are reporters that use eitherchromophores (e.g., β-galactosidase) or radioactive isotopes (e.g., chloram-phenicol acetyltransferase [CAT]). These reporters are generally thought to beeither too cumbersome or not sensitive enough for high-throughput screeningprotocols.
3.3. Choosing a Host
The primary concerns when selecting a host cell line for transient transfectionsare its transfectability, its endogenous level of transcription factors, and its bio-logical relevance to your transcription factor. As discussed next, there are severalapproaches available for transfecting DNA into mammalian cells. Several celllines appear to be highly receptive to this process, whereas most primary cells arevery refractive to it. Cell lines we have had reasonable success with using the leastexpensive technology available (CaPO4 precipitation) include the human embry-onic kidney (HEK) 293 cell line, the human hepatocellular carcinoma cell line
Luciferase Reporter Assay 55
Hep G2, and the African Green Monkey kidney cell line COS-7. Our research uti-lizes this assay to reconstitute and evaluate steroid receptor-mediated transcrip-tion events (18,19). One complication we have encountered with cell lines isbackground noise from endogenous receptors. For this reason, reporter-only con-trols are necessary for all transfections. Identifying a host cell system that fits yourneeds is a combination of literature research and trial and error.
3.4. Choosing a Transfection System
Three basic approaches—CaPO4 precipitation, liposome technologies andelectroporation—have usually been employed to transfect DNA into mammaliancells. Academic scientists with low budgets find it important to identify cost-effective measures to implement research of this nature. The transfection systemwe will describe in this article is the most economical we could find: the CaPO4precipitation methodology (18,20). We might also point out that, like all of thetechnologies available, it has its strengths and weaknesses. The CaPO4 precipi-tation technology is the cheapest and is fairly reproducible once the system is de-fined, but of the three it is the lengthiest and the most limited in host cell choices.The liposome technology is easy, quick, and useful with a large number of hostcells, but from a reagent perspective it the most expensive and struggles at timeswith reproducibility issues. Electroporation is moderately cheap once one hasmade the purchase of the machinery, requires very little time, and can be usedwith a variety of cell types, but can suffer from reproducibility and cell viabilityissues, which can be detracting in high-throughput studies.
3.5. Choosing a Plate-Reading Luminometer
Choosing the right plate-reading luminometer can also be a serious consid-eration. To begin with, they are not inexpensive. Plate-reading luminometersrange in price from $10,000 to $90,000, but we would caution anyone seriousabout doing these types of studies to try to get the best machine they can findfor the type of studies they hope to implement. This doesn’t mean buying the$90,000 machine, but rather purchasing the highest-quality machine for the typeof assay they wish to perform. Contact vendors, set up demos, and talk to otherinvestigators performing these types of assays. The complexities of these lumi-nometers vary considerably and the software packages that come with them caneither decrease or increase your workload substantially. One consideration thataffects both the type and the price of the luminometer chosen is the choice ofreporter and reporter system one hopes to use. If reading luciferin-flash kinet-ics or doing dual luciferase assays, we have found that luminometers that havedual-injector systems seem to give more reproducible results. If simply readingglow kinetics as generated by Renilla luciferase, then plate readers without in-jectors work fine. In our laboratory, we are currently running a Molecular De-
56 Noonan et al.
vices Lmax plate reading luminometer with dual injectors. This luminometer al-lows us to do either single luciferase or dual luciferase assays and the softwarepackage and service support are very good. This is not to say there are not com-parable or better systems out there, so shop around before you buy.
3.6. Robotics or Manual
If you are serious about implementing a high-throughput assay to screen alarge number of chemical compounds and have the money available, you maywish to consider including robotic workstations into your assay to reducehuman error and streamline your operation. At first this may seem impracticalfor something like the CaPO4 precipitation protocol, but when we were design-ing this 96-well plate assay back in the early 1990s, we had programmable Bio-Mek workstations set up in laminar flow hoods that created all of the ligand di-lutions, distributed the transfected cells into 96-well plates, prepared theluminometer plates, prepared the b-galactosidase plates, distributed the lysates,and read the b-galactosidase. This relegated the scientists to doing the transfec-tion and operating the computers.
3.7. Kit Science or Home Brew
We believe our preference here (Home Brew) should be clear to the reader,but I feel it important to point out that there are many commercial luciferase as-say systems available now (see http://www.biocompare.com/molbio.asp?catid=1620 for a comparison of the various systems available), some of which havepublished track records to support their credibility. The upside of these systems isthat you simply follow the manufacturer’s protocol; the downsides are the priceand some of the innate limitations on troubleshooting the systems.
3.8. Preparing Plasmids
The use of clean plasmid preps can be critical to obtaining reproducible resultswith transfection technologies. Two pieces of advice relating to the preparation ofplasmids for transfection are: check the integrity of the plasmid preparation priorto using it in the assay and, if storing a plasmid for over 1 mo, freeze it at �20°C.We normally use double cesium-banded plasmid preparations. Others have usedcommercial kits (e.g., Qiagen, Valencia, CA) for plasmid preparation with somesuccess, but it is important that these plasmid preparations be examined on anagarose gel for contamination with genomic DNAand RNA, which will occur oc-casionally if the capacity of the technology is pushed to its upper limits. One finalnote of interest that we have observed while using the CaPO4 technology is thatthe salts used in the final precipitation of the plasmid preparation can impact theCaPO4 precipitate formation. When potassium salts (e.g., reprecipitating with1/10th volume of solution 3 of the alkaline lysis procedure) (21) are used in the
Luciferase Reporter Assay 57
final precipitation of plasmid DNA, the CaPO4 precipitate formed in the transfec-tion protocol generally is more robust and flocculent, whereas if NH4 acetate orsodium salts are used, the precipitate is finer. This can be good or bad dependingon the cell type one is transfecting into. For example, transfection efficiency intoHep G2 cells appears to be improved substantially by the flocculent precipitate,whereas the finer precipitate appears to work better in the COS 7 cells. Again, thisis a trial and error type of technology so our advice is to test the water and do pilotstudies before jumping into the deep end of the pond.
3.9. Preparing Cells
Transfection of mammalian cells is still somewhat of a mystery science withregard to defining the correct conditions for transfection. Depending on thetechnology used, a variety of factors appear to impact the efficiency of trans-fection. These include pH, salts, cell cycle, and integrity of one’s DNA prepa-ration. We have also found that using a logarithmic growing population of cellsgenerally gives us our highest transfection efficiency. For this purpose, we rou-tinely passage cells on consecutive days, plating at approx 70% confluency eachday. In addition, newly thawed cells need to be passaged for a week or so be-fore they begin to transfect with any efficiency. Finally, efficiency also seemsto decline as cells reach higher passage numbers (e.g., 40–50 passages for thecells used here).
3.10. Our Home Brew Protocol
This is the protocol used on a daily basis in our laboratory to analyze ligandactivation of steroid receptor systems reconstituted in mammalian cells. Ourmammalian expression plasmid of choice is a pRSV vector (22) and our DNAbinding elements specific for our receptor plasmid are cloned into a pBLluciferase vector (22) that utilizes a thymidine kinase minimal promoter for fa-cilitation of transcription initiation. Using this protocol without any robotic as-sistance and analyzing a single set of plasmids, a trained technician can easilyanalyze 10–96 well plates in 1 wk.
3.10.1. Day 1
1. Choose one plate of cells (e.g., COS-7 cells) that is �90% confluent.2. Wash cells with phosphate-buffered saline (PBS).3. Trypsinize cells with 1 mL Trypsin.4. Incubate 37°C, 5% CO2, 5–15 min (see Note 5).5. Resuspend cells with DMEM 10% fetal bovine serum (FBS) in a total vol-
ume of 5 mL per plate.6. Split the above plate 1:5 to create a sufficient log growth–phase stock of
cells (see Note 6).
58 Noonan et al.
3.10.2. Day 2
1. Wash cells with PBS.2. Trypsinize cells with 1 mL Trypsin.3. Incubate 37°C, 5% CO2, 5–15 min.4. Resuspend cells with Dulbecco’s Modified Eagle’s Medium (DMEM) 10%
FBS in a total volume of 5 mL per plate.5. Combine the cells from all the 10-cm plates into a 50-mL centrifuge tube.6. Vortex the tube for 10–20 s. Remove 50 lL for counting.7. Add the 50 lL of cells to 450 lL 0.4% Trypan Blue and count cells using
a hemocytometer (see Note 7).8. Plate cells at 8.5 � 105 cells/plate in a total volume of 8 mL/plate.
3.10.3. Day 3
1. Determine the number of plates to be transfected and the amount of eachplasmid needed.
2. We commonly use the following four plasmids as a plasmid set:
a. Luciferase reporter.b. b-Galactosidase expression plasmid for normalizing data.c. Transcription factor plasmid in a mammalian expression vector.d. pUC19 carrier plasmid.
3. We use 5 lg of reporter, 5 lg normalizing plasmid, 1 lg of receptor, and9 lg of carrier for each plate, holding the concentration at 20 lg per plate(see Note 8). Determine the amount of the following reagents needed:
a. 2X HBS: 500 lL/plate.b. 100X Phosphate: 10 lL/plate.c. ddH2O: 420 lL/plate.d. 2 M CaCl2: 60 lL/plate.
4. Perform the following in a laminar flow hood. The order of addition isimportant.
a. Begin by labeling two tubes per transfection:i. Tube A1-An (sterile Eppendorf tube).ii. Tube B1-Bn (sterile 15 mL Falcon polypropylene tube).
b. Add the 2X HBS (500 lL) and 100X phosphate (10 lL) per plate to eachTube B.
c. Add the sterile ddH2O (420 lL) to each Tube A.d. Add each plasmid to their respective Tube A.e. Add the 60 lL of 2 M CaCl2 to tube A1 and mix gently by pipetting.f. While gently vortexing (e.g., setting 4), add dropwise the contents in
Tube A1 to Tube B1.
Luciferase Reporter Assay 59
g. Start the timer and continue with Tube A2 and so forth.
5. Incubate for 30 min at room temperature.6. After 30 min, add the solution from B1 dropwise to cells. Observe precip-
itate (see Note 9). Continue with B2-Bn.7. Incubate for 6–7 h, 37°C, 5% CO2.8. One h prior to the end of the incubation period, begin preparing ligand di-
lutions (20 lL/well) using DMEM � 10% FBS (see Note 10). Add ligandsto appropriate wells of a 96-well plate.
9. Remove plates from incubator and wash each plate twice with PBS.10. Trypsinize to release cells.11. Resuspend each plate in a total volume of 10 mL with DMEM � 10% FBS
(see Note 10).12. Transfer cell suspensions into centrifuge tubes. If more than one plate of
the same plasmid set was made, combine cell suspensions.13. Vortex centrifuge tube. Remove 50 lL and count cells using Trypan Blue
(see Note 7).14. Determine dilutions needed based on 180 lL per well at a concentration of
15,000 cells/well.15. Dilute cells and add 180 ll into appropriate wells of your 96-well plate con-
taining ligand(s).16. Return each plate to the incubator when finished.
3.10.4. Day 4
Continue incubation of transfected cells (see Note 11).
3.10.5. Day 5
1. Determine the volume of reagents needed (see Note 12).
a. Lysis buffer: Per 96-well plate mix 5.645 mL ligand base, 0.046 mL 1 MMgCl2-50 mM Tris-HCl, 0.058 mL 100 mM dithiothreitol (DTT), and0.012 mL 0.2 M PMSF. Keep at room temperature.
b. Potassium-Phosphate KHPO4-ATP � MgCl2 solution: Per 96-well platemix 11.52 mL KHPO4-ATP solution with 0.247 mL 1M MgCl2-50 mMTris-HCl. Store covered and on ice until use.
c. b-Galactosidase buffer: Per 96-well plate mix 23.04 mL ONPG solutionwith 0.075 mL 14.2M b-mercaptoethanol. Store at room temperature.Good for 1 d.
d. Luciferin solution: Per 96-well plate, mix 9.504 mL of 0.1 M potassiumphosphate buffer with 1.056 mL 10X luciferin. Store covered and atroom temperature until use. Good for 1 d.
60 Noonan et al.
2. Remove plates from incubator and examine for viability (see Note 13).Aspirate off media.
3. Add 50 lL of lysis buffer to each well. Incubate the plate 30 min at roomtemperature.
4. Aliquot 100 lL/well KHPO4-ATP � MgCl2 into luminometer plates.5. At the end of 30 min, add 20 lL of the cell lysate to appropriate lumi-
nometer plate wells containing 100 lL KHPO4-ATP � MgCl2.6. Submit luminometer plate to the luminometer for luciferase activity read-
ings (see Note 14).7. To remaining 30 lL of lysate, add 200 lL of ONPG�bME to each well.
Begin timer when completing plate.8. Place plates at 37°C and check for yellow color formation every 5–10 min
for a maximum total time of 150 min (see Note 15).9. Remove large bubbles from the surface of the plate by rapidly passing the
flame of a Bunsen burner over the surface of the 96-well plate. Record thetime elapsed. Determine absorbance at 415 nm on an Eliza plate reader. Anoptimum sample has an absorbance value of 0.30–1.00 at 415 nm.
10. Determined normalized results: Luciferase value/(b-gal at A415 nm/time).
3.11. Tabulating the Data
Most luminometers and plate readers available today come with softwarepackages that allow either direct manipulation of the data generated in a lu-ciferase assay, or the ability to download that data into another file or program.For our assays, we have found it convenient to download both the luciferase andb-galactosidase data into a Microsoft Excel program. With a little preparatorywork, one is able to set up Macros in Excel wherein the b-galactosidase data canbe merged with the luciferase data in a single spreadsheet. From there it is fairlystraightforward to create Macros that: (1) incorporate the time it took the b-galac-tosidase to develop and calculate a b-galactosidase rate, (2) divide the luciferasedata by the b-galactosidase rate to establish a normalized luciferase value, and (3)average the repeats for each treatment to establish an average for the normalizeddata (see Note 16). In addition, Excel allows you to graphically display thesedata, so simple Macros can also be developed to facilitate this process.
4. Notes1. These are detergents that we have tested for efficient and gentle cell lysis
of mammalian cells and work optimal in our system. They are slightly moreexpensive then using Triton X-100 or NP-40, but we feel they are worth it.We have only tested this detergent combination for its impact on luciferaseand b-galactosidase activity, so if the use of another reporter (e.g., GFP orRFP) should be desired it would be advisable to re-evaluate.
Luciferase Reporter Assay 61
2. The pH of the HBS solution can have significant effects on the efficiencyof transfections, and although we list pH 7.1 here, it is possible that the op-timum pH for your cells may be different. If problems occur with transfec-tion efficiency that are not traceable to plasmid preparations, you may wantto try playing with the pH of your HBS solution (e.g., performing test trans-fections while varying the pH by 0.5 pH units between pH 6.8 and 7.2).
3. If using “kit science” the purchase of luciferin and most of the remainderof these reagents is not required. For economical reasons, we buy ourLuciferin in 1-g quantities (10 � 100 mg vials) that we store at �70°C inpowder form. One-hundred milligrams is enough luciferin to theoreticallyevaluate more than thirty-four 96-well plates, but in practice, this numberis closer to 30 plates. This totals approx $4/plate for Luciferin.
4. We generally use flash kinetics for our luciferase assays and normalize fortransfection efficiency and nonspecific variations in reporter expressionusing a b-galactosidase expression plasmid (18). The use of dual luciferaseapproaches and normalizing with firefly luciferase, Renilla luciferase, orgreen fluorescent protein (GFP) plasmids are also popular systems (23).Using alternative normalizing plasmids to the one described here will re-quire some modification to the reagent list given, but may be worth track-ing down a bulk supplier of those reagents and developing them yourself.
5. Always monitor detachment of cells using a microscope. Different celllines have different sensitivities to the trypsinization process and commer-cial trypsin can vary from lot to lot as well as with age. Occasionally tap-ping the edge of the plate against the palm of your free hand can facilitatethe detachment process.
6. Each plate split 1:5 on Monday should be sufficient to make at least threeto five plates for transfection. If more than 25 plates are needed for trans-fection, combine two to three parent plates and vortex them thoroughlybefore aliquoting to insure the population of cells is homogeneous. Fur-thermore, in the final platting for transfection, if your cell line is looselyadherent (e.g., HEK cells) you may want to coat your 10-cm plates withpoly-L-lysine. Incubate a 10 cm plate with 1–2 mL (just enough to coverthe bottom) of a 50 lg/mL solution of poly-L-lysine (made up in sterileddH2O), at 37°C for 30 min just prior to plating. Aspirate off the poly-L-lysine solution and add media and cells. The same applies to the 96-wellplates used with these cells.
7. We generally count the living cells (those not filled with blue color) in allfour outer corners of the hemocytometer grid (each corner contains 16smaller squares). Multiplying this number by 25,000 gives the number ofcells per mL in your sample. If your cell viability (live cells/dead cells) isnot greater than 95%, then you may either be trypsinizing the cells too longor handling the cells too roughly.
62 Noonan et al.
8. The amount and ratio of your transcription factor plasmid to your reporterplasmid can significantly impact the level of expression of your reporter. Ifyou are having trouble getting good expression, it might be worth the in-vestment of time to test different amounts of transcription factor plasmid(e.g., 0.1 lg–5.0 lg) in the assay. Remember to standardize your total DNAto 20 lg by altering the amount of pUC plasmid used.
9. A precipitate should be formed almost immediately. If your luciferase andb-galactosidase values are low and your precipitate fails to rapidly formupon addition to your cells, then this may be the source of problems. Thetwo most likely culprits would be either one of the solutions or your plas-mid DNA preparation. Check the pH on your HBS solution to make certainit has not changed and try reprecipitating plasmid preps.
10. If screening with ligands that might be a constituent in FBS (e.g., growthfactors, steroids, and other lipophilic ligands), it might be necessary tochange to serum-free media, charcoal-stripped media (HyClone), or delip-idated (Sigma) media, all of which are commercially available. Also, notethat each ligand will be diluted 1:10 in the well when cells are added andthe volume is brought up to 200 lL, therefore, if you want a 10�4 M finalconcentration, add 20 lL of a10�3 M ligand to each well.
11. Incubation of cells can be for anywhere from 18–72 h. If using a strong pro-moter (see Subheading 3.1.) on your mammalian expression plasmids, itmight be better to process your transfections 24–36 h after transfectingDNA into cells, especially if you feel there might be some toxicity issuewith one of your plasmids.
12. The calculation of these volumes as presented includes an extra 20% toaccommodate for pipeting errors and luminometer priming should it benecessary.
13. If cells look sick, are detaching from the surface, and/or there are a lot offloating cells in the wells, something is either wrong with one of your so-lutions (the most probable is the ligand, many of which are toxic at highconcentrations), your plasmids (e.g., transfection of apoptosis or growth-suppressing proteins) or your media (check pH if using phenol red free-media or serum-free media).
14. To reduce background phosphorescence, allow the luminometer plate to in-cubate a minute or so in the darkness of the luminometer prior to startingthe reading.
15. This is a factor of the transfection efficiency, the length of time transfectedcells were incubated, and the promoter driving the b-galactosidase gene. Ifincubating moderately poor transfecting cells for relatively short periods oftime (18–36 h), use a pCMV-b-gal plasmid. If incubating good transfect-ing cells for longer periods of time (36–72 h), use a pRSV-b-gal plasmid.
Luciferase Reporter Assay 63
Generally, moderately good transfecting cell lines with the pRSV-b-galplasmid take approx 30 min to develop.
16. One final note for consideration is potential complications with normaliz-ing plasmids. We have observed that when analyzing specific modulatorsof transcription factor activity (e.g., coregulatory molecules) that these pro-teins can also modulate the levels of our b-galactosidase expression, mak-ing it difficult to normalize the luciferase data. In those cases, it is first nec-essary to define this modulation as a proliferation, protein degradation, ortranscription effect. If it turns out to be a transcription effect, it may be nec-essary to normalize to some other parameter (e.g., cell number, DNA, ortotal protein). Alternatively, there are other assays available wherein thereadout is based on protein: protein interactions (9).
References1. Gill, G. (2001) Regulation of the initiation of eukaryotic transcription. Essays
Biochem. 37, 33–43.2. Beato, M. and Klug, J. (2000) Steroid hormone receptors: an update. Hum. Reprod.
Update 6, 225–236.3. Hatina, J. and Reischig, J. (2000) Hormonal regulation of gene transcription: nu-
clear hormone receptors as ligand-activated transcription factors. Cesk Fysiol 49,61–72.
4. Kato, S. (2000) Nuclear receptor-mediated signaling pathway. Nippon YakurigakuZasshi 116, 133–140.
5. Aranda, A. and Pascual, A. (2001) Nuclear hormone receptors and gene expression.Physiol. Rev. 81, 1269–1304.
6. Wiseman, H. and Duffy, R. (2001) New advances in the understanding of the roleof steroids and steroid receptors in disease. Biochem. Soc. Trans. 29, 205–209.
7. Jones, T. K., Pathirana, C., Goldman, M. E., (1996) Discovery of novel intracellu-lar receptor modulating drugs. J. Steroid Biochem. Mol. Biol. 56, 61–66.
8. Silverman, L., Campbell, R., and Broach, J. R. (1998) New assay technologies forhigh-throughput screening. Curr. Opin. Chem. Biol. 2, 397–403.
9. Zhou, G., Cummings, R., Li, Y., et al. (1998) Nuclear receptors have distinct affini-ties for coactivators: characterization by fluorescence resonance energy transfer.Mol. Endocrinol. 12, 1594–1604.
10. Boshart, M., Kluppel, M., Schmidt, A., et al. (1992) Reporter constructs with lowbackground activity utilizing the cat gene. Gene 110, 129–130.
11. Thirunavukkarasu, K., Miles, R. R., Halladay, D. L., and Onyia, J. E. (2000) Cryp-tic enhancer elements in luciferase reporter vectors respond to the osteoblast-spe-cific transcription factor Osf2/Cbfa1. Biotechniques 28, 506–510.
12. Ibrahim, N. M., Marinovic, A. C., Price, S. R., et al. (2000) Pitfall of an internalcontrol plasmid: response of Renilla luciferase (pRL-TK) plasmid to dihy-drotestosterone and dexamethasone. Biotechniques 29, 782–784.
13. Stables, J., Scott, S., Brown, S., et al. (1999) Development of a dual glow-signal
64 Noonan et al.
firefly and Renilla luciferase assay reagent for the analysis of G-protein coupled re-ceptor signalling. J. Recept. Signal Transduct. Res. 19, 395–410.
14. Dyer, B. W., Ferrer, F. A., Klinedinst, D. K., and Rodriguez, R. (2000) A noncom-mercial dual luciferase enzyme assay system for reporter gene analysis. Anal.Biochem. 282, 158–161.
15. Wang, Y., Yu, Y. A., Shabahang, S., et al. (2002) Renilla luciferase-Aequorea GFP(Ruc-GFP) fusion protein, a novel dual reporter for real-time imaging of gene ex-pression in cell cultures and in live animals. Mol. Genet. Genomics 268, 160–168.
16. Zhang, J., Campbell, R. E., Ting, A. Y., and Tsien, R. Y. (2002) Creating new fluo-rescent probes for cell biology. Nat. Rev. Mol. Cell Biol. 3, 906–918.
17. Lippincott-Schwartz, J. and Patterson, G. H. (2003) Development and use of fluo-rescent protein markers in living cells. Science 300, 87–91.
18. Henry, K., O’Brien, M. L., Clevenger, W., et al. (1995) Peroxisome proliferator-activated receptor response specificities as defined in yeast and mammalian celltranscription assays. Toxicol. Appl. Pharmacol. 132, 317–324.
19. Mukherjee, R., Jow, L., Noonan, D., and McDonnell, D. P. (1994) Human and ratperoxisome proliferator activated receptors (PPARs) demonstrate similar tissue dis-tribution but different responsiveness to PPAR activators. J. Steroid Biochem. Mol.Biol. 51, 157–166.
20. Wigler, M., Pellicer, A., Silverstein, S., et al. (1979) DNA-mediated transfer of theadenine phosphoribosyltransferase locus into mammalian cells. Proc. Natl. Acad.Sci. USA 76, 1373–1376.
21. Birnboim, H. C. and Doly, J. (1979) A rapid alkaline extraction procedure forscreening recombinant plasmid DNA. Nucleic Acids Res. 7, 1513–1523.
22. Giguere, V., Hollenberg, S. M., Rosenfeld, M. G., and Evans, R. M. (1986) Func-tional domains of the human glucocorticoid receptor. Cell 46, 645–652.
23. Day, R. N., Kawecki, M., and Berry, D. (1998) Dual-function reporter protein foranalysis of gene expression in living cells. Biotechniques 25, 848–856.
Luciferase Reporter Assay 65
5
Determining Protein Half-Lives
Pengbo Zhou
SummaryControlling the stability of cellular proteins is a fundamental way by which cells regulate
growth, differentiation, survival, and development. Measuring the turnover rate of a protein isoften the first step in assessing whether or not the function of a protein is regulated by proteoly-sis under specific physiological conditions. Over the years, procedures to determine the half-lifeof proteins in cultured eukaryotic cells have been well-established. This chapter describes in de-tail the two most frequently used methods, pulse-chase analysis and cycloheximide blocking, todetermine a protein’s half-life in yeast and cultured mammalian cells.
Key Words: Protein degradation; proteasome; pulse-chase; turnover.
1. IntroductionProteolysis has recently emerged as an essential regulatory mechanism un-
derlying virtually any cellular processes, including the cell cycle, signal trans-duction, apoptosis, and embryonic development. Owing to the irreversiblenature and the profound efficiency of various cellular protein-degradation path-ways, regulated proteolysis has evolved as the most efficient means cells ex-ploit to rapidly reprogram cellular processes in response to alterations of growthconditions or environmental cues. In most cases, regulated proteolysis is carriedout via the ubiquitin-proteasome pathway, which constitutes the bulk of cyto-plasmic proteolysis (reviewed in ref. 1). Other cellular protein destruction ap-paratus, such as calpain and lysosome, also play significant roles in posttrans-lational processing and degradation of specific cellular proteins (reviewed in
From: Methods in Molecular Biology, vol. 284:Signal Transduction Protocols
Edited by: R. C. Dickson © Humana Press Inc., Totowa, NJ
67
68 Zhou
refs. 2,3). Determining the stability of a given cellular protein is one of the firststeps towards understanding whether its cellular abundance and activity aresubjected to proteolytic control. The availability of specific inhibitors for dif-ferent proteolytic enzymes further allows for rapid identification of specific pro-tein degradation pathway(s) that are involved.
Among the approaches developed to measure protein half-lives, pulse-chaseanalysis is the most frequently used method because it imposes minimal dis-ruption or interference with normal cell growth and metabolism. Typically, theprotein of interest is first metabolically labeled in rapidly growing cells for ashort period of time with a radioactive precursor (e.g; 35S-labeled methionineand/or cysteine). During the subsequent chase period, an excess of nonradioac-tive precursor molecules are added to the culture to prevent further incorpora-tion of the radiolabel into proteins. At different times during the chase period,samples of the cells are lysed and immunoprecipitated with antibody against thetarget protein. Radiolabeled protein is subjected to sodium dodecyl sulfate-polyacrylamide gel electrophoresis (SDS-PAGE) and quantified by phospho-rimage analysis or similar procedure. The half-life of a protein is defined as thetime it takes for the concentration of the radiolabeled target protein to be re-duced by 50% relative to the level at the beginning of the chase.
Another method to determine the turnover rate of a given protein is referredto as cycloheximide blocking. Protein synthesis is inhibited by cycloheximideand the decay of a target protein over time is determined by SDS-PAGE and im-munoblot analysis. One caveat for the cycloheximide block approach is that theprotein half-life is measured when overall protein synthesis is abrogated and,thus, may not reflect the actual turnover rate under normal growth conditions.The stability and abundance of the proteolytic enzymes themselves might alsobe affected, which further complicates the accurate measurement of proteinturnover rate. However, cycloheximide blockage is a useful alternative ap-proach in the event that the target protein is refractory to metabolic labeling. Inyeast cells, target genes expressed under the control of inducible promoters,such as the galactose-inducible GAL1 promoter, can be turned off rapidly(within minutes) after switching cells to glucose-containing medium (reviewedin ref. 4). Therefore, the turnover rate of a protein can be determined by fol-lowing its decay after the silencing of the inducible GAL1 promoter. This chap-ter will describe commonly used methods to determine the half-lives of proteinsin mammalian and yeast cells.
2. Materials2.1. Pulse-Chase Analysis in Mammalian Cells
1. Dulbecco’s Modified Eagle’s Medium (DMEM) containing 1 g/L glucoseand 4 mM glutamine, supplemented with 10% fetal calf serum (FCS).
2. DMEM free of L-methionine and L-cysteine (Invitrogen, Carlsbad, CA, cat.no. 21013024, or Mediatech, Herndon, VA, cat. no. 17-204-CI).
3. Phosphate-buffered saline (PBS): 1 L is made from 10 g NaCl, 0.25 g KCl,1.5 g Na2HPO4, 0.25 g KH2PO4, pH 7.2. The solution is autoclaved andstored at room temperature or 4°C.
4. Trypsin-EDTA solution (Invitrogen, cat. no. 25200056).5. Express-35S protein labeling mix containing both 35S-methionine and
35S-cysteine (Applied Biosystems, Foster City, CA, cat. no. NEF-772).6. 200 mM L-methionine in sterile water (Sigma, St. Louis, MO., cat. no.
M2893).7. 200 mM L-cysteine in sterile water (Sigma, cat. no. C7880).8. RIPA lysis buffers: 50 mM Tris-HCl, pH 7.5, 150 mM NaCl, 1% Nonidet
P-40 (NP-40), 0.5% deoxycholate (DOC), and 0.1% SDS.9. Protease inhibitor cocktail: 2.5 lg/mL chymostatin, 2.5 lg/mL pepstatin
A, 2.5 lg/mL leupeptin, and 2.5 lg/mL antipain. Phenylmethylsulfonyl flu-oride (PMSF) is made fresh in 95% ethanol and added to lysis buffer at afinal concentration of 1 mM just prior to use.
10. Bradford protein assay kit (Bio-Rad, Richmond, CA, cat. no. 77432A).11. Protein-A or Protein-G sepharose slurry: wash the Protein-A or Protein-G
sepharose suspensions (Amersham Biosciences, Piscataway, NJ, cat. no.17-0974-01 or 17-0618-01) three times in RIPA buffer. Resuspend in RIPAbuffer to the original suspension volume and store at 4°C.
12. Sterile microfuge tubes (1.5 and 2 mL).
2.2. Pulse-Chase and Promoter Turn-Off Analysis in Yeast Cells
1. YPD medium: 1% yeast extract, 2% peptone, and 2% dextrose (glucose).2. Synthetic complete (SC) medium (1 L): 1.3 g complete supplement mix-
ture (CSM) dropout powder (Qbiogene, Carlsbad, CA), 1.7 g yeast nitro-gen base without amino acids and ammonium sulfate, 5 g (NH4)2SO4, and20 g dextrose or raffinose.
3. 20% Dextrose (glucose).4. 20% Galactose.5. CSM medium without L-methionine (Qbiogene, cat. no. 4510-712).6. Acid-washed glass beads (425-600 lm) (Sigma, cat. no. G8772 ).7. ECL plusTM Western blotting reagents pack (Amersham Bioscience, cat.
no. RPN2124), or a regular ECL kit (Western LightningTM Chemilumines-cence Reagent Plus, Applied Biosystems, cat. no. NEL105).
8. 2X Laemmli buffer (10 mL): 0.15 g Tris-HCl base (final concentration is0.125 M), pH adjusted to 6.8 with HCl, 4 mL 10% SDS (final concentra-tion is 4%), 1 mL glycerol (final concentration is 10%), 20 mg bromophe-nol blue (final concentration is 0.02%), 0.4 mL b-mercaptoethanol (finalconcentration is 4%).
Protein Turnover 69
9. Sterile 50 mL Falcon tubes.10. Sterile microfuge tubes.
2.3. Equipment
1. Vibra CellTM sonicator (VC 130PB) with microtip (Sonics and Materials,Newtown, CT).
2. End-over-end mixer (VWR, West Chester, PA).3. Microcentrifuge and refrigerated table top centrifuge.4. Spectrophotometer.5. Vertical gel electrophoresis system.6. Western-blotting apparatus.7. Gel dryer.8. Phosphorimager and storage phosphor screens.9. Orbital shaker.
3. Methods3.1. Measuring Half-Lives of Proteins in Mammalian Cells by Pulse-Chase Analysis
This section describes a standard procedure for measuring half-lives of pro-teins in adherent tissue culture cells. The same principle applies to nonadherentcells, although the initial metabolic labeling procedure will be slightly different(see Note 1).
3.1.1. Cell-Culture Preparation
1. For measuring the half-lives of proteins exogenously expressed via tran-sient transfection, plate 2 � 106 HeLa cells on one to two 10 cm dishes,and incubate in CO2 incubator overnight.
2. Transfect with a plasmid expressing the gene of interest by calcium phos-phate or other transfection procedures and incubate cells for 12–16 h.
3. Wash with cells PBS and incubate them in fresh DMEM medium with 10%FCS for 6–8 h.
4. Remove medium, trypsinize, and seed equal aliquots of cell suspensions infive 100-mm dishes. Incubate overnight in a CO2 incubator at 37°C.
For measuring half-lives of endogenous proteins, plate equal number ofcells in five 100 mm dishes and culture for 1 d. Enough cells should beplated on each dish so they reach 60–80% confluency on the second day,which is optimal for pulse labeling (see Note 2).
3.1.2. Pulse-Chase
1. Aspirate medium and wash the cells three times with 5 mL prewarmed PBS.2. Remove PBS completely. Starve cells by adding 1 mL methionine- and
cysteine-free DMEM medium containing 10% dialyzed FCS. Incubate at
70 Zhou
37°C for 1 h. Shake occasionally so that the cells are fully covered by themedium.
3. Add 100 lCi of Express-35S protein-labeling mix to each 100-mm plate (seeNote 3). Incubate the cells for 30 min at 37°C with shaking every 5–10 min.
4. Remove radioactive medium. Wash cells once with 5 mL of prewarmedPBS.
5. For the “Time 0” plate, proceed to cell lysis and extract preparation instep 8.
6. For all other time points, add 3 mL chase medium containing prewarmedDMEM, 10% FCS, 3 mM L-methionine, and 1 mM L-cysteine to each plate.Immediately return plates to the CO2 incubator. Note that cell permeableprotease inhibitors can be included in chase medium in a parallel experi-ment to assess whether or not a specific proteolytic mechanism is involvedin degrading the protein of interest (see Note 4).
7. Remove medium from plates at desired time points (0.5, 1.0, 2.5, and 5.0 hare good starting points). Wash once with 3 mL PBS and then remove PBScompletely.
8. Add 300 lL of ice-cold RIPA lysis buffer containing protease inhibitors toplate. Scrape cells using a disposable cell scraper and transfer them to afresh microfuge tube. Cells can also be frozen in liquid nitrogen at this stepand processed when all time points are collected (see Note 5). Denaturinglysis buffer can be used if high background is observed following im-munoprecipitation and SDS-PAGE analysis (see Note 6).
9. Sonicate cells with three to five bursts using the microtip of a Vibra-Cell™VC500 sonicator.
10. Rotate the microfuge tube containing cell extracts on an end-over-endmixer for 30 min at 4°C.
11. Centrifuge at 14,000 rpm for 10 min at 4°C. Transfer the supernatant fluidto a fresh microfuge tube.
12. Determine the protein concentration with the Bradford assay kit. Samplesare diluted 200–500 times in Bradford assay buffer to minimize interfer-ence to the colorimetric reactions by detergents in RIPA buffer. Alterna-tively, use the Bio-Rad DC protein assay kit, which is compatible with bothionic and nonionic detergents.
3.1.3. Immunoprecipitation, SDS-PAGE, and Autoradiography
1. Transfer 500 lg to 1 mg each of cell lysate to fresh microfuge tubes. Makeup the total volume (300–500 lL) with RIPA buffer.
2. Preclear the lysates by adding 20 lL of pre-washed Protein-A or Protein-Gsepharose beads. Rotate at 4°C for 1 h on an end-over-end mixer.
3. Centrifuge samples at 14,000 rpm in a microcentrifuge for 10 s at 4°C.Transfer supernatant fluids to fresh microfuge tubes.
Protein Turnover 71
4. Add the appropriate amount of antibody to each sample (see Note 7 and thechapter in this volume on immunoprecipitation). Rotate on an end-over-endmixer at 4°C for 1 h.
5. Centrifuge tubes briefly. Add 50 lL of 50% slurry of prewashed Protein-Aor Protein-G sepharose beads. Rotate on an end-over-end mixer for 1 h toovernight at 4°C.
6. Centrifuge samples at top speed for 10 s at 4°C.7. Remove supernatant fluid. Add 1 mL of RIPA buffer to the pellet and shake
up and down to wash. Centrifuge samples at 4°C for 10 s to pellet thesepharose beads containing the bound protein of interest. Aspirate super-natant fluid.
8. Repeat washing two more times.9. Aspirate all liquid from the sepharose beads. Resuspend in 50 lL of 2X
Laemmli buffer (5). Heat at 95°C for 5 min.10. Centrifuge briefly in microcentrifuge. Resolve the eluted proteins by SDS-
PAGE.11. Fix gel in 50% methanol and 10% acetic acid for 30 min to 1 h after elec-
trophoresis, dry under vacuum, and expose to a phosphor screen.12. Quantitate the intensity of individual bands of the protein of interest using
the phosphoimager and plot the percentage of proteins on a logarithmicscale over time. The half-life is the time point at which 50% of the proteinremains relative to that at the beginning (Time 0) of the chase.
3.2. Measuring the Half-Life of Yeast Proteins
This section describes two commonly used methods to determine the half-lives of proteins in yeast: pulse-chase analysis and promoter turn-off. Pulse-chase analysis is generally used for determining the turnover rate of endoge-nous proteins or proteins expressed from constitutive promoters on plasmids.Promoter turnoff is a simple procedure used to measure the stability of pro-teins exogenously expressed from inducible promoters on plasmids.
3.2.1. Pulse-Chase Analysis
3.2.1.1. PREPARATION OF YEAST CULTURE
1. Grow yeast cells overnight to stationary phase in either YPD for endoge-nous proteins or synthetic complete medium lacking the amino acid corre-sponding to the selectable marker on the transformed plasmid.
2. Dilute yeast cells to an OD600nm of 0.1 in 30 mL medium. Grow to log phase(OD600nm of 0.4–0.6) (see Note 8).
72 Zhou
3.2.1.2. PULSE-CHASE
1. Collect yeast cells by centrifugation in a tabletop centrifuge at 2000 rpmfor 5 min at room temperature. Remove supernatant fluid completely.
2. Resuspend cells in 30 mL of synthetic complete medium without L-methio-nine. Transfer to a sterile flask and shake at 30°C for 1 h in an orbital shaker.
3. Transfer culture to a 50 mL Falcon tube. Centrifuge at 2000 rpm for 5 minto pellet cells and resuspend in 6 mL synthetic complete medium withoutL-methionine.
4. Add 100–500 lCi of Express-35S protein labeling mix per mL of cell cul-ture and shake at 30°C for 10 min. See Note 10 for measuring half-life intemperature sensitive mutant yeast cells.
5. Pellet cells and remove radioactive medium carefully.6. Resuspend cells in 6 mL prewarmed synthetic complete medium contain-
ing 1 mg/mL L-methionine and 1 mg/mL L-cysteine (add fresh).7. Immediately aliquot 1.4 mL yeast culture to a 2 mL screw-cap microfuge
tube as the “Time 0” cells. Centrifuge at 14,000 rpm for 15–20 s in themicrofuge tube. Remove supernatant fluid and freeze the cell pellet in liq-uid nitrogen. Keep at �80°C until all the time points are collected.
8. At the desired time points, aliquot 1.4 mL yeast culture, collect cell pelletby centrifugation and freeze in liquid nitrogen as in step 7. Typical timepoints are 0, 10, 20, 40, 60, and 120 min, but shorter or longer time pointsmay be needed in specific cases.
3.2.1.3. PREPARATION OF YEAST EXTRACT
1. Resuspend cell pellets in 300 lL ice-cold RIPA buffer containing proteaseinhibitors.
2. Add 300 lL acid-washed and ice-chilled glass beads (500 lm) to each tube.3. Vortex vigorously for 30 s in the cold room. Chill on ice for at least 30 s.
Repeat vortexing and chilling cycle six more times (see Note 9).4. Centrifuge at 14,000 rpm for 10 min at 4°C. Transfer supernatant fluid to a
fresh microfuge tube. Centrifuge for another 10 min. Transfer supernatantfluid to a fresh microfuge tube.
5. Determine the protein concentrations by the Bradford assay or the DC pro-tein assay (Bio-Rad) (see step 11 of Subheading 3.1.2.).
6. Proceed to step 7 or freeze samples in liquid nitrogen for later analysis.7. Perform immunoprecipitation, SDS-PAGE, and autoradiography to deter-
mine the half-life of target protein as described in Subheading 3.1.3.
Protein Turnover 73
3.2.2. Promoter Turn-Off
To determine the turnover rate of a target protein exogenously expressedfrom inducible promoters, such as GAL1, a promoter turn-off procedure is oftenthe method of choice.
3.2.2.1. TRANSIENT INDUCTION AND PROMOTER TURN-OFF
1. Yeast cells transformed with plasmid expressing target gene are grown to earlylog phase (OD600 of 0.4–0.6) in 30 mL synthetic complete dropout mediumcontaining 2% raffinose. The carbon source must be one that does not repressexpression of the GAL1 promoter, which is strongly repressed by glucose.
2. Add sterile galactose to cell culture at a final concentration of 2% to inducetarget gene expression for 30 min.
3. Transfer cells to a 50 mL sterile Falcon tube. Centrifuge at 2000 rpm for5 min. Remove supernatant fluid.
4. Wash cells by resuspending in 30 mL of sterile PBS. Centrifuge as aboveto pellet cells. Remove supernatant fluid.
5. Resuspend cells in 6 mL synthetic complete dropout medium containing2% raffinose and 2% glucose (see Note 11).
6. Immediately transfer 1 mL of cells to a fresh microfuge tube as the “Time0” sample. Centrifuge in a microcentrifuge at 14,000 rpm for 15 s. Removesupernatant fluid and freeze the cell pellet in liquid nitrogen.
7. At appropriate time points (see step 8 of Subheading 3.2.1.2.), remove1 mL of cells, centrifuge and freeze cell pellet in liquid nitrogen.
3.2.2.2. YEAST EXTRACT PREPARATION
Prepare yeast cell extracts as described in Subheading 3.2.1.3.
3.2.2.3. SDS-PAGE AND IMMUNOBLOTTING
1. 100–200 lg each of total protein extract is subjected to SDS-PAGE andimmunoblotting using standard procedures (5).
2. Visualize the protein bands of interest using the ECL plus reagent. Exposethe blot to a phosphorimager screen to determine the intensity of bands overtime using a phosphorimager. If regular ECL reagents are used, multiple ex-posures to X-ray films are necessary to determine the range in which theresponse of the film is linear. Densitometers can be used to scan the expo-sure within the linear range to measure the band intensity.
4. Notes1. For metabolic labeling of suspension cultures, collect cells by centrifuga-
tion at 400 g for 5 min. Wash once with prewarmed PBS and centrifuge as
74 Zhou
before. Resuspend cells at approx107 cells/mL in prewarmed medium con-taining 10% dialyzed FCS, lacking L-methionine and L-cysteine. Incubatefor 1 h at 37°C. Add Express-35S protein labeling mix at 10 mCi/mL andincubate for 30 min to 1 h at 37°C. Mix occasionally. Collect cells by cen-trifugation and suspend in cold chase medium containing excess L-methio-nine (3 mM) and L-cysteine (1 mM). Collect cells at appropriate time pointsas in Subheading 3.1.2.
2. Confluency of cells required for efficient 35S labeling will depend on thegrowth rate of individual cells. HeLa cells are fast growing and efficientlabeling can be achieved at approx 60% confluency. For slower growingcells, a higher density of 75–85% confluency is required.
3. Proteins with only a few amino acid residues of the radioactive precursor, orthose with a slow turnover rate might not be labeled efficiently. UsingExpress-35S protein labeling mix, which contains both radioactive methion-ine and cysteine, often results in increased labeling of the target protein com-pared to that of 35S-methionine alone. If both methionine and cysteine arerare in the target protein, other radioactive precursors, such as 35S-leucine,can be used as an alternative. Proteins that have slow metabolic turnoverrate should be labeled for a longer period of time prior to chase. If the afore-mentioned methods fail, cycloheximide blocking procedure can be consid-ered as an alternate approach for half-life measurement (6).
4. Proteasome, calpain, or lysosomal inhibitors can be included in the chasemedium in parallel experiments to assess whether degradation of the pro-tein of interest is mediated by a specific proteolytic mechanism. Frequentlyused proteasome inhibitors include lactacystine (12.5 lM), MG132 (50 lM),and LLnL (50 lM). Lactacystin specifically inhibits the 26S proteasomeactivity, whereas the more economical MG132 and LLnL abrogate thefunctions of both calpain and the proteasome. Other inhibitors used in theliterature include calpeptin (30–60 lM) or calpain inhibitor II (5 lM) forcalpain, and E64 (50 lM) for cysteine proteases found in organelles in-cluding lysosome (6). Note that many protease inhibitors often block thefunction of several proteases. The result from half-life studies using pro-tease inhibitors should only serve as a starting point to estimate cellulardegradation pathways that may or may not be involved in the turnover ofthe protein of interest.
5. Cells can be scraped into 0.5 mL ice-cold PBS. Transfer to microfuge tubeand centrifuge at 14,000 rpm for 1 min at 4°C. Remove the supernatant fluidand freeze the cell pellet in liquid nitrogen. Store at �80°C until all timepoints are collected and then proceed to cell lysis and extract preparation.
6. If high background is encountered, cells can be lysed under denaturingconditions for immunoprecipitation: Scrape cells from a 100-mm dish are
Protein Turnover 75
scraped in 350 lL of preboiled 1% SDS lysis buffer (50 mM Tris-HCl, pH7.5, 0.5 mM EDTA, 1% SDS, 1 mM dithiothreitol[DTT]). If the lysate istoo viscous owing to high-molecular-weight DNA, sonicate to break theDNA. Boil for 10 min, then dilute 1:10 in 0.5% NP-40 lysis buffer (50 mMTris, pH 7.5, 150 mM NaCl, 0.5 % NP-40, 50 mM NaF, 1 mM DTT, 1 mMNaVO3, and protease inhibitors) and perform the immunoprecipitation asin Subheading 3.1.3.
7. The amount of antibody and cell extracts used should be determined on acase-by-case basis (5). For 500 lg of total protein extracts, 2–3 lL of crudeantiserum or 2.5–5 lg of affinity-purified antibody are good starting points,but it is best to titrate the sample with increasing amounts of antibody tofind the amount needed to immunoprecipitate the protein of interest.
8. Yeast cells can be synchronized with a-factor (3 lg/mL) at G1 phase, hy-droxyurea (10 mg/mL) in S phase, or 15 µg/mL nocodazole in M phase ofthe cell cycle. The half-life of the target protein at different cell cycle stagescan then be measured (3,9).
9. To determine whether degradation of a given yeast protein is dependent ona specific protease, yeast strains carrying temperature-sensitive mutationsof the corresponding enzyme can be used to measure the half-lives at non-permissive temperature. These measurements can then be compared to thehalf-lives determined at permissive temperature (9). Grow temperature-sensitive mutant yeast to early log phase (OD600 of 0.4–0.6) at permissivetemperature and shifted to nonpermissive temperature for 1–2 h. Pulse-chase or promoter turnoff experiments are then performed at the nonper-missive temperature using procedures described in Subheadings 3.2.1.2.and 3.2.2.2.
10. To determine if yeast cells are completely lysed by mechanical force, a fewmicroliters of lysis material can be spotted on a glass slide and observedunder the light microscope. Additional vortexing is necessary if a largenumber of yeast cells are still intact.
11. For proteins translated from short-lived mRNAs (e.g., Cln3, t1/ 2 approx 3.5min), glucose addition is sufficient to block the biosynthesis of the targetprotein (9). For those synthesized from stable mRNAs, 1 mg/mL of cyclo-heximide can be included in chase medium containing glucose to blockboth transcription and translation (7–9).
AcknowledgmentsThe author would like to thank Josie Siegel and Maurizio DiLiberto for crit-
ical reading of the manuscript, Xiaoai Chen and Yue Zhang for optimizing thesemethods, and James Miller and Danial DiBartolo for editing. Studies in our lab-oratory in this area are supported by the Sidney Kimmel Foundation for Cancer
76 Zhou
Research, the AMDeC Foundation, the Mary Kay Ash Charitable Foundation,the New York Academy of Medicine, the Susan G. Komen Breast Cancer Foun-dation, the Dorothy Rodbell Cohen Foundation for Sarcoma Research, and theNational Institute of Health.
References1. Hershko, A. and Ciechanover, A. (1998) The ubiquitin system. Annu. Rev. Biochem.
67, 425–479.2. Carafoli, E. and Molinari, M. (1998) Calpain: A protease in search of a function?
Biochem. Biophys. Res. Commun. 247, 193–203.3. Pillay, C. S., Elliott, E., and Dennison, C. (2002) Endolysosomal proteolysis and
its regulation. Biochem. J. 363, 417–429.4. Johnston, M. (1987) A model fungal gene regulatory mechanism: the GAL genes of
Saccharomyces cerevisiae. Microbiol. Rev. 51, 458–476.5. Harlow, E. and Lane, D. (1988) Antibodies: A Laboratory Manual. Cold Spring
Harbor Laboratory Press, Cold Spring Harbor, NY.6. Patrick, G. N., Zhou, P., Kwon, Y. T., et al. (1998) p35, The neuronal-specific acti-
vator of cyclin-dependent kinase 5 (Cdk5) is degraded by the ubiquitin-proteasomepathway. J. Biol. Chem. 273, 24,057–24,064.
7. Amon, A., Irniger, S., and Nasmyth K. (1994) Closing the cell cycle circle in yeast:G2 cyclin proteolysis initiated at mitosis persists until the activation of G1 cyclinsin the next cycle. Cell 77, 1037–1050.
8. Yaglom, J., Linskens, M. H., Sadis, S., et al. (1995) p34 Cdc28-mediated controlof Cln3 cyclin degradation. Mol. Cell Biol. 15, 731–741.
9. Zhou, P. and Howley, P. M. (1998) Ubiquitination and degradation of the substraterecognition subunits of SCF ubiquitin-protein ligases. Mol. Cell 2, 571–580.
Protein Turnover 77
6
Assaying Protein Kinase Activity
Jan Brábek and Steven K. Hanks
SummaryProtein kinases, encoded by approx 2% of eukaryotic genes, represent one of the major classes
of cell-regulatory molecules. Assessment of the catalytic activity of a specific protein kinase canbe an important step in elucidating signal-transduction pathways that affect cell behavior. As anexample of approaches taken to measure protein kinase activity, this chapter presents methodsuseful for determination of the activity of the oncogenic protein-tyrosine kinase v-Src. Includedare protocols for heterologous expression of the kinase in yeast Saccharomyces cerevisiae, im-munoaffinity purification from yeast cell lysates, kinase reactions using incorporation of 32P intopeptide substrates, and quantifying protein kinase activity. The Notes section discusses alterna-tive approaches for assaying the activity of Src recovered from vertebrate cells and it gives rec-ommendations for assaying the activity of the other protein kinases with respect to the substratespecifity and the composition of kinase reaction buffer.
Key Words: Src; protein-tyrosine kinase; kinase assay; peptide substrate; heterologous pro-tein expression; Saccharomyces cerevisiae.
1. IntroductionPhosphorylation by protein kinases is a major signal-transduction mecha-
nism used by eukaryotic cells to regulate proliferation, gene expression, me-tabolism, motility, membrane transport, and virtually every other activity thatdefines their phenotypic behavior. Given their diverse cellular roles, it is not sur-prising that protein kinases are encoded by a substantial portion of eukaryoticgenes. The genome of the budding yeast S. cerevisiae contains 130 distinct
From: Methods in Molecular Biology, vol. 284:Signal Transduction Protocols
Edited by: R. C. Dickson © Humana Press Inc., Totowa, NJ
79
genes encoding protein kinases, representing approx 2% of all genes (1). Thehuman genome carries 518 protein kinase genes (approx 1.7% of all genes) (2).A large majority (approx 90%) of these protein kinases belong to the eukaryoticprotein kinase (EPK) superfamily defined on the basis of a homologous kinasecatalytic domain (3,4). The EPK domain interacts with both ATP and protein(peptide) substrates and functions to transfer the c-phosphate of ATP onto thehydroxyl group of a serine, threonine, or tyrosine amino-acid residue within thepeptide substrate.
Based on catalytic domain relatedness, the EPK superfamily has beenbroadly subdivided into seven major groups: (1) AGC kinases, (2) CAMK-related kinases, (3) CMGC kinases, (4) STE kinases, (5) type I casein kinases,(6) tyrosine kinases, and (7) “tyrosine kinase-like” kinases (4,5). The latter twogroups are absent from yeast, reflective of their functions in signaling pathwaysassociated with metazoan complexity. Each major group is composed of manydistinct families whose individual members have highly-similar EPK domainsand exhibit additional homology outside the EPK domain core. Other EPK fam-ilies fall outside the seven major groups. Table 1 shows the number of humanEPKs within each family (and group) that are known or likely to have proteinkinase activity. Notably, this classification scheme groups together protein ki-nases that have common specificities in peptide recognition and phosphoryla-tion. The obvious example is the tyrosine kinase group composed of EPKs thatspecifically phosphorylate tyrosine residues. However, protein kinases that fallwithin the other major groups also tend to have similar serine/threonine speci-ficity determinants (6–8). Thus, kinases of the AGC group (which includes thePKA, PKG, and PKC families) and the closely-related CAMK group (which in-cludes families of calmodulin-regulated kinases) tend to be basophilic; that is,they frequently phosphorylate serine/threonine residues residing near basicresidues. Similarly, members of the casein kinase I group are acidophilic. Thetyrosine kinases also tend to be acidophilic. Many CMGC group members(including the namesake CDK, MAPK, GSK, and CLK families) are highly se-lective for serine/threonine residues lying immediately N-terminal to a prolineresidue.
To successfully assay protein kinase phosphotransfer activity, the investiga-tor must first obtain a pure preparation of the protein kinase of interest. Im-munoprecipitation of the endogenous protein kinase from nondenaturing celllysates (described in another chapter of this book), is commonly used to achievethis goal. However, this approach should be taken with caution (and the use ofproper controls), because it is possible the immunoprecipitate will not only con-tain the kinase of interest, but other protein kinases that either coprecipitate,cross-react with the antibody, or nonspecifically bind to the affinity matrix. Inmany cases, it is useful to carry out the assays using the most highly purified
80 Brábek and Hanks
protein kinase preparation that can be obtained through heterologous expressionin bacteria, yeast, or insect cells. It is also necessary to obtain an appropriateprotein or peptide substrate that can be efficiently phosphorylated by the pro-tein kinase of interest. The Protein Kinase Factsbook (6) provides much infor-mation regarding physiological substrates and specificity determinants formany protein kinases. The PhosphoBase database (8) provides phosphorylationsite data for �50 well-characterized protein kinases and is another useful re-source for identifying suitable substrates for utilization in kinase reactions. Forpoorly characterized protein kinases of unknown specificity, identifying anappropriate substrate presents a challenge. However, it is anticipated that
Protein Kinase Assay 81
Table 1. Human EPK Groups and Families a
Group Families (# members)
Tyrosine kinases (84 total) Ack (2), Abl (2), Csk (2), FAK (2), Fer (2), JAK (4), Src (11), Syk (2), Tec (5), Alk (2), Axl (3), DDR (2), EGFR (3), Eph (12), FGFR (4), InsR (3), Lmr (3), Met (2), Musk (1), PDGFR/VEGFR (8), Ret (1), Ror (2), Sev (1), Tie (2), Trk (3),
AGC kinases (61 total) PKA (5), PKG (2), PKC (9), AKT (3), DMPK (7),GRK (7), MAST (5), NDR (4), PKB (1), PKN (3), RSK (9), SGK (3), YANK (3).
CAMK-related (65 total) CAMK1 (5), CAMK2 (4), CAMKL (20), DAPK (5), DCAMKL (3), MAPKAPK (5), MLCK (3), PHK (2), PIM (3), PKD (3), PSK (1), RAD53 (1),Trio (4), TSSK (5), CAMK-Unique (1).
CMGC kinases (61 total) CDK (20), MAPK (14), GSK (2), CLK (4), CDKL (5), DYRK (10), RCK (3), SRPK (3)
STE kinases (45 total) STE7 (7), STE20 (28), STE11 (8), STE-Unique (2).Tyrosine kinase-like (37 total) RAK (2), LISK (4), LRRK (2), MLK (9), RAF
(3), RIPK (5), STKR (12).Type I casein kinases (11 total) CK1 (7), TTBK (2), VRK (2).“Other” kinases (63 total) Aur (3), BUB (1), Bud32 (1), CAMKK (2),
CDC7 (1), CK2 (2), IKK (4), IRE (2), MOS (1), NAK (4), NEK (11), NKF1 (3), NKF2 (1), NKF4(2), PEK (4), PLK (4), TLK (2), TOPK (1), TTK (1), ULK (4), VPS15 (1), WEE (3), Wnk (4), Other-Unique (2).
a Only EPK family members with known or likely kinase activity are included. About 50 addi-tional EPKs that lack one or more key residues important for phosphotransfer activity are not rep-resented. Family names are those used in the KinBase searchable database found in ref. 27.
proteomic approaches to define protein kinase peptide specificity determinants(9,10) will soon provide information on suitable protein or peptide substratesfor all protein kinases.
This chapter illustrates commonly used approaches to assay protein kinaseactivity using the oncogenic Src tyrosine kinase as an example. First, wepresent a protocol for obtaining purified v-Src expressed in the yeast Sac-charomyces cerevisiae, which has proven to be a useful heterologous ex-pression system because nonspecific copurification of endogenous tyrosinekinases is minimized (10–13). The system enables rapid production of a largeamount of the kinase with specific activity comparable to that obtained withkinases expressed in vertebrate cells (14,15). To assay the activity of a pu-rified serine/threonine kinase, the only major change that would need to bemade to these basic protocols is the substitution of a suitable peptide sub-strate for the kinase reaction.
2. Materials1. Basic molecular biology reagents and equipment including equipment for
agarose gel electrophoresis, thermocycler and thermostable polymerase forpolymerase chain reaction (PCR), restriction endonucleases, T4 DNA lig-ase, Escherichia. coli strains and growth media, ampicillin, and so on.
2. Equipment for SDS-PAGE (sodium dodecyl sulfate-polyacrylamide gelelectrophoresis) and Western blotting.
3. v-src Gene (Prague C variant) in plasmid pATV-8 (American Type CultureCollection).
4. Oligonucleotide primers for PCR amplification of the v-src gene:upstream: 5�-gtcggatccatgggtagtagcaagagcaagc-3�downstream: 5�-gccgaattcttactcagcgacctccaacac-3�.
5. Plasmid pYES2 (Invitrogen, Carlsbad, CA).6. S. cerevisiae strain EGY48 (Invitrogen).7. YPAD media for standard yeast culture: 20 g/L peptone (Difco, Detroit,
MI), 10 g/L yeast extract (Difco), 100 lg/L adenine hemisulfate (Sigma, St.Louis, MO), 2% glucose.
8. SD-U media for yeast selection: 6.7 g/L yeast nitrogen base without aminoacids (Difco), 0.6 g/L -His/-Leu/-Trp/-Ura DO (dropout) supplement (Clon-tech; Palo Alto, CA) 20 mg/L L-histidine HCl monohydrate, 100 mg/LL-leucine, 20 mg/L L-tryptophan. For solid media, include 18 g/L agar.
9. Additional reagents for yeast selection, induction, transformation and, lysis(all can be obtained from Sigma): raffinose, galactose (glucose-free),lithium acetate, polyethylene glycol 3350 average MW, salmon spermDNA, 0.5 mm glass beads for cell lysis.
82 Brábek and Hanks
10. Lysis buffer LB1: 50 mM HEPES, pH 7.4, 0.5% Nonidet P40, 5% glycerol,100 mM sodium chloride, 0.5 mg/mL Pefabloc (Roche, Indianapolis, IN),5 lg/mL leupeptin (Sigma), 5 lg/mL aprotinin (Sigma), 0.5 mM sodium or-thovanadate, 1 mM sodium fluoride.
11. Anti-v-Src monoclonal antibody MAb 327 (Calbiochem, San Diego, CA).12. Antimouse IgG agarose (Sigma).13. Stock solutions for protein kinase assay buffer (see Notes 1 and 2): 500 mM
HEPES, pH 7.4, 800 mM MgCl2, 200 mM MnCl2, 2 mM ATP, 10 mMsodium orthovanadate, 500 lg/mL leupeptin, and 500 lg/mL aprotinin.
14. [c-32P]ATP (3000 Ci/mmol; Amersham Biosciences, Piscataway, NJ).15. Tyrosine kinase substrate peptide RRLIEDAEYAARG (Sigma).16. 21-mm Diameter circles of P81 cellulose phosphate paper (Whatman,
Clifton, NJ).17. Trichloroacetic acid (TCA).18. Vacuum manifold for washing filters.19. Random amino acid copolymer poly (Glu, Tyr) (4:1) (Sigma).20. Liquid-scintillation counter.21. Device for scanning densitometry.
3. MethodsThe methods described below outline: (1) expression of v-Src kinase in yeast
S. cerevisiae, (2) immunoaffinity purification of the expressed kinase, (3) assayof Src tyrosine kinase activity, and (4) quantification of kinase activity.
3.1. Expression of Src in S. cerevisiae
This section presents a brief overview of the steps involved in subcloning thev-Src cDNA into a yeast expression plasmid, introducing the expression plas-mid into S. cerevisiae, and inducing expression of v-Src in the yeast cells. Theinvestigator should be familiar with basic molecular biology methods, whichare not described in detail.
The v-src gene is amplified from the pATV-8 plasmid by standard PCR usingthe oligonucleotide primers, digested with BamHI and EcoRI restriction en-zymes, cloned into the BamHI and EcoRI sites of the galactose-inducible vec-tor pYES2, and verified by sequencing. The resulting pYES2-Src plasmid isthen transformed into S. cerevisiae strain EGY48 by standard Li-acetate method(16) and selected on SD-U agar plates. The transformed yeast cells are grownovernight (see Note 3) (to saturation density) in 30 mL SD-U medium supple-mented with 2% raffinose, pelleted by centrifugation (2500 g, 3 min, 20°C), andthen grown for an additional 4 h in 50 mL fresh SD-U medium containing 2%raffinose and 2% galactose to induce v-Src expression.
Protein Kinase Assay 83
3.2. Purification of Expressed v-Src Protein
This section gives detailed protocols for preparing yeast cell extracts and re-covering the induced v-Src protein by immunoprecipitation.
3.2.1. Preparing Yeast Cell Extracts
1. After cooling the 50 mL induced yeast culture on ice, pellet the cells bycentrifugation (2500g, 3 min, 4°C).
2. Resuspend the cell pellet in 2 mL ice-cold lysis buffer LB1 (see Note 4).Transfer the suspension equally into three precooled 10-mL glass cen-trifuge tubes.
3. Pellet the cells again by centrifugation (2000 g, 3 min, 0°C), carefully as-pirate the supernatant, then add 1.5 mL of washed, dried, and precooled0.5 mm glass beads to each tube. Wrap the tubes with parafilm and lyse thecells by vortexing vigorously for 5 min at 4°C (in cold room).
4. Add 1 mL of lysis buffer LB1 to each of the three tubes and mix with thelysed cell/bead slurry by pipetting with a 1-mL volume tip. Collect the crudeextract solutions (without the beads) into two 1.5-mL microfuge tubes.
5. Centrifuge (15,000g, 15 min, 0°C) to remove any insoluble cellular mate-rial, nonlysed cells, or contaminating beads. Pool the supernatants. Aliqoutscan be stored at �80°C or used for the next step.
3.2.2. Immunoaffinity Purification of Src From Yeast Extracts
1. Aliqout 400 lL of the yeast cell extract to a 1.5-mL microtube then add1 lg/mL (400 ng) of anti-v-Src monoclonal antibody 327. Vortex to mix,then incubate for 3 h at 4°C to allow the antigen/antibody complex to form(see Note 5).
2. During the aforementioned incubation step, prepare a 50% slurry of anti-mouse IgG1 agarose beads by washing three times with at least five vol-umes of 50 mM HEPES, pH 7.4. After the last wash, add 1 bead-volume ofthe same buffer.
3. After the 3 h incubation of step 1, add 40 lL of the 50% washed slurry tothe tube. Gently rock the tube on a rotator for 1 h at 4°C, allowing the anti-gen-antibody complexes to become bound to the beads.
4. Wash the beads (immunoprecipitates) three times with at least 50 vol ofLB1 buffer, then once with 50 mM HEPES, pH 7.4. The immunoprecipi-tates should be kept on ice during these steps. For each wash, the beads areresuspended by gentle vortexing and spun down by centrifugation (3000g,3 min, 0°C). At the final wash step, divide the beads equally into two0.5 mL tubes. The final bead volume will be approx 10 lL per tube. Onetube is used to assess the recovery of v-Src in the immunoprecipitates
84 Brábek and Hanks
(step 5). The other tube is used for the kinase assays described in Sub-heading 3.3., and should be kept on ice in the final 50 mM HEPES washbuffer until ready for use.
5. Add 20 lL 2X SDS-PAGE sample buffer to one tube, mix with the bead byvortexing, heat for 5 min at 100°C. Then separate the sample by SDS-PAGE and analyze by Western blot to ascertain that the Src protein wasproperly expressed and affinity-purified. The anti-v-Src 327 MAb can alsobe used for the Western analysis.
3.3. Assaying Src Protein-Tyrosine Kinase Activity
Two different protocols are presented below to assay the activity of purifiedSrc kinase using incorporation of 32P into different peptide substrates (seeNote 6).
3.3.1. Assaying Tyrosine Kinase Activity Using Substrate-Based Oligopeptide
The first protocol makes use of a small synthetic peptide substrate. Such pep-tides can be designed as optimized substrates for any protein kinase of interest,thus enabling precise determination of kinetic parameters (17). The oligopep-tide includes basic residues allowing its separation from nucleotides and freephosphate present in the kinase reaction mixture through its ability to bindtightly to phosphocellulose paper (18).
1. For each reaction, prepare 10 lL of 3X concentrated protein kinase assaybuffer (3XPKB): 50 mM HEPES, pH 7.4, 24 mM MgCl2, 6 mM MnCl2,300 lM Na3VO4, 60 lM ATP, 15 lg/mL leupeptin, 15 lg/mL aprotinin, and5 lCi [c-32P]ATP (see Notes 1 and 2). Use the kinase assay buffer stocksolutions and mix thoroughly by pipeting after adding each compound. Besure to account for radioactive decay when adding the [c-32P]ATP. The[c-32P]ATP should be added last; from this step you must exercise radioac-tive safety precautions.
2. Add 10 lL 3XPKB to the immunoprecipitates (see Note 7).3. Start the kinase reaction by adding 10 lL of the RRLIEDAEYAARG pep-
tide substrate from a 3.6 mM solution prepared in 50 mM HEPES (1.2 mMfinal concentration) (see Note 8).
4. Incubate the kinase reaction tube for 20 min at 30°C with gentle shaking(i.e., rotate in a hybridization oven). For kinetic analysis, the reaction timeand/or enzyme concentration should be varied to achieve kinetics in the lin-ear range. If time course experiments are carried out, a large reaction can
Protein Kinase Assay 85
be prepared. At the desired time points, aliquots are withdrawn andprocessed as described later.
5. Terminate the reaction by adding 45 lL of ice cold 5% TCA, then incubate5 min on ice.
6. Centrifuge the sample (12,000g, 1 min, 4°C). Spot 20 lL of the supernatant(in triplicate) on 21 mm diameter P81 cellulose phosphate filter circles.
7. Wash the P81 filter circles three times with 100 mL 0.5% phosphoric acidusing a filter-washing device such as a vacuum manifold (approx 1 min perwash). Unincorporated ATP will be washed off the paper. Progress of thewashing steps can be followed by including a P81 filter circle for a blank re-action (lacking the peptide substrate) and monitoring with a Geiger counter.
8. Transfer papers into 5-mL polypropylene scintillation vials with 2.5 mL ofdeionized H2O. Measure the incorporation of [c-32P]ATP into substratebound to filters in a liquid-scintillation counter using the Cerenkov method.For quantification of the results, see Subheading 3.4.
3.3.2. Protein-Tyrosine Kinase Assay Using Synthetic Aminoacid Polymers
This alternative protocol utilizes a random polymer-containing glutamateand tyrosine in a four to one ratio. This inexpensive aminoacid polymer is a suit-able substrate for most, if not all, protein-tyrosine kinases (19,20) (see Note 9).The phosphorylated polymers can be separated from the reaction mixture byeither TCA precipitation or gel electrophoresis.
1. Prepare the Src immunoprecipitates and 3X concentrated protein kinaseassay buffer (3XPKB) as seen earlier, except substitute 10 lL of syntheticpoly (Glu, Tyr) aminoacid polymer (from a 1 mg/mL stock solution pre-pared in 50 mM HEPES) for the RRLIEDAEYAARG peptide.
2 Incubate the kinase reaction tube for 20 min at 30°C with gentle shaking(i.e., rotate in a hybridization oven).
3. Terminate the reaction by adding 30 lL of 2X SDS-PAGE sample buffer.Mix by vortexing and heat for 5 min at 100°C.
4. Mix 10 lL of the sample together with 2 lL of SDS-PAGE marker(prestained broad range) and load onto a 12% polyacrylamide SDS-PAGEminigel for electrophoretic separation. Stop the electrophoresis just as thedye runs off the gel (the unincorporated ATP will also have run out of thegel by this time).
5. Cut the gel lane containing the loaded sample using a razor blade (seeNote 10). The prestained marker proteins enable precise cutting of indi-vidual lanes. Transfer each gel slice (using tweezers) into a separate scin-tillation vial containing 2 mL of deionized H2O.
86 Brábek and Hanks
6. Measure the incorporation of [c-32P]ATP into the synthetic poly (Glu, Tyr)substrate in a liquid-scintillation counter using the Cerenkov method.
3.4. Quantification of Results
In the protocols presented earlier, Src kinase activity is measured as incor-poration of 32P into either a substrate-based oligopeptide (see Subheading 3.3.1.)or synthetic random amino-acid polymer (see Subheading 3.3.2.). The levels ofphosphorylated substrate are quantified by determining the 32P-radioactivity inwashed phosphocellulose filters (see Subheading 3.3.1.) or excised gel slices(see Subheading 3.3.2.). This section discusses approaches that can accuratelyquantify the results and determine kinetic parameters.
First, it is necessary to obtain a quantitative measurement of the level of Srcprotein from the Western blot analysis performed in Subheading 3.2.2., step 5.This can be achieved by using densitometry scanning of the Western blots,whether they are developed by either alkaline phosphatase reactions on themembrane or by a chemiluminescence exposure of X-ray film. For accuratequantification, it is necessary to quantitate several dilutions of the kinase sam-ple (e.g., 1:2, 1:4, 1:8), which also ensures that the Western blots are not overde-veloped. A normalized kinase activity can then be determined with respect tothe amount of Src protein in the reaction mixture relative to the measured in-corporation of radioactivity into the substrate. Normalized kinase activities ob-tained in this way are useful for comparing different kinase isoforms or muta-tional variants.
If the protein kinase under study is available in a defined concentration, it ispossible to determine Km (for peptide) and Vmax for the kinase reactions de-scribed here. In this case, one would carry out multiple reactions using variousamounts of peptide substrate (ranging from 0.1 to 10 mM; the range could varywith different enzymes and substrates), and determine kinetic constants byweighted nonlinear least-squares fit to the hyperbolic velocity versus peptideconcentration using iterative programs such as DYNAFIT (21), or KINSIM(22), and FITSIM (23).
4. Notes1. Optimal buffer composition, pH, ionic strength, and divalent cation con-
centration must be determined for each kinase under study. The most fre-quently used buffers are HEPES, PIPES, and TRIS-HCl at the concentra-tions in the range 20–50 mM, with pH in the range 6.8–8.0. Most kinaseshave Km values for ATP in the range of 5–200 lM; it is necessary to usesaturation concentration of ATP when determining Km and Vmax for sub-strate. The optimal concentration of divalent cations is usually between
Protein Kinase Assay 87
10–20 mM. In general, serine/threonine kinases prefer MgCl2, whereas ty-rosine kinases prefer MnCl2. For dual specifity kinases, specifity may bedetermined by the nature of the divalent cation bound to ATP; Mg2� resultsin serine phosphorylation and Mn2� promotes tyrosine phosphorylation(24). The addition of phosphatase inhibitors, e.g., sodium vanadate for ty-rosine phosphatases or okadaic acid, and EGTA for serine-threonine phos-phatases is necessary if there is a possibility of phosphatase contaminationof the kinase preparation (as in immunoprecipitates of endogenous proteins).
2. MnCl2 is light-sensitive and the stock solution should be prepared just be-fore performing the assay.
3. v-Src interferes with cell-cycle progression in yeast cells (25,26) and it istherefore necessary to use the inducible expression system and induce Srcexpression for a short time (3–4 h) at high cell density.
4. When protein kinases are expressed in mammalian cells for use in kinaseassays, the cells are usually lysed in RIPA or NP-40 buffer (lacking SDS),and cell debris is removed by centrifugation before immunoprecipitation.It is essential that the investigator assures that no “contaminating” proteinkinases are present in the immunoprecipitate. It is important to carry outcontrol reactions in which the primary antibody incubation step is omitted.If protein kinase activity is associated with the affinity beads obtained fromsuch control lysates, steps must be taken to eliminate the nonspecific ac-tivity. The lysates for example can be preincubated with the affinity beadsto reduce or eliminate the nonspecific activity.
5. Some kinase antibodies can inhibit or modify kinase activity. Thus, it maybe necessary to test several antibodies to identify one suitable for direct as-says of immunoprecipitated kinases.
6. Alternatively, proteins can be used as a substrate for protein kinase assays.Commonly used protein substrates include acid-treated enolase, alpha andbeta casein, myelin basic protein (MBP), calmodulin, histones H1 andH2B, and angiotensin. After the kinase reaction, proteins are resolved usingSDS-PAGE, transferred to membrane, and incorporation of 32P is assessedby autoradiography followed by densitometry scanning.
7. Highly purified active c-Src can be purchased from commercial sources(e.g., Upstate Cell Signaling Solutions [Charlottesville, VA], Calbiochem[San Diego, CA]) and used as an alternative source of enzyme for the ki-nase assay. In this case, the reaction should be initiated by the addition ofkinase to the complete reaction mixture.
8. The peptide can be incorporated directly into the kinase buffer if multipleassays are being performed using the same peptide substrate concentration.The RRLIEDAEYAARG peptide utilized in this protocol is a good substratefor many tyrosine kinases in addition to Src. Regarding assays of serine/
88 Brábek and Hanks
threonine kinases, the investigator will need to identify an appropriate sub-strate peptide, as discussed in the Introduction.
9. Specificity for individual groups of tyrosine kinases can be increased by theintroduction of other amino-acid residues such as alanine or lysine (19).
10. Commercially available synthetic amino-acid polymers are very heteroge-nous with respect to the range of molecular weight (even each batch ofproduct may differ) and thus are not suitable for reproducible pattern analy-sis using SDS-PAGE (autoradiography).
AcknowledgmentsWe wish to thank D. Mojzita for his useful comments on the protocols. Work
from the authors’ laboratory is supported by Public Health Service grantsGM49882 and DK56018.
References1. Hunter, T. and Plowman, G. D. (1997) The protein kinases of budding yeast: six
score and more. Trends Biochem. Sci. 22, 18–22.2. Manning, G., Whyte, D. B., Martinez, R., et al. (2002) The protein kinase comple-
ment of the human genome. Science 298, 1912–1934.3. Hanks, S. K., Quinn, A. M., and Hunter, T. (1988) The protein kinase family: con-
served features and deduced phylogeny of the catalytic domains. Science 241, 42–52.4. Hanks, S. K. and Hunter, T. (1995). The eukaryotic protein kinase superfamily: ki-
nase (catalytic) domain structure and classification. FASEB J. 9, 576–596.5. Manning, G., Plowman, G. D., Hunter, T., and Sudarsanam, S. (2002) Evolution of
protein kinase signaling from yeast to man. Trends Biochem. Sci. 27, 514–520.6. Hardie, G. and Hanks, S. K. (1995) The Protein Kinase Facts Book. Vol. II: Pro-
tein-Serine Kinases. Academic Press, London, UK.7. Kreegipuu, A., Blom, N., Brunak, S., and Järv, J. (1998) Statistical analysis of pro-
tein kinase specificity determinants. FEBS Lett. 430, 45–50.8. Kreegipuu, A., Blom, N., and Brunak, S. (1999) PhosphoBase, a database of phos-
phorylation sites: release 2.0. Nucleic Acids Res. 27, 237–239.9. Songyang, Z., Lu, K. P., Kwon, Y. T., et al (1996) A structural basis for substrate
specificities of protein Ser/Thr kinases: Primary sequence preference of casein ki-nases I and II, NIMA, phosphorylase kinase, calmodulin-dependent kinase II,CDK5, and Erk1. Mol. Cell Biol. 16, 6486–6493.
10. Zhu, H., Klemic, J. F., Chang, S., et al (2000) Analysis of yeast protein kinasesusing protein chips. Nature Genet. 26, 283–289.
11. Murphy, S. M., Bergman, M., and Morgan, D. O. (1993) Suppression of c-Src ac-tivity by C-terminal Src kinase involves the c-Src SH2-domain and SH3-domain-analysis with Saccharomyces cerevisiae. Mol. Cell Biol. 13, 5290–5300.
12. Gonfloni, S., Williams, J. C., Hattula, K., et al (1997) The role of the linker betweenthe SH2 domain and catalytic domain in the regulation and function of Src. EMBOJ. 16, 7261–7271.
Protein Kinase Assay 89
13. Brábek, J., Mojzita, D., Novotny, M., et al (2002) The n- and RT-loops of the SH3domain of Src can downregulate its kinase activity in the absence of the SH2 do-main-Y527 interaction. Biochem. Biophys. Res. Commun. 296, 664–670.
14. Kornbluth, S., Jove, R., and Hanafusa, H. (1987) Characterization of avian and viralp60src proteins expressed in yeast. Proc. Natl. Acad. Sci. USA 84, 4455–4459.
15. Brábek, J., Mojzita, D., Hamplová, L., and Folk, P. (2002) The regulatory region ofPrague C v-Src inhibits the activity of the Schmidt-Ruppin A v-Src kinase domain.Folia Biol. (Prague) 48, 28–33.
16. Schiestl, R. H. and Gietz, R. D. (1989) High efficiency transformation of intact yeastcells using single stranded nucleic acids as a carrier. Curr. Genet. 16, 339–346.
17. Casnellie, J. E. (1998) Assay of protein kinases using peptides with basic residuesfor phosphocellulose binding, in Protein Phosphorylation (Sefton B. M. andHunter, T., eds.), Academic Press, San Diego, CA, pp. 111–116.
18. Witt J. J. and Roskoski, R. Jr. (1975) Rapid protein kinase assay using phospho-cellulose-paper absorption. Anal. Biochem. 66, 253–258.
19. Braun, S., Raymond, W. E., and Racker, E. (1984) Synthetic tyrosine polymers assubstrates and inhibitors of tyrosine-specific protein kinases. J. Biol. Chem. 259,2051–2054.
20. Racker, E. (1998) Use of synthetic amino acid polymers for assay of protein-tyrosine and protein-serine kinases, in Protein Phosphorylation (Sefton B. M. andHunter, T., eds.), Academic Press, San Diego, CA, pp. 111–116.
21. Kuzmic, P. (1996) Program DYNAFIT for the analysis of enzyme kinetic data:application to HIV proteinase. Anal. Biochem. 237, 260–273.
22. Barshop, B. A., Wrenn, R. F., and Frieden, C. (1983) Analysis of numerical meth-ods for computer simulation of kinetic processes: development of KINSIM; a flex-ible, portable system. Anal. Biochem. 130, 134–45.
23. Zimmerle, C. T. and Frieden, C. (1989) Analysis of progress curves by simulationsgenerated by numerical integration. Biochem. J. 258, 381–387.
24. Yuan, C. J., Huang C. Y., and Graves D. J. (1993) Phosphorylase kinase, a metalion-dependent dual specificity kinase. J. Biol. Chem. 268, 17,683–17,686.
25. Boschelli, F., Uptain, S. M., and Lightbody, J. J. (1993) The lethality of p60(v-src)in Saccharomyces cerevisiae and the activation of p34(cdc28) kinase are depend-ent on the integrity of the SH2 domain. J. Cell Sci. 105, 519–528.
26. Florio, M., Wilson, L. K., Trager, J. B., et al (1994) Aberrant protein phosphoryla-tion at tyrosine is responsible for the growth-inhibitory action of pp60(v-src)expressed in the yeast Saccharomyces cerevisiae. Mol. Biol. Cell 5, 283–296.
27. Kinase.com [http://kinase.com/]
90 Brábek and Hanks
7
Comparative Phosphorylation Site MappingFrom Gel-Derived Proteins Using a Multidimensional ES/MS-Based Approach
Francesca Zappacosta, Michael J. Huddleston, and Roland S. Annan
SummaryUnderstanding how phosphorylation regulates the behavior of individual proteins is critical to
understanding signaling pathways. These studies usually involve knowledge of which amino acidresidues are phosphorylated on a given protein and the extent of such a modification. This is oftena rather difficult task in that most phosphoproteins contain multiple substoichiometric sites ofphosphorylation.
Here we describe the multidimensional electrospray (ES) mass spectrometry (MS)-basedphosphopeptide-mapping strategy developed in our laboratory. In the first dimension of theprocess, phosphopeptides present in a protein digest are selectively detected and collected intofractions during on-line liquid chromatography (LC)/ES/MS, which monitors for phosphopep-tide-specific marker ions. This analysis generates a phosphorylation profile that can be used to as-sess changes in the phosphorylation state of a protein pointing to those phosphopeptides that re-quire further investigation. The phosphopeptide-containing fractions are then analyzed in thesecond dimension by nano-ES with precursor-ion scan for the marker ion m/z 79. As the finalstep, direct sequencing of the phosphopeptides is performed by LC/ES/MS/MS. Merits and lim-itations of the strategy, as well as experimental details and suggestions, are described here.
Key Words: Phosphorylation; protein kinase; mass spectrometry; electrospray; liquidchromatography.
1. IntroductionProtein phosphorylation is surely the most important posttranslational modifi-
cation by which signals are transmitted within the cell (1). Signal transduction
From: Methods in Molecular Biology, vol. 284:Signal Transduction Protocols
Edited by: R. C. Dickson © Humana Press Inc., Totowa, NJ
91
through reversible phosphorylation of intracellular proteins plays an essentialrole in controlling many aspects of cell growth, metabolism, and differentiation.Dissecting the biological pathways that lead to these effects often involves un-derstanding how phosphorylation regulates the behavior of individual proteinsin the pathway. Key to this process is identifying sites of phosphorylation on se-lected components in the pathway.
Knowledge of the specific amino acids phosphorylated on a given protein isoften critical to understanding how that protein’s function is regulated. Recentlyit has become clear that multisite phosphorylation is quite common (2), but thatnot every site contributes to regulating a particular function. The extent to whichany given site is modified in response to stimulation of the cell or a change inits environment speaks to the physiological relevance of that site.
The challenges for any technique designed to study protein phosphorylationare at least fourfold. First, the modification can occur at one or several (usually)of many potential sites within the protein sequence. Therefore, the analyticaltechnique must sample as much sequence coverage as possible to reasonablyensure that no sites are missed. Second, many phosphoproteins of interest arepresent in the cell at very low level, thus the technique needs to be quite sensi-tive. Third, the extent of phosphorylation at the various sites can vary greatly(from 1 to 100%), therefore, the analysis technique needs to have enough se-lectivity to allow detection of phosphorylated peptides from among the usuallyvery abundant nonphosphorylated peptides. Last, once the phosphorylated pep-tide has been detected and tentatively identified, there are usually multiple po-tential amino acids that could be modified, therefore, it is almost always neces-sary to determine the exact site of phosphorylation by direct sequencing. Thetwo techniques that deal most effectively with these challenges are the Hunter2D phosphopeptide mapping technique (3) coupled to Edman sequencing andLC coupled to ES/MS/MS (4,5). The major drawback with the first method isthe need to incorporate a radioactive label onto the phosphate group. Althoughthis can be conveniently done for in vitro assays, metabolic labelling of grow-ing cells requires large amounts of radioactivity and the prospect of purifying alow copy number protein from a liter or more of radioactive cell-culture mate-rial is unappealing to most researchers. For this reason, MS is emerging as thekey technology both for phosphosite mapping and for the determination ofphosphorylation stoichiometry (5–12).
In our laboratory, we have developed and over the years refined, a multidi-mensional ES/MS-based strategy that allows for selective and sensitive detec-tion and identification of multisite phosphorylation on proteins. Because thefirst dimension provides a profile of the phosphorylation state of the entire pro-tein, it can also give a semiquantitative measure of the extent to which phos-phorylation at any given site changes in response to different cellular conditions
92 Zappacosta et al.
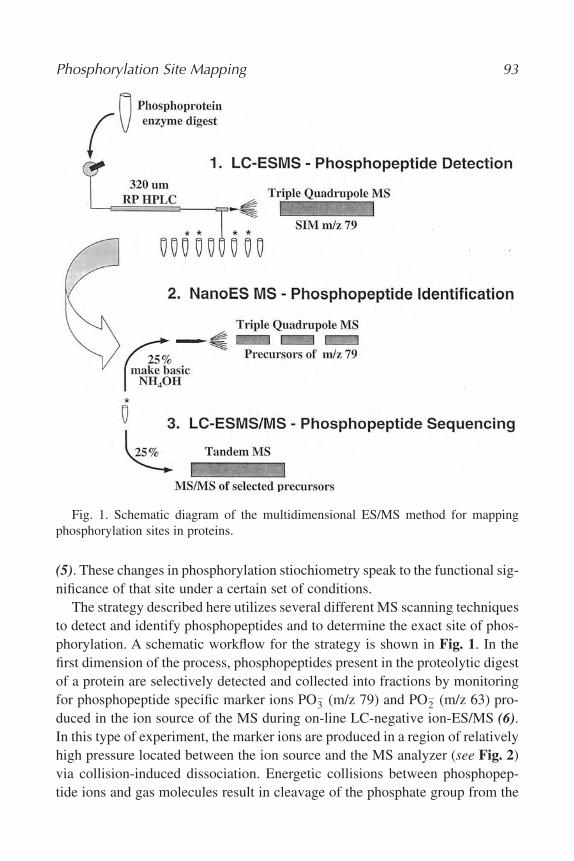
(5). These changes in phosphorylation stiochiometry speak to the functional sig-nificance of that site under a certain set of conditions.
The strategy described here utilizes several different MS scanning techniquesto detect and identify phosphopeptides and to determine the exact site of phos-phorylation. A schematic workflow for the strategy is shown in Fig. 1. In thefirst dimension of the process, phosphopeptides present in the proteolytic digestof a protein are selectively detected and collected into fractions by monitoringfor phosphopeptide specific marker ions PO3
� (m/z 79) and PO2� (m/z 63) pro-
duced in the ion source of the MS during on-line LC-negative ion-ES/MS (6).In this type of experiment, the marker ions are produced in a region of relativelyhigh pressure located between the ion source and the MS analyzer (see Fig. 2)via collision-induced dissociation. Energetic collisions between phosphopep-tide ions and gas molecules result in cleavage of the phosphate group from the
Phosphorylation Site Mapping 93
Fig. 1. Schematic diagram of the multidimensional ES/MS method for mappingphosphorylation sites in proteins.
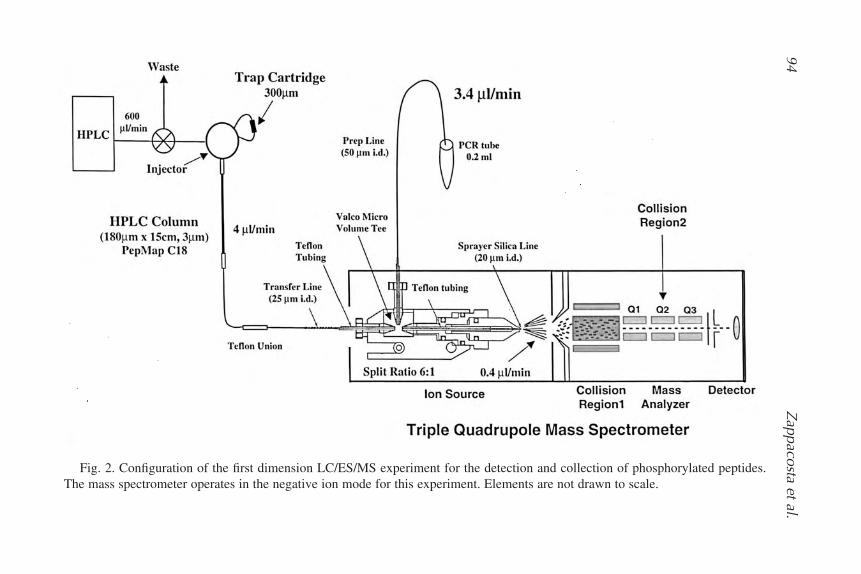
94Z
appacosta et al.
Fig. 2. Configuration of the first dimension LC/ES/MS experiment for the detection and collection of phosphorylated peptides.The mass spectrometer operates in the negative ion mode for this experiment. Elements are not drawn to scale.
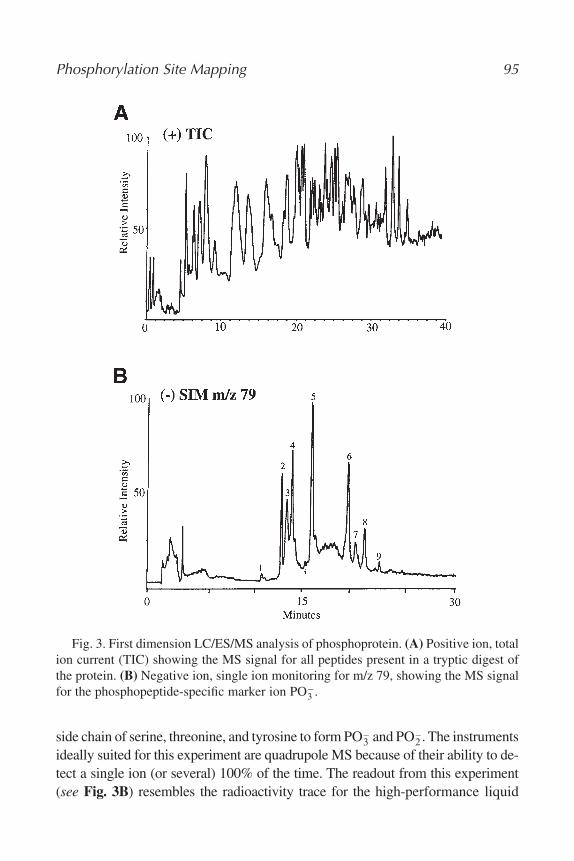
side chain of serine, threonine, and tyrosine to form PO3� and PO2
�. The instrumentsideally suited for this experiment are quadrupole MS because of their ability to de-tect a single ion (or several) 100% of the time. The readout from this experiment(see Fig. 3B) resembles the radioactivity trace for the high-performance liquid
Phosphorylation Site Mapping 95
Fig. 3. First dimension LC/ES/MS analysis of phosphoprotein. (A) Positive ion, totalion current (TIC) showing the MS signal for all peptides present in a tryptic digest ofthe protein. (B) Negative ion, single ion monitoring for m/z 79, showing the MS signalfor the phosphopeptide-specific marker ion PO3
�.
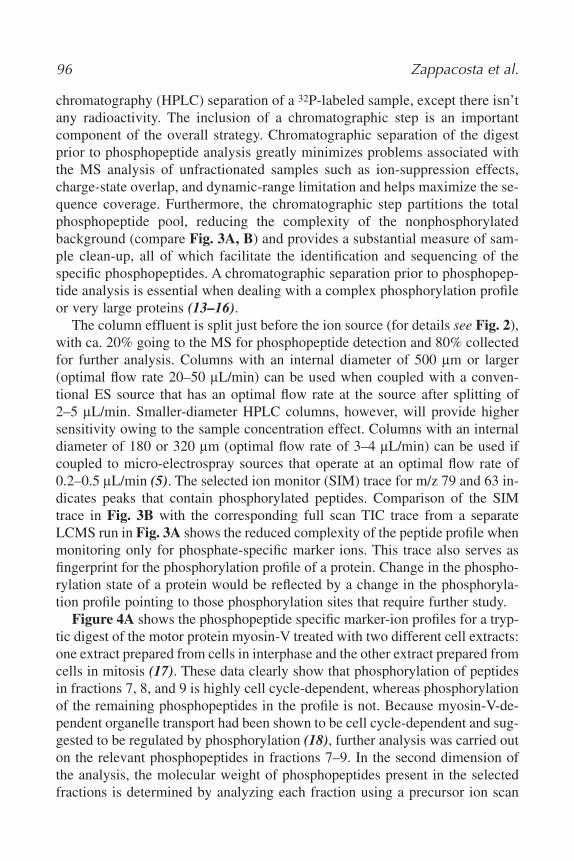
chromatography (HPLC) separation of a 32P-labeled sample, except there isn’tany radioactivity. The inclusion of a chromatographic step is an importantcomponent of the overall strategy. Chromatographic separation of the digestprior to phosphopeptide analysis greatly minimizes problems associated withthe MS analysis of unfractionated samples such as ion-suppression effects,charge-state overlap, and dynamic-range limitation and helps maximize the se-quence coverage. Furthermore, the chromatographic step partitions the totalphosphopeptide pool, reducing the complexity of the nonphosphorylatedbackground (compare Fig. 3A, B) and provides a substantial measure of sam-ple clean-up, all of which facilitate the identification and sequencing of thespecific phosphopeptides. A chromatographic separation prior to phosphopep-tide analysis is essential when dealing with a complex phosphorylation profileor very large proteins (13–16).
The column effluent is split just before the ion source (for details see Fig. 2),with ca. 20% going to the MS for phosphopeptide detection and 80% collectedfor further analysis. Columns with an internal diameter of 500 lm or larger(optimal flow rate 20–50 lL/min) can be used when coupled with a conven-tional ES source that has an optimal flow rate at the source after splitting of2–5 lL/min. Smaller-diameter HPLC columns, however, will provide highersensitivity owing to the sample concentration effect. Columns with an internaldiameter of 180 or 320 lm (optimal flow rate of 3–4 lL/min) can be used ifcoupled to micro-electrospray sources that operate at an optimal flow rate of0.2–0.5 lL/min (5). The selected ion monitor (SIM) trace for m/z 79 and 63 in-dicates peaks that contain phosphorylated peptides. Comparison of the SIMtrace in Fig. 3B with the corresponding full scan TIC trace from a separateLCMS run in Fig. 3A shows the reduced complexity of the peptide profile whenmonitoring only for phosphate-specific marker ions. This trace also serves asfingerprint for the phosphorylation profile of a protein. Change in the phospho-rylation state of a protein would be reflected by a change in the phosphoryla-tion profile pointing to those phosphorylation sites that require further study.
Figure 4A shows the phosphopeptide specific marker-ion profiles for a tryp-tic digest of the motor protein myosin-V treated with two different cell extracts:one extract prepared from cells in interphase and the other extract prepared fromcells in mitosis (17). These data clearly show that phosphorylation of peptidesin fractions 7, 8, and 9 is highly cell cycle-dependent, whereas phosphorylationof the remaining phosphopeptides in the profile is not. Because myosin-V-de-pendent organelle transport had been shown to be cell cycle-dependent and sug-gested to be regulated by phosphorylation (18), further analysis was carried outon the relevant phosphopeptides in fractions 7–9. In the second dimension ofthe analysis, the molecular weight of phosphopeptides present in the selectedfractions is determined by analyzing each fraction using a precursor ion scan
96 Zappacosta et al.
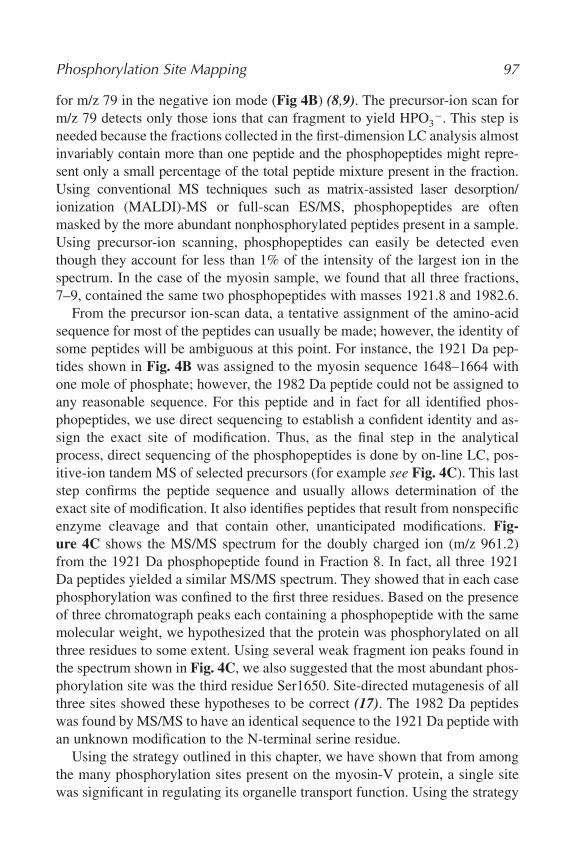
for m/z 79 in the negative ion mode (Fig 4B) (8,9). The precursor-ion scan form/z 79 detects only those ions that can fragment to yield HPO3
�. This step isneeded because the fractions collected in the first-dimension LC analysis almostinvariably contain more than one peptide and the phosphopeptides might repre-sent only a small percentage of the total peptide mixture present in the fraction.Using conventional MS techniques such as matrix-assisted laser desorption/ionization (MALDI)-MS or full-scan ES/MS, phosphopeptides are oftenmasked by the more abundant nonphosphorylated peptides present in a sample.Using precursor-ion scanning, phosphopeptides can easily be detected eventhough they account for less than 1% of the intensity of the largest ion in thespectrum. In the case of the myosin sample, we found that all three fractions,7–9, contained the same two phosphopeptides with masses 1921.8 and 1982.6.
From the precursor ion-scan data, a tentative assignment of the amino-acidsequence for most of the peptides can usually be made; however, the identity ofsome peptides will be ambiguous at this point. For instance, the 1921 Da pep-tides shown in Fig. 4B was assigned to the myosin sequence 1648–1664 withone mole of phosphate; however, the 1982 Da peptide could not be assigned toany reasonable sequence. For this peptide and in fact for all identified phos-phopeptides, we use direct sequencing to establish a confident identity and as-sign the exact site of modification. Thus, as the final step in the analyticalprocess, direct sequencing of the phosphopeptides is done by on-line LC, pos-itive-ion tandem MS of selected precursors (for example see Fig. 4C). This laststep confirms the peptide sequence and usually allows determination of theexact site of modification. It also identifies peptides that result from nonspecificenzyme cleavage and that contain other, unanticipated modifications. Fig-ure 4C shows the MS/MS spectrum for the doubly charged ion (m/z 961.2)from the 1921 Da phosphopeptide found in Fraction 8. In fact, all three 1921Da peptides yielded a similar MS/MS spectrum. They showed that in each casephosphorylation was confined to the first three residues. Based on the presenceof three chromatograph peaks each containing a phosphopeptide with the samemolecular weight, we hypothesized that the protein was phosphorylated on allthree residues to some extent. Using several weak fragment ion peaks found inthe spectrum shown in Fig. 4C, we also suggested that the most abundant phos-phorylation site was the third residue Ser1650. Site-directed mutagenesis of allthree sites showed these hypotheses to be correct (17). The 1982 Da peptideswas found by MS/MS to have an identical sequence to the 1921 Da peptide withan unknown modification to the N-terminal serine residue.
Using the strategy outlined in this chapter, we have shown that from amongthe many phosphorylation sites present on the myosin-V protein, a single sitewas significant in regulating its organelle transport function. Using the strategy
Phosphorylation Site Mapping 97
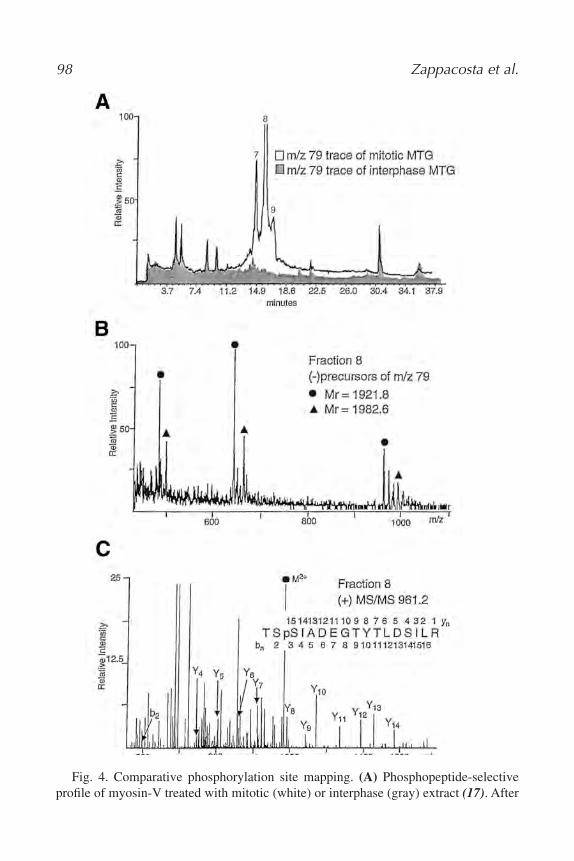
98 Zappacosta et al.
Fig. 4. Comparative phosphorylation site mapping. (A) Phosphopeptide-selectiveprofile of myosin-V treated with mitotic (white) or interphase (gray) extract (17). After
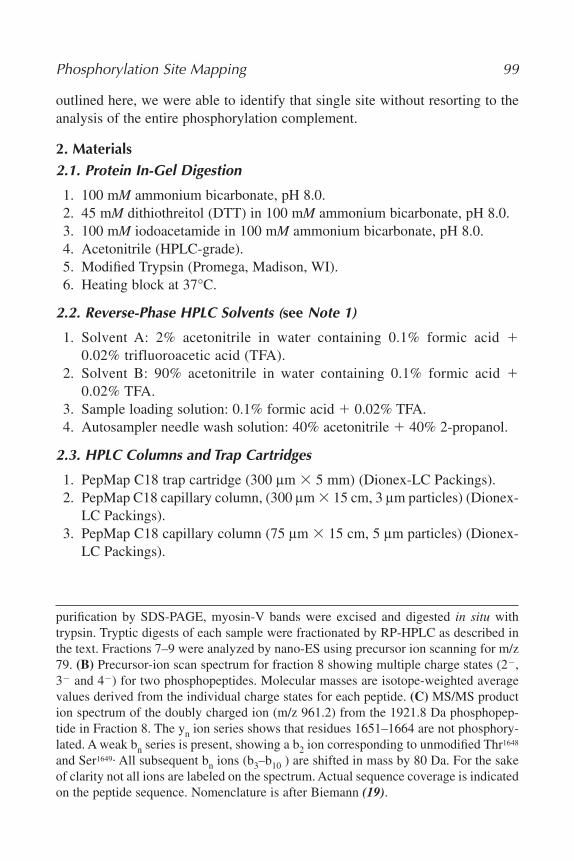
outlined here, we were able to identify that single site without resorting to theanalysis of the entire phosphorylation complement.
2. Materials2.1. Protein In-Gel Digestion
1. 100 mM ammonium bicarbonate, pH 8.0.2. 45 mM dithiothreitol (DTT) in 100 mM ammonium bicarbonate, pH 8.0.3. 100 mM iodoacetamide in 100 mM ammonium bicarbonate, pH 8.0.4. Acetonitrile (HPLC-grade).5. Modified Trypsin (Promega, Madison, WI).6. Heating block at 37°C.
2.2. Reverse-Phase HPLC Solvents (see Note 1)
1. Solvent A: 2% acetonitrile in water containing 0.1% formic acid �0.02% trifluoroacetic acid (TFA).
2. Solvent B: 90% acetonitrile in water containing 0.1% formic acid �0.02% TFA.
3. Sample loading solution: 0.1% formic acid � 0.02% TFA.4. Autosampler needle wash solution: 40% acetonitrile � 40% 2-propanol.
2.3. HPLC Columns and Trap Cartridges
1. PepMap C18 trap cartridge (300 lm � 5 mm) (Dionex-LC Packings).2. PepMap C18 capillary column, (300 lm � 15 cm, 3 lm particles) (Dionex-
LC Packings).3. PepMap C18 capillary column (75 lm � 15 cm, 5 lm particles) (Dionex-
LC Packings).
Phosphorylation Site Mapping 99
purification by SDS-PAGE, myosin-V bands were excised and digested in situ withtrypsin. Tryptic digests of each sample were fractionated by RP-HPLC as described inthe text. Fractions 7–9 were analyzed by nano-ES using precursor ion scanning for m/z79. (B) Precursor-ion scan spectrum for fraction 8 showing multiple charge states (2�,3� and 4�) for two phosphopeptides. Molecular masses are isotope-weighted averagevalues derived from the individual charge states for each peptide. (C) MS/MS production spectrum of the doubly charged ion (m/z 961.2) from the 1921.8 Da phosphopep-tide in Fraction 8. The yn ion series shows that residues 1651–1664 are not phosphory-lated. A weak bn series is present, showing a b2 ion corresponding to unmodified Thr1648
and Ser1649. All subsequent bn ions (b3–b10 ) are shifted in mass by 80 Da. For the sakeof clarity not all ions are labeled on the spectrum. Actual sequence coverage is indicatedon the peptide sequence. Nomenclature is after Biemann (19).
2.4. Nano-ES Solvents for m/z 79 Precursor-Ion Scanning
1. Basic solution: 50% methanol in water containing 10% ammonium hy-droxide (made from a 30% stock solution).
2.5. Instrumentation
1. Phosphopeptide selective LC/ES/SIM experiments have been carried outusing an API III triple quadrupole MS (Sciex/Applied Biosystem) equippedwith a nanoflow source from Micromass (Waters). This experiment hasbeen shown by other laboratories around the world to work equally well ona variety of triple quadrupole instruments from this and other manufactur-ers. Instrument lens and voltages used to optimize sensitivity for produc-tion of the marker ions will vary among the different kinds of triple quads.Single quadrupole instruments can also be used.
2. Precursor-ion spectra are acquired on an API 3000 triple quadrupole MS(Sciex/Applied Biosystem) equipped with a nano ES source (Sciex/Applied Biosystem). These experiments can also be performed on anyother triple quadrupole MS system. We use medium size metal-coatedcapillary nano-ES spray tips available commercially (Proxeon, OdenseM Denmark).
3. Targeted LC/MS/MS is performed on a Micromass QTOF instrumentequipped with a Micromass nanoflow source. Any type of LC-tandem MSinstruments can be used to produce MS/MS data. Sensitivity and resolutionwill vary with make and model.
4. A conventional Shimadzu HPLC system is used for the capillaryLC/ES/MS/SIM experiments. A precolumn flow rate of 4 lL/min wasachieved using an LC-Packing Acurate microflow splitter. Postcolumn splitis made using a stainless steel or titanium 0.15-mm i.d. micro-volume Valcotee near the source to make the high-voltage connection.
5. An LC Packings Ultimate system is used for the nanobore LC/MS/MSexperiments.
3. Methods3.1. Protein In-Gel Digestion (see Note 2)
1. Excise the band of interest from a Coomassie Blue stained gel (see Note 3)using a clean razor blade or scalpel. The gel band is placed in a 2.0-mLscrew-cap tube.
2. Wash with 500 lL of 100 mM ammonium bicarbonate, pH 8.0, for at least1 h or until Coomassie blue stain is gone (see Note 4).
3. Discard the liquid. Add 150 lL of 100 mM ammonium bicarbonate, pH 8.0,and 10 lL of 45 mM DTT in 100 mM ammonium bicarbonate. Incubate for30 min at 37°C.
100 Zappacosta et al.
4. Add 10 lL of 100 mM Iodoacetamide in 100 mM ammonium bicarbonate.Incubate for 30 min at room temperature in the dark (see Notes 5 and 6)
5. Discard the liquid. Wash the gel piece with 1 mL of 50% acetonitrile (v/v)in 100 mM ammonium bicarbonate, pH 8.0, for 2 h.
6. Discard the liquid. The gel band is cut in small pieces (1�1 mm) and placedin a 0.5-mL microcentrifuge tube.
7. Add 50 lL of acetonitrile. Let it stand for 15 min at room temperature. Re-move the liquid and dry down the gel piece in a Speed-Vac.
8. Gel band is re-swollen in 10 lL of a modified trypsin solution (10 ng/lL in100 mM ammonium bicarbonate, pH 8.0). Allow to re-swell for 15 min andthen add the appropriate volume of 100 mM ammonium bicarbonate,pH 8.0, to cover the band (usually 15–30 lL ) (see Notes 7 and 8).
9. Incubation at 37°C overnight.10. Transfer the liquid to a clean 0.5-mL microcentrifuge tube.11. Add 25 lL of acetonitrile (or enough liquid to cover the band). Let stand
for 10 min. Transfer the liquid to the tube containing the digestion solution.12. Repeat step 10 (see Note 9).13. Concentrate the sample using a Speed-Vac. This step is required both to
remove the organic solvent before LC separation as well as to reduce sam-ple volume. Do not let the sample go dry.
3.2. Phosphopeptide Mapping Using a Multidimensional ES/MS-Based Strategy3.2.1. First-Dimension Analysis: Micropreparative Fractionation ofPhosphopeptides Using Phosphate-Specific LC/ES/MS (see Note 10)
1. Prior to analysis of samples the production and detection of the phosphate-specific marker ions by LC/MS should be optimized (see Note 11). Gener-ally speaking, the optimization of the ion-source conditions for the pro-duction of the marker ions needs only to be done once, but sensitivityshould be checked prior to any round of experiments. For general tuningand calibration (see Note 12).
2. After checking the MS sensitivity, the LC is connected to the mass spec-trometer and the whole set-up tested by injecting 200 fmol of phosphopep-tide standard TRDIYETDYpYRK (Anaspec, San Jose, CA). For this phos-phopeptide, under these conditions, a signal-to-noise ratio of ca. 10:1should be observed.
3. Protein digests to be analyzed are acidified (pH �3.0) using an appropriatevolume of 0.1% TFA or loading solution.
4. Protein digests are injected onto a PepMap C18 trap cartridge (300 lm �5 mm) used in place of the sample loop on the HPLC injector (see Note 13).After washing with loading solution, the peptides are back flushed off of
Phosphorylation Site Mapping 101
the cartridge with a 4 lL/min acetonitrile/water gradient (2–50% B in20–30 min) onto a PepMap C18 capillary column (300 lm � 15cm, 3 lmparticles) fitted directly into the injector. HPLC mobile phases contain both0.1% formic acid and 0.02% TFA (see Note 14). The column outlet is con-nected to a Micromass nanoflow ion source via a 25 lm i.d. fused silica linethreaded directly into the source (see Fig. 2). Column flow is split prior tothe MS by means of a 0.15 mm i.d. microvolume Valco tee insert, whichdirects 0.4–0.6 lL/min to a 20 lm i.d. tapered fused silica ES tip from NewObjectives (Cambridge, MA) (see Note 15). The remainder of the flow issent to the prep line for manual collection into polymerase chain reaction(PCR) tubes. The prep line is PEEK (63 lm i.d., 22.5 cm length) from thesource tee to a Valco union (SS, 0.15 mm i.d.) and fused silica (50 lm i.d.,45 cm length) on the other side of the union (see Note 16).
5. Fractions that have been shown to contain phosphopeptides are manuallycollected into PCR tubes (see Note 17), and immediately placed on ice.Fractions are stored at –70°C (see Note 18).
3.2.2. Second-Dimension Analysis: Determination of the MolecularMasses of the Phosphopeptides by Nano-ES With Precursor Ion Scanning
1. Phosphopeptides are detected in the fractions collected in the first dimen-sion by precursor-ion scanning for m/z 79 (PO3
–) (see Note 19). Precursorion mass spectra are obtained using a nano-ES interface.
2. One-half (or less for abundant phosphopeptides) of each fraction that con-tains phosphopeptides (or only fractions containing phosphopeptides of in-terest in cases of differential phosphorylation studies) is made basic byadding one volume of 50/50 methanol/water containing 10% ammoniumhydroxide (see Note 20). 1.5 lL of sample in the basic solution is loadedinto the back of a medium, metal-coated ES spray needle using an elec-trophoresis gel-loading pipet tip. The nanospray needle is positioned in theion source with the aid of the 2 CCD cameras (see Note 21).
3. Acquire full-scan negative ion spectra to check instrument status and de-termine optimal spray flow and positioning (see Notes 22 and 23).
4. Acquire negative ion m/z 79 precursor-ion spectra to determine the molec-ular weight of the phosphopeptide(s) present in the fractions (see Note 24).In some cases, phosphopeptides can be identified at this stage by theirmolecular weight.
3.2.3. Third-Dimension Analysis: Localization of the Site of Modification by Targeted On-Line LC/MS/MS
Once identified, phosphorylated peptides are sequenced by targeted LC/ES/MS/MS on a Micromass QTOF equipped with a nanoflow ion source. Individ-
102 Zappacosta et al.
ual fractions are loaded on a PepMap C18 trap cartridge (300 lm � 5 mm) and,after washing of the cartridge with loading solution, are back-flushed onto aPepMap C18 capillary column (75 lm � 15cm, 5lm particles) at 0.3 lL/minusing a 5–50% B gradient in 30 min. HPLC mobile phases contained 0.1%formic acid and 0.02% TFA. MS/MS data are collected on a single precursor oron a set of predefined precursors (see Note 25) using a 2-s scan with a precur-sor-ion window of �3 Da. When multiple precursors need to be sequenced (seeNote 26), different precursors can be analyzed according to their retention timein time windows during the LC separation. For closely eluting peptides, the in-strument can be set to alternate between precursors after each scan. By target-ing a single precursor m/z (or several in a time dependent manner), we are ableto integrate the MS/MS signal over the entire elution profile of the peptide, thusobtaining some of the nano-ES signal averaging advantage while taking advan-tage of the tremendous concentration advantage provided by 75 lm (i.d.) cap-illary LC columns. The use of the chromatographic step also significantly re-duces interference from chemical noise and other peptides of similar m/z (seeNote 27).
Alternatively, if there is no fractionated sample left, targeted LC/ES/MS/MScan be performed on the whole peptide mixture.
4. Notes1. All solvents must be HPLC-grade. All chemicals must be of the highest pu-
rity commercially available.2. This procedure assumes one SDS-PAGE band from a 1.0-mm thick mini
gel. When working with gel-purified sample, gloves must be worn at alltimes (including staining of the gel, excision of the bands, and protease di-gestion) and clean laboratory procedures must be applied (i.e., always keeptubes in closed containers, change solutions often, do not touch with barehands tubes and tips, wash surfaces that will be in contact with the gel withwater and methanol). This will help to minimize keratin and dust contami-nation. Although these precautions do not seem to be as critical in the firsttwo dimensions of the strategy in which only phosphopeptides are detected,it might affect the third-dimension experiment.
3. The procedure reported for the detection and identification of phosphopep-tides has not been tested with silver-stained gel bands. Whenever possible,colloidal Coomassie should be used.
4. For heavily Comassie-stained bands, an overnight wash is advisable.Coomassie Blue dye contains a sulfonate group that will generate a SO3
�
ion (m/z 80) both in the first-dimension and in the second dimensionexperiment. During the LC separation, the dye will elute very late in thegradient, so in most cases it should not interfere with the analysis, how-ever, it is probably advisable to remove it anyway. Extensive washes
Phosphorylation Site Mapping 103
are mandatory in cases when no LC separation is used prior to m/z 79precursor-ion scanning.
5. DTT and iodoacetamide solutions can be prepared and kept at 4°C for a fewdays. The iodoacetamide solution should be kept in the dark (for instance,by wrapping the tube in foil).
6. Reduction and alkylation is essential for samples separated by first-dimen-sion SDS-PAGE even when the reducing agent was already present in theloading buffer. This step, however, might be skipped if samples are derivedfrom second-dimension-gel electrophoresis in that a reduction and an alky-lation step is already performed between the first- and second-dimensionanalysis.
7. The most commonly used enzyme for generating peptide digests for mass-spectrometric analysis is trypsin. This enzyme, which specifically cleavesafter the Lys and Arg residues (except cases when the following residue isa Pro), usually generates peptides ideally suited for MS analysis in size(500–3000 Da) and that present fragmentation patterns well-understood.However, other proteolytic enzyme can be used if the sequence of the pro-tein under investigation requires it. Asp-N, Glu-C, Lys-C, and Arg-C are alluseful. Enzymes with less-stringent specificity such as chymotrypsin mightstill be used, though nearly all peptide assignments will need to be validatedby MS/MS sequencing.
8. Modified porcine trypsin (Promega) is usually employed in our laboratory.In this form of the enzyme, the Lys residues have been modified so as topartially inhibit autolysis. A 100 ng/lL trypsin solution is prepared in water,aliquoted (10 lL/aliquots), and immediately stored at –20°C. For each use,90 lL of 100 mM ammonium bicarbonate, pH 8.0, are added to an aliquot,vortexed, and 10 lL added to each dried gel band. The unused dilutedenzyme is discarded.
9. Although we found that organic extraction does not greatly improve the ex-traction of the peptides from the gel matrix, we still use it to displace all thepeptide-containing aqueous solution trapped in the gel pieces.
10. Introducing an HPLC separation step will provide sample clean-up andpeptide fractionation. However, very hydrophilic or very hydrophobic(phospho) peptides might not be recovered after the LC separation owingto their chromatographic properties on typical C18 stationary phases. Inthese cases, an alternative (or additional) proteolytic digestion might beemployed in order to change the character of the peptide.
11. Conditions described here are specific to acquisition of ES mass spectra onSciex/Applied Biosystems quadrupole mass spectrometer API-III (Con-cord, Ontario, Canada). Instrument conditions (declustering potential,spray position, sample flowrates, gas flows, voltage settings, etc.) for the
104 Zappacosta et al.
production of m/z 63 and 79 are optimized by infusing a 5 pmol/lL solu-tion of a phosphopeptide standard in 30% HPLC mobile phase B contain-ing 0.1% formic acid � 0.02 % TFA. We use KRPpSQRHGSK (Univer-sity of Michigan Protein and Carbohydrate Structure Facility). The signalfor m/z 63 and 79 are simultaneously monitored in real time by SIM (100ms dwell per ion). The signals are then maximized individually by adjust-ing the declustering potential for each. On the Sciex API-III, the optimaldeclustering voltages are ca. �350V for m/z 63, and �300V for m/z 79using TFA-containing mobile phases. The low mass region of the spectrumcontaining the phosphate marker ions is shown in Fig. 5A. For comparisonthe solvent background is shown in Fig. 5B. The signal-to-background form/z 63 and 79 is typically ca. 40:1 and 70:1, respectively, by constantinfusion of the standards under these conditions.
12. Tuning and calibration is performed using a solution containing a mixtureof polypropylene glycol (PPG) 425, 1000, and 2000 (3 � 10-5M, 1 �10-4M, and 2 � 10-4M, respectively) in 50/50/0.1 water/methanol/formicacid (v/v/v), 1 mM ammonium acetate. The m/z range of 10–2400 is cali-brated in the negative-ion mode by multiple-ion monitoring of the isotopeclusters of six PPG ion signals and two TFA-related ions, m/z 69 (CF3) andm/z 113 (CF3CO2). The TFA-derived ions are present as background in anymass spectrometer that is regularly exposed to TFA-containing HPLC mo-bile phases. Mass spectra are recorded at instrument conditions sufficientto resolve the first two isotopes of anion m/z 991.7 (PPG � HCO2)� sothat the valley between them is 55% of the height of the second isotope forthe singly charged ion.
13. The use of a trap cartridge in place of an injection loop has two advantages:it allows loading of a larger sample volume and provides sample clean-up.Injection volume can be up to several hundred lL. Wash of the trap car-tridge after sample loading should be performed in 0.1% TFA or loadingsolution regardless of the solvent used during the LC run. Under these con-ditions, retention of the hydrophilic peptides on the trap cartridge is maxi-mized. For best retention of peptides, caution should be used not to load thesample too quickly. On this size trap, we typically load 10 lL in 20–30 s.
14. Although conventional 0.1% TFA-containing mobile phases may beemployed, sensitivity for phosphopeptide detection is increased approx2.5-fold (as measured by signal-to-noise ratio) using a combination of0.02% TFA and 0.1% formic acid. The degree to which the quality of thechromatographic separation is compromised can range from minimal tosignificant depending on the specific type of C18 employed. Therefore,columns should be tested with a mixture of standard phosphorylated andnonphosphorylated peptides prior to committing real samples for analysis.
Phosphorylation Site Mapping 105
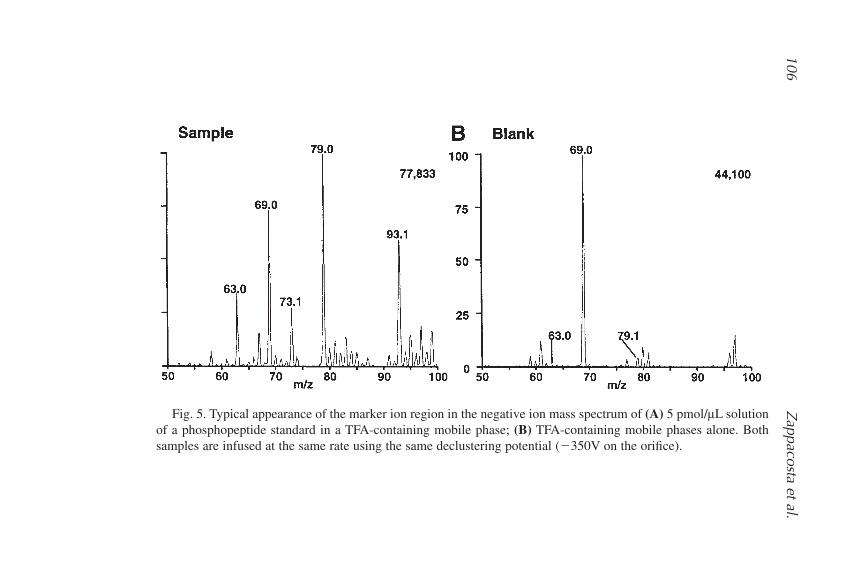
106Z
appacosta et al.
Fig. 5. Typical appearance of the marker ion region in the negative ion mass spectrum of (A) 5 pmol/lL solutionof a phosphopeptide standard in a TFA-containing mobile phase; (B) TFA-containing mobile phases alone. Bothsamples are infused at the same rate using the same declustering potential (�350V on the orifice).
For maximum sensitivity of peptide analysis by LC/ES/MS positive ion,TFA may be eliminated altogether and replaced with 0.2% formic acid.However, no apparent benefit is seen for phosphate marker ion sensitivitywhen doing LC/ES/MS SIM with 0.2 % formic acid alone. Some chro-matographic peak integrity is sacrificed under these conditions, althoughcertain column packings (such as the PepMap C18 phase, LC-Packingsused in our laboratory) can perform very well.
15. To reduce the risk of plugging, immediately following LC/ES/MS, a sy-ringe is connected in place of the column flow and methanol is infused toflush the source and split lines free of acetonitrile and TFA. Following this,the syringe is filled with air and the system flushed until no liquid is seencoming from the ends of the spray and the prep fused silica.
16. The prep line union is grounded to prevent electrospraying at the exit.When manually collecting fractions according to elution profile, a delaytime given by the length of the prep line should be taken in consideration.
17. To minimize coelution of several phosphopeptides, fractions should be col-lected according to the LC/SIM peak elution profile and not at specifiedtime intervals.
18. When working with low-abundance phosphopeptides, it is imperative tocarry out the whole phosphorylation mapping procedure in the shortest timepossible, never letting the fractions sit for more than a day or two.
19. Phosphopeptide-selective detection by precursor ion scanning using nano-ES is optimized using freshly prepared stock solutions of standard phospho-peptides to produce and detect the m/z 79 (PO3
�) marker ion. Five hundredfemtomoles of phosphopeptide KRPpSQRHGSKY (University of Michi-gan Protein Structure Facility) is diluted just prior to analysis to a final con-centration of 100 femtomole/lL using 5 lL of 50/50 methanol/watercontaining 10% ammonium hydroxide. The basic solution is made up freshby diluting a 30% ammonium hydroxide stock solution with H2O to make a20% NH4OH solution, which is then mixed 1:1 with methanol in a 1.5-mLEppendorf tube. 1.5 lL of the standard solution is loaded into the nanospraycapillary. The resolution of Q3 is reduced to pass a 4–5 Da window aroundthe marker ion of interest (m/z 79) to enhance precursor scan sensitivity. Afurther small gain in sensitivity is obtained by decreasing the resolution ofQ1. Nitrogen gas is used as the collision gas in Q2.
20. In our previously reported studies, dried down the samples prior to nega-tive-ES precursor ion scanning for m/z 79 experiments. Samples wereafterwards resuspended in 50/50 methanol/water containing 10% ammo-nium hydroxide. However, we found that bringing samples to dryness wasthe main cause of tip plugging. Therefore we changed our protocol and nowjust make the solution basic by adding an appropriate volume of 50/50
Phosphorylation Site Mapping 107
methanol/water containing 10% ammonium hydroxide, typically 1:1 sam-ple to basic solution. This has reduced drastically the incidence of tip plug-ging. After fractions have been made basic, the samples should be analyzedas soon as possible, preferably the same day.
21. The optimal position in terms of S/N on the Sciex nano-ES source is a fewmm directly in front of the orifice. To generate a stable signal and maintaina minimum flow rate (20–40 nL/min), a positive air pressure on the samplein the capillary, of slightly more than atmosphere, usually is required. Somecapillaries require touching to the gate valve plate (voltages off and apply-ing air pressure) to initiate sample flow. With sample flowing, the elec-tronics are then turned on before the final adjustment of moving the capil-lary toward the orifice. This last adjustment is made using the cameras andby monitoring the changes in the mass spectra from scan to scan in realtime. Tuning and calibration for full-scan data acquisition in negative ionnano-ES modes is carried out as described in Note 12.
22. In order to help prevent plugging of the needle and, hence, deterioration ofspray stability (which can happen during negative ion nano-ES of basic so-lutions), a slightly higher spray air pressure is used compared to that neededto do positive ion. If plugging occurs, it can often be removed by increas-ing the air pressure to the capillary, and forceful touching of the tip to theentrance plate (with voltages off). When a droplet is observed, air pressureis reduced to normal operating levels.
23. When acquiring data on samples that approach the limit of detection (lessthan 50 fmoles total), there may be little or no obvious peptide signal in thefull-scan negative ion mode. In such cases, we often add a peptide as an in-ternal standard to the sample (50 fmole/lL). In this case, a narrow m/z win-dow around the peptide can be used to rapidly assess S/N and spray stabil-ity while optimizing air pressure (flow rate) and sprayer position.
24. Acquisition is terminated when the overall ion statistics and appearance ofthe spectrum are satisfactory to the researcher. Acquisition times canrange between a few minutes (3–5 min) for abundant phosphopeptides, to30–45 min for samples that approach the limit of detection.
25. If enough material is available, it might be wise to use a small aliquot ofthe sample for LC/MS analysis to determine the preferential charge statefor the phosphopeptide(s) under investigation. By switching from negativeto positive ion and from basic to acidic condition, the most abundant chargestate can not always be anticipated. LC/MS analysis will be beneficial evenin these cases when more that one phosphopeptide per fraction needs to betargeted for sequencing. Knowledge of the retention time, in fact, will allowsequencing several precursors in a single-targeted LC/MS/MS experimentby changing the targeted precursor according to its elution time.
108 Zappacosta et al.
26. On a QTOF instrument (as well as on a triple quadrupole instrument) theamount of collision energy (CE) applied to induce peptide fragmentation iscritical for the quality of the spectra and therefore for the completeness ofthe sequence. A certain correlation exists between peptide size, charge state,and optimal CE (for instance for a doubly charged peptide at m/z 650, theoptimal CE should range around 26–27 eV). These value can be empiricallydetermined. For the Micromass Q TOF, a list of collision energies for var-ious peptide m/z and charge-state ranges is available with the instrument toassist in setting up the LC/MS/MS experiments. It should be noted that theCE values suggested by Micromass are almost invariably too high for triplycharged peptides. Whenever the phosphorylation stoichiometry is low (ca.5–10%), a viable alternative is to determine optimal conditions using thenonphosphorylated counterpart, which of course will require far less sam-ple. The bulk of the sample can then be used for sequencing the phospho-peptide. It should be pointed out that if an ion trap instrument is used in-stead of a quadrupole-TOF instrument for targeted peptide LC/MS/MS, thecollisional parameters are less critical.
27. In some cases, nano-ES might be a better choice for phosphopeptides se-quencing over targeted LC/ES/MS/MS. For large or otherwise difficult tofragment peptides, averaging of the signal over a longer period of time canbe extremely beneficial.
References1. Hunter, T. (1987) A thousand and one protein kinases Cell 50, 823–829.2. Cohen, P. (2000) The regulation of protein function by multisite phosphorylation:
a 25 year update. Trends Biochem. Sci. 25, 596–601.3. Boyle, W. J., van der Geer, P., and Hunter, T. (1991) Phosphopeptide mapping and
phosphoamino acid analysis by two-dimensional separation on thin-layer celluloseplates. Methods Enzymol. 201, 110–149.
4. Annan, R. S., Huddleston, M. J., Verma, R., et al. ( 2001) A multidimensionalelectrospray MS-based approach to phosphopeptide mapping. Anal. Chem. 73,393–404.
5. Zappacosta, F., Huddleston, M. J., Karcher, R. L., et al., (2002) Improved sensitiv-ity for phosphopeptide mapping using capillary column HPLC and microionspraymass spectrometry: comparative phosphorylation site mapping from gel-derivedproteins. Anal. Chem. 74, 3221–32.
6. Huddleston, M. J., Annan, R. S., Bean, M. F., and Carr, S. A. (1993) Selective de-tection of phosphopeptides in complex mixtures by electrospray liquid chromatog-raphy/mass spectrometry. J. Am. Soc. Mass. Spectrom. 4, 710–715.
7. Watts, J. D., Affolter, M., Krebs, D. L., et al. (1994) Identification by electrosprayionization mass spectrometry of the sites of tyrosine phosphorylation induced in
Phosphorylation Site Mapping 109
activated Jurkat T cells on the protein tyrosine kinase ZAP-70. J. Biol. Chem. 269,29,520–29,529.
8. Wilm, M., Neubauer, G., and Mann, M. (1996) Parent ion scans of unseparated pep-tide mixtures. Anal. Chem. 68, 527–533.
9. Carr, S. A., Huddleston, M. J., and Annan, R. S. (1996) Selective detection and se-quencing of phosphopeptides at the femtomole level by mass spectrometry. Anal.Biochem. 239, 180–92.
10. Zhang, X., Herring, C. J., Romano, P. R., et al. (1998) Identification of phosphory-lation sites in proteins separated by polyacrylamide gel electrophoresis. Anal.Chem. 70, 2050–2059.
11. Posewitz, M. C. and Tempst, P. (1999) Immobilized gallium(III) affinity chro-matography of phosphopeptides. Anal. Chem. 71, 2883–2892.
12. Steen, H., Kuster, B., Fernandez, M., et al. (2001) Detection of tyrosine phospho-rylated peptides by precursor ion scanning quadrupole TOF mass spectrometry inpositive ion mode. Anal. Chem. 73, 1440–1448.
13. Verma, R., Annan, R. S., Huddleston, M. J., et al. (1997) Phosphorylation of Sic1pby G1 cyclin/Cdk is required for its degradation and entry into S phase, Science278, 455–560.
14. Chen, S. L., Huddleston, M. J., Shou, W., et al. (2002) Mass spectrometry basedmethods for phosphorylation site mapping of hyperphosphorylated proteins appliedto Net1, a regulator of exit from mitosis in yeast. Mol. Cell Proteomics 1, 186–196.
15. Wu, X., Ranganahan, V., Weisman, D. S., et al. (2000) ATM phosphorylation of Ni-jmegen breakage syndrome protein is required in a DNA damage response. Nature405, 477–482.
16. Watty, A., Neubauer, G., Dreger, M., et al. (2000) The in vitro and in vivo phos-photyrosine map of activated MuSK. Proc. Nat. Acad. Sci. USA 97, 4585–4590.
17. Karcher, R. L., Roland, J. T., Zappacosta, F., et al. (2001) Cell cycle regulation ofmyosin-V by calcium/calmodulin-dependent protein kinase II. Science 293,1317–1320.
18. Rogers, S. L., Karcher, R. L., Roland, J. T., et al. (1999) Regulation of melanosomemovement in the cell cycle by reversible association with myosin V. J. Cell Biol.146, 1265–1276.
19. Biemann, K. (1990) Nomenclature for Peptide Fragment Ions, in Methods in En-zymology, vol. 193 (McCloskey J., ed.), Academic Press, pp. 886–887.
110 Zappacosta et al.
8
Studies of Calmodulin-Dependent Regulation
Paul C. Brandt and Thomas C. Vanaman
SummaryMethods are presented for purifying bovine testes calmodulin and the calmodulin-regulated
plasma-membrane calcium ATPase from human erythrocytes by calcium dependent affinity chro-matography. The assay of CaM Kinase II using a synthetic peptide substrate is also described.
Key Words: Affinity chromatography; calcium; calmodulin; plasma membrane calciumpumping ATPase; CaM-dependent protein kinase; enzyme assay; phenothiazine.
1. IntroductionCalmodulin (CaM) is a small (17 kDa) highly acidic protein first described
more than 30 yr ago as an activator of cyclic nucleotide phosphodiesterase (1,2),later shown to be dependent on its ability to bind calcium (3). Subsequent work(4) showed that calmodulin is widely distributed throughout all eukaryotes as ahighly conserved, high-affinity calcium-binding protein that serves as the arche-type for the EF-hand family of calcium-regulated proteins.
To date, calmodulin has been identified as a direct calcium-dependent regu-lator of numerous enzymes and proteins involved in signal transduction (for re-view see ref. 5) including the aforementioned phosphodiesterase, both mam-malian and bacterial adenylate cyclases, numerous protein kinases, thephosphoprotein phosphatase calcineurin, three forms of mammalian nitric oxidesynthase, plasma membrane calcium pumps and channels, G proteins, transcrip-tion factors, histone deacetylases, and other cellular proteins. These various
From: Methods in Molecular Biology, vol. 284:Signal Transduction Protocols
Edited by: R. C. Dickson © Humana Press Inc., Totowa, NJ
111
proteins and their corresponding regulatory cascades are involved in many di-verse aspects of cellular function, division, differentiation, and even cell death.
In almost all cases, calmodulin acts as a calcium-dependent activator of re-sponses. This requires calcium binding to all four EF-hand calcium-bindingsites that are arranged in pairs in each end of the molecule. As is now clearfrom three-dimensional structures of apo (6) and calcium replete (7) calmod-ulin, calcium binding causes conformational changes in CaM exposing hy-drophobic/ aromatic binding pockets. These pockets plus acidic residues in thecentral helix of the molecule provide a recognition surface for proteins withcomplementary basic amphipathic helical segments representing calmodulin-binding domains. Conformational flexibility of these interacting surfaces (8)permits calmodulin to bind to a variety of sequences with moderate (lM) tohigh (nM) affinity.
The variety of cellular targets for calmodulin action as well as the presenceof over 200 genes in mammals encoding proteins containing the EF hand struc-ture involved in high-affinity calcium binding make assessment of a physio-logical role for calmodulin in regulating a biological process a challenging task.This task is made even more difficult by the fact that calmodulin is an essentialprotein in all eukaryotes, thus, limiting genetic approaches.
The reader is referred to the web site http://structbio.vanderbilt.edu/cabp_database/cabp.htmL for more detailed information on calmodulin structure andfunction and the calcium-binding protein (CaBP) super family of proteins.
This chapter will describe in detail how to isolate calmodulin and calmod-ulin-binding proteins by calcium-dependent affinity-binding methods and howto assay a specific calmodulin-regulated enzyme, CaM Kinase II, in either crudehomogenates or following purification by immunoprecipitation.
2. Materials2.1. Calmodulin Purification by Trifluroaminopropylphenothiazine(TAPP): Sepharose Affinity Chromatography
1. 10X Homogenization buffer: Prepare 1 L of 100 mM Tris (12.1 g Tris-freebase), 10 mM EGTA (3.8 g) adjusted to pH 7.5 with 6 N HCl.
2. 10X TAPP loading buffer: Prepare 1 L of 100 mM Tris (12.1 g Tris-freebase), 20 mM CaCl2 (2.9 g), 2 M NaCl (116.9 g) adjusted to pH 7.5 with6 N HCl.
3. TAPP-Sepharose elution buffer: Prepare 1 L of 10 mM Tris (1.21 g Tris-free base), 200 mM NaCl (11.7 g), 10 mM EGTA (3.9 g), 1 mM 2-mercap-toethanol (70 lL) adjusted to pH 7.5 with 6 N HCl.
4. 100 mM Phenylmethylsulfonyl fluoride (PMSF) in 95% ethanol (preparedjust prior to use).
112 Brandt and Vanaman
5. TAPP-Sepharose (50 mL packed resin): Prestripped with 6 M guanidiniumchloride and equilibrated in 1X TAPP loading buffer containing 70 lL/L2-mercaptoethanol.
6. Cold deionized water.7. 6 M H2SO4 in saturated Ammonium sulfate.8. 1 M Tris-free base (121.7 g/L).9. 10 mM ammonium bicarbonate (0.79 g/L).
10. Sephadex G-50 (250 mL packed bed) in 10 mM ammonium bicarbonate.
2.2. Preparation of CaM-Sepharose
All solutions should be prepared in advance and chilled. Washing steps alsorequire large volumes of chilled deionized water.
1. Activating buffer: 2 M sodium carbonate, pH 11.0 (212 g/L)2. Washing buffer: 0.1 M sodium bicarbonate, pH 9.5 (8.4 g/L)3. Coupling buffer: 0.2 M sodium bicarbonate (16.8 g/L), 0.5 M NaCl
(29.3 g/L), pH 8.3.4. CNBr stock solution: 2 g/mL in acetonitrile (prepare immediately before use).5. CaM stock solution: 1 mg/mL in coupling buffer (prepared from dried CaM
stock immediately before use).6. Quenching solution: 1 M ethanolamine-HCl, pH 8.0.7. Storage buffer: 40 mM Tris (4.87 g/L Tris free base), 1 mM CaCl2
(0.111 g/L of anhydrous CaCl2) adjusted to pH 8.0 with 1 M HCl.
2.3. CaM-Sepharose Chromatography of Human Erythrocyte Ca2�-Pumping ATPase
1. RBC wash buffer: 10 mM Tris-HCl (1.58 g/L), 0.13 M KCl (9.69 g/L), ad-justed to pH 7.2 with 1 M HCl or 1 M KOH.
2. Lysis buffer: 10 mM Tris-HCl (1.58 g/L), 5 mM EGTA (1.90 g/L), adjustedto pH 7.2 with 1 M HCl or 1 M KOH.
3. HEPES wash buffer: 10 mM HEPES (2.38 g/L) adjusted to pH 7.2–7.4 with1 M HCl.
4. Ghost storage buffer: 10 mM HEPES (2.38 g/L), 0.13 M KCl (7.46 g/L), 0.5mM MgCl2 (0.05 g/L), 0.05 mM CaCl2 (5.5 mg/L), adjusted to pH 7.2–7.4.
5. CaM-Sepharose loading buffer: 20 mM HEPES (4.76 g/L), 0.13 M KCl(7.46 g/L), 0.5% (w/v) Triton X-100 (S.G. � 1.07: 4.67 mL/L), 0.05%(w/v) phosphatidylcholine (20 mL of 25 mg/mL stock solution in H2O/L),0.1 mM CaCl2 (11.1 mg/L), 20 lM PMSF (200 lL of 0.1 M stock solutionin ethanol/L), pH 7.4.
6. CaM-Sepharose elution buffer: 20 mM HEPES (4.76 g/L), 0.13 M KCl(7.46 g/L), 0.5% (w/v) Triton X-100 (S.G. � 1.07: 4.67 mL/L), 0.05%
Calmodulin-Dependent Regulation 113
(w/v) phosphatidylcholine (20 mL of 25 mg/mL stock solution in H2O),5 mM EGTA (1.46 g/L), 20 lM PMSF (200 lL of 0.1 M stock solution inethanol/L), pH 7.4.
7. ATPase assay cocktail: 30 mM HEPES (7.14 g/L), 120 mM KCl (6.89 g/L),0.05 mM CaCl2 (5.55 mg/L), 0.5 mM MgCl2 (0.05 g/L), 0.5 mM K2ATP(dihydrate: 0.31 g/L), 60 nM CaM (1 mg/L), pH 7.4.
8. Lanzetta reagent: Mix 1 volume of 4.2% (4.2 g/100 mL H2O) ammoniummolybdate in 4 N HCl with 3 volumes of 0.045% (0.045 gm/100 mL H2O)malachite green hydrochloride in H2O, mix for 20 min, and filter throughWhatman no. 5 filter paper.
9. 34% (34 g/100 mL H2O) sodium citrate dihydrate in H2O.
2.4. Measurement of CaM-Kinase II Activity in Tissue Extracts
1. Calmodulin: Prepare a 1 mg/mL solution of purified calmodulin in waterand store in aliquots at �70°C
2. Autocamtide-3: Prepare autocamtide-3 (KKALHRGETVDAL, BiosourceInternational, Camarillo, CA or Calbiochem, San Diego, CA) at 1 mM(1.44 mg/mL) in water and store in aliquots at �70°C.
3. Mg-ATP solution: Mix equal volumes of 20 mM Na2ATP and 20 mMMgCl2. Adjust to pH 7.4 with either HCl or NaOH as necessary.
4. 5X CaM Kinase II assay buffer: 100 mM Tris, pH 7.4, 25 mM MgCl2, and5 mM CaCl2.
5. [c-32P]-ATP working solution: Typically, [c-32P]-ATP is purchased with aspecific activity of 3000 Ci/mmol and is available from a variety of sources.Prepare a working solution of [c-32P]-ATP by adding 1 lL of the 10 mMMg-ATP solution to 89 lL water and then adding 10 ll of 10 lCi/lL[c-32P]-ATP. This will produce a final working solution of [c-32P]-ATP thatis 1 lCi/lL. The new specific activity for this [c-32P]-ATP working solu-tion is 10 Ci/mmol.
6. P-81 phosphocellulose paper: P-81 phosphocellulose paper (Whatman,Clifton, NJ) may be purchased as pre-cut 2.5 cm diameter circles or largersheets that may be cut into 2 cm � 2 cm squares. The sample numbershould be marked on the filter paper in pencil because most inks dissolvein the final acetone wash.
7. Phosphoric acid: 75 mM orthophosphoric acid (4.00 mL 100% O-phosphoricacid/L).
8. Reagent grade acetone.9. Lysis buffer: 50 mM HEPES, pH 7.4, 100 mM NaCl, 1% Triton X-100,
2 mM EDTA, 2 mM EGTA, 50 mM NaF, 5 mM b-glycerophosphate, 1 mMNa ortho-vanadate, 1 lg/mL leupeptin, 1 lg/mL pepstatin A, 1 lg/mL an-tipain, 1 mM PMSF.
114 Brandt and Vanaman
10. Modified RIPA buffer: 50 mM Tris-HCl, pH 7.4, 1% NP40, 150 mM NaCl,2 mM EDTA, 2 mM EGTA, 1 mM Na ortho-vanadate, 1 mM NaF, 1 lMleupeptin, 1 lM pepstatin A, 1 lM aprotinin, 1 mM PMSF.
11. Protein A or G agarose: Use Protein A with rabbit polyclonal antibodies(PAbs) and Protein G with mouse monoclonal antibodies (Mabs). Wash theresin twice in phosphate-buffered saline (PBS) and prepare as a 50% slurryin PBS. Store at 4°C.
12. Anti-CaM kinase II antibody: Many commercial CaM kinase II antibodiesare available for use in immunoprecipitation. However, not all will precip-itate the kinase without also blocking activity. Unless, it is specified that theantibody is compatible with kinase assays, it will be necessary to determinethat the antibody will precipitate an active kinase.
13. PBS for 1 L: 11.5 g Na2HPO4, 2 g KH2PO4, 80 g NaCl, 2.0 g KCl yieldspH 7.4.
14. Bicinchoninic acid protein assay reagent (BCA): Pierce Chemical Com-pany, Rockford, IL.
3. Methods3.1. Purification of Calmodulin by Calcium-Dependent Affinity Chromatography
The ability of calmodulin to bind to hydrophobic/aromatic moieties, includ-ing small molecules, in a calcium-dependent manner provides the basis for avery simple and specific method for its isolation. The protocol set forth belowwas first described (9) for the purification of CaM using a column prepared witha reactive amine containing des-methyl derivative, chloroaminopropyl phe-nothiazine (CAPP), of the calmodulin antagonist, chlorpromazine. A number ofother phenothiazine derivatives useful for calmodulin isolation have been de-scribed (10) including TAPP-Sepharose as shown below. The protocol alsoworks well with commercially available phenyl-Sepharose with only minor al-terations to the protocol (11).
The procedure described below is for isolating CaM from bovine testis. It in-volves preparing an initial extract and subjecting it to fractionation with am-monium sulfate prior to TAPP-Sepharose chromatography to remove interfer-ing contaminants. Purification of CaM from other eukaryotic sources mayrequire additional steps as a result of the presence of other proteins (especiallyrelated CaBPs) that also interact with the resin (see Note 1).
3.1.1. Day 1
Do all work at 4°C.
1. Starting with three adult bull testes (approx 800 g), remove the testes fromthe scrotal sack. (This is most easily done using frozen testes that have been
Calmodulin-Dependent Regulation 115
partially thawed overnight in the cold room.) Testes are chopped into smallpieces, then minced by passage two times through a meat grinder andweighed.
2. Dilute homogenization buffer 1:10 and add 2-mercaptoethanol to 1 mM(70 lL/L), then add 10 mL of stock PMSF solution per liter.
3. Homogenize minced testes in 2 volumes (per weight) of homogenizationbuffer in a Waring blender 3 � 1 min at top speed.
4. Centrifuge at 10,400g (see http://opbs.okstate.edu/~melcher/CentHelp.htmlfor appropriate rotor speed) for 60 min.
5. Pour supernatant through cheesecloth and save. Re-homogenize the pelletin 1 volume of homogenization buffer. Centrifuge as previously-mentionedand combine this supernatants with the first one.
6. Pass combined supernatants through cheesecloth again.7. Sixty percent Ammonium sulfate cut: Slowly add 390 g/L of ammonium
sulfate (see ref. 12) to the combined supernatant with vigorous stirring.Maintain at pH 7.5 by titration with 1 M NH4OH or 1 M H2SO4 as needed.
8. Stir at 4ºC for at least 1 h. Recheck pH.9. Centrifuge at 25,000 g for 60 min and collect the supernatant fraction by
pouring through cheesecloth to remove residual particulates.10. Acid Precipitation of Ammonium Sulfate Supernatant: Adjust the filtered
60% ammonium sulfate supernatant to pH 4.1 using ammonium sulfate-saturated 6 M H2SO4. Stir for at least 60 min. Readjust to pH 4.1.
11. Centrifuge at 25,000 g for 60 min. Decant the supernatant fraction anddiscard.
12. Resuspend the pH 4.1 pellet in a minimum volume of 1X TAPP loadingbuffer by using a dounce homogenizer. Dissolve the pellet by adjusting thesuspension to pH 7.5 with 1 M Tris (free base) while stirring. After the sus-pension has clarified, stir for an additional 30 min while maintaining pH 7.5.Try to keep volume small (100 mL).
13. Centrifuge the redissolved pellet fraction at 105,000g for 30 min and re-cover the supernatant fluid; adjust the pH to 7.5 if necessary.
14. Load the supernatant onto a 2.0 � 16 cm column of TAPP-Sepharose equil-ibrated with calcium-containing TAPP loading buffer, collect the flow-through, and pass over the column a second time.
15. Wash the column overnight with TAPP loading buffer (at least 2 L).
3.1.2. Day 2
1. Monitor the A235nm of the unbound pass through fraction against loadingbuffer. When it is less than 0.l, begin elution.
2. Elute the column with TAPP-Sepharose elution buffer, collecting 2.5-mLfractions in tubes containing 150 lL TAPP loading buffer that has beenmade 500 mM in CaCl2 (see Note 1).
116 Brandt and Vanaman
3. Measure the A235nm or A280nm and pool corresponding protein-containingfractions.
4. Desalt over a Sephadex G-50 column (2.0 � 50 cm) in 10 mM ammoniumbicarbonate, collecting 2.5-mL fractions. Detect CaM by A280nm, pool andlyophilize. (N.B: CaM concentration can be estimated based on extinctionat 276 nm. E1mg/mL, 276nm � 0.18).
3.2. Preparation of CaM Sepharose
The ability of CaM to interact with most target proteins only in the presenceof Ca2� offers an excellent method for their purification as well. The protocolbelow, first described (13) for isolating CaM-sensitive cyclic nucleotide phos-phodiesterase, has been used widely for the isolation of a variety of CaM-reg-ulated enzymes and to demonstrate their CaM dependence. It should be notedthat most tissues have a large number of CaM-binding proteins. For example,we have detected over 30 proteins from synaptosomes that bind to CaM-Sepharose as judged by two-dimension gel electrophoresis. These include pro-teins such as plasma-membrane calcium pumps, CaM Kinase II, calcineurin,cyclic nucleotide phosphodiesterase, and other proteins known to be present atthe synapse. The preparation of CaM-Sepharose is straightforward and involvescoupling to CNBr-activated Sepharose 4B. This and related activated supportscan be purchased commercially or prepared as described below based on theoriginal protocol of March et al. (14).
3.2.1. Activation
(All operations should be performed in a chemical fume hood.)
1. Using a 600-mL coarse sintered-glass funnel, wash 50 mL (packed volume)of sepharose 4B extensively with distilled water (1–2 L), then twice with300 mL of activating buffer.
2. Dry the resin to a moist cake (until liquid just enters resin bed) by suctionand transfer to a beaker as a 1:1 slurry in activating buffer.
3. While stirring, add 0.05 volumes of the cyanogen bromide solution in ace-tonitrile dropwise over about 2–3 min, and continue stirring vigorously forabout 5 min.
4. Transfer the activated resin to the original coarse sintered-glass funnel andwash extensively with water (2–3 L minimum) until no smell of CNBr isdetected (see Note 2).
5. Wash the resin with 10 volumes of 0.1 M sodium bicarbonate, pH 9.5, fol-lowed by 10 volumes of coupling buffer (0.2 M sodium bicarbonate, 0.5 MNaCl, pH 8.3).
Calmodulin-Dependent Regulation 117
3.2.2. Coupling
6. Dry the activated resin again to a moist cake and transfer to a mixing flaskwith a suspended magnetic stirring bar (100-mL spinner culture bottles areexcellent for this purpose).
7. Add 50 mL of a 1 mg/mL solution of CaM in coupling buffer and stir thereaction mixture gently overnight at 4°C.
8. Transfer the coupled resin to a sintered-glass funnel and remove the reactedcoupling mixture by suction. (N.B.: This fraction may be saved to test forresidual calmodulin to assess coupling efficiency [usually 80%].)
3.2.3. Quenching and Storage (see Note 2)
1. Wash the coupled resin with 5 volumes of coupling buffer, suction to amoist cake, and resuspend as a 1:1 slurry in quenching solution.
2. React with gentle stirring for 1 h to block any remaining activated functionalgroups. (It should be noted that ethanolamine is ideal for this purpose, be-cause reaction with the amine moiety results in incorporation of an aliphatichydroxyl moiety, preserving the properties of the Sepharose matrix.)
3. Finally, wash the resin exhaustively with storage buffer and store as a 1:1slurry in this buffer at 4ºC. The resulting CaM-Sepharose conjugate is func-tional for 3–6 mo.
3.3. CaM-Sepharose Chromatography of Human Erythrocyte Ca2�-Pumping ATPase
CaM-Sepharose can be used for the purification of both readily soluble cy-tosolic proteins and membrane-localized proteins that require detergent solubi-lization. An excellent example of the latter is the purification of the plasma-membrane calcium-pumping ATPase (PMCA) in animal cells by the protocolbelow first described by Carafoli and co-workers (15,16) for human erythrocytePMCA. Unless otherwise specified, all of the following operations are carriedout at 4°C.
3.3.1. Day 1: Preparation of Erythrocyte Membrane (RBC Ghosts) Fraction
1. Resuspend 6 to 7 U (1.5–1.7 L) of recently outdated packed red blood cells(RBCs) from the local blood bank in 5 volumes wash buffer.
2. Centrifuge at 5,800g for 10 min in 1-L swinging bucket rotor bottles.3. Gently aspirate off the supernatant, including the white blood cells
(WBCs), which come off in large clumps. (Be sure to remove WBCs ascompletely as possible, even at the sacrifice of some RBCs, as they containproteases as well as numerous calmodulin binding proteins.)
118 Brandt and Vanaman
4. Repeat step 1. (N.B.: At this stage, the sedimented RBC fraction is a veryloose pellet behaving like a very thick liquid rather than a hard pellet. It iseasily resuspended, requiring great care in handling.)
5. Resuspend the washed RBC fraction from step 2 by filling the 1-L cen-trifuge bottles with lysis buffer followed by gentle mixing with inversionand pellet the RBC ghosts by centrifuging at 24,000g for 35 min in a fixedangle rotor (routinely in 250 mL centrifuge bottles).
6. Carefully remove the supernatant containing hemoglobin and other solublered cell constituents, taking care not to lose pellet material (very soft anddifficult to see as the supernatant is dark red).
7. Resuspend the RBC ghosts in half the original volume of lysis buffer andcombine the contents of pairs of centrifuge bottles to concentrate the ghostpreparation, centrifuge, and remove the supernatant as above.
8. Using the same procedure as set forth in step 5 for concentrating the ghosts,wash the resulting RBC ghost pellet two to three times further with theHEPES wash buffer by resuspension and centrifugation until the ghosts arewhite or light pink. During these washes, pool the washed RBC ghost(membrane) fraction with care not to disturb the red pellet (unlysed RBCs)at the bottom of the bottles. (N.B.: The final preparation should be in a sin-gle 250-mL centrifuge bottle.)
9. Perform a final wash of the recovered RBC membrane fraction by fillingthe centrifuge bottle with HEPES storage buffer, centrifuge, and remove thesupernatant. Store the RBC ghost preparation at 4ºC overnight.
3.3.2. Day 2: CaM-Sepharose Chromatography
1. Resuspend the soft RBC ghost pellet by gentle swirling. Measure the vol-ume of the ghosts and assay for protein content. Add sufficient HEPESstorage buffer to make the final protein concentration approx 5 mg/mL.
2. Solubilize RBC ghosts by the addition of 5 mL of 10% Triton X-100(10 g/100 mL: Specific Gravity � 1.07 g/mL) per 100 mL of resuspendedRBC ghosts to give a final concentration of 5 mg Triton X-100/mL (1:1 w/wratio with protein). Stir slowly with a magnetic stirrer for 25 min at 4°C.
3. Centrifuge the solubilized RBC ghosts at 100,000g for 35 min at 4°C andcollect the supernatant fractions from each centrifuge bottle and combineas necessary.
4. Measure the volume of the pooled supernatants and add, for each 100 mL ofsupernatant, 2 mL of stock phosphatidyl choline (25 mg/mL), 2 mL of stockdithiothreitol (DTT) (100 mM) and 100 lL of 100 mM CaCl2 (final concen-trations: 0.5 mg/mL phosphatidyl choline, 2 mM DTT and 0.1 mM CaCl2).
5. Apply the supernatant to a 1.5 � 10 cm CaM-Sepharose column equili-brated in sample application buffer and wash with 2–3 bed volumes of this
Calmodulin-Dependent Regulation 119
buffer followed by at least 2–3 bed volumes of wash buffer until the A280 nm reaches baseline.
6. Elute the column with elution buffer collecting 1-mL fractions into tubescontaining 0.1 mL of the 50% glycerol stabilizing solution.
7. Read the A280 nm and assay fractions for ATPase activity as follows:
a. Mix 200 lL assay cocktail with 10 lL of each fraction.b. Incubate at 37°C for 10 min.c. Add 59 lL of the reaction mixture to 800 lL of Lanzetta (17) reagent
and mix.d. After l min, add 100 lL of 34% (w/v) sodium citrate, mix, and incubate
for 30 min at 25°C.e. Measure A660 nm. The color is stable for about 4 h. (N.B.: The assay must
include a blank for background color correction and a sodium phosphatestandard curve [1–10 nmoles/mL] for calculation of Pi release [ATPhydrolysis]).
8. Pool the active fractions and aliquot into 200–300 lL fractions and store at�70°C. (see Note 3).
3.4. Measurement of CaM-Kinase II Activity in Cell Extracts
Of the calmodulin-regulated kinases (CaM kinases), CaM kinases II and IVhave among the broadest substrate specificity and consequently affect a varietyof processes within the cell (18). The contribution of CaM kinase II to learningand memory, through its effects on long-term potentiation has been studied ex-tensively (19). Both CaM kinases II and IV are involved in regulation of genetranscription (20).
Autophosphorylation of Thr268 and Thr305 or Thr306 in CaM kinase II canproduce calmodulin-independent activation of CaM kinase II, so it is importantto measure activity in the absence of calmodulin (see Note 4). Phosphorylationof CaM kinase II at Thr268 still allows further stimulation of the kinase bycalmodulin, but phosphorylation at Thr305 or Thr306 does not allow binding ofcalmodulin and calmodulin-dependent stimulation is not observed (21).
3.4.1. Cell Lysis
1. Prepare 0.5–1.0 � 106 cells for assay. Either adherent or nonadherent cellsmay be used. For adherent cells, a semiconfluent 35-cm dish usually pro-vides sufficient material for assay.
2. Wash cells twice in ice-cold PBS. Adherent cells may be washed directly onthe plates. Nonadherent cells may be collected by centrifugation and washed.
3. Add 300 lL of ice-cold lysis buffer to each sample and let stand on ice for10 min.
120 Brandt and Vanaman
4. Collect lysate into a tube and centrifuge at 12,000 g for 10 min at 4°C.5. Carefully remove the supernatant and assay the protein content by the BCA
method relative to a protein standard.
3.4.2. Direct Assay (see Note 4)
1. Assay samples in at least duplicate.2. For each sample to be assayed, mix the following components in a tube:
4 lL 5X CaM kinase II assay buffer, 2 lL 1 mM autocamide-3, 2 lL[c-32P]-ATP working solution, 2 lL 1 mg/mL calmodulin. These compo-nents may be prepared as a combined master mix that is aliquoted into in-dividual assay tubes.
3. For each sample, also prepare a reaction without calmodulin (substitutewater) to account for background phosphorylation and auto-activated CaMkinase II activity. The inclusion of samples that do not contain autocamtide-3can be used to control for determining the background signal owing tophosphorylation of endogenous substrates that might bind to the P-81 phos-phocellulose paper.
4. Add 10 lL of lysate to each tube and incubate at 30°C for 10 min. It is often agood practice to first do a dilution series with the sample with which you ex-pect to have the greatest activity to ensure that you are working within the lin-ear range of the assay. If 10 lL of extract will produce a signal that exceedsthe capacity of the assay, it may be diluted appropriately with lysis buffer.
5. Adsorption of autocamtide-3 onto phosphocellulose paper. Apply 15 lL ofeach reaction onto a prelabeled piece of P-81 phosphocellulose paper. Placefilters in a 500-mL beaker containing 350–400 mL 75 mM orthophosphoricacid. Stir with a glass rod for 5 min. Decant the orthophosphoric acid andrepeat this wash step four additional times.
6. After decanting the last orthophosphoric acid wash, add 400 mL acetoneand stir for 5 min. Remove the papers and air dry.
7. Place each dried filter in a 7 mL liquid-scintillation vial and add 4 mL ofscintillation cocktail (e.g., Econofluour) and count radioactivity in a liquid-scintillation counter. Each set of analyses should include both negative con-trol filters (no added 32P) for background correction and vials with knownamounts of 32P to correct for counting efficiency.
3.4.3. Assay With Immunoprecipitation
If excessive nonspecific background phosphorylation or dephosphorylationof the substrate peptide or endogenous substrates is suspected, it is possible toimmunoprecipitate the CaM kinase II and to a large extent separate it from thesekinases and phosphatases.
Calmodulin-Dependent Regulation 121
1. To the cells prepared as described in Subheading 2.4., add 500 lL of ice-cold modified RIPA buffer to each 35-mm dish and collect the extract byscraping.
2. Centrifuge sample at 14,000 g at 4°C for 15 min. Transfer supernatant to anew tube.
3. Measure the protein content as described in Subheading 3.4.1. and diluteto approx 1 mg/mL with modified RIPA buffer. If the concentration is belowuse 1 mg/mL, use the extract at that concentration.
4. Preclear the extract by adding 100 lL of protein A or G-agarose beads to1 mg (1 mL) of extract. Incubate at 4°C with continuous inversion mixingfor 1 h.
5. Remove Protein A or G agarose by centrifugation at 14,000 g at 4°C for5 min. Transfer the supernatant to a fresh tube.
6. Add sufficient antibody to quantitatively precipitate the CaM kinase II inthe clarified lysate and incubate at 4°C for 1 h. (N.B.: To determine if CaMkinase II is being quantitatively immunoprecipitated, a series of prelimi-nary experiments can be undertaken in which serial immunoprecipitationsof the same batch of extract are prepared and assayed for CaM kinase II ac-tivity. When no more CaM kinase II activity is precipitated, this is the min-imum amount of antibody needed for quantitative recovery of enzyme fromthe extract.)
7. Add sufficient Protein A or G agarose to the sample to precipitate all of theadded anti-CaM kinase II antibody. Incubate at 4°C with inversion mixingfor 1 h. The IgG binding capacity of Protein A or G agarose is usually sup-plied by the manufacturer.
8. Collect immune complex by centrifugation at 14,000 g at 4°C for 5 min.Remove the supernatant, add 1 mL modified lysis buffer to the agarose pel-let, mix, and collect by centrifugation. Repeat three times.
9. Wash one time with 1X kinase assay buffer and collect the immune com-plex by centrifugation.
10. This immobilized complex may be used directly in the CaM kinase II assaydescribed earlier. Substitute water for the 10 lL of extract that would nor-mally be added.
3.4.4. Calculations
1. Determination of counting efficiency. For the control sample containing aknown amount of 32P, determine the theoretical dpm in the vial. 1 lCi �2.2 � 106 dpm, so a counting efficiency of 100% would produce 2.2 � 106
cpm for every lCi in the vial. Although the counting efficiency for 32P ishigh, it is never 100%. Counting efficiency (%) � (cpm measured) / (the-oretical dpm for lCi 32P in vial) � 100.
122 Brandt and Vanaman
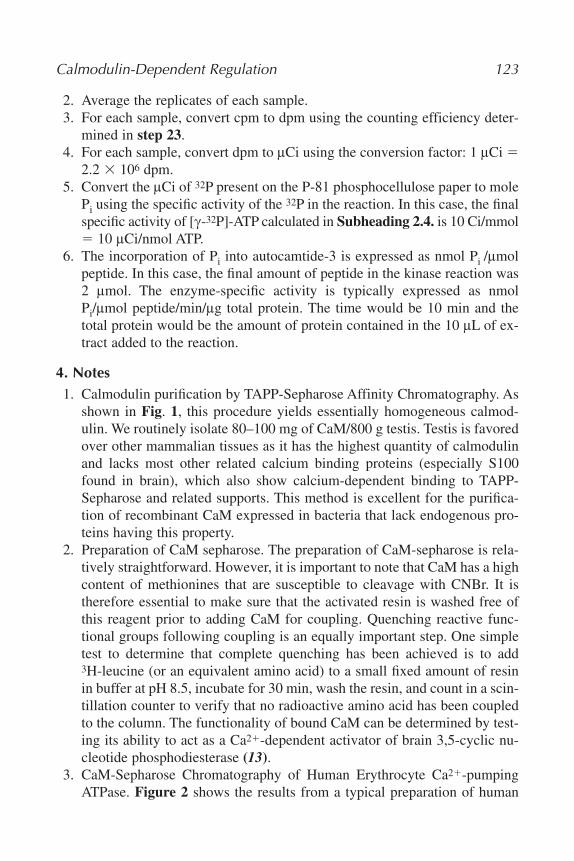
2. Average the replicates of each sample.3. For each sample, convert cpm to dpm using the counting efficiency deter-
mined in step 23.4. For each sample, convert dpm to lCi using the conversion factor: 1 lCi �
2.2 � 106 dpm.5. Convert the lCi of 32P present on the P-81 phosphocellulose paper to mole
Pi using the specific activity of the 32P in the reaction. In this case, the finalspecific activity of [c-32P]-ATP calculated in Subheading 2.4. is 10 Ci/mmol� 10 lCi/nmol ATP.
6. The incorporation of Pi into autocamtide-3 is expressed as nmol Pi /lmolpeptide. In this case, the final amount of peptide in the kinase reaction was2 lmol. The enzyme-specific activity is typically expressed as nmolPi/lmol peptide/min/lg total protein. The time would be 10 min and thetotal protein would be the amount of protein contained in the 10 lL of ex-tract added to the reaction.
4. Notes1. Calmodulin purification by TAPP-Sepharose Affinity Chromatography. As
shown in Fig. 1, this procedure yields essentially homogeneous calmod-ulin. We routinely isolate 80–100 mg of CaM/800 g testis. Testis is favoredover other mammalian tissues as it has the highest quantity of calmodulinand lacks most other related calcium binding proteins (especially S100found in brain), which also show calcium-dependent binding to TAPP-Sepharose and related supports. This method is excellent for the purifica-tion of recombinant CaM expressed in bacteria that lack endogenous pro-teins having this property.
2. Preparation of CaM sepharose. The preparation of CaM-sepharose is rela-tively straightforward. However, it is important to note that CaM has a highcontent of methionines that are susceptible to cleavage with CNBr. It istherefore essential to make sure that the activated resin is washed free ofthis reagent prior to adding CaM for coupling. Quenching reactive func-tional groups following coupling is an equally important step. One simpletest to determine that complete quenching has been achieved is to add3H-leucine (or an equivalent amino acid) to a small fixed amount of resinin buffer at pH 8.5, incubate for 30 min, wash the resin, and count in a scin-tillation counter to verify that no radioactive amino acid has been coupledto the column. The functionality of bound CaM can be determined by test-ing its ability to act as a Ca2�-dependent activator of brain 3,5-cyclic nu-cleotide phosphodiesterase (13).
3. CaM-Sepharose Chromatography of Human Erythrocyte Ca2�-pumpingATPase. Figure 2 shows the results from a typical preparation of human
Calmodulin-Dependent Regulation 123
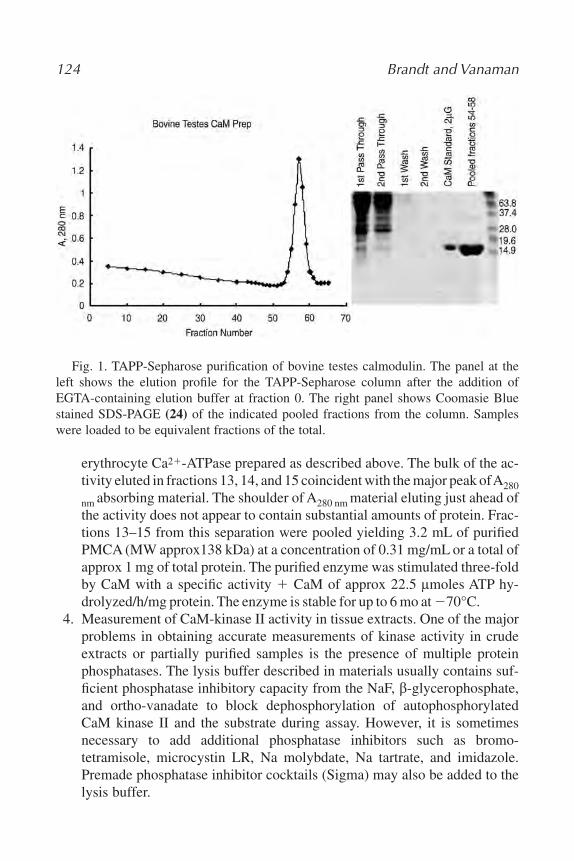
erythrocyte Ca2�-ATPase prepared as described above. The bulk of the ac-tivity eluted in fractions 13, 14, and 15 coincident with the major peak of A280
nm absorbing material. The shoulder of A280 nm material eluting just ahead ofthe activity does not appear to contain substantial amounts of protein. Frac-tions 13–15 from this separation were pooled yielding 3.2 mL of purifiedPMCA (MW approx138 kDa) at a concentration of 0.31 mg/mL or a total ofapprox 1 mg of total protein. The purified enzyme was stimulated three-foldby CaM with a specific activity � CaM of approx 22.5 lmoles ATP hy-drolyzed/h/mg protein. The enzyme is stable for up to 6 mo at �70°C.
4. Measurement of CaM-kinase II activity in tissue extracts. One of the majorproblems in obtaining accurate measurements of kinase activity in crudeextracts or partially purified samples is the presence of multiple proteinphosphatases. The lysis buffer described in materials usually contains suf-ficient phosphatase inhibitory capacity from the NaF, b-glycerophosphate,and ortho-vanadate to block dephosphorylation of autophosphorylatedCaM kinase II and the substrate during assay. However, it is sometimesnecessary to add additional phosphatase inhibitors such as bromo-tetramisole, microcystin LR, Na molybdate, Na tartrate, and imidazole.Premade phosphatase inhibitor cocktails (Sigma) may also be added to thelysis buffer.
124 Brandt and Vanaman
Fig. 1. TAPP-Sepharose purification of bovine testes calmodulin. The panel at theleft shows the elution profile for the TAPP-Sepharose column after the addition ofEGTA-containing elution buffer at fraction 0. The right panel shows Coomasie Bluestained SDS-PAGE (24) of the indicated pooled fractions from the column. Sampleswere loaded to be equivalent fractions of the total.
CaM kinase II activity determined as described in Methods can be presentedas two activities: the CaM-stimulated activity and the endogenous activityowing to autophosphorylation at Thr286 (22). Also, if phosphorylation of auto-camtide-3 is calmodulin-independent, this could be a measure of the Thr305autophosphorylated CaM kinase II. However, this is less likely owing to the ex-pected rapid turnover of this form of the enzyme. Thus, calmodulin-independentphosphorylation of autocamtide-3 would more likely represent a kinase not pre-viously known to phosphorylate this substrate or endogenous phosphorylatedmaterial binding to the P-81 paper. Alternatively, calmodulin-stimulation ofCaM kinase II activity can be presented as the fold induction of activity by tak-ing the ratio of the kinase activity when calmodulin is present to the activitywithout added calmodulin.
The assays described for CaM kinase II also can be used for CaM kinaseIV by simply replacing the substrate peptide with one that is specificallyrecognized by CaM kinase IV. The c-peptide (KSDGGVKKRKSSSS) de-rived from CaM kinase II c is a highly specific substrate for CaM kinase IV(23). It does not appear to be recognized by other calmodulin-dependent
Calmodulin-Dependent Regulation 125
Fig. 2. Calcium-dependent chromatography of detergent solubilized erythrocyteCa2�-pumping ATPase on CaM-Sepharose. The graph shows both the A280 nm and ac-tivity (A595 nm) elution profile for fractions from the CaM-Sepharose column operatedas described in Subheading 3.3.2. The inset silver stained 7% Sodium dodecyl sulfatepolymerase gel electrophoresis (SDS-PAGE) gel (24) shows 10 lL aliquots of fractions13, 14, and 15 as indicated.
kinases. The c-peptide is commercially available from Biosource Internationalor Biomol.
It is also possible to discriminate between these and other kinases by usingspecific inhibitors that are commercially available. KN-93 will inhibit calmod-ulin activation of CaM kinase II and IV by binding to the calmodulin-bindingdomain of each enzyme and preventing calmodulin binding. An inactive isomerof KN-93, KN-92, can be used as a control for possible nonspecific effects (e.g.,owing to the need to solubilize the compounds in dimethyl sulfoxide [DMSO]).KN-92 and KN-93 are available from a variety of sources, including Cal-biochem and Alexis Biochemicals. They are added to cellular extracts to a finalconcentration of 10 lM for 30 min before adding the extracts to the kinase re-action mixture. Numerous other inhibitors of CaM and its regulated enzymesare also available commercially and can be used both in vitro and in vivo.
References1. Cheung, W. Y. (1970) Cyclic 3', 5'-nucleotide phosphodiesterase. Demonstration of
an activator. Bioche. Biophys. Res. Commun. 38, 533–538.2. Kakiuchi, S. and Yamazaki, R. (1970) Calcium dependent phosphodiesterase ac-
tivity and its activating factor (PAF) from brain studies on cyclic 3', 5'-nucleotidephosphodiesterase (3). Biochem. Biophys. Res. Commun. 41, 1104–1110.
3. Teo, T. S. and Wang, J. H. (1973) Mechanism of activation of a cyclic adenosine3', 5'-monophosphate phosphodiesterase from bovine heart by calcium ions. Iden-tification of the protein activator as a Ca2� binding protein. J. Biol. Chem. 248,5950–5955.
4. Vanaman, T. C. (1980) The structure, function and evolution of calmodulin, in Cal-cium Binding Proteins as Cellular Regulators (Cheung, W. Y., ed.), AcademicPress, New York, NY, pp. 41–58.
5. Van Eldik, L. J. and Watterson, D. M. (1998) Calmoduin and calcium signal trans-duction: an introduction, in Calmodulin and Signal Transduction (Van Eldik, L. J.and Watterson, D. M., eds.), Academic Press, New York, NY, pp. 1–14.
6. Kuboniwa, H., Tjandra, N., Grzesiek, S., et al. (1995). Solution structure of cal-cium-free calmodulin. Nat. Struct. Biol. 2, 768–776.
7. Babu, Y. S., Sack, J. S., Greenhough, T. J., et al. (1985). Three-dimensional struc-ture of calmodulin. Nature 315, 37–40.
8. Vetter, S. W. and Leclerc, E. (2003) Novel aspects of calmodulin target recognitionand activation. Eur. J. Biochem. 270, 404–414.
9. Jamieson, G. A., Jr. and Vanaman, T. C. (1979) Calcium-dependent affinity chro-matography of calmodulin on an immobilized phenothiazine. Biochem. Biophys.Res. Commun. 90, 1048–1056.
10. Hart, R. C., Hice, R. E., Charbonneau, H., et al. (1983) Preparation and propertiesof calcium-dependent resins with increased selectivity for calmodulin. Anal.Biochem. 135, 208–220.
11. Gopalakrishna, R. and Anderson, W. B. (1982) Ca2�-induced hydrophobic site on
126 Brandt and Vanaman
calmodulin: application for purification of calmodulin by phenyl-sepharose affin-ity chromatography. Biochem. Biophys. Res. Commun. 104, 830–836.
12. Englard, S. and Seifter, S. (1990) Precipitation techniques. Methods Enzymol. 182,285–300.
13. Watterson, D. M. and Vanaman, T. C. (1976) Affinity chromatography purificationof a cyclic nucleotide phosphodiesterase using immobilized modulator protein, atroponin C-like protein from brain. Biochem. Biophys. Res. Commun. 73, 40–46.
14. March, S. C., Parikh, I,. and Cuatrecasas, P. (1974) A simplified method forcyanogen bromide activation of agarose for affinity chromatography. Anal.Biochem. 60, 149–152.
15. Niggli, V., Penniston, J. T., and Carafoli, E. (1979) Purification of the (Ca2�-Mg2�)-ATPase from human erythrocyte membranes using a calmodulin affinity column.J. Biol. Chem. 254, 9955–9958.
16. Niggli, V., Zurini, M., and Carafoli, E. (1987) Purification, reconstitution, and mo-lecular characterization of the Ca2� pump of plasma membranes. Methods Enzy-mol. 139, 791–808.
17. Lanzetta, P. A., Alvarez, L. J., Reinach, P. S., and Candia, O. A. (1979) An improvedassay for nanomole amounts of inorganic phosphate. Anal. Biochem. 100, 95–97.
18. Hanson, P. I. and Schulman, H. (1992) Neuronal Ca2�/calmodulin-dependent pro-tein kinases. Annu. Rev. Biochem. 61, 559–601.
19. Lisman, J., Schulman, H., and Cline, H. (2002) The molecular basis of CaMKIIfunction in synaptic and behavioural memory. Nat. Rev. Neurosci. 3, 175–190.
20. Means, A. R. (2000) Regulatory cascades involving calmodulin-dependent proteinkinases. Mol. Endocrinol. 14, 4–13.
21. Fujisawa, H. (2001) Regulation of the activities of multifunctional Ca2�/calmod-ulin-dependent protein kinases. J. Biochem. (Tokyo) 129, 193–199.
22. Hudmon, A. and Schulman, H. (2002) Structure-function of the multifunctionalCa2�/calmodulin-dependent protein kinase II. Biochem. J. 364, 593–611.
23. Miyano, O., Kameshita, I., and Fujisawa, H. (1992). Purification and characteriza-tion of a brain-specific multifunctional calmodulin-dependent protein kinase fromrat cerebellum. J. Biol. Chem. 267, 1198–1203.
24. Laemmli, U. K. (1970) Cleavage of structural proteins during the assembly of thehead of bacteriophage T4. Nature 227, 680–685.
Calmodulin-Dependent Regulation 127
9
Measurement of Protein–DNA Interactions In Vivo by Chromatin Immunoprecipitation
Hogune Im, Jeffrey A. Grass, Kirby D. Johnson, Meghan E. Boyer, Jing Wu, and Emery H. Bresnick
SummaryElucidating mechanisms controlling nuclear processes requires an understanding of the nucleo-
protein structure of genes at endogenous chromosomal loci. Traditional approaches to measuringprotein–DNA interactions in vitro have often failed to provide insights into physiological mecha-nisms. Given that most transcription factors interact with simple DNA sequence motifs, which areabundantly distributed throughout a genome, it is essential to pinpoint the small subset of sitesbound by factors in vivo. Signaling mechanisms induce the assembly and modulation of complexpatterns of histone acetylation, methylation, phosphorylation, and ubiquitination, which are crucialdeterminants of chromatin accessibility. These seemingly complex issues can be directly addressedby a powerful methodology termed the chromatin immunoprecipitation (ChIP) assay. ChIP analy-sis involves covalently trapping endogenous proteins at chromatin sites, thereby yielding snapshotsof protein–DNA interactions and histone modifications within living cells. The chromatin is soni-cated to generate small fragments, and an immunoprecipitation is conducted with an antibodyagainst the desired factor or histone modification. Crosslinks are reversed, and polymerase chainreaction (PCR) is used to assess whether DNA sequences are recovered immune-specifically.Chromatin-domain scanning coupled with quantitative analysis is a powerful means of dissectingmechanisms by which signaling pathways target genes within a complex genome.
Key Words: Chromatin; histone; immunoprecipitation; DNA; transcription; crosslink.
1. IntroductionA critical mechanism that creates diversity from cells to organisms involves
the regulated activation and repression of genes, thereby establishing the
From: Methods in Molecular Biology, vol. 284:Signal Transduction Protocols
Edited by: R. C. Dickson © Humana Press Inc., Totowa, NJ
129
complement of proteins characteristic of a specific cell type. Great efforts havebeen made to elucidate mechanisms that confer cell type-specific patterns ofgene expression. Unraveling the underlying mechanisms has enormous poten-tial for revealing the molecular basis of diseases and for the development ofnovel therapeutics through the specific modulation of gene expression.
Perhaps the most fundamental step in transcriptional control involves thesequence-specific recognition of DNA by transcription factors known as trans-acting factors. The development of a grab bag of experimental approaches hasushered in major progress in understanding how proteins bind their cognateDNA recognition sequences specifically within the complex milieu of cellularDNA. Filter-binding assays were initially used to measure protein–DNA inter-actions in vitro (1,2). This assay involves a short incubation to allow proteinbinding to DNA, after which protein–DNA complexes are trapped on a filter.Through the use of radiolabeled DNA, quantitative measurements of equilib-rium-binding constants and rate constants can be obtained. Although filter-binding assays have considerable utility for analyzing binding with purified orsemipurified components, this method is not ideal for analyzing binding withcomplex mixtures of proteins. By contrast, the electrophoretic mobility shiftassay (EMSA) (3) allows one to identify proteins with sequence-specific DNAbinding activity in crude extracts containing hundreds or even thousands of pro-teins. Protein–DNA complexes are rapidly resolved from unbound radiolabeledDNA on a nondenaturing gel. Similarly, DNaseI footprinting (4) allows for thedetection of sequence-specific DNA binding with crude protein extracts. DNa-seI footprinting involves binding an extract or purified protein to a DNA frag-ment of approx 100–500 base pairs uniquely labeled on the five or three end.Complexes are incubated with DNaseI, which readily cleaves free DNA. Se-quence-specific protein–DNA interactions protect the bound sequence fromcleavage, revealing a “footprint” (the protected region) upon analysis of DNAfragments on a denaturing urea-polyacrylamide gel. These methods are usedroutinely to rapidly define the DNA sequence preferences for sequence-specificDNA binding proteins. Thus, it can be straightforward to identify proteins thatinteract with conserved cis-acting elements on regulatory regions (e.g., pro-moters, enhancers, silencers, and locus-controls regions) of genes in vitro, animportant first step in analyzing transcriptional-control mechanisms.
The physiological template for transcription and other nuclear processes,such as DNA replication, recombination, and repair, is chromatin rather thannaked DNA (5–7). Although EMSA and footprinting assays are powerful ap-proaches for analyzing transcriptional mechanisms, studying the interaction oftrans-acting factors with naked DNA has intrinsic limitations. A reoccurringproblem is that multiple, highly related transcription factors often bind an iden-tical DNA sequence in vitro, whereas these factors can have different functions
130 Im et al.
in vivo (8). For example, multiple E-proteins exist that bind E-box consensussequences (CANNTG). Certain proteins, such as upstream stimulatory factor,are readily detected using in vitro DNA binding assays, whereas the binding ofother factors such as c-myc is difficult to measure, in part owing to the lowabundance of c-myc in nuclear extracts (9,10). In vitro binding assays com-monly identify the most abundant, highest-affinity interactor in the extract,which is often not the functional factor in vivo. Furthermore, transcription fac-tors can reside in the cell nucleus in an “active” state, and therefore such factorsin cell-free extracts readily bind cognate recognition sites. However, chromatinstructure can exclude factors from constitutively binding recognition motifs invivo (6,11,12), thus establishing a chromatin-remodeling requirement for fac-tor access to the template. Given these serious issues, it is imperative thatprotein–DNA interactions detected in vitro be validated via in vivo analysis.
Despite the seemingly formidable problem of how to detect binding of a pro-tein to a target DNA sequence in a living cell, major progress has been made indeveloping the requisite technology. Although it is not the intent of this chapterto comprehensively review such technologies, it is important to recognize theadvance afforded by knowing what factors occupy specific cis-elements in a liv-ing cell. Initial studies utilized in vivo footprinting, which often involves treat-ing cells with dimethyl sulfate, which methylates the N7 position of guanosine(13). Guanosine methylation is efficient and relatively uniform in vitro. How-ever, if a high percentage of the templates in the cell population are occupiedby a DNA-binding protein, the protein can severely inhibit or enhance methy-lation, thus providing the basis for the footprinting assay. Genomic DNA is pu-rified from cells and subjected to Maxam-Gilbert chemistry to cleave the DNAat the methylated sites. By incorporating an elegant ligation-mediated poly-merase chain reaction (PCR) step (14), fragments can be displayed on a dena-turing urea-containing polyacrylamide gel at base-pair resolution. Throughcomparisons of cleavage patterns of naked DNA and DNA from dimethyl sul-fate-treated cells, conclusions can be reached regarding whether a particular siteis occupied by protein(s) in vivo. A modification of the assay has been reportedin which protein contacts with both adenosine and guanosine residues can bemeasured (15), which expands the repertoire of cis-elements that can be ana-lyzed. In addition, another variation involves adding DNaseI to permeabilizedcells (16) or to isolated nuclei (17). The differential cleavage of chromatinizedfree DNA reflects occupancy of specific sequences by proteins.
In vivo footprinting assays have utility for scanning a defined region, such asa promoter, to delineate sequences bound by proteins in living cells. In certaincases, the enhancement or diminishment of cleavage can be correlated with thepattern obtained by in vitro footprinting, which can provide important clues as tothe identity of the protein bound. Importantly, the footprinting assay cannot iden-
Chromatin Occupancy 131
tify the bound protein, but can only provide a clue, based on the DNA sequenceof the respective region. Thus, this highlights a major limitation of in vivo foot-printing assays. A goal of such studies is to pinpoint cis-elements bound by fac-tors in vivo, which should provide important clues regarding the identity of thecognate-binding protein. However, the identity of binding proteins is based uponinference, because related factors often bind identical DNA sequences.
Studies utilizing ultraviolet (UV) light and lasers to crosslink histones tochromatin provided a foundation for the development of methodology to over-come the major limitations of in vivo footprinting (17–20). The chromatin im-munoprecipitation or ChIP assay has evolved to use a relatively nonspecificcrosslinking reagent formaldehyde to rapidly crosslink proteins to cognate-binding sequences in cells or tissues (21,22). Following the covalent trappingof proteins at their site of interaction in native chromatin, the chromatin is frag-mented into small pieces (less than approx 1 kb), and an antibody against theprotein is used to co-immunoprecipitate the protein and the bound chromatin(23). Antibodies can be directed against any protein of interest—trans-actingfactors that bind DNA sequence-specifically, as well as proteins that bind fre-quently throughout genomes, such as acetylated or methylated core histones.Upon deproteinization of the immunoprecipitate, PCR is used to determine if asequence is recovered in an immune-specific manner, which would indicate thatthe protein associated with the sequence in living cells.
The simplest scenario resulting from ChIP analysis is that the protein bindsdirectly to a known cis-element, thereby revealing the endogenous interactorwith the site in living cells. However, given the extensive network ofprotein–DNA and protein–protein crosslinks generated by formaldehyde, therecovery of a specific DNA fragment does not necessarily mean that the proteinassociates directly with the fragment. This is an intrinsic limitation of ChIPanalysis vis-à-vis identifying interactors with defined sequences in chromatin.It is possible, however, to assign the contribution of specific cis-elements tobinding. A DNA fragment containing or lacking a site suspected of mediatingbinding in vivo can be stably integrated into chromosomal DNA, and ChIPcan be used to determine if the site is required for binding (24).
ChIP analysis can also yield functionally important information on higher-order nucleoprotein complexes. Sequences directly and indirectly bound to theprotein can be immunoprecipitated. Complex scenarios arise upon considera-tion of indirect crosslinking, an example being the tethering of coregulator com-plexes to a DNA-bound protein via protein–protein interactions. Alternatively,a DNA-bound protein might be crosslinked to a distant site owing to long-rangephysical interactions between distinct chromatin regions. As long-range chro-matin interactions commonly control nuclear processes (23), measurements ofsuch interactions can be highly significant.
132 Im et al.
Beyond defining protein interactions with known cis-elements, entire chro-matin domains can be scanned by ChIP, revealing the native nucleoprotein struc-ture of the domain (25–28). As certain cis-elements are scattered throughoutgenomes, based on the simplicity of the specific recognition motif, domain scan-ning provides a powerful means of distinguishing endogenous, physiologicallyrelevant sites of interaction from the numerous sites that would be detected byin vitro binding analyses with naked DNA. This situation is exemplified byanalysis of the binding of GATA family transcription factors to GATA consensusmotifs (WGATAR) (29,30). Although the murine l-globin and GATA-2 loci con-tain 286 and 88 consensus GATA motifs, respectively, only a small subset ofthese sites are occupied in vivo, based upon ChIP analysis (26,31). Domain scan-ning coupled with the use of quantitative real-time PCR is a powerful way to de-fine the biological consequences of protein–DNA interactions in vivo.
ChIP methodology continues to be modified to increase the utility of theassay. A genomic microarray step has been incorporated so that preimmune andimmune reactions are labeled with fluorophores and hybridized to genomic mi-croarrays (32,33). This approach allows one to define a large complement ofgenes bound by a factor of interest in a single experiment, without having to an-alyze data from PCR reactions with hundreds of site-specific primer sets. Itshould be obvious that methodologies to define protein–DNA interactions invivo have advanced considerably from the initial approaches in which major ef-fort was required to determine whether specific base pairs at a single locus areprotected from modification. This chapter describes in detail the core ChIPmethodology used in our laboratory, which can be modified based on the spe-cific application desired.
2. Materials2.1. Buffers
The following buffers, should be prepared before beginning the protocol:
1. 1 M Tris-HCl, pH 8.0, 0.5 M EDTA, pH 8.0, 5 M NaCl, 10% Nonidet P40,20% sodium dodecyl sulfate (SDS), and 20% Triton X-100.
2. 1X phosphate-buffered saline (PBS), 2.5 M glycine, 3 M sodium acetate, pH5.2, cell lysis buffer, nuclei lysis buffer, IP dilution buffer, IP wash buffer 1,IP wash buffer 2, 1X TE, and elution buffer. All buffers are stored at roomtemperature, and when necessary, an aliquot is chilled on ice before use.
2.2. Crosslinking
1. Platform shaker (Hoefer, San Francisco, CA, cat. no. PR70/75-115V).2. 37% Formaldehyde (Sigma, St. Louis, MO, cat. no. F-1268).3. 2.5 M glycine (Promega, Madison, WI, cat. no. H-5073).
Chromatin Occupancy 133
4. Deionized-distilled water (ddH2O) (Millipore, Billeria, MA, Milli-Q system).5. 1X PBS, pH 7.4: 8.0 g NaCl, 0.2 g KCl, 2.71 g Na2HPO4 · 7H2O, 0.24 g
KH2PO4, ddH2O to 1 L.
2.3. Cell Lysis
1. Histone deacetylase and protease inhibitors (10 mM n-butyric acid, sodiumsalt (Sigma, cat. no. B-5887) (�20°C), 1 lg/mL leupeptin (Roche AppliedScience, cat. no. 1-017-128) (�20°C), 50 lg/mL phenylmethylsulfonyl flu-oride (PMSF) in 100% ethanol (Boehringer, Danbury, CT, cat. no. 837-091)(�20°C), add to an aliquot of the ChIP buffer immediately before use (seeNote 1).
2. 1 M Tris-HCl, pH 8.0.3. 5 M sodium chloride.4. 10% Nonidet P40 (Igepal CA-630, Sigma).5. Cell lysis buffer: 10 mM Tris-HCl, pH 8.0, 10 mM NaCl, 0.2% NP40. Add
histone deacetylase and protease inhibitors to the buffer immediately be-fore use.
2.4. Nuclei Lysis
1. 0.5 M ethylenediaminetetraacetic acid (EDTA), pH 8.0.2. Nuclei lysis buffer: 50 mM Tris-HCl, pH 8.0, 10 mM EDTA, 1% SDS. Add
histone deacetylase and protease inhibitors to the buffer immediately be-fore use.
2.5. Sonication and Preclearing
1. 20% Triton X-100.2. Immunoprecipitation (IP) dilution buffer: 20 mM Tris-HCl, pH 8.0, 2 mM
EDTA, 150 mM NaCl, 1% Triton X-100, 0.01% SDS. Add histone deacety-lase and protease inhibitors to the buffer immediately before use.
3. Normal rabbit serum (�20°C) (Covance Research Products, Princeton, NJ).4. Branson sonifier 250 (Branson Ultrasonics, Danbury, CT, cat. no. 101-063-
196) with microtip horn-1/8 in solid-tapered (cat. no. 101-148-062).5. Protein A-sepharose, 20% slurry (Sigma, cat. no. P-3391) (4°C) (see Note 2).6. Hematology/chemistry mixer (Fisher, Pittsburg, PA, cat. no. 14-059-346).7. Falcon polypropylene tubes (no. 2096).
2.6. Immunoprecipitation
1. IP dilution buffer (see Subheading 2.5.).2. Nuclei lysis buffer (see Subheading 2.4.).3. Protein A-sepharose, 20% slurry (4°C).
134 Im et al.
2.7. Washing Protein A-Sepharose/Immune Complexes
1. IP wash buffer 1: 20 mM Tris-HCl, pH 8.0, 2 mM EDTA, 50 mM NaCl, 1%Triton X-100, 0.1% SDS.
2. Lithium chloride.3. Deoxycholic acid.4. IP wash buffer 2: 10 mM Tris-HCl, pH 8.0, 1 mM EDTA, 250 mM LiCl,
1% NP40, 1% deoxycholic acid.5. 1X Tris-EDTA (TE) buffer: 10 mM Tris-HCl, pH 8.0, 1 mM EDTA.
2.8. Immune Complex Elution
1. Sodium bicarbonate (NaHCO3).2. Elution Buffer (100 mM NaHCO3, 1% SDS).
2.9. Reverse Crosslinking
1. 1 mg/mL RNase A (Sigma, cat. no. R-4875) (�20°C) (see Note 3).2. 5 M NaCl.3. 20 mg/mL Proteinase K (Promega, cat. no. V-3021) (�20°C).
2.10. DNA Purification
1. 1X TE buffer.2. 10 mg/mL tRNA (Sigma, cat. no. R-7876) (�20°C).3. Phenol.4. Phenol saturated with 0.1 M Tris-HCl, pH 8.0 (see Note 4).5. Chloroform.6. Sodium acetate.7. Glacial acetic acid.8. 3 M sodium acetate (NaOAc), pH 5.2.9. 10 mg/mL Glycogen (�20°C).
10. 100% and 70% ethanol (EtOH).11. 10 mM Tris-HCl, pH 8.0.12. Agarose.
2.11. Quantitative Real-Time Polymerase Chain Reaction
1. ABI 7000 sequence detection system (Applied Biosystems, Foster City, CA).2. 96-well plates (Eppendorf, cat. no. 954-02-030-3).3. SYBR Green PCR master mix (Applied Biosystems, cat. no. 4309155).4. ABI PRISM optical adhesive covers (Applied Biosystems, cat. no. 4311971)
(see Note 5).5. ABI PRISM optical caps (8 caps/strip) (Applied Biosystems, cat. no.
4323032).
Chromatin Occupancy 135
3. MethodsThe following steps apply to the analysis of a single-cell line or a primary
cell sample, in which five conditions will be used for the immunoprecipitation.Although most of our studies have utilized blood cell lines and primary bloodcells, which are largely non-adherent, only minor modifications are required foranalysis of adherent cells (see Note 6). Up to four ChIP experiments routinelyare conducted in parallel. The protocol requires at least 3 d to complete, withthe final steps in Subheadings 3.4. and 3.8. requiring overnight incubations.
3.1. Crosslinking
1. Use 1 � 107 cells per IP condition. Transfer the cells to a 500-mL Erlen-meyer flask (see Note 7).
2. Dilute the cells to 90 mL (5 � 105 cells/mL, final) with sterile tissue-cul-ture medium at room temperature (see Note 8).
3. Crosslink by adding 1 mL 37% formaldehyde (0.4% final). Mix for 10 minat room temperature (setting 4–5, platform shaker).
4. Stop the crosslinking reaction by adding 5 mL of 2.5 M glycine (0.125 Mfinal). Mix for 5 min at room temperature (setting 4–5, platform shaker)(see Note 9).
5. Transfer the cells to 50-mL conical centrifuge tubes, and centrifuge at 240gfor 7 min at 4°C in a swinging bucket rotor. Keep the sample on ice afterthis step.
6. Resuspend the cells with 0.5 mL ice-cold PBS and divide equally into two1.5-mL microfuge tubes.
7. Wash the 50-mL tubes with an additional 0.5 mL of ice-cold PBS and trans-fer to the 1.5-ml microfuge tubes from step 6.
8. Pellet the cells at 600 g for 5 min at 4°C (see Note 10).
3.2. Cell Lysis
1. Chill 1 mL cell lysis buffer on ice for 5 min.2. Carefully remove the supernatant from the cell pellet with a pipet (see
Note 11).3. Estimate the total cell pellet volume.4. Resuspend the cells in 1.5 � pellet volumes of ice-cold cell lysis buffer by
gently pipetting up and down (see Note 12).5. Combine the resuspended cells into one tube and then incubate on ice for
10 min.6. Centrifuge at 600 g for 5 min at 4°C.7. Remove the supernatant with a pipet, being careful not to disturb the nuclei
pellet (see Note 13).
136 Im et al.
3.3. Nuclei Lysis
1. Chill 1.5 mL nuclei lysis buffer on ice for 3 min (see Note 14).2. Resuspend the nuclei pellet in 1 mL nuclei lysis buffer by repetitive pipetting.3. Incubate the sample for 10 min at 4°C (see Note 15).
3.4. Sonication and Preclearing
1. Chill 1 mL of IP Dilution Buffer on ice for 5 min. Transfer the lysed nucleito a 15 mL Falcon 2096 conical tube, and add 0.8 mL of ice-cold IP Dilu-tion buffer.
2. Sonicate the chromatin to reduce the average size to approx 500 bp (seeNote 16):
a. Number of bursts: 8.b. Length of bursts: 30–40 s.c. Output control setting: 20%.d. Duty cycle: constant.
3. Transfer the sonicated chromatin to a 2 mL microfuge tube and centrifugeat 16,000 g for 10 min at 4°C to pellet any insoluble material.
4. Transfer the supernatant to a 15-mL conical polypropylene Falcon 2096 tube.5. Add 2 mL IP dilution buffer to the sample to bring the total ratio of nuclei
lysis buffer: IP dilution buffer to 1:4 (see Note 17).6. Preclear the chromatin by adding 50 lL of preimmune rabbit serum. Mix
at 4°C for at least 1 h.7. In a 1.5-ml microfuge tube, pellet 500 lL of (20% slurry) by centrifuging
at 4000g for 2 min at 4°C.8. Use 500 lL of the chromatin solution to resuspend the Protein A-sepharose
pellet and transfer back to the 15-mL tube. Mix at 4°C overnight.9. End of d 1.
3.5. Immunoprecipitation
1. Pellet the from the preclearing reaction by centrifuging in a swingingbucket rotor at 1500g for 2 min at 4°C.
2. Aliquot the chromatin into 1.5-ml microfuge tubes: 180 lL for the inputsample and 900 lL for each IP sample (see Note 18).
3. Set up a “no chromatin” sample, as a negative control, by mixing 180 lLnuclei lysis buffer and 720 lL IP Dilution Buffer in a 1.5-mL microfugetube. Treat the sample identical to samples incubated with antibodies (seeNote 19).
4. Add antibodies: Usually 0.8% to 1.6% (i.e., 7.5 lL anti-acetyl-histone H3,1 mg/mL; Upstate Biotechnology, cat. no. 06-599). Add 10 lL of normalrabbit serum to one aliquot of chromatin as a negative control. In addition,
Chromatin Occupancy 137
set up a “no chromatin” sample lacking antibody. Mix for 2–3 h at 4°C (seeNote 20 and 21).
5. Centrifuge the IP samples at 16,000 g for 5 min at 4°C to remove any in-soluble material.
6. For each IP sample, prepare one 1.5-mL microfuge tube containing 150 lLof Protein A-sepharose (20% slurry) centrifuge at 4000 g for 2 min at 4°C,and discard the supernatant.
7. Transfer the samples to the Protein A-sepharose pellets. Mix for 1–2 h at 4°C.
3.6. Washing Protein A-Sepharose/Immune Complexes
1. Pellet the Protein A-sepharose-bound immune complexes by centrifugingat 4000 g for 2 min at 4°C.
2. Wash the Protein A-sepharose-bound immune complexes with 500 lL ofeach solution: twice with ice-cold IP wash buffer 1, once with ice-cold IPwash buffer 2, and twice with ice-cold 1X TE buffer.
3. Transfer the Protein A-sepharose/immune complex pellets to new 1.5-mLmicrofuge tubes with first wash of IP wash buffer 1. This step is critical forreducing background.
4. Resuspend the immunoadsorbed immune complexes by vortexing for 1–2 sat low speed after each buffer addition.
5. Pellet the Protein A-sepharose at 4000 g for 2 min at 4°C, and discard thesupernatant (see Note 22).
3.7. Immune Complex Elution
1. Elute the immune complexes from the Protein A-sepharose with 150 lL ofelution buffer at room temperature (see Note 23).
2. Vortex for 2–3 s at medium speed, centrifuge at 4000 g for 2 min at roomtemperature, and transfer the supernatants to new 1.5-mL microfuge tubes.
3. Elute the immune complexes with an additional 150 lL of elution buffer,and combine both eluted samples in the same tube.
3.8. Reverse Crosslinking
1. To the IP samples add 1 lL of 1 mg/mL RNase A and 18 lL of 5 M NaCl.2. To the input sample add 1 lL of 1 mg/mL RNase Aand 10.8 lL of 5 M NaCl.3. Incubate the samples in a heating block at 67°C for a minimum of 4 h (see
Note 24).4. Add 3 lL of 20 mg/mL Proteinase K to each sample, and then vortex for
1–2 s at low setting. Reduce the temperature to 45°C and incubate over-night (see Note 25).
5. End of d 2.
138 Im et al.
3.9. Nucleic Acid Purification
1. Add 120 lL of 1X TE buffer to the input sample.2. Add 1 lL of 10 mg/mL tRNA to the input and IP samples.3. Extract the input and IP samples with 300 lL of 1:1 phenol/chloroform by
vortexing well (10–15 s at highest speed) and centrifuging at 16,000 g for5 min at room temperature. Transfer the top aqueous phase to a new 1.5-mLmicrofuge tube after each extraction.
4. Extract the input sample with 1:1 phenol/chloroform an additional time,vortex well, and centrifuge at 16,000 g for 5 min at room temperature (seeNote 26).
5. Extract the input and IP samples once with 300 lL of chloroform, vortexwell, and centrifuge at 16,000 g for 5 min at room temperature.
6. Add 30 lL of 3 M NaOAc, pH 5.2, 0.5 lL of 10 mg/mL tRNA and 0.5 lLof 10 mg/mL glycogen to the input and IP samples.
7. Add 750 lL of 100% EtOH (2.5 sample volumes) to each sample, and mixby inverting tubes several times. Incubate at least 30 min at �80°C (seeNote 27).
8. Centrifuge the samples at 16,000 g for 20 min at 4°C. Discard the super-natant (see Note 28).
9. Wash the pellets with 800 lL of ice cold 70% EtOH, and centrifuge at16,000 g for 10 min at 4°C. Discard the supernatant (see Note 29).
10. Air-dry the pellets for 5–10 min. Do not overdry the pellets, as they maynot completely dissolve.
11. Dissolve the IP samples and the input samples in 30 lL and 66.7 lL of auto-claved 10 mM Tris-HCl, pH 8.0, respectively (see Note 30).
12. Incubate samples for 10 min at room temperature. Mix with moderate vor-texing for 2–3 s.
13. Run 4 lL of the input sample on a 1.6% agarose gel to check the chromatinsize (see Note 31).
14. Store samples at �20°C.
3.10. Quantitative Real-Time Polymerase Chain Reaction
1. Set up a real-time PCR plate document on the instrument. For each primerset/sample set combination, use a unique detector.
2. Prepare the following serial dilution of the input sample in 10 mM Tris-HCl, pH 8.0: 1/5, 1/25, 1/125, and 1/625. Use the diluted input samples togenerate a standard curve for each primer set/sample set combination.
3. Load each well to be used in the plate with assay mix containing; 12.5 lLSYBR green master mix, 100 nM forward and 100 nM reverse primer, and
Chromatin Occupancy 139
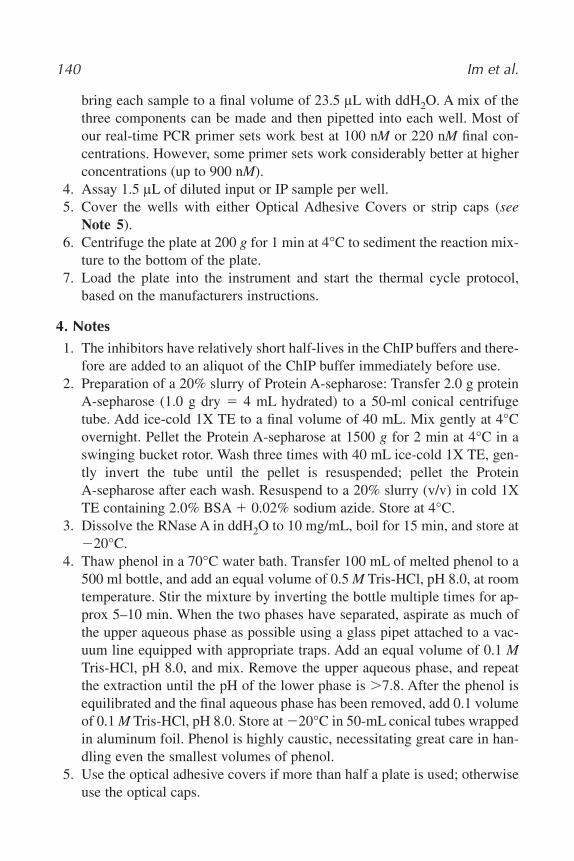
bring each sample to a final volume of 23.5 lL with ddH2O. A mix of thethree components can be made and then pipetted into each well. Most ofour real-time PCR primer sets work best at 100 nM or 220 nM final con-centrations. However, some primer sets work considerably better at higherconcentrations (up to 900 nM).
4. Assay 1.5 lL of diluted input or IP sample per well.5. Cover the wells with either Optical Adhesive Covers or strip caps (see
Note 5).6. Centrifuge the plate at 200 g for 1 min at 4°C to sediment the reaction mix-
ture to the bottom of the plate.7. Load the plate into the instrument and start the thermal cycle protocol,
based on the manufacturers instructions.
4. Notes1. The inhibitors have relatively short half-lives in the ChIP buffers and there-
fore are added to an aliquot of the ChIP buffer immediately before use.2. Preparation of a 20% slurry of Protein A-sepharose: Transfer 2.0 g protein
A-sepharose (1.0 g dry � 4 mL hydrated) to a 50-ml conical centrifugetube. Add ice-cold 1X TE to a final volume of 40 mL. Mix gently at 4°Covernight. Pellet the Protein A-sepharose at 1500 g for 2 min at 4°C in aswinging bucket rotor. Wash three times with 40 mL ice-cold 1X TE, gen-tly invert the tube until the pellet is resuspended; pellet the ProteinA-sepharose after each wash. Resuspend to a 20% slurry (v/v) in cold 1XTE containing 2.0% BSA � 0.02% sodium azide. Store at 4°C.
3. Dissolve the RNase A in ddH2O to 10 mg/mL, boil for 15 min, and store at�20°C.
4. Thaw phenol in a 70°C water bath. Transfer 100 mL of melted phenol to a500 ml bottle, and add an equal volume of 0.5 M Tris-HCl, pH 8.0, at roomtemperature. Stir the mixture by inverting the bottle multiple times for ap-prox 5–10 min. When the two phases have separated, aspirate as much ofthe upper aqueous phase as possible using a glass pipet attached to a vac-uum line equipped with appropriate traps. Add an equal volume of 0.1 MTris-HCl, pH 8.0, and mix. Remove the upper aqueous phase, and repeatthe extraction until the pH of the lower phase is �7.8. After the phenol isequilibrated and the final aqueous phase has been removed, add 0.1 volumeof 0.1 M Tris-HCl, pH 8.0. Store at �20°C in 50-mL conical tubes wrappedin aluminum foil. Phenol is highly caustic, necessitating great care in han-dling even the smallest volumes of phenol.
5. Use the optical adhesive covers if more than half a plate is used; otherwiseuse the optical caps.
140 Im et al.
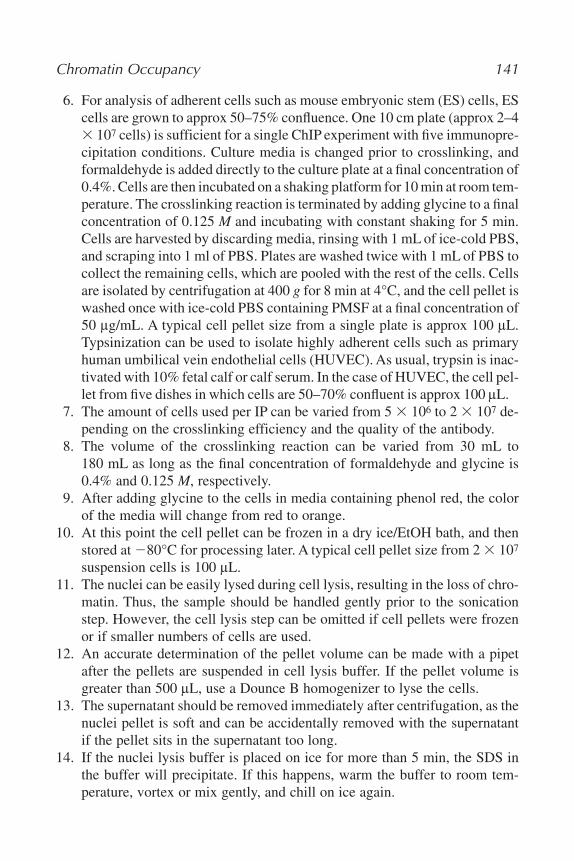
6. For analysis of adherent cells such as mouse embryonic stem (ES) cells, EScells are grown to approx 50–75% confluence. One 10 cm plate (approx 2–4� 107 cells) is sufficient for a single ChIP experiment with five immunopre-cipitation conditions. Culture media is changed prior to crosslinking, andformaldehyde is added directly to the culture plate at a final concentration of0.4%. Cells are then incubated on a shaking platform for 10 min at room tem-perature. The crosslinking reaction is terminated by adding glycine to a finalconcentration of 0.125 M and incubating with constant shaking for 5 min.Cells are harvested by discarding media, rinsing with 1 mL of ice-cold PBS,and scraping into 1 ml of PBS. Plates are washed twice with 1 mL of PBS tocollect the remaining cells, which are pooled with the rest of the cells. Cellsare isolated by centrifugation at 400 g for 8 min at 4°C, and the cell pellet iswashed once with ice-cold PBS containing PMSF at a final concentration of50 lg/mL. A typical cell pellet size from a single plate is approx 100 lL.Typsinization can be used to isolate highly adherent cells such as primaryhuman umbilical vein endothelial cells (HUVEC). As usual, trypsin is inac-tivated with 10% fetal calf or calf serum. In the case of HUVEC, the cell pel-let from five dishes in which cells are 50–70% confluent is approx 100 lL.
7. The amount of cells used per IP can be varied from 5 � 106 to 2 � 107 de-pending on the crosslinking efficiency and the quality of the antibody.
8. The volume of the crosslinking reaction can be varied from 30 mL to180 mL as long as the final concentration of formaldehyde and glycine is0.4% and 0.125 M, respectively.
9. After adding glycine to the cells in media containing phenol red, the colorof the media will change from red to orange.
10. At this point the cell pellet can be frozen in a dry ice/EtOH bath, and thenstored at �80°C for processing later. A typical cell pellet size from 2 � 107
suspension cells is 100 lL.11. The nuclei can be easily lysed during cell lysis, resulting in the loss of chro-
matin. Thus, the sample should be handled gently prior to the sonicationstep. However, the cell lysis step can be omitted if cell pellets were frozenor if smaller numbers of cells are used.
12. An accurate determination of the pellet volume can be made with a pipetafter the pellets are suspended in cell lysis buffer. If the pellet volume isgreater than 500 lL, use a Dounce B homogenizer to lyse the cells.
13. The supernatant should be removed immediately after centrifugation, as thenuclei pellet is soft and can be accidentally removed with the supernatantif the pellet sits in the supernatant too long.
14. If the nuclei lysis buffer is placed on ice for more than 5 min, the SDS inthe buffer will precipitate. If this happens, warm the buffer to room tem-perature, vortex or mix gently, and chill on ice again.
Chromatin Occupancy 141
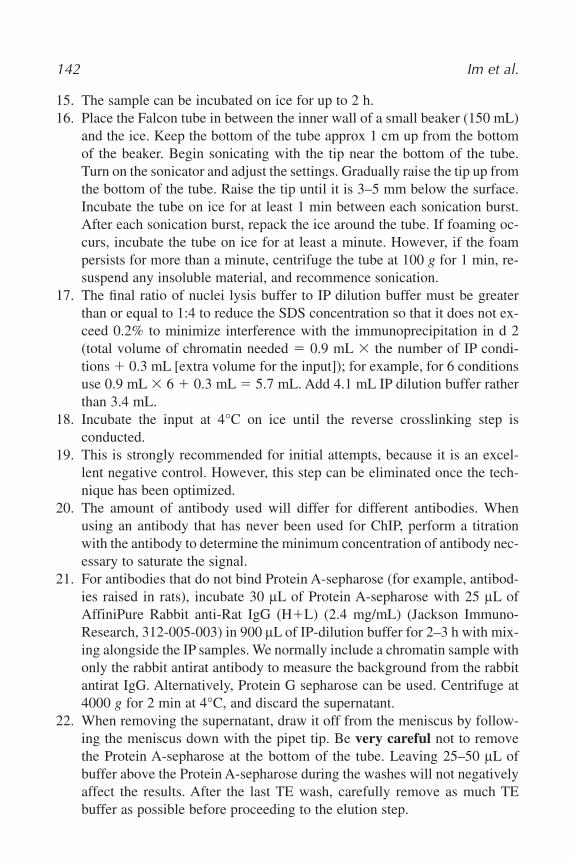
15. The sample can be incubated on ice for up to 2 h.16. Place the Falcon tube in between the inner wall of a small beaker (150 mL)
and the ice. Keep the bottom of the tube approx 1 cm up from the bottomof the beaker. Begin sonicating with the tip near the bottom of the tube.Turn on the sonicator and adjust the settings. Gradually raise the tip up fromthe bottom of the tube. Raise the tip until it is 3–5 mm below the surface.Incubate the tube on ice for at least 1 min between each sonication burst.After each sonication burst, repack the ice around the tube. If foaming oc-curs, incubate the tube on ice for at least a minute. However, if the foampersists for more than a minute, centrifuge the tube at 100 g for 1 min, re-suspend any insoluble material, and recommence sonication.
17. The final ratio of nuclei lysis buffer to IP dilution buffer must be greaterthan or equal to 1:4 to reduce the SDS concentration so that it does not ex-ceed 0.2% to minimize interference with the immunoprecipitation in d 2(total volume of chromatin needed � 0.9 mL � the number of IP condi-tions � 0.3 mL [extra volume for the input]); for example, for 6 conditionsuse 0.9 mL � 6 � 0.3 mL � 5.7 mL. Add 4.1 mL IP dilution buffer ratherthan 3.4 mL.
18. Incubate the input at 4°C on ice until the reverse crosslinking step isconducted.
19. This is strongly recommended for initial attempts, because it is an excel-lent negative control. However, this step can be eliminated once the tech-nique has been optimized.
20. The amount of antibody used will differ for different antibodies. Whenusing an antibody that has never been used for ChIP, perform a titrationwith the antibody to determine the minimum concentration of antibody nec-essary to saturate the signal.
21. For antibodies that do not bind Protein A-sepharose (for example, antibod-ies raised in rats), incubate 30 lL of Protein A-sepharose with 25 lL ofAffiniPure Rabbit anti-Rat IgG (H�L) (2.4 mg/mL) (Jackson Immuno-Research, 312-005-003) in 900 lL of IP-dilution buffer for 2–3 h with mix-ing alongside the IP samples. We normally include a chromatin sample withonly the rabbit antirat antibody to measure the background from the rabbitantirat IgG. Alternatively, Protein G sepharose can be used. Centrifuge at4000 g for 2 min at 4°C, and discard the supernatant.
22. When removing the supernatant, draw it off from the meniscus by follow-ing the meniscus down with the pipet tip. Be very careful not to removethe Protein A-sepharose at the bottom of the tube. Leaving 25–50 lL ofbuffer above the Protein A-sepharose during the washes will not negativelyaffect the results. After the last TE wash, carefully remove as much TEbuffer as possible before proceeding to the elution step.
142 Im et al.
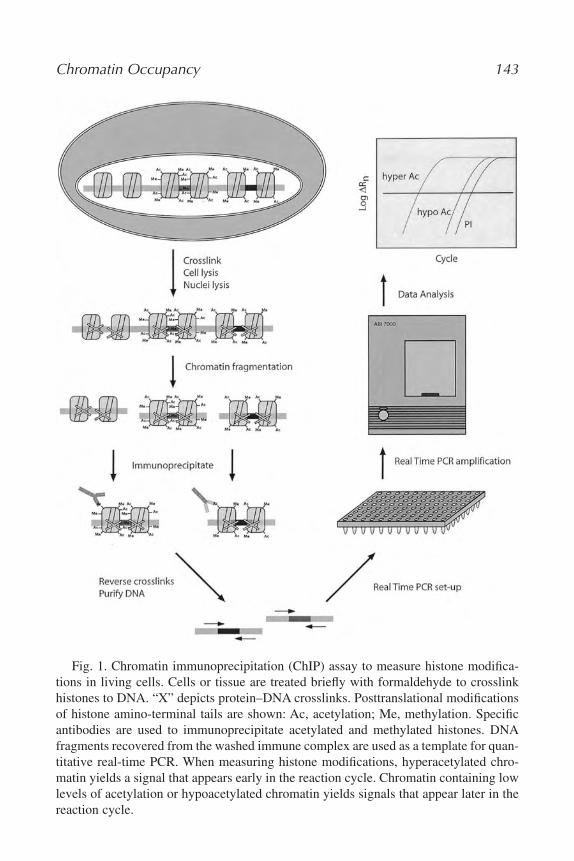
Chromatin Occupancy 143
Fig. 1. Chromatin immunoprecipitation (ChIP) assay to measure histone modifica-tions in living cells. Cells or tissue are treated briefly with formaldehyde to crosslinkhistones to DNA. “X” depicts protein–DNA crosslinks. Posttranslational modificationsof histone amino-terminal tails are shown: Ac, acetylation; Me, methylation. Specificantibodies are used to immunoprecipitate acetylated and methylated histones. DNAfragments recovered from the washed immune complex are used as a template for quan-titative real-time PCR. When measuring histone modifications, hyperacetylated chro-matin yields a signal that appears early in the reaction cycle. Chromatin containing lowlevels of acetylation or hypoacetylated chromatin yields signals that appear later in thereaction cycle.
23. Do not chill the elution buffer before or during use, because the SDS willprecipitate, and the buffer will need to be warmed at 37°C for 1–2 min.
24. A water bath may be used rather than a heating block. This step reversesthe crosslinking and digests any RNA that is bound to the immune pellet.
25. The Proteinase K treatment can be stopped after 2 h, following either a 4 hor overnight RNase A treatment. After this step is completed, the samplescan be stored at �20°C for processing at a later time.
26. Certain input samples may require more than two extractions with 1:1phenol/chloroform.
27. The samples can be stored at �80°C for as long as necessary.28. The IP pellets should appear as small translucent or white ovals of about
1–2 lL, and the input pellet should be white, about 5–10 lL.29. After discarding the 70% EtOH wash, centrifuge for 1–2 s to isolate the re-
maining EtOH at the bottom. Using a pipet, remove as much of the EtOHas possible.
30. Autoclaved ddH2O can be used in place of 10 mM Tris-HCl, pH 8.0.Inputs are dissolved in a volume to achieve 0.3% total chromatin immuno-precipitated per lL and used to generate a 125-fold range for the stan-dard curve.
31. If agarose gel analysis reveals that the chromatin is too large, the length ofbursts and/or the output setting can be increased to reduce chromatin lengthin subsequent experiments. However, increasing the sonication time and/oroutput may elevate the temperature of the sample and may decrease theyield of immunoprecipitated chromatin. Adjusting the number of bursts toreduce the chromatin size is usually not as effective as adjusting the burstduration or the output setting.
References1. von Hippel, P. H. and McGhee, J. D. (1972) DNA-protein interactions. Ann. Rev.
Biochem. 41, 231–300.2. Woodbury, C. P. and von Hippel, P. H. (1983) On the determination of deoxyri-
bonucleic acid-protein interaction parameters using the nitrocellulose filter-bindingassay. Biochem. 22, 4730–4737.
3. Garner, M. M. and Revzin, A. (1981) A gel electrophoresis method for quantifyingthe binding of proteins to specific DNAregions: application to components of the Es-cherichia coli lactose operon regulatory system. Nucleic Acids Res. 9, 3047–3060.
4. Galas, D. J. and Schmitz, A. (1978) DNaseI footprinting: a simple method for thedetection of protein–DNA binding specificity. Nucleic Acids Res. 5, 3157–3170.
5. Felsenfeld, G. (1992) Chromatin as an essential part of the transcriptional mecha-nism. Nature 355, 219–224.
144 Im et al.
6. Hager, G. L., Archer, T. K., Fragoso, G., et al. (1993) Influence of chromatin struc-ture on the binding of transcription factors to DNA. Cold Spring Harb. Symp.Quant. Biol. 58, 63–71.
7. Wolffe, A. P. (1994) Transcription: in tune with the histones. Cell 77, 13–16.8. Weinmann, A. S., Bartley, S. M., Zhang, T., et al. (2000) Use of chromatin immuno-
precipitation to clone novel e2f target promoters. Mol. Cell Biol. 21, 6820–6832.9. Boyd, K. E. and Farnham, P. J. (1997) Myc versus USF: discrimination at the cad
gene is determined by core promoter elements. Mol. Cell Biol. 17, 2529–2537.10. Boyd, K. E., Wells, J., Gutman, J., et al. (1998) c-Myc target gene specificity is de-
termined by a post-DNA binding mechanism. Proc. Natl. Acad. Sci. USA. 95,13,887–13,892.
11. Cordingley, M. G., Riegel, A. T., and Hager, G. L. (1987) Steroid-dependent inter-action of transcription factors with the inducible promoter of mouse mammarytumor virus in vivo. Cell 48, 261–270.
12. Cordingley, M. G. and Hager, G. L. (1988) Binding of multiple factors to theMMTV promoter in crude and fractionated nuclear extracts. Nucleic Acids Res. 16,609–628.
13. Nick, H. and Gilbert, W. (1985) Detection in vivo of protein–DNA interactionswithin the lac operon of Escherichia coli. Nature 313, 795–798.
14. Mueller, P. R. and Wold, B. (1989) In vivo footprinting of a muscle specific en-hancer by ligation mediated PCR. Science 246, 780–786.
15. Strauss, E. C. and Orkin, S. H. (1992) In vivo protein–DNA interactions at hyper-sensitive site 3 of the human beta-globin locus control region. Proc. Natl. Acad. Sci.USA. 89, 5809–5813.
16. Tanguay, R. L., Preifer, G. P., and Riggs, A. D. (1990) PCR-aided DNaseI foot-printing of single copy gene sequences in permeabilized cells. Nucleic Acids Res.18, 5902.
17. Bresnick, E. H., Bustin, M., Marsaud, V., et al. (1992) The transcriptionally-activeMMTV promoter is depleted of histone H1. Nucleic Acids Res. 20, 273–278.
18. Stefanovsky, V., Dimitrov, S. I., Angelov, D., and Pashev, I. G. (1989) Interactionsof acetylated histones with DNA as revealed by UV laser induced histone-DNAcrosslinking. Biochem. Biophys. Res. Commun. 164, 304–310.
19. Nacheva, G. A., Guschin, D. Y., Preobrazhenskaya, O. V., et al. (1989) Change in thepattern of histone binding to DNA upon transcriptional activation. Cell 58, 27–36.
20. Postnikov, Y. V., Shick, V. V., Belyavsky, A. V., et al. (1991) Distribution of highmobility group proteins 1/2, E and 14/17 and linker histones H1 and H5 on tran-scribed and non-transcribed regions of chicken erythrocyte chromatin. NucleicAcids Res. 19, 717–725.
21. Solomon, M. J., Larsen, P. L., and Varshavsky, A. (1988). Mapping protein–DNAinteractions in vivo with formaldehyde: evidence that histone H4 is retained on ahighly transcribed gene. Cell 53, 937–947.
22. Dedon, P. C., Soults, J. A., Allis, C. D., and Gorovsky, M. A. (1991) Formaldehydecross-linking and immunoprecipitation demonstrate developmental changes in H1association with transcriptionally active genes. Mol. Cell Biol. 11, 1729–1733.
Chromatin Occupancy 145
23. Johnson, K. D. and Bresnick, E. H. (2002) Dissecting long-range transcriptionalmechanisms by chromatin immunoprecipitation. Methods 26, 27–36.
24. Forsberg, E. C., Downs, K. M., and Bresnick, E. H. (2000) Direct interaction ofNF-E2 with hypersensitive site 2 of the beta-globin locus control region in livingcells. Blood 96, 334–339.
25. Forsberg, E. C., Downs, K. M., Christensen, H. M., et al. (2000) Developmentallydynamic histone acetylation pattern of a tissue-specific chromatin domain. Proc.Natl. Acad. Sci. USA. 97, 14,494–14,499.
26. Johnson, K. D., Grass, J. D., Boyer, M. E., et al. (2002) Cooperative activities ofhematopoietic regulators recruit RNA polymerase II to a tissue-specific chromatindomain. Proc. Natl. Acad. Sci. USA 99, 11,760–11,765.
27. Kiekhaefer, C. M., Grass, J. A., Johnson, K. D., et al. (2002) Hematopoietic activa-tors establish an overlapping pattern of histone acetylation and methylation within atissue-specific chromatin domain. Proc. Natl. Acad. Sci. USA 99, 14,309–14,314.
28. Grass, J. A., Boyer, M. E., Paul, S., et al. (2003) GATA-1-dependent transcriptionalrepression of GATA-2 via disruption of positive autoregulation and domain-widechromatin remodeling. Proc. Natl. Acad. Sci. USA 100, 8811–8816.
29. Merika, M. and Orkin, S. H. (1993) DNA-binding specificity of GATA family tran-scription factors. Mol. Cell Biol. 13, 3999–4010.
30. Ko, L. J. and Engel, J. D. (1993) DNA-binding specificities of the GATA tran-scription factor family. Mol. Cell Biol. 13, 4011–4022.
31. Grass, J. A., Boyer, M. E., Paul, S., et al. et al. (2003) GATA-1-dependent tran-scriptional repression of GATA-2 via disruption of positive autoregulation and do-main-wide chromatin remodeling. Proc. Natl. Acad. Sci. USA 100, 8811–8816.
32. Lee, T. I., Rinaldi, N. J., Robert, F., et al. (2002) Transcriptional regulatory net-works in Saccharomyces cerevisiae. Science 298, 799–804.
33. Weinmann, A. S., Yan, P. S., Oberley, M. J., et al. (2002) Isolating human tran-scription factor targets by coupling chromatin immunoprecipitation and CpG islandmicroarray analysis. Genes Dev. 16, 235–244.
146 Im et al.
10
Characterization of Protein–DNA Association In Vivo by Chromatin Immunoprecipitation
Laurent Kuras
SummaryChromatin immunoprecipitation (ChIP) is one of the most powerful methods to identify
and characterize the association of proteins with specific genomic regions in the context of intactcells. In this method, cells are first treated with formaldehyde to crosslink protein–protein andprotein–DNA complexes in situ. Next, the crosslinked chromatin is sheared by sonication to gen-erate small chromatin fragments, and the fragments associated with the protein of interest are im-munoprecipitated using antibodies to the protein. Finally, protein–DNA crosslinks are reversedand the DNA is examined for the presence of particular sequences by quantitative polymerasechain reaction (PCR). Enrichment of specific sequences in the precipitate indicates that the se-quences are associated with the protein of interest in vivo. The ChIP method described here is in-tended for studying protein–DNA association in the budding yeast Saccharomyces cerevisiae, butit can be easily implemented in other cell types, including fly, mammalian, and plant cells.
Key Words: Chromatin; crosslinking reagents; DNA; DNA-binding proteins; formaldehyde;immunoprecipitation; polymerase chain reaction; protein–DNA interactions; yeast.
1. IntroductionChromatin immunoprecipitation (ChIP) is a highly powerful method to iden-
tify and characterize protein–DNA interactions in vivo within a natural chro-matin environment. The basic ChIP method is remarkably versatile and hasbeen used in a wide range of cell types, including yeast, fly, mammalian andplant cells (for examples, see refs. 1–20). The ChIP method uses formaldehyde
From: Methods in Molecular Biology, vol. 284:Signal Transduction Protocols
Edited by: R. C. Dickson © Humana Press Inc., Totowa, NJ
147
(molecular formula: HCHO) as a crosslinking agent to “freeze” protein–DNAinteractions directly in situ, within intact cells, and to prevent dissociation andredistribution of proteins during chromatin extraction and immunoprecipita-tion (9,21). Formaldehyde is a membrane soluble and dipolar compound thatreacts with amino and imino group of amino acids (side-chain of lysines,arginines, and histidines) and of nucleic acids (e.g., adenines and cytosines).Formaldehyde produces both protein–protein, protein–DNA and protein–RNAcrosslinks. Therefore, it can be used to study proteins that are not directlycrosslinkable to DNA but that interact with proteins that are themselves di-rectly crosslinkable to DNA (22). Another key advantage of using formalde-hyde is that the crosslinks are fully reversible (9), which simplifies subsequentcharacterization of the interacting molecules. Following fixation withformaldehyde, cells are lysed and the crosslinked chromatin is isolated andsonicated to produce short DNA fragments (400 bp average). Then the DNAfragments associated with the protein of interest are purified by selective im-munoprecipitation with an antibody specific for the protein (either antibodiesto the native protein or antibodies to the tag in case the protein was tagged).Finally, following reversal of crosslinks and purification of DNA, the pool ofimmunoprecipitated DNA fragments is examined for the presence of specificregions by quantitative polymerase chain reaction (PCR).
2. Materials2.1. Cell Growth and Formaldehyde Crosslinking
1. Liquid media for yeast (23).2. Formaldehyde, 37% aqueous solution.3. 2.5 M glycine, autoclaved and stored at room temperature.4. 20 mM Tris-HCl, pH 8.0, ice cold.5. FA lysis buffer: 50 mM HEPES-KOH, pH 7.5, 150 mM NaCl, 1 mM EDTA,
1% (v/v) Triton X-100, 0.1% (w/v) deoxycholic acid sodium salt, 0.1%(w/v) sodium dodecyl sulfate SDS, filter-sterilized through 0.22 lm filterand stored at 4ºC (see Note 1).
6. Falcon 14-mL polypropylene round-bottom tubes (Becton Dickinson).7. 100 mM phenylmethylsulfonyl fluoride (PMSF) in isopropanol, stored up
to 9 mo at room temperature. PMSF is a strong neurotoxin and should beused with extreme caution.
2.2. Preparation of Crosslinked Chromatin Extracts
1. Ice-cold FA lysis buffer.2. 100 mM PMSF.
148 Kuras
3. Protease inhibitor cocktail tablets (Roche).4. 0.5-mm Zirconia/silica beads (BioSpec Products).5. Vortexer (e.g., Vortex-Genie 2, Scientific Industries).6. Kimwipes.7. Black (22 G) hypodermic needle.8. 50-mL NALGENE Oak Ridge centrifuge tubes (Nalge Nunc International).9. 15-mL COREX centrifuge tubes.
10. 2-mL microcentrifuge tube (Eppendorf).11. Sonication device fitted with a microtip (e.g., Bronson sonifier 250, Bran-
son Ultrasonices).12. 1.5 mL Safe-Lock tubes (Eppendorf).13. 5X Elution buffer: 125 mM Tris-HCl, pH 7.5, 25 mM EDTA, 2.5% (w/v)
SDS. Filter through 0.22-lm filter and store at room temperature.14. 20 mg/mL Pronase in water (Roche).15. TE buffer: 10 mM Tris-HCl pH 8.0, 1 mM EDTA. Autoclave and store at
room temperature.16. Agarose and DNA gel electrophoresis equipment.
2.3. Immunoprecipitation
1. 1.5-mL Costar low-binding microcentrifuge tubes (Corning Life Sciences).2. Protein A sepharose CL-4B gel (Amersham Biosciences), 25% slurry in
PBS prepared from dry powder as recommended by the manufacturer.Store at 4ºC.
3. PBS: 20 mM Na phosphate, pH 7.0, 150 mM NaCl, 10 mM EDTA. Filterthrough 0.45-lm filter, autoclave and store at room temperature.
4. 20 mg/mL Acetylated bovine serum albumin (Ac-BSA) (Sigma).5. 5 mg/mL Sonicated salmon sperm DNA (400 bp average size) in TE.6. Rotating wheel.7. Drawn-out Pasteur pipets.8. FA-lysis/0.5 M NaCl buffer: 50 mM HEPES-KOH pH 7.5, 500 mM NaCl,
1 mM EDTA, 1% (v/v) Triton X-100, 0.1% (w/v) deoxycholic acidsodium salt, 0.1% (w/v) SDS. Filter-sterilize through 0.22-lm filter. Storeat room temperature.
9. LiCl/detergent buffer: 10 mM Tris-HCl, pH 8.0, 0.25 M LiCl, 1 mM EDTA,0.5% (v/v) Nonidet P40, 0.5% (w/v) deoxycholic acid sodium salt. Filter-sterilize through 0.22-lm filter and store at room temperature.
10. Elution buffer: 25 mM Tris-HCl, pH 7.5, 5 mM EDTA, 0.5% (w/v) SDS.Filter-sterilize through 0.22-lm filter and store at room temperature.
11. 65ºC Water bath or heat block.12. 1.5 mL Safe-Lock tubes (Eppendorf).
Characterization of Protein–DNA Association by ChIP 149
2.4. Reversal of the Crosslinks and Purification of DNA
1. 5X Elution buffer.2. 65ºC Air incubator or oven.3. 10 mg/mL DNase-free RNase (Roche).4. 25:24:1 (v/v/v) phenol/chloroforme/isoamyl alcohol.5. Chloroform.6. 20 mg/mL Glycogen, molecular biology-grade (Roche).7. 4 M LiCl, filter through 0.45-lm filter and autoclave.8. 100% Ethanol.
2.5. Analysis of Immunoprecipitated DNA by Quantitative PCR
1. Oligonucleotides: 24- to 26-mers with approx 40% GC content and similarmelting temperature (around 60ºC), designed to produce 150–300 bp frag-ments. Prepare 20 lM working dilutions in water and store at �20ºC.
2. HotStarTaq DNA polymerase with 10X reaction buffer (Qiagen).3. High-purity dNTP mix containing 2 mM dATP, dCTP, dGTP, and dTTP
each (Amersham Biosciences).4. 10 mCi/mL [a-32P]dATP (specific activity: 3000 Ci/mmol).5. Thin-walled 0.2-mL PCR tubes, DNase- and RNase-free.6. Aerosol filter pipet tips (optional).7. Thermal cycler with a heated cover.8. Gel loading buffer: 50% glycerol (w/v), 10 mM EDTA, 0.1% (w/v) bro-
mophenol blue, 0.1% (w/v) xylene cyanol. Store at 4ºC.9. Apparatus and accessories for polyacrylamide gel electrophoresis.
10. 40% Acrylamide-bisacrylamide solution, 37.5:1.11. 10% (w/v) Ammonium persulfate in water, store up to 2 wk at 4ºC.12. TEMED (N,N,N',N'-tetramethylethylenediamine).13. 10X TBE (0.89 M Tris-HCl base, 0.89 M boric acid, 0.025 M EDTA,
pH 8.0).14. Whatman 3MM chromatography paper.15. Plastic wrap.16. Gel-drying system.17. Autoradiography films, intensifying screen, and cassette.18. Phosphorimaging equipment, e.g., PhosphorImager (Molecular Dynamics)
or Storm System (Amersham Biosciences).
3. MethodThe method described here is based on that developed by Strahl-Bolsinger et
al. (5) and focuses more specifically on the budding yeast Saccharomyces cere-visiae (see Note 2). This section outlines: (1) the growth and fixation with
150 Kuras
formaldehyde of yeast cells, (2) the extraction of the crosslinked chromatin, (3)the immunoprecipitation of the crosslinked chromatin, (4) the reversal of thecrosslinks and purification of DNA, and (5) the analysis of DNA by quantita-tive PCR.
3.1. Cell Growth and Formaldehyde Fixation
3.1.1. Cell Growth
1. Inoculate 5 mL of appropriate liquid growth medium with a single colonypicked from a fresh plate and allow to grow overnight at 30ºC.
2. Dilute an aliquot into 100 mL of fresh liquid-growth medium in a 500-mLflask so that the culture will have reached an optical density (OD) at 600 nmof 1–2 (ca. 2–3 107 cells/ mL) the next morning (see Note 3).
3.1.2. Formaldehyde Fixation
1. When the culture has reached the desired density, add 2.8 mL of 37%formaldehyde (see Note 4) directly to the medium (final concentration � 1%).After adding formaldehyde, mix rapidly and leave the suspension at roomtemperature for 15 min with occasional shaking (every 5 min) (see Note 5).
2. Add 20 mL of 2.5 M glycine (final concentration = 0.4 M) to stop thecrosslinking reaction, mix, and incubate for 5 min at room temperature.
3. Transfer the suspension into a 250-mL centrifuge bottle and pellet cells bycentrifugation for 8 min at 10,000 g at 4ºC.
4. Discard the supernatant (see Note 6) and resuspend cells in 250 mL of cold20 mM Tris-HCl, pH 8.0.
5. Centrifuge for 8 min at 10,000 g at 4ºC to pellet cells and discard thesupernatant.
6. Resuspend cells in 5 mL of cold FA-lysis buffer and add 50 lL of 100 mMPMSF (final concentration = 1 mM) (see Note 7). Transfer the suspensioninto a 14-mL round-bottom polypropylene tube and pellet cells by cen-trifugation for 5 min at 2500 g at 4ºC.
7. Discard the supernatant by aspiration with a Pasteur pipet connected toa vacuum aspirator and keep on ice. At this point cells can either be di-rectly extracted or frozen and stored in a �80ºC freezer for several weeks.
3.2. Extraction of the Crosslinked Chromatin
Tubes should be kept on ice between the successive manipulations during ex-traction of crosslinked chromatin.
1. If cells were frozen, thaw on ice first.2. Resuspend cells in 1 mL of ice-cold FA-lysis buffer containing 1 mM
PMSF and 1X protease inhibitor cocktail.
Characterization of Protein–DNA Association by ChIP 151
3. Add 1.5 mL of 0.5 mm zirconia/silica beads (see Note 8).4. To lyse cells, vortex vigorously 12 times for 1 min and place on wet ice for
1 min in between each time (see Note 9).5. Add 4 mL of FA-lysis buffer containing 1 mM PMSF and 1X protease in-
hibitor cocktail.6. To collect the suspension without the beads, wipe off ice and water from
the outside of the tube with a Kimwipe, invert the tube, puncture the bot-tom with a hot black (22 G) needle and insert the tube in a 50-mL OakRidge centrifuge tube. Centrifuge for 2 min at 1000 g at 4ºC to bring thesuspension down. Repeat centrifugation if part of the suspension has notbeen transferred to the 50 mL tube.
7. Transfer the whole extract in a 15 mL COREX tube and centrifuge for20 min at 2000 g at 4ºC to pellet the crosslinked chromatin (see Note 10).
8. Discard the supernatant and add 1.6 mL of cold FA-lysis buffer containing1 mM PMSF and 1X protease inhibitor cocktail to wash the pellet. Breakup the pellet by gently pipeting up and down with a 1-mL micropipetor.
9. Transfer the whole suspension into a 2-mL tube taking care that no mate-rial is left behind in the COREX tube. Spin at maximum speed in a micro-centrifuge for 20 min at 4ºC.
10. Discard the supernatant and add 1.6 mL of cold FA-lysis buffer containing1 mM PMSF and 1X protease inhibitor cocktail. Break up the pellet as instep 8 and place the tube on a holder in an ice-water bath.
11. Sonicate the suspension to yield DNA fragments in a size range between100 and 1000 bp with an average of 400 bp. Use a sonication device fittedwith a microtip. Place the microtip at the 0.5 mL graduation mark on the2 mL tube and hold the tube firmly to prevent movement during sonication.Sonicate for short cycles (20 maximum) at the maximum microtip powersetting. Place the tube in ice-water at least 5 min in between two sonicationcycles to avoid excessive heating in the sample. If several samples areprocessed in turns, wash the microtip thoroughly with water and ethanol inbetween samples to avoid cross-contamination. Every sonication device isdifferent and the number of cycles required with a particular device toachieve the desired DNA fragment size should be determined in a pilot ex-periment. Four to six cycles are generally sufficient to get DNA fragmentswith an average size of 400 bp (see Note 11).
12. Transfer the suspension to a 15-mL COREX tube and add 4 mL of coldFA-lysis buffer containing 1 mM PMSF and 1X protease inhibitor cocktail.Let stand on ice for 30–60 min.
13. Centrifuge for 20 min at 12,000 g at 4ºC to remove cell debris and insolu-ble components.
152 Kuras
14. Transfer the supernatant (which contains the fragmented crosslinked chro-matin) into a fresh 14-mL round-bottom polypropylene tube and discard thepellet. Save 100 lL to check the size of the DNA fragments and divide therest into 0.5 mL aliquots. Freeze the aliquots in liquid nitrogen and store at�80°C (see Note 12)
15. To check the size of the DNA fragments, mix 100 lL of extract with 25 lLof 5X elution buffer in a 1.5-mL Safe-Lock tube, add 6 lL of 20 mg/mLPronase, incubate 1 h at 37ºC, and proceed as described in Subheading 3.4.,Steps 2–8 to reverse crosslinks and purify DNA. Resuspend purified DNAin 50 lL of TE and analyze 20 lL by electrophoresis on a 1.5% agarose geland staining with ethidium bromide (see Note 13).
3.3. Immunoprecipitation
A control immunoprecipitation with either pre-immune serum, immuneserum depleted of the antibodies, peptide-block antibodies, or no antibody at allshould be performed to determine the specificity of the immunoprecipitation(see Note 14).
3.3.1. Coupling of Antibodies to Protein A Beads
1. In a 1.5-mL low-binding microcentrifuge tube, combine the appropriateamount of antibody (amount sufficient to deplete at least 90% of the anti-gen from 500 lL of chromatin extract, see Note 15) with 60 lL of 25% Pro-tein A sepharose bead slurry (see Note 16), 25 lL of 20 mg/mL Acetylated-Bovine Serum Albumin (Ac-BSA), and 4 lL of 5 mg/mL sonicated salmonsperm DNA. Bring the volume to 1 mL with ice-cold PBS.
2. Incubate for 4 h to overnight at 4ºC on a rotating wheel.3. Microcentrifuge 5 s at maximum speed at room temperature.4. Aspirate the supernatant (which contains unbound antibodies) using a
drawn out Pasteur pipet connected to a vacuum aspirator.5. Add 1 mL of ice-cold PBS and resuspend the beads by inverting the tube.6. Repeat steps 3 and 4 to collect beads.7. Add 25 lL of 20 mg/mL Ac-BSA, 4 lL of 5 mg/mL sonicated salmon
sperm DNA, and mix by gently flicking the bottom of the tube. Keep on ice.
3.3.2. Immunoprecipitation
1. If chromatin extracts were frozen, thaw on ice first and spin in a microcen-trifuge for 20 min at 16,000 g at 4ºC to clarify the extract from protein ag-gregates that may have formed during freezing and thawing.
2. Add 500 lL of chromatin extract to the antibody-conjugated Protein Abeads prepared before.
3. Incubate for 1–2 h at room temperature on a rotating wheel (see Note 17).
Characterization of Protein–DNA Association by ChIP 153
4. Microcentrifuge 1 min at 1000 g at room temperature to collect the beadsand remove the supernatant by aspiration with a drawn out Pasteur pipetconnected to a vacuum aspirator.
5. Add 1.4 mL of FA-lysis/0.5 M NaCl buffer and incubate for 5 min at roomtemperature on a rotating wheel (see Note 18).
6. Microcentrifuge 1 min at 1000g at room temperature and remove the super-natant as in step 4 (see Note 19).
7. Repeat steps 5 and 6 twice.8. Repeat steps 5 and 6 with 1.4 mL of LiCl/detergent buffer.9. Repeat steps 5 and 6 with 1.4 mL of TE buffer.
10. Add 125 lL of elution buffer, mix by vortexing, and incubate 20 min in a65ºC water bath or heat block to elute the immunoprecipitate from proteinA beads.
11. Microcentrifuge 1 min at maximum speed at room temperature and trans-fer eluate to a 1.5 mL Safe-Lock tube.
3.4. Reversal of the Crosslinks and Purification of DNA
It is important to treat at the same time as the immunoprecipitate an aliquotof the chromatin extract (routinely 100 lL, i.e., 20% of the volume used for theimmunoprecipitation, adjusted to 25 mM Tris-HCl, pH 7.5, 5 mM EDTA, 0.5%(w/v) SDS with 25 lL of 5X elution buffer). This will serve as the total (orinput) control for later analysis.
1. Add 6 lL of 20 mg/mL Pronase to the immunoprecipitate and the totalchromatin aliquot, and incubate 1 h at 37ºC to digest proteins.
2. Place samples in a air incubator or an oven at 70ºC and incubate for at least6 h up to overnight to reverse protein-DNA crosslinks (see Note 20).
3. Add 5 lg of DNase-free RNase and incubate 30 min at 37ºC.4. Extract samples once with an equal volume of 25:24:1 phenol/chloroforme/
isoamyl alcohol and once with an equal volume of chloroform.5. Add 20 lg of glycogen and 1/10 volume of 4 M LiCl, and vortex. Add 2 vol
of 100% ethanol and vortex again. Incubate at least 2 h up to overnight at�20ºC to precipitate DNA (see Note 21).
6. Microcentrifuge at maximum speed for 20 min at 4ºC.7. Remove the supernatant, wash the pellet with 1 mL of 100% ethanol, and
microcentrifuge at maximum speed for 5 min at 4ºC (see Note 22).8. Remove the supernatant and air dry the pellet for 10–15 min at room
temperature.9. Resuspend immunoprecipitate and total DNA in 200 lL of TE buffer (see
Note 23).
154 Kuras
3.5. Analysis of DNA by Quantitative PCR
Our method of choice to detect the presence of specific genomic fragmentsin the immunoprecipitate DNA is PCR (see Notes 24 and 25). The relative en-richment of a particular fragment in the immunoprecipitate DNA is calculatedby dividing the amount of PCR product obtained from the immunoprecipitateby that obtained from the total input DNA. For accurate quantification, it is es-sential to make sure that calculation is based on PCR signals that are in the lin-ear range of the amplification reaction. Indeed, the amount of product generatedduring amplification is proportional to the amount of template only during thelogarithmic-linear phase of the reaction. Therefore, it is essential to process sev-eral dilutions of the immunoprecipitate and input DNA (two- or threefold serialdilutions in TE buffer) and check that the amount of PCR product decreases pro-portionally with the amount of template.
It is equally important to perform appropriate PCR controls (i.e., with oligonu-cleotide primers specific for genomic regions that are not expected to associate,and therefore coimmunoprecipitate, with the protein of interest). These controlswill serve to determine the background level of the whole ChIP experiment andto appreciate the significance of the enrichment obtained for the other regions.
3.5.1. PCR Analysis
PCR amplifications are carried out in 15 lL reaction volumes containing1 lM of each oligonucleotide primer, 0.2 mM of each dNTP, 0.1 mCi/mL of[a-32P]dATP (specific activity, 3000 Ci/mmol) and 0.75 U of HotStarTaqDNA polymerase (Qiagen) or equivalent Taq polymerase (see Note 26). Tomicropipet reagents and DNA samples, use aerosol filter tips to prevent PCRcontaminations.
1. Prepare a common PCR premix containing the appropriate amount of H2O,10X PCR buffer, primers, dNTPs, [a-32P]dATP, and Taq polymerase (seeNote 27). The minimal number of samples includes two or three differentdilutions (two-or threefold serial dilutions) of the immunoprecipitate andthe input DNA. Adjust the final premix volume assuming that 5 lL of DNAtemplate will be added next.
2. Distribute 10 lL of the premix into 0.2-mL PCR tubes at room temperature.3. Add the DNA template. The amount of template added is typically 5 lL of
1:1 (undiluted), 1:2, and 1:4 dilutions of the immunoprecipitate DNA(which corresponds to 1/40, 1/80, and 1/160 of the immunoprecipitate as-suming a sample volume of 200 lL) and 5 lL of 1:25, 1:50, and 1:100 dilu-tions of the input DNA sample (which corresponds to 1/5000, 1/10,000, and1/20,000 of the total input DNA assuming a sample volume of 200 lL andreversal of 100 lL of chromatin extract).
Characterization of Protein–DNA Association by ChIP 155
4. Place the PCR tubes in a thermal cycler with a heated cover and startamplification using a cycling program consisting of a 2-min initial denatu-ration at 95ºC (15 min if Qiagen HotStarTaq DNA polymerase is used) fol-lowed by 25 cycles with 30 in. at 94ºC (denaturation), 30 in. at 55ºC (an-nealing), and 60 in. at 72ºC (elongation), and by a final extention step at72ºC for 5 min.
3.5.2. Gel Electrophoresis and Quantitation
PCR products are separated by vertical electrophoresis on nondenaturingpolyacrylamide gels and visualized by film autoradiography. Intensity of ra-dioactive PCR signals is quantitated by phosphorimager analysis.
1. After PCR is completed, microcentrifuge tubes for a few seconds to bringcondensation down.
2. Add 2 lL of loading buffer and mix by vortexing.3. Load 4 lL on a 8% polyacrylamide/1X TBE gel (20cm � 20cm � 1mm,
25 wells) and run the gel at 10 volt/cm, taking care to avoid excessiveheating.
4. Stop migration when the Bromophenol Blue dye has reached two-thirds ofthe plate length. Discard the 1X TBE buffer present in the lower reservoirof the electrophoresis tank in a radioactive waste (this buffer may containfree [a-32P]dATP).
5. Detach the plates from the electrophoresis apparatus and carefully pry themapart so that the gel is still attached to one plate.
6. Transfer the gel onto a piece of Whatman 3MM paper, place on a preheatedgel dryer connected to a vacuum pump, cover with plastic wrap, and dryfor 20 min at 80ºC.
7. Expose the dried gel to an autoradiography film or to a storage phosphorscreen for visualization and quantification of PCR products (see Notes 28and 29).
4. Notes1. Solutions used for chromatin extraction and immunoprecipitation should be
prepared from Molecular Biology grade reagents using distilled and deion-ized water. It is convenient to prepare solutions from individual concen-trated stock solutions (e.g., prepare FA lysis buffer from 0.5 M HEPES-KOH, pH 7.5, 5 M NaCl, 0.5 M EDTA, pH 8.0, 20% [v/v] Triton X-100,10% [w/v] deoxycholic acid sodium salt, and 10% [w/v] SDS solutions).Solutions must be filtered through 0.22- or 0.45-lm filter (respectively, forsterilization and/or removal of particles) and, when appropriate, auto-claved. Do not autoclave solutions with HEPES or detergent.
156 Kuras
2. Implementation of the ChIP method to cell types other than yeast willrequire to adapt the steps of cell fixation and chromatin extraction to theparticular characteristics of the cells used. For examples, Drosophila andhuman cells do not have a cell wall as yeast cells do and therefore can belysed without vortexing in the presence of glass beads (see refs. 10,12,16).Other steps (immunoprecipitation, reversal, and DNA analysis) can be im-plemented without modifications.
3. Growth properties of strains depend on their genetic background. Impor-tant differences exist among strains. In addition, the growth rate of a straindepends on the composition of the growth medium. Therefore the size ofthe inoculate that will lead to the desired cell density the next morningshould be determined in advance in pilot experiments.
4. Formaldehyde is toxic and should be manipulated with gloves and in afume hood to prevent contact with skin and inhalation of noxious fumes. Inaddition, flasks should be kept covered (for example with aluminium foil)after addition of formaldehyde.
5. The optimal concentration of formaldehyde, incubation time, and temper-ature at which the reaction is performed should be determined experimen-tally. Crosslinking times reported previously range from 10 min at roomtemperature to overnight at 4ºC. The use of 1% formaldehyde at room tem-perature for 15 min represents standard conditions that were shown to workwell with a number of proteins. However, these conditions should not beconsidered to be suitable for all proteins. The extent of crosslinking is oneof the most important parameters for the success of the ChIP experiment.Excessive crosslinking may result in poor cell breakage and poor chromatinfragmentation during extraction and sonication. Excessive crosslinkingmay also alter reactivity of the epitopes recognized by the antibodies, re-sulting in poor immunoprecipitation. On the other hand, suboptimalcrosslinking may result in fewer crosslinks between the protein of interestand DNA, leading to weak enrichment of the genomic targets of the protein.
6. Formaldehyde-containing wastes must be disposed of as hazardous chem-ical waste. Do not discard them down the sink but keep them in appropri-ate bottles and consult your institution’s safety office for the rules regard-ing storage and disposal.
7. PMSF is unstable in aqueous solution (half-life of 35 min at pH 8.0) andshould be added to buffers immediately before use.
8. 0.5-mm acid-washed glass beads (Sigma) can be used instead of 0.5-mmzirconia/silica beads.
9. Cell-breakage efficiency should be greater than 90% to achieve maximumextraction. It is important to make sure that bead movement is not con-stricted during vortexing, which could otherwise result in poor and unequal
Characterization of Protein–DNA Association by ChIP 157
cell lysis among samples. Eight samples can be processed in no longer than48 min if two vortexers are used at the same time. It may be convenient touse a multivortexer or a BeadBeater (BioSpec Products) if one wants toprocess more samples.
10. After centrifugation of the whole-cell lysate at 20,000 g, the crosslinkedchromatin is found in the pellet with cell debris and potential unbrokencells. This characteristic of the crosslinked chromatin allows to separate itfrom soluble proteins that might interfere during immunoprecipitation.
11. Sonication is a crucial step because it promotes solubilization of thecrosslinked chromatin and allows it to separate from cell debris and insol-uble components. In addition, shorter DNA fragments allows for mappingDNA-protein interactions with higher resolution, and to define more accu-rately regions where proteins are recruited.
12. The amount of chromatin extract prepared from 100 mL of culture grownto an OD600 of 1–2 is sufficient to carry out up to 10 immunoprecipitations.Chromatin extracts can be stored at �80ºC for several months withoutdamage. However, it is recommended to use fresh extracts in experimentsstudying proteins never assayed before.
13. It is important to check the size of the DNA fragments to confirm that theyare in the expected range.
14. An alternative control in experiments using cells expressing epitope-taggedproteins (e.g., HA- or Myc-tagged proteins) is to perform a parallel im-munoprecipitation (including antibodies) with chromatin extract preparedfrom untagged, isogenic cells.
15. Differences in the amount of protein–DNA complexes between sampleswill be accurately measured only if almost all complexes are immunopre-cipitate in each sample. It is recommended to perform preliminary experi-ments to determine the appropriate amount of antibodies to use. Chromatinextract should be subjected to immunoprecipitation with varying amountsof antibodies, and the supernatant after immunoprecipitation examined byimmunoblotting for the presence of the antigen. It is important to remem-ber that immunoprecipitation of proteins is less efficient in crosslinked ex-tracts compared to noncrosslinked ones, probably owing to modification ormasking of the epitopes, and it has been reported that epitopes of some pro-teins seem to become inaccessible when the protein gets crosslinked to theDNA (either directly or indirectly) (see ref. 3). This potential problem canbe circumvented by using polyclonal antibodies (pAbs) rather than mon-clonal ones.
16. Substitute Protein G for Protein A if the antibody is from a species or sub-class that does not bind to Protein A (see ref. 24 for Protein A/G affinitiesfor antibodies from various species and subclasses).
158 Kuras
17. Prolonged incubations (e.g., overnight in the cold room) tend to result inincreased background (i.e., nonspecific precipitation of chromatin frag-ments) and should be avoided.
18. It is not recommended to complete all the washes too quickly (i.e., withoutincubation time) because this may not allow enough time for proteins in-cluded within the antigen-antibody-protein A bead latticework to diffuseout of it. Instead, beads should be washed over approx 30 min (all washesincluded).
19. Remove supernatant as completely as possible during washes to achieve thelowest background as possible. The Pasteur pipet should be moved progres-sively toward the bottom of the tube as the wash buffer is withdrawn untilthe very surface of the beads. Use gentle vacuum to avoid removing beads.
20. It is preferable to use an air incubator or oven instead of a heat-block orwater bath because it prevents concentration of the sample by condensation.
21. Glycogen serves as a carrier to maximize DNA precipitation and helps tovisualize the pellet after centrifugation.
22. The DNA pellet from the immunoprecipate sample will be very small andnearly invisible. Therefore, the supernatant should be removed with ex-treme caution to avoid any loss of material.
23. Alternatively, the DNA can be purified using the QIAquick PCR purifica-tion kit (Qiagen). Follow the protocol described in the QIAquick spin han-book supplied with the kit. To elute DNA from the QIAquick column, add200 lL of TE buffer, let the column stand for 10 min at room temperature,and microcentrifuge at maximum speed for 1 min.
24. Alternatively, coimmunoprecipitated DNA can be analyzed by slot blot orSouthern hybridization (for examples, see refs. 1,4,10). For slot-blot analy-sis, immunoprecipitated and total DNA samples are immobilized on a nylonmembrane by slot blot, and the membrane is hybridized with 32P-labeledprobes for specific genes. For Southern analysis, immunoprecipitated DNAis radiolabeled and used as a probe against genomic DNA fragments sepa-rated by agarose gel electrophoresis and immobilized onto a hybridizationmembrane. Both methods have been shown to give good results but wefavor PCR analysis because of high sensitivity and specificity of the PCRmethod.
25. PCR, slot blot or Southern hybridization analyses can be carried out in anylaboratory provided with standard equipment. Unfortunately, these analy-ses are restricted to studying interaction of proteins with a limited numberof target fragments. A method of global analysis using DNA microarrayshave recently been developed to monitor protein–DNA interactions acrossthe entire yeast genome (25–27). In these methods, immunoprecipitateand input DNA fragments are amplified and differentially labeled using
Characterization of Protein–DNA Association by ChIP 159
different fluorescent dyes, and then hybridized to microarray plates thatcontain the whole genome (or only intergenic regions in case of transcrip-tion factors that specifically target promoter region). This approach allowsone to localize DNA-bound proteins at the whole genome level.
26. It is highly convenient to use a Taq DNA polymerase that is inactive untilPCR cycles start. This permits set-up at ambient temperature and reducesformation of nonspecific products and primer-dimers.
27. To minimize exposure to radiation, PCR reactions should be set up behindan appropriate shield and in a place designated for radioactive work. PCRsamples must be in a shielded container during storage and transportation.
28. Exposition for 1 h at �80ºC should be long enough to detect a signal whenusing an intensifying screen. After exposition, the film can be scanned andsignals quantitated using an imaging software if the laboratory is notequipped for phosphorimager autoradiography.
29. A faster and more convenient way to quantitate the immunoprecipitateDNA is using real-time PCR if one has the necessary instrument (e.g.,LightCycler from Roche or ABI PRISM 7700 from Applied Biosystems).
AcknowledgmentsI thank Nadia Benaroudj for helpful comments on the manuscript. L.K. is
supported by the CNRS and an ACI grant from the French Ministry of Research.
References1. Braunstein, M., Rose, A. B., Holmes, S. G., et al. (1993) Transcriptional silenc-
ing in yeast is associated with reduced nucleosome acetylation. Genes Dev. 7,592–604.
2. Kuo, M. H., Brownell, J. E., Sobel, R. E., et al. (1996) Transcription-linked acety-lation by Gcn5p of histones H3 and H4 at specific lysines. Nature 383, 269–272.
3. Aparicio, O. M., Weinstein, D. M., and Bell, S. P. (1997) Components and dynam-ics of DNA replication complexes in S. cerevisiae: redistribution of MCM proteinsand Cdc45p during S phase. Cell 91, 59–69.
4. Meluh, P. B. and Koshland, D. (1997) Budding yeast centromere composition andassembly as revealed by in vivo cross-linking. Genes Dev. 11, 3401–3412.
5. Strahl-Bolsinger, S., Hecht, A., Luo, K., and Grunstein, M. (1997) SIR2 and SIR4interactions differ in core and extended telomeric heterochromatin in yeast. GenesDev. 11, 83–93.
6. Tanaka, T., Knapp, D., and Nasmyth, K. (1997) Loading of an Mcm protein ontoDNA replication origins is regulated by Cdc6p and CDKs. Cell 90, 649–660.
7. Kuras, L. and Struhl, K. (1999) Binding of TBP to promoters in vivo is stimulatedby activators and requires Pol II holoenzyme. Nature 399, 609–613.
8. Kuras, L., Kosa, P., Mencia, M., and Struhl, K. (2000) TAF-Containing and TAF-independent forms of transcriptionally active TBP in vivo. Science 288, 1244–1248.
160 Kuras
9. Solomon, M. J. and Varshavsky, A. (1985) Formaldehyde-mediated DNA-proteincrosslinking: a probe for in vivo chromatin structures. Proc. Natl. Acad. Sci U S A82, 6470–6474.
10. Orlando, V. and Paro, R. (1993) Mapping Polycomb-repressed domains in thebithorax complex using in vivo formaldehyde cross-linked chromatin. Cell 75,1187–1198.
11. Park, J. M., Werner, J., Kim, J. M., et al. (2001) Mediator, not holoenzyme, is di-rectly recruited to the heat shock promoter by HSF upon heat shock. Mol. Cell 8,9–19.
12. Boyd, K. E., Wells, J. Gutman, J., et al. (1998) c-Myc target gene specificity is de-termined by a post-DNAbinding mechanism. Proc. Natl. Acad. Sci. USA 95,13,887–13,892.
13. Chen, H., Lin, R. J., Xie, W., et al. (1999) Regulation of hormone-induced histonehyperacetylation and gene activation via acetylation of an acetylase. Cell 98,675–686.
14. Parekh, B. S. and Maniatis, T. (1999) Virus infection leads to localized hyper-acetylation of histones H3 and H4 at the IFN-beta promoter. Mol. Cell 3, 125–129.
15. Agalioti, T., Lomvardas, S., Parekh, B., et al. (2000) Ordered recruitment of chro-matin modifying and general transcription factors to the IFN-beta promoter. Cell103, 667–678.
16. Shang, Y., Hu, X., DiRenzo, J., et al. (2000) Cofactor dynamics and sufficiency inestrogen receptor-regulated transcription. Cell 103, 843–852.
17. Frank, S. R. Schroeder, M., Fernandez, P., et al. (2001) Binding of c-Myc to chro-matin mediates mitogen-induced acetylation of histone H4 and gene activation.Genes Dev. 15, 2069–2082.
18. Christova, R. and Oelgeschlager, T. (2002) Association of human TFIID-promotercomplexes with silenced mitotic chromatin in vivo. Nat. Cell Biol. 4, 79–82.
19. Johnson, C., Boden, E., Desai, M., et al. (2001) In vivo target promoter-binding ac-tivities of a xenobiotic stress-activated TGA factor. Plant J. 28, 237–243.
20. Wang, H., Tang, W., Zhu, C., and Perry, S. E. (2002) A chromatin immunoprecipi-tation (ChIP) approach to isolate genes regulated by AGL15, a MADS domain pro-tein that preferentially accumulates in embryos. Plant J. 32, 831–843.
21. Solomon, M. J., Larsen, P. L., and Varshavsky, A., et al. (1988) Mapping protein-DNA interactions in vivo with formaldehyde: evidence that histone H4 is retainedon a highly transcribed gene. Cell 53, 937–947.
22. Orlando, V., Strutt, H., and Paro, R. (1997) Analysis of chromatin structure by invivo formaldehyde cross-linking. Methods 11, 205–214.
23. Sherman, F. (2002) in Methods in Enzymology, “Guide to yeast genetics and mo-lecular and all biology” (Guthrie, C. and Fink, J. R., eds.), 350, pp. 3–41, Acade-mic Press, Amsterdam.
24. Harlow, E. and Lane, D. (1988) Antibodies: A Laboratory Manual. Cold SpringHarbor Laboratory Press, Cold Spring Harbor, NY.
25. Ren, B., Robert, F., and Wyrick, J. J., et al. (2000) Genome-wide location and func-tion of DNA binding proteins. Science 290, 2306–2309.
Characterization of Protein–DNA Association by ChIP 161

26. Iyer, V. R., Horak, C. E., and Scafe, C. S., et al. (2001) Genomic binding sites ofthe yeast cell-cycle transcription factors SBF and MBF. Nature 409, 533–538.
27. Lieb, J. D., Liu, X., Botstein, D., and Brown, P. O. (2001) Promoter-specific bind-ing of Rap1 revealed by genome-wide maps of protein–DNA association. Nat.Genet. 28, 327–334.
162 Kuras
11
Nonradioactive Methods for Detecting Activation of Ras-Related Small G Proteins
Douglas A. Andres
SummaryRas-related small GTPases serve as critical regulators for a wide range of cellular signaling
pathways and are activated by the conversion of the GDP-bound state to the GTP-bound confor-mation. Until recently, measurement of the GTP-bound active form of Ras-related G proteins in-volved immunoprecipitation of 32P-labeled protein followed by separation of the labeledGTP/GDP bound to GTPase. A new method based on the large affinity difference of the GTP-and GDP-bound form of Ras proteins for specific binding domains of effector proteins in vitrohas been developed. By using glutathione S-transferase (GST) fusion proteins containing thesebinding domains, the GTP-bound form of the GTPase can be precipitated from cell lysates. Inprinciple, this method can be used for all members of the Ras superfamily. Here we describe ageneral procedure to monitor the GTP-bound form of Ras-related GTPases.
Key Words: GTP-bound; Ras; GTPase; activation probe.
1. Introduction
Small Ras-like GTPases are activated by the conversion of the GDP-boundconformation into the GTP-bound conformation and inactivated by GTP hy-drolysis. In their activated GTP-bound forms, the Ras proteins interact with avariety of intracellular effector proteins to initiate signaling pathways that con-tribute to cell proliferation, differentiation, or cell survival, depending on thecellular context and individual G protein (1–4). Therefore the ability to measure
From: Methods in Molecular Biology, vol. 284:Signal Transduction Protocols
Edited by: R. C. Dickson © Humana Press Inc., Totowa, NJ
163
the activation state of Ras family proteins provides a useful tool in the exami-nation of a number of biological systems.
The level of Ras-related protein activation (the fraction of the total cellularprotein bound to GTP) and the duration of this activated state are tightly con-trolled by the opposing actions of guanine-nucleotide exchange factors (GEFs),which stimulate GDP for GTP exchange, and GTPase-activating proteins(GAPs), which stimulate the intrinsic GTPase activity of Ras-related proteins.Both the level and duration of Ras family activation appear to contribute to bothdownstream signal strength and the resulting biological effects. Therefore, tofully understand the role that Ras GTPases play in regulating cellular signalingpathways, it is essential to be able to monitor the level, duration, and timing ofcellular Ras family protein activation.
A variety of methods for studying the activation of Ras-like small G proteinshave been described. The earliest of these methods directly measured the ratioof GTP to GDP bound to Ras-like GTPases extracted from cells (5,6). These ap-proaches rely on the use of radiolabeled guanine nucleotides and purified pro-teins to measure exchange activity in vitro or radiolabeling cells with ortho-phosphate and specifically immunoprecipitating the G protein of interest tomeasure the ratio of bound radiolabeled GTP to GDP by thin-layer chromatog-raphy (TLC). Although these assays have been useful in studies of Ras func-tion, the approach suffers from several technical drawbacks that have limited itsuse for many members of the Ras superfamily. First, the success of this methodis based in large part on the ability to find an effective immunoprecipitating an-tibody that also blocks GAP interaction and therefore acts to inhibit GTPhydrolysis on the G protein during the experimental procedure. Because anti-bodies for many Ras-related GTPases with appropriate immunprecipitating/inhibiting characteristics are not available, it is often necessary to introduce epi-tope-tagged G protein by transient overexpression or to analyze purified pro-teins to study activation. Second, these methods require large amounts of ra-dioactivity to metabolically label cells. This can be costly, requires strictradiation safety procedures, and the radiolabeling procedure may itself influ-ence cellular pathways and effect the experimental outcome.
Nonisotopic methods have recently been devised that enable the detection ofthe activation status of numerous Ras-like small G proteins in treated cell lysates(Fig. 1). The method is based on the large affinity difference of the GTP- vsGDP-bound form for specific binding domains of downstream effector proteinsin vitro. By using glutathione S-transferase (GST) fusion proteins containingthese binding domains, the GTP-bound form of the GTPase can be precipitatedfrom cell lysates (7–10). In principle, this method can be used for all small GT-Pases and has proved to function for the Ras (11), Rap1 (12,13), Rap2 (14,15),R-Ras (10), ARF (16,17), Ral (18,19), and Rin GTPases (20) (Table 1).
164 Andres
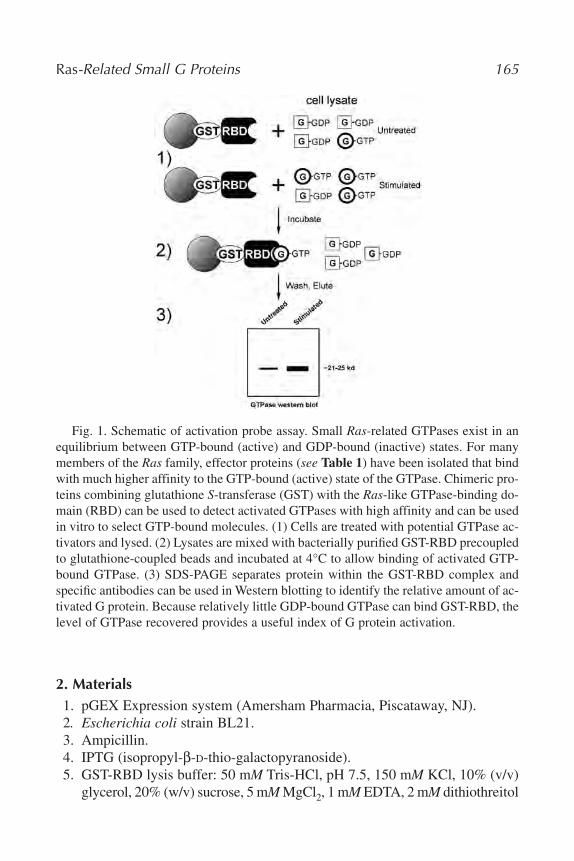
Ras-Related Small G Proteins 165
Fig. 1. Schematic of activation probe assay. Small Ras-related GTPases exist in anequilibrium between GTP-bound (active) and GDP-bound (inactive) states. For manymembers of the Ras family, effector proteins (see Table 1) have been isolated that bindwith much higher affinity to the GTP-bound (active) state of the GTPase. Chimeric pro-teins combining glutathione S-transferase (GST) with the Ras-like GTPase-binding do-main (RBD) can be used to detect activated GTPases with high affinity and can be usedin vitro to select GTP-bound molecules. (1) Cells are treated with potential GTPase ac-tivators and lysed. (2) Lysates are mixed with bacterially purified GST-RBD precoupledto glutathione-coupled beads and incubated at 4°C to allow binding of activated GTP-bound GTPase. (3) SDS-PAGE separates protein within the GST-RBD complex andspecific antibodies can be used in Western blotting to identify the relative amount of ac-tivated G protein. Because relatively little GDP-bound GTPase can bind GST-RBD, thelevel of GTPase recovered provides a useful index of G protein activation.
2. Materials1. pGEX Expression system (Amersham Pharmacia, Piscataway, NJ).2. Escherichia coli strain BL21.3. Ampicillin.4. IPTG (isopropyl-β-D-thio-galactopyranoside).5. GST-RBD lysis buffer: 50 mM Tris-HCl, pH 7.5, 150 mM KCl, 10% (v/v)
glycerol, 20% (w/v) sucrose, 5 mM MgCl2, 1 mM EDTA, 2 mM dithiothreitol
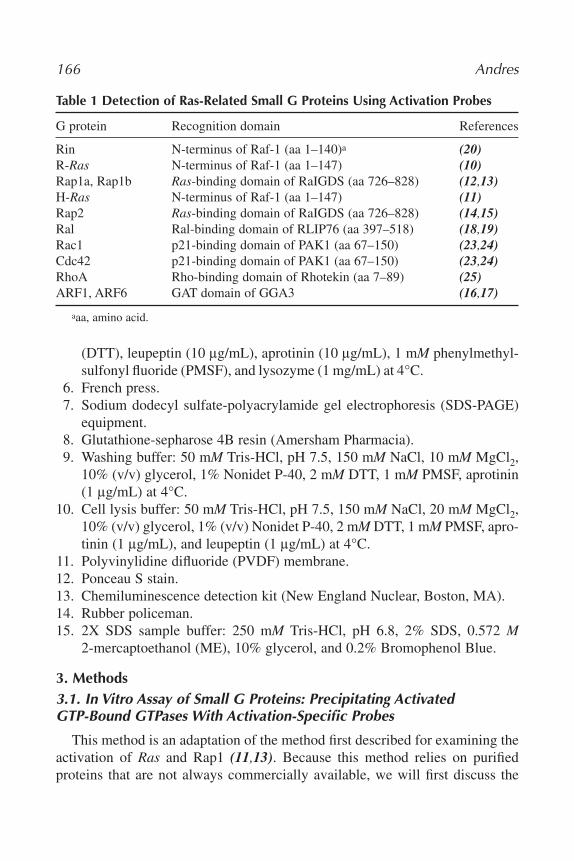
166 Andres
(DTT), leupeptin (10 lg/mL), aprotinin (10 lg/mL), 1 mM phenylmethyl-sulfonyl fluoride (PMSF), and lysozyme (1 mg/mL) at 4°C.
6. French press.7. Sodium dodecyl sulfate-polyacrylamide gel electrophoresis (SDS-PAGE)
equipment.8. Glutathione-sepharose 4B resin (Amersham Pharmacia).9. Washing buffer: 50 mM Tris-HCl, pH 7.5, 150 mM NaCl, 10 mM MgCl2,
10% (v/v) glycerol, 1% Nonidet P-40, 2 mM DTT, 1 mM PMSF, aprotinin(1 lg/mL) at 4°C.
10. Cell lysis buffer: 50 mM Tris-HCl, pH 7.5, 150 mM NaCl, 20 mM MgCl2,10% (v/v) glycerol, 1% (v/v) Nonidet P-40, 2 mM DTT, 1 mM PMSF, apro-tinin (1 lg/mL), and leupeptin (1 lg/mL) at 4°C.
11. Polyvinylidine difluoride (PVDF) membrane.12. Ponceau S stain.13. Chemiluminescence detection kit (New England Nuclear, Boston, MA).14. Rubber policeman.15. 2X SDS sample buffer: 250 mM Tris-HCl, pH 6.8, 2% SDS, 0.572 M
2-mercaptoethanol (ME), 10% glycerol, and 0.2% Bromophenol Blue.
3. Methods3.1. In Vitro Assay of Small G Proteins: Precipitating ActivatedGTP-Bound GTPases With Activation-Specific Probes
This method is an adaptation of the method first described for examining theactivation of Ras and Rap1 (11,13). Because this method relies on purifiedproteins that are not always commercially available, we will first discuss the
Table 1 Detection of Ras-Related Small G Proteins Using Activation Probes
G protein Recognition domain References
Rin N-terminus of Raf-1 (aa 1–140)a (20)R-Ras N-terminus of Raf-1 (aa 1–147) (10)Rap1a, Rap1b Ras-binding domain of RaIGDS (aa 726–828) (12,13)H-Ras N-terminus of Raf-1 (aa 1–147) (11)Rap2 Ras-binding domain of RaIGDS (aa 726–828) (14,15)Ral Ral-binding domain of RLIP76 (aa 397–518) (18,19)Rac1 p21-binding domain of PAK1 (aa 67–150) (23,24)Cdc42 p21-binding domain of PAK1 (aa 67–150) (23,24)RhoA Rho-binding domain of Rhotekin (aa 7–89) (25)ARF1, ARF6 GAT domain of GGA3 (16,17)
aaa, amino acid.
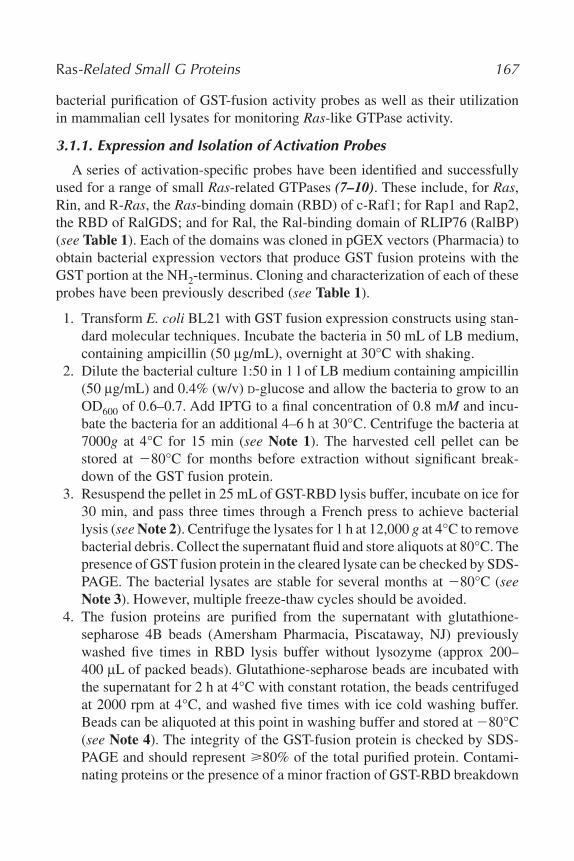
bacterial purification of GST-fusion activity probes as well as their utilizationin mammalian cell lysates for monitoring Ras-like GTPase activity.
3.1.1. Expression and Isolation of Activation Probes
A series of activation-specific probes have been identified and successfullyused for a range of small Ras-related GTPases (7–10). These include, for Ras,Rin, and R-Ras, the Ras-binding domain (RBD) of c-Raf1; for Rap1 and Rap2,the RBD of RalGDS; and for Ral, the Ral-binding domain of RLIP76 (RalBP)(see Table 1). Each of the domains was cloned in pGEX vectors (Pharmacia) toobtain bacterial expression vectors that produce GST fusion proteins with theGST portion at the NH2-terminus. Cloning and characterization of each of theseprobes have been previously described (see Table 1).
1. Transform E. coli BL21 with GST fusion expression constructs using stan-dard molecular techniques. Incubate the bacteria in 50 mL of LB medium,containing ampicillin (50 lg/mL), overnight at 30°C with shaking.
2. Dilute the bacterial culture 1:50 in 1 l of LB medium containing ampicillin(50 lg/mL) and 0.4% (w/v) D-glucose and allow the bacteria to grow to anOD600 of 0.6–0.7. Add IPTG to a final concentration of 0.8 mM and incu-bate the bacteria for an additional 4–6 h at 30°C. Centrifuge the bacteria at7000g at 4°C for 15 min (see Note 1). The harvested cell pellet can bestored at �80°C for months before extraction without significant break-down of the GST fusion protein.
3. Resuspend the pellet in 25 mL of GST-RBD lysis buffer, incubate on ice for30 min, and pass three times through a French press to achieve bacteriallysis (see Note 2). Centrifuge the lysates for 1 h at 12,000 g at 4°C to removebacterial debris. Collect the supernatant fluid and store aliquots at 80°C. Thepresence of GST fusion protein in the cleared lysate can be checked by SDS-PAGE. The bacterial lysates are stable for several months at �80°C (seeNote 3). However, multiple freeze-thaw cycles should be avoided.
4. The fusion proteins are purified from the supernatant with glutathione-sepharose 4B beads (Amersham Pharmacia, Piscataway, NJ) previouslywashed five times in RBD lysis buffer without lysozyme (approx 200–400 lL of packed beads). Glutathione-sepharose beads are incubated withthe supernatant for 2 h at 4°C with constant rotation, the beads centrifugedat 2000 rpm at 4°C, and washed five times with ice cold washing buffer.Beads can be aliquoted at this point in washing buffer and stored at �80°C(see Note 4). The integrity of the GST-fusion protein is checked by SDS-PAGE and should represent 80% of the total purified protein. Contami-nating proteins or the presence of a minor fraction of GST-RBD breakdown
Ras-Related Small G Proteins 167
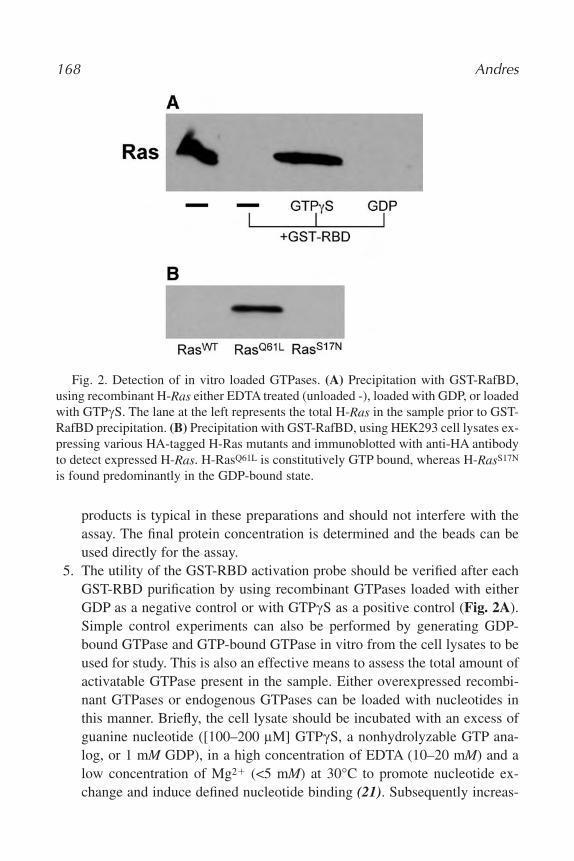
products is typical in these preparations and should not interfere with theassay. The final protein concentration is determined and the beads can beused directly for the assay.
5. The utility of the GST-RBD activation probe should be verified after eachGST-RBD purification by using recombinant GTPases loaded with eitherGDP as a negative control or with GTPcS as a positive control (Fig. 2A).Simple control experiments can also be performed by generating GDP-bound GTPase and GTP-bound GTPase in vitro from the cell lysates to beused for study. This is also an effective means to assess the total amount ofactivatable GTPase present in the sample. Either overexpressed recombi-nant GTPases or endogenous GTPases can be loaded with nucleotides inthis manner. Briefly, the cell lysate should be incubated with an excess ofguanine nucleotide ([100–200 lM] GTPcS, a nonhydrolyzable GTP ana-log, or 1 mM GDP), in a high concentration of EDTA (10–20 mM) and alow concentration of Mg2� (<5 mM) at 30°C to promote nucleotide ex-change and induce defined nucleotide binding (21). Subsequently increas-
168 Andres
Fig. 2. Detection of in vitro loaded GTPases. (A) Precipitation with GST-RafBD,using recombinant H-Ras either EDTA treated (unloaded -), loaded with GDP, or loadedwith GTPcS. The lane at the left represents the total H-Ras in the sample prior to GST-RafBD precipitation. (B) Precipitation with GST-RafBD, using HEK293 cell lysates ex-pressing various HA-tagged H-Ras mutants and immunoblotted with anti-HA antibodyto detect expressed H-Ras. H-RasQ61L is constitutively GTP bound, whereas H-RasS17N
is found predominantly in the GDP-bound state.
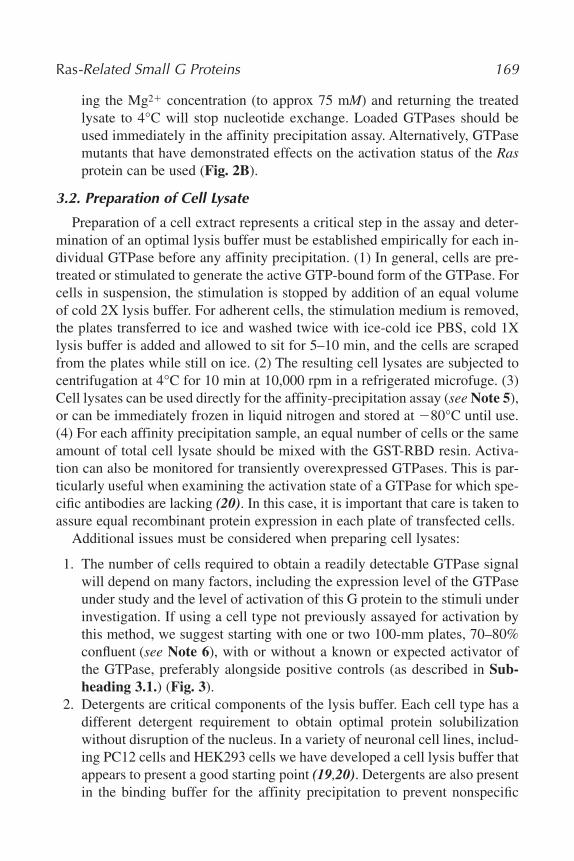
ing the Mg2� concentration (to approx 75 mM) and returning the treatedlysate to 4°C will stop nucleotide exchange. Loaded GTPases should beused immediately in the affinity precipitation assay. Alternatively, GTPasemutants that have demonstrated effects on the activation status of the Rasprotein can be used (Fig. 2B).
3.2. Preparation of Cell Lysate
Preparation of a cell extract represents a critical step in the assay and deter-mination of an optimal lysis buffer must be established empirically for each in-dividual GTPase before any affinity precipitation. (1) In general, cells are pre-treated or stimulated to generate the active GTP-bound form of the GTPase. Forcells in suspension, the stimulation is stopped by addition of an equal volumeof cold 2X lysis buffer. For adherent cells, the stimulation medium is removed,the plates transferred to ice and washed twice with ice-cold ice PBS, cold 1Xlysis buffer is added and allowed to sit for 5–10 min, and the cells are scrapedfrom the plates while still on ice. (2) The resulting cell lysates are subjected tocentrifugation at 4°C for 10 min at 10,000 rpm in a refrigerated microfuge. (3)Cell lysates can be used directly for the affinity-precipitation assay (see Note 5),or can be immediately frozen in liquid nitrogen and stored at �80°C until use.(4) For each affinity precipitation sample, an equal number of cells or the sameamount of total cell lysate should be mixed with the GST-RBD resin. Activa-tion can also be monitored for transiently overexpressed GTPases. This is par-ticularly useful when examining the activation state of a GTPase for which spe-cific antibodies are lacking (20). In this case, it is important that care is taken toassure equal recombinant protein expression in each plate of transfected cells.
Additional issues must be considered when preparing cell lysates:
1. The number of cells required to obtain a readily detectable GTPase signalwill depend on many factors, including the expression level of the GTPaseunder study and the level of activation of this G protein to the stimuli underinvestigation. If using a cell type not previously assayed for activation bythis method, we suggest starting with one or two 100-mm plates, 70–80%confluent (see Note 6), with or without a known or expected activator ofthe GTPase, preferably alongside positive controls (as described in Sub-heading 3.1.) (Fig. 3).
2. Detergents are critical components of the lysis buffer. Each cell type has adifferent detergent requirement to obtain optimal protein solubilizationwithout disruption of the nucleus. In a variety of neuronal cell lines, includ-ing PC12 cells and HEK293 cells we have developed a cell lysis buffer thatappears to present a good starting point (19,20). Detergents are also presentin the binding buffer for the affinity precipitation to prevent nonspecific
Ras-Related Small G Proteins 169
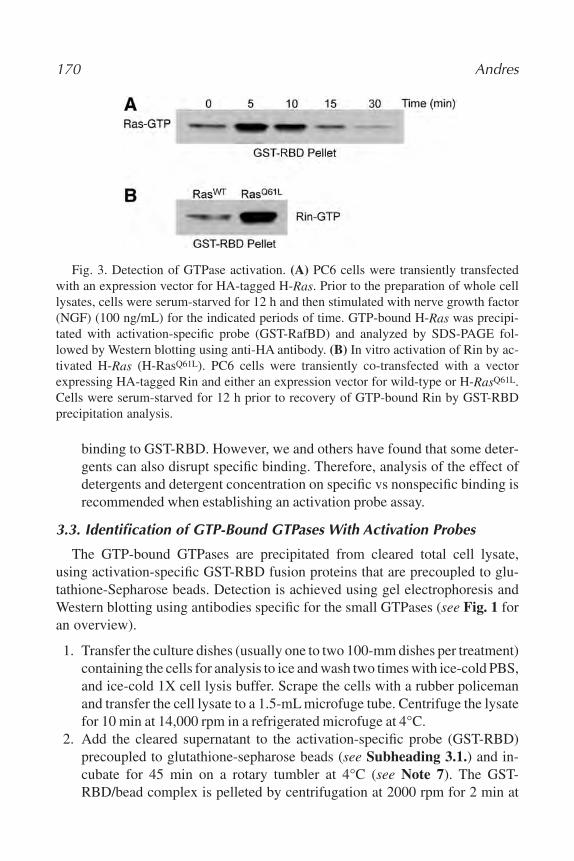
binding to GST-RBD. However, we and others have found that some deter-gents can also disrupt specific binding. Therefore, analysis of the effect ofdetergents and detergent concentration on specific vs nonspecific binding isrecommended when establishing an activation probe assay.
3.3. Identification of GTP-Bound GTPases With Activation Probes
The GTP-bound GTPases are precipitated from cleared total cell lysate,using activation-specific GST-RBD fusion proteins that are precoupled to glu-tathione-Sepharose beads. Detection is achieved using gel electrophoresis andWestern blotting using antibodies specific for the small GTPases (see Fig. 1 foran overview).
1. Transfer the culture dishes (usually one to two 100-mm dishes per treatment)containing the cells for analysis to ice and wash two times with ice-cold PBS,and ice-cold 1X cell lysis buffer. Scrape the cells with a rubber policemanand transfer the cell lysate to a 1.5-mL microfuge tube. Centrifuge the lysatefor 10 min at 14,000 rpm in a refrigerated microfuge at 4°C.
2. Add the cleared supernatant to the activation-specific probe (GST-RBD)precoupled to glutathione-sepharose beads (see Subheading 3.1.) and in-cubate for 45 min on a rotary tumbler at 4°C (see Note 7). The GST-RBD/bead complex is pelleted by centrifugation at 2000 rpm for 2 min at
170 Andres
Fig. 3. Detection of GTPase activation. (A) PC6 cells were transiently transfectedwith an expression vector for HA-tagged H-Ras. Prior to the preparation of whole celllysates, cells were serum-starved for 12 h and then stimulated with nerve growth factor(NGF) (100 ng/mL) for the indicated periods of time. GTP-bound H-Ras was precipi-tated with activation-specific probe (GST-RafBD) and analyzed by SDS-PAGE fol-lowed by Western blotting using anti-HA antibody. (B) In vitro activation of Rin by ac-tivated H-Ras (H-RasQ61L). PC6 cells were transiently co-transfected with a vectorexpressing HA-tagged Rin and either an expression vector for wild-type or H-RasQ61L.Cells were serum-starved for 12 h prior to recovery of GTP-bound Rin by GST-RBDprecipitation analysis.
4°C. The beads are washed four times with 1X lysis buffer (see Note 8).After the final wash remove the remaining liquid with an insulin syringeand resuspend the beads in 20 lL of Laemmli buffer. Heat the samples at95°C for 5 min to elute the bound proteins.
3. Separate the proteins on a 12.5% (w/v) sodium dodecyl sulfate-polyacry-lamide gel, and transfer to PVDF membrane. Stain the membrane with Pon-ceau S to check for equal transfer of GST-probe in all samples.
4. Probe the immunoblot with GTPase-specific primary antibody (directedagainst the GTPase itself, or toward an epitope tag if overexpression of re-combinant G protein is being analyzed) and visualize the bound secondaryantibody by enhanced chemiluminescence (New England Nuclear, Boston,MA) according to the manufacturer’s protocol.
4. Notes1. GST-activation probe proteins are stable under these production conditions,
although slightly higher yields of protein can be obtained by growing cellsat lower temperatures (20–25°C) for longer periods (6–12 h) following in-duction with IPTG.
2. Alternatively, lysis can be achieved by sonication (microtip, 10 times, 30 seach). Oversonication can adversely affect performance of the GST-fusionprotein: if this appears to be a problem it may be worthwhile trying differ-ent output settings to determine the lowest necessary for efficient GST-RBD recovery.
3. For most purposes, 10% of the lysate from a 1 l bacterial preparation willprovide more than enough fusion protein for an experiment. Alternatively,multiple unlysed bacterial pellets can be stored and processed as needed.
4. We have found that the stability of the GST-RBD beads varies between dif-ferent preparations. There is some loss in G protein-binding capacity afterstorage for 1–2 d at 4°C. It is therefore recommended that new batches ofbeads be either stored at �80°C (and the efficiency of thawed beads be de-termined as described above) or that new beads be made on the day of theexperiment. Because the GST-RBD beads can be prepared rapidly, we havefound this to be convenient. However, if performing this assay infrequently,or with few samples per experiment, it is advisable to use fresh thawedbeads or scale down the resin preparation to conserve both recombinantGST-RBD protein and glutathione beads.
5. It is important to work quickly and keep lysates on ice, because the GTP-bound form of Ras-like GTPases will be susceptible to GAP activity untilincubation with GST-RBD.
6. It may be important to maintain cells at subconfluency because certain Ras-like GTPases may be regulated by cell density (22).
Ras-Related Small G Proteins 171
7. A general guideline for each sample is to add approx 40 lg of purified GST-RBD protein precoupled to glutathione-sepharose beads to a 0.5–1 mL totalreaction volume containing 0.5–1 mg of total cellular protein. An importantvariable to consider when designing experiments examining small G proteinactivation is that the time-course for activation can vary greatly dependingon the Ras-like protein being examined, cell type, and the stimulus. There-fore it is important to examine a wide range of time-points (from 30 s to1–2 h) following exposure to stimuli.
8. Nonspecific precipitation of GDP-bound GTPase from cell lysates is gen-erally not a problem. However, if signal to background is low it may be ad-visable to perform a parallel affinity precipitation with GST alone or withan irrelevant GST fusion protein.
References1. Macara, I. G., Lounsbury, K. M., Richards, S. A., et al. (1996) The Ras superfam-
ily of GTPases. FASEB J. 10, 625–630.2. Campbell, S. L., Khosravi-Far, R., Rossman, K. L., et al. (1998) Increasing com-
plexity of Ras signaling. Oncogene 17, 1395–1413.3. Hall, A. (1998) Rho GTPases and the actin cytoskeleton. Science 279, 509–514.4. Malumbres, M. and Pellicer, A. (1998) RAS pathways to cell cycle control and cell
transformation. Front Biosci. 3, d887–d912.5. Satoh, T. and Kaziro, Y. (1995) Measurement of Ras-bound guanine nucleotide in
stimulated hematopoietic cells. Methods Enzymol. 255, 149–155.6. Gibbs, J. B. (1995) Determination of guanine nucleotides bound to Ras in mam-
malian cells. Methods Enzymol. 255, 118–125.7. Carey, K. D. and Stork, P. J. (2002) Nonisotopic methods for detecting activation
of small G proteins. Methods Enzymol. 345, 383–397.8. Benard, V. and Bokoch, G. M. (2002) Assay of Cdc42, Rac, and Rho GTPase acti-
vation by affinity methods. Methods Enzymol. 345, 349–359.9. Taylor, S. J., Resnick, R. J., and Shalloway, D. (2001) Nonradioactive determina-
tion of Ras-GTP levels using activated ras interaction assay. Methods Enzymol. 333,333–342.
10. van Triest, M., de Rooij, J., and Bos, J. L. (2001) Measurement of GTP-bound Ras-like GTPases by activation-specific probes. Methods Enzymol. 333, 343–348.
11. Taylor, S. J. and Shalloway, D. (1996) Cell cycle-dependent activation of Ras Curr.Biol. 6, 1621–1627.
12. Spaargaren, M. and Bischoff, J. R. (1994) Identification of the guanine nucleotidedissociation stimulator for Ral as a putative effector molecule of R-ras, H-ras,K-ras, and Rap. Proc. Natl. Acad. Sci. USA 91, 12,609–12,613.
13. Franke, B., Akkerman, J. W., and Bos, J. L. (1997) Rapid Ca2�-mediated activationof Rap1 in human platelets. EMBO J. 16, 252–259.
14. Ohba, Y., Mochizuki, N., Matsuo, K., et al. (2000) Rap2 as a slowly respondingmolecular switch in the Rap1 signaling cascade. Mol. Cell Biol. 20, 6074–6083.
172 Andres
15. Reedquist, K. A. and Bos, J. L. (1998) Costimulation through CD28 suppresses Tcell receptor-dependent activation of the Ras-like small GTPase Rap1 in human Tlymphocytes. J. Biol. Chem. 273, 4944–4949.
16. Dell’Angelica, E. C., Puertollano, R., Mullins, C., et al. (2000) GGAs: A family ofADP ribosylation factor-binding proteins related to adaptors and associated withthe Golgi complex. J. Cell Biol. 149, 81–94.
17. Santy, L. C. and Casanova, J. E. (2001) Activation of ARF6 by ARNO stimulatesepithelial cell migration through downstream activation of both Rac1 and phos-pholipase D. J. Cell Biol. 154, 599–610.
18. Goi, T., Rusanescu, G., Urano, T., and Feig, L. A. (1999) Ral-specific guanine nu-cleotide exchange factor activity opposes other Ras effectors in PC12 cells by in-hibiting neurite outgrowth. Mol. Cell Biol. 19, 1731–1741.
19. Shao, H. and Andres, D. A. (2000) A novel RalGEF-like protein, RGL3, as a candi-date effector for rit and Ras [In Process Citation]. J. Biol. Chem. 275, 26,914–26,924.
20. Spencer, M. L., Shao, H., Tucker, H. M., and Andres, D. A. (2002) Nerve GrowthFactor-dependent Activation of the Small GTPase Rin. J. Biol. Chem. 277,17,605–17,615.
21. Self, A. J. and Hall, A. (1995) Measurement of intrinsic nucleotide exchange andGTP hydrolysis rates. Methods Enzymol. 256, 67–76.
22. Posern, G., Weber, C. K., Rapp, U. R., and Feller, S. M. (1998) Activity of Rap1 isregulated by bombesin, cell adhesion, and cell density in NIH3T3 fibroblasts. J.Biol. Chem. 273, 24,297–24,300.
23. Benard, V., Bohl, B. P., and Bokoch, G. M. (1999) Characterization of rac andcdc42 activation in chemoattractant-stimulated human neutrophils using a novelassay for active GTPases. J. Biol. Chem. 274, 13,198–13,204.
24. Bagrodia, S., Taylor, S. J., Jordon, K. A., et al. (1998) A novel regulator of p21-activated kinases. J. Biol. Chem. 273, 23,633–23,636.
25. Ren, X. D., Kiosses, W. B., and Schwartz, M. A. (1999) Regulation of the smallGTP-binding protein Rho by cell adhesion and the cytoskeleton. EMBO J. 18,578–585.
Ras-Related Small G Proteins 173
12
Nucleocytoplasmic Glycosylation, O-GlcNAcIdentification and Site Mapping
Natasha Elizabeth Zachara, Win Den Cheung, and Gerald Warren Hart
Summaryb-O-linked N-acetylglucosamine (O-GlcNAc) is posttranslationally added to serine and thre-
onine residues of many nuclear and cytoplasmic proteins found in metazoans. This modificationis dynamic and responsive to numerous stimuli and conditions, suggesting an important role inmany regulatory pathways. Moreover, the O-GlcNAc modification seems to compete with phos-phorylation for sites of attachment, indicating a reciprocal relationship with phosphorylation.This chapter includes protocols for: (1) identifying the O-GlcNAc modification on proteinsthrough immunoblotting, lectin affinity chromatography, and galactosyltransferase labeling; and(2) identifying and enriching for the sites of attachment using the mass spectrometry-based b-elimination followed by Michael addition with dithiothreitol (BEMAD) technique.
Key Words: b-O-linked N-acetylglucosamine; posttranslational modification; glycosylation;site-mapping; detection.
1. IntroductionHundreds, if not thousands, of nuclear and cytoplasmic proteins in meta-
zoans are modified by monosaccharides of b-O-linked N-acetylglucosamine,also known as O-GlcNAc. Notably, O-GlcNAc is added and removed to pro-teins in the cytoplasm and nucleus, on serine and threonine residues. O-GlcNAclevels respond to extracellular glucose concentrations, morphogens, and the cellcycle, suggesting that O-GlcNAc plays an important role in different signal-transduction pathways. Moreover, aberrations in the regulation of O-GlcNAc
From: Methods in Molecular Biology, vol. 284:Signal Transduction Protocols
Edited by: R. C. Dickson © Humana Press Inc., Totowa, NJ
175
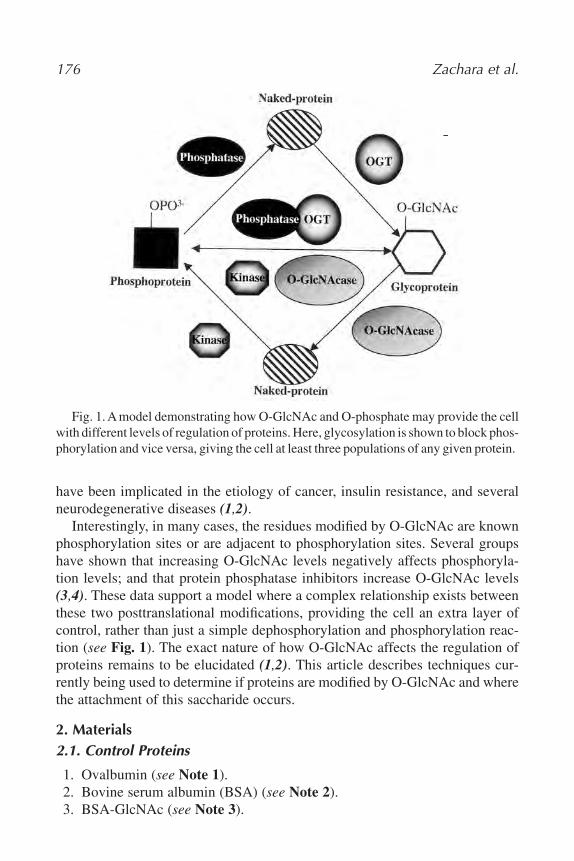
176 Zachara et al.
have been implicated in the etiology of cancer, insulin resistance, and severalneurodegenerative diseases (1,2).
Interestingly, in many cases, the residues modified by O-GlcNAc are knownphosphorylation sites or are adjacent to phosphorylation sites. Several groupshave shown that increasing O-GlcNAc levels negatively affects phosphoryla-tion levels; and that protein phosphatase inhibitors increase O-GlcNAc levels(3,4). These data support a model where a complex relationship exists betweenthese two posttranslational modifications, providing the cell an extra layer ofcontrol, rather than just a simple dephosphorylation and phosphorylation reac-tion (see Fig. 1). The exact nature of how O-GlcNAc affects the regulation ofproteins remains to be elucidated (1,2). This article describes techniques cur-rently being used to determine if proteins are modified by O-GlcNAc and wherethe attachment of this saccharide occurs.
2. Materials2.1. Control Proteins
1. Ovalbumin (see Note 1).2. Bovine serum albumin (BSA) (see Note 2).3. BSA-GlcNAc (see Note 3).
Fig. 1. A model demonstrating how O-GlcNAc and O-phosphate may provide the cellwith different levels of regulation of proteins. Here, glycosylation is shown to block phos-phorylation and vice versa, giving the cell at least three populations of any given protein.
2.2. Immunoblotting With CTD 110.6
1. Purified or crude protein separated by sodium dodecyl sulfate polyacry-lamide gel electrophoresis (SDS-PAGE) and electroblotted to polyvinyli-dene difluoride (PVDF) or nitrocellulose.
2. Tris-HCl-buffered saline (TBS): 10 mM Tris-HCl, pH 7.5, 150 mM NaCl.3. TBS-High Tween (TBS-HT): 10 mM Tris-HCl, pH 7.5, 150 mM NaCl,
0.3% (v/v) Tween-20.4. CTD 110.6 (Covance, Richmond, CA) ascites diluted 1/2500 in TBS-HT.5. Anti-Mouse IgM-horseradish peroxidase (HRP) (Sigma-Aldrich, St Louis,
MO) diluted 1/5000 in TBS-HT.6. Enhanced chemiluminescence (ECL) (Amersham Biosciences, Piscat-
away, NJ).7. 10 mM GlcNAc in TBS-HT.
2.3. Immunoblotting With Succinylated Wheat-Germ Agglutinin (SWGA)
1. Purified or crude protein separated by SDS-PAGE and blotted to PVDF ornitrocellulose.
2. Tris-HCl-buffered saline Tween (TBST): 10 mM Tris-HCl, pH 7.5, 150 mMNaCl, 0.05% (v/v) Tween-20.
3. Blocking agent: 3% (w/v) BSA in TBST.4. TBS.5. High-salt TBST: (HS-TBST): 10 mM Tris-HCl, pH 7.5, 1M NaCl, 0.05%
(v/v) Tween-20.6. 0.1 lg/mL sWGA-HRP (EY Labs, San Mateo, CA) in TBST (see Note 4).7. 1 M GlcNAc in HS-TBST.8. ECL reagent (Amersham Biosciences).
2.4. In Vitro Transcription Translation
1. cDNA subcloned into an expression vector with an SP6 or T7 promoter(approx 0.5–1 lg/lL).
2. Rabbit reticulocyte lysate in vitro transcription translation kit (Promega,Madison, WI).
3. Label, 35S-Met, or 35S-Cys, or 14C-Leu.4. SWGA-agarose (Vector Labs, Burlingame, CA).5. 1-mL tuberculin syringe with a glass wool frit or a Bio-Spin disposable
chromatography column (Bio-Rad, Hercules, CA).6. Sephadex G-50.7. Phosphate-buffered saline (PBS): 10 mM phosphate buffer, pH 7.5, 150 mM
NaCl.8. SWGA wash buffer: PBS, 0.2% (v/v) NP-40.9. SWGA Gal elution buffer: PBS, 0.2% (v/v) NP-40, 1 M D-(�)-Gal.
O-GlcNAc Identification and Site-Mapping 177
10. SWGA GlcNAc elution buffer: PBS, 0.2% (v/v) NP-40, 1 M GlcNAc.11. SDS-PAGE equipment and buffers.12. Gel dryer.13. Liquid-scintillation counter.
2.5. Galactosyltransferase Labeling
1. Protein sample(s).2. Buffer H: 50 mM HEPES, pH 6.8, 50 mM NaCl, 2% (v/v) Triton-X100.3. 10X Labeling buffer: 100 mM HEPES, pH 7.5, 100 mM Gal, 50 mM MnCl2.4. 25 mM 5'-adenosine monophosphate (5'-AMP), in Milli-Q water, pH 7.0.5. UDP-[3H]Gal, 1.0mCi/mL (specific activity 17.6 Ci/mmol) in 70% (v/v)
ethanol.6. UDP-Gal (not radioactive).7. Stop solution: 10% (w/v) SDS, 0.1 M EDTA.8. Desalting column, Sephadex G-50 (30 � 1cm) equilibrated in 50 mM am-
monium formate, 0.1% (w/v) SDS.
2.6. Autogalactosylated Galactosyltransferase
1. 10X galactosyltransferase buffer: 100 mM HEPES, pH 7.4, 100 mM Galand 50 mM MnCl2.
2. Galactosyltransferase storage buffer: 2.5 mM HEPES, pH 7.4, 2.5 mMMnCl2, 50% (v/v) glycerol.
3. Saturated ammonium sulfate, 7.4 g (NH4)2SO4 in 25 mL Milli-Q water.4. 85% ammonium sulfate 14 g (NH4)2SO4 in 25 mL Milli-Q water.5. 25 mM 5'-AMP, in Milli-Q water, pH 7.0.6. Aprotinin.7. b-Mercaptoethanol.8. UDP-Gal.9. 30–50mL centrifuge tubes.
2.7. PNGase F
1. Peptide N: glycosidase F (PNGase F).2. 10X PNGase F denaturing buffer: 5% (w/v) SDS, 10% (v/v) b-mercap-
toethanol in 50 mM sodium phosphate buffer, pH 7.5.3. 10X PNGase F reaction buffer: 500 mM sodium phosphate buffer, pH 7.5.4. 10% (v/v) NP-40.5. PIC 1: Leupeptin, 1 mg/mL, antipain, 2 mg/mL, benzamide, 10 mg/mL,
dissolved in aprotinin, 10,000 U/mL.6. PIC 2: Chemostatin, 1 mg/mL, Papstatin, 2 mg/mL, dissolved in dimethyl
sulfoxide (DMSO).
178 Zachara et al.
2.8. Hexosaminidase Digestion
1. N-acetyl-b-D-glucosaminidase, from jack bean (Sigma-Aldrich, V-Labs,Covington, LA).
2. 2% (w/v) SDS.3. 2X reaction mixture: 80 mM citrate-phosphate buffer, pH 4.0, 1 U N-acetyl-
b-D-glucosaminidase (V-labs), 8% (v/v) Triton X-100 or (v/v) NP-40, 0.01 Uaprotinin, 1 lg of leupeptin, 1 lg a2-macroglobulin.
2.9. Increasing Levels of O-GlcNAc With PUGNAc
1. PUGNAc (Carbogen; Switzerland) 20 mM stock in Milli-Q water.
2.10. Mapping Sites of O-GlcNAc Attachment
1. Trypsin, sequencing-grade modified (Promega).2. 40 mM Ammonium bicarbonate, pH 8.0.3. Trifluoroacetic acid (TFA).4. Performic acid oxidation buffer (made fresh): 45% (v/v) formic acid, 5%
(v/v) hydrogen peroxide, in Milli-Q water.5. MgCl2.6. Alkaline phosphatase (Promega).7. Dithiothreitol (DTT), high purity (Amersham Biosciences).8. BEMAD solution (made fresh): 1% (v/v) Triethylamine, 0.1% (v/v) NaOH,
10 mM DTT.9. C18 Reversed-phase macro-spin columns (The Nest Group, Southbor-
ough, MA).10. Buffer A: 1% (v/v) TFA.11. Buffer B: 1% (v/v) TFA, 75% (v/v) Acetonitrile.12. Thiol column buffer (made fresh), degassed: PBS, 1 mM EDTA.13. Thiol column elution buffer (made fresh), degassed: PBS, 1 mM EDTA,
20 mM DTT.14. Thiopropyl sepharoseTM 6B (Amersham Biosciences).15. 1% (v/v) acetic acid.16. Savant Speed-Vac concentrator.17. Finnigan LCQ with nanospray source.18. Control peptides (see Note 5)19. Approximately 1–100 pmol of protein sample in 40 mM ammonium bicar-
bonate, pH 8.0 (see Note 6).20. Seal-RiteTM Natural microcentrifuge tubes (USA Scientific, Ocala, FL) (see
Note 7).
3. MethodsThe methods presented are broken down into two categories (Fig. 2), those
that can be used to detect if proteins are modified by O-GlcNAc (Subhead-ing 3.1.) and those that can be used to map glycosylation sites (Subheading 3.2.).
O-GlcNAc Identification and Site-Mapping 179
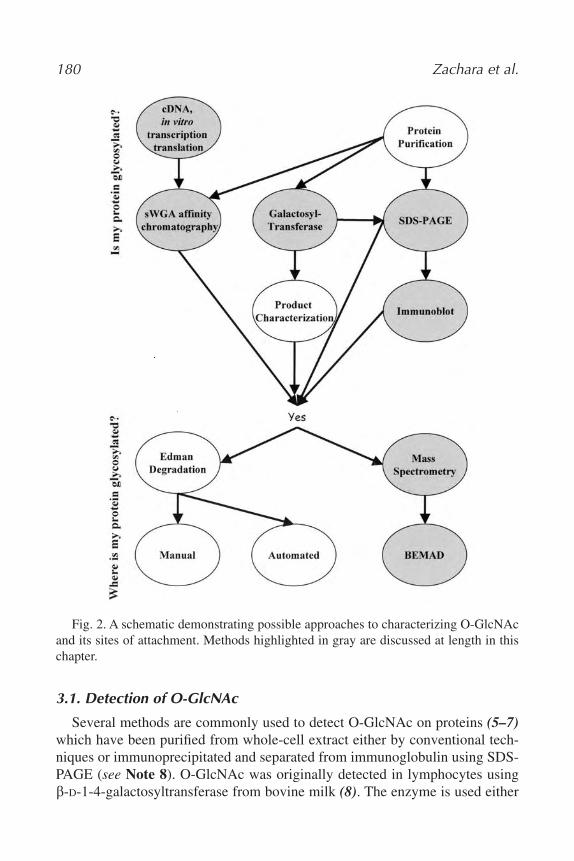
180 Zachara et al.
Fig. 2. A schematic demonstrating possible approaches to characterizing O-GlcNAcand its sites of attachment. Methods highlighted in gray are discussed at length in thischapter.
3.1. Detection of O-GlcNAc
Several methods are commonly used to detect O-GlcNAc on proteins (5–7)which have been purified from whole-cell extract either by conventional tech-niques or immunoprecipitated and separated from immunoglobulin using SDS-PAGE (see Note 8). O-GlcNAc was originally detected in lymphocytes usingb-D-1-4-galactosyltransferase from bovine milk (8). The enzyme is used either
in vitro or in vivo to label terminal GlcNAc residues on proteins with [63H]Gal,forming a [3H]-bGal1-4bGlcNAc disaccharide (5–8). Labeling of proteins andsubsequent product analysis to determine the size and chemical composition ofthe released carbohydrate remains the gold standard for the detection and char-acterization of O-GlcNAc. In addition, labeling O-GlcNAc allows for the sub-sequent detection of the proteins and peptides of interest during SDS-PAGE,high-performance liquid chromatography (HPLC), protease digestion, andEdman degradation steps (5,6). Although this technique is used for comprehen-sive studies, several other techniques have been developed to screen proteinsfor the O-GlcNAc modification; these include: immunoblotting with O-Glc-NAc-specific antibodies (Subheading 3.1.1.) (9–13) and lectins (Subhead-ing 3.1.2.), and screening low-abundance proteins for O-GlcNAc using sWGA-affinity chromatography of in vitro transcribed and translated proteins(Subheading 3.1.3.) (5).
3.1.1. Detection of O-GlcNAc Using the Monoclonal Antibody CTD 110.6
Several monoclonal antibodies (MAbs) have been developed that includedO-GlcNAc as part of their epitope, specifically RL2 (9), HGAC85 (10) andMY95 (13). However, many of these antibodies also have some peptide speci-ficity, and as a result only recognize a subset of O-GlcNAc-modified proteins(11). Recently, Comer and co-workers (12) showed that an antibody raisedagainst the glycosylated C-terminal domain of the RNA Polymerase II largesubunit was a general O-GlcNAc antibody. It should be noted that CTD 110.6does not recognize all proteins modified by O-GlcNAc.
To confirm that the antibody is working in a specific manner, a number ofcontrols should be included in this experiment. Controls include: treating puri-fied proteins with hexosaminidase (Subheading 3.1.5.2.) to remove O-GlcNAc,treating cell extract with PUGNAc (Subheading 3.1.5.3.) to increase O-Glc-NAc levels, competing the signal away with free GlcNAc, and running appro-priate positive and negative controls on gels (see Note 1) such as ovalbumin(negative; Sigma-Aldrich) and BSA-GlcNAc (positive; Sigma-Aldrich).
1. Proteins of interest are blotted onto either a PVDF or a nitrocellulose mem-brane (see Note 9).
2. Block blots with TBS-HT for 60 min at room temperature (see Note 10).3. Incubate blots with CTD 110.6 (1/2500) in TBS-HT with and without
10 mM GlcNAc overnight at 4ºC.4. Wash blots in TBS-HT 3 � 10 min.5. Incubate blots with anti mouse IgM (Sigma), at approx 1/5000 in TBS-HT,
with shaking at room temperature for 50 min.
O-GlcNAc Identification and Site-Mapping 181
6. Wash blots in TBS-HT 5 � 10 min.7. Wash blots in TBS 1 � 10 min.8. Develop the HRP-reaction (see Note 11).
3.1.2. Immunological Detection of O-GlcNAc Using SWGA
Typically SWGA has been used to detect O-GlcNAc (see Note 12). However,because SWGA will recognize any terminal b-GlcNAc residue, samples shouldbe treated with PNGase F to remove N-linked sugars (Subheading 3.1.5.1.),and further characterization would be required to determine if the activity wasassociated with a monosaccharide or a longer complex O-glycan. The controlsfor this method are similar to those used for CTD 110.6.
1. Wash duplicate blots for 10 min in 3% (w/v) BSA in TBST (see Note 13).2. Incubate blots in 3% (w/v) BSA in TBST for 60 min at room temperature
(see Note 14).3. Wash blots 3 � 10 min in TBST.4. Incubate blots in 0.1 lg/mL SWGA-HRP in TBST with and without 1 M
GlcNAc overnight at 4ºC.5. Wash blots in HS-TBST 6 � 10 min.6. Wash blots in TBS 1 � 10 min.7. Develop the HRP-reaction.
3.1.3. In Vitro Transcription Translation
When initially characterizing the O-GlcNAc transferase, Haltiwanger and colleagues observed activity of this enzyme in rabbit reticulocyte lysate(14). Later, it was determined that proteins expressed in a rabbit reticulocytelysate were modified by O-GlcNAc. This has been utilized as a screening tech-nique to determine if low copy number proteins, and proteins that are chal-lenging to purify, are glycosylated. Proteins, labeled with 35S-Met, 35S-Cys, or14C-Leu in an in vitro transcription translation (ITT) system (Promega), aretested for their ability to bind sWGA immobilized on an agarose column.
3.1.3.1. SYNTHESIS OF PROTEINS IN RABBIT RETICULOCYTE LYSATE
1. Synthesize proteins using the rabbit reticulocyte lysate ITT system accord-ing to the manufacturer’s instructions. Include the protein of interest, a pos-itive control for sWGA binding (for example, nuclear pore protein p62),and a negative control (luciferase, supplied with kit).
2. Treat half of each sample with hexosaminidase (Subheading 3.1.5.2.).3. Desalt samples using spin filtration, Amersham Biosciences MicrospinTM
G50 columns (see manufacturer’s instructions), or a 1 mL G50 desaltingcolumn.
182 Zachara et al.
3.1.3.2. DESALTING
1. Pour exactly 1 mL Sephadex G-50 in a tuberculin syringe that has beenpacked with a small glass wool frit (approx 200 lL).
2. Wash column with 5 mL sWGA wash buffer.3. Load protein sample onto column. The volume of sample can be up to
200 lL.4. Wash the column with SWGA wash buffer so that the total volume of this
wash and the protein sample is 350 lL. For example, if sample volume is150 lL, add 200 lL desalting buffer.
5. Transfer the syringe column to a clean prechilled tube. Elute protein with200 lL desalting buffer. This is the desalted sample.
3.1.3.3. sWGA CHROMATOGRAPHY
The following steps are carried out at 4ºC.
1. Equilibrate approx 150 lL of sWGA-agarose in sWGA wash buffer.2. Apply sample to the column and stand at 4ºC for 30 min, or seal and incu-
bate for 30 min with rotating or rocking.3. Let the unbound material run though the column.4. Wash the column with 15 mL of wash buffer at approx 10 mL/h, collecting
0.5 mL fractions.5. Load the column with 500 lL of Gal elution buffer and stand at 4ºC for
20 min.6. Wash column with 5 mL of Gal elution buffer, collecting 0.5 mL fractions.7. Repeat steps 5 and 6 using the GlcNAc elution buffer.8. Count 25 lL of each fraction using a liquid scintillation counter.9. Pool the positive fractions that elute in the presence of GlcNAc and pre-
cipitate using TCA or methanol (see Note 15).10. Analyze the pellet by SDS-PAGE and autoradiography to confirm that the
label has been incorporated into a protein of an appropriate size.
3.1.4. Galactosyltransferase Labeling
Samples should be denatured prior to labeling with galactosyltransferase, forexample by boiling in the presence of 10 mM DTT and 0.5% (w/v) SDS. Up to0.5% (w/v) SDS can be used (see Note 16). However, it should be titrated outwith 10 times more NP-40 (v/v), so the solution should be brought to 5% (v/v)NP-40. Note that the solution should then be diluted to reduce the total NP-40concentration to less than 2% (see Note 16). Galactosyltransferase requires1–5 mM Mn2� for activity, but is inhibited by higher concentrations (>20 mM)and is inhibited by Mg2�.
O-GlcNAc Identification and Site-Mapping 183
To control for specificity, samples should be treated with PNGase F (Sub-heading 3.1.5.1.) to remove any contaminating N-linked sugars. Once la-beled, proteins can be detected by autoradiography after separation by SDS-PAGE. To confirm that label was incorporated onto a single GlcNAc residue,“product analysis” should be performed. Product analysis entails: (1) the re-lease of carbohydrates as sugar alditols by reductive b-elimination (15); (2)confirmation that a disaccharide has been released by size-exclusion chro-matography (15,16); (3) confirmation that the product is [3H]bGal1-4bGlc-NAcol (from galactosyltransferase labeling), which is typically performed byhigh-performance anion-exchange chromatography on a DIONEX CarboPacPA100 column (17,18).
1. Remove solvent from label in a Speed-Vac or under a stream of nitrogen,dry approx 1–2 lCi/reaction (see Note 17). Resuspend label in 25 mM5'-AMP, 50 lL per reaction (see Note 18).
2. Set reactions up as follows:Sample, final concentration 0.5–5 mg/mL up to 50 lLBuffer H 350 lL10X labeling buffer 50 lLUDP-[3H]Gal/5'-AMP 50 lLGalactosyltransferase 30–50 U/Ml 2–5 lLCalf intestinal alkaline phosphatase (see Note 19) 1–4 UMilli Q water, to a final volume of 500 lL
3. Labeling is typically done at 37ºC for 2 h or at 4ºC overnight.4. Add cold UDP-Gal to a final concentration of 0.5–1.0 mM and another
2–5 lL of galactosyltransferase (see Note 20).5. Add 50 lL of stop solution to each sample and heat to 100ºC for 5 min.6. Resolve the protein from unincorporated label using a Sephadex G-50 col-
umn (30 � 1cm, equilibrated in 50 mM ammonium formate, 0.1% (w/v)SDS), collect 1 mL fractions (see Note 21).
7. Count an aliquot (50 lL) of each fraction using a liquid-scintillation counter.8. Approximately 2 � 106 DPM of 3H-Gal should be incorporated into 2 lg
of Ovalbumin.9. Combine the fractions containing the void volume and lyophilize to dryness.
10. Resuspend the sample in (100–1000 lL) Milli-Q water and acetoneprecipitate.
11. Add 3–5 volumes of cold acetone (�20°C) to the sample.12. Incubate for 2–18 h at �20°C.13. Pellet protein at 4°C for 10 min at 3000–16,000 g.
184 Zachara et al.
3.1.4.1. AUTOGALACTOSYLATION OF GALACTOSYLTRANSFERASE
Because galactosyltransferase contains N-linked carbohydrates, it is neces-sary to block these before using this enzyme to probe other proteins for termi-nal GlcNAc.
1. Resuspend 25 U of galactosyltransferase (Sigma) in 1 mL of 1X galacto-syltransferase buffer.
2. Transfer sample to 30–50 mL centrifuge tube.3. Remove a 5 lL aliquot for an activity assay.4. Add 10 lL of aprotinin, 3.5 lL of b-mercaptoethanol, and 1.5–3.0 mg of
UDP-Gal.5. Incubate the sample on ice for 30–60 min.6. Add 5.66 mL of prechilled saturated ammonium sulfate in a dropwise man-
ner, and incubate on ice for 30 min.7. Centrifuge at 10,000g for 15 min at 4ºC.8. Resuspend pellet in 5 mL of cold 85% ammonium sulfate and incubate on
ice for 30 min.9. Centrifuge at 10,000g for 15 min at 4ºC.
10. Resuspend pellet in 1 mL of galactosyltransferase storage buffer.11. Aliquot enzyme (50 lL).12. Assay 5 lL of the autogalactosylated and nongalactosylated against a
known substrate to determine the activity.13. Store at �20ºC for up to 1 yr.
3.1.5. Control Experiments
3.1.5.1. REMOVING N-LINKED SUGARS
Digestion of sample and control proteins with Peptide N: glycosidase F(PNGase F; EC 3.2.2.18.; see Note 22) is a useful way of showing that reactiv-ity with lectins and galactosyltransferase is not owing to N-linked glycans. Apositive control for the PNGase F reaction should be included (see Note 23) asshown in Fig. 3.
1. Add 1/10 sample volume of 10X PNGase F denaturing buffer to each sam-ple and heat to 100ºC for 10 min (see Note 24).
2. Add 1/10 sample volume of 10X PNGase F reaction buffer and 10% (v/v)NP-40, mix (see Note 25).
3. Add 1 lL of PNGase F and incubate samples at 37ºC for 1 h to overnight.
3.1.5.2. REMOVING O-GLCNAC
Terminal b-GlcNAc and O-GlcNAc can be removed from proteins using com-mercial hexosaminidases; these enzymes will also cleave terminal b-GalNAc
O-GlcNAc Identification and Site-Mapping 185
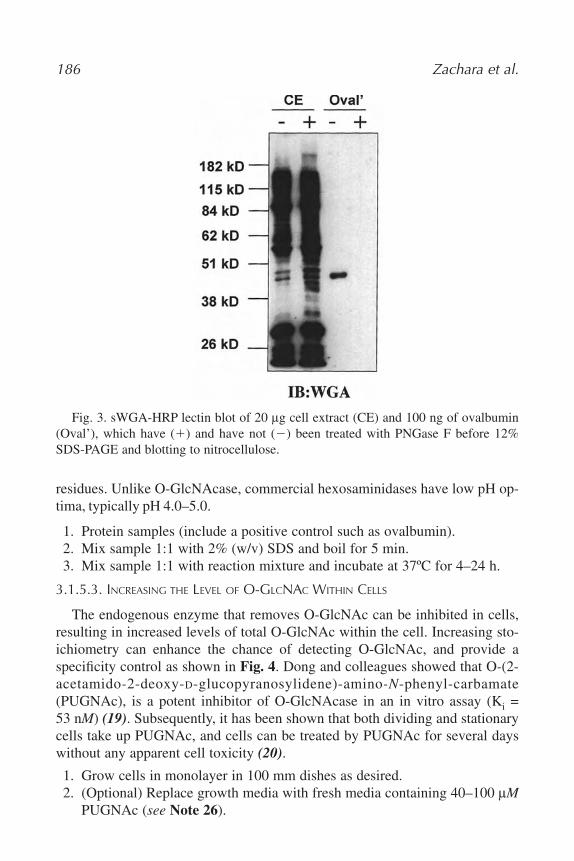
186 Zachara et al.
residues. Unlike O-GlcNAcase, commercial hexosaminidases have low pH op-tima, typically pH 4.0–5.0.
1. Protein samples (include a positive control such as ovalbumin).2. Mix sample 1:1 with 2% (w/v) SDS and boil for 5 min.3. Mix sample 1:1 with reaction mixture and incubate at 37ºC for 4–24 h.
3.1.5.3. INCREASING THE LEVEL OF O-GLCNAC WITHIN CELLS
The endogenous enzyme that removes O-GlcNAc can be inhibited in cells,resulting in increased levels of total O-GlcNAc within the cell. Increasing sto-ichiometry can enhance the chance of detecting O-GlcNAc, and provide aspecificity control as shown in Fig. 4. Dong and colleagues showed that O-(2-acetamido-2-deoxy-D-glucopyranosylidene)-amino-N-phenyl-carbamate(PUGNAc), is a potent inhibitor of O-GlcNAcase in an in vitro assay (Ki =53 nM) (19). Subsequently, it has been shown that both dividing and stationarycells take up PUGNAc, and cells can be treated by PUGNAc for several dayswithout any apparent cell toxicity (20).
1. Grow cells in monolayer in 100 mm dishes as desired.2. (Optional) Replace growth media with fresh media containing 40–100 lM
PUGNAc (see Note 26).
Fig. 3. sWGA-HRP lectin blot of 20 lg cell extract (CE) and 100 ng of ovalbumin(Oval’), which have (�) and have not (�) been treated with PNGase F before 12%SDS-PAGE and blotting to nitrocellulose.
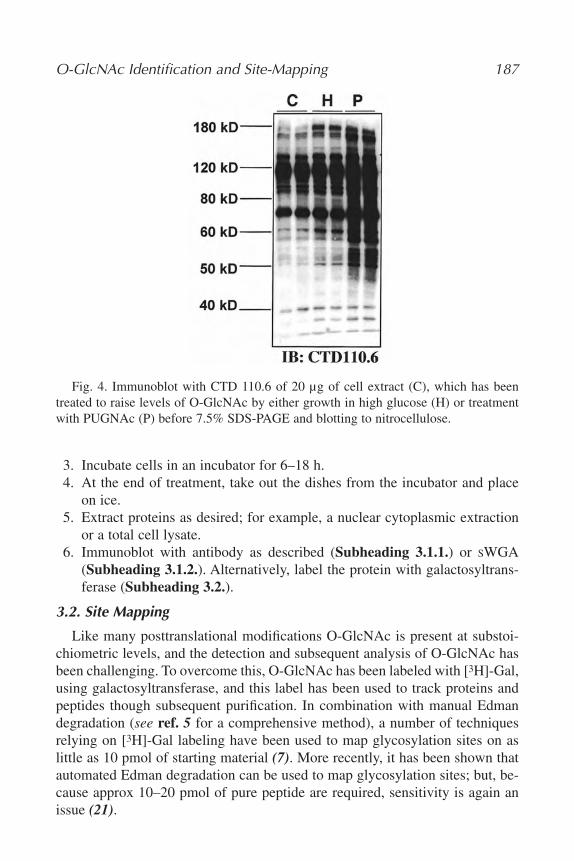
O-GlcNAc Identification and Site-Mapping 187
3. Incubate cells in an incubator for 6–18 h.4. At the end of treatment, take out the dishes from the incubator and place
on ice.5. Extract proteins as desired; for example, a nuclear cytoplasmic extraction
or a total cell lysate.6. Immunoblot with antibody as described (Subheading 3.1.1.) or SWGA
(Subheading 3.1.2.). Alternatively, label the protein with galactosyltrans-ferase (Subheading 3.2.).
3.2. Site Mapping
Like many posttranslational modifications O-GlcNAc is present at substoi-chiometric levels, and the detection and subsequent analysis of O-GlcNAc hasbeen challenging. To overcome this, O-GlcNAc has been labeled with [3H]-Gal,using galactosyltransferase, and this label has been used to track proteins andpeptides though subsequent purification. In combination with manual Edmandegradation (see ref. 5 for a comprehensive method), a number of techniquesrelying on [3H]-Gal labeling have been used to map glycosylation sites on aslittle as 10 pmol of starting material (7). More recently, it has been shown thatautomated Edman degradation can be used to map glycosylation sites; but, be-cause approx 10–20 pmol of pure peptide are required, sensitivity is again anissue (21).
Fig. 4. Immunoblot with CTD 110.6 of 20 µg of cell extract (C), which has beentreated to raise levels of O-GlcNAc by either growth in high glucose (H) or treatmentwith PUGNAc (P) before 7.5% SDS-PAGE and blotting to nitrocellulose.
Mass spectrometry (MS) is very sensitive and several MS-based strategieshave been developed for mapping sites of O-GlcNAc attachment. However,until recently, MS provided little advantage over conventional techniques, be-cause the addition of a single GlcNAc to a peptide has been shown to reducethe signal by approximately fivefold; and the presence of the unglycosylatedpeptide suppresses the signal further (22). Moreover, the b-O-GlcNAc bond ishighly labile, and in conventional electrospray ionization-MS, O-GlcNAc isoften released at the source and/or at lower collision energies than is requiredto sequence peptides. To map sites in the mass spectrometer, Greis and co-workers (7) analyzed peptides before and after b-elimination. b-elimination ofcarbohydrates from Ser (89 amu) and Thr (101 amu) residues results in the for-mation of 2-aminopropenoic acid (69 amu) and a-aminobutyric acid (83 amu),respectively. Because these amino acids have unique masses compared to theirparent amino acids, they can be used to map the site of attachment. It should benoted that this method would also release phosphate linked to Ser and Thrresidues. In an adaptation of this method, Wells and co-workers add DTT backto the peptide backbone, labeling the glycosylation site (23). Tryptic peptidesof the purified proteins are subjected to phosphatase treatment to dephosphory-late the peptides. The peptides then undergo mild b-elimination, followed byMichael addition with DTT (Cleland’s reagent, DTT). Derivatizing the b-elim-inated peptides with DTT tags the site of modification with a unique molecularweight, facilitating database searching. Also, the DTT tag may be used to en-rich for DTT-modified peptides by thiol-affinity chromatography, thereby of-fering a solution to the issue of low-abundance O-GlcNAc-modified proteins.
3.2.1. BEMAD
3.2.1.1. PERFORMIC ACID OXIDATION (SEE NOTE 27)
1. Suspend protein sample in 300 lL Performic acid oxidation buffer.2. Spike with 1–10 pmol of control peptides.3. Incubate on ice for 1 h.4. Dry down in Speed-Vac.
3.2.1.2. TRYPSIN DIGESTION
1. Resuspend protein sample in 40 mM ammonium bicarbonate.2. Digest by addition of 1:10–1:100 (w/w) sequencing-grade trypsin
overnight at 37°C.3. Acidify digest by the addition of TFA to 1% (v/v) final concentration.4. Clean up over a C18 reversed-phase column (see manufacturer’s instructions).5. Dry peptides using a Speed-Vac concentrator.
188 Zachara et al.
3.2.1.3. PHOSPHATASE TREATMENT
1. Resuspend peptides in 40 mM ammonium bicarbonate, 1 mM MgCl2.2. Add alkaline phosphatase (1 U/10 lL) and incubate at 37°C for 4 h.3. Dry peptides using a Speed-Vac concentrator.
3.2.1.4. BEMAD TREATMENT (SEE NOTE 28)
1. Resuspend peptides in 500 lL BEMAD solution and adjust pH to12.0–12.5 with triethylamine, if necessary.
2. Incubate reaction at 50°C for 2.5 h.3. Stop reaction by adding TFA to 1% (v/v) final concentration.4. Clean up over C18 reversed-phase column (see manufacturer’s instructions).5. Dry peptides using a Speed-Vac concentrator.
3.2.1.5. THIOL-AFFINITY COLUMN (SEE NOTE 29)
1. Swell and wash thiopropyl sepharose resin in degassed thiol column buffer.2. Resuspend peptides in thiol column buffer.3. Bind peptides to thiol column at room temperature for 1 h.4. Wash column with 20 mL thiol column buffer.5. Elute peptides three times sequentially with 150 lL Thiol elution buffer.6. Acidify peptides by adding TFA to 1% (v/v) final concentration.7. Clean up over C18 reversed-phase column to remove free DTT.8. Dry down peptides.
3.2.1.6. LIQUID CHROMATOGRAPHY TANDEM MASS SPECTROMETRY (LC/MS/MS),ANALYSIS (SEE NOTE 30)
1. Resuspend peptides in 1% (v/v) acetic acid.2. Load sample onto nanobore column packed with C18, desalted with 1%
(v/v) acetic acid.3. Separate sample over a 75 min linear gradient of increasing acetonitrile at
a flow rate of approx 200 nL/min into the MS source (Finnigan LCQ). Datamay be collected in automatic mode with a MS scan (2 � 500 ms) followedby two MS/MS scans (3 � 750 ms) of the two highest-intensity peptideswith a dynamic exclusion of 2 and a mass gate of 2.0 daltons. Alternatively,MS/MS data may be collected manually by choosing peaks of interest forfragmentation from the MS scans during the run.
4. Turbosequest software may be used to interpret MS/MS data, allowing fora differential mass increase of 136.2 daltons to Ser and Thr residues, 120.2daltons to Cys residues that may have been derivatized with DTT, 48.0 dal-tons to performic acid oxidized Cys and Trp residues, and 32.0 daltons toperformic acid oxidized Met residues.
O-GlcNAc Identification and Site-Mapping 189
4. Notes1. Ovalbumin (Sigma-Aldrich) is a protein modified by GlcNAc-terminating
N-linked oligosaccharides that is used as a negative control for im-munoblotting with CTD 110.6 (use 100 ng), a positive control for sWGA(use 100 ng) and galactosyltransferase labeling (use 2 lg).
2. BSA (Sigma-Aldrich) is a nonglycosylated protein that can be used as anegative control.
3. BSA-GlcNAc (Sigma-Aldrich) is a protein chemically modified to containGlcNAc residues, that is used as a positive control for immunoblotting withCTD 110.6 and sWGA (use 1–5 ng).
4. SWGA-HRP can be stored at 1 mg/ml in PBS, pH 7.4, at �20ºC for atleast 1 y.
5. As a control, sample should be spiked with 1–10 pmol of known phos-phorylated and/or O-GlcNAc-modified peptides. A commonly used gly-cosylated peptide is the BPP peptide (PSVPVS(O-GlcNAc)GSAPGR).Glycosylated peptides can be synthesized as described in (6).
6. The amount of starting material will vary depending on the sensitivity ofthe LC/MS/MS instrument and the purity of the sample. With the FinniganLCQ Classic, which is able to reach sensitivities in the final range, pmolamounts of starting protein may be enough, given that its purity is approx90% and assuming that the stoichiometry of the O-GlcNAc modification isapprox 10%. Additional details on protein sample preparation for BEMADmay be found in (23).
7. In order to lessen plastic contamination, we recommend the use of thesetubes. All plastic tubes and columns should be rinsed with 50% acetonitrileprior to use and never autoclaved. Also, clear pipet tips should be usedwhenever possible.
8. Gal-transferase labeling can be performed in conjunction with immuno-precipitation. However, cell extract should be labeled and then the proteinof interest should be precipitated, because immunoglobulin contains largeamounts of GlcNAc-terminating N-linked sugars, which will be preferen-tially labeled to O-GlcNAc.
9. 20–30 lg of total cytoplasmic, nuclear, or total cell extract is sufficient. Forpurified proteins, Comer and co-workers found that 25–50 ng of a neogly-coconjugate was sufficient (12).
10. High concentrations of Tween-20 substitute for blocking membranes withmilk or (BSA).
11. The antibody often cross-reacts with prestained markers.12. Before succinylation, WGA will recognize both sialic acid and GlcNAc.
190 Zachara et al.
13. To determine changes in levels of O-GlcNAc in total cell extract, approx20 lg of total protein should be loaded.
14. Note that milk cannot be used as the blocking agent because many of theproteins in milk are modified by glycans that react with sWGA.
15. Acetone is not recommended because free GlcNAc will precipitate.16. Galactosyltransferase is also active in solutions containing 5 mM DTT,
0.5 M NaCl, up to 2% (v/v) Triton-X 100, up to 2% (v/v) NP-40, and 1 Murea. Digitonin should be used with care because it is a substrate for galac-tosyltransferase.
17. Ethanol can inhibit the galactosyltransferase reaction, but if less than 4 lLis required, the label can be added directly to the reaction (final reactionvolume 500 lL).
18. The 5' AMP is included to inhibit possible phophodiesterase reactions,which might compete for label during the labeling experiment.
19. Free UDP is also an inhibitor, and for studies where complete labeling ofthe GlcNAc is preferable, such as site mapping, calf intestinal alkalinephosphatase is included in the reaction because it degrades UDP.
20. For studies where complete labeling of the GlcNAc is required, such as sitemapping, the reactions are chased with unlabeled UDP-Gal and fresh galac-tosyltransferase.
21. Size-exclusion chromatography, using Sephadex G50, traditionally is usedto desalt samples. However, TCA precipitation, spin filtration/buffer ex-change, or other forms of size-exclusion chromatography (e.g., PharmaciaPD10 desalting column) can be used. The addition of carrier proteins suchas BSA (approx 67 kDa) and Cytochrome C (approx 12.5 kDa) to samplesand buffers will reduce the amount of protein lost owing to nonspecific pro-tein adsorption.
22. PNGase F is distinct from endoglycosidase F (EC 3.2.1.96), which cleavesonly a subset of N-linked sugars. In addition, PNGase F will not cleaveN-linked sugars with a core a1-3fucose or N-linked sugars at the N- orC-terminus of a protein or peptide.
23. Ovalbumin, which contains one N-linked glycosylation site, will increasein mobility by several kilodaltons on a gel (10–12% SDS-PAGE) aftertreatment with PNGase F. This mobility shift is difficult to detect on a 7.5%SDS-PAGE gel.
24. Protein samples can contain protease inhibitor cocktails (PIC), such asPIC1 and PIC2 (11).
25. PNGase F is inhibited by SDS. It is essential to add NP-40 to the reactionmixture.
O-GlcNAc Identification and Site-Mapping 191
26. The dose-dependence curve for PUGNAc is different in different celltypes (20).
27. Performic acid oxidation may be performed before or after trypsin diges-tion. It is observed that it may help denature samples with many Cysresidues. As an alternative, Cys residues may be alkylated using iodoac-etamide. If this is done, a mass increase of 57.052 daltons should be al-lowed for during database searching.
28. This method may be adapted for Ser and Thr phosphorylation sites as fol-lows. Instead of phosphatase treatment, the sample should be acidified topH 4.5 with TFA and treated with (1 U/20 lL) b-hexosaminidase (NewEngland Biolabs) at 37°C for 16h. Also, the BEMAD solution should bemodified to 2% (v/v) Triethylamine, 0.2% (v/v) NaOH, 10 mM DTT, andthe reaction allowed to proceed for 5 h at 50°C.
29. Peptides may be bound to the thiol column for longer than 1 h. This is aminimum incubation time.
30. These LC/MS/MS methods should be used as a general guide only. Meth-ods should be optimized according to the specific instrument being used.
AcknowledgmentsThe authors work is supported by NIH grants HD13563 and CA42486 to
GWH, and the National Heart, Lung, and Blood Institute, National Institutes ofHealth, contract No. N01-HV-28180. Under a licensing agreement between Co-vance Research Products and The Johns Hopkins University, Dr. Hart receivesa share of royalty received by the university on sales of the CTD 110.6 anti-body. The terms of this arrangement are being managed by The Johns HopkinsUniversity in accordance with its conflict of interest policies.
References1. Wells, L., Vosseller, K., and Hart, G. W. (2001) Glycosylation of nucleocytoplas-
mic proteins: signal transduction and O-GlcNAc. Science 291, 2376–2378.2. Zachara, N. E. and Hart, G. W. (2002) The emerging significance of O-GlcNAc in
cellular regulation. Chem. Rev. 102, 431–438.3. Griffith L. S. and Schmitz, B. (1999) O-linked N-acetylglucosamine levels in cere-
bellar neurons respond reciprocally to pertubations of phosphorylation. Eur. J.Biochem. 262, 824–831.
4. Lefebvre, T., Alonso, C., Mahboub, S., et al. (1999) Effect of okadaic acid onO-linked N-acetylglucosamine levels in a neuroblastoma cell line. Biochim. Bio-phys. Acta 1472, 71–81.
5. Roquemore, E. P., Chou, T. Y., and Hart G. W. (1994) Detection of O-linkedN-acetylglucosamine (O-GlcNAc) on cytoplasmic and nuclear proteins. MethodsEnzymol. 230, 443–460.
192 Zachara et al.
6. Greis, K. D., Hayes B. K., Comer, F. I., et al. (1996) Selective detection and site-analysis of O-GlcNAc modified glycopeptides by beta-elimination and tandemelectrospray mass spectrometry. Anal. Biochem. 234, 38–49.
7. Greis, K. D. and Hart, G. W. (1998) Analytical methods for the study of O-GlcNAcglycoproteins and glycopeptides. Methods Mol. Biol. 76, 19–33.
8. Torres, C. R. and Hart, G. W. (1984) Topography and polypeptide distribution ofterminal N-acetylglucosamine residues on the surfaces of intact lymphocytes. Evi-dence for O-linked GlcNAc. J. Biol. Chem. 259, 3308–3317.
9. Snow, C. M., Senior, A., and Gerace, L. (1987) Monoclonal antibodies identify agroup of nuclear pore complex glycoproteins. J. Cell Biol. 104, 1143–1156.
10. Turner, J. R., Tartakoff, A. M., and Greenspan, N. S. (1990) Cytologic assessment ofnuclear and cytoplasmic O-linked N-acetylglucosamine distribution by using anti-streptococcal monoclonal antibodies. Proc. Natl. Acad. Sci. USA 87, 5608–5612.
11. Holt, G. D., Snow, C. M., Senior, A., et al. (1987) Nuclear pore complex glyco-proteins contain cytoplasmically disposed O-linked N-acetylglucosamine. J. CellBiol. 104, 1157–1164.
12. Comer, F. I., Vosseller, K., Wells, R. L., et al. (2001) Characterization of a mousemonoclonal antibody specific for O-Linked GlcNAc. Anal. Biochem. 293, 169–177.
13. Matsuoka, Y., Shibata, S., et al. (2002) Identification of Ewing’s sarcoma gene prod-uct as a glycoprotein using a monoclonal antibody that recognizes an immunodeter-minant containing O-linked N-acetylglucosamine moiety. Hybrid. Hybridomics 21,233–236.
14. Haltiwanger, R. S., Blomberg, M. A., and Hart, G. W. (1992) Glycosylation of nu-clear and cytoplasmic proteins. Purification and characterization of a uridinediphospho-N-acetylglucosamine: polypeptide b-N-acetylglucosaminyltransferaseJ. Biol. Chem. 267, 9005–9013.
15. Fukuda, M. (1990) Characterization of O-linked saccharide structures from cellsurface glycoproteins. Methods Enzymol. 179, 17–29.
16. Kobata, A. (1994) Size fractionation of oligosaccharides. Methods Enzymol. 230,200–208.
17. Townsend, R. R., Hardy, M. R., and Lee, Y. C. (1990) Separation of oligosaccha-rides using high-performance anion-exchange chromatography with pulsed amper-ometric detection. Methods Enzymol. 179, 65–76.
18. Hardy, M. R. and Townsend, R. R. (1994) High-pH anion exchange chromatogra-phy of glycoprotein-derived carbohydrates. Methods Enzymol. 230, 208–225.
19. Dong, D. L.-Y. and Hart, G. W. (1994) Purification and characterization of anO-GlcNAc selective N-Acety-b-D-glucosaminidase from rat spleen cytosol. J. Biol.Chem. 269, 19,321–19,330.
20. Haltiwanger, R. S., Grove, K., and Philipsberg, G. A. (1998) Modulation of O-linkedN-acetylglucosamine levels on nuclear and cytoplasmic proteins in vivo using thepeptide O-GlcNAc-b-N-acetylglucosaminidase inhibitor O-(2-acetamido-2-deoxy-D-glucopyranosylidene)amino-N-phenylcarbamate. J. Biol. Chem. 273, 3611–3617.
21. Zachara, N. E. and Gooley, A. A. (2000) Identification of glycosylation sites inmuch peptides by edman degradation. Methods Mol. Biol. 125, 121–128.
O-GlcNAc Identification and Site-Mapping 193

22. Hart, G. W., Cole, R. N., Kreppel, L. K., et al. (2000) Glycosylation of proteins-amajor challenge in mass spectrometry and proteomics, in Proceedings of the 4th In-ternational Symposium on Mass Spectrometry in the Health and Life Sciences(Burlingame, A., Carr, S., and Baldwin, M., eds.), Humana Press, Totowa, NJ, pp.365–382.
23. Wells, L., Vosseller, K., Cole, R. N., et al. (2002) Mapping sites of O-GlcNAc mod-ification using affinity tags for serine and threonine post-translational modifica-tions. Mol. Cell Proteomics 1, 791–804.
194 Zachara et al.
13
Techniques in Protein Methylation
Jaeho Lee, Donghang Cheng, and Mark T. Bedford
SummaryProteins can be methylated on the side-chain nitrogens of arginine and lysine residues or on
carboxy-termini. Protein methylation is a way of subtly changing the primary sequence of a pep-tide so that it can encode more information. This common posttranslational modification is im-plicated in the regulation of a variety of processes including protein trafficking, transcription andprotein–protein interactions. In this chapter, we will use the arginine methyltransferases to illus-trate different approaches that have been developed to assess protein methylation. Both in vivoand in vitro methylation techniques are described, and the use of small molecule inhibitors of pro-tein methylation will be demonstrated.
Key Words: Protein methylation; lysine; arginine, histones; PABP1; Sam68; AdoMet.
1. IntroductionSignal-transduction pathways commonly use posttranslational modifications
to convey information through the cell. Protein methylation is a component ofthis cellular information network. Proteins can be methylated on carboxy-termini or on the side-chain nitrogens of arginine and lysine residues (1–3).Within signaling pathways, protein methylation occurs both proximal to receptor-mediated responses (4,5) and distal to primary signaling events, where methyla-tion of histones is crucial for laying down the “histone code” and the subsequentactivation (or inactivation) of transcriptional loci (6). In addition, methylation isinvolved in protein trafficking (7), the biogenesis of spliceosomal proteins (8,9)and the regulation of protein–protein interactions (8,10). Arginine residues can
From: Methods in Molecular Biology, vol. 284:Signal Transduction Protocols
Edited by: R. C. Dickson © Humana Press Inc., Totowa, NJ
195
be dimethylated either asymmetrically (by Type I enzymes) or symmetrically(by Type II enzymes) (11). In mammals, five Type I enzymes (PRMT1–4 and –6)(12–16) and a single Type II enzyme (PRMT5) (17) have been described. Re-cently, the SET domain-dependent lysine methyltransferases were discovered(18). The founding member of this family of methyltransferases, Suv39H1, se-lectively methylates the N-terminus of histone H3. Lysine residues can accept upto three methyl groups forming mono-, di-, and trimethylated derivatives (19).Studies with arginine methyltransferases will be described in this chapter to il-lustrate different approaches that can be used to investigate protein methylation.
2. Materials1. pGEX6P-1 Bacterial expression vector (Amersham Biosciences, Piscat-
away, NJ).2. Glutathione sepharose 4B (Amersham Biosciences).3. Glutathione reduced.4. Escherichia coli strain BL21.5. Luria-Bertani (LB) broth: Per liter: 10 g Pancreatic digest of Casein, 5 g of
Yeast extract, 10 g of NaCl.6. Agar: Per liter:10 g of Tryptone, 5 g of yeast extract, 10 g of NaCl, 15 g
of Agar.7. IPTG (isopropyl-b-D-thio-galactopyranoside).8. Ampicillin.9. Phosphate-buffered saline (PBS): 137 mM NaCl, 2.7 mM KCl, 4.3 mM
Na2HPO4, 1.4 mM KH2PO4, pH 7.410. Acrylamide.11. Nonfat dry milk.12. Tween-20.13. Glacial acetic acid.14. Ethanol.15. S-adenosyl-L-[methyl-3H]methionine or [3H]AdoMet; approx 70–85 Ci/mmol
from a 12.6 lM stock solution in dilute HCl/ethanol 9:1, pH 2.0–2.5.(Amersham Biosciences).
16. EN3HANCE spray (PerkinElmer Life Sciences, Boston, MA).17. UltraLink immobilized protein A/G (Pierce, Rockford, IL).18. Elution buffer: 100 mM Tris-HCl, pH 8.0, 120 mM NaCl, 30 mM glu-
tathione reduced.19. Tris-Glycine running buffer: 25 mM Tris-base, 0.2 M glycine, 0.1% SDS.20. Transfer buffer: 25 mM Tris-base, 0.2 M glycine, 0.1% sodium dodecyl sul-
fate (SDS), 20% methanol.21. Coommassie Blue staining solution: 0.5 g Coomassie Blue, 200 mL
methanol 100%.
196 Lee et al.
22. Histones (Sigma, St Louis, MO).23. 6X SDS protein sample loading buffer: 180 mM Tris-HCl, pH 6.8, 30%
glycerol, 10% SDS, 0.6 M ditriothreitol (DTT), 0.012% bromophenol blue.24. PVDF (polyvinylidene difluoride) (Milipore, Bedford, MA).25. Growth Medium A: Dulbecco’s Modified Eagle’s Medium (DMEM), 10%
Fetal Bovine Serum (FBS), cycloheximide (100 lg/mL), chloroampheni-col (40 lg/mL).
26. Growth Medium B: Dulbecco’s Modified Eagle’s Medium without me-thionine (DMEM/-Met), 10% FBS (dialysed), cycloheximide (100 lg/mL),chloroamphenicol (40 lg/mL).
27. L-[methyl-3H]methionine; approx 70–85 Ci/mmol (Amersham Biosciences).28. Mild lysis buffer: 10 mM Tris-HCl, pH 7.5, 1% (v/v) Triton X-100, 150 mM
NaCl, 5 mM EDTA, protease inhibitor cocktail (Roche, Indianapolis, IN).29. Adenosine-2, 3-dialdehyde (AdOx) (Sigma).30. Sonic dismembrater (model 500) with tapered tip (Fisher Scientific, Pitts-
burgh, PA).31. Miniprotean three electrophoresis cell (Bio-Rad, Hercules, CA).32. Semidry electroblotter apparatus (Amersham Biosciences).33. Kodak Biomax MS X-ray film (Eastman Kodak, Rochester, NY).34. Antibodies
3. MethodsThe analysis of protein methylation can be performed in vitro using recom-
binant enzymes and substrates, or in vivo in tissue culture. The methods de-scribed here detail: (1) the purification of recombinant methyltransferase en-zymes, (2) an in vitro methylation assay using enzymes and their substrates, (3)an in vivo methylation assay, (4) the use of methyltransferase inhibitors in com-bination with in vivo labeling techniques to identify methylated proteins withina cellular context, and (5) a methylation assay using recombinant substrates andcell extracts as the source of enzyme activity.
Certain techniques that are central to the analysis of protein methylation havenot been addressed here. Amino-acid analysis of substrates is often used to es-tablish the type of methylation event catalyzed (12,20). In addition, recent stud-ies have demonstrated that methylated peptides are good immunogens andmethyl-specific antibody can be produced that track these posttranslationalmodifications in the cell (19,21,22).
3.1. Purification of Recombinant Methyltransferase Enzymes
The majority of protein arginine methyltransferases (PRMTs) and the SETdomain-containing lysine methyltransferases are active as glutathione S-trans-ferase (GST) fusion proteins. Thus, facilitating the use of recombinant enzymes
Techniques in Protein Methylation 197
to test the substrate specificity of the recombinant enzymes in vitro. Proteinmethyltransferases were cloned into pGEX vectors using standard molecular-biology techniques. The resulting constructs were transformed into competentbacterial cells (BL21).
1. Inoculate single colony of transformed E. coli into 5 mL of LB broth contain-ing 50 lg/mL Ampicillin. Grow overnight at 37°C with shaking (250 rpm).
2. Next morning, add the 5 mL overnight bacterial culture to 50 mL of LBbroth containing 50 lg/mL Ampicillin (see Note 1).
3. Culture at 37ºC for 1–2 h until optical density (OD600) reaches 0.5.4. Add 50 lL of 0.1 M IPTG to induce recombinant protein expression.5. Culture at 37ºC for an additional 4 h shaking (250 rpm).6. Centrifuge cells at 3000 g for 10 min at 4ºC (The pellet can be stored at
�70ºC).7. Resuspend pellet in 5 mL of cold 1X PBS.8. Sonicate for 20 s with pulses of 0.5 s on and 0.5 s off (amplitude 30%).9. Centrifuge at 10,000 g for 15 min at 4ºC.
10. Wash Glutathione sepharose beads once with chilled 1X PBS, then put30 lL of rinsed beads into a 1.5 mL microcentrifuge tube and add the su-pernatant from step 9.
11. Rock the sample tubes for 1 h at 4ºC.12. Wash the beads three times with cold 1X PBS.13. Add 100 lL of freshly made Elution buffer to the beads and rock for 15 min
at 4ºC.14. Centrifuge at 700 g for 5 s and remove the supernatant carefully. The super-
natant contains the active enzyme.15. Keep the samples at 4ºC for 1–2 d or directly use the enzyme (see Note 2).16. An aliquot of the supernatant should be analyzed to confirm that recombi-
nant protein has been purified. Add 2 lL of 6X protein loading buffer to10 lL of the purified GST-fusion protein sample, heat at 95ºC for 5 min andrun on a 10% SDS-PAGE gel at 100 volts for 1 h using Tris/Glycine run-ning buffer. Stain with Coommassie Blue staining solution for 30 min, thendestain with 30% ethanol and 10% glacial acetic acid for 1 h (see Fig. 1).
3.2. In Vitro Methylation Assay Using Enzymes and Their Substrates
Both the protein arginine methyltransferases and the SET domain-containinglysine methyltransferases display a large degree of substrate specificity. Differ-ent PRMTs can methylate RNA binding proteins, myelin basic protein (MBP),histones, and growth factors (16,23–26). Lysine methylated proteins include hi-stones and elongation factor 1A (27,28). In vivo methylation assays are used toestablish whether a newly discovered methyltransferase is active as a GST
198 Lee et al.
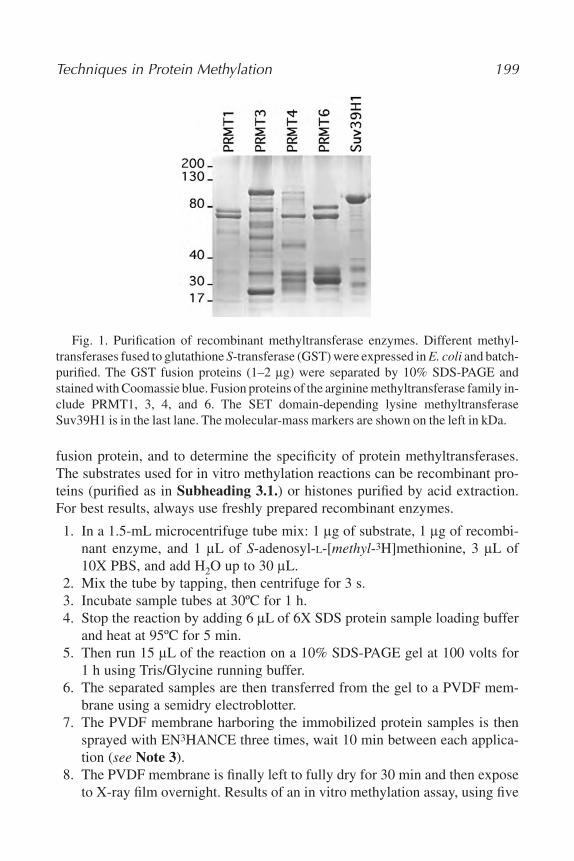
fusion protein, and to determine the specificity of protein methyltransferases.The substrates used for in vitro methylation reactions can be recombinant pro-teins (purified as in Subheading 3.1.) or histones purified by acid extraction.For best results, always use freshly prepared recombinant enzymes.
1. In a 1.5-mL microcentrifuge tube mix: 1 lg of substrate, 1 lg of recombi-nant enzyme, and 1 lL of S-adenosyl-L-[methyl-3H]methionine, 3 lL of10X PBS, and add H2O up to 30 lL.
2. Mix the tube by tapping, then centrifuge for 3 s.3. Incubate sample tubes at 30ºC for 1 h.4. Stop the reaction by adding 6 lL of 6X SDS protein sample loading buffer
and heat at 95ºC for 5 min.5. Then run 15 lL of the reaction on a 10% SDS-PAGE gel at 100 volts for
1 h using Tris/Glycine running buffer.6. The separated samples are then transferred from the gel to a PVDF mem-
brane using a semidry electroblotter.7. The PVDF membrane harboring the immobilized protein samples is then
sprayed with EN3HANCE three times, wait 10 min between each applica-tion (see Note 3).
8. The PVDF membrane is finally left to fully dry for 30 min and then exposeto X-ray film overnight. Results of an in vitro methylation assay, using five
Techniques in Protein Methylation 199
Fig. 1. Purification of recombinant methyltransferase enzymes. Different methyl-transferases fused to glutathione S-transferase (GST) were expressed in E. coli and batch-purified. The GST fusion proteins (1–2 lg) were separated by 10% SDS-PAGE andstained with Coomassie blue. Fusion proteins of the arginine methyltransferase family in-clude PRMT1, 3, 4, and 6. The SET domain-depending lysine methyltransferaseSuv39H1 is in the last lane. The molecular-mass markers are shown on the left in kDa.
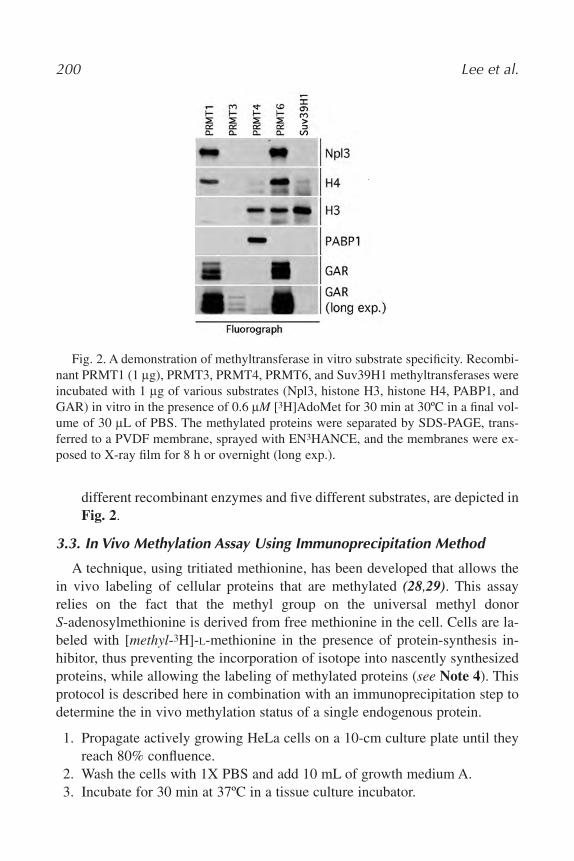
different recombinant enzymes and five different substrates, are depicted inFig. 2.
3.3. In Vivo Methylation Assay Using Immunoprecipitation Method
A technique, using tritiated methionine, has been developed that allows thein vivo labeling of cellular proteins that are methylated (28,29). This assayrelies on the fact that the methyl group on the universal methyl donorS-adenosylmethionine is derived from free methionine in the cell. Cells are la-beled with [methyl-3H]-L-methionine in the presence of protein-synthesis in-hibitor, thus preventing the incorporation of isotope into nascently synthesizedproteins, while allowing the labeling of methylated proteins (see Note 4). Thisprotocol is described here in combination with an immunoprecipitation step todetermine the in vivo methylation status of a single endogenous protein.
1. Propagate actively growing HeLa cells on a 10-cm culture plate until theyreach 80% confluence.
2. Wash the cells with 1X PBS and add 10 mL of growth medium A.3. Incubate for 30 min at 37ºC in a tissue culture incubator.
200 Lee et al.
Fig. 2. A demonstration of methyltransferase in vitro substrate specificity. Recombi-nant PRMT1 (1 lg), PRMT3, PRMT4, PRMT6, and Suv39H1 methyltransferases wereincubated with 1 lg of various substrates (Npl3, histone H3, histone H4, PABP1, andGAR) in vitro in the presence of 0.6 lM [3H]AdoMet for 30 min at 30ºC in a final vol-ume of 30 lL of PBS. The methylated proteins were separated by SDS-PAGE, trans-ferred to a PVDF membrane, sprayed with EN3HANCE, and the membranes were ex-posed to X-ray film for 8 h or overnight (long exp.).
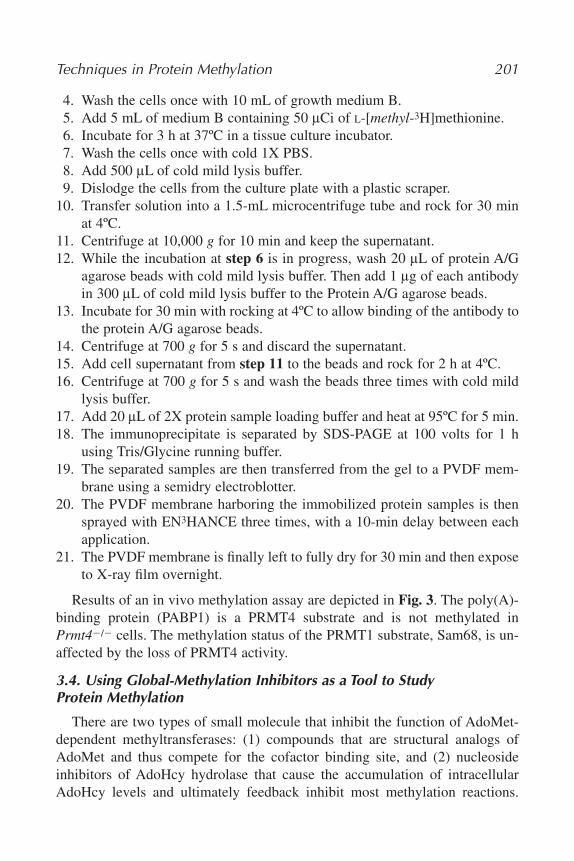
4. Wash the cells once with 10 mL of growth medium B.5. Add 5 mL of medium B containing 50 lCi of L-[methyl-3H]methionine.6. Incubate for 3 h at 37ºC in a tissue culture incubator.7. Wash the cells once with cold 1X PBS.8. Add 500 lL of cold mild lysis buffer.9. Dislodge the cells from the culture plate with a plastic scraper.
10. Transfer solution into a 1.5-mL microcentrifuge tube and rock for 30 minat 4ºC.
11. Centrifuge at 10,000 g for 10 min and keep the supernatant.12. While the incubation at step 6 is in progress, wash 20 lL of protein A/G
agarose beads with cold mild lysis buffer. Then add 1 lg of each antibodyin 300 lL of cold mild lysis buffer to the Protein A/G agarose beads.
13. Incubate for 30 min with rocking at 4ºC to allow binding of the antibody tothe protein A/G agarose beads.
14. Centrifuge at 700 g for 5 s and discard the supernatant.15. Add cell supernatant from step 11 to the beads and rock for 2 h at 4ºC.16. Centrifuge at 700 g for 5 s and wash the beads three times with cold mild
lysis buffer.17. Add 20 lL of 2X protein sample loading buffer and heat at 95ºC for 5 min.18. The immunoprecipitate is separated by SDS-PAGE at 100 volts for 1 h
using Tris/Glycine running buffer.19. The separated samples are then transferred from the gel to a PVDF mem-
brane using a semidry electroblotter.20. The PVDF membrane harboring the immobilized protein samples is then
sprayed with EN3HANCE three times, with a 10-min delay between eachapplication.
21. The PVDF membrane is finally left to fully dry for 30 min and then exposeto X-ray film overnight.
Results of an in vivo methylation assay are depicted in Fig. 3. The poly(A)-binding protein (PABP1) is a PRMT4 substrate and is not methylated inPrmt4�/� cells. The methylation status of the PRMT1 substrate, Sam68, is un-affected by the loss of PRMT4 activity.
3.4. Using Global-Methylation Inhibitors as a Tool to Study Protein Methylation
There are two types of small molecule that inhibit the function of AdoMet-dependent methyltransferases: (1) compounds that are structural analogs ofAdoMet and thus compete for the cofactor binding site, and (2) nucleosideinhibitors of AdoHcy hydrolase that cause the accumulation of intracellularAdoHcy levels and ultimately feedback inhibit most methylation reactions.
Techniques in Protein Methylation 201
Sinefungin is a commonly used AdoMet analogue and adenosine dialdehyde(AdOx) is often used as an AdoHcy hydrolase inhibitor. Because demethylaseactivity is very low or absent in cells (see Note 5), endogenous protein sub-strates are generally fully-methylated. Cells in culture can be treated with AdOxto generate hypomethylated protein extracts that are good all-purpose in vitrosubstrates for methyltransferases (12,30). Here we describe using AdOx in invivo methylation assays to affirm that tritium labeling is owing to the transferof a methyl group by an AdoMet-dependent methyltransferase.
3.4.1. AdOx Treatment of Cultured Cells and In Vivo Protein Methylation
A stock solution of AdOx (0.5 M) is prepared in dimethyl sulfoxide (DMSO).HeLa cells are grown on a 10 cm culture plate until they are 60% confluent. Thecells are then incubated with AdOx at a final concentration of 20 lM (seeNote 6). After 24 h of AdOx treatment the cells are subjected to an in vivomethylation labeling. The procedure is the same as described in Subheading 3.3.,except growth medium A and B are now supplemented with 20 lM AdOx.
3.4.2. Immunoprecipitation Using aSam68 Antibodies
The RNA binding protein, Sam68, is a well-described substrate for PRMT1(31), and is frequently used as a positive control in methylation experiments.An immunoprecipitation is performed using aSam68 antibodies and the endo-genous Sam68 is separated by SDS-PAGE, transferred to a PVDF membraneand subjected to fluorography as described in steps 20 and 21 of Subhead-ing 3.3. (see Fig 4). After fluorography the same membrane can be washed (see
202 Lee et al.
Fig. 3. In vivo methylation assay. Proteins in wild-type (���) and Prmt4 mutant(���) MEF cell lines were labeled in vivo with L-[methyl-3H]methionine. Immuno-precipitations (IP) were performed with aPABP1 (a PRMT4 substrate) and aSam68 (aPRMT1 substrate) antibodies. The 3H-labeled proteins were visualized by fluorography.The molecular mass markers are shown on the left in kDa.
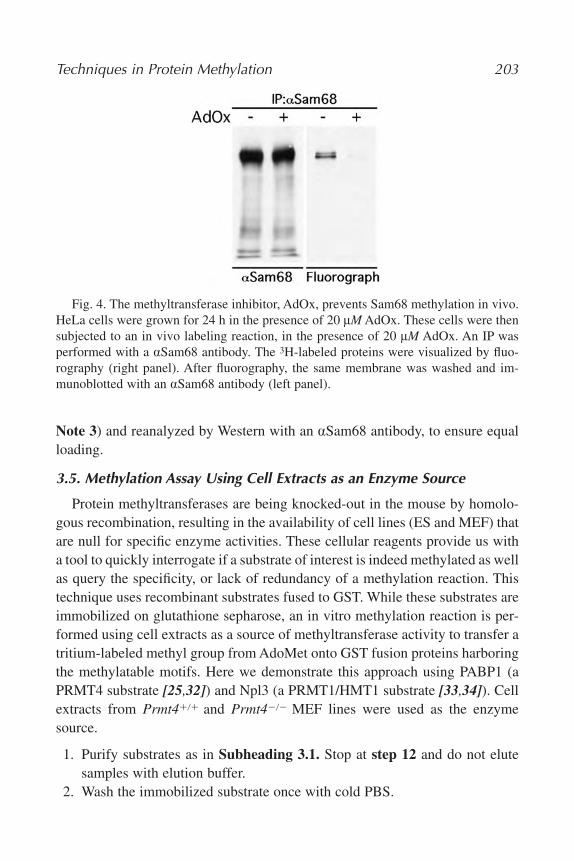
Note 3) and reanalyzed by Western with an aSam68 antibody, to ensure equalloading.
3.5. Methylation Assay Using Cell Extracts as an Enzyme Source
Protein methyltransferases are being knocked-out in the mouse by homolo-gous recombination, resulting in the availability of cell lines (ES and MEF) thatare null for specific enzyme activities. These cellular reagents provide us witha tool to quickly interrogate if a substrate of interest is indeed methylated as wellas query the specificity, or lack of redundancy of a methylation reaction. Thistechnique uses recombinant substrates fused to GST. While these substrates areimmobilized on glutathione sepharose, an in vitro methylation reaction is per-formed using cell extracts as a source of methyltransferase activity to transfer atritium-labeled methyl group from AdoMet onto GST fusion proteins harboringthe methylatable motifs. Here we demonstrate this approach using PABP1 (aPRMT4 substrate [25,32]) and Npl3 (a PRMT1/HMT1 substrate [33,34]). Cellextracts from Prmt4��� and Prmt4��� MEF lines were used as the enzymesource.
1. Purify substrates as in Subheading 3.1. Stop at step 12 and do not elutesamples with elution buffer.
2. Wash the immobilized substrate once with cold PBS.
Techniques in Protein Methylation 203
Fig. 4. The methyltransferase inhibitor, AdOx, prevents Sam68 methylation in vivo.HeLa cells were grown for 24 h in the presence of 20 lM AdOx. These cells were thensubjected to an in vivo labeling reaction, in the presence of 20 lM AdOx. An IP wasperformed with a aSam68 antibody. The 3H-labeled proteins were visualized by fluo-rography (right panel). After fluorography, the same membrane was washed and im-munoblotted with an aSam68 antibody (left panel).
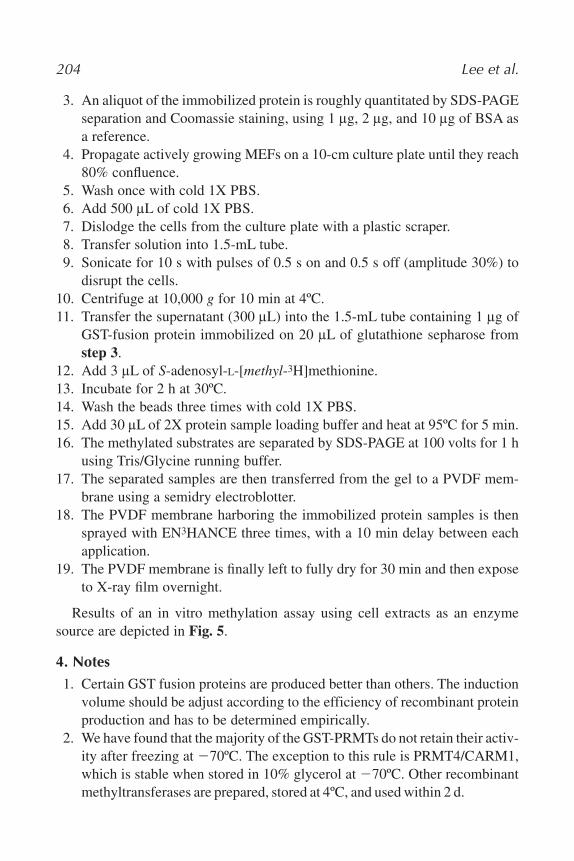
3. An aliquot of the immobilized protein is roughly quantitated by SDS-PAGEseparation and Coomassie staining, using 1 lg, 2 lg, and 10 lg of BSA asa reference.
4. Propagate actively growing MEFs on a 10-cm culture plate until they reach80% confluence.
5. Wash once with cold 1X PBS.6. Add 500 lL of cold 1X PBS.7. Dislodge the cells from the culture plate with a plastic scraper.8. Transfer solution into 1.5-mL tube.9. Sonicate for 10 s with pulses of 0.5 s on and 0.5 s off (amplitude 30%) to
disrupt the cells.10. Centrifuge at 10,000 g for 10 min at 4ºC.11. Transfer the supernatant (300 lL) into the 1.5-mL tube containing 1 lg of
GST-fusion protein immobilized on 20 lL of glutathione sepharose fromstep 3.
12. Add 3 lL of S-adenosyl-L-[methyl-3H]methionine.13. Incubate for 2 h at 30ºC.14. Wash the beads three times with cold 1X PBS.15. Add 30 lL of 2X protein sample loading buffer and heat at 95ºC for 5 min.16. The methylated substrates are separated by SDS-PAGE at 100 volts for 1 h
using Tris/Glycine running buffer.17. The separated samples are then transferred from the gel to a PVDF mem-
brane using a semidry electroblotter.18. The PVDF membrane harboring the immobilized protein samples is then
sprayed with EN3HANCE three times, with a 10 min delay between eachapplication.
19. The PVDF membrane is finally left to fully dry for 30 min and then exposeto X-ray film overnight.
Results of an in vitro methylation assay using cell extracts as an enzymesource are depicted in Fig. 5.
4. Notes
1. Certain GST fusion proteins are produced better than others. The inductionvolume should be adjust according to the efficiency of recombinant proteinproduction and has to be determined empirically.
2. We have found that the majority of the GST-PRMTs do not retain their activ-ity after freezing at �70ºC. The exception to this rule is PRMT4/CARM1,which is stable when stored in 10% glycerol at �70ºC. Other recombinantmethyltransferases are prepared, stored at 4ºC, and used within 2 d.
204 Lee et al.
3. Traditionally, fluorography for the detection of a tritium signal is performedby soaking a gel in an enhance solution, drying the gel in vacuo, and thenexposing the gel to film at �70ºC. We have found that our signal intensityis much higher if we transfer the protein onto a PVDF membrane and thenspray the PVDF membrane with EN3HANCE aerosol. This approach alsohas the added advantage of allowing the fluorograph to be analyzed byWestern, to ensure equal loading. To do a Western on a PVDF membrane(postfluorography), simply wash it two times with 100% methanol and twotimes in TBST (Tris-buffered saline with 0.1% Tween-20) to remove theenhance reagent. The washed membrane is then blocked with a skim milksolution followed by a Western blot analysis.
4. It is important to control for the effectiveness of the protein synthesisinhibitors. If protein synthesis is not fully inhibited, then tritium-labeledmethionine will be incorporated into newly synthesized proteins and willdistort the assay. To confirm the effectiveness of the protein-synthesis in-hibitors, one 10-cm culture plate of HeLa cells can be incubated for30 min in growth medium A and then labeled with 5 mL of medium B
Techniques in Protein Methylation 205
Fig. 5. Cell extracts from Prmt4��� cells are unable to methylate recombinantPABP1. GST-fusion proteins of PABP1 and Npl3 were left bound to glutathionesepharose beads and methylated, in the presence of 0.12 lM [3H]AdoMet for 2 h at30ºC, using the wild-type and mutant cell extracts as an enzyme source. After themethylation reaction the beads harboring the recombinant substrate were washed andeluted by boiling with protein sample loading buffer. Proteins were run on a gel, trans-ferred onto a membrane, sprayed with EN3HANCE, and exposed to X-ray filmovernight. The molecular-mass markers are shown on the left in kDa.
containing 50 lCi of L-[35S]methionine for 3 h. A second plate can belabeled in the absence of protein synthesis inhibitors. Cells from the twoplates are lysed in protein loading buffer and an aliquot (25 lL/500 lL)of the protein is separated by SDS-PAGE, and then exposed to X-rayfilm overnight.
5. The current thinking is that there is no demethylase to counteract the ac-tivities of PRMTs and the SET domain-containing lysine methyltrans-ferases (35). The irreversible nature of N-arginine and N-lysine methylationresults in the steady accumulation of these modifications.
6. It has been established that 20 lM of AdOx effectively prevents proteinmethylation in PC12 (36) and RAT1 (37) cells. AdOx is cytotoxic at mi-cromolar concentrations and AdOx-treated cells stop growing and loseviability.
AcknowledgmentsWe wish to thank P. A. Silver for the GST-Npl3 vector, M. Stallcup for the
GST-CARM1 vector, S. Clarke for the GST-PRMT1 and GST-GAR vectors, T.Jenuwein for the GST-Suv39H1 vector, and S. Richard for the aSam68 anti-body. Mark T. Bedford is supported by NIH grant number DK62248-01.
References1. Aletta, J. M., Cimato, T. R., and Ettinger, M. J. (1998) Protein methylation: a sig-
nal event in post-translational modification. Trends Biochem. Sci. 23, 89–91.2. Comb, D. G., Sarkar, N., and Pinzino, C. J. (1966) The methylation of lysine
residues in protein. J. Biol. Chem. 241, 1857–1862.3. Paik, W. K. and Kim, S. (1968) Protein methylase I. Purification and properties of
the enzyme. J. Biol. Chem. 243, 2108–2114.4. Mowen, K. A., Tang, J., Zhu, W., et al. (2001) Arginine methylation of STAT1 mod-
ulates IFNalpha/beta-induced transcription. Cell 104, 731–741.5. Abramovich, C., Yakobson, B., Chebath, J., and Revel, M. (1997) A protein-
arginine methyltransferase binds to the intracytoplasmic domain of the IFNAR1chain in the type I interferon receptor. EMBO J. 16, 260–266.
6. Strahl, B. D. and Allis, C. D. (2000) The language of covalent histone modifica-tions. Nature 403, 41–45.
7. McBride, A. E. and Silver, P. A. (2001) State of the arg: protein methylation at argi-nine comes of age. Cell 106, 5–8.
8. Friesen, W. J., Massenet, S., Paushkin, S., et al. (2001) SMN, the product of thespinal muscular atrophy gene, binds preferentially to dimethylarginine-containingprotein targets. Mol. Cell 7, 1111–1117.
9. Brahms, H., Meheus, L., de Brabandere, V., et al. (2001) Symmetrical dimethyla-tion of arginine residues in spliceosomal Sm protein B/B and the Sm-like proteinLSm4, and their interaction with the SMN protein. RNA 7, 1531–1542.
206 Lee et al.
10. Bedford, M. T., Frankel, A., Yaffe, M. B., et al. (2000) Arginine methylation in-hibits the binding of proline-rich ligands to Src homology 3, but not WW, domains.J. Biol. Chem. 275, 16,030–16,036.
11. Gary, J. D. and Clarke, S. (1998) RNA and protein interactions modulated by pro-tein arginine methylation. Prog. Nucleic Acid Res. Mol. Biol. 61, 65–131.
12. Frankel, A., Yadav, N., Lee, J., et al. (2002) The novel human protein arginineN-methyltransferase PRMT6 is a nuclear enzyme displaying unique substratespecificity. J. Biol. Chem. 277, 3537–3543.
13. Lin, W. J., Gary, J. D., Yang, M. C., et al. (1996) The mammalian immediate-earlyTIS21 protein and the leukemia-associated BTG1 protein interact with a protein-arginine N-methyltransferase. J. Biol. Chem. 271, 15,034–15,044.
14. Scott, H. S., Antonarakis, S. E., Lalioti, M. D., et al. (1998) Identification and char-acterization of two putative human arginine methyltransferases (HRMT1L1 andHRMT1L2). Genomics 48, 330–340.
15. Tang, J., Gary, J. D., Clarke, S., and Herschman, H. R. (1998) PRMT 3, a type Iprotein arginine N-methyltransferase that differs from PRMT1 in its oligomeriza-tion, subcellular localization, substrate specificity, and regulation. J. Biol. Chem.273, 16,935–16,945.
16. Chen, D., Ma, H., Hong, H., et al. (1999) Regulation of transcription by a proteinmethyltransferase. Science 284, 2174–2177.
17. Branscombe, T. L., Frankel, A., Lee, J. H., et al. (2001) Prmt5 (janus kinase-bind-ing protein 1) catalyzes the formation of symmetric dimethylarginine residues inproteins. J. Biol. Chem. 276, 32,971–32,976.
18. Rea, S., Eisenhaber, F., O’Carroll, D., et al. (2000) Regulation of chromatin struc-ture by site-specific histone H3 methyltransferases. Nature 406, 593–599.
19. Santos-Rosa, H., Schneider R., Bannister A. J., et al. (2002) Active genes are tri-methylated at K4 of histone H3. Nature 419, 407–411.
20. Gary, J. D. and Clarke, S. (1995) Purification and characterization of an isoaspartyldipeptidase from Escherichia coli. J. Biol. Chem. 270, 4076–4087.
21. Chevillard-Briet, M., Trouche, D., and Vandel, L. (2002) Control of CBP co-acti-vating activity by arginine methylation. EMBO J 21, 5457–5466.
22. Li, H., Park S., Kilburn B., et al. (2002) Lipopolysaccharide-induced methylationof HuR, an mRNA-stabilizing protein, by CARM1. Coactivator-associated argininemethyltransferase. J. Biol. Chem. 277, 44,623–44,630.
23. Sommer, A., Moscatelli, D., and Rifkin, D. B. (1989) An amino-terminally ex-tended and post-translationally modified form of a 25kD basic fibroblast growthfactor. Biochem. Biophys. Res. Commun. 160, 1267–1274.
24. Baldwin, G. S. and Carnegie, P. R. (1971) Isolation and partial characterization ofmethylated arginines from the encephalitogenic basic protein of myelin. Biochem.J. 123, 69–74.
25. Lee, J. and Bedford, M. T. (2002) PABP1 identified as an arginine methyltrans-ferase substrate using high-density protein arrays. EMBO Rep. 3, 268–273.
26. Davie, J. K. and Dent, S. Y. (2002) Transcriptional control: an activating role forarginine methylation. Curr. Biol. 12, R59–R61.
Techniques in Protein Methylation 207
27. Lachner, M., O’Sullivan, R. J., and Jenuwein, T. (2003) An epigenetic road map forhistone lysine methylation. J. Cell Sci. 116, 2117–2124.
28. Coppard, N. J., Clark, B. F., and Cramer, F. (1983) Methylation of elongation fac-tor 1 alpha in mouse 3T3B and 3T3B/SV40 cells. FEBS Lett. 164, 330–334.
29. Liu, Q. and Dreyfuss, G. (1995) In vivo and in vitro arginine methylation of RNA-binding proteins. Mol. Cell Biol. 15, 2800–2808.
30. Frankel, A. and Clarke, S. (1999) RNase treatment of yeast and mammalian cell ex-tracts affects in vitro substrate methylation by type I protein arginine N-methyl-transferases. Biochem. Biophys. Res. Commun. 259, 391–400.
31. Cote, J., Boisvert, F. M., Boulanger, M. C., et al. (2003) Sam68 RNA binding pro-tein is an in vivo substrate for protein arginine N-methyltransferase 1. Mol. Biol.Cell 14, 274–287.
32. Yadav, N., Lee, J., Kim, J., et al. (2003) Specific protein methylation defects andgene expression perturbations in coactivator-associated arginine methyltransferase1-deficient mice. Proc. Natl. Acad. Sci. USA 100, 6464–6468.
33. Henry, M. F. and Silver, P. A. (1996) A novel methyltransferase (Hmt1p) modifiespoly(A)�-RNA-binding proteins. Mol. Cell Biol. 16, 3668–3678.
34. Siebel, C. W. and Guthrie, C. (1996) The essential yeast RNA binding proteinNp13p is methylated. Proc. Natl. Acad. Sci. USA 93, 13,641–13,646.
35. Bannister, A. J., Schneider, R., and Kouzarides, T. (2002) Histone methylation: dy-namic or static? Cell 109, 801–806.
36. Najbauer, J. and Aswad, D. W. (1990) Diversity of methyl acceptor proteins in ratpheochromocytoma (PC12) cells revealed after treatment with adenosine dialde-hyde. J. Biol. Chem. 265, 12,717–12,721.
37. Frankel, A. and Clarke, S. (2000) PRMT3 is a distinct member of the protein argi-nine N-methyltransferase family. Conferral of substrate specificity by a zinc-fingerdomain. J. Biol. Chem. 275, 32,974–32,982.
208 Lee et al.

14
Assaying Lipid Phosphate Phosphatase Activities
Gil-Soo Han and George M. Carman
SummaryLipid phosphate molecules such as phosphatidate, lysophosphatidate, and diacylglycerol
pyrophosphate play roles as signaling molecules in prokaryotic and eukaryotic cells. The cellu-lar processes by which lipid phosphate molecules signal may be attenuated through the actionof lipid phosphate phosphatase enzymes. The levels of lipid phosphate phosphatase activitiesmay be used as a marker of signaling events in the cell. In this chapter we describe enzymaticassays that are routinely used to measure the activities of phosphatidate phosphatase, lysophos-phatidate phosphatase, and diacylglycerol pyrophosphate phosphatase. These activities aremeasured by following the release of water-soluble radioactive inorganic phosphate from chlo-roform-soluble radioactive lipid phosphate substrate following a simple chloroform/methanol/water phase partition.
Key Words: Diacylglycerol pyrophosphate phosphatase; phosphatidate phosphatase; lyso-phosphatidate phosphatase; lipid signaling.
1. IntroductionLipid phosphate phosphatases (LPPs) are integral membrane proteins that
catalyze the dephosphorylation of a variety of lipid phosphates, including phos-phatidate (PA), lysophosphatidate (lysoPA), and diacylglycerol pyrophosphate(DGPP) (1). These enzymes are Mg2�-independent and N-ethylmaleimide-insensitive, and the genes encoding them have been identified in diverse or-ganisms from bacteria to mammals (2,3). LPPs contain a three-domain lipidphosphatase motif that is essential for catalytic activity (1,4–6). LPPs have been
From: Methods in Molecular Biology, vol. 284:Signal Transduction Protocols
Edited by: R. C. Dickson © Humana Press Inc., Totowa, NJ
209
previously classified as type 2 PA phosphatases (PAP2s) to distinguish themfrom type 1 PA phosphatases (PAP1s) (7,8). PAP1 enzymes are Mg2+-dependentand N-ethylmaleimide-sensitive, and they have distinct substrate specificity forPA. These enzymes have been identified in cytosol and membrane fractions, andthey are thought to play a major role in phospholipid synthesis. However, thegenes encoding them have not yet been identified.
The broad substrate specificity of LPPs on bioactive lipid phosphates suggeststhat these enzymes are involved in signaling events rather than in phospholipidsynthesis (9,10). LPPs can play a role in signal transduction by terminating sig-naling events of lipid phosphates. Because the products of LPPs are also bioac-tive lipid molecules, they can initiate signal transduction by producing signalingmolecules. The expression of LPP activities is likely to modulate the balance ofsignaling molecules, eliciting differential physiological responses in the organism.In this chapter we describe the methods to measure LPP activity using enzymati-cally synthesized radioactive PA, lysoPA, and DGPP substrates. These activitiesare measured by following the release of water-soluble radioactive inorganicphosphate from chloroform-soluble radioactive lipid phosphate substrate follow-ing a simple chloroform/methanol/water phase partition.
2. Materials1. Cardiolipin.2. DG.3. DGPP.4. Monoacylglycerol.5. PA.6. 5X DG kinase buffer: 250 mM imdazole-HCl, pH 6.6, 250 mM octyl-b-D-
glucopyranoside, 250 mM NaCl, 62.5 mM MgCl2, 5 mM EGTA, 50 mMb-mercaptoethanol, 25 mM ATP.
7. 5X PA kinase buffer: 200 mM imidazole-HCl, pH 6.1, 50 mM MgCl2,500 mM NaCl, 0.5 mM EDTA, 2.5 mM DTT.
8. Escherichia coli (E. coli) DG kinase (Sigma, D3065).9. Catharanthus roseus (C. roseus ) PA kinase (see Note 1).
10. 3 mM PA in 2% Triton X-100.11. 1 mM PA in 10 mM Triton X-100.12. 1 mM DGPP in 20 mM Triton X-100.13. 1% Potassium oxalate in methanol/water (2:3, v/v).14. Anhydrous chloroform (see Note 2).15. 0.1 N HCl in methanol.16. 1 N NH4OH in methanol.17. 1 M MgCl2.18. 100 mM NaF.
210 Han and Carman
19. 1 mM ATP.20. [c-32P]ATP (3000 Ci/mmol, 5 mCi/mL).21. Chloroform/methanol (2:1, v/v) containing 1% of concentrated HCl.22. Chloroform/methanol/1 N HCl (1:2:0.8, v/v).23. Scintillation fluid for aqueous samples (e.g., Ecoscint H, National Diag-
nostics LS-275).24. Thin layer chromatography (TLC) solvent for the purification of PA and
lysoPA: chloroform/methanol/water (65:25:4, v/v).25. TLC solvent for the purification of DGPP: chloroform/acetone/methanol/
acetic acid/water (50:15:13:12:4, v/v).26. TLC plates: silica gel 60, 5 � 20 cm.27. TLC chambers.28. Polypropylene tubes (17 � 100 mm).29. Polypropylene tubes with screw caps (17 � 100 mm).30. Glass tubes (12 � 75 mm).31. Scintillation vials.32. Speed-Vac.
3. MethodsThe methods described below outline: (1) the preparation of 32P-labeled
phospholipid substrates (PA, lysoPA, and DGPP), (2) assay method, and (3)data analysis.
3.1. Preparation of Substrates
E. coli DG kinase catalyzes the phosphorylation of both DG and monoacyl-glycerol as substrates. The 32P-labeled PA and lysoPA are therefore enzymati-cally synthesized from [c-32P]ATP and DG, and [c-32P]ATP and monoacyl-glycerol, respectively (11). [b-32P]DGPP is synthesized from PA and[c-32P]ATP using C. roseus PA kinase (12).
3.1.1. Synthesis and Purification of [32P]PA and [32P]lysoPA
1. Mix 10 lL of diacylglycerol or monoacylglycerol (25 mg/mL) and 1.8 lLof cardiolipin (5 mg/mL) in a polypropylene tube, and evaporate to drynessin a fume hood (for 10–20 min).
2. Add 40 lL of water and 20 lL of 5X DG kinase buffer. Suspend the lipidsthoroughly by vortexing for 5 s.
3. Add 10 lL of DG kinase (4 U/mL) and 30 lL of [c-32P]ATP (5 mCi/mL).Mix and incubate for 40 min at 30°C.
4. Stop the reaction by adding 0.5 mL of 0.1 N HCl. Add 1.0 mL of chloro-form and 1.5 mL of 1 M MgCl2.
5. Mix the solutions by gentle vortexing and centrifuge for 3 min at 100 g.
Lipid Phosphate Phosphatase Assays 211

6. Remove the aqueous phase by aspiration, and add 0.5 mL of 0.1 N HCl inmethanol and 1.5 mL of 1 M MgCl2.
7. Mix the solutions and centrifuge as before.8. Remove the aqueous phase and transfer the chloroform phase to a glass tube.9. Dry the lipids completely in the Speed-Vac (for about 30 min) and resus-
pend in 20 lL of anhydrous chloroform.10. Spot the chloroform solution on the oxalate-treated TLC plate. Rinse the
tube with 15 lL of chloroform and spot the samples again (see Note 3).11. Develop the plate in a TLC chamber until the solvent front reaches about
2–3 cm from the top of the plate (for about 2 h).12. Dry the TLC plates in the fume hood, wrap with plastic film, and expose to
a photographic film or a phosphorimager screen (for 1–5 min).13. Develop the film, or scan the image and print it to actual size.14. Align the unwrapped plate with the film or printed image on a light box and
mark the region of [32P]PA or [32P]lysoPA.15. Moisten the radioactive spot on the TLC plate by using a water sprayer and
place a sheet of weighing paper underneath the plate.16. Scrape the silica off the plate using a new razor blade and transfer the sil-
ica into a 15-mL polypropylene centrifuge tube.17. Add 1 mL of chloroform/methanol/1 N HCl (1:2:0.8, v/v) and mix by vig-
orous shaking.18. Centrifuge for 3 min at 100 g and transfer the supernatant to a new 15-mL
polypropylene centrifuge tube (see Note 4).19. Repeat steps 16–18, and combine the extractions.20. Add 0.5 mL of chloroform and 0.6 mL of 0.1 N HCl, and mix by vortexing.21. Centrifuge for 3 min at 100 g and remove the aqueous phase by aspiration.22. Add 1 mL of methanol and 1 mL of 0.1 N HCl, mix and centrifuge as before.23. Remove the aqueous phase and transfer the chloroform phase to a glass tube.24. Adjust the pH of the chloroform solution to neutral with 1 N NH4OH in
methanol (see Note 5) and dry completely in a Speed-Vac (for about 30 min).25. Resuspend the radioactive material in an appropriate volume of 1 mM PA
or 1 mM lysoPA in 10 mM Triton X-100 (see Note 6) to adjust the specificlabel to 10,000 cpm/nmol. If not for immediate use, store the radioactivesubstrates at �20°C.
3.1.2. Synthesis of [b-32P]DGPP
1. Add the following reagents in a polypropylene centrifuge tube:5X PA kinase buffer 20 lL3 mM PA in 2% Triton X-100 10 lL1 mM ATP 10 lL100 mM NaF 5 lLWater 15 lL
212 Han and Carman
[c-32P]ATP (5 mCi/mL) 30 llPA kinase (4 U/mL) 10 lL
2. Incubate the reaction mixture overnight at 30°C.3. Add 1.5 mL of chloroform/methanol (2:1, v/v) containing 1% concentrated
HCl, and 0.5 mL of water.4. Mix by gentle vortexing and centrifuge for 3 min at 100g.5. Remove the aqueous phase by aspiration, and add 0.5 mL of 0.1 N HCl in
methanol and 0.5 mL of water.6. Mix by vortexing and centrifuge as before.7. Remove the aqueous phase by aspiration and transfer the chloroform phase
to a glass tube.8. Follow steps 9–24 as described for synthesis of PA and lysoPA in Sub-
heading 3.1.1.9. Resuspend the dried radioactive DGPP in an appropriate volume of 1 mM
DGPP in 20 mM Triton X-100 to adjust the specific label of [b-32P] DGPPto 10,000 cpm/nmol. If not for immediate use, store the radioactive sub-strates at �20°C.
3.2. Assay
PA, lysoPA, and DGPP phosphatase activities are measured for 20 min at30°C by following the release of water-soluble [32P]Pi from chloroform-soluble[32P]PA, [32P]lysoPA, and [b-32P]DGPP (10,000 cpm/nmol) in a total volume of0.1 mL. The principle of all three assays is the same. They differ only in thesubstrates used and the assay conditions (e.g., pH) specific for each enzyme. Forexample, the yeast LPP1-encoded enzyme has different assay conditions de-pending on substrates (13). All assays are conducted in triplicate.
3.2.1. PA and LysoPA Phosphatase Assays
1. Add the following reagents in a polypropylene centrifuge tube:500 mM Tris-maleate, pH 7.0 10 lL100 mM b-mercaptoethanol 10 lLWater 60 lLEnzyme (1.0 mg/mL) (see Note 7) 10 lL
2. Add 10 lL of 1 mM [32P]PA (10,000 cpm/nmol) or lysoPA (10,000 cpm/nmol) in 10 mM Triton X-100 and incubate the reaction mixture for 20 minat 30°C. Add the radioactive substrate to other tubes in 15-s intervals.
3. Stop the reaction by adding 0.5 mL of 0.1 N HCl in methanol. Add 1 mLof chloroform and 1 mL of 1 M MgCl2 (see Note 8).
4. Mix by gentle vortexing and centrifuge for 3 min at 100 g.5. Transfer 0.5 mL of aqueous phase to a scintillation vial and add 4 mL of
scintillation fluid (see Note 9).6. Mix by shaking and measure the radioactivity.
Lipid Phosphate Phosphatase Assays 213
3.2.2. DGPP Phosphatase Assay
1. Add the following reagents to a polypropylene centrifuge tube:500 mM Citrate buffer, pH 5.0 10 lLWater 60 lL100 mM b-mercaptoethanol 10 lLEnzyme (1.0 mg/mL) 10 lL
2. Add 10 lL of 1 mM [b-32P]DGPP (10,000 cpm/nmol) in 20 mM TritonX-100 and incubate the reaction mixture for 20 min at 30°C. Add the radio-active substrate to other tubes in 15-s intervals.
3. Follow steps 3–6 described for PA phosphatase assay in Subheading 3.2.1.
3.3. Analysis of Data
The specific activity of an enzyme is expressed by U/mg protein. One unit ofPA, lyso PA, or DGPP phosphatase is defined as the amount of enzyme that cat-alyzes the formation of 1 nmol of product per min. Apply the following formulato calculate the specific activity:
Specific activity (nmol/min/mg protein) � {3.2 (correction factor) � cpm(corrected for background)} /{specific label (cpm/nmol) � time (min) � pro-tein volume (mL) � protein concentration (mg/mL)} (see Note 10).
4. Notes1. PA kinase is not commercially available. PA kinase can be purified from C.
roseus cells as described by Wissing and Behrbohm (12). If pure PA kinaseis not available, membrane preparations from red beet or broccoli can beused as alternative sources of PA kinase.
2. Anhydrous chloroform is prepared by adding solid sodium sulfate to asmall bottle of chloroform. Shake well and allow the sodium sulfate to set-tle. This reagent can be used for several weeks.
3. TLC plates are pretreated with potassium oxalate by soaking them forfew seconds in methanol/water (2:3) containing 1% potassium oxalate.The oxalate-treated TLC plates are dried at room temperature and thenincubated for at least 30 min at 100–115°C to remove the residual mois-ture. The hot TLC plates are cooled to room temperature in a dessicatorbefore use.
4. If phase separation occurs and silica is present in the aqueous phase, this iscaused by excess water present in the silica. Add a small volume ofmethanol, mix, and centrifuge again.
5. 1 N NH4OH in methanol is stored in the refrigerator and should be usedwithin 2 wk after its preparation.
6. PA in chloroform (100–200 lL) is transferred into a glass tube and driedcompletely in a Speed-Vac (for about 30 min). The dried PA is measured
214 Han and Carman
and resuspended in an appropriate volume of 10 mM Triton X-100 to thefinal concentration of 1 mM. If a chloroform solution of PA is out of thefreezer for longer than a few minutes, it is kept on ice. Before returning tothe freezer, the container is purged with nitrogen gas and sealed. To preventlight-induced oxidation, the container is wrapped with aluminum foil.
7. Crude enzyme preparations used in the assay are generally at a protein con-centration of 1.0 mg/mL for a final concentration of 0.1 mg/mL. Be surethat assays are linear with time and protein by varying reaction time andprotein concentration.
8. If many samples are routinely assayed, a bottle-top dispenser is efficient todeliver solutions (0.1 N HCl in methanol, chloroform, and 1 M MgCl2).During the incubation of reaction mixtures, prime the dispenser for properdelivery.
9. Make sure that the scintillation fluid is for aqueous samples.10. In calculating the specific activity, a correction factor of 3.2 is applied because
0.5 mL out of 1.6 mL (total sample volume) is used for the measurement.
AcknowledgmentWe wish to thank June Oshiro for helpful comments during the preparation
of this chapter.
References1. Brindley, D. N. and Waggoner, D. W. (1998) Mammalian lipid phosphate phos-
phohydrolases. J. Biol. Chem. 273, 24,281–24,284.2. Carman, G. M. (1997) Phosphatidate phosphatases and diacylglycerol pyrophos-
phate phosphatases in Saccharomyces cerevisiae and Escherichia coli. Biochim.Biophys. Acta 1348, 45–55.
3. Kanoh, H., Kai, M., and Wada, I. (1997) Phosphatidic acid phosphatase from mam-malian tissues: discovery of channel-like proteins with unexpected functions.Biochim. Biophys. Acta 1348, 56–62.
4. Stukey, J. and Carman, G. M. (1997) Identification of a novel phosphatase sequencemotif. Protein Sci. 6, 469–472.
5. Neuwald, A. F. (1997) An unexpected structural relationship between integralmembrane phosphatases and soluble haloperoxidases. Protein Sci. 6, 1764–1767.
6. Hemrika, W., Renirie, R., Dekker, H. L., et al. (1997) From phosphatases to vana-dium peroxidases: a similar architecture of the active site. Proc. Nat. Acad. Sci.USA 94, 2145–2149.
7. Jamal, Z., Martin, A., Gomez-Munoz, A., and Brindley, D. N. (1991) Plasma mem-brane fractions from rat liver contain a phosphatidate phosphohydrolase distinctfrom that in the endoplasmic reticulum and cytosol. J. Biol. Chem. 266, 2988–2996.
8. Brindley, D. N. (1984) Intracellular translocation of phosphatidate phosphohydro-lase and its possible role in the control of glycerolipid synthesis. Prog. Lipid Res.23, 115–133.
Lipid Phosphate Phosphatase Assays 215
9. Brindley, D. N., English, D., Pilquil, C., et al. (2002) Lipid phosphate phosphatasesregulate signal transduction through glycerolipids and sphingolipids. Biochim. Bio-phys. Acta. 1582, 33–44.
10. Sciorra, V. A. and Morris, A. J. (2002) Roles for lipid phosphate phosphatases inregulation of cellular signaling. Biochim. Biophys. Acta 1582, 45–51.
11. Walsh, J. P. and Bell, R. M. (1986) sn-1,2-diacylglycerol kinase of Escherichia coli.Structural and kinetic analysis of the lipid cofactor dependence. J. Biol. Chem. 261,15,062–15,069.
12. Wissing, J. B. and Behrbohm, H. (1993) Phosphatidate kinase, a novel enzyme inphospholipid metabolism. Purification, subcellular localization, and occurrence inthe plant kingdom. Plant Physiol. 102, 1243–1249.
13. Furneisen, J. M. and Carman, G. M. (2000) Enzymological properties of the LPP1-encoded lipid phosphatase from Saccharomyces cerevisiae. Biochim. Biophys. Acta1484, 71–82.
216 Han and Carman
15
Assaying Phosphoinositide Phosphatases
Gregory S. Taylor and Jack E. Dixon
SummaryThe roles of phosphoinositide second messengers as signaling molecules in a vast array of cel-
lular processes including cell growth, metabolism, vesicular transport, programmed cell death,and responses to extracellular signals are only beginning to be understood. The recent identifica-tion of novel phosphoinositide signaling molecules underscores the need for methodology withwhich to characterize the enzymes responsible for regulating cellular phosphoinositide levels.One of the ways in which cells control these lipids is through dephosphorylation by phospho-inositide phosphatases, which oppose and regulate the actions of phosphoinositide kinases. Wedescribe herein two rapid and simple assays for characterizing phosphoinositide phosphatasesthat can be used to provide a basis for understanding the activity and specificity of these enzymes.
Key Words: Phosphatase; phosphoinositide; phosphatidylinositol; Ymr1p; myotubularin;PTEN; PTP.
1. IntroductionThe role of phosphoinositides as second messengers in cellular signaling
processes has been intensively studied over the last approx 25 yr. Perhaps themost widely known example of phosphoinositide signaling is the receptor-mediated hydrolysis of phosphatidylinositol 4,5-bisphosphate (PI(4,5)P2) byphospholipase C to release diacylglycerol, an activator of protein kinase C(PKC), and inositol 1,4,5-trisphosphate, which causes the release of intracellu-lar Ca2�. The study of phosphoinositide signaling has recently enjoyed a dra-matic resurgence owing to the identification of novel inositol lipids that arecritical for a fantastic array of physiological functions that include such diverse
From: Methods in Molecular Biology, vol. 284:Signal Transduction Protocols
Edited by: R. C. Dickson © Humana Press Inc., Totowa, NJ
217
cellular processes as growth, development, apoptosis, membrane trafficking,and vesicular transport, as well as signaling in the cell nucleus (1–3). As mightbe expected for such important signaling molecules, abnormal phosphoinositideregulation has also been associated with several human diseases (4,5).
In order to understand the mechanisms by which different phosphoinositidesare able to carry out such a wide variety of signaling tasks, it is necessary toidentify how these lipids are regulated both spatially and temporally. The lev-els of cellular phosphoinositides can be controlled by at least three types of en-zymes including phospholipases, phosphoinositide kinases, and phosphoinosi-tide phosphatases. Of these three groups of inositol lipid-modifying enzymes,the phospholipases and phosphoinositide kinases have historically enjoyed themore intensive scrutiny (2,7). However, recent attention has been focused onthe roles of phosphoinositide phosphatases as regulators of signaling lipidsowing to their involvement in human diseases. This interest has been fueled inpart by the discovery that PTEN and myotubularin family protein tyrosine phos-phatase-like enzymes actually utilize inositol lipids rather than phosphoproteinsas their physiological substrates (8–10). In addition, Sac1 domain-containinglipid phosphatase and inositol polyphosphate 5�-phosphatase families have alsobeen shown to play essential roles in regulating phosphoinositide-dependentcellular processes (11,12). These examples provide compelling evidence that acomplete understanding of inositol lipid-signaling pathways will require furtherinsight into not only the mechanisms by which phospholipases and phospho-inositide kinases are regulated, but also by which the lipid phosphatases con-tribute to the overall regulation of cellular phosphoinositide levels. To this end,we describe herein methods for carrying out the in vitro assay of phospho-inositide phosphatase activity. We have found these approaches useful not onlyfor quantitating the specific activities of these enzymes, but also for determin-ing their substrate preferences among the different phosphoinositide species.
2. Materials2.1. Fluorescent Phosphoinositide Substrate Assay
1. Fluorescent di-C6-NBD6 synthetic phosphoinositide substrates (PI, PI(3)P,PI(4)P, PI(5)P, PI(3,4)P2, PI(3,5)P2, PI(4,5)P2, and PI(3,4,5)P3 at a concen-tration of 1 lg/lL in dH2O) (Echelon Biosciences, Salt Lake City, UT).
2. Fluorescent substrate assay buffer composed of 50 mM ammonium acetateand/or 50 mM ammonium carbonate buffer containing 0.1% (v:v) 2-mer-captoethanol (Sigma Chemicals, St. Louis, MO).
3. 1.2% Potassium oxalate in dH2O/MeOH (6:4) (Sigma).4. Chloroform, methanol, acetone, glacial acetic acid, 2-propanol (Fisher Sci-
entific, Pittsburgh, PA).
218 Taylor and Dixon
5. Speed-Vac concentrator.6. Dry bath incubator.7. Glass-thin layer chromatography (TLC) tank.8. Glass-backed Whatman silica gel TLC plates; 60Å, 250 lm thickness,
20 cm � 20 cm (Fisher Scientific).9. DNA gel UV illumination/camera system.
2.2. Malachite Green-Based Assay for Inorganic Phosphate
1. Di-C16 synthetic phosphoinositide substrates (PI, PI(3)P, PI(4)P, PI(5)P,PI(3,4)P2, PI(3,5)P2, PI(4,5)P2, and PI(3,4,5)P3 at a concentration of 1 mMin CHCl3/MeOH (9:1) (single phosphate group), or CHCl3/MeOH/dH2O(5:5:1) (two or more phosphate groups) (Echelon Biosciences, Inc.).
2. Chloroform, methanol (Fisher Scientific).3. Dioleoylphosphatidylserine at a concentration of 10 mM in CHCl3/MeOH
(9:1) (Sigma Chemicals).4. Malachite green assay buffer: 100 mM sodium acetate, 50 mM bis-Tris,
50 mM Tris (pH range from 5.0–8.0) containing 10 mM dithiothreitol (DTT).5. 20 mM sodium orthovanadate in dH2O.6. Malachite green reagent (prepared as described in Subheading 3.2.1.)
(Sigma Chemicals).7. KH2PO4 inorganic phosphate standard (40 lM in dH2O).8. Speed-Vac concentrator.9. Dry bath incubator.
10. Refrigerated microfuge.11. Spectrophotometer with microcuvet (50 lL volume).12. Probe sonicator: 130 watt ultrasonic cell disruptor with 13 mm probe tip
(PGC Scientifics, Frederick, MD).
3. Methods3.1. Fluorescent Phosphoinositide Substrate Assay
When testing a putative phosphoinositide phosphatase for lipid phosphataseactivity, we have found it useful to conduct the preliminary assays with fluor-escent phosphoinositide substrates (13). This procedure is advantageous for aninitial enzymatic characterization because it allows the detection of even low-level lipid phosphatase activity in a manner that is relatively insensitive to re-action conditions. This occurs primarily because many lipid phosphatases pos-sess a high degree of substrate specificity such that the reaction can be allowedto proceed to a point where, even under nonoptimal conditions, sufficient sub-strate is hydrolyzed to allow visualization of the reaction product. In addition,because this technique employs TLC to follow the lipid moiety of the substrate
Phosphoinositide Phosphatase Assays 219
rather than inorganic phosphate, it is useful for assessing not only the generalsubstrate specificity of a lipid phosphatase (i.e., PIP vs PIP2 vs PIP3), but alsofor determining the specific phosphate group(s) on the inositol ring that are hy-drolyzed when using multiply-phosphorylated phosphoinositide substrates.This procedure is carried out as follows:
1. Prepare a silica-gel TLC plate by completely immersing it in 1.2% potas-sium oxalate solution. Place the plate in a fume hood until visibly dry, fol-lowed by drying for 1 h in a baking oven (80–100°C).
2. In separate 0.5-mL microfuge tubes, combine 1 lL (1 lg total) of eachphosphoinositide substrate [PI(3)P, PI(4)P, PI(5)P, PI(3,4)P2, PI(3,5)P2,PI(4,5)P2, or PI(3,4,5)P3] with 17 lL fluorescent substrate assay buffer(usually from pH 5.0–8.0) and prewarm the samples for 10 min in a drybath (usually from 30 to 37°C).
3. Initiate the reactions by adding 2 lL of enzyme (usually from 5 ng to 5 lgof enzyme per sample) and incubate for 30–60 min.
4. Terminate the reactions by adding 100 lL acetone and dry the samplesunder vacuum in a Speed-Vac concentrator (approx 15–20 min using“medium” heat setting).
5. While the samples are drying, prepare the TLC tank by rinsing it twice withapprox 100 mL of organic mobile phase (chloroform/methanol/acetone/glacial acetic acid/water, 75:50:20:20:20 v/v) as described by Okada et al.(14). After rinsing, fill the tank to approx 1 cm deep with mobile phase(about 150 mL).
6. Dissolve the reaction products in 20 lL of spotting solution (chloroform/2-propanol/methanol/glacial acetic acid, 5:5:5:2 v/v) and adsorb (spot)each sample onto the prepared TLC plate. By spotting each sample acrossan area approx 0.5–1 cm wide at the origin, “bands” that are easier to vi-sualize when compared to “spots” will be obtained. Be sure to also spot asample corresponding to approx 1 lg of PI as a standard. Allow the spot-ted samples to dry completely (5–10 min in a fume hood).
7. Develop the thin layer plate in mobile phase until the solvent front has trav-eled approx three-fourths of the distance from the origin to the top of theplate. Remove the plate and allow it to dry completely in a fume hood.
8. Visualize fluorescent phosphoinositides by placing the thin layer plate faceup on a DNA gel ultraviolet (UV) light box. Photographs can be taken witheither a film or digital camera.
To illustrate the procedure outlined previously, we have tested a bacterial re-combinant budding yeast myotubularin (Ymr1p) His-tagged fusion proteinagainst fluorescent lipid substrates. We have previously reported that recombi-nant Ymr1p can effectively dephosphorylate PI(3)P (15). However, recent re-
220 Taylor and Dixon
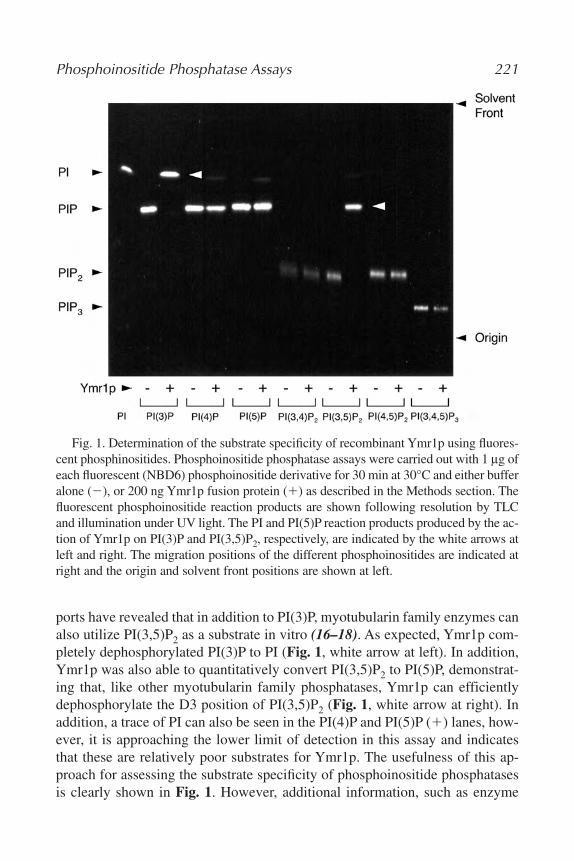
ports have revealed that in addition to PI(3)P, myotubularin family enzymes canalso utilize PI(3,5)P2 as a substrate in vitro (16–18). As expected, Ymr1p com-pletely dephosphorylated PI(3)P to PI (Fig. 1, white arrow at left). In addition,Ymr1p was also able to quantitatively convert PI(3,5)P2 to PI(5)P, demonstrat-ing that, like other myotubularin family phosphatases, Ymr1p can efficientlydephosphorylate the D3 position of PI(3,5)P2 (Fig. 1, white arrow at right). Inaddition, a trace of PI can also be seen in the PI(4)P and PI(5)P (�) lanes, how-ever, it is approaching the lower limit of detection in this assay and indicatesthat these are relatively poor substrates for Ymr1p. The usefulness of this ap-proach for assessing the substrate specificity of phosphoinositide phosphatasesis clearly shown in Fig. 1. However, additional information, such as enzyme
Phosphoinositide Phosphatase Assays 221
Fig. 1. Determination of the substrate specificity of recombinant Ymr1p using fluores-cent phosphinositides. Phosphoinositide phosphatase assays were carried out with 1 lg ofeach fluorescent (NBD6) phosphoinositide derivative for 30 min at 30°C and either bufferalone (�), or 200 ng Ymr1p fusion protein (�) as described in the Methods section. Thefluorescent phosphoinositide reaction products are shown following resolution by TLCand illumination under UV light. The PI and PI(5)P reaction products produced by the ac-tion of Ymr1p on PI(3)P and PI(3,5)P2, respectively, are indicated by the white arrows atleft and right. The migration positions of the different phosphoinositides are indicated atright and the origin and solvent front positions are shown at left.
specific activity or, in the case of Ymr1p, relative activity between two differ-ent inositol lipid substrates, is often desirable. To this end, we will describe nexta malachite green-based assay for inorganic phosphate that we have adapted foruse with phosphoinositide phosphatases.
3.2. Malachite Green-Based Assay for Inorganic Phosphate
Although the fluorescent phosphoinositide phosphatase assay described ear-lier is a useful tool for dissecting the specificity of lipid phosphatases, the pri-mary drawback of this approach is that it is generally a qualitative rather than aquantitative assay (13). To obtain a more quantitative assessment of lipid phos-phatase activity, we routinely employ a malachite green-based assay for inor-ganic phosphate as a complement to the fluorescent phosphoinositide assay. Wehave adapted this method from the procedure of Harder et al. specifically foruse with phosphoinositide phosphatases (19,20). In this method, the enzyme-catalyzed release of inorganic phosphate from synthetic phosphoinositide sub-strates is quantitated by comparison to a standard curve of inorganic phosphateusing a colorimetric assay. This procedure is carried out as follows:
1. Prepare the malachite green reagent by adding one volume of 4.2% (w:v)ammonium molybdate in 4 N HCl to 3 volumes of 0.045% (w:v) aqueousmalachite-green solution. Stir the solution for approx 30 min prior to filtra-tion through a 0.22 lm filter. This solution is stable for several months at4°C. Just before use, add Tween 20 to a final concentration of 0.01% (v:v).
2. In separate 1.5-mL microfuge tubes, combine an aliquot of each 1 mMphosphoinositide substrate (PI(3)P, PI(4)P, PI(5)P, PI(3,4)P2, PI(3,5)P2,PI(4,5)P2, or PI(3,4,5)P3) organic stock solution with a fivefold molar ex-cess of dioleoylphosphatidylserine (PS). Be sure to prepare an excess ofsubstrate for the number of samples to be tested. For example, to carry out10 � 20 lL reactions at a final concentration (apparent) of 100 lM phos-phoinositide and 500 lM PS carrier lipid, combine enough of each lipid or-ganic stock solution for 12–15 samples (i.e., 24–30 lL of 1 mM phospho-inositide, and 12–15 lL of 10 mM PS). This prevents running out ofsubstrate preparation for the last one or two samples to be tested. Dry thelipid mixtures in a Speed-Vac concentrator (approx 15–20 min using“medium” heat setting).
3. Prepare the lipid suspension by adding malachite-green assay buffer(18 mL per each sample to be tested) and sonication in a water bath with aprobe-type sonicator. This is carried out by immersing the tip of the soni-cator probe just under the surface in a small (approx 400-mL) glass beaker.With the sonicator running at maximum output, hold the microfuge tube bythe hinge and immerse the buffer/dried lipid mixture in the water bath di-
222 Taylor and Dixon
rectly under the probe tip for 30 s. Be sure to move the tube around under-neath the probe tip to obtain complete dispersal of the lipid mixture. Aftersonication, the suspension should have a uniform, pearlescent/translucentappearance. If large particles or aggregates are visible, continue the soni-cation until complete dispersal of the lipid suspension is achieved. After thesonication is complete, transfer 18 lL of substrate preparation to a 0.5-mLmicrofuge tube for each sample to be tested and prewarm the samples for10 min in a dry bath (usually at 30 or 37°C).
4. Initiate the reactions by the adding 2 lL of enzyme (usually from 1–500 ngof enzyme) and incubate for 2–30 min.
5. Terminate the reactions by adding an equal volume (20 lL) of ice-cold20 mM sodium orthovanadate followed by centrifugation at 18,000 � g for10 min at 4°C. Alternatively, the reactions can be terminated by the addi-tion of 20 lL of 100 mM n-ethylmaleimide. The choice of terminationreagent should be based on which compound is the most efficient inhibitorof your enzyme. The purpose of the centrifugation step is to sediment thelipid aggregates, which cause light-scatter and interfere with subsequentspectrophotometric measurements.
6. Remove 25 lL of the supernatant and combine it with 50 lL of malachite-green reagent (containing 0.01% Tween 20) in a new microfuge tube. Mea-sure the absorbance of the samples at 620 nm.
7. Create a standard curve of inorganic phosphate using the 40 lM KH2PO4stock solution, which is prepared with KH2PO4 that has been thoroughlydried in a vacuum oven to remove all traces of moisture. The standard curveconsists of 25 lL samples of inorganic phosphate (0, 100, 200, 400, 600,800, and 1000 pmol per 25 lL sample) combined with 50 lL malachite-green reagent as carried out for the lipid-phosphatase reactions. Typically,these samples are prepared in triplicate, and the mean absorbance at 620 nmplotted versus pmol inorganic phosphate per 25 lL sample as shown inFig. 2. A line equation can be calculated from most graphing software ap-plications and is used to determine the total amount of phosphate releasedin each lipid phosphatase reaction supernatant. The total phosphate liber-ated in each sample will be 1.6 times that calculated from the standardcurve because the total sample volume after termination of the reactions is40 lL (i.e., 25 lL � 1.6 = 40 lL).
A typical inorganic phosphate standard curve obtained using this procedureis shown in Fig. 2. For this standard curve, we have used a fixed total amountof inorganic phosphate in a volume of 25 lL because this is identical to thesample size removed and measured from the actual lipid phosphatase reac-tions. Alternatively, a concentration-based standard curve can also be used. As
Phosphoinositide Phosphatase Assays 223
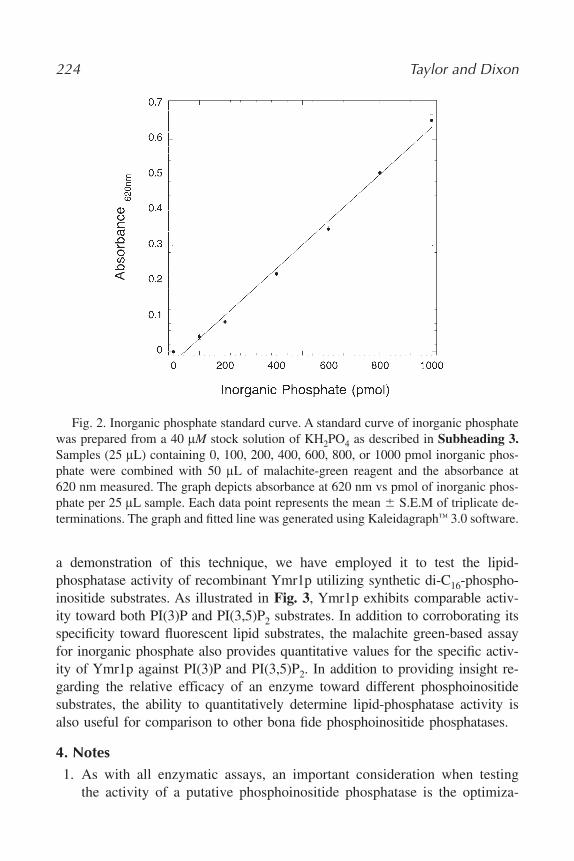
a demonstration of this technique, we have employed it to test the lipid-phosphatase activity of recombinant Ymr1p utilizing synthetic di-C16-phospho-inositide substrates. As illustrated in Fig. 3, Ymr1p exhibits comparable activ-ity toward both PI(3)P and PI(3,5)P2 substrates. In addition to corroborating itsspecificity toward fluorescent lipid substrates, the malachite green-based assayfor inorganic phosphate also provides quantitative values for the specific activ-ity of Ymr1p against PI(3)P and PI(3,5)P2. In addition to providing insight re-garding the relative efficacy of an enzyme toward different phosphoinositidesubstrates, the ability to quantitatively determine lipid-phosphatase activity isalso useful for comparison to other bona fide phosphoinositide phosphatases.
4. Notes1. As with all enzymatic assays, an important consideration when testing
the activity of a putative phosphoinositide phosphatase is the optimiza-
224 Taylor and Dixon
Fig. 2. Inorganic phosphate standard curve. A standard curve of inorganic phosphatewas prepared from a 40 lM stock solution of KH2PO4 as described in Subheading 3.Samples (25 lL) containing 0, 100, 200, 400, 600, 800, or 1000 pmol inorganic phos-phate were combined with 50 lL of malachite-green reagent and the absorbance at620 nm measured. The graph depicts absorbance at 620 nm vs pmol of inorganic phos-phate per 25 lL sample. Each data point represents the mean � S.E.M of triplicate de-terminations. The graph and fitted line was generated using Kaleidagraph™ 3.0 software.
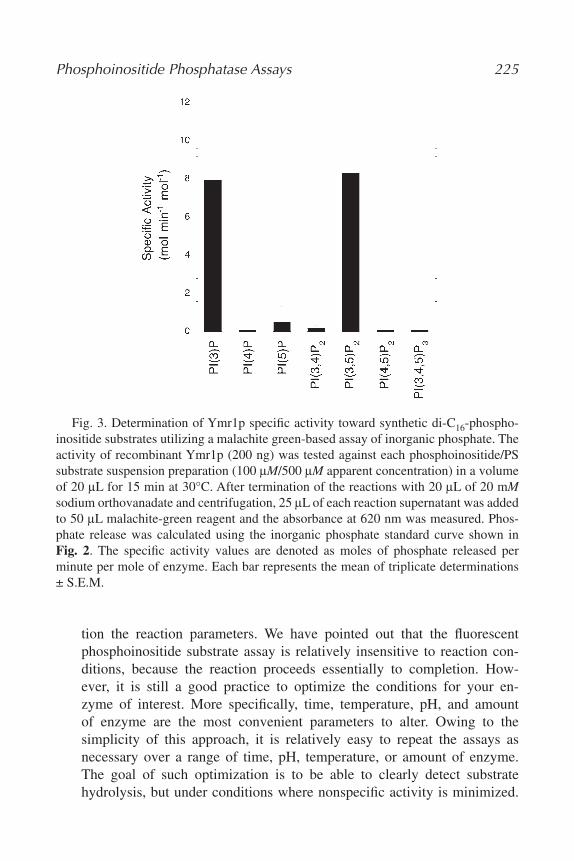
tion the reaction parameters. We have pointed out that the fluorescentphosphoinositide substrate assay is relatively insensitive to reaction con-ditions, because the reaction proceeds essentially to completion. How-ever, it is still a good practice to optimize the conditions for your en-zyme of interest. More specifically, time, temperature, pH, and amountof enzyme are the most convenient parameters to alter. Owing to thesimplicity of this approach, it is relatively easy to repeat the assays asnecessary over a range of time, pH, temperature, or amount of enzyme.The goal of such optimization is to be able to clearly detect substratehydrolysis, but under conditions where nonspecific activity is minimized.
Phosphoinositide Phosphatase Assays 225
Fig. 3. Determination of Ymr1p specific activity toward synthetic di-C16-phospho-inositide substrates utilizing a malachite green-based assay of inorganic phosphate. Theactivity of recombinant Ymr1p (200 ng) was tested against each phosphoinositide/PSsubstrate suspension preparation (100 lM/500 lM apparent concentration) in a volumeof 20 lL for 15 min at 30°C. After termination of the reactions with 20 lL of 20 mMsodium orthovanadate and centrifugation, 25 lL of each reaction supernatant was addedto 50 lL malachite-green reagent and the absorbance at 620 nm was measured. Phos-phate release was calculated using the inorganic phosphate standard curve shown inFig. 2. The specific activity values are denoted as moles of phosphate released perminute per mole of enzyme. Each bar represents the mean of triplicate determinations± S.E.M.
In the case of the malachite-green assay, it is critical to limit the sub-strate dephosphorylation to �10% of the total substrate present in thereaction in order to maintain the reaction kinetics.
2. Another consideration when carrying out lipid-phosphatase assays is thespecific form in which the substrate is presented. The fluorescent sub-strates are completely water-soluble, regardless of acyl-chain length orfluorophore, which may restrict their use in micelle or vesicle prepara-tions. Moreover, the shorter acyl chain nonfluorescent phosphoinositidederivatives (di-C4 and di-C8) are also water soluble, which allows theiruse in determining kinetic parameters. We generally use the di-C6-NBD6derivatives in the fluorescent phosphoinositide substrate assay, and bothdi-C8 and di-C16 nonfluorescent derivatives in the malachite green-basedassay. It is most important to test different acyl chain-length derivativeswhen using the nonfluorescent phosphoinositides, because we have notedthat there can be differences in specificity between them. For example,myotubularins do not efficiently dephosphorylate di-C8-PI(3,5)P2 underthe conditions described here, however, they actually exhibit a slight pref-erence for this substrate over PI(3)P when the di-C16 forms are used.This is most likely because of an effect of the acyl-chain length on theconformation of the substrate head group within the lipid-suspensionpreparations. It is also worth mentioning that there are many differentmethods for the preparation of lipid suspensions that vary parameterssuch as lipid content (i.e., PC, PE, PI, cholesterol, and sphingolipids)and specific ways in which the actual suspension is physically carriedout. Obviously, such parameters may have a profound effect on the ac-tivity of a lipid-modifying enzyme and many of these methods for prepar-ing lipid suspensions are perfectly compatible with the malachite green-based asssay for inorganic phosphate release described here.
AcknowledgmentsThis work has been supported by grants from the National Institutes of
Health and the Walther Cancer Institute. G.T. is supported by a grant from theMuscular Dystrophy Association (MDA).
References1. Simonsen, A., Wurmser, A. E., Emr, S. D., and Stenmark, H. (2001) The role of
phosphoinositides in membrane transport. Curr. Opin. Cell Biol. 13, 485–492.2. Cantley, L. C. (2002) The phosphoinositide 3-kinase pathway. Science 296, 1655–1657.3. Toker, A. (2002) Phosphoinositides and signal transduction. Cell Mol. Life Sci. 59,
761–779.
226 Taylor and Dixon
4. Martelli, A. M., Tabellini, G., Borgatti, P., (2003) Nuclear lipids: new functions forold molecules? J. Cell Biochem. 88, 455–461.
5. Irvine, R. F. (2003) Nuclear lipid signalling. Nature Rev. Mol. Cell Biol. 4, 1–12.6. Pendaries, C., Tronchere, H., Plantavid, M., and Payrastre, B. (2003) Phospho-
inositide signaling disorders in human diseases. FEBS Lett. 546, 25–31.7. Kanaho, Y. and Suzuki, T. (2002) Phosphoinositide kinases as enzymes that pro-
duce versatile signaling lipids, phosphoinositides. J. Biochem. 131, 503–509.8. Maehama, T., Taylor, G. S., and Dixon, J. E. (2001) PTEN and myotubularin: novel
phosphoinositide phosphatases. Annu. Rev. Biochem. 70, 247–279.9. Nandurkar, H. H. and Huysmans, R. (2002) The myotubularin family: novel phos-
phoinositide regulators. IUBMB Life 53, 37–43.10. Wishart, M. J. and Dixon, J. E. (2002) PTEN and myotubularin phosphatases: from
3-phosphoinositide dephosphorylation to disease. Trends Cell Biol. 12, 579–585.11. Hughes, W. E., Cooke, F. T., and Parker, P. J. (2000) Sac phosphatase domain pro-
teins. Biochem. J. 350, 337–352.12. Whisstock, J. C., Wiradjaja, F., Waters, J. E., and Gurung, R. (2002) The structure
and function of catalytic domains within the inositol polyphosphate 5-phos-phatases. IUBMB Life 53, 15–23.
13. Taylor, G. S. and Dixon, J. E. (2001) An assay for phosphoinositide phosphatasesutilizing fluorescent substrates. Anal. Biochem. 295, 122–126.
14. Okada, T., Hazeki, O., Ui, M., and Katada, T. (1996) Synergistic activation of Pt-dIns 3-kinase by tyrosine-phosphorylated peptide and beta gamma-subunits ofGTP-binding proteins. Biochem. J. 317, 475–480.
15. Taylor, G. S., Maehama, T., and Dixon, J. E. (2000) Myotubularin, a protein tyro-sine phosphatase mutated in myotubular myopathy, dephosphorylates the lipid sec-ond messenger, phosphatidylinositol 3-phosphate. Proc. Natl. Acad. Sci. USA 97,8910–8915.
16. Walker, D. M., Urbe, S., Dove, S. K., et al. (2001) Characterization of MTMR3, aninositol lipid 3-phosphatase with novel substrate specificity. Curr. Biol. 11,1600–1605.
17. Berger, P., Bonneick, S., Willi, S., et al. (2002) Loss of phosphatase activity in my-otubularin-related protein 2 is associated with Charcot-Marie-Tooth disease type4B1. Hum. Mol. Genet. 11, 1569–1579.
18. Schaletzky, J., Dove, S. K., Short, B., et al. (2003) Phosphatidylinositol-5-phos-phate activation and conserved substrate specificity of the myotubularin phos-phatidylinositol 3-phosphatases. Curr. Biol. 13, 504–509.
19. Maehama, T., Taylor, G. S., Slama, J. T., and Dixon, J. E. (2000) A sensitive assayfor phosphoinositide phosphatases. Anal. Biochem. 279, 248–250.
20. Harder, K. W., Owen, P., Wong, L. K. H., et al. (1994) Characterization and kineticanalysis of the intracellular domain of human protein tyrosine phosphatase b(HPTPb) using synthetic phosphopeptides. Biochem. J. 298, 395–401.
Phosphoinositide Phosphatase Assays 227
16
Assaying Phospholipase A2 Activity
Christina C. Leslie and Michael H. Gelb
SummaryMammalian cells contain many structurally and functionally diverse phospholipases A2
(PLA2) that catalyze the hydrolysis of sn-2 fatty acid from membrane phospholipid. Assays aredescribed for measuring the activity of Group IVA cytosolic PLA2a (cPLAa) and for secretedPLA2s (sPLA2) that are suitable for purified enzymes and for measuring activity in crude celllysates and culture medium. The assay for cPLA2a involves measuring the calcium-dependentrelease of radiolabeled sn-2 arachidonic acid from small unilamellar vesicles of phosphatidyl-choline. Methods are described for distinguishing cPLA2a activity in cell lysates from otherPLA2s. sPLA2 activity is monitored using a fluorimetric assay that measures the continuouscalcium-dependent formation of albumin-bound pyrene fatty acid from the sn-2 position ofphosphatidylglycerol.
Key Words: Phospholipase A2; phospholipid; fatty acid; arachidonic acid; calcium; smallunilamellar vesicles; phosphatidylcholine; phosphatidylglycerol; liposome; pyrene fatty acid.
1. Introduction
Mammalian cells contain multiple structurally diverse forms of phospholi-pases A2 (PLA2) that catalyze the hydrolysis of the sn-2 fatty acid from mem-brane phospholipid. PLA2s function in dietary lipid breakdown, in phospholipidacyl-chain remodeling, in lipid-mediator production and in host defense againstmicroorganisms. There are at least 15 genes in mammals encoding PLA2 en-zymes that comprise three main types: the secreted PLA2s (sPLA2), the GroupIV cytosolic PLA2s (cPLA2), and the Group VI calcium-independent PLA2s
From: Methods in Molecular Biology, vol. 284:Signal Transduction Protocols
Edited by: R. C. Dickson © Humana Press Inc., Totowa, NJ
229
(iPLA2) (1–3). All cells contain members of each of these types of enzymes,suggesting that they play distinct functional roles. This chapter describes assaysfor measuring the activity of the well-characterized, ubiquitous cPLA2a (groupIVA) that mediates agonist-induced arachidonic-acid release (4), and for meas-uring the activity of sPLA2s that are secreted into cell culture medium. The as-says can be used for purified enzymes or for measuring their activity in crude cellfractions. The cPLA2a assay involves measuring the hydrolysis of radiolabeledarachidonic acid from the sn-2 position of phosphatidylcholine, in the form ofsmall unilamellar vesicles (5). Procedures are described for processing the cells,preparing the substrate, incubating cell fractions with substrate, terminating theenzymatic reaction, and separating product. Approaches for distinguishingcPLA2a activity from other PLA2 enzymes in cell lysates are outlined. The assayfor measuring sPLA2 activity involves monitoring the calcium-dependent for-mation of albumin-bound pyrene fatty acid from the sn-2 position of phos-phatidylglycerol. This continuous fluorimetric assay is carried out in a cuvet or amicrotiter plate.
2. Materials2.1. cPLA2a Assay
1. Homogenization buffer: 10 mM HEPES, pH, 7.4, 0.34 M sucrose, 10%glycerol, 1 mM EGTA, 1 mM phenylmethylsulfonylchloride, 1 lg/mL leu-peptin, 10 lg/mL aprotinin.
2. Dithiothreitol (DTT).3. 1-Palmitoyl-2[1-14C]arachidonyl-phosphatidylcholine (Perkin Elmer Life
Sciences).4. 1-Palmitoyl-2-arachidonyl-phosphatidylcholine (Avanti Polar Lipids).5. CaCl2.6. Dioleoylglycerol.7. Sodium chloride.8. Bovine serum albumin (BSA; fatty acid free).9. Dole reagent: 2-propanol/heptane/0.5 M H2SO4, 20/5/1 (v/v/v).
10. Silica gel LC-SI solid-phase extraction (SPE) tubes (Sulpelco, Belle-fonte, PA).
11. Visiprep soldi-phase extraction manifold (Supelco).12. Oleic acid.13. Probe sonicator with microprobe tip (Braun Instruments).14. Arachidonyl trifluoromethylketone (Caymen Chemicals).15. Bromoenol lactone (Caymen Chemicals).16. Heptane.
230 Leslie and Gelb
2.2. sPLA2 Assay
1. BSA (fatty acid free, Sigma).2. CaCl2.3. EGTA.4. 1-Hexadecanoyl-2-(1-pyrenedecanoyl)-sn-glycero-3-phosphoglycerol am-
monium salt (Molecular Probes, Eugene, OR).5. Isopropanol.6. 1-Pyrenedecanoic acid (Molecular Probes).7. Sodium chloride.8. Toluene.9. Tris.
3. Methods3.1. Assay for Measuring cPLA2a Activity
cPLA2a is present in most cells at sufficient amounts to detect its enzymaticactivity in cell lysates. cPLA2a can also be over-expressed in mammalian cellsor in insect cells using baculovirus (6,7). The vesicle assay described here issuitable for measuring activity of the purified enzyme or for measuring activityof cPLA2a in crude cell lysates.
3.1.1. Preparation of Cell Lysates
1. Wash cells twice with homogenization buffer (see Note 1).2. Resuspend the cells in a small amount of homogenization buffer that will re-
sult in a protein concentration of approx 2 lg/lL after homogenization.3. Sonicate the cell suspension on ice using a microprobe tip for 10 s, two to
four times. Monitor the extent of cell disruption, which is variable dependingon the cell type, after each 10-s burst of sonication by light microscopy.
4. Centrifuge the lysate at 100,000 g for 1 h at 4°C to separate the soluble (cy-tosolic) and particulate (membrane) fractions using a Beckman TL100tabletop ultracentrifuge. Transfer the supernatant to another tube and main-tain at 0°C. Gently rinse the pellet and sides of the tube with homogeniza-tion buffer to remove the small amount of remaining cytosol (discard therinse), and then resuspend the pellet in a small volume of homogenizationbuffer (see Note 2).
5. Determine the protein concentration in the cytosol and membrane fractions,and then add DTT to a final concentration of 1 mM to protect cPLA2 fromoxidative inactivation (see Note 3).
Assaying Phospholipase A2 Activity 231
3.1.2. Concentration of Assay Components
The final concentration of components in the assay (50 lL final volume/reaction) are as follows.
1. 30 lM 1-palmitoyl-2-[1-14C]arachidonyl-phosphatidylcholine (100,000 dpm/reaction) (see Notes 4 and 5).
2. 9 lM dioleoylglycerol (see Note 6).3. 150 mM NaCl (see Note 6).4. 1 mg/mL BSA (see Note 6).5. 50 mM HEPES, pH 7.4.6. 1 mM CaCl2 (see Note 7).
3.1.3. Preparation of Substrate
1. Prepare a concentrated stock of substrate by mixing in a glass tube (12 mm� 75 mm) 1-palmitoyl-2[1-14C]arachidonyl-phosphatidylcholine and unla-beled 1-palmitoyl-2-arachidonyl-phosphatidylcholine to achieve a ratio of100,000 dpm/1.5 nmol. Mix enough for several reactions and then add di-oleoylglycerol at 30 mol% (30% of lipid is dioleoylglycerol and 70% isphosphotidylcholine) of the phosphatidylcholine concentration (this resultsin 0.45 nmol dioleolyglycerol/reaction).
2. Evaporate the solvents from the lipid mixture under a stream of nitrogen.Add 50 mM HEPES buffer, pH 7.4, to make a concentrated substrate solu-tion that is 5–10 times the final assay concentration.
3. Sonicate the substrate mixture for 4 s on ice using a microprobe (Braun In-struments) to form small unilamellar vesicles. Count an aliquot of the so-lution after sonication to determine the efficiency of liposome formation.Usually �90% of the radioactivity is solubilized. Prepare liposomes fresh(if they are not used immediately, then store on ice for no more than 4 h).
3.1.4. Incubation Conditions
1. Aliquot the substrate mixture into assay tubes (round bottom disposableglass screw cap tubes, 13 mm � 100 mm).
2. Add the NaCl, albumin and calcium.3. Start the reaction by adding the cytosol or membrane fractions (approx
20 lg protein or more depending on the amount of cPLA2a present in thecells). The final reaction volume after adding all the components is 50 lL.Incubate at 37°C with shaking for five min.
4. Terminate the reaction by adding 2.5 mL of Dole reagent (2-propanol: hep-tane: 0.5 M H2SO4, 20:5:1, v/v/v) to each tube. After each reaction is termi-nated with Dole reagent, add 1.5 mL heptane and 1 mL water to each tube.
232 Leslie and Gelb
5. Add unlabeled oleic acid (20 lg of a 2 mg/mL stock in chloroform) to eachtube to aid in the extraction efficiency.
6. Vortex each tube for approx 20 s and then centrifuge the tubes at 1000 g atroom temperature for 5 min to cleanly separate the two phases. The radio-labeled fatty acid product is extracted into the heptane phase. The reactionsdo not need to be immediately processed at this point but can be refriger-ated and processed the next day.
7. Remove the upper heptane phase with a pasteur pipet being careful not toremove any of the lower phase. Pass the heptane phase through an SPE tubeusing a Visiprep SPE manifold. Elute the radiolabeled fatty acid with2.5 mL of chloroform and collect the eluent in scintillation vials. Contam-inating radiolabeled phospholipid substrate in the heptane phase is noteluted by chloroform and is retained on the silica gel.
8. Dry the eluent thoroughly under a stream of nitrogen to remove chloroform,which is a strong quenching agent. Add 0.5 mL heptane, vortex the vials,and let the vials stand at room temperature for about 10 min to solubilizethe dried radiolabeled fatty acid. Add scintillation fluid, vortex briefly, andcount by liquid-scintillation spectrometry.
9. Control reactions that contain substrate but no enzyme are similarly incu-bated and processed, and the dpms are subtracted from the experimental re-sults.
3.2. Methods for Distinquishing cPLA2a Activity From Other PLA2 Enzymes
3.2.1. Group VI Calcium-Independent PLA2s (iPLA2)
iPLA2s are widely distributed in tissues and are found in both the soluble andmembrane fractions of cells (8). They are commonly-assayed using micelles ofphospholipid mixed with Triton X-100, however, the vesicle assay described formeasuring cPLA2a activity will also detect iPLA2s (9). To determine if some ofthe activity measured using the vesicle assay in crude cell fractions is owing toiPLA2, omit calcium from the assay and include excess EGTA (1 mM). cPLA2aand sPLA2s are inactive in the absence of calcium and remaining activity islikely owing to iPLA2. Additionally, bromoenol lactone (Cayman Chemical) se-lectively inhibits iPLA2s in the 0.5–5.0 lM range without affecting cPLA2a ac-tivity (10,11) (see Note 8).
3.2.2. Secreted PLA2 Enzymes
There are 10 distinct mammalian sPLA2 enzymes that are synthesized andsecreted by cells or stored in intracellular granules of secretory cells (2). Anassay for measuring the activity of purified sPLA2, or sPLA2 secreted into
Assaying Phospholipase A2 Activity 233
cell-culture media, is described in Subheading 3.3. The vesicle assay describedfor measuring cPLA2a activity in crude cell fractions is not optimal for meas-uring sPLA2 enzymes, especially if the vesicle assay is carried out in the pres-ence of 1–2 lM free calcium with phosphatidylcholine substrate (see Note 9),which is optimal for cPLA2a but suboptimal for sPLA2 enzymes. Many sPLA2s(Groups IB, IIA, IID, IIE, IIF) preferentially hydrolyze anionic phospholipids,however, Group V and X sPLA2s hydrolyze phosphatidylcholine vesicles andmay be present in crude cell fractions (12).
Although the sPLA2s are rich in disulfide linkages, the susceptibility of theseenzymes to inactivation by treatment with DTT varies widely (12). For exam-ple, groups IIE, IIF, and X sPLA2 retain significant activity even when treatedfor 30 min at 50°C with 10 mM DTT, whereas some sPLA2s like Group IIA arefully inactivated after a 10-min treatment at 37°C (12). DTT sensitivity is acommonly reported method for evaluating whether the PLA2 activity in a celllysate is owing to an sPLA2, but caution is now advised. However, treating cellfractions with the commercially available inhibitor, arachidonyl trifluo-romethylketone at a concentration of 10 lM will inactivate cPLA2a but notsPLA2s (13).
3.2.3. Other Group IV cPLA2 Enzymes
Group IVC cPLA2c is constitutively associated with membrane and is cal-cium-independent because it lacks the C2 domain (14–16). Consequently,cPLA2a can be distinguished from cPLA2c by omitting calcium from the vesi-cle assay. Group IVB cPLA2b is calcium-dependent because it contains a C2domain, but preliminary characterization of its enzymatic properties suggeststhat it does not exhibit specificity for sn-2 arachidonic acid, a characteristicof cPLA2a (17). Therefore cPLA2a can be distinguished from cPLA2b bydemonstrating that activity in cell fractions is greater (10- to 20-fold) usingvesicles composed of 1-palmitoyl-2-arachidonyl-phosphatidylcholine com-pared to dipalmitoyl-phosphatidylcholine.
3.3. Assay for Measuring sPLA2 Activity
The sPLA2 assay described here is a modification of the original procedurefirst described by Radvanyi et al. (18). The assay makes use of a phosphatidyl-glycerol substrate (see Note 9) with a pyrene fluorophore on the terminal end ofthe sn-2 fatty acyl chain. When these phospholipids pack into the membrane bi-layer, the close proximity of the pyrenes, from neighboring phospholipids, causesthe spectral properties to change relative to that of monomeric pyrene (owing toexciplex formation). BSAis present in the aqueous phase and captures the pyrenefatty acid when it is liberated from the glycerol backbone owing to the sPLA2-catalyzed reaction. These features allow for a sensitive sPLA2 assay by monitor-
234 Leslie and Gelb
ing the fluorescence of monomeric, albumin-bound pyrene fatty acid. This fluori-metric assay monitors product formation continuously in the presence of calcium(see Note 10), and the sensitivity of the assay approaches that of conventionalfixed time-point assays with radiolabeled phospholipids.
3.3.1. Preparation of Assay Solutions and Substate
1. Dissolve 1 mg of 1-hexadecanoyl-2-(1-pyrenedecanoyl)-sn-glycero-3-phosphoglycerol (PPyrPG) in 1 mL of toluene: isopropanol (1:1) and vor-tex until all solid dissolves (may require slight warming).
2. Measure the concentration of PPyrPG in the stock solution by determiningthe absorbance at 342 nm in methanol using the extinction coefficient of40,000 M�1 cm�1. Store the stock solution at �20°C in a vial with a teflon-lined screw cap (tightly secure the cap in place with parafilm).
3. Pipet 200 lL of PPyrPM stock solution into an Eppendorf tube, and com-pletely remove the solvent with a stream of nitrogen. Add ethanol (1 mL),and vortex the sample until the lipid dissolves (may require slight warm-ing). Centrifuge the sample (full speed in a microfuge for 2 min) to removea small amount of particulate that may be present. Transfer the supernatantto a new tube and determine the absorbance of the solution at 342 nm (asabove in step 2). The concentration of PPyrPM should be approx100–200 lM. Store the ethanol stock solution at �20°C (as in step 2 above).
4. Prepare assay buffer (50 mM Tris-HCl, pH 7.4, 100 mM NaCl, 1 mMEGTA) and pass the solution through a 0.2–0.4 micron syringe filter to re-move dust particles. Use high quality water to make the buffer (i.e., Milli-Q, Millipore Inc.). Store assay buffer at 4°C.
5. Prepare a solution of BSA (fatty acid-free, Sigma) in purified water at aconcentration of 100 mg/mL and filter through a 0.2–0.4 micron syringe fil-ter. Store in small aliquots at �20°C.
6. Prepare 1 M CaCl2 in purified water and store at 4°C.7. To prepare a working solution of assay cocktail for 30 assays (1 mL each),
add 300 lL of 100 lM PPyrPG in ethanol (or the appropriate volume of amore concentrated substrate stock) (warm the stock solution in your handsand vortex it before taking the aliquot) to 29.7 mL of assay buffer. Add thePPyrPG drop-wise over approx 1 min to the continuously vortexing solutionof assay buffer. This gives a working solution of 1 lM PPyrPG as unilamellarliposomes. This solution is stable at room temperature for up to 24 h.
3.3.2. sPLA2 Assay Procedure
1. Into a quartz fluorescence cuvette fitted with a small magnetic stir bar, add0.98 mL of assay cocktail and then add 10 lL of 10% BSA. Finally add thedesired amount of sPLA2 (see Notes 11 and 12) to the cuvette. Place the
Assaying Phospholipase A2 Activity 235
cuvette in the fluorimeter. For most accurate kinetics, the cuvette holdershould be thermostatted at 37°C, but reasonably reliable data can be ob-tained at ambient temperature. Set the fluorimeter excitation wavelength to342 nm and the emission wavelength to 395 nm. The fluorescence isrecorded for approx 1 min in the absence of calcium to obtain the back-ground rate. The reaction is initiated by adding 10 lL of 1 M CaCl2 stocksolution. The initial reaction velocity is recorded for approx 2–4 min withmagnetic stirring (see Note 13).
3.3.3. Assay Calibration
In order to determine the specific activity from the observed assay slope, theassay has to be calibrated by adding a known amount of product, 1-pyrenede-canoic acid, to the complete assay cocktail in the absence of sPLA2.
1. Prepare a stock solution of 1-pyrenedecanoic acid (Molecular Probes) inabsolute ethanol at a concentration of 50 lM. Store at �20°C in a glass vialwith a teflon-lined screw cap.
2. Prepare an assay reaction (see Subheading 3.3.1.) with all componentsexcept enzyme. Record the initial fluorescence and the increase in fluo-rescence after adding 250 pmole of 1-pyrenedecanoic acid to the cuvette.Use the measured increase in fluorescence per pmole to convert the ob-served slope measured in the sPLA2 assay to lmol product produced permin per mg of sPLA2.
3.3.4. Microtiter Plate Assay of sPLA2
The aforementioned assay with PPyrPG can also be carried out in a 96-wellmicrotiter-plate using a microtiter plate fluorimeter.
1. Prepare a stock solution of 3% (w/v) BSA in assay buffer (50 mM Tris,pH 8.0, 50 mM KCl, 1 mM CaCl2) and filter (see Subheading 3.3.1.). Storein aliquots at �20°C.
2. Prepare working solution A (60 lL of 3% BSA plus 940 lL of assay buffer).3. Prepare solution B (1 mL of solution A plus an aliquot of sPLA2, typically
5–2000 ng depending on the specific activity of the sPLA2). Solution Bshould be prepared immediately before use to minimize loss owing to ab-sorption of sPLA2 to the tube.
4. Prepare solution C (4.2 lM PPyrPG in assay buffer, prepared (see Sub-heading 3.3.1.) for the 1 lM solution).
5. Add 100 lL solution A to each well followed by 100 lL solution B to eachwell. With a multichannel pipetor, deliver 100 lL of solution C to each well
236 Leslie and Gelb
to start the reaction (see Note 14). Place the plate in the plate reader to mon-itor the fluorescence in each well (see Note 15).
4. Notes1. Protease inhibitor-cocktail tablets are commercially available (Roche
Diagnostics, Mannheim, Germany) and can be used in place of the indi-vidually added protease inhibitors (phenylmethysulfonylfluoride [PMSF],leupeptin, aprotinin). However, if the PLA2 assay is carried out at calciumconcentrations in the nM–lM range, which requires the use ofcalcium/EGTA buffers, use protease inhibitor cocktails without EDTA.
2. Small plastic Pellet Pestles (Kontes Glass Company, Vineland, NJ) are veryuseful for resuspending the compact membrane pellet into a homogeneoussuspension. It is important not to vortex the cell fractions, which will sub-ject cPLA2 to oxidation.
3. cPLA2a exhibits calcium-dependent translocation from cytosol to mem-brane in cells treated with agonists that increase intracellular calcium(19,20). However, we have found that this membrane association is not sta-ble and can be reversed if cells are homogenized in the presence of calciumchelators (21). However, some reports have suggested that there is stableassociation of cPLA2a with membrane, although the basis for this is not un-derstood (22,23). The relative amount of cPLA2a in the soluble and partic-ulate fraction can be determined by Western blotting using commerciallyavailable antibodies (Santa Cruz Biotechnology). cPLA2a activity associ-ated with membrane can be measured using the vesicle assay, but it is im-portant to note that the specific activity can not be directly compared to thespecific activity in the soluble fraction. Because cPLA2a will hydrolyze theunlabeled phospholipid in the membrane, this effectively dilutes the labeledsubstrate in the vesicles, resulting in a lower specific activity.
4. 1-stearoyl-2[1-14C]arachidonyl-phosphatidylcholine (Amersham Biosciences,Piscataway, NJ) or the sn-1 ether-linked substrate 1-O-hexadecyl-2[1-14C]arachidonyl-phosphatidylcholine (American Radiolabeled Chemicals) canalso be used as substrates to measure cPLA2a activity. When using a diacyl-phospholipid substrate, cPLA2a will sequentially cleave the sn-2 and then thesn-1 fatty acid because it has both PLA2 and lysophospholipase activity (24,25).However, cPLA2a cannot hydrolyze the sn-1 aliphatic group from the 1-O-alkyl-linked substrate, 1-O-hexadecyl-2-arachidonyl-phosphatidylcholine.
5. Arachidonic acid is highly susceptible to oxidation and the arachidonyl-containing substrates (labeled and unlabeled) should be stored under nitro-gen. Make a concentrated stock solution of unlabeled 1-palmitoyl-2-arachidonyl-phosphatidylcholine in chloroform: methanol (90:10) and store
Assaying Phospholipase A2 Activity 237
aliquots at �80°C in glass vials with Teflon-lined caps and with the capsadditionally sealed with Teflon tape. Chloroform is very volatile and anyevaporation will affect the concentration of the stock solution.
6. cPLA2a has unusual kinetic properties on sonicated vesicles, exhibiting aninitial burst of activity that ceases abruptly in about 10–20 min (24,26,27).This is not owing to depletion of substrate, product inhibition, or irreversibleinactivation of cPLA2a. Rather cPLA2a becomes “trapped” on the vesiclesas product accumulates. The addition of NaCl and albumin to the reactionhelps to prevent trapping and leads to more linear reaction-progress curves.The presence of dioleolyglycerol in the vesicle also enhances activity andimproves the reaction progress (26–28). Dioleolyglycerol acts to perturb thepacking density of the phosphatidylcholine bilayer, thereby allowing greaterability of cPLA2a to penetrate the bilayer and access the substrate. Diole-olyglycerol may also help prevent trapping on the vesicle.
7. Calcium is required in the assay to promote binding of cPLA2a to phos-pholipid vesicles (6,29,30). A final concentration of 1 mM free calcium inthe assay is saturating. To achieve this final calcium concentration, theamount of EGTA in the homogenization buffer added to the assay (from thecell fractions) must be taken into account. At 37°C, 1 mol of EGTA chelates1 mol of calcium. A characteristic of cPLA2a is that concentrations of cal-cium in the low micromolar range promote its binding to phospholipidvesicles (29). To evaluate the effect of physiological concentrations of freecalcium in the vesicle assay, calcium/EGTA buffers are used. A computerprogram (available at http://www.stanford.edu/~cpatton/webmaxcSR.htm)is used to determine the amount of CaCl2 to add to the reaction mixture,containing a known final concentration of EGTA, which will result in freecalcium in the range of 0.1–5 lM. Do not include albumin in the vesicleassay for measuring cPLA2 activity at low micromolar concentrations offree calcium because it can bind calcium.
8. The inhibitors, arachidonyl trifluoromethylketone and methylarachidonylfluorophosphonate, cannot be used to distinguish cPLA2a and iPLA2 be-cause both enzymes are inhibited at similar concentrations of these com-pounds (10,31,32).
9. A detailed study of the interfacial kinetic properties of the full set of mam-malian sPLA2s has revealed that all of these enzyme display relatively highactivity on anionic phosphatidylglycerol vesicles, whereas only the groupV and X sPLA2s also display high activity on phosphatidylcholine vesicles(12). The use of phosphatidylcholine vesicles is not recommended for de-tecting sPLA2s in general, because many enzymes such as the human andmouse group IIA sPLA2s display very low activity on these vesicles owingto poor interfacial binding to the zwitterionic interface. However, even
238 Leslie and Gelb
using phosphatidylglycerol, which is the most preferred sPLA2 substrate,the specific activity of the mammalian sPLA2s varies considerably. For ex-ample, the specific activity of human group IB sPLA2 is approx 2000-foldhigher than the specific activity of human group IIE sPLA2 (12). The phys-iological significance of this variation in specific activity for the variousmammalian sPLA2s remains to be understood, and it raises the possibilitythat glycero-phospholipids may not always be the physiological substratesfor all of the enzymes. At the present time, phosphatidylglycerol remainsthe most generally preferred substrate for mammalian sPLA2s.
10. It is often stated that sPLA2s require millimolar concentrations of calciumfor maximal activity. This is not the case (12). The concentration of calciumrequired for optimal enzymatic activity of an sPLA2 depends on the enzymespecies and the type of phospholipid substrate used in the assay. This isbecause calcium is required for the binding of a single phospholipid mole-cule in the active site of the sPLA2 at the membrane interface and substratebinding cannot occur if the enzyme is in the water layer. Thus, interfacialbinding of sPLA2 to the membrane surface and calcium binding in the ac-tive site are coupled. For example, human group V sPLA2 binds tighter tophosphatidylglycerol vesicles than to phosphatidylcholine vesicles, and theobserved apparent KCa for this enzyme in the presence of the anionic vesi-cles is 1 lM, whereas the apparent KCa increases to 225 lM in the presenceof zwitterionic vesicles (12). The statement made in Subheading 3.2.1. thatcPLA2a but not sPLA2 is maximally active in the presence of 1–2 lM cal-cium holds as long as phosphatidylcholine is the substrate. In the presenceof phosphatidylglycerol vesicles, the apparent KCa varies from about 1 lM(group V sPLA2s) to about 100 lM (group IIE sPLA2s) (12).
11. Purified sPLA2s readily absorb on the walls of containers at concentrationsbelow about 10 lg/mL. Highly dilute sPLA2 stock solutions, appropriatefor adding nanogram amounts to the PPyrPG assay are best prepared byfresh dilution into buffer with approx 1 mg/mL BSA. For the most activesPLA2s (i.e., group IB and IIA), as little as 0.2–0.5 ng of enzyme gives areadily measured initial velocity. The specific activities of the full set ofhuman and mouse sPLA2s acting on phosphatidylglycerol vesicles has beenmeasured (12).
12. It is also possible to add crude samples containing sPLA2 to the PPyrPGassay. For example, we have been able to add up to 50 lL of tissue culturemedium containing sPLA2 (from transfected cells) to the assay.
13. If the amount of sPLA2 added to the PPyrPG assay is too high, the reac-tion-progress curve will display significant curvature, and all of the sub-strate will be consumed in less than a few minutes. A sufficient amount ofenzyme should be added to give a progress curve that remains linear for the
Assaying Phospholipase A2 Activity 239
first few minutes. It is best to confirm that the initial velocity is proportionalto the amount of enzyme.
14. The use of a multichannel pipetor allows the reaction to be initiated in allwells at the same time.
15. Typically eight wells are assayed at a time (more wells can be assayed ifthe plate reader is capable of measuring the fluorescence from multiplewells several times per minute). At least one well should be reserved for aminus enzyme control. The plate reader needs to be equipped with the ap-propriate filters to deliver the desired excitation and emission wavelengths(see the cuvette assay for wavelengths). The microtiter plate assay can becalibrated with 1-pyrenedecanoic acid as for the cuvette assay.
AcknowledgmentsThe authors work is supported by NIH grants HL34303 and HL61378 (to C.
Leslie) and HL50040 and HL36236 (to M. Gelb).
References1. Six, D. A. and Dennis, E. A. (2000) The expanding superfamily of phospholipase
A2 enzymes: classification and characterization. Biochim. Biophys. Acta 1488,1–19.
2. Valentin, E. and Lambeau, G. (2000) Increasing molecular diversity of secretedphospholipases A2 and their receptors and binding proteins. Biochim. Biophys. Acta1488, 59–70.
3. Kudo, I. and Murakami, M. (2002) Phospholipase A2 enzymes. ProstaglandinsOther Lipid Mediat. 68–69, 3–58.
4. Leslie, C. C. (1997) Properties and regulation of cytosolic phospholipase A2. J.Biol. Chem. 272, 16,709–16,712.
5. Leslie, C. (1990) Macrophage phospholipase A2 specific for sn-2 arachidonic acidin Methods in Enzymology vol. 187 (Murphy, R. and Fitzpatrick, F., eds.), Acade-mic Press, Orlando, FL, pp. 216–225.
6. Clark, J. D., Lin, L.-L., Kriz, R. W., et al. (1991) A novel arachidonic acid-selec-tive cytosolic PLA2 contains a Ca2+-dependent translocation domain with homol-ogy to PKC and GAP. Cell 65, 1043–1051.
7. de Carvalho, M. S., McCormack, F. X., and Leslie, C. C. (1993) The 85-kDa,arachidonic acid-specific phospholipase A2 is expressed as an activated phospho-protein in Sf9 cells. Arch. Biochem. Biophys. 306, 534–540.
8. Winstead, M. V., Balsinde, J., and Dennis, E. A. (2000) Calcium-independent phos-pholipase A2: structure and function. Biochim. Biophys. Acta 1488, 28–39.
9. Tang, J., Kriz, R. W., Wolfman, N., et al. (1997) A novel cytosolic calcium-inde-pendent phospholipase A2 contains eight ankyrin motifs. J. Biol. Chem. 272,8567–8575.
240 Leslie and Gelb
10. Ackermann, E. J., Conde-Frieboes, K., and Dennis, E. A. (1995) Inhibition ofmacrophage Ca2+-independent phospholipase A2 by bromoenol lactone and triflu-oromethyl ketones. J. Biol. Chem. 270, 445–450.
11. Jenkins, C. M., Han, X., Mancuso, D. J., and Gross, R. W. (2002) Identification ofcalcium-independent phospholipase A2 (iPLA2)b, and not iPLA2c, as the mediatorof arginine vasopressin-induced arachidonic acid release in A-10 smooth musclecells. J. Biol. Chem. 277, 32,807–32,814.
12. Singer, A. G., Ghomashchi, F., Le Calvez, C., et al. (2002) Interfacial kinetic andbinding properties of the complete set of human and mouse groups I, II, V, X, andXII secreted phospholipases A2. J. Biol. Chem. 277, 48,535–48,549.
13. Street, I. P., Lin, H. K., Laliberté, F., et al. (1993) Slow- and tight-binding inhibitorsof the 85-kDa human phospholipase A2. Biochemistry 32, 5935–5940.
14. Stewart, A., Ghosh, M., Spencer, D. M., and Leslie, C. C. (2002) Enzymatic prop-erties of human cytosolic phospholipase A2c. J. Biol. Chem. 277, 29,526–29,536.
15. Pickard, R. T., Strifler, B. A., Kramer, R. M., and Sharp, J. D. (1999) Molecularcloning of two new human paralogs of 85-kDa cytosolic phospholipase A2. J. Biol.Chem. 274, 8823–8831.
16. Underwood, K. W., Song, C., Kriz, R. W., et al. (1998) A novel calcium-independ-ent phospholipase A2, cPLA2-c, that is prenylated and contains homology tocPLA2. J. Biol. Chem. 273, 21,926–21,932.
17. Song, C., Chang, X. J., Bean, K. M., et al. (1999) Molecular characterization of cy-tosolic phospholipase A2-b. J. Biol. Chem. 274, 17,063–17,067.
18. Radvanyi, F., Jordan, L., Russo-Marie, F., and Bon, C. (1989) A sensitive and con-tinuous fluorometric assay for phospholipase A2 using pyrene-labeled phospho-lipids in the presence of serum albumin. Anal. Biochem. 177, 103–109.
19. Glover, S., de Carvalho, M. S., Bayburt, T., et al. (1995) Translocation of the 85-kDa phospholipase A2 from cytosol to the nuclear envelope in rat basophilicleukemia cells stimulated with calcium ionophore or IgE/antigen. J. Biol. Chem.270, 15,359–15,367.
20. Evans, J. H., Spencer, D. M., Zweifach, A., and Leslie, C. C. (2001) Intracellularcalcium signals regulating cytosolic phospholipase A2 translocation to internalmembranes. J. Biol. Chem. 276, 30,150–30,160.
21. Channon, J. and Leslie, C. C. (1990) A calcium-dependent mechanism for associ-ating a soluble arachidonoyl-hydrolyzing phospholipase A2 with membrane in themacrophage cell line, RAW 264.7. J. Biol. Chem. 265, 5409–5413.
22. Peters-Golden, M. and McNish, R. W. (1993) Redistribution of 5-lipoxygenase andcytosolic phospholipase A2 to the nuclear fraction upon macrophage activation.Biochem. Biophys. Res. Commun. 196, 147–153.
23. Sheridan, A. M., Sapirstein, A., Lemieux, N., et al. (2001) Nuclear translocation ofcytosolic phospholipase A2 is induced by ATP depletion. J. Biol. Chem. 276,29,899–29,905.
Assaying Phospholipase A2 Activity 241
24. Leslie, C. C. (1991) Kinetic properties of a high molecular mass arachidonoyl-hy-drolyzing phospholipase A2 that exhibits lysophospholipase activity. J. Biol. Chem.266, 11,366–11,371.
25. de Carvalho, M. G. S., Garritano, J., and Leslie, C. C. (1995) Regulation oflysophospholipase activity of the 85-kDa phospholipase A2 and activation in mouseperitoneal macrophages. J. Biol. Chem. 270, 20,439–20,446.
26. Leslie, C. C. and Channon, J. Y. (1990) Anionic phospholipids stimulate an arachi-donoyl-hydrolyzing phospholipase A2 from macrophages and reduce the calciumrequirement for activity. Biochim. Biophys. Acta. 1045, 261–270.
27. Ghomashchi, F., Schuttel, S., Jain, M. K., and Gelb, M. H. (1992) Kinetic analysisof a high molecular weight phospholipase A2 from rat kidney: divalent metal-de-pendent trapping of enzyme on product-containing vesicles. Biochemistry 31,3814–3824.
28. Kramer, R. M., Checani, G. C., and Deykin, D. (1987) Stimulation of Ca2�-acti-vated human platelet phospholipase A2 by diacylglycerol. Biochem. J. 248,779–783.
29. Nalefski, E. A., Sultzman, L. A., Martin, D. M., et al. (1994) Delineation of twofunctionally distinct domains of cytosolic phospholipase A2, a regulatory Ca2�-de-pendent lipid-binding domain and a Ca2�-independent catalytic domain. J. Biol.Chem. 269, 18,239–18,249.
30. Hixon, M. S., Ball, A., and Gelb, M. H. (1998) Calcium-dependent and -independ-ent interfacial binding and catalysis of cytosolic group IV phospholipase A2.Biochem. 37, 8516–8526.
31. Lio, Y. C., Reynolds, L. J., Balsinde, J., and Dennis, E. A. (1996) Irreversible inhi-bition of Ca(2+)-independent phospholipase A2 by methyl arachidonyl fluorophos-phonate. Biochim. Biophys. Acta 1302, 55–60.
32. Ghomashchi, F., Loo, R. W., Balsinde, J., et al. (1999) Trifluoromethyl ketones andmethyl fluorophosphonates as inhibitors of group IV and VI phospholipases A2:Structure-function studies with vesicle, micelle, and membrane assays. Biochim.Biophys. Acta 1420, 45–56.
242 Leslie and Gelb
17
Measurement and Immunofluorescence of Cellular Phosphoinositides
Hiroko Hama, Javad Torabinejad, Glenn D. Prestwich, and Daryll B. DeWald
SummaryPhosphoinositides are a vitally important class of intracellular-signaling molecules that regu-
late cellular processes, including signaling through cell-surface receptors, remodeling of thecytoskeleton, vesicle-mediated protein trafficking, and various nuclear functions. Methods for theanalysis of in vivo phosphoinositide concentration, such as the one described in this chapter en-able quantification of all phosphoinositides from a population of cells. This method involvesmetabolic labeling of cells with myo-[2-3H] inositol, followed by lipid extraction, and quantifi-cation by high-performance liquid chromatography (HPLC). It provides improved efficiency andreproducibility when analyzing yeast, plant cells, and is applicable to animal cells as well. In ad-dition, a technique for determining the intracellular location of phosphoinositides is described.When quantification and localization techniques are used in parallel, an investigator can identifycell, and even subcellular concentration changes. The technique described in this chapter uses im-munodetection with antiphosphoinositide antibodies to determine the localization and relativeconcentrations of phosphinositides in fixed cells. The availability of antibodies allows an inves-tigator to perform immunofluorescence and potentially immunoelectron microscopy of phospho-inositide localization on particular cellular, organellar, or vesicular membranes.
Key Words: Signal transduction; HPLC; animal; plant; yeast cells.
1. Introduction
The potential role of phosphoinositides as intracellular signaling moleculeswas first reported half a century ago by Hokin and Hokin (1). Since then, a great
From: Methods in Molecular Biology, vol. 284:Signal Transduction Protocols
Edited by: R. C. Dickson © Humana Press Inc., Totowa, NJ
243
deal has been learned about the complexity of cellular processes regulated by phos-phoinositides. The growing list of phosphoinositide-regulated cellular processesincludes signaling through cell-surface receptors (2–4), remodeling of the cy-toskeleton (5,6), vesicle-mediated protein trafficking (7,8), and various nuclearfunctions (9–11). Each process can be simultaneously regulated by one or morespecific phosphoinositides, owing to temporally and spatially restricted formationof phosphoinositides. In addition to phosphatidylinositol (PtdIns) itself, there areseven known phosphoinositides in eukaryotic cells with phosphate monoesters at-tached to the 3, 4, or 5 positions of the inositol ring of phosphatidylinositol:PtdIns(3)P, PtdIns(4)P, PtdIns(5)P, PtdIns(3,4)P2, PtdIns(3,5)P2, PtdIns(4,5)P2,and PtdIns(3,4,5)P3. The remodeling of phosphoinositide phosphorylation inspace and time is precisely coordinated via regulated actions of phosphati-dylinositol and phosphoinositide kinases, phosphoinositide phosphatases, andphospholipases.
Following synthesis at a specific site of action, phosphoinositides recruit andbind effector (phosphoinositide-binding) proteins and activate a variety of down-stream signaling cascades. Unique among the phosphoinositides, PtdIns(4,5)P2either binds effector proteins and/or serves as a precursor for the second mes-sengers inositol trisphosphate and diacylglycerol. However, binding to proteinsand altering their localization and/or activity appears to be the primary functionof phosphoinositides. Effector protein relocalization involves specific interac-tions between phosphoinositides and phosphoinositide-binding domains effector-protein. Among the 10 or more recognition motifs characterized are the PH(pleckstrin homology) domains, PX (Phox homology) domains, and FYVE(Fab1p, YOTB, Vac1, EEA1) domains. These phosphoinositide-binding motifsfacilitate relocalization, conformational changes, and activation or inactivationof numerous downstream-effector proteins. This is significant because hundredsof eukaryotic proteins contain motifs that are likely to confer phosphoinositidebinding. For example, in the human genome, there are approx 150–200 proteinscontaining predicted PH domains.
A number of studies have been conducted to measure the activities of phos-phatidylinositol kinases in cell extracts to demonstrate the roles of phospho-inositides in signaling pathways (reviewed in ref. 12). Although these studiesprovided evidence for involvement of phosphoinositides and phosphoinositidekinases in regulatory systems, further analyses were necessary to demonstratein vivo formation of specific phosphoinositides. Methods for the analysis ofin vivo phosphoinositide concentrations such as the one described in this chap-ter enable quantification of all seven phosphoinositides from a population ofcells. This method involves metabolic labeling of cells with myo-[2-3H] inos-itol, followed by lipid extraction, and quantification by high-performanceliquid chromatography (HPLC). The procedure described here is a modified
244 Hama et al.
version of the one developed by Cantley et al. (13). It provides improved ef-ficiency and reproducibility when analyzing yeast and plant cells (14,15) andis applicable to animal cells as well (16).
In addition to whole-cell and tissue quantification of phosphoinositides,techniques have been developed to determine the intracellular localization ofphosphoinositides. When quantification and localization techniques are used inparallel, an investigator can identify whole-tissue, cell, and even subcellularconcentration changes. This is valuable, because phosphoinositide synthesis ordegradation usually does not occur uniformly throughout the cell. Instead, it oc-curs at distinct membrane sites like the Golgi or plasma membrane.
Localization of specific phosphoinositides in living cells can be determinedusing fluorescence microscopy of cells transfected with gene constructs encod-ing phosphoinositide-binding proteins fused to the green fluorescent protein(GFP) (17). Colocalization of the GFP fusion and phosphoinositides occurs viaassociation of the phosphoinositide-binding domain with phosphoinositides.This powerful technique has been described several times, and will not be cov-ered here. A less commonly-used approach is the use of fluorescently labeledrhodamine to visualize PtdIns(4,5)P2 in cells, which localizes intracellular andintranuclear PtdIns(4,5)P2 that cannot be detected by the GFP-PH domain con-structs (18). An alternative method described in this chapter involves phospho-inositide immunodetection with antiphosphoinositide antibodies (19–23) todetermine the localization and relative concentrations in fixed cells. The avail-ability of antibodies allows an investigator to perform immunofluorescence andpotentially immunoelectron microscopy of phosphoinositide localization onparticular cellular, organellar, or vesicular membranes.
1.1. Measurement of Phosphoinositides
Analysis of relative phosphoinositide concentrations using HPLC is some-times called “headgroup analysis,” because chromatographic separation of thewater-soluble moiety of phosphoinositides (glycerophosphoinositol phos-phates; gPIPs) is done after removal of the hydrophobic acyl chains (deacyla-tion). Cells are first metabolically labeled with myo-[2-3H] inositol for 12–24 h.Before lipid extraction, cells are treated with trichloroacetic acid (TCA) to in-activate enzymes that might degrade phosphoinositides during the extractionprocess. [3H]-Labeled phosphoinositides are extracted with organic solvents,and deacylated by alkaline treatment. The resulting gPIPs are separated usingstrong anion-exchange HPLC. Small fractions are collected and radioactivity ismeasured by scintillation counting. Here we present protocols for labeling tis-sue-culture cells (NIH3T3 fibroblasts and 3T3-L1 preadipocytes), yeast (Sac-charomyces cerevisiae), and plant cells (Arabidopsis thaliana submerged and
Cellular Phosphoinositides 245
hydroponic cultures). Lipid extracts from these cells are deacylated and ana-lyzed by HPLC using the same procedure.
1.2. Immunofluorescence of Phosphoinositides
Monoclonal antibodies (MAbs) directed against PtdIns(4,5)P2 and PtdIns(3,4,5)P3 have been developed, and immunofluorescence procedures using thesereagents enable the detection of these phosphoinositide species in fixed mam-malian cells. When combined with the cellular phosphoinositide analyses de-scribed earlier, this approach allows an investigator to visualize in a cell the preciselocation where modulation of phosphoinositide concentrations is occurring. Forthe cellular immunolocalization of phosphoinositides, the cells must first be fixedwith a chemical fixative (e.g., formaldehyde) and then permeabilized with a de-tergent (e.g., Triton X-100). Nonspecific binding sites in the cells are then blockedby incubating the cells in a solution containing a blocking reagent such as goatserum. The cells are incubated with the primary antibody directed againstPtdIns(4,5)P2 (20,21) or PtdIns(3,4,5)P3 (22). The cells are washed with a bufferedsalt solution and then incubated with a fluorophore-tagged secondary antibody.After a final washing to remove nonspecifically bound secondary antibodies, cellsare visualized by epifluorescence or laser-scanning confocal microscopy.
2. Materials2.1. Growth Media
1. NIH3T3 or 3T3-L1 cells are grown in Dulbecco’s Modified Eagle’sMedium (DMEM) containing 10% calf serum.
2. A yeast nitrogen base medium containing appropriate supplements and car-bon source is used for the growth of yeast cells. The “drop-out mix” (24)is prepared without inositol.
3. Arabidopsis thaliana is grown submerged in a medium composed of 0.5XMurashige and Skoog (MS) and B5 vitamins. Alternatively, plants can begrown hydroponically on the same medium excluding the vitamins.
4. Falcon 2059 tubes (Becton Dickinson Labware, Lincoln Park, NJ).5. Disposable cell scrapers (Fisher Scientific, Pittsburgh, PA).
2.2. Radiochemicals
1. myo-[2-3H] Inositol (10–25 Ci/mmol) (American Radiolabeled Chemicals,(ARC), St. Louis, MO; Amersham Biosciences, Piscataway, NJ, ICN Biomed-ical, Irvine, CA; or PerkinElmer Life Sciences, PerkinElmer, Boston, MA).
2. For HPLC standards, PtdIns(4)P [inositol-2-3H] (ARC). PtdIns(4,5)P2[inositol-2-3H] (ARC or PerkinElmer).
246 Hama et al.
3. [32P] PtdIns(3)P is prepared by in vitro phosphorylation of PtdIns by yeastPtdIns 3-kinase with [c-32P] ATP, followed by separation by thin-layerchromatography (TLC) and extraction from the TLC media (15).
4. [32P] PtdIns(3,4)P2 and [32P]PtdIns(3,4,5)P3 are prepared by in vitro phos-phorylation of PtdIns(4)P and PtdIns(4,5)P2, respectively, by mammalianPI 3-kinase with [c-32P] ATP, followed by TLC purification.
5. PtdIns(3,5)P2 [inositol-2-3H] is produced in vivo by salt-stressed yeastcells (15,25).
2.3. Chromatography Media
1. Silica gel 60 TLC plates (0.25 mm thick, Merck no. 5724 or equivalent) areused to purify [32P]-labeled standards prepared by in vitro phosphorylation.
2. Strong anion-exchange columns Partisil 5 SAX (4.6 mm � 250 mm) orPartisil 10 SAX (4.6 mm � 250 mm) (Whatman, Clifton, NJ) are used forHPLC headgroup analysis.
3. Ion-exchange columns must be fitted with guard columns (e.g., Phe-nomenex, SecurityGuard™, Torrance, CA, part no. KJO-4282) containingSAX inserts (Phenomenex, part no. AJO-431).
2.4. Immunofluorescence Reagents
1. Coverslips and slides (Fisher Scientific, or Ted Pella, Redding, CA).2. Purified RC6F8 anti-PtdIns(3,4,5)P3 IgM and 2C11 anti-PtdIns(4,5)P2 IgM
(Echelon Biosciences, Salt Lake City, UT).3. High quality formaldehyde (Ted Pella, Redding, CA).4. Fluorophore-tagged (e.g., FITC, Texas Red) antimouse IgM secondary
antibodies are available (Jackson ImmunoResearch Laboratories, WestGrove, PA or Rockland, Gilbertsville, PA).
2.5. Other Chemicals
1. All eight forms of nonradioactive phosphoinositides, with different acyl-chain lengths and a variety of reporter groups (Echelon Biosciences).
2. Additional natural and synthetic phosphoinositides (Avanti Polar Lipids,Alabaster, AL; Matreya State College, PA; and Calbiochem, San Diego, CA).
3. Organic solvents and all other chemicals can be purchased from severalcommercial sources (see Subheading 4.) for methylamine.
4. Scintillation cocktail must be miscible with aqueous solutions in order toprovide consistent results when counting fractions.
2.6. Lipid Handling
Lipid extracts and deacylated lipids should be dried under a stream of nitro-gen gas or in a Speed-Vac concentrator (Thermo Savant, Holbrook, NY). Dried
Cellular Phosphoinositides 247
lipids should be re-suspended using an bath sonicator such as Bransonic table-top cleaners (Branson Ultrasonics, Danbury, CT). A TLC tank is used for stan-dard preparation by in vitro phosphorylation.
2.7. HPLC
Headgroup analysis can be performed with a Beckman System Gold HPLCwith 32 Karat software (Beckman Coulter, Fullerton, CA) or equivalent. Thesystem should be equipped with pumps for dual solvent delivery, an ultraviolet(UV) detector, and a fraction collector. The fraction collector is fitted with arack for liquid-scintillation vials. Alternatively, an on-line radioactivity detec-tor (e.g., b-RAM, INUS, Tampa, FL) can be used to detect separated gPIPs, inlieu of fraction collection and scintillation counting.
2.8. Microscopy
Epifluorescence or laser scanning confocal microscopes are used to examinecells labeled with fluorescently tagged antibodies. For the work presented in thischapter, cells were examined using a Nikon TE-300 inverted microscope inter-faced with a Bio-Rad MRC 1024 confocal system (Bio-Rad Laboratories,Hercules, CA). Images are collected using 60X oil-immersion objective. De-pending on the fluorophore, appropriate excitation wavelengths and emissionfilters are used.
3. Methods3.1. Labeling and Lipid Extraction of Yeast Cells
1. A synthetic medium containing 5 lCi/mL of myo-[2-3H] inositol is inocu-lated with a small amount of fresh culture to give an A600nm of 0.01. A 5 mLculture is sufficient for each sample.
2. Cells are grown with shaking (200 rpm) until the A600nm is 0.6–1.0, typi-cally 14–20 h at 30ºC.
3. Growth is terminated by addition of TCA (final concentration 5%), fol-lowed by incubation on ice for 1 h in polypropylene tubes (Falcon 2059).This treatment prevents degradation of lipids by lipases during manipula-tion of the cells (26). It is important to avoid excessive exposure to TCA(higher concentrations, higher temperatures, or prolonged periods), be-cause lipids can be degraded by the acid (26).
4. Cells are harvested by centrifugation, and washed twice with 1 mL of H2O.5. The washed pellet can be stored at �80°C or used directly in step 6.6. This procedure relies on a solvent for extraction that is very effective for
yeast cells (26) and can be used for other cells as well (15,16). The extrac-tion solvent contains 95% ethanol/H2O/diethyl ether/pyridine/conc. NH4OH
248 Hama et al.
(15/15/5/1/0.018 v/v). This solution without H2O (called EEP solvent) canbe prepared for use in a series of experiments for a few days, but long-termstorage of EEP solvent is not recommended.
7. Washed yeast cells (5 mL of culture in late-log phase growth) are suspendedin 0.5 mL of H2O and 0.75 mL of EEP solvent is added. Extraction is con-ducted at 57ºC for 30 min with occasional mixing. While the mixture is stillwarm, cell debris is removed by centrifugation for 5 min at 5000 g at roomtemperature. The supernatant fluid is dried under a stream of N2 or in aSpeed-Vac concentrator with appropriate traps.
8. Extracted lipids can be stored at �80°C or immediately deacylated.
3.2. Labeling and Lipid Extraction of Mammalian Cells
1. For labeling NIH 3T3 fibroblasts or 3T3-L1 preadipocytes, cells should begrown to at least 60% confluency in 75 cm2 flasks.
2. Cells are washed and then labeled for 36 h with myo-[2-3H] inositol(20 lCi/mL) in inositol-free DMEM � 10% calf serum.
3. After 24 h, the medium should be removed and replaced with a fresh myo-[2-3H] inositol-containing medium. At this point, if growth-factor stimula-tion (e.g., with PDGF to activate PI 3-kinase) is part of the experiment, cellsare serum deprived for 2 h in inositol-free and serum-free DMEM contain-ing 0.2% BSA and 10 lCi/mL myo-(2-3H)-inositol, followed by platelet-derived growth factor (PDGF) (50 ng/mL) stimulation and harvest.
4. For cell harvest, ice-cold TCA is added to the medium in the flasks to a finalconcentration of 10%. The flasks containing the 10% TCA are incubated onice for 1 h with the cells immersed in the solution.
5. Cells are released from the flasks by gently scraping with a disposable cellscraper followed by pipeting them into 15- or 50-mL conical screw-capcentrifuge tubes.
6. Centrifuge the samples for 5 min at 5000 g.7. Remove supernatant fluid and add 5 mL of a 5% TCA, 1 mM EDTA solu-
tion to the pellets.8. After the cells are resuspended, they should be centrifuged as above and the
supernatant removed. Pellets can be stored at �80ºC, or lipids can be ex-tracted immediately.
9. Lipids are extracted from the cell pellet by resuspending cells in 0.75 mLchloroform/methanol/HCl (40/80/1 v/v) and vortexing the cells vigorouslyevery 60 s for 15 s. Cells must be kept on ice between vortexing.
10. Add 0.25 mL of chloroform and 0.45 mL of 0.1 M HCl to the cells and vor-tex the tube.
11. Samples are centrifuged at 5000 g for 2 min, and the bottom, organic layeris transferred to another tube for continued processing.
Cellular Phosphoinositides 249
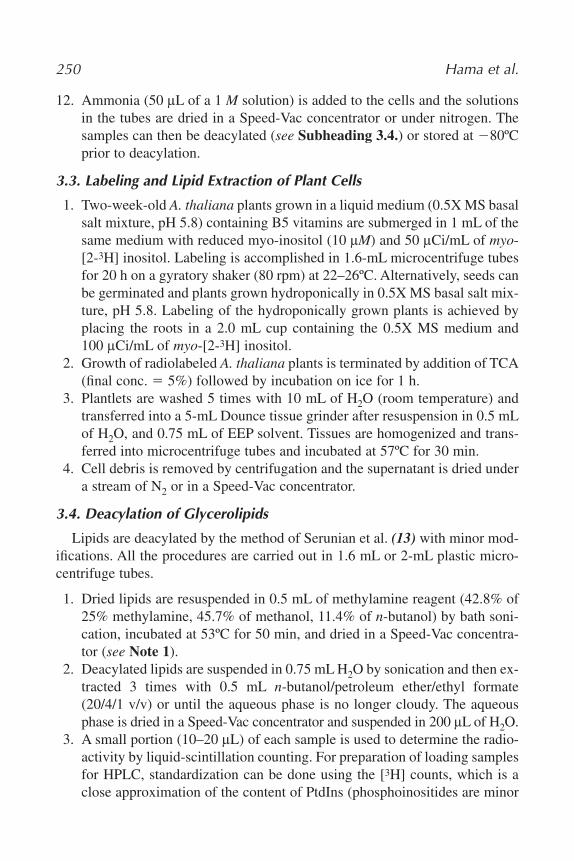
12. Ammonia (50 lL of a 1 M solution) is added to the cells and the solutionsin the tubes are dried in a Speed-Vac concentrator or under nitrogen. Thesamples can then be deacylated (see Subheading 3.4.) or stored at �80ºCprior to deacylation.
3.3. Labeling and Lipid Extraction of Plant Cells
1. Two-week-old A. thaliana plants grown in a liquid medium (0.5X MS basalsalt mixture, pH 5.8) containing B5 vitamins are submerged in 1 mL of thesame medium with reduced myo-inositol (10 lM) and 50 lCi/mL of myo-[2-3H] inositol. Labeling is accomplished in 1.6-mL microcentrifuge tubesfor 20 h on a gyratory shaker (80 rpm) at 22–26ºC. Alternatively, seeds canbe germinated and plants grown hydroponically in 0.5X MS basal salt mix-ture, pH 5.8. Labeling of the hydroponically grown plants is achieved byplacing the roots in a 2.0 mL cup containing the 0.5X MS medium and100 lCi/mL of myo-[2-3H] inositol.
2. Growth of radiolabeled A. thaliana plants is terminated by addition of TCA(final conc. � 5%) followed by incubation on ice for 1 h.
3. Plantlets are washed 5 times with 10 mL of H2O (room temperature) andtransferred into a 5-mL Dounce tissue grinder after resuspension in 0.5 mLof H2O, and 0.75 mL of EEP solvent. Tissues are homogenized and trans-ferred into microcentrifuge tubes and incubated at 57ºC for 30 min.
4. Cell debris is removed by centrifugation and the supernatant is dried undera stream of N2 or in a Speed-Vac concentrator.
3.4. Deacylation of Glycerolipids
Lipids are deacylated by the method of Serunian et al. (13) with minor mod-ifications. All the procedures are carried out in 1.6 mL or 2-mL plastic micro-centrifuge tubes.
1. Dried lipids are resuspended in 0.5 mL of methylamine reagent (42.8% of25% methylamine, 45.7% of methanol, 11.4% of n-butanol) by bath soni-cation, incubated at 53ºC for 50 min, and dried in a Speed-Vac concentra-tor (see Note 1).
2. Deacylated lipids are suspended in 0.75 mL H2O by sonication and then ex-tracted 3 times with 0.5 mL n-butanol/petroleum ether/ethyl formate(20/4/1 v/v) or until the aqueous phase is no longer cloudy. The aqueousphase is dried in a Speed-Vac concentrator and suspended in 200 lL of H2O.
3. A small portion (10–20 lL) of each sample is used to determine the radio-activity by liquid-scintillation counting. For preparation of loading samplesfor HPLC, standardization can be done using the [3H] counts, which is aclose approximation of the content of PtdIns (phosphoinositides are minor
250 Hama et al.
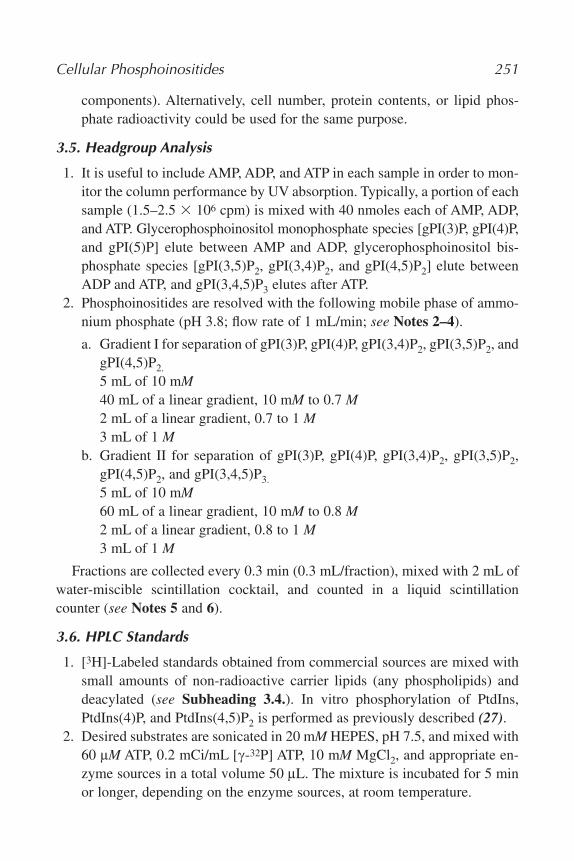
components). Alternatively, cell number, protein contents, or lipid phos-phate radioactivity could be used for the same purpose.
3.5. Headgroup Analysis
1. It is useful to include AMP, ADP, and ATP in each sample in order to mon-itor the column performance by UV absorption. Typically, a portion of eachsample (1.5–2.5 � 106 cpm) is mixed with 40 nmoles each of AMP, ADP,and ATP. Glycerophosphoinositol monophosphate species [gPI(3)P, gPI(4)P,and gPI(5)P] elute between AMP and ADP, glycerophosphoinositol bis-phosphate species [gPI(3,5)P2, gPI(3,4)P2, and gPI(4,5)P2] elute betweenADP and ATP, and gPI(3,4,5)P3 elutes after ATP.
2. Phosphoinositides are resolved with the following mobile phase of ammo-nium phosphate (pH 3.8; flow rate of 1 mL/min; see Notes 2–4).
a. Gradient I for separation of gPI(3)P, gPI(4)P, gPI(3,4)P2, gPI(3,5)P2, andgPI(4,5)P2.
5 mL of 10 mM40 mL of a linear gradient, 10 mM to 0.7 M2 mL of a linear gradient, 0.7 to 1 M3 mL of 1 M
b. Gradient II for separation of gPI(3)P, gPI(4)P, gPI(3,4)P2, gPI(3,5)P2,gPI(4,5)P2, and gPI(3,4,5)P3.
5 mL of 10 mM60 mL of a linear gradient, 10 mM to 0.8 M2 mL of a linear gradient, 0.8 to 1 M3 mL of 1 M
Fractions are collected every 0.3 min (0.3 mL/fraction), mixed with 2 mL ofwater-miscible scintillation cocktail, and counted in a liquid scintillationcounter (see Notes 5 and 6).
3.6. HPLC Standards
1. [3H]-Labeled standards obtained from commercial sources are mixed withsmall amounts of non-radioactive carrier lipids (any phospholipids) anddeacylated (see Subheading 3.4.). In vitro phosphorylation of PtdIns,PtdIns(4)P, and PtdIns(4,5)P2 is performed as previously described (27).
2. Desired substrates are sonicated in 20 mM HEPES, pH 7.5, and mixed with60 lM ATP, 0.2 mCi/mL [c-32P] ATP, 10 mM MgCl2, and appropriate en-zyme sources in a total volume 50 lL. The mixture is incubated for 5 minor longer, depending on the enzyme sources, at room temperature.
Cellular Phosphoinositides 251
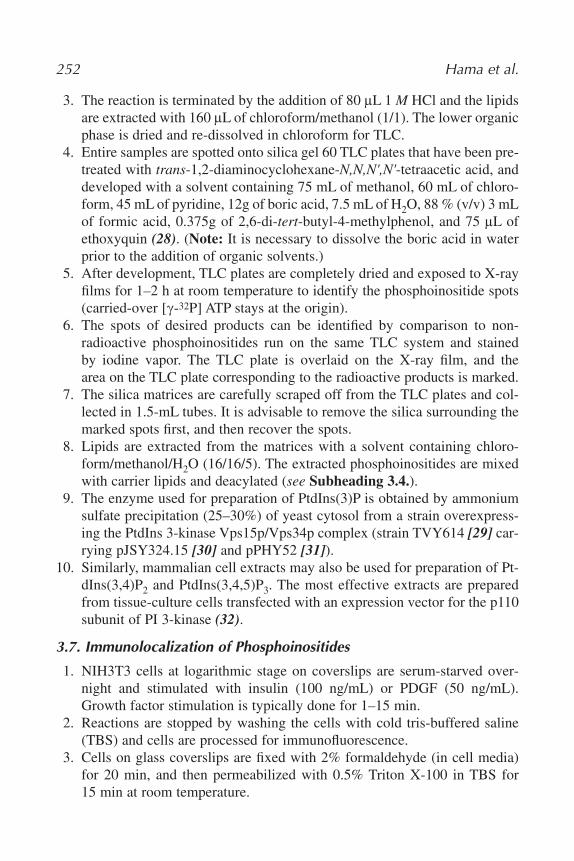
3. The reaction is terminated by the addition of 80 lL 1 M HCl and the lipidsare extracted with 160 lL of chloroform/methanol (1/1). The lower organicphase is dried and re-dissolved in chloroform for TLC.
4. Entire samples are spotted onto silica gel 60 TLC plates that have been pre-treated with trans-1,2-diaminocyclohexane-N,N,N',N'-tetraacetic acid, anddeveloped with a solvent containing 75 mL of methanol, 60 mL of chloro-form, 45 mL of pyridine, 12g of boric acid, 7.5 mL of H2O, 88 % (v/v) 3 mLof formic acid, 0.375g of 2,6-di-tert-butyl-4-methylphenol, and 75 lL ofethoxyquin (28). (Note: It is necessary to dissolve the boric acid in waterprior to the addition of organic solvents.)
5. After development, TLC plates are completely dried and exposed to X-rayfilms for 1–2 h at room temperature to identify the phosphoinositide spots(carried-over [c-32P] ATP stays at the origin).
6. The spots of desired products can be identified by comparison to non-radioactive phosphoinositides run on the same TLC system and stainedby iodine vapor. The TLC plate is overlaid on the X-ray film, and thearea on the TLC plate corresponding to the radioactive products is marked.
7. The silica matrices are carefully scraped off from the TLC plates and col-lected in 1.5-mL tubes. It is advisable to remove the silica surrounding themarked spots first, and then recover the spots.
8. Lipids are extracted from the matrices with a solvent containing chloro-form/methanol/H2O (16/16/5). The extracted phosphoinositides are mixedwith carrier lipids and deacylated (see Subheading 3.4.).
9. The enzyme used for preparation of PtdIns(3)P is obtained by ammoniumsulfate precipitation (25–30%) of yeast cytosol from a strain overexpress-ing the PtdIns 3-kinase Vps15p/Vps34p complex (strain TVY614 [29] car-rying pJSY324.15 [30] and pPHY52 [31]).
10. Similarly, mammalian cell extracts may also be used for preparation of Pt-dIns(3,4)P2 and PtdIns(3,4,5)P3. The most effective extracts are preparedfrom tissue-culture cells transfected with an expression vector for the p110subunit of PI 3-kinase (32).
3.7. Immunolocalization of Phosphoinositides
1. NIH3T3 cells at logarithmic stage on coverslips are serum-starved over-night and stimulated with insulin (100 ng/mL) or PDGF (50 ng/mL).Growth factor stimulation is typically done for 1–15 min.
2. Reactions are stopped by washing the cells with cold tris-buffered saline(TBS) and cells are processed for immunofluorescence.
3. Cells on glass coverslips are fixed with 2% formaldehyde (in cell media)for 20 min, and then permeabilized with 0.5% Triton X-100 in TBS for15 min at room temperature.
252 Hama et al.
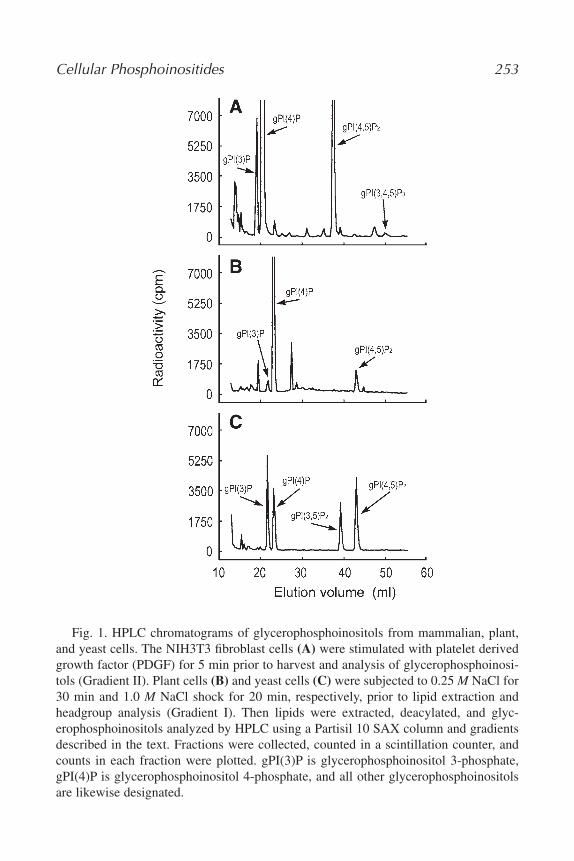
Cellular Phosphoinositides 253
Fig. 1. HPLC chromatograms of glycerophosphoinositols from mammalian, plant,and yeast cells. The NIH3T3 fibroblast cells (A) were stimulated with platelet derivedgrowth factor (PDGF) for 5 min prior to harvest and analysis of glycerophosphoinosi-tols (Gradient II). Plant cells (B) and yeast cells (C) were subjected to 0.25 M NaCl for30 min and 1.0 M NaCl shock for 20 min, respectively, prior to lipid extraction andheadgroup analysis (Gradient I). Then lipids were extracted, deacylated, and glyc-erophosphoinositols analyzed by HPLC using a Partisil 10 SAX column and gradientsdescribed in the text. Fractions were collected, counted in a scintillation counter, andcounts in each fraction were plotted. gPI(3)P is glycerophosphoinositol 3-phosphate,gPI(4)P is glycerophosphoinositol 4-phosphate, and all other glycerophosphoinositolsare likewise designated.
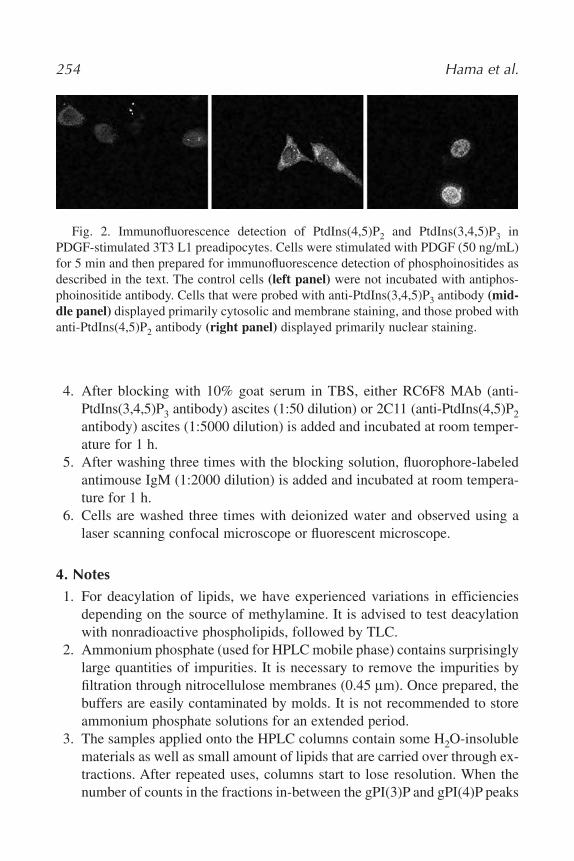
4. After blocking with 10% goat serum in TBS, either RC6F8 MAb (anti-PtdIns(3,4,5)P3 antibody) ascites (1:50 dilution) or 2C11 (anti-PtdIns(4,5)P2antibody) ascites (1:5000 dilution) is added and incubated at room temper-ature for 1 h.
5. After washing three times with the blocking solution, fluorophore-labeledantimouse IgM (1:2000 dilution) is added and incubated at room tempera-ture for 1 h.
6. Cells are washed three times with deionized water and observed using alaser scanning confocal microscope or fluorescent microscope.
4. Notes1. For deacylation of lipids, we have experienced variations in efficiencies
depending on the source of methylamine. It is advised to test deacylationwith nonradioactive phospholipids, followed by TLC.
2. Ammonium phosphate (used for HPLC mobile phase) contains surprisinglylarge quantities of impurities. It is necessary to remove the impurities byfiltration through nitrocellulose membranes (0.45 lm). Once prepared, thebuffers are easily contaminated by molds. It is not recommended to storeammonium phosphate solutions for an extended period.
3. The samples applied onto the HPLC columns contain some H2O-insolublematerials as well as small amount of lipids that are carried over through ex-tractions. After repeated uses, columns start to lose resolution. When thenumber of counts in the fractions in-between the gPI(3)P and gPI(4)P peaks
254 Hama et al.
Fig. 2. Immunofluorescence detection of PtdIns(4,5)P2 and PtdIns(3,4,5)P3 inPDGF-stimulated 3T3 L1 preadipocytes. Cells were stimulated with PDGF (50 ng/mL)for 5 min and then prepared for immunofluorescence detection of phosphoinositides asdescribed in the text. The control cells (left panel) were not incubated with antiphos-phoinositide antibody. Cells that were probed with anti-PtdIns(3,4,5)P3 antibody (mid-dle panel) displayed primarily cytosolic and membrane staining, and those probed withanti-PtdIns(4,5)P2 antibody (right panel) displayed primarily nuclear staining.
is above background (loss of baseline resolution), the guard column shouldbe replaced with a new one.
4. A new SAX column should be conditioned first by running left-over sam-ples or nonradioactive samples. For unknown reasons, a significant portionof sample is so tightly bound to a new column that it never elutes. We havealso observed that a very small portion of bound species remains boundthroughout the gradient even at 1 M ammonium phosphate. When the samegradient is run without injecting a sample, sometimes small glycerophos-phoinositol peaks elute. To avoid any interference from a previous columnrun, we typically apply two “cleaning cycles” of 10 mL linear gradient of10 mM to 1 M ammonium phosphate between each HPLC run.
5. Recently, a nonradioactive method was reported (33). In this method, gPIPsare separated by anion-exchange HPLC and detected by conductivity mea-surements. Although the apparent resolution of this procedure is not ashigh, it is less expensive and avoids the use of radioactive materials. In ad-dition, a sensitive mass assay for PtdIns(3,4,5)P3 has been reported, but thisonly works with this phosphoinositide and requires an isotope-dilutionmethod with deacylation and analysis of the Ins(1,3,4,5)P4 head group (34).A third approach is the use of matrix-assisted laser desorption/ionizationtime-of-flight mass spectrometry (MALDI-TOF MS), which has been usedfor the detection and quantification of phosphoinositides (35).
6. Phosphoinositides from cell extracts and in vitro enzyme-catalyzed reac-tions may also be analyzed by competitive displacement reactions usingtagged and/or labeled PH domains as probes. Stable complexes are formedbetween a biotinylated target lipid and an appropriate PH domain, and phos-phoinositides present in samples are detected by their ability to compete forbinding to the PH domain. The complexes are detected using time-resolvedFRET (36). This concept has been independently used to develop a competi-tive fluorescence polarization (FP)-based assay amenable to high throughputscreening. The FPassay has been used to determine activity of phosphoinosi-tide 3-kinase (PI 3-K) and the type-II SH2-domain-containing inositol5-phosphatase (SHIP2) (37). This assay is based on the interaction of specificphosphoinositide binding proteins with fluorophore-labeled phosphoinosi-tide and inositol phosphate tracers. The enzyme reaction products are de-tected by their ability to compete with the fluorescent tracers for proteinbinding, leading to an increase in the amount of free tracer and a decrease inpolarization values. The antilipid and competitive assay methodologies offernew opportunities in detection of phosphoinositide abnormalities in cancercells, discovery of new anticancer agents targeted at inhibition of PI 3-kinase, and targeted monitoring of the effects of these agents in vivo (38).
Cellular Phosphoinositides 255
AcknowledgmentsThe authors wish to thank the American Cancer Society and NIH (Grant
NS29632 to G.D.P.) for support of work at Utah State University and theUniversity of Utah, and Echelon Biosciences, for providing reagents in ourlaboratories.
References1. Hokin, M. R. and Hokin, L. E. (1953) Enzyme secretion and the incorporation of
P-32 into phospholipids of pancreas slices. J. Biol. Chem. 203, 967–977.2. Carpenter, C. L. and Cantley, L. C. (1996) Phosphoinositide kinases. Curr. Opin.
Cell Biol. 8, 153–158.3. Stoyanov, B., Volinia, S., Hanck, T., et al. (1995) Cloning and characterization of a
G protein-activated human phosphoinositide-3 kinase. Science 269, 690–693.4. Stephens, L. R., Eguinoa, A., Erdjument-Bromage, H., et al. (1997) The G beta
gamma sensitivity of a PI3K is dependent upon a tightly associated adaptor, p101.Cell 89, 105–114.
5. Hall, A. (1998) Rho GTPases and the actin cytoskeleton. Science 279, 509–514.6. Yin, H. L. and Janmey, P. A. (2003) Phosphoinositide regulation of the actin cy-
toskeleton. Annu. Rev. Physiol. 65, 761–789.7. De Camilli, P., Emr, S. D., McPherson, P. S., and Novick, P. (1996) Phosphoinosi-
tides as regulators in membrane traffic. Science 271, 1533–1539.8. Czech, M. P. (2003) Dynamics of phosphoinositides in membrane retrieval and in-
sertion. Annu. Rev. Physiol. 65, 791–8159. Irvine, R. F. (2002) Nuclear lipid signaling. Sci. STKE 2002, RE13.
10. Irvine, R. F. (2003) Nuclear lipid signalling. Nat. Rev. Mol. Cell Biol. 4, 349–361.11. Martelli, A. M., Tabellini, G., Borgatti, P., et al. (2003) Nuclear lipids: new func-
tions for old molecules? J. Cell Biochem. 88, 455–461.12. Toker, A. (2002) Phosphoinositides and signal transduction. Cell Mol. Life Sci 59,
761–779.13. Serunian, L. A., Auger, K. R., and Cantley, L. C. (1991) Identification and quan-
tification of polyphosphoinositides produced in response to platelet-derived growthfactor stimulation. Methods Enzymol. 198, 78–87.
14. Stock, S. D., Hama, H., DeWald, D. B., and Takemoto, J. Y. (1999) SEC14-dependent secretion in Saccharomyces cerevisiae. Nondependence on sphingolipidsynthesis-coupled diacylglycerol production. J. Biol. Chem. 274, 12979–12983.
15. Hama, H., Takemoto, J. Y., and DeWald, D. B. (2000) Analysis of phosphoinosi-tides in protein trafficking. Methods 20, 465–473.
16. DeWald, D. B. (2003) Measurements of cellular phosphoinositide levels in 3T3-L1adipocytes. Methods Mol. Med. 83, 145–154.
17. Balla, T., Bondeva, T., and Varnai, P. (2000) How accurately can we image inosi-tol lipids in living cells? Trends Pharmacol Sci. 21, 238–241.
18. Holz, R. W., Hlubek, M. D., Sorensen, S. D., et al. (2000) A pleckstrin homologydomain specific for phosphatidylinositol 4, 5- bisphosphate (PtdIns-4,5-P2) and
256 Hama et al.
fused to green fluorescent protein identifies plasma membrane PtdIns-4,5-P2 asbeing important in exocytosis. J. Biol. Chem. 275, 17,878–17,885.
19. Fukami, K., Matsuoka, K., Nakanishi, O., et al. (1988) Antibody to phosphatidyli-nositol 4,5-bisphosphate inhibits oncogene-induced mitogenesis. Proc. Natl. Acad.Sci. USA 85, 9057–9061.
20. Thomas, C. L., Steel, J., Prestwich, G. D., and Schiavo, G. (1999) Generation ofphosphatidylinositol-specific antibodies and their characterization. Biochem. Soc.Trans. 27, 648–652.
21. Osborne, S. L., Thomas, C. L., Gschmeissner, S., and Schiavo, G. (2001) NuclearPtdIns(4,5)P2 assembles in a mitotically regulated particle involved in pre-mRNAsplicing. J. Cell Sci. 114, 2501–2511.
22. Chen, R., Kang, V. H., Chen, J., et al. (2002) A monoclonal antibody to visualizePtdIns(3,4,5)P3 in cells. J. Histochem. Cytochem. 50, 697–708.
23. Niswender, K. D., Gallis, B., Blevins, J. E., et al. (2003) Immunocytochemical de-tection of phosphatidylinositol 3-kinase activation by insulin and leptin. J. His-tochem. Cytochem. 51, 275–283.
24. Burke, D., Dawson, D., and Stearns, T. (2000) Methods in Yeast Genetics 2000: ACold Spring Harbor Laboratory Course Manual. Cold Spring Harbor LaboratoryPress, Cold Spring Harbor, New York.
25. Dove, S. K., Cooke, F. T., Douglas, M. R., et al. (1997) Osmotic stress activatesphosphatidylinositol-3,5-bisphosphate synthesis. Nature 390, 187–192.
26. Hanson, B. A. and Lester, R. L. (1980) The extraction of inositol-containing phos-pholipids and phosphatidylcholine from Saccharomyces cerevisiae and Neurosporacrassa. J. Lipid Res. 21, 309–315.
27. Stack, J. H., DeWald, D. B., Takegawa, K., and Emr, S. D. (1995) Vesicle-mediatedprotein transport: regulatory interactions between the Vps15 protein kinase and theVps34 PtdIns 3-kinase essential for protein sorting to the vacuole in yeast. J. CellBiol. 129, 321–334.
28. Walsh, J. P., Caldwell, K. K., and Majerus, P. W. (1991) Formation of phos-phatidylinositol 3-phosphate by isomerization from phosphatidylinositol 4-phos-phate. Proc. Natl. Acad. Sci. USA 88, 9184–9187.
29. Vida, T. A. and Emr, S. D. (1995) A new vital stain for visualizing vacuolar mem-brane dynamics and endocytosis in yeast. J. Cell Biol. 128, 779–792.
30. Stack, J. H., Herman, P. K., Schu, P. V., and Emr, S. D. (1993) A membrane-associated complex containing the Vps15 protein kinase and the Vps34 PI 3-kinaseis essential for protein sorting to the yeast lysosome-like vacuole. EMBO J. 12,2195–2204.
31. Herman, P. K. and Emr, S. D. (1990) Characterization of VPS34, a gene requiredfor vacuolar protein sorting and vacuole segregation in Saccharomyces cerevisiae.Mol. Cell Biol. 10, 6742–6754.
32. Katagiri, H., Asano, T., Ishihara, H., et al. (1996) Overexpression of catalytic sub-unit p110alpha of phosphatidylinositol 3- kinase increases glucose transport activ-ity with translocation of glucose transporters in 3T3-L1 adipocytes. J. Biol. Chem.271, 16,987–16,990.
Cellular Phosphoinositides 257
33. Nasuhoglu, C., Feng, S., Mao, J., et al. (2002) Nonradioactive analysis of phos-phatidylinositides and other anionic phospholipids by anion-exchange high-per-formance liquid chromatography with suppressed conductivity detection. Anal.Biochem. 301, 243–254.
34. van der Kaay, J., Batty, I. H., Cross, D. A., et al. (1997) A novel, rapid, and highlysensitive mass assay for phosphatidylinositol 3,4,5-trisphosphate (PtdIns(3,4,5)P3)and its application to measure insulin-stimulated PtdIns(3,4,5)P3 production in ratskeletal muscle in vivo. J. Biol. Chem. 272, 5477–5481.
35. Muller, M., Schiller, J., Petkovic, M., et al. (2001) Limits for the detection of (poly-)phosphoinositides by matrix-assisted laser desorption and ionization time-of-flight mass spectrometry (MALDI-TOF MS). Chem. Phys. Lipids 110, 151–164.
36. Gray, A., Olsson, H., Batty, I. H., et al. (2003) Nonradioactive methods for the assayof phosphoinositide 3-kinases and phosphoinositide phosphatases and selective de-tection of signaling lipids in cell and tissue extracts. Anal. Biochem. 313, 234–245.
37. Drees, B. E., Weipert, A., Hudson, H., et al. (2003) Competitive fluorescence po-larization assays for the detection of phosphoinositide kinase and phosphatase ac-tivity. Comb. Chem. High Throughput Screen 6, 321–330.
38. Prestwich, G. D., Chen, R., Feng, L., et al. (2002) In situ detection of phospholipidand phosphoinositide metabolism. Adv. Enzyme Regul. 42, 19–38.
258 Hama et al.
18
Measuring Dynamic Changes in cAMP UsingFluorescence Resonance Energy Transfer
Sandrine Evellin, Marco Mongillo, Anna Terrin, Valentina Lissandron,and Manuela Zaccolo
SummarycAMP is a ubiquitous second messenger that controls numerous cellular events including
movement, growth, metabolism, contraction, and synaptic plasticity. With the emerging conceptof compartmentalization of cAMP-dependent signaling, a detailed study of the spatio-temporalintracellular dynamics of cAMP is required. Here we describe a new methodology for monitor-ing fluctuations of cAMP in living cells, based on the use of a genetically encoded biosensor. Theregulatory and catalytic subunits of the main cAMP effector, the protein kinase A (PKA), fusedwith two suitable green fluorescent protein (GFP) mutants is used for measuring changes in flu-orescence resonance energy transfer (FRET) that correlate with changes in intracellular cAMPlevels. This method allows the study of cAMP fluctuations in living cells with high resolutionboth in time and in space.
Key Words: cAMP; biosensor; protein kinase A (PKA); signal transduction; green fluorescentproteins; cell imaging; fluorescence resonance energy transfer (FRET).
1. IntroductioncAMP dependent signals represent one of the major intracellular-transduction
pathways and are involved in numerous cellular events including movement,growth, metabolism, contraction, and synaptic plasticity (1). Most of cAMP cel-lular effects are mediated by protein kinase A (PKA), an holotetramer composedof two regulatory (R) and two catalytic (C) subunits. Activation of PKA by
From: Methods in Molecular Biology, vol. 284:Signal Transduction Protocols
Edited by: R. C. Dickson © Humana Press Inc., Totowa, NJ
259
cAMP induces a conformational change in the R subunits and, consequently, thedissociation of the C subunits from the R subunits (2). The liberated C subunitsboth phosphorylate a large variety of cytoplasmic substrates and diffuse into thenucleus, where they modify transcription processes by phosphorylating severaltranscription factors (3,4). cAMP, therefore, is capable of transmitting a largevariety of different signals, but how such diversity is encoded by a single sec-ond messenger is still largely to be explained. In recent years, evidence has beenaccumulating that the specificity of response to a given stimulus is conferrednot only by a tight regulation of the temporal dynamics of the signaling mole-cules, but also by a precise spatial organization of the signaling pathways (5).In particular, the view is emerging that cAMP/PKA mediated signaling is highlycompartmentalized: PKA is anchored via A kinase anchoring proteins (AKAPs)to specific subcellular structures and cAMP itself can be generated in discretepools that, in turn, can selectively activate defined PKA subsets (6–10).
1.1. Imaging of cAMP in Single Living Cell
Commonly, total cellular cAMP levels are measured in cell lysates with ra-dioimmunoassays. Such an approach offers very poor temporal resolution and nospatial resolution and is therefore inadequate to study the fine details of the cAMPdependent signaling pathway (11,12). An approach to image the dynamics of freecAMP in single living cells is based on microinjection of fluorescein-labeledPKA C-a subunits and rhodamine-labeled PKA RI-b subunits (13). Such ap-proach relies on fluorescence resonance energy transfer (FRET), a physicochem-ical phenomenon whereby the excited state energy of a donor fluorophore can betransferred to an acceptor fluorophore, which can then emit its own characteristicfluorescence (14–17). With FRET, the intensity of the donor’s fluorescence emis-sion decreases and concomitantly there is an increase in the acceptor’s emissionintensity. For FRET to occur, the acceptor must absorb at roughly the same wave-lengths as the donor emits. Moreover, FRET depends on the antiparallel align-ment of the donor and acceptor fluorophores electric dipoles and is highly sensi-tive to the donor-acceptor distance (between 10 Å and 100 Å). In fact, FRETefficiency decreases with the sixth power of the distance between donor and ac-ceptor, and therefore a minimal perturbation of the spatial relationship betweenthe two fluorophores can drastically alter the efficiency of energy transfer. As aconsequence, FRET is one of the few tools available for measuring nanometerscale distances and changes in distances, both in vitro and in vivo. The fluores-cein- and rhodamine-labeled probe for cAMP has not found a wide application,owing to some technical drawbacks: it requires microinjection of a very largeprotein complex (approx 170-kD) and such a procedure is not applicable to allcell types. Moreover, a high amount of the cAMP-biosensor needs to be injected,resulting in unequal distribution of the probe and in toxicity. A further problem is
260 Evellin et al.
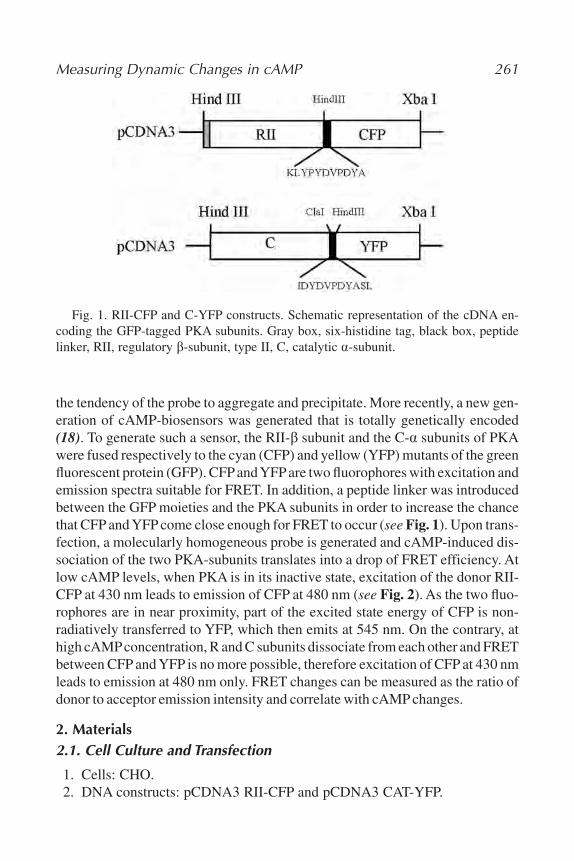
Measuring Dynamic Changes in cAMP 261
Fig. 1. RII-CFP and C-YFP constructs. Schematic representation of the cDNA en-coding the GFP-tagged PKA subunits. Gray box, six-histidine tag, black box, peptidelinker, RII, regulatory b-subunit, type II, C, catalytic a-subunit.
the tendency of the probe to aggregate and precipitate. More recently, a new gen-eration of cAMP-biosensors was generated that is totally genetically encoded(18). To generate such a sensor, the RII-b subunit and the C-a subunits of PKAwere fused respectively to the cyan (CFP) and yellow (YFP) mutants of the greenfluorescent protein (GFP). CFP and YFP are two fluorophores with excitation andemission spectra suitable for FRET. In addition, a peptide linker was introducedbetween the GFP moieties and the PKA subunits in order to increase the chancethat CFP and YFP come close enough for FRET to occur (see Fig. 1). Upon trans-fection, a molecularly homogeneous probe is generated and cAMP-induced dis-sociation of the two PKA-subunits translates into a drop of FRET efficiency. Atlow cAMP levels, when PKA is in its inactive state, excitation of the donor RII-CFP at 430 nm leads to emission of CFP at 480 nm (see Fig. 2). As the two fluo-rophores are in near proximity, part of the excited state energy of CFP is non-radiatively transferred to YFP, which then emits at 545 nm. On the contrary, athigh cAMPconcentration, R and C subunits dissociate from each other and FRETbetween CFP and YFP is no more possible, therefore excitation of CFP at 430 nmleads to emission at 480 nm only. FRET changes can be measured as the ratio ofdonor to acceptor emission intensity and correlate with cAMP changes.
2. Materials2.1. Cell Culture and Transfection
1. Cells: CHO.2. DNA constructs: pCDNA3 RII-CFP and pCDNA3 CAT-YFP.
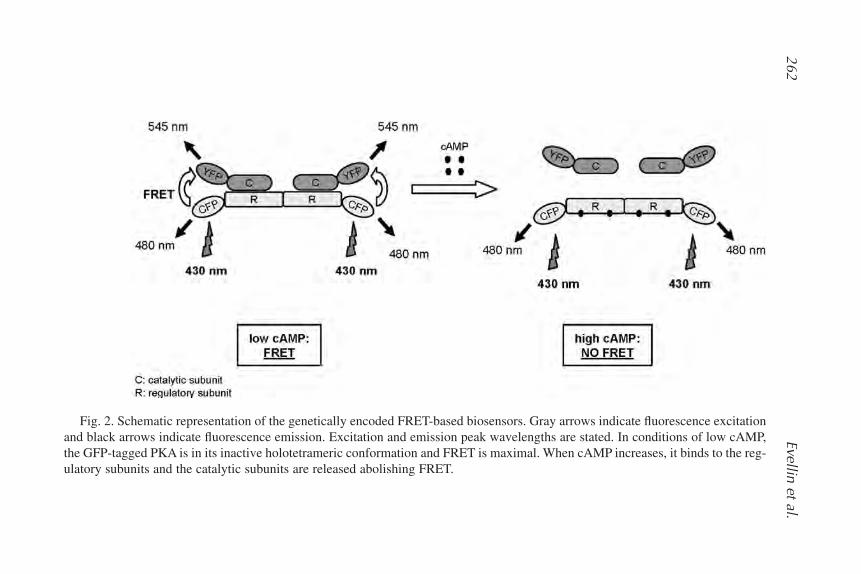
262Evellin et al.
Fig. 2. Schematic representation of the genetically encoded FRET-based biosensors. Gray arrows indicate fluorescence excitationand black arrows indicate fluorescence emission. Excitation and emission peak wavelengths are stated. In conditions of low cAMP,the GFP-tagged PKA is in its inactive holotetrameric conformation and FRET is maximal. When cAMP increases, it binds to the reg-ulatory subunits and the catalytic subunits are released abolishing FRET.
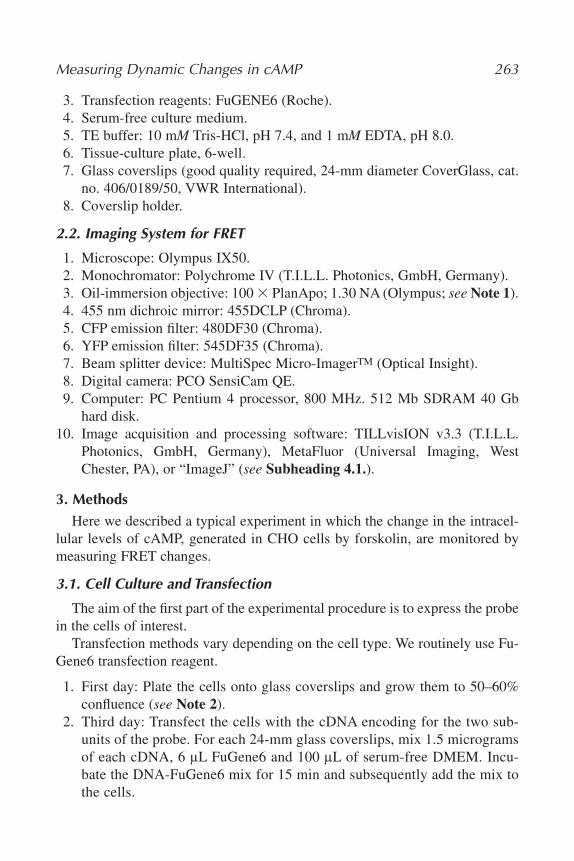
3. Transfection reagents: FuGENE6 (Roche).4. Serum-free culture medium.5. TE buffer: 10 mM Tris-HCl, pH 7.4, and 1 mM EDTA, pH 8.0.6. Tissue-culture plate, 6-well.7. Glass coverslips (good quality required, 24-mm diameter CoverGlass, cat.
no. 406/0189/50, VWR International).8. Coverslip holder.
2.2. Imaging System for FRET
1. Microscope: Olympus IX50.2. Monochromator: Polychrome IV (T.I.L.L. Photonics, GmbH, Germany).3. Oil-immersion objective: 100 � PlanApo; 1.30 NA (Olympus; see Note 1).4. 455 nm dichroic mirror: 455DCLP (Chroma).5. CFP emission filter: 480DF30 (Chroma).6. YFP emission filter: 545DF35 (Chroma).7. Beam splitter device: MultiSpec Micro-ImagerTM (Optical Insight).8. Digital camera: PCO SensiCam QE.9. Computer: PC Pentium 4 processor, 800 MHz. 512 Mb SDRAM 40 Gb
hard disk.10. Image acquisition and processing software: TILLvisION v3.3 (T.I.L.L.
Photonics, GmbH, Germany), MetaFluor (Universal Imaging, WestChester, PA), or “ImageJ” (see Subheading 4.1.).
3. MethodsHere we described a typical experiment in which the change in the intracel-
lular levels of cAMP, generated in CHO cells by forskolin, are monitored bymeasuring FRET changes.
3.1. Cell Culture and Transfection
The aim of the first part of the experimental procedure is to express the probein the cells of interest.
Transfection methods vary depending on the cell type. We routinely use Fu-Gene6 transfection reagent.
1. First day: Plate the cells onto glass coverslips and grow them to 50–60%confluence (see Note 2).
2. Third day: Transfect the cells with the cDNA encoding for the two sub-units of the probe. For each 24-mm glass coverslips, mix 1.5 microgramsof each cDNA, 6 lL FuGene6 and 100 lL of serum-free DMEM. Incu-bate the DNA-FuGene6 mix for 15 min and subsequently add the mix tothe cells.
Measuring Dynamic Changes in cAMP 263
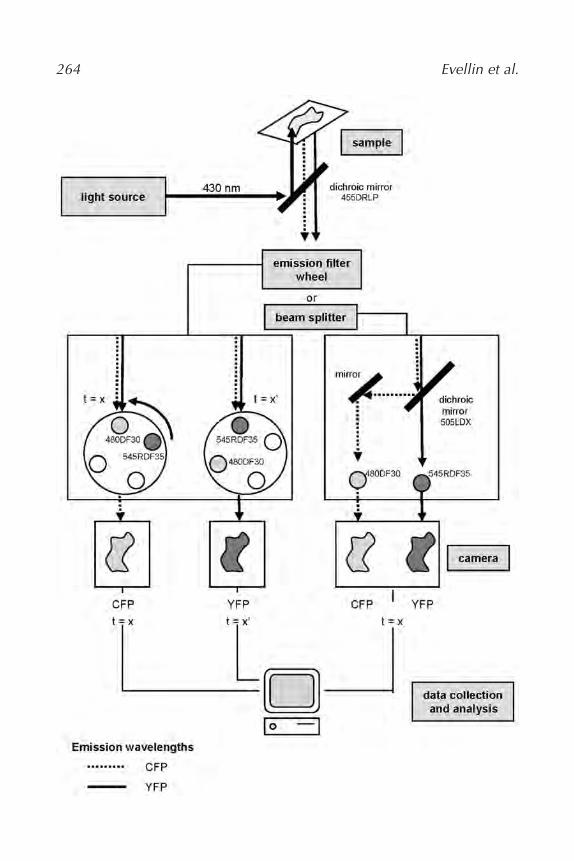
264 Evellin et al.
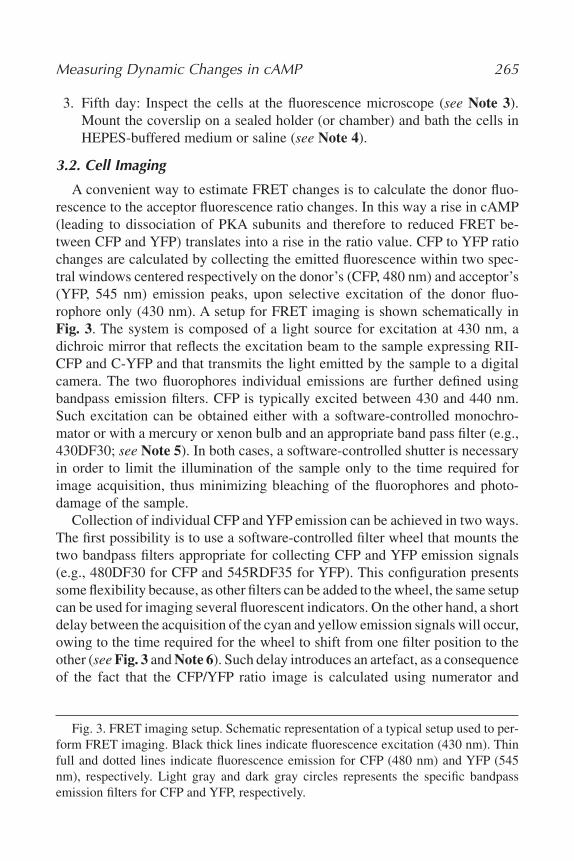
3. Fifth day: Inspect the cells at the fluorescence microscope (see Note 3).Mount the coverslip on a sealed holder (or chamber) and bath the cells inHEPES-buffered medium or saline (see Note 4).
3.2. Cell Imaging
A convenient way to estimate FRET changes is to calculate the donor fluo-rescence to the acceptor fluorescence ratio changes. In this way a rise in cAMP(leading to dissociation of PKA subunits and therefore to reduced FRET be-tween CFP and YFP) translates into a rise in the ratio value. CFP to YFP ratiochanges are calculated by collecting the emitted fluorescence within two spec-tral windows centered respectively on the donor’s (CFP, 480 nm) and acceptor’s(YFP, 545 nm) emission peaks, upon selective excitation of the donor fluo-rophore only (430 nm). A setup for FRET imaging is shown schematically inFig. 3. The system is composed of a light source for excitation at 430 nm, adichroic mirror that reflects the excitation beam to the sample expressing RII-CFP and C-YFP and that transmits the light emitted by the sample to a digitalcamera. The two fluorophores individual emissions are further defined usingbandpass emission filters. CFP is typically excited between 430 and 440 nm.Such excitation can be obtained either with a software-controlled monochro-mator or with a mercury or xenon bulb and an appropriate band pass filter (e.g.,430DF30; see Note 5). In both cases, a software-controlled shutter is necessaryin order to limit the illumination of the sample only to the time required forimage acquisition, thus minimizing bleaching of the fluorophores and photo-damage of the sample.
Collection of individual CFP and YFP emission can be achieved in two ways.The first possibility is to use a software-controlled filter wheel that mounts thetwo bandpass filters appropriate for collecting CFP and YFP emission signals(e.g., 480DF30 for CFP and 545RDF35 for YFP). This configuration presentssome flexibility because, as other filters can be added to the wheel, the same setupcan be used for imaging several fluorescent indicators. On the other hand, a shortdelay between the acquisition of the cyan and yellow emission signals will occur,owing to the time required for the wheel to shift from one filter position to theother (see Fig. 3 and Note 6). Such delay introduces an artefact, as a consequenceof the fact that the CFP/YFP ratio image is calculated using numerator and
Measuring Dynamic Changes in cAMP 265
Fig. 3. FRET imaging setup. Schematic representation of a typical setup used to per-form FRET imaging. Black thick lines indicate fluorescence excitation (430 nm). Thinfull and dotted lines indicate fluorescence emission for CFP (480 nm) and YFP (545nm), respectively. Light gray and dark gray circles represents the specific bandpassemission filters for CFP and YFP, respectively.
denominator intensity values that are not acquired at the same time. Such artefactis particularly relevant when fast kinetics for cAMPchanges are expected. Also, avery obvious misalignment artefact can be generated when imaging cells thatmove during the experiment (such as contracting myocytes), resulting in the ac-quisition of CFP and YFP images that are not perfectly superimposable for ratiocalculation. A possible alternative to the filter wheel is the use of a beam splitter.With such a device, it is possible to acquire simultaneously CFP and YFP emis-sions on the two halves of the camera sensor, by means of a 505 nm dichroic mir-ror (505LDX) that splits emitted light into two spectrally separate, independentbeams. The reflected beam (wavelengths 505 nm) and the transmitted beam(wavelength �505 nm) are then further defined by the bandpass-emission filters480DF30 and 545DF35 to give, respectively, CFP and YFP emission images onthe detector. For image acquisition, a high sensitivity, low intrinsic noise, digitalcamera must be used, in order to decrease integration time. A scientific-grade,cooled charge-coupled-device (CCD) digital camera, 12 bit, is normally thechoice.
3.2.1. Set Protocol
The aim of the experiment is to record a series of images of CFPand YFPemis-sion intensities in a time-course and the following parameters have to be defined:
1. Set the exposure time. This corresponds to the time in which the sample is il-luminated and the camera acquires CFP and YFP emission signals. Oneshould aim at generating images with signal to background ratio �3. Indica-tively, exposure time is normally between 50 ms and 300 ms (see Note 7).
2. Set the delay time. This corresponds to the time between two consecutiveilluminations of the sample. During this time, the shutter controlling the in-cident light has to be closed in order to minimize bleaching of the fluo-rophores. The duration of the delay time depends on the kinetics expected.We generally use delay times �500 ms (see Note 8).
3. Set the number of acquisitions.4. Set the camera binning. Binning 2 or 4 is normally the choice. A higher bin-
ning increases the intensity of the signal at the expense of resolution.
3.2.2. Run Protocol
During this phase of the experiment, the chosen cell is excited at the appro-priate wavelength and the emitted CFP to YFP fluorescence is collected by thecamera. Most types of software allow a live display of the mean fluorescenceintensities for each fluorophore. A typical time course of CFP and YFP emis-sion intensities, acquired upon stimulation of the transfected cell with forskolin,is illustrated in Fig. 4D.
266 Evellin et al.
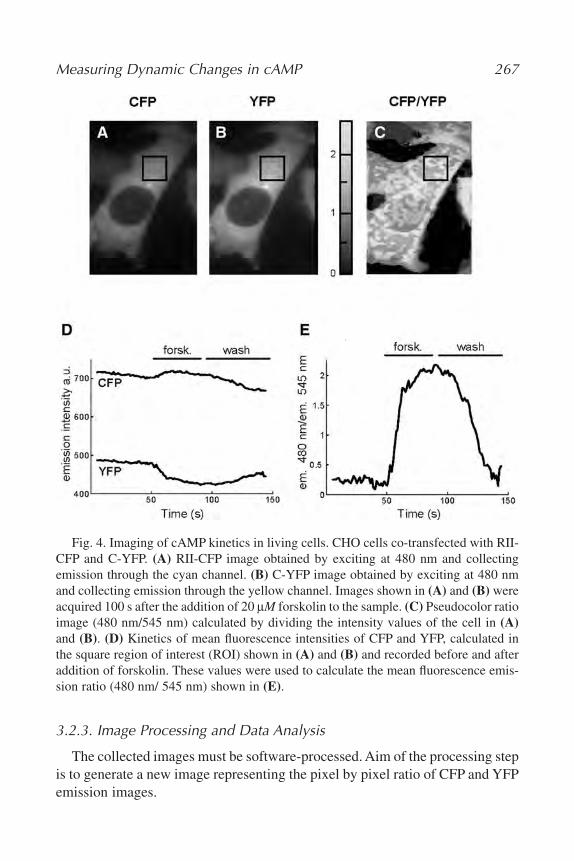
3.2.3. Image Processing and Data Analysis
The collected images must be software-processed. Aim of the processing stepis to generate a new image representing the pixel by pixel ratio of CFP and YFPemission images.
Measuring Dynamic Changes in cAMP 267
Fig. 4. Imaging of cAMP kinetics in living cells. CHO cells co-transfected with RII-CFP and C-YFP. (A) RII-CFP image obtained by exciting at 480 nm and collectingemission through the cyan channel. (B) C-YFP image obtained by exciting at 480 nmand collecting emission through the yellow channel. Images shown in (A) and (B) wereacquired 100 s after the addition of 20 lM forskolin to the sample. (C) Pseudocolor ratioimage (480 nm/545 nm) calculated by dividing the intensity values of the cell in (A)and (B). (D) Kinetics of mean fluorescence intensities of CFP and YFP, calculated inthe square region of interest (ROI) shown in (A) and (B) and recorded before and afteraddition of forskolin. These values were used to calculate the mean fluorescence emis-sion ratio (480 nm/ 545 nm) shown in (E).
1. If the system is equipped with a beam splitter: Split and align CFP and YFPimages, in order to obtain two distinct and superimposable images. If thesystem is equipped with a filter wheel, CFP and YFP image acquisition arealready in two separate stacks.
2. Subtract the background noise to each of the collected images. Such oper-ation removes the out-of-the-cell fluorescence and the intrinsic electronicnoise of the camera, reducing artifacts and increasing the dynamic range ofthe measure (see Note 9).
3. Calculate the ratio between CFP and YFP images. The value of each pixelin the ratio image corresponds to the CFP/YFP ratio in the correspondingpixels of the raw images (see Fig. 4C and Note 10). Such ratiomeric im-ages are normally displayed in pseudocolor, according to a user-definedlookup table that assigns to each ratio value a different color. Draw regionsof interest (ROIs) in the cell compartment of interest, in order to measurethe average ratio kinetics within that region, as shown in Fig. 4C, and E.
4. Notes1. Care must be taken in the choice of the objective: Regardless of the magnifica-
tion, one should choose a high-quality-high-numerical aperture (�1,1 NA)objective, in order to achieve optimal collection of fluorescence emission.
2. Cell concentration should be such that cells are not confluent when the ex-periment is performed. Confluent cells may downregulate their surface re-ceptors and, as a consequence, may not respond to hormonal stimuli. Foradherent cells, enough time should be allowed for the cells to settle on thecoverslip, for optimal efficiency; therefore, we normally transfect the cells36–48 h after plating.
3. Virtually any epifluorescence microscope can be used for FRET imaging.An inverted microscope is usually preferable, because a top-open experi-mental chamber is more accessible for addition of compounds to the sam-ple. An upright microscope can also be used, but it requires a closed ex-perimental chamber making the setup less flexible.
4. Culture medium containing phenol-red is not recommended because it isautofluorescent and measuring FRET in such medium would therefore in-crease the background.
5. A new xenon or mercury bulb generates a more intense light beam, as com-pared to bulbs that have been used for several hours. This can cause veryrapid photobleaching and photodamage of the sample. To minimize damage,it is appropriate to use a neutral density filter in the excitation beam path.
6. In the case of a set up equipped with a filter wheel, it is possible to mini-mize the delay between the acquisition of the cyan and yellow emission sig-nals by mounting the emission filters next to each other.
268 Evellin et al.
7. The exposure time depends on the fluorescence intensity of the sample. Oneshould tend to select for observation cells that are bright enough to allow300 ms exposure time. Higher exposure time and the consequent overillumination of the cell induces a quicker irreversible photodestruction(bleaching) of the fluorophores.
8. Faster acquisition rate can be difficult to achieve. Indeed fast repetitiveillumination of the sample accelerates bleaching and may induce a changein the fluorescent properties of the fluorophores (photoisomerisation) thatcan lead to artefacts.
9. Background fluorescence is owing to intrinsic noise of the camera and tocells’ autofluorescence. Background subtraction is particularly important ifthe analyzed cell presents a low fluorescence level. In this case a large pro-portion of the total signal is owing to background signal that will notchange during the experiment. Because background intensity may be dif-ferent in the cyan and yellow channels, this results in artefactual ratio values.
10. The CFP/YFP ratio is a pure number, the absolute value of which dependsstrictly on the experimental conditions and setup. The ratiometric meas-urement corrects, within a certain limit, for uneven distribution of the probeor changes in the focal plane.
4.1. On-Line Links
MultiSpec Micro-ImagerTM E-mail: [email protected] web-site: http://www.olympus.comTILLvisION web-site: http://www.till-photonics.de/software
E-mail: [email protected]. Photonics web-site: http://www.till-photonics.de
E-mail service: [email protected]: http://www.chroma.comOmega Opticals: http://www.omegafilters.comImageJ: http://rsb.info.nih.gov/ii/
AcknowledgmentsData in this manuscript is drawn from research funded by Telethon Italy and
the European Commission (project QLK3-CT-2002-02149).
References1. Beavo, J. A. and Brunton, L. L. (2002) Cyclic nucleotide research: still expanding
after half a century. Nat. Rev. Mol. Cell Biol. 3, 710–718.2. Taylor, S. S., Buechler, J. A. and Yonemoto, W. (1990) cAMP-dependent protein
kinase: framework for a diverse family of regulatory enzymes. Annu. Rev. Biochem.59, 971–1005.
Measuring Dynamic Changes in cAMP 269
3. Walsh, D. A. and Van Patten, S. M. (1994) Multiple pathway signal transduction bythe cAMP-dependent protein kinase. FASEB J. 8, 1227–1236.
4. Lee, K. A. (1991) Transcriptional regulation by cAMP. Curr. Opin. Cell Biol. 3,953–959.
5. Zaccolo, M., Magalhaes, P. and Pozzan, T. (2002) Compartmentalisation of cAMPand Ca2+ signals. Curr. Opin. Cell Biol. 14, 160–166.
6. Hempel, C. M., Vincent, P., Adams, S. R, et al.. (1996) Spatio-temporal dynamicsof cyclic AMP signals in an intact neural circuitm. Nature 384, 166–169.
7. Rich, T. C., Fagan, K. A., Tse, T. E., et al. (2001) A uniform extracellular stimulustriggers distinct cAMP signals in different compartments of a simple cell. Proc.Natl. Acad. Sci. USA. 98, 13,049–13,054.
8. Griffioen, G. and Thevelein, J. M. (2002) Molecular mechanisms controlling thelocalisation of protein kinase A. Curr. Genet. 41, 199–207.
9. Kapiloff, M. S. (2002) Contributions of protein kinase A anchoring proteins to com-partmentation of cAMP signaling in the heart. Mol. Pharmacol. 62, 193–199.
10. Zaccolo, M. and Pozzan, T. (2002) Discrete microdomains with high concentrationof cAMP in stimulated rat neonatal cardiac myocytes. Science 295, 1711–1715.
11. Zaccolo, M. and Pozzan, T. (2003) CAMP and Ca2+ interplay: a matter of oscilla-tion patterns. Trends Neurosci. 26, 53–55.
12. Schwartz, J. H. (2001) The many dimensions of cAMP signaling. Proc. Natl. Acad.Sci. USA. 98, 13,482–13,484.
13. Adams, S. R., Harootunian, A. T., Buechler, Y. J., et al. (1991) Fluorescence ratioimaging of cyclic AMP in single cells. Nature 349, 694–697.
14. Miyawaki, A. and Tsien, R. Y. (2000) Monitoring protein conformations and inter-actions by fluorescence resonance energy transfer between mutants of green fluo-rescent protein. Methods Enzymol. 327, 472–500.
15. Selvin, P. R. (2000) The renaissance of fluorescence resonance energy transfer. Nat.Struct. Biol. 7, 730–734.
16. Zaccolo, M. and Pozzan, T. (2000) Imaging signal transduction in living cells withGFP-based probes. IUBMB Life 49, 375–379.
17. Pozzan, T., Mongillo, M., Rudolf, R. (2003) Investigating signal transduction withgenetically encoded fluorescent probes. Eur. J. Biochem. 270, 2343–2352.
18. Zaccolo, M., De Giorgi, F., Cho, C. Y., et al. (2000) A genetically encoded, fluo-rescent indicator for cyclic AMP in living cells. Nat. Cell Biol. 2, 25–29.
270 Evellin et al.
19
In Vivo Detection of Protein–Protein Interaction in Plant Cells Using BRET
Chitra Subramanian, Yao Xu, Carl Hirschie Johnson, and Albrecht G. von Arnim
SummaryThe emerging technique of bioluminescence resonance energy transfer (BRET) allows us to
detect protein interactions in live cells and in real time, thus providing a new window into cellu-lar signal transduction processes. We present experimental protocols for expressing fusion pro-teins between luciferase and fluorescent proteins that are the basis for BRET measurement, aswell as for measuring and imaging BRET in a variety of cell types. Despite our focus on plantcells, the techniques described here are easily adaptable to other cell systems that have yet to ben-efit from the BRET technique.
Key Words: Bioluminescence; protein–protein interaction; live imaging; Arabidopsis; yellowfluorescent protein; Renilla luciferase; coelenterazine.
1. Introduction
Protein interactions are important for coordinating cellular signaling events aswell as metabolic functions in any cell. Numerous techniques have been devel-oped to detect and study protein–protein interactions either in vitro or in vivo.Among the more widely used in vitro methods are co-immunoprecipitation, fil-ter binding, surface plasmon resonance spectroscopy, and pull-down assays (1).Unfortunately, it is often difficult to verify one underlying premise for such invitro assays, namely, that the interacting proteins are extracted or present in their
From: Methods in Molecular Biology, vol. 284:Signal Transduction Protocols
Edited by: R. C. Dickson © Humana Press Inc., Totowa, NJ
271
native state. Among the in vivo methods, the yeast two-hybrid assay has becomeimmensely popular because it lends itself to the selection of interacting proteinsfrom a library of partner proteins. However, even this elegant and powerful tech-nique has its drawbacks. For example, the interaction is tested only in thenucleus of a yeast cell. Moreover, interactions that depend on cellular compart-mentalization or on more than two interaction partners are not always detectableby this method. Finally, the yeast two hybrid assay is based on reporter-gene ex-pression as an indirect readout. The exquisite sensitivity afforded by this featurealso renders the assay less than quantitative and prone to false positive results.
A number of in vivo assays are variations on the theme of fragment com-plementation (2–4). These assays may be less sensitive and thus less prone tofalse-positive results than assays including a reporter gene. However, fragmentcomplementation may not provide a real-time readout of the interaction.
Interaction assays based on direct and physical resonance energy transfer be-tween two compatible interaction partners can eliminate some of the disadvan-tages of indirect two-hybrid based methods. Bioluminescence resonance energytransfer (BRET) is a nondestructive in vivo assay for the real time detection ofprotein interactions (5). In the jellyfish Aequorea victoria, the blue luminescenceof the “donor” protein aequorin is quenched by resonance energy transfer to anassociated “acceptor” protein, green fluorescent protein (GFP), followed byemission of a photon according to the emission spectrum of GFP (6).
In general, BRET is defined as radiationless energy transfer between a lu-ciferase donor and a fluorescent protein acceptor. BRET was first developedinto a tool for protein interaction studies by fusing one partner protein to theblue light-emitting luciferase from the sea pansy Renilla (RLUC) and a secondpartner protein to yellow fluorescent protein (YFP); (5,7). BRET is detectedonly when RLUC and YFP are brought into close proximity by a protein inter-action between their covalently attached fusion partners (Fig. 1).
Since its establishment in Escherichia coli, BRET has been applied elegantlyin mammalian cells to monitor protein–protein interactions in vivo (8), in par-ticular to follow temporal changes in the ligand-dependent conformation,dimerization, or early signal-transduction events of G–protein coupled recep-tors (9–18). However, applications of BRET in mammalian cells beyond theG–protein coupled receptors are rare (19).
In principle, BRET is closely related to fluorescence resonance energy trans-fer (FRET) between fluorescent proteins such as cyan fluorescent protein (CFP)and YFP, with the exception that the photon donor for FRET is a fluorescent pro-tein (e.g., CFP) rather than a luciferase (20). For both BRET and FRET alike, theacceptor needs to be located within about 50Å of the photon donor and the emis-sion spectrum of the donor must overlap with the excitation spectrum of theacceptor. Both FRET and BRET are suitable for real time in vivo measurements
272 Subramanian et al.
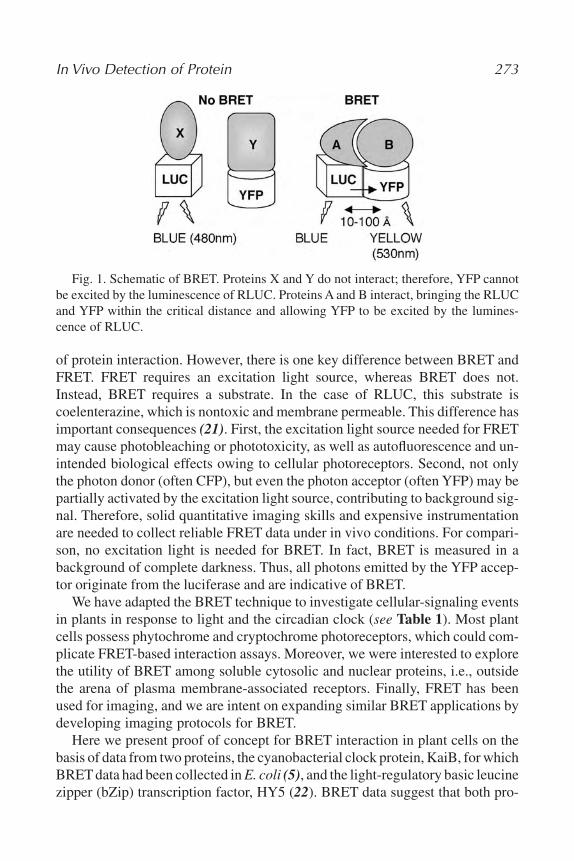
In Vivo Detection of Protein 273
Fig. 1. Schematic of BRET. Proteins X and Y do not interact; therefore, YFP cannotbe excited by the luminescence of RLUC. Proteins A and B interact, bringing the RLUCand YFP within the critical distance and allowing YFP to be excited by the lumines-cence of RLUC.
of protein interaction. However, there is one key difference between BRET andFRET. FRET requires an excitation light source, whereas BRET does not.Instead, BRET requires a substrate. In the case of RLUC, this substrate iscoelenterazine, which is nontoxic and membrane permeable. This difference hasimportant consequences (21). First, the excitation light source needed for FRETmay cause photobleaching or phototoxicity, as well as autofluorescence and un-intended biological effects owing to cellular photoreceptors. Second, not onlythe photon donor (often CFP), but even the photon acceptor (often YFP) may bepartially activated by the excitation light source, contributing to background sig-nal. Therefore, solid quantitative imaging skills and expensive instrumentationare needed to collect reliable FRET data under in vivo conditions. For compari-son, no excitation light is needed for BRET. In fact, BRET is measured in abackground of complete darkness. Thus, all photons emitted by the YFP accep-tor originate from the luciferase and are indicative of BRET.
We have adapted the BRET technique to investigate cellular-signaling eventsin plants in response to light and the circadian clock (see Table 1). Most plantcells possess phytochrome and cryptochrome photoreceptors, which could com-plicate FRET-based interaction assays. Moreover, we were interested to explorethe utility of BRET among soluble cytosolic and nuclear proteins, i.e., outsidethe arena of plasma membrane-associated receptors. Finally, FRET has beenused for imaging, and we are intent on expanding similar BRET applications bydeveloping imaging protocols for BRET.
Here we present proof of concept for BRET interaction in plant cells on thebasis of data from two proteins, the cyanobacterial clock protein, KaiB, for whichBRET data had been collected in E. coli (5), and the light-regulatory basic leucinezipper (bZip) transcription factor, HY5 (22). BRET data suggest that both pro-
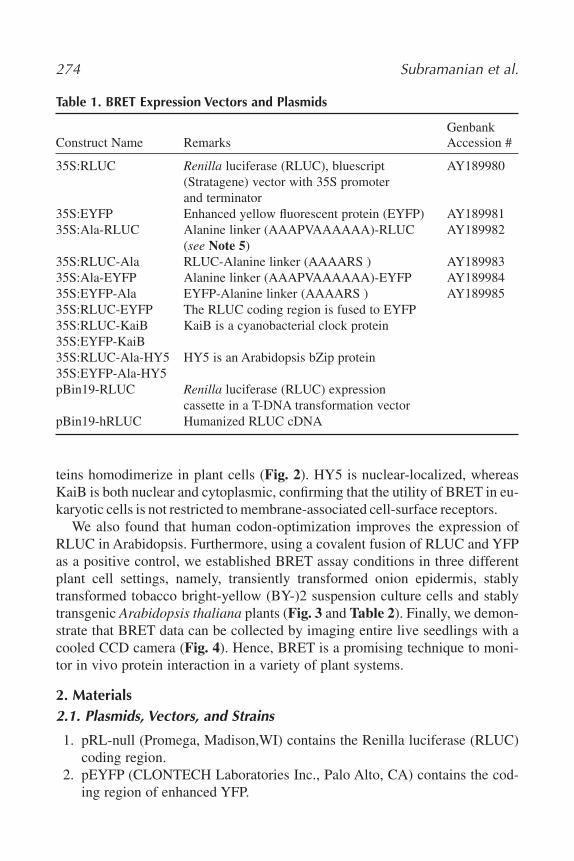
teins homodimerize in plant cells (Fig. 2). HY5 is nuclear-localized, whereasKaiB is both nuclear and cytoplasmic, confirming that the utility of BRET in eu-karyotic cells is not restricted to membrane-associated cell-surface receptors.
We also found that human codon-optimization improves the expression ofRLUC in Arabidopsis. Furthermore, using a covalent fusion of RLUC and YFPas a positive control, we established BRET assay conditions in three differentplant cell settings, namely, transiently transformed onion epidermis, stablytransformed tobacco bright-yellow (BY-)2 suspension culture cells and stablytransgenic Arabidopsis thaliana plants (Fig. 3 and Table 2). Finally, we demon-strate that BRET data can be collected by imaging entire live seedlings with acooled CCD camera (Fig. 4). Hence, BRET is a promising technique to moni-tor in vivo protein interaction in a variety of plant systems.
2. Materials2.1. Plasmids, Vectors, and Strains
1. pRL-null (Promega, Madison,WI) contains the Renilla luciferase (RLUC)coding region.
2. pEYFP (CLONTECH Laboratories Inc., Palo Alto, CA) contains the cod-ing region of enhanced YFP.
274 Subramanian et al.
Table 1. BRET Expression Vectors and Plasmids
GenbankConstruct Name Remarks Accession #
35S:RLUC Renilla luciferase (RLUC), bluescript AY189980(Stratagene) vector with 35S promoter and terminator
35S:EYFP Enhanced yellow fluorescent protein (EYFP) AY18998135S:Ala-RLUC Alanine linker (AAAPVAAAAAA)-RLUC AY189982
(see Note 5)35S:RLUC-Ala RLUC-Alanine linker (AAAARS ) AY18998335S:Ala-EYFP Alanine linker (AAAPVAAAAAA)-EYFP AY18998435S:EYFP-Ala EYFP-Alanine linker (AAAARS ) AY18998535S:RLUC-EYFP The RLUC coding region is fused to EYFP35S:RLUC-KaiB KaiB is a cyanobacterial clock protein35S:EYFP-KaiB35S:RLUC-Ala-HY5 HY5 is an Arabidopsis bZip protein35S:EYFP-Ala-HY5pBin19-RLUC Renilla luciferase (RLUC) expression
cassette in a T-DNA transformation vectorpBin19-hRLUC Humanized RLUC cDNA
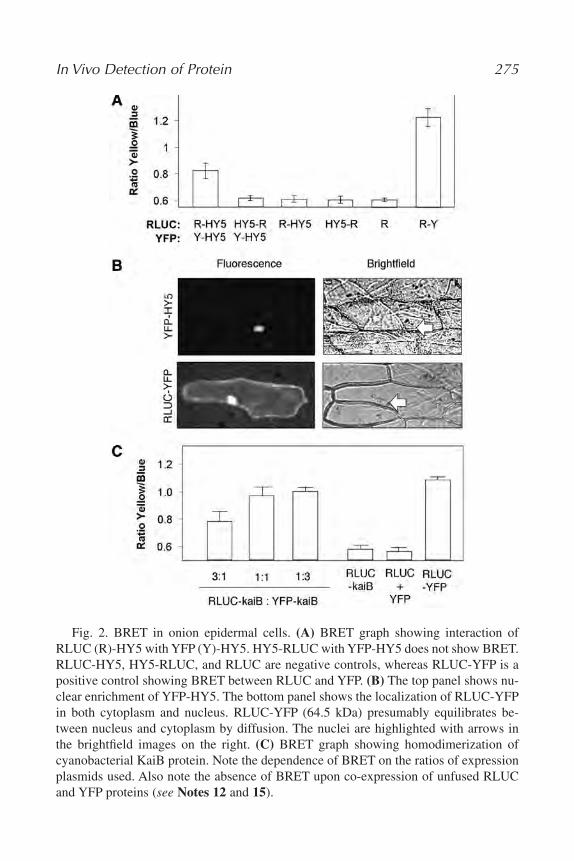
In Vivo Detection of Protein 275
Fig. 2. BRET in onion epidermal cells. (A) BRET graph showing interaction ofRLUC (R)-HY5 with YFP (Y)-HY5. HY5-RLUC with YFP-HY5 does not show BRET.RLUC-HY5, HY5-RLUC, and RLUC are negative controls, whereas RLUC-YFP is apositive control showing BRET between RLUC and YFP. (B) The top panel shows nu-clear enrichment of YFP-HY5. The bottom panel shows the localization of RLUC-YFPin both cytoplasm and nucleus. RLUC-YFP (64.5 kDa) presumably equilibrates be-tween nucleus and cytoplasm by diffusion. The nuclei are highlighted with arrows inthe brightfield images on the right. (C) BRET graph showing homodimerization ofcyanobacterial KaiB protein. Note the dependence of BRET on the ratios of expressionplasmids used. Also note the absence of BRET upon co-expression of unfused RLUCand YFP proteins (see Notes 12 and 15).
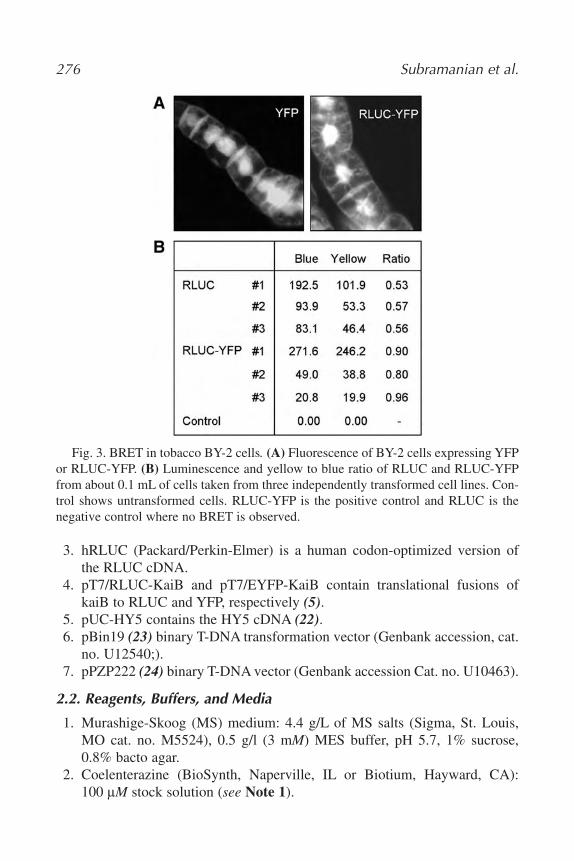
276 Subramanian et al.
Fig. 3. BRET in tobacco BY-2 cells. (A) Fluorescence of BY-2 cells expressing YFPor RLUC-YFP. (B) Luminescence and yellow to blue ratio of RLUC and RLUC-YFPfrom about 0.1 mL of cells taken from three independently transformed cell lines. Con-trol shows untransformed cells. RLUC-YFP is the positive control and RLUC is thenegative control where no BRET is observed.
3. hRLUC (Packard/Perkin-Elmer) is a human codon-optimized version ofthe RLUC cDNA.
4. pT7/RLUC-KaiB and pT7/EYFP-KaiB contain translational fusions ofkaiB to RLUC and YFP, respectively (5).
5. pUC-HY5 contains the HY5 cDNA (22).6. pBin19 (23) binary T-DNA transformation vector (Genbank accession, cat.
no. U12540;).7. pPZP222 (24) binary T-DNA vector (Genbank accession Cat. no. U10463).
2.2. Reagents, Buffers, and Media
1. Murashige-Skoog (MS) medium: 4.4 g/L of MS salts (Sigma, St. Louis,MO cat. no. M5524), 0.5 g/l (3 mM) MES buffer, pH 5.7, 1% sucrose,0.8% bacto agar.
2. Coelenterazine (BioSynth, Naperville, IL or Biotium, Hayward, CA):100 lM stock solution (see Note 1).
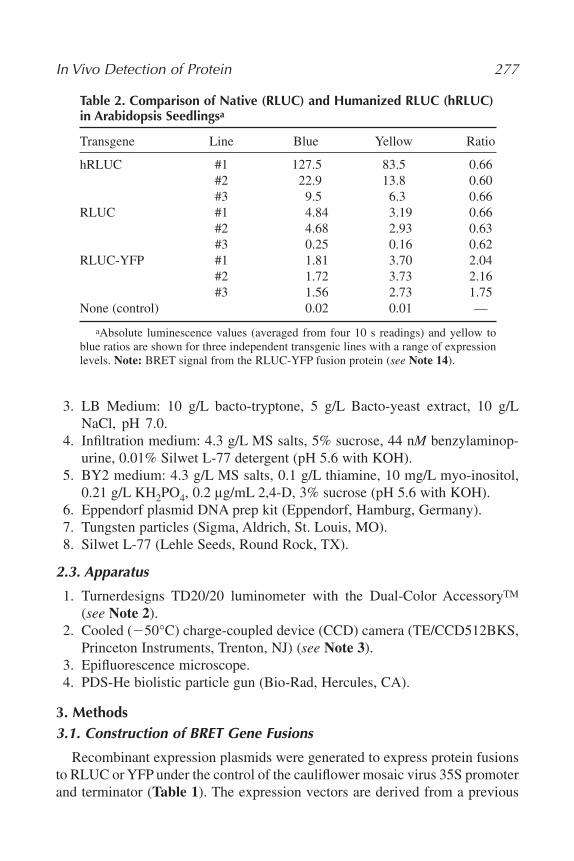
3. LB Medium: 10 g/L bacto-tryptone, 5 g/L Bacto-yeast extract, 10 g/LNaCl, pH 7.0.
4. Infiltration medium: 4.3 g/L MS salts, 5% sucrose, 44 nM benzylaminop-urine, 0.01% Silwet L-77 detergent (pH 5.6 with KOH).
5. BY2 medium: 4.3 g/L MS salts, 0.1 g/L thiamine, 10 mg/L myo-inositol,0.21 g/L KH2PO4, 0.2 lg/mL 2,4-D, 3% sucrose (pH 5.6 with KOH).
6. Eppendorf plasmid DNA prep kit (Eppendorf, Hamburg, Germany).7. Tungsten particles (Sigma, Aldrich, St. Louis, MO).8. Silwet L-77 (Lehle Seeds, Round Rock, TX).
2.3. Apparatus
1. Turnerdesigns TD20/20 luminometer with the Dual-Color AccessoryTM
(see Note 2).2. Cooled (�50°C) charge-coupled device (CCD) camera (TE/CCD512BKS,
Princeton Instruments, Trenton, NJ) (see Note 3).3. Epifluorescence microscope.4. PDS-He biolistic particle gun (Bio-Rad, Hercules, CA).
3. Methods3.1. Construction of BRET Gene Fusions
Recombinant expression plasmids were generated to express protein fusionsto RLUC or YFP under the control of the cauliflower mosaic virus 35S promoterand terminator (Table 1). The expression vectors are derived from a previous
In Vivo Detection of Protein 277
Table 2. Comparison of Native (RLUC) and Humanized RLUC (hRLUC) in Arabidopsis Seedlingsa
Transgene Line Blue Yellow Ratio
hRLUC #1 127.5 83.5 0.66#2 22.9 13.8 0.60#3 9.5 6.3 0.66
RLUC #1 4.84 3.19 0.66#2 4.68 2.93 0.63#3 0.25 0.16 0.62
RLUC-YFP #1 1.81 3.70 2.04#2 1.72 3.73 2.16#3 1.56 2.73 1.75
None (control) 0.02 0.01 —
aAbsolute luminescence values (averaged from four 10 s readings) and yellow toblue ratios are shown for three independent transgenic lines with a range of expressionlevels. Note: BRET signal from the RLUC-YFP fusion protein (see Note 14).
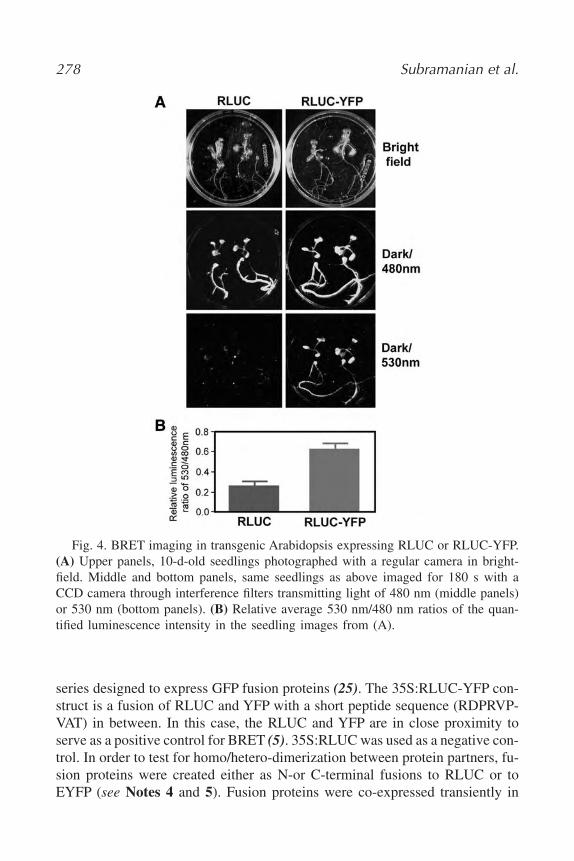
278 Subramanian et al.
Fig. 4. BRET imaging in transgenic Arabidopsis expressing RLUC or RLUC-YFP.(A) Upper panels, 10-d-old seedlings photographed with a regular camera in bright-field. Middle and bottom panels, same seedlings as above imaged for 180 s with aCCD camera through interference filters transmitting light of 480 nm (middle panels)or 530 nm (bottom panels). (B) Relative average 530 nm/480 nm ratios of the quan-tified luminescence intensity in the seedling images from (A).
series designed to express GFP fusion proteins (25). The 35S:RLUC-YFP con-struct is a fusion of RLUC and YFP with a short peptide sequence (RDPRVP-VAT) in between. In this case, the RLUC and YFP are in close proximity toserve as a positive control for BRET (5). 35S:RLUC was used as a negative con-trol. In order to test for homo/hetero-dimerization between protein partners, fu-sion proteins were created either as N-or C-terminal fusions to RLUC or toEYFP (see Notes 4 and 5). Fusion proteins were co-expressed transiently in
onion epidermal cells or stably in transgenic Arabidopsis thaliana or tobaccoBY-2 suspension culture cells.
3.2. Co-Transformation and Co-Expression of Fusion Proteins
Both green and unpigmented plant tissues are suitable for BRET experi-ments. However, it is critical that the pigmentation level is the same betweentissue co-expressing the RLUC-and YFP-tagged proteins and tissue expressingthe RLUC-only control. It is important to include the RLUC-tagged proteinalone as a negative control in every experiment.
3.2.1. Onion Epidermis
1. High-quality DNA of the expression plasmids is obtained using the Eppen-dorf Mini Prep Kit.
2. 500 ng of each DNA (RLUC fusion and YFP fusion) are coated onto tung-sten particles. For each bombardment 20 lL of the coated tungsten parti-cles are bombarded into a single layer of onion epidermal cells using thePDS-He biolistic particle gun (see Note 6).
3. For biolistic transformation of expression plasmids into onion epidermalcells, the inner epidermis of an onion scale is peeled and placed on a petriplate containing MS medium (see Note 7).
4. The bombardment is performed according to the procedure provided withthe particle gun from Bio-Rad.
5. The transformed onion epidermis is incubated at room temperature in dark-ness overnight.
6. YFP expression is confirmed by examining the yellow fluorescence on anepifluorescence microscope as shown in Fig. 2B.
7. The RLUC expression is measured using a TD-20/20 luminometer(Fig. 2A, 2C; see Subheading 3.3. for details; also see Note 8).
3.2.2. Arabidopsis
1. In order to perform luminescence assays in Arabidopsis the expression cas-sette is first transferred to a binary vector, for example pBin19 or pPZP222(Table 1).
2. Agrobacterium strain GV3101 is transformed with the binary vector con-taining the transgene, which is then transformed into Arabidopsis (seeNote 9).
3. Transformed seedlings are selected by their ability to grow on antibioticmedium (kanamycin or gentamycin). YFP expression is checked by fluo-rescence microscopy.
4. Seedlings are tested for expression of RLUC using the TD20/20 lumi-nometer as shown in Table 2.
In Vivo Detection of Protein 279
3.2.3. Tobacco BY-2 Cells
1. Agrobacterium harboring the appropriate plasmid is grown to an OD600 of1.0 in LB in the presence of appropriate antibiotics, namely kanamycin forpBin19 and spectinomycin for pPZP222 T-DNA vectors.
2. For each transformation 5 mL of 3-d-old BY-2 cells are transferred to anempty petri dish.
3. 5 lL of 20 mM acetosyringone is added and swirled gently to mix.4. Two transformations are set up for each plasmid containing the transgene.
25 lL or 100 lL of Agrobacteria are added to each petri dish. The petri dishis wrapped with parafilm and incubated at 27°C for 2 d.
5. The cells are transferred to a fresh tube and washed three times with 10 mLof BY2 medium. A final wash is done with 10 mL of BY2 medium con-taining 500 lg/mL of carbenicillin or 125 lg/mL of cefotaxime to controlAgrobacterium growth.
6. 1 mL of the cell suspension is plated on to petri plates containing BY2medium and carbenicillin/cefotaxime and other appropriate antibiotics(kanamycin for pBin19 and gentamycin for pPZP222 T-DNAs).
7. The petri plates are wrapped with parafilm and incubated at 27°C for10–14 d.
8. Transformed calli are transferred to fresh antibiotic plates and checked forYFP (Subheading 3.2.1., step 6) and RLUC expression (Fig. 3).
9. BRET is measured using the TD-20/20 luminometer as shown in Fig. 3B.
3.3. BRET Assays
3.3.1. Luminescence Assays in Plant Cells
1. Once YFP expression has been confirmed, the tissues are examined forBRET. The tissue is placed in an Eppendorf tube or a 12 � 50 mm roundbottom polypropylene tube.
2. In case of onion epidermal cells, the tissue is immersed in 900 lL of dis-tilled water. Half-strength MS medium (2.15 g/L MS salts) containing0.02% Silwet L-77 is used for Arabidopsis seedlings. For tobacco BY-2cells, a small amount of cells from the calli is aseptically removed and sus-pended in 500 lL of BY2 medium.
3. Freshly diluted coelenterazine is added to a final concentration of 1 lM (seeNote 10).
4. The luminescence is measured in the TD-20/20 luminometer with the dual-color accessory (see Note 2).
5. Four individual pairs of luminescence readings are collected through blueand yellow filters (see Notes 8, 10, and 11).
280 Subramanian et al.
6. Background readings are obtained using untransformed tissue in the pres-ence of coelenterazine substrate. The average background value is typicallybetween 0.02–0.05 for the blue filter and 0.00–0.01 for the yellow filter.
7. BRET is determined by calculating the yellow to blue ratio from the back-ground-subtracted readings (for data see Figs. 2A, 2C, and 3B; see Sub-heading 3.3.2.).
3.3.2. Calculations for BRET
1. Four pairs of readings are taken for each tissue sample and average back-ground is subtracted from each individual reading (see Note 13).
2. The BRET ratio is calculated by taking the sum of background correctedyellow (Y) readings and dividing them by the sum of background correctedblue (B) readings. (see Note 14)
BRET � [R (Y sample � Ybackground ) ] / [R ( Bsample � B background)]
3. Results in onion cells indicate homodimerization of HY5 and KaiB(Fig. 2A, 2C). In the case of a BRET interaction the yellow to blue ratio isusually between 0.8 and 1.1. For comparison, the yellow to blue ratio forthe negative control, i.e. the RLUC fusion alone, lies between 0.55–0.69.This variation may be owing to subtle differences in the pigmentation ofthe host tissue samples. It is important to note that RLUC and YFP do notinteract with each other; only if the fusion protein interacts with its partnerthe RLUC and YFP are in close proximity to perform BRET. The positivecontrol is the RLUC-YFP fusion, which gives a yellow to blue ratio of 1 to1.3 (see Notes 12 and 15).
4. Results in Arabidopsis seedlings suggest that about fivefold higher luci-ferase levels can be achieved with a human codon optimized version ofRLUC (Perkin-Elmer, Table 2).
5. Results in tobacco BY-2 cells confirm that BRET is detectable in this celltype (Fig. 3). The yellow to blue ratios in BY-2 cells are usually lower thanin onion epidermis, perhaps owing to the slight pigmentation of the cells.
3.3.3. BRET Imaging In Vivo
1. Transgenic Arabidopsis seedlings expressing RLUC or RLUC-YFP aregrown in the light for 10 d and transferred to a 35-mm Petri dish contain-ing 1 mL of MS salts with 3 lM of coelenterazine.
2. Seedlings are imaged in darkness with a cooled-CCD camera through ei-ther a 475–485 nm or a 525–535 nm interference filter. For comparison,seedlings are photographed under regular brightfield conditions (Fig. 4A).
3. The 530/480 nm luminescence ratio in different parts of the seedlings iscalculated. We used custom software created by Dr. Takao Kondo (CCD
In Vivo Detection of Protein 281
focus [26]). Many image-analysis programs should be adequate for thispurpose (Fig. 4B).
4. Notes1. The substrate coelenterazine is sensitive to light and oxygen. Coelenter-
azine is dissolved in ethanol to a final concentration of 250 lM. Smallaliquots are made and dried in a Speed-Vac. Each tube is gently flushedwith N2 gas to remove the O2 and stored at �80°C until further use. Priorto the assay the substrate is redissolved in a small volume of ethanol anddistilled water is added for a final concentration of 100 lM.
2. The TD20/20 Luminometer is sensitive to 0.1 femtogram of luciferase andhas a wide dynamic range of greater than 105. The Dual-Color AccessoryTM
contains alternative filters, a blue band-pass filter (333–463 nm) with a >90%transmittance over a bandwidth of 370–410 nm, and a yellow long-pass fil-ter (520 nm and greater) with a >80% transmittance above 550 nm. These fil-ters together capture about 10% of the total luminescence. Alternatively,plate-reading luminometers that have been designed for BRET include theFusion (Perkin-Elmer/Packard), the Mithras (Berthold Technologies, OakRidge, TN), and the PolarStar (BMG Lab Technologies, Durham, NC).
3. We used 475–485 nm and 525–535 nm interference filters (Ealing Electro-Optics, Holliston, MA) to detect blue and yellow luminescence, respectively.
4. In order to test BRET between two protein partners, one has to constructthe partner proteins as either RLUC or YFP fusions. When constructingN-terminal fusions to RLUC/YFP, the stop codon in the cDNA to be taggedmust be removed. Care must be taken that the fusion partners are in frame.Errors during synthesis of oligonucleotides intended for subcloning are acommon source of unintended frameshifts. It is advisable to create bothN-and C-terminal fusions of RLUC or YFP and both partner proteins inorder to test all possible combinations of heterodimers (eight combinations)or homodimers (four combinations). This increases the probability of a tightjuxtaposition between RLUC and YFP, which is crucial for efficient BRET.However, sometimes BRET cannot be observed in any of the possible com-binations even though the two proteins may be well-established as interac-tion partners using other methods; perhaps the optimal distance betweenRLUC and EYFP still cannot be achieved owing to steric hindrance or pro-tein-folding problems. As shown in Fig. 2A, only one of the two combina-tions that we tested for HY5 homodimerization showed BRET.
5. 35S:RLUC-Ala and 35S:EYFP-Ala add four to nine alanine residues in be-tween the RLUC or YFP and the fusion protein partner in an attempt to min-imize the risk of steric hindrance within and among hybrid fusion proteins.Genbank accession numbers for the BRET vectors are given in Table 1.
282 Subramanian et al.
6. Following standard procedure, tungsten particles are prepared by suspend-ing them at 50 mg/mL in 100% ethanol. The slurry is sonicated for 30 min-utes and washed with ethanol four times. The particles are stored in �20°Cas 1-mL aliquots until further use. Before the bombardment the aliquot oftungsten particle is vigorously vortexed for 15 min. Per bombardment,20 lL is placed into a separate Eppendorf tube and washed twice withwater. 500 ng of DNA in up to 5 lL TE is added along with 20 lL 2.5 MCaCl2 and 8 lL 0.1 M spermidine, free base. The sample is incubated onice for 15 min and then washed three to five times with 100% ethanol. TheDNA-coated tungsten particles are dried onto a plastic disk (macrocarrier,Bio-Rad). Until bombardment, the disk is kept in a petri dish containing afilter paper and some drying agent.
7. The onion is cut into four quarters and the inner and outer most leaves(scales) of the onion bulb are discarded. Using a fine pair of forceps theinner epidermis is peeled and placed, inside up, on a petri plate containingMS medium. The petri plate is kept covered until bombardment to preventdrying.
8. The luminometer is set to read after a 3-s delay in case of onion and BY-2cell samples and a 20-s delay in case of Arabidopsis to allow the decay ofdelayed chlorophyll autofluorescence in green tissues. For each data point,four pairs of luminescence readings are taken through blue and yellow fil-ters. The integration time is set to 10-s in each case.
9. For Arabidopsis transformation, we routinely transfer RLUC fusions intopPZP222 (which confers plant gentamycin-resistance) and YFP fusions intopBIN19 (plant kanamycin-resistance) to facilitate selection of double-trans-formed Arabidopsis. Strain GV3101 is transformed by electroporation (ca-pacitance 50 microFarad; load resistance 150 Ohm; gap width 1 mm) andtransformants are selected on LB plates containing kanamycin (pBin19) orspectinomycin (pPZP222), as well as gentamycin and rifampicin.
10. It is important to add the coelenterazine substrate immediately before tak-ing the reading in case of onion epidermal cells as the time when the lumi-nescence peaks varies from sample to sample (5–30 min). Moreover, someinteractions could be transient and so results could be flawed if there is adelay between the treatment and analysis of the sample.
11. Before measurement, it is advisable to keep the samples in darkness or verydim light, because bright light can excite delayed chlorophyll fluorescencethat might obscure the true luminescence signal.
12. Transient transformation with equal amounts of RLUC- and-YFP fusionplasmid may still result in unequal amounts of expression of each protein,in part owing to differences in the expression or stability of the proteins inthe cell. The optimal ratio should be determined empirically. In the case of
In Vivo Detection of Protein 283
RLUC-kaiB and YFP-kaiB fusions we found that RLUC:YFP ratios of 3:1,1:1 and 1:3 yielded BRET with 40, 90, and 100% relative efficiency(Fig. 2C). When working with transgenic plants one could optimize thedosage of the BRET-tagged genes. For example, given F1 hybrid plants het-erozygous (+/�; +/�) for the two genes of interest, their selfed F2 progenywill contain individual plants with three different dosages of the two genes(1:2, 1:1, and 2:1).
13. Luminescence typically drifts over time in part because the luciferase is un-stable in the presence of substrate. If the drift is substantial, data points maybe extrapolated to the same time point for blue and yellow readings.
14. There are several ways to calculate the magnitude of BRET. According tothe “BRET ratio” recommended by Angers and coworkers (8), the BRETsignal of the “RLUC-only” control is set to near zero. Instead, we simplyexpress BRET as the ratio of background corrected yellow (Y) and blue (B)luminescence readings.
15. BRET is primarily an in vivo technique for learning more about protein in-teractions that have previously been identified by other methods. However,this does not preclude utilizing BRET to screen for new interactions (5,21).In our experience only about 10% of protein pairs tested have shownBRET, even though in vitro or yeast two-hybrid interaction data had beencollected for the majority of these pairs.
16. Supporting website at http://fp.bio.utk.edu/vonarnim/BRET.html
Acknowledgments
This work was supported by NSF grant MCB-0114653 (to A. G. von Arnimand C. H. Johnson) and DOE grant DE-FG02-96ER20223 (to A. G. von Arnim).We thank Kristin Kolberg and Turnerdesigns for their cooperation in building afilter accessory for luminometry.
References1. Golemis, E. (2002) Protein-Protein Interactions: A Molecular Cloning Laboratory
Manual. Cold Spring Harbor Laboratory Press, Cold Spring Harbor, NY.2. Hu, C. D., Chinenov, Y., and Kerppola, T. K. (2002) Visualization of interactions
among bZIP and Rel family proteins in living cells using bimolecular fluorescencecomplementation. Mol. Cell 9, 789–798.
3. Subramaniam, R., Desveaux, D., Spickler, C., et al. (2001) Direct visualization ofprotein interactions in plant cells. Nat. Biotechnol. 19, 769–772.
4. Spotts, J. M., Dolmetsch, R. E., and Greenberg, M. E. (2002) Time-lapse imagingof a dynamic phosphorylation-dependent protein-protein interaction in mammaliancells. Proc. Natl. Acad. Sci. USA 99, 15,142–15,147.
284 Subramanian et al.
5. Xu, Y., Piston, D. W., and Johnson, C. H. (1999) A bioluminescence resonance en-ergy transfer (BRET) system: application to interacting circadian clock proteins.Proc. Natl. Acad. Sci. USA 96, 151–156.
6. Prendergast, F. G. (1999) Biophysics of the green fluorescent protein. Methods CellBiol. 58, 1–18.
7. Xu, Y., Johnson, C. H., and Piston, D. (2002) Bioluminescence resonance energytransfer assays for protein-protein interactions in living cells. Methods Mol. Biol.183, 121–133.
8. Angers, S., Salahpour, A., Joly, E., et al. (2000) Detection of beta 2-adrenergic re-ceptor dimerization in living cells using bioluminescence resonance energy trans-fer (BRET). Proc. Natl. Acad. Sci. USA 97, 3684–3689.
9. Cheng, Z. J. and Miller, L. J. (2001) Agonist-dependent dissociation of oligomericcomplexes of G protein-coupled cholecystokinin receptors demonstrated in livingcells using bioluminescence resonance energy transfer. J. Biol. Chem. 276,48,040–48,047.
10. Kroeger, K. M., Hanyaloglu, A. C., Seeber, R. M., et al. (2001) Constitutive andagonist-dependent homo-oligomerization of the thyrotropin-releasing hormone re-ceptor. Detection in living cells using bioluminescence resonance energy transfer.J. Biol. Chem. 276, 12,736–12,743.
11. Hanyaloglu, A. C., Seeber, R. M., Kohout, T. A., et al. (2002) Homo-and hetero-oligomerization of thyrotropin-releasing hormone (TRH) receptor subtypes. Dif-ferential regulation of beta-arrestins 1 and 2. J. Biol. Chem. 277, 50,422–50,430.
12. Issafras, H., Angers, S., Bulenger, S., et al. (2002) Constitutive agonist-independ-ent CCR5 oligomerization and antibody-mediated clustering occurring at physio-logical levels of receptors. J. Biol. Chem. 277, 34,666–34,673.
13. Jensen, A. A., Hansen, J. L., Sheikh, S. P., and Brauner-Osborne, H. (2002) Prob-ing intermolecular protein-protein interactions in the calcium-sensing receptor ho-modimer using bioluminescence resonance energy transfer (BRET). Eur. J.Biochem. 269, 5076–5087.
14. Lavine, N., Ethier, N., Oak, J. N., et al. (2002) G protein-coupled receptors formstable complexes with inwardly rectifying potassium channels and adenylyl cy-clase. J. Biol. Chem. 277, 46,010–46,019.
15. Mercier, J. F., Salahpour, A., Angers, S., et al. (2002) Quantitative assessment ofbeta 1 and beta 2-adrenergic receptor homo and hetero-dimerization by biolumi-nescence resonance energy transfer. J. Biol. Chem. 277, 44,925–44,931.
16. Ramsay, D., Kellett, E., McVey, M., et al. (2002) Homo- and hetero-oligomeric in-teractions between G-protein-coupled receptors in living cells monitored by twovariants of bioluminescence resonance energy transfer (BRET): hetero-oligomersbetween receptor subtypes form more efficiently than between less closely relatedsequences. Biochem. J. 365, 429–440.
17. Wang, Y., Wang, G., O’Kane, D. J., and Szalay, A. A. (2001) A study of protein-protein interactions in living cells using luminescence resonance energy transfer(LRET) from Renilla luciferase to Aequorea GFP. Mol. Gen. Genet. 264, 578–587.
In Vivo Detection of Protein 285
18. Yoshioka, K., Saitoh, O., and Nakata, H. (2002) Agonist-promoted heteromericoligomerization between adenosine A(1) and P2Y(1) receptors in living cells.FEBS Lett. 523, 147–151.
19. Germain-Desprez, D., Bazinet, M., Bouvier, M., and Aubry, M. (2003) Oligomer-ization of TIF1 transcriptional regulators and interaction with ZNF74 nuclear ma-trix protein revealed by BRET in living cells. J. Biol. Chem. 278, 22,367–22,373.
20. Boute, N., Jockers, R., and Issaad, T.. (2002) The use of resonance energy transferin high-throughput screening: BRET versus FRET. Trends Pharmacol Sci. 23,351–354.
21. Xu, Y., Kanauchi, A., von Arnim, A. G., et al. (2003) Bioluminescence resonanceenergy transfer: monitoring protein-protein interactions in living cells. Methods En-zymol. 360, 289–301.
22. Oyama, T., Shimura, Y., and Okada, K. (1997) The Arabidopsis HY5 gene encodesa bZIP protein that regulates stimulus-induced development of root and hypocotyl.Genes Dev. 11, 2983–2995.
23. Bevan, M. (1984) Binary Agrobacterium vectors for plant transformation. NucleicAcids Res. 12, 8711–8721.
24. Hajdukiewicz, P., Svab, Z., and Maliga, P. (1994) The small, versatile pPZP fam-ily of Agrobacterium binary vectors for plant transformation. Plant Mol. Biol. 25,989–994.
25. von Arnim, A. G., Deng, X. W., and Stacey, M. G. (1998) Cloning vectors for theexpression of green fluorescent protein fusion proteins in transgenic plants. Gene221, 35–43.
26. Kondo, T., Tsinoremas, N. F., Golden, S. S., et al. (1994) Circadian clock mutantsof cyanobacteria. Science 266, 1233–1236.
286 Subramanian et al.
20
Revealing Protein Dynamics by PhotobleachingTechniques
Frank van Drogen and Matthias Peter
SummaryGreen fluorescent proteins (GFPs) are widely used tools to visualize proteins and study their
intracellular distribution. One feature of working with GFP variants, photobleaching, has recentlybeen combined with an older technique known as fluorescence recovery after photobleaching(FRAP) to study protein kinetics in vivo. During photobleaching, fluorochromes get destroyed ir-reversibly by repeated excitation with an intensive light source. When the photobleaching is ap-plied to a restricted area or structure, recovery of fluorescence will be the result of active or pas-sive diffusion from fluorescent molecules from unbleached surrounding areas. Fluorescence lossin photobleaching (FLIP) is a variant of FRAP where an area is bleached, and loss of fluorescencein surrounding areas is observed. FLIP can be used to study the dynamics of different pools of aprotein or can show how a protein diffuses, or is transported through a cell or cellular structure.Here, we discuss these photobleaching fluorescent imaging techniques, illustrated with examplesof these techniques applied to proteins of the Saccharomyces cerevisiae pheromone responseMAPK pathway.
Key Words: Fluorescence recovery after photobleaching (FRAP); fluorescence loss in pho-tobleaching (FLIP); GFP; fluorescence; kinetics; dynamics; microscopy.
1. Introduction
Green fluorescent proteins (GFPs), identified in the jellyfish Aequoravictoria, are widely used tools to tag proteins and study their intracellular dis-tribution (1,2). A wide variety of techniques have been developed to study the
From: Methods in Molecular Biology, vol. 284:Signal Transduction Protocols
Edited by: R. C. Dickson © Humana Press Inc., Totowa, NJ
287
three-dimensional distribution of GFP-tagged proteins in cells and organismsand color variants of GFP have been developed to observe several proteins at thesame time (3,4). Microscopes have also been enhanced to facilitate time-lapseexperiments (5). During the last few years one feature of GFP variants, photo-bleaching, has been combined with an older technique known as fluorescence re-covery after photobleaching (FRAP) to study protein kinetics in vivo (6).
Photobleaching is a phenomenon in which fluorochromes can be destroyedirreversibly by repeated excitations with an intensive light source. When thephotobleaching is applied to a restricted area, generally achieved by using alaser, recovery of fluorescence in this area will be the result of active or passivediffusion from fluorescent molecules from unbleached surrounding areas. Whena distinct subcellular structure is bleached, recovery will represent passive oractive transport of fluorescent molecules to the bleached structure (8). Althoughphotobleaching destroys the fluorochrome of the bleached protein, the rigidstructure of GFP itself is not compromised. Hence, when a protein fused to GFPis shown to be functional and behaving like the wild-type protein, photo-bleaching will not change its properties.
Fluorescence loss in photobleaching (FLIP) is a variant of FRAP where anarea is bleached, and loss of fluorescence in surrounding areas is observed. FLIPcan be used to study the dynamics of different pools of a protein or can showhow a protein diffuses, or is transported through a cell or cellular structure.
FRAP historically has been used to study the dynamics and mobility of mem-brane components labeled with fluorophores, or fluorescent antibodies in vari-ous cells and artificial membranes. FRAP with GFP fusion proteins was initiallyalso used to study membrane proteins (8). However, photobleaching techniquesusing GFP-tagged proteins are now used to show kinetic properties of proteins,the exchange between different cellular departments and changes in mobility.For example, we have used FRAP and FLIP to study the dynamics of MAPKsignaling cascades, including nuclear turnover and dynamics between mem-brane associated pools and the nucleus (9–11). Others have used FRAP to studyrecruitment of proteins to centrosomes during the cell cycle (12,13), or to studycytoskeletal architecture and arrangements (14). In a very elegant study, the El-lenberg lab used different GFP variants, one of which was bleached, to showchromosomal positioning in nuclei (15).
2. Materials1. Expression vectors with GFP.2. a-GFP-antibody or antibody specific for the protein of interest.3. cDNA of protein of interest.4. Oligonucleotide primers.5. Molecular biology reagents (restriction enzymes, T4 DNA ligase, etc.).
288 van Drogen and Peter
6. Material for minipreps (see ref. 16 or one of the many commercially avail-able kits).
7. Appropriate growth medium for system used.8. Microscopy slides and coverslips.9. Microscope suitable for photobleaching experiments. (We used a Zeiss
LSM510 confocal laser scanning microscope.)10. Cycloheximide.11. Formaldehyde.
3. MethodsThe methods described here outline the construction of the GFP fusion vec-
tor (Subheading 3.1.), the control of expression and functionality of the GFPfusion construct (Subheading 3.2.), optimization of detection with a confocallaser-scanning microscope (Subheading 3.3.), fluorescence recovery after pho-tobleaching (Subheading 3.4.), and fluorescence loss in photobleaching (Sub-heading 3.5.). These methods will be illustrated with the examples of the yeastMAPK Fus3p and Kss1p.
3.1. GFP-Fusion Proteins
Vectors with the different GFP variants are available from different sources;care should be taken to choose a vector with optimal codon usage for the partic-ular organism used. Although all GFP variants (GreenFP, CyanFP, YellowFP,RedFP, etc.) can be used in photobleaching experiments, the procedures are de-scribed here are essentially for Enhanced-GFP (EGFP) (see Note 1). EGFP hastwo mutations that improve its characteristics. First, a phenylalanine to leucinemutation at position 64 reduces temperature sensitivity (17), whereas mutatingthe serine at position 65 to a threonine increases fluorescence intensity and pro-tein stability (18). The choice of the promoter to drive expression of the fusionproduct is dependent on a number of variables; in general it is desirable to choosea promoter, which results in levels close to the levels of the endogenous proteinof interest under the circumstances studied if expression from such a promoter issufficient for visualization (see Note 2).
The cDNA sequence of interest should be cloned in frame with GFP. The GFPsequence can either be 5 or 3 of the cDNA, and will lead to an amino-terminal ora carboxyl-terminal localization of GFP, respectively (see Notes 3 and 4).
3.1.1. Vector Construction
Throughout this chapter examples of previously described experiments willbe presented, mainly using two MAPK from the budding yeast Saccharomycescerevisiae.
Revealing Protein Dynamics 289
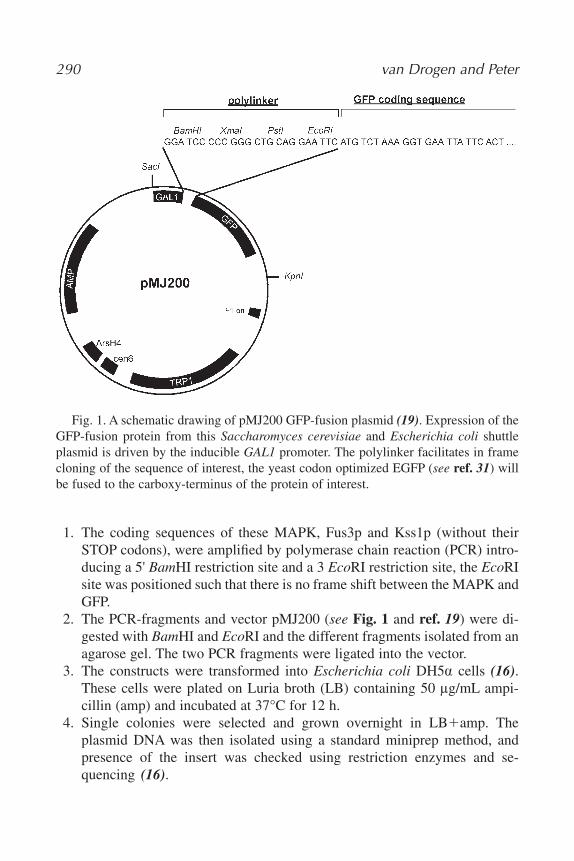
290 van Drogen and Peter
1. The coding sequences of these MAPK, Fus3p and Kss1p (without theirSTOP codons), were amplified by polymerase chain reaction (PCR) intro-ducing a 5' BamHI restriction site and a 3 EcoRI restriction site, the EcoRIsite was positioned such that there is no frame shift between the MAPK andGFP.
2. The PCR-fragments and vector pMJ200 (see Fig. 1 and ref. 19) were di-gested with BamHI and EcoRI and the different fragments isolated from anagarose gel. The two PCR fragments were ligated into the vector.
3. The constructs were transformed into Escherichia coli DH5a cells (16).These cells were plated on Luria broth (LB) containing 50 lg/mL ampi-cillin (amp) and incubated at 37°C for 12 h.
4. Single colonies were selected and grown overnight in LB�amp. Theplasmid DNA was then isolated using a standard miniprep method, andpresence of the insert was checked using restriction enzymes and se-quencing (16).
Fig. 1. A schematic drawing of pMJ200 GFP-fusion plasmid (19). Expression of theGFP-fusion protein from this Saccharomyces cerevisiae and Escherichia coli shuttleplasmid is driven by the inducible GAL1 promoter. The polylinker facilitates in framecloning of the sequence of interest, the yeast codon optimized EGFP (see ref. 31) willbe fused to the carboxy-terminus of the protein of interest.
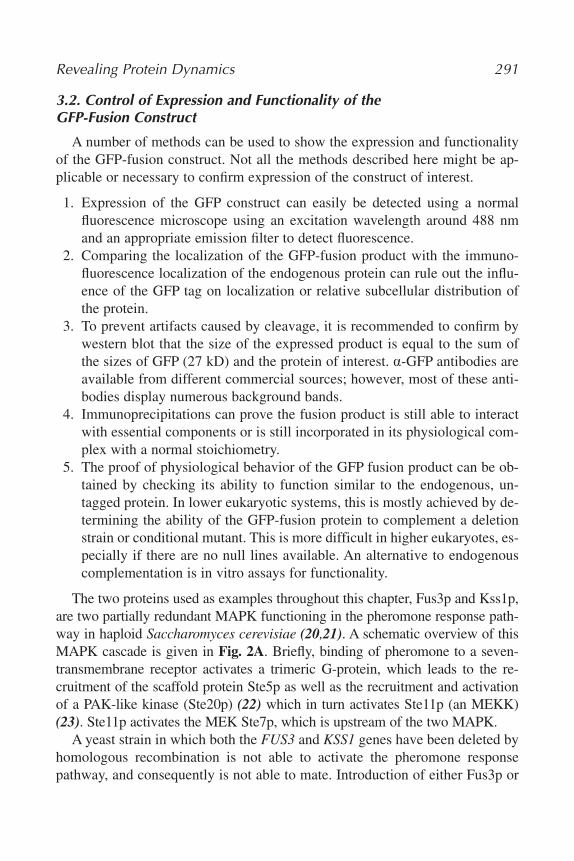
3.2. Control of Expression and Functionality of the GFP-Fusion Construct
A number of methods can be used to show the expression and functionalityof the GFP-fusion construct. Not all the methods described here might be ap-plicable or necessary to confirm expression of the construct of interest.
1. Expression of the GFP construct can easily be detected using a normalfluorescence microscope using an excitation wavelength around 488 nmand an appropriate emission filter to detect fluorescence.
2. Comparing the localization of the GFP-fusion product with the immuno-fluorescence localization of the endogenous protein can rule out the influ-ence of the GFP tag on localization or relative subcellular distribution ofthe protein.
3. To prevent artifacts caused by cleavage, it is recommended to confirm bywestern blot that the size of the expressed product is equal to the sum ofthe sizes of GFP (27 kD) and the protein of interest. a-GFP antibodies areavailable from different commercial sources; however, most of these anti-bodies display numerous background bands.
4. Immunoprecipitations can prove the fusion product is still able to interactwith essential components or is still incorporated in its physiological com-plex with a normal stoichiometry.
5. The proof of physiological behavior of the GFP fusion product can be ob-tained by checking its ability to function similar to the endogenous, un-tagged protein. In lower eukaryotic systems, this is mostly achieved by de-termining the ability of the GFP-fusion protein to complement a deletionstrain or conditional mutant. This is more difficult in higher eukaryotes, es-pecially if there are no null lines available. An alternative to endogenouscomplementation is in vitro assays for functionality.
The two proteins used as examples throughout this chapter, Fus3p and Kss1p,are two partially redundant MAPK functioning in the pheromone response path-way in haploid Saccharomyces cerevisiae (20,21). A schematic overview of thisMAPK cascade is given in Fig. 2A. Briefly, binding of pheromone to a seven-transmembrane receptor activates a trimeric G-protein, which leads to the re-cruitment of the scaffold protein Ste5p as well as the recruitment and activationof a PAK-like kinase (Ste20p) (22) which in turn activates Ste11p (an MEKK)(23). Ste11p activates the MEK Ste7p, which is upstream of the two MAPK.
A yeast strain in which both the FUS3 and KSS1 genes have been deleted byhomologous recombination is not able to activate the pheromone responsepathway, and consequently is not able to mate. Introduction of either Fus3p or
Revealing Protein Dynamics 291
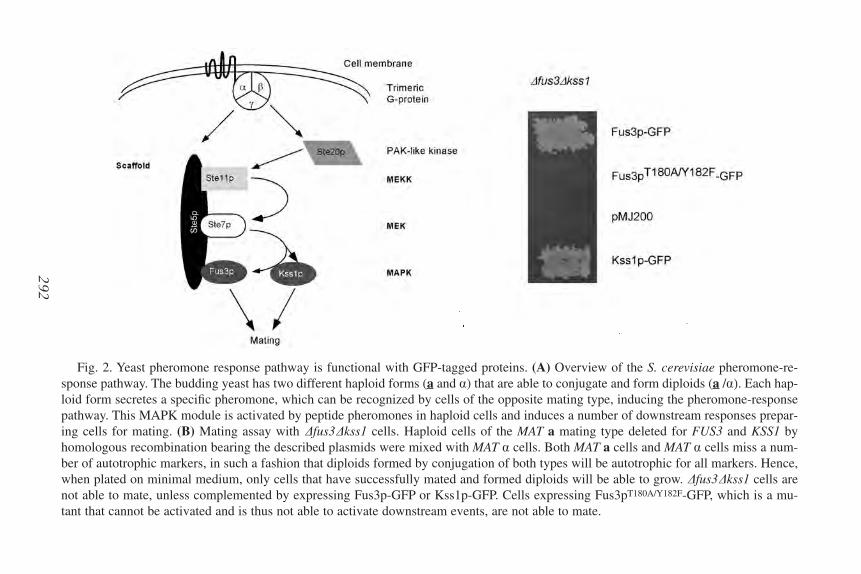
292
Fig. 2. Yeast pheromone response pathway is functional with GFP-tagged proteins. (A) Overview of the S. cerevisiae pheromone-re-sponse pathway. The budding yeast has two different haploid forms (a and a) that are able to conjugate and form diploids (a /a). Each hap-loid form secretes a specific pheromone, which can be recognized by cells of the opposite mating type, inducing the pheromone-responsepathway. This MAPK module is activated by peptide pheromones in haploid cells and induces a number of downstream responses prepar-ing cells for mating. (B) Mating assay with Dfus3Dkss1 cells. Haploid cells of the MAT a mating type deleted for FUS3 and KSS1 byhomologous recombination bearing the described plasmids were mixed with MAT a cells. Both MAT a cells and MAT a cells miss a num-ber of autotrophic markers, in such a fashion that diploids formed by conjugation of both types will be autotrophic for all markers. Hence,when plated on minimal medium, only cells that have successfully mated and formed diploids will be able to grow. Dfus3Dkss1 cells arenot able to mate, unless complemented by expressing Fus3p-GFP or Kss1p-GFP. Cells expressing Fus3pT180A/Y182F-GFP, which is a mu-tant that cannot be activated and is thus not able to activate downstream events, are not able to mate.
Kss1p alone is sufficient to reconstitute the pathway, and cells are no longersterile. To confirm the functionality of GFP-tagged Fus3p and Kss1p fusion pro-teins, they were introduced in a kss1Dfus3D strain and their ability to activatethe pheromone response pathway in response to the appropriate stimulus wasdetermined (Fig. 2B).
3.3. Optimalization of Signal Detection
At the present time, the only convenient way to perform photobleaching ex-periments is with the use of a laser-scanning confocal microscope (LCSM). Be-cause the acquisition of images with a confocal microscope is different fromthat with a standard wide-field microscope, a brief introduction to confocal mi-croscopes is given in this section, followed by several considerations that haveto be taken in account when optimizing image acquisition with the LCSM forthe live imaging necessary for photobleaching experiments.
3.3.1. Laser-Scanning Confocal Microscopes
A conventional wide field fluorescence microscope illuminates the entiresample for image collection. This facilitates the use of film cameras or CCDcameras to collect the data, or the field can be viewed by eye. Although lensesfocus on one horizontal section, signals from above and below this focal planewill be captured during data collection. Although there are (mathematical)means of correcting this, the stray light has a negative influence on image qual-ity. In contrast, in confocal microscopy a beam of laser light is scanned onto thesample. Because the laser beam is focused in one plane, the image produced byscanning the sample represents one optical section (24,25).
LSCMs are generally built onto a conventional light microscope, but a laseris used as a light source and generally sensitive photomultiplier tubes (PMTs)are used for data collection. The key characteristic of confocal microscopy isthe use of pinholes to eliminate out-of-focus light (26). As depicted in Fig. 3,the beam emitted by the laser passes through a pinhole before being focusedonto the sample by an objective lens. The fluorescence emitted by the samplepasses through the objective lens and is focused on a second pinhole, which ithas to pass through before reaching the PMT. This arrangement with pinholesprevents light emitted above or below the focal plane from being detected bythe PMT. The signal detected by the PMT is converted into a gray value for thespecific point. In general, mirrors are used to scan the sample in the X and Yplanes, whereas either a moveable stage or a moveable lens is responsible formovement in the third dimension.
3.3.2. Image Acquisition
Most modern confocal microscopes are equipped with both a laser source,and a mercury bulb. Although it is possible to look at the slide to find a region
Revealing Protein Dynamics 293
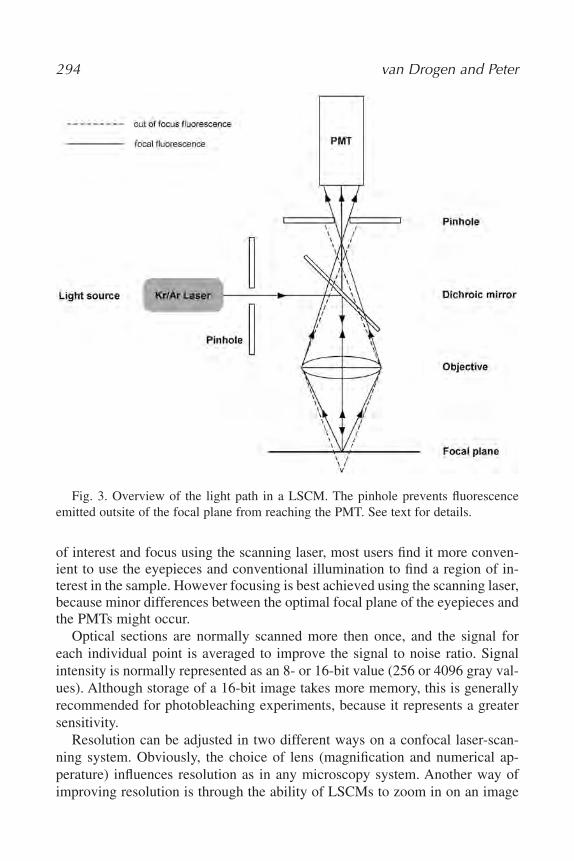
of interest and focus using the scanning laser, most users find it more conven-ient to use the eyepieces and conventional illumination to find a region of in-terest in the sample. However focusing is best achieved using the scanning laser,because minor differences between the optimal focal plane of the eyepieces andthe PMTs might occur.
Optical sections are normally scanned more then once, and the signal foreach individual point is averaged to improve the signal to noise ratio. Signalintensity is normally represented as an 8- or 16-bit value (256 or 4096 gray val-ues). Although storage of a 16-bit image takes more memory, this is generallyrecommended for photobleaching experiments, because it represents a greatersensitivity.
Resolution can be adjusted in two different ways on a confocal laser-scan-ning system. Obviously, the choice of lens (magnification and numerical ap-perature) influences resolution as in any microscopy system. Another way ofimproving resolution is through the ability of LSCMs to zoom in on an image
294 van Drogen and Peter
Fig. 3. Overview of the light path in a LSCM. The pinhole prevents fluorescenceemitted outsite of the focal plane from reaching the PMT. See text for details.
without changing the objective lens. The zoom is controlled by the scanningmirrors, which are able to increase or decrease the area that is targeted by thelaser. However, an improved resolution directly and linearly correlates with in-creased photobleaching, whether this improvement is achieved by changing theobjective or by zooming in on the sample. A useful advantage of the fact thatthe movements of the laser are controllable is the fact that users can define oneor more regions of interest in the field that can be scanned. This means the timeto make one image is reduced, and also protects regions that are not illuminatedby the laser from inappropriate bleaching.
Regardless of whether an 8- or a 16-bit mode of gray-tone representation isused, it is recommended to adjust the settings and parameters of the micro-scopes in such a fashion that images are collected at the full dynamic range.Most LSCMs have a mode that facilitates this by representing areas generatingno signal as green pixels and areas saturating the detector as red pixels. Whilelaser intensity is kept as low as feasable, the detector sensitivity, gain, and blacklevels should be adjusted until there are a few red and a few green pixels in theimages, indicating the full dynamic range (4069 gray colors in the 16-bit mode)is used.
3.3.3. Reduction of Intrinsic Photobleaching
Paradoxically, one of the main objectives during photobleaching experimentsis to reduce inappropriate bleaching during measurements. In this respect, mi-croscope settings might differ slightly from those used to collect static images.When static images are collected, or even during the collection of a Z-stack, thequality of the final image is important and generally a significant amount ofbleaching is tolerated. However, during photobleaching experiments, during ashorter or longer time period, a series of images is collected of the same cellsand fluorescence intensities are compared through time. Ideally, the fluores-cence intensity should not be influenced by the scans made during these timeseries. Furthermore, photobleaching experiments are by definition performedon live specimens on which intensive laser light might have adverse effects(mainly owing to heat stress and possibly oxidative damage caused by the ex-cited fluorochromes). Thus, the aim should be to use the least amount of laserpower to quickly collect high quality-data.
As stated in Subheading 3.3.2., an optical section is generally scanned morethen once, followed by signal averaging to improve the signal to noise ratio. Al-though a high signal to noise ratio is obviously desirable during photobleach-ing experiments, reducing the number of scans per image to a maximum of fouror less is an effective means to prevent intrinsic photobleaching. Other methodsthat allow reduction of laser intensity for image acquisition are the increase ofdetector sensitivity and gain. When bleaching still cannot be sufficiently
Revealing Protein Dynamics 295
prevented, or when the signal to noise ratios are too low, it might be advisibleto increase expression levels of the GFP-tagged protein, or alternatively fusemore then one GFP tag in tandem to the protein of interest.
3.4. Fluorescence Recovery After Photobleaching
This section is divided into three parts. First, data collection during FRAPexperiments is described, including the recommended microscopy settings andprocedures. The second part of this section deals with standard data analyses,and, finally, advanced data analysis and a number of possible control experi-ments are presented.
3.4.1. Data Collection
1. When microscope settings have been optimized for photobleaching ex-periments, a specimen can be selected for bleaching. To reduce variablesas much as possible, try to choose cells that have approximately the sameproperties (size and orientation) and fluorescence intensity within the ex-periment. Although the procedures described here are for single cell analy-sis, FRAP can be performed on more then one cell simultaneously (seeNote 5). An example of a typical FRAP experiment is depicted in Fig. 4.
2. To reduce the time needed to perform the scans, and to reduce the size ofthe file with the collected data, it may be preferable to choose a region ofinterest around the cell.
3. The subcellular area to be bleached is chosen. Most modern LSCMs havethe ability to define a number of regions of interest (ROIs); the region con-taining the complete cell can be defined as ROI-1 and the one containingthe structure that will be bleached as ROI-2 (see Note 6).
4. Generally, the number of bleach iterations (number of times the laserbeampasses each point in ROI-2) and both the laser output and transmission canbe chosen.
5. During image acquisition, the laser output is normally kept as low as pos-sible, both to prevent bleaching and to prolong laser lifetime. Because it hasbeen reported that fast switches in output levels are detrimental to the laser,it is recommended to increase the transmission but not the output. The bestsolution is to find an optimum between increased transmission and an in-creased number of iterations (see Note 7). The fluorescence levels imme-diately after the bleaching procedure should be between 15% and 30% ofthe initial fluorescence (Fig. 4).
6. Other parameters to be set are the number of initial scans before the bleach-ing and the time lapse between scans (both before and after bleaching).
296 van Drogen and Peter
a. The initial (prebleach) scans are used to calculate the fluorescence in-tensity before bleaching, which is arbitrarily set to 100% (Fig. 4B, D).Because there are always fluctuations in fluorescence intensity, morethan one scan should be made, with the highest value representing 100%fluorescence intensity.
b. The time lapse between scans—that is, between datapoints during therecovery—is dependent mainly on recovery rate and, once again, on in-trinsic bleaching. When maximum recovery is reached within a minute,it is optimal to perform one or more scans per second. When recoveryis a matter of minutes, larger delays between scans can be chosen (seeNote 8). Ideally the recovery period should be covered by 50–100 dat-apoints, with the consideration that less points cause less inappropriatebleaching and more points generally gives rise to better quality data.
3.4.2. Standard Data Analysis
1. Generally, the data collected during a FRAP experiment will initially be pre-sented as a stack of images, a subset of an example is shown in Fig. 4C. Eachpoint (x,y) represents a gray value (when using a 16-bit mode: 0-4095). Thedata-analysis programs of most LSCMs (in the case of our example, a ZeissLSM510) offer the possibility to select areas by drawing an ROI around it,and calculating the average fluorescence intensity (see Note 6).
2. The values obtained from the procedure described in step 1 can be shownas a table or a line chart, or they can be exported as a data file to generalspreadsheet programs such as Microsoft Excel.
3. In the spreadsheet program, the relative fluorescence values of all points asa percentage can be calculated, relative to the point with the highest ab-solute fluorescence, and plotted in a chart (Fig. 4B, D).
4. To compare recovery rates of different experiments, the time required toreach half the recovery (s1/2) can be calculated. First, the intensity at s1/2 isdetermined according to equation 1:
I(1/2) � ((I(t) � I(0)) / 2) � I(0) (1)
where I(1/2) is the intensity at which half the recovery has occured, I(0) rep-resents the fluorescence intensity immediately after bleaching and I(t) is theterminal, or maximum intensity reached after bleaching (Fig. 4B). The timebetween bleaching and the point at which I(1/2) is reached is s1/2.
Because FRAP experiments are performed on single cells, a relativelyhigh variability between measurements might occur, and it is necessarytherefore to carry out a large number of experiments and use statisticalanalysis to show variation between measurements. Experiments done on
Revealing Protein Dynamics 297
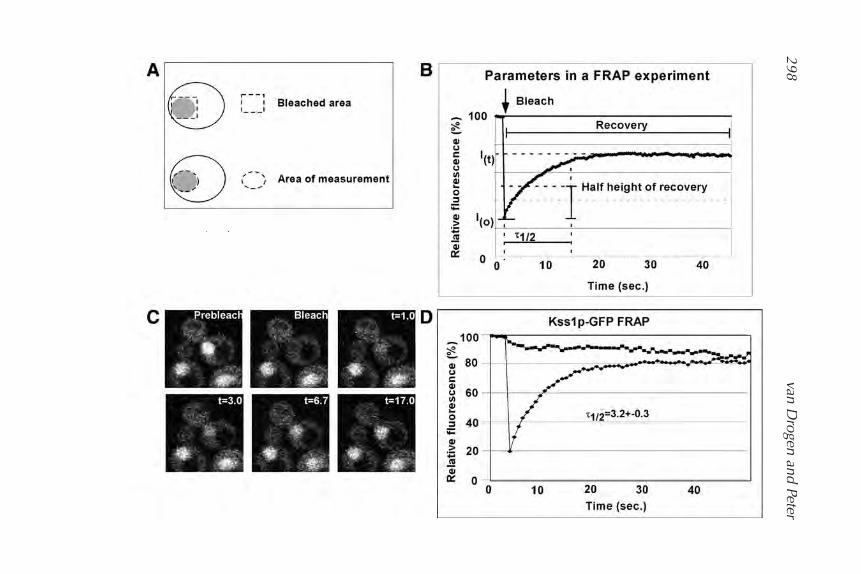
298van D
rogen and Peter
Fus3p-GFP as published in (9) and shown in the examples used here wererepeated a minimum of 15 times, s1/2 was calculated for each individual ex-periment, and the standard deviation was determined.
3.4.3. Advanced Data Analysis
There are a number of “obligatory” control experiments that always shouldbe performed when doing FRAP; furthermore, it is possible to do a number ofadditional experiments to confirm the data obtained. These experiments are de-scribed here.
1. Although in general all possible measures are taken to avoid intrinsicbleaching, fluorescence intensity from a sample that is not bleached, butotherwise has undergone the same treatment as bleached samples, can beshown. Except for the elimination of the bleaching step, all other imagingand data collection procedures obviously should be kept identical. Whenunavoidable intrinsic bleaching is severe (the final fluorescence intensitybeing 10–20% lower then the initial intensity), the percentage of bleachingper data point can be calculated for the control, and measured values in thebleached samples can be adjusted accordingly.
2. When recovery time is longer, i.e., several minutes, there is the possibilitythat new protein synthesis accounts for part of the measured recovery. In-hibition of protein synthesis, for example via addition of cycloheximide,rules this possibility out. However, the time it takes GFP to fold properly,(a prerequisite for fluorescence) is notoriously long (around 30 min to 1 h),and is not inhibited by cycloheximide. Sufficient time should be taken intoaccount between the addition of the protein-synthesis inhibitor and theFRAP experiment.
3. After photobleaching, full recovery is rarely obtained. This is owing to twomain reasons. First, there is often an immobile fraction of the GFP-tagged
Revealing Protein Dynamics 299
Fig. 4. Nuclear FRAP experiment of Kss1p-GFP. (A) Schematic representation ofthe performed FRAP experiment. The GFP-signal is specifically photobleached in thenucleus (rectangle), and recovery of nuclear fluorescence (circle) is measured in a time-dependent manner. (B) Parameters in a standard FRAP experiment. The intensity of nu-clear GFP-fluorescence is plotted as a function of time in seconds. The recovery of half-maximum nuclear fluorescence (s1/2) is determined as indicated. The arrow marks thetime of photobleaching. (C) The nucleus of a vegetatively growing wild-type cell ex-pressing Kss1p-GFP (prebleach) was photobleached (t = 0; bleach) as depicted in (A).The cell was photographed at the times indicated (in s). (D) Recovery of Kss1p-GFP inwild-type cells was measured by nuclear FRAP (diamonds). Nuclear recovery wasquantified as described in the text, and shown as (s1/2) with its standard deviation. As acontrol, the fluorescence intensity of a nucleus that was not bleached is shown (squares).
protein that is not able to move freely throughout the cell. When the poolof fluorescent molecules in the cell is orders of magnitude larger than theamount of molecules bleached, repetition of the bleaching experiment onthe same area should yield a recovery rate of 100% (with I(t) of experiment2 being equal to I(t) of experiment 1). Secondly, depending on the experi-ment, the number of molecules bleached can represent a substantial frac-tion of the total cellular amount. In these cases, full recovery will never bepossible. Repetition of bleaching experiments on these cells will give alower I(t) (compared to I(i) of the first experiment) after each round. Fur-thermore, when fluorescence intensity of the complete cell is determined,it will show a decrease after the bleaching step. However, in both situationss1/2 should remain constant when experiments are repeatedly done on thesame cell or area.
4. A standard negative control is mildly fixing the cells, or crosslinking thecellular proteins with for example formaldehyde. Because protein move-ment is prohibited, no recovery should be observed in these cases.
5. Cells are three-dimensional structures, whereas a confocal microscope onlyilluminates and bleaches a single horizontal plane within a cell. Verticalmovement of GFP-tagged proteins in and out of the focal plane is thereforea concern. The use of small, or at least flat cell types can partially alleviatethis problem. Collecting a number of z-sections immediately after photo-bleaching should confirm that the fluorescence intensity of the structure ofinterest is indeed reduced and that no variations exist within the structure.The collection of z-sections can be repeated a number of times during re-covery to make sure no variation in fluorescence intensity occurs.
3.5. Fluorescence Loss in Photobleaching
Whereas FRAP experiments concentrate on recovery of fluorescence in thecellular structure that has been bleached, FLIP experiments look at the relationbetween pools of fluorescent molecules in different cellular compartments.When there is an exchange between pools, bleaching of pool 1 will eventuallylead to a reduction in fluorescence intensity of pool 2 (Fig. 5A). Instead ofbleaching with one relatively long, intensive laser pulse as applied for FRAP,short pulses are given repeatedly during a FLIP experiment. A number of scansare made to collect data between each of two pulses. First, this will lead to amore gradual reduction of fluorescence intensity at the bleached structure. Sec-ond, when there is an exchange of fluorescent molecules with another structure,fluorescence intensity will decrease at this structure as well.
1. During FLIP, an ROI is chosen around one or more cells of interest (ROI-1).2. Subsequently, the region which is to be bleached is chosen (ROI-2).
300 van Drogen and Peter
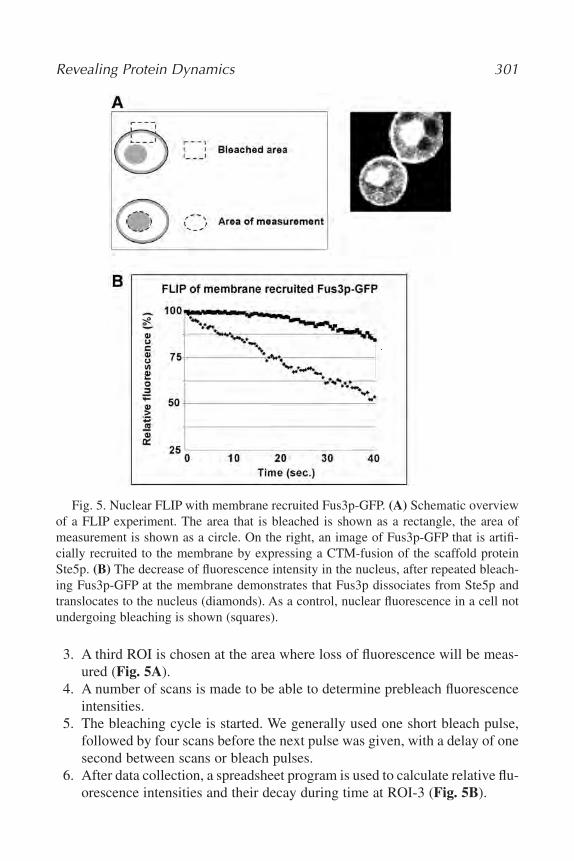
3. A third ROI is chosen at the area where loss of fluorescence will be meas-ured (Fig. 5A).
4. A number of scans is made to be able to determine prebleach fluorescenceintensities.
5. The bleaching cycle is started. We generally used one short bleach pulse,followed by four scans before the next pulse was given, with a delay of onesecond between scans or bleach pulses.
6. After data collection, a spreadsheet program is used to calculate relative flu-orescence intensities and their decay during time at ROI-3 (Fig. 5B).
Revealing Protein Dynamics 301
Fig. 5. Nuclear FLIP with membrane recruited Fus3p-GFP. (A) Schematic overviewof a FLIP experiment. The area that is bleached is shown as a rectangle, the area ofmeasurement is shown as a circle. On the right, an image of Fus3p-GFP that is artifi-cially recruited to the membrane by expressing a CTM-fusion of the scaffold proteinSte5p. (B) The decrease of fluorescence intensity in the nucleus, after repeated bleach-ing Fus3p-GFP at the membrane demonstrates that Fus3p dissociates from Ste5p andtranslocates to the nucleus (diamonds). As a control, nuclear fluorescence in a cell notundergoing bleaching is shown (squares).
302 van Drogen and Peter
7. As a control, relative fluorescence intensities at a structure of interest thatis not bleached can be determined.
4. Notes1. Screens done on randomly mutated GFPs, as well as rational introduced
mutations in the fluorochrome, have given rise to a number of variants withdifferent excitation and emission spectra. The most common of these areblue fluorescent protein (BFP) (Tyr66→ His, excitation peak 384 nm, emis-sion peak 448 nm) (27) cyan fluorescent protein (CFP) (Tyr66→ Trp, ex-citation peak 434 nm, emission peak 476 nm) (27), and yellow fluorescentprotein (YFP) (Ser65→Gly and Thr203 → Tyr, excitation peak 514 nm,emission peak 527 nm) (28). Variants fluorescent in the red wavelengthrange have not been identified, however, red fluorescent proteins (RFPs)have been isolated from other organisms, the best known of which is DsRed(excitation peak 558 nm, emission peak 583 nm) (29,30).
There are two reasons why EGFP is the fluorochrome of choice. First,owing to the nature of the photobleaching experiments, using the most pho-tostable variant (at present EGFP) will facilitate more accurate measure-ments. Second, most conventional confocal microscopes will be equippedwith an argon laser, with an output wavelength of 488 nm, and filters mostsuitable for working with GFP. However, under certain circumstancesexperimental design could require the use of one of the other variants (forexample when photobleaching is used as a control during fluorescent reso-nance energy transfer), which should not cause major problems. In general,the procedures described here can be followed when the change in excita-tion and emission wave-lengths are taken into account.
2. Although expression levels as close to physiological as possible for the pro-tein of interest are recommended, there are a number of considerations.When expression of the (GFP-fusion) product is toxic, an inducible systemshould be considered. The main concern, however, is the detectability ofthe GFP-fusion protein during the FRAP and FLIP experiments. If the prod-uct is hard to detect, the laser intensity during measurements will need tobe increased, resulting in more intrinsic bleaching and less accurate datacollection (see also Subheading 3.3.); this might lead to the necessity ofusing a stronger promoter. As an alternative, the protein of interest could betagged with multiple copies of GFP, increasing the signal accordingly.However, this leads to a significant increase in the size of the protein, whichmight influence its behavior.
3. Some proteins are not functional when fused to GFP (or any other tag)whether it is an amino-terminal or carboxyl-terminal fusion. Under these
circumstances, it can be considered to place the GFP sequence “internally.”When the domain structure of the protein is known or predicted, the GFPsequence can be cloned between different domains that do not need to beproximal in order to function.
4. Expression of fusion products from certain promoters might lead to thetranscription of two proteins. Often this is caused by presence of two startsites in the beginning of the sequence, relatively close to the promoter. Thiscould occur when GFP is present 5� of the protein of interest, or when theprotein of interest is relatively small. Deleting or mutating the ATG of thesecond part of the sequence might prevent the transcription of two differ-ent proteins under these circumstances. However, in most cases, deletion ofthe second start site is not necessary.
5. When recovery times are relatively long compared to the time it takes toscan or bleach the sample, two or more cells within the same ROI can bechosen or more than one ROI can be defined to collect data from more thenone cell. Because different bleach ROI also can be defined, different cellsin the ROI(s) can be bleached simultaneously. On the other hand, havingmore then one cell in the field facilitates direct comparison of fluorescencelevels in bleached and unbleached cells during data collection (see Sub-heading 3.4.3.).
6. When recovery occurs extremely quickly, it is necessary to take a largenumber of data points in a small amount of time. In the system we used,a Zeiss LSM510, the laserbeam is directed from left to right, and fromtop to bottom over the sample, and mirrors regulate the on/off status ofthe laser. We noticed that choosing an irregular ROI-shape (in contrastto a rectangular ROI-shape) increased the time to scan an area signifi-cantly. Therefore, in all experiments shown we chose rectangular shapesfor all ROIs. Furthermore, we noticed that scanning an area of 500 �200 pixels took less time than scanning an area of 200 � 500 pixels,apparently because the laser moves from left to right over the X-axis,and is then moved up one pixel on the Y axis and scans again from leftto right.
7. As an example: during the experiments with Fus3p our Krypton/Argonlaser was consistantly used at 25 mW output. During normal image cap-ture/data collection, it was used at 0.1% transmission with four iterations.For the purpose of bleaching, the transmission was increased to 25% trans-mission and 20 iterations of the ROI were generally required to reduce flu-orescence levels as desired.
8. For samples that reached a maximum recovery within 2 min, but were sen-sitive to bleaching, we chose a staged time-lapse schedule. This reduces
Revealing Protein Dynamics 303
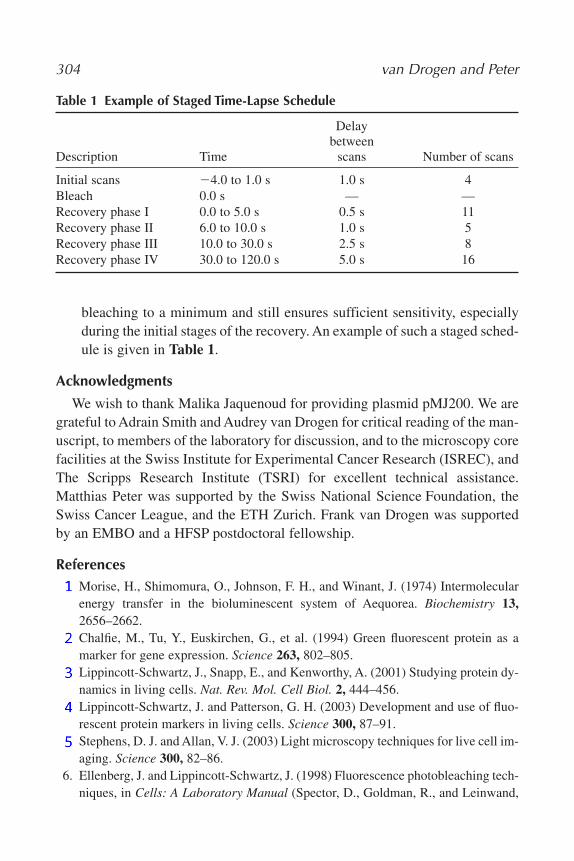
bleaching to a minimum and still ensures sufficient sensitivity, especiallyduring the initial stages of the recovery. An example of such a staged sched-ule is given in Table 1.
Acknowledgments
We wish to thank Malika Jaquenoud for providing plasmid pMJ200. We aregrateful to Adrain Smith and Audrey van Drogen for critical reading of the man-uscript, to members of the laboratory for discussion, and to the microscopy corefacilities at the Swiss Institute for Experimental Cancer Research (ISREC), andThe Scripps Research Institute (TSRI) for excellent technical assistance.Matthias Peter was supported by the Swiss National Science Foundation, theSwiss Cancer League, and the ETH Zurich. Frank van Drogen was supportedby an EMBO and a HFSP postdoctoral fellowship.
References1. Morise, H., Shimomura, O., Johnson, F. H., and Winant, J. (1974) Intermolecular
energy transfer in the bioluminescent system of Aequorea. Biochemistry 13,2656–2662.
2. Chalfie, M., Tu, Y., Euskirchen, G., et al. (1994) Green fluorescent protein as amarker for gene expression. Science 263, 802–805.
3. Lippincott-Schwartz, J., Snapp, E., and Kenworthy, A. (2001) Studying protein dy-namics in living cells. Nat. Rev. Mol. Cell Biol. 2, 444–456.
4. Lippincott-Schwartz, J. and Patterson, G. H. (2003) Development and use of fluo-rescent protein markers in living cells. Science 300, 87–91.
5. Stephens, D. J. and Allan, V. J. (2003) Light microscopy techniques for live cell im-aging. Science 300, 82–86.
6. Ellenberg, J. and Lippincott-Schwartz, J. (1998) Fluorescence photobleaching tech-niques, in Cells: A Laboratory Manual (Spector, D., Goldman, R., and Leinwand,
304 van Drogen and Peter
Table 1 Example of Staged Time-Lapse Schedule
Delaybetween
Description Time scans Number of scans
Initial scans �4.0 to 1.0 s 1.0 s 4Bleach 0.0 s — —Recovery phase I 0.0 to 5.0 s 0.5 s 11Recovery phase II 6.0 to 10.0 s 1.0 s 5Recovery phase III 10.0 to 30.0 s 2.5 s 8Recovery phase IV 30.0 to 120.0 s 5.0 s 16
L., eds.), Cold Spring Harbor Laboratory Press, Cold Spring Harbor, NY, pp.79.1–79.23.
7. Phair, R. D. and Misteli, T. (2001) Kinetic modelling approaches to in vivo imag-ing. Nat. Rev. Mol. Cell Biol. 2, 898–907.
8. Nehls, S., Snapp, E. L., Cole, N. B., et al. (2000) Dynamics and retention of mis-folded proteins in native ER membranes. Nat. Cell Biol. 2, 288–295.
9. van Drogen, F., Stucke, V. M., Jorritsma, G., and Peter, M. (2001) MAP kinase dy-namics in response to pheromones in budding yeast. Nat. Cell Biol. 3, 1051–1059.
10. van Drogen, F. and Peter, M. (2001) MAP kinase dynamics in yeast. Biol. Cell 93,63–70.
11. van Drogen, F. and Peter, M. (2002) Spa2p functions as a scaffold-like protein torecruit the Mpk1p MAP kinase module to sites of polarized growth. Curr. Biol. 12,1698–1703.
12. Leidel, S. and Gonczy, P. (2003) SAS-4 is essential for centrosome duplication inC elegans and is recruited to daughter centrioles once per cell cycle. Dev. Cell 4,431–439.
13. Stenoien, D. L., Sen, S., Mancini, M. A., and Brinkley, B. R. (2003) Dynamic as-sociation of a tumor amplified kinase, Aurora-A, with the centrosome and mitoticspindle. Cell Motil. Cytoskel. 55, 134–46.
14. Carballido-Lopez, R. and Errington, J. (2003) The bacterial cytoskeleton: in vivodynamics of the actin-like protein Mbl of Bacillus subtilis. Dev. Cell 4, 19–28.
15. Gerlich, D., Beaudouin, J., Kalbfuss, B., et al. (2003) Global chromosome positionsare transmitted through mitosis in mammalian cells. Cell 112, 751–764.
16. Sambrook, J., Fritsch, E. F., and Maniatis, T. (1989) Molecular Cloning: A Labo-ratory Manual. Cold Spring Harbor Laboratory Press, Cold Spring Harbor, NY.
17. Cormack, B. P., Valdivia, R. H., and Falkow, S. (1996) FACS-optimized mutantsof the green fluorescent protein (GFP). Gene 173, 33–38.
18. Heim, R., Cubitt, A. B., and Tsien, R. Y. (1995) Improved green fluorescence. Na-ture 373, 663–664.
19. Jaquenoud, M., Gulli, M. P., Peter, K., and Peter, M. (1998) The Cdc42p effectorGic2p is targeted for ubiquitin-dependent degradation by the SCFGrr1 complex.EMBO J. 17, 5360–5373.
20. Breitkreutz, A. and Tyers, M. (2002) MAPK signaling specificity: It takes two totango. Trends Cell Biol. 12, 254–257.
21. Elion, E. A. (2000) Pheromone response, mating and cell biology. Curr. Opin. Mi-crobiol. 3, 573–581.
22. Dohlman, H. G. (2002) G proteins and pheromone signaling. Annu. Rev. Physiol.64, 129–152.
23. van Drogen, F., O’Rourke, S. M., Stucke, V. M., et al. (2000) Phosphorylation ofthe MEKK Ste11p by the PAK-like kinase Ste20p is required for MAP kinase sig-naling in vivo. Curr. Biol. 10, 630–639.
24. Paddock, S. W. (1999) Confocal laser scanning microscopy. Biotechniques 27,992–996, 998–1002, 1004.
Revealing Protein Dynamics 305

25. Paddock, S. W. (1999) An introduction to confocal imaging. Methods Mol. Biol.122, 1–34.
26. Pawley, J. B. (1995) Handbook of Biological Confocal Microscopy. Plenum Press,New York, NY.
27. Heim, R., Prasher, D. C., and Tsien, R. Y. (1994) Wavelength mutations and post-translational autoxidation of green fluorescent protein. Proc. Natl. Acad. Sci. USA91, 12,501–12,504.
28. Ormo, M., Cubitt, A. B., Kallio, K., et al. (1996) Crystal structure of the Aequoreavictoria green fluorescent protein. Science 273, 1392–1395.
29. Matz, M. V., Fradkov, A. F., Labas, Y. A., et al. (1999) Fluorescent proteins fromnonbioluminescent Anthozoa species. Nat. Biotechnol. 17, 969–973.
30. Bevis, B. J. and Glick, B. S. (2002) Rapidly maturing variants of the Discosomared fluorescent protein (DsRed). Nat. Biotechnol. 20, 83–7.
31. Cormack, B. P., Bertram, G., Egerton, M., et al. (1997) Yeast-enhanced green flu-orescent protein (yEGFP)a reporter of gene expression in Candida albicans. Mi-crobiology 143 (Pt 2), 303–311.
306 van Drogen and Peter
21
Assaying Cytochrome c Translocation During Apoptosis
Nigel J. Waterhouse, Rohan Steel, Ruth Kluck, and Joseph A. Trapani
SummaryTranslocation of proteins from the mitochondrial intermembrane space to the cytoplasm is a
critical event during apoptosis. There are several methods for assaying this event cited in the lit-erature. In this chapter, we highlight separation of cytosolic and mitochondrial fractions of cul-tured cells using digitonin as the method for measuring cytochrome c release that, in our handshas been the simplest and most reproducible.
Key Words: Cytochrome c; apoptosis; fractionation; outer membrane permeabilization;mitochondria; digitonin.
1. Introduction
It has been known for many years that Bcl-2 family members regulate apop-totic cell death (1). It is now known that this is done at least in part by regulat-ing specific permeabilization of the mitochondrial outer membrane (2–4). Pro-apoptotic Bcl-2 family members induce mitochondrial outer membranepermeabilization (MOMP) resulting in the release of several proteins from themitochondrial intermembrane space (MIS). Anti-apoptotic Bcl-2 family mem-bers antagonize the pro-apoptotic family members to block the permeabiliza-tion event.
Of the proteins released, cytochrome c, second mitochondrial activator ofcaspases (SMAC)/Diablo, and HtrA2/Omi have been shown to participate in theactivation of caspases; the proteases that orchestrate apoptotic cell death. On
From: Methods in Molecular Biology, vol. 284:Signal Transduction Protocols
Edited by: R. C. Dickson © Humana Press Inc., Totowa, NJ
307
entering the cytosol, cytochrome c forms a protein complex with apoptotic pro-tease activating factor-1 (APAF-1) and the zymogen form of caspase-9 (5). For-mation of this complex, “the apoptosome,” brings several pro-caspase-9 mole-cules within sufficient proximity to allow auto-activation (6). SMAC/Diabloand htRA2/Omi deregulate caspases by displacing endogenous caspase in-hibitors, the inhibitor of apoptosis proteins (IAPs) (7–11) allowing unfetteredcaspase activation. MOMP is therefore a critical event in apoptosis and as suchthe measurement of this event is a component of many studies on cell death.
MOMP can be assayed in several ways. In many instances, measuring loss ofthe mitochondrial transmembrane potential (DWm) provides an indicator ofMOMP as the electrochemical potential across the mitochondrial inner membraneis lost as a consequence of cytochrome c release (12). However, this loss of DWmis only transient in the absence of caspase activation, such that in cells with cas-pase-9 or APAF-1 deficiency, measuring loss of DWm may not yield an accurateindication of MOMP (12). By far the most common method to detect MOMP isby following the translocation of proteins from the MIS to the cytosol. Althoughthere is debate as to whether all MIS proteins are co-released, cytochrome c ap-pears to be the most abundant and easily detectable of the MIS proteins.
Detection of mitochondrial cytochrome c release is accomplished by Westernblot of cellular fractions, by immunocytochemistry or by following cytochrome cfused to green fluorescent protein (GFP) (13–15). Immunocytochemistry gives anaccurate representation of the number of cells with translocated cytochrome c, al-though in suspension cells or in cells with a low cytoplasmic to nucleus ratio, itcan be difficult to distinguish between cytosolic and mitochondrial cytochrome c.Measurement of translocated cytochrome c-GFP obviously requires transfectionof the fusion protein into cells, which is not always possible. Analysis of cy-tochrome c release by Western blot of cellular fractions is relatively simple andcan be achieved in many primary and transformed populations of cells. This tech-nique therefore remains one of the most widely applicable ways to assay for cy-tochrome c release. This chapter describes the digitonin method of isolating mi-tochondrial and cytosolic fractions from cultured cells for analysis of cytochromec release by Western blot or flow cytometry.
2. Materials1. Apoptotic stimulus (e.g., granzyme B/Perforin (16,17), heat shock (18),
irradiation (19), cytotoxic drugs (12).2. Plasma membrane permeabilization buffer: 200 lg/mL digitonin, 80 mM
KCl in PBS (see Notes 1 and 2).3. Total cell lysis buffer: 50 mM Tris-HCl, pH 7.4, 150 mM NaCl, 2 mM
EGTA, 2 mM EDTA, 0.2% Triton X-100, 0.3% NP-40, 1X CompleteTM
Protease Inhibitor (Bohringer Mannheim).
308 Waterhouse et al.
4. Phosphate-buffered saline (PBS): 8 g NaCl, 0.2 g KCl, 1.15 g Na2HPO4 �7H2O, 0.2 g KH2PO4/L, pH approx 7.3.
5. Paraformaldehyde (4 % in PBS).6. Blocking buffer: 3% Bovine serum albumin (BSA), 0.05% saponin in PBS
(make fresh).7. V-bottomed 96-well plate.8. Anti-cytochrome c (clone 6H2.B4, BD Pharmingen, San Diego, CA).9. Anti-cytochrome c antibody (clone 7H8.2C12, BD Pharmingen, San
Diego, CA).10. Electrophoresis apparatus for sodium dodecyl sulfate polyacrylamide gel
electrophoresis (SDS-PAGE).
3. MethodThe methods below outline: (1) efficient isolation of cytosol from mito-
chondrial fractions, and (2) detection of cytochrome c by Western blot or fluo-rescence-activated cell sorting (FACS).
3.1. Isolation of Cytosolic and Mitochondrial Fractions
Early studies used physical disruption (homogenization) of the plasma mem-brane followed by differential centrifugation to separate cytosolic and mito-chondrial fractions.
However, using homogenization, it is difficult to disrupt a large percentage ofthe cells while ensuring that all mitochondria remain intact, generally resulting inrelatively few cells being analyzed. More recently, it has been shown that lyticmolecules such as digitonin or streptolysin O disrupt plasma membrane at lowerconcentrations than are required to lyse mitochondrial outer membrane. Treat-ment of cells with plasma membrane-permeabilization buffer (containing digi-tonin) allows diffusion of cytosolic proteins out of cells. Separation of the cytosolfrom the mitochondria can then be obtained by a single centrifugation step.
1. Resuspend 1 � 106 cells in 100 lL of ice-cold plasma-membrane-perme-abilization buffer and incubate on ice for 5 min (see Notes 3–6).
2. Centrifuge lysates (800 g for 5 min at 4°C).3. Store the supernatant (cytosolic fraction) at �70°C (for Western blot, see
Subheading 3.2.). Do not discard the pellet.4. Continue to Subheading 3.2. for Western blot or Subheading 3.3. for FACS.
3.2. Detection of Cytochrome c by Western Blot
With this procedure about 80% of the cytochrome c is released from HeLacells treated with 1 lM Actinomycin D for 12 h, with ultraviolet (UV) light(80 mJ/m2) and incubated for 6 h, with 230 ng/mL Trail for 2 h or with Jurkat
Cytrochrome c Translocation 309
cells treated with 40 lM Etoposide for 8 h, 500 nM Actinomycin D for 8 h or500 nM Staurosporine for 8 h.
1. Resuspend the pellet from Subheading 3.1., Step 2 in 100 lL of ice-coldtotal cell lysis buffer and rock gently at 4°C for 10 min.
2. Centrifuge the lysate (10,000 g for 10 min at 4°C).3. Store the supernatant (mitochondria/nuclear/membrane fraction) at �70°C.4. Load pellet fractions (Subheading 3.2., Step 3) and cytosolic fractions
(Subheading 3.1., Step 3), normalized for protein content, on a 12 or 15%SDS-PAGE gel and transfer the proteins to nitrocellulose (see Notes 7–9).
5. Detect cytochrome c (12.3 kDa) with anticytochrome c clone 7H8.2C12using standard immunoblotting protocol.
3.3. Detection of Cytochrome c by FACS Analysis
1. Resuspend the pellet from Subheading 3.1., Step 2 in 100 lL of parafor-maldehyde and incubate for 20 min at room temperature.
2. Place the suspension in individual wells of a 96-well plate and wash thepellet three times in PBS (see Note 10).
3. Incubate the pellet in blocking buffer for 1 h at room temperature.4. Resuspend the pellet in anticytochrome c clone 6H2.B4 diluted 1:200 in
blocking buffer and incubate overnight at 4°C.5. Wash the pellet three times in blocking buffer.6. Resuspend the pellet in phycoerythrin (PE) labeled secondary antibody di-
luted 1:200 in blocking buffer and incubate for 1 h at room temperature.7. Wash the pellet and analyze by flow cytometry detecting PE fluorescence
in the FL-2 channel of a flow cytometer (see Notes 11 and 12). Cells thathave undergone cytochrome c release will have low PE fluorescence.
4. Notes
1. This buffer should be made fresh. We use digitonin from Sigma. We makea 20 mg/mL stock of digitonin by adding PBS just before it is needed andheat the mixture at 95°C until dissolved.
2. At least 80 mM KCl is required in the buffer to allow cytochrome c that hasbeen released from mitochondria to dissociate from membranes. KCl ispresent in cytoplasm at approx 137 mM.
3. The amount of permeabilization buffer should be titrated for each cell linesuch that at least 95% of cells are permeabilized. This can be monitoredby staining small aliquots of the permeabilized cells with trypan blue.
4. Ensure that the concentration of digitonin is not lysing mitochondria. Un-treated, intact cells should exhibit only background cytochrome c release,
310 Waterhouse et al.
e.g., reduced fluorescence by FACS or a faint band in the cytosolic frac-tions assayed by Western blot.
5. The number of cells assayed can be varied as long as the digitonin con-centration is titrated according to Notes 3 and 4.
6. In permeabilized cells, Ca2+ will access mitochondria and induce perme-ability transition and swelling. EDTA should therefore be added to the per-meabilization buffer if the cells were treated in media containing high Ca2+.
7. The abundance of cytochrome c in many cells makes it easy to detect byWestern blot, however this also means that small changes may appear sig-nificant. It is therefore essential to assay both the cytosolic and mitochon-drial fractions.
8. Because Western blotting shows an averaged result from a population ofcells, it is not possible to determine whether all the cytochrome c is cyto-plasmic in a small percentage of cells or all cells have partially redistributedtheir cytochrome c. Immunocytochemistry/FACS-based analysis (Sub-heading 3.3.) is recommended to quantitate the percentage of cells havingundergone cytochrome c release.
9. Western blotting may not be possible in cells that have very low levels ofcytochrome c (e.g., primary T cells [20]). In the event of low yields of cy-tochrome c in the cytosolic fractions, we have successfully concentrated theproteins from this fraction by acetone precipitation. High levels of digi-tonin, however, can interfere with precipitation.
10. We have found that V-shaped bottoms in 96-well plates facilitates pelletwashing without losing samples.
11. Using the immunocytochemistry/FACS-based analysis, cells can be visual-ized by fluorescence microscopy for confirmation.
12. The FACS-based assay will only be useful in cells that have sufficient lev-els of cytochrome c such that the fluorescence of stained vs unstained cellsis easily distinguishable.
Acknowledgments
NJW is a Peter Doherty Fellow (REG Key 165405), and JAT is a PrincipalResearch Fellow of the National Health and Medical Research Council Australia.
References1. Vaux, D. L., Cory, S., and Adams, J. M. (1988) Bcl-2 gene promotes haemopoietic
cell survival and cooperates with c-myc to immortalize pre-B cells. Nature 335,440–442.
2. Yang, J., Liu, X., Bhalla, K., et al. (1997) Prevention of apoptosis by Bcl-2: releaseof cytochrome c from mitochondria blocked. Science 275, 1129–1132.
Cytrochrome c Translocation 311
3. Waterhouse, N. J., Ricci, J. E., and Green, D. R . (2002) And all of a sudden it’sover: mitochondrial outer-membrane permeabilization in apoptosis. Biochimie 84,113–121.
4. Kluck, R. M., Bossy-Wetzel, E., Green, D. R., and Newmeyer, D. D. (1997) Therelease of cytochrome c from mitochondria: a primary site for Bcl-2 regulation ofapoptosis. Science 275, 1132–1136.
5. Zou, H., Li, Y., Liu, X., and Wang, X. (1999) An APAF-1.cytochrome c multimericcomplex is a functional apoptosome that activates procaspase-9. J. Biol. Chem. 274,11,549–11,556.
6. Salvesen, G. S. and Dixit, V. M. (1999) Caspase activation: the induced-proximitymodel. Proc. Natl. Acad. Sci. USA 96, 10,964–10,967.
7. Verhagen, A. M., Silke, J., Ekert, P. G., et al. (2002) HtrA2 promotes cell deaththrough its serine protease activity and its ability to antagonize inhibitor of apop-tosis proteins. J. Biol. Chem. 277, 445–454.
8. Verhagen, A. M., Ekert, P. G., Pakusch, M., et al. (2000) Identification of DIABLO,a mammalian protein that promotes apoptosis by binding to and antagonizing IAPproteins. Cell 102, 43–53.
9. van Loo, G., van Gurp, M., Depuydt, B., et al. (2002) The serine proteaseOmi/HtrA2 is released from mitochondria during apoptosis. Omi interacts withcaspase-inhibitor XIAP and induces enhanced caspase activity. Cell Death Differ.9, 20–26.
10. Suzuki, Y., Imai, Y., Nakayama, H., et al. (2001) A serine protease, HtrA2, is re-leased from the mitochondria and interacts with XIAP, inducing cell death. Mol.Cell 8, 613–621.
11. Du, C., Fang, M., Li, Y., Li, L., and Wang, X. (2000) Smac, a mitochondrial pro-tein that promotes cytochrome c-dependent caspase activation by eliminating IAPinhibition. Cell 102, 33–42.
12. Waterhouse, N. J., Goldstein, J. C., von Ahsen, O., et al. (2001) Cytochrome cmaintains mitochondrial transmembrane potential and ATP generation after outermitochondrial membrane permeabilization during the apoptotic process. J. CellBiol. 153, 319–328.
13. Goldstein, J. C., Waterhouse, N. J., Juin, P., et al. (2000) The coordinate release ofcytochrome c during apoptosis is rapid, complete and kinetically invariant. Nat.Cell Biol. 2, 156–162.
14. Waterhouse, N. J., Goldstein, J. C., Kluck, R. M., et al. (2001) The (Holey) studyof mitochondria in apoptosis. Methods Cell Biol. 66, 365–391.
15. Finucane, D. M., Bossy-Wetzel, E., Waterhouse, N. J., et al. (1999) Bax-inducedcaspase activation and apoptosis via cytochrome c release from mitochondria is in-hibitable by Bcl-xL. J. Biol. Chem. 274, 2225–2233.
16. Sutton, V. R., Davis, J. E., Cancilla, M., et al. (2000) Initiation of apoptosis bygranzyme B requires direct cleavage of bid, but not direct granzyme B-mediatedcaspase activation. J. Exp. Med. 192, 1403–1414.
312 Waterhouse et al.
17. Pinkoski, M. J., Waterhouse, N. J., Heibein, J. A., et al. (2001) GranzymeB-mediated apoptosis proceeds predominantly through a Bcl-2-inhibitable mito-chondrial pathway. J. Biol. Chem. 276, 12,060–12,067.
18. Buzzard, K. A., Giaccia, A. J., Killender, M., and Anderson, R. L. (1998) Heatshock protein 72 modulates pathways of stress-induced apoptosis. J. Biol. Chem.273, 17,147–17,153.
19. Waterhouse, N., Kumar, S., Song, Q., et al. (1996) Heteronuclear ribonucleopro-teins C1 and C2, components of the spliceosome, are specific targets of interleukin1beta-converting enzyme-like proteases in apoptosis. J. Biol. Chem. 271,29,335–29,341.
20. Murphy, B. M., O’Neill, A. J., Adrain, C., et al. (2003) The apoptosome pathwayto caspase activation in primary human neutrophils exhibits dramatically reducedrequirements for cytochrome c. J. Exp. Med. 197, 625–632.
Cytrochrome c Translocation 313

Top Related
Copyright © 2022 FDOKUMEN

