


Bahasa
Halaman
Hukum

Integrins Regulate Neutrophil Traction under Spatial Confinement
1
Matrix Confinement Plays a Pivotal Role in Regulating Neutrophil-generated Tractions,
Speed and Integrin Utilization
Jennet Toyjanova1, Estefany Flores-Cortez2, Jonathan S. Reichner2, and Christian Franck1
1School of Engineering, Brown University, Providence, RI 2Department of Surgery, Rhode Island Hospital and the Warren Alpert Medical School of Brown
University, Providence, RI
*Running Title: Integrins Regulate Neutrophil Traction under Spatial Confinement
To whom correspondence should be addressed: Christian Franck, PhD, School of Engineering, Brown University, 182 Hope St. Box D. Providence, RI, 02912; Tel: 401-863-2863; Fax: 401-863-9009; E-mail: [email protected]
Keywords: integrins; traction; neutrophil migration; matrix confinement
Background: Neutrophils must generate well-regulated forces to migrate within the confined, three-dimensional space of diseased tissues. Results: Spatial confinement induces switch to integrin-independent motility but integrins regulate 3D traction force generation. Conclusion: Physical confinement is sufficient to induce integrin-independent motility. Significance: Spatially confined double hydrogels are a biomimetic system that may allow for ex vivo testing of neutrophil-specific therapeutics.
Neutrophils are capable of switching from integrin-dependent motility on two-dimensional (2D) substrata to integrin-independent motion following entry into the confined three-dimensional (3D) matrix of an afflicted tissue. Yet whether integrins still maintain a regulatory role for cell traction generation and cell locomotion under the physical confinement of the 3D matrix is unknown, and is challenging to deduce from motility studies alone. Using 3D TFM and a double hydrogel sandwich system, we determined the 3D spatiotemporal traction forces of motile neutrophils at unprecedented
resolution and show, for the first time, that entry into a highly confined space (2.5D) is a sufficient trigger to convert to integrin-independent migration. We find that integrins exert a significant regulatory role in determining the magnitude and spatial distribution of tractions and cell speed on confined cells. We also find that 90% of neutrophil tractions are in the out-of-plane axis and this may be a fundamental element of neutrophil traction force generation.
An inflammatory response is initiated
when circulating neutrophils enter the three-dimensional (3D) microenvironment of a damaged tissue or organ (1). A well-regulated inflammatory response is rapid in onset, brief in duration and sufficient to clear contaminating microbes and initiate healing. The consequence of an improperly regulated inflammatory response is medically significant. An inadequate response places the host at risk for the infection to spread. If the response is excessive, hyperactive neutrophils can cause damage to the tissues it is designed to protect (1,2). In order to understand how an optimal inflammatory response occurs, it is important to identify
http://www.jbc.org/cgi/doi/10.1074/jbc.M114.619643The latest version is at JBC Papers in Press. Published on December 18, 2014 as Manuscript M114.619643
Copyright 2014 by The American Society for Biochemistry and Molecular Biology, Inc.
by guest on July 2, 2016http://w
ww
.jbc.org/D
ownloaded from
Integrins Regulate Neutrophil Traction under Spatial Confinement
2
factors within an infected or injured tissue that regulate neutrophil activity.
Similar to other mammalian cells, neutrophils generate and transmit forces to their surrounding environment in order to locomote; these are defined as cell tractions. On two-dimensional (2D) substrates, neutrophils, like most other eukaryotic cells, engage ligand-specific integrins to adhere and generate tractions (3-5). However, in vivo, as neutrophils pass through the blood vascular wall, they transit from a predominantly 2D to a confined three-dimensional (3D) environment, where PMNs reach migration speeds up to 20 µm/min (6,7). In 2008 Lämmermann et al., reported that leukocytes devoid of integrins migrate with normal kinetics within a draining lymph node and in a confined fibrillar scaffold (8). This is consistent with an integrin-independent motility mechanism operative in 3D but not in 2D, in which surface contact forces produced by a forward expanding actin network are sufficient to drive cell motility (8-11). The biological relevance of the ability of a leukocyte to switch strategies of migration immediately upon entry into a three-dimensional extracellular microenvironment is that it allows these cells to function within any damaged or infected organ regardless of geometry or molecular composition. The physical components of a three-dimensional microenvironment include such factors as substrate stiffness, confinement and matrix geometry making it difficult to determine the contribution of each element in inducing the switch to integrin-independent migration in an extravasated leukocyte. Moreover, it is not clear if integrins are entirely dispensable or exert a regulatory function in generating leukocyte traction in a 3D setting.
To isolate the effect of physical confinement on the generation of traction, we combine three-dimensional traction force microscopy (3D TFM) with a double hydrogel sandwich system (2.5D system) originally developed by Beningo et al. (12). The 2.5D terminology denotes the presence of confinement between two impenetrable gels without complete envelopment of the cell within the substratum. This experimental system overcomes the limitation of more widely used
native gels where changing confinement in the matrix structure coincidently affects matrix stiffness and ligand density, thereby coupling these physical parameters (13,14). Furthermore, this system allows in situ temporal control of confinement, and permits repeated measures of an individual cell as it transitions from a 2D planar system to a 2.5D highly confined system.
Using 3D TFM, we found that over 90% of neutrophil-generated forces are directed vertically against the extracellular matrix (out-of-plane direction). This disproportionate exertion of force in the out-of-plane direction by the neutrophil is unlike the distributions reported for adhesive cell types and for ameboid Dictyostelium cells both of which produce both in-plane and out-of-plane forces but to equivalent extents (15-17). The magnitude of neutrophil traction increases significantly when the cells are placed on stiffer substrates or within a confined space, but the overall predominance of out-of-plane force generation is consistent and mechano-insensitive for stiffness and geometry. Furthermore, the relative spatiotemporal patterns of cell tractions remained unchanged upon entry into a highly confined space.
Function-blocking of the β1β2 family integrins of confined neutrophils induced a significant change in the speed of cell migration and in the spatial distribution of cell tractions. Taken together, our data show that physical confinement itself is sufficient for triggering integrin-independent motility, and that integrins continue to play a significant regulatory role for neutrophil force generation and migration speed.
EXPERIMENTAL PROCEDURES
Preparation and Mechanical Characterization of Polyacrylamide Substrates - Polyacrylamide gel substrates were prepared from acrylamide (40% w/v, Bio-Rad Laboratories) and N,N-methylene-bis-acrylamide (BIS, 2% w/v, Bio-Rad Laboratories) stock solutions as described previously (16,17). The concentrations of acrylamide and BIS were varied to control the mechanical properties of the substrates and were chosen to be 8%/0.08% for stiffer substrates and 3%/0.2% for softer substrates. The chosen
by guest on July 2, 2016http://w
ww
.jbc.org/D
ownloaded from
Integrins Regulate Neutrophil Traction under Spatial Confinement
3
concentrations yielded Young's moduli of 8.3±0.2 kPa and 1.5±0.1 kPa. All substrates contained 14% (w/v) of fluorescent microspheres (0.5 µm in diameter, carboxylate modified, Life Technologies). Polyacrylamide gel solution was vortexed for about 30 seconds, and 30 µl of polyacrylamide solution with green fluorescent microspheres were pipetted on the surface of an activated microscope slide (see below) for bottom substrate and sandwiched with a hydrophobic glass coverslip (22 mm in diameter), yielding a final thickness of around 60 µm. For the top substrate, 20 µl of polyacrylamide gel solution containing red fluorescent beads were deposited on top of an activated circular coverslide (30 mm in diameter) and sandwiched with a small hydrophobic coverslip (15 mm in diameter), yielding a final thickness of approximately 60 µm.
Glass Coverslips and Microscope Slides Surface Modification - Rectangular (75x25 mm, Fisher Scientific) and circular (30 mm in diameter, Esslinger and Company, MN) microscope slides were chemically modified to allow covalent attachment of polyacrylamide substrates. Glass coverslips and slides were rinsed with ethanol and placed in a petri dish containing a solution of 0.5% (v/v) 3-aminopropyltrimethoxysilane (Sigma-Aldrich) in ethanol for 5 minutes. Next, coverslips and microscope slides were washed with ethanol and submersed in a solution of 0.5% glutaraldehyde (Polysciences, Inc.) in deionized (DI) water for 30 minutes. Activated coverslips and slides were washed with DI water and left to dry. To allow easier gel detachment, round glass coverslips of two different sizes (22 mm and 15 mm in diameter) were chemically modified to create hydrophobic surfaces. Briefly, glass coverslips were placed in a petri dish containing 97% (v/v) hexane (Fisher Scientific, MA), 2.5% (v/v) (tridecafluoro-1,1,2,2-tetrahydrooctyl)-triethoxysilane (SIT) (Gelest, Morrisville, PA), and 0.5% (v/v) acetic acid (Sigma-Aldrich, St. Louis, MO) for approximately 1 minute. Coverslips were then removed and left to dry. To neutralize any effects due to complex lipopolysaccharides (LPS), 0.01% (v/v) of antibiotic polymyxin B (Life Technologies) was
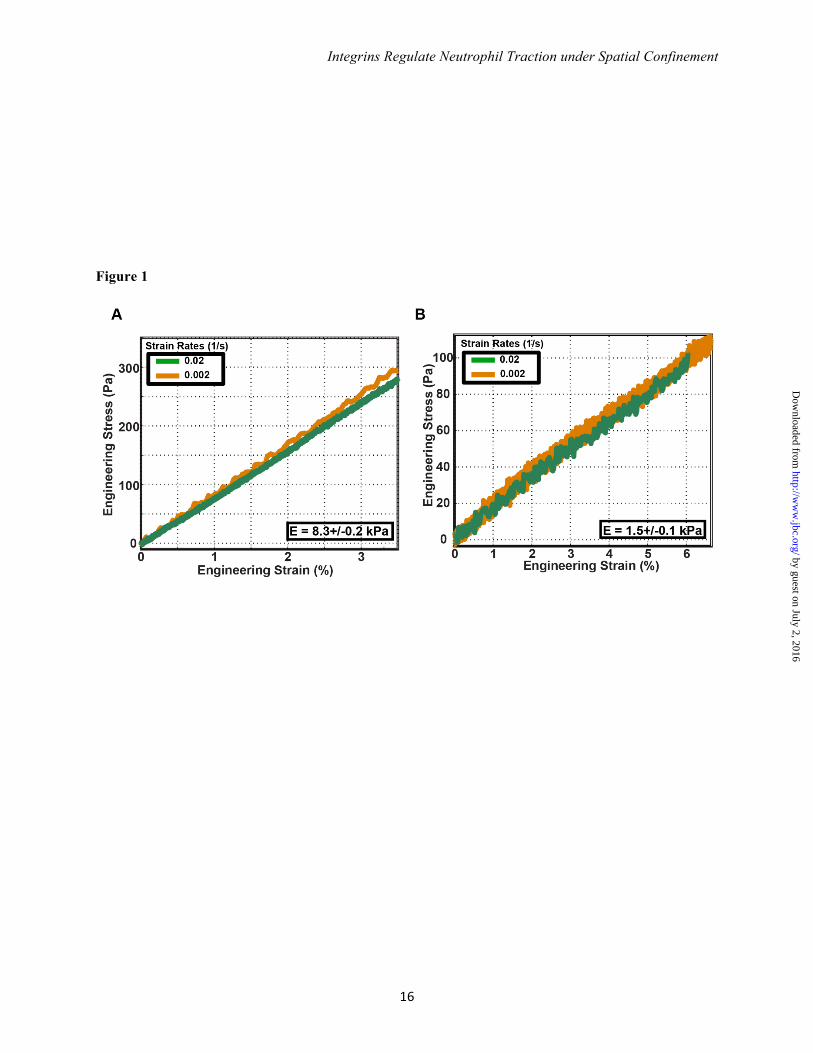
mixed into the gel solution. Cross-linking was initiated through the addition of ammonium persulfate (Sigma-Aldrich) and N,N,N,N-tetramethylethylenediamine (Life Technologies). Mechanical Characterization of Polyacrylamide Gels - Characterization was based on our previously established testing protocols on a custom-built uniaxial compression device (16,17). Gel samples were cast in circular nylon molds (16 mm in diameter and 10 mm in height). Following polymerization, the molds were removed and the samples were submersed in DI water. The custom-built compression device consisted of a centrally positioned linear actuator (Series A, Ultra Motion) equipped with a built-in linear encoder that provides displacement information with a displacement resolution of 1µm. To measure the compressive forces acting on each sample a 50 gram linear force transducer (LCFA-50F, Omega Engineering Inc.) was attached to the end of the linear actuator. To ensure uniaxial compression conditions, a ball point tip-platten top was placed on each gel sample, and all samples were carefully aligned along the central compression axis of the linear actuator. Nominal stress, σ, was computed by dividing the measured applied force by the circular contact area. Nominal strain, ε, was calculated by measuring the height change of each sample divided by the sample's original height. Each sample was compressed at three different strain rates (10-2, 10-1, and 100) to capture any time-dependence in the material behavior. Young's moduli were calculated from the slope of each linear stress-strain curve as E = σ/ε. The polyacrylamide gel can be described as neo-Hookean solid that has the same Young's modulus as the linear stress-strain relationship in the limit of small strains. The Poisson's ratio is taken to be 0.45, which is within the range of the typical values chosen for traction force microscopy studies.
A set of representative material stress-strain curves used to determine the Young’s modulus for each of the soft and stiff polyacrylamide gels is shown in Fig. 1.
Functionalization of Polyacrylamide Substrates - To promote cell attachment to
by guest on July 2, 2016http://w
ww
.jbc.org/D
ownloaded from
Integrins Regulate Neutrophil Traction under Spatial Confinement
4
polyacrylamide films, top and bottom substrates were functionalized with fibronectin using the bifunctional crosslinker, sulfo-SANPAH (Thermo Fisher) (16-18). Excess water was removed prior deposition of 100 µL of sulfo-SANPAH (1mg/mL) onto the surface of each film, followed by a 15 minute exposure to UV light. The darkened sulfo-SANPAH solution was aspirated and the procedure was repeated. The samples were thoroughly washed with DI water, and covered with a solution of 0.2 mg/mL fibronectin (Life Technologies) diluted in 50 mM HEPES (pH 8, Sigma-Aldrich) and left undisturbed at 4oC overnight. Following overnight incubation, the substrates were rinsed three times with 1x PBS mixed with polymyxin B (0.01% v/v) and sterilized with UV irradiation before depositing cells. Bifunctional crosslinker was also used for coating with polymer poly(L-lysine) with poly(ethylene-glycol) chains (PLL-PEG, 0.2 mg/mL final concentration, SuSoS).
Neutrophil Preparation - Neutrophils were isolated from healthy human volunteers into ethylenediaminetetraacetic acid-containing Vacutainer tubes (BD Biosciences, CA) according to Institutional Review Board procedures. Histopaque cell separation was followed by gravity sedimentation through 3% dextran. Hypotonic lysis to remove erythrocytes yielded a neutrophil purity of >95%. Neutrophils were suspended in HBSS (without Ca++/Mg++) on ice until use. All reagents contained <0.1 pg/mL endotoxin. For traction measurements, approximately 350,000 cells were resuspended in a vial containing 1 mL of phenol free Leibovitz L-15 medium and 2 mg/mL glucose. Prior to imaging, formyl-methionyl-leucyl-phenylalanine (fMLF, 100 nM final concentration, Sigma-Aldrich) was added to the cell solution to activate and induce migration.
For integrin blocking experiments, we used a previously described method (4). Anti -β1 (clone 6S6, EMD Millipore) and anti-β2 (clone TS1/18, Thermo Fisher Scientific) integrin blockade, neutrophils were incubated in the 10 µg/mL concentration of antibody in HBSS(-/-) on ice for 20 minutes. Once incubation is complete, cells were transferred into L15+glucose medium, where the antibody
concentration was maintained throughout the experiment. For controls, neutrophils were pretreated with 20 µg/mL of IgG1. Similar to blockade experiments, the concentration of 20 µg/mL was maintained throughout the whole experiment.
To inhibit actin polymerization in migrating neutrophils, cells were treated with latrunculin A (Life Technologies). At high concentrations of latrunculin A, treated neutrophils neither adhere to nor generate measurable forces on the substrates. Thus, a variety of the concentrations (0.5 µM - 0.01 µM) were tried during the experiment, and 0.2 µM concentration was chosen as an optimal concentration for force measurements. Before each experiment, cells were incubated in the presence of latrunculin A on ice for 30 minutes. Once incubation is complete, cells were transferred into L15+glucose medium, where the inhibitor concentration was maintained throughout the experiment.
To inhibit myosin II in migrating neutrophils, cells were pre-treated with blebbistatin at 50 µM concentration on ice for 30 minutes. Similarly, cells were then transferred into L15+glucose medium prior to experiment, and the inhibitor concentration was maintained throughout the duration of experiment. Due to sensitivity of blebbistatin to blue light (488 nm laser), both top and bottom substrates were impregnated with red fluorescent beads and excited with a green (561 nm) laser for all blebbistatin-treated cell experiments.
Live Cell Imaging - Three-dimensional image stacks were acquired using a Nikon A-1 confocal system mounted on a TI Eclipse inverted optical microscope controlled by NI-Elements Nikon Software. A 40x plan fluor air objective mounted on a piezo objective positioner was used for all the experiments, which allowed to image at speeds up to 30 frames per second. Green fluorescent microspheres were used for the bottom substrate and excited with an Argon (488 nm) laser. Red 0.5 µm fluorescent microspheres in the top substrate were excited with a diode 561 nm laser. 512 x 512 x Z voxels (102µm x 102 µm x Z) confocal volume stacks were recorded every 15 seconds with Z ranging from 128 to 250
by guest on July 2, 2016http://w
ww
.jbc.org/D
ownloaded from
Integrins Regulate Neutrophil Traction under Spatial Confinement
5
pixels (~38 µm - 75 µm) depending whether only bottom (2D) or both bottom and top (3D) substrates were imaged simultaneously. To ensure physiological imaging conditions within the imaging chamber, temperature was controlled at 37oC during time lapse recording as previously described (17). During experiment, cell outline was estimated from phase contrast microscopy.
Calculation of Displacements and 3D Tractions - Three-dimensional image stacks of the motion of the fluorescent beads were recorded by using a Nikon A-1 confocal system mounted on a TI Eclipse inverted optical microscope controlled by NI-Elements Nikon Software. Cell-generated full field displacements and tractions were determined using our recently developed large deformation 3D traction force microscopy (LD-3DTFM) method (19). Briefly, three-dimensional time-lapsed volumetric images of fluorescent beads embedded in polyacrylamide substrates were recorded using laser scanning confocal microscopy (LSCM). A new fast iterative digital volume correlation (FIDVC) algorithm was used to track the motion of the embedded fluorescent beads in all three dimensions between each time increment (20). This newly developed FIDVC technique provides significant higher spatial resolution, signal-to-noise, and faster computation times than our previous DVC algorithm (21). When quantifying neutrophil induced substrate deformations, we find that the displacement gradients are non-negligible, which requires stress and traction analysis within a finite, rather than a linear, continuum framework. As shown previously, polyacrylamide gels undergoing large deformations can be constitutively described as a Neo-Hookean material (22). Thus, cell-generated substrate stresses, σ, can be calculated as
𝜎 = 𝜇
𝐽!!
𝑩 − 13 𝑡𝑟𝑎𝑐𝑒 𝑩 ∙ 𝑰 + 𝐾 𝐽 − 1 𝑰
where µμ and 𝐾 are the shear and bulk moduli of the polyacrylamide gels. Both of the quantities are related to the Young's modulus of a material by
𝐾 = 𝐸
3(1 − 2𝜈)
𝜇 = 𝐸
2(1 + 𝜈)
The quantity 𝑩 = 𝑭 ∙ 𝑭𝑇 is the left Cauchy-Green tensor and 𝐽 is the Jacobian of deformation gradient tensor,𝑭. In both of these relations, the deformation gradient tensor 𝑭 is calculated from the full-field displacements using an 11-tap discrete differentiation kernel described by Farid et al. (23), which we showed to provide optimal spatial accuracy in the presence of noise (20).
Finally, the 3D neutrophil surface tractions can be calculated using the well-known Cauchy relation
𝒕 = 𝒏 ∙ 𝝈
where 𝒏 is the surface normal vector. The surface normal vectors were determined directly from the raw LSCM images. In brief, we take advantage of the spatial locations of the embedded fluorescent beads in the raw LSCM images. A scattered data representation of the surface is built by finding a bead's maximum 𝑧 location within a window that slides in the 𝑥 – 𝑦 plane. After least-squared fitting and surface gradient smoothing, the surface normals are calculated from a Delaunay triangulation of the surface (24). The subsequent surfaces in the time-lapse are computed by translating the surface points in the reference configuration by the displacement calculated via our FIDVC algorithm. The magnitude of the three-dimensional traction vector in the global coordinate system is then calculated as
|𝒕| = 𝑡𝑥! + 𝑡𝑦
! + 𝑡𝑧!
where 𝑡𝑥 and 𝑡𝑦 are the in-plane traction force components under the cell and 𝑡𝑧 corresponded to the out-of-plane component. We calculate the total force exerted by the cell on its substrate by integrating the magnitude of all surface tractions over the total cell area 𝑆 as
by guest on July 2, 2016http://w
ww
.jbc.org/D
ownloaded from
Integrins Regulate Neutrophil Traction under Spatial Confinement
6
𝑭 = |𝒕|𝑑𝑆
Similarly, the traction vector was resolved into components acting in-plane and out-of-plane to the surface (25):
𝒕! = 𝒕 ∙ 𝒏 𝒏
𝒕|| = 𝒕 − 𝒕!
In-plane and out-of-plane forces were then calculated as
𝐹∥ = |𝒕|||𝑑𝑆
𝐹! = |𝒕!|𝑑𝑆
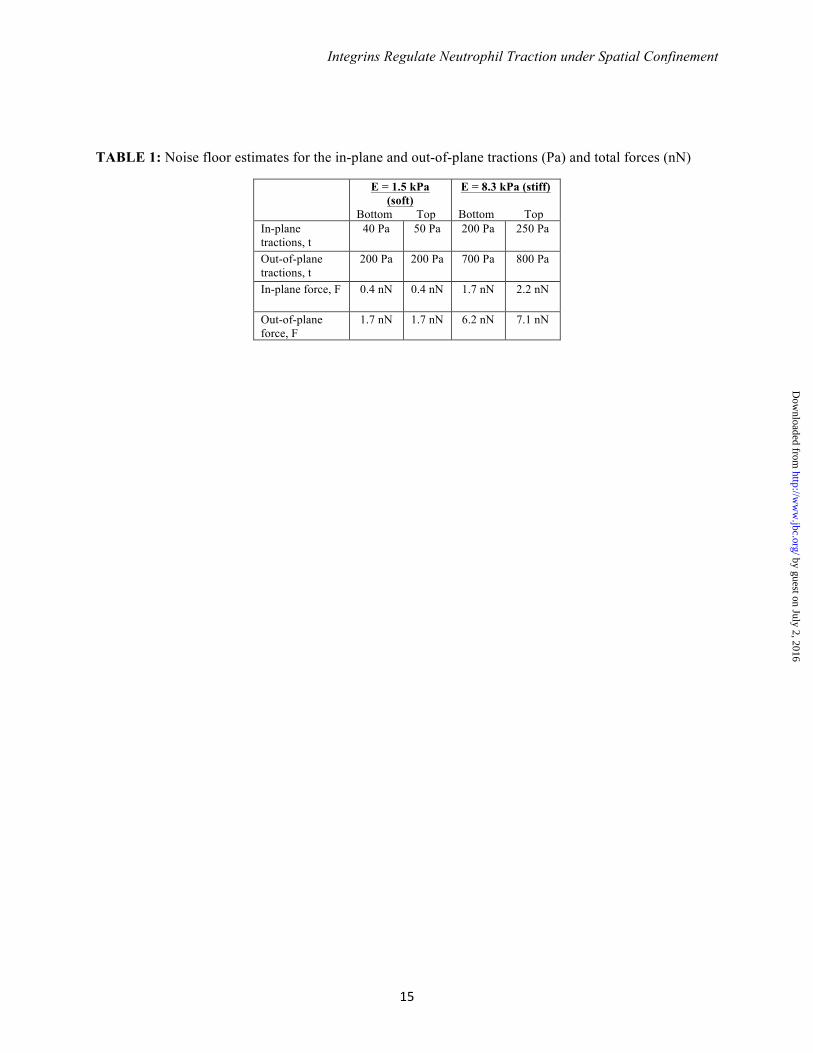
The volume integrals in this study were numerically carried out using an eight-point Gaussian quadrature of hexahedral elements with nodes centered at the grid point locations of the stress-strain values. All computations were performed in MATLAB 2013B (MathWorks, Natick, MA). The resolution of our FIDVC technique was determined by measuring the noise floor outside of the projected cell area for each experimentally obtained cell deformation field. This was done for all of the datasets for bottom and top substrates separately. Based on laser scanning confocal microscopy this technique yields a displacement noise floor of 0.08 µm in x and y (in-plane), and 0.15 µm in the z (out-of-plane) directions. The calculated noise floor for the in-plane, out-of-plane tractions and total forces are summarized in Table 1. Any traction data with signal-to-noise ratio less than two was excluded from analysis.
Cell Speed Calculations - To calculate PMN speed during migration in both 2D and 3D systems, cell boundaries from captured phase images were recorded and cell centroids were computed during each imaging increment using a custom-written Matlab algorithm. Using this information, cell speed per time increment can be calculated as
𝑣 = 𝑣𝑥! + 𝑣𝑦
!
It should be noted since the cell speed information is based of centroid calculations derived from phase images, only the in-plane (𝑥, 𝑦) velocity components could be detected.
Global Force and Moment Balance - We compute the sum of all forces and moments acting on any given control volume inside each polyacrylamide gel at every time point to verify static force and moment equilibrium are satisfied. The overall procedure is identical to our previously published methodology (17). Under all experimental conditions and imaging time points we found static equilibrium satisfied with force and moment magnitudes on the order of 10-10-10-9 N (forces), and 10-15 – 10-14 N·m (moments), respectively. These numbers are consistent with our noise floor measurements.
Statistical analysis - Data were subjected to the chi-square goodness-of-fit test to determine if a data sample comes from a normal distribution. Kruskal-Wallis non-parametric test was used to compare the medians of the groups of data to determine if the samples come from the same population. Wilcoxon rank-sum test was used for comparison of the medians of the data and their interactions. All of the distributions are presented in Figs. S1-3.
RESULTS
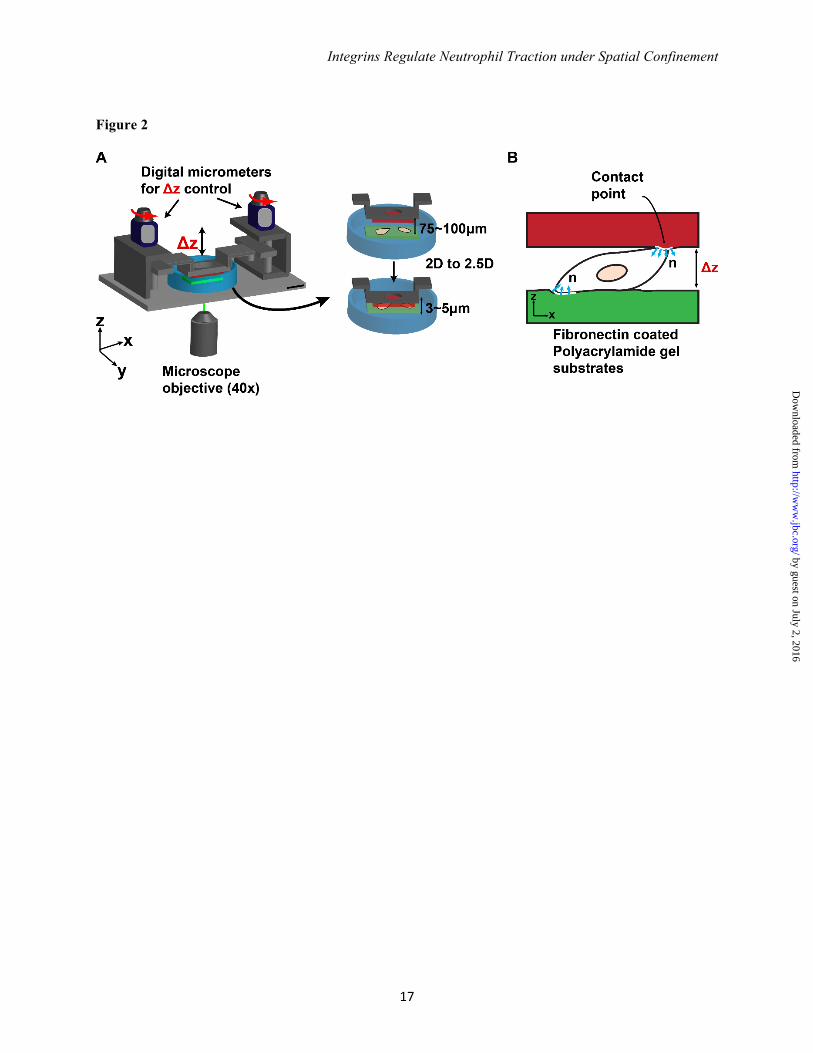
Neutrophil Force Generation as a Function of Spatial Confinement - To investigate how confinement affects the traction signatures of moving neutrophils, cells were seeded between two compliant fibronectin-coated polyacrylamide substrates separated by an adjustable gap distance to switch from a 2D to a highly confined (2.5D) microenvironment. In order to control confinement of the neutrophil-gel system, a custom-designed micromanipulator system was built. Figure 2 presents a schematic of the micromanipulator and neutrophil-gel system (Fig. 2A), as well as the orientation of the two surface normal vectors used in the 3D traction calculations (Fig. 2B).
To determine dynamic cell tractions, neutrophil-generated substrate deformation fields were recorded and analyzed using our
by guest on July 2, 2016http://w
ww
.jbc.org/D
ownloaded from
Integrins Regulate Neutrophil Traction under Spatial Confinement
7
recently developed high-resolution 3D TFM technique (19). Although the basic working principle is similar to our previous 3D TFM technique (16,17), this new technique features significantly improved spatial resolution, signal-to-noise, and computational efficiency. To determine the influence of substrate stiffness on neutrophil force generation and speed as the matrix changes from an unconfined 2D to a confined 2.5D system, two substrate stiffnesses were chosen: E = 1.5 kPa to mimic soft tissues, such as endothelial or lung tissue, and E = 8.3 kPa to mimic stiffer tissues, like muscle (Fig. 1).
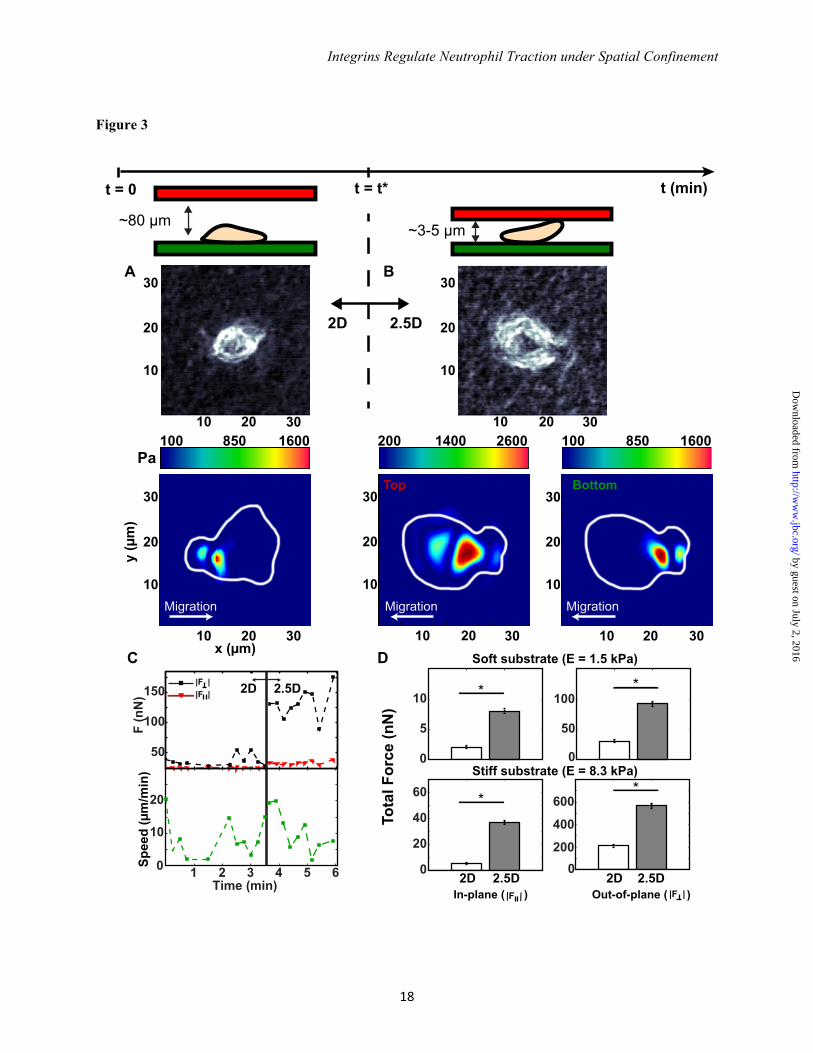
Initially, PMNs were seeded on the bottom gel (Fig. 2A) while maintaining a gap height of approximately 80 µm, which is significantly larger than the average spherical cell diameter (8 µm (26)) thus simulating a 2D environment. Once adhered to the bottom gel, time-lapse video of cellular motion and cell-generated substrate deformations were recorded every 15 seconds for a total of 10 minutes via confocal microscopy. This time period is sufficient to recapitulate cellular morphologies and trajectories when compared to previous 2D studies (3-5). Figure 3 shows a representative map of cellular tractions as a single neutrophil switched from a 2D to a confined environment (gel modulus: E = 1.5 kPa). Figure 3A depicts a snapshot of the neutrophil morphology and a color contour map of the magnitude of the 3D traction vector during chemokinesis in 2D (gap height ~ 80 µm). The magnitude of the 3D traction vector peaked around 1300 Pa at the rear of the cell relative to its direction of motion. The observation of asymmetric traction profiles is consistent with previously reported 2D studies on neutrophil motility (3,5).
Following the initial 2D acquisition period (t = t*), the top substrate was lowered to an effective substrate-to-substrate gap size of approximately 3-5 µm, which is slightly less than the average spherical neutrophil cell diameter (26). This change in gap size generated a confined 2.5D space, allowing for neutrophil attachment to either, or both, top and bottom surfaces. Cell position and substrate deformations were recorded for another 10 minutes at 15 second intervals. Figure 3B is representative of the typically observed
neutrophil morphology and the magnitude of the 3D traction vectors for both bottom and top substrates. The bottom contour plot shows cellular traction generation with magnitudes similar to that shown in Fig. 3A, whereas the top substrate shows roughly a doubling of tractions when compared to the 2D case. The asymmetric distribution of tractions seen in 2D was maintained in confinement in both the upper and lower gels. Although these data represent only single time points during time-lapse, they represent the typical behavior observed for most neutrophils in 2D and confined 2.5D environments.
Even more striking is the breakdown of the total force into its in-plane and out-of-plane components during the transition to confinement. Figure 3C illustrates strong upregulation of the out-of-plane force component as the neutrophil switched from a 2D to a confined 2.5D environment with little attenuation in its in-plane component. Similarly striking is the observation that the average neutrophil speed remained unattenuated despite the significant increase in total traction force. Dynamic oscillations in force and speed magnitudes observed in Fig. 3C are similar to the force undulations observed in previous 2D studies, where these oscillations are generated by variations in the amoeboid cell protrusion, contraction, adhesion, and relaxation force transmission cycle (27,28).
To account for the donor dependence and variance among individual neutrophils, we computed the total in-plane and out-of-plane forces for all recorded cells (N>100, Supplementary Figs. 1A,B) summarized in Fig. 3D, represented by their median and standard error. For both substrate stiffnesses, the in-plane and out-of-plane force components are approximately three times larger in the confined system as compared to 2D, although force magnitudes scale with substrate stiffness. The ratios of out-of-plane to in-plane force components are significantly higher than previous measurements on other anchorage-dependent cells (17,29). Higher out-of-plane force measurements support previous theories of a fast peeling mechanism during cellular
by guest on July 2, 2016http://w
ww
.jbc.org/D
ownloaded from
Integrins Regulate Neutrophil Traction under Spatial Confinement
8
detachment for amoeboid-type locomoting cells (30-32).
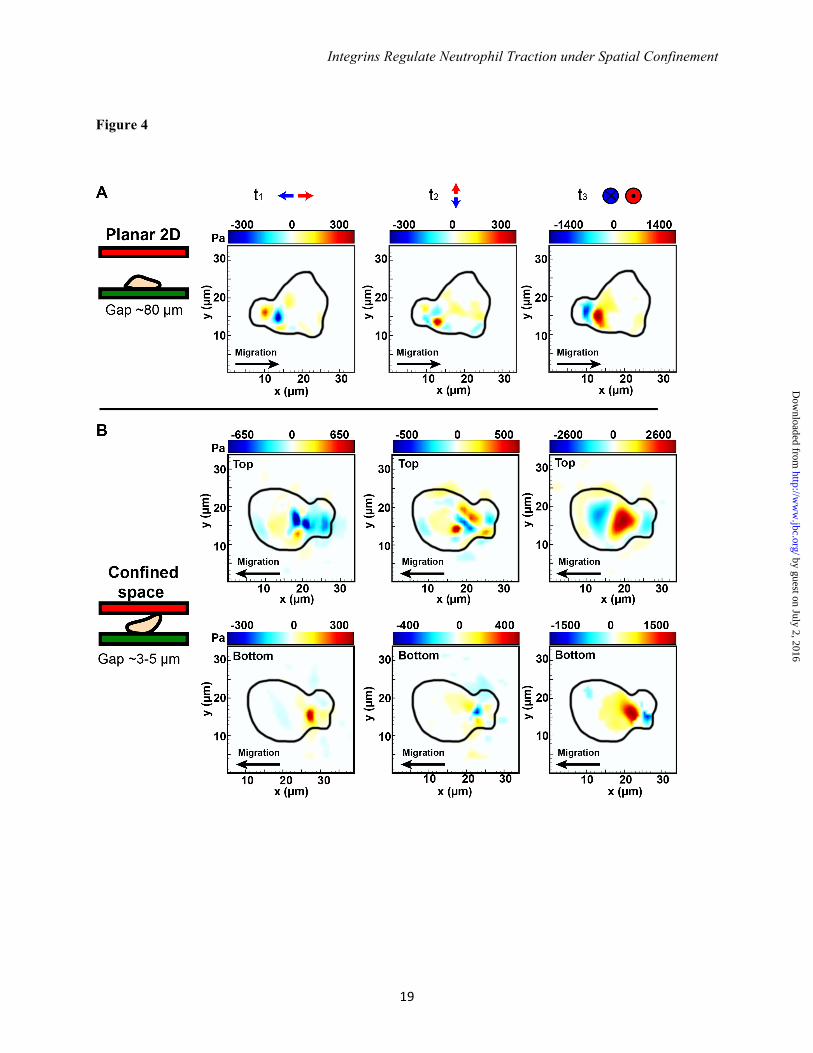
While the spatial distribution of surface tractions shows strong similarities in the bottom gels for both the 2D and 2.5D cases, the intriguing distribution of tractions in the upper gels prompted closer examination of each traction component individually plotted in Fig. 4. As can been seen in Fig. 4B the out-of-plane (t3) traction component is the major contributor of all surface tractions generated in the upper gel. Spatial localization of the t3 traction component in the upper gel visually coincides with the nuclear region observed in the phase images, suggesting a significant contribution of the nuclear region to the measured upper gel surface tractions during locomotion.
Neutrophil Forces and Speed are Integrin-independent in Confined 2.5D Environments - On 2D substrates neutrophils engage ligand-specific integrins to adhere and generate forces (4,5). However, it has been reported that integrins are dispensable for migration in 3D spaces (10,33). A recently proposed 3D leukocyte migration model suggests that there might be two different modes of force generation. The dominant mechanism in 2D relies on forming adhesive ligand-integrin contacts and is, therefore, adhesion-based. Locomotion in 3D is characterized by pressure-induced substrate deformations, which does not rely on the use of integrins and so is integrin-independent (9,10).
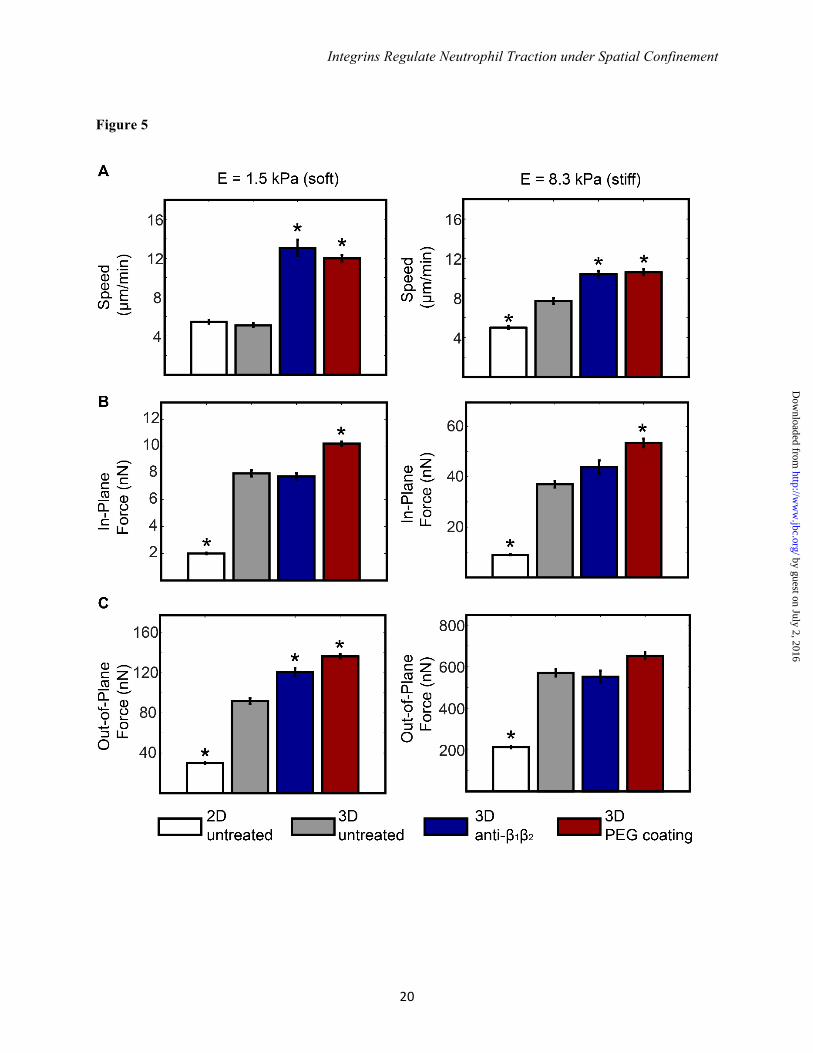
Our studies isolated spatial confinement as an experimental variable to determine if confinement is sufficient for the acquisition of integrin-independent neutrophil motility as would be encountered in a complex 3D setting. Measures of cell speed, force generation and the spatial distribution of tractions of a given cell were determined on fibronectin-conjugated hydrogels of different stiffnesses beginning in 2D with repeated measures taken over time as confinement (2.5D) was imposed. Speed, traction and force measures were also determined in the presence or absence of function-blocking integrin antibodies (Fig. 5). Integrin blockade was performed to cover all β1 and β2 integrins (such as CD11b/CD18) and cells were also assayed on PEGylated surface
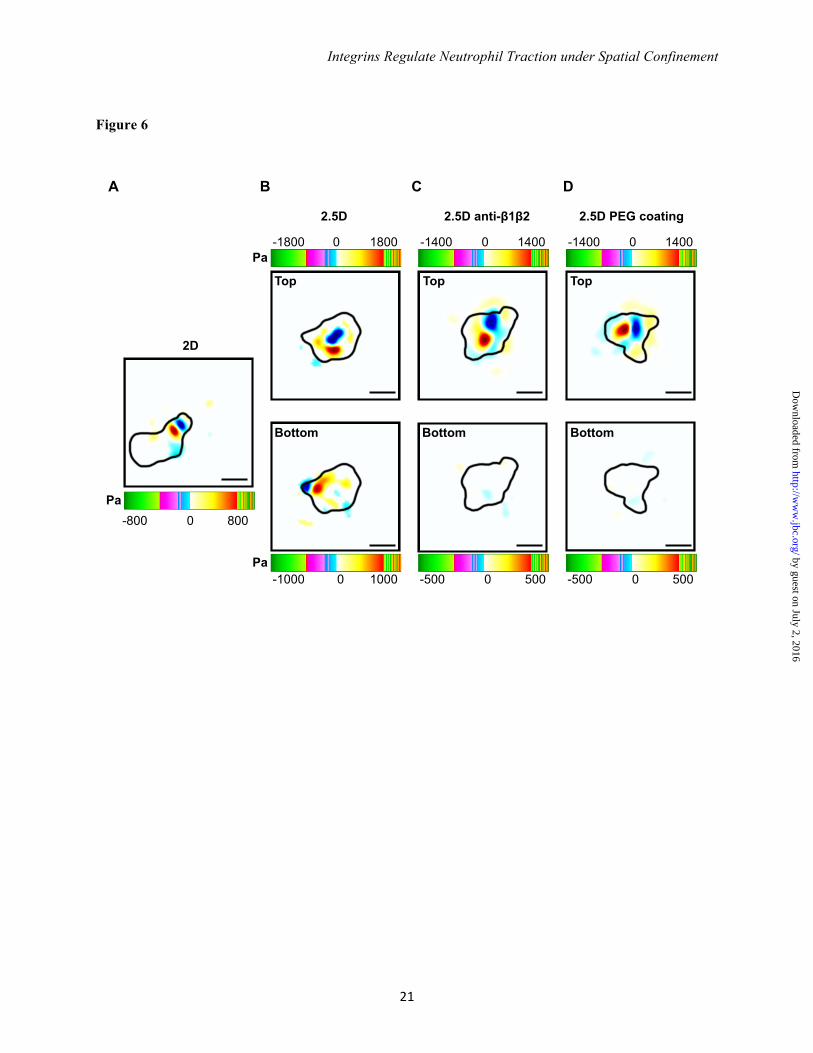
providing complete absence of matrix ligands. Under conditions of pan-β1 and β2 inhibition on soft and stiff gels, neutrophil speed and force generation was either unchanged or increased demonstrating a lack of dependence on integrins for traction force generation. Cells treated with nonspecific IgG at identical concentrations were not different than untreated control cells (not shown). Although these calculations (Fig. 5) show that upon imposition of confinement, the total force magnitudes and speeds produced by neutrophils are not reliant on integrins, they do not determine whether integrins play a subtler regulatory role in the traction generation under confinement. Figure 6 presents traction patterns generated by cells as a function of confinement and integrin utilization. Findings shown are for the predominating out-of-plane traction component for neutrophils moving on planar 2D, and subsequently, under highly confined 2.5D conditions. The application of confinement does not alter traction distribution. Pan inhibition of β1 and β2 integrins, or the absence of any ligand (PEG surface), significantly alter traction pattern during locomotion (Fig. 6(C) and (D)). Here, instead of the typically featured traction dipole pattern (Fig. 3, Fig. 6(A) and (B)) which is characteristic of an adhesion-based motility mode (27), the primary traction contribution likely stems from surface contact pressures between the nuclear lobes of the cell with the top surface. Although the bottom surfaces for both Fig. 6(C) and (D) do not show any significant tractions above our measurement noise, integration of our resolution limit (Table 1) across the bottom surface yields a force equal in magnitude and opposite to the neutrophil’s force imposed against the top surface. This implies that the type of motility featured in Fig. 6(C) and (D) does not engage the surface at focal points but rather distributes its contact forces across the entire surface of the cell. Thus, these data show that integrins continue to be utilized by a locomoting neutrophil to affect traction distribution even after entry into a highly confined space.
We examined the temporal evolution of the total force and speed patterns of untreated and antibody treated neutrophils to determine
by guest on July 2, 2016http://w
ww
.jbc.org/D
ownloaded from
Integrins Regulate Neutrophil Traction under Spatial Confinement
9
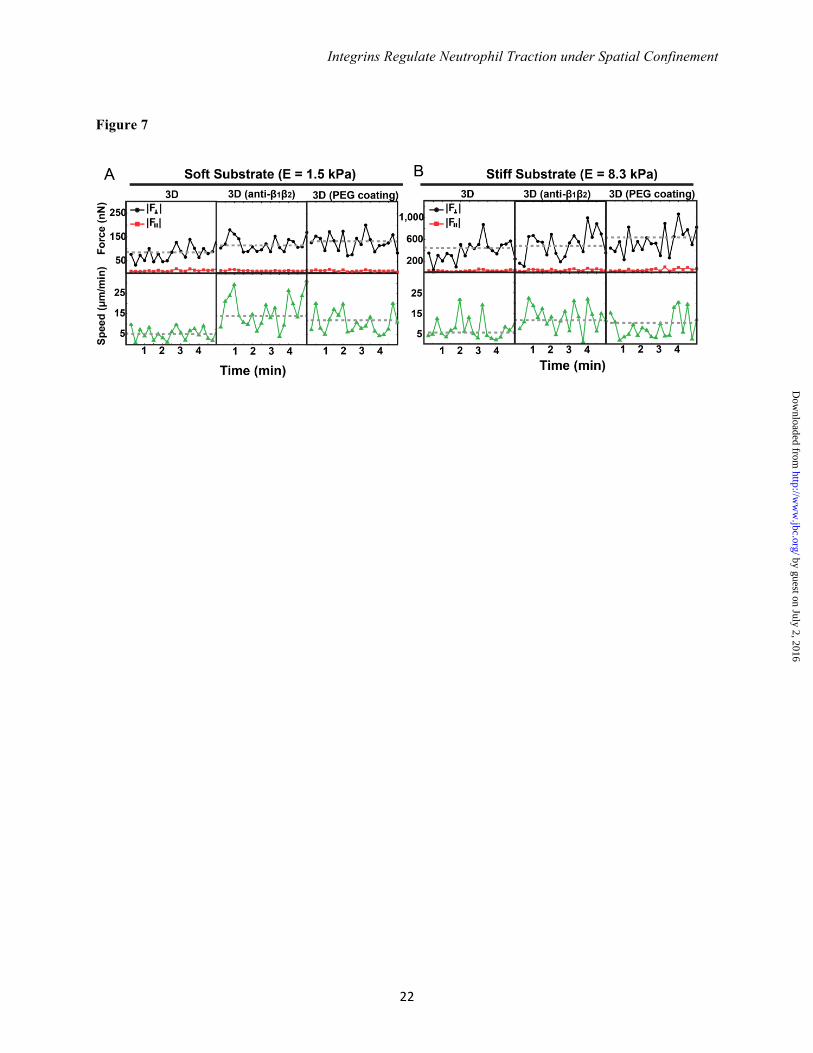
whether integrin blockade would introduce significant differences in their temporal profiles (Fig. 7). We did not find any significant differences in the temporal distribution of neutrophil speed and force patterns except for changes in their mean levels (Fig. 7, dashed line), which are reflected in Fig. 5. The general oscillations in the neutrophil-generated forces shown in Fig. 7 are similar to the force undulations observed in previous 2D studies during chemokineses, where these oscillations are generated by variations in the amoeboid cell protrusion, contraction, adhesion, and relaxation force transmission cycle (27-28). Experiments were conducted to investigate whether changes in cell generated forces correlate to changes in cell speed for control and integrin-blocked cells. Dynamic oscillations between speed and in-plane and out-of-plane forces do not statistically correlate. This result is in concert with Meili et al., where it is shown that migrating leukocytes attain their peak forces during the contraction phase, whereas the highest speeds are reached during the protrusion step (28).
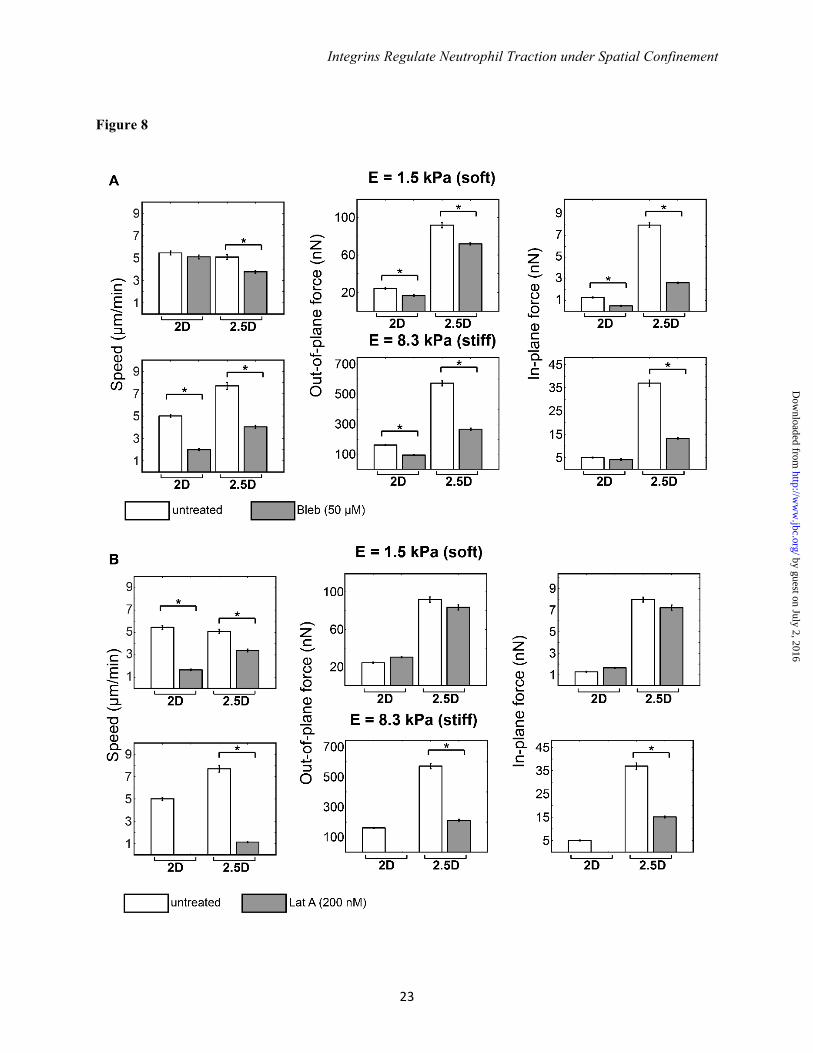
The Role of Actin-Based Protrusive and Myosin-Based Contractile Forces During Confinement – To determine the effect of confinement on the cytoskeletal force-motility machinery of the neutrophil, actin and myosin were differentially blocked with latrunculin A and blebbistatin. In confined 2.5D environments, cell speed was dependent on contributions from both actin and myosin-based machineries and is not a function of matrix stiffness (Fig.8). The role of myosin on cell speed and force generation, other than a modest effect of blebbistatin on soft substrates, is significant regardless of confinement and substrate stiffness (Fig. 8A). Of speed, in-plane and out-of-plane forces, myosin inhibition had the most pronounced effect on reducing the in-plane shear forces of confined neutrophils irrespective of substrate stiffness.
Like myosin, actin plays an essential role in generating cell speed under confinement and irrespective of stiffness as noted by sensitivity to latrunculin A (Fig. 8B). Sensititivity to latrunculin A with regard to traction force production is mechanosensitive under confinement affecting both in-plane and
out-of-plane forces on stiff, but not soft, gels (Fig. 8; Supplementary Figs. 2-3). These results are consistent with the notion that cells generate larger tractions during locomotion on stiffer substrates, which requires significant actin polymerization and F-actin assembly to sustain the increase in cell tractions. While in 2.5D neutrophils can generate significant contact pressures against the confining upper and lower surfaces, cells in 2D rely exclusively on actomyosin force generation, which requires myosin recruitment to F-actin. Without the capacity to polymerize enough F-actin actomyosin force generation is unsuccessful leading to complete abrogation of force and speed generation as shown in Fig. 8B.
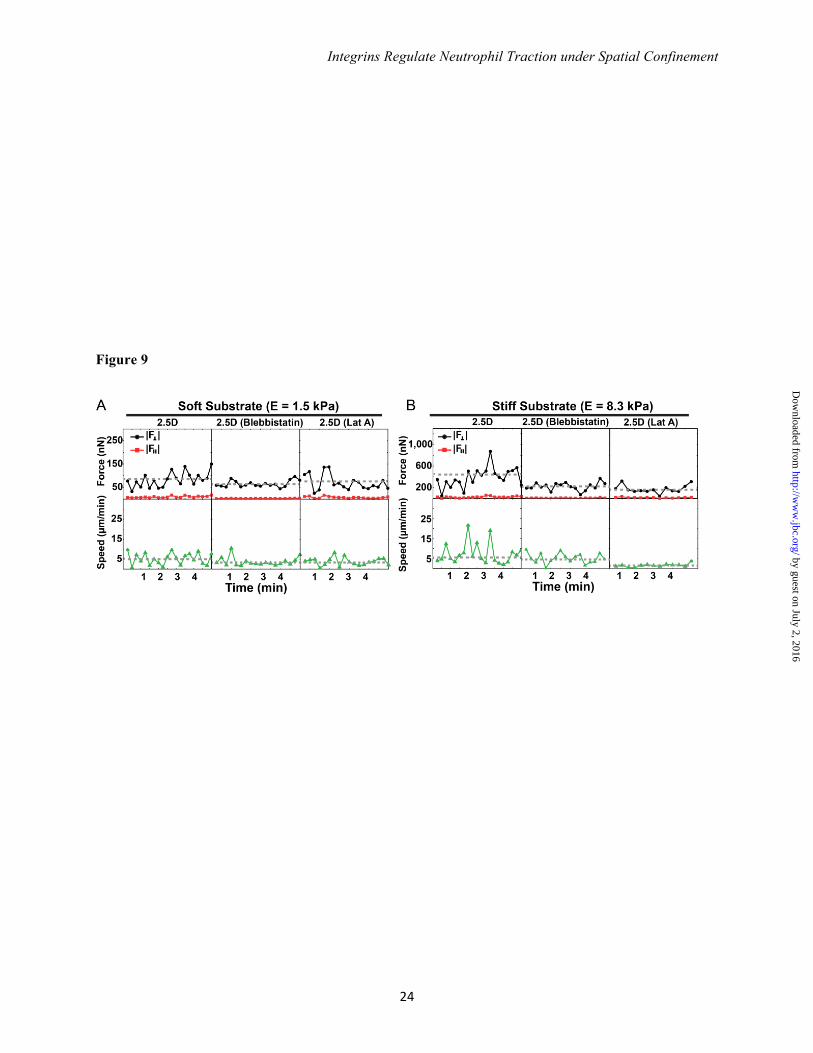
A similar, and consistent picture emerges when examining the temporal evolution of neutrophil total force and speed patterns in the presence of differential actomyosin blockade (Fig. 9). Of note is the importance of both actin polymerization and myosin II activity to achieve large temporal changes in speed and force production indicated by the pronounced undulations in the force and speed profiles for untreated cells versus blebbistatin and latrunculin treated cells.
DISCUSSION
In this study we utilized a tunable, double-hydrogel system that allowed neutrophils to be studied under conditions that more closely model a tissue microenvironment. Using 3D traction force microscopy, both in-plane (x,y) and out-of-plane (z) traction force measurements were obtained for neutrophils in 2D, and under highly confined 2.5D conditions. We find that the traction force signature of the neutrophil is highly 3D with the strongest traction force contribution stemming from the out-of-plane traction component regardless of confinement or substrate stiffness. This suggests the predominance of out-of-plane traction is a generalized mechanism by which neutrophils exert forces upon their substratum whether planar or confined, and under integrin-dependent or independent conditions. Whereas inhibition of ligand-specific integrins prohibits cell attachment and force generation in 2D, we show that integrin
by guest on July 2, 2016http://w
ww
.jbc.org/D
ownloaded from
Integrins Regulate Neutrophil Traction under Spatial Confinement
10
blockade does not limit force generation or cell speed in a highly confined system. We show that in the presence of integrin function, neutrophil generated traction patterns are up-regulated in 2.5D as compared to 2D planar surfaces. Moreover, integrin blockade of cells in 2.5D resulted in a distinct change in cellular traction patterns and increase in cell speeds. Taken together these findings show that a change in physical confinement is sufficient to switch neutrophils to an integrin-independent motility mode but the magnitude of traction and the speed of migration is integrin regulated. The 2.5D system also showed that the cell need not be completely enveloped by a 3D matrix in order to generate in-plane and out-of-plane force without integrins. The observation of significant out-of-plane tractions under such conditions can be explained by a general friction-based motility mechanism, which had been previously put forth theoretically but never quantified experimentally at the level of traction resolution presented here (34,35). Adhesion strength of bonds formed between cells and substrate is a direct function of traction angle. A traction angle of 90° (i.e., out-of-plane) correlates with weakest adhesion and shortest bond lifetime and formation of such bonds may correlate with rapid motility (36,37). This model of rapid motility is in contrast to the situation for the adhesion of mesenchymal cells which form a relatively even distribution of in-plane and out-of-plane tractions but adhere more tightly and move more slowly (16,38).
Surprisingly, for neutrophils placed under hydrogel confinement, integrin blockade up-regulated cell speed on both soft and stiff matricies suggesting that integrins may serve as a regulatory brake for motility as a function of confinement. The biological impact of
regulating the migration speed of extravasated neutrophils by integrins cannot be discerned by an ex vivo system but our findings indicate that, upon entry into a confined microenvironment, integrins may continue to be consequential to functions relevant to host defense. For example, integrins have been shown to regulate neutrophil apoptosis, respiratory burst, phagocytosis and NETosis (2,39). Whether integrins continue to regulate these functions within a 3D microenvironment warrants further study.
We investigated the role of actin and myosin II activity during force-dependent motility and found that neutrophil speed and force generation in 2.5D decreased upon inhibition of myosin II and actin polymerization, but not by the absence of integrin-engagement (Figs. 5-7). To our knowledge, these are the first quantitative 3D force measurements for human neutrophils across different substrate dimensions and stiffnesses following inhibition of its cellular force machinery. Similar observations have been previously documented for dendritic cells confined in a 3D collagen network, where the inhibition of actin polymerization and myosin II contraction reduces cell migration speeds but integrin blockade was without effect (9). In sum, we demonstrate that confinement is a sufficient condition to switch neutrophil motility from integrin-dependence to integrin-independence, but that integrins continue to operate in a regulatory capacity. The sensitivity to both geometric and mechanical cues encountered by neutrophils in the 3D microenvironment should be considered in the future development of anti-inflammatory drugs.
REFERENCES 1. Nathan, C. (2006) Neutrophils and immunity: challenges and opportunities. Nature reviews.
Immunology 6, 173-182 2. Mayadas, T.N., and Cullere, X. (2005) Neutrophil beta2 integrins: moderators of life or death
decisions. Trends in immunology 26, 388-395 3. Smith L.A., Aranda-Espinoza, H., Haun, J.B., Dembo, M., and Hammer D.A. (2007) Neutrophil
traction stresses are concentrated in the uropod during migration Biophys J 92, L58-L60
by guest on July 2, 2016http://w
ww
.jbc.org/D
ownloaded from
Integrins Regulate Neutrophil Traction under Spatial Confinement
11
4. Oakes, P.W., Patel, D.C., Morin, N.A., Zitterbart, D.P., Fabry, B., Reichner, J.S., and Tang, J. X. (2009) Neutrophil morphology and migration are affected by substrate elasticity. Blood 114, 1387-1395
5. Jannat R.A., D. M., and Hammer D.A. (2011) Traction forces of neutrophils migrating on compliant substrates. Biophys J 101, 575-584
6. Stroka, K.M., and Aranda-Espinoza. H. (2009) Neutrophils display biphasic relationship between migration and substrate stiffness. Cell. Motil. Cytoskeleton 66, 328-341
7. Butler, K.L., Ambravaneswaran, V., Agrawal, N., Bilodeau, M., Toner, M., Tompkins, R.G., Fagan, S., and Irimia, D. (2010) Burn Injury Reduces Neutrophil Directional Migration Speed in Microfluidic Devices. PLoS ONE 5, e11921
8. Lammermann, T., Bader, B.L., Monkley, S.J., Worbs, T., Wedlich-Soldner, R., Hirsch, K., Keller, M., Forster, R., Critchley, D.R., Fassler, R., and Sixt, M. (2008) Rapid leukocyte migration by integrin-independent flowing and squeezing. Nature 453, 51-55
9. Lammermann, T., and Sixt, M. (2009) Mechanical modes of 'amoeboid' cell migration. Current opinion in cell biology 21, 636-644
10. Renkawitz J., and Sixt, M. (2010) Mechanisms of force generation and force transmission during interstitial leukocyte migration. EMBO Rep 11, 744-750
11. Lammermann, T., and Germain, R.N. (2014) The multiple faces of leukocyte interstitial migration. Seminars in immunopathology 36, 227-251
12. Beningo, K.A., Dembo, M., and Wang Y-L. (2004) Responses of fibroblasts to anchorage of dorsal extracellular matrix receptors. Proc. Natl. Acad. Sci. USA 101, 18024-18029
13. Miron-Mendoza, M., Seemann, J., and Grinnell, F. (2010) The differential regulation of cell motile activity through matrix stiffness and porosity in three dimensional collagen matrices. Biomaterials 31, 6425-6435
14. Carey, S.P., Kraning-Rush, C.M., Williams, R.M., and Reinhart-King, C.A. (2012) Biophysical control of invasive tumor cell behavior by extracellular matrix microarchitecture. Biomaterials 33, 4157-4165
15. Delanoe-Ayari, Rieu, J.P., and Sano, M. (2010) 4D traction force microscopy reveals asymmetric cortical forces in migrating Dictyostelium cells. Phys. Rev. Lett. 105, 248103-1-248103-4
16. Maskarinec, S.A., Franck, C., Tirrell, D.A., and Ravichandran, G. (2009) Quantifying cellular traction forces in three dimensions. Proc. Natl. Acad. Sci. USA 106, 22108-22113
17. Franck, C., Maskarinec, S. A., Tirrell, D.A., and Ravichandran, G. (2011) Three-dimensional traction force microscopy: a new tool for quantifying cell-matrix interactions. PLoS ONE 6, e17833
18. Dembo, M., and Wang, Y.-L. (1999) Stresses at the cell-to-substrate interface during locomotion of fibroblasts. Biophys J 76, 2307-2316
19. Toyjanova, J., Bar-Kochba, E., Lopez-Fagundo, C., Reichner, J., Hoffman-Kim, D., and Franck, C. (2014) High resolution, large deformation 3D traction force microscopy. PLoS ONE 9:e90976
20. Bar-Kochba, E., Toyjanova, J., Andrews, E., Kim, K-S., and Franck, C. (2014) A fast iterative digital volume correlation algorithm for large deformations. Exp.Mech. DOI:10.1007/s11340-014-9874-2
21. Franck C., Hong, S., Maskarinec S.A., Tirrell D.A., and Ravichandran G. (2007) Three-dimensional full-field measurements of large deformations in soft materials using confocal microscopy and digital volume correlation. Exp.Mech. 47, 427-438
22. Long R., Hall, M.S., Wu M., and Hui C-Y. (2011) Effects of gel thickness on microscopic indentation measurements of gel modulus. Biophys J 101, 643-650
23. Farid H., and Simoncelli, E.P. (2004) Differentiation of discrete multi-dimensional signals. IEEE Trans Image Process 13, 496-508
24. D'Errico, J. (2005) Surface fitting using gridfit. MATLAB Central File Exchange 25. Bower, A.F. (2010) Applied Mechanics of Solids, CRC Press
by guest on July 2, 2016http://w
ww
.jbc.org/D
ownloaded from
Integrins Regulate Neutrophil Traction under Spatial Confinement
12
26. Ting-Beall, H.P., Needham, D., and Hochmuth, R.M. (1993) Volume and osmotic properties of human neutrophils. Blood 81, 2774-2780
27. Shin, M.E., He, Y., Li D., Na, S., Chowdhury, F., Poh, Y.C., Collin, O., Su, P., de Lanerolle, P., Schwartz, M.A., Wang, N., and Wang, F. (2010) Spatiotemporal organization, regulation, and functions of tractions during neutrophil chemotaxis. Blood 116, 3297-3310
28. Meili, R., Baldomero, A.-L., del Alamo, J.C., Firtel, R.A., and Lasheras, J.C. (2010) Myosin II is essential for the spatiotemporal organization of traction forces during cell motility. Mol Biol Cell 21, 405-417
29. Hur, S.S., Zhao. Y., Li, Y-S., Botvinick, E., and Chien, S. (2009) Live cells exert 3-dimensional traction forces on their substrata. Cell Mol Bioeng 2, 425-436
30. Sundd, P., Gutierriz, E., Pospieszalska, M.K., Zhang, H., Groisman, A., and Ley, K. (2010) Quantitative dynamic footprinting microscopy reveals mechanisms of neutrophil rolling. Nature Methods 7, 821-824
31. Pospieszalska, M.K., Lasiecka. I., and Ley, K. (2011) Cell protrusions and tethers: a unified approach Biophys J 100, 1697-1707
32. Lin, Y. (2010) A model of cell motility leading to biphasic dependence of transport speed on adhesive strength. J. Mech. Phys. Solids 58, 502-514
33. Brown, A.F. (1982) Neutrophil granulocytes: adhesion and locomotion on collagen substrata and in collagen matrices. J. Cell. Sci. 58, 455-467
34. Aubry, D., Thiam, H., Piel, M., and Allena, R. (2014) A computational mechanics approach to assess the link between cell morphology and forces during confined migration. Biomechanics and modeling in mechanobiology
35. Hawkins, R.J., Piel, M., Faure-Andre, G., Lennon-Dumenil, A. M., Joanny, J.F., Prost, J., and Voituriez, R. (2009) Pushing off the walls: a mechanism of cell motility in confinement. Physical Rev. Lett. 102, 058103
36. Qian, J., Wang, J., Lin, Y., and Gao, H. Lifetime and strength of Periodic bond clusters between elastic media under inclined loading. Biophys. J. 97, 2438-2445
37. Ward, M. D., and Hammer, D. A. (1993). A theoretical analysis for the effect of focal contact information on cell-substrate attachment strength. Biophys. J. 64, 936–959.
38. Lopez-Fagundo, C., Bar-Kochba, E., Livi, L.L., Hoffman-Kim, D., and Franck, C. (2014) Three-dimensional traction forces of Schwann cells on compliant substrates. J.R. Soc. Interface 11, 20140247.
39. Byrd, A.S., O'Brien, X.M., Johnson, C.M., Lavigne, L.M., and Reichner, J.S. (2013) An extracellular matrix-based mechanism of rapid neutrophil extracellular trap formation in response to Candida albicans. Journal of immunology 190, 4136-4148
Acknowledgements-C.F. acknowledges support from Haythornthwaite Foundation. J.S.R. acknowledges support from NIH GM066194. C.F. and J.S.R. acknowledge support from AI101469 and a Brown University seed grant. The authors also acknowledge Xian O'Brien and Angel Byrd for helpful discussions.
FIGURE LEGENDS FIGURE 1. Stress-strain curves for an unconfined compression test of cylindrical polyacrylamide samples for (A) stiffer (E = 8.3 kPa) substrates and (B) softer (E = 1.5 kPa) substrates.
FIGURE 2. (A) Schematic overview of a custom-built micro-manipulator to switch from a 2D to a confined 2.5D neutrophil gel-system. (B) A schematic of the cell-surface contact points and definition of the surface normal on the top (red) and bottom (green) substrates.
by guest on July 2, 2016http://w
ww
.jbc.org/D
ownloaded from
Integrins Regulate Neutrophil Traction under Spatial Confinement
13
FIGURE 3. Phase contrast images of a neutrophil and its associated cell traction profiles in (A) a 2D system; and (B) a 2.5D system. The color contour map displays the magnitude of the 3D traction vector. (C) Dynamic out-of-plane (black) and in-plane (red) total forces, and cell speed (green) for a neutrophil during dimensional switch from a 2D to a 2.5D system. (D) Total out-of-plane (right column) and in-plane (left column) force components in our 2D (white) and 2.5D (grey) systems on soft and stiff substrates (top and bottom rows). Quantitative data reflects the median and standard error (*P < 0.01 vs. 2D, Kruskal-Wallis test. N>100). FIGURE 4. Decomposition of traction forces shown in Fig. 3 ((A) and (B)) into their t1,t2 (in-plane), and t3 (out-of-plane) traction components in 2D (A) and 2.5D (B). All of the contour maps and colorbars represent tractions in Pascals (Pa). Positive and negative t3 traction are defined using the local, positive outward normal vector for each upper and lower gels as illustrated in Fig. 2B. Comparison of the 2D and 2.5D traction profiles reveals similar spatiotemporal patterns with significant traction generation in the uropod of the cell. Traction profiles in 2.5D show a significant contribution from the central, nuclear region of the neutrophil against the top surface. FIGURE 5. Neutrophils migrate and generate forces in the absence of integrin-engaged adhesions. Bar plots present (A) the average cell speed, (B) in-plane and (C) out-of-plane forces on soft (left) and stiff (right) substrates in 2D and 2.5D systems. All of the data is presented for untreated and treated (anti-β1β2 (10µg/mL each)) neutrophils on fibronectin and untreated neutrophils on PEG coated substrates. All quantitative data are represented by their medians and standard error. Statistical significance is shown against the untreated cells in 2.5D (*P<0.01 vs. 2.5D, untreated; Kruskal-Wallis test. N>100). FIGURE 6. Color contour maps of the out-of-plane component of the 3D traction vector highlighting integrin dependent traction generation in (A) unconfined 2D, and (B) confined 2.5D systems, as well as integrin-independent upon (C) anti-β1β2 blockade and (D) in the absence of matrix ligand on PEG coated substrates. Integrin-dependent traction generation shows a distinct localized out-of-plane traction distribution in the uropod of the cell ((A) and (B)) similar to the results shown in Fig. 4. In the absence of integrins, neutrophils generate most of their surface tractions using contact pressure of their nuclear region ((C) and (D)). All of the colorbars represent tractions in Pascals (Pa). Positive and negative t3 traction are defined using the local, positive outward normal vector for each upper and lower gels as illustrated in Fig. 2B. Scale bar = 10 µm. FIGURE 7. Temporal evolution of the out-of-plane (black) and in-plane (red) neutrophil-generated total forces, and the corresponding cell speeds (green) in a 2.5D system on (A) soft and (B) stiff substrates. The data is presented in 2.5D for untreated neutrophils and pan-β1β2 (10µg/mL of each) antibody blocked cells migrating on fibronectin-coated substrates, as well as untreated neutrophils on PEG-coated substrates. FIGURE 8. Neutrophil motility and force generation decrease with inhibition of (A) myosin-based contractile and (B) actin-based protrusive forces. Bar plots present the average cell speed, in-plane and out-of-plane forces on soft (top) and stiff (bottom) substrates in our 2D and 2.5D systems. All of the data is presented for untreated and treated (50 µM blebbistatin and 200 nM latrunculin A respectively) neutrophils on fibronectin coated substrates. All quantitative data are represented by their medians and standard error. Statistical significance is shown against the untreated cells (*P<0.01 vs. untreated; Kruskal-Wallis test. N>100).
by guest on July 2, 2016http://w
ww
.jbc.org/D
ownloaded from

Integrins Regulate Neutrophil Traction under Spatial Confinement
14
FIGURE 9. Temporal evolution of the out-of-plane (black) and in-plane (red) neutrophil-generated total forces, and corresponding speeds (green) in a 2.5D system on (A) soft and (B) stiff substrates. The data is presented for neutrophils with and without respective blebbistatin and latrunculin A treatment.
by guest on July 2, 2016http://w
ww
.jbc.org/D
ownloaded from
Integrins Regulate Neutrophil Traction under Spatial Confinement
15
TABLE 1: Noise floor estimates for the in-plane and out-of-plane tractions (Pa) and total forces (nN)
E = 1.5 kPa (soft)
Bottom Top
E = 8.3 kPa (stiff)
Bottom Top In-plane tractions, t
40 Pa 50 Pa 200 Pa 250 Pa
Out-of-plane tractions, t
200 Pa 200 Pa 700 Pa 800 Pa
In-plane force, F 0.4 nN 0.4 nN 1.7 nN 2.2 nN
Out-of-plane force, F
1.7 nN 1.7 nN 6.2 nN 7.1 nN
by guest on July 2, 2016http://w
ww
.jbc.org/D
ownloaded from
Integrins Regulate Neutrophil Traction under Spatial Confinement
16
Figure 1
by guest on July 2, 2016http://w
ww
.jbc.org/D
ownloaded from
Integrins Regulate Neutrophil Traction under Spatial Confinement
17
Figure 2
by guest on July 2, 2016http://w
ww
.jbc.org/D
ownloaded from
Integrins Regulate Neutrophil Traction under Spatial Confinement
18
Figure 3
0
50
100
0
20
40
60
0
200
400
600
0
5
10
50
100
150
F (
nN
)
30
20
10
10 20 30
30
20
10
10 20 30
30
20
10
10 20 30
t = 0 t = t* t (min)
x (µm)
y (
µm
)
2D 2.5D
500 Pa
2D 2.5D
To
tal
Fo
rc
e (
nN
)
Soft substrate (E = 1.5 kPa)
2D 2.5D 2D 2.5D
A B
C D
Top Bottom
30
20
10
10 20 30
30
20
10
10 20 30
100 1600850 200 26001400 100 1600850
|F |
|F |
In-plane ( )|F | Out-of-plane ( )|F |
~80 μm ~3-5 μm
Pa
Stiff substrate (E = 8.3 kPa)
* *
**
01 2 3 4 5 6
10
20
Time (min)
Sp
eed
(µ
m/m
in)
Migration Migration Migration
by guest on July 2, 2016http://w
ww
.jbc.org/D
ownloaded from
Integrins Regulate Neutrophil Traction under Spatial Confinement
19
Figure 4
by guest on July 2, 2016http://w
ww
.jbc.org/D
ownloaded from
Integrins Regulate Neutrophil Traction under Spatial Confinement
20
Figure 5
by guest on July 2, 2016http://w
ww
.jbc.org/D
ownloaded from
Integrins Regulate Neutrophil Traction under Spatial Confinement
21
Figure 6
2D
-800 800 0
A DCB
-500 500 0
2.5D anti-β1β2
-1400 1400 0
Top
Bottom
-1400 1400 0
-500 500 0
2.5D PEG coating
Top
Bottom
2.5D
-1000 1000 0
-1800 1800 0
Top
Bottom
Pa
Pa
Pa
by guest on July 2, 2016http://w
ww
.jbc.org/D
ownloaded from
Integrins Regulate Neutrophil Traction under Spatial Confinement
22
Figure 7
by guest on July 2, 2016http://w
ww
.jbc.org/D
ownloaded from
Integrins Regulate Neutrophil Traction under Spatial Confinement
23
Figure 8
by guest on July 2, 2016http://w
ww
.jbc.org/D
ownloaded from
Integrins Regulate Neutrophil Traction under Spatial Confinement
24
Figure 9
by guest on July 2, 2016http://w
ww
.jbc.org/D
ownloaded from
Jennet Toyjanova, Estefany Flores-Cortez, Jonathan S. Reichner and Christian FranckTractions, Speed and Integrin Utilization
Matrix Confinement Plays a Pivotal Role in Regulating Neutrophil-generated
published online December 18, 2014J. Biol. Chem.
10.1074/jbc.M114.619643Access the most updated version of this article at doi:
Alerts:
When a correction for this article is posted•
When this article is cited•
to choose from all of JBC's e-mail alertsClick here
Supplemental material:
http://www.jbc.org/content/suppl/2014/12/18/M114.619643.DC1.html
http://www.jbc.org/content/early/2014/12/18/jbc.M114.619643.full.html#ref-list-1
This article cites 0 references, 0 of which can be accessed free at
by guest on July 2, 2016http://w
ww
.jbc.org/D
ownloaded from
Top Related
Copyright © 2022 FDOKUMEN

