


Bahasa
Halaman
Hukum

A
BtaoMiRicCa©
K
AS
r
0d
Neurobiology of Aging 27 (2006) 1280–1288
Markers of inflammation, Vitamin E and peripheralnervous system functionThe InCHIANTI study
Angelo Di Iorio a,∗,1, Antonio Cherubini b,1, Stefano Volpato c, Eleonora Sparvieri a,Fulvio Lauretani d, Claudio Franceschi e, Umberto Senin b, Giuseppe Abate a,
Roberto Paganelli f, Antonio Martin g, Cristina Andres-Lacueva h, Luigi Ferrucci d,i
a Laboratory of Clinical Epidemiology, Department of Medicine and Sciences of Aging, University “G. D’Annunzio”,Via dei Vestini 5, 66013 Chieti Scalo, Italy
b Institute of Gerontology and Geriatric, University of Perugia, Perugia, Italyc Department of Clinical and Experimental Medicine University of Ferrara, Italy
d Laboratory of Clinical Epidemiology, Tuscany Regional Health Agency, Florence, Italye Department of Experimental Pathology, University of Bologna, Italy
f Laboratory of Immunology and Allergy, Department of Medicine and Sciences of Aging, University “G. D’Annunzio”, Chieti Scalo, Italyg Human Nutrition Research Center on Aging, Tufts University, Boston, USA
h Department of Nutrition & Food Science, CeRTA, University of Barcelona, Spaini Longitudinal Studies Section, Clinical Research Branch, National Institute on Aging, NIH, Baltimore, MD, USA
Received 10 December 2004; received in revised form 27 May 2005; accepted 10 July 2005Available online 22 August 2005
bstract
ackground:: Aging of the peripheral nervous system is associated with several morphologic and functional changes, including a decrease ofhe nerve conduction velocity. There is evidence that these changes contribute to age-related-decline in muscle strength, sensory discrimination,nd autonomic responses. The aim of this study was to characterize the decline in nerve conduction velocity in the peripheral nervous systemver the aging process and to identify factors that, independent of age, affect nerve conduction velocity.ethods:: We measured motor nerve conduction velocity of the right superficial peroneal nerve using a standard neurophysiologic technique
n a population-based sample of subjects aged between 20 and 103 years old enrolled in the InCHIANTI study.esults:: Average conduction velocities in the peripheral nerve decreased linearly with age in both sexes. We found that diabetes, cognitive
mpairment, uric acid, sIL-6R and �-tocopherol were significant predictors of nerve conduction velocity independently of the potentialonfounding effect of age, sex, sex × age interaction term, height, lymphocytes, neutrophils number, �1 and �2-globulin serum protein.
onclusions:: Our findings are consistent with the hypothesis that inflammation and inadequate antioxidant defenses are associated withccelerated decline of nerve conduction velocity over the aging process.2005 Elsevier Inc. All rights reserved.
eywords: Inflammation; Vitamin E; Peripheral nervous system; Aging
∗ Corresponding author at: University G D’Annunzio, Medicine andging, Geriatric Unit and Epidemiology, Via dei vestini 5, 66100 Chieticalo, Italy. Tel.: +39 0871 551533; fax: +39 0871 551533.
E-mail address: [email protected] (A. Di Iorio).1 Angelo Di Iorio and Antonio Cherubini contributed equally in the prepa-
ation of the paper.
1
pfb
197-4580/$ – see front matter © 2005 Elsevier Inc. All rights reserved.oi:10.1016/j.neurobiolaging.2005.07.004
. Introduction
Aging is characterized by a decline in function of multi-le physiological systems and progressive exhaustion of theirunctional reserve. The causes of this decline are still unclearut it has been proposed that increased oxidative stress, dis-
ogy of A
to
afd(jdodd
iasicl
iiltl
2
t
Aptcrv6lsotwla(
asnt
mytda
TP
M
W
A. Di Iorio et al. / Neurobiol
urbances in energy metabolism, and a primary dysregulationf the immune system might play an important role [22].
A number of observational studies have shown ange-associated decline in peripheral nervous system (PNS)unction. Longitudinal assessment performed in subjects ofifferent ages demonstrated that nerve conduction velocityNCV) and signal amplitude decrease with age even in sub-ects free of diabetes and other major diseases [24]. Suchecline has been attributed to structural changes, such as lossf myelinated and unmyelinated fibers and decreased pro-uction of the major myelin proteins with subsequent myelineterioration [33].
Factors that have been associated with reduced NCVnclude diabetes, inflammatory disease, smoking, alcoholbuse and chronic infection [1,23]. However, no previoustudy tested the hypothesis that independently of age, a pro-nflammatory and pro-oxidative state, characterized by cir-ulating levels of inflammatory markers and low circulatingevels of antioxidants, is associated with reduced NCV.
The aim of this study was to evaluate whether the declinen NCV occurs linearly over the entire life span and to ver-fy whether, independent of age and chronic diseases, highevels of inflammatory markers and low levels of Vitamin E,he most important lipophilic antioxidant, are associated withower NCV.
. Population and methods
InCHIANTI is an epidemiological study of factors con-ributing to the decline of mobility in late life. The InCHI-
2
f
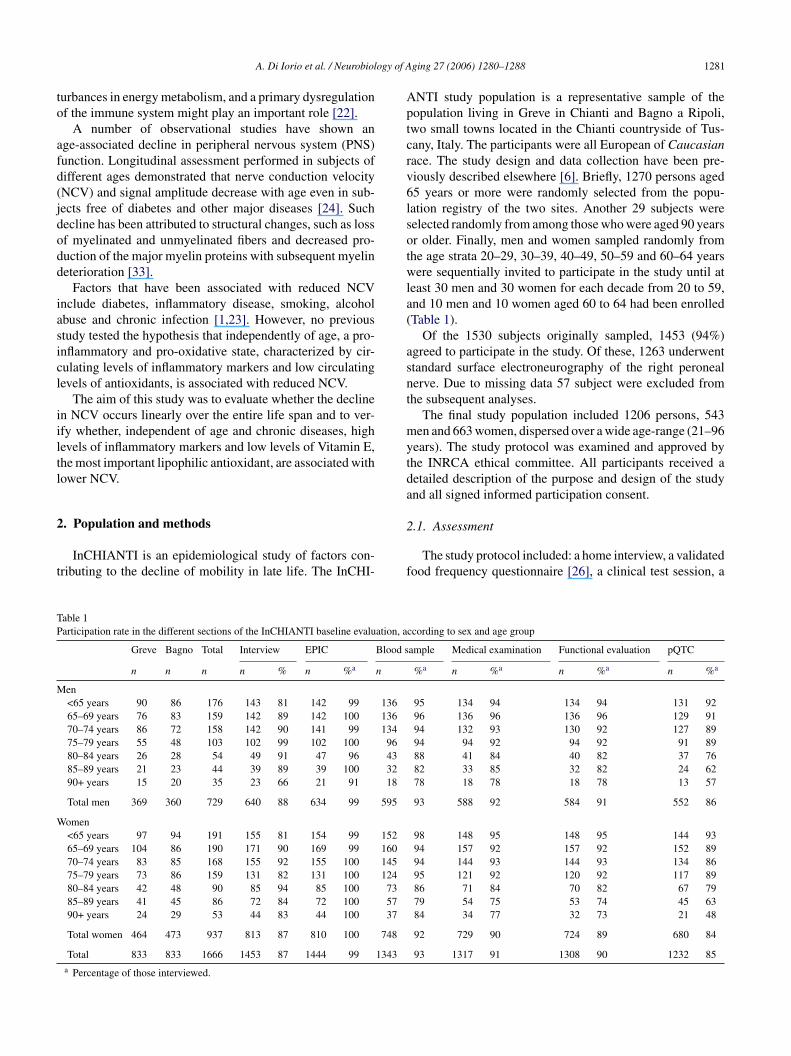
able 1articipation rate in the different sections of the InCHIANTI baseline evaluation, a
Greve Bagno Total Interview EPIC Blood s
n n n n % n %a n
en<65 years 90 86 176 143 81 142 99 13665–69 years 76 83 159 142 89 142 100 13670–74 years 86 72 158 142 90 141 99 13475–79 years 55 48 103 102 99 102 100 9680–84 years 26 28 54 49 91 47 96 4385–89 years 21 23 44 39 89 39 100 3290+ years 15 20 35 23 66 21 91 18
Total men 369 360 729 640 88 634 99 595
omen<65 years 97 94 191 155 81 154 99 15265–69 years 104 86 190 171 90 169 99 16070–74 years 83 85 168 155 92 155 100 14575–79 years 73 86 159 131 82 131 100 12480–84 years 42 48 90 85 94 85 100 7385–89 years 41 45 86 72 84 72 100 5790+ years 24 29 53 44 83 44 100 37
Total women 464 473 937 813 87 810 100 748
Total 833 833 1666 1453 87 1444 99 1343a Percentage of those interviewed.
ging 27 (2006) 1280–1288 1281
NTI study population is a representative sample of theopulation living in Greve in Chianti and Bagno a Ripoli,wo small towns located in the Chianti countryside of Tus-any, Italy. The participants were all European of Caucasianace. The study design and data collection have been pre-iously described elsewhere [6]. Briefly, 1270 persons aged5 years or more were randomly selected from the popu-ation registry of the two sites. Another 29 subjects wereelected randomly from among those who were aged 90 yearsr older. Finally, men and women sampled randomly fromhe age strata 20–29, 30–39, 40–49, 50–59 and 60–64 yearsere sequentially invited to participate in the study until at
east 30 men and 30 women for each decade from 20 to 59,nd 10 men and 10 women aged 60 to 64 had been enrolledTable 1).
Of the 1530 subjects originally sampled, 1453 (94%)greed to participate in the study. Of these, 1263 underwenttandard surface electroneurography of the right peronealerve. Due to missing data 57 subject were excluded fromhe subsequent analyses.
The final study population included 1206 persons, 543en and 663 women, dispersed over a wide age-range (21–96
ears). The study protocol was examined and approved byhe INRCA ethical committee. All participants received aetailed description of the purpose and design of the studynd all signed informed participation consent.
.1. Assessment
The study protocol included: a home interview, a validatedood frequency questionnaire [26], a clinical test session, a
ccording to sex and age group
ample Medical examination Functional evaluation pQTC
%a n %a n %a n %a
95 134 94 134 94 131 9296 136 96 136 96 129 9194 132 93 130 92 127 8994 94 92 94 92 91 8988 41 84 40 82 37 7682 33 85 32 82 24 6278 18 78 18 78 13 57
93 588 92 584 91 552 86
98 148 95 148 95 144 9394 157 92 157 92 152 8994 144 93 144 93 134 8695 121 92 120 92 117 8986 71 84 70 82 67 7979 54 75 53 74 45 6384 34 77 32 73 21 48
92 729 90 724 89 680 84
93 1317 91 1308 90 1232 85
1 ogy of Aging 27 (2006) 1280–1288
mls
2
pdEwpw[u
ttmbpdtgi
etir
wcot[tibtd
f
2
q[
2
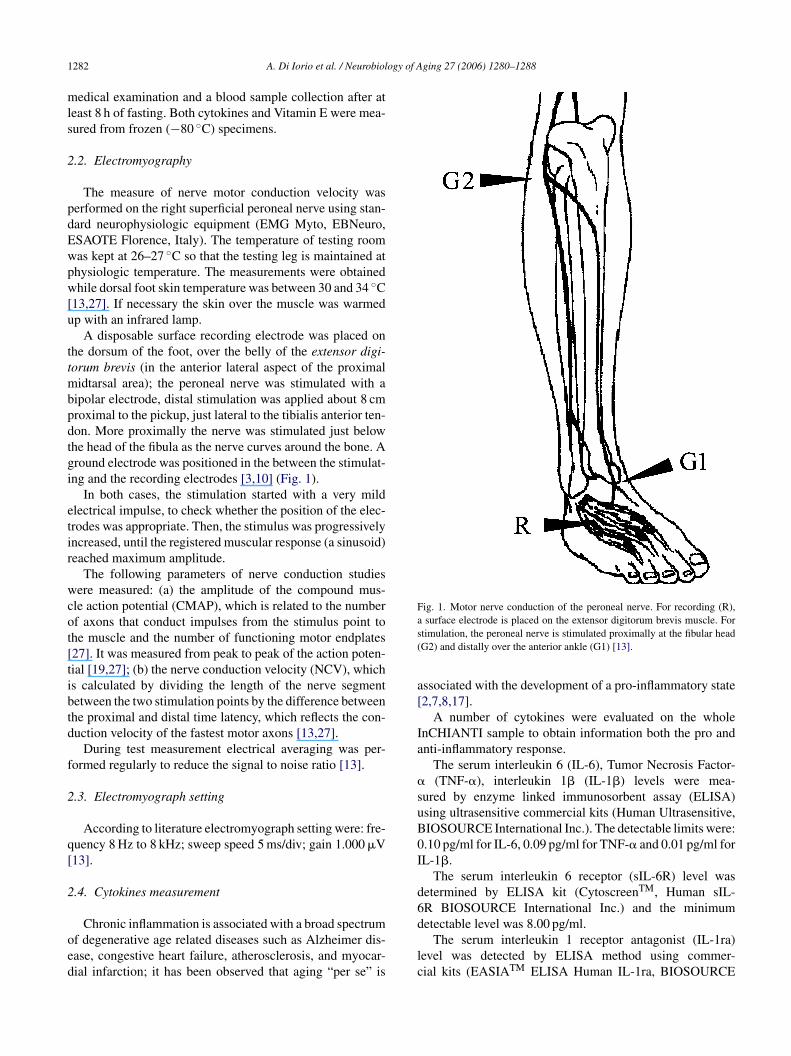
oed
Fig. 1. Motor nerve conduction of the peroneal nerve. For recording (R),as(
a[
Ia
�suB0I
d6
282 A. Di Iorio et al. / Neurobiol
edical examination and a blood sample collection after ateast 8 h of fasting. Both cytokines and Vitamin E were mea-ured from frozen (−80 ◦C) specimens.
.2. Electromyography
The measure of nerve motor conduction velocity waserformed on the right superficial peroneal nerve using stan-ard neurophysiologic equipment (EMG Myto, EBNeuro,SAOTE Florence, Italy). The temperature of testing roomas kept at 26–27 ◦C so that the testing leg is maintained athysiologic temperature. The measurements were obtainedhile dorsal foot skin temperature was between 30 and 34 ◦C
13,27]. If necessary the skin over the muscle was warmedp with an infrared lamp.
A disposable surface recording electrode was placed onhe dorsum of the foot, over the belly of the extensor digi-orum brevis (in the anterior lateral aspect of the proximal
idtarsal area); the peroneal nerve was stimulated with aipolar electrode, distal stimulation was applied about 8 cmroximal to the pickup, just lateral to the tibialis anterior ten-on. More proximally the nerve was stimulated just belowhe head of the fibula as the nerve curves around the bone. Around electrode was positioned in the between the stimulat-ng and the recording electrodes [3,10] (Fig. 1).
In both cases, the stimulation started with a very mildlectrical impulse, to check whether the position of the elec-rodes was appropriate. Then, the stimulus was progressivelyncreased, until the registered muscular response (a sinusoid)eached maximum amplitude.
The following parameters of nerve conduction studiesere measured: (a) the amplitude of the compound mus-
le action potential (CMAP), which is related to the numberf axons that conduct impulses from the stimulus point tohe muscle and the number of functioning motor endplates27]. It was measured from peak to peak of the action poten-ial [19,27]; (b) the nerve conduction velocity (NCV), whichs calculated by dividing the length of the nerve segmentetween the two stimulation points by the difference betweenhe proximal and distal time latency, which reflects the con-uction velocity of the fastest motor axons [13,27].
During test measurement electrical averaging was per-ormed regularly to reduce the signal to noise ratio [13].
.3. Electromyograph setting
According to literature electromyograph setting were: fre-uency 8 Hz to 8 kHz; sweep speed 5 ms/div; gain 1.000 �V13].
.4. Cytokines measurement
Chronic inflammation is associated with a broad spectrumf degenerative age related diseases such as Alzheimer dis-ase, congestive heart failure, atherosclerosis, and myocar-ial infarction; it has been observed that aging “per se” is
d
lc
surface electrode is placed on the extensor digitorum brevis muscle. Fortimulation, the peroneal nerve is stimulated proximally at the fibular headG2) and distally over the anterior ankle (G1) [13].
ssociated with the development of a pro-inflammatory state2,7,8,17].
A number of cytokines were evaluated on the wholenCHIANTI sample to obtain information both the pro andnti-inflammatory response.
The serum interleukin 6 (IL-6), Tumor Necrosis Factor-(TNF-�), interleukin 1� (IL-1�) levels were mea-
ured by enzyme linked immunosorbent assay (ELISA)sing ultrasensitive commercial kits (Human Ultrasensitive,IOSOURCE International Inc.). The detectable limits were:.10 pg/ml for IL-6, 0.09 pg/ml for TNF-� and 0.01 pg/ml forL-1�.
The serum interleukin 6 receptor (sIL-6R) level wasetermined by ELISA kit (CytoscreenTM, Human sIL-R BIOSOURCE International Inc.) and the minimum
etectable level was 8.00 pg/ml.The serum interleukin 1 receptor antagonist (IL-1ra)evel was detected by ELISA method using commer-ial kits (EASIATM ELISA Human IL-1ra, BIOSOURCE
ogy of A
Itw(c
2
sroi0Mwwngw(ErtwpLcatdrbW�w
2
meotirusp
St“
df
t((((8(pgc(eR(0>sI0
2
wmftfdqed
wlp
ta
3
wwNnws
A. Di Iorio et al. / Neurobiol
nternational Inc.). The minimum detectable concentra-ion was 4.00 pg/ml. The serum interleukin 10 (IL-10)as detected by Human IL10 CytoSETSTM ELISA kits
BIOSOURCE International Inc.). The minimum detectableoncentration was 1.00 pg/ml.
.5. α-Tocopherol measurement
Vitamin E (�-tocopherol) plasma concentration was mea-ured by reverse-phase high performance liquid chromatog-aphy (HPLC) as previously described [16]. Briefly, 100 �lf plasma were mixed with 100 �l ethanol; after vortex-ng, tocopherol was extracted into 500 �l hexane containing.002% butylated hydroxyl toluene (BHT) (Sigma St. Louis,O). Tocol (a gift from Hoffman La Roche, Nutley, NJ),as added to the mixture as an internal standard. Samplesere centrifuged at 800 rpm for 5 min at 4 ◦C. The super-atant was collected and dried under a stream of nitrogenas, and reconstituted in 100 �l of methanol. Tocopherolsere separated by high performance liquid chromatography
HPLC) using a 3 �m C18 reverse phase column (Perkin-lmer, Norwalk, CT). The mobile phase, delivered at a flow
ate of 1.0 ml/min, consisted of 1% water in methanol, con-aining 10 mmol/l lithium perclorate. Samples were injectedith an autosampler, 1100 series, Hewlett Packard. Elutedeaks were detected at an applied potential of +0.6 V by aC 4B amperometric electrochemical detector (Bioanalyti-al System, West Lafayette, IN). Peaks were integrated withChemStation software (Hewlett Packard). Tocopherol (�-
ocopherol) concentration was expressed in �mol/l. Repro-ucibility and accuracy of the assay was tested by analyzingepresentative samples in triplicate from a sample providedy the American Association for Laboratory Accreditation,ashington, DC, USA containing known concentration of
-tocopherol. Intra- and inter-batch coefficients of variationere 3% and 4.2%, respectively.
.6. Covariates
Average daily alcohol consumption was evaluated byeans of the food frequency questionnaire. Smoking was cat-
gorized into: never smoker, past smoker and smoker. Basedn self report, the diagnosis of several chronic medical condi-ions was established using pre-defined criteria that combinednformation from medical history, physical exam and medicalecords. The list of diseases includes: congestive heart fail-re (CHF), angina, myocardial infarction (MI), hypertension,troke, diabetes, deep venous thrombosis, parkinson disease,eripheral artery diseases and hip fracture [25].
Cognitive function was assessed using the Mini Mentaltatus Examination (MMSE) corrected for age and educa-
ion. Participants who scored 19 or less were considered as
cognitive impaired”.Height was clustered according to sex specific tertiles ofistribution; ranges for male were 163 and 169 cm, rangesor female were 150 and 158 cm.
a
pd
ging 27 (2006) 1280–1288 1283
The results of blood tests were categorized accordingo tertiles of distribution: (a) �1 globulin (% total protein)<2.4, 2.4–2.7, >2.7); (b) �2 globulin (% total protein)<10.5, 10.5–11.6, >11.6); (c) albumin (% total protein)<58.1, 58.1–60.5, >60.5); (d) total cholesterol (mg/dl)<198, 198–230, >230); (e) tryglicerides (mg/dl) (<88,8–131, >131); (f) uric acid (mg/dl) (<4.2, 4.2–5.4, >5.4);g) �-tocopherol (�mol/l) (<19.5, 19.5–22.63, >22.63); (h)lasma creatinine (mg/dl) (<0.83, 0.83–0.96, >0.96); (i)lycemia (mg/dl) (<88.0, 88.0–92.0, >92.0); (j) lympho-ytes (number) (<3.13, 3.13–4.02, >4.02); (k) neutrophilesnumber) (<1.57, 1.57–2.07, >2.07). Cytokines were cat-gorized according to tertiles of distribution: (a) IL-1a (pg/ml) (<105.29, 105.29–159.92, >159.92); (b) IL-1�
pg/ml) (<0.09, 0.09–0.15, >0.15); c) IL-6 (pg/ml) (<0.87,.87–1.70, >1.70); (d) IL-6 R (ng/ml) (<74.96, 74.96–110.15,110.15); (e) TNF-� (pg/ml) (<3.57, 3.57–6.70, >6.70); (f)ince a large number of subjects had undetectable levels ofL-10, IL-10 was clustered in two groups (greater or equal to.1 pg/ml versus undetectable).
.7. Statistical analysis
Differences among groups in nerves conduction velocityere evaluated by analysis of variance with generalized linearodel (PROC GLM). All preliminary analyses were adjusted
or age, sex and age × sex interaction, under the assumptionhat the effect of age on nerve conduction velocity was dif-erent in men and women. The linearity of the age-associatedecline in nerve conduction velocity was verified in subse-uent regression models by testing whether the combinedffect of age and age-squared significantly improved the pre-iction of nerve conduction velocity, compared to age only.
Variables that in the univariate analyses were associatedith nerve conduction velocity with a p value of 0.10 or
ess were entered in a linear regression model (PROC REG)redicting nerve conduction velocity.
A p value less or equal to 0.05 was used to establish statis-ical significance. Analysis for outliers and for leverage waslso conducted.
All analyses were performed using SAS release 8.2.
. Results
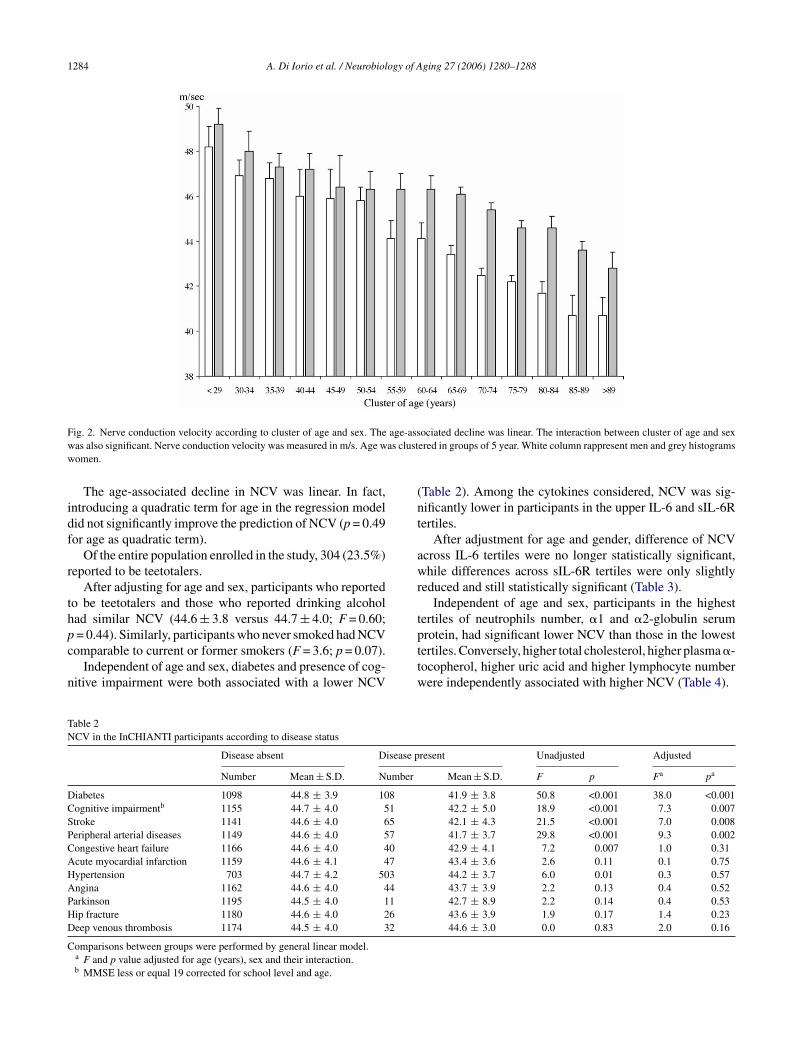
Of the 1292 subjects enrolled in the study, 573 (44.3%)ere males and 719 (55.7%) females. Average NCV declinedith age in both men and women, and in each age-groupCV was higher in women than in men (Fig. 2). In fact,o significant differences could be found between men andomen until the 50–54 years group; after this age, the sex
pecific trajectories show different slopes, with men having
lower NCV, than women, in the 90+ years cluster.There was a significant age × sex interaction in the modelredicting NCV, indicating that the role of age associatedecline in NCV was significant steeper in men than in women.
1284 A. Di Iorio et al. / Neurobiology of Aging 27 (2006) 1280–1288
F age-assw as clustw
idf
r
thpc
n
(nt
awr
t
TN
DCSPCAHAPHD
C
ig. 2. Nerve conduction velocity according to cluster of age and sex. Theas also significant. Nerve conduction velocity was measured in m/s. Age women.
The age-associated decline in NCV was linear. In fact,ntroducing a quadratic term for age in the regression modelid not significantly improve the prediction of NCV (p = 0.49or age as quadratic term).
Of the entire population enrolled in the study, 304 (23.5%)eported to be teetotalers.
After adjusting for age and sex, participants who reportedo be teetotalers and those who reported drinking alcoholad similar NCV (44.6 ± 3.8 versus 44.7 ± 4.0; F = 0.60;
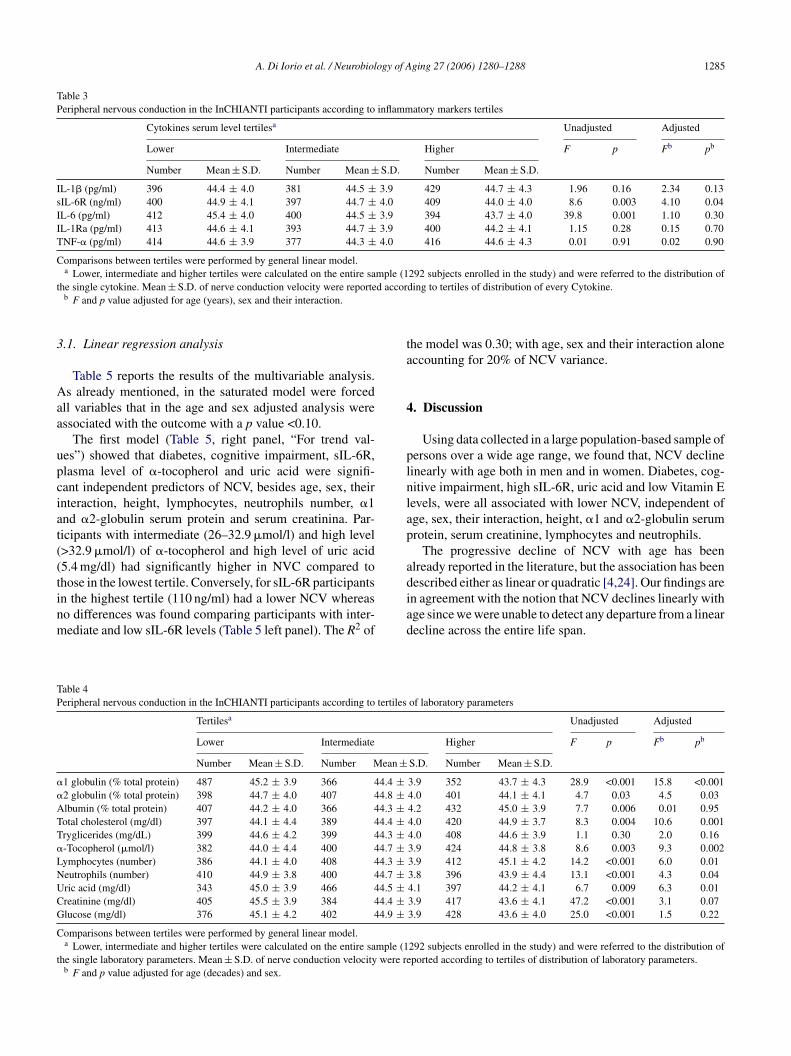
= 0.44). Similarly, participants who never smoked had NCVomparable to current or former smokers (F = 3.6; p = 0.07).Independent of age and sex, diabetes and presence of cog-itive impairment were both associated with a lower NCV
pttw
able 2CV in the InCHIANTI participants according to disease status
Disease absent Disease p
Number Mean ± S.D. Number
iabetes 1098 44.8 ± 3.9 108ognitive impairmentb 1155 44.7 ± 4.0 51troke 1141 44.6 ± 4.0 65eripheral arterial diseases 1149 44.6 ± 4.0 57ongestive heart failure 1166 44.6 ± 4.0 40cute myocardial infarction 1159 44.6 ± 4.1 47ypertension 703 44.7 ± 4.2 503ngina 1162 44.6 ± 4.0 44arkinson 1195 44.5 ± 4.0 11ip fracture 1180 44.6 ± 4.0 26eep venous thrombosis 1174 44.5 ± 4.0 32
omparisons between groups were performed by general linear model.a F and p value adjusted for age (years), sex and their interaction.b MMSE less or equal 19 corrected for school level and age.
ociated decline was linear. The interaction between cluster of age and sexered in groups of 5 year. White column rappresent men and grey histograms
Table 2). Among the cytokines considered, NCV was sig-ificantly lower in participants in the upper IL-6 and sIL-6Rertiles.
After adjustment for age and gender, difference of NCVcross IL-6 tertiles were no longer statistically significant,hile differences across sIL-6R tertiles were only slightly
educed and still statistically significant (Table 3).Independent of age and sex, participants in the highest
ertiles of neutrophils number, �1 and �2-globulin serum
rotein, had significant lower NCV than those in the lowestertiles. Conversely, higher total cholesterol, higher plasma �-ocopherol, higher uric acid and higher lymphocyte numberere independently associated with higher NCV (Table 4).resent Unadjusted Adjusted
Mean ± S.D. F p Fa pa
41.9 ± 3.8 50.8 <0.001 38.0 <0.00142.2 ± 5.0 18.9 <0.001 7.3 0.00742.1 ± 4.3 21.5 <0.001 7.0 0.00841.7 ± 3.7 29.8 <0.001 9.3 0.00242.9 ± 4.1 7.2 0.007 1.0 0.3143.4 ± 3.6 2.6 0.11 0.1 0.7544.2 ± 3.7 6.0 0.01 0.3 0.5743.7 ± 3.9 2.2 0.13 0.4 0.5242.7 ± 8.9 2.2 0.14 0.4 0.5343.6 ± 3.9 1.9 0.17 1.4 0.2344.6 ± 3.0 0.0 0.83 2.0 0.16
A. Di Iorio et al. / Neurobiology of Aging 27 (2006) 1280–1288 1285
Table 3Peripheral nervous conduction in the InCHIANTI participants according to inflammatory markers tertiles
Cytokines serum level tertilesa Unadjusted Adjusted
Lower Intermediate Higher F p Fb pb
Number Mean ± S.D. Number Mean ± S.D. Number Mean ± S.D.
IL-1� (pg/ml) 396 44.4 ± 4.0 381 44.5 ± 3.9 429 44.7 ± 4.3 1.96 0.16 2.34 0.13sIL-6R (ng/ml) 400 44.9 ± 4.1 397 44.7 ± 4.0 409 44.0 ± 4.0 8.6 0.003 4.10 0.04IL-6 (pg/ml) 412 45.4 ± 4.0 400 44.5 ± 3.9 394 43.7 ± 4.0 39.8 0.001 1.10 0.30IL-1Ra (pg/ml) 413 44.6 ± 4.1 393 44.7 ± 3.9 400 44.2 ± 4.1 1.15 0.28 0.15 0.70TNF-� (pg/ml) 414 44.6 ± 3.9 377 44.3 ± 4.0 416 44.6 ± 4.3 0.01 0.91 0.02 0.90
Comparisons between tertiles were performed by general linear model.a Lower, intermediate and higher tertiles were calculated on the entire sample (1292 subjects enrolled in the study) and were referred to the distribution of
t d accor
3
Aaa
upciat((tinm
ta
4
plnlap
adescribed either as linear or quadratic [4,24]. Our findings are
TP
�
�
ATT�
LNUCG
C
t
he single cytokine. Mean ± S.D. of nerve conduction velocity were reporteb F and p value adjusted for age (years), sex and their interaction.
.1. Linear regression analysis
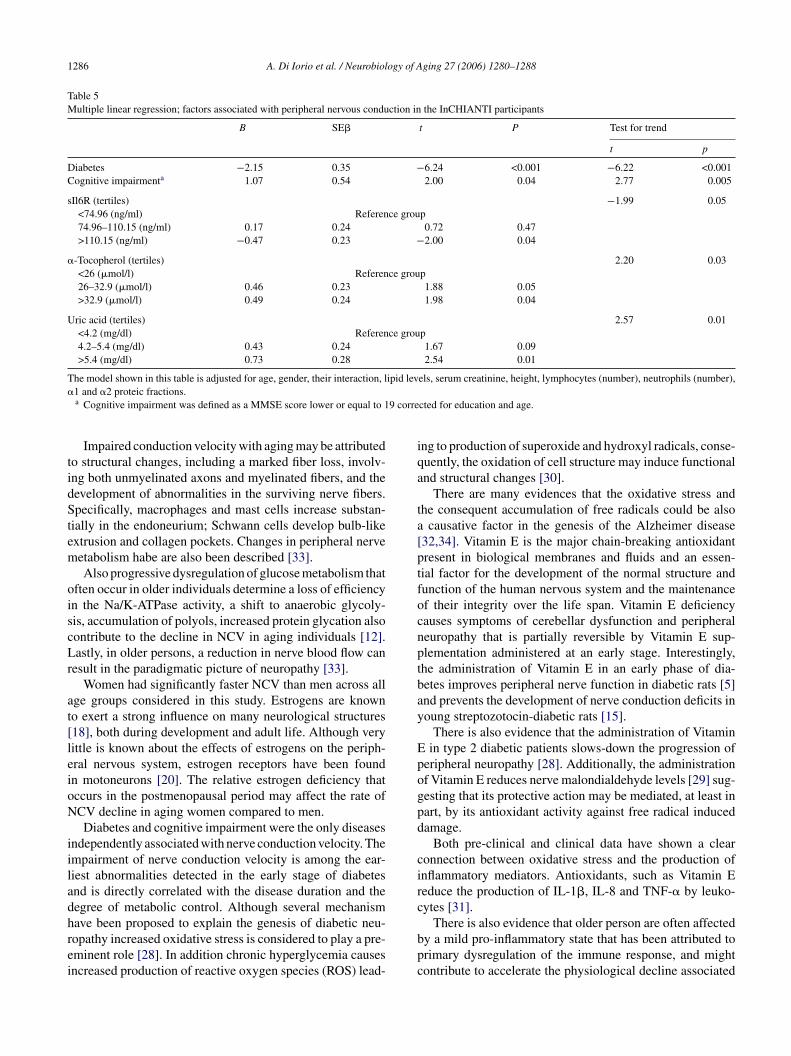
Table 5 reports the results of the multivariable analysis.s already mentioned, in the saturated model were forced
ll variables that in the age and sex adjusted analysis weressociated with the outcome with a p value <0.10.
The first model (Table 5, right panel, “For trend val-es”) showed that diabetes, cognitive impairment, sIL-6R,lasma level of �-tocopherol and uric acid were signifi-ant independent predictors of NCV, besides age, sex, theirnteraction, height, lymphocytes, neutrophils number, �1nd �2-globulin serum protein and serum creatinina. Par-icipants with intermediate (26–32.9 �mol/l) and high level>32.9 �mol/l) of �-tocopherol and high level of uric acid5.4 mg/dl) had significantly higher in NVC compared tohose in the lowest tertile. Conversely, for sIL-6R participants
n the highest tertile (110 ng/ml) had a lower NCV whereaso differences was found comparing participants with inter-ediate and low sIL-6R levels (Table 5 left panel). The R2 ofiad
able 4eripheral nervous conduction in the InCHIANTI participants according to tertiles
Tertilesa
Lower Intermediate
Number Mean ± S.D. Number Mean ±1 globulin (% total protein) 487 45.2 ± 3.9 366 44.4 ±2 globulin (% total protein) 398 44.7 ± 4.0 407 44.8 ±lbumin (% total protein) 407 44.2 ± 4.0 366 44.3 ±otal cholesterol (mg/dl) 397 44.1 ± 4.4 389 44.4 ±ryglicerides (mg/dL) 399 44.6 ± 4.2 399 44.3 ±-Tocopherol (�mol/l) 382 44.0 ± 4.4 400 44.7 ±ymphocytes (number) 386 44.1 ± 4.0 408 44.3 ±eutrophils (number) 410 44.9 ± 3.8 400 44.7 ±ric acid (mg/dl) 343 45.0 ± 3.9 466 44.5 ±reatinine (mg/dl) 405 45.5 ± 3.9 384 44.4 ±lucose (mg/dl) 376 45.1 ± 4.2 402 44.9 ±omparisons between tertiles were performed by general linear model.a Lower, intermediate and higher tertiles were calculated on the entire sample (1
he single laboratory parameters. Mean ± S.D. of nerve conduction velocity were reb F and p value adjusted for age (decades) and sex.
ding to tertiles of distribution of every Cytokine.
he model was 0.30; with age, sex and their interaction aloneccounting for 20% of NCV variance.
. Discussion
Using data collected in a large population-based sample ofersons over a wide age range, we found that, NCV declineinearly with age both in men and in women. Diabetes, cog-itive impairment, high sIL-6R, uric acid and low Vitamin Eevels, were all associated with lower NCV, independent ofge, sex, their interaction, height, �1 and �2-globulin serumrotein, serum creatinine, lymphocytes and neutrophils.
The progressive decline of NCV with age has beenlready reported in the literature, but the association has been
n agreement with the notion that NCV declines linearly withge since we were unable to detect any departure from a linearecline across the entire life span.
of laboratory parameters
Unadjusted Adjusted
Higher F p Fb pb
S.D. Number Mean ± S.D.
3.9 352 43.7 ± 4.3 28.9 <0.001 15.8 <0.0014.0 401 44.1 ± 4.1 4.7 0.03 4.5 0.034.2 432 45.0 ± 3.9 7.7 0.006 0.01 0.954.0 420 44.9 ± 3.7 8.3 0.004 10.6 0.0014.0 408 44.6 ± 3.9 1.1 0.30 2.0 0.163.9 424 44.8 ± 3.8 8.6 0.003 9.3 0.0023.9 412 45.1 ± 4.2 14.2 <0.001 6.0 0.013.8 396 43.9 ± 4.4 13.1 <0.001 4.3 0.044.1 397 44.2 ± 4.1 6.7 0.009 6.3 0.013.9 417 43.6 ± 4.1 47.2 <0.001 3.1 0.073.9 428 43.6 ± 4.0 25.0 <0.001 1.5 0.22
292 subjects enrolled in the study) and were referred to the distribution ofported according to tertiles of distribution of laboratory parameters.
1286 A. Di Iorio et al. / Neurobiology of Aging 27 (2006) 1280–1288
Table 5Multiple linear regression; factors associated with peripheral nervous conduction in the InCHIANTI participants
B SE� t P Test for trend
t p
Diabetes −2.15 0.35 −6.24 <0.001 −6.22 <0.001Cognitive impairmenta 1.07 0.54 2.00 0.04 2.77 0.005
sIl6R (tertiles) −1.99 0.05<74.96 (ng/ml) Reference group74.96–110.15 (ng/ml) 0.17 0.24 0.72 0.47>110.15 (ng/ml) −0.47 0.23 −2.00 0.04
�-Tocopherol (tertiles) 2.20 0.03<26 (�mol/l) Reference group26–32.9 (�mol/l) 0.46 0.23 1.88 0.05>32.9 (�mol/l) 0.49 0.24 1.98 0.04
Uric acid (tertiles) 2.57 0.01<4.2 (mg/dl) Reference group4.2–5.4 (mg/dl) 0.43 0.24 1.67 0.09>5.4 (mg/dl) 0.73 0.28 2.54 0.01
The model shown in this table is adjusted for age, gender, their interaction, lipid levels, serum creatinine, height, lymphocytes (number), neutrophils (number),�
9 corre
tidStem
oiscLr
at[leioN
iiladhrei
iqa
ta[ptfocnptbay
Epogpd
circ
1 and �2 proteic fractions.a Cognitive impairment was defined as a MMSE score lower or equal to 1
Impaired conduction velocity with aging may be attributedo structural changes, including a marked fiber loss, involv-ng both unmyelinated axons and myelinated fibers, and theevelopment of abnormalities in the surviving nerve fibers.pecifically, macrophages and mast cells increase substan-
ially in the endoneurium; Schwann cells develop bulb-likextrusion and collagen pockets. Changes in peripheral nerveetabolism habe are also been described [33].Also progressive dysregulation of glucose metabolism that
ften occur in older individuals determine a loss of efficiencyn the Na/K-ATPase activity, a shift to anaerobic glycoly-is, accumulation of polyols, increased protein glycation alsoontribute to the decline in NCV in aging individuals [12].astly, in older persons, a reduction in nerve blood flow can
esult in the paradigmatic picture of neuropathy [33].Women had significantly faster NCV than men across all
ge groups considered in this study. Estrogens are knowno exert a strong influence on many neurological structures18], both during development and adult life. Although veryittle is known about the effects of estrogens on the periph-ral nervous system, estrogen receptors have been foundn motoneurons [20]. The relative estrogen deficiency thatccurs in the postmenopausal period may affect the rate ofCV decline in aging women compared to men.Diabetes and cognitive impairment were the only diseases
ndependently associated with nerve conduction velocity. Thempairment of nerve conduction velocity is among the ear-iest abnormalities detected in the early stage of diabetesnd is directly correlated with the disease duration and theegree of metabolic control. Although several mechanism
ave been proposed to explain the genesis of diabetic neu-opathy increased oxidative stress is considered to play a pre-minent role [28]. In addition chronic hyperglycemia causesncreased production of reactive oxygen species (ROS) lead-bpc
cted for education and age.
ng to production of superoxide and hydroxyl radicals, conse-uently, the oxidation of cell structure may induce functionalnd structural changes [30].
There are many evidences that the oxidative stress andhe consequent accumulation of free radicals could be also
causative factor in the genesis of the Alzheimer disease32,34]. Vitamin E is the major chain-breaking antioxidantresent in biological membranes and fluids and an essen-ial factor for the development of the normal structure andunction of the human nervous system and the maintenancef their integrity over the life span. Vitamin E deficiencyauses symptoms of cerebellar dysfunction and peripheraleuropathy that is partially reversible by Vitamin E sup-lementation administered at an early stage. Interestingly,he administration of Vitamin E in an early phase of dia-etes improves peripheral nerve function in diabetic rats [5]nd prevents the development of nerve conduction deficits inoung streptozotocin-diabetic rats [15].
There is also evidence that the administration of Vitaminin type 2 diabetic patients slows-down the progression of
eripheral neuropathy [28]. Additionally, the administrationf Vitamin E reduces nerve malondialdehyde levels [29] sug-esting that its protective action may be mediated, at least inart, by its antioxidant activity against free radical inducedamage.
Both pre-clinical and clinical data have shown a clearonnection between oxidative stress and the production ofnflammatory mediators. Antioxidants, such as Vitamin Eeduce the production of IL-1�, IL-8 and TNF-� by leuko-ytes [31].
There is also evidence that older person are often affectedy a mild pro-inflammatory state that has been attributed torimary dysregulation of the immune response, and mightontribute to accelerate the physiological decline associated
ogy of
wibbitto
ian
6
trv
icdpw
scdoet
ioo
ltti
A
(i2
s
FbsU
bS
R
[
[
[
[
[
[
[
[
[
A. Di Iorio et al. / Neurobiol
ith aging [9]. Inflammatory states are pleomorphic andnvolve a variety of cell types, including not only neutrophilsut also macrophages and lymphocytes. These cells may acty releasing a wide range of signaling molecules, includ-ng growth factors, cytokines and chemokines. Many ofhese molecules, and in particular the IL-6 family cytokineshrough a receptor complex exert important biological effectn the nervous system cells.
The delivery of IL-6 after an insult, in the central andn the peripheral nervous system promotes neuronal survivalnd outgrowth, attenuates motor deficits and may accelerateerve regeneration.
Recent evidences suggest that neuronal cells require sIL-R to be responsive to IL-6 [11,14,21].
For example, in pre-clinical models of axonal damage,he addition of IL-6 and sIl-6R enhances the speed of axonalegeneration, while the addition of IL-6 or sIl-6R alone haveirtually no effects.
It has also been demonstrated that high levels of pro-nflammatory cytokines and high oxidative stress are asso-iated with neuronal apoptosis. Thus, it is conceivable that aysregulation of the inflammatory pathway and the excessiveroduction of ROS may negative influence neuronal function,hich results clinically in lower NCV.The main limitation of this study concerns the cross-
ectional design, that does not enable us to establish a directausal effect relationship. Additionally, because of the epi-emiological nature of this study, we were able to collectnly one measure of motor conduction velocity so we cannotxclude that variable associated with sensitive nerve conduc-ion could have been different.
Our results support the hypothesis that inflammation andncreased (impaired) oxidative stress accelerate the declinef function in the peripheral nervous system that is oftenbserved during the aging process.
This hypothesis should be further confirmed in epidemio-ogical longitudinal studies whether the chronic administra-ion of antioxidants or anti-inflammatory agents slow-downhe neuronal age-associated decline in NCV should be testedn randomized controlled trials.
cknowledgments
The InCHIANTI Study is supported as a “target project”ICS 110.1/RS97.71) by the Italian Ministry of Health andn part by the U.S. National Institute on Aging (Contracts63 MD 9164 13 and 263 MD 821336).
This research was also partially supported by an unre-tricted grant by BRACCO imaging SpA, Italy.
This study was conducted in the framework of the EU
P5 (EC grant QLK6-CT1999-02031) and partly supportedy a grant of the Italian Ministry of Education and Univer-ity (MIUR) to the Center of Excellence on Aging of theniversity “G. D’Annunzio”.[
[
Aging 27 (2006) 1280–1288 1287
Angelo Di Iorio is supported by a fund cosponsoredy University “G. D’Annunzio” Chieti and SANOFI-YNTHELABO SpA.
eferences
[1] Biessels GJ, van der Heide LP, Kamal A, Bleys RL, Gispen WH.Ageing and diabetes: implications for brain function. Eur J Pharma-col 2002;441(1–2):1–14.
[2] Caruso C, Candore G, Colonna-Romano G, Lio D, Franceschi C.Inflammation and life-span. Science 2005;307(5707):208–9.
[3] Checkles NS, Bailey JA, Johnson EW. Tape and caliper surface mea-surements in determination of peroneal nerve conduction velocity.Arch Phys Med Rehabil 1969;50(4):214–8.
[4] Choi SJ, Harii K, Lee MJ, Furuya F, Ueda K. Electrophysiolog-ical, morphological, and morphometric effects of aging on nerveregeneration in rats. Scand J Plast Reconstr Surg Hand Surg1995;29(2):133–40.
[5] Cotter MA, Love A, Watt MJ, Cameron NE, Dines KC. Effects ofnatural free radical scavengers on peripheral nerve and neurovascularfunction in diabetic rats. Diabetologia 1995;38(11):1285–94.
[6] Ferrucci L, Bandinelli S, Benvenuti E, Di Iorio A, Macchi C, HarrisTB, et al. Subsystems contributing to the decline in ability to walk:bridging the gap between epidemiology and geriatric practice in theInCHIANTI study. J Am Geriatr Soc 2000;48(12):1618–25.
[7] Ferrucci L, Ble A, Bandinelli S, Lauretani F, Suthers K, GuralnikJM. A flame burning within. Aging Clin Exp Res 2004;16(3):240–3.
[8] Ferrucci L, Corsi A, Lauretani F, Bandinelli S, Bartali B, TaubDD, et al. The origins of age-related proinflammatory state. Blood2005;105(6):2294–9.
[9] Franceschi C, Bonafe M. Centenarians as a model for healthy aging.Biochem Soc Trans 2003;31(2):457–61.
10] Jimenez J, Easton JK, Redford JB. Conduction studies of theanterior and posterior tibial nerves. Arch Phys Med Rehabil1970;51(3):164–9.
11] Jones SA, Rose-John S. The role of soluble receptors in cytokinebiology: the agonistic properties of the sIL-6R/IL-6 complex.Biochim Biophys Acta 2002;1592(3):251–63.
12] Kikkawa Y, Kuwabara S, Misawa S, Tamura N, Kitano Y, OgawaraK, et al. The acute effects of glycemic control on nerve conductionin human diabetics. Clin Neurophysiol 2005;116(2):270–4.
13] Kimura J. Assessment of individual nerves. Philadelphia: F.A. Davis;1993.
14] Lacroix S, Chang L, Rose-John S, Tuszynski MH. Delivery of hyper-interleukin-6 to the injured spinal cord increases neutrophil andmacrophage infiltration and inhibits axonal growth. J Comp Neu-rol 2002;454(3):213–28.
15] Love A, Cotter MA, Cameron NE. Effects of alpha-tocopherol onnerve conduction velocity and regeneration following a freeze lesionin immature diabetic rats. Naunyn Schmiedebergs Arch Pharmacol1997;355(1):126–30.
16] Martin A, Zulueta J, Hassoun P, Blumberg JB, Meydani M. Effectof Vitamin E on hydrogen peroxide production by human vascularendothelial cells after hypoxia/reoxygenation. Free Radic Biol Med1996;20(1):99–105.
17] McGeer PL, McGeer EG. Inflammation and the degenerative diseasesof aging. Ann N Y Acad Sci 2004;1035:104–16.
18] Norbury R, Cutter WJ, Compton J, Robertson DM, Craig M, White-head M, et al. The neuroprotective effects of estrogen on the aging
brain. Exp Gerontol 2003;38(1–2):109–17.19] Oh SJ. Clinical electromyography: nerve conduction studies. 2nd ed.Batimore: Williams &Wilkins; 1993.
20] Patrone C, Andersson S, Korhonen L, Lindholm D. Estro-gen receptor-dependent regulation of sensory neuron survival
1 ogy of
[
[
[
[
[
[
[
[
[
[
[
[
[
288 A. Di Iorio et al. / Neurobiol
in developing dorsal root ganglion. Proc Natl Acad Sci USA1999;96(19):10905–10.
21] Pizzi M, Sarnico I, Boroni F, Benarese M, Dreano M, GarottaG, et al. Prevention of neuron and oligodendrocyte degenerationby interleukin-6 (IL-6) and IL-6 receptor/IL-6 fusion protein inorganotypic hippocampal slices. Mol Cell Neurosci 2004;25(2):301–11.
22] Prolla TA, Mattson MP. Molecular mechanisms of brain aging andneurodegenerative disorders: lessons from dietary restriction. TrendsNeurosci 2001;24(11 Suppl):S21–31.
23] Resnick HE, Vinik AI, Heimovitz HK, Brancati FL, GuralnikJM. Age 85+ years accelerates large-fiber peripheral nerve dys-function and diabetes contributes even in the oldest-old: theWomen’s Health and Aging Study. J Gerontol A Biol Sci Med Sci2001;56(1):M25–31.
24] Rivner MH, Swift TR, Malik K. Influence of age and height onnerve conduction. Muscle Nerve 2001;24(9):1134–41.
25] Simonsick EM, Maffeo CE, Rogers SK, Skinner EA, Davis D,Guralnik JM, et al. Methodology and feasibility of a home-basedexamination in disabled older women: the Women’s Health andAging Study. J Gerontol A Biol Sci Med Sci 1997;52(5):M264–74.
26] Slimani N, Ferrari P, Ocke M, Welch A, Boeing H, Liere M, etal. Standardization of the 24-h diet recall calibration method usedin the european prospective investigation into cancer and nutrition(EPIC): general concepts and preliminary results. Eur J Clin Nutr2000;54(12):900–17.
[
Aging 27 (2006) 1280–1288
27] Stalberg E, Fuglsang-Frederiksen A, Bischoff C. Quantitation andstandardization in EMG and neurography. Suppl Clin Neurophysiol2000;53:101–11.
28] Tutuncu NB, Bayraktar M, Varli K. Reversal of defective nerveconduction with Vitamin E supplementation in type 2 diabetes: apreliminary study. Diabetes Care 1998;21(11):1915–8.
29] van Dam PS, Bravenboer B, van Asbeck BS, Marx JJ, GispenWH. High rat food Vitamin E content improves nerve function instreptozotocin-diabetic rats. Eur J Pharmacol 1999;376(3):217–22.
30] van Dam PS, van Asbeck BS, Erkelens DW, Marx JJ, Gispen WH,Bravenboer B. The role of oxidative stress in neuropathy and otherdiabetic complications. Diabetes Metab Rev 1995;11(3):181–92.
31] van Tits LJ, Demacker PN, de Graaf J, Hak-Lemmers HL, Stal-enhoef AF. �-Tocopherol supplementation decreases production ofsuperoxide and cytokines by leukocytes ex vivo in both nor-molipidemic and hypertriglyceridemic individuals. Am J Clin Nutr2000;71(2):458–64.
32] Varadarajan S, Yatin S, Aksenova M, Butterfield DA. Review:Alzheimer’s amyloid beta-peptide-associated free radical oxidativestress and neurotoxicity. J Struct Biol 2000;130(2–3):184–208.
33] Verdu E, Ceballos D, Vilches JJ, Navarro X. Influence of agingon peripheral nerve function and regeneration. J Peripher Nerv Syst
2000;5(4):191–208.34] Yatin SM, Varadarajan S, Butterfield DA. Vitamin E preventsAlzheimer’s amyloid beta-peptide (1-42)-induced neuronal proteinoxidation and reactive oxygen species production. J Alzheimers Dis2000;2(2):123–31.
Copyright © 2022 FDOKUMEN

