


Bahasa
Halaman
Hukum


Joachim Inkmann and Zhen Shi are at the Department of Finance, University of Melbourne, Level 12, 198
Berkeley Street, VIC 3010, Australia. They can be contacted via e-mail: [email protected] and
[email protected], respectively. David Blake is at the Pensions Institute, Cass Business School, 106 Bunhill
Row, London EC1Y 8TZ, United Kingdom. He can be contacted via e-mail: [email protected]. The authors are
also Research Fellows of Netspar. They thank Ron Anderson, Gabrielle Demange, Bart Diris, Joost Driessen,
Francesco Franzoni, Frank de Jong, David Laibson, Raimond Maurer, Alexander Michaelides, Theo Nijman,
Eduard Ponds, Joshua Rauh, Katarzyna Romaniuk, Peter Schotman, Peter Vlaar and two anonymous referees for
helpful comments. They also thank participants at a European Meeting of the Financial Management
Association, a Meeting of the European Financial Management Association, an Australian Colloquium of
Superannuation Researchers, and workshops and seminars at Cologne, Copenhagen, Konstanz, London School
of Economics, Louvain-La-Neuve, Maastricht, Mannheim, Massey University, Tilburg, UNSW, Warwick
Business School, Wellington, and York for helpful comments.
MANAGING FINANCIALLY DISTRESSED PENSION
PLANS IN THE INTEREST OF BENEFICIARIES
Joachim Inkmann David Blake
Zhen Shi
January 2015
ABSTRACT
The beneficiaries of a corporate defined benefit pension plan in financial distress care about
the security of their promised pensions. We propose to value the pension obligations of a
corporate defined benefit plan using a discount rate which reflects the funding ability of the
pension plan and its sponsoring company, and therefore depends, in part, on the chosen asset
allocation. An optimal valuation is determined by a strategic asset allocation which is optimal
given the risk premium a representative pension plan member demands for being exposed to
funding risk. We provide an empirical application using the General Motors pension plan.
Key words: strategic asset allocation, pension plan, default risk, liability, discount rate
JEL Classification: G11, G23

2
INTRODUCTION
Assume you are an employee and member of the defined benefit pension plan of General
Motors at the beginning of 2003. 2002 was a year of falling stock markets and falling interest
rates.1 As a consequence, you notice from the latest financial statements of your employer
that pension assets decreased to 60.9 bn USD, while the projected benefit pension obligation
(PBO) increased to 80.1 bn USD, resulting in a funding ratio of just 76%. You also notice that
the total net worth of General Motors is 6.8 bn USD and therefore insufficient to close the
funding gap. Assume you also understand from the extensive press coverage of the General
Motors pension plan that the PBO is calculated using a discount rate which exceeds the yield
on riskless long-maturity U.S. Treasury bonds by 1.74% which means that the present value
of the promised pension payments is considerably larger than the PBO. To make matters
worse, you realize that another large U.S. company with severely underfunded pension
obligations, United Airlines, filed for bankruptcy in December 2002. Would you not become
just a little worried about the security of your promised future pension? Is the value of the
pension promise little different to that of a junk bond?
The question we are going to answer in this paper is this: how should we value the pension
obligation of a corporate defined benefit pension plan in financial distress?2 We propose a
valuation framework which borrows from the literature of corporate bond pricing to derive a
discount rate for the valuation of the pension obligation which reflects the risk that the
pension plan and its sponsor default on the pension obligation. This default risk incorporates
both the insolvency risk of the plan sponsor and market risk. Both types of risk affect future
1 We focus on the market situation in 2002 which has become known as the “perfect storm” for defined benefit
plans because of its dramatic impact on the plans’ funding ratios of pension assets to liabilities. 2 Although corporate DB pension plans are increasingly being replaced by defined contribution plans, DB plan
assets are still substantial and amounted to $7.9 trillion in the U.S. at the end of 2013 (Towers Watson, 2014).

3
underfunding probabilities. We associate default risk with the funding risk in our model of
pension assets and liabilities, i.e., the risk that assets are not sufficient to meet liabilities
in full as they fall due. As in the corporate bond pricing literature, we express the funding
risk in terms of a discount rate for expected liabilities that involve a spread (henceforth,
denoted a funding spread) over the yield on a riskless government bond of appropriate
maturity, which equals the duration of the pension liability in our case. However, we go one
step further than this literature and derive the valuation of the pension obligation within a
model of the optimal strategic asset allocation of the pension plan. What we are proposing is
nothing less than a fully integrated asset-liability management solution for pension plans. The
rationale for this is straightforward: the ability of the pension plan and its sponsoring
company to fund the future pension payments promised to the beneficiaries depends on the
future values of pension plan assets which themselves depend on the current strategic asset
allocation policy of the pension plan. Thus, funding spreads which appropriately reflect
funding risk depend on the chosen asset allocation. We cannot value the pension obligation
without knowing the strategic asset allocation policy of the pension plan.
To find an optimal valuation of the pension obligation, we optimize the strategic asset
allocation of the pension plan. Unlike the existing literature on asset-liability management for
pension plans (e.g. van Binsbergen and Brandt (2009), Hoevenaars et al. (2008), and
Sundaresan and Zapatero (1997), described below), we propose an asset-liability management
approach which is directly targeted to address the interests of the pension plan members as
ultimate beneficiaries of the plan. We optimize the funding spread used for the valuation of
the pension obligation by means of a strategic asset allocation which is optimal given the risk
premium a representative pension plan member demands for being exposed to funding risk.
Using the optimal funding spread, the present discounted value of expected future pension

4
payments optimally approaches the present discounted value of promised future pension
payments. We call the first value the benefit that pension plan beneficiaries can expect to
receive and the second value the liability that the pension plan and its sponsoring company
have promised to make. The liability should be discounted using the yield on a riskless
government bond with a maturity equal to the duration of the pension obligation. This reflects
the fact that the promises an on-going business makes will be honored in full. The benefit is
calculated using a discount rate which exceeds this yield by the funding spread. Unlike the
spread used for the calculation of the PBO, the funding spread in our model is determined
endogenously as a result of the funding ratio, the optimized asset allocation and the
preferences of a representative beneficiary.
We take the beneficiaries’ perspective in deriving the value of pension liabilities and the
optimal asset allocation of the plan assets as required by U.S. law. The Board of Trustees of a
corporate defined benefit pension plan is responsible for the asset-liability management of the
plan. Paragraph 404(a)(1) of the Employee Retirement Income Security Act (ERISA)
regulates the role of trustees in the investment process. Fiduciaries are required to act “solely
in the interest of the participants and beneficiaries and for the exclusive purpose of providing
benefits to participants and their beneficiaries.” The objective function we formalize in this
paper is wholly consistent with this requirement. Schneider and Pinheiro (2008) point out that
a breach of this exclusive purpose rule may result in the loss of a plan’s tax-qualified status.
Hence, the trustees have a very strong incentive to act in the best interests of the beneficiaries,
indeed to act as if the beneficiaries choose the strategic asset allocation.3
3 This does not rule out the possibility that agency problems might arise in later stages of the investment process.
In particular, the pension plan might decide to hire investment managers to manage particular asset classes
consistent with the strategic asset allocation set by the board of trustees. These investment managers might
instead pursue their own objectives. Van Binsbergen and Brandt (2009) discuss such agency problems in the
context of delegated portfolio management.

5
Our proposed asset-liability management framework differs from current practices in
pension liability valuation and asset allocation in two major aspects. First, corporate pension
liabilities are usually valued using actuarial methods. The strategic asset allocation is then
determined using an asset-liability model which takes the value of these liabilities as an input.
By contrast, our model determines simultaneously the optimal asset allocation and benefit
valuation. Second, pension plan sponsors are currently obliged to publish a liability value (the
PBO) which is calculated using a discount rate determined by accounting standards. In
practice, sponsoring companies often use the average yield to maturity on long-term corporate
bonds with a Moody’s AA rating (Coronado and Sharpe, 2003) for this purpose. 4 We propose
to publish two values: the liability value which is the current value of the pension promise and
the benefit value which is the funding-risk-adjusted value of the pension promise. By
comparing these values, plan participants and all other stakeholders in the pension plan –
shareholders of the sponsoring company, the sponsor, and the pension regulator – will have a
realistic assessment of the plan’s true funding situation and are able to adjust their behavior
accordingly. Yields on corporate bonds are specific to the rating status of the issuer, yet the
current practice in pension liability valuation is to treat all pension plans identically and
ignore the different funding abilities of different plan sponsors. In other words, discount rates
do not reflect the true risk underlying the promised future pension payments, a violation of the
basic principles of financial economics. This is what we attempt to address in this paper.
We apply our model to the U.S. pension plan of General Motors in December 2002. To
better understand our contribution, it will be helpful to preview some of our results. On the
basis of the yield on a government bond with maturity equal to the duration of the pension
liability, General Motors’ pension liability was about 100 bn USD in December 2002. Thus,
4 This holds for the time period relevant for the asset-liability management study conducted in a later section of
this paper. More recently, the PBO discount rate was linked to an average yield on 30-year Treasury securities.

6
the funding ratio was about 60%. The net worth of General Motors was about 7% of the
liability value. The outcome of our asset-liability modeling exercise yields a funding-risk-
adjusted benefit value of around 80-85% of the liability value, depending on the relative risk
aversion of the representative investor. This means, given the funding ability of General
Motors in December 2002, the members of the defined benefit pension plan of the company
should have expected a reduction in their pension wealth by around 15-20%.
One could argue that the Pension Benefit Guaranty Corporation (PBGC) was introduced to
provide a (partial) hedge against defaults on pension obligations. There are two reasons why
we believe that the valuation of the corporate defined benefit obligation should not include the
recovery option provided by the PBGC. First, unless the government fully underwrites any
funding gap, the PBGC is itself subject to default risk, as a result of both systematic risk – all
corporate pension funds are affected by falling stock markets and interest rates at the same
time – and moral hazard in the form of increased risk taking behavior by companies whose
liabilities are covered by a guaranty fund like the PBGC (as shown by McCarthy and
Neuberger, 2005). Second, we are evaluating the obligations of the plan sponsor from the
viewpoint of the plan members. They certainly want to avoid a situation where the PBGC has
to step in to secure pension payments, since this is also likely to be associated with
unemployment and a reduction in pension benefits for many members. Correspondingly, we
propose to minimize the funding risk in the absence of any intervention by the PBGC.
Petersen (1996) and Ippolito (2002) have already proposed that the discount rate for the
valuation of the pension liability should reflect funding risk. Broeders (2010) and Broeders
and Chen (2013) use contingent claims analysis to value corporate pension liabilities in the
presence of funding risk and compare alternative arrangements of securing these liabilities.
However, none of these papers attempts to obtain funding spreads and, hence, funding-risk-
adjusted discount rates. This is what we deliver in this paper. We believe that our approach

7
brings significant advantages to all stakeholders of the pension plan compared with current
practice. Most importantly, it provides plan members with a realistic value of their pension
wealth and so allows them to adjust their life-cycle consumption and savings trajectories if the
benefit falls short of the liability. In particular, they may choose to compensate a reduction in
expected pension payments with increased private savings.
The pension regulator should also be interested in our approach, since it limits the
discretion of firms in setting the discount rates for the valuation of the pension obligation. The
outcome of our asset-liability model is a unique funding-risk-adjusted discount rate for each
pension plan. Bergstresser et al. (2006) and Addoum et al. (2010) provide evidence that the
expected return on plan assets, another assumption required by U.S. pension accounting
standards, tends to be used to manipulate earnings. Similarly, Cocco and Volpin (2007) show
that insider trustees, who are also executive directors of the sponsoring company, tend to act
in favor of the shareholders of the sponsor, rather than in the interests of the pension plan
members. The discount rate is likely to be used in a similar strategic way. We provide an
example later in the paper.
The shareholders of the pension plan sponsor are another group of stakeholders that profit
from our valuation approach. Coronado and Sharpe (2003) and Franzoni and Marín (2006)
find that the market does not correctly value firms with a defined benefit pension plan.
Coronado and Sharpe report that all companies with a defined benefit plan are overvalued,
while Franzoni and Marín show that the market only overvalues companies with underfunded
pension liabilities. The benefit value we compute provides a plan-specific evaluation of the
sponsor’s ability to fund the pension promise which is likely to increase transparency for the
shareholders of the sponsoring company and ameliorate the overvaluation problem.
The sponsoring company itself will benefit from the information on future underfunding
probabilities that are calculated for the determination of the funding spread. Rauh (2006)

8
shows that, for companies facing financial constraints, capital expenditures decline by the
amount of mandatory contributions to their defined benefit pension plans. Again, our
approach immediately highlights possible future financial constraints arising from the current
decisions of the plan sponsor. Henceforth, the plan sponsor will no longer be surprised by the
need to make future mandatory contributions to the plan, nor by the consequential
requirement to curtail corporate investment or dividends.
Van Binsbergen and Brandt (2009) derive the strategic asset allocation for a corporate
defined benefit pension plan which explicitly accounts for such mandatory contributions.
They formulate the objective function of a fund manager who manages the assets of the
pension plan on behalf of the plan sponsor and is concerned about reputation loss emerging
from the need of the sponsor to pay mandatory contributions. By contrast, our objective
function is formulated to represent the interests of the plan beneficiaries. While we do not
explicitly describe a contribution policy for the plan, we treat the plan as an integral part of
the company and effectively merge the net worth of the sponsor with the pension plan assets.
We do this in recognition that the sponsor is ultimately liable for closing any funding gap. In
our model, contributions are merely a shift of assets from the company’s balance sheet to the
pension plan and do not affect funding risk. Van Binsbergen and Brandt (2009) do not
consider funding risk and instead value liabilities using the yield on a government bond or a
weighted average of past yields. However, like these authors and previously Longstaff (2001)
and Brandt et al. (2005), we adopt the Longstaff and Schwartz (2001) simulation
methodology to solve the dynamic asset allocation problem.
Hoevenaars et al. (2008) propose an asset-liability model to determine the asset allocation
of a defined benefit plan. They assume the perspective of the plan sponsor, but do not
integrate the plan and the sponsor. By contrast, we assume the perspective of the plan
members and view the pension plan as an integrated part of the sponsoring company.

9
Moreover, we derive an optimal strategic asset allocation under the assumption that
rebalancing occurs optimally in future to adjust to time-varying investment opportunities,
while Hoevenaars et al. consider suboptimal rebalancing to a portfolio which is the same at all
rebalancing times. Unlike Hoevenaars et al., we are not only interested in the optimal asset
allocation, but also in the optimal liability valuation and we explicitly address funding risk.
Sundaresan and Zapatero (1997) relate the valuation of pension liabilities and the
allocation of pension plan assets to the lifetime marginal utility of the worker. They show that
the worker will retire when the ratio of pension benefits to current wages reaches a critical
value which depends on the discount rate. The discount rate and asset allocation strategy is
chosen from the perspective of the pension plan sponsor, while we assume the perspective of
the pension plan member. The worker in the Sundaresan and Zapatero model behaves as if
there is no funding risk, while the pension plan beneficiaries in our model are concerned
about this risk. Finally, in contrast with Sundaresan and Zapatero (1997), we consider time
variation in investment opportunities.
The remainder of the paper is structured as follows. The first section describes the asset-
liability model. The output from this model is an optimal strategic asset allocation and a
valuation of the pension benefit which is consistent with this allocation. In the second section,
we apply our model to a pension plan in financial distress: the General Motors U.S. pension
plan in December 2002. The third section concludes.
ASSET-LIABILITY MANAGEMENT
We propose a new approach to the management of the assets and liabilities of a corporate
defined benefit pension plan which reflects the interests of the plan beneficiaries.
Pension Liability Valuation

10
We investigate a stylized corporate defined benefit pension plan which promises its
beneficiaries a constant nominal pension payment of magnitude 𝐸𝐸 at fixed intervals up to
some date of maturity 𝑀𝑀. The present discounted value of the promised future pension
payments defines the liability value, 𝐿𝐿𝑡𝑡, of the pension plan:
𝐿𝐿𝑡𝑡 = �𝐸𝐸
(1 + 𝑌𝑌𝑡𝑡𝑚𝑚)𝑚𝑚
𝑀𝑀
𝑚𝑚=1
. (1)
𝑌𝑌𝑡𝑡𝑚𝑚 denotes the current yield-to-maturity on a riskless zero-coupon bond with maturity 𝑚𝑚. To
reiterate, discounting using a riskless rate is appropriate because we are valuing promised
pension payments and can therefore treat them as though they are guaranteed.
Equation (1) is valid if we assume that the plan is sufficiently large that longevity risk is
diversified away. This is in line with van Binsbergen and Brandt (2009) and Hoevenaars et al.
(2008). Like these authors, we also assume that the maturity of the pension liability is
constant, which holds for a pension plan in a stationary state where the distribution of age
cohorts and accrued benefit rights of plan members remains constant over time. Finally, like
Hoevenaars et al., we assume that new contributions to the plan exactly offset any increase in
accrued pension rights. The overarching purpose of these assumptions is to allow us to focus
on the change in liability value arising exclusively from changes in the yield curve.
Plan beneficiaries are concerned about the present discounted value of expected future
pension payments which we call the benefit value (𝐵𝐵𝑡𝑡) henceforth. The benefit will be less
than the liability of the pension fund if there is a probability, 𝜋𝜋𝑡𝑡𝑚𝑚, that the pension plan and its
sponsoring company default on their pension obligation at any time 𝑡𝑡 + 𝑚𝑚, 𝑚𝑚 = 1, … ,𝑀𝑀.
Recognizing that the sponsoring company is ultimately liable for the obligation of the pension
plan, default occurs if the assets of the pension plan and the net worth of the sponsoring
11
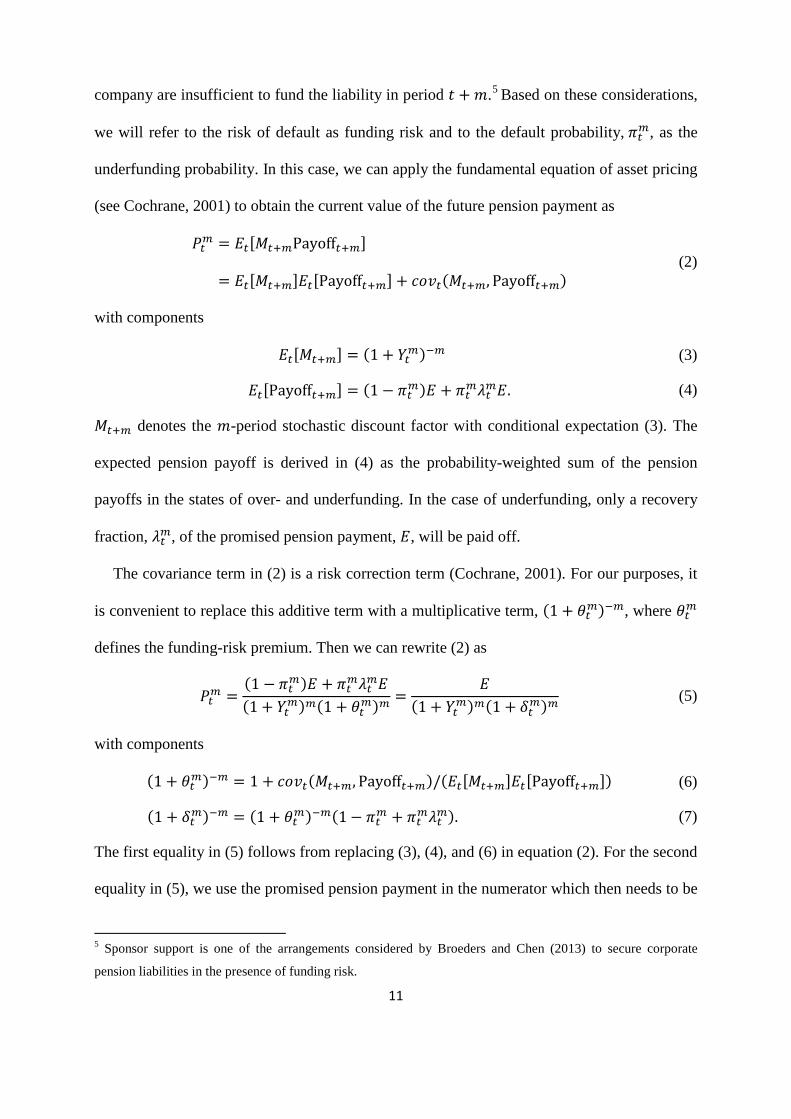
company are insufficient to fund the liability in period 𝑡𝑡 + 𝑚𝑚.5 Based on these considerations,
we will refer to the risk of default as funding risk and to the default probability, 𝜋𝜋𝑡𝑡𝑚𝑚, as the
underfunding probability. In this case, we can apply the fundamental equation of asset pricing
(see Cochrane, 2001) to obtain the current value of the future pension payment as
𝑃𝑃𝑡𝑡𝑚𝑚 = 𝐸𝐸𝑡𝑡[𝑀𝑀𝑡𝑡+𝑚𝑚Payoff𝑡𝑡+𝑚𝑚]
= 𝐸𝐸𝑡𝑡[𝑀𝑀𝑡𝑡+𝑚𝑚]𝐸𝐸𝑡𝑡[Payoff𝑡𝑡+𝑚𝑚] + 𝑐𝑐𝑐𝑐𝑣𝑣𝑡𝑡(𝑀𝑀𝑡𝑡+𝑚𝑚, Payoff𝑡𝑡+𝑚𝑚) (2)
with components
𝐸𝐸𝑡𝑡[𝑀𝑀𝑡𝑡+𝑚𝑚] = (1 + 𝑌𝑌𝑡𝑡𝑚𝑚)−𝑚𝑚
𝐸𝐸𝑡𝑡[Payoff𝑡𝑡+𝑚𝑚] = (1 − 𝜋𝜋𝑡𝑡𝑚𝑚)𝐸𝐸 + 𝜋𝜋𝑡𝑡𝑚𝑚𝜆𝜆𝑡𝑡𝑚𝑚𝐸𝐸.
(3)
(4)
𝑀𝑀𝑡𝑡+𝑚𝑚 denotes the 𝑚𝑚-period stochastic discount factor with conditional expectation (3). The
expected pension payoff is derived in (4) as the probability-weighted sum of the pension
payoffs in the states of over- and underfunding. In the case of underfunding, only a recovery
fraction, 𝜆𝜆𝑡𝑡𝑚𝑚, of the promised pension payment, 𝐸𝐸, will be paid off.
The covariance term in (2) is a risk correction term (Cochrane, 2001). For our purposes, it
is convenient to replace this additive term with a multiplicative term, (1 + 𝜃𝜃𝑡𝑡𝑚𝑚)−𝑚𝑚, where 𝜃𝜃𝑡𝑡𝑚𝑚
defines the funding-risk premium. Then we can rewrite (2) as
𝑃𝑃𝑡𝑡𝑚𝑚 =(1 − 𝜋𝜋𝑡𝑡𝑚𝑚)𝐸𝐸 + 𝜋𝜋𝑡𝑡𝑚𝑚𝜆𝜆𝑡𝑡𝑚𝑚𝐸𝐸(1 + 𝑌𝑌𝑡𝑡𝑚𝑚)𝑚𝑚(1 + 𝜃𝜃𝑡𝑡𝑚𝑚)𝑚𝑚 =
𝐸𝐸(1 + 𝑌𝑌𝑡𝑡𝑚𝑚)𝑚𝑚(1 + 𝛿𝛿𝑡𝑡𝑚𝑚)𝑚𝑚 (5)
with components
(1 + 𝜃𝜃𝑡𝑡𝑚𝑚)−𝑚𝑚 = 1 + 𝑐𝑐𝑐𝑐𝑣𝑣𝑡𝑡(𝑀𝑀𝑡𝑡+𝑚𝑚, Payoff𝑡𝑡+𝑚𝑚)/(𝐸𝐸𝑡𝑡[𝑀𝑀𝑡𝑡+𝑚𝑚]𝐸𝐸𝑡𝑡[Payoff𝑡𝑡+𝑚𝑚])
(1 + 𝛿𝛿𝑡𝑡𝑚𝑚)−𝑚𝑚 = (1 + 𝜃𝜃𝑡𝑡𝑚𝑚)−𝑚𝑚(1− 𝜋𝜋𝑡𝑡𝑚𝑚 + 𝜋𝜋𝑡𝑡𝑚𝑚𝜆𝜆𝑡𝑡𝑚𝑚).
(6)
(7)
The first equality in (5) follows from replacing (3), (4), and (6) in equation (2). For the second
equality in (5), we use the promised pension payment in the numerator which then needs to be
5 Sponsor support is one of the arrangements considered by Broeders and Chen (2013) to secure corporate
pension liabilities in the presence of funding risk.

12
discounted by a funding-risk-adjusted discount factor using the funding spread, 𝛿𝛿𝑡𝑡𝑚𝑚, defined
in (7), over the yield of a riskless bond with maturity 𝑚𝑚. By varying 𝑚𝑚, (7) defines a term
structure of funding spreads. We introduce the funding spreads to emphasize the point that the
discount rate for calculating the present value of all future pension payments should reflect
the degree of funding risk in the case where future pension payments are defaultable.6 The
funding spread increases with the funding-risk premium. For a given funding-risk premium,
the funding spread increases with an increasing underfunding probability and decreases with
an increasing recovery fraction. Now we can derive the benefit value as follows
𝐵𝐵𝑡𝑡 = �𝐸𝐸
(1 + 𝑌𝑌𝑡𝑡𝑚𝑚)𝑚𝑚(1 + 𝛿𝛿𝑡𝑡𝑚𝑚)𝑚𝑚
𝑀𝑀
𝑚𝑚=1
. (8)
The term structure of funding spreads is completely defined by 𝜋𝜋𝑡𝑡𝑚𝑚, 𝜆𝜆𝑡𝑡𝑚𝑚, and 𝜃𝜃𝑡𝑡𝑚𝑚. We delay
discussion of the funding-risk premium, 𝜃𝜃𝑡𝑡𝑚𝑚, to later. We define for 𝑚𝑚 = 1, … ,𝑀𝑀
𝜋𝜋𝑡𝑡𝑚𝑚 = 𝑃𝑃𝑃𝑃𝑐𝑐𝑏𝑏𝑡𝑡 �𝐴𝐴𝑡𝑡+𝑚𝑚 + 𝑁𝑁𝑡𝑡+𝑚𝑚
𝐿𝐿𝑡𝑡+𝑚𝑚< 1� (9)
𝜆𝜆𝑡𝑡𝑚𝑚 = 𝐸𝐸𝑡𝑡 �𝐴𝐴𝑡𝑡+𝑚𝑚 + 𝑁𝑁𝑡𝑡+𝑚𝑚
𝐿𝐿𝑡𝑡+𝑚𝑚|𝐴𝐴𝑡𝑡+𝑚𝑚 + 𝑁𝑁𝑡𝑡+𝑚𝑚
𝐿𝐿𝑡𝑡+𝑚𝑚< 1�. (10)
Here 𝐴𝐴𝑡𝑡+𝑚𝑚 denotes the pension plan assets and 𝑁𝑁𝑡𝑡+𝑚𝑚 the net worth7 of the sponsoring
company in period 𝑡𝑡 + 𝑚𝑚. Funding risk at horizon 𝑡𝑡 + 𝑚𝑚 exists if there is a positive
conditional probability that the total funding ratio, 𝐺𝐺𝑡𝑡+𝑚𝑚 = (𝐴𝐴𝑡𝑡+𝑚𝑚 + 𝑁𝑁𝑡𝑡+𝑚𝑚)/𝐿𝐿𝑡𝑡+𝑚𝑚, falls below
unity. We call 𝐺𝐺𝑡𝑡+𝑚𝑚 the total funding ratio because it relates the sum of pension assets and net
worth of the sponsoring company to the pension liability. The more familiar funding ratio,
𝐹𝐹𝑡𝑡+𝑚𝑚 = 𝐴𝐴𝑡𝑡+𝑚𝑚/𝐿𝐿𝑡𝑡+𝑚𝑚, describes the funding position in the pension plan only and ignores the
6 Our approach to deriving funding spreads resembles the derivation of credit spreads in credit risk models. Das
and Sundaram (2000) provide a discrete time reduced-form model which leads to credit spreads of the form (7). 7 More generally, the net worth variable captures those assets of the corporate sponsor which – depending on the
seniority of the pension claims – can be used to cover underfunded pension liabilities in the case of default.

13
liability of the plan sponsor. The underfunding probability in (9) takes into account both the
insolvency risk of the plan sponsor which affects 𝑁𝑁𝑡𝑡+𝑚𝑚 and market risk which affects the
future assets, 𝐴𝐴𝑡𝑡+𝑚𝑚, and liabilities, 𝐿𝐿𝑡𝑡+𝑚𝑚, of the pension plan. The recovery ratio in (10) is the
conditionally expected total funding ratio when the latter falls below unity.
Strategic Asset Allocation
We observe a pension plan in period 𝑡𝑡 with funding ratio 𝐹𝐹𝑡𝑡 and total funding ratio 𝐺𝐺𝑡𝑡. 8 While
we do not discuss the reasons why a particular funding ratio arises at time 𝑡𝑡, we are mostly
interested in pension plans in financial distress, which have insufficient assets to fund their
pension liability. The beneficiaries of the pension plan were promised 𝐿𝐿𝑡𝑡, but realize that their
benefit, 𝐵𝐵𝑡𝑡, may fall below 𝐿𝐿𝑡𝑡 in the presence of funding risk, reflected by a positive funding
spread, 𝛿𝛿𝑡𝑡𝑚𝑚, for 𝑚𝑚 = 1, … ,𝑀𝑀. The funding spread depends on the asset allocation chosen by
the board of trustees on behalf of the pension plan members. In representing the interests of
the members, the board of trustees of the pension plan will allocate the plan assets in such a
way that the benefit approaches the liability as closely as possible given the funding risk
appetite of the plan members.9 Since the benefit can never exceed the liability of the pension
plan, this objective function can be formalized as
𝑉𝑉(𝑍𝑍𝑡𝑡 , 𝐽𝐽) = 𝑚𝑚𝑚𝑚𝑚𝑚�𝑤𝑤𝑡𝑡+𝑗𝑗�𝑗𝑗=0
𝐽𝐽−1𝐸𝐸𝑡𝑡 �𝑙𝑙𝑐𝑐𝑙𝑙�𝐵𝐵𝑡𝑡+𝐽𝐽�� = 𝑚𝑚𝑚𝑚𝑚𝑚
𝑤𝑤𝑡𝑡𝐸𝐸𝑡𝑡 [𝑉𝑉(𝑍𝑍𝑡𝑡+1, 𝐽𝐽 − 1)] (11)
where 𝑍𝑍𝑡𝑡 denotes a vector of state variables at time 𝑡𝑡. We assume in (11) that the preferences
of the representative pension plan member can be described by a log utility function. The
trustees will determine a sequence of optimal asset allocations, 𝑤𝑤𝑡𝑡+𝑗𝑗, 𝑗𝑗 = 0, … , 𝐽𝐽 − 1, which
8 We do not discuss the reasons why this particular funding ratio arises at time t. 9 Recall from the introduction that this objective function is completely in line with ERISA regulations. In
particular, trustees are required by law to act “solely in the interest of the participants and beneficiaries” and to
diversify investments “so as to minimize the risk of large losses” (ERISA 404(a)(1)).

14
maximizes the conditionally expected benefit at some investment horizon, 𝐽𝐽. A natural choice
for 𝐽𝐽 is the duration of pension liabilities, 𝐷𝐷. Equation (11) defines a strategic asset allocation
problem (Campbell and Viceira, 2002) in the sense that today’s optimal asset allocation
decision already reflects future optimal rebalancing of the portfolio in response to changes in
the investment opportunity set described by the vector of state variables. We assume
throughout the paper that the pension fund is not allowed to short-sell.
The output from this optimization program is not only a sequence of optimal asset
allocations but also a value for the benefit at time 𝑡𝑡, 𝐵𝐵𝑡𝑡. Hence, (11) simultaneously solves the
asset allocation and benefit valuation problems of the pension plan resulting in a term
structure of funding spreads, 𝛿𝛿𝑡𝑡𝑚𝑚, for 𝑚𝑚 = 1, … ,𝑀𝑀, evaluated at the optimal asset allocation
choice. As a consequence, the asset allocation and benefit valuation exercises are completely
interdependent. We argued in the introduction that pension plans should be obliged to publish
𝐵𝐵𝑡𝑡 along side 𝐿𝐿𝑡𝑡 to give plan beneficiaries the chance to adjust their savings and consumption
patterns if 𝐵𝐵𝑡𝑡 is below 𝐿𝐿𝑡𝑡. Solving (11) determines the optimal discount rates for the
calculation of 𝐵𝐵𝑡𝑡.
The recommendation to publish the present discounted value of both promised and
expected pension payments, 𝐿𝐿𝑡𝑡 and 𝐵𝐵𝑡𝑡, stands in stark contrast to the current publication
requirements of corporate defined benefit pension plans. As pointed out in the introduction,
pension plans currently publish one liability value, which has the form of the benefit in (8)
with the important difference that the funding spread (usually the average spread of AA-rated
long-term corporate bonds) is determined exogenously and independent of the actual funding
risk associated with the specific pension plan. In our case, the funding spread is fully
consistent with the current total funding ratio of the pension plan and its asset allocation.

15
The benefit at the investment horizon can be rewritten as 𝐵𝐵𝑡𝑡+𝐽𝐽 = 𝐵𝐵𝑡𝑡(1 + 𝑅𝑅𝑡𝑡+𝐽𝐽𝐵𝐵(𝐽𝐽)), where we
introduce the convention that subscripts on return variables denote the time the return is
realized and superscripts in parentheses denote the holding period. The 𝐽𝐽-period benefit return
1 + 𝑅𝑅𝑡𝑡+𝐽𝐽𝐵𝐵(𝐽𝐽) = ��1 + 𝑅𝑅𝑡𝑡+𝑗𝑗
𝐵𝐵(1)�𝐽𝐽
𝑗𝑗=1
= �∑ 𝑃𝑃𝑡𝑡+𝑗𝑗𝑚𝑚𝑀𝑀𝑚𝑚=1
∑ 𝑃𝑃𝑡𝑡+𝑗𝑗−1𝑚𝑚𝑀𝑀𝑚𝑚=1
𝐽𝐽
𝑗𝑗=1
= ��𝑃𝑃𝑡𝑡+𝑗𝑗−1𝑚𝑚
∑ 𝑃𝑃𝑡𝑡+𝑗𝑗−1𝑚𝑚𝑀𝑀𝑚𝑚=1
𝑃𝑃𝑡𝑡+𝑗𝑗𝑚𝑚
𝑃𝑃𝑡𝑡+𝑗𝑗−1𝑚𝑚
𝑀𝑀
𝑚𝑚=1
𝐽𝐽
𝑗𝑗=1
= �� 𝑣𝑣𝑡𝑡+𝑗𝑗−1𝑚𝑚 𝑃𝑃𝑡𝑡+𝑗𝑗𝑚𝑚
𝑃𝑃𝑡𝑡+𝑗𝑗−1𝑚𝑚
𝑀𝑀
𝑚𝑚=1
𝐽𝐽
𝑗𝑗=1
= �� 𝑣𝑣𝑡𝑡+𝑗𝑗−1𝑚𝑚 �1 + 𝑌𝑌𝑡𝑡+𝑗𝑗𝑚𝑚 �−𝑚𝑚�1 + 𝛿𝛿𝑡𝑡+𝑗𝑗𝑚𝑚 �
−𝑚𝑚
�1 + 𝑌𝑌𝑡𝑡+𝑗𝑗−1𝑚𝑚 �−𝑚𝑚�1 + 𝛿𝛿𝑡𝑡+𝑗𝑗−1𝑚𝑚 �
−𝑚𝑚
𝑀𝑀
𝑚𝑚=1
𝐽𝐽
𝑗𝑗=1
= �� 𝑣𝑣𝑡𝑡+𝑗𝑗−1𝑚𝑚 �1 + 𝑆𝑆𝑡𝑡+𝑗𝑗𝑚𝑚(1)��1 + Δ𝑡𝑡+𝑗𝑗
𝑚𝑚(1)�𝑀𝑀
𝑚𝑚=1
𝐽𝐽
𝑗𝑗=1
(12)
follows from (5) and (8), where 𝑆𝑆𝑡𝑡+𝑗𝑗𝑚𝑚(1) is the 1-period net return on a default-free zero-coupon
bond with maturity 𝑚𝑚, Δ𝑡𝑡+𝑗𝑗𝑚𝑚(1) the 1-period net return on the corresponding funding spread, and
𝑣𝑣𝑡𝑡+𝑗𝑗−1𝑚𝑚 , 𝑚𝑚 = 1, … ,𝑀𝑀, a number of weights with obvious definition which sum to unity.
Equation (12) involves the term structure of interest rates and funding spreads for
maturities ranging from 1, … ,𝑀𝑀. In practice, a single discount rate is usually used for the
valuation of the pension obligation. This interest rate should be appropriate for the duration of
the pension obligation. In this case, (12) can be simplified to
1 + 𝑅𝑅𝑡𝑡+𝐷𝐷𝐵𝐵(𝐷𝐷) = ��1 + 𝑆𝑆𝑡𝑡+𝑗𝑗
𝐷𝐷(1)��1 + Δ𝑡𝑡+𝑗𝑗𝐷𝐷(1)�
𝐷𝐷
𝑗𝑗=1
. (13)
It is only the second factor, 1 + Δ𝑡𝑡+𝑗𝑗𝐷𝐷(1), in this equation that can be influenced by the strategic
asset allocation. For funding spreads of size zero at all rebalancing times, the second factor
becomes unity, ∀𝑗𝑗, and (13) reduces to the D-period liability holding return, which we denote
as 1 + 𝑅𝑅𝑡𝑡+𝐷𝐷𝐿𝐿(𝐷𝐷).

16
The strategic asset allocation influences (13) via the underfunding probabilities, 𝜋𝜋𝑡𝑡+𝑗𝑗𝐷𝐷 , and
recovery ratios, 𝜆𝜆𝑡𝑡+𝑗𝑗𝐷𝐷 , for 𝑗𝑗 = 0, … ,𝐷𝐷. For example, for the current period, 𝑗𝑗 = 0, these two
quantities depend on the total funding ratio, 𝐺𝐺𝑡𝑡+𝐷𝐷, at the duration of the liabilities, as can be
seen from (9) and (10). The components of 𝐺𝐺𝑡𝑡+𝐷𝐷 can be expressed as 𝐿𝐿𝑡𝑡+𝐷𝐷 = 𝐿𝐿𝑡𝑡(1 + 𝑅𝑅𝑡𝑡+𝐷𝐷𝐿𝐿(𝐷𝐷)),
𝑁𝑁𝑡𝑡+𝐷𝐷 = 𝑁𝑁𝑡𝑡(1 + 𝑅𝑅𝑡𝑡+𝐷𝐷𝑁𝑁(𝐷𝐷)) and 𝐴𝐴𝑡𝑡+𝐷𝐷 = 𝐴𝐴𝑡𝑡(1 + 𝑅𝑅𝑡𝑡+𝐷𝐷
𝐴𝐴(𝐷𝐷)) with
1 + 𝑅𝑅𝑡𝑡+𝐷𝐷𝐴𝐴(𝐷𝐷) = ��1 + 𝑅𝑅𝑡𝑡+𝑗𝑗
𝐴𝐴(1)�𝐷𝐷
𝑗𝑗=1
= ��1 + 𝑅𝑅𝑡𝑡+𝑗𝑗𝑓𝑓(1) + 𝑤𝑤𝑡𝑡+𝑗𝑗−1
′ 𝑅𝑅𝑡𝑡+𝑗𝑗𝑒𝑒(1)�
𝐷𝐷
𝑗𝑗=1
(14)
where 𝑅𝑅𝑡𝑡+𝑗𝑗𝑓𝑓(1) denotes the 1-period net return on a riskless asset and 𝑅𝑅𝑡𝑡+𝑗𝑗
𝑒𝑒(1) denotes a vector of
1-period excess returns above the riskless return for the number of risky assets under
consideration.
By now, it should be clear how the asset allocation influences the benefit in our proposed
optimization problem (11): the asset allocation affects the portfolio return on plan assets, (14),
and, thus, future asset values in the pension plan. These are important components in the
determination of underfunding probabilities, (9), and recovery ratios, (10), which, in turn,
affect the funding spreads, (7). The funding spreads directly influence the return on benefits,
(13). These interactions are certainly more complex than those between the nearest
comparable relationship typically considered in the finance literature, namely that between the
asset allocation and the terminal value of assets at an investment horizon. But beneficiaries of
a defined benefit pension plan are not primarily concerned about the terminal value of plan
assets. They are concerned that the promised benefit will be paid off in full during their
retirement and this will only happen with certainty if funding risk is eliminated. In this case,
funding spreads become zero and the liability of the pension plan and its sponsor equals the
benefit promised to the members. Since it is possible that the current total funding ratio of the

17
pension plan is insufficient to completely eliminate the funding risk, funding risk should be
minimized. This is precisely the objective of our optimization problem (11).
Deriving the Funding-Risk Premium
We delayed the derivation of the funding-risk premium, (6), until this point, because it does
not significantly contribute to the understanding of the value function, (11). We propose a
simplified form for the funding-risk premium which is easy to calculate for pension plan
sponsors and which depends on only one additional parameter.10 This new parameter needs to
be set by an organization independent of the sponsor, such as the pension regulator.
From (7), it is clear that we need the funding-risk premium, 𝜃𝜃𝑡𝑡𝐷𝐷, in addition to the
underfunding probability, 𝜋𝜋𝑡𝑡𝐷𝐷, and recovery ratio, 𝜆𝜆𝑡𝑡𝐷𝐷, in order to calculate the current funding
spread, 𝛿𝛿𝑡𝑡𝐷𝐷. The funding spread is determined by the specification of the stochastic discount
factor. Since we only need two states of the world for the derivation of the expected payoff in
(4), namely those of overfunding and underfunding, we can simplify the derivation of the
funding-risk premium by similarly decomposing the expected stochastic discount factor
𝐸𝐸𝑡𝑡[𝑀𝑀𝑡𝑡+𝑚𝑚] = (1 − 𝜋𝜋𝑡𝑡𝑚𝑚)𝑀𝑀𝑡𝑡+𝑚𝑚𝑜𝑜 + 𝜋𝜋𝑡𝑡𝑚𝑚𝑀𝑀𝑡𝑡+𝑚𝑚
𝑢𝑢 , where 𝑀𝑀𝑡𝑡+𝑚𝑚𝑜𝑜 and 𝑀𝑀𝑡𝑡+𝑚𝑚
𝑢𝑢 are the stochastic discount
factors in the states of over- and underfunding, respectively. Equation (2) then becomes
𝑃𝑃𝑡𝑡𝐷𝐷 = 𝐸𝐸𝑡𝑡[𝑀𝑀𝑡𝑡+𝐷𝐷Payoff𝑡𝑡+𝐷𝐷] = (1 − 𝜋𝜋𝑡𝑡𝐷𝐷)𝑀𝑀𝑡𝑡+𝐷𝐷𝑜𝑜 𝐸𝐸 + 𝜋𝜋𝑡𝑡𝐷𝐷𝑀𝑀𝑡𝑡+𝐷𝐷
𝑢𝑢 𝜆𝜆𝑡𝑡𝐷𝐷𝐸𝐸 for 𝑚𝑚 = 𝐷𝐷. By equating this
expression to the first expression in (5), we obtain
(1 + 𝜃𝜃𝑡𝑡𝐷𝐷)−𝐷𝐷 =(1 − 𝜋𝜋𝑡𝑡𝐷𝐷)
[1 − 𝜋𝜋𝑡𝑡𝐷𝐷 + 𝜋𝜋𝑡𝑡𝐷𝐷𝜆𝜆𝑡𝑡𝐷𝐷]𝑀𝑀𝑡𝑡+𝐷𝐷𝑜𝑜
𝐸𝐸𝑡𝑡[𝑀𝑀𝑡𝑡+𝐷𝐷] +𝜋𝜋𝑡𝑡𝐷𝐷𝜆𝜆𝑡𝑡𝐷𝐷
[1 − 𝜋𝜋𝑡𝑡𝐷𝐷 + 𝜋𝜋𝑡𝑡𝐷𝐷𝜆𝜆𝑡𝑡𝐷𝐷]𝑀𝑀𝑡𝑡+𝐷𝐷𝑢𝑢
𝐸𝐸𝑡𝑡[𝑀𝑀𝑡𝑡+𝐷𝐷]. (15)
The funding-risk premium is now completely determined by 𝜋𝜋𝑡𝑡𝐷𝐷, 𝜆𝜆𝑡𝑡𝐷𝐷 and the ratios of the
stochastic discount factors in the states of over- and underfunding to the expected stochastic
10 In the corporate bond pricing literature it is sometimes assumed that the risk premium is proportional to the
short spread, 𝛿𝛿𝑡𝑡1 (Das and Sundaram, 2000) where the proportionality factor is an additional parameter.

18
discount factor. Since we are valuing benefits from the viewpoint of members of a pension
plan, a consumption-based asset pricing model (see, e.g. Cochrane, 2001) with power utility
seems an appropriate choice. In this case, 𝑀𝑀𝑡𝑡+𝐷𝐷ℎ𝑜𝑜 and 𝑀𝑀𝑡𝑡+𝐷𝐷ℎ
𝑢𝑢 can be defined exogenously as
𝑀𝑀𝑡𝑡+𝐷𝐷𝑜𝑜 = 𝛽𝛽𝐷𝐷 �
𝐶𝐶𝑡𝑡+𝐷𝐷𝑜𝑜
𝐶𝐶𝑡𝑡�−𝛾𝛾
= 𝛽𝛽𝐷𝐷(𝑙𝑙𝑡𝑡+𝐷𝐷𝑜𝑜 )−𝛾𝛾
𝑀𝑀𝑡𝑡+𝐷𝐷𝑢𝑢 = 𝛽𝛽𝐷𝐷 �
𝐶𝐶𝑡𝑡+𝐷𝐷𝑢𝑢
𝐶𝐶𝑡𝑡�−𝛾𝛾
= 𝛽𝛽𝐷𝐷(𝑙𝑙𝑡𝑡+𝐷𝐷𝑢𝑢 )−𝛾𝛾
(16)
(17)
where 𝑙𝑙𝑡𝑡+𝐷𝐷𝑜𝑜 = 𝐶𝐶𝑡𝑡+𝐷𝐷𝑜𝑜 /𝐶𝐶𝑡𝑡 and 𝑙𝑙𝑡𝑡+𝐷𝐷𝑢𝑢 = 𝐶𝐶𝑡𝑡+𝐷𝐷𝑢𝑢 /𝐶𝐶𝑡𝑡 measure consumption growth in the states of
over- and underfunding (corresponding to states of boom and slump, respectively), 𝛽𝛽 denotes
the subjective time-discount factor, and 𝛾𝛾, the coefficient of relative risk aversion for the
representative investor in the economy.
The funding-risk premium, (15), is positive if 𝑀𝑀𝑡𝑡+𝐷𝐷𝑢𝑢 > 𝑀𝑀𝑡𝑡+𝐷𝐷
𝑜𝑜 which happens when 𝑙𝑙𝑡𝑡+𝐷𝐷𝑜𝑜 >
𝑙𝑙𝑡𝑡+𝐷𝐷𝑢𝑢 . This is likely to be the case when overfunding corresponds to a state of high asset
values and the representative investor in the economy invests in the same asset classes as the
pension plan and increases his consumption when his wealth is high. Given (16) and (17), the
remaining components of (15) follow as
𝑀𝑀𝑡𝑡+𝐷𝐷𝑜𝑜
𝐸𝐸𝑡𝑡[𝑀𝑀𝑡𝑡+𝐷𝐷] =(𝑙𝑙𝑡𝑡+𝐷𝐷𝑜𝑜 )−𝛾𝛾
(1 − 𝜋𝜋𝑡𝑡𝐷𝐷)(𝑙𝑙𝑡𝑡+𝐷𝐷𝑜𝑜 )−𝛾𝛾 + 𝜋𝜋𝑡𝑡𝐷𝐷(𝑙𝑙𝑡𝑡+𝐷𝐷𝑢𝑢 )−𝛾𝛾 = [1 − 𝜋𝜋𝑡𝑡𝐷𝐷 + 𝜋𝜋𝑡𝑡𝐷𝐷𝜙𝜙𝛾𝛾]−1
𝑀𝑀𝑡𝑡+𝐷𝐷𝑢𝑢
𝐸𝐸𝑡𝑡[𝑀𝑀𝑡𝑡+𝐷𝐷] =(𝑙𝑙𝑡𝑡+𝐷𝐷𝑢𝑢 )−𝛾𝛾
(1 − 𝜋𝜋𝑡𝑡𝐷𝐷)(𝑙𝑙𝑡𝑡+𝐷𝐷𝑜𝑜 )−𝛾𝛾 + 𝜋𝜋𝑡𝑡𝐷𝐷(𝑙𝑙𝑡𝑡+𝐷𝐷𝑢𝑢 )−𝛾𝛾 = [(1 − 𝜋𝜋𝑡𝑡𝐷𝐷)𝜙𝜙−𝛾𝛾 + 𝜋𝜋𝑡𝑡𝐷𝐷]−1
(18)
(19)
where 𝜙𝜙 = 𝑙𝑙𝑡𝑡+𝐷𝐷𝑜𝑜 /𝑙𝑙𝑡𝑡+𝐷𝐷𝑢𝑢 denotes the relative consumption growth which we set to a constant
larger than unity. This parameter only affects the funding-risk premium which itself is a
quantitatively unimportant component of the funding spread (7). For practical applications of
our model, 𝜙𝜙 could be set by the pension regulator or the financial accounting standards board
within the rules governing the valuation of pension obligations.

19
It is useful to derive some comparative statics results from (15) for 𝜃𝜃𝑡𝑡𝐷𝐷. First, we can see
that 𝜃𝜃𝑡𝑡𝐷𝐷 is zero, whenever 𝜋𝜋𝑡𝑡𝐷𝐷 = 0 or 𝜋𝜋𝑡𝑡𝐷𝐷 = 1. Hence, if one of the two possible states of the
world occurs with certainty, the funding-risk premium is zero, whether or not this state is
favorable or unfavorable for the pension plan member. For conditional underfunding
probabilities between the two extreme outcomes, 0 < 𝜋𝜋𝑡𝑡𝐷𝐷 < 1, we can show (after some
straightforward but tedious calculations) that the funding-risk premium increases with an
increasing underfunding probability (for given maturity, 𝐷𝐷, and recovery fraction, 𝜆𝜆𝑡𝑡𝐷𝐷) when
𝜙𝜙−𝛾𝛾 > 𝜆𝜆𝑡𝑡𝐷𝐷(𝜋𝜋𝑡𝑡𝐷𝐷)2(1 − 𝜋𝜋𝑡𝑡𝐷𝐷)2. The premium decreases with an increasing underfunding
probability when this inequality is reversed. In the case of maximum uncertainty about the
future state of the world, 𝜙𝜙−𝛾𝛾 = 𝜆𝜆𝑡𝑡𝐷𝐷(𝜋𝜋𝑡𝑡𝐷𝐷)2(1 − 𝜋𝜋𝑡𝑡𝐷𝐷)2, pension plan members will demand the
highest risk premium. The funding-risk premium decreases with increasing maturity, 𝐷𝐷, and
recovery fraction, 𝜆𝜆𝑡𝑡𝐷𝐷, and becomes zero for 𝜆𝜆𝑡𝑡𝐷𝐷 = 1. All comparative statics results therefore
conform with a priori expectations.
Solving the Optimization Problem
The asset-liability modeling problem, (11), cannot be solved analytically. To solve this
problem, we use a simulation method which was developed by Longstaff and Schwartz
(2001) and applied to dynamic portfolio choice problems by Longstaff (2001) and Brandt et
al. (2005). This requires us to generate a large number of future scenarios for all the state and
return variables of interest for which we use a vector autoregressive equation system. The
dynamic programming problem is then solved backwards by replacing conditional
expectations with estimates obtained from cross-scenario regressions of the variables of
interest on lagged state variables. At every rebalancing date, we use a grid search over the

20
possible space of asset allocations (excluding short sales as noted before) with a step size of
5%. The Appendix provides the details of the solution technique.
APPLICATION: GENERAL MOTORS
We apply our proposed asset-liability framework to the specific example of the General
Motors U.S. pension plan in December 2002.
The General Motors U.S. Pension Plan in December 2002
The proposed asset-liability model will generate the most interesting results for corporate
defined benefit plans in financial distress as measured by a low total funding ratio. If the total
funding ratio is well above unity, funding spreads reduce to zero and – as we will show below
– the optimal asset allocation becomes a liability hedging portfolio.11
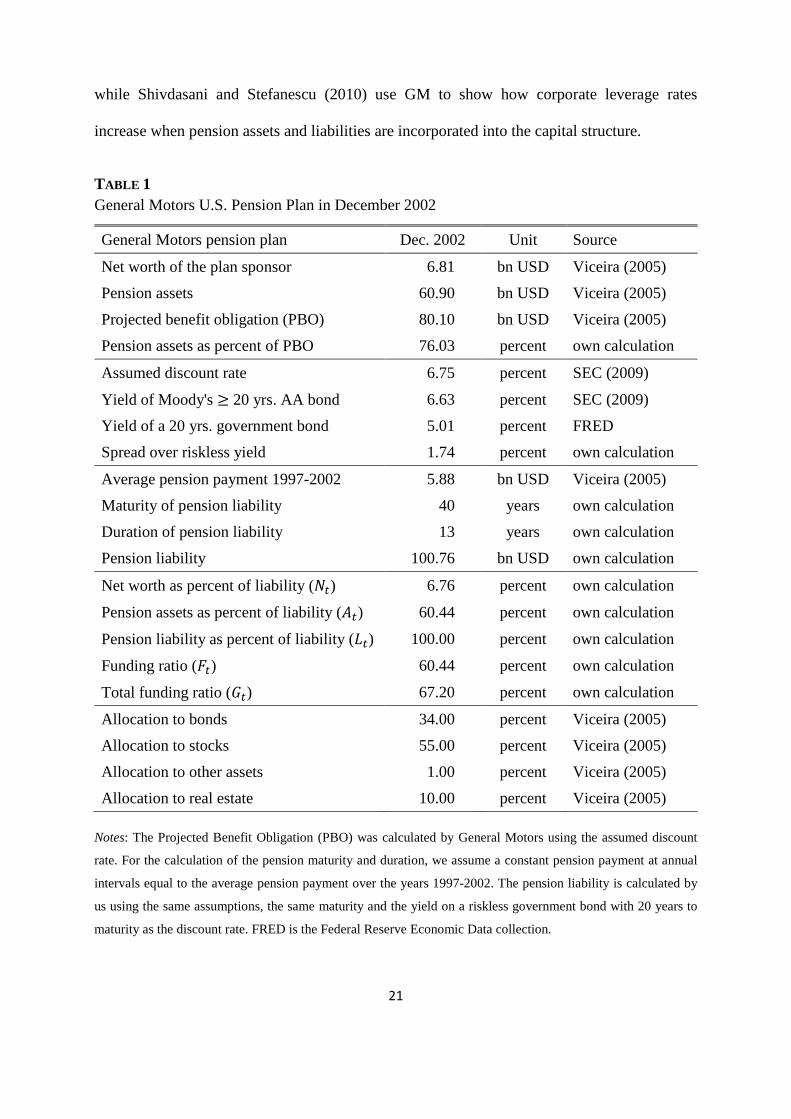
Correspondingly, we focus on a pension plan in deep financial distress. In 2002, General
Motors (GM) had the largest pension plan of any U.S. company (SEC, 2009). Table 1
summarizes key indicators of the GM plan. In December 2002, the PBO amounted to 80.1 bn
USD. The pension plan assets were only 60.9 bn USD, which is 76% of the PBO. The net
worth of GM was 6.8 bn USD and therefore insufficient to eliminate the funding gap between
assets and PBO. Given these statistics, the GM pension plan was clearly in financial distress
in December 2002. GM employees had every reason to be concerned that they would not
receive their promised pension payments in full when they retired. This concern was reflected
in a huge amount of press coverage at the time which focused on the funding gap caused by a
combination of both falling stock markets and interest rates in 2002. Academics also found
interest in the GM case. Viceira (2005) presents a case study about the GM pension plan,
11 This consists of an investment in assets which provide returns that are as highly as possible correlated with the
pension liability return.
21
while Shivdasani and Stefanescu (2010) use GM to show how corporate leverage rates
increase when pension assets and liabilities are incorporated into the capital structure.
TABLE 1 General Motors U.S. Pension Plan in December 2002
General Motors pension plan Dec. 2002 Unit Source
Net worth of the plan sponsor 6.81 bn USD Viceira (2005)
Pension assets 60.90 bn USD Viceira (2005)
Projected benefit obligation (PBO) 80.10 bn USD Viceira (2005)
Pension assets as percent of PBO 76.03 percent own calculation
Assumed discount rate 6.75 percent SEC (2009)
Yield of Moody's ≥ 20 yrs. AA bond 6.63 percent SEC (2009)
Yield of a 20 yrs. government bond 5.01 percent FRED
Spread over riskless yield 1.74 percent own calculation
Average pension payment 1997-2002 5.88 bn USD Viceira (2005)
Maturity of pension liability 40 years own calculation
Duration of pension liability 13 years own calculation
Pension liability 100.76 bn USD own calculation
Net worth as percent of liability (𝑁𝑁𝑡𝑡) 6.76 percent own calculation
Pension assets as percent of liability (𝐴𝐴𝑡𝑡) 60.44 percent own calculation
Pension liability as percent of liability (𝐿𝐿𝑡𝑡) 100.00 percent own calculation
Funding ratio (𝐹𝐹𝑡𝑡) 60.44 percent own calculation
Total funding ratio (𝐺𝐺𝑡𝑡) 67.20 percent own calculation
Allocation to bonds 34.00 percent Viceira (2005)
Allocation to stocks 55.00 percent Viceira (2005)
Allocation to other assets 1.00 percent Viceira (2005)
Allocation to real estate 10.00 percent Viceira (2005) Notes: The Projected Benefit Obligation (PBO) was calculated by General Motors using the assumed discount
rate. For the calculation of the pension maturity and duration, we assume a constant pension payment at annual
intervals equal to the average pension payment over the years 1997-2002. The pension liability is calculated by
us using the same assumptions, the same maturity and the yield on a riskless government bond with 20 years to
maturity as the discount rate. FRED is the Federal Reserve Economic Data collection.

22
The PBO is calculated as the present value of future nominal pension payments evaluated
at a discount rate chosen by the sponsor within the limits set by the accounting statement No.
87 concerning “Employers’ Accounting for Pensions” published by the U.S. Financial
Accounting Standards Board (FASB). The statement requires that “assumed discount rates
shall reflect the rates at which the pension benefits could be effectively settled.” FAS87
allows the company “to look to rates of return of high-quality fixed income investments
currently available and expected to be available during the period to maturity of the pension
benefits.” In practice, sponsoring companies at the time often used the average yield to
maturity on long-term corporate bonds with a Moody’s AA rating (Coronado and Sharpe,
2003).
We are able to gain an unusually deep insight into how the discount rate was set within
GM in 2002 from SEC (2009). This document is a litigation report for a complaint issued by
the Securities and Exchange Commission about misstatements concerning the disclosure of
critical pension accounting estimates in GM’s 2002 10-K filings. In respect of the discount
rate, the SEC complained that GM proposed using a term structure of yields on high-quality
corporate bonds to value the PBO in a conference call with analysts and the press in August
2002, but instead used a single yield from Moody’s AA-rated index for the 10-K filings
submitted in March 2003. The duration-matched discount rate implied by the yield curve was
6.0% at the end of December 2002, while the Moody’s index generated a 6.63% yield which,
according to SEC (2009), was adjusted by GM to a 6.75% discount rate based on a survey
about pension accounting assumptions among U.S. companies. This is clearly a good example
of the discretionary freedom that companies have in the determination of pension liability
discount rates, which we criticized in the introduction of this paper.
Moody’s AA index measures the average yield on AA-rated bonds with maturities of 20
years and above. At the end of 2002, the yield on a riskless government bond with a 20-year

23
maturity was 5.01%. Thus, the spread implied by the discount rate used by GM was 1.74%.
For our asset-liability model, we need to compute the liability as the present discounted value
of all future promised pension payments, discounted with the yield on a riskless bond of
appropriate duration, 5.01% in the present case. While this liability value is not published by
GM, we can nevertheless estimate it from the PBO and the average pension payments of GM
throughout the years 1997-2002 which equal 5.88 bn USD (calculated from Viceira, 2005). If
we assume a constant annual pension payment of this amount, the size of the PBO is
consistent with a maturity value of 40 years.12 This corresponds to a duration of the liability
of 13 years. Using the riskless yield of 5.01%, we estimate a liability value of 100.8 bn USD.
Hence, the PBO understates the present value of promised pension payments by about 20%.
The current funding ratio of GM in 2002 was 𝐹𝐹𝑡𝑡 = 60% and the total funding ratio (including
the net worth of GM) was 𝐺𝐺𝑡𝑡 = 67%. While these figures are adequate for our purposes, GM
would have been in a position to calculate them more precisely. We also conduct comparative
statics exercises to see how our results change when we alter the observed funding ratio.
Table 1 summarizes the various discount rates and associated liability values. The table
also contains information on the asset allocation adopted by the GM pension plan at the end
of 2002. The plan had an allocation of 55% in stocks, 34% in bonds and 10% in real estate.
We can compare this asset allocation and the selected spread of 1.74% above the yield on a
riskless bond with the optimal asset allocation and funding spread derived from our model, in
order to see how well the beneficiaries’ interests are represented by the actions of GM.
12 Only GM know how their pension payments evolve over time to maturity. The maturity of 40 years that we
estimate probably understates the true maturity of the GM pension liabilities, because pension payments for the
current stock of employees are likely to decrease over time. Our assumption of a constant stream of pension
payments, while consistent with the simplifying assumption made in the model above, should be treated as a first
approximation.

24
Data and Estimated Return Dynamics
Following Campbell et al. (2003), van Binsbergen and Brandt (2009), Hoevenaars et al.
(2008) and many others, we model the log return dynamics with a vector autoregressive
equation system with one lag. We include the asset classes – cash, bonds and stocks – that are
standard in the dynamic portfolio choice literature (e.g. Campbell et al. (2003), and van
Binsbergen and Brandt, 2009). Although GM had a small allocation to real estate in 2002,
Hoevenaars et al. (2008) show that (listed) real estate plays a negligible role in optimal
portfolios derived from a dynamic asset-liability model, so we merge real estate with stocks in
what follows. We use the nominal 3-month Treasury bill rate obtained from FRED (Federal
Reserve Economic Data, item TBM3) for cash, the return on a portfolio of government bonds
with maturities of between 5 and 10 years from CRSP (Center for Research in Security Prices,
item le_120) for bonds, and the value-weighted CRSP stock market index including
distributions (CRSP item vwretd) for stocks.
We use the return on equity to proxy the return on the net worth of the sponsoring
company. The return on equity refers to the ratio of net income to stockholder’s equity for
GM. Both variables are obtained from Compustat (items NIQ and SEQQ).
Consistent with GM’s own practice, we model liability returns using yields on a 20-year
constant maturity bond obtained from FRED (item TCMNOMY20).13 As in Hoevenaars et al.
(2008), we use the log-linear approximation suggested by Campbell et al. (1997) to model the
log return on liabilities (𝑠𝑠𝑡𝑡+1) from log yields (𝑦𝑦𝑡𝑡, 𝑦𝑦𝑡𝑡+1) as 𝑠𝑠𝑡𝑡+1 = 0.25𝑦𝑦𝑡𝑡+1 − 𝐷𝐷(𝑦𝑦𝑡𝑡+1 − 𝑦𝑦𝑡𝑡)
13 This time series has missing observations between January 1987 – September 1993. We replace these missing
values with forecasts from a linear regression of 20-year maturity yields on 10- and 30-year maturity yields
(FRED items TCMNOMY10 and TCMNOMY30) using monthly data between February 1977 – December 1986
and October 1993 – May 2009.

25
where 𝐷𝐷 is the constant duration of liabilities. The factor 0.25 results from using quarterly
data but annual yields. We set 𝐷𝐷 = 13 to approximate the duration of GM’s pension liability.
Our choice of state variables is guided by the literature on return predictability (e.g. Chen
et al., 1986) and dynamic asset allocation (e.g. Campbell et al., 2003). We employ the log
dividend-price ratio, the log term spread and the log credit spread as state variables. The log
dividend-price ratio is defined as the difference between the log cumulative one-year
distributions on the value-weighted CRSP stock market index and the corresponding log price
index (CRSP item vwindx), the log term spread is the difference between the log yield of a 5-
year zero-coupon bond obtained from the CRSP Fama-Bliss dataset (CRSP item yield5) and
the log nominal T-bill rate, the log credit spread is the difference between the log yields of
Moody’s BAA- and AAA-rated corporate bonds (FRED items BAANA and AAANA).
The final sample comprises quarterly data from 1970.II - 2002.IV. 1970.II is the first
quarter for which we observe the return on equity for GM, 2002.IV is the period in which we
conduct the asset-liability modeling study for GM. Descriptive statistics for all variables are
shown in Table 2.
Over our sample period, GM achieved an average return on equity of 15.2% per year. The
average nominal T-bill rate was 6.4% and the average bond and stock excess returns were
2.7% and 5.7%, respectively. The average liability return was 9.7%. The constructed bond
return series is highly correlated with the constructed liability return series with a correlation
coefficient of 0.71. Stock returns have a positive correlation (0.31) with liability returns while
cash returns have a negative correlation (-0.18).
Table 3 shows the estimation results. Like Campbell et al. (2003), Hoevenaars et al.
(2008), and many other studies, we find evidence for mean reversion in log stock excess
returns caused by the log dividend-yield.

26
TABLE 2 Descriptive Statistics
Mean Standard deviation
Sharpe ratio
Correlation with liability
Nominal T-bill return 0.0635 0.0134 0.0000 -0.1764
Bond excess return 0.0270 0.0793 0.3398 0.7136
Stock excess return 0.0572 0.1970 0.2903 0.3071
Return on equity 0.1515 0.1071 0.8224 -0.1462
Liability return 0.0972 0.1331 0.2533 1.0000
Log dividend-price ratio -3.5247 0.4281
Log term spread 0.0117 0.0105
Log credit spread 0.0100 0.0037 Notes: The moments of the returns are annualized and are generated by appropriately adjusting the moments for
the underlying log returns. The Sharpe ratio is the mean excess return over the nominal T-bill return divided by
the standard deviation of the return. The statistics are calculated from quarterly U.S. data from 1970.II-2002.IV.
1970.II is the first quarter for which we observe the return on equity for General Motors. 2002.IV is the period in
which we conduct the asset-liability modeling study for General Motors.
Optimization Results
Table 4 shows the optimization results of the asset-liability management study for GM in
December 2002 for the representative investor’s coefficient of relative risk aversion, 𝛾𝛾, lying
between 1 and 9. The first panel of the table summarizes the input parameters. As discussed
before, we set the duration of the pension liability, 𝐷𝐷, to 13 years. The investment horizon, 𝐽𝐽,
equals the liability duration. Corresponding to annual rebalancing and quarterly data, we set
ℎ = 4. We assume that relative consumption growth, 𝜙𝜙, is 1.5. 14
14 To put this into perspective, the ratio of the 66th to the 33rd percentile of monthly real personal consumption
expenditures over the period January 1959 – December 2002 was about 1.5 according to Table 2.8.5 of the
National Income and Product Accounts (NIPA), adjusted with the PCEPI price index from FRED.

27
TABLE 3 Vector Autoregression Estimation Results
Tbill BXR SXR RoE Liab DP Term Def Cons R2
Tbill 0.95 -0.01 0.01 0.01 0.00 0.00 0.00 -0.02 0.00 0.91 t-val. 18.3 -2.35 2.58 1.49 -0.13 1.54 0.60 -1.15 1.55 (0.00) BXR 2.67 -0.13 -0.07 -0.12 0.08 -0.02 0.63 -0.42 -0.12 0.17 t-val. 2.73 -1.13 -2.00 -1.64 1.02 -2.08 4.38 -1.04 -2.34 (0.00) SXR -2.47 0.23 -0.07 0.02 0.21 0.05 -0.07 0.37 0.21 0.09 t-val. -1.04 0.81 -0.77 0.09 1.10 1.91 -0.20 0.38 1.71 (0.15) RoE -1.55 -0.16 -0.01 0.43 0.11 0.00 -0.05 0.03 0.04 0.24 t-val. -1.37 -1.21 -0.26 5.09 1.24 0.04 -0.29 0.07 0.77 (0.00) Liab 4.78 0.78 -0.10 -0.05 0.00 -0.03 0.79 -0.72 -0.15 0.31 t-val. 3.43 4.66 -2.01 -0.50 0.03 -1.67 3.86 -1.25 -2.08 (0.00) DP 1.10 -0.18 0.08 0.05 -0.24 0.98 0.01 -0.27 -0.09 0.96 t-val. 0.48 -0.65 0.96 0.29 -1.35 39.4 0.02 -0.29 -0.77 (0.00) Term -0.62 0.02 -0.02 -0.02 0.03 0.00 0.74 0.48 0.00 0.71 t-val. -1.32 0.31 -0.95 -0.60 0.69 -0.06 10.8 2.46 0.15 (0.00) Def 0.17 -0.01 -0.02 -0.01 -0.01 0.00 0.00 0.87 0.00 0.86 t-val. 1.43 -0.90 -3.77 -1.58 -0.85 0.36 -0.22 17.7 0.68 (0.00) Residual correlation matrix (volatilities in main diagonal)
Tbill 0.19 BXR -0.61 3.51 SXR -0.22 0.22 8.53 RoE 0.09 -0.16 0.18 4.04 Liab -0.62 0.82 0.27 -0.09 5.02 DP 0.21 -0.20 -0.98 -0.15 -0.24 8.21 Term -0.71 -0.04 0.09 0.02 -0.02 -0.09 1.68 Def -0.32 0.37 0.23 -0.04 0.41 -0.23 0.08 0.42
Notes: The estimation is based on quarterly U.S. data from 1970.II - 2002.IV. 1970.II is the first quarter for
which we observe the return on equity for General Motors. 2002.IV is the period in which we conduct the asset-
liability modeling study for General Motors. Tbill denotes the nominal log Treasury bill rate, BXR the log bond
excess return, SXR the log stock excess return, RoE the return on equity for General Motors, Liab the log
liability return, DP the log dividend-price ratio, Term the log term spread, Def the log credit spread and Cons the
intercept. Numbers in parentheses are p-values. The maximum eigenvalue of the slope matrix is 0.9781.

28
TABLE 4 Optimization Results when Varying the Coefficient of Relative Risk Aversion
1) Input: parameters
Relative risk aversion (𝛾𝛾) 1 3 5 7 9
Relative consumption growth (𝜙𝜙) 1.5 1.5 1.5 1.5 1.5
Investment horizon (𝐽𝐽) in years 13 13 13 13 13
Liability duration (𝐷𝐷) in years 13 13 13 13 13
2) Input: observed assets and liabilities
Net worth of the sponsor (𝑁𝑁𝑡𝑡) 0.07 0.07 0.07 0.07 0.07
Pension assets (𝐴𝐴𝑡𝑡) 0.60 0.60 0.60 0.60 0.60
Pension liability (𝐿𝐿𝑡𝑡) 1.00 1.00 1.00 1.00 1.00
Funding ratio (𝐹𝐹𝑡𝑡) 0.60 0.60 0.60 0.60 0.60
Total funding ratio (𝐺𝐺𝑡𝑡) 0.67 0.67 0.67 0.67 0.67
3) Output: optimal asset allocation
Allocation to cash (1 − 𝑤𝑤𝑡𝑡′12) 0.00 0.00 0.00 0.00 0.00
Allocation to bonds (𝑤𝑤𝑡𝑡,1) 0.32 0.46 0.56 0.62 0.64
Allocation to stocks (𝑤𝑤𝑡𝑡,2) 0.68 0.54 0.44 0.38 0.36
4) Output: optimal benefit valuation
Exp. total fund. ratio (𝐸𝐸𝑡𝑡[𝐺𝐺𝑡𝑡+𝐷𝐷]) 0.9484 0.9328 0.9218 0.9152 0.9129
Underfunding probability (𝜋𝜋𝑡𝑡𝐷𝐷) 0.6300 0.6555 0.6747 0.6865 0.6904
Recovery ratio (𝜆𝜆𝑡𝑡𝐷𝐷) 0.7908 0.7937 0.7944 0.7942 0.7941
Funding-risk premium (𝜃𝜃𝑡𝑡𝐷𝐷) 1.0017 1.0040 1.0051 1.0055 1.0057
Funding spread (𝛿𝛿𝑡𝑡𝐷𝐷) 1.0126 1.0152 1.0167 1.0174 1.0177
Pension benefit (𝐵𝐵𝑡𝑡) 0.8496 0.8215 0.8067 0.7996 0.7964 Notes: Input and output refers to required input to and resulting output from the asset-liability modeling study.
We assume annual pension payment and rebalancing intervals.
The second panel of Table 4 contains information on the observed (December 2002)
funding situation of the GM pension fund expressed in percent of the liability value, 𝐿𝐿𝑡𝑡. We
can normalize the liability value to unity, since only the ratio of assets to liabilities is relevant
for the outcome of the optimization exercise. The funding ratio is 𝐹𝐹𝑡𝑡 = 0.60 and the total

29
funding ratio (including the net worth of the sponsor) 𝐺𝐺𝑡𝑡 = 0.67. The third and fourth panels
of Table 4 contain the optimization results. Panel 3 summarizes the optimal asset allocation,
while panel 4 displays relevant information on the funding spread, its components and the
implied pension benefit value.
All optimizations in this and the following tables generate a zero allocation to cash. This is
not too surprising, since we are dealing with a long-run asset-liability model. The riskless
asset in this context is not cash, but a liability hedging portfolio. Due to the negative
correlation between the returns on cash and liabilities, cash is not part of the liability hedging
portfolio. The allocation to stocks decreases from 68% for 𝛾𝛾 = 1 to 36% for 𝛾𝛾 = 9. If we
aggregate GM’s observed allocation to real estate with stocks, we find an allocation to risky
assets of 65%. In our framework, such a portfolio only would be optimal for very low degrees
of risk aversion close to unity.
The underfunding probabilities increase from 𝜋𝜋𝑡𝑡 = 63% to 𝜋𝜋𝑡𝑡 = 69% when 𝛾𝛾 increases
from 1 to 9. This is because lower allocations to stocks increase underfunding probabilities,
since stocks have higher expected returns than other assets and also exhibit long-run mean
reversion. Recovery ratios first increase from 𝜆𝜆𝑡𝑡 = 79.08% to 𝜆𝜆𝑡𝑡 = 79.44% when 𝛾𝛾 increases
from 1 to 5 and then slightly decrease to 𝜆𝜆𝑡𝑡 = 79.41% for 𝛾𝛾 = 9. Recall that the recovery
ratio is the conditionally expected total funding ratio, given that the latter falls below unity.
This conditional expectation is not monotonically increasing in the allocation to stocks. The
conditional expectation of the total funding ratio is also shown in panel 4 of Table 4 and
decreases from 𝐸𝐸𝑡𝑡[𝐺𝐺𝑡𝑡+𝐷𝐷ℎ] = 95% to 𝐸𝐸𝑡𝑡[𝐺𝐺𝑡𝑡+𝐷𝐷ℎ] = 91% when 𝛾𝛾 increases from 1 to 9. The
annualized funding-risk premium, 𝜃𝜃𝑡𝑡𝐷𝐷, increases from 0.17% to 0.57%, confirming the
increase in funding risk as the optimal asset allocation moves from aggressive to conservative.

30
In summary, these results imply an annualized funding spread, 𝛿𝛿𝑡𝑡𝐷𝐷, of between 1.26% for
𝛾𝛾 = 1 and 1.77% for 𝛾𝛾 = 9. A plan member with a low degree of risk aversion will choose a
lower discount rate than a more risk-averse member. This will then be reflected in the benefit
value which decreases from 𝐵𝐵𝑡𝑡 = 85% to 𝐵𝐵𝑡𝑡 = 79.6% when 𝛾𝛾 increases from 1 to 9. Bearing
in mind that 𝐵𝐵𝑡𝑡 is a measure of expected pension wealth, a difference of the order of 5.4
percentage points is economically significant. This illustrates our main result: given GM’s
funding ability in December 2002, plan members could reasonably anticipate that the
effective value of their pension payments (𝐵𝐵𝑡𝑡) was only around 80-85% of their promised
pension payments (𝐿𝐿𝑡𝑡). It would have been sensible of them to have adjusted their
consumption and savings behavior to compensate for this expected loss in retirement benefits.
It is interesting to compare the optimized asset allocation and benefit valuation outcomes
with the actual portfolio and discount rate chosen by GM in December 2002. Recall that GM
allocated about 65% of the pension assets to risky assets (real estate and stocks) and 35% to
bonds. At the same time, the company chose a discount rate which implied a spread of 1.74%
over the yield on a government bond. Most interestingly, our asset-liability model generates
exactly the same spread when 𝛾𝛾 = 7. Our model could therefore be used to justify the
assumed discount rate for the calculation of the PBO if there is reason to believe that the
representative investor is highly risk averse. However, the optimal asset allocation consistent
with this funding spread implies an allocation of 62% to bonds and 38% to stocks. With 65%
of its pension assets allocated to risky assets, GM chose a strategic asset allocation which was
much too risky for the presumed preferences of the representative plan member. Such
inconsistencies are avoided in our proposed asset-liability model, because the optimal
strategic asset allocation and optimal discount rate are determined simultaneously.
Comparative Statics

31
We will now use 𝛾𝛾 = 5 in Table 4 as a benchmark for a comparative statics exercise in Table
5. We will depart from the observed funding ratio describing the GM pension plan in
December 2002 to obtain further insights into the way our model operates.
TABLE 5 Optimization Results when Varying the Observed Funding Ratio
1) Input: parameters
Relative risk aversion (𝛾𝛾) 5 5 5 5 5
Relative consumption growth (𝜙𝜙) 1.5 1.5 1.5 1.5 1.5
Investment horizon (𝐽𝐽) in years 13 13 13 13 13
Liability duration (𝐷𝐷) in years 13 13 13 13 13
2) Input: observed assets and liabilities
Net worth of the sponsor (𝑁𝑁𝑡𝑡) 0.07 0.07 0.07 0.07 0.07
Pension assets (𝐴𝐴𝑡𝑡) 0.40 0.60 0.80 1.00 1.20
Pension liability (𝐿𝐿𝑡𝑡) 1.00 1.00 1.00 1.00 1.00
Funding ratio (𝐹𝐹𝑡𝑡) 0.40 0.60 0.80 1.00 1.20
Total funding ratio (𝐺𝐺𝑡𝑡) 0.47 0.67 0.87 1.07 1.27
3) Output: optimal asset allocation
Allocation to cash (1 − 𝑤𝑤𝑡𝑡′12) 0.00 0.00 0.00 0.00 0.00
Allocation to bonds (𝑤𝑤𝑡𝑡,1) 0.26 0.56 0.66 0.70 0.74
Allocation to stocks (𝑤𝑤𝑡𝑡,2) 0.74 0.44 0.34 0.30 0.26
4) Output: optimal benefit valuation
Exp. total fund. ratio (𝐸𝐸𝑡𝑡[𝐺𝐺𝑡𝑡+𝐷𝐷]) 0.7159 0.9218 1.1350 1.3519 1.5658
Underfunding probability (𝜋𝜋𝑡𝑡𝐷𝐷) 0.9015 0.6747 0.3322 0.1077 0.0262
Recovery ratio (𝜆𝜆𝑡𝑡𝐷𝐷) 0.6677 0.7944 0.8651 0.9020 0.9226
Funding-risk premium (𝜃𝜃𝑡𝑡𝐷𝐷) 1.0031 1.0051 1.0052 1.0029 1.0009
Funding spread (𝛿𝛿𝑡𝑡𝐷𝐷) 1.0310 1.0167 1.0087 1.0037 1.0010
Pension benefit (𝐵𝐵𝑡𝑡) 0.6724 0.8067 0.8933 0.9531 0.9869 Notes: Input and output refers to required input to and resulting output from the asset-liability modeling study.
We assume annual pension payment and rebalancing intervals.

32
The observed funding ratio is varied between 𝐹𝐹𝑡𝑡 = 0.4 and 𝐹𝐹𝑡𝑡 = 1.2 in Table 5. The results
suggest that a pension plan should optimally shift from an aggressive portfolio to a liability
hedging portfolio as the funding ratio increases from severe underfunding to overfunding. A
funding ratio of unity implies an optimal allocation of 70% to bonds, while 𝐹𝐹𝑡𝑡 = 0.4 implies
26% in bonds and 𝐹𝐹𝑡𝑡 = 1.2 implies 74% in bonds. Annualized funding spreads decrease
substantially from 3.1% to 0.1% over the same range of funding ratios. Correspondingly, the
benefit increases from 𝐵𝐵𝑡𝑡 = 67% to 𝐵𝐵𝑡𝑡 = 99%. At a funding ratio of 100%, the benefit still
falls short of the liability by about 4.7% because of the remaining funding risk over the
duration of the liability. Most pension plans had funding ratios in the range 𝐹𝐹𝑡𝑡𝜖𝜖[0.8,1.0] in the
adverse economic environment of 2002. For these pension plans, we derive optimal funding
spreads of between 0.87% and 0.37%. These spreads are much smaller than the yield spread
on AA-rated bonds of 1.62% (see Table 1).
Thus, the common practice of using a discount rate in line with the average yield on long-
term AA-rated bonds leads to PBO values for most pension plans which are much too small to
reflect the value of the benefits that plan members can realistically expect to achieve. As
already emphasized in the introduction, it violates a key principle in financial economics if
pension plans with different funding abilities use the same discount rate. The discount rate
should reflect the plan-specific funding risk.
Figure 1 shows the optimal allocation to stocks and the optimal funding spread for a larger
range of observed funding ratios between 𝐹𝐹𝑡𝑡 = 0.2 and 𝐹𝐹𝑡𝑡 = 2. It is readily apparent that as
the funding ratio increases, the funding spread converges to zero and the optimal portfolio
becomes the liability hedging portfolio. Nevertheless, the optimal portfolio continues to
include an allocation to stocks of about 20%, even for funding ratios above 1.6.

33
FIGURE 1 Allocation to Stocks and Funding Spreads for Different Observed Funding Ratios
Notes: The horizontal axis shows the observed funding ratio. The vertical axes denote the allocation to stocks on
the left-hand side and the funding spread on the right-hand side. Based on 𝛾𝛾 = 5,𝜙𝜙 = 1.5, 𝐽𝐽 = 13, and 𝐷𝐷 = 13.
FIGURE 2 Underfunding Probabilities and Recovery Ratios for Different Observed Funding Ratios
Notes: The horizontal axis shows the observed funding ratio. The vertical axes denote the underfunding
probability on the left-hand side and the recovery ratio on the right-hand side. Based on 𝛾𝛾 = 5,𝜙𝜙 = 1.5, 𝐽𝐽 = 13,
and 𝐷𝐷 = 13.
1.00
1.02
1.04
1.06
1.08
1.10
0.0
0.2
0.4
0.6
0.8
1.0
0.2 0.4 0.6 0.8 1.0 1.2 1.4 1.6 1.8 2.0
Stock allocation (left) Funding spread (right)
0.40
0.52
0.64
0.76
0.88
1.00
0.0
0.2
0.4
0.6
0.8
1.0
0.2 0.4 0.6 0.8 1.0 1.2 1.4 1.6 1.8 2.0
Underfunding probability (left) Recovery ratio (right)

34
Figure 2 shows that underfunding probabilities monotonically switch from unity to zero
over the same range of observed funding ratios, while recovery ratios move in the opposite
direction from near zero to unity.
CONCLUSIONS
In this paper, we propose a new approach to the valuation of the pension obligation of a
corporate defined benefit pension plan. We borrow from the literature on corporate bond
pricing and derive a discount rate which consists of the yield on a riskless government bond
plus a funding spread which depends on the ability of the plan sponsor to fund promised
future pension payments. The funding spread converges to zero with decreasing underfunding
probabilities and increasing recovery ratios. We view the pension fund as an integral part of
the company and merge the pension plan assets with the net worth of the sponsoring company
for the purpose of computing total funding ratios.
We demonstrate that the proposed discount rate depends on the chosen asset allocation
which influences future funding outcomes. To find an optimal discount rate, we propose an
optimal strategic asset allocation which optimizes funding spreads. Our aim is to reflect the
interests of the pension plan beneficiaries who care about the security of their future pensions.
The resulting asset-liability model leads simultaneously to an optimal strategic asset
allocation and an optimal valuation of the pension obligation which is consistent with the
asset allocation. This stands in marked contrast with current practice, in which the valuation
of liabilities and the allocation of pension assets are treated as separate tasks.
We argue that our approach has important advantages for all stakeholders of the corporate
pension plan. In particular, plan beneficiaries get a clearer picture of the current funding-risk-
adjusted value of their pension promise. If this turns out to be too low, they can optimally
adjust their savings behavior. Our approach also removes the discretion of the plan sponsor to

35
choose the discount rate in a strategic way, for example, to manipulate reported earnings.
Finally, our approach increases transparency for the sponsoring company and, especially, its
shareholders who are now better able to plan for future contributions into the pension plan
and to value the sponsoring company more accurately.
We applied our asset-liability model to the U.S. pension plan of General Motors in
December 2002. With a reported funding ratio of pension assets to projected benefit
obligations of 76%, the GM pension plan was in financial distress after a period of both
falling stock markets and interest rates. Our model implies that the beneficiaries of the GM
plan should have expected a reduction in their pension wealth of the order of 15-20%,
depending on the relative risk aversion of the representative pension plan member. We found
that the discount rate chosen by GM in December 2002 could be justified in our model only if
the representative investor is very risk averse. However, our model also implies a much more
conservative optimal asset allocation than the one chosen by GM.
Pension plans which are sufficiently well funded to reduce funding risk to a negligible
amount optimally choose an asset allocation in our framework which is close to a liability
hedging portfolio but which additionally includes a small allocation to stocks to help keep
future underfunding probabilities low as a result of the higher expected mean-reverting return
to stocks.
Finally, we note that the optimal discount rates implied by our model tend to be smaller
than those used by companies with moderate underfunding for calculating their projected
benefit obligations. The current practice of using the same discount rate for all pension plans
regardless of their individual funding abilities is misleading and carries no justification in
financial economics. A revision to the accounting standards that report the valuation of
corporate defined benefit obligations is a clear policy implication from our analysis.

36
APPENDIX: SIMULATION APPROACH
We use the simulation approach suggested by Brandt et al. (2005) to solve the dynamic
programming problem (11). We first generate a large number (5,000) of (𝐽𝐽 + 𝐷𝐷)-period
forecasts for all the variables of the vector autoregressive equation system presented in Table
3. We then solve the dynamic programming problem recursively for every rebalancing time,
𝑡𝑡 + 𝑗𝑗ℎ for 𝑗𝑗 = 𝐽𝐽 − 1, 𝐽𝐽 − 2, … ,0. At every rebalancing time, we evaluate the objective function
in every scenario for a grid of 61 possible funding ratios, 𝐹𝐹𝑡𝑡+𝑗𝑗ℎ , and 231 possible portfolios,
𝑤𝑤𝑡𝑡+𝑗𝑗, comprising all possible combinations of allocation to cash, bonds, and stocks in 2%
steps. From 𝐹𝐹𝑡𝑡+𝑗𝑗 we can calculate 𝐺𝐺𝑡𝑡+𝑗𝑗 and 𝑙𝑙𝑡𝑡+𝑗𝑗 = 𝑙𝑙𝑐𝑐𝑙𝑙𝐺𝐺𝑡𝑡+𝑗𝑗 in every scenario using the
return on the company’s net worth. For the calculation of the funding spread, 𝛿𝛿𝑡𝑡+𝑗𝑗𝐷𝐷 , we need
the future total funding ratio 𝐺𝐺𝑡𝑡+𝑗𝑗+𝐷𝐷 which is obtained for every 𝐹𝐹𝑡𝑡+𝑗𝑗 and 𝑤𝑤𝑡𝑡+𝑗𝑗 by projecting
the returns on liabilities, the net worth and the respective portfolio in every scenario. In line
with the requirements for dynamically consistent behavior emphasized by Cuoco et al. (2008),
the risk measure – value at risk in their case, the funding spread in our case – is dynamically
re-evaluated at every rebalancing time, 𝑡𝑡 + 𝑗𝑗, under the assumption that the asset allocation is
kept unchanged over the evaluation interval, 𝐷𝐷. Let 1 + 𝑅𝑅𝑡𝑡+𝑗𝑗+𝐷𝐷𝐺𝐺(𝐷𝐷) = 𝐺𝐺𝑡𝑡+𝑗𝑗+𝐷𝐷/𝐺𝐺𝑡𝑡+𝑗𝑗 denote the
gross return on the total funding ratio over the liability duration and 𝑃𝑃𝑡𝑡+𝑗𝑗+𝐷𝐷𝐺𝐺(𝐷𝐷) = 𝑙𝑙𝑐𝑐𝑙𝑙�1 +
𝑅𝑅𝑡𝑡+𝑗𝑗+𝐷𝐷𝐺𝐺(𝐷𝐷) �, the corresponding log return. Then we can compute the components
𝜋𝜋𝑡𝑡+𝑗𝑗𝐷𝐷 = 𝑃𝑃𝑃𝑃𝑐𝑐𝑏𝑏𝑡𝑡+𝑗𝑗�𝑙𝑙𝑡𝑡+𝑗𝑗 + 𝑃𝑃𝑡𝑡+𝑗𝑗+𝐷𝐷𝐺𝐺(𝐷𝐷) < 0� = Φ�
−𝑙𝑙𝑡𝑡+𝑗𝑗 − 𝐸𝐸𝑡𝑡+𝑗𝑗�𝑃𝑃𝑡𝑡+𝑗𝑗+𝐷𝐷𝐺𝐺(𝐷𝐷) �
𝑉𝑉𝑡𝑡+𝑗𝑗+𝐷𝐷0.5 �𝑃𝑃𝑡𝑡+𝑗𝑗+𝐷𝐷𝐺𝐺(𝐷𝐷) �
�
𝜆𝜆𝑡𝑡+𝑗𝑗𝐷𝐷 =1
𝜋𝜋𝑡𝑡+𝑗𝑗𝐷𝐷 𝑒𝑒𝑚𝑚𝑒𝑒 �𝑙𝑙𝑡𝑡+𝑗𝑗 + 𝐸𝐸𝑡𝑡+𝑗𝑗�𝑃𝑃𝑡𝑡+𝑗𝑗+𝐷𝐷𝐺𝐺(𝐷𝐷) � + 0.5𝑉𝑉𝑡𝑡+𝑗𝑗+𝐷𝐷0.5 �𝑃𝑃𝑡𝑡+𝑗𝑗+𝐷𝐷
𝐺𝐺(𝐷𝐷) �� ×
(A1)
(A2)

37
Φ�−𝑙𝑙𝑡𝑡+𝑗𝑗 − 𝐸𝐸𝑡𝑡+𝑗𝑗�𝑃𝑃𝑡𝑡+𝑗𝑗+𝐷𝐷
𝐺𝐺(𝐷𝐷) � − 𝑉𝑉𝑡𝑡+𝑗𝑗+𝐷𝐷�𝑃𝑃𝑡𝑡+𝑗𝑗+𝐷𝐷𝐺𝐺(𝐷𝐷) �
𝑉𝑉𝑡𝑡+𝑗𝑗+𝐷𝐷0.5 �𝑃𝑃𝑡𝑡+𝑗𝑗+𝐷𝐷𝐺𝐺(𝐷𝐷) �
�
of the funding spread using the properties of the truncated lognormal distribution (see Lien,
1985). The conditional expectations are obtained by regressing 𝑃𝑃𝑡𝑡+𝑗𝑗+𝐷𝐷𝐺𝐺(𝐷𝐷) on a polynomial in the
state variables at date 𝑡𝑡 + 𝑗𝑗 across all scenarios as suggested by Brandt et al. (2005). Once the
funding spreads are obtained, we can obtain 𝐵𝐵𝑡𝑡+𝑗𝑗 in every scenario.
Assume now we are at rebalancing date 𝑗𝑗 = 𝐽𝐽 − 1. We evaluate the objective function in
𝐵𝐵𝑡𝑡+𝐽𝐽 = 𝐵𝐵𝑡𝑡+𝐽𝐽−1(1 + 𝑅𝑅𝑡𝑡+𝐽𝐽𝐵𝐵(1)) in every scenario for every possible portfolio and funding ratio
grid value. For a given funding ratio grid value, the particular portfolio which maximizes the
conditionally expected utility in 𝐵𝐵𝑡𝑡+𝐽𝐽 is optimal. The conditional expectation is again
computed by a cross-scenario regression on a polynomial in (1 + 𝑅𝑅𝑡𝑡+𝐽𝐽𝐵𝐵(1)) on 𝐵𝐵𝑡𝑡+𝐽𝐽−1 the state
variables at the rebalancing time. Once we have obtained an optimal portfolio for every
funding ratio grid value, we regress the optimal (1 + 𝑅𝑅𝑡𝑡+𝐽𝐽𝐵𝐵(1)) on 𝐵𝐵𝑡𝑡+𝐽𝐽−1 for every funding ratio
grid value in every scenario. We use this auxiliary regression later to match benefit values. At
𝑗𝑗 = 𝐽𝐽 − 2, we need to evaluate the utility function in 𝐵𝐵𝑡𝑡+𝐽𝐽ℎ = 𝐵𝐵𝑡𝑡+(𝐽𝐽−2)ℎ(1 + 𝑅𝑅𝑡𝑡+(𝐽𝐽−1)ℎ𝐵𝐵(ℎ) )(1 +
𝑅𝑅𝑡𝑡+𝐽𝐽ℎ𝐵𝐵(ℎ) ). We obtain the first factor, 𝐵𝐵𝑡𝑡+𝐽𝐽−1 = 𝐵𝐵𝑡𝑡+𝐽𝐽−2(1 + 𝑅𝑅𝑡𝑡+𝐽𝐽−1
𝐵𝐵(1) ), as before for every possible
portfolio and funding ratio grid value and use this value as an explanatory variable in the
aforementioned auxiliary regression to obtain the second factor (1 + 𝑅𝑅𝑡𝑡+𝐽𝐽𝐵𝐵(1)). The auxiliary
regression provides a match between the optimized end of period 𝑡𝑡 + 𝐽𝐽 − 1 benefit and the
optimal benefit return in period 𝑡𝑡 + 𝐽𝐽 resulting from an initial benefit 𝐵𝐵𝑡𝑡+𝐽𝐽−1 and replaces
alternative interpolation methods (e.g., van Binsbergen and Brandt, 2009).
We continue the process until we reach the current period with 𝑗𝑗 = 0. In the current
period there is no need to estimate conditional expectations with regressions on state variables
38
as the current state variables are known. Hence, sample averages replace the conditional
expectations. For 𝑗𝑗 = 0, we obtain the current value of the benefit, 𝐵𝐵𝑡𝑡, which is now a
function of the current optimal portfolio, 𝑤𝑤𝑡𝑡, and all future optimal portfolios derived from the
dynamic programming exercise.
REFERENCES
Addoum, J.M., van Binsbergen, J.H., Brandt, M.W., 2010, Asset Allocation and Managerial
Assumptions in Corporate Pension Plans, working paper, Stanford University. and Duke
University.
Bergstresser, D., Desai, M.A., Rauh, J.D., 2006, Earnings Manipulation, Pensions
Assumptions, and Managerial Investment Decisions, Quarterly Journal of Economics,
121, 157-195.
Brandt, M.W., Goyal, A., Santa-Clara, P., Stroud, J.R., 2005, A Simulation Approach to
Dynamic Portfolio Choice with an Application to Learning about Predictability, Review
of Financial Studies, 18 (3), 831-873.
Broeders, D., 2010, Valuation of Contingent Pension Liabilities and Guarantees under
Sponsor Default Risk, Journal of Risk and Insurance, 77 (4), 911-934.
Broeders, D., Chen, A., 2013, Pension Benefit Security: a Comparison of Solvency
Requirements, a Pension Guarantee Fund, and Sponsor Support, Journal of Risk and
Insurance, 80 (2), 239-272.
Campbell, J.Y., Chan, Y.L., Viceira, L.M., 2003, A Multivariate Model of Strategic Asset
Allocation, Journal of Financial Economics, 67, 41-80.
Campbell, J.Y., Lo, A.W., MacKinlay, A.C., 1997, The Econometrics of Financial Markets,
Princeton University Press, Princeton.
Campbell, J.Y., Viceira, L.M., 2002, Strategic Asset Allocation: Portfolio Choice for Long-
Term Investors, Oxford, Oxford University Press.

39
Chen, N.-F., Roll, R., Ross, S.A., 1986, Economic Forces and the Stock Market, Journal of
Business, 59 (3), 383-403.
Cocco, J.F., Volpin, P.F., 2007, Corporate Governance of Pension Plans: The U.K. Evidence.
Financial Analysts Journal, 63 (1), 70-83.
Cochrane, J.H., 2001, Asset Pricing, Princeton University Press, Princeton.
Coronado, J.L., Sharpe, S.A., 2003, Did Pension Plan Accounting Contribute to a Stock
Market Bubble? Brookings Papers on Economic Activity, 1, 323-359.
Cuoco, D., He, H., Isaenko, S., 2008, Optimal Dynamic Trading Strategies with Risk Limits,
Operations Research, 56 (2), 358-368.
Das, R.D., Sundaram, R.K., 2000, A Discrete-Time Approach to Arbitrage-Free Pricing of
Credit Derivatives, Management Science, 46 (1), 46-62.
Franzoni, F., Marín, J.M., 2006, Pension Plan Funding and Stock Market Efficiency, Journal
of Finance, 61 (2), 921-956.
Hoevenaars, R., Molenaar, R., Schotman, P., Steenkamp, T., 2008, Strategic Asset Allocation
with Liabilities: Beyond Stocks and Bonds, Journal of Economic Dynamics and Control,
32, 2930-2970.
Ippolito, R.A., 2002, Replicating Default Risk in a Defined Benefit Plan, Financial Analysts
Journal, 58 (6), 31-40.
Lien, D.-H.D., 1985, Moments of Truncated Bivariate Lognormal Distributions, Economics
Letters, 19, 243-247.
Longstaff, F.A., 2001, Optimal Portfolio Choice and the Valuation of Illiquid Securities,
Review of Financial Studies, 14 (2), 113-147.
Longstaff, F.A., Schwartz, E.S., 2001, Valuing American Options by Simulation: a Simple
Least-Squares Approach, Review of Financial Studies, 14 (1), 407-431.
McCarthy, D., Neuberger, A., 2005, The Pension Protection Fund, Fiscal Studies, 26, 139-167.
Petersen, M.A., 1996, Allocating Assets and Discounting Cash Flows: Pension Plan Finance,
in: Fernandez, P.A., Turner, J.A., Hinz, R.P. (eds.), Pensions, Savings and Capital
Markets, U.S. Department of Labor, Washington, D.C..

40
Rauh, J., 2006, Investment and Financing Constraints: Evidence from Funding of Corporate
Pension Plans, Journal of Finance, 61 (1), 33-71.
SEC, 2009, Securities and Exchange Commission v. General Motors Corporation, Litigation
Release No. 20861 (www.sec.gov/litigation/litreleases/2009/lr20861.htm).
Shivdasani, A., Stefanescu, I., 2010, How Do Pensions Affect Corporate Capital Structure
Decisions?, Review of Financial Studies, 23 (3), 1287-1323.
Schneider, P., Pinheiro, B., 2008, ERISA: A Comprehensive Guide, 3rd edition. Aspen.
Sundaresan, S., Zapatero, F., 1997, Valuation, Optimal Asset Allocation and Retirement
Incentives of Pension Plans, Review of Financial Studies, 10 (3), 631-660.
Towers Watson, 2014, Global Pension Asset Study 2014. From www.towerswatson.com.
Van Binsbergen, J.H., Brandt, M.W., 2009, Optimal Asset Allocation in Asset Liability
Management, working paper, Stanford University and Duke University.
Viceira, L., 2005, General Motors U.S. Pension Funds, Harvard Business School Case Study.
Top Related
Copyright © 2022 FDOKUMEN

