


Bahasa
Halaman
Hukum


MADAGASCAR
PUBLIC EXPENDITURE REVIEW 2015
EDUCATION
Version: June 24, 2015
Pub
lic D
iscl
osur
e A
utho
rized
Pub
lic D
iscl
osur
e A
utho
rized
Pub
lic D
iscl
osur
e A
utho
rized
Pub
lic D
iscl
osur
e A
utho
rized

ii
ACKNOWLEDGEMENTS
To be Completed

1
CONTENTS
ACKNOWLEDGEMENTS .................................................................................................................................. II
LIST OF TABLES................................................................................................................................................ 2
LIST OF FIGURES .............................................................................................................................................. 2
LIST OF BOXES .................................................................................................................................................. 3
SECTION A – OVERVIEW OF THE EDUCATION SECTOR AND ITS NEEDS ........................................... 5
A.1 ORGANIZATION OF PUBLIC EDUCATION ................................................................................................................. 5 A.2 RECENT TRENDS IN EDUCATION OUTPUTS AND OUTCOMES ....................................................................................... 7 A.3 RECENT TRENDS IN THE DISTRIBUTION OF INPUTS .................................................................................................. 10 A.4 RELIANCE ON COMMUNITY TEACHERS (FRAM) ..................................................................................................... 12 A.5. KEY FINDINGS AND POLICY IMPLICATIONS ............................................................................................................ 15
SECTION B. TOTAL PUBLIC EXPENDITURES: SIZE AND OVERALL PERFORMANCE ................... 16
B.1 WHO FINANCES EDUCATION? ........................................................................................................................... 16 B.2 GOVERNMENT EXPENDITURES IN EDUCATION: SIZE AND TRENDS .............................................................................. 17 B.3 GOVERNANCE AND BUDGET CONSTRAINTS ........................................................................................................... 20 B.4 OVERALL EFFICIENCY ANALYSIS: LINKING PUBLIC EXPENDITURES AND OUTCOMES ....................................................... 28 B.5 KEY FINDINGS AND POLICY IMPLICATIONS ............................................................................................................ 33
SECTION C. ELEMENTS TO ASSESS TECHNICAL EFFICIENCY OF EDUCATION EXPENDITURE 34
C.1 ELEMENTS TO ASSESS TECHNICAL EFFICIENCY: ANALYSIS OF INPUT SHARES ................................................................ 34 C.2 ELEMENTS TO ASSESS ALLOCATIVE EFFICIENCY: EXPENDITURE ANALYSIS BY FUNCTION ................................................. 39 C.3 UNIT COSTS .................................................................................................................................................... 43 C.4 KEY FINDINGS AND POLICY IMPLICATIONS ............................................................................................................ 45
SECTION D. DISTRIBUTIONAL ANALYSIS OF PUBLIC EDUCATION EXPENDITURE ...................... 46
D.1 DISTRIBUTION OF PUBLIC EDUCATION EXPENDITURES BY REGION AND TYPE OF RESIDENCE ........................................... 46 D.2 DIRECT HOUSEHOLD EXPENDITURES ON EDUCATION AND THEIR IMPACT ON REGIONAL AND INCOME INEQUALITIES.............. 51 D.3 DISTRIBUTION OF EXPENDITURES BY SOCIOECONOMIC CATEGORY OF USER: BIA ......................................................... 56 D.4 DISTRIBUTION OF EXPENDITURES BY GENDER: BIA ................................................................................................ 59 D.5 KEY FINDINGS AND POLICY IMPLICATIONS ............................................................................................................ 62
REFERENCES ................................................................................................................................................... 63
ANNEX 1. TABLE SUPPLEMENT ................................................................................................................. 64
ANNEX 2. FIGURE SUPPLEMENT ................................................................................................................ 66
ANNEX 3. ANALYTICAL SUPPLEMENT ..................................................................................................... 67
A.3.1 OVERALL PUBLIC EXPENDITURE PERFORMANCE ......................................................................................................... 67 A3.2. ROBUSTNESS ANALYSIS FOR FUNCTIONAL CLASSIFICATIONS OF EXPENDITURES IN EDUCATION SINCE 2006 ............................ 75

2
LIST OF TABLES
TABLE 2. CROSS-COUNTRY COMPARISON OF PRIMARY COMPLETION RATES, 2005-2012 .......................................... 10 TABLE 5. INTERNAL AND EXTERNAL FUNDING OF PUBLIC EXPENDITURE IN EDUCATION, 2009-2013 ........................ 16 FIGURE 10. GOVERNMENT EDUCATION EXPENDITURE (GEE), 2000 TO 2013 ............................................................. 17 TABLE 6. INTERNATIONAL COMPARISON OF PUBLIC EDUCATION EXPENDITURES (PERCENT OF GDP) ........................ 18 FIGURE 11. EDUCATION EXPENDITURE IN GENERAL GOVERNMENT EXPENDITURE, 2000 TO 2013 (PERCENT) ........... 19 TABLE 7. INTERNATIONAL COMPARISON OF THE SHARE OF EDUCATION IN GOVERNMENT EXPENDITURES ................ 20 TABLE 8. UNDER-ACCOUNTING OF FOREIGN AID IN GOVERNMENT ACCOUNTS, 2009-2013 ...................................... 21 TABLE 9. REGULATION RATES, 2010-2014 (PERCENT) ................................................................................................ 21 FINAL VS INITIAL BUDGET APPROPRIATIONS IN EDUCATION AND OVERALL, 2006-2013 ............................................ 23 TABLE 10. EXECUTION RATES IN EDUCATION VS OVERALL EXECUTION OF THE BUDGET, 2006-2013 ........................ 24 TABLE 13. SHARE OF SALARIES IN PUBLIC SPENDING ON PRIMARY EDUCATION, COMPARISON WITH SELECTED
COUNTRIES .......................................................................................................................................................... 34 TABLE 14. DECOMPOSITION OF EXECUTED EXPENDITURES OF THE NON-WAGE RECURRENT BUDGET INTO LABOR
AND NON-LABOR EXPENDITURES, 2006-2013 ..................................................................................................... 38 TABLE 15. INTERNATIONAL COMPARISONS OF PUBLIC EXPENDITURE SHARES BY LEVEL OF EDUCATION, AVERAGES
2000-2012 ........................................................................................................................................................... 43 TABLE 16. PRIMARY SCHOOL UNIT COST COMPARISONS, MADAGASCAR AND SUB-SAHARAN AFRICA ...................... 44 TABLE 17. CORRELATION COEFFICIENTS BETWEEN GOVERNMENT EXPENDITURES BY REGION AND POVERTY .......... 49 TABLE 18. POVERTY AND CONSUMPTION BY TYPE OF RESIDENCE, 2005 AND 2010 .................................................... 50 TABLE 19. SHARE OF EXPENDITURES TO RURAL AREAS VS SHARE OF THE POPULATION ............................................. 51 TABLE 20. SHARE OF HOUSEHOLDS IN THE SOUTHERN DISTRICTS THAT PAID ENROLLMENT FEES, PTA
CONTRIBUTIONS AND MONTHLY SCHOOL FEES, 2009 AND 2012 (SAMPLE SELECTION) ..................................... 51
Annex tables
TABLE A1. ANNUAL SALARIES BY PROVINCES AS A RATIO TO SIGFP REMUNERATIONS BY PROVINCES ................... 64 TABLE A2. SHARE OF SALARY BY REGIONS, 2006-2007 AND 2010-2013.................................................................. 65 TABLE A3. PUBLIC SCHOOL UTILIZATION BY GENDER AND QUINTILE, 2005 AND 2010 ............................................. 65 TABLE A4. MADAGASCAR’S DEVIATIONS FROM EXPECTED EDUCATION OUTCOMES AND EXPENDITURE, PANEL DATA
RESULTS .............................................................................................................................................................. 67 TABLE A5. MADAGASCAR’S DEVIATIONS FROM EXPECTED EDUCATION OUTCOMES AND EXPENDITURE, PANEL DATA
SUMMARY RESULTS ............................................................................................................................................. 72
LIST OF FIGURES
FIGURE 2. PRIMARY SCHOOL ENROLLMENT SINCE 2000 ................................................................................................ 7 TABLE 1. ATTENDANCE STATUS OF CHILDREN, BY AGE GROUP, 2005 AND 2010 (LEVEL AND PERCENT) ..................... 8 FIGURE 3. ATTENDANCE RATES FOR CHILDREN AGED 6-10 YEARS, BY GENDER AND AREA OF RESIDENCE, 2005 AND
2010 ...................................................................................................................................................................... 8 FIGURE 9. INTERNAL AND EXTERNAL FUNDING OF PUBLIC EXPENDITURE IN EDUCATION, 2009-2013 ....................... 17 FIGURE 11. DECONCENTRATION OF TOTAL PUBLIC SPENDING IN EDUCATION (ALL MISSIONS), 2006-2013 ................. 27 FIGURE 12. DECONCENTRATION OF CURRENT NON-WAGE PUBLIC SPENDING IN EDUCATION (UP TO SECONDARY),
2006-2013 ........................................................................................................................................................... 27 FIGURE 13. EXPENDITURE PERFORMANCE OF PUBLIC EDUCATION: PRE/POST-CRISIS EFFICIENCY BASED ON
COMPLETION RATES ............................................................................................................................................ 31 FIGURE 14. EXPENDITURE PERFORMANCE OF PUBLIC EDUCATION: PRE- VS POST-CRISIS EFFICIENCY BASED ON
GROSS ENROLLMENT RATIOS (PRIMARY/SECONDARY COMBINED) ...................................................................... 32 32 FIGURE 15. EVOLUTION OF REAL EDUCATION EXPENDITURES BY BROAD ECONOMIC CATEGORY .............................. 35

3
FIGURE 16. DECOMPOSITION OF THE EDUCATION BUDGET INTO BROAD INPUT CATEGORIES, 2006-2013 ..................... 38 FIGURE 17. NET CHANGES IN INVESTMENT IN EDUCATION, INCLUDING FOREIGN AID, 2009-2013 ............................. 39 FIGURE 18. ALLOCATION OF RECURRENT EDUCATION EXPENDITURE BY LEVEL AND FUNCTION, 2002-2013 ............. 41 FIGURE 19. ALLOCATION OF CURRENT NON-WAGE EXPENDITURES BY LEVEL, 2002-2013 ........................................ 42 FIGURE 20. TOTAL CURRENT EXPENDITURE BY LEVEL OF EDUCATION, AVERAGE 2011-2013 ................................... 43 FIGURE 21. PUBLIC NON-INVESTMENT EXPENDITURE PER STUDENT, 2002-2012 ........................................................ 44 FIGURE 22. CURRENT EXPENDITURE (UP TO SECONDARY) BY PROVINCE IN RELATION TO POPULATION ..................... 47 FIGURE 23. DISTRIBUTION OF PUBLIC EDUCATION REGULAR WAGES ACROSS REGIONS VS POPULATION SHARES,
2013 .................................................................................................................................................................... 48 FIGURE 24. CURRENT PUBLIC EXPENDITURE PER CAPITA IN EDUCATION BY REGION RANKED BY 2005 POVERTY
RATES .................................................................................................................................................................. 49 FIGURE 25. RURAL/URBAN SHARES OF NON-WAGE RECURRENT EXPENDITURES DIRECTLY ASSIGNED TO COMMUNES
............................................................................................................................................................................ 50 FIGURE 26. HOUSEHOLD DIRECT EDUCATION EXPENDITURE, 2005 AND 2012 ............................................................. 52 FIGURE 27. PRIMARY ATTENDANCE RATE AND THE SHARE OF HOUSEHOLD BUDGET ON EDUCATION BY REGION,
2012 .................................................................................................................................................................... 53 FIGURE 28. COST PER CHILD IN SCHOOL BY REGION, RANKED BY POVERTY LEVEL, 2005 AND 2010 ......................... 53 FIGURE 29. BURDEN OF EDUCATION EXPENDITURES BY REGION, RANKED BY POVERTY LEVELS, 2005 AND 2010 .... 54 FIGURE 31. LORENZ CURVES BY QUINTILE FOR UTILIZATION OF PUBLIC EDUCATION, 2005-2010, 2010-2012 AND
2005-2012 ........................................................................................................................................................... 57 FIGURE 32. GOVERNMENT SUBSIDY TO EDUCATION FROM CURRENT EXPENDITURE, BY QUINTILE, 2011-2013 ......... 58 FIGURE 33. ESTIMATED DISTRIBUTION OF BENEFITS FROM EDUCATION EXPENDITURES FOR ALL LEVELS COMBINED
(PRIMARY, SECONDARY AND HIGHER EDUCATION) .............................................................................................. 59 FIGURE 34. GENDER EQUALITY IN THE PUBLIC SCHOOLS ............................................................................................ 59 FIGURE 35. GENDER EQUALITY IN THE PUBLIC SCHOOLS BY QUINTILE, 2005 AND 2010 ............................................ 60 FIGURE 36. GOVERNMENT SUBSIDY TO EDUCATION FROM CURRENT EXPENDITURE BY GENDER AND CONSUMPTION
QUINTILE, 2011-2013 .......................................................................................................................................... 61
Annex Figures
FIGURE A.1. CURRENT PUBLIC EXP PER CAPITA IN EDUCATION BY REGION AND PER CAPITA CONSUMPTION ............. 66 FIGURE A.2. STRUCTURAL EFFICIENCY OF EDUCATION EXPENDITURE BASED ON PRIMARY COMPLETION RATES, 1980-
2012 68 FIGURE A.3. STRUCTURAL EFFICIENCY OF EDUCATION EXPENDITURE BASED ON GROSS ENROLLMENT IN PRIMARY
AND SECONDARY COMBINED, 1980-2012 ............................................................................................................ 70 FIGURE A.4. STRUCTURAL EFFICIENCY OF EDUCATION EXPENDITURE BASED ON YOUTH LITERACY RATES, 1980-
2012 71 FIGURE A.5. CURRENT EFFICIENCY OF 2000-2008 GOVERNMENT EXPENDITURES BASED ON 2000 YOUTH LITERACY
RATE 72 FIGURE A.6. CURRENT EFFICIENCY OF 2009-2012 GOVERNMENT EXPENDITURES BASED ON 2010 YOUTH LITERACY
RATE 73 FIGURE A.7. TRENDS IN EDUCATION EXPENDITURES BY LEVEL OF EDUCATION USING DIFFERENT STAGES OF
EXPENDITURES AND CLASSIFICATION METHODS (2008-2013) .............................................................................. 76 FIGURE A.8. TRENDS IN EDUCATION EXPENDITURES BY LEVEL OF EDUCATION USING DIFFERENT STAGES OF
EXPENDITURES AND CLASSIFICATION METHODS (2008-2013) .............................................................................. 76
LIST OF BOXES
BOX 1. THE RISE OF COMMUNITY TEACHERS AS THE MAIN COMPONENT OF THE TEACHING FORCE ........................... 13 BOX 3. IMPROVING THE TRANSFER OF COMMUNITY TEACHERS’ SALARIES: RESULTS FROM A FIELD STUDY.............. 24 BOX 4. MEASURING THE DECONCENTRATION OF EDUCATION EXPENDITURE USING SIGFP ....................................... 26 BOX 5. EFFICIENCY ANALYSIS OF PUBLIC EDUCATION EXPENDITURE ........................................................................ 28

4
BOX 6. ANALYZING INPUT SHARES IN EDUCATION ...................................................................................................... 35 BOX 7. THE IMPACT OF THE REGULARIZATION OF COMMUNITY TEACHERS AS CIVIL SERVANTS ................................ 36 BOX 8. ALLOCATIVE EFFICIENCY ANALYSIS USING FUNCTIONAL ALLOCATIONS OF EXPENDITURE IN EDUCATION ... 39 BOX 9. PARENTS’ CONTRIBUTION TO SCHOOL FINANCING: RESULTS FROM A FIELD STUDY ...................................... 55
5
SECTION A – OVERVIEW OF THE EDUCATION SECTOR AND ITS NEEDS
A.1 Organization of Public Education
1. Administration of education
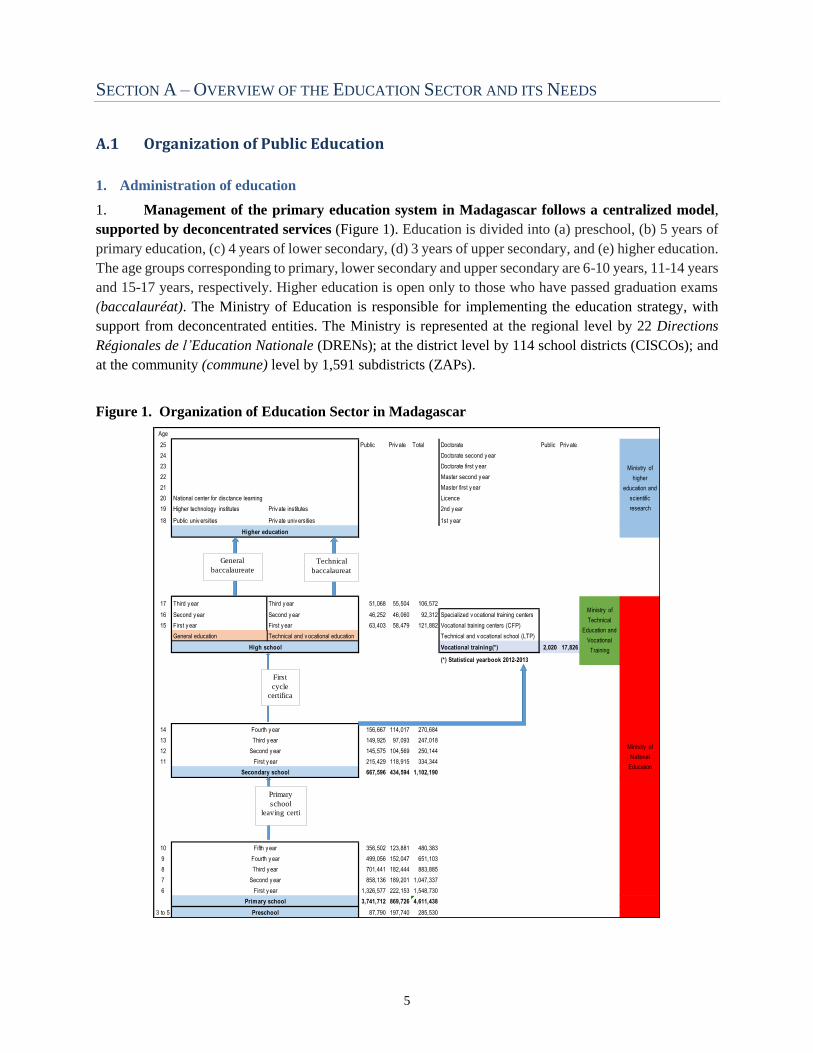
1. Management of the primary education system in Madagascar follows a centralized model,
supported by deconcentrated services (Figure 1). Education is divided into (a) preschool, (b) 5 years of
primary education, (c) 4 years of lower secondary, (d) 3 years of upper secondary, and (e) higher education.
The age groups corresponding to primary, lower secondary and upper secondary are 6-10 years, 11-14 years
and 15-17 years, respectively. Higher education is open only to those who have passed graduation exams
(baccalauréat). The Ministry of Education is responsible for implementing the education strategy, with
support from deconcentrated entities. The Ministry is represented at the regional level by 22 Directions
Régionales de l’Education Nationale (DRENs); at the district level by 114 school districts (CISCOs); and
at the community (commune) level by 1,591 subdistricts (ZAPs).
Figure 1. Organization of Education Sector in Madagascar
Age
25 Public Priv ate Total Doctorate Public Priv ate
24 Doctorate second y ear
23 Doctorate first y ear
22 Master second y ear
21 Master first y ear
20 National center for disctance learning Licence
19 Higher technology institutes Priv ate institutes 2nd y ear
18 Public univ ersities Priv ate univ ersities 1st y ear
17 Third y ear Third y ear 51,068 55,504 106,572
16 Second y ear Second y ear 46,252 46,060 92,312 Specialized v ocational training centers
15 First y ear First y ear 63,403 58,479 121,882 Vocational training centers (CFP)
General education Technical and v ocational education Technical and v ocational school (LTP)
Vocational training(*) 2,020 17,826
(*) Statistical yearbook 2012-2013
14 156,667 114,017 270,684
13 149,925 97,093 247,018
12 145,575 104,569 250,144
11 215,429 118,915 334,344
667,596 434,594 1,102,190
10 356,502 123,881 480,383
9 499,056 152,047 651,103
8 701,441 182,444 883,885
7 858,136 189,201 1,047,337
6 1,326,577 222,153 1,548,730
3,741,712 869,726 4,611,438
3 to 5 87,790 197,740 285,530
Higher education
Primary school
Preschool
Ministry of
higher
education and
scientific
research
Ministry of
Technical
Education and
Vocational
Training
First y ear
Ministry of
National
Education
Fourth y ear
Third y ear
Second y ear
First y ear
Fifth y ear
Fourth y ear
Third y ear
Second y ear
High school
Secondary school
Technical
baccalaureat
General
baccalaureate
First
cycle
certifica
Primary
school
leaving certi

6
2. The sector has suffered from an overall lack of strategic leadership during the most recent
political and economic crisis. The 2005-08 period was marked by the preparation of sector strategies,
including important reforms aimed at improving the functioning and performance of the education system.
These reforms included extension of the primary cycle from five to seven years, as well as the revision of
curricula and the training of teachers. Implemented as pilots in many education districts (CISCOs), the
reforms were not scaled up to the national level, and in some cases were interrupted, because of the crisis.
The lack of continuity in management of the sector at all levels—central, regional (DREN), district
(CISCO) and local (ZAP)—has had a substantial negative impact on the pace of progress and formulation
of a longer-term strategic vision. The elaboration and adoption of an Interim Education Plan (PIE) for the
2013-15 period has temporarily mitigated this situation by guiding the short-term development of the sector
(PIE, 2013), but important weaknesses remain in terms of strategic leadership.
3. Program-based budgeting, introduced in the 2000s, has not been fully implemented. While
public finance management in Madagascar was based on a “traditional” budget up until 2004, a result-based
approach and a logic of results was introduced in the Organic Law of Finance (LOLF) in 2004, resulting in
the budget nomenclature being structured around missions and objectives. The LOLF has created a wide
range of new roles and management tools, but the learning process was interrupted during the crisis. This
led to dysfunctions in the expenditures chain and to a de facto return to a resource budget. Besides, many
factors have contributed to the return to a logic of means: (a) the inexistence of a budget timetable, (b) the
lack of conciliation between the Ministry of Finance and technical Ministries, (c) the lack of cost analysis
in the definition of allocations and (d) the lack of cooperation between the Direction of
Planning/Administrative and Financial Direction and technical directions.
4. An important feature of the Malagasy education system is the relatively well developed
framework for school-based management. The school management committees (FAFs, Fiaraha-
miombon’Antoka ho amin’ny Fampandrosoana ny sekoly) consist of parents, teachers, the school director,
and representatives from the local community. They have been in existence in each school since 2002, when
the government started providing annual grants to schools on a per capita basis to cover part of schools’
operating expenses. The FAFs are responsible for managing these grants, and play a critical role in
improving accountability of service delivery and promoting community engagement and social dialogue
among local stakeholders. The FAFs are also increasingly participating in the financing of school
operations, including hiring and paying community teachers and financing basic supplies. Trends in
contributions from school committees in the financing of education are examined in details later in the
paper.
2. Human resources management – key features
5. Two categories of teachers coexist in public schools—civil servant teachers and those hired
by the community, known as FRAM teachers. Civil servant teachers acquire their status after formal
training (in ENIs, then in CRINFPs)1 for six months to two years, or by internal promotion within the civil
service based on their profile. Community teachers consist of two groups: (a) subsidized teachers, who
receive indemnities from the State, and also, depending on the local context, receive additional funding
from parents; (b) non-subsidized teachers, who receive indemnities solely from parents.
1 Regional pedagogic training centers.

7
6. The community teachers system relies on coordination and cooperation between the Ministry
of National Education (MEN) and parents. Community teachers are locally hired and employed by the
parents’ association based on criteria recommended by the MEN. The contract between the parents'
association and the community teacher is subject to approval and supervision by the various local/regional
levels of the education administration (sub-district/district levels).
A.2 Recent Trends in Education Outputs and Outcomes
1. Overall enrollment trends
7. Despite relatively rapid growth, the enrollment rate in preschool remains very low, especially
in rural areas. The numbers of children attending preschool increased six-fold from 2001 to 2013, from
about 45,000 to nearly 285,000, an average annual growth rate of 18.8 percent. However, this sub-sector
remains the least developed in the educational system, representing only 4.5 percent of total enrollment in
2013-14, or less than 10 percent of pre-school age children. Moreover, the share of private schools in
preschool enrollment is very high, 69 percent in 2013-14. This is particularly linked to the weakness of
public schools, which are characterized by a lack of infrastructure, furniture, teaching aids and trained
teachers, and a lack of resources at the household level to support preschools.
8. Enrollment in primary education has increased at a slow pace since 2009 (Figure 2). Between
2001 and 2003, enrollment in primary education increased rapidly following various incentive measures
taken by the State in the context of Education For All. The pace slowed between 2003 and 2006 while the
number continued to grow, which can be partly explained by the depletion of late entries. The pace picked
up again between 2006 to 2008 with the abolition of school fees, and the provision of school kits to new
school children and school canteens in areas of high food insecurity. However between 2009 and 2011,
primary enrollment stagnated at 4.3 million pupils. This stagnation was at odds with the overall context of
rapid population growth, and was in sharp contrast to the period immediately preceding the crisis, when the
annual growth rate of primary enrollment averaged 7.8 percent over 10 years and 6.2 percent over 3 years.
Figure 2. Primary School Enrollment since 2000
Source: Education statistical yearbooks, 2000-13.
9. In a context of rapid population growth, the slower pace of enrollment translated in substantial
drop in enrollment and attendance rates since 2009. According to the education statistical yearbooks,
the gross enrollment rate (GER) for primary dropped from 157 percent in 2008/09 to 144 percent in
2,307 2,409
2,856
3,3663,598 3,699
3,8374,020
4,324 4,330 4,305 4,366 4,4864,611
2,200
2,700
3,200
3,700
4,200
4,700
Th
ou
san
ds
of
Pu
pils

8
2013/14, equivalent to a 13 percentage point drop. The rate has decreased especially for Grades 2 and 5,
losing 23 and 19 percentage points over the period, respectively. According to the Household Surveys, the
attendance rate of children aged 6 to 14 years has also receded strongly over the 2005-12 period, from 77
percent to 74 percent in 2010 and 69 percent in 2012. Between 2005 and 2010, the drop was most apparent
for primary school-aged children (aged 6 to 10 years), for whom the rate was reduced by 4.6 percentage
points, against 1.2 percentage points for children aged 11 to 14 years. However, over the 2010-12 period,
the decrease was more obvious for children aged 11 to 14 years, with 6.7 percentage points lower
attendance, against 2.1 percentage points for primary school-aged children (Table 1).
Table 1. Attendance Status of Children, by Age Group, 2005 and 2010 (level and percent)
%
2005 2010 2012
Attended Dropped
out
Never
Enrolled Attended
Dropped
out
Never
Enrolled Attended
Dropped
out
Never
Enrolled
6-10 79.6 2.8 17.6 75.0 2.9 22.1 72.9 6.6 20.5
11-14 73.8 15.0 11.3 72.6 15.2 12.3 65.9 19.3 14.9
6-14 77.2 7.8 15.0 74.0 7.8 18.2 69.9 11.9 18.2
Source: Household Surveys 2005 and 2010, and ENSOMD 2012.
10. The drop in attendance rates has been unequal, especially affecting rural zones and the
southern regions. On the basis of the Household Surveys, the attendance rates for children aged 6 to 10
have dropped for all socioeconomic categories, the greatest reductions and levels of exclusion being
observed in rural areas, especially for boys (Figure 3). In rural areas, the share of children having never
attended school has increased over the past five years, whereas the dropout rate has varied little (see Annex
Table A.4). Regional differences in terms of attendance rates are equally important. Over the 2005-10
period, rates have receded the most in Anosy, Atsimo-Andrefana, Boeny and Menabe (in the south and
west), whereas rates in other regions such as Androy, Vatovavy-Fitovinany and Ihorombe have deteriorated
over 2010-12 period.
Figure 3. Attendance Rates for Children Aged 6-10 Years, by Gender and Area of Residence, 2005
and 2010
Source: Household Surveys 2005 and 2010, and ENSMOD 2012.
60
65
70
75
80
85
90
95
100
National Urban Rural Boys Girls UrbanBoys
UrbanGirls
RuralBoys
RuralGirls
Perc
en
t
2005 2010 2012

9
11. The most recent estimates indicate that 1.4 million children aged 6-10 are likely out of school.2
Despite a gross enrollment rate largely above 100 percent, a large number of children and youth remain out
of school. Among them, we can distinguish: (a) children who have never attended school; and (b) those
who dropped out early. According to the 2010 Household Survey, dropout from primary school starts
around 9 years old, when 5 percent of enrolled children drop out. By age 15, 43 percent have dropped out,
and only 20 percent of youth remain enrolled at age 20. Overall, about 60 percent of 11-14 year-olds (or
about 190,000 youths) who dropped out did so before completing Grade 3, and about 10 percent of that
cohort never enrolled in school (Figure 4).
Figure 4. School Situation of Children and Youth Aged 6 to 25 years
Source: Based on data from 2010 Household Survey.
12. Financial problems are the key drivers of dropout for more than one third of households.
Among the reasons for leaving school, one has to distinguish between those related to supply and those
related to demand. Household Survey data show that demand-related issues largely predominate with three-
quarters of school dropouts being explained by demand-side factors. In particular, direct costs are the key
determinant of non-enrollment for children less than 10 years old, and for the older ones, that reason is
combined with the necessity to work. The negative perception of school comes second amongst demand-
side constraints. Other reasons include class repetition and early marriage/pregnancy. On the supply side,
the malfunctioning of the school is the most frequently cited reason, followed by its remoteness.
2. Education outcomes
13. The primary completion rate decreased over the last three years and now mirrors completion
rates across low-income countries and Sub-Saharan Africa. Prior to the crisis, Madagascar experienced
an upward trend in primary completion rates. Since 2009, however, the primary completion rate has
declined from 73 percent to 71 percent, whereas the average in Sub-Saharan Africa (SSA) has increased
from 67 to 69 percent (Table 2).
2 Analysis based in part on "School Exclusion and Inclusion in Primary Education in Madagascar," UNICEF 2012.

10
Table 2. Cross-Country Comparison of Primary Completion Rates, 2005-2012
2005 2006 2007 2008 2009 2010 2011 2012
Madagascar 57.7 56.6 60.9 67.2 73.9 70.5 71.0 69.5
Sub-Saharan Africa 61.4 64.4 64.5 65.5 67.8 69.2 69.2 -
Low-income countries 58.6 60.1 61.0 63.6 65.8 66.7 66.5 -
Source: UNESCO database.
14. The quality of learning has deteriorated, as evidenced by the low learning outcomes at the end
of primary education. Comparison of data across three rounds of learning assessments indicates a sharp
downward trend in all three subject areas (Figure 5). PASEC data, between 1998 and 2005, indicated a
sharp decline in grade 5 student learning achievement. French and mathematics test scores decreased by 11
and 8 points, respectively. This trend has worsened considerably over the last few years, especially in the
mathematics score, which dropped by another 11 points. Overall, between 1998 and 2012, the national
average in French has dropped by 16 percentage points and the math score by 19 percentage points.
Comparison of PASEC test results in CONFEMEN countries shows that the French score of Madagascar
in 2012 is the worst among all participating countries and the Math score also slipped quite a bit between
2005 and 2012.
Figure 5: 1998, 2005 and 2012 learning scores
Source: Data from Ministry of Education.
A.3 Recent Trends in the Distribution of Inputs
1. Learning material and instructional time
15. The critical lack of learning material and reduced instructional time contribute to the low
quality of teaching. Every school is supposed to have one textbook per pupil per subject, in either
Malagasy or French. However, according to the results of the learning assessment surveys conducted for
the fifth grade in 2012, only 55 percent of the surveyed schools have one book for two pupils in French, 58
percent in mathematics and 71 in Malagasy. For 10 percent of the schools, there was one textbook per six
students for the three subjects. Moreover, while instructional time is supposed to amount to 960 hours per
year in primary education, as much as 15 percent of that time may be lost due to various reasons, including
non-adherence to the school calendar, late back-to-school times, extended recess times, early ending times,
extended school holidays, natural disasters, examination days, and meetings and trainings carried out by
the Ministry of National Education, technical and financial partners or local authorities.
0
10
20
30
40
50
60
70
PASEC 1998 PASEC 2005 MEN 2012
Lea
rnin
g s
core
s
French Mathematics Malagasy

11
2. Classrooms and Infrastructure
16. The slow pace of school constructions over the past years resulted in increased pupil-classroom
ratios which are inequitably distributed across the country. While the pupil-classroom ratio was 47:1
in 2011, the slower pace of school construction between 2012 and 2014 resulted in an increased in the
pupil-classroom ratio to 53:1 in 2013/14. This average hide large, and increasing, inequality in how
classrooms are distributed across the country. For example, Androy and Atsimo-Atsinanana saw their pupil-
classroom ratios increase from 80:1 and 72:1 in 2009 to 81:1 and 87:1 respectively in 2014. On the other
hand, pupil-classrooms ratios remain much lower than the average in some regions, including Analamanga,
Alaotra-Mangoro and Amoron’i Mania, at 43:1 and 41:1 respectively in 2013.
17. A new strategy for school constructions was adopted in 2008, which emphasized community-
based construction. In 2007-2008, the Ministry of Education launched the design and implementation of
a new school construction strategy. The strategy aimed at addressing the following challenges: (i)
weaknesses in the programming of classroom constructions, (ii) absence of standardized procedures and
technical standards in school constructions, (iii) cost and financing issues and (iv) difficulties encountered
by the sector to manage the programs related to school constructions. As part of this strategy, new
construction standards, classrooms designs and cost standards were defined. In addition, the strategy
introduced a participatory approach, relying on capacity building, resources and skill transfer to local actors.
18. Implementation of the new school construction strategy was satisfactory, despite substantial
financial and capacity constraints. While the initial targets set by the Ministry were not entirely achieved
due to financial constraints during the early years of the political crisis, the strategy yielded positive results
in many aspects. Indeed, a thorough evaluation carried out in 2012 showed that construction costs had been
contained and implementation pace was satisfactory. Moreover, involving local communities and
decentralized entities of the MoE had ensured a real transfer of capacity and resources and resulted into
effective empowerment of local stakeholders. Finally, as different entities at different levels took part in
the process, transparency in the general management of the program had significantly improved.
3. Teachers
19. Pupil-teacher ratios have improved since 2009, due to an increase in the number of teachers
and the stagnation in primary enrollment numbers. In 2006/07, the annual growth rates of pupils and
teachers were 4.1 and 4.7 percent, respectively, resulting in a pupil-teacher ratio of 52:1. However, primary
enrollment numbers dropped in 2009 and have increased only slowly since then, while the number of
teachers has continued to rise, except in 2011-12. Consequently, the pupil-teacher ratio decreased from 51:1
in 2008/09 to 41:1 in 2012/13, although the trend seems to reverse in 2013/14 (Figure 6).
Figure 6. Annual Growth Rate of Pupils and Teachers, and Pupil-Teacher Ratio in Public Primary
Schools, 2006/07-2013/14
52 50 5148
44 4641
44
0
10
20
30
40
50
60
-8.0%
-4.0%
0.0%
4.0%
8.0%
12.0%
2006-07 2007-08 2008-09 2009-10 2010-11 2011-12 2012-13 2013-14
Annual growth rate ofpupils
Annual growth rate ofteachers
Pupils/teacher ratio

12
Source: Education statistical yearbooks, 2006/07-2013/14.
20. The distribution of teachers is unequal across and within regions. In 2013/14, 69 percent of
schools had a pupil-teacher ratio between 30 and 60, and 15 percent had a pupil-teacher ratio below 30. The
lowest pupil-teacher ratios were in Analamanga and Alaotra-Mangoro, with ratios of 36 and 40
respectively, on average. The highest pupil-teacher ratios were found in the south, especially in Anosy and
Androy regions, with ratios of 61 and 63, respectively. Despite this wide variation in averages, there were
also substantial differences in pupil-teacher ratio within regions. For instance, in Analamanga, 25 percent
of the schools had a pupil-teacher ratio below 26 and half had a pupil-teacher ratio below 35. The highest
pupil-teacher ratios were found in these regions (312 for Anosy and 271 for Androy). For Androy
particularly, half of the schools had a pupil-ratio higher than 56, and one fourth had a pupil-teacher ratio of
75 (Figure 7).
Figure 7. Distribution of Pupil-Teacher Ratio in Primary Public Schools, 2013
Source: Education statistical yearbooks, 2006/07-2013/14.
A.4 Reliance on community teachers (FRAM)
21. The share of civil servant teachers has fallen considerably over recent years, and community
teachers now make up 80 percent of the total. As explained in the introduction, teachers are divided into
two categories, civil servants and community teachers. In 2006, civil servant teachers represented 47
percent of the total, but were no more than 16 percent in 2013/14 (Figure 8 and Box 1). The drop in the
number of civil servant teachers has translated into an important rise of community teachers, from 51
percent in 2006 to 78 percent in 2013. Nearly 70 percent of primary public schools in Madagascar do not
have civil servant teachers, and this number is as high as 80 percent in 4 out of 22 regions. The share of
community teachers who are subsidized by the State has also decreased over the period.
0.1%2.9%
12.5%
23.7%
27.8%
17.1%
7.2%
3.4%1.7% 1.2% 2.4%
[0-10[ [10-20[ [20-30[ [30-40[ [40-50[ [50-60[ [60-70[ [70-80[ [80-90[ [90-100[ [100+[

13
Figure 8. Public Primary Teachers by Status, 2006/07-2013/14
Source: Education statistical yearbooks, 2006/07-2013/14.
22. Community teachers are unequally distributed across regions, while civil servant teachers are
concentrated in a few regions. There is a strong correlation between the share of community teachers and
poverty rates. The share of community teachers was more than 84 percent, on average, in the poor regions
Atsimo Andrefana, Atsimo Atsinanana, Betsiboka, Bongolava and Melaky. The absence of civil servant
teachers is particularly striking in the very poor regions of Ampanihy (4 percent), Benenitra (8 percent),
Kandreho (6 percent) and Besalampy (9 percent). In contrast, the share of civil servants in the total was 37
percent in the less poor regions Analamanga and 51 percent in Amoron’i Mania (Table 3).
47.2 43.9 41.1 38.3 32.6 27.3 29.315.3
38.6 44.0 42.3 46.646.6
48.8 48.6
52.4
12.9 11.8 16.4 14.9 20.5 23.8 22.026.0
2006-07 2007-08 2008-09 2009-10 2010-11 2011-12 2012-13 2013-14
Civil servant teachers
Subsidized FRAM teachers
Unsubsidized FRAM teachers
Others/contractual
Box 1. The Rise of community Teachers as the Main Component of the Teaching Force
In 2014, there were a total of 82,850 community
teachers in pre-primary, primary and secondary
combined, making up 69 percent of the teaching force
(against 58 percent in 2010). At the primary level,
community teachers made up 78.4 percent of total
teachers in 2014. The phenomenon of community
teachers has thus become the most dominant aspect of
the education sector. It has enabled the expansion of
the system and ensured its financial sustainability.
Between 2000 and 2014, the pupil-teacher ratio
decreased from 55 to 44.
Trend of community teachers in primary school
(2000-2014)
The adoption of a remuneration policy for community teachers was the logical consequence of the increasing
importance of the phenomenon. The amount of the subvention has increased over the years, from 30,000 MGA
per month over 9 months in 2002 to 110,000 MGA per month over 12 months in 2013. Therefore, the annual
remuneration of community teachers has increased nearly fivefold in nominal terms, from 270,000 MGA/year
in 2002 to 1,320,000 MGA/year in 2014. In real terms, subsidies to community teachers have increased by 4.1
percent annually between 2002 and 2014, which is largely above the increase on GDP per capita over the same
period (0.8 percent annually). Recent trends, however, show a decline in the amount of subsidies to community
teachers by 4.2 percent since 2010. Finally, the share of community teachers who receive subsidies has fallen
from 75 percent in 2007 to less than 67 percent in 2014.

14
Table 3. Schools without Civil Servant Teachers by Region, 2013/14
Region % Region %
ANALAMANGA 37% MENABE 74%
AMORON'I MANIA 51% SOFIA 76%
HAUTE MATSIATRA 55% ANOSY 77%
VAKINANKARATRA 55% BONGOLAVA 78%
ITASY 58% ATSIMO-ATSINANANA 78%
ANALANJIROFO 62% IHOROMBE 78%
ALAOTRA-MANGORO 63% BOENY 79%
ATSINANANA 67% BETSIBOKA 81%
DIANA 71% ATSIMO-ANDREFANA 82%
SAVA 73% MELAKY 85%
VATOVAVY FITOVINANY 74% ANDROY 88%
Source: Education statistical yearbooks, 2013-14.
The high reliance on community teachers who are vastly undertrained and underqualified is a
contributing factor to the low quality of education outcomes (Table 4). Community teachers are
generally underqualified, with more than 80 percent of them having no form of teaching qualification. Only
civil servant teachers benefit from initial, pre-service training, although any form of pre-service training
was suspended between 2006 and 2012. In addition to non-existent pre-service training, the in-service
training programs managed by the MoE do not match the needs of a growing cohort of generally unqualified
community teachers with limited skills. The lack of appropriate training is aggravated by the lack of a
coherent teacher support system. School inspectors have virtually disappeared. The ratio of pedagogical
counselors to teachers is low in the school districts (1:173). The sub-district officers (chefs ZAP), who are
closest to schools, lack the resources, time, and skills to support teachers with limited teaching and language
skills. Various analyses have shown the direct impact of the increasing share of community teachers on
education outcomes. The 2012 learning assessment, for example, showed a strong and significant
relationship between community teachers and low learning outcomes.
Table 4. Determinants of Learning Outcomes in CM2 Public Schools, 2012
(1) (2) (3)
Score in French Score in Math Score in Malagasy
Characteristics of teachers
community teachers -4.421** -5.853** -1.161
(1.34) (1.99) (1.93)
Duration of teacher training 0.199* 0.238 0.048
(in number of days) (0.09) (0.14) (0.13)
Absence of teacher (2 or more days) -0.901 -3.007** -0.891
(0.78) (1.16) (1.12)
Other characteristics
Multigrade class 2.190* -0.034 5.221***
(1.06) (1.59) (1.52)
Permanent or semi-permanent classroom 5.447*** 13.897*** 6.659***
(1.17) (1.75) (1.65)
Constant 20.088*** 28.449*** 34.906***
(2.43) (3.64) (3.67)
Observations 919 919 919
Threshold of significance: *10%, **5% and *** 1%.

15
A.5. Key Findings and Policy Implications
Key Findings
Madagascar’s education system exhibits severe weaknesses that leave a large number of children without the basic
skills required to function on the labor market:
Structural weaknesses
The last 10-15 years have witnessed a rapid drop in education outcomes.
The absence of a sustained and quality mechanism for teachers training has had a large impact on the declining
quality of education.
The large number of out-of-school children is putting substantial pressure on the system.
Conjectural weaknesses
Enrollments in primary education have stagnated, and even decreased in some years, since the start of the
political and economic crisis in 2009.
Inputs to the sector have been dramatically reduced, including the number of civil servant teachers, which has
continuously decreased, resulting in a rapid increase in the number of community-hired teachers. These
teachers now make 80 percent of the total teaching force in primary schools.
Policy Implications
Madagascar has an urgent need to improve the quality of its education system, while at the same time catering to the
specific needs of children who are absent from the system.
Investing in quality
Stabilizing the teaching force. Improving management of teachers is perhaps the highest priority for the
Government of Madagascar. This will entail:
(i) creating a sustainable supply of qualified teachers,
(ii) ensuring the equitable distribution of teachers across the country, with a special focus on the
distribution of qualified teachers to areas where they are the most needed,
(iii) reestablishing adequate administrative and pedagogical support to the teaching force.
Creating the conditions for learning. In addition to teachers, there is a need to harmonize and improve the
quality of other important inputs, including:
(i) the curricula across the country,
(ii) the supply of textbooks and other learning materials.
Addressing the needs of out-of-school children
Scale up effective interventions targeting the most vulnerable, including conditional cash transfers and
school feeding programs.
Pilot interventions providing second-chance education.

16
SECTION B. TOTAL PUBLIC EXPENDITURES: SIZE AND OVERALL PERFORMANCE
B.1 Who Finances Education?
23. Total public spending on education has decreased since 2009, mostly due to a contraction in
external funding to the sector. Total public spending on education was sustained for a few years after the
crisis at around 3.5 percent of GDP, but decreased substantially to 3.1 percent in 2012 and 2013. This
decrease is not explained by a GDP growing more quickly than public spending, but rather by a contraction
in the total amount spent on education. Total public expenditures on education decreased by 8 percent
between 2009 and 2013 (from 782 to 721 billion 2013 Ar.), despite an initial 10 percent increase between
2009 and 2011 (Table 5).3 Changes in the level of foreign aid explain the trend, as internally financed
expenditures remained fairly stable in constant terms throughout the period (Figure 9).4 Internal financing
now largely dominates public funding of education, and reached 81 percent of public expenditures in 2012
and 2013.5
Table 5. Internal and External Funding of Public Expenditure in Education, 2009-2013
In Millions of constant 2013 Ar. 2009 2010 2011 2012 2013
Internal funding 593,690 529,854 608,228 593,177 582,620
Foreign aid: on-budget 98,540 146,999 145,976 60,755 27,497
Foreign aid: off-Budget 90,191 148,412 103,665 77,581 110,738
Total public expenditures (a) 782,421 825,265 857,869 731,513 720,855
Percent of GDP 3.4% 3.6% 3.7% 3.1% 3.1%
Percent internally funded 76% 64% 71% 81% 81%
(a) includes major NGOs
Source: Calculated from AMP disbursements and SIGFP data from MFB.
3 The figure includes funding from major international NGOs as reported on the Aid Management Platform; however,
contributions from major NGOs are small relative to contributions from other sources. 4 Although it would appear that foreign aid increased in 2010 while government funding went down, this is likely due
to the fact that budget support is not distinguished from internal resources in the government accounts. When the
budget support was cut in 2010, this translated into a reduction in domestic funding, when in fact it may have been
entirely due to a reduction in budget support. 5 There was no budgetary aid in these years, so the category is fully internally financed.

17
Figure 9. Internal and External funding of Public Expenditure in Education, 2009-2013
Source: Calculated from AMP disbursements and MFB/SIGFP data. Total public expenditure includes major NGOs.
B.2 Government Expenditures in Education: Size and Trends6
24. Government education expenditures were on an increasing trend from 2000 to 2005, but
subsequently decreased to reach a low of 2.6 percent in 2013.7 Figure 10 traces total government
expenditures in education8 from 2000 to 2013. The sharp increase in both levels and percent of GDP from
2003 to 2005 brought public education expenditures to a high of 3.8 percent of GDP in 2005. In real terms,
government education expenditures reached their maximum in 2008, followed by a sharp drop coinciding
with the political crisis. The period since 2010 shows remarkable stability, but the 2.6 percent of GDP
reached in 2012 and 2013 is still the lowest since 2000.
Figure 10. Government Education Expenditure (GEE), 2000 to 2013
6 Due to problems of data interpretation and documentation, different sources of data tend to show significant
differences in the magnitude of government expenditures in education as well as total government expenditures. The
analysis below presents results using data from MFB (SIGFP, the MEN’s Interim Education Plan (.PIE), the IMF (for
general government expenditure), and UNESCO. 7 The series combines data from the MEN/PIE for 2000-2011 and government accounts from MFB/SIGFP for 2011-
2013. Expenditures are taken at the level of commitment rather than execution (mandatement) to match the PIE
definition. Although total education expenditures from the PIE could not be reconciled with SIGFP data for the period
2006-2009, largely because of large differences in investment expenditures, the 2011 totals matched very closely, so
the PIE series could be extended to 2013 with reasonable confidence in comparability. However, the exercise
confirmed some weaknesses in government accounting of externally financed on-budget expenditures. 8 Total government expenditure includes all levels from pre-school and literacy to higher education and research.
594 530 608 593 583
189 295250
138 138
0
200
400
600
800
1000
2009 2010 2011 2012 2013
Billio
ns
of
con
stan
t 2
01
3 A
r.
Foreign Aid
Gov. Exp: Internalfunding
0.0
1.0
2.0
3.0
4.0
5.0
6.0
7.0
8.0
9.0
0
100
200
300
400
500
600
700
800
900
2000 2001 2002 2003 2004 2005 2006 2007 2008 2009 2010 2011 2012 2013
%
GEE*, billions 2013 Ar. GEE*, % of GDP GEE % of GDP (UNESCO)

18
Note: A star (*) denotes expenditures recorded at the commitment level (montants engagés) instead of execution
(mandatement), as was done for the PIE. The GEE* series is from PIE for the period 2000-2010 and from SIGFP for
2011-2013.
Source: Data from MFB/SIGFP, MEN/PIE, UNESCO Institute of Statistics.
25. Relative to other countries, the share of GDP allocated to education appears lower than average
over all time periods since 2000, and the gap increased after 2009. Madagascar spent on average 3.1
percent of GDP over 2000-2012 compared to 3.7 in SSA developing countries (LDCs) and 3.4 in low-
income countries (LICs). The country also went against the trend of increasing education expenditures
observable in all comparison groups—a diverging trend that started around the 2009 crisis. The Madagascar
2010-2012 average is one-third lower than the SSA and LIC averages (Table 6).
Table 6. International Comparison of Public Education Expenditures (percent of GDP)
Government Education Expenditure/GDP averages (on
available data)
Country/Comparison Group 2000-2012 2008-2012 2010-2012
Kenya 6.36 6.67 6.67
Comoros 5.71 7.61 n/a
Mozambique 4.89 n/a n/a
Rwanda 4.70 4.71 4.92
Senegal 4.33 5.39 5.60
Cote d'Ivoire 4.27 4.60 n/a
Burkina Faso 4.15 3.63 3.63
Niger 3.50 4.03 3.97
Madagascar 3.10 2.89 2.75
Cameroon 3.08 3.30 3.33
Congo, Dem. Rep. 2.50 2.50 2.50
Zimbabwe 2.50 2.50 2.50
Central African Republic 1.42 1.25 1.21
Sub-Saharan Africa (developing only) 3.73 4.08 4.31
Low income 3.42 3.88 4.16
Low & middle income 3.91 4.35 4.53
High income 5.20 5.40 5.46
Source: UNESCO Institute of Statistics.
26. The low share of GDP allocated to education seems, however, to reflect the overall contraction
of public spending rather than a lack of prioritization by the Government. Over the last ten years,
general government expenditures decreased overall, from a peak of 25 percent of GDP in 2004 to a low of
15 percent in 2012.9 It is therefore important to look more closely at the evolution of education expenditures
in the general budget to assess the evolution of GOM’s commitment to education. While important data
limitations exist, it seems that the priority given to education in the overall budget has in fact increased
9 IMF data, total general government expenditures percent of GDP.

19
quite substantially over the period 2006-2013.10 The series shows an increase in the share of education in
government expenditures (Figure 11).
Figure 11. Education Expenditure in General Government Expenditure, 2000 to 2013 (percent)
Note: A star (*) denotes expenditures recorded at the commitment level (montants engagés) rather than at execution
(mandatement), as was done for the PIE. GEE are government education expenditures, and GGE are total expenditures
of the government from the general budget. GGE* was not available in the data received from MFB prior to 2009.
GGX are general government expenditures from IMF data.
Source: Data from MFB/SIGFP, MEN/PIE, IMF, UNESCO Institute of Statistics.
27. In fact, in the midst of a severe budgetary and fiscal crisis, which saw an important contraction
of overall public spending, the share of education in the public budget has remained higher than in
most SSA countries (Table 7). International comparisons of the share of public spending allocated to
education can only be made using the UNESCO data series. Although data availability is largely uneven
across years and across countries, it is sufficient to establish international benchmarks. According to these
data, 21 percent of total spending is allocated to education in Madagascar, which is substantially higher
than the average of SSA developing countries and the low income group as a whole. The relatively high
share of education in government expenditures can be interpreted as a sign of political commitment to
education; but since we have been considering executed expenditures rather than budget appropriations, it
could also be the result of a stronger execution of the budget, which is discussed below.
10 Major inconsistencies across data sources resulted in difficulty in assessing recent trends in the share of total budget
allocated to education. Differences of up to 10 percentage points were identified and the direction of change was not
consistent from one source to the next, especially looking at the post-crisis period (Figure xx). The most reliable series
in terms of trend is the one based on realized expenditures from the MFB. Indeed, both education and total general
budget expenditures rely on the same raw data and take account of actual executed expenditures (verification stage).
However, the data from SIGFP are only available since 2009. The 2006 and 2008 data were reconstituted by MFB
from records in SIGFP.
0
5
10
15
20
25
30
2000 2001 2002 2003 2004 2005 2006 2007 2008 2009 2010 2011 2012 2013
GEE % of GGE (SIGFP) GEE* % of GGE* GEE* % of GGX

20
Table 7. International Comparison of the Share of Education in Government Expenditures
% of General Government Spending
(average based on available data)
Country/Comparison Group 2000-2012 2008-2012 2010-2012
Comoros 24.12 n/a n/a
Kenya 22.45 17.21 17.21
Cote d'Ivoire 22.17 24.61 n/a
Mozambique 21.85 n/a n/a
Rwanda 20.90 20.16 20.06
Senegal 20.52 21.51 n/a
Burkina Faso 18.50 19.43 19.43
Niger 17.65 18.51 19.30
Madagascar 17.43 18.21 20.60
Cameroon 16.00 17.60 17.09
Central African Republic 13.02 12.08 12.04
Congo, Dem. Rep. 8.89 8.89 8.89
Zimbabwe 8.26 8.26 8.26
Sub-Saharan Africa (developing only) 17.28 17.43 17.13
Low income 16.99 17.47 17.58
Low & middle income 12.26 16.48 16.29
High income 13.79 13.57 13.96
Source: Data from UNESCO Institute of Statistics.
B.3 Governance and Budget Constraints
1. Execution of the budget: Governance issues
28. Several factors need to be taken into account when interpreting execution rates. Normally,
comparing budget appropriations to executed expenditure can be used as a measure of planning capacity at
the line ministry level, and of general quality of governance both at the ministry level and in overall budget
management. For Madagascar, several issues need to be considered in interpreting execution rates. First,
executed expenditures recorded in the government accounts (SIGFP) may not fully account for all realized
expenditures, leading to over- or underestimating execution rates, depending on the performance of
expenditures not included in the SIGFP or whether they are included differently at different stages. Second,
various blockages in the budget exist that may prevent ministries from using budgeted funds. These
blockages are not necessarily due to a lack of capacity for budget execution; rather, they may signal a need
for specific attention to overall management of the budget, in particular of cash flows.
29. Differences between budget appropriations and expenditures could also be attributed, in
large part, to the way externally financed investment expenditures are recorded in the government
budget. Indeed, disbursements of foreign aid marked on-budget in the Aid Management Platform are much
higher than externally financed executed education expenditures in SIGFP (Table 8). This does not appear
to be a feature of the education sector, but of government accounts in general. These differences can lead

21
to underestimating execution rates, as some expenditures related to externally funded projects are not
included in the government accounts at the stage of execution, yet most are included in budget
appropriations.11 Documentation relative to the rules regarding inclusion/exclusion of foreign aid managed
by the government (normally on-budget but in fact not spent through the budget) would be necessary to
allow better tracking of investments and to analyze execution rates more precisely. This is particularly true
of investment expenditures, which are in most part financed by foreign aid and therefore not fully included
in the government SIGFP records. It is important to separate the current and investment budgets in the
following analysis of budget execution.
Table 8. Under-Accounting of Foreign Aid in Government Accounts, 2009-2013
2009 2010 2011 2012 2013
AMP foreign aid disbursements marked on-budget
(billion 2013 Ar.) 98.5 147.0 146.0 60.8 27.5
of which, percentage included in SIGFP 0.3 6.1 8.3 20.4 10.2
Source: Data from Primature (AMP), MFB/SIGFP.
30. Rules related to the execution of the budget may also prevent full execution; this is notably the
case for regulation rates imposed by the MFB. Operational budgets financed by internal resources are
subject to quarterly regulation rates—the maximum percentage of appropriations that can be committed by
the end of each semester, the fourth quarter rate normally being 100 percent. Civil servant salaries are
subject to a linear regulation (25, 50, 75 and 100 percent), but the quarterly percentages for other expenses
in the operational budget, including indemnities, are subject to a non-linear schedule that can be changed
during the year (Table 9 and Box 2).
Table 9. Regulation Rates, 2010-2014 (percent)
Term 1 Term 2 Term 3 Term 4
2010 12.5 32.5 58 100
2011 12.8 43.1 69.4 100
2012 11.3 41.6 68.0 100
2013 8.80 52.10 67.20 100
2014 4.30 42.20 71.40 100
Note: The regulation rates shown in the table concern only investment expenditures, except for 2011 and 2012, which
also encompass salaries. Data source: MEN via MFB.
11 Another issue identified in the course of this PER is related to the payment of value-added taxes (VAT), which are
paid by some externally funded projects and subsequently reimbursed by the Government. It is not clear exactly where
these provisions appear in the budget, but they seem to be included in the SIGFP procedure, and provisions need to
be made as part of the budget process to pay for these liabilities. Due to lack of predictability regarding the total
amount of these expenditures, there might appear to be some blockages. Unfortunately, the data obtained for this PER
is not sufficient to determine the magnitude of the problem.

22
31. The issue of regulation rates is particularly relevant to the education sector and is often raised
as an important constraint in budget execution. There are at least two reasons why regulation rates are
more constraining for the education sector than for other line ministries. First, the first quarter of the
academic year is the last quarter of the fiscal year, so budget restrictions announced in the last quarter affect
expenses at the beginning of the academic year and could therefore have a real effect on the full academic
year. Second, as noted earlier, the education ministry relies heavily on community personnel to supplement
teaching personnel in public schools. The subsidies for these community teachers are also subject to
regulation rates, since they are included in the non-wage operational budget. Tight regulation rates therefore
have a large impact on the capacity of the ministry to transfer these subsidies. To understand the magnitude
of this problem and the impact of budget management techniques that have been necessary to mitigate these
constraints, there would need to be a careful examination of quarterly budget data, which could not be
obtained for this PER.
32. Budget reallocation and rectification may also lead to an overestimation of the ministry’s
capacity to execute according to plans. Issues related to difficulties in planning for both external
resources and enrollments for the next academic year could explain, at least partially, the need to rearrange
credits across the ministry during the year. The observed effective fungibility between allocations and
expenses across different sub-administrations and programs is likely to increase execution rates for total
expenditures but significantly reduce the ability to track expenditures by function or at the program level.12
Here also, it is difficult to appreciate the magnitude of the problem and its impact on allocation and
execution, but it needs to be taken into account when evaluating resource allocations by functions at the
executed level.
12 This is particularly notable when looking at changes in the amounts of transfer expenditures not detailed in the
SIGFP (for example, transfers to CNAPMAD).
Box 2. Budget Rectification
In Madagascar, budget allocations within broad categories are generally modified mid-year to accommodate
requested transfers of credits. A new Finance Law is not necessary if these changes follow certain criteria. From
the month of May, ordonnateurs and program coordinators can request modifications to the SIGFP to move credits.
These requests need to be approved by MFB and published by decree before they are effective in the SIGFP. Rules
differ depending on whether the transfer is (a) within programs, (c) across programs in the same ministry; or (c)
across programs of different ministries. The procedure is simplified when changes are within programs, although
the change still needs to be published by decree. It is, however, clear from the Law that, for operational expenses,
whatever the nature of the modification requested, the total amount in each economic category reported in the Law
(indemnities, goods and services, and transfers) cannot be changed. Regulations/procedures concerning these
modifications are delineated in MFB circulaires. Any change across categories requires a rectification of the Law
of Finance. Consequently, in years when the Law was not rectified (all years in the period considered except 2008
and 2010), there may be differences between total appropriations initially granted to a line ministry and final
appropriations, but there should be no difference by category for operational expenditures. Restrictions, however,
do not apply to externally financed credits, in particular for the investment budget.
Based on past budget data, it is clear that there have been allocation changes made to initial budget
appropriations, especially in the non-wage current budget, but the education sector cannot be identified as a
net gainer or a net loser in the reallocation process overall. It was a net beneficiary in 2008, 2009 and 2013 and a

23
2. Execution of the budget: Execution rates
33. Overall execution rates for the Ministry of Education have been consistently higher than those
of the general budget, by 5-15 percentage points every year since 2006 (Table 10).13 Breaking down
this rate across broad budget categories reveals some differences, however. Execution rates for operational
expenditures have been consistently higher in education than overall, except in 2013 when they fell just
below execution rates of the general budget, although they remained above 90 percent. Looking at the
internally financed investment budget gives a different picture, with the execution rates in education
following those of the general budget until 2010, and then falling significantly below.14
13 Rates are calculated relative to the rectified budget. Comparing executed expenditures to initial appropriations since
2006 do not reveal important or systematic over- or under-budgeting by broad categories for education. The only
noticeable tendency is in positive rectifications of the wage budget, which reveal themselves as unnecessary in view
of final execution rates. In most other cases, the amounts allocated in the rectified budget were almost entirely used,
except in 2013, when under-budgeting for non-wage recurrent expenditures led to an over-budgeting (by about 10
percent) in the rectified budget. 14 Given the caveats raised above about the accounting of foreign aid in government accounts, it is not possible to
interpret execution rates for the externally financed investment program. Internally financed investment, on the other
hand, should not be subject to such problems. It is not clear why executed expenditures for the internally financed
investment program overall could be higher than final voted appropriations in 2012 and 2013, except if some executed
expenditures were, in fact, based on the initial budget. What is clear, however, is that a large part of the weak execution
rates for internally financed investment in education are not related to governance inside the ministry, but rather to
overall budget management issues.
net loser in 2006, 2011 and 2012. Table xx gives the ratio of final (modified) to initial budget appropriations for
the education sector and for the non-financial general budget. Changes in the operational budgets were on the order
of 10 percent in most years except 2010 (when a revision to the Law of Finance was approved), and up to 17 percent
in 2013. The 2010 differences are likely due to the reduction in budgetary aid.*
Final vs Initial Budget Appropriations in Education and Overall, 2006-2013
2006 2008 2009 2010 2011 2012 2013
Overall education budget 0.89 1.03 1.01 0.88 0.98 0.97 1.04
Current operations: regular wages 0.99 1.05 1.03 1.04 0.93 1.01 1.01
Other current operations 0.92 1.08 1.00 0.63 1.09 0.90 1.17
Internally financed Investment program 0.75 0.87 1.00 0.39 1.00 0.62 1.00
Externally financed Investment program 0.73 1.00 1.00 0.93 1.00 1.00 1.00
Overall general non-financial budget 1.03 1.06 1.00 0.80 1.00 1.00 1.00
Current operations: regular wages 1.00 1.00 1.00 1.00 1.00 1.00 1.00
Other current operations 0.97 1.12 1.00 0.73 1.01 1.01 1.01
Internally financed Investment program 0.84 1.17 1.00 0.99 0.97 0.94 0.95
Externally financed Investment program 1.19 1.00 1.00 0.61 1.00 1.00 1.00
*The information on budget support could not be obtained from the MFB.
Source: Data from MFB/SIGFP.

24
Table 10. Execution Rates in Education vs Overall Execution of the Budget, 2006-2013
2006 2008 2009 2010 2011 2012 2013
Education 0.78 0.71 0.65 0.80 0.76 0.93 0.86
Current operations: regular wages 0.95 0.86 0.84 0.90 0.95 0.94 0.92
Other current operations 0.98 0.99 0.84 0.95 0.95 0.99 0.91
Internally financed Investment program 0.71 0.93 0.59 0.92 0.30 0.77 0.51
Externally financed Investment program 0.02 0.05 0.00 0.10 0.13 0.46 0.07
General non-financial budget 0.61 0.60 0.49 0.74 0.67 0.80 0.81
Current operations: regular wages 0.95 0.88 0.79 0.92 0.95 0.93 0.93
Other current operations 0.94 0.61 0.68 0.94 0.84 0.97 0.93
Internally financed Investment program 0.74 0.93 0.53 0.97 0.59 1.34 1.48
Externally financed Investment program 0.24 0.26 0.12 0.12 0.15 0.10 0.04 Note: Rates are calculated as the ratio of executed expenditures (dépenses mandatées) to final appropriations (credits
modifies).
Data source: MFB (SIGFP).
34. Interestingly, the comparison of executed expenditures to final appropriations does not
exemplify problems related to the sharp (nearly 50 percent) reduction in the current non-wage
budget in the fourth quarter. To all appearances, the constraint was not binding in the end, since only 10
percent of final appropriations for the recurrent non-wage budget were not executed. Looking at modified
versus initial budget appropriations, however, reveals that 2013 budget appropriations for non-wage
recurrent expenditures were revised upward by close to 20 percent mid-year, which must have significantly
eased the fourth semester’s budget constraint.
Box 3. Improving the Transfer of community Teachers’ Salaries: Results from a Field Study
A case study was undertaken in the context of this PER that analyzed various aspects related to community
teachers, including the payment of their subsidies. The results show that the existing payment mechanisms have
had positive impact on the system, including:
an improvement of the conditions of community teachers, which are explicitly part of the sector strategy
and recognized as such by the MoE;
a reduction of absenteeism of community teachers and an overall increase in motivation;
a reduction of the costs of education borne by families who previously financed the salaries of community
teachers
a relative efficacy of the payment mechanisms which varied according to local circumstances.
Despite these positive aspects, some important weaknesses persist, including:
Substantial delays in payment combined with long periodicity in payments, resulting in severe financial
difficulties for teachers and often translate in higher contributions from parents to fill the gap,
in remote areas, the payment of subsidies require long travel for community teachers which have
implications in terms of absenteeism and financial costs for community teachers,
Improving the payment mechanisms of community teachers would require the following:
25
3. Deconcentration of education expenditure
35. The level at which expenditures are administered can impact the overall performance of
budget execution. On the one hand, deconcentration of expenditures can improve the efficiency of budget
execution, allowing a closer connection between administrative and operational units. On the other hand,
for deconcentration to have the intended effects requires additional capacity at the local levels, as well as
strengthened communication between various actors along the expenditure chain. Deconcentration of
expenditures has been an important priority at the Ministry of Education, and the ratio of central to
deconcentrated expenditure was retained as one of the ten indicators included in the pluri-annual
performance sheet prepared for the MFB and used as a budget preparation tool. Box 4 provides the
background necessary to understand how deconcentration can be measured in government accounts
(SIGFP).
Revising the procedures for managing the payment of community teachers’ subsidies which are complex
and cumbersome. They include the need for a confirmation of teachers’ presence and efforts, through an
attestation de service, which often constitutes a bottleneck and results in delays. With the development of
a database at regional and central levels, the identification and localization of community teachers has
become more reliable, which calls for a shift from control a priori to an a posteriori form of control.
During the transition, control a priori could be done only twice per year.
Reducing delays in payment. Such delays are mostly due to lengthy administrative processes (including
the mailing by post of control documents) and to delays in accessing funds at central levels (the
classification of community teachers’ subsidies as transfers in the budget implies that they are subject to
restrictions imposed by MFB, including through the regulation rates). These delays are different in nature
and entail different recommendations. On the one hand, the move towards an automatized system and a
posteriori controls would accelerate administrative procedures, but would require substantial technical
assistance to support the process. On the other hand, the reclassification of community teachers’ subsidies
as “quasi-salaries” in MFB budget would contribute to reducing delays by lifting the existing restrictions
imposed by MFB.
Modifying the periodicity of payment. While subsidies are currently paid every two months, this could be
brought down to one month. This would not necessarily involve an increase in transaction costs for MoE
or MFB and would substantially improve the working conditions of community teachers.
Clarifying the fiscal status of subsidies. The current fiscal status of subsidies remain unclear. While they
constitute an income, they are usually not declared by beneficiaries and therefore not taxed. Options for
clarifying the current situation include the promulgation of an exoneration of taxes for community
teachers’ subsidies, the consequences of which could be analyzed in details by a special commission.

26
36. Over the period 2006 to 2013, the share of expenditure managed at a deconcentrated level
below the province level has decreased to less than 10 percent of total MOE expenditure (Figure 11).
Considering the totality of MOE expenditure (including wages and including all education missions) and
assigning transfers to public schools to the deconcentrated levels, the central level manages over half of all
expenditure while another 40 percent goes to the provincial treasuries to pay non-central salaries. The share
managed by the central level has increased from 43 to 50 percent while the share going to lower levels
(including central level transfers to public facilities) has decreased from 17.6 to 8.2 percent of total MOE
expenditure.15
15 Restricting the data to education up to secondary level gives a deconcentrated share (below the province and
including transfers to public entities) at less than 4 percent, down from 18 percent in 2006.
Box 4. Measuring the Deconcentration of Education Expenditure Using SIGFP
Something can be inferred about deconcentration of public expenditure by looking at the level at which
expenditures are mandated in government accounts (SIGFP). The following four levels of administration relevant
to the public education sector are coded in SIGFP: the central level (Ministry), the 22 regions (DRENs), the 113
district (CISCO), and 303 grouping of communes (ZAPs, although their expenses are effectively managed at the
district level), and the school.
In addition, there are six general Treasuries located in each ex-province, which administer the payment of regular
salaries. There are also 148 lower secondary schools (CEG and CEGR), and 199 upper secondary schools (lycées)
with own expenditures in SIGFP.
The following items are particularly interesting when looking at deconcentration of expenses:
Regular wages, which represent the bulk of MoE expenditures, are administered at the central level by the
MFB, with salaries distributed across the six ex-provinces and the central administration.
Transfers, which make up 81-84 percent of the non-wage operational budget, are mostly composed of subsidies
to pay community teachers and transfers to primary schools for general educational expenses (caisse ecole)
.
- Subsidies to community teachers, part of the non-wage operational budget, mandated and transferred by
the central level (DGEFA) to regional treasuries. DRENs are responsible for administrating the payments
at the regional level upon verification at the school and CISCO levels. Transfers to pay community
teachers are included as subsidies to the private sectors in SIGFP, they are included as centrally managed
below.
- Transfers to public entities, in particular those going to primary schools, can be considered as
deconcentrated in the sense that the schools are directly responsible for the management of expenses paid
out of the allocated amounts.

27
Figure 11. Deconcentration of Total Public Spending in Education (all missions), 2006-2013
Source: Data from MFB/SIGFP.
37. The centralization of resources is even more pronounced for expenditures up to secondary
education (Figure 12).16 Excluding higher education and professional training, the analysis shows a sharp
increase in the share of centrally managed spending over the period 2006-2013. This centralization of
resources is mostly attributable to the increasing share of salaries in MoE budget, resulting from the overall
contraction of spending and priorization of salaries within the ministry’s budget. The most recent period
was marked by drastic cuts in the budgets of CISCOs and schools, resulting more of the budget constraints
than from a deliberated attempt to limit deconcentration of resources. It is worth noting however, that the
budget cuts at lower levels were partially compensated by external funding (especially cuts in schools
operational budget coming from domestic resources) and it is unclear whether these external resources have
been taken into consideration in SIGFP.
Figure 12. Deconcentration of Current Non-Wage Public Spending in Education (up to secondary),
2006-2013
Source: Data from MFB/SIGFP.
16 This analysis does not include expenditures that are not marked as linked to education in the program budget. Some
investment expenditures directed to education are in fact realized outside the education missions under the Ministry
of Decentralization through the Local Development Fund (FDL). Expenditures directed to education make up about
30 percent of funds in the FDL but are still very small relative to Education expenditures of the MOE (less than 0.5
percent). Nevertheless, they have the potential to increase and could improve the decentralization picture of
investment, which is currently fully centralized in Education.
0%
10%
20%
30%
40%
50%
60%
70%
80%
90%
100%
2006 2008 2009 2010 2011 2012 2013
Lower levels (including transfers to publicfacilities)
Province
Central (excluding transfers to publicfacilities)
0%
20%
40%
60%
80%
100%
2006 2008 2009 2010 2011 2012 2013
Transfers to public entities
Etablissement (CEG, Lycee)
Communes (ZAPs)
Districts (CISCOs)
Regional (DRENs)
Central (excl. transfers to public entities)

28
B.4 Overall Efficiency Analysis: Linking Public Expenditures and Outcomes
38. Overall efficiency analyses are particularly helpful to benchmark the structural performance
of the system in comparison to other countries (Box 5). The objective of this analysis is to establish a
link between the level of public education expenditures and general education outcomes using information
from a large set of countries of all income groups and regions. The methodology and motivation as well as
limitations of the analysis in terms of the outcome indicators chosen are presented in Box xx. The structural
analysis, which evaluates a long-run “Madagascar effect” based on estimation from an unbalanced panel of
144-176 countries over the period 1980-2012 is presented in Annex xx along with details on the
methodology and regression results for both structural and current efficiency analyses.
39. However, various limitations to the analysis impose caution when interpreting the results. In
order to grasp the overall picture and make policy recommendations regarding the size of public
expenditure, one cannot look at results of the efficiency analysis in isolation of analyses of inequalities in
terms of financial burdens and outcomes. In addition, because education outcomes are usually affected with
substantial delays by changes in the learning and teaching environment, it is possible that the efficiency
analysis does not capture accurately the capacity of the system to transmit competencies and knowledge to
its pupils.
Box 5. Efficiency Analysis of Public Education Expenditure
Overall/system efficiency analysis is often presented comparing efficiency score estimated by Data Envelopment
Analysis methods (DEA) to situate countries relative to an Efficiency Frontier (see Herrera and Pang (2005) for a
review of the literature). It is, however, difficult to interpret DEA efficiency scores for countries with low levels
of spending. In particular, a country can obtain a very high efficiency score despite very poor education outcomes.
Keeping sight of where the country stands in terms of both levels of input and output while assessing efficiency is
thus very useful. The methodology presented here uses the same data as for DEA but efficiency is assessed visually
in two dimensions rather than using a summary indicator. One dimension is obtained using deviations from
expected public expenditure and the other using deviations from expected education outcome. Expected outcomes
and expected expenditures take account of the country’s income level (in PPP), its size, and effects of regional and
income groupings for LDCs. The unexplained variation is used to determine relative efficiency.
Evaluating “structural” efficiency: Structural efficiency relates to the long-term standing of the country relative
to others in terms of public expenditure performance. It is important to measure to establish some benchmark that
can be used to interpret current efficiency, especially because these results depend on characteristics of the
Madagascar’s education system (such as the relative importance of the private sector). A measure of structural
efficiency can be obtained using all time periods and countries for which data are available and exploiting the panel
structure of the data. A random-effects regression separates the residual variance in two parts: one that is common
to all countries and one that is country specific. The country specific residual variance or “random effect” can be
used to measure the structural advantage/disadvantage of the country (the country’s typical deviation from expected
outcomes).
Evaluating changes in “current/conjectural” efficiency: Beyond looking at the general position of the country
relative to others, it is important to gage how it has changed across two time periods. In this case, expectations are
estimated for each time period averaging values over 2 or more years (dampening measurement errors) and running
an Ordinary Least Square regression on the cross-section of countries for which data is available. Residuals are
then calculated as the difference between observed and predicted values.

29
40. Structurally, Madagascar places in the group of most efficient countries in terms of
enrollment and underachiever in terms of completion (Figure 13). In other words, considering the full
variation of expenditures and outcomes over 1980-2012, Madagascar tends to spend slightly less on
education (in percent of GDP) than its level of income, size and geographical location would predict while
it achieves average or better than expected outcomes in terms of enrollment (primary and secondary
combined) and youth literacy. However, the result is different when looking at completion rates:
Madagascar achieves slightly lower completion rates than the levels of expenditure would predict. These
The choice of outcomes indicators: Different types of outcomes can be considered depending on whether
efficiency is assessed over a long time period (structural efficiency), or using averages calculated over short time
periods (current efficiency). In general, outcomes that are most contemporaneously related to current expenditures,
sufficiently dependent on the overall situation in the country, and sufficiently available and comparable across
countries are best suited to evaluate changes over time. Herrera and Pang (2005) use primary and secondary
enrollment (gross and net), completion rates (first and second level), years in school, and learning scores. Based on
data availability, the gross primary and secondary combined enrollment ratios, primary completion rates, and the
youth literacy rate (only available 2000 and 2009) are used here. The youth literacy rate is most relevant to the
structural analysis as it is less contemporaneously related to expenditure than the other two but is only sparsely
available. Enrollment rates are somewhat problematic for Madagascar given the inaccuracy of population estimates.
Combining primary and secondary rates dampens (but does not solve) the problem. Learning outcomes would have
been a good indicator in the structural analysis to capture the quality dimension but are not sufficiently available
(number of years) or comparable across countries. Unfortunately, this was the case for all other internationally
comparable indicators of quality.
The choice of expenditure indicators. Government education expenditure data in percentage of GDP (or GNI)
are widely available in the UNESCO Institute of Statistics’ database for the period 1980-2012 (covering 177-211
countries, depending on the year). The indicator is comparable across countries and goes through country clearance
procedures. The indicator includes all public expenditures externally or internally financed.
The four-quadrants graphical illustrations. Results can be plotted into a four quadrant graph where (0,0) is the
point where both education outcome and expenditures are at levels predicted by the model. Deviations from
expected education outcomes are represented vertically (y-axis) and deviations from expected expenditure
horizontally (x-axis). For most education outcome indicators, higher is better, so a position in the NW quadrant is
most efficient and a position to the SE is least efficient. The SW quadrant includes countries which underperform
in terms of education outcomes but also have relatively low expenditures. They are called underachievers. Those
in the NE quadrants are overachievers.
Why focus on government expenditure? Although outcomes are the combined result of public and private
education, and all education expenditures are expected to have some effect on outcome, the present analysis only
considers public expenditures. First, as discussed above, there are no reliable data on total expenditures in education
and no data that are comparable across countries. Second, according to the evidence provided above, public
education represents the bulk of education expenditures, and it is also closely connected to the private education
system; third, the outcomes considered focus on primary and primary/secondary education, accounting for more
than 80 percent of children under 14 years. Finally, and importantly, even if comparable data on private expenditure
are available, the point here is to evaluate public expenditure needs on efficiency grounds. If a country can obtain
better education outcome overall with less public expenditure because the private sector takes on a larger part of
the burden, it is indeed an efficiency improvement in terms of public expenditure.

30
results are however not to be interpreted as reflecting the current situation but need to be taken into
consideration when interpreting the results presented below.
41. Overall, the system demonstrated some resilience to the severe cuts in public funding during
the crisis and remains broadly efficient compared to other countries. The analysis shows a slight
increase in efficiency during the period 2009-2012 compared to 2000-2008 in terms of completion rates
(Figure 14). In other words, the decrease in completion was less than what could have been predicted given
the simultaneous decreased in spending. However, it is likely that the delayed effect on completion explains
part of this result. On the other hand, the analysis shows that although the country’s advantage in terms of
GERs was reduced, it remains well above expectation. This may indicate a certain degree of resilience of
the system, likely to be related to the rapid increased in private spending to compensate the cuts in public
spending. In addition, it is important to note that this analysis does not fully take into account the potential
loss in terms of education quality which would be measured through learning outcomes.17
42. Overall, the above analysis shows the relatively good structural performance of the system, but
hides important weaknesses, including in terms of learning outcomes. Madagascar has a high potential
in education as it has managed to achieve better or similar outcomes than comparable countries with lower
expenditures. So far, the crisis does not appear to have had a significant impact on efficiency if 2009-2012
averages are considered. This would seem to indicate that there some room to increase public expenditure
on education without moving to a situation of overspending relative to other countries. Important caveats
include however (a) it is likely that the full impact of the recent years is not fully captured, especially on
indicators which react with a delay (such as completion rates), (b) the efficiency of the system is so far
analyzed through the lenses of enrollments and completion, ignoring therefore changes in the equality of
education. Given the dramatic decrease in education learning outcomes over the past decade, it is probably
the case that although Madagascar is relatively more efficient than others at getting children to school, it is
performing particularly poorly in terms of ensuring that resources are translated into improved learning
outcomes.
17 The full set of results is presented in Annex3.

31
Figure 13. Expenditure Performance of Public Education: Pre/Post-Crisis Efficiency Based on
Completion Rates

32
Figure 14. Expenditure Performance of Public Education: Pre- vs Post-Crisis Efficiency Based on
Gross Enrollment Ratios (primary/secondary combined)

33
B.5 Key Findings and Policy Implications
Key Findings
Madagascar’s education system appears to be largely underfinanced, and public investment in the sector remains, for now,
relatively efficient in terms of enrollment and completion.
Level of public spending to education
Public spending on education has consistently received a relatively high priority in the budget.
However, Madagascar spends only 3.1 percent of GDP on education, the lowest share among comparable
countries, due mainly to the overall low envelope of public spending.
Public spending on education has decreased since 2010 due to a sharp drop in external funding. More than 80
percent of public sector funding comes from domestic resources, compared with 65 percent in 2010.
Execution of public spending
Execution rates appear to be relatively high, but multiple budget reallocations indicate a low capacity of the
Ministry of Education to execute its budget according to initial plans,
Tight regulation rates appear the be an issue for the education sector, especially in Q3
The sector remains highly centralized in terms of budget execution, despite a well-established school management
framework.
There exist serious limitations in the way budget execution is captured by SIGFP, which reduces MoE ability to
perform budget analysis and to use the budget as a tool for implementing the sector strategy.
Overall efficiency of public spending
The efficiency analysis shows a certain resilience of the system to severe spending cuts, in terms of enrolling
children in school.
However, the efficiency analysis does not capture: (a) the substantial increase in households’ contributions, which
may have mitigated the impact of cuts in government spending; or (b) the probable impact on education outcomes
of falling investments in the sector.
Policy Implications
In a context of rapid fall in learning outcomes, there is a need for additional public spending targeted directly at improving
quality.
Spending more
To durably improve education outcomes, Madagascar needs to invest more in education, in line with other
countries.
Given the already high share of education in the total budget, increased spending must come from either an overall
larger envelope of public spending or increased contributions from external funding (public or private).
Executing better
Better tools are needed to inform budget decisions. The SIGFP needs to be fully utilized, and key information needs
to be inputted into the system. External funds, especially on-budget funds, should be consistently recorded in the
SIGFP.
There is room to further deconcentrate the execution of spending, and the channeling of additional funds to schools
could be explored.
Regulation rates could be adjusted to the specific needs of the education sector, to alleviate some of the pressures
in preparing the new school year.
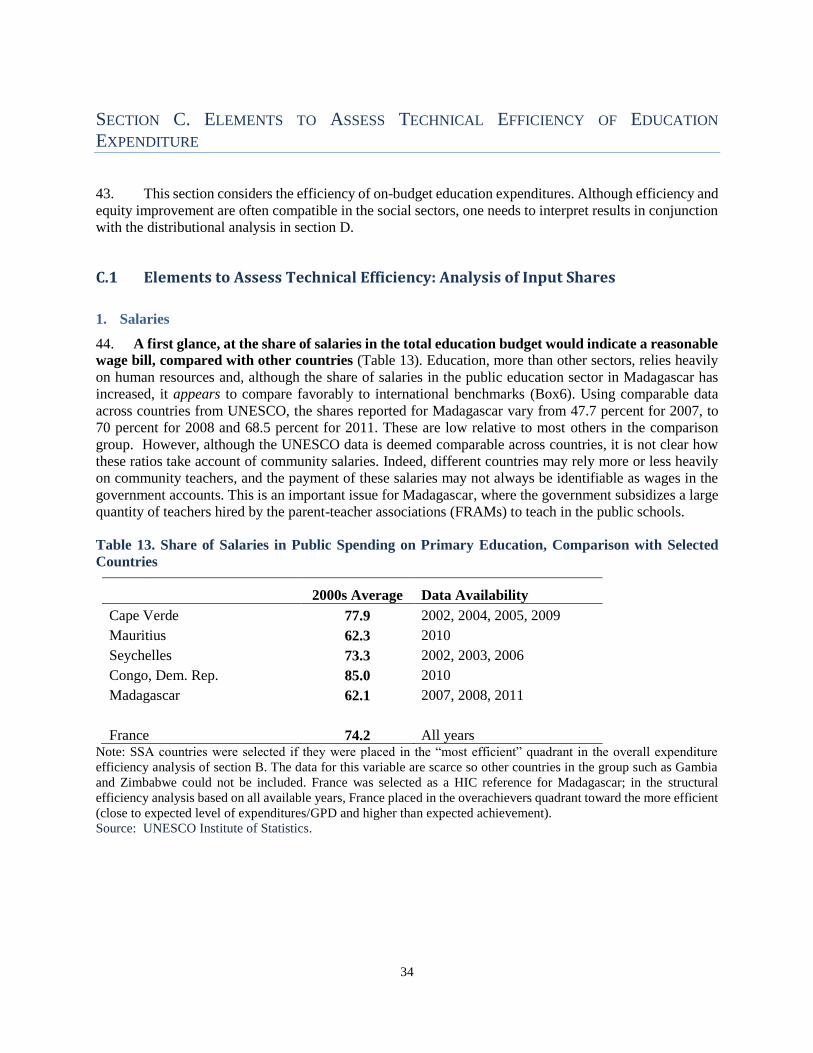
34
SECTION C. ELEMENTS TO ASSESS TECHNICAL EFFICIENCY OF EDUCATION
EXPENDITURE
43. This section considers the efficiency of on-budget education expenditures. Although efficiency and
equity improvement are often compatible in the social sectors, one needs to interpret results in conjunction
with the distributional analysis in section D.
C.1 Elements to Assess Technical Efficiency: Analysis of Input Shares
1. Salaries
44. A first glance, at the share of salaries in the total education budget would indicate a reasonable
wage bill, compared with other countries (Table 13). Education, more than other sectors, relies heavily
on human resources and, although the share of salaries in the public education sector in Madagascar has
increased, it appears to compare favorably to international benchmarks (Box6). Using comparable data
across countries from UNESCO, the shares reported for Madagascar vary from 47.7 percent for 2007, to
70 percent for 2008 and 68.5 percent for 2011. These are low relative to most others in the comparison
group. However, although the UNESCO data is deemed comparable across countries, it is not clear how
these ratios take account of community salaries. Indeed, different countries may rely more or less heavily
on community teachers, and the payment of these salaries may not always be identifiable as wages in the
government accounts. This is an important issue for Madagascar, where the government subsidizes a large
quantity of teachers hired by the parent-teacher associations (FRAMs) to teach in the public schools.
Table 13. Share of Salaries in Public Spending on Primary Education, Comparison with Selected
Countries
2000s Average Data Availability
Cape Verde 77.9 2002, 2004, 2005, 2009
Mauritius 62.3 2010
Seychelles 73.3 2002, 2003, 2006
Congo, Dem. Rep. 85.0 2010
Madagascar 62.1 2007, 2008, 2011
France 74.2 All years Note: SSA countries were selected if they were placed in the “most efficient” quadrant in the overall expenditure
efficiency analysis of section B. The data for this variable are scarce so other countries in the group such as Gambia
and Zimbabwe could not be included. France was selected as a HIC reference for Madagascar; in the structural
efficiency analysis based on all available years, France placed in the overachievers quadrant toward the more efficient
(close to expected level of expenditures/GPD and higher than expected achievement).
Source: UNESCO Institute of Statistics.

35
45. The share of regular teachers’ salaries in the budget has been fast increasing, and the wage bill
has reached unsustainable levels. Looking at changes in regular salaries is informative to address issues
of sustainability because regular salaries are not flexible downward. Using more recent data from the
MFB/SIGFP shows that the share of regular salaries is following a fast increasing trend, reaching over three
fourths of the education executed budget in 2013 (Figure 15). Although this is still within reasonable limits,
the trend is not sustainable. The recent announcement that 10,000 community teachers will be absorbed
into the civil service in 2014, and another 10,000 in 2015, are in that sense worrying (see Box 7 for more
details).
Figure 15. Evolution of Real Education Expenditures by Broad Economic Category
Source: Data from MFB/SIGFP.Data source: MFB/SIGFP.
0.0
100.0
200.0
300.0
400.0
500.0
600.0
700.0
2006 2008 2009 2010 2011 2012 2013
Billio
n C
on
stan
t 2
01
3 A
r.
Capital Expenditures
Other Recurrent Expenditure
Regular Salaries
Box 6. Analyzing Input Shares in Education
There are no benchmarks relative to the optimal combination of inputs that go into the “production” of education
(labor, capital, materials and supplies), but we know that (a) the production of education is highly labor intensive,
and (b) there is a large degree of complementarity among inputs.
Teachers are the most important resource, but they need schools and supplies to teach effectively, and more supplies
or more classrooms would not have much effect without more teachers. When too much is spent on one input
(particularly wages), other inputs are crowded out and the imbalance impedes efficiency, in particular by reducing
the quality of education. In addition to being necessary on efficiency grounds, keeping a reasonable balance
between expenditures on different inputs in the education sector is necessary to ensure sustainability. This is why,
although efficient ratios cannot be determined with the available data, it is important to track changes in the relative
shares of public expenditures going to each input.

36
Box 7. The Impact of the Regularization of Community Teachers as Civil Servants
Recent political decisions in the sector include the progressive integration of community teachers in the civil
service. Analyses carried out under this PER have aimed at estimating the potential impact on the MFB budget of
such integration, using various scenarios. Projections for 2020 show that the number of teachers would reach 96,100
for an expected 5.2 million children in primary school. This would translate into the recruitment of an additional
68,000 civil servants compared with 2014. An analysis of the potential impact of this decision on public spending
on education is presented below. The evolution of the macroeconomic context was simulated using two different
scenarios, in line with the recent scenarios elaborated by the IMF. More details on the methodology and scenarios
for the macro context are provided in the case study developed for this PER.
In addition, the analysis examined two different hypothesis for integrating community teachers in the civil service:
Hypothesis 1: all community teachers are integrated in the civil service as early as 2016, and new teachers are
hired as civil servants.
Hypothesis 2: community teachers are progressively integrated in the civil service to ensure that all teachers are
civil servants by 2020. More specifically, this hypothesis assumes the integration of 10,000 community
teachers in 2016, 15,000 in 2017, 15,000 in 2018, 16,000 in 2019 and 16,960 in 2020.
The results of projections show that Hypothesis 1 is unsustainable even in the most favorable case of the evolution
of the macroeconomic context. Indeed, from 2016 onwards, the salary needs for primary schools would amount to
550 billion MGA. This amount exceeds the global amount of the 2014 MFB budget, which was 541 billion MGA
in 2014, and is 10 times larger than the current amount allocated to community teachers’ subsidies.
In the case of Hypothesis 2, the results of projections show
that the integration of 10,000 community teachers in 2016
and as many in 2017 would result in salary costs equivalent
to about 300 billion Ar in 2016 and as much as 350 billion
Ar in 2017. This compares with 286 billion Ar and 318
billion Ar projected for salary costs in 2016 and 2017
respectively. Under both scenarios 1 and 2, the wage bill
would amount to 600 billion Ar by 2020, far above the
projected resources available for salaries under scenario 1
(504 billion Ar) and scenario 2 (414 billion Ar). This
scenario seems hardly sustainable even in the case of
favorable economic growth (Scenario 1), and completely
unrealistic in case of a slower economic growth (Scenario 2).
Simulating the impact of the integration of
community teachers
The results of these simulations show that the integration of community teachers as planned will have large and
unsustainable consequences on the MoE budget. To improve its feasibility, it would seem essential to envisage one
of the following options: (a) dramatically slow down the progression of integration, or (b) allocate more resources
to education. Even in the latter case, this simulation shows that the integration of community teachers into the
public service, even if progressive, will result in further increasing the already high weight of salaries in the MoE
budget. The interventions aiming to improve the quality of education, such as the improvement of infrastructure,
but also teacher training and the improvement of the availability of learning material, could therefore not be
financed by the State budget.

37
46. The way salaries of community teachers are accounted makes it difficult for the Ministry of
Education to have an accurate picture of the current and future wage bill. It is important to include all
labor costs when looking at efficiency issues in terms of the balance of inputs. Given the weight of
community teachers in the total, it is particularly important to incorporate their salaries when assessing the
level and trends of the wage bills. Yet, these salaries are currently included in the SIGFP as transfers to the
private sector and not directly distinguishable from other subsidies. In order to properly account for the
total wage bill, the non-wage budget was decomposed into labor and non-labor costs, and the amounts paid
to community teachers was identified. Given the importance of these subsidies for primary education and
as a share of the budget (as will be shown below), they should be explicitly separated from subsidies to the
private sector and identified as indemnities, so that the Ministry can easily monitor the levels of spending
on salaries.
47. Once community teachers are considered, the share of salaries in total education spending
reaches 90 percent, up from 70 percent in 2006, a level far above the regional average. Including
subsidies to community teachers, up to 70 percent of the non-wage budget consists of labor costs.18 The
proportion has fluctuated over the years without an identifiable trend, with peaks in 2009 and 2013, although
the subsidy to community teachers decreased in real terms in 2013.19 All labor costs included, the share of
the labor in public education went up from 70 percent in 2006 to 90 percent in 2013, while capital
expenditures went from 11 to 2 percent and non-labor operational expenditures from 19 to 7 percent. The
series in constant currency units shows that the changes in shares are due both to a steady increase in
expenditures on labor and a significant decrease in expenditures on the other inputs. The first sharp increase
in labor costs happened before the crisis, followed by a period of relative stability as a share of the budget
from 2009 to 2012 and another sharp increase in 2013 (Table 14). Figure 16 clearly shows capital and non-
wage recurrent expenditures crowded out by labor in 2013.
18 The figures on community teachers’ subsidies are based on verified data for 2011-2013, and on educated guesses
for the previous years, based on disaggregation of accounts by SOA. Note that the decomposition, in addition to
identifying all labor costs, removes the effects of possible changes in accounting that may affect reported trends. 19 Details on transfers for 2010 to 2011 were obtained from the MoE at the level of budget appropriation. Additional
data from the Direction in charge of fundamental education and literacy (DGEFA), the SOA from which the most
community teachers’ subsidy transfers originated in 2011 to 2013, provided the data on executed transfers. The
distinction is quite important, especially in the post-crisis years, as large differences could be identified between
modified credits and mandated expenditures at the disaggregated level in the MoE budget. The differences were
particularly large for credits directed to pay the subsidies to community teachers. Comparing the data provided by the
MEN to the SIGFP data disaggregated by account code and administrative units (SOA), correspondences could be
established so that executed expenditures on community teachers’ subsidies could be at least approximated. Since
community teachers’ subsidies were found to account for more than 97 percent of transfers to the private sector in
administrations overseeing the functioning of schools, our estimates are reasonable. Once again, the data for 2010 are
found to be problematic, as 25 percent of the community teachers’ subsidies (8.5 billion current Ar.) that were
identified in the final budget appropriations documented by the MoE data could not be found in the corresponding
SIGFP account.

38
Table 14. Decomposition of Executed Expenditures of the Non-Wage Recurrent Budget into Labor
and Non-Labor Expenditures, 2006-2013
In percent of the non-wage recurrent budget 2006 2008 2009 2010 2011 2012 2013
Regular personnel salaries and charges 14.1 22.3 31.8 20.4 28.1 13.6 31.5
community teachers 19.9 30.7 39.0 28.1 31.0 33.8 35.0
Other non-regular personnel 0.5 0.4 0.4 0.3 0.4 0.7 0.4
Good and services 65.5 46.6 28.8 51.1 40.4 51.9 33.1
Recurrent capital expenditures 4.9 7.8 6.2 8.9 1.8 0.6 0.9
Others recurrent expenditures 24.1 16.3 14.9 17.2 13.8 13.0 12.1
Labor costs in non-wage recurrent exp. 34.5 53.4 71.2 48.9 59.6 48.1 66.9
Data sources: Government accounts from MFB (2006 and 2008-2011), MoE (2010-2013).
Figure 16. Decomposition of the Education budget into broad input categories, 2006-2013
Note: Decomposition based on executed expenditures (dépenses mandates). Labor and capital include expenditures from the
recurrent non-wage budget (category 3 expenditures).
Source: Data from MFB/SIGFP. Data source: MBF (SIGFP) data (reconstituted for 2006 and 2008).
2. Investment
48. External support to investment through external funds has not compensated for the decrease
in the share of domestic spending allocated to this category of expenses. Given that capital expenditures
are mostly off-budget and, as seen before, even on-budget foreign funds appear to end up being spent off-
budget, it is important to include these expenditures in looking at the balance of inputs—particularly since
they also go in the production of public education and are in good part directed to investment. It does not
appear, however, that foreign aid not included in the government account compensated for decreases in
capital. In fact, the opposite occurred in 2011 and 2012, with both domestic investment and foreign aid
going down (Figure 17).
0.0
100.0
200.0
300.0
400.0
500.0
600.0
2006 2008 2009 2010 2011 2012 2013
In b
illio
n 2
01
3 A
r.
Total labor expenditure
Other recurrent expenditure
Capital expenditure

39
Figure 17. Net changes in Investment in Education, Including Foreign Aid, 2009-2013
Source: Data from MFB/SIGFP. Data sources: MoE (SIGFP) and AMP (foreign aid).
49. Overall, the high share of the budget devoted to salaries leaves very little room for
complementary inputs, which are key to improving education outcomes. While Madagascar appears
to have labor costs lower or comparable to other countries when looking at regular teacher salaries,
including payments to community teachers puts the country way above international benchmarks. This
leaves little space for spending on other type of inputs that are also key to improving education outcomes,
including school infrastructure, teacher training, and teaching and learning materials. Indeed, the quality
issue is not just about having a sufficient number of teachers in the classroom, but about necessary
complementary inputs that both regular and community teachers need to fully utilize their skills.
C.2 Elements to Assess Allocative Efficiency: Expenditure Analysis by Function
-9.4 -3.8-24.1
14.8
98.0
-48.9
-111.5
9.5
2009 to 2010 2010 to 2011 2011 to 2012 2012 to 2013
Billio
ns
of
con
stan
t 2
01
3 A
r.
Change in capital exp in gov. accounts
Change in disbursements of aid not in gov.accounts
Box 8. Allocative Efficiency Analysis Using Functional Allocations of Expenditure in Education
Allocative efficiency analyses generally examine the types and combinations of goods and services produced in
relation to demand. The term allocative efficiency is loosely interpreted here in the sense that consumer preferences
and demand are not directly measured. Instead, the analysis rests on some general appreciation of needs based
mostly on enrollment ratios, completion rates, and literacy indicators and on well-known characteristics of
education at different levels.
Analysis of the distribution of education expenditures by level are useful to assess allocative efficiency in terms of
whether expenditures are aligned with the needs of the population and are directed to functions with highest positive
externalities and best value-for-money characteristics. The question is whether efforts are placed where they are
most needed and where they will have most effect.
The need to prioritize some levels against others is based on specific conditions of the country in terms of level of
development, demographic characteristics, and current educational achievement. In the case of Madagascar, the
Government has identified primary education as a priority to ensure that all children possess basic skills and
competencies.

40
1. Data quality and governance considerations
50. Although Madagascar has been using a programmatic budget for the period in this report
(2006-2013), there were many changes across years in the way expenditures are categorized within
and across programs. The definitions of programs were changed several times between 2006 and 2011.
In particular, it is difficult to track primary and lower secondary levels separately or to identify
administrative expenditure versus educational expenses within programs and for the Ministry as a whole.
Even after 2011 when budget classifications stabilized, significant differences were detected in the way
equivalent types of expenditure were processed within and across programs in different years. Moreover,
the structure of the programmatic budget has not been aligned with the objectives and main programs of
the Interim Education Sector Plan 2013-2015, making it difficult to assess the alignment between budget
and strategies.
51. Related to this, the lack of disaggregation of salaries by program makes it difficult to monitor
changes in functional distribution of spending across the years. Considering that personnel costs
account for such a large part of the executed budget, the way salaries are accounted for severely limits the
analysis. Indeed, personnel expenses are not broken down by program, so assigning salary expenditures to
the different programs cannot be routinely done using the SIGFP data. In the absence of such prior sorting,
classifications can be reconstructed with some degree of approximation using average salaries by category
of personnel, combined with data on the distribution of personnel within the different programs.20
Allocating salaries by program in the budget would be an important improvement to better inform budget
decision.21
52. Similarly, administration expenditures cannot be properly separated into the different levels
of education. Indeed, the way administration was included in the accounts changed frequently since the
introduction of program budgeting. In addition, the assignments by level introduced in 2010 looked
arbitrary and also changed every year.22 Allocations free of administrative changes would have to be done
using fixed shares (as was done for the PIE) and, although this could be useful to calculate unit costs, it
does not add any information when looking at trends.
53. Moreover, large differences at the disaggregated level between executed expenditures and
voted budgets make the use of budget appropriations as a measure of functional distribution
problematic. Classifications at the level of execution could also be problematic if, within the same
20 Such a breakdown of salaries by program was reconstituted for the Education Interim report (PIE) up to 2011.The
analysis was done using 2006 and 2010 detailed personnel and average salary information. Fixed percentages were
then used for in-between years. We rely on this breakdown and complete the series for 2012 and 2013 using the same
ratios as in 2011. The breakdown of community teachers into the different levels of education would normally be done
automatically by assigning a different program to the transfer expenditure. Unfortunately, this is not always done in
the SIGFP so the figures below rely on data provided by the MEN on appropriations and a decomposition by SOA to
approximate these numbers.
21 The work represent an important cost for the MEN personnel who need to periodically reconstitute these series to
produce typical reports such as the PIE and the information gained by these estimations is incomplete relative to what
would be gained using program budgeting tools, especially with regards to trends. 22 For example, in 2009, 50 percent of DREN expenses were allocated to secondary education; in 2010, it went down
to 19 percent ; in 2011, 92 percent and in 2012 and 2013, zero

41
administration, funds designated for a certain type of activity are in fact used for another activity but still
accounted as pertaining to the original one. Movements between SOAs with different functions between
the final credit stage and the execution stage make the functional analysis less reliable.
2. Functional classifications of expenditures
54. The analysis below uses the reconstitution by program that was presented for the PIE and extends it
to 2013.23 Regular wages up to secondary education are based on 2011 ratios found in the PIE data,
implicitly assuming that the labor ratios remained constant.24 Given the weakness of the investment data
previously documented, the analysis focuses on expenditures of the recurrent budget.25 A reconstitution of
expenditures by level and function, using an alternative methodology based on detailed information on
administrative units and account codes in SIGFP, is presented in Annex 3.
55. Primary education absorbs almost half of total non-investment education expenditure, driving
most changes in the recurrent budget for education. Data from the SIGFP show a remarkable stability
in shares allocated to the different levels across the period. However, this stability does not necessarily
reflects a continuous priority to primary education, but results from the methodology used to allocated
salaries across levels and functions (using quasi-fixed shares, as explained above). Yet, beyond the trends,
it remains that primary education receives a large share of public spending on education, between 45 and
48 percent over the period 2002-2013 (Figure 18). This share is in line with that in other countries at a
similar level of development, and reflects the priority given to primary education by successive
governments.
Figure 18. Allocation of Recurrent Education Expenditure by Level and Function, 2002-2013
Note: 2011-2013 are base of MFB data, except for the allocations of regular wages by levels up to secondary which
are based on 2011 ratios from PIE calculations.
Source: Data from MEN/PIE and MFB/SIGFP.
23 The series reports expenditures at the commitment level instead of executed to match the PIE methodology.
Extension to 2013 data was possible given that total expenditures reported in the PIE matched the 2011 SIGFP totals
(although it was not the case for previous years) and budget programs remained the same between 2011 and 2013. 24 Taking account of changes in these ratios requires detailed data on staffing that was not received at this time. 25 In addition, important errors in the investment numbers for primary education in 2003 to 2005 were detected for
2003 to 2005 in the PIE spreadsheet.
0%10%20%30%40%50%60%70%80%90%
100%Administration
Post-Secondary and research
Professional training
Secondary
Junior secondary
Primary
Alphabetisation and pre-school

42
56. The non-wage recurrent budget, although a much smaller part of total expenses shows a
surprisingly large and increasing share of education spending going to post-secondary education.
While the share of primary education in the non-wage recurrent budget is approximately the same as above,
post-secondary education and research become nearly as prevalent, while the intermediary levels (all
secondary and professional training) receive very little of the non-wage budget (Figure 19). The surprisingly
high share of non-wage recurrent budget going to post-secondary may be related to the fairly large program
of support to university students, including scholarships. Still, the extremely low share of non-wage
recurrent budget allocated to secondary education is worrying, given the increasing importance of this level
of education for the acquisition of key skills and competencies.
Figure 19. Allocation of Current Non-Wage Expenditures by Level, 2002-2013
Note: 2011-2013 are based on MFB (SIGFP) data and budget classifications.
Source: Data from MEN/PIE and MFB/SIGFP.
57. The large share of non-wage recurrent budget allocated to primary education is mostly
explained by the subsidies to community teachers. As mentioned above, subsidies to community teachers
are included in the non-wage recurrent budget and have made up over two thirds of non-wage recurrent
expenditures going to primary education since 2009, and up 78 percent in 2013.26 These subsidies have also
significantly contributed to changes in non-wage recurrent expenditure since 2009. The large share of
primary education found in the data above is therefore due mostly to labor costs.
58. Overall, including all salaries but excluding investment, Madagascar spends more than half of
its education budget for primary education, while relatively little is spent on secondary education
(Figure 20). Internationally comparable data places Madagascar close to the average of low-income and
SSA countries. The more recent data presented above, although it does not include investment, would
indicate that the share going to primary and lower secondary have increased above the average of most
countries in the sample except Burkina Faso. The data presented in Table 15 is based on all data available
in the 2000-2012 period, although availability is very uneven across countries.
26 Figures based on SIGFP executed expenditure for Education Fondamentale 1er cycle, mandatement level.
0%
10%
20%
30%
40%
50%
60%
70%
80%
90%
100%
2002 2003 2004 2005 2006 2007 2008 2009 2010 2011 2012 2013
Administration
Post-Secondary and research
Professional training
Secondary
Junior secondary
Primary
Alphabetisation and pre-school

43
Figure 20. Total Current Expenditure by Level of Education, Average 2011-2013
Note: Fixed salary allocation for up to secondary education using PIE weights, general administration expenditure
excluded. Series based on the existing budget classification.
Source: Data from MFB/SIGFP; fixed salary allocation for up to secondary education using PIE weights.
Table 15. International Comparisons of Public Expenditure Shares by Level of Education, averages
2000-2012
Primary
(2000-2012)
Secondary
(2000-2012)
Primary
(2010-2012)
Secondary
(2010-2012)
Burkina Faso 63.5 15.4 59.4 18.4
Benin 53.3 26.2 52.8 28.0
Cabo Verde 48.7 31.8 43 37.1
Burundi 46.5 28.8 46.2 26.6
Senegal 43.6 24.6 40.0 29.0
Cote d'Ivoire 42.3 33.5 .. ..
Congo, Dem. Rep. 36.8 28.2 33.0 33.7
Congo, Rep. 33.7 35.9 31.0 53.3
Cameroon 33.6 54.4 34.3 51.4
Seychelles 28.8 25.3 24.0 16.1
Mauritius 28.8 44.5 26.8 51.7
Average LIC s 50.3 25.4 .. ..
Average SSA
(LDC) 45.6 28.7
..
.. Source: Data from UNESCO.
C.3 Unit costs
59. Unit costs have decreased for all levels but primary education since 2009. Figure 21 shows a
significant decrease in the unit cost per student in secondary education, consistent with increasing
enrollments and non-increasing or decreasing expenditure. The unit cost for primary education remained
very stable, at less than 100,000 Ar. per student for most of the period, which represents less than 10 percent
of the estimated GDP per capita in 2013. Excluding investment, the 2012 unit costs in USD at the 2013
exchange rates are 39 USD per student per year for primary school, 71 for junior secondary and 141 for
upper secondary school (8, 15, and 30 percent of GDP per capita). When adding investment spending, unit
0.4%
55.2%18.2%
7.2%
2.8%16.4%
Current expenditure by level of education, average 2011-2013
(excludes general administration)
Preschool/literacy
Primary
Junior secondary
Secondary
Professional training
Post-secondary and research

44
cost in primary education amounted to 42 USD or 9 percent of GDP/capita in 2012. (Note that the figure
is higher than the 6.51 percent reported in the UNESCO series below.)
Figure 21. Public Non-Investment Expenditure per Student, 2002-2012
Source: Data from MEN, Annuaires Statistiques and PIE; MFB/SIGFP. 2012-2013 enrollments not yet available.
60. Using the UNESCO series (to retain comparability), Table 16 below shows that unit costs in
Madagascar are lower than the regional average but comparable to countries with comparable per
capita GDP. It is interesting to see that the Gambia, which placed high in terms of overall efficiency in
section B analysis, spends a much higher share of its GDP per student in primary school. On the other hand,
the DRC, which also placed in the efficient region, spends very little per student (although the DRC data is
based on a single year and is likely much less robust than the Gambia result based on the full period).
Table 16. Primary School Unit Cost Comparisons, Madagascar and Sub-Saharan Africa
In percent of GDP/capita
Average Years data GDP in USD/capita
Gross
enrollment
ratio
Years data
2008-2012 available 2012 primary (%)
2012 available
Congo. Dem. Rep. 4.91 2010 231 110.8 2008-2012
Cameroon 6.55 2008-2012 1181 110.6 2008-2012
Uganda 7.15 2009-2012 596 ..
Madagascar 7.17 2008-2012 451 145.1 2008-2012
Rwanda 7.93 2008-2012 682 133.7 2008-2012
Seychelles 8.62 2011 11240 ..
Mauritius 10.02 2008-2012 8850 108.1 2008-2012
Togo 10.11 2008-2012 607 132.8 2008-2012
Cote d'Ivoire 15.44 2012 1057 94.2 2008-2012
Burkina Faso 15.70 2010-2012 636 84.9 2008-2012
Gambia. The 17.05 2008-2012 497 85.2 2008-2012
Sub-Saharan Africa (all
income levels) 12.85 2010 101.7
Source: Data from UNESCO Institute of Statistics series for unit cost/GDP.
0
100
200
300
400
500
600
700
800
900
2002 2003 2004 2005 2006 2007 2008 2009 2010 2011 2012
Th
ou
san
d o
f c
on
stan
t 2
01
3 A
r.
Pre-school and literacy
Primary
Junior secondary
Secondary

45
C.4 Key Findings and Policy Implications
Key Findings
Madagascar’s public education spending is mostly geared towards salaries, which are rapidly
increasing, leaving little room to finance the quality agenda.
Economic analysis of public spending
Combining regular and community teachers, salary costs represent 90 percent of total public
spending on education, up from 70 percent in 2006.
Regular teachers, who represent 78 percent of the total teaching force, absorb a disproportionate
share of the wage bill.
Community teachers’ salaries are classified as “transfers” in SIGFP, which complicates the analysis
of changes in the wage bill.
Capital spending has been dramatically reduced, due to a combination of factors, including the drop
in external aid.
Overall, public spending on education is heavily focused on salaries, leaving little room to finance
other inputs that have an impact on education quality. The ongoing regularization of community
teachers into the civil service is likely to aggravate this situation over the short term.
Functional analysis of public spending
The share of primary education in total education spending is line with comparable countries.
Unit costs in primary education appear to be on the lower side of comparable countries, while the
rapid decrease in unit costs in secondary education is worrying, given its importance in terms of skills
acquisition and in promoting primary completion.
Policy Implications
There is a need to progressively reorient spending towards inputs that have a direct impact on quality,
while improving the ability of the Ministry to perform economic and functional analysis of the budget.
Supporting the quality agenda through better targeting of public investment
Until the system is allocated more resources, containing the wage bill will be necessary to ensure that
other items can be supported. This might require a slower implementation of the ongoing
regularization of community teachers.
Madagascar could also consider further refining its framework for contractual teachers, to ensure that
the necessary improvement in the status of community teachers remains sustainable.
The ongoing regularization provides an opportunity to improve the distribution of qualified teachers
across the country, which has been shown to be a key driver of learning achievements.
Investing in items other than salaries is an absolute priority. In particular, more public resources are
needed to substantially improve teacher training, curricula and learning materials.
The learning crisis in primary should not entirely detracts attention from secondary education, which
remains key for future growth and development.
Better use of the budget as a strategic tool for the sector
A renewed focus on program budgeting would help the Ministry in the preparation and analysis
of the budget.
Various adjustments could be made to facilitate budget analysis, including better categorizing
of salary costs of community teachers, and systemizing the rationalization of administrative and
salary costs by level of education.
46
SECTION D. DISTRIBUTIONAL ANALYSIS OF PUBLIC EDUCATION EXPENDITURE
D.1 Distribution of Public Education Expenditures by Region and Type of Residence
61. Given that Madagascar has not had a census for many years, per capita distributions may not be a
good reflection of reality. However, spending decisions at the Ministry level are typically done according
to enrollment figures, with the aim of creating a close relationship between population and expenditures.
Public education expenditures should also be positively related to poverty. The following analysis is based
on current education expenditures, including wages.27 Levels of education considered include up to
secondary to ensure that facilities are available in all regions. The distribution by province and region with
regard to population is examined first,28 followed by an analysis of the relationship between per capita
expenditures and regional poverty levels. The last subsection briefly assesses rural/urban differences
1. Regional allocations versus population shares
62. The distribution of current public spending on education is broadly equal across former
provinces; however, some economies of scale are noted. The allocation of non-central non-investment
education expenditures by ex-province roughly follows current population estimates, although Mahajanga
and Toamasina receive 50 percent more per capita than Toliara and Antananarivo (Figure 22).29 In addition,
the allocation by province has remained stable since 2010 after an important reduction of relative
expenditures going to the province of Antananarivo in 2008 and 2009.
27 Unfortunately, the analysis cannot include investment which is not identified by recipient region for the most part.
Funds allocated to regions by the FDL are also too small to make a difference in the picture presented here but
difference in FDL allocations by regions should be monitored considering the fact that this type of investment will
have a direct impact on communities. 28 The allocations by province relies fully on data from the SIGFP while allocations of wages by regions are based on
specific salary data, also from MFB. Differences between the two sources are documented in Annex 1, Tables A.1
and A.2). 29 Antananarivo likely benefits disproportionately from expenditures at the central level so a lower per capita benefit
from non-central expenditure is expected. About one half of current public education expenditures (including wages)
are allocated to the central level, the rest being allocated across provinces.

47
Figure 22. Current Expenditure (up to Secondary) by Province in Relation to Population
Note : Excludes Expenditures assigned to the central level (56 % of current expenditure in 2009, 44 % in 2013)
Source: Expenditure from MFB, population data from INSTAT, Madagascar.
63. Looking at regular salaries, the data also show a reasonably equitable distribution across
regions, although Androy and Atsimo-Atsinanana stand out as receiving less and Amaron’i Mania
as receiving more (Figure 23). As shown earlier, regular salaries constitute a sizeable part of current
expenditure. Although the SIGFP does not distribute salaries by region, the information could be obtained
separately from the MFB (Service de la Solde). The differences between the SIGFP data and the salary data
are reasonably distributed across regions and should not affect distributional results.30 The breakdown of
salaries by region shows a relatively good alignment between population and salaries of regular teachers.
It is worth noting, however, that some regions receive significantly less than their population share,
including Androy and Atsimo-Atsinanana, which are among the most vulnerable regions in terms of poverty
and education outcomes.31
30 The 2008 and 2009 salaries by region were not shared by the MFB. Salaries identified as paid to central personnel
were removed from the regional totals and grouped with central salaries (on account that central level personnel likely
spend most of their time in the Capital). The regional amounts were aggregated at the province level and compared to
the wage data in the government accounts (SIGFP). The salary data included 11-32 percent more than SIGFP for years
prior to 2009 and about 10 percent less in the period 2010-2013 (Annex 1, Table A.2). 31 Because physical mutation of staff happen significantly faster than changes in the accounting of these salaries that
are subject to more cumbersome procedures, some salaries may be assigned to one region when in fact the staff works
in another. Staff at the MoF evaluated this issue as relevant for up to 15 percent of the staff in any region. However,
they do not anticipate that this would affect regional breakdowns because all regions are affected equally, except for
the Antananarivo because some staff would prefer to keep their files in the capital.
01234567
010203040506070
Mill
ion
s
Bill
ion
co
nst
ant
20
13
Ar.
Average 2009-2013
Population
12
15
10
15 14
10
Per capita, 2013
1000 of Ar.

48
Figure 23. Distribution of Public Education Regular Wages across Regions vs Population Shares,
2013
Source: Data from MFB, direction de la Solde
2. Relationship between expenditures and poverty
64. The distribution of government current expenditures by region indicates some regressivity,
with some leveling out during the most recent period.32 Data show that government current expenditure
per capita by region is negatively correlated to poverty ratios and positively related to per capita
consumption in both periods, which would indicate some regressivity, although statistical significance is
weak (Table 17). Although one cannot see clearly whether the distribution is more or less regressive in
2010, the correlation coefficient between the change in expenditures and poverty rates indicates that
government expenditures decreased less in poorer regions (Figure 24). One possible explanation is that
poverty ratios changed significantly in the period considered and evened out across regions, while
expenditure per capita decreased in all regions by an average of 40 percent without marked differences
among regions (ranging from about 30 to 50 percent).
32 To increase data quality, in particular to smooth issues related to mutations of personnel mentioned above, averages
of 2006-2008 current expenditures are compared to averages of 2009-2013. Salaries are averaged over 2006 and 2007
for the pre-crisis period and 2010-2013 for the post-crisis period. Other current expenditures from SIGFP are averages
of 2006 and 2008 for the first period and 2009-2013 for the second period. Poverty levels are calculated from the
periodic Household Survey (EPM) 2005 and 2010.
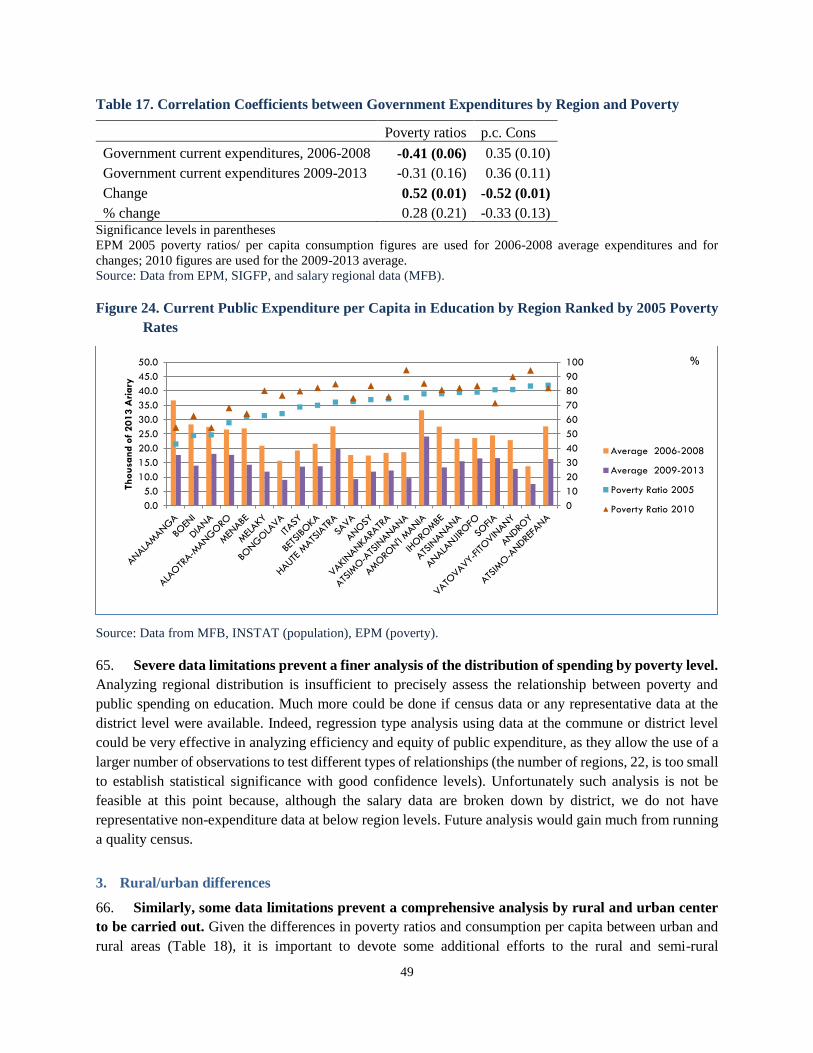
49
Table 17. Correlation Coefficients between Government Expenditures by Region and Poverty
Poverty ratios p.c. Cons
Government current expenditures, 2006-2008 -0.41 (0.06) 0.35 (0.10)
Government current expenditures 2009-2013 -0.31 (0.16) 0.36 (0.11)
Change 0.52 (0.01) -0.52 (0.01)
% change 0.28 (0.21) -0.33 (0.13) Significance levels in parentheses
EPM 2005 poverty ratios/ per capita consumption figures are used for 2006-2008 average expenditures and for
changes; 2010 figures are used for the 2009-2013 average.
Source: Data from EPM, SIGFP, and salary regional data (MFB).
Figure 24. Current Public Expenditure per Capita in Education by Region Ranked by 2005 Poverty
Rates
Source: Data from MFB, INSTAT (population), EPM (poverty).
65. Severe data limitations prevent a finer analysis of the distribution of spending by poverty level.
Analyzing regional distribution is insufficient to precisely assess the relationship between poverty and
public spending on education. Much more could be done if census data or any representative data at the
district level were available. Indeed, regression type analysis using data at the commune or district level
could be very effective in analyzing efficiency and equity of public expenditure, as they allow the use of a
larger number of observations to test different types of relationships (the number of regions, 22, is too small
to establish statistical significance with good confidence levels). Unfortunately such analysis is not be
feasible at this point because, although the salary data are broken down by district, we do not have
representative non-expenditure data at below region levels. Future analysis would gain much from running
a quality census.
3. Rural/urban differences
66. Similarly, some data limitations prevent a comprehensive analysis by rural and urban center
to be carried out. Given the differences in poverty ratios and consumption per capita between urban and
rural areas (Table 18), it is important to devote some additional efforts to the rural and semi-rural
0
10
20
30
40
50
60
70
80
90
100
0.0
5.0
10.0
15.0
20.0
25.0
30.0
35.0
40.0
45.0
50.0 %
Th
ou
san
d o
f 2
01
3 A
riary
Average 2006-2008
Average 2009-2013
Poverty Ratio 2005
Poverty Ratio 2010

50
disadvantaged areas. The government expenditure data cannot be directly divided into rural and urban
locations, but it identifies activity units by commune code. To carry out an analysis by type of residence,
we used the official delineation of communes into rural and urban categories under the 2011 Decree.33
Communes were classified into four levels of urbanization to minimize border effects and avoid over-
identifying communes as rural. Unfortunately, many expenditures for primary schools are in transfers that
are not identifiable by commune with the data obtained. The small amounts that can be identified by
commune, however, are likely to be indicative of the level of activity.
Table 18. Poverty and Consumption by Type of Residence, 2005 and 2010
Poverty rate
% p.c. Consumption in PPP
2013 Ar, capital city
2005 2010 2005 2010
Capital city 34.4 30.1 266014 680428
Large urban centers 43.4 31.6 230112 662635
Secondary urban centers 63.4 62.1 167412 426743
Rural areas 73.5 82.2 137847 283781 Source: Household Surveys (EPM 2005, 2010).
67. Expenditure shares by type of residence have evolved in favor of the large urban centers (+14
percent), mostly at the expense of other urban areas and peri-urban rural areas (Figure 25, Table 19).
Rural areas (including the peri-urban areas) received less than a third of expenditures. Considering that
approximately two- third of the population lives in rural areas, this represent a very unequal distribution.
The most rural communes received less than 10 percent of government current expenditures throughout the
period, and a low of 5.6 percent in 2008.
Figure 25. Rural/Urban Shares of Non-wage recurrent expenditures directly assigned to communes
Data sources: SIGFP and Décret-n°2011-0042 (MFB).
33 Décret-n°2011-0042-portant-classement-des-Communes-en-Communes-urbaines-ou-en-Communes-rurales,
MFB.
3589 4479 2243 1553 1535 2874 2236
2314822621 14195 7573 7661
7325 4882
83016690 4887 2410 2507 2643 1698
3748 2000 1360 934 1200 1168 811
2006 2008 2009 2010 2011 2012 2013
Large urban centers Urban Rural/Urban Rural
51
Table 19. Share of Expenditures to Rural Areas vs Share of the Population
In percent 2006 2008 2010 2011 2012 2013
share of rural* in total expenditure 9.7 5.6 6.0 7.5 9.3 8.3
share of rural-extended* in total expenditure 31.1 24.3 27.5 26.8 28.7 27.2
Approximate share of rural population 70.6 69.3 68.7 68.1 67.4 66.8 *Note: Rural only includes the most rural communes (category 2 rural). Peri-urban communes (category1 rural) are included in the
rural-extended category.
Data source: WDI, SIGFP.
D.2 Direct household expenditures on education and their impact on regional and income inequalities
1. Distribution of household expenditure by income levels and regions
68. In the recent years, private spending on education has generally increased, with some direct
impact on enrollment. Since the crisis, a greater number of households with a child in Grade 2 has had to
pay enrollment fees, PTA contributions and monthly school fees (Table 20). The share of households paying
enrollment fees has increased the most, by 7 percentage points, against 4 percentage points for the share
paying PTA contributions and one percent for those paying school fees. In addition to be more frequent,
the amount paid in school fees have generally increased. Average household per pupil spending increased
from Ar 6,561 to Ar 8,277, representing a 26 percent increase over three years.34 This has had direct
repercussions in terms of enrollment. Indeed, financial problems are the first reason given by household to
explain dropout, and this has only worsened since the beginning of the crisis in 2009.
Table 20. Share of Households in the Southern Districts that Paid Enrollment Fees, PTA
Contributions and Monthly School Fees, 2009 and 2012 (Sample Selection)
Percent 2009 2012 2009-12 Gap
(% Points)
Households having paid enrollment fees 34.6 41.5 6.9
Households having paid PTA contributions 36.5 40.9 4.4
Share of parents having paid late 71.4 85.2 13.8
Parents exempt from PTA contributions 20.0 14.5 -5.5
Households having paid monthly school fees 12.5 13.8 1.3
Source: South Survey in the Districts of Amboasary and Betioky, 2009 and 2012.
69. The share of household budget spent on education increased more for the richest. To interpret
this data, it is important to note that, in Madagascar, the poverty level is situated around the average level
of consumption in the fourth quintile (and even closer to the high end of the fourth quintile in 2010). The
34 Annex B explains the difference between the two groups: Sample Selection and Tracer Study.

52
distribution in 2005 was U-shaped, with the poorest spending a higher share of their income than households
in the second, third and fourth quintiles. The situation was more clearly progressive in 2010, with shares of
income increasing for the richer households, but this came with an increase in household expenditures on
education for all but the bottom two quintiles, with all quintiles paying a higher share of their budget in
2010.35 Looking at average education expenses per child in school, there was a slightly higher cost in the
third and fourth quintiles in the bottom two and richest quintiles (Figure 26).
Figure 26. Household Direct Education Expenditure, 2005 and 2012
Source: EPM 2005 and ENSMOD 2012.
70. The cost per child in school differs significantly by region, and is inversely related to poverty
rates. Correlation coefficients with contemporaneous poverty are negative and significant (-0.70 in 2005
and -0.90 in 2010), after adjusting for regional price variations. The strong correlation results hide some
important variance across regions, however, especially when looking at changes in costs between 2005 and
2010 (Figure 27). Changes across time show that all regions experienced an increase in cost in real terms,
except for Ihorombe. Regions with the highest poverty rate in 2005 also experienced some of the highest
increases in expenditure per child in school (Sofia and Atsimo Andrefana, in particular).36
35 A lower budget share in the poorest quintile would not have led to a positive interpretation, however, as it would
have likely meant that the poorest students do not go to school altogether, which is not desirable. 36 The correlation coefficient between the change in cost and poverty rates are, however, not significant.
0.0
50.0
100.0
150.0
200.0
250.0
300.0
0
0.5
1
1.5
2
2.5
3
3.5
4
4.5
5
Lowest quintile Secondquintile
Third quintile Fouth quintile Richest
Th
ou
snad c
on
stan
t 2
01
3 A
r.
% of budget 2005
% of budget, 2012
Avg exp. per child in school, 2005
Avg Exp. per child in school, 2012

53
Figure 27. Primary Attendance Rate and the Share of Household Budget on Education by Region,
2012
Source: ENSOMD 2012.
71. The share of primary education in the household budget is weakly related to primary
attendance rates, indicating that the private cost of public education can be higher for families living
in regions where attendance is low. According to 2012 Household Survey data, the share of education in
household expenditure increases with primary attendance, but the correlation coefficient is weak (0.34).
Figure 28 shows differences across regions. The regions of Analamanga, Diana and Sava stand the highest
attendance rate with greater share of household expenditure on education, whereas the region of Anosy has
a high household expenditure with less attendance primary rate.
Figure 28. Cost per Child in School by Region, Ranked by Poverty Level, 2005 and 2010
Note: Cost per child is adjusted to reflect prices in the capital.
Data source: Household Surveys 2005 and 2010.
0
10
20
30
40
50
60
70
80
90
0 0.5 1 1.5 2 2.5 3
Pri
mary
atten
dan
ce r
ate
(6
-10
y
ears
) 2
01
2
Education expense in primary as share of budget, 2012
Androy
Analamanga
Boeny
Melaky
SAVA
Ihorombe
DIANA
Anosy
0
10
20
30
40
50
60
70
80
90
100
0.0
20.0
40.0
60.0
80.0
100.0
120.0
Th
ou
san
d o
f 2
01
3 A
riary
Cost per child in school, 2005 Cost per child in school, 2010 Poverty ratio 2005 (secondary axis) Poverty ratio, 2010
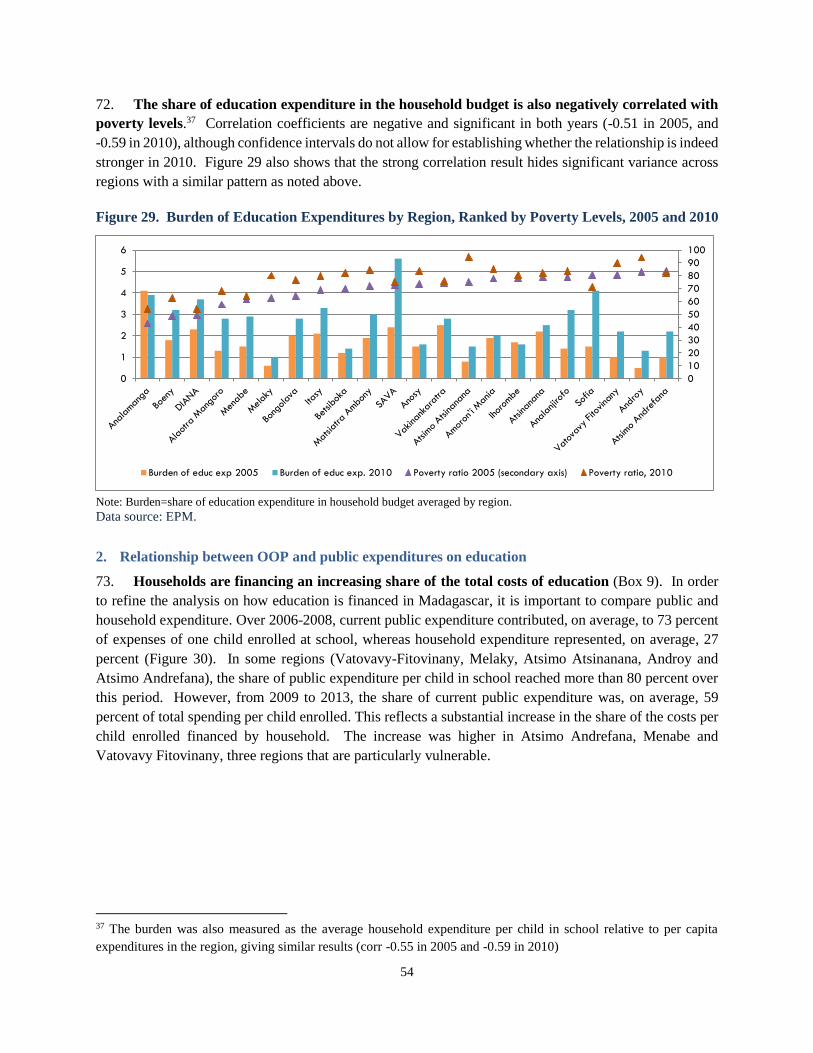
54
72. The share of education expenditure in the household budget is also negatively correlated with
poverty levels.37 Correlation coefficients are negative and significant in both years (-0.51 in 2005, and
-0.59 in 2010), although confidence intervals do not allow for establishing whether the relationship is indeed
stronger in 2010. Figure 29 also shows that the strong correlation result hides significant variance across
regions with a similar pattern as noted above.
Figure 29. Burden of Education Expenditures by Region, Ranked by Poverty Levels, 2005 and 2010
Note: Burden=share of education expenditure in household budget averaged by region.
Data source: EPM.
2. Relationship between OOP and public expenditures on education
73. Households are financing an increasing share of the total costs of education (Box 9). In order
to refine the analysis on how education is financed in Madagascar, it is important to compare public and
household expenditure. Over 2006-2008, current public expenditure contributed, on average, to 73 percent
of expenses of one child enrolled at school, whereas household expenditure represented, on average, 27
percent (Figure 30). In some regions (Vatovavy-Fitovinany, Melaky, Atsimo Atsinanana, Androy and
Atsimo Andrefana), the share of public expenditure per child in school reached more than 80 percent over
this period. However, from 2009 to 2013, the share of current public expenditure was, on average, 59
percent of total spending per child enrolled. This reflects a substantial increase in the share of the costs per
child enrolled financed by household. The increase was higher in Atsimo Andrefana, Menabe and
Vatovavy Fitovinany, three regions that are particularly vulnerable.
37 The burden was also measured as the average household expenditure per child in school relative to per capita
expenditures in the region, giving similar results (corr -0.55 in 2005 and -0.59 in 2010)
0
10
20
30
40
50
60
70
80
90
100
0
1
2
3
4
5
6
Burden of educ exp 2005 Burden of educ exp. 2010 Poverty ratio 2005 (secondary axis) Poverty ratio, 2010

55
Box 9. Parents’ Contribution to School Financing: Results from a Field Study
The results of the survey carried out for this study (non-nationally representative) show that household expenditures
averaged 18,000 MGA for a child in primary school, ranging from 27,000 MGA in Analamanga to 7,300 MGA in
Melaky. Parental contributions to school expenditures averaged more than 21,000MGA in the regions of
Analamanga and Atsinanana. A survey conducted by MEN in 2013-2014 in 30 schools of the Antananarivo
Renivohitra CISCO showed comparable results, included an average contribution of parents to the school budget
of 18,410 MGA, varying from 5,000 MGA to 28,000 MGA. In 30 surveyed schools, the collected resources reached
a total of 128 million MGA, an average budget of 5.3 million MGA per school.
Parental contribution for a child enrolled in primary
school (EPP)
Source : Survey conducted during the study
Parental contribution to school expenditures :
distribution by area –(in MGA/parent/year)
Source : survey conducted during the study
Parental contributions are essentially used to pay
community teachers and the school keeper, purchase
supplies, pay for repairs, and finance report cards and
school sports. With the contribution of parents, the
surveyed schools provide a monthly subsidy to
subsidized and non-subsidized community teachers.
The amounts are almost equivalent, 63,500 MGA/
month for the non-subsidized community teachers
and 61,150 MGA/month for subsidized community
teachers. Nearly 72 percent of parents consider that
the level of the subvention is more than they can
afford (52.6 percent) or is rather high (19.2 percent).
Moreover, parents’ satisfaction with the performance
of teachers differs according to their status. The
highest satisfaction rates go to the subsidized
community teachers (92 percent) surpassing the
satisfaction rates of the civil servants (less than 86
percent), and largely surpassing the satisfaction rates
for the performance of non-subsidized community
teachers (37 percent).
Breakdown of the use of school budget realized
through parental contributions
Source : survey conducted during the study

56
Figure 30. Average Household Expense per Child Compared to per Pupil Government Education
Expenditure, 2005 and 2010
Note: The expenditure data is averaged over 2006-2007 for salaries by region and 2006 and 2008 for other current
expenditure.
Data sources: EPM 2005 and 2010, MFB.
D.3 Distribution of Expenditures by Socioeconomic Category of User: BIA
74. Benefit Incidence Analysis (BIA) can be carried out using the simple utilization (or usage) approach.
The method assumes that all individuals using the service receive the same benefits. This is the approach
used in Glick & Razakamanantsoa (2002) in their BIA for health and education using 1990 data. Another
assumption implied by this method is that the quality in schools does not depend on average income levels;
this is not a realistic assumption but allows the use of data that is more reliable than other approaches (Glick
& Razakamanantsoa 2002).
0%
10%
20%
30%
40%
50%
60%
70%
80%
90%
100%
Average of 2006-2008 current expenditure on education per child in school Average expenditure per child in school, 2005
0%
10%
20%
30%
40%
50%
60%
70%
80%
90%
100%
Average of 2009-2013 current expenditure on education per child in school Average expenditure per child in school, 2010

57
1. Marginal benefit of government expenditure by level of education
75. Looking at the utilization of public schools across household expenditure quintiles, additional
spending in primary education is clearly pro-poor, while spending on lower secondary schools is
reasonably equal and spending on higher education has no direct benefit on the poor. The utilization of
public schools by welfare group presents a picture of who currently uses the public service and how public
spending can affect the distribution of resources to the poor. Figure 31 gives the Lorenz curves38 by quintile
for the entire population for 2005, 2010 and 2012. Looking at each year independently, they clearly show
the pro-poor aspect of primary education, while inequalities by income increase along the education cycle.
In 2005, more than 22 percent of children in primary school are from the poorest quintile, and this increases
to 24 percent in 2012. Higher education is not accessible for anybody under the fourth quintile, and—
recalling that the poverty threshold is into the fourth quintile in Madagascar—this means that almost none
of the poor can access universities (only 1.3 percent of students are from the poorest quintile in 2012).
Visual comparison of the 2005 and 2010 data shows increasing inequalities at the secondary level, and this
inequality is most apparent in 2012.39 The result that is most likely significant statistically is for secondary
education, indicating that the number of school dropouts in teenage years has increased among the poor.
Figure 31. Lorenz Curves by Quintile for Utilization of Public Education, 2005-2010, 2010-2012 and
2005-2012
Data source: EPM 2005, EPM 2010 and ENSOMD 2012.
38 The figure shows the case of public primary, secondary and higher education enrollments using Household Surveys.
The cumulative shares of individuals in the population, ranked by per capita household expenditures, are shown on
the x-axis, while the y-axis presents the cumulative share of enrollments for public primary, secondary and higher
education. The degree of convexity of the Lorenz curve indicates that the enrollment distribution is quite unequal. If
the benefit curve lies above the 45-degree line, it insures that the poor receives a disproportionate share of the benefit,
which indicates that the public service is pro-poor. 39 Statistical significance of the differences has not been established.
0
10
20
30
40
50
60
70
80
90
100
0 Lowest quintile Second quintile Third quintile Fouth quintile Richest
2005 to 2012 (2005 superimposed in small points)
Primary education
45 Degree line
Junior Secondary
Senior secondary
Higher education
Primary education
Junior Secondary
Senior secondary
Higher education

58
2. Average benefits of education expenditures (BIA)
76. On average between 2010 and 2013 the government spent per year about 468 billion 2013 Ar.
on the different education levels (excluding all administrative units, general research, and investment). 40
How much of this money benefited the poor? The goal of the BIA is to give an estimate of average benefits
across consumption quintiles taking account of utilization of the services provided. In order to assess
average benefits, the average of current government expenditures by levels between 2009 and 2013 is
combined with the utilization data from the 2010 EPM presented above.
77. The richest quintile benefits twice as much as the poorest quintile, the lowest quintile benefits
the least, but the middle three quintiles benefit approximately equally (Figure 32). Looking at all
education levels combined, the richest quintile receives 30 percent of current public expenditures (which
represents, on average, 138.2 billion Ar. per year), whereas the lower quintile receives only about 15
percent. Regarding the share of enrollment in 2010, the richest quintile enrolled far fewer children at the
public primary level (10.6 percent of total primary enrollment, which represents, on average, 29 billion
Ar.), but its shares of enrollment in senior secondary and higher education are higher (respectively, 55 and
92 percent of students). With only senior secondary and higher education, they receive, on average, 89
billion Ar. Conversely, although the poorest quintile receives 60.3 billion Ar. from the primary budget, it
receives a smaller subsidy than other levels, as the poor quintile’s enrollment in secondary and higher
education is marginal.
Figure 32. Government Subsidy to Education from Current Expenditure, by Quintile, 2011-2013
Note: Current expenditures from SIGFP data, using fixed salary weights for wages up to upper secondary based on
PIE estimates. Expenditures do not include general administration. Utilization by quintile is based on 2010 EPM.
Data sources: MFB (SIGFP), MEN (PIE), EPM.
78. Focusing on the distribution of expenditures rather than actual amounts, benefits can be presented in
a Lorenz-curve type graph that cumulates benefits across quintiles, the 45 degree line being the line of
perfect equality (Figure 33). The graph shows a mild pro-rich bias resembling the level found in utilization
of lower secondary schools.
40 See section C2 for the functional breakdown of expenditure. The amount for Post-secondary and research was
reduced to better reflect expenditures directed to students of universities using estimates from the PIE (92 percent).
69.8 84.0 85.6 90.1
138.2
-
20.0
40.0
60.0
80.0
100.0
120.0
140.0
160.0
Lowest quintile Second quintile Third quintile Fouth quintile Richest
Billio
n 2
01
3 A
r.

59
Figure 33. Estimated Distribution of Benefits from Education Expenditures for All Levels Combined
(primary, secondary and higher education)
Data sources: MFB (SIGFP), MEN (PIE), EPM.
D.4 Distribution of Expenditures by Gender: BIA
79. Overall, gender does not appear to be an issue for public education in Madagascar. Figure 34
implicitly assumes that equality of utilization is the desired outcome and traces differences between equal
utilization and actual utilization of female in the different education levels in 2005 and 2010 using
Household Survey data.41 Madagascar has achieved perfect equality at the primary level in 2010. The junior
secondary level is also used equally by boys and girls, although the 2010 result shows slightly lower usage
among girls.42 The significant gender difference at the senior secondary level was reduced in 2010, although
boys still have an advantage of about 5 percent. At the university level, the survey data showed a strong
advantage to girls in 2005 that is no longer present in the 2010 results.
Figure 34. Gender Equality in the Public Schools
Data Source: EPM2005 and 2010.
41 Note that the gender differences identified in the data could emanate from supply or demand effects. The source of
difference has not been tested for this exercise. 42 Statistical significance has not been established, and the standard errors are still also low.
0
0.1
0.2
0.3
0.4
0.5
0.6
0.7
0.8
0.9
1
0 Lowestquintile
Secondquintile
Thirdquintile
Fouthquintile
Richest
45 degree line
cumulative benefits -Average 2011-2013
-20
-10
0
10
20
Primary education Junior secondary Senior secondary Higher education
perc
en
tage p
oin
ts
Female advantage/disadvantage
(percent female in the level-50)
2005 2010
Above zero=female advantage
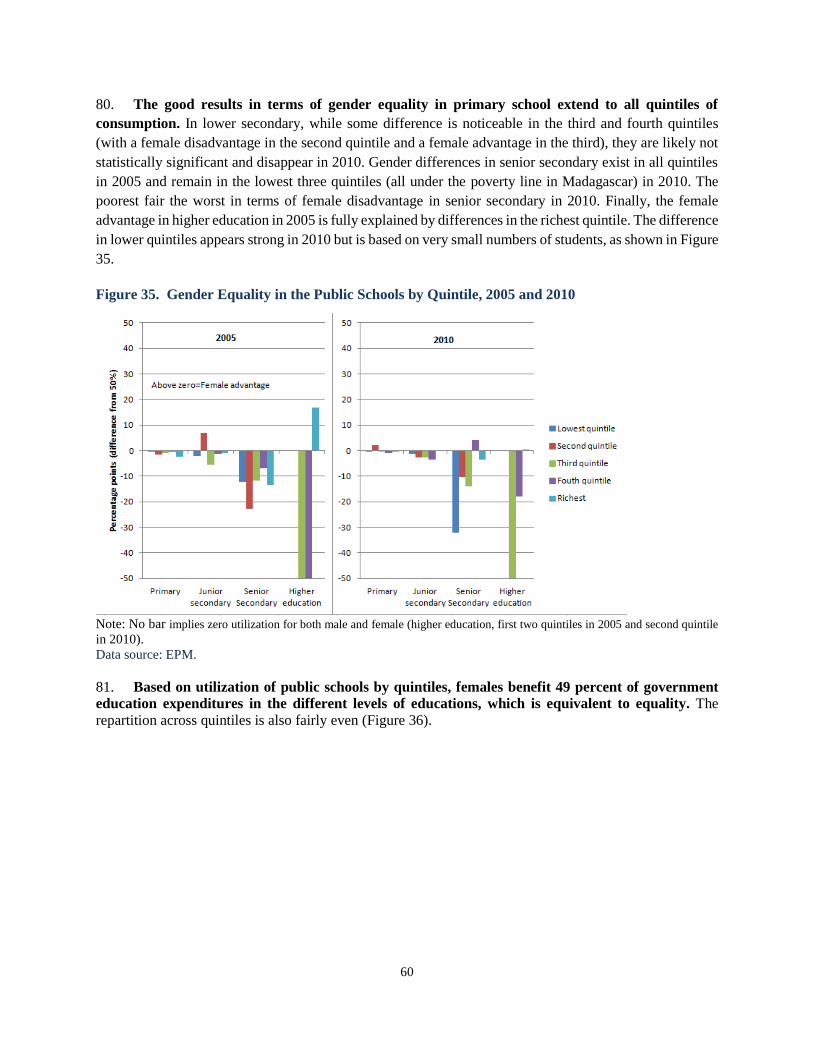
60
80. The good results in terms of gender equality in primary school extend to all quintiles of
consumption. In lower secondary, while some difference is noticeable in the third and fourth quintiles
(with a female disadvantage in the second quintile and a female advantage in the third), they are likely not
statistically significant and disappear in 2010. Gender differences in senior secondary exist in all quintiles
in 2005 and remain in the lowest three quintiles (all under the poverty line in Madagascar) in 2010. The
poorest fair the worst in terms of female disadvantage in senior secondary in 2010. Finally, the female
advantage in higher education in 2005 is fully explained by differences in the richest quintile. The difference
in lower quintiles appears strong in 2010 but is based on very small numbers of students, as shown in Figure
35.
Figure 35. Gender Equality in the Public Schools by Quintile, 2005 and 2010
Note: No bar implies zero utilization for both male and female (higher education, first two quintiles in 2005 and second quintile
in 2010).
Data source: EPM.
81. Based on utilization of public schools by quintiles, females benefit 49 percent of government
education expenditures in the different levels of educations, which is equivalent to equality. The
repartition across quintiles is also fairly even (Figure 36).

61
Figure 36. Government Subsidy to Education from Current Expenditure by Gender and
Consumption Quintile, 2011-2013
Note: Current expenditures from SIGFP data using fixed salary weights for wages up to upper secondary based on
PIE estimates. Expenditures do not include general administration. Utilization by quintile is based on 2010 EPM.
Data sources: MFB, MoE (PIE), EPM.
34.442.8 41.0 43.0
68.8
35.4 41.2 44.6 47.0
69.4
Lowest quintile Second quintile Third quintile Fouth quintile Richest
in billions of 2013 Ar.
Total subsidy to females Total subsidy to males

62
D.5 Key Findings and Policy Implications
Key Findings
Although the distribution of public spending appears overall equitable, the large increase in household spending
over the past five years has had far-reaching consequences in terms of enrollments, and even more in terms of
quality and learning outcomes.
Distribution of public spending
Based on access, public spending on primary appears largely pro-poor, public spending on secondary appears
broadly equal, and public spending on higher education has no direct benefit to the poor. There is, however,
increasing inequity in secondary education.
The distribution of public spending across regions show signs of regressivity, with some evening out recently
due to the overall increase in poverty across regions.
The distribution of wage expenditures reflects the highly inequitable distribution of civil servants across
regions. Some of the most vulnerable regions seem clearly disadvantaged.
Household spending
The last 5 years have witnessed a rapid increase in the share of education costs financed by households.
The share of household budget going to education increased more for the richest, indicating a possible transfer
of these children to private schools.
The poorest spent, on average, 3.5 percent of their budget on education in 2012, against 2 percent in 2005.
The distribution of regular teachers seems to have a direct impact on household spending, with the regions
receiving less than average in terms of wage expenditure having the higher share of household contributions to the
total costs of education per child enrolled.
Policy Implications
Better equity in the distribution of spending will require that regular teachers are equally distributed across the
country, which will reduce the pressure on household spending as well as promote equitable access to quality
education.
More equitable repartition of resources
In the current context, where the allocation of human resources drives the distribution of spending, it is key to
ensure that ongoing and future recruitments serve areas currently suffering from severe shortages of teachers.
Beyond the evening out of inequality in the distribution of spending, the focus needs to be on the equal
distribution of quality, which will heavily rely on qualified and trained teachers in the short term.
This again points to the importance of using the ongoing regularization of community teachers as a strategic
tool to ensure the equitable repartition of resources and of education quality.
Further reducing the financial burden on the poorest
Government support to schools and families in terms of learning materials and school furniture could be scaled
up and better targeted.
Support to children and families with high opportunity costs of schooling could be achieved through various
interventions such as conditional cash transfers or vouchers.

63
REFERENCES
Baldacci, E., Gupta. S. Clements, B., and Cui, Q. (2008), “Social Spending, Human Capital and Growth
in Developing Countries,” World Development. Vol. 36(8), pp. 1317-1341
Efficiency of Public Spending in Developing Countries: An Efficiency Frontier Approach: Santiago
Herrera & Gaobo Pang – Policy Research Working Paper Series 3645, The World Bank.
http://siteresources.worldbank.org/INTQFA/Resources/EfficiencyofPublicSpendinginDevelopingCount
ries_MAY05.pdf
Glick, P. and M. Razakamanantsoa (2002) ‘The Distribution of Social Services in Madagascar, 1993–99’,
Working Paper No. 128, Cornell University Food and Nutrition Policy Program
http://www.cfnpp.cornell.edu/images/wp128.pdf or http://www.instat.mg/pdf/iloinstat_7.pdf
Glick, P. and M. Razakamanantsoa (2005) . The Distribution of Education and Health Services in
Madagascar over the 1990s: Increasing Progressivity in an Era of Low Growth. Journal of African
Economies, 15(3):pp. 399-433 (published version of the 2002 paper but with less specific information)
Glick P., R. Saha , and S. D. Younger (2004). Integrating Gender into Benefit Incidence and Demand
Analysis. Working Paper of the Food and Nutrition Policy Program, Cornell University.
http://www.cfnpp.cornell.edu/images/wp167.pdf
World Bank. (2006) Djibouti - Public Expenditure Review (PER) - making public finances work for
growth and poverty reduction. World Bank Report #34624

64
ANNEXES
ANNEX 1. TABLE SUPPLEMENT
Table A1. Annual salaries by provinces as a ratio to SIGFP remunerations by provinces
2006
201
0
201
1
201
2 2013
All education missions
Total salaries in wage data/ total remunerations in SIGFP 1.45 0.84 0.92 0.89 0.90
ANTANANARIVO 2.90 1.93 2.13 2.21 2.28
ANTSIRANANA 2.73 0.96 1.58 1.59 1.58
FIANARANTSOA 2.02 1.39 1.44 1.42 1.47
MAHAJANGA 2.32 1.16 1.23 1.23 1.30
TOAMASINA 2.06 1.21 1.41 1.35 1.45
TOLIARA 1.73 1.45 1.43 1.38 1.51
Basic and secondary education only
Total salaries in wage data/ total remunerations in SIGFP 1.28 0.84 0.92 0.89 0.91
ANTANANARIVO 2.30 1.52 1.67 1.70 1.75
ANTSIRANANA 2.42 0.83 1.43 1.40 1.40
FIANARANTSOA 1.93 1.34 1.38 1.36 1.40
MAHAJANGA 2.17 1.09 1.16 1.13 1.19
TOAMASINA 1.94 1.15 1.34 1.28 1.38
TOLIARA 1.59 1.35 1.33 1.27 1.39
Share of total salary not assigned to a region in SIGFP
All missions 0.34 0.38 0.38 0.41 0.41
Basic and secondary education only 0.34 0.31 0.32 0.34 0.34 Data sources: MFB, SIGFF and Direction of Remunerations (Solde)
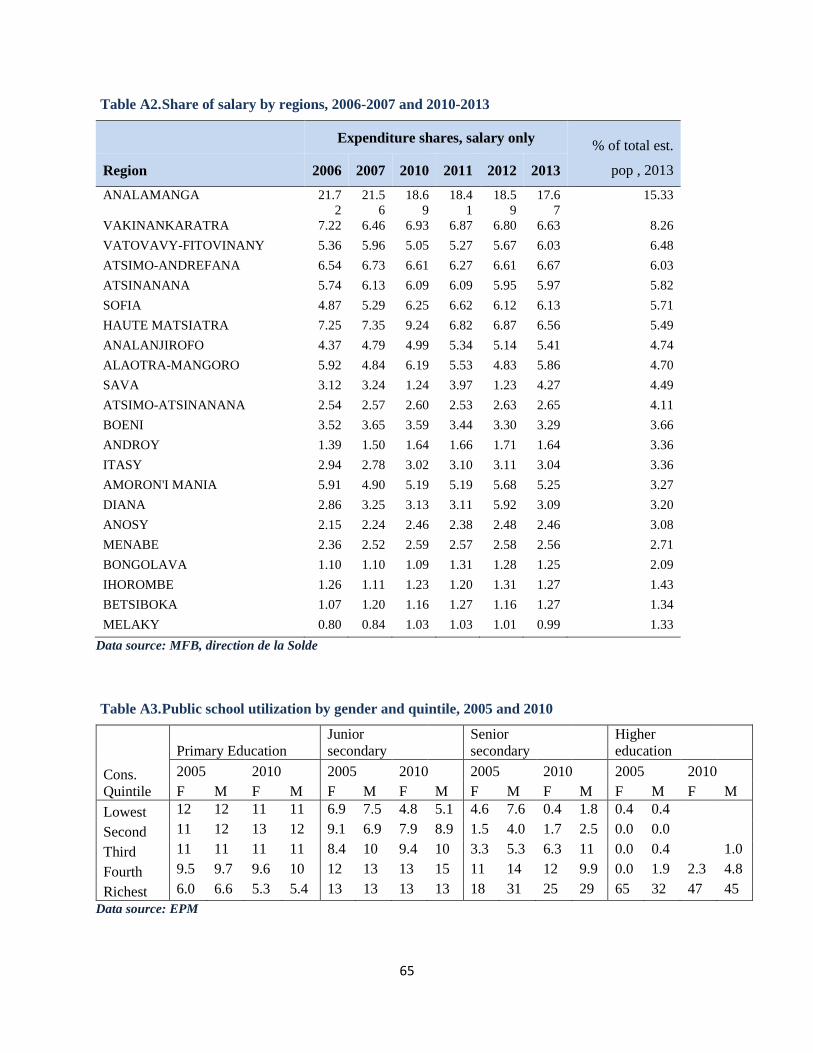
65
Table A2. Share of salary by regions, 2006-2007 and 2010-2013
Expenditure shares, salary only % of total est.
pop , 2013 Region 2006 2007 2010 2011 2012 2013
ANALAMANGA 21.7
2
21.5
6
18.6
9
18.4
1
18.5
9
17.6
7
15.33
VAKINANKARATRA 7.22 6.46 6.93 6.87 6.80 6.63 8.26
VATOVAVY-FITOVINANY 5.36 5.96 5.05 5.27 5.67 6.03 6.48
ATSIMO-ANDREFANA 6.54 6.73 6.61 6.27 6.61 6.67 6.03
ATSINANANA 5.74 6.13 6.09 6.09 5.95 5.97 5.82
SOFIA 4.87 5.29 6.25 6.62 6.12 6.13 5.71
HAUTE MATSIATRA 7.25 7.35 9.24 6.82 6.87 6.56 5.49
ANALANJIROFO 4.37 4.79 4.99 5.34 5.14 5.41 4.74
ALAOTRA-MANGORO 5.92 4.84 6.19 5.53 4.83 5.86 4.70
SAVA 3.12 3.24 1.24 3.97 1.23 4.27 4.49
ATSIMO-ATSINANANA 2.54 2.57 2.60 2.53 2.63 2.65 4.11
BOENI 3.52 3.65 3.59 3.44 3.30 3.29 3.66
ANDROY 1.39 1.50 1.64 1.66 1.71 1.64 3.36
ITASY 2.94 2.78 3.02 3.10 3.11 3.04 3.36
AMORON'I MANIA 5.91 4.90 5.19 5.19 5.68 5.25 3.27
DIANA 2.86 3.25 3.13 3.11 5.92 3.09 3.20
ANOSY 2.15 2.24 2.46 2.38 2.48 2.46 3.08
MENABE 2.36 2.52 2.59 2.57 2.58 2.56 2.71
BONGOLAVA 1.10 1.10 1.09 1.31 1.28 1.25 2.09
IHOROMBE 1.26 1.11 1.23 1.20 1.31 1.27 1.43
BETSIBOKA 1.07 1.20 1.16 1.27 1.16 1.27 1.34
MELAKY 0.80 0.84 1.03 1.03 1.01 0.99 1.33
Data source: MFB, direction de la Solde
Table A3. Public school utilization by gender and quintile, 2005 and 2010
Cons.
Quintile
Primary Education
Junior
secondary
Senior
secondary
Higher
education
2005 2010 2005 2010 2005 2010 2005 2010
F M F M F M F M F M F M F M F M
Lowest 12 12 11 11 6.9 7.5 4.8 5.1 4.6 7.6 0.4 1.8 0.4 0.4
Second 11 12 13 12 9.1 6.9 7.9 8.9 1.5 4.0 1.7 2.5 0.0 0.0
Third 11 11 11 11 8.4 10 9.4 10 3.3 5.3 6.3 11 0.0 0.4 1.0
Fourth 9.5 9.7 9.6 10 12 13 13 15 11 14 12 9.9 0.0 1.9 2.3 4.8
Richest 6.0 6.6 5.3 5.4 13 13 13 13 18 31 25 29 65 32 47 45
Data source: EPM
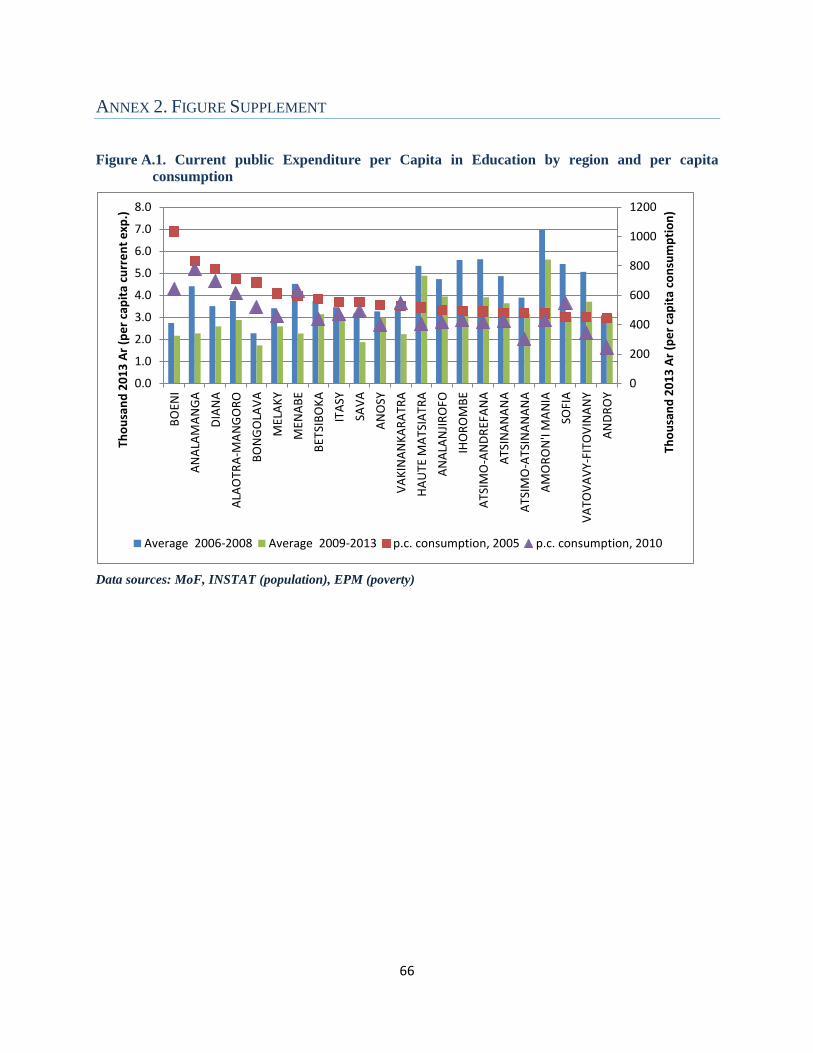
66
ANNEX 2. FIGURE SUPPLEMENT
Figure A.1. Current public Expenditure per Capita in Education by region and per capita
consumption
Data sources: MoF, INSTAT (population), EPM (poverty)
0
200
400
600
800
1000
1200
0.0
1.0
2.0
3.0
4.0
5.0
6.0
7.0
8.0
BO
ENI
AN
ALA
MA
NG
A
DIA
NA
ALA
OTR
A-M
AN
GO
RO
BO
NG
OLA
VA
MEL
AK
Y
MEN
AB
E
BET
SIB
OK
A
ITA
SY
SAV
A
AN
OSY
VA
KIN
AN
KA
RA
TRA
HA
UTE
MA
TSIA
TRA
AN
ALA
NJI
RO
FO
IHO
RO
MB
E
ATS
IMO
-AN
DR
EFA
NA
ATS
INA
NA
NA
ATS
IMO
-ATS
INA
NA
NA
AM
OR
ON
'I M
AN
IA
SOFI
A
VA
TOV
AV
Y-FI
TOV
INA
NY
AN
DR
OY
Tho
usa
nd
20
13
Ar
(pe
r ca
pit
a co
nsu
mp
tio
n)
Tho
usa
nd
20
13
Ar
(pe
r ca
pit
a cu
rre
nt
exp
.)
Average 2006-2008 Average 2009-2013 p.c. consumption, 2005 p.c. consumption, 2010

67
ANNEX 3. ANALYTICAL SUPPLEMENT
A.3.1 Overall Public Expenditure Performance
1. Structural efficiency analysis
Methodology
The analysis relies on the full panel of countries in the UNESCO/IS database creating a panel of 144-176
countries (depending on the indicator used) with data from 1995 to 2012.43 The panel structure of the data
is exploited to identify an average “Madagascar effect”. The country specific residuals are the ui ‘s obtained
from a random effect GLS regression on GDP per capita, income group, region, population and size.
Results
Madagascar places among the most efficient (spending less than expected and achieving more than
expected) when using Primary and Secondary Combined Enrollment Ratios as the outcome measure. It also
places in the efficient quadrant for youth literacy rates, although mostly due to lower expenditures, and
places as a slight underachiever using Primary Completion Rates. Table xx sows the deviations from
expected outcome relative to the standard error of the deviation in the full sample. Figure xx to xx
graphically shows the results.
Table A4. Madagascar’s deviations from expected education outcomes and expenditure, panel data
results
Madagascar
“effect”
Madagascar’s effect /standard deviation of
the random effects
Primary completion rates -3.8 -0.29
Gross enrollment ratio, Primary and
secondary combined
15.4 1.27
Youth literacy rate 3.1 0.31
Public expenditure -0.41 -0.30 Source: Authors – data from UNESCO/IS and IMF
43 The 1980-2012 range is determined by education expenditure data availability. The panel is very much unbalanced
due to uneven reporting across years, especially for youth literacy rates.

68
Figure A.2. Structural efficiency of education expenditure based on Primary Completion Rates,
1980-2012

69

70
Figure A.3. Structural efficiency of education expenditure based on Gross Enrollment in Primary
and Secondary combined, 1980-2012

71
Figure A.4. Structural efficiency of education expenditure based on Youth literacy Rates, 1980-2012
2. Current efficiency: pre- and post-crisis expenditure performance
Methodology
The analysis is based on methodology presented in the 2006 Djibouti PER although it includes additional
variables in the estimation to calculate expectations (as for the structural analysis above). It relies on cross-
country regressions on average levels of expenditures and average outcomes for 2000-2008 and for 2009-
2012 to correspond to the pre- and post-crisis periods. For each period, averages outcomes and average
expenditures are calculated for all countries in the sample. The number of countries with available data
varies between 114 and 166 depending on the indicator and the time period considered. Deviations from
expected values are based on residuals in a simple OLS regression using average GDP/c and its square in
PPP, income group, region (for LDCs only), population and size on the right hand side. The analysis is
done using primary completion rates, primary and secondary combined enrollment ratios, and youth literacy
rate, although the youth literacy rate is based on 2000 and 2009 data only so the later period cannot be
considered post-crisis.
Results
Comparing the relative expenditure performance of Madagascar during the pre-crisis years (2000-2008)
and the post crisis years (2009-2012) shows that Madagascar has dropped its level of expenditure further
below expectations but has been able to increase its advantage for completion rate. Its advantage in gross
enrollment ratios was reduced but remains above expectations. Changes in youth literacy rates have pushed
Madagascar in the under-achieving group but the result is only based on 2009 youth literacy data and can

72
therefore not be attributed to the crisis. Table xx presents Madagascar’s deviation from expectations relative
to the standard deviations in the sample and their evolutions between 2000-2008 and 2009-2012. The
greatest loss has been in Youth literacy, although the estimation is only based on 2000 and 2009 data for
Madagascar. The gain in advantage in completion rates is almost 1 standard deviation. Results for primary
completion rates and gross enrollment ratios are presented in the text. Figures xx to xx present the youth
literacy results.
Table A5. Madagascar’s deviations from expected education outcomes and expenditure, panel data
summary results
Madagascar deviation/standard deviation
2000-2008 2009-2012 Change (a)
Primary completion rates -0.20 0.73 0.93
Gross enrollment ratio (primary and secondary combined) 1.39 1.17 -0.22
Youth literacy rate 0.77 (2000) -0.85 (2009) -1.62
Public expenditure -0.28 -0.66 -0.38 (a) A negative number in the outcome dimension indicates that Madagascar is losing its advantage in that dimension.
Source: Authors – data from UNESCO/IS and IMF
Figure A.5. Current Efficiency of 2000-2008 Government Expenditures based on 2000 Youth
Literacy Rate
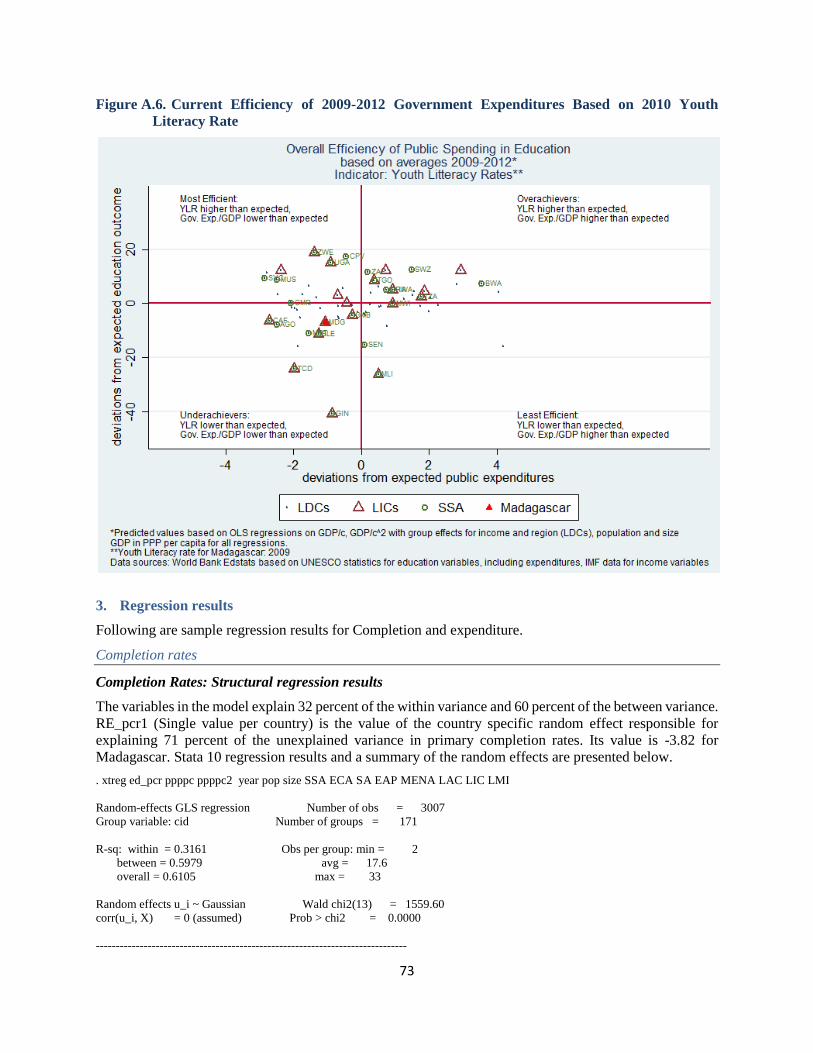
73
Figure A.6. Current Efficiency of 2009-2012 Government Expenditures Based on 2010 Youth
Literacy Rate
3. Regression results
Following are sample regression results for Completion and expenditure.
Completion rates
Completion Rates: Structural regression results
The variables in the model explain 32 percent of the within variance and 60 percent of the between variance.
RE_pcr1 (Single value per country) is the value of the country specific random effect responsible for
explaining 71 percent of the unexplained variance in primary completion rates. Its value is -3.82 for
Madagascar. Stata 10 regression results and a summary of the random effects are presented below.
. xtreg ed_pcr ppppc ppppc2 year pop size SSA ECA SA EAP MENA LAC LIC LMI
Random-effects GLS regression Number of obs = 3007
Group variable: cid Number of groups = 171
R-sq: within = 0.3161 Obs per group: min = 2
between = 0.5979 avg = 17.6
overall = 0.6105 max = 33
Random effects u_i ~ Gaussian Wald chi2(13) = 1559.60
corr(u_i, X) = 0 (assumed) Prob > chi2 = 0.0000
------------------------------------------------------------------------------

74
ed_pcr | Coef. Std. Err. z P>|z| [95% Conf. Interval]
-------------+----------------------------------------------------------------
ppppc | -.0009019 .0001177 -7.66 0.000 -.0011327 -.0006712
ppppc2 | 7.30e-09 1.89e-09 3.87 0.000 3.60e-09 1.10e-08
year | .876639 .0282828 31.00 0.000 .8212058 .9320721
pop | 1.90e-09 9.57e-09 0.20 0.843 -1.69e-08 2.07e-08
size | -2.90e-07 6.81e-07 -0.43 0.670 -1.62e-06 1.04e-06
SSA | -22.5266 4.385146 -5.14 0.000 -31.12133 -13.93187
ECA | -3.869631 4.229748 -0.91 0.360 -12.15978 4.420524
SA | -5.319994 6.77654 -0.79 0.432 -18.60177 7.96178
EAP | -2.741014 5.052243 -0.54 0.587 -12.64323 7.1612
MENA | -15.43923 5.105525 -3.02 0.002 -25.44587 -5.432581
LAC | -10.48159 3.723563 -2.81 0.005 -17.77964 -3.18354
LIC | -39.97556 4.170106 -9.59 0.000 -48.14881 -31.8023
LMI | -21.2268 3.296154 -6.44 0.000 -27.68714 -14.76645
_cons | -1640.985 55.40475 -29.62 0.000 -1749.576 -1532.393
-------------+----------------------------------------------------------------
sigma_u | 14.184202
sigma_e | 9.101526
rho | .70834785 (fraction of variance due to u_i)
------------------------------------------------------------------------------
. sum RE_pcr1
Variable | Obs Mean Std. Dev. Min Max
-------------+--------------------------------------------------------
RE_pcr1 | 171 5.58e-09 13.86423 -52.29763 44.53711
Completion rates: cross-country regression using 2009-2012 averages
Completion rates are available yearly. They are averaged over 2009-2013 before running the OLS
regression. The variables in the model explain 58 percent of the variation in completion rates (Adj R2).
Madagascar’s deviation from expected outcomes based on this regression (residual) is -2.8. Stata 10
regression results and a summary of the residual variable are presented below.
. reg ed_pcr ppppc ppppc2 pop size SSA ECA SA EAP MENA LAC LIC LMI
Source | SS df MS Number of obs = 161
-------------+------------------------------ F( 12, 148) = 19.61
Model | 49431.2023 12 4119.26686 Prob > F = 0.0000
Residual | 31095.2133 148 210.102793 R-squared = 0.6139
-------------+------------------------------ Adj R-squared = 0.5825
Total | 80526.4157 160 503.290098 Root MSE = 14.495
------------------------------------------------------------------------------
ed_pcr | Coef. Std. Err. t P>|t| [95% Conf. Interval]
-------------+----------------------------------------------------------------
ppppc | .0012175 .0006249 1.95 0.053 -.0000174 .0024523
ppppc2 | -1.28e-08 9.34e-09 -1.37 0.173 -3.12e-08 5.66e-09
pop | -4.97e-09 1.44e-08 -0.35 0.730 -3.34e-08 2.34e-08
size | -8.03e-07 7.46e-07 -1.08 0.283 -2.28e-06 6.71e-07
SSA | -1.576453 7.202508 -0.22 0.827 -15.80949 12.65659
ECA | 20.88661 7.018098 2.98 0.003 7.01799 34.75523
SA | 22.45718 9.128703 2.46 0.015 4.417743 40.49662
EAP | 19.81402 7.488931 2.65 0.009 5.014979 34.61307
MENA | 7.922435 7.86529 1.01 0.315 -7.620342 23.46521
LAC | 13.24642 6.282909 2.11 0.037 .8306185 25.66221

75
LIC | -22.59437 5.908889 -3.82 0.000 -34.27105 -10.91768
LMI | -9.615214 4.404162 -2.18 0.031 -18.31838 -.9120499
_cons | 74.84384 10.30335 7.26 0.000 54.48315 95.20453
------------------------------------------------------------------------------
Variable | Obs Mean Std. Dev. Min Max
-------------+--------------------------------------------------------
RES_pcr1 | 161 5.46e-09 13.94077 -46.7936 58.83405
A3.2. Robustness analysis for functional classifications of Expenditures in Education since 2006
Without the raw data for the period prior to 2006, it was not possible to identify how the classifications into
levels were re-constructed for the period 2002 to 2005 in the PIE. Moreover, because of the many and
frequent administrative changes mentioned above, the MoF data could not be reconciled with the PIE results
for the period 2006-2010. In order to provide an alternative means of classification more stable over time,
another series was constructed using classifications of expenditures by sub-administrative units (SoA)
which were classified according to their main function.44
This new classification offers the advantage of being completely independent of other differences in budget
accounting and takes into account the administrative changes. As above the analysis is limited by data
availability on regular salaries. The SIGFP separates salaries for practical training, post-secondary
education and research so actual totals could be used for these levels. Assignments within primary and
secondary education, however, had to be estimated using fixed proportions as in the PIE. Expenditures at
the executed level were used for this exercise (as opposed to commitments in the PIE analysis).
Figure A.7 shows that results are quite robust to the changes in methodology. The new classification
dampens the drop in total recurrent expenditures from 2006 to 2010 and reduces the amounts attributed to
primary education overall but differences in general are small, thus confirming results discussed in the text.
44 SoAs labeled as serving the ministry as a whole were all included in administration. Intermediary classifications
were created for SoAs that had functions across two or more levels. These did not represent a large part of total
expenditure and the total could be added to the administrative function. In cases when expenditures from a single SoA
were assigned to different programs by levels of education in the SIGFP, the program was used to refine the estimation.

76
Figure A.7. Trends in Education expenditures by level of education using different stages of
expenditures and classification methods (2008-2013)
Data sources: SIGFP (MFB) and PIE spreadsheet (MEN). The second graph is entirely based on SIGFP.
Figure A.8. Trends in Education expenditures by level of education using different stages of
expenditures and classification methods (2008-2013)
Data sources: SIGFP from MoF and PIE spreadsheet from MoE. The second graph is entirely based on SIGFP.
Top Related
Copyright © 2022 FDOKUMEN

