


Bahasa
Halaman
Hukum

Technical Assistance Consultant’s Report
PUBLIC
Project Number: 52064-001 March 2022
Regional: Southeast Asia Urban Services Facility Feasibility Study for Cambodia: Livable Cities Investment Project (Poipet)
Volume 5: Solid Waste Management
Prepared by: Egis
For: Ministry of Public Works and Transport
This consultant’s report does not necessarily reflect the views of ADB or the Government concerned, and ADB and the Government cannot be held liable for its contents. (For project preparatory technical assistance: All the views expressed herein may not be incorporated into the proposed project’s design.
²
Volume 5 Solid Waste Management
POIPET Feasibility Study
CAM: LIVABLE CITIES INVESTMENT PROJECT March 2022
REVISION HISTORY
Document Reference TA9554-CAMTO3-POI-FST-SWM-001
D
C 15/03/2022 Final report Jean Roussillon Sophanara
Taing Benjamin
Biscan
B 21/05/2021 Draft Final report – 2nd Submission
Géraud de Saint Seine / Christopher Round
Aidan Roux-Melet
Benjamin Biscan
A 19/12/2020 Draft Final report – 1st Submission
Géraud de Saint Seine / Christopher Round
Benjamin
Biscan
Rev Date Description Written by Checked by Approved by
This Consultant’s Report was prepared under TA 9554-REG Southeast Asia Urban Services Facility and co-financed by ADB and ADB-administered trust funds: the Project Readiness Improvement Trust Fund with funding from the Nordic Development Fund; and the Sanitation Financing Partnership Trust Fund under the Water Financing Partnership Facility. The views expressed in this report are those of the authors and do not necessarily reflect the views and policies of the funders or ADB.
ABBREVIATIONS
AAGR – Average Annual Growth Rates
ADB – Asian Development Bank
AH – Affected household
AP – Affected people
CAPEX – Capital Expenditure
CCS – Comprehensive City Survey
CDC – Council for the Development of Cambodia
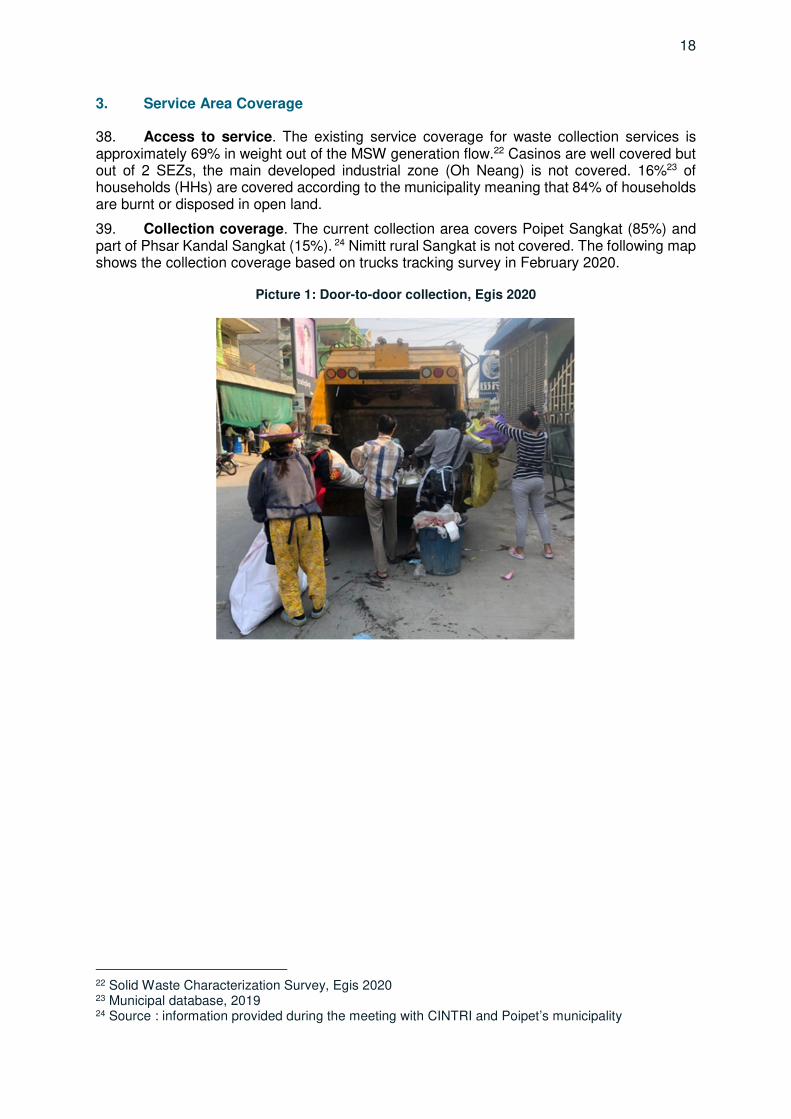
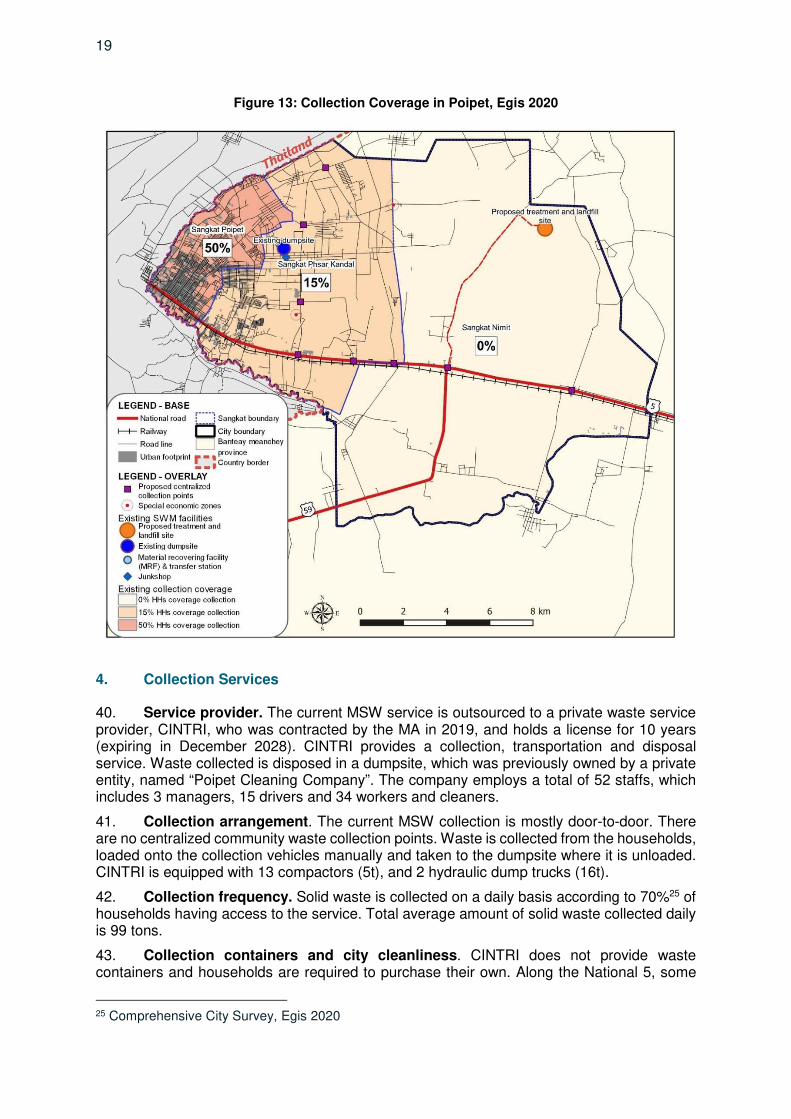
COVID-19 – Coronavirus 2019
CRVA – Climate Change Risk and Vulnerability
CSDG – Cambodia Sustainable Development Goals
DED – Detailed Engineering Design
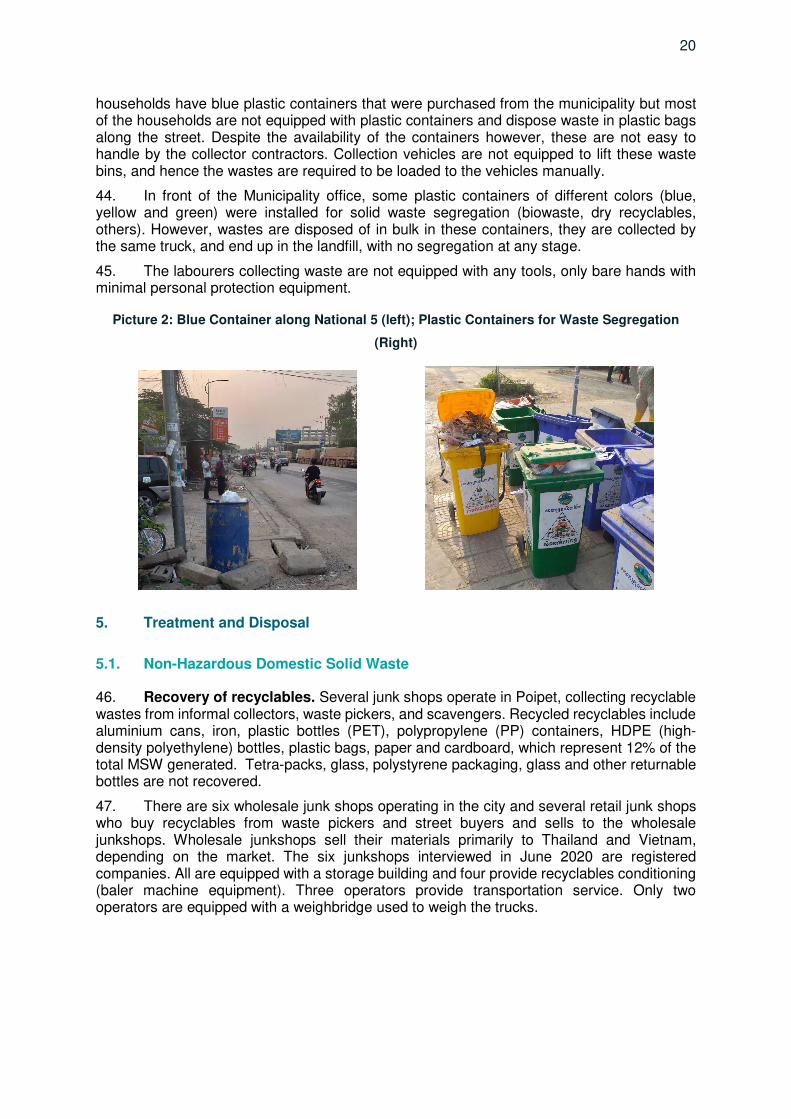
EIA – Environmental Impact Assessment
FHH – Female Headed Households
FIRR - Financial Internal Rate of Return
GDR – General Department of Resettlement
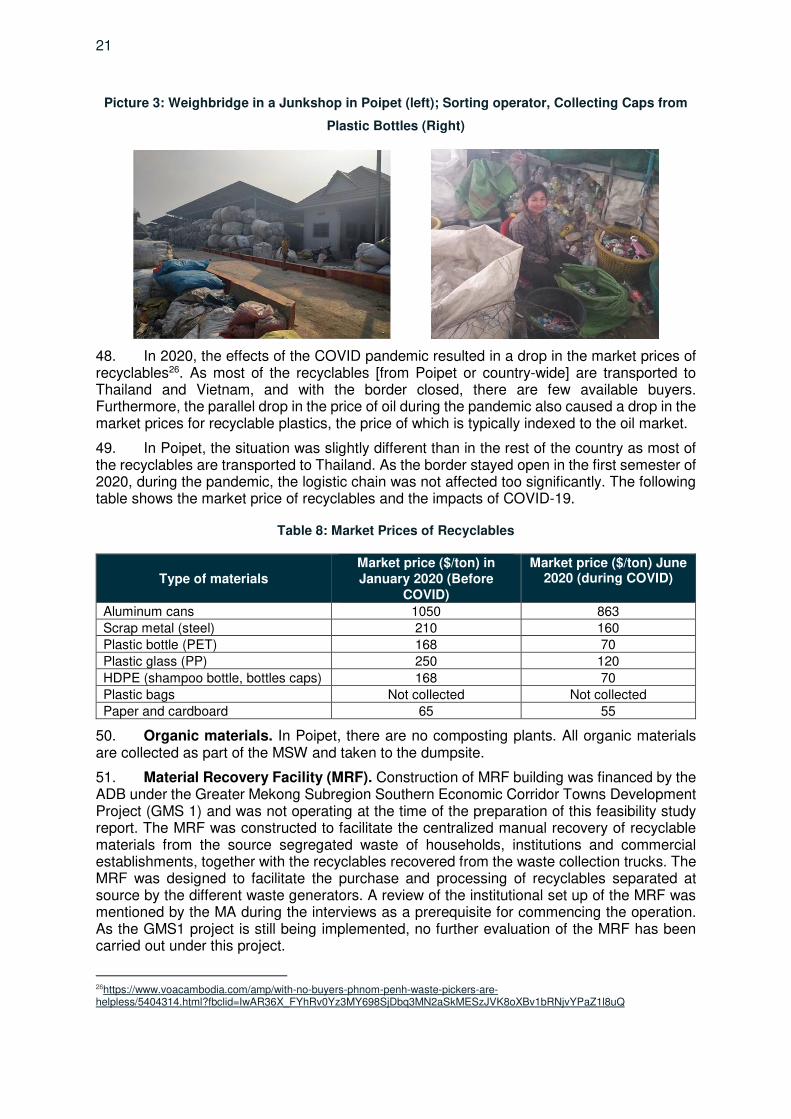
GHGs – Greenhouse gases
HDPE – High density polyethylene
HH – Households
IDP – Industry Development Policy
IEIA – Environmental Impact Assessment
IP – Indigenous People
KHR – Khmer Riels (currency)
km – Kilometer
Lao PDR – Lao People's Democratic Republic
LCIP – Livable Cities Investment Project
LFG – Landfill gas
LGU – Local Government Unit
m – Meter
MA – Municipal Administration
MEF – Ministry of Economy and Finance
MLMUPC – Ministry of land Management, Urban Planning and Construction
mm – Millimeter
MOE – Ministry of Environment
MOI – Ministry of Interior
MOP – Ministry of planning
MOWRAM – Ministry of Water Resources and Meteorology
MP – Master Plan
MPWT – Ministry of Public Works and Transport
MRF – Material Recovery Facility
MSW – Municipal Solid Waste
NGO – Non-governmental organization
NR – National Road
NRCS – National resource conservation service
NSDP – National Strategic Development Plan
O&M – Operation and Maintenance
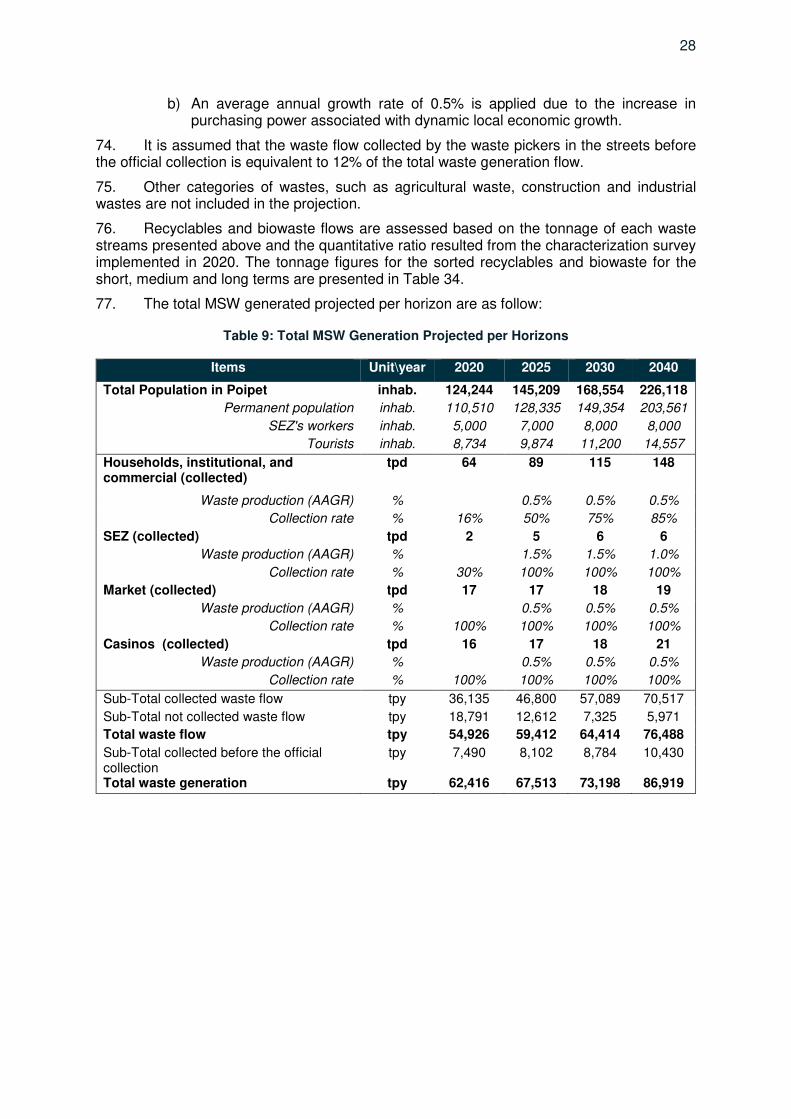
OPEX – Operational Expenditures
PET – Polyethylene Terephthalate
PPE – Personal Protective Equipment
PS – Polystyrene
PVC – Polyvinyl chloride
RCP – Representative Concentration Pathway
SEZ – Special Economic Zone
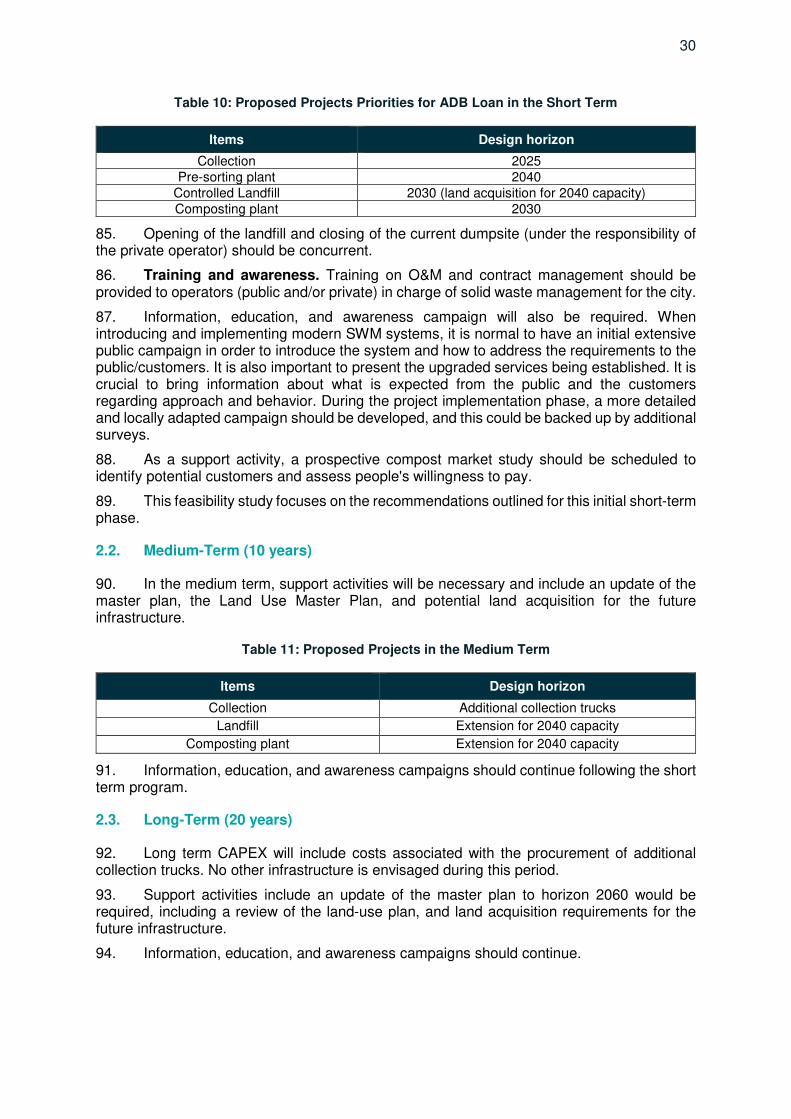
SWM – Solid Waste Management
TA – Technical assistant
tpd – Ton per day
tpy – Ton per year
UDS – Urban Development Strategy
UNDP – United Nation Development Programme
USD – U.S. Dollar
UXO – Unexploded ordonnances
VAT – Value Added Tax
WACC - Weighted Average Cost of Capital
WEEE – Waste electrical and electronic equipment
WTP – Water Treatment Plan
WW – Wastewater
WWT – Wastewater treatment
WWTP – Wastewater Treatment Plant
Y – Year
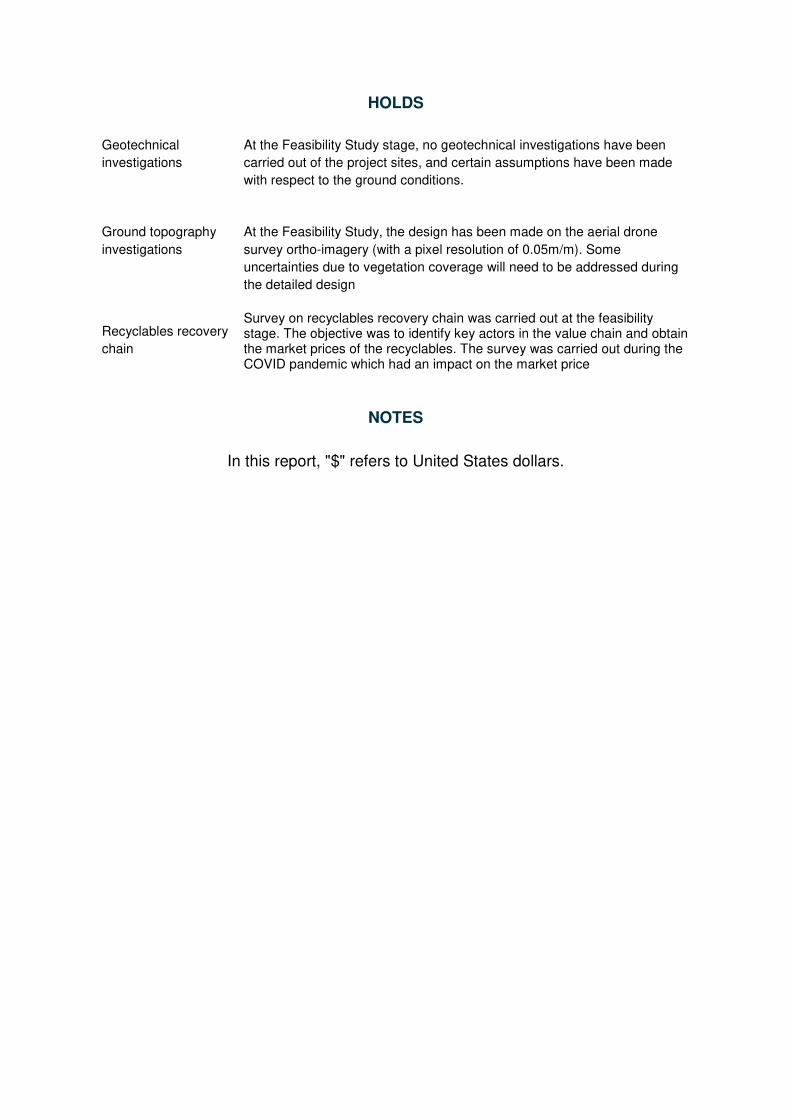
HOLDS
Geotechnical
investigations
At the Feasibility Study stage, no geotechnical investigations have been
carried out of the project sites, and certain assumptions have been made
with respect to the ground conditions.
Ground topography
investigations
At the Feasibility Study, the design has been made on the aerial drone
survey ortho-imagery (with a pixel resolution of 0.05m/m). Some
uncertainties due to vegetation coverage will need to be addressed during
the detailed design
Recyclables recovery
chain
Survey on recyclables recovery chain was carried out at the feasibility stage. The objective was to identify key actors in the value chain and obtain the market prices of the recyclables. The survey was carried out during the COVID pandemic which had an impact on the market price
NOTES
In this report, "$" refers to United States dollars.
CONTENTS
Page
EXECUTIVE SUMMARY 12
INTRODUCTION 1
CITY OVERVIEW 2
1. Urban Boundaries 2
2. Population Growth and Future Spatial Development 3
3. Commercial/industrial areas and activities 7
4. Social and gender considerations 8
5. Environment and geography 8
6. Climate Change 10
SECTOR POLICY AND FRAMEWORK 11
1. National Agency Responsible for the Solid Waste Sector 11
2. Solid Waste Sector Policies and Regulations 12
EXISTING SOLID WASTE MANAGEMENT SERVICES 15
1. Waste Generation 15
2. Composition of the MSW 16
3. Service Area Coverage 18
4. Collection Services 19
5. Treatment and Disposal 20
6. Adequacy of Current Solid Waste Facilities 25
7. Ongoing and Planned Investments 26
SOLID WASTE MANAGEMENT - SERVICES DEMAND 27
1. Current SWM loads and Flows 27
2. Future Projections 27
INVESTMENT ROADMAP SUMMARY 29
1. Overall Strategy 29
2. Infrastructure Roadmap 29
3. Impact Assessment 31
DESIGN CRITERIA AND STANDARDS 32
1. National Design Criteria 32
2. General Design Criteria 32
3. MSW Generation 32
4. Ground Conditions and Topography 32
5. Sorting Plant Design Parameters 33
6. Composting Plant Design Parameters 33
7. Landfill Design Parameters 33
TECHNICAL OPTIONS ASSESSSMENT 35
1. Site Selection 35
2. Technical Options for Collection 36
3. Technical Options for Treatment 38
4. Technical Options for Landfill 41
5. Summary of the Selected Option 45
SELECTED OPTION 47
1. Overview 47
2. Collection Equipment and Infrastructure requirements 49
3. Treatment Infrastructure Requirements 56
4. Disposal Requirements 67
5. Permits 71
6. CAPEX / OPEX 72
7. Financial Analysis 74
8. Safeguards Considerations 76
9. Measures to Integrate Climate Change Resilience 78
10. Institutional Arrangement 79
11. Procurement 80
APPENDICES 81
Appendix 1-MSW generation 82
Appendix 2-Landfill Gas Production 85
Appendix 3-Drawings of SWM Installations 98
Appendix 4-Cost Estimates 102
LIST OF FIGURES
Figure 1: Strategic Planning Framework 1 Figure 2: City Location 2 Figure 3: Current Administrative Status 3 Figure 4: Temporary projected population 2020-2040 5 Figure 5: Projected overall population growth 5 Figure 6: Current Land-Use (Based on the Year 2015) 6 Figure 7: Projected Land-Use (Based on the Year 2030) 7 Figure 8: Employment by Economic Sector 8 Figure 9 National Parks and Wildlife Sanctuaries of Cambodia 9 Figure 10: Solid Waste Categories 15 Figure 11 Solid Waste Composition 16 Figure 12: Origin of Solid Waste, Egis 2020. 17 Figure 13: Collection Coverage in Poipet, Egis 2020 19 Figure 14: Summary of the Current SWM Situation 24 Figure 15: Impact Diagram – Current Situation (weight based ratios) 25 Figure 16: Proposed Locations for SWM Facilities 36 Figure 17: Silo Composting Process and Pictures of Silos 40 Figure 18: Estimate of LFG production 44 Figure 19: MSW flows in Treatment & Disposal Facilities (2040) 47 Figure 20: Proposed Location of Solid Waste Facilities (SWM) 48 Figure 21: Zoning of waste collection service 50 Figure 22: Collection Scheme for Biowaste 52 Figure 23: Junkshops and Markets locations 53 Figure 24: View of the layout of the sorting line 58 Figure 25: Flow Diagram of the Sorting Plant in 2040 60 Figure 26: Sorting Plant Equipment 62 Figure 27: Composting Process Flow Diagram based on 2040 Production 66 Figure 28: Landfill general layout 68
LIST OF TABLES
Table 1: General Population Censuses 1998, 2008 and 2019 3 Table 2: Projected population 2020-2040 4 Table 3: Main Considerations - Social and Gender 8 Table 4: Agency Responsibility for Solid Waste 11 Table 5: Roles and Responsibilities of Actors by Sub-Functions for Wastewater Management 13 Table 6: Distances for selection site for a new landfill (MOE Guideline) 14 Table 7: Solid Waste Composition per Origin 17 Table 8: Market Prices of Recyclables 21 Table 9: Total MSW Generation Projected per Horizons 28 Table 10: Proposed Projects Priorities for ADB Loan in the Short Term 30 Table 11: Proposed Projects in the Medium Term 30 Table 12: Main Biological Parameters for Composting 33 Table 13: Compost Quality Parameters 33 Table 14: Summary of landfill site assessments 35 Table 15: Technical options for Collection 37 Table 16: Comparison of Treatment Technologies 38 Table 17: Comparison of Technical Options for Composting 40 Table 18: Comparative Analysis of Basal Liner Options 42 Table 19: Comparative Analysis of Leachate Treatment Options 43 Table 20: Estimate of LFG Production 44 Table 21: Comparative Analysis of LFG Treatment Options 45 Table 22: Summary of the Selected Options 46 Table 23: Solid Waste Management Sub-Components 48 Table 24: Solid waste production per zone and per horizon 49 Table 25: Number of Trucks Required for Door-to-Door SW Collection 51 Table 26: Truck and Container Requirements for Collection Points 52 Table 27: Market Biowaste Generation and Recovery Rates 53 Table 28: Truck requirements for Market biowaste 54 Table 29: Container Types for Household Hazardous Waste Storage 54 Table 30: Total Collection Trucks Requirements 55 Table 31: Total Operators Required 55 Table 32: Total fuel consumption 55 Table 33: Dimensioning of the sorting line based on 2040 capacity 59 Table 34: Sorted recyclables tonnage by horizon 60 Table 35: Equipment Requirements for Sorting Plant 61 Table 36: Composting Plant Input 64 Table 37: Estimate of requirements for windrows 65 Table 38: Design of the Maturation Area 65 Table 39: Compost Production by Horizon 66 Table 40: Equipment Requirements for the Composting Plant 66 Table 41: Estimate of Void Space Required for Landfill 67 Table 42: Power Requirements for the Landfill Site 70 Table 43: Plant/vehicles requirements for landfill 71 Table 44: Contingencies assumptions 72 Table 45: Summary of CAPEX - Landfill 72 Table 46: Summary of CAPEX – Sorting plant 72 Table 47: Summary of CAPEX – Composting plant 73 Table 48: Summary of CAPEX - Collection 73 Table 49: Synthesis 73 Table 50: Summary for OPEX in 2025 74 Table 51: Waste Collection Tariffs 75

Table 52: Overview of Project Impacts related to Resettlement – Specific to SWM 77 Table 53: Calculated Likelihood and Consequence of Impact from Flooding Hazard for the Infrastructure Element of the Stormwater Component. 78 Table 54: Procurement Package 80

LIST OF PICTURES
Picture 1: Door-to-door collection, Egis 2020 ........................................................................18 Picture 2: Blue Container along National 5 (left); Plastic Containers for Waste Segregation (Right) ..............................................................................................................20 Picture 3: Weighbridge in a Junkshop in Poipet (left); Sorting operator, Collecting Caps from Plastic Bottles (Right) ...................................................................................................21 Picture 4: Current Dumpsite in Poipet ...................................................................................22 Picture 5: Windrow Composting Process ..............................................................................39 Picture 6: Centralized collection point and containers ...........................................................51 Picture 7: of a sorting line in Vietnam ...................................................................................56 Picture 8: Ampliroll-Type Truck for Transport of Rejects .......................................................61
EXECUTIVE SUMMARY
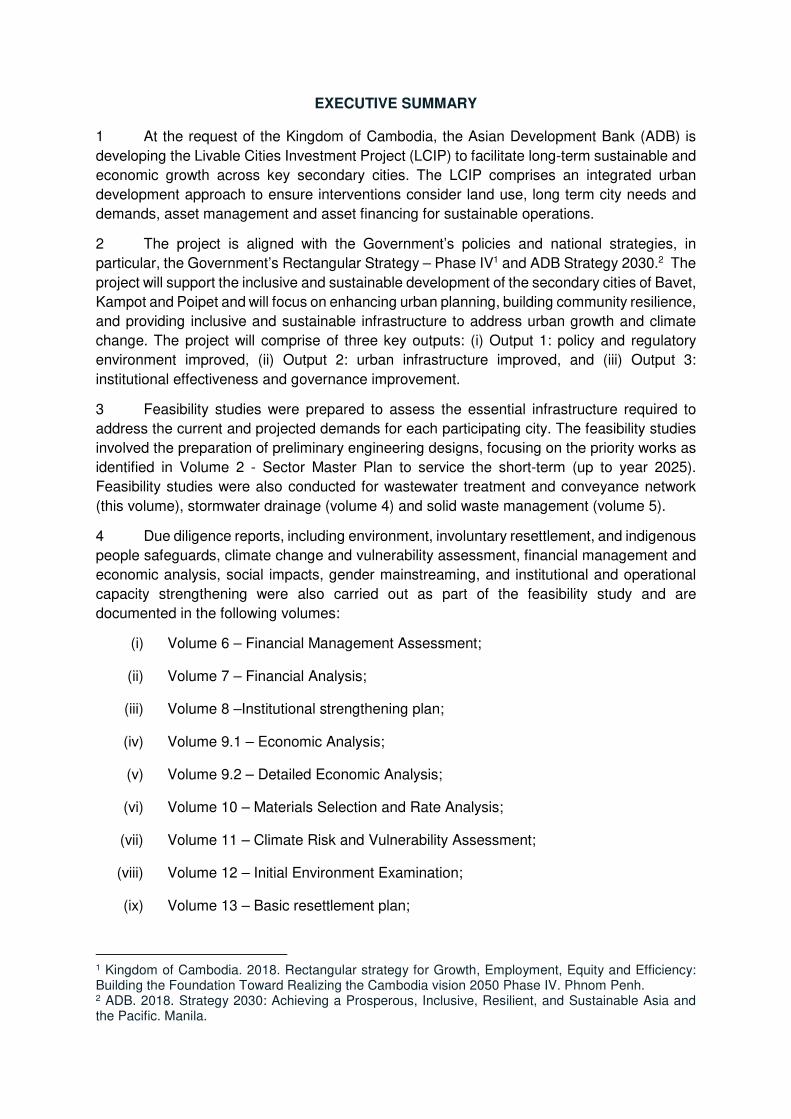
1 At the request of the Kingdom of Cambodia, the Asian Development Bank (ADB) is
developing the Livable Cities Investment Project (LCIP) to facilitate long-term sustainable and
economic growth across key secondary cities. The LCIP comprises an integrated urban
development approach to ensure interventions consider land use, long term city needs and
demands, asset management and asset financing for sustainable operations.
2 The project is aligned with the Government’s policies and national strategies, in
particular, the Government’s Rectangular Strategy – Phase IV1 and ADB Strategy 2030.2 The
project will support the inclusive and sustainable development of the secondary cities of Bavet,
Kampot and Poipet and will focus on enhancing urban planning, building community resilience,
and providing inclusive and sustainable infrastructure to address urban growth and climate
change. The project will comprise of three key outputs: (i) Output 1: policy and regulatory
environment improved, (ii) Output 2: urban infrastructure improved, and (iii) Output 3:
institutional effectiveness and governance improvement.
3 Feasibility studies were prepared to assess the essential infrastructure required to
address the current and projected demands for each participating city. The feasibility studies
involved the preparation of preliminary engineering designs, focusing on the priority works as
identified in Volume 2 - Sector Master Plan to service the short-term (up to year 2025).
Feasibility studies were also conducted for wastewater treatment and conveyance network
(this volume), stormwater drainage (volume 4) and solid waste management (volume 5).
4 Due diligence reports, including environment, involuntary resettlement, and indigenous
people safeguards, climate change and vulnerability assessment, financial management and
economic analysis, social impacts, gender mainstreaming, and institutional and operational
capacity strengthening were also carried out as part of the feasibility study and are
documented in the following volumes:
(i) Volume 6 – Financial Management Assessment;
(ii) Volume 7 – Financial Analysis;
(iii) Volume 8 –Institutional strengthening plan;
(iv) Volume 9.1 – Economic Analysis;
(v) Volume 9.2 – Detailed Economic Analysis;
(vi) Volume 10 – Materials Selection and Rate Analysis;
(vii) Volume 11 – Climate Risk and Vulnerability Assessment;
(viii) Volume 12 – Initial Environment Examination;
(ix) Volume 13 – Basic resettlement plan;
1 Kingdom of Cambodia. 2018. Rectangular strategy for Growth, Employment, Equity and Efficiency: Building the Foundation Toward Realizing the Cambodia vision 2050 Phase IV. Phnom Penh. 2 ADB. 2018. Strategy 2030: Achieving a Prosperous, Inclusive, Resilient, and Sustainable Asia and the Pacific. Manila.
(x) Volume 14 – Indigenous Peoples Due Diligence Report;
(xi) Volume 15 – Social development, poverty, and gender;
(xii) Volume 16 – Strategic Procurement Plan.
Volume 16 – Strategic Procurement Plan.5 Poipet City is surrounded by Thailand’s east
border town Aranyaprathet in the northwest and west side; by Malai District on the
southwestern side; and by Ou Chrov District in the northeast and eastern portions. The city
has experienced major development, because of foreign investment from the construction of
hotels and casinos and low to medium density and high rise residential and commercial
development. This has resulted in spillover of urban growth and the expansion of the
administrative boundary of Poipet, with the city now comprising of three quarters (Sangkat):
Sangkat Poipet, Sangkat Nimitt, and Sangkhat Phsar Kandal, with a total of 38 villages.
6 The Poipet municipality comprises built-up and rural areas with a total population of
124,244 inhabitants, which includes a large number of temporary workers and tourists. The
population is expected to grow up to 226,118 by horizon 2040.
7 Land Use Master Plan for the 2030 horizon, which has been prepared by the Ministry
of Land Management Urban Planning and Construction (MLMUPC) have identified that to
cater for the projected population growth, that approximately 49km2 of land will be converted
to residential, by 2030.
8 Access to services. Currently, the Municipal Solid Waste (MSW) collection is
managed by a private company, CINTRI, and is limited to the dense urban area and Special
Economic Zones (SEZs). Most of the solid waste is disposed of and burned in a dumpsite.
Sorting and recycling are limited and mainly driven by the informal sector.
9 Adequacy of services. The current generation of municipal solid waste in Poipet is
estimated at 170 ton per day (tpd) equivalent to 62,416 ton per year (tpy), of which 99 tpd is
collected by the official collection operator, 20 tpd is collected by waste pickers and 51 tpd is
not collected. 3
10 The key issues with respect to solid waste management faced by the city is
summarized as follows:
(i) Poor management of solid waste. The assessment of the MSW disposal chain, both in rural and urban areas, suggests that 88% of the MSW is not managed safely. The household collection coverage is only approximately 16%. A large portion of the MSW is also left uncollected and is dumped directly in the nearby natural environment and/or burnt. It is necessary to improve the collection of the whole city.
(i) Fast urban development. The socio-economic condition of Poipet contributes to rapid urbanization and the rapid development of SEZs. The lack of service described in point (i) contributes to stormwater capacity reduction due to solid waste blocking the channels.
3 Solid Waste Characterization Survey, Egis 2020
(ii) Hazardous household waste. There are currently no available facilities for recycling hazardous waste (i.e., waste motor oils, car batteries, batteries, paint, solvents, etc.) within an economically-viable distance of Poipet.
(iii) Climate Change. With a projected rainfall increase of 5%, there is a moderate risk of impact due to localized flooding overwhelming the stormwater management facilitiy leading to leachate leaving the site.
11 The following recommendations have been identified, following the conclusion of the
feasibility study assessment to address the issues and challenges.
12 Waste Collection. The waste collection is proposed to be improved through the
following means:
(i) In urban areas. Door-to-door collection will be provided. In the dense urban area, where every household is very close one to another, the door-to-door collection will be a high service standard. Wastes will be collected at each property limit. Wastes generated from SEZs that are within the urban areas will also be collected with the door-to-door system.
(ii) In rural areas. Households that are relatively scattered and/or with poor road access (most of the roads in rural areas are not asphalted) will be serviced through the use of centralized collection points. There are eight (8) proposed locations in the rural sangkats at the junction of major roads.
13 Sorting plant. A sorting plant will be included as part of the waste management chain.
The aim of the sorting plant is to separate the municipal wastes into different categories:
valuable plastics, including PET bottles, plastic glass, plastic bags; cans and metals; and the
fraction of green waste >80 mm for composting.
14 Green waste recovered from the sorting line is transferred to the nearby composting
plant. The capacity of the composting facility comprises 57% of biowaste from markets and
43% of green waste from the sorting plant. The composting facility can also treat sewage
sludge from the municipal wastewater treatment plant (WWTP) if the moisture content of the
sludge would need to be lower than 80%.
15 New Controlled Landfill. A new landfill (land to be acquired) will be created
approximately 25 km from the current dumpsite. The majority of the leachate will be
recirculated back into the landfill mass, with the excess being tankered off-site for treatment
at the WWTP
16 Management of stormwater run-off. The storm-water run-off from the on-site road
and hardstanding areas will be collected in the run-off ditches and then to the settlement
lagoon before discharge to the watercourse. The stormwater management facility is designed
to handle extreme rainfall events, considering climate change assumptions.
17 Closure of the existing dumpsite. It is recommended that the existing dumpsite
(private) be closed, subject to discussion with MOE and the provincial government. This
activity is proposed to be carried out in conjunction with the implementation of LCIP but has
not been included as part of the scope of the project.
18 Biowaste collection from markets: Market sellers at the Ra Thmei, Phsar Thmei,
Phsar Trei, Mondul Boun, Samakoum, and Kandal markets will manage the segregation at
the source and bring the biowaste to the collection point. It is assumed that 80% of the market
biowaste could be recovered by implementing such a dedicated collection system. Biowaste
should be collected in waste containers of 660L located at markets in a 15 m2 storage area.
One compacting truck of 5t capacity is required to collect biowaste in each market.
19 Management of hazardous household waste It is proposed that waste motor oils,
batteries, car batteries, and household hazardous waste be temporarily stored at a storage
platform to be created at the controlled landfill. It shall remain stored until an economically
viable quantity is collected for shipment to treatment and elimination facilities in Phnom Penh
or elsewhere.
20 Investment proposed. Based on the feasibility assessment, the following investments
are proposed for the city:
(i) Construction of one sorting plant (capacity 66,709 tpy) and one composting plant (capacity 5,486 tpy);
(ii) Construction of one controlled landfill (capacity 632,784 m3); and
(iii) Acquisition of 18 waste collection trucks (compacting trucks).
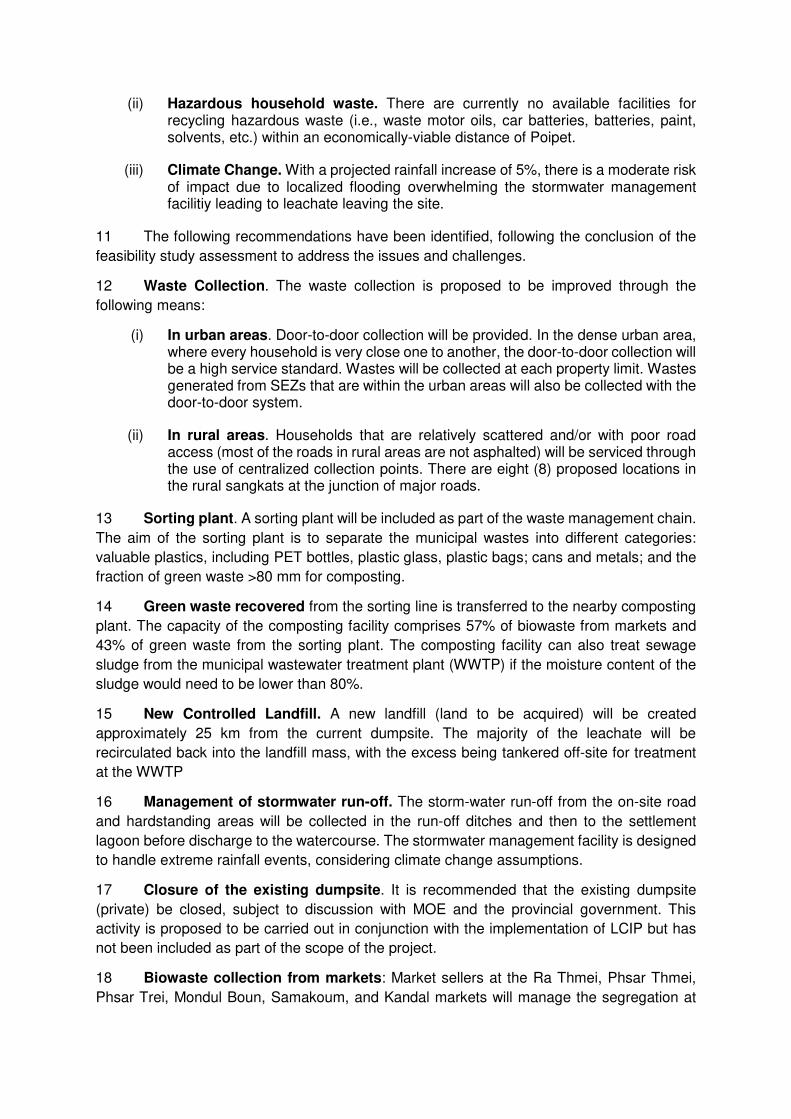
21 The estimated capital and operational costs are provided in the following
tables:
Component
(civil works and Equipment)
TOTAL
($)
Landfill $ 5,685,940 Sorting Plant $ 2,613,628 Composting plant $ 2,083,400 Collection $ 1,465,813 Sub-total $ 11,848,781 Mobilization (additional) $ 351,000 TOTAL $ 12,199,781
Note: Total including civil works, equipment, and excluding consulting services, VAT, physical contingency and price contingency.
Synthesis Annual Cost
($) Landfill $ 174 762 Sorting plant $ 527 689 Composting plant $ 111 720 Collection $ 892 739 TOTAL ANNUAL OPEX $ 1 706 911

1
INTRODUCTION
1. The urban population in Cambodia has increased at a rate of 8.1% per year since 2008, and in 2019, represents approximately 6.14 million out of a total population of 15.5 million in 2019.4 As a result, many cities across the country have experienced rapid urban growth, which has highlighted deficiencies in the existing basic infrastructure, where it is no longer operating optimally or capable of servicing the increased demands. The Livable Cities Investment Project (LCIP) has been designed to facilitate long-term sustainable and economic growth across the key secondary cities of Bavet, Kampot and Poipet, which have been selected for their economic potential and location at key trade and tourism zones. The project incorporates a holistic approach that takes into consideration current and future urban development trends, Land Use Master Plan, city needs and demands, asset management, and asset financing to enable long-term sustainability of the city.
2. The project is aligned with the following impact: livability of secondary cities improved, and will have the following outcome: access to urban infrastructure and services in participating cities improved. The project outputs include: (i) Output 1: policy and regulatory environment improved; (ii) Output 2: urban infrastructure improved; and (iii) Output 3: institutional effectiveness and governance improved. The project is aligned with the Government’s policies and national strategies, in particular, the Government’s Rectangular Strategy – Phase IV5 and ADB Strategy 20306.
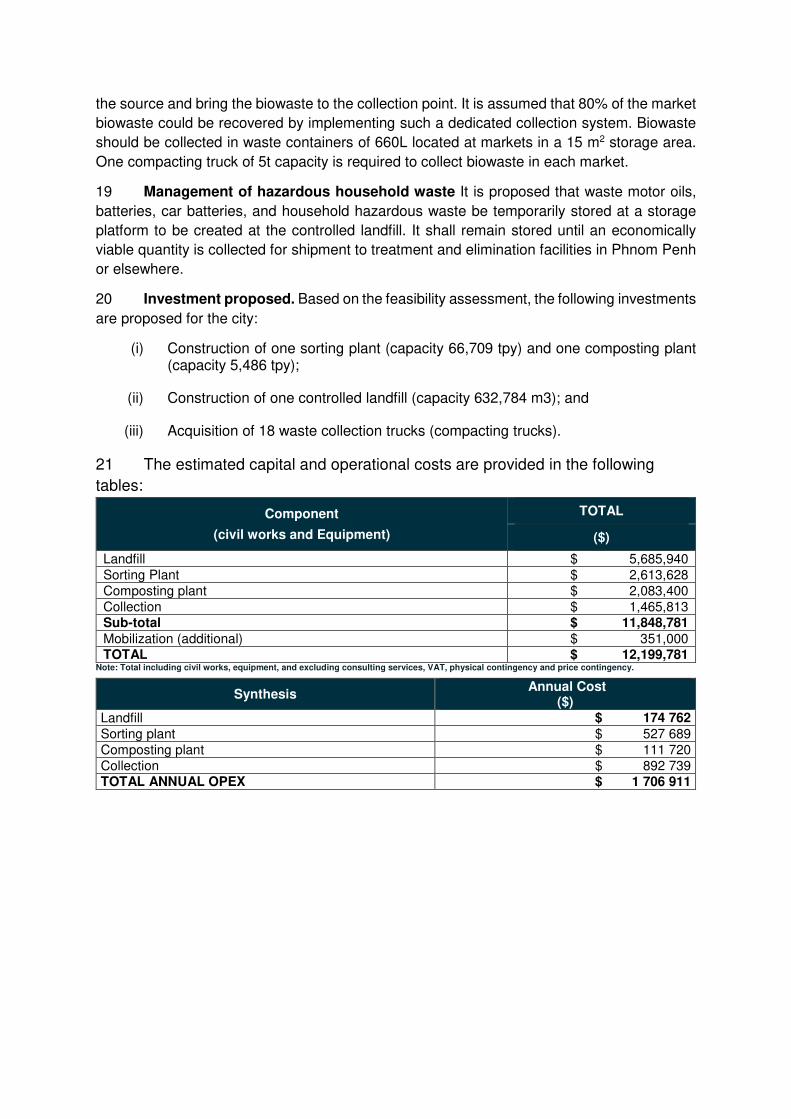
3. This feasibility study has been prepared to assess the technical solutions to meet the future urban needs and outlines the proposed infrastructure investments required to service the short-term horizon (up to 2025). It builds on the recommendations as identified in the earlier Urban Development Scenario report (April 2020) and the Sector Master Plan (March 2021).
Figure 1: Strategic Planning Framework
4 Government of Cambodia. 2020. General Population Census of the Kingdom of Cambodia 2019. Phnom Penh. 5 Kingdom of Cambodia. 2018. Rectangular strategy for Growth, Employment, Equity and Efficiency: Building the Foundation Toward Realizing the Cambodia vision 2050 Phase IV. Phnom Penh. 6 ADB. 2018. Strategy 2030: Achieving a Prosperous, Inclusive, Resilient, and Sustainable Asia and the Pacific. Manila.
2
CITY OVERVIEW
1. Urban Boundaries
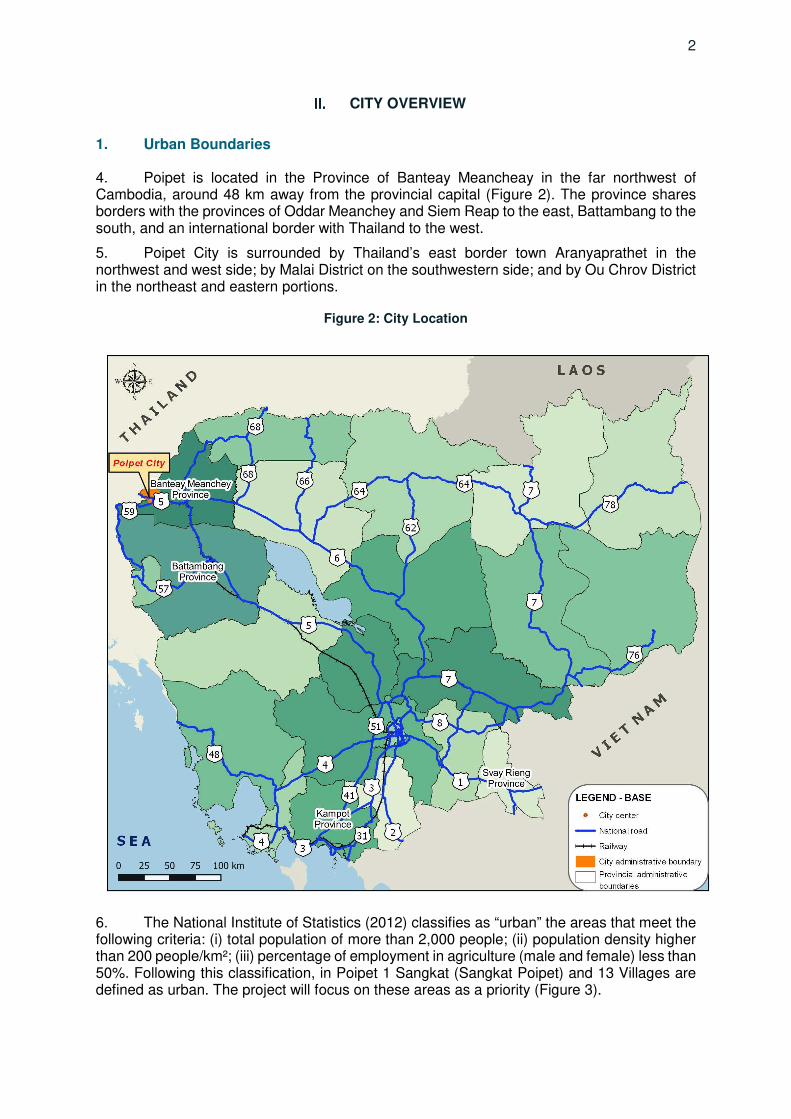
4. Poipet is located in the Province of Banteay Meancheay in the far northwest of Cambodia, around 48 km away from the provincial capital (Figure 2). The province shares borders with the provinces of Oddar Meanchey and Siem Reap to the east, Battambang to the south, and an international border with Thailand to the west.
5. Poipet City is surrounded by Thailand’s east border town Aranyaprathet in the northwest and west side; by Malai District on the southwestern side; and by Ou Chrov District in the northeast and eastern portions.
Figure 2: City Location
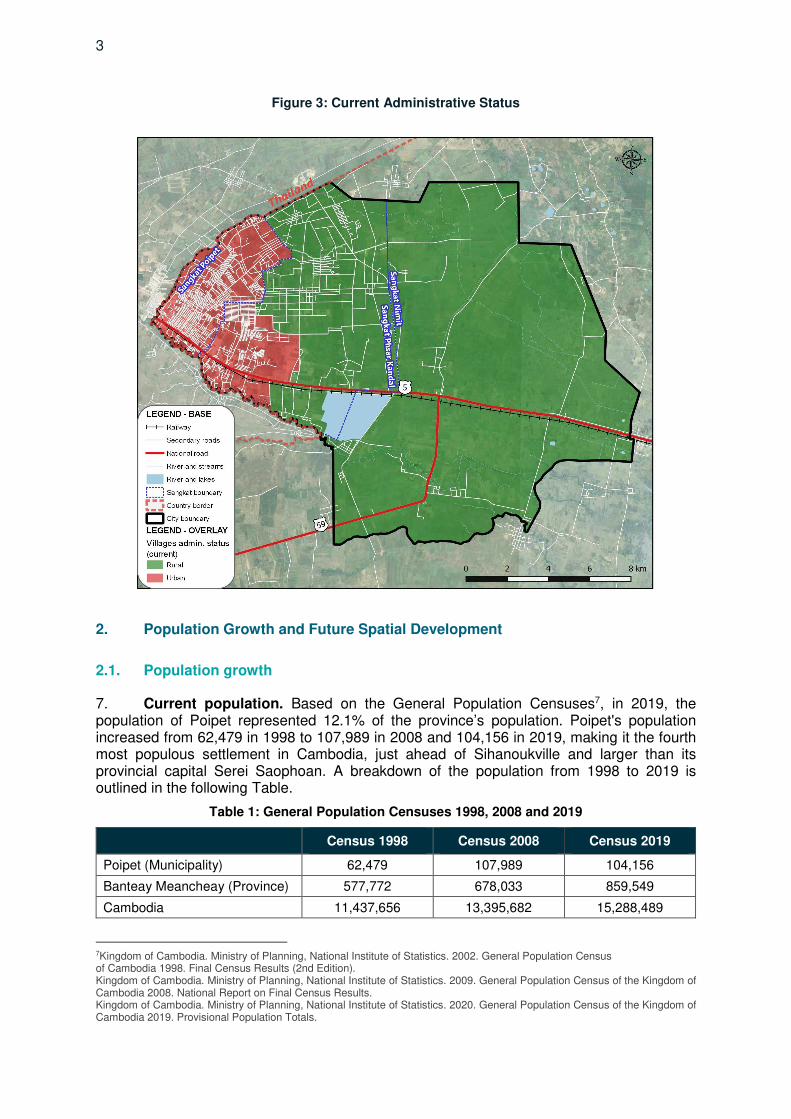
6. The National Institute of Statistics (2012) classifies as “urban” the areas that meet the following criteria: (i) total population of more than 2,000 people; (ii) population density higher than 200 people/km²; (iii) percentage of employment in agriculture (male and female) less than 50%. Following this classification, in Poipet 1 Sangkat (Sangkat Poipet) and 13 Villages are defined as urban. The project will focus on these areas as a priority (Figure 3).
3
Figure 3: Current Administrative Status
2. Population Growth and Future Spatial Development
2.1. Population growth
7. Current population. Based on the General Population Censuses7, in 2019, the population of Poipet represented 12.1% of the province’s population. Poipet's population increased from 62,479 in 1998 to 107,989 in 2008 and 104,156 in 2019, making it the fourth most populous settlement in Cambodia, just ahead of Sihanoukville and larger than its provincial capital Serei Saophoan. A breakdown of the population from 1998 to 2019 is outlined in the following Table.
Table 1: General Population Censuses 1998, 2008 and 2019
Census 1998 Census 2008 Census 2019
Poipet (Municipality) 62,479 107,989 104,156
Banteay Meancheay (Province) 577,772 678,033 859,549
Cambodia 11,437,656 13,395,682 15,288,489
7Kingdom of Cambodia. Ministry of Planning, National Institute of Statistics. 2002. General Population Census of Cambodia 1998. Final Census Results (2nd Edition). Kingdom of Cambodia. Ministry of Planning, National Institute of Statistics. 2009. General Population Census of the Kingdom of Cambodia 2008. National Report on Final Census Results. Kingdom of Cambodia. Ministry of Planning, National Institute of Statistics. 2020. General Population Census of the Kingdom of Cambodia 2019. Provisional Population Totals.
4
8. Projected population growth. The population growth by population type has been projected, based on the adopted growth scenario as detailed in the Urban Scenario Report.
(i) Permanent population contribution. Using the historical census data as a basis, the population projection to 2040 for the city has been determined based on the Average Annual Growth Rate (AAGR) 2015-2018 at the Village administrative level (range of 0.2%-5.02% AAGR per Village).
(ii) Temporary population contribution. This is computed based on the Average Annual Growth Rate (AAGR) of the official temporary population for four years from 2012 to 2018 (City Socio-Economic Status report).
(iii) Tourism contribution. Tourism contribution is computed using the Average Annual Growth Rate (AAGR) from 2014 to 2018 of the foreign tourists (1.08%) and local tourists (2.09%).
(iv) Special Economic Zone (SEZ) worker's contribution. No growth rate is proposed, but the creation of new SEZs is anticipated by considering new factories allowing between 500-2000 additional workers contributing to the global dynamics of the city. The SEZ workers are included in the temporary population by estimating 3,000 additional workers by 2030.
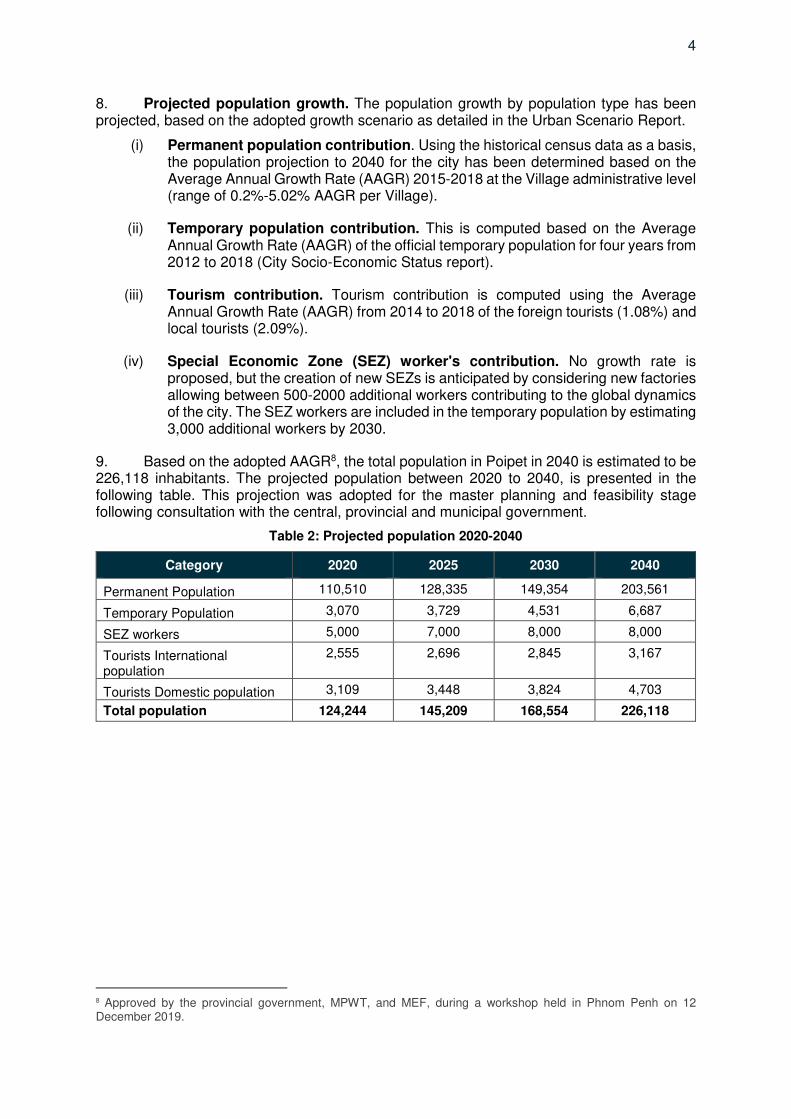
9. Based on the adopted AAGR8, the total population in Poipet in 2040 is estimated to be 226,118 inhabitants. The projected population between 2020 to 2040, is presented in the following table. This projection was adopted for the master planning and feasibility stage following consultation with the central, provincial and municipal government.
Table 2: Projected population 2020-2040
Category 2020 2025 2030 2040
Permanent Population 110,510 128,335 149,354 203,561
Temporary Population 3,070 3,729 4,531 6,687
SEZ workers 5,000 7,000 8,000 8,000
Tourists International population
2,555 2,696 2,845 3,167
Tourists Domestic population 3,109 3,448 3,824 4,703
Total population 124,244 145,209 168,554 226,118
8 Approved by the provincial government, MPWT, and MEF, during a workshop held in Phnom Penh on 12 December 2019.
5
10. The figures shown below illustrates the projected population growth for Poipet city:
Figure 4: Temporary projected population 2020-2040
Figure 5: Projected overall population growth
2.2. Future spatial development
11. Existing Land Use 2018. In 2018, agricultural land use represented the biggest portion of the city with 211 km² or 77%, followed by urban use at 58 km² or 21%, water at 0.77%, natural forest at 0.61% and open space at 0.07%.
12. Proposed Land Use 2030. The Land Use Master Plan 2030, which has been developed by the Ministry of Land Management Urban Planning and Construction (MLMUPC) is the official document for the city development and was used as a basis for the development of the sector master plans and this feasibility study.
13. As shown in the maps below, a significant land-use conversion, of approximately 50 km2, from agricultural to residential is proposed for 2030.9 Agricultural land will still remain the largest land use category at just under 60% land use, with urban representing 31%. Given the
9 Spatial plan for the horizon 2030 prepared by the Ministry of Urban Planning and Construction (MLMUPC), approved in 2020.
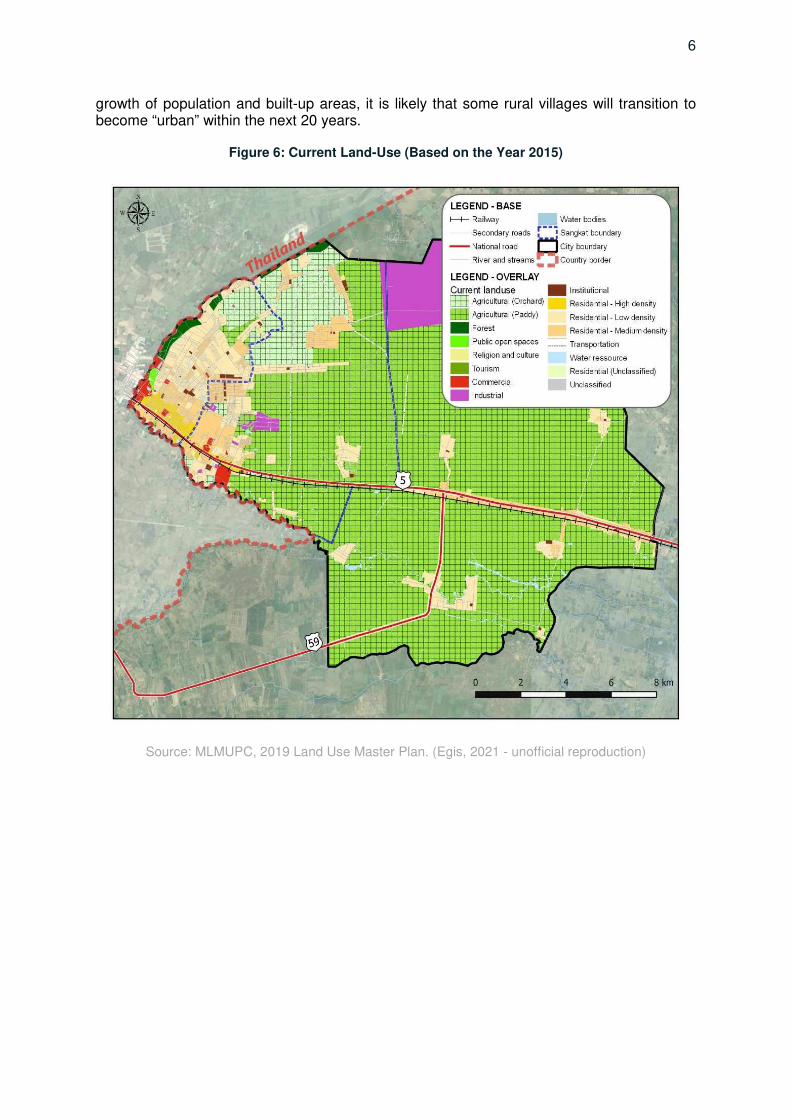
6
growth of population and built-up areas, it is likely that some rural villages will transition to become “urban” within the next 20 years.
Figure 6: Current Land-Use (Based on the Year 2015)
Source: MLMUPC, 2019 Land Use Master Plan. (Egis, 2021 - unofficial reproduction)
7
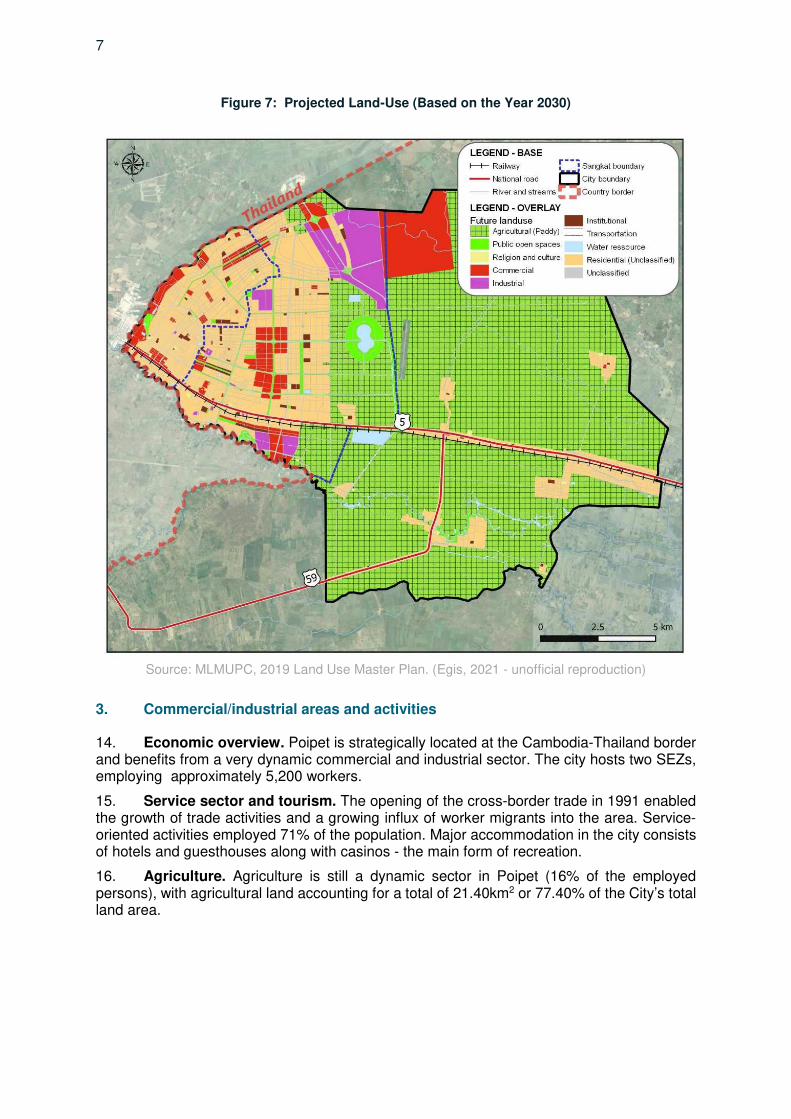
Figure 7: Projected Land-Use (Based on the Year 2030)
Source: MLMUPC, 2019 Land Use Master Plan. (Egis, 2021 - unofficial reproduction)
3. Commercial/industrial areas and activities
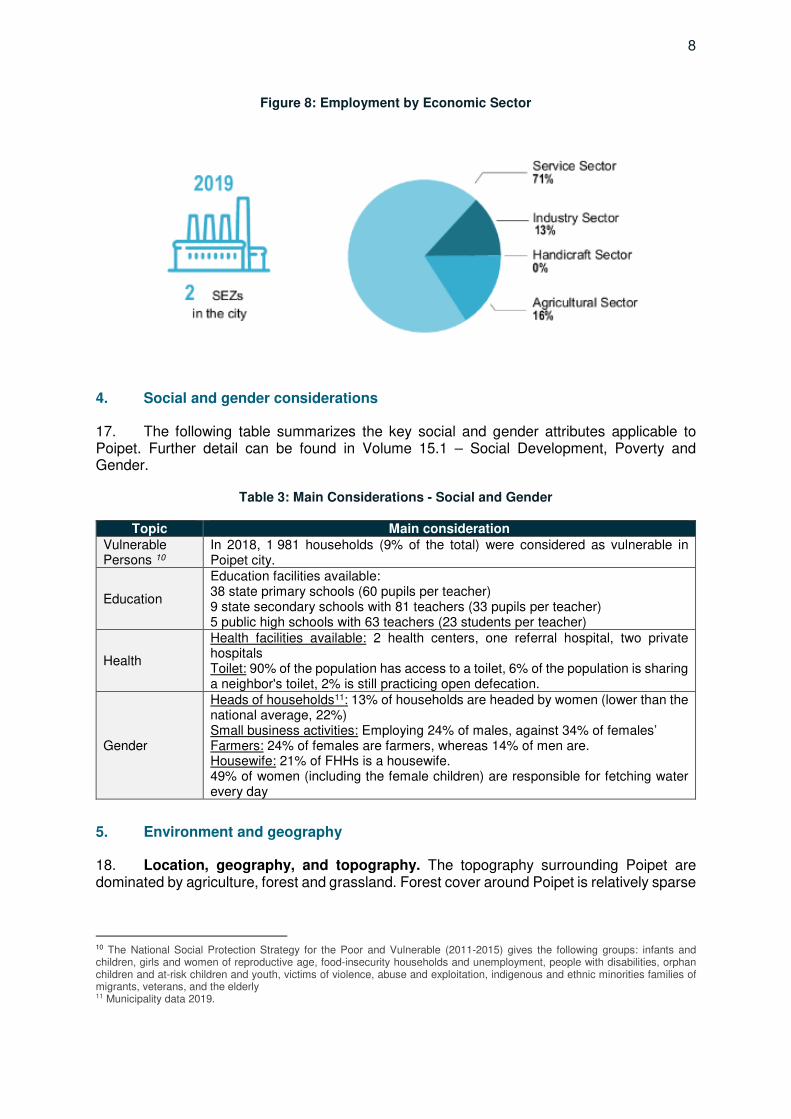
14. Economic overview. Poipet is strategically located at the Cambodia-Thailand border and benefits from a very dynamic commercial and industrial sector. The city hosts two SEZs, employing approximately 5,200 workers.
15. Service sector and tourism. The opening of the cross-border trade in 1991 enabled the growth of trade activities and a growing influx of worker migrants into the area. Service-oriented activities employed 71% of the population. Major accommodation in the city consists of hotels and guesthouses along with casinos - the main form of recreation.
16. Agriculture. Agriculture is still a dynamic sector in Poipet (16% of the employed persons), with agricultural land accounting for a total of 21.40km2 or 77.40% of the City’s total land area.
8
Figure 8: Employment by Economic Sector
4. Social and gender considerations
17. The following table summarizes the key social and gender attributes applicable to Poipet. Further detail can be found in Volume 15.1 – Social Development, Poverty and Gender.
Table 3: Main Considerations - Social and Gender
Topic Main consideration Vulnerable Persons 10
In 2018, 1 981 households (9% of the total) were considered as vulnerable in Poipet city.
Education
Education facilities available: 38 state primary schools (60 pupils per teacher) 9 state secondary schools with 81 teachers (33 pupils per teacher) 5 public high schools with 63 teachers (23 students per teacher)
Health
Health facilities available: 2 health centers, one referral hospital, two private hospitals Toilet: 90% of the population has access to a toilet, 6% of the population is sharing a neighbor's toilet, 2% is still practicing open defecation.
Gender
Heads of households11: 13% of households are headed by women (lower than the national average, 22%) Small business activities: Employing 24% of males, against 34% of females’ Farmers: 24% of females are farmers, whereas 14% of men are. Housewife: 21% of FHHs is a housewife. 49% of women (including the female children) are responsible for fetching water every day
5. Environment and geography
18. Location, geography, and topography. The topography surrounding Poipet are dominated by agriculture, forest and grassland. Forest cover around Poipet is relatively sparse
10 The National Social Protection Strategy for the Poor and Vulnerable (2011-2015) gives the following groups: infants and children, girls and women of reproductive age, food-insecurity households and unemployment, people with disabilities, orphan children and at-risk children and youth, victims of violence, abuse and exploitation, indigenous and ethnic minorities families of migrants, veterans, and the elderly 11 Municipality data 2019.
9
and characterized as deciduous dipterocarp forest, which can be distinguished by an open canopy combined with a grassy ground layer.12
19. The topography around Poipet is defined by extensive lowlands, with a few higher areas to the north and east, ranging from 30 to 80 meters above sea level. The highest point is a hill formation north of the city and lowest elevations surround the stream south of the city.
20. Geology and soils. In the region of Poipet, the dominating geological group is quaternary sedimentary rock basement and unconsolidated sediments. There are three main types of substratum or layers around Poipet: Pediments, Deltaïc deposits and Terrace alluvial deposits. Over the four hydrologic soil groups defined by the NRCS13, most of Poipet soils are classified as a group D soil (D’s soils have the greatest runoff potential) according to the HYSOGs250m14 dataset. This soil type has a high runoff potential.
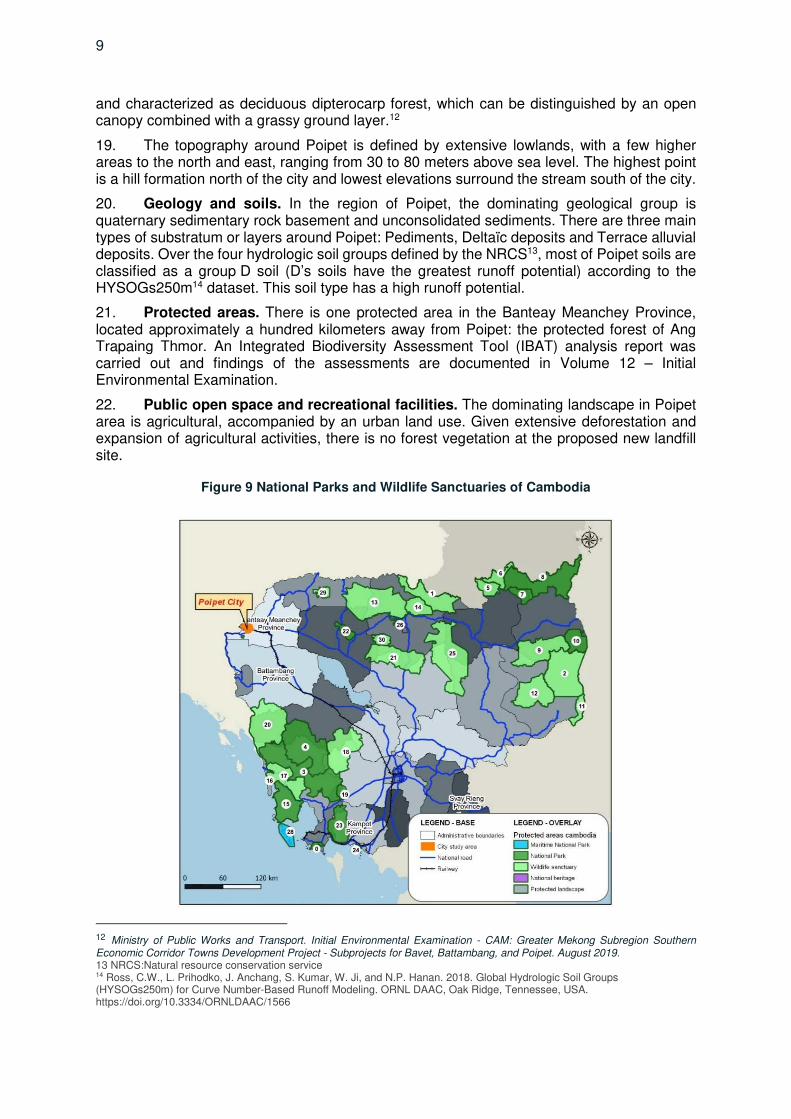
21. Protected areas. There is one protected area in the Banteay Meanchey Province, located approximately a hundred kilometers away from Poipet: the protected forest of Ang Trapaing Thmor. An Integrated Biodiversity Assessment Tool (IBAT) analysis report was carried out and findings of the assessments are documented in Volume 12 – Initial Environmental Examination.
22. Public open space and recreational facilities. The dominating landscape in Poipet area is agricultural, accompanied by an urban land use. Given extensive deforestation and expansion of agricultural activities, there is no forest vegetation at the proposed new landfill site.
Figure 9 National Parks and Wildlife Sanctuaries of Cambodia
12 Ministry of Public Works and Transport. Initial Environmental Examination - CAM: Greater Mekong Subregion Southern Economic Corridor Towns Development Project - Subprojects for Bavet, Battambang, and Poipet. August 2019. 13 NRCS:Natural resource conservation service 14 Ross, C.W., L. Prihodko, J. Anchang, S. Kumar, W. Ji, and N.P. Hanan. 2018. Global Hydrologic Soil Groups (HYSOGs250m) for Curve Number-Based Runoff Modeling. ORNL DAAC, Oak Ridge, Tennessee, USA. https://doi.org/10.3334/ORNLDAAC/1566
10
6. Climate Change
23. Temperature. The mean maximum temperature is 28°C, and the mean minimum temperature is 22°C. Maximum temperatures above 32°C are common before the start of the rainy season (May-October) and may rise to over 38°C. In the next decades, the number of days above 35°C is projected to increase from 25-30 days per year to over 50 days per year15 by 2050 under RCP8.5. The average annual temperature is projected16 to increase by 1 °C by 2030, by 2.2 °C by 2050, and by 3.6°C by the end of the century.
24. Rainfall. Based on the Climate Change scenarios, the maximum precipitation should increase by +5% (UNDP Scenario) by 205017.
25. Droughts. Bantey Meanchey Province is generally presented as being susceptible to drought and is listed as impacted in many of the reported droughts listed above. The initial Survey of Rural Cambodian Households carried out as part of the Formulation of the NAPA found that Bantey Meanchey was vulnerable to drought and ranked the province as the 3th highest province out of 2118. However, an assessment of drought vulnerability within the Province carried out in 2008 by the NCDM rated the area immediately around Poipet as low priority in terms of drought19.
26. Extreme weather events. When there are heavy rains in the central part of the country, runoff floods areas along smaller rivers and parts of the provinces around the Tonle Sap Lake. Bantey Meanchey Province is basically upstream of Tonle Sap and can flood over large areas due to the flat terrain. Based on MPWT’s in-house (the specific department remains unknown in the source referenced) software for determining the magnitude of flood risk, the Flood Risk Management Interface (FRMI), classifies NR5 as being at high risk of flooding with the only source of flood risk related to large-area flooding20.
15 Katzfey, J. et al, 2013. Climate change projections for Mondulkiri and Koh Kong Provinces in Cambo- Dia 16 C. McSweeney, M. New, G. Lizcano, Cambodia Climate Change Profile Oxford University, 2008. 17 ADB, Climate Risks in the Mekong Delta: Ca Mau and Kien Giang Provinces of Viet Nam, 2013.
18 MoE 2005. Vulnerability and Adaptation to Climate Hazards and to Climate Change: A Survey of Rural Cambodian Households. MoE, Phnom Phenh. 19 NCDM 2008. Stategic National Action Plan for Disaster Risk Reduction 2008~2013. National Committee for Disaster Management. Phnom Penh. 20 Ministry of Rural Development. 2018. Project Climate and Disaster Risk Assessment for CAM 42334 Cambodia: Rural Roads Improvement Project III. Ministry of Rural Development, Phnom Penh
11
SECTOR POLICY AND FRAMEWORK
1. National Agency Responsible for the Solid Waste Sector
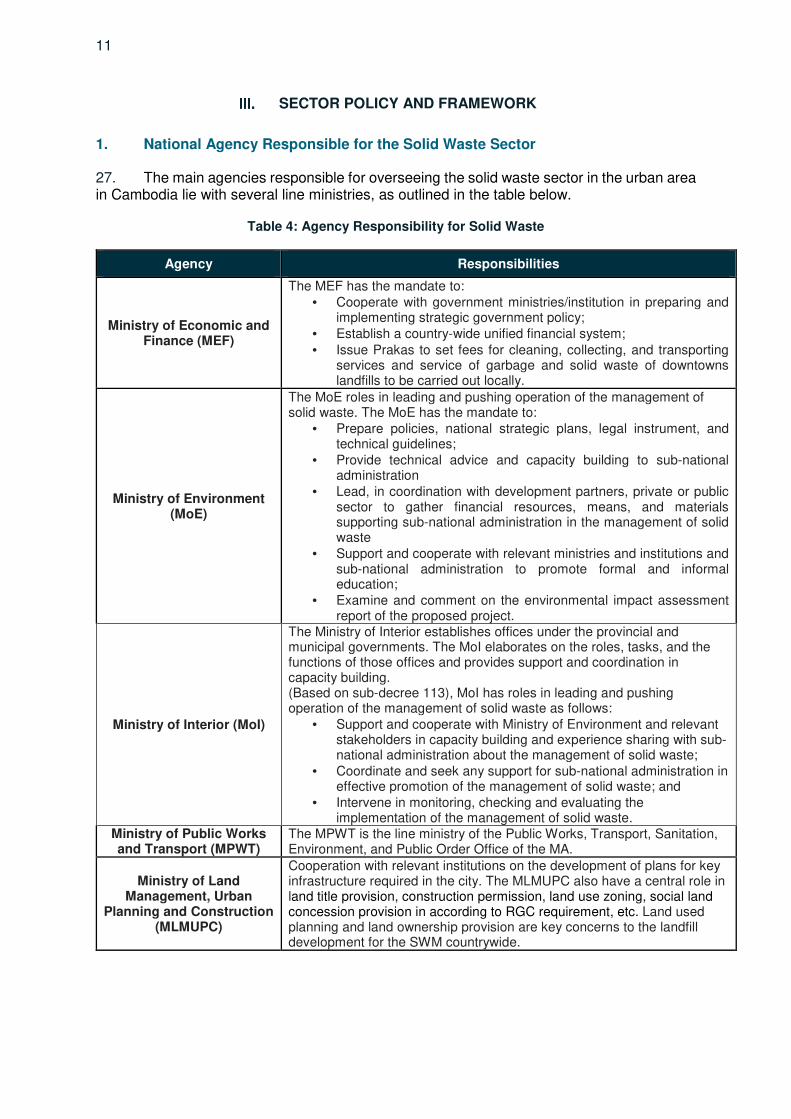
27. The main agencies responsible for overseeing the solid waste sector in the urban area in Cambodia lie with several line ministries, as outlined in the table below.
Table 4: Agency Responsibility for Solid Waste
Agency Responsibilities
Ministry of Economic and Finance (MEF)
The MEF has the mandate to: • Cooperate with government ministries/institution in preparing and
implementing strategic government policy; • Establish a country-wide unified financial system; • Issue Prakas to set fees for cleaning, collecting, and transporting
services and service of garbage and solid waste of downtowns landfills to be carried out locally.
Ministry of Environment (MoE)
The MoE roles in leading and pushing operation of the management of solid waste. The MoE has the mandate to:
• Prepare policies, national strategic plans, legal instrument, and technical guidelines;
• Provide technical advice and capacity building to sub-national administration
• Lead, in coordination with development partners, private or public sector to gather financial resources, means, and materials supporting sub-national administration in the management of solid waste
• Support and cooperate with relevant ministries and institutions and sub-national administration to promote formal and informal education;
• Examine and comment on the environmental impact assessment report of the proposed project.
Ministry of Interior (MoI)
The Ministry of Interior establishes offices under the provincial and municipal governments. The MoI elaborates on the roles, tasks, and the functions of those offices and provides support and coordination in capacity building. (Based on sub-decree 113), MoI has roles in leading and pushing operation of the management of solid waste as follows:
• Support and cooperate with Ministry of Environment and relevant stakeholders in capacity building and experience sharing with sub-national administration about the management of solid waste;
• Coordinate and seek any support for sub-national administration in effective promotion of the management of solid waste; and
• Intervene in monitoring, checking and evaluating the implementation of the management of solid waste.
Ministry of Public Works and Transport (MPWT)
The MPWT is the line ministry of the Public Works, Transport, Sanitation, Environment, and Public Order Office of the MA.
Ministry of Land Management, Urban
Planning and Construction (MLMUPC)
Cooperation with relevant institutions on the development of plans for key infrastructure required in the city. The MLMUPC also have a central role in land title provision, construction permission, land use zoning, social land concession provision in according to RGC requirement, etc. Land used planning and land ownership provision are key concerns to the landfill development for the SWM countrywide.
12
Agency Responsibilities
Council for the Development of Cambodia
(CDC)
Promote implementation of the Industry Development Policy (IDP) 2021-2025 Promotion of investments in SEZ Facilitating the development of provincial industrial zones, including prioritization of key infrastructure (i.e., solid Waste Management) to facilitate development. Entrance gate for both national and local investors to start their business/ development project in Cambodia before any registration with other in-line ministeries. It is the key institution on behalf of the RGC
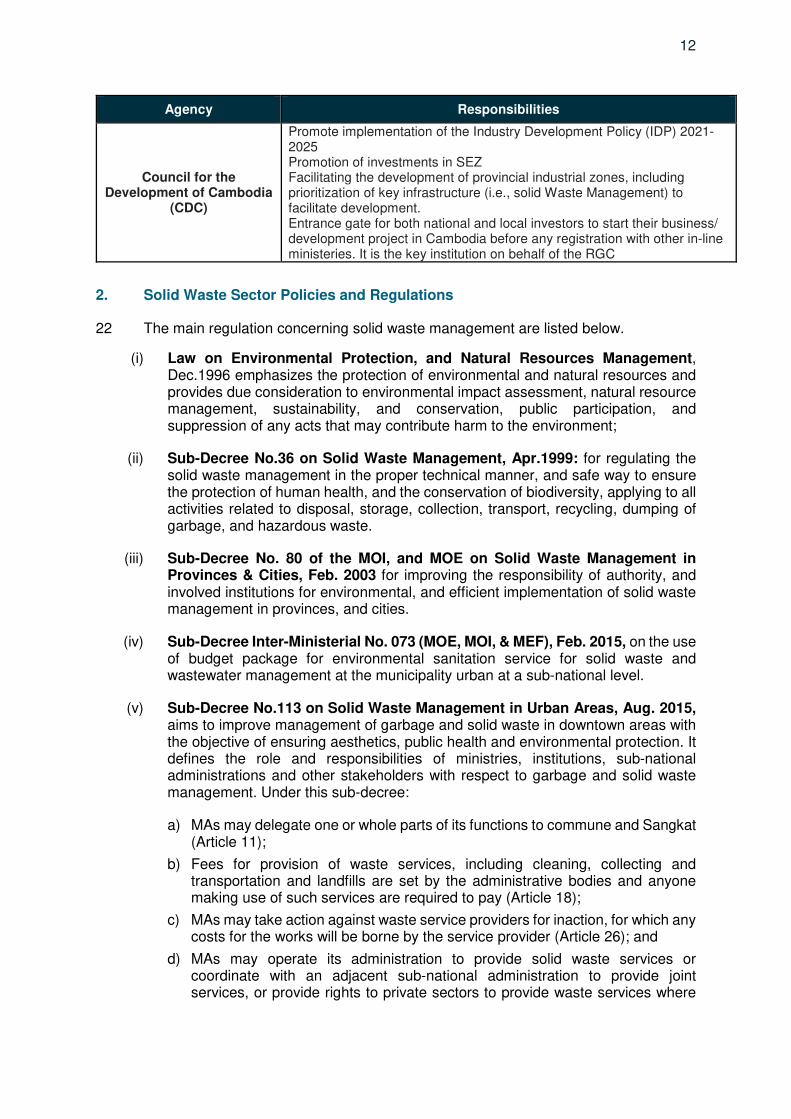
2. Solid Waste Sector Policies and Regulations
22 The main regulation concerning solid waste management are listed below.
(i) Law on Environmental Protection, and Natural Resources Management, Dec.1996 emphasizes the protection of environmental and natural resources and provides due consideration to environmental impact assessment, natural resource management, sustainability, and conservation, public participation, and suppression of any acts that may contribute harm to the environment;
(ii) Sub-Decree No.36 on Solid Waste Management, Apr.1999: for regulating the solid waste management in the proper technical manner, and safe way to ensure the protection of human health, and the conservation of biodiversity, applying to all activities related to disposal, storage, collection, transport, recycling, dumping of garbage, and hazardous waste.
(iii) Sub-Decree No. 80 of the MOI, and MOE on Solid Waste Management in Provinces & Cities, Feb. 2003 for improving the responsibility of authority, and involved institutions for environmental, and efficient implementation of solid waste management in provinces, and cities.
(iv) Sub-Decree Inter-Ministerial No. 073 (MOE, MOI, & MEF), Feb. 2015, on the use of budget package for environmental sanitation service for solid waste and wastewater management at the municipality urban at a sub-national level.
(v) Sub-Decree No.113 on Solid Waste Management in Urban Areas, Aug. 2015, aims to improve management of garbage and solid waste in downtown areas with the objective of ensuring aesthetics, public health and environmental protection. It defines the role and responsibilities of ministries, institutions, sub-national administrations and other stakeholders with respect to garbage and solid waste management. Under this sub-decree:
a) MAs may delegate one or whole parts of its functions to commune and Sangkat (Article 11);
b) Fees for provision of waste services, including cleaning, collecting and transportation and landfills are set by the administrative bodies and anyone making use of such services are required to pay (Article 18);
c) MAs may take action against waste service providers for inaction, for which any costs for the works will be borne by the service provider (Article 26); and
d) MAs may operate its administration to provide solid waste services or coordinate with an adjacent sub-national administration to provide joint services, or provide rights to private sectors to provide waste services where
13
such entitlement shall not be longer than 10 years for each contract (Articles 31 and 32).
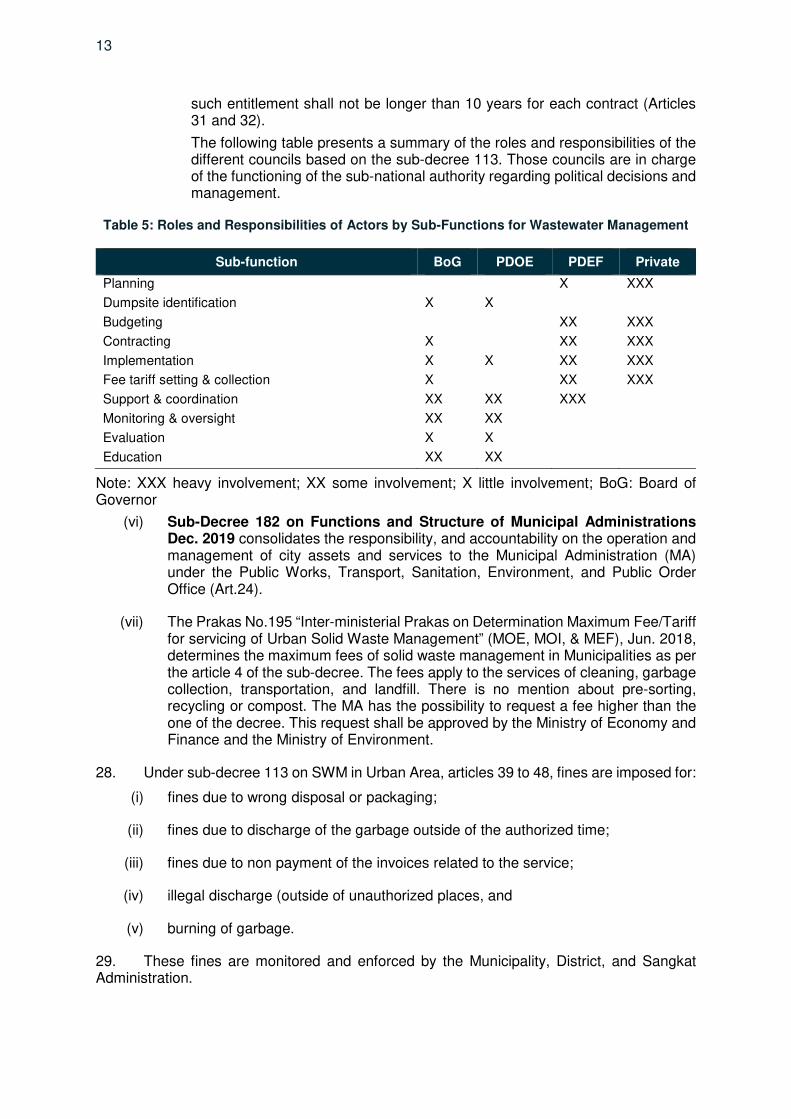
The following table presents a summary of the roles and responsibilities of the different councils based on the sub-decree 113. Those councils are in charge of the functioning of the sub-national authority regarding political decisions and management.
Table 5: Roles and Responsibilities of Actors by Sub-Functions for Wastewater Management
Sub-function BoG PDOE PDEF Private
Planning X XXX
Dumpsite identification X X
Budgeting XX XXX
Contracting X XX XXX
Implementation X X XX XXX
Fee tariff setting & collection X XX XXX
Support & coordination XX XX XXX
Monitoring & oversight XX XX
Evaluation X X
Education XX XX
Note: XXX heavy involvement; XX some involvement; X little involvement; BoG: Board of Governor
(vi) Sub-Decree 182 on Functions and Structure of Municipal Administrations Dec. 2019 consolidates the responsibility, and accountability on the operation and management of city assets and services to the Municipal Administration (MA) under the Public Works, Transport, Sanitation, Environment, and Public Order Office (Art.24).
(vii) The Prakas No.195 “Inter-ministerial Prakas on Determination Maximum Fee/Tariff for servicing of Urban Solid Waste Management” (MOE, MOI, & MEF), Jun. 2018, determines the maximum fees of solid waste management in Municipalities as per the article 4 of the sub-decree. The fees apply to the services of cleaning, garbage collection, transportation, and landfill. There is no mention about pre-sorting, recycling or compost. The MA has the possibility to request a fee higher than the one of the decree. This request shall be approved by the Ministry of Economy and Finance and the Ministry of Environment.
28. Under sub-decree 113 on SWM in Urban Area, articles 39 to 48, fines are imposed for:
(i) fines due to wrong disposal or packaging;
(ii) fines due to discharge of the garbage outside of the authorized time;
(iii) fines due to non payment of the invoices related to the service;
(iv) illegal discharge (outside of unauthorized places, and
(v) burning of garbage.
29. These fines are monitored and enforced by the Municipality, District, and Sangkat Administration.
14
30. Sub-decree No.189 on Establishment of Enterprise for Managing of Transfer Station and Landfill of Solid Waste (EML) Nov.2020. The EML has, as mission, to manage the incompliance of transfer station and landfill for solid waste in the Kingdom of Cambodia with the policy of the RGC in managing and developing urban solid waste in regards of the esthetic, sustainability, and welfare. The EML operates under the governance of MoE for technical aspect and MEF for financial aspect.
31. Other declarations, guidelines, and prakas relevant to the solid waste sector includes:
(i) Guideline No.11 SCN BS on Solid Waste Management in Factory, Enterprise, and Company, dated 16 Jan.2003;
(ii) Health Care Waste Management Jul.2008;
(iii) Prakas 387 on standard consumption for toxic substances or hazards permitted disposal (2015);
(iv) Sub-decree No.16, Feb. 2016, on Management of Electrical, and Electronic Waste;
(v) Statement No.12 SCN BS on Stop Selling of Provision, and Burning Industrial Waste;
(vi) Joint Declaration MoE, and MoI on Household Waste Management;
(vii) Prakas 447 on Battery Waste Management (2016), and
(viii) Sub-decree 168, Oct. 2017, on plastic bag management.
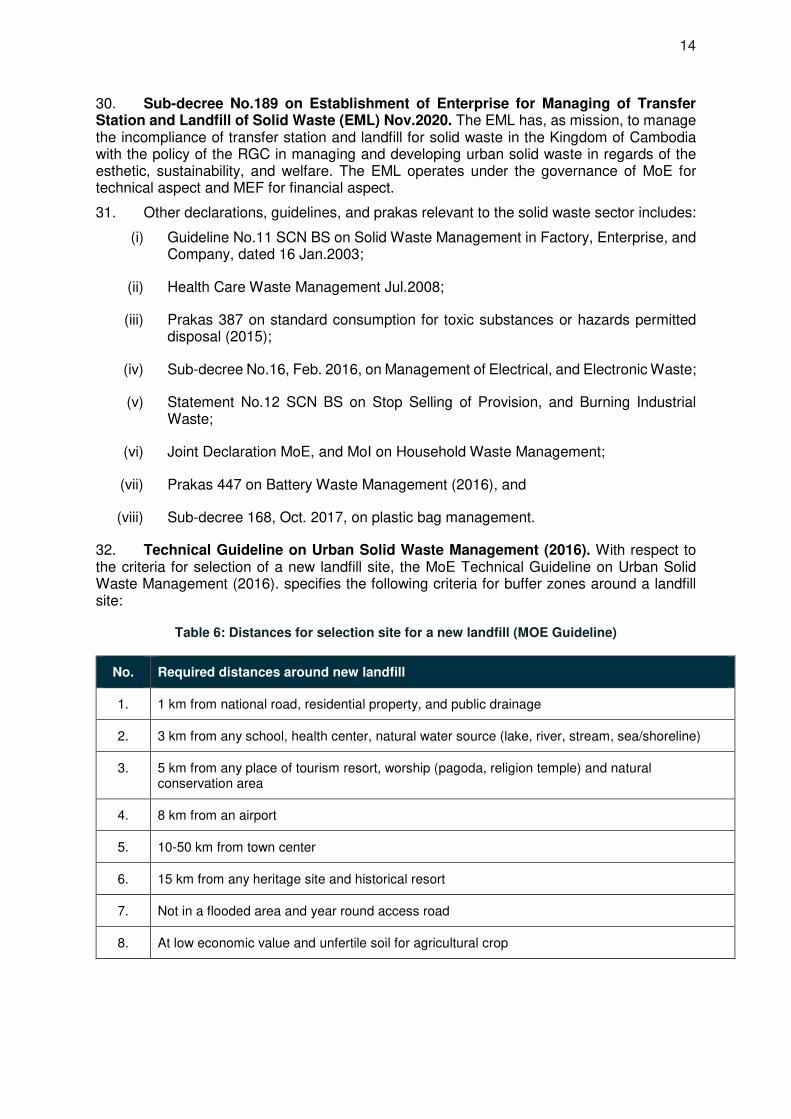
32. Technical Guideline on Urban Solid Waste Management (2016). With respect to the criteria for selection of a new landfill site, the MoE Technical Guideline on Urban Solid Waste Management (2016). specifies the following criteria for buffer zones around a landfill site:
Table 6: Distances for selection site for a new landfill (MOE Guideline)
No. Required distances around new landfill
1. 1 km from national road, residential property, and public drainage
2. 3 km from any school, health center, natural water source (lake, river, stream, sea/shoreline)
3. 5 km from any place of tourism resort, worship (pagoda, religion temple) and natural conservation area
4. 8 km from an airport
5. 10-50 km from town center
6. 15 km from any heritage site and historical resort
7. Not in a flooded area and year round access road
8. At low economic value and unfertile soil for agricultural crop
15
EXISTING SOLID WASTE MANAGEMENT SERVICES
1. Waste Generation
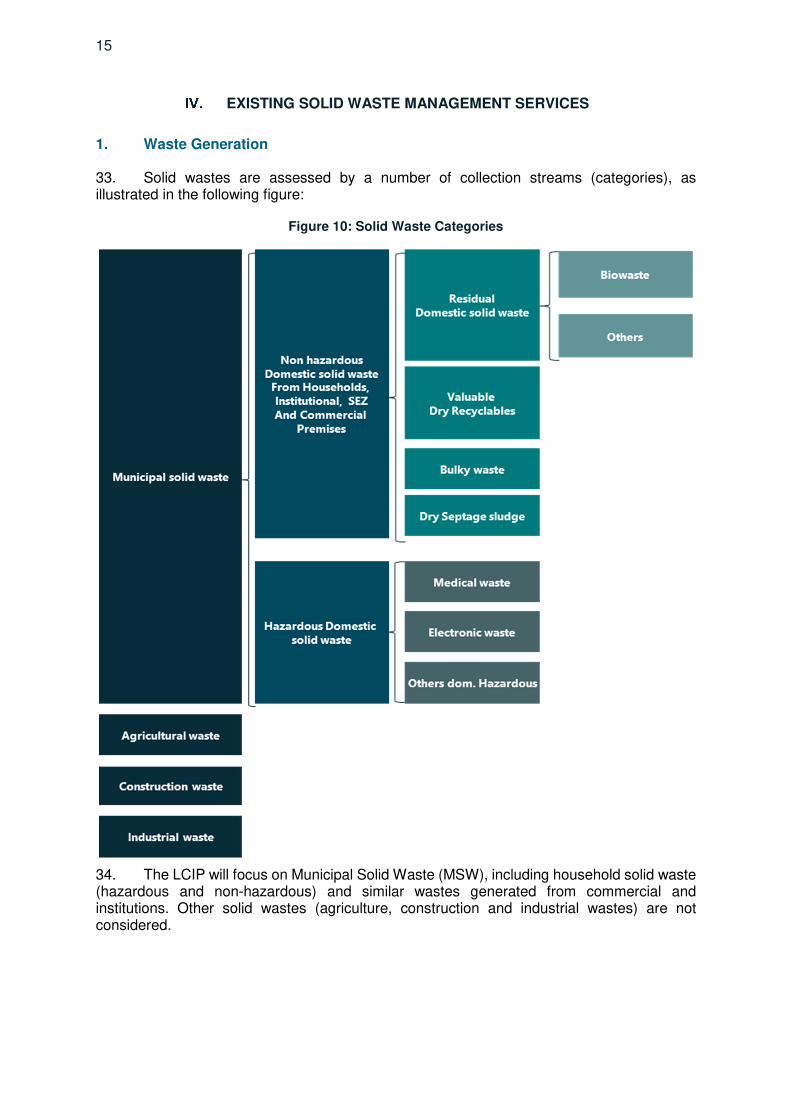
33. Solid wastes are assessed by a number of collection streams (categories), as illustrated in the following figure:
Figure 10: Solid Waste Categories
34. The LCIP will focus on Municipal Solid Waste (MSW), including household solid waste (hazardous and non-hazardous) and similar wastes generated from commercial and institutions. Other solid wastes (agriculture, construction and industrial wastes) are not considered.
16
35. The current generation of municipal solid waste in Poipet is estimate at 170 ton per day (tpd) equivalent to 62,416 ton per year (tpy), of which 99 tpd is collected by the official collection operator, 20 tpd is collected by waste pickers and 51 tpd is not collected. 21
2. Composition of the MSW
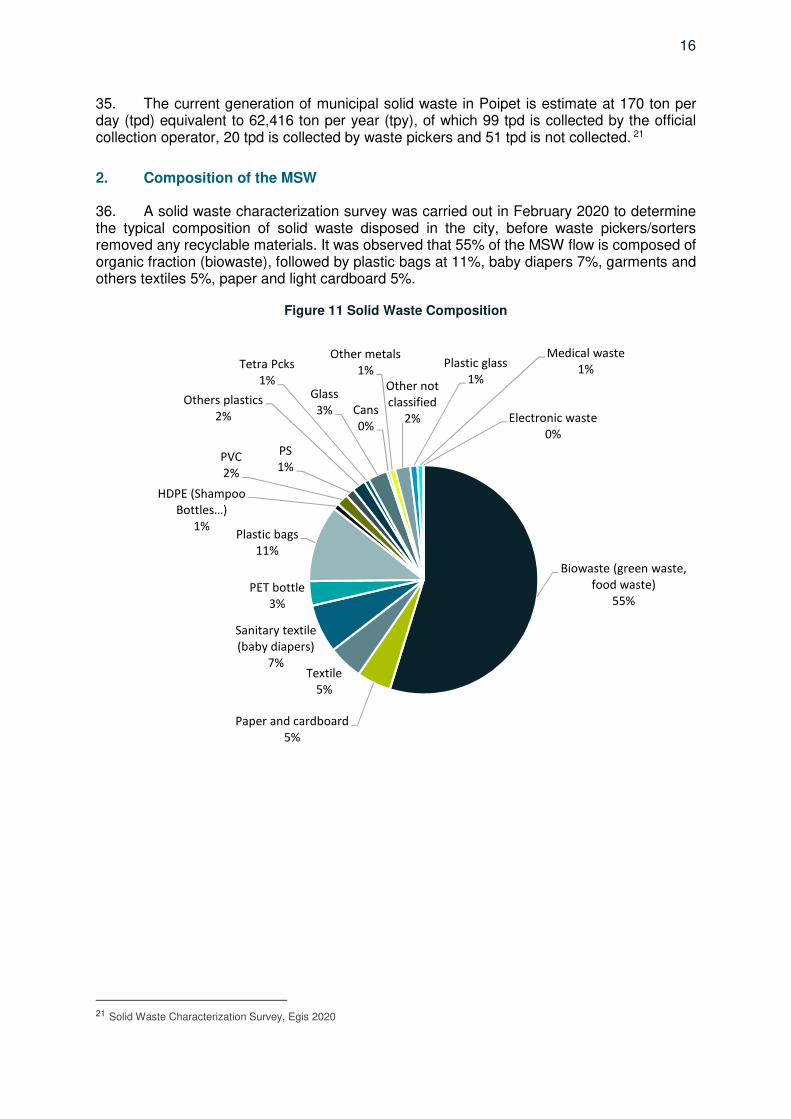
36. A solid waste characterization survey was carried out in February 2020 to determine the typical composition of solid waste disposed in the city, before waste pickers/sorters removed any recyclable materials. It was observed that 55% of the MSW flow is composed of organic fraction (biowaste), followed by plastic bags at 11%, baby diapers 7%, garments and others textiles 5%, paper and light cardboard 5%.
Figure 11 Solid Waste Composition
21 Solid Waste Characterization Survey, Egis 2020
Biowaste (green waste,
food waste)
55%
Paper and cardboard
5%
Textile
5%
Sanitary textile
(baby diapers)
7%
PET bottle
3%
Plastic bags
11%
HDPE (Shampoo
Bottles…)
1%
PVC
2%
PS
1%
Others plastics
2%
Tetra Pcks
1%Glass
3% Cans
0%
Other metals
1%
Other not
classified
2%
Plastic glass
1%
Medical waste
1%
Electronic waste
0%
17
Table 7: Solid Waste Composition per Origin
Market Households Casino SEZ Average
proportion
Based on waste quantities per origin
Biowaste (green waste, food waste)
68% 59% 30% 6% 54,8%
Paper and cardboard 2% 3% 13% 8% 4,8%
Textile 5% 4% 6% 32% 4,9%
Sanitary textile (baby diapers)
2% 8% 10% 1% 6,9%
PET bottle 1% 2% 12% 2% 3,4%
Plastic bags 14% 9% 14% 8% 10,9%
HDPE (Shampoo Bottles…)
0% 1% 1% 4% 0,8%
PVC 1% 2% 1% 1% 1,7%
PS 1% 1% 2% 2% 1,3%
Others plastics 1% 2% 1% 5% 1,9%
Tetra Packs 0% 1% 0% 1% 0,7%
Glass 1% 2% 7% 3% 2,7%
Cans 0% 0% 1% 1% 0,4%
Other metals 1% 1% 0% 2% 0,8%
Other not classified 2% 2% 1% 25% 2,1%
Plastic glass 1% 1% 1% 1% 1,0%
Medical waste 0% 1% 0% 0% 0,8%
Electronic waste 0% 0% 0% 0% 0,1%
TOTAL 100% 100% 100% 100% 100%
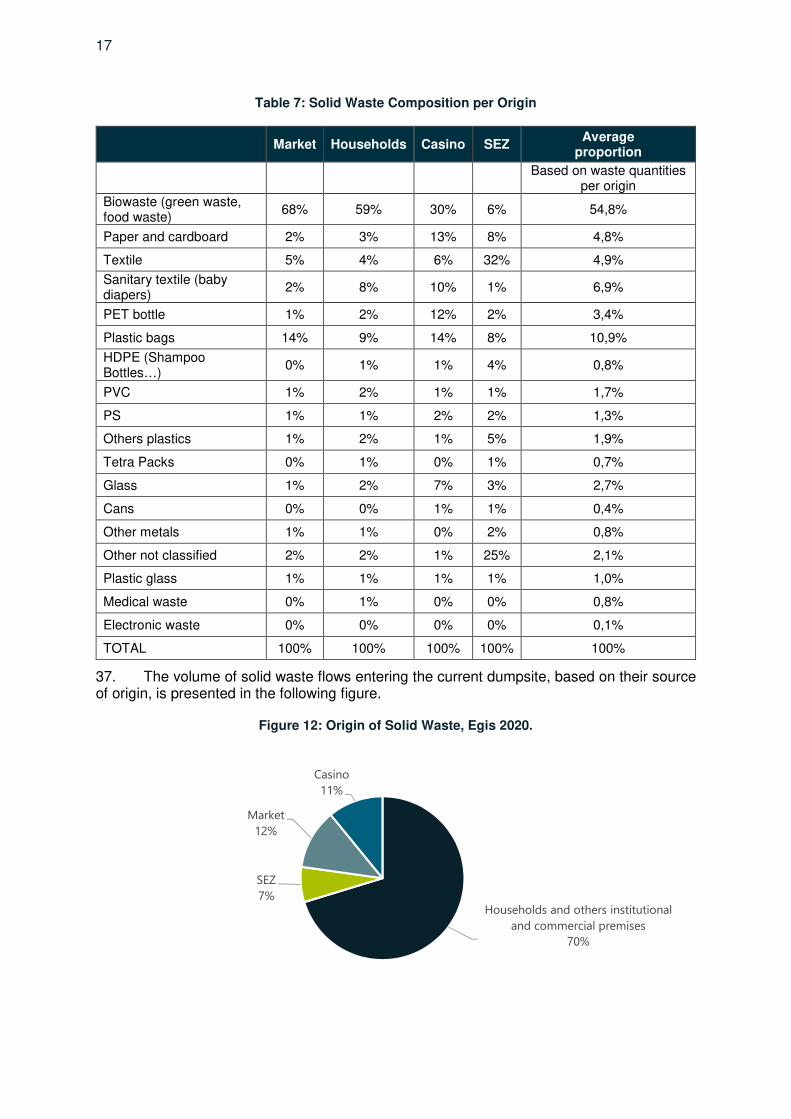
37. The volume of solid waste flows entering the current dumpsite, based on their source of origin, is presented in the following figure.
Figure 12: Origin of Solid Waste, Egis 2020.
Households and others institutional
and commercial premises
70%
SEZ
7%
Market
12%
Casino
11%
18
3. Service Area Coverage
38. Access to service. The existing service coverage for waste collection services is approximately 69% in weight out of the MSW generation flow.22 Casinos are well covered but out of 2 SEZs, the main developed industrial zone (Oh Neang) is not covered. 16%23 of households (HHs) are covered according to the municipality meaning that 84% of households are burnt or disposed in open land.
39. Collection coverage. The current collection area covers Poipet Sangkat (85%) and part of Phsar Kandal Sangkat (15%). 24 Nimitt rural Sangkat is not covered. The following map shows the collection coverage based on trucks tracking survey in February 2020.
Picture 1: Door-to-door collection, Egis 2020
22 Solid Waste Characterization Survey, Egis 2020 23 Municipal database, 2019 24 Source : information provided during the meeting with CINTRI and Poipet’s municipality
19
Figure 13: Collection Coverage in Poipet, Egis 2020
4. Collection Services
40. Service provider. The current MSW service is outsourced to a private waste service provider, CINTRI, who was contracted by the MA in 2019, and holds a license for 10 years (expiring in December 2028). CINTRI provides a collection, transportation and disposal service. Waste collected is disposed in a dumpsite, which was previously owned by a private entity, named “Poipet Cleaning Company”. The company employs a total of 52 staffs, which includes 3 managers, 15 drivers and 34 workers and cleaners.
41. Collection arrangement. The current MSW collection is mostly door-to-door. There are no centralized community waste collection points. Waste is collected from the households, loaded onto the collection vehicles manually and taken to the dumpsite where it is unloaded. CINTRI is equipped with 13 compactors (5t), and 2 hydraulic dump trucks (16t).
42. Collection frequency. Solid waste is collected on a daily basis according to 70%25 of households having access to the service. Total average amount of solid waste collected daily is 99 tons.
43. Collection containers and city cleanliness. CINTRI does not provide waste containers and households are required to purchase their own. Along the National 5, some
25 Comprehensive City Survey, Egis 2020
20
households have blue plastic containers that were purchased from the municipality but most of the households are not equipped with plastic containers and dispose waste in plastic bags along the street. Despite the availability of the containers however, these are not easy to handle by the collector contractors. Collection vehicles are not equipped to lift these waste bins, and hence the wastes are required to be loaded to the vehicles manually.
44. In front of the Municipality office, some plastic containers of different colors (blue, yellow and green) were installed for solid waste segregation (biowaste, dry recyclables, others). However, wastes are disposed of in bulk in these containers, they are collected by the same truck, and end up in the landfill, with no segregation at any stage.
45. The labourers collecting waste are not equipped with any tools, only bare hands with minimal personal protection equipment.
Picture 2: Blue Container along National 5 (left); Plastic Containers for Waste Segregation
(Right)
5. Treatment and Disposal
5.1. Non-Hazardous Domestic Solid Waste
46. Recovery of recyclables. Several junk shops operate in Poipet, collecting recyclable wastes from informal collectors, waste pickers, and scavengers. Recycled recyclables include aluminium cans, iron, plastic bottles (PET), polypropylene (PP) containers, HDPE (high-density polyethylene) bottles, plastic bags, paper and cardboard, which represent 12% of the total MSW generated. Tetra-packs, glass, polystyrene packaging, glass and other returnable bottles are not recovered.
47. There are six wholesale junk shops operating in the city and several retail junk shops who buy recyclables from waste pickers and street buyers and sells to the wholesale junkshops. Wholesale junkshops sell their materials primarily to Thailand and Vietnam, depending on the market. The six junkshops interviewed in June 2020 are registered companies. All are equipped with a storage building and four provide recyclables conditioning (baler machine equipment). Three operators provide transportation service. Only two operators are equipped with a weighbridge used to weigh the trucks.
21
Picture 3: Weighbridge in a Junkshop in Poipet (left); Sorting operator, Collecting Caps from
Plastic Bottles (Right)
48. In 2020, the effects of the COVID pandemic resulted in a drop in the market prices of recyclables26. As most of the recyclables [from Poipet or country-wide] are transported to Thailand and Vietnam, and with the border closed, there are few available buyers. Furthermore, the parallel drop in the price of oil during the pandemic also caused a drop in the market prices for recyclable plastics, the price of which is typically indexed to the oil market.
49. In Poipet, the situation was slightly different than in the rest of the country as most of the recyclables are transported to Thailand. As the border stayed open in the first semester of 2020, during the pandemic, the logistic chain was not affected too significantly. The following table shows the market price of recyclables and the impacts of COVID-19.
Table 8: Market Prices of Recyclables
Type of materials Market price ($/ton) in January 2020 (Before
COVID)
Market price ($/ton) June 2020 (during COVID)
Aluminum cans 1050 863
Scrap metal (steel) 210 160
Plastic bottle (PET) 168 70
Plastic glass (PP) 250 120
HDPE (shampoo bottle, bottles caps) 168 70
Plastic bags Not collected Not collected
Paper and cardboard 65 55
50. Organic materials. In Poipet, there are no composting plants. All organic materials are collected as part of the MSW and taken to the dumpsite.
51. Material Recovery Facility (MRF). Construction of MRF building was financed by the ADB under the Greater Mekong Subregion Southern Economic Corridor Towns Development Project (GMS 1) and was not operating at the time of the preparation of this feasibility study report. The MRF was constructed to facilitate the centralized manual recovery of recyclable materials from the source segregated waste of households, institutions and commercial establishments, together with the recyclables recovered from the waste collection trucks. The MRF was designed to facilitate the purchase and processing of recyclables separated at source by the different waste generators. A review of the institutional set up of the MRF was mentioned by the MA during the interviews as a prerequisite for commencing the operation. As the GMS1 project is still being implemented, no further evaluation of the MRF has been carried out under this project.
26https://www.voacambodia.com/amp/with-no-buyers-phnom-penh-waste-pickers-are-helpless/5404314.html?fbclid=IwAR36X_FYhRv0Yz3MY698SjDbq3MN2aSkMESzJVK8oXBv1bRNjvYPaZ1l8uQ
22
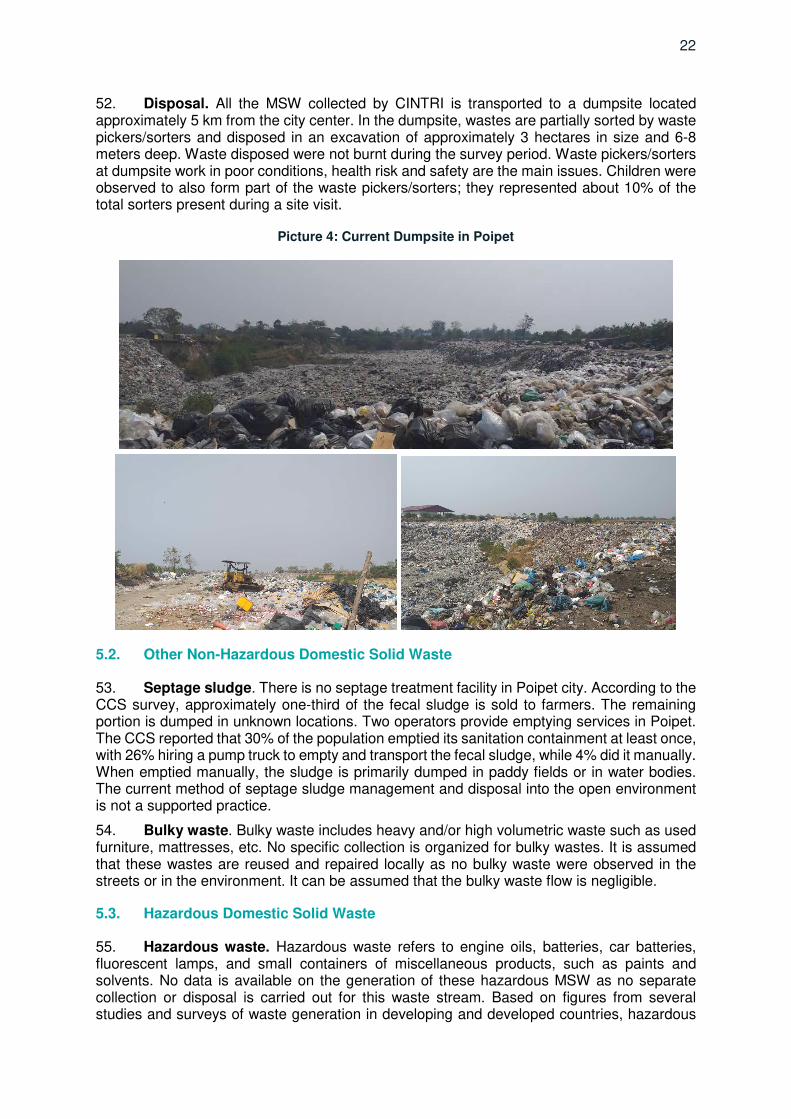
52. Disposal. All the MSW collected by CINTRI is transported to a dumpsite located approximately 5 km from the city center. In the dumpsite, wastes are partially sorted by waste pickers/sorters and disposed in an excavation of approximately 3 hectares in size and 6-8 meters deep. Waste disposed were not burnt during the survey period. Waste pickers/sorters at dumpsite work in poor conditions, health risk and safety are the main issues. Children were observed to also form part of the waste pickers/sorters; they represented about 10% of the total sorters present during a site visit.
Picture 4: Current Dumpsite in Poipet
5.2. Other Non-Hazardous Domestic Solid Waste
53. Septage sludge. There is no septage treatment facility in Poipet city. According to the CCS survey, approximately one-third of the fecal sludge is sold to farmers. The remaining portion is dumped in unknown locations. Two operators provide emptying services in Poipet. The CCS reported that 30% of the population emptied its sanitation containment at least once, with 26% hiring a pump truck to empty and transport the fecal sludge, while 4% did it manually. When emptied manually, the sludge is primarily dumped in paddy fields or in water bodies. The current method of septage sludge management and disposal into the open environment is not a supported practice.
54. Bulky waste. Bulky waste includes heavy and/or high volumetric waste such as used furniture, mattresses, etc. No specific collection is organized for bulky wastes. It is assumed that these wastes are reused and repaired locally as no bulky waste were observed in the streets or in the environment. It can be assumed that the bulky waste flow is negligible.
5.3. Hazardous Domestic Solid Waste
55. Hazardous waste. Hazardous waste refers to engine oils, batteries, car batteries, fluorescent lamps, and small containers of miscellaneous products, such as paints and solvents. No data is available on the generation of these hazardous MSW as no separate collection or disposal is carried out for this waste stream. Based on figures from several studies and surveys of waste generation in developing and developed countries, hazardous
23
waste typically represents around 1% of the total MSW flow. Based on this assumption, it is considered that the order of 500 tpy of hazardous waste is generated in Poipet.
56. There are no facilities in the region for receiving and treating hazardous waste (the closest site is in Phnom Penh).
57. Medical waste. Hazardous medical wastes are collected and treated onsite at the hospital. No hazardous medical wastes were fund at dumpsite during the survey, only laboratory waste and bottles.
58. Waste electrical and electronic equipment (WEEE). No data is available at province or city level concerning the generation of WEEE. No WEEE were observed at the dumpsite. In principle, WEEE should be managed by retailers, who should provide collection points. However, repairing WEEE or metal recovery activities are common in Cambodia, so it can be assumed that the electronic waste flow is negligible.
5.4. Agricultural Waste
59. Agricultural waste production rate is unknown. There are no dedicated collection or treatment site. Currently, Poipet does not have a designated area for the disposal of potentially hazardous agricultural and industrial waste.
5.5. Construction and Demolition (C&D) Waste
60. C&D waste production rate is unknown as it is collected by informal operators. CINTRI is not charged to collect C&D waste under its contract. There is limited information available on these wastes as there is no control over how C&D are collected and treated. However, based on observations, it is likely that reuse of C&D wastes (as backfill for construction sites) is a fairly common practice.
5.6. Industrial Waste
61. In the SEZ, the household and industrial wastes are segregated. The industrial hazardous waste is collected by local contractors and treated by private operators who have an agreement from the MoE. Currently, there is no facility available in the region for receiving and treating industrial hazardous waste. The industrial non-hazardous waste is collected by CINTRI or informal waste collection operators depending to the SEZ. The ones collected by CINTRI are disposed in the dumpsite.
24
5.7. Summary of Current SWM Situation
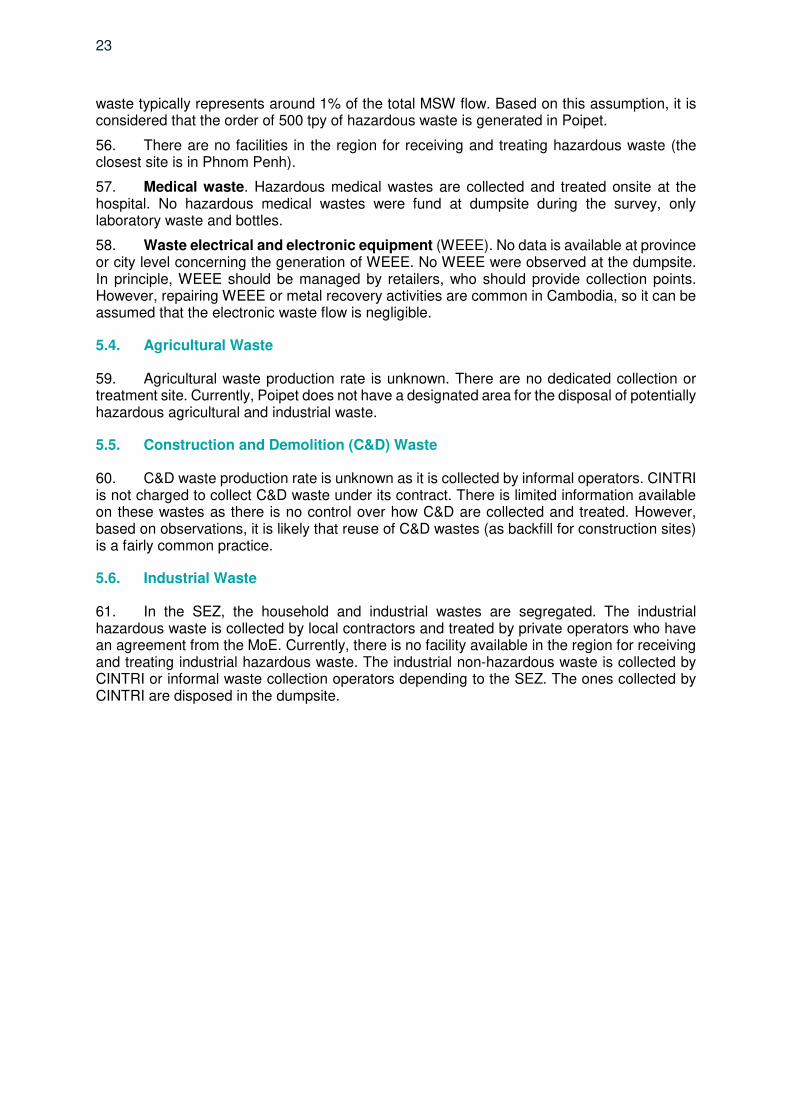
62. The current solid waste management in Poipet can be summarized as follows:
Figure 14: Summary of the Current SWM Situation
25
6. Adequacy of Current Solid Waste Facilities
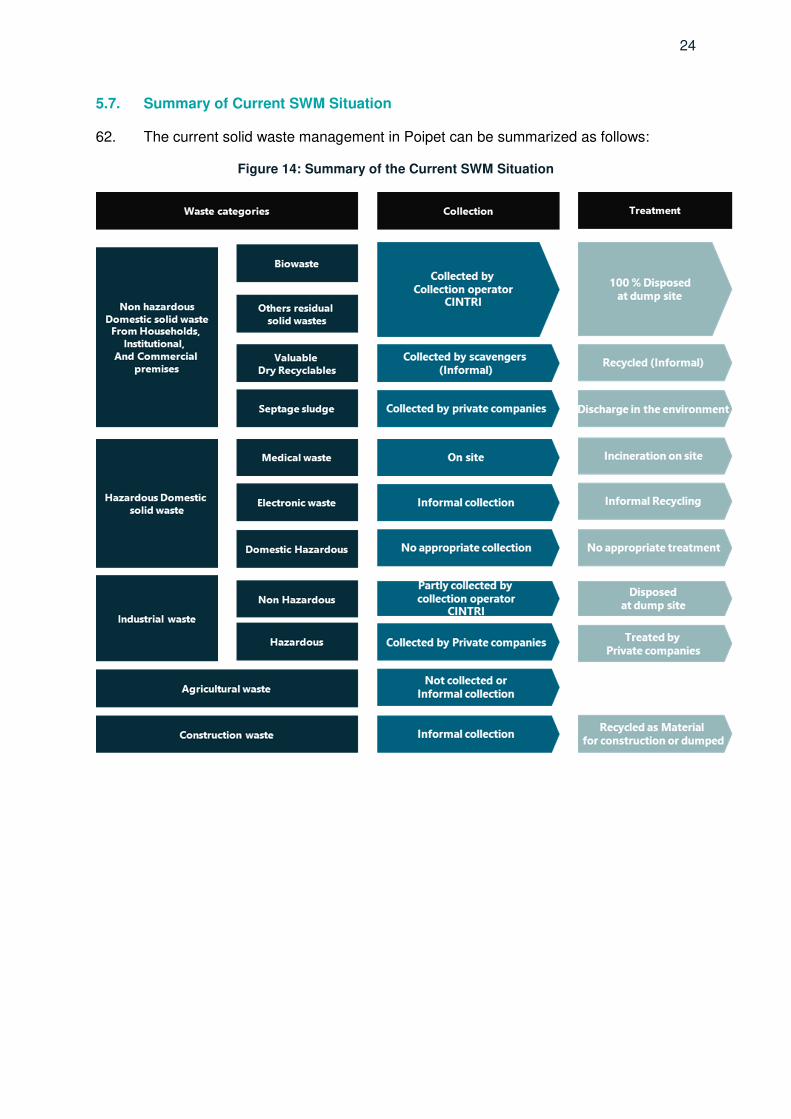
63. Based on the situation assessment, it is estimated that 88% of the solid waste generated is unsafely managed.
Figure 15: Impact Diagram – Current Situation (weight based ratios)
64. Figure 15 above shows that there are severe deficiencies in the collection, recovering and disposal of the solid waste generated in Poipet.
65. The existing service coverage for waste collection services is approximately 69 % (in terms of waste weight) including households, SEZ, institutional and commercial premises. Household collection coverage is only approximatively 16% in the whole administrative area of the city. Waste are often disposed in bags along the street, creating health and environmental problems and making the collection inefficient. A large portion of the SW is also left uncollected and dumped directly in the nearby environment and/or burnt. It is necessary to improve the collection service for the whole city.
66. There is currently no collection system for hazardous domestic waste. This might lead to contamination of the near environment of the population either during collection or during treatment.
67. The dumpsite is not operated as either a controlled dumpsite or sanitary landfill. Waste are burnt on site, there are no engineering measures such a basal liner to prevent infiltration of leachate into the ground and no leachate or landfill gas management measures. In terms of site operation, there is no regular cover placed on the waste, no control on the operating face, no record-keeping, and access is open. It is necessary to improve the environment impact of MSW disposal by closing the dumpsite and creating a properly engineered landfill site to dispose the MSW.
68. Recyclables recovery rate is estimated at 12% of the total MSW flow. The waste pickers in the streets and waste pickers/sorters in the dumpsite work in poor conditions with consequences on their health and safety. It is necessary to improve recyclables recovery ratio and working conditions of the waste pickers/sorters and waste-pickers.

26
7. Ongoing and Planned Investments
69. No investments in this sector were mentioned by the authorities during the preparation of this report.
27
SOLID WASTE MANAGEMENT - SERVICES DEMAND
1. Current SWM loads and Flows
70. The current generation of municipal solid waste in Poipet is estimated at 170 ton per day (tpd) equivalent to 62,416 ton per year (tpy), of which 99 tpd is collected by the official collection operator, 20 tpd is collected by waste pickers and 51 tpd is not collected. 27
2. Future Projections
71. With the growing urban household population and with the increasing number of commercial establishments and SEZs, the SWM service has to be developed to meet the present and future requirements. The population projection for Poipet shows that by 2040, the population will be approaching 225,000.
72. The MSW volumes projected are based on the current collected volume and collection rates estimated during the assessment. The estimated new collected household (based on the population projection), as well as the impact of increased tourist arrivals and the creation of new SEZs has been added to this baseline.
73. Collection rates for hazardous and non-hazardous domestic solid waste and AAGR by wastes streams (baselines were determined with the Solid Waste Characterization survey Egis in 2020):
(i) Households, institutional and commercial premise:
a) Baseline: 64 tpd
b) Collection rate (based on population): 16% in 2020, 50% in 2025, 75% in 2030, and 85% in 2040. Increases in the collection rate are applied linearly between two targets.
c) For the new households, the waste production ratio applied is 0.5 kg/cap/day. An average annual growth rate of 0,5% is applied to this ratio to integrate an increase in purchasing power associated with dynamic local economic growth.
(ii) SEZs:
a) Baseline: 2 tpd
b) Collection rate: 30% in 2020 and 100% in 2025.
c) An average annual growth rate of 1.5%, due to SEZ development, is proposed until 2030 due to high sector dynamism in the near future. The AAGR is applying to the baseline. It is then proposed to decrease this AAGR from 1,5% to 1% between 2030 and 2040 to follow the population projection assumptions (SEZ).
(iii) Markets:
a) Baseline: 17 tpd
b) An average annual growth rate of 0.5% is applied due to the increase in purchasing power associated with dynamic local economic growth.
(iv) Casinos:
a) Baseline: 16 tpd
27 Solid Waste Characterization Survey, Egis 2020
28
b) An average annual growth rate of 0.5% is applied due to the increase in purchasing power associated with dynamic local economic growth.
74. It is assumed that the waste flow collected by the waste pickers in the streets before the official collection is equivalent to 12% of the total waste generation flow.
75. Other categories of wastes, such as agricultural waste, construction and industrial wastes are not included in the projection.
76. Recyclables and biowaste flows are assessed based on the tonnage of each waste streams presented above and the quantitative ratio resulted from the characterization survey implemented in 2020. The tonnage figures for the sorted recyclables and biowaste for the short, medium and long terms are presented in Table 34.
77. The total MSW generated projected per horizon are as follow:
Table 9: Total MSW Generation Projected per Horizons
Items Unit\year 2020 2025 2030 2040
Total Population in Poipet inhab. 124,244 145,209 168,554 226,118
Permanent population inhab. 110,510 128,335 149,354 203,561
SEZ's workers inhab. 5,000 7,000 8,000 8,000
Tourists inhab. 8,734 9,874 11,200 14,557
Households, institutional, and commercial (collected)
tpd 64 89 115 148
Waste production (AAGR) %
0.5% 0.5% 0.5%
Collection rate % 16% 50% 75% 85%
SEZ (collected) tpd 2 5 6 6
Waste production (AAGR) %
1.5% 1.5% 1.0%
Collection rate % 30% 100% 100% 100%
Market (collected) tpd 17 17 18 19
Waste production (AAGR) %
0.5% 0.5% 0.5%
Collection rate % 100% 100% 100% 100%
Casinos (collected) tpd 16 17 18 21
Waste production (AAGR) %
0.5% 0.5% 0.5%
Collection rate % 100% 100% 100% 100%
Sub-Total collected waste flow tpy 36,135 46,800 57,089 70,517
Sub-Total not collected waste flow tpy 18,791 12,612 7,325 5,971
Total waste flow tpy 54,926 59,412 64,414 76,488
Sub-Total collected before the official collection
tpy 7,490 8,102 8,784 10,430
Total waste generation tpy 62,416 67,513 73,198 86,919
29
INVESTMENT ROADMAP SUMMARY
1. Overall Strategy
78. Because of the expected growth of the urban population and the increase in the number of commercial establishments, strong solid waste management is required to address the present and future needs. The current SWM presents a severe deficiency in the collection, recovery, and disposal of the solid waste generated in Poipet city.
79. In the preparation of the master plan, the following technical scenarios were considered:
(i) Scenario 1: Construction of a controlled landfill with collection service;
(ii) Scenario 2: Construction of a controlled landfill with a pre-sorting plant and collection service;
(iii) Scenario 3: Construction of a controlled landfill with a pre-sorting plant, composting plant and collection service.
80. The scenarios were evaluated, and it was assessed that Scenario 3 would provide the highest diversion rate from landfilling, along with providing economic opportunities and benefits. Scenario 3 was approved to proceed as the basis of this feasibility study during a workshop held in Phnom Penh on 22 April 2020 with the MPWT, the Provincial Government, and the Municipal Administration.
2. Infrastructure Roadmap
81. The following sections provides a summary of the approach to delivering the preferred scenario.
2.1. Short Term (5 years)
82. Collection. The roadmap starts with the improvement of the existing door-to-door collection system in the urban area by modernizing the truck fleet to have a positive impact on overall collection coverage.
83. To improve the global collection coverage, centralized collection points in rural Sangkat will be necessary to allow people to dispose of their waste near their house. As current collection vehicles are inadequate, the collection operator should be equipped with new compacting trucks.
84. Treatment. In terms of treatment, priority is to build a transfer station and a landfill for disposal of the residual waste. Then it is recommended to invest in the pre-sorting plant to reduce waste landfilled and to employ waste pickers/sorters as sorting operators. Finally, a composting plant is proposed to divert part of the biowaste from landfilling.
30
Table 10: Proposed Projects Priorities for ADB Loan in the Short Term
Items Design horizon
Collection 2025 Pre-sorting plant 2040
Controlled Landfill 2030 (land acquisition for 2040 capacity) Composting plant 2030
85. Opening of the landfill and closing of the current dumpsite (under the responsibility of the private operator) should be concurrent.
86. Training and awareness. Training on O&M and contract management should be provided to operators (public and/or private) in charge of solid waste management for the city.
87. Information, education, and awareness campaign will also be required. When introducing and implementing modern SWM systems, it is normal to have an initial extensive public campaign in order to introduce the system and how to address the requirements to the public/customers. It is also important to present the upgraded services being established. It is crucial to bring information about what is expected from the public and the customers regarding approach and behavior. During the project implementation phase, a more detailed and locally adapted campaign should be developed, and this could be backed up by additional surveys.
88. As a support activity, a prospective compost market study should be scheduled to identify potential customers and assess people's willingness to pay.
89. This feasibility study focuses on the recommendations outlined for this initial short-term phase.
2.2. Medium-Term (10 years)
90. In the medium term, support activities will be necessary and include an update of the master plan, the Land Use Master Plan, and potential land acquisition for the future infrastructure.
Table 11: Proposed Projects in the Medium Term
Items Design horizon
Collection Additional collection trucks
Landfill Extension for 2040 capacity
Composting plant Extension for 2040 capacity
91. Information, education, and awareness campaigns should continue following the short term program.
2.3. Long-Term (20 years)
92. Long term CAPEX will include costs associated with the procurement of additional collection trucks. No other infrastructure is envisaged during this period.
93. Support activities include an update of the master plan to horizon 2060 would be required, including a review of the land-use plan, and land acquisition requirements for the future infrastructure.
94. Information, education, and awareness campaigns should continue.

31
3. Impact Assessment
95. Through this scenario, it is envisaged that in the short term, 82% of waste generated will be collected, increasing to 94% of by 2040. Household collection coverage will grow from an initial 50% in 2025, to 85% and the volume of waste diverted from landfill will gradually increase through the operation of the pre-sorting and composting facilities.
32
DESIGN CRITERIA AND STANDARDS
1. National Design Criteria
96. For design purposes, priority was given to the following guidelines:
(i) MoE Technical guidance on Urban Solid Waste Management (2016), criteria for selection of the site for a landfill.
(ii) ADB ‘Integrated Solid Waste Management for Local Governments, A Practical Guide’ (ADB, 2017).
2. General Design Criteria
2.1. Catchment Area
97. The sector master plan focused on the urban area within the administrative boundary, using the projected land use map for the year 2030. The three main categories of land use (industrial, commercial, and residential) have been considered.
98. Zoning maps per horizon are presented in Figure 7: Projected Land-Use (Based on the Year 2030).
2.2. Planning Horizons
99. The current situation has been assessed for the period 2019 to 2020. Three horizons are considered: (i) a short term until 2025; (ii) medium-term until 2030; and (iii) long term until 2040. The facilities will be designed considering the 2030 or 2040 capacity.
2.3. Population Projections
100. The population projection, as identified during the urban development scenario (refer to Table 2) was adopted as the basis of the feasibility study.
2.4. Future Provision of Services
101. It is assumed that the new facilities (landfill) will be owned and operated directly by the municipality. For waste collection, it is assumed that the provision of services will be taken over directly by the municipality. This assumption ensures that the capex and opex are fully costed to an appropriate level. In this case, all the future assets for operation of the services, notably the collection vehicles and landfill plant, will be acquired and owned by the municipality.
3. MSW Generation
102. The total MSW generated per horizon has been adopted as the basis of this feasibility study. Appendix 1 presents the MSW generation volumes.
4. Ground Conditions and Topography
103. No geotechnical site investigation was conducted during the feasibility study stage. At this stage, it is assumed that the underlying soils are not clayey in nature (i.e., not impermeable).
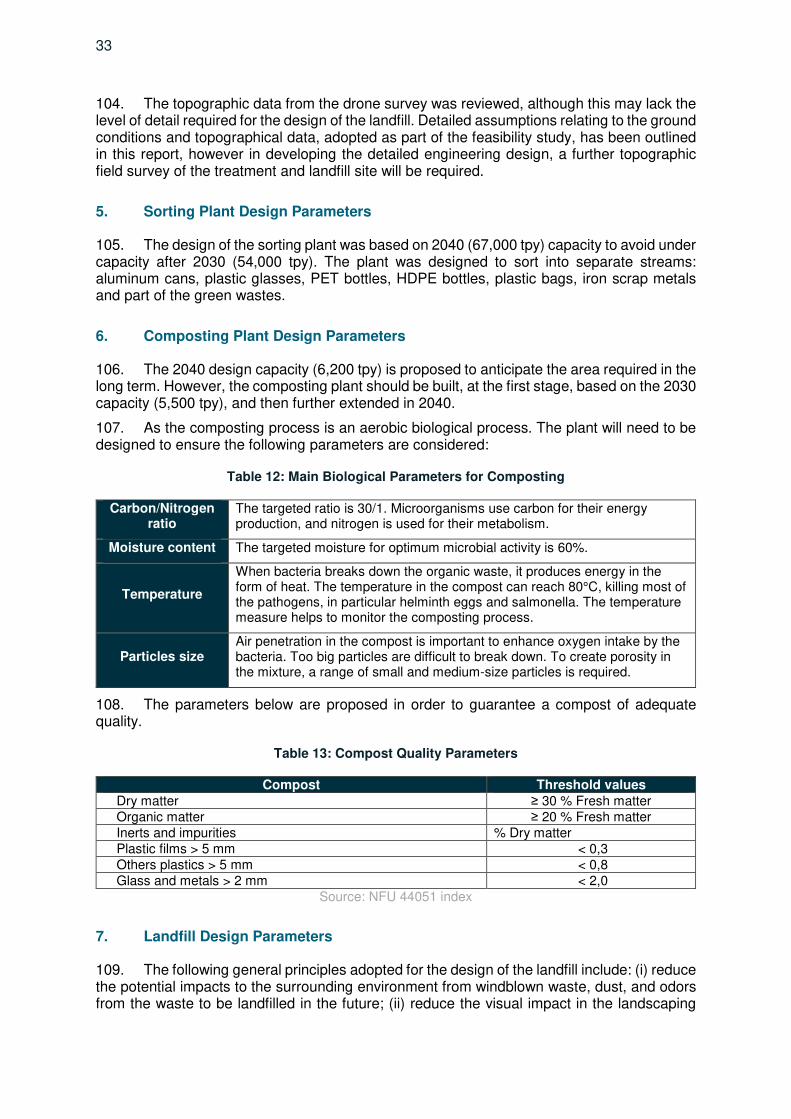
33
104. The topographic data from the drone survey was reviewed, although this may lack the level of detail required for the design of the landfill. Detailed assumptions relating to the ground conditions and topographical data, adopted as part of the feasibility study, has been outlined in this report, however in developing the detailed engineering design, a further topographic field survey of the treatment and landfill site will be required.
5. Sorting Plant Design Parameters
105. The design of the sorting plant was based on 2040 (67,000 tpy) capacity to avoid under capacity after 2030 (54,000 tpy). The plant was designed to sort into separate streams: aluminum cans, plastic glasses, PET bottles, HDPE bottles, plastic bags, iron scrap metals and part of the green wastes.
6. Composting Plant Design Parameters
106. The 2040 design capacity (6,200 tpy) is proposed to anticipate the area required in the long term. However, the composting plant should be built, at the first stage, based on the 2030 capacity (5,500 tpy), and then further extended in 2040.
107. As the composting process is an aerobic biological process. The plant will need to be designed to ensure the following parameters are considered:
Table 12: Main Biological Parameters for Composting
Carbon/Nitrogen ratio
The targeted ratio is 30/1. Microorganisms use carbon for their energy production, and nitrogen is used for their metabolism.
Moisture content The targeted moisture for optimum microbial activity is 60%.
Temperature
When bacteria breaks down the organic waste, it produces energy in the form of heat. The temperature in the compost can reach 80°C, killing most of the pathogens, in particular helminth eggs and salmonella. The temperature measure helps to monitor the composting process.
Particles size Air penetration in the compost is important to enhance oxygen intake by the bacteria. Too big particles are difficult to break down. To create porosity in the mixture, a range of small and medium-size particles is required.
108. The parameters below are proposed in order to guarantee a compost of adequate quality.
Table 13: Compost Quality Parameters
Compost Threshold values Dry matter ≥ 30 % Fresh matter Organic matter ≥ 20 % Fresh matter Inerts and impurities % Dry matter Plastic films > 5 mm < 0,3 Others plastics > 5 mm < 0,8 Glass and metals > 2 mm < 2,0
Source: NFU 44051 index
7. Landfill Design Parameters
109. The following general principles adopted for the design of the landfill include: (i) reduce the potential impacts to the surrounding environment from windblown waste, dust, and odors from the waste to be landfilled in the future; (ii) reduce the visual impact in the landscaping
34
setting of the landfill; (iii) ensure that there is no uncontrolled loss of leachate to the environment (surface water, groundwater); (iv) be relatively easy to operate and maintain; and (v) be adapted to the local climatic conditions. The landfill should also be designed to be able to be upgraded, in the event that national standards change in the future, and to provide for future expansion, after the 20 year design
110. The following parameters were considered for the landfill design:
(i) Design capacity to 2040 horizon.
(ii) A density of MSW in the landfill of 0.8 t/m3 is assumed (representing a reasonable degree of compaction using a dedicated waste compactor).
(iii) A ratio of daily cover to waste of 10% (by volume).
(iv) Total capacity for 20 years of operation, allowing for phased development (phase 1 – 10 years capacity; Phase 2 – 10 years capacity)
(v) Permeability of basal liner layer: <1x10⁻⁹ m/s
(vi) Rainfall intensity: duration 24h, the 10-year return period
(vii) Leachate drainage, leachate treatment (on or off-site): There are no national guidelines for quality of leachate for discharge – it is assumed that there is no direct discharge of untreated leachate to the environment. Leachate will be managed through a combination of recirculation and treatment.
111. The landfill will be designed to accept the following waste types: residual waste, non-recoverable and recyclable plastics, paper, cardboard, textiles, etc., nonrecoverable oversize waste (furniture, appliances, etc.), construction and demolition wastes, ash, glass, tires
112. The following waste types will not be accepted: all types of hazardous waste, liquid wastes
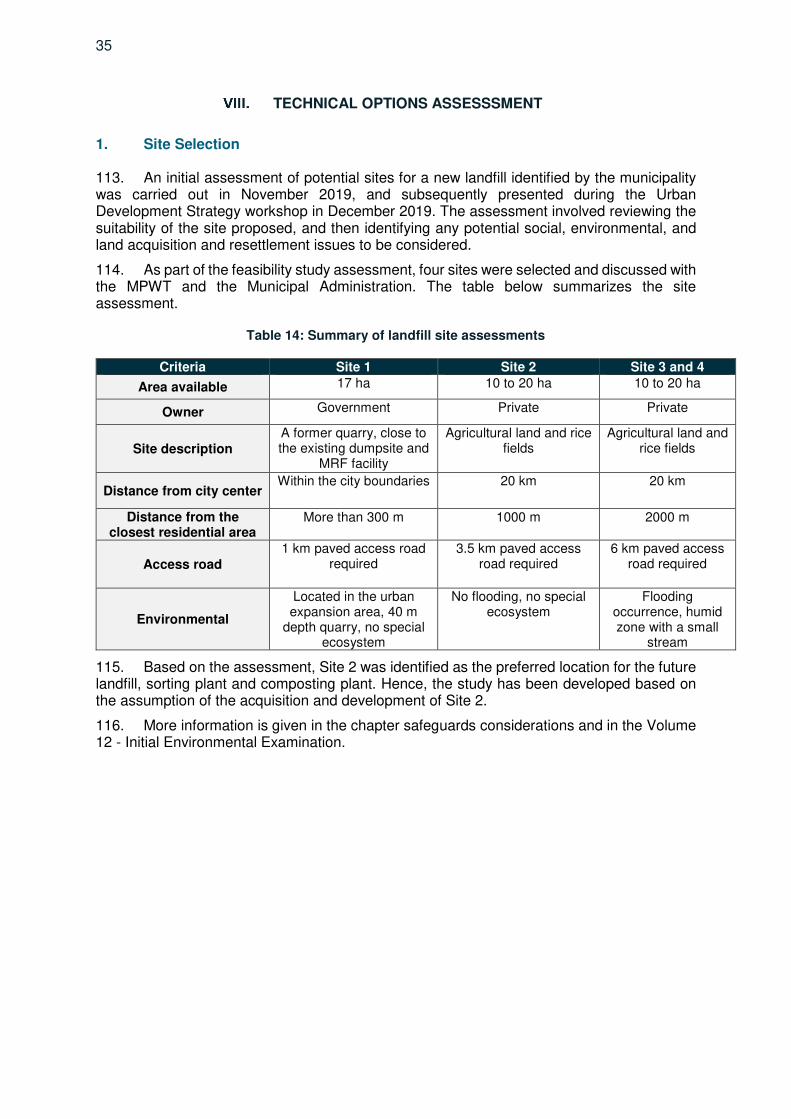
35
TECHNICAL OPTIONS ASSESSSMENT
1. Site Selection
113. An initial assessment of potential sites for a new landfill identified by the municipality was carried out in November 2019, and subsequently presented during the Urban Development Strategy workshop in December 2019. The assessment involved reviewing the suitability of the site proposed, and then identifying any potential social, environmental, and land acquisition and resettlement issues to be considered.
114. As part of the feasibility study assessment, four sites were selected and discussed with the MPWT and the Municipal Administration. The table below summarizes the site assessment.
Table 14: Summary of landfill site assessments
Criteria Site 1 Site 2 Site 3 and 4
Area available 17 ha 10 to 20 ha 10 to 20 ha
Owner Government Private Private
Site description A former quarry, close to the existing dumpsite and
MRF facility
Agricultural land and rice fields
Agricultural land and rice fields
Distance from city center Within the city boundaries 20 km 20 km
Distance from the closest residential area
More than 300 m 1000 m 2000 m
Access road 1 km paved access road
required 3.5 km paved access
road required 6 km paved access
road required
Environmental
Located in the urban expansion area, 40 m
depth quarry, no special ecosystem
No flooding, no special ecosystem
Flooding occurrence, humid zone with a small
stream
115. Based on the assessment, Site 2 was identified as the preferred location for the future landfill, sorting plant and composting plant. Hence, the study has been developed based on the assumption of the acquisition and development of Site 2.
116. More information is given in the chapter safeguards considerations and in the Volume 12 - Initial Environmental Examination.
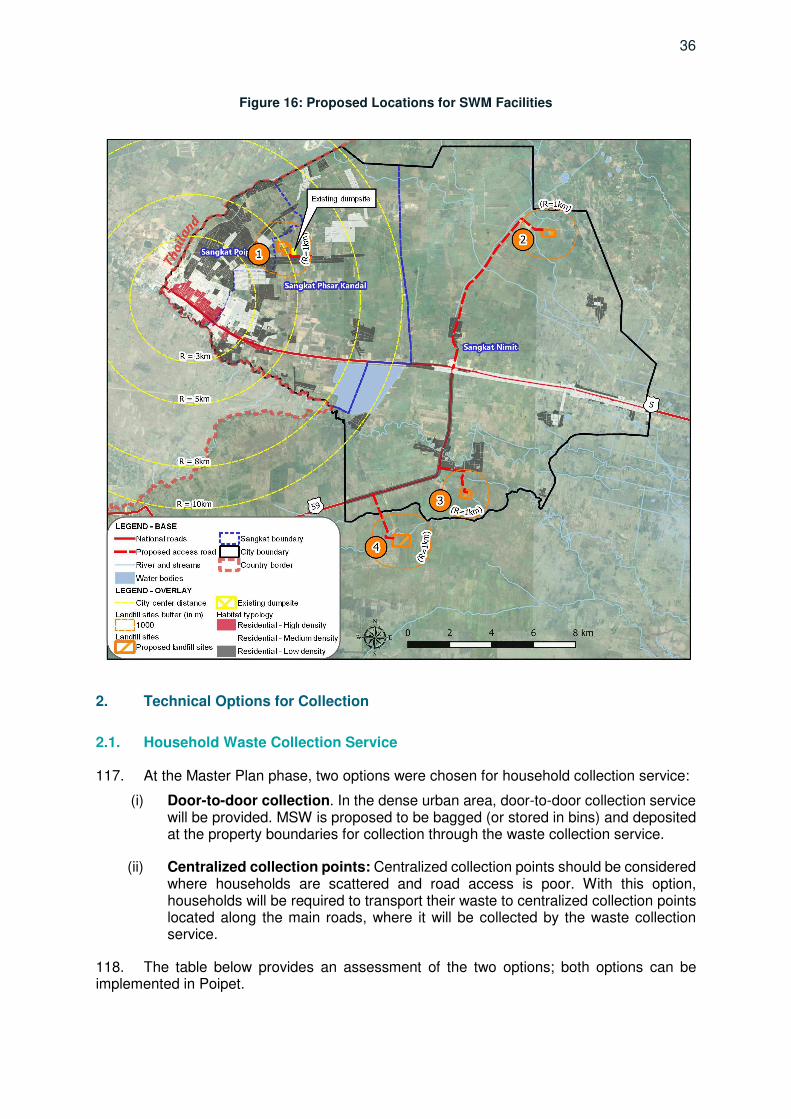
36
Figure 16: Proposed Locations for SWM Facilities
2. Technical Options for Collection
2.1. Household Waste Collection Service
117. At the Master Plan phase, two options were chosen for household collection service:
(i) Door-to-door collection. In the dense urban area, door-to-door collection service will be provided. MSW is proposed to be bagged (or stored in bins) and deposited at the property boundaries for collection through the waste collection service.
(ii) Centralized collection points: Centralized collection points should be considered where households are scattered and road access is poor. With this option, households will be required to transport their waste to centralized collection points located along the main roads, where it will be collected by the waste collection service.
118. The table below provides an assessment of the two options; both options can be implemented in Poipet.
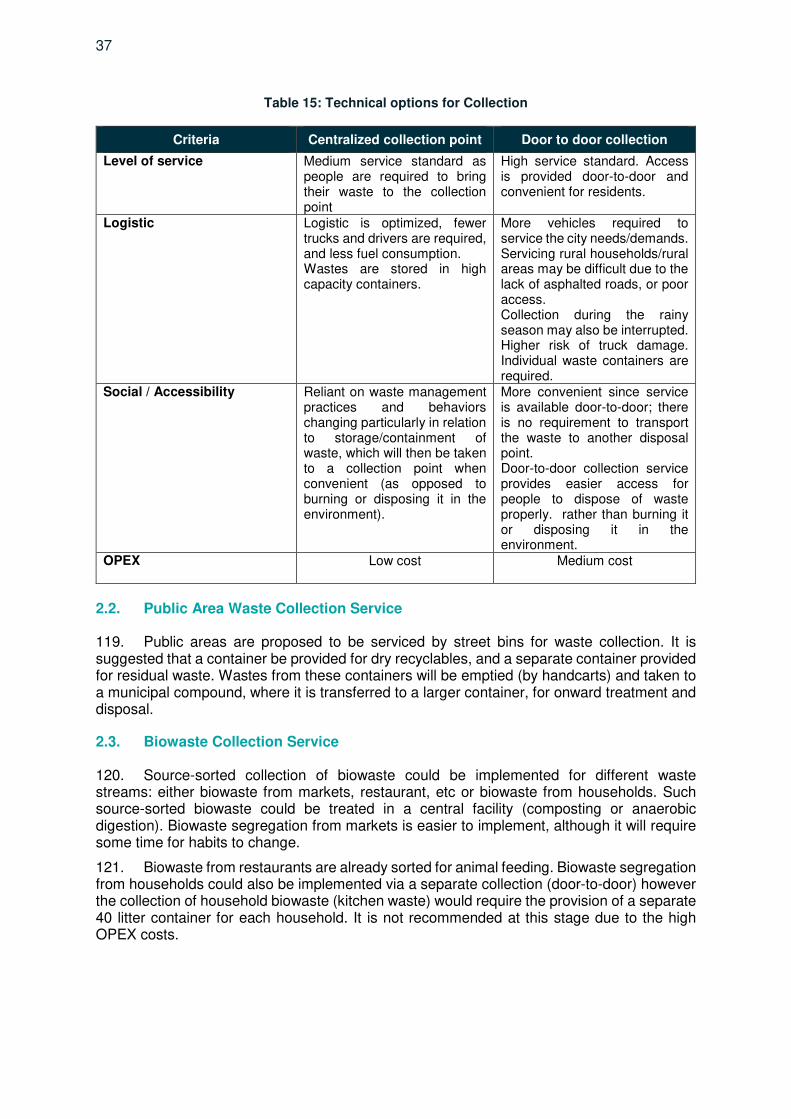
37
Table 15: Technical options for Collection
Criteria Centralized collection point Door to door collection
Level of service Medium service standard as people are required to bring their waste to the collection point
High service standard. Access is provided door-to-door and convenient for residents.
Logistic Logistic is optimized, fewer trucks and drivers are required, and less fuel consumption. Wastes are stored in high capacity containers.
More vehicles required to service the city needs/demands. Servicing rural households/rural areas may be difficult due to the lack of asphalted roads, or poor access. Collection during the rainy season may also be interrupted. Higher risk of truck damage. Individual waste containers are required.
Social / Accessibility Reliant on waste management practices and behaviors changing particularly in relation to storage/containment of waste, which will then be taken to a collection point when convenient (as opposed to burning or disposing it in the environment).
More convenient since service is available door-to-door; there is no requirement to transport the waste to another disposal point. Door-to-door collection service provides easier access for people to dispose of waste properly. rather than burning it or disposing it in the environment.
OPEX Low cost Medium cost
2.2. Public Area Waste Collection Service
119. Public areas are proposed to be serviced by street bins for waste collection. It is suggested that a container be provided for dry recyclables, and a separate container provided for residual waste. Wastes from these containers will be emptied (by handcarts) and taken to a municipal compound, where it is transferred to a larger container, for onward treatment and disposal.
2.3. Biowaste Collection Service
120. Source-sorted collection of biowaste could be implemented for different waste streams: either biowaste from markets, restaurant, etc or biowaste from households. Such source-sorted biowaste could be treated in a central facility (composting or anaerobic digestion). Biowaste segregation from markets is easier to implement, although it will require some time for habits to change.
121. Biowaste from restaurants are already sorted for animal feeding. Biowaste segregation from households could also be implemented via a separate collection (door-to-door) however the collection of household biowaste (kitchen waste) would require the provision of a separate 40 litter container for each household. It is not recommended at this stage due to the high OPEX costs.
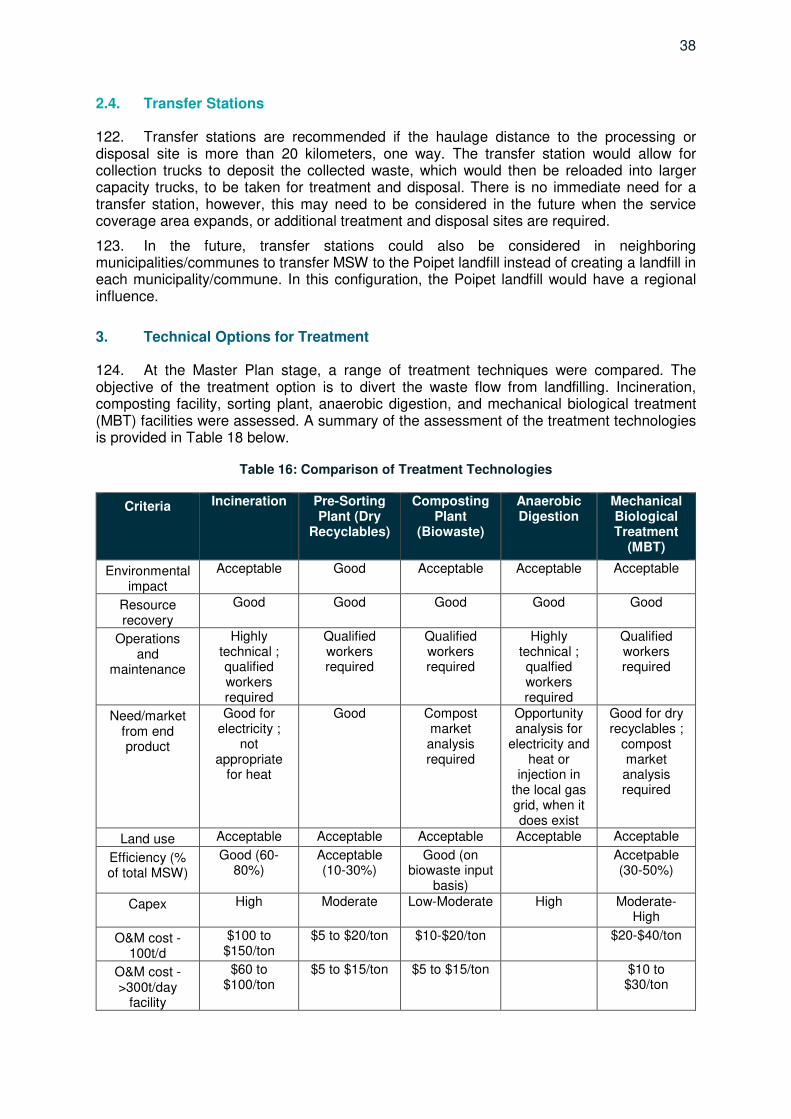
38
2.4. Transfer Stations
122. Transfer stations are recommended if the haulage distance to the processing or disposal site is more than 20 kilometers, one way. The transfer station would allow for collection trucks to deposit the collected waste, which would then be reloaded into larger capacity trucks, to be taken for treatment and disposal. There is no immediate need for a transfer station, however, this may need to be considered in the future when the service coverage area expands, or additional treatment and disposal sites are required.
123. In the future, transfer stations could also be considered in neighboring municipalities/communes to transfer MSW to the Poipet landfill instead of creating a landfill in each municipality/commune. In this configuration, the Poipet landfill would have a regional influence.
3. Technical Options for Treatment
124. At the Master Plan stage, a range of treatment techniques were compared. The objective of the treatment option is to divert the waste flow from landfilling. Incineration, composting facility, sorting plant, anaerobic digestion, and mechanical biological treatment (MBT) facilities were assessed. A summary of the assessment of the treatment technologies is provided in Table 18 below.
Table 16: Comparison of Treatment Technologies
Criteria Incineration Pre-Sorting Plant (Dry
Recyclables)
Composting Plant
(Biowaste)
Anaerobic Digestion
Mechanical Biological Treatment
(MBT)
Environmental impact
Acceptable Good Acceptable Acceptable Acceptable
Resource recovery
Good Good Good Good Good
Operations and
maintenance
Highly technical ; qualified workers required
Qualified workers required
Qualified workers required
Highly technical ; qualfied workers required
Qualified workers required
Need/market from end product
Good for electricity ;
not appropriate
for heat
Good Compost market analysis required
Opportunity analysis for
electricity and heat or
injection in the local gas grid, when it does exist
Good for dry recyclables ;
compost market analysis required
Land use Acceptable Acceptable Acceptable Acceptable Acceptable
Efficiency (% of total MSW)
Good (60-80%)
Acceptable (10-30%)
Good (on biowaste input
basis)
Accetpable (30-50%)
Capex High Moderate Low-Moderate High Moderate-High
O&M cost - 100t/d
$100 to $150/ton
$5 to $20/ton $10-$20/ton $20-$40/ton
O&M cost - >300t/day
facility
$60 to $100/ton
$5 to $15/ton $5 to $15/ton $10 to $30/ton
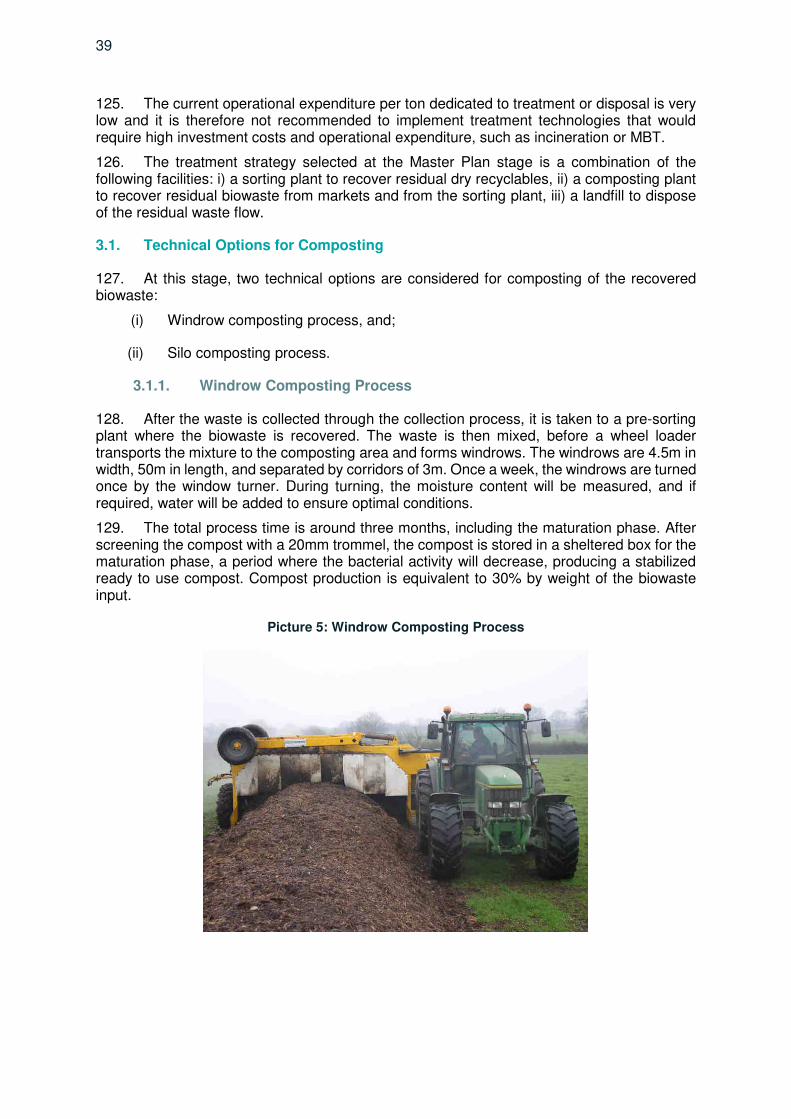
39
125. The current operational expenditure per ton dedicated to treatment or disposal is very low and it is therefore not recommended to implement treatment technologies that would require high investment costs and operational expenditure, such as incineration or MBT.
126. The treatment strategy selected at the Master Plan stage is a combination of the following facilities: i) a sorting plant to recover residual dry recyclables, ii) a composting plant to recover residual biowaste from markets and from the sorting plant, iii) a landfill to dispose of the residual waste flow.
3.1. Technical Options for Composting
127. At this stage, two technical options are considered for composting of the recovered biowaste:
(i) Windrow composting process, and;
(ii) Silo composting process.
3.1.1. Windrow Composting Process
128. After the waste is collected through the collection process, it is taken to a pre-sorting plant where the biowaste is recovered. The waste is then mixed, before a wheel loader transports the mixture to the composting area and forms windrows. The windrows are 4.5m in width, 50m in length, and separated by corridors of 3m. Once a week, the windrows are turned once by the window turner. During turning, the moisture content will be measured, and if required, water will be added to ensure optimal conditions.
129. The total process time is around three months, including the maturation phase. After screening the compost with a 20mm trommel, the compost is stored in a sheltered box for the maturation phase, a period where the bacterial activity will decrease, producing a stabilized ready to use compost. Compost production is equivalent to 30% by weight of the biowaste input.
Picture 5: Windrow Composting Process
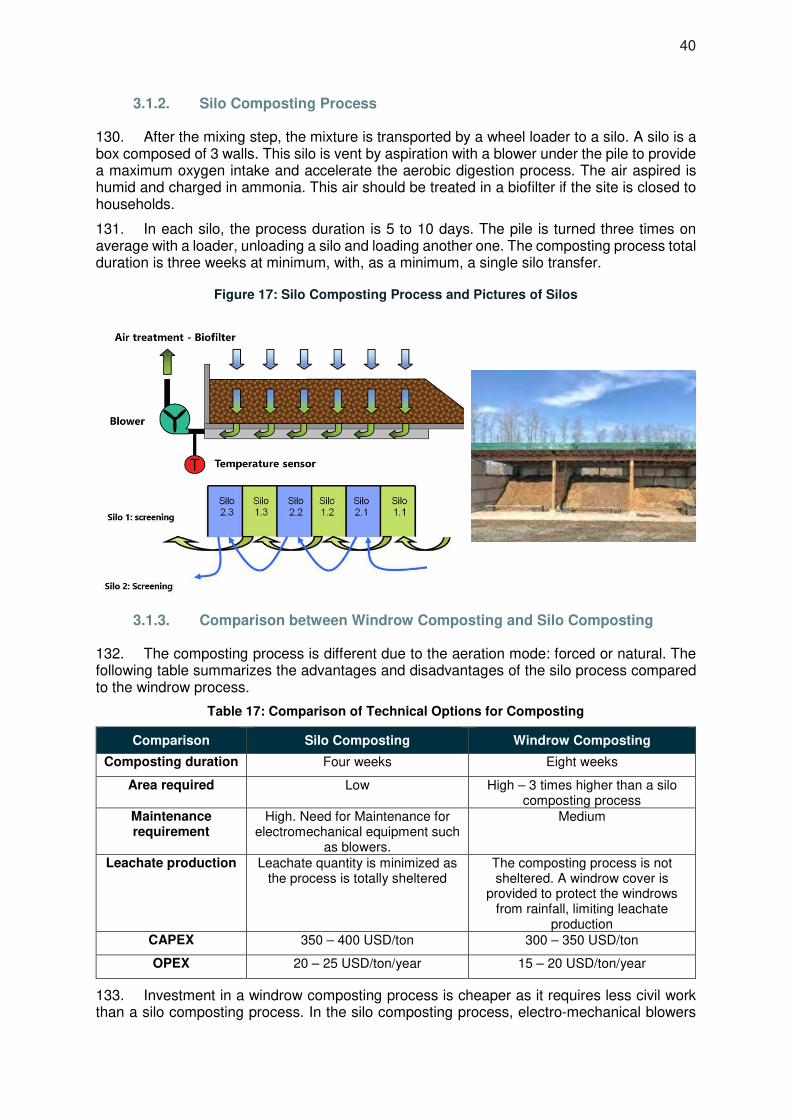
40
3.1.2. Silo Composting Process
130. After the mixing step, the mixture is transported by a wheel loader to a silo. A silo is a box composed of 3 walls. This silo is vent by aspiration with a blower under the pile to provide a maximum oxygen intake and accelerate the aerobic digestion process. The air aspired is humid and charged in ammonia. This air should be treated in a biofilter if the site is closed to households.
131. In each silo, the process duration is 5 to 10 days. The pile is turned three times on average with a loader, unloading a silo and loading another one. The composting process total duration is three weeks at minimum, with, as a minimum, a single silo transfer.
Figure 17: Silo Composting Process and Pictures of Silos
3.1.3. Comparison between Windrow Composting and Silo Composting
132. The composting process is different due to the aeration mode: forced or natural. The following table summarizes the advantages and disadvantages of the silo process compared to the windrow process.
Table 17: Comparison of Technical Options for Composting
Comparison Silo Composting Windrow Composting
Composting duration Four weeks Eight weeks
Area required Low High – 3 times higher than a silo composting process
Maintenance requirement
High. Need for Maintenance for electromechanical equipment such
as blowers.
Medium
Leachate production Leachate quantity is minimized as the process is totally sheltered
The composting process is not sheltered. A windrow cover is
provided to protect the windrows from rainfall, limiting leachate
production CAPEX 350 – 400 USD/ton 300 – 350 USD/ton
OPEX 20 – 25 USD/ton/year 15 – 20 USD/ton/year
133. Investment in a windrow composting process is cheaper as it requires less civil work than a silo composting process. In the silo composting process, electro-mechanical blowers
41
are required. The electricity costs are higher, and it also requires adequate maintenance. Windrow composting is a robust system that is easier to operate and maintain than silo composting.
4. Technical Options for Landfill
134. Two solutions for final disposal of residual waste were proposed:
(i) Controlled landfills; and
(ii) Sanitary landfills.
135. According to ADB guidelines, a controlled landfill is usually the most appropriate disposal system for most small to midsize municipalities. A sanitary landfill is generally too expensive and too complex for small to midsize municipalities to operate sustainably without ongoing external technical support or funding. Also, the additional operating costs for items like the leachate treatment plant are significant but yield little or no environmental gain at this scale, given their demonstrated unreliability. Furthermore, the required removal of all waste scavenging from the site could have significant social impacts and increase airspace consumption.
136. The solution for final disposal selected at the Master Plan stage was a controlled landfill. Within this overall definition, consideration must be given to the different technical options for the landfill, focusing on the following three principal elements:
(i) The basal lining system;
(ii) The leachate treatment system; and
(iii) The landfill gas treatment system
4.1. Basal Lining System
137. It is necessary for the landfill cells to have a low permeability basal liner, with a permeability less than 1x10⁻⁹ m/s, for which there are two options:
(i) Geomembrane liner, comprising a 2mm thick high-density polyethylene (HDPE) fusion-welded geomembrane. This HDPE geomembrane is generally protected by a non-woven geotextile fabric.
(ii) Mineral liner, typically comprising a 1m thick layer of on-site or imported clay, carefully reworked, placed, and compacted in layers. In this case, possible sources of clay would need to be identified. Alternatively, if there is no available source of clay in the proximity of the site, then it may be possible to rework and treat the site soils with powdered bentonite to lower the permeability.
42
138. A comparative analysis of the liner options has been carried out based on the criteria listed in Table 18 below:
Table 18: Comparative Analysis of Basal Liner Options
Criteria HDPE Geomembrane Mineral Clay Liner
Availability of materials Easily available on the market
No source identified
Ease of installation Requires trained installation contractor (of which there
are many)
Requires appropriate plant (sheepsfoot roller) and expertise
Need for controls during construction
An installation QA/AC scheme is necessary
An installation QA/AC scheme is necessary
Degree of protection permeability
High <1x10-12 m/s
Good <1x10-11 m/s
Long-term durability Good Excellent
Cost High High
139. In view of the above analysis, it is recommended that a basal geomembrane liner be used. This is mainly because of the doubts about the availability of clay (in-situ or off-site) for a mineral liner; this point may be verified at the detailed engineering design stage, based upon the findings of the site investigation.
4.2. Leachate Treatment System
140. The leachate will be drained by gravity towards the collection well at the low point and then, by gravity, to a leachate storage lagoon. There are three options for the treatment of the leachate, as follows:
(i) On-site leachate treatment plant. There are many methods of leachate treatment on the market: aerobic biological treatment (aerated lagoons, activated sludge); anaerobic biological treatment; physio-chemical treatment; coagulation; and more advanced techniques such as reverse osmosis, microfiltration, etc. In many applications, a combination of these techniques is used in sequence to treat the different pollutants in the leachate. In general, unless the requirement is for pre-treatment only, then the leachate treatment plant is both complex and costly to operate because of the need for technical supervision and the energy and reagent requirements: this is considerably more so for small landfills where the cost per m3 treated can be very high.
(ii) Off-site treatment at WWTP. This common solution for small landfills is generally the most cost-effective treatment solution: the capital and operating expenses for the treatment are shared with the WWTP.
(iii) Leachate recirculation. This solution pumps the leachate back into the waste mass, which has a high capacity to absorb the leachate. This solution is adopted in many countries as an active operational measure to accelerate the degradation of the waste in the landfill and, thus, reducing the time required for the landfill to stabilize.
141. It should be remembered that an operating principle of the landfill should be to minimize the production of leachate by using good landfill practices, particularly:
(i) Reduction of the operating surface of the waste to the minimum required;
(ii) Placing of daily and intermediate covers on the waste to reduce infiltration; and
43
(iii) Effective management of stormwater on the site to avoid mixing rainwater with leachate or allowing storm-water to enter the waste mass.
Table 19: Comparative Analysis of Leachate Treatment Options
Criteria On-site treatment Off-site treatment Recirculation
Technical complexity
High, depending upon the
technology used.
None (on-site). Low. The only operating plant is the
pumping station.
Investment cost
High, depending upon the
technology selected.
None. Moderate. The recirculation system
requires a small pump, distribution pipework,
and infiltration drains or wells.
Operating cost
The operating costs per m3
treated are high for a small leachate
treatment plant, requiring
manpower, reagents, and
electricity.
Moderate. There are two costs - the
transport cost by tanker and the cost
charged by the WWTP for treating the
leachate.
Low. The only costs
are pump maintenance and electricity.
Environmental impact
Dependent upon the degree of
treatment applied – for high-tech
solutions, such as reverse osmosis, the discharge is
very clean.
The transport of the leachate to the
WWTP has an impact (GHG emissions, traffic circulation).
Otherwise, the impact of the discharge is
dependent upon the quality of treatment at
the WWTP.
The recirculation of the leachate into the waste mass does promote the
degradation of the waste and, thus, LFG emissions. It requires an effective operation of the site and good
LFG measures.
142. It is proposed to use a combination of leachate recirculation and off-site treatment at WWTP.
143. This solution is chosen because it avoids expensive and complex on-site treatment whilst, at the same time, providing a flexible means of managing the leachate as its quantity and quality vary over time.
144. The use of leachate recirculation is a tried and tested technique, which, although it does need to be properly managed, does not require expensive reagents and technical expertise to implement.
145. The majority of the leachate will be recirculated back into the landfill mass, with the excess being tankered off-site for treatment at the WWTP. The recirculation uses a pump in the leachate pond, with pressure lines leading from the leachate pond up to the landfill surface, where the leachate enters the waste mass via infiltration drains or wells.
4.3. Landfill Gas Treatment System
146. The calculation of the estimated LFG production is presented in detail in Appendix 2. This estimate is based upon an LFG generation that considers the future landfilling (tpy) and the residual waste composition (% readily degradable organic fraction, moisture content) after the sorting process, interpreted as potential methane generation capacity and rate. Further to the estimation of LFG production, an estimate of the electricity generation potential has been
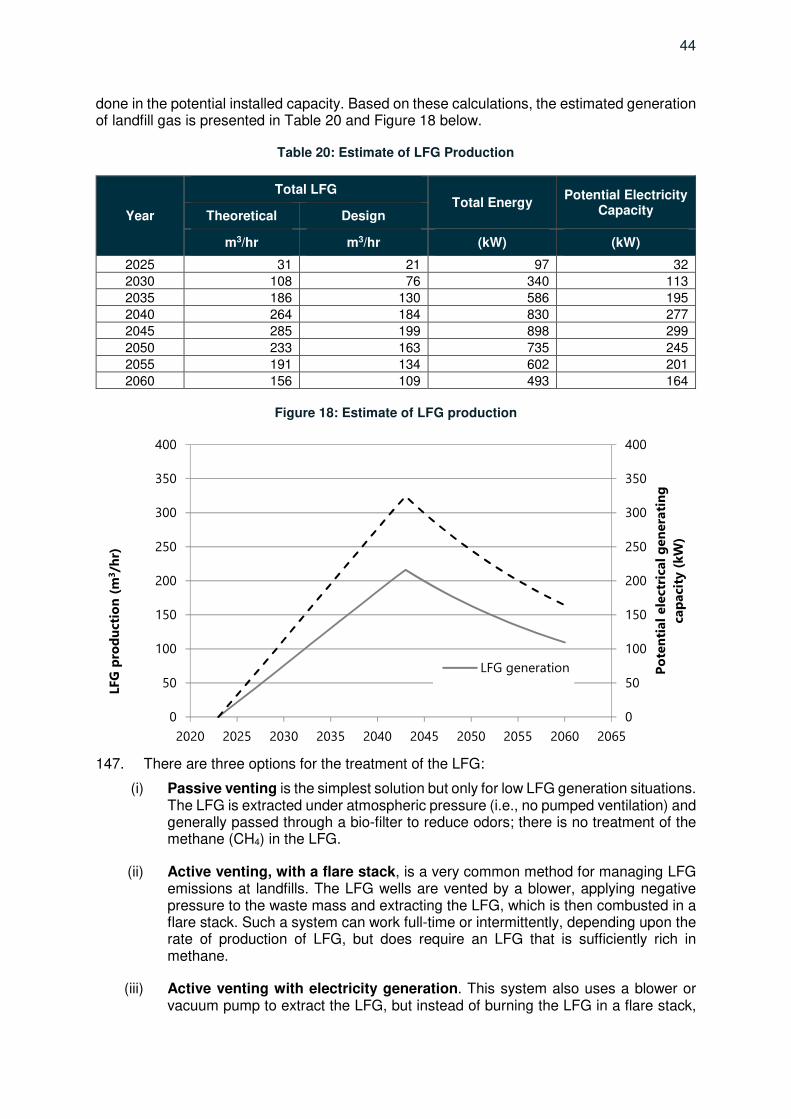
44
done in the potential installed capacity. Based on these calculations, the estimated generation of landfill gas is presented in Table 20 and Figure 18 below.
Table 20: Estimate of LFG Production
Year
Total LFG Total Energy
Potential Electricity Capacity Theoretical Design
m3/hr m3/hr (kW) (kW)
2025 31 21 97 32
2030 108 76 340 113
2035 186 130 586 195
2040 264 184 830 277
2045 285 199 898 299
2050 233 163 735 245
2055 191 134 602 201
2060 156 109 493 164
Figure 18: Estimate of LFG production
147. There are three options for the treatment of the LFG:
(i) Passive venting is the simplest solution but only for low LFG generation situations. The LFG is extracted under atmospheric pressure (i.e., no pumped ventilation) and generally passed through a bio-filter to reduce odors; there is no treatment of the methane (CH4) in the LFG.
(ii) Active venting, with a flare stack, is a very common method for managing LFG emissions at landfills. The LFG wells are vented by a blower, applying negative pressure to the waste mass and extracting the LFG, which is then combusted in a flare stack. Such a system can work full-time or intermittently, depending upon the rate of production of LFG, but does require an LFG that is sufficiently rich in methane.
(iii) Active venting with electricity generation. This system also uses a blower or vacuum pump to extract the LFG, but instead of burning the LFG in a flare stack,
0
50
100
150
200
250
300
350
400
0
50
100
150
200
250
300
350
400
2020 2025 2030 2035 2040 2045 2050 2055 2060 2065
Po
ten
tial
ele
ctri
cal
gen
era
tin
g
cap
aci
ty (
kW
)
LFG
pro
du
ctio
n (
m3/h
r)
LFG generation
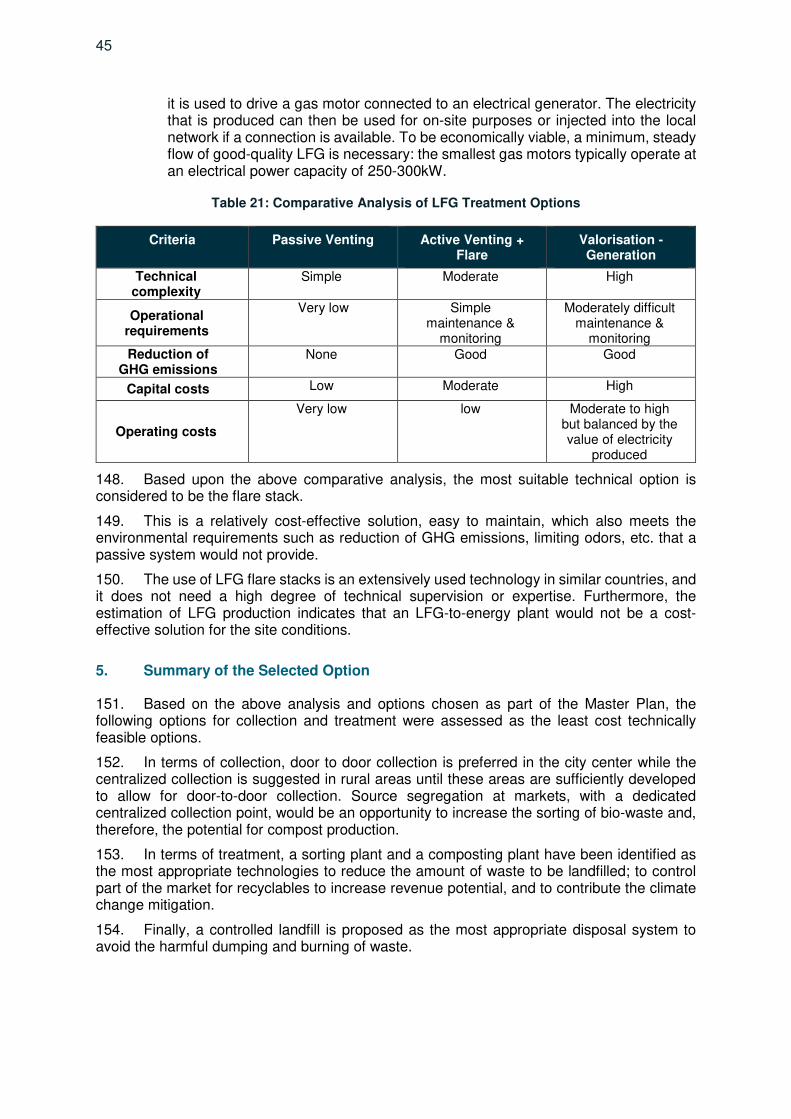
45
it is used to drive a gas motor connected to an electrical generator. The electricity that is produced can then be used for on-site purposes or injected into the local network if a connection is available. To be economically viable, a minimum, steady flow of good-quality LFG is necessary: the smallest gas motors typically operate at an electrical power capacity of 250-300kW.
Table 21: Comparative Analysis of LFG Treatment Options
Criteria Passive Venting Active Venting + Flare
Valorisation - Generation
Technical complexity
Simple Moderate High
Operational requirements
Very low Simple maintenance &
monitoring
Moderately difficult maintenance &
monitoring Reduction of
GHG emissions None Good Good
Capital costs Low Moderate High
Operating costs
Very low low Moderate to high but balanced by the value of electricity
produced
148. Based upon the above comparative analysis, the most suitable technical option is considered to be the flare stack.
149. This is a relatively cost-effective solution, easy to maintain, which also meets the environmental requirements such as reduction of GHG emissions, limiting odors, etc. that a passive system would not provide.
150. The use of LFG flare stacks is an extensively used technology in similar countries, and it does not need a high degree of technical supervision or expertise. Furthermore, the estimation of LFG production indicates that an LFG-to-energy plant would not be a cost-effective solution for the site conditions.
5. Summary of the Selected Option
151. Based on the above analysis and options chosen as part of the Master Plan, the following options for collection and treatment were assessed as the least cost technically feasible options.
152. In terms of collection, door to door collection is preferred in the city center while the centralized collection is suggested in rural areas until these areas are sufficiently developed to allow for door-to-door collection. Source segregation at markets, with a dedicated centralized collection point, would be an opportunity to increase the sorting of bio-waste and, therefore, the potential for compost production.
153. In terms of treatment, a sorting plant and a composting plant have been identified as the most appropriate technologies to reduce the amount of waste to be landfilled; to control part of the market for recyclables to increase revenue potential, and to contribute the climate change mitigation.
154. Finally, a controlled landfill is proposed as the most appropriate disposal system to avoid the harmful dumping and burning of waste.
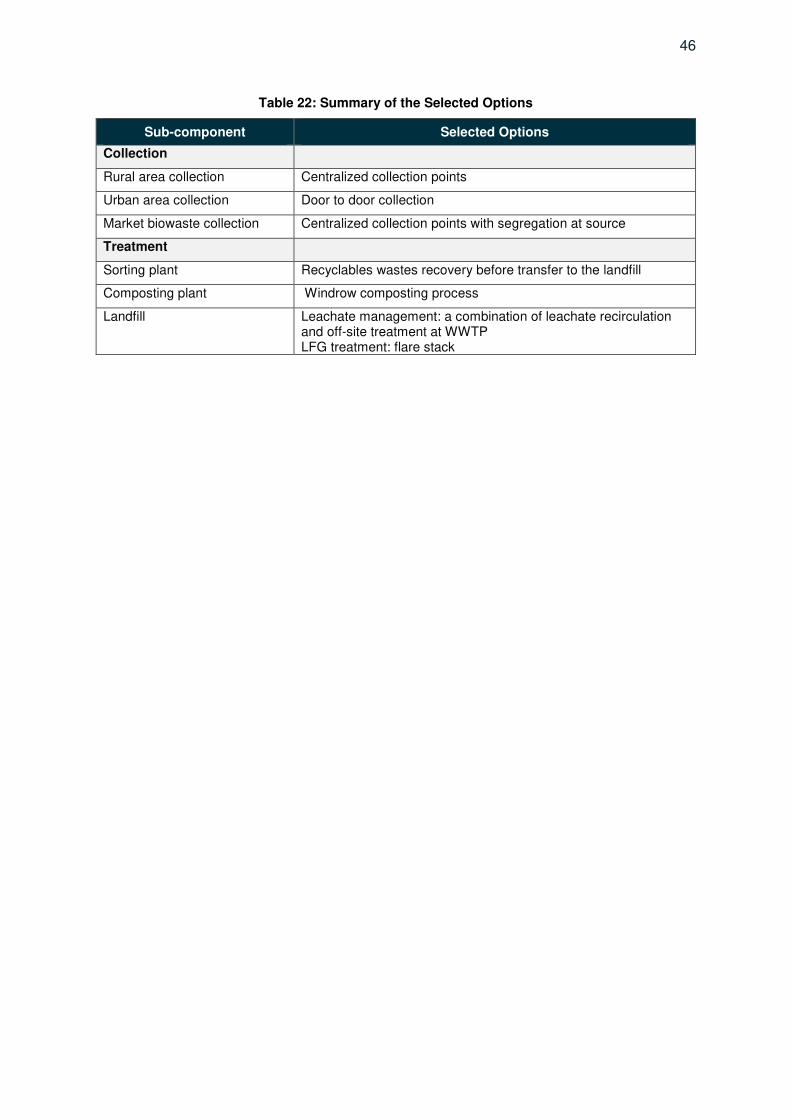
46
Table 22: Summary of the Selected Options
Sub-component Selected Options
Collection
Rural area collection Centralized collection points
Urban area collection Door to door collection
Market biowaste collection Centralized collection points with segregation at source
Treatment
Sorting plant Recyclables wastes recovery before transfer to the landfill
Composting plant Windrow composting process
Landfill Leachate management: a combination of leachate recirculation and off-site treatment at WWTP LFG treatment: flare stack
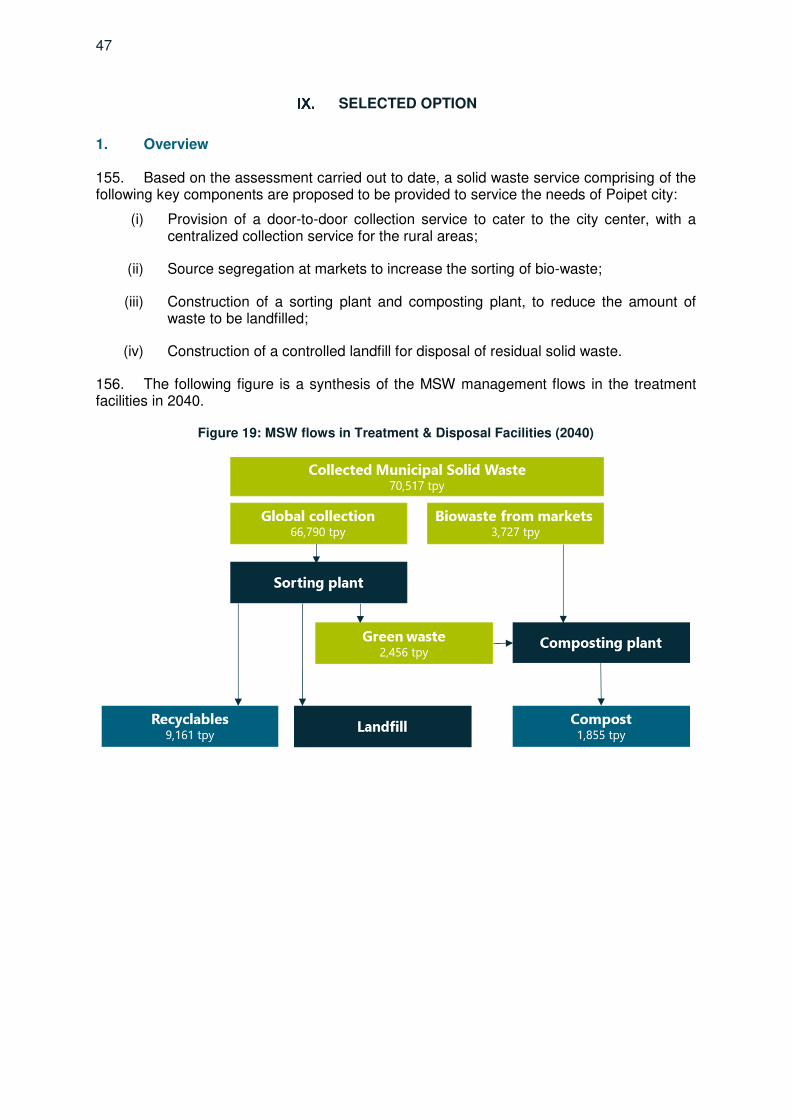
47
SELECTED OPTION
1. Overview
155. Based on the assessment carried out to date, a solid waste service comprising of the following key components are proposed to be provided to service the needs of Poipet city:
(i) Provision of a door-to-door collection service to cater to the city center, with a centralized collection service for the rural areas;
(ii) Source segregation at markets to increase the sorting of bio-waste;
(iii) Construction of a sorting plant and composting plant, to reduce the amount of waste to be landfilled;
(iv) Construction of a controlled landfill for disposal of residual solid waste.
156. The following figure is a synthesis of the MSW management flows in the treatment facilities in 2040.
Figure 19: MSW flows in Treatment & Disposal Facilities (2040)
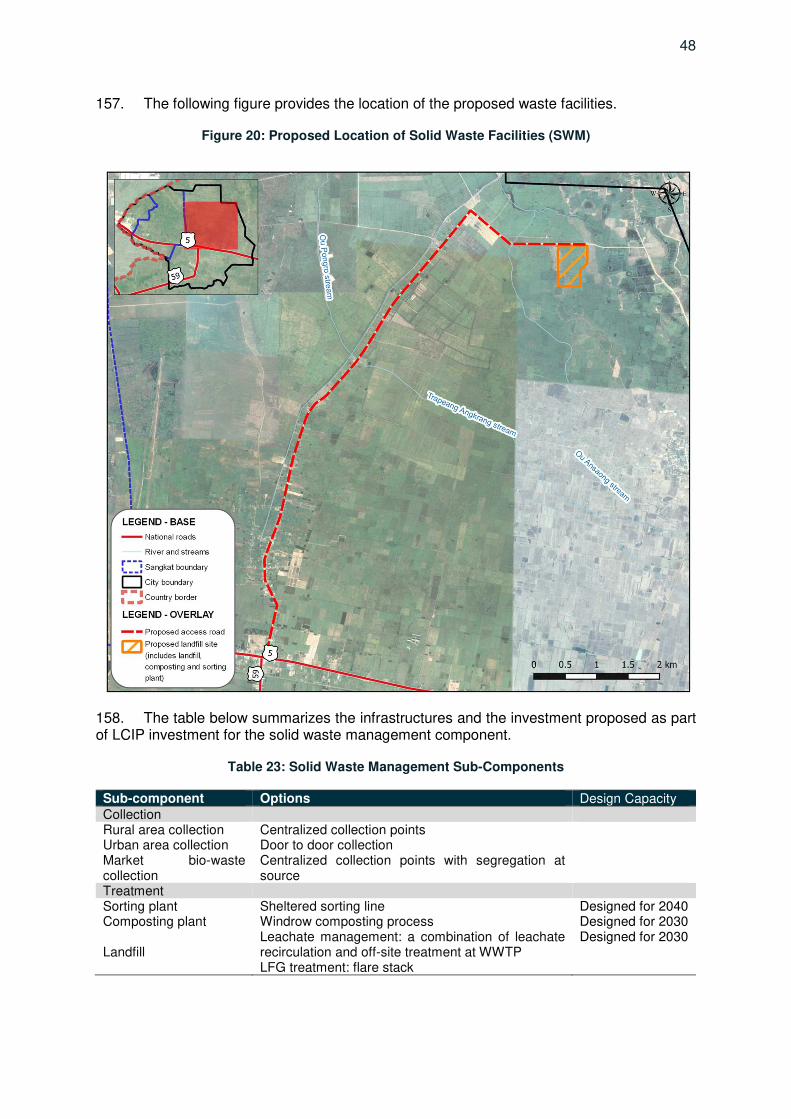
48
157. The following figure provides the location of the proposed waste facilities.
Figure 20: Proposed Location of Solid Waste Facilities (SWM)
158. The table below summarizes the infrastructures and the investment proposed as part of LCIP investment for the solid waste management component.
Table 23: Solid Waste Management Sub-Components
Sub-component Options Design Capacity Collection Rural area collection Centralized collection points Urban area collection Door to door collection Market bio-waste collection
Centralized collection points with segregation at source
Treatment Sorting plant Sheltered sorting line Designed for 2040 Composting plant Windrow composting process Designed for 2030
Landfill Leachate management: a combination of leachate recirculation and off-site treatment at WWTP LFG treatment: flare stack
Designed for 2030
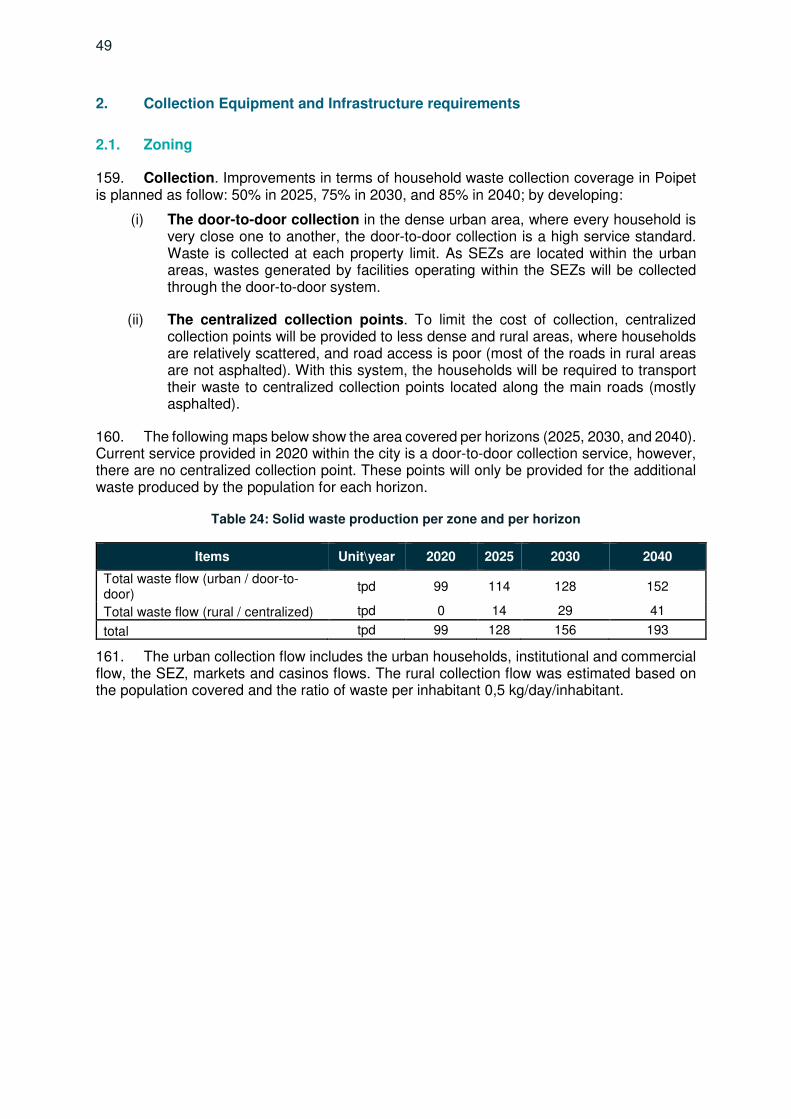
49
2. Collection Equipment and Infrastructure requirements
2.1. Zoning
159. Collection. Improvements in terms of household waste collection coverage in Poipet is planned as follow: 50% in 2025, 75% in 2030, and 85% in 2040; by developing:
(i) The door-to-door collection in the dense urban area, where every household is very close one to another, the door-to-door collection is a high service standard. Waste is collected at each property limit. As SEZs are located within the urban areas, wastes generated by facilities operating within the SEZs will be collected through the door-to-door system.
(ii) The centralized collection points. To limit the cost of collection, centralized collection points will be provided to less dense and rural areas, where households are relatively scattered, and road access is poor (most of the roads in rural areas are not asphalted). With this system, the households will be required to transport their waste to centralized collection points located along the main roads (mostly asphalted).
160. The following maps below show the area covered per horizons (2025, 2030, and 2040). Current service provided in 2020 within the city is a door-to-door collection service, however, there are no centralized collection point. These points will only be provided for the additional waste produced by the population for each horizon.
Table 24: Solid waste production per zone and per horizon
Items Unit\year 2020 2025 2030 2040
Total waste flow (urban / door-to-door)
tpd 99 114 128 152
Total waste flow (rural / centralized) tpd 0 14 29 41
total tpd 99 128 156 193
161. The urban collection flow includes the urban households, institutional and commercial flow, the SEZ, markets and casinos flows. The rural collection flow was estimated based on the population covered and the ratio of waste per inhabitant 0,5 kg/day/inhabitant.
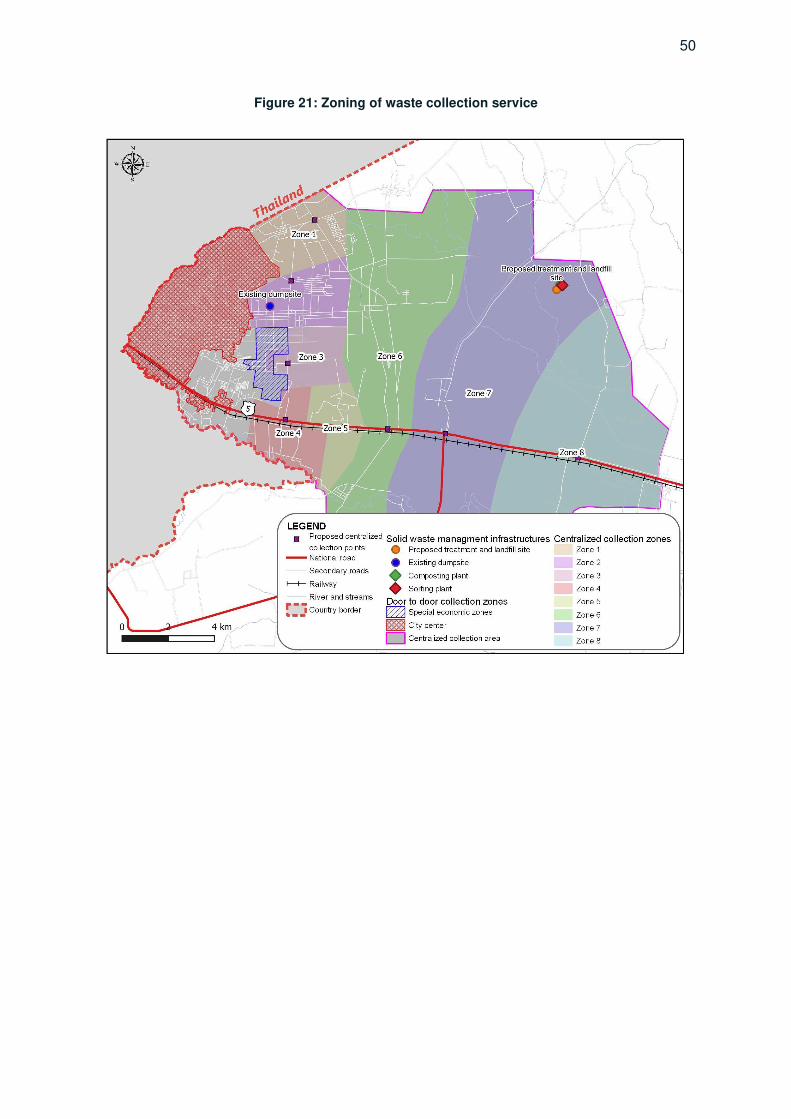
50
Figure 21: Zoning of waste collection service
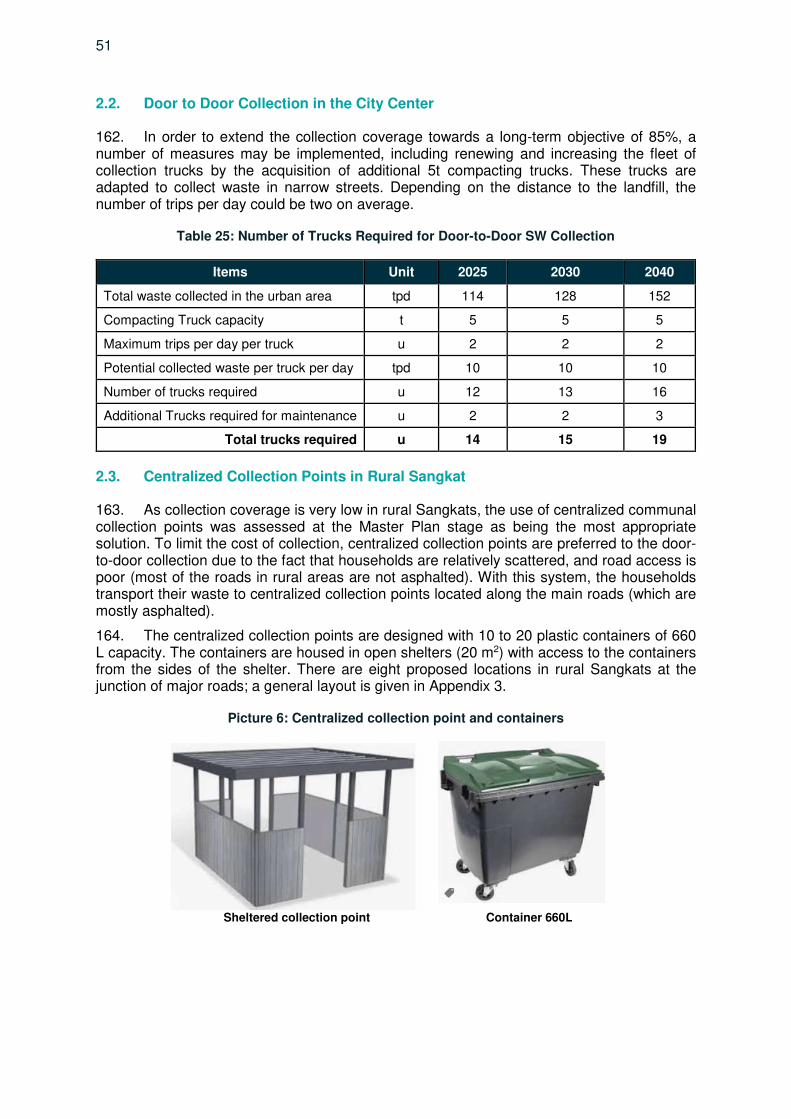
51
2.2. Door to Door Collection in the City Center
162. In order to extend the collection coverage towards a long-term objective of 85%, a number of measures may be implemented, including renewing and increasing the fleet of collection trucks by the acquisition of additional 5t compacting trucks. These trucks are adapted to collect waste in narrow streets. Depending on the distance to the landfill, the number of trips per day could be two on average.
Table 25: Number of Trucks Required for Door-to-Door SW Collection
Items Unit 2025 2030 2040
Total waste collected in the urban area tpd 114 128 152
Compacting Truck capacity t 5 5 5
Maximum trips per day per truck u 2 2 2
Potential collected waste per truck per day tpd 10 10 10
Number of trucks required u 12 13 16
Additional Trucks required for maintenance u 2 2 3
Total trucks required u 14 15 19
2.3. Centralized Collection Points in Rural Sangkat
163. As collection coverage is very low in rural Sangkats, the use of centralized communal collection points was assessed at the Master Plan stage as being the most appropriate solution. To limit the cost of collection, centralized collection points are preferred to the door-to-door collection due to the fact that households are relatively scattered, and road access is poor (most of the roads in rural areas are not asphalted). With this system, the households transport their waste to centralized collection points located along the main roads (which are mostly asphalted).
164. The centralized collection points are designed with 10 to 20 plastic containers of 660 L capacity. The containers are housed in open shelters (20 m2) with access to the containers from the sides of the shelter. There are eight proposed locations in rural Sangkats at the junction of major roads; a general layout is given in Appendix 3.
Picture 6: Centralized collection point and containers
Sheltered collection point Container 660L
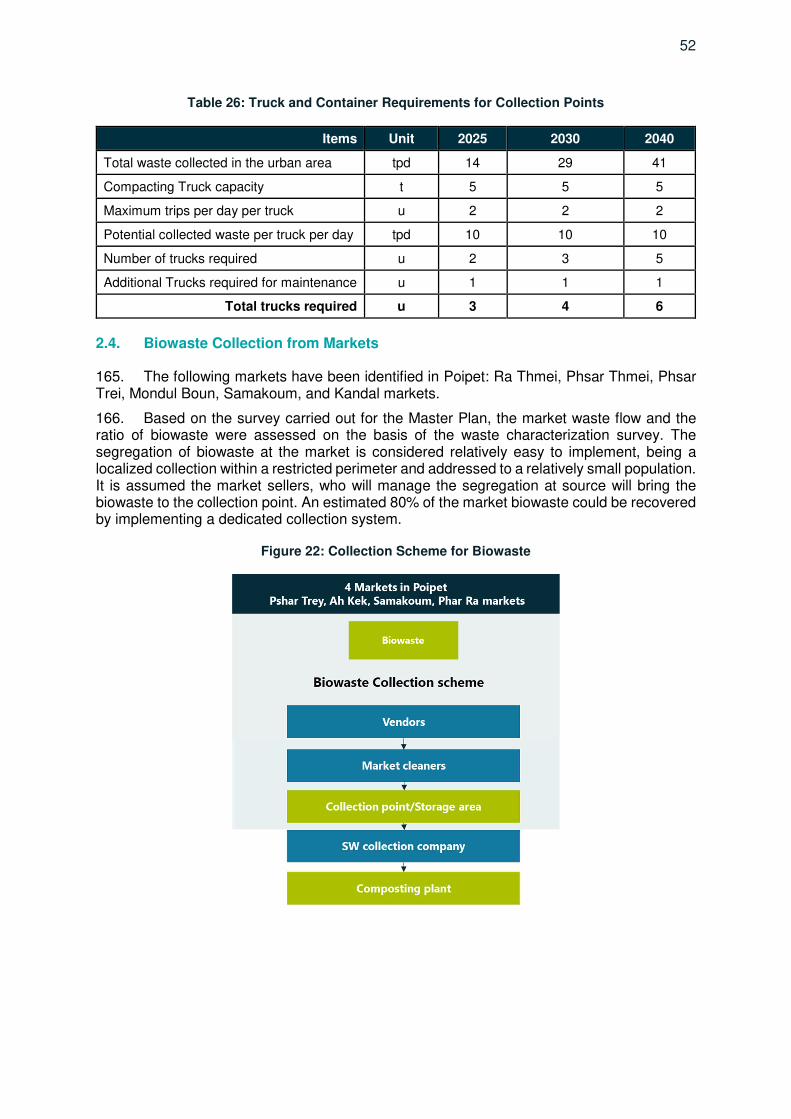
52
Table 26: Truck and Container Requirements for Collection Points
Items Unit 2025 2030 2040
Total waste collected in the urban area tpd 14 29 41
Compacting Truck capacity t 5 5 5
Maximum trips per day per truck u 2 2 2
Potential collected waste per truck per day tpd 10 10 10
Number of trucks required u 2 3 5
Additional Trucks required for maintenance u 1 1 1
Total trucks required u 3 4 6
2.4. Biowaste Collection from Markets
165. The following markets have been identified in Poipet: Ra Thmei, Phsar Thmei, Phsar Trei, Mondul Boun, Samakoum, and Kandal markets.
166. Based on the survey carried out for the Master Plan, the market waste flow and the ratio of biowaste were assessed on the basis of the waste characterization survey. The segregation of biowaste at the market is considered relatively easy to implement, being a localized collection within a restricted perimeter and addressed to a relatively small population. It is assumed the market sellers, who will manage the segregation at source will bring the biowaste to the collection point. An estimated 80% of the market biowaste could be recovered by implementing a dedicated collection system.
Figure 22: Collection Scheme for Biowaste
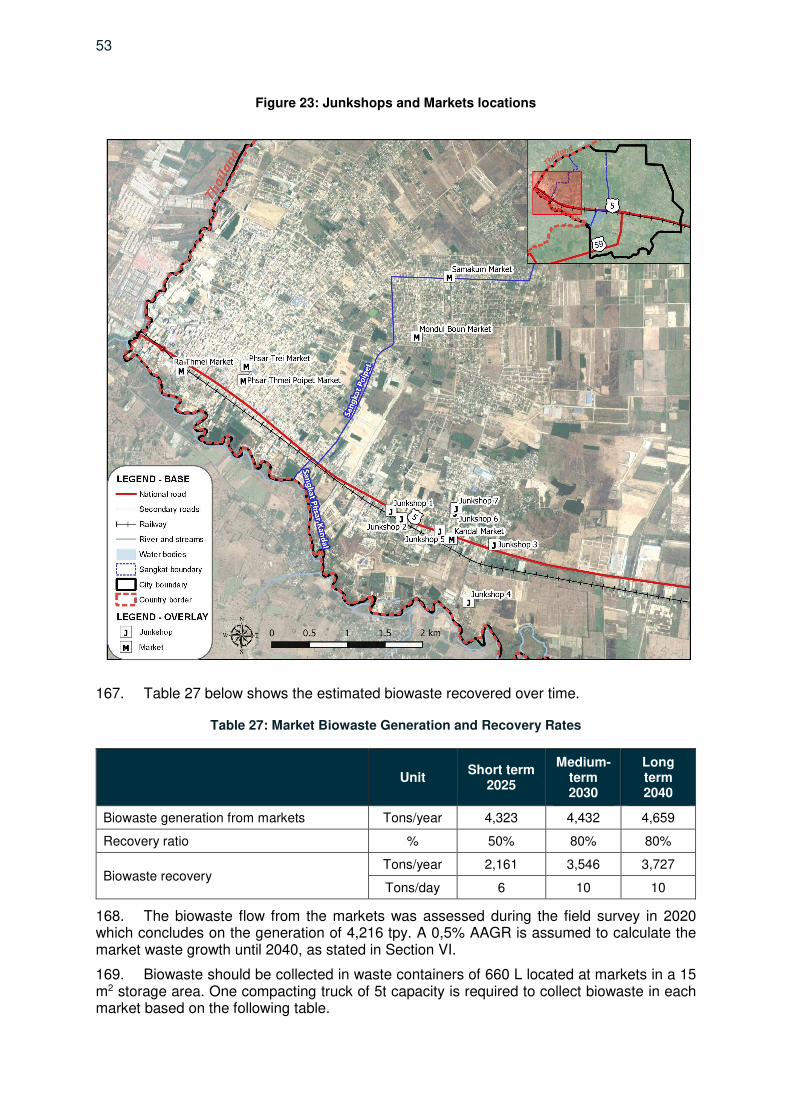
53
Figure 23: Junkshops and Markets locations
167. Table 27 below shows the estimated biowaste recovered over time.
Table 27: Market Biowaste Generation and Recovery Rates
Unit Short term
2025
Medium-term 2030
Long term 2040
Biowaste generation from markets Tons/year 4,323 4,432 4,659
Recovery ratio % 50% 80% 80%
Biowaste recovery Tons/year 2,161 3,546 3,727
Tons/day 6 10 10
168. The biowaste flow from the markets was assessed during the field survey in 2020 which concludes on the generation of 4,216 tpy. A 0,5% AAGR is assumed to calculate the market waste growth until 2040, as stated in Section VI.
169. Biowaste should be collected in waste containers of 660 L located at markets in a 15 m2 storage area. One compacting truck of 5t capacity is required to collect biowaste in each market based on the following table.
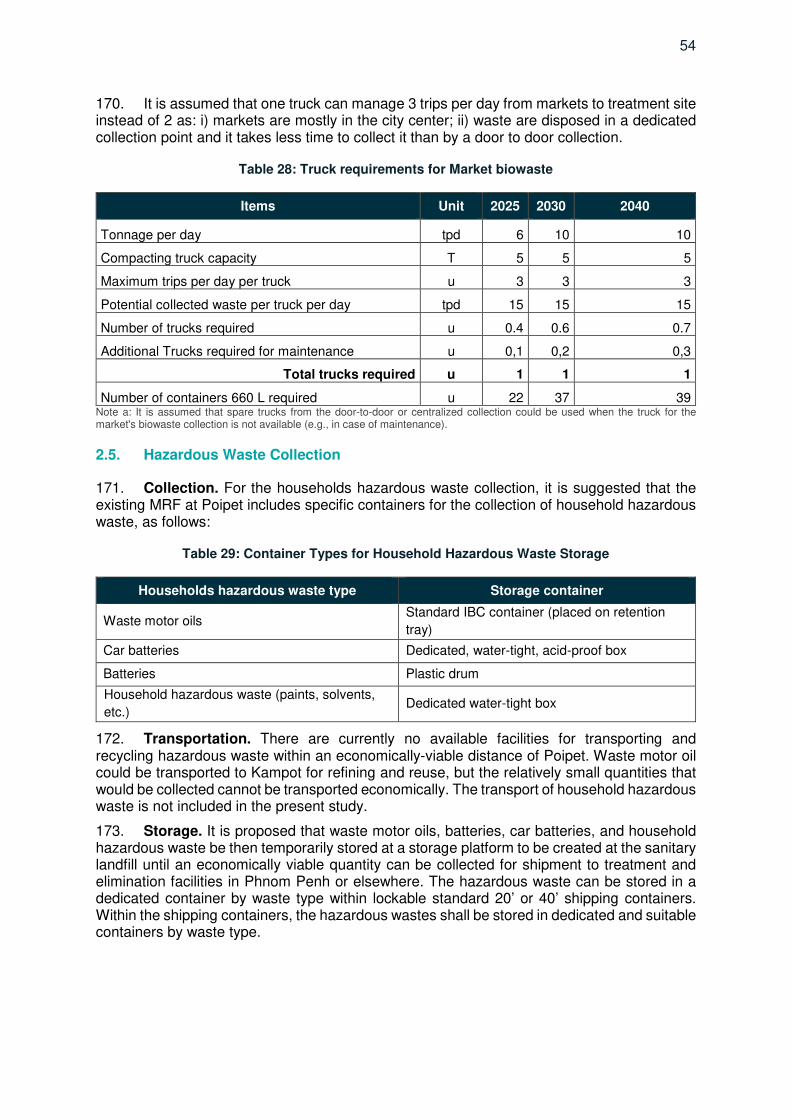
54
170. It is assumed that one truck can manage 3 trips per day from markets to treatment site instead of 2 as: i) markets are mostly in the city center; ii) waste are disposed in a dedicated collection point and it takes less time to collect it than by a door to door collection.
Table 28: Truck requirements for Market biowaste
Items Unit 2025 2030 2040
Tonnage per day tpd 6 10 10
Compacting truck capacity T 5 5 5
Maximum trips per day per truck u 3 3 3
Potential collected waste per truck per day tpd 15 15 15
Number of trucks required u 0.4 0.6 0.7
Additional Trucks required for maintenance u 0,1 0,2 0,3
Total trucks required u 1 1 1
Number of containers 660 L required u 22 37 39 Note a: It is assumed that spare trucks from the door-to-door or centralized collection could be used when the truck for the market's biowaste collection is not available (e.g., in case of maintenance).
2.5. Hazardous Waste Collection
171. Collection. For the households hazardous waste collection, it is suggested that the existing MRF at Poipet includes specific containers for the collection of household hazardous waste, as follows:
Table 29: Container Types for Household Hazardous Waste Storage
Households hazardous waste type Storage container
Waste motor oils Standard IBC container (placed on retention
tray)
Car batteries Dedicated, water-tight, acid-proof box
Batteries Plastic drum
Household hazardous waste (paints, solvents,
etc.) Dedicated water-tight box
172. Transportation. There are currently no available facilities for transporting and recycling hazardous waste within an economically-viable distance of Poipet. Waste motor oil could be transported to Kampot for refining and reuse, but the relatively small quantities that would be collected cannot be transported economically. The transport of household hazardous waste is not included in the present study.
173. Storage. It is proposed that waste motor oils, batteries, car batteries, and household hazardous waste be then temporarily stored at a storage platform to be created at the sanitary landfill until an economically viable quantity can be collected for shipment to treatment and elimination facilities in Phnom Penh or elsewhere. The hazardous waste can be stored in a dedicated container by waste type within lockable standard 20’ or 40’ shipping containers. Within the shipping containers, the hazardous wastes shall be stored in dedicated and suitable containers by waste type.
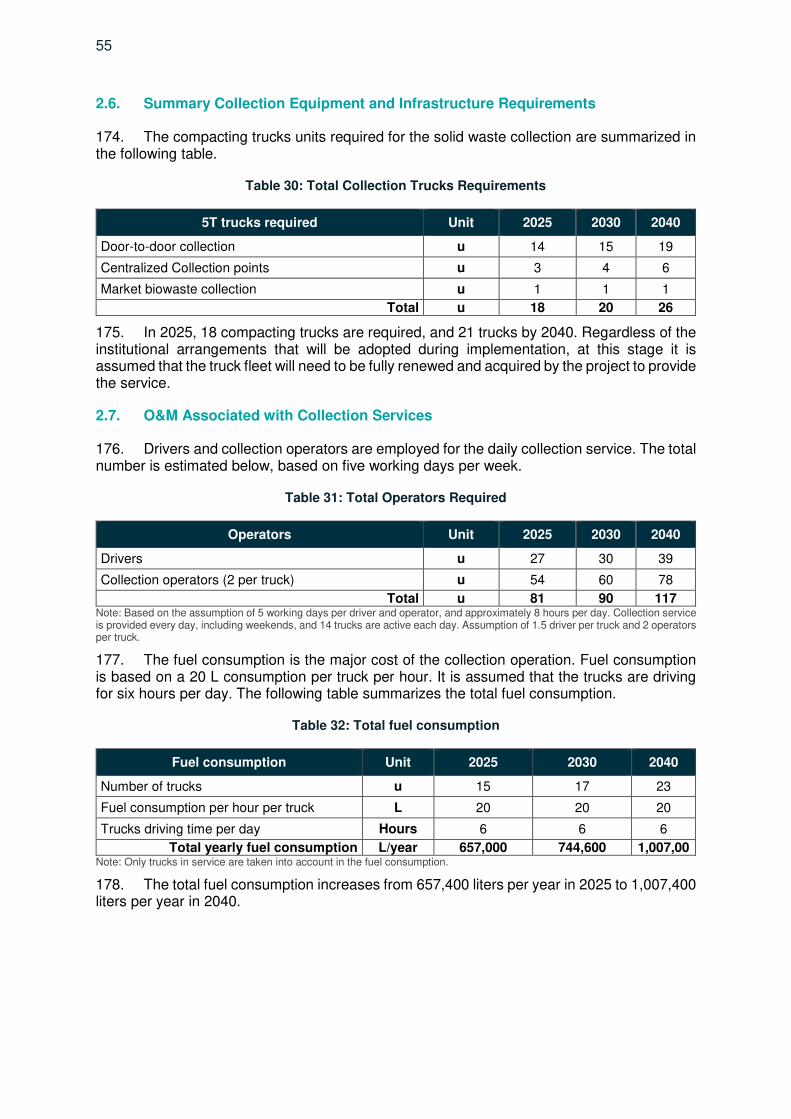
55
2.6. Summary Collection Equipment and Infrastructure Requirements
174. The compacting trucks units required for the solid waste collection are summarized in the following table.
Table 30: Total Collection Trucks Requirements
5T trucks required Unit 2025 2030 2040
Door-to-door collection u 14 15 19
Centralized Collection points u 3 4 6
Market biowaste collection u 1 1 1
Total u 18 20 26
175. In 2025, 18 compacting trucks are required, and 21 trucks by 2040. Regardless of the institutional arrangements that will be adopted during implementation, at this stage it is assumed that the truck fleet will need to be fully renewed and acquired by the project to provide the service.
2.7. O&M Associated with Collection Services
176. Drivers and collection operators are employed for the daily collection service. The total number is estimated below, based on five working days per week.
Table 31: Total Operators Required
Operators Unit 2025 2030 2040
Drivers u 27 30 39
Collection operators (2 per truck) u 54 60 78
Total u 81 90 117 Note: Based on the assumption of 5 working days per driver and operator, and approximately 8 hours per day. Collection service is provided every day, including weekends, and 14 trucks are active each day. Assumption of 1.5 driver per truck and 2 operators per truck.
177. The fuel consumption is the major cost of the collection operation. Fuel consumption is based on a 20 L consumption per truck per hour. It is assumed that the trucks are driving for six hours per day. The following table summarizes the total fuel consumption.
Table 32: Total fuel consumption
Fuel consumption Unit 2025 2030 2040
Number of trucks u 15 17 23
Fuel consumption per hour per truck L 20 20 20
Trucks driving time per day Hours 6 6 6
Total yearly fuel consumption L/year 657,000 744,600 1,007,00 Note: Only trucks in service are taken into account in the fuel consumption.
178. The total fuel consumption increases from 657,400 liters per year in 2025 to 1,007,400 liters per year in 2040.
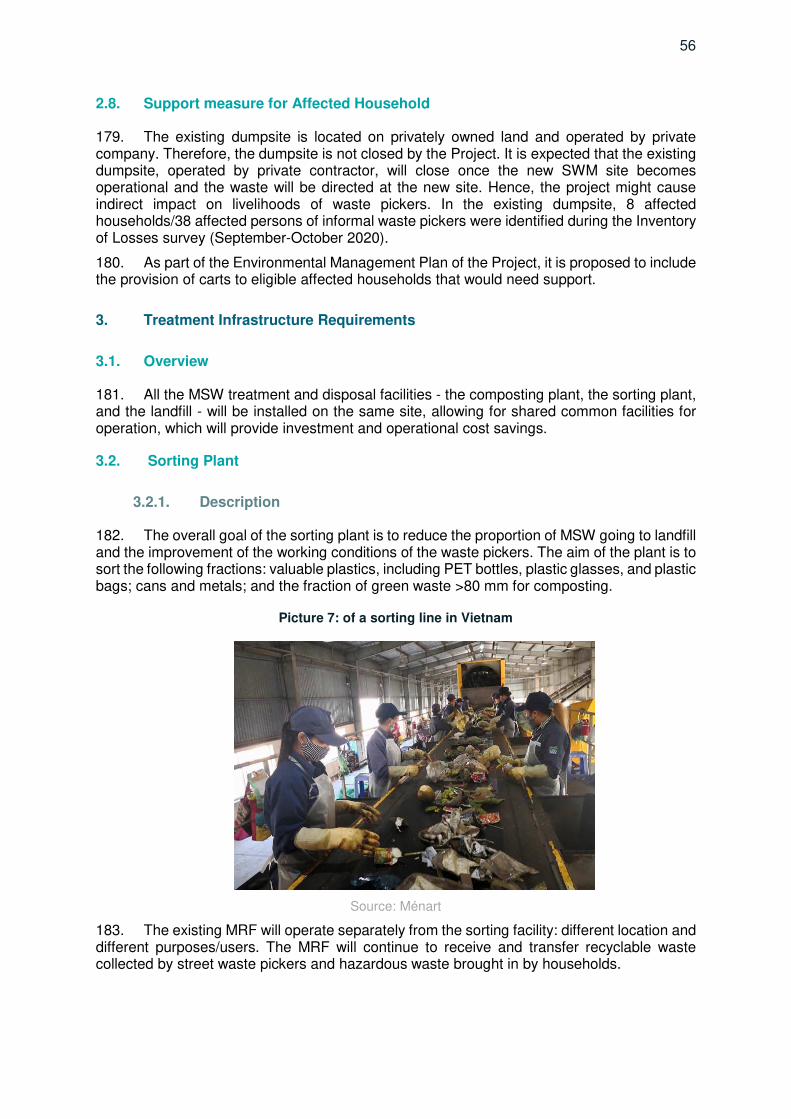
56
2.8. Support measure for Affected Household
179. The existing dumpsite is located on privately owned land and operated by private company. Therefore, the dumpsite is not closed by the Project. It is expected that the existing dumpsite, operated by private contractor, will close once the new SWM site becomes operational and the waste will be directed at the new site. Hence, the project might cause indirect impact on livelihoods of waste pickers. In the existing dumpsite, 8 affected households/38 affected persons of informal waste pickers were identified during the Inventory of Losses survey (September-October 2020).
180. As part of the Environmental Management Plan of the Project, it is proposed to include the provision of carts to eligible affected households that would need support.
3. Treatment Infrastructure Requirements
3.1. Overview
181. All the MSW treatment and disposal facilities - the composting plant, the sorting plant, and the landfill - will be installed on the same site, allowing for shared common facilities for operation, which will provide investment and operational cost savings.
3.2. Sorting Plant
3.2.1. Description
182. The overall goal of the sorting plant is to reduce the proportion of MSW going to landfill and the improvement of the working conditions of the waste pickers. The aim of the plant is to sort the following fractions: valuable plastics, including PET bottles, plastic glasses, and plastic bags; cans and metals; and the fraction of green waste >80 mm for composting.
Picture 7: of a sorting line in Vietnam
Source: Ménart
183. The existing MRF will operate separately from the sorting facility: different location and different purposes/users. The MRF will continue to receive and transfer recyclable waste collected by street waste pickers and hazardous waste brought in by households.
57
184. The sorting plant will include the following components:
(i) Waste reception area. Only the municipal collection vehicles, or suitably approved contractors, will be allowed direct access to the treatment and landfill site. Regular checks will be made to ensure that the site remains secure (checking the condition of the fence, locking the gate outside of working hours). When collection trucks arrive at the site entrance, they are weighed at the weighbridge (located at the entrance of the sorting plant) and inspected: as a minimum, the following will be recorded: (i) truck registration number; (ii) owner or operator of the truck; (iii) waste origin/producer; (iv) waste type; (v) weight of the waste (the difference between the weight of full and empty truck); (vi) acceptance/ non-acceptance of the waste; (vii) the place of disposal of each load. After the discharge of solid waste, the trucks will be guided to the space for cleansing of vehicles with wheel-wash prior to leaving the site.
(ii) Weighbridge. A weighbridge will be built at the entrance of the sorting plant. The weighbridge will have a capacity of at least 30t and typically be 3m x 18m in size. The weighbridge will be linked to the computer in the reception building, with the necessary tracking software for vehicle/waste records. The weighbridge will be equipped with an external weight display and traffic lights. The maximum vehicle size considered is 16m long and 2.6m width.
(iii) Management building. The location of the management building will be close to the reception area. It will house the site management personnel and also provide sanitary facilities for the site operatives (up to 70 persons per shift) plus site visitors (an additional ten persons).
(iv) Entrance gate and fencing. The facilities will have a single entrance via a gate into the reception area at the western end of the site. For security reasons, the entire site will be fenced, ensuring controlled operation of the facilities and preventing intrusion.
3.2.2. Utilities and Services
185. Utilities for the sorting plant, landfill and composting site, including water supply and sewerage, electricity, and fuel, are described in this section, as follows:
(i) Water supply. The connection of the site to the municipal water network will be studied at the detailed design stage; if no connection is possible, then the site will need to be supplied by tankers. For process water demand and sanitary demand (shower and water closet), it may be possible to use collected rainwater in addition to the municipal supply. Alternatively, depending on site conditions and environmental issues, the use of a drilled water well may be an appropriate solution.
(ii) Wastewater. Both sanitary wastewater and greywater will be collected in a septic tank (no sewage network has been identified in proximity to the site). Wastewater from the composting or sorting lines will be drained into the leachate pond.
(iii) Electricity supply. In order to supply the sites with electricity on the site, a sub-station with an installed capacity estimated to 300 kVA shall be constructed . From the sub-station, situated on the edge of the site, the site LV network will distribute the electricity to the buildings, equipment, lighting, etc. Solar panels will be installed on the roofs of the buildings to supply part of the electricity
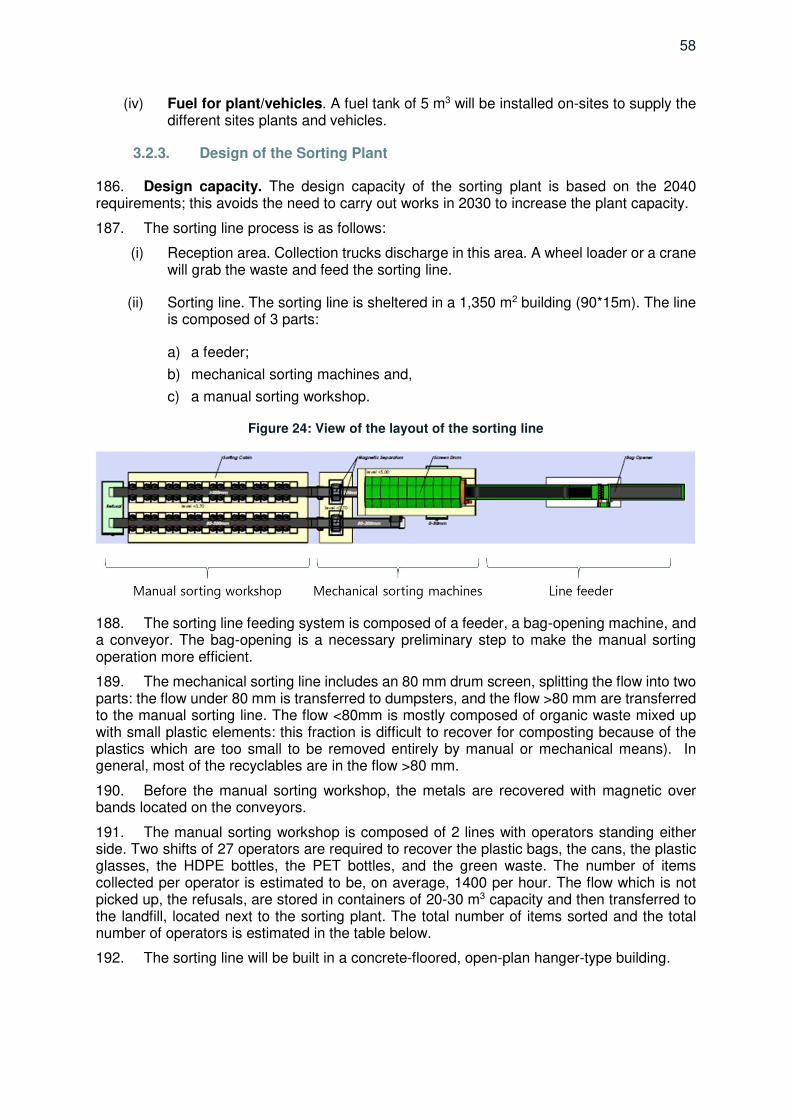
58
(iv) Fuel for plant/vehicles. A fuel tank of 5 m3 will be installed on-sites to supply the different sites plants and vehicles.
3.2.3. Design of the Sorting Plant
186. Design capacity. The design capacity of the sorting plant is based on the 2040 requirements; this avoids the need to carry out works in 2030 to increase the plant capacity.
187. The sorting line process is as follows:
(i) Reception area. Collection trucks discharge in this area. A wheel loader or a crane will grab the waste and feed the sorting line.
(ii) Sorting line. The sorting line is sheltered in a 1,350 m2 building (90*15m). The line is composed of 3 parts:
a) a feeder;
b) mechanical sorting machines and,
c) a manual sorting workshop.
Figure 24: View of the layout of the sorting line
188. The sorting line feeding system is composed of a feeder, a bag-opening machine, and a conveyor. The bag-opening is a necessary preliminary step to make the manual sorting operation more efficient.
189. The mechanical sorting line includes an 80 mm drum screen, splitting the flow into two parts: the flow under 80 mm is transferred to dumpsters, and the flow >80 mm are transferred to the manual sorting line. The flow <80mm is mostly composed of organic waste mixed up with small plastic elements: this fraction is difficult to recover for composting because of the plastics which are too small to be removed entirely by manual or mechanical means). In general, most of the recyclables are in the flow >80 mm.
190. Before the manual sorting workshop, the metals are recovered with magnetic over bands located on the conveyors.
191. The manual sorting workshop is composed of 2 lines with operators standing either side. Two shifts of 27 operators are required to recover the plastic bags, the cans, the plastic glasses, the HDPE bottles, the PET bottles, and the green waste. The number of items collected per operator is estimated to be, on average, 1400 per hour. The flow which is not picked up, the refusals, are stored in containers of 20-30 m3 capacity and then transferred to the landfill, located next to the sorting plant. The total number of items sorted and the total number of operators is estimated in the table below.
192. The sorting line will be built in a concrete-floored, open-plan hanger-type building.
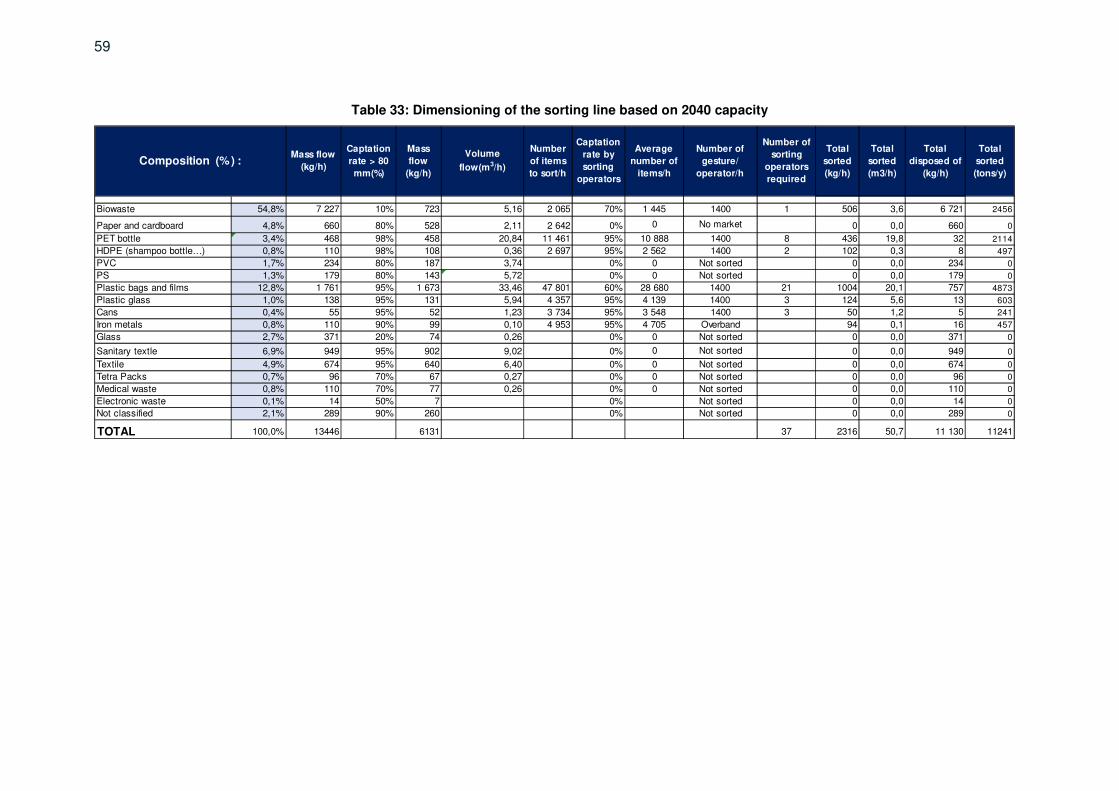
59
Table 33: Dimensioning of the sorting line based on 2040 capacity
Mass flow
(kg/h)
Captation
rate > 80
mm(%)
Mass
flow
(kg/h)
Volume
flow(m3/h)
Number
of items
to sort/h
Captation
rate by
sorting
operators
Average
number of
items/h
Number of
gesture/
operator/h
Number of
sorting
operators
required
Total
sorted
(kg/h)
Total
sorted
(m3/h)
Total
disposed of
(kg/h)
Total
sorted
(tons/y)
Biowaste 54,8% 7 227 10% 723 5,16 2 065 70% 1 445 1400 1 506 3,6 6 721 2456
Paper and cardboard 4,8% 660 80% 528 2,11 2 642 0% 0 No market 0 0,0 660 0
PET bottle 3,4% 468 98% 458 20,84 11 461 95% 10 888 1400 8 436 19,8 32 2114
HDPE (shampoo bottle…) 0,8% 110 98% 108 0,36 2 697 95% 2 562 1400 2 102 0,3 8 497
PVC 1,7% 234 80% 187 3,74 0% 0 Not sorted 0 0,0 234 0
PS 1,3% 179 80% 143 5,72 0% 0 Not sorted 0 0,0 179 0
Plastic bags and films 12,8% 1 761 95% 1 673 33,46 47 801 60% 28 680 1400 21 1004 20,1 757 4873
Plastic glass 1,0% 138 95% 131 5,94 4 357 95% 4 139 1400 3 124 5,6 13 603
Cans 0,4% 55 95% 52 1,23 3 734 95% 3 548 1400 3 50 1,2 5 241
Iron metals 0,8% 110 90% 99 0,10 4 953 95% 4 705 Overband 94 0,1 16 457
Glass 2,7% 371 20% 74 0,26 0% 0 Not sorted 0 0,0 371 0
Sanitary textle 6,9% 949 95% 902 9,02 0% 0 Not sorted 0 0,0 949 0
Textile 4,9% 674 95% 640 6,40 0% 0 Not sorted 0 0,0 674 0
Tetra Packs 0,7% 96 70% 67 0,27 0% 0 Not sorted 0 0,0 96 0
Medical waste 0,8% 110 70% 77 0,26 0% 0 Not sorted 0 0,0 110 0
Electronic waste 0,1% 14 50% 7 0% Not sorted 0 0,0 14 0
Not classified 2,1% 289 90% 260 0% Not sorted 0 0,0 289 0
TOTAL 100,0% 13446 6131 37 2316 50,7 11 130 11241
Composition (%) :
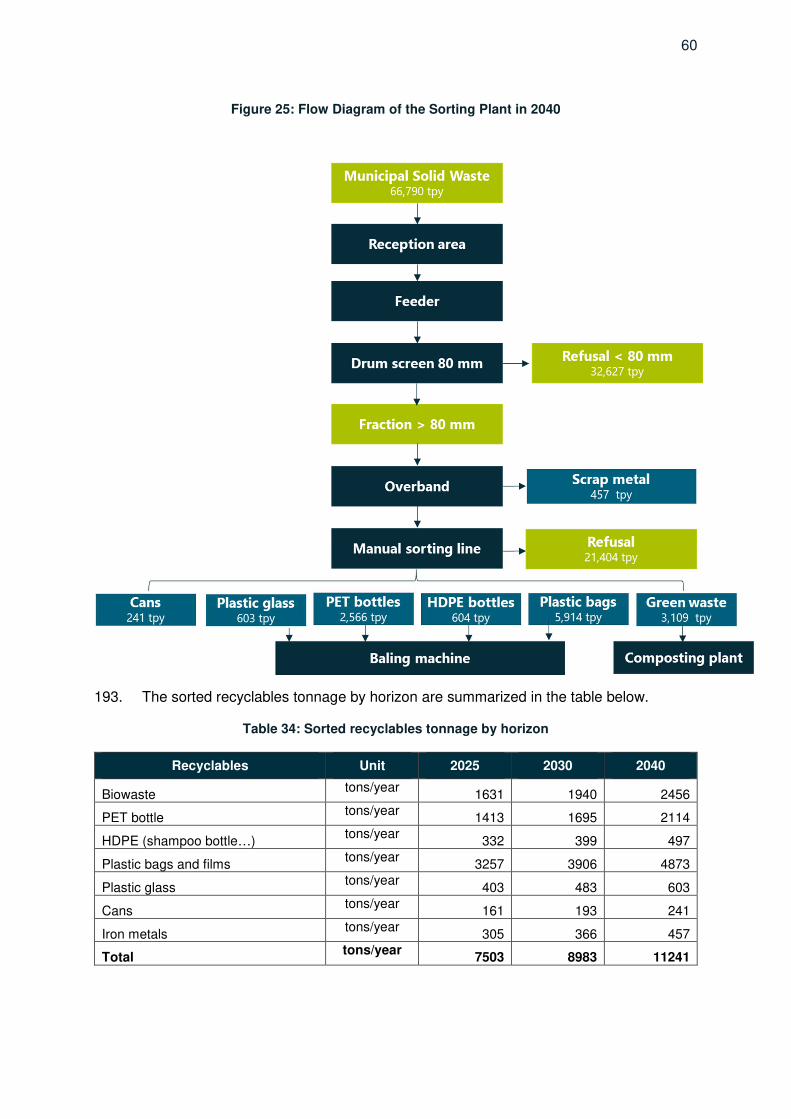
60
Figure 25: Flow Diagram of the Sorting Plant in 2040
193. The sorted recyclables tonnage by horizon are summarized in the table below.
Table 34: Sorted recyclables tonnage by horizon
Recyclables Unit 2025 2030 2040
Biowaste tons/year
1631 1940 2456
PET bottle tons/year
1413 1695 2114
HDPE (shampoo bottle…) tons/year
332 399 497
Plastic bags and films tons/year
3257 3906 4873
Plastic glass tons/year
403 483 603
Cans tons/year
161 193 241
Iron metals tons/year
305 366 457
Total tons/year
7503 8983 11241
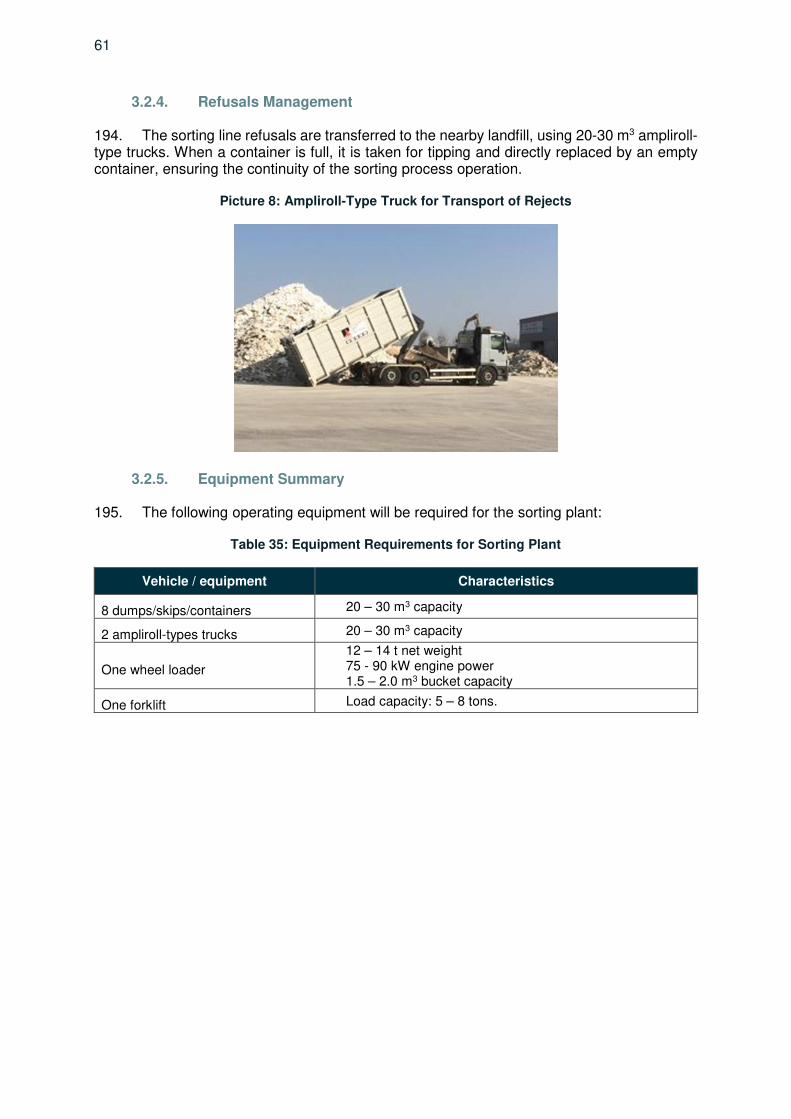
61
3.2.4. Refusals Management
194. The sorting line refusals are transferred to the nearby landfill, using 20-30 m3 ampliroll-type trucks. When a container is full, it is taken for tipping and directly replaced by an empty container, ensuring the continuity of the sorting process operation.
Picture 8: Ampliroll-Type Truck for Transport of Rejects
3.2.5. Equipment Summary
195. The following operating equipment will be required for the sorting plant:
Table 35: Equipment Requirements for Sorting Plant
Vehicle / equipment Characteristics
8 dumps/skips/containers 20 – 30 m3 capacity
2 ampliroll-types trucks 20 – 30 m3 capacity
One wheel loader
12 – 14 t net weight 75 - 90 kW engine power 1.5 – 2.0 m3 bucket capacity
One forklift Load capacity: 5 – 8 tons.
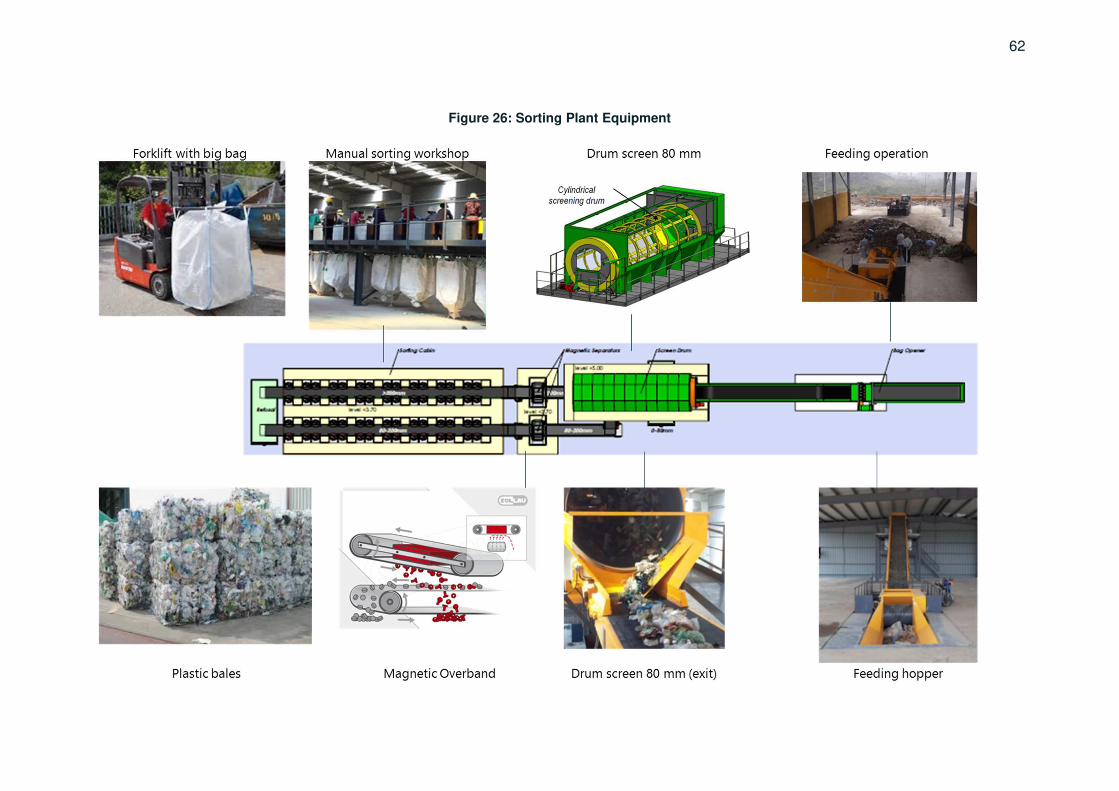
62
Figure 26: Sorting Plant Equipment
63
3.2.6. O&M Requirements
196. Operators. The total number of working days is assumed to be 347 per annum. The plant operates in 2 shifts per day, for a total of 16 hours per day. The operation is organized into two shifts per day. Each shift is 8 hours, including a one hour break. Thus, in total, the sorting line will work 14 hours per day.
197. With 2 maintenance operators, 8 drivers, and 2 managers, it is anticipated that staffing will reach 62 sorting operators in 2025, 72 in 2030, and 86 in 2040.
198. Power requirements. The electrical power required for the sorting line is estimated at 80kW. The electricity consumption would reach 291 MWh per year or 6 kWh per ton of waste treated.
3.3. Composting of Organic Waste
3.3.1. Description
199. Green waste recovered from the sorting line will be transferred to the nearby composting plant where it will be shredded and mixed with the biowaste from the markets. The green waste provides carbon and confers a suitable structure to the mixture, creating porosity in the mixture that will improve the oxygen supply to the composting bacteria. The biowaste from the markets brings both nitrogen and water, enhancing bacterial growth. This mixing process is important in the success of the subsequent composting process.
200. The biowaste is then placed in windrows on the composting platform. Each day of the two months process, the windrows are turned with a windrow turning the machine on a tractor. The tractor can also carry a water tank in order to add water into the windrow when the moisture content is too low. In the rainy season, windrows are covered from rainwater with a plastic cover system in order to reduce leachate production. After two months, the fresh compost is screened before being moved to the maturation area. The screen size is 20 mm. The overflow material is mixed with the fresh waste to improve the structure and starting conditions of the composting process.
201. The compost is ready to use after a final maturation process.
3.3.2. Utilities and Services
202. Utilities for the site, including water supply and sewerage, electricity, and fuel, will be shared with the sorting plant and the landfill.
3.3.3. Design of the Composting Plant
203. The overall design capacity for the composting plant is based on 2040 requirements in order to plan for the total surface area required in the long term. However, it is proposed to build the composting plant in two phases: a first phase, based on the 2030 capacity, and then further extension in 2040.
204. The following parameters will be considered for the composting plant design:
(i) Collection trucks discharge their waste at the dedicated zone of the composting plant.
(ii) The green waste is shredded into 30 mm particles.
(iii) The typical size of windrows is 50m length, 4m width, and 3m spacing between the windows.
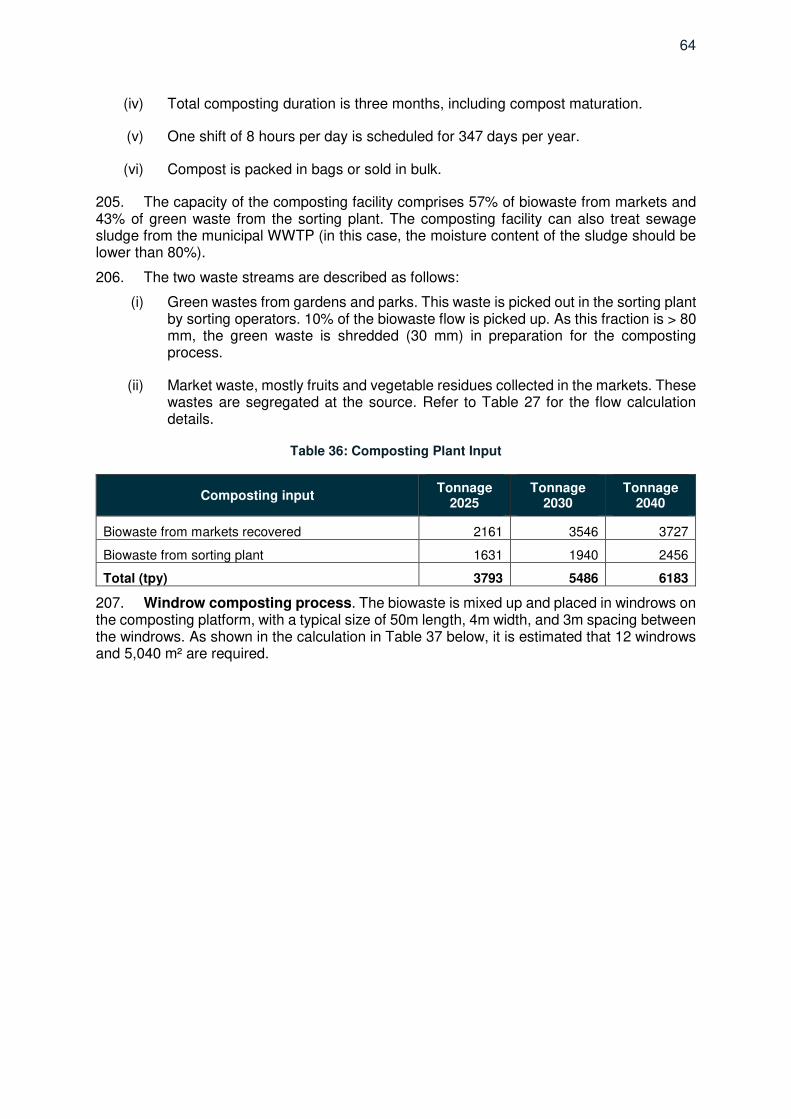
64
(iv) Total composting duration is three months, including compost maturation.
(v) One shift of 8 hours per day is scheduled for 347 days per year.
(vi) Compost is packed in bags or sold in bulk.
205. The capacity of the composting facility comprises 57% of biowaste from markets and 43% of green waste from the sorting plant. The composting facility can also treat sewage sludge from the municipal WWTP (in this case, the moisture content of the sludge should be lower than 80%).
206. The two waste streams are described as follows:
(i) Green wastes from gardens and parks. This waste is picked out in the sorting plant by sorting operators. 10% of the biowaste flow is picked up. As this fraction is > 80 mm, the green waste is shredded (30 mm) in preparation for the composting process.
(ii) Market waste, mostly fruits and vegetable residues collected in the markets. These wastes are segregated at the source. Refer to Table 27 for the flow calculation details.
Table 36: Composting Plant Input
Composting input Tonnage
2025 Tonnage
2030 Tonnage
2040
Biowaste from markets recovered 2161 3546 3727
Biowaste from sorting plant 1631 1940 2456
Total (tpy) 3793 5486 6183
207. Windrow composting process. The biowaste is mixed up and placed in windrows on the composting platform, with a typical size of 50m length, 4m width, and 3m spacing between the windrows. As shown in the calculation in Table 37 below, it is estimated that 12 windrows and 5,040 m² are required.
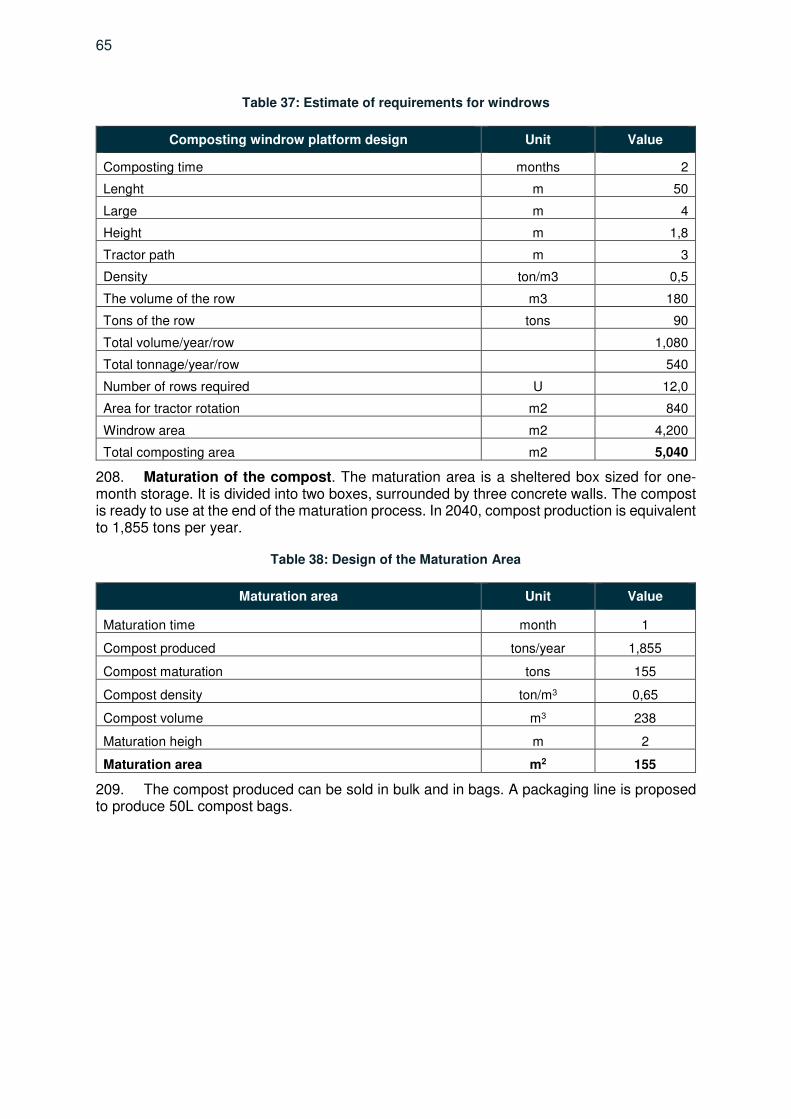
65
Table 37: Estimate of requirements for windrows
Composting windrow platform design Unit Value
Composting time months 2
Lenght m 50
Large m 4
Height m 1,8
Tractor path m 3
Density ton/m3 0,5
The volume of the row m3 180
Tons of the row tons 90
Total volume/year/row 1,080
Total tonnage/year/row 540
Number of rows required U 12,0
Area for tractor rotation m2 840
Windrow area m2 4,200
Total composting area m2 5,040
208. Maturation of the compost. The maturation area is a sheltered box sized for one-month storage. It is divided into two boxes, surrounded by three concrete walls. The compost is ready to use at the end of the maturation process. In 2040, compost production is equivalent to 1,855 tons per year.
Table 38: Design of the Maturation Area
Maturation area Unit Value
Maturation time month 1
Compost produced tons/year 1,855
Compost maturation tons 155
Compost density ton/m3 0,65
Compost volume m3 238
Maturation heigh m 2
Maturation area m2 155
209. The compost produced can be sold in bulk and in bags. A packaging line is proposed to produce 50L compost bags.
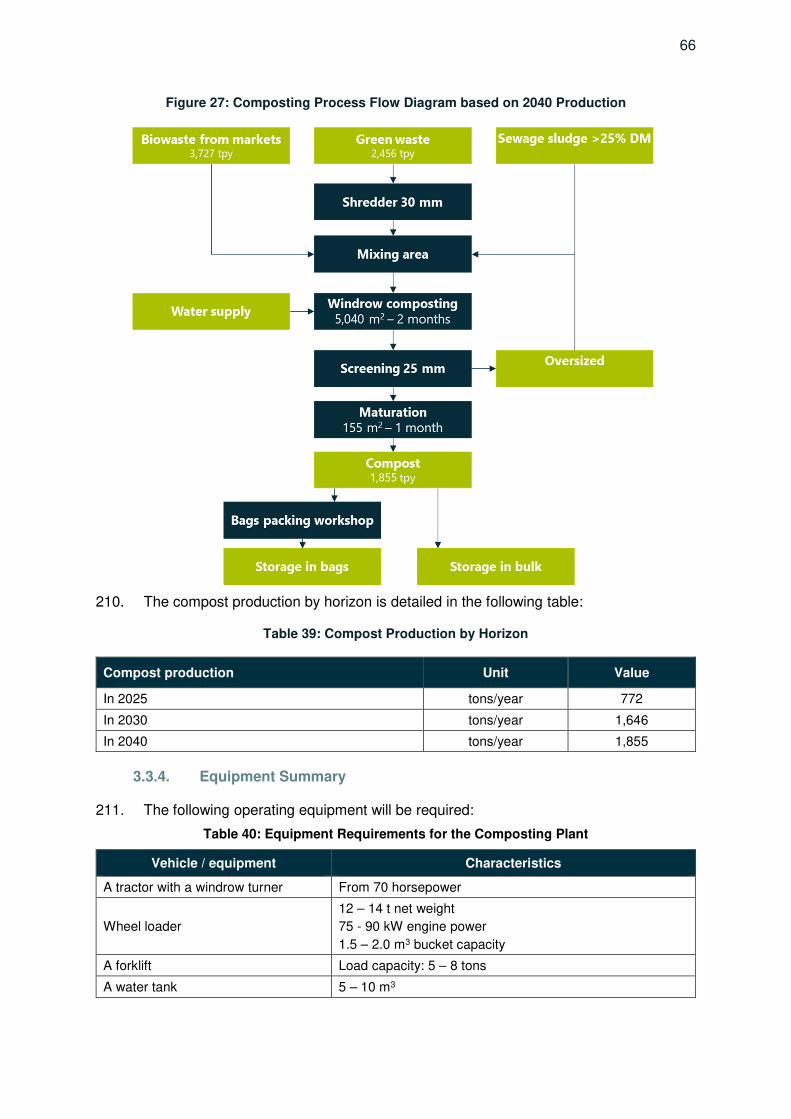
66
Figure 27: Composting Process Flow Diagram based on 2040 Production
210. The compost production by horizon is detailed in the following table:
Table 39: Compost Production by Horizon
Compost production Unit Value
In 2025 tons/year 772
In 2030 tons/year 1,646
In 2040 tons/year 1,855
3.3.4. Equipment Summary
211. The following operating equipment will be required:
Table 40: Equipment Requirements for the Composting Plant
Vehicle / equipment Characteristics
A tractor with a windrow turner From 70 horsepower
Wheel loader
12 – 14 t net weight
75 - 90 kW engine power
1.5 – 2.0 m3 bucket capacity
A forklift Load capacity: 5 – 8 tons
A water tank 5 – 10 m3
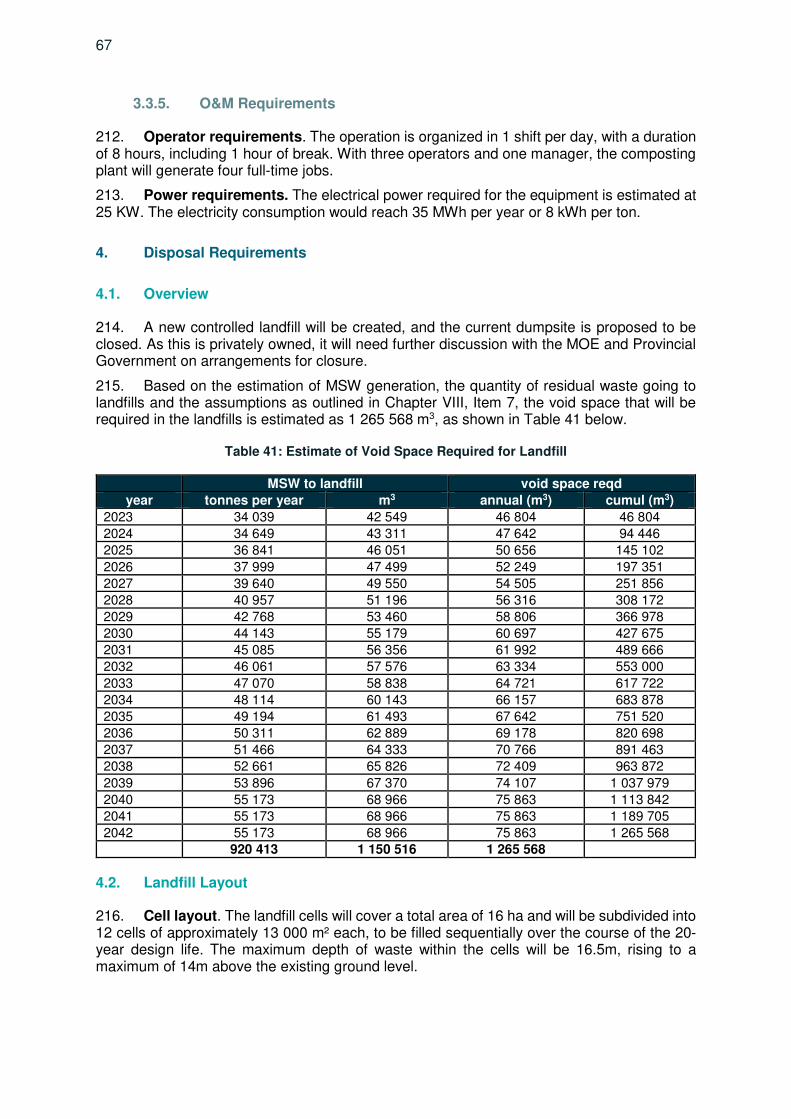
67
3.3.5. O&M Requirements
212. Operator requirements. The operation is organized in 1 shift per day, with a duration of 8 hours, including 1 hour of break. With three operators and one manager, the composting plant will generate four full-time jobs.
213. Power requirements. The electrical power required for the equipment is estimated at 25 KW. The electricity consumption would reach 35 MWh per year or 8 kWh per ton.
4. Disposal Requirements
4.1. Overview
214. A new controlled landfill will be created, and the current dumpsite is proposed to be closed. As this is privately owned, it will need further discussion with the MOE and Provincial Government on arrangements for closure.
215. Based on the estimation of MSW generation, the quantity of residual waste going to landfills and the assumptions as outlined in Chapter VIII, Item 7, the void space that will be required in the landfills is estimated as 1 265 568 m3, as shown in Table 41 below.
Table 41: Estimate of Void Space Required for Landfill
MSW to landfill void space reqd
year tonnes per year m3 annual (m3) cumul (m3)
2023 34 039 42 549 46 804 46 804
2024 34 649 43 311 47 642 94 446
2025 36 841 46 051 50 656 145 102
2026 37 999 47 499 52 249 197 351
2027 39 640 49 550 54 505 251 856
2028 40 957 51 196 56 316 308 172
2029 42 768 53 460 58 806 366 978
2030 44 143 55 179 60 697 427 675
2031 45 085 56 356 61 992 489 666
2032 46 061 57 576 63 334 553 000
2033 47 070 58 838 64 721 617 722
2034 48 114 60 143 66 157 683 878
2035 49 194 61 493 67 642 751 520
2036 50 311 62 889 69 178 820 698
2037 51 466 64 333 70 766 891 463
2038 52 661 65 826 72 409 963 872
2039 53 896 67 370 74 107 1 037 979
2040 55 173 68 966 75 863 1 113 842
2041 55 173 68 966 75 863 1 189 705
2042 55 173 68 966 75 863 1 265 568
920 413 1 150 516 1 265 568
4.2. Landfill Layout
216. Cell layout. The landfill cells will cover a total area of 16 ha and will be subdivided into 12 cells of approximately 13 000 m² each, to be filled sequentially over the course of the 20-year design life. The maximum depth of waste within the cells will be 16.5m, rising to a maximum of 14m above the existing ground level.
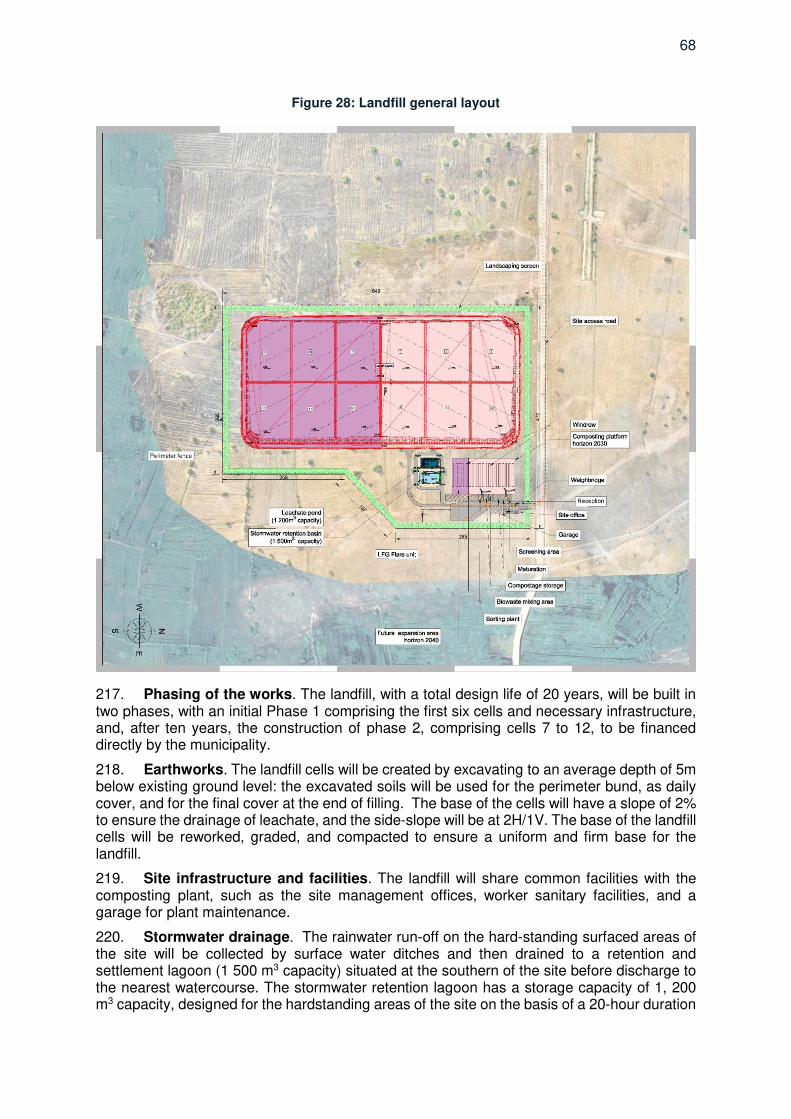
68
Figure 28: Landfill general layout
217. Phasing of the works. The landfill, with a total design life of 20 years, will be built in two phases, with an initial Phase 1 comprising the first six cells and necessary infrastructure, and, after ten years, the construction of phase 2, comprising cells 7 to 12, to be financed directly by the municipality.
218. Earthworks. The landfill cells will be created by excavating to an average depth of 5m below existing ground level: the excavated soils will be used for the perimeter bund, as daily cover, and for the final cover at the end of filling. The base of the cells will have a slope of 2% to ensure the drainage of leachate, and the side-slope will be at 2H/1V. The base of the landfill cells will be reworked, graded, and compacted to ensure a uniform and firm base for the landfill.
219. Site infrastructure and facilities. The landfill will share common facilities with the composting plant, such as the site management offices, worker sanitary facilities, and a garage for plant maintenance.
220. Stormwater drainage. The rainwater run-off on the hard-standing surfaced areas of the site will be collected by surface water ditches and then drained to a retention and settlement lagoon (1 500 m3 capacity) situated at the southern of the site before discharge to the nearest watercourse. The stormwater retention lagoon has a storage capacity of 1, 200 m3 capacity, designed for the hardstanding areas of the site on the basis of a 20-hour duration
69
for a 10-year rainfall event. The storm-water settlement lagoon will also serve as a reserve of water for fire-fighting purposes.
221. Soil stockpile. The excess soil from the excavation of the landfill cells not used for the perimeter bunds will be stockpiled on-site and then reused during the site operation for the daily/intermediate cover and then for the final cover layer.
222. Basal liner. The landfill cells will have a low permeability liner with a permeability of less than 1x10⁻⁹ m/s, comprising a geomembrane liner of 2mm thick high-density polyethylene (HDPE) fusion-welded geomembrane. The HDPE geomembrane is generally protected by a non-woven geotextile fabric.
223. Leachate drainage. The basal liner (HDPE geomembrane) will be overlain by a leachate drainage layer consisting of 0,5m of soils of permeability greater than or equal to 104 m/s (e.g., clean well-graded sands or gravels).
224. Leachate treatment. The leachate will be drained by gravity towards the collection well at the low point and then, still by gravity, to the leachate storage lagoon (1,200m3 capacity). – 600m3 for the run-off from the composting platform (20-hour duration for 10-year rainfall event) and 600m3 for leachate. It is proposed to use a combination of leachate recirculation and off-site treatment at WWTP. The majority of the leachate will be recirculated back into the landfill mass, with the excess being tankered off-site for treatment at the WWTP. The recirculation uses a pump in the leachate pond, with pressure lines leading from the leachate pond up to the landfill surface, where the leachate enters the waste mass via infiltration drains or wells
4.3. Landfill Gas Management
225. Landfill gas (LFG) drainage & treatment. The drainage of LFG is assured by vertical wells installed during the landfilling operations at a density of 2 – 3 wells per cell. The technical requirements of the LFG drainage wells are as follows:
(i) The LFG wells comprise a 110mm diameter HDPE pipe, slotted for the entire length of the well except for the top 2m.
(ii) Each LFG well is fitted with a well-head, comprising a 110mm diameter HDPE pipe fitted with a T-piece: the vertical section is closed with a flange and bolted plate fitted with a sampling port, and the horizontal section is fitted with flange for connection of the collector pipe, a butterfly valve and a sampling ports before and after the valve.
(iii) The LFG wells are connected by a 110mm HDPE pipe to the main collector pipe (250mm diameter), which then transports the LFG to the treatment facility.
(iv) The LFG wells are vented by a blower, applying negative pressure to the waste mass and extracting the LFG, which is then combusted in a flare stack. Such a system can work full-time or intermittently, depending upon the rate of production of LFG, but does require an LFG that is sufficiently rich in methane.
4.4. Final Cover System
226. Structure of the final cover. A final cover layer will be placed progressively over the waste mass during the course of the landfilling. Before the installation of the final cover layer, the surface of the waste mass may need to be remodelled to provide a uniform final site profile to ensure adequate surface run-off and allow for a long-term settlement of the waste. The final cover will comprise at least 0.5m of fine-graded soil, preferably silt or clay. The profile of the final cover system will have a slope of 4 to 6 % to ensure adequate surface run-off and allow
70
for long-term settlement. The final cover will be grassed to ensure the integration of the closed site with its surroundings.
4.5. Utilities and Services
227. Electrical power requirements. The energy requirements for the landfill facilities are listed in Table 42 below:
Table 42: Power Requirements for the Landfill Site
facility Power requirement
(kW)
Operating periods
Annual power consumption
(kWh)
Annual power consumption
(kWh/t)
Recirculation pump 8 2hrs/day 5 840 0.13
Flare stack 10 8hrs/day 29 200 0.63
Total 18 kW 35 040 0.76 *: t of MSW entering landfill (2030)
228. Fire-fighting. The operations of landfill feature a number of fire risks associated with the waste and the presence of LFG. The fire-fighting measures will include the provision of a supply of fire-fighting water in the surface run-off lagoon and of the provision of a stock of soil that can be used to suppress a fire within the waste mass.
229. PV Plant. A study on photovoltaic solar energy has been carried out (Volume 9 - Materials Selection and Rate Analysis). Solar power through the use of photovoltaic modules could be used to complement the power requirements of the landfill management building and leachate disposal. The photovoltaic modules will be placed on a metallic structure near the buildings of the new landfill. The solar power is a 130 kWp system with a capacity to produce a total of 118,420 kWh annually. Due to the shift between solar radiation hours and energy need, only 69% of the power needs of the landfill non-process equipment (i.e., 60,000 kWh annually) and 77% of leachate disposal (i.e., 26,980kWh annually) will be met by local solar production with the rest to be purchased from the electric grid, producing an estimated saving of 7,828 kg CO2 28. At this stage, the surplus photovoltaic electricity is not considered to be resold to Electricité Du Cambodge (EDC). However, further negotiations with EDC could provide a new source of revenue for the operator and reduce the burden of electricity consumption.
4.6. O&M Requirements
230. Waste filling method and phasing. The landfilling of the waste will be done sequentially, cell-by-cell, and in a series of vertical lifts. The aim is to limit the extent of the working landfill face to reduce windblown waste and reduce the vertical infiltration of rainwater into the waste (producing leachate). The waste will be covered periodically with an intermediate or daily cover of soil taken from the on-site stockpile. As filling progresses and the final waste height is reached, then the final cover layer will be placed, comprising a 0.5m layer of soil, pushed and compacted by a bulldozer. The soil for the cover layer will either be taken from the stock of excess soil from the construction of the landfill.
28 Based on Energy CO2 emissions of 0.09 Kg CO2 per kWh (In 2014). From Ritchie and Roser (2017) - "CO₂ and Greenhouse Gas Emissions". Published online at OurWorldInData.org. Retrieved from: 'https://ourworldindata.org/co2-and-other-greenhouse-gas-emissions' [Online Resource]
71
231. Operating plant and equipment. The following operating plant will be required:
Table 43: Plant/vehicles requirements for landfill
Vehicle / plant characteristics
Landfill waste compactor Purpose-built landfill compactor with compaction pads and blade
23 – 28 t net weight
170 – 200 kW net power
Pressurized cab
Track-loader 13 – 18 t net weight
100 - 130 kW net power
Excavation, trimming & ditch buckets
Dumper truck 12 – 16 m3 capacity
Excavator 12 – 14 t net weight
75 - 90 kW engine power
1.5 – 2.0 m3 bucket capacity
Pick-up truck 4 x 4
150hp
232. Management of storm-water run-off. The cells that are yet to be filled will be kept hydraulically separate from the operating cells to avoid mixing clean rainwater with leachate. Any clean rainwater that accumulates in the unused cells can be pumped out by a portable pump towards the surface run-off ditches. The storm-water run-off from the on-site road and hardstanding areas will be collected in the run-off ditches and then to the settlement lagoon before discharge to the watercourse.
233. Groundwater monitoring. The landfill will be provided with three groundwater monitoring wells, one up-gradient, and two downgradient of the site. It is recommended that sampling of the groundwater wells is done on a six-monthly basis. The samples should be tested for the following parameters: dissolved oxygen (DO), biochemical oxygen demand (BOD5), chemical oxygen demand (COD), heavy metals, ammonium, nitrite, nitrate, chloride, sulfates, electrical conductivity, suspended solids (SS).
5. Permits
234. According to the law on construction29, construction permits are issued by the Ministry of Land Management, Urban Planning and Construction. The application must be completed before construction begins and takes 3-6 months to process.
235. The law and the sub-decree do not clearly specify whether public projects require a construction permit. In practice, public projects (e.g., WWTP) do not request construction permits before implementation. It has been assumed that the preparation and approval of EIA or IEIA studies by the Ministry of Environment are sufficient for the construction works to commence. Confirmation from the relevant line ministries would be required to ensure no non-compliances with national regulations.
29 Law on Construction, Royal Kram No NS/RKM/1119/019 dated 02 November 2019 and Sub-decree 224 Sub-decree On Construction permit dated 02 December 2020
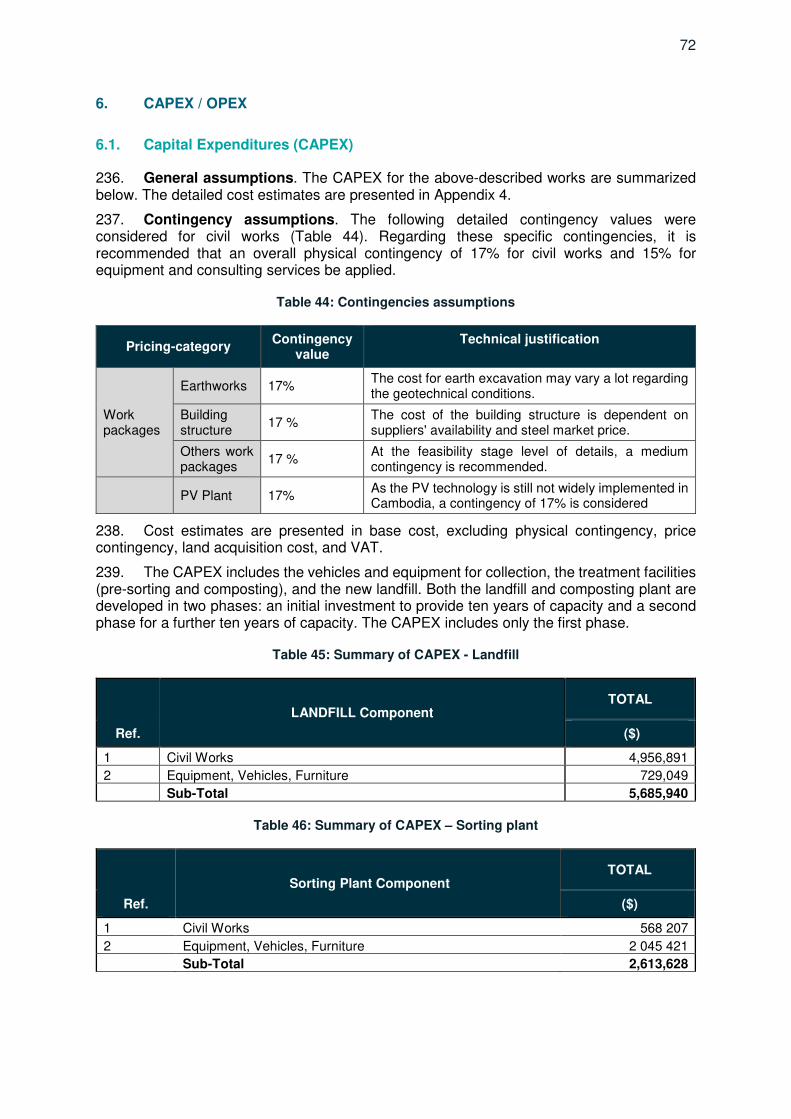
72
6. CAPEX / OPEX
6.1. Capital Expenditures (CAPEX)
236. General assumptions. The CAPEX for the above-described works are summarized below. The detailed cost estimates are presented in Appendix 4.
237. Contingency assumptions. The following detailed contingency values were considered for civil works (Table 44). Regarding these specific contingencies, it is recommended that an overall physical contingency of 17% for civil works and 15% for equipment and consulting services be applied.
Table 44: Contingencies assumptions
Pricing-category Contingency
value Technical justification
Work packages
Earthworks 17% The cost for earth excavation may vary a lot regarding the geotechnical conditions.
Building structure
17 % The cost of the building structure is dependent on suppliers' availability and steel market price.
Others work packages
17 % At the feasibility stage level of details, a medium contingency is recommended.
PV Plant 17% As the PV technology is still not widely implemented in Cambodia, a contingency of 17% is considered
238. Cost estimates are presented in base cost, excluding physical contingency, price contingency, land acquisition cost, and VAT.
239. The CAPEX includes the vehicles and equipment for collection, the treatment facilities (pre-sorting and composting), and the new landfill. Both the landfill and composting plant are developed in two phases: an initial investment to provide ten years of capacity and a second phase for a further ten years of capacity. The CAPEX includes only the first phase.
Table 45: Summary of CAPEX - Landfill
Ref.
LANDFILL Component TOTAL
($)
1 Civil Works 4,956,891
2 Equipment, Vehicles, Furniture 729,049
Sub-Total 5,685,940
Table 46: Summary of CAPEX – Sorting plant
Ref.
Sorting Plant Component TOTAL
($)
1 Civil Works 568 207
2 Equipment, Vehicles, Furniture 2 045 421
Sub-Total 2,613,628
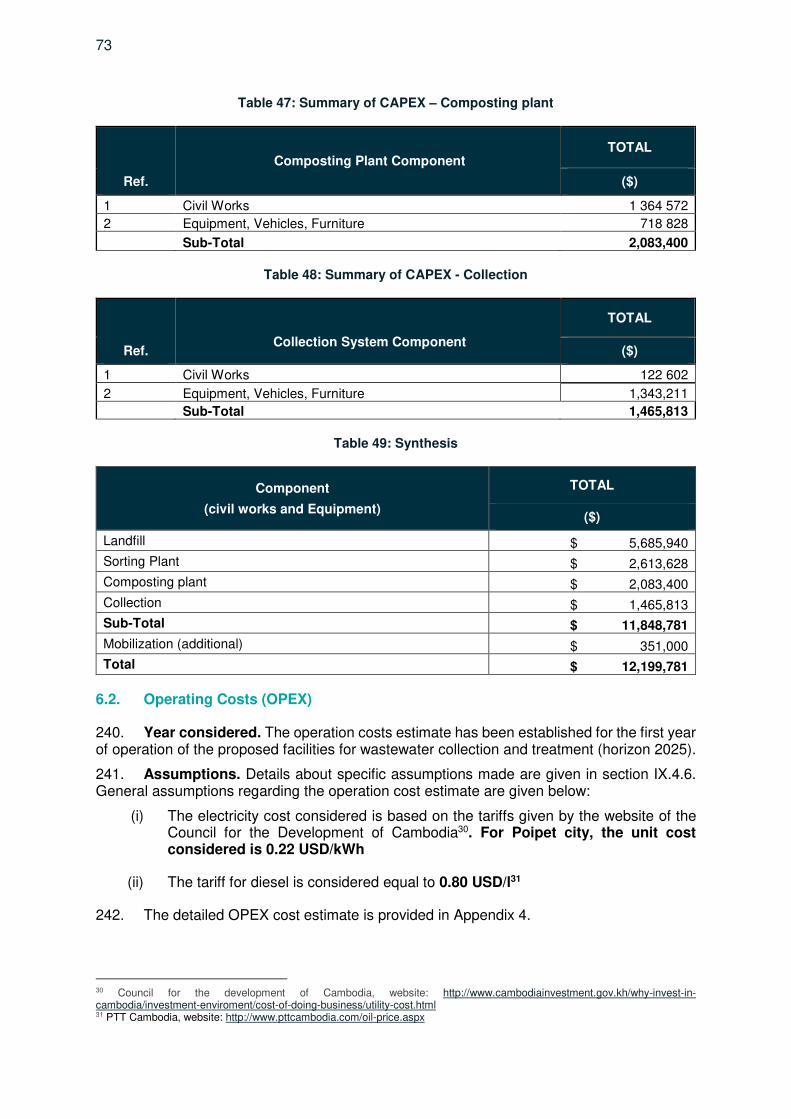
73
Table 47: Summary of CAPEX – Composting plant
Ref.
Composting Plant Component TOTAL
($)
1 Civil Works 1 364 572
2 Equipment, Vehicles, Furniture 718 828
Sub-Total 2,083,400
Table 48: Summary of CAPEX - Collection
Ref.
Collection System Component
TOTAL
($)
1 Civil Works 122 602
2 Equipment, Vehicles, Furniture 1,343,211
Sub-Total 1,465,813
Table 49: Synthesis
Component
(civil works and Equipment)
TOTAL
($)
Landfill $ 5,685,940
Sorting Plant $ 2,613,628
Composting plant $ 2,083,400
Collection $ 1,465,813
Sub-Total $ 11,848,781
Mobilization (additional) $ 351,000
Total $ 12,199,781
6.2. Operating Costs (OPEX)
240. Year considered. The operation costs estimate has been established for the first year of operation of the proposed facilities for wastewater collection and treatment (horizon 2025).
241. Assumptions. Details about specific assumptions made are given in section IX.4.6. General assumptions regarding the operation cost estimate are given below:
(i) The electricity cost considered is based on the tariffs given by the website of the Council for the Development of Cambodia30. For Poipet city, the unit cost considered is 0.22 USD/kWh
(ii) The tariff for diesel is considered equal to 0.80 USD/l31
242. The detailed OPEX cost estimate is provided in Appendix 4.
30 Council for the development of Cambodia, website: http://www.cambodiainvestment.gov.kh/why-invest-in-cambodia/investment-enviroment/cost-of-doing-business/utility-cost.html 31 PTT Cambodia, website: http://www.pttcambodia.com/oil-price.aspx
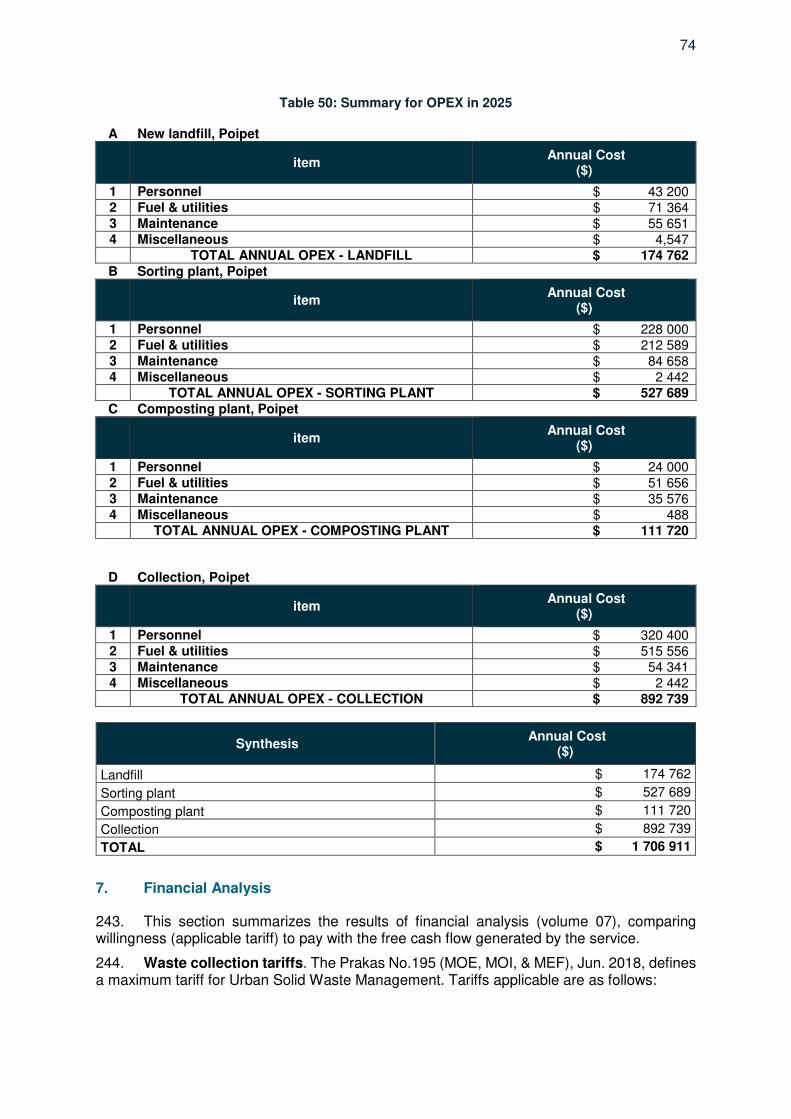
74
Table 50: Summary for OPEX in 2025
A New landfill, Poipet
item Annual Cost
($)
1 Personnel $ 43 200 2 Fuel & utilities $ 71 364 3 Maintenance $ 55 651 4 Miscellaneous $ 4,547 TOTAL ANNUAL OPEX - LANDFILL $ 174 762 B Sorting plant, Poipet
item Annual Cost
($)
1 Personnel $ 228 000 2 Fuel & utilities $ 212 589 3 Maintenance $ 84 658 4 Miscellaneous $ 2 442 TOTAL ANNUAL OPEX - SORTING PLANT $ 527 689 C Composting plant, Poipet
item Annual Cost
($)
1 Personnel $ 24 000 2 Fuel & utilities $ 51 656 3 Maintenance $ 35 576 4 Miscellaneous $ 488 TOTAL ANNUAL OPEX - COMPOSTING PLANT $ 111 720
D Collection, Poipet
item Annual Cost
($)
1 Personnel $ 320 400 2 Fuel & utilities $ 515 556 3 Maintenance $ 54 341 4 Miscellaneous $ 2 442 TOTAL ANNUAL OPEX - COLLECTION $ 892 739
Synthesis Annual Cost
($)
Landfill $ 174 762
Sorting plant $ 527 689
Composting plant $ 111 720
Collection $ 892 739
TOTAL $ 1 706 911
7. Financial Analysis
243. This section summarizes the results of financial analysis (volume 07), comparing willingness (applicable tariff) to pay with the free cash flow generated by the service.
244. Waste collection tariffs. The Prakas No.195 (MOE, MOI, & MEF), Jun. 2018, defines a maximum tariff for Urban Solid Waste Management. Tariffs applicable are as follows:
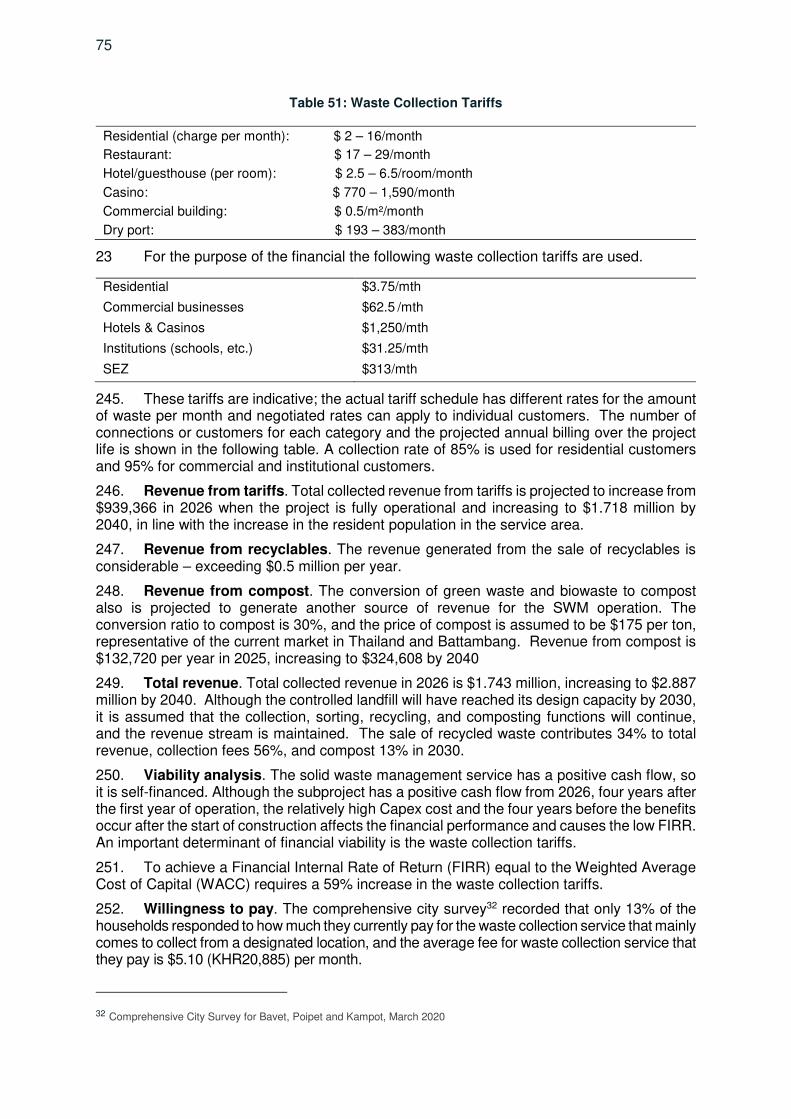
75
Table 51: Waste Collection Tariffs
Residential (charge per month): $ 2 – 16/month
Restaurant: $ 17 – 29/month
Hotel/guesthouse (per room): $ 2.5 – 6.5/room/month
Casino: $ 770 – 1,590/month
Commercial building: $ 0.5/m²/month
Dry port: $ 193 – 383/month
23 For the purpose of the financial the following waste collection tariffs are used.
Residential $3.75/mth
Commercial businesses $62.5 /mth
Hotels & Casinos $1,250/mth
Institutions (schools, etc.) $31.25/mth
SEZ $313/mth
245. These tariffs are indicative; the actual tariff schedule has different rates for the amount of waste per month and negotiated rates can apply to individual customers. The number of connections or customers for each category and the projected annual billing over the project life is shown in the following table. A collection rate of 85% is used for residential customers and 95% for commercial and institutional customers.
246. Revenue from tariffs. Total collected revenue from tariffs is projected to increase from $939,366 in 2026 when the project is fully operational and increasing to $1.718 million by 2040, in line with the increase in the resident population in the service area.
247. Revenue from recyclables. The revenue generated from the sale of recyclables is considerable – exceeding $0.5 million per year.
248. Revenue from compost. The conversion of green waste and biowaste to compost also is projected to generate another source of revenue for the SWM operation. The conversion ratio to compost is 30%, and the price of compost is assumed to be $175 per ton, representative of the current market in Thailand and Battambang. Revenue from compost is $132,720 per year in 2025, increasing to $324,608 by 2040
249. Total revenue. Total collected revenue in 2026 is $1.743 million, increasing to $2.887 million by 2040. Although the controlled landfill will have reached its design capacity by 2030, it is assumed that the collection, sorting, recycling, and composting functions will continue, and the revenue stream is maintained. The sale of recycled waste contributes 34% to total revenue, collection fees 56%, and compost 13% in 2030.
250. Viability analysis. The solid waste management service has a positive cash flow, so it is self-financed. Although the subproject has a positive cash flow from 2026, four years after the first year of operation, the relatively high Capex cost and the four years before the benefits occur after the start of construction affects the financial performance and causes the low FIRR. An important determinant of financial viability is the waste collection tariffs.
251. To achieve a Financial Internal Rate of Return (FIRR) equal to the Weighted Average Cost of Capital (WACC) requires a 59% increase in the waste collection tariffs.
252. Willingness to pay. The comprehensive city survey32 recorded that only 13% of the households responded to how much they currently pay for the waste collection service that mainly comes to collect from a designated location, and the average fee for waste collection service that they pay is $5.10 (KHR20,885) per month.
32 Comprehensive City Survey for Bavet, Poipet and Kampot, March 2020

76
253. In response to a question on how much the household would be willing to pay for a monthly collection service fee if new or improved solid waste service is created, the response from the 64% of the surveyed households that responded indicated that on average they are willing to pay $3.20 with a median of $2.40.
254. Ability to pay. At a residential tariff of $3.75 per month, the average monthly cost for solid waste management represents less 0.7% of the average monthly household income. Therefore, it can be concluded that the tariff is affordable.
8. Safeguards Considerations
8.1. Environment
255. An environmental assessment was carried out which assessed the following key risks and impacts:
(i) Positive impact. By creating a new landfill and closing the current dumpsite, groundwater pollution will be reduced, as the leachate management within the new landfill will prevent any leak into the groundwater whereas the current dumpsite is not equipped to treat leachate. The new solid waste management will minimize the population practice of waste burning and waste disposal into water bodies and other natural habitats. This will help reducing air, water, and soil pollution, with a big improvement in the biological and chemical quality of local water bodies.
(ii) Impacts on land. As long as new facilities will be built, they will have an impact on land availability. The Initial Environmental Examination suggests the implementation of several mitigation measures to protect the environment and especially protect endangered species during vegetation removal operations.
(iii) Pollution risk. All the construction works must pay attention to potential water contamination due to their activities. In addition to the water pollution risk, soil pollution risk shall be considered too.
(iv) UXO. Construction sites may be concerned by unexploded ordnance (UXO), which can be uncovered by earthworks. Sites for earthworks that are suspected of having UXO should be surveyed by the Government before construction.
(v) Noise emission. The operation of construction vehicles might induce noise emissions disturbing the surrounding households. Noise impacts will be mainly restricted to the construction phase and will not have any consequences on population health as the landfill and composting plant will be located in an agriculture area.
(vi) Excavation and backfill work. Excavation and backfill may have a high impact on the surrounding environment of the surrounding sites. Several mitigation measures are proposed to mitigate these impacts. These measures consist of using appropriate storage areas for excavated materials, no creation of new excavation sites, and avoidance of soil contamination.
256. Further detailed findings of the environmental assessment, including the environmental management plan (EMP) is documented in Volume 12.
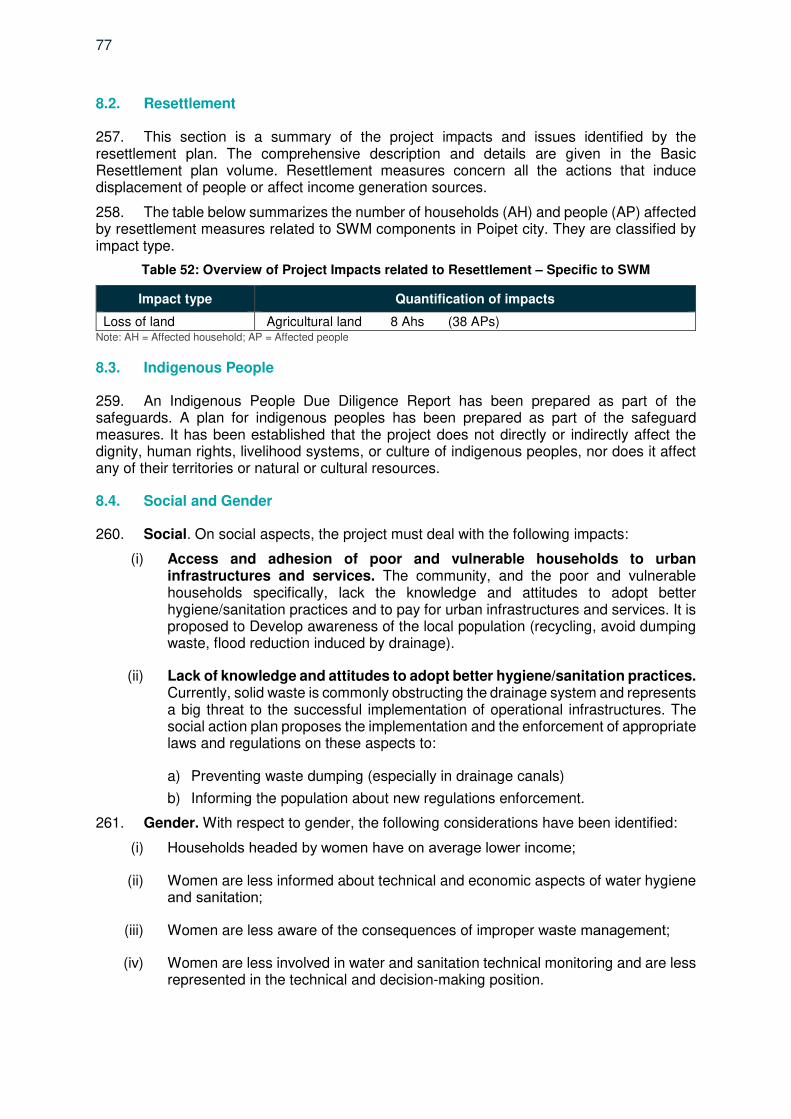
77
8.2. Resettlement
257. This section is a summary of the project impacts and issues identified by the resettlement plan. The comprehensive description and details are given in the Basic Resettlement plan volume. Resettlement measures concern all the actions that induce displacement of people or affect income generation sources.
258. The table below summarizes the number of households (AH) and people (AP) affected by resettlement measures related to SWM components in Poipet city. They are classified by impact type.
Table 52: Overview of Project Impacts related to Resettlement – Specific to SWM
Impact type Quantification of impacts
Loss of land Agricultural land 8 Ahs (38 APs)
Note: AH = Affected household; AP = Affected people
8.3. Indigenous People
259. An Indigenous People Due Diligence Report has been prepared as part of the safeguards. A plan for indigenous peoples has been prepared as part of the safeguard measures. It has been established that the project does not directly or indirectly affect the dignity, human rights, livelihood systems, or culture of indigenous peoples, nor does it affect any of their territories or natural or cultural resources.
8.4. Social and Gender
260. Social. On social aspects, the project must deal with the following impacts:
(i) Access and adhesion of poor and vulnerable households to urban infrastructures and services. The community, and the poor and vulnerable households specifically, lack the knowledge and attitudes to adopt better hygiene/sanitation practices and to pay for urban infrastructures and services. It is proposed to Develop awareness of the local population (recycling, avoid dumping waste, flood reduction induced by drainage).
(ii) Lack of knowledge and attitudes to adopt better hygiene/sanitation practices. Currently, solid waste is commonly obstructing the drainage system and represents a big threat to the successful implementation of operational infrastructures. The social action plan proposes the implementation and the enforcement of appropriate laws and regulations on these aspects to:
a) Preventing waste dumping (especially in drainage canals)
b) Informing the population about new regulations enforcement.
261. Gender. With respect to gender, the following considerations have been identified:
(i) Households headed by women have on average lower income;
(ii) Women are less informed about technical and economic aspects of water hygiene and sanitation;
(iii) Women are less aware of the consequences of improper waste management;
(iv) Women are less involved in water and sanitation technical monitoring and are less represented in the technical and decision-making position.
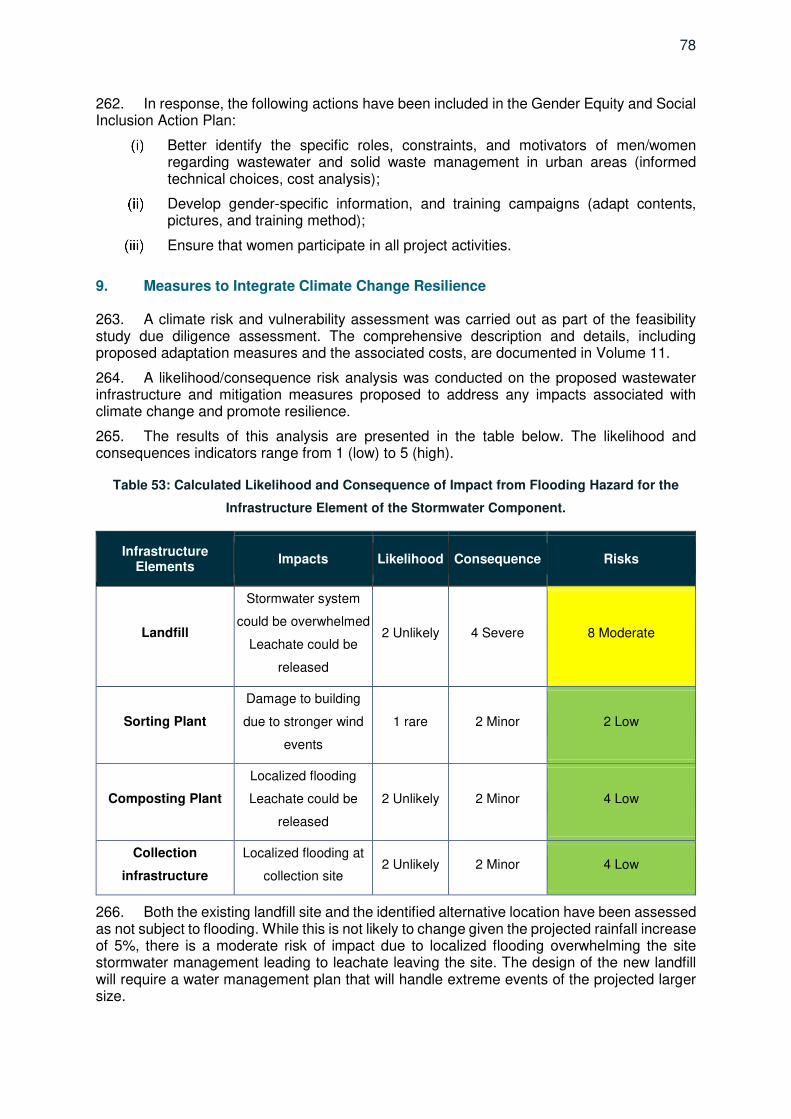
78
262. In response, the following actions have been included in the Gender Equity and Social Inclusion Action Plan:
Better identify the specific roles, constraints, and motivators of men/women regarding wastewater and solid waste management in urban areas (informed technical choices, cost analysis);
Develop gender-specific information, and training campaigns (adapt contents, pictures, and training method);
Ensure that women participate in all project activities.
9. Measures to Integrate Climate Change Resilience
263. A climate risk and vulnerability assessment was carried out as part of the feasibility study due diligence assessment. The comprehensive description and details, including proposed adaptation measures and the associated costs, are documented in Volume 11.
264. A likelihood/consequence risk analysis was conducted on the proposed wastewater infrastructure and mitigation measures proposed to address any impacts associated with climate change and promote resilience.
265. The results of this analysis are presented in the table below. The likelihood and consequences indicators range from 1 (low) to 5 (high).
Table 53: Calculated Likelihood and Consequence of Impact from Flooding Hazard for the
Infrastructure Element of the Stormwater Component.
Infrastructure Elements
Impacts Likelihood Consequence Risks
Landfill
Stormwater system
could be overwhelmed
Leachate could be
released
2 Unlikely 4 Severe 8 Moderate
Sorting Plant
Damage to building
due to stronger wind
events
1 rare 2 Minor 2 Low
Composting Plant
Localized flooding
Leachate could be
released
2 Unlikely 2 Minor 4 Low
Collection
infrastructure
Localized flooding at
collection site 2 Unlikely 2 Minor 4 Low
266. Both the existing landfill site and the identified alternative location have been assessed as not subject to flooding. While this is not likely to change given the projected rainfall increase of 5%, there is a moderate risk of impact due to localized flooding overwhelming the site stormwater management leading to leachate leaving the site. The design of the new landfill will require a water management plan that will handle extreme events of the projected larger size.
79
267. Proper management and disposal of solid waste will increase the resilience of the population by improving the health and wellbeing by reducing exposure to unhealthy waste and minimize health risks during both flood events and drought. Ecological solid waste management will contribute to improved air quality and decrease the exposure of the community by removing waste blocking the drainage system that increase the extent and length of flood events.
268. The solid waste treatment plant is not exposed to climate change impacts. However, water management design for the landfill will be designed using the current extreme rainfall event size +5%. The majority of the leachate will be recirculated back into the landfill mass, with the excess being sent off-site for treatment at the WWTP. The projected increase in extreme event rainfall of 5% is not expected to have a large impact on this process as the extra leachate produced will be within the designed capacity redundancy and excess leachate can be pumped back into the landfill.
10. Institutional Arrangement
269. Vision. During the workshop held, on October 6th, 2020, at Provincial Hall of Banteay Mean Chey, the different stakeholders had the opportunity to express their visions for the operation and management of the solid waste service.
270. Although the MA is still discussing internally on the preferred institutional arrangement, there is a strong preference for the involvement of the private sector. It was highlighted that there are a few private companies wishing to work on SWM. It was proposed that the private sector be in charge of the collection and transportation of solid waste, and management of sorting plant, composting plant and landfill. The Poipet MA would only monitor the contract and the quality of the service.
271. MPWT promotes the system, which is being implemented in Phnom Penh33 where the MA will collect the revenues, sub-contract the collection to several private companies, and where transfer stations and landfills will be managed by a public enterprise.
272. Recommendation. The preferred scenario is that of a private provider to be engaged to provide the collection service and a public operator for O&M of the facilities at the landfill (including sorting and composting plants). Discussions will have to take place at a short term phase of the implementation to define the scope of services and contractual relations between the private operator and the MA. In particular, depending on the ability of private operators to finance the initial investment, operation and maintenance, a rental fee could be applied for the use of the facilities or the collection truck fleet.
273. Institutional Development Road Map and Capacity Building. The Institutional Strengthening Plan (refer to Volume 8) recommends for a range of capacity-building tasks to be undertaken to support the implementation of the new service. Key activities include: (i) Improve the institutional arrangements to facilitate sustainable service delivery in the long term; (ii) Formalizing roles and responsibilities for service delivery; (iii) Improve budget and financial planning to address O&M shortfalls; (iv) Improve asset monitoring and performance reporting; (v) Staff development and training; (vi) Improve operational efficiencies through implementation of Smart – ICT systems.
33 Sub-Decree 189 on Establishement of Enterprise on Management of transfer station and storage of solid waste. RGC, 16 November 2020
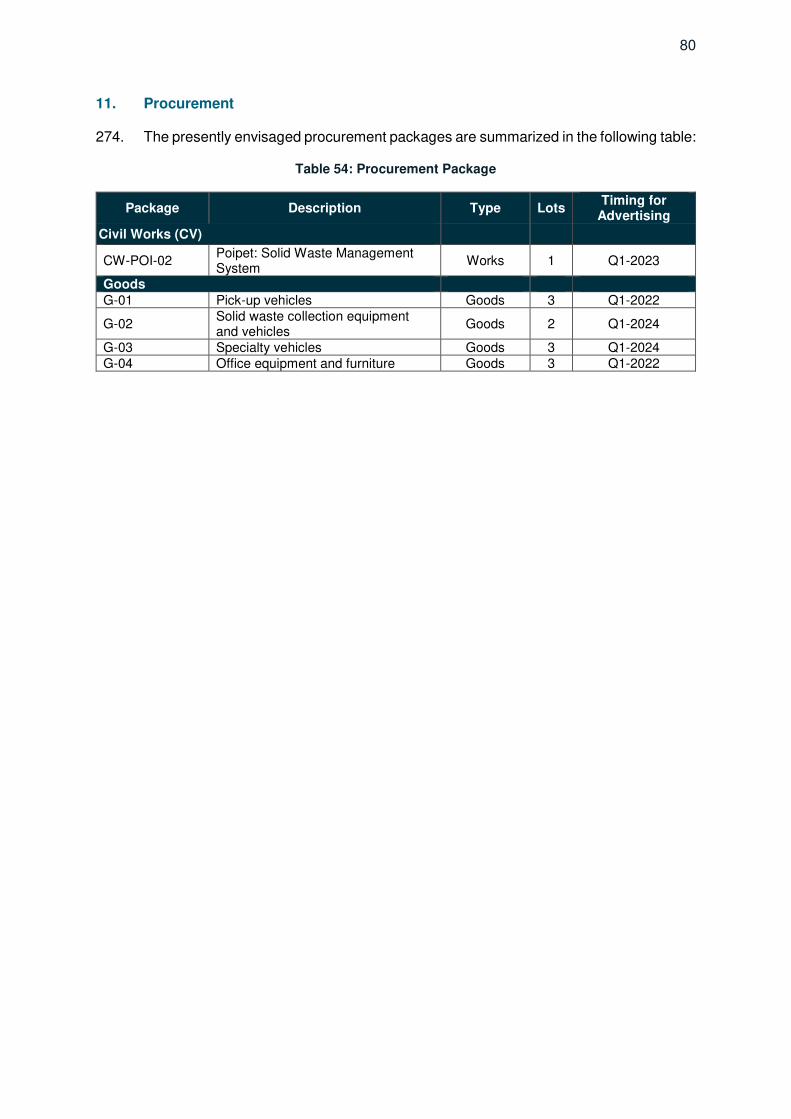
80
11. Procurement
274. The presently envisaged procurement packages are summarized in the following table:
Table 54: Procurement Package
Package Description Type Lots Timing for
Advertising
Civil Works (CV)
CW-POI-02 Poipet: Solid Waste Management System
Works 1 Q1-2023
Goods G-01 Pick-up vehicles Goods 3 Q1-2022
G-02 Solid waste collection equipment and vehicles
Goods 2 Q1-2024
G-03 Specialty vehicles Goods 3 Q1-2024 G-04 Office equipment and furniture Goods 3 Q1-2022

81
APPENDICES
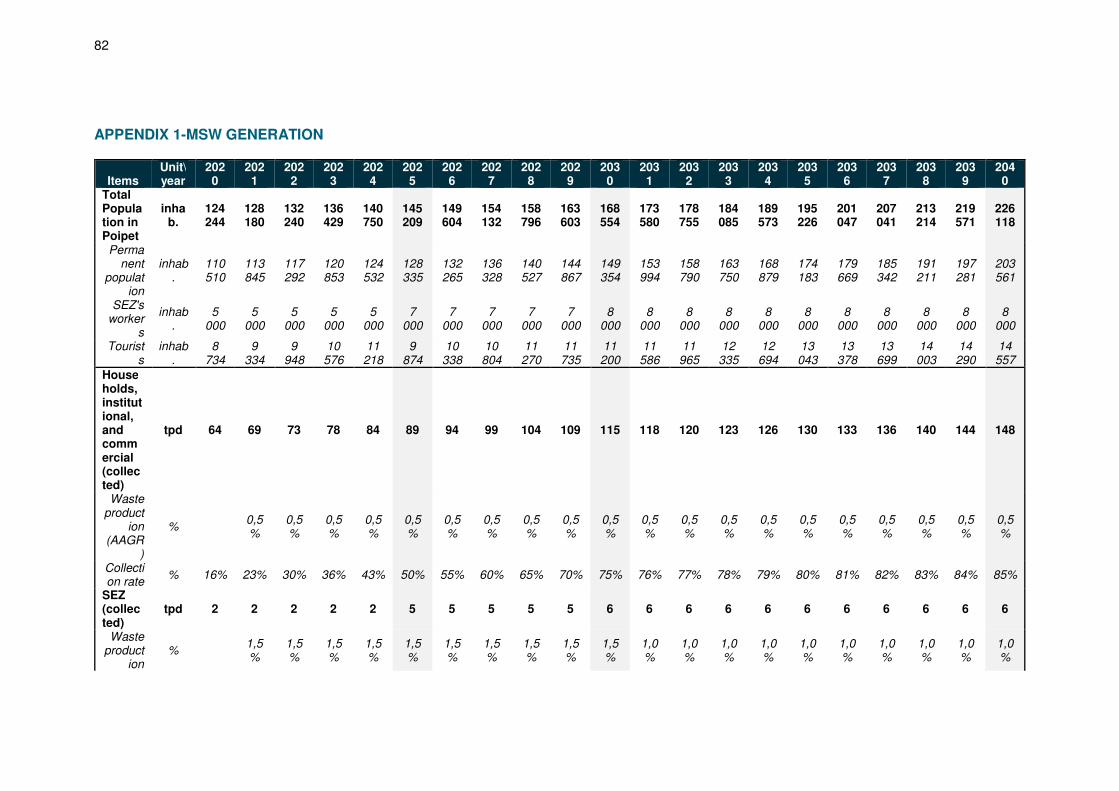
82
APPENDIX 1-MSW GENERATION
Items Unit\year
2020
2021
2022
2023
2024
2025
2026
2027
2028
2029
2030
2031
2032
2033
2034
2035
2036
2037
2038
2039
2040
Total Population in Poipet
inhab.
124 244
128 180
132 240
136 429
140 750
145 209
149 604
154 132
158 796
163 603
168 554
173 580
178 755
184 085
189 573
195 226
201 047
207 041
213 214
219 571
226 118
Permanent
population
inhab.
110 510
113 845
117 292
120 853
124 532
128 335
132 265
136 328
140 527
144 867
149 354
153 994
158 790
163 750
168 879
174 183
179 669
185 342
191 211
197 281
203 561
SEZ's worker
s
inhab.
5 000
5 000
5 000
5 000
5 000
7 000
7 000
7 000
7 000
7 000
8 000
8 000
8 000
8 000
8 000
8 000
8 000
8 000
8 000
8 000
8 000
Tourists
inhab.
8 734
9 334
9 948
10 576
11 218
9 874
10 338
10 804
11 270
11 735
11 200
11 586
11 965
12 335
12 694
13 043
13 378
13 699
14 003
14 290
14 557
Households, institutional, and commercial (collected)
tpd 64 69 73 78 84 89 94 99 104 109 115 118 120 123 126 130 133 136 140 144 148
Waste product
ion (AAGR
)
% 0,5%
0,5%
0,5%
0,5%
0,5%
0,5%
0,5%
0,5%
0,5%
0,5%
0,5%
0,5%
0,5%
0,5%
0,5%
0,5%
0,5%
0,5%
0,5%
0,5%
Collection rate
% 16% 23% 30% 36% 43% 50% 55% 60% 65% 70% 75% 76% 77% 78% 79% 80% 81% 82% 83% 84% 85%
SEZ (collected)
tpd 2 2 2 2 2 5 5 5 5 5 6 6 6 6 6 6 6 6 6 6 6
Waste product
ion % 1,5
% 1,5%
1,5%
1,5%
1,5%
1,5%
1,5%
1,5%
1,5%
1,5%
1,0%
1,0%
1,0%
1,0%
1,0%
1,0%
1,0%
1,0%
1,0%
1,0%
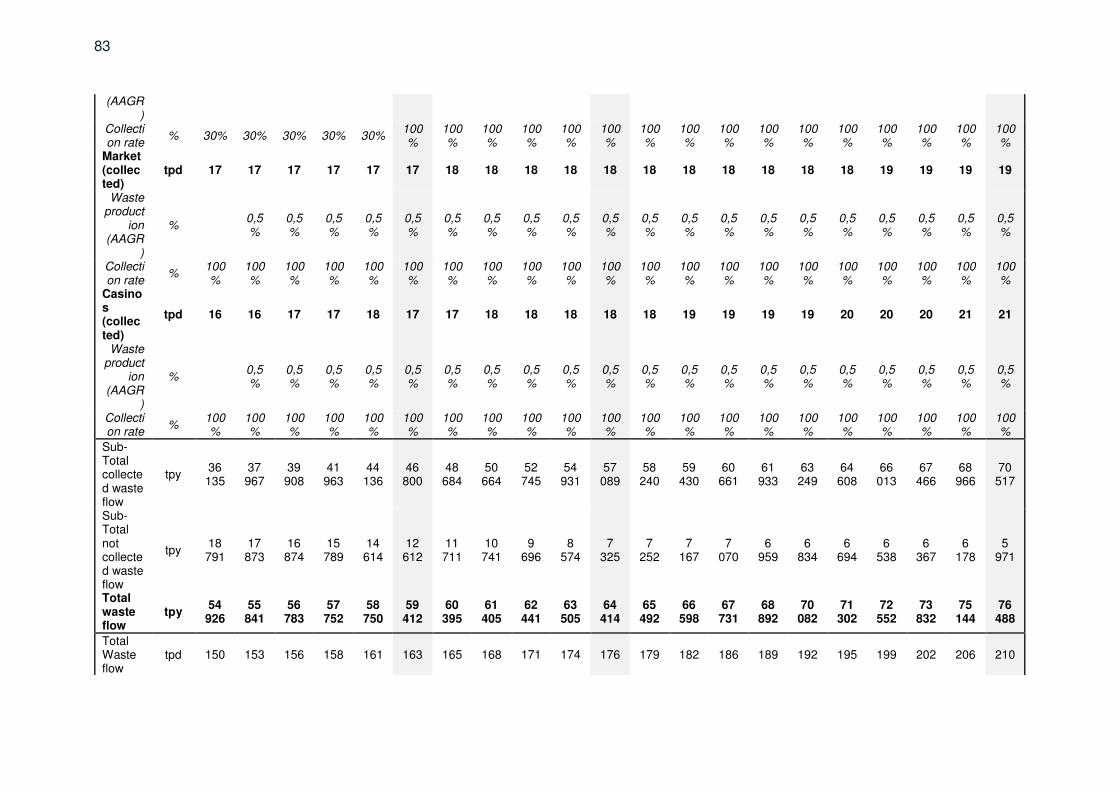
83
(AAGR)
Collection rate
% 30% 30% 30% 30% 30% 100%
100%
100%
100%
100%
100%
100%
100%
100%
100%
100%
100%
100%
100%
100%
100%
Market (collected)
tpd 17 17 17 17 17 17 18 18 18 18 18 18 18 18 18 18 18 19 19 19 19
Waste product
ion (AAGR
)
% 0,5%
0,5%
0,5%
0,5%
0,5%
0,5%
0,5%
0,5%
0,5%
0,5%
0,5%
0,5%
0,5%
0,5%
0,5%
0,5%
0,5%
0,5%
0,5%
0,5%
Collection rate
% 100%
100%
100%
100%
100%
100%
100%
100%
100%
100%
100%
100%
100%
100%
100%
100%
100%
100%
100%
100%
100%
Casinos (collected)
tpd 16 16 17 17 18 17 17 18 18 18 18 18 19 19 19 19 20 20 20 21 21
Waste product
ion (AAGR
)
% 0,5%
0,5%
0,5%
0,5%
0,5%
0,5%
0,5%
0,5%
0,5%
0,5%
0,5%
0,5%
0,5%
0,5%
0,5%
0,5%
0,5%
0,5%
0,5%
0,5%
Collection rate
% 100%
100%
100%
100%
100%
100%
100%
100%
100%
100%
100%
100%
100%
100%
100%
100%
100%
100%
100%
100%
100%
Sub-Total collected waste flow
tpy 36 135
37 967
39 908
41 963
44 136
46 800
48 684
50 664
52 745
54 931
57 089
58 240
59 430
60 661
61 933
63 249
64 608
66 013
67 466
68 966
70 517
Sub-Total not collected waste flow
tpy 18 791
17 873
16 874
15 789
14 614
12 612
11 711
10 741
9 696
8 574
7 325
7 252
7 167
7 070
6 959
6 834
6 694
6 538
6 367
6 178
5 971
Total waste flow
tpy 54 926
55 841
56 783
57 752
58 750
59 412
60 395
61 405
62 441
63 505
64 414
65 492
66 598
67 731
68 892
70 082
71 302
72 552
73 832
75 144
76 488
Total Waste flow
tpd 150 153 156 158 161 163 165 168 171 174 176 179 182 186 189 192 195 199 202 206 210
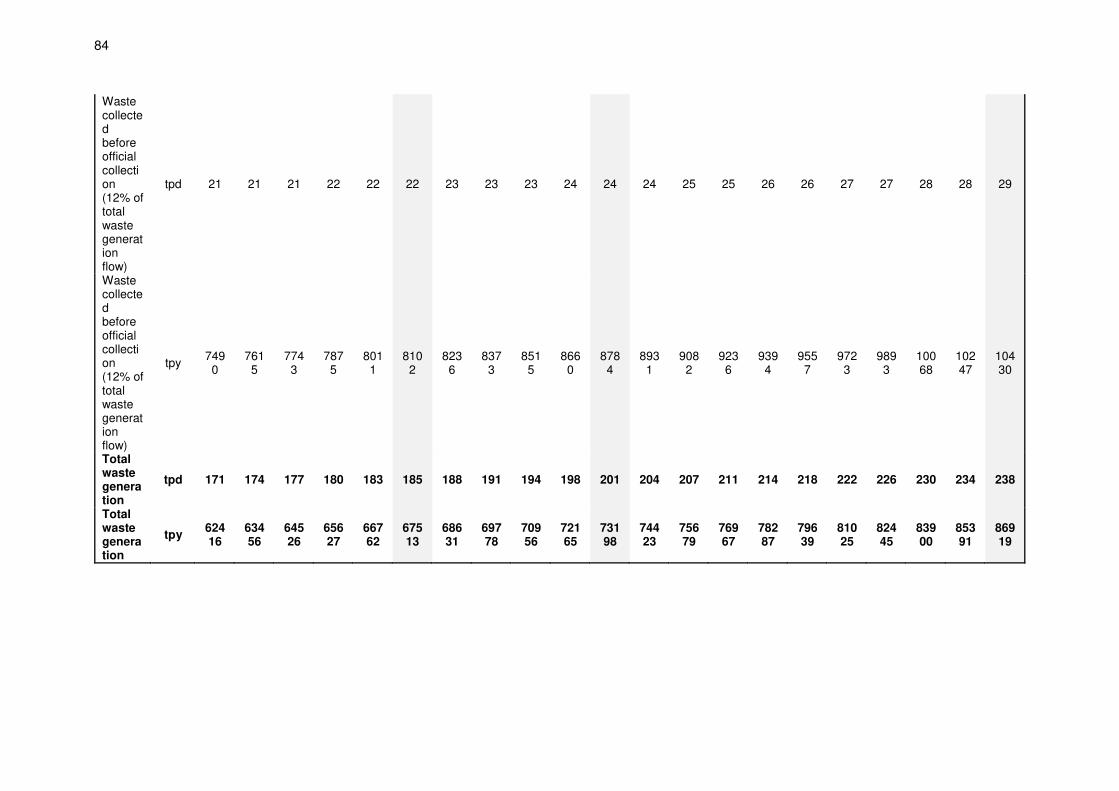
84
Waste collected before official collection (12% of total waste generation flow)
tpd 21 21 21 22 22 22 23 23 23 24 24 24 25 25 26 26 27 27 28 28 29
Waste collected before official collection (12% of total waste generation flow)
tpy 7490
7615
7743
7875
8011
8102
8236
8373
8515
8660
8784
8931
9082
9236
9394
9557
9723
9893
10068
10247
10430
Total waste generation
tpd 171 174 177 180 183 185 188 191 194 198 201 204 207 211 214 218 222 226 230 234 238
Total waste generation
tpy 62416
63456
64526
65627
66762
67513
68631
69778
70956
72165
73198
74423
75679
76967
78287
79639
81025
82445
83900
85391
86919
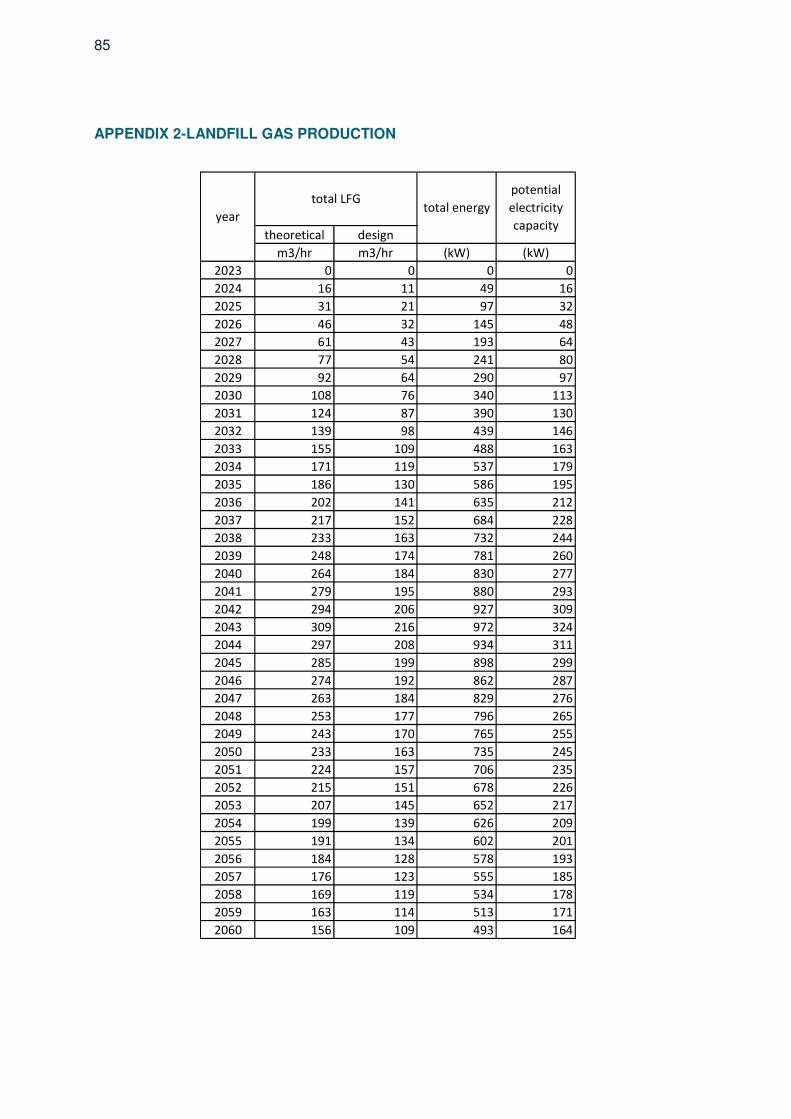
85
APPENDIX 2-LANDFILL GAS PRODUCTION
theoretical design
m3/hr m3/hr (kW) (kW)
2023 0 0 0 0
2024 16 11 49 16
2025 31 21 97 32
2026 46 32 145 48
2027 61 43 193 64
2028 77 54 241 80
2029 92 64 290 97
2030 108 76 340 113
2031 124 87 390 130
2032 139 98 439 146
2033 155 109 488 163
2034 171 119 537 179
2035 186 130 586 195
2036 202 141 635 212
2037 217 152 684 228
2038 233 163 732 244
2039 248 174 781 260
2040 264 184 830 277
2041 279 195 880 293
2042 294 206 927 309
2043 309 216 972 324
2044 297 208 934 311
2045 285 199 898 299
2046 274 192 862 287
2047 263 184 829 276
2048 253 177 796 265
2049 243 170 765 255
2050 233 163 735 245
2051 224 157 706 235
2052 215 151 678 226
2053 207 145 652 217
2054 199 139 626 209
2055 191 134 602 201
2056 184 128 578 193
2057 176 123 555 185
2058 169 119 534 178
2059 163 114 513 171
2060 156 109 493 164
year
total LFGtotal energy
potential
electricity
capacity
86
LFG generation Poipet (landgem).xls 25/08/2020
Summary Report
Landfill Name or Identifier: Bavet
Date:
First-Order Decomposition Rate Equation:
Where,
QCH4 = annual methane generation in the year of the calculation (m3/year )
i = 1-year time increment Mi = mass of waste accepted in the i th year (Mg ) n = (year of the calculation) - (initial year of waste acceptance)
j = 0.1-year time increment
k = methane generation rate (year-1 )
Lo = potential methane generation capacity (m3
/Mg )
About LandGEM:
mardi 25 août 2020
LandGEM is based on a first-order decomposition rate equation for quantifying emissions from the decomposition of landfilled waste in
municipal solid waste (MSW) landfills. The software provides a relatively simple approach to estimating landfill gas emissions. Model defaults
are based on empirical data from U.S. landfills. Field test data can also be used in place of model defaults when available. Further guidance on
EPA test methods, Clean Air Act (CAA) regulations, and other guidance regarding landfill gas emissions and control technology requirements
can be found at http://www.epa.gov/ttnatw01/landfill/landflpg.html.
Description/Comments:
tij = age of the jth section of waste mass M i accepted in the i
th year
(decimal years , e.g., 3.2 years)
LandGEM is considered a screening tool — the better the input data, the better the estimates. Often, there are limitations with the available data
regarding waste quantity and composition, variation in design and operating practices over time, and changes occurring over time that impact
the emissions potential. Changes to landfill operation, such as operating under wet conditions through leachate recirculation or other liquid
additions, will result in generating more gas at a faster rate. Defaults for estimating emissions for this type of operation are being developed to
include in LandGEM along with defaults for convential landfills (no leachate or liquid additions) for developing emission inventories and
determining CAA applicability. Refer to the Web site identified above for future updates.
REPORT - 1
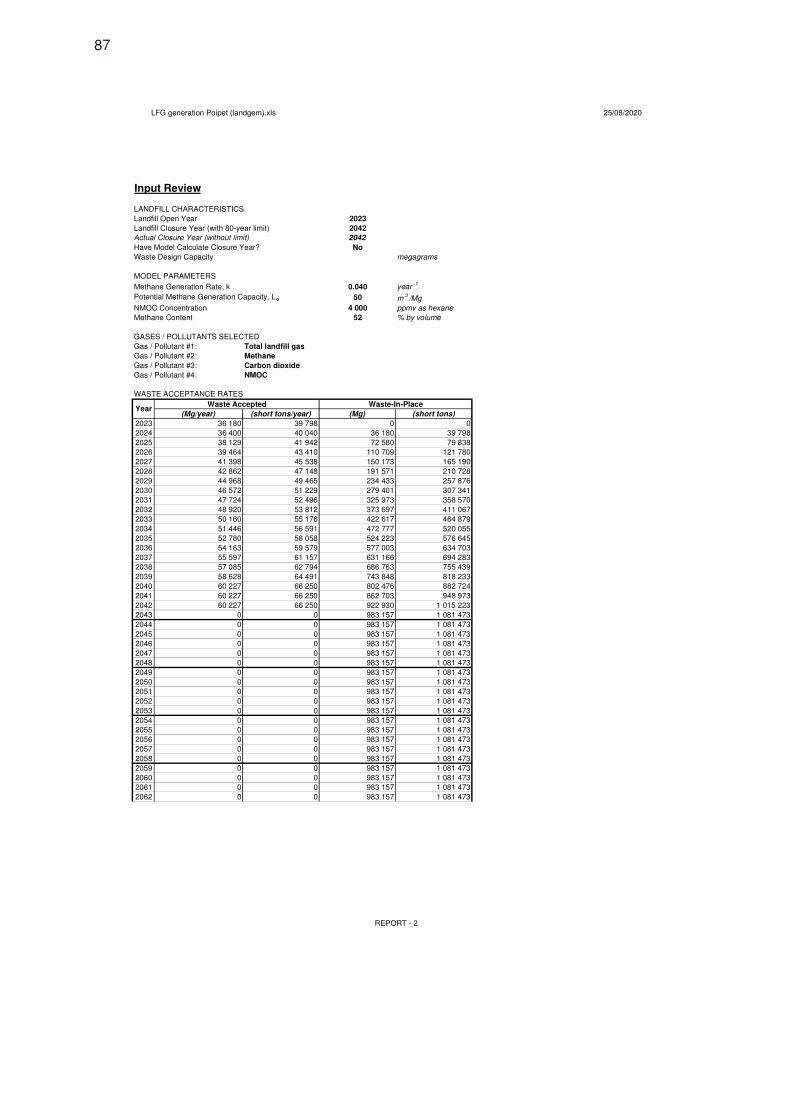
87
LFG generation Poipet (landgem).xls 25/08/2020
Input Review
LANDFILL CHARACTERISTICS
Landfill Open Year 2023
Landfill Closure Year (with 80-year limit) 2042
Actual Closure Year (without limit) 2042
Have Model Calculate Closure Year? No
Waste Design Capacity megagrams
MODEL PARAMETERS
Methane Generation Rate, k 0.040 year-1
Potential Methane Generation Capacity, Lo 50 m3/Mg
NMOC Concentration 4 000 ppmv as hexane
Methane Content 52 % by volume
GASES / POLLUTANTS SELECTED
Gas / Pollutant #1: Total landfill gas
Gas / Pollutant #2: Methane
Gas / Pollutant #3: Carbon dioxide
Gas / Pollutant #4: NMOC
WASTE ACCEPTANCE RATES
(Mg/year) (short tons/year) (Mg) (short tons)
2023 36 180 39 798 0 0
2024 36 400 40 040 36 180 39 798
2025 38 129 41 942 72 580 79 838
2026 39 464 43 410 110 709 121 780
2027 41 398 45 538 150 173 165 190
2028 42 862 47 148 191 571 210 728
2029 44 968 49 465 234 433 257 876
2030 46 572 51 229 279 401 307 341
2031 47 724 52 496 325 973 358 570
2032 48 920 53 812 373 697 411 067
2033 50 160 55 176 422 617 464 879
2034 51 446 56 591 472 777 520 055
2035 52 780 58 058 524 223 576 645
2036 54 163 59 579 577 003 634 703
2037 55 597 61 157 631 166 694 283
2038 57 085 62 794 686 763 755 439
2039 58 628 64 491 743 848 818 233
2040 60 227 66 250 802 476 882 724
2041 60 227 66 250 862 703 948 973
2042 60 227 66 250 922 930 1 015 223
2043 0 0 983 157 1 081 473
2044 0 0 983 157 1 081 473
2045 0 0 983 157 1 081 473
2046 0 0 983 157 1 081 473
2047 0 0 983 157 1 081 473
2048 0 0 983 157 1 081 473
2049 0 0 983 157 1 081 473
2050 0 0 983 157 1 081 473
2051 0 0 983 157 1 081 473
2052 0 0 983 157 1 081 473
2053 0 0 983 157 1 081 473
2054 0 0 983 157 1 081 473
2055 0 0 983 157 1 081 473
2056 0 0 983 157 1 081 473
2057 0 0 983 157 1 081 473
2058 0 0 983 157 1 081 473
2059 0 0 983 157 1 081 473
2060 0 0 983 157 1 081 473
2061 0 0 983 157 1 081 473
2062 0 0 983 157 1 081 473
YearWaste Accepted Waste-In-Place
REPORT - 2
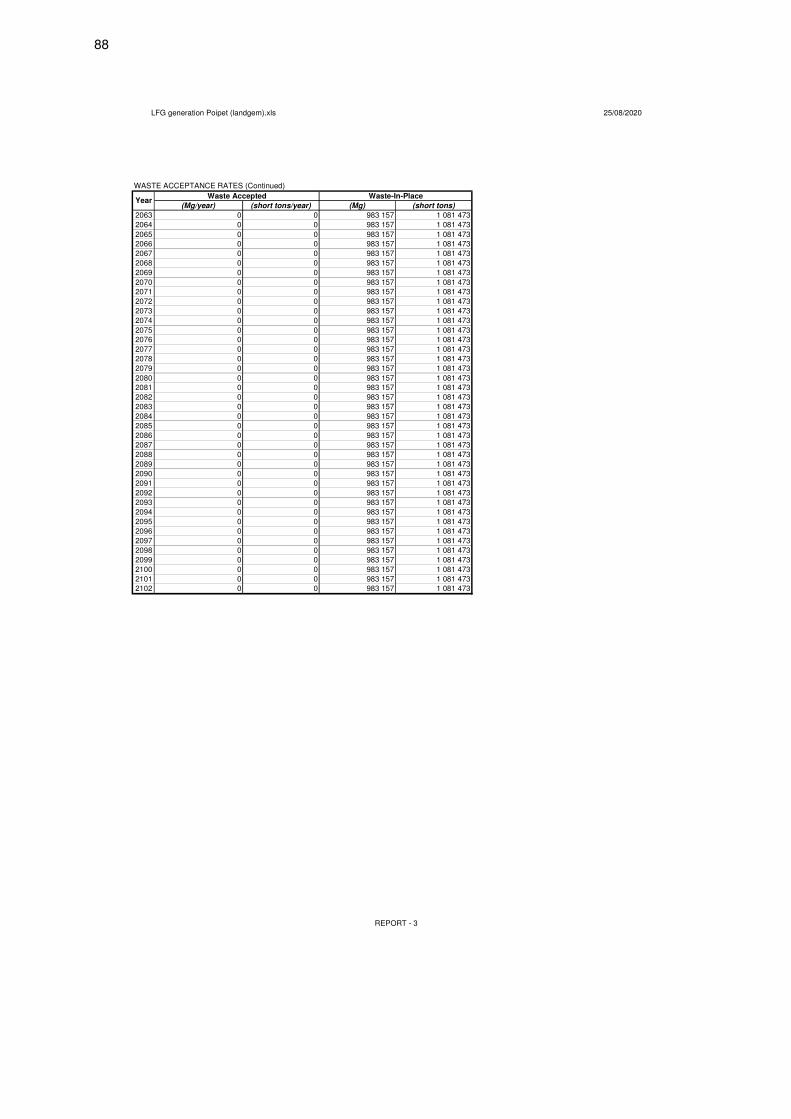
88
LFG generation Poipet (landgem).xls 25/08/2020
WASTE ACCEPTANCE RATES (Continued)
(Mg/year) (short tons/year) (Mg) (short tons)
2063 0 0 983 157 1 081 473
2064 0 0 983 157 1 081 473
2065 0 0 983 157 1 081 473
2066 0 0 983 157 1 081 473
2067 0 0 983 157 1 081 473
2068 0 0 983 157 1 081 473
2069 0 0 983 157 1 081 473
2070 0 0 983 157 1 081 473
2071 0 0 983 157 1 081 473
2072 0 0 983 157 1 081 473
2073 0 0 983 157 1 081 473
2074 0 0 983 157 1 081 473
2075 0 0 983 157 1 081 473
2076 0 0 983 157 1 081 473
2077 0 0 983 157 1 081 473
2078 0 0 983 157 1 081 473
2079 0 0 983 157 1 081 473
2080 0 0 983 157 1 081 473
2081 0 0 983 157 1 081 473
2082 0 0 983 157 1 081 473
2083 0 0 983 157 1 081 473
2084 0 0 983 157 1 081 473
2085 0 0 983 157 1 081 473
2086 0 0 983 157 1 081 473
2087 0 0 983 157 1 081 473
2088 0 0 983 157 1 081 473
2089 0 0 983 157 1 081 473
2090 0 0 983 157 1 081 473
2091 0 0 983 157 1 081 473
2092 0 0 983 157 1 081 473
2093 0 0 983 157 1 081 473
2094 0 0 983 157 1 081 473
2095 0 0 983 157 1 081 473
2096 0 0 983 157 1 081 473
2097 0 0 983 157 1 081 473
2098 0 0 983 157 1 081 473
2099 0 0 983 157 1 081 473
2100 0 0 983 157 1 081 473
2101 0 0 983 157 1 081 473
2102 0 0 983 157 1 081 473
Waste-In-PlaceYear
Waste Accepted
REPORT - 3
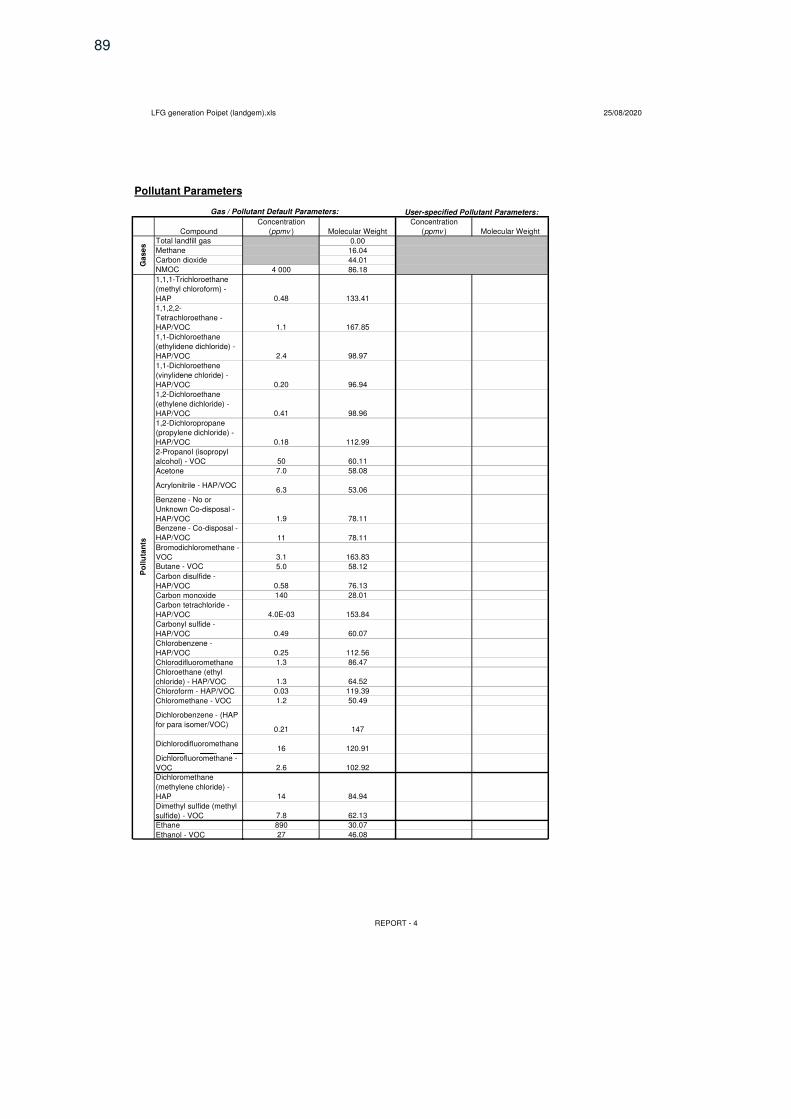
89
LFG generation Poipet (landgem).xls 25/08/2020
Pollutant Parameters
Concentration Concentration
Compound (ppmv ) Molecular Weight (ppmv ) Molecular Weight
Total landfill gas 0.00
Methane 16.04
Carbon dioxide 44.01
NMOC 4 000 86.18
1,1,1-Trichloroethane
(methyl chloroform) -
HAP 0.48 133.41
1,1,2,2-
Tetrachloroethane -
HAP/VOC 1.1 167.85
1,1-Dichloroethane
(ethylidene dichloride) -
HAP/VOC 2.4 98.97
1,1-Dichloroethene
(vinylidene chloride) -
HAP/VOC 0.20 96.94
1,2-Dichloroethane
(ethylene dichloride) -
HAP/VOC 0.41 98.96
1,2-Dichloropropane
(propylene dichloride) -
HAP/VOC 0.18 112.99
2-Propanol (isopropyl
alcohol) - VOC 50 60.11
Acetone 7.0 58.08
Acrylonitrile - HAP/VOC6.3 53.06
Benzene - No or
Unknown Co-disposal -
HAP/VOC 1.9 78.11
Benzene - Co-disposal -
HAP/VOC 11 78.11
Bromodichloromethane -
VOC 3.1 163.83
Butane - VOC 5.0 58.12
Carbon disulfide -
HAP/VOC 0.58 76.13
Carbon monoxide 140 28.01
Carbon tetrachloride -
HAP/VOC 4.0E-03 153.84
Carbonyl sulfide -
HAP/VOC 0.49 60.07
Chlorobenzene -
HAP/VOC 0.25 112.56
Chlorodifluoromethane 1.3 86.47
Chloroethane (ethyl
chloride) - HAP/VOC 1.3 64.52
Chloroform - HAP/VOC 0.03 119.39
Chloromethane - VOC 1.2 50.49
Dichlorobenzene - (HAP
for para isomer/VOC)0.21 147
Dichlorodifluoromethane16 120.91
Dichlorofluoromethane -
VOC 2.6 102.92
Dichloromethane
(methylene chloride) -
HAP 14 84.94
Dimethyl sulfide (methyl
sulfide) - VOC 7.8 62.13
Ethane 890 30.07
Ethanol - VOC 27 46.08
Gas / Pollutant Default Parameters:
Po
llu
tan
ts
User-specified Pollutant Parameters:
Ga
se
s
REPORT - 4
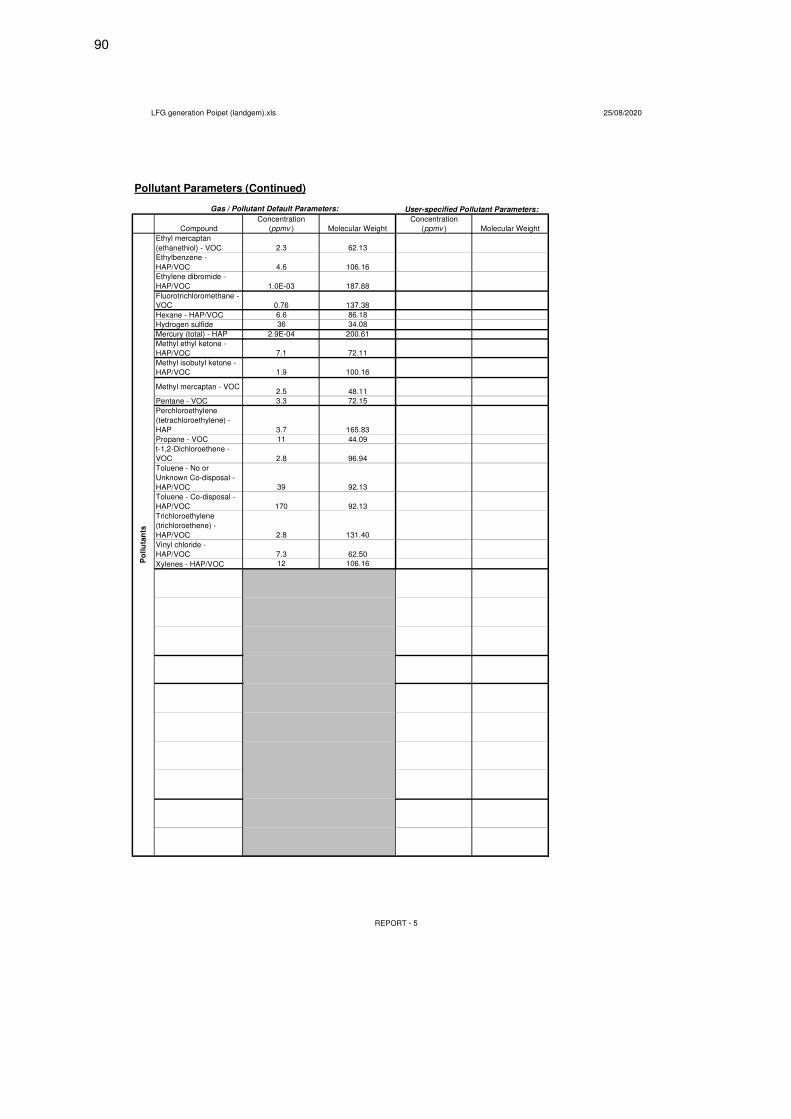
90
LFG generation Poipet (landgem).xls 25/08/2020
Pollutant Parameters (Continued)
Concentration Concentration
Compound (ppmv ) Molecular Weight (ppmv ) Molecular Weight
Ethyl mercaptan
(ethanethiol) - VOC 2.3 62.13
Ethylbenzene -
HAP/VOC 4.6 106.16
Ethylene dibromide -
HAP/VOC 1.0E-03 187.88
Fluorotrichloromethane -
VOC 0.76 137.38
Hexane - HAP/VOC 6.6 86.18
Hydrogen sulfide 36 34.08
Mercury (total) - HAP 2.9E-04 200.61
Methyl ethyl ketone -
HAP/VOC 7.1 72.11
Methyl isobutyl ketone -
HAP/VOC 1.9 100.16
Methyl mercaptan - VOC2.5 48.11
Pentane - VOC 3.3 72.15
Perchloroethylene
(tetrachloroethylene) -
HAP 3.7 165.83
Propane - VOC 11 44.09
t-1,2-Dichloroethene -
VOC 2.8 96.94
Toluene - No or
Unknown Co-disposal -
HAP/VOC 39 92.13
Toluene - Co-disposal -
HAP/VOC 170 92.13
Trichloroethylene
(trichloroethene) -
HAP/VOC 2.8 131.40
Vinyl chloride -
HAP/VOC 7.3 62.50
Xylenes - HAP/VOC 12 106.16
User-specified Pollutant Parameters:Gas / Pollutant Default Parameters:
Po
llu
tan
ts
REPORT - 5
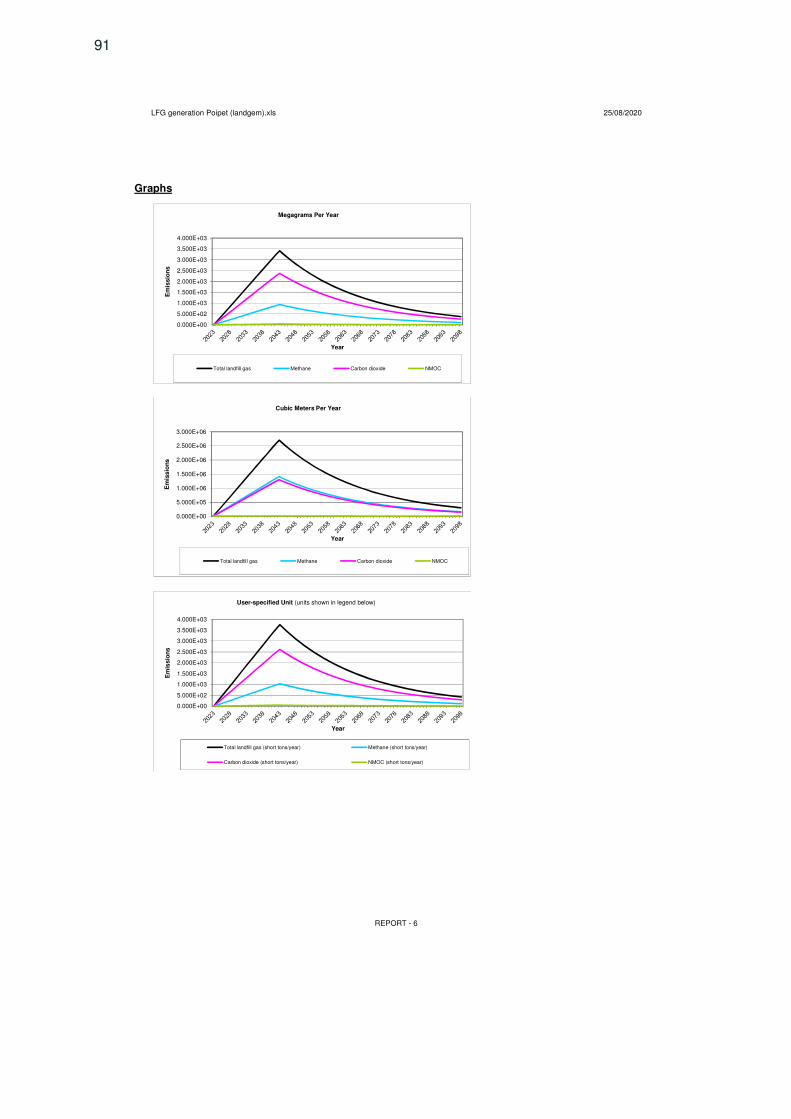
91
LFG generation Poipet (landgem).xls 25/08/2020
Graphs
0.000E+00
5.000E+02
1.000E+03
1.500E+03
2.000E+03
2.500E+03
3.000E+03
3.500E+03
4.000E+03
Em
issio
ns
Year
Megagrams Per Year
Total landfill gas Methane Carbon dioxide NMOC
0.000E+00
5.000E+05
1.000E+06
1.500E+06
2.000E+06
2.500E+06
3.000E+06
Em
issio
ns
Year
Cubic Meters Per Year
Total landfill gas Methane Carbon dioxide NMOC
0.000E+00
5.000E+02
1.000E+03
1.500E+03
2.000E+03
2.500E+03
3.000E+03
3.500E+03
4.000E+03
Em
issio
ns
Year
User-specified Unit (units shown in legend below)
Total landfill gas (short tons/year) Methane (short tons/year)
Carbon dioxide (short tons/year) NMOC (short tons/year)
REPORT - 6
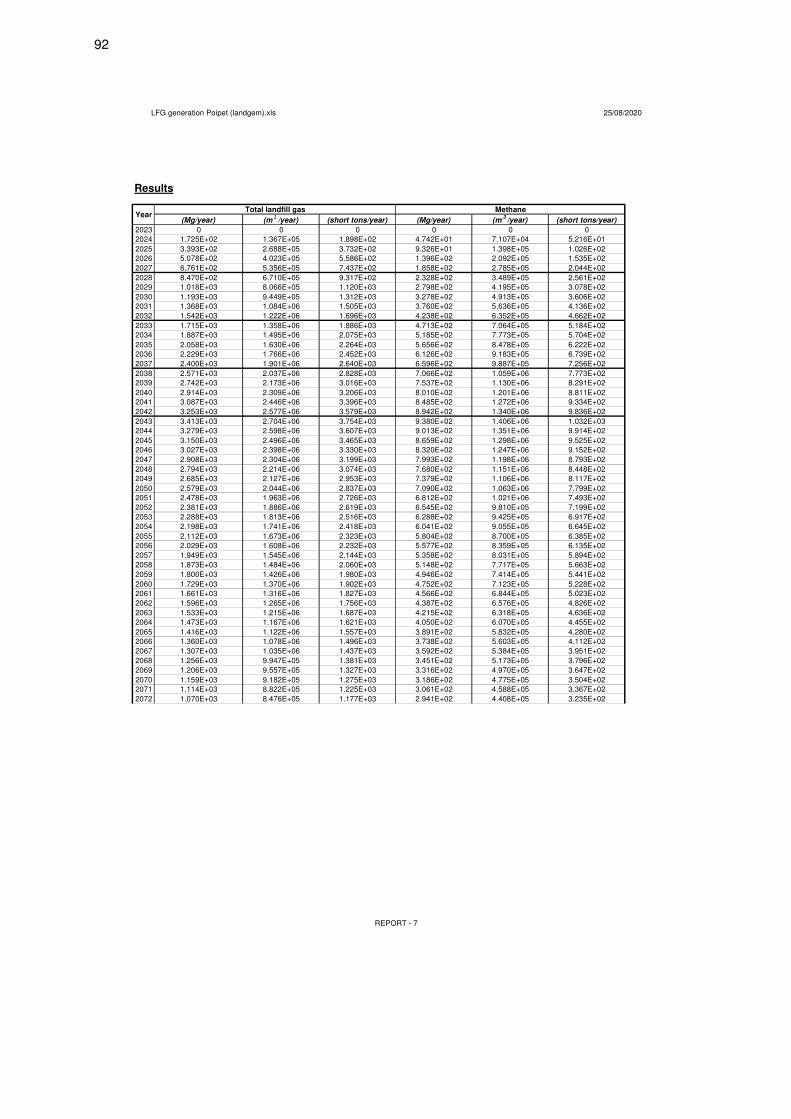
92
LFG generation Poipet (landgem).xls 25/08/2020
Results
(Mg/year) (m3/year) (short tons/year) (Mg/year) (m
3/year) (short tons/year)
2023 0 0 0 0 0 0
2024 1.725E+02 1.367E+05 1.898E+02 4.742E+01 7.107E+04 5.216E+01
2025 3.393E+02 2.688E+05 3.732E+02 9.326E+01 1.398E+05 1.026E+02
2026 5.078E+02 4.023E+05 5.586E+02 1.396E+02 2.092E+05 1.535E+02
2027 6.761E+02 5.356E+05 7.437E+02 1.858E+02 2.785E+05 2.044E+02
2028 8.470E+02 6.710E+05 9.317E+02 2.328E+02 3.489E+05 2.561E+02
2029 1.018E+03 8.066E+05 1.120E+03 2.798E+02 4.195E+05 3.078E+02
2030 1.193E+03 9.449E+05 1.312E+03 3.278E+02 4.913E+05 3.606E+02
2031 1.368E+03 1.084E+06 1.505E+03 3.760E+02 5.636E+05 4.136E+02
2032 1.542E+03 1.222E+06 1.696E+03 4.238E+02 6.352E+05 4.662E+02
2033 1.715E+03 1.358E+06 1.886E+03 4.713E+02 7.064E+05 5.184E+02
2034 1.887E+03 1.495E+06 2.075E+03 5.185E+02 7.773E+05 5.704E+02
2035 2.058E+03 1.630E+06 2.264E+03 5.656E+02 8.478E+05 6.222E+02
2036 2.229E+03 1.766E+06 2.452E+03 6.126E+02 9.183E+05 6.739E+02
2037 2.400E+03 1.901E+06 2.640E+03 6.596E+02 9.887E+05 7.256E+02
2038 2.571E+03 2.037E+06 2.828E+03 7.066E+02 1.059E+06 7.773E+02
2039 2.742E+03 2.173E+06 3.016E+03 7.537E+02 1.130E+06 8.291E+02
2040 2.914E+03 2.309E+06 3.206E+03 8.010E+02 1.201E+06 8.811E+02
2041 3.087E+03 2.446E+06 3.396E+03 8.485E+02 1.272E+06 9.334E+02
2042 3.253E+03 2.577E+06 3.579E+03 8.942E+02 1.340E+06 9.836E+02
2043 3.413E+03 2.704E+06 3.754E+03 9.380E+02 1.406E+06 1.032E+03
2044 3.279E+03 2.598E+06 3.607E+03 9.013E+02 1.351E+06 9.914E+02
2045 3.150E+03 2.496E+06 3.465E+03 8.659E+02 1.298E+06 9.525E+02
2046 3.027E+03 2.398E+06 3.330E+03 8.320E+02 1.247E+06 9.152E+02
2047 2.908E+03 2.304E+06 3.199E+03 7.993E+02 1.198E+06 8.793E+02
2048 2.794E+03 2.214E+06 3.074E+03 7.680E+02 1.151E+06 8.448E+02
2049 2.685E+03 2.127E+06 2.953E+03 7.379E+02 1.106E+06 8.117E+02
2050 2.579E+03 2.044E+06 2.837E+03 7.090E+02 1.063E+06 7.799E+02
2051 2.478E+03 1.963E+06 2.726E+03 6.812E+02 1.021E+06 7.493E+02
2052 2.381E+03 1.886E+06 2.619E+03 6.545E+02 9.810E+05 7.199E+02
2053 2.288E+03 1.813E+06 2.516E+03 6.288E+02 9.425E+05 6.917E+02
2054 2.198E+03 1.741E+06 2.418E+03 6.041E+02 9.055E+05 6.645E+02
2055 2.112E+03 1.673E+06 2.323E+03 5.804E+02 8.700E+05 6.385E+02
2056 2.029E+03 1.608E+06 2.232E+03 5.577E+02 8.359E+05 6.135E+02
2057 1.949E+03 1.545E+06 2.144E+03 5.358E+02 8.031E+05 5.894E+02
2058 1.873E+03 1.484E+06 2.060E+03 5.148E+02 7.717E+05 5.663E+02
2059 1.800E+03 1.426E+06 1.980E+03 4.946E+02 7.414E+05 5.441E+02
2060 1.729E+03 1.370E+06 1.902E+03 4.752E+02 7.123E+05 5.228E+02
2061 1.661E+03 1.316E+06 1.827E+03 4.566E+02 6.844E+05 5.023E+02
2062 1.596E+03 1.265E+06 1.756E+03 4.387E+02 6.576E+05 4.826E+02
2063 1.533E+03 1.215E+06 1.687E+03 4.215E+02 6.318E+05 4.636E+02
2064 1.473E+03 1.167E+06 1.621E+03 4.050E+02 6.070E+05 4.455E+02
2065 1.416E+03 1.122E+06 1.557E+03 3.891E+02 5.832E+05 4.280E+02
2066 1.360E+03 1.078E+06 1.496E+03 3.738E+02 5.603E+05 4.112E+02
2067 1.307E+03 1.035E+06 1.437E+03 3.592E+02 5.384E+05 3.951E+02
2068 1.256E+03 9.947E+05 1.381E+03 3.451E+02 5.173E+05 3.796E+02
2069 1.206E+03 9.557E+05 1.327E+03 3.316E+02 4.970E+05 3.647E+02
2070 1.159E+03 9.182E+05 1.275E+03 3.186E+02 4.775E+05 3.504E+02
2071 1.114E+03 8.822E+05 1.225E+03 3.061E+02 4.588E+05 3.367E+02
2072 1.070E+03 8.476E+05 1.177E+03 2.941E+02 4.408E+05 3.235E+02
MethaneTotal landfill gasYear
REPORT - 7

93
LFG generation Poipet (landgem).xls 25/08/2020
Results (Continued)
(Mg/year) (m3/year) (short tons/year) (Mg/year) (m
3/year) (short tons/year)
2073 1.028E+03 8.144E+05 1.131E+03 2.825E+02 4.235E+05 3.108E+02
2074 9.876E+02 7.825E+05 1.086E+03 2.715E+02 4.069E+05 2.986E+02
2075 9.489E+02 7.518E+05 1.044E+03 2.608E+02 3.909E+05 2.869E+02
2076 9.117E+02 7.223E+05 1.003E+03 2.506E+02 3.756E+05 2.756E+02
2077 8.759E+02 6.940E+05 9.635E+02 2.408E+02 3.609E+05 2.648E+02
2078 8.416E+02 6.668E+05 9.258E+02 2.313E+02 3.467E+05 2.545E+02
2079 8.086E+02 6.406E+05 8.895E+02 2.222E+02 3.331E+05 2.445E+02
2080 7.769E+02 6.155E+05 8.546E+02 2.135E+02 3.201E+05 2.349E+02
2081 7.464E+02 5.914E+05 8.211E+02 2.052E+02 3.075E+05 2.257E+02
2082 7.172E+02 5.682E+05 7.889E+02 1.971E+02 2.955E+05 2.168E+02
2083 6.890E+02 5.459E+05 7.579E+02 1.894E+02 2.839E+05 2.083E+02
2084 6.620E+02 5.245E+05 7.282E+02 1.820E+02 2.727E+05 2.002E+02
2085 6.361E+02 5.039E+05 6.997E+02 1.748E+02 2.621E+05 1.923E+02
2086 6.111E+02 4.842E+05 6.722E+02 1.680E+02 2.518E+05 1.848E+02
2087 5.872E+02 4.652E+05 6.459E+02 1.614E+02 2.419E+05 1.775E+02
2088 5.641E+02 4.470E+05 6.206E+02 1.551E+02 2.324E+05 1.706E+02
2089 5.420E+02 4.294E+05 5.962E+02 1.490E+02 2.233E+05 1.639E+02
2090 5.208E+02 4.126E+05 5.728E+02 1.431E+02 2.145E+05 1.574E+02
2091 5.003E+02 3.964E+05 5.504E+02 1.375E+02 2.061E+05 1.513E+02
2092 4.807E+02 3.809E+05 5.288E+02 1.321E+02 1.981E+05 1.453E+02
2093 4.619E+02 3.659E+05 5.081E+02 1.270E+02 1.903E+05 1.396E+02
2094 4.438E+02 3.516E+05 4.881E+02 1.220E+02 1.828E+05 1.342E+02
2095 4.264E+02 3.378E+05 4.690E+02 1.172E+02 1.757E+05 1.289E+02
2096 4.096E+02 3.246E+05 4.506E+02 1.126E+02 1.688E+05 1.239E+02
2097 3.936E+02 3.118E+05 4.329E+02 1.082E+02 1.622E+05 1.190E+02
2098 3.782E+02 2.996E+05 4.160E+02 1.039E+02 1.558E+05 1.143E+02
2099 3.633E+02 2.879E+05 3.997E+02 9.986E+01 1.497E+05 1.098E+02
2100 3.491E+02 2.766E+05 3.840E+02 9.595E+01 1.438E+05 1.055E+02
2101 3.354E+02 2.657E+05 3.689E+02 9.219E+01 1.382E+05 1.014E+02
2102 3.222E+02 2.553E+05 3.545E+02 8.857E+01 1.328E+05 9.743E+01
2103 3.096E+02 2.453E+05 3.406E+02 8.510E+01 1.276E+05 9.361E+01
2104 2.975E+02 2.357E+05 3.272E+02 8.176E+01 1.226E+05 8.994E+01
2105 2.858E+02 2.264E+05 3.144E+02 7.855E+01 1.177E+05 8.641E+01
2106 2.746E+02 2.176E+05 3.021E+02 7.547E+01 1.131E+05 8.302E+01
2107 2.638E+02 2.090E+05 2.902E+02 7.252E+01 1.087E+05 7.977E+01
2108 2.535E+02 2.008E+05 2.788E+02 6.967E+01 1.044E+05 7.664E+01
2109 2.435E+02 1.930E+05 2.679E+02 6.694E+01 1.003E+05 7.363E+01
2110 2.340E+02 1.854E+05 2.574E+02 6.432E+01 9.640E+04 7.075E+01
2111 2.248E+02 1.781E+05 2.473E+02 6.179E+01 9.262E+04 6.797E+01
2112 2.160E+02 1.711E+05 2.376E+02 5.937E+01 8.899E+04 6.531E+01
2113 2.075E+02 1.644E+05 2.283E+02 5.704E+01 8.550E+04 6.275E+01
2114 1.994E+02 1.580E+05 2.193E+02 5.481E+01 8.215E+04 6.029E+01
2115 1.916E+02 1.518E+05 2.107E+02 5.266E+01 7.893E+04 5.792E+01
2116 1.841E+02 1.458E+05 2.025E+02 5.059E+01 7.583E+04 5.565E+01
2117 1.768E+02 1.401E+05 1.945E+02 4.861E+01 7.286E+04 5.347E+01
2118 1.699E+02 1.346E+05 1.869E+02 4.670E+01 7.000E+04 5.137E+01
2119 1.633E+02 1.293E+05 1.796E+02 4.487E+01 6.726E+04 4.936E+01
2120 1.569E+02 1.243E+05 1.725E+02 4.311E+01 6.462E+04 4.742E+01
2121 1.507E+02 1.194E+05 1.658E+02 4.142E+01 6.209E+04 4.556E+01
2122 1.448E+02 1.147E+05 1.593E+02 3.980E+01 5.965E+04 4.378E+01
2123 1.391E+02 1.102E+05 1.530E+02 3.824E+01 5.731E+04 4.206E+01
YearMethaneTotal landfill gas
REPORT - 8
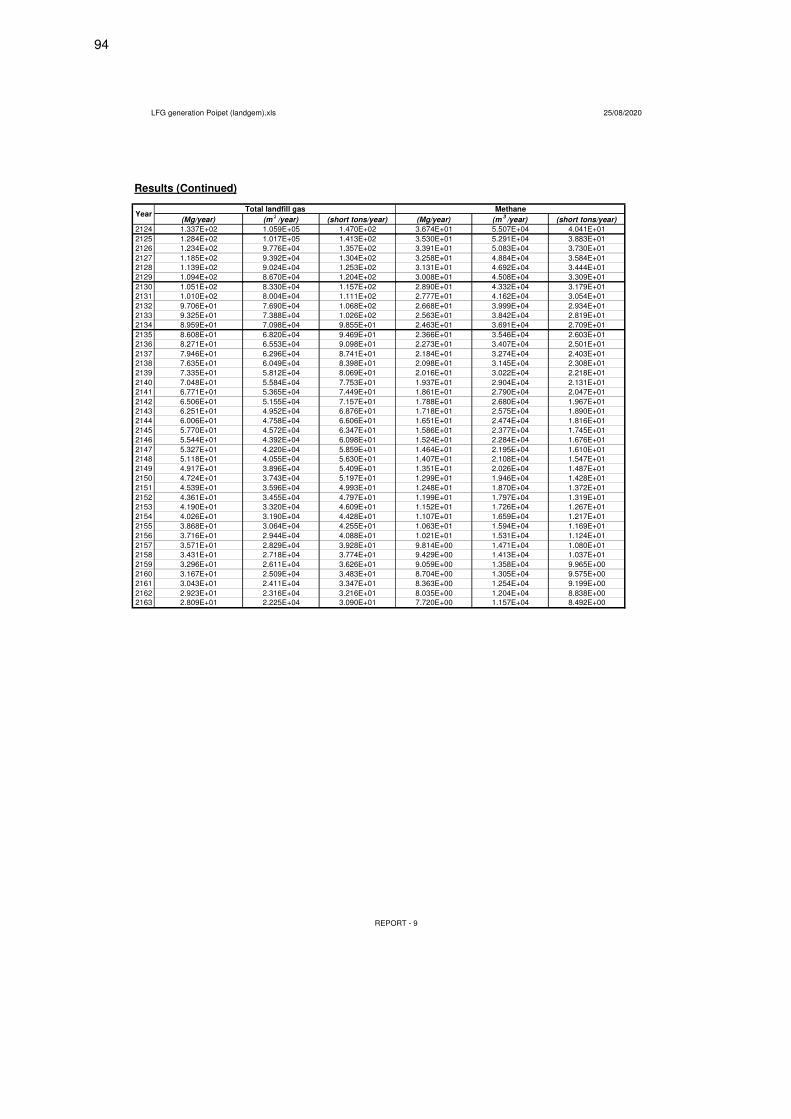
94
LFG generation Poipet (landgem).xls 25/08/2020
Results (Continued)
(Mg/year) (m3/year) (short tons/year) (Mg/year) (m
3/year) (short tons/year)
2124 1.337E+02 1.059E+05 1.470E+02 3.674E+01 5.507E+04 4.041E+01
2125 1.284E+02 1.017E+05 1.413E+02 3.530E+01 5.291E+04 3.883E+01
2126 1.234E+02 9.776E+04 1.357E+02 3.391E+01 5.083E+04 3.730E+01
2127 1.185E+02 9.392E+04 1.304E+02 3.258E+01 4.884E+04 3.584E+01
2128 1.139E+02 9.024E+04 1.253E+02 3.131E+01 4.692E+04 3.444E+01
2129 1.094E+02 8.670E+04 1.204E+02 3.008E+01 4.508E+04 3.309E+01
2130 1.051E+02 8.330E+04 1.157E+02 2.890E+01 4.332E+04 3.179E+01
2131 1.010E+02 8.004E+04 1.111E+02 2.777E+01 4.162E+04 3.054E+01
2132 9.706E+01 7.690E+04 1.068E+02 2.668E+01 3.999E+04 2.934E+01
2133 9.325E+01 7.388E+04 1.026E+02 2.563E+01 3.842E+04 2.819E+01
2134 8.959E+01 7.098E+04 9.855E+01 2.463E+01 3.691E+04 2.709E+01
2135 8.608E+01 6.820E+04 9.469E+01 2.366E+01 3.546E+04 2.603E+01
2136 8.271E+01 6.553E+04 9.098E+01 2.273E+01 3.407E+04 2.501E+01
2137 7.946E+01 6.296E+04 8.741E+01 2.184E+01 3.274E+04 2.403E+01
2138 7.635E+01 6.049E+04 8.398E+01 2.098E+01 3.145E+04 2.308E+01
2139 7.335E+01 5.812E+04 8.069E+01 2.016E+01 3.022E+04 2.218E+01
2140 7.048E+01 5.584E+04 7.753E+01 1.937E+01 2.904E+04 2.131E+01
2141 6.771E+01 5.365E+04 7.449E+01 1.861E+01 2.790E+04 2.047E+01
2142 6.506E+01 5.155E+04 7.157E+01 1.788E+01 2.680E+04 1.967E+01
2143 6.251E+01 4.952E+04 6.876E+01 1.718E+01 2.575E+04 1.890E+01
2144 6.006E+01 4.758E+04 6.606E+01 1.651E+01 2.474E+04 1.816E+01
2145 5.770E+01 4.572E+04 6.347E+01 1.586E+01 2.377E+04 1.745E+01
2146 5.544E+01 4.392E+04 6.098E+01 1.524E+01 2.284E+04 1.676E+01
2147 5.327E+01 4.220E+04 5.859E+01 1.464E+01 2.195E+04 1.610E+01
2148 5.118E+01 4.055E+04 5.630E+01 1.407E+01 2.108E+04 1.547E+01
2149 4.917E+01 3.896E+04 5.409E+01 1.351E+01 2.026E+04 1.487E+01
2150 4.724E+01 3.743E+04 5.197E+01 1.299E+01 1.946E+04 1.428E+01
2151 4.539E+01 3.596E+04 4.993E+01 1.248E+01 1.870E+04 1.372E+01
2152 4.361E+01 3.455E+04 4.797E+01 1.199E+01 1.797E+04 1.319E+01
2153 4.190E+01 3.320E+04 4.609E+01 1.152E+01 1.726E+04 1.267E+01
2154 4.026E+01 3.190E+04 4.428E+01 1.107E+01 1.659E+04 1.217E+01
2155 3.868E+01 3.064E+04 4.255E+01 1.063E+01 1.594E+04 1.169E+01
2156 3.716E+01 2.944E+04 4.088E+01 1.021E+01 1.531E+04 1.124E+01
2157 3.571E+01 2.829E+04 3.928E+01 9.814E+00 1.471E+04 1.080E+01
2158 3.431E+01 2.718E+04 3.774E+01 9.429E+00 1.413E+04 1.037E+01
2159 3.296E+01 2.611E+04 3.626E+01 9.059E+00 1.358E+04 9.965E+00
2160 3.167E+01 2.509E+04 3.483E+01 8.704E+00 1.305E+04 9.575E+00
2161 3.043E+01 2.411E+04 3.347E+01 8.363E+00 1.254E+04 9.199E+00
2162 2.923E+01 2.316E+04 3.216E+01 8.035E+00 1.204E+04 8.838E+002163 2.809E+01 2.225E+04 3.090E+01 7.720E+00 1.157E+04 8.492E+00
YearTotal landfill gas Methane
REPORT - 9
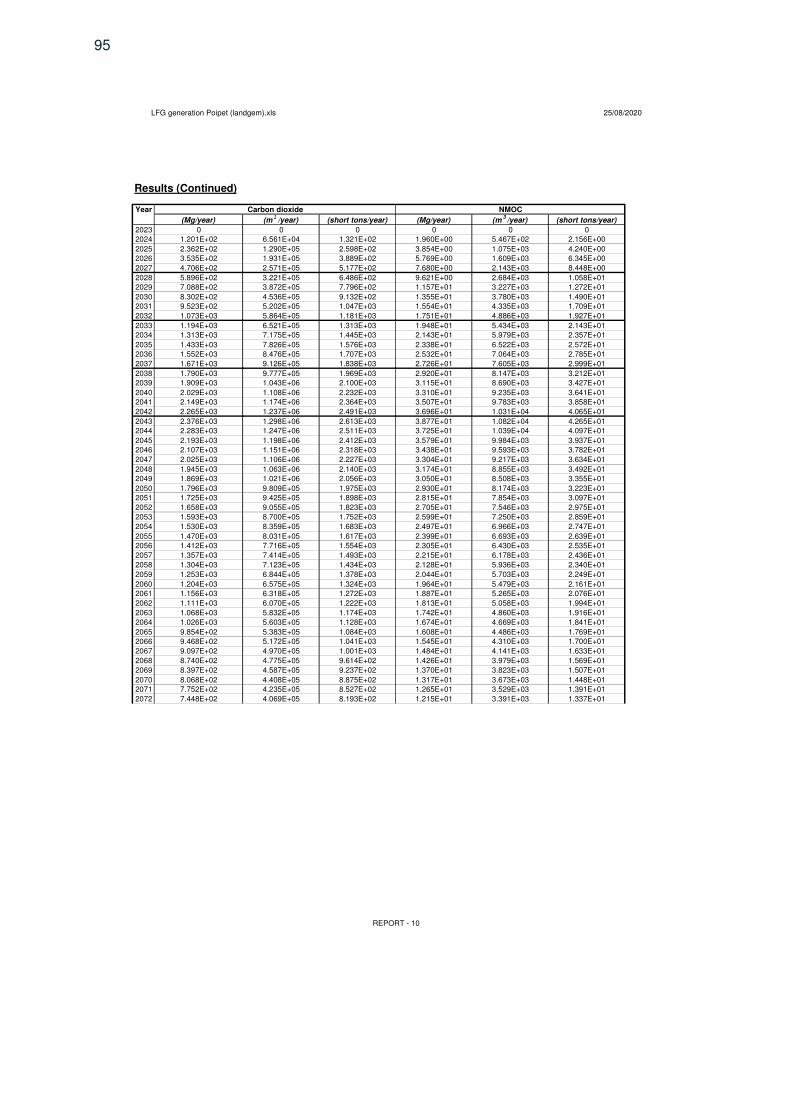
95
LFG generation Poipet (landgem).xls 25/08/2020
Results (Continued)
Year
(Mg/year) (m3/year) (short tons/year) (Mg/year) (m
3/year) (short tons/year)
2023 0 0 0 0 0 0
2024 1.201E+02 6.561E+04 1.321E+02 1.960E+00 5.467E+02 2.156E+00
2025 2.362E+02 1.290E+05 2.598E+02 3.854E+00 1.075E+03 4.240E+00
2026 3.535E+02 1.931E+05 3.889E+02 5.769E+00 1.609E+03 6.345E+00
2027 4.706E+02 2.571E+05 5.177E+02 7.680E+00 2.143E+03 8.448E+00
2028 5.896E+02 3.221E+05 6.486E+02 9.621E+00 2.684E+03 1.058E+01
2029 7.088E+02 3.872E+05 7.796E+02 1.157E+01 3.227E+03 1.272E+01
2030 8.302E+02 4.536E+05 9.132E+02 1.355E+01 3.780E+03 1.490E+01
2031 9.523E+02 5.202E+05 1.047E+03 1.554E+01 4.335E+03 1.709E+01
2032 1.073E+03 5.864E+05 1.181E+03 1.751E+01 4.886E+03 1.927E+01
2033 1.194E+03 6.521E+05 1.313E+03 1.948E+01 5.434E+03 2.143E+01
2034 1.313E+03 7.175E+05 1.445E+03 2.143E+01 5.979E+03 2.357E+01
2035 1.433E+03 7.826E+05 1.576E+03 2.338E+01 6.522E+03 2.572E+01
2036 1.552E+03 8.476E+05 1.707E+03 2.532E+01 7.064E+03 2.785E+01
2037 1.671E+03 9.126E+05 1.838E+03 2.726E+01 7.605E+03 2.999E+01
2038 1.790E+03 9.777E+05 1.969E+03 2.920E+01 8.147E+03 3.212E+01
2039 1.909E+03 1.043E+06 2.100E+03 3.115E+01 8.690E+03 3.427E+01
2040 2.029E+03 1.108E+06 2.232E+03 3.310E+01 9.235E+03 3.641E+01
2041 2.149E+03 1.174E+06 2.364E+03 3.507E+01 9.783E+03 3.858E+01
2042 2.265E+03 1.237E+06 2.491E+03 3.696E+01 1.031E+04 4.065E+01
2043 2.376E+03 1.298E+06 2.613E+03 3.877E+01 1.082E+04 4.265E+01
2044 2.283E+03 1.247E+06 2.511E+03 3.725E+01 1.039E+04 4.097E+01
2045 2.193E+03 1.198E+06 2.412E+03 3.579E+01 9.984E+03 3.937E+01
2046 2.107E+03 1.151E+06 2.318E+03 3.438E+01 9.593E+03 3.782E+01
2047 2.025E+03 1.106E+06 2.227E+03 3.304E+01 9.217E+03 3.634E+01
2048 1.945E+03 1.063E+06 2.140E+03 3.174E+01 8.855E+03 3.492E+01
2049 1.869E+03 1.021E+06 2.056E+03 3.050E+01 8.508E+03 3.355E+01
2050 1.796E+03 9.809E+05 1.975E+03 2.930E+01 8.174E+03 3.223E+01
2051 1.725E+03 9.425E+05 1.898E+03 2.815E+01 7.854E+03 3.097E+01
2052 1.658E+03 9.055E+05 1.823E+03 2.705E+01 7.546E+03 2.975E+01
2053 1.593E+03 8.700E+05 1.752E+03 2.599E+01 7.250E+03 2.859E+01
2054 1.530E+03 8.359E+05 1.683E+03 2.497E+01 6.966E+03 2.747E+01
2055 1.470E+03 8.031E+05 1.617E+03 2.399E+01 6.693E+03 2.639E+01
2056 1.412E+03 7.716E+05 1.554E+03 2.305E+01 6.430E+03 2.535E+01
2057 1.357E+03 7.414E+05 1.493E+03 2.215E+01 6.178E+03 2.436E+01
2058 1.304E+03 7.123E+05 1.434E+03 2.128E+01 5.936E+03 2.340E+01
2059 1.253E+03 6.844E+05 1.378E+03 2.044E+01 5.703E+03 2.249E+01
2060 1.204E+03 6.575E+05 1.324E+03 1.964E+01 5.479E+03 2.161E+01
2061 1.156E+03 6.318E+05 1.272E+03 1.887E+01 5.265E+03 2.076E+01
2062 1.111E+03 6.070E+05 1.222E+03 1.813E+01 5.058E+03 1.994E+01
2063 1.068E+03 5.832E+05 1.174E+03 1.742E+01 4.860E+03 1.916E+01
2064 1.026E+03 5.603E+05 1.128E+03 1.674E+01 4.669E+03 1.841E+01
2065 9.854E+02 5.383E+05 1.084E+03 1.608E+01 4.486E+03 1.769E+01
2066 9.468E+02 5.172E+05 1.041E+03 1.545E+01 4.310E+03 1.700E+01
2067 9.097E+02 4.970E+05 1.001E+03 1.484E+01 4.141E+03 1.633E+01
2068 8.740E+02 4.775E+05 9.614E+02 1.426E+01 3.979E+03 1.569E+01
2069 8.397E+02 4.587E+05 9.237E+02 1.370E+01 3.823E+03 1.507E+01
2070 8.068E+02 4.408E+05 8.875E+02 1.317E+01 3.673E+03 1.448E+01
2071 7.752E+02 4.235E+05 8.527E+02 1.265E+01 3.529E+03 1.391E+01
2072 7.448E+02 4.069E+05 8.193E+02 1.215E+01 3.391E+03 1.337E+01
NMOCCarbon dioxide
REPORT - 10
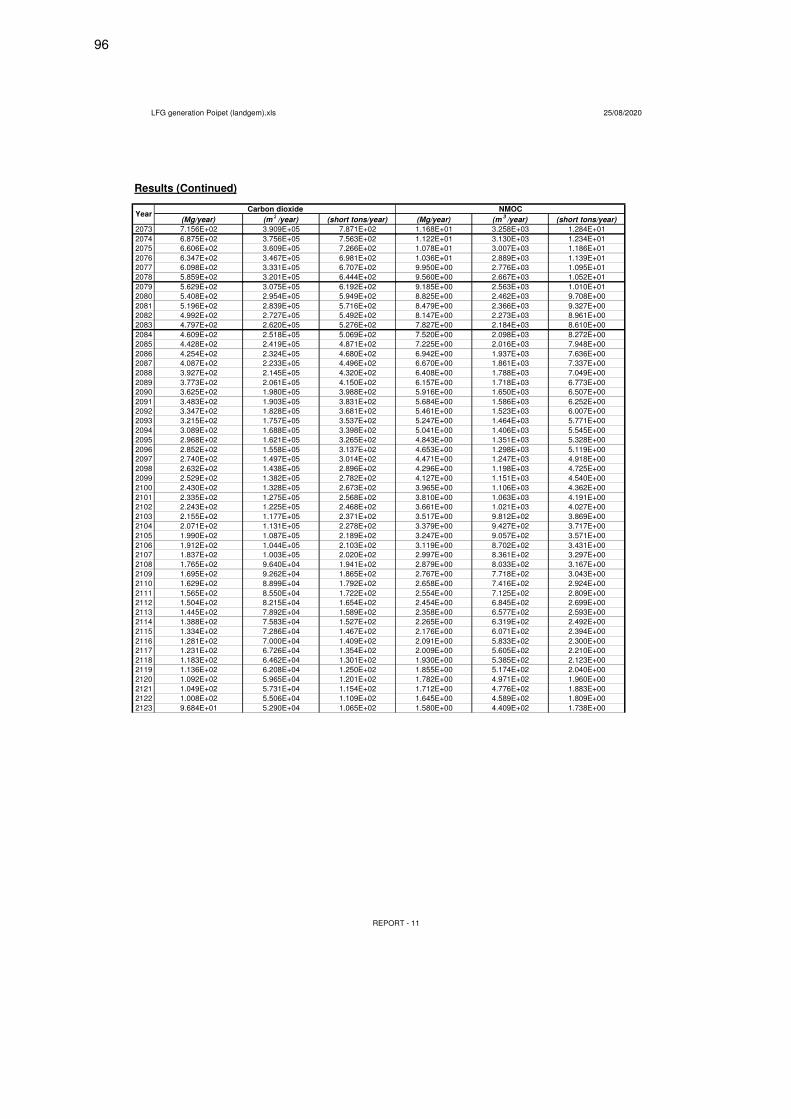
96
LFG generation Poipet (landgem).xls 25/08/2020
Results (Continued)
(Mg/year) (m3/year) (short tons/year) (Mg/year) (m
3/year) (short tons/year)
2073 7.156E+02 3.909E+05 7.871E+02 1.168E+01 3.258E+03 1.284E+01
2074 6.875E+02 3.756E+05 7.563E+02 1.122E+01 3.130E+03 1.234E+01
2075 6.606E+02 3.609E+05 7.266E+02 1.078E+01 3.007E+03 1.186E+01
2076 6.347E+02 3.467E+05 6.981E+02 1.036E+01 2.889E+03 1.139E+01
2077 6.098E+02 3.331E+05 6.707E+02 9.950E+00 2.776E+03 1.095E+01
2078 5.859E+02 3.201E+05 6.444E+02 9.560E+00 2.667E+03 1.052E+01
2079 5.629E+02 3.075E+05 6.192E+02 9.185E+00 2.563E+03 1.010E+01
2080 5.408E+02 2.954E+05 5.949E+02 8.825E+00 2.462E+03 9.708E+00
2081 5.196E+02 2.839E+05 5.716E+02 8.479E+00 2.366E+03 9.327E+00
2082 4.992E+02 2.727E+05 5.492E+02 8.147E+00 2.273E+03 8.961E+00
2083 4.797E+02 2.620E+05 5.276E+02 7.827E+00 2.184E+03 8.610E+00
2084 4.609E+02 2.518E+05 5.069E+02 7.520E+00 2.098E+03 8.272E+00
2085 4.428E+02 2.419E+05 4.871E+02 7.225E+00 2.016E+03 7.948E+00
2086 4.254E+02 2.324E+05 4.680E+02 6.942E+00 1.937E+03 7.636E+00
2087 4.087E+02 2.233E+05 4.496E+02 6.670E+00 1.861E+03 7.337E+00
2088 3.927E+02 2.145E+05 4.320E+02 6.408E+00 1.788E+03 7.049E+00
2089 3.773E+02 2.061E+05 4.150E+02 6.157E+00 1.718E+03 6.773E+00
2090 3.625E+02 1.980E+05 3.988E+02 5.916E+00 1.650E+03 6.507E+00
2091 3.483E+02 1.903E+05 3.831E+02 5.684E+00 1.586E+03 6.252E+00
2092 3.347E+02 1.828E+05 3.681E+02 5.461E+00 1.523E+03 6.007E+00
2093 3.215E+02 1.757E+05 3.537E+02 5.247E+00 1.464E+03 5.771E+00
2094 3.089E+02 1.688E+05 3.398E+02 5.041E+00 1.406E+03 5.545E+00
2095 2.968E+02 1.621E+05 3.265E+02 4.843E+00 1.351E+03 5.328E+00
2096 2.852E+02 1.558E+05 3.137E+02 4.653E+00 1.298E+03 5.119E+00
2097 2.740E+02 1.497E+05 3.014E+02 4.471E+00 1.247E+03 4.918E+00
2098 2.632E+02 1.438E+05 2.896E+02 4.296E+00 1.198E+03 4.725E+00
2099 2.529E+02 1.382E+05 2.782E+02 4.127E+00 1.151E+03 4.540E+00
2100 2.430E+02 1.328E+05 2.673E+02 3.965E+00 1.106E+03 4.362E+00
2101 2.335E+02 1.275E+05 2.568E+02 3.810E+00 1.063E+03 4.191E+00
2102 2.243E+02 1.225E+05 2.468E+02 3.661E+00 1.021E+03 4.027E+00
2103 2.155E+02 1.177E+05 2.371E+02 3.517E+00 9.812E+02 3.869E+00
2104 2.071E+02 1.131E+05 2.278E+02 3.379E+00 9.427E+02 3.717E+00
2105 1.990E+02 1.087E+05 2.189E+02 3.247E+00 9.057E+02 3.571E+00
2106 1.912E+02 1.044E+05 2.103E+02 3.119E+00 8.702E+02 3.431E+00
2107 1.837E+02 1.003E+05 2.020E+02 2.997E+00 8.361E+02 3.297E+00
2108 1.765E+02 9.640E+04 1.941E+02 2.879E+00 8.033E+02 3.167E+00
2109 1.695E+02 9.262E+04 1.865E+02 2.767E+00 7.718E+02 3.043E+00
2110 1.629E+02 8.899E+04 1.792E+02 2.658E+00 7.416E+02 2.924E+00
2111 1.565E+02 8.550E+04 1.722E+02 2.554E+00 7.125E+02 2.809E+00
2112 1.504E+02 8.215E+04 1.654E+02 2.454E+00 6.845E+02 2.699E+00
2113 1.445E+02 7.892E+04 1.589E+02 2.358E+00 6.577E+02 2.593E+00
2114 1.388E+02 7.583E+04 1.527E+02 2.265E+00 6.319E+02 2.492E+00
2115 1.334E+02 7.286E+04 1.467E+02 2.176E+00 6.071E+02 2.394E+00
2116 1.281E+02 7.000E+04 1.409E+02 2.091E+00 5.833E+02 2.300E+00
2117 1.231E+02 6.726E+04 1.354E+02 2.009E+00 5.605E+02 2.210E+00
2118 1.183E+02 6.462E+04 1.301E+02 1.930E+00 5.385E+02 2.123E+00
2119 1.136E+02 6.208E+04 1.250E+02 1.855E+00 5.174E+02 2.040E+00
2120 1.092E+02 5.965E+04 1.201E+02 1.782E+00 4.971E+02 1.960E+00
2121 1.049E+02 5.731E+04 1.154E+02 1.712E+00 4.776E+02 1.883E+00
2122 1.008E+02 5.506E+04 1.109E+02 1.645E+00 4.589E+02 1.809E+00
2123 9.684E+01 5.290E+04 1.065E+02 1.580E+00 4.409E+02 1.738E+00
Carbon dioxideYear
NMOC
REPORT - 11
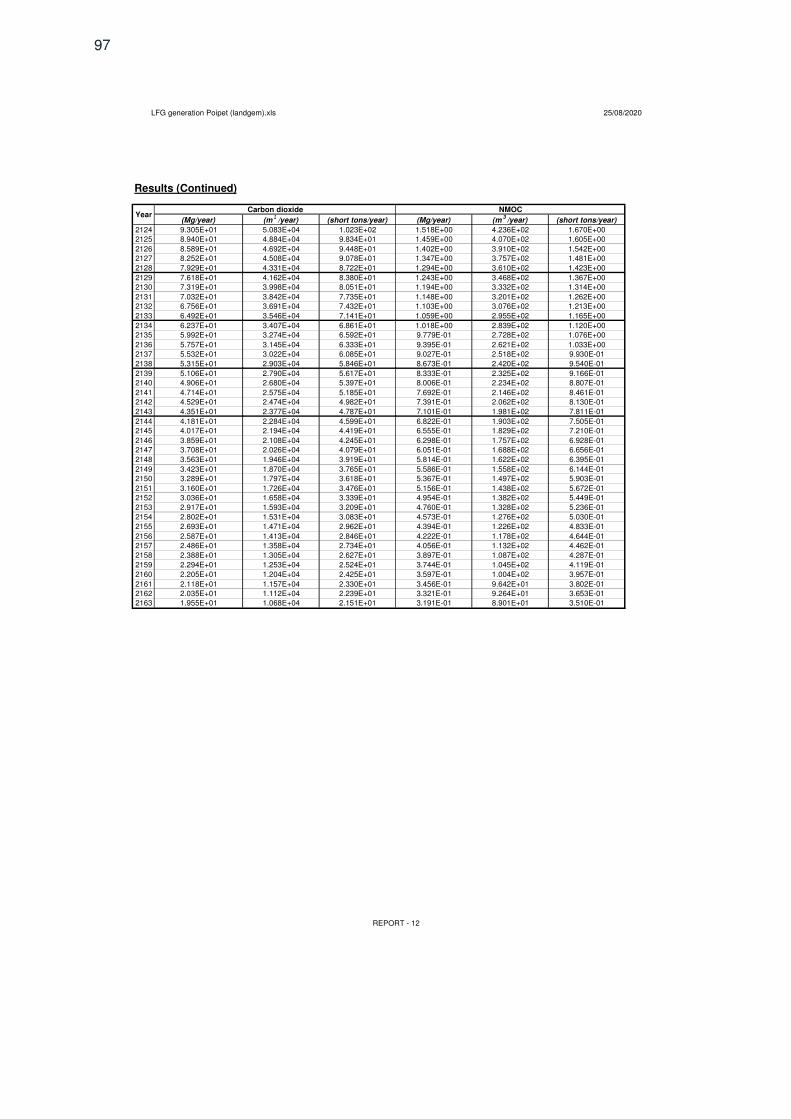
97
LFG generation Poipet (landgem).xls 25/08/2020
Results (Continued)
(Mg/year) (m3/year) (short tons/year) (Mg/year) (m
3/year) (short tons/year)
2124 9.305E+01 5.083E+04 1.023E+02 1.518E+00 4.236E+02 1.670E+00
2125 8.940E+01 4.884E+04 9.834E+01 1.459E+00 4.070E+02 1.605E+00
2126 8.589E+01 4.692E+04 9.448E+01 1.402E+00 3.910E+02 1.542E+00
2127 8.252E+01 4.508E+04 9.078E+01 1.347E+00 3.757E+02 1.481E+00
2128 7.929E+01 4.331E+04 8.722E+01 1.294E+00 3.610E+02 1.423E+00
2129 7.618E+01 4.162E+04 8.380E+01 1.243E+00 3.468E+02 1.367E+00
2130 7.319E+01 3.998E+04 8.051E+01 1.194E+00 3.332E+02 1.314E+00
2131 7.032E+01 3.842E+04 7.735E+01 1.148E+00 3.201E+02 1.262E+00
2132 6.756E+01 3.691E+04 7.432E+01 1.103E+00 3.076E+02 1.213E+00
2133 6.492E+01 3.546E+04 7.141E+01 1.059E+00 2.955E+02 1.165E+00
2134 6.237E+01 3.407E+04 6.861E+01 1.018E+00 2.839E+02 1.120E+00
2135 5.992E+01 3.274E+04 6.592E+01 9.779E-01 2.728E+02 1.076E+00
2136 5.757E+01 3.145E+04 6.333E+01 9.395E-01 2.621E+02 1.033E+00
2137 5.532E+01 3.022E+04 6.085E+01 9.027E-01 2.518E+02 9.930E-01
2138 5.315E+01 2.903E+04 5.846E+01 8.673E-01 2.420E+02 9.540E-01
2139 5.106E+01 2.790E+04 5.617E+01 8.333E-01 2.325E+02 9.166E-01
2140 4.906E+01 2.680E+04 5.397E+01 8.006E-01 2.234E+02 8.807E-01
2141 4.714E+01 2.575E+04 5.185E+01 7.692E-01 2.146E+02 8.461E-01
2142 4.529E+01 2.474E+04 4.982E+01 7.391E-01 2.062E+02 8.130E-01
2143 4.351E+01 2.377E+04 4.787E+01 7.101E-01 1.981E+02 7.811E-01
2144 4.181E+01 2.284E+04 4.599E+01 6.822E-01 1.903E+02 7.505E-01
2145 4.017E+01 2.194E+04 4.419E+01 6.555E-01 1.829E+02 7.210E-01
2146 3.859E+01 2.108E+04 4.245E+01 6.298E-01 1.757E+02 6.928E-01
2147 3.708E+01 2.026E+04 4.079E+01 6.051E-01 1.688E+02 6.656E-01
2148 3.563E+01 1.946E+04 3.919E+01 5.814E-01 1.622E+02 6.395E-01
2149 3.423E+01 1.870E+04 3.765E+01 5.586E-01 1.558E+02 6.144E-01
2150 3.289E+01 1.797E+04 3.618E+01 5.367E-01 1.497E+02 5.903E-01
2151 3.160E+01 1.726E+04 3.476E+01 5.156E-01 1.438E+02 5.672E-01
2152 3.036E+01 1.658E+04 3.339E+01 4.954E-01 1.382E+02 5.449E-01
2153 2.917E+01 1.593E+04 3.209E+01 4.760E-01 1.328E+02 5.236E-01
2154 2.802E+01 1.531E+04 3.083E+01 4.573E-01 1.276E+02 5.030E-01
2155 2.693E+01 1.471E+04 2.962E+01 4.394E-01 1.226E+02 4.833E-01
2156 2.587E+01 1.413E+04 2.846E+01 4.222E-01 1.178E+02 4.644E-01
2157 2.486E+01 1.358E+04 2.734E+01 4.056E-01 1.132E+02 4.462E-01
2158 2.388E+01 1.305E+04 2.627E+01 3.897E-01 1.087E+02 4.287E-01
2159 2.294E+01 1.253E+04 2.524E+01 3.744E-01 1.045E+02 4.119E-01
2160 2.205E+01 1.204E+04 2.425E+01 3.597E-01 1.004E+02 3.957E-01
2161 2.118E+01 1.157E+04 2.330E+01 3.456E-01 9.642E+01 3.802E-01
2162 2.035E+01 1.112E+04 2.239E+01 3.321E-01 9.264E+01 3.653E-01
2163 1.955E+01 1.068E+04 2.151E+01 3.191E-01 8.901E+01 3.510E-01
YearCarbon dioxide NMOC
REPORT - 12
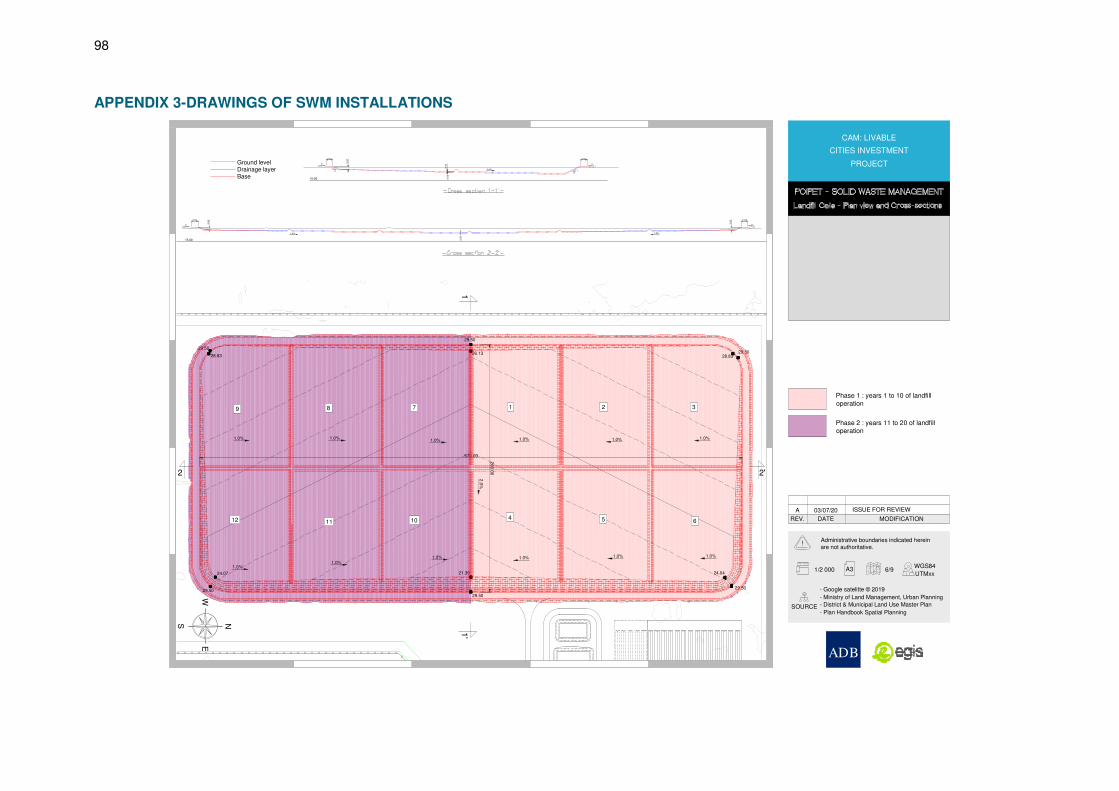
98
APPENDIX 3-DRAWINGS OF SWM INSTALLATIONS
ADB
A3
SOURCE
!Administrative boundaries indicated hereinare not authoritative.
- Google satelitte © 2019
- Ministry of Land Management, Urban Planning
- District & Municipal Land Use Master Plan
- Plan Handbook Spatial Planning
REV. DATE MODIFICATION
PROJECT
CITIES INVESTMENT
CAM: LIVABLE
UTMxx
WGS846/91/2 000
ISSUE FOR REVIEW03/07/20A
NS
EW
Phase 1 : years 1 to 10 of landfilloperation
Phase 2 : years 11 to 20 of landfilloperation
1.0% 1.0%
1.0%
1.0%
1.0%
1.0%
1.0%1.0%1.0%
1.0%1.0%
1.0%
2.0
%
28.8329.50
24.04
29.50
29.50
29.50
28.83
29.50
24.07
29.50
21.39
26.13
570.00
260
.00
7 1 2 3
4 5 6
89
101112
1
2'2
1'
26.77
15.00
15.00
21
2.0%2
1
31
3
1.0%
1
1.0%
7.00
3.3
7
0.4
9
2.5
0
3.0
07.00
7.00
7.00
0.5
0
0.5
0
31
31
Ground levelDrainage layerBase
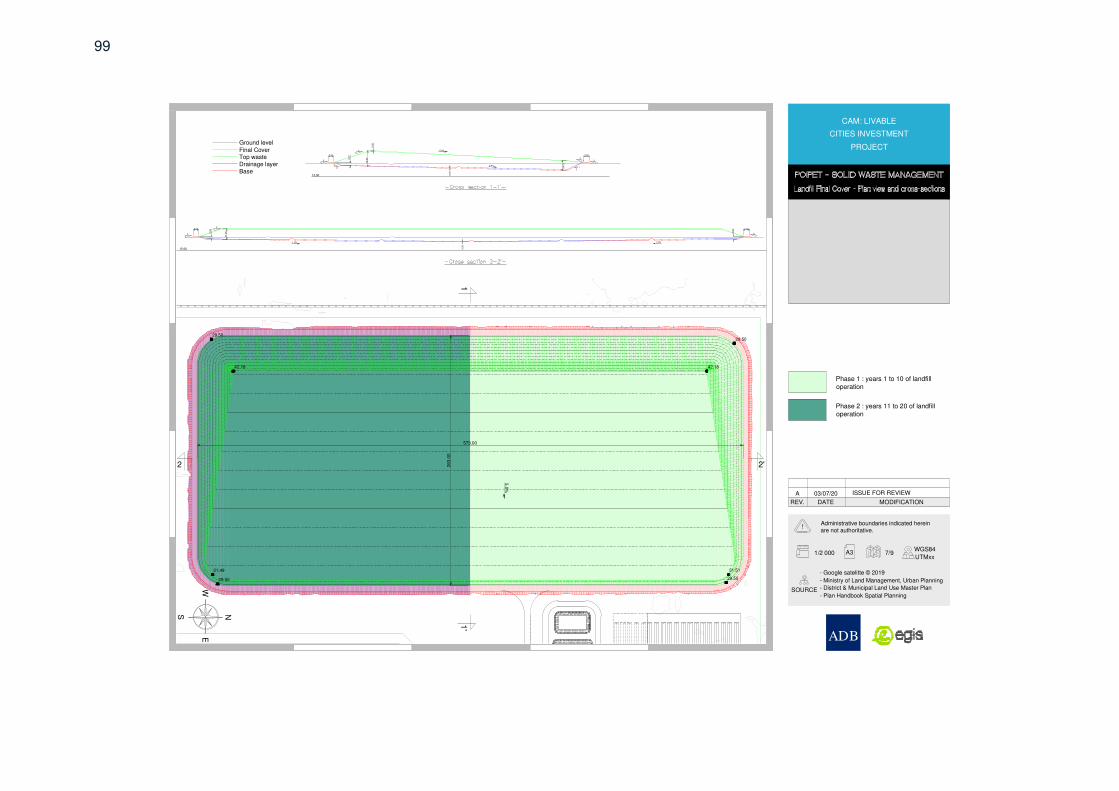
99
ADB
A3
SOURCE
!Administrative boundaries indicated hereinare not authoritative.
- Google satelitte © 2019
- Ministry of Land Management, Urban Planning
- District & Municipal Land Use Master Plan
- Plan Handbook Spatial Planning
REV. DATE MODIFICATION
PROJECT
CITIES INVESTMENT
CAM: LIVABLE
UTMxx
WGS847/91/2 000
ISSUE FOR REVIEW03/07/20A
NS
EW
Phase 1 : years 1 to 10 of landfilloperation
Phase 2 : years 11 to 20 of landfilloperation
1.0% 1.0%
1.0%
1.0%
1.0%
1.0%
1.0%1.0%1.0%
1.0%1.0%
1.0%
263
.00
573.00
5.0
%
42.18
31.51
29.50
29.50
42.18
31.49
29.50
29.50
1
2'2
1'
15.00
15.00
21
2.0%2
1
31
3
1.0%
1
1.0%
5.50
3.3
7
0.5
0
2.5
0
11
.28 3.0
05.50
5.50
7.00
0.5
0
0.5
0
31
31
5.0%31
31
31
16
.65
10
.40
Top waste
Ground level
Drainage layer
Final Cover
Base
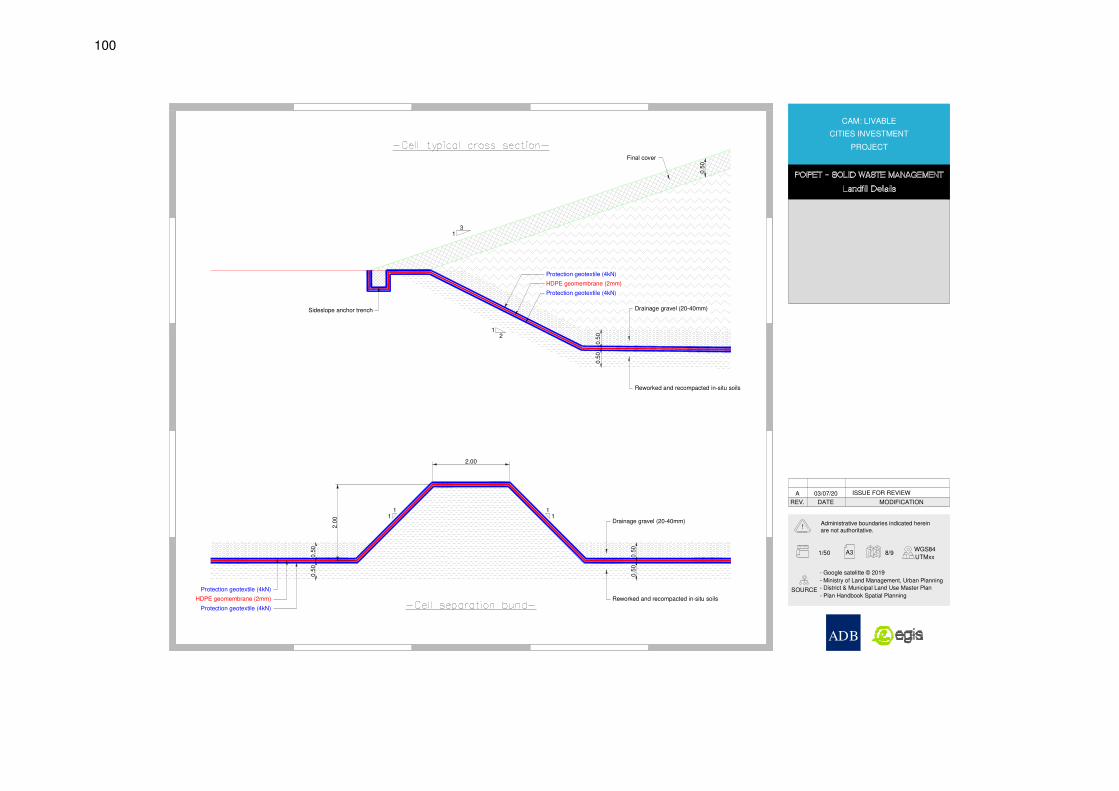
100
ADB
A3
SOURCE
!Administrative boundaries indicated hereinare not authoritative.
- Google satelitte © 2019
- Ministry of Land Management, Urban Planning
- District & Municipal Land Use Master Plan
- Plan Handbook Spatial Planning
REV. DATE MODIFICATION
PROJECT
CITIES INVESTMENT
CAM: LIVABLE
UTMxx
WGS848/91/50
ISSUE FOR REVIEW03/07/20A
1
2.00
0.5
0Drainage gravel (20-40mm)
1
Protection geotextile (4kN)
1
Drainage gravel (20-40mm)
Protection geotextile (4kN)
0.5
0
HDPE geomembrane (2mm)
0.5
0
Protection geotextile (4kN)
0.5
0
Reworked and recompacted in-situ soils
2.0
01
1
1
0.5
0
HDPE geomembrane (2mm)0
.50
Reworked and recompacted in-situ soils
Final cover
0.5
0
2
Protection geotextile (4kN)
3
Sideslope anchor trench
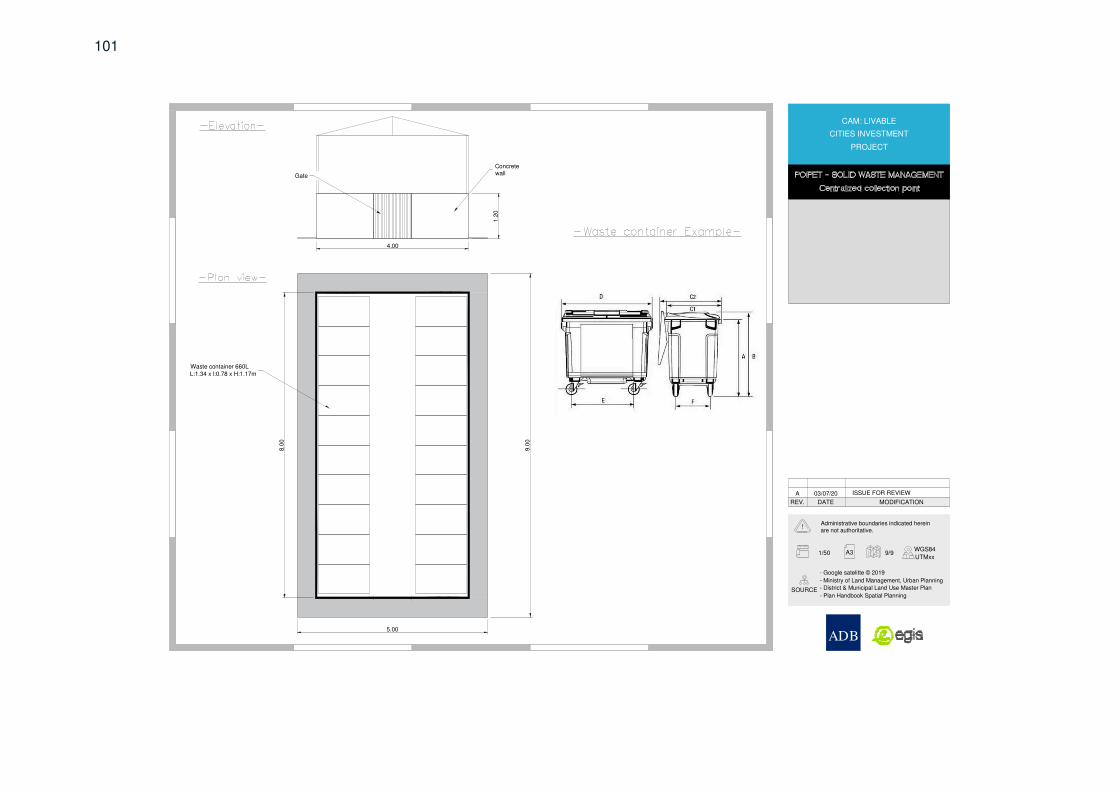
101
ADB
A3
SOURCE
!Administrative boundaries indicated hereinare not authoritative.
- Google satelitte © 2019
- Ministry of Land Management, Urban Planning
- District & Municipal Land Use Master Plan
- Plan Handbook Spatial Planning
REV. DATE MODIFICATION
PROJECT
CITIES INVESTMENT
CAM: LIVABLE
UTMxx
WGS849/91/50
ISSUE FOR REVIEW03/07/20A
9.0
0
5.00
8.0
0
Waste container 660LL:1.34 x l:0.78 x H:1.17m
1.2
0
4.00
ConcretewallGate
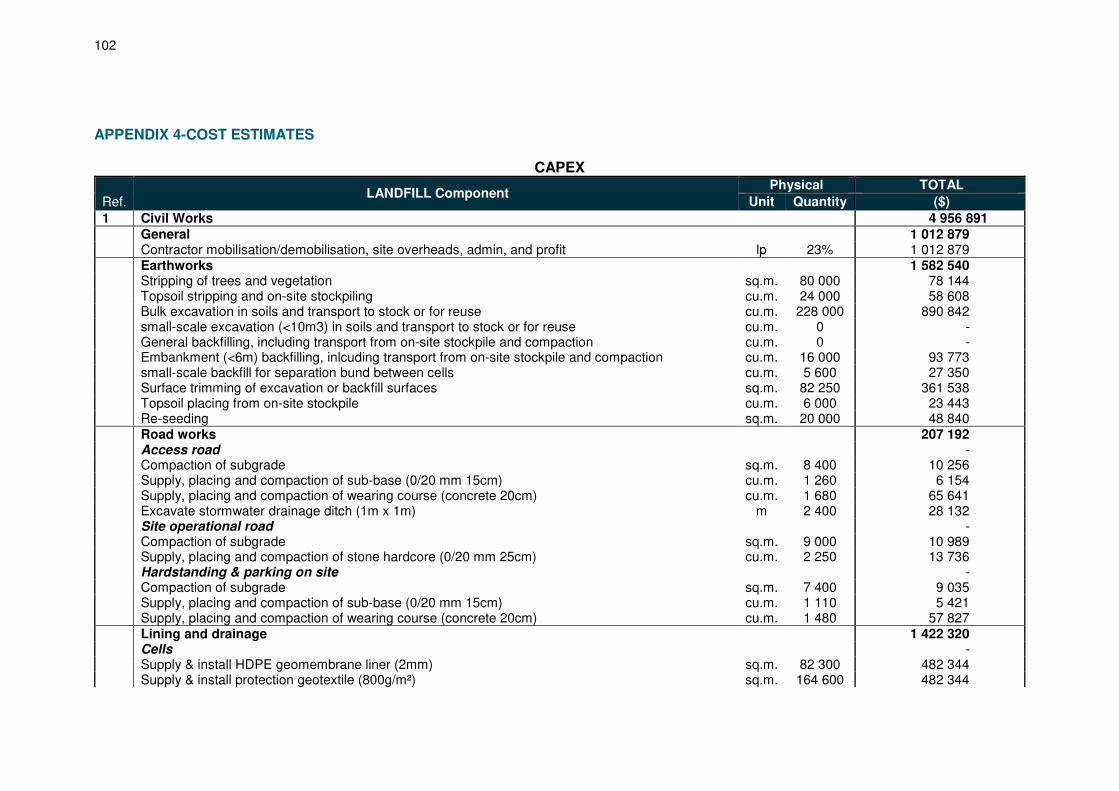
102
APPENDIX 4-COST ESTIMATES
CAPEX
Ref. LANDFILL Component
Physical TOTAL
Unit Quantity ($)
1 Civil Works 4 956 891 General 1 012 879 Contractor mobilisation/demobilisation, site overheads, admin, and profit lp 23% 1 012 879 Earthworks 1 582 540 Stripping of trees and vegetation sq.m. 80 000 78 144 Topsoil stripping and on-site stockpiling cu.m. 24 000 58 608 Bulk excavation in soils and transport to stock or for reuse cu.m. 228 000 890 842 small-scale excavation (<10m3) in soils and transport to stock or for reuse cu.m. 0 - General backfilling, including transport from on-site stockpile and compaction cu.m. 0 - Embankment (<6m) backfilling, inlcuding transport from on-site stockpile and compaction cu.m. 16 000 93 773 small-scale backfill for separation bund between cells cu.m. 5 600 27 350 Surface trimming of excavation or backfill surfaces sq.m. 82 250 361 538 Topsoil placing from on-site stockpile cu.m. 6 000 23 443 Re-seeding sq.m. 20 000 48 840 Road works 207 192 Access road - Compaction of subgrade sq.m. 8 400 10 256 Supply, placing and compaction of sub-base (0/20 mm 15cm) cu.m. 1 260 6 154 Supply, placing and compaction of wearing course (concrete 20cm) cu.m. 1 680 65 641 Excavate stormwater drainage ditch (1m x 1m) m 2 400 28 132 Site operational road - Compaction of subgrade sq.m. 9 000 10 989 Supply, placing and compaction of stone hardcore (0/20 mm 25cm) cu.m. 2 250 13 736 Hardstanding & parking on site - Compaction of subgrade sq.m. 7 400 9 035 Supply, placing and compaction of sub-base (0/20 mm 15cm) cu.m. 1 110 5 421 Supply, placing and compaction of wearing course (concrete 20cm) cu.m. 1 480 57 827 Lining and drainage 1 422 320 Cells - Supply & install HDPE geomembrane liner (2mm) sq.m. 82 300 482 344 Supply & install protection geotextile (800g/m²) sq.m. 164 600 482 344
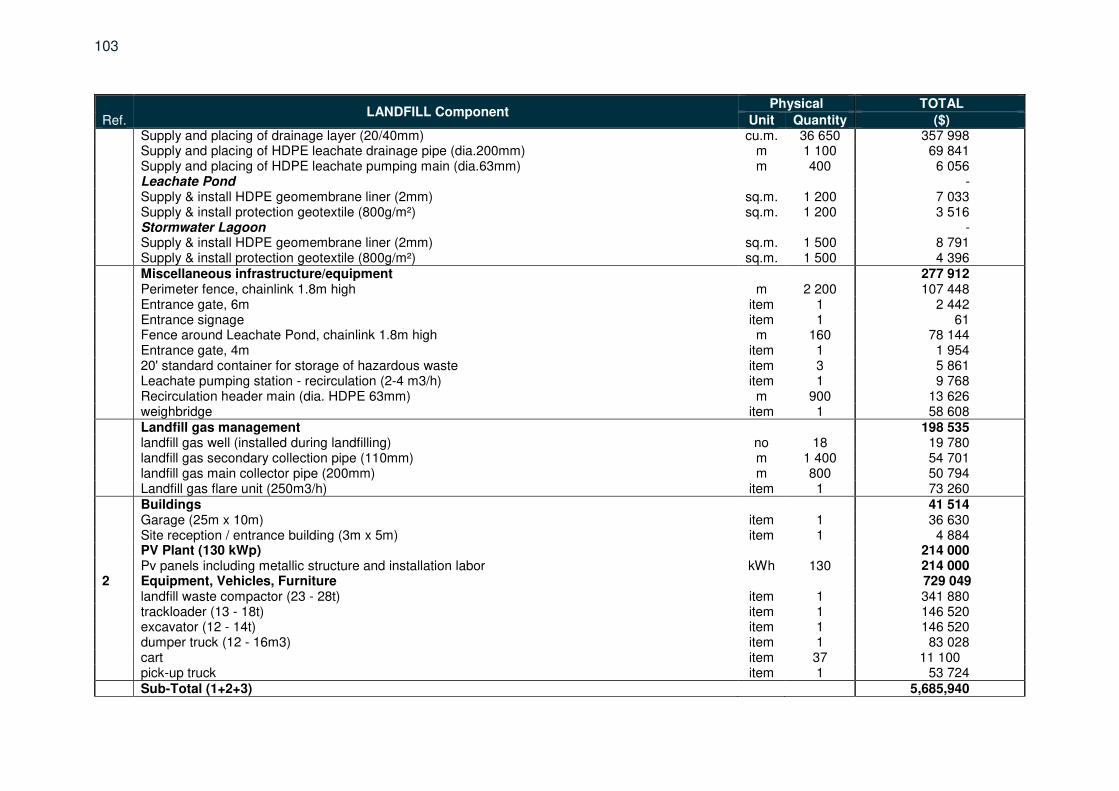
103
Ref. LANDFILL Component
Physical TOTAL
Unit Quantity ($) Supply and placing of drainage layer (20/40mm) cu.m. 36 650 357 998 Supply and placing of HDPE leachate drainage pipe (dia.200mm) m 1 100 69 841 Supply and placing of HDPE leachate pumping main (dia.63mm) m 400 6 056 Leachate Pond - Supply & install HDPE geomembrane liner (2mm) sq.m. 1 200 7 033 Supply & install protection geotextile (800g/m²) sq.m. 1 200 3 516 Stormwater Lagoon - Supply & install HDPE geomembrane liner (2mm) sq.m. 1 500 8 791 Supply & install protection geotextile (800g/m²) sq.m. 1 500 4 396 Miscellaneous infrastructure/equipment 277 912 Perimeter fence, chainlink 1.8m high m 2 200 107 448 Entrance gate, 6m item 1 2 442 Entrance signage item 1 61 Fence around Leachate Pond, chainlink 1.8m high m 160 78 144 Entrance gate, 4m item 1 1 954 20' standard container for storage of hazardous waste item 3 5 861 Leachate pumping station - recirculation (2-4 m3/h) item 1 9 768 Recirculation header main (dia. HDPE 63mm) m 900 13 626 weighbridge item 1 58 608 Landfill gas management 198 535 landfill gas well (installed during landfilling) no 18 19 780 landfill gas secondary collection pipe (110mm) m 1 400 54 701 landfill gas main collector pipe (200mm) m 800 50 794 Landfill gas flare unit (250m3/h) item 1 73 260 Buildings 41 514 Garage (25m x 10m) item 1 36 630 Site reception / entrance building (3m x 5m) item 1 4 884 PV Plant (130 kWp) 214 000 Pv panels including metallic structure and installation labor kWh 130 214 000 2 Equipment, Vehicles, Furniture 729 049 landfill waste compactor (23 - 28t) item 1 341 880 trackloader (13 - 18t) item 1 146 520 excavator (12 - 14t) item 1 146 520 dumper truck (12 - 16m3) item 1 83 028 cart item 37 11 100 pick-up truck item 1 53 724 Sub-Total (1+2+3) 5,685,940
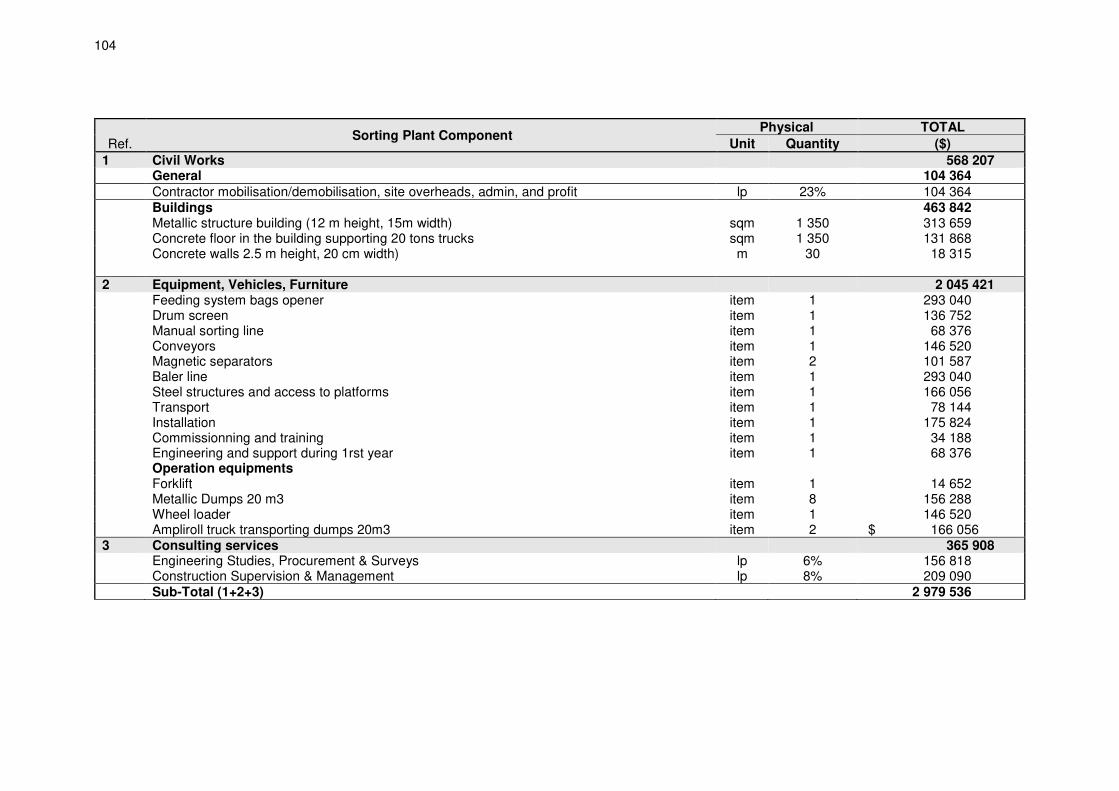
104
Ref. Sorting Plant Component
Physical TOTAL
Unit Quantity ($)
1 Civil Works 568 207 General 104 364 Contractor mobilisation/demobilisation, site overheads, admin, and profit lp 23% 104 364 Buildings 463 842 Metallic structure building (12 m height, 15m width) sqm 1 350 313 659 Concrete floor in the building supporting 20 tons trucks sqm 1 350 131 868 Concrete walls 2.5 m height, 20 cm width) m 30 18 315 2 Equipment, Vehicles, Furniture 2 045 421 Feeding system bags opener item 1 293 040 Drum screen item 1 136 752 Manual sorting line item 1 68 376 Conveyors item 1 146 520 Magnetic separators item 2 101 587 Baler line item 1 293 040 Steel structures and access to platforms item 1 166 056 Transport item 1 78 144 Installation item 1 175 824 Commissionning and training item 1 34 188 Engineering and support during 1rst year item 1 68 376 Operation equipments Forklift item 1 14 652 Metallic Dumps 20 m3 item 8 156 288 Wheel loader item 1 146 520 Ampliroll truck transporting dumps 20m3 item 2 $ 166 056 3 Consulting services 365 908 Engineering Studies, Procurement & Surveys lp 6% 156 818 Construction Supervision & Management lp 8% 209 090 Sub-Total (1+2+3) 2 979 536
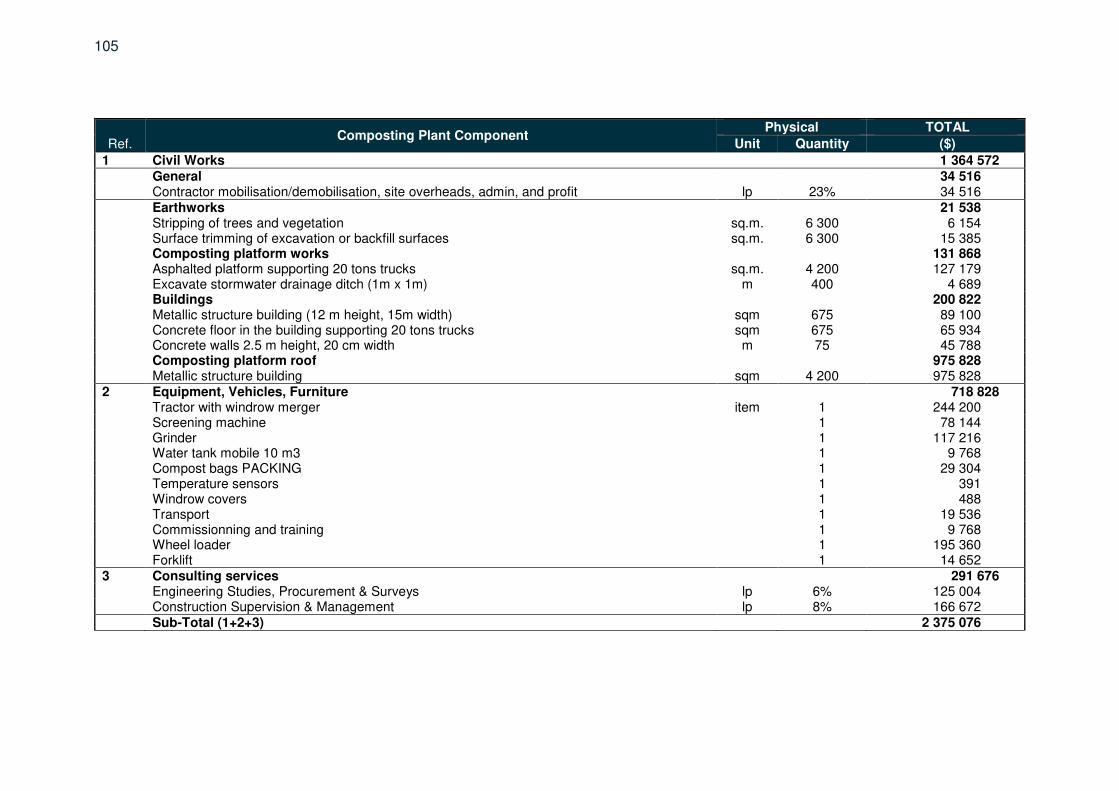
105
Ref. Composting Plant Component
Physical TOTAL
Unit Quantity ($)
1 Civil Works 1 364 572 General 34 516 Contractor mobilisation/demobilisation, site overheads, admin, and profit lp 23% 34 516 Earthworks 21 538 Stripping of trees and vegetation sq.m. 6 300 6 154 Surface trimming of excavation or backfill surfaces sq.m. 6 300 15 385 Composting platform works 131 868 Asphalted platform supporting 20 tons trucks sq.m. 4 200 127 179 Excavate stormwater drainage ditch (1m x 1m) m 400 4 689 Buildings 200 822 Metallic structure building (12 m height, 15m width) sqm 675 89 100 Concrete floor in the building supporting 20 tons trucks sqm 675 65 934 Concrete walls 2.5 m height, 20 cm width m 75 45 788 Composting platform roof 975 828 Metallic structure building sqm 4 200 975 828 2 Equipment, Vehicles, Furniture 718 828 Tractor with windrow merger item 1 244 200 Screening machine 1 78 144 Grinder 1 117 216 Water tank mobile 10 m3 1 9 768 Compost bags PACKING 1 29 304 Temperature sensors 1 391 Windrow covers 1 488 Transport 1 19 536 Commissionning and training 1 9 768 Wheel loader 1 195 360 Forklift 1 14 652 3 Consulting services 291 676 Engineering Studies, Procurement & Surveys lp 6% 125 004 Construction Supervision & Management lp 8% 166 672 Sub-Total (1+2+3) 2 375 076
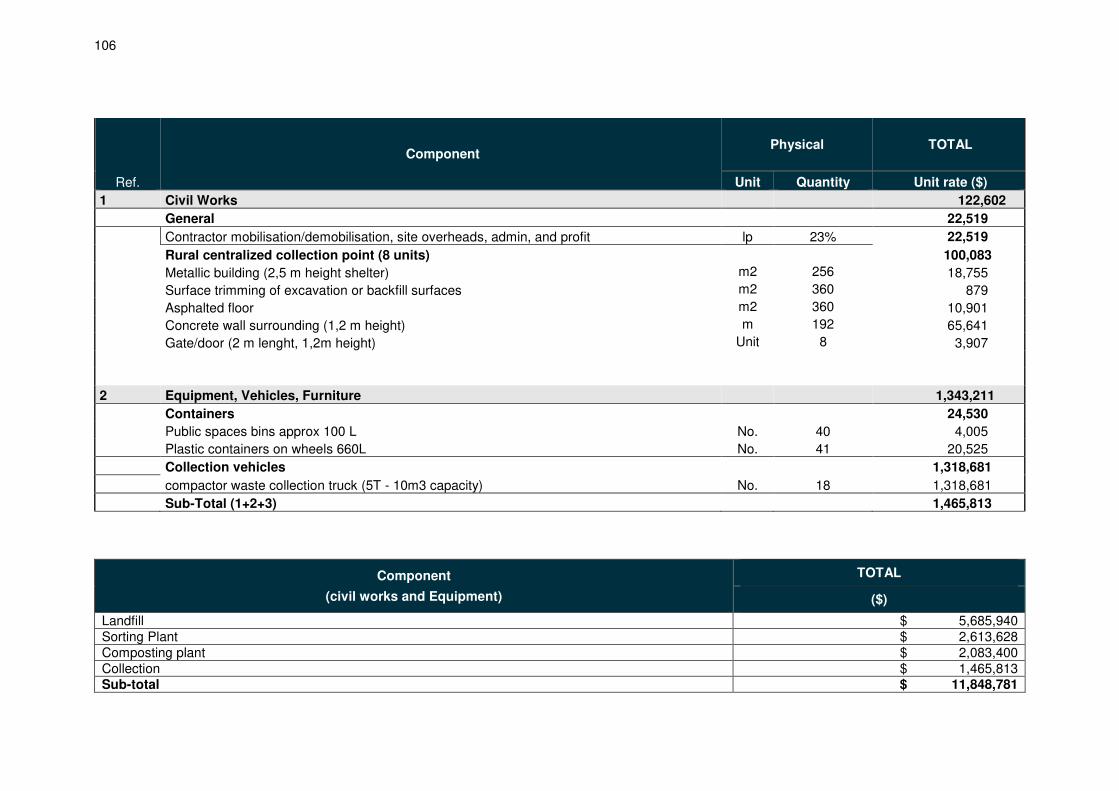
106
Ref.
Component Physical TOTAL
Unit Quantity Unit rate ($)
1 Civil Works 122,602
General 22,519
Contractor mobilisation/demobilisation, site overheads, admin, and profit lp 23% 22,519
Rural centralized collection point (8 units) 100,083
Metallic building (2,5 m height shelter) m2 256 18,755
Surface trimming of excavation or backfill surfaces m2 360 879
Asphalted floor m2 360 10,901
Concrete wall surrounding (1,2 m height) m 192 65,641
Gate/door (2 m lenght, 1,2m height) Unit 8 3,907
2 Equipment, Vehicles, Furniture 1,343,211
Containers 24,530
Public spaces bins approx 100 L No. 40 4,005
Plastic containers on wheels 660L No. 41 20,525
Collection vehicles 1,318,681
compactor waste collection truck (5T - 10m3 capacity) No. 18 1,318,681
Sub-Total (1+2+3) 1,465,813
Component
(civil works and Equipment)
TOTAL
($)
Landfill $ 5,685,940 Sorting Plant $ 2,613,628 Composting plant $ 2,083,400 Collection $ 1,465,813 Sub-total $ 11,848,781
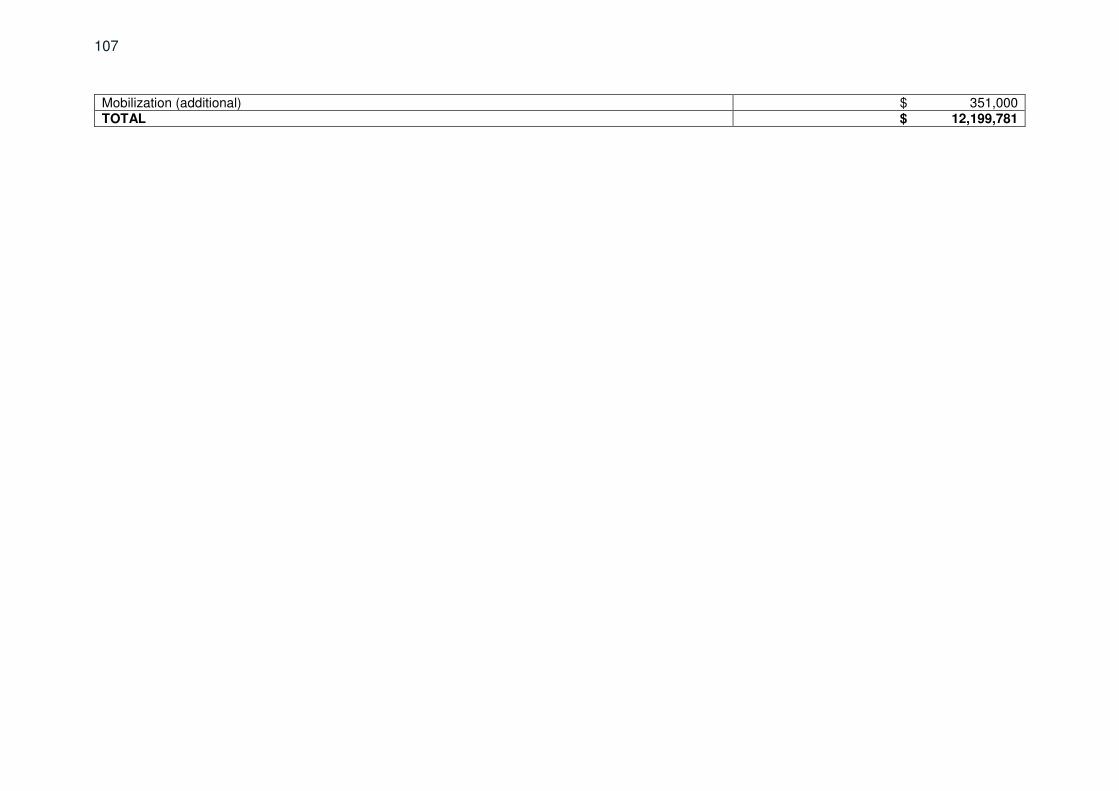
107
Mobilization (additional) $ 351,000 TOTAL $ 12,199,781
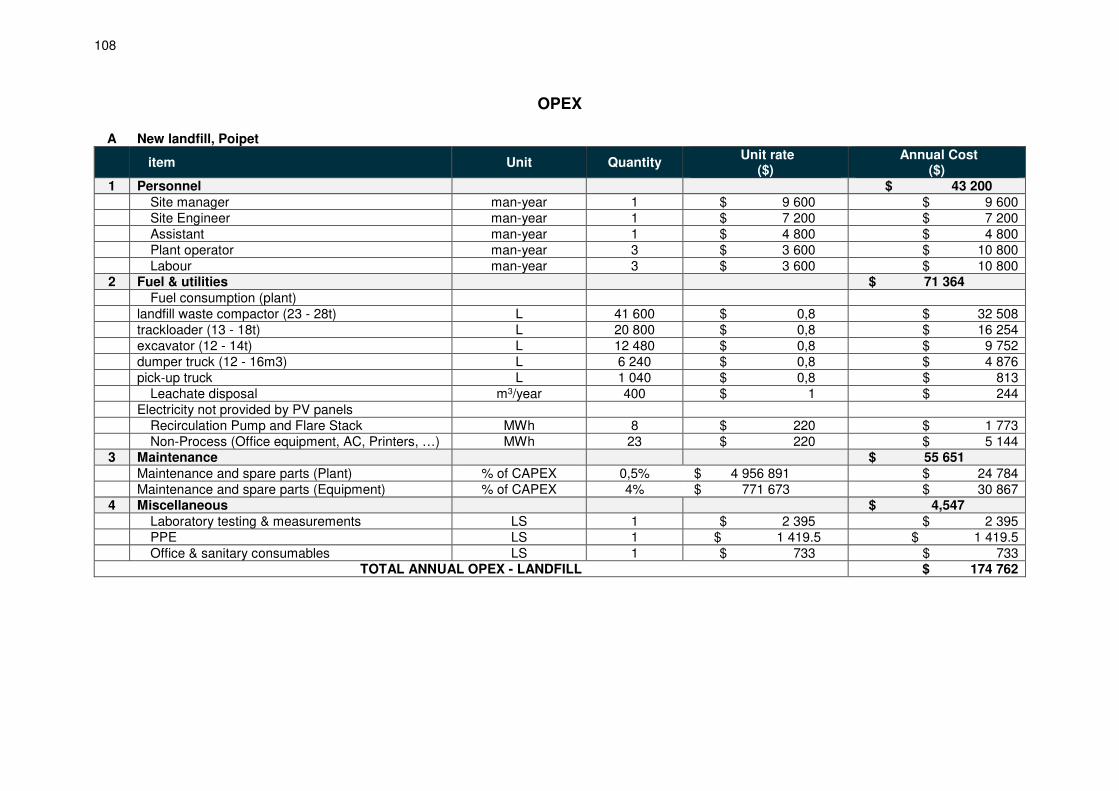
108
OPEX
A New landfill, Poipet
item Unit Quantity Unit rate
($) Annual Cost
($) 1 Personnel $ 43 200 Site manager man-year 1 $ 9 600 $ 9 600 Site Engineer man-year 1 $ 7 200 $ 7 200 Assistant man-year 1 $ 4 800 $ 4 800 Plant operator man-year 3 $ 3 600 $ 10 800 Labour man-year 3 $ 3 600 $ 10 800 2 Fuel & utilities $ 71 364 Fuel consumption (plant) landfill waste compactor (23 - 28t) L 41 600 $ 0,8 $ 32 508 trackloader (13 - 18t) L 20 800 $ 0,8 $ 16 254 excavator (12 - 14t) L 12 480 $ 0,8 $ 9 752 dumper truck (12 - 16m3) L 6 240 $ 0,8 $ 4 876 pick-up truck L 1 040 $ 0,8 $ 813 Leachate disposal m3/year 400 $ 1 $ 244 Electricity not provided by PV panels Recirculation Pump and Flare Stack MWh 8 $ 220 $ 1 773 Non-Process (Office equipment, AC, Printers, …) MWh 23 $ 220 $ 5 144 3 Maintenance $ 55 651 Maintenance and spare parts (Plant) % of CAPEX 0,5% $ 4 956 891 $ 24 784 Maintenance and spare parts (Equipment) % of CAPEX 4% $ 771 673 $ 30 867 4 Miscellaneous $ 4,547 Laboratory testing & measurements LS 1 $ 2 395 $ 2 395 PPE LS 1 $ 1 419.5 $ 1 419.5 Office & sanitary consumables LS 1 $ 733 $ 733
TOTAL ANNUAL OPEX - LANDFILL $ 174 762
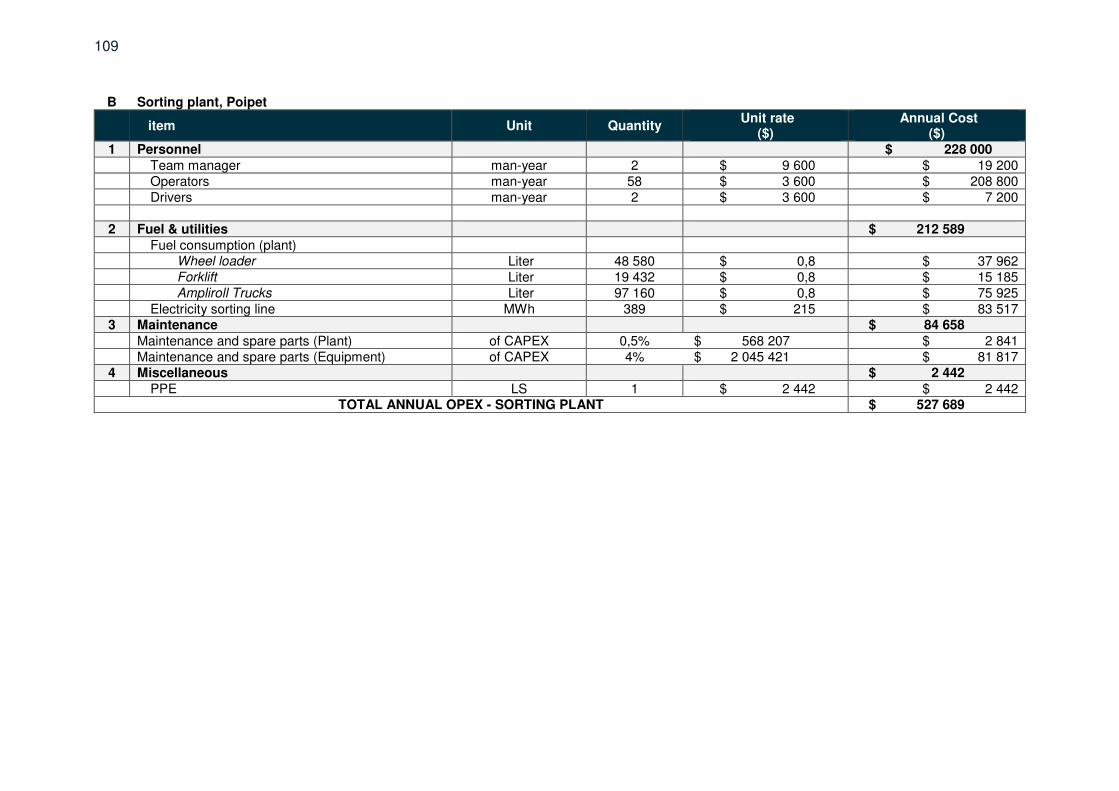
109
B Sorting plant, Poipet
item Unit Quantity Unit rate
($) Annual Cost
($) 1 Personnel $ 228 000 Team manager man-year 2 $ 9 600 $ 19 200 Operators man-year 58 $ 3 600 $ 208 800 Drivers man-year 2 $ 3 600 $ 7 200 2 Fuel & utilities $ 212 589 Fuel consumption (plant) Wheel loader Liter 48 580 $ 0,8 $ 37 962 Forklift Liter 19 432 $ 0,8 $ 15 185 Ampliroll Trucks Liter 97 160 $ 0,8 $ 75 925 Electricity sorting line MWh 389 $ 215 $ 83 517 3 Maintenance $ 84 658 Maintenance and spare parts (Plant) of CAPEX 0,5% $ 568 207 $ 2 841 Maintenance and spare parts (Equipment) of CAPEX 4% $ 2 045 421 $ 81 817 4 Miscellaneous $ 2 442 PPE LS 1 $ 2 442 $ 2 442
TOTAL ANNUAL OPEX - SORTING PLANT $ 527 689
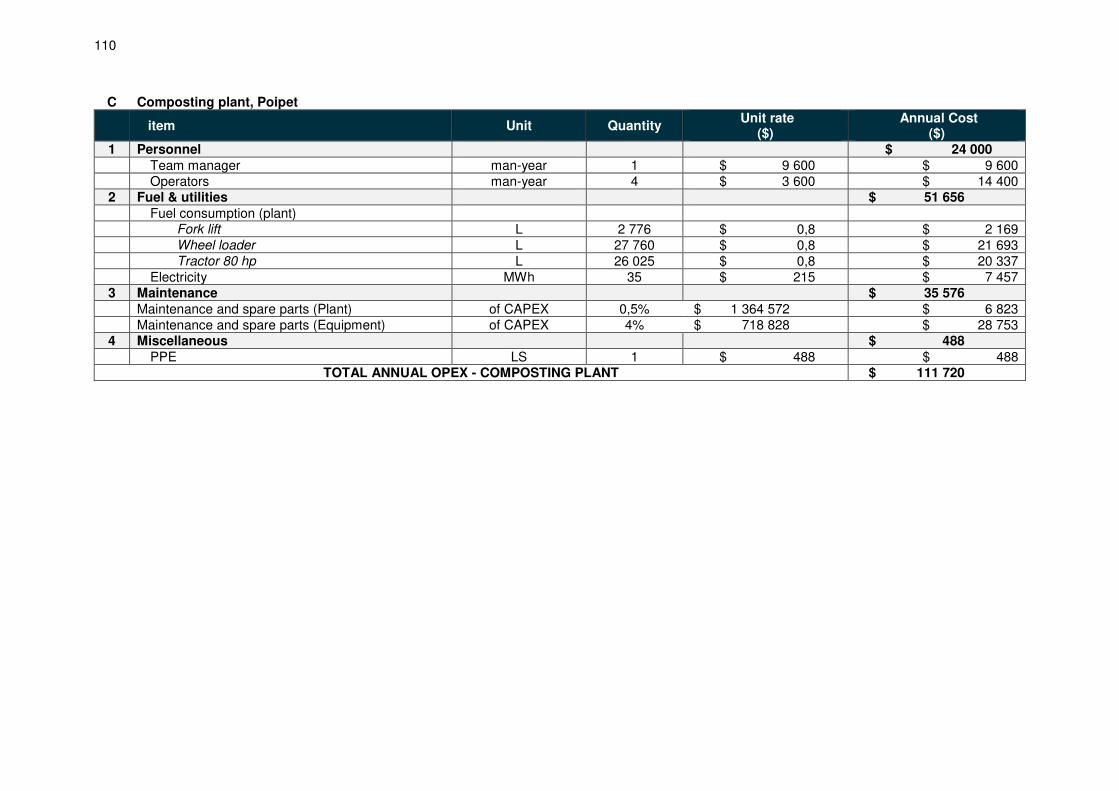
110
C Composting plant, Poipet
item Unit Quantity Unit rate
($) Annual Cost
($) 1 Personnel $ 24 000 Team manager man-year 1 $ 9 600 $ 9 600 Operators man-year 4 $ 3 600 $ 14 400 2 Fuel & utilities $ 51 656 Fuel consumption (plant) Fork lift L 2 776 $ 0,8 $ 2 169 Wheel loader L 27 760 $ 0,8 $ 21 693 Tractor 80 hp L 26 025 $ 0,8 $ 20 337 Electricity MWh 35 $ 215 $ 7 457 3 Maintenance $ 35 576 Maintenance and spare parts (Plant) of CAPEX 0,5% $ 1 364 572 $ 6 823 Maintenance and spare parts (Equipment) of CAPEX 4% $ 718 828 $ 28 753 4 Miscellaneous $ 488 PPE LS 1 $ 488 $ 488
TOTAL ANNUAL OPEX - COMPOSTING PLANT $ 111 720
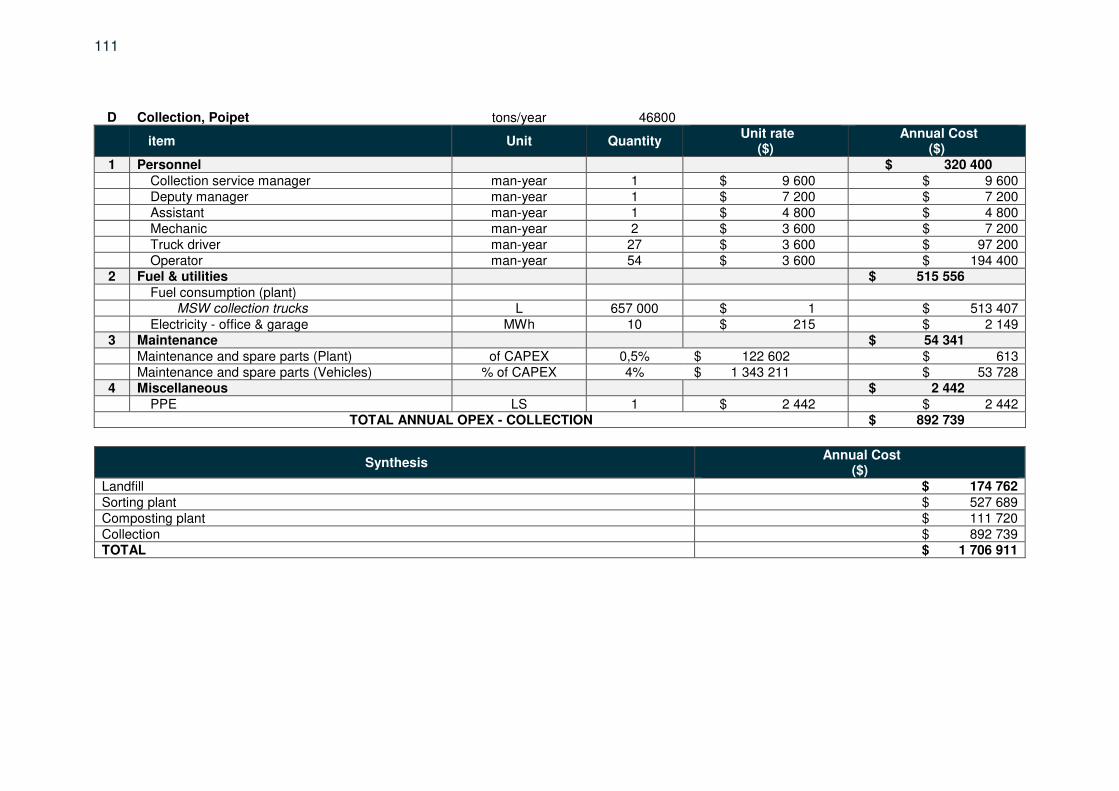
111
D Collection, Poipet tons/year 46800
item Unit Quantity Unit rate
($) Annual Cost
($) 1 Personnel $ 320 400 Collection service manager man-year 1 $ 9 600 $ 9 600 Deputy manager man-year 1 $ 7 200 $ 7 200 Assistant man-year 1 $ 4 800 $ 4 800 Mechanic man-year 2 $ 3 600 $ 7 200 Truck driver man-year 27 $ 3 600 $ 97 200 Operator man-year 54 $ 3 600 $ 194 400 2 Fuel & utilities $ 515 556 Fuel consumption (plant) MSW collection trucks L 657 000 $ 1 $ 513 407 Electricity - office & garage MWh 10 $ 215 $ 2 149 3 Maintenance $ 54 341 Maintenance and spare parts (Plant) of CAPEX 0,5% $ 122 602 $ 613 Maintenance and spare parts (Vehicles) % of CAPEX 4% $ 1 343 211 $ 53 728 4 Miscellaneous $ 2 442 PPE LS 1 $ 2 442 $ 2 442
TOTAL ANNUAL OPEX - COLLECTION $ 892 739
Synthesis Annual Cost
($) Landfill $ 174 762 Sorting plant $ 527 689 Composting plant $ 111 720 Collection $ 892 739 TOTAL $ 1 706 911

Copyright © 2022 FDOKUMEN

