


Bahasa
Halaman
Hukum

arX
iv:c
ond-
mat
/980
7369
v1 [
cond
-mat
.str
-el]
28
Jul 1
998
Lattice vibrations of α′-NaV2O5
M. N. Popova, A. B. Sushkov, S. A. Golubchik, B. N. Mavrin, and V. N. DenisovInstitute of Spectroscopy, Russian Academy of Sciences,
142092 Troitsk, Moscow reg., Russia
B. Z. Malkin and A. I. IskhakovaKazan State University, 420008 Kazan, Russia
M. Isobe and Y. UedaInstitute for Solid State Physics, The University of Tokyo
7–22–1 Roppongi, Minato-ku, Tokyo 106, Japan
(February 1, 2008)
We have measured far infrared reflectance and transmittance spectra as well as Raman scatteringspectra of α′-NaV2O5 single crystals for all the principal polarizations. The temperature rangeabove the phase transition temperature Tc = 35 K was investigated, mainly. On the basis of thisexperimental study and of the lattice dynamics calculations we conclude that the symmetry ofNaV2O5 in the high temperature phase is described by the centrosymmetric D13
2h space group. Theassignment of the observed phonons is given. Values of dielectric constants are obtained from theinfrared data. Asymmetric shapes of several infrared lines as well as higher order infrared vibrationalspectra are discussed. The crystal field energy levels of the 3d electron localized at the V4+ site havebeen calculated in the framework of the exchange charge model using the values of effective chargesobtained from the lattice dynamics calculations. According to the results of these calculations, theearlier observed broad optical bands in the region of 1 eV can be interpreted as phonon assistedd − d transitions.
63.20.Dj 78.30.Hv
I. INTRODUCTION
The vanadate α′-NaV2O5 has attracted a considerable interest recently as the second inorganic compound undergo-ing the spin-Peierls transition (at the highest known temperature for the spin-Peierls compounds, Tc = 35 K [1]). Thespin-Peierls transition is expected to occur within a system of linear spin-1/2 Heisenberg antiferromagnetic chainscoupled to a three-dimensional phonon field. As a result of such a coupling, magnetic atoms of the chain dimer-ize and a spin gap opens [2]. One-dimensional magnetic properties of NaV2O5 above 35 K follow from magneticsusceptibility [1], ESR [3] and angle-resolved photoemission [4] measurements.
Below 35 K the lattice dimerizes, as observed by X-ray [5] and Raman [6,7] scattering, infrared transmission [8]and reflection [9] measurements, while the magnetic susceptibility decreases isotropically, thus showing a spin gapformation [6]. The size of the gap ∆ = 10 meV follows from inelastic neutron scattering study of NaV2O5 singlecrystals [5,10].
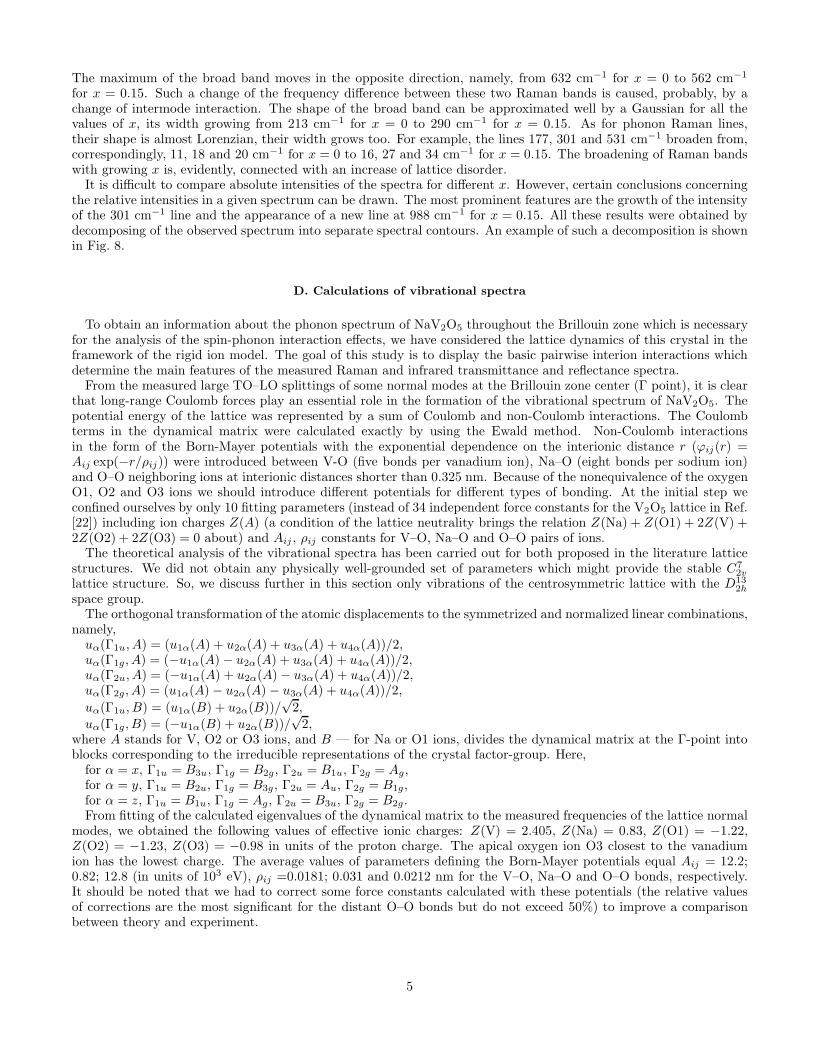
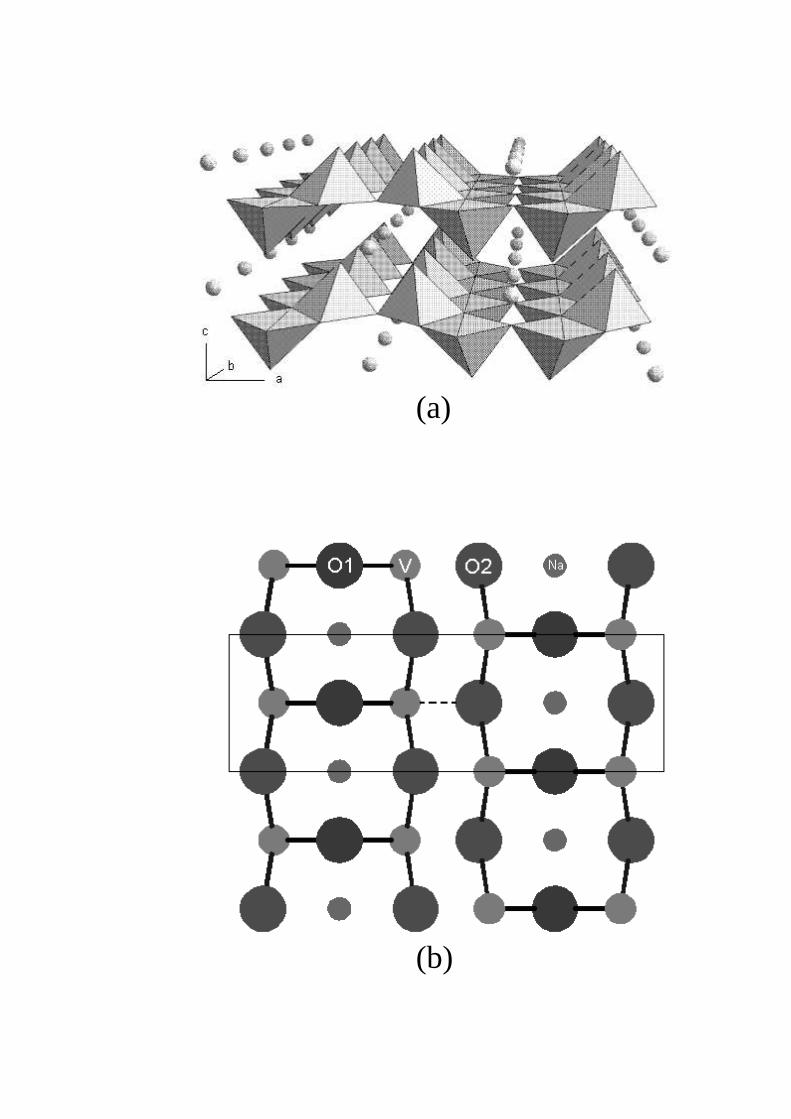
The structure of NaV2O5 contains double chains of edge sharing distorted VO5 pyramids running along the or-thorhombic b-axis (see Fig. 1). These double chains are linked together via common corners of the pyramids to formthe ab-layers. Na atoms lie between the layers [11,1]. The structure of NaV2O5 looks like the structure of V2O5 [12]intercalated with sodium. In an early X-ray room temperature investigation on polycrystalline samples of NaV2O5
Carpy and Galy [11] suggested the noncentrosymmetric space group C72v-P21mn with two nonequivalent vanadium
positions in the unit cell. The picture of magnetic chains of V4+O5 (S = 1/2) pyramids isolated by nonmagneticchains of V5+O5 (S = 0) pyramids proposed to account for one-dimensional magnetic properties of this mixed valence(V4.5+) compound is compatible with this space group [1].
However, the recent redetermination of the structure by single crystal X-ray diffraction at room temperature wasin favor of the centrosymmetric D13
2h-Pmmn group with only one vanadium position in the structure [13,14]. Thoughthe topology of the structure remains essentially the same as in the previously proposed noncentrosymmetric spacegroup [11], the possibility for charge ordering is, however, lost in the new higher symmetry group. Smolinski atal. [13] and Horsch and Mack [15] suggested a quarter-filled ladder model for NaV2O5, with the spins carried by V–O–V molecular orbitals on the rungs of the ladder. They argued that the exchange interaction along the ladder is muchgreater than that between the neighboring ladders which would explain the one-dimensional magnetic properties ofthe high temperature phase of NaV2O5. The transition at 35 K was supposed to be an ordinary spin-Peierls transition.
1
Quite recent 51V-NMR experiment on a single-crystalline sample of NaV2O5 also revealed only one vanadium positionin the high temperature phase but pointed unambiguously to the existence of two different vanadium sites occupiedby V4+ and V5+ at liquid helium temperatures [16]. Thus, the transition at 35 K is connected with a structure and acharge ordering processes. Very recently, Seo and Fukuyama [17] and Mostovoy and Khomskii [18] proposed a zig-zagscheme of V4+–V5+ ordering. Seo and Fukuyama argued that, as a result, two-dimensional lattice of antiferromagneticdimers is formed [17], while Mostovoy and Khomskii gave reasons in support of a system of alternating chains [18].Thalmeier and Fulde [19] have presented some theoretical reasons for the primary charge ordering which providesneighboring linear V4+ and V5+ chains with the subsequent spin-Peierls transition. Two close transitions near 35 Kin NaV2O5 were detected by Koppen et al. by the thermal expansion measurements [20].
In view of these recent works, the symmetry problem of the high temperature phase seems to be a matter of greaturgency. Raman and infrared measurements could give an additional information to clarify the question whether thespace group is centrosymmetric or not, because of totally different selection rules in these two cases. We reanalyzedour earlier infrared and Raman spectra of NaV2O5 [21] and found that they are in a better agreement with thecentrosymmetric D13
2h space group than with the noncentrosymmetric C72v one. However, in our work [21] we did not
measure infrared spectra in the E||c polarization. Also, the signal-to-noise ratio of Raman spectra was rather low. Inthe present work, we reinvestigate vibrational spectra of the high temperature phase of NaV2O5 using different singlecrystals, including extraordinary big ones. We present far-infrared reflectivity as well as Raman-scattering spectra forall principal polarizations. In addition, transmittance spectra were studied. We show that our results are in a muchbetter agreement with the centrosymmetric D13
2h group than with the noncentrosymmetric C72v one. The assignment
of vibrational modes is given based on a comparison with results on the previously studied V2O5 [22] and on latticedynamics calculations of this work performed in the framework of the rigid ion model.
II. EXPERIMENTAL
Single crystals of stoichiometric α′-NaV2O5 used in this study were grown by a melt growth method using NaVO3 asa flux [23]. Samples from different batches were used. One sample was 1.3×8×1 mm, another one was 3×17.3×1.6 mmalong a-, b- and c-axes, respectively. For transmission measurements we have prepared four thin samples cleavedperpendicular to the c-axis. Their thicknesses were 110± 1, 45± 5, 14± 1.5 and 6± 1 µm. The samples were checkedwith X-ray diffraction, magnetization and ESR measurements. They exhibited a sharp transition at about 35 K.
Reflection and transmission measurements were performed with a BOMEM DA3.002 Fourier-transform spectrom-eter at nearly normal incidence of polarized infrared radiation. The following geometries of the experiment wereused: 1) k||c, E||a and E||b; 2) k||a, E||c and E||b. Room temperature reflectance and transmittance spectra weremeasured in a spectral range 30–5000 cm−1 with a resolution 0.5–2.0 cm−1. Using both reflectance and transmittancespectra, the absorption coefficient α was calculated. Low temperature (down to 6 K) transmittance spectra weremeasured with a He vapor cryostat in the spectral range 30–1000 cm−1 with a resolution 0.05–1.0 cm−1.
Raman spectra were excited at room temperature by the 514 nm and 488 nm lines of an Ar-ion laser in backscatteringgeometries, dispersed by a home-made triple spectrograph and recorded using a multichannel system consisting of animage intensifier tube with a multichannel plate and a vidicon.
III. RESULTS
A. Factor-group analysis
There are two formula units and, hence, 16 atoms in the NaV2O5 orthorhombic unit cell with lattice constantsa = 1.1316 nm, b = 0.3611 nm, c = 0.4797 nm [11,13,14]. Below, we present the results of factor-group analysis forboth centrosymmetric D13
2h [13,14] and noncentrosymmetric C72v [11] space groups.
a. Space group D132h-Pmmn The notation Pmmn refers to the standard setting, such that x||a, y||b, z||c. It follows
from X-ray diffraction data of Refs. [13,14] that Na atoms occupy 2b positions (the corresponding fractional atomiccoordinates are defined by the basis vectors r1( Na ) = −r2(Na) = (1/4,−1/4, z1), z1 = 0.8592) and oxygen O1atoms occupy 2a positions (r1(O1) = −r2(O1) = (1/4, 1/4, z2), z2 = 0.5195), both these positions having Cz
2v localsymmetry. V, O2 and O3 atoms reside in different 4f positions (r1(A) = −r3(A) = (xA, 1/4, zA), r2(A) = −r4(A) =(1/2 − xA, 1/4, zA), xV = 0.40212, zV = 0.39219, xO2 = 0.57302, zO2 = 0.48769, xO3 = 0.38548, zO3 = 0.05803) withthe local symmetry Cxz
s . These positions yield the following irreducible representations [24,25]:
Cz2v : Γ = Ag + B2g + B3g + B1u + B2u + B3u
2
Cxzs : Γ = 2Ag + B1g + 2B2g + B3g + Au + 2B1u + B2u + 2B3u
Multiplying the representations given above by the number of different positions of the appropriate symmetry, sum-marizing them and subtracting acoustic modes (B1u +B2u +B3u), we obtain the following NaV2O5 optical vibrationalmodes:
ΓvibNaV2O5
(Pmmn) = 8Ag(aa, bb, cc) + 3B1g(ab) +
+8B2g(ac) + 5B3g(bc) + 3Au +
+7B1u(E||c) + 4B2u(E||b) + 7B3u(E||a) (1)
There are 45 vibrational modes in total. Au modes being silent, 24 Raman (Ag, B1g, B2g, B3g) and 18 infrared (B1u,B2u, B3u) active modes are expected to be found in the spectra of NaV2O5, provided the crystal space group is D13
2h.b. Space group C7
2v-P21mn In their original work [11] Carpy and Galy adopted the axes setting for the P21mnspace group. Below, we use the standard setting for the Pmn21 space group: x||b, y||c, z||a. There are two nonequiv-alent V positions, five nonequivalent O positions and one Na position in this group, all of them being 2a positionswith Cyz
s local symmetry. In the same way as in the previous case, using tables [25] and subtracting acoustic modes(A1 + B2 + B1), we find the following vibrational modes:
ΓvibNaV2O5
(Pmn21) = 15A1(aa, bb, cc;E||a) +
+8A2(bc) + 7B1(ab;E||b) + 15B2(ac;E||c) (2)
There are 45 optical modes again. But in the case of this noncentrosymmetric space group all of them are Ramanactive, 37 of them are also infrared active.
B. Infrared spectra
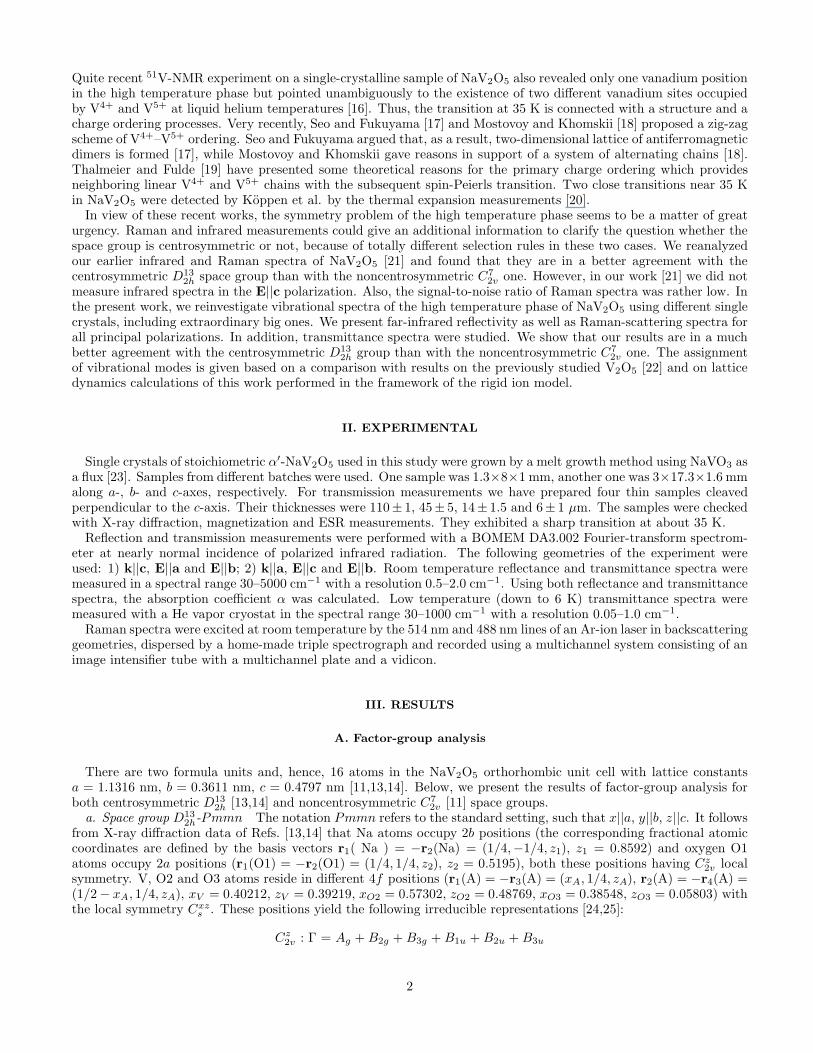
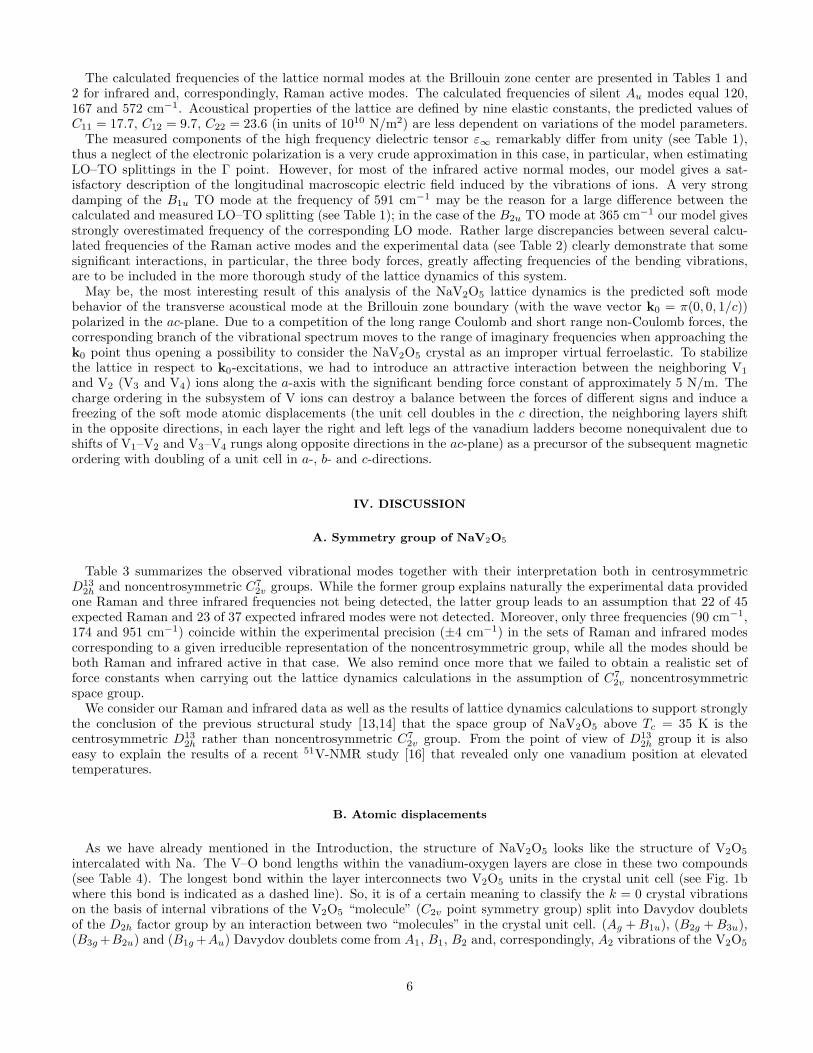
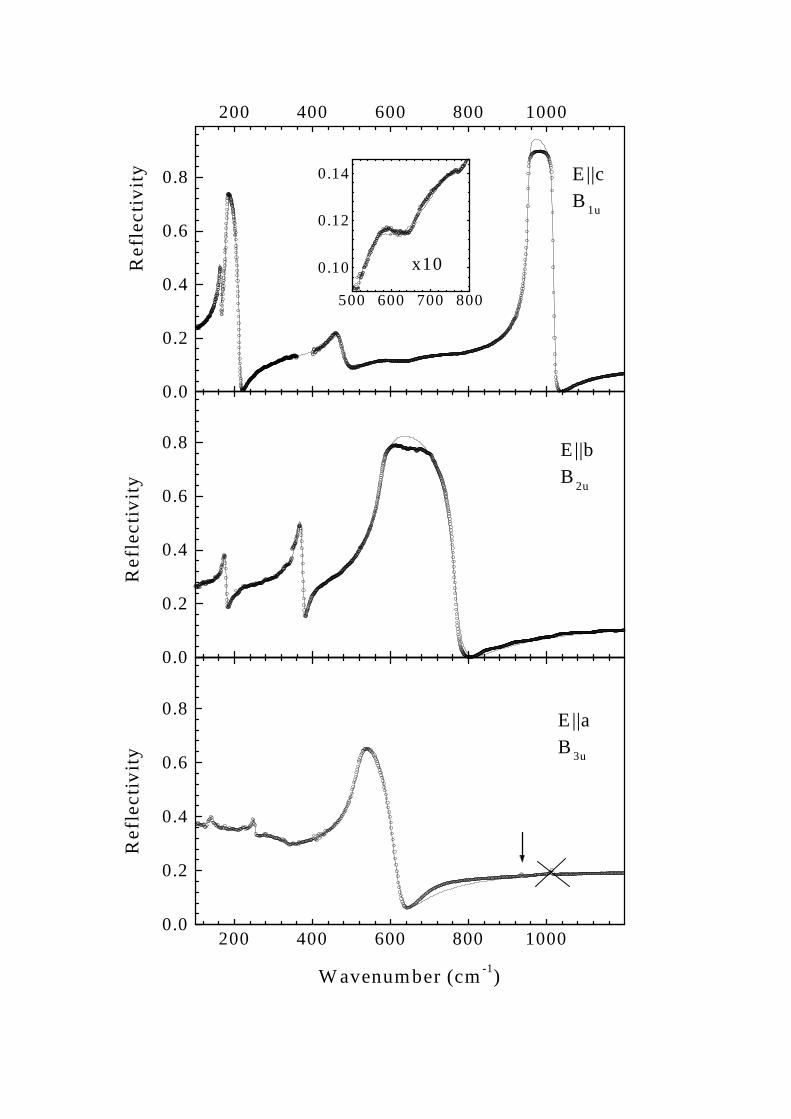
Fig. 2 shows the room temperature far-infrared reflectivity spectra of NaV2O5 for different polarizations of theincident light. Experimental data are presented by open circles. Measured spectra were least-squares fitted by thespectra computed according to the expression
R =
∣
∣
∣
∣
√ε − 1√ε + 1
∣
∣
∣
∣
2
(3)
The classical dispersion formula for N independent damped oscillators was used:
ε = ε∞ +
N∑
i=1
4πfiω2i
ω2i − ω2 − ıγiω
(4)
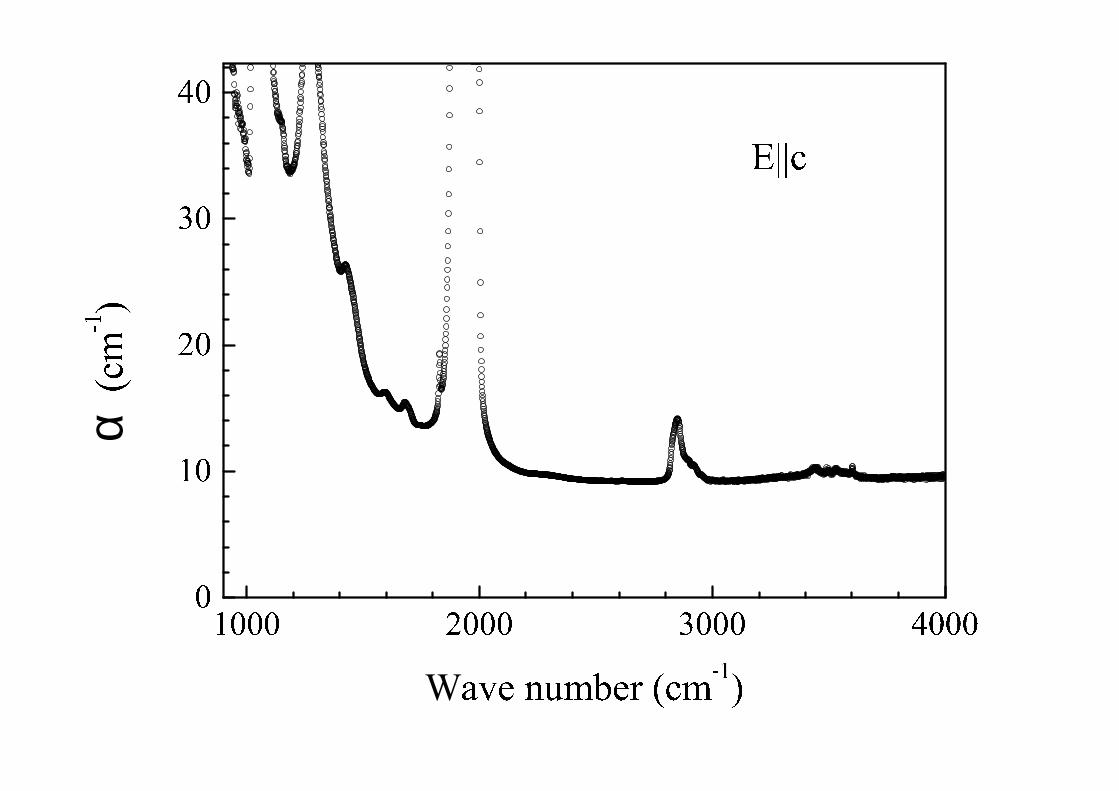
For E||b and E||a polarizations the number of oscillators and initial values of parameters were taken from thetransmittance spectra ( [21] and the present work). The peculiarity at 1014 cm−1 in E||a polarization crossed outin Figs. 2 and 3 and observed also in E||b polarization for some samples depends on a particular sample and is not,evidently, an intrinsic property of NaV2O5. It was not taken into account in the fitting procedure. In addition to weaklydamped phonon oscillators, an overdamped oscillator centered at about 300 cm−1 (ωi = 291 cm−1, γi = 260 cm−1,fi = 0.38) was introduced in E||a polarization to account for a low frequency part of a broad absorption band of acomplex two-humped shape found in our previous study [21] (see also Fig 3). We failed to model the high frequencyhump of this band centered at about 1000 cm−1 by a similar oscillator and did not try to use a more complicatedmodel. This results in a not so good fitting of the high frequency part of the reflectance spectrum. In E||a polarizationthe phonon at about 150 cm−1 could not be fitted well. This line is strongly asymmetric in transmittance spectra,obviously, due to the interaction with the underlying broad band.
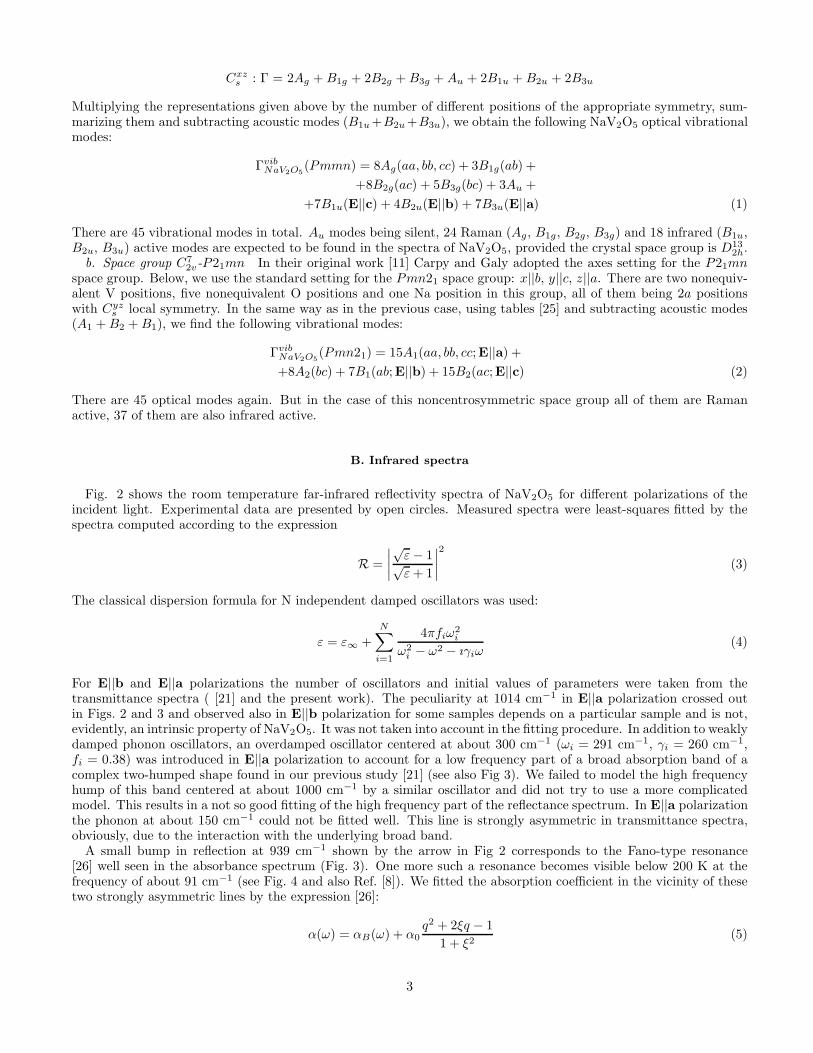
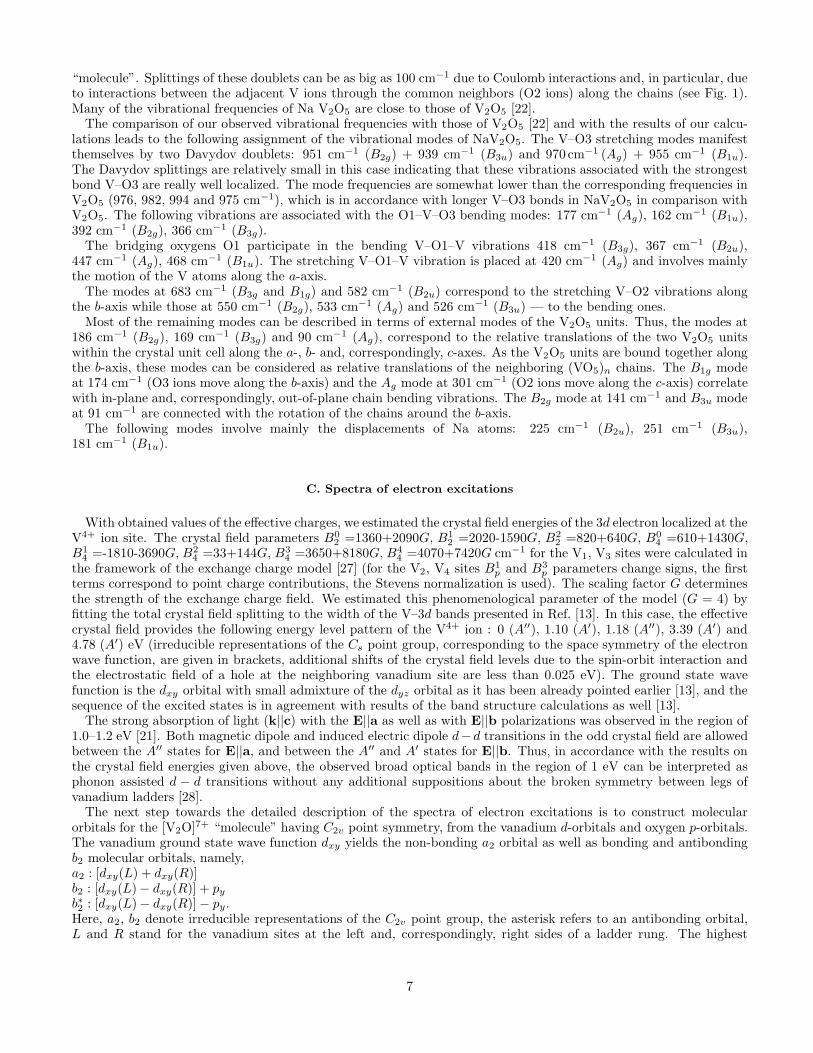
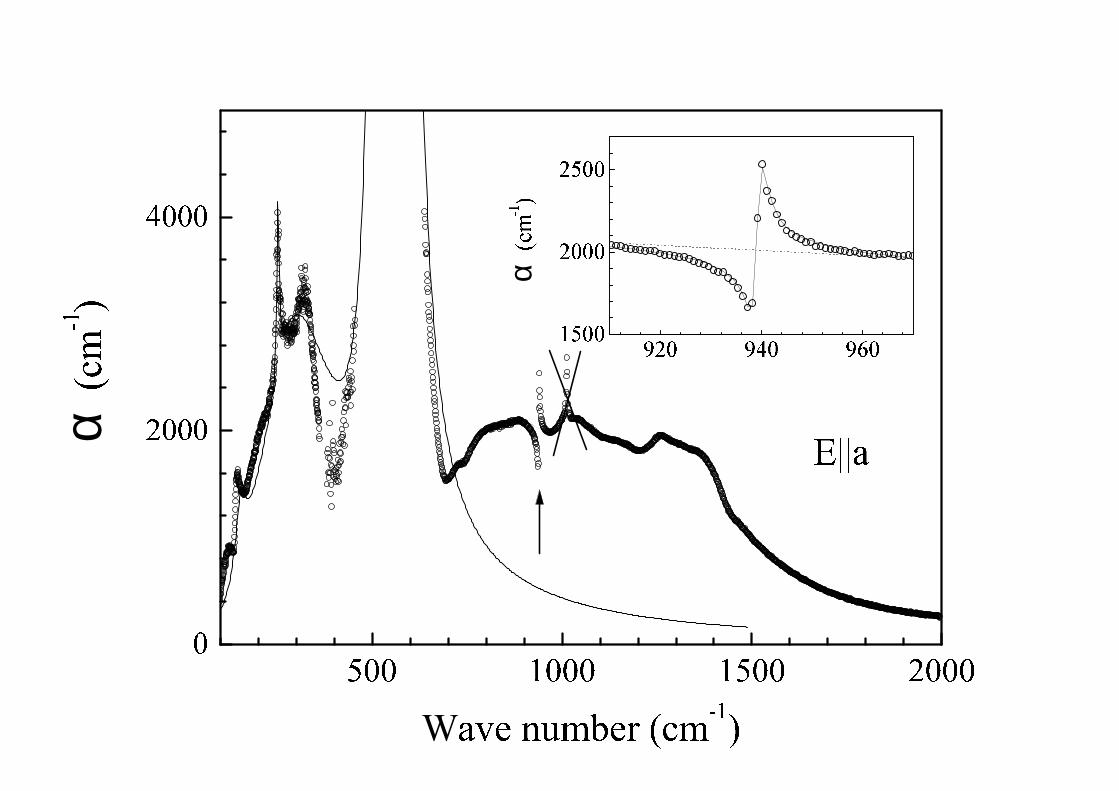
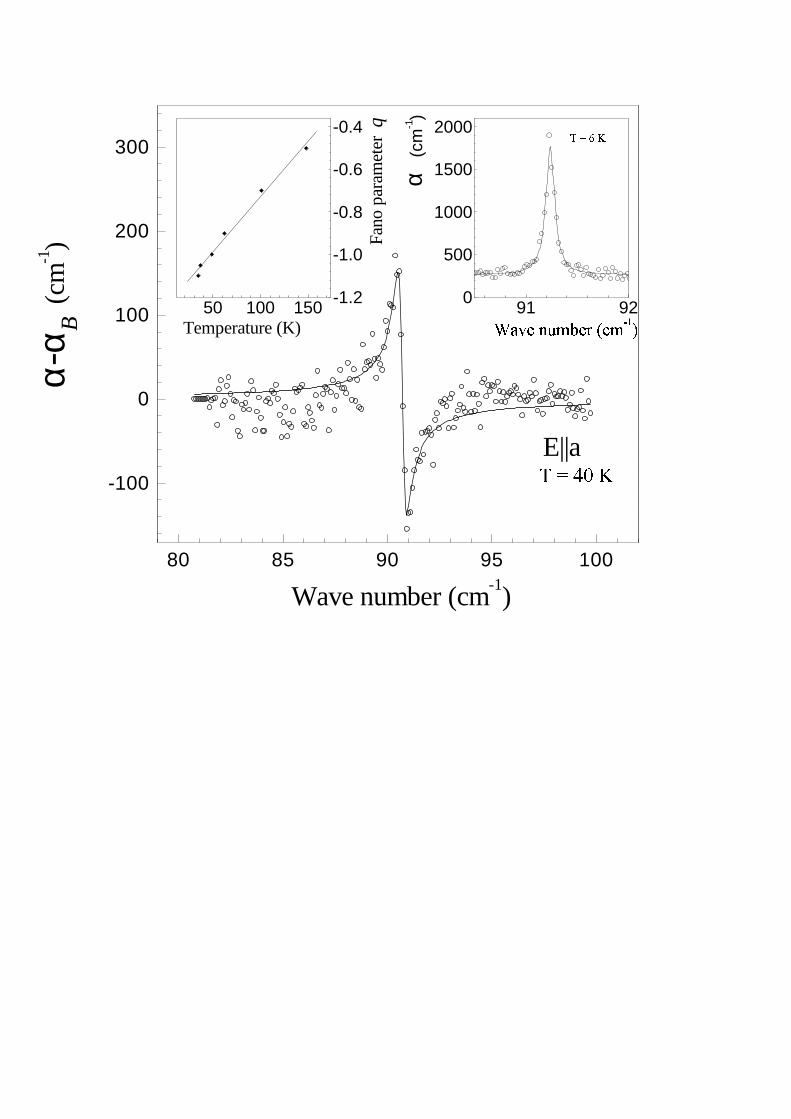
A small bump in reflection at 939 cm−1 shown by the arrow in Fig 2 corresponds to the Fano-type resonance[26] well seen in the absorbance spectrum (Fig. 3). One more such a resonance becomes visible below 200 K at thefrequency of about 91 cm−1 (see Fig. 4 and also Ref. [8]). We fitted the absorption coefficient in the vicinity of thesetwo strongly asymmetric lines by the expression [26]:
α(ω) = αB(ω) + α0
q2 + 2ξq − 1
1 + ξ2(5)
3
where ξ = (ω −ωr)/γ, αB(ω) is a slowly varying broad band absorption (it is shown by a dashed line in the vicinityof the 939 cm−1 sharp resonance in Fig. 3), α0, ωr, γ and q being variable parameters. Such an expression describesvarious physical situations of a sharp transitions being overlapped by a broad continuum. The lineshape of a sharptransition is changed by an interference with a continuum and depends essentially on the strength of an interactionbetween discrete and continuum states. The parameter q being inversely proportional to the matrix element of aninteraction, the case |q| = ∞ corresponds to zero interaction and results in a normal Lorenzian resonance, |q| = 1yields a dispersion-like curve, while |q| = 0 gives an inverted Lorenzian (antiresonance). The ratio α0/αB shows whatfraction of the continuum states interacts with a sharp excited state. The results of the fitting are displayed in theinset of Fig. 3 and in Fig. 4. A similar fitting should be performed for the resonance at about 150 cm−1 but we failedto construct αB(ω) in this case. The parameters obtained from the fittings are listed in Table 1. ωTO and γTO standfor ωi and, correspondingly, γi of Eq. (4) or for ωr and γ of Eq. (5). LO frequencies and damping constants werecalculated as complex roots of the equation ε(ω) = 0.
The left inset of Fig. 4 presents the temperature dependence of the Fano parameter q for the spectral line near91 cm−1 for the temperatures higher than Tc = 35 K. It should be mentioned that below 35 K, the shape of this linechanges to an ordinary Lorenzian lineshape (see the right inset of Fig. 4 and also [8]). Simultaneously, a continuumabsorption diminishes markedly in this spectral region while it practically does not change at the maximum of thelow-frequency hump at 320 cm−1.
With decreasing the temperature, besides the asymmetric resonance at 91 cm−1 in E||a transmission, two lines at215 and 225 cm−1 appear in E||b transmittance spectra as well [8,21]. We have studied the resonances at 91 and939 cm−1 (E||a); 215 and 225 cm−1 (E||b) for the samples of different thicknesses and found that while the intensityof 91, 939 and 225 cm−1 lines grow proportionally to the sample thickness d (that is, α = const), the intensity of the215 cm−1 line does not, practically, depend on the thickness (αd ≃ const). Consequently, while the frequencies 91and 939 cm−1 (E||a) and 225 cm−1 (E||b) correspond to intrinsic resonances, ω = 215 cm−1 must refer to a surfaceexcitation. All the observed infrared phonon frequencies together with the calculated ones are displayed in Table 1.
NaV2O5 crystals are well transparent in the frequency region between 2500 and 4500 cm−1 and below 100 cm−1. Inthese regions, an interference pattern was observed in (E||a) and (E||b) transmittance spectra of the samples of goodquality. We also managed to observe the interference pattern below 100 cm−1 in E||c transmittance of 1.3 mm thicksample. By measuring the distances ∆ between the interference maxima, we have found the values of the refractiveindexes n according to the relation
∆ =1
2dn, (6)
d being the thickness of a sample. The appropriate values of ε = n2 are listed in Table 1.We also looked for the higher order vibrational spectra by measuring the transmittance of thick (d=0.4–3.0 mm)
samples in the frequency range 1000–4000 cm−1. While no pronounced features were found in E||a and E||b polar-izations, sharp resonances were observed in E||c (k||a) polarization at 1930, 2858 and, possibly, 1072 and 1270 cm−1,the latter two lines being somewhat masked by the edge of a strong phonon at 955 cm−1 (see Fig. 5).
C. Raman spectra
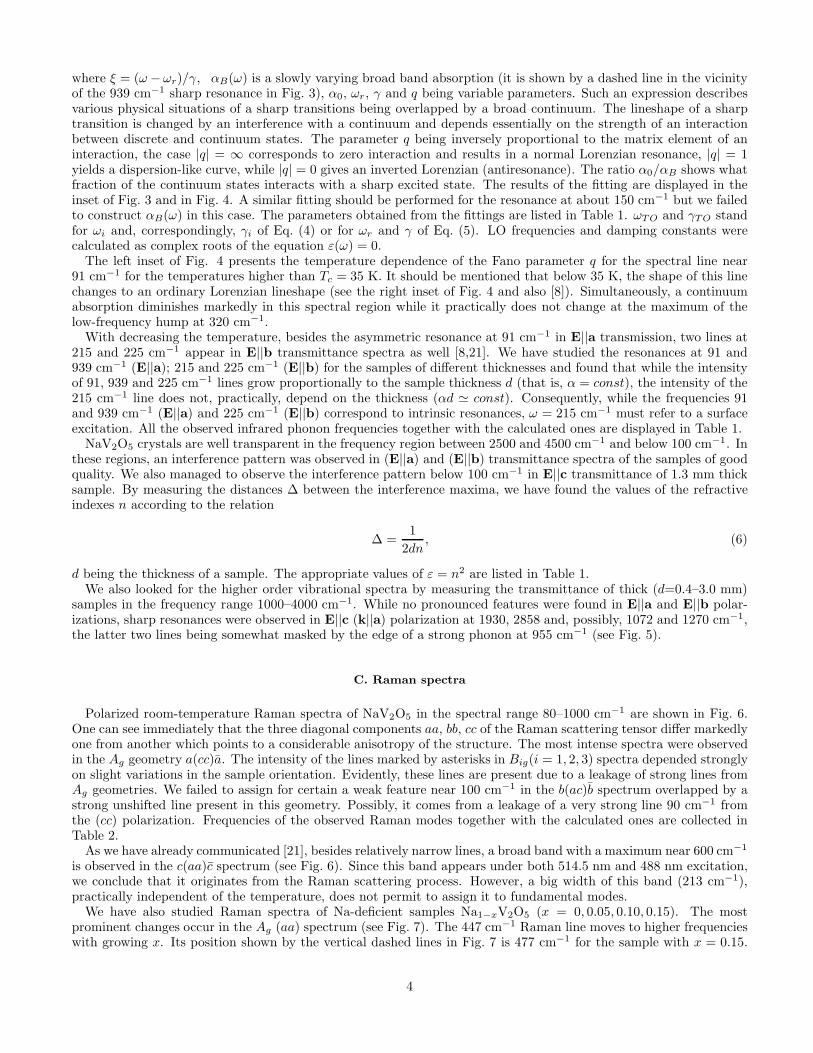
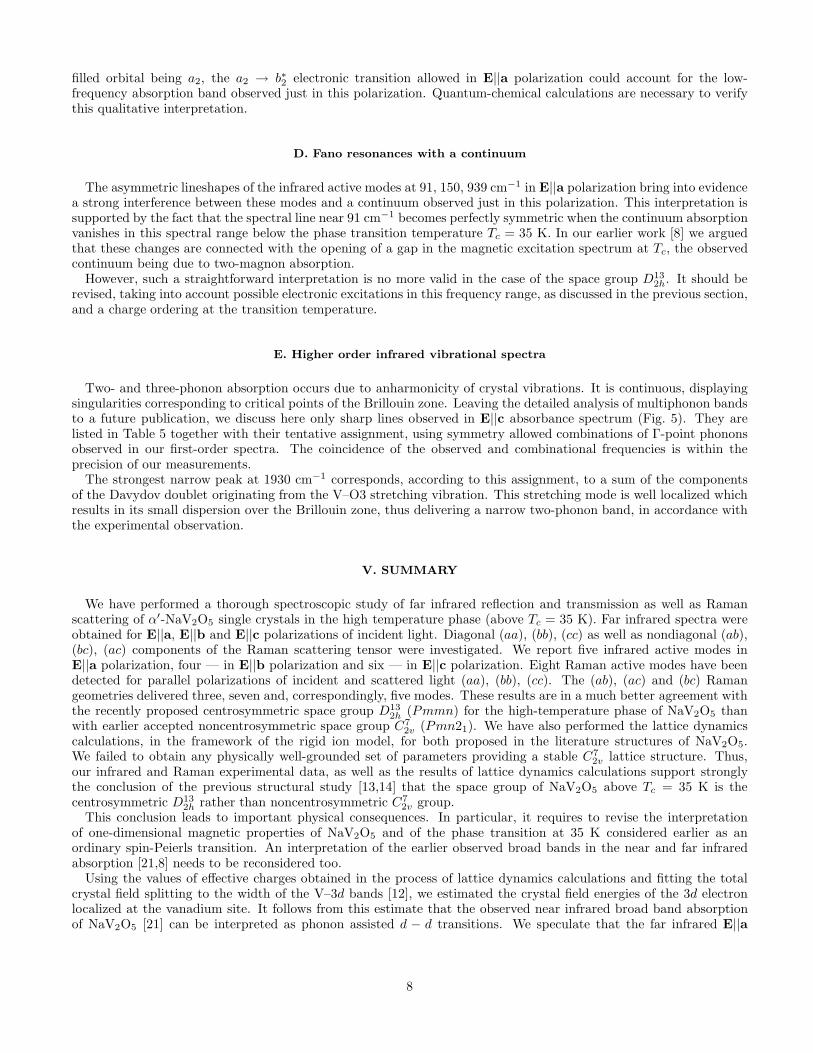
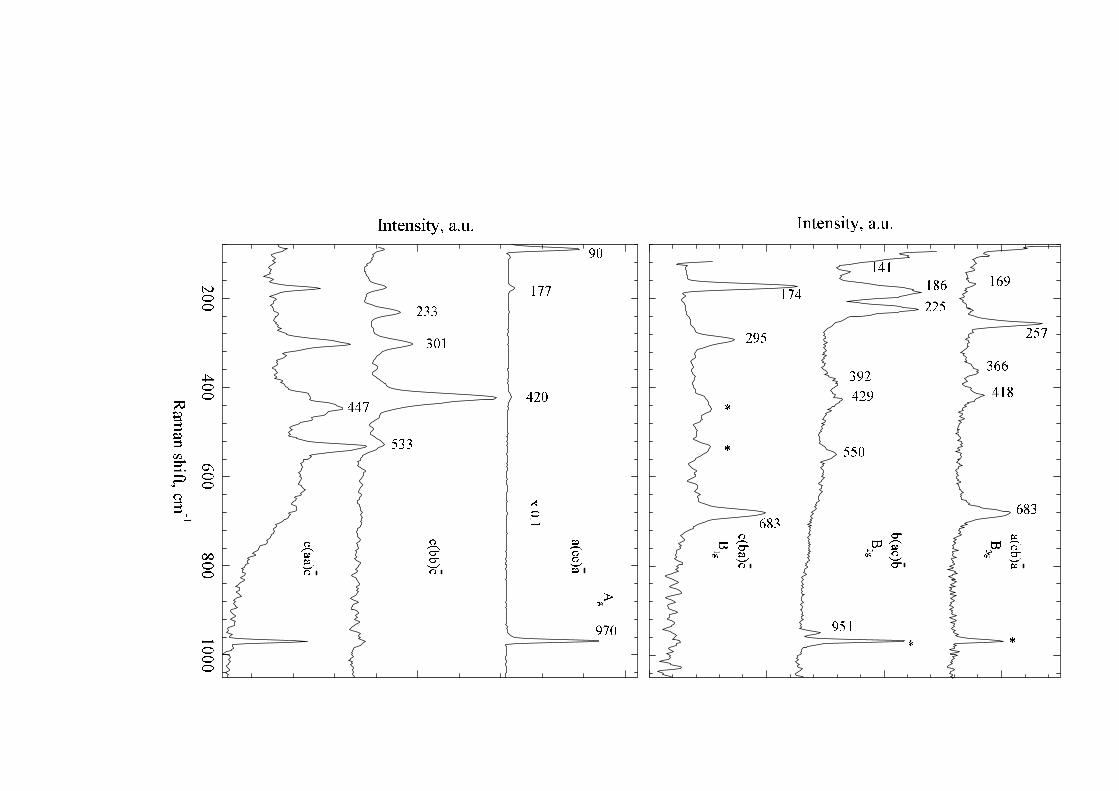
Polarized room-temperature Raman spectra of NaV2O5 in the spectral range 80–1000 cm−1 are shown in Fig. 6.One can see immediately that the three diagonal components aa, bb, cc of the Raman scattering tensor differ markedlyone from another which points to a considerable anisotropy of the structure. The most intense spectra were observedin the Ag geometry a(cc)a. The intensity of the lines marked by asterisks in Big(i = 1, 2, 3) spectra depended stronglyon slight variations in the sample orientation. Evidently, these lines are present due to a leakage of strong lines fromAg geometries. We failed to assign for certain a weak feature near 100 cm−1 in the b(ac)b spectrum overlapped by astrong unshifted line present in this geometry. Possibly, it comes from a leakage of a very strong line 90 cm−1 fromthe (cc) polarization. Frequencies of the observed Raman modes together with the calculated ones are collected inTable 2.
As we have already communicated [21], besides relatively narrow lines, a broad band with a maximum near 600 cm−1
is observed in the c(aa)c spectrum (see Fig. 6). Since this band appears under both 514.5 nm and 488 nm excitation,we conclude that it originates from the Raman scattering process. However, a big width of this band (213 cm−1),practically independent of the temperature, does not permit to assign it to fundamental modes.
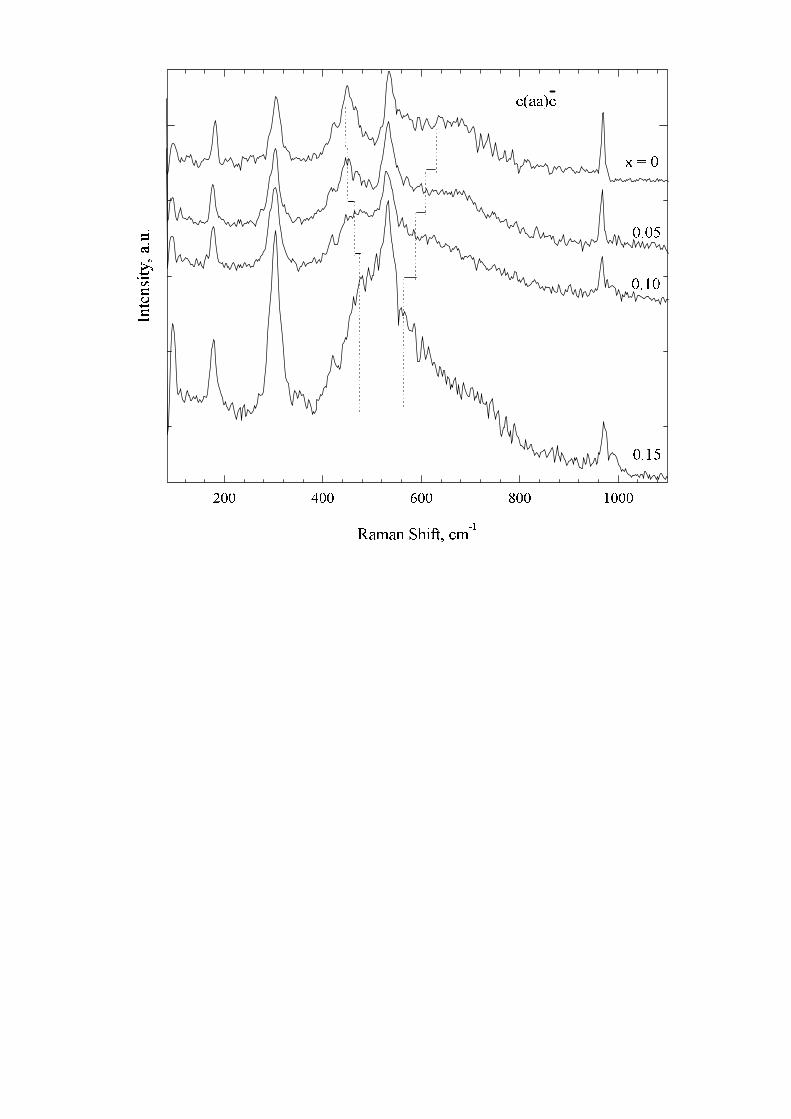
We have also studied Raman spectra of Na-deficient samples Na1−xV2O5 (x = 0, 0.05, 0.10, 0.15). The mostprominent changes occur in the Ag (aa) spectrum (see Fig. 7). The 447 cm−1 Raman line moves to higher frequencieswith growing x. Its position shown by the vertical dashed lines in Fig. 7 is 477 cm−1 for the sample with x = 0.15.
4
The maximum of the broad band moves in the opposite direction, namely, from 632 cm−1 for x = 0 to 562 cm−1
for x = 0.15. Such a change of the frequency difference between these two Raman bands is caused, probably, by achange of intermode interaction. The shape of the broad band can be approximated well by a Gaussian for all thevalues of x, its width growing from 213 cm−1 for x = 0 to 290 cm−1 for x = 0.15. As for phonon Raman lines,their shape is almost Lorenzian, their width grows too. For example, the lines 177, 301 and 531 cm−1 broaden from,correspondingly, 11, 18 and 20 cm−1 for x = 0 to 16, 27 and 34 cm−1 for x = 0.15. The broadening of Raman bandswith growing x is, evidently, connected with an increase of lattice disorder.
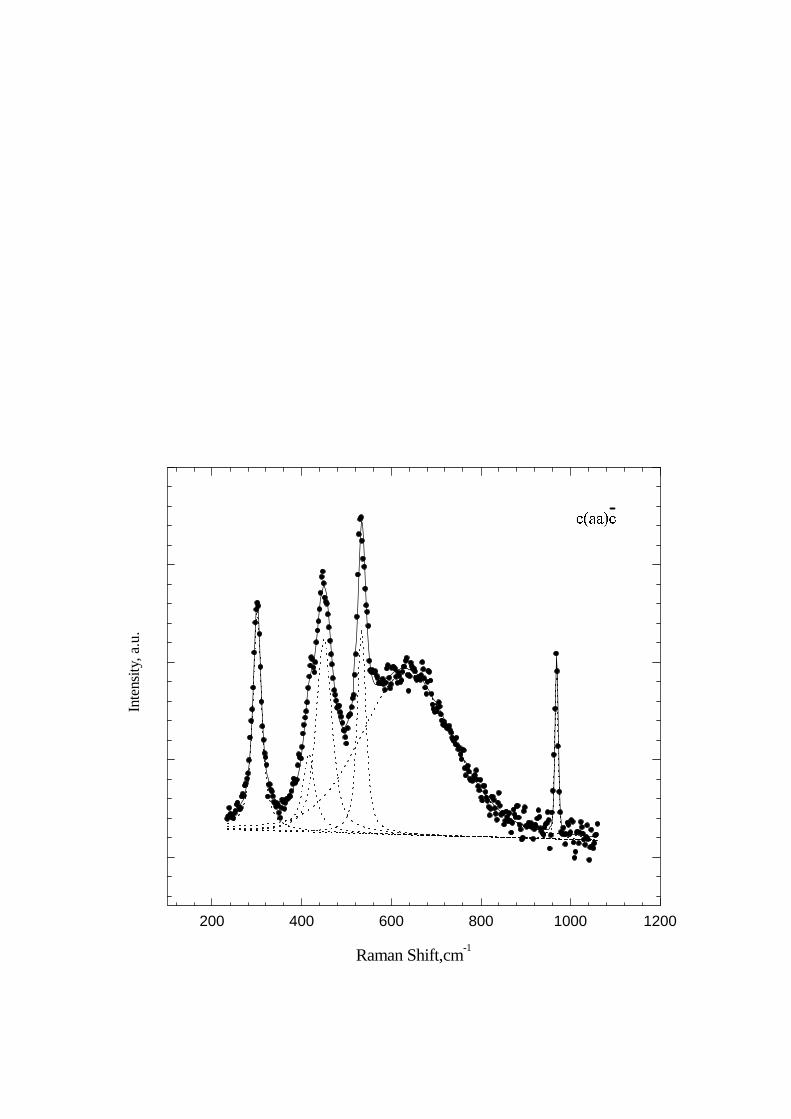
It is difficult to compare absolute intensities of the spectra for different x. However, certain conclusions concerningthe relative intensities in a given spectrum can be drawn. The most prominent features are the growth of the intensityof the 301 cm−1 line and the appearance of a new line at 988 cm−1 for x = 0.15. All these results were obtained bydecomposing of the observed spectrum into separate spectral contours. An example of such a decomposition is shownin Fig. 8.
D. Calculations of vibrational spectra
To obtain an information about the phonon spectrum of NaV2O5 throughout the Brillouin zone which is necessaryfor the analysis of the spin-phonon interaction effects, we have considered the lattice dynamics of this crystal in theframework of the rigid ion model. The goal of this study is to display the basic pairwise interion interactions whichdetermine the main features of the measured Raman and infrared transmittance and reflectance spectra.
From the measured large TO–LO splittings of some normal modes at the Brillouin zone center (Γ point), it is clearthat long-range Coulomb forces play an essential role in the formation of the vibrational spectrum of NaV2O5. Thepotential energy of the lattice was represented by a sum of Coulomb and non-Coulomb interactions. The Coulombterms in the dynamical matrix were calculated exactly by using the Ewald method. Non-Coulomb interactionsin the form of the Born-Mayer potentials with the exponential dependence on the interionic distance r (ϕij(r) =Aij exp(−r/ρij)) were introduced between V-O (five bonds per vanadium ion), Na–O (eight bonds per sodium ion)and O–O neighboring ions at interionic distances shorter than 0.325 nm. Because of the nonequivalence of the oxygenO1, O2 and O3 ions we should introduce different potentials for different types of bonding. At the initial step weconfined ourselves by only 10 fitting parameters (instead of 34 independent force constants for the V2O5 lattice in Ref.[22]) including ion charges Z(A) (a condition of the lattice neutrality brings the relation Z(Na) + Z(O1) + 2Z(V) +2Z(O2) + 2Z(O3) = 0 about) and Aij , ρij constants for V–O, Na–O and O–O pairs of ions.
The theoretical analysis of the vibrational spectra has been carried out for both proposed in the literature latticestructures. We did not obtain any physically well-grounded set of parameters which might provide the stable C7
2v
lattice structure. So, we discuss further in this section only vibrations of the centrosymmetric lattice with the D132h
space group.The orthogonal transformation of the atomic displacements to the symmetrized and normalized linear combinations,
namely,uα(Γ1u, A) = (u1α(A) + u2α(A) + u3α(A) + u4α(A))/2,uα(Γ1g, A) = (−u1α(A) − u2α(A) + u3α(A) + u4α(A))/2,uα(Γ2u, A) = (−u1α(A) + u2α(A) − u3α(A) + u4α(A))/2,uα(Γ2g, A) = (u1α(A) − u2α(A) − u3α(A) + u4α(A))/2,
uα(Γ1u, B) = (u1α(B) + u2α(B))/√
2,
uα(Γ1g, B) = (−u1α(B) + u2α(B))/√
2,where A stands for V, O2 or O3 ions, and B — for Na or O1 ions, divides the dynamical matrix at the Γ-point intoblocks corresponding to the irreducible representations of the crystal factor-group. Here,
for α = x, Γ1u = B3u, Γ1g = B2g, Γ2u = B1u, Γ2g = Ag,for α = y, Γ1u = B2u, Γ1g = B3g, Γ2u = Au, Γ2g = B1g,for α = z, Γ1u = B1u, Γ1g = Ag, Γ2u = B3u, Γ2g = B2g.From fitting of the calculated eigenvalues of the dynamical matrix to the measured frequencies of the lattice normal
modes, we obtained the following values of effective ionic charges: Z(V) = 2.405, Z(Na) = 0.83, Z(O1) = −1.22,Z(O2) = −1.23, Z(O3) = −0.98 in units of the proton charge. The apical oxygen ion O3 closest to the vanadiumion has the lowest charge. The average values of parameters defining the Born-Mayer potentials equal Aij = 12.2;0.82; 12.8 (in units of 103 eV), ρij =0.0181; 0.031 and 0.0212 nm for the V–O, Na–O and O–O bonds, respectively.It should be noted that we had to correct some force constants calculated with these potentials (the relative valuesof corrections are the most significant for the distant O–O bonds but do not exceed 50%) to improve a comparisonbetween theory and experiment.
5
The calculated frequencies of the lattice normal modes at the Brillouin zone center are presented in Tables 1 and2 for infrared and, correspondingly, Raman active modes. The calculated frequencies of silent Au modes equal 120,167 and 572 cm−1. Acoustical properties of the lattice are defined by nine elastic constants, the predicted values ofC11 = 17.7, C12 = 9.7, C22 = 23.6 (in units of 1010 N/m2) are less dependent on variations of the model parameters.
The measured components of the high frequency dielectric tensor ε∞ remarkably differ from unity (see Table 1),thus a neglect of the electronic polarization is a very crude approximation in this case, in particular, when estimatingLO–TO splittings in the Γ point. However, for most of the infrared active normal modes, our model gives a sat-isfactory description of the longitudinal macroscopic electric field induced by the vibrations of ions. A very strongdamping of the B1u TO mode at the frequency of 591 cm−1 may be the reason for a large difference between thecalculated and measured LO–TO splitting (see Table 1); in the case of the B2u TO mode at 365 cm−1 our model givesstrongly overestimated frequency of the corresponding LO mode. Rather large discrepancies between several calcu-lated frequencies of the Raman active modes and the experimental data (see Table 2) clearly demonstrate that somesignificant interactions, in particular, the three body forces, greatly affecting frequencies of the bending vibrations,are to be included in the more thorough study of the lattice dynamics of this system.
May be, the most interesting result of this analysis of the NaV2O5 lattice dynamics is the predicted soft modebehavior of the transverse acoustical mode at the Brillouin zone boundary (with the wave vector k0 = π(0, 0, 1/c))polarized in the ac-plane. Due to a competition of the long range Coulomb and short range non-Coulomb forces, thecorresponding branch of the vibrational spectrum moves to the range of imaginary frequencies when approaching thek0 point thus opening a possibility to consider the NaV2O5 crystal as an improper virtual ferroelastic. To stabilizethe lattice in respect to k0-excitations, we had to introduce an attractive interaction between the neighboring V1
and V2 (V3 and V4) ions along the a-axis with the significant bending force constant of approximately 5 N/m. Thecharge ordering in the subsystem of V ions can destroy a balance between the forces of different signs and induce afreezing of the soft mode atomic displacements (the unit cell doubles in the c direction, the neighboring layers shiftin the opposite directions, in each layer the right and left legs of the vanadium ladders become nonequivalent due toshifts of V1–V2 and V3–V4 rungs along opposite directions in the ac-plane) as a precursor of the subsequent magneticordering with doubling of a unit cell in a-, b- and c-directions.
IV. DISCUSSION
A. Symmetry group of NaV2O5
Table 3 summarizes the observed vibrational modes together with their interpretation both in centrosymmetricD13
2h and noncentrosymmetric C72v groups. While the former group explains naturally the experimental data provided
one Raman and three infrared frequencies not being detected, the latter group leads to an assumption that 22 of 45expected Raman and 23 of 37 expected infrared modes were not detected. Moreover, only three frequencies (90 cm−1,174 and 951 cm−1) coincide within the experimental precision (±4 cm−1) in the sets of Raman and infrared modescorresponding to a given irreducible representation of the noncentrosymmetric group, while all the modes should beboth Raman and infrared active in that case. We also remind once more that we failed to obtain a realistic set offorce constants when carrying out the lattice dynamics calculations in the assumption of C7
2v noncentrosymmetricspace group.
We consider our Raman and infrared data as well as the results of lattice dynamics calculations to support stronglythe conclusion of the previous structural study [13,14] that the space group of NaV2O5 above Tc = 35 K is thecentrosymmetric D13
2h rather than noncentrosymmetric C72v group. From the point of view of D13
2h group it is alsoeasy to explain the results of a recent 51V-NMR study [16] that revealed only one vanadium position at elevatedtemperatures.
B. Atomic displacements
As we have already mentioned in the Introduction, the structure of NaV2O5 looks like the structure of V2O5
intercalated with Na. The V–O bond lengths within the vanadium-oxygen layers are close in these two compounds(see Table 4). The longest bond within the layer interconnects two V2O5 units in the crystal unit cell (see Fig. 1bwhere this bond is indicated as a dashed line). So, it is of a certain meaning to classify the k = 0 crystal vibrationson the basis of internal vibrations of the V2O5 “molecule” (C2v point symmetry group) split into Davydov doubletsof the D2h factor group by an interaction between two “molecules” in the crystal unit cell. (Ag + B1u), (B2g + B3u),(B3g +B2u) and (B1g +Au) Davydov doublets come from A1, B1, B2 and, correspondingly, A2 vibrations of the V2O5
6
“molecule”. Splittings of these doublets can be as big as 100 cm−1 due to Coulomb interactions and, in particular, dueto interactions between the adjacent V ions through the common neighbors (O2 ions) along the chains (see Fig. 1).Many of the vibrational frequencies of Na V2O5 are close to those of V2O5 [22].
The comparison of our observed vibrational frequencies with those of V2O5 [22] and with the results of our calcu-lations leads to the following assignment of the vibrational modes of NaV2O5. The V–O3 stretching modes manifestthemselves by two Davydov doublets: 951 cm−1 (B2g) + 939 cm−1 (B3u) and 970 cm−1 (Ag) + 955 cm−1 (B1u).The Davydov splittings are relatively small in this case indicating that these vibrations associated with the strongestbond V–O3 are really well localized. The mode frequencies are somewhat lower than the corresponding frequencies inV2O5 (976, 982, 994 and 975 cm−1), which is in accordance with longer V–O3 bonds in NaV2O5 in comparison withV2O5. The following vibrations are associated with the O1–V–O3 bending modes: 177 cm−1 (Ag), 162 cm−1 (B1u),392 cm−1 (B2g), 366 cm−1 (B3g).
The bridging oxygens O1 participate in the bending V–O1–V vibrations 418 cm−1 (B3g), 367 cm−1 (B2u),447 cm−1 (Ag), 468 cm−1 (B1u). The stretching V–O1–V vibration is placed at 420 cm−1 (Ag) and involves mainlythe motion of the V atoms along the a-axis.
The modes at 683 cm−1 (B3g and B1g) and 582 cm−1 (B2u) correspond to the stretching V–O2 vibrations alongthe b-axis while those at 550 cm−1 (B2g), 533 cm−1 (Ag) and 526 cm−1 (B3u) — to the bending ones.
Most of the remaining modes can be described in terms of external modes of the V2O5 units. Thus, the modes at186 cm−1 (B2g), 169 cm−1 (B3g) and 90 cm−1 (Ag), correspond to the relative translations of the two V2O5 unitswithin the crystal unit cell along the a-, b- and, correspondingly, c-axes. As the V2O5 units are bound together alongthe b-axis, these modes can be considered as relative translations of the neighboring (VO5)n chains. The B1g modeat 174 cm−1 (O3 ions move along the b-axis) and the Ag mode at 301 cm−1 (O2 ions move along the c-axis) correlatewith in-plane and, correspondingly, out-of-plane chain bending vibrations. The B2g mode at 141 cm−1 and B3u modeat 91 cm−1 are connected with the rotation of the chains around the b-axis.
The following modes involve mainly the displacements of Na atoms: 225 cm−1 (B2u), 251 cm−1 (B3u),181 cm−1 (B1u).
C. Spectra of electron excitations
With obtained values of the effective charges, we estimated the crystal field energies of the 3d electron localized at theV4+ ion site. The crystal field parameters B0
2 =1360+2090G, B12 =2020-1590G, B2
2 =820+640G, B04 =610+1430G,
B14 =-1810-3690G, B2
4 =33+144G, B34 =3650+8180G, B4
4 =4070+7420G cm−1 for the V1, V3 sites were calculated inthe framework of the exchange charge model [27] (for the V2, V4 sites B1
p and B3p parameters change signs, the first
terms correspond to point charge contributions, the Stevens normalization is used). The scaling factor G determinesthe strength of the exchange charge field. We estimated this phenomenological parameter of the model (G = 4) byfitting the total crystal field splitting to the width of the V–3d bands presented in Ref. [13]. In this case, the effectivecrystal field provides the following energy level pattern of the V4+ ion : 0 (A′′), 1.10 (A′), 1.18 (A′′), 3.39 (A′) and4.78 (A′) eV (irreducible representations of the Cs point group, corresponding to the space symmetry of the electronwave function, are given in brackets, additional shifts of the crystal field levels due to the spin-orbit interaction andthe electrostatic field of a hole at the neighboring vanadium site are less than 0.025 eV). The ground state wavefunction is the dxy orbital with small admixture of the dyz orbital as it has been already pointed earlier [13], and thesequence of the excited states is in agreement with results of the band structure calculations as well [13].
The strong absorption of light (k||c) with the E||a as well as with E||b polarizations was observed in the region of1.0–1.2 eV [21]. Both magnetic dipole and induced electric dipole d− d transitions in the odd crystal field are allowedbetween the A′′ states for E||a, and between the A′′ and A′ states for E||b. Thus, in accordance with the results onthe crystal field energies given above, the observed broad optical bands in the region of 1 eV can be interpreted asphonon assisted d − d transitions without any additional suppositions about the broken symmetry between legs ofvanadium ladders [28].
The next step towards the detailed description of the spectra of electron excitations is to construct molecularorbitals for the [V2O]7+ “molecule” having C2v point symmetry, from the vanadium d-orbitals and oxygen p-orbitals.The vanadium ground state wave function dxy yields the non-bonding a2 orbital as well as bonding and antibondingb2 molecular orbitals, namely,a2 : [dxy(L) + dxy(R)]b2 : [dxy(L) − dxy(R)] + py
b∗2 : [dxy(L) − dxy(R)] − py.Here, a2, b2 denote irreducible representations of the C2v point group, the asterisk refers to an antibonding orbital,L and R stand for the vanadium sites at the left and, correspondingly, right sides of a ladder rung. The highest
7
filled orbital being a2, the a2 → b∗2 electronic transition allowed in E||a polarization could account for the low-frequency absorption band observed just in this polarization. Quantum-chemical calculations are necessary to verifythis qualitative interpretation.
D. Fano resonances with a continuum
The asymmetric lineshapes of the infrared active modes at 91, 150, 939 cm−1 in E||a polarization bring into evidencea strong interference between these modes and a continuum observed just in this polarization. This interpretation issupported by the fact that the spectral line near 91 cm−1 becomes perfectly symmetric when the continuum absorptionvanishes in this spectral range below the phase transition temperature Tc = 35 K. In our earlier work [8] we arguedthat these changes are connected with the opening of a gap in the magnetic excitation spectrum at Tc, the observedcontinuum being due to two-magnon absorption.
However, such a straightforward interpretation is no more valid in the case of the space group D132h. It should be
revised, taking into account possible electronic excitations in this frequency range, as discussed in the previous section,and a charge ordering at the transition temperature.
E. Higher order infrared vibrational spectra
Two- and three-phonon absorption occurs due to anharmonicity of crystal vibrations. It is continuous, displayingsingularities corresponding to critical points of the Brillouin zone. Leaving the detailed analysis of multiphonon bandsto a future publication, we discuss here only sharp lines observed in E||c absorbance spectrum (Fig. 5). They arelisted in Table 5 together with their tentative assignment, using symmetry allowed combinations of Γ-point phononsobserved in our first-order spectra. The coincidence of the observed and combinational frequencies is within theprecision of our measurements.
The strongest narrow peak at 1930 cm−1 corresponds, according to this assignment, to a sum of the componentsof the Davydov doublet originating from the V–O3 stretching vibration. This stretching mode is well localized whichresults in its small dispersion over the Brillouin zone, thus delivering a narrow two-phonon band, in accordance withthe experimental observation.
V. SUMMARY
We have performed a thorough spectroscopic study of far infrared reflection and transmission as well as Ramanscattering of α′-NaV2O5 single crystals in the high temperature phase (above Tc = 35 K). Far infrared spectra wereobtained for E||a, E||b and E||c polarizations of incident light. Diagonal (aa), (bb), (cc) as well as nondiagonal (ab),(bc), (ac) components of the Raman scattering tensor were investigated. We report five infrared active modes inE||a polarization, four — in E||b polarization and six — in E||c polarization. Eight Raman active modes have beendetected for parallel polarizations of incident and scattered light (aa), (bb), (cc). The (ab), (ac) and (bc) Ramangeometries delivered three, seven and, correspondingly, five modes. These results are in a much better agreement withthe recently proposed centrosymmetric space group D13
2h (Pmmn) for the high-temperature phase of NaV2O5 thanwith earlier accepted noncentrosymmetric space group C7
2v (Pmn21). We have also performed the lattice dynamicscalculations, in the framework of the rigid ion model, for both proposed in the literature structures of NaV2O5.We failed to obtain any physically well-grounded set of parameters providing a stable C7
2v lattice structure. Thus,our infrared and Raman experimental data, as well as the results of lattice dynamics calculations support stronglythe conclusion of the previous structural study [13,14] that the space group of NaV2O5 above Tc = 35 K is thecentrosymmetric D13
2h rather than noncentrosymmetric C72v group.
This conclusion leads to important physical consequences. In particular, it requires to revise the interpretationof one-dimensional magnetic properties of NaV2O5 and of the phase transition at 35 K considered earlier as anordinary spin-Peierls transition. An interpretation of the earlier observed broad bands in the near and far infraredabsorption [21,8] needs to be reconsidered too.
Using the values of effective charges obtained in the process of lattice dynamics calculations and fitting the totalcrystal field splitting to the width of the V–3d bands [12], we estimated the crystal field energies of the 3d electronlocalized at the vanadium site. It follows from this estimate that the observed near infrared broad band absorptionof NaV2O5 [21] can be interpreted as phonon assisted d − d transitions. We speculate that the far infrared E||a
8
polarized absorption continuum might be associated with electron excitations of [V2O]7+ rungs in the crystal field ofC2v symmetry.
Strongly asymmetric spectral lines observed in E||a absorbance spectra of NaV2O5 bring into evidence a stronginterference between relatively narrow phonon lines and the underlying continuum. This points to an interactionbetween crystal vibrations and magnetic or electronic excitations. The detailed physical interpretation of the observedphenomenon depends on the nature of the far infrared E||a polarized continuum which requires a special investigation.
In conclusion, we reported also some preliminary results on higher order vibrational spectra of NaV2O5 appearingdue to anharmonicity of lattice vibrations.
ACKNOWLEDGMENTS
We are grateful to A. I. Smirnov for checking the samples by ESR measurements. We acknowledge A. N. Vasil’evfor stimulating discussions and G. N. Zhizhin for a constant support of this research. This work was made possiblein part by the Grant No. 98-02-17620 from the Russian Fund for Basic Research.
[1] M. Isobe and Y. Ueda, J. Phys. Soc. Jap. 65, 1178 (1996).[2] A.I. Buzdin and L.N. Bulaevskii, Usp. Fiz. Nauk 131, 495 (1980) [Sov. Phys. Usp. 23, 409 (1980)].[3] J. Hemberger, M. Lohmann, N. Nickloas, A. Loidl, M. Klemm, G. Obermeier, and S. Horn, Europhys. Lett. 42, 661 (1998);
T. Yamada, private communication.[4] K. Kobayashi, T. Mizokawa, A. Fujimori, M. Isobe, and Y. Ueda, Phys. Rev. Lett. 80, 3121 (1998).[5] Y. Fujii, H. Nakao, T. Yoshihama et al., J. Phys. Soc. Jap. 66, 326 (1997).[6] M. Weiden, R. Hauptmann, C. Geibel, F. Steglich, M. Fisher, P. Lemmens, and G. Guntherodt, Z. Phys. B 103, 1 (1997).[7] H. Curoe, H. Seto, J. Sasaki, T. Sekine, M. Isobe, and Y. Ueda, J. Phys. Soc. Japan, in press, cond-mat/9805251.[8] M.N. Popova, A.B. Sushkov, A.N. Vasil’ev, M. Isobe, and Y. Ueda, Pis’ma v ZhETF 65 711 (1997) [JETP Lett. 65 743
(1997)], cond-mat/9711052.[9] D. Smirnov, P. Millet, J. Leotin, D. Poilblanc, J. Riera, D. Augier, and P. Hansen, Phys. Rev. B 57, R11035 (1998).
[10] T. Yoshihama, M. Nishi, K. Nakajima, Y. Fujii, M. Isobe, and Y. Ueda, Physica B 234-236, 539 (1997).[11] A. Carpy and J. Galy, Acta Crystallogr. B 31, 1481 (1975).[12] H.G. Backman, F.R. Ahmed, and W.H. Barnes, Z. Krist. 115, 110 (1961).[13] H. Smolinski, C. Gros, W. Weber, U. Peuchert, G. Roth, M. Weiden, and C. Geibel, Phys. Rev. Lett. 80, 5164 (1998).[14] A. Meetsma, J.L. de Boer, A. Damascelli, T.T.M. Palstra, J. Jegoudez, and A. Revcolevschi, Acta Cryst., in press,
cond-mat/9806081.[15] P. Horsch and F. Mack, cond-mat/9801316.[16] T. Ohama, H. Yasuoka, M. Isobe, and Y. Ueda, preprint.[17] H. Seo and H. Fukuyama, cond-mat/9805185.[18] M.V. Mostovoy and D.I. Khomskii, cond-mat/9806215.[19] P. Thalmeier and P. Fulde, cond-mat/9805230.[20] M. Koppen, D. Pankert, R. Hauptmann, M. Lang, M. Weiden, C. Geibel, and F. Steglich, Phys. Rev. B 57, 8466 (1998).[21] S.A. Golubchik, M. Isobe, A.N. Ivlev, B.N. Mavrin, M.N. Popova, A.B. Sushkov, Y. Ueda, and A.N. Vasil’ev, J. Phys.
Soc. Japan 66, 4042 (1997).[22] L. Abello, E. Husson, Y. Repelin, and G. Lucazeau, Spectrochemica Acta 39A, 641 (1983).[23] M. Isobe, C. Kagami, and Y. Ueda, J. Crystal Growth 181, 314 (1997).[24] B.N. Mavrin, Optika i Spectroscopiya 49, 79 (1980).[25] D.L. Rousseau, R.P. Bauman, and S.P.S. Porto, J. Raman Spectr. 10, 253 (1981).[26] U. Fano, Phys. Rev. 124, 1866 (1961).[27] B.Z. Malkin, in: Spectroscopy of solids containing rare-earth ions, ed. A.A. Kaplyanskii and R.M. Macfarlane, Elsevier
Science PB, Amsterdam, 1987, 13-49.[28] A. Damascelli, D. van der Marel, J. Jegoudez, G. Dhalenne, and A. Revcolevschi, cond-mat/9806222.
9
FIGURE CAPTIONS
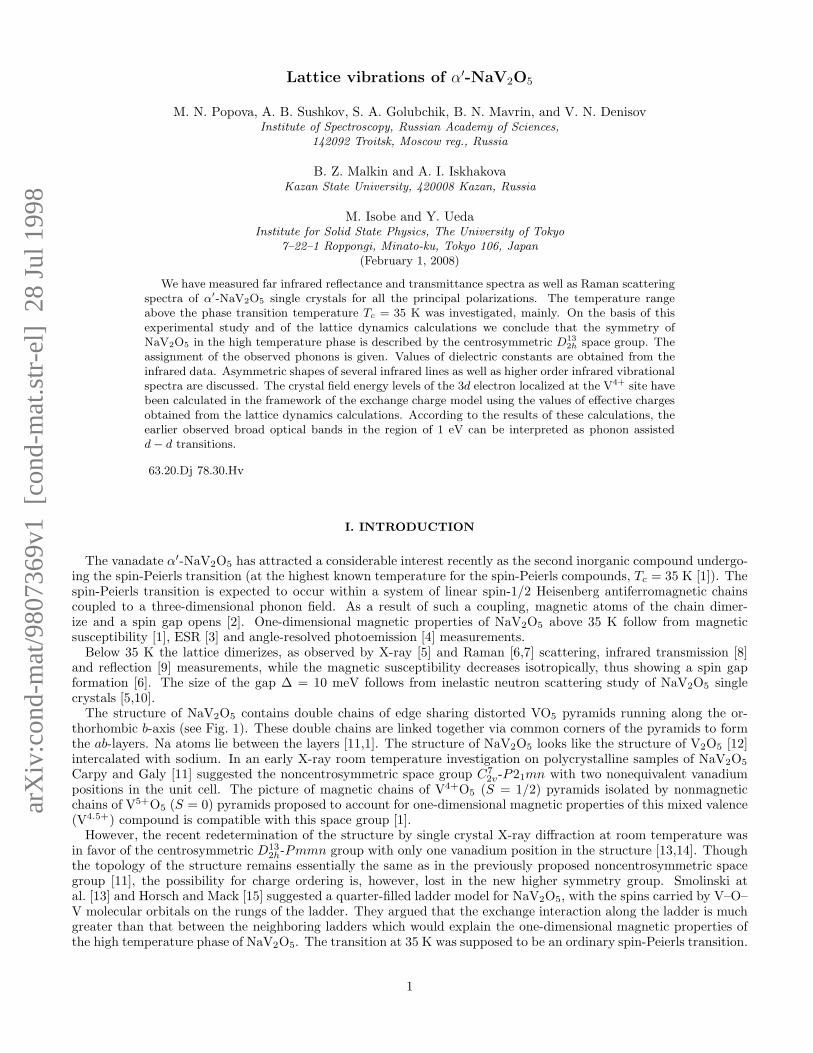
FIG. 1. The structure of NaV2O5. (a) A stereometric projection. Oxygen and vanadium atoms are at the corners ofand, correspondingly, inside the pyramids. Sodium atoms are presented as balls. (b) ab projection. Apical oxygen O3 atoms(situated above or below the corresponding V atoms) are not shown. A dashed line indicates the longest V–O2 bond (0.199 nm).ab-projection of the crystal unit cell is shown by a thin solid line.
FIG. 2. Room temperature far-infrared reflectivity spectra of NaV2O5. Open circles represent experimental data. Solid linesare the result of the fitting (see the text).
FIG. 3. Absorption coefficient α in the region of low frequency absorption bands at room temperature. An arrow indicatesa Fano-type resonance. It is shown separately in the inset. Open circles represent experimental data. Solid line in the mainfigure was calculated using the parameters obtained from the fitting of the reflectance spectrum. Solid line in the inset is aresult of the fitting by the expression (5) with αB(ω) shown as a dashed line.
FIG. 4. Fano resonance near 91 cm−1 at the temperature of 40 K (open circles) and its fitting by the equation (5) withparameters ωr = 90.7 cm−1, γ = 0.2 cm−1, q = −1.0, αB(ω2) = 270 cm−1, α0/αB = 0.3 (solid line). The temperaturedependence of the Fano parameter q is given in the left inset. The right inset presents the absorption spectrum in thevicinity of 91 cm−1 line at 6 K taken with the resolution of 0.05 cm−1 (open circles) and its fitting by the Lorenzian with aFWHM=0.10 cm−1.
FIG. 5. Absorbance spectrum of NaV2O5 in the region of multiphonon bands at room temperature.
FIG. 6. Room temperature Raman spectra of NaV2O5. Asterisks mark Ag lines seen in Big (i = 1, 2, 3) spectra.
FIG. 7. Room temperature Raman spectra of Na1−xV2O5 for different x.
FIG. 8. Decomposition of the room temperature c(aa)c Raman spectrum of NaV2O5 into separate contours (dashed lines).The sum of these contours shown by a solid line approximates the experimental spectrum (circles) rather well.
10
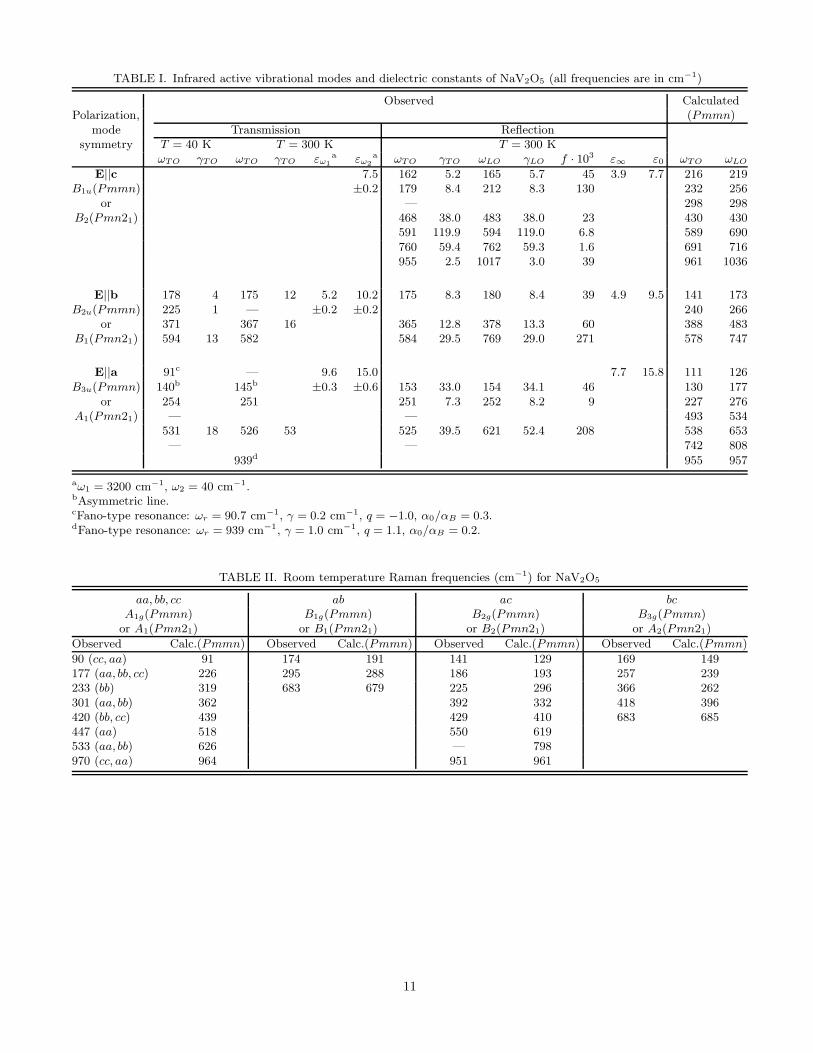
TABLE I. Infrared active vibrational modes and dielectric constants of NaV2O5 (all frequencies are in cm−1)
Observed CalculatedPolarization, (Pmmn)
mode Transmission Reflectionsymmetry T = 40 K T = 300 K T = 300 K
ωTO γTO ωTO γTO εω1
a εω2
a ωTO γTO ωLO γLO f · 103 ε∞ ε0 ωTO ωLO
E||c 7.5 162 5.2 165 5.7 45 3.9 7.7 216 219B1u(Pmmn) ±0.2 179 8.4 212 8.3 130 232 256
or — 298 298B2(Pmn21) 468 38.0 483 38.0 23 430 430
591 119.9 594 119.0 6.8 589 690760 59.4 762 59.3 1.6 691 716955 2.5 1017 3.0 39 961 1036
E||b 178 4 175 12 5.2 10.2 175 8.3 180 8.4 39 4.9 9.5 141 173B2u(Pmmn) 225 1 — ±0.2 ±0.2 240 266
or 371 367 16 365 12.8 378 13.3 60 388 483B1(Pmn21) 594 13 582 584 29.5 769 29.0 271 578 747
E||a 91c — 9.6 15.0 7.7 15.8 111 126B3u(Pmmn) 140b 145b ±0.3 ±0.6 153 33.0 154 34.1 46 130 177
or 254 251 251 7.3 252 8.2 9 227 276A1(Pmn21) — — 493 534
531 18 526 53 525 39.5 621 52.4 208 538 653— — 742 808
939d 955 957
aω1 = 3200 cm−1, ω2 = 40 cm−1.bAsymmetric line.cFano-type resonance: ωr = 90.7 cm−1, γ = 0.2 cm−1, q = −1.0, α0/αB = 0.3.dFano-type resonance: ωr = 939 cm−1, γ = 1.0 cm−1, q = 1.1, α0/αB = 0.2.
TABLE II. Room temperature Raman frequencies (cm−1) for NaV2O5
aa, bb, cc ab ac bcA1g(Pmmn) B1g(Pmmn) B2g(Pmmn) B3g(Pmmn)
or A1(Pmn21) or B1(Pmn21) or B2(Pmn21) or A2(Pmn21)
Observed Calc.(Pmmn) Observed Calc.(Pmmn) Observed Calc.(Pmmn) Observed Calc.(Pmmn)
90 (cc, aa) 91 174 191 141 129 169 149177 (aa, bb, cc) 226 295 288 186 193 257 239233 (bb) 319 683 679 225 296 366 262301 (aa, bb) 362 392 332 418 396420 (bb, cc) 439 429 410 683 685447 (aa) 518 550 619533 (aa, bb) 626 — 798970 (cc, aa) 964 951 961
11
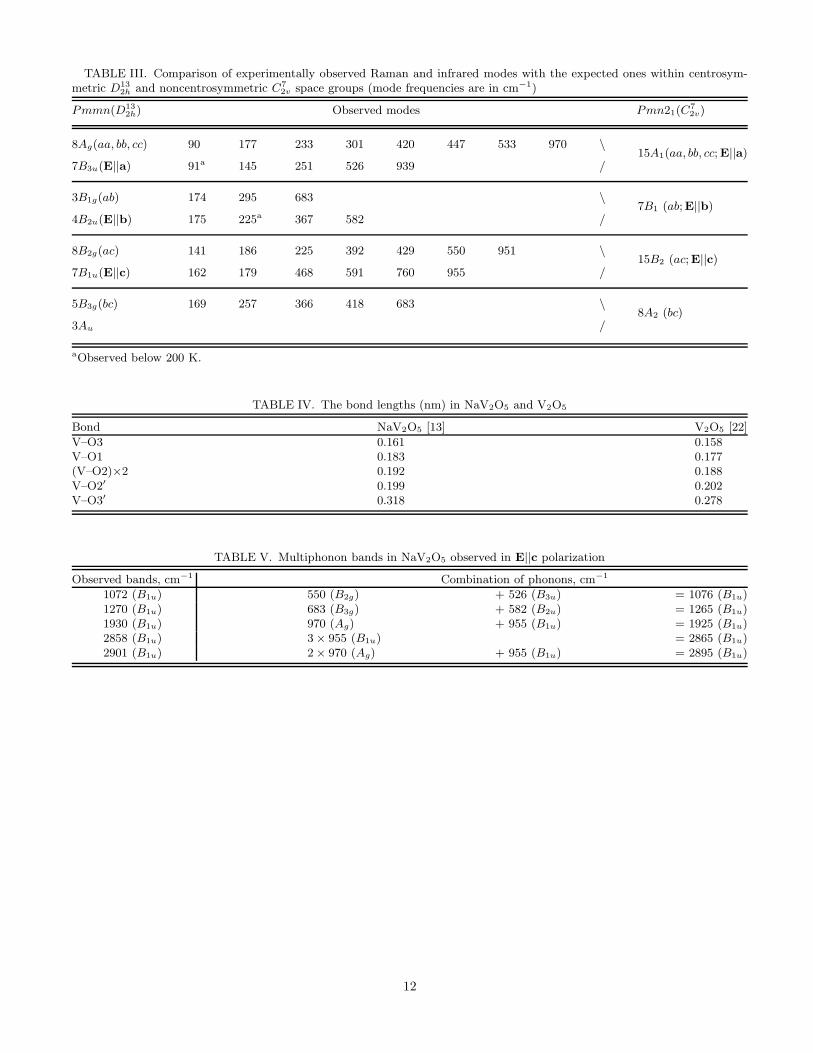
TABLE III. Comparison of experimentally observed Raman and infrared modes with the expected ones within centrosym-metric D13
2h and noncentrosymmetric C72v space groups (mode frequencies are in cm−1)
Pmmn(D132h) Observed modes Pmn21(C
72v)
8Ag(aa, bb, cc) 90 177 233 301 420 447 533 970 \15A1(aa, bb, cc;E||a)
7B3u(E||a) 91a 145 251 526 939 /
3B1g(ab) 174 295 683 \7B1 (ab;E||b)
4B2u(E||b) 175 225a 367 582 /
8B2g(ac) 141 186 225 392 429 550 951 \15B2 (ac;E||c)
7B1u(E||c) 162 179 468 591 760 955 /
5B3g(bc) 169 257 366 418 683 \8A2 (bc)
3Au /
aObserved below 200 K.
TABLE IV. The bond lengths (nm) in NaV2O5 and V2O5
Bond NaV2O5 [13] V2O5 [22]
V–O3 0.161 0.158V–O1 0.183 0.177(V–O2)×2 0.192 0.188V–O2′ 0.199 0.202V–O3′ 0.318 0.278
TABLE V. Multiphonon bands in NaV2O5 observed in E||c polarization
Observed bands, cm−1 Combination of phonons, cm−1
1072 (B1u) 550 (B2g) + 526 (B3u) = 1076 (B1u)1270 (B1u) 683 (B3g) + 582 (B2u) = 1265 (B1u)1930 (B1u) 970 (Ag) + 955 (B1u) = 1925 (B1u)2858 (B1u) 3 × 955 (B1u) = 2865 (B1u)2901 (B1u) 2 × 970 (Ag) + 955 (B1u) = 2895 (B1u)
12
(a)
(b)
0.0
0.2
0.4
0.6
0.8
200 400 600 800 1000
x10
E||cB
1u
Ref
lect
ivit
y
500 600 700 800
0.10
0.12
0.14
0.0
0.2
0.4
0.6
0.8 E||bB
2u
Ref
lect
ivit
y
200 400 600 800 10000.0
0.2
0.4
0.6
0.8
W avenumber (cm -1)
E ||aB
3u
Ref
lect
ivit
y
� � � � � � � � � � � � � � ��� � � �
� � � �
� � �α
�� � �
� �� � � � �� �� � � ����� �� � � ��! � �
� � � �� ! � �
α
"#$%& '
80 85 90 95 100
-100
0
100
200
300
� � �� �E||a
Wave number (cm-1)
α-α B
(cm
-1)
91 920
500
1000
1500
2000
���� ��� ������α
(cm
-1) � � � �
50 100 150-1.2
-1.0
-0.8
-0.6
-0.4
Fano
par
amet
er q
Temperature (K)
� � � � � � � � � � � � � � � ��� �
� �� �
� � � � ��
α
���
�� �� � � � �� �� � � ��
� � �� �� � �� � � � �
� ��� � �� �
�� � �� �� � ��
� � � � � �� �� � � � �� � ��� � �� � � �
������ ���� ��� �� ����� ��������
!!"!!#!!
$!!%!!!� ����� � ����� ����� � &�
� � � � �� � �� � �
'() (*+ ,-./01)23
� � �� �� �� �� � �� � �
� ���� � � �
4567
��� ��� ��� ��� ����
�����
�� ��� � � �� �� �
����� ������ ���� !"# !" ! #$ %
200 400 600 800 1000 1200
������
Inte
nsity
, a.u
.
Raman Shift,cm-1
Top Related
Copyright © 2022 FDOKUMEN

