


Bahasa
Halaman
Hukum


Large-scale grazing history effects on Arctic-alpinegerminable seed banks
Victoria T. Gonzalez • Kari Anne Brathen •
Virve T. Ravolainen • Marianne Iversen •
Snorre B. Hagen
Received: 16 February 2009 / Accepted: 6 October 2009 / Published online: 17 October 2009
� Springer Science+Business Media B.V. 2009
Abstract Grazing constitutes a selective pressure
on vegetation recruitment through modification of the
seed banks. Here we address changes in seed bank
density and its life history trait composition in century-
old pastures, where contrasting reindeer densities
have developed during the last decades. We cover
the actual scales used by these wide-roaming herbi-
vores by sampling 70 productive tundra habitats over
7,421 km2 in the reindeer summer pastures of North-
ern Norway. Results showed that the seed bank density
was significantly lowered where reindeer densities had
increased in recent decades, whereas the century-long
history of grazing probably explains the main
seed bank traits typical of grazing tolerant plants.
The dominant trait characteristics were small seeds
(\0.5 mg), seeds lacking dispersal mechanism and
individuals with a graminoid growth form. Finally,
differences between regions introduced trait variation
independent of grazing history, reinforcing the impor-
tance of using scales covering several contexts when
designing ecological studies.
Keywords Reindeer (Rangifer tarandus) �Growth form � Seed mass � Diaspore morphology �Temporal scale � Spatial scale � Context dependency
Introduction
Seed bank accumulation is one of the most important
strategies for plant survival and propagation in
disturbed and variable environments, such as grazed
ecosystems (Chambers and Macmahon 1994). It is
well documented that the vertebrate grazing changes
the seed abundance and species composition of the
seed banks (e.g., Chippindale and Milton 1934;
O’Connor and Pickett 1992; Jutila 1998; Mayor
et al. 2003; Sternberg et al. 2003; Eskelinen and
Virtanen 2005). However, studies on seed bank trait
composition in relation to grazing are few, in spite of
the scientific evidence showing that plant life history
traits influence plant tolerance to grazing (Diaz et al.
2001; Sternberg et al. 2003).
Electronic supplementary material The online version ofthis article (doi:10.1007/s11258-009-9676-2) containssupplementary material, which is available to authorized users.
V. T. Gonzalez (&) � K. A. Brathen � V. T. Ravolainen �S. B. Hagen
Department of Biology, University of Tromsø,
9037 Tromsø, Norway
e-mail: [email protected]
K. A. Brathen
e-mail: [email protected]
V. T. Ravolainen
e-mail: [email protected]
S. B. Hagen
e-mail: [email protected]
M. Iversen
Sami College, Hannuluohkka 45, 9520 Guovdageaidnu/
Kautokeino, Norway
e-mail: [email protected]
123
Plant Ecol (2010) 207:321–331
DOI 10.1007/s11258-009-9676-2

Plant life history traits are used to monitor the
effects of herbivores on the vegetation (e.g., Wardle
et al. 1998; McIntyre et al. 1999; Rusch et al. 2003;
Cornelissen et al. 2004; Brathen et al. 2007b).
Because the seed bank is an important vegetation
regeneration stage, the study of its life history traits
could give information on the direction to which the
vegetation is heading in case of disturbance. Studies
on ungulate grazing in northern areas have shown that
the use of growth forms to describe the vegetation
reliably capture plants’ different responses to grazing
(White and Trudell 1980; Chapin et al. 1996; Brathen
and Oksanen 2001; Brathen et al. 2007b). This, in
turn is also likely to be manifested as changes in the
seed bank. Changes in seed bank structure associated
with grazing could also be influenced by processes
related to seed and dispersal unit characteristics,
because of their critical role in determining species
responses to disturbance (Navie and Rogers 1997;
Osem et al. 2006). Grazing is known to favor plants
with small and round seeds lacking dispersal assisting
structures (Eriksson and Eriksson 1997; Navie and
Rogers 1997). Thus, in our approach to study the seed
bank under grazing conditions, we consider both
plant traits (growth form) and seed traits (seed mass
and diaspore morphology).
Based on hierarchical foraging theory (Senft et al.
1987) it can be expected that the effect of large
herbivores on the seed banks may be highly spatially
variable and dependent on type of grazer. However,
the effect of grazers on seed banks has previously
only been addressed in small extent studies (Jutila
1998; Eskelinen and Virtanen 2005; Olofsson 2006;
Osem et al. 2006), which may be highly dependent on
specific ecological context (Noda 2004) and which
fail to include enough spatial variation in their design
(Hobbs 2003). Here we apply a design including
several ecological contexts and covering the actual
scales used by a wide-roaming large herbivore that
covers hundreds of km2 while grazing its pastures.
Reindeer (Rangifer tarandus tarandus) are often
the most abundant large-roaming herbivore found in
the circumpolar region (Batzli et al. 1980; Klein
1999). Reindeer are known to pick their food non-
randomly by selecting plant reproductive parts and
some species before others (White and Trudell 1980;
Klein 1990; Wada 1999; Brathen and Oksanen 2001;
Cooper and Wookey 2003). As a result, reindeer can
change the seed bank density (Cooper 2006) and
potentially shape the composition of the plant life
history traits present in the seed bank.
Reindeer have been present in coastal northern
Norway since the deglaciation of 10,000–15,000 years
BP (Skogland 1994). Herds migrate seasonally
between inland winter pastures and coastal summer
pastures. Since the sixteenth century, reindeer herds in
Finnmark have become semi-domesticated and are
now entirely herded by the indigenous Sami people,
although the seasonal migration pattern is maintained
(Muga 1986). The summer pastures are naturally
delineated by the coastal line into distinct geographic
areas, and these are separated by fences as to form
discrete management districts. These summer districts
vary in terms of pasture area and reindeer density.
Over the last two to three decades significant density-
dependent reductions in calf growth have existed
between districts (Fauchald et al. 2004; Tveraa et al.
2007), probably as a result of the deteriorated quality
of the grazing grounds where densities have been high
in the last two to three decades (Brathen et al. 2007b).
Yet, no study has evaluated at a large scale the reindeer
grazing impact on the potential recruitment of the
vegetation.
It is hypothesized in this study that reindeer
grazing has modified the seed bank density of the
pastures where reindeer density has increased over
the last decades. Also, it is hypothesized that this
grazing constitutes a selective pressure on the com-
position of life history traits in the seed bank. To test
out these hypotheses, we paired neighboring reindeer
herding districts with contrasting histories of reindeer
densities. The opportunity to implement a quasi-
experimental (Shadish et al. 2002) study design, with
both a temporal dimension (i.e., different histories of
reindeer densities) and a spatial dimension (i.e.,
contrasting large-scale areas of different histories) is
not common. As such, this seed bank study represents
a pioneering approach.
Methods
Study area
The study was carried out in the coastal alpine tundra
of Finnmark County, Northern Norway, between
latitudes 77�910N–30�900E and 78�540N–64�280E(Fig. 1). The study sites were located in the low
322 Plant Ecol (2010) 207:321–331
123
alpine zone, where snow cover remains until
late June and the main vegetation types are grass
and herbaceous dicotyledon meadows, Empetrum-
and Vaccinium-dominated heaths and Eriophorum and
Carex marshes. The main herbivore in these areas are
semi-domestic reindeer (Rangifer tarandus tarandus),
followed in a less extent by moose (Alces alces), and
locally, domestic sheep (Ovis aries). Also widespread
are Norwegian lemmings (Lemmus lemmus), ptarmi-
gan (Lagopus lagopus), and gray sided voles (Clethr-
ionomys rufocanus), although high peak spring
densities have been lacking during the last decades
(Ims and Fuglei 2005). Finnmark County is charac-
terized by climatically steep gradients from west
to east as well as from coast to inland (Hanssen-Bauer
1999), caused by the NE Atlantic Current that
gradually declines from west to east. The northernmost
coast of Finnmark is classified as Arctic (Walker et al.
2005). Average (range in parenthesis) precipitation in
the summer months is 65 (52–84), 54 (47–60), and 48
(38–55) mm in the region west, region middle, and
region east of Finnmark, respectively. Average (range
in parenthesis) temperature is 10.6 (8.5–12.1), 10.1
(7.9–11.6), and 8.7 (6.2–10.5)�C, in the region west,
region middle, and region east, respectively (30 year
normal, average for June, July, and August; Norwe-
gian Meteorological Institute 2006).
Study design
For this study six large-scale reindeer herding
districts, ranging in area from 300 to 4,000 km2
(total area 7,421 km2), were paired according to their
history of reindeer density. The two districts forming
a pair had maintained constant reindeer numbers
from the 1950’s to the 1980’s, after which, one of the
districts in the pair increased its density from 100 to
200% (i.e., increased reindeer density district), while
the other district maintained its density constant
(i.e., stable reindeer density district) (Anonymous
2004) (Fig. 2). Density changes are to a large extent
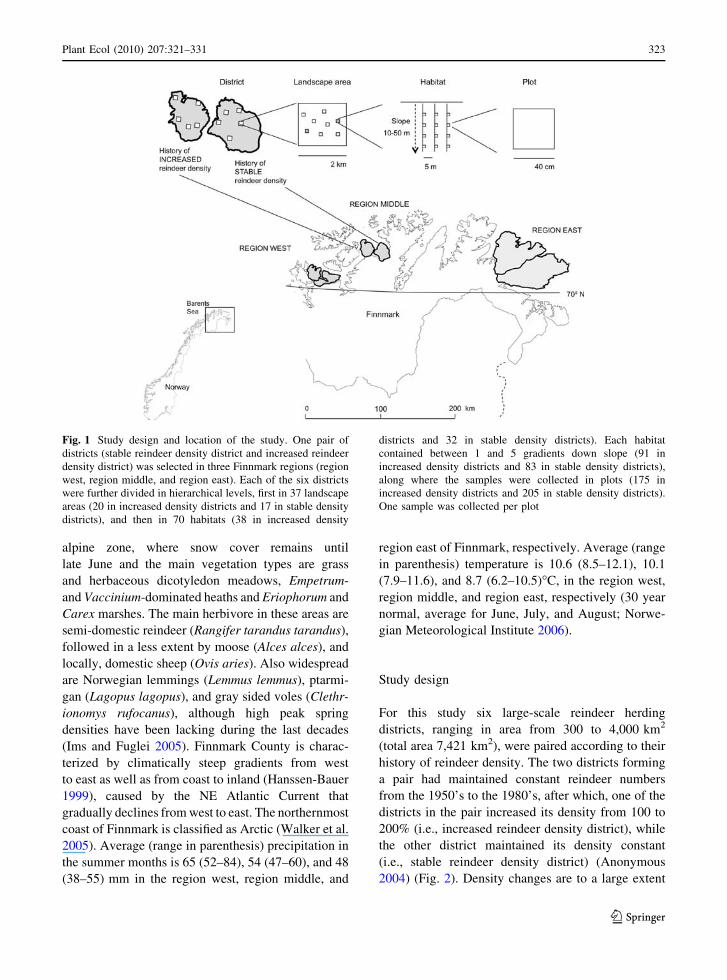
Fig. 1 Study design and location of the study. One pair of
districts (stable reindeer density district and increased reindeer
density district) was selected in three Finnmark regions (region
west, region middle, and region east). Each of the six districts
were further divided in hierarchical levels, first in 37 landscape
areas (20 in increased density districts and 17 in stable density
districts), and then in 70 habitats (38 in increased density
districts and 32 in stable density districts). Each habitat
contained between 1 and 5 gradients down slope (91 in
increased density districts and 83 in stable density districts),
along where the samples were collected in plots (175 in
increased density districts and 205 in stable density districts).
One sample was collected per plot
Plant Ecol (2010) 207:321–331 323
123

determined by spatio-temporally heterogeneous man-
agement practices (Tveraa et al. 2007; Naess et al.
2009). Feces counts confirmed that the focal habitats
of the increased reindeer density districts had a higher
animal density than habitats from stable density
districts. Furthermore, both districts forming a pair
had to be neighboring districts in order to reduce
climatic and geoedaphic differences sensu Krucke-
berg (2002). Under these criteria, three pairs of
districts were identified. The pairs were located in
three different regions, covering the gradient from the
westernmost to the easternmost parts of Finnmark
and termed region west, region middle, and region
east (Fig. 1).
In order to randomly choose representative habi-
tats, each district was divided into nested levels
(Fig. 1). The first level was landscape areas of
2 9 2 km2. Landscape areas containing major roads,
sea, lakes, glaciers, or more than 50% forests were
discarded.
Within each landscape area, suitable habitats were
located based on topographic curvature, slope, and
altitude above sea level (asl) in order to stratify our
sampling to relatively productive habitats in the low-
alpine zone. Areas with concave curvature accumulate
moisture and nutrients, hence, they were assumed to be
relatively more productive. Furthermore, snow beds in
concave habitats have been shown to attract reindeer
(Edenius et al. 2003) and accumulate seeds (Larsson
and Molau 2001). Therefore, concave habitats with a
mean slope between 7.5� and 30� (between 5� and 30�in the Region East which is less steep) were chosen.
Terrain above 600 m asl in Region West, above
500 m asl in Region Middle Finnmark, and above
300–350 m asl in Region East, was excluded. Altitu-
dinal belts above these heights generally represent the
middle to high alpine zone, which contains sparse
vegetation. Potential habitats were located selecting
pixels with the specified topographic measures from a
terrain model with 25 9 25 m resolution using GIS
software (ArcGIS 2004). Each habitat was located in
the field with geographical coordinates (longitude and
latitude) provided by the GIS programme.
Landscape areas that contained the largest number
of potential habitats were visited, 20 and 17 land-
scape areas for increased and stable districts, respec-
tively. Once located in the field, the habitat had to
meet certain conditions. First, the vegetation cover
had to be higher than 75%, and second, the study site
had to be large enough to include at least two
gradients (each no less than 10 m long) and should
not contain paths, electric posts, marsh, or bog. If a
habitat failed to meet any of these conditions, it was
discarded and the next one closest to it was visited
and inspected for possible analysis. Once the habitat
was selected, between two and five gradients were
laid out down slope with a 5-m separation between
them. Gradient length varied between 10 and 50 m
and was limited by the habitat size since sampling
was stopped before entering new convex area with
heath vegetation. Samples were gathered in plots
every tenth meter of each gradient in order for data to
be representative of the habitat. Between 1 and 5
plots were sampled per gradient depending on its
length. If the plot had more than 50% stones, it was
discarded and the plot in the next 2 m was taken
instead. If that plot also failed to meet the conditions,
the plot 2 m before the original plot was taken. If
none of those options was successful, the sample was
not collected. The amount of gathered samples per
habitat varied between 2 and 14.
The two districts of a pair were sampled simulta-
neously in order to avoid differences in plant phenol-
ogy. Data were assembled over 4 weeks, starting in
Fig. 2 History of reindeer density (mean number of reindeer
per km2 with 95% confidence intervals) for districts in the
west, middle, and east region from 1945 to 1980 and from 1980
to 2003. This reindeer density development provides the basis
for the contrasting between districts with a history of increased
or stable reindeer density districts, respectively
324 Plant Ecol (2010) 207:321–331
123

the region west, during July and August 2004. At that
time, current year seeds were dispersing. It is therefore
possible that the samples contained both transient
seeds, i.e., with a life span of less than a year, and
persistent seeds, i.e., at least 1-year-old (Thompson
et al. 1997). Plant nomenclature follows Lid and Lid
(1994).
Sampling
In each plot, a 2.5-cm diameter soil core was
collected with a 10-cm long metal cylinder placed
down at soil level, below the humus layer, on the
bottom right corner of the studied plot. The core
depth varied in accordance with the thickness of the
organic soil layer of the plot in order for all seeds,
recent and old, to be collected. Top layer samples,
i.e., moss and litter layer down to the humus layer,
were taken by collecting a 15 9 15 cm sample from
each studied plot. All samples were stored in paper
bags and frozen no later than 8 h after collection.
Samples were frozen at -18�C in order to simulate a
stratification period. After 2 months they were taken
out to thaw in dark chambers at 2�C before the
experiment started. A total of 380 soil core samples
and 384 top layer samples were collected from the 70
visited habitats.
Soil core samples were crumbled onto Petri dishes
(diameter 8.7 cm, depth 1.4 cm) with a filter paper in
the bottom to keep moisture. About half of every top
layer sample (10 9 10 cm) was put in a transparent
box (15 9 10 cm), also with filter paper in the
bottom. All samples were randomly placed in two
phytotron chambers where optimal germination con-
ditions for most northern alpine plants were simu-
lated: 24 h of daylight split into 12 h at 20�C and
12 h at 15�C. All samples were kept moist by water
spraying every third day. Emerged seedlings were
transplanted to seedling boxes and kept until identi-
fication was possible. After 4 months, all samples
were set in refrigerated dark chambers at 2�C in order
to simulate a winter period. Soil cores were crumbled
again and returned together with the top layer
samples to the growth chambers for the germination
to continue after 3 weeks of chilling. To further
stimulate seed germination, samples were sprayed
after the second chilling period once a week, during
2 weeks, with KNO3 (10 mM; Giba et al. 2003).
Seedling emergence was monitored during a total of
7 months, until no more seedlings emerged from the
samples. Seedlings dying before identification were
classified in general groups: dicotyledon, graminoid,
ericoid shrub, or ‘‘plant.’’ Some graminoids were cold
treated (0.5�C) to initiate flowering, in order to
identify them. Measurements of soil pH were taken
with pH papers from every soil sample. The range in
pH was between 3.6 and 5.5 in all the regions. All
samples were set up at the same time and received the
same conditions and treatment during the germina-
tion period.
Data on geoedaphic and geographic factors per
habitat were identified using GIS. Data on the major
categories of bedrock types were identified from
geological maps (Geological Survey of Norway
2004), and classified as poor, moderate, or rich in
bedrock nutrient content based on Tarbuck and
Lutgens (1992). Data on slope and altitude were
identified from the 25 9 25 m pixel terrain model.
There were generally only small differences in the
geoedaphic and geographic factors between districts
with a history of stable and increased reindeer
density. However, bedrock nutrient content showed
a gradient from rich bedrock in the region west,
intermediately rich in region middle to mostly poor
bedrock in the region east. Similarly, slope and
altitude showed a gradient from steeper slopes at
higher altitudes (average of approx. 18� and 350 m
asl) in the region west, to intermediate steep slopes at
intermediate altitudes (average of approx. 13� and
275 m asl) in the region middle, to less steep slopes
and lower altitudes (average of approx. 8� and
200 m asl) in the region east.
Preparation of data for statistical analysis
Germination data were converted to seed density by
calculating the seed density per m2. Soil seed bank
and top layer samples were summed together because
of the large amount of zeros present in the soil seed
bank data. From now on they are referred to as the
seed bank data. Germinating seeds were classified
after three life history traits. Each life history trait
was divided in several trait groups: (1) Growth form
(graminoid, herbaceous dicotyledon, shrub); (2) Seed
mass (\0.1 mg,[0.1 to 0.5 mg,[0.5 to 1 mg,[1 to
5 mg); (3) Diaspore morphologies [no appendages,
animal dispersed appendages (hooks, fruits and
elaiosome), wind dispersed appendages (wings and
Plant Ecol (2010) 207:321–331 325
123

pappus)]. Data on seed mass and diaspore morphol-
ogy were extracted from several internet data bank
sources (Fitter and Peat 1994; Klotz et al. 2002),
literature (Welling and Laine 2002; Welling et al.
2004), and personal observation. Growth form clas-
sification was based on Chapin et al. (1996) with
some modifications. Due to the low number of
species germinating, we grouped sedges and grasses
as one group, called graminoids, while all herbaceous
dicotyledons were another group. See Appendix in
Supplementary material for a classification of the
germinating species after the different traits.
Statistical analysis
All data were sampled at the plot level and were then
averaged to habitat since this level was the focus of
sampling. Data were transformed by loge(x ? 1) and
analyzed using linear mixed effects models (lme;
Pinheiro et al. 2005). Lme models allow the usage in
nested designs of explanatory variables that are a
mixture of fixed effects and random effects (Pinheiro
and Bates 2000). We tested for main effects and
possible interactions of grazing history and life history
traits on seed bank densities (seeds/m2). A separate
analysis was carried out for each of the three focal life
history traits (growth form, seed mass categories, and
diaspore morphology), always including grazing his-
tory as the other main predictor variable in all analyses.
We also included in all analyses region as a covariate,
since we expected seed densities to differ according to
context differences between regions. Grazing history
was a categorical variable with two levels: increased or
stable. Region had three categories: region west,
region middle, and region east. In all analyses, district
and landscape area were considered random effects.
However, district was eventually dropped as a random
factor as it explained very little variation (var =
0.05 ± 0.01) and this spatial level corresponds to the
spatial level of grazing history and region.
All statistical output is presented as geometric
means, i.e., back transforming results from the
logarithmic scale. Data analyses were performed in
the statistical environment R (version 2.4.0; R
Development Core Team 2006).
Results
Out of 2,056 individuals that germinated from the
seed bank samples, 70% were identified to species
level and classified according to the selected traits to
run the analyses. The mean seed density in the seed
bank per habitat was 1,268 ± 470 (95% CI, n = 70)
seeds/m2 and 62 species were encountered (see
Appendix).
The results from the three statistical analyses
showed that the seed bank density (seeds/m2) per
habitat was significantly affected by grazing history
and region, and that seed density differed signifi-
cantly between growth forms, seed mass categories,
and diaspore morphologies (Table 1). Habitats in
districts with a history of increased reindeer density
had lower seed bank densities (Fig. 3). Between the
Table 1 Main results (ANOVA tables) from linear mixed
effect models carried out to assess the impact of grazing history
and region on seed bank density (seeds per m2) per habitat, for
each of the three life history traits, i.e., growth forms, seed
mass categories, and diaspore morphologies
Parameters Life history traits
Growth forms Seed mass categories Diaspore morphologies
df F-value P [ |t| df F-value P [ |t| df F-value P [ |t|
Intercept 1,165 214.3 \0.01 1,231 191.19 \0.01 1,165 97.17 \0.01
Grazing history 1,33 4.51 0.02* 1,33 3.92 0.04* 1,33 2.87 0.05*
Trait 2,165 6.63 \0.01* 3,231 12.40 \0.01* 2,165 4.50 0.04*
Region 2,33 5.88 \0.01* 2,33 8.12 \0.01* 2,33 5.99 \0.01*
Grazing history 9 trait 2,165 0.05 0.95 3,231 0.84 0.46 2,165 0.42 0.65
Region 9 trait 4,165 2.37 0.04* 4,231 2.21 0.05* 4,165 2.41 0.05*
For each statistical model, the results for ‘‘trait’’ refer to the significance of the different life history trait categories evaluated in that
model
* Significant value at P \ 0.05
326 Plant Ecol (2010) 207:321–331
123

regions, the seed bank densities were higher in the
region middle and the region west than in the region
east (Fig. 3). The distribution of life history traits was
independent of history of reindeer grazing (Table 1),
while there was an interaction with region (Table 1).
For instance, the region east had a higher proportion
of seeds that are wind dispersed and of shrub growth
form (Table 2). Overall, small seeds (\0.5 mg),
seeds with no appendages, and seeds belonging to
graminoid growth form were the most common traits
found in the seed bank (Fig. 4). The estimated effects
of the random factors in the mixed models were
generally low between the landscape areas compared
to habitats within landscape areas for all life history
traits (standard deviation for landscape areas vs.
habitat within landscape areas were 1.89 vs. 9.18 for
growth forms, 1.86 vs. 8.58 for seed mass categories,
and 2.03 vs. 9.91 for diaspore morphologies).
Discussion
Districts with a history of increased reindeer densities
had lower seed density in the seed bank as opposed to
districts where reindeer densities had remained
stable. However, no indications of selective pressure
on life history trait distribution were found due to
differences in this recent grazing history. Overall,
individuals with a graminoid growth form, small
seeds (\0.5 mg), and seeds lacking a mechanism for
seed dispersal were the most common traits present in
the seed banks from this alpine grazed ecosystem.
These are traits common among grazing tolerant
plants, and may reflect that the vegetation has adapted
to a longer grazing history in Finnmark, where
reindeer have been present for several centuries
(Skogland 1994). Both seed density and the life
history trait compositions were found unevenly
distributed across the regions, indicating dependency
on contexts varying at the large spatial scale of this
study (Fig. 3; Table 1).
Lower seed densities in districts with a history of
increased reindeer density indicate that the recruit-
ment opportunities of this alpine vegetation are
reduced. The decrease in seed density is likely
because reindeer graze in a selective manner, by
choosing plant reproductive parts when available
(Klein 1990; Brathen and Oksanen 2001; Cooper and
Fig. 3 Mean seed density
(seeds per m2; geometric
mean with 95% confidence
intervals) for the two
different grazing histories
and for the three different
Finnmark regions
Plant Ecol (2010) 207:321–331 327
123

Wookey 2003). Furthermore, there is also evidence
that high grazing pressure not only decreases the
amount of flowers, but also reduces the investment on
sexual reproduction in many reindeer forage species
(Ehrlen 1997; Wada 1999; Brathen and Junttila
2006). Many alpine areas are known to be already
seed limited (Turnbull et al. 2000; Eskelinen and
Virtanen 2005) and recent studies on geese (Kuijper
et al. 2006) and Svalbard reindeer (Cooper 2006)
have discovered intensive grazing in the High Arctic
to have depleted the seed banks, thus having a lasting
impact in these plant communities.
Parallel with the grazing history effect, we found a
regional gradient in seed density from region west and
middle to region east. This regional gradient in seed
density could be attributed to factors such as slope
(Csontos et al. 2004), altitude (Molau and Larsson
2000; Cummins and Miller 2002), the physical envi-
ronment of the soil (Chambers et al. 1991), or climate
(Hill and Vander Kloet 2005). For instance, even small
increases in temperature can accelerate flowering of
some alpine species (Arroyo et al. 1981; Molau et al.
2005) increasing seed production and consequently
increasing seed bank densities.
However, the recent history of reindeer grazing did
not appear to be a selective force behind the
distribution of the different life history traits. Similar
trait dominance was found in both stable and
increased districts. The general pattern reflected in
both seed banks from increased and stable districts
seemed to correspond to a more classic overall grazed
ecosystem, i.e., small seeds lacking dispersal mech-
anisms (Navie and Rogers 1997) and mainly of
graminoid growth form. Several graminoid species
Table 2 Geometric means (and 95% confidence intervals) for the seed density (seeds per m2) per habitat (n) of the different growth
forms, and seed traits, i.e., seed mass and diaspore morphology
Grazing
history
Region n Growth forms
Herbaceous dicotyledon Graminoid Shrub
Increased West 9 12.1 (1.8, 60.6) 48.9 (7.2, 300.9) 39.9 (5.6, 251.1)
Middle 13 39.0 (6.1, 224.9) 269.4 (35.6, 1997.2) 9.0 (0.9, 52)
East 16 2.1 (0.2, 7) 8.1 (1.1, 38.6) 13.6 (2.2, 65)
Stable West 9 168.0 (32.8, 844.6) 189.6 (63.7, 560.2) 33.5 (3, 294.9)
Middle 13 37.1 (7.9, 161.4) 322.8 (75.7, 1365.5) 82.1 (29.3, 227.1)
East 10 8.3 (0.5, 57) 28.4 (2.5, 248.6) 25.3 (5.4, 107.9)
Grazing
history
Region n Seed mass categories
\0.1 mg [0.1 to 0.5 mg [0.5 to 1 mg [1 to 5 mg
Increased West 9 24.0 (4.1, 121.7) 61.2 (8.1, 423.1) 1.9 (0.4, 14) 6.3 (0.2, 45.1)
Middle 13 33.8 (4.1, 236.5) 107.9 (17.2, 651) 89.0 (11.3, 657.5) 4.9 (0.1, 31.8)
East 16 5.2 (0.4, 25.6) 20.3 (5, 74.9) 1.4 (0.2, 6.1) 1.9 (0, 7.5)
Stable West 9 72.0 (8.3, 571.5) 138.8 (27.5, 684.4) 89.9 (17.2, 453.9) 3.6 (0.1, 17.7)
Middle 13 173.2 (54.1, 549) 124.2 (37.5, 406.5) 74.9 (11.3, 467.7) 32.1 (10, 98.5)
East 10 13.9 (1.6, 83.8) 26.4 (2.3, 227.1) 6.4 (0.5, 35.2) 2.1 (0.2, 10.2)
Grazing
history
Region n Diaspore morphologies
No appendages Animal dispersed Wind dispersed
Increased West 9 50.9 (7.7, 310.1) 41.1 (5.8, 261.4) 7.3 (0.7, 39.9)
Middle 13 147.4 (15.9, 1298.8) 77.3 (14, 406.5) 18.1 (2.2, 114.6)
East 16 6.7 (0.7, 33.5) 5.5 (0.9, 21.4) 13.0 (2, 64.4)
Stable West 9 199.3 (32.4, 1198.9) 92.7 (19.7, 423.1) 18.7 (1.1, 182.1)
Middle 13 289.0 (68.4, 1211) 137.4 (42.4, 440.4) 30.8 (6.2, 140.2)
East 10 17.7 (1.1, 169.7) 9.1 (0.7, 59.3) 14.3 (1.5, 91.8)
Geometric means are given for each combination of grazing history and region
328 Plant Ecol (2010) 207:321–331
123

are known for their capacity of compensatory or even
overcompensatory growth under grazing pressure
(Wegener and Odasz 1997; Brathen and Odasz-
Albrigtsen 2000). Thus, the several centuries’ of long
history of reindeer grazing in Finnmark have prob-
ably been a major factor in shaping the seed bank trait
composition.
Inconsistently with our results, a recent study on
reindeer in Finnmark found more graminoid and forb
seedlings emerging in areas where reindeer densities
were high (Olofsson 2006). However, results in
Olofsson (2006) are based on findings close to reindeer
fences while we found no effect of reindeer on
graminoid seed density when embracing the summer
pastures at their full extent. Thus, our results reinforce
the importance of ecological context and scale. It is
also worth noting that for vegetation composition
responses to reindeer grazing in Finnmark, results
found in a study at local scale (Olofsson et al. 2001) are
contradicted by a study at larger scale (Brathen et al.
2007b). Furthermore, reindeer dispersal of seeds by
endozoochory has, in Finnmark, been found to be
highly dependent on ecological scale and context
(Brathen et al. 2007a). Consequently, rather than
choosing only one environmental context for our
study, we believed it was important to know how seed
bank densities were affected over a range of different
environmental contexts for reindeer grazing. Among
all studies on herbivore effects on seed banks, our
study is the only one in line with the theoretical under-
standing that context-dependency can be approached
by study scaling and design (Wiens 1989; Hobbs 2003;
Noda 2004).
Finally, because we have used a study design where
reindeer history effects are studied at a scale that
includes different ecological contexts, we believe our
results to conservatively explain reindeer density
effects on the seed banks. We suggest more effort
should be made at studying the importance of differing
ecological contexts and their interactions on seed
banks. For instance, different contexts may be of high
relevance for the effect of climate change on seed
banks. Large-scale studies, such as the current, should
then be of high priority.
Fig. 4 Mean seed density (seeds per m2; geometric mean with 95% confidence intervals) for the different growth forms, and seed
traits, i.e., seed mass categories and diaspore morphologies
Plant Ecol (2010) 207:321–331 329
123

Acknowledgments We would like to thank the Norwegian
Coast Guard, Leidulf Lund, Jarle Nilsen, and Kjell Nilsen for
their help at the phytotron, Torstein Engelskjøn for help with
species identification, Asle Lilletun, all the participants of
Ecosystem Finnmark, and Tina Dahl, Alina Evans and Mette
Nielsen for field assistance and Rolf Anker Ims and Nigel
Yoccoz for discussions on the study design. This study is part
of the ‘‘Ecosystem Finnmark’’ project, which was financed by
the Norwegian Research Council.
References
Anonymous (2004) Ressursregnskap for reindriftsnæringen
1945–2003. Alta, Norway, p 135 (in Norwegian)
ArcGIS (2004) ESRI GIS and mapping software. Version 8.3.0
Arroyo MTK, Armesto JJ, Villagran C (1981) Plant pheno-
logical patterns in the high Andean Cordillera of central
Chile. J Ecol 69:205–223
Batzli GO, White RG, MacLean SF, Pitelka FA, Collier BD
(1980) The herbivore-based trophic system In: Brown J,
Miller RG, Tieszen LL, Bunnell FL (eds) An Arctic
ecosystem: the coastal tundra at Barrow, Alaska. US/IBP
Synthesis Series. Dowden, Hutchinson and Ross, Stro-
udsburg, pp 335–410
Brathen KA, Junttila O (2006) Infertile times: response to
damage in genets of the clonal sedge Carex bigelowii.Plant Ecol 187:83–95
Brathen KA, Odasz-Albrigtsen AM (2000) Tolerance of the
arctic graminoid Luzula arcuata ssp. confusa to simulated
grazing in two nitrogen environments. Can J Bot
78:1108–1113
Brathen KA, Oksanen J (2001) Reindeer reduce biomass of
preferred plant species. J Veg Sci 12:473–480
Brathen KA, Gonzalez VT, Iversen M, Killengreen S, Ravo-
lainen VT, Ims RA, Yoccoz NG (2007a) Endozoochory
varies with ecological scale and context. Ecography
30:308–320
Brathen KA, Ims RA, Yoccoz NG, Fauchald P, Tveraa T,
Hausner V (2007b) Induced shift in ecosystem produc-
tivity? Extensive scale effects of abundant large herbi-
vores. Ecosystems 10:773–789
Chambers JC, Macmahon JA (1994) A day in the life of a seed:
movements and fates of seeds and their implications for
natural and managed systems. Annu Rev Ecol Syst
25:263–292
Chambers J, Macmahon J, Haefner J (1991) Seed entrapment
in alpine ecosystems—effects of soil particle-size and
diaspore morphology. Ecology 72:1668–1677
Chapin FS, BretHart MS, Hobbie SE, Zhong HL (1996) Plant
functional types as predictors of transient responses of
arctic vegetation to global change. J Veg Sci 7:347–358
Chippindale HG, Milton WEJ (1934) On the viable seeds
present in the soil beneath pastures. J Ecol 22:508–531
Cooper EJ (2006) Reindeer grazing reduces seed and propagule
bank in the high Arctic. Can J Bot 84:1740–1752
Cooper EJ, Wookey PA (2003) Floral herbivory of Dryasoctopetala by Svalbard reindeer. Arct Antarct Alp Res
35:369–376
Cornelissen J, Quested H, Gwynn-Jones D, Van Logtestijn R,
De Beus M, Kondratchuk A, Callaghan T, Aerts R (2004)
Leaf digestibility and litter decomposability are related in
a wide range of subarctic plant species and types. Funct
Ecol 18:779–786
Csontos P, Tamas J, Podani J (2004) Slope aspect affects the
seed mass spectrum of grassland vegetation. Seed Sci Res
14:379–385
Cummins R, Miller GR (2002) Altitudinal gradients in seed
dynamics of Calluna vulgaris in eastern Scotland. J Veg
Sci 13:859–866
Diaz S, Noy-Meir I, Cabido M (2001) Can grazing response of
herbaceous plants be predicted from simple vegetative
traits? J Appl Ecol 38:497–508
Edenius L, Vencatasawmy CP, Sandstrom P, Dahlberg U
(2003) Combining satellite imagery and ancillary data to
map snowbed vegetation important to reindeer Rangifertarandus. Arct Antarct Alp Res 35:150–157
Ehrlen J (1997) Risk of grazing and flower number in a
perennial plant. Oikos 80:428–434
Eriksson A, Eriksson O (1997) Seedling recruitment in semi-
natural pastures: the effects of disturbance, seed size,
phenology and seed bank. Nord J Bot 17:469–482
Eskelinen A, Virtanen R (2005) Local and regional processes
in low-productive mountain plant communities: the roles
of seed and microsite limitation in relation to grazing.
Oikos 110:360–368
Fauchald P, Tveraa T, Yoccoz NG, Ims RA (2004) En økologisk
bærekraftig reindrift Hva begrenser naturlig produksjon og
høsting? NINA Fagrapport 76 (in Norwegian)
Fitter A, Peat H (1994) The ecological flora database. J Ecol
82:415–425. www.ecoflora.co.uk
Geological Survey of Norway (2004) Digital maps of bedrock
and superficial deposits in Troms and Finnmark 1:250000
Giba Z, Gribisic D, Konjevic C (2003) Nitrogen oxides as
environmental sensors for seeds. Seed Sci Res 13:
187–196
Hanssen-Bauer I (1999) Klima i nord de siste 100 ar. Ottar
99:41–48 (in Norwegian)
Hill NM, Vander Kloet SP (2005) Longevity of experimentally
buried seed in Vaccinium: relationship to climate, repro-
ductive factors and natural seed banks. J Ecol 93:1167–1176
Hobbs NT (2003) Challenges and opportunities in integrating
ecological knowledge across scales. For Ecol Manag
181:223–238
Ims RA, Fuglei E (2005) Trophic interaction cycles in tundra
ecosystems and the impact of climate change. Bioscience
55:311–322
Jutila H (1998) Seed banks of grazed and ungrazed Baltic
seashore meadows. J Veg Sci 9:395–408
Klein DR (1990) Variation in quality of caribou and reindeer
forage plants associated with season, plant part and phe-
nology. Rangifer Spec Issue 3:123–130
Klein DR (1999) The role of climate and insularity in estab-
lishment and persistence of Rangifer tarandus populations
in the high Arctic. Ecol Bull 47:96–104
Klotz S, Kuhn I, Durka W (2002) Biolflor—eine datenbank zu
biologisch-okologischen merkmalen der gefaßpflanzen in
deutschland. Schriftenreihe fur Vegetationskunde 38.
Bundesamt fur Naturschutz, Bonn. www.biolflor.de
330 Plant Ecol (2010) 207:321–331
123

Kruckeberg AR (2002) Geology and plant life: the effects of
landforms and rock types on plants. University of Wash-
ington Press, Seattle
Kuijper DPJ, Bakker JP, Cooper EJ, Ubels R, Jonsdottir IS,
Loonen MJJE (2006) Intensive grazing by barnacle geese
depletes high Arctic seed bank. Can J Bot 84:995–1004
Larsson E-L, Molau U (2001) Snowbeds trapping seed rain: a
comparison of methods. Nord J Bot 21:385–392
Lid J, Lid DT (1994) Norsk flora. Det Norske Samlaget, Olso
Mayor MD, Boo RM, Pelaez DV, Elıa OR (2003) Seasonal
variation of the soil seed bank of grasses in central
Argentina as related to grazing and shrub cover. J Arid
Environ 53:467–477
McIntyre S, Lavorel S, Landsberg J, Forbes T (1999) Distur-
bance response in vegetation—towards a global perspec-
tive on functional traits. J Veg Sci 10:621–630
Molau U, Larsson E-L (2000) Seed rain and seed bank along an
alpine altitudinal gradient in Swedish Lapland. Can J Bot
78:728–747
Molau U, Nordenhall U, Eriksen B (2005) Onset of flowering
and climate variability in an alpine landscape: a 10-year
study from Swedish Lapland. Am J Bot 92:422–431
Muga DA (1986) A commentary on the historical transfor-
mation of the Sami communal mode of production. J Ethn
Stud 14:111–121
Naess MW, Fauchald P, Tveraa T (2009) Scale dependency
and the ‘‘marginal’’ value of labor. Hum Ecol 37:193–
211
Navie SC, Rogers RW (1997) The relationship between attri-
butes of plants represented in the germinable seed bank
and stocking pressure in a semi-arid subtropical range-
land. Aust J Bot 45:1055–1071
Noda T (2004) Spatial hierarchical approach in community
ecology: a way beyond high context-dependency and
low predictability in local phenomena. Popul Ecol 46:
105–117
Norwegian Meteorological Institute (2006). www.met.no
O’Connor TG, Pickett GA (1992) The influence of grazing on
seed production and seed-banks of some African savannah
grasslands. J Appl Ecol 29:247–260
Olofsson J (2006) Short- and long-term effects of changes in
reindeer grazing pressure on tundra heath vegetation. J
Ecol 94:431–440
Olofsson J, Kitti H, Rautiainen P, Stark S, Oksanen L (2001)
Effects of summer grazing by reindeer on composition of
vegetation, productivity and nitrogen cycling. Ecography
24:13–24
Osem Y, Perevolotsky A, Kigel J (2006) Size traits and site
conditions determine changes in seed bank structure
caused by grazing exclusion in semiarid annual plant
communities. Ecography 29:11–20
Pinheiro J, Bates D (2000) Mixed-effects models in S and S-
plus. Springer, New York
Pinheiro J, Bates D, DebRoy S, Sarkar D (2005) Nlme: linear
and nonlinear mixed effects models R package version
3.1–6.4
R Development Core Team (2006) R: a language and envi-
ronment for statistical computing. R Foundation for Sta-
tistical Computing, Vienna. www.R-project.org
Rusch GM, Pausas JG, Leps J (2003) Plant functional types in
relation to disturbance and land use: introduction. J Veg
Sci 14:307–310
Senft RL, Coughenour MB, Bailey DW, Rittenhouse LR, Sala
OE, Swift DM (1987) Large herbivore foraging and
ecological hierarchies. Bioscience 37:789–799
Shadish WR, Cook TD, Campbell DT (2002) Experimental and
quasi-experimental designs for generalized causal infer-
ence. Houghton Mifflin, Boston
Skogland T (1994) Villrein: fra urinnvaner til miljøbarometer.
Teknologisk Forlag, Oslo (in Norwegian)
Sternberg M, Gutman M, Perevolotsky A, Kigel J (2003)
Effects of grazing on soil seed bank dynamics: an
approach with functional groups. J Veg Sci 14:375–386
Tarbuck EJ, Lutgens FK (1992) The earth: an introduction to
physical geology. Macmillan, New York
Thompson K, Bakker J, Bekker R (1997) The soil seed banks
of North West Europe: methodology, density and lon-
gevity. Cambridge University Press, Cambridge
Turnbull LA, Crawley MJ, Rees M (2000) Are plant popula-
tions seed-limited? A review of seed sowing experiments.
Oikos 88:225–238
Tveraa T, Fauchald P, Yoccoz NG, Ims RA, Aanes R, Høgda
KA (2007) What regulate and limit reindeer populations
in Norway? Oikos 116:706–715
Wada N (1999) Factors affecting the seed-setting success of
Dryas octopetala in front of Brøggerbreen (Brøgger gla-
cier) in the high arctic, Ny Alesund, Svalbard. Polar Res
18:261–268
Walker DA, Raynolds MK, Daniels FJA, Einarsson E, Elve-
bakk A, Gould WA, Katenin AE, Kholod SS, Markon CJ,
Melnikov ES, Moskalenko NG, Talbot SS, Yurtsev BA,
Team C (2005) The circumpolar arctic vegetation map.
J Veg Sci 16:267–282
Wardle D, Barker G, Bonner K, Nicholson K (1998) Can com-parative approaches based on plant ecophysiological traits
predict the nature of biotic interactions and individual plant
species effects in ecosystems? J Ecol 86:405–420
Wegener C, Odasz AM (1997) Effects of laboratory simulated
grazing on biomass of the perennial arctic grass Dupontiafisheri from Svalbard: evidence of overcompensation.
Oikos 79:496–502
Welling P, Laine K (2002) Regeneration by seeds in alpine
meadow and heath vegetation in sub-arctic Finland. J Veg
Sci 13:217–226
Welling P, Tolvanen A, Laine K (2004) The alpine soil seed
standing vegetation bank in relation to field seedlings and
in subarctic Finland. Arct Antarct Alp Res 36:229–238
White RC, Trudell J (1980) Habitat preference and forage
consumption by reindeer and caribou near Atkasook,
Alaska. Arct Antarct Alp Res 12:511–529
Wiens JA (1989) Spatial scaling in ecology. Funct Ecol 3:
385–397
Plant Ecol (2010) 207:321–331 331
123
Top Related
Copyright © 2022 FDOKUMEN

