


Bahasa
Halaman
Hukum


Temi di discussione(Working papers)
Jun
e 20
08
672
Num
ber
Labour market for teachers: Demographic characteristics and allocative mechanisms
by Gianna Barbieri, Piero Cipollone and Paolo Sestito

The purpose of the Temi di discussione series is to promote the circulation of working papers prepared within the Bank of Italy or presented in Bank seminars by outside economists with the aim of stimulating comments and suggestions.
The views expressed in the articles are those of the authors and do not involve the responsibility of the Bank.
Editorial Board: Domenico J. Marchetti, Patrizio Pagano, Ugo Albertazzi, Michele Caivano, Stefano Iezzi, Paolo Pinotti, Alessandro Secchi, Enrico Sette, Marco Taboga, Pietro Tommasino.Editorial Assistants: Roberto Marano, Nicoletta Olivanti.

“la bontà di una istituzione, in ultima analisi, dipende sempre dalla qualità dei suoi membri e dei suoi capi, ma non vi è dubbio che rigidi ordinamenti istituzionali possono frustrare e obliterare generosi dosi di buona volontà e di energie umane”
Carlo Maria Cipolla Literacy and Development in the West
LABOUR MARKET FOR TEACHERS: DEMOGRAPHIC CHARACTERISTICS
AND ALLOCATIVE MECHANISMS
By Gianna Barbieri∗, Piero Cipollone and Paolo Sestito♣
Abstract
The paper considers the teachers’ labour market in Italy. The quality and motivation of teachers are certainly among the determinants of pupils’ achievement, but they are difficult to measure, so we examine the composition of the pool of teachers and their behaviour to infer information about them. We look also at the institutional features that motivate the implicit contract that drives Italian teachers' behaviour, which essentially involves low salary and correspondingly low commitment and effort. In particular we examine the mechanism that allocates teachers to schools. For each school we construct three indicators; one indicating the level of turnover, which we interpret as a source of turmoil; one that refers to the mismatch between tenured teachers and their school; and a “revealed preferences indicator” that measures the schools’ quality as evaluated by the population of tenured teachers. We measure the association at the school level of our indicators with achievement as gauged by PISA 2003. Students scores are correlated negatively to the turnover and the mismatch indicators, positively to revealed preferences.
JEL Classification: I20, I21, I28
Keyvords: teachers labour market, Italian educational system
Contents 1 Introduction and main results...........................................................................................3 2 Motivation and outline of the paper.................................................................................4 3 Who are the teachers. .......................................................................................................7 4 The behaviour of teachers in the labour market: a comparative exercise......................11 5 Consequences of the allocative system: turnover, mismatch and revealed preference .15
5.1 Turnover and turmoil in the Italian schools ...........................................................18 5.2 Mismatch and revealed preference of teachers. .....................................................22
6 Basic correlations...........................................................................................................25 7 Conclusions....................................................................................................................27 References ..............................................................................................................................30 Tables and figures ..................................................................................................................32
∗ Ministry of Education. ♣ Bank of Italy, Department for Structural Economic Analysis.

3
1 Introduction and main results1
This paper examines teachers’ labour market in Italy. We look at the composition of their
pool, to their behaviour and to the mechanisms that allocate them to schools. The motivation for this
endeavour is the search for credible explanations for the disappointing performance of the Italian
schooling system, as evidenced in PISA and, to a more limited extent, in other comparable
international surveys of students achievement such as PIRLS and TIMSS. We believe that the
administrative rules governing this market are such to divert teachers’ incentives from pursuing the
best performance of their students. This thrust has been stimulated by the reading of the growing
body of literature that is convincingly demonstrating that teachers matters (OECD 2004). The link
between teachers’ market functioning and teachers effectiveness is not easy to establish because the
dearth of reliable information about teachers’ quality, motivation and exerted effort. The idea of this
paper is to overcome this lack of information and to look at the correlation between students’
achievements and some features of the teachers’ labour market. On the link between these features
and the motivation and quality of teachers this paper is more speculative.
The contribution of the paper is mostly descriptive. Firstly we use LFS data in order to
compare teachers’ socio-economic characteristics and labour market behaviour to those of other
Italian workers, providing indirect support to the claim that Italian teachers are very much under
stress (OECD 2004) and suffer from the lack of incentives and motivation. Then we use
administrative data in order to construct three indicators for each individual school: one indicating
the level of turnover, one the quality of the match between tenured teachers and their school (a
mismatch indicator) and the third measuring the quality of the school as evaluated by the whole
population of tenured teachers (revealed preferences indicator). In our interpretation, turnover is a
source of turmoil with potentially negative implications for the effectiveness of teaching activity,
particularly in the Italian context where schools and their principals have little voice on the concrete
teaching activity that is under strict and unquestionable control of the single teacher. The actual
turnover that we measure is quite large and it is not uniquely accounted for by the presence of
teachers hired under temporary contract, peregrinating from one school to another every single year.
To a sizable extent it is due to tenured teachers, fully covered against the risk of loosing their job
position, who ask and obtain to move to other schools in force of a seniority based system. Actually
our second indicator, the mismatch indicator that measures the total number of mobility
1 The opinions here expressed are exclusively personal and do not necessarily involve the Institutions the Authors
belong to. We would like to thank for their suggestions Giuseppe Bertola, Daniele Checchi and an anonymous referee. A special thank to Federico Giorgi for providing an excellent research assistance.

4
applications, shows that every year one out of six tenured teachers express the desire to leave the
school where currently engaged. In our interpretation this suggests that many teachers are very
poorly motivated to exert any effort in their current position; at the end of the day it is their
seniority, rather than their current teaching performance, that counts for the probability to have their
mobility request accepted. Our third indicator, the revealed preference indicator, is constructed by
counting how many tenured teachers want to leave a given school and how many want to move into
the same school; thus we can classify schools according to the degree of preferences received from
the whole population of tenured teachers.
All of these three indicators have a large variability across schools that appears remarkable
given the lack of concrete autonomy of schools and the existence of centrally defined administrative
rules in the allocation of teachers. While we do not attempt to identify, in any econometric sense,
the causal effect of our indicators on schools’ performance, we do measure their association with
pupils achievement at the school level as measured by PISA 2003. These very preliminary exercises
are rather encouraging as students performance appears to be negatively related to teachers turnover
and to the incidence of tenured teachers mismatched to their school. The revealed preferences
indicator is positively correlated to the students performance, showing that teachers (on average)
know which are the best learning environments (notwithstanding the lack of standardised exams)
and gradually attempt to move there.
2 Motivation and outline of the paper.
Economists look at schools through the lenses of production theory. Teachers, and other
inputs, are combined in schools in order to develop students competencies. Such a frame is quite
powerful in focusing the attention upon schools effectiveness by relating output (some measure of
what students have learnt) to inputs (firstly the number and costs of teachers)2.
The production theory frame is not a simplistic scheme in which more (teachers) is always
better (for students’ learning). Actually a massive body of econometric work has shown that the
quantities do not matter very much and the teacher to pupils ratio has no clearly discernible impact
2 Todd and Wolpin (2003) discuss the general econometric framework and the data requirement for the empirical
estimation of an Education Production Function. The specification problems derive from the fact that learning is a cumulative process and therefore genetic traits, family background and the very early years of life and schooling have an enormous impact upon the subsequent school’s and labour market performance of a person (Cunha and Heckman (2007)). The family background importance goes beyond the direct parenting activities: actually much of the parents effect, besides its relevance in shaping the genetical endowment of their kids, comes through the residential choice and its implications upon the quality of the children’s peers and environment (Harris, 1999).

5
upon learning3. In contrast it is clear that teachers’ motivation and quality matter a lot not only
through the ability to transmit the content of the curricula but also through their impact upon
students’ motivation and behaviour.
Institutional arrangements are important determinants of the quality and motivation of
teachers as they set the recruitment rules and shape the incentives teachers face in their daily
activity (Bishop and Woessmann 2002 for a simple model)4. Within a given institutional
arrangement it appears that sizable differences in students’ learning are associated to the identity of
their teachers5. For example Aaronson et al. (2007) find that a standard deviation in teachers’
effectiveness – as measured by the average change in their students’ performance – equals one fifth
of the average change associated with one additional year of schooling6.
However effectiveness of a teacher is only observable ex-post and there is always the doubt
that is it contingent on a specific situation. From a policy maker point of view it would be important
to be able to predict teacher effectiveness on the basis of ex ante observable characteristics.
Unfortunately this is a difficult endeavour. Aaronson et al. (2007) indeed do not find strong links
between effectiveness and observable traits, including the credentials used (in that environment) for
selecting and paying the teachers. On the other hand Clotfelter, Ladd and Vigdor (2007a and 2007b)
– using North Carolina data – show that teachers’ experience (at least up to a few years of
experience) and quality (as measured by the tests teachers themselves took while graduating)
matter7. However education credentials may not be always conducive to better performance; for
instance having a Ph.D. in the subject taught has no impact upon effectiveness, possibly because the
people involved are overqualified and not really motivated to teaching. This example shows that
whatever the entry criteria, the composition of the teachers’ pool depends on the alternatives jobs
available. For instance, the decline over time in the quality of female teachers in the US8 has been
attributed by Hoxby and Leigh (2004) to the evolution of the interplay of relative wages between
3 See on this the summaries of the evidence provided by Hanushek (2003) and Krueger (2003). 4 A stylised fact emerging from the across countries analysis of comparable outcome measures – firstly those provided
by PISA − is that the most effective systems are those combining schools’ autonomy and strong accountability of results (Fuchs and Woessmann 2007).
5 The use of standardised tests to identify good and bad performers, at the level of individual students, teachers or schools, is made more difficult by the presence of measurement errors and the risk of inducing a “teaching to the test” behaviour (see Kane and Staiger, 2002). Albeit this may limit the usefulness of those tests in designing appropriate incentive schemes – for schools and teachers – the presence of sizable differences attributable to schools’ and teachers’ effectiveness is quite robust.
6 The results refer to 8th and 9th grade students of the public schools in the Chicago area. The impact of having a “good” teacher appears to be more sizable for less able students.
7 They also find a negative impact of class size (i.e. quantity matters as well) even though the magnitude of the impact is negligible.
8 The quality has been measured by the results of the tests undertaken by the different cohorts of teachers’ applicants at the end of their students’ career (see Corcoran et al., 2004).

6
the teachers and other professions: the increased chances of getting access to other professions –
previously basically closed to female candidates – and (more importantly) the compression of
teachers wages (vis-à-vis an increase in pay dispersion in the US economy at large) explain why
only the least able female graduates have increasingly opted for the teaching profession9.
To sum up, there is increasing evidence that teachers matter (OECD, 2004). Their quantity
matters for the costs of education (as teachers represent about two thirds of the current expenditure
for education at the primary and secondary level in the OECD average) while students
achievements are much more affected by teachers’ quality and motivation. However these two last
traits are not easy to build up and to instil through training and experience (albeit some experience
matters). Neither they are immediately linked to some specific characteristics easily identifiable ex
ante; the connection between observable traits and teachers’ quality is often confounded by the fact
that the way people select themselves into the teaching profession changes over time depending on
the evolution of the overall labour market.
Given these stylized facts, looking at the teachers’ labour market in Italy is of potential
relevance in order to understand the disappointing performance of the Italian schooling system– as
evidenced in PISA and, to a more limited extent, in the other comparable international surveys
about the competencies acquired by Italian students10. This paper moves from the consideration that
the regulation of the teachers’ market in Italy creates a contradiction between teachers and school
goals that eventually de-motivate the teachers and produce poorly educated students. To support
this claim is difficult because there are not direct evidence on teachers’ quality and motivation.
Ideally we would like to analyse the forces driving the processes through which Italian
teachers are selected and self-select into the profession and the individual schools and to identify
their impact upon students’ learning. While the information available in the Italian case falls short
that required to address this question, we think that it is still worth exploiting the available
information in order to uncover the sign and the strength of the correlation between students
achievements and several features characterizing the teaching profession. We refer to teachers
socio-demographic traits, their labour market behaviour and specific characteristics of the way they
are allocated to schools. The bulk of the paper consists in recovering and in synthesizing, in an
intelligible way, the relevant information into few crucial variables. As a first assessment of the
validity of our indicators we report their correlations with the available measures of students’
9 The negative self-selection of males teachers might also explain why, according to the cited Clotfelter et al. paper,
female teachers are ceteris paribus conducive to better students’ results (even after taking account that having a teacher of the same sex and race of the student has also a positive impact).
10 For a summary of these disappointing results see Cipollone and Sestito (2007) and Montanaro (2007).

7
achievement at the school level. These correlations are just a first step in the journey that eventually
leads to identify causal links between allocation rules, teachers’ observable characteristics, their
labour market attitudes, their motivation and quality and students’ achievement.
The choice of variables we focus upon is largely dictated by data availability and by the
Italian institutional setting. For example in the Italian case teachers’ quality cannot be inferred from
records of entry exams into the profession due to the absence of such entry tests and any recruiting
standards. To overcome this dearth of data and to recover some hints about teachers’ quality we
look at their demographic characteristics including information about their graduation grades
relative to the rest of the population; similarly we try to gain insights about teachers’ satisfaction
and motivation, that by definition are latent variables, by monitoring their behaviour in the labour
market. Finally, in order to look at how the institutional framework may affect students
achievement via teachers’ behaviour, we examine the effect of recruiting mechanisms on school
turnover, teachers’ mismatch and revealed preferences.
We exploit several statistical sources. Most of the information about teachers characteristics
and labour market behaviour are obtained from the Italian labour force survey (LFS) and the Bank
of Italy survey on household income and wealth (SHIW); these two sources allow us to directly
compare teachers to other workers; the drawback is the paucity of the details about the teachers’
career and (in the case of SHIW) the small sample size. We make use of the administrative school
records to construct indicators of teachers turnover, mismatch and revealed preferences.
The next sections are organized as follows. In section 3 we focus upon the composition of
teachers’ pool in terms of socio-demographic characteristics. Section 4 then compares teachers to
other workers in terms of some labour market indicators. Section 5 focuses upon turnover,
mismatch and revealed preference indicators. Section 6 finally discusses the relevance of our
indicators by showing how they correlate to some standardised measures of students learning.
Section 7 concludes.
3 Who are the teachers.
We recover information about the composition of the teachers’ pool from the Labour Force
Survey where a worker is identified as a teacher according to the description of the primary job held

8
during the survey’s reference week. Notice that we include both people temporarily absent because
of paid holidays, sickness etc, and people possibly hired as their replacement11.
More generally we include both tenured teachers and those hired with a temporary contract
(while only a subset of the latter are included in the administrative counts used in sections 5 and 6).
There are three types of temporary contracts for teachers in Italy, all included (but not
distinguishable) in the LFS. The first type lasts one year, from the 1st September to the 31st August,
and it is the most preferred as it covers and pays the period during which there is not teaching
activity; in contrast this period is not covered in the second type of temporary contract that ends
with the actual teaching activity (“fino al termine delle attivita’ didattiche”). These two contracts
are used to fill annual vacancies due both to physiological absences and to the fact that tenured
teachers are fewer than the actual teaching positions. This shortage of tenured teachers depends on
public finance constraints that do not allow the ministry of education to hire with a permanent
contract the number of teachers required by administrative rules on the basis of the number and
composition of enrolled students12 (for the public purse temporary contracts are cheaper and less
risky than permanent ones). Only tenured teachers (with permanent contracts) and those working
with these two types of temporary contract are recorded into the administrative archives that we will
exploit in sections 5 and 6. The third type of temporary contract is signed directly by the schools to
cover short term vacancies, i.e. vacancies that expire before the end of the academic year. Since
these contracts are paid directly by the schools they are not registered into the central administrative
archives and therefore are excluded from our analysis in paragraphs 5 and 6. In contrast they are
covered by the Labour Force Survey. Thus the number of teachers identified in the Labour Force
Survey well exceeds the number of those identified in the central administrative archives,
notwithstanding we consider the weekly average number of people having had a teaching
engagement over the year rather than the yearly total headcount of people ever teaching over the
previous 12 months.
The household survey nature of the data means that we may not identify very well some
details of teachers such as, for instance, subjects taught and school. So we limit ourselves to
11 In the regressions presented in section 4 we exclude the summer quarter from the analysis in order to avoid problems
in the counting of paid holidays and other physical absences related to the summer interruption in teaching activities. Notice that so doing we also avoid problems related to the uncertain definition of those teachers who have been employed with a temporary contract that ends with the actual teaching activity (“fino al termine delle attivita’ didattiche”). While formally they are not employed (being not covered by a contract over those months), some of them might still classify themselves as employed on the expectation of getting a new temporary contract (or even a tenured position) at the start of the new schooling year.
12 Several features of these rules coupled with a lack of financial autonomy and accountability at the school level tend to inflate the number of positions and teachers. Italy is characterised by a low students to teacher ratio. We explored these issues in an ad hoc chapter of a previous draft, available to the interested readers upon request.

9
distinguish between primary, lower and upper secondary schools (considering as a separate group
those acting in support of disable pupils and those teaching religion classes), pooling together
private and state schools teachers13. The great advantage of using the LFS is that it allows a
comparison of teachers’ characteristics and behaviour with that of other groups of workers14.
Table 1 presents a snapshot of the composition of teachers’ pool, on the basis of age (five
age groups), gender, region (the South and the Centre-North) and educational attainment. Tables 2
and 3 replicate the same frame separately for primary and secondary school teachers. It appears that
teachers are quite old (adding together the values of the age composition raw pertaining to the two
columns relative to 50-59 and 60+ years of age, respectively 36.2 and 4.9%, it appears that about 4
out of 10 teachers are more than 50 years old), predominantly females (the gender composition raw
for the all age groups column shows that, in the total of all age groups, 75.7% of teachers are
females) and still with relatively low level of education (adding together the two raw relative to
lower and upper secondary grades for the rightmost column, relative to all age and gender groups, it
appears that 40.7% have no more than an upper secondary grade). Lower educational attainment
and old age are more relevant in the South than in the North possibly signalling a geographic
stratification of teachers’ quality.
Teachers characteristics differ across schools. While always predominant, females are just 2
out of 3 in secondary schools (the precise value is 66.5%; table 2 ) being ubiquitous in primary
schools (where they are 93.4%; table 3). Primary schools teachers are less often college graduates
(72.7 per cent of them hold an upper secondary degree) and younger than the rest of the pool. The
difference in the educational attainment is a reflection of the different access requirements to the
teaching profession; this explains the larger presence of relatively young persons (the share of
teachers that are less than 40 year old is 32% and 20 % in primary and secondary school
respectively) as primary school teachers may enter relatively soon into the profession. The stronger
feminization of primary school teachers is likely a reflection of a traditional and well entrenched
perception of different gender roles; over time, the increase in the feminization of the profession
(considering the teachers less than 40 years of age females are more than 4 out of 5) is however
mostly driven by secondary school teachers. The above mentioned geographical differences – the
lower educational attainment and older age of teachers in the South – are however confirmed both
in primary and in secondary school.
13 Neither in a sampling survey as the LFS we may identify the school principals. 14 This strategy provides additional information with respect to the two surveys focused upon teachers which have been
so far used in Italy in order to analyse composition and behaviour of teachers (see Cavalli, 1992 and Cavalli, 2000). On the other hand the LFS has no specific question about what teachers think about their profession.

10
The association between these characteristics and teachers quality is far from obvious; while
it might be reasonable to associate teachers’ low educational attainment to low quality (controlling
for type of school and subject taught), it is harder for example to state that primary school teachers
are worse than the rest of the pool just because of this lower level of education. As a matter of fact
primary school teachers choose such a career by pursuing a specific educational track already at the
upper secondary level. While getting a further grade might improve their skills (and actually the
current law asks for this) such an early and explicit choice might be a good indicator of a strong
motivation. Quite on the contrary, many secondary school teachers are college graduates that opted
for the teaching profession only after graduation, without any ex-ante commitment.
Same ambiguity holds for age. On general grounds older teachers may be less effective
because a large age gap with their pupils may lead to problems in the student-teacher dialogue; on
the other hand aged teachers are also more experienced even though the gains from experience are
likely to accumulate only up to a given threshold. In the Italian case the relationship between
quality and age is further complicated by the institutional and historical development of the
educational system. The quality of the different cohorts within the existing pool of teachers may
well depend upon the vagaries of the recruitment process. While almost all existing cohorts have
entered the profession without going through a proper selection mechanism, the size of the entrant
pools and their origins has fluctuated over time. More importantly, the composition of each cohort
of new entrants has subsequently changed as a consequence of a progressive self-selection process.
The ones remained in the profession, notwithstanding its relatively flat and seniority based wage
profile and the precariousness of its initial steps (as only the transition to a tenured position provides
for job security), are either the ones most motivated or the ones unable to find a better outside
alternative. We will come back upon this selection mechanism, which unfortunately we do not
observe in its details, in section 4, when considering some features of teachers behaviour vis-à-vis
the behaviour of other workers.
Again gender composition has no direct bearing on teachers’ quality (if any, the US
evidence discussed in the previous section would signal a better performance of female teachers). It
might contribute to the worse performance of boys students as the paucity of male teachers might
weaken the teachers’ guidance role in the case of male students. More worryingly, the increasing
feminization of the profession might proxy for the declining appeal of the profession, as male
workers have more often better alternatives to pursue. Furthermore it might be the case that in Italy,
as in other advanced economies, the teaching profession is not, as it used to be, the only available
option for the most skilled females.

11
As an additional indicator of the social status and perceived importance of the teaching
profession we looked at the marriage market15. Here an hint of motivational factors is the fact that
while many male teachers are married with a female teacher, a sizable share of the female teachers
have a partner with a higher educational and professional status. In other words, many female
teachers are likely to be a secondary earner in their household16.
More direct considerations about the quality of the teachers pool have been obtained by
looking in more detail at their educational attainment. By using the SHIW data, we have computed
graduation marks of teachers and other individuals (we considered relative graduation marks within
each cohort and study field so as to purge from possible drift over time and across fields in the
graduation marks). On average, teachers have better graduation marks than other people, either
working elsewhere or currently not employed (Figure 1). So teachers are definitively not less
qualified than other workers, even though their better marks might simply reflect a peculiar
orientation towards “intellectual” and school-related activities. It is also false that the youngest
teachers, especially males, are worse than the oldest; in fact they are slightly better in terms of
relative graduation marks. More difficult is to say whether this age gradient reflects an
improvement in the quality of new applicants or, quite on the contrary, it simply signals that the
best individuals leave the teaching profession after having tested it (and other alternatives) after
having graduated. The story of a higher quality of new cohorts of entrants would be a bit puzzling
given that there has not been an uplift in the access requirements to the teaching profession17;
moreover in the next section we will show some results that are consistent with a negative self-
selection among those who remain in the profession. However, at this stage we have to conclude
that there is no direct evidence that allow us to discriminate between these two hypothesis18.
4 The behaviour of teachers in the labour market: a comparative exercise
An advantage of using the LFS is that it provides information about the labour market
behaviour of teachers and it allows comparisons with other groups of workers. In what follows we
15 We follow Schizzerotto (2000) in considering the mating decisions as an indicator of social status. 16 The detailed results have not been reported for sake of brevity and are available from the Authors. 17 In theory the law has dictated that new teachers have to pass through a post graduate school (the so called SISS),
characterised by an entry selection. Whatever the actual selectiveness of these schools – questionable as there are no strict exit exams for the participants and so the system as such might simply imply a further entry postponement – they had so far no remarkable impact as the applicants passed through the SISS are still the last in the queue of people with an accumulated right to be appointed as a teacher.
18 We exploit both the panel dimension of SHIW and a pseudo-panel approach to consider the evolution in the quality (as measured by the relative graduation marks) of those teachers who left, those that stayed and those who entered into the teaching profession between 2000 and 2004. However the small sample size of the SHIW data did not allow us to reach robust conclusions.

12
constructed simple indicators of relevant labour market behaviour and we verified to what extent
teachers differ from other workers. The basic idea is to compare the working conditions and labour
market behaviour of teachers and other workers and to examine whether being a teacher is
associated to those features. Our analytical tool is a regression framework (either a linear or a probit
model, depending upon the nature of the left hand side variable) that we use to sort out partial
correlation; we start from a simple model (model 1) in which being a teacher is the only right hand
side (dummy) variable considered in the specification. Next we move to model 2 where that dummy
is inserted along with few other controls for age (the same 5 age groups already considered in tables
1-3), gender, educational attainment (the same 3 groups considered in tables 1-3), geographical area
(3 dummies respectively for North, Centre and South) and a dummy identifying public sector
employees, as most teachers work anyway for the public sector. In models 3 and 4 the same
specification is further enriched by allowing the teacher’s dummy to vary according to either the
type of school (model 3) or to the age, gender and educational attainment groups (model 4). In all
cases we focus upon the teacher dummy, attaching no causal interpretation to the results as we
simply look at whether being a teacher is associated to the feature under examination.
The choice of the features and behaviours examined is somehow related to the availability of
information in the LFS. We start from some characteristics of the contract (the elapsed job tenure in
months, whether the contract is temporary and, if so, its further expected duration in months) and of
the actual work behaviour (the weekly hours of actual work and whether the worker was absent
from the work during the survey week, whatever the reasons for the absence). The contractual
features to a large extent may be interpreted in order to classify the “quality” of the job position,
particularly so the temporariness quite often deemed as a synonymous of precariousness in Italy.
The working hours quantify a relevant aspect of the work effort19 – even if the absence of
information concerning the earnings do not allow to infer much about the overall working
conditions package. The absenteeism indicator quantifies a relevant behaviour which may have
direct implications for students performance (see on this Clotfelter, Ladd, Vigdor 2007c) and which,
stemming out health factors (unlikely to differ so widely across so broad groups of workers), may
be directly interpreted as an indicator of both workers’ motivation and the laxity of the monitoring
upon workers’ behaviour. We complement these indicators with an additional one even more
directly related to workers’ satisfaction − whether the worker is currently looking for a different job,
something which we interpret as an indicator of dissatisfaction and reduced professional motivation
19 Notice that the hours of work considered in the survey are not the teaching hours formally due but the actual hours,
including the time spent preparing the lectures, the tests correction time etc. as declared by the individual respondent.

13
– and another one related to the effort and motivation put into the current job, that is whether the
worker is holding a secondary job position on top of the principal one. We further verify the
existence of at least one different job spell and whether the current work is located in a municipality
different from that of residence.
Table 4 provides a summary of the results20. The incidence of temporary contracts is
confirmed to be larger for teachers than for the other employees. According to model 1 (with no
control) teachers have a 5 percentage points increased chance of being on a temporary contract (the
average chance for an employee is 12%; column 1). Moreover, their temporary engagements are
shorter: the contract duration column (column 10) in the table (again with reference to model 1)
shows that being a teacher lowers the residual contract duration by 4.41 months (the overall average
is around 13 months). Such an indication of precariousness is not due to the peculiar socio-
demographic composition of teachers, as actually moving from model 1 to model 2 the point
estimates of the teacher’s dummy are enlarged: the chance of being on a temporary contract is 6
percentage points higher in the case of a teacher and the residual duration of the temporary contract
is 5.52 months lower in the case of a teacher. On the other hand model 4 shows that the
precariousness of the teacher’s profession is very much an age related phenomenon related to the
entrance in the profession. Model 3 shows that the precariousness is much more intense among
teachers in support of disable pupils.
Notice that the precariousness of the teacher profession is not due to the fact that they are
new entrants. On average teachers have longer tenure (of 75 months, the overall average being of
126 months; column 11) and are more likely to have had other work experiences before their
current work (the actual values change a little bit according to whether the model is estimated in the
employees sample – 19 percentage points of difference – or in the overall workers population – 17
percentage points of difference; columns 6 and 7). Most of these differences are however due to
compositional factors as the estimated effects shrink considerably when passing from model 1 to
model 2 (for the tenure, the difference becomes of 15 months, for the probability of having had a
different work experience the effects becomes of 5-7 percentage points according to the comparison
group). As such this is evidence that teachers have longer careers composed by spells of
employment in other sectors. While these other work experiences may have been quite
unsatisfactorily – to some extent they have to be so, as the concerned individual has chosen to
become a teacher – people are not trapped into their teaching profession.
20 The actual figures change a little bit (particularly the ones concerning the weekly hours of work) when including or
excluding (as in the table) the summer months.

14
Quite interesting are also the figures of the likelihood of being in search for an alternative
job (columns 2 and 3), an indicator of dissatisfaction with the current job in our interpretation. As
such, teachers are less likely to look for alternatives (according to model 1 they have a negative
differential of 3-4 percentage points, depending upon the identity of the comparison group, either
the employees or the whole workers’ population). Even if this negative gap is entirely due to
compositional factors (so that it disappears in model 2), our reading is that teachers’ precariousness
per se does not lead to a search of alternatives because the overall working package is likely to be
relatively satisfactory. Quite interesting is however to look at models 3 and 4 where the teacher
effects are differentiated. Male and young teachers along with those in support of disabled students
are the most likely to be looking for job alternatives. On the contrary, older teachers, who are not
anymore suffering from precarious contractual arrangements, and females, of all ages, are not
unsatisfied with their current job (at least given the alternative chances they perceive as available
for them).
We have no way to assess the overall working package (albeit something will be said later
concerning the hours of work) so that we may not establish the reasons of this apparent appreciation
of their current status by teachers. However, an interesting feature to be examined is the presence of
a secondary activity. As such, a secondary activity may divert the effort to be put forward in the
principal position; at the same time, the possibility to conduct such a secondary activity may be part
of an equilibrium in which the principal position is considered attractive not per se but because of
the large amount of time and resources left for alternative uses. Overall, teachers are more likely to
hold a secondary position in addition to their principal job: using model 1 the difference amounts to
3 percentage points, even if it somehow shrinks to just 1 percentage point when taking account of
compositional effects (in model 2). Males teachers are the ones most likely to hold a secondary job.
The differences according to age are more negligible (there is a tiny decrease in the probability of
holding a second job notwithstanding the above noticed larger decline in the degree of
precariousness of the principal position).
The hours of work are the only element of the working package which may be measured in
the LFS data. According to our results, teachers enjoy a working week 14.5 hours shorter; the
difference is due to compositional factors only to a limited extent (in model 2 the effect shrinks to
11.5 hours per week). The reduced workweek is more relevant for secondary school teachers
(model 3) and among males (see model 4), the two things being somehow interrelated; it is also
more relevant for highly educated persons. While the descriptive evidence here presented does not
allow to identify casual links it is quite plausible that the short working week is a relevant element

15
of the overall satisfactoriness of the teaching profession and of the fact that teachers,
notwithstanding the precariousness often suffered, do not search for alternatives.
Another interesting element is the analysis of the absences. Model 1 shows that teachers are
more likely to be absent for the whole working week (a 2 percentage points difference); such an
effect shrinks but does not disappear when considering compositional factors (in model 2 the effect
is about 1 percentage point). Notice that the absenteeism of teachers is more pronounced among
most educated people.
While the evidence so far assembled is inherently descriptive, it seems that, on average,
precariousness does not lead to a more diffuse search for alternatives. Our reading is that the overall
package is deemed satisfactory by teachers (at least considering the likely alternatives). The reasons
for this are likely to be differentiated. To some extent it may be due to the reduced working week,
particularly for females, but also to the possibility – inherently related to the reduced working week
– to hold a secondary position. There may be differences across age groups, as the precariousness is
a feature of youths, who may have to pursue several professional alternatives (both having a
secondary activity and looking for alternatives), while for older teachers, that have permanent
engagements and do not look for alternatives, holding a secondary position is a way to exploit the
short working week at the school; males are likely to either hold a secondary position or look for an
alternative, while females are likely to enjoy the shorter work week for its intrinsic value.
Summing up it is difficult to say that teachers working conditions are so poor that a general
dissatisfaction emerges, the peculiar career – starting from precariousness and ending to
immovability with no selective hiring and retraining policies in between – may have profound
negative implications for teachers’ effectiveness. Notwithstanding the perspective of a long period
of precariousness many young workers are attracted to the profession but lack any specific
motivation and quite often are looking for alternatives; older teachers are likely to be those who
have not found alternatives and are sufficiently satisfied with the combination of low work load, the
possibility to pursue other interests (either a second job or family duties) and the contractual
immovability; these amenities compensate the relatively low monthly pay.
5 Consequences of the allocative system: turnover, mismatch and revealed preference
The thrust of this paper is that the way teachers are allocated to schools creates a wedge
between teachers incentives and school goals. We try to support this idea by providing some
evidence on teachers turnover, actual and desired mobility based on the exploitation of
administrative archives. The large flow of teachers across schools is likely to have a negative

16
impact on students achievement as it is not driven by standard matching effort that both parties,
schools and teachers, exert in the attempt to find the most suitable mate; on the contrary teachers are
allocated to schools by centrally determined administrative mechanisms, based mostly upon
seniority rules and regardless any efficiency or optimal matching consideration. As a matter of fact
a typical teacher at the beginning of the carrier spends several years working under temporary
contracts and often changing school every single year. By means of this peregrination among
schools, she accumulates years of seniority that eventually will allow her to gain a fully tenured
position. From that moment onwards she cannot be dismissed nor transferred to any other school
without her explicit request21. Yet she can always ask to move to another school and her request
cannot be refused as long as there are vacancies open and no other applications with higher priority.
All these allocation processes occur without any selection of candidates taking place at either the
central or the school level; the individual school has no voice in choosing among its own applicants
and even no right to refuse the candidates assigned to them by the centrally managed allocation
mechanisms. In Italy teachers choose schools, but schools never choose teachers.
The data at our disposal allow us to characterize this allocative mechanism through some
school level indicators. Firstly we define a standard measure of job turnover at school level using
the fact that we know the identity of the person holding a given job in two adjacent years; we are
also able to distinguish turnover due to temporary and tenured teachers. In our reading the turnover
is an indicator of turmoil in the teaching activity that may hamper the continuity in teaching activity
because teachers, and not the school, are in charge of most decisions concerning what actually is
done in the classroom. The potentially negative effects of turnover upon teaching effectiveness is
further strengthened by the peculiar features of the rules governing teachers’ mobility across
schools. In the economy at large, turnover is the result of an intense screening activity operated by
both sides of the market in search of an optimal match. In the Italian education system instead it
reflects two phenomena: the peregrination of temporary teachers whose main motivation is to
accumulate seniority rights and the presence of mismatched tenured teachers aspiring to change
school. In both cases there is no link between the actual performance and the chances to step up
(becoming tenured or getting the desired location) because the allocation of both temporary and
tenured teachers to schools is defined according to centrally determined rules that preclude any
21 Tenured teachers may be put on mobility if there is a contraction in the enrolment and a reduction in the number of
job positions in their school. Such a redundancy scenario is quite unlikely given the many levers (and the few incentives) schools have in order to avoid (to look for) reductions in the number of job positions; even where and when such contraction happens in an individual school, the presence of temporary contracts holders would provide a buffer. In any case the tenured teacher made redundant in an individual schools would acquire the highest priority in the mobility upon request mechanism later on described. All in all tenured teachers are so significantly covered against any mobility risk and fully insured against any redundancy risk.

17
choice from the school side. The system is not a centralised clearing house market in which the two
sides of the market, instead of meeting through atomistic moves, list their priorities then processed,
at once, by a clearing house algorithm. These markets – see for a recent survey Niederle e Roth
(2007) – allow to avoid the costs associated with the atomistic matching but still are based upon an
explicit choice and ranking of choices made by both sides of the market. The actual mechanism
present in Italy would be equivalent to a clearing house scheme only in the case all teachers are
alike – so that schools have no preference to be expressed, the only relevant rankings being those
expressed by teachers with respect to attributes unrelated to the teaching itself (for instance the
school’s location)
According to the existing rules, tenured teachers that are willing to leave their current school
have to file a formal request specifying also their preferred destination; they can list up to 20
desired schools. Whether their request will be satisfied and which of the listed schools will be
assigned depend essentially on their seniority. We exploit these mobility lists to construct two
additional indicators at the school level. The first is a mismatch indicator defined as the share of the
tenured teachers present in a school that have actually filled in a formal request to move elsewhere.
This indicator can capture the teachers’ dissatisfaction with their current school. Our prior is that
large mismatch may reduce students’ achievement because teachers wishing to leave have a lower
motivation in their current activity and lack long term commitment to their current school.
Moreover, they have no incentive to well perform in the current school as their behaviour does not
change their chances to move to the desired school22.
The last indicator considers how many teachers would like to move in or out any individual
school; for each school we assign value +1 to each teacher working in an a different school that
wants to move in23 and value -1 to each teacher that wants to move out. Our indicator is the
arithmetic sum of all the applicants wishing to mover in and out (expressed as a ratio to the school
size). This is a revealed preferences indicator: a school with a positive balance is a school where
more teachers are willing to move in than those who want to move out. Assuming that idiosyncratic
preferences are netted out, a school with a positive balance is more likely to have a better schooling
environment, which is likely to be reflected in the students’ achievement.
22 Hanushek et al. (2005) find some evidence that teachers on a move are less effective in their teaching. They consider
people who actually move (out of a school, a district school or the whole school system) as the institutional features of the system they look at (Texas in US) do not allow to understand people’s intentions.
23 More precisely we scale the positive values by the number of desired schools listed in the teacher’s mobility application.

18
Notice that we are not in the position to clearly identify the direction of the causation
between our indicators and the schools performance (in terms of students’ achievements). Besides
the standard difficulties in explaining students performances – particularly with the existing Italian
data which do not allow for longitudinal observations of individual students and the schools they
are enrolled to – there are some ambiguities in the interpretation of the indicators we have just
presented. We tend to prefer for the latter indicator – the revealed preferences indicator – an
interpretation according to which it measures the quality of the learning environment (whatever the
factors behind it, for instance the social background of the students of that school). One might
however legitimately assume that a nicer environment, besides possibly stimulating students24
elicits teachers motivation and effort, so that the indicator truly reflects teaching effectiveness25.
Specularly, some concerns may be raised with respect to the mismatch indicator as the desire of
leaving a given school might simply reflect the perception of a bad learning environment and not
the lower motivation of the existing teachers and their effectiveness26.
5.1 Turnover and turmoil in the Italian schools
We start our analysis by looking at how teachers move across schools. More specifically we
constructed turnover measures, using the Davis and Haltiwanger framework, considering for each
individual school (about 11000 State schools considering the pre-primary, the primary and the
lower and upper secondary education levels) the number of jobs and the identity of the person
covering them in two adjacent academic years (2004/05 and 2005/06). Thus we are able to identify
whether in the two subsequent years the same chair was covered by one or two teachers. The total
turnover measure is simply constructed by adding up all inflows and outflows in each individual
school and scaling the sum by the school size calculated as the average number of positions in the
two years27. Knowledge of the destination and origin of inflows and outflows and the type of
contractual engagement allows us to separately identify the components of the total turnover. For
24 So triggering a peer effect – for evidence upon such a channel in the Italian context see Cipollone and Rosolia (2007). 25 Additional sources of concern were suggested to us by a referee stressing the fact that teachers do not posses
information about students’ actual competences but only about grades and this combined with the presence of other factors impinging upon our indicator (as teachers may be attracted by student/teacher ratios, by proximity, by the social status associated to some schools etc.) in impeding to consider this indicator as a measure of the learning and schooling environment. As a matter of fact we believe that these and other shortcomings are issues to be dealt with empirically, verifying whether our indicator is or is not related to schools performance and which are the learning environment features which are possibly captured and proxied by our indicator.
26 To disentangle the different effects we would need to analyse the impact of the (intention to) move of a single teacher (upon the students directly concerned) controlling – eventually on the basis of our mismatch and revealed preferences indicators – for the school learning environment. However, we are not yet in a situation in which individual teachers and their students may be matched (within and across schools).
27 The range of variation of the measure runs from -2 (for a disappearing school) to +2 (for a newly opened school).

19
instance we know the amount due to retirements or to temporary contracts transformed into
permanent.
Our turnover measure is a lower bound of the total workers flows. Indeed, for each year and
job position we consider only the principal job holder and not all the people who may have been
engaged to fill that position during the year. We therefore exclude teachers hired by the school to
fill a short term vacancy due to temporary absence of another teacher (these teachers are not even
recorded in the administrative files here used; see section 3). Moreover we do not consider all the
within-year turnover at the school level, which may be quite sizable28.
In our interpretation the turnover measure is an indicator of turbulence and turmoil in the
teaching activity. In the Italian system the team of teachers working on the same class is in charge
of planning and organizing the teaching activity within an institutional framework in which school
principals have very limited managerial power and coexist with a powerful central authority
dictating even the details of the syllabus. The actual decision power is very much tilted towards the
teachers’ group (and the individual teachers) as the lack of common and standardised exams implies
that the individual teachers, who are in principle supposed to transmit to students a centrally
decided content, are the real masters of the game. In such a system, the arrival of a new teacher may
be disruptive because of the unforeseeable changes she may introduce, while the school cannot
pursue any educational project by means of a specific recruiting policy29.
As a matter of fact when a new teacher arrives in a school it happens because she is entitled
to get that job on the basis of her position in a complex system of seniority regulated waiting lists
rather than in accordance to some criteria decided at the school level. Roughly speaking one can
imagine that the available vacancies are firstly allocated to the already tenured teachers who aspire
28 There are two main sources of this intra-year mobility. The first case occurs when a teacher who was supposed to
cover a position for the whole year becomes unable to teach until the end of the school year and need to be substituted. Our data do not allow us to take into account this substitution as we only observe the identity of the job holder at a given date during the year. The second case occurs because at the beginning of the school year many temporary teachers are allocated to a school on a transitory base and can be reassigned within few weeks. Albeit here not measured, this “musical chairs” game within the year is quite sizable, because of the possibility for temporary contract teachers to queue up for several positions; moreover the purely administrative nature of the allocation system might elicit further turnover because teachers who perceive unjust their allocation (or lack of allocation) may appeal to the Courts that might reverse the initial administrative allocation. Generally speaking the priority rules in these allocations of temporary workers as well as in the appointment of newly tenured teachers are governed by seniority principle. However, the system is segmented into many different lists and the details of the priority rules may be changed from time to time – furthering the scope of judicial litigation – as a consequence of unions’ led bargaining and political interventions.
29 Just as a simple example considers the choice of the textbooks that is decided well in advance of the beginning of the school year by a team of teachers that only seldom will not change its composition by the time of the opening of the school. Since this early choice needs to be confirmed by the actual teachers allocated for the whole year there is an implicit value for families to wait buying textbooks until later on in the school year when the chances of further changes in the teachers team and of the textbooks adopted are limited.

20
to change their school. By filling the available vacancies they free up other vacancies, triggering a
vacancy chain. Some of the vacancies still left unfilled by tenured teachers are subsequently
occupied by other teachers that get a permanent status. Who they are depends upon the position
they had into special waiting lists. Those who occupy positions in these lists that are too low to be
appointed as tenured teachers may still get access to the remaining vacancies assigned on a yearly
basis30. The individual school has no voice in this process. Only for shorter term engagements (the
ones here not considered) there is some room of manoeuvre for the individual school who may hire
from a list of people who specifically applied for a temporary contract in that school. This is
however a residual system that is important mostly because it allows “would be” teachers to start
teaching and thereby the entry and the accumulation of seniority right in the above depicted waiting
lists. So it constitutes an entry port into the above depicted system of waiting lists31 not an
alternative mechanism: neither the school nor the teacher are very keen in finding a long-run
potential mate.
In such a seniority based system, teachers do not have any incentive to be effective. Even
those hired with fixed term contract, that live in a condition of great uncertainty about their own
working future, do not see any link between how well they teach and their chances of being retained
and rewarded as tenured teacher in the individual school. Their ability and motivation is not
evaluated by the school and has no impact whatsoever on their future chances, in that school or
elsewhere. This is a striking difference between the teaching profession and the rest of the
economy. In the economy at large temporary contracts are often used as screening devices that
trigger a supplement of effort from the worker side; this is not the case in the education system,
where the segmentation between temporary and permanent contracts, besides producing an equity
problem, lowers worker’s commitment without affecting worker’s effort. Furthermore, similar
considerations apply also to tenured teachers. Their chances to move to their most preferred school
are related only to seniority and other administrative features, rather than to the choice of the school
(something which should improve the quality of the matching) or their teaching performance,
somehow evaluated, in the current school.
For the whole country the value of the turnover is 0.47, that is the sum of the entries and
exits into the average school is equal to almost 50 per cent of the total number of teachers in the
30 For the reasons and the types of contract used for these yearly assignments see the discussion in section 3. 31 Being used only for rather shorter term appointments the system has not enlarged very much the scope for
autonomous recruiting policies at the school level. At the same time, its use as an additional entry to the waiting lists has allowed to sidestep the formal requirement, formally introduced since 1999, that the applicants to a teacher position should pass through a special post graduate school (the so called SISS; see footnote 18).

21
school (Table 5, column 1). The value grows as we move from primary to upper secondary schools.
On top of that, there is a large variability across individual schools. For the whole country the
standard deviation is equal to 68 per cent of the average value. This ratio is very large in the pre-
primary schools and declines moderately in the other order of schools. In the South the variability
as a ratio of the average value is the highest for all levels of school. Among upper secondary
schools there is little turnover only in the lyceum track; in other types of school the number of
entries and exits are well above 50 per cent of the teachers pool: it is 75 per cent in vocational
schools. These patterns might be influenced by specific characteristics of the schools. In order to
fully explore this possibility we used a simple regression framework. The turnover indicator
computed for each individual school is regressed upon a few possible determinants of turnover - the
gender and age composition of the initial stock of teachers, the shares of temporary contracts and
support staff for disable pupils in the initial pool, a set of dummies pertaining to the change in the
number of students (positive changes, negative changes and negligible changes) as driving factor of
the likely changes in the number of job positions – as well as a set of provincial dummies, and
dummies relative to the municipality size. The regressions have been conducted separately for 4
orders of schools (primary, lower and upper secondary, and the pre-primary schools32); in the case
of primary schools we also inserted a dummy indicating whether the municipality is in a mountain
area and for the upper secondary schools a set of dummies for the different education tracks. As
expected the turnover is positively associated with the presence of temporary contracts and teachers
supporting handicapped pupils. However, these are not the only relevant factors and a lot of residual
variability remains, both across and within provinces. In the third column of table 5 we present
average turnover by the geographical area (computed as average of the provincial dummies) and by
type of school (using the estimated dummies inserted for the upper secondary schools) net of the
indicated controls.
Netting from the available controls (inter alia netting from the effects of an higher incidence
of temporary teachers) it turns out that turnover is much smaller in the North than in the Centre and
in the South. This pattern seems to hold in all levels of school from pre-primary to upper secondary.
For the latter there are very large differences between academic oriented schools (lyceum) and
technical or vocational schools (again netting from controls and the higher incidence of temporary
contracts). Far from being conclusive, these results appear coherent with our interpretation that the
32 The results for the pre-primary level are less significant because the State schools here considered (which incidentally
are characterised by a level of turnover slightly lower than the average) cover a much lower fraction of the whole market. Our data also exclude the provinces of Aosta, Bolzano and Trento.

22
turnover indicator may be negatively related to teaching effectiveness as the worse performance of
Southern and vocational schools is quite well known.
The information at our disposal allow us to dig further into the determinants of turnover. In
particular in Table 6 we decompose the flow of teachers entries in every single school in its basic
components.
On average a school changes 22 per cent of its teaching staff every years. Temporary
teachers that represent about 15 per cent of the total average stock, account for most of this entry
(13.3 per cent): 2.2 per cent is due to temporary teachers that get a permanent position (column 2),
4.1 per cent are new teachers hired with a temporary contract (column 5) and 7.0 per cent are
temporary teachers that change school. The rest of temporary teachers either does not get a new
yearly contract (about 1 out of 10 temporary teachers)33 or remains in the same school. The total
entry flow is further fuelled by the presence of tenured teachers moving towards their preferred
school; these flows account for about 7% of the total positions (column 1), approximately one third
of the total mobility in entrance into the schools. There are large geographical differences. In the
North, entries are mostly due to the presence of many temporary contract teachers. In this area
about one fourth of the total entry flow is due to permanent teachers; at the same time not tenured
teachers have larger chances to get a renewal of the yearly contract or to become permanent, even in
the same school they are currently working. In the South, on the contrary, the contribution of the
permanent teachers to total mobility is larger.
5.2 Mismatch and revealed preference of teachers.
In the previous section we defined and showed an indicator of turnover that we interpreted
as a measure of turmoil in the teaching activity. We showed that it is not explained by and uniquely
related to the presence of temporary contracts and to the centralised seniority based system through
which these are renewed and eventually transformed into permanent contracts. Actually, a quite
similar centralised seniority based system governs tenured teachers’ mobility and contributes to the
turmoil in the teaching activity. In this section we further explore some implications for teaching
effectiveness of this latter system.
Basically we exploit the administrative archives that constitute the information basis of the
system governing the voluntary mobility of tenured teachers. Every single tenured teacher can apply
33 Not necessarily these people end up into involuntary unemployment. They might have refused the contracts offered to
them, possibly because they did not need to accumulate further work experiences in order to advance into the lists. Unfortunately we do not identify the refusals.

23
for moving to a different school by filling up a form in which she lists her preferences. Whether
these aspirations will be met or not depends upon a complex set of administrative norms unrelated
to her current teaching performance. We use this information about the preferences expressed by
teachers to derive a measure of the commitment of teachers to a long run relationship with their
current school. In our interpretation the fact that a large share of tenured teachers aspire to leave
their current school is a symptom of their little motivation to teach in that school; indeed to the
extent that they have good chances to leave that school, they could be quite uninterested to establish
good lasting relationships with their colleagues and their students. Therefore the incidence at the
school level of tenured teachers that express the desire to leave can be a measure of the average
teachers’ motivation. We named this incidence the mismatch indicator34.
The second source of information at our disposal comes from the fact that the teachers
willing to move fill a form that includes up to 20 preferred schools (ordered according to each
individual preferences). Thus for each individual school we construct an indicator of the net
revealed preferences expressed by the whole population of tenured teachers. In such an indicator we
give a negative value to the occurrence of a teacher that wants to leave a given school and a positive
value (scaled up in order to take account that each individual may list up to 20 desired moves) to the
circumstance that a teacher wants to be transferred to a given school. As in the aggregate we are
netting out from the idiosyncrasies related to individual preferences, this revealed preferences
indicator is telling of the average judgement about every single school as expressed by tenured
teachers, who are likely to be the most informed people in the system. To the extent that teaching is
easier in schools well functioning and with better students (whatever the cause, possibly just
because of their social background), these revealed preferences contain a judgment about the
different schools’ performance.
We tend to interpret the mismatch indicator as a measure of the motivation of the teachers
currently acting in a given school and the revealed preference indicator as a measure of the overall
judgement about the teaching environment present in a given school. In this interpretation the first
indicator could have a direct impact on school performance through teachers motivation; the second
indicator should also be related to those determinants of individual school performance but not
through teachers’ effectiveness. As already said, there are however several confounding elements
that render ambiguous the interpretation of these indicators that we are not in a position to solve
34 The mismatch indicator at the individual school level will be expressed as a ratio to the tenured teachers, the ones
allowed to file a mobility request. The aggregate data in table 7 will consider the number of teachers who have filed a request as a ratio to both the total pool of teachers (including those engaged with a yearly contract) and the tenured ones.

24
out: a poor students’ performance, with too many students difficult to deal with, might cause
teachers to desire a move (and a high mismatch indicator) and a good learning environment, as
captured by our revealed preferences indicator, might elicit additional effort by the teachers.
Turning to the results presented in table 5 it appears that in the aggregate 17.6% of the
tenured teachers would like to leave their current school (column 4). Mismatch is higher in the
South (also within each order of schools) and it grows going from pre-primary to secondary
schools; here it more than doubles as we move from more academic oriented tracks toward
technical and vocational schools. Both facts square rather well with what it is known about the
quality of the different schools. Again we are interested in understanding whether the geographical
variation is real or simple mirror variability in observable characteristics of school. We use as
controls the same list of covariates used in the analysis of turnover in the previous section, so as to
purge somehow from the fact that schools which are likely to have a larger turnover have also more
request of mobility; as for turnover we run separate regressions for the different order of schools
(and with additional controls in the case of primary and upper secondary schools, where educational
tracks have been considered); results are presented in column 6 of table 5. Both the geographical
differences and those among tracks of the upper secondary education are confirmed netting out
from the available controls. Notice that the geographical gap is so notwithstanding the fact the
presence of many southern born teachers working in the North who aspire to move back to the
South. The most likely reason is that they do not wait for vacancies in their most preferred school
but are willing to move in any school closer to their final destination; thus when arriving in the
South many of them still remain on the move.
As for the demographic characteristics of the people who file the mobility request table 735
shows that there is not gender differences, while there is a strong gradient by age and tenure. The
indicator is highest among recently tenured (and younger) teachers: 97% of them aspire to move
into a new location; this large value of the mismatch depends on the fact that these people have
accepted a position in that school just as a way to access to the permanent worker status. The
mobility across schools however continues well after that initial stage: 10% of the teachers with 10
or more years of tenure (in the permanent status) are still looking for a different school.
Turning to the revealed preferences indicator it is worth to stress that by construction what
matters is its variability across schools. In a system in which only idiosyncratic elements drive the
mobility of teachers because all schools are alike in their “fundamentals” – which is what in
35 The numbers of table 5 and 7 may differ because in the former they are unweighted averages at school level.

25
principle should be in a centrally regulated system like that in Italy − all schools should have a
value of the indicator about equal to zero (with no many differences in the numbers of those who
want to leave and those who want to enter into that school). Quite on the contrary, there are large
and systematic differences across schools. Schools in the North are more preferred than those in the
South, and pre–primary and upper secondary school score highest (table 5, column 7). It does not
surprise the fact that academic oriented schools are the most preferred by teachers. As before in
order to understand whether these differences are systematic, we focus upon the differences across
provinces and, within the upper secondary level, across the different tracks controlling for
observable determinants. The last column of table 5 presents the means adjusted for the usual
observable characteristics. According to the revealed preferences indicator the schools in the South
remain the least preferred even in the adjusted data. Notice that this results holds notwithstanding
the fact that most geographical mobility is from South to North; it appears that northern teachers
apply only for schools located in the north while southern ones apply everywhere. As for the
secondary school tracks the least wanted are vocational and technical schools, which are actually
often considered to be the lowest quality segment in the Italian system. At the other extreme are the
lyceums.
All in all our reading is that considering both the mismatch indicator, interpreted as a proxy
for the motivation of the current teachers, and the revealed preference indicator, interpreted as a
summary measure of the judgement made by well informed subjects about the quality of the
different schools, there are quite large and systematic differences across schools. Broadly speaking,
our indicators are coherent with the identification of the areas of the system considered as more
problematic, that is the South, the lower secondary education level and the vocational upper
secondary schools.
6 Basic correlations
Our aim in this paper was describing and measuring some stylised facts of the teachers’
labour market in Italy. On the basis of our interpretation of the institutional set up and its actual
functioning we also constructed some indicators that allows us to measure the effect of the system
of recruitment and allocation of teachers for each individual school. Our aim was not that of
explaining the performance of the Italian education system on the basis of these indicators. Yet,
understanding whether these indicators are associated to the dismal performance of the Italian
system is an important preliminary test towards the identification of a possible causal relationship.

26
At this stage the dearth of data about pupils’ achievement in every single school limit our
ability to conduct a systematic examination over time and across schools36. As a very first run, we
limit ourselves to the differences across (about 400) upper secondary schools as captured by PISA
2003. Thus we look at the sign and the size of the correlation at the school level between our
indicators and PISA results.
This is a very limited picture as PISA covers only the 15 years old students so leaving aside
the primary and the lower secondary schools. Moreover the academic accomplishments of those 15
years old students are not uniquely related to the upper secondary schools they are currently
attending. Actually they had been in that school for no more than 2 years; therefore their PISA
achievements also reflect their family and individual background and the quality of the schools they
attended at earlier stages. To some extent we take account of these confounding elements by
looking also at regression adjusted PISA data37; we consider four blocks of regression adding
progressively more controls; we start with our three indicators, then we add controls for basic
characteristics of students such as gender and family background; next we add provincial and track
dummies and finally we include the school controls already used in the previous section to purge
our three indicators38. As performance variable we choose the score in math of each students as
PISA 2003 focused upon mathematics (however we had run similar results for the other items
considered by PISA 2003). Standard errors are clustered at school level. Our analysis differs from
that conducted by Bratti, Checchi and Fillippin (2007) that used a fully fledged model to decompose
the variance of the of the PISA results; while having a much less rich set of controls, we attempt to
focus less on traditional school input and more on proxies of teachers effort and motivation.
Admittedly, our exercises are far from identifying a pure school contribution to students’
achievements as we do not separate the effect of taking courses in a given school from the sorting of
students in that school. At any rate we have discussed at length how the nature of our indicators
does not allow any casual interpretation of their link with the PISA results in terms of the impact of
teachers upon students’ learning. To reinforce this caution we need to add that our indicators refer
to years 2005-06 and, albeit we suspect they are quite stable over time, may not have “caused” the
PISA 2003 results.
The results, in table 8, are rather encouraging. Students’ performance is negatively
associated to both turnover and mismatch, in all but one case; for turnover the association is
36 Cipollone and Sestito, 2007 and Montanaro, 2007 for a full description of the data on students achievement. 37 See Bratti, Checchi and Fillippin (2007) for a fully fledged analysis of the PISA determinants. 38 Notice that the most important among these controls pertain to the incidence of temporary contracts, already shown as
a variable possibly related to PISA results by Bratti et al. (2007).

27
statistically different from zero in all specifications even though the strength of the association
shrinks as we include more controls. It is remarkable that it remains significant also when
controlling for the incidence of temporary teachers, which may affect turnover as well as having a
direct impact upon students’ performance through teachers’ experience and motivation. The effect
is not negligible: one standard deviation in the turnover is associated with a PISA score lower by 17
points (using results from model 1 with no controls). This a relevant effect that is equivalent to
about half year of school. The effect becomes smaller, about 4 PISA points, using the results with
all controls. Association with mismatch is less robust from a statistical point of view; it basically
disappears when we include in the regression provincial and educational tracks. However the
strength of the association is remarkable in Model 1 with no controls as one standard deviation of
mismatch is associated with a lower score of 50 points, more than one year of schooling. Finally
association with the revealed preference indicator is always positive, as we expected, even though it
is weak from a statistical point of view. While these are only preliminary results our reading is that
the rules governing the teachers market may have an impact on students achievement that is worth
to be further explored.
7 Conclusions
In this paper we have shown that there are not specific observable characteristic of teachers
that can be easily linked to their effectiveness in the classroom. In contrast the rules governing the
teachers market seem to shape teachers behavior in such a way to drive an edge between their
incentives and school goals. We have characterized this market with the use of three indicators that
highlight three important features of this segment of the labor market: turnover, mismatch vis-à-vis
the current school and preferences expressed towards different school locations. We consider the
first indicator as a measure of the turmoil in the school; the second as a measure of the mismatch
between teachers and the school where they are currently engaged; we expect both indicators to
have a negative effect on students achievement; the last indicator measures the ability of schools to
attract teachers which we tend to think somehow captures school quality and therefore we expect to
be positively correlated with pupils achievement. Empirically it turns out that the distribution of the
three indicators by geographical area and type of schools is coherent with the general perception
about what are the best schools; furthermore, the three indicators appear correlated as expected with
the school’s averages of PISA 2003 scores in mathematics (even controlling for some standard
factors affecting students performance).
These results are only preliminary and several strands of research appear worth to be
pursued. On one side, the characterization of the teachers labour market would need to be enriched

28
by looking more explicitly at the processes through which teachers enter and decide to remain into
the profession. On the other side, the analysis of the impact of our indicators upon school’s
outcomes need to be enriched – by considering a wider range of school outcomes such as drop out
rates, repetition rates and scores in the national tests covering the universe of Italian schools – and
refined in order to better disentangle casual effects from spurious correlations. As somehow
anticipated, we believe longitudinal observations are necessary in order to separately identify the
valued added provided by a given school and the differences in the pool of students enrolled by
each school. With specific reference to our indicators we are fine tuning them in order to separately
identify the possible effects of teachers’ tenure and turmoil – both at present caught by our turnover
measure – as well as to distinguish between the lack of motivation of people on the move and the
(general perception of) quality of the learning environment – at present somehow jointly captured
by the mismatch and revealed preferences indicators.
Yet our results are already suggestive of the many pitfalls of current teachers’ recruitment
and allocative system. As here described, it is clear that it does not guarantee an high enough
quality level. The initial screening is almost absent and no relationship exists between a teacher’s
practice and performance and the subsequent passage to a tenured position. The long and seniority
based waiting lists used for this purpose imply that the individuals who stay on to become a teacher
may be either those very motivated – a positive feature, of course – or those unable to find
alternatives and attracted to the teaching profession precisely because of its lack of monitoring, the
reduced working hours and the possibilities to pursue other goals (a secondary job activity, the
household etc.). Moreover, the centralized and burocratic allocation system leaves no room for the
schools to pursue an active role in selecting and motivating their own teachers. Teachers may end
up always waiting for some burocratically engineered step in their career, being poorly motivated in
their current teaching activity. This unnatural amputation of one side of the market – as schools are
rather passive in these processes in which only teachers are allowed to make their choices and wait
for them to materialize in due time and after enough seniority has allowed them to get what they
want – does not contrast the inequalities within the system which many fears would be associated
with a more decentralized set-up. Possibly because teachers are the only subjects relatively well
informed in a system lacking a proper comparability of exams and grades across different schools,
the majority of the teachers are willing to move towards the schools where, possibly because of
their social background and support from the local community, students fare well. No compensatory
policy is therefore put in place and problematic schools are left with poorly motivated teachers and
high turmoil, as the teachers there working are just waiting to move elsewhere. The absence of
schools’ competition in attracting households and resources so does not prevent the presence of

29
wide inequalities across schools and learning environments (actually, to the extent that better off
households have better information in a context lacking properly comparable exams and grades,
they may more easily select the high quality schools without having to pay any extra-fee).

30
References
Aaronson D., Barrow L. e W. Sander (2002), “Teachers and Student Achievement in Chicago
Public High School”, Journal of Labour Economics, Vol. 25-1, 2007, pp. 95-136.
Bratti M., D. Checchi and A. Filippin (2007): “Territorial Differences in Italian students’
mathematical competencies: Evidence from Pisa 2003” in this Issue of Giornale degli
Economisti e Annali di Economia.
Bishop J. and L. Woessmann (2002), “Institutional Effects in a Simple Model of Educational
Production”, IZA w.p. 484
Cavalli A., (Ed) (1992), “Insegnare oggi. Primo Rapporto IARD sulle condizioni di vita e di lavoro
nella scuola italiana” Bologna, Il Mulino.
Cavalli A., (Ed) (2000), “Gli insegnati nella scuola che cambia. Seconda indagine IARD sulle
condizioni di vita e di lavoro nella scuola italiana” Bologna, Il Mulino
Cipollone P. and P. Sestito (2007), “Quanto Imparano gli studenti italiani: i divari Nord-Sud”,
mimeo Banca d’Italia
Cipollone P. and A. Rosolia (2007), “Social Inetraction in High School: Lessons from an
Earthquake”, American Economic Review, Volume 97 N.3, June.
Clotfelter C. T., H.F. Ladd, and J.L.Vigdor (2007a), “How and Why do Teacher Credentials Matter
for Student Achievement?”, NBER Working Paper n. 12828.
Clotfelter C. T., H.F. Ladd, and J.L.Vigdor (2007b), “Teacher Credentials and Students
Achievement in High School: a Cross-Subject Analysis With Students Fixed Effects”,
NBER Working Paper n. 13617.
Clotfelter C. T., H.F. Ladd, and J.L.Vigdor (2007c), “Are Teacher Absences Worth Worrying
About In The U.S.?”, NBER Working Paper n. 13648.
Corcoran S.P., Evans W.N. and R.S. Schwab (2004) “Changing Labor, Market Opportunities for
Women and the Qaulity of Teachers 1957-1992”, American Economic Review, Vol. 94-
2, 2004, pp. 230-235.
Cunha F. and J.J. Heckman (2007) , “The technology of skill formation” NBER working Paper
n.12840
31
Fuchs T. and L. Woessmann (2007), “What accounts for international differences in student
performances? A re-examinantion using PISA data” Empirical Economic forthcoming
Kane T. J. and D.O. Staiger (2002), “The promise and pitfalls of using imprecise school
accountability measures”, The Journal of Economic Perspectives, Volume 16, Number
4, Fall 2002.
Krueger A. (2003), “Economic Consideration and class size ” Economic Journal n.113 F34-F63.
Hanushek E. (2003), “The failure of input-based schooling policies” Economic Journal n.113 F64-
F98.
Hanushek E., J.F. Kain, D. M. O’Brien and S. G. Rivkin (2005), “The market for teacher quality”
NBER Working paper no. 11154.
Harris J. R. (1999), “The Nurture Assumption: Why Children Turn Out the Way They Do”, Free
Press.
Hoxby C.M. and A. Leigh (2004), “Pulled Away or Pushed Out? Explaining the Decline of Teacher
Aptitude in the United States”, American Economic Review, Vol. 94-2, 2004
Montanaro Pasqualino (2007): “La qualità dell’istruzione italiana”; lavoro preparatorio per la
relazione sul 2006; Banca d’Italia, Nucleo di ricerca della sede di Ancona.
Niederle Muriel and Alvin E. Roth (2007), “The Effects of a Centralized Clearinghouse on Job
Placement, Wages, and Hiring Practices”, NBER Working Paper n. 13529.
OECD (2004). “Attracting, Developing and Retaining Effective Teachers - Final Report: Teachers
Matter” OECD, Paris.
Schizzerotto A. (2000), “La condizione sociale e la carriera lavorativa degli insegnanti italiani” in
Scuola che cambia, Cavalli, A. (a cura di), 2000
Todd E. P. and K. I. Wolpin (2003), “On the specification and estimation of the production function
for cognite achievement” Economic Journal n.113 F3-F33.

32
Tables and Figures
Table 1
<=29 30-39 40-49 50-59 60+ All <=29 30-39 40-49 50-59 60+ All <=29 30-39 40-49 50-59 60+ All
Lower secondary 0.0 1.8 0.7 0.7 1.3 0.9 0.2 0.2 0.8 0.4 0.5 0.5 0.2 0.5 0.7 0.5 0.9 0.6
Upper secondary 33.0 34.6 34.8 32.8 35.7 34.0 47.4 40.7 42.8 39.5 59.7 42.0 45.4 39.6 41.0 37.7 48.0 40.1
College or more 67.0 63.6 64.5 66.4 63.1 65.0 52.3 59.0 56.4 60.1 39.7 57.5 54.4 59.9 58.3 61.8 51.1 59.4
Total 100.0 100.0 100.0 100.0 100.0 100.0 100.0 100.0 100.0 100.0 100.0 100.0 100.0 100.0 100.0 100.0 100.0 100.0
Age composition (within gender) 2.6 16.2 31.7 39.8 9.7 100.0 5.2 22.9 33.6 35.0 3.3 100.0 4.6 21.3 33.1 36.2 4.9 100.0
Gender composition (within group) 13.9 18.5 23.3 26.8 48.6 24.3 86.1 81.5 76.7 73.2 51.4 75.7 100.0 100.0 100.0 100.0 100.0 100.0
Lower secondary 0.0 2.8 0.6 0.8 0.2 1.0 0.3 0.2 0.9 0.6 0.1 0.6 0.3 0.7 0.8 0.7 0.1 0.7
Upper secondary 31.1 29.2 35.4 27.7 32.5 31.2 45.2 42.6 42.1 37.4 55.2 41.3 42.9 40.1 40.5 34.9 43.2 38.8
College or more 68.9 68.0 63.9 71.5 67.3 67.9 54.5 57.2 57.0 62.0 44.7 58.2 56.8 59.2 58.7 64.5 56.7 60.5
Total 100.0 100.0 100.0 100.0 100.0 100.0 100.0 100.0 100.0 100.0 100.0 100.0 100.0 100.0 100.0 100.0 100.0 100.0
Age composition (within gender) 3.8 16.7 33.8 35.8 9.9 100.0 6.2 23.7 34.8 32.5 2.8 100.0 5.6 22.0 34.6 33.3 4.5 100.0
Gender composition (within group) 16.5 18.4 23.7 26.1 53.1 24.2 83.5 81.6 76.3 73.9 46.9 75.8 100.0 100.0 100.0 100.0 100.0 100.0
Lower secondary 0.0 0.2 0.7 0.7 3.0 0.8 0.0 0.2 0.6 0.1 1.0 0.3 0.0 0.2 0.6 0.3 1.9 0.4
Upper secondary 44.4 43.0 33.9 38.6 40.4 38.2 52.8 37.7 44.0 42.1 64.4 43.1 52.2 38.7 41.7 41.2 54.1 41.9
College or more 55.6 56.8 65.4 60.7 56.6 61.0 47.2 62.0 55.4 57.8 34.6 56.6 47.8 61.1 57.7 58.6 44.1 57.7
Total 100.0 100.0 100.0 100.0 100.0 100.0 100.0 100.0 100.0 100.0 100.0 100.0 100.0 100.0 100.0 100.0 100.0 100.0
Age composition (within gender) 0.9 15.4 28.7 45.6 9.4 100.0 3.8 21.8 31.7 38.7 4.0 100.0 3.1 20.3 31.0 40.4 5.3 100.0
Gender composition (within group) 7.2 18.7 22.7 27.6 43.0 24.5 92.8 81.3 77.3 72.4 57.0 75.5 100.0 100.0 100.0 100.0 100.0 100.0Source: Labour Force Survey
Italy
Center and North
South
Socio-economic characteristics of primary and secondary school teachers: years 2005(percentage values)
Education
Male Female All
Age Group

33
Table 2
<=29 30-39 40-49 50-59 60+ All <=29 30-39 40-49 50-59 60+ All <=29 30-39 40-49 50-59 60+ All
Lower secondary 0.0 1.3 0.7 0.6 0.0 0.7 0.2 0.0 0.5 0.3 0.7 0.3 0.2 0.1 0.5 0.3 0.6 0.3
Upper secondary 52.6 61.3 63.9 62.6 97.5 64.6 66.5 62.1 78.9 75.9 91.3 73.3 65.9 62.1 78.1 74.8 92.0 72.7
College or more 47.4 37.4 35.3 36.8 2.5 34.7 33.3 37.9 20.6 23.8 8.0 26.4 33.9 37.8 21.4 24.9 7.4 26.9
Total 100.0 100.0 100.0 100.0 100.0 100.0 100.0 100.0 100.0 100.0 100.0 100.0 100.0 100.0 100.0 100.0 100.0 100.0
Age composition (within gender) 3.4 23.2 26.5 40.5 6.5 100.0 5.5 26.5 32.7 31.4 3.9 100.0 5.3 26.3 32.3 32.0 4.0 100.0
Gender composition (within group) 4.2 5.8 5.4 8.3 10.6 6.6 95.8 94.2 94.6 91.7 89.4 93.4 100.0 100.0 100.0 100.0 100.0 100.0
Lower secondary 0.0 2.0 1.8 1.1 0.0 1.4 0.4 0.0 0.7 0.4 0.0 0.4 0.3 0.2 0.8 0.4 0.0 0.4
Upper secondary 52.6 43.9 65.4 53.3 92.3 54.6 61.8 60.7 78.4 74.5 90.6 71.7 61.3 59.7 77.9 72.7 90.8 70.6
College or more 47.4 54.1 32.8 45.6 7.7 44.0 37.8 39.3 20.8 25.1 9.4 28.0 38.4 40.2 21.3 26.9 9.2 29.0
Total 100.0 100.0 100.0 100.0 100.0 100.0 100.0 100.0 100.0 100.0 100.0 100.0 100.0 100.0 100.0 100.0 100.0 100.0
Age composition (within gender) 6.2 27.6 19.9 42.4 3.9 100.0 6.1 28.0 33.8 29.3 2.8 100.0 6.1 28.0 33.0 30.1 2.9 100.0
Gender composition (within group) 6.3 6.1 3.7 8.7 8.5 6.2 93.7 93.9 96.3 91.3 91.5 93.8 100.0 100.0 100.0 100.0 100.0 100.0
Lower secondary 0.0 0.0 0.0 0.0 0.0 0.0 0.0 0.0 0.1 0.2 1.2 0.2 0.0 0.0 0.1 0.2 1.0 0.2
Upper secondary 0.0 92.8 62.9 74.7 100.0 76.3 74.8 64.4 79.6 77.6 91.8 75.6 74.8 65.9 78.3 77.3 92.8 75.7
College or more 0.0 7.2 37.1 25.3 0.0 23.7 25.2 35.6 20.3 22.2 7.0 24.2 25.2 34.1 21.6 22.5 6.2 24.2
Total 100.0 100.0 100.0 100.0 100.0 100.0 100.0 100.0 100.0 100.0 100.0 100.0 100.0 100.0 100.0 100.0 100.0 100.0
Age composition (within gender) 0.0 18.0 34.2 38.2 9.6 100.0 4.6 24.5 31.2 34.4 5.4 100.0 4.3 24.0 31.4 34.6 5.7 100.0
Gender composition (within group) 0.0 5.4 7.8 7.9 12.1 7.1 100.0 94.6 92.2 92.1 87.9 92.9 100.0 100.0 100.0 100.0 100.0 100.0Source: Labour Force Survey
Italy
Center and North
South
Socio-economic characteristics of primary school teachers: years 2005(percentage values)
Education
Male Female All
Age Group

34
Table 3
<=29 30-39 40-49 50-59 60+ All <=29 30-39 40-49 50-59 60+ All <=29 30-39 40-49 50-59 60+ All
Lower secondary 0.0 0.1 0.1 0.4 0.0 0.2 0.0 0.0 0.4 0.2 0.1 0.2 0.0 0.0 0.3 0.3 0.0 0.2
Upper secondary 22.2 25.3 28.0 27.1 36.5 27.7 8.4 10.1 9.1 12.4 21.8 11.0 12.5 14.3 15.3 17.5 29.6 16.6
College or more 77.8 74.5 71.9 72.5 63.5 72.1 91.6 89.9 90.5 87.4 78.1 88.8 87.5 85.7 84.4 82.2 70.4 83.2
Total 100.0 100.0 100.0 100.0 100.0 100.0 100.0 100.0 100.0 100.0 100.0 100.0 100.0 100.0 100.0 100.0 100.0 100.0
Age composition (within gender) 2.3 14.1 33.6 43.1 7.0 100.0 2.8 18.4 34.8 40.9 3.1 100.0 2.6 17.0 34.4 41.6 4.4 100.0
Gender composition (within group) 29.3 27.7 32.7 34.6 53.1 33.5 70.7 72.3 67.3 65.4 46.9 66.5 100.0 100.0 100.0 100.0 100.0 100.0
Lower secondary 0.0 0.0 0.0 0.8 0.0 0.3 0.0 0.0 0.2 0.3 0.1 0.2 0.0 0.0 0.1 0.5 0.1 0.2
Upper secondary 18.7 21.4 29.3 21.4 36.8 25.2 2.4 13.9 8.4 11.2 26.7 10.9 7.7 15.9 15.4 14.5 31.4 15.5
College or more 81.3 78.6 70.7 77.8 63.2 74.5 97.6 86.1 91.4 88.5 73.2 88.9 92.3 84.1 84.5 85.0 68.5 84.2
Total 100.0 100.0 100.0 100.0 100.0 100.0 100.0 100.0 100.0 100.0 100.0 100.0 100.0 100.0 100.0 100.0 100.0 100.0
Age composition (within gender) 3.3 14.2 37.7 38.9 5.9 100.0 3.4 18.6 36.3 38.5 3.2 100.0 3.3 17.1 36.8 38.6 4.1 100.0
Gender composition (within group) 32.4 27.0 33.4 32.8 47.0 32.6 67.6 73.0 66.6 67.2 53.0 67.4 100.0 100.0 100.0 100.0 100.0 100.0
Lower secondary 0.0 0.3 0.4 0.0 0.0 0.2 0.0 0.0 0.6 0.0 0.0 0.2 0.0 0.1 0.6 0.0 0.0 0.2
Upper secondary 40.1 30.7 25.7 33.1 36.2 31.0 24.1 4.5 10.4 14.0 14.1 11.3 27.3 12.0 15.2 21.0 27.4 18.1
College or more 59.9 69.0 73.9 66.9 63.8 68.8 75.9 95.5 89.0 86.0 85.9 88.5 72.7 87.9 84.2 78.9 72.6 81.7
Total 100.0 100.0 100.0 100.0 100.0 100.0 100.0 100.0 100.0 100.0 100.0 100.0 100.0 100.0 100.0 100.0 100.0 100.0
Age composition (within gender) 0.9 13.9 28.2 48.6 8.5 100.0 1.9 18.3 32.5 44.4 2.9 100.0 1.5 16.7 31.0 45.9 4.9 100.0
Gender composition (within group) 19.8 28.8 31.5 36.8 60.4 34.7 80.2 71.2 68.5 63.2 39.6 65.3 100.0 100.0 100.0 100.0 100.0 100.0Source: Labour Force Survey
Italy
Center and North
South
Socio-economic characteristics of secondary school teachers: years 2005(percentage values)
Education
Male Female All
Age Group

35
Table 4
1 2 3 4 5 6 7 8 9 10 11 12
being on a fixed term contract
looking for another job (2)
looking for another job
holding a second job position (2)
holding a second job
position
having had a previous
work exper. (2)
having had a previous
work exper.
weekly hours of work (2)
Absent from work
(2)
expected further contract
duration - in months (3)
Tenure (in months)
Working in a different
municipality (2)
Teacher dummy 0.05 -0.03 -0.04 0.03 0.03 0.17 0.19 -14.49 0.02 -4.41 75.03 0.02Standard error 0.01 0.00 0.00 0.00 0.00 0.01 0.01 0.17 0.00 0.22 1.83 0.01
Teacher dummy 0.06 0.00 -0.01 0.01 0.01 0.05 0.07 -11.46 0.01 -5.52 15.35 -0.03Standard error 0.01 0.00 0.00 0.00 0.00 0.01 0.01 0.20 0.00 0.42 1.52 0.01
Dummy for teacher in primary school 0.04 -0.02 -0.02 -0.01 -0.01 0.11 0.11 -8.01 0.01 -6.32 20.48 0.02Standard error 0.01 0.01 0.01 0.00 0.00 0.01 0.01 0.23 0.00 0.44 2.15 0.01Dummy for teacher in lower secondary school 0.10 -0.01 -0.01 0.01 0.01 0.03 0.05 -12.44 0.00 -5.30 14.76 -0.10Standard error 0.01 0.01 0.01 0.00 0.00 0.02 0.02 0.36 0.01 0.50 3.42 0.02Dummy for teacher in upper secondary school 0.07 0.00 -0.01 0.02 0.01 0.01 0.03 -12.86 0.00 -5.01 10.90 -0.06Standard error 0.01 0.01 0.01 0.00 0.00 0.01 0.01 0.27 0.00 0.54 2.31 0.01Dummy for teacher of religiuos subject -0.05 -0.05 P.F. -0.01 -0.01 0.31 0.39 12.61 -0.03 4.94 91.78 0.26Standard error 0.02 0.00 0.00 0.00 0.04 0.04 1.77 0.01 7.27 12.73 0.04Dummy for teacher supporting disable students 0.11 0.06 0.05 0.01 0.00 -0.07 -0.07 -7.07 0.03 -5.33 -26.98 -0.13Standard error 0.02 0.02 0.02 0.01 0.01 0.02 0.02 0.80 0.02 0.93 4.60 0.03
Teacher dummy 0.28 0.05 0.04 0.02 0.02 0.03 0.06 0.51 -0.02 3.34 -23.67 0.02Standard error 0.09 0.02 0.02 0.01 0.01 0.08 0.09 3.08 0.02 9.91 19.05 0.09
<= 29 R.G. R.G. R.G. R.G. R.G. R.G. R.G. R.G. R.G. R.G. R.G. R.G.Standard error30-39 0.00 -0.03 -0.03 -0.01 -0.01 0.09 0.12 0.82 -0.02 6.61 3.59 0.06Standard error 0.02 0.01 0.01 0.00 0.00 0.04 0.04 0.90 0.01 0.67 2.64 0.0440-49 -0.08 -0.04 -0.05 -0.01 -0.01 0.14 0.18 1.55 -0.02 7.37 37.37 0.15Standard error 0.01 0.00 0.00 0.00 0.00 0.04 0.04 0.86 0.01 0.70 2.97 0.0350-59 -0.10 -0.05 -0.05 -0.01 -0.01 0.24 0.28 1.98 -0.03 5.91 80.14 0.20Standard error 0.00 0.00 0.00 0.00 0.00 0.04 0.04 0.86 0.01 1.10 3.23 0.03 60 e oltre -0.10 P.F. P.F. -0.01 -0.01 0.25 0.36 7.61 -0.02 15.96 132.48 0.13Standard error 0.00 0.00 0.00 0.05 0.05 1.39 0.01 8.06 9.07 0.05
Female R.G. R.G. R.G. R.G. R.G. R.G. R.G. R.G. R.G. R.G. R.G. R.G.Standard errorMale 0.05 0.08 0.09 0.08 0.08 -0.01 0.00 -3.37 0.00 -0.34 -9.88 0.04Standard error 0.01 0.02 0.02 0.01 0.01 0.01 0.01 0.45 0.01 0.55 3.09 0.02
up to junior high school R.G. R.G. R.G. R.G. R.G. R.G. R.G. R.G. R.G. R.G. R.G. R.G.Standard errorHigh school -0.04 0.00 0.00 0.00 0.00 -0.07 -0.12 -9.69 0.11 -14.51 -2.59 -0.17Standard error 0.03 0.06 0.06 2.98 0.07 9.90 19.02 0.08College or more -0.02 0.00 0.00 -0.01 -0.01 -0.15 -0.17 -12.65 0.10 -14.79 -9.55 -0.24Standard error 0.04 0.01 0.01 0.00 0.00 0.05 0.05 2.98 0.07 9.92 19.00 0.07
0.12 0.06 0.07 0.02 0.01 0.32 0.30 36.24 0.05 13.25 126.60 0.54
Interaction teacher dummy with age group
variable mean value
Interaction teacher dummy with gender
Interaction teacher dummy with educational attainment
Model 1
Model 2
Model 3
Model 4 (3)
Models
Indicator
Comparitive labour market behavior of teachers in primary and secondary school (1)( the sample includes all employees, unless diffently indicated)
Source: calculation on Labour Force Survey Data, ISTAT.
(1) The label P.F. means that the effect is not identifiable because all the observations in the group have the same outcome. Models 2,3 and 4 also include dummies for 5 age groups, gender, 3 educational attainment levels, 3 geographical areas and a dummy for working in the public sector. In model 4 the reported effects of the interaction of the teacher dummy refers to the difference between teachers and non-teachers in those groups; the labels R.G. stand for reference groups: therefore the reference group in this models refers female teachers age 29 or less with a junior high school degree. (2) The sample includes the whole workers' population. (3) The sample refers to employees with a fixed term contract.

36
Table 5
Turnover, mismatch and revealed preference indicator; basic statistics(1)
Mean standard deviation
Regression adjusted mean Mean standard
deviationRegression
adjusted mean Mean standard deviation
Regression adjusted mean
All levels of education 0.494 0.314 0.015 0.136 0.196 0.025 0.014 0.048 0.005North 0.477 0.324 0.069 0.159 0.218 0.088 0.012 0.051 -0.008Centre 0.453 0.331 0.106 0.213 0.254 0.156 0.003 0.063 -0.014South
0.472 0.324 0.176 0.231 0.008 0.057Italy
Pre-primaryNorth 0.418 0.274 -0.018 0.075 0.110 0.001 0.023 0.041 0.007Centre 0.360 0.256 -0.005 0.088 0.120 0.034 0.017 0.038 -0.009South 0.346 0.275 0.050 0.128 0.167 0.096 0.009 0.053 -0.022
Italy 0.371 0.274 0.104 0.145 0.015 0.047
PrimaryNorth 0.332 0.143 0.005 0.063 0.060 0.010 0.015 0.052 0.007Centre 0.330 0.170 0.044 0.101 0.128 0.059 0.011 0.046 -0.008South 0.310 0.192 0.077 0.143 0.123 0.110 0.003 0.051 -0.017
Italy 0.321 0.173 0.107 0.112 0.008 0.051Lower secondary
North 0.587 0.301 0.068 0.185 0.213 0.060 0.004 0.040 -0.002Centre 0.608 0.338 0.149 0.237 0.273 0.157 -0.001 0.051 -0.019South 0.560 0.332 0.162 0.314 0.282 0.224 -0.015 0.064 -0.028
Italy 0.579 0.322 0.251 0.262 -0.005 0.054Upper secondary
North 0.608 0.396 -0.028 0.200 0.273 0.009 0.019 0.058 0.013Centre 0.585 0.377 0.040 0.194 0.253 0.067 0.022 0.061 0.009South 0.602 0.394 0.063 0.262 0.338 0.125 0.017 0.080 0.010
Classic Lyceum 0.452 0.260 (baseline category) 0.128 0.166 (baseline category) 0.055 0.057 (baseline category)Scientific lyceum 0.484 0.316 0.011 0.129 0.175 -0.007 0.044 0.079 -0.007Artistic lyceum 0.576 0.398 0.083 0.195 0.216 0.061 0.049 0.071 -0.010Art school 0.559 0.345 0.043 0.196 0.204 0.044 0.022 0.066 -0.023School for teachers 0.510 0.283 0.025 0.169 0.156 0.019 0.038 0.051 -0.016Technical school 0.587 0.428 0.108 0.245 0.331 0.113 0.015 0.065 -0.034Vocational school 0.746 0.381 0.117 0.298 0.351 0.099 -0.006 0.065 -0.047
Italy 0.601 0.392 0.227 0.302 0.019 0.069
Turnover Mismatch Teachers' revealed preferences
1 In the regressions adjusted column the reference provinces is Torino.

37
Table 6
Entry in the Italian schools for academic 2004/2005 e 2005/2006
Entries of tenured teachers
Entries of temporary teachers
total entry
1 2 3 4 5 6=1+2+3+4+5
Famele 7.1 2.4 7.1 1.4 4.0 21.9Males 8.0 1.8 7.0 1.0 4.3 22.0Total 7.2 2.2 7.0 1.3 4.1 21.9
<29 years 5.3 5.7 27.8 8.5 44.1 91.430-39 years 10.1 5.6 19.8 3.9 12.5 51.940-49 years 9.0 2.6 7.1 0.9 2.5 22.1>=60 years 5.1 0.5 1.2 0.3 0.4 7.5
North 6.2 2.5 7.9 1.5 5.0 23.2Center 7.7 2.3 6.9 1.4 4.5 22.8South 8.0 2.0 6.3 1.0 3.1 20.5
Total 7.2 2.2 7.0 1.3 4.1 21.9
Tenured teachers in both years
that changed school
Newly tenured teachers in year
2005-06 that changed school
Temporary teachers in both years
that changed school

38
Table 7
Mobility request of tenured teachers (number and percentage values)
1 The row Total includes those cases in that we are unable to attribute to type or geographical location of the school.
Number of requests Number of request as share of tenured teachers Number of requests as a share of the total number of
teachers (1)
North Center South Italy North Center South Italy North Center South Italy
Females 32.371 17.672 47.841 97.884 15,4 16,4 18,9 17,2 12,7 14,0 16,6 14,6
Males 8.387 4.405 13.284 26.076 17,2 18,2 19,9 18,7 14,1 15,5 17,2 15,8
<29 years 1.875 558 940 3.373 61,5 66,0 62,8 62,6 16,4 15,3 17,8 16,6
30-39 years 12.662 6.168 15.537 34.367 34,0 37,8 41,5 37,8 18,8 22,5 26,7 22,5
40-49 years 18.086 9.596 27.611 55.293 17,5 21,5 25,4 21,5 15,4 18,4 21,9 18,7
50-59 years 7.897 5.501 16.120 29.518 7,2 8,8 10,8 9,2 7,1 8,6 10,6 9,0
>=60 years 238 254 917 1.409 3,7 3,5 4,0 3,8 3,6 3,4 3,9 3,8
Years of
Just tenured 14.833 6.324 11.982 33.139 97,1 96,7 97,7 97,2 97,1 96,7 97,7 97,2
1-3 1.264 625 1.567 3.456 21,2 25,6 34,8 26,8 21,2 25,6 34,8 26,8
4-6 6.992 3.697 11.245 21.934 24,5 28,6 36,2 30,2 24,5 28,6 36,2 30,2
7-10 2.201 2.167 8.216 12.584 15,4 18,7 27,0 22,4 15,4 18,7 27,0 22,4
>10 15.459 9.254 28.101 52.814 7,9 9,4 11,6 9,9 7,9 9,4 11,6 9,9
Total(1) 40.758 22.079 61.129 123.966 15,7 16,8 19,1 17,4 12,9 14,3 16,7 14,9
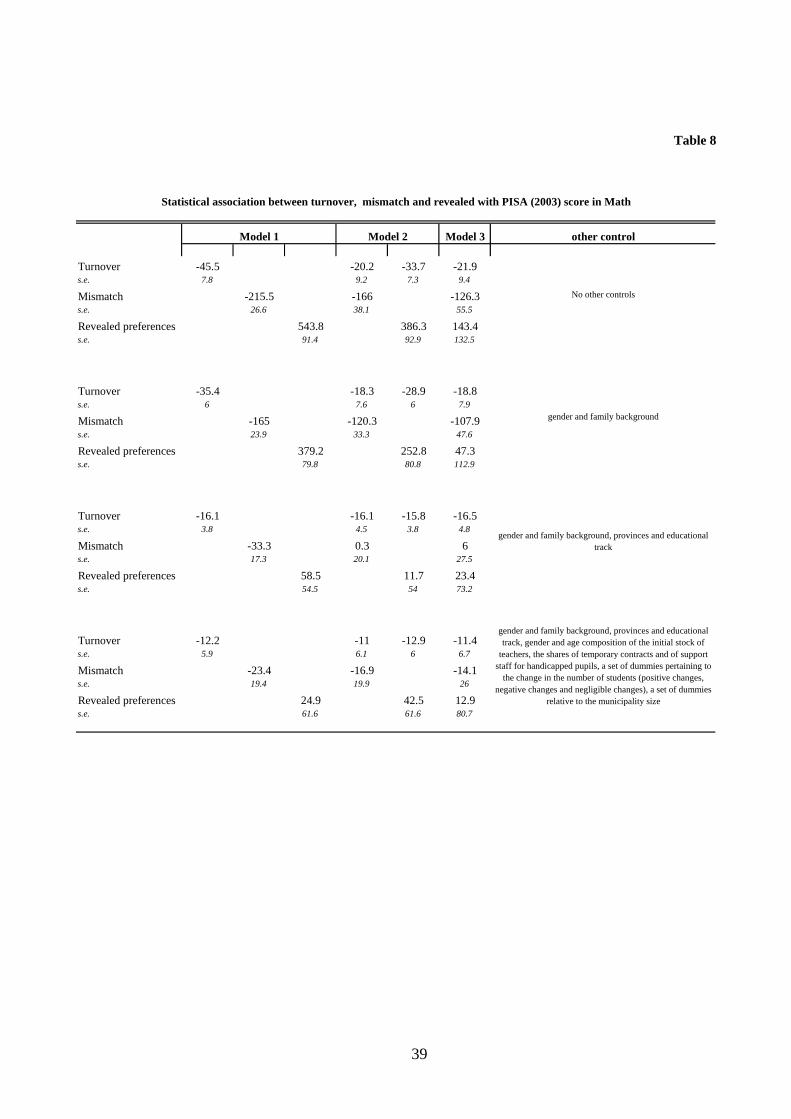
39
Table 8
Model 3 other control
Turnover -45.5 -20.2 -33.7 -21.9s.e. 7.8 9.2 7.3 9.4
Mismatch -215.5 -166 -126.3s.e. 26.6 38.1 55.5
Revealed preferences 543.8 386.3 143.4s.e. 91.4 92.9 132.5
Turnover -35.4 -18.3 -28.9 -18.8s.e. 6 7.6 6 7.9
Mismatch -165 -120.3 -107.9s.e. 23.9 33.3 47.6
Revealed preferences 379.2 252.8 47.3s.e. 79.8 80.8 112.9
Turnover -16.1 -16.1 -15.8 -16.5s.e. 3.8 4.5 3.8 4.8
Mismatch -33.3 0.3 6s.e. 17.3 20.1 27.5
Revealed preferences 58.5 11.7 23.4s.e. 54.5 54 73.2
Turnover -12.2 -11 -12.9 -11.4s.e. 5.9 6.1 6 6.7
Mismatch -23.4 -16.9 -14.1s.e. 19.4 19.9 26
Revealed preferences 24.9 42.5 12.9s.e. 61.6 61.6 80.7
gender and family background, provinces and educational track
gender and family background, provinces and educational track, gender and age composition of the initial stock of
teachers, the shares of temporary contracts and of support staff for handicapped pupils, a set of dummies pertaining to
the change in the number of students (positive changes, negative changes and negligible changes), a set of dummies
relative to the municipality size
Statistical association between turnover, mismatch and revealed with PISA (2003) score in Math
Model 1 Model 2
gender and family background
No other controls

40
Figure 1
Kernel density estimates of the distribution of graduation marks as percentage of maximum score
(all population)
0
0.01
0.02
0.03
0.04
0.05
16 18 19 21 23 25 26 28 30 32 33 35 37 39 40 42 44 46 47 49 51 53 54 56 58 60 61 63 65 67 68 70 72 74 75 77 79 81 82 84 86 88 89 91 93 95 96 98 100
Not at work Other people at work Teachers
People younger than 36
0
0.01
0.02
0.03
0.04
0.05
16 18 19 21 23 25 26 28 30 32 33 35 37 39 40 42 44 46 47 49 51 53 54 56 58 60 61 63 65 67 68 70 72 74 75 77 79 81 82 84 86 88 89 91 93 95 96 98 100
Not at work Other people at work Teachers
People older than 35
0
0.01
0.02
0.03
0.04
0.05
0.06
16 18 19 21 23 25 26 28 30 32 33 35 37 39 40 42 44 46 47 49 51 53 54 56 58 60 61 63 65 67 68 70 72 74 75 77 79 81 82 84 86 88 89 91 93 95 96 98 100
Not at work Other people at work Teachers
Males younger than 36
0
0.01
0.02
0.03
0.04
0.05
0.06
16 18 19 21 23 25 26 28 30 32 33 35 37 39 40 42 44 46 47 49 51 53 54 56 58 60 61 63 65 67 68 70 72 74 75 77 79 81 82 84 86 88 89 91 93 95 96 98 100
Not at work Other people at work Teachers
Males older than 35
0
0.01
0.02
0.03
0.04
0.05
16 18 19 21 23 25 26 28 30 32 33 35 37 39 40 42 44 46 47 49 51 53 54 56 58 60 61 63 65 67 68 70 72 74 75 77 79 81 82 84 86 88 89 91 93 95 96 98 100
Not at work Other people at work Teachers
Females younger than 36
0
0.01
0.02
0.03
0.04
0.05
16 18 19 21 23 25 26 28 30 32 33 35 37 39 40 42 44 46 47 49 51 53 54 56 58 60 61 63 65 67 68 70 72 74 75 77 79 81 82 84 86 88 89 91 93 95 96 98 100
Not at work Other people at work Teachers
Females older than 35
Graduation marks as percentage of maximum score
Sources: Bank of Italy, SHIW

(*) Requestsforcopiesshouldbesentto:Bancad’Italia–ServizioStudidistrutturaeconomicaefinanziaria–DivisioneBibliotecaeArchiviostorico–ViaNazionale,91–00184Rome–(fax00390647922059).TheyareavailableontheInternetwww.bancaditalia.it.
RECENTLYPUBLISHED“TEMI”(*)
N. 643 – The producer service sector in Italy: Long-term growth and its local determinants,byValterDiGiacintoandGiacintoMicucci(September2007).
N. 644 – Aggregazioni bancarie e specializzazione nel credito alle PMI: peculiarità per area geografica,byEnricoBerettaandSilviaDelPrete(November2007).
N. 645 – Costs and benefits of creditor concentration: An empirical approach, byAmandaCarmignaniandMassimoOmiccioli(November2007).
N. 646 – Does the underground economy hold back financial deepening? Evidence from the Italian credit market,byGiorgioGobbiandRobertaZizza(November2007).
N. 647 – Optimal monetary policy under low trend inflation, byGuidoAscari andTizianoRopele(November2007).
N. 648 – Indici di bilancio e rendimenti di borsa: un’analisi per le banche italiane,byAngelaRomagnoli(November2007).
N. 649 – Bank profitability and taxation, by Ugo Albertazzi and Leonardo Gambacorta(November2007).
N. 650 – Modelling bank lending in the euro area: A non-linear approach, by LeonardoGambacortaandCarlottaRossi(November2007).
N. 651 – Revisiting poverty and welfare dominance, byGianMariaTomat(November2007).N. 652 – The general equilibrium effects of fiscal policy: Estimates for the euro area, by
LorenzoForni,LiberoMonteforteandLucaSessa(November2007).N. 653 – Securitisation and the bank lending channel, by Yener Altunbas, Leonardo
GambacortaandDavidMarqués(November2007).N.654 – The cyclical response of fiscal policies in the euro area. Why do results of empirical
research differ so strongly?, by Roberto Golinelli and Sandro Momigliano(January2008).
N. 655 – What’s behind “inflation perceptions”? A survey-based analysis of Italian consumers,byPaoloDelGiovane,SilviaFabianiandRobertoSabbatini(January2008).
N. 656 – The effects of fiscal policy in Italy: Evidence from a VAR model,byRaffaelaGiordano,SandroMomigliano,StefanoNeriandRobertoPerotti(January2008).
N. 657 – Excess money growth and inflation dynamics,byBarbaraRoffiaandAndreaZaghini(January2008).
N. 658 – R&D and market structure in a horizontal differentiation framework, by DavideFantino(January2008).
N. 659 – Housing market spillovers: Evidence from an estimated DSGE model, byMatteoIacovielloandStefanoNeri(January2008).
N. 660 – Real exchange rate volatility and disconnect: An empirical investigation,byRiccardoCristadoro,AndreaGerali,StefanoNeriandMassimilianoPisani(April2008).
N. 661 – The effect of investment tax credit: Evidence from an atypical programme in Italy,byRaffaelloBronzini,GuidodeBlasio,GuidoPellegriniandAlessandroScognamiglio(April2008).
N. 662 – Accounting for sampling design in the SHIW,byIvanFaiella(April2008).N. 663 – Delayed privatization,byBernardoBortolottiandPaoloPinotti(April2008).N. 664 – Portfolio selection with mononotone mean-variance preferences, by Fabio
Maccheroni,MassimoMarinacci,AldoRustichiniandMarcoTaboga(April2008).N. 665 – Directed matching with endogenous Markov probability: Clients or competitors?,by
EmanuelaCiapanna(April2008).N. 666 – What are borders made of? An analysis of barriers to European banking integration,
byMassimilianoAffinitoandMatteoPiazza(April2008).N. 667 – Innovation driven sectoral shocks and aggregate city cycles,byAndreaR.Lamorgese
(April2008).N. 668 – On applying synthetic indices of multidimensional well-being: Health and income
inequalities in selected EU countries,byAndreaBrandolini(April2008).N. 669 – Values, inequality and happiness, by Claudia Biancotti and Giovanni D’Alessio
(April2008).

"TEMI" LATER PUBLISHED ELSEWHERE
2005
L. DEDOLA and F. LIPPI, The monetary transmission mechanism: Evidence from the industries of 5 OECD countries, European Economic Review, 2005, Vol. 49, 6, pp. 1543-1569, TD No. 389 (December 2000).
D. Jr. MARCHETTI and F. NUCCI, Price stickiness and the contractionary effects of technology shocks. European Economic Review, Vol. 49, 5, pp. 1137-1164, TD No. 392 (February 2001).
G. CORSETTI, M. PERICOLI and M. SBRACIA, Some contagion, some interdependence: More pitfalls in tests of financial contagion, Journal of International Money and Finance, Vol. 24, 8, pp. 1177-1199, TD No. 408 (June 2001).
GUISO L., L. PISTAFERRI and F. SCHIVARDI, Insurance within the firm. Journal of Political Economy, Vol. 113, 5, pp. 1054-1087, TD No. 414 (August 2001)
R. CRISTADORO, M. FORNI, L. REICHLIN and G. VERONESE, A core inflation indicator for the euro area, Journal of Money, Credit, and Banking, Vol. 37, 3, pp. 539-560, TD No. 435 (December 2001).
F. ALTISSIMO, E. GAIOTTI and A. LOCARNO, Is money informative? Evidence from a large model used for policy analysis, Economic & Financial Modelling, Vol. 22, 2, pp. 285-304, TD No. 445 (July 2002).
G. DE BLASIO and S. DI ADDARIO, Do workers benefit from industrial agglomeration? Journal of regional Science, Vol. 45, (4), pp. 797-827, TD No. 453 (October 2002).
G. DE BLASIO and S. DI ADDARIO, Salari, imprenditorialità e mobilità nei distretti industriali italiani, in L. F. Signorini, M. Omiccioli (eds.), Economie locali e competizione globale: il localismo industriale italiano di fronte a nuove sfide, Bologna, il Mulino, TD No. 453 (October 2002).
R. TORRINI, Cross-country differences in self-employment rates: The role of institutions, Labour Economics, Vol. 12, 5, pp. 661-683, TD No. 459 (December 2002).
A. CUKIERMAN and F. LIPPI, Endogenous monetary policy with unobserved potential output, Journal of Economic Dynamics and Control, Vol. 29, 11, pp. 1951-1983, TD No. 493 (June 2004).
M. OMICCIOLI, Il credito commerciale: problemi e teorie, in L. Cannari, S. Chiri e M. Omiccioli (eds.), Imprese o intermediari? Aspetti finanziari e commerciali del credito tra imprese in Italia, Bologna, Il Mulino, TD No. 494 (June 2004).
L. CANNARI, S. CHIRI and M. OMICCIOLI, Condizioni di pagamento e differenziazione della clientela, in L. Cannari, S. Chiri e M. Omiccioli (eds.), Imprese o intermediari? Aspetti finanziari e commerciali del credito tra imprese in Italia, Bologna, Il Mulino, TD No. 495 (June 2004).
P. FINALDI RUSSO and L. LEVA, Il debito commerciale in Italia: quanto contano le motivazioni finanziarie?, in L. Cannari, S. Chiri e M. Omiccioli (eds.), Imprese o intermediari? Aspetti finanziari e commerciali del credito tra imprese in Italia, Bologna, Il Mulino, TD No. 496 (June 2004).
A. CARMIGNANI, Funzionamento della giustizia civile e struttura finanziaria delle imprese: il ruolo del credito commerciale, in L. Cannari, S. Chiri e M. Omiccioli (eds.), Imprese o intermediari? Aspetti finanziari e commerciali del credito tra imprese in Italia, Bologna, Il Mulino, TD No. 497 (June 2004).
G. DE BLASIO, Credito commerciale e politica monetaria: una verifica basata sull’investimento in scorte, in L. Cannari, S. Chiri e M. Omiccioli (eds.), Imprese o intermediari? Aspetti finanziari e commerciali del credito tra imprese in Italia, Bologna, Il Mulino, TD No. 498 (June 2004).
G. DE BLASIO, Does trade credit substitute bank credit? Evidence from firm-level data. Economic notes, Vol. 34, 1, pp. 85-112, TD No. 498 (June 2004).
A. DI CESARE, Estimating expectations of shocks using option prices, The ICFAI Journal of Derivatives Markets, Vol. 2, 1, pp. 42-53, TD No. 506 (July 2004).
M. BENVENUTI and M. GALLO, Il ricorso al "factoring" da parte delle imprese italiane, in L. Cannari, S. Chiri e M. Omiccioli (eds.), Imprese o intermediari? Aspetti finanziari e commerciali del credito tra imprese in Italia, Bologna, Il Mulino, TD No. 518 (October 2004).
L. CASOLARO and L. GAMBACORTA, Redditività bancaria e ciclo economico, Bancaria, Vol. 61, 3, pp. 19-27, TD No. 519 (October 2004).
F. PANETTA, F. SCHIVARDI and M. SHUM, Do mergers improve information? Evidence from the loan market, CEPR Discussion Paper, 4961, TD No. 521 (October 2004).

P. DEL GIOVANE and R. SABBATINI, La divergenza tra inflazione rilevata e percepita in Italia, in P. Del Giovane, F. Lippi e R. Sabbatini (eds.), L'euro e l'inflazione: percezioni, fatti e analisi, Bologna, Il Mulino, TD No. 532 (December 2004).
R. TORRINI, Quota dei profitti e redditività del capitale in Italia: un tentativo di interpretazione, Politica economica, Vol. 21, 1, pp. 7-41, TD No. 551 (June 2005).
M. OMICCIOLI, Il credito commerciale come “collateral”, in L. Cannari, S. Chiri, M. Omiccioli (eds.), Imprese o intermediari? Aspetti finanziari e commerciali del credito tra imprese in Italia, Bologna, il Mulino, TD No. 553 (June 2005).
L. CASOLARO, L. GAMBACORTA and L. GUISO, Regulation, formal and informal enforcement and the development of the household loan market. Lessons from Italy, in Bertola G., Grant C. and Disney R. (eds.) The Economics of Consumer Credit: European Experience and Lessons from the US, Boston, MIT Press, TD No. 560 (September 2005).
S. DI ADDARIO and E. PATACCHINI, Lavorare in una grande città paga, ma poco, in Brucchi Luchino (ed.), Per un’analisi critica del mercato del lavoro, Bologna , Il Mulino, TD No. 570 (January 2006).
P. ANGELINI and F. LIPPI, Did inflation really soar after the euro changeover? Indirect evidence from ATM withdrawals, CEPR Discussion Paper, 4950, TD No. 581 (March 2006).
S. FEDERICO, Internazionalizzazione produttiva, distretti industriali e investimenti diretti all'estero, in L. F. Signorini, M. Omiccioli (eds.), Economie locali e competizione globale: il localismo industriale italiano di fronte a nuove sfide, Bologna, il Mulino, TD No. 592 (October 2002).
S. DI ADDARIO, Job search in thick markets: Evidence from Italy, Oxford Discussion Paper 235, Department of Economics Series, TD No. 605 (December 2006).
2006
F. BUSETTI, Tests of seasonal integration and cointegration in multivariate unobserved component models, Journal of Applied Econometrics, Vol. 21, 4, pp. 419-438, TD No. 476 (June 2003).
C. BIANCOTTI, A polarization of inequality? The distribution of national Gini coefficients 1970-1996, Journal of Economic Inequality, Vol. 4, 1, pp. 1-32, TD No. 487 (March 2004).
L. CANNARI and S. CHIRI, La bilancia dei pagamenti di parte corrente Nord-Sud (1998-2000), in L. Cannari, F. Panetta (a cura di), Il sistema finanziario e il Mezzogiorno: squilibri strutturali e divari finanziari, Bari, Cacucci, TD No. 490 (March 2004).
M. BOFONDI and G. GOBBI, Information barriers to entry into credit markets, Review of Finance, Vol. 10, 1, pp. 39-67, TD No. 509 (July 2004).
FUCHS W. and LIPPI F., Monetary union with voluntary participation, Review of Economic Studies, Vol. 73, pp. 437-457 TD No. 512 (July 2004).
GAIOTTI E. and A. SECCHI, Is there a cost channel of monetary transmission? An investigation into the pricing behaviour of 2000 firms, Journal of Money, Credit and Banking, Vol. 38, 8, pp. 2013-2038 TD No. 525 (December 2004).
A. BRANDOLINI, P. CIPOLLONE and E. VIVIANO, Does the ILO definition capture all unemployment?, Journal of the European Economic Association, Vol. 4, 1, pp. 153-179, TD No. 529 (December 2004).
A. BRANDOLINI, L. CANNARI, G. D’ALESSIO and I. FAIELLA, Household wealth distribution in Italy in the 1990s, in E. N. Wolff (ed.) International Perspectives on Household Wealth, Cheltenham, Edward Elgar, TD No. 530 (December 2004).
P. DEL GIOVANE and R. SABBATINI, Perceived and measured inflation after the launch of the Euro: Explaining the gap in Italy, Giornale degli economisti e annali di economia, Vol. 65, 2 , pp. 155-192, TD No. 532 (December 2004).
M. CARUSO, Monetary policy impulses, local output and the transmission mechanism, Giornale degli economisti e annali di economia, Vol. 65, 1, pp. 1-30, TD No. 537 (December 2004).
A. NOBILI, Assessing the predictive power of financial spreads in the euro area: does parameters instability matter?, Empirical Economics, Vol. 31, 1, pp. 177-195, TD No. 544 (February 2005).
L. GUISO and M. PAIELLA, The role of risk aversion in predicting individual behavior, In P. A. Chiappori e C. Gollier (eds.) Competitive Failures in Insurance Markets: Theory and Policy Implications, Monaco, CESifo, TD No. 546 (February 2005).

G. M. TOMAT, Prices product differentiation and quality measurement: A comparison between hedonic and matched model methods, Research in Economics, Vol. 60, 1, pp. 54-68, TD No. 547 (February 2005).
F. LOTTI, E. SANTARELLI and M. VIVARELLI, Gibrat's law in a medium-technology industry: Empirical evidence for Italy, in E. Santarelli (ed.), Entrepreneurship, Growth, and Innovation: the Dynamics of Firms and Industries, New York, Springer, TD No. 555 (June 2005).
F. BUSETTI, S. FABIANI and A. HARVEY, Convergence of prices and rates of inflation, Oxford Bulletin of Economics and Statistics, Vol. 68, 1, pp. 863-878, TD No. 575 (February 2006).
M. CARUSO, Stock market fluctuations and money demand in Italy, 1913 - 2003, Economic Notes, Vol. 35, 1, pp. 1-47, TD No. 576 (February 2006).
S. IRANZO, F. SCHIVARDI and E. TOSETTI, Skill dispersion and productivity: An analysis with matched data, CEPR Discussion Paper, 5539, TD No. 577 (February 2006).
R. BRONZINI and G. DE BLASIO, Evaluating the impact of investment incentives: The case of Italy’s Law 488/92. Journal of Urban Economics, Vol. 60, 2, pp. 327-349, TD No. 582 (March 2006).
R. BRONZINI and G. DE BLASIO, Una valutazione degli incentivi pubblici agli investimenti, Rivista Italiana degli Economisti , Vol. 11, 3, pp. 331-362, TD No. 582 (March 2006).
A. DI CESARE, Do market-based indicators anticipate rating agencies? Evidence for international banks, Economic Notes, Vol. 35, pp. 121-150, TD No. 593 (May 2006).
L. DEDOLA and S. NERI, What does a technology shock do? A VAR analysis with model-based sign restrictions, Journal of Monetary Economics, Vol. 54, 2, pp. 512-549, TD No. 607 (December 2006).
R. GOLINELLI and S. MOMIGLIANO, Real-time determinants of fiscal policies in the euro area, Journal of Policy Modeling, Vol. 28, 9, pp. 943-964, TD No. 609 (December 2006).
P. ANGELINI, S. GERLACH, G. GRANDE, A. LEVY, F. PANETTA, R. PERLI,S. RAMASWAMY, M. SCATIGNA and P. YESIN, The recent behaviour of financial market volatility, BIS Papers, 29, QEF No. 2 (August 2006).
2007
L. CASOLARO. and G. GOBBI, Information technology and productivity changes in the banking industry, Economic Notes, Vol. 36, 1, pp. 43-76, TD No. 489 (March 2004).
M. PAIELLA, Does wealth affect consumption? Evidence for Italy, Journal of Macroeconomics, Vol. 29, 1, pp. 189-205, TD No. 510 (July 2004).
F. LIPPI. and S. NERI, Information variables for monetary policy in a small structural model of the euro area, Journal of Monetary Economics, Vol. 54, 4, pp. 1256-1270, TD No. 511 (July 2004).
A. ANZUINI and A. LEVY, Monetary policy shocks in the new EU members: A VAR approach, Applied Economics, Vol. 39, 9, pp. 1147-1161, TD No. 514 (July 2004).
R. BRONZINI, FDI Inflows, agglomeration and host country firms' size: Evidence from Italy, Regional Studies, Vol. 41, 7, pp. 963-978, TD No. 526 (December 2004).
L. MONTEFORTE, Aggregation bias in macro models: Does it matter for the euro area?, Economic Modelling, 24, pp. 236-261, TD No. 534 (December 2004).
A. DALMAZZO and G. DE BLASIO, Production and consumption externalities of human capital: An empirical study for Italy, Journal of Population Economics, Vol. 20, 2, pp. 359-382, TD No. 554 (June 2005).
M. BUGAMELLI and R. TEDESCHI, Le strategie di prezzo delle imprese esportatrici italiane, Politica Economica, v. 3, pp. 321-350, TD No. 563 (November 2005).
L. GAMBACORTA and S. IANNOTTI, Are there asymmetries in the response of bank interest rates to monetary shocks?, Applied Economics, v. 39, 19, pp. 2503-2517, TD No. 566 (November 2005).
S. DI ADDARIO and E. PATACCHINI, Wages and the city. Evidence from Italy, Development Studies Working Papers 231, Centro Studi Luca d’Agliano, TD No. 570 (January 2006).
P. ANGELINI and F. LIPPI, Did prices really soar after the euro cash changeover? Evidence from ATM withdrawals, International Journal of Central Banking, Vol. 3, 4, pp. 1-22, TD No. 581 (March 2006).
A. LOCARNO, Imperfect knowledge, adaptive learning and the bias against activist monetary policies, International Journal of Central Banking, v. 3, 3, pp. 47-85, TD No. 590 (May 2006).

F. LOTTI and J. MARCUCCI, Revisiting the empirical evidence on firms' money demand, Journal of Economics and Business, Vol. 59, 1, pp. 51-73, TD No. 595 (May 2006).
P. CIPOLLONE and A. ROSOLIA, Social interactions in high school: Lessons from an earthquake, American Economic Review, Vol. 97, 3, pp. 948-965, TD No. 596 (September 2006).
A. BRANDOLINI, Measurement of income distribution in supranational entities: The case of the European Union, in S. P. Jenkins e J. Micklewright (eds.), Inequality and Poverty Re-examined, Oxford, Oxford University Press, TD No. 623 (April 2007).
M. PAIELLA, The foregone gains of incomplete portfolios, Review of Financial Studies, Vol. 20, 5, pp. 1623-1646, TD No. 625 (April 2007).
K. BEHRENS, A. R. LAMORGESE, G.I.P. OTTAVIANO and T. TABUCHI, Changes in transport and non transport costs: local vs. global impacts in a spatial network, Regional Science and Urban Economics, Vol. 37, 6, pp. 625-648, TD No. 628 (April 2007).
G. ASCARI and T. ROPELE, Optimal monetary policy under low trend inflation, Journal of Monetary Economics, v. 54, 8, pp. 2568-2583, TD No. 647 (November 2007).
R. GIORDANO, S. MOMIGLIANO, S. NERI and R. PEROTTI, The Effects of Fiscal Policy in Italy: Evidence from a VAR Model, European Journal of Political Economy, Vol. 23, 3, pp. 707-733, TD No. 656 (December 2007).
2008
S. MOMIGLIANO, J. Henry and P. Hernández de Cos, The impact of government budget on prices: Evidence from macroeconometric models, Journal of Policy Modelling, v. 30, 1, pp. 123-143 TD No. 523 (October 2004).
P. ANGELINI and A. Generale, On the evolution of firm size distributions, American Economic Review, v. 98, 1, pp. 426-438, TD No. 549 (June 2005).
P. DEL GIOVANE, S. FABIANI and R. SABATINI, What’s behind “inflation perceptions”? A survey-based analysis of Italian consumers, in P. Del Giovane e R. Sabbatini (eds.), The Euro Inflation and Consumers’ Perceptions. Lessons from Italy, Berlin-Heidelberg, Springer, TD No. 655 (January 2008).
FORTHCOMING
S. SIVIERO and D. TERLIZZESE, Macroeconomic forecasting: Debunking a few old wives’ tales, Journal of Business Cycle Measurement and Analysis, TD No. 395 (February 2001).
P. ANGELINI, Liquidity and announcement effects in the euro area, Giornale degli economisti e annali di economia, TD No. 451 (October 2002).
S. MAGRI, Italian households' debt: The participation to the debt market and the size of the loan, Empirical Economics, TD No. 454 (October 2002).
P. ANGELINI, P. DEL GIOVANE, S. SIVIERO and D. TERLIZZESE, Monetary policy in a monetary union: What role for regional information?, International Journal of Central Banking, TD No. 457 (December 2002).
L. MONTEFORTE and S. SIVIERO, The Economic Consequences of Euro Area Modelling Shortcuts, Applied Economics, TD No. 458 (December 2002).
L. GUISO and M. PAIELLA,, Risk aversion, wealth and background risk, Journal of the European Economic Association, TD No. 483 (September 2003).
G. FERRERO, Monetary policy, learning and the speed of convergence, Journal of Economic Dynamics and Control, TD No. 499 (June 2004).
F. SCHIVARDI e R. TORRINI, Identifying the effects of firing restrictions through size-contingent Differences in regulation, Labour Economics, TD No. 504 (giugno 2004).
C. BIANCOTTI, G. D'ALESSIO and A. NERI, Measurement errors in the Bank of Italy’s survey of household income and wealth, Review of Income and Wealth, TD No. 520 (October 2004).
D. Jr. MARCHETTI and F. Nucci, Pricing behavior and the response of hours to productivity shocks, Journal of Money Credit and Banking, TD No. 524 (December 2004).
L. GAMBACORTA, How do banks set interest rates?, European Economic Review, TD No. 542 (February 2005).

R. FELICI and M. PAGNINI,, Distance, bank heterogeneity and entry in local banking markets, The Journal of Industrial Economics, TD No. 557 (June 2005).
M. BUGAMELLI and R. TEDESCHI, Le strategie di prezzo delle imprese esportatrici italiane, Politica Economica, TD No. 563 (November 2005).
S. DI ADDARIO and E. PATACCHINI, Wages and the city. Evidence from Italy, Labour Economics, TD No. 570 (January 2006).
M. BUGAMELLI and A. ROSOLIA, Produttività e concorrenza estera, Rivista di politica economica, TD No. 578 (February 2006).
PERICOLI M. and M. TABOGA, Canonical term-structure models with observable factors and the dynamics of bond risk premia, TD No. 580 (February 2006).
E. VIVIANO, Entry regulations and labour market outcomes. Evidence from the Italian retail trade sector, Labour Economics, TD No. 594 (May 2006).
S. FEDERICO and G. A. MINERVA, Outward FDI and local employment growth in Italy, Review of World Economics, Journal of Money, Credit and Banking, TD No. 613 (February 2007).
F. BUSETTI and A. HARVEY, Testing for trend, Econometric Theory TD No. 614 (February 2007). V. CESTARI, P. DEL GIOVANE and C. ROSSI-ARNAUD, Memory for Prices and the Euro Cash Changeover: An
Analysis for Cinema Prices in Italy, In P. Del Giovane e R. Sabbatini (eds.), The Euro Inflation and Consumers’ Perceptions. Lessons from Italy, Berlin-Heidelberg, Springer, TD No. 619 (February 2007).
B. ROFFIA and A. ZAGHINI, Excess money growth and inflation dynamics, International Finance, TD No. 629 (June 2007).
M. DEL GATTO, GIANMARCO I. P. OTTAVIANO and M. PAGNINI, Openness to trade and industry cost dispersion: Evidence from a panel of Italian firms, Journal of Regional Science, TD No. 635 (June 2007).
A. CIARLONE, P. PISELLI and G. TREBESCHI, Emerging Markets' Spreads and Global Financial Conditions, Journal of International Financial Markets, Institutions & Money, TD No. 637 (June 2007).
S. MAGRI, The financing of small innovative firms: The Italian case, Economics of Innovation and New Technology, TD No. 640 (September 2007).
Top Related
Copyright © 2022 FDOKUMEN

