


Bahasa
Halaman
Hukum

L e o £ * v E P
off** ©ft * f CbtiF
M*f\ JFEMP/SUB-102
NATURAL PHENOMENA HAZARDS EVALUATION OF CONCRETE SILOS 2, 2, 3 AND 4 AT FERNALD, OHIO
BY
Dr. CV. Char PARSONS Environmental Remedial Action Project
6120 South Gilxnore Road Fairfield, Ohio 45014
and Thomas J. Shiner
FERMCO P.O. Box 538704
Cincinnati, Ohio 45253-8704
August, 1995
Prepared For FERMCO* Fernald Environmental Management
P.O. Box 538704 Cincinnati, Ohio 45253-8 704
For Presentation at the DOE Natural Phenomena Hazards Mitigation Symposium
Denver Colorado November 13-14, 1995
(PAPER)
* Fernald Environmental Restoration Management Corporation with the U.S. Department of Energy under Contract No. DE-AC24-920R21972
DISTRIBUTION OF WIS DOCUMENT IS UNLMOTED % * I 0^ !
DISCLAIMER
Portions of this document may be illegible in electronic image products. Images are produced from the best available original document.
T H I S A8STRACT/PAPER/REP0RT WAS PREPARED AS AN ACCOUNT OF WORK SPONSORED BY AN AGENCY OF THE UNITED STATES GOVERNMENT. REFERENCE HEREIN TO ANY SPECIFIC COMMERCIAL PRODUCT, PROCESS, OR SERVICE BY TRADE NAME, TRADEMARK, MANUFACTURER, OR OTHERWISE DOES NOT CONSTITUTE OR IMPLY ITS ENDORSEMENT, RECOMMENDATION, OR FAVORING BY THE UNITED STATES GOVERNMENT OR ANY AGENCY THEREOF. THE VIEWS AND OPINIONS OF AUTHORS EXPRESSED HEREIN DO NOT NECESSARILY STATE OR REFLECT THOSE OF THE UNITED STATES GOVERNMENT, OR ANY AGENCY THEREOF OR FERNALD ENVIRONMENTAL RESTORATION MANAGEMENT CORPORATION, ITS AFFILIATES OR ITS PARENT COMPANIES.
NATURAL PHENOMENA HAZARDS EVALUATION OF CONCRETE SILOS 1, 2, 3 AND 4 AT FERNALD, OHIO
BY
Channagiri V. Char PARSONS Environmental Remediation Action Project
6120 South Gilmore Road Fairfield, Ohio 45014
Thomas J. Shiner FERMCO
P.O. Box 538704 Cincinnati, Ohio 45253-8704
ABSTRACT
Fernald Environmental Management Project (FEMP) is a United States Department of Energy (DOE) site located near Cincinnati, Ohio. FEMP was formerly established as die Feed Materials Production Center (FMPC) in 1951 under the Atomic Energy Commission. FEMP is currendy undergoing site wide environmental remediation. This paper addresses four concrete silos built during die 1950s and located in Operable Unit 4 (OU-4). Silos 1 and 2 known as K-65 Silos contain residues from Uranium Ore processing. Silo 3 contains metal oxides in powder form. Silo 4 is empty. The Silos are categorized as low hazard facilities and die Natural Phenomena Hazards (NPH) performance category is PC-2, based on a recendy completed safety analysis report.
This paper describes die structural evaluation of concrete Silos 1, 2, 3 and 4 for NPH. Non Destructive Tests (NDT) were conducted to establish die current conditions of die silos. Analytical and computer metiiods were used to evaluate me stresses and displacements for different silo configurations and different loading combinations. Finite element models were developed to uniquely represent each silo, and analyzed using SAP90 computer program. The SAPLOT post processor was used for rapid determination of critical areas of concern for critical loading combinations and for varying silo configurations.
INTRODUCTION
The FEMP established operations in 1951 under orders of die Atomic Energy Commission and produced uranium and otiier metals for use at odier DOE facilities under die name Feed Materials Production Center. The FEMP is located near Fernald, Ohio, approximately 20 miles northwest of Cincinnati. At present, production at die FEMP has ceased and die environmental remediation of me entire site is ongoing. To aid in die remediation effort, die FEMP is separated into five Operable
Units (OUs).
Silos 1, 2, 3, and 4 are located in me west central boundary of die FEMP in OU-4. Silos 1 and 2, also known as die K-65 Silos, contain radium-bearing residues from pitchblende (high-grade uranium/radium) ore processes at die FEMP. Silo 3 contains dry uranium oxide and otiier metal oxides. Silo 4 has never been used and is empty.
A Vitrification Pilot Plant (VPP) is also being constructed for vitrification of K-65 material,
bentonite clay, and Silo 3 material.
The structural integrity of silos during waste retrieval operations was established to meet safety objectives and NPH requirements in accordance with DOE ORDERS 5480.28 [Hand 6430.1 A [2].
DOE-STD-1020 [12] and existing conditions of the silos. Data from existing construction drawings and field observations were also included in the evaluations.
SEISMIC HAZARD
PREVIOUS STUDIES
The silos have been a subject of study in the past due to public concern for safety. The original studies were made by Camargo and Associates in 1986 [3,4 ] and 1989 [5] using methods available at that time and also included NDT on all four silos.
For DOE sites which have multiple seismic hazard curves by TERRA, EPRI or LLNL, corrections to the Horizontal Peak Ground Acceleration (HPGA) are needed in accordance with DOE STD-1024 [13] for consistent estimate of the probabilistic seismic hazard.
The Camargo studies were supplemented by additional studies by Bechtel National [6], University of Cincinnati [7 ] and Sandia National Lab [ 8 ] .
The scopes of the previous studies were varied in nature and met their objectives. However, they were inconclusive and inadequate to meet the requirements of me current waste retrieval operations and the more challenging regulatory requirements.
HAZARD CATEGORY
The Preliminary Safety Analysis Report (PSAR) [9] for OU-4 has been completed using the latest concepts based on DOE ORDER 5480.23 [10].
The PSAR provides the safety basis for the design of the Vitrification Pilot Plant (VPP) and also addresses the safety of the existing silos during VPP operations.
The accident scenarios considered in the PSAR included natural phenomena events including earthquakes, tornados, snow, straight winds, and natural degradation. Based on using graded approach and facility segmentation methods, the silos were categorized as Hazard Category 3 (low hazard) facilities. Using the guidelines of DOE STD-1021 [11] for the NPH categorization of Structures Systems and Components, the silo structures were categorized as PC-2.
HAZARD CURVES FOR NPH
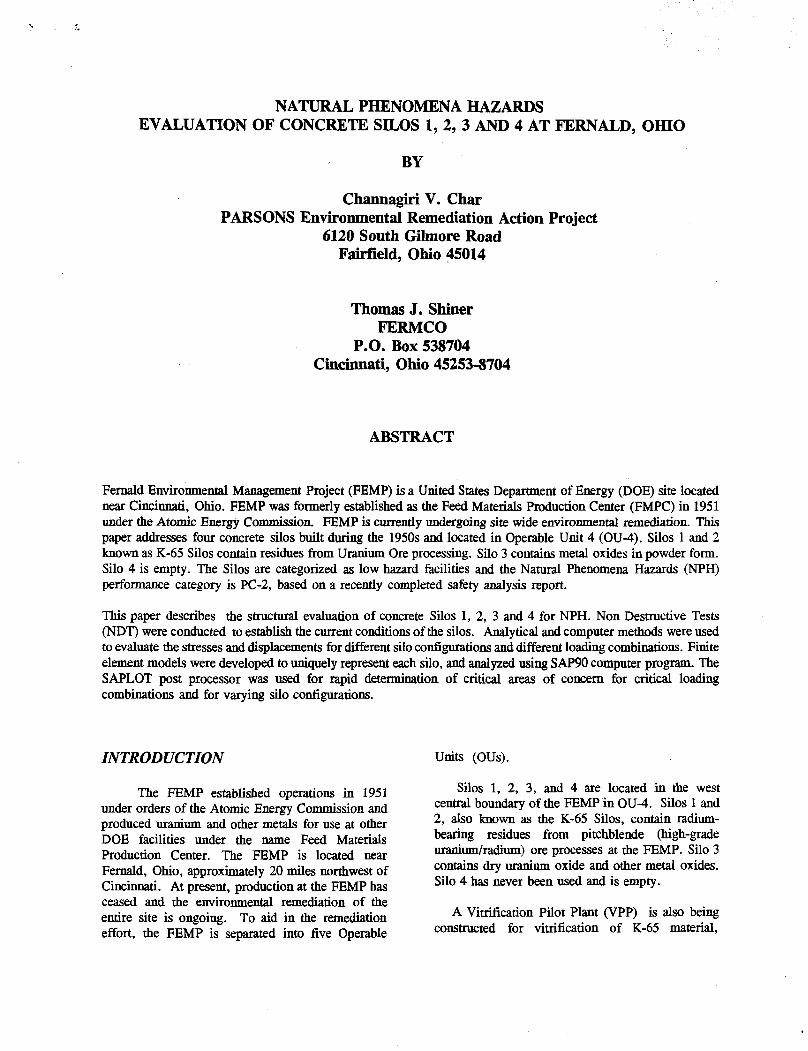
The hazard curves seismic hazard, wind/tornado hazards and flood hazard were based on site specific information. The structural evaluations of the silos for NPH were made using the general guidelines of
Figure 1 : Response Spectrum for FEMP
For the FEMP site no corrections to HPGA were needed since mere is only one set of seismic hazard curves originally developed by TERRA. The Seismic hazard curve and the response spectrum anchored to lg are presented in UCRL 53582 [14] under FMPC. The HPGA value the PC-2 category silos at FEMP is 0.13g, the same value as listed in DOE-STD-1020 under FMPC. The response spectrum for FEMP site is shown in Figure 1.
WIND AND TORNADO HAZARD Wind and tornado hazard curves for Fernald site
are listed under FMPC in UCRL 53526 [15] and are the same as developed by McDonald and Fujita for the original wind/ tornado hazards modelling project for DOE sites. The straight wind and tornado wind speeds for FEMP are also listed in DOE STD-1020 for different NPH Performance Categories. The basic wind speed (80 mph) is based on local Ohio Basic Building Code [16], which is more critical than DOE STD-1020 value (70 mph) for a PC-2 category structure at FEMP.
FLOOD HAZARD
FEMP site was not included in the original list of DOE sites for which flood hazard models were developed. A site specific flood hazard study is currently being completed to include the 2000 year, 10000 year and 100000 year (PMP) floods. Based on site specific studies there are no credible flood hazards for PC-2 category silo structures at FEMP for the 2000 year flood.
SILO DESIGN AND CONSTRUCTION
Silos 1, 2, 3, and 4 were designed by Preload Engineering, Inc., and constructed by Catalytic Construction Company during 1951-1952. All four silos are similar in construction. The silos were constructed as circular wire-wrapped prestressed concrete tanks and post-tensioned by vertical tendons. The provisions of ACI 318 [17] and ACI344-W [18] are considered applicable for prestressed concrete shell structures of this type of construction.
Each silo is approximately 80-foot inside diameter, 27-foot height at the top of the wall, and 36-foot height to the top of the dome at the center of the silo.
The walls were designed to be 8 inches thick and cast in place with 4,500 pounds per square inch (psi) concrete. They were wrapped on the outside surface with prestressed steel wires stressed to about 100,000 psi and covered with 1-inch-thick gunite. The walls have no vertical reinforcement or steel diaphragm as in modern tanks, but instead the walls were pre-compressed by vertical preload units post-tensioned to about 150,000 psi and spaced about 4 feet apart around the circumference.
The dome was designed to be 8 inches thick maximum near die edge, tapering to 4 inches thick minimum at the center, and was cast in place using 4,500 psi concrete. Dome reinforcement consisted primarily of welded wire mesh. The.dome is tied to the wall with reinforcement. A circumferentially prestressed dome ring is provided at die base of die dome shell to resist die horizontal component of die dome thrust.
The floor is 4 inch thick nominally reinforced and rests on 8 inch layer of stone gravel and a compacted impervious subgrade. The floor is tied to the walls with reinforcement. The wall footings are 3-foot 6 inches wide and reinforced circumferentially. The walls are not cast monolidiic with the floor slab.
SILO CONFIGURATIONS
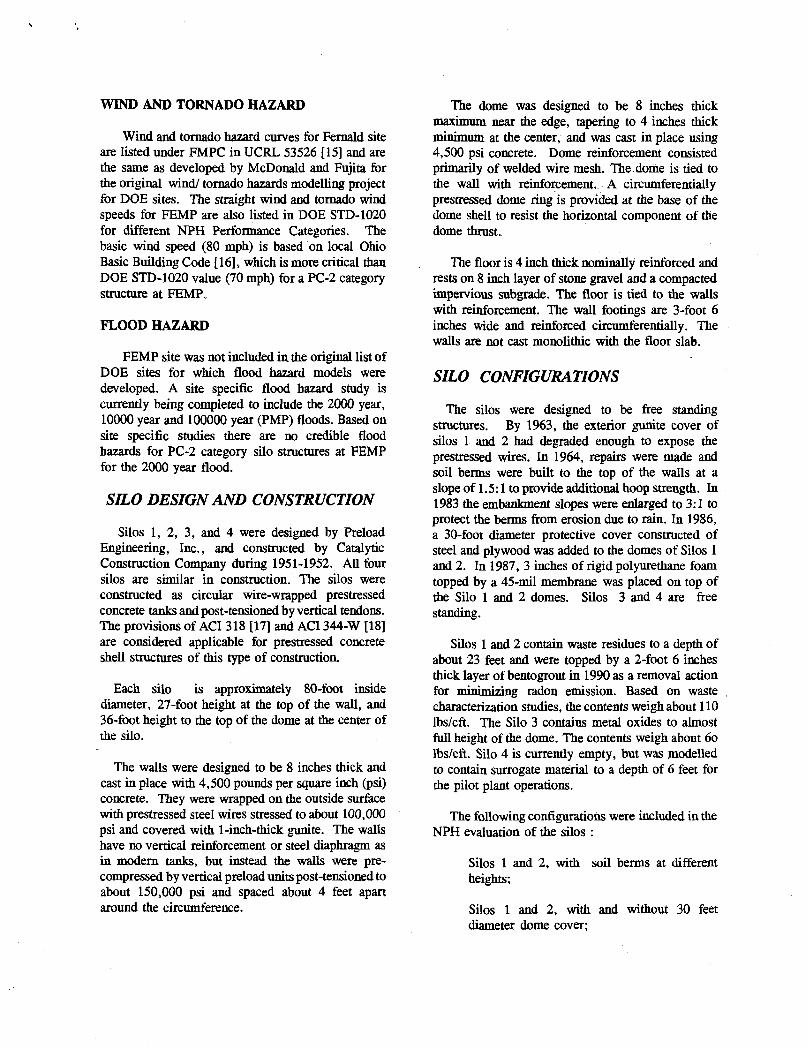
The silos were designed to be free standing structures. By 1963, the exterior gunite cover of silos 1 and 2 had degraded enough to expose die prestressed wires. In 1964, repairs were made and soil berms were built to uie top of the walls at a slope of 1.5:1 to provide additional hoop strengui. In 1983 me embankment slopes were enlarged to 3:1 to protect die berms from erosion due to rain. In 1986, a 30-foot diameter protective cover constructed of steel and plywood was added to the domes of Silos 1 and 2. In 1987, 3 inches of rigid polyureuiane foam topped by a 45-mil membrane was placed on top of the Silo 1 and 2 domes. Silos 3 and 4 are free standing.
Silos 1 and 2 contain waste residues to a depth of about 23 feet and were topped by a 2-foot 6 inches thick layer of bentogrout in 1990 as a removal action for minimizing radon emission. Based on waste characterization studies, die contents weigh about 110 lbs/eft. The Silo 3 contains metal oxides to almost full height of uie dome. The contents weigh about 6o lbs/eft. Silo 4 is currently empty, but was modelled to contain surrogate material to a depth of 6 feet for me pilot plant operations.
The following configurations were included indie NPH evaluation of the silos :
Silos 1 and 2, with soil berms at different heights;
Silos 1 and 2, with and without 30 feet diameter dome cover;
Silos 1, 2, 3, and 4 with and without an enlarged 7 foot diameter opening at the center of the dome.
Figure 2 shows typical silo configurations considered in the NPH evaluations.
Silos 1 and 2 have protective cover at dome center and soil berms around the walls.
Figure 2: Silo Configurations
NON DESTRUCTIVE TESTS
Due to the uncertainty of the existing conditions of
the silos and safety concerns associated with destructive tests, NDT tests were considered appropriate to determine die present condition of the reinforcement, concrete thicknesses, concrete strengths, and crack data.
A Silo Testing Plan [19] was prepared to include Impulse Radar Tests, Pulse Echo Tests, Impact Echo Tests, Pachometer Tests and Visual Inspection to establish die current conditions of Silos 1, 2, 3 and 4. The NDT results were obtained for all silos based on this testing plan and are contained in a separate report [20].
Based on these NDT results the concrete strengths were essentially the same as original design values throughout the silos except in the center portion of the dome. The prestress wires and rebars had lost some effective area due to corrosion in certain locations. The concrete thicknesses were essentially the same except at the center portion where the thickness was reduced. The cracks revealed were reported as being present over a period of many years, and were attributed to normal shrinkage and the presence of cold joints. These cracks were not considered as structural cracks.
LOADING CONDITIONS
Self Weight (SW)
This load includes die self weight of concrete. For Silos 1 and 2, the weight of dome cover and foam cover was added. Dead load due to self weight of concrete was automatically included in the analysis. Dead load due to dome cover on Silos 1 and 2 was applied as a circular line load.
Live Load (LL)
Roof live load of 20 psf was used over die dome surface only. Live loads were applied as joint loads using tributary areas. Live loads from the dome covers resting on Silos 1 and 2 were applied as a circular line load.
Prestress Load (PL)
The vertical post tensioning loads and prestress loads in wrapped wires were based on uie number and diameter of wires as shown in construction drawings. Prestress loads were adjusted to account for wire loss and odier data from NDT results. The prestress loads were computed using conventional
methods. Embankment Load (EM)
Content Loads (CD
The content loads were based on the depth and density of contents and bentogrout. For Silo 4, the height of the contents was taken as 6 feet and die unit weight was the same as for Silo 2. The density and unit weights for Silos 1,2, and 3 were based on the OU-4 Treatability Study Report for Silos 1,2, and 3.
Wind Loads (WL)
Wind loads were based on wind velocity of 80 miles per hour based on Ohio Basic Building Code [18]. Wind pressures were based on using exposure C and the procedures of ASCE 7-93 [21]. Wind loads were applied for the free standing Silos 3 and 4 only. Wind hazard curve was taken from UCRL 53526 [17]. For Silos 1 and 2, with walls covered by soil berms the wind loads were not critical. Wind loads on the dome surface were based on ASCE paper No. 3269 [22].
Tornado winds and missile criteria were not applicable for NPH category PC-2 silo structures at FEMP per DOE STD-1020.
Earthquake Loads (EOK)
Earthquake loads were based on the general guidelines of DOE STD-1020. A static force method based on the Uniform Building Code [23] and site specific data was adequate for a PC-2 structure. However, for the earthquake analysis of the silo structures it was convenient to use the response spectrum and modal superposition methods. The site-specific response spectrum for the FEMP was taken from UCRL 53582. Peak ground acceleration value of 0.13 g for the FEMP was taken from DOE-STD-1020.
The ground acceleration values were input as digitized response spectrum curve of spectral acceleration "versus time period. The mass of contents was lumped at the wall nodes using approximate contributory masses. Trial runs were made on a crude full model to verify adequacy of the approximations made in die quarter model and associated boundary conditions. Vertical accelerations were taken as 2/3 of die horizontal accelerations. Directional components were combined using the Square Root of the Sum of the Squares (SRSS) meuiod.
Embankment loads were applied for Silos 1 and 2 only. The soil properties were based on site specific information from geotechnical report for me Pilot Plant [24]. The soil loading was applied as a triangular distributed load. Soil-structure interaction was not considered.
Temperature Loads (TL)
Temperature loads were not critical based on the results of trial runs assuming a uniform temperature differential of about ±30 degrees F.
LOADING COMBINATIONS
A number of loading combinations were considered to include the dead loads, live loads, wind loads, content loads, earthquake loads, and embankment loads (Silos 1 and 2).
For simplicity some loading combinations which were not critical were eliminated based on results obtained from trial runs. Loading combinations were also based on specific silo configurations.
Note: Dead Load (DL) includes Self Weight (SW) and Prestress Loads (PL).
The following load combinations were used for Silos 1 and 2: (EM1=26 ft., EM2=16 ft.).
1) DL + EMI 2) DL + LL + EMI 3) 0.75(DL + EQK + EMI) 4) DL + CL + EMI 5) DL + LL + CL + EMI 6) 0.75(DL + LL + CL + EQK + EMI) 7 ) DL + LL + CL + EM2 8) 0.75(DL + LL + CL + EQK + EM2)
The following load combinations were used for Silos 3 and 4:
1) DL 2) DL + LL 3) DL + WL 4) 0.75(DL + EQK) 5) DL + CL 6) DL + LL + CL 7) 0.75(DL + LL + CL + EQK) 8) 0.75(DL + LL + CL + WL)
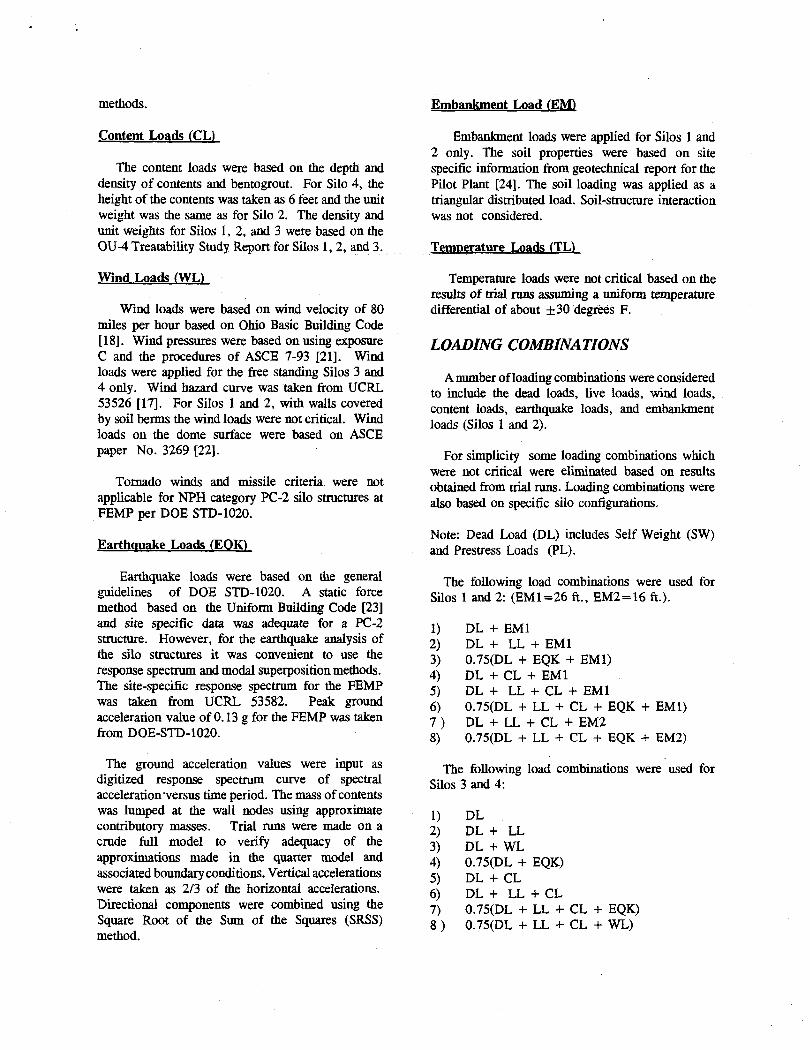
FINITE ELEMENT MODEL
A basic finite element model was first developed to represent a typical silo with appropriate boundary conditions, typical details applicable for all silos and common features including locations of manways.
The wall was assumed hinged at the base and fixed at the dome wall intersection.
Figure 3 shows the finite element model for a typical silo.
Due to the limitations of the quarter model, the silo structures and loadings were only approximately represented. Based on results obtained on a separate crude full model, the results from the quarter model were shown to be adequate for the evaluation of the silos for all the anticipated loadings.
The basic finite element models were then customized for each silo to include the unique element thicknesses and other properties based on the NDT results for concrete strengths, prestress data and concrete thicknesses.
2$° (TYP. ) - C-^£f * m m M )
1 2}° (TYP.) ( 1 . 7 6 ' )
Figure 3: Finite Element Model for a Typical Silo
Shell elements combining the membrane and plate behavior were used to model the silo structures. The plate bending behavior did not include any effects for shear deformations. The membrane behavior included translational in-plane stiffness components in the direction normal to the plane of the elements.
SAP90 [25], a PC-based general purpose finite element analysis computer software, was used for the analysis of Silos 1, 2, 3, and 4. The SAPIN graphics model generator was used in creating the model. SAPLOT graphics post processor was used for verification of input data and for evaluation of the computer solutions. Input data was verified for
loadings, node numbers, element axes, element properties, etc. The computer solutions reviewed included modal shapes, deformed shapes, and stress contours.
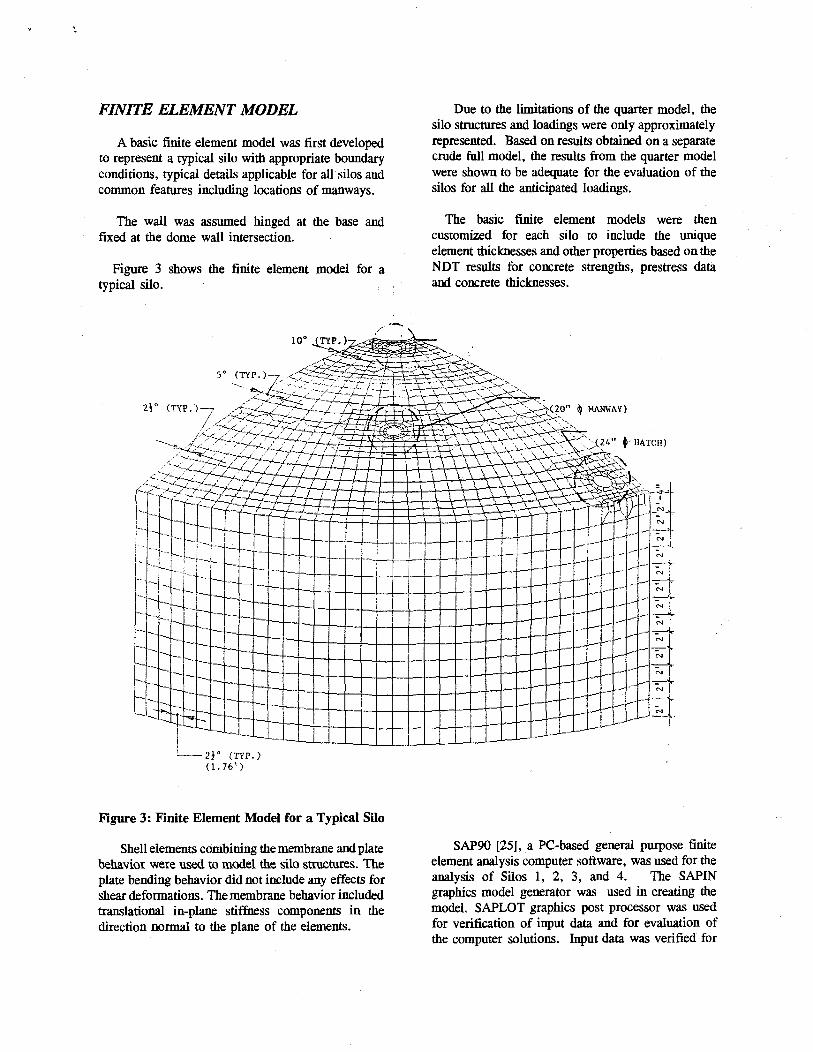
Figure 4 shows a typical detail of me finite element model near the dome-wall junction from SAPLOT.
Figure 4 : Typical Detail near Dome- Wall Junction.
ALLOWABLE STRESSES
Dome Buckling
Dome buckling stress was calculated using the elastic theory of dome shell stability based on ACI 344-W. This method accounts for creep, imperfections, material variability, cracking, and nonlinearity. The buckling stress was also calculated by a second method based on ACI SP 67 [26] . For the silo dome with a constant duckness of at least 2 1/2 inches, the calculated buckling stress was about 100 psf, well above the maximum anticipated loading.
Allowable Stresses In Concrete
The allowable stresses were based on the alternate design provisions of ACI 318 and ACI 344-W applicable for prestressed concrete shell structures of uiis type of construction. The allowable tensile stresses in me dome were based on plain concrete [27,28] to establish criteria for cracking in concrete.
The allowable limits for hoop stress, meridional stress and shear stress were established separately for die wall and the dome for compression and tension. The concrete strengdis, thicknesses and reinforcing data were based on NDT results for each silo.
Allowable Stresses in Reinforcement
The allowable stresses inrebars and welded wire mesh were taken as 24,000 psi based on the provisions of ACI 318 and yield strength of 40000 psi.
Allowable Stresses in Prestress Wires
The prestress wires are assumed to be field die-drawn wires corresponding to ASTM A821 or equal with specified tensile strength (fpu) of 218,000 psi.
Based on ACI 344-W the allowable stress for prestress wires was taken as 152,600 psi corresponding to 0.7 fpu.
EVALUATION OF RESULTS
Finite element solutions were obtained using customized finite element models for Silos 1, 2, 3, and 4 for all me different silo configurations and for all critical loading combinations using SAP90 computer software.
The meridional, hoop, and shear stresses were obtained for the dome and shell elements at the top and bottom surface for tension and compression for all elements.
The following stress components were evaluated:
SI IT; Hoop Stress at Top surface SUB: Hoop Stress at Bottom surface S22T: Meridional Stress at Top surface S22B: M e r i d i o n a l S t r e s s
at Bottom surface S12: Shear Stress component
The displacements were obtained in X, Y, and Z directions at all nodes.
Table 1 shows typical results for the meridional stress components in the wall for a typical silo. Similar results were obtained for the hoop and meridional stress components in the dome and wall for all silos for all loading combinations.
Due to numerous loading combinations and different silo configurations the task of evaluating the various stress components would have been formidable, if one had to sift through the voluminous results for all elements and nodes to determine critical areas of concern.
Load Combination Joint Number
Silo 3 : Meidional Stresses in Wall Load Combination Joint Number -S22T +S22T -S22B +S22B
LC-1 -108 -1.56 ^13.0 50.1
Jt. No 1333 1103 1147 1387
LC-2 -94 ^ .88 ^t0.5 49.4
Jt. No 1406- 1103 1036 1387
LC-3 -105 1.90 42.1 51.2
J t N o 1406 1103 1110 1386
LC-4 -72 -0.9 -31.9 37.8
Jt. No 1406 1103 1147 1387
LC-6 84 -1.74 -42.2 35.5
Jt. No 1406 1103 1147 1387
LC-7 -88 -5.1 -36 34.7
Jt. No 1406 1103 1184 1387
LC-8 -64 -3.57 -36.5 26.2
Jt .No 1406 1103 1147 1387
LC-9 -66 1.28 -31.4 27.2
Jt. No 1406 1103 1110 1386
SI IT - Hoop Stress top surface S22T - Meridional Stress top surface SI IB - Hoop Stress bottom surface S22B - Meridional Stress bottom surface
Notes: 1) Allowable stresses in concrete are based on concrete strengdi
from NDT results. 2) Joint number shown in second row of each load case indicates
approximate location where the marimnni stress occurs. 3) Maximum stresses were determined after viewing the stress contour
for each stress component.
Table 1: Maximum Stresses for a Typical Silo
However, the SAPLOT post processor was effective for a quick identification of critical areas of concern by observing the stress intensities of the
color stress contours. Color stress contour plots for each loading combination and for each stress component were viewed on the screen for obvious indications of high stress intensities throughout the silo structure. Based on these preliminary reviews of the color stress contours, specific areas were enlarged and exact elements and nodes were identified and results confirmed or further reviewed in detail.
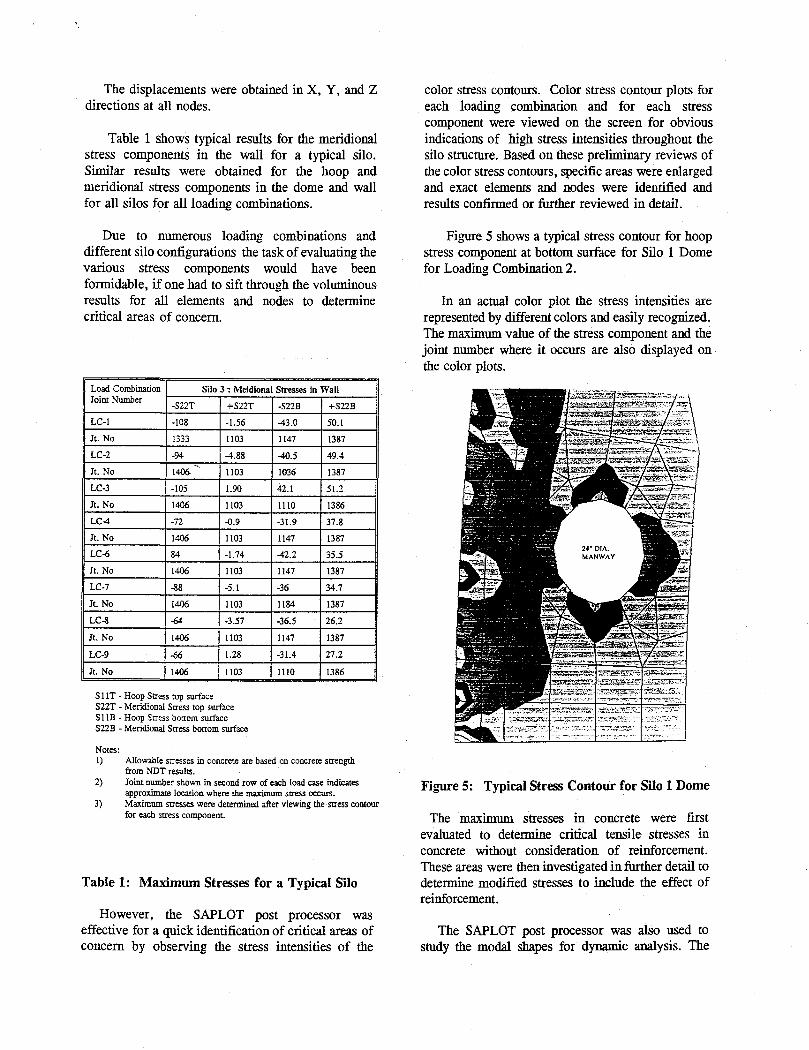
Figure 5 shows a typical stress contour for hoop stress component at bottom surface for Silo 1 Dome for Loading Combination 2.
In an actual color plot the stress intensities are represented by different colors and easily recognized. The maximum value of the stress component and the joint number where it occurs are also displayed on the color plots.
Figure 5: Typical Stress Contour for Silo 1 Dome
The maximum stresses in concrete were first evaluated to determine critical tensile stresses in concrete without consideration of reinforcement. These areas were then investigated in further detail to determine modified stresses to include the effect of reinforcement.
The SAPLOT post processor was also used to study the modal shapes for dynamic analysis. The
deformed shapes were also effective in determining the maximum displacements and to study the effect of specific loadings for specific silo configurations.
FINDINGS AND CONCLUSIONS
The following findings and conclusions are based on me NPH evaluations of the silo structures.
Maximum Stresses and Displacements
The hoop and meridional tensile stresses in concrete in the dome elements near the dome wall intersection and at interior points at the 24-inch diameter hatch were within the allowable tensile stress limits, with die reinforcement included at these locations. The hoop and meridional compressive stresses in the dome were within the allowable stresses in concrete. The shear stresses in the dome and walls were within allowable limits for all silo configurations and for all loading combinations.
The maximum displacements in the X, Y, and Z directions were less than 0.25 inches for all silos.
Effect of Enlarged Opening at Dome Center
For the silo configurations wim an enlarged opening at the center of die dome me maximum stresses were widiin the allowable stresses for Silos 1, 2, 3, and 4.
Effect of Removal Of Dome Cover
The effect of dome cover for Silos 1 and 2 was to increase the tensile stresses at die bottom surface of die domes where die dome cover was supported. Removal of die dome cover would help reduce die stresses at these locations.
Restrictions on Removal Of Contents
For load combinations corresponding to Silos 1 and 2 being empty with die embankment in place, die meridional tensile stresses in me walls exceeded me allowable stress by as much as 130 percent. For me same load combinations die hoop compressive stresses in the wall also exceeded me allowable compressive stress in concrete by about 6 percent.
Since mere is no metal diaphragm or additional vertical reinforcement in the silo walls to resist the meridional tensile stresses, loading restrictions were
placed to maintain relative depths of the silo contents and embankment heights widiin certain limits. Emptying die silos with full embankment in place was not allowed during retrieval operations.
Silos Empty Condition
When me silos were empty, the meridional tensile stresses in die inside face of die walls exceeded die allowable by about 5 percent. Since the walls have no vertical reinforcement on the inner face minor cracking was possible on the inside face of die walls, at the lower depdis, up to about 8 feet from die bottom of die silo wall. The minor cracking was not critical, especially when the silos are empty.
REFERENCES
[1] U.S. Department of Energy, Natural Phenomena Hazards Mitigation, DOE Order 5480.28, January 1993.
[2] U.S. Department of Energy, General Design Criteria, DOE Order 6430.1 A, April 1989.
[3] Camargo and Associates (1986), K-65 Silos Study and Evaluation Report.
[4] Camargo and Associates (1986), Metal Oxide and Empty Silo Study and Evaluation Report.
[5] Camargo and Associates (1989), Study and Evaluation, Internal Attenuation Layer Effects on K-65 Silos.
[6] Bechtel, 1990. Study and Evaluation of K-65 Silos for die Feed Materials Production Center at Fernald, Ohio.
[7] University of Cincinnati, A Probabilistic Risk Assessment for die K-65 Silos at die FMPC, College of Engineering Report, FMPC/SUB-029 (1990).
[8] Sandia (1991). Review of die K-65 Silo Studies for the Feed Materials Production Center at Fernald, Ohio.
[9] PARSONS, Preliminary Safety Analysis Report for Operable Unit 4 (1994).
[10] U.S. Department of Energy, Nuclear Safety Analysis Reports, DOE Order 5480.23, April
1992. 3269.
[11] U.S. Department of Energy, Natural Phenomena Hazards Performance Categorization Guidelines for Structures, Systems and Components, DOE-STD-1021, July, 1993.
[12] U.S, Department of Energy, Natural Phenomena Hazards Design and Evaluation Criteria for Department of Energy Facilities, DOE-STD-1020, April 1994.
[13] U.S. Department of Energy, Guidelines for the use of Probabilistic Seismic Hazard Curves at Department of Energy Sites, DOE-STD-1024, December 1992.
[14] Coats, D.W., and R.C. Murray (1984), Natural Phenomena Hazard Modeling Project: Seismic Hazard Models for Department of Energy Sites, LLNL Report UCRL-53582, Rev.l.
[15] Coats, D.W., and R.C. Murray (1984), Natural Phenomena Hazard Modeling Project: Extreme Wind/Tornado Hazard Models for Department of Energy Sites, LLNL Report UCRL-53526, Rev.l.
[16] Ohio Basic Building Code, 1991.
[ 17] American Concrete Institute (1989), Building Requirements for Reinforced Concrete with Commentary, ACI 318-89.
[18] American Concrete Institute (ACI 1988), Design and Construction of Circular Wire and Strand Wrapped Prestressed Concrete Structures, ACI 344-W.
[19] PARSONS Silo Testing Plan.
[20] Muenow and Associates, Inc. ,Non Destructive Testing of Silos 1, 2, 3, and 4 at the FEMP (1993).
[21] American Society of Civil Engineers, Minimum Design Loads for Buildings and Other Structures, ASCE 7-88 (ANSI A58.1).
[22] American Society of Civil Engineers, (1972). Wind Forces on Structures, ASCE Paper No.
[23] Uniform Building Code, 1991. UBC 91.
[24] H.C. Nutting, 1993. Report of Geotechnical Investigation Surrounding Silos 1-4, Pilot PlantVitrification Facility, Fernald, Ohio.
[25] SAP90. Wilson, Edward L. and Ashraf Habibullah. A Series of Computer Programs for the Finite Element Analysis of Structures, Computers and Structures, Inc.
[26] American Concrete Institute (1981), Concrete Shell Buckling - ACI SP-67.
[27] American Concrete Institute (ACI 1989), Building Code Requirements for Structural Plain Concrete, ACI318.1.
[28] Nawy, E.G., Prestressed Concrete - A Fundamental Approach (1989).
Top Related
Copyright © 2022 FDOKUMEN

