


Bahasa
Halaman
Hukum

sustainability
Article
Integrating Sustainability and Lean: SLIM Methodand Enterprise Game Proposed
Ilie Mihai Tăucean , Matei Tămăs, ilă *, Larisa Ivascu * , S, erban Miclea and Mircea Negrut,
Department of Management, Faculty of Management in Production and Transportation, Politehnica Universityof Timisoara, via Victoria Square No. 2, 300006 Timisoara, Romania; [email protected] (I.M.T.);[email protected] (S, .M.); [email protected] (M.N.)* Correspondence: [email protected] (M.T.); [email protected] (L.I.)
Received: 31 December 2018; Accepted: 28 March 2019; Published: 9 April 2019�����������������
Abstract: Sustainability and leanness are organizational approach concepts for more efficient activitiesand increased competitiveness. This paper presents a study and an application of the concepts ofsustainability and lean, with the purpose to capitalize on the benefits of the two concepts’ toolswhen used together in an industry and education activity. A literature review was carried out toevaluate qualitatively and empirically the concepts of sustainability, lean, and enterprise games,and the possibility to integrate the first two concepts into a new tool applied into an enterprisegame. An online survey was done to identify which tools are used within companies in the region,how and what training methods they used, and what the reported benefits are. The survey resultswere used to design a new tool integrated in a new enterprise game (SLIM) developed by theauthors. The game was tested and validated in educational laboratory with students and actualemployees from companies. The game follows the frame of an enterprise game, considering thesimulation of enterprise classical functions. The game’s purpose is to improve the activity insuccessive rounds. A scorecard is used to fill in and compute the key performance indicators(KPIs), and a new indicator is proposed (SLIMx). Applications of the instrument/game include:students’ training in an educational laboratory; lifelong learning; professional training in companies;and professional perfection/reconversion of potential employees and the unemployed. The SLIMgame was simulated in a team of 15 players over three rounds, with teachers playing the role of thesupervisor. A number of possible improvements have been identified. The next step is testing it inenterprises with various fields of activity. SLIM has proven to be an effective solution to improveorganizational efficiency and motivate players to gain new knowledge.
Keywords: waste management; efficiency; quality; game; sustainable development; lean production;process improvement; production flexibility
1. Introduction
Currently, there are a number of management approaches that contribute to increasingcompetitiveness and business development capacity. Some businesses are targeting environmentalpractices to improve process activities and improve public image. Many businesses are concernedabout the tools, methods, and techniques that help streamline process resource utilization. Mostare involved in corporate social responsibility activities to improve their public image. TheseCSR activities are complementary to processes streamlining actions. Sustainability is addressedin many companies [1–3]. The three dimensions of sustainability are addressed: social, economic, andenvironmental. Some organizations address cumulatively the three responsibilities, others partially.Involvement in sustainable development is not mandatory at the national or international level.Sustainability reporting is also optional [4], but many businesses report their sustainability to improve
Sustainability 2019, 11, 2103; doi:10.3390/su11072103 www.mdpi.com/journal/sustainability
Sustainability 2019, 11, 2103 2 of 28
their impact on stakeholders. From a production efficiency perspective, lean manufacturing orlean production, often simply “lean”, involves reducing the amount of waste without minimizingproduction capacity [5]. These goals can be achieved by using less resources to generate the sameresult. Operations management plays an important role in delivering positive results. The interactionbetween lean and sustainability is addressed in specialized literature, highlighting the benefits of theintegrated use of the two concepts [2–6]. The approach of the two concepts, lean production andsustainability, within enterprises can contribute to increasing the competitiveness, capacity to develop,and make more efficient use of organizational resources (human, financial, informational, and materialresources) [5–8].
In 2017, Cherrafi et al. stated that there was no study showing the relationship betweensustainability and lean. Prior to 2012, most studies presented that sustainability and lean benefitswere particularly limited to environmental responsibility [6–8]. After 2012, research into the integratedapproach of the two concepts began to intensify [5].
The structure of the paper is as follows: a literature review of the concepts of sustainability,lean, and enterprise games, methods, and industry needs research using a questionnaire is conducted;followed by a presentation (introduction) of a new instrument; and a new enterprise game is developedby the authors (which integrates sustainability and lean concepts to address industry needs).
The objective of the paper is to introduce a new enterprise game and indicator developed by theauthors following the research in the interdisciplinary domain related to two concepts: sustainabilityand lean. These two concepts are considered here together, and integrated with similarities andcomplementarities which should lead to improvement in companies’ competitiveness.
2. Introducing Concepts of Lean and Sustainability with Enterprise Games
2.1. The Implication of Sustainability
From the perspective of enterprises, their actions on increasing competitiveness and makingproduction more efficient have become necessary and mandatory. The urgency to get involvedin environmental protection, sustaining society, and improving economic performance (the triplebaseline—TBL) was mainly due to the fact that companies began to feel more pressure fromstakeholders than ever [8–11]. Long-term organizational survival conditions have changed so thatsocial and environmental performance aspects in addition to financial excellence are included [12].They, therefore, sought to respect the widespread recognition of voluntary and imposed regulations,actions and standards developed by national and global authorities such as: International StandardsOrganization (ISO): ISO 14000 series—Environmental Protection Oriented, ISO 9000 series—QualityOriented, ISO 45000 series—Health and Safety Oriented, ISO 27000 series—Information SecurityOriented, Occupational Safety and Health Administration (OSHA); Occupational Safety and HealthAdministration (OSHA): Occupational Safety and Health Act of 1970—Safety and Health Oriented;British Standards Institution (BSI): OHSAS 18000 series—Health and Safety Oriented; US EnvironmentProtection Agency (EPA); Lean and Environment Toolkit—Environment Protection Oriented; Lean,Energy and Climate Toolkit—Environment Protection and Resource Preservation Oriented; EuropeanUnion (EU) Standards: Eco-Management and Audit Scheme (EMAS)—Environment ProtectionOriented, Health and Safety at Work Act, 7 Waste; Life Cycle Sustainability Assessment—LCSA;Resource Efficient and Cleaner Production-RECP and other [3–11].
Sustainable development targets 17 principles and 169 targets. The 17 Sustainable DevelopmentGoals (17 SDGs) are accompanied by 169 specific targets and are part of the strategic document calledthe “2030 Agenda for Sustainable Development”. The implications of the 17 SDGs are presented inTable 1.
Sustainability 2019, 11, 2103 3 of 28
Table 1. Short description of the 17 Sustainable Development Goals.
Goal Short Description
SDG 1 Eradicate poverty in all its formsSDG 2 Food safety and sustainable agricultureSDG 3 Healthy life at all agesSDG 4 Lifelong learningSDG 5 Equality between women and menSDG 6 Sustainable water management and sanitation for allSDG 7 Affordable prices and sustainable resourcesSDG 8 Promoting economic growth, productive and decent workSDG 9 Promoting industrialization and stimulating innovation
SDG 10 Reducing inequalities between countriesSDG 11 Developing secure living environmentsSDG 12 Sustainable consumption and efficient productionSDG 13 Urgent action to combat climate changeSDG 14 Sustainable use of marine resourcesSDG 15 Restoration of terrestrial ecosystemsSDG 16 Responsibility of society and equity of institutional levelsSDG 17 Partnerships for the goals
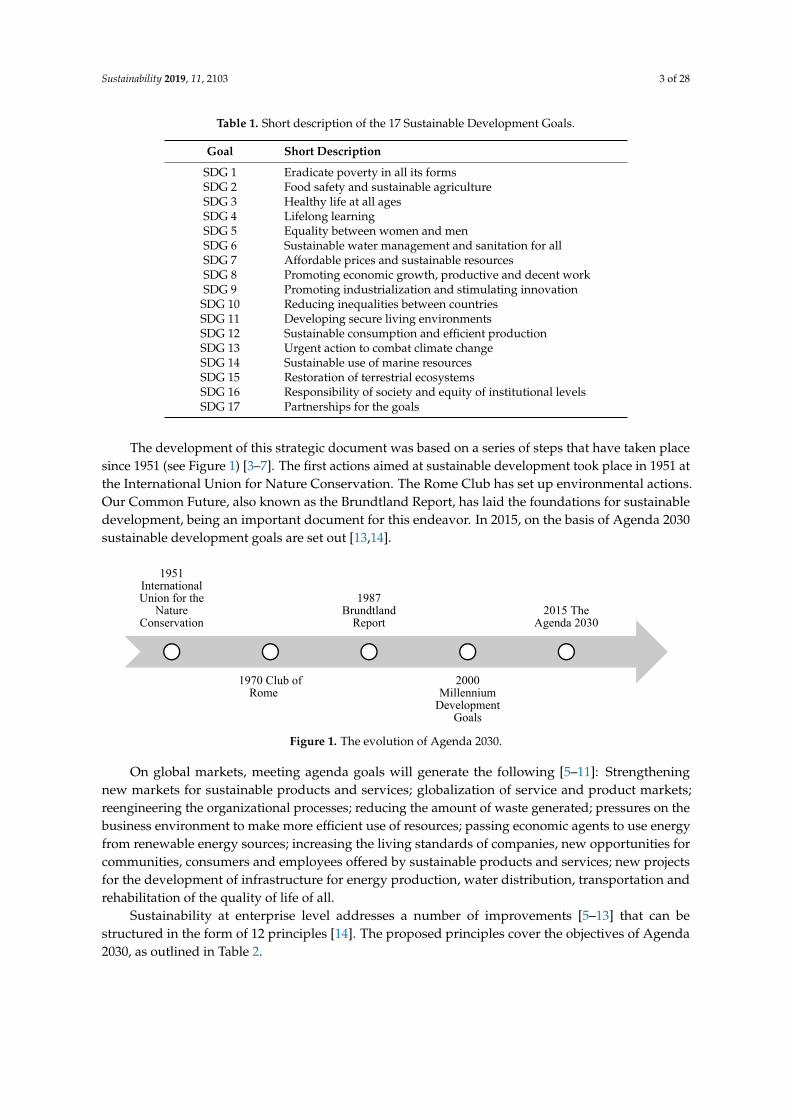
The development of this strategic document was based on a series of steps that have taken placesince 1951 (see Figure 1) [3–7]. The first actions aimed at sustainable development took place in 1951 atthe International Union for Nature Conservation. The Rome Club has set up environmental actions.Our Common Future, also known as the Brundtland Report, has laid the foundations for sustainabledevelopment, being an important document for this endeavor. In 2015, on the basis of Agenda 2030sustainable development goals are set out [13,14].
Sustainability 2019, 11, x FOR PEER REVIEW 3 of 27
Table 1. Short description of the 17 Sustainable Development Goals.
Goal Short Description SDG 1 Eradicate poverty in all its forms SDG 2 Food safety and sustainable agriculture SDG 3 Healthy life at all ages SDG 4 Lifelong learning SDG 5 Equality between women and men SDG 6 Sustainable water management and sanitation for all SDG 7 Affordable prices and sustainable resources SDG 8 Promoting economic growth, productive and decent work SDG 9 Promoting industrialization and stimulating innovation SDG 10 Reducing inequalities between countries SDG 11 Developing secure living environments SDG 12 Sustainable consumption and efficient production SDG 13 Urgent action to combat climate change SDG 14 Sustainable use of marine resources SDG 15 Restoration of terrestrial ecosystems SDG 16 Responsibility of society and equity of institutional levels SDG 17 Partnerships for the goals
The development of this strategic document was based on a series of steps that have taken place since 1951 (see Figure 1) [3–7]. The first actions aimed at sustainable development took place in 1951 at the International Union for Nature Conservation. The Rome Club has set up environmental actions. Our Common Future, also known as the Brundtland Report, has laid the foundations for sustainable development, being an important document for this endeavor. In 2015, on the basis of Agenda 2030 sustainable development goals are set out [13,14].
Figure 1. The evolution of Agenda 2030.
On global markets, meeting agenda goals will generate the following [5–11]: Strengthening new markets for sustainable products and services; globalization of service and product markets; reengineering the organizational processes; reducing the amount of waste generated; pressures on the business environment to make more efficient use of resources; passing economic agents to use energy from renewable energy sources; increasing the living standards of companies, new opportunities for communities, consumers and employees offered by sustainable products and services; new projects for the development of infrastructure for energy production, water distribution, transportation and rehabilitation of the quality of life of all.
Sustainability at enterprise level addresses a number of improvements [5–13] that can be structured in the form of 12 principles [14]. The proposed principles cover the objectives of Agenda 2030, as outlined in Table 2.
1951International Union for the
Nature Conservation
1970 Club of Rome
1987Brundtland
Report
2000Millennium
Development Goals
2015 The Agenda 2030
Figure 1. The evolution of Agenda 2030.
On global markets, meeting agenda goals will generate the following [5–11]: Strengtheningnew markets for sustainable products and services; globalization of service and product markets;reengineering the organizational processes; reducing the amount of waste generated; pressures on thebusiness environment to make more efficient use of resources; passing economic agents to use energyfrom renewable energy sources; increasing the living standards of companies, new opportunities forcommunities, consumers and employees offered by sustainable products and services; new projectsfor the development of infrastructure for energy production, water distribution, transportation andrehabilitation of the quality of life of all.
Sustainability at enterprise level addresses a number of improvements [5–13] that can bestructured in the form of 12 principles [14]. The proposed principles cover the objectives of Agenda2030, as outlined in Table 2.
Sustainability 2019, 11, 2103 4 of 28
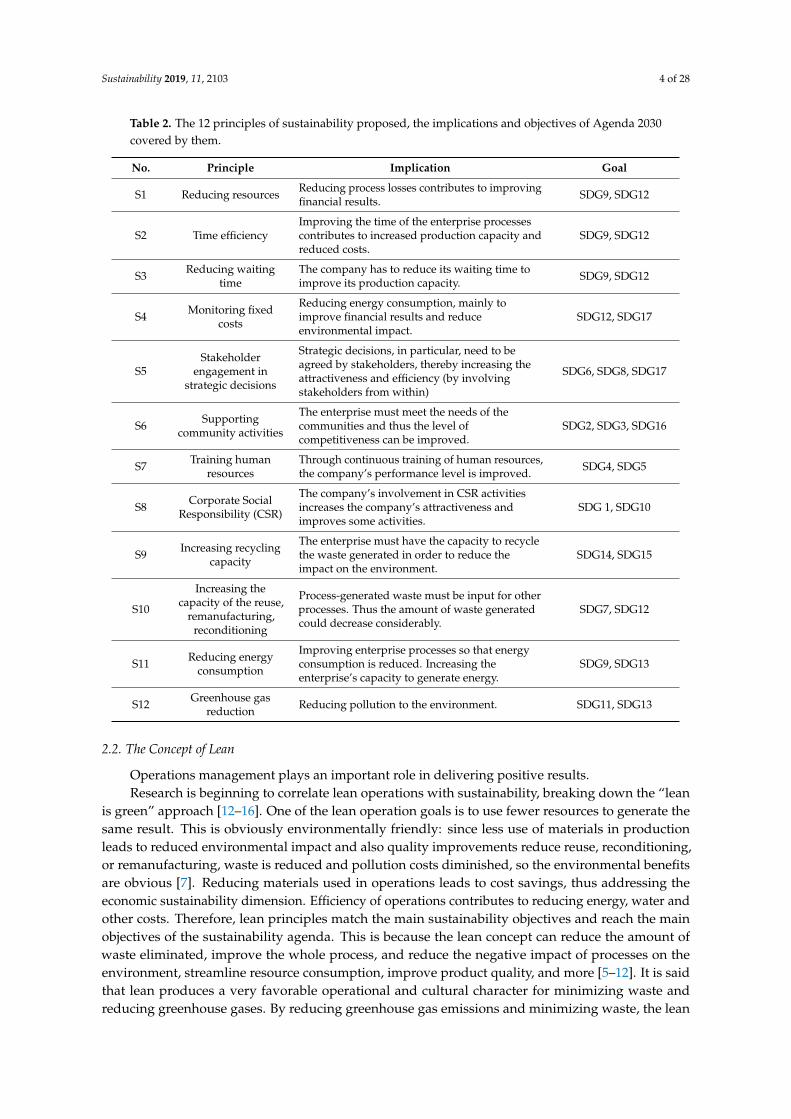
Table 2. The 12 principles of sustainability proposed, the implications and objectives of Agenda 2030covered by them.
No. Principle Implication Goal
S1 Reducing resources Reducing process losses contributes to improvingfinancial results. SDG9, SDG12
S2 Time efficiencyImproving the time of the enterprise processescontributes to increased production capacity andreduced costs.
SDG9, SDG12
S3 Reducing waitingtime
The company has to reduce its waiting time toimprove its production capacity. SDG9, SDG12
S4 Monitoring fixedcosts
Reducing energy consumption, mainly toimprove financial results and reduceenvironmental impact.
SDG12, SDG17
S5Stakeholder
engagement instrategic decisions
Strategic decisions, in particular, need to beagreed by stakeholders, thereby increasing theattractiveness and efficiency (by involvingstakeholders from within)
SDG6, SDG8, SDG17
S6 Supportingcommunity activities
The enterprise must meet the needs of thecommunities and thus the level ofcompetitiveness can be improved.
SDG2, SDG3, SDG16
S7 Training humanresources
Through continuous training of human resources,the company’s performance level is improved. SDG4, SDG5
S8 Corporate SocialResponsibility (CSR)
The company’s involvement in CSR activitiesincreases the company’s attractiveness andimproves some activities.
SDG 1, SDG10
S9 Increasing recyclingcapacity
The enterprise must have the capacity to recyclethe waste generated in order to reduce theimpact on the environment.
SDG14, SDG15
S10
Increasing thecapacity of the reuse,
remanufacturing,reconditioning
Process-generated waste must be input for otherprocesses. Thus the amount of waste generatedcould decrease considerably.
SDG7, SDG12
S11 Reducing energyconsumption
Improving enterprise processes so that energyconsumption is reduced. Increasing theenterprise’s capacity to generate energy.
SDG9, SDG13
S12 Greenhouse gasreduction Reducing pollution to the environment. SDG11, SDG13
2.2. The Concept of Lean
Operations management plays an important role in delivering positive results.Research is beginning to correlate lean operations with sustainability, breaking down the “lean
is green” approach [12–16]. One of the lean operation goals is to use fewer resources to generate thesame result. This is obviously environmentally friendly: since less use of materials in productionleads to reduced environmental impact and also quality improvements reduce reuse, reconditioning,or remanufacturing, waste is reduced and pollution costs diminished, so the environmental benefitsare obvious [7]. Reducing materials used in operations leads to cost savings, thus addressing theeconomic sustainability dimension. Efficiency of operations contributes to reducing energy, water andother costs. Therefore, lean principles match the main sustainability objectives and reach the mainobjectives of the sustainability agenda. This is because the lean concept can reduce the amount ofwaste eliminated, improve the whole process, and reduce the negative impact of processes on theenvironment, streamline resource consumption, improve product quality, and more [5–12]. It is saidthat lean produces a very favorable operational and cultural character for minimizing waste andreducing greenhouse gases. By reducing greenhouse gas emissions and minimizing waste, the lean
Sustainability 2019, 11, 2103 5 of 28
concept promotes sustainability in business processes [12–14]. Among the most used tools lean forsustainability purposes were identified to be Value Stream Mapping (VSM), 5S, Kaizen, Just-In-Time(JIT), Cellular Manufacturing, Single Minute Exchange of Dies (SMED), Standardized Work, andTotal Preventive Maintenance (TPM), Plan-Do-Check-Act (PDCA), and Problem Solving. Other leantools, methods, and techniques that have a potential contribution to sustainable development are:Sort-Set In order-Shine-Standardize-Sustain (5S), Six Sigma, Jidoka, Gemba Walk, Kaikaku, Shop FloorManagement (SFM), Bottleneck Analysis, and others [5–8,15]. Lean manufacturing leads to a series ofimprovements [7–12,14–16], in the short- and long-term, at the level of the enterprises, as follows:
• Improving quality—a considerable part of lean environment activities is directed to improvingthe quality of operations.
• Improved visual management—an improved visual scan helps to increase time for operations.• Increased efficiency—standardized activities contribute to increasing resource efficiency.• Manpower reductions—if emphasis is placed on standardized work and increased efficiency, the
ability to perform operations with fewer people becomes a very real possibility.• Easier to manage—standardization activities and increased operations efficiency contribute to the
development of an easy-to-manage environment.• Problem elimination—lean principles force the investigation of the identified problem until it
is eliminated.• Redundant space—streamlining raw material consumption, waste reduction and standardized
work contributes to reducing the space used (stocks no longer occupy a lot of space vertically andhorizontally).
• Safer work environment—unnecessary things taken from current operations contribute toconducting an organized job (example 5S technique).
• Improved employee morale—if the lean concept implementation is accepted by employees, therewill be a decrease in the stress level and employee morale will improve.
2.3. The Relation between Lean and Sustainability Indices
Between lean and sustainability there is a relationship and interaction that contributes toincreasing competitiveness and making production more efficient [8–16]. In vision [7] it is statedthat lean represents the holistic vision of sustainability and streamlines processes in terms ofcosts, time, waste, and quality. This approach covers part of the sustainability objectives (SDG9,SDG12, SDG13) taking into account the quality of the environment, social equity, and the economy.In another approach [9], it takes into account the principles of sustainability, focusing on environmentalprotection, re-use of waste, and reducing greenhouse gas emissions. Cherrafi et al. asserts thatsustainable development is indispensable in the lean approach, as reducing energy consumption,reducing environmental pollution, and streamlining material consumption cover the principles ofsustainability [8]. The implications of sustainability are found in the operational part of lean production.Studies conducted to research the relationship between leanness and sustainability [1–14] show that theapplication of lean concepts and sustainability shows a number of similarities and complementarities.By applying these two concepts, businesses could achieve increased performance [14–16]. Followingthe evaluation of the specialized literature and the implications of the lean concept, 12 principles areproposed, presented in Table 3.
Sustainability 2019, 11, 2103 6 of 28
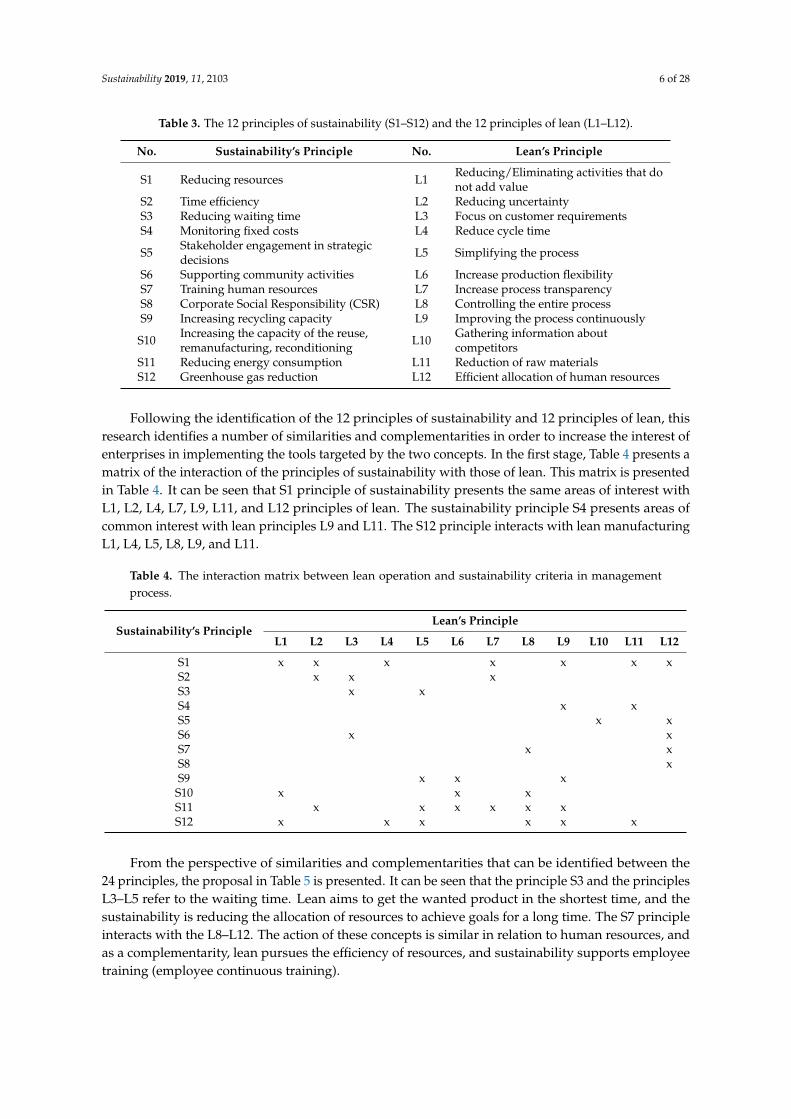
Table 3. The 12 principles of sustainability (S1–S12) and the 12 principles of lean (L1–L12).
No. Sustainability’s Principle No. Lean’s Principle
S1 Reducing resources L1 Reducing/Eliminating activities that donot add value
S2 Time efficiency L2 Reducing uncertaintyS3 Reducing waiting time L3 Focus on customer requirementsS4 Monitoring fixed costs L4 Reduce cycle time
S5 Stakeholder engagement in strategicdecisions L5 Simplifying the process
S6 Supporting community activities L6 Increase production flexibilityS7 Training human resources L7 Increase process transparencyS8 Corporate Social Responsibility (CSR) L8 Controlling the entire processS9 Increasing recycling capacity L9 Improving the process continuously
S10 Increasing the capacity of the reuse,remanufacturing, reconditioning L10 Gathering information about
competitorsS11 Reducing energy consumption L11 Reduction of raw materialsS12 Greenhouse gas reduction L12 Efficient allocation of human resources
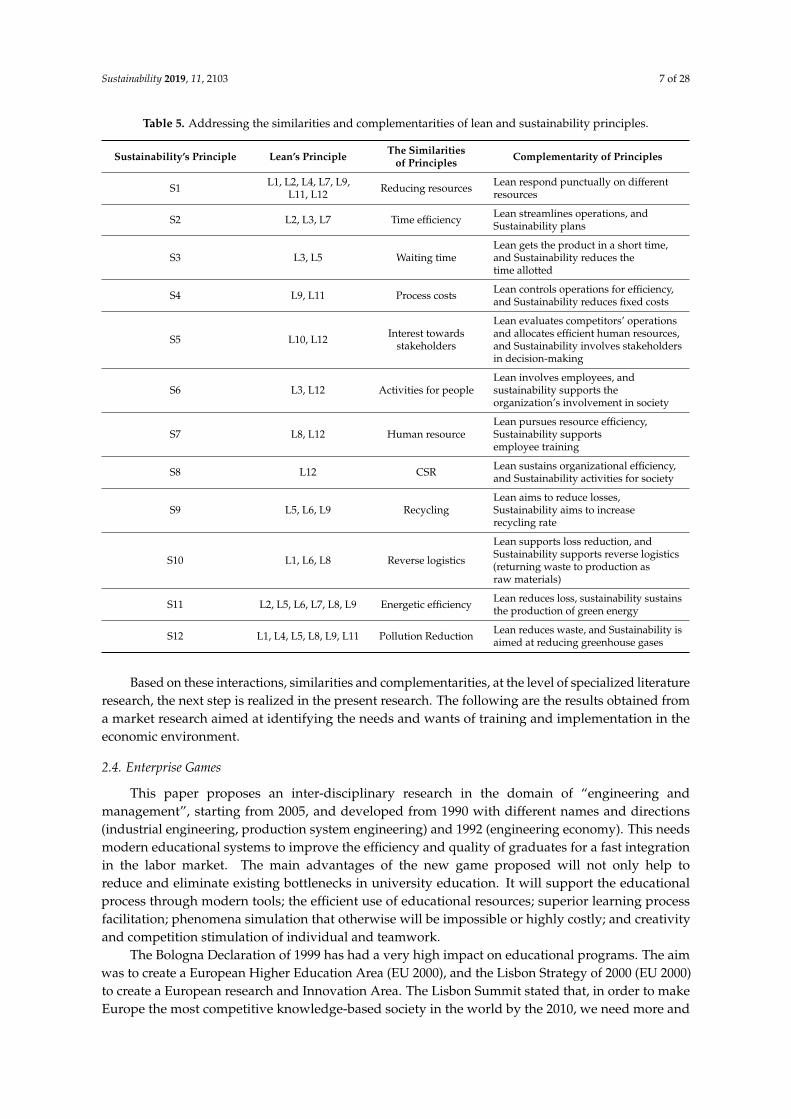
Following the identification of the 12 principles of sustainability and 12 principles of lean, thisresearch identifies a number of similarities and complementarities in order to increase the interest ofenterprises in implementing the tools targeted by the two concepts. In the first stage, Table 4 presents amatrix of the interaction of the principles of sustainability with those of lean. This matrix is presentedin Table 4. It can be seen that S1 principle of sustainability presents the same areas of interest withL1, L2, L4, L7, L9, L11, and L12 principles of lean. The sustainability principle S4 presents areas ofcommon interest with lean principles L9 and L11. The S12 principle interacts with lean manufacturingL1, L4, L5, L8, L9, and L11.
Table 4. The interaction matrix between lean operation and sustainability criteria in managementprocess.
Sustainability’s PrincipleLean’s Principle
L1 L2 L3 L4 L5 L6 L7 L8 L9 L10 L11 L12
S1 x x x x x x xS2 x x xS3 x xS4 x xS5 x xS6 x xS7 x xS8 xS9 x x xS10 x x xS11 x x x x x xS12 x x x x x x
From the perspective of similarities and complementarities that can be identified between the24 principles, the proposal in Table 5 is presented. It can be seen that the principle S3 and the principlesL3–L5 refer to the waiting time. Lean aims to get the wanted product in the shortest time, and thesustainability is reducing the allocation of resources to achieve goals for a long time. The S7 principleinteracts with the L8–L12. The action of these concepts is similar in relation to human resources, andas a complementarity, lean pursues the efficiency of resources, and sustainability supports employeetraining (employee continuous training).
Sustainability 2019, 11, 2103 7 of 28
Table 5. Addressing the similarities and complementarities of lean and sustainability principles.
Sustainability’s Principle Lean’s Principle The Similaritiesof Principles Complementarity of Principles
S1 L1, L2, L4, L7, L9,L11, L12 Reducing resources Lean respond punctually on different
resources
S2 L2, L3, L7 Time efficiency Lean streamlines operations, andSustainability plans
S3 L3, L5 Waiting timeLean gets the product in a short time,and Sustainability reduces thetime allotted
S4 L9, L11 Process costs Lean controls operations for efficiency,and Sustainability reduces fixed costs
S5 L10, L12 Interest towardsstakeholders
Lean evaluates competitors’ operationsand allocates efficient human resources,and Sustainability involves stakeholdersin decision-making
S6 L3, L12 Activities for peopleLean involves employees, andsustainability supports theorganization’s involvement in society
S7 L8, L12 Human resourceLean pursues resource efficiency,Sustainability supportsemployee training
S8 L12 CSR Lean sustains organizational efficiency,and Sustainability activities for society
S9 L5, L6, L9 RecyclingLean aims to reduce losses,Sustainability aims to increaserecycling rate
S10 L1, L6, L8 Reverse logistics
Lean supports loss reduction, andSustainability supports reverse logistics(returning waste to production asraw materials)
S11 L2, L5, L6, L7, L8, L9 Energetic efficiency Lean reduces loss, sustainability sustainsthe production of green energy
S12 L1, L4, L5, L8, L9, L11 Pollution Reduction Lean reduces waste, and Sustainability isaimed at reducing greenhouse gases
Based on these interactions, similarities and complementarities, at the level of specialized literatureresearch, the next step is realized in the present research. The following are the results obtained froma market research aimed at identifying the needs and wants of training and implementation in theeconomic environment.
2.4. Enterprise Games
This paper proposes an inter-disciplinary research in the domain of “engineering andmanagement”, starting from 2005, and developed from 1990 with different names and directions(industrial engineering, production system engineering) and 1992 (engineering economy). This needsmodern educational systems to improve the efficiency and quality of graduates for a fast integrationin the labor market. The main advantages of the new game proposed will not only help toreduce and eliminate existing bottlenecks in university education. It will support the educationalprocess through modern tools; the efficient use of educational resources; superior learning processfacilitation; phenomena simulation that otherwise will be impossible or highly costly; and creativityand competition stimulation of individual and teamwork.
The Bologna Declaration of 1999 has had a very high impact on educational programs. The aimwas to create a European Higher Education Area (EU 2000), and the Lisbon Strategy of 2000 (EU 2000)to create a European research and Innovation Area. The Lisbon Summit stated that, in order to makeEurope the most competitive knowledge-based society in the world by the 2010, we need more and
Sustainability 2019, 11, 2103 8 of 28
better trained researchers (EU 2000). By the end of 2010, most of the goals of the Lisbon Strategy werenot met. Official appraisal of the Lisbon Strategy took place in 2010 at a European Summit, where thenew “Europe 2020” strategy was also launched. It aims at “smart, sustainable, inclusive growth” withgreater coordination of national and European policy (EU 2010). The strategy promotes modernizingeducation and training. Quantitative targets are proposed, including increasing the employment rate toat least 75% from the current 69% and boosting spending on research and development to 3% of grossdomestic product—it is currently only 2% of GDP, significantly less than in the US and Japan [15–17].
One of the most efficient ways to learn by experience in management and engineering (in initialtraining, in universities and business schools, as well in continuous training in enterprises whereemployee work) is the use of enterprise games. Enterprise games where developed from the wargame model of training, by simulating conflict situations and by applying efficient war strategies.The first one was realized by the American Management Association in 1950 [18,19]. Later, manyuniversities on business administration introduced games in university curricula, and some companies(IBM, General Electric) elaborate their own games which were used in training managers or to supportstrategic decisions (especially investments decisions) [20]. With games, an organization can shift froman outmoded top-down hierarchy to an agile network structure that promotes coordination overcontrol. Industrial Age business structures from the 20th century no longer work. It is necessary todesign real-time business collaboration systems, using massively multiplayer game concepts, makingin-house systems more agile [18].
Simulation of production processes is a less common (usually simulation is about informationflows) and is usually harder than other enterprise departments because of the differences in eachtype of production system (even in the same domain, with the same products) and the multitude ofactivities category and different procedures/algorithms. Benchmarking analysis will lead to improvedacademic organization structure, of educational options for students (new study plans for licenseand master levels, new directions of research at the doctoral level, improvement of existing ones andcorrelation of them), will ensure a better students and graduates training to cope with labor marketchallenges, and will lead to better trainer quality by using new/innovating training tools [15–21].
In Romania, the educational system was pushed towards using games (simulation games,enterprise games, management/business games, practice enterprise), integrated in teaching activities,by necessity from the 1990s [21–23]. The necessity of students’ training in the same conditions as infuture workplaces, with minimum costs, was implemented in universities and high school educationthrough practice enterprise tools, in which we have identical activities as in real enterprises, usingthe same procedures and benefits from the same structure [24]. There is a European network wherepractice firms can affiliate, entitled the European Practice Enterprises Network (EUROPEN), foundedin 1997. The practice firms in the domain of Engineering and Management has existed in Romaniafrom 2001.
Additionally, many games were used and are used today in universities for teaching and learning,developed outside Romania (e.g., INNOV8 [25]) or in Romania (e.g., TOPSIM, CEFE [26], CORAV [27],“Simulation enterprise” [28], PRELEM XXI [29], and “Decision in cascade” [30]). Considering all ofthese, the authors can consider that educational system of Romania is adequate enough to ease theimplementation of games in the teaching activities, such as the one proposed in the paper. The newgame was developed by the authors within a project framework especially to be used in an educationallaboratory for student teaching. The approval of this project to be implemented in the universityalso explains the policy-makers’ implications of the new methods and instruments to be used inuniversity education.
3. Methods
For each part of the paper we use specific methods.In the first part we conducted a literature review to evaluate qualitatively and empirically the
concepts of sustainability, lean, and enterprise games, and the possibility to integrate the first two
Sustainability 2019, 11, 2103 9 of 28
concepts into a new instrument applied into a new enterprise game. The authors have identified anumber of improvements that develop a sustainable development into an enterprise. The number ofimprovements we have structured in the form of 12 principles (S1–S12, Table 2). Then, the authorsidentified a number of improvements made by the lean concept. We have structured the numberof improvements in the form of 12 principles (L1–L12, Table 3). Following the identification of the12 principles of sustainability and 12 principles of lean, the authors identify a number of similarities andcomplementarities in order to increase the interest of enterprises in implementing the tools targeted bythe two concepts (Table 4). The similarities and complementarities are included in the market research(online survey), and then in the new algorithm of the new game developed by the authors.
Using an online survey, we collected data regarding the needs to use “lean” and “sustainability”tools within companies in our region. The survey contained a total of 14 questions, out of which10 structured question with predetermined response options (dichotomic answers, multiple answersand a five-point Likert scale), while the rest of them were structured for open response options.The purpose of the survey was to identify which tools of “lean” and “sustainability” concepts are usedwithin the companies, how and what training tools they used, which are the reported benefits of usingthe tools, and if the companies create an annual sustainability report.
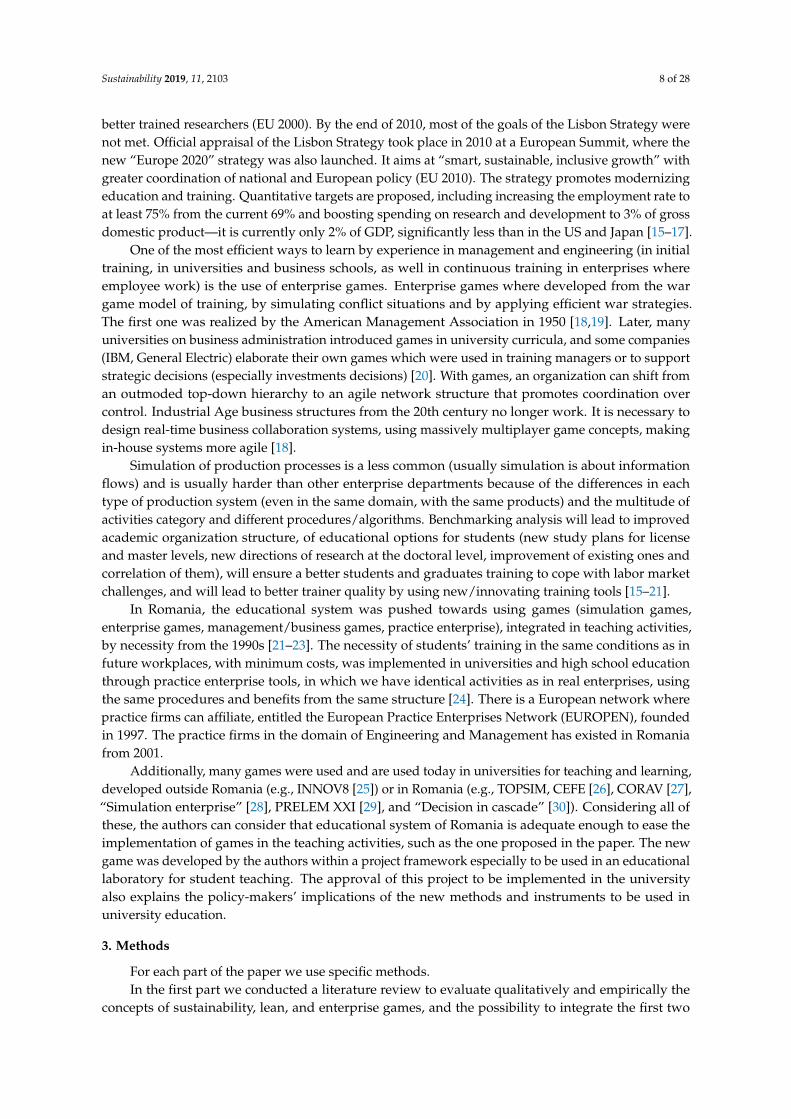
Addressing the sustainability and lean concepts is very important for organizationalcompetitiveness. A number of important directions have been identified through this online survey.Based on the “Interaction matrix between lean operation and sustainability criteria in the managementprocess (Table 4)”, and the results of the online market research, the authors developed a newgame. Our approach, based on an enterprise game, proposes a number of improvements to theenterprise’s issues. In Figure 2 are presented the enterprise architecture (EA) issues. There are severalEAs, as follows: EA developed by Sparx Systems in Australia, BIZZdesign developed by IBM inNetherland, PowerDesigner developed by Novalys in France, ArchiMate developed by team from theTelematica Instituut in cooperation with Dutch partners from government, industry and academiain the Netherlands. We used ArchiMate® to build the enterprise architecture. This is one of the openstandards hosted by The Open Group® and is fully aligned with TOGAF®. Enterprise issues solved byour enterprise game are: enterprise management, production efficiency, warehouse efficiency, qualityassessment, customer relationship management (CRM), and environmental impact.
Sustainability 2019, 11, x FOR PEER REVIEW 9 of 27
the open standards hosted by The Open Group® and is fully aligned with TOGAF®. Enterprise issues solved by our enterprise game are: enterprise management, production efficiency, warehouse efficiency, quality assessment, customer relationship management (CRM), and environmental impact.
Figure 2. Enterprise architecture issues.
Using on the survey results, we design and tested an enterprise game. The game follows the framework of an enterprise game, considering the simulation of an enterprise classical functions and departments, jobs implemented in order that the enterprise activity is simulated in rounds (like work days or shifts). The purpose of the game is to improve the activity results in successive rounds, using sustainability and lean tools. A scorecard is used to compute the key performance indicators (KPIs), and the main indicator used here is an aggregate one from sustainability and lean indicators.
4. Results of the “Lean” and “Sustainability” Surveys
A total of 65 valid responses (N) were obtained from companies’ employees situated in the western region of Romania and represent the database for our descriptive statistics and main results. We have conducted statistical analysis on our survey result by computing in SPSS the standard deviation (Std. Dev. or SD) to determine if our responses are concentrated around the mean and standard error (Std. Err or SE) to indicate the reliability of the mean.
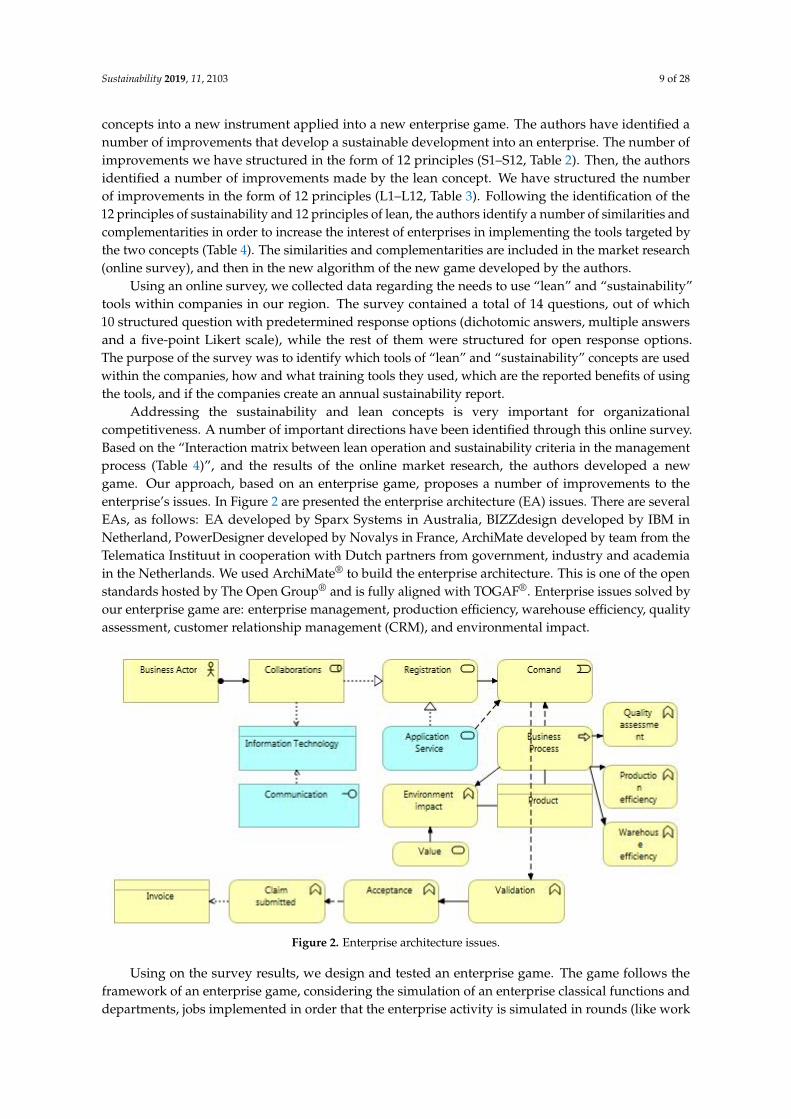
From Figure 3 we can observe that most respondents are from the administrative or support department (43.08%), followed by the technical department (35.38%). The answers have been obtained from the following areas: production areas (21.54%), thus recoding smaller percentages for production managers (16.92%), and respective production operators (4.62%).
Figure 2. Enterprise architecture issues.
Using on the survey results, we design and tested an enterprise game. The game follows theframework of an enterprise game, considering the simulation of an enterprise classical functions anddepartments, jobs implemented in order that the enterprise activity is simulated in rounds (like work
Sustainability 2019, 11, 2103 10 of 28
days or shifts). The purpose of the game is to improve the activity results in successive rounds, usingsustainability and lean tools. A scorecard is used to compute the key performance indicators (KPIs),and the main indicator used here is an aggregate one from sustainability and lean indicators.
4. Results of the “Lean” and “Sustainability” Surveys
A total of 65 valid responses (N) were obtained from companies’ employees situated in the westernregion of Romania and represent the database for our descriptive statistics and main results. We haveconducted statistical analysis on our survey result by computing in SPSS the standard deviation(Std. Dev. or SD) to determine if our responses are concentrated around the mean and standard error(Std. Err or SE) to indicate the reliability of the mean.
From Figure 3 we can observe that most respondents are from the administrative or supportdepartment (43.08%), followed by the technical department (35.38%). The answers have been obtainedfrom the following areas: production areas (21.54%), thus recoding smaller percentages for productionmanagers (16.92%), and respective production operators (4.62%).Sustainability 2019, 11, x FOR PEER REVIEW 10 of 27
Figure 3. The percentage of respondents based on company department.
After coding our responses with “1” for production/operator, “2” for production/manager, “3” for administrative/support, and “4” for technical department, in Table 6 we can observe the distribution of respondents based on company department. Looking at the mean (3.09) and SD (0.843) values we can observe that most of the respondents are from the administrative/support and technical department.
Table 6. Descriptive statistic for the number of respondents based on company department.
N Min. Max. Mean Std. Dev.
Statistic Statistic Statistic Statistic Std. Err. Statistic Company department 65 1 4 3.09 0.105 0.843
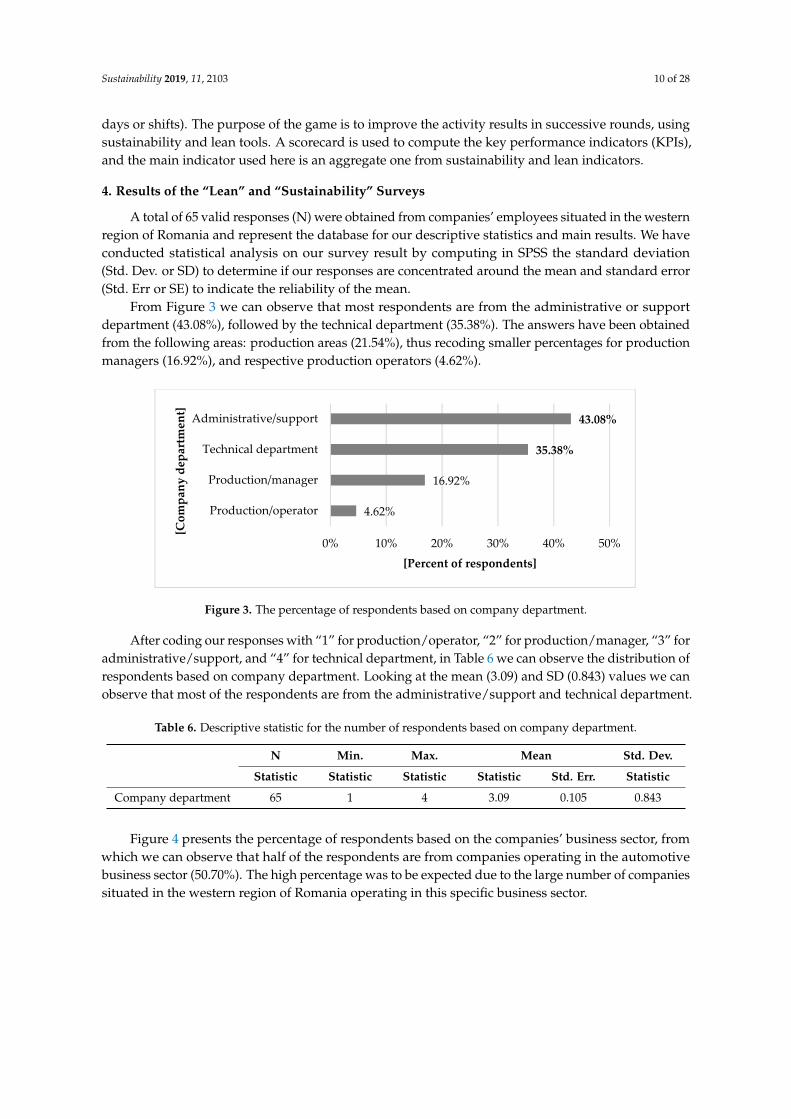
Figure 4 presents the percentage of respondents based on the companies’ business sector, from which we can observe that half of the respondents are from companies operating in the automotive business sector (50.70%). The high percentage was to be expected due to the large number of companies situated in the western region of Romania operating in this specific business sector.
Figure 4. The percentage of respondents based on company industry.
Table 7 show the distribution of respondents based on company industry. We coded with values from 1 to 8 the industries that can be found in the Western Region of Romania: automotive, IT and C; data processing and analysis; chemical, food, and beverage retail; furniture; and included possible responses for “other industries”, respectively “not specified”. The high value of the SD (2.317) indicates a wide distribution of responses, meaning that we obtained several responses for each
4.62%
16.92%
35.38%
43.08%
0% 10% 20% 30% 40% 50%
Production/operator
Production/manager
Technical department
Administrative/support
[Percent of respondents]
[Com
pany
dep
artm
ent]
9.23%
3.08%
3.08%
3.08%
4.62%
9.23%
16.92%
50.77%
0% 20% 40% 60% 80% 100%
Not specified
Other
Food & Beverage Retail
Furniture
Chemical
Data processing & Analysis
IT&C
Automotive
[Percent of respondents]
[Bus
ines
s se
ctor
]
Figure 3. The percentage of respondents based on company department.
After coding our responses with “1” for production/operator, “2” for production/manager, “3” foradministrative/support, and “4” for technical department, in Table 6 we can observe the distribution ofrespondents based on company department. Looking at the mean (3.09) and SD (0.843) values we canobserve that most of the respondents are from the administrative/support and technical department.
Table 6. Descriptive statistic for the number of respondents based on company department.
N Min. Max. Mean Std. Dev.
Statistic Statistic Statistic Statistic Std. Err. Statistic
Company department 65 1 4 3.09 0.105 0.843
Figure 4 presents the percentage of respondents based on the companies’ business sector, fromwhich we can observe that half of the respondents are from companies operating in the automotivebusiness sector (50.70%). The high percentage was to be expected due to the large number of companiessituated in the western region of Romania operating in this specific business sector.
Sustainability 2019, 11, 2103 11 of 28
Sustainability 2019, 11, x FOR PEER REVIEW 10 of 27
Figure 3. The percentage of respondents based on company department.
After coding our responses with “1” for production/operator, “2” for production/manager, “3” for administrative/support, and “4” for technical department, in Table 6 we can observe the distribution of respondents based on company department. Looking at the mean (3.09) and SD (0.843) values we can observe that most of the respondents are from the administrative/support and technical department.
Table 6. Descriptive statistic for the number of respondents based on company department.
N Min. Max. Mean Std. Dev.
Statistic Statistic Statistic Statistic Std. Err. Statistic Company department 65 1 4 3.09 0.105 0.843
Figure 4 presents the percentage of respondents based on the companies’ business sector, from which we can observe that half of the respondents are from companies operating in the automotive business sector (50.70%). The high percentage was to be expected due to the large number of companies situated in the western region of Romania operating in this specific business sector.
Figure 4. The percentage of respondents based on company industry.
Table 7 show the distribution of respondents based on company industry. We coded with values from 1 to 8 the industries that can be found in the Western Region of Romania: automotive, IT and C; data processing and analysis; chemical, food, and beverage retail; furniture; and included possible responses for “other industries”, respectively “not specified”. The high value of the SD (2.317) indicates a wide distribution of responses, meaning that we obtained several responses for each
4.62%
16.92%
35.38%
43.08%
0% 10% 20% 30% 40% 50%
Production/operator
Production/manager
Technical department
Administrative/support
[Percent of respondents]
[Com
pany
dep
artm
ent]
9.23%
3.08%
3.08%
3.08%
4.62%
9.23%
16.92%
50.77%
0% 20% 40% 60% 80% 100%
Not specified
Other
Food & Beverage Retail
Furniture
Chemical
Data processing & Analysis
IT&C
Automotive
[Percent of respondents]
[Bus
ines
s se
ctor
]
Figure 4. The percentage of respondents based on company industry.
Table 7 show the distribution of respondents based on company industry. We coded with valuesfrom 1 to 8 the industries that can be found in the Western Region of Romania: automotive, IT and C;data processing and analysis; chemical, food, and beverage retail; furniture; and included possibleresponses for “other industries”, respectively “not specified”. The high value of the SD (2.317) indicatesa wide distribution of responses, meaning that we obtained several responses for each industry, whilethe mean (2.60) and SE (0.287) values, show that the responses are concentrated around the first twoindustries: automotive and IT and C.
Table 7. Descriptive statistic for the number of respondents based on company industry.
N Min. Max. Mean Std. Dev.
Statistic Statistic Statistic Statistic Std. Err. Statistic
Company industry 65 1 8 2.60 0.287 2.317
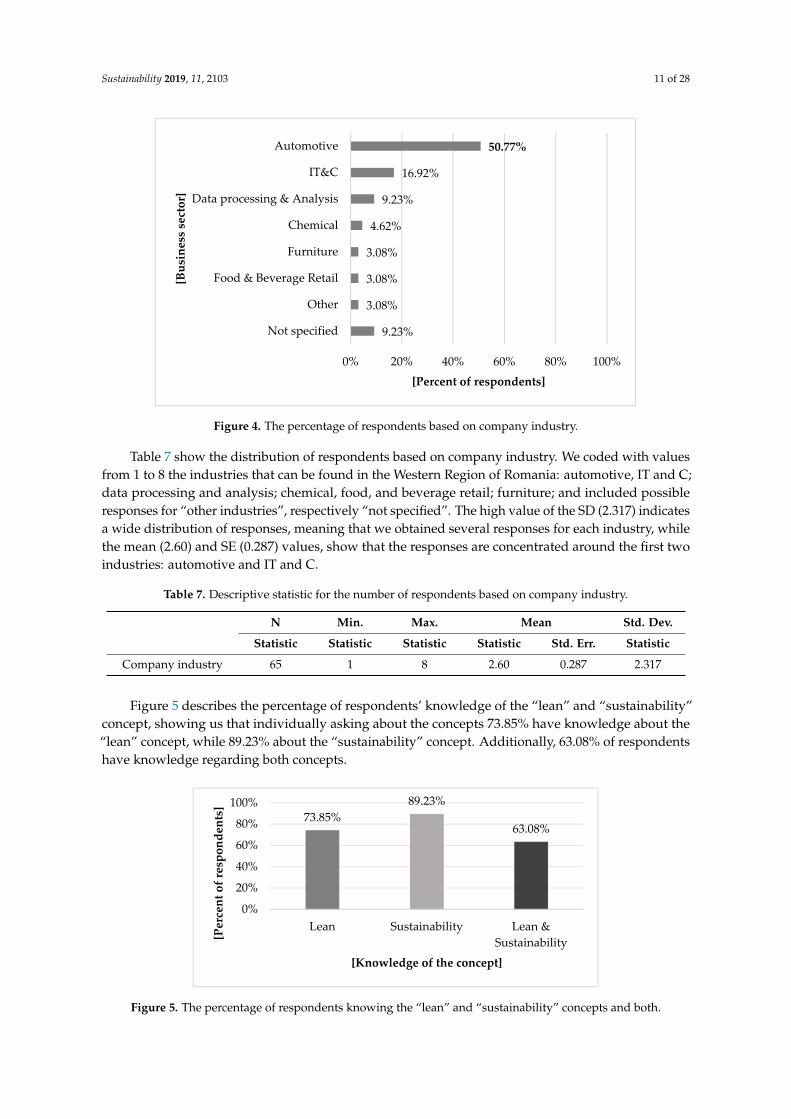
Figure 5 describes the percentage of respondents’ knowledge of the “lean” and “sustainability”concept, showing us that individually asking about the concepts 73.85% have knowledge about the“lean” concept, while 89.23% about the “sustainability” concept. Additionally, 63.08% of respondentshave knowledge regarding both concepts.
Sustainability 2019, 11, x FOR PEER REVIEW 11 of 27
industry, while the mean (2.60) and SE (0.287) values, show that the responses are concentrated around the first two industries: automotive and IT and C.
Table 7. Descriptive statistic for the number of respondents based on company industry.
N Min. Max. Mean Std. Dev.
Statistic Statistic Statistic Statistic Std. Err. Statistic Company industry 65 1 8 2.60 0.287 2.317
Figure 5 describes the percentage of respondents’ knowledge of the “lean” and “sustainability” concept, showing us that individually asking about the concepts 73.85% have knowledge about the “lean” concept, while 89.23% about the “sustainability” concept. Additionally, 63.08% of respondents have knowledge regarding both concepts.
Figure 5. The percentage of respondents knowing the “lean” and “sustainability” concepts and both.
In Table 8, we observe the small values of SD and SE describing a normal distribution in relation to the Mean, taking in consideration that we coded with “1” knowing the lean, sustainability, respectively both concepts, while with “0” not knowing the lean or sustainability concept, respectively knowing at least one. Our results clearly indicate that, statistically, there are more than 2/3 respondent that have knowledge of one or both concepts.
Table 8. Descriptive statistics for the number of respondents knowing the “lean” and “sustainability” concepts.
N Min. Max. Mean Std. Dev.
Statistic Statistic Statistic Statistic Std. Err. Statistic Lean 65 0 1 0.74 0.055 0.443
Sustainability 65 0 1 0.89 0.039 0.312 Both 65 0 1 0.63 0.060 0.486
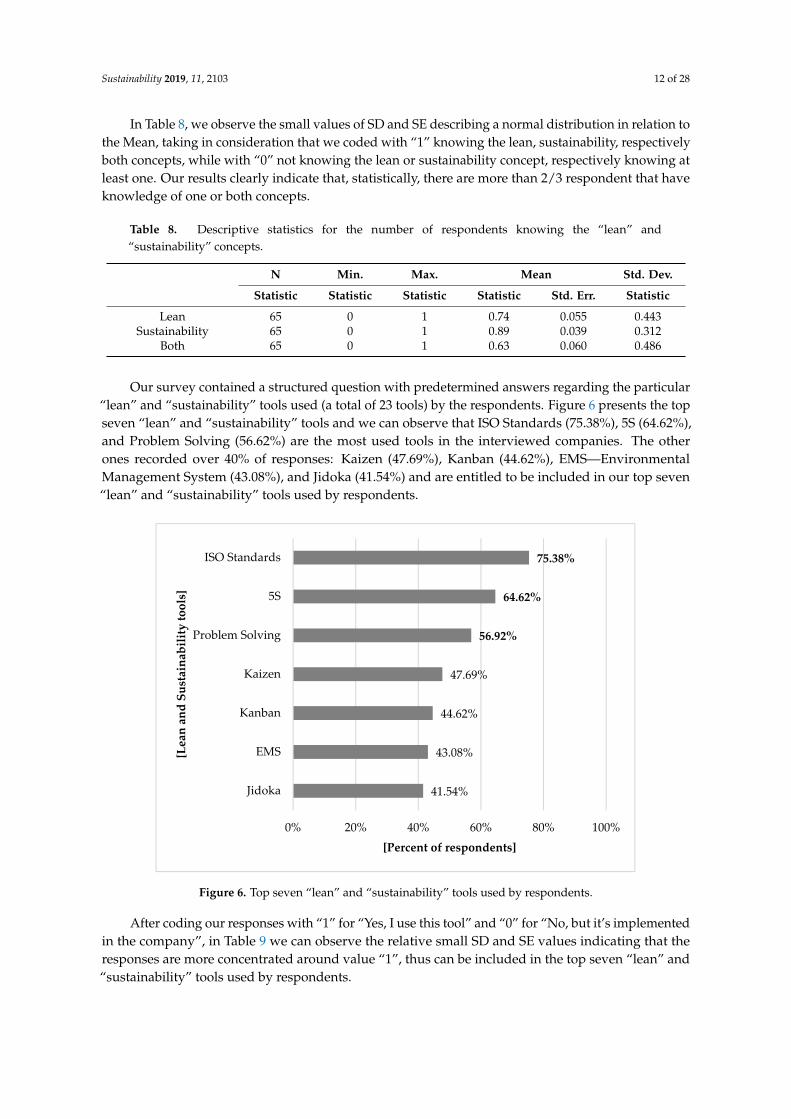
Our survey contained a structured question with predetermined answers regarding the particular “lean” and “sustainability” tools used (a total of 23 tools) by the respondents. Figure 6 presents the top seven “lean” and “sustainability” tools and we can observe that ISO Standards (75.38%), 5S (64.62%), and Problem Solving (56.62%) are the most used tools in the interviewed companies. The other ones recorded over 40% of responses: Kaizen (47.69%), Kanban (44.62%), EMS—Environmental Management System (43.08%), and Jidoka (41.54%) and are entitled to be included in our top seven “lean” and “sustainability” tools used by respondents.
After coding our responses with “1” for “Yes, I use this tool” and “0” for “No, but it’s implemented in the company”, in Table 9 we can observe the relative small SD and SE values indicating that the responses are more concentrated around value “1”, thus can be included in the top seven “lean” and “sustainability” tools used by respondents.
73.85%89.23%
63.08%
0%
20%
40%
60%
80%
100%
Lean Sustainability Lean &Sustainability[P
erce
nt o
f res
pond
ents
]
[Knowledge of the concept]
Figure 5. The percentage of respondents knowing the “lean” and “sustainability” concepts and both.
Sustainability 2019, 11, 2103 12 of 28
In Table 8, we observe the small values of SD and SE describing a normal distribution in relation tothe Mean, taking in consideration that we coded with “1” knowing the lean, sustainability, respectivelyboth concepts, while with “0” not knowing the lean or sustainability concept, respectively knowing atleast one. Our results clearly indicate that, statistically, there are more than 2/3 respondent that haveknowledge of one or both concepts.
Table 8. Descriptive statistics for the number of respondents knowing the “lean” and“sustainability” concepts.
N Min. Max. Mean Std. Dev.
Statistic Statistic Statistic Statistic Std. Err. Statistic
Lean 65 0 1 0.74 0.055 0.443Sustainability 65 0 1 0.89 0.039 0.312
Both 65 0 1 0.63 0.060 0.486
Our survey contained a structured question with predetermined answers regarding the particular“lean” and “sustainability” tools used (a total of 23 tools) by the respondents. Figure 6 presents the topseven “lean” and “sustainability” tools and we can observe that ISO Standards (75.38%), 5S (64.62%),and Problem Solving (56.62%) are the most used tools in the interviewed companies. The otherones recorded over 40% of responses: Kaizen (47.69%), Kanban (44.62%), EMS—EnvironmentalManagement System (43.08%), and Jidoka (41.54%) and are entitled to be included in our top seven“lean” and “sustainability” tools used by respondents.Sustainability 2019, 11, x FOR PEER REVIEW 12 of 27
Figure 6. Top seven “lean” and “sustainability” tools used by respondents.
Table 9. Descriptive statistics for the top seven “lean” and “sustainability” tools used by respondents.
N Min. Max. Mean Std. Dev.
Statistic Statistic Statistic Statistic Std. Err. Statistic ISO Standards 65 0 1 0.75 0.054 0.434
5S 65 0 1 0.65 0.060 0.482 Problem Solving 65 0 1 0.57 0.062 0.499
Kaizen 65 0 1 0.48 0.062 0.503 Kanban 65 0 1 0.45 0.062 0.501
EMS 65 0 1 0.43 0.062 0.499 Jidoka 65 0 1 0.42 0.062 0.497
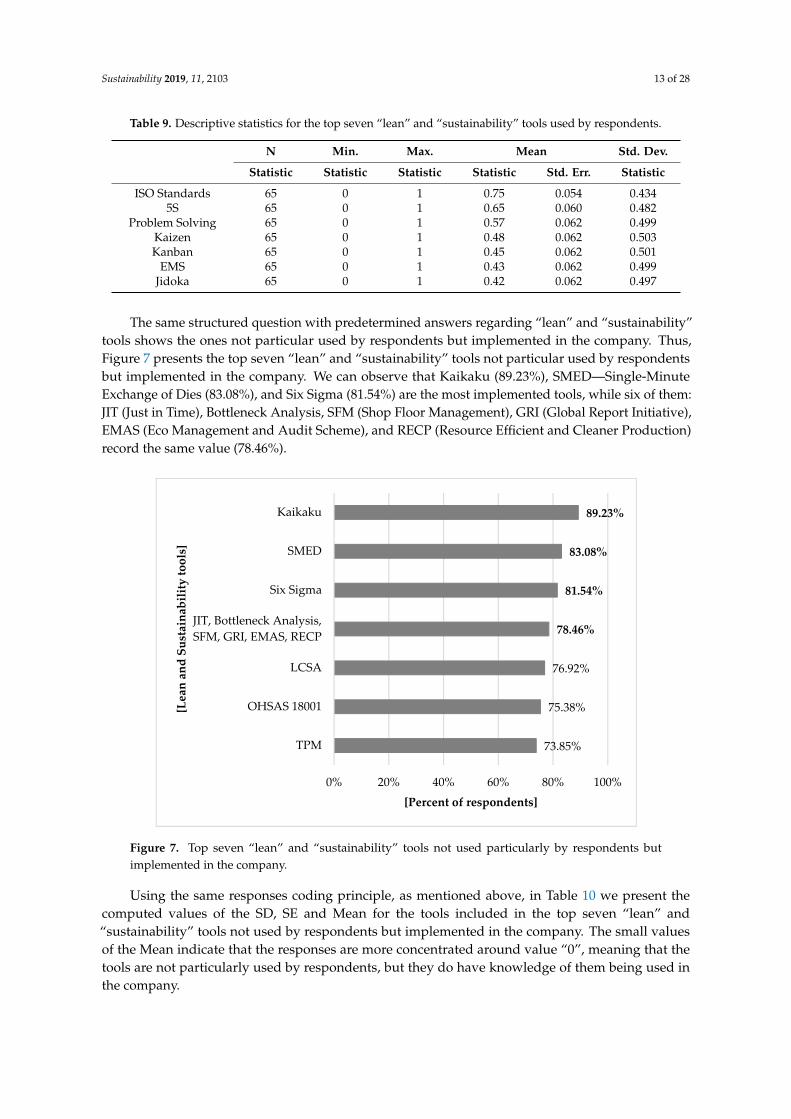
The same structured question with predetermined answers regarding “lean” and “sustainability” tools shows the ones not particular used by respondents but implemented in the company. Thus, Figure 7 presents the top seven “lean” and “sustainability” tools not particular used by respondents but implemented in the company. We can observe that Kaikaku (89.23%), SMED—Single-Minute Exchange of Dies (83.08%), and Six Sigma (81.54%) are the most implemented tools, while six of them: JIT (Just in Time), Bottleneck Analysis, SFM (Shop Floor Management), GRI (Global Report Initiative), EMAS (Eco Management and Audit Scheme), and RECP (Resource Efficient and Cleaner Production) record the same value (78.46%).
41.54%
43.08%
44.62%
47.69%
56.92%
64.62%
75.38%
0% 20% 40% 60% 80% 100%
Jidoka
EMS
Kanban
Kaizen
Problem Solving
5S
ISO Standards
[Percent of respondents]
[Lea
n an
d Su
stai
nabi
lity
tool
s]
Figure 6. Top seven “lean” and “sustainability” tools used by respondents.
After coding our responses with “1” for “Yes, I use this tool” and “0” for “No, but it’s implementedin the company”, in Table 9 we can observe the relative small SD and SE values indicating that theresponses are more concentrated around value “1”, thus can be included in the top seven “lean” and“sustainability” tools used by respondents.
Sustainability 2019, 11, 2103 13 of 28
Table 9. Descriptive statistics for the top seven “lean” and “sustainability” tools used by respondents.
N Min. Max. Mean Std. Dev.
Statistic Statistic Statistic Statistic Std. Err. Statistic
ISO Standards 65 0 1 0.75 0.054 0.4345S 65 0 1 0.65 0.060 0.482
Problem Solving 65 0 1 0.57 0.062 0.499Kaizen 65 0 1 0.48 0.062 0.503Kanban 65 0 1 0.45 0.062 0.501
EMS 65 0 1 0.43 0.062 0.499Jidoka 65 0 1 0.42 0.062 0.497
The same structured question with predetermined answers regarding “lean” and “sustainability”tools shows the ones not particular used by respondents but implemented in the company. Thus,Figure 7 presents the top seven “lean” and “sustainability” tools not particular used by respondentsbut implemented in the company. We can observe that Kaikaku (89.23%), SMED—Single-MinuteExchange of Dies (83.08%), and Six Sigma (81.54%) are the most implemented tools, while six of them:JIT (Just in Time), Bottleneck Analysis, SFM (Shop Floor Management), GRI (Global Report Initiative),EMAS (Eco Management and Audit Scheme), and RECP (Resource Efficient and Cleaner Production)record the same value (78.46%).Sustainability 2019, 11, x FOR PEER REVIEW 13 of 27
Figure 7. Top seven “lean” and “sustainability” tools not used particularly by respondents but implemented in the company.
Using the same responses coding principle, as mentioned above, in Table 10 we present the computed values of the SD, SE and Mean for the tools included in the top seven “lean” and “sustainability” tools not used by respondents but implemented in the company. The small values of the Mean indicate that the responses are more concentrated around value “0”, meaning that the tools are not particularly used by respondents, but they do have knowledge of them being used in the company.
Table 10. Descriptive statistics for the top seven “lean” and “sustainability” tools not used by respondents but implemented in the company.
N Min. Max. Mean Std. Dev.
Statistic Statistic Statistic Statistic Std. Err. Statistic Kaikaku 65 0 1 0.11 0.039 0.312 SMED 65 0 1 0.17 0.047 0.378
Six Sigma 65 0 1 0.18 0.048 0.391 JIT 65 0 1 0.22 0.051 0.414
Bottleneck Analysis 65 0 1 0.22 0.051 0.414 SFM 65 0 1 0.22 0.051 0.414 GRI 65 0 1 0.22 0.051 0.414
EMAS 65 0 1 0.22 0.051 0.414 RECP 65 0 1 0.22 0.051 0.414 LCSA 65 0 1 0.23 0.053 0.425
OHSAS 18001 65 0 1 0.25 0.054 0.434 TPM 65 0 1 0.26 0.055 0.443
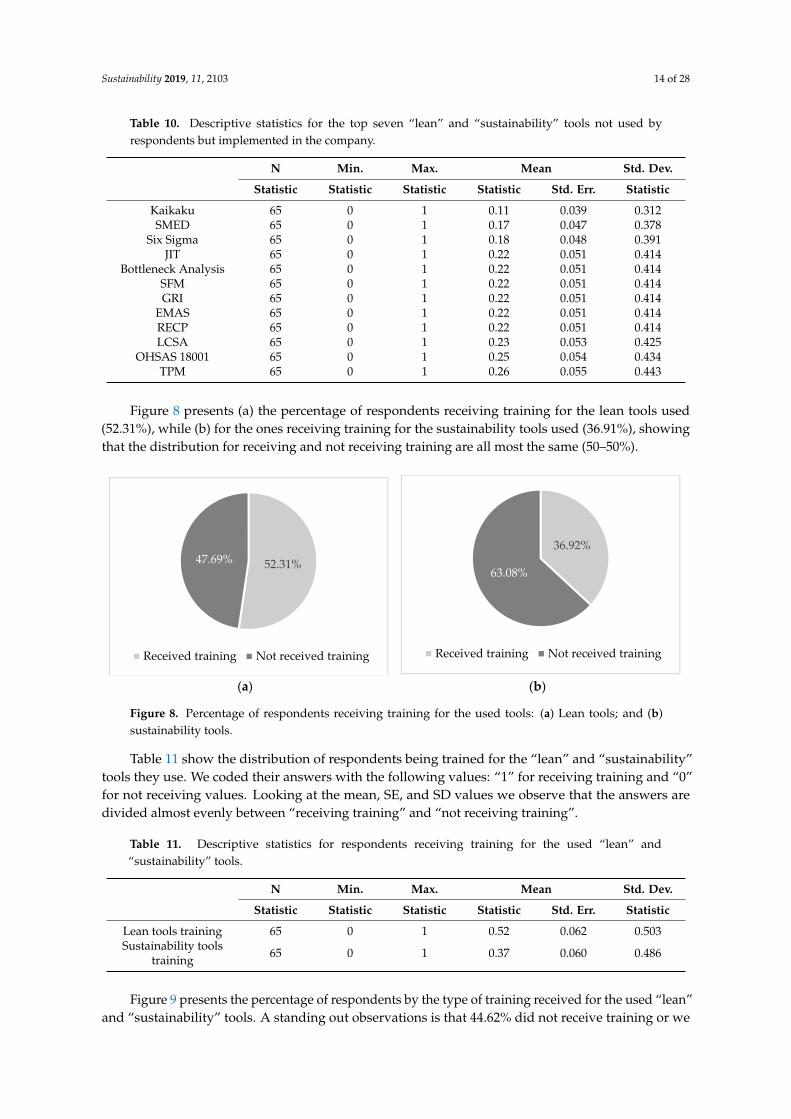
Figure 8 presents (a) the percentage of respondents receiving training for the lean tools used (52.31%), while (b) for the ones receiving training for the sustainability tools used (36.91%), showing that the distribution for receiving and not receiving training are all most the same (50–50%).
73.85%
75.38%
76.92%
78.46%
81.54%
83.08%
89.23%
0% 20% 40% 60% 80% 100%
TPM
OHSAS 18001
LCSA
JIT, Bottleneck Analysis,SFM, GRI, EMAS, RECP
Six Sigma
SMED
Kaikaku
[Percent of respondents]
[Lea
n an
d Su
stai
nabi
lity
tool
s]
Figure 7. Top seven “lean” and “sustainability” tools not used particularly by respondents butimplemented in the company.
Using the same responses coding principle, as mentioned above, in Table 10 we present thecomputed values of the SD, SE and Mean for the tools included in the top seven “lean” and“sustainability” tools not used by respondents but implemented in the company. The small valuesof the Mean indicate that the responses are more concentrated around value “0”, meaning that thetools are not particularly used by respondents, but they do have knowledge of them being used inthe company.
Sustainability 2019, 11, 2103 14 of 28
Table 10. Descriptive statistics for the top seven “lean” and “sustainability” tools not used byrespondents but implemented in the company.
N Min. Max. Mean Std. Dev.
Statistic Statistic Statistic Statistic Std. Err. Statistic
Kaikaku 65 0 1 0.11 0.039 0.312SMED 65 0 1 0.17 0.047 0.378
Six Sigma 65 0 1 0.18 0.048 0.391JIT 65 0 1 0.22 0.051 0.414
Bottleneck Analysis 65 0 1 0.22 0.051 0.414SFM 65 0 1 0.22 0.051 0.414GRI 65 0 1 0.22 0.051 0.414
EMAS 65 0 1 0.22 0.051 0.414RECP 65 0 1 0.22 0.051 0.414LCSA 65 0 1 0.23 0.053 0.425
OHSAS 18001 65 0 1 0.25 0.054 0.434TPM 65 0 1 0.26 0.055 0.443
Figure 8 presents (a) the percentage of respondents receiving training for the lean tools used(52.31%), while (b) for the ones receiving training for the sustainability tools used (36.91%), showingthat the distribution for receiving and not receiving training are all most the same (50–50%).Sustainability 2019, 11, x FOR PEER REVIEW 14 of 27
(a) (b)
Figure 8. Percentage of respondents receiving training for the used tools: (a) Lean tools; and (b) sustainability tools.
Table 11 show the distribution of respondents being trained for the “lean” and “sustainability” tools they use. We coded their answers with the following values: “1” for receiving training and “0” for not receiving values. Looking at the mean, SE, and SD values we observe that the answers are divided almost evenly between “receiving training” and “not receiving training”.
Table 11. Descriptive statistics for respondents receiving training for the used “lean” and “sustainability” tools.
N Min. Max. Mean Std. Dev.
Statistic Statistic Statistic Statistic Std. Err. Statistic Lean tools training 65 0 1 0.52 0.062 0.503
Sustainability tools training 65 0 1 0.37 0.060 0.486
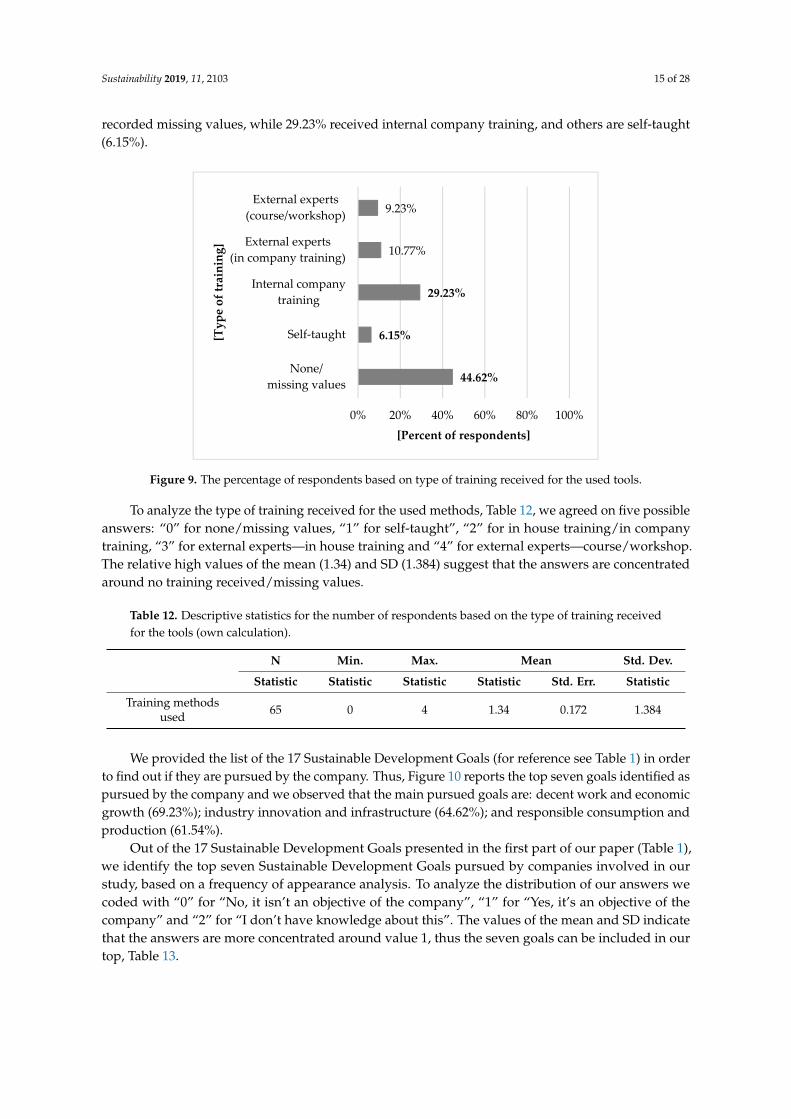
Figure 9 presents the percentage of respondents by the type of training received for the used “lean” and “sustainability” tools. A standing out observations is that 44.62% did not receive training or we recorded missing values, while 29.23% received internal company training, and others are self-taught (6.15%).
Figure 9. The percentage of respondents based on type of training received for the used tools.
44.62%
6.15%
29.23%
10.77%
9.23%
0% 20% 40% 60% 80% 100%
None/missing values
Self-taught
Internal companytraining
External experts(in company training)
External experts(course/workshop)
[Percent of respondents]
[Typ
e of
trai
ning
]
52.31%47.69%
Received training Not received training
36.92%
63.08%
Received training Not received training
Figure 8. Percentage of respondents receiving training for the used tools: (a) Lean tools; and (b)sustainability tools.
Table 11 show the distribution of respondents being trained for the “lean” and “sustainability”tools they use. We coded their answers with the following values: “1” for receiving training and “0”for not receiving values. Looking at the mean, SE, and SD values we observe that the answers aredivided almost evenly between “receiving training” and “not receiving training”.
Table 11. Descriptive statistics for respondents receiving training for the used “lean” and“sustainability” tools.
N Min. Max. Mean Std. Dev.
Statistic Statistic Statistic Statistic Std. Err. Statistic
Lean tools training 65 0 1 0.52 0.062 0.503Sustainability tools
training 65 0 1 0.37 0.060 0.486
Figure 9 presents the percentage of respondents by the type of training received for the used “lean”and “sustainability” tools. A standing out observations is that 44.62% did not receive training or we
Sustainability 2019, 11, 2103 15 of 28
recorded missing values, while 29.23% received internal company training, and others are self-taught(6.15%).
Sustainability 2019, 11, x FOR PEER REVIEW 14 of 27
(a) (b)
Figure 8. Percentage of respondents receiving training for the used tools: (a) Lean tools; and (b) sustainability tools.
Table 11 show the distribution of respondents being trained for the “lean” and “sustainability” tools they use. We coded their answers with the following values: “1” for receiving training and “0” for not receiving values. Looking at the mean, SE, and SD values we observe that the answers are divided almost evenly between “receiving training” and “not receiving training”.
Table 11. Descriptive statistics for respondents receiving training for the used “lean” and “sustainability” tools.
N Min. Max. Mean Std. Dev.
Statistic Statistic Statistic Statistic Std. Err. Statistic Lean tools training 65 0 1 0.52 0.062 0.503
Sustainability tools training 65 0 1 0.37 0.060 0.486
Figure 9 presents the percentage of respondents by the type of training received for the used “lean” and “sustainability” tools. A standing out observations is that 44.62% did not receive training or we recorded missing values, while 29.23% received internal company training, and others are self-taught (6.15%).
Figure 9. The percentage of respondents based on type of training received for the used tools.
44.62%
6.15%
29.23%
10.77%
9.23%
0% 20% 40% 60% 80% 100%
None/missing values
Self-taught
Internal companytraining
External experts(in company training)
External experts(course/workshop)
[Percent of respondents]
[Typ
e of
trai
ning
]
52.31%47.69%
Received training Not received training
36.92%
63.08%
Received training Not received training
Figure 9. The percentage of respondents based on type of training received for the used tools.
To analyze the type of training received for the used methods, Table 12, we agreed on five possibleanswers: “0” for none/missing values, “1” for self-taught”, “2” for in house training/in companytraining, “3” for external experts—in house training and “4” for external experts—course/workshop.The relative high values of the mean (1.34) and SD (1.384) suggest that the answers are concentratedaround no training received/missing values.
Table 12. Descriptive statistics for the number of respondents based on the type of training receivedfor the tools (own calculation).
N Min. Max. Mean Std. Dev.
Statistic Statistic Statistic Statistic Std. Err. Statistic
Training methodsused 65 0 4 1.34 0.172 1.384
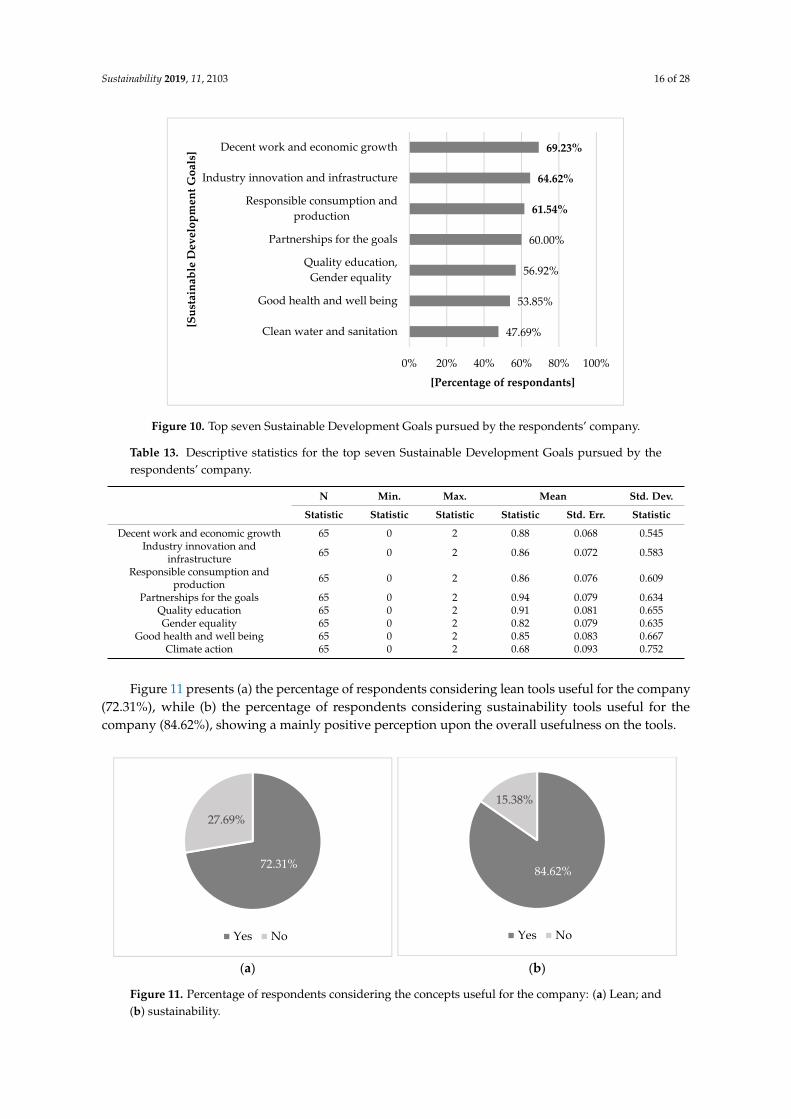
We provided the list of the 17 Sustainable Development Goals (for reference see Table 1) in orderto find out if they are pursued by the company. Thus, Figure 10 reports the top seven goals identified aspursued by the company and we observed that the main pursued goals are: decent work and economicgrowth (69.23%); industry innovation and infrastructure (64.62%); and responsible consumption andproduction (61.54%).
Out of the 17 Sustainable Development Goals presented in the first part of our paper (Table 1),we identify the top seven Sustainable Development Goals pursued by companies involved in ourstudy, based on a frequency of appearance analysis. To analyze the distribution of our answers wecoded with “0” for “No, it isn’t an objective of the company”, “1” for “Yes, it’s an objective of thecompany” and “2” for “I don’t have knowledge about this”. The values of the mean and SD indicatethat the answers are more concentrated around value 1, thus the seven goals can be included in ourtop, Table 13.
Sustainability 2019, 11, 2103 16 of 28
Sustainability 2019, 11, x FOR PEER REVIEW 15 of 27
To analyze the type of training received for the used methods, Table 12, we agreed on five possible answers: “0” for none/missing values, “1” for self-taught”, “2” for in house training/in company training, “3” for external experts—in house training and “4” for external experts—course/workshop. The relative high values of the mean (1.34) and SD (1.384) suggest that the answers are concentrated around no training received/missing values.
Table 12. Descriptive statistics for the number of respondents based on the type of training received for the tools (own calculation).
N Min. Max. Mean Std. Dev.
Statistic Statistic Statistic Statistic Std. Err. Statistic Training methods used 65 0 4 1.34 0.172 1.384
We provided the list of the 17 Sustainable Development Goals (for reference see Table 1) in order to find out if they are pursued by the company. Thus, Figure 10 reports the top seven goals identified as pursued by the company and we observed that the main pursued goals are: decent work and economic growth (69.23%); industry innovation and infrastructure (64.62%); and responsible consumption and production (61.54%).
Out of the 17 Sustainable Development Goals presented in the first part of our paper (Table 1), we identify the top seven Sustainable Development Goals pursued by companies involved in our study, based on a frequency of appearance analysis. To analyze the distribution of our answers we coded with “0” for “No, it isn’t an objective of the company”, “1” for “Yes, it’s an objective of the company” and “2” for “I don’t have knowledge about this”. The values of the mean and SD indicate that the answers are more concentrated around value 1, thus the seven goals can be included in our top, Table 13.
Figure 10. Top seven Sustainable Development Goals pursued by the respondents’ company.
Table 13. Descriptive statistics for the top seven Sustainable Development Goals pursued by the respondents’ company.
N Min. Max. Mean Std. Dev.
Statistic Statistic Statistic Statistic Std. Err. Statistic Decent work and economic growth 65 0 2 0.88 0.068 0.545
47.69%
53.85%
56.92%
60.00%
61.54%
64.62%
69.23%
0% 20% 40% 60% 80% 100%
Clean water and sanitation
Good health and well being
Quality education,Gender equality
Partnerships for the goals
Responsible consumption andproduction
Industry innovation and infrastructure
Decent work and economic growth
[Percentage of respondants]
[Sus
tain
able
Dev
elop
men
t Goa
ls]
Figure 10. Top seven Sustainable Development Goals pursued by the respondents’ company.
Table 13. Descriptive statistics for the top seven Sustainable Development Goals pursued by therespondents’ company.
N Min. Max. Mean Std. Dev.
Statistic Statistic Statistic Statistic Std. Err. Statistic
Decent work and economic growth 65 0 2 0.88 0.068 0.545Industry innovation and
infrastructure 65 0 2 0.86 0.072 0.583
Responsible consumption andproduction 65 0 2 0.86 0.076 0.609
Partnerships for the goals 65 0 2 0.94 0.079 0.634Quality education 65 0 2 0.91 0.081 0.655Gender equality 65 0 2 0.82 0.079 0.635
Good health and well being 65 0 2 0.85 0.083 0.667Climate action 65 0 2 0.68 0.093 0.752
Figure 11 presents (a) the percentage of respondents considering lean tools useful for the company(72.31%), while (b) the percentage of respondents considering sustainability tools useful for thecompany (84.62%), showing a mainly positive perception upon the overall usefulness on the tools.
Sustainability 2019, 11, x FOR PEER REVIEW 16 of 27
Industry innovation and infrastructure 65 0 2 0.86 0.072 0.583
Responsible consumption and production 65 0 2 0.86 0.076 0.609
Partnerships for the goals 65 0 2 0.94 0.079 0.634 Quality education 65 0 2 0.91 0.081 0.655 Gender equality 65 0 2 0.82 0.079 0.635
Good health and well being 65 0 2 0.85 0.083 0.667 Climate action 65 0 2 0.68 0.093 0.752
Figure 11 presents (a) the percentage of respondents considering lean tools useful for the company (72.31%), while (b) the percentage of respondents considering sustainability tools useful for the company (84.62%), showing a mainly positive perception upon the overall usefulness on the tools.
(a) (b)
Figure 11. Percentage of respondents considering the concepts useful for the company: (a) Lean; and (b) sustainability.
Being a dichotomic response question, we coded the answers with “0” for not considering the tools useful, and “1” for considering the tools useful, thus the mean (0.72, respectively 0.85) and SD (0.451, respectively 0.364) show that the answers are concentrate around value 1, indicating a large number of respondents considering the tools useful for their company (see Table 14).
Table 14. Descriptive statistics for the respondents considering the concepts useful for the company.
N Min. Max. Mean Std. Dev.
Statistic Statistic Statistic Statistic Std. Err Statistic Considering “lean” tools useful 65 0 1 0.72 0.056 0.451
Considering “sustainability” tools useful
65 0 1 0.85 0.045 0.364
Using a five-point Likert Scale Figure 12 presents the cumulative percentage of high and maximum values for the order of each benefits in the companies’ activity based on respondents’ perception: quality assurance (89.23%), working standards (81.54%), and visual management (78.46%) being the top activities in which “lean” and “sustainability” tool implementation brought benefits.
Based on our five-point Likert scale, the high mean and SD values, Table 15, indicate that responses are concentrated around high and maximum values (4 and 5, respectively) based on respondents’ perception upon the activities in which “lean” and “sustainability” tool implementation brought benefits.
72.31%
27.69%
Yes No
84.62%
15.38%
Yes No
Figure 11. Percentage of respondents considering the concepts useful for the company: (a) Lean; and(b) sustainability.
Sustainability 2019, 11, 2103 17 of 28
Being a dichotomic response question, we coded the answers with “0” for not considering thetools useful, and “1” for considering the tools useful, thus the mean (0.72, respectively 0.85) and SD(0.451, respectively 0.364) show that the answers are concentrate around value 1, indicating a largenumber of respondents considering the tools useful for their company (see Table 14).
Table 14. Descriptive statistics for the respondents considering the concepts useful for the company.
N Min. Max. Mean Std. Dev.
Statistic Statistic Statistic Statistic Std. Err Statistic
Considering “lean” tools useful 65 0 1 0.72 0.056 0.451Considering “sustainability”
tools useful 65 0 1 0.85 0.045 0.364
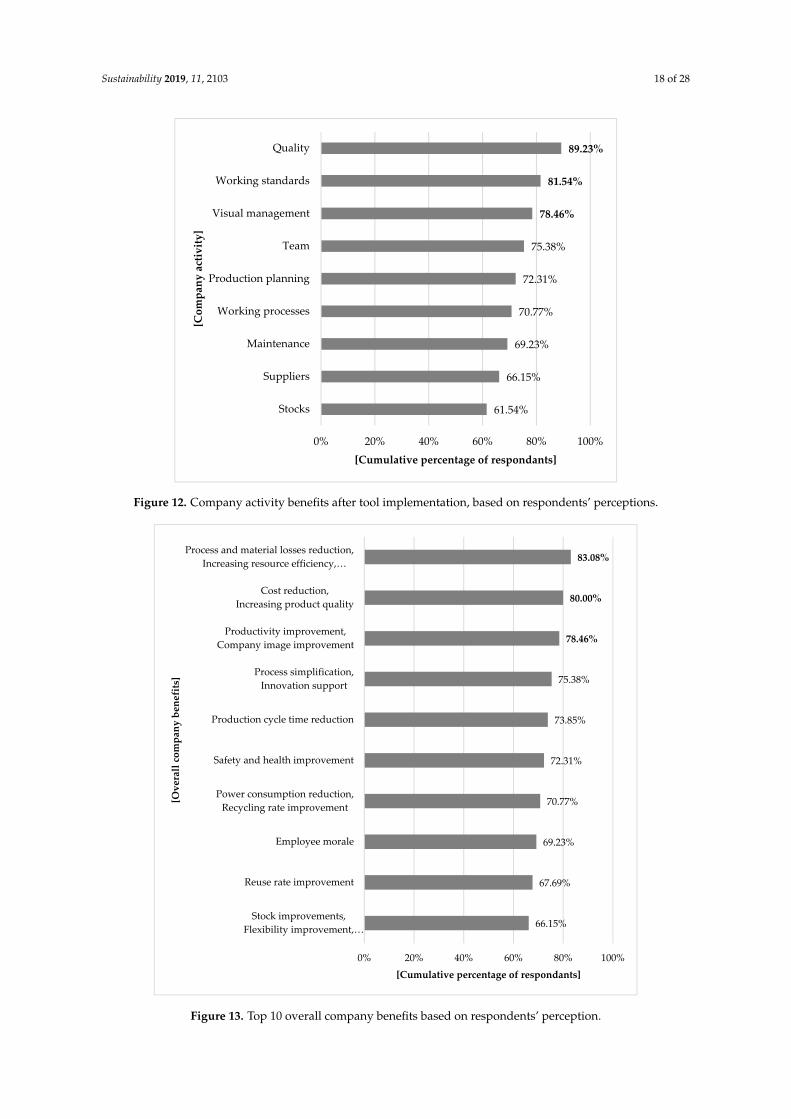
Using a five-point Likert Scale Figure 12 presents the cumulative percentage of high and maximumvalues for the order of each benefits in the companies’ activity based on respondents’ perception:quality assurance (89.23%), working standards (81.54%), and visual management (78.46%) being thetop activities in which “lean” and “sustainability” tool implementation brought benefits.
Based on our five-point Likert scale, the high mean and SD values, Table 15, indicate thatresponses are concentrated around high and maximum values (4 and 5, respectively) based onrespondents’ perception upon the activities in which “lean” and “sustainability” tool implementationbrought benefits.
Table 15. Descriptive statistics for company activity benefits after tool implementation, based onrespondents’ perceptions.
N Min. Max. Mean Std. Dev.
Statistic Statistic Statistic Statistic Std. Err. Statistic
Stocks 65 1 5 3.74 0.139 1.122Suppliers 65 2 5 3.86 0.109 0.882
Maintenance 65 1 5 4.02 0.127 1.023Production planning 65 1 5 4.05 0.131 1.052
Team 65 1 5 4.09 0.120 0.964Working processes 65 1 5 4.11 0.126 1.017
Visual management 65 2 5 4.15 0.103 0.833Working standards 65 2 5 4.28 0.109 0.875
Quality 65 2 5 4.45 0.096 0.771
Using a five-point Likert Scale Figure 13 presents the cumulative percentage of high and maximumvalues for respondents’ perception upon each overall company benefit brought by “lean” and“sustainability” tool implementation. Since some company benefits reported the same value, we placedthem in groups. Focusing on the first three groups of benefits: Process and Material Losses Reduction,Increasing Resource Efficiency and Customer Satisfaction (83.08%), Cost Reduction and IncreasingProduct Quality (80.00%), and Productivity Improvement and Company Image Improvement (78.46%)we can also consider them high priority objectives for the overall company activity and the mainreason for which companies implement “lean” and “sustainability” tools.
Sustainability 2019, 11, 2103 18 of 28
Sustainability 2019, 11, x FOR PEER REVIEW 17 of 27
Figure 12. Company activity benefits after tool implementation, based on respondents’ perceptions.
Table 15. Descriptive statistics for company activity benefits after tool implementation, based on respondents’ perceptions.
N Min. Max. Mean Std. Dev.
Statistic Statistic Statistic Statistic Std. Err. Statistic Stocks 65 1 5 3.74 0.139 1.122
Suppliers 65 2 5 3.86 0.109 0.882 Maintenance 65 1 5 4.02 0.127 1.023
Production planning 65 1 5 4.05 0.131 1.052 Team 65 1 5 4.09 0.120 0.964
Working processes 65 1 5 4.11 0.126 1.017 Visual management 65 2 5 4.15 0.103 0.833 Working standards 65 2 5 4.28 0.109 0.875
Quality 65 2 5 4.45 0.096 0.771
Using a five-point Likert Scale Figure 13 presents the cumulative percentage of high and maximum values for respondents’ perception upon each overall company benefit brought by “lean” and “sustainability” tool implementation. Since some company benefits reported the same value, we placed them in groups. Focusing on the first three groups of benefits: Process and Material Losses Reduction, Increasing Resource Efficiency and Customer Satisfaction (83.08%), Cost Reduction and Increasing Product Quality (80.00%), and Productivity Improvement and Company Image Improvement (78.46%) we can also consider them high priority objectives for the overall company activity and the main reason for which companies implement “lean” and “sustainability” tools.
61.54%
66.15%
69.23%
70.77%
72.31%
75.38%
78.46%
81.54%
89.23%
0% 20% 40% 60% 80% 100%
Stocks
Suppliers
Maintenance
Working processes
Production planning
Team
Visual management
Working standards
Quality
[Cumulative percentage of respondants]
[Com
pany
act
ivity
]
Figure 12. Company activity benefits after tool implementation, based on respondents’ perceptions.Sustainability 2019, 11, x FOR PEER REVIEW 18 of 27
Figure 13. Top 10 overall company benefits based on respondents’ perception.
Using the same responses coding principle for the five-point Likert scale, as mentioned above, in Table 16 we present the computed values of the SD, SE, and mean for the top overall company benefits brought by the “lean” and “sustainability” tools implementation and observed by the company employees. the high mean and SD values indicate that responses are concentrate around high and maximum values (4 and 5, respectively) based on respondents’ perceptions upon the observed overall company benefits.
Table 16. Descriptive statistics for the top 10 overall company benefits based on respondents’ perceptions.
N Min. Max. Mean Std. Dev. Statistic Statistic Statistic Statistic Std. Err. Statistic
Flexibility improvement 65 2 5 3.88 0.119 0.960 Production risk reduction 65 1 5 3.89 0.122 0.986
Employee morale 65 2 5 3.89 0.112 0.904 Reuse rate improvement 65 1 5 3.92 0.125 1.005
Stock improvements 65 2 5 3.95 0.113 0.909 Recycling rate improvement 65 1 5 3.97 0.132 1.060
Power consumption reduction 65 1 5 4.00 0.124 1.000 Safety and health improvement 65 1 5 4.05 0.113 0.909
Innovation support 65 2 5 4.06 0.103 0.827
66.15%
67.69%
69.23%
70.77%
72.31%
73.85%
75.38%
78.46%
80.00%
83.08%
0% 20% 40% 60% 80% 100%
Stock improvements,Flexibility improvement,…
Reuse rate improvement
Employee morale
Power consumption reduction,Recycling rate improvement
Safety and health improvement
Production cycle time reduction
Process simplification,Innovation support
Productivity improvement,Company image improvement
Cost reduction,Increasing product quality
Process and material losses reduction,Increasing resource efficiency,…
[Cumulative percentage of respondants]
[Ove
rall
com
pany
ben
efits
]
Figure 13. Top 10 overall company benefits based on respondents’ perception.
Sustainability 2019, 11, 2103 19 of 28
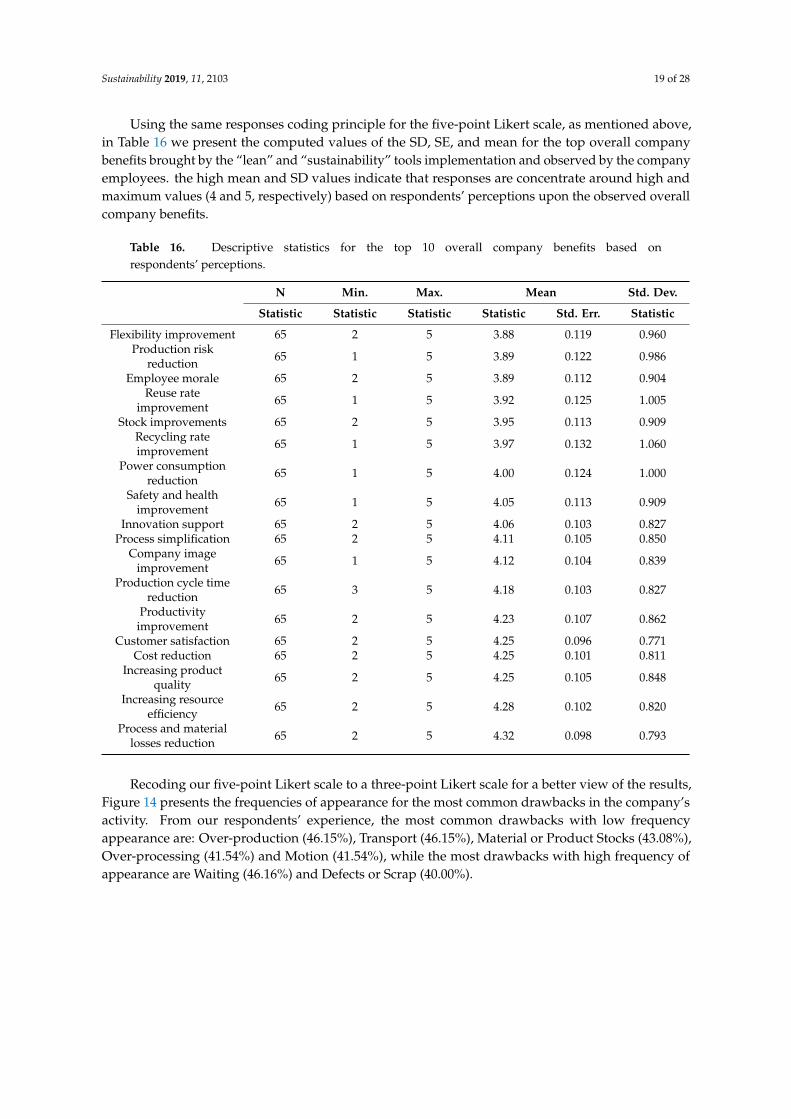
Using the same responses coding principle for the five-point Likert scale, as mentioned above,in Table 16 we present the computed values of the SD, SE, and mean for the top overall companybenefits brought by the “lean” and “sustainability” tools implementation and observed by the companyemployees. the high mean and SD values indicate that responses are concentrate around high andmaximum values (4 and 5, respectively) based on respondents’ perceptions upon the observed overallcompany benefits.
Table 16. Descriptive statistics for the top 10 overall company benefits based onrespondents’ perceptions.
N Min. Max. Mean Std. Dev.
Statistic Statistic Statistic Statistic Std. Err. Statistic
Flexibility improvement 65 2 5 3.88 0.119 0.960Production risk
reduction 65 1 5 3.89 0.122 0.986
Employee morale 65 2 5 3.89 0.112 0.904Reuse rate
improvement 65 1 5 3.92 0.125 1.005
Stock improvements 65 2 5 3.95 0.113 0.909Recycling rateimprovement 65 1 5 3.97 0.132 1.060
Power consumptionreduction 65 1 5 4.00 0.124 1.000
Safety and healthimprovement 65 1 5 4.05 0.113 0.909
Innovation support 65 2 5 4.06 0.103 0.827Process simplification 65 2 5 4.11 0.105 0.850
Company imageimprovement 65 1 5 4.12 0.104 0.839
Production cycle timereduction 65 3 5 4.18 0.103 0.827
Productivityimprovement 65 2 5 4.23 0.107 0.862
Customer satisfaction 65 2 5 4.25 0.096 0.771Cost reduction 65 2 5 4.25 0.101 0.811
Increasing productquality 65 2 5 4.25 0.105 0.848
Increasing resourceefficiency 65 2 5 4.28 0.102 0.820
Process and materiallosses reduction 65 2 5 4.32 0.098 0.793
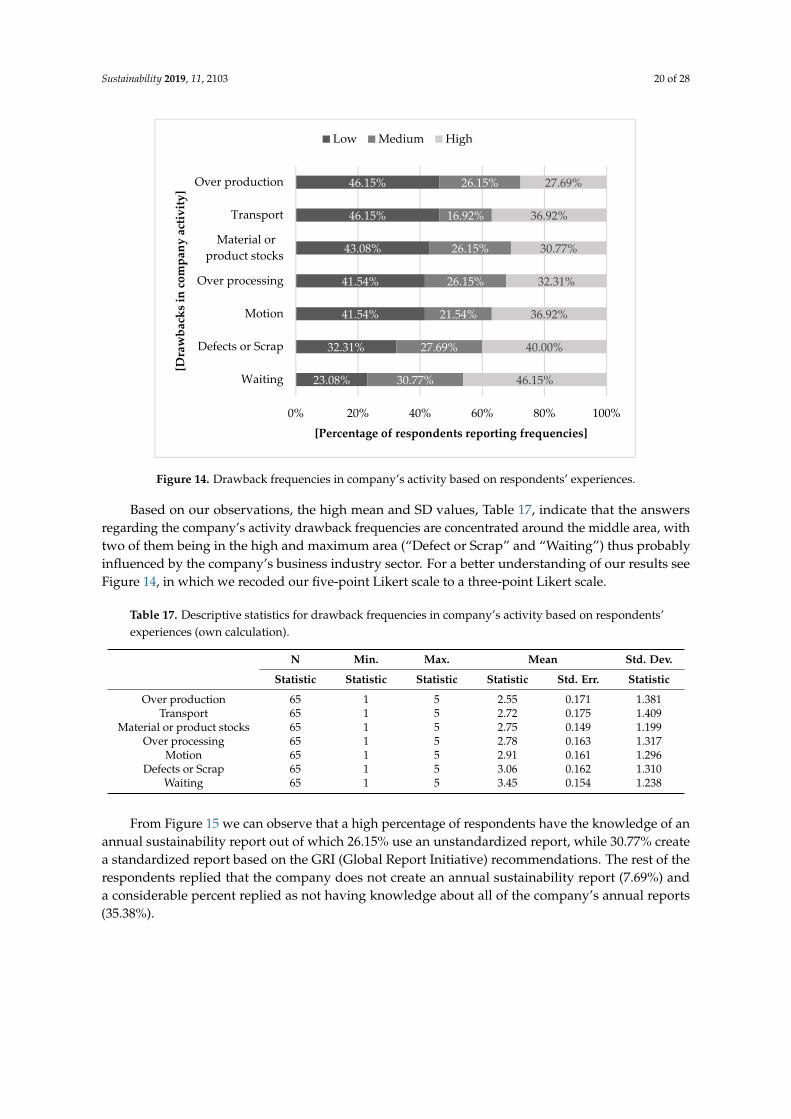
Recoding our five-point Likert scale to a three-point Likert scale for a better view of the results,Figure 14 presents the frequencies of appearance for the most common drawbacks in the company’sactivity. From our respondents’ experience, the most common drawbacks with low frequencyappearance are: Over-production (46.15%), Transport (46.15%), Material or Product Stocks (43.08%),Over-processing (41.54%) and Motion (41.54%), while the most drawbacks with high frequency ofappearance are Waiting (46.16%) and Defects or Scrap (40.00%).
Sustainability 2019, 11, 2103 20 of 28
Sustainability 2019, 11, x FOR PEER REVIEW 19 of 27
Process simplification 65 2 5 4.11 0.105 0.850 Company image improvement 65 1 5 4.12 0.104 0.839
Production cycle time reduction 65 3 5 4.18 0.103 0.827 Productivity improvement 65 2 5 4.23 0.107 0.862
Customer satisfaction 65 2 5 4.25 0.096 0.771 Cost reduction 65 2 5 4.25 0.101 0.811
Increasing product quality 65 2 5 4.25 0.105 0.848 Increasing resource efficiency 65 2 5 4.28 0.102 0.820
Process and material losses reduction
65 2 5 4.32 0.098 0.793
Recoding our five-point Likert scale to a three-point Likert scale for a better view of the results, Figure 14 presents the frequencies of appearance for the most common drawbacks in the company’s activity. From our respondents’ experience, the most common drawbacks with low frequency appearance are: Over-production (46.15%), Transport (46.15%), Material or Product Stocks (43.08%), Over-processing (41.54%) and Motion (41.54%), while the most drawbacks with high frequency of appearance are Waiting (46.16%) and Defects or Scrap (40.00%).
Based on our observations, the high mean and SD values, Table 17, indicate that the answers regarding the company’s activity drawback frequencies are concentrated around the middle area, with two of them being in the high and maximum area (“Defect or Scrap” and “Waiting”) thus probably influenced by the company’s business industry sector. For a better understanding of our results see Figure 14, in which we recoded our five-point Likert scale to a three-point Likert scale.
Figure 14. Drawback frequencies in company’s activity based on respondents’ experiences.
Table 17. Descriptive statistics for drawback frequencies in company’s activity based on respondents’ experiences (own calculation).
N Min. Max. Mean Std. Dev.
Statistic Statistic Statistic Statistic Std. Err. Statistic Over production 65 1 5 2.55 0.171 1.381
Transport 65 1 5 2.72 0.175 1.409 Material or product stocks 65 1 5 2.75 0.149 1.199
Over processing 65 1 5 2.78 0.163 1.317 Motion 65 1 5 2.91 0.161 1.296
23.08%
32.31%
41.54%
41.54%
43.08%
46.15%
46.15%
30.77%
27.69%
21.54%
26.15%
26.15%
16.92%
26.15%
46.15%
40.00%
36.92%
32.31%
30.77%
36.92%
27.69%
0% 20% 40% 60% 80% 100%
Waiting
Defects or Scrap
Motion
Over processing
Material orproduct stocks
Transport
Over production
[Percentage of respondents reporting frequencies]
[Dra
wba
cks
in c
ompa
ny a
ctiv
ity]
Low Medium High
Figure 14. Drawback frequencies in company’s activity based on respondents’ experiences.
Based on our observations, the high mean and SD values, Table 17, indicate that the answersregarding the company’s activity drawback frequencies are concentrated around the middle area, withtwo of them being in the high and maximum area (“Defect or Scrap” and “Waiting”) thus probablyinfluenced by the company’s business industry sector. For a better understanding of our results seeFigure 14, in which we recoded our five-point Likert scale to a three-point Likert scale.
Table 17. Descriptive statistics for drawback frequencies in company’s activity based on respondents’experiences (own calculation).
N Min. Max. Mean Std. Dev.
Statistic Statistic Statistic Statistic Std. Err. Statistic
Over production 65 1 5 2.55 0.171 1.381Transport 65 1 5 2.72 0.175 1.409
Material or product stocks 65 1 5 2.75 0.149 1.199Over processing 65 1 5 2.78 0.163 1.317
Motion 65 1 5 2.91 0.161 1.296Defects or Scrap 65 1 5 3.06 0.162 1.310
Waiting 65 1 5 3.45 0.154 1.238
From Figure 15 we can observe that a high percentage of respondents have the knowledge of anannual sustainability report out of which 26.15% use an unstandardized report, while 30.77% createa standardized report based on the GRI (Global Report Initiative) recommendations. The rest of therespondents replied that the company does not create an annual sustainability report (7.69%) anda considerable percent replied as not having knowledge about all of the company’s annual reports(35.38%).
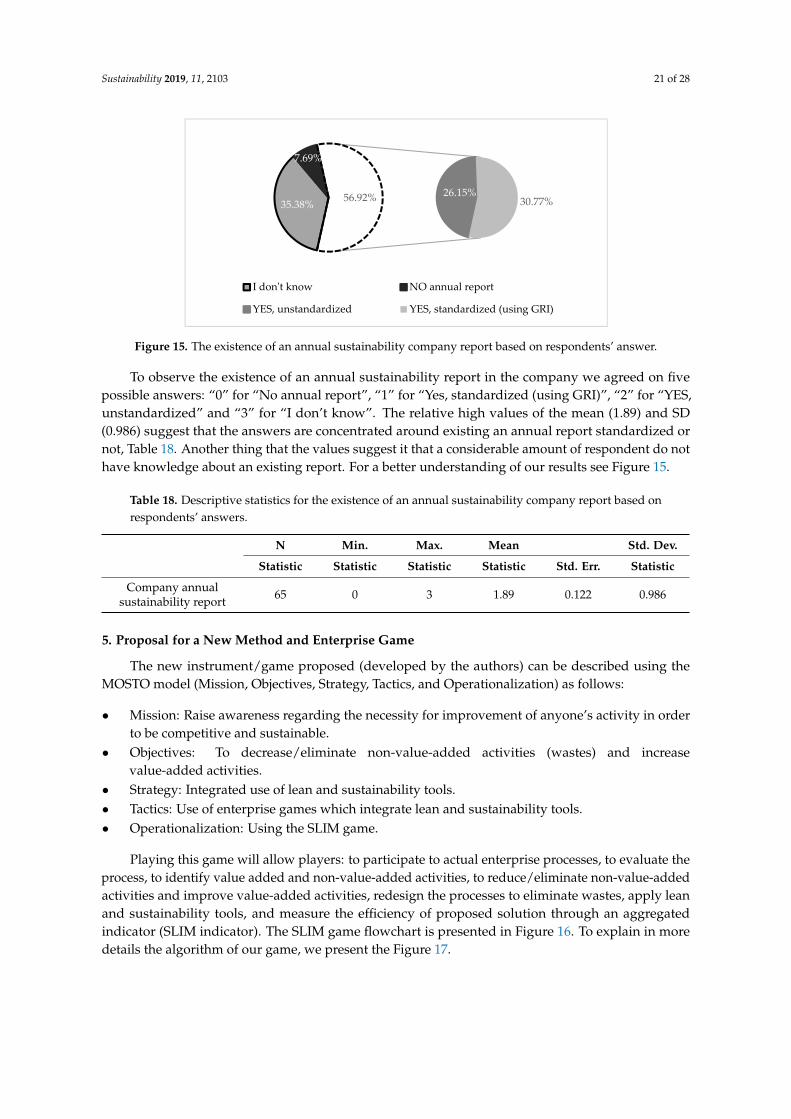
Sustainability 2019, 11, 2103 21 of 28
Sustainability 2019, 11, x FOR PEER REVIEW 20 of 27
Defects or Scrap 65 1 5 3.06 0.162 1.310 Waiting 65 1 5 3.45 0.154 1.238
From Figure 15 we can observe that a high percentage of respondents have the knowledge of an annual sustainability report out of which 26.15% use an unstandardized report, while 30.77% create a standardized report based on the GRI (Global Report Initiative) recommendations. The rest of the respondents replied that the company does not create an annual sustainability report (7.69%) and a considerable percent replied as not having knowledge about all of the company’s annual reports (35.38%).
Figure 15. The existence of an annual sustainability company report based on respondents’ answer.
To observe the existence of an annual sustainability report in the company we agreed on five possible answers: “0” for “No annual report”, “1” for “Yes, standardized (using GRI)”, “2” for “YES, unstandardized” and “3” for “I don’t know”. The relative high values of the mean (1.89) and SD (0.986) suggest that the answers are concentrated around existing an annual report standardized or not, Table 18. Another thing that the values suggest it that a considerable amount of respondent do not have knowledge about an existing report. For a better understanding of our results see Figure 15.
Table 18. Descriptive statistics for the existence of an annual sustainability company report based on respondents’ answers.
N Min. Max. Mean Std. Dev.
Statistic Statistic Statistic Statistic Std. Err. Statistic Company annual
sustainability report 65 0 3 1.89 0.122 0.986
5. Proposal for a New Method and Enterprise Game
The new instrument/game proposed (developed by the authors) can be described using the MOSTO model (Mission, Objectives, Strategy, Tactics, and Operationalization) as follows:
• Mission: Raise awareness regarding the necessity for improvement of anyone’s activity in order to be competitive and sustainable.
• Objectives: To decrease/eliminate non-value-added activities (wastes) and increase value-added activities.
• Strategy: Integrated use of lean and sustainability tools. • Tactics: Use of enterprise games which integrate lean and sustainability tools. • Operationalization: Using the SLIM game.
Playing this game will allow players: to participate to actual enterprise processes, to evaluate the process, to identify value added and non-value-added activities, to reduce/eliminate non-value-added activities and improve value-added activities, redesign the processes to eliminate wastes,
35.38%
7.69%
26.15%30.77%56.92%
I don't know NO annual report
YES, unstandardized YES, standardized (using GRI)
Figure 15. The existence of an annual sustainability company report based on respondents’ answer.
To observe the existence of an annual sustainability report in the company we agreed on fivepossible answers: “0” for “No annual report”, “1” for “Yes, standardized (using GRI)”, “2” for “YES,unstandardized” and “3” for “I don’t know”. The relative high values of the mean (1.89) and SD(0.986) suggest that the answers are concentrated around existing an annual report standardized ornot, Table 18. Another thing that the values suggest it that a considerable amount of respondent do nothave knowledge about an existing report. For a better understanding of our results see Figure 15.
Table 18. Descriptive statistics for the existence of an annual sustainability company report based onrespondents’ answers.
N Min. Max. Mean Std. Dev.
Statistic Statistic Statistic Statistic Std. Err. Statistic
Company annualsustainability report 65 0 3 1.89 0.122 0.986
5. Proposal for a New Method and Enterprise Game
The new instrument/game proposed (developed by the authors) can be described using theMOSTO model (Mission, Objectives, Strategy, Tactics, and Operationalization) as follows:
• Mission: Raise awareness regarding the necessity for improvement of anyone’s activity in orderto be competitive and sustainable.
• Objectives: To decrease/eliminate non-value-added activities (wastes) and increasevalue-added activities.
• Strategy: Integrated use of lean and sustainability tools.• Tactics: Use of enterprise games which integrate lean and sustainability tools.• Operationalization: Using the SLIM game.
Playing this game will allow players: to participate to actual enterprise processes, to evaluate theprocess, to identify value added and non-value-added activities, to reduce/eliminate non-value-addedactivities and improve value-added activities, redesign the processes to eliminate wastes, apply leanand sustainability tools, and measure the efficiency of proposed solution through an aggregatedindicator (SLIM indicator). The SLIM game flowchart is presented in Figure 16. To explain in moredetails the algorithm of our game, we present the Figure 17.
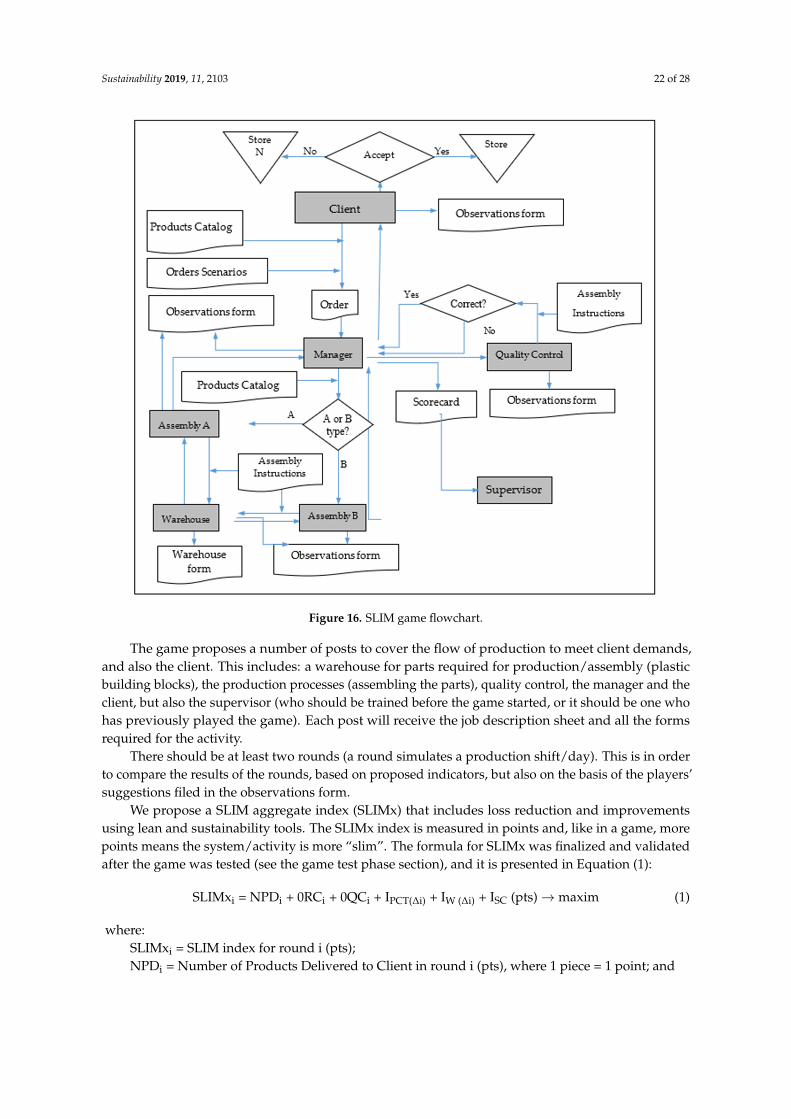
Sustainability 2019, 11, 2103 22 of 28
Sustainability 2019, 11, x FOR PEER REVIEW 21 of 27
apply lean and sustainability tools, and measure the efficiency of proposed solution through an aggregated indicator (SLIM indicator). The SLIM game flowchart is presented in Figure 16. To explain in more details the algorithm of our game, we present the Figure 17.
The game proposes a number of posts to cover the flow of production to meet client demands, and also the client. This includes: a warehouse for parts required for production/assembly (plastic building blocks), the production processes (assembling the parts), quality control, the manager and the client, but also the supervisor (who should be trained before the game started, or it should be one who has previously played the game). Each post will receive the job description sheet and all the forms required for the activity.
There should be at least two rounds (a round simulates a production shift/day). This is in order to compare the results of the rounds, based on proposed indicators, but also on the basis of the players’ suggestions filed in the observations form.
Figure 16. SLIM game flowchart. Figure 16. SLIM game flowchart.
The game proposes a number of posts to cover the flow of production to meet client demands,and also the client. This includes: a warehouse for parts required for production/assembly (plasticbuilding blocks), the production processes (assembling the parts), quality control, the manager and theclient, but also the supervisor (who should be trained before the game started, or it should be one whohas previously played the game). Each post will receive the job description sheet and all the formsrequired for the activity.
There should be at least two rounds (a round simulates a production shift/day). This is in orderto compare the results of the rounds, based on proposed indicators, but also on the basis of the players’suggestions filed in the observations form.
We propose a SLIM aggregate index (SLIMx) that includes loss reduction and improvementsusing lean and sustainability tools. The SLIMx index is measured in points and, like in a game, morepoints means the system/activity is more “slim”. The formula for SLIMx was finalized and validatedafter the game was tested (see the game test phase section), and it is presented in Equation (1):
SLIMxi = NPDi + 0RCi + 0QCi + IPCT(∆i) + IW (∆i) + ISC (pts)→maxim (1)
where:SLIMxi = SLIM index for round i (pts);NPDi = Number of Products Delivered to Client in round i (pts), where 1 piece = 1 point; and
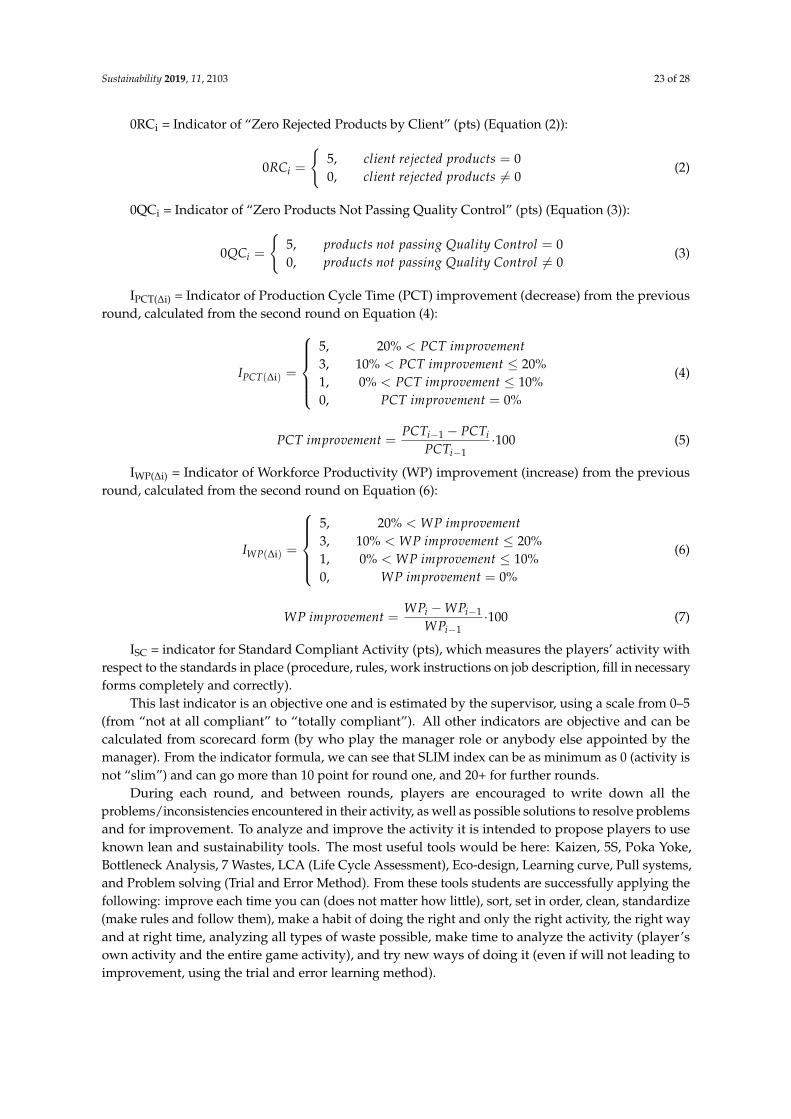
Sustainability 2019, 11, 2103 23 of 28
0RCi = Indicator of “Zero Rejected Products by Client” (pts) (Equation (2)):
0RCi =
{5, client rejected products = 00, client rejected products 6= 0
(2)
0QCi = Indicator of “Zero Products Not Passing Quality Control” (pts) (Equation (3)):
0QCi =
{5, products not passing Quality Control = 00, products not passing Quality Control 6= 0
(3)
IPCT(∆i) = Indicator of Production Cycle Time (PCT) improvement (decrease) from the previousround, calculated from the second round on Equation (4):
IPCT(∆i) =
5, 20% < PCT improvement3, 10% < PCT improvement ≤ 20%1, 0% < PCT improvement ≤ 10%0, PCT improvement = 0%
(4)
PCT improvement =PCTi−1 − PCTi
PCTi−1·100 (5)
IWP(∆i) = Indicator of Workforce Productivity (WP) improvement (increase) from the previousround, calculated from the second round on Equation (6):
IWP(∆i) =
5, 20% < WP improvement3, 10% < WP improvement ≤ 20%1, 0% < WP improvement ≤ 10%0, WP improvement = 0%
(6)
WP improvement =WPi −WPi−1
WPi−1·100 (7)
ISC = indicator for Standard Compliant Activity (pts), which measures the players’ activity withrespect to the standards in place (procedure, rules, work instructions on job description, fill in necessaryforms completely and correctly).
This last indicator is an objective one and is estimated by the supervisor, using a scale from 0–5(from “not at all compliant” to “totally compliant”). All other indicators are objective and can becalculated from scorecard form (by who play the manager role or anybody else appointed by themanager). From the indicator formula, we can see that SLIM index can be as minimum as 0 (activity isnot “slim”) and can go more than 10 point for round one, and 20+ for further rounds.
During each round, and between rounds, players are encouraged to write down all theproblems/inconsistencies encountered in their activity, as well as possible solutions to resolve problemsand for improvement. To analyze and improve the activity it is intended to propose players to useknown lean and sustainability tools. The most useful tools would be here: Kaizen, 5S, Poka Yoke,Bottleneck Analysis, 7 Wastes, LCA (Life Cycle Assessment), Eco-design, Learning curve, Pull systems,and Problem solving (Trial and Error Method). From these tools students are successfully applying thefollowing: improve each time you can (does not matter how little), sort, set in order, clean, standardize(make rules and follow them), make a habit of doing the right and only the right activity, the right wayand at right time, analyzing all types of waste possible, make time to analyze the activity (player’sown activity and the entire game activity), and try new ways of doing it (even if will not leading toimprovement, using the trial and error learning method).
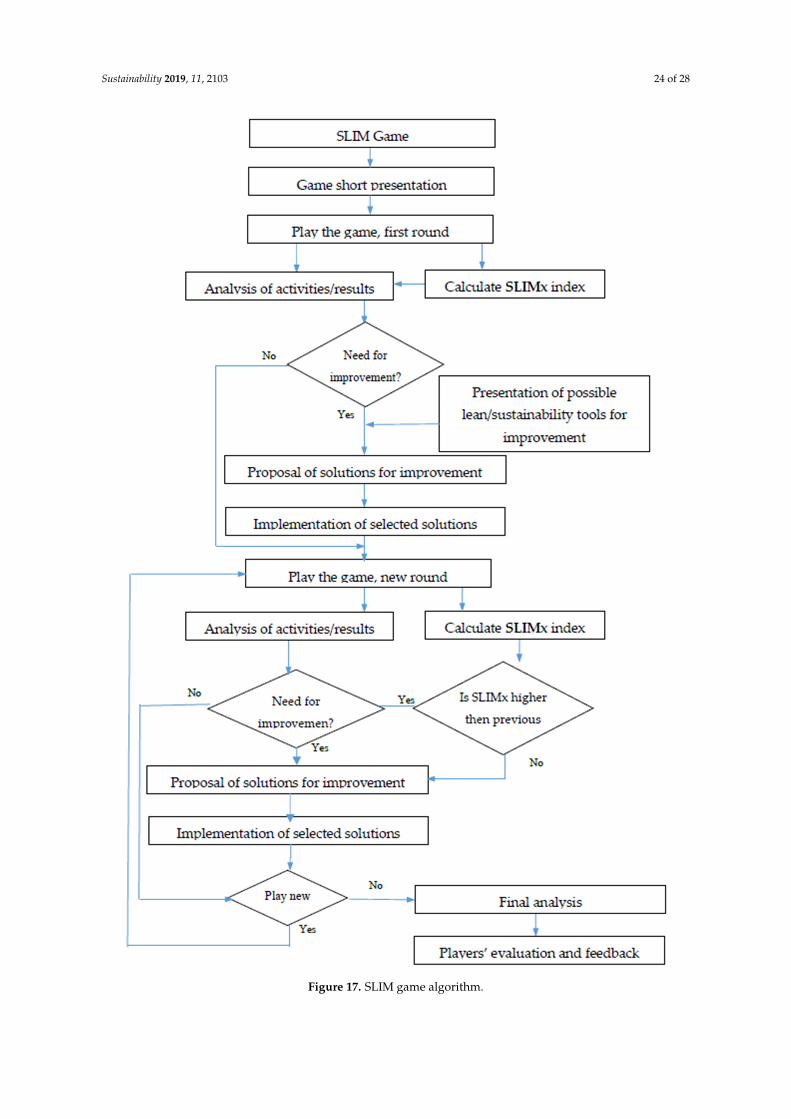
Sustainability 2019, 11, 2103 24 of 28
2
Figure 17. SLIM game algorithm.
Sustainability 2019, 11, 2103 25 of 28
The solutions proposed by the players are discussed, approved (by the manager or by vote)and implemented. All procedures/forms needed to be modified are modified. Being a game,rewards/prizes can be considered and offered for different results obtained by the players during thegame and at the end for individual and/or team success.
In the end, discussions may be moderated to find possibilities of implementing improvementproposals in enterprises, at the workplace of the players.
The game is flexible in different ways: duration, type and number of post/players, activities,ordering scenarios, etc. The game can run for a minimum recommendation of 60 min, but it cantake up to two, four, or more hours, depending on the duration of a round (recommended between15 and 45 min), depending on the number of players (minimum six, without a maximum), dependingon the number of spare parts available, or depending on the customer order scenario (more or lessproducts can be ordered, or less or more often during a round). Other types of posts can be added:logistics (transport between posts may be one of the most probable/frequent problems), humanresources (player/employee evaluation), accounting and financial (to assess the results and establishthe efficiency of the activity), and marketing (to promote products, establish new products, etc.).
We recommend to start the game without prior training of the players, all that they need toknow and do is written in the job description. Additionally, the work instructions must be sufficientlydetailed and clear that the activity can be performed, but with obvious (or less obvious) possibilities forimprovement, such as: better activities description, more detailed information, clearer/larger picturesand step-by-step or piece-by-piece assembly algorithms. The game space should be sufficient, but alsowith the possibility to extend it if players propose, when bottlenecks appear on the activity flows.
The game was tested by playing it in a new educational laboratory with 15 players over threerounds, with teachers playing the supervisor position. The new educational laboratory, called“LeanSusLab” was created especially for teaching students using games, in the framework of a researchproject “Research and didactic laboratory: “Lean and Sustainability”. The test results exceededexpectations. The players were happy, even delighted, by the game (general feedback score of 4.87 outof 5), as a role playing game (4.80) with the possibility to participate on actual processes of an enterprise,by individual and team work requirements, by the interactivity (4.93), and by the applicability ofwhat they learn (4.60). Game shortcomings where more related to playing the game, as they do notunderstand exactly what and how they are supposed to do their job. A great deal of improvementpossibilities and solutions were pointed out, and some of them were implemented with relative success(the trial and error method was emphasized). Following the game test in the laboratory, we validatedthe algorithm, activities, and forms of the game, and the SLIMx indicator was finalized as in Equation(1) previously presented (with subindicators in Equations (2)–(7)).
6. Summary of Findings
In this section are presented the most important directions identified during the development ofthe research:
• The profile of our respondents can be described as employees from companies operating inthe automotive business sector (50.70%), working in the administrative or support department(43.08%) or technical department (35.38%), and mostly having knowledge of both concepts(63.08%).
• Individually asked about the concepts, we observed that respondents have a high knowledgeabout the concepts (73.85% for “lean” and 89.23% for “sustainability” concepts).
• Correlating the results from Figure 5 with the profile of our respondents shows that most of themwork in the administrative or support department (43.08%) or technical department (35.38%),and use specific tools for their working area: ISO Standards (75.38%), 5S (64.62%), and ProblemSolving (56.62%).
Sustainability 2019, 11, 2103 26 of 28
• Correlating results from Figures 5 and 6 can conclude that the interviewed companies use andimplement a vast palette of “lean” and “sustainability” tools.
• Correlating the results from Figures 7 and 8 we can conclude that the distribution of receivingand not receiving training for the “lean” and “sustainability” tools being almost equal has itsjustification in the fact that, for the type of training received, 44.62% did not receive training or werecorded missing values. This can be considered as an opportunity for our proposed game to beused by the interviewed companies.
• Although the companies’ main pursued sustainability goals are decent work and economic growth(69.23%), industry innovation and infrastructure (64.62%), and responsible consumption andproduction (61.54%), our interest also focuses on partnership for the goals (60.00%) and qualityeducation (56.92%) because we consider all of them an opportunity for our proposed game tohelp companies in achieving the goals.
• The fact that a high majority of respondents consider “lean” and “sustainability” tools to be usefulfor the company’s activity shows us the respondents’ openness towards a better understanding ofthe concept and their tools.
• Correlating the findings presented in Figures 9 and 11 we can conclude that product quality andworking conditions are of high interest for companies and its employees.
• Studying the top 10 overall company benefits based on respondents’ perception presented inFigure 12, the main pursued sustainability goals presented in Figure 9, the usefulness of thetools presented in Figure 10 and are the top activities in which “lean” and “sustainability” toolimplementation brought benefits presented in Figure 11, all come as a support to acknowledgethe latent link between “lean” and “sustainability” concepts and their tools.
• The most important finding is that Waiting (46.16%) and Defects or Scrap (40.00%) are thehighest frequency appearance drawbacks that respondents encounter in the company’s activity.Additionally, these two types of drawbacks are the most common “lean” and “sustainability”tool’s targets of improvement.
• It is noticed that 56.92% understand the importance of sustainability and report it. Even ifthere is no legislative requirement, 30.77% use standardized reporting, GRI. This strengthens theorganizational concern for increasing competitiveness and improving public image.
• The team of the 15 people who played the SLIM game contributed to the generation ofimprovement solutions, including: streamlining the communication with the warehouse and withthe managers, consolidating the position of the managers, the parts developed to be accompaniedby additional instructions, and orders from customers to be verified by a leader.
• The team members were enthusiastically involved in the game. There was a general feedbackscore of 4.87 out of 5; as a role play (4.80), with the ability to participate in the real processes of anenterprise, through individual and team requirements, through interactivity (4.93), and throughthe applicability of what they learn (4.60).
7. Conclusions, Discussion, and Limitations
Possible application of the instrument/game are: students use the game for training in thementioned domain (engineering and management) with the possibility to expand to other connecteddomain, at all levels (license, master, doctorate); the use of anyone who wants to perfect lifelong (postand pre-university level) learning; employees’ use from the enterprises for professional perfection;and the use of potential employees and the unemployed for professional perfection/reconversion.
The use potential in the social and economic environments can be related to the possibilityto exploit the intellectual property rights, especially for universities and other institutions andorganizations/companies that offer training services.
The game has a limited number of job types, but with possibilities of extension already mentioned.Game applicability is limited to production processes, but with possibilities of extension to any
Sustainability 2019, 11, 2103 27 of 28
workplace. It was designed as a paper-based system, which can be changed to a digitally-based system,using ITC technologies, mobile technologies—especially which can be used easily by players to checktheir role, responsibilities, work instructions, and forms to be filled in (digitally). These can helpautomated computation of results into KPIs, and the extension of KPIs used.
As future research the game should be used for education purposes in university and outsideuniversity, in companies interested in solutions for activity improvement. This supposes that the gameshould be tailored to meet specific needs anytime it is used. Before any use of the game, a needs studyshould be carried out, using the questionnaire already designed, but which can be modified accordingto research purposes.
The current research should be continued, and the questionnaire should be applied again in thefuture, at least yearly, with extension of the number of target companies/employees. The results canhelp improve the game to have a larger applicability in student education and in industry.
Author Contributions: All authors contributed equally to the research presented in this paper and to thepreparation of the final manuscript.
Funding: This research was funded by Politehnica University of Timisoara, research grant PCD-TC-2017 number15, contract number 16182/21.11.2017.
Acknowledgments: The authors want to acknowledge the support of Politehnica University of Timisoara, Facultyof Management in Production and Transportation, and Management Department for administrative and technicalsupport, for the use of the infrastructure, especially for allowing to create a new laboratory for research anddidactic use. We want to also acknowledge the implication of the authors’ colleagues and students in the researchand in designing and testing the new game. Additionally, we acknowledge the support of industry in the regionfor helpful discussions and survey responses.
Conflicts of Interest: The authors declare no conflict of interest.
References
1. Dües, C.M.; Tan, K.H.; Lim, M. Green as the new Lean: How to use Lean practices as a catalyst to greeningyour supply chain. J. Clean. Prod. 2013, 40, 93–100. [CrossRef]
2. Martínez-Jurado, P.J.; Moyano-Fuentes, J. Lean management, supply chain management and sustainability:A literature review. J. Clean. Prod. 2014, 85, 134–150. [CrossRef]
3. Piercy, N.; Rich, N. The relationship between lean operations and sustainable operations. Int. J. Oper. Prod.Manag. 2015, 35, 282–315. [CrossRef]
4. Adebanjo, D.; Laosirihongthong, T.; Samaranayake, P. Prioritizing lean supply chain management initiativesin healthcare service operations: A fuzzy AHP approach. Prod. Plan. Control 2016, 27, 953–966. [CrossRef]
5. Tasdemir, C.; Gazo, R. A Systematic Literature Review for Better Understanding of Lean Driven Sustainability.Sustainability 2018, 10, 2544. [CrossRef]
6. Govindan, K.; Azevedo, S.G.; Carvalho, H.; Cruz-Machado, V. Lean, Green and Resilient Practices Influenceon Supply Chain Performance: Interpretive Structural Modeling Approach. Int. J. Environ. Sci. Technol. 2015,12, 15–34. [CrossRef]
7. Egbue, O.; Wang, E.; Eseonu, C. A Lean Life Cycle Framework for Assessing Product Sustainability.In Proceedings of the IIE Annual Conference and Expo, Montréal, QC, Canada, 31 May–3 June 2014;pp. 2069–2074.
8. Cherrafi, A.; Elfezazi, S.; Govindan, K.; Garza-Reyes, J.A.; Benhida, K.; Mokhlis, A. A Framework for theIntegration of Green and Lean Six Sigma for Superior Sustainability Performance. Int. J. Prod. Res. 2017, 55,4481–4515. [CrossRef]
9. Ben Ruben, R.; Vinodh, S.; Asokan, P. Implementation of Lean Six Sigma Framework with EnvironmentalConsiderations in an Indian Automotive Component Manufacturing Firm: A Case Study. Prod. Plan. Control2017, 28, 1193–1211. [CrossRef]
10. Das, D. Development and Validation of a Scale for Measuring Sustainable Supply Chain ManagementPractices and Performance. J. Clean. Prod. 2017, 164, 1344–1362. [CrossRef]
11. Camuffo, A.; de Stefano, F.; Paolino, C. Safety Reloaded: Lean Operations and High Involvement WorkPractices for Sustainable Workplaces. J. Bus. Ethics 2015, 143, 245–259. [CrossRef]
Sustainability 2019, 11, 2103 28 of 28
12. Shou, W.; Wang, J.; Wu, P.; Wang, X.; Chong, H.Y. A Cross-Sector Review on the Use of Value StreamMapping. Int. J. Prod. Res. 2017, 55, 3906–3928. [CrossRef]
13. Vinodh, S.; Arvind, K.R.; Somanaathan, M. Tools and Techniques for Enabling Sustainability through LeanInitiatives. Clean Technol. Environ. Policy 2011, 13, 469–479. [CrossRef]
14. Faulkner, W.; Badurdeen, F. Sustainable Value Stream Mapping (Sus-VSM): Methodology to Visualize andAssess Manufacturing Sustainability Performance. J. Clean. Prod. 2014, 85, 8–18. [CrossRef]
15. Taucean, I.; Ivascu, L.; Miclea, S.; Negrut, M. Synergies between Lean and Sustainability: A Literature Reviewof Concepts and Tools. Qual. Access Success J. 2018, 20, 559–570.
16. Taucean, I.M.; Ivascu, L.; Negrut, M.; Miclea, S. Assessment of Lean Manufacturing and SustainabilityRelationship in Production Processes. In Proceedings of the 32nd IBIMA Conference, Seville, Spain,15–16 November 2018; pp. 255–262, ISBN 978-0-9998551-1-9.
17. European Commission. Europe 2020: Commission Proposes New Economic Strategy. Available online:https://ec.europa.eu/social/main.jsp?catId=89&langId=en&newsId=724&furtherNews=yes (accessed on30 December 2018).
18. Hugos, M. Enterprise Games: Using Game Mechanics to Build a Better Business, 1st ed.; O’Reilly Media: Newton,MA, USA, 2012.
19. Iftimescu, A. Business Games. Management of Simulated Enterprises. Available online: http://www.scribd.com/doc/121772636/Managementul-intreprinderilor (accessed on 1 October 2018).
20. Wells, R.A. Management Games and Simulations in Management Development: An Introduction. J. Manag.Dev. 1990, 9, 4–6. [CrossRef]
21. Tartavulea, R.I.; Belu, M.G.; Paraschiv, D.M. Using Business Simulation as a Complementary EducationalMethod in Universities. Ovidius Univ. Ann. 2012, XII, 138–142.
22. Taucean, I.M.; Matei, T. Research challenges for eLearning support in engineering and management training.Procedia-Soc. Behav. Sci. 2014, 124, 210–218. [CrossRef]
23. Ionita, F.; Cochina, I.; Shuleski, D. Never Stop Playing: Management Games as Valuable Training Tools.In Proceedings of the International Management Conference, Bucharest, Romania, 5–6 November 2015;Volume 9, pp. 266–277.
24. Condurache, G.; Daianu, D.C.; Taucean, I. Aspects regarding the competences of teacher/trainers in apractice enterprise. In Proceedings of the International Seminar on Quality Management in Higher EducationLocation, Quality Management in Higher Education, Iasi, Romania, 8–10 July 2006; pp. 55–59.
25. Pavaloiu, I.B. Games as student groundwork for business management training. In Proceedings of theInternational Conference, European Proceedings of Social and Behavioural Sciences, Pitesti, Romania, 4–5 November2016; pp. 1016–1024. [CrossRef]
26. Trifan, L.; Mustata, C. Inducing entrepreneurial behaviour by business management simulation games.In Proceedings of the 7th International Conference on Education and New Learning Technologies(Edulearn15), Barcelona, Spain, 7–8 July 2015; pp. 6426–6433.
27. Ivascu, L.; Cioca, L.-I. Occupational Accidents Assessment by Field of Activity and Investigation Model forPrevention and Control. Safety 2019, 5, 12. [CrossRef]
28. Mocofan, M. Learning by games; a study case of the coffe project implementation in Romania. In Proceedingsof the International Scientific Conference eLearning and Software for Education, Bucharest, Romania,21–22 April 2016; Volume 1, p. 529.
29. Zamfir, A.; Plumb, I.; Dobrin, C.; Popa, I. Using computers and simulations in business education.In Proceedings of the 10th WSEAS international conference on Mathematics and computers in business andeconomics, Prague, Czech Republic, 23–25 March 2009; pp. 147–152.
30. Chichernea, V. Interactive methods used in graduate programs. Reliab. Qual. Control Pract. Exp. J. 2007, 2,171–178.
© 2019 by the authors. Licensee MDPI, Basel, Switzerland. This article is an open accessarticle distributed under the terms and conditions of the Creative Commons Attribution(CC BY) license (http://creativecommons.org/licenses/by/4.0/).
Top Related
Copyright © 2022 FDOKUMEN

