


Bahasa
Halaman
Hukum

Buildings 2022, 12, 770. https://doi.org/10.3390/buildings12060770 www.mdpi.com/journal/buildings
Article
Integrated Building Maintenance and Safety Framework:
Educational and Public Facilities Case Study
Kun‐Chi Wang 1, Reut Almassy 2, Hsi‐Hsien Wei 3 and Igal M. Shohet 1,4,*
1 Department of Civil and Construction Engineering, Chaoyang University of Technology,
Taichung 413, Taiwan; [email protected] 2 Safety Management and Engineering Unit, Department of Civil and Environmental Engineering,
Faculty of Engineering Sciences, Ben‐Gurion University of the Negev, Beer‐Sheva 8410501, Israel;
[email protected] 3 Department of Building and Real Estate, Hong Kong Polytechnic University, Hong Kong, China;
[email protected] 4 Department of Civil and Environmental Engineering, Faculty of Engineering Sciences,
Ben‐Gurion University of the Negev, Beer‐Sheva 8410501, Israel
* Correspondence: [email protected]
Abstract: The facility safety is a highly important issue in educational institutions and public facili‐
ties, where the safety and health of the occupants (students, educational and public service staff) is
a high‐order priority. The research hypothesizes that a synergy exists between the maintenance and
safety of public facilities. Analytical–empirical research methods were aimed at the development of
an integrated maintenance–safety framework. The framework was validated through inferential
statistics and a case study. A correlation (R2) of 0.74 between the level of maintenance and the safety
level of 24 educational facilities was found using the Pearson correlation coefficient. The levels of
maintenance and of safety observed were marginal. An innovative Integrated Safety–maintenance
performance framework was developed for synergetic safety–maintenance monitoring, control and
management. The framework proposes a cycle loop of safety–maintenance–performance audits of
facilities as a key tool for advanced maintenance and safety management in public facilities. The
framework was validated in a case study of public facility. The time history of maintenance perfor‐
mance and safety shows a high level of fitness (R2 = 0.8865, p‐Value < 0.05). These research findings
stress that integrated safety and maintenance should be implemented as a unified procedure to en‐
hance the advanced maintenance performance and safety climate in public facilities management.
Keywords: facilities management; maintenance; performance; risk; safety
1. Introduction
Facility safety is highly important in educational institutions and public facilities in
particular, where the safety and health of the occupants (students, educational and public
service staff) is a high order of priority [1,2]. The safety of users of buildings and facilities
is a highly important facility management issue. During the construction of the building,
design methods and materials will be reviewed for different types of buildings and facil‐
ities to ensure the sustainability of the facilities, as well as the safety of users of the build‐
ings and facilities [3–5]. In addition to the consideration of the construction process, the
proactive management of maintenance and performance, as well as safety assessment of
the facility during the maintenance phase, are required in order to effectively improve the
safety mode of the building [6]. However, for the safety assessment of building facilities,
there is currently no definite assessment methodology or indicator, nor a set of valid as‐
sessment models, for the implementation of these procedures [7]. To this end, this study
summarizes the development of an integrated risk‐informed methodology aimed at the
integration between the maintenance and safety of facilities as a performance
Citation: Wang, K.‐C.; Almassy, R.;
Wei, H.‐H.; Shohet, I.M. Integrated
Building Maintenance and Safety
Framework: Educational and Public
Facilities Case Study. Buildings 2022,
12, 770. https://doi.org/
10.3390/buildings12060770
Academic Editor: Ana Silva
Received: 26 April 2022
Accepted: 30 May 2022
Published: 5 June 2022
Publisher’s Note: MDPI stays neu‐
tral with regard to jurisdictional
claims in published maps and institu‐
tional affiliations.
Copyright: © 2022 by the authors. Li‐
censee MDPI, Basel, Switzerland.
This article is an open access article
distributed under the terms and con‐
ditions of the Creative Commons At‐
tribution (CC BY) license (https://cre‐
ativecommons.org/licenses/by/4.0/).
Buildings 2022, 12, 770 2 of 22
management tool for the fostering of the maintenance and safety of facilities, taking ad‐
vantage of the synergy between these disciplines. The research develops a model for eval‐
uating and managing building safety and maintenance through this integrated method‐
ology of maintenance and safety indicators.
The development of methods for safety assessments in educational institutions is a
ubiquitous research topic, Al‐Hemoud and Al‐Asfoor [2] developed the Behavioral‐Based
Safety (BBS) that introduces safety using a behavioral safety approach. This theory follows
Heinrich’s [8] theory of the human factor in accident causation and stresses the training
of individuals, safety control and inspection. DePasquale and Geller [9] examined the suc‐
cess of BBS models from the workers’ perspective and found five predictive parameters
of the success of the method: (a) effective training, (b) senior management trust, (c) effec‐
tive safety control, (d) training of workers and (e) workers’ commitment. Elementary and
high school educational institution occupants are heterogenic groups with diverse pat‐
terns of safety behavior assimilation and, therefore, are more vulnerable to safety hazards
[10–12]. Sabatino et al. [13] stressed that a methodology for the optimal maintenance of
buildings must integrate into its considerations the consequences of a system failure or
poor performance. Lai and Yik [14] studied the parameters of the optimal maintenance
setup that will provide safety, efficiency and high user satisfaction within the building’s
occupants. Through a survey of 279 questionnaires in residential buildings in Hong Kong,
the researchers analyzed five parameters of maintenance services: safety, cleanliness,
break down and routine maintenance, aesthetics and overall satisfaction. This research
did not consider the building performance as a key parameter of an optimal maintenance
plan. Olanrewaju et al. [15] studied resource allocation priority settings in university fa‐
cilities in Malaysia. The researchers found out that breakdown maintenance of visible
components such as elevators, power supply and roofing failures are a high‐order priority
and should receive higher precedence in the allocation of routine maintenance resources.
This review emphasizes the ultimate role of facility maintenance in ensuring the occu‐
pants’ safety and satisfaction, as the latter is highly important and crucial in educational
institutions and public facilities.
The research main objective is to investigate the correlation between maintenance
and safety performance in educational and public facilities as a basis for the development
of integrated maintenance and safety framework. Six research subgoals are defined as fol‐
lows:
a. Definition of the risk factors, according to the facility components, performance and
users;
b. Development of a methodology for the assessment of the safety risks in educational
and public facilities;
c. Assessment of the maintenance and safety performances in educational and public
facilities;
d. Development of an Integrated Safety–Maintenance management framework;
e. Implementation of the framework and validation of the research hypotheses;
f. Recommendations for further research and concluding remarks.
Subsequent from the research hypotheses, findings and conclusions, a new frame‐
work for integrated risk‐informed maintenance and safety surveys and performance as‐
sessments is introduced as a part of the facility management. The framework is designated
to take advantage of the synergy between safety and maintenance so as to enhance the
maintenance, performance and safety of public facilities. This proposed framework will
stimulate lower probabilities of safety hazards in the performances of public facilities; im‐
prove the sustainable performance of the facilities on a continuous basis and can fit into
other types of facilities such as energy, healthcare, residential buildings and off‐shore fa‐
cilities. While previous research on the topic of safety and maintenance focused on the
role of the human factor, in the synergy between maintenance and safety, e.g., Hobbs and
Williamson [16] in the Aeronautics industry and Farrington‐Darby et al. [17]. In the
Buildings 2022, 12, 770 3 of 22
railway maintenance industry, this research develops a systemic and inherent synergy
and introduces an integrated performance control of safety and maintenance management
in public and educational facilities.
2. Literature Review
The literature review develops a research theme based on the definitions of the core
topics of the research, review of the risk factors maintenance and safety indicators in fa‐
cilities.
The core variables of this study, encompassing safety, maintenance, risk, acceptable
risk and building performance, were defined on the basis of the literature, as follows in
Table 1:
Table 1. Cross‐comparative definitions of the core variables of the research.
Parameter Definition Cross‐Comparative Definition
Safety All preventive measures aimed at ensuring
user well‐being and facility‐designated use.
Hollnagel [18] indicated that safety is accom‐
plished through the prevention of hazards, un‐
safe events and the consequences of structural
failures.
Maintenance
Activities carried out to maintain the durabil‐
ity and performance of the building in ac‐
cordance with its designated use.
Three aspects of key facility maintenance: (1) ac‐
tual service condition of the system, (2) failures
affecting the service condition provided by the
system and (3) actual preventive activities car‐
ried out to maintain acceptable designated ser‐
vice condition [19].
Risk The probability and severity of an undesired
event.
Aven [20] stated that the capability to express
risk quantitatively and compare alternative miti‐
gation strategies is at the heart of risk manage‐
ment.
Building performance
The concept in which the functions of build‐
ings are defined by their outcomes rather
than by prescription. Performance is deter‐
mined by a building’s success in achieving
user satisfaction and meeting designated per‐
formance criteria.
The evaluation of the overall service condition of
the building or of the building portfolio, accord‐
ing to the performance criteria of its components
and systems defined by its designated use and
current standards [19].
Acceptable risk The level of risk deemed acceptable for an
organization.
Hollnagel [21] stated that risk and safety are
conceptually and practically linked—with
higher safety meaning lower risk—and that the
most effective way to achieve safety is through
proactive mitigation actions.
The definitions stem from the performance concept and are supported by cross‐ref‐
erencing from the literature.
2.1. Risk Factors
Risk assessment and management is a key driver of building performance and
maintenance management [15,17]. Using the fatigue design factor, Straub and Faber [22]
developed a risk‐based inspection strategy for planning an optimal inspection regime for
structural components. Khalil et al. [23] developed integrated indicators of a building per‐
formance and user risk through the analytical hierarchy process method. Their method‐
ology yielded a building performance risk rating tool (BPRT). They identified five critical
risk indicators: (1) structural stability, (2) fire protection services, (3) building‐related pa‐
thology, (4) emergency exits and (5) electrical services. The BPRT was implemented in the
Buildings 2022, 12, 770 4 of 22
maintenance of higher education buildings in Malaysia. Khan et al. [24] introduced a risk‐
based maintenance methodology composed of three modules: (1) risk estimation, (2) risk
evaluation and (3) maintenance planning. They used a heating, ventilation and air‐condi‐
tioning (HVAC) system as a case study of risk‐based maintenance to validate their meth‐
odology. The case study contributed to the successful reduction of risk in an HVAC sys‐
tem from an unacceptable level to an acceptable level.
Backlund and Hannu [25] compared three strategies of systems risk assessment to
identify a maintenance strategy that minimizes maintenance costs as a part of the dereg‐
ulation of the Swedish hydro power plants sector. The researchers identified several key
maintenance‐related tasks for accurately assessing risk: (1) exposure time, (2) frequency
estimation, (3) consequence estimation, (4) qualitative and quantitative methods for relia‐
bility and frequency estimation, (5) teamwork, (6) performance analysis and (7) uncer‐
tainty and sensitivity analysis. Khan and Haddara [26] developed effective risk‐based
maintenance for HVAC systems by using a scenario analysis, probabilistic failure analy‐
sis, risk estimation and evaluation and maintenance planning.
De Silva et al. [27] identified 10 maintenance‐related risk factors for buildings: (1)
architecture and design risks; (2) structural and detailing risks; (3) service integration
risks; (4) accessibility risks; (5) maintenance requirement risks; (6) material and spare parts
risks; (7) constructability risks; (8) maintenance process quality risks; (9) characteristics,
environment and exposure risks and (10) user requirement and change‐related risks. De
Silva et al. [27] emphasized the integration of various characteristics of the exposure of the
building environment to hazards. Addressing such exposure requires the integration of
risk management, safety and maintenance. Ruparathna et al. [28] developed a risk‐based
scenario planning approach that incorporates predicted changes in technology, costs and
organizational strategies for the selection of maintenance strategies. Their methodology
minimizes financial risk. Their study also stressed the integration between risk and
maintenance planning.
Chiu et al. [29] used the concept of the reliability of a series system to develop a theory
of the deterioration risk of Reinforced Concrete structures exposed to chloride attacks.
They determined an optimal maintenance plan using probabilistic effect assessment mod‐
els that considered the effects of maintenance strategies on the failure and spalling prob‐
ability of a structure and could be used to estimate life cycle costs and performances. Their
study emphasized the need to integrate safety and maintenance in a comprehensive
framework.
2.2. Maintenance
Despite being part of the last stage of the facilities life cycle, the maintenance and
management of buildings should be considered throughout the design stage. Such con‐
siderations should include the intensity of the facility use, facility attributes, facility
maintenance methods, facility maintenance costs, facility vulnerabilities, the total number
of facilities and the facility maintenance period [30–32]. That is, the impact of the building
material configuration on the building facilities (including durability and replaceability)
must be considered in the building design. If these factors are considered in detail in the
design stage, a building can be maintained and managed at low cost [33].
The quality of buildings and their facilities is often poor because of a lack of proper
building maintenance and management, even with high maintenance costs [34–36]. In ad‐
dition, once passive management is adopted, various types of building defects, including
structural or nonstructural cracking and concrete fragments spalling, can cause severe
damage. Therefore, many studies have proposed building maintenance and management
methods that fall into one of three categories: corrosive, preventive or predictive mainte‐
nance. Among these, corrosive maintenance is passive and involves repairing equipment
after it is damaged, whereas the other two types of maintenance are active [30]. An opti‐
mization framework was developed to consider the interdependencies among different
Buildings 2022, 12, 770 5 of 22
units of HVAC equipment and interdependencies among maintenance, operation and
equipment durability to deduce predictive and preventive maintenance.
Saqib, Faruoqui and Lodi [37] identified 77 factors and classified them into seven
categories, including project management–related factors, procurement‐related factors,
client‐related factors and business‐related factors. They revealed that the 10 CSFs (Critical
Success Factors) of a project are decision‐making effectiveness, project manager experi‐
ence, contractor cash flow, contractor experience, owner or owner representative decision
timeliness, site management, supervision, planning effort, project management experi‐
ence and client decision‐making ability. They determined that the five CSF groups that
most influence project success are contractor‐related factors, project manager–related fac‐
tors, procurement‐related factors, design team–related factors and project management‐
related factors. Au Yong et al. [38,39] validated the importance and role of safety for set‐
ting the priority of maintenance activities.
2.3. Safety Indicators
Safety indicators are the core and key tool for the control and management of safety
in the facilities life cycle. Ho et al. [40] developed a system composed of a building health
and hygiene index (BHHI) and a building safety and conditions index (BSCI) for the im‐
provement of tall residential building performance, hygiene and safety in Hong Kong.
They surveyed 140 tall residential buildings and used their survey results to develop an
assessment method based on a hierarchy of indicators: (1) architectural design, (2) build‐
ing services design, (3) the surrounding environment, (4) operations and maintenance and
(5) management. They concluded that management systems account for 82% of the vari‐
ance in the BHHI and 45% of the variance in the BSCI. Their results emphasized the im‐
portance of building management systems for the safety and health of building users, par‐
ticularly in densely populated areas. Hopkins [41] stressed that process safety indicators
should measure the effectiveness of the risk control system and that these indicators must
be included in an incentive payment scheme. Nevertheless, Hopkins emphasized that
careful attention is required to avoid managing the management process rather than ac‐
tual safety. Following Hopkins, Harms‐Ringdahl [42] determined that the core safety in‐
dicators can be static or dynamic and should reflect the organizational safety process, as
well as the outcomes. Ryczyński et al. [43] proposed that, to strengthen structural safety
and durability, special attention must be paid to the causes of cracks, as well as to planning
and conducting appropriate repairs. In addition, many building safety accidents are
caused by faulty designs. Therefore, risk assessment in the design stage is crucial in risk
management [44].
This review of the concepts of risk factors, maintenance and safety indicators reveals
a gap in the integration between risk, maintenance and safety for synergetic and inte‐
grated maintenance and the safety management of facilities and indicates the research
gap. The latter derived the principal purpose of the research: the development of an inte‐
grated maintenance–safety framework, as well as the subgoals, to examine the correlation
between safety and maintenance in educational and public facilities.
The research hypotheses were derived from the research gap and literature as fol‐
lows:
a. A correlation exists between the maintenance performance of the educational facility
and its safety, i.e., the higher the maintenance performance of the facility, the higher
the safety of the facility is.
b. There exists a correlation between the density of occupants (occupancy) and the per‐
formance and safety of educational and public facilities.
3. Integrated Risk‐Informed Safety–Maintenance Framework
An integrated risk‐informed safety–maintenance framework was developed within
the scope of the research. The framework is composed of the performance model
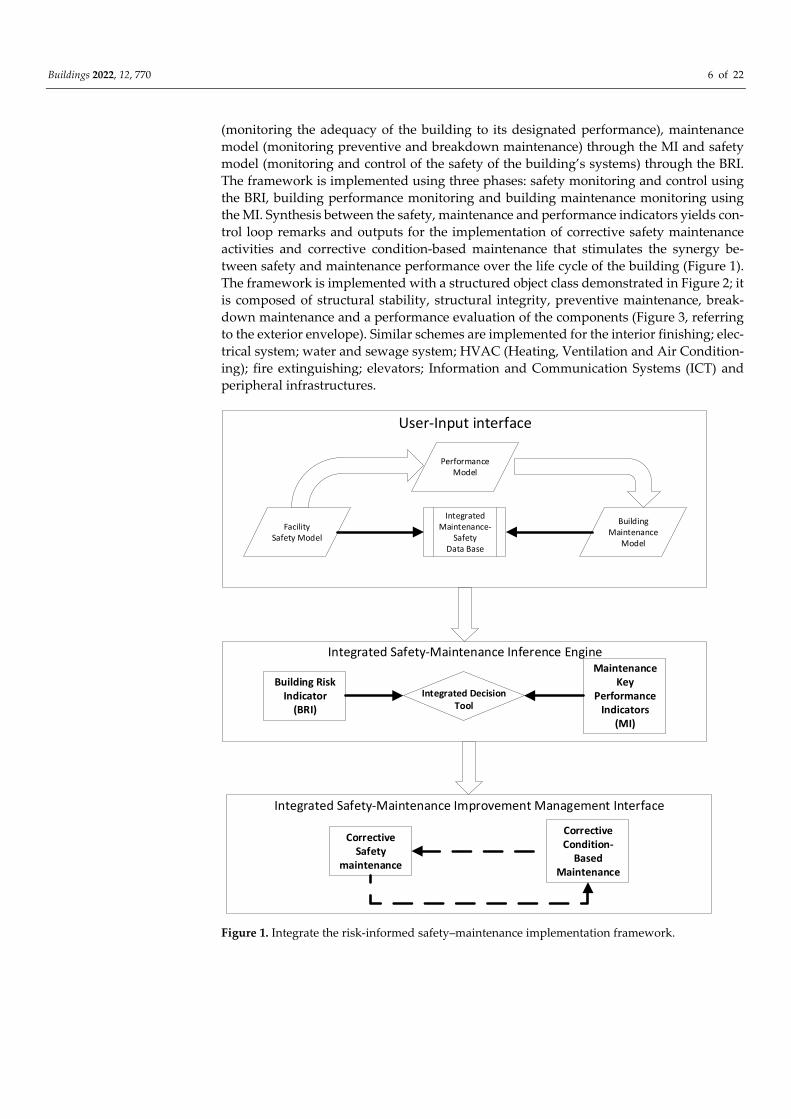
Buildings 2022, 12, 770 6 of 22
(monitoring the adequacy of the building to its designated performance), maintenance
model (monitoring preventive and breakdown maintenance) through the MI and safety
model (monitoring and control of the safety of the building’s systems) through the BRI.
The framework is implemented using three phases: safety monitoring and control using
the BRI, building performance monitoring and building maintenance monitoring using
the MI. Synthesis between the safety, maintenance and performance indicators yields con‐
trol loop remarks and outputs for the implementation of corrective safety maintenance
activities and corrective condition‐based maintenance that stimulates the synergy be‐
tween safety and maintenance performance over the life cycle of the building (Figure 1).
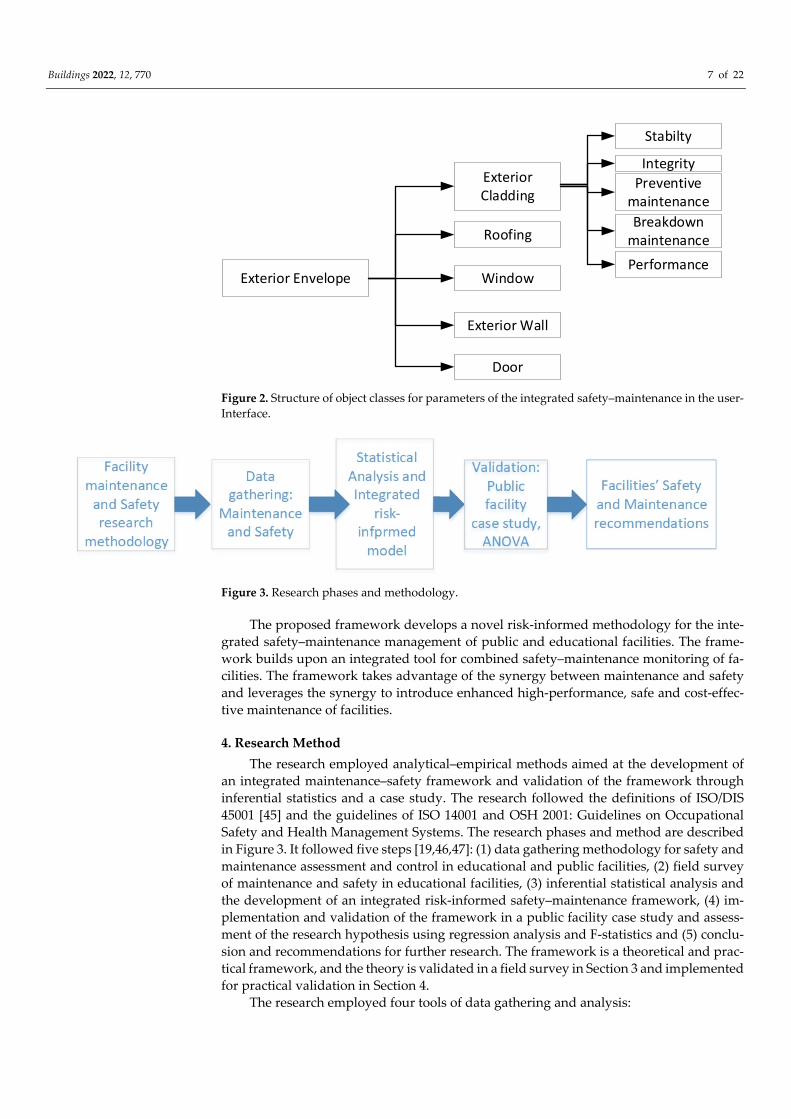
The framework is implemented with a structured object class demonstrated in Figure 2; it
is composed of structural stability, structural integrity, preventive maintenance, break‐
down maintenance and a performance evaluation of the components (Figure 3, referring
to the exterior envelope). Similar schemes are implemented for the interior finishing; elec‐
trical system; water and sewage system; HVAC (Heating, Ventilation and Air Condition‐
ing); fire extinguishing; elevators; Information and Communication Systems (ICT) and
peripheral infrastructures.
Figure 1. Integrate the risk‐informed safety–maintenance implementation framework.
User‐Input interface
Facility Safety Model
Building Maintenance
Model
Performance Model
Integrated Maintenance‐
Safety Data Base
Building Risk Indicator(BRI)
Integrated Decision Tool
Maintenance Key
Performance Indicators
(MI)
Integrated Safety‐Maintenance Inference Engine
Integrated Safety‐Maintenance Improvement Management Interface
Corrective Safety
maintenance
Corrective Condition‐Based
Maintenance
Buildings 2022, 12, 770 7 of 22
Figure 2. Structure of object classes for parameters of the integrated safety–maintenance in the user‐
Interface.
Figure 3. Research phases and methodology.
The proposed framework develops a novel risk‐informed methodology for the inte‐
grated safety–maintenance management of public and educational facilities. The frame‐
work builds upon an integrated tool for combined safety–maintenance monitoring of fa‐
cilities. The framework takes advantage of the synergy between maintenance and safety
and leverages the synergy to introduce enhanced high‐performance, safe and cost‐effec‐
tive maintenance of facilities.
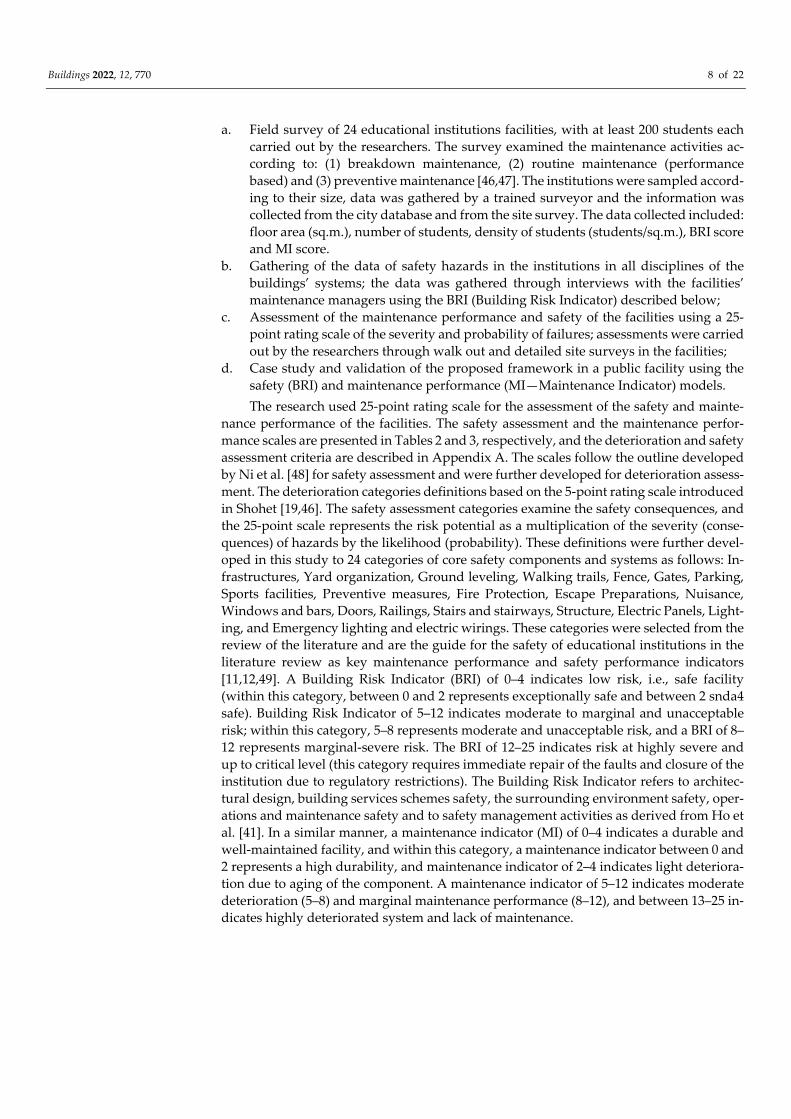
4. Research Method
The research employed analytical–empirical methods aimed at the development of
an integrated maintenance–safety framework and validation of the framework through
inferential statistics and a case study. The research followed the definitions of ISO/DIS
45001 [45] and the guidelines of ISO 14001 and OSH 2001: Guidelines on Occupational
Safety and Health Management Systems. The research phases and method are described
in Figure 3. It followed five steps [19,46,47]: (1) data gathering methodology for safety and
maintenance assessment and control in educational and public facilities, (2) field survey
of maintenance and safety in educational facilities, (3) inferential statistical analysis and
the development of an integrated risk‐informed safety–maintenance framework, (4) im‐
plementation and validation of the framework in a public facility case study and assess‐
ment of the research hypothesis using regression analysis and F‐statistics and (5) conclu‐
sion and recommendations for further research. The framework is a theoretical and prac‐
tical framework, and the theory is validated in a field survey in Section 3 and implemented
for practical validation in Section 4.
The research employed four tools of data gathering and analysis:
Exterior Envelope
Exterior Cladding
Roofing
Window
Door
Exterior Wall
Integrity
Preventive maintenance
Breakdown maintenance
Stabilty
Performance
Buildings 2022, 12, 770 8 of 22
a. Field survey of 24 educational institutions facilities, with at least 200 students each
carried out by the researchers. The survey examined the maintenance activities ac‐
cording to: (1) breakdown maintenance, (2) routine maintenance (performance
based) and (3) preventive maintenance [46,47]. The institutions were sampled accord‐
ing to their size, data was gathered by a trained surveyor and the information was
collected from the city database and from the site survey. The data collected included:
floor area (sq.m.), number of students, density of students (students/sq.m.), BRI score
and MI score.
b. Gathering of the data of safety hazards in the institutions in all disciplines of the
buildings’ systems; the data was gathered through interviews with the facilities’
maintenance managers using the BRI (Building Risk Indicator) described below;
c. Assessment of the maintenance performance and safety of the facilities using a 25‐
point rating scale of the severity and probability of failures; assessments were carried
out by the researchers through walk out and detailed site surveys in the facilities;
d. Case study and validation of the proposed framework in a public facility using the
safety (BRI) and maintenance performance (MI—Maintenance Indicator) models.
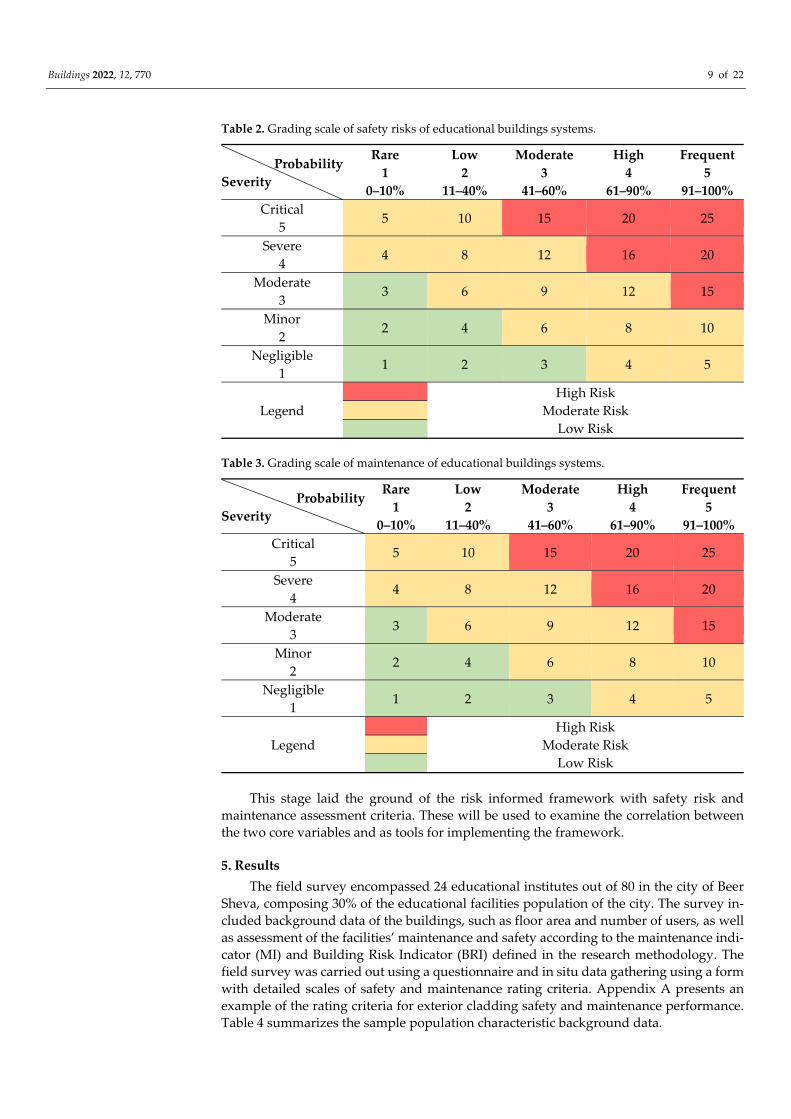
The research used 25‐point rating scale for the assessment of the safety and mainte‐
nance performance of the facilities. The safety assessment and the maintenance perfor‐
mance scales are presented in Tables 2 and 3, respectively, and the deterioration and safety
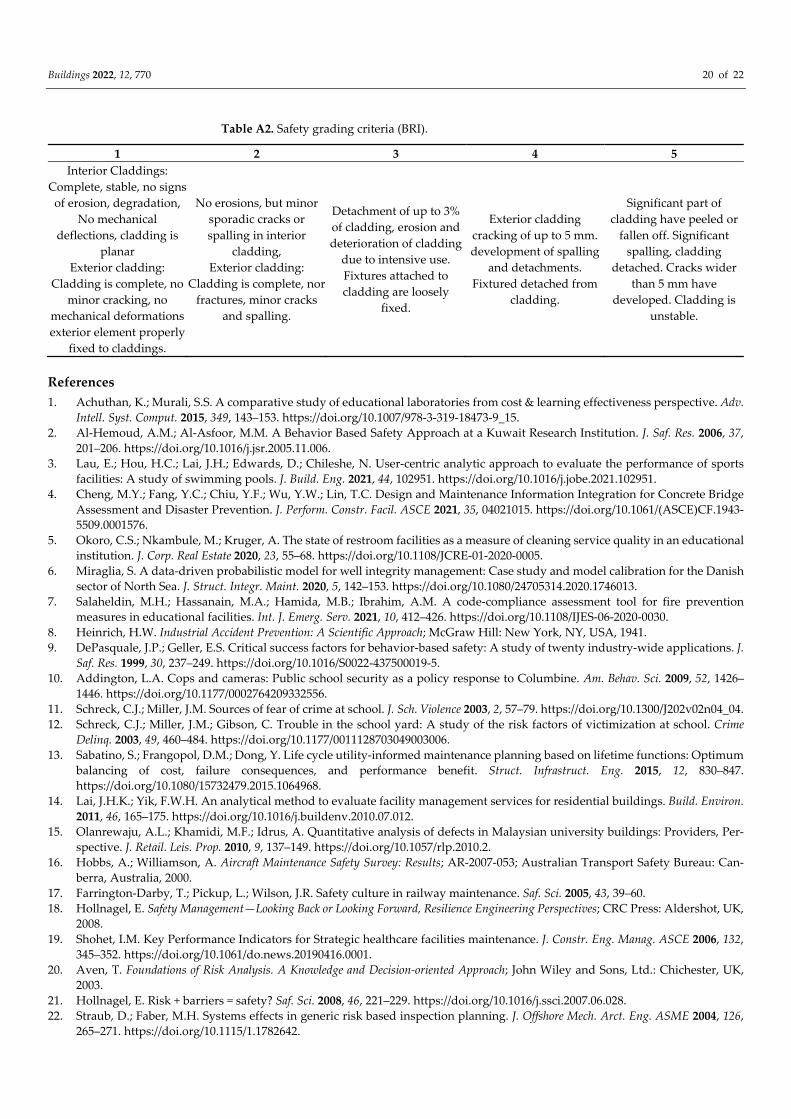
assessment criteria are described in Appendix A. The scales follow the outline developed
by Ni et al. [48] for safety assessment and were further developed for deterioration assess‐
ment. The deterioration categories definitions based on the 5‐point rating scale introduced
in Shohet [19,46]. The safety assessment categories examine the safety consequences, and
the 25‐point scale represents the risk potential as a multiplication of the severity (conse‐
quences) of hazards by the likelihood (probability). These definitions were further devel‐
oped in this study to 24 categories of core safety components and systems as follows: In‐
frastructures, Yard organization, Ground leveling, Walking trails, Fence, Gates, Parking,
Sports facilities, Preventive measures, Fire Protection, Escape Preparations, Nuisance,
Windows and bars, Doors, Railings, Stairs and stairways, Structure, Electric Panels, Light‐
ing, and Emergency lighting and electric wirings. These categories were selected from the
review of the literature and are the guide for the safety of educational institutions in the
literature review as key maintenance performance and safety performance indicators
[11,12,49]. A Building Risk Indicator (BRI) of 0–4 indicates low risk, i.e., safe facility
(within this category, between 0 and 2 represents exceptionally safe and between 2 snda4
safe). Building Risk Indicator of 5–12 indicates moderate to marginal and unacceptable
risk; within this category, 5–8 represents moderate and unacceptable risk, and a BRI of 8–
12 represents marginal‐severe risk. The BRI of 12–25 indicates risk at highly severe and
up to critical level (this category requires immediate repair of the faults and closure of the
institution due to regulatory restrictions). The Building Risk Indicator refers to architec‐
tural design, building services schemes safety, the surrounding environment safety, oper‐
ations and maintenance safety and to safety management activities as derived from Ho et
al. [41]. In a similar manner, a maintenance indicator (MI) of 0–4 indicates a durable and
well‐maintained facility, and within this category, a maintenance indicator between 0 and
2 represents a high durability, and maintenance indicator of 2–4 indicates light deteriora‐
tion due to aging of the component. A maintenance indicator of 5–12 indicates moderate
deterioration (5–8) and marginal maintenance performance (8–12), and between 13–25 in‐
dicates highly deteriorated system and lack of maintenance.
Buildings 2022, 12, 770 9 of 22
Table 2. Grading scale of safety risks of educational buildings systems.
Probability
Severity
Rare
1
0–10%
Low
2
11–40%
Moderate
3
41–60%
High
4
61–90%
Frequent
5
91–100%
Critical
5 5 10 15 20 25
Severe
4 4 8 12 16 20
Moderate
3 3 6 9 12 15
Minor
2 2 4 6 8 10
Negligible
1 1 2 3 4 5
Legend
High Risk
Moderate Risk
Low Risk
Table 3. Grading scale of maintenance of educational buildings systems.
Probability
Severity
Rare
1
0–10%
Low
2
11–40%
Moderate
3
41–60%
High
4
61–90%
Frequent
5
91–100%
Critical
5 5 10 15 20 25
Severe
4 4 8 12 16 20
Moderate
3 3 6 9 12 15
Minor
2 2 4 6 8 10
Negligible
1 1 2 3 4 5
Legend
High Risk
Moderate Risk
Low Risk
This stage laid the ground of the risk informed framework with safety risk and
maintenance assessment criteria. These will be used to examine the correlation between
the two core variables and as tools for implementing the framework.
5. Results
The field survey encompassed 24 educational institutes out of 80 in the city of Beer
Sheva, composing 30% of the educational facilities population of the city. The survey in‐
cluded background data of the buildings, such as floor area and number of users, as well
as assessment of the facilities’ maintenance and safety according to the maintenance indi‐
cator (MI) and Building Risk Indicator (BRI) defined in the research methodology. The
field survey was carried out using a questionnaire and in situ data gathering using a form
with detailed scales of safety and maintenance rating criteria. Appendix A presents an
example of the rating criteria for exterior cladding safety and maintenance performance.
Table 4 summarizes the sample population characteristic background data.
Buildings 2022, 12, 770 10 of 22
Table 4. Parameters of educational institutes’ samples.
Variable Total Mean
Floor area (sq.m.) 98,270 4095
Number of students 14,381 599
Density (Number of students/100 sq.m.) ‐ 15.94
Mean Maintenance score (MI) ‐ 5.88
Mean Safety Score (BRI) ‐ 5.42
The mean maintenance indicator (MI) and Building Risk Indicator (BRI) were found
to be 5.88 and 5.42, respectively, indicating moderate/marginal maintenance performance
and safety risks. The main safety and maintenance faults found are sports grounds, gates,
emergency lights and electricity end fixtures. Examination of the correlation between the
density of students and the maintenance, as well as the safety performance of the institu‐
tions found no systematic ratio, and led to rejection of the second research hypothesis.
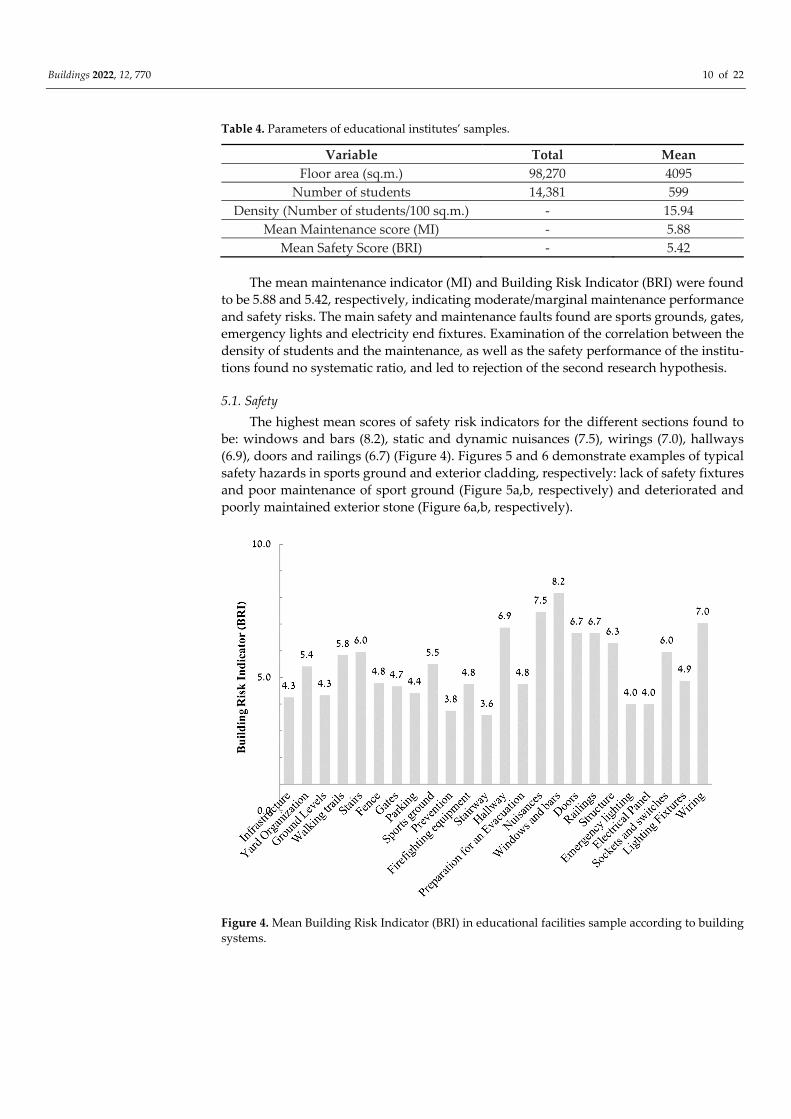
5.1. Safety
The highest mean scores of safety risk indicators for the different sections found to
be: windows and bars (8.2), static and dynamic nuisances (7.5), wirings (7.0), hallways
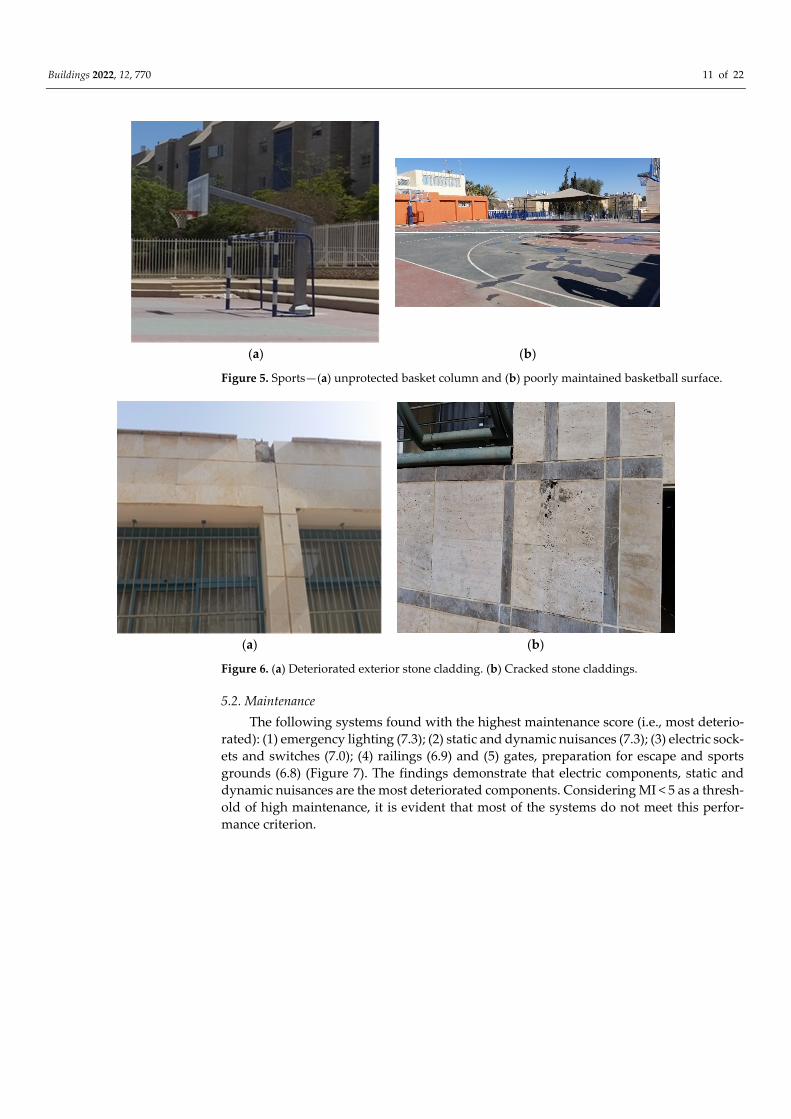
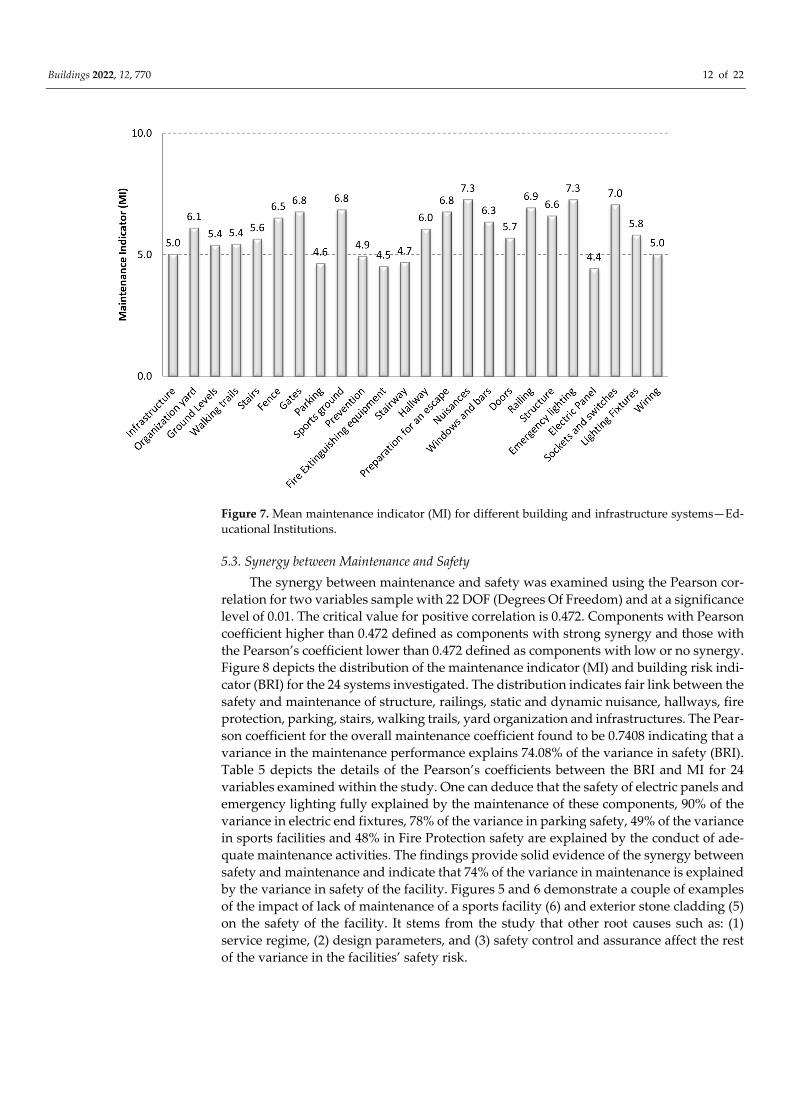
(6.9), doors and railings (6.7) (Figure 4). Figures 5 and 6 demonstrate examples of typical
safety hazards in sports ground and exterior cladding, respectively: lack of safety fixtures
and poor maintenance of sport ground (Figure 5a,b, respectively) and deteriorated and
poorly maintained exterior stone (Figure 6a,b, respectively).
Figure 4. Mean Building Risk Indicator (BRI) in educational facilities sample according to building
systems.
Buildings 2022, 12, 770 11 of 22
(a) (b)
Figure 5. Sports—(a) unprotected basket column and (b) poorly maintained basketball surface.
(a) (b)
Figure 6. (a) Deteriorated exterior stone cladding. (b) Cracked stone claddings.
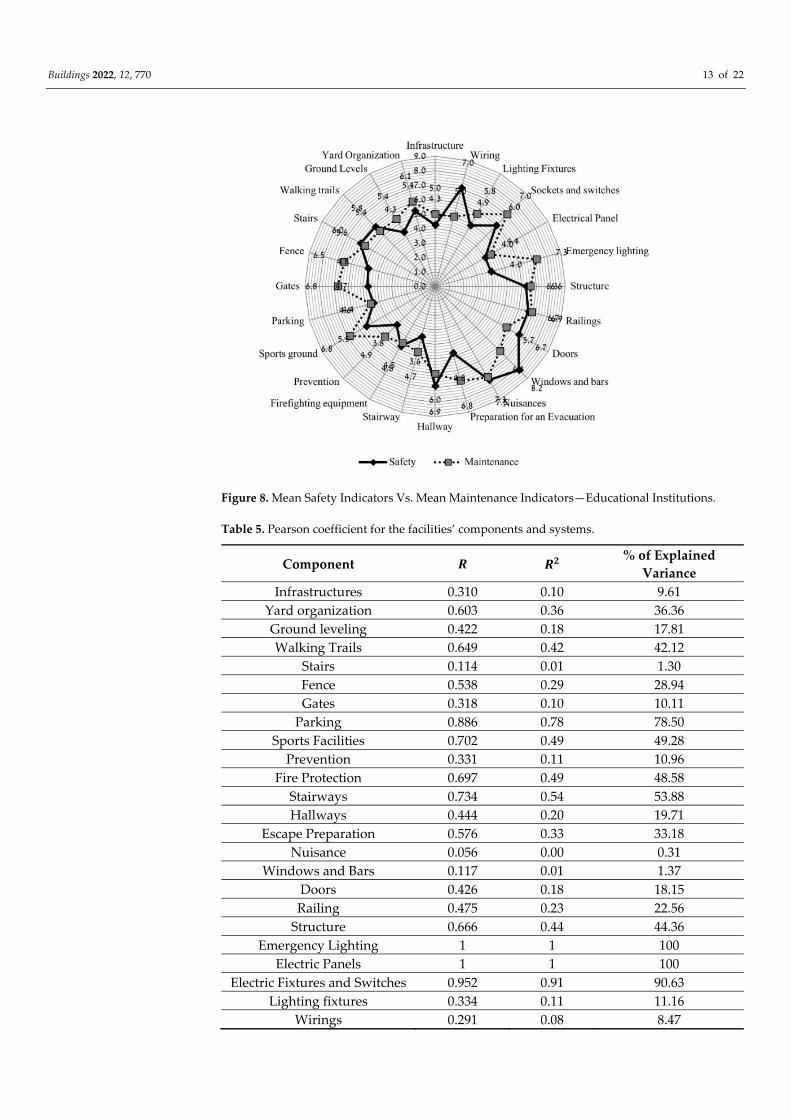
5.2. Maintenance
The following systems found with the highest maintenance score (i.e., most deterio‐
rated): (1) emergency lighting (7.3); (2) static and dynamic nuisances (7.3); (3) electric sock‐
ets and switches (7.0); (4) railings (6.9) and (5) gates, preparation for escape and sports
grounds (6.8) (Figure 7). The findings demonstrate that electric components, static and
dynamic nuisances are the most deteriorated components. Considering MI < 5 as a thresh‐
old of high maintenance, it is evident that most of the systems do not meet this perfor‐
mance criterion.
Buildings 2022, 12, 770 12 of 22
Figure 7. Mean maintenance indicator (MI) for different building and infrastructure systems—Ed‐
ucational Institutions.
5.3. Synergy between Maintenance and Safety
The synergy between maintenance and safety was examined using the Pearson cor‐
relation for two variables sample with 22 DOF (Degrees Of Freedom) and at a significance
level of 0.01. The critical value for positive correlation is 0.472. Components with Pearson
coefficient higher than 0.472 defined as components with strong synergy and those with
the Pearson’s coefficient lower than 0.472 defined as components with low or no synergy.
Figure 8 depicts the distribution of the maintenance indicator (MI) and building risk indi‐
cator (BRI) for the 24 systems investigated. The distribution indicates fair link between the
safety and maintenance of structure, railings, static and dynamic nuisance, hallways, fire
protection, parking, stairs, walking trails, yard organization and infrastructures. The Pear‐
son coefficient for the overall maintenance coefficient found to be 0.7408 indicating that a
variance in the maintenance performance explains 74.08% of the variance in safety (BRI).
Table 5 depicts the details of the Pearson’s coefficients between the BRI and MI for 24
variables examined within the study. One can deduce that the safety of electric panels and
emergency lighting fully explained by the maintenance of these components, 90% of the
variance in electric end fixtures, 78% of the variance in parking safety, 49% of the variance
in sports facilities and 48% in Fire Protection safety are explained by the conduct of ade‐
quate maintenance activities. The findings provide solid evidence of the synergy between
safety and maintenance and indicate that 74% of the variance in maintenance is explained
by the variance in safety of the facility. Figures 5 and 6 demonstrate a couple of examples
of the impact of lack of maintenance of a sports facility (6) and exterior stone cladding (5)
on the safety of the facility. It stems from the study that other root causes such as: (1)
service regime, (2) design parameters, and (3) safety control and assurance affect the rest
of the variance in the facilities’ safety risk.
Buildings 2022, 12, 770 13 of 22
Figure 8. Mean Safety Indicators Vs. Mean Maintenance Indicators—Educational Institutions.
Table 5. Pearson coefficient for the facilities’ components and systems.
Component 𝑹 𝑹𝟐 % of Explained
Variance
Infrastructures 0.310 0.10 9.61
Yard organization 0.603 0.36 36.36
Ground leveling 0.422 0.18 17.81
Walking Trails 0.649 0.42 42.12
Stairs 0.114 0.01 1.30
Fence 0.538 0.29 28.94
Gates 0.318 0.10 10.11
Parking 0.886 0.78 78.50
Sports Facilities 0.702 0.49 49.28
Prevention 0.331 0.11 10.96
Fire Protection 0.697 0.49 48.58
Stairways 0.734 0.54 53.88
Hallways 0.444 0.20 19.71
Escape Preparation 0.576 0.33 33.18
Nuisance 0.056 0.00 0.31
Windows and Bars 0.117 0.01 1.37
Doors 0.426 0.18 18.15
Railing 0.475 0.23 22.56
Structure 0.666 0.44 44.36
Emergency Lighting 1 1 100
Electric Panels 1 1 100
Electric Fixtures and Switches 0.952 0.91 90.63
Lighting fixtures 0.334 0.11 11.16
Wirings 0.291 0.08 8.47
Buildings 2022, 12, 770 14 of 22
Figures 4–8 indicate marginal maintenance and safety performance in the educa‐
tional facilities sample. It stems from the mean scores of MI and BRI of most of the com‐
ponents at levels higher than 5.74% of the variance in Risk were explained by the execu‐
tion of maintenance. These findings are demonstrated by Figures 5 and 6. In the next phase
of the research a case study of the proposed framework was implemented in public facility
to assess the validity of the framework.
5.4. Case‐Study—Public Building Integrated Maintenance and Safety
The case study is a public building (courthouse) located in the north of Israel. Its floor
area is 26,000 sq.m. of office floors, 3000 sq.m. of parking floors and 4000 sq.m. of gardens
and paved access paths. It was constructed in 1999, and its average occupancy is: 340 em‐
ployees and 3000 visitors per working day (250 days/year). The service regime in the
building is standard [50,51]. The integrated risk‐informed safety–maintenance framework
was implemented in the building between 2010 and 2021 using the safety and mainte‐
nance indicators through integrated maintenance–safety audits. An overview of the build‐
ing, its exterior envelope and electromechanical systems conditions as per 2021 are pre‐
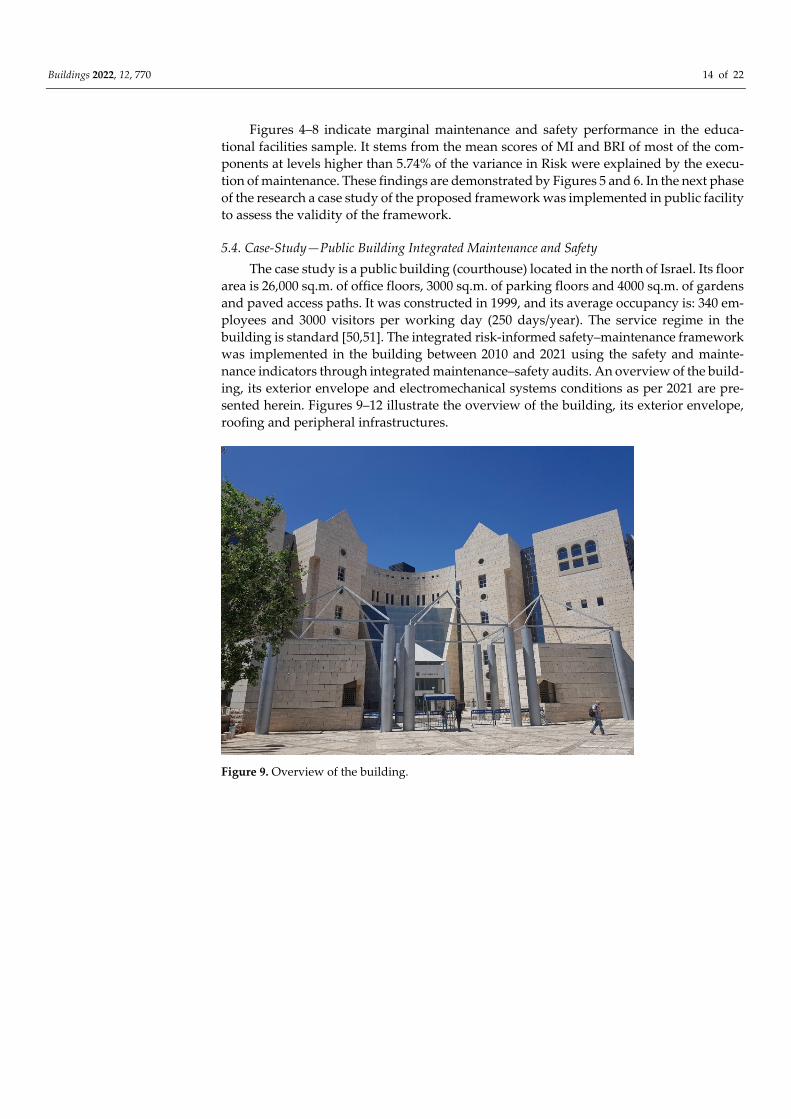
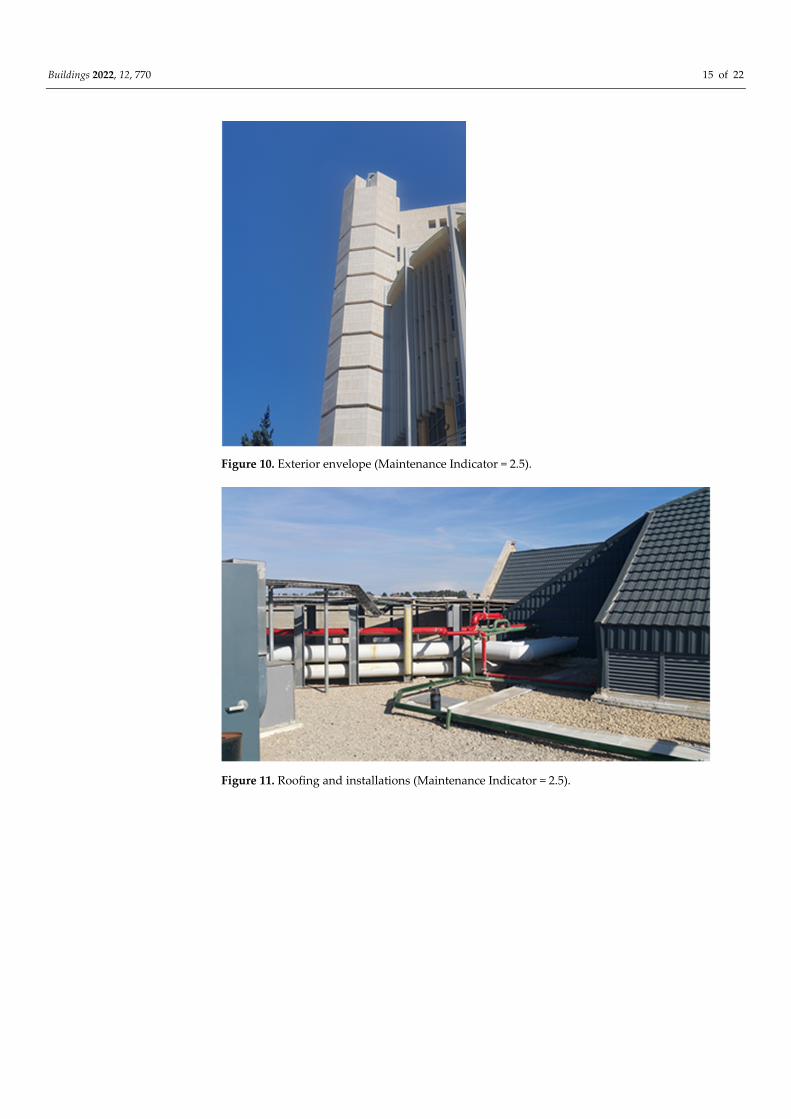
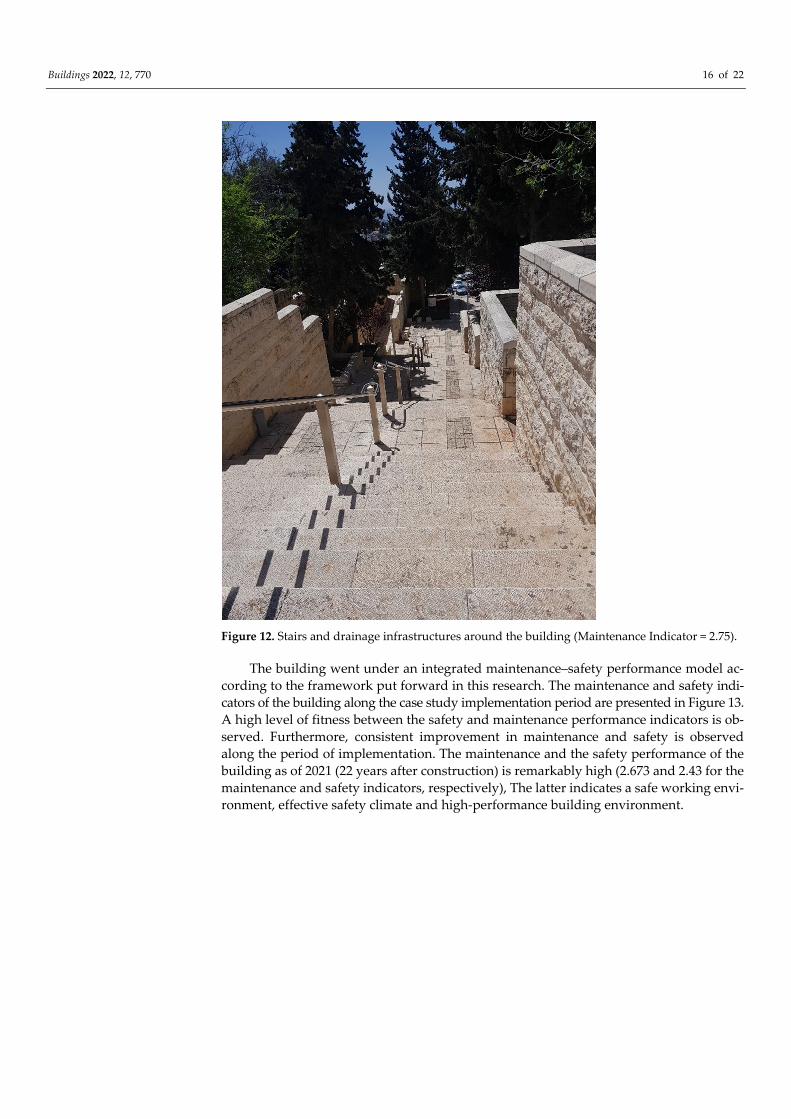
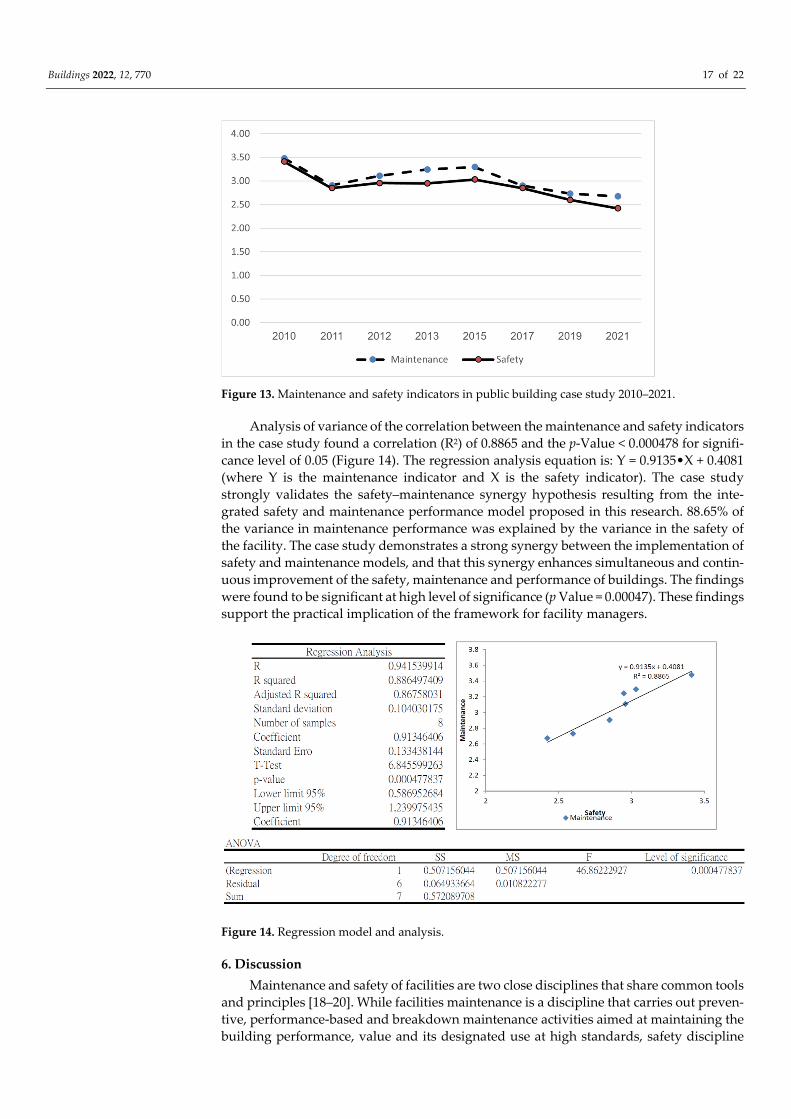
sented herein. Figures 9–12 illustrate the overview of the building, its exterior envelope,
roofing and peripheral infrastructures.
Figure 9. Overview of the building.
Buildings 2022, 12, 770 15 of 22
Figure 10. Exterior envelope (Maintenance Indicator = 2.5).
Figure 11. Roofing and installations (Maintenance Indicator = 2.5).
Buildings 2022, 12, 770 16 of 22
Figure 12. Stairs and drainage infrastructures around the building (Maintenance Indicator = 2.75).
The building went under an integrated maintenance–safety performance model ac‐
cording to the framework put forward in this research. The maintenance and safety indi‐
cators of the building along the case study implementation period are presented in Figure 13.
A high level of fitness between the safety and maintenance performance indicators is ob‐
served. Furthermore, consistent improvement in maintenance and safety is observed
along the period of implementation. The maintenance and the safety performance of the
building as of 2021 (22 years after construction) is remarkably high (2.673 and 2.43 for the
maintenance and safety indicators, respectively), The latter indicates a safe working envi‐
ronment, effective safety climate and high‐performance building environment.
Buildings 2022, 12, 770 17 of 22
Figure 13. Maintenance and safety indicators in public building case study 2010–2021.
Analysis of variance of the correlation between the maintenance and safety indicators
in the case study found a correlation (R2) of 0.8865 and the p‐Value < 0.000478 for signifi‐
cance level of 0.05 (Figure 14). The regression analysis equation is: Y = 0.9135•X + 0.4081
(where Y is the maintenance indicator and X is the safety indicator). The case study
strongly validates the safety–maintenance synergy hypothesis resulting from the inte‐
grated safety and maintenance performance model proposed in this research. 88.65% of
the variance in maintenance performance was explained by the variance in the safety of
the facility. The case study demonstrates a strong synergy between the implementation of
safety and maintenance models, and that this synergy enhances simultaneous and contin‐
uous improvement of the safety, maintenance and performance of buildings. The findings
were found to be significant at high level of significance (p Value = 0.00047). These findings
support the practical implication of the framework for facility managers.
Figure 14. Regression model and analysis.
6. Discussion
Maintenance and safety of facilities are two close disciplines that share common tools
and principles [18–20]. While facilities maintenance is a discipline that carries out preven‐
tive, performance‐based and breakdown maintenance activities aimed at maintaining the
building performance, value and its designated use at high standards, safety discipline
Buildings 2022, 12, 770 18 of 22
uses audits and control tools to maintain acceptable level of risk and maintain the facility
safety performance and the wellbeing of the facility occupants.
An integrated theoretical and practical multi‐layered risk informed safety–mainte‐
nance framework is introduced. The model follows four layers: (1) risk assessment, (2)
corrective safety maintenance, (3) maintenance performance assessment and (4) risk‐in‐
formed preventive maintenance and safety activities. Frangopol et al. [52] introduced the
integration of risk, sustainability and resilience into the service life planning of structural
bridge systems and components. The model integrates risk and life‐cycle loss assessment
with multi‐objective optimization of bridge and bridge network management. This re‐
search emphasizes that a parallel model for educational and other public facilities attains
the potential for optimum life cycle costs, as well as meeting the safety and performance
constraints.
The preliminary phases of the study revealed that the conduct of high‐quality
maintenance activities explains 74% of the safety risks variations in educational facilities.
The density of the occupants (service regime) does not significantly affect the level of
safety risks. The outcomes of the research are similar to preceding research by Arunraj
and Maiti [53] in the chemical industry, Geng et al. [54] in virtual maintenance in improv‐
ing the maintenance safety design and by Khalil et al. [23] in high education facilities. A
case study in public facility for a period of 11 years yielded a consistent and continuous
improvement of safety and performance of the facility and showed a correlation coeffi‐
cient of 0.8665 between the safety and the maintenance performance of the facility. The
research proposes a novel integrated safety–maintenance management model, and pro‐
vides solid, validated evidence regarding the synergy between safety and maintenance.
The proposed framework may be implemented in various types of facilities such as critical
facilities, energy, healthcare and off‐shore facilities.
7. Conclusions
The research introduces the topic of synergy and integrated risk‐informed safety–
maintenance in facilities management. An integrated safety–maintenance model for pub‐
lic facilities was developed and implemented in a case study in the last phase of the re‐
search. The following conclusions summarize the research findings:
a. Safety performance in educational institutions was found to be highly dependent on
the variance in maintenance performance; this conclusion was deduced from the high
Pearson coefficient between the Building Risk Indicator and the Maintenance Indica‐
tor;
b. It was found that maintenance activities strongly affect the safety of electric system
components (electric panels, lighting, end‐fixtures and switches); infrastructures
(parking lots, sports facilities, walking trails, and yard organization), fire protection
and structural components (stairways, walls, roofs and columns). This conclusion
deduced from the partial Pearson coefficients of the facilities’ systems between the
safety and the maintenance performance for these systems;
c. The study indicates that systematic maintenance of the critical facilities’ components
such as electric system components, structural components, fire protection and infra‐
structures implemented with robust, integrated safety–maintenance procedures.
This conclusion stems from the inherent dependency between these systems safety
and maintenance performance as depicted by the Pearson coefficients discussed
above.
d. Annual safety audits of the systems seem to be insufficient in light of the study find‐
ings, higher frequencies of maintenance, and safety audits with intervals of between
3 and 6 months are suggested. This conclusion drawn from the marginal performance
of maintenance indicator (MI) and safety (BRI) in the sample population, which ac‐
complished in annual safety and performance audits regime.
e. An integrated safety–maintenance performance framework was introduced for syn‐
ergetic safety–maintenance monitoring, control and management. The framework
Buildings 2022, 12, 770 19 of 22
proposes a cycle loop of safety–maintenance–performance of facilities as a key tool
for advanced and effective maintenance and safety management with intervals be‐
tween 3 and 6 months in public facilities.
f. The framework was validated in a case study of public facility along a period of 11
years. The time history of maintenance performance and safety shows a high level of
fitness (R2 = 0.8865 p < 0.05). The latter finding supports the practical implication of
the framework for facility management applications.
g. This research findings stresses that integrated safety and maintenance should be im‐
plemented as a unified and integrated procedure and that this procedure will en‐
hance advanced maintenance performance and safety.
The research develops and provides a robust framework for risk‐informed integrated
safety–maintenance management framework for educational and public facilities. The
theory has been validated in educational and public facilities.
A methodology for the implementation of the framework has been put forward and
lay the ground for integrated safety–maintenance methodology. The case study provided
solid evidence of sustainable development of the performance of the facility under the
implementation of the framework. Future research is recommended to elaborate the
framework for automation withing the IFC schema and implement the principles through
AI and machine learning tools.
8. Limitations of the Research
The research was carried out on a limited sample of educational public facilities. Ex‐
tending the research sample could improve the reliability and validity of the research.
Further case studies can elaborate the significance and applicability of the methodol‐
ogy in critical facilities; healthcare and infrastructures such as water, communications, etc.
The research did not refer to the cost‐effectiveness of the proposed framework. This
should include labor, equipment and spare parts and overheads costs. Analysis of the
cost‐effectiveness could shed light on the sustainability of the methodology and provide
economic and organizational drivers to implement the methodology.
Author Contributions: Conceptualization, I.M.S.; Data curation, R.A.; Investigation, K.‐C.W., R.A.
and H.‐H.W.; Methodology, K.‐C.W. and I.M.S.; Project administration, I.M.S.; Software, H.‐H.W.;
Supervision, I.M.S.; Validation, I.M.S.; Visualization, K.‐C.W., R.A. and H.‐H.W.; Writing—original
draft, K.‐C.W. and Writing—review and editing, I.M.S. All authors have read and agreed to the
published version of the manuscript.
Funding: This research received no external funding.
Data Availability Statement: The researchers committed to confidentiality of the data collected at
educational and public institutions.
Acknowledgments: The authors wish to acknowledge the municipality of Beer Sheva for the avail‐
ability of the educational facilities data, the courthouse management for accessibility to the case
study data and David Ben‐Porat for his professional escort of the case study and remarks on the
case study.
Conflicts of Interest: The authors declare no conflicts of interest.
Appendix A—Static and Dynamic Nuisance Maintenance and Safety Grading Criteria
Table A1. Maintenance grading criteria (MI).
1 2 3 4 5
Cladding is complete and
undamaged. No cladding
elements have fallen off.
Some capillary cracking
may be present.
Capillary cracks have de‐
veloped on portions of
the cladding. Single clad‐
ding elements have fallen
off.
Cracks 0.5 mm wide
cover less than 5% of the
total cladding area. Up to
3 % of cladding elements
have fallen off
Cracks wider than 1 mm
have developed on 5% or
more of the cladding area.
Portions of stone cladding
have fallen off.
Significant portions of the
cladding have peeled or
fallen off. Cracks wider
than 5 mm have devel‐
oped
Buildings 2022, 12, 770 20 of 22
Table A2. Safety grading criteria (BRI).
1 2 3 4 5
Interior Claddings:
Complete, stable, no signs
of erosion, degradation,
No mechanical
deflections, cladding is
planar
Exterior cladding:
Cladding is complete, no
minor cracking, no
mechanical deformations
exterior element properly
fixed to claddings.
No erosions, but minor
sporadic cracks or
spalling in interior
cladding,
Exterior cladding:
Cladding is complete, nor
fractures, minor cracks
and spalling.
Detachment of up to 3%
of cladding, erosion and
deterioration of cladding
due to intensive use.
Fixtures attached to
cladding are loosely
fixed.
Exterior cladding
cracking of up to 5 mm.
development of spalling
and detachments.
Fixtured detached from
cladding.
Significant part of
cladding have peeled or
fallen off. Significant
spalling, cladding
detached. Cracks wider
than 5 mm have
developed. Cladding is
unstable.
References
1. Achuthan, K.; Murali, S.S. A comparative study of educational laboratories from cost & learning effectiveness perspective. Adv.
Intell. Syst. Comput. 2015, 349, 143–153. https://doi.org/10.1007/978‐3‐319‐18473‐9_15.
2. Al‐Hemoud, A.M.; Al‐Asfoor, M.M. A Behavior Based Safety Approach at a Kuwait Research Institution. J. Saf. Res. 2006, 37,
201–206. https://doi.org/10.1016/j.jsr.2005.11.006.
3. Lau, E.; Hou, H.C.; Lai, J.H.; Edwards, D.; Chileshe, N. User‐centric analytic approach to evaluate the performance of sports
facilities: A study of swimming pools. J. Build. Eng. 2021, 44, 102951. https://doi.org/10.1016/j.jobe.2021.102951.
4. Cheng, M.Y.; Fang, Y.C.; Chiu, Y.F.; Wu, Y.W.; Lin, T.C. Design and Maintenance Information Integration for Concrete Bridge
Assessment and Disaster Prevention. J. Perform. Constr. Facil. ASCE 2021, 35, 04021015. https://doi.org/10.1061/(ASCE)CF.1943‐
5509.0001576.
5. Okoro, C.S.; Nkambule, M.; Kruger, A. The state of restroom facilities as a measure of cleaning service quality in an educational
institution. J. Corp. Real Estate 2020, 23, 55–68. https://doi.org/10.1108/JCRE‐01‐2020‐0005.
6. Miraglia, S. A data‐driven probabilistic model for well integrity management: Case study and model calibration for the Danish
sector of North Sea. J. Struct. Integr. Maint. 2020, 5, 142–153. https://doi.org/10.1080/24705314.2020.1746013.
7. Salaheldin, M.H.; Hassanain, M.A.; Hamida, M.B.; Ibrahim, A.M. A code‐compliance assessment tool for fire prevention
measures in educational facilities. Int. J. Emerg. Serv. 2021, 10, 412–426. https://doi.org/10.1108/IJES‐06‐2020‐0030.
8. Heinrich, H.W. Industrial Accident Prevention: A Scientific Approach; McGraw Hill: New York, NY, USA, 1941.
9. DePasquale, J.P.; Geller, E.S. Critical success factors for behavior‐based safety: A study of twenty industry‐wide applications. J.
Saf. Res. 1999, 30, 237–249. https://doi.org/10.1016/S0022‐437500019‐5.
10. Addington, L.A. Cops and cameras: Public school security as a policy response to Columbine. Am. Behav. Sci. 2009, 52, 1426–
1446. https://doi.org/10.1177/0002764209332556.
11. Schreck, C.J.; Miller, J.M. Sources of fear of crime at school. J. Sch. Violence 2003, 2, 57–79. https://doi.org/10.1300/J202v02n04_04.
12. Schreck, C.J.; Miller, J.M.; Gibson, C. Trouble in the school yard: A study of the risk factors of victimization at school. Crime
Delinq. 2003, 49, 460–484. https://doi.org/10.1177/0011128703049003006.
13. Sabatino, S.; Frangopol, D.M.; Dong, Y. Life cycle utility‐informed maintenance planning based on lifetime functions: Optimum
balancing of cost, failure consequences, and performance benefit. Struct. Infrastruct. Eng. 2015, 12, 830–847.
https://doi.org/10.1080/15732479.2015.1064968.
14. Lai, J.H.K.; Yik, F.W.H. An analytical method to evaluate facility management services for residential buildings. Build. Environ.
2011, 46, 165–175. https://doi.org/10.1016/j.buildenv.2010.07.012.
15. Olanrewaju, A.L.; Khamidi, M.F.; Idrus, A. Quantitative analysis of defects in Malaysian university buildings: Providers, Per‐
spective. J. Retail. Leis. Prop. 2010, 9, 137–149. https://doi.org/10.1057/rlp.2010.2.
16. Hobbs, A.; Williamson, A. Aircraft Maintenance Safety Survey: Results; AR‐2007‐053; Australian Transport Safety Bureau: Can‐
berra, Australia, 2000.
17. Farrington‐Darby, T.; Pickup, L.; Wilson, J.R. Safety culture in railway maintenance. Saf. Sci. 2005, 43, 39–60.
18. Hollnagel, E. Safety Management—Looking Back or Looking Forward, Resilience Engineering Perspectives; CRC Press: Aldershot, UK,
2008.
19. Shohet, I.M. Key Performance Indicators for Strategic healthcare facilities maintenance. J. Constr. Eng. Manag. ASCE 2006, 132,
345–352. https://doi.org/10.1061/do.news.20190416.0001.
20. Aven, T. Foundations of Risk Analysis. A Knowledge and Decision‐oriented Approach; John Wiley and Sons, Ltd.: Chichester, UK,
2003.
21. Hollnagel, E. Risk + barriers = safety? Saf. Sci. 2008, 46, 221–229. https://doi.org/10.1016/j.ssci.2007.06.028.
22. Straub, D.; Faber, M.H. Systems effects in generic risk based inspection planning. J. Offshore Mech. Arct. Eng. ASME 2004, 126,
265–271. https://doi.org/10.1115/1.1782642.
Buildings 2022, 12, 770 21 of 22
23. Khalil, N.; Kamaruzzaman, S.N.; Baharum, M.R. Ranking the indicators of building performance and the users’ risk via Ana‐
lytical Hierarchy Process (AHP): Case of Malaysia. Ecol. Indic. 2016, 71, 567–576. https://doi.org/10.1016/j.ecolind.2016.07.032.
24. Khan, F.I.; Sadiq, R.; Haddara, M. Risk‐based inspection and maintenance (RBIM) multi‐attribute decision making with aggre‐
gate risk analysis. Process Saf. Environ. Prot. 2004, 82, 398–411. https://doi.org/10.1205/psep.82.6.398.53209.
25. Backlund, F.; Hannu, J. Can we make maintenance decisions on risk analysis results? J. Qual. Maint. Eng. 2000, 8, 77–91.
https://doi.org/10.1108/13552510210420603.
26. Khan, F.I.; Haddara, M.R. Risk‐based maintenance (RBM): A quantitative approach for maintenance/inspection scheduling and
planning. J. Loss Prev. Process Ind. 2003, 16, 561–573. https://doi.org/10.1016/j.jlp.2003.08.011.
27. De Silva, N.; Malik, R. Maintainability risks of condominiums in Sri Lanka. J. Financ. Manag. Prop. Constr. 2010, 15, 41–60.
https://doi.org/10.1108/13664381011027971.
28. Ruparathna, R.; Hewage, K.; Sadiq, R. Multi‐period maintenance planning for public buildings: A risk based approach for cli‐
mate conscious operation. J. Clean. Prod. 2018, 170, 1338–1353. https://doi.org/10.1016/j.jclepro.2017.09.178.
29. Chiu, C.K.; Chien, W.Y.; Noguchi, T. Risk‐based life‐cycle maintenance strategies for corroded reinforced concrete buildings
located in the region with high seismic hazard. Struct. Infrastruct. Eng. 2012, 8, 1108–1122.
https://doi.org/10.1080/15732479.2010.505243.
30. Wu, Y.; Maravelias, C.T.; Wenzel, M.J.; ElBsat, M.N.; Turney, R.T. Predictive maintenance scheduling optimization of building
heating, ventilation, and air conditioning systems. Energy Build. 2021, 231, 110487. https://doi.org/10.1016/j.enbuild.2020.110487.
31. Duan, C.; Li, Z.; Liu, F. Condition‐based maintenance for ship pumps subject to competing risks under stochastic maintenance
quality. Ocean. Eng. 2020, 218, 108180. https://doi.org/10.1016/j.oceaneng.2020.108180.
32. Kim, S.; Ge, B.; Frangopol, D.M. Optimum Target Reliability Determination for Efficient Service Life Management of Bridge
Networks. J. Bridge Eng. ASCE 2020, 25, 04020087. https://doi.org/10.1061/(ASCE)BE.1943‐5592.0001623.
33. Akanmu, A.A.; Olayiwola, J.; Olatunji, O.A. Automated checking of building component accessibility for maintenance. Autom.
Constr. 2020, 114, 103196. https://doi.org/10.1016/j.autcon.2020.103196.
34. Park, C.H.; Lim, H. A parametric approach to integer linear fractional programming: Newton’s and Hybrid‐Newton methods
for an optimal road maintenance problem. Eur. J. Oper. Res. 2014, 289, 1030–1039. https://doi.org/10.1016/j.ejor.2019.07.010.
35. Chen, W.; Chen, K.; Cheng, J.C.; Wang, Q.; Gan, V.J. BIM‐based framework for automatic scheduling of facility maintenance
work orders. Autom. Constr. 2018, 91, 15–30. https://doi.org/10.1016/j.autcon.2018.03.007.
36. Chen, C.; Tang, L. BIM‐based integrated management workflow design for schedule and cost planning of building fabric
maintenance. Autom. Constr. 2019, 107, 102944. https://doi.org/10.1016/j.autcon.
37. Saqib, M.; Farooqui, R.U.; Lodi, S.H. Assessment of critical success factors for construction projects in Pakistan. In Proceedings
of the First International Conference on Construction in Developing Countries, Karachi, Pakistan, 4–5 August 2008; pp. 392–
404.
38. Au‐Yong, C.P. Maintenance priority in high‐rise housings: practitioners’ perspective versus actual practice. J. Eng. Res. 2019, 7,
167–177. https://doi.org/10.6084/m9.figshare.10566191.v1.
39. Au‐Yong, C.P.; Chua, S.J.L.; Ali, A.S.; Tucker, M. Optimising maintenance cost by prioritising maintenance of facilities services
in residential buildings. Eng. Constr. Archit. Manag. 2019, 26, 1593–1607. https://doi.org/10.1108/ECAM‐07‐2018‐0265/.
40. Ho, D.C.W.; Chau, K.W.; Cheung, A.K.C.; Yau, Y.; Wong, S.K.; Leung, H.F.; Lau, S.S.Y.; Wong, W.S. A survey of the health and
safety conditions of apartment buildings in Hong Kong. Build. Environ. 2008, 43, 764–775. https://doi.org/10.1016/j.build‐
env.2007.01.035.
41. Hopkins, A. Thinking about process safety indicators. Saf. Sci. 2009, 47, 460–465. https://doi.org/10.1016/j.ssci.2007.12.006.
42. Harms‐Ringdahl, L. Dimensions in safety indicators. Saf. Sci. 2009, 47, 481–482.
43. Ryczyński, J.; Saska, P.; Surowiecki, A.; Ksiądzyna, K. Selected safety issues in designing engineering structures. Sci. J. Mil.
Univ. Land Forces 2020, 195, 135–153. https://doi.org/10.5604/01.3001.0014.0269.
44. Lu, Y.; Gong, P.; Tang, Y.; Sun, S.; Li, Q. BIM‐integrated construction safety risk assessment at the design stage of building
projects. Autom. Constr. 2021, 124, 103553. https://doi.org/10.1016/j.autcon.2021.103553.
45. ISO/DIS 45001:2016; Occupational Health and Safety Management Systems: Requirements with Guidance for Use. ISO: Geneva,
Switzerland, 2016.
46. Shohet, I.M. Building evaluation methodology for setting priorities in hospital buildings. Constr. Manag. Econ. 2003, 21, 681–
692. https://doi.org/10.1080/0144619032000115562.
47. Shohet, I.M.; Lavy‐Leibovich, S.; Bar‐On, D. Integrated maintenance monitoring of hospital buildings. Constr. Manag. Econ. 2003,
21, 219–228. https://doi.org/10.1080/0144619032000079734.
48. Ni, H.; Chen, A.; Chen, N. Some extensions on risk matrix approach. Saf. Sci. 2010, 48, 1269–1278.
https://doi.org/10.1016/j.ssci.2010.04.005.
49. Ministry of Education. Director General Guidelines Paper 5‐52: Safety and Security in Educational Institutions. State of Israel.
2013. Available online: http://cms.education.gov.il/EducationCMS/Applications/Mankal/EtsMedorim/5/5‐1/HoraotKeva/K‐
2013‐6‐1‐5‐1‐52.htm (accessed on 13 April 2019).
50. Shohet, I.M.; Nobili, L. Performance‐Based Maintenance of Public Facilities: Principles and Implementation in Courthouses. J.
Perform. Constr. Facil. ASCE 2016, 30, 04015086. https://doi.org/10.1061/(ASCE)CF.1943‐5509.0000835.
51. Shohet, I.M.; Nobili, L. Enterprise Resource Planning System for Performance‐Based Maintenance of Healthcare Clinics. Autom.
Constr. 2016, 65, 33–41. https://doi.org/10.1016/j.autcon.2016.01.008.
Buildings 2022, 12, 770 22 of 22
52. Frangopol, D.M.; Dong, Y.; Sabatino, S. Bridge life‐cycle performance and cost: Analysis, prediction, optimisation and decision‐
making. Struct. Infrastruct. Eng. 2017, 13, 1239–1257. https://doi.org/10.1080/15732479.2016.1267772.
53. Arunraj, N.S.; Maiti, J. Risk‐based maintenance techniques and applications. J. Hazard. Mater. 2007, 142, 653–661.
https://doi.org/10.1016/j.jhazmat.2006.06.069.
54. Geng, J.; Zhou, D.; Lv, C.; Wang, Z.L. A modeling approach for maintenance safety evaluation in a virtual maintenance envi‐
ronment. Comput.‐Aided Des. 2013, 45, 937–949. https://doi.org/10.1016/j.cad.2013.01.007.
.
Copyright © 2022 FDOKUMEN

