


Bahasa
Halaman
Hukum

American International Journal of Contemporary Research Vol. 4, No. 6; June 2014
159
Instrumental Variables Approach to Estimating the Continuing Effect of HIV/AIDS
Epidemic on Global Development
Mary Ann Yeboah
Department of Mathematics and Statistics
Faculty of Applied Science
Kumasi Polytechnic
P.O. Box 854, Kumasi-Ghana
Mary Opokua Ansong
Institute of System Engineering
Faculty of Science
Jiangsu University
301 Xuefu, Zhenjiang 212013
China
Department of Computer Science
Faculty of Applied Science
Kumasi Polytechnic
P.O. Box 854, Kumasi
Ghana
Francis Appau-Yeboah
Francis Yaw Anyan
Francis Julius Gyebil
Department of Mathematics and Statistics
Faculty of Applied Science
Kumasi Polytechnic
P.O. Box 854, Kumasi
Ghana
Henry Asante Antwi
Ethel Yiranbon
School of Management
Jiangsu University
301 Xuefu Road, Zhenjiang 212013
Jiangsu, P.R. China
Abstract
The world has experienced different forms of epidemics outbreaks: cholera including VHF, H1N1, & TB, SAS,
INFLUENZA, SWINE FLU, meningitis, which impact affect nations' income. Yet the case of HIV-AIDS remains a
chronic albatross around the neck of the globe with its ramifying effects. Ironically, the HIV/AIDS epidemic has
targeted mainly adults and therefore impacted negatively on human capital accumulation by reducing its
productivity. The burden of any disease, or the loss of health capital, has had a powerful influence on the
economic activity of a country at different levels of income, especially when it affects the labour force. There is
plenty of evidence that the HIV/AIDS epidemic has deeply affected humankind for more than three decades.
© Center for Promoting Ideas, USA www.aijcrnet.com
160
In this paper we present instrumental variables approach to estimate or investigate the continuing effect of
HIV/AIDS epidemic on global development. The instrumental variables employed for this purpose are a set of
social and epidemiological determinants of the HIV infection, and macroeconomic indexes at the country level,
provided by the International Country Risk Guide and the Worldwide Governance Indicators. The result of this
examination provides support to our hypothesis that the HIV/AIDS epidemic has lowered the rate of growth of
GDP per capita between 1990 and 2012 in the group of 86 developed and developing countries, and in the sub-
sample for poor countries.
Keywords: Instrumental Variables, economic growth, human capital, HIV/AIDS, healthcare
1. Introduction
1. 1Approaches to Estimating the Effects of HIV/AIDS: An Instrumental Variables Perspective
A variety of economic modeling approaches have been employed to estimate the macroeconomic effects of the
HIV/AIDS epidemic. In general, the task is to estimate how the economy would have performed in the absence
of AIDS and contrast that result with an estimate of economic performance, given the estimated or projected
number of HIV/AIDS cases (Weil, 2001). The economic outcome studied is typically growth in total gross
domestic product per capita and/or growth in total GDP. Sometimes intermediate outcomes, such as effects on
savings rates, have also been estimated. Sometimes the analyst is interested as much in trying to gain insight into
the epidemic’s differential effects on particular sectors of the economy as in estimating its effects on GDP as a
whole (UNDP / Government of Botswana, 2000). Some studies have employed cross-national data, which may
pertain to a single time period or to a time series. In those analyses, regression analysis was used to estimate the
effects of one or more indicators of the volume of HIV/AIDS infections or deaths on economic outcomes,
control- link for other variables that previous work had identified as having an important effect on economic
growth.
Other analyses have employed an economic model fitted to the data of a particular country and usually,
projected for 10 or 15 years into the future (Stanciole & Abegunde, 2006). In a typical neoclassical growth model,
AIDS affects total output directly, by decreasing the number and efficiency of workers, and also indirectly, by
decreasing savings and investment. Since HIV/AIDS also results in a lower population than would otherwise
have existed, the effect on GDP per capita is smaller than the effect on total output; at least in principal, there
could be situations in which the net effect on GDP per capita would be nil or even positive. Since it is commonly
the case that the values of some of the model's key parameters are not precisely known, analyses often include
various scenarios, assuming different plausible values for the unknown parameters. Some analyses have further
elaborated the model by positing a d u a l -sector econo my, i n which there is a relatively well-paying and
productive formal sector, which tends to employ the more highly skilled workers, and a relatively low- wage, low-
productivity informal sector that employs labour that is in surplus to the needs of the formal sector (Barro & Lee,
1993). With such a dual-sector model, the predicted economic effects of the HIV/AIDS pandemic can vary
significantly depending on the degree to which infections are assumed to be concentrated in the more skilled
workers that are key to the functioning of the formal sector.
If a country has a substantial pool of surplus labour with very low marginal productivity, and if HIV/AIDS is
highly concentrated in the pool of unskilled labour, then even a substantial prevalence of HIV/AIDS might have
only a small effect on performance of the macro economy, while if the same number of infections were to occur
in the skilled labour force, the macroeconomic effect could be large. The latter type of model has, however,
been criticized by some analysts (for example (Borro, 1991) for downplaying the importance of the in- formal
sector as an engine of economic advancement and also for downplaying the degree of expertise embodied in
informal-sector employees and entrepreneurs, whose knowledge may be as difficult to replace as that of the
skilled workers of the formal sector. Even if a substantial loss of un- skilled labour were to have only a minor
impact the growth of GDP in a particular economy, the impact on the families that depended on such labour
would be dire. Many families depend on low-wage workers to maintain a basic level of subsistence, and the loss
of those workers will deepen their poverty (Hacker, 2004).
Other, more elaborated models have also been used to analyse how the impacts of HIV/AIDS on different sectors
of an economy relate to overall economic performance. For instance, (Hamoudi & Sachs, 1999) applied an
eleven- sector computable general equilibrium (CGE) model to estimate the economic effects of HIV/AIDS in
Cameroon. The model is based on a snapshot picture of an economy contained in a social accounting matrix.
American International Journal of Contemporary Research Vol. 4, No. 6; June 2014
161
CGE models are rich in sectoral and distributional data as compared with time-series-based and aggregated
macro econometric models, and are widely used to evaluate trade and expenditure, since they commonly have
differential impacts within society. Again, a lack of knowledge about many of the variables and their
relationships often makes it necessary to make assumptions or borrow estimates from other situations in order
to apply the models to the situations of particular countries affected by HIV/AIDS (Hamoudi & Sachs, 1999).
Another approach is to focus only on those directly affected by the epidemic, excluding from consideration the
rest of the society. For example, (Quattek K. , 2000) estimated the cost of HIV/AIDS in South Africa. The costs
are divided into direct costs and indirect costs, where direct costs include the costs of health services provided by
both public and private sectors to the persons living with AIDS at all stages of the disease, including testing costs,
prevention research and education. The indirect costs include the economic value of disability and premature
mortality as a result of HIV/AIDS, estimated as the present value of lost future earnings (Salinas & Haacker,
2006). The approach leaves out such macroeconomic effects as reduced investment as resources are diverted
from other economic areas in order to cope with HIV/AIDS. Good-quality estimates of the direct and indirect
costs of dealing with the epidemic are, however, much needed in order to derive sound estimates of the full
macroeconomic effects.
The objective of this paper is to obtain estimates of the effect of HIV prevalence on the growth rate of real GDP
per capita that are not affected by the presence of simultaneity between 1990 and 2012. To achieve this goal
requires a set of instrumental variables that are correlated with changes in the prevalence of HIV but is otherwise
unrelated with the error term of the growth equation. The instrumental variables employed for this purpose are a
set of social and epidemiological determinants of the HIV infection, and macroeconomic indices at the country
level, provided by the International Country Risk Guide and the Worldwide Governance Indicators.
2. Literature Review
2.1 The Burden of the HIV/AIDS Disease
The vast literature on the economic effect of HIV/AIDS, especially for African countries, starts with the analysis
of its socio-demographic impact in order to determine the path of the disease and to assess whether or not the
illness represents a threat to economic growth (World Bank, IMF, UNAIDS) (Kaufman, Kraay, & Mastruzzi,
2006). A major tradition in modeling HIV/AIDS epidemics has been the use of back-calculations techniques such
as the so called Epimodel, since the standard constructions cannot be used in most cases to follow the path of the
HIV pandemic in developing countries (Knowles & Owen, 1995) (ALemu, Roe, & Smith, 2006). This is flexible
and allows the distribution of age at HIV infection to change over time and it requires data on which year the HIV
epidemic began, the number of cases at some later point in time and the year in which new cases of HIV infection
are expected to reach their peak to construct reliable estimates of HIV prevalence. Some studies have tried to
account for the effect of different sources of uncertainty on the trajectory of the epidemic. (Bonnel, 2000) use the
Epimodel with a maximum likelihood approach to utilize all the available data from antenatal clinics for their
curve fitting exercise, as well as to represent some of the uncertainty in the estimates. In (Arellano & Bond, 1991)
the analytical objective is to find the set of model parameters that are most likely to have produced the observed
data on prevalence; each set of parameter values seems to generate a unique set of incidence, prevalence and
mortality curves.
Several theoretical attempts have been made with the intention of explaining the burden of HIV/AIDS in
economic growth (Barro & Lee, 2000) (Barro & Sala-i-Martin, 1992) (Nicholls & etal., 2000) (Cornia &
Zagonari, 2007) (Ravallion, 2003) especially for those cases where the illness has shown evident devastating
results, as the experience for quite a lot of African countries, where the rate of prevalence of HIV/AIDS is
relatively high. Although some Asian and Latin American countries experience low prevalence of the disease,
their importance in the AIDS map is quite significant due to the fact that, in relative numbers, this represents a
huge amount of human beings living with the virus and therefore the impact on sensitive variables related to
economic growth might be significant (Mayer-Foulkes, 2004).
Nevertheless, middle- and low-income countries are dealing with a broaden HIV/AIDS epidemic and not much
information is known or at least the results provided are not conclusive (Mayer-Foulkes, 2004) most of the time
due to the lack of reliable sources of information. Available data reveals a continuous increase in prevalence
during the past decade; however, it may not reflect the reality of these nations due to the fact that the estimated
cases of people living the HIV infection seem to be far above the ground (Heston, Summers, & Aten, 2006).
© Center for Promoting Ideas, USA www.aijcrnet.com
162
Besides, there is not enough empirical evidence regarding the economic and demographic impact of HIV/AIDS at
the country level or over time. It also seems that the existing literature on the effect of HIV/AIDS on economic
performance have had mixed outcomes: some studies show that the AIDS epidemic has had an insignificant effect
on the growth rate of per capita income, with no evidence of reverse causality (Bloom, Canning, & Malaney,
1999). Some others point out that HIV reduces economic growth and increases poverty, which in turn accelerates
the spread of HIV (Mayer-Foulkes, 2004). (Arndt & Lewis, 2000) (Bell, S, & Gersbach, 2004) and some others
indicate that countries where the prevalence of HIV is relatively low the impact of the epidemic conforms to
“normal” expectations, but when the prevalence of the epidemic is relatively high the macroeconomic impact is
unclear (Bloom & Mahal, 1997) (Cuddington, 1993).
So far we cannot deny the importance of health on economic growth, as well as the lack of it (Dorrington,
Johnson, & Budlender, 2005) (Chin & Lwanga, 1991) (Arndt & Wobst, 2002). In (Mayer-Foulkes, 2004) the
economic impact of HIV/AIDS that occurs through the social fabric is described as very uneven across
individuals or households; he argues that any analysis capturing only the main aggregates economic variables
would miss many of the microeconomic effects of the disease on living standards, which also matter for public
policy and affect the main aggregate economic variables. (Heston, Summers, & Aten, 2006) analyzes the nature
and strength of the association between the reduction in the rate of growth of per capita income and HIV
prevalence in African countries, using macroeconomic performance and institutional variables as instruments
within a structural model; this connection is explained through a fall in the rate of growth of labor force due to
premature death and disability as well as a decrease in capital investments caused by lower incentives to save
associated with higher medical costs and loss of revenues.
2.2 Conceptual Framework for the Impact of HIV/AIDS on Economic Growth
The HIV/AIDS epidemic can affect the economy in a number of ways:
The AIDS epidemic will slow or reverse growth in the labour supply. The economic impact can vary
according to the sector of the economy, the degree to which HIV/AIDS affects hard-to- replace skilled
labour and whether or not there is a substantial pool of “surplus labour” [23] (Bloom, Canning, & Malaney,
1999) .
Savings a n d i n v e s t m e n t s of families will be reduced owing to the increase in HIV/AIDS-related health
expenditures. If children’s education, health and nutrition suffer as a result, prospects for longer-run
economic growth and development will decline (Arndt & Lewis, 2000).
The AIDS epidemic may also divert public spending from investments in physical and human capital to
health expenditures, leading over time to slower growth of the gross domestic product. Foreign and
domestic private investment might also decline if potential investors become convinced that the epidemic is
seriously undermining the rate of return to investment (Bell, S, & Gersbach, 2004).
The HIV/AIDS epidemic may also deepen the poverty of the most affected countries by decreasing the
growth rate of per capita income and by selectively impoverishing the individuals and families that are directly
affected (Bloom & Mahal, 1997). (Cuddington , 1993) among others, stresses the effect of HIV on the size
of the working population, which tends to reduce total output and worsen the dependency ratio. More children
and elderly people may have to be supported by a smaller active labour force. In addition, the composition of
the labour force may change with respect to skills, education and experience, which would decrease the
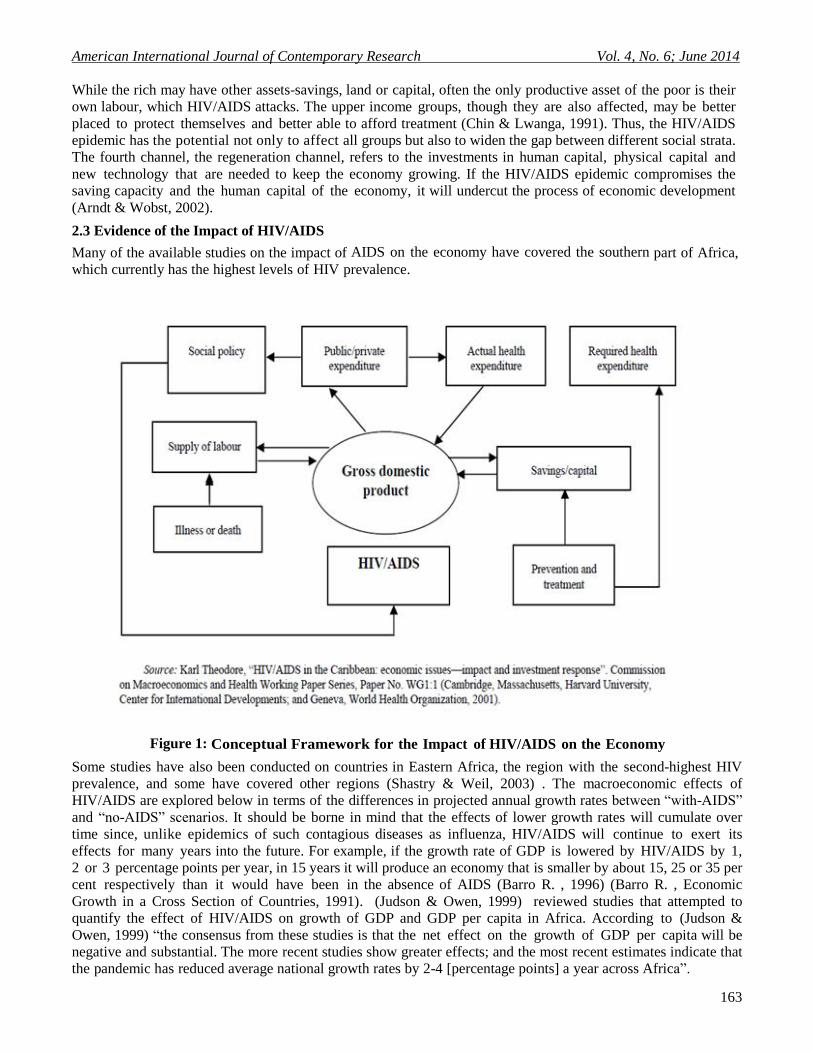
productivity of labour. (Dorrington, Johnson, & Budlender, 2005) in a model applied to several Caribbean
countries, identified four channels through which HIV/AIDS may affect the economy: the production channel;
the allocation channel; the distribution channel; and the regeneration channel (figure 1). The production channel
refers to the mechanisms through which HIV/AIDS affects the main factors of production-labour and capital,
causing the production process to be less fruitful than it would have been in the absence of HIV/AIDS. The
second channel through which HIV/AIDS may affect the economy is the allocation channel. One of the most
important functions of the economic system is to ensure an efficient allocation of resources. HIV/AIDS
reroutes some of those resources to medical expenses and away from other productive uses (Chin & Lwanga,
1991)
The third assumed channel through which HIV/AIDS affects the economy is the distribution channel,
specifically, the distribution of income. In the face of an epidemic that increases health expenditures and
weakens the income base, the lowest income groups may fare the worst.
American International Journal of Contemporary Research Vol. 4, No. 6; June 2014
163
While the rich may have other assets-savings, land or capital, often the only productive asset of the poor is their
own labour, which HIV/AIDS attacks. The upper income groups, though they are also affected, may be better
placed to protect themselves and better able to afford treatment (Chin & Lwanga, 1991). Thus, the HIV/AIDS
epidemic has the potential not only to affect all groups but also to widen the gap between different social strata.
The fourth channel, the regeneration channel, refers to the investments in human capital, physical capital and
new technology that are needed to keep the economy growing. If the HIV/AIDS epidemic compromises the
saving capacity and the human capital of the economy, it will undercut the process of economic development
(Arndt & Wobst, 2002).
2.3 Evidence of the Impact of HIV/AIDS
Many of the available studies on the impact of AIDS on the economy have covered the southern part of Africa,
which currently has the highest levels of HIV prevalence.
Figure 1: Conceptual Framework for the Impact of HIV/AIDS on the Economy
Some studies have also been conducted on countries in Eastern Africa, the region with the second-highest HIV
prevalence, and some have covered other regions (Shastry & Weil, 2003) . The macroeconomic effects of
HIV/AIDS are explored below in terms of the differences in projected annual growth rates between “with-AIDS”
and “no-AIDS” scenarios. It should be borne in mind that the effects of lower growth rates will cumulate over
time since, unlike epidemics of such contagious diseases as influenza, HIV/AIDS will continue to exert its
effects for many years into the future. For example, if the growth rate of GDP is lowered by HIV/AIDS by 1,
2 or 3 percentage points per year, in 15 years it will produce an economy that is smaller by about 15, 25 or 35 per
cent respectively than it would have been in the absence of AIDS (Barro R. , 1996) (Barro R. , Economic
Growth in a Cross Section of Countries, 1991). (Judson & Owen, 1999) reviewed studies that attempted to
quantify the effect of HIV/AIDS on growth of GDP and GDP per capita in Africa. According to (Judson &
Owen, 1999) “the consensus from these studies is that the net effect on the growth of GDP per capita will be
negative and substantial. The more recent studies show greater effects; and the most recent estimates indicate that
the pandemic has reduced average national growth rates by 2-4 [percentage points] a year across Africa”.
© Center for Promoting Ideas, USA www.aijcrnet.com
164
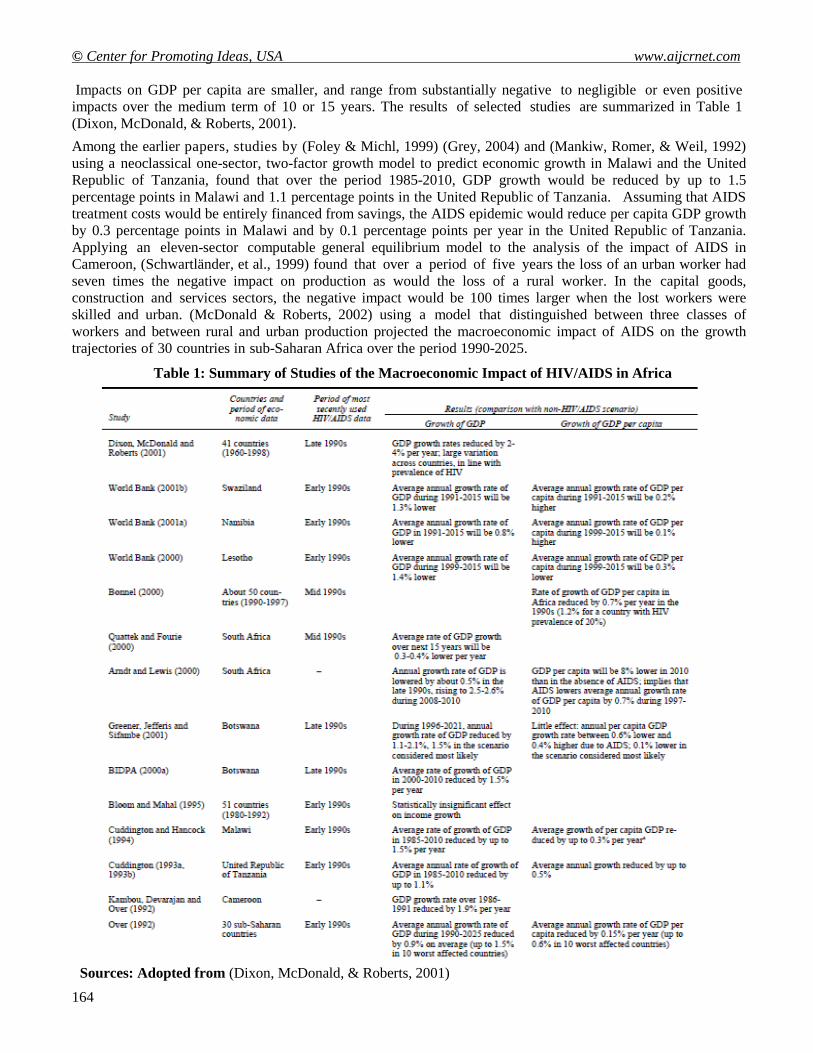
Impacts on GDP per capita are smaller, and range from substantially negative to negligible or even positive
impacts over the medium term of 10 or 15 years. The results of selected studies are summarized in Table 1
(Dixon, McDonald, & Roberts, 2001).
Among the earlier papers, studies by (Foley & Michl, 1999) (Grey, 2004) and (Mankiw, Romer, & Weil, 1992)
using a neoclassical one-sector, two-factor growth model to predict economic growth in Malawi and the United
Republic of Tanzania, found that over the period 1985-2010, GDP growth would be reduced by up to 1.5
percentage points in Malawi and 1.1 percentage points in the United Republic of Tanzania. Assuming that AIDS
treatment costs would be entirely financed from savings, the AIDS epidemic would reduce per capita GDP growth
by 0.3 percentage points in Malawi and by 0.1 percentage points per year in the United Republic of Tanzania.
Applying an eleven-sector computable general equilibrium model to the analysis of the impact of AIDS in
Cameroon, (Schwartländer, et al., 1999) found that over a period of five years the loss of an urban worker had
seven times the negative impact on production as would the loss of a rural worker. In the capital goods,
construction and services sectors, the negative impact would be 100 times larger when the lost workers were
skilled and urban. (McDonald & Roberts, 2002) using a model that distinguished between three classes of
workers and between rural and urban production projected the macroeconomic impact of AIDS on the growth
trajectories of 30 countries in sub-Saharan Africa over the period 1990-2025.
Table 1: Summary of Studies of the Macroeconomic Impact of HIV/AIDS in Africa
Sources: Adopted from (Dixon, McDonald, & Roberts, 2001)
American International Journal of Contemporary Research Vol. 4, No. 6; June 2014
165
The macroeconomic impact varied depending on assumptions about relative levels of HIV infection in educated
and uneducated workers and on the amount of the treatment costs taken from savings. For the assumptions the
author regarded as most plausible (that 50 per cent of the treatment costs were financed out of savings and that
each education class of workers has double the risk of the one beneath it), the net effect of the AIDS epidemic
on the annual growth rate of per capita GDP was a r e d u c t i o n of about 0.15 percentage point on average and
one third percentage point in the ten countries with the most advanced epidemics. The effect in the 10 most
affected countries would be 0.6 percentage point if all the treatment costs were financed from savings. (Dixon,
McDonald, & Roberts, 2001) estimated the economic losses associated with HIV in three Caribbean countries
(Jamaica, Saint Lucia and Trinidad and Tobago). He found that by 2005 HIV/AIDS would lead to a
reduction of GDP, by comparison with a “no-AIDS” scenario, of 4.9 per cent in Jamaica, 2.1 per cent in Saint
Lucia and 5.6 per cent in Trinidad and Tobago. Those estimates assume that all infected persons would be
medically covered, with an estimated p e r c a p i t a t r e a t me n t c o s t o f $4,000.
(Gupta, Verhoeven, & Tiongson, 2003) used cross-national regressions to estimate relationships among
economic growth, policy, institutional variables and HIV/AIDS.
He estimated that, for a sub-Saharan country with HIV prevalence of 20 percent, the annual growth rate of GDP
per capita d u r i n g t h e p e r i o d 1 9 9 0 t o 1 9 9 7 would have been 1.2 per cent higher without HIV/AIDS.
(McDonald & Roberts, 2004) developed a growth model to assess the risks of an HIV/AIDS epidemic and its
potential economic consequences in nine countries in Western Asia and Northern Africa: Algeria, Djibouti,
Egypt, Iran, Jordan, Lebanon, Morocco, Tunisia and Yemen. Adult HIV prevalence is still low in those countries,
and prospects for future transmission are highly uncertain. However, given the mean values from the authors’
simulations, HIV prevalence may reach 3-4 per cent of the adult population by 2015 (higher in Djibouti), and over
the period 2000-2025, the annual growth rate of GDP would be 0.3- 0.4 percentage points lower than in the
absence of AIDS (1.6 points in Djibouti). A 2002 World Bank study of the economic impact of HIV/AIDS in
the Russian Federation showed that GDP in 2010 could be up to 4 per cent lower and that without
intervention the loss could rise to 10 per cent by 2020 (McDonald & Roberts, 2004). The study projected that the
most significant impact for long-term development was the uninhibited spread of HIV, which would diminish the
economy’s long- term growth rate, taking off half a percentage point annually by 2010 and a full percentage
point annually by 2020. Another result of the study was that investment would decline more than production. In
the pessimistic scenario, its level would decline by 5.5 per cent in 2010 and 14.5 per cent in 2020.
How large are these effects in comparison to other factors affecting economic growth? Some analysts note that
other factors can produce effects on economic growth that are at least as large as those estimated to result from
the spread of HIV/AIDS. For instance, (Quattek K. , 2000) states that a reduction in the rate of growth of GDP
by between 0.5 and 2.6 percentage points, which encompasses the size of the effect indicated by most studies, “is
within the range of variation that could be caused by poor economic management or fiscal policy. This implies
that the macroeconomic impacts of HIV/AIDS, in themselves, can be substantially reduced by appropriate policy
interventions (Revenga, et al., 2006). Nevertheless, such observations cannot bring much comfort, since such
factors as poor economic management, war or drought are likely to make it all the more difficult to mount an
effective response to the threat of HIV/AIDS.
In i n t e rp re t i ng the e s t ima tes , i t s ho u ld be borne in mind that economic forecasting is not an exact
science. It is not unusual to find economists-even those engaged in such analyses-adding cautionary notes about
the reliability of the analytic outcomes. For instance, (Cuddington , 1993) states, “It cannot be said that
econometric modeling...has a good track record. Also, it should be readily admitted that we know relatively little
about those structural relationships which are important for estimating the impact of HIV on development”. One
manifestation of this uncertainty is that analysts may come to substantially different conclusions about the impact
of HIV/AIDS on a particular economy as a result of differing assumptions built into their economic models. For
instance, (Dixon, McDonald, & Roberts, 2001) observes that studies of South Africa by (Revenga, et al., 2006)
(Bhargava, 2001) drew on the same demographic projections; however, the first study predicted that GDP per
capita would be 7.5 percentage points higher by 2010 than in the absence of AIDS, but the second study
projected that GDP per capita would be 8 percentage points lower by 2010 than in the absence of AIDS.
© Center for Promoting Ideas, USA www.aijcrnet.com
166
(Dixon, McDonald, & Roberts, 2001) (Bhargava, 2001) argues that many analyses have ignored the potential
negative impact of HIV/AIDS on foreign investment and that this has probably led to an underestimate of the
negative effect of the epidemic on the macro-economy. Specifically, many of the analyses employing one-sector
and dual-economy neoclassical growth models imply that the rate of return to capital would decline, but the
analyses usually do not take account of the declines in foreign investment and the outflow of domestic capital that
may occur in response. Haacker’s own estimates indicate that the effect could be large. Some of the
macroeconomic estimates presented above are themselves part of more comprehensive assessments that examine
sector- specific impacts of HIV/AIDS and consider the effects on different strata of society. Such reports
sometimes give a graver assessment of impacts on particular areas of the economy than might be supposed from
the relatively modest size of the projected macroeconomic effects.
Examples include the following: The World Bank study of Swaziland cited in Table 1 estimated that
HIV/AIDS would have the greatest impact on the agricultural, manufacturing and distribution sectors, which
together accounted for over 60 per cent of value added in the national economy, with a likely devastating
impact of AIDS on the productive sectors of the economy (UNAIDS WHO, 2012) (UNFPA, 2010). At the same
time, the macroeconomic model employed projected essentially no effect on growth of GDP per capita over the
period 1991-2015. In Botswana, related analyses by the Botswana Institute for Development Policy Analysis
(2000) (BIDPA, 2000) concluded that even though per capita GDP will be little affected by the epidemic over
the period 1996-2021, HIV/AIDS will come to dominate health systems, and AIDS patients may crowd out
those with other illnesses. There will be an increase in poverty, and the degree of poverty will deepen. Up to half
of households are likely to have at least one infected member, and one quarter of households are likely to
lose an income earner within 10 years (BIDPA, 2000). In this case, the divergence between the serious effects
projected for households and the health sector and the relatively modest projected macroeconomic results can be
attributed to the circumstance that Botswana’s macroeconomic performance and its Government income are
heavily dependent on its diamond industry, which is capital intensive and whose revenue probably will not be
greatly affected by AIDS. Most of the impact is likely to fall on households, whose per capita income may fall by
8-12 per cent over the period 1996- 2021 (Chin & Lwanga, 1991) (Hacker, 2004).
A number of researchers have argued that analyses of the epidemic’s macroeconomic effects tend to give an
overly sanguine assessment of the eventual economic impact of the epidemic because they fail to take account
of effects on human capital and social capital that will become increasingly prominent as time goes on.
According to (BIDPA & Bank, 2006) (McDonald & Roberts, 2004) “not only does AIDS destroy existing human
capital, but by killing mostly young adults, it also weakens the mechanism through which knowledge and abilities
are transmitted from one generation to the next; for the children of AIDS victims will be left without one or both
parents to love, raise and educate them”. A report by (Bhargava, 2001) indicates “None of the models has
adequately allowed for the erosion of networks and information channels that are fundamental to labour
specialization and the maintenance of social capital”.
That the available estimates are open to question does not detract from the importance of trying to assess overall
economic effects of the epidemic (Bhargava, 2001). Policy makers need to have some understanding of how the
epidemic will affect the economy and government income if they are to make sound choices in combating the
epidemic and its effects.
2.4 Beyond Gross Domestic Product: Income Distribution and Welfare
Gross domestic product is not itself a measure of welfare. For one thing, the costs of responding to manmade or
natural disasters add to GDP, even though well-being would have been greater had that spending not been
needed. According to Greener (Barro & Lee, 2000), “activities such as increased household and government
expenditure on health care related to HIV, will be counted as a part of GDP, even though they are not part of
what would normally be thought of as a productive activity. Impact should perhaps be measured in terms of a
more satisfactory indicator of socially productive economic activity”. Another limitation is that conventional
macroeconomic indicators are not by themselves informative about trends in the distribution of income or, in
particular, about the extent of and trends in poverty. In addition, as mentioned previously, the concept of
“development” is too broad to be captured by measures of material welfare alone (Macfarlan & Sgherri, 2001).
American International Journal of Contemporary Research Vol. 4, No. 6; June 2014
167
Most economists who have commented on the issue think that HIV/AIDS in developing countries will tend to
make income distribution more unequal and will increase poverty, notably by impoverishing many of the
households directly affected by the disease. Such effects can be dire for the well-being of the population and yet
might have relatively little impact on GDP as conventionally measured: the fraction of national income
represented by the poor is much smaller than the fraction they represent in the total population, and it follows
that the deepening impoverishment of those who were already poor may have little effect on macroeconomic
statistics (Karl, 2001). With respect to indicators of welfare broader than GDP, a few studies used the human
development index developed in the early 1990s by the United Nations Development Programme as an indicator
to assess the impact of HIV/AIDS (ALemu, Roe, & Smith, 2006) (Mayer-Foulkes, 2004). AIDS affects the
index through its effects on life expectancy, which is a component of the index. Another approach is to try to
include the economic value of health as an aspect of “economic welfare”, which by definition is not a matter of
income alone. (Jamison, Sachs, & Wang, 2001) and (Macfarlan & Sgherri, 2001) attempted to assess the
contribution of mortality changes in sub-Saharan Africa to such a broader measure of economic welfare. The
first step is to estimate in monetary terms the value that societies place on improved longevity and then to use
such valuations to derive a more inclusive measure of trends in e c o n o m i c welfare that incorporates trends
in both mortality and GDP per capita. Empirical assessments of societies' willingness to pay to avert an adult
death have found values ranging from about 75 to over 180 times per capita GDP (Macfarlan & Sgherri, 2001).
Therefore, the value attached to actual mortality changes can be large in relation to the size of conventionally
measured trends in GDP. Estimates for five countries that have been heavily impacted by HIV/AIDS (Botswana,
Kenya, Malawi, Zambia and Zimbabwe) show that between 1960 an d 1985, when mortality was falling, the
impact of lower mortality was to add a welfare value that was between 1.7 and 2.7 percentage points per
annum above the growth rate of per capita GDP alone. However, between 1985 and 2000 the impact of the
AIDS-induced increase in mortality was to subtract between 5 and 8 per cent annually, producing substantial
reductions in the combined GDP/mortality measure of change in economic welfare. (Weil, 2001) adopted a
similar approach to estimate the economic value of the loss in life expectancy attributable to HIV/AIDS,
expressed as a percentage of GDP. They estimated that the value of welfare losses in 2003 resulting from lower
life expectancy was substantial even in countries where HIV prevalence was 1-3 per cent and “horrific” in the
countries with the highest prevalence. For instance, in the countries with adult HIV prevalence above 10 per
cent, the estimated welfare loss caused by higher mortality has already resulted in a loss of welfare of over 40
per cent of GDP, and in Botswana this figure is about 80 per cent. The direct welfare effects of HIV/AIDS
through increased mortality substantially outweigh even the worst projections of the impact on GDP per
capita (Weil, 2001).
3. Materials and Methods
3.1 Research Data
This is a cross-country study using a sample of 86 industrial and developing countries1, randomly chosen based on
the availability of information to build the data set, which basically comes from the Human Development Report
(UNDP, 2012) according to their low-, middle- and high-income economy ranking. The growth equation was
estimated as a system with equations for determinants of growth, HIV prevalence and instrumental variables2.
1 ENTIRE SAMPLE: Argentina, Australia, Austria, Bahamas, Bangladesh, Barbados, Belgium, Belize, Benin, Botswana,
Brazil, Burkina Faso, Burundi, Cambodia, Cameroon, Canada, Central African Rep., Chad, Chile, China, Colombia, Congo
(Democratic Republic), Congo (Republic), Costa Rica, Cote d'Ivoire, Denmark, Djibouti, Dominican Republic, El Salvador,
Ethiopia, Finland, France, Gabon, Gambia, Germany, Ghana, Greece, Guatemala, Guinea-Bissau, Haiti, Honduras, Hong
Kong, India, Indonesia, Ireland, Israel, Italy, Jamaica, Kenya, Korea (Republic), Lesotho, Malawi, Malaysia, Mali,
Mauritania, Mexico, Mozambique, Nepal, Netherlands, Nigeria, Norway, Panama, Papua New Guinea, Philippines, Portugal,
Rwanda, Sierra Leone, Singapore, South Africa, Spain, Sri Lanka, Suriname, Swaziland, Sweden, Switzerland, Tanzania,
Thailand, Togo, Trinidad & Tobago, Turkey, Uganda, United Kingdom, United States of America, Venezuela, Zambia, and
Zimbabwe. 2 The application of the instrumental variables estimator in the context of the classical regression analysis is straightforward:
if the error distribution cannot be considered independent of the regressor’s distribution, instrumental variable is called for,
using an appropriate set of instruments (Baum, 2003).
© Center for Promoting Ideas, USA www.aijcrnet.com
168
The average rate of growth of per capita GDP3 and other indicators were built using information from Heston and
Summers data set (Penn World Table Version 6.2, Center for International Comparisons of Production).
Instrumental variables and other relevant data that matched to economic and socio-demographic figures were
found also in the Human Development Report (UNDP, several years), the World Development Indicators (World
Bank, several years), World Mortality Report (UNDP, 2005), and the Population, Resources, Environment and
Development: The 2005 Revision (UNDP). The institutional variables have been obtained from the Worldwide
Governance Indicators (Kaufman, 2012) and the macroeconomic policy indicators were calculated using
information of the International Country Risk Guide which monitor 161 countries, rating a wide range of risks
(political, financial and economic) to international businesses and financial institutions4. The HIV/AIDS
prevalence5 estimates were obtained using information from the Report on the Global AIDS Epidemic
(UNAIDS/WHO, 2012) and the Human Development Report (UNDP, 2012). Unfortunately, these estimates are
only available per country for a specific year, so the time series and the average of this period have not been
considered for this analysis; nonetheless, the current state of the epidemic is a good approximation to understand
the effect of the disease on the rate of growth. The period analyzed in this paper (1990-2012) is relevant in the
historical path of the HIV/AIDS epidemic because most likely the illness became more apparent at this point in
time, even though there is a sizeable number of AIDS cases worldwide at the beginning of the 1980’s.
The calculation on HIV prevalence took into consideration two different types of epidemics at the country level:
a) Generalized, based on data generated by surveillance systems that focus on pregnant women who attend
selected number of sentinel antenatal clinics and in increasing the number of countries on national representative
serosurveys; b) Concentrated or with a low level, based on surveillance data collected from populations at high
risk and estimates of the size of populations at high and low risk (UNAIDS, 2006). The equations (1)-(3), relate
to the growth rate of real per capita GDP to a number of variables whose relationship has been well established in
the empirical literature on growth (Mayer-Foulkes, 2004) (Bloom, Canning, & Malaney, 1999). This analysis is
recognized in the vast literature that uses cross-country regressions to seek associations between the long-run
average growth rates and a variety of economic policy, political and institutional factors; a common feature in this
type of econometric breakdown is that the explanatory variables are entered independently and linearly.
3.2 Analytical Model
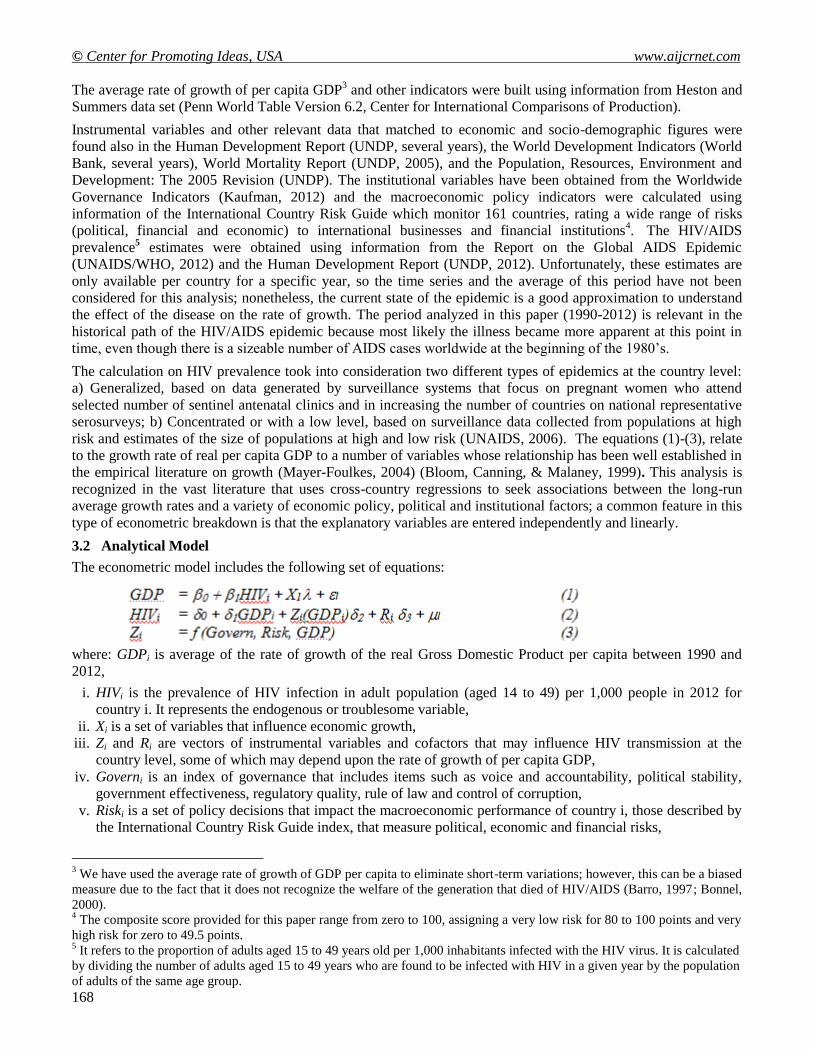
The econometric model includes the following set of equations:
where: GDPi is average of the rate of growth of the real Gross Domestic Product per capita between 1990 and
2012,
i. HIVi is the prevalence of HIV infection in adult population (aged 14 to 49) per 1,000 people in 2012 for
country i. It represents the endogenous or troublesome variable,
ii. Xi is a set of variables that influence economic growth,
iii. Zi and Ri are vectors of instrumental variables and cofactors that may influence HIV transmission at the
country level, some of which may depend upon the rate of growth of per capita GDP,
iv. Governi is an index of governance that includes items such as voice and accountability, political stability,
government effectiveness, regulatory quality, rule of law and control of corruption,
v. Riski is a set of policy decisions that impact the macroeconomic performance of country i, those described by
the International Country Risk Guide index, that measure political, economic and financial risks,
3 We have used the average rate of growth of GDP per capita to eliminate short-term variations; however, this can be a biased
measure due to the fact that it does not recognize the welfare of the generation that died of HIV/AIDS (Barro, 1997; Bonnel,
2000). 4 The composite score provided for this paper range from zero to 100, assigning a very low risk for 80 to 100 points and very
high risk for zero to 49.5 points. 5 It refers to the proportion of adults aged 15 to 49 years old per 1,000 inhabitants infected with the HIV virus. It is calculated
by dividing the number of adults aged 15 to 49 years who are found to be infected with HIV in a given year by the population
of adults of the same age group.
American International Journal of Contemporary Research Vol. 4, No. 6; June 2014
169
vi. are the parameters (or vector of parameters) to be estimated, and
vii. are the random disturbance terms in each equation.
Simultaneity between the HIV epidemic and economic growth makes it difficult to isolate the causal effect of
changes in HIV prevalence on the rate of growth of real per capita GDP. To break this simultaneity this paper
uses a set of social and epidemiological determinants of the HIV infection as well as macroeconomic and
institutional performance at the country level as instruments for changes in the troublesome variable. Because
HIV Incidence, so to speak the rate of growth at which the illness changes over time, is not easily observable
among developing countries, we need to find a reliable measure for our explanatory variable, which is HIV
prevalence (described as HIV i), the number of people suffering HIV infection at a certain point in time. HIV
prevalence at the country level depends on its incidence and the error term, so it follows that the regressor is
contemporaneously correlated with the equation’s disturbance, that is: E [(HIV i i] is different to zero.
Consequently, ordinary least squares (OLS) estimates are biased and inconsistent, therefore the need for a two
stage least square regression.
The objective of this paper is to obtain estimates of the effect of HIV prevalence on the growth rate of real GDP
per capita between 1990 and 2012 that are not affected by the presence of simultaneity. To achieve this goal
requires instrumental variables that are correlated with changes in the prevalence of HIV but is otherwise
unrelated to the growth rate of real GDP per capita. An instrument is a variable that does not itself belong in the
regression, that is correlated with the suspect explanatory variable, and that is uncorrelated with the error term.
The variables employed in this paper are the social and epidemiological determinants of the HIV infection and
macroeconomic performance at the country level, measured by the indexes provided by the International country
risk guide and the worldwide governance indicators. If changes in social and epidemiological factors as well as in
macroeconomic policy are truly exogenous shifters of HIV prevalence, then a comparison of the patterns of HIV
prevalence and changes in the growth rate of GDP per capita under the different proxies for the so called
instruments should provide a rough measure of the effect of HIV on economic growth. If increases in HIV
prevalence have a large impact on the growth rate of GDP per capita, then one would expect the signs of the
values in both regressions to be the opposites.
4. Results
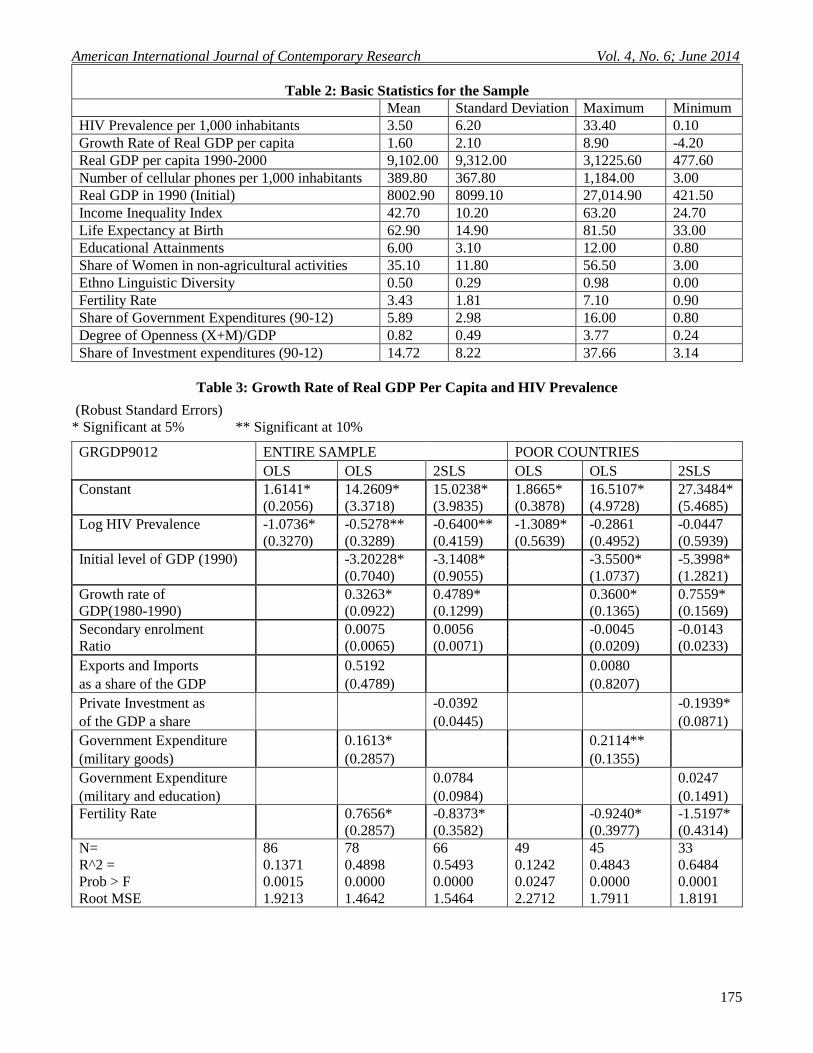
The simple statistics for the sample illustrate (see table 2) that the average prevalence of HIV/AIDS per 1,000
adults is 3.5 (s.d. = 6.2), showing an alarming two-digit rate for several African countries, such as Botswana,
Central African Republic, Lesotho, Malawi, Mozambique, South Africa, Swaziland, Zambia and Zimbabwe and
very low prevalence (0.1% or less) for most of the industrial and some emerging economies. The average growth
rate of real GDP per capita for the period between 1990 and 2004 was 1.6 (s.d. = 2.1), where the best performance
was accomplished by China (an average of almost 9%) and the worst by the Democratic Republic of Congo (-
4.2%). The average level of GDP per capita for the sample is $9,341.50, where the highest value belongs to the
United States of America ($31,225.55) and the lowest corresponds to Cambodia ($477.58). The level of
infrastructure, measured by the number of cellular phones per 1,000 inhabitants, is 390 (s.d. = 368), accounting
only 3 lines per 1,000 people in Ethiopia and 1,184 in Hong Kong. Life expectancy, which reflects access to
health services that depend on the level of income, is 63 years for the sample with a standard deviation of 14.9
(the highest value is for 81.5 years for Hong Kong and the lowest 33 years for Swaziland).
4.1 Determinants of Economic Growth and HIV Prevalence
The existing literature on cross-country investigation of growth used in an assortment of theoretical papers
includes real income (lagged and initial values), government consumption, the ratio of exports and imports to
GDP, population rates and human capital as some of the main factors that influence growth. At the same time, the
spread of HIV/AIDS may be influenced by a wide range of economic, social and epidemiological factors,
certainly difficult to isolate one another. It seems that HIV/AIDS is generalized within a big number of countries,
which means that the main vehicle of transmission occurs through heterosexual sex rather than being concentrated
among the population at higher risk, such as commercial blood donors, sex workers, men having sex with men,
injecting drug users and the like.
© Center for Promoting Ideas, USA www.aijcrnet.com
170
First, a series of regressions on economic growth and HIV prevalence without the influence of one another
substantiate the following results: in the growth regression, the coefficient for the initial level of GDP per capita
(1990) is robust negative showing the presence of the convergence hypothesis; also, secondary enrolment ratio,
previous growth rates and government expenditure in military goods seem to influence positive increases in real
income, and a rise in population (measured by fertility rate) accounts for a large cross-country variation in
income per capita. At the same time, the reduced form describes the explanatory variables in the HIV regression
with the absence of the growth rate; socio-demographic and macroeconomic factors may play an important role
in this explanation. All the coefficients of this calculation are highly significant and robust (except for the share
of women in non-agricultural activities).
Secondly, a simple regression of HIV on the growth rate of income, controlling for the factors that explain the
spread of the disease also shows a strong association among the dependent and independent variables. The rate
of growth is significantly different from zero when controlling for the share of women in non-agricultural
activities (this coefficient is weak, but an important element to build the regression), population Muslim,
ethnical diversity, migration rate, population urban, secondary enrolment and the time since the first AIDS case
was established; also, regressing HIV versus the growth of income in the presence of a dummy variable for poor
countries shows that weak economic performance and factor associated to poverty may explain the rapid spread
of the illness.
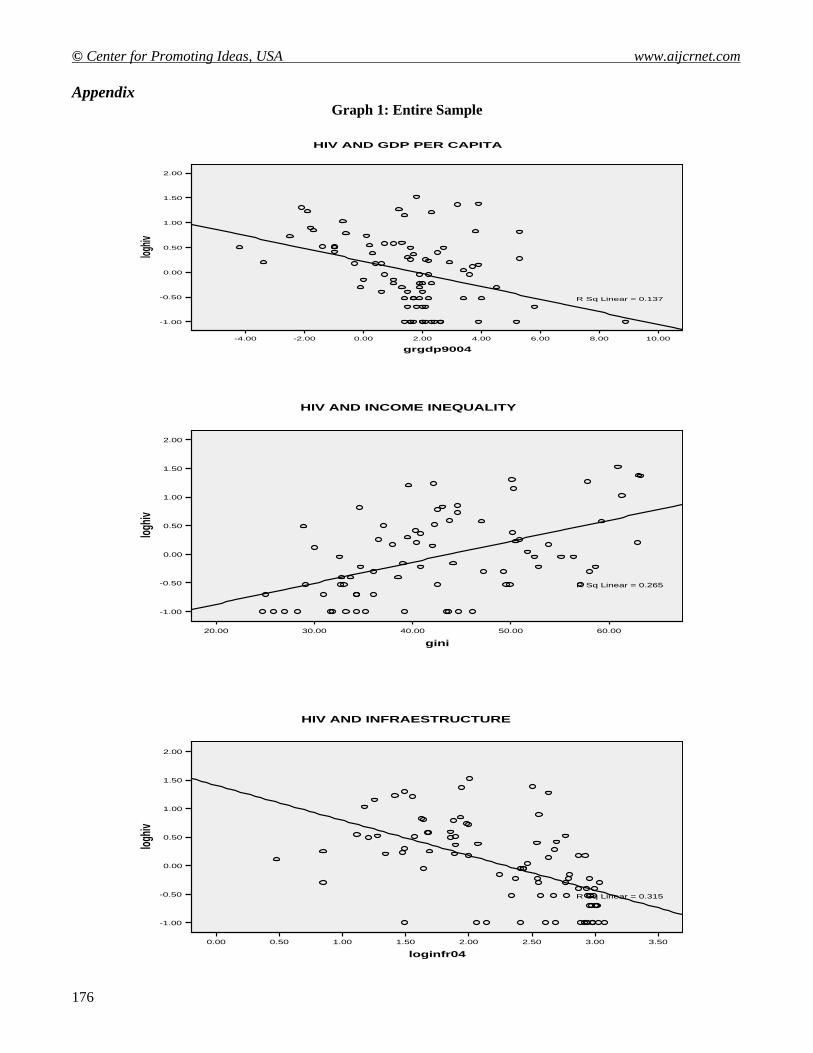
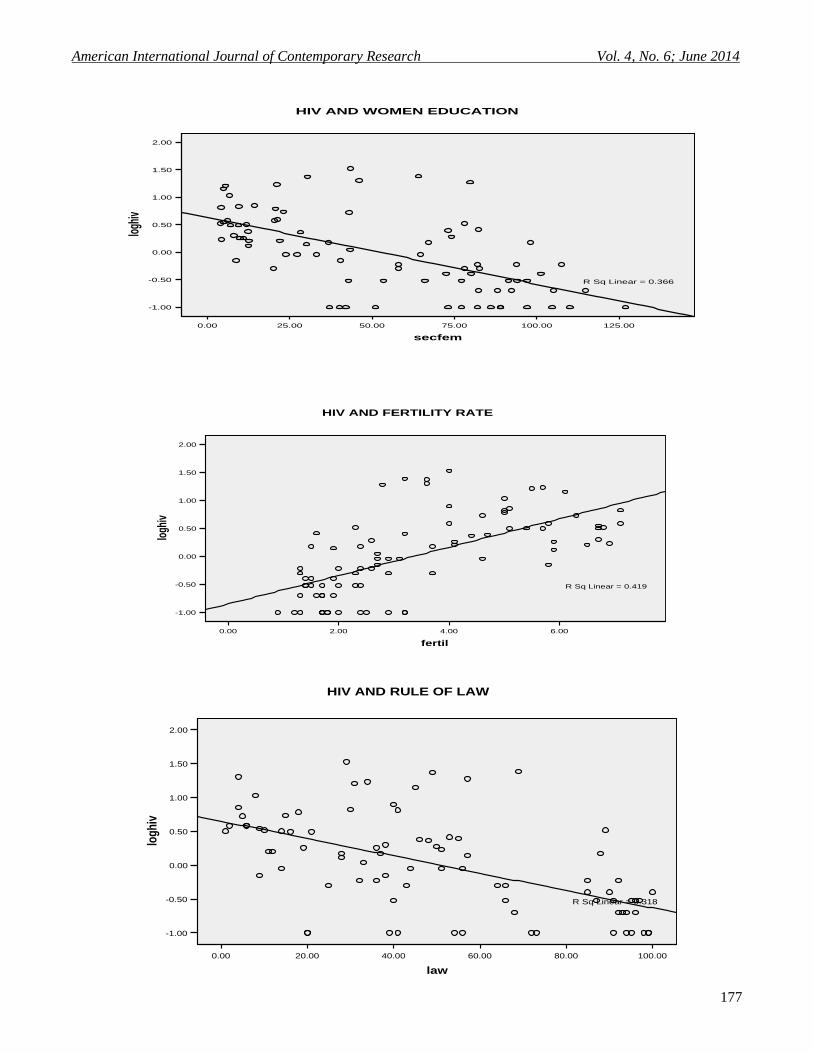
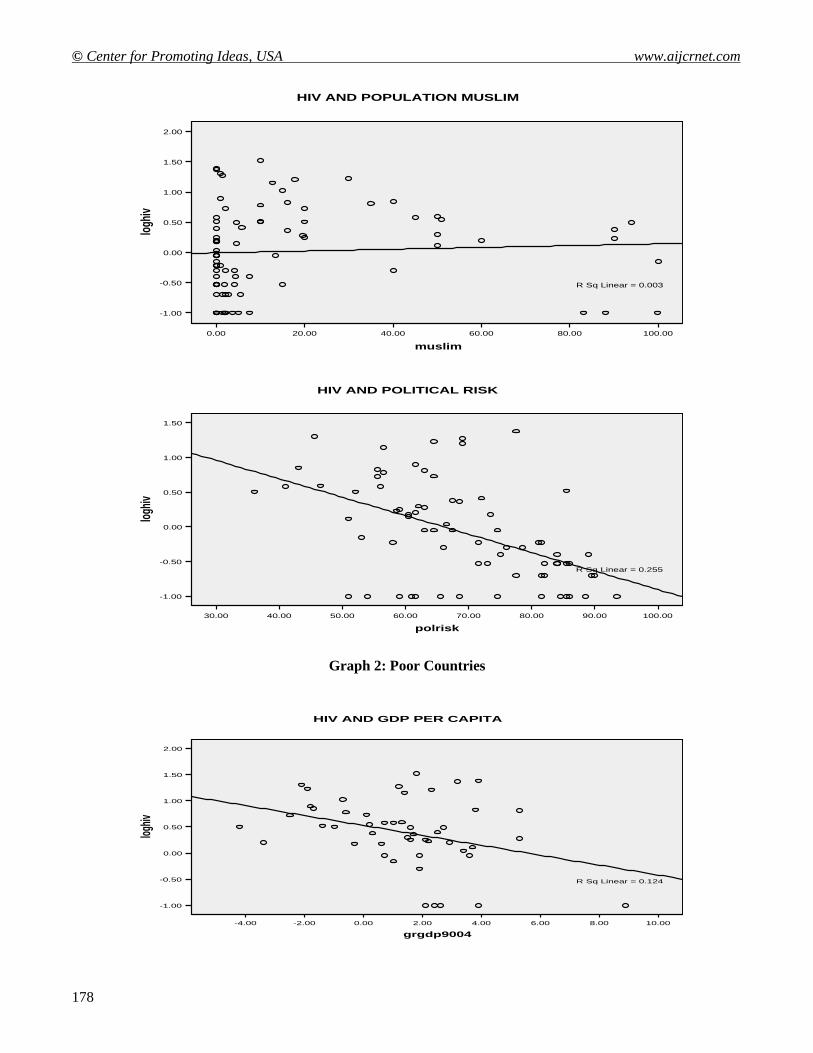
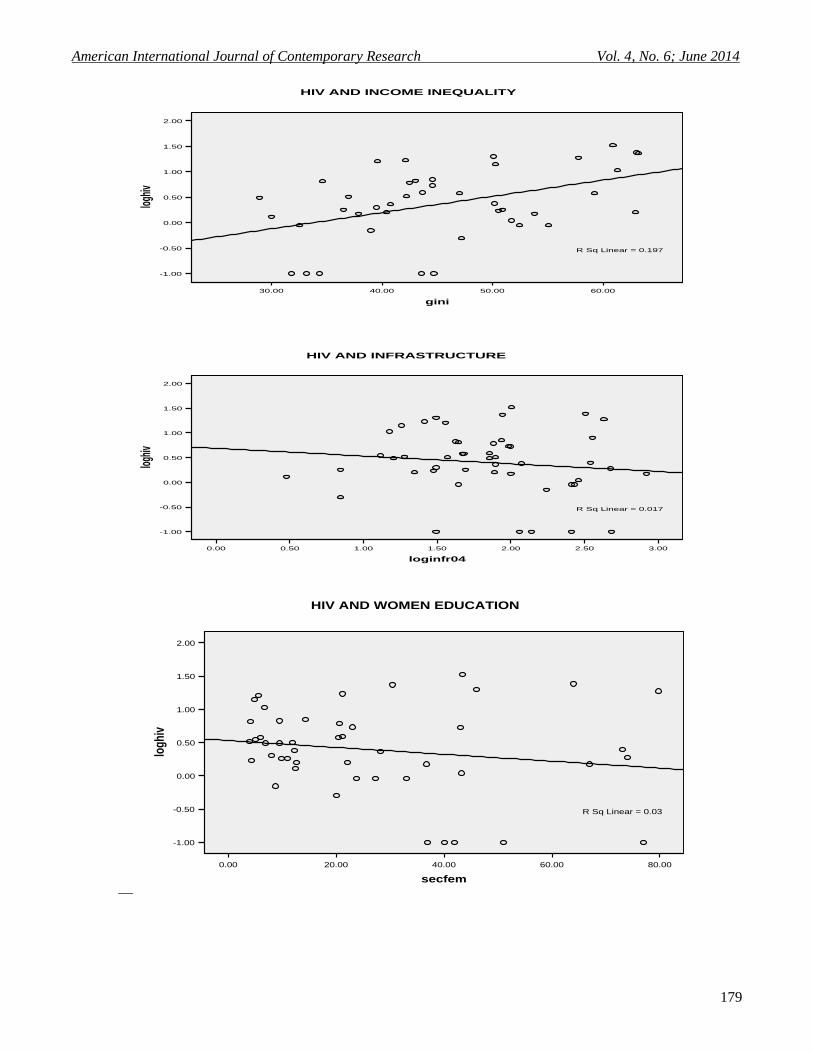
Thirdly, a series of scatter plots help us to establish important relationships between HIV and its main
determinants (see graphs 1 and 2). The rate of growth of GDP per capita is negatively related to HIV prevalence
implying the possibility of a reverse causation due to the fact that some factors leading to economic
development are also important in the HIV epidemic (Bonnel, 2000); the coefficients in both samples are
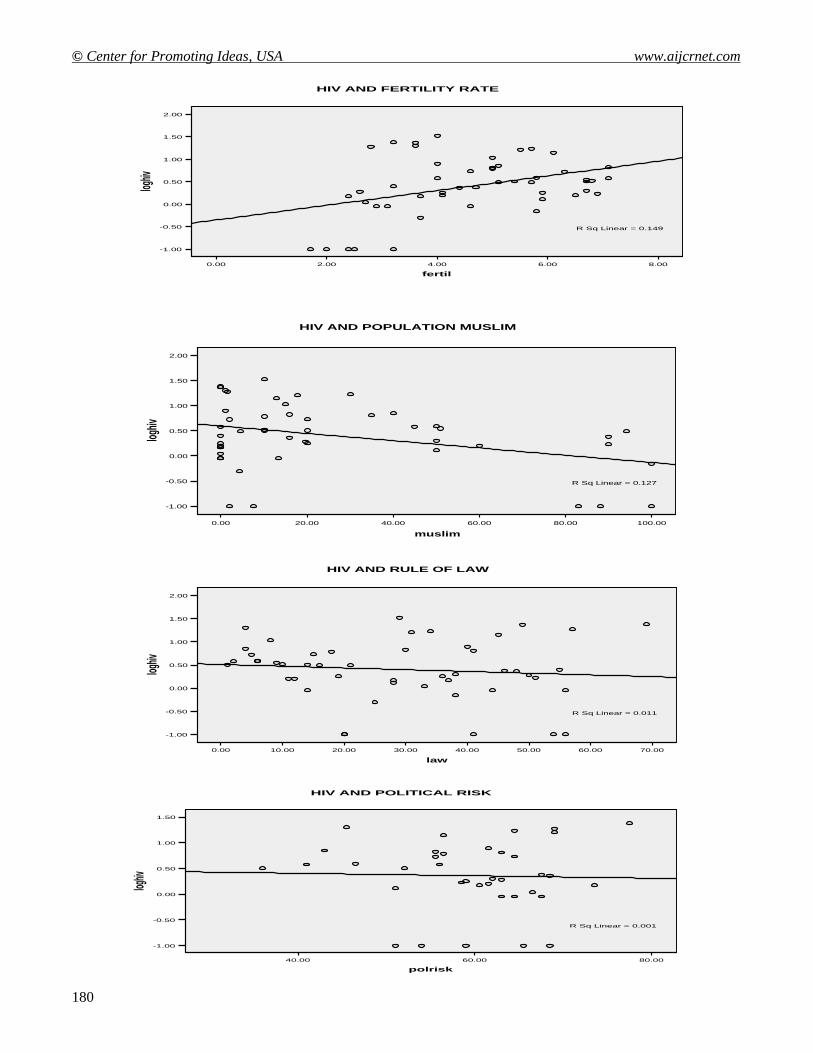
robust and significantly different from zero. Income inequality within and among countries as well as fertility
rates are positively related to HIV in both the entire sample and the sub-sample for poor countries; these factors
may suggest that unequal regional development and a rapid population expansion enhance the negative spillover
effect of the HIV infection.
Better infrastructure, women’s education in the form of secondary enrolment ratio as well as macroeconomic and
institutional variables (rule of law and political risk) show strong negative partial correlation with HIV prevalence
for the whole sample but seem not to be significantly associated with poor countries. Religious constraints on
sexuality may have consequences for the diffusion of sexually transmitted diseases, such as HIV infection. If
followed, the recognition that several Islamic tenets may have the effect of reducing the sexual transmission of
HIV, the hypothesis that Muslims have lower HIV prevalence than non-Muslims can be supported by the positive
correlation between HIV prevalence and being Muslim as shown in the scatter plot, at least in the sample for poor
countries.
Studies on the relationship of risk factors to HIV prevalence have provided mixed evidence with respect to
following Islamic sexual codes and other factors, but that benefits arising from circumcision may help account for
lower HIV prevalence among Muslims. The substantiation that adult male circumcision is efficacious in reducing
sexual transmission of HIV from women to men is compelling. The partial protective effect of male circumcision,
which accounts for approximately 60% reduction in risk of heterosexually acquired HIV infection, is remarkably
consistent across the observational studies (ecological, cross-sectional and cohort) and the randomized controlled
trials conducted in diverse settings by the UNAIDS en past years.
Finally, one of the main arguments in the recent literature of the economic impact of the AIDS epidemic is that
high HIV prevalence is usually associated to a low rate of growth and vice versa. This is true for majority of
countries observed, however, there are some divergences in the HIV prevalence – growth rate of GDP per capita
relationship. On the one hand, one can find that some countries such as Botswana, Lesotho, Uganda and Rwanda
exhibit high growth rates but also high HIV prevalence. On another hand, one can say that the opposite is also
true, low HIV prevalence related to low income as in Brazil, Mexico, Philippines, Germany, Sweden, and
Finland.
4.2 HIV, Macroeconomic Policy and Economic Growth
Table 3 reports OLS and 2SLS estimates of the parameters of the growth equation Following and contrasting with
(Arellano & Bond, 1991) findings; the first column shows that the growth rate of real GDP per capita during 1990
and 2004 in the entire sample is negatively related with the HIV prevalence at the country level.
American International Journal of Contemporary Research Vol. 4, No. 6; June 2014
171
This coefficient is significant and sizeable with each additional HIV case per 1,000 inhabitants per year being
associated with a 1.07% reduction in the average annual rate of growth. The regression for poor countries6
(column 4) illustrate the same pattern, showing an even higher coefficient, meaning that each additional HIV case
per 1,000 people per year would decrease economic growth in 1.31% in the sub sample. Table 2 also reports the
association between HIV prevalence and economic growth controlling for various possible influences on
economic growth. Based on well established relationships of the growth theory, the following controllers were
included: the initial level of real GDP per capita (1990), the lagged growth rate of GDP (1980-1990), the
secondary enrolment ratio (2012) as a proxy for human capital, the ratio of private investment to GDP (2012), the
ratio of exports and imports to GDP (2012), fertility rate (2012), and the ratio of public investment to GDP (2012)
taking as proxies both education plus military expenditures and military expenditure alone.
The inclusion of controller lowered the HIV coefficient in almost half of its original value within the simple OLS
regression; nonetheless, the coefficient is very robust, demonstrating that an additional case of HIV per 1,000
people would decrease the rate of growth in 0.53 percentage point per year. As expected, the growth rate of GDP
per capita 1990-2012 is negatively related to the initial level of per capita GDP (1990), which suggests a strong
convergence in levels of income per capita; also, consistent with the existing literature, fertility rate is negatively
associated with the dependent variable, suggesting that rapid population growth depresses economic growth.
In the same fashion, government spending is positively related to economic growth and becomes significant when
is accounted as the outlays in military good. The estimate for the proxies of human capital is relatively small and
insignificant, so it does not support that growth is enhanced by having a higher human capital stock.
The regression for poor countries (column 5) presents a sharp decrease in the HIV coefficient and on top became
insignificant; the convergence property is still strong, military spending as a proxy for government investments is
positively related to the rate of growth and fertility rate may explain that higher population decreases economic
growth, all of them being very robust. As in the entire sample, the other controller (human capital) does not
support that growth is promoted by these elements. Column 3 reports the 2SLS estimates for the entire sample,
accounting for possible feedback effects of economic growth on the spread of HIV across countries. The
macroeconomic policy and institutional indicators were instrumented with both the dependent and troublesome
variables in order to find the best elements for the first stage of the regression. In this set of circumstances, the
best candidates for instruments were the rule of law and political stability as proxies for governance and political
risk for macroeconomic performance; in addition, some of the determinants of HIV such as ethnic diversity,
women empowerment, population being Muslim, time since the first case was discovered and income inequality
among others were included in the regression.
The 2SLS shows a robust coefficient for HIV prevalence in the entire sample, which may indicate that an
additional case of HIV per 1,000 inhabitants per year would lower the average annual rate of growth in 0.64
percentage point with a critical value for this statistics at the 10% level; for the poor countries examined in the sub
sample, the HIV coefficient became relatively small and exceeded the expected level of significance necessary to
explain simultaneity between the growth rate and the burden of the disease. Nevertheless, even when these
coefficients are not significantly different from zero, they are able to capture the estimated effects of HIV on
economic growth. In both cases, the entire sample and the sub-sample, the convergence property is quite strong
and population growth (measured by fertility rate) is associated with a decrease of output. Human capital as well
as public and private investments do not support that gains in GDP over time are influenced by these factors.
5. Conclusions and Public Health Implication
This paper involves the use of instrumental variable estimation to assess the impact of the HIV epidemic on
economic growth in the presence of simultaneity; the most frequently used instrumental variable estimator is two-
stage least square.
6 POOR COUNTRIES: Bangladesh, Belize, Benin, Botswana, Burkina Faso, Burundi, Cambodia, Cameroon, Central African
Republic, Chad, China, Congo (Democratic Republic), Congo (Republic), Cote d'Ivoire, Djibouti, Dominican Republic, El
Salvador, Ethiopia, Gabon, Gambia, Ghana, Guatemala, Guinea-Bissau, Haiti, Honduras, India, Indonesia, Jamaica, Kenya,
Lesotho, Malawi, Mali, Mauritania, Mozambique, Nepal, Nigeria, Papua New Guinea, Rwanda, Sierra Leone, South Africa,
Sri Lanka, Suriname, Swaziland, Tanzania, Togo, Turkey, Uganda, Zambia and Zimbabwe.
© Center for Promoting Ideas, USA www.aijcrnet.com
172
Following the contradicting findings in (Bonnel, 2000) (ALemu, Roe, & Smith, 2006) [14] [15], the result of this
examination provides support to our original hypothesis that the HIV/AIDS epidemic has lowered the rate of
growth of GDP per capita between 1990 and 2012 in the group of 86 developed and developing countries, and in
the sub-sample for poor countries. Using controls commonly applied in empirical studies and the economic theory
and instrumenting for the main determinants of HIV as well as macroeconomic and institutional variables, the
estimates for HIV prevalence are robust and significantly different from zero. In the 2SLS regression, one
additional case of HIV per 1,000 inhabitants per year decreases the average rate of income growth in a 0.64 point
percent, which is consistent with other findings.
Among the factors influencing the spread of the sickness, economic and demographic factors can be mentioned,
such as the levels of infrastructure measured by the number of cellular phone lines per 1,000 and women’s
empowerment quantified by the share of women in non-agricultural activities and female secondary enrolments.
Also, institutional variables (rule of law), macroeconomic indexes (political risk), income inequality and fertility
rates are important explanatory variables in the instrumental regression. The nature of the epidemic, whether it is
generalized or concentrated, responds also to socio-epidemiological factors and religious beliefs; for instance,
being Muslim and circumcision seem to be associated to lower rates of prevalence of HIV. At the same time,
ethnical diversity appears to increase the speed at which HIV infection evolves. These two former factors seem to
be good explanatory variables within the investigation.
The epidemic affects several aspects of human life with devastating consequences, imposing heavy burdens on
individuals, families, communities and nations, especially for those with low income. Evidently, HIV infection
represents a great challenge for governments and policy makers because the proliferation of the disease depends
upon several factor related not only to economic growth but also to life styles, which are relatively hard to reach
through policy decisions. There remains a need for policymakers to understand the impacts that HIV/AIDS
will have on overall performance of economies and budgets. In the most affected countries, the HIV/AIDS
epidemic is yet another obstacle on the road to development. The difficulty of measuring the impact of the AIDS
epidemic does not mean that there is less cause for alarm. Indeed, the real likelihood is that the full impact has yet
to occur. Nonetheless, it seems to be a consensus in the current literature that fighting poverty, improvements in
health conditions, creation of more job opportunities, promotion of infrastructure, greater investments on
education, especially for women, and a comprehensive approach in medical treatment could lessen the impact of
HIV on labour productivity in the long run.
American International Journal of Contemporary Research Vol. 4, No. 6; June 2014
173
References
ALemu, Z., Roe, T., & Smith, R. (2006). The Impact of HIV on Total Factor Productivity. In the 9th Annual
Conference on Global Economic Analysis, Addis Ababa, Ethiopia. Addis Ababa.
Arellano, M., & Bond, S. (1991). Some Tests of Specification for Panel Data: Monte Carlo Evidence and an
Application to Employment Equations . The Review of Economic Studies, 58(2), 277-297.
Arndt, C., & Lewis, J. (2000). The Macro Implications of HIV/AIDS in South Africa: A Preliminary Assessment.
South African Journal of Economics, 68(5), 856-887.
Arndt, C., & Wobst, P. (2002). HIV and Labor Markets in Tanzania, International Food Policy Research Institute.
TDM Discussion Paper Washington, October., 102.
Barro, R. (1991). Economic Growth in a Cross Section of Countries. The Quarterly Journal of Economics,
106(2), 407-443.
Barro, R. (1996). Health and Economic Growth, Pan American Health Organization, Division of Health and
Human Development, Series Health, Human Capital and Economic Growth.
Barro, R., & Lee, J. (1993). International Comparisons of Educational Attainments. Journal of Monetary
Economics, 32, 363-394.
Barro, R., & Lee, J. (2000). International Data on Educational Attainments: Updates and Implications, Center for
International Development Harvard University. Working Paper No. 42, 42.
Barro, R., & Sala-i-Martin, X. (1992). Convergence. The Journal of Political Economy, 100(2), 223-251.
Bell, C., S, D., & Gersbach, H. (2004). Thinking About the Long-Run Economic Costs of AIDS. In Haacker (ed.)
(2004).
Bhargava, A. etal. (2001). Modeling the Effects of Health on Economic Growth. Journal of Health Economics,
20(3), 423-40.
BIDPA. (2000). The Macroeconomic Impacts of the HIV/AIDS Epidemic in Botswana, Report prepared for
Government of Botswana . Gaborone: BIDPA.
BIDPA, & Bank, W. (2006). Prospects for Export Diversification in Botswana . Gaborone: BIDPA/World Bank.
Bloom, D., & Mahal, A. (1997). Does the AIDS Epidemic Threatens Economic Growth? Journal of
Econometrics,, 77(105), 105-124.
Bloom, D., Canning, D., & Malaney, P. (1999). Demographic Change and Economic Growth in Asia, Center for
International Development, Harvard University. Working Paper No. 15.
Bonnel, R. (2000). HIV/AIDS: Does it Increase or Decrease Growth in Africa? World Bank, ACT Africa.
Borro, R. (1991). Economic Growth in a Cross Section of Countries. The Quarterly Journal of Economics,
106(2), 407-443.
Chin, J., & Lwanga, S. K. (1991). Estimation and projection of adult AIDS cases: A simple epidemiological
model. Bulletin of the World Health Organization, 69(4), 399-406.
Cornia, G., & Zagonari, F. (2007). The HIV and AIDS impact on the rural and urban economy. AIDS, public
policy and child well-being , 185-205.
Cuddington, J. (1993). Modelling the Macroeconomic Effects of AIDS, with an Application to Tanzania. World
Bank Economic Review, 7(2), 173-189.
Dixon, S., McDonald, S., & Roberts, J. (2001). AIDS and Economic Growth in Africa: A Panel Data Analysis.
Journal of International Development,, 13, 411-426.
Dorrington, R., Johnson, L., & Budlender, D. (2005). ASSA2003 AIDS and Demographic models: User guide.
Centre for Actuarial Research, University of Cape Town, for the AIDS Committee of the Actuarial Society
of South Africa, 1-45.
Foley, D., & Michl, T. (1999). Growth and Distribution. Harvard University Press.
Grey, P. (2004). HIV and Islam: Is HIV Prevalence lower among Muslims. Journal Social and Medicine, 58(9),
1751-1756.
Gupta, S., Verhoeven, M., & Tiongson, E. R. (2003). Public Spending on Health Care and the Poor. Journal of
Health Economics, 12(8), 685-696.
Hacker, M. (2004). The Macroeconomics of HIV/AIDS. International Monetary Fund,(Editor, 2004).
Hamoudi, A., & Sachs, J. (1999). Economic Consequences of Health Status: A Review of the Evidence, Center
for International Development. Harvard University, Working Paper No. 30, December.
Heston, A., Summers, R., & Aten, B. (2006). Penn World Table Version 6.2, Center for International
Comparisons of Production, Income and Prices. University of Pennsylvania, September.
© Center for Promoting Ideas, USA www.aijcrnet.com
174
Jamison, D. T., Sachs, J. D., & Wang, J. (2001). The effect of the AIDS epidemic on economic welfare in sub-
Saharan Africa.
Judson, R., & Owen, A. (1999). Estimating Dynamic Panel Data Models: a Guide for Macroeconomists.
Economics Letters, 65, 9-15.
Karl, T. (2001). HIV/AIDS in the Caribbean: economic issues—impact and investment response. Commission on
Macroeconomics and Health Working Paper Series, Paper No. WG1:1 (Cambridge, Massachusetts,
Harvard University, Center for International Developments; and Geneva, World Health Organization.
Kaufman, D., Kraay, A., & Mastruzzi, M. (2006). Governance Matters V: Governance Indicators for 1996-2005,
World Bank. Policy Research Working Paper.
Knowles, S., & Owen, P. (1995). Health Capital and Cross-Country Variation in Income Per-Capita in the
Mankiw-Romer-Weil Model. Economics Letters, 48, 99-106.
Macfarlan, M., & Sgherri, S. (2001). The Macroeconomic Impact of HIV/AIDS in Botswana. IMF Working
Paper 01/80 (Washington DC: IMF) .
Mankiw, N., Romer, D., & Weil, D. (1992). A Contribution to the Empirics of Economic Growth,.
Quarterly(105), 407-437.
Mayer-Foulkes, D. (2004). The Intergenerational Impact of Health on Economic Growth, CIDE, Mexico.
McDonald, S., & Roberts, J. (2002). Growth and Multiple Form of Human Capital in an Augmented Solow
Model: a Panel Data Investigation. Economics Letters, 74, 271-276.
McDonald, S., & Roberts, J. (2004). AIDS and Economic growth: A Human Capital Approach. Sheffield
Economic Research Paper Series No. 2004008.
McDonald, S., & Roberts, J. (2004). AIDS and Economic growth: A Human Capital Approach,. Sheffield
Economic Research Paper Series No. 2004008, August.
Nicholls, S., & etal. (2000). Modelling the macroeconomic impact of HIV/AIDS in the English speaking
Caribbean: the case of Trinidad and Tobago and Jamaica. Paper presented at the IAEN Symposium: The
Economics of HIV/AIDS in Developing Countries.
Quattek, K. (2000). The Economic Impact of HIV/AIDS in South Africa: A Dark Cloud on the Horizon.
Johannesburg: Ing Barings.
Ravallion, M. &. (2003). Measuring Pro-Poor Growth. Economic Letters, 78, 93-99.
Revenga, A., Over, M., Masaki, E., Peerapatanapokin, W., Gold, J., Tangcharoensathien, V., . . . El-Maroufi, K.
(2006). Risks and Macroeconomic Impacts of HIV/AIDS in the Middle East and North Africa. Why
Waiting to Intervene Can Be Costly? World Bank, Working Paper Series No. 26.
Salinas, G., & Haacker, M. (2006). HIV/AIDS: The Impact on Poverty and Inequality. IMF Working Paper
WP/06/126 (Washington DC: IMF).
Schwartländer, B., Stanecki, K. A., Brown, T., Way, O. P., Monasch, R., Chin, J., . . . Walker, N. (1999).
Country-specific estimates and models of HIV and AIDS: methods and limitations. AIDs, 13(17), 2445-
2458.
Shastry, G., & Weil, D. (2003). How Much of Cross-Country Income Variation is Explained by Health? . Journal
of the European Economic Association, 1(2), 387-396.
Stanciole, A., & Abegunde, D. (2006). The Economic Impact of Chronic Diseases: How Do Households Respond
to Shocks? Evidence from Brazil, India and Russia,. University of York / World Health Organization,
November.
UNAIDS WHO. (2012). Report on the Global AIDS Epidemic (Geneva: UNAIDS, May).
UNDP / Government of Botswana, U. (2000). Towards an AIDS-Free Generation (Gaborone).
UNFPA. (2010). International Conference on Population and Development: Botswana Country Report.
Weil, D. (2001). Accounting for the Effect of Health on Economic Growth. Department of Economics, Brown
University.
American International Journal of Contemporary Research Vol. 4, No. 6; June 2014
175
Table 2: Basic Statistics for the Sample
Mean Standard Deviation Maximum Minimum
HIV Prevalence per 1,000 inhabitants 3.50 6.20 33.40 0.10
Growth Rate of Real GDP per capita 1.60 2.10 8.90 -4.20
Real GDP per capita 1990-2000 9,102.00 9,312.00 3,1225.60 477.60
Number of cellular phones per 1,000 inhabitants 389.80 367.80 1,184.00 3.00
Real GDP in 1990 (Initial) 8002.90 8099.10 27,014.90 421.50
Income Inequality Index 42.70 10.20 63.20 24.70
Life Expectancy at Birth 62.90 14.90 81.50 33.00
Educational Attainments 6.00 3.10 12.00 0.80
Share of Women in non-agricultural activities 35.10 11.80 56.50 3.00
Ethno Linguistic Diversity 0.50 0.29 0.98 0.00
Fertility Rate 3.43 1.81 7.10 0.90
Share of Government Expenditures (90-12) 5.89 2.98 16.00 0.80
Degree of Openness (X+M)/GDP 0.82 0.49 3.77 0.24
Share of Investment expenditures (90-12) 14.72 8.22 37.66 3.14
Table 3: Growth Rate of Real GDP Per Capita and HIV Prevalence
(Robust Standard Errors)
* Significant at 5% ** Significant at 10%
GRGDP9012 ENTIRE SAMPLE POOR COUNTRIES
OLS OLS 2SLS OLS OLS 2SLS
Constant 1.6141* 14.2609* 15.0238* 1.8665* 16.5107* 27.3484* (0.2056) (3.3718) (3.9835) (0.3878) (4.9728) (5.4685) Log HIV Prevalence -1.0736* -0.5278** -0.6400** -1.3089* -0.2861 -0.0447 (0.3270) (0.3289) (0.4159) (0.5639) (0.4952) (0.5939) Initial level of GDP (1990) -3.20228* -3.1408* -3.5500* -5.3998* (0.7040) (0.9055) (1.0737) (1.2821)
Growth rate of 0.3263* 0.4789* 0.3600* 0.7559* GDP(1980-1990) (0.0922) (0.1299) (0.1365) (0.1569)
Secondary enrolment 0.0075 0.0056 -0.0045 -0.0143 Ratio (0.0065) (0.0071) (0.0209) (0.0233)
Exports and Imports 0.5192 0.0080
as a share of the GDP (0.4789) (0.8207)
Private Investment as -0.0392 -0.1939*
of the GDP a share (0.0445) (0.0871)
Government Expenditure 0.1613* 0.2114**
(military goods) (0.2857) (0.1355)
Government Expenditure 0.0784 0.0247
(military and education) (0.0984) (0.1491) Fertility Rate 0.7656* -0.8373* -0.9240* -1.5197* (0.2857) (0.3582) (0.3977) (0.4314) N= 86 78 66 49 45 33 R^2 = 0.1371 0.4898 0.5493 0.1242 0.4843 0.6484 Prob > F 0.0015 0.0000 0.0000 0.0247 0.0000 0.0001 Root MSE 1.9213 1.4642 1.5464 2.2712 1.7911 1.8191
© Center for Promoting Ideas, USA www.aijcrnet.com
176
Appendix Graph 1: Entire Sample
10.008.006.004.002.000.00-2.00-4.00
grgdp9004
2.00
1.50
1.00
0.50
0.00
-0.50
-1.00
logh
ivHIV AND GDP PER CAPITA
R Sq Linear = 0.137
60.0050.0040.0030.0020.00
gini
2.00
1.50
1.00
0.50
0.00
-0.50
-1.00
logh
iv
HIV AND INCOME INEQUALITY
R Sq Linear = 0.265
3.503.002.502.001.501.000.500.00
loginfr04
2.00
1.50
1.00
0.50
0.00
-0.50
-1.00
logh
iv
HIV AND INFRAESTRUCTURE
R Sq Linear = 0.315
American International Journal of Contemporary Research Vol. 4, No. 6; June 2014
177
125.00100.0075.0050.0025.000.00
secfem
2.00
1.50
1.00
0.50
0.00
-0.50
-1.00
logh
iv
HIV AND WOMEN EDUCATION
R Sq Linear = 0.366
6.004.002.000.00
fertil
2.00
1.50
1.00
0.50
0.00
-0.50
-1.00
logh
iv
HIV AND FERTILITY RATE
R Sq Linear = 0.419
100.0080.0060.0040.0020.000.00
law
2.00
1.50
1.00
0.50
0.00
-0.50
-1.00
log
hiv
HIV AND RULE OF LAW
R Sq Linear = 0.318
© Center for Promoting Ideas, USA www.aijcrnet.com
178
Graph 2: Poor Countries
100.0080.0060.0040.0020.000.00
muslim
2.00
1.50
1.00
0.50
0.00
-0.50
-1.00
logh
iv
HIV AND POPULATION MUSLIM
R Sq Linear = 0.003
100.0090.0080.0070.0060.0050.0040.0030.00
polrisk
1.50
1.00
0.50
0.00
-0.50
-1.00
logh
iv
HIV AND POLITICAL RISK
R Sq Linear = 0.255
10.008.006.004.002.000.00-2.00-4.00
grgdp9004
2.00
1.50
1.00
0.50
0.00
-0.50
-1.00
logh
iv
HIV AND GDP PER CAPITA
R Sq Linear = 0.124
American International Journal of Contemporary Research Vol. 4, No. 6; June 2014
179
__
60.0050.0040.0030.00
gini
2.00
1.50
1.00
0.50
0.00
-0.50
-1.00
logh
iv
HIV AND INCOME INEQUALITY
R Sq Linear = 0.197
3.002.502.001.501.000.500.00
loginfr04
2.00
1.50
1.00
0.50
0.00
-0.50
-1.00
logh
iv
HIV AND INFRASTRUCTURE
R Sq Linear = 0.017
80.0060.0040.0020.000.00
secfem
2.00
1.50
1.00
0.50
0.00
-0.50
-1.00
logh
iv
HIV AND WOMEN EDUCATION
R Sq Linear = 0.03
© Center for Promoting Ideas, USA www.aijcrnet.com
180
8.006.004.002.000.00
fertil
2.00
1.50
1.00
0.50
0.00
-0.50
-1.00
loghiv
HIV AND FERTILITY RATE
R Sq Linear = 0.149
100.0080.0060.0040.0020.000.00
muslim
2.00
1.50
1.00
0.50
0.00
-0.50
-1.00
logh
iv
HIV AND POPULATION MUSLIM
R Sq Linear = 0.127
70.0060.0050.0040.0030.0020.0010.000.00
law
2.00
1.50
1.00
0.50
0.00
-0.50
-1.00
logh
iv
HIV AND RULE OF LAW
R Sq Linear = 0.011
80.0060.0040.00
polrisk
1.50
1.00
0.50
0.00
-0.50
-1.00
loghiv
HIV AND POLITICAL RISK
R Sq Linear = 0.001
Top Related
Copyright © 2022 FDOKUMEN

