


Bahasa
Halaman
Hukum

Ž .Geoderma 98 2000 11–33www.elsevier.nlrlocatergeoderma
Inorganic nitrogen dynamics in fallows and maizeon an Oxisol and Alfisol in the highlands of Kenya
Alfred E. Hartemink a,), R.J. Buresh b,1, P.M. van Bodegom c,A.R. Braun c, Bashir Jama b,1, B.H. Janssen c
a International Soil Reference and Information Centre, PO Box 353,6700 AJ Wageningen, Netherlands
b International Centre for Research in Agroforestry, PO Box 30677, Nairobi, Kenyac Soil Science and Plant Nutrition Section, Wageningen UniÕersity, PO Box 8005,
6700 EC Wageningen, Netherlands
Received 9 August 1999; received in revised form 26 April 2000; accepted 23 June 2000
Abstract
Fallows with naturally regenerated or planted vegetation are important in many subsistenceagricultural systems of tropical regions, but the underlying soil processes in fallows are notproperly understood. We investigated N dynamics under different fallow vegetation on a Kandiu-
Ž . Ždalfic Eutrudox 2372-mm rain in 16 months and a Kandic Paleustalf 1266-mm rain in 15.months in the Kenyan highlands. The treatments, which extended for three cropping seasons
Ž . Ž . Ž .15–16 months , were Zea mays maize , natural regrowth of vegetation natural fallow , plantedŽ . Ž .Sesbania sesban sesbania fallow and uncultivated soil without vegetation bare fallow . Inor-
Ž . y1ganic N nitrateqammonium-N to 2-m depth under bare fallow increased by 242 kg N hayeary1 on the Oxisol and 54 kg N hay1 yeary1 on the Alfisol, indicating that N mineralization
Ž .exceeded N losses. Subsoil inorganic N 0.5–2.0 m remained relatively unchanged after threecrops of unfertilized maize, which produced limited total biomass because of P deficiency.Inorganic N decreased during natural and sesbania fallows, and both fallows similarly depletedsubsoil inorganic N. The fallows depleted inorganic N at 0.5–2.0 m by 75–125 kg N hay1 yeary1
down to a minimum N content between 40 and 80 kg N hay1. After slashing sesbania andincorporating the above-ground biomass with 154–164 kg N hay1, soil inorganic N increasedwithin 2 months by 136 kg N hay1 on the Oxisol and 148 kg N hay1 on the Alfisol. Inorganic Ndecreased after cropping the bare fallow on the Oxisol with maize, indicating that inorganic N was
) Corresponding author. Tel.: q31-317-471-711; fax: q31-317-471-700.Ž .E-mail address: [email protected] A.E. Hartemink .
1 Current address: International Rice Research Institute, MCPO Box 3127, Makati City, 1271,Philippines.
0016-7061r00r$ - see front matter q2000 Elsevier Science B.V. All rights reserved.Ž .PII: S0016-7061 00 00072-0
( )A.E. Hartemink et al.rGeoderma 98 2000 11–3312
prone to leaching during heavy rains when the maize was small. A considerable part of the N inbiomass of the natural fallow was recycled. Much of the total N accumulated by the sesbaniafallow was removed with the wood and the amount of N recycled was similar on the Oxisol andAlfisol. We conclude that sesbania fallows can retrieve considerable subsoil inorganic N on deepsoils with high subsoil N and effectively cycle this N through its rapidly decomposable biomass tosubsequent crops. q 2000 Elsevier Science B.V. All rights reserved.
Keywords: agroforestry; improved fallow; subsoil N; nitrate; Kenya; maize; natural fallow; barefallow; Sesbania sesban
1. Introduction
Nitrogen is commonly deficient and limits crop production in cultivated soilsŽ .of the tropics Sanchez, 1976; Ahmad, 1996 . The main sources of N for crops
are the mineralization of soil organic matter, inorganic fertilizers and organicinputs, and biological N fixation. In tropical regions, the supply of organic2
inputs is often insufficient to meet crop demand for N, and inorganic fertilizersŽ .are commonly expensive with low profitability McIntire, 1986 . For many
farmers, the only viable option for increasing N supply in crops is throughfallowing — the rotation of crops with either naturally regenerated or plantedvegetation.
An ideal fallow species — from a soil N point of view — would grow fast,take up and recycle N within the soil–plant system and fix atmospheric N . The2
fallow species should also yield economic products like wood, fodder or fruits.Ž .Young 1997 listed several species that fit these criteria, including SesbaniaŽ .sesban L. Merr., a N -fixing shrub with a high potential to maintain and2
improve soil fertility. Studies in Zambia indicated that planted sesbania fallowsŽ .of 2–3 years can increase yields of subsequent maize Zea mays L. crops
Žwithout the use of inorganic fertilizers Kwesiga and Coe, 1994; Kwesiga et al.,. y11999 . Maize grain yields were 2.3, 5.6 and 6.0 Mg ha after 1, 2 and 3 years,
respectively, of fallow with sesbania as compared with yields of 1.6, 1.2 and 1.8Mg hay1 after 1, 2 and 3 years, respectively, of continuous maize cropping.
The processes responsible for such yield increases following sesbania are yetŽ .to be quantified Sanchez et al., 1997 , but they could include changes in soil
physical properties, input of N through biological N fixation, and retrieval of N2Ž .from subsoil layers that are inaccessible to maize roots Buresh and Tian, 1997 .
Obviously, the processes differ under contrasting agro-ecological conditionswith different fallow vegetation. In order to quantify the effects of sesbaniafallows on nutrient dynamics and soil properties, we started experiments in 1993in the highlands of Kenya. We compared planted sesbania fallows with continu-ous cropping of maize and with the farmers’ existing fallowing practice, whichinvolves natural regeneration of native vegetation without cultivation. Theexperiments were conducted on an Alfisol and an Oxisol, which are common
( )A.E. Hartemink et al.rGeoderma 98 2000 11–33 13
Ž .soil types in Kenya Sombroek et al., 1982 and they represent about 25% of theŽ .soils in Africa Eswaran et al., 1997 .
Ž .From these experiments, Hartemink et al. 1996 reported N dynamics duringone crop growing season and provided evidence that sesbania fallows take up
Ž .NO –N from oxic subsoils. Maroko et al. 1998 in these experiments, and3Ž .Barrios et al. 1997 in other experiments in Zambia, measured N mineralization
and soil inorganic N at the end of fallows and showed distinct differencesbetween fallows. These studies did not report soil inorganic N dynamics duringan entire fallow cycle, quantify changes in inorganic N immediately afterslashing the fallow vegetation and planting maize, nor estimate the uptake ofsubsoil N by fallow vegetation.
In this paper, we report soil inorganic N during and immediately followingŽ .1.5-year long fallows equivalent to three cropping seasons with either planted
sesbania, natural regrowth of native vegetation or uncultivated bare soil. TheŽ .objectives are i to monitor inorganic N changes in fallows and a maize crop
Ž .control on two different soil types, ii to estimate the retrieval of subsoilŽ .inorganic N by sesbania and natural fallows, iii to monitor changes in soil
Ž .inorganic N after slashing the fallows and planting maize and iv to compare Naccumulation and recycling by the fallows with changes in soil inorganic N.
2. Materials and methods
2.1. Site description
Ž .The research was done at two farms Ochinga and Muange in Kenya.Ž X X . ŽOchinga 0806 N, 34834 E is located in the highlands of western Kenya Vihiga
.District at an altitude of 1420 m. Rainfall is distributed between two cropgrowing seasons with a yearly mean of about 1800 mm. The soil at Ochinga is
Ž .classified as an Acric Ferralsol World Reference Base or as a very fine,Ž .kaolinitic, isohyperthermic Kandiudalfic Eutrudox Oxisol in USDA Soil Tax-
Ž .onomy. Air-dried and sieved -2 mm soil had the following properties in theŽ . y1top 0.15 m: pH H O 1:2.5 w per v s5.1, organic Cs15 g kg , bicarbon-2
ate–EDTA extractable Ps2 mg kgy1, KCl extractable Cas34 mmol kgy1,c
KCl extractable Mgs14 mmol kgy1, bicarbonate–EDTA extractable Ks1.2c
mmol kgy1, exchangeable aciditys4 mmol kgy1, clays460 g kgy1 andc c
sands260 g kgy1.Ž X X .Muange 1831 S, 37819 E is located in the highlands of eastern Kenya
Ž .Machakos District at an altitude of 1920 m. Mean annual rainfall is about 900mm, distributed between two crop growing seasons. The soil at Muange isclassified as a Rhodic Luvisol in the World Reference Base and as a fine,
Ž .mixed, isothermic Kandic Paleustalf Alfisol in USDA Soil Taxonomy. Air-Ž .dried and sieved -2 mm soil had the following properties in the top 0.15 m:
Ž . y1pH H O 1:2.5 w per v s5.7, organic Cs8 g kg , bicarbonate–EDTA2
( )A.E. Hartemink et al.rGeoderma 98 2000 11–3314
extractable Ps5 mg kgy1, extractable Cas34 mmol kgy1, extractable Mgsc
11 mmol kgy1, extractable Ks4.7 mmol kgy1, exchangeable aciditys2c c
mmol kgy1, clays290 g kgy1 and sands560 g kgy1. Additional soilcŽ .analytical data are given in Hartemink et al. 1996 .
2.2. Experimental set-up
The experiment was laid out at each site as a randomized complete block withŽ . Žfour treatments land-use systems : sesbania grown for three seasons sesbania
.fallow , natural regrowth of vegetation without cultivation for three seasonsŽ . Ž .natural fallow , unfertilized maize grown for three seasons maize and bare
Ž .uncultivated soil without vegetation for three seasons bare fallow . All treat-ments were followed by unfertilized maize. Treatments were replicated fourtimes at each site. Plot size was 10=10 m2.
Sesbania was established one season before the start of the experiment. OnŽ . Žthe Oxisol, sesbania Kisii provenance was direct-seeded in four rows 2.25=
2 .0.4-m spacing on 4 April 1993. Three rows of maize at 0.75=0.25-m spacingwere grown between two sesbania rows, and the maize was harvested in August.Thereafter, the sesbania plots were not cropped with maize. On the Alfisol,
Ž .4-month old sesbania Kisii provenance seedlings were planted without maizeat 10,000 plants hay1 at 1=1-m2 spacing on 11 May 1993. Maize, naturalfallow and bare fallow plots were cropped with maize in the season before thestart of the experiment and harvested on 15 August 1993 on the Oxisol and on17 September 1993 on the Alfisol. Weeds were manually removed from all plots
Žat the start of the experiment September 1993 on the Oxisol and November.1993 on the Alfisol .
Ž .In the maize land-use system, maize Kenya seed, hybrid 511 or 512 wassown at 53,330 plants hay1 at 0.75=0.25-m2 spacing in each season. On theOxisol, maize was sown on 1 September 1993 and harvested on 17 January
Ž .1994 138 days after sowing, DAS in season 1, sown on 14 March andŽ .harvested on 4 August 1994 143 DAS in season 2 and sown on 25 August
Ž .1994 and harvested on 27 January 1995 155 DAS in season 3. On the Alfisol,Žmaize was sown on 2 November 1993 and harvested on 26 March 1994 144
. ŽDAS in season 1, sown on 27 March and harvested on 9 September 1994 166
.DAS in season 2 and sown on 14 October 1994 and harvested on 13 MarchŽ .1995 150 DAS in season 3. In all maize plots, weeds were manually removed
at regular intervals, and all above-ground maize biomass was removed after eachcrop.
Natural fallow contained regrowth of weeds following manual removal ofweeds at the start of the experiment. Predominant weed species are described in
Ž . Ž .Hartemink et al. 1996 and Maroko et al. 1999 . The bare fallow wasmaintained free of vegetation by frequent hand-pulling of weeds. Sesbania plotswere manually maintained free of weeds for the duration of the experiment on

( )A.E. Hartemink et al.rGeoderma 98 2000 11–33 15
Ž .the Alfisol, but only in the first season September 1993 to February 1994 onthe Oxisol. In order to limit root growth outside the sesbania plots, 1-m deeptrenches were dug at least once in each cropping season around the sesbaniaplots and then back filled.
On 16–18 January 1995 on the Oxisol and 20–21 February 1995 on theAlfisol, all vegetation in the sesbania and natural fallows was cut at ground leveland placed in the plots to dry. Woody materials were removed from the plots butleaves and litter were incorporated into the soil. The woody material removedfrom the sesbania fallow was 19.7 Mg hay1 on the Oxisol and 24.6 Mg hay1 onthe Alfisol, whereas woody biomass removed from the natural fallow was 4.1Mg hay1 on the Oxisol and 0.4 Mg hay1 on the Alfisol. All plots were manuallytilled to 0.15-m depth and maize was sown at a spacing of 0.75=0.25 m2
without the use of inorganic fertilizers, on 14 March 1995 on the Oxisol and 27Ž .March 1995 on the Alfisol Maroko et al., 1999 .
2.3. Soil sampling and analysis
Soils were sampled six or seven times during each of the three growingŽseasons September 1993 to January 1995 on the Oxisol and November 1993 to
.February 1995 on the Alfisol and two times after slashing the fallows. Soilsamples were collected with an Edelman auger from six depths: 0–0.15,0.15–0.30, 0.30–0.50, 0.50–1.0, 1.0–1.5 and 1.5–2.0 m.
In each plot with maize, natural fallow and bare fallow, soil was collected andcomposited from eight locations for layers above 1.0 m and from four locationsfor layers below 1.0 m. In maize plots, half the sampling locations were betweenmaize rows and half were within rows. In sesbania plots, the distance betweentwo rows on the Oxisol and two diagonal trees on the Alfisol was divided into
Ž .strata Rao and Coe, 1991; Mekonnen et al., 1999 . On the Oxisol, the distanceŽ .between rows of sesbania 2.25 m was divided into nine strata in the first
Ž .season stratum widths0.25 m and six strata in the second and third seasonŽ .stratum widths0.37 m . Soil samples were collected from all strata between
Žthe four sesbania rows 27 locations in the first season and 18 locations in the.second and third season and composited into one sample per stratum.
Ž .On the Alfisol, the diagonal distance between two trees 1.4 m was dividedŽ .into three strata 0–0.25, 0.25–0.50 and 0.50–0.70 m from the tree in the first
Ž .season and two strata 0–0.50 and 0.50–0.70 m from the tree in the second andthird season. Four to eight samples were collected from each stratum and thencomposited into one sample per stratum. Inorganic N for a plot at each site wascalculated as a weighted mean of values for all strata, taking into account thesurface area represented by each stratum. For more details on the soil sampling
Ž .procedures, see Mekonnen et al. 1999 .Soil samples were stored, field moist, in a refrigerator at 58C immediately
after collection. In the first season, about 10 g field moist soil was extracted
( )A.E. Hartemink et al.rGeoderma 98 2000 11–3316
with 100 ml 2-M KCl, with shaking for 1 h at 150 reciprocations per min andsubsequent gravity filtering using prewashed Whatman 42 paper. In the secondseason, about 20 g field moist soil was extracted with 100 ml 2-M KCl andfiltered through prewashed Whatman 5 paper. Soil water content was deter-mined simultaneously with extraction in order to calculate the dry weight of theextracted soil. No difference was found in the bulk density of the differenttreatments. Ammonium-N in the KCl extract was determined by the salicylate–
Ž .hypochlorite method Anderson and Ingram, 1993 . Nitrate- plus nitrite-N wasŽ .determined by cadmium reduction Dorich and Nelson, 1984 with subsequentŽ .colorimetric determination of NO Hilsheimer and Harwig, 1976 . Reported2
inorganic N values are the sum of NH -N, NO -N and NO -N. Soil bulk4 3 2Ždensity, determined with cores collected in a pit before the first season for
.details, see Hartemink et al., 1996 , was used to convert inorganic N values intokilogram per hectare.
2.4. Plant sampling and analysis
Litterfall in the sesbania plots was collected at 3–4-week intervals with threelitter traps per plot for 1 year before the harvest of the trees. The area of eachlitter trap was 1.7 m2 at the Oxisol site and 1.0 m2 at the Alfisol site. Total
Žbiomass of sesbania litter, leaves and pods on the trees at harvest and wood )2.cm diameter and F2 cm diameter at harvest were determined on an oven dry
Ž .weight 708C basis. In the natural fallow plots, total above-ground woody andŽ .non-woody biomass were determined at harvest on an oven dry weight 708C
basis. In plots with maize, maize stover and grain and weeds from each of thethree seasons were dried at 708C and expressed on an oven dry weight basis.Subsamples of all collected plant parts in each plot were analyzed for total N by
Ž .digestion with H SO and H O Parkinson and Allen, 1975 .2 4 2 2
2.5. Statistical procedures
Inorganic N was summed for the six sampling depths to determine totalinorganic N in the 2-m soil profile. Changes in inorganic N were calculated forperiods roughly corresponding to each of the three cropping seasons and theinterval between cropping seasons. An analysis of variance was conducted onthese changes using GENSTAT version 5, and standard errors of the differences
Ž .in treatment means SED are reported. The inorganic N data for individualsampling times were grouped into intervals that roughly corresponded to theperiod before treatment differences, the latter part of the first season, the secondseason and the third season. Orthogonal contrasts were conducted on means forthese intervals, whereby the treatments were grouped as sesbania fallow vs.natural fallow, maize vs. sesbania and natural fallows and bare fallow vs. othertreatments.
( )A.E. Hartemink et al.rGeoderma 98 2000 11–33 17
Inorganic N for each sampling depth was compared at three sampling timesduring the experiment to determine changes within the soil profile for eachland-use system. The three sampling times were handled as treatments, and anindividual analysis of variance was conducted for each sampling depth of thefour land-use systems. SED are reported.
About 95% of all inorganic N data sets undergoing an analysis of variancewere normally distributed. Log transformation of those data sets without normaldistribution before analysis of variance had no effect on the separation oftreatment means at P-0.05. Therefore, all analysis of variance were conductedwith untransformed data. Mention of statistical significance refers to P-0.05unless stated otherwise.
3. Results
3.1. Inorganic N during fallows
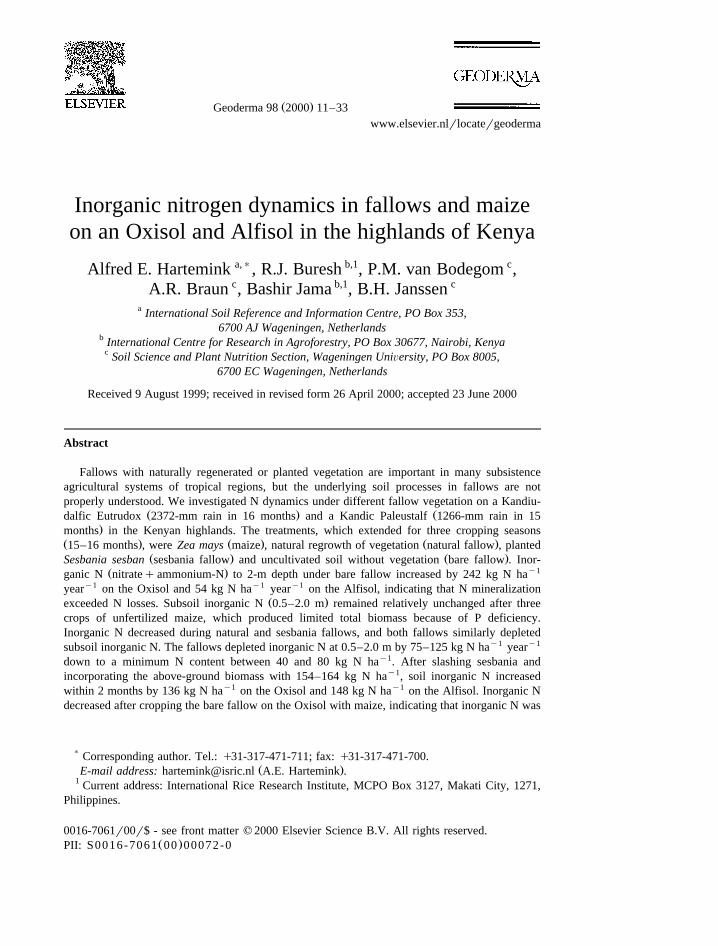
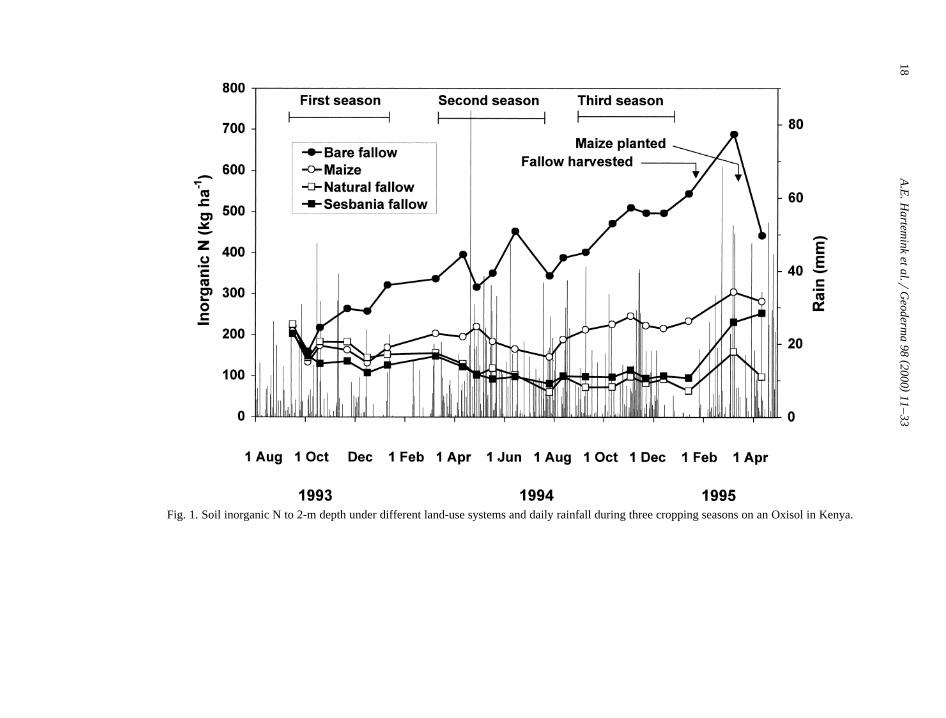
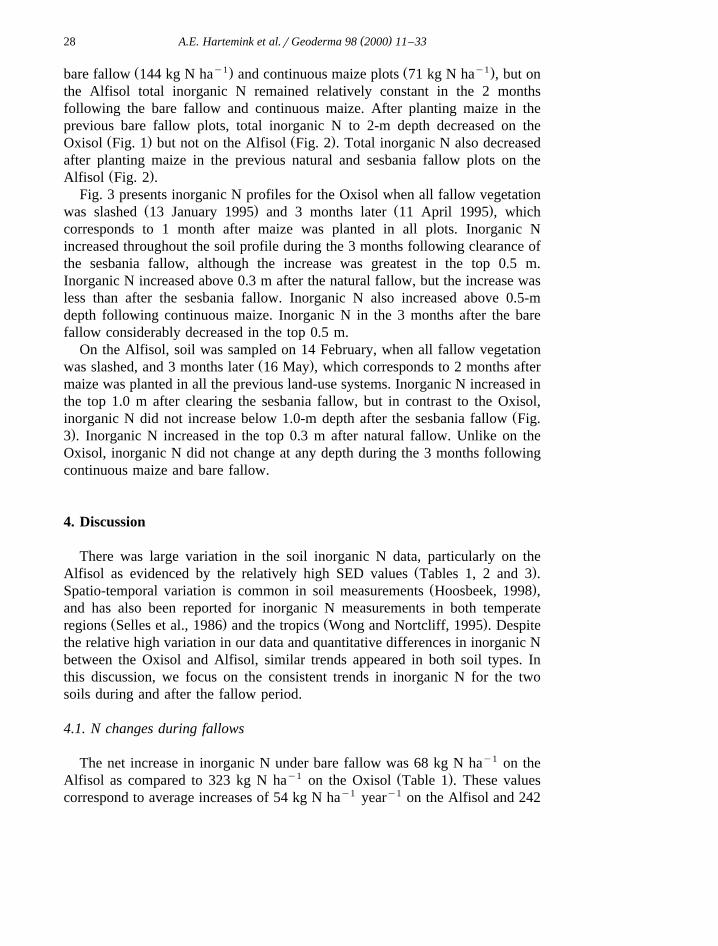
On the Oxisol, levels of soil inorganic N to 2-m depth varied between 131and 246 kg N hay1 under maize during the three growing seasons from
Ž .September 1993 and January 1995 Fig. 1 . During the first and second growingseason of maize, inorganic N decreased by 39 and 57 kg N hay1, respectively.
y1 Ž .In the third season, inorganic N increased by 21 kg N ha Table 1 . AfterŽthree growing seasons, inorganic N under maize increased slightly 25 kg N
y1.ha .Inorganic N increased under bare fallow by 323 kg N hay1 between
Ž .September 1993 and January 1995 Fig. 1, Table 1 . However, inorganic Ndecreased under the natural and sesbania fallows during this period. Thedecrease was 162 and 108 kg N hay1 under natural and sesbania fallows,
Ž .respectively Table 1 .Ammonium-N to 2-m depth was not affected by land-use systems, and it
remained relatively constant throughout the three seasons. Ammonium-N to 2-mdepth during the three seasons ranged between 36 and 106 kg N hay1 andaveraged 62 kg N hay1 in the Oxisol. As inorganic N decreased with duration of
Ž .the natural and sesbania fallows Fig. 1 , the relative contribution of NO to3
inorganic N decreased. At the completion of the fallows in January 1995,NO -N represented 25% of the inorganic N under the natural fallow, 38% of the3
inorganic N under the sesbania fallow, 76% of the inorganic N under continuousmaize and 90% of the inorganic N under bare fallow.
Total rainfall during the three growing seasons on the Oxisol was 2372 mm.The first season was relatively dry with 404 mm of rain, whereas rain was 959
Ž .mm in the second season and 587 mm in the third season Table 1 . The highestdaily rainfall was 85 mm on 20 April 1994. Little relation was evident betweendaily rainfall and total inorganic N under the different land-use systems,
()
A.E
.Hartem
inket
al.rG
eoderma
982000
11–
3318
Fig. 1. Soil inorganic N to 2-m depth under different land-use systems and daily rainfall during three cropping seasons on an Oxisol in Kenya.
()
A.E
.Hartem
inket
al.rG
eoderma
982000
11–
3319
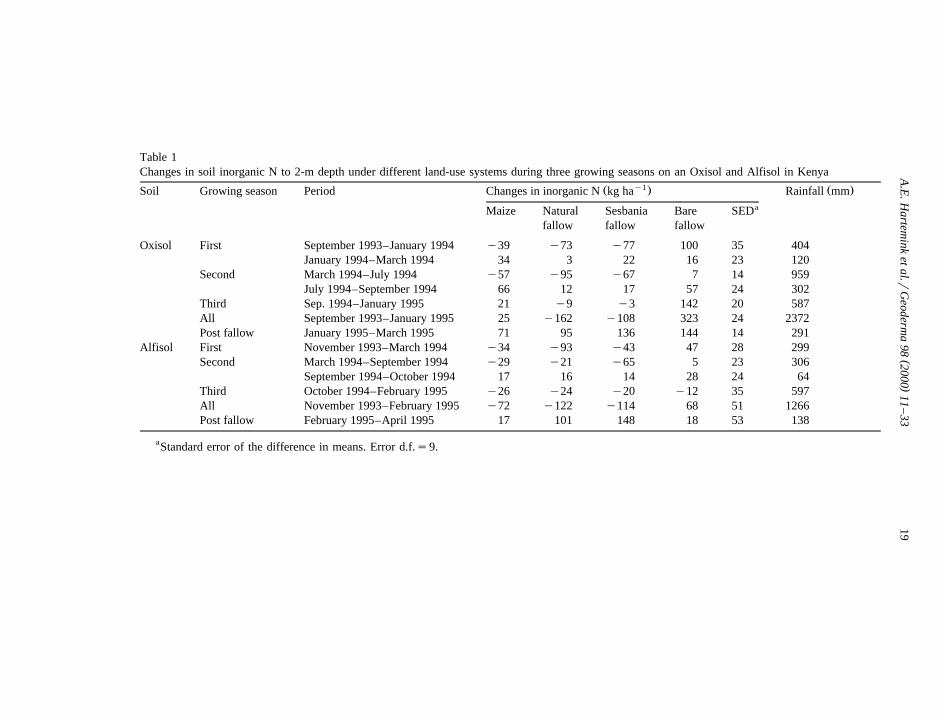
Table 1Changes in soil inorganic N to 2-m depth under different land-use systems during three growing seasons on an Oxisol and Alfisol in Kenya
y1Ž . Ž .Soil Growing season Period Changes in inorganic N kg ha Rainfall mmaMaize Natural Sesbania Bare SED
fallow fallow fallow
Oxisol First September 1993–January 1994 y39 y73 y77 100 35 404January 1994–March 1994 34 3 22 16 23 120
Second March 1994–July 1994 y57 y95 y67 7 14 959July 1994–September 1994 66 12 17 57 24 302
Third Sep. 1994–January 1995 21 y9 y3 142 20 587All September 1993–January 1995 25 y162 y108 323 24 2372Post fallow January 1995–March 1995 71 95 136 144 14 291
Alfisol First November 1993–March 1994 y34 y93 y43 47 28 299Second March 1994–September 1994 y29 y21 y65 5 23 306
September 1994–October 1994 17 16 14 28 24 64Third October 1994–February 1995 y26 y24 y20 y12 35 597All November 1993–February 1995 y72 y122 y114 68 51 1266Post fallow February 1995–April 1995 17 101 148 18 53 138
aStandard error of the difference in means. Error d.f.s9.
( )A.E. Hartemink et al.rGeoderma 98 2000 11–3320
although the decrease in N under bare fallow in April and June 1994 followedŽ .high rainfall Fig. 1 .
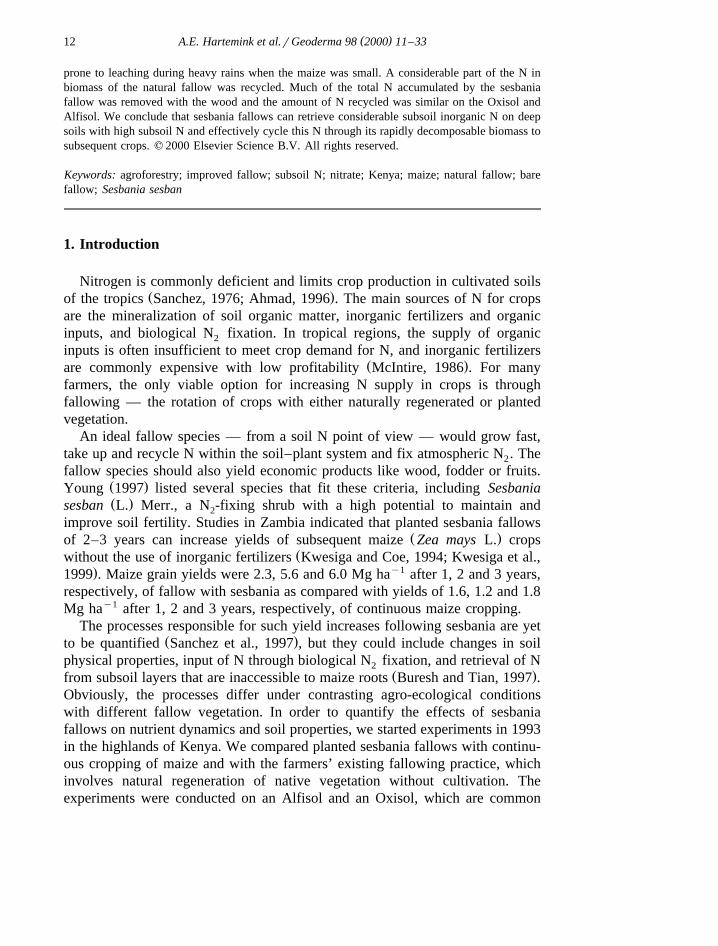
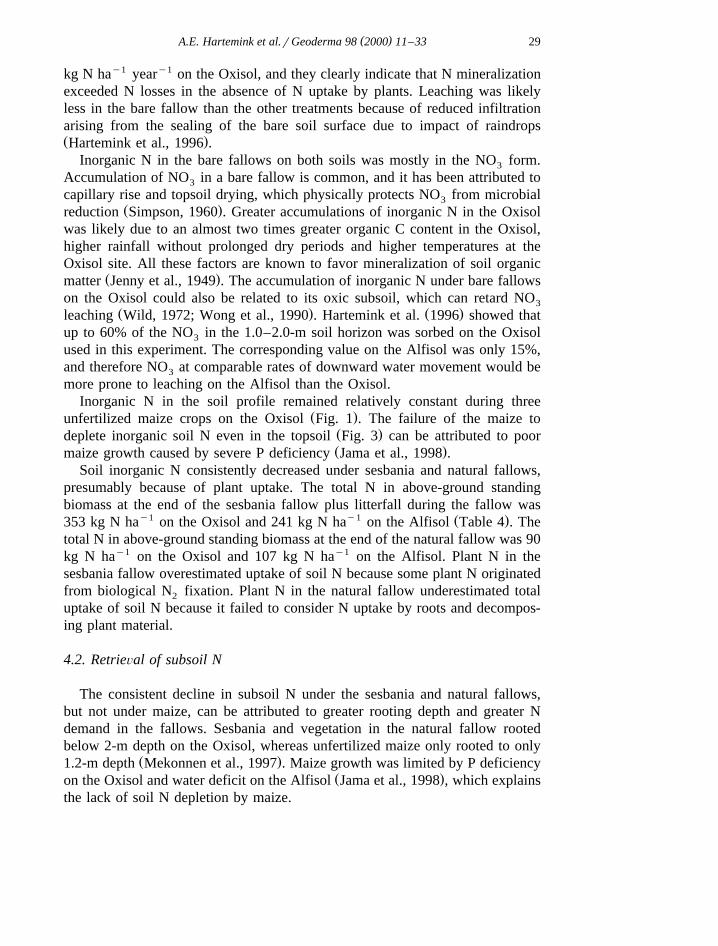
The increase in inorganic N to 2-m depth under bare fallow was less on theAlfisol than on the Oxisol. On the Alfisol, inorganic N increased under bare soilby 68 kg N hay1 during the three seasons from November 1993 to February
Ž . y1 Ž1995 Table 1 , and it reached 277 kg N ha after three growing seasons Fig..2 . Inorganic N under maize decreased in all three growing seasons, and the
y1 Ž .overall decrease was 72 kg N ha Table 1 . As on the Oxisol, inorganic Ndecreased under natural and sesbania fallows. During the three seasons, inor-ganic N decreased by 122 and 114 kg N hay1 under natural and sesbaniafallows, respectively. Soil inorganic N slightly increased in the dry periodbetween the second and third season in all four land-use systems on the AlfisolŽ .Table 1 .
Most of the inorganic N for all four land use systems on the Alfisol was inthe NO form. Ammonium-N was not affected by the land-use systems. During3
the three seasons, NH to 2-m depth ranged between 16 and 51 kg N hay1, and4
it averaged 30 kg N hay1. At the completion of the fallows in February 1995,NO -N represented 61% of the inorganic N under the natural fallow, 62% of the3
inorganic N under the sesbania fallow, 71% of the inorganic N under continuousmaize and 93% of the inorganic N under bare fallow. These trends amongland-use systems were similar to those found on the Oxisol, although percent-ages differed.
Rainfall was much lower at the Alfisol than at the Oxisol site. As on theOxisol, soil inorganic N was not strongly related to rainfall, although inorganic
Ž .N decreased in all land-use systems after relatively heavy rain 329 mm inNovember 1994.
During the first 2 months of the experiment, total inorganic N to 2-m depthŽ .was comparable among the land-use systems on both soils Figs. 1 and 2 .
Inorganic N remained comparable under sesbania and natural fallow throughoutthe fallow period on both soils. Inorganic N became progressively greater undermaize than sesbania and natural fallows, and the difference was significantŽ . ŽP-0.001 in the second and third growing seasons in the Oxisol statistical
.analysis not shown . On the Alfisol, mean inorganic N was only slightly higherunder maize than natural and sesbania fallows between April and September
Ž y1 .1994 76 kg N ha , P-0.10 and between October 1994 and February 1995Ž y1 . Ž .63 kg N ha , P-0.07 . Inorganic N was significantly greater P-0.001under the bare fallow than under other land-use systems after November 1993on the Oxisol and after April 1994 on the Alfisol.
3.2. Changes in subsoil inorganic N
Ž .Concentrations of subsoil inorganic N 0.5–2.0 m did not significantlyŽ .Ps0.05 change under maize during the three growing seasons between the

()
A.E
.Hartem
inket
al.rG
eoderma
982000
11–
3321
Fig. 2. Soil inorganic N to 2-m depth under different land-use systems and daily rainfall during three cropping seasons on an Alfisol in Kenya.
( )A.E. Hartemink et al.rGeoderma 98 2000 11–3322
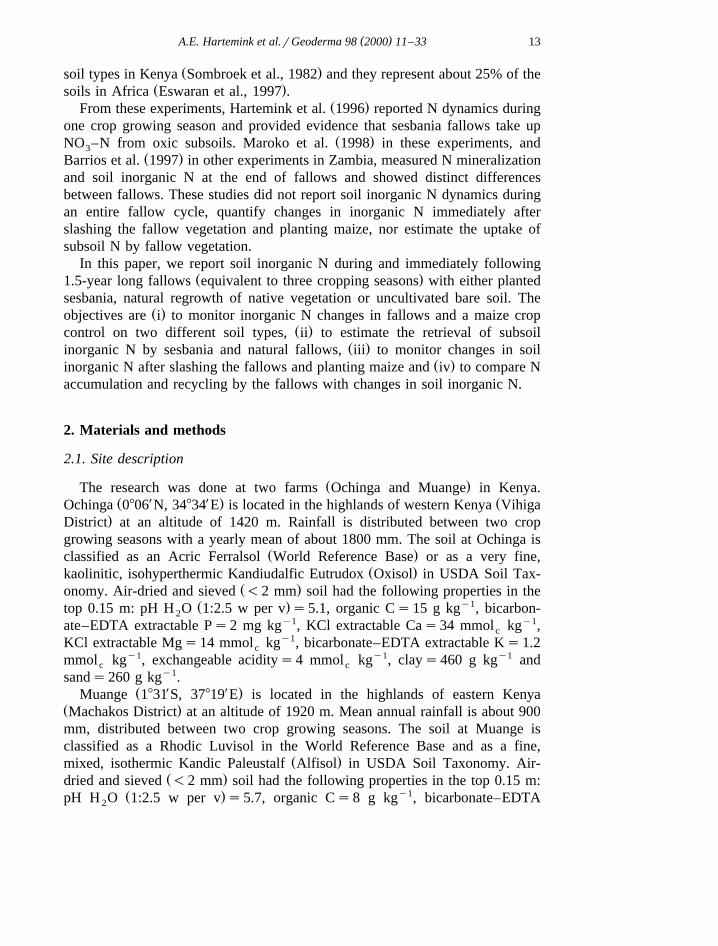
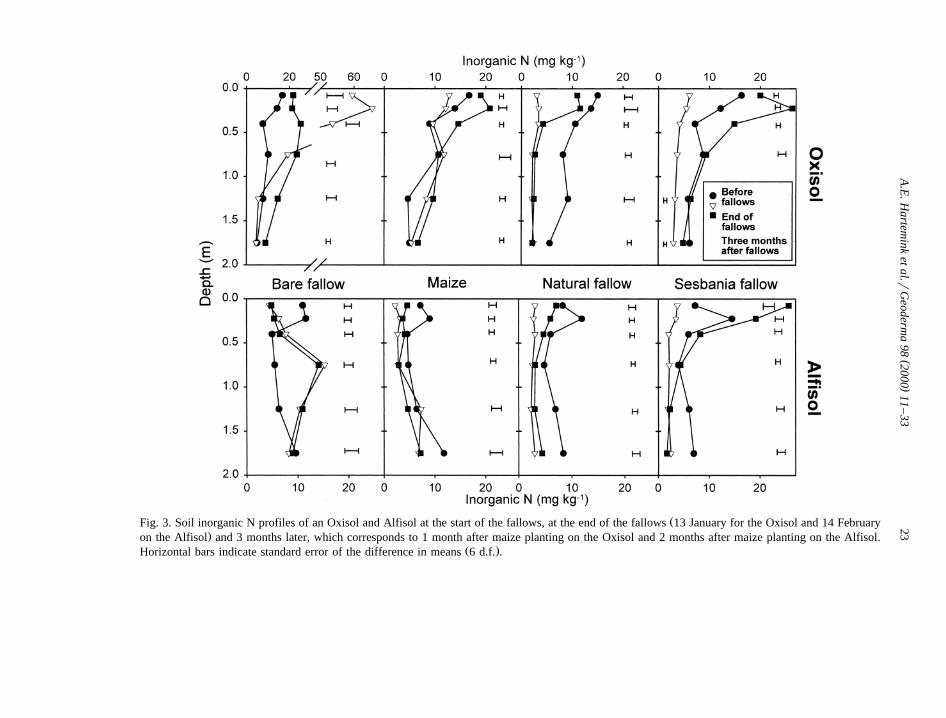
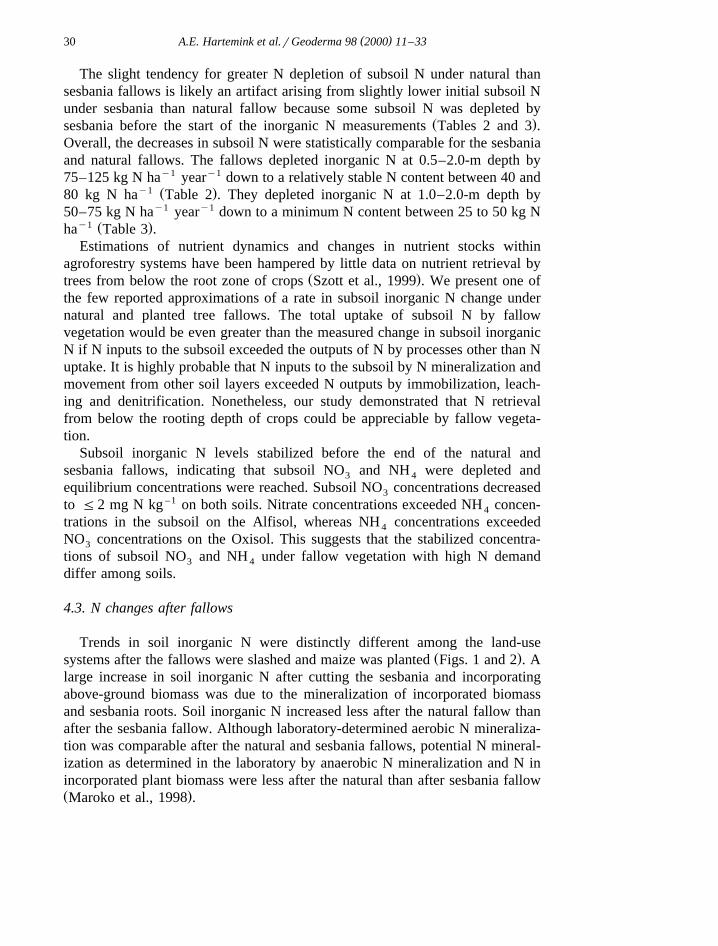
Žonset of the experiment and the end of the fallows 16 months on the Oxisol and. Ž .15 months on the Alfisol Fig. 3 . However, inorganic N significantly increased
at 0.5–1.0-m depth under the bare fallow on both soils during this time.Inorganic N decreased in each of the three subsoil layers under natural andsesbania fallows on both soils.
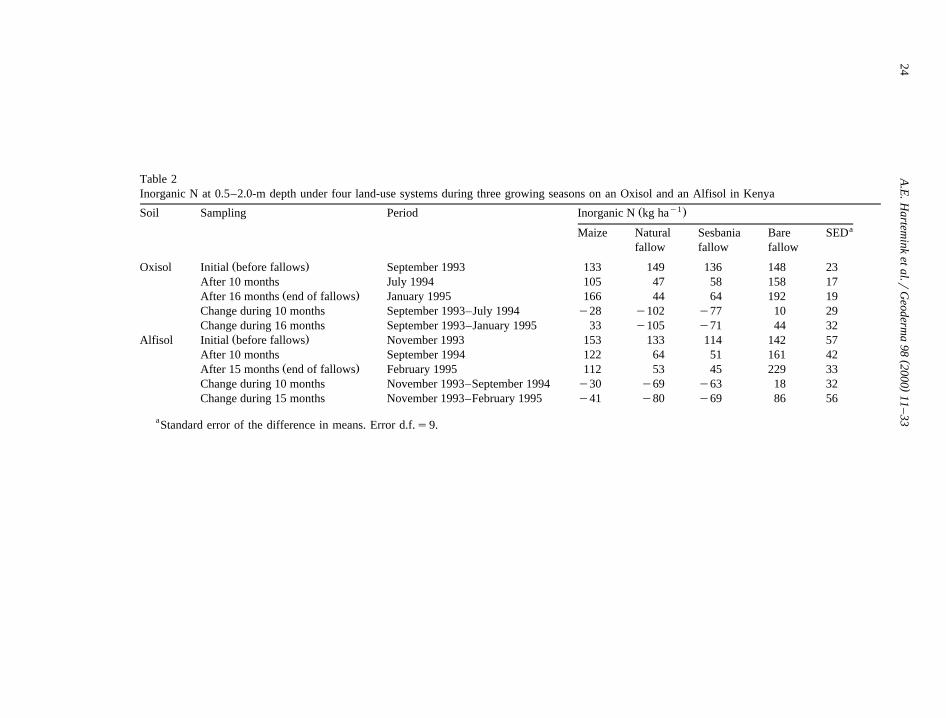
Ž . y1Inorganic N in the subsoil 0.5–2.0 m under sesbania was 136 kg N ha atŽ .the beginning of the fallow on the Oxisol Table 2 . When the sesbania was
y1 Žslashed 16 months later, the inorganic N had decreased by 71 kg N ha Table. Ž2 . The decrease in subsoil N under sesbania on the Alfisol was comparable 69
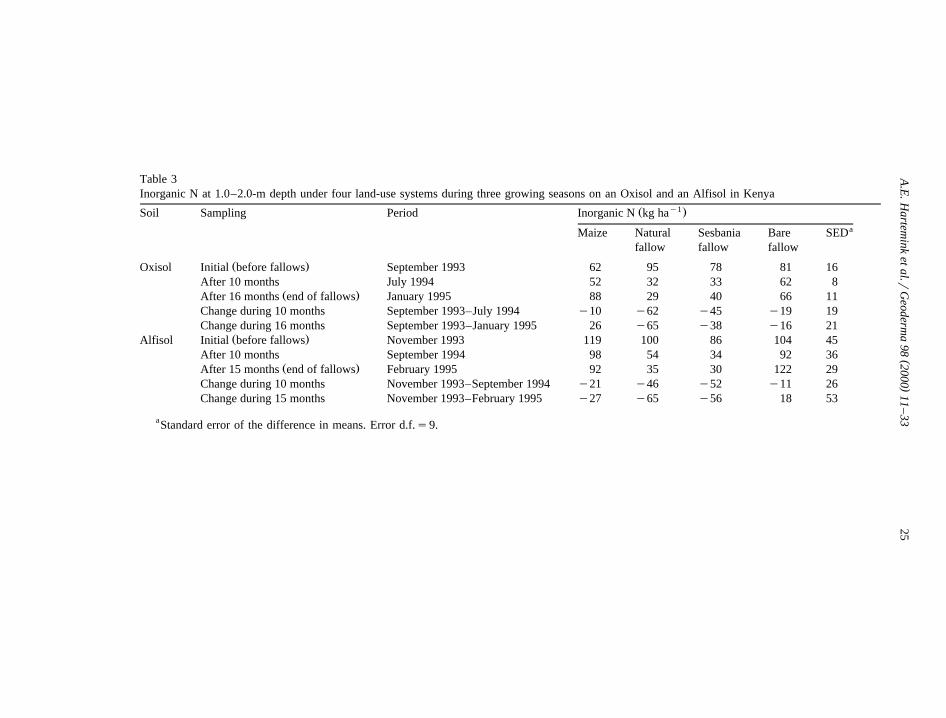
y1.kg N ha . More than half of the decreases in subsoil inorganic N underŽ .sesbania occurred in the 1.0–2.0-m soil horizon Table 3 . Subsoil inorganic N
similarly decreased under natural fallow, and the decrease in the 0.5–2.0-m soilhorizon during the entire fallow was 105 kg N hay1 on the Oxisol and 80 kg N
y1 Ž .ha on the Alfisol Table 2 . As with the sesbania fallow, most of the decreasein subsoil inorganic N under natural fallow occurred in the 1.0–2.0-m soil
Ž .horizon Table 3 .Ž .Under bare fallow, subsoil inorganic N 0.5–2.0 m considerably increased
Ž y1 y1during the fallow period 44 kg N ha on the Oxisol and 86 kg N ha on the. Ž .Alfisol . This increase occurred mainly at 0.5–1.0-m depth Fig. 3 . The change
in subsoil inorganic N under three continuous maize crops was small and notconsistent between the two soils. Subsoil inorganic N slightly increased under
Žmaize on the Oxisol, but it decreased under maize on the Alfisol Tables 2 and.3 .
The decrease in subsoil inorganic N under natural and sesbania fallowsessentially occurred within the first 10 months of the fallows. After 10 months,
Žthe subsoil inorganic N remained relatively constant under these fallows Tables.2 and 3 . During the first 10 months, the inorganic N at 0.5–2.0-m depth under
sesbania decreased by 77 kg N hay1 on the Oxisol and 63 kg N hay1 on theAlfisol. The corresponding decreases at 1.0–2.0-m depth were 45 kg N hay1 onthe Oxisol and 52 kg N hay1 on the Alfisol. The decreases under the naturalfallow were similar to those under sesbania fallow.
During the last 6 months of the natural and sesbania fallows on the Oxisol,y1 Žinorganic N at 0.5–2.0 m stabilized between 45 and 80 kg N ha averages61
y1 y1 .kg N ha under natural fallow and 71 kg N ha under sesbania . Inorganic Ny1 Žat 1.0–2.0 m stabilized between 30 and 50 kg N ha averages44 kg N
y1.ha . During this period, most of the inorganic N was NH . Nitrate averaged4
about 25–30% of the subsoil inorganic N under the natural and sesbania fallows.Subsoil NO concentration remained F2 mg N kgy1 and averaged 0.7 mg N3
kgy1 under natural fallow and 1.1 mg N kg –1 under sesbania.On the Alfisol, inorganic N at 0.5–2.0 m stabilized between 40 and 65 kg Ny1 Ž y1.ha under the natural and sesbania fallows averages57 kg N ha . Inor-
ganic N at 1.0–2.0 m stabilized between 25 and 45 kg N hay1. Unlike on theOxisol, most subsoil inorganic N was NO . Nitrate represented 60% of the3
()
A.E
.Hartem
inket
al.rG
eoderma
982000
11–
3323
ŽFig. 3. Soil inorganic N profiles of an Oxisol and Alfisol at the start of the fallows, at the end of the fallows 13 January for the Oxisol and 14 February.on the Alfisol and 3 months later, which corresponds to 1 month after maize planting on the Oxisol and 2 months after maize planting on the Alfisol.
Ž .Horizontal bars indicate standard error of the difference in means 6 d.f. .
()
A.E
.Hartem
inket
al.rG
eoderma
982000
11–
3324
Table 2Inorganic N at 0.5–2.0-m depth under four land-use systems during three growing seasons on an Oxisol and an Alfisol in Kenya
y1Ž .Soil Sampling Period Inorganic N kg haaMaize Natural Sesbania Bare SED
fallow fallow fallow
Ž .Oxisol Initial before fallows September 1993 133 149 136 148 23After 10 months July 1994 105 47 58 158 17
Ž .After 16 months end of fallows January 1995 166 44 64 192 19Change during 10 months September 1993–July 1994 y28 y102 y77 10 29Change during 16 months September 1993–January 1995 33 y105 y71 44 32
Ž .Alfisol Initial before fallows November 1993 153 133 114 142 57After 10 months September 1994 122 64 51 161 42
Ž .After 15 months end of fallows February 1995 112 53 45 229 33Change during 10 months November 1993–September 1994 y30 y69 y63 18 32Change during 15 months November 1993–February 1995 y41 y80 y69 86 56
aStandard error of the difference in means. Error d.f.s9.
()
A.E
.Hartem
inket
al.rG
eoderma
982000
11–
3325
Table 3Inorganic N at 1.0–2.0-m depth under four land-use systems during three growing seasons on an Oxisol and an Alfisol in Kenya
y1Ž .Soil Sampling Period Inorganic N kg haaMaize Natural Sesbania Bare SED
fallow fallow fallow
Ž .Oxisol Initial before fallows September 1993 62 95 78 81 16After 10 months July 1994 52 32 33 62 8
Ž .After 16 months end of fallows January 1995 88 29 40 66 11Change during 10 months September 1993–July 1994 y10 y62 y45 y19 19Change during 16 months September 1993–January 1995 26 y65 y38 y16 21
Ž .Alfisol Initial before fallows November 1993 119 100 86 104 45After 10 months September 1994 98 54 34 92 36
Ž .After 15 months end of fallows February 1995 92 35 30 122 29Change during 10 months November 1993–September 1994 y21 y46 y52 y11 26Change during 15 months November 1993–February 1995 y27 y65 y56 18 53
aStandard error of the difference in means. Error d.f.s9.
( )A.E. Hartemink et al.rGeoderma 98 2000 11–3326
subsoil inorganic N at the end of natural and sesbania fallows. Subsoil NO3
concentration was -2 mg N kgy1 at the end of the fallows.
3.3. N uptake and changes in the soil
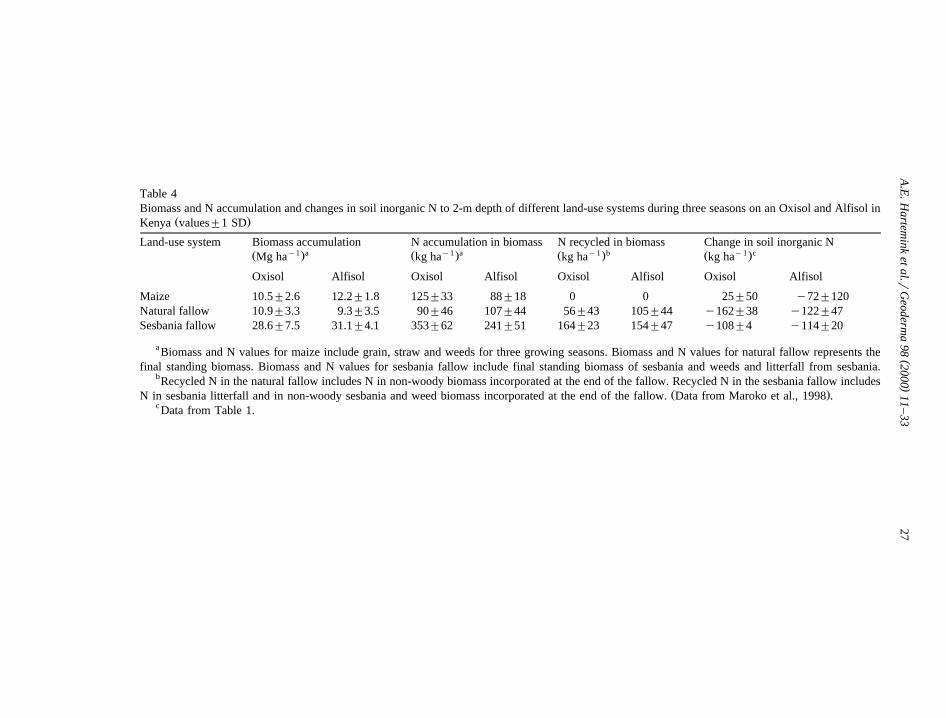
Total biomass accumulation in maize plots during the three growing seasonsŽ .was higher on the Alfisol than on the Oxisol Table 4 , but maize accumulated
less N on the Alfisol because of lower grain production as compared to theOxisol. Total above-ground biomass and N accumulation by the sesbania wasgreater than the above-ground biomass and plant N in the natural fallow atharvest. A considerable part of the N in the final standing biomass in the naturalfallow was recycled, i.e. returned to the soil when the fallow was slashed. Much
Žof the total N accumulated by the sesbania fallow 54% on the Oxisol and 36%.on the Alfisol was removed with the wood. Overall, the amount of N recycled
by the sesbania fallow was similar on the Oxisol and Alfisol.The last column in Table 4 shows the net changes in soil inorganic N over the
Ž .three seasons data from Table 1 , and these represent the net effects of gains byN addition and mineralization and N removal by leaching, gaseous loss andplant uptake. The change in soil inorganic N was comparable to the total Naccumulation by the maize on the Alfisol but not the Oxisol. The inorganic Nvalues for maize plots have a high standard deviation, reflecting the high plot toplot variability in subsoil inorganic N.
The net decrease in soil inorganic N was greater than the N in the standingbiomass at the end of the natural fallow, possibly because values for N
Ž . Ž .accumulation do not consider a N in below-ground plant parts and b the tieup and cycling of soil inorganic N through the turnover of plant biomass withinthe natural fallow. The N accumulation in sesbania biomass was greater than thenet decrease in inorganic soil N. This could be related to inputs of N viabiological N fixation. The estimation of N fixation by difference requires2 2
assumptions on the magnitude of N losses and net N mineralization. Given theuncertainty with these values and likely differences in N mineralization among
Ž .land-use systems as indicated by Maroko et al. 1998 , reliable estimates cannotbe made on the magnitude of biological N fixation.2
3.4. Inorganic N after fallows
Soil inorganic N on both soils increased considerably after slashing thenatural and sesbania fallows and incorporating the leaf and litter material into
Ž .the soil Figs. 1 and 2 . During the 2 months after slashing the fallows, totalinorganic N to 2-m depth increased in the previous sesbania plots by 136 kg N
y1 y1 Ž .ha on the Oxisol and by 148 kg N ha on the Alfisol Table 1 . The increasein the previous natural fallow plots was 95 kg N hay1 on the Oxisol and 101 kgN hay1 on the Alfisol. On the Oxisol, inorganic N also increased in the previous
()
A.E
.Hartem
inket
al.rG
eoderma
982000
11–
3327
Table 4Biomass and N accumulation and changes in soil inorganic N to 2-m depth of different land-use systems during three seasons on an Oxisol and Alfisol in
Ž .Kenya values"1 SD
Land-use system Biomass accumulation N accumulation in biomass N recycled in biomass Change in soil inorganic Ny1 a y1 a y1 b y1 cŽ . Ž . Ž . Ž .Mg ha kg ha kg ha kg ha
Oxisol Alfisol Oxisol Alfisol Oxisol Alfisol Oxisol Alfisol
Maize 10.5"2.6 12.2"1.8 125"33 88"18 0 0 25"50 y72"120Natural fallow 10.9"3.3 9.3"3.5 90"46 107"44 56"43 105"44 y162"38 y122"47Sesbania fallow 28.6"7.5 31.1"4.1 353"62 241"51 164"23 154"47 y108"4 y114"20
aBiomass and N values for maize include grain, straw and weeds for three growing seasons. Biomass and N values for natural fallow represents thefinal standing biomass. Biomass and N values for sesbania fallow include final standing biomass of sesbania and weeds and litterfall from sesbania.
bRecycled N in the natural fallow includes N in non-woody biomass incorporated at the end of the fallow. Recycled N in the sesbania fallow includesŽ .N in sesbania litterfall and in non-woody sesbania and weed biomass incorporated at the end of the fallow. Data from Maroko et al., 1998 .
cData from Table 1.
( )A.E. Hartemink et al.rGeoderma 98 2000 11–3328
Ž y1. Ž y1.bare fallow 144 kg N ha and continuous maize plots 71 kg N ha , but onthe Alfisol total inorganic N remained relatively constant in the 2 monthsfollowing the bare fallow and continuous maize. After planting maize in theprevious bare fallow plots, total inorganic N to 2-m depth decreased on the
Ž . Ž .Oxisol Fig. 1 but not on the Alfisol Fig. 2 . Total inorganic N also decreasedafter planting maize in the previous natural and sesbania fallow plots on the
Ž .Alfisol Fig. 2 .Fig. 3 presents inorganic N profiles for the Oxisol when all fallow vegetation
Ž . Ž .was slashed 13 January 1995 and 3 months later 11 April 1995 , whichcorresponds to 1 month after maize was planted in all plots. Inorganic Nincreased throughout the soil profile during the 3 months following clearance ofthe sesbania fallow, although the increase was greatest in the top 0.5 m.Inorganic N increased above 0.3 m after the natural fallow, but the increase wasless than after the sesbania fallow. Inorganic N also increased above 0.5-mdepth following continuous maize. Inorganic N in the 3 months after the barefallow considerably decreased in the top 0.5 m.
On the Alfisol, soil was sampled on 14 February, when all fallow vegetationŽ .was slashed, and 3 months later 16 May , which corresponds to 2 months after
maize was planted in all the previous land-use systems. Inorganic N increased inthe top 1.0 m after clearing the sesbania fallow, but in contrast to the Oxisol,
Žinorganic N did not increase below 1.0-m depth after the sesbania fallow Fig..3 . Inorganic N increased in the top 0.3 m after natural fallow. Unlike on the
Oxisol, inorganic N did not change at any depth during the 3 months followingcontinuous maize and bare fallow.
4. Discussion
There was large variation in the soil inorganic N data, particularly on theŽ .Alfisol as evidenced by the relatively high SED values Tables 1, 2 and 3 .
Ž .Spatio-temporal variation is common in soil measurements Hoosbeek, 1998 ,and has also been reported for inorganic N measurements in both temperate
Ž . Ž .regions Selles et al., 1986 and the tropics Wong and Nortcliff, 1995 . Despitethe relative high variation in our data and quantitative differences in inorganic Nbetween the Oxisol and Alfisol, similar trends appeared in both soil types. Inthis discussion, we focus on the consistent trends in inorganic N for the twosoils during and after the fallow period.
4.1. N changes during fallows
The net increase in inorganic N under bare fallow was 68 kg N hay1 on they1 Ž .Alfisol as compared to 323 kg N ha on the Oxisol Table 1 . These values
correspond to average increases of 54 kg N hay1 yeary1 on the Alfisol and 242
( )A.E. Hartemink et al.rGeoderma 98 2000 11–33 29
kg N hay1 yeary1 on the Oxisol, and they clearly indicate that N mineralizationexceeded N losses in the absence of N uptake by plants. Leaching was likelyless in the bare fallow than the other treatments because of reduced infiltrationarising from the sealing of the bare soil surface due to impact of raindropsŽ .Hartemink et al., 1996 .
Inorganic N in the bare fallows on both soils was mostly in the NO form.3
Accumulation of NO in a bare fallow is common, and it has been attributed to3
capillary rise and topsoil drying, which physically protects NO from microbial3Ž .reduction Simpson, 1960 . Greater accumulations of inorganic N in the Oxisol
was likely due to an almost two times greater organic C content in the Oxisol,higher rainfall without prolonged dry periods and higher temperatures at theOxisol site. All these factors are known to favor mineralization of soil organic
Ž .matter Jenny et al., 1949 . The accumulation of inorganic N under bare fallowson the Oxisol could also be related to its oxic subsoil, which can retard NO3
Ž . Ž .leaching Wild, 1972; Wong et al., 1990 . Hartemink et al. 1996 showed thatup to 60% of the NO in the 1.0–2.0-m soil horizon was sorbed on the Oxisol3
used in this experiment. The corresponding value on the Alfisol was only 15%,and therefore NO at comparable rates of downward water movement would be3
more prone to leaching on the Alfisol than the Oxisol.Inorganic N in the soil profile remained relatively constant during three
Ž .unfertilized maize crops on the Oxisol Fig. 1 . The failure of the maize toŽ .deplete inorganic soil N even in the topsoil Fig. 3 can be attributed to poorŽ .maize growth caused by severe P deficiency Jama et al., 1998 .
Soil inorganic N consistently decreased under sesbania and natural fallows,presumably because of plant uptake. The total N in above-ground standingbiomass at the end of the sesbania fallow plus litterfall during the fallow was
y1 y1 Ž .353 kg N ha on the Oxisol and 241 kg N ha on the Alfisol Table 4 . Thetotal N in above-ground standing biomass at the end of the natural fallow was 90kg N hay1 on the Oxisol and 107 kg N hay1 on the Alfisol. Plant N in thesesbania fallow overestimated uptake of soil N because some plant N originatedfrom biological N fixation. Plant N in the natural fallow underestimated total2
uptake of soil N because it failed to consider N uptake by roots and decompos-ing plant material.
4.2. RetrieÕal of subsoil N
The consistent decline in subsoil N under the sesbania and natural fallows,but not under maize, can be attributed to greater rooting depth and greater Ndemand in the fallows. Sesbania and vegetation in the natural fallow rootedbelow 2-m depth on the Oxisol, whereas unfertilized maize only rooted to only
Ž .1.2-m depth Mekonnen et al., 1997 . Maize growth was limited by P deficiencyŽ .on the Oxisol and water deficit on the Alfisol Jama et al., 1998 , which explains
the lack of soil N depletion by maize.
( )A.E. Hartemink et al.rGeoderma 98 2000 11–3330
The slight tendency for greater N depletion of subsoil N under natural thansesbania fallows is likely an artifact arising from slightly lower initial subsoil Nunder sesbania than natural fallow because some subsoil N was depleted by
Ž .sesbania before the start of the inorganic N measurements Tables 2 and 3 .Overall, the decreases in subsoil N were statistically comparable for the sesbaniaand natural fallows. The fallows depleted inorganic N at 0.5–2.0-m depth by75–125 kg N hay1 yeary1 down to a relatively stable N content between 40 and
y1 Ž .80 kg N ha Table 2 . They depleted inorganic N at 1.0–2.0-m depth by50–75 kg N hay1 yeary1 down to a minimum N content between 25 to 50 kg N
y1 Ž .ha Table 3 .Estimations of nutrient dynamics and changes in nutrient stocks within
agroforestry systems have been hampered by little data on nutrient retrieval byŽ .trees from below the root zone of crops Szott et al., 1999 . We present one of
the few reported approximations of a rate in subsoil inorganic N change undernatural and planted tree fallows. The total uptake of subsoil N by fallowvegetation would be even greater than the measured change in subsoil inorganicN if N inputs to the subsoil exceeded the outputs of N by processes other than Nuptake. It is highly probable that N inputs to the subsoil by N mineralization andmovement from other soil layers exceeded N outputs by immobilization, leach-ing and denitrification. Nonetheless, our study demonstrated that N retrievalfrom below the rooting depth of crops could be appreciable by fallow vegeta-tion.
Subsoil inorganic N levels stabilized before the end of the natural andsesbania fallows, indicating that subsoil NO and NH were depleted and3 4
equilibrium concentrations were reached. Subsoil NO concentrations decreased3
to F2 mg N kg –1 on both soils. Nitrate concentrations exceeded NH concen-4
trations in the subsoil on the Alfisol, whereas NH concentrations exceeded4
NO concentrations on the Oxisol. This suggests that the stabilized concentra-3
tions of subsoil NO and NH under fallow vegetation with high N demand3 4
differ among soils.
4.3. N changes after fallows
Trends in soil inorganic N were distinctly different among the land-useŽ .systems after the fallows were slashed and maize was planted Figs. 1 and 2 . A
large increase in soil inorganic N after cutting the sesbania and incorporatingabove-ground biomass was due to the mineralization of incorporated biomassand sesbania roots. Soil inorganic N increased less after the natural fallow thanafter the sesbania fallow. Although laboratory-determined aerobic N mineraliza-tion was comparable after the natural and sesbania fallows, potential N mineral-ization as determined in the laboratory by anaerobic N mineralization and N inincorporated plant biomass were less after the natural than after sesbania fallowŽ .Maroko et al., 1998 .
( )A.E. Hartemink et al.rGeoderma 98 2000 11–33 31
Ž .Barrios et al. 1997 similarly reported greater topsoil inorganic N andlaboratory-determined N mineralization after sesbania than natural grass fallows.They attributed the high N mineralization following sesbania to the high qualityof its leaf biomass, as indicated by its relatively high N content and low ligninand polyphenol contents. Lower inorganic N and N mineralization after naturalthan sesbania fallows can also be attributed to the higher C-to-N ratio of organic
Ž .residues from natural than sesbania fallows Maroko et al., 1998 .The substantial decrease in inorganic N after planting maize in the former
Ž .bare fallow on the Oxisol coincided with a period of intense rain Fig. 1 ,suggesting that NO leaching caused the loss of inorganic N. Most of the3
inorganic N under the bare fallows was in the NO form. Rainfall was much less3
during the same period on the Alfisol, and inorganic N did not appreciablyŽ .decrease after planting maize on the bare fallow Fig. 2 . The rapid loss of
inorganic N after the bare fallow on the Oxisol occurred early in the maizegrowing season, when leaching potential is great due to relatively low soil water
Ž .depletion and root development by the crop Silvertooth et al., 1992 . HagedornŽ .et al. 1997 similarly found that large decreases in topsoil inorganic N on an
Oxisol in Rwanda coincided with heavy rains at the onset of the rainy season.ŽHigh N losses have also been reported by others on Oxisols Duwig et al.,
.1998 .
5. Conclusions
The retrieval of subsoil inorganic N by fallow vegetation and the subsequentrapid in situ mineralization of plant biomass after slashing the fallow can partlyexplain the reported residual benefits of fallows to crops. The retrieval of subsoilinorganic N can be appreciable with both sesbania and natural fallows on deepsoils with accumulations of inorganic N in the subsoil. Sesbania fallows,however, produce higher N content organic residues, which more readily releaseinorganic N to subsequent crops. Sesbania fallows also produce wood that canbe useful in areas where firewood is scarce, and they fix atmospheric N .2
Acknowledgements
We thank Obadiah Kyunguti and James Kinyangi for the management of thefield experiments, Patrick Angala for data management, and Jane Poole andRichard Coe for assistance in the statistical analysis. We thank the Swedish
Ž .International Development Cooperation Agency Sida for financial support toICRAF that made this work possible. Useful comments on the draft of thismanuscript were obtained from Meine van Noordwijk and we are grateful toGeorge Cadisch, Ram Dalal, Alvin Mosier and Donald Sparks for reviewing thispaper.
( )A.E. Hartemink et al.rGeoderma 98 2000 11–3332
References
Ž .Ahmad, N. Ed. , Nitrogen Economy in Tropical Soils. Kluwer Academic Publishing, Dordrecht.Ž .Anderson, J.M., Ingram, J.S.I. Eds. , Tropical Soil Biology and Fertility, A Handbook of
Methods. CAB International, Wallingford.Barrios, E., Kwesiga, F., Buresh, R.J., Sprent, J.I., 1997. Light fraction soil organic matter and
available nitrogen following trees and maize. Soil Sci. Soc. Am. J. 61, 826–831.Buresh, R.J., Tian, G., 1997. Soil improvement by trees in sub-Saharan Africa. Agrofor. Syst. 38,
51–76.Dorich, R.A., Nelson, D.W., 1984. Evaluation of manual cadmium reduction methods for
determination of nitrate in potassium chloride extracts of soil. Soil Sci. Soc. Am. J. 48, 72–75.Duwig, C., Becquer, T., Clothier, B.E., Vauclin, M., 1998. Nitrate leaching through oxisols of the
Ž .Loyalty Islands New Caledonia under intensified agricultural practices. Geoderma 84, 29–43.Eswaran, H., Almaraz, R., van den Berg, E., Reich, P., 1997. An assessment of the soil resources
of Africa in relation to productivity. Geoderma 77, 1–18.Hagedorn, F., Steiner, K.G., Sekayange, L., Zech, W., 1997. Effect of rainfall pattern on nitrogen
mineralization and leaching in a green manure experiment in South Rwanda. Plant Soil 195,365–375.
Hartemink, A.E., Buresh, R.J., Jama, B., Janssen, B.H., 1996. Soil nitrate and water dynamics insesbania fallows, weed fallows, and maize. Soil Sci. Soc. Am. J. 60, 568–574.
Hilsheimer, R., Harwig, J., 1976. Colorimetric determination of nitrite from meat and other foods:An alternative colour reagent for the carcinogenic 1-naphthyllamine and improved extractionmethod. Can. Inst. Food Sci. Technol. J. 9, 225–227.
Hoosbeek, M.R., 1998. Incorporating scale into spatio-temporal variability: applications to soilquality and yield data. Geoderma 85, 113–131.
Jama, B., Buresh, R.J., Place, F.M., 1998. Sesbania tree fallows on phosphorus-deficient sites:maize yield and financial benefits. Agron. J. 90, 717–726.
Jenny, H., Gessel, S.P., Bingham, F.T., 1949. Comparative study of decomposition rates oforganic matter in temperate and tropical regions. Soil Sci. 68, 419–432.
Kwesiga, F., Coe, R., 1994. The effect of short rotation Sesbania sesban planted fallows on maizeyield. For. Ecol. Manage. 64, 199–208.
Kwesiga, F.R., Franzel, S., Place, F., Phiri, D., Simwanza, C.P., 1999. Sesbania sesban improvedfallows in eastern Zambia: their inception, development and farmer enthusiasm. Agrofor. Syst.47, 49–66.
Maroko, J.B., Buresh, R.J., Smithson, P.C., 1998. Soil nitrogen availability as affected byfallow–maize systems on two soils in Kenya. Biol. Fertil. Soils 26, 229–234.
Maroko, J.B., Buresh, R.J., Smithson, P.C., 1999. Soil phosphorus fractions in unfertilizedfallow–maize systems on two tropical soils. Soil Sci. Soc. Am. J. 63, 320–326.
McIntire, J., 1986. Constraints to fertilizer use in sub-Saharan Africa. In: Mokwunye, A.U., Vlek,Ž .P.L.G. Eds. , Management of Nitrogen and Phosphorus Fertilizers in Sub-Saharan Africa.
Martinus Nijhoff Publishers, Dordrecht, pp. 33–57.Mekonnen, K., Buresh, R.J., Coe, R., Kipleting, K.M., 1999. Root length and nitrate under
Sesbania sesban: vertical and horizontal distribution and variability. Agrofor. Syst. 42,265–282.
Mekonnen, K., Buresh, R.J., Jama, B., 1997. Root and inorganic nitrogen distributions in sesbaniafallow, natural fallow and maize fields. Plant Soil 188, 319–327.
Parkinson, J.A., Allen, S.E., 1975. A wet oxidation procedure suitable for the determination ofnitrogen and mineral nutrients in biological materials. Commun. Soil Sci. Plant Anal. 6, 1–11.
Rao, M.R., Coe, R.D., 1991. Measuring crop yields in on-farm agroforestry studies. Agrofor. Syst.15, 275–289.
( )A.E. Hartemink et al.rGeoderma 98 2000 11–33 33
Sanchez, P.A., 1976. Properties and Management of Soils in the Tropics. Wiley, New York.Sanchez, P.A., Buresh, R.J., Leakey, R.R.B., 1997. Trees, soils, and food security. In: Greenland,
Ž .D.J., Gregory, P.J., Nye, P.H. Eds. , Land Resources: On the Edge of the MalthusianPrecipice? The Royal Society, London, pp. 949–961.
Selles, F., Karamanos, R.E., Kachanoski, R.G., 1986. The spatial variability of Nitrogen-15 andits relation to the variability of other soil properties. Soil Sci. Soc. Am. J. 50, 105–110.
Silvertooth, J.C., Watson, J.E., Malcuit, J.E., Doerge, T.A., 1992. Bromide and nitrate movementin an irrigated cotton production system. Soil Sci. Soc. Am. J. 56, 548–555.
Simpson, J.R., 1960. The mechanism of surface nitrate accumulation on a bare fallow soil inUganda. J. Soil Sci. 11, 45–60.
Sombroek, W.G., Braun, H.M.H. and van de Pouw, B.J.A., 1982. Exploratory soil map andagro-climatic map zone map of Kenya. Exploratory Soil Survey Report no E1. Kenya SoilSurvey, Nairobi.
Szott, L.T., Palm, C.A., Buresh, R.J., 1999. Ecosystem fertility and fallow function in the humidand subhumid tropics. Agrofor. Syst. 47, 163–196.
Wild, A., 1972. Nitrate leaching under bare fallow at a site in northern Nigeria. J. Soil Sci. 23,315–324.
Wong, M.T.F., Hughes, R., Rowell, D.L., 1990. Retarded leaching of nitrate in acid soils from thetropics: measurement of the effective anion exchange capacity. J. Soil Sci. 41, 655–663.
Wong, M.F.T., Nortcliff, S., 1995. Seasonal fluctuations of native available N and soil manage-ment implications. Fert. Res. 42, 13–26.
Young, A., 1997. Agroforestry for Soil Management. 2nd edn. CAB International, Wallingford,UK.
Top Related
Copyright © 2022 FDOKUMEN

