


Bahasa
Halaman
Hukum

Autho
r's
pers
onal
co
py
Influence of initial and boundary conditions for ozone modelingin very complex terrains: A case study in the northeastern
Iberian Peninsula
Pedro Jimenez a,*, Rene Parra b, Jose M. Baldasano a,b
a Barcelona Supercomputing Center-Centro Nacional de Supercomputacion (BSC-CNS), Jordi Girona 29, 08034 Barcelona, Spainb Laboratory of Environmental Modeling, Universitat Politecnica de Catalunya (UPC), Avda. Diagonal 647 10.23, 08028 Barcelona, Spain
Received 3 March 2005; received in revised form 13 January 2006; accepted 21 August 2006
Available online 27 October 2006
Abstract
Initial (IC) and boundary conditions (BC) are required in order to solve the set of stiff differential equations included in air quality models. Inthis work, the influences of ICeBC are analyzed in the northeastern Iberian Peninsula (NEIP) by applying MM5eEMICAT2000eCMAQ. Amultiscale-nested configuration has been used to generate the ICeBC. The wider domain (D1) covers an area of 1392� 1104 km2 centeredin the Iberian Peninsula. Domain 2 (D2) covers an area of 272� 272 km2 in the NEIP (D2) with high spatial and temporal resolution. Theinformation related to BC has been supplied to D2 through one-way nesting. Different scenarios were considered (base case, increments ofþ50% in ozone (O3) IC, þ50% in O3 BC, þ50% in O3 precursors IC, þ50% in O3 precursors BC and clean BC). The impacts of the IC ona site decrease with simulation time. Focusing on the conditions within the PBL, a 48-h spin-up time is sufficient to reduce the impact factorof IC to 10% or less for O3 since the influence of pervasive local emissions. The influences of BC are more important for areas near domainboundaries, especially in areas where the contribution of O3 precursors is due to a short-medium range transport.� 2006 Elsevier Ltd. All rights reserved.
Keywords: Ozone; Air quality modeling; Initial and boundary conditions; Photochemistry; Complex terrains
1. Introduction
A three-dimensional air quality model contains a set of stiffdifferential equations, which describe the time evolution ofchemical species in the atmosphere. Initial (IC) and boundaryconditions (BC) are required in order to solve these equations.IC are specified within the simulation domain at the beginningof simulation, while BC are prescribed throughout the simula-tion period. Ideally, ICeBC should be determined based onobservations. However, such high-resolution observations aregenerally not available. Model studies of photochemical pol-lutants pertained to a limited region and over a limited time pe-riod to some degree will be affected by the assumed ICeBC.
The extent of influence will be most profound shortly afterthe model simulation has been initialized and close to themodel boundaries. However, the impact of these conditionscould depend on several factors: quenching, depositions,chemical reactions, etc.
Since ICeBC are usually specified in some extent of pre-sumption, it is important to minimize the influence of ICeBC in the model calculations. Three general methods areused to specify ICeBC (National Research Council, 1991):(1) use the output of a larger domain simulation; (2) use theobjective or interpolated techniques when applying ambientobserved data; and (3) isolate simulation domain from signif-icant sources.
Liu et al. (2001) quantified the influences of ICeBCthrough theoretical analysis of the governing equation and ver-ified the results by applying SARMAP air quality model. Theinfluence of BC, on the other hand, decreases during the
* Corresponding author. Tel.: þ34 934134050; fax: þ34 93340255.
E-mail address: [email protected] (P. Jimenez).
1364-8152/$ - see front matter � 2006 Elsevier Ltd. All rights reserved.
doi:10.1016/j.envsoft.2006.08.004
Environmental Modelling & Software 22 (2007) 1294e1306www.elsevier.com/locate/envsoft
Autho
r's
pers
onal
co
py
downwind transport, and is significant to a selected site whenthe arrival time of boundary condition is short and the specieslifetime is long. Therefore, influences of BC are more impor-tant for area near domain boundaries.
Berge et al. (2001) have indicated that the influence of ICcould be minimized through spin-up or ‘‘start-up’’ prior toformal simulations. Influences of IC basically depend onspecies lifetime. Impacts of IC on a given site decreasewith simulation time and significantly affect the species con-centrations before the arrival of BC, and disappear after theirarrival.
The species evolution in the downwind area is continuouslyaffected by upwind BC through this spin-up process. Thus,Seinfeld and Pandis (1998) have suggested a few rules to re-duce the influences of BC. First, include all the sources thatmay have potential effects on the given region in the simula-tion domain. Second, include the sources implicitly in BC;and third, apply the simulation results of larger model domainto the BC of smaller simulation domains within. This last pro-cedure leads to the utilization of using multiscale simulationsand is called multiscale-nested modeling, and allows capturingthe non-linearities of atmospheric chemistry, yet conservingcomputational resources. Multiscale-nested models are con-sidered the current state-of-the-science for air quality model-ing (Russell and Dennis, 2000).
A description of the process of initialization and genera-tion of BC for MM5eEMICAT2000eCMAQ through per-forming simulations in the entire Iberian Peninsula, andusing a multiscale approach, is shown in this work. The widerdomain is coupled via one-way nesting to the domain of thenortheastern Iberian Peninsula (NEIP), in order to provide theBC. Furthermore, an analysis of the influences of ICeBC andtheir sensitivity is presented, indicating the necessity of a cor-rect initialization of the model by means of spin-up proce-dures; and also the availability of good-quality boundaryinformation when performing simulations in very complexterrains.
2. Multiscale-nested simulation approach
Indications of the National Research Council (1991), Sein-feld and Pandis (1998) and Liu et al. (2001) were followed forthe NEIP, in order to minimize the impacts of ICeBC in thesimulations and to maximize local characteristics. In this sec-tion, a short description of the methods used for the nestedsimulation is indicated.
The simulations were started at 00.00 UTC of 13 August2000, and extend for a period of 72 h. This episode corre-sponds to a typical summertime low pressure gradient withhigh levels of photochemical pollutants over the Iberian Pen-insula. The day was characterized by a weak synoptic forcing,so that mesoscale phenomena, induced by the particular geog-raphy of the region would be dominant. This situation is asso-ciated with weak winds in the lower troposphere, cloudlessskies and high maximum temperatures. A high sea level pres-sure and almost non-existent surface pressure gradients overthe domain characterize this day, with slow northwesterlies
aloft. This situation is representative of an episode of photo-chemical pollution in the Western Mediterranean Basin, sincethe occurrence of regional re-circulations at low levels repre-sents 45% of the yearly (and 78% of summertime days) trans-port patterns over the area of study (Jorba et al., 2004). Thesesituations are associated with local-regional episodes of airpollution in the NEIP that result in high levels of ozone (O3)(Perez et al., 2006) and an increase of particulate matter withinthe boundary layer during summer.
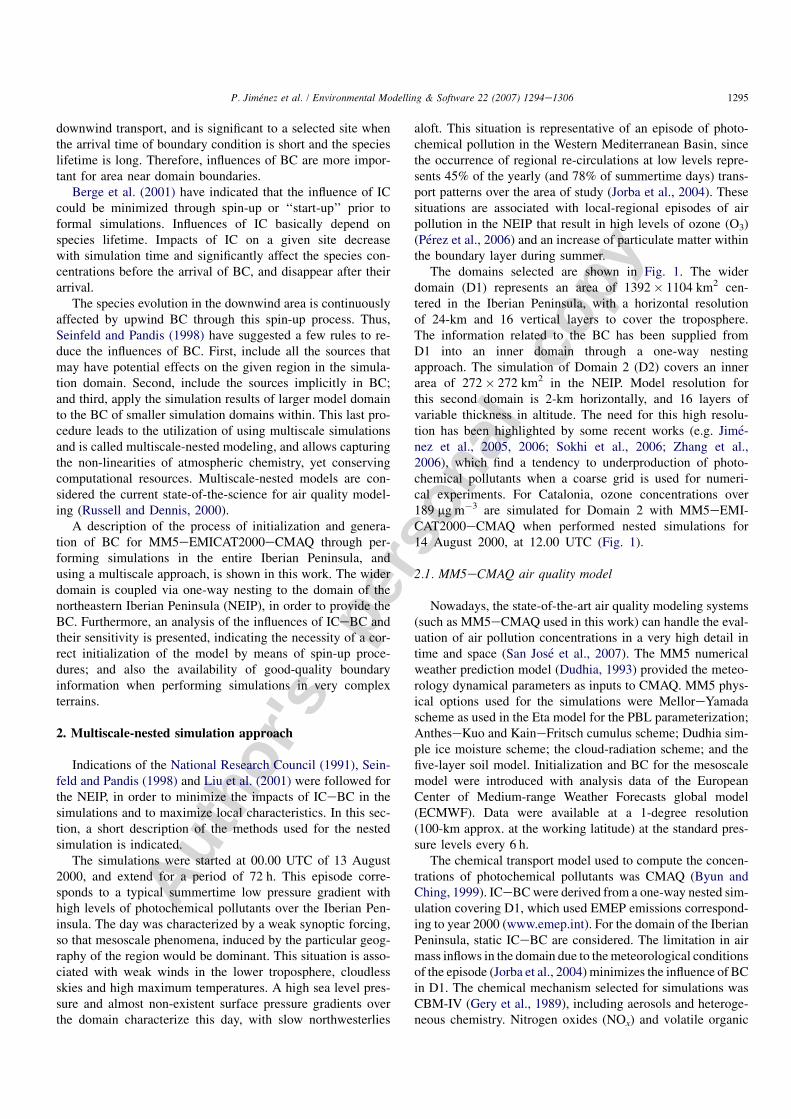
The domains selected are shown in Fig. 1. The widerdomain (D1) represents an area of 1392� 1104 km2 cen-tered in the Iberian Peninsula, with a horizontal resolutionof 24-km and 16 vertical layers to cover the troposphere.The information related to the BC has been supplied fromD1 into an inner domain through a one-way nestingapproach. The simulation of Domain 2 (D2) covers an innerarea of 272� 272 km2 in the NEIP. Model resolution forthis second domain is 2-km horizontally, and 16 layers ofvariable thickness in altitude. The need for this high resolu-tion has been highlighted by some recent works (e.g. Jime-nez et al., 2005, 2006; Sokhi et al., 2006; Zhang et al.,2006), which find a tendency to underproduction of photo-chemical pollutants when a coarse grid is used for numeri-cal experiments. For Catalonia, ozone concentrations over189 mg m�3 are simulated for Domain 2 with MM5eEMI-CAT2000eCMAQ when performed nested simulations for14 August 2000, at 12.00 UTC (Fig. 1).
2.1. MM5eCMAQ air quality model
Nowadays, the state-of-the-art air quality modeling systems(such as MM5eCMAQ used in this work) can handle the eval-uation of air pollution concentrations in a very high detail intime and space (San Jose et al., 2007). The MM5 numericalweather prediction model (Dudhia, 1993) provided the meteo-rology dynamical parameters as inputs to CMAQ. MM5 phys-ical options used for the simulations were MelloreYamadascheme as used in the Eta model for the PBL parameterization;AntheseKuo and KaineFritsch cumulus scheme; Dudhia sim-ple ice moisture scheme; the cloud-radiation scheme; and thefive-layer soil model. Initialization and BC for the mesoscalemodel were introduced with analysis data of the EuropeanCenter of Medium-range Weather Forecasts global model(ECMWF). Data were available at a 1-degree resolution(100-km approx. at the working latitude) at the standard pres-sure levels every 6 h.
The chemical transport model used to compute the concen-trations of photochemical pollutants was CMAQ (Byun andChing, 1999). ICeBC were derived from a one-way nested sim-ulation covering D1, which used EMEP emissions correspond-ing to year 2000 (www.emep.int). For the domain of the IberianPeninsula, static ICeBC are considered. The limitation in airmass inflows in the domain due to the meteorological conditionsof the episode (Jorba et al., 2004) minimizes the influence of BCin D1. The chemical mechanism selected for simulations wasCBM-IV (Gery et al., 1989), including aerosols and heteroge-neous chemistry. Nitrogen oxides (NOx) and volatile organic
1295P. Jimenez et al. / Environmental Modelling & Software 22 (2007) 1294e1306
Autho
r's
pers
onal
co
py
compounds (VOCs) specification of EMICAT2000 emissions,as required by CBM-IV, could be found in Parra et al. (2006).The algorithm chosen for the resolution of tropospheric chemis-try was the Modified Euler Backward Iterative (MEBI) method(Huang and Chang, 2001).
2.2. Emissions within MM5eEMICAT2000eCMAQ
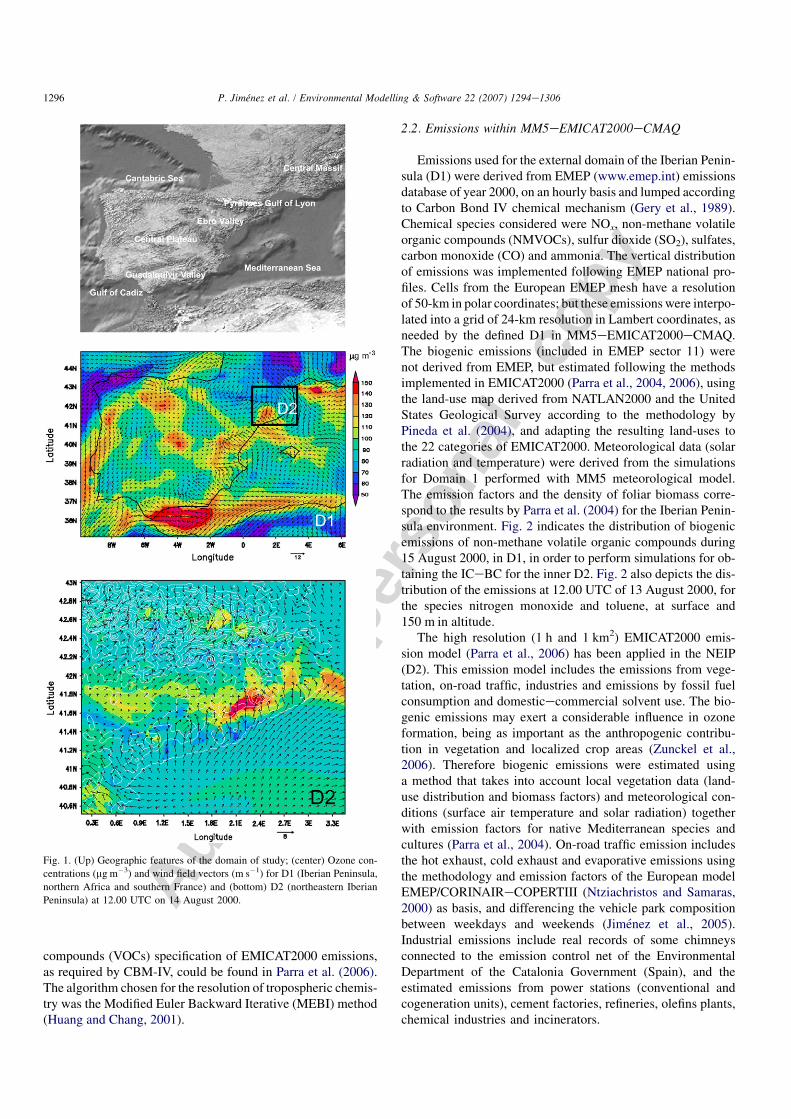
Emissions used for the external domain of the Iberian Penin-sula (D1) were derived from EMEP (www.emep.int) emissionsdatabase of year 2000, on an hourly basis and lumped accordingto Carbon Bond IV chemical mechanism (Gery et al., 1989).Chemical species considered were NOx, non-methane volatileorganic compounds (NMVOCs), sulfur dioxide (SO2), sulfates,carbon monoxide (CO) and ammonia. The vertical distributionof emissions was implemented following EMEP national pro-files. Cells from the European EMEP mesh have a resolutionof 50-km in polar coordinates; but these emissions were interpo-lated into a grid of 24-km resolution in Lambert coordinates, asneeded by the defined D1 in MM5eEMICAT2000eCMAQ.The biogenic emissions (included in EMEP sector 11) werenot derived from EMEP, but estimated following the methodsimplemented in EMICAT2000 (Parra et al., 2004, 2006), usingthe land-use map derived from NATLAN2000 and the UnitedStates Geological Survey according to the methodology byPineda et al. (2004), and adapting the resulting land-uses tothe 22 categories of EMICAT2000. Meteorological data (solarradiation and temperature) were derived from the simulationsfor Domain 1 performed with MM5 meteorological model.The emission factors and the density of foliar biomass corre-spond to the results by Parra et al. (2004) for the Iberian Penin-sula environment. Fig. 2 indicates the distribution of biogenicemissions of non-methane volatile organic compounds during15 August 2000, in D1, in order to perform simulations for ob-taining the ICeBC for the inner D2. Fig. 2 also depicts the dis-tribution of the emissions at 12.00 UTC of 13 August 2000, forthe species nitrogen monoxide and toluene, at surface and150 m in altitude.
The high resolution (1 h and 1 km2) EMICAT2000 emis-sion model (Parra et al., 2006) has been applied in the NEIP(D2). This emission model includes the emissions from vege-tation, on-road traffic, industries and emissions by fossil fuelconsumption and domesticecommercial solvent use. The bio-genic emissions may exert a considerable influence in ozoneformation, being as important as the anthropogenic contribu-tion in vegetation and localized crop areas (Zunckel et al.,2006). Therefore biogenic emissions were estimated usinga method that takes into account local vegetation data (land-use distribution and biomass factors) and meteorological con-ditions (surface air temperature and solar radiation) togetherwith emission factors for native Mediterranean species andcultures (Parra et al., 2004). On-road traffic emission includesthe hot exhaust, cold exhaust and evaporative emissions usingthe methodology and emission factors of the European modelEMEP/CORINAIReCOPERTIII (Ntziachristos and Samaras,2000) as basis, and differencing the vehicle park compositionbetween weekdays and weekends (Jimenez et al., 2005).Industrial emissions include real records of some chimneysconnected to the emission control net of the EnvironmentalDepartment of the Catalonia Government (Spain), and theestimated emissions from power stations (conventional andcogeneration units), cement factories, refineries, olefins plants,chemical industries and incinerators.
Fig. 1. (Up) Geographic features of the domain of study; (center) Ozone con-
centrations (mg m�3) and wind field vectors (m s�1) for D1 (Iberian Peninsula,
northern Africa and southern France) and (bottom) D2 (northeastern Iberian
Peninsula) at 12.00 UTC on 14 August 2000.
1296 P. Jimenez et al. / Environmental Modelling & Software 22 (2007) 1294e1306
Autho
r's
pers
onal
co
py3. Results and discussions
Multiscale-nesting technique grids are needed to providethe required high resolution simulations. Nesting techniquesallow one-way or two-way exchange of information amongfiner and coarser grids. The only difference between theone-way and two-way nesting is whether concentrations incoarser grid simulations are updated with the finer grid simu-lations through the feedback processors or not. Soriano et al.(2002) studied the influence of one-way and two-way nestingtechniques over the very complex terrain of the NEIP undera situation of low synoptic forcing. The differences in the sim-ulated fields are significant when choosing one or another nest-ing technique, yielding the two-way simulation worst resultswhen evaluating the model against ambient data. Therefore,the decision of considering one-way approaches was takenfor the simulations performed in this work both for MM5and CMAQ.
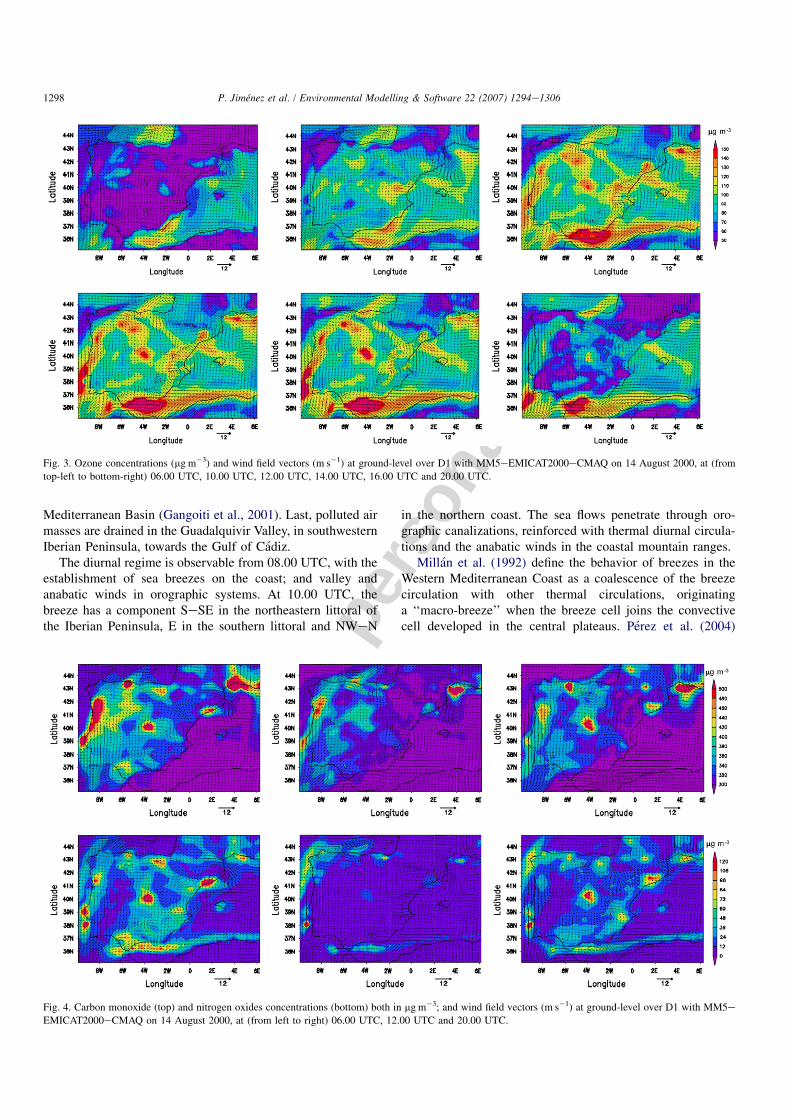
The evolution of the flows and the concentrations of photo-chemical pollutants for a daily cycle over the Iberian
Peninsula are shown in Fig. 3 for O3 and Fig. 4 in the casesof CO and NOx. The simulations depict the results for 14August 2000 in the D1 (covering the Iberian Peninsula, north-ern Africa and southern France) since this day is representativeof the episode of pollution covering from 10 to 19 August2000, characterized by thermal circulations that dominatemost of the Peninsula for these days.
The nocturnal regime is characterized by the developmentof mountain and katabatic winds in main orographic systemsand the formation of land breezes in coastal areas. In thewest littoral, flows are influenced by the anticyclonic dorsal.At night, there are three important drainages of pollutants inD1. First, the drainage through the Ebro Valley in the north-eastern part of the Peninsula is hampered by the penetrationof hot air masses from the Mediterranean induced by the anti-cyclonic circulation over the sea. Second, flows are canalizedbetween the Pyrenees and the Central Massif, introducingnorthwestern flows into the Mediterranean through the Gulfof Lyon. This canalization plays an important role, becauseit is the only pass bringing fresh air into the Western
Fig. 2. Emissions for D1: map of biogenic emissions on 15 August 2000, for D1 (top); and categories NO and TOL of CBM-IV mechanism: (left) surface; and
(right) 150 m height.
1297P. Jimenez et al. / Environmental Modelling & Software 22 (2007) 1294e1306
Autho
r's
pers
onal
co
py
Mediterranean Basin (Gangoiti et al., 2001). Last, polluted airmasses are drained in the Guadalquivir Valley, in southwesternIberian Peninsula, towards the Gulf of Cadiz.
The diurnal regime is observable from 08.00 UTC, with theestablishment of sea breezes on the coast; and valley andanabatic winds in orographic systems. At 10.00 UTC, thebreeze has a component SeSE in the northeastern littoral ofthe Iberian Peninsula, E in the southern littoral and NWeN
in the northern coast. The sea flows penetrate through oro-graphic canalizations, reinforced with thermal diurnal circula-tions and the anabatic winds in the coastal mountain ranges.
Millan et al. (1992) define the behavior of breezes in theWestern Mediterranean Coast as a coalescence of the breezecirculation with other thermal circulations, originatinga ‘‘macro-breeze’’ when the breeze cell joins the convectivecell developed in the central plateaus. Perez et al. (2004)
Fig. 3. Ozone concentrations (mg m�3) and wind field vectors (m s�1) at ground-level over D1 with MM5eEMICAT2000eCMAQ on 14 August 2000, at (from
top-left to bottom-right) 06.00 UTC, 10.00 UTC, 12.00 UTC, 14.00 UTC, 16.00 UTC and 20.00 UTC.
Fig. 4. Carbon monoxide (top) and nitrogen oxides concentrations (bottom) both in mg m�3; and wind field vectors (m s�1) at ground-level over D1 with MM5eEMICAT2000eCMAQ on 14 August 2000, at (from left to right) 06.00 UTC, 12.00 UTC and 20.00 UTC.
1298 P. Jimenez et al. / Environmental Modelling & Software 22 (2007) 1294e1306
Autho
r's
pers
onal
co
py
have corroborated these processes in the eastern coast of theIberian Peninsula by using numerical weather predictionmodels.
The surface heating during daytime hours and the conver-gence of flows inland the Iberian Peninsula produces thedevelopment of the Iberian Thermal Low (Millan et al.,1992, 1996, 1997), which leads to very weak circulations inthe central Plateau. The maximum development of the IberianThermal Low is observed around 18.00 UTC. The pressuregradient in the central Plateau of the Iberian Peninsula is neg-ligible. From 20.00 UTC, flows weaken and the nocturnal reg-imen dominates the dynamics of air pollutants. Drainages aredeveloped in main valleys and peninsular orographic systems.
In order to assess the influence of ICeBC in troposphericO3 levels, different simulations were performed in D2 by mod-ifying the ICeBC generated from the nested simulation of D1.Apart from the base case, five different scenarios were defined:(1) Scenario 1: increase of þ50% in O3 IC; (2) Scenario 2:þ50% in O3 precursors’ IC; (3) Scenario 3: increase ofþ50% in O3 BC; (4) Scenario 4: þ50% in O3 precursors’BC; and (5) Scenario 5: clean BC.
3.1. Influence of initial and boundary conditions
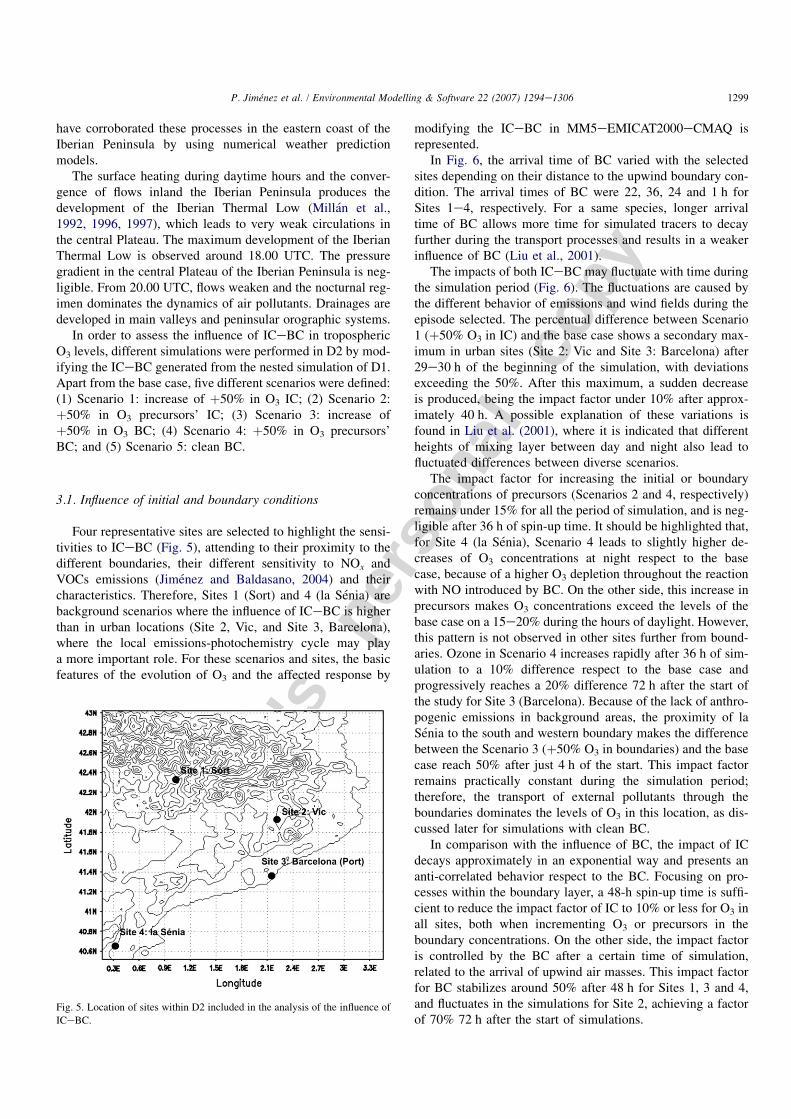
Four representative sites are selected to highlight the sensi-tivities to ICeBC (Fig. 5), attending to their proximity to thedifferent boundaries, their different sensitivity to NOx andVOCs emissions (Jimenez and Baldasano, 2004) and theircharacteristics. Therefore, Sites 1 (Sort) and 4 (la Senia) arebackground scenarios where the influence of ICeBC is higherthan in urban locations (Site 2, Vic, and Site 3, Barcelona),where the local emissions-photochemistry cycle may playa more important role. For these scenarios and sites, the basicfeatures of the evolution of O3 and the affected response by
modifying the ICeBC in MM5eEMICAT2000eCMAQ isrepresented.
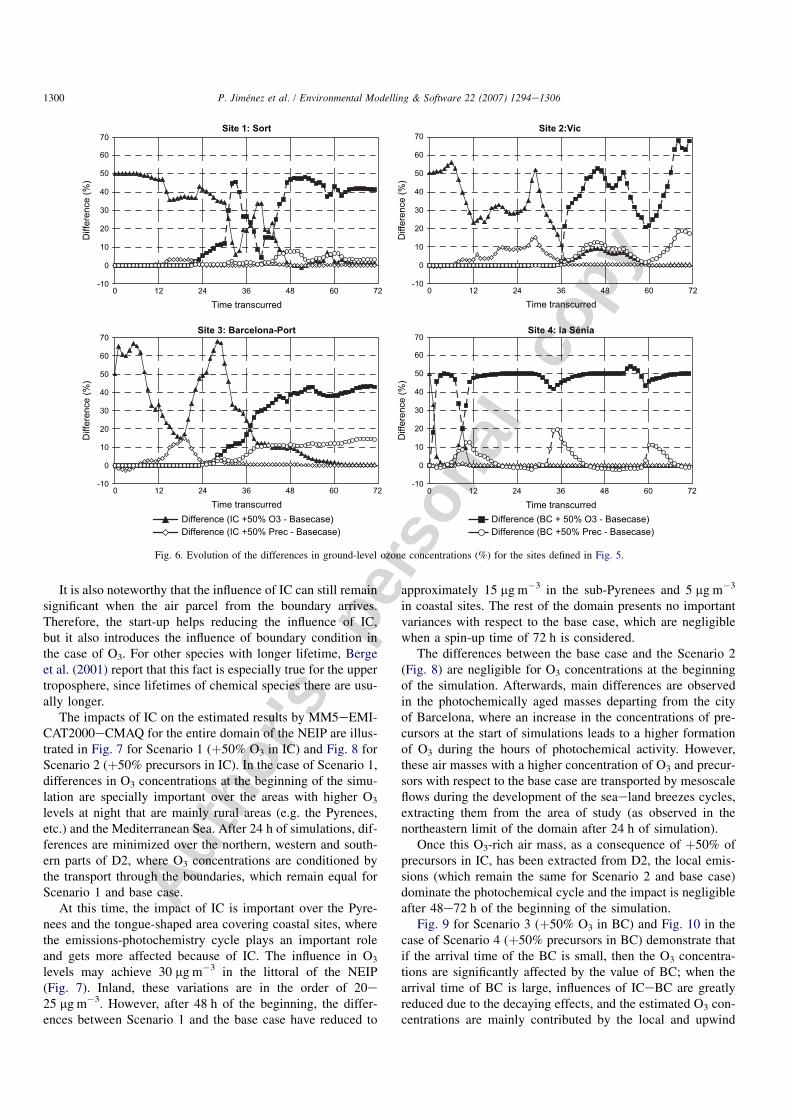
In Fig. 6, the arrival time of BC varied with the selectedsites depending on their distance to the upwind boundary con-dition. The arrival times of BC were 22, 36, 24 and 1 h forSites 1e4, respectively. For a same species, longer arrivaltime of BC allows more time for simulated tracers to decayfurther during the transport processes and results in a weakerinfluence of BC (Liu et al., 2001).
The impacts of both ICeBC may fluctuate with time duringthe simulation period (Fig. 6). The fluctuations are caused bythe different behavior of emissions and wind fields during theepisode selected. The percentual difference between Scenario1 (þ50% O3 in IC) and the base case shows a secondary max-imum in urban sites (Site 2: Vic and Site 3: Barcelona) after29e30 h of the beginning of the simulation, with deviationsexceeding the 50%. After this maximum, a sudden decreaseis produced, being the impact factor under 10% after approx-imately 40 h. A possible explanation of these variations isfound in Liu et al. (2001), where it is indicated that differentheights of mixing layer between day and night also lead tofluctuated differences between diverse scenarios.
The impact factor for increasing the initial or boundaryconcentrations of precursors (Scenarios 2 and 4, respectively)remains under 15% for all the period of simulation, and is neg-ligible after 36 h of spin-up time. It should be highlighted that,for Site 4 (la Senia), Scenario 4 leads to slightly higher de-creases of O3 concentrations at night respect to the basecase, because of a higher O3 depletion throughout the reactionwith NO introduced by BC. On the other side, this increase inprecursors makes O3 concentrations exceed the levels of thebase case on a 15e20% during the hours of daylight. However,this pattern is not observed in other sites further from bound-aries. Ozone in Scenario 4 increases rapidly after 36 h of sim-ulation to a 10% difference respect to the base case andprogressively reaches a 20% difference 72 h after the start ofthe study for Site 3 (Barcelona). Because of the lack of anthro-pogenic emissions in background areas, the proximity of laSenia to the south and western boundary makes the differencebetween the Scenario 3 (þ50% O3 in boundaries) and the basecase reach 50% after just 4 h of the start. This impact factorremains practically constant during the simulation period;therefore, the transport of external pollutants through theboundaries dominates the levels of O3 in this location, as dis-cussed later for simulations with clean BC.
In comparison with the influence of BC, the impact of ICdecays approximately in an exponential way and presents ananti-correlated behavior respect to the BC. Focusing on pro-cesses within the boundary layer, a 48-h spin-up time is suffi-cient to reduce the impact factor of IC to 10% or less for O3 inall sites, both when incrementing O3 or precursors in theboundary concentrations. On the other side, the impact factoris controlled by the BC after a certain time of simulation,related to the arrival of upwind air masses. This impact factorfor BC stabilizes around 50% after 48 h for Sites 1, 3 and 4,and fluctuates in the simulations for Site 2, achieving a factorof 70% 72 h after the start of simulations.
Fig. 5. Location of sites within D2 included in the analysis of the influence of
ICeBC.
1299P. Jimenez et al. / Environmental Modelling & Software 22 (2007) 1294e1306
Autho
r's
pers
onal
co
pyIt is also noteworthy that the influence of IC can still remain
significant when the air parcel from the boundary arrives.Therefore, the start-up helps reducing the influence of IC,but it also introduces the influence of boundary condition inthe case of O3. For other species with longer lifetime, Bergeet al. (2001) report that this fact is especially true for the uppertroposphere, since lifetimes of chemical species there are usu-ally longer.
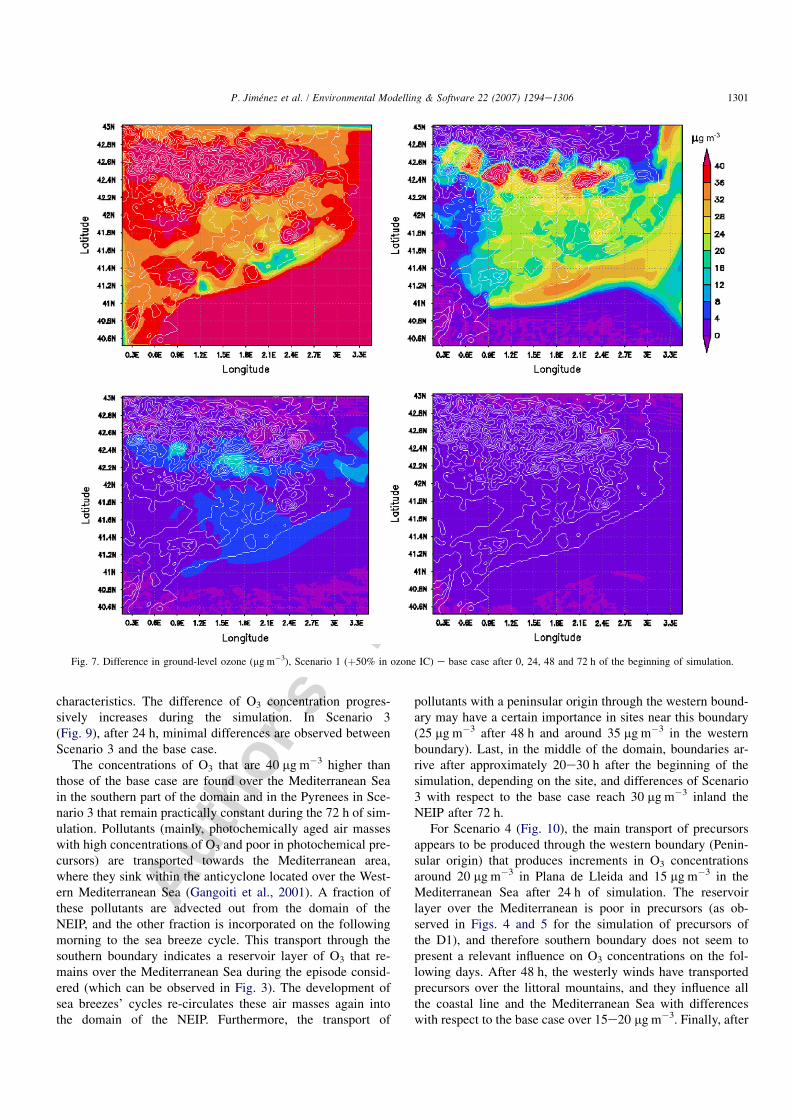
The impacts of IC on the estimated results by MM5eEMI-CAT2000eCMAQ for the entire domain of the NEIP are illus-trated in Fig. 7 for Scenario 1 (þ50% O3 in IC) and Fig. 8 forScenario 2 (þ50% precursors in IC). In the case of Scenario 1,differences in O3 concentrations at the beginning of the simu-lation are specially important over the areas with higher O3
levels at night that are mainly rural areas (e.g. the Pyrenees,etc.) and the Mediterranean Sea. After 24 h of simulations, dif-ferences are minimized over the northern, western and south-ern parts of D2, where O3 concentrations are conditioned bythe transport through the boundaries, which remain equal forScenario 1 and base case.
At this time, the impact of IC is important over the Pyre-nees and the tongue-shaped area covering coastal sites, wherethe emissions-photochemistry cycle plays an important roleand gets more affected because of IC. The influence in O3
levels may achieve 30 mg m�3 in the littoral of the NEIP(Fig. 7). Inland, these variations are in the order of 20e25 mg m�3. However, after 48 h of the beginning, the differ-ences between Scenario 1 and the base case have reduced to
approximately 15 mg m�3 in the sub-Pyrenees and 5 mg m�3
in coastal sites. The rest of the domain presents no importantvariances with respect to the base case, which are negligiblewhen a spin-up time of 72 h is considered.
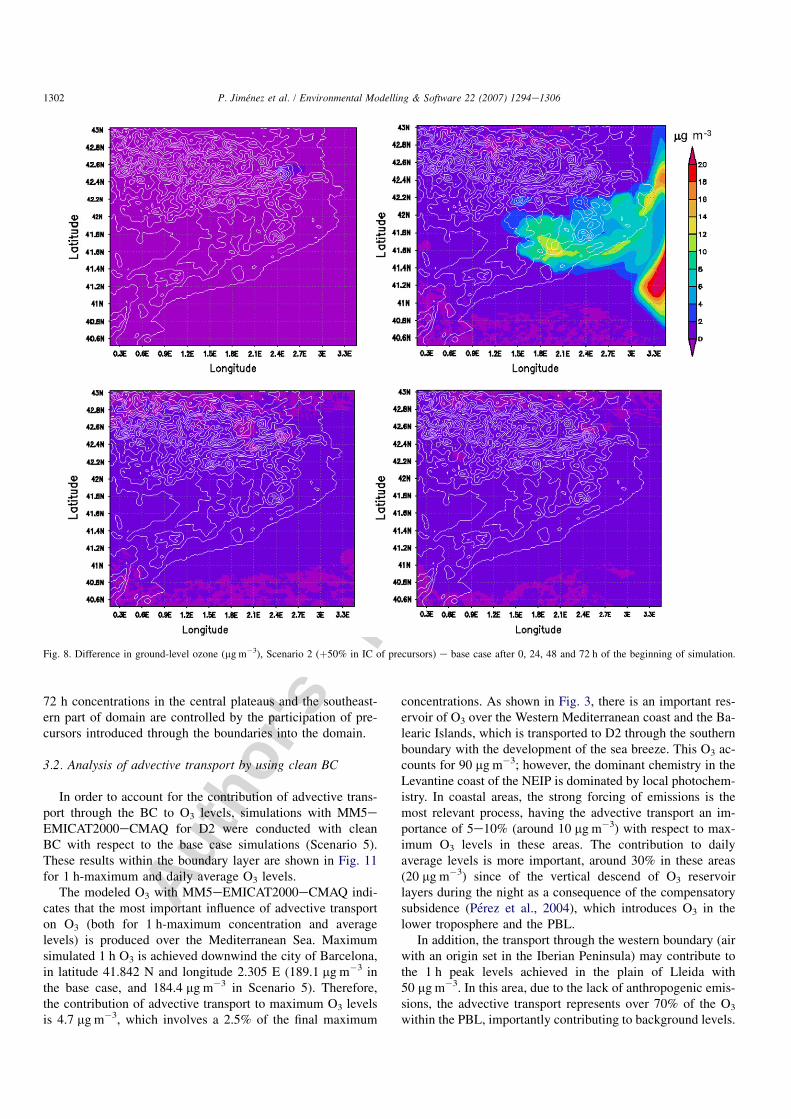
The differences between the base case and the Scenario 2(Fig. 8) are negligible for O3 concentrations at the beginningof the simulation. Afterwards, main differences are observedin the photochemically aged masses departing from the cityof Barcelona, where an increase in the concentrations of pre-cursors at the start of simulations leads to a higher formationof O3 during the hours of photochemical activity. However,these air masses with a higher concentration of O3 and precur-sors with respect to the base case are transported by mesoscaleflows during the development of the seaeland breezes cycles,extracting them from the area of study (as observed in thenortheastern limit of the domain after 24 h of simulation).
Once this O3-rich air mass, as a consequence of þ50% ofprecursors in IC, has been extracted from D2, the local emis-sions (which remain the same for Scenario 2 and base case)dominate the photochemical cycle and the impact is negligibleafter 48e72 h of the beginning of the simulation.
Fig. 9 for Scenario 3 (þ50% O3 in BC) and Fig. 10 in thecase of Scenario 4 (þ50% precursors in BC) demonstrate thatif the arrival time of the BC is small, then the O3 concentra-tions are significantly affected by the value of BC; when thearrival time of BC is large, influences of ICeBC are greatlyreduced due to the decaying effects, and the estimated O3 con-centrations are mainly contributed by the local and upwind
Site 1: Sort
-10
0
10
20
30
40
50
60
70
0 12 24 36 48 60 72
Diff
eren
ce (%
)
Site 2:Vic
Site 3: Barcelona-Port
-10
0
10
20
30
40
50
60
70
Diff
eren
ce (%
)
Site 4: la Sénia
Time transcurred
Time transcurred
Difference (IC +50% O3 - Basecase)Difference (IC +50% Prec - Basecase)
Difference (BC + 50% O3 - Basecase)Difference (BC +50% Prec - Basecase)
0 12 24 36 48 60 72 0 12 24 36 48 60 72
0 12 24 36 48 60 72
Time transcurred
Time transcurred
-10
0
10
20
30
40
50
60
70
Diff
eren
ce (%
)
-10
0
10
20
30
40
50
60
70
Diff
eren
ce (%
)
Fig. 6. Evolution of the differences in ground-level ozone concentrations (%) for the sites defined in Fig. 5.
1300 P. Jimenez et al. / Environmental Modelling & Software 22 (2007) 1294e1306
Autho
r's
pers
onal
co
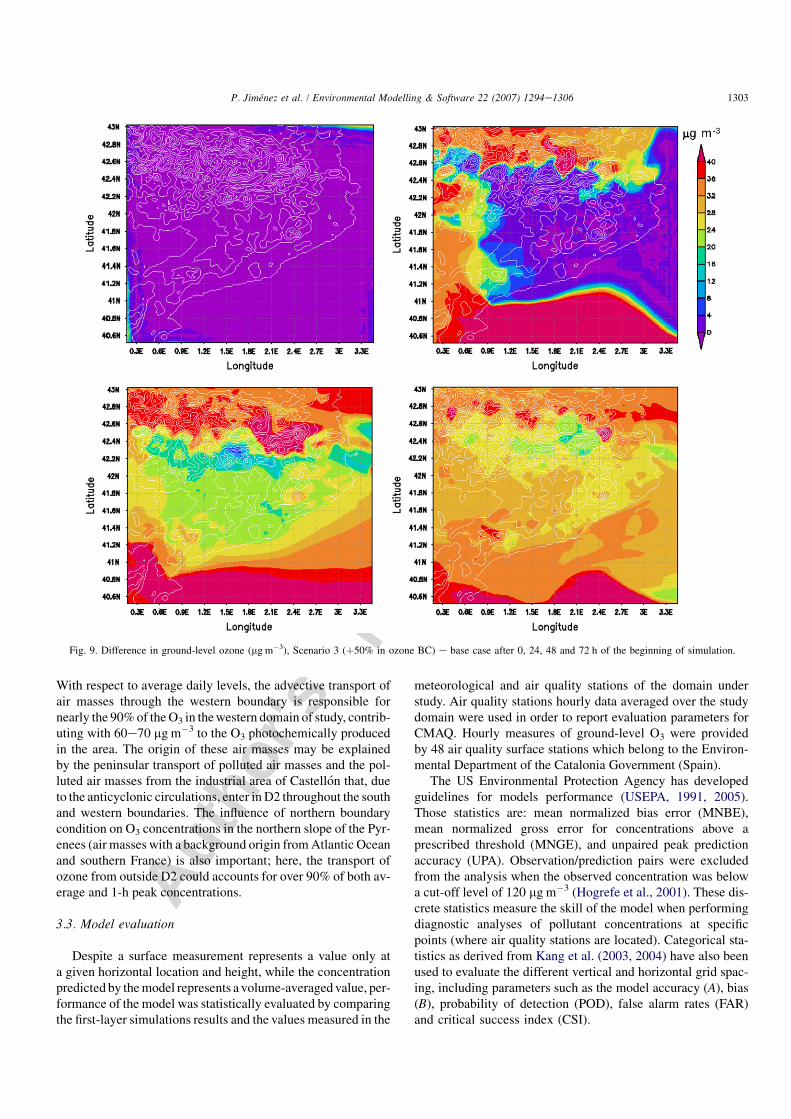
pycharacteristics. The difference of O3 concentration progres-sively increases during the simulation. In Scenario 3(Fig. 9), after 24 h, minimal differences are observed betweenScenario 3 and the base case.
The concentrations of O3 that are 40 mg m�3 higher thanthose of the base case are found over the Mediterranean Seain the southern part of the domain and in the Pyrenees in Sce-nario 3 that remain practically constant during the 72 h of sim-ulation. Pollutants (mainly, photochemically aged air masseswith high concentrations of O3 and poor in photochemical pre-cursors) are transported towards the Mediterranean area,where they sink within the anticyclone located over the West-ern Mediterranean Sea (Gangoiti et al., 2001). A fraction ofthese pollutants are advected out from the domain of theNEIP, and the other fraction is incorporated on the followingmorning to the sea breeze cycle. This transport through thesouthern boundary indicates a reservoir layer of O3 that re-mains over the Mediterranean Sea during the episode consid-ered (which can be observed in Fig. 3). The development ofsea breezes’ cycles re-circulates these air masses again intothe domain of the NEIP. Furthermore, the transport of
pollutants with a peninsular origin through the western bound-ary may have a certain importance in sites near this boundary(25 mg m�3 after 48 h and around 35 mg m�3 in the westernboundary). Last, in the middle of the domain, boundaries ar-rive after approximately 20e30 h after the beginning of thesimulation, depending on the site, and differences of Scenario3 with respect to the base case reach 30 mg m�3 inland theNEIP after 72 h.
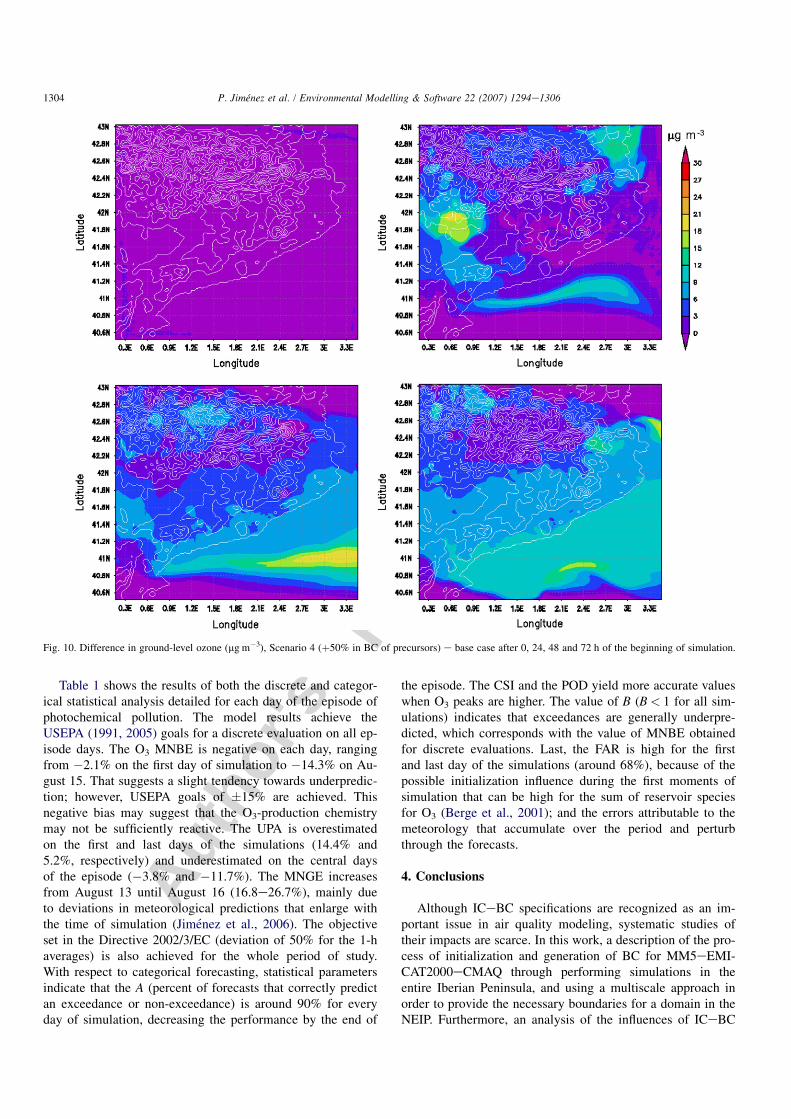
For Scenario 4 (Fig. 10), the main transport of precursorsappears to be produced through the western boundary (Penin-sular origin) that produces increments in O3 concentrationsaround 20 mg m�3 in Plana de Lleida and 15 mg m�3 in theMediterranean Sea after 24 h of simulation. The reservoirlayer over the Mediterranean is poor in precursors (as ob-served in Figs. 4 and 5 for the simulation of precursors ofthe D1), and therefore southern boundary does not seem topresent a relevant influence on O3 concentrations on the fol-lowing days. After 48 h, the westerly winds have transportedprecursors over the littoral mountains, and they influence allthe coastal line and the Mediterranean Sea with differenceswith respect to the base case over 15e20 mg m�3. Finally, after
Fig. 7. Difference in ground-level ozone (mg m�3), Scenario 1 (þ50% in ozone IC) e base case after 0, 24, 48 and 72 h of the beginning of simulation.
1301P. Jimenez et al. / Environmental Modelling & Software 22 (2007) 1294e1306
Autho
r's
pers
onal
co
py72 h concentrations in the central plateaus and the southeast-ern part of domain are controlled by the participation of pre-cursors introduced through the boundaries into the domain.
3.2. Analysis of advective transport by using clean BC
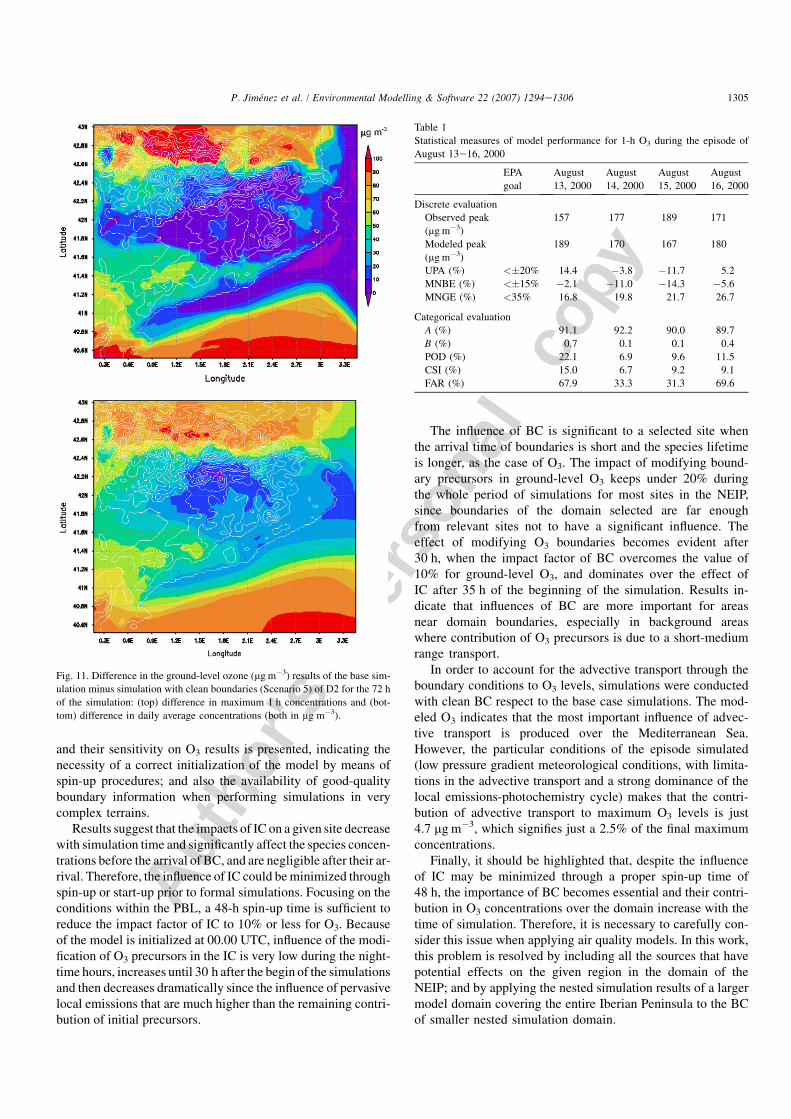
In order to account for the contribution of advective trans-port through the BC to O3 levels, simulations with MM5eEMICAT2000eCMAQ for D2 were conducted with cleanBC with respect to the base case simulations (Scenario 5).These results within the boundary layer are shown in Fig. 11for 1 h-maximum and daily average O3 levels.
The modeled O3 with MM5eEMICAT2000eCMAQ indi-cates that the most important influence of advective transporton O3 (both for 1 h-maximum concentration and averagelevels) is produced over the Mediterranean Sea. Maximumsimulated 1 h O3 is achieved downwind the city of Barcelona,in latitude 41.842 N and longitude 2.305 E (189.1 mg m�3 inthe base case, and 184.4 mg m�3 in Scenario 5). Therefore,the contribution of advective transport to maximum O3 levelsis 4.7 mg m�3, which involves a 2.5% of the final maximum
concentrations. As shown in Fig. 3, there is an important res-ervoir of O3 over the Western Mediterranean coast and the Ba-learic Islands, which is transported to D2 through the southernboundary with the development of the sea breeze. This O3 ac-counts for 90 mg m�3; however, the dominant chemistry in theLevantine coast of the NEIP is dominated by local photochem-istry. In coastal areas, the strong forcing of emissions is themost relevant process, having the advective transport an im-portance of 5e10% (around 10 mg m�3) with respect to max-imum O3 levels in these areas. The contribution to dailyaverage levels is more important, around 30% in these areas(20 mg m�3) since of the vertical descend of O3 reservoirlayers during the night as a consequence of the compensatorysubsidence (Perez et al., 2004), which introduces O3 in thelower troposphere and the PBL.
In addition, the transport through the western boundary (airwith an origin set in the Iberian Peninsula) may contribute tothe 1 h peak levels achieved in the plain of Lleida with50 mg m�3. In this area, due to the lack of anthropogenic emis-sions, the advective transport represents over 70% of the O3
within the PBL, importantly contributing to background levels.
Fig. 8. Difference in ground-level ozone (mg m�3), Scenario 2 (þ50% in IC of precursors) e base case after 0, 24, 48 and 72 h of the beginning of simulation.
1302 P. Jimenez et al. / Environmental Modelling & Software 22 (2007) 1294e1306
Autho
r's
pers
onal
co
pyWith respect to average daily levels, the advective transport ofair masses through the western boundary is responsible fornearly the 90% of the O3 in the western domain of study, contrib-uting with 60e70 mg m�3 to the O3 photochemically producedin the area. The origin of these air masses may be explainedby the peninsular transport of polluted air masses and the pol-luted air masses from the industrial area of Castellon that, dueto the anticyclonic circulations, enter in D2 throughout the southand western boundaries. The influence of northern boundarycondition on O3 concentrations in the northern slope of the Pyr-enees (air masses with a background origin from Atlantic Oceanand southern France) is also important; here, the transport ofozone from outside D2 could accounts for over 90% of both av-erage and 1-h peak concentrations.
3.3. Model evaluation
Despite a surface measurement represents a value only ata given horizontal location and height, while the concentrationpredicted by the model represents a volume-averaged value, per-formance of the model was statistically evaluated by comparingthe first-layer simulations results and the values measured in the
meteorological and air quality stations of the domain understudy. Air quality stations hourly data averaged over the studydomain were used in order to report evaluation parameters forCMAQ. Hourly measures of ground-level O3 were providedby 48 air quality surface stations which belong to the Environ-mental Department of the Catalonia Government (Spain).
The US Environmental Protection Agency has developedguidelines for models performance (USEPA, 1991, 2005).Those statistics are: mean normalized bias error (MNBE),mean normalized gross error for concentrations above aprescribed threshold (MNGE), and unpaired peak predictionaccuracy (UPA). Observation/prediction pairs were excludedfrom the analysis when the observed concentration was belowa cut-off level of 120 mg m�3 (Hogrefe et al., 2001). These dis-crete statistics measure the skill of the model when performingdiagnostic analyses of pollutant concentrations at specificpoints (where air quality stations are located). Categorical sta-tistics as derived from Kang et al. (2003, 2004) have also beenused to evaluate the different vertical and horizontal grid spac-ing, including parameters such as the model accuracy (A), bias(B), probability of detection (POD), false alarm rates (FAR)and critical success index (CSI).
Fig. 9. Difference in ground-level ozone (mg m�3), Scenario 3 (þ50% in ozone BC) e base case after 0, 24, 48 and 72 h of the beginning of simulation.
1303P. Jimenez et al. / Environmental Modelling & Software 22 (2007) 1294e1306
Autho
r's
pers
onal
co
pyTable 1 shows the results of both the discrete and categor-
ical statistical analysis detailed for each day of the episode ofphotochemical pollution. The model results achieve theUSEPA (1991, 2005) goals for a discrete evaluation on all ep-isode days. The O3 MNBE is negative on each day, rangingfrom �2.1% on the first day of simulation to �14.3% on Au-gust 15. That suggests a slight tendency towards underpredic-tion; however, USEPA goals of �15% are achieved. Thisnegative bias may suggest that the O3-production chemistrymay not be sufficiently reactive. The UPA is overestimatedon the first and last days of the simulations (14.4% and5.2%, respectively) and underestimated on the central daysof the episode (�3.8% and �11.7%). The MNGE increasesfrom August 13 until August 16 (16.8e26.7%), mainly dueto deviations in meteorological predictions that enlarge withthe time of simulation (Jimenez et al., 2006). The objectiveset in the Directive 2002/3/EC (deviation of 50% for the 1-haverages) is also achieved for the whole period of study.With respect to categorical forecasting, statistical parametersindicate that the A (percent of forecasts that correctly predictan exceedance or non-exceedance) is around 90% for everyday of simulation, decreasing the performance by the end of
the episode. The CSI and the POD yield more accurate valueswhen O3 peaks are higher. The value of B (B< 1 for all sim-ulations) indicates that exceedances are generally underpre-dicted, which corresponds with the value of MNBE obtainedfor discrete evaluations. Last, the FAR is high for the firstand last day of the simulations (around 68%), because of thepossible initialization influence during the first moments ofsimulation that can be high for the sum of reservoir speciesfor O3 (Berge et al., 2001); and the errors attributable to themeteorology that accumulate over the period and perturbthrough the forecasts.
4. Conclusions
Although ICeBC specifications are recognized as an im-portant issue in air quality modeling, systematic studies oftheir impacts are scarce. In this work, a description of the pro-cess of initialization and generation of BC for MM5eEMI-CAT2000eCMAQ through performing simulations in theentire Iberian Peninsula, and using a multiscale approach inorder to provide the necessary boundaries for a domain in theNEIP. Furthermore, an analysis of the influences of ICeBC
Fig. 10. Difference in ground-level ozone (mg m�3), Scenario 4 (þ50% in BC of precursors) e base case after 0, 24, 48 and 72 h of the beginning of simulation.
1304 P. Jimenez et al. / Environmental Modelling & Software 22 (2007) 1294e1306
Autho
r's
pers
onal
co
py
and their sensitivity on O3 results is presented, indicating thenecessity of a correct initialization of the model by means ofspin-up procedures; and also the availability of good-qualityboundary information when performing simulations in verycomplex terrains.
Results suggest that the impacts of IC on a given site decreasewith simulation time and significantly affect the species concen-trations before the arrival of BC, and are negligible after their ar-rival. Therefore, the influence of IC could be minimized throughspin-up or start-up prior to formal simulations. Focusing on theconditions within the PBL, a 48-h spin-up time is sufficient toreduce the impact factor of IC to 10% or less for O3. Becauseof the model is initialized at 00.00 UTC, influence of the modi-fication of O3 precursors in the IC is very low during the night-time hours, increases until 30 h after the begin of the simulationsand then decreases dramatically since the influence of pervasivelocal emissions that are much higher than the remaining contri-bution of initial precursors.
The influence of BC is significant to a selected site whenthe arrival time of boundaries is short and the species lifetimeis longer, as the case of O3. The impact of modifying bound-ary precursors in ground-level O3 keeps under 20% duringthe whole period of simulations for most sites in the NEIP,since boundaries of the domain selected are far enoughfrom relevant sites not to have a significant influence. Theeffect of modifying O3 boundaries becomes evident after30 h, when the impact factor of BC overcomes the value of10% for ground-level O3, and dominates over the effect ofIC after 35 h of the beginning of the simulation. Results in-dicate that influences of BC are more important for areasnear domain boundaries, especially in background areaswhere contribution of O3 precursors is due to a short-mediumrange transport.
In order to account for the advective transport through theboundary conditions to O3 levels, simulations were conductedwith clean BC respect to the base case simulations. The mod-eled O3 indicates that the most important influence of advec-tive transport is produced over the Mediterranean Sea.However, the particular conditions of the episode simulated(low pressure gradient meteorological conditions, with limita-tions in the advective transport and a strong dominance of thelocal emissions-photochemistry cycle) makes that the contri-bution of advective transport to maximum O3 levels is just4.7 mg m�3, which signifies just a 2.5% of the final maximumconcentrations.
Finally, it should be highlighted that, despite the influenceof IC may be minimized through a proper spin-up time of48 h, the importance of BC becomes essential and their contri-bution in O3 concentrations over the domain increase with thetime of simulation. Therefore, it is necessary to carefully con-sider this issue when applying air quality models. In this work,this problem is resolved by including all the sources that havepotential effects on the given region in the domain of theNEIP; and by applying the nested simulation results of a largermodel domain covering the entire Iberian Peninsula to the BCof smaller nested simulation domain.
Fig. 11. Difference in the ground-level ozone (mg m�3) results of the base sim-
ulation minus simulation with clean boundaries (Scenario 5) of D2 for the 72 h
of the simulation: (top) difference in maximum 1 h concentrations and (bot-
tom) difference in daily average concentrations (both in mg m�3).
Table 1
Statistical measures of model performance for 1-h O3 during the episode of
August 13e16, 2000
EPA
goal
August
13, 2000
August
14, 2000
August
15, 2000
August
16, 2000
Discrete evaluation
Observed peak
(mg m�3)
157 177 189 171
Modeled peak
(mg m�3)
189 170 167 180
UPA (%) <�20% 14.4 �3.8 �11.7 5.2
MNBE (%) <�15% �2.1 �11.0 �14.3 �5.6
MNGE (%) <35% 16.8 19.8 21.7 26.7
Categorical evaluation
A (%) 91.1 92.2 90.0 89.7
B (%) 0.7 0.1 0.1 0.4
POD (%) 22.1 6.9 9.6 11.5
CSI (%) 15.0 6.7 9.2 9.1
FAR (%) 67.9 33.3 31.3 69.6
1305P. Jimenez et al. / Environmental Modelling & Software 22 (2007) 1294e1306
Autho
r's
pers
onal
co
py
Acknowledgements
This work was developed under the research contractREN2003-09753-C02 of the Spanish Ministry of Scienceand Technology. The Spanish Ministry of Education and Sci-ence is also thanked for the FPU doctoral fellowship hold by P.Jimenez. The authors gratefully acknowledge O. Jorba for pro-viding meteorological inputs and E. Lopez for the implemen-tation of EMICAT2000 into a GIS system. Air quality stationsdata and information for implementing industrial emissionswere provided by the Environmental Department of the Cata-lonia Government (Spain).
References
Byun, D.W., Ching, J.K.S. (Eds.), 1999. Science Algorithms of the EPA
Models-3 Community Multiscale Air Quality (CMAQ) Modeling System.
EPA Report N. EPA-600/R-99/030, Office of Research and Development.
U.S. Environmental Protection Agency, Washington, DC.
Berge, E., Huang, H.-C., Chang, J., Liu, T.-H., 2001. A study of the impor-
tance of initial conditions for photochemical oxidant modeling. Journal
of Geophysical Research 106 (D1), 1346e1363.
Dudhia, J., 1993. A nonhydrostatic version of the Penn State/NCAR mesoscale
model: validation tests and simulation of an Atlantic cyclone and cold
front. Monthly Weather Review 121, 1493e1513.
Gangoiti, G., Millan, M.M., Salvador, R., Mantilla, E., 2001. Long-range
transport and re-circulation of pollutants in the western Mediterranean dur-
ing the project regional cycles of air pollution in the west-central Mediter-
ranean area. Atmospheric Environment 35, 6267e6276.
Gery, M.W., Whitten, G.Z., Killus, J.P., Dodge, M.C., 1989. A photochemical
kinetics mechanism for urban and regional scale computer modeling. Jour-
nal of Geophysical Research 94 (D10), 12925e12956.
Hogrefe, C., Rao, S.T., Kasibhatla, P., Hao, W., Sistla, G., Mathur, R.,
McHenry, J., 2001. Evaluating the performance of regional-scale photo-
chemical modeling systems: part II e ozone predictions. Atmospheric En-
vironment 35, 4175e4188.
Huang, H.-C., Chang, J.S., 2001. On the performance of numerical solvers for
a chemistry submodel in three-dimensional air quality models. Journal of
Geophysical Research 106, 20175e20188.
Jimenez, P., Baldasano, J.M., 2004. Ozone response to precursor controls in
very complex terrains: use of photochemical indicators to assess O3e
NOxeVOC sensitivity in the northeastern Iberian Peninsula. Journal of
Geophysical Research 109, D20309, doi:10.1029/2004JD004985.
Jimenez, P., Parra, R., Gasso, S., Baldasano, J.M., 2005. Modeling the ozone
weekend effect in very complex terrains: a case study in the northeastern
Iberian Peninsula. Atmospheric Environment 39, 429e444.
Jimenez, P., Jorba, O., Parra, R., Baldasano, J.M., 2006. Evaluation of MM5e
EMICAT2000eCMAQ performance and sensitivity in complex terrain:
high-resolution application to the northeastern Iberian Peninsula. Atmospheric
Environment 40 (26), 5056e5072, doi:10.1016/j.atmosenv.2005.12.060.
Jorba, O., Perez, C., Rocadenbosch, F., Baldasano, J.M., 2004. Cluster analysis
of 4-day back trajectories arriving in the Barcelona area (Spain) from 1997
to 2002. Journal of Applied Meteorology 43, 887e901.
Kang, D., Eder, B.K., Schere, K.L., 2003. The evaluation of regional-scale air
quality models as part of NOAA’s air quality forecasting pilot program. In:
26th NATO International Technical Meeting on Air Pollution Modeling
and its Application, Istanbul, Turkey, 404e411.
Kang, D., Eder, B.K., Mathur, R., Yu, S., Schere, K.L., 2004. An operational
evaluation of the ETA-CMAQ air quality forecast model. In: 27th NATO
International Technical Meeting on Air Pollution Modeling and its Appli-
cation, Banff, Canada, 233e240.
Liu, T.-H., Jeng, F.-T., Huang, H.-C., Berge, E., Chang, J.S., 2001. Influences
of initial and boundary conditions on regional and urban scale Eulerian air
quality transport model simulations. Chemosphere e Global Change Sci-
ence 3, 175e183.
Millan, M.M., Artinano, B., Alonso, L., Castro, M., Fernandez-Patier, R.,
Goberna, J., 1992. Mesometeorological Cycles of Air Pollution in the Ibe-
rian Peninsula. In: Air Pollution Research Report 44. Commission of the
European Communities, Brussels, Belgium, 219 pp.
Millan, M.M., Salvador, R., Mantilla, E., Artınano, B., 1996. Meteorology and
photochemical air pollution in southern Europe: experimental results from
EC research projects. Atmospheric Environment 30, 1909e1924.
Millan, M., Salvador, R., Mantilla, E., Kallos, G., 1997. Photooxidant dynam-
ics in the Mediterranean basin in summer: results from European research
projects. Journal of Geophysical Research 102, 8811e8823.
National Research Council, 1991. Rethinking the Ozone Problem in Urban and
Regional Air Pollution. National Academy Press, Washington, DC.
Ntziachristos, L., Samaras, Z., 2000. COPERTIII, Computer Programme to
Calculate Emissions from Road Transport. Methodology and Emission
Factors (Version 2.1). Technical report No 49. European Environment
Agency.
Parra, R., Jimenez, P., Baldasano, J.M., 2006. Development of the high spatial
resolution EMICAT2000 emission model for air pollutants from the north-
eastern Iberian Peninsula (Catalonia, Spain). Environmental Pollution 140,
200e219.
Parra, R., Gasso, S., Baldasano, J.M., 2004. Estimating the biogenic emissions
of non-methane volatile organic compounds from the North western Med-
iterranean vegetation of Catalonia, Spain. Science of the Total Environ-
ment 329, 241e259.
Perez, C., Sicard, M., Jorba, O., Comeron, A., Baldasano, J.M., 2004. Sum-
mertime re-circulations of air pollutants over the north-eastern Iberian
coast observed from systematic EARLINET lidar measurements in Barce-
lona. Atmospheric Environment 38, 3983e4000.
Perez, C., Jimenez, P., Jorba, O., Sicard, M., Baldasano, J.M., 2006. Influence
of the PBL scheme on high resolution photochemical simulations in an ur-
ban coastal area over the Western Mediterranean. Atmospheric Environ-
ment 40 (27), 5274e5297, doi:10.1016/j.atmosenv.2006.04.039.
Pineda, N., Jorba, O., Jorge, J., Baldasano, J.M., 2004. Using NDVI SPOT-
VGT data to update land-use map: application to a mesoscale meteorolog-
ical model. International Journal of Remote Sensing 25 (1), 129e143.
Russell, A., Dennis, R., 2000. NARSTO critical review of photochemical
models and modeling. Atmospheric Environment 34, 2283e2324.
Sokhi, R.S., San Jose, R., Kitwiroon, N., Fragkou, E., Perez, J.L.,
Middleton, D.R., 2006. Prediction of ozone levels in London using the
MM5CMAQ modelling system. Environmental Modelling & Software
21 (4), 566e576.
Seinfeld, J.H., Pandis, S.N. (Eds.), 1998. Atmospheric Chemistry and Physics:
From Air Pollution to Climate Change. Wiley-Interscience, New York,
1326 pp.
San Jose, R., Perez, J.L., Gonzalez, R.M., 2007. An operational real-time air
quality modelling system for industrial plants. Environmental Modelling
& Software 22 (3), 297e307.
Soriano, C., Jorba, O., Baldasano, J.M., 2002. One-way nesting versus two-
way nesting: does it really make a difference? In: Borrego, C., Suyches, G.
(Eds.), Air Pollution Modeling and its Applications XV. Kluwer Aca-
demic/Plenum Publishers, pp. 177e185.
USEPA, 1991. Guideline for Regulatory Application of the Urban Airshed
Model. US EPA Report No. EPA-450/4-91-013. Office of Air and Radia-
tion, Office of Air Quality Planning and Standards, Technical Support
Division, Research Triangle Park, North Carolina, US.
USEPA, October 2005. Guidance on the Use of Models and Other Analyses in
Attainment Demonstrations for the 8-hour Ozone NAAQS. US EPA Report
No. EPA-454/R-05-002. Office of Air Quality Planning and Standards,
Research Triangle Park, North Carolina, US, 128 pp.
Zhang, M., Pu, Y., Zhang, R., Han, Z., 2006. Simulation of sulfur transport and
transformation in East Asia with a comprehensive chemical transport
model. Environmental Modelling & Software 21 (6), 812e820.
Zunckel, M., Koosailee, A., Yarwood, G., Maure, G., Venjonoka, J., van
Tienhoven, A.M., Otter, L., 2006. Modelled surface ozone over southern
Africa during the Cross Border Air Pollution Impact Assessment Project.
Environmental Modelling & Software 21 (7), 911e924.
1306 P. Jimenez et al. / Environmental Modelling & Software 22 (2007) 1294e1306
Top Related
Copyright © 2022 FDOKUMEN

