


Bahasa
Halaman
Hukum

Industrial and
Engineering Chemistry
Volume 37 • Number 10
OCTOBER, 1945
R E PR IN T ED ITIO N
A D V ERTISIN G O M ITTED

EDITOR: WALTER J. MURPHY
Assistant to Editor: N . A . PARKINSON
Managing Editor: F. J . V A N A N TW ERPEN
Associate Editor: J A M E S M . C R O W E
Midwest Editor: Ro b e r t F . G o u l d
Industrial Editor: H A R R Y W . STENERSON
Manuscript Editor: H E LE N K . N E W T O N
Make-up Editor: BERTHA REYNOLDS
Manuscript Assistant: STELLA A N D E R S O N
Contributing Editors
C h a r l e s O w e n Br o w n
Ra l p h H . M u n c h
H a r o l d R. M u r d o c k
W alter v o n Pe c h m a n n
Advisory BoardW . L BADGER
H . E BARNARD
W . H . D O W
G A S T O N DUBOIS
G U S T A V U S J . ESSELEN
PER 1C FRO LICH
C F. KETTERING
O . L M A Y
C S. M INER
H . R. M U RDO CK
C . F. PRUTTON
A . S. R IC H A R D SO N
W . A . S C H M ID T
R. N . SHREVE
L V . STECK
C M . A . STINE
E. C S U L L IV A N
E. R. W EIDLEIN
J. M . WEISS
The Am erican Chemical S ocie ty assumes no re
spons ib ility fo r the statements and op in ions ad
vanced by contributors to Its pub lica tions.
C o py rig h t 1945 by Am erican Chemical Society
3 2 ,2 00 copies o f this Issue printed
Fuel savings « * n id e in th* plant of Texas Gulf Sulphur Company (s»a photograph above) by passing Incoming water through economizers which extract h u t from the watte flue gases.
ISSUED OCTOBER 16, 1945 • VOL. 37, NO. 10 • CONSECUTIVE NO. 19
DEPARTMENTSE d ito ria ls ........................................................................................................................... 911H eadlines...........................................................................................................................1027I. & E. C. Reports .......................................................................................................... *5A s We See It . . . . .................................................................................................. *87Equipment and Design. Charles O wen B ro w n ...................................................... *99Instrumentation. Ralph H. Munch .......................................................................... *105Waste Utilization. Harold R. M u rd o c k .................................................................... *111Plant Management. Walter von Pechmann.............................................................. *117Last-Minute Flashes.......................................................................................................... *164
TECHNICAL ARTICLES Application of Automatic Controllers to Heat Exchangers......................................
J. L. More, F. J. Q uail, and J. W. Bain 912Corrosion of Lead by Oxidizing Agents and Laurie Acid in Hydrocarbon Solvents
C. F. Prutton, David Turnbull, and D. R. Frey 917 Alkylation of Isoparaffins by Olefins in Presence of Hydrogen Fluoride . . . .
Carl B. Linn and Aristid V. Grosse 924 Vapor-Liquid Equilibria for Natural Gas-Crude Oil Mixtures. C. H . Roland . . 930TNT Wastes from Shell-Loading P lan ts ........................................................................
C. C. Rucnhoft, M . LeBosquet, Jr., and William G. Meckler 937Carboxymethylcellulose. Uses and A p p lic a tio n s ...................................................
C. B. Hollabaugh, Leland H. Burt, and Anna Peterson Walsh 943 Physical Testing of Glue Compositions. . . . . W. C. Griffin and E. G. Almy 948Tall O il Esters as Plasticizers for GR-S. W . I. Harber and C. S’ Y o ra n ................... 953Two-Component Equilibrium Curves for Multicomponent Fractionation.................
Frank J. Jenny and Michael J. Cicalese 956Cellulose Compounds in Thermoplastic L a m in a te s ..................................
C. W. Eurenius, R. H. Hecht, William Koch, and H. C. Malpass 959Aconitic Acid from Citric Acid by Catalytic Dehydration ..................................
Robert R. Umbdenstock and Paul F. Bruins 963 Estérification of Butanol and Acetic A cid. C. E. Leyes and D. F. Othmer . . . 968Viscosity of Carbonated Aluminate Solutions. J. M . Hall and S. J. Green . . 977Peanut Protein Hydrates. R. S. Burnett, E. D. Parker, and E. J. Roberts . . . . 980Catalytic Cracking of Pure Hydrocarbons. B. S. Greensfelder and H. H. Voge . 983Redwood Products as Inhibitors of Oxidation in Petroleum Hydrocarbons. . . .
H. F. Lewis, M . A . Buchanan, D. Fronmuller, and E. F. Kurth 988Nomographs for Enthalpies of Pure Hydrocarbons and Their M ix tu res .................
Edward G. Scheibel and Frank J. Jenny 990Production of Tyrothricin in Cultures of Bacillus b r e v i s ..........................................
J. C. Lewis, Keene P. Dimick, and I. C. Feustel 996Factors Affecting Boiling in a Liquid. Reinhold F. Larson . ..................................1004Occurrence of Metastable States of Liquid and Vapor. Reinhold F. Larson . . 1010 Specific Gravity of Aluminum Sulfate Solutions. J. W. Silva and J. E. Chenevey 1016 Vapor Pressure of Water Adsorbed on Dehydrated Eggs. Benjamin Makower . 1018Solvent Extraction of Cottonseed and Peanut O i l s ...................................................
E. F. Pollard, H. L. E. V ix, and E. A . Gastrock 1022
* Indicates page number In (he advertising section.
Published by the American Chemical Society at Easton, Pa. E dito ria l H eadquarters: 1155 16th S treet, N . W ., Washington 6 , D. C ./ telephone, Republic 5301, cab le , Jiechem (W ashington). N e w Y ork Editoria l Branch, 6 0 East 42nd Street, N e w Y ork 17, N . Y .; te lephone, M urray H il l 2 -4662. Chicago Editoria l Branch, 3 10 South M ichigan A venue, Chicago 4 , 111., te lephone, Wabash 7376. Business O ffic e : Am erican Chemical Society, 1155 16th Street, N . W .. Washington 6 , D. C. Advertis ing O ffice : 332 W est 42nd Street, N e w Y ork 18, N . V ., telephone, Bryant 9 -4430 .
Entered as second-class matter at the Post O ffice at Easton, Pa., under the A c t o f M arch 3, 1879, as 2 4 times a year— Industrial Edition monthly on the 1st, A na ly tica l Edition monthly on the 15th. Acceptance fo r mailing at special rate o f postage p ro v ided fo r in Section 1103, A c t o f O c to b e r 3 ,1 9 1 7 , authorized Ju ly 1 3 ,1 9 1 8 .
Remittances and orders fo r subscriptions and fo r single copies, notices o f changes o f address and n e w professional connections, and claims fo r missing numbers should be sent to th e Am erican Chemical Society, 1155 16th S treet, N . w . , Washington 6 ,
D. C . Changes o f address fo r the industrial Edition must be received on o r before the 18th o f the preceding month and fo r the A na lytica l Edition not la ter than the 30th o f the preceding month. Claims fo r missing numbers w i l l not be a llo w ed (1 ) i f received more than 6 0 days from date o f issue (o w in g to the hazards o f wartime delivery, no claims can be honored from subscribers outside o f N o rth Am erica), (2 ) i f loss was due to failure o f notice o f change o f address to be received before the dates specified in the preceding sentence, o r (3 ) if the reason fo r claim is "missing from files".
Annual subscriptions— Industrial Edition and A na ly tica l Edition sold on ly as a un it, members $ 3 .0 0 , nonmembers $ 4 .0 0 . Postage to countries not in the Pan-American U nion $ 2 .2 5 , Canadian postage $0.75. Single copies— current Issues, Industrial Edition $ 0 .7 5 , A na ly tica l Edition $ 0 .5 0 , back numbers, Industrial Edition $ 0 .8 0 , A na lytica l Edition prices on request, special rates to members.
The American Chemical Society also publishes Chemical and Engineering News, Chemical Abstracts, and Journa l of the American Chemical Society. Rates on request.
INDUSTRIAL and ENGINEERING CHEMISTRY
REPORTSON THE CHEMICAL WOILP TODAY
m iu u d x M jy
A tom I te m s . N o sooner h a d th e a to m b om b explosion becom e new s th a n p h o n es b eg an to r in g in th e office of L ie u te n a n t C olonel C. C onsodine, C orps of E n g in eers in W ash in g to n . F o r five d a y s a n d n ig h ts th e C olonel and h is sta ff co n tin u o u sly rem a in ed on d u ty answ ering questio n s , c learing sto ries , a n d a rran g in g in te rv iew s a b o u t th e e v e n t. S leeping on th e floor to answ er in q u iries com ing in a t a n y h o u r does n o t im p ro v e on e’s d isp o sitio n , b u t som e of th e in c id e n ts p ro v id ed lau g h s w hich he lp ed p u t th e d e v e lo p m en t in a d iffe ren t lig h t. P h o n e calls averaged fou r h u n d re d an d fifty a d ay , a n d tw o e x tra phones, in a d d itio n to th e m an y a lre ad y in th e office, h a d to be in sta lled . T he U nited S ta tes reacted as only she could.
F irs t a rad io s ta tio n requested th e W ar D ep a rtm en t to rep ea t th e explosion so th a t th e sound m igh t be picked up by stra teg ica lly placed m icrophones. A le tte r was received from an ex-sailor who w anted to be d ropped w ith an a tom ic bom b and radio equ ipm ent in order to give a p lay-by-p lay description of w h a t happened.
A nother ta sk of C onsodine’s was clearing credits. A fer
tilizer com pany which had p u t m ateria l on th e law n of one h osp ital of th e p la n t in Tennessee w anted to tell th e public of its im p o rtan t p a r t in m aking th e a tom bom b. A nother fertilizer com pany w anted clearance on an advertisem ent which proclaim ed th a t, of th e thousand-odd ind u stria l companies in u pper New Y ork s ta te which assisted in m aking the bom b, th ey alone h ad noth ing to do w ith it. A le tte r of cong ra tu la tio n arrived which, in add ition , pointed o u t tw o fu rth er goals to be reached b y th e a tom bom b group— overcom ing g rav ity so th a t a irp lanes could n o t fall, and m aking com m ercial th e cold ligh t of th e firefly.
T h e new spapers reported on th e farm er who w anted to purchase som e atom bom bs to discourage insects from b o th ering his crops, b u t th ey m issed th e prospector who claim ed to have discovered a lode of valuable high-grade ore 25 feet below th e surface of some rock. W ould th e W ar D ep artm en t please oblige b y dropping a bom b to strip off the overburden?
D u rin g th e recen t hurricane th e m ayor of a F lorida c ity w anted a bom b dropped in th e m iddle of th e sto rm to tu rn i t
aw ay from his m etropolis. W hile on th e sub ject of w eather, there was th e m other who h ad heard th a t th e clim ate would be affected b y all these a tom s; would C onsodine’s office
please tell her w hether i t would becom e colder, in o rder to give her a chance to m ake su itab le clothing for h e r children?
W hile we were in terview ing th e Colonel, a S en a to r called to ask how he could o b ta in perm ission for a co n stitu en t to v isit th e site of th e bom b explosion in N ew M exico; th e cons titu e n t, a doctor, w anted to cam p th e re w ith his wife and
children for a tw o-w eek vacation .C oncessionaires began b eating th e to m -tom . C ould th ey
o b ta in th e concession to th e a tom ic bom b c ra te r in New M exico so th a t jew elery m ig h t be m ade of th e s tone which fused in to green, h a rd pellets w hen th e bom b exploded? T hey even h ad a nam e for i t— “atom ic jad e ” .
O vernight th e office of C olonel C onsodine changed from a secrecy organization, b e n t on keeping a tom s o u t of public inform ation channels, in to a pu b lic ity office, h and ling th e
biggest sto ry ever encountered and try in g to keep speculation, en thusiasm , and “ guesstim ations” w ith in reason. One of th e officers of th e D ep a rtm en t was in Sw itzerland w hen th e bom b was dropped. N o t being able to read th e language b u t seeing unm istakab le headlines ab o u t th e ev en t, he could only guess th a t th e w eapon h ad been used. W ith o u t th e deta ils he dared n o t question na tives for fear i t was n o t w h a t he th o u g h t and his in te rest m igh t provide an unw elcom e leak.
A new shoulder insignia has been designed for those who worked on th e p ro ject. In side th e to p h a lf of th e shield,
which has a b lue background, is a n A rm y service s ta r A round th e s ta r is th e loop of a question m ark , th e ta il cross
ing th e blue field in th e form of a zigzag of ligh tn ing which trav e ls to th e b o tto m of th e p a tc h w here i t strikes a round golf ball (presum ably an a tom ) an d breaks i t in to th ree p a rts . T his has becom e a collector’s item , and a t th e tim e we were in th e office, a le tte r cam e from a “ fo u r-sta r general” , aged eleven, and adop ted son of th e R ainbow D ivision; he, w ith his “ d ad d y ” was running a race w ith th e U .S.O . hostess in his tow n as to who would have th e p a tc h first. W ould G eneral G roves please oblige, etc.?
T hen, too, th ere was th e person who closed his le tte r w ith “Y ours for th e conquest of space” ; as you can guess, i t h ad to do w ith rocketing to th e m oon. C ould h e g e t th e first p erm it to use a tom ic pow er for th is purpose? C onsodine answ ered th is question easily b y referring th e w rite r to th e In te rs ta te Com m erce Com m ission. (Continued on page 8)
/J n in U *f**ta U u e . n to tU ltb f cUtf&U fa * cU em iiU , cU em iaal e*ufineefui, an d
in the. ch em ical pH oduciny and. oU am ioal co*U um i*uf induAbumA.
« S & & & *•*«•**• " ¿a" asa * -4- 4«.Today Today
Lactic Acid Secret. T h e use of lac tic acid in norm al tim es for th e m an u fa c tu re of such essen tia ls as lea th er, tex tiles, foods, a n d liquors does n o t exp lain th e large in crease in lac tic p ro d u c tio n w hich to o k place d u rin g th e w ar. T h e c u rta in on th is m y ste ry has now been p a rtia lly lifted b y m ilita ry au th o ritie s , an d we find t h a t lac tic p e rfo rm ed one of th e w ar’s sm all b u t im p o rta n t jobs. I t was used in a fire-quenching so lu tion to p re v en t explosion and
d e a th in ta n k in te rio rs.M an y trag ed ies h ad ta k e n place inside of ta n k s when
enem y shells p ierced th e a rm o r a n d se t fire to am m u n itio n supplies. A n u m b er of rem edies h ad been tr ie d unsuccessfu lly u n til som eone th o u g h t of th e h igh su rface a c tiv ity a n d w e ttin g p ro p e rtie s of a so lu tion of a lac tic acid com po und . I n a c tu a l p rac tice , th e so lu tion , A m m udam p, was jack e ted a ro u n d th e ta n k ’s m agazine, sides, an d b o tto m , as well as in th e spaces be tw een th e shell racks. A n in v ad ing shell re leased th e fire-quenching m edium , an d even if th e am m u n itio n was se t ablaze, th e resu ltin g fire could be qu ick ly b ro u g h t u n d e r contro l.
In th is m an n er a p ro d u c t n o rm ally used in th e p re p a ra tio n of sa u e rk ra u t, p ickles, a n d essences m ade one of ch em istry ’s v a lu ab le co n trib u tio n s to w arfare . T h e first sh ipm ent of th is fire-eater was m ade on O ctober 30,1944, three m onths a fte r th e m anufacturers h ad been asked by Army O rdnance to w ork w ith th e G overnm ent on th e problem .
Swords and Plowshares. T he sm oke generators which so effectively concealed U . S. troop m ovem ents m ay find a good postw ar m ark e t. T he S tandard Oil C om pany of New Jersey is conducting experim ents on th e use of th is generator in the citrus area. A t p resent sm oke pots are n o t efficient in pre ven ting frost losses, b u t th e smoke generator can create a dense b lanket of sm oke which m ight m ore fully p ro tec t the trees. T his m achine m ight also be used to disperse insecticides as a fine m ist over large areas of orchards.
Absorbable Sponge. In I . & E . C . R e p o rts fo r M ay , 1945 (page 5), we spoke of ab so rb ab le cellulose. A no ther physio log ically ab so rb ab le p ro d u c t h a s now m ade its ap pearan ce , w ith th e he lp of th e U p jo h n C o m p an y . I t was rep o rte d b y Jo h n T . C orrell, H azel R . P ren tice , and E . C . W ise on th e p ro g ram of th e D iv ision of M edicinal C h em istry of th e A m e r ic a n C h e m ic a l S o c ie t y ’s 1945 M ee tin g -in -P rin t. T h e new p ro d u c t, G elfoam , is a sponge of p a r tia lly d e n a tu re d p ro te in m ate ria l. A lth o u g h i t was developed specifically as a m ed ium for th ro m b in , th e b lo o d -clo ttin g enzym e, i t w ill p ro b a b ly h a v e g enera l a p p lica tio n in su rg e ry w here a sponge th a t can be le ft in th e body will be useful.
T he effectiveness of th rom bin was lim ited by th e fact th a t i t was applied as a fluid. A sponge th a t could be soaked in throm bin , squeezed out, and placed on th e hem orrhage to absorb blood and hold th e clot would facilita te its use. Sponges of fibrin, starch , and gela tin (Continued on page 10)
were tried , b u t the gelatin sponge appeared to be th e m ost sa tisfactory in regard to b o th physical properties and absorp tion. T he gelatin sponge is prepared by a ir-drying a foam m ade from a specially prepared gelatin solution, and is light, tough, nonelastic, and porous. A fter th e sponge has dried, i t is packaged and sterilized by d ry h e a t since autoclaving resu lts in a com plete loss of desired properties. I t is n o t readily w et by w ater u n til i t is kneaded to b reak th e a ir cells, whereupon i t will im bibe up to fifty tim es its w eight and can be used repeated ly . I t is n o t soluble in w ater, b u t a 1% solu tion of U .S .P . X I I pepsin will digest a 100-mg. sponge in vitro in ab o u t 30 m inutes a t 37° C. Extensive clinical investigations on labora to ry anim als have dem onstra ted th a t i t is absorbed in th e body and th a t i t disappears, -with no antigenic m anifestations, in 30 to 90 days.
Plastics by the Mile. T h e w orld w as a sto u n d ed w hen th e la te T h o m as A. E dison succeeded in send ing four M orse te leg rap h ic tran sm iss io n s over one line w ith o u t in te rfe r ence. T o d ay , th a n k s to co n tin u ed scientific d ev elo p m en t of co m m unica tions eq u ip m en t, i t is possib le to use a single line fo r as m an y as 1440 tw o-w ay co n v ersatio n s. T h e coaxial cable is responsib le an d its success is a sc rib ed to i ts h igh in su la tio n p ro p ertie s . T h e in su la tin g resin is p o ly e th y len e , a s tra ig h t-c h a in th e rm o p las tic po ly m er of liqu id e th y len e . I t s low e lectrical losses an d chem ical an d p h y sical p ro p e rtie s a re id ea l fo r th is pu rpose .
As w ith m an y o th e r recen t d iscoveries, p o ly e th y len e d e m o n stra ted its v a lue on a large scale in m ilita ry eq u ip m en t. A lth o u g h m an u fa c tu re d in B rita in on a m odest scale, i t is sa id th a t th e I . G . F a rb e n in d u s tr ie o b ta in e d th e p lastic for use in u n d ersea cables. W hen th e w ar b eg an in Sep tem ber, 1939, th e B ritish exp an d ed p o ly e th y len e p ro d u c tio n for in su la tio n in ra d a r as well as in cables. In th is co u n try o u tp u t of th e resin w as u n d e rta k e n b y tw o lead ing chem ical m an u fac tu re rs fo r such m ilita ry ap p lica tions as rad ar and shipboard com m unications.
P ro d u c tiv e c ap a c ity c rea te d d u rin g th e w ar for p o ly e th y len e is now av ailab le fo r m an y uses besides coaxial cables, a lth o u g h th a t field ap p ea rs to be th e m o st p ro m ising. C ables of th is so rt a re necessary for link ing to g e th e r telev ision s ta tio n s , an d th e fu tu re m ay w itness a w ide use of p o ly e th y len e for th is a p p lica tio n alone. As in su la tio n for u ltra h ig h frequencies i t will p lay an im p o r ta n t p a r t in link ing to g e th e r a n a tio n w id e te lev is io n n e tw o rk . As sh u n t losses a re b u t one tw e lfth of th o se experienced w ith h a rd ru b b e r, th e te lephone, also, is ex p ec ted to m ake ex ten sive use of th is m ate ria l.
Our Error. P lu to n iu m changes to U-235 th ro u g h em is
sion of an a lpha particle . L as t m on th we b k m ed th is tran s
form ation on th e neu tron in our rep o rt “A tom ic Age” . You
will be glad to learn th a t th e neu tro n does n o t have to w orry
ab o u t degrading p lu tonium and can devote all of its energies to sp litting atom s. (Continued on page 12)
I. & E. C.Report on the .
Chemical World ¿' ca'* ° " wc4 Today
I. & E. C. Reports on the
Chemical World Today
G o m m e te e
a t t d
O tu lu & b u f
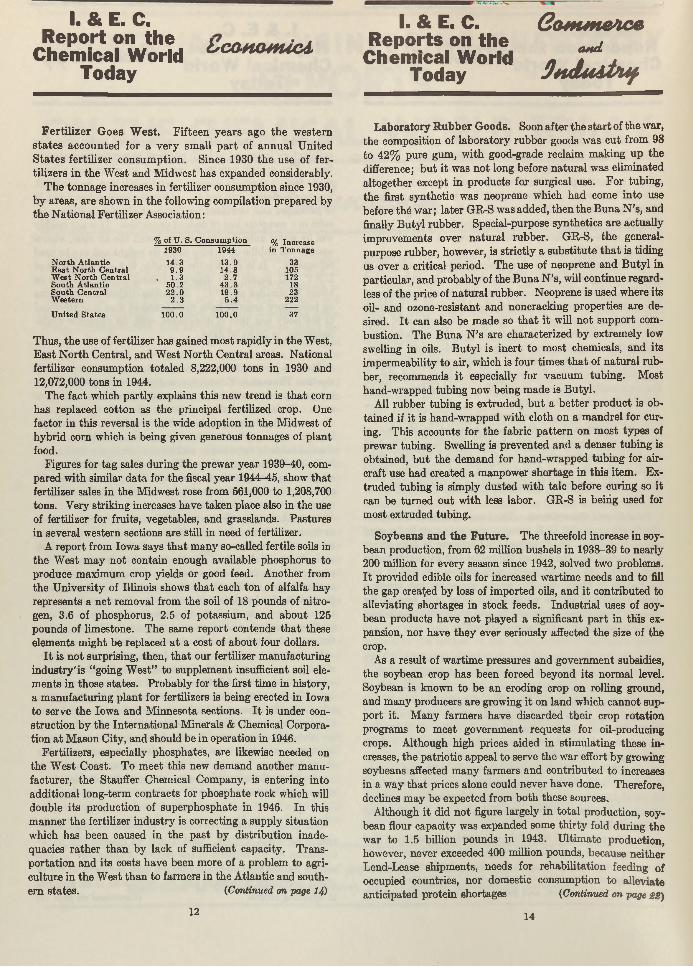
Fertilizer Goes West. F ifte e n y e a rs ago th e w estern
s ta te s a cc o u n ted fo r a v e ry sm all p a r t of a n n u a l U n ited S ta te s fe rtiliz e r co n su m p tio n . Since 1930 th e use of fe rtilize rs in th e W est an d M idw est has expanded considerably.
T h e tonnage increases in fertilizer consum ption since 1930, b y areas, a re show n in th e following com pilation prepared by th e N a tio n a l F ertilizer A ssociation:
% of U. S. Consum ption % Increase1930 1944 in Tonnage
N orth A tlantic 14.3 13.9 33E a s t N orth Central 9 .9 14.8 105W est N orth Cen tra l . 1 .3 2 .7 172South A tlantic 50.2 4 3 .3 18South Cen tra l 22 .0 19.9 23W estern 2 .3 5 .4 222
U nited S tates 100.0 100.0 37
T hus, th e use of fertilizer has gained m ost rap id ly in th e W est, E a s t N o rth C en tra l, and W est N o rth C en tra l areas. N ational
fertilizer consum ption to ta led 8,222,000 tons in 1930 and 12,072,000 tons in 1944.
T h e fac t which p a rtly explains th is new tren d is th a t corn has replaced co tto n as th e principal fertilized crop. One factor in th is reversal is th e wide adoption in th e M idw est of h y b rid corn which is being given generous tonnages of p lan t
food.F igures for tag sales du ring th e p rew ar year 1939-40, com
pared w ith sim ilar d a ta for th e fiscal y ear 1944-45, show th a t fertilizer sales in th e M idw est rose from 561,000 to 1,208,700 tons. V ery strik ing increases have tak en place also in th e use of fertilizer for fru its , vegetables, and grasslands. Pastu res in several w estern sections are still in need of fertilizer.
A rep o rt from Iow a says th a t m an y so-called fertile soils in th e W est m ay n o t con ta in enough available phosphorus to produce m axim um crop yields or good feed. A nother from th e U n iversity of Illinois shows th a t each to n of alfalfa hay represen ts a n e t rem oval from th e soil of 18 pounds of n itro gen, 3.6 of phosphorus, 2.5 of potassium , and ab o u t 125 pounds of lim estone. T h e sam e rep o rt contends th a t these elem ents m ight be replaced a t a cost of ab o u t four dollars.
I t is n o t surprising, th en , th a t our fertilizer m anufacturing in d u s try 'is “ going W est” to supplem ent insufficient soil elem en ts in those s ta te s . P robab ly for th e first tim e in h istory , a m an u factu rin g p la n t for fertilizers is being erected in Iow a to serve th e Iow a and M inneso ta sections. I t is under cons tru c tio n b y th e In te rn a tio n a l M inerals & Chem ical C orporatio n a t M ason C ity , and should be in operation in 1946.
Fertilizers, especially phosphates, a re likewise needed on th e W est C oast. T o m ee t th is new dem and another m an u factu rer, th e S tauffer C hem ical C om pany, is entering in to ad d itio n al long-term co n tracts for phosphate rock which will
double its p roduction of superphosphate in 1946. In th is m an n er th e fertilizer in d u stry is correcting a supply situation
which has been caused in th e p a s t b y d istrib u tio n inadequacies ra th e r th a n b y lack of sufficient capacity . T ran s p o rta tio n and its costs have been m ore of a problem to agricu ltu re in th e W est th a n to farm ers in th e A tlan tic and sou th ern s ta te s . (Continued on page 14)
12
Laboratory Rubber Goods. Soon a fte r th e s ta r t of th e w ar,th e com position of lab o ra to ry ru b b er goods w as c u t from 98 to 42% pure gum , w ith good-grade reclaim m aking u p th e
difference; b u t i t was n o t long before n a tu ra l w as elim inated a ltoge ther except in p roducts fox surgical use. F o r tub ing ,
th e first syn the tic w as neoprene w hich h ad come in to use before th e w ar; la te r G R -S w as added , th en th e B u n a N ’s, and finally B u ty l rubber. Special-purpose syn the tics a re actua lly
im provem ents over n a tu ra l rubber. G R -S , th e general- purpose rubber, how ever, is s tr ic tly a su b s titu te th a t is tid ing us over a critical period. T h e use of neoprene an d B u ty l in p articu lar, and p robab ly of th e B u n a N ’s, will con tinue regard less of th e price of n a tu ra l ru b b er. N eoprene is used w here its
oil- and ozone-resistant an d noncrack ing p roperties a re desired. I t can also be m ade so th a t i t will n o t su p p o rt combustion . T h e B una N ’s a re characterized b y ex trem ely low swelling in oils. B u ty l is in e rt to m ost chem icals, and its im perm eability to a ir, which is four tim es th a t of n a tu ra l rub ber, recom m ends i t especially for vacuum tub ing . M ost hand-w rapped tu b in g now being m ade is B u ty l.
All rubber tu b in g is ex truded , b u t a b e tte r p ro d u c t is ob
tained if i t is hand-w rapped w ith c lo th on a m andre l for curing. T his accounts fo r th e fabric p a tte rn on m o st ty p es of prew ar tub ing . Swelling is p rev en ted a n d a denser tu b in g is obtained, b u t th e dem and for hand-w rapped tu b in g for a irc raft use h ad created a m anpow er shortage in th is item . E xtru d ed tu b in g is sim ply d u sted w ith ta lc before curing so i t can be tu rn ed o u t w ith less labor. G R -S is being used for
m ost ex truded tub ing .
Soybeans and the Future. T he threefold increase in soybean production , from 62 m illion bushels in 1938-39 to nearly 200 m illion for every season since 1942, solved tw o problem s.
I t provided edible oils for increased w artim e needs an d to fill th e gap created b y loss of im ported oils, and i t con trib u ted to alleviating shortages in stock feeds. In d u str ia l uses of soybean products have n o t played a significant p a r t in th is expansion, nor have th ey ever seriously affected th e size of the crop.
As a resu lt of w artim e pressures an d governm ent subsidies, th e soybean crop has been forced beyond its norm al level. Soybean is know n to be a n eroding crop on rolling ground, and m any producers a re growing i t on lan d w hich canno t sup p o rt it. M an y farm ers have d iscarded th e ir crop ro ta tio n program s to m eet governm ent requests for oil-producing crops. A lthough h igh prices a ided in stim u la tin g these increases, th e p a trio tic appeal to serve th e w ar effort b y growing soybeans affected m an y farm ers an d con trib u ted to increases in a w ay th a t prices alone could never have done. Therefore, declines m ay b e expected from b o th these sources.
A lthough i t did n o t figure largely in to ta l p roduction , soybean flour capacity was expanded some th ir ty fold du ring th e w ar to 1.5 billion pounds in 1943. U ltim ate p roduction , however, never exceeded 400 m illion pounds, because n e ith e r L end-Lease sh ipm ents, needs for reh ab ilita tio n feeding of occupied countries, no r dom estic consum ption to a llev iate an tic ip a ted p ro te in shortages (Continued on page 22)
14
I. & E. C. Commence Report on the
Chemical World Today
assum ed expected proportions. Postw ar volum e will probably be som ew hat lower th an the inflated production.
Industrially , soy is no t a “wonder bean” , no m atte r how useful th is term m ay be in prom oting its products. I t is prim arily a source of food products. A m ounting to a meager •3% of to ta l prew ar o u tp u t, th e industria l uses of soybean products are no t im portan t in the over-all p icture. P a in t uses of soybean oil have declined because of greater dem ands for i t as an edible oil. Soybean synthetic rubber was an in teresting w ar-born developm ent, b u t i t had no special ad van tages to w arran t th e use of an edible oil for th is purpose Soybean plastics are on th e decline. T hey have water- sensitive characteristics and o ther shortcom ings which cannot be offset b y price advantages in certain applications. By now, plastics have gone beyond th e soybean pro tein stage.
New industria l prospects for soybean products include isolated proteins for paperm aking and other industrial uses and fractionated oils on which in teresting w ork is now being done. Soybeans, however, will probably never figure prom in en tly as an industrial raw m aterial, sim ply because the farm er gets too m uch for his crop for i t to compete against wood, coal, and petroleum . Soybean products are n o t b y products. Oil and m eal will have to be codeveloped because the ind u stry is n o t in a position to operate on a by-product basis. T he postw ar fu tu re of soybean products, therefore, will continue to be in edible products.
I ta lia n R e n a issan c e . V ita liza tio n of th e I ta l ia n chem ical in d u s try is one of th e m ost im p o r ta n t p rob lem s facing th e A llied M ilita ry G o v ern m en t. O ver 40% of th e in d u str ia l p la n ts of I ta ly h a d been dam aged , m o stly b y bom bing, b u t m an y also b y G erm an sab o tag e . L ack of coal has been th e m ost serious raw m ate ria l sh o rtag e , a n d only w ith g re a t d ifficulty h av e m ost of th e p la n ts been m ade o per
able.One of the first to be reopened was a chlorine p lan t, for
reasons of health . T he hem p in d u stry has been brough t to some degree of usefulness, m ostly due to th e financial stability given the m ark e t by th e m ilitary officials.
T h e allied com m ission h as s ta r te d six cem en t p la n ts cap ab le to g e th e r of tu rn in g o u t 10,000 to n s p er m o n th . S u p erp h o sp h a te p la n ts w ere b a d ly dam aged , owing to th e fact t h a t th e cooling sheds w ere fav o rite m ilita ry sto rag e u n its an d , consequently , fav o rite ta rg e ts for p lanes. T o d ay th is industry , v ita l to agriculture, has been rehab ilita ted to the po in t where i t is tu rn ing ou t ab o u t 200,000 tons per year. M any of th e furnaces h ad been destroyed b y th e Germ ans and could n o t be used un til p lan ts m aking a certain refractory
cem ent h ad been repaired and were producing.M ercu ry m ines w ere large ly u n d am ag ed , an d a sto re of
8000 flasks of m ercu ry , h id d en from th e G erm ans, were u ncovered . C opper su lfa te for insecticides is being m ade again a t a ra te of 3000 to n s p e r m o n th ; sa lvaged b ra ss is th e raw m ate ria l.
M ak in g n itro g en o u s fe rtilizer d id n o t y ield to an easy so lu tion . T h e G erm ans h a d decam ped w ith all th e p la tin u m c a ta ly s t from th e C ro to n e p la n t.
Q4k L
O tu b tiito f
22

O ctober, 1945 I N D U S T R I A L A N D E N G I N E E R I N G C H E M I S T R Y m
Controlled Exchange. The application of controllers to chemical p lan t equipm ent is never easy, since the m any factors affecting operation and response yield only to complex analysis or to trial and error. D uring the past few years, however, practical applications have been investigated w ith a view to applying complex theoretical analysis to the problems posed. A m ajor stum bling block has been difficulty in the application of controls to heat exchangers. More, Quail, and Bain have, in th is issue, described some of their pioneering work in this field. See “Application of Autom atic Controllers to H eat Exchangers” .
O ut of Hiding. Censorable articles which are finding their way into the lives of the Editors are being welcomed with open arm s because these contributions can now be p u t in print instead of being hidden in .the safe. One article recently out of the censored sta tus is th a t of Linn and Grosse entitled “Alkylation of Isoparafims by Olefins in Presence of Hydrogen Fluoride” . This process is im portant in the manufacture of aviation gasoline, and we are pleased to make the knowledge available. As information becomes further declassified, more on th is subject will be spread before you.
Explosive Watte. Despite the m odem techniques for eliminating all residual T N T from liquids em anating from shell-loading plants, i t was found th a t 100 parts per million of T N T was not uncommon in the discharged waters. Since this was a nuisance of considerable m agnitude for the stream s into which the waste was dumped, research was institu ted w ith the hope of finding an adequate answer. Ruchhoft, LeBosquet, and Meckler, of the U nited States Public H ealth Service, found th a t soil and activated carbon absorption bore most promise as a tem porary war measure. Now, w ith the advent of peace, i t m ay seem th a t such an article is of little immediate value. However the chemical plants of the nation are going to be faced w ith analogous disposal problems, and the results presented here will remain im portant long after the plants, for which the studies were made, are razed.
Bearing Up W ell. Corrosion of bearings by chemical mechanisms is a t present undergoing interpretive and exhaustive research. P ru tton , Turnbull, and Frey, specifically studying the corrosion of lead by peroxides, have added to our knowledge of the basic corrosive reactions in lubrication systems. One of the im portant considerations in the evaluation of the corrosivity of an oil, according to the authors, is the therm al stability of the oxidizing agent.
Another Sell in Cellulose. Carboxymethylcellulose, made by reacting monochloroacetic acid on alkali cellulose, is now introduced commercially and has begun its career of usefulness to the chemical industry. Hollabaugh and B urt of the Hercules Powder Company, anticipating a need for information on this compound, have compiled a complete sum m ary of its history, properties, and possible applications. Apparently research team s in m any industries will spend much tim e on th is substance, for th e list of applications is lengthy.
Cracking Olefins. Greensfelder and Voge report again on the cracking of hydrocarbons. This tune it is the olefins, and the work was done w ith a silica-zirconia-alumina catalyst. Results are reported and analyzed.
Bacillus brevis. Chemical Manufacturer. T he efficient growth of Bre’r brevis is becoming a first-class problem in chemical economics and m anufacturing. Brevis is the chemical cow which gives the milk containing tyrothricin. Lewis, Dimick, and Feustel are wondering whether it cannot be done b e tte r in shallow- layer growth on a culture of juice made from asparagus b u tts—a waste product of food canning. According to th is report, yields am ount to as much as 2 grams per liter, which, they say, is greater than any reported so far.
Boil and Bubble. Liquids, like humans, boil a t different degrees and for different reasons. Larsonr in “Factors Affecting Boiling in a Liquid” , investigates a phase of un it operations th a t has been somewhat neglected, and arrives a t conclusions th a t will be helpful to the designers of heat exchangers. W orrying the facts of nucleate and film boiling, he bu ilt an apparatus for testing ebul- lators or bubble makers and found th a t m etals of different composition seemingly produce different ebullition tem peratures. One of his conclusions is th a t ebullition does depend upon an aid whose property determines the am ount of superheat tolerated. Following the paper the same author investigates and discusses thermodynamically the reasons for bubble formation.
Design Data. Noting the increasing popularity of continuous solvent-extraction m ethods for vegetable oils, Pollard, Vix, and Gastrock, of the Southern Regional Research Laboratory, are publishing d a ta on boiling points and densities of cottonseed and peanut oils mixed w ith hexane. This is im portan t to the designers of vacuum evaporators and strippers used in the extraction processes.
Plastic Intermediate. Aconitic a6id m ay be used in acrylic resins as a modifier; its esters enter a variety of chemical m aterials, and its decomposition product, itaconic acid, can, through esters, be used as a plastic. W ith all these uses, aconitic acid should be popular w ith the chemical fra tern ity ; Um bdenstock and Bruins report on the catalytic dehydration of citric acid to make this intermediate.
W ith the Departments. Von Pechm ann senses the confusion which has existed in m any plants in the swing to peacetime production and suggests the planning of sound policies. M urdock examines the three areas available for the disposal of industrial wastes. Brown sees th a t m any new wartim e products will be im portant to industry in the postwar. M unch writes the chapter and verse on the application of stra in gages to pressure measure» ment.
RIAL a n d EN G IN EER IN G CHEMISTRYBLI SHED BY THE A M E R I C A N C H E M I C A L SO CI ET Y
W A L T E R J. M U R P H Y , E D I T O R
A Scientific Credo
FOR years the editors of T h i s J o u r n a l have urged the chemists of the Nation to show an active and
intelligent participation in the affairs of the world. Decrying the ivory tower of science, and begging the chemist to assume responsibilities in our everyday world, we have pointed out many, many times that the course of civilization could be better directed if the approach of science were among those many arts and diverse forces that today mold our public opinion.
Now we notice that the anthropologists, too, are beginning to become interested in this aspect of living and Dr. Gene Weltfish, of the Department of Anthropology at Columbia University, in the September Scientific Monthly has written a stirring and moving plea for cooperation by scientists in our everyday affairs. Miss Weltfish states that some years ago, while attending commencement exercises, she heard the medical graduates recite the Hippocratic oath. She was impressed by its solemnity, but even more striking was to her the fact that the only group of graduates that was asked to express any public responsibility were the physicians.
She abhors the disinterestedness of the scientists, stating that it amounts to a lack of evaluation of purposes, and that as a consequence the scientist can readily become the creator of havoc and destruction. For our reconstructed world she thinks that graduates should take cognizance of their responsibilities and the social consequences resulting from their use of scientific techniques. In order to make them conscious of their obligations she proposes a simple yet moving oath which she titles “The Scientist’s Oath”, and which we pass on to you because of its importance in the thought currents that are stirring us today.
“I pledge that I will use my knowledge for the good of humanity and against the destructive forces of the world and the ruthless intent of men; and that I will work together with my fellow scientists of whatever nation, creed, or color, for these, our common ends.”
This is an important suggestion. Perhaps what is needed is some simple impressive ceremony which will bring to our scientists a deep understanding of their responsibilities and their great potentialities.
Mankind has had a narrow squeak in the war that has just ceased. Under the wrong sponsorship, science had become, in the totalitarian countries, something awful to behold. Without proper guidance from men of gen
erous outlook, science can become, in any part of the globe, a force of evil.
Winston Churchill expressed it early in the war when he said, in speaking of the yearning need for victory, “if we fail, then the whole world *** and all that we have known and cared for will sink into the abyss of a new dark age made more sinister, and perhaps more prolonged by the lights of a perverted science". Vision is the need, for without it the people will surely perish.
Revising N ational Defense
t > EPRESENTATIVE Arends of the State of Illinois has introduced a bill in the House of Representatives,
Resolution 4152, for the establishment of a “commission of national defense to study the technological revision of our national defense necessitated by atomic and other weapons”. To us, an appealing and admirable feature of the proposed act is that it makes provision for the commission to be staffed by “representatives of scientific and industrial research and other leading citizens who are conversant with the problems of the national defense”. This group will be advised by military representatives who will give the commission full access to the facts relating to technological revolution in warfare. The commission, in turn, will make interim quarterly reports to Congress so that an adequate national defense program may be formulated. A fund of a half-million dollars is also recommended to enable the study to be carried out properly.
This proposal constitutes a step in the right direction. Our Nation has had a long-unfilled need for the services of scientific men in the executive direction of national defense and other problems of government. At long last this may come about, provided the bill is passed; but only because science has, with a new weapon of unsurpassed magnitude, contrived to impress upon the minds of the legislators the necessity of expert and adequate advice in this field. We hope not only for the passage of the Arends bill but also that many more proposals such as this one, providing for the cooperation of science, are introduced into the Congress of the United States. Science with its varied talents for research and investigation into the basic facts and laws underlying our civilization has much to offer, and we sincerely hope that the time has come for the complete recognition of this fact—and for its application, in a practical way, to this age and to its problems.
911
COURTESY. THE LUMMUS COMPANY
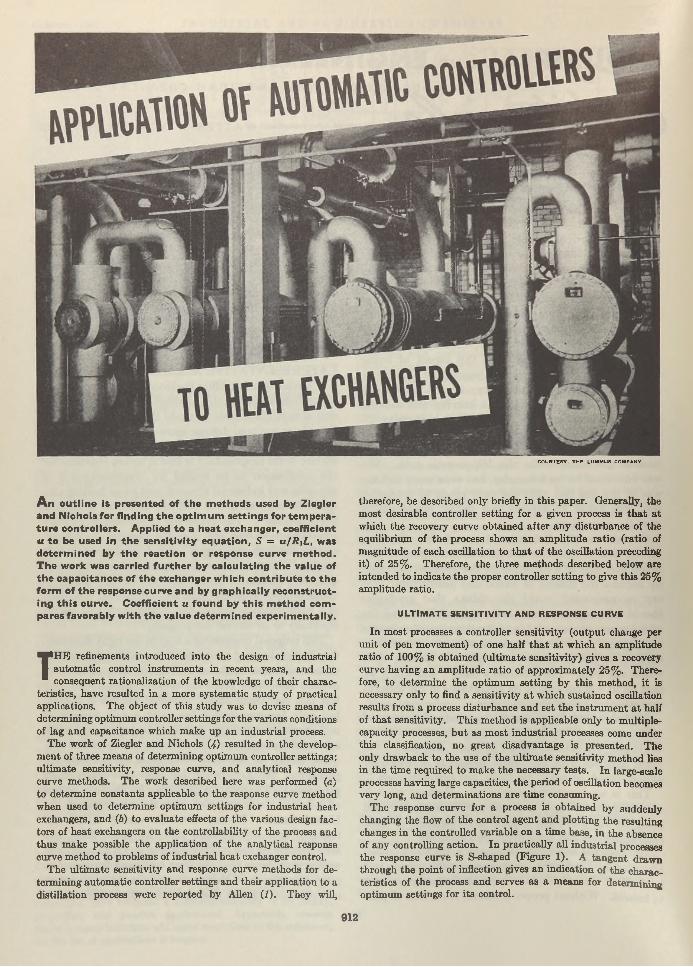
A n o u tlin e is presented of th e m ethods used by Ziegler and Nichols for finding th e o p tim u m se ttings for tem pera ture controllers. Applied t o a heat exchanger, coefficient u t o be used in th e sensitiv ity equation , 5 = u /R iL , was determ ined by th e reaction or response curve m ethod . T he work was carried further by calculating th e value of th e capacitances of th e exchanger w hich contribute to th e form of th e response curve and by graphically reconstructing th is curve. Coefficient u found by th is m ethod co m pares favorably w ith th e value determ ined experim entally.
TH E refinements introduced into the design of industrial autom atic control instrum ents in recent years, and the consequent rationalization of the knowledge of their charac
teristics, have resulted in a more system atic study of practical applications. The object of this study was to devise means of determ ining optim um controller settings for the various conditions of lag and capacitance which m ake up an industrial process.
The work of Ziegler and Nichols (4) resulted in the developm ent of three m eans of determining optimum controller se ttings: u ltim ate sensitivity, response curve, and analytical response curve m ethods. The work described here was performed (a) to determ ine constants applicable to the response curve m ethod when used to determ ine optim um settings for industrial heat exchangers, and (6) to evaluate effects of the various design factors of heat exchangers on the controllability of the process and thus m ake possible the application of the analytical response curve m ethod to problems of industrial heat exchanger control.
The u ltim ate sensitivity and response curve m ethods for determ ining autom atic controller settings and their application to a distillation process were reported by Allen (1). They will,
therefore, be described only briefly in th is paper. Generally, the m ost desirable controller setting for a given process is th a t a t which the recovery curve obtained afte r any disturbance of the equilibrium of the process shows an am plitude ra tio (ratio of m agnitude of each oscillation to th a t of the oscillation preceding it) of 25% . Therefore, the three m ethods described below are intended to indicate the proper controller setting to give th is 25% am plitude ratio.
ULTIMATE SENSITIVITY AND RESPONSE CURVE
In m ost processes a controller sensitivity (ou tpu t change per unit of pen m ovem ent) of one half th a t a t which an am plitude ratio of 100% is obtained (ultim ate sensitivity) gives a recovery curve having an am plitude ra tio of approxim ately 25% . Therefore, to determ ine the optim um setting by th is m ethod, i t is necessary only to find a sensitivity a t which sustained oscillation results from a process disturbance and se t the instrum ent a t half of th a t sensitivity. This m ethod is applicable only to m ultiple- capacity processes, b u t as m ost industrial processes come under this classification, no great disadvantage is presented. The only drawback to the use of the u ltim ate sensitivity m ethod lies in the tim e required to m ake th e necessary tests. In large-scale processes having large capacities, th e period of oscillation becomes very long, and determ inations are tim e consuming.
The response curve for a process is obtained by suddenly changing the flow of the control agent and plotting th e resulting changes in the controlled variable on a tim e base, in the absence of any controlling action. In practically all industrial processes the response curve is S-shaped (Figure 1). A tangen t drawn through the point of inflection gives an indication of the characteristics of the process and serves as a m eans for determ ining optim um settings for its control.
912
J. u. MORE
| STE. ANNE PAPER COMPANY, BEAUPRE, QUEBEC, CANADA
F. J. QUAIL. AND J. W. BAH
u K iv e fts iry o f to r o n to , Can a d a
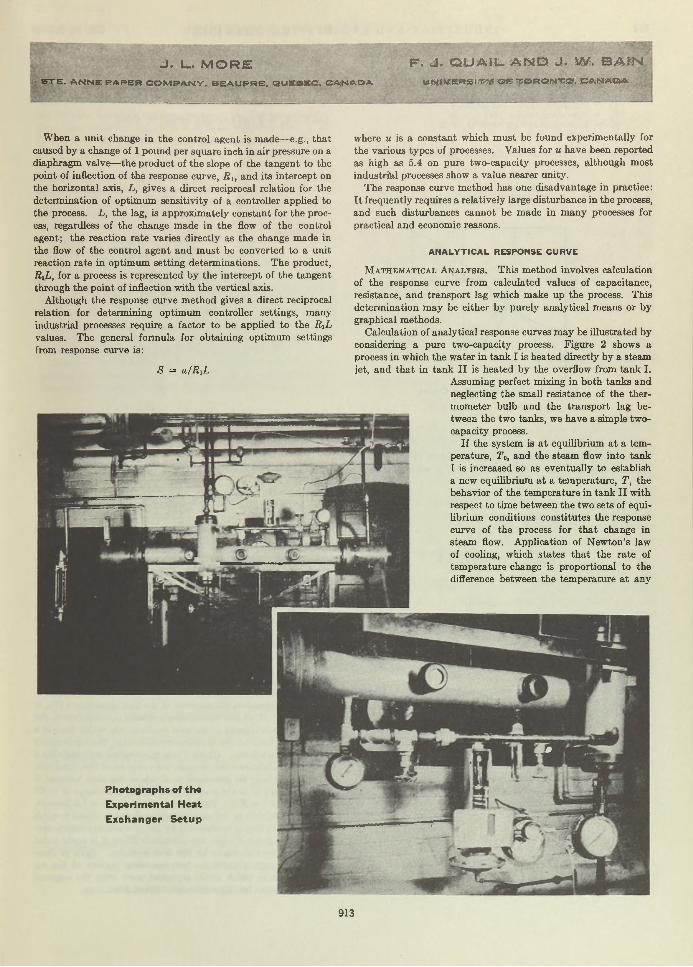
Photographs of th e
Experimental Heat
E xchanger S e tu p
W hen a unit change in the control agent is made—e.g., that caused by a change of 1 pound per square inch in air pressure on a diaphragm valve—the product of the slope of the tangent to the point of inflection of the response curve, Ri, and its intercept on the horizontal axis, L, gives a direct reciprocal relation for the determ ination of optimum sensitivity of a controller applied to the process. L, the lag, is approxim ately constant for the process, regardless of the change made in the flow of the control agent; the reaction ra te varies directly as the change made in the flow of the control agent and m ust be converted to a unit reaction ra te in optimum setting determinations. The product, RiL, for a process is represented by the intercept of the tangent through the point of inflection w ith the vertical axis.
Although the response curve m ethod gives a direct reciprocal relation for determining optim um controller settings, many industrial processes require a factor to be applied to the RJL, values. The general formula for obtaining optimum settings from response curve is:
£ = u /R iL
where it is a constant which m ust be found experimentally for the various types of processes. Values for u have been reported as high as 5.4 on pure two-capacity processes, although most industrial processes show a value nearer unity.
The response curve m ethod has one disadvantage in practice: I t frequently requires a relatively large disturbance in the process, and such disturbances cannot be made in m any processes for practical and economic reasons.
ANALYTICAL RESPONSE CURVE
M a t h e m a t i c a l A n a l y s i s . This m ethod involves calculation of the response curve from calculated values of capacitance, resistance, and transport lag which make up the process. This determ ination m ay be either by purely analytical means or by graphical methods.
Calculation of analytical response curves m ay be illustrated by considering a pure two-capacity process. Figure 2 shows a process in which the w ater in tank I is heated directly by a steam jet, and th a t in tank I I is heated by the overflow from tank I.
Assuming perfect mixing in both tanks and neglecting the small resistance of the thermometer bulb and the transport lag between the two tanks, we have a simple two- capacity process.
If the system is a t equilibrium a t a tem perature, T 0, and the steam flow into tank I is increased so as eventually to establish a new equilibrium a t a tem perature, T, the behavior of the tem perature in tank I I with respect to time between the two sets of equilibrium conditions constitutes the response curve of the process for th a t change in steam flow. Application of Newton’s law of cooling, which states th a t the ra te of tem perature change is proportional to the difference between the tem perature a t any
913

914 I N D U S T R I A L Ä N D E N G I N E E R I N G C H E M I S T R Y Vol. 37, No. 10
in stan t and the u ltim ate tem perature, m akes i t possible to calculate th is curve.
L et t = tem perature a t any in stan t in tan k I T = ultim ate tem perature To = initial or datum tem perature Kx = tim e constant for tank I, min.K 3 = tim e constant for tan k II , min.9 = time
Then for tan k I, N ew ton’s law m ay be expressed as follows:
dt/dd = (T — t) /K i
~ y _ ~ = do IK ,
Integrating,
- l n (T - i) = e/Ky + C,
when 0 = 0, 6 / K x = 0, and t = To. Therefore Ci = —l n ( r - To) and - I n (T - t) = e /K i - ln(5P - To), which becomes
ln (T - To) (T - t)
T - t
e / K x
e~0/K>T - To
or t = T - (T - To)e-e/Kt
L et T — To = a; then
t = T — ae~e/ (1)
which is the equation for the tem perature of tan k I a t any instant. Considering tan k II ,
det - t '
K 2
where t = tem perature of tan k I t ' = tem perature of tan k II K t = constant for tan k II
bu t
K idt' = tde - t'de
t = T — ae->/Ki (from Equation 1)
.'. K 2dt' = Td6 — ae~o/Kidß — t ’dO
Kzdt' — (T — t')de — ae-0/Ku16 (2)
where V and 0 are variable. L et t ' — T = x, and e~e Kl = y. Then,
dt' = dx
and
e~e/Ki d$ = —Kidy
de =
t h e n K 2dx = xK i — + aKidy ( f r o m E q u a t i o n 2 )V
Kj r ydx — xdy —aydy = 0
L et K i/K i — b and m ultiply by nyn_1; then,
bnyndx — nxyn~ ldy — nayndy = 0
L et bn = — 1,
n = — 1/b
and
Integrating ,
—d(ynx) -n + l
»«+i = 0
b u t
xyn H-----~r"T vn+1 = CiW T 1
~ na■ x = C , y - - ^ T 1 y
x = t ' - T
y = e—
1 _ Kiw ------ 6 “ iC2
" ~ n = f i
n K i
(3)
71 + 1 -Kj ~ -^1
Substitu ting in E quation 3,
t' - T = C2 „ g i a „ - e“ «/*»ii.2 “ A 1
= c , (« -* /* ) + ' ^ T K l 6-6/Xl
and f ' = r + C2e - « / ^ +K\d
K z - K ie~B/Ki (4)
Ct can be evaluated from the fact th a t, when 6 = 0, t ' — To. R and L can be calculated from E quation 4, b u t the m ethod is cumbersome. The addition of a th ird capacity fu rther complicates the final equation, and its usefulness disappears.
G r a p h i c a l A n a l y s i s . The substitu tion of values in complex equations can be avoided by graphically constructing response curves of processes whose tim e constants are known. Such curves (Figure 3) are close enough approxim ations to th e true response curves for optim um setting determ inations and are m uch more convenient th an the purely m athem atical analysis. Figure 3 was drawn for a three-capacity process w ith tim e constan ts of 4, 4, and 8 m inutes.
Curve I represents the response of the first capacitance (Ki = 8 m inutes). If, a t any tim e during a change in tem perature, the tem perature is allowed to rise a t a constant ra te ra ther th an a t a ra te proportional to the tem perature difference, the tem perature curve becomes linear. Curve I was constructed by imagining a series of constant-rate tem perature rises over small tim e intervals; i.e., A to B may be prolonged to C where the tim e between C and C' (where C ' is the average tim e during the change A to B ) is 8 m inutes ( = K i). Tim e increm ent A to B is 1.0 m inute. The next addition to the curve s ta rts a t B and is aim ed towards E. This addition is represented by BC, the average tim e is represented by point E ', and the tim e from E ' to E is again equal to K i, the tim e constant for the first capacity. Each of these short lines approxim ates the corresponding portion of th e exponential curve which would represent more tru ly the response of a capacitance having a tim e constant of 8 m inutes.

O ctober, 1945 I N D U S T R I A L A N D E N G I N E E R I N G C H E M I S T R Y 91S
Curve I I represents the response of the second capacitance (K t = 4 m inutes) and is similar to curve I except th a t each of the short stra igh t lines is directed toward th e point on curve I with an abscissa 4 m inutes removed from the mid-point of the line. This is because the potential tem perature of the second capacitance a t any instan t is the tem perature of the first capacitance a t th a t same instan t; e.g., F is 4 m inutes removed from A , FO is drawn toward point C', the mid-point between F and G being4 m inutes from C", etc. Once again each time increm ent is 1.0 m inute.
Curve I I I represents the response of the th ird capacitance {K% = 4 m inutes) and is similar to the other two, except th a t the lines are directed towards corresponding points on curve II . This represents the response curve which would be obtained from a process having the characteristics described; from it the value of R iL can be found in the m anner described for experimental response curves.
When transport lags are present, they are included by adding a horizontal portion to the curve along the line of Tq. The final curve is drawn only as far as the point of inflection, which is easily found by noting the changes in inclination of the straightedge used to construct it. In the application of this method, the time constants can be used in any order w ithout changing the final result, b u t i t is generally more convenient to plot the curves in the order of descending magnitude of tim e constant.
E ither of the modifications of the analytical response curve method for determining optimum settings can be used without experimental work, if constant u and the governing capacitances
Figure 2. Example of Sim ple Two-Capacity Process
F ig u re 3. G rap h ica l C o n s tru c tio n of a U n it R esponse C urve
of the particular type of process are known. The following work is concerned w ith the evaluation of these factors for tubular heat exchangers.
DESCRIPTION OF HEAT EXCHANGER
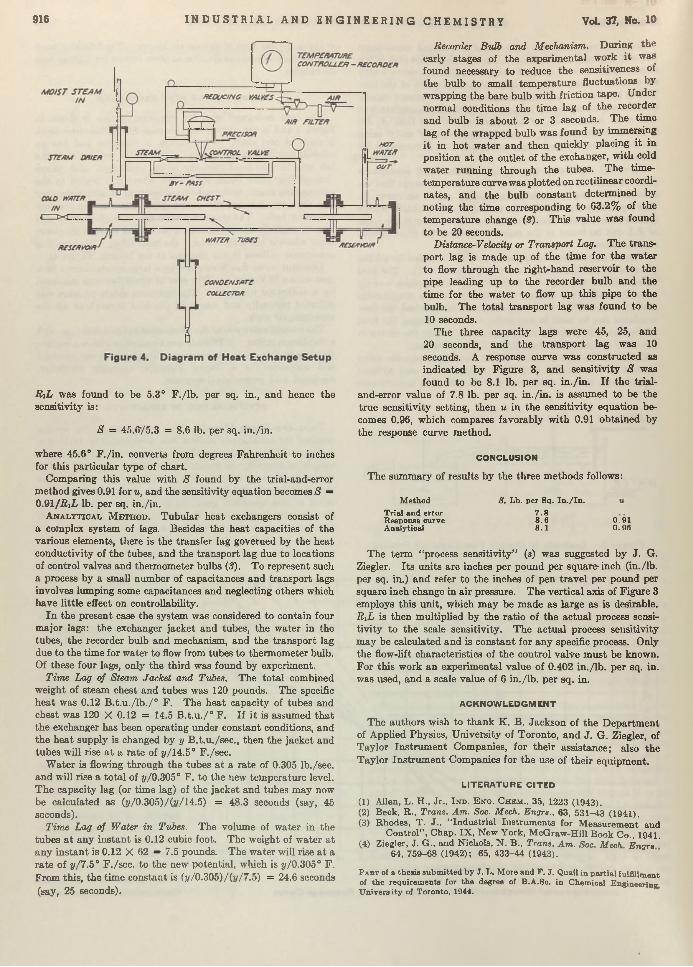
The heat exchanger used for this investigation is shown in Figure 4 and in the photographs on page 915. The outer chest is made of cast steel; i t is 5 inches in diam eter and has an over-all length of about 6 feet. Cold w ater enters from the left into the left-hand reservoir of the exchanger, and passes through four inner 1-inch steel tubes, where i t is heated by the surrounding steam, to the right-hand reservoir or mixing chamber and then out through the outlet pipe past the tem perature controller bulb. The steam is passed first through a dryer and then through the circuit containing the control valve to the steam chest where i t heats the w ater in the inner tubes. The resulting condensate collects in the chamber a t the bottom (Figure 4).
C onstant w ater flow is attained by a large constant-head tank (not shown in Figure 4). The ra te of w ater flow was measured by a calibrated rotam eter. The upstream steam pressure was adjusted manually and was held constant throughout all the experimental work.
The control valve was of the air-to-close beveled disk type with a diaphragm motor. A Precisor was attached to ensure adequate response to changes in a ir pressure. Tem perature was recorded and controlled by a Taylor Fulscope recording controller, equipped w ith proportional response.
DETERMINATION OF SENSITIVITY
T r i a l - a n d - E b b o r M e t h o d . The actual sensitivity setting required for satisfactory control was. determined by making a series of settings of the sensitivity dial; for each value of the sensitivity selected, the system was upset by causing a sudden change in the heat supply. To do this, the control point was changed abruptly and then readjusted to its former value. The result of this operation gave the familiar wavelike tracing of tem perature change about the control point. Sensitivity S , which gave a die-away curve having a 25% amplitude ratio, was found to be 7.8 lb. per sq. in ./in . This value was taken as the most desirable sensitivity setting for the process.
R e s p o n s e C u r v e M e t h o d .
Under conditions of constant outlet water tem perature, and with the controller acting as a tem perature recorder only and not as a controller, the air pressure to the diaphragm of the control valve was suddenly changed. This resulted in a corresponding alteration in the steam supply and, hence, a change in the tem perature of the outgoing water. To facilitate th e plotting of the tem perature response curve on rectilinear coordinates, the clock in the recorder was stopped, and the tem perature chart of the instrum ent rotated by hand every 5 seconds. This resulted in a stepwise tracing of tem p e r a tu r e vs. 5 - s e c o n d intervals.
A plot of the d a ta obtained in th is way gave the characteristic S-shaped curve.
916 I N D U S T R I A L A N D E N G I N E E R I N G C H E M I S T R Y VoL 37, N a 10
R iL was found to be 5.3° F ./lb . per sq. in., and hence the sensitivity is:
S = 45.6y5.3 = 8.6 lb. per sq. in ./in .
where 45.6° F ./in . converts from degrees Fahrenheit to inches for th is particular type of chart.
Comparing this value with S found by the trial-and-error m ethod gives 0.91 for u, and the sensitivity equation becomes S =0.91 /R iL lb. per sq. in ./in .
A n a l y t ic a l M e t h o d . T ubular heat exchangers consist of a complex system of lags. Besides the heat capacities of the various elements, there is the transfer lag governed by the heat conductivity of the tubes, and the transport lag due to locations of control valves and therm om eter bulbs (3). To represent such a process by a small num ber of capacitances and transport lags involves lumping some capacitances and neglecting others which have little effect on controllability.
In the present case the system was considered to contain four m ajor lags: the exchanger jacket and tubes, the w ater in the tubes, the recorder bulb and mechanism, and the transport lag due to the tim e for water to flow from tubes to therm om eter bulb. Of these four lags, only the th ird was found by experiment.
Time Lag of Steam Jacket and Tubes. The to ta l combined weight of steam chest and tubes was 120 pounds. The specific heat was 0.12 B .t.u ./lb ./° F. The heat capacity of tubes and chest was 120 X 0.12 = 14.5 B .t.u ./° F . If i t is assumed th a t the exchanger has been operating under constant conditions, and the heat supply is changed by y B .t.u ./sec., then the jacket and tubes will rise a t a ra te of y / 14.5° F./sec.
W ater is flowing through the tubes a t a rate of 0.305 lb./sec. and will rise a to ta l of y / 0.305° F. to the new tem perature level. T he capacity lag (or tim e lag) of the jacket and tubes m ay now be calculated as (2//0.305)/(i//14.5) = 48.3 seconds (say, 45 seconds).
Time Lag of Water in Tubes. The volume of w ater in the tubes a t any instan t is 0.12 cubic foot. The weight of w ater a t any in stan t is 0.12 X 62 = 7.5 pounds. The w ater will rise a t a ra te of y / 7.5° F ./sec. to the new potential, which is j//0.305° F. From this, the tim e constant is (j//0.305)/(i//7.5) = 24.6 seconds (say, 25 seconds).
Recorder Bulb and Mechanism. During the early stages of the experim ental work i t was found necessary to reduce the sensitiveness of the bulb to small tem perature fluctuations by wrapping the bare bulb w ith friction tape. Under normal conditions the tim e lag of the recorder and bulb is about 2 or 3 seconds. The tim e lag of the wrapped bulb was found by immersing i t in ho t w ater and then quickly placing i t in position a t the outlet of the exchanger, w ith cold w ater running through the tubes. The time- tem perature curve was plotted on rectilinear coordinates, and the bulb constant determ ined by noting the time corresponding to 63.2% of the tem perature change (2). This value was found to be 20 seconds.
Distance-Velocity or Transport Lag. The transp ort lag is m ade up of the tim e for the w ater to flow through the right-hand reservoir to the pipe leading up to the recorder bulb and the tim e for the w ater to flow up th is pipe to the bulb. The to ta l transport lag was found to be10 seconds.
The three capacity lags were 45, 25, and 20 seconds, and the transport lag was 10 seconds. A response curve was constructed as indicated by Figure 3, and sensitivity S was found to be 8.1 lb. per sq. in ./in . If the trial-
and-error value of 7.8 lb. per sq. in ./in . is assumed to be the true sensitivity setting, then u in the sensitivity equation becomes 0.96, which compares favorably w ith 0.91 obtained by the response curve method.
CONCLUSION
The sum m ary of results by the three m ethods follows:
M ethod
T ria l an d error Response curve Analytical
S, Lb. per Sq. I n . / I n .
7 .88.68 . 1
0 .9 10 .9 6
The term “process sensitivity” (s) was suggested by J. G. Ziegler. I ts units are inches per pound per square-inch (in./lb. per sq. in.) and refer to the inches of pen trave l per pound per square inch change in air pressure. The vertical axis of Figure 3 employs th is unit, which m ay be m ade as large as is desirable. R iL is then m ultiplied by the ra tio of the actual process sensitiv ity to the scale sensitivity. The actual process sensitivity m ay be calculated and is constant for any specific process. Only the flow-lift characteristics of the control valve m ust be known. For th is work an experim ental value of 0.402 in ./lb . per sq. in. was used, and a scale value of 6 in ./lb . per sq. in.
ACKNOWLEDGM ENT
The authors wish to th an k K. B. Jackson of the D epartm ent of Applied Physics, U niversity of Toronto, and J . G. Ziegler, of Taylor Instrum ent Companies, for their assistance; also the Taylor Instrum ent Companies for the use of their equipm ent.
LITERATURE CITED
(1) A llen , L . H . , J r . , I n d . E n g . C h e m ., 35, 1223 (1 943 ) .(2) B e c k , R . , Trans. A m . Soc. Mech. Engrs., 63, 5 3 1 - 4 3 (1 94 1 ) .
(3) Rhodes, T. J . , “ Industrial Instruments for Measurement andC o n t r o l ” , C h a p . I X , N e w Y o r k , M c G r a w - H i l l B o o k C o . , 1941.
(4) Z ieg le r, J . G . , a n d N ic h o ls , N . B ., Trans. A m . Soc. M ech Engrs6 4 , 7 5 9 - 6 8 (1 9 4 2 ); 6 5 ,4 3 3 - 4 4 (19 43 ) .
P a st of a thesis sub m it ted b y J . L. M ore and P . J . Quail in p a r t ia l fulfillment of th e requirem ents for th e degree of B.A.So. in Chem ical Engineering U n iv e rs i ty of Toronto, 1944.
Corrosion of Lead by Oxidizing Agents and Laurie Acid
in Hydrocarbon SolventsC. F. PRUTTON, DAVID TURNBULL,
AND D. R. FREYCase S choo l o f A p p lied Science, C leveland, O hio
R ates o f co rrosion o f p u re lead by rep re se n ta tiv e o rg an ic peroxides in h y d ro carb o n m ed ia c o n ta in in g o rg an ic acids a re co m p ared . O rg an ic oxid iz ing a g e n ts o th e r th a n peroxides o r oxygen m ay b e effective in cau s in g co rrosion o f lead in th e se m e d ia ; o x y n itro g en co m p o u n d s, q u in o n es , a n d d iace ty l a re a g e n ts o f th is ty p e . F o r hydroperox ides a n d oxygen i t is like ly t h a t lead hydrox ide o r lead oxide is in te rm e d ia te in th e co rrosion process. F o r o th e r types o f peroxides a n d nonp ero x id ic oxid iz ing a g e n ts th e evid ence in d ic a te s t h a t th e re is n o m e ta l oxide o r hydrox ide in te rm e d ia te in th e process. R eac tiv ity o f oxid iz ing ag en ts to w ard lead a re co m p ared a t a c o n s ta n t ac id c o n c e n tra tio n . To ev a lu a te th e effective co rrosiv ity o f a n o il, i t is necessary to co n sid er th e th e rm a l s ta b ili ty o f th e ox id izing a g e n t as w ell as i ts ch em ica l re ac tiv ity . E vidence is c ited to show t h a t o x y n itro g en co m p o u n d s , as w ell as peroxides a n d oxygen, m ay be a m o n g th e oxid iz ing a g e n ts p re se n t in o ils.
FOR some tim e it has been known (3, 7) th a t oxygen m ust be present before m etals will be attacked by pure fa tty acid. The importance of the presence of oxygen or of peroxides formed
from oxygen in the corrosion of bearing metals by acid lubricating oils was not emphasized until recently (2, 10). Denison postulated (2) th a t the corrosion of m etal bearings takes place in the following steps: (a) formation of peroxides by reaction ofoxygen with the oil, (b) reaction of peroxide with m etal to form a metal oxide, and (c) dissolution of m etal oxide in organic acid to form soluble soap. His results also indicated th a t after sufficient acidity had developed to dissolve the oxide coating initially formed, the corrosion ra te was principally determined by peroxide concentration.
Recent work (10) confirmed many of Denison’s conclusions, b u t in addition showed th a t, w ith acids present in the oil, dissolved molecular oxygen may form the m etal oxide in step 6 without the formation of any peroxide interm ediate. Thus step b m ust be modified to “reaction of peroxide and /or oxygen with m etal to form a m etal oxide” . I t was further found th a t the corrosion rate was independent of acid concentration and was determined only by oxygen or peroxide concentration above 0.02 to 0.03 N acid. There was some indication, however, th a t the corrosion rate was partially determined by acid concentration below 0.02 N acid.
I t seemed desirable to study the mechanism of the reaction more thoroughly to determine the dependence of corrosion rate upon the concentration of acid and oxidizing agent. M any different initial ratios of the acid and oxidizing agent were used. Since there were indications from previous work (10) th a t different peroxides exhibited very different corrosive reactivities, a study of the corrosive reactivity of various pure peroxides in lauric acid solutions was undertaken. I t occurred to thé authors th a t corrosion of m etals by acid in hydrocarbon media m ight
be promoted by oxidizing agents in the more general sense as well as by such specific oxidizing agents as oxygen and peroxides. Consequently the corrosive reactivity of various general oxidizing agents which m ight conceivably be present in oils, such as organic nitrogen compounds and quinones, was tested and compared. This paper reports the results of these investigations.
Experimental procedures were described in a previous paper(10). Wheeler’s method (11) for determination of peroxides was used in modified form in this work. W hen the reaction m ixture was perm itted to stand for a half hour and then heated to boiling prior to titration, it was possible to determine accurately all of the peroxides employed.
CO R R O SIO N BY P E R O X ID E S
If the corrosion ra te is determined by the concentration of oxidizing agent and is independent of acid concentration, the rate expression may be formulated as follows:
- d C „/dt = k A Cox (1)
where Cox — concentration of oxidizing agent a t tim e t A = test piece area k = reaction rate constant
Upon integration the rate expression becomes
k = ^ log« C°„/C„ (2)
where CJ, = Coz when t = 0
I t was often more convenient to express the ratio Cm/Co* in term s of the actual m etal weight loss. Then if Wo is the m etal weight loss after the reaction has gone to completion and W is the weight loss in time t, Equation 2 may be rewritten
k = (2.303/i A ) logift W a/(W o - W) (3)
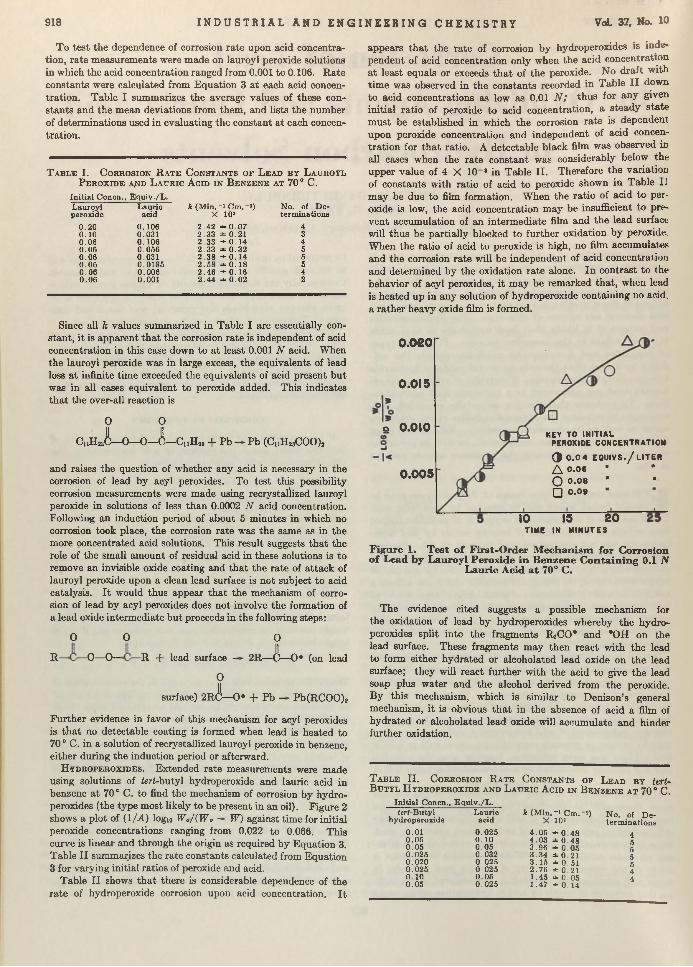
Thus if the corrosion ra te is proportional to the concentration of oxidizing agent, the values of k calculated from E quation 3 should be constant, and a straight line should be obtained when (1 /A ) logio Wo/(Wo — W) is plotted against t.
A c y l P e r o x i d e . To test thoroughly the dependence o f c o r
rosion ra te upon peroxide concentration, various concentrations of lauroyl peroxide were made up in benzene 0.1 N with respect to lauric acid. The rate of corrosion in these solutions of lead test pieces, whose to ta l area averaged about 21.5 sq. cm., was measured a t 70° C. One atmosphere of nitrogen was always m aintained above the test solution in order to prevent refluxing of the solvent. In itial concentrations of peroxide ranging from0.04 to 0.09 N were employed. Values of (lM )logio Wo/(Wo — W) calculated from the results are plotted against time in Figure1. W ithin experimental error the points from^the different initial concentrations fall on the same curve, which is linear in the early and middle stages of the reaction, and which passes through the origin as required by Equation 3.
917
918 I N D U S T R I A L A N D E N G I N E E R I N G C H E M I S T R Y Vol. 37, No. 10
To tes t the dependence of corrosion ra te upon acid concentration, ra te m easurements were m ade on lauroyl peroxide solutions in which the acid concentration ranged from 0.001 to 0.106. R ate constants were calculated from Equation 3 a t each acid concentration . Table I summarizes the average values of these constan ts and the m ean deviations from them , and lists the number of determ inations used in evaluating the constant a t each concentration.
T a b l e I. C o r r o s i o n R a t e C o n s t a n t s o p L e a d b y L a u r o y l P e r o x i d e ajsid L a u r i c A c i d i n B e n z e n e a t 70° C .
In itia l Concn., E q u iv ./L .Lauroyl Lauric k (M in .-1 C m .- *) No. of D eperoxide acid X 103 te rm inations
0 .20 0 .106 2 .42 ± 0 .0 7 40 .10 0.031 2 .3 3 ± 0.21 30.06 0 .106 2 .3 3 ± 0 .14 40.06 0 .056 2 .3 3 =*= 0 .32 50.06 0.031 2 .3 8 ± 0 .14 50.06 0.0185 2 .5 8 ± 0 .18 50 .06 0.006 2 .46 ± 0 .16 40 .06 0.001 2 .4 4 ± 0 .02 2
Since all k values summarized in Table I are essentially constan t, it is apparent th a t the corrosion ra te is independent of acid concentration in this case down to a t least 0.001 N acid. When the lauroyl peroxide was in large excess, the equivalents of lead loss a t infinite tim e exceeded the equivalents of acid present bu t was in all cases equivalent to peroxide added. This indicates th a t the over-all reaction is
O O
c „h J U - o - U . h . + Pb Pb (CiiH 23COO)2
appears th a t the rate of corrosion by hydroperoxides is independent of acid concentration only when the acid c o n c e n t r a t i o n
a t least equals or exceeds th a t of the peroxide. No d raft with tim e was observed in the constants recorded in Table I I down to acid concentrations as low as 0.01 N ; thus for any given initial ratio of peroxide to acid concentration, a steady sta te m ust be established in which the corrosion ra te is dependent upon peroxide concentration and independent of acid concentra tion for th a t ratio. A detectable black film was observed in all cases when the ra te constant was considerably below the upper value of 4 X 10“ 3 in Table II . Therefore the variation of constants with ratio of acid to peroxide shown in Table II m ay be due to film formation. W hen the ratio of acid to peroxide is low, the acid concentration m ay be insufficient to prevent accumulation of an interm ediate film and the lead surface will thus be partially blocked to further oxidation by peroxide. W hen the ratio of acid to peroxide is high, no film accumulal.es and the corrosion ra te will be independent of acid concentration and determined by the oxidation ra te alone. In contrast to the behavior of acyl peroxides, it m ay be remarked th a t, when lead is heated up in any solution of hydroperoxide containing no acid, a rather heavy oxide film is formed.
and raises the question of whether any acid is necessary in the corrosion of lead by acyl peroxides. To test this possibility corrosion measurements were made using recrystallized lauroyl peroxide in solutions of less than 0.0002 N acid concentration. Following an induction period of about 5 minutes in which no corrosion took place, the corrosion ra te was the same as in the more concentrated acid solutions. This result suggests th a t the role of the small amount of residual acid in these solutions is to remove an invisible oxide coating and th a t the rate of a ttack of lauroyl peroxide upon a clean lead surface is not subject to acid catalysis. I t would thus appear th a t the mechanism of corrosion of lead by acyl peroxides does not involve the formation of a lead oxide interm ediate bu t proceeds in the following steps:
O O O
R — —O—O— —R -{- lead surface — 2R—(Ü—0*
O
k !—o*
(on lead
surface) 2RC—O* + Pb — Pb(RCOO)2
Further evidence in favor of this mechanism for acyl peroxides is th a t no detectable coating is formed when lead is heated to 70 ° C . in a solution of recrystallized lauroyl peroxide in benzene, either during the induction period or afterward.
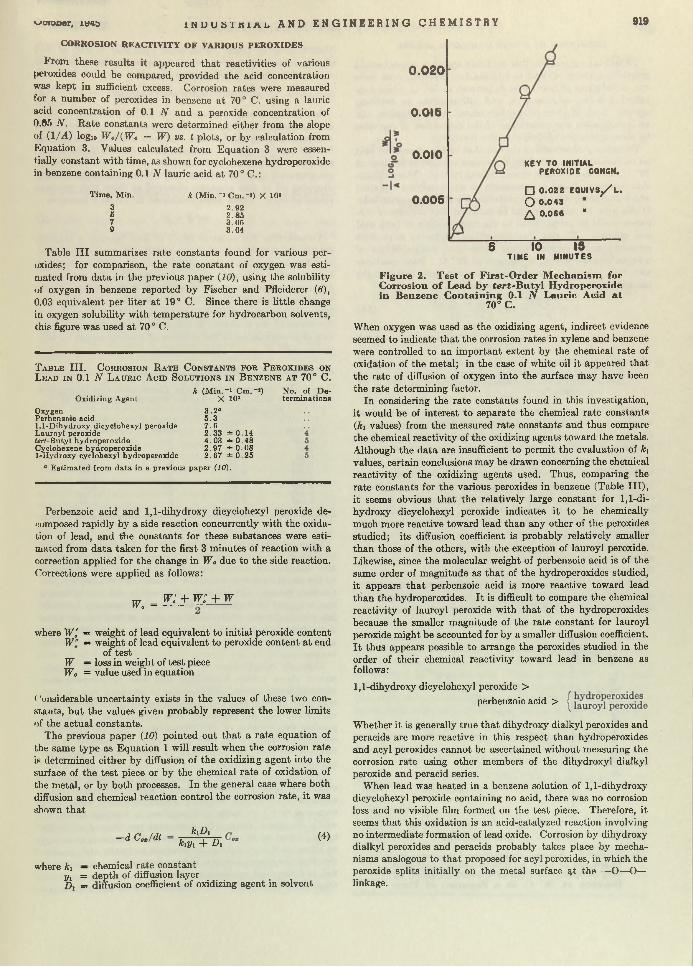
H y d r o p e r o x i d e s . Extended rate measurements were made using solutions of ieri-butyl hydroperoxide and lauric acid in benzene a t 70° C . to find the mechanism of corrosion by hydroperoxides (the type most likely to be present in an oil). Figure 2 shows a plot of (1/A ) logio W0/{Wo — W) against tim e for initial peroxide concentrations ranging from 0.022 to 0.066. This curve is linear and through the origin as required by Equation 3. Table I I summarizes the rate constants calculated from Equation3 for varying initial ratios of peroxide and acid.
Table I I shows th a t there is considerable dependence of the ra te of hydroperoxide corrosion upon acid concentration. I t
The evidence cited suggests a possible mechanism for the oxidation of lead by hydroperoxides whereby the hydroperoxides split into the fragments R 3CO* and *OH on the lead surface. These fragments m ay then react w ith the lead to form either hydrated or alcoholated lead oxide on the lead surface; they will react further w ith the acid to give the lead soap plus w ater and the alcohol derived from the peroxide. By this mechanism, which is sim ilar to Denison’s general mechanism, i t is obvious th a t in the absence of acid a film of hydrated or alcoholated lead oxide will accum ulate and hinder further oxidation.
T a b l e II. C o r r o s i o n R a t e C o n s t a n t s o f L e a d b y tert- B u t y l H y d r o p e r o x i d e a n d L a u r i c A c i d i n B e n z e n e a t 70° C .
In itia l Concn., E q u iv ./L .
No. of D ete rm ina tions
45 5 5 5 4 4
ieri-Butyl Lauric k (M in .- i C m .-2)hydroperoxide acid X 103
0.01 0 .025 4 .0 5 =fc 0 .480 .05 0 .10 4 .0 3 ± 0 . 4 80 .05 0 .05 3 .96 ± 0 .050 .025 0.032 3 .3 4 ± 0.210 .020 0 .025 3 .1 5 =«= 0.510.025 0 .025 2 .76 =*= 0.210 .10 0 .05 1.45 ± 0 .050 .05 0 .025 1.47 =*= 0 .14
0.020
0.015
o 0.010
0.005
KEY TO INITIAL PEROXIDE CONCENTRATION
3 0 .0 4 E0UIVS./L IT E R
A 0 .0 6 ‘ *O 0 .0 8 * *□ 0 .09
10 15 20TIME IN MINUTES
Figure 1. T est o f First-O rder M echan ism for Corrosion o f Lead by Lauroyl Peroxide in B enzen e C on ta in in g 0.1 N
Lauric Acid a t 70° C.
v->ciouer, ia^D l N U U S i n i A L A N D E N G I N E E R I N G C H E M I S T R Y 919
C O R R O S IO N R E A C T IV IT Y O F VARIO U S P E R O X ID E S
I1 rom these results it appeared th a t reactivities of various peroxides could be compared, provided the acid concentration was kept in sufficient excess. Corrosion rates were measured for a number of peroxides in benzene a t 70° C. using a lauric acid concentration of 0.1 N and a peroxide concentration of 0.05 N. R ate constants were determined either from the slope of (1 /A ) logio W 0/(W c — W) vs. t plots, or by calculation from Equation 3. Values calculated from Equation 3 were essentially constant with time, as shown for cyclohexene hydroperoxide in benzene containing O.liV lauric acid a t 70° C.:
Time, Min.
3579
k (M in .- i Cm."*) X 10*
2 .922.853 .063.04
Table I I I summarizes rate constants found for various peroxides; for comparison, the rate constant of oxygen was estimated from data in the previous paper (10), using the solubility of oxygen in benzene reported by Fischer and Pfleiderer (<?), 0.03 equivalent per liter a t 19° C. Since there is little change in oxygen solubility with tem perature for hydrocarbon solvents, this figure was used a t 700 C.
T a b l e I I I . C o r r o s i o n R a t e C o n s t a n t s f o r P e r o x i d e s o n L e a d i n 0.1 N L a u r i c A c i d S o l u t i o n s i n B e n z e n e a t 70° C .
No. of D eterminationsOxidizing Agent
OxygenPerbenzoic acid1,1-Dihydroxy dicyclohexyl peroxide Lauroyl peroxide feri-Butyl hydroperoxide Cyclohexene hydroperoxide 1-Hydroxy cyclohexyl hydroperoxide
k (M in .-1 C m .-2) X 103
3 .2°5 .3 7 .62.33 ± 0.144 .03 ± 0 .48 2 .97 =*=0.08 2.67 ± 0 . 2 5
° E stim ated from da ta in a previous paper (10).
Perbenzoic acid and 1,1-dihydroxy dicyclohexyl peroxide decomposed rapidly by a side reaction concurrently with the oxidation of lead, and $ie constants for these substances were estimated from d a ta taken for the first 3 minutes of reaction with a correction applied for the change in Wo due to the side reaction. Corrections were applied as follows:
W 0 =W„' + W l + W
where W,' = weight of lead equivalent to initial peroxide content W " = weight of lead equivalent to peroxide content a t end
of testW — loss in weight of test piece W„ = value used in equation
Considerable uncertainty exists in the values of these two constants, bu t the values given probably represent the lower limits of the actual constants.
The previous paper (10) pointed out th a t a rate equation of the same type as Equation 1 will result when the corrosion rate is determined either by diffusion of the oxidizing agent into the surface of the test piece or by the chemical ra te of oxidation of the m etal, or by both processes. In the general case where both diffusion and chemical reaction control the corrosion rate, it was shown th a t
—d Cox/dlkiDi
kiyi + Di(4)
where ki — chemical rate constant y l = depth of diffusion layerDi = diffusion coefficient of oxidizing agent in solvent
0.020
0.015
0 .0 1 0
0.005
KEY TO INITIALPEROXIDE C0NGN.
□ 0 .0 2 2 E 0 U I V S / l .
O 0.043 *& 0 .066 *
5 10TIME IN
15MINUTES
F ig u re 2. T es t o f F irs t-O rd e r M ech an ism for C orrosion o f Lead by te r t-B u ty l H ydroperoxide in B enzene C o n ta in in g 0.1 JV L au ric Acid a t
70° C.
When oxygen was used as the oxidizing agent, indirect evidence seemed to indicate th a t the corrosion rates in xylene and benzene were controlled to an im portant extent by the chemical rate of oxidation of the m etal; in the case of white oil it appeared th a t the rate of diffusion of oxygen into the surface may have been the rate determining factor.
In considering the rate constants found in this investigation, i t would be of interest to separate the chemical rate constants (hi values) from the measured rate constants and thus compare the chemical reactivity of the oxidizing agents toward the metals. Although the d a ta are insufficient to permit the evaluation of k t values, certain conclusions may be drawn concerning the chemical reactivity of the oxidizing agents used. Thus, comparing the rate constants for the various peroxides in benzene (Table III) , it seems obvious th a t the relatively large constant for 1,1-dihydroxy dicyclohexyl peroxide indicates it to be chemically much more reactive toward lead than any other of the peroxides studied; its diffusion coefficient is probably relatively smaller than those of the others, with the exception of lauroyl peroxide. Likewise, since the molecular weight of perbenzoic acid is of the same order of magnitude as th a t of the hydroperoxides studied, it appears th a t perbenzoic acid is more reactive toward lead than the hydroperoxides. I t is difficult to compare the chemical reactivity of lauroyl peroxide with th a t of the hydroperoxides because the smaller magnitude of the rate constant for lauroyl peroxide m ight be accounted for by a smaller diffusion coefficient. I t thus appears possible to arrange the peroxides studied in the order of their chemical reactivity toward lead in benzene as follows:
1,1-dihydroxy dicyclohexyl peroxide >
perbenzoic acid >
W hether it is generally true th a t dihydroxy dialkyl peroxides and peracids are more reactive in this respect than hydroperoxides and acyl peroxides cannot be ascertained w ithout measuring the corrosion rate using other members of the dihydroxyl dialkyl peroxide and peracid series.
When lead was heated in a benzene solution of 1,1-dihydroxy dicyclohexyl peroxide containing no acid, there was no corrosion loss and no visible film formed on the test piece. Therefore, it seems th a t this oxidation is an acid-catalyzed reaction involving no interm ediate formation of lead oxide. Corrosion by dihydroxy dialkyl peroxides and peracids probably takes place by mechanisms analogous to th a t proposed for acyl peroxides, in which the peroxide splits initially on the metal surface q,t the —O—O— linkage.
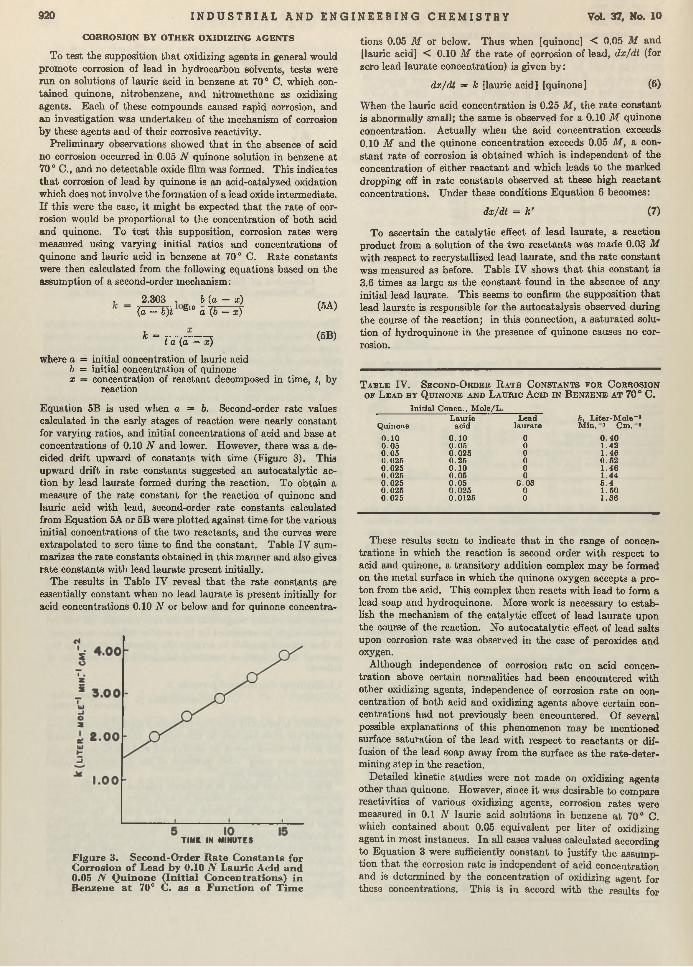
920 I N D U S T R I A L A N D E N G I N E E R I N G C H E M I S T R Y Vol. 37, No. 10
C O R R O S IO N R Y O T H E R O X ID IZ IN G A G E N T S
To test the supposition th a t oxidizing agents in general would prom ote corrosion of lead in hydrocarbon solvents, tests were run on solutions of lauric acid in benzene a t 700 C. which contained quinone, nitrobenzene, and nitrom ethane as oxidizing agents. Each of these compounds caused rapid corrosion, and an investigation was undertaken of the mechanism of corrosion by these agents and of their corrosive reactivity.
Prelim inary observations showed th a t in the absence of acid no corrosion occurred in 0.05 N quinone solution in benzene a t 7 0 ° C., and no detectable oxide film was formed. This indicates th a t corrosion of lead by quinone is an acid-catalyzed oxidation which does not involve th e formation of a lead oxide intermediate. If this were the case, it m ight be expected th a t the rate of corrosion would be proportional to the concentration of both acid and quinone. To test this supposition, corrosion rates were measured using varying initial ratios and concentrations of quinone and lauric acid in benzene a t 70° C. R ate constants were then calculated from the following equations based on the assumption of a second-order m echanism :
, 2.303 . b (a — x)( a - b)t gl° a ( J H À
k =t a (a — x)
(5A)
(5B)
where a = initial concentration of lauric acid b = initial concentration of quinone x — concentration of reactant decomposed in time, i, by
reaction
E quation 5B is used when a = b. Second-order rate values calculated in the early stages of reaction were nearly constant for varying ratios, and initial concentrations of acid and base a t concentrations of 0.10 N and lower. However, there was a decided drift upward of constants with tim e (Figure 3). This upward drift in rate constants suggested an autocatalytic action by lead laurate formed during the reaction. To obtain a measure of the rate constant for the reaction of quinone and lauric acid w ith lead, second-order ra te constants calculated from E quation 5A or 5B were plotted against time for the various initial concentrations of the two reactants, and the curves were extrapolated to zero time to find the constant. Table IV summarizes the ra te constants obtained in this manner and also gives ra te constants with lead laurate present initially.
The results in Table IV reveal th a t the rate constants are essentially constant when no lead laurate is present initially for acid concentrations 0.10 N or below and for quinone concentra-
TIME IN MINUTES
F ig u re 3. S eco n d -O rd er R a te C o n s ta n ts fo r C orrosion o f L ead by 0.10 N L au ric Acid an d 0.05 TV Q u in o n e ( In itia l C o n c e n tra tio n s) in B en zen e a t 70° C. as a F u n c tio n o f T im e
tions 0.05 M or below. Thus when [quinone] < 0.05 M and [lauric acid] < 0.10 M the ra te of corrosion of lead, dx/d t (for zero lead laurate concentration) is given by:
dx/dt = k [lauric acid] [quinone] (6)
When the lauric acid concentration is 0.25 M , the ra te constant is abnormally small; the same is observed for a 0.10 t f quinone concentration. Actually when the acid concentration exceeds 0.10 M and the quinone concentration exceeds 0.05 M , a constan t ra te of corrosion is obtained which is independent of the concentration of either reac tan t and which leads to the m arked dropping off in ra te constants observed a t these high reactan t concentrations. Under these conditions E quation 6 becomes:
dx/dt = k ' ( 7 )
To ascertain the catalytic effect of lead laurate, a reaction product from a solution of the two reactants was m ade 0.03 M with respect to recrystallized lead laurate, and the ra te constant was measured as before. Table IV shows th a t th is constant is3.6 times as large as the constant found in the absence of any initial lead laurate. This seems to confirm the supposition th a t lead laurate is responsible for the autocatalysis observed during the course of the reaction; in this connection, a satu rated solution of hydroquinone in the presence of quinone causes no corrosion.
T a b l e IV. S e c o n d -O r d e r R a t e C o n s t a n t s f o r C o r r o s i o n o p L e a d b y Q u i n o n e a n d L a u r i c A c id i n B e n z e n e a t 7 0 ° C.
In it ia l Concn., M ole/L .__________Lauric Lead k, L i te r-M o le“1
Quinone acid laura te M in. “1 C m .- l
0 .10 0 .10 0 0 .4 00.05 0 .05 0 1 .420 .05 0 .025 0 1 .460 .025 0 .25 0 0 .520 .025 0 .10 0 1.460 .025 0 .05 0 1.440 .025 0 .05 C.03 5 .40 .025 0.025 0 1 .500 .025 0.0125 0 1.36
These results seem to indicate th a t in the range of concentrations in which the reaction is second order w ith respect to acid and quinone, a transitory addition complex m ay be formed on the m etal surface in which the quinone oxygen accepts a proton from the acid. This complex then reacts w ith lead to form a lead soap and hydroquinone. More work is necessary to establish the mechanism of the catalytic effect of lead laurate upon the course of the reaction. No autocatalytic effect of lead salts upon corrosion ra te was observed in the case of peroxides and oxygen.
Although independence of corrosion ra te on acid concentration above certain normalities had been encountered w ith other oxidizing agents, independence of corrosion ra te on concentration of both acid and oxidizing agents above certain concentrations had not previously been encountered. Of several possible explanations of this phenomenon m ay be mentioned surface saturation of the lead w ith respect to reactants or diffusion of the lead soap away from the surface as the rate-deter- mining step in the reaction.
Detailed kinetic studies were no t m ade on oxidizing agents other than quinone. However, since i t was desirable to compare reactivities of various oxidizing agents, corrosion rates were measured in 0.1 N lauric acid solutions in benzene a t 70° C. which contained about 0.05 equivalent per liter of oxidizing agent in most instances. In all cases values calculated according to Equation 3 were sufficiently constant to justify the assumption th a t the corrosion rate is independent of acid concentration and is determined by the concentration of oxidizing agent for these concentrations. This is in accord with the results for
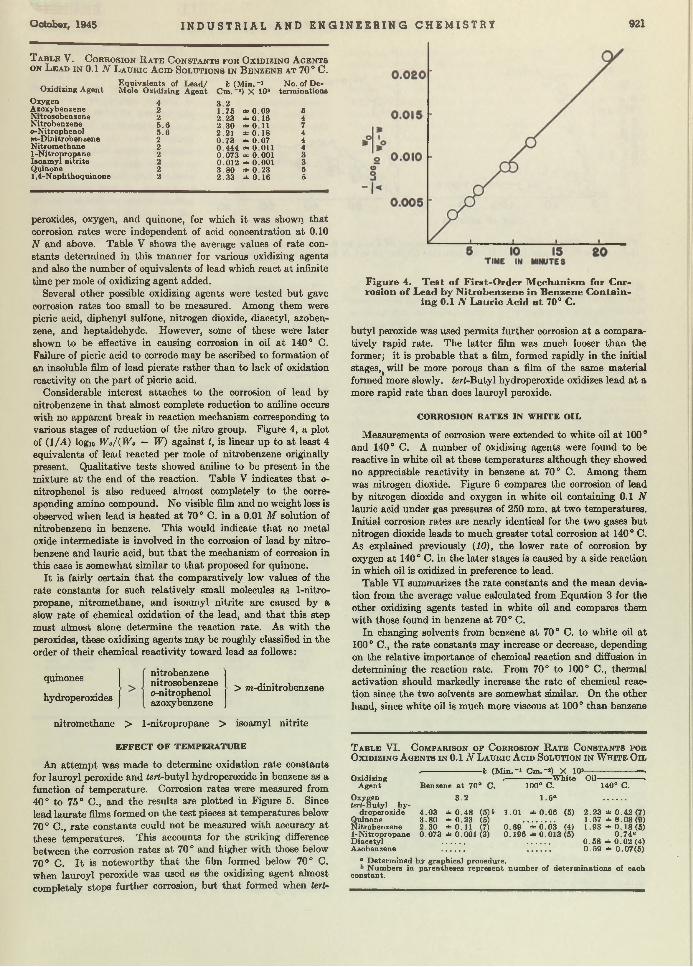
O ctober, 1945 I N D U S T R I A L A N D E N G I N E E R I N G C H E M I S T R Y 921
T a b l e V. C o r r o s i o n R a t e C o n s t a n t s f o r O x i d i z i n g A g e n t s o n L e a d i n 0 .1 AT L a u r i c A c i d S o l u t i o n s i n B e n z e n e a t 7 0 ° C .
_ . . Equivalents of L e a d / k (M in .*1 No. of De-Uxidizing A gent Mole Oxidizing Agent Cm. ~!) X 10s term inations
Oxygen 4 3 2Azoxybenzene 2 1 .7 5 * 0 .09 5N itrosobenzene 2 2 23 * 0 16 4N itrobenzene 6 . 6 2 30 * O i l 70-Nitrophenol 5 . 6 2 .21 ± 0 . 1 8 4m-Dinitroben-zene 2 0 .73 ± 0 .07 4N itrom ethane 2 0 444 =*= o ' o i l 41-N itropropane 2 0 .073 * 0 .001 3Isoamyl n itr i te 2 0 .012 * 0 .001 3Quinone 2 3 .8 0 ± 0 . 2 3 61,4-N aphthoquinone 2 2 .33 ± 0 . 1 6 5
peroxides, oxygen, and quinone, for which it was showi) th a t corrosion rates were independent of acid concentration a t 0.10 N and above. Table V shows the average values of rate constants determined in this m anner for various oxidizing agents and also the num ber of equivalents of lead which react a t infinite time per mole of oxidizing agent added.
Several other possible oxidizing agents were tested bu t gave corrosion rates too small to be measured. Among them were picric acid, diphenyl sulfone, nitrogen dioxide, diacetyl, azoben- zene, and heptaldehyde. However, some of these were later shown to be effective in causing corrosion in oil a t 140° C. Failure of picric acid to corrode m ay be ascribed to formation of an insoluble film of lead picrate rather than to lack of oxidation reactivity on the p a rt of picric acid.
Considerable interest attaches to the corrosion of lead by nitrobenzene in th a t almost complete reduction to aniline occurs with no apparent break in reaction mechanism corresponding to various stages of reduction of the nitro group. Figure 4, a plot of (1/A) log« W a/(W o — W) against t, is linear up to a t least 4 equivalents of lead reacted per mole of nitrobenzene originally present. Qualitative tests showed aniline to be present in the mixture a t the end of the reaction. Table V indicates th a t o- nitrophenol is also reduced almost completely to the corresponding amino compound. No visible film and no weight loss is observed when lead is heated a t 70° C. in a 0.01 M solution of nitrobenzene in benzene. This would indicate th a t no metal oxide interm ediate is involved in the corrosion of lead by nitrobenzene and lauric acid, bu t th a t the mechanism of corrosion in this case is somewhat sim ilar to th a t proposed for quinone.
I t is fairly certain th a t the comparatively low values of the rate constants for such relatively small molecules as 1-nitro- propane, nitrom ethane, and isoamyl nitrite are caused by a slow rate of chemical oxidation of the lead, and th a t this step m ust almost alone determine the reaction rate. As with the peroxides, these oxidizing agents may be roughly classified in the order of their chemical reactivity toward lead as follows:
quinones
hydroperoxides
nitrobenzenenitrosobenzeneo-nitrophenolazoxybenzene
> w-dinitrobenzene
nitrom ethane > 1-nitropropane > isoamyl nitrite
E F F E C T O F T E M P E R A T U R E
An attem pt was made to determine oxidation ra te constants for lauroyl peroxide and ierf-butyl hydroperoxide in benzene as a function of tem perature. Corrosion rates were measured from 40° to 75° C., and the results are plotted in Figure 5. Since lead laurate films formed on the tes t pieces a t tem peratures below 70° C., ra te constants could not be measured with accuracy a t these tem peratures. This accounts for the striking difference between the corrosion rates a t 70° and higher with those below 70° C. I t is noteworthy th a t the film formed below 70° C. when lauroyl peroxide was used as the oxidizing agent almost completely stops further corrosion, bu t th a t formed when tert-
butyl peroxide was used permits further corrosion a t a comparatively rapid rate. The la tter film was much looser than the former; i t is probable th a t a film, formed rapidly in the initial stages,( will be more porous than a film of the same m aterial formed more slowly. ieri-Butyl hydroperoxide oxidizes lead a t a more rapid rate than does lauroyl peroxide.
C O R R O S IO N R A T E S IN W H IT E O IL
Measurements of corrosion were extended to white oil a t 100 0 and 140° C. A number of oxidizing agents were found to be reactive in white oil a t these tem peratures although they showed no appreciable reactivity in benzene a t 70° C. Among them was nitrogen dioxide. Figure 6 compares the corrosion of lead by nitrogen dioxide and oxygen in white oil containing 0.1 N lauric acid under gas pressures of 250 mm. a t two tem peratures. Initial corrosion rates are nearly identical for the two gases bu t nitrogen dioxide leads to much greater to ta l corrosion a t 140° C. As explained previously (10), the lower rate of corrosion by oxygen a t 140° C. in the later stages is caused by a side reaction in which oil is oxidized in preference to lead.
Table VI summarizes the rate constants and the mean deviation from the average value calculated from Equation 3 for the other oxidizing agents tested in white oil and compares them with those found in benzene a t 70° C.
In changing solvents from benzene a t 70° C. to white oil a t 100° C., the rate constants may increase or decrease, depending on the relative importance of chemical reaction and diffusion in determining the reaction rate. From 70° to 100° C., therm al activation should m arkedly increase the rate of chemical reaction since the two solvents are somewhat similar. On the other hand, since white oil is much more viscous a t 100° than benzene
T a b l e VI. C o m p a r i s o n o p C o r r o s i o n R a t e C o n s t a n t s f o r O x i d i z i n g A g e n t s i n 0.1 JV L a u r i c A c i d S o l u t i o n i n W h i t e O i l
------------------------ le (M in .- 1 C m .-s) X 10*----------------------- -Oxidizing /------------------ W hite Oil------------------ »
Agent Benzene a t 70° C. 100° C. 140° C.
Oxygen 3 .2 1 .5« ...........tert-Buty l hy
droperoxide 4 .0 3 ± 0 . 4 8 (5)6 1.01 ± 0 .06 (5) 2 .23 ± 0 .4 2 ( 7 )Quinone 3 .8 0 ± 0 .23 (5) ................ 1 .57 ± 0 .0 8 ( 9 )Nitrobenzene 2 .30 ± 0 . 1 1 (7) 0 .69 ± 0 .03 (4) 1.93 ± 0 . 1 8 ( 5 )1-Nitropropane 0 .073 ± 0.001 (3) 0 .196 ± 0 .013 (5) 0 .7 4 “Diacetyl ........... ........... 0 .5 8 ± 0 .02 (4)Azobenzene ........... ........... 0 .59 ± 0.07(5)
c Determined by graphical procedure.Num bers in parentheses represent num ber of de term inations of each
constant.
F ig u re 4. T e s t o f F irs t-O rd e r M ech an ism fo r C orro sio n o f Lead by N itro b en zen e in B enzene C o n ta in
in g 0.1 N L au ric Acid a t 70° C.

922 I N D U S T R I A L A N D E N G I N E E R I N G C H E M I S T R Y Vol. 37, Mo. iu
Figure 5. Effect o f T em perature on Corrosion o f Lead by 0.06 N Lauroyl Peroxide (ie /t) and 0.043 N tert-B u ty l Hydroperoxide (.right) in 0.1 N Laurie Acid in B enzene
a t 70° C., diffusion of reactants into the m etal surface will be slower in white oil th an in benzene. Thus, when the corrosion ra te is controlled principally by chemical reaction in benzene or in both solvents, the ra te constant in white oil a t 100° m ay be expected to be greater than in benzene a t 70° C.; if the corrosion ra te is controlled principally by diffusion in both solvents, the reverse will be the case.
Table VI shows th a t the more active oxidizing agents in benzene—namely, ieri-butyl hydroperoxide, quinone, and nitrobenzene—show smaller ra te constants in white oil. This indicates th a t rates of corrosion by these substances are partially limited by diffusion in benzene solution and are almost wholly lim ited by diffusion in white oil solution under the conditions of the experiments. Oxidizing agents which are less active in benzene—namely, 1-nitropropane, diacetyl, and azobenzene—- show larger rate constants in white oil than in benzene. This behavior indicates th a t the corrosion rate in benzene is limited principally by chemical reaction; and since the rates of these agents are still considerably smaller than those of the more reactive agents in white oil, chemical reaction probably also determines the corrosion ra te in white oil. Of the oxidizing agents studied, all show the same order of reactivity in white oil as in benzene except th a t quinone and nitrobenzene are reversed. A rate constant for quinone a t 100° C. could no t be determined because of the formation of an insoluble film a t this tem perature, presumably composed of P b ^ C jH s K
All the peroxides studied decomposed to a considerable extent in white oil containing the lead samples a t 100° and 140° C. A t 100° both lauroyl peroxide and 1,1-dihydroxy dicyclohexyl peroxide decomposed almost completely before lead had corroded to any appreciable extent. In this connection, lauroyl peroxide rapidly decomposes under these conditions in the absence of m etal while 1,1-dihydroxy dicyclohexyl peroxide decomposes only if lead is present. Hydroperoxides were much more stable than the other types bu t only in the case of tert- buty l hydroperoxide was the stability sufficient to permit rate constants to be measured w ith reasonable accuracy a t both 100° and 140° C.
This finding emphasizes the importance of stability in determining the effective corrosivity of various oxidizing agents. Thus, although 1,1-dihydroxy dicyclohexyl peroxide is much more reactive on lead than any of the hydroperoxides studied, its effectiveness in causing corrosion is almost negligible since it decomposes on a lead surface in a short time. Likewise such compounds as quinone and nitrobenzene, if present in oil, would prove much more damaging as corrosive reagents than any of the peroxides studied since they decompose only by reaction w ith lead and acid, whereas the peroxide m ay rapidly decompose w ithout reaction with lead.
Diacetyl and azobenzene, although ineffective in causing corrosion in benzene a t 70°, proved effective in oil a t 140° C. because of therm al activation. Considerable interest attaches to the corrosion mechanism of lead by azobenzene since the molecule contains no oxygen and there is no possibility th a t a lead oxide interm ediate m ay form. Therefore ti e mechanism of lead corrosion by azobenzene was studied in some detail. Corrosion ra te constants were determined a t different starting ratios of acid and azobenzene upon the assumption of a second-order mechanism. Table V II lists these constants.
These constants indicate th a t the reaction is second order up to an acid concentration of 0.10. Above this concentration however, the ra te is independent of acid concentration. The reaction mechanism in th is case is probably similar to th a t forquinone and lauric acid on lead. Two equivalents of lead reacted at infinite tim e w ith one mole of azobenzene, from which it m ay be inferred th a t the reduction product is hydrazobenzene.
From the ra te constants a t two tem peratures in Table VI, activation energies were calculated for various oxidizing agents and lauric acid in white oil:
A ctivation Energy,Oxidizing A gent C al ./M o le
ierf-Butyl hydroperoxide 6,000N itrobenzene 7,9001-N itropropane 10,200
These activation energies are in the expected order if it is assumed th a t the activation energy for the chemical reaction involved is considerably greater th an th a t for diffusion of reacta n t into the test piece, which is probably the case. If this is true, the activation energy should be highest for the least active oxidizing agent. Comparison of the activation energies with ra te constants in Table VI shows th a t, as the ra te constant decreases, the activation energy increases for the compounds studied.
T a b l e V II. S e c o n d - O r d e r R a t e C o n s t a n t s f o r C o r r o s i o n o f L e a d b t L a u r i c A c i d a n d A z o b e n z e n e i n W h i t e O i l
a t 140° C .
In itia l Concn. M olea/L .Laurio Azo- k, M i n . ' 1 M o le “I No. of D e
acid benzene Liter-Cm . te rm ina tio ns
0 .025 0 .0 5 0 .0156 * 0 .0024 40 .05 0 .05 0 .0160 ± 0 .0023 40 .1 0 0 .0 5 0 .0146 ± 0 .0023 50 .25 0 .0 5 0 .0070 =t 0 .0009 5
D IS C U S S IO N
From the work of Denison, the authors, and others there can be no doubt of the role of peroxides and molecular oxygen in causing corrosion of bearing m etals. Proof th a t m any of the other oxidizing agents studied are present or are formed in oil would be difficult; bu t from a corrosion standpoint these compounds would prove far more damaging in a lubricant th an peroxides and oxygen because they tend to oxidize the m etal in preference to the oil a t all tem peratures studied. For oxygen and peroxides the reverse is likely to be true a t high tem peratures.
Nitrogen compounds which are oxidizing agents or which m ay readily oxidize to give oxidizing agents m ay arise in a lubricant
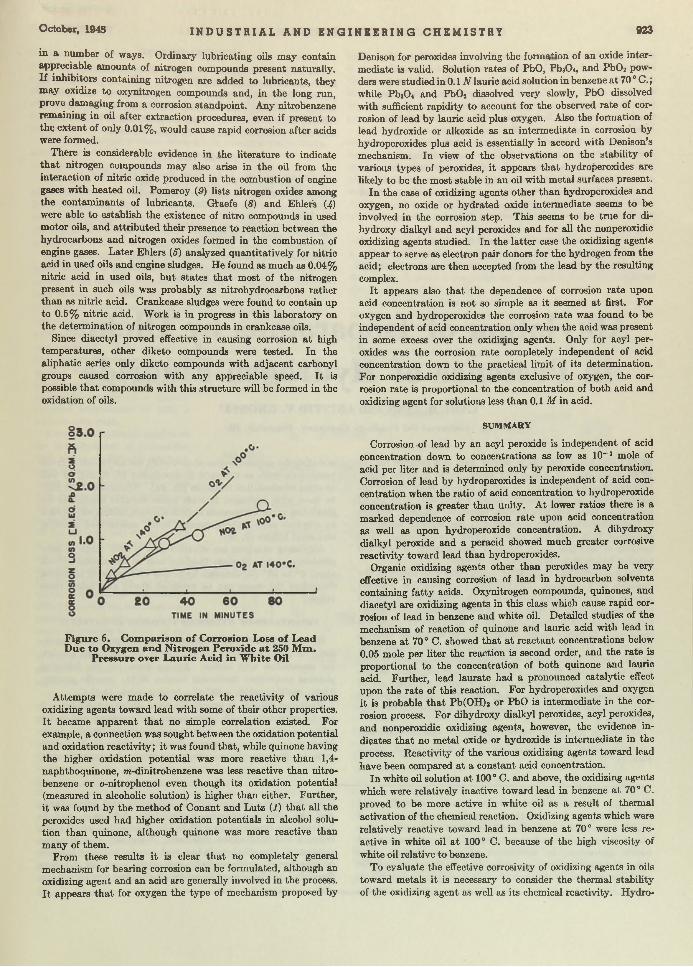
O ctober, 1945 I N D U S T R I A L A N D E N G I N E E R I N G C H E M I S T R Y 923
in a num ber of ways. Ordinary lubricating oils m ay contain appreciable amounts of nitrogen compounds present naturally. If inhibitors containing nitrogen are added to lubricants, they m ay oxidize to oxymtrogen compounds and, in the long run, prove damaging from a corrosion standpoint. Any nitrobenzene remaining in oil after extraction procedures, even if present to the extent of only 0.01%, would cause rapid corrosion after acids were formed.
There is considerable evidence in the literature to indicate th a t nitrogen compounds m ay also arise in the oil from the interaction of nitric oxide produced in the combustion of engine gases with heated oil. Pomeroy (9) lists nitrogen oxides among the contam inants of lubricants. O ae fe (5) and Ehleré U) were able to establish the existence of nitro compounds in used m otor oils, and attribu ted their presence to reaction between the hydrocarbons and nitrogen oxides formed in the combustion of engine gases. L ater Ehlers (6) analyzed quantitatively for nitric acid in used oils and engine sludges. He found as much as 0.04% nitric acid in used oils, bu t states th a t most of the nitrogen present in such oils was probably as nitrohydrocarbons rather than as nitric acid. Crankcase sludges were found to contain up to 0.5% nitric acid. Work is in progress in this laboratory on the determ ination of nitrogen compounds in crankcase oils.
Since diacetyl proved effective in causing corrosion a t high tem peratures, other diketo compounds were tested. In the aliphatic series only diketo compounds with adjacent carbonyl groups caused corrosion with any appreciable speed. I t is possible th a t compounds with this structure will be formed in the oxidation of oils.
F ig u re 6. C o m p ariso n o f C orrosion Loss o f Lead D ue to O xygen a n d N itro g en Peroxide a t 250 M m .
P re ssu re over L au rie A cid in W h ite Oil
A ttem pts were made to correlate the reactivity of various oxidizing agents toward lead with some of their other properties. I t became apparent th a t no simple correlation existed. For example, a connection was sought between the oxidation potential and oxidation reactivity; i t was found th a t, while quinone having the higher oxidation potential was more reactive than 1,4- naphthoquinone, wi-dinitrobenzene was less reactive than nitrobenzene or o-nitrophenol even though its oxidation potential (measured in alcoholic solution) is higher than either. Further, i t was found by the m ethod of Conant and Lutz (1) th a t all the peroxides used had higher oxidation potentials in alcohol solution than quinone, although quinone was more reactive than many of them.
From these results i t is clear th a t no completely general mechanism for bearing corrosion can be formulated, although an oxidizing agent and an acid are generally involved in the process. I t appears th a t for oxygen the type of mechanism proposed by
Denison for peroxides involving the formation of an oxide intermediate is valid. Solution rates of PbO, Pb3Oi, and P b 0 2 powders were studied in 0 .1N lauric acid solution in benzene a t 70 0 C .; while Pb30 ( and P b 0 2 dissolved very slowly, PbO dissolved with sufficient rapidity to account for the observed rate of corrosion of lead by lauric acid plus oxygen. Also the formation of lead hydroxide or alkoxide as an interm ediate in corrosion by hydroperoxides plus acid is essentially in accord with Denison’s mechanism. In view of the observations on the stability of various types of peroxides, i t appears th a t hydroperoxides are likely to be the most stable in an oil with m etal surfaces present.
In the case of oxidizing agents other than hydroperoxides and oxygen, no oxide or hydrated oxide interm ediate seems to be involved in the corrosion step. This seems to be true for dihydroxy dialkyl and acyl peroxides and for all the nonperoxidic oxidizing agents studied. In the la tter case the oxidizing agents appear to serve as electron pair donors for the hydrogen from the acid; electrons are then accepted from the lead by the resulting complex.
I t appears also th a t the dependence of corrosion rate upon acid concentration is not so simple as it seemed a t first. For oxygen and hydroperoxides the corrosion rate was found to be independent of acid concentration only when the acid was present in some excess over the oxidizing agents. Only for acyl peroxides was the corrosion rate completely independent of acid concentration down to the practical lim it of its determination. For nonperoxidic oxidizing agents exclusive of oxygen, the corrosion rate is proportional to the concentration of both acid and oxidizing agent for solutions less than 0.1 M in acid.
SUM M ARY
Corrosion of lead by an acyl peroxide is independent of acid concentration down to concentrations as low as 10“ 3 mole of acid per liter and is determined only by peroxide concentration. Corrosion of lead by hydroperoxides is independent of acid concentration when the ratio of acid concentration to hydroperoxide concentration is greater than unity. A t lower ratios there is a marked dependence of corrosion ra te upon acid concentration as well as upon hydroperoxide concentration. A dihydroxy dialkyl peroxide and a peracid showed much greater corrosive reactivity toward lead than hydroperoxides.
Organic oxidizing agents other than peroxides m ay be very effective in causing corrosion of lead in hydrocarbon solvents containing fa tty acids. Oxynitrogen compounds, quinones, and diacetyl are oxidizing agents in this class which cause rapid corrosion of lead in benzene and white oil. Detailed studies of the mechanism of reaction of quinone and lauric acid with lead in benzene a t 70° C. showed th a t a t reactant concentrations below 0.05 mole per liter the reaction is second order, and the rate is proportional to the concentration of both quinone and lauric acid. Further, lead laurate had a pronounced catalytic effect upon the ra te of this reaction. For hydroperoxides and oxygen it is probable th a t Pb(O H)2 or PbO is intermediate in the corrosion process. For dihydroxy dialkyl peroxides, acyl peroxides, and nonperoxidic oxidizing agents, however, the evidence indicates th a t no m etal oxide or hydroxide is interm ediate in the process. Reactivity of the various oxidizing agents toward lead have been compared a t a constant acid concentration.
In white oil solution a t 100° C. and above, the oxidizing agents which were relatively inactive toward lead in benzene a t 70° C. proved to be more active in white oil as a result of thermal activation of the chemical reaction. Oxidizing agents which were relatively reactive toward lead in benzene a t 70° were less reactive in white oil a t 100° C. because of the high viscosity of white oil relative to benzene.
To eyaluate the effective corrosivity of oxidizing agents in oils toward metals it is necessary to consider the therm al stability of the oxidizing agent as well as its chemical reactivity. Hydro

924 I N D U S T R I A L A N D E N G I N E E R I N G C H E M I S T R Y Vol. 37. No. 10
peroxides, although less reactive toward lead th an either dihydroxy dialkyl or acyl peroxides, are likely to be much more damaging from a corrosion standpoint since they possess greater stability tow ard heated oil. If nonperoxidic oxidizing agents other than oxygen were present in oils, they would prove to be much more damaging than peroxides because of their high sta bility w ith respect to heated oil.
Although hydroperoxides and oxygen are the oxidizing agents most likely to be present in oils, there is a possibility th a t nonperoxidic oxidizing agents m ay form from (a) oxidation of nitrogen containing inhibitors and natural nitrogen compounds in the oil, (b) oxidation of oil, (c) reaction of nitrogen oxides produced in the combustion of engine gases w ith the heated oil, or (d) nitrobenzene not completely removed following solvent extraction of the oil.
A t low tem peratures insoluble soap films formed on the lead surface are very effective in slowing the corrosion ra te . A film formed slowly appears to be more protective than one formed rapidly.
a c k n o w l e d g m e n t
The authors are pleased to extend their appreciation to the Lubri-Zol Corporation, sponsors of this work, for permission to publish the results. They are also grateful to Gus Abood, George J . Dlouhy, and M arjorie Palenschat for assistance in running m any of the tests. They are indebeted to Paul F. H artm an who synthesized m any of the peroxides used.
LITERATURE C ITED
(1) Conant and Lutz, J. Am. Chem. Soe., 46, 1254 (1924).(2) Denison, I n d . E n q . C h e m ., 36, 477 (1944).(3) Donath, J . Soc. Chem. Ind., 14, 283 (1895).(4) Ehlers, Petroleum Z., 28, No. 43 (1932).(5) Ibid., 31, No. 15 (1935).(6) Fischer and Pfleiderer, Z. anorg. allgem. Chem., 124, 61 (1922).(7) Fox, Analyst, 8, 116 (1883).(8) Graefe, Petroleum Z., 28, No. 23 (1932).(9) Pomeroy, J . Inat. Petroleum, 30, 95 (1944).
(10) Prutton et al., I n d . E n o . C h e m ., 37, 90 (1945).(11) Wheeler, Oil & Soap, 9, 89 (1932).
Alkylation o f Isoparaffins by Olefins in Presence o f Hydrogen Fluoride
CARL B. LINN AND A RISTID V . GROSSE1
U niversal O il P ro d u c ts C o m p a n y , R ive rsid e , III.
H YDROGEN fluoride is widely used as a catalyst for the interaction of olefins and isobutane to produce highly
branched liquid paraffins (1, 7, 10), a process which has an importan t place in the aviation gasoline program. The liquid product of the alkylation process, known as alkylate, consists of highly branched-chain paraffins and has superior antiknock properties both w ith and w ithout added tetraethyllead. The am ount of alkylate being regularly incorporated in aviation gasoline blends runs from about 25 to 40%.
The discovery th a t isoparaffins would react w ith olefins in the presence of a catalyst (14, 16, 16) overthrew the classical concept of the chemical inertness of the paraffins and opened extensive new fields for research. I t has been found th a t alkylation of isoparaffin hydrocarbons can be catalyzed by numerous compounds including m etal halides such as aluminum chloride (14, 16, 17, 21), zirconium chloride, etc. (8), sulfuric acid (3, 4, 19, SO), boron fluoride (15), hydrogen fluoride (10), and others. Of these, hydrogen fluoride, sulfuric acid, and aluminum halides are being used commercially. The alkylation processes are of great commercial importance and our H F alkylation process is of particular interest as a chemical and engineering developm ent (7).
Anhydrous hydrogen fluoride catalyzes various reactions,
1 Present address, H oudry Process Corporation of Pennsylvania, M arcus H ook, P a.
including the polymerization of olefins (9), the alkylation of cyclic compounds such as arom atic hydrocarbons (6, 9, 24), as well as other condensation reactions (23, 24). M aterials which may be used w ith hydrogen fluoride under suitable conditions for alkylating cyclic compounds include alcohols, olefins, oxides such as ethylene oxide, ethers, organic acids, unsaturated alcohols, and alkyl halides (6, 25).
Alkylating catalysts are effective over a wide range of tem peratures; m any of them function best a t tem peratures from about 0° to 50° C., although by proper correlation of operating conditions the range can be extended above and below these values.
A DVANTAGES O F H Y D R O G E N F L U O R ID E A S C A T A L Y S T
Hydrogen fluoride has a num ber of advantages which recommend its use as a catalyst, particularly in the process for alkylating isoparaffins w ith olefins. Among these are the following physical properties: molecular weight, 20.01; specific gravity,0.988; m elting point, —83° C.; boiling point, 19.4° C.
Hydrogen fluoride is one of the m ost stable compounds; it can be subjected to high tem peratures and pressures and to the action of other catalytic agents w ithout being broken down. M any of its organic compounds decompose either by heat alone or in the presence of catalysts to regenerate hydrogen fluoride,
H ydrogen fluoride catalyzes th e in teraction o f olefins and isoparaffins to form saturated products con sistin g o f h igh ly branched paraffinic hydrocarbons. T he alkylation w as carried o u t in th e laboratory, b o th by con tin u ou s and b a tch operation , in apparatus o f sim ple design . T he effects o f tem perature, co n ta ct t im e , ratio o f isoparaffin to o lefin , and ca ta lyst con cen tration in w ater are described.
R u ns involving th e paraffins iso b u ta n e and iso p en ta n e , and th e olefins, propene, iso b u ty len e , 1 -b u ten e , and 2 - b u ten e , are reported, as w ell as th e produ ction o f a lk y la te from a b u ta n e-b u ten e m ixture. N orm ally th e fluorine co n ten t o f th e a lkylate is low and can be reduced further by trea tm en t w ith certain m ateria ls su ch as ca lc iu m fluoride and a lu m in u m fluorides a t elevated tem peratures.
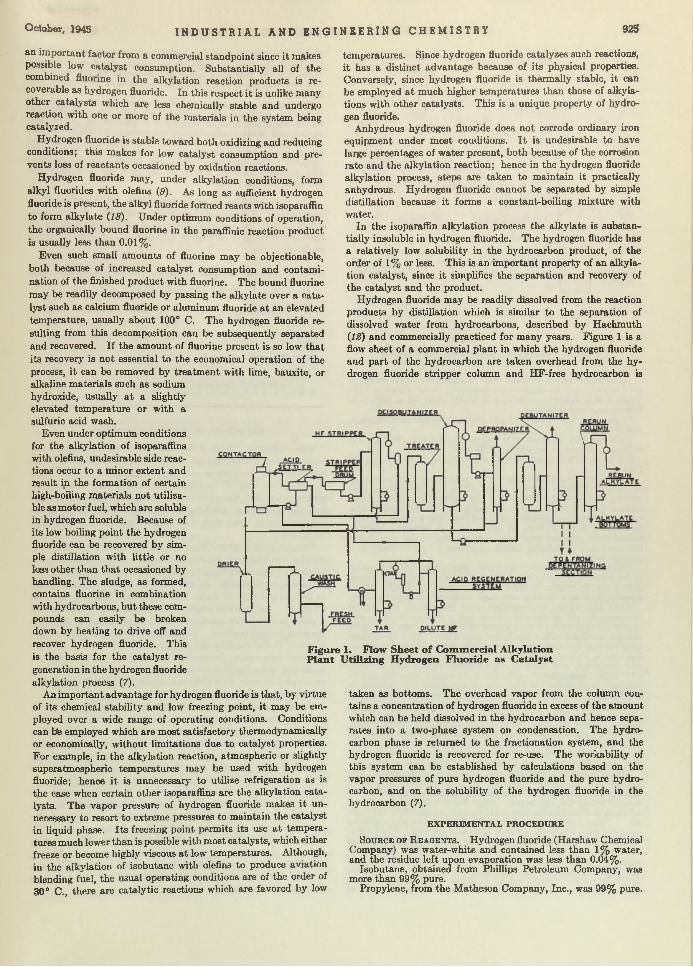
October, 1945 I N D U S T R I A L A N D E N G I N E E R I N G C H E M I S T R Y 925
an im portant factor from a commercial standpoint since it makes possible low catalyst consumption. Substantially all of the combined fluorine in the alkylation reaction products is recoverable as hydrogen fluoride. In this respect it is unlike many other catalysts which are less chemically stable and undergo reaction w ith one or more of the m aterials in the system being catalyzed.
Hydrogen fluoride is stable toward both oxidizing and reducing conditions; this makes for low catalyst consumption and prevents loss of reactants occasioned by oxidation reactions.
Hydrogen fluoride may, under alkylation conditions, form alkyl fluorides w ith olefins (9). As long as sufficient hydrogen fluoride is present, the alkyl fluoride formed reacts with isoparaffin to form alkylate (18). Under optimum conditions of operation, the organically bound fluorine in the paraffinic reaction product is usually less than 0.01%.
Even such small am ounts of fluorine m ay be objectionable, both because of increased catalyst consumption and contamination of the finished product w ith fluorine. The bound fluorine m ay be readily decomposed by passing the alkylate over a catalyst such as calcium fluoride or aluminum fluoride a t an elevated temperature, usually about 100° C. The hydrogen fluoride resulting from this decomposition can be subsequently separated and recovered. If the am ount of fluorine present is so low that its recovery is not essential to the economical operation of the process, it can be removed by treatm ent w ith lime, bauxite, or alkaline m aterials such as sodium hydroxide, usually a t a slightly elevated tem perature or w ith a sulfuric acid wash.
Even under optimum conditions for the alkylation of isoparaffins with olefins, undesirable side reactions occur to a minor extent and result in the formation of certain high-boiling m aterials not utiliza- ble as m otor fuel, which are soluble in hydrogen fluoride. Because of its low boiling point the hydrogen fluoride can be recovered by simple distillation with little or no loss other than th a t occasioned by handling. The sludge, as formed, contains fluorine in combination with hydrocarbons, bu t these compounds can easily be broken down by heating to drive off and recover hydrogen fluoride. This is the basis for the catalyst regeneration in the hydrogen fluoride alkylation process (7).
An im portant advantage for hydrogen fluoride is that, by virtue of its chemical stability and low freezing point, it may be employed over a wide range of operating conditions. Conditions can bte employed which are most satisfactory thermodynamically or economically, w ithout lim itations due to catalyst properties. For example, in the alkylation reaction, atmospheric or slightly superatmospheric tem peratures m ay be used w ith hydrogen fluoride; hence it is unnecessary to utilize refrigeration as is the case when certain other isoparaffins are the alkylation catalysts. The vapor pressure of hydrogen fluoride makes i t unnecessary to resort to extreme pressures to m aintain the catalyst in liquid phase. I ts freezing point permits its use a t temperatures much lower than is possible with most catalysts, which either freeze or become highly viscous a t low tem peratures. Although, in the alkylation of isobutane with olefins to produce aviation blending fuel, the usual operating conditions are of the order of 30° C., there are catalytic reactions which are favored by low
tem peratures. Since hydrogen fluoride catalyzes such reactions, it has a distinct advantage because of its physical properties. Conversely, since hydrogen fluoride is thermally stable, i t can be employed a t much higher tem peratures than those of alkylations with other catalysts. This is a unique property of hydrogen fluoride.
Anhydrous hydrogen fluoride does not corrode ordinary iron equipment under m ost conditions. I t is undesirable to have large percentages of w ater present, both because of the corrosion rate and the alkylation reaction; hence in the hydrogen fluoride alkylation process, steps are taken to m aintain it practically anhydrous. Hydrogen fluoride cannot be separated by simple distillation because it forms a constant-boiling mixture with water.
In the isoparaffin alkylation process the alkylate is substantially insoluble in hydrogen fluoride. The hydrogen fluoride has a relatively low solubility in the hydrocarbon product, of the order of 1 % or less. This is an im portant property of an alkylation catalyst, since it simplifies the separation and recovery of the catalyst and the product.
Hydrogen fluoride may be readily dissolved from the reaction products by distillation which is similar to the separation of dissolved water from hydrocarbons, described by Hachm uth (IS) and commercially practiced for many years. Figure 1 is a flow sheet of a commercial p lant in which the hydrogen fluoride and p art of the hydrocarbon are taken overhead from the hydrogen fluoride stripper column and HF-free hydrocarbon is
taken as bottoms. The overhead vapor from the column contains a concentration of hydrogen fluoride in excess of the amount which can be held dissolved in the hydrocarbon and hence separates into a two-phase system on condensation. The hydrocarbon phase is returned to the fractionation system, and the hydrogen fluoride is recovered for re-use. The workability of this system can be established by calculations based on the vapor pressures of pure hydrogen fluoride and the pure hydrocarbon, and on the solubility of the hydrogen fluoride in the hydrocarbon (7).
E X P E R IM E N T A L P R O C E D U R E
S o u r c e o r R e a g e n t s . Hydrogen fluoride (Harshaw Chemical Company) was water-white and contained less than 1% water, and the residue left upon evaporation was less than 0.04%.
Isobutane, obtained from Phillips Petroleum Company, was more than 99% pure.
Propylene, from the M atheson Company, Inc., was 99% pure.
Figure 1. Flow Sheet o f Com m ercial Alkylation P lant U tilizing Hydrogen Fluoride as Catalyst
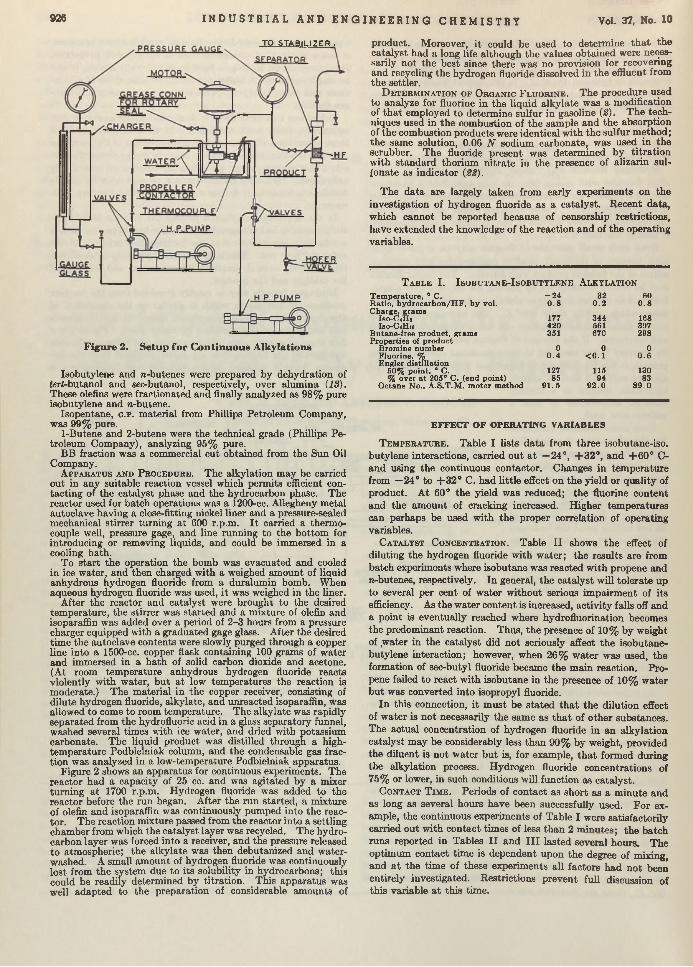
926 I N D U S T R I A L A N D E N G I N E E R I N G C H E M I S T R Y Vol. 37, No. 10
TO STABILIZER .
-H F
Figure 2. Setup for C ontinuous A lkylations
Isobutylene and n-butenes were prepared by dehydration of ferf-butanol and sec-butanol, respectively, over alum ina (13). These olefins were fractionated and finally analyzed as 98% pure isobutylene and n-butene.
Isopentane, c .p . m aterial from Phillips Petroleum Company, was 99% pure.
1-Butene and 2-butene were the technical grade (Phillips Petroleum Company), analyzing 95% pure.
BB fraction was a commercial cut obtained from the Sun Oil Company.
A p p a r a t u s a n d P r o c e d u r e . The alkylation m ay be carried out in any suitable reaction vessel which permits efficient contacting of the catalyst phase and the hydrocarbon phase. The reactor used for batch operations was a 1200-cc. Allegheny m etal autoclave having a close-fitting nickel liner and a pressure-sealed mechanical stirrer turning a t 600 r.p.m. I t carried a thermocouple well, pressure gage, and line running to the bottom for introducing or removing liquids, and could be immersed in a cooling bath.
To s ta rt the operation the bomb was evacuated and cooled in ice water, and then charged w ith a weighed amount of liquid anhydrous hydrogen fluoride from a duralumin bomb. When aqueous hydrogen fluoride was used, i t was weighed in the liner.
After the reactor and catalyst were brought to the desired tem perature, the stirrer was started and a m ixture of olefiü and isoparaffin was added over a period of 2-3 hours from a pressure charger equipped with a graduated gage glass. After the desired tim e the autoclave contents were slowly purged through a copper line into a 1500-cc. copper flask containing 100 grains of water and immersed in a ba th of solid carbon dioxide and acetone. (At room tem perature anhydrous hydrogen fluoride reacts violently with water, bu t a t low tem peratures the reaction is moderate.) The m aterial in the copper receiver, consisting of dilute hydrogen fluoride, alkylate, and unreacted isoparaffin, was allowed to come to room tem perature. The alkylate was rapidly separated from the hydrofluoric acid in a glass separatory funnel, washed several times with ice water, and dried with potassium carbonate. The liquid product was distilled through a high- tem perature Podbielniak column, and the condensable gas fraction was analyzed in a low-temperature Podbielniak apparatus.
Figure 2 shows an apparatus for continuous experiments. The reactor had a capacity of 25 cc. and was agitated by a mixer turning a t 1700 r.p.m. Hydrogen fluoride was added to the reactor before the run began. After the run started, a mixture of olefin and isoparaffin was continuously pumped into the reactor. The reaction mixture passed from the reactor into a settling chamber from which the catalyst layer was recycled. The hydrocarbon layer was forced into a receiver, and the pressure released to atmospheric; the alkylate was then debutanized and water- washed. A small amount of hydrogen fluoride was continuously lost from the system due to its solubility in hydrocarbons; this could be readily determined by titration. This apparatus was well adapted to the preparation of considerable amounts of
product. Moreover, it could be used to determ ine th a t th e catalyst had a long life although the values obtained were necessarily not the best since there was no provision for recovering and recycling the hydrogen fluoride dissolved in the effluent from the settler.
D e t e r m i n a t i o n o p O r g a n i c F l u o r i n e . T he procedure used to analyze for fluorine in the liquid alkylate was a modification of th a t employed to determine sulfur in gasoline (2). The techniques used in the combustion of the sample and th e absorption of the combustion products were identical with the sulfur m ethod; the same solution, 0.06 N sodium carbonate, was used in the scrubber. The fluoride present was determ ined by titra tio n w ith standard thorium n itra te in the presence of alizarin sulfonate as indicator (22).
The data are largely taken from early experim ents on the investigation of hydrogen fluoride as a catalyst. R ecent data, which cannot be reported because of censorship restrictions, have extended the knowledge of the reaction and of the operating variables.
T a b l e I . I s o b u t a n e - I s o b u t y l e n e A l k y l a t i o n
Tem peratu re , ° C. - 2 4 32 60Ratio , hyd ro ca rb o n /H F , b y vol. 0 .8 0 .2 0 .8Charge, gram s
L30-C4H 8 177 344 168I8O-C4H 10 420 561 397
Butane-free product, gram s Properties of p roduct
351 670 298
Bromine num ber 0 0 0Fluorine, % 0 .4 < 0 .1 0 .6Engler distilla tion
50% point, 0 C. 127 115 130% over a t 205° C. (end point) 85 94 83
O ctane No., A .S.T .M . m otor m ethod 9 1 .5 9 2 .0 8 9 .0
E FF E C T O F O PERATING V ARIABLES
T e m p e r a t u r e . Table I lists d a ta from three isobutane-iso. butylene interactions, carried ou t a t —24°, + 3 2 ° , and + 6 0 ° C- and using the continuous contactor. Changes in tem perature from —24° to + 3 2 ° C. had little effect on the yield or quality of product. A t 60° the yield was reduced; the fluorine content and the am ount of cracking increased. Higher tem peratures can perhaps be used with the proper correlation of operating variables.
C a t a l y s t C o n c e n t r a t i o n . Table I I shows th e effect of diluting the hydrogen fluoride w ith w ater; the results are from batch experiments where isobutane was reacted w ith propene and n-butenes, respectively. In general, the catalyst will to lerate up to several per cent of w ater without serious im pairm ent of its efficiency. As the w ater content is increased, activity falls off and a point is eventually reached where hydrofluorination becomes the predominant reaction. Thus, the presence of 10% by weight of .water in the catalyst did not seriously affect the isobutane- butylene interaction; however, when 26% w ater was used, the formation of sec-butyl fluoride became the m ain reaction. Propene failed to react w ith isobutane in the presence of 10% w ater b u t was converted into isopropyl fluoride.
In this connection, i t m ust be sta ted th a t the dilution effect of w ater is not necessarily the same as th a t of o ther substances. The actual concentration of hydrogen fluoride in an alkylation catalyst m ay be considerably less than 90% by weight, provided the diluent is not w ater bu t is, for example, th a t formed during the alkylation process. Hydrogen fluoride concentrations of 75% or lower, in such conditions will function as catalyst.
C o n t a c t T i m e . Periods of contact as short as a m inute and as long as several hours have been successfully used. For example, the continuous experiments of Table I were satisfactorily carried out w ith contact times of less than 2 m in u ta ; the batch runs reported in Tables I I and I I I lasted several hours. The optim um contact tim e is dependent upon the degree of mixing, and a t the time of these experiments all factors had n o t been entirely investigated. Restrictions prevent full discussion of this variable a t this time.

O ctober, 1945 I N D U S T R I A L A N D E N G I N E E R I N G C H E M I S T R Y 927
T a b l e II,
Olefin used
E f f e c t o f W a t e r o n H y d r o g e n F l u o r i d e a s a n A l k y l a t i o n C a t a l y s t
Propene n-Butene8
I 10 1 10 2625 25 28 25 2575 80 80 50 75
2 .5 3 .0 3 .3 4 .0 3 .50 .6 8 0.52 0.23 0.56 0.56
153 192 270 140 14063 88 0 0 0
0 0 162 95 95
10 0 0 0 061 180 95 44 130
135 a 323 182 b10 14 9
0.02 0.01 0.06
214 N ear 0 199 192 N ear 0
W ater in ca ta lyst , % by wt.Temp., ° C .Pressure, av. lb . /sq . in. gage Reaction time, nr.Vol. ratio, ca ta lyst /hydrocarbon
Reactants , gram s charged Isobutane Propene n-Butenes
H ydrocarbon recovery, grams Propane ButanesPentanes and higher Loss
Wt. % fluorine liquid Vield liquid alkylate as wt. % of
olefin reacting
° Propene largely converted to isopropyl fluoride. Only 8 gram s of m aterial boiling above 0° C.
b Butenes largely converted to aec-butyl fluoride. Only 10 gram s of m aterial boiling above 30° C.
R a t i o o f O l e f i n t o P a r a f f i n . The ratio of isobutane to butylene was studied over a range of 1.5 and higher. In each case the products were completely saturated. The yield of alkylate obtained would indicate th a t higher ratios of isobutane to butylene would improve the operation by making it more selective. The octane content of the product should be increased by the higher ratio of isobutane to olefin. This should also result in a product of improved quality for utilization in aviation blending fuel.
R a t i o o f A c i d t o H y d r o c a r b o n . Ratios of hydrogen fluoride to hydrocarbon of 0.15 to about 5.0 by volume were investigated. Satisfactory results were obtained a t a ratio of about one p a rt of acid to one of hydrocarbon.
ISO PA R A FFIN -O LEFIN INTERACTION
Table I I I gives data from batch experiments a t 10° C. w ith pure reactants and one continuous run a t 38°. The respective products were distilled on a Podbielniak Hyper-Cal Heligrid- packed column of greater than fifty-plate efficiency; and distillation curves are shown by Figures 3 to 9. In the discussion, “selective alkylation” refers to a reaction giving a relatively high product content of the paraffin species, corresponding to the sum of the molecular weights of the olefins and isoparaffin involved (Equation 1).
T a b l e III . D a t a f r o m S e v e n B a t c h a n d O n e C o n t i n u o u s E x p e r i m e n t
T em perature, ° C.Reaction time, hours*C ata lys t/hydrocarbon v . 10 Isoparaffin/olefin mole ra tio 3 .5
Charging stock, mole %Propene Isobutylene1-Butene2-Butene Isobutane n-Butane Isopentane
Liquid alkylate yield Wt. % olefin reacted Fluorine in alkylate*, %150° end-point gasoline
as wt. % of product O ctane No. of 300° end
point product
Figure No. of distn . curve« Commercial BB fraction as source of olefin. ^ ,b Time from beginning of addition of hydrocarbon charge until p roduct
was removed from autoclave.
d Exciusiv^of1pentanes. Counting isobutane formed as product, the yield
W“8 N o t t i e a te d to remove fluorine. In commercial operations th is is always done. After tre a tm en t the fluorine con ten t was 0.0056%.
10 10 10 10 10 10 10 38°5 .0 5 .0 5 .0 5 .0 5 .0 5 .0 5 .0
0.13 0.16 0 .16 0 .16 0 .16 0.15 0.15 i ! i3 .5 3 .0 3 .3 3 .2 3 .5 3 .3 1 .5 6
22 25 0 0 0 0 0 4 C0 0 0 0 22 19 200 0 22 4 0 0 0 ’ 20 0 1 10 0 0 0 9 .50 75 77 76 78 62 30 72 .50 0 0 0 0 19 50 11.5
78 0 0 0 0 0 0 0 .5
272d! 230 194 203 197 210 168 2270.08 0.01 0.01 0.01 0.01 0.01 0.01 0.026
73 81 85 91 91 89 69 95
9 0 .5 92 .7 95.3 96.7 95 .6 92 94.9
3 4 5 6 7 8 9
I s o p e n t a n e + P r o p e n e . Only 26% of the reaction product boiled in the octane range, and the distillation curve (Figure 3) shows m any plateaus. This indicates a nonselective reaction with extensive autodestructive alkylation. The yield of alkylate boiling higher than pentanes was 272% of the olefin reacted; however, isobutane was also found and if this is included in the calculation as product, the yield becomes 291%. The octane number of this m aterial was not determined; from other runs involving these reactants, the octane number found has been in the high eighties.
In general, these results are characteristic for alkylation with isopentane, the reacting paraffin. Usually the reaction is nonselective, isobutane is a reaction product, and the yield based on the olefin is greater than corresponds to equimolecular combination with isopentane.
I s o b u t a n e - |- P r o p e n e . The heptane content of this product was 50% and there were significant plateaus a t 80° and 89° C. (Figure 4). The more extensive of these (89°) was found by physical constants and spectroscopic analysis to correspond to 2,3-dime thy lpentane. The plateau near 99° is 2,2,4-trimethyl- pentane or iso-octane. The content of aviation gasoline and the octane number show th a t propylene reacts to give a desirable product.
I s o b u t a n e -(- B u t e n e s . Under optimum conditions the reaction between isobutane and the respective isomeric butylenes is selective; more than 80% of the product boils in the octane range. The distillation curves (Figures 5, 6, and 7) show two
Figures 3 and 4 . D istillation Curves for a n Isoparaffin P lus Propene
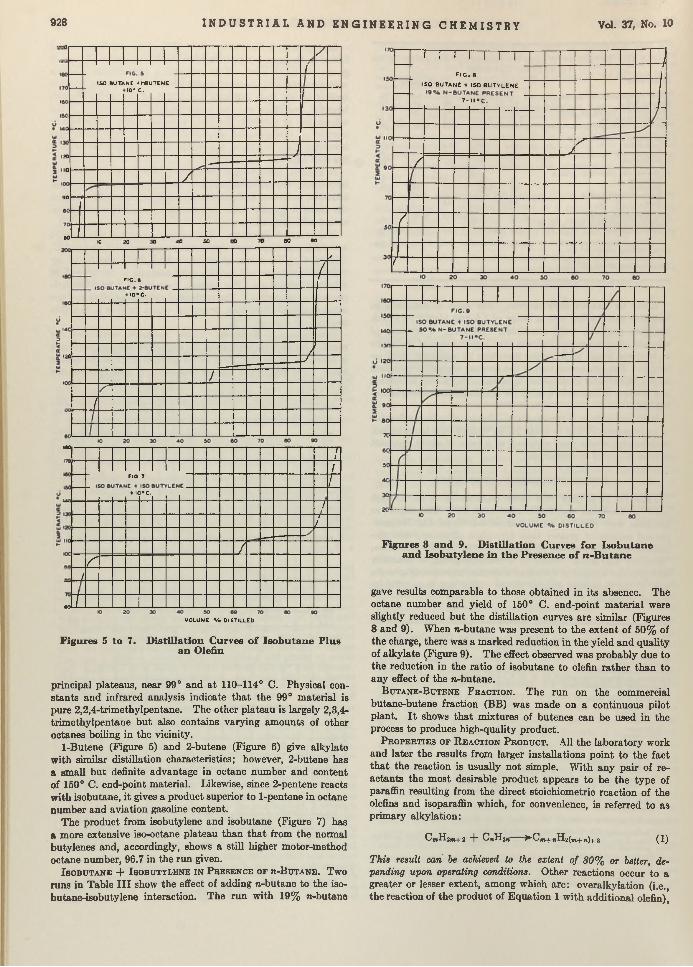
928 I N D U S T R I A L A N D E N G I N E E R I N G C H E M I S T R Y Vol. 37, No. 10
o — /i
ISO BUTANE •H'BUTENE10° C.
! 0 ------ J0 --
/10 - H
50'— -jL—L—L_10 ■O to o 50 0 0 eo 90
1 I /
* 1 1 (FIG . 6
I0 *C -
0 ---------- r//
/
ieo 1i
1FIG 7 1
i♦ l<)« C .
/1
!
/
r/
e o IVOLUME • / • 01 STILLED
Figures 5 to 7. D istilla tion Curves o f Isobutane P lus an Olefin
principal plateaus, near 99° and a t 110-114° C. Physical constan ts and infrared analysis indicate th a t the 99° m aterial is pure 2,2,4-trimethylpentane. The other plateau is largely 2,3,4- trim ethylpentane b u t also contains varying amounts of other octanes boiling in the vicinity.
1-Butene (Figure 5) and 2-butene (Figure 6) give alkylate w ith similar distillation characteristics; however, 2-butene has a small bu t definite advantage in octane num ber and content of 150° C. end-point m aterial. Likewise, since 2-pentene reacts w ith isobutane, it gives a product superior to 1-pentene in octane num ber and aviation gasoline content.
The product from isobutylene and isobutane (Figure 7) has a more extensive iso-octane plateau than th a t from the normal butylenes and, accordingly, shows a still higher motor-method octane number, 96.7 in the run given.
I s o b u t a n e + - I s o b u t y l e n e i n P r e s e n c e o f » - B u t a n e . Two runs in Table I I I show the effect of adding n-butane to the iso- butane-isobutylene interaction. The run w ith 19% n-butane
ri i i i i
f i g . e
SO BU TAN E + ISO B U T Y L E N
1
E
7 - 11 ° C
/s
/
/
/
Figures 8 and 9. D istilla tion Curves for Isobutane and Isobutylene in th e Presence o f n -B u tan e
gave results comparable to those obtained in its absence. The octane num ber and yield of 150° C. end-point m aterial were slightly reduced bu t the distillation curves are sim ilar (Figures 8 and 9). When n-butane was present to the extent of 50% of the charge, there was a m arked reduction in the yield and quality of alkylate (Figure 9). The effect observed was probably due to the reduction in the ratio of isobutane to olefin ra ther than to any effect of the n-butane.
B u t a n e - B u t e n e F r a c t i o n . The run on the commercial butane-butene fraction ( B B ) was m ade on a continuous pilot plant. I t shows th a t m ixtures of butenes can be used in the process to produce high-quality product.
P r o p e r t i e s o f R e a c t i o n P r o d u c t . All the laboratory work and later the results from larger installations point to the fact th a t the reaction is usually no t simple. W ith any pair of reactants the m ost desirable product appears to be the type of paraffin resulting from the direct stoichiometric reaction of the olefins and isoparaffin which, for convenience, is referred to as prim ary alkylation:
C „H 2m+2 + C„H 2» ^Cn+ ł|U2(m . n) ł- 2 (1)This result can be achieved to the extent of 80% or belter, depending upon operating conditions. O ther reactions occur to a greater or lesser extent, among which are: overalky la tion (i.e., the reaction of the product of E quation 1 w ith additional olefin),
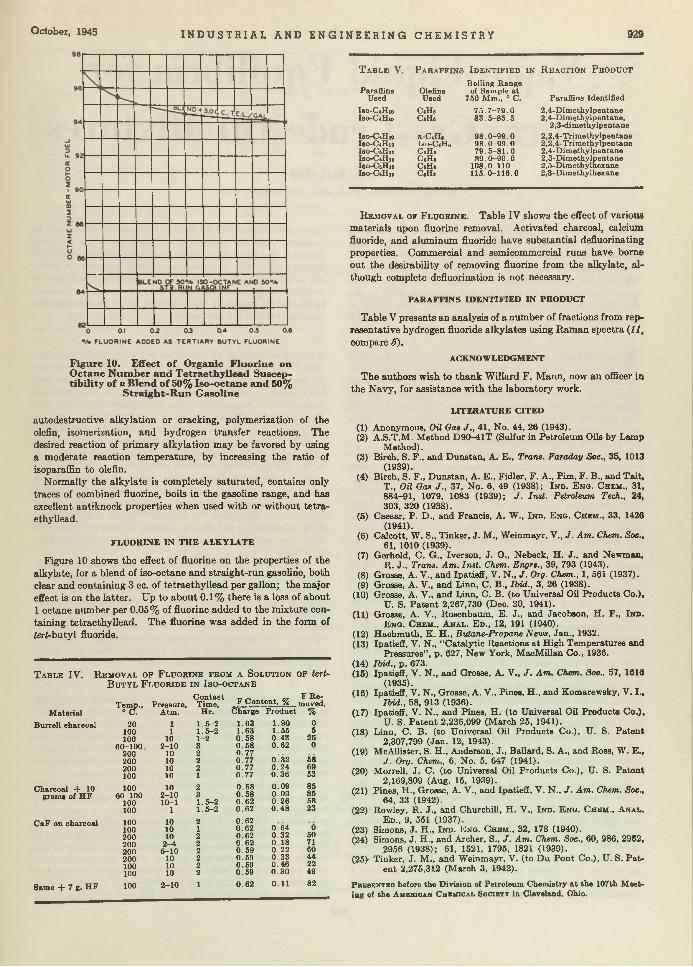
October, 1945 I N D U S T R I A L A N D E N G I N E E R I N G C H E M I S T R Y 929
T a b l e V. P a r a f f i n s I d e n t i f i e d i n R e a c t i o n P r o d u c t
Figure 10. Effect o f Organic F luorine on O ctane Num ber and Tetraethyllead Susceptib ility o f a Blend o f 50% Iso-octane and 50%
Straight-R un G asoline
autodestructive alkylation or cracking, polymerization of the olefin, isomerization, and hydrogen transfer reactions. The desired reaction of prim ary alkylation may be favored by using a moderate reaction tem perature, by increasing the ratio of isoparaffin to olefin.
Normally the alkylate is completely saturated, contains only traces of combined fluorine, boils in the gasoline range, and has excellent antiknock properties when used with or without te tra ethyllead.
F L U O R IN E IN T H E A LK Y L A T E
Figure 10 shows the effect of fluorine on the properties of the alkylate, for a blend of iso-octane and straight-run gasoline, both clear and containing 3 cc. of tetraethyllead per gallon; the m ajor effect is on the latter. Up to about 0.1% there is a loss of about1 octane num ber per 0.05% of fluorine added to the m ixture containing tetraethyllead. The fluorine was added in the form of ieri-butyl fluoride.
T a b l e IV. R e m o v a l o f F l u o r i n e f r o m a S o l u t i o n o f tert- B u t y l F l u o r i d e i n I s o - o c t a n e
M aterial
Burrell charcoal
Charcoal + 10 grams of H F
C aF on charcoal
Same + 7 g. H F
Temp., Pressure,C ontactTime, F C ontent, %
F Removed,
° C. Atm. Hr. Charge P roduct %
20 1 1 .5 -2 1.63 1.90 0100 1 1 .5 -2 1.63 1.55 5100 10 1-2 0 .58 0.43 26
60-100 2-10 3 0 .58 0 .62 0200 10 2 0 .77200 10 2 0.77 0 .32 58200 10 2 0 .77 0 .24 69100 10 1 0.77 0 .36 53
100 10 2 0 .58 0.09 8560-100 2-10 3 0 .58 0 .09 85
100 10-1 1 .5 -2 0 .62 0 .26 58100 1 1 .5 -2 0 .62 0 .4 8 23
100 10 2 0 .62100 10 1 0 .6 2 0 .64 0200 10 2 0 .62 0 .32 50200 2-4 2 0 .62 0 .18 71200 6-10 2 0 .59 0 .22 60200 10 2 0 .59 0 .33 44100 10 2 0.59 0 .46 22100 10 2 0 .59 0 .30 49
100 2-10 1 0 .62 0 .11 82
ParaffinsUsed
Iso-CiHioIso-CiHio
Iso-CiHioIso-C^HioIso-CiHiaIso-CiHi!Iso-CiHiaIso-C .Hn
Boiling RangeOlefins of Sample atUsed 750 Mm., ° C.
C»Hfl 7 5 .7 -7 9 .0CaH« 8 3 .5 -8 5 .5
n-CiHs 9 8 .0 -9 9 .0Iso-CiHg 9 8 .0 -9 9 .0CsHa 7 9 .5 -8 1 .0CaH« 8 9 .0 -9 0 .0CaH« 108.0-110CaH# 115 .0-116.0
Paraffins Identified
2 .4-D im ethylpentane2.4-Dimethylpentane,
2,3-di m ethylpentane2.2.4-Trimethylpentane2.2.4-Trimethylpentane2.4-D imethylpentane2.3-Dimethylpentane2.5-Dimethylhexane2.3-Dimethylhexane
R emoval of F lu o r in e . Table IV shows the effect of various materials upon fluorine removal. Activated charcoal, calcium fluoride, and aluminum fluoride have substantial defluorinating properties. Commercial and semicommercial runs have borne out the desirability of removing fluorine from the alkylate, although complete defluorination is not necessary.
PA R AFFINS ID EN TIFIED IN PRODUCT
Table V presents an analysis of a number of fractions from representative hydrogen fluoride alkylates using Ram an spectra {11, compare 6).
ACKNOW LEDGMENT
The authors wish to thank Willard F . Mann, now an officer in the Navy, for assistance with the laboratory work.
LITERATURE CITED
(1) Anonymous, Oil Gas J ., 41, No. 44, 26 (1943).(2) A.S.T.M. Method D90-41T (Sulfur in Petroleum Oils by Lamp
M ethod).(3) Birch, S. F., and Dunstan, A. E., Trans. Faraday Soc., 35, 1013
(1939).(4) Birch, S. F., Dunstan, A. E., Fidler, F. A., Pim, F. B., and T ait,
T ., Oil Gas J ., 37, No. 6 , 49 (1938); Ind . E nq. Chem., 31, 884-91, 1079, 1083 (1939); J . Inst. Petroleum Tech., 24, 303, 320 (1938).
(5) Caesar, P. D., and Francis, A. W., Ind. Eng. Chem., 33, 1426(1941).
(6) Calcott, W. S., Tinker, J. M., W einmayr, V., J . Am. Chem. Soc.,61, 1010 (1939).
(7) Gerhold, C. G., Iverson, J. O., Nebeck, H. J., and Newman,R. J., Trans. Am. Inst. Chem. Engrs., 39, 793 (1943).
(8 ) Grosse, A. V., and Ipatieff, V. N., J . Org. Chem., 1, 561 (1937).(9) Grosse, A. V., and Linn, C. B., Ibid., 3, 26 (1938).
(10) Grosse, A. V., and Linn, C. B. (to Universal Oil Products Co.),U. S. Paten t 2,267,730 (Dec. 30, 1941).
(11) Grosse, A. V., Rosenbaum, E. J., and Jacobson, H . F., Ind.E nq. Chem ., Anal. E d., 12, 191 (1940).
(12) Hachm uth, K. H., Butane-Propane News, Jan., 1932.(13) Ipatieff, V. N., “Catalytic Reactions at High Temperatures and
Pressures” , p. 627, New York, MacMillan Co., 1936.(14) Ibid., p. 673.(15) Ipatieff, V. N., and Grosse, A. V., J . Am . Chem. Soc., 57, 1616
(1935).(16) Ipatieff, V. N., Grosse, A. V., Pines, H., and Komarewsky, V. I.,
Ibid., 58, 913 (1936).(17) Ipatieff, V. N., and Pines, H . (to Universal Oil Products Co.),
U. S. P aten t 2,236,099 (March 25, 1941).(18) Linn, C. B. (to Universal Oil Products Co.), U. S. P aten t
2,307,799 (Jan. 12, 1943).(19) McAllister, S. H., Anderson, J., Ballard, S. A., and Ross, W. E.,
J . Org. Chem., 6 , No. 5, 647 (1941).(20) Morrell, J . C. (to Universal Oil Products Co.), U. S. P aten t
2,169,809 (Aug. 15, 1939).(21) Pines, H., Grosse, A. V., and Ipatieff, V. N., J . Am . Chem. Soc.,
64, 33 (19-42).(22) Rowley, R. J., and Churchill, H. V., Ind. E nq. Chem., Anal.
E d., 9, 551 (1937).(23) Simons, J. H., Ind. E nq. Chem ., 32, 178 (1940).(24) Simons, J. H ., and Archer, S., J . Am. Chem. Soc., 60, 986, 2952,
2956 (1938); 61, 1521, 1795, 1821 (1939).(25} Tinker, J . M., and Weinmayr, V. (to D u Pont Co.), U. S. P a t
ent 2,275,312 (M arch 3, 1942).
P r e s e n t e d b e f o r e t h e D i v i s i o n o f P e t r o l e u m C h e m i s t r y a t t h e 1 0 7 t h M e e t
i n g o f t h e A m e r i c a n C h e m ic a l S o c i e t y i n C le v e l a n d , O h io .

Vapor-Liquid Equilibria for
Natural Gas-Crude Oil MixturesC. H . ROLAND
P h illip s P e tro le u m C o m p a n y , B a rtle sv ille , O kla .
A con sisten t set o f equilibrium con stan ts and related phase data were obtained for a m ixture o f League City natural gas and B illings crude oil for pressures from 1000 to 1 0 , 0 0 0 pounds per square in ch and a t tem peratures o f 120“ and 200° F. D ata were also obtained for m iscellaneous m ixtures o f th e o il and gas, and were com pared to th e data for th e fixed-com position m ixture. T he effect o f com position upon th e equilibria is n oted , and through
two experim ents in w h ich th e com position is varied by rem oval from th e system o f a liq u id phase a t a h igher pressure th e effect o f a particu lar com position change is determ ined . T he com position change appears to affect th e com ponent characteristic o f th e h eptan es and heavier com ponent b u t n o t th e equilibrium co n sta n ts . Colored hydrocarbon fractions were show n to be p resen t in the vapor phase a t h igh pressures.
VAPOR-liquid equilibrium constants and related d a ta have been determined for mixtures of a natural gas and crude oil
a t 120° and 200° F. for pressures from 1000-10,000 pounds per square inch. These data are useful to those engaged in process design and reservoir engineering for predicting phase relations. The range of tem peratures and pressures studied include those which represent the initial conditions existing in most of the known oil and gas producing reservoirs.
Several investigators have reported vapor-liquid equilibrium constants for multicomponent hydrocarbon m ixtures with a wide range of volatility such as occur in natural gas and crude oil separations. K atz and Hachm uth (2) presented data for pressures to 3000 pounds per square inch a t 40°, 120°, and 200° F., determined with natural gas and Oklahoma City Wilcox crude oil mixtures. These data were extrapolated in the published article to a convergence pressure of 5000 pounds per square inch. Webber (5) published equilibrium constant data for hydrocarbons in absorption oil a t 33°, 100°, and 180° F. and pressures from 100 to 5000 pounds per square inch. These mixtures were made up synthetically by adding the pure hydrocarbons to the absorption oil. The varying amounts of hydrocarbons used affected the equilibrium constants and thus indicated how im portant were the relative amounts of hydrocarbons present a t pressures above 1000 pounds. Roland, Smith, and Kaveler (S) published equilibrium constant data for Gulf Coast distillate-natural gas mixtures a t 40°, 120°, and 200° F. for pressures from 200 to 4000 pounds per square inch. Measurements were made a t pressures both above and below the lim it for existence of a two-phase condition, and the determinations established with a reasonable degree of certainty the existence of a convergence pressure (pressure a t which the equilibrium constants appear to converge to unity for certain mixtures). Eilerts and Smith (1) includedsomeequilib- rium constant data obtained in a study of separator gas-liquid hydrocarbon mixtures from a distillate well. These d a ta were obtained a t 3192 pounds per square inch pressure and 228° F. for various mixtures of separator gas and liquid. They show a considerable variation of the equilibrium constant vyrith the ratio of gas to liquid in the mixture. Standing and Katz (4) published equilibrium constant d a ta for four different mixtures of natural gas and crude oils a t 35 ° to 250 ° F. from 100 to 8220 pounds per square inch. T heir measurements included the phase densities under the equilibrium conditions; these data assist in determining whether the increase in pressure on the system produces a bubble point or a dew point. A t high pressures their equilibrium constant d a ta as plotted against pressure on logarithmic paper
indicated a reversal in the curvature of the equilibrium constam lines similar to th a t shown in the plots of W ebber. T h a t such reversal of curvature was not present in the distillate systems may be a ttributed to the fact th a t, for the distillate mixtures, the temperature of the determinations was much nearer the critical temperatures of the mixtures.
The data obtained in the experimental work of this paper may be divided into three groups. In the first, gas and crude oil were combined in various proportions to produce miscellaneous mixtures. The equilibrium d ata were then determ ined for these mixtures. In the second group the gas and oil were combined in a fixed ratio, and the equilibrium d ata were determined for various pressures from 1000 to 10,000 pounds per square inch. In the third group a vapor phase was removed from one of the equilibria of the second group and used as a system a t a lower pressure for which the equilibrium constants and related phase d a ta were determined.
In addition to the equilibrium constant data , particular a tten tion was given to the specific gravity and molecular weight of the heptanes and heavier fractions. In the phase equilibria a t high pressures such as are encountered in reservoir studies, the equilibrium constant of the heptanes and heavier fraction is of prime importance and in m any cases is the determ ining factor in a calculation. The significant variations of the molecular weight and specific gravities are im portant in helping to select the correct value for the heptanes and heavier constant.
EX PER IM EN TA L D ETA ILS
The apparatus included an equilibrium cell, constant-tem pera- ture bath, gages, hand-operated m ercury pum p, volumetric mer- cury-displacement pump, and analytical apparatus. The equilibrium cell was of the rocking-bomb type. The analytical equipm ent included two sets of low-temperature fractionating columns; a balance, pycnometers, and cryoscopic molecular weight apparatus were used to study the heptanes and heavier fractions.
C r u d e O i l a n d N a t u r a l G a s . The crude oil used in making up the equilibrium samples was a pipe line oil from the Wilcox form ation near Billings, Okla., in Noble county. A commercial preparation (Tretolite) was added to the oil to assist in removing the water. The percentage of T retolite was very small and was assumed to have no effect on the equilibria. T h irty gallons of this oil were thoroughly agitated in a drum. From this drum 23 quart cans were filled and sealed so th a t a fresh can of oil would be available for each charge of the equilibrium cell. Table I gives a fractional analysis of the oil and Figure 1 shows a distillation chart .
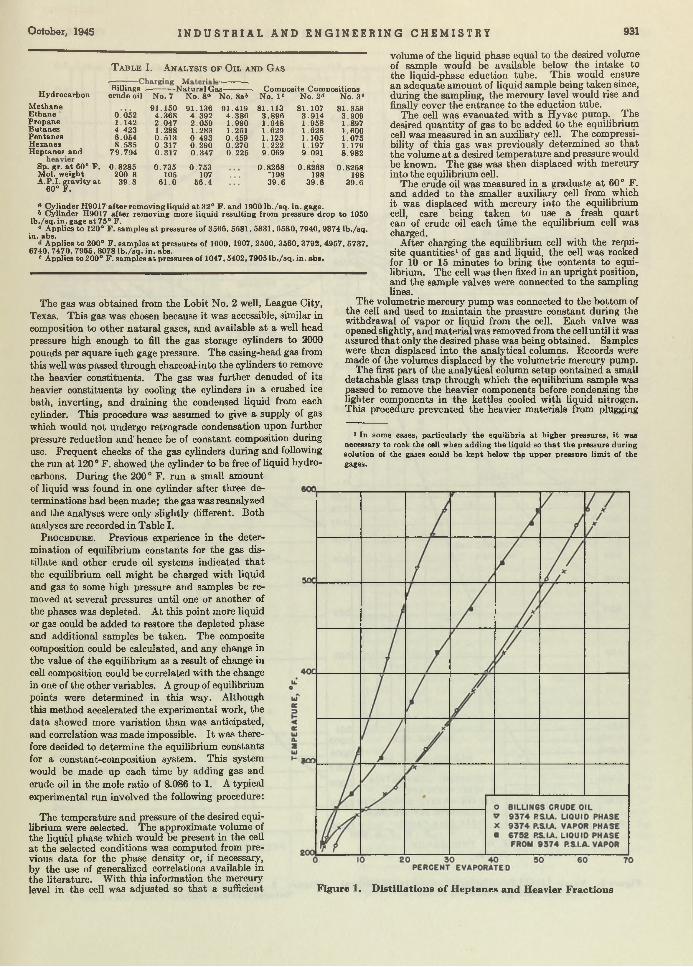
O ctober, 1945 I N D U S T R I A L A N D E N G I N E E R I N G C H E M I S T R Y 931
T a b l e I. A n a l y s i s o f O i l a n d G a s
H ydrocarbonBillings .
----------------------- «-----------N atu ra l Gas-----------> Composite Compositions
crude oil No. 7 No. 8“ No. 8a& No. 1° No. 2d No. 3®M ethane 91.150 91.136 91.419 81.113 81.107 81.358E th an e ' (KÖ52 4 .368 4.392 4 .386 3.896 3.914 3.909Propane 1.142 2 .047 2 .059 1.990 1.948 1.958 1.897B utanes 4.423 1.288 1.283 1.251 1.629 1.628 1.600Pentanes 6.054 0.513 0.493 0.459 1.123 1.105 1.075Hexanes 8.535 0.317 0.290 0 .270 1.222 1.197 1.179H eptanes and 79 .794 0 .317 0 .347 0.225 9 .069 9.091 8.982
Sp. gr. a t 60° F. 0.8285 0 .735 0.753 0.8268 0.8268 0.8268Mol. weight 200.8 105 107 "198 198 198A .P.I. g rav ity a t
60° F .39 .3 61 .0 56 .4 39 .6 39 .6 39.6
° Cylinder H 90I7 'after removing liquid a t 32° F. and 1900 lb . / sq . in. gage.6 Cylinder H9017 after rem oving more liquid resulting from pressure drop to 1050
lb ./sq . in . gage a t 75° F.e Applies to 120° F . samples a t pressures of 3566, 5581, 5831, 6580, 7940, 9374 lb ./sq .
in. abs.Applies to 200° F . samples a t pressures of 1600, 1907, 2500, 3560, 3792, 4957, 5737,
6740, 7470, 7965, 8078 lb . /sq . in. abs.9 Applies to 200° F . samples a t pressures of 1047,5402,7905 lb . /sq . in. abs.
The gas was obtained from the Lobit No. 2 well, League City, Texas. This gas was chosen because it was accessible, similar in composition to other natural gases, and available a t a well head pressure high enough to fill the gas storage cylinders to 2000 pounds per square inch gage pressure. The casing-head gas from this well was passed through charcoaHnto the cylinders to remove the heavier constituents. The gas was further denuded of its heavier constituents by cooling the cylinders in a crushed ice bath, inverting, and draining the condensed liquid from each cylinder. This procedure was assumed to give a supply of gas which would not undergo retrograde condensation upon further pressure reduction and' hence be of constant composition during use. Frequent checks of the gas cylinders during and following the run a t 120 0 F. showed the cylinder to be free of liquid hydrocarbons. During the 200° F. run a small amount of liquid was found in one cylinder after three determinations had been made; the gas was reanalyzed and the analyses were only slightly different. Both analyses are recorded in Table I.
P r o c e d u r e . Previous experience in the determination of equilibrium constants for the gas distillate and other crude oil systems indicated th a t the equilibrium cell m ight be charged with liquid and gas to some high pressure and samples be removed a t several pressures until one or another of the phases was depleted. A t this point more liquid or gas could be added to restore the depleted phase and additional samples be taken. The composite composition could be calculated, and any change in the value of the equilibrium as a result of change in cell composition could be correlated with the change in one of the other variables. A group of equilibrium points were determined in this way. Although this method accelerated the experimental work, the data showed more variation than was anticipated, and correlation was made impossible. I t was therefore decided to determine the equilibrium constants for a constant-composition system. This system would be made up each time by adding gas and crude oil in the mole ratio of 8.086 to 1. A typical experimental run involved the following procedure:
The tem perature and pressure of the desired equilibrium were selected. The approximate volume of the liquid phase which would be present in the cell a t the selected conditions was computed from previous data for the phase density or, if necessary, by the use of generalized correlations available in the literature. W ith this information the mercury level in the cell was adjusted so th a t a sufficient
volume of the liquid phase equal to the desired volume of sample would be available below the intake to the liquid-phase eduction tube. This would ensure an adequate am ount of liquid sample being taken since, during the sampling, the mercury level would rise and finally cover the entrance to the eduction tube.
The cell was evacuated with a Hyvac pump. The desired quantity of gas to be added to the equilibrium cell was measured in an auxiliary cell. The compressibility of this gas was previously determined so th a t the volume a t a desired tem perature and pressure would be known. The gas was then displaced with mercury into the equilibrium cell.
The crude oil was measured in a graduate a t 60° F. and added to the smaller auxiliary cell from which it was displaced with mercury into the equilibrium cell, care being taken to use a fresh quart can of crude oil each time the equilibrium cell was charged.
After charging the equilibrium cell with the requisite quantities1 of gas and liquid, the cell was rocked for 10 or 15 minutes to bring the contents to equilibrium. The cell was then fixed in an upright position, and the sample valves were connected to the sampling lines.
The volumetric mercury pump was connected to the bottom of the cell and used to m aintain the pressure constant during the withdrawal of vapor or liquid from the cell. Each valve was opened slightly, and m aterial was removed from the cell until it was assured th a t only the desired phase was being obtained. Samples were then displaced into the analytical columns. Records were made of the volumes displaced by the volumetric mercury pump.
The first part of the analytical column setup oontained a small detachable glass trap through which the equilibrium sample was passed to remove the heavier components before condensing the lighter components in the kettles cooled with liquid nitrogen. This procedure prevented the heavier materials from plugging
1 In some cases, particularly the equilibria a t higher pressures, i t was necessary to rock the cell when adding the liquid so th a t the pressure during solution of the gases could be kep t below the upper pressure lim it of the gages.
Figure 1. Distillations of Heptanes and Heavier Fractions
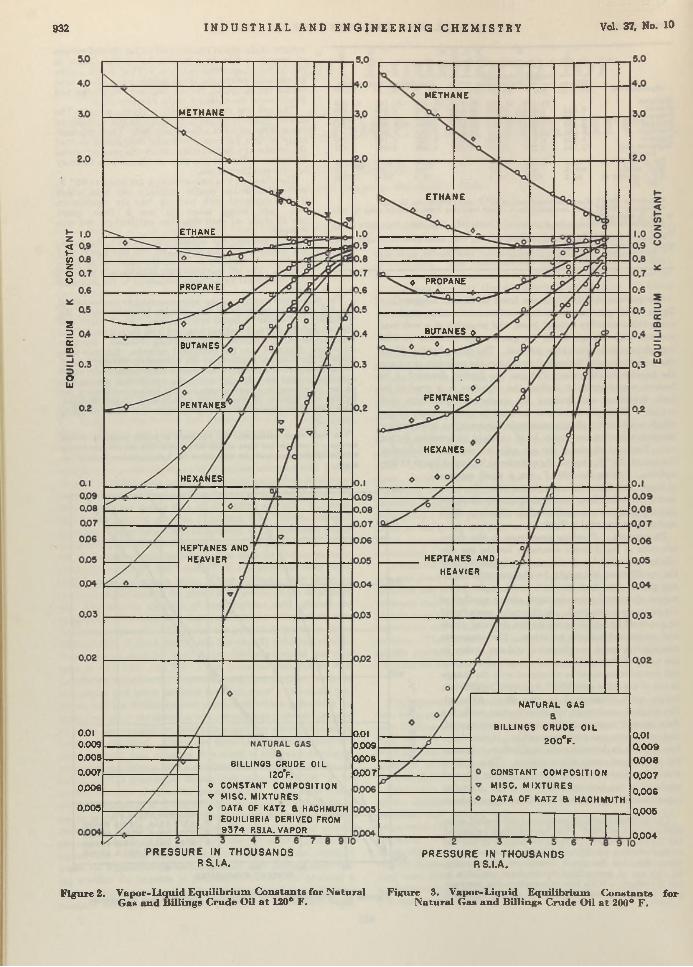
Figure 2. Vapor-Liquid E quilibrium C onstants for Natural Figure 3. Vapor-Liquid Equilibrium C onstants fo rGas and B illings Crude Oil a t 120° F. N atural Gas and B illings Crude Oil a t 200° F.
METHANE
METHANE
E T H A N E
ETHANE
« PROPANEPROPANE
BUTANES »
BUTANES
PENTANESPENTANES
HEXANES
HEXANES
HEPTANES AND
HEAVIER _ J HEPTANES ANO
HEAVIER
NATURAL 6A S
BILLINGS CRUDE OIL
2 0 0 ° F .0.010.0090.008
0.007
0.006
0.010.0090 00 8
0P 0T
0.010.0090.008
0.007
0.006
BILLINGS CRUDE OIL I20*F.
o CONSTANT COMPOSITION
v MISC. MIXTURES
0 DATA OF KATZ a HACHMUTH 0 EQUILIBRIA DERIVED FROM
9 3 7 4 P.S.I.A. VAPOR
CONSTANT COMPOSITION
M ISC. M IX T U RE S
DATA OF KATZ 6 HACHMUTH0.003 0.005
0.004
PRESSURE IN THOUSANDS P. S. I.A.
PRESSURE IN THOUSANOS P.S.I.A.
932 I N D U S T R I A L A N D E N G I N E E R I N G C H E M I S T R Y Vol. 37, No. 10
<*-wzoo
s2ocm
oÜJ

O ctober, 1945 I N D U S T R I A L A N D E N G I N E E R I N G C H E M I S T R Y 933
T a b l e II.
M ethaneE thanePropaneButanesPentanesHexanesH eptanes and heavier
M ol. weight Sp. gr. a t 60° F .
Moles sampled Cc. sampled Z = P V / N R T
P h a s e A n a l y s e s a n d E q u i l i b r i u m C o n s t a n t s f o r M i s c e l l a n e o u s M i x t u r e s o f N a t u r a l G a s a n d
B i l l i n g s C r u d e O i l
3201 Lb.“ . 120° F.Vapor
91.2563.5001.4841.2210 .7500.5671 . 2 2 21150.75331.1181107.80.795
Liquid
50.4544 .0342 .6823.4633.0833 .596
32 .6 882070.83260.1492
21 .31.174
5040 Lb., 120“ F. 5153 Lb., 120° F. 5153 Lb., 120° F.K
1.8090.8670 .5530 .3520 .2440 .1580.0374
Vapor
88.76)33 .9691.9141.3800 .7860 .6922 .4921360.77490.8495
6 2 .80 .958
Liquid
59.3654.3142.6212 .4281.7972 .025
27.4512270.84590.4140
47.8001.495
1.4800 .9 220 .7300 .56 80 .4380.3420.0908
Vapor
87.4423 .0801.5611.5361.1701.0204.1911320.77220.5981
43.970.974
Liquid K
82.971 1 .3883 .192 0 .9652 .340 0 .6672 .48 2 0 .6182 .090 0 .5602 .170 0 .470
24.760 0 .169196.5 0 .8293 0.3921
40.91 1.383
Vapor
86.7453.2941.7131.5261.1721.0414.5101300.77870.3044
21.320 .927
Liquid
62.2983 .4 682 .2282.6052.1812 .645
24.676196.50.831p0.2443
26.031.413
K1.3920.9500.7690.6090.5370.3940 .183
M ethane E thane Propane Butanes Pentanes HexaneßH eptanes and heavier
Mol. wt.Sp. gr. a t 60° F.
Moles sampled Cc. sampled Z = P V /N R T
° Pressure in pounds per square inch.
5173 Lb., 120° F. 6678 Lb., 120° F. 7968 Lb., 120° F. 9695 Lb.. 120° F.89.532 58.807 1.522 87.332 64.072 1.363 84.595 68.642 1.230 82.112 69.451 1.182
4 .185 4.616 0.907 3 .486 4.327 0 .806 3 .918 4.010 0.976 4.208 3 .972 0.9441.942 2.748 0.707 1.980 2 .486 0.796 1.933 2 .220 0 .8 68 2.034 2.059 0 .98 81.367 2 .448 0.559 1.605 21337 0 .68 8 1.629 1.989 0 .818 1.734 2.061 0.8410 .687 1.574 0 .437 0 .958 1.772 0.541 1.037 1.416 0.732 1.220 1.621 0.7630 .508 1.843 0 .276 0 .850 2.018 0.421 1.037 1.665 0 .662 1.111 1.879 0.5921.778 27.964 0.0636 3.790 22 .988 0.165 5.851 20.053 0.302 7 .582 18.958 0 .400143 254 154 254 171 229 186.5 2800.7805 0.8587 0.7918 0.8602 0.8041 0.8566 0.8205 0.88070 .758 0.1339 0.9104 0.3017 0.6895 0.3171 0.7012 0.2475
55.770 17.94 62 .38 3 3 .7 46.20 30.9 52.41 23.060.979 1.785 1.178 1.919 1.372 1.998 1 .862 2 .322
the small neck leading to the kettle of the column. At the end of sampling, the trap was heated to drive all components more volatile than heptane into the kettle of the analytical column.
Analysis of the sample was carried through the hexanes, and the residue of heptanes and heavier was condensed and weighed.
The molecular weight was determined by the cryoscopic method, using benzene saturated w ith water. Standardization of molecular weight determinations was carried out against pure iso-octane. The density of the residue was determined in calibrated pycnom- eters, and the remaining residue was sealed in bottles and retained for further examination.
EQUILIBRIUM CONSTANT DATA
The data determined a t 1200 F. for miscellaneous mixtures of natural gas and Billings crude oil are recorded in Table II. These constants and the other recorded phase d a ta show th a t variables other than tem perature, pressure, and general type of system—i.e., distillate or crude oil systems—are im portant in determining the value of the constant. These variables are the relative amounts of each component present in the mixture. In this connection the term “component” refers to each individual chemical component and, when used in this sense, the effect of the mixture of components commonly reported as heptanes and heavier may be properly understood.
M any investigators have pointed out th a t by the phase rule there are (re — 2) variables besides tem perature and pressure to be satisfied before a two-phase multicomponent system with n components is fixed. To fix all these variables would be virtually impossible in a practical problem; therefore it is desirable to find the minimum number of general properties th a t may be determined and readily measured in order to fix the equilibria with a reasonable degree of accuracy.
The first problem was to obtain a consistent set of equilibria for a system with a fixed composition. Accordingly, for each equilibrium, gas and oil having the compositions and properties given in Table I were combined in the ratio of 8.086 moles of gas per mole of oil. The equilibria determined for this constant composition system are recorded in Table I I I for 120° and 200° F. Plots of the equilibrium constants and related data were prepared to inspect the consistency of the data so th a t possible errors might be eliminated.
Figures 2 and 3 were prepared from equilibrium constant data. Curves were drawn through the data for the fixed composition system beginning a t 3000 pounds per square inch absolute for the 120° F. isotherm and 1000 pounds for the 200° F. isotherm. Those values found to be inconsistent were considered from the standpoint of whether the errors were introduced in charging the equilibrium cell, sampling, or analyzing. The related phase data
■<--------------------------------------------Figure 4. Phase Distribution at Equilibrium Pressure and Temperature
4000
II000.------------------------------------------MATERIAL BALANCE BASED ON
10000.
9000
£ 0 0 ° F, OI2 0°F. •12 0°F. *
t EQUILIBRIA DERIVED FROM
9 374 RS.I.A. VAPOR
METHANE HEPTANES AND HEAVIER
<> S♦ n
8000
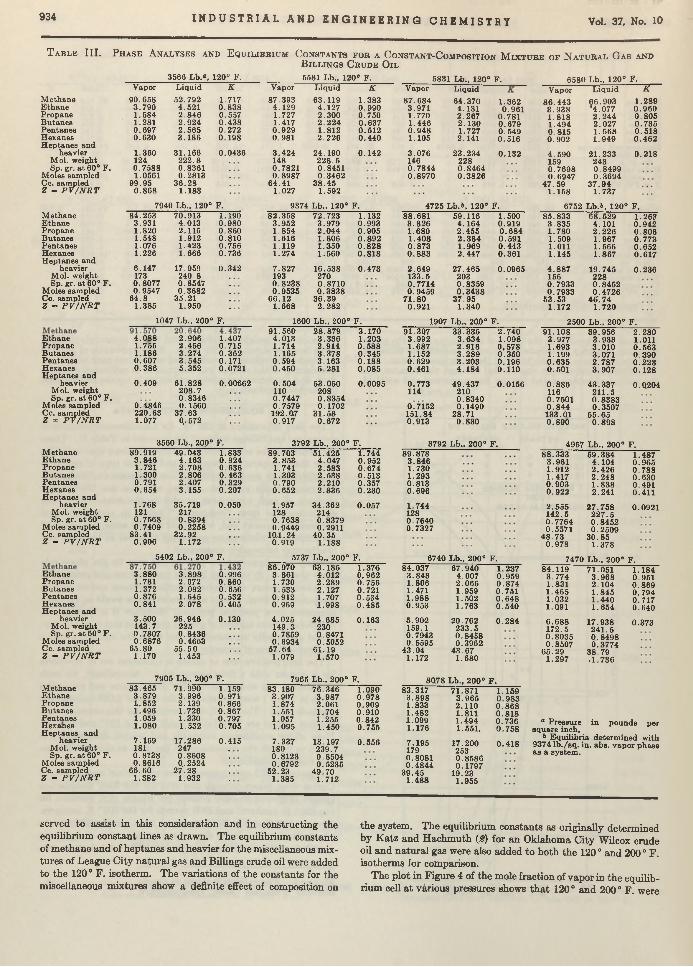
934 I N D U S T R I A L A N D E N G I N E E R I N G C H E M I S T R Y Vol. 37, No. 10
T a b l e I I I . P h a s e A n a l y s e s a n d E q u i l i b r i u m : C o n s t a n t s f o r a C o n s t a n t - C o m p o s i t i o n M i x t u r e o f N a t u r a l G a s a n d
B i l l i n g s C r u d e O i l
M ethane E th an e P ropane B utanes P entanes Hexanes H ep tanes and
heavier Mol. weight Sp. gr. a t 60° F .
M oles sampled Cc. sampled Z = P V / N R T
E th an e Propane B utanes P entanes Hexanes H eptanes and
heavier Mol. weight Sp. gr. a t 60° F.
Moles sampled Cc. sampled Z = P V /N R T
3566 Lb.“ , 120° F.Vapor L iquid K
90 .658 52 .792 1.7173 .790 4 .521 0 .83 81 .584 2 .8 46 0 .5571.281 2 .924 0 .4380 .697 2 .565 0 .2720 .630 3 .1 8 6 0 .198
5581 Lb., 120° F.Vapor L iquid K
87.393 63 .119 1 .3834 .129 4 .127 0 .9901.727 2 .300 0 .7501.417 2 .2 2 4 0 .6370 .9 2 9 1 .812 0 .5120.981 2 .2 2 6 0 .440
5831 Lb., 120° F.Vapor Liquid
8 7 .68 4 64 .370 1 .3623 .971 4 .131 0 .9611 .770 2 .267 0 .7811 .446 2 .1 30 0 .6790 .9 4 8 1 .727 0 .5491 .105 2 .141 0 .516
6580 Lb., 120° F. Vapor L iquid K
8 6 .44 3 66 .903 1 .2893 .9 3 8 *4.077 0 .9 6 01 .818 2 .2 4 4 0 .8051 .494 2 .0 27 0 .7350 .815 1 .56 8 0 .5180 .902 1 .949 0 .4 6 2
1.3601240.75881.0561
99.950.868
31.166222.80.83610.2813
3 6 .281.183
0.0436 3 .4 2 4 24 .190148 2 28 .50 .7821 0.84510 .8 987 0.3462
64.41 3 8 .451.027 1.592
0 .142 3 .076 23 .234146 2280 .7844 0 .84640.8970 0 .3826
0 .132 4 .590 21 .233159 2430 .7698 0 .84990 .6947 0 .3694
4 7 .5 9 3 7 .9 41 .158 1 .737
0 .218
7940 Lb., 120° F. 9374 Lb., 120° F. 4725 L b > , 120° F. 6752 Lb.», 120° F.M ethane 84.253 70.913 1.190 82.358 72.723 1.132 88.681 59.116 1.500 ' 85 .833 68 .529 1.263Ethane 3.931 4.013 0 .980 3 .952 3 .979 0 .993 3 .826 4 .164 0 .919 3 .835 4.101 0 .942P ropane 1.820 2.115 0 .860 1.854 2 .044 0 .905 1.680 2 .455 0 .6 8 4 1 .780 2 .226 0 .806B utanes 1 .548 1.912 0 .810 1.616 1 .806 0 .8 9 2 1 .408 2 .38 4 0 .591 1.509 1.967 0.773P entanes 1.076 1.423 0.756 1.119 1.350 0 .8 2 8 0 .873 1.969 0 .443 1.011 1.566 0 .652Hexanes 1.226 1.666 0.736 1.274 1 .560 0 .818 0 .883 2 .447 0 .361 1.145 1.867 0 .617H eptanes and
heavier 6 .147 17.959 0 .342 7 .827 16.538 0 .473 2 .649 27.465 0.0965 4 .8 8 7 19.745 0 .236M ol. weight 173 240.8 193 270 133.5 203 156 228Sp. gr. a t 60° F. 0 .8077 0.8547 0 .8 238 0 .8710 0.7714 0.8359 0.7933 0 .8452
M oles sampled 0.9547 0.3682 0.9535 0 .3838 0.9459 0 .3438 0,7933 0 .4726Cc. sampled 64 .8 35.21 66 .12 36.39 71 .80 37 .95 53.53 4 6 .7 4Z = P V /N R T 1.385 1.950 1.668 2 .282 0 .921 1.340 1.172 1 .720
1047 Lb., 200° F. 1600 Lb., 200° F. 1907 Lb., 200° F. 2500 Lb., 200° F.
4 .0 881.7551.1860 .6070 .386
0 .409
0.4846220.631.077
2.9062.4563 .2743 .5455 .352
61.828208.70.83460.1560
37.63 0.. 572
1.4070.7150 .3620.1710.0721
0.00662
91 .560 28 .879 3 .1704 .013 3 .336 1 .2031.714 2 .914 0 .5881 .165 3 .3 7 8 0 .3450 .594 3 .163 0 .1880 .450 5 .281 0 .085
0 .504 53.050110 2080 .7447 0.83540 .7579 0.1702192.0,7 31 .580 .917 0 .672
0.0095
91.307 33 .335 2 .7403 .9 92 3 .63 4 1 .0981 .687 2 .918 0 ,5781 .152 3 .2 8 9 0 .3500 .6 29 3 .2 03 0 .1960 .461 4 .1 84 0 .110
0.773114
49.437 2100 .8340
0.7152 0.1490151.84 28.710 .913 0 .830
0.0156
91 .108 39 .956 2 .2803 .977 3 .933 1.0111 .693 3 .0 1 0 0 .5631 .199 3 .071 0 .3900 .6 35 2 .787 0 .2280 .501 3 .907 0 .128
0 .8 8 6 43 .337116 211.50.7501 0 .83830 .8 4 4 0.3507133.01 55 .650 .8 90 0 .8 9 8
0.Q204
3560 Lb., 20.0° F. 3792 Lb., 200° F. 3792 Lb., 200° F .M ethane 89.919 49.043 1.833 89.703 51.425 1.744 89.878E th an e 3 .846 4 .163 0 .924 3 .853 4 .047 0 .952 3 .846P ropane 1.721 2 .708 0 .636 1.741 2 .583 0 .674 1.730B utanes 1 .300 2 .806 0 .463 1.303 2 .538 0 .513 1.293P en tanes 0 .791 2 .407 0 .329 0 .790 2.210 0 .357 0 .813Hexanes 0 .654 3.155 0.207 0.652 2 .836 0 .230 0 .696H eptanes and
heavier 1 .768 35.719 0 .050 1.957 34 .362 0.057 1 .744Mol. weight 121 217 128 214 128Sp. gr. a t 60° F. 0.7568 0.8394 0.7638 0.8379 0.7640
Moles sampled 0.7409 0 .2258 0.9449 0.2911 0.7327Cc. sampled 83.41 32.92 10,1.24 40.35Z = P V /N R T 0 .906 1.172 0.919 1.188
5402 Lb., 200° F. 5737 Lb., 200° F. 6740 Lb., 200° F.
4957 Lb.. 200° F.
E thane Propane Butanes Pentanes Hexanes H eptanes and
heavier Mol. weight Sp. gr. a t 60° F.
Moles sampled Cc. sampled Z = P V /N R T
3 .8801.7811.3720 .8760.841
3.500143.70.78070.6876
65.801.170
3 .8982.0722.0921.6452.078
26.9462250.84360.4663
55 .5 01.453
0 .9960 .8600 .6560 .532Ó.405
0.130
86 .970 63 .185 1 .3763 .861 4 .012 0 ,9621.730 2 .28 9 0 .7561.533 2 .127 0.7210 .912 1.707 0 .5340 .969 1 .998 0 .485
4 .025 24 .685149.3 2300.7859 0.84710.6934 0.5052
57.64 61.191.079 1.570
0 .163
84.037 67 .940 1.2373 .84 3 4 .007 0 .9591 .806 2 .066 0 .8741.471 1 .959 0 .7511 .988 1 .502 0 .6480 .953 1.763 0 .540
5 .902 20 .762159.1 233.50.7943 0 .84580.5595 0 .3962
43 .04 4 3 .671.172 1 .680
0 .28 4
88.333 59.384 1.4873 .961 4 .104 0 .9651.912 2 .4 26 0 .78 81.417 2 .24 8 0 .63 00.903 1 .838 0.4910 .922 2.241 0.411
2.555 27 .758 0.0921142.5 22 7 .50.7764 0 .84520.5571 0 .2509
48 .73 3 0 .850 .978 1.378
7470 Lb., 200° F. 84 .119 71.051 1 .184
3 .774 3 .9 6 8 0.9511.831 2 .104 0 .8691 .46 5 1 .845 0 ,7941.032 1 .440 0 .7171.Q91 1 .654 0 .640
6 .68 8 17.938172 .5 241 .50 .8035 0 .84980.8507 0.3774
6 5 .29 38 .791 .29 7 .1 .736
0.373
7905 Lb., 200° F.M ethane E thane Propane Butanes Pentanes Hexanes H eptanes and
heavier Mol. weight Sp. gr. a t 60° F.
Moles sampled Cc. sampled Z - P V /N R T
7965 Lb., 200° F. 8Q78 Lb., 200° F .83 .465
3 .8791.8521.4961.0591 .080
71.9903.9962.1391.7261.3301.532
1.1590.9710.8660 .8670.7970 .705
83.1803.9071.8741.5511.0571.095
76.3463 .9872.0611.7041.2551.450
1.0900 .9780 .9090 .9100.8420.755
83.3173 .8981.8331.4821.0991.176
71.8713 .9652 .1101.8111 .4941.551.
1 .1590 .9 830 .8 6 80 .8180 .7360 .7 58
7.1691810.81380.8616
66.601.382
17.286 247 0 .8608 0, 2524
27 .28 1.932
0 .415 7 .3371800.81230.6792
52.231.385
13.197239.70.85040.5235
49.701.712
0.556 7.1951790.80810 .4844
39.451 .488
17.2002530.85860.1797
19.231.955
0 .418
“ Pressure in pounds per square inoh.
6 E quilibria determ ined with 9374 lb . / sq . in. abs. v apor phase as a system.
served to assist in this consideration and in constructing the equilibrium constant lines as drawn. The equilibrium constants of m ethane and of heptanes and heavier for the miscellaneous mixtures of League City natural gas and Billings crude oil were added to the 120 0 F. isotherm. The variations of the constants for the miscellaneous mixtures show a definite effect of composition on
the system. The equilibrium constants as originally determined by K atz and H achm uth (£) for an Oklahoma C ity Wilcox crudeoil and natural gas were also added to both the 120° and 200° F. isotherms for comparison.
The plot in Figure 4 of the mole fraction of vapor in the equilibrium cell a t various pressures shows th a t 120 ° and 2000 F. were
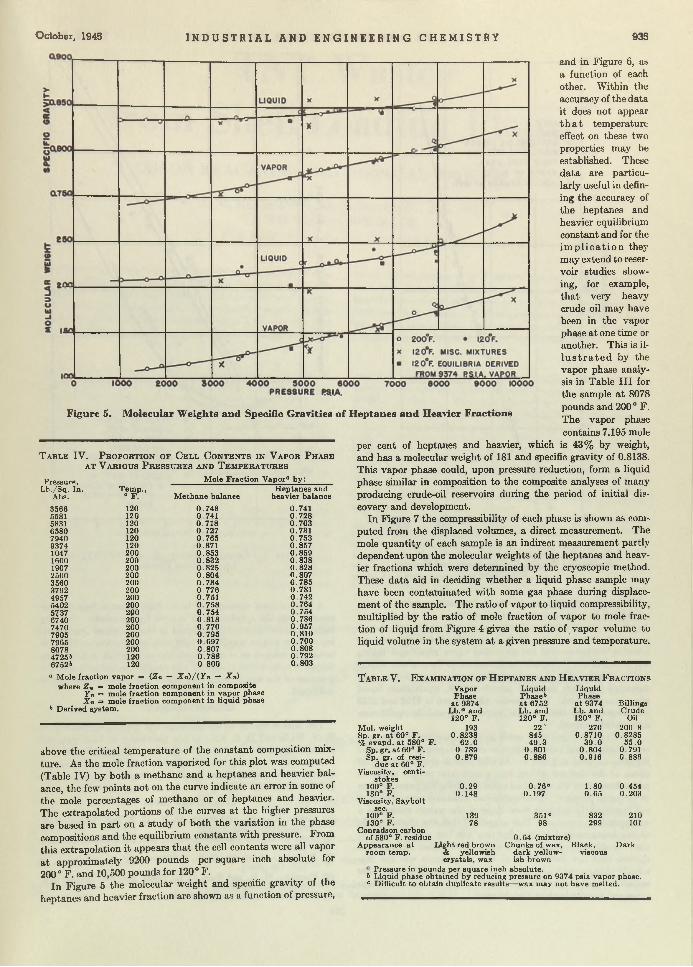
O ctober, 1945 I N D U S T R I A L A N D E N G I N E E R I N G C H E M I S T R Y 935
Figure 5. M olecular W eights and Specific Gravities o f H eptanes and Heavier Fractions
T a b l e I V . P r o p o r t i o n o f C e l l C o n t e n t s i n V a p o r P h a s e a t V a r i o u s P r e s s u r e s a n d T e m p e r a t u r e s
Pressure, Mole Fraction Vapor® by:Lb./Sq. In. Temp., H eptanes and
Abs. 0 F M ethane balance heavier balance
3566 120 0.748 0.7415581 120 0.741 0.7285831 120 0 .718 0 .7036580 120 0.727 0.7317940 120 0.765 0.7539374 120 0.871 0.8571047 200 0.853 0.8591600 200 0.832 0.8381907 200 0.825 0.8282500 200 0.804 0.8073560 200 0.784 0.7853792 200 0 .776 0.7814957 200 0.751 0.7425402 200 0 .758 0.7645737 290 0.754 0.7546740 200 0.818 0.7867470 200 0 .770 0 .9577905 200 0.795 0.8107965 200 0.697 0.7008078 200 0.807 0.80847256 120 0.788 0.7926752 b 120 0.800 0.803
a Mole fraction vapor ■ ■ (Zn — X n) / (Y n — Xn) where Zn =* mole fraction com ponent in composite
Yn = mole fraction com ponent in vapor phase Xn =* mole fraction com ponent in liquid phase
b Derived system.
above the critical tem perature of the constant composition mix- ture. As the mole fraction vaporized for this plot was computed (Table IV) by both a m ethane and a heptanes and heavier balance, the few points not on the curve indicate an error in some of the mole percentages of m ethane or of heptanes and heavier. The extrapolated portions of the curves a t the higher pressures are based in part on a study of both the variation in the phase compositions and the equilibrium constants with pressure. From this extrapolation it appears th a t the cell contents were all vapor a t approximately 9200 pounds per square inch absolute for 2 0 0 ° F. and 10,500 pounds for 120° F.
In Figure 5 the molecular weight and specific gravity of the heptanes and heavier fraction are shown as a function of pressure,
and in Figure 6, a« a function of each other. Within the accuracy of the data it does not appear t h a t tem perature effect on these two properties may be established. These da ta are particularly useful in defining the accuracy of the heptanes and heavier equilibrium constant and for t he im p l ic a t io n they may extend to reservoir studies showing, for example, th a t very heavy crude oil may have been in the vapor phase a t one time or another. This is ¡1- l u s t r a t e d by the vapor phase analysis in Table I I I for the sample a t 8078 pounds and 200 ° F. The vapor phase contains 7.195 mole
per cent of heptanes and heavier, which is 43% by weight, and has a molecular weight of 181 and specific gravity of 0.8138. This vapor phase could, upon pressure reduction, form a liquid phase similar in composition to the composite analyses of many producing crude-oil reservoirs during the period of initial discovery and development.
In Figure 7 the compressibility of each phase is shown as computed from the displaced volumes, a direct measurement. The mole quantity of each sample is an indirect measurement partly dependent upon the molecular weights of the heptanes and heavier fractions which were determined by the cryoscopic method. These data aid in deciding whether a liquid phase sample may have been contaminated with some gas phase during displacement of the sample. The ratio of vapor to liquid compressibility, multiplied by the ratio of mole fraction of vapor to mole fraction of liquid from Figure 4 gives the ratio o f , vapor volume to liquid volume in the system a t a given pressure and temperature.
T a b l e V . E x a m i n a t i o n o f H e p t a n e s a n d H e a v i e r F r a c t i o n s
Vapor Liquid LiquidPhase Phase b Phase
a t 9374 a t 6752 a t 9374 BillingsLb.° and Lb. and Lb. and Crude120° F. 120° F. 120° F. Oil
Mol. weight 193 22 "■ 270 200.8Sp. gr. a t 60° F. 0.8238 845 0.8710 0.8285% evapd. a t 580° F . 62 .0 49 .3 39 .0 55 .0
Sp. gr. a t 60° F. 0.789 0.801 0.804 0.791Sp. gr. of resi 0 .879 0.886 0.916 0.886
due a t 60° F.Viscosity, centi-
stokes100° F. 0 .29 0.76® 1.80 0.454130° F. 0 .148 0.197 0.65 0.203
Viscosity, Sayboltsec.
100° F. 139 351c 832 210130° F. 78 98 299 101
Conradson carbonof 580° F. residue 0 .64 (mixture)
Appearance a t L ight red brown Chunks of wax, dark yellowish brown
Black, Darkroom temp. & yellowish
crystals, waxviscous
1 Pressure in pounds per square inch absolute.ressure o . _-w ax may no t have melted.
b Liquid phase obtained by reducing pressure on 9374 psia vapor phase. c Difficult to obtain duplicate results—
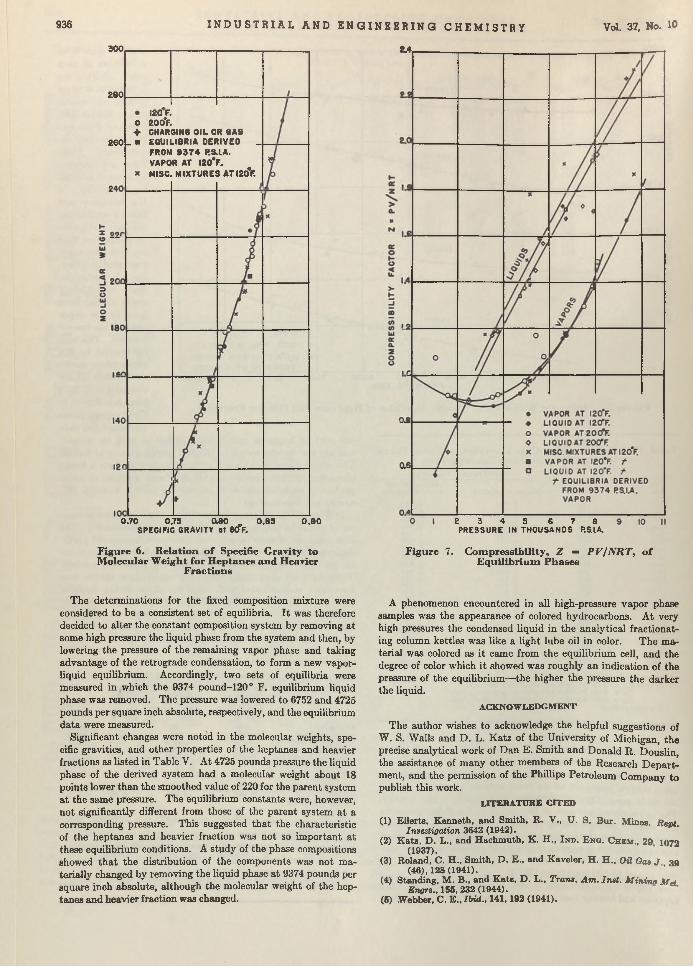
936
300r
2 8 0 .
I N D U S T R I A L A N D E N G I N E E R I N G C H E M I S T R Y
i.4
Vol. 37, No. 10
o ♦
2601- ■
120 F.200°F.CHARGING OIL OR 8A9 EQUILIBRIA DERIVED FROM 9 3 7 4 P.&LA. VAPOR AT I20*F.MISC. MIXTURES ATI20*F.
0 .70 0.75 0 8 0 „ 0 .8 5SPECIFIC GRAVITY ot 6 0 F.
0 . 9 0
Figure 6 . R elation o f Specific Gravity to M olecular W eight for H eptanes and Heavier
Fractions
2 3 4 5 6 7 8PRESSURE IN THOUSANDS P.SIA.
Figure 7. C om pressib ility , 2 = P V /N R T , o f E quilibrium P hases
The determinations for the fixed composition mixture were considered to be a consistent set of equilibria. I t was therefore decided to alter the constant composition system by removing a t some high pressure the liquid phase from the system and then, by lowering the pressure of the remaining vapor phase and taking advantage of the retrograde condensation, to form a new vapor- liquid equilibrium. Accordingly, two sets of equilibria were measured in which the 9374 pound-120 ° F. equilibrium liquid phase was removed. The pressure was lowered to 6752 and 4725 pounds per square inch absolute, respectively, and the equilibrium d ata were measured.
Significant changes were noted in the molecular weights, specific gravities, and other properties of the heptanes and heavier fractions as listed in Table V. At 4725 pounds pressure the liquid phase of the derived system had a molecular weight about 18 points lower than the smoothed value of 220 for the parent system a t the same pressure. The equilibrium constants were, however, not significantly different from those of the parent system a t a corresponding pressure. This suggested th a t the characteristic of the heptanes and heavier fraction was not so im portant a t these equilibrium conditions. A study of the phase compositions showed th a t the distribution of the components was not m aterially changed by removing the liquid phase a t 9374 pounds per square inch absolute, although the molecular weight of the heptanes and heavier fraction was changed.
A phenomenon encountered in all high-pressure vapor phase samples was the appearance of colored hydrocarbons. A t very high pressures the condensed liquid in the analytical fractionating column kettles was like a light lube oil in color. The m aterial was colored as it came from the equilibrium cell, and the degree of color which it showed was roughly an indication of the pressure of the equilibrium—-the higher the pressure the darker the liquid.
ACK NO W LEDG M ENT
T he author wishes to acknowledge the helpful suggestions of W. S. Walls and D. L. Katz of the University of Michigan, the precise analytical work of D an E. Sm ith and Donald R. Douslin, the assistance of m any other members of the Research D epartm ent, and the permission of the Phillips Petroleum Com pany to publish this work.
LITERATURE C ITED
(1) Eilerts, K enneth, and Sm ith, R . V., U. S. Bur. Mines. Revt.Investigation 3642 (1942).
(2) K atz, D. L., and H achm uth, K . H ., I n d . E n g . C hem ., 29 1072(1937).
(3) Roland, C. H ., Sm ith, D . E „ and Kaveler, H . H „ Oil Gas J 39(46), 128 (1941).
(4) Standing, M . B., and K atz, D . L., Tran». A m . In st. M in in a MelEngrs., 155, 232 (1944).
(5) .Webber. C. E „Ibid., 141 ,192 (1941).
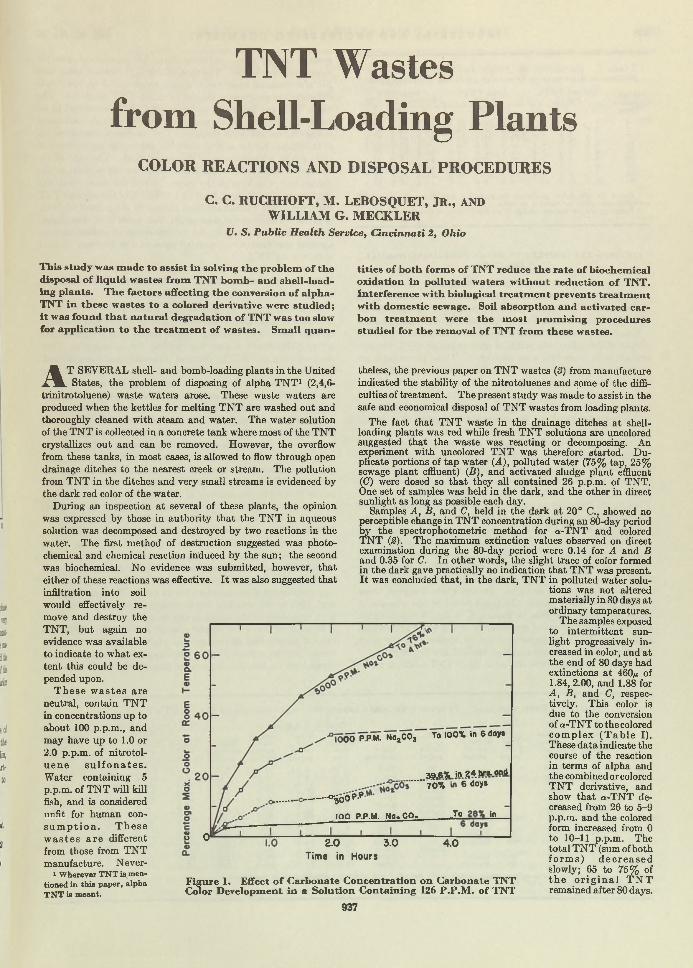
TNT Wastes from Shell-Loading Plants
COLOR REACTIONS AND DISPOSAL PROCEDURES
C. C. RUCHHOFT, M. LeBOSQUET, J r ., AND WILLIAM G. MECKLER
U. S . P u b lic H e a lth Service, C in c in n a ti 2, O hio
This study was m ade to assist in solving th e problem o f the disposal o f liqu id w astes from TNT bom b- and shell-load ing p lants. T he factors affecting th e conversion o f alpha- TNT in these w astes to a colored derivative were studied; i t was found th a t natural degradation o f TNT was too slow for application to th e treatm ent o f w astes. Sm all quan
titie s o f bo th form s o f TNT reduce th e rate o f biochem ical oxidation in polluted waters w ithou t reduction o f TNT. Interference w ith biological treatm ent prevents treatm ent w ith dom estic sewage. Soil absorption and activated carbon treatm ent were th e m ost prom ising procedures studied for th e rem oval o f TNT from these wastes.
A T SEVERAL shell- and bomb-loading plants in the United States, the problem of disposing of alpha T N T 1 (2,4,6-
trinitrotoluene) waste waters arose. These waste waters are produced when the kettles for melting T N T are washed out and thoroughly cleaned with steam and water. The w ater solution of the T N T is collected in a concrete tank where most of the T N T crystallizes out and can be removed. However, the overflow from these tanks, in most cases, is allowed to flow through open drainage ditches to the nearest creek or stream. The pollution from T N T in the ditches and very small streams is evidenced by the dark red color of the water.
During an inspection a t several of these plants, the opinion was expressed by those in authority th a t the T N T in aqueous solution was decomposed and destroyed by two reactions in the water. The first m ethod of destruction suggested was photochemical and chemical reaction induced by the sun ; the second was biochemical. No evidence was submitted, however, th a t either of these reactions was effective. I t was also suggested that infiltration into soil would effectively remove and destroy the TN T, but again no evidence was available to indicate to w hat exten t this could be depended upon.
T h e s e w a s te s a re neutral, contain TN T in concentrations up to about 100 p.p.m., and may have up to 1.0 or 2.0 p.p.m. of nitrotol- u e n e s u l f o n a te s .W ater containing 5 p.p.m. of T N T will kill fish, and is considered unfit, for human cons u m p t io n . T h e s e w a s te s a r e different from those from T N T manufacture. Never-
i W herever T N T is mentioned in th is paper, alpha TNT is meant.
theless, the previous paper on T N T wastes (3) from manufacture indicated the stability of the nitrotoluenes and some of the difficulties of treatm ent. The present study was made to assist in the safe and economical disposal of T N T wastes from loading plants.
The fact th a t T N T waste in the drainage ditches a t shell- loading plants was red while fresh T N T solutions are uncolored suggested th a t the waste was reacting or decomposing. An experiment with uncolored TN T was therefore started. Duplicate portions of tap water (A), polluted water (75% tap, 25% sewage plant effluent) (B ), and activated sludge plant effluent (C) were dosed so th a t they all contained 26 p.p.m. of TNT. One set of samples was held in the dark, and the other in direct sunlight as long as possible each day.
Samples A , B, and C, held in the dark a t 20° C., showed no perceptible change in T N T concentration during an 80-day period by the spectrophotometric method for a-TN T and colored T N T (2). The maximum extinction values observed on direct examination during the 80-day period were 0.14 for A and B and 0.35 for C. In other words, the slight trace of color formed in the dark gave practically no indication that T N T was present. I t was concluded that, in the dark, T N T in polluted water solu
tions was not altered materially in 80 days a t ordinary temperatures.
The samples exposed to interm ittent sunlight progressively increased in color, and a t the end of 80 days had extinctions a t 460yu of1.84, 2.00, and 1.88 for A , B, and C, respectively. This color is due to the conversion of a-TN T to the colored co m p le x (T a b le I). These data indicate the course of the reaction in terms of alpha and the combined or colored T N T derivative, and show th a t a-TN T decreased from 26 to 5-9 p.p.m. and the colored form increased from 0 to 10-11 p.p.m. The to tal T N T (sum of both fo rm s ) d e c re a s e d slowly; 65 to 75% of th e o r ig in a l T N T remained after 80 days.
0 0 P PM. No2COj To 100% in 6 doy*
3 9 ,6 % In ? 4 hr»..ond
......70% 6 doy»
-------^ 0 0 P -P
IPO P.P.M. No. CO. -To in
S O ' 2.0 3.0Time in Hours
4.0
Figure 1. Effect o f Carbonate C oncentration on Carbonate TNT Color D evelopm ent in a Solution C ontaining 126 P.P.M . o f TNT
937

938 I N D U S T R I A L A N D E N G I N E E R I N G C H E M I S T R Y Vol. 37, No. 10
T a b l e I . E s t i m a t e s o f A l p h a a n d C o l o r e d T N T i n S o l u t i o n s E x p o s e d t o S u n l i g h t a t R o o m T e m p e r a t u r e
SunlightExposure,
Colored T N T “, P .P .M .
A lpha TNT&, P .P .M .
T ota l T N T Rem aining, P .P .M .
D ays A B C A B C A B C
0 0 0 0 26.1 2 5 .5 2 6 .5 26 .1 25 .5 2 6 .52 1 .7 1 .7 2 .3 2 5 .2 2 4 .5 2 5 .4 2 6 .9 26 .2 2 7 .77 2 .3 2 .2 3 .7 2 5 .0 21.1 19.4 2 7 .3 23 .3 23.1
13 3 .5 3 .7 4 .4 19.4 18.8 18.3 2 2 .9 2 2 .5 2 2 .720 4 .4 4 .5 5 .2 20 .9 18.8 16.8 2 5 .3 23 .3 2 2 .028 4 .1 4 .8 5 .9 2 0 .0 17.2 14.2 24 .1 2 2 .0 20.135 6 .5 5 .9 6 .0 17.2 16.0 14.2 2 3 .7 2 1 .9 2 0 .249 7 .1 9 .1 9 .4 14.9 11 .8 12 .0 2 2 .0 2 0 .8 2 1 .480 10.0 11.0 10.7 9 .4 5 .6 6 .7 19.4 16.6 17.4
° Based on th e color produced on s tand ing an d th e ca rbonate T N T complex extinction correlation a t 460*i.
I Based on the ne t extinction due to sulfite-hydroxide t re a tm en t a t 505p.
COLORED T N T COM PLEX IN W ATER CONTAINING NORM AL CARBONATE
Data on the effect of carbonate concentration, tem perature, and light upon the formation of colored T N T derivative are given in Table II. The term “equivalent extinction” is used for the extinction observed a t a dilution multiplied by the dilution factor.
Using the maximum extinction values obtained a t room tem peratures throughout the period of observation as 100%, the percentage color intensities were calculated. These percentages are plotted to show the effects of various factors in Figures 1,2, and 3. Figure 1 illustrates the maximum color developed a t room tem perature in the presence of ordinary daylight (but no direct sunlight) for 5 hours w ith variations in carbonate concentration; it demonstrates the great importance of carbonate or a similar constituent in the solution for rapid color formation.
The four lower curves of Figure 2 show the effect of temperature on color formation in the T N T solution containing 300 p.p.m. of sodium carbonate. Unfortunately the light conditions were not similar for all of these samples. H and I were held in the dark; D, J , K , and M were held in daylight in the laboratory. Even so, the tem perature was the most im portant factor and gave color results increasing w ith tem perature for the first two hours.
The lower curve of Figure 3 demonstrates th a t in the absence of sodium carbonate the effect of sunlight was negligible. W ith solutions containing 300 and 1000 p.p.m. of sodium carbonate, the curves showing the ra te of color formation in sunlight are more erratic and have minor fluctuations due apparently to changes in intensity of sunlight. On the whole, however, these curves follow fairly closely the trend noted in the absence of direct sunlight. The data in Figures 1, 2, and 3 indicate th a t tem perature and chemical constituents of the w ater and stream bottom are the most im portant factors involved in the color reaction in T N T solutions and th a t sunlight is secondary.
To follow the progressive change in dilute T N T solutions under
some of th e pertinent conditions of th e last experiment, another experiment was set up. The d a ta (Table I I I ) indicate again th a t pH and chemical constituents in the w ater and li h t conditions influence the progressive change in dilute T N T solutions. The alpha T N T was converted to the colored addition product in all cases, and the ra te of this reaction increased w ith the carbonate concentration and w ith sunlight. The maximum concentration of the colored form was produced after one day in the presence of 1000 p.p.m . of carbonate in this experiment. The ra te of reduction in to ta l T N T in this experiment was no t so great as the change from one form to the other. W hen the experim ent was term inated after 36 days, from 53.1 to 73.0% of the original T N T remained in the various portions, largely as the colored addition product. This demonstrates again th a t these slow decomposition reactions produced by the concentration of sodium carbona te used here cannot be depended upon as a satisfactory method of destroying TN T.
EFFEC T O F T N T ON N A TU R A L BIOCHEM ICAL PU R IFIC A TIO N IN STREA M S
An earlier study (3) showed th a t wastes from T N T manufacture in considerable concentration had no B.O.D. and adversely affected the B.O.D. reaction. These earlier d a ta were obtained by crude m ethods before the m ethod for determ ining TN T concentration and B.O.D. reaction separately had been devised Consequently, a num ber of experiments were performed on sewage dilutions to determ ine the extent of the interference of small quantities of T N T on the natural biochemical oxidation of organic m atter. Table IV lists the d a ta obtained in one experim ent w ith concentrations of 1.17 to 80 p.p.m . of T N T in 1% sewage in a mineralized dilution w ater (1). The B.O.D. data indicate th a t all concentrations of T N T down to 1.17 p.p.m. had a decided retarding effect on th e observed B.O.D. throughout the 6-day observation period. The m ean percentage of the normal B.O.D. th a t can be expected w ith short incubation periods (up to 6 days) in the presence of T N T has been calculated from the data. In dilutions having oxygen depletions up to about4 p.p.m ., 1 to 2 p.p.m . of T N T reduce the B.O.D. values 15 to 30% below normal. As the T N T concentration increases, a smaller percentage of the normal B.O.D. can be expected. With 80 p.p.m. of TN T, only 44% of the normal B.O.D. was obtained.
Although some fluctuations in T N T concentration are shown during the incubation period, 60 to 90% of the initial concentration remained in these samples after 25 days. These d a ta suggest th a t T N T is not attacked biochemically to any appreciable extent, regardless of the initial concentration.
Because of the great im portance of the B.O.D. reaction in natural purification in stream s, the above experim ent was also carried out on colored T N T . The oxygen depletions obtained throughout the incubation period in this experiment decreased as
T a b l e II . E f f e c t o f L i g h t , T e m p e r a t u r e , a n d C a r b o n a t e C o n c e n t r a t i o n o n C o l o r e d T N T F o r m a t i o n
Tem p, of Sample, 0 C.E qu ivalen t E x tinc t io n0 T N T Concn., P .P .M .
F inalvation bonate F irs t Rem ain during for obser Original Colored UncolPeriod, Added, 2-31/2 der of Entire Light first entire vation uncolored T N T ored
Sample Days P .P .M . hours period period Condition 3 hr. period period a - T N T complex a - T N T
A 37 None 20 D ark 0 .1 0 0 .1 5 0 .1 5 126 0 .5 125.5B 37 None Room& Sun 0 .10 9 .0 9 .0 192 4 .3 147.0C 37 100 Room*» Room 1.32 13.6 13 .6 192 9 5 .5 6 1 .0D 32 300 Room*» Room 5.05 2 0 .2 2 0 .2 126 8 0 .8 2 4 .8E 32 300 Room*» Sun 5.45 21 .6 2 1 .6 126 86 .0 18.9F 32 1000 Room& Room 9 .2 5 2 7 .5 2 1 .8 126 88 .0 4 .6G 32 1000 R oo m 6 Sun 10.75 2 6 .0 21 .4 126 80 .2 10.0H 31 300 10-12 D ark 2 .8 0 17.7 17.7 126 7 2 .9 50.1I 31 300 37 D ark 4 .7 0 19.2 19.2 126 73.7 17 .8J 29 300 50 R oom 6 Room 9 .1 2 0 .8 2 0 .8 126 78.9 16.8K 29 300 80 Room*» Room 2 4 .0 23 .4 23 .4 126 88 .5 18.1L 26 5000 R oo m 6 Room 17.4 2 0 .0 2 0 .0 126 7 7 .5 8 .5M 27 1000 80 R oom 6 Room 3 3 .5 3 3 .5 25 .0 126 95 .7 11.6N 27 2000 80 Room*» Room 3 1 .0 3 1 .0 2 6 .0 126 9 7 .5 11.6
° E X dilution fac tor (for sam; b Varied from abo u t 15° to 26
ijjle as resu lt of t re a tm en t described and w ithout sulfite-hydroxide trea tm en t) .
To ta l T N T in
soln.
126151.3156.5105.6 104.9
9 2 .6 9 0 .2
123.0 91 .595 .7
106.6 86.0
107.6109.1
Original T N T Accounted
for, %
10078 .4 81 .18 3 .8 8 3 .37 3 .57 1 .69 7 .6 72.6-7 5 .98 4 .6 6 8 .2 85.186.6
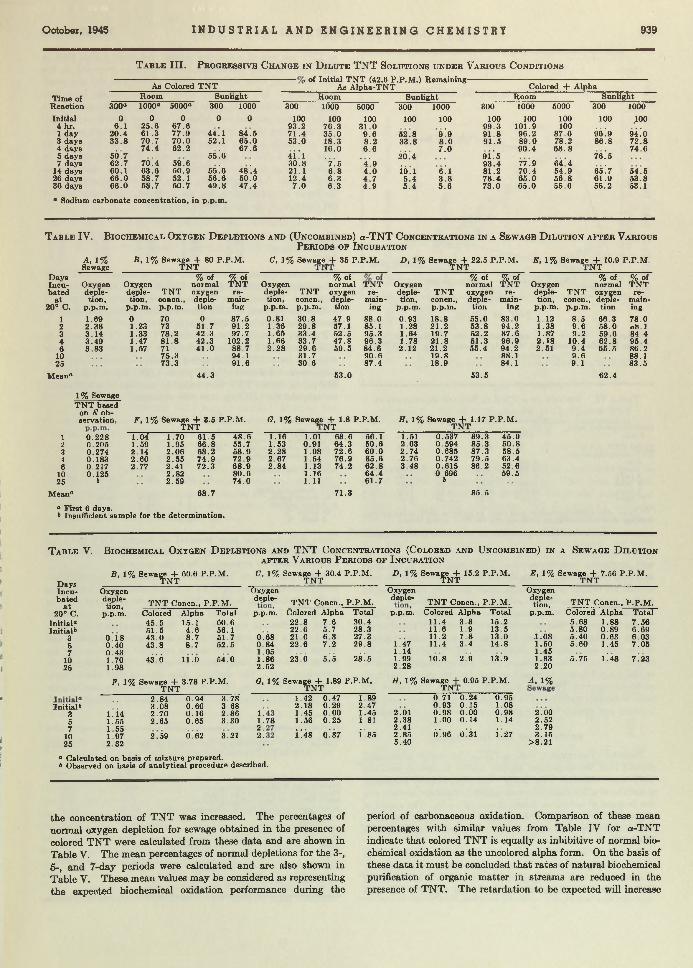
O ctober, 1945 I N D U S T R I A L A N D E N G I N E E R I N G C H E M I S T R Y 939
T a b l e I I I . P r o g r e s s i v e C h a n g e i n D i l u t e T N T S o l u t i o n s u n d e r V a r i o u s C o n d i t i o n s
As Colored T N T, of Initial T N T (42.6 P .P .M .) R em aining- ________As A lpha-T N T _______ Colored + Alpha
a Sodium carbonate concentration, in p.p.m.
Time of Room Sunlight Room Sunlight Room SunlightReaction 300“ 1000« 5000“ 300 1000 300 1000 5000 300 1000 300 1000 5000 300 1000
Initial 0 0 0 0 0 100 100 100 100 100 100 100 100 100 .1004 hr. 6 .1 25 .6 67 .6 93.2 76 .3 31 .0 99.3 101.9 1001 day 20.4 61 .3 77 .9 44 ! l 84 .5 71 .4 3 5 .0 9 .6 52.8 9Í9 9 1 .8 96 .2 87 .6 96.9 9 Ü 03 days 3 3 .8 70 .7 7 0 .0 52.1 6 5 .0 53 .0 18.3 8 .2 33 .8 8 .0 91.5 89 .0 78.2 8 6 .8 72 .84 days 7 4 .4 62.2 6 7 .6 16.0 6 .6 7 .0 90 .4 6 8 .8 74.65 days 5Ô.7 5s! 6 4Í *1 2Ó.4 9 Ü 5 76*57 days 6 2 .7 70 .4 59.6 3 0 .8 '7 .5 ' 4 '. 9 93 .4 77.9 64*4
14 days 60.1 63 .6 50 .9 55.6 48'.4 21.1 6 .8 4 .0 i ó i i ¿ ! l 81.2 70 .4 54.9 65.7 54.526 days 6 6 .0 58 .7 52.1 56 .6 50.0 12.4 6 .3 4 .7 5 .4 3 .8 78.4 6 5 .0 56 .8 61 .9 53 .836 days 6 6 .0 58 .7 5 0 .7 4 9 .8 47 .4 7 .0 6 .3 4 .9 5 .4 5 .6 73 .0 65 .0 55.6 55.2 53.1
T a b l e IV. B i o c h e m i c a l O x y g e n D e p l e t i o n s a n d ( U n c o m b i n e d ) a - T N T C o n c e n t r a t i o n s i n a S e w a g e D i l u t i o n a f t e r V a r i o u s
P e r i o d s o f I n c u b a t i o n
A, 1% Sewage
B t 1% Sewage + 80 P .P.M . T N T
C, 1% Sewage^ 4- 35 P .P.M . D, 1% Sewage -f 22.5 P .P .M . T N T
E , 1% S e w a g e ^ 10.9 P .P.M .
DaysIncu Oxygen Oxygen
deple
% o fnormal
% of T N T Oxygen
% of normal T O T Oxygen
% o fnormal M Oxygen
deple
% o fnormal
% of T N T
bated deple T N T oxygen re deple T N T oxygen re deple T N T oxygen re T N T oxygen rea t tion, tion, concn., deple main tion, concn.. deple main tion. concn., deple main tion, concn., deple main
20° C. p.p.m. p.p .m . p.p.m. tion ing p.p.m. p.p.m. tion ing p.p.m. p.p.m. tion ing p.p.m. p.p.m. tion ing
1 1.69 0 70 0 87.5 0.81 30.8 47 .9 88 .0 0.93 18.8 55 .0 83 .6 1.12 8 .5 66 .3 78.02 2.38 1.23 73 51.7 91 .2 1.36 29.8 57.1 85.1 1.28 21.2 53.8 94 .2 1.38 9 .6 58 .0 0 8 .13 3 .14 1.33 78.2 42 .3 97 .7 1.65 33.4 52 .5 95.3 1.64 19.7 52.2 87 .6 1.87 9 .2 59.6 84 .44 3.49 1.47 8 1 .8 42.3 102.2 1.66 33.7 47 .8 96.3 1.78 21.8 51.3 96 .9 2 .18 10.4 62.8 95.46 3.83 1.57 71 41 .0 88 .7 2 .28 2 9 .6 59.5 84 .6 2.12 21.2 55 .4 94 .2 2.51 9 .4 65.5 86 .2
10 75.3 94.1 31 .7 90.6 19.8 88.1 9 .6 88.125 73.3 91 .6 30 .6 87.4 18.9 84.1 9 .1 83.5
Mean® 44.3 53.0 53 .5 62.4
1% Sewage T N T based
on E observation, F, 1% Sewage + 3.5 P .P.M .
T N TO, 1% S e w a ç e ^ 1.8 P .P.M . H , 1% Sewage + 1.17 P .P .M .
T N T1 0 .228 1.04’ 1.70 61.5 4 8 .6 1.16 1.01 68.6 56.1 1.51 0.537 89.3 45.92 0.205 1.59 1.95 66 .8 55.7 1.53 0.91 64.3 50 .6 2.03 0.594 85.3 50 .83 0.274 2.14 2 .06 68.2 58 .9 2 .28 1.08 72.6 60 .0 2.74 0.685 87.3 58.54 0.183 2.60 2 .55 74.9 7 2 .9 2 .67 1.54 76.9 85 .6 2 .76 0.742 79.5 63.46 0.217 2.77 2.41 72.3 68 .9 2 .84 1.13 74.2 62 .8 3 .48 0.615 86.2 52.6
10 0.125 2.82 80.6 1.16 64.4 0.696 59.525
Mean®
b 2.59
68.7
74 .0 1.11
71.3
61 .7 b
85.5
° First 6 days.& Insufficient sample for the determination.
T a b l e V .
Days Incubated
a t 20° C.
In it ia l0 In it ia l6
3 5 7
10 25
B io c h e m i c a l O x y g e n D e p l e t i o n s a n d T N T C o n c e n t r a t i o n s ( C o l o r e d a n d U n c o m b i n e d ) i n a S e w a g e D i l u t i o n
a f t e r V a r i o u s P e r i o d s o f I n c u b a t i o n
B, 1% Sewage + 60.6 P .P.M ._____________ T N TOxygen depletion,
p.p.m.
0 .1 80 .400 .431.701.98
F, 1% Sewage + 3.78 P .P .M . T N T
T N T Concn., P. P .M .Colored Alpha Total45 .5 15.1 60 .651.5 4 .6 56.14 3 .0 8 .7 51.74 3 .8 8 .7 52.5
43 ; Ó 11.0 54 .0
C, 1% Sewage + 30.4 P .P .M ._____________ T N T _____________Oxygen
d *pIe‘ T N T Concn., P .P.M .
D, 1% Sewage + 15.2 P .P .M ._____________ T N T _____________Oxygendeple- T N T Concn., P .P .M .
2.84 0.94 3.78In i t ia l6 3 .08 0.60 3.68
3 1.14 2 .70 0.16 2.86 1 .
5 1.55 2.65 0.65 3.30 1 .
7 1.55 2.1025
1.972.32
2 .59 0.62 3.21 2.
p.p.m. Colored Alpha Total p.p.m. Colored Alpha Total22 .8 7 .6 30.4 11.4 3 .8 15.222 .6 5.7 28.3 11.6 1.9 13.5
0 .68 21.0 6 .3 27.3 11.2 1 .8 13.00 .84 22 .6 7 .2 29.8 1.47 11.4 3 .4 14.81.05 1.141.862.52
23 .0 5 .5 28 .5 1.992 .28
10.8 2 .9 13.9
G, 1% Sewage + 1.89 P T N T
■P.M. H, 1% S e w a ^ - f 0.95 P .P .M .
78
5.40
° Calculated on basis of mixture prepared.6 Observed on basis of analytical procedure described.
1.42 0.47 1.89 0.71 0 .24 0.952.18 0.29 2.47 0.93 0.15 1.081.45 0 .00 1.45 2.01 0.98 0 .00 0 .98 2.001.56 0.25 1.81 2.38 1.00 0.14 1.14 2.52
2.41 2 .79Ü 48 Q.37 i l 85 2.85 Ó! 96 0 ! 31 i .27 3.15
>8.21
T N T Concn., P .P .M .
E , 1% Sewage + 7.56 P .P .M .______________ T N T _____________Oxygen depletion,
p.p.m.
1 .081.501.451.832.20
A, 1%
Colored Alpha Total5.68 1.88 7.565.80 0.89 6.695.40 0.63 6.035.60 1.45 7.05
5.75 l ‘.48 7.23
the concentration of T N T was increased. The percentages of normal oxygen depletion for sewage obtained in the presence of colored T N T were calculated from these data and are shown in Table V. The mean percentages of normal depletions for the 3-, 6-, and 7-day periods were calculated and are also shown in Table V. These, mean values may be considered as representing the expected biochemical oxidation performance during the
period of carbonaceous oxidation. Comparison of these mean percentages with similar values from Table IV for a-TN T indicate th a t colored T N T is equally as inhibitive of normal biochemical oxidation as the uncolored alpha form. On the basis of these data it m ust be concluded th at rates of natural biochemical purification of organic m atter in streams are reduced in the presence of TNT. The retardation to be expected will increase
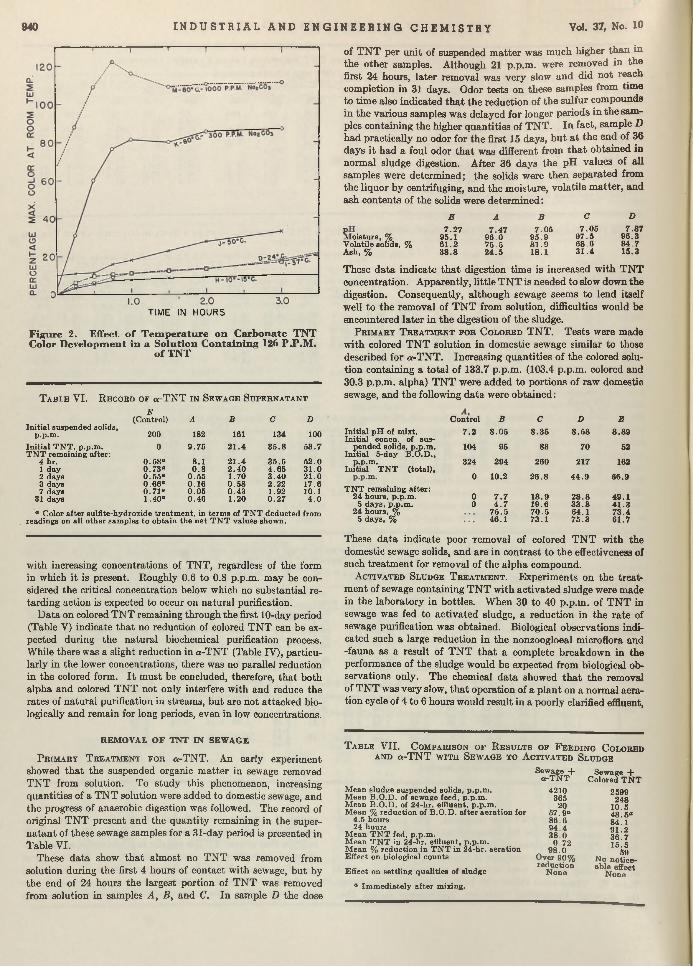
940 I N D U S T R I A L A N D E N G I N E E R I N G C H E M I S T R Y Vol. 37, No. 10
TIME IN HOURS
Figure 2. Effect o f Tem perature on Carbonate TNT Color D evelopm ent in a So lu tion C ontain ing 126 P.P .M .
o f TNT
E(Control) A B C D
200 182 161 134 100
0 9.75 2 1 .4 3 5 .8 5 3 .7
0 .58« 8 .1 2 1 .4 35 .5 5 2 .00 .73° 0 .8 2 .4 0 4.65 3 1 .00 .5 5 “ 0 .5 5 1.70 3 .4 0 2 1 .00 .6 6 “ 0.16 0 .58 2.22 17.60 .7 1 “ 0.05 0.43 1.92 10.11.40° 0 .46 1.20 0 .27 4 .0
T a b l e V I . R e c o r d o p a - T N T i n S e w a g e S u p e r n a t a n t
Initial suspended solids, p.p.m.
In it ia l T N T , p .p .m .T N T remaining after:
4 hr.1 day2 days3 days 7 days
31 days
a Color after sulfite-hydroxide t rea tm en t, in terms of T N T deducted from readings on all other samples to obta in the n e t T N T values shown.
with increasing concentrations of TN T, regardless of the form in which it is present. Roughly 0.6 to 0.8 p.p.m. may be considered the critical concentration below which no substantial retarding action is expected to occur on natural purification.
D ata on colored T N T remaining through the first 10-day period (Table V) indicate th a t no reduction of colored T N T can be expected during the natural biochemical purification process. While there was a slight reduction in a-TN T (Table IV), particularly in the lower concentrations, there was no parallel reduction in the colored form. I t m ust be concluded, therefore, th a t both alpha and colored T N T not only interfere with and reduce the rates of natural purification in streams, bu t are not attacked biologically and remain for long periods, even in low concentrations.
of T N T per unit of suspended m atter was much higher th an in the other samples. Although 21 p.p.m . were removed in the first 24 hours, la te r removal was very slow and did not reach completion in 31 days. Odor tests on these samples from tim e to tim e also indicated th a t the reduction of the sulfur compounds in the various samples was delayed for longer periods in the samples containing the higher quantities of T N T . In fact, sample D had practically no odor for the first 15 days, bu t a t the end of 36 days i t had a foul odor th a t was different from th a t obtained in normal sludge digestion. After 36 days the pH values of all samples were determ ined; the solids were then separated from the liquor by centrifuging, and the m oisture, volatile m atter, and ash contents of the solids were determ ined:
Kloieture, %Volatile solids, %Ash, %
These d a ta indicate th a t digestion tim e is increased w ith T N T concentration. Apparently, little T N T is needed to slow down the digestion. Consequently, although sewage seems to lend itself well to the removal of T N T from solution, difficulties would be encountered late r in the digestion of the sludge.
P r i m a r y T r e a t m e n t f o r C o l o r e d T N T . T ests were made w ith colored T N T solution in domestic sewage similar to those described for a-T N T . Increasing quantities of the colored solution containing a to ta l of 133.7 p.p.m . (103.4 p.p.m. colored and 30.3 p.p.m. alpha) T N T were added to portions of raw domestic sewage, and the following d a ta were obtained:
In it ia l p H of mixt. In it ia l concn. of sus
pended solids, p .p .m . In it ia l 5-day B.O .D.,
E A B C D
7 .2 7 7 .4 7 7 .0 5 7 .0 5 7 .3795.1 9 6 .0 9 5 .9 9 7 .5 9 6 .361 .2 75 .5 81 .9 6 8 .6 8 4 .73 8 .8 2 4 .5 18.1 3 1 .4 15.3
p .p .m . In it ia l T N T (to tal).
Control B C D E
7 .2 8 .0 5 8 .3 5 8 .5 8 8 .89
104 95 83 70 52
324 294 260 217 162
0 10.2 2 6 .8 4 4 .9 66.9
0 7 .7 18 .9 2 8 .8 49 .10 4 .7 19.6 3 3 .8 41 .3
7 5 .5 7 0 .5 64 .1 73 .446 .1 73 .1 7 5 .3 61 .7
T N T rem aining after:24 hours, p.p .m .
5 days, p.p .m .24 hours, %
5 days, %
These d a ta indicate poor Temoval of colored T N T w ith the domestic sewage solids, and are in contrast to the effectiveness of such treatm ent for removal of the alpha compound.
A c t i v a t e d S l u d g e T r e a t m e n t . Experim ents on the treatm ent of sewage containing T N T with activated sludge were made in the laboratory in bottles. W hen 30 to 40 p.p.m . of T N T in sewage was fed to activated sludge, a reduction in the ra te of sewage purification was obtained. Biological observations indicated such a large reduction in the nonzoogloeal microflora and -fauna as a result of T N T th a t a complete breakdown in the performance of the sludge would be expected from biological observations only. The chemical d a ta showed th a t the removal of T N T was very slow, th a t operation of a p lan t on a norm al aeration cycle of 4 to 6 hours would result in a poorly clarified effluent,
REMOVAL O F TN T IN SEW AGE
P r i m a r y T r e a t m e n t f o r a-TN T. An early experiment showed th a t the suspended organic m atter in sewage removed T N T from solution. To study this phenomenon, increasing quantities of a T N T solution were added to domestic sewage, and the progress of anaerobic digestion was followed. The record of original T N T present and the quantity remaining in the superna tan t of these sewage samples for a 31-day period is presented in Table VI.
These d a ta show th a t almost no T N T was removed from solution during the first 4 hours of contact with sewage, bu t by the end of 24 hours the largest portion of T N T was removed from solution in samples A , B , and C. In sample D the dose
T a b l e V II. C o m p a r i s o n o f R e s u l t s o f F e e d i n g C o l o r e d a n d a-T N T w i t h S e w a g e t o A c t i v a t e d S l u d g e
M ean sludge suspended solids, p.p .m .M ean B .O.D. of sewage feed, p .p .m .M ean B.O .D. of 24-hr. effluent, p.p .m .M ean % reduction of B.O .D. a fter ae ra tion for
4.5 hours 24 hours
M ean T N T fed, p.p .m .M ean T N T in 24-hr. effluent, p.p .m .M ean % reduction in T N T in 24-hr. aeration Effect on biological counts
Effect on sett ling qualities of sludge
a Im m edia tely after mixing.
Sewage + a -T N T
421036520
57 .9°86.694 .438 .0
0 .729 8 .0
Over 90% reduction
N one
Sewage + Colored T N T
2599248
10 .5 48 .5 °8 4 .19 1 .2 3 6 .715 .5
6.9•No notice* able effect
N one
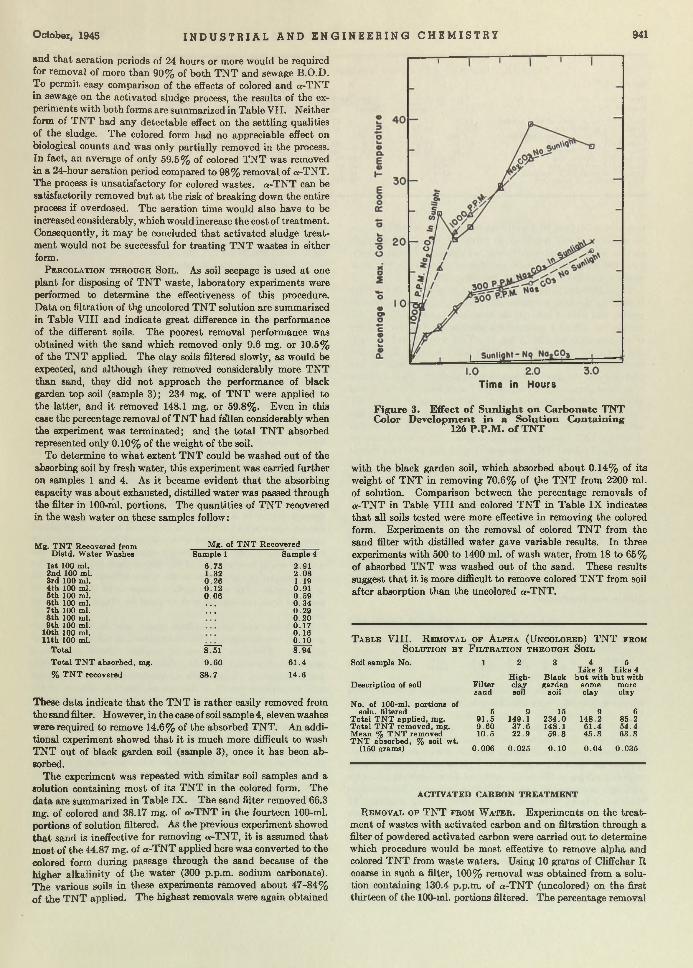
O ctober, 194S I N D U S T R I A L A N D E N G I N E E R I N G C H E M I S T R Y 941
and th a t aeration periods of 24 hours or more would be required for removal of more than 90% of both T N T and sewage B.O.D. To perm it easy comparison of the effects of colored and a-TN T in sewage on the activated sludge process, the results of the experiments with both forms are summarized in Table VII. Neither form of T N T had any detectable effect on the settling qualities of the sludge. The colored form had no appreciable effect on biological counts and was only partially removed in the process. In fact, an average of only 59.5% of colored T N T was removed in a 24-hour aeration period compared to 98% removal of a-TN T. The process is unsatisfactory for colored wastes. a-TN T can be satisfactorily removed but a t the risk of breaking down the entire process if overdosed. The aeration time would also have to be increased considerably, which would increase the cost of treatm ent. Consequently, it may be concluded th a t activated sludge treatment would not be successful for treating T N T wastes in either form.
P e r c o l a t i o n t h r o u g h S o i l . A s soil seepage is used a t one plant for disposing of T N T waste, laboratory experiments were performed to determine the effectiveness of this procedure. D ata on filtration of th$ uncolored T N T solution are summarized in Table V III and indicate great difference in the performance of the different soils. The poorest removal performance was obtained with the sand which removed only 9.6 mg. or 10.5% of the TN T applied. The clay soils filtered slowly, as would be expected, and although they removed considerably more T N T than sand, they did not approach the performance of black garden top soil (sample 3); 234 mg. of T N T were applied to the latter, and it removed 148.1 mg. or 59.8%. Even in this case the percentage removal of T N T had fallen considerably when the experiment was term inated; and the to tal T N T absorbed represented only 0.10% of the weight of the soil.
To determine to w hat extent T N T could be washed out of the absorbing soil by fresh water, this experiment was carried further on samples 1 and 4. As it became evident th a t the absorbing capacity was about exhausted, distilled w ater was passed through the filter in 100-ml. portions. The quantities of T N T recovered in the wash w ater on these samples follow:
Mg. of T N T RecoveredSample 1 Sample 4
6 .75 2.911.32 2 .080 .26 1.190 .1 2 0.910 .0 6 0 .59. • • 0 .34. . . 0 .29
0 .200 .1 70.160 .1 0
o r 8 .94
9 .60 6 1 .4
88 .7 14.6
Mg. T N T Recovered from Distd. W ater Washes
1st 100 ml.2nd 100 ml.3rd 100 ml.4 th 100 ml.5 th 100 ml.6 th 100 ml.7 th 100 ml.8 th 100 ml.0 th 100 ml.
10th 100 ml.11th 100 ml.
To ta l
T o ta l T N T absorbed, mg.
% T N T recovered
These data indicate th a t the T N T is ra ther easily removed from the sand filter. However, in the case of soil sample 4, eleven washes were required to remove 14.6% of the absorbed TN T. An additional experiment showed th a t i t is much more difficult to wash T N T out of black garden soil (sample 3), once it has been absorbed.
The experiment was repeated w ith similar soil samples and a solution containing most of its T N T in the colored form. The data are summarized in Table IX . The sand filter removed 66.3 mg. of colored and 38.17 mg. of a-TN T in the fourteen 100-ml. portions of solution filtered. As the previous experiment showed th a t sand is ineffective for removing a-TN T, it is assumed th a t m ost of the 44.87 mg. of a-T N T applied here was converted to the colored form during passage through the sand because of the higher alkalinity of the w ater (300 p.p.m. sodium carbonate). T he various soils in these experiments removed about 47-84% of th e T N T applied. The highest removals were again obtained
Time in Hours
Figure 3. Effect o f Su n ligh t on Carbonate TNT Color D evelopm ent in a Solu tion C ontain ing
126 P.P .M . o f TNT
with the black garden soil, which absorbed about 0.14% of its weight of T N T in removing 70.6% of 1 he T N T from 2200 ml. of solution. Comparison between the percentage removals of a-TN T in Table V III and colored T N T in Table IX indicates th a t all soils tested were more effective in removing the colored form. Experiments on the removal of colored T N T from the sand filter with distilled water gave variable results. In three experiments w ith 500 to 1400 ml. of wash water, from 18 to 65% of absorbed T N T was washed out of the sand. These results suggest th a t i t is more difficult to remove colored T N T from soil after absorption than the uncolored a-TN T.
T a b l e V III. R e m o v a l o f A l p h a ( U n c o l o r e d ) T N T f r o m S o l u t i o n b t F i l t r a t i o n t h r o u g h S o i l
Soil sample No.
Description of soil
No. of 100-ml. portions of soln. filtered
Total T N T applied, mg. To ta l T N T removed, mg. M ean % T N T removed T N T absorbed, % soil wt.
(150 grams)
A CTIV ATED CA RBON T R E A T M E N T
R e m o v a l o f T N T f r o m W a t e r . Experiments on the treatm ent of wastes w ith activated carbon and on filtration through a filter of powdered activated carbon were carried out to determine which procedure would be most effective to remove alpha and colored T N T from waste waters. Using 10 grams of Cliffchar R
coarse in such a filter, 100% removal was obtained from a solution containing 130.4 p.p.m. of a-T N T (uncolored) on the first thirteen of the 100-ml. portions filtered. The percentage removal
1 2 3 4Like 3
5Like 4
High- Black b u t w ith b u t withF ilter clay
soilgarden some more
sand soil clay clay
5 9 15 9 691 .5 149.1 234.0 148.2 85 .29 .60 37 .6 148.1 61 .4 54 .410.5 22 .9 5 9 .8 4 5 .8 63 .8
0 .006 0.025 0 .1 0 0 .0 4 0 .035
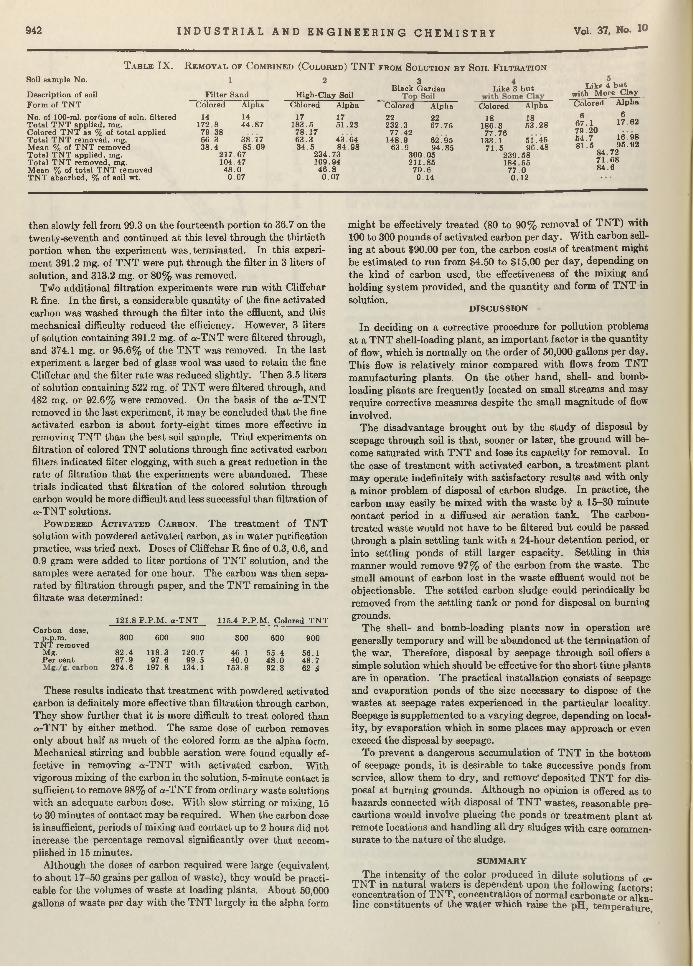
942 I N D U S T R I A L A N D E N G I N E E R I N G C H E M I S T R Y Vol. 37, No. 10
T a b l e IX. R e m o v a l o f C o m b i n e d ( C o l o r e d ) T N T f r o m S o l u t i o n b y S o i l F i l t r a t i o n
Soil sample No.
D escription of soil F orm of T N T
No. of 100-ml. portions of soln. filtered Tota l T N T applied, mg.Colored T N T as % of to ta l applied Tota l T N T removed, mg.M ean % of T N T removed T o ta l T N T applied, mg.To ta l T N T removed, mg.M ean % of to ta l T N T removed T N T absorbed, % of soil wt.
F ilte r Sand H igh-Clay Soil
3Black G arden Like 3 b u t
Colored Alpha Cölored Alpha Colored Alpha Colored Alpha
14 14 17 17 22 22 18 18172.8 44 .87 183.5 51.23 232.3 67 .75 186.3 53 .28
79.38 78.17 77.42 77 .766 6 .3 38.17 63 .3 43 .64 148.9 62.95 133.1 51 .453 8 .4 85.09 3 4 .5 84 .98 63 .9 94.85 7 1 .5 96 .48
217.67 234.73 300.05 239.58104.47 109.94 211.85 184.5548 .0 4 6 .8 70 .6 77 .0
0 .07 0 .07 0 .14 0 .12
Like 4 b u t w ith M ore C lay Colored A lpha
667.17 9 .2054 .78 1 .5
84.727 1 .688 4 .6
617.62
l é .98 9 5 .92
then slowly fell from 99.3 on the fourteenth portion to 36.7 on the twenty-seventh and continued a t this level through the th irtieth portion when the experiment was. term inated. In this experim ent 391.2 mg. of T N T were put through the filter in 3 liters of solution, and 313.2 mg. or 80% was removed.
Two additional filtration experiments were run with Cliffchar R fine. In the first, a considerable quantity of the fine activated carbon was washed through the filter into the effluent, and this mechanical difficulty reduced the efficiency. However, 3 liters of solution containing 391.2 mg. of «-TN T were filtered through, and 374.1 mg. or 95.6% of the T N T was removed. In the last experiment a larger bed of glass wool was used to retain the fine Cliffchar and the filter rate was reduced slightly. Then 3.5 liters of solution containing 522 mg. of T N T were filtered through, and 482 mg. or 92.6% were removed. On the basis of the «-TN T removed in the last experiment, it may be concluded th a t the fine activated carbon is about forty-eight times more effective in removing T N T than the best soil sample. Trial experiments on filtration of colored T N T solutions through fine activated carbon filters indicated filter clogging, with such a great reduction in the rate of filtration th a t the experiments were abandoned. These trials indicated th a t filtration of the colored solution through carbon would be more difficult and less successful than filtration of «-TN T solutions.
P o w d e r e d A c t i v a t e d C a r b o n . The treatm ent of T N T solution with powdered activated carbon, as in w ater purification practice, was tried next. Doses of Cliffchar R fine of 0.3, 0.6, and0.9 gram were added to liter portions of T N T solution, and the samples were aerated for one hour. The carbon was then separated by filtration through paper, and the T N T remaining in the filtrate was determined:
121.8 P .P .M . a--TN T 115.4 P .P . M. Colored T N T
300 600 900 300 600 900
82 .4 118.3 120.7 46.1 55 .4 56.167.9 97 .6 99 .5 40 .0 4 8 .0 48 .7
274.6 197.8 134.1 153.8 92 .3 62 .^
C arbon dose, p.p.m.
T N T removed Mg.P er cent
These results indicate th a t treatm ent with powdered activated carbon is definitely more effective than filtration through carbon. They show further th a t it is more difficult to trea t colored than «-T N T by either method. The same dose of carbon removes only about half as much of the colored form as the alpha form. Mechanical stirring and bubble aeration were found equally effective in removing a-TN T with activated carbon. W ith vigorous mixing of the carbon in the solution, 5-minute contact is sufficient to remove 98% of a-T N T from ordinary waste solutions w ith an adequate carbon dose. W ith slow stirring or mixing, 15 to 30 m inutes of contact may be required. When the carbon dose is insufficient, periods of mixing and contact up to 2 hours did not increase the percentage removal significantly over th a t accomplished in 15 minutes.
Although the doses of carbon required were large (equivalent to about 17-50 grains per gallon of waste), they would be practicable for the volumes of waste a t loading plants. About 50,000 gallons of waste per day with the T N T largely in the alpha form
m ight be effectively treated (80 to 90% removal of T N T ) with 100 to 300 pounds of activated carbon per day. W ith carbon selling a t about 190.00 per ton, the carbon costs of trea tm en t might be estim ated to run from $4.50 to $15.00 per day, depending on the kind of carbon used, the effectiveness of the mixing and holding system provided, and the quan tity and form of T N T in solution.
D ISC U SSIO N
In deciding on a corrective procedure for pollution problems a t a T N T shell-loading plant, an im portant factor is the quantity of flow, which is normally on the order of 50,000 gallons per day. This flow is relatively m inor compared w ith flows from TN T m anufacturing plants. On the other hand, shell- and bomb- loading p lants are frequently located on small stream s and may require corrective measures despite the small m agnitude of flow involved.
The disadvantage brought out by the study of disposal by seepage through soil is th a t, sooner or later, the ground will become saturated w ith T N T and lose its capacity for removal. In the case of treatm ent w ith activated carbon, a treatm ent plant m ay operate indefinitely w ith satisfactory results and w ith only a m inor problem of disposal of carbon sludge. In practice, the carbon m ay easily be mixed w ith the waste bj^ a 15-30 minute contact period in a diffused air aeration tank . The carbon- treated waste would not have to be filtered b u t could be passed through a plain settling tank w ith a 24-hour detention period, or into settling ponds of still larger capacity. Settling in this m anner would remove 97% of the carbon from the waste. The small amount of carbon lost in the waste effluent would not be objectionable. The settled carbon sludge could periodically be removed from the settling tank or pond for disposal on burning grounds.
The shell- and bomb-loading p lants now in operation are generally tem porary and will be abandoned a t th e term ination of the war. Therefore, disposal by seepage through soil offers a simple solution which should be effective for the short time plants are in operation. The practical installation consists of seepage and evaporation ponds of the size necessary to dispose of the wastes a t seepage ra tes experienced in the particular locality. Seepage is supplemented to a varying degree, depending on locality, by evaporation which in some places m ay approach or even exceed the disposal by seepage.
To prevent a dangerous accum ulation of T N T in the bottom of seepage ponds, it is desirable to take successive ponds from service, allow them to dry, and remove' deposited T N T for disposal a t burning grounds. Although no opinion is offered as to hazards connected w ith disposal of T N T wastes, reasonable precautions would involve placing the ponds or trea tm en t plant a t remote locations and handling all dry sludges w ith care commensurate to the nature of the sludge.
SUM M ARY
The intensity of the color produced in dilute solutions of <*- TNT in natural waters is dependent upon the following factors: concentration of TNT, concentration of normal carbonate or alkaline constituents of the w ater which raise the pH, temperature
October, 194S I N D U S T R I A L A N D E N G I N E E R I N G C H E M I S T R Y 943
th ? cond>tions. The colored complex seems more stable than the » T N T , and it is difficult to reverse the reaction, once the colored complex is formed. All water samples containing colored T N T m ust be examined for T N T in both forms, a- T A T solutions in tap waters of low alkalinity or polluted waters
o i f maln uncolored for 100 days and longer in the dark a t 20 C. a-T N T solutions in distilled w ater can be exposed to sunli' h t for long periods w ith the formation of only a trace of colored complex and w ithout other decomposition. W ith relatively pure or polluted surface waters, from 40 to 55% of a-TN T is converted to the colored form in 80 days a t ordinary temperatures in in term ittent sunlight. The percentage of colored TN T formed can be increased to 90% or more in one day or less by increasing the alkaline constituents of the water and /o r the temperature.
The conversion of a-TN T to the colored form is considered the principal reaction during prolonged storage of T N T solutions. During this conversion, however, there is a slow reduction of total T N T which depends to a large extent upon carbonate concentration or pH and light conditions. In the surface and polluted water samples tested, 65 to 75% of the original TN T remained in one form or the other after 80 days in interm ittent sunlight. In water containing 300 to 1000 p.p.m. of normal carbonate, 53 to 55% of the T N T remained (largely in the colored form) after 36 days in in term ittent sunlight. This decomposition reaction is considered too slow for practical application.
Concentrations of a-T N T above 1.0 p.p.m. have a retarding effect on the biochemical oxidation of sewage. There is little biochemical removal of T N T as the result of biochemical oxidation in dilute sewage. Colored T N T was equally as inhibitive as a-TN T to normal biochemical oxidation of organic m atter during the carbonaceous stage. The study of colored TN T wastes indicated th a t no reduction of the color can be expected by natural biochemical purification in streams.
Raw domestic sewage a t pH values of 7.2 to 7.8 removed concentrations of a-TN T up to about 35 p.p.m. from solution in a 24-hour contact period. The quantity of T N T removed seems
to depend upon the suspended organic m atter in the sewage. The rate of anaerobic digestion of sewage solids is decreased considerably by the T N T absorbed. I t was more difficult to remove colored T N T from solution during prim ary treatm ent of sewage than a-TN T.
Even with concentrations of a-TN T as low as 30 p.p.m. in sewage, activated sludge treatm ent requires aeration periods up to 24 hours for 9 0 % removal of both T N T and B.O.D. Although colored T N T did not inhibit the process as much as alpha, it was not removed so readily.
F iltration experiments indicated th a t a black garden soil was best for removing TN T. Such soils might be expected to remove a total amount of T N T up to about 0 .1 % of their weight. Colored T N T is removed more effectively by all soils than a-TN T. Alkalinizing the waste slightly with soda ash to convert the T N T to the colored form is advantageous for soil percolation. As the absorption capacity of the soil becomes exhausted, fresh water removes some of the absorbed TN T.
Dosing and mixing activated carbon into the waste were more effective in removing T N T than filtration through carbon, a- T N T was removed from solution more readily than the colored derivative. A satisfactory chemical treatm ent of T N T wastes from shell-loading plants would involve holding the T N T in the alpha form, followed by treatm ent with activated carbon to remove it from solution. Such a procedure is considered practical for the volumes of waste discharged from shell-loading plants.
LITERATURE CITED
(1) Ruchhoft, C. C „ Sewage Works / . , 13, 669 (1941).(2) Ruchhoft, C . C., and Meckler, W . G., I n d . E n g . C h e m ., A n a l .
E d ., 17, 430 (1945).(3 ) Schott, S tuart, Ruchhoft, C . C . , and Megregian, Stephen, I n d .
E ng . C h e m ., 35, 1122 (1943).
P r e s e n t e d as p a r t of the Symposium on Industria l W astes before the Division of W ater, Sewage, and Sanitation C hem istry a t the 108th Meeting of th e A m e r i c a n C h e m i c a l S o c i e t y in New York, N. Y.
CARBOXYMETHYLCELLULOSE------Uses and Applications
C. B. HOLLABAUGH, LELAND H. BURT, AND ANNA PETERSON WALSHH ercules P ow der C o m p a n y , W ilm in g to n , Del.
TH E newest member of the cellulose derivative family to be introduced commercially, carboxymethylcellulose, is finding
wide acceptance in industry. I t is the reaction product of monochloroacetic acid on alkali cellulose, and is generally supplied to the trade as the sodium salt which is a white, granular, odorless, and tasteless powder. This salt is readily soluble or dispersible in w ater or alkaline solutions to form highly viscous solutions useful for their thickening, suspending, and stabilizing properties; furthermore, these solutions can be evaporated to form tough fiLms.
The sodium salt of carboxymethylcellulose is known in the trade by several different names including cellulose gum, sodium cellulose glycolate, Carboxymethocel, Collocel, and CMC. The first two are used as general trade designations; the last three are trade names for specific types sold by individual producers.
A reasonably complete summary of published literature (both patents and technical articles) on carboxymethylcellulose and its derivatives is assembled here. No effort has been made to evaluate the literature references, because commercial exploitation of carboxymethylcellulose is so recent and is expanding a t such a rate th a t any critical evaluation could be out of date before publication. Research in this laboratory has been carried out on possible useful applications of the product. Conclusions not yet published are cited throughout this paper w ithout literature
references; they are for the reader’s use in conjunction with his study of the references cited.
Since it was first developed by Jansen {40) in Germany toward the end of World W ar I, carboxymethylcellulose has been suggested as a substitute for such products as gelatin, glue, gum arabic, agar-agar, carragheen moss, tragacanth, cherry gum, wheat gluten, and locust bean gum {33, 40). The original Jansen process was later improved upon by Chowdhury (5) and Hoppler {33).
Carboxymethylcellulose is usually used in the form of its sodium salt (cellulose gum) which, so far, is its m ost im portant industrial derivative (3). Low-substituted types, soluble in alkali bu t not in w ater {SO, 50), are known. A highly substituted form {10), insoluble in alkali or w ater bu t soluble in organic solvents, has also been produced. The potassium salt resembles the sodium salt in many of its properties and gives a similar solution in water. The ammonium salt also is w ater soluble, and is particularly interesting because i t is unstable and loses ammonia on heating to 50-60 ° C. The chief insoluble salts of carboxymethylcellulose so far investigated are those of lead, silver, mercury, and aluminum, all of which are colorless, the copper and nickel salts which are blue, and the ferric salt which is red.
Generally speaking, sodium carboxymethylcellulose is indicated wherever hydrophilic colloids possessing marked suspending,

944 I N D U S T R I A L A N D E N G I N E E R I N G C H E M I S T R Y Vol. 37, No. 10
thickening, stabilizing, and film-forming properties are required. Some of the better-known applications cited are as thickening agents in textile prin t pastes and as textile finishing and sizing agents {33). Sodium carboxymethylcellulose can be used as an emulsifying agent. Also, it is applicable wherever a protective colloid is needed in oil-in-water emulsions (3). I ts excellent film-forming properties should be valuable in paper sizing and coating. Höppler {33) disclosed the use of sodium carboxymethylcellulose in adhesives, color ag- g lu tin an ts , em ulsify ing agents, finishing and sizing agents, low- viscosity m aterial to be used for textile finishes and sizes (the medium- and high-viscosity materials were disclosed for use as color agglutinants), paper-hanging paste, thickeners, and emulsifying agents. Feeding tests {3) on animals showed it to be harmless physiologically.
T E X T IL E IN D U S T R Y
In the textile industry many uses based on the high-viscosity and film-forming properties of sodium carboxym ethylcellu lose have been proposed. This water- soluble product has been suggested for use in printing pastes, sizes, finishes, and lubricants. Allan and W ainwright {1) disclosed its application as an aqueous printing paste for use on cellulose- derivative fabrics such as those from cellulose acetate. The paste contained a high-boiling solvent for the fabric material, a coloring material, water, and, as a thickening agent, enough water-soluble carboxymethylcellulose to give a 5% aqueous solution having a specific viscosity of 20 centipoises (capillary tube method). Johnson {41) used less than 1% of the sodium salt of carboxymethylcellulose to stabilize dye suspensions, and to prevent settling and froth or foam formation upon storage. Sodium carboxymethylcellulose treated with epichlorohydrin to increase its viscosity, was reported as being useful in printing pastes for textiles {58). Oxley and co-workers suggested the use of carboxymethylcellulose for printing pastes {71). In order to increase dye penetrations in fabric coloring, the wetting property of the sodium salt was utilized {23). Also, this wetting property was said to be useful for promoting bleeding or running in the dyeing of piece goods {37). Sodium carboxymethylcellulose has also been suggested (7) as a retardant in vat dyeing of textiles.
Sponsel {82) discussed the use of water-soluble carboxymethylcellulose in sizes and in water-soluble finishing agents; it was considered particularly valuable for wool sizing on account of its good film-forming properties. In finishing operations, the stability of carboxymethylcellulose toward the effects of light, tem perature, and bacteria were said to be very good. This investigator reported th a t the water-soluble carboxymethylcellulose can be mixed and used together with not only the older known starches and usual fa tty substances bu t also with such synthetic substances as acrylic acid esters and polyvinyl ethers. A gas-retaining fabric was prepared {39) by coating a base fabric w ith an aqueous solution of a soluble salt of carboxymethylcellulose and insolubilizing it with acetic acid.
Dreyfus and co-workers disclosed the warp sizing of yarns w ith aqueous solutions or dispersions of carboxymethylcellulose
{18), as well as the use of these solutions in the sizing of filaments, threads, yarns, fabrics, and other textile m aterial {19). Dreyfus {16) employed aqueous solutions of an ammonium salt of carboxymethylcellulose for sizing textile yarns, and R oberts described for the same purpose the use of the alum inum sa lt which is insoluble in w ater {78). A water-soluble carboxymethylcellulose powder prepared by drying an aqueous solution in thin
films a t above 100° C. has been proposed for use in various sizes and as a thickener for printing inks {67). A glazed finish for fabrics was reported as having been obtained by applying carboxym ethy lce llu lose and a
reactive decomposable quaternary ammonium salt, drying, calendering, and a t some stage reacting the carboxymethylcellulose and the ammonium compound by heating to yield an insoluble coating {36). Film s of water- soluble carboxymethylcellulose can be used for sizing dairy filter
cloth.Brown and Houghton (3)
revealed th a t sodium carboxym ethylcellulose acts as an effective stabilizer for oil emulsions; they used 0.5 to 1%, preferably, of the high-viscosity type with such oils as castor, linseed, rapeseed, and liquid paraffin in conjunction w ith sodium stearate and members of the olive oil series.
In the field of textile finishing, the water-insoluble alkali- soluble type of carboxymethylcellulose was said by Sponsel {82) to be im portant because of the permanence of the finish which could be obtained. He sta ted th a t twenty-five washings of fabrics treated with an alkali-soluble cellulose e ther did not remove the ether from the fabric. Since the alkali-soluble cellulose derivative m ay be applicable to cotton goods, denims, and linenlike cotton white goods, the principal field for it was thought to be in cellulose wool, artificial silk, and mixed fabrics. This finishing agent also was said to allow production of a plastic effect on velvet, clothing, and furniture fabrics. Lilienfeld {50) advocated the use of the alkali-soluble carboxymethylcellulose in textile finishing and disclosed a process in which cotton or other woven fabrics were coated w ith one or several layers of carboxymethylcellulose, dried between coats, steam ed after the last coat, passed through a precipitating bath, washed and dried, all under tension. The precipitating or coagulating medium for a perm anent size of alkali-soluble carboxymethylcellulose was reported to be a 10% sulfuric acid solution {20). Brown and Cooper (4) utilized the m aterial as a lam inating layer for fabrics. Using the type of carboxymethylcellulose which is soluble in alkali a t low tem peratures only, Bolton {2) sized cotton fabrics w ith a caustic soda solution of the carboxymethylcellulose and coagulated the carboxymethylcellulose on the fabric w ith 8% sulfuric acid followed by 5% alum solution.
The alkali-soluble carboxymethylcellulose has been reported as being useful in printing pastes. According to Lilienfeld {50), 100 parts of carboxymethylcellulose, 6 to 10 parts of m ica or 4 parts of lampblack or 8 to 10 parts of zinc oxide can be printed w ith suitable prin ting rollers on cotton m aterials; the printed fabric in the dry condition is then treated w ith a precipitating solution to set the layer. Houghton and Craik {34) treated a
C om m ercial usage o f carboxym ethylcellu lose , u su a lly in th e form o f its sod iu m sa lt, has increased rapidly in recent years. T his product is a cellu lose derivative form ed by th e reaction o f m onochloroacetic acid on alkali cellu lose. T he sod ium sa lt is readily solub le or dispersib le in w ater to form h igh ly viscous so lu tion s. Such so lu tion s are u tilized for the ir th ick en ing properties, to aid in th e su spension o f p igm en ts and o ther finely divided solids in liquid m edia , and to stab ilize em ulsions o f various types. T his article d iscusses briefly and gives references to m o st o f th e published literature w ith o u t effort to evaluate th e m any and varied su ggestion s. M ost o f th e references in th e appended bibliography show pu blica tio n dates o f recent years.
October, 1945 I N D U S T R I A L A N D E N G I N E E R I N G C H E M I S T R Y 945
solution of carboxymethylcellulose in dilute aqueous alkali with a coagulating agent so as to produce gelatinous properties w ithout complete gelation or precipitation, and used this dispersion with pigments on textiles. Clark (6) showed th a t alkali-soluble carboxymethylcellulose is a carrier for those dyestuffs which are developed after their application to textile material.
Alkali-soluble carboxymethylcellulose after heat treatm ent a t 40° C. for 12 to 24 hours plus treatm ent a t 250° C. for 5 minutes may be used, according to Lilienfeld (57), for fabric dressings, textile printing pastes, book cloth, tracing cloth, and yarn sizing. Lilienfeld (49) partially reacted cellulose in the form of fabrics with monochloroacetic acid in the presence of an alkali a t 50° to 60° C. until the effect desired was obtained. I t was claimed th a t patterns and differential printing effects could be produced in this way. Dreyfus elaborated on this textile trea tm ent (14)- Textile fabrics of carboxymethylcellulose were stabilized by treatm ent with 0.25 to 5.0% of a soluble thio- cyanate (35).
P A P E R IN D U S T R Y
Carboxymethylcellulose has been proposed for sizing and coating compositions, and for use in pulp imprégnants. Thomas and Oxley (85) disclosed the use of boric-acid-treated carboxymethylcellulose as a size for paper. The grease-resistant properties of carboxymethylcellulose suggested th a t it m ight be especially valuable in greaseproofing paper. Merrill (65) disclosed it as both a beater size and a surface size for greaseproof paper, useful for packaging foodstuffs. He claimed th a t such sizes also could be used to control printing ink penetration. Wrapping paper for dynamite cartridges, sized w ith carboxymethylcellulose, was said to have a lower rate of vapor diffusion for volatile explosive constituents such as ethylene glycol dinitrate.
To a beater furnish, Larson (48) added a 1 % solution of carboxymethylcellulose which was then precipitated with alum. This furnish was then sheeted and treated w ith an alkaline agent to render the size highly swollen to just short of a sol state. The action of the swelling agent was stopped a t th a t point, and the sheet dried in the usual manner, to give a grease-resistant paper suitable for packaging foodstuffs and lubricating oil.
Paper coatings of carboxymethylcellulose and its sodium salt were described by Gloor (27) who combined 10 parts of carboxymethylcellulose w ith 2 to 30 parts of an alkali m etal silicate, such as water glass, to coat or impregnate paper or fiberboard. Kallock (42) used carboxymethylcellulose in a blushing lacquer for paper to give a pressure-sensitive chart paper.
The alkali-soluble water-insoluble carboxymethylcellulose was first disclosed for use as a paper size and coating by Lilienfeld(50). An example of sizing with this type was given by Maxwell and Larson (60) in which a sodium carboxymethylcellulose was added to a clay coating composition. The binding effect given by one th ird as much carboxymethylcellulose as had been previously used of casein was said to be equivalent to th a t obtained with a good grade of casein. Dilute, aqueous, colloidal solutions of the salts of carboxymethylcellulose were claimed to be suitable for sizing colored paper (30). Krestinskil (46) found alkali-soluble carboxymethylcellulose useful in the impregnation of pulp for waterproofing. Freeman, Peterson, and Greminger(25) disclosed a greaseproofed paper treated with an ammoniacal solution of aluminum carboxymethylcellulose. Roberts (78) reported aqueous aluminum carboxymethylcellulose solutions for sizing paper, and Sichel (81) also showed viscous solutions of the aluminum salt to be useful as size.
FO O D IN D U S T R Y
Tests were carried out by Brown and Houghton (3) in England and Werle (91) in Germany to establish the fact th a t sodium carboxymethylcellulose is physiologically inert. The chemical constitution suggested to them th a t i t should be innocuous, and their feeding tests indicated th a t ra ts and dogs suffered no ill
effects. Post mortem examination of the vital organs showed these to be normal in every way. An analysis (3) of the foodstuff quality of one variety of carboxymethylcellulose showed the lead content of the salt to be only 8 parts per million, and copper and zinc were each less than 1 p.p.m. I t was concluded, therefore, th a t i t could be used in preparations for internal consumption such as medicine and foodstuffs as well as in toilet preparations for external application (3, 91).
Maxwell (58) disclosed th a t carboxymethylcellulose treated with epichlorohydrin could serve as a thickener for food, and Wallach (89) claimed th a t the addition of 10 to 50% water- soluble carboxymethylcellulose based on the weight of pure carbohydrate or carbohydrate foodstuffs would reduce the absorbability of such foods. The alkali-soluble carboxymethylcellulose may be used, it is said (5), to stabilize salts of hydro- sulfurous acid and related hydrosulfite compounds toward moist air, particularly where the hydrosulfite product is used in an alkaline bath. These stabilized hydrosulfite compounds were disclosed for bleaching fats and sugar (9).
The water-soluble salts of carboxymethylcellulose, particularly sodium carboxymethylcellulose, are being used to stabilize ice cream, sherberts, and ices, as well as chocolate milk and some types of cheese. They can be used in place of gums in icings, meringue powders, doughs, flours, jellies, pie fillings, puddings, and other bakery products. Their effective function as a protective colloid is used in oil-in-water emulsions such as flavor emulsions, salad dressing, and some types of mayonnaise.
Reichel (76) and co-workers suggested the preparation of sausage casings from carboxymethylcellulose followed by conversion of the carboxymethylcellulose to cellulose hydrate. Such casings also have been prepared by extruding a mixture of alkali- soluble carboxymethylcellulose and cellulose xanthate in alkaline solution and coagulating the mixture, followed by reconversion of the xanthate to cellulose hydrate (74).
A film of carboxymethylcellulose is reported as having found use as a flexible wrapper for frozen foodstuffs (75). Greasy or oily foods may be packaged in paper containers coated with water- soluble carboxymethylcellulose according to Collings, Peterson, and Kelly (8).
D R U G S AND C O SM E T IC S
One investigator reported th a t sodium carboxymethylcellulose may be used to replace tragacanth, carob gum, and gum arabic in the m anufacture of face creams, and may be used as a base or stabilizer in medicinal preparations (43). According to Wenck(90), it may be employed with agar-agar as a medium for cultivating bacteria. H ia tt (32) reported th a t medicaments, such as capsules, tablets, and powders surrounded by an enteric film or layer of carboxymethylcellulose, are insoluble in the stomach acids but soluble in alkaline intestinal fluids. Development of liquid-absorbing surgical dressings saturated with water-soluble carboxymethylcellulose have been reported (93).
Protective colloid action of the water-soluble salts of carboxymethylcellulose has found application in dentifrices, wave set compositions, hand lotions, and other types of pharmaceutical and cosmetic emulsions (62). Their ease of dispersion in hot or cold water makes them valuable as ointm ent bases in the drug field. Their grease and organic solvent-resistant films are useful in protective hand creams. D ental impression m aterials m ight contain various salts of carboxymethylcellulose.
Stains from copying inks or pencils or from typew riter ribbons, it is claimed, m ay be removed by compositions of pasty consistency containing carboxymethylcellulose swollen by water, with or w ithout the addition of soap or glycerol (38).
CER A M IC S
Ceramic bodies, especially for electrical purposes, can be more readily m anufactured by mixing with the ceramic material carboxymethylcellulose which swells or dissolves in water, then
946 I N D U S T R I A L A N D E N G I N E E R I N G C H E M I S T R Y Vol. 37, No. 10
molding the ceramic body and sintering it a t a tem perature of about 1500° C. (70).
L E A T H E R
Lilienfeld (50) described in early patents the use of alkali- soluble water-insoluble carboxymethylcellulose as a leather dressing. This type can also be used, i t is said, for impregnating leather to increase its waterproofness (46). A leather coating and coloring composition has been reported which contains 100 grams of a 5% solution of a carboxymethylcellulose salt, 3 grams of Turkey red oil, 2 grams of glycerol, 15 grams of dyestuff, and 30 grams of w ater (72). The water-soluble salts are being used to control adhesiveness in the leather-pasting operation.
P A IN T S AND LA CQ U ERS
Because of its film-forming properties, carboxymethylcellulose has been proposed for many types of protective coatings. Lilienfeld (50) disclosed coatings of the alkali-soluble type resistant to water and most chemicals; he also recommended a heat-treated carboxymethylcellulose for this purpose (57).
The water-soluble salts of carboxymethylcellulose have been suggested by Kohler (44) for the priming of interior walls, particularly when coloring m atter is desired in the prime coat.
Medl (61) described an aqueous composition particularly suitable for coating iron and other surfaces; his composition contained sodium carboxymethylcellulose w ith water-soluble nonacid salts of phosphoric, boric, and other polybasic acids to prevent rusting by the solution. These coatings are said to be impervious to grease and oil. He also suggested (62) a complex ester condensation product of a polyhydric alcohol with boric acid as a modifier to plasticize films of carboxymethylcellulose which are used as coatings for paper, cardboard, plaster or concrete surfaces, iron structural members, and black iron sheets.
The epichlorohydrin-treated carboxymethylcellulose of Maxwell (58) was reported as a thickening agent in emulsion-type paints. Sodium carboxymethylcellulose was also suggested for emulsion paints and lacquers (69). Carboxymethylcellulose m ay be used, it is said, to extend white pigments and improve their hiding power in flat paint formulations (28, 29).
Reichel and Craver (77) reported carboxymethylcellulose as a hydrophilic colloid thickener in a coating composition containing a cellulose derivative and a wax in an organic solvent. The water-insoluble polyvalent m etal salts of carboxymethylcellulose(26) also have been recommended for coatings.
Water-soluble salts of carboxymethylcellulose are being used to control viscosity and brushing properties, and to protect the emulsion in resin emulsion paints.
Slightly soluble crystalline materials, useful as pigments, extenders, fillers, or bases, such as calcium sulfate, may be treated, it is said, with water-soluble salts of carboxymethylcellulose to inhibit crystalline growth (83).
A D H ESIV ES
Voss (87) disclosed both the water-soluble and alkali-soluble types of carboxymethylcellulose as adhesives. A viscous aqueous solution containing 3 to 8% of sodium, potassium, ammonium, triethanolamine, or triethylammonium carboxymethylcellulose, alone or with soluble starches, was reported as forming adhesives suitable for hanging wallpaper or pasting paper products such as boxes (44). Robie (79) reported the use of carboxymethylcellulose to bond abrasive particles to a base in the manufacture •of sandpaper and various abrasive articles.
The alkali-soluble type was proposed as an adhesive by Lilienfeld (50), Maxwell and Larson (60), and others. I t has also been suggested as a cement for lam inating nonfibrous sheets (88).
Meyer (67) disclosed a specially dried and powdered water- soluble carboxymethylcellulose or its sodium salt as an adhesive, and Medl (61) reported the use of a sodium carboxymethyl
cellulose with alkaline salts of phosphoric, boric, or other polybasic acid in adhesives.
The aluminum salt of carboxymethylcellulose as an adhesive for pasting paper and wallpaper was described by Sichel (81).
F IL M S AND F IL A M E N T S
Films of carboxymethylcellulose, particularly the alkali-soluble type, have been proposed for “cellophane-type” wrappings. Such films are said to be tough and difficultly combustible (40).
Lilienfeld (50) disclosed films prepared by coagulating an alkaline solution of a water-insoluble carboxym ethylcellulose with 10 to 20% sulfuric acid, 25% acetic acid, 30% ammonium chloride solution, 20% tannin, or 40% formaldehyde solution, or by the usual viscose precipitating bath. The solidified film was washed with w ater and dried. Flexibility m ay be increased, i t was said, by plasticizing w ith 10% glycerol. Ellsworth (20, 21) coated alkali-soluble films of carboxymethylcellulose w ith a composition of a synthetic resin w ith wax and plasticizer to increase moisture resistance. A coating or surface size of nitrocellulose or other cellulose derivative emulsion m ay be used w ith water-sensitive films according to Kojevnikoff (45). In preparing a wrapping tissue of carboxymethylcellulose carrying a moistureproofing coating, Muller and Herrm ann (68) used an interm ediate coating of the polymerization product of maleic anhydride and vinyl m ethyl ether. For wrapping frozen foods, a carboxymethylcellulose film plasticized w ith water, glycerol, and diethylene glycol was recommended (75).
I t is reported th a t alkali-soluble films of carboxymethylcellulose m ay be treated w ith deformation-restricting agents (63, 64, 86). A film of mixed structure (84) was prepared by precipitating 20 parts of a polyamide dissolved in 6 N hydrochloric acid in a ba th consisting of a solution of 10 parts of carboxymethylcellulose in 80 parts of 6 N sodium hydroxide.
M IS C E L L A N E O U S
Miscellaneous proposed uses of carboxymethylcellulose include a coating for the inside of m etal molds used for the polymerization of resin-forming liquids (24), sticking agents for insecticides (60), clarifying agents for liquids (60), crystallization inhibitors(60), boiler compounds (31), creaming and thickening latex (31, 66, 80), oil drilling m uds (31), can-sealing compounds (31), antistick compounds to prevent blocking, and emulsifiers in the photographic field (43). The water-soluble salts m ay also be used as suspending agents in tungsten wire-drawing compounds.
The molding of insulating blocks has been patented, using1.5 to 5% of a polyvalent m etal salt of carboxymethylcellulose as the binder for exfoliated vermiculite (73). The aluminum, copper, zinc, iron, tin, nickel, and chromium salts were said to be suitable.
Substances found to be compatible w ith carboxymethylcellulose, which m ay be used in conjunction w ith it, include hydrated cellulose or hydrocellulose soluble in alkalies; viscose (cellulose xanthate) in the crude form or purified by any known process; albuminous substances, proteins, and glue (gelatin); amyloid, starch, and starchlike m aterials; tragasol; resins soluble in alkalies; resinous condensation products (soluble in alkalies) obtained by the condensation of a phenol or an arom atic amine or of a urea w ith an aldehyde; shellac; glycerol, diglycerol, polyglycerol, glycols, and sugars and sirups; soaps, fats, am monium or alkali-m etal derivatives of fa tty sulfonic acids such as Turkey red oil (50); drying or nondrying oils; and halogen derivatives of polyhydric alcohols, particularly halohydrins (57).
Carboxymethylcellulose, i t is said, m ay be plasticized with polyhydric alcohols (47) or special iV-hydroxyalkyl amides (92). Aluminum carboxymethylcellulose in combination with wax in an ammoniacal solution has been disclosed (94).
Since carboxymethylcellulose was first developed during World W ar I as a substitute for scarce natural products, it has
October, 1945 I N D U S T R I A L A N D E N G I N E E R I N G C H E M I S T R Y 947
atta ined a position based on its own virtues. Unique among cellulose derivatives, i t acts both as a film former and as a stabilizer and emulsifier for aqueous systems. This combination of properties makes carboxymethylcellulose potentially useful in fields in which gums, glues, and gelatins have so far not been used.
Neither the highly substituted organic-soluble type of carboxymethylcellulose (10) .nor its many derivatives, with the exception of the metallic salts, have been discusse'd in this paper. The numerous possibilities for derivatives are illustrated in part in patents which show xanthate derivatives (22, 51,'63, 64, 56); nitrogen-containing derivatives (11, 16); acid halides of carboxymethylcellulose (12, IS); derivatives containing carboxy and amine groups (17); and mixed ethers (56). M ixtures of carboxymethylcellulose w ith viscose have also been suggested (52, 59).
L IT E R A T U R E C IT E D
(1) Allan, J., and W ainwright, J . A. (to Celanese Corp.), U. S.P aten t 2,248,048 (July 8, 1941).
(2) Bolton, E. K. (to Du Pont Co.), Ibid., 2,087,237 (July 20,1937).(3) Brown, C. J., and Houghton, A. A., J . Soc. Chem. Ind., 60, 254-8
(1941).(4) Brown, R . R. H., and Cooper, J . N. (to Im perial Chem. Ind.),
U. S. P aten t 2,192,297 (M arch 5, 1940).(5) Chowdhury, J . K ., Biochem. Z., 148, 76-97 (1924).(6) Clark, J . A. (to Sylvania Industrial Corp.), U. S. P a ten t 2,259,-
796 (Oct. 21, 1941).(7) Clarkson, R . G. (to Du Pont Co.), Ibid., 2,021,932 (Nov. 26,
1935).(8) Collings, W. R., Peterson, F. C., and Kelly, H . C. (to Dow
Chemical Co.), Ibid., 2,235,798 (March 18, 1941).(9) Downing, F. B., and Pedersen, C. J., (to D u Pont Co.), Ibid.,
2,121,397 (June 21, 1938).(10) Dreyfus, H „ Ibid., .1,884,629 (Oct. 25, 1932).(11) Ibid., 2,007,950 (July 9, 1935).(12) Ibid., 2,015,104 (Sept. 24, 1935).(13) Ibid., 2,053,768 (Sept. 8, 1936).(14) Ibid., 2,098,335 (Nov. 9, 1937).(15) Ibid., 2,106,298 (Jan. 25, 1938).(16) Ibid., 2,186,101 (Jan. 9, 1940).(17) Ibid., 2,233,475 (M arch 4, 1941).(18) Dreyfus, H ., Dickie, W. A., and Sowter, P . F. C. (to Celanese
Corp.), Ibid., 1,950,664 (M arch 13, 1934).(19) Ibid., 1,978,785 (Oct. 30, 1934). .(20) Ellsworth, D. C. (to Du Pont Co.), Ibid., 2,060,056 (Nov.
10, 1936).(21) Ibid., 2,123,883 (July 19, 1938).(22) Ellsworth, D . C., and Haskins, J . F ., Ibid., 2,201,663 (M ay 21,
1940).(23) Franke, H., Deut. Färber-Ztg., 1932, 85-6; Gränacher, C., B rit.
P aten t 347,117 (April 17, 1929).(24) Freeman, R. D. (to Dow Chemical Co.), U .'S. P a ten t 2,348,677
(M ay 9, 1944).(25) Freeman, R. D., Peterson, F. C., and Greminger, G. K., Jr.,
Ibid., 2,308,692 (Jan. 19, 1943).(26) Freeman, R . D., and Roberts, M. J., Ibid., 2,331,858 (Oct. 12,
1943).(27) Gloor, W. E . (to Hercules Powder Co.), Ibid., 2,350,161 (M ay
30, 1944).(28) Hanahan, M. L. (to Du Pont Co.), Ibid., 2,231,467 (Feb. 11,
1941).(29) Ibid., 2,231,468 (Feb. 11, 1941).(30) Henkel & Cie G.m .b.H ., French P a ten t 808,699 (Feb. 12,1937).(31) Hercules Powder Co., “Sodium Carboxymethylcellulose” ,
June, 1944.(32) H iatt, G. D. (to Eastm an K odak Co.), U. S. P aten t 2,196,768
(April 9, 1940).(33) Höppler, F., Chem.-Ztg., 66, 132-5 (April, 1942).(34) Houghton, A. A., and Craik, J. (to Imperial Chem. Ind.), U. S.
P aten t 2,253,297 (Aug. 19, 1941).(35) H unt, J. K., and Latham , G. H. (to Du Pont Co.), Ibid., 2,086,-
419 (July 6, 1937).<36) H urd, I. S. (to Rohm & H aas Co.), Ibid., 2,314,277 (M arch 16,
1943).(37) I. G. Farbenindustrie A.-G., Brit. P aten ts 305,230 (Feb. 2,-
1928) and 317,117 (M ay 9, 1928).(38) Ibid., 340,232 (Aug. 17, 1929).(39) Jacobson, I. M., and T ruscott, S., U. S. P aten t 1,706,295
(M arch 19, 1929).(40) Jansen (to Deutsche Celluloid Fabrik Eilenburg), German
P atent 332,203 (1918).
(41) Johnson, A. J. (to D u Pont Co.), U. S. P a ten t 1,979,869 (Nov. 6 .1934).
(42) Kallock, W. F . (to McLaurin-Jones Co.), Ibid., 2,299,991 (Oct.27, 1942).
(43) K innard, V., Foreign Commerce Weekly, M ay 15.1943, pp. 11, 13.(44) Köhler, R. (to Henkel & Cie G .m .b.H .), U. S. P a ten t 2,180,152
(M ay 14, 1939).(45) Kojevnikoff, N . N . (to D u Pont Co.), Ibid., 2,123,700 (July 12,
1938).(46) Krestinskiï, V., Kunststoffe, 23, 64 (1933); abstracted from
Novosti Tekhniki, 15, No. 5, 5 (1933).(47) Kropscott, E . L. (to Dow Chemical Co.), U. S. P aten t 2,226,823
(Dec. 31, 1940).(48) Larson, L. L. (to Du Pont Co.), Ibid., 2,216,845 (Oct. 8 , 1940).(49) Lilienfeld, L., Brit. P a ten t 231,803 (April 4, 1924).(50) Lilienfeld, L., U. S. P a ten t 1,682,293 (Aug. 28, 1928).(51) Ibid., 2,004,875 (June 11, 1935).(52) Lilienfeld, L. (to Lilienfeld P aten ts Inc.), Ibid., 2,176,085 (Oct.
17, 1939).(53) Ibid., 2,265,914 (Dec. 9, 1941).(54) Ibid., 2,265,915 (Dec. 9, 1941).(55) Ibid., 2,266,916 (Dec. 9, 1941).(56) Ibid., 2^265,918 (Dec. 9, 1941).(57) Ibid., 2,265,919 (Dec. 9, 1941).(58) Maxwell, R . W. (to D u Pont Co.), Ibid., 2,148,952 (Feb. 28,
1939).(59) Ibid., 2,162,460 (June 13, 1939).(60) Maxwell, R. W., and Larson, L. L., Ibid., 2,236,545 (April 1,
1944).(61) Medl, R. C., Jr. (to Hercules Powder CoĄ, Ibid., 2,340,072 (Jan.
25, 1944).(62) Ibid., 2,362,761 (Nov. 14, 1944).(63) Meigs, F. M. (to D u Pont Co.), Ibid., 2,170,828 (Aug. 29,1939).(64) Ibid., 2,170,829 (Aug. 29, 1939).(65) Merrill, W. J. (to Du Pont Co.), Ibid., 2,184,312 (Dec 26, 1939).(66 ) Metallgesellschaft A.-G., B rit. P a ten t 429,559 (M ay 31, 1935).(67) Meyer, Georg, U. S. P aten t 2,288,200 (June 20, 1942).(68) Müller, P ., and Herrm ann, O. (to D u Pont Co.), Ibid., 2,252,091
(Aug. 12, 1941).(69) N atl. Paint, Varnish Lacquer Assoc., Sei. Sect., Cire. 688 (Aug.,
ip44).(70) N. V. Philips Gloeilampenfabrieken (to Philips Lamps L td.),
B rit. P a ten t 552,719 (April 21, 1943).(71) Oxley, H . F., Thomas, E . B., and Downing, J . (to Celanese
Corp.), U. S. P aten t 2,184,564 (Dec. 26, 1939).(72) Pense, W., and Bestian, H . (vested in Alien Property Custodian),
Ibid., 2,341,413 (Feb. 8 , 1944).(73) Peterson, N . R. (to Dow Chemical Co.), Ibid., 2,336,636 (Deo.
14,1943).(74) Reichel, F . H . (to Sylvania Industrial Corp.), Ibid., 2,267,217
(Dec. 23, 1941).(75) Reichel, F . H., and Cornwell, R. T. K ., Ibid., 2,281,513 (April
28, 1942).(76) Reichel, F . H ., and Craver, A. E „ Ibid., 2,176,925 (Oct. 24,
1939).(77) Ibid., 2,245,499 (June 10, 1941).(78) Roberts, M. J . (to Dow Chemical Co.), Ibid., 2,331,859 (Oct. 12,
1943).(79) Robie, N . P . (to Carborundum Co.), Ibid., 2,280,852 (April 28,
1942).(80) Schweitzer, Otto, Rubber Chem. Tech., 13, 408-14 (1940);
Kautschuk, 15, No. 10, 169-72 (1939).(81) Sichel, Ferdinand, A.-G., Brit. P aten t 496,354 (Nov. 29, 1938).(82) Sponsel, K., Melliand Textilber., 19, 738-9 (1938).(83) Sullivan, R. W. (to Du Pont Co.), U. S. P aten t 2,177,269 (Oct.
24, 1939).(84) Thinius, K. (vestedin Alien P roperty Custodian), Ibid., 2,347,-
525 (April 25, 1944).(85) Thomas, E. B„ and Oxley, H . F. (to Celanese Corp. of America),
Ibid., 2,135,128 (Nov. 1, 1943).(86) Underwood, W. F., and Rothrock, N. S. (to Du Pont Co.),Ibid.,
2,170,827 (Aug. 29, 1939).(87) Voss, J . (to Kalle & Co. A.-G.), Ibid., 2,179,457 (Nov. 7, 1939).(88 ) Wallach, R. (to Sylvania Industrial Corp.), Ibid., 2,273,677
(Feb. 17, 1942).(89) Ibid., 2,302,511 (Nov. 17, 1942).(90) Wenck, P. R. (to Dow Chemical Co.), Ibid., 2,358,549 (Sept. 19,
1944).(91) Werle, E., Chem.-Ztg., 65, 320 (1941).(92) Woodhouse, J. C. (to Du Pont Co.), U. S. P aten t 2,170,845
(Aug. 29, 1939).(93) Wrede, H. (to Rudolph Koeppe & Co. Chemische Fabrik A.-G.),
German P aten t 714,870 (Nov. 13, 1941).(94) Young, A. E., and Freeman, R. D . (to Dow Chemical Co.).
U. S. P aten t 2,308,664 (Jan. 19, 1943).
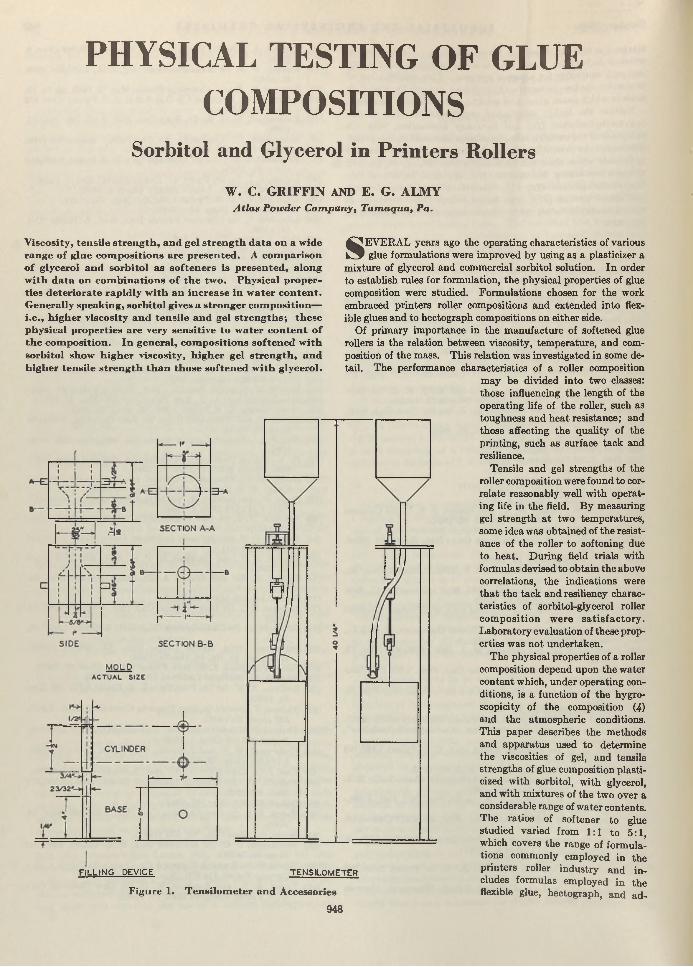
PHYSICAL TESTING OF GLUE
COMPOSITIONSSorbitol and Glycerol in Printers Rollers
W. C. G RIFFIN AND E. G. ALMYA tla s P ow der C o m p a n y , T a m a q u a , Pa.
V iscosity , ten sile strength , and gel stren gth data on a wide range o f g lue com positions are presented. A com parison o f glycerol and sorbitol as softeners is presented, along w ith data on com binations o f th e tw o. P hysical properties deteriorate rapidly w ith an increase in w ater co n ten t. G enerally speaking, sorbitol gives a stronger com position—i.e ., h igher viscosity and ten sile and gel strengths; these physical properties are very sensitive to water co n ten t o f th e com position . In general, com positions softened w ith sorbitol show h igher viscosity, h igher gel stren gth , and higher tensile strength than those softened w ith glycerol.
FILLING DEVICE TENSILOMETER
Figure 1. T ensilom eter and Accessories
9 4 8
SEVERAL years ago the operating characteristics of various glue form ulations were improved by using as a plasticizer a
m ixture of glycerol and commercial sorbitol solution. In order to establish rules for form ulation, the physical properties of glue composition were studied. Form ulations chosen for the work embraced printers roller compositions and extended in to flexible glues and to hectograph compositions on either side.
Of prim ary im portance in the m anufacture of softened glue rollers is the relation between viscosity, tem perature, and composition of the mass. This relation was investigated in some detail. The performance characteristics of a roller composition
m ay be divided into two classes: those influencing the length of the operating life of the roller, such as toughness and heat resistance; and those affecting the quality of the printing, such as surface tack and resilience.
Tensile and gel strengths of the roller composition were found to correlate reasonably well w ith operating life in the field. By measuring gel strength a t two tem peratures, some idea was obtained of the resistance of the roller to softening due to heat. D uring field trials with formulas devised to obtain the above correlations, the indications were th a t the tack and resiliency characteristics of sorbitol-glycerol roller com position w ere sa tis fac to ry . Laboratory evaluation of these properties was not undertaken.
The physical properties of a roller composition depend upon the water content which, under operating conditions, is a function of the hygro- scopicity of the composition (4) and the atm ospheric conditions. This paper describes the m ethods and apparatus used to determine the viscosities of gel, and tensile strengths of glue composition plasticized w ith sorbitol, w ith glycerol, and with m ixtures of the two over a considerable range of w ater contents. The ratios of softener to glue studied varied from 1:1 to 5:1, which covers the range of form ulations commonly employed in the printers roller industry and includes formulas employed in the flexible glue, hectograph, and ad-

O ctober, 1945 I N D U S T R I A L A N D E N G I N E E R I N G C H E M I S T R Y 949
hesive industries. Form ulations containing tanning or i n s o l u b i l i z i n g agents are not included in this study.
Standard m ethods of testing glue were adopted by the N ational Assoc i a t i o n of Gl ue M anufacturers in 1934(7,8), utilizing the Bloom gelome- ter and a pipet-type viscometer. However, little has been published concerning the testing of p l a s t i c i z e d glue compositions a t low water contents. I t was therefore necessary to devise suitable methodsof testing. The dependence of these properties on w ater content is so great th a t it was necessary to know accurately the moisture content of each composition under test. The rap id t itr im e tr ic method for determining w ater {2) developed in this laboratory m ade possible the requisite control analyses.
M ETH ODS O F TE ST IN G
D eterm ination o f V iscosm r. A Hoeppler falling- ball viscometer (5, 6) was used for the roller compositions. Viscosities were determined a t 75° C. (167° F.) which is in the range of casting tem perature for printers roller compositions. Theliquid density was assumed to be 1.3 grams per cc. in all tests. Maximum deviation from this value would be 0.1 gram per cc., which would introduce an error of less than 2% . This is within the reproducibility of the compositions.
1,000,000500.000200.000 100,000
50,000
4,000
u. 200.c\A
0200
>
X v
FIGURE 3 ,
20
50
O
%FIGURE 3C
\
15 20 25 30Weight Pcrccntoge of Wot«r
35
2,000
1,000
600
\
FIGUR: 4A ' —5ti
I0 20 25 30
%K
>FIGUFE 40
10 1. 20 2 5 30
N& > .
FIGUR: 4C
13 à 20 25 30<'
\ V.O\
: &FIGUR : 5a
' ~~o c
; 400
’ 200
Figures 2 to 5. P hysical Properties’ o f Softened G lue C om positions: 2 , V iscosity 5 3, T ensileStrength; 4, Gel S trength a t 25° C . 5 5, Gel
Strength a t 40° C.A. Arlex a s so ften er; v aria tion s w ith w eig h t p ercen tage w ater
c o n ten t; lin e s o f co n s ta n t so ften er-g lu e ra tio show n .B. G lycerol as so ften er; varia tion s w ith w eig h t p ercen tage
w ater co n ten t; lin e s o f co n s ta n t so ften er-g lu e ra tio show n .
C. A rlex-glycerol as so ften er; varia tion s w ith p ercen tage o fArlex in so ften er; lin e s o f c o n sta n t so ften er com p o sition ; d o tted lin e s are all-A rlex or a ll-g lycero l so ften er form u la s .
400, ■■
• Vi V. o ¥ ,
FIGUR: sc VyN
Weight P«re«nleg« of Wof«r
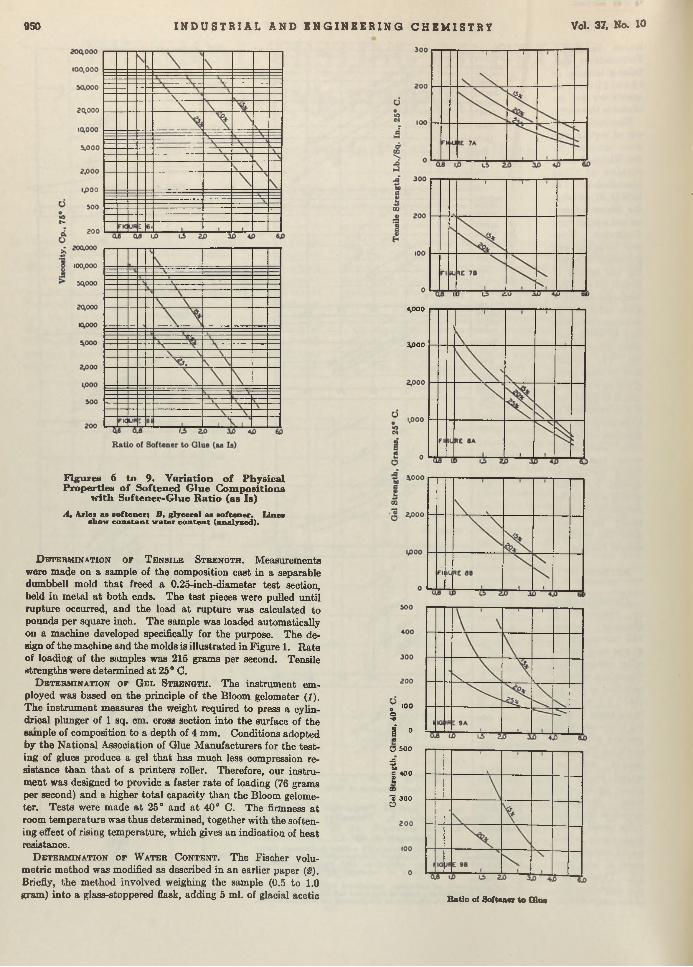
950 I N D U S T R I A L A N D E N G I N E E R I N G C H E M I S T R Y Vol. 37, No. 10
Figures 6 to 9. Variation o f Physical Properties o f Softened G lue C om positions
w ith Softener-G lue R atio (as Is)
A, Axlex a s s o f te n e r ; B , g ly cero l a s s o f te n e r . L in es show c o n s ta n t w a te r c o n te n t (an a ly sed ) .
D b t t e r m in a t io n o p T e n s i l e S t r e n g t h . M easurements were made on a sample of the composition cast in a separable dumbbell mold th a t freed a 0.25-inch-diameter test section, held in m etal a t both ends. The test pieces were pulled until rupture occurred, and the load a t rupture was calculated to pounds per square inch. The sample was loaded automatically on a machine developed specifically for the purpose. The design of the machine and the molds is illustrated in Figure 1. R ate of loading of the samples was 215 grams per second. Tensile strengths were determined a t 26° C.
D e t e r m i n a t i o n o f G e l S t r e n g t h . The instrum ent employed was based on the principle of the Bloom gelometer (/). The instrum ent measures the weight required to press a cylindrical plunger of 1 sq. cm. cross section into the surface of the sample of composition to a depth of 4 mm. Conditions adopted by the N ational Association of Glue M anufacturers for the testing of glues produce a gel th a t has much less compression resistance than th a t of a printers roller. Therefore, our instrum ent was designed to provide a faster ra te of loading (76 grams per second) and a higher to ta l capacity than the Bloom gelometer. T ests were made a t 25° and a t 40° C. The firmness a t room tem perature was thus determined, together w ith the softening effect of rising tem perature, which gives an indication of heat resistance.
D e t e r m i n a t i o n o f W a t e r C o n t e n t . The Fischer volum etric m ethod was modified as described in an earlier paper (2). Briefly, the m ethod involved weighing the sample (0.5 to 1.0 gram) into a glass-stoppered flask, adding 5 ml. of glacial acetic Ratio of So/ten er to Ota*
4,000
4000
r 1 0 0e•*
i ° <8Q 500
ta 400 £ m’S 300O
O ctober, 1945 I N D U S T R I A L A N D E N G I N E E R I N G C H E M I S T R Y 951
T a b l e I. A n a l y s e s o f P r i n t e r s R o l l e r C o m p o s it io n s
GlueNo.A-l A-2 A-3 A-4 A-5 A-6 A-7 A-8 A-9 A-10 A - l l A-12 A-13 A-14 A-16 A-16 A-17 A-18 A-19 A-20 A-21 G-l 0-2 0 -3 0 -4 G-5 G-6 G-7 0-8 0 -9 0-10 G - l l G-12 AG-1
AG-2AG-3AO-4
AO-5AO-6AO-7
AO-8AO-9
Softener Arlex Arlex Arlex Arlex Arlex Arlex Arlex Arlex Arlex Arlex Arlex Arlex Arlex Arlex Arlex Arlex Arlex Arlex Arlex Arlex Arlex Glycerol Glyoerol Glycerol Glycerol Glycerol Glycerol Glycerol Glycerol Glycerol Glycerol Glycerol Glycerol 50% Arlex—
50% glycerol
75% Arlex— 25% glycerol
5% A rlex- 65% glyoerol
Softener: G lue R atio
(as Is)
1:11:11:1
1 .7 6 :11 .75 :11 .7 8 :12 .6:12 .5 :12 .5 :13 .0 :1
3 .2 6 :13 .2 5 :13 .2 5 :13 .5 :13 .5 :14 .0 :14 .0 :14 .0 :15 .0 :16 . 0:15 .0 :1
1:11:11:1
1 .7 6 :11 .7 6 :11 .7 6 :12 .5 :12 .5 :12 .5 :1
3 .2 5 :13 .2 5 :13 .2 5 :11 .75 :1
1 .7 5 :11 .7 6 :11 .7 5 :1
1 .7 5 :11 .7 5 :11 .75 :1
1 .7 5 :11 .7 6 :1
AnalysedWater
19.92 2 .92 5 .817.619 .82 2 .414.616.7 22.116.715.217.621.7 16.023 .215.024 .980 .714.823 .128 .517.618.520.216.717.9 20.114.815.916.513.214.31 5 .6 12.1
14.818.714.9
17.121.616.6
19.3 2 1 .5
Viscosity a t 75° C..
Centipoises
396.000177.00061.50082.70037.500 19,20079.70036.400 10,350 10,10020.400 11,0503,670
11,5301,960
10,000958360
6,490664296
75.000 44,800 23,100
9,2506,9704,6503,7902,6102,1452,4801,6461,423
88.400
35,30016,90077.400
42.500 14,56025.700
11,1606,600
Tensile a t 25° G.,
L b ./S q . In .
204193171173149155 146 10084
13710883917596 60 34 88 63
7161174156 11897 94 89 68 67 65 57 37
155
143115160
165131150
12293
Oel Strength, G ram s
26° C. 40 “ C.350030402890200015001140169014001120968950900700792845968670480620460390
294528602340180315201480119011761088975
800820
2020
210018052435
199016052120
20151700
578276250360240114323235117140187142
76123
Liquid142
80Liquid
LiquidLiquid
630430234297244113211159104171116110528
376200375
210119408
237117
A tared aluminum stirrer, anchor type, was inserted, and the glue was mixed w ith the liquid by swirling and brief hand stirring until all of the glue was w etted by the liquid medium. T he neck of the flask was covered w ith an inverted one-hole rubber stopper, fitting loosely about the stirrer shaft. The stirrer was then driven a t a speed of approxim ately 100 r.p.m . Heating was continued in the w ater bath (a t 75° C.) until there were no detectable swollen undispersed glue particles. A uniform cooking tim e could not be established since the dispersion and degradation of the glue a t the cooking tem perature are a function of time, w ater content, and softener-glue ratio. Thus, in a high- ratio or high-water-content composition the glue is dispersed in appreciably less time than in a low-ratio or low-water-content formula; if th e two are heated the same length of time, the higher ra te of degradation for the former composition would result in too great a change in physical properties. One and a half hours were sufficient for complete cooking of a m ajority of the compositions. T hirty m inutes and 4 hours represent extremes in tim e of cooking. Good agreement of d a ta were obtained on duplicate preparations.
PH YSICAL PR OPERTIES
acid, allowing the sample to stand overnight a t room tem perature to effect solution, adding an excess of modified Fischer reagent, and titra ting w ith water-alcohol solution. The acetic acid introduces w ater for which a correction m ust be made. On occasion, samples very low in water, or tanned to an insoluble state, were found which would not disperse completely with this treatm ent. In such case the sample was heated gently after standing overnight in acid. No compositions have been encountered th a t would resist th is combined treatm ent.
G LU E COM POSITIONS
¡Several series of compositions were prepared, tested, and analyzed: (a) all-sorbitol, (6) all-glycerol, and (c) soribtol-glyc-erol softened compositions. The ingredients are listed with specifications:
G l u e . A balanced grade of hide glue containing approximately 16% water (analyzed 16.3%); 410 to 415 grams gel strength (Bloom), 135-millipoi8e viscosity, ground to 24-26 mesh, pH 5.9 in 20% solution (pH of plasticized glue mixture was found to be 6.0 =*= 0.2).
G l y c e r o l . Dynam ite grade, 1 % water.S o r b i t o l . Commercial solution (Arlex) containing 16% water.
The ratio of softener to glue was varied between the lim its of 1:1 and 5:1. Each basic composition was prepared a t three different w ater contents so th a t the effect of varying w ater content on the properties Hinder consideration could be determined. At one softener-glue ratio (1.75:1), the composition of the softener was varied from 100% Arlex to 100% glycerol in 25% steps to study the effects of this progressive substitution.
The liquid ingredients, including any added water, were weighed into a tared round-bottom flask. The am ount chosen was one th ird to one half of the volume of the flask. The mixture was .warmed to 65 75 C. (with a steam or hot water jacket), and the proper quan tity of glue was added.
The data are summarized in Table I. I t m ust be kept in m ind th a t softener-glue
ratios and softener percentage compositions are based on the ingredients as commercially available. The w ater contents (column 4) are, on the other hand, analyzed values and include the moisture of the ingredients as well as the added water. In computing the formulas, i t was necessary to allow for the water of the ingredients in order to bring the analyzed w ater values within the desired range.
The physical properties given in Table I are plotted as a function of w ater content (at constant softener-glue ratios) in Figures 2 to 5. A satisfactory graph for viscosity vs. w ater content, essentially Unear throughout the working range, was obtained by plotting the empirical function log-log (cp. + 1), where cp. represents the Hoeppler viscosity in centipoises.
Besides being considered from the standpoint of varying w ater content, the data may be expressed as a function of the softener- glue ratios (at constant w ater contents) in Figures 6 to 9. In plotting viscosity vs. softener-glue ratio (Figure 6), linear curves were obtained if logarithmic scales were used for both ordinate and abscissa. For the other properties no true linear relations were found. However, the use of the logarithm of softener-glue ratio in these curves was found to be advantageous.
T able II . C o m p a r is o n o f P r o p e r l y C o o k e d a n d O v e r c o o k e d S o r b i t o l -S o f t e n e d C o m p o s it io n s
No.
Softener: Glue Ratio
(as Is)
A%AnalysedW ater
Visoosity a t 75° C., C en
tipoises
Tensile a t 75° C.,
L b ./Sq . In .
Gel Strength, Grams
25° C. 40° C.
A-17A-18A-20A-21
4 .0 :14 .0 :15 .0 :15 .0 :1
24.930 .723.128 .5
Properly Cooked958 60 360 34 664 53 296 7
670480460390
80LiquidLiquidLiquid
A-17-aA-18-aA-20-aA-21-a
4 .0 :14 .0 :15 .0 :16 .0 :1
24 .73 0 .62 4 .930.2
Overcooked414129318159
7777
250160270240
LiquidLiquidLiquidLiquid
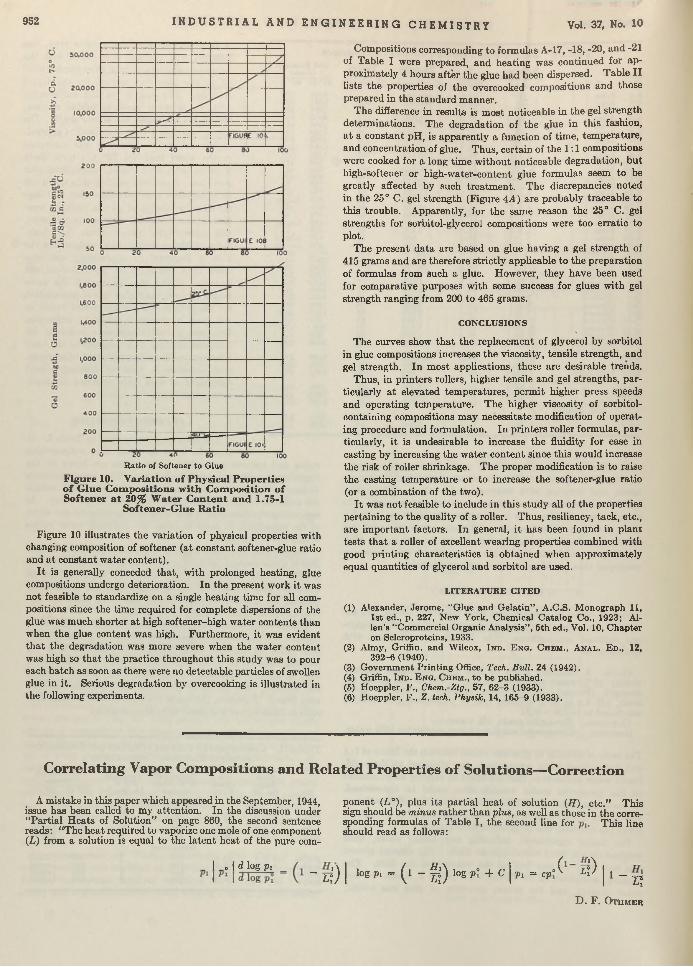
952 I N D U S T R I A L A N D E N G I N E E R I N G C H E M I S T R Y Vol. 37, No. 10
R atio of Softener to Glue
Figure 10. Variation o f Physical Properties o f G lue C om positions w ith C om position o f Softener a t 20% W ater C ontent and 1.75-1
Softener-G lue Ratio
Figure 10 illustrates the variation of physical properties with changing composition of softener (at constant softener-glue ratio and a t constant water content).
I t is generally conceded th a t, with prolonged heating, glue compositions undergo deterioration. In the present work it was not feasible to standardize on a single heating time for all compositions since the time required for complete dispersions of the glue was much shorter a t high softener-high w ater contents than when the glue content was high. Furthermore, it was evident th a t the degradation was more severe when the w ater content was high so th a t the practice throughout this study was to pour each batch as soon as there were no detectable particles of swollen glue in it. Serious degradation by overcooking is illustrated in the following experiments.
Compositions corresponding to formulas A-17, -18, -20, and -21 of Table I were prepared, and heating was continued for ap proximately 4 hours after the glue had been dispersed. Table I I lists the properties of the overcooked compositions and those prepared in the standard manner.
The difference in results is m ost noticeable in the gel strength determ inations. The degradation of the glue in th is fashion, a t a constant pH, is apparently a function of time, tem perature, and concentration of glue. Thus, certain of the 1:1 compositions were cooked for a long time w ithout noticeable degradation, bu t high-softener or high-water-content glue formulas seem to be greatly affected by such treatm ent. The discrepancies noted in the 25° C. gel strength (Figure 4A ) are probably traceable to this trouble. Apparently, for the same reason the 25° C. gel strengths for sorbitol-glycerol compositions were too erratic to plot.
The present data are based on glue having a gel strength of 415 grams and are therefore strictly applicable to the preparation of formulas from such a glue. However, they have been used for comparative purposes w ith some success for glues w ith gel strength ranging from 200 to 465 grams.
C O N C L U S IO N S
The curves show th a t the replacem ent of glycerol by sorbitol in glue compositions increases the viscosity, tensile strength, and gel strength. In m ost applications, these are desirable trends.
Thus, in printers rollers, higher tensile and gel strengths, particularly a t elevated tem peratures, perm it higher press speeds and operating tem perature. The higher viscosity of sorbitol- containing compositions m ay necessitate modification of operating procedure and formulation. In printers roller formulas, particularly, it is undesirable to increase the fluidity for ease in casting by increasing the w ater content since th is would increase the risk of roller shrinkage. The proper modification is to raise the casting tem perature or to increase the softener-glue ratio (or a combination of the two).
I t was not feasible to include in th is study all of the properties pertaining to the quality of a roller. Thus, resiliency, tack, etc., are im portant factors. In general, i t has been found in plant tests th a t a roller of excellent wearing properties combined with good printing characteristics is obtained when approximately equal quantities of glycerol and sorbitol are used.
L IT E R A T U R E C IT E D
(1) Alexander, Jerome, "Glue and G elatin” , A.C.S. M onograph 11,1st ed., p. 227, New York, Chemical Catalog Co., 1923; Allen’s “ Commercial Organic Analysis” , 5th ed., Vol. 10, C hapter on Scleroproteins, 1933.
(2) A lm y , Griffin, and Wilcox, I n d . E n g . C h e m ., A n a l . E d . , 12,392-6 (1940).
(3) Government P rinting Office, Tech. Bull. 24 (1942).(4) Griffin, I n d . E n g . C h e m ., to be published.(5) Hoeppler, F ., Chem.-Ztg., 57, 62-3 (1933).(6) Hoeppler, F ., Z. tech. Physik, 14, 165-9 (1933).
Correlating Vapor Compositions and Related Properties of Solutions—Correction
A mistake in this paper which appeared in the September, 1944, issue has been called to my attention. In the discussion under “Partial H eats of Solution” on page 860, the second sentence reads: “The heat required to vaporize one mole of one component (L ) from a solution is equal to the laten t heat of the pure com-
_ | _o | d log Pi
ponent (L°), plus its partial heat of solution (H), e tc .” This sign should be minus rather than plus, as well as those in the corresponding formulas of Table I, the second line for This line should read as follows:
~ T°) I log Vl = 0 “ fj) log p° + c I Pl = cp°^ L°^ I 1 ~ pD . F . O t h m e r

Tall Oil Esters as Plasticizers for GR-S
W . I. H ARBER AND C. S . Y O R AN1W itco C h em ica l C o m p a n y , C hicago, III.
Tall o il is a rich source o f resin and fa tty acids. Previous work has show n th a t th is m ateria l exerts a p lasticizing effect on G R -S. T he structure o f ta ll o il was m odified by esterification w ith a lcohols. M ost in teresting were those esters derived from hydroxy com pounds related to G R-S
u n it structure. T hey were superior to tall o il in rate o f incorporation in to th e G R-S and general p lastic iz ing ac tio n . For a com prehensive p icture o f th e properties o f ta ll oil esters, data are also given for esters o f a liphatic, phenolic , cycloaliphatic, and polyhydroxy alcohols.
TALL oil is a by-product of the pine wood paper industry- I t consists of approximately equal amounts of fa tty and
resin acids plus 6-10% of unsaponifiable m atter. I t would be expected to have the general properties of resin and fa tty acids; tests made in these laboratories indicated th a t tall oil exerted a plasticizing action in GR-S. However, when added to GR-S on the laboratory mill i t produced greasiness and incorporated into the mix ra ther slowly. Furthermore, the tall oil tended to bleed out of the stock on curing, and the stock was sticky when hot. I t seemed desirable, therefore, to seek ways of improving the properties of this material.
The simplest chemical modification which was considered practical was to convert the tall oil to its esters. In this manner the chemical constitution of the m aterial could be brought closer to th a t of GR-S. In the following formulas R represents the ali- phatic-phenanthrene residue of tall oil:
Tall oil: RC—OH
JGR-S unit:
Tall oil esters
(6) (5) (4) (3) (1)- h 2c —c h = c h —c h 2—c h -
(2) CH2
: R —G—O— y phenyl (GR-S uni II ' ------ groups 1-6)A
S unit less
aliphatic residues of the fa tty acids and the phenanthrene residue of the resinic acids continue to be of m ajor importance.
While those esters of tall oil which are related to the structure of GR-S are of more importance, it was considered of interest to prepare esters of other classes in order to present a complete picture of the value of tall oil esters in plasticizing GR-S. The following basic formula for tire tread stock was used in comparing the properties of the tall oil esters w ith tall oil and commercial plasticizers:
GR-S 100M ercaptobenzothiazole 1 .5Stearite 2Zinc oxide 5
Witco No. 12 channel blackSulfurSoftener
502
15
R —C—O—GHj— ' /benzyl (GR-S unit less x------ groups 2-6)
R—C—O—CH2 C H r - / N/3-phenyl ethyl (GR-Sjj ----- / unit less groups 2 ,4 ,5 ,6 )
R —-C—-0—CH— Nmethyl phenyl carbinyl (GR-S ' ------ unit less groups 3-6)
0 CH,
R —C—O—CH2—C H = C H — \ c i n n am yl (GR-S
i ------ unit less groups1-3)
Effecting this change should result in greater solubility of the tall oil in GR-S and, consequently, more rapid incorporation and enhanced plasticizing action. These effects a t best would be produced only m oderately because whatever the change in the carboxyl group of the tall oil, the contribution of the long-chain
i P resen t address. Brown R u bb er C om pany, L afayette , Ind .
The esters were prepared either by direct reaction of the tall oil and the hydroxy compound, or by conversion of the tall oil to its acid chlorides and reaction of these with the hydroxy compounds.
E S T E R PR EP A R A TIO N AND R U B B E R T E S T IN G
P o l y h y d r o x y A l c o h o l E s t e r s o f T a l l O i l . The preparation of the glycerol ester illustrates the procedure: A 3-liter three-necked flask was equipped with a glass inlet tube, thermometer, and air-cooled reflux condenser a t the top of which was a water-cooled take-off condenser and receiver. In the flask were placed 879 grams (3 moles) of Indusoil (distilled tall oil), 110 grams (1,2 moles) of glycerol, and 0.5 gram of litharge catalyst. The flask was heated in a graphite bath while nitrogen was bubbled through the reaction mix. Heating was continued a t 250° C. for 4 hours a t which time the acid number of the product dropped to 2.1. During heating, the water of reaction passed through the air condenser and was collected in the receiver. A t the end of the reaction time the tem perature of the flask was raised above the boiling point of the glycerol to remove any unreacted material. The yield was quantitative.
E s t e r s o f O t h e r C l a s s e s . Esters other than those of polyhydroxy alcohols were prepared from the tall oil acid chlorides and the hydroxy compound. The preparation of the cresyl esters illustrates the procedure: A 1-liter Claisen flask was equipped with a dropping funnel, and through the other neck was placed a short air condenser which was, in turn, connected to a hydrochloric acid-w ater trap. The distilling tube of the flask was plugged with a glass rod. In the flask were placed 104 grams (0.5 mole) of phosphorus pentachloride. Through the dropping funnel were added slowly 145 grams (0.5 mole) of Indusoil. After the initial vigorous reaction had subsided, the reaction was brought to completion by warming on the steam bath for 30 minutes. The flask was then equipped for vacuum distillation (water pump) and heated in an oil bath, and the phosphorus oxy- chloride was removed. As soon as decomposition was noted in the flask (around 110° C.), heating was stopped. The flask was
953
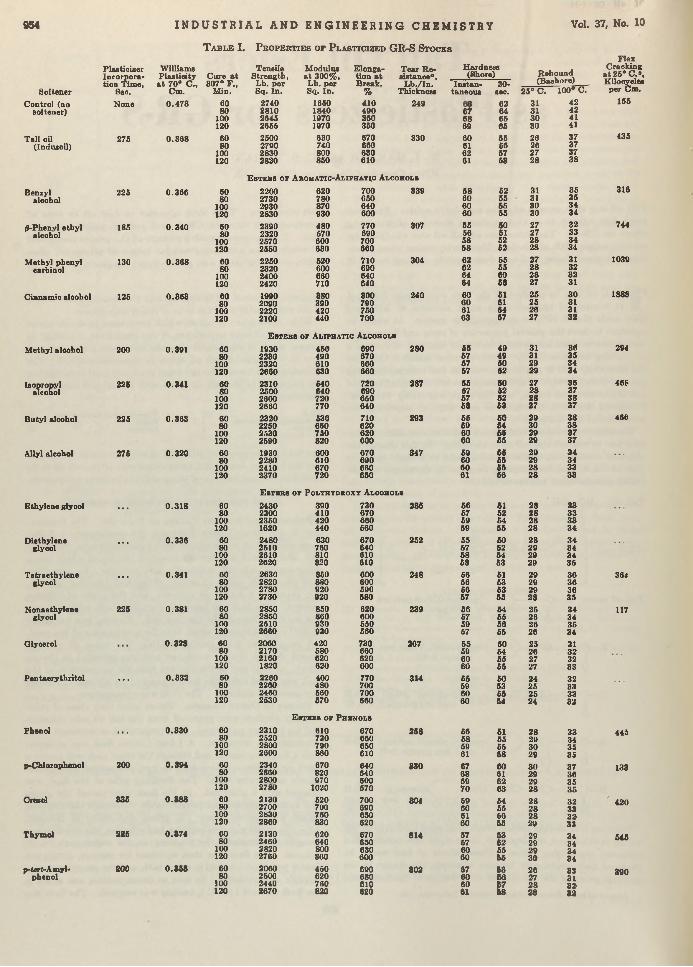
954 I N D U S T R I A L A N D E N G I N E E R I N G C H E M I S T R Y Vol. 37, No. 10
T a b l e I. P b o p e r t i e s o f P l a s t i c i z e d GR-S S t o c k s
FlexPlaaticiaer Incorpora tion Time,
Sec.
W illis ms P lasticity Cure a t
TensileS treng th ,
M odulus » t 300% ,
E longation a t
T ear R esistance9.
H ardness(Shore) R ebound
(Bashore)___
Cracking a t 25° C.», Kilocycless t 70° C., 8076 F., Lb. p e r
8 q . In .Lb. per Sq. In .
B reak . L b . / In . In s tan - Thickness taneous
30-Softener Cm. M in. % seo. 25° C. 100° C. per Cm.
Control (no softener)
N one 0 .473 6080
100120
27402810264«2665
1650184019701970
410490860350
2496 ?6869
6264 6665
31313030
42424141
155
T all oil (Indusoil)
275 0 .368 6080
100120
2500279028302820
630740800850
670660630610
330 60616261
55666768
26262728
37373738
435
E s t e b s or A r o m a t i c - A l i p h a t i c A l c o h o l s
Benzylalcohol
225 0 .366 6080
100120
2200273029302830
620780870930
700650640600
339 68606060
62556555
31313030
35353434
316
0-Phenyl e thyl alcohol
185 0 .340 6080
100120
2390232025702550
480570600630
770690700660
307 65565858
50615262
272728 28
323334 34
744
M ethyl phenyl carbinol
130 0 .368 6080
100120
2250232024002420
520600660710
710690640640
304 62626464
55656068
2728 28 27
3132 32 31
1039
Cianamio alcohol 125 0 .363 6080
100120
1990209022202100
380390420440
800790750700
240 60606163
61615467
25252827
30313132
1888
E s t e b s o f A l i p h a t i c A l c o h o l s
M ethyl alcohol 200 0.391 6080
100120
1930223023202660
450490610630
690670660660
280 55676757
494950 52
31312929
36353434
294
Isopropylalcohol
225 0.341 6080
100120
2310250026002660
540640720770
720690650640
287 65575768
60525253
2728 28 27
363738 37
468
B uty l alcohol 225 0 .363 6080
100120
2320225025302590
530660750820
710620620600
293 55696060
5054 6555
2930 29 29
38383737
466
Allyl alcohol 275 0 .320 6080
100120
1930228024102370
600610670720
670690660650
847 5960 60 61
6565 5566
29292828
34343333
E s t i b s o r P o l y h y d r o x y A l c o h o l s
Ethy lene glycol . . . 0 .318 6080
100120
2430230023501620
390410420440
730670660560
285 66576969
51526465
28282828
33333334
Diethyleneglycol
• • • 0 .336 6080
100120
2480251026102620
630760810820
670640610610
252 555758 68
60626453
28292929
34343435
T etraethyleneglycol
• • • 0.341 6080
100120
2630282027802730
850880920920
600600590580
248 56665667
61636366
29292928
36363635
364
N onaethyleneglycol
225 0.381 6080
100120
2850285026102660
850860930930
620600550560
239 66575957
6465 58 65
2526 26 26
343435 34
117
Glycerol 0 .328 *080
100120
2060217021601820
420580620620
730660620600
267 655960 60
50546565
2526 27 27
31323233
Pen taery th r i to l . . . 0.332 6080
100120
2260226024602530
400480660570
770700700660
314 65696060
60536664
2425 25 24
3233 33 32
E b t k r b o f P h b n o l s
Phenol • • • 0 .330 6080
100120
2310252028002600
610730790860
670660650610
258 66685961
61656568
282930 29
333435 35
445
p-Chlorophenol 200 0 .894 6080
100120
2340286028002780
670820970
1020
640640600570
830 67686970
60616263
30292928
37363535
133
Cresol 83« 0 .8 8 8 6080
100120
2130270028302860
620700760830
700690650620
804 69606160
54656065
28282829
32333233
420
Thym ol 226 0 .874 6080
100120
2130246028202760
620640800860
670650630600
814 57676060
53626565
29292930
34343434
545
p-teri-Amyl-phenol
200 0 .158 6080
100120
2060250024402670
450620760820
690680610620
803 67606061
6366B768
262728 28
333132 32
890
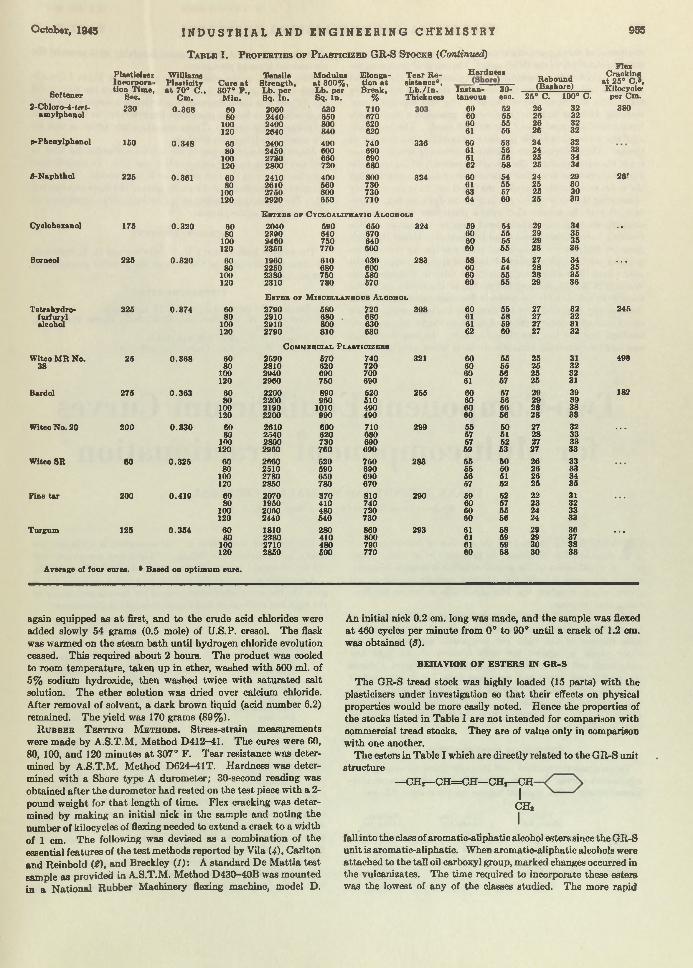
O ctober, 1945 I N D U S T R I A L A N D E N G I N E E R I N G C I TEM I S T RY 955
T a b l e I . P r o p e r t i e s o p P l a s t i c i z e d G R - S S t o c k s (Continued)
Softener
2-Chloro-4-<er<-am ylphenol
p-Phenylphenol
Ä-Naphthol
Cyclohexanol
Borneo!
Tetrahydro-furiurylalcohol
Witco M R No. 38
Bardol
Witco No. 20
Witco SB
Pine ta r
Turgum
Plasticfser I nr>on>o r a tion T im e,
Seo.
230
150
Williame P lasticity a t 70» C .,
Cm .
0 .3 68
0 .348
225 0.361
C ure a t'Pensile
S treng th ,M odulus a t 300% ,
E longation a t
307« P ., Lb. per Sq. In .
L b . per Sq. In .
B reak ,M in. %
60 2060 530 71080 2440 660 670
100 2400 800 620120 2640 840 620
60 2400 490 74080 2450 600 690
100 2780 660 690120 2800 720 680
60 2410 400 80080 2610 560 730
100 2750 600 730120 2920 650 710
T e ar R e sistance0,
L b . / In . Thickness
336
H ardnessRebound
324
In s ta n 30- (Bashore)taneous seo. 25® C. 100° C.
60 52 26 3260 55 26 3260 55 26 3261 56 26 32
60 53 24 3261 56 24 3361 56 25 3462 58 25 34
60 54 24 2961 55 25 3063 57 25 3064 60 25 30
E s t x b s o r C y c l o a l i p h a t i c A l c o h o l s
Flex Cracking
a t 25° C.», Kilocyclet
p e r Cm.
380
2 9 r
175 0 .320 60 2040 590 650 324 59 64 29 34 .,80 2390 640 670 60 55 29 35
100 2460 750 640 60 56 29 35120 2350 770 600 60 65 28 36
225 0 .320 60 1960 610 630 283 58 54 27 34 . . .
80 2250 680 600 60 54 28 35100 2380 750 580 60 55 28 35120 2310 780 670 60 65 29 36
E s t u b o f M i s c e l l a n e o u s A l c o h o l
225 0.374 60 2790 580 720 308 60 55 27 32 24580 2910 680 680 61 68 27 32
100 2910 800 630 61 59 27 31120 2790 810 630 62 60 27 32
C o m m e r c ia l Pl.A8TICIZF.HB
25 0 .368 60 2590 670 740 321 60 65 25 31 49880 2810 620 720 60 65 25 32
100 2940 690 700 60 66 25 32120 2960 750 690 61 67 25 31
275 0 .363 60 2200 890 620 255 60 57 29 39 18280 2200 960 510 60 66 29 39
100 2190 1010 490 60 56 28 38120 2200 990 490 60 56 28 38
200 0 .33 0 60 2610 600 710 299 55 50 27 32 . . .80 2540 620 680 57 51 28 33
ino 2800 730 690 57 52 27 33120 2960 760 690 69 63 27 33
80 0 .325 60 2660 620 750 283 55 50 26 3380 2510 590 690 55 50 26 33
100 2780 650 690 56 61 26 34120 2850 780 670 57 52 25 85
200 0.419 60 2070 370 810 290 59 52 22 3180 1950 410 740 60 57 23 32
100 2060 480 720 60 55 24 33120 2440 540 730 60 66 24 33
125 0 .354 60 1810 280 860 293 61 68 29 36 • « •80 2380 410 800 61 59 29 37
100 2710 480 790 61 59 30 38120 2850 600 770 60 58 30 38
Average of four cure«. » Based on optim um cure.
again equipped as a t first, and to the crude acid chlorides were added slowly 54 crams (0.5 mole) of U.S. P. cresol. The flask was warmed on the steam bath until hydrogen chloride evolution ceased. This required about 2 hours. The product was cooled to room tem perature, taken up in ether, washed w ith 500 ml. of 5% sodium hydroxide, then washed twice with saturated salt solution. The ether solution was dried over calcium chloride. After removal of solvent, a dark brown liquid (acid num ber 6.2) remained. The yield was 170 grams (89%).
R u b b e r T e s t i n g M e t h o d s . Stress-strain measurements were made by A.S.T.M. M ethod D412-41. The cures were 60, 80, 100, and 120 minutes a t 307° F. T ear resistance was determined by A.S.T.M. Method D624-41T. Hardness was determined with a Shore type A durometer; 30-second reading was obtained after the durometer had rested on the test piece with a 2- pound weight for th a t length of time. Flex cracking was determined by making an initial nick in the sample and noting the number of kilocycles of flexing needed to extend a crack to a width of 1 cm. T he following was devised as a combination of the essential features of the test methods reported by Vila (4), Carlton and Reinbold (8), and Breckley ( /) : A standard De M attia test sample as provided in A.S.T.M. Method D430-40B was mounted in a N ational Rubber Machinery flexing machine, model D.
An initial nick 0.2 cm. long was made, and the sample was flexed a t 460 cycles per minute from 0° to 90° until a crack of 1.2 cm. was obtained (3).
B EH A V IO R O F E S T E R S IN G R -S
The GR-S tread stock was highly loaded (15 parts) w ith the plasticizers under investigation so th a t their effects on physical properties would be more easily noted. Hence the properties of the stocks listed in Table I are not intended for comparison with commercial tread stocks. They are of value only in comparison with one another.
The esters in Table I which are directly related to the GR-S unit structure
—CH,—C H = C H —CH,—CH
ICH,
Ifall into the class of aromatic-aliphatic alcohol esters since the GR-S unit is aromatic-aliphatic. When aromatic-aliphatic alcohols were attached to the tall oil carboxyl group, marked changes occurred in the vulcanizates. The time required to incorporate these esters was the lowest of any of the classes studied. The more rapid
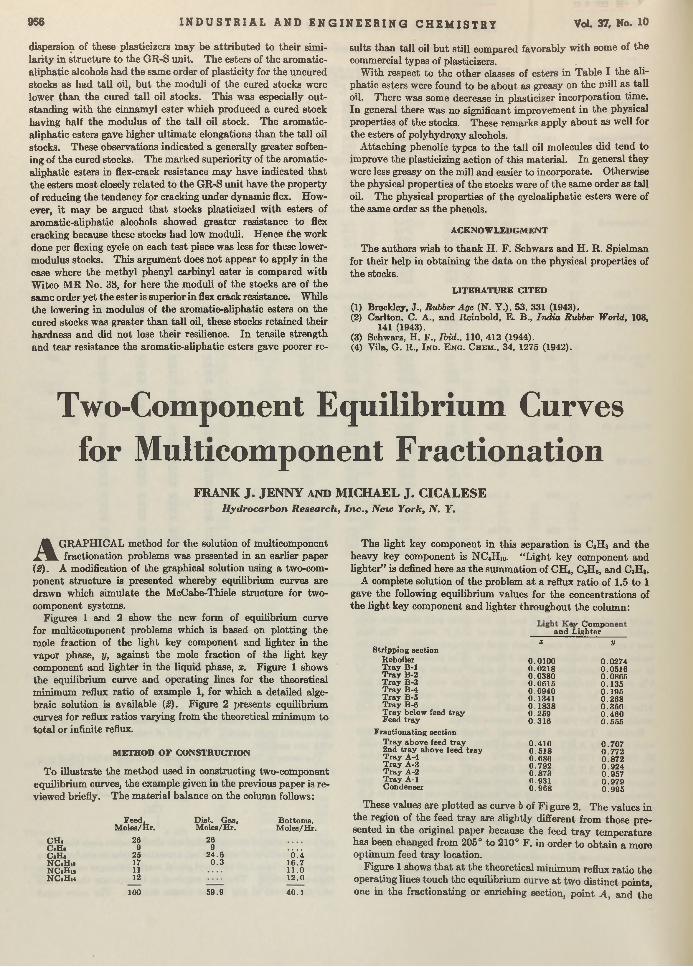
956 I N D U S T R I A L A N D E N G I N E E R I N G C H E M I S T R Y VoL 37, No. 10
dispersion of these plasticizers m ay be a ttribu ted to their similarity in structure to the GR-S unit. The esters of the aromatic- aliphatic alcohols had the same order of plasticity for the uncured stocks as had tall oil, bu t the moduli of the cured stocks were lower th an the cured ta ll oil stocks. This was especially outstanding w ith the cinnamyl ester which produced a cured stock having half the modulus of the ta ll oil stock. The aromatic- aliphatic esters gave higher ultim ate elongations than the tall oil stocks. These observations indicated a generally greater softening of the cured stocks. The marked superiority of the aromatic- aliphatic esters in flex-crack resistance m ay have indicated th a t the esters most closely related to the GR-S unit have the property of reducing the tendency for cracking under dynamic flex. However, i t may be argued th a t stocks plasticized w ith esters of aromatic-aliphatic alcohols showed greater resistance to flex cracking because these stocks had low moduli. Hence the work done per flexing cycle on each test piece was less for these lower- modulus stocks. This argum ent does no t appear to apply in the case where the m ethyl phenyl carbinyl ester is compared with Witco M R No. 38, for here the moduli of the stocks are of the same order yet the ester is superior in flex crack resistance. While the lowering in modulus of the aromatic-aliphatic esters on the cured stocks was greater than tall oil, these stocks retained their hardness and did not lose their resilience. In tensile strength and tear resistance the aromatic-aliphatic esters gave poorer re
sults than tall oil bu t still compared favorably w ith some of the commercial types of plasticizers.
W ith respect to the other classes of esters in Table I the aliphatic esters were found to be about as greasy on the mill as tall oil. There was some decrease in plasticizer incorporation time. In general there was no significant improvem ent in the physical properties of the stocks. These remarks apply about as well for the esters of polyhydroxy alcohols.
Attaching phenolic types to the tall oil molecules did tend to improve the plasticizing action of this m aterial. In general they were less greasy on the mill and easier to incorporate. Otherwise the physical properties of the stocks were of the same order as tall oil. The physical properties of the cycloaliphatic esters were of the same order as the phenols.
ACKNOW LEDGM ENT
The authors wish to thank H. F. Schwarz and H. R. Spielman for their help in obtaining the d a ta on the physical properties of the stocks.
LITERATURE C ITED
(1) Breekley, J., Rubber Age (N. Y.), 53, 331 (1943).(2) Carlton, CL A., and Reinbold, E. B., India Rubber World, 108,
141 (1943).(3) Schwarz, H. F., Ibid., 110, 412 (1944).(4) Vila, G. R., I n d . E n g . C h e m ., 34, 1275 (1942).
Two-Component Equilibrium Curves for Multicomponent Fractionation
FRANK J . JENNY AND MICHAEL J . CICALESEH ydrocarbon R esearch , In c ., N ew Y o rk , N . Y .
A GRAPHICAL method for the solution of multicomponent fractionation problems was presented in an earlier paper
(2). A modification of the graphical solution using a two-component structure is presented whereby equilibrium curves are drawn which sim ulate the McCabe-Thiele structure for two- component systems.
Figures 1 and 2 show the new form of equilibrium curve for multicomponent problems which is based on plotting the mole fraction of the light key component and lighter in the vapor phase, y, against the mole fraction of the light key component and lighter in the liquid phase, x. Figure 1 shows the equilibrium curve and operating lines for the theoretical minimum reflux ratio of example 1, for which a detailed algebraic solution is available (2). Figure 2 presents equilibrium curves for reflux ratios varying from the theoretical minimum to to ta l or infinite reflux.
M ETHOD O F CONSTRUCTION
To illustrate the m ethod used in constructing two-component equilibrium curves, the example given in the previous paper is reviewed briefly. The m aterial balance on the column follows:
CH4
Feed, M oles/H r.
26
D ist. Gas, M oles/H r.
26
B ottoms,M oles/H r.
C*H« 9 9C.Hs 25 2 4 .6 ’ÔÜN C 4H 1« 17 0 .3 16.7NCiHw 11 11.0NC«Hi4 12 12.0
100 59.9 40.1
The light key component in this separation is C3H 8 and the heavy key component is NC4H i0. “L ight key component and lighter” is defined here as the sum m ation of CH4, C2H,, and C3H 8.
A complete solution of the problem a t a reflux ratio of 1.5 to 1 gave the following equilibrium values for the concentrations of the light key component and lighter throughout the column:
and5v Compi L ighter
X VStripping section
Reboiler 0 .0100 0.0274Tray B -l 0 .0218 0.0516T ra y B-2 0.0380 0.0865T ra y B-3 0.0615 0 .135T ra y B-4 0.0940 0 .1 95T ra y B-5 0.1341 0 .268T ray B-6 0.1838 0 .350T ra y below feed tray 0 .259 0 .4 6 0Feed tray 0 .316 0 .555
F ractionating sectionT ra y above feed tray 0 .416 0 .7072nd tra y above feed tray 0 .518 0 .772T ra y A-4 0 .686 0 .872T ray A-3 0 .792 0 .924T ray A-2 0 .873 0.957T ray A -l 0.931 0 .979Condenser 0 .968 0 .995
These values are plotted as curve b of F igure 2. The values in the region of the feed tray are slightly different from those presented in the original paper because the feed tray tem perature has been changed from 205° to 210° F. in order to obtain a more optimum feed tray location.
Figure 1 shows th a t a t the theoretical minimum reflux ratio the operating lines touch the equilibrium curve a t two distinct points, one in the fractionating or enriching section, poin t A , and thé

Mo
il
f R
A C
Y I
ö N
IN
V*
M*
.
O ctober, 1945 I N D U S T R I A L A N D E N G I N E E R I N G C H E M I S T R Y 957
other in the stripping section, point D. Between these two points is a region representing the fractionation in the vicinity of the feed tray. Point C corresponds to equilibrium on the feed tray and point B corresponds to equilibrium on the bottom tray of the fractionating section. Section A B corresponds to the bottom trays of the fractionating section in which section components heavier than the heavy key component are refluxed back completely. A t point A, the heavy key component goes through its theoretical maximum concentration. Section CD corresponds to the top trays of the stripping section in which section components lighter than the light key component are completely stripped. A t point D the light key component goes through its theoretical maximum concentration. The equilibrium curve is discontinuous between points B and C, representing the crossover from the stripping to the fractionating section.
Figure 2 shows the effect of reflux ratio on the position of the equilibrium curve a t constant to ta l pressure. For the example illustrated, a t total reflux the equilibrium curve (d, Figure 2) approximates the equilibrium curve for a two-component system
A new m ethod o f p lotting equilibrium curves for m u lti- com ponent system s is based o n th e use o f equilibrium values for th e “ lig h t key com ponent and ligh ter” . T h is m ethod sim u la tes th e M cC abe-T hiele structure for tw o-com pon en t system s. It h as been in use for over five years, and its application to th e so lu tion o f industrial problem s has been usefu l and tim e saving. Illustrative exam ples are included. The proposed m ethod o f applying th e tw o-com pon en t structure presupposes th a t a com p le te so lu tion is available for a specific problem and th a t an oth er so lu tion is desired in w h ich cond itions are not greatly changed from th e orig inal problem .
E q u i l i b r i u m C u r v e s B a s e d o n f a l l o w i n g a Th e o r e t i c a l M i n i m u m R m u x Rati o .95 to Ib R t flux Ra t i o 1.5 to I ___C R e fl u x R m i o 3 to I d I n v i m h e Re f l u x Ra t i oe Tw o - C o m p o h e n t S y j t i m ( X t r C o m r o N t H T i ) / ^ :
/ _______________ F i g u r e 2 _________________
E f f e c t o f K e f l u x E a t i oo n
P o s i t i o n of E q u i l i b r i u m C u r v e
M u l t i c o m p o n e n t F r a c t i o n m i o n
E q u i l i b r i u m C u r v e F o r 1 'L i g h t K ey C o m p o n e n t ah b l ic h t e r . "

958 I N D U S T R I A L A N D E N G I N E E R I N G C H E M I S T R Y Vol. 37, No. 10
in which the two components are th e light and heavy key components of the multicom ponent problem. A t lower reflux ratios the equilibrium curve becomes more concave w ith respect to the diagonal.
A P P L IC A T IO N O F C U R V E S
The proposed two-component structure has found widespread application in the design of industrial fractionating columns during the past five years. The m ethod has also been of considerable m erit in aiding students of distillation to visualize the m athematical significance of multicomponent tray calculations in much the same m anner as the McCabe-Thiele m ethod has served for strictly two-component systems. Shiah (4) also published a two- component method for multicom ponent systems. However, Shiah did not include in his m ethod the effect of change in position of equilibrium curve with changing reflux ratio. Figure 2 illustrates th a t for the general problem of multicomponent fractionation, it is no t always permissible to neglect this change in position of the equilibrium curve. Similar methods were also proposed by Obryadchakoff (3) and Brown, Singer, and WilsonU ).
An obvious and useful application of the two-component structure is in determining the effects of relatively small changes in reflux ratio an d /o r changes in term inal conditions. Thus, in the example given, if i t were desired to change the term inal conditions from 1.0 to 2.0% propane in the bottom s, and also
change the butane content in the overhead from 0.5 to 1.0% a t a reflux ratio of 1.5 to 1, new operating lines could be drawn in and the number of trays required could be determ ined graphically by using equilibrium curve 6 of Figure 2. Before stepping off the num ber of trays from curve b for the new case, a small correction is made a t either end of the equilibrium curve for the revised term inal conditions, based on a bubble poin t calculation on the bottom s liquid and a dew point calculation on the overhead vapor. An exact solution of this problem gives 11.9 calculated theoretical trays (exclusive of a reboiler and partia l condenser) compared to 12.1 theoretical trays determ ined graphically. Similarly, an exact solution for the original term inal conditions, for a reflux ratio of 2.0 to 1, gives 12.7 calculated theoretical trays compared to 11.9 theoretical trays determined graphically from equilibrium curve b of Figure 2 which was calculated for a reflux ratio of 1.5 to 1. The short-cut m ethod of stepping off the required num ber of theoretical trays a t a reflux ratio of 2 to 1 from curve 6 gives a solution which is slightly low. This is to be expected since the equilibrium curve will become somewhat flatter a t the higher reflux ratio. Actually w ith a reflux ratio of 1.75 to 1 the shift in the equilibrium curve is so slight than aD exact solution gives the same num ber of trays, 13.6, as th a t obtained by using curve b.
This application of the two-component structure presupposes th a t a complete solution is available for a specific problem and th a t another solution is desired in which conditions are not
greatly changed from the original problem. A commercial application is illustrated by another problem.
In an alkylation unit the effluent from the reactor contains a considerable percentage of isobutane since the alkylation reaction is favored by a large excess of this component. T h i s s t r e a m is generally charged directly to an iso- b u t a n e column w h e r e substantially all the isobutane in a high degree of purity is taken overhead and recycled to the reactor. Since the fractionation required is a relatively sharp one b e t w e e n close- boiling key components (iso- and n-butane), the isob u t a n e c o l u m ni s g e n e r a l l y a large and expensive tower, and its high consumption of utilities is an im portant factor
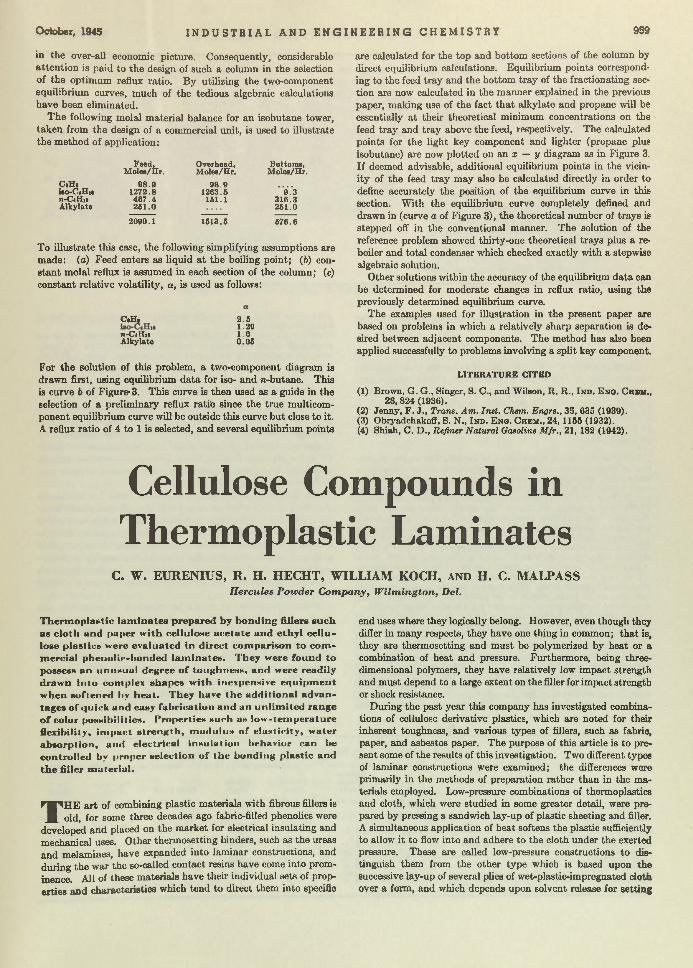
O ctober, 1945 I N D U S T R I A L A N D E N G I N E E R I N G C H E M I S T R Y 959
in the over-all economic picture. Consequently, considerable a tten tion is paid to the design of such a column in the selection of the optimum reflux ratio. By utilizing the two-component equilibrium curves, much of the tedious algebraic calculations have been eliminated.
T he following molal m aterial balance for an isobutane tower, taken from the design of a commercial unit, is used to illustrate the m ethod of application:
C .H ,
Feed,M olee /H r.
9 8 .9
Overhead,M oles/H r.
9 8 .9
Bottoms,M ole*/Hr.
iso-CjHj« 1272.8 1263.5 ' *9* .*3ji-CjHi* 4 67 .4 151.1 316.3Alkylate 2 51 .0 261.0
2090.1 1513.5 576.6
To illustrate this case, the following simplifying assumptions are made: (a) Feed enters as liquid a t the boiling point; (6) constan t molal reflux is assumed in each section of the column; (c) constant relative volatility, a , is used as follows:
C .H ,
n -C il lnA lkylate
2 .51.291.00.05
For the solution of this problem, a two-component diagram is drawn first, using equilibrium d ata for iso- and n-butane. This is curve b of F igure 3. This curve is then used as a guide in the selection of a preliminary reflux ratio since the true multicomponent equilibrium curve will be outside this curve bu t close to it. A reflux ratio of 4 to 1 is selected, and several equilibrium points
are calculated for the top and bottom sections of the column by direct equilibrium calculations. Equilibrium points corresponding to the feed tray and the bottom tray of the fractionating section are now calculated in the m anner explained in the previous paper, making use of the fact th a t alkylate and propane will be essentially a t their theoretical minimum concentrations on the feed tray and tray above the feed, respectively. The calculated points for the light key component and lighter (propane plus isobutane) are now plotted on an x — y diagram as in Figure 3. If deemed advisable, additional equilibrium points in the vicinity of the feed tray may also be calculated directly in order to define accurately the position of the equilibrium curve in this section. W ith the equilibrium curve completely defined and drawn in (curve a of Figure 3), the theoretical number of trays is stepped off in the conventional manner. The solution of the reference problem showed thirty-one theoretical trays plus a reboiler and total condenser which checked exactly with a stepwise algebraic solution.
Other solutions within the accuracy of the equilibrium d ata can be determined for moderate changes in reflux ratio, using the previously determined equilibrium curve.
The examples used for illustration in the present paper are based on problems in which a relatively sharp separation is desired between adjacent components. The method has also been applied successfully to problems involving a split key component.
LIT E R A T U R E C IT E D
(1) Brown, G. G., Singer, S. C ., and Wilson, R. R., I n d . E n o . C h s u „28, 824 (1936).
(2) Jenny, F. J., Trans. Am. Inst. Chem. Bngrs., 35, 635 (1939).(3) Obryadchakoff, S. N ., I n d . E n g . C heu ., 24, 1155 (1932).(4) Shiah, C . D „ Refiner Natural Gasoline M fr., 21, 182 (1942).
Cellulose Compounds in Thermoplastic Laminates
C. W. EURENIUS, R. H. HECHT, WILLIAM KOCH, AND H. C. MALPASSH ercules Pow der C o m p a n y , W ilm in g to n , Del.
T herm oplastic lam in ates prepared by bonding fillers euch as c loth and pa|*er w ith cellu lose acetate and e th y l cellu lose plastics were evaluated in direct com parison to com m ercial pheuoli<--l>onded lam inate». They were found to posses» an unusual degree o f toughness, and were readily drawn in to com plex shapes w ith inexpensive equipm ent w hen soften«*d l»y heat. They have the additional advantages o f quick and easy fabrication and an unlim ited range o f color possib ilities. Properties such as low -tem perature flexibility, im pact strength , m odulus o f e lastic ity , water absorption, and electrical insu lation behavior can be controlled hv proper se lection o f the bonding plastic and th e filler m ateria l.
TH E a rt of combining plastic m aterials with fibrous fillers is old, for some three decades ago fabric-filled phenolics were developed and placed on the m arket for electrical insulating and
mechanical uses. Other therm osetting binders, such as the ureas and melamines, have expanded into laminar constructions, and during the war the so-called contact resins have come into prominence. All of these m aterials have their individual sets of properties and characteristics which tend to direct them into specifio
end uses where they logically belong. However, even though they differ in many respects, they have one thing in common; th a t is, they are therm osetting and m ust be polymerized by heat or a combination of heat and pressure. Furthermore, being three- dimensional polymers, they have relatively low impact strength and m ust depend to a large extent on the filler for impact strength or shock resistance.
During the past year this company has investigated combinations of cellulose derivative plastics, which are noted for their inherent toughness, and various types of fillers, such as fabric, paper, and asbestos paper. The purpose of this article is to present some of the results of this investigation. Two different types of laminar constructions were examined; the differences were primarily in the methods of preparation rather than in the materials employed. Low-pressure combinations of thermoplastics and cloth, which were studied in some greater detail, were prepared by pressing a sandwich lay-up of plastic sheeting and filler. A simultaneous application of heat softens the plastic sufficiently to allow it to flow into and adhere to the cloth under the exerted pressure. These are called low-pressure constructions to distinguish them from the other type which is based upon the successive lay-up of several plies of wet-plastic-impregnated cloth over a form, and which depends upon solvent release for setting

960 I N D U S T R I A L A N D E N G I N E E R I N G C H E M I S T R Y Vol. 37, No. 10
T a b l e I. P h y s i c a l P r o p e r t i e s o f T h e r m o p l a s t i c L a m i n a t e s
(R atio of p lastic to cloth, 70 :30 ; ty pe of cloth, 8-ounce drill)Cellulose A cetate ____ Ethylcellulose
F orm ula 1, soft F orm ula 3, hard Form ula 4, soft Form ula 6, h ard Phenolic G rade C
Izod im pact s treng th , f t.- lb ./in . notch, edgewi.se Flexural s trength , lb ./sq . in.M odulus of elastic ity in flexure, lb ./sq . in. X 103 Tensile streng th , lb ./sq . in.Elongation, %M odulus of elasticity in tension, lb ./sq . in. X 108 W ater absorption, %
100% relative hum idity , 168 hr., 77° F.24-hr. immersion®
T herm al conductivity , ca l./sec ./sq . c m ./° C ./cm . X lO-s
Therm al expansion, in . / in . / ° C. X 10 8 Sp. gr. a t 77° F.Dimensional s tab ility , % change a t 80% R .H ., 168 hr.
140° F.LengthwiseEdgewiseFlatwise
4680
14500
7516
1.26
7 .31600
414300
1079
746
1.31
2 .99600
2307200
26260
4 .36
1.32
10400260
80408
390
6 .803 .30
543
1.33
- 0 . 3 4- 0 . 4 9+ 3 . 0
+4005 .7460
379
3 .66
1.06
5 .81900
622940
759
7 .9 9
715
1.16
4 .05000
1083100
15140
4 .3 0
1.09
5 .45900
1505370
7337
5 .782.00
547
1.13
- 0 . 3 6- 0 . 4 9+ 0 .6 0
13000440
80001.3850
4 .9 3
432 .9
1.35
+ 0 .1 8+0.20+ 0 .6 7
" D eterm ined by A .S.T .M . D570-42; edges were sealed.
into a rigid unit. The la tte r type will be discussed later in this report.
LO W -PRESSUR E LAM INATES
Three prim ary factors are recognized as having an influence on the properties of therm oplastic laminates: plastic composition, type of filler, and ratio of plastic to filler. The broad range of properties obtainable by variation in plastic composition is founded on the ability of thermoplastics to be modified w ith high or low percentages of plasticizer giving soft and flexible or hard and rigid plastics.
In the examination of the effect of formulation on the properties of lam inates several plastic compositions, based upon cellulose acetate and ethylcellulose of varying degrees of plasticization, were combined with an 8-ounce drill fabric under pressure and heat. 'T his drill cloth weighed 7.7 ounces per square yard, w ith a 72/60 thread count, 61.5% of the weight being in the warp threads. The cellulose acetate, type PH-1, had a combined acetic acid content of 52-53.5% and a viscosity of 85-120 seconds by the conventional falling-ball m ethod in a 20% solution with 90:10 acetone:ethanol. The ethylcellulose (type N-100) had an ethoxyl content of 46.8-48.5% and a viscosity of 100 centi- poises in a 5% solution, the solvent being 80:20 toluene:ethanol. These two cellulose derivatives are standard m aterials used in commercial plastic work. T he ratio of plastic to cloth was held constant a t 70 parts plastic to 30 parts cloth by weight, which was found to represent an optimum combination of properties.
The m aterials to be laminated, consisting of alternate layers of plastic sheeting and fabric, were placed between a/i6-inch, polished, chrome-plated steel platens in a heated press which was closed, bu t no pressure was applied during the initial heating period of 6 minutes. The tem perature ranged from 275° F. for the very soft formulas to 350° for the hard formulas. Pressure was then applied and m aintained while the press was cooled. This required from 10 to 12 minutes. Pressures ranged from 100 pounds per square inch for the soft formulas to as high as 400 pounds for the hard formulas. The alternate layers of cloth
were cross-laid in order to obtain balanced physical properties in both directions.
As far as possible, A.S.T.M . tests were employed. In tests requiring specimens w ith a greater thickness than */8 inch, composite specimens were used in accordance w ith A.S.T.M. practice.
E FFEC T O F PLA STIC COM POSITION ON PR O PER TIES
Table I presents some properties of therm oplastic laminates and compares the unfilled plastics, designated P, and the laminates based on these plastics, designated L. The d a ta obtained on a commercial Grade C phenolic lam inate are also included. “Grade C” is the N ational Electric M anufacturer’s Association designation for the high-impact cloth-phenolic combination which is generally recommended for mechanical uses.
One m ethod of interpreting the d a ta in Table I is to observe the effect of cloth when combined w ith the different plastic binders. W hether the plastic formulation is hard or soft, or whether the binder is based on cellulose acetate or ethylcellulose, the general effect of the fabric filler is one of increasing the impact, flexural, and tensile strengths, the modulus of elasticity in flexure and in tension, and the therm al conductivity. On the other hand, thermal expansion and percentage elongation decrease as cloth is combined with plastic.
W ater absorption, as would be expected, is greater in the laminates than in the unfilled plastic. D a ta on all compositions were obtained by subjecting the test specimens to 100% relative hum idity for 168 hours a t 77 0 F . This procedure was used because ab ro ad range of plastics was being tested; some contained large percentages of plasticizer while others had very little. Im mersion of these m aterials in water, as required by A.S.T.M . M ethod D570-42, would result in relatively large am ounts of plasticizer loss for some of the soft specimens, w ith the possibility
T a b l e II. E f f e c t o f F a b r ic T y p e o n P r o p e r t i e s o f T h e r m o p l a s t i c L a m i n a t e s
Type of cloth
C ountBreaking s treng th
A .S .T .M . raveled s tr ip method A .S.T .M . g rab m ethod
W eight, oz./yd .No. of layers of clothIaod im pac t s treng th , f t.- lb ./in . notch, edgewise Flexural s treng th , lb ./sq . in.Tensile s treng th , lb ./sq . in.E longation, %Elastic modulus in tension, lb ./sq . in , X 10s W ater absorp tion (100% R .H ., 168 hr. 77° F .), $
Airplane
BalloonBasketWeave
ChaferDuck
ChaferD uck Hose Duck
80 X 80 104 X 98 35 X 25 23 X 23 26 X 22
80 X 80 120 X 12092 X 61 201 X 191 119 X 122
4 .6 5 .6 5 .6 14.0 98 6 6 2 3
2 .7 3 .4 2 .5 3 .6 3 .516,500 17,200 14,000 12,400 12,10011,200 15,100 8,700 7,300 8,000
6 .9 3 .5 4 .5 7 .6 6 .6900 1000 610 430 4405 .7 6 .4 7 .0 7 .2 7 .2
H arv es te rDuck
32 X 16Va
546 X 4323 1 .5
15 .2
12,7007,40011.93506 .5
DrillCloth
84
5 .510,400
8,0408
3906.8

O ctober, 1945 I N D U S T R I A L A N D E N G I N E E R I N G C H E M I S T R Y
Figure 1. Parts o f Drawing M andrel ( le ft) and Assem bled (r igh t)
th a t water absorption data would not be correct even though the procedure described in D570-42 is supposed to compensate for such loss. However, lim ited d a ta were obtained on formulas 3 and 6 according to D570-42 in order to obtain comparative values. The edges of the specimens subjected to the high hum idity test were not sealed so th a t the specimens would come to equilibrium with the humid atmosphere within the test period of 168 hours. Sealing the edges by coating them with a solvent solution of the plastic with which the lam inate was made would greatly lower water absorption by reducing the wicking action of the fabric.
Another interpretation of Table I is the analysis of the effect of plastic formulations on physical properties. This is done by comparing the two L columns under formulations 1 and 3 for cellulose acetate or the L columns under formulas 4 and 6 for ethylcellulose. The general effect of decreasing the plasticizer content, or increasing the cellulose derivative in the bonding plastic, is to lower im pact strength and therm al conductivity; on the other hand, flexural and tensile strengths and elastic moduli in flexure and in tension increase substantially.
The thermoplastic lam inate which shows the closest degree of sim ilarity w ith the Grade C phenolic lam inate is based upon the hard cellulose acetate formulation. The phenolic structure has higher flexural strength, higher modulus, lower w ater absorption, and slightly lower therm al conductivity while the thermoplastic construction has greater im pact strength and higher elongation
T a b l e II I . E l e c t r i c a l P r o p e r t i e s o p T h e r m o p l a s t i c L a m i n a t e s
Cellulose A cetate Ethylcellulose Phenolic,formula Form ula Form ula Form ula Grade1, soft 3, hard 4, soft 6, hard LE
320 360 370 480 36027 210 82 68 78
0 .299 0 .080 0.038 0.071 0 34> 0 .7 0 0 .109 0 .135 0 .045 0 .66
0.0509 0 .0434 0 .0443 0.0289 0.05700 .132 0.133 0 .100 0.107 0.122
8 .2 5 .6 4 .5 4 .3 12.9> 3 0 .0 16.4 13.1 13.8 > 3 0 .0
6 .0 4 .4 4 .2 3 .6 5 .213.1 9 .6 6 .6 8 .1 6 .8
Dielectric s treng th (25° C., 60 cycles), vo lts/m il (step bystep)
D ry Wet«
Power fac to r (25°C.)60 cycles
D ry W et
1.000.000 cycles • D ryW et
Dielectric constan t (25° C.)
60 cycles D ry W et
1.000.000 cycles D ry W et
a Signifies 7 day s’ im mersion in w ater a t 25° C.
The two are comparable from the standpoints of tensile strength and therm al expansion.
In concluding this phase of investigation where plastic formulation and its effect on physical properties have been covered, it is pertinent to point out th a t the range of plastic compositions, from soft to hard, is not complete. The limit on the soft end of the range has been approached and is determined by plasticizer retention. Since the maximum tem perature available in our laboratory equipment is approximately 350° F., and since this is also the maximum with large commercial laminating presses, the hard formulations contain as little plasticizer as possible, consistent with proper impregnation a t 350 ° F. and up to 400 pounds per square inch pressure. A ttem pts to obtain impregnation of harder plastics with greater pressure were unsuccessful due to lateral flow of the plastic and tearing of the fabric. W hen higher temperatures are made available in commercial equipment, the use of harder formulations will result in greater tensile and flexural strengths and greater elastic moduli, all of which are im portant properties in many end uses. However, research with fabrics other than 8-ounce drill cloth has resulted in considerable improvement in these properties (Table I I ) .
E FFEC T O F FABRIC T Y PE S ON PR O PERTIES
W ith plastic composition and ratio of plastic to cloth held constant, results in -Table I I indicate th a t the type of fabric has a definite bearing on the physical properties of the laminated structure. For instance, the use of balloon cloth resulted in laminates having greatly increased tensile and flexural strengths and an elastic modulus in tension of more than twice th a t obtained with 8-ounce drill. However, these properties are increased a t the expense of impact strength which is considerably lower than th a t obtained with the drill cloth. The four duck weaves fall in between the two extremes when strength qualities are examined, and all of the fabrics give w ater absorption results within a fairly narrow range.
ELECTRICAL PR O PERTIES
The electrical properties of thermoplastic laminates (Table III) were determined on soft and hard combinations by standardA.S.T.M. methods. For comparison, tests were conducted a t the Bame time on a Grade LE phenolic lam inate which is commonly used for electrical applications requiring toughness. Both the thermoplastic and thermosetting compositions break down rather badly after soaking in water. In the dry state, however, the thermoplastic laminates are good insulating materials. For dielectric strength the cellulose acetate structures are roughly comparable to the Grade LE phenolic lam inate while the ethyl-
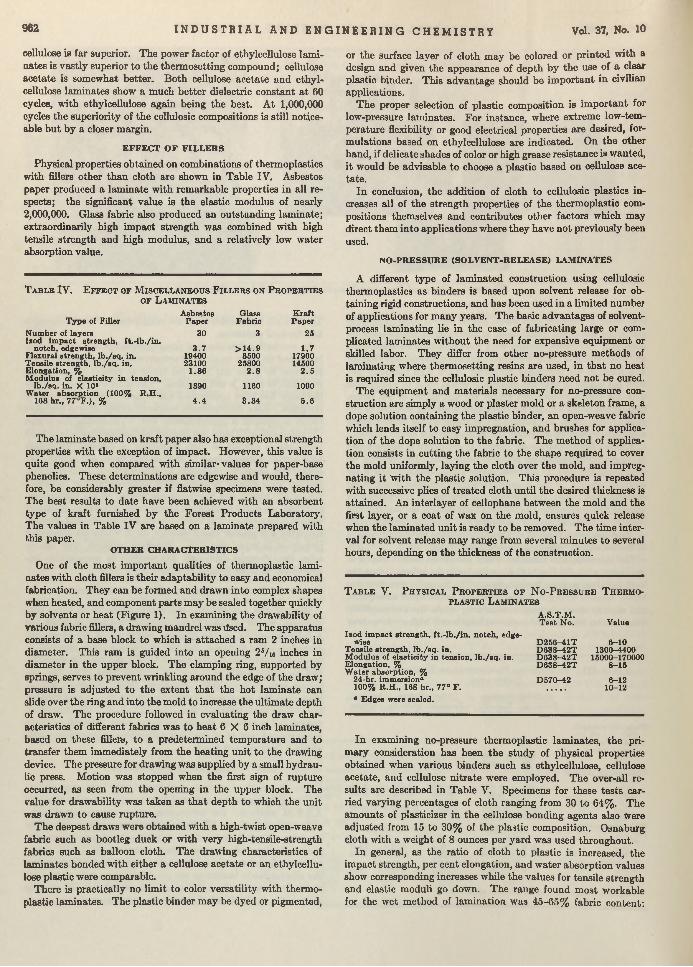
962 I N D U S T R I A L A N D E N G I N E E R I N G C H E M I S T R Y Vol. 37, No. 10
cellulose is far superior. The power factor of ethylcellulose laminates is vastly superior to the therm osetting compound; cellulose acetate is somewhat better. B oth cellulose acetate and ethylcellulose lam inates show a much b e tte r dielectric constant a t 60 cycles, with ethylcellulose again being the best. A t 1,000,000 cycles the superiority of the cellulosic compositions is still noticeable bu t by a closer margin.
E FF E C T O F F IL L E R S
Physical properties obtained on combinations of therm oplastics with fillers other than cloth are shown in Table IV. Asbestos paper produced a lam inate w ith rem arkable properties in all respects; the significant value is the elastic modulus of nearly 2,000,000. Glass fabric also produced an outstanding lam inate; extraordinarily high im pact strength was combined w ith high tensile strength and high modulus, and a relatively low water absorption value.
T a b l e IV. E f f e c t o f M i s c e l l a n e o u s F i l l e r s o n P r o p e r t i e s
o f L a m i n a t e s
Asbestos Glass K raftT y p e of Filler P ap er F abric P aper
N um ber of layers 30 3 25Ixod im pact s treng th , f t.- lb ./in .
notch, edgewise 3 .7 > 1 4 .9 1 .7Flexural s treng th , lb ./sq . in. 19400 8500 17900Tensile streng th , lb ./sq . in. E longation, %
23100 25800 145001.86 2 .8 2 .5
M odulus of elasticity in tension,lb ./sq . in. X 10* 1890 1160 1000
W ater absorption (100% R.H ..168 hr., 77 F .) , % 4 .4 3 .3 4 5 .6
The lam inate based on kraft paper also has exceptional strength properties w ith the exception of impact. However, this value is quite good when compared w ith sim ilar-values for paper-base phenolics. These determinations are edgewise and would, therefore, be considerably greater if flatwise specimens were tested. The best results to date have been achieved with an absorbent type of kraft furnished by th e Forest Products Laboratory. The values in Table IV are based on a lam inate prepared with this paper.
OTHER CHARACTERISTICS
One of the most im portant qualities of thermoplastic lami- aates with cloth fillers is their adaptability to easy and economical fabrication. They can be formed and drawn into complex shapes when heated, and component parts m ay be sealed together quickly by solvents or heat (Figure 1). In examining the drawability of various fabric fillers, a drawing mandrel was ilsed. The apparatus consists of a base block to which is attached a ram 2 inches in diameter. This ram is guided into an opening 25/ h inches in diam eter in the upper block. The clamping ring, supported by springs, serves to prevent wrinkling around the edge of the draw; pressure is adjusted to the extent th a t the hot lam inate can slide over the ring and into the mold to increase the ultim ate depth of draw. The procedure followed in evaluating the draw characteristics of different fabrics was to heat 6 X 6 inch laminates, based on these fillers, to a predetermined tem perature and to transfer them immediately from the heating unit to the drawing device. T he pressure for drawing was supplied by a small hydraulic press. M otion was stopped when the first sign of rupture occurred, as seen from th e opening in the upper block. The value for drawability was taken as th a t depth to which the unit was drawn to cause rupture.
The deepest draws were obtained with a high-twist open-weave fabric such as bootleg duck or w ith very high-tensile-strength fabrics such as balloon cloth. T he drawing characteristics of lam inates bonded with either a cellulose acetate or an ethylcellulose plastic were comparable.
There is practically no lim it to color versatility w ith therm oplastic lam inates. The plastic binder may be dyed or pigmented,
or the surface layer of cloth m ay be colored or printed w ith a design and given the appearance of depth by the use of a clear plastic binder. This advantage should be im portant in civilian applications.
The proper selection of plastic composition is im portan t for low-pressure lam inates. For instance, where extreme low-tem- perature flexibility or good electrical properties are desired, form ulations based on ethylcellulose are indicated. On the other hand, if delicate shades of color or high grease resistance is wanted, i t would be advisable to choose a plastic based on cellulose acetate .
In conclusion, the addition of cloth to cellulosic plastics increases all of the strength properties of the therm oplastic compositions themselves and contributes other factors which may direct them into applications where they have no t previously been used.
N O -PR E SSU R E (SO LV EN T-R ELEA SE) LAM INATES
A different type of lam inated construction using cellulosic thermoplastics as binders is based upon solvent release for obtaining rigid constructions, and has been used in a lim ited number of applications for m any years. The basic advantages of solvent- process lam inating lie in the ease of fabricating large or complicated lam inates w ithout the need for expensive equipm ent or skilled labor. They differ from other no-pressure m ethods of lam inating where therm osetting resins are used, in th a t no heat is required since the cellulosic plastic binders need not be cured.
The equipm ent and m aterials necessary for no-pressure construction are simply a wood or plaster mold or a skeleton frame, a dope solution containing the plastic binder, an open-weave fabric which lends itself to easy impregnation, and brushes for application of the dope solution to the fabric. The m ethod of application consists in cutting the fabric to the shape required to cover the mold uniformly, laying the cloth over the mold, and impregnating it With the plastic solution. This procedure is repeated w ith successive plies of treated cloth until the desired thickness is attained. An interlayer of cellophane between the m old and the first layer, or a coat of wax on the mold, ensures quick release when the lam inated unit is ready to be removed. The tim e interval for solvent release m ay range from several m inutes to several hours, depending on the thickness of the construction.
T a b l e V. P h y s i c a l P r o p e r t i e s o f N o - P r e s s u r e T h e r m o p l a s t i c L a m i n a t e s
I io d im pact s treng th , f t .- lb ./ in . notch, edgewise
Tensile streng th , lb ./sq . in.M odulus of elastic ity in tension, lb . / sq . in. E longation, %W ater absorption, %
24-hr. immersion®100% R .H ., 168 hr., 77° F.
a Edges were sealed.
In examining no-pressure therm oplastic lam inates, the prim ary consideration has been the study of physical properties obtained when various binders such as ethylcellulose, cellulose acetate, and cellulose n itra te were employed. The over-all results are described in Table V. Specimens for these tests carried varying percentages of cloth ranging from 30 to 64%. The amounts of plasticizer in the cellulose bonding agents also Were adjusted from 15 to 30% of the plastic composition. Osnaburg cloth w ith a weight of 8 ounces per yard was used throughout.
In general, as the ratio of cloth to plastic is increased, the impact strength, per cent elongation, and w ater absorption values show corresponding increases while the values for tensile strength and elastic moduli go down. The range found m ost workable for the wet m ethod of lam ination was 45-65% fabric content;
A .S.T .M .T est No. Value
D 256-41T 6-10D 638-42T 1300-4400D 638-42T 15000-170000D 638-42T 8-15
D 570-42 6-1210-12
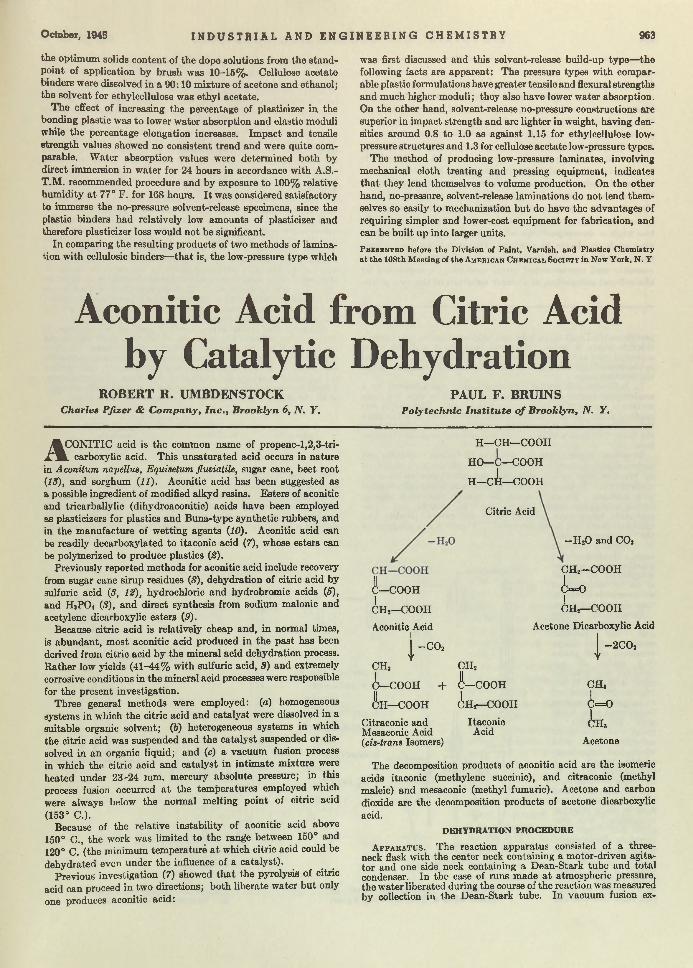
O ctober, 1945 I N D U S T R I A L A N D E N G I N E E R I N G C H E M I S T R Y 963
the optimum solids content of the dope solutions from the standpoint of application by brush was 10-15%. Cellulose acetate binders were dissolved in a 90:10 mixture of acetone and ethanol; the solvent for ethylcellulose was ethyl acetate.
T he effect of increasing the percentage of plasticizer in the bonding plastic was to lower water absorption and elastio moduli while the percentage elongation increases. Im pact and tensile strength values showed no consistent trend and were quite comparable. W ater absorption values were determined both by direct immersion in w ater for 24 hours in accordance w ith A.S.- T .M . recommended procedure and by exposure to 100% relative hum idity a t 77° F. for 168 hours. I t was considered satisfactory to immerse the no-pressure solvent-release specimens, since the plastic binders had relatively low amounts of plasticizer and therefore plasticizer loss would not be significant.
In comparing the resulting products of two methods of lamination with cellulosic binders—th a t is, the low-pressure type which
was first discussed and this solvent-release build-up type—the following facts are apparent: The pressure types with comparable plastic formulations have greater tensile and flexural strengths and much higher moduli; they also have lower water absorption. On the other hand, solvent-release no-pressure constructions are superior in im pact strength and are lighter in weight, having densities around 0.8 to 1.0 as against 1.15 for ethylcellulose low- pressure structures and 1.3 for cellulose acetate low-pressure types.
The method of producing low-pressure laminates, involving mechanical cloth treating and pressing equipment, indicates th a t they lend themselves to volume production. On the other hand, no-pressure, solvent-release laminations do not lend them selves so easily to mechanization bu t do have the advantages of requiring simpler and lower-cost equipment for fabrication, and can be built up into larger units.
P b e s b n t e d before th e Division of Pain t, Varnish, and Plastic» Chem istry a t the 108th M eeting of the A m e r i c a n C h e m i c a l S o c i e t y in New York, N. Y.
Aconitic Acid from Citric Acid by Catalytic Dehydration
ROBERT R. UMBDENSTOCKC harles P fizer & C o m p a n y , In c ., B ro o k ly n 6, N . Y.
PAUL F. BRUINSP o ly tech n ic I n s t i tu te o f B ro o k lyn , IV. Y .
AC ON ITIC acid is the common name of propene-l,2,3-tri- L carboxylic acid. This unsaturated acid occurs in nature
in Aconitum napellus, Equisetum fluviatile, sugar cane, beet root (IS), and sorghum (11). Aconitic acid has been suggested as a possible ingredient of modified alkyd resins. Esters of aconitic and tricarballylic (dihydroaconitic) acids have been employed as plasticizers for plastics and Buna-type synthetic rubbers, and in the m anufacture of wetting agents (10). Aconitic acid can be readily decarboxylated to itaconic acid (7), whose esters can be polymerized to produce plastics (2).
Previously reported m ethods for aconitic acid include recovery from sugar cane sirup residues (8), dehydration of citric acid by sulfuric acid (3, 12), hydrochloric and hydrobromic acids (5), and H,PO< (3), and direct synthesis from sodium malonic and acetylene di carboxylic esters (9).
Because citric acid is relatively cheap and, in normal times, is abundant, m ost aconitic acid produced in the past has been derived from citric acid by the mineral acid dehydration process. Rather low yields (41-44% with sulfuric acid, 3) and extremely corrosive conditions in the m ineral acid processes were responsible for the present investigation.
Three general m ethods were employed: (a) homogeneoussystems in which the citric acid and catalyst were dissolved in a suitable organic solvent; (b) heterogeneous systems in which the citric acid was suspended and the catalyst suspended or dissolved in an organic liquid; and (c) a vacuum fusion process in which the citric acid and catalyst in intim ate mixture were heated under 23-24 mm. mercury absolute pressure; in this process fusion occurred a t the tem peratures employed which were always below the normal melting point of citric acid
(153° C.).Because of the relative instability of aconitic acid above
150° C., the work was lim ited to the range between 150° and 120° C. (the minimum tem perature a t which citric acid could be dehydrated even under the influence of a catalyst).
Previous investigation (7) showed th a t the pyrolysis of citric acid can proceed in two directions; both liberate water bu t only one produces aconitic acid:
H —CH—COOH
HO—C—COOH
H - C ¿ —COOH
Citric Acid
¿ —COOH
¿ H 2—COOH
Aconitic Acid
- C 0 2> t
CH,
¿ —COOH +
Ah —c o o H
Citraconic and Mesaconic Acid (cis-trans Isomers)
CH2
¿ —COOH
¿ H j—COOH
ItaconicAcid
— H 20 and C 0 2
CH2—COOH
¿==o
¿ H 2—COOH
Acetone Dicarboxylic Acid
I - 2 C 0 2
CH,
¿ = 0
¿ H ,
Acetone
The decomposition products of aconitic acid are the isomeric acids itaconic (methylene succinic), and citraconic (methyl maleic) and mesaconic (methyl fumaric). Acetone and carbon dioxide are the decomposition products of acetone dicarboxylic acid.
DEH Y D RA TIO N P R O C E D U R E
A p p a r a t u s . The reaction apparatus consisted of a three- neck flask with the center neck containing a motor-driven agitator and one side neck containing a Dean-Stark tube and total condenser. In the case of runs made a t atmospheric pressure, the water liberated during the course of the reaction was measured by collection in the Dean-Stark tube. In vacuum fusion ex-
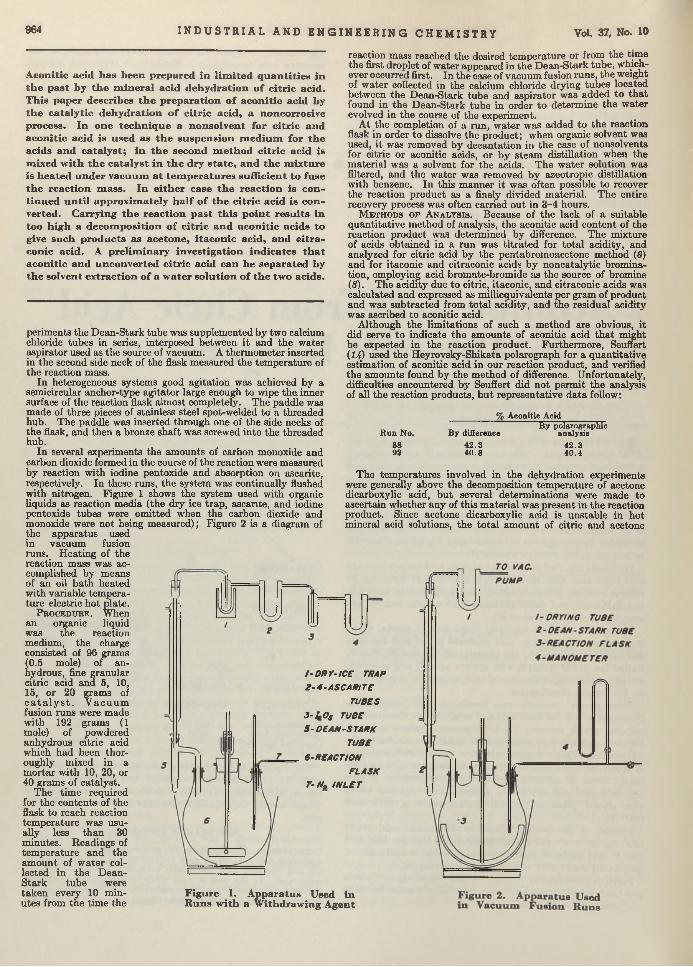
964 I N D U S T R I A L A N D E N G I N E E R I N G C H E M I S T R Y Vol. 37, No. 10
A conitic acid h as been prepared in lim ite d q u a n tities in th e p ast by th e m ineral acid dehyd ration o f c itr ic acid . T his paper describes th e preparation o f aco n itic acid by th e ca ta ly tic dehydration o f citr ic acid , a noncorrosive process. In on e tech n iq u e a non so lven t for c itr ic and acon itic acid is used as th e su sp en sion m ed iu m for th e acids and cata lyst; in th e second m eth od citr ic acid is m ixed w ith th e ca ta lyst in th e dry sta te , and th e m ixture is heated under vacuum a t tem peratures su ffic ien t to fuse th e reaction m ass. In e ith er case th e reaction is con tin u ed u n til approxim ately h a lf o f th e citr ic acid is con verted. Carrying th e reaction p ast th is p o in t resu lts in too h ig h a d ecom position o f citr ic and acon itic acids to give su ch products as aceton e, ita co n ic acid , and e itra- conic acid . A prelim inary investiga tion in d ica tes th a t acon itic and unconverted citr ic acid can be separated by th e solvent extraction o f a w ater so lu tion o f th e tw o acids.
periments the D ean-Stark tube was supplemented by two calcium chloride tubes in series, interposed between it and the water aspirator used as the source of vacuum. A therm om eter inserted in the second side neck of the flask measured the tem perature of the reaction mass.
In heterogeneous systems good agitation was achieved by a semicircular anchor-type agitator large enough to wipe th e inner surface of the reaction flask almost completely. The paddle was made of three pieces of stainless steel spot-welded to a threaded hub. The paddle was inserted through one of the side necks of the flask, and then a bronze shaft was screwed into the threaded hub.
In several experiments the amounts of carbon monoxide and carbon dioxide formed in the course of the reaction were measured by reaction w ith iodine pentoxide and absorption on ascarite, respectively. In these runs, the system was continually flushed with nitrogen. Figure 1 shows the system used with organic liquids as reaction media (the dry ice trap , ascante, and iodine pentoxide tubes were om itted when the carbon dioxide and monoxide were not being m easured); Figure 2 is a diagram of the apparatus used in vacuum fusion runs. Heating of the reaction mass was accomplished by means of an oil bath heated with variable tem perature electric hot plate.
P r o c e d u r e . When an organic liquid was the reaction medium, the charge consisted of 96 grams (0.5 mole) of anhydrous, fine granular citric acid and 5, 10,15, or 20 grams of c a t a l y s t . V a c u u m fusion runs were made with 192 grams (1 mole) of powdered anhydrous citric acid which had been thoroughly mixed in a m ortar w ith 10, 20, or 40 grams of catalyst.
The tim e required for the contents of the flask to reach reaction tem perature was usually less than 30 minutes. Readings of tem perature and the am ount of w ater collected in the D ean- S tark tube were taken every 10 m inutes from the tim e the
reaction mass reached the desired tem perature or from the tim e the first droplet of w ater appeared in the D ean-S tark tube, whichever occurred first. In the case of vacuum fusion runs, the weight of w ater collected in the calcium chloride drying tubes located between the D ean-Stark tube and aspirator was added to th a t found in the D ean-Stark tube in order to determ ine th e w ater evolved in the course of the experiment.
A t the completion of a run, w ater was added to the reaction flask in order to dissolve the product; when organic solvent was used, i t was removed by decantation in the case of nonsolvents for citric or aconitic acids, or by steam distillation when the m aterial was a solvent for the acids. The w ater solution was filtered, and the w ater was removed by azeotropic distillation with benzene. In this m anner it was often possible to recover the reaction product as a finely divided m aterial. The entire recovery process was often carried out in 3-4 hours.
M e t h o d s o f A n a l y s i s . Because of the lack of a suitable quantitative method of analysis, the aconitic acid content of the reaction product was determ ined by difference. The m ixture of acids obtained in a run was titra ted for to ta l acidity, and analyzed for citric acid by the pentabrom oacetone method (6) and for itaconic and citraconic acids by noncatalytic bromina- tion, employing acid bromate-bromide as the source of bromine (8). The acidity due to citric, itaconic, and citraconic acids was calculated and expressed as milliequivalents per gram of product and was subtracted from to ta l acidity, and the residual acidity was ascribed to aconitic acid.
Although the lim itations of such a m ethod are obvious, it did serve to indicate the am ounts of aconitic acid th a t might be expected in the reaction product. Furtherm ore, Seuffert (14) used the Heyrovsky-Shikata polarograph for a quantitative estim ation of aconitic acid in our reaction product, and verified the amounts found by the m ethod of difference. Unfortunately, difficulties encountered by Seuffert did not perm it the analysis of all the reaction products, b u t representative d a ta follow:
Aconitic Acid
R u n No.
8892
B y difference
4 2 .34 0 .8
By polarographic analysis
4 2 .34 0 .4
The tem peratures involved in the dehydration experiments were generally above the decomposition tem perature of acetone dicarboxylic acid, b u t several determ inations were m ade to ascertain whether any of this m aterial was present in the reaction product. Since acetone dicarboxylic acid is unstable in hot mineral acid solutions, the to ta l am ount of citric and acetone
1-DRY-ICE TRAP
2 - 4 - ASCARITE
TUBES
3 - iO s TUBE
5 - DEAN-STARK
TUBE
6-REACTION
FLASK
7 -N , IN LET
Figure 1. Apparatus Used in R u ns w ith a W ithdrawing A gent

O ctober, 194S I N D U S T R I A L A N D E N G I N E E R I N G C H E M I S T R Y 963
dicarboxylic acids in the product was determined as pentabromo- acetone; then a separate sample of the product was boiled in dilute sulfuric acid solution for one hour, and the citric acid alone was determined by precipitation as pentabromoacetone. Because of the tim e required to make the analysis and because check runs showed comparatively little acetone dicarboxylic acid in the reaction product, this determination was run only when a complete analysis was desired.
D a t a . A to ta l of 1 4 2 runs was carried out. A few of the reaction products obtained were no t analyzed because i t was obvious from the weights of the m aterial recovered th a t the catalyst had caused excessive pyrolysis of the citric acid and the products of the reaction. Representative data are listed in Tables I and II.
O R G A N IC L IQ U ID S A S R EA C T IO N M ED IA
In these runs orthophosphoric acid, ethyl phosphoric acid (a mixture of approximately 65% monoester and 35% diester, as received from M onsanto Chemical Company), and a mixture of phosphoric acid and fuller’s earth supplied by Universal Oil Products Company were found to be good catalysts.
The m ost suitable media for the reaction were the nonsolvents for citric and aconitic acids. The selection of such a reaction medium depended solely on its boiling point. The solvents for citric acid, such as the ketones and diethyl Cellosolve were of little value as reaction media because it was impossible to control the pyrolysis to obtain the desired aconitic acid. These runs were all characterized by low recovery of a reaction product containing 10 to 25% of itaconic and citraconic acids.
Of the nonsolvents, aromatic hydrocarbons were used as reaction media because they were readily available and had the desired boiling points. I t was found th a t the reaction could be carried out from 120° to 150° C. In this tem perature range and with the catalysts mentioned, i t was possible to obtain good conversions of citric acid to aconitic acid provided the reaction was only 50% complete. If the reaction was carried beyond the
T a b l e I. D a t a f b o m R u n s w i t h a n O f.g a n i c L i q u i d a s R e a c t i o n M e d i u m
Figure 3 . Effect o f R eaction Tem perature on R ate o f W ater R em oval in R uns M ade w ith a W ithdrawing
A gent and 5.2% Phosphoric Acid as Catalyst
M l. HjO Removed Reaction Com pn. of P roduct, %
Run R eaction M edium per Mole Time, Citrio Aconitic ItaoomNo. C ata lys t, % (B .P . in 0 C.) 1Citric Acid H r . : Min. acid acid acid®
23 H .PO ., 5.2 50% xylene + 50% 23.6 17:45 4 1 .7 5 1 .5 3 .1toluene (120)
24 H jPOi, 5.2 75% xylene + 25% 3 0 .8 21:15 N o t analyzedtoluene (130)
14 HiPO(, 5.2 X ylene (138) 19.6 3 :55 N ot analysed16» H 3PO 4, 5.2 X ylene 19.8 6 :30 4 8 .9 4 4 .1 0 .232 E .P .A . ', 5.2 Xylene 14.0 4 :30 6 8 .0 2 4 .5 3 .0
2 8 .8 10:50 9 .2 7 2 .3 8 .968 E.P.A ., 10.4 Xylene 30 .0 8 :5 11.8 67.2 6 .157 E.P .A ., 15.6 Xylene 34 .6 11:15 0 .2 7 4 .9 11.052 U.O.P. 2d, 5.2 Xylene 3 6 .0 13:10 1 .8 67 .2 14.165 U.O.P. 2, 10.4 Xylene 28 .2 6:15 21 .5 58 .8 9 .763 U.O.P. 2, 15.6 Xylene 3 3 .8 7:40 7 .3 7 2 .0 9 .872 U.O.P. 2, 10.4 Xylene 18.0 4:30 55 .4 34 .7 3 .674 U.O.P. 2, 10.4 Xylene-cymene (142) 18.8 3 :20 4 8 .4 4 0 .0 8 .892 U.O.P. Í, 20.8 X ylene 19.2 3:10 52 .5 4 0 .8 2 .9
M -l H »P 0 4 , 5.2 M ethy l isobuty l ketone
M ethy l n-am yl ketone
16.8 9:20 6 6 .0 6 .4 27 .7
M-6 HiPO,, 5.2 3 6 .0 10:0 13 .4 63 .0 23 .4M-12 H iPO., 5.2 D iisopropyl ketone 3 1 .0 25:5 2 3 .4 51 .8 17.0
° Includes citraconic acid.& 2.5 moles of citric acid were used in th is run, 0.5 mole in all o ther runs. c E th y l phosphoric acid from M onsan to Chem ical Com pany.
U niversal Oil P rod u cts C om pany ca ta lyst.
T a b l e II. E f f e c t o f W a t e r R e m o v a l o n C o n v e r s i o n o f C i t r i c A c id i n V a c u u m F u s i o n R u n s w i t h 20.8% U.O.P. C a t a l y s t
Compn. of P roduct, %___M l. HaORemoved Pressure,
R un per Mole M m . of Temp.,No. C itric Acid H g ° C .
83 12.7 10 13288 18.5 12 13785 2 5 .0 12 13695 30 .7 19 144
Citric Aconitic Itaconicacid acid acid
75 .2 2 4 .0 0 .855.8 42 .7 1 .538.7 5 5 .8 5 .5
6 .5 76 .5 17.0
50% point, recoveries of reaction products decreased markedly and greatly increased formation of itaconic and citraconic acidsand nonacidic tarry materials. For every mole of citric aciddehydrated, 2 moles of w ater were formed. Only half of the water liberated was due to the pyrolysis of the citric acid; i t was probable th a t the extra w ater formed in the dehydration reaction was due to the formation of acid anhydrides.
Figure 3 illustrates the effect of temperature on the ra te of reaction. Three runs were made using 5.2% orthophosphoric acid as catalyst and either xylene or a blend of xylene and toluene as reaction medium. The xylene boiled a t 138° C., and the blends had boilingpoints of 130° and 120° C. under to ta lreflux. The run with xylene as reaction medium was completed in about 31/« hours; those employing the blends required about 9 and 14 hours, respectively.
The effect of catalyst concentration on the ra te of reaction is less m arked than is the effect of reaction temperature. Figure 4 shows the effects of increasing concentrations of ethyl phosphoric acid, which is completely soluble in the reaction medium in the concentrations used, and of U.O.P. catalyst, which is insoluble in the reaction medium. The soluble catalyst is, of course, more intim ately associated with the citric acid than is U.O.P. No. 2 and, therefore, the effect of catalyst concentration on the ra te of reaction is more marked than for the U.O.P. catalyst. However, tripling the catalyst concentration had far less effect on the ra te of reaction than increasing the tem perature from 130° to 138° C.
% R e % Concovery version
9 9 .2 94 .89 6 .7 99 .29 3 .8 8 1 .581 .4 65 .5

966 I N D U S T R I A L A N D E N G I N E E R I N G C H E M I S T R Y Vol. 37, No. 10
E thylphoaphoric acid as ca ta ly st U .O .P . N o . 2 as ca ta ly st
Figure 4. Effect o f C atalyst C oncentration on R ate o f W ater R em oval U sin g X ylene as W ithdraw ing A gent
Figure 5. Effect o f Con- F ig u r e 6 . E f f e c tcen tration o f U .O .P. o f W ater Rem ovalNo. 2 on W ater Rem oval o n C o n v e r s i o n
' i n V acuum F usion R uns o f C i t r i c A c i d
RECOVERY
ML. OF WATER REMOVED PER MOL O f ACM
°ACONITIC ACID
CONVERSION
CITRIC A CIO
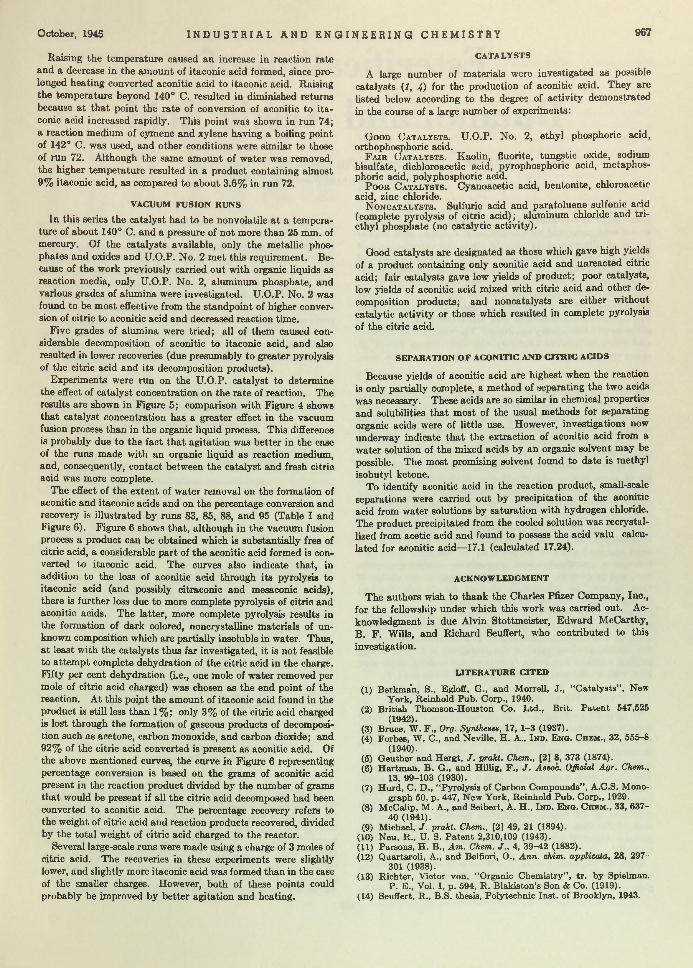
October, 194S I N D U S T R I A L A N D E N G I N E E R I N G C H E M I S T R Y 967
Raising the tem perature caused an increase in reaction rate and a decrease in the am ount of itaconic acid formed, since prolonged heating converted aconitic acid to itaconic acid. Raising the tem perature beyond 140° C. resulted in diminished returns because a t th a t point the rate of conversion of aconitic to ita conic acid increased rapidly. This point was shown in run 74; a reaction medium of cymene and xylene having a boiling point of 142° C. was used, and other conditions were similar to those of run 72. Although the same am ount of w ater was removed, the higher tem perature resulted in a product containing almost 9% itaconic acid, as compared to about 3.6% in run 72.
VACUUM FUSIO N R UNS
In this series the catalyst had to be nonvolatile a t a temperature of about 140° C. and a pressure of not more than 25 mm. of mercury. Of the catalysts available, only the metallic phosphates and oxides and U.O.P. No. 2 m et this requirement. Because of the work previously carried out with organic liquids as reaction media, only U.O.P. No. 2, aluminum phosphate, and various grades of alumina were investigated. U.O.P. No. 2 was found to be most effective from the standpoint of higher conversion of citric to aconitic acid and decreased reaction time.
Five grades of alumina were tried; all of them caused considerable decomposition of aconitic to itaconic acid, and also resulted in lower recoveries (due presumably to greater pyrolysis of the citric acid and its decomposition products).
Experiments were run on the U.O.P. catalyst to determine the effect of catalyst concentration on the ra te of reaction. The results are shown in Figure 5; comparison with Figure 4 shows th a t catalyst concentration has a greater effect in the vacuum fusion process than in the organic liquid process. This difference is probably due to the fact th a t agitation was better in the case of the runs made w ith an organic liquid as reaction medium, and, consequently, contact between the catalyst and fresh citric acid was more complete.
The effect of the extent of water removal on the formation of aconitic and itaconic acids and on the percentage conversion and recovery is illustrated by runs 83, 85, 88, and 95 (Table I and Figure 6). Figure 6 shows th at, although in the vacuum fusion process a product can be obtained which is substantially free of citric acid, a considerable p a rt of the aconitic acid formed is converted to itaconic acid. The curves also indicate that, in addition to the loss of aconitic acid through its pyrolysis to itaconic acid (and possibly citraconic and mesaconic acids), there is further loss due to more complete pyrolysis of citric and aconitic acids. The latter, more complete pyrolysis results in the formation of dark colored, noncrystalline materials of unknown composition which are partially insoluble in water. Thus, a t least with the catalysts thus far investigated, it is not feasible to attem pt complete dehydration of the citric acid in the charge. Fifty per cent dehydration (i.e., one mole of water removed per mole of citric acid charged) was chosen as the end point of the reaction. A t this point the amount of itaconic acid found in the product is still less than 1% ; only 3% of the citric acid charged is lost through the formation of gaseous products of decomposition such as acetone, carbon monoxide, and carbon dioxide; and 92% of the citric acid converted is present as aconitic acid. Of the above mentioned curves, the curve in Figure 6 representing percentage conversion is based on the grams of aconitic acid present in the reaction product divided by the number of grams that would be present if all the citric acid decomposed had been converted to aconitic acid. The percentage recovery refers to the weight of citric acid and reaction products recovered, divided by the total weight of citric acid charged to the reactor.
Several large-scale runs were made using a charge of 3 moles of citric acid. The recoveries in these experiments were slightly lower, and slightly more itaconic acid was formed than in the case of the smaller charges. However, both of these points could probably be improved by better agitation and heating.
CATALYSTS
A large number of materials were investigated as possible catalysts (1, 4) f°r the production of aconitic acid. They are listed below according to the degree of activity demonstrated in the course of a large num ber of experiments:
G o o d C a t a l y s t s . U.O.P. No. 2 , ethyl phosphoric acid, orthophosphoric acid.
F a i r C a t a l y s t s . Kaolin, fluorite, tungstic oxide, sodium bisulfate, dichloroacetic acid, pyrophosphoric acid, metaphos- phoric acid, polyphosphoric acid.
P o o r C a t a l y s t s . Cyanoacetic acid, bentonite, chloroacetic acid, zinc chloride.
N o n c a t a l y s t s . Sulfuric acid and paratoluene sulfonic acid (complete pyrolysis of citric acid); aluminum chloride and tri- ethyl phosphate (no catalytic activity).
Good catalysts are designated as those which gave high yields of a product containing only aconitic acid and unreacted citric acid; fair catalysts gave low yields of product; poor catalysts, low yields of aconitic acid mixed with citric acid and other decomposition products; and noncatalysts are either without catalytic activity or those which resulted in complete pyrolysis of the citric acid.
SEPARATION O F ACONITIC AND CITRIC ACIDS
Because yields of aconitic acid are highest when the reaction is only partially complete, a m ethod of separating the two acids was necessary. These acids are so similar in chemical properties and solubilities th a t most of the usual methods for separating organic acids were of little use. However, investigations now underway indicate th a t the extraction of aconitic acid from a w ater solution of the mixed acids by an organic solvent may be possible. The most promising solvent found to date is methyl isobutyl ketone.
To identify aconitic acid in the reaction product, small-scale separations were carried out by precipitation of the aconitic acid from water solutions by saturation with hydrogen chloride. The product precipitated from the cooled solution was recrystallized from acetic acid and found to possess the acid valu calculated for aconitic acid— 17.1 (calculated 17.24).
ACKNOW LEDGMENT
The authors wish to thank the Charles Pfizer Company, Inc., for the fellowship under which this work was carried out. Acknowledgment is due Alvin Stottmeister, Edward M cCarthy,B. F. Wills, and Richard Seuffert, who contributed to this investigation.
LITERATURE CITED
(1) Berkma’n, S., Egloff, G., and Morrell, J., “C atalysts” , NewYork, Reinhold Pub. Corp., 1940.
(2) British Thomson-Houston Co. L td., Brit. P aten t 547,525(1942).
(3) Bruce, W. F ., Org. Syntheses, 17, 1-3 (1937).(4) Forbes, W. C., and Neville, H. A., I n d . E n g . Chem., 32, 555-8
(1940).(5) Geuther and H ergt, J . prakt. Chem., [2] 8, 373 (1874).(6) H artm an, B. G., and Hillig, F ., J . Assoc. Official Agr. Chem.,
13, 99-103 (1930).(7) H urd, C. D., “Pyrolysis of Carbon Compounds” , A.C.S. Mono
graph 50, p. 447, New York, Reinhold Pub. Corp., 1929.(8) McCalip, M . A., and Seibert, A. H., I n d . E n g . Chem., 33, 637-
40 (1941).(9) Michael, J. prakt. Chem., [2] 49, 21 (1894).
(10) Neu, R., U. S. P aten t 2,310,109 (1943).(11) Parsons, H . B., Am . Chem. J ., 4, 39—42 (1882).(12) Quartaroli, A., and Belfiori, O., Ann. chim. applicata, 28, 297-
301 (1938).(13) Richter, Victor von, “ Organic Chemistry” , tr . by Spielman,
P. E., Vol. I, p. 594, R. Blakiston’s Son & Co. (1919).(14) Seuffert, R., B.S. thesis, Polytechnic Inst, of Brooklyn, 1943.
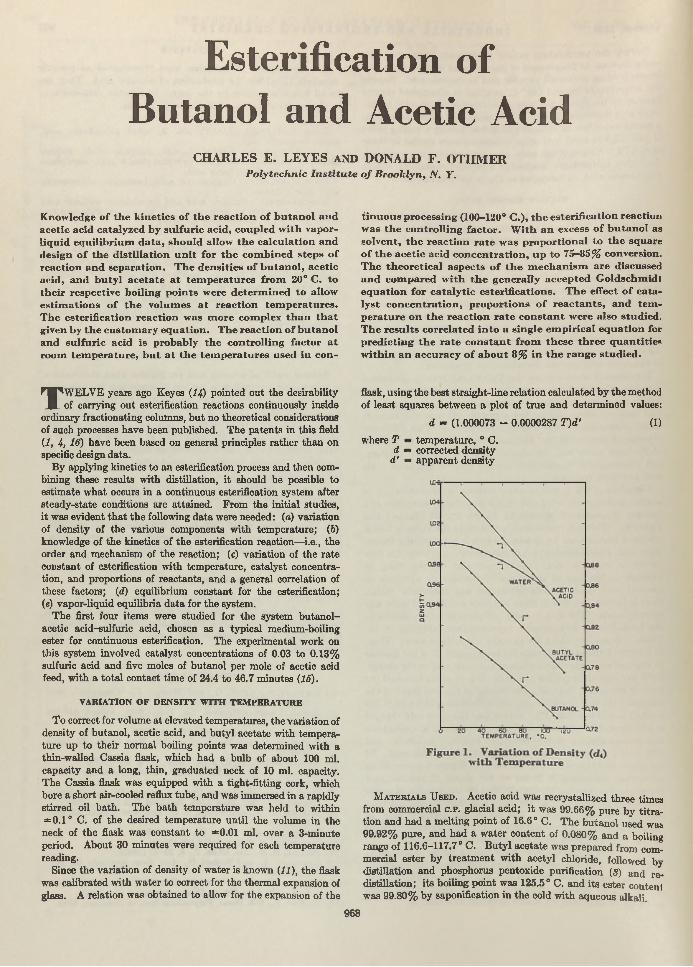
Estérification of Butanol and Acetic Acid
CHARLES E. LEYES AND DONALD F. OTHMERP o ly tec h n ic I n s t i t u t e o f B ro o k ly n , JV, Y.
K now ledge o f th e k in e tic s o f th e re a c tio n o f b u ta n o l a n d a ce tic ac id ca ta ly zed by su lfu r ic ac id , c o u p led w ith vap o r- liq u id e q u ilib r iu m d a ta , sh o u ld a llow th e c a lc u la tio n a n d d esig n o f th e d is t il la t io n u n i t fo r th e co m b in e d s te p s o f re a c tio n a n d se p a ra tio n . T h e d e n s itie s o f b u ta n o l , a ce tic acid , a n d b u ty l a c e ta te a t te m p e ra tu re s f ro m 20° C. to th e ir resp ectiv e b o ilin g p o in ts w ere d e te rm in e d to allow e s tim a tio n s o f th e v o lum es a t re a c tio n te m p e ra tu re s . T h e e s te rif ic a tio n re a c tio n w as m o re com plex th a n t h a t given by th e c u s to m a ry e q u a tio n . T h e re a c tio n o f b u ta n o l a n d su lfu r ic a c id is p ro b ab ly th e c o n tro llin g fa c to r a t room te m p e ra tu re , b u t a t th e te m p e ra tu re s u se d in co n -
t in u o u s p ro cessin g (100-120° C .), th e e s te r if ic a tio n re ac tio n w as th e c o n tro llin g fa c to r . W ith a n excess o f b u ta n o l as so lv en t, th e re a c tio n r a te w as p ro p o r tio n a l to th e sq u are o f th e a ce tic a c id c o n c e n tra t io n , u p to 75—85% conversion . T h e th e o re t ic a l a sp e c ts o f th e m e c h a n is m a re d iscussed a n d c o m p a re d w ith th e g e n era lly a c c e p te d G o ld sch m id l e q u a tio n fo r c a ta ly t ic e s te r if ic a tio n s . T h e effect o f c a ta ly s t c o n c e n tra t io n , p ro p o r tio n s o f r e a c ta n ts , a n d te m p e ra tu re o n th e re a c tio n r a te c o n s ta n t w ere a lso s tu d ied . T h e re s u lts c o rre la te d in to a s in g le e m p ir ic a l e q u a tio n for p re d ic tin g th e r a te c o n s ta n t f ro m th e s e th re e q u a n tit ie s w ith in a n a cc u rac y o f a b o u t 8% in th e ra n g e s tu d ie d .
TW ELVE years ago Keyes (14) pointed out the desirability of carrying out esterification reactions continuously inside
ordinary fractionating columns, b u t no theoretical considerations of such processes have been published. The patents in this field (1, 4, 16) have been based on general principles ra ther th an on specific design data.
By applying kinetics to an esterification process and then combining these results w ith distillation, i t should be possible to estim ate w hat occurs in a continuous esterification system after steady-state conditions are attained. From the in itial studies, i t was evident th a t th e following d a ta were needed: (a) variation of density of the various components w ith tem perature; (5) knowledge of the kinetics of the esterification reaction—i.e., the order and mechanism of the reaction; (c) variation of the rate constant of esterification with tem perature, catalyst concentration, and proportions of reactants, and a general correlation of these factors; (d) equilibrium constant for the esterification; (e) vapor-liquid equilibria d a ta for the system.
The first four item s were studied for the system butanol- acetic acid-sulfuric acid, chosen as a typical medium-boiling ester for continuous esterification. The experimental work on this system involved catalyst concentrations of 0.03 to 0.13% sulfuric acid and five moles of butanol per mole of acetic acid feed, w ith a to ta l contact time of 24.4 to 46.7 m inutes (15).
V ARIA TIO N O F D E N S IT Y W IT H T E M P E R A T U R E
To correct for volume a t elevated tem peratures, the variation of density of butanol, acetic acid, and butyl acetate w ith tem perature up to their normal boiling points was determined w ith a thin-walled Cassia flask, which had a bulb of about 100 ml. capacity and a long, thin, graduated neck of 10 ml. capacity. The Cassia flask was equipped w ith a tight-fitting cork, which bore a short air-cooled reflux tube, and was immersed in a rapidly stirred oil bath . The ba th tem perature was held to within =*=0.1° C. of the desired tem perature until the volume in the neck of the flask was constant to ±0.01 ml. over a 3-minute period. About 30 m inutes were required for each tem perature reading.
Since the variation of density of w ater is known (11), the flask was calibrated w ith w ater to correct for the therm al expansion of glass. A relation was obtained to allow for the expansion of the
flask, using the best straight-line relation calculated by the method of least squares between a plot of tru e and determ ined values:
d = (1.000073 - 0.0000287 T )d ' (1)
where T — tem perature, ° C. d = corrected density
d' — apparent density
M a t e r i a l s U s e d . Acetic acid was recrystallized three times from commercial c . p . glacial acid; i t was 99.66% pure by titra tion and had a melting point of 16.6° C. The butanol used was 99.92% pure, and had a w ater content of 0.080% and a boiling range of 116.6-117.7° C. B uty l acetate was prepared from commercial ester by treatm ent w ith acetyl chloride, followed by distillation and phosphorus pentoxide purification (3) and re-* distillation; its boiling point was 125.5° C. and its ester content was 99.80% by saponification in th e cold w ith aqueous alkali.
968

O ctober, 1945 I N D U S T R I A L A N D E N G I N E E R I N G C H E M I S T R Y
T a b l e I. V a r i a t i o n o p D e n s i t y w i t h T e m p e r a t u r e
In d ica ted
E xpan Ind ica ted A pparent Corrected
L iteratu re Differ
Temp. sion,M l.
Volume, D ensity ,d'
D ensity , Value®, ence,T,° C. M l. d do (d - dc)
20Acetic
0 .0 0Acid, 99.6042 G ram s a t 20° C., 99.66% P ure
9 4 .86 1.0500 1.0495 1.0498 - 0 .000330 0 .9 8 95 .84 1.0393 1.03S5 1.0387 — 0.000240 1.98 96 .84 1.0285 1.0274 1.0274 0.000050 2 .97 97 .83 1.0181 1.0167 1.0160 + 0 .0 0 0 760 4 .1 0 98 .96 1.0065 1.0048 1.0046 + 0 .0 0 0 270 5 .25 100.11 0 .9949 0.9929 0.9931 — 0.000280 6 .32 101.18 0.9844 0.9822 0.9816 + 0 .0 0 0 690 7,51 102.37 0.9730 0.9705 0.9699 + 0 .0 0 0 6
100 8 .7 8 103.64 0.9611 0.9584 0.9582 + 0 .0 0 0 2110 10.00 104.86 0.9499 0.9470115 10.7 105.56 0 .9436 0.9405
20Butanol, 76.7361 G ram s a t 20
0 .0 0 9 4 .86 0 .80890 C., 99.92% Pure
0 .8085 0 .8086
=*=0.0003
- 0 .0 0 0 130 0 .76 95.62 0.8025 0.8019 0.8000 + 0 .0 0 1 940 1.60 96.46 0.7955 0.7946 0.7908 + 0 .0 0 3 850 2.61 97.47 0.7873 0.7862 0.7810 + 0.005260 3.63 98.49 0.7791 0.777870 4 .70 99.56 0.7707 0.769280 5 .98 100.84 0.7610 0.759390 7 .05 101.91 0 .7530 0.7511
100 8 .20 103.06 0.7446 0.7425110 9.69 104.55 0.7339 0.7316115 10.2 105.06 0.7304 0.7280
20B utyl Acetate, 83.5792
0 .0 0 94 .86G ram s a t 20° C., 99.80% Pure 0 .8811 0.8807
30 1.00 9 5 .86 0.8719 0.871240 2.13 96.99 0.8617 0.860850 3 .28 98.14 0.8516 0.8504 ...60 4.43 99.29 0.8418 0.840470 5.78 100.64 0.8305 0.828980 7.02 101.88 0.8204 0.818690 8.41 103.27 0.8093 0.8073
100 9 .80 104.66 0.7986 0.7964110 11.2 106.06 0.7880 0.7856120 12.67 107.53 0.7773 0.7747
B Calculated from density-tem perature equations {12).
Table I and Figure 1 summarize the data. Those for acetic acid are in good accord w ith the literature, bu t the values for butanol are considerably higher.
R A T E O F R EA CTIO N
The mechanism of eaterification depends on such variables as the concentration of reactants, concentration of catalyst, and temperature. To study these variables, batches of 50 to 135 grams to ta l were weighed out in the order sulfuric acid, acetic acid, butanol, and were cooled in ice water. Approximately 5-ml. samples were pipetted into drawn-down soft glass test tubes (13 X 100 mm.), which were sealed and inserted into a con- stant-tem perature bath. Tubes were removed a t various times, cooled, and dried. Then the tips were broken off, and 2 to 5 ml. of the contents were weighed out into a tared 250-ml. Erlenmeyer Bask. Each sample was diluted with 50 ml. of distilled water and titrated immediately w ith 0.1 N sodium hydroxide, using phenol- phthalein to determine the free acidity. The time was measured from insertion in the ba th (the maximum elapsed time from the addition of butanol to insertion in the sealed tube in the bath
--------1--------------- 1---------------1--------------- 1------"I25-30“ C.
TIME, HOURS
Figure 2. Reaction of Butanol anil Sulfuric Acida t Various Temperatures
was 8 to 10 minutes). Some reaction undoubtedly occurs in thia treatm ent, but it is insignificant compared with the amount of reaction a t the elevated tem peratures (for example, see Figure 9).
M a t e r i a l s U s e d . Acetic acid for runs B through R was commercial c .p . glacial acid, 99.51% pure by titration, with a melting point of 15.5° C. For runs S through Z, the acid was recrystallized three times; 99.66% by titra tion and a melting point of 16.6° C. were obtained. Commercial butanol was used throughout; it had no acidity, a water content of 0.080%, and a boiling range of 116.6-117.7° C. The sulfuric acid was reagent grade, titra ted 97.19 to 97.45% as sulfuric acid using phenol- phthaleln, and gave 97.42% when assayed as barium sulfate. The average value of 97.38% was taken.
REA CTIO N O F BU TA N O L AND S U L F U R IC ACID
To obtain the acetic acid present, the free acidity m ust be corrected for the presence of the catalyst. There is, however, a reaction between the alcohol and sulfuric acid (19, 20). The butyl monosulfate formed has a different equivalent weight from th a t of sulfuric acid in titration (154.18 compared to 49.04). Since the total number of moles of sulfate radical in the system is constant, the amount of butyl sulfuric acid formed can be determined from a single titration value, and the known amount of sulfuric acid:
grams butyl sulfuric acid formed = (154.18/1000) (2M — ml. N)
grams sulfuric acid remaining - (ml. N — M )1UUU
where M = millimoles sulfuric acid originally presentml. N = titration equivalents used (ml. base X normality)
Table I I and Figure 2 give the results of tests with approximately 2% sulfuric acid in butanol. The reaction of butanol and sulfuric acid varies greatly with tem perature. A t 0° and 13° C. the rate is scarcely measurable up to 8 hours, a t 25 ° to 30 ° C. the reaction proceeds over a period of days, and a t 100° and 115° C. the reaction is so rapid (95 to 96% complete in 15 to 30 minutes) th a t the rate cannot be followed accurately. After 4 hours a t 100° C. the amount of butyl sulfuric acid present decreases con-
969
T a b l e II. R e a c t i o n o f B u t a n o l a n d S u l f u r i c A c id
Time,Hr.
Sample,Grams
T itration , Millimoles H 2SO4
A pparentMilli-equiv-
Ml. N Original Rem aining Combined aient, B
0° C., 1.9230% H 2SO4
12358
3.28603.71443.28663.93143.7262
1.27991.4543 1.2902 1.53121.4543
0.64430.72830.64440.77080.7306
0.63560.72600.64580.76040.7237
1 .3 50.31
- 0 . 2 21.35 0 .94
49.37 4 9 .12 4 8 .9949.37 49 .27
13° C., 1.9230% H 2SO4
012358
168
3.99023.94723.97203.92433.99894.05113.5623
1.5640 1.5466 1.5487 1.5292 1.5569 1.5702 1.3107
0.78230.77390.77880.76940.78400.79430.6984
0.78170.77270.76990.75980.77290.77590.6123
0 .080 .151.141.251.422.31
12.34
49.0649.0849.3249.3549.3949.6152.26
25 to 30° C., 1.9440% H 2SO41616404088
768
4.00123.97203.96314.23034.09624.0646
1.4248 1.3439 1.0923 1.1616 0 .9128 0 .8477
0.79310.78730.78550 .83860.81190.8056
0.63170.55660.30680 .32300.10090.0421
20.3429.3160.9461 .4887 .5794.77
54.595 7.4670.537 0 .808 7.2493.21
100° C., 1.9230% H 2SO40 .250 .511 .5248
1630
4.18894.38154.21604.11234.50704.72604.63864.19623 .8925
0.85540.90050.86250.84100.92100.98250.96300.87720.8174
0 .82130.85900.82660.80630.88370.92660.90950.82270.7632
0.03410.04150.03590.03470.03730.05590.05350.05450.0542
95.8595.1795.6695.7095.7893.9794.1293.3792.89
94.1793.57 94 .00 94.08 94 .10 92 .50 92 .63 91 .9991.57
115° C., 1.9230% H sS 040 .5 3.8350 0.7805 0.7519 0 .0286 96 .20 94.49
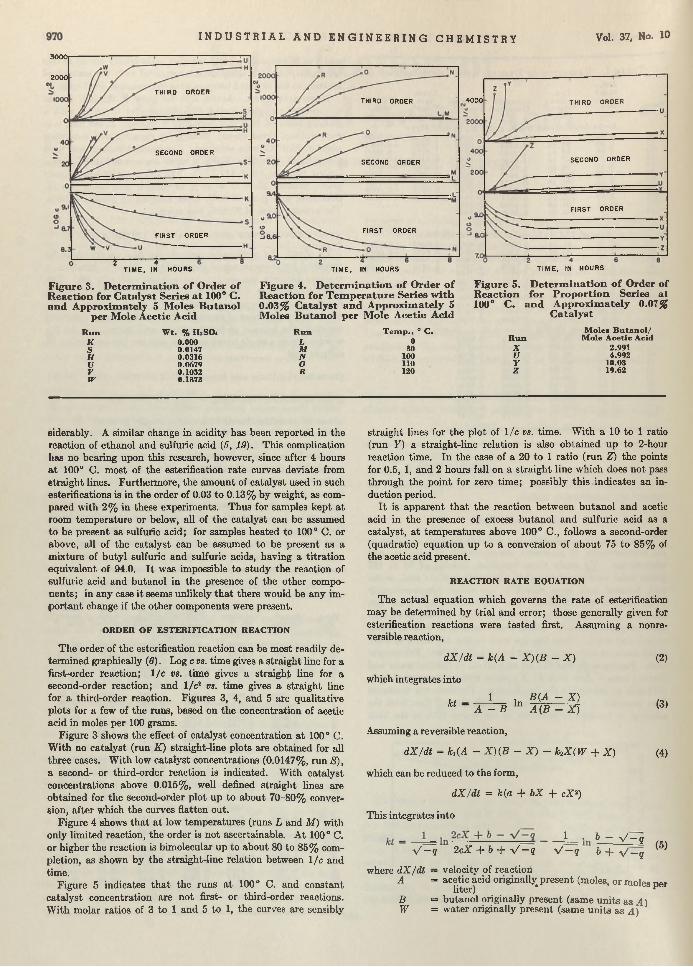
3000
2000
THIRD ORDER4000 THIRD ORDER
SECOND ORDERSECOND ORDER
FIRST ORDER
I N D U S T R I A L A N D E N G I N E E R I N G C H E M I S T R Y Vol. 37, No. 10
THIRD ORDER
SECOND ORDER
FIRST ORDER
FIRST ORDER
2 4TIME, IN HOURS
Figure 3. D eterm ination o f Order o f R eaction for C atalyst Series a t 100° C. and Approxim ately 5 M oles B utanol
per M ole A cetic Acid
TIME, IN HOURS
Figure 4. D eterm ination o f Order o f R eaction for T em perature Series w ith 0.03% C atalyst and A pproxim ately 5 M oles B utan ol per M ole A cetic Acid
TIME, IN HOURS
Figure 5. D eterm in ation o f Order of R eaction for Proportion Series at 100° C. and A pproxim ately 0.07%
C atalyst
R unKSHUVw
W t. % H 2SO4
0.000 0.0147 0.0316 0.0679 0.1032 0.1373
R unLMNOR
T em p ., 0 C.0
30 100 110 120
M oles B u ta n o l/R un M ole A cetic Acid
X 2.991V 4.992r 10.03Z 19.62
eiderably. A similar change in acidity has been reported in the reaction of ethanol and sulfuric acid (5, 19). This complication has no bearing upon this research, however, since after 4 hours a t 100° C. most of the esterification ra te curves deviate from etraight lines. Furtherm ore, the amount of catalyst used in such esterifications is in the order of 0.03 to 0.13% by weight, as compared with 2% in these experiments. Thus for samples kept a t room tem perature or below, all of the catalyst can be assumed to be present as sulfuric acid; for samples heated to 100° C. or above, all of the catalyst can be assumed to be present as a mixture of butyl sulfuric and sulfuric acids, having a titra tion equivalent of 94.0. I t was impossible to study the reaction of sulfuric acid and butanol in the presence of the other components; in any case it seems unlikely th a t there would be any importan t change if the other components were present.
ORDER O F ESTERIFICATIO N REACTION
T he order of the esterification reaction can be most readily determined graphically (6). Log c vs. time gives a straight line for a first-order reaction; 1/c vs. time gives a straight line for a second-order reaction; and 1/c* vs. time gives a straight line for a third-order reaction. Figures 3, 4, and 5 are qualitative plots for a few of the runs, based on the concentration of acetic acid in moles per 100 grams.
Figure 3 shows the effect of catalyst concentration a t 100° C. W ith no catalyst (run K ) straight-line plots are obtained for all three cases. W ith low catalyst concentrations (0.0147%, run S), a second- or third-order reaction is indicated. W ith catalyst concentrations above 0.015%, well defined straight lines are obtained for the second-order plot up to about 70-80% conversion, after which the curves flatten out.
Figure 4 shows th a t a t low tem peratures (runs L and M) with only lim ited reaction, the order is not ascertainable. A t 100° C. or higher the reaction is bimolecular up to about 80 to 85% completion, as shown by the straight-line relation between 1/c and time.
Figure 5 indicates th a t the runs a t 100° C. and constant catalyst concentration are not first- or third-order reactions. W ith molar ratios of 3 to 1 and 5 to 1, the curves are sensibly
straight lines for the plot of 1/c vs. time. W ith a 10 to 1 ratio (run Y) a straight-line relation is also obtained up to 2-hour reaction tim e. In the case of a 20 to 1 ratio (run Z) the points for 0.5, 1, and 2 hours fall on a straight line which does not pass through the point for zero tim e; possibly th is indicates an induction period.
I t is apparent th a t the reaction between butanol and acetic acid in the presence of excess butanol and sulfuric acid as a catalyst, a t tem peratures above 100° C., follows a second-order (quadratic) equation up to a conversion of about 75 to 85% of the acetic acid present.
REACTION R ATE EQUATION
The actual equation which governs the ra te of esterification may be determined by tria l and error; those generally given for esterification reactions were tested first. Assuming a nonre- versible reaction,
d X /d t = k(A - X ) (B - X )
which integrates into
kt —1
InB (A - X )
(2)
(3)A — B A (B - X )
Assuming a reversible reaction,
d X /d t = k,(A - X ) (B - X ) - k2X ( W + X ) (4)
which can be reduced to the form,
d X /d t = k(a + bX + cX*)
This integrates into
1 1 b — y / — q
V —q 2 cX + b + V — q V — q b + V — q ^
where d X /d t — velocity of reactionA = acetic acid originally present (moles, or moles ner
liter) ’ pB = butanol originally present (same units as 4 )W = w ater originally present (same units as A)
October, 1945 I N D U S T R I A L A N D E N G I N E E R I N G C H E M I S T R Y 971
X = am ount of acetic acid transformed in interval (same units as A)
k, fci = reaction ra te constantsfc2 = reverse reaction rate constantK = equilibrium constant = ki/k ta = A Bb = (A + B + W /K )c = 1 - 1 / Kq = 4ac — b2, where 62 > 4ac
None of these equations correlated all of the experimental data, bu t after a number of trials it was found that the equation
d X /d t = k.(A - X)* (6)
fitted the experimental d a ta for all of the runs very well, up to a conversion of about 75 to 85% (as in the second- order reaction plot).
integration of Equation 6 gives
A - X= kt + I
Evaluating I by setting X = 0 when i = 0,
Xkt =
A (A - X ) (7)
The proper form of the rate equation may be determined graphically by plotting various functions against time and noting which gives a straight-line relation: For Equation 3, log{A — X ) /{ B — X) vs. t; for Equation 5, log (2cX + b — V ^ -q ) / (2cX + b + V — q) vs. t; for Equation 7, X /( A — X ) vs. t.
The data for run B for these tests are plotted in Figure 6. Equation 3 gives a well defined curve and hence does not apply. The last six points on the curve for Equation 5 appear to fall on a straight line; on a larger scale, however, these points show a definite curve, and the initial point (zero time) falls far off the straight-line relation. Equation 7, however, shows a straight- line relation from 0 to 3 hours, with the point for 4 hours slightly low.
As a further illustration the data for run N , using Equations 5 and 7, are plotted in Figure 7. W ith a larger scale and a check point a t 0.5 hour, it is apparent th a t during the early stages the rate equation does not correspond to the mechanism proposed by Equation 5, bu t Equation 7 does give a straight line.
At the 3-hour point run N is 84.5% completed and run B is 86.3% completed. At the 4-hour point and above, Equation 7 no longer holds; the mechanism changes apparently to one approaching Equation 5 since the reverse reaction, saponification, is beginning to have an effect. This is indicated by the straight- line portion of the log plot above 4 hours, which shows th a t the normal esterification equilibrium law is setting in and is obeyed. However, in the continuous column esterification studies reported elsewhere (15), it was desired to reduce the time of contact to about 30 minutes; hence Equation 7, which gives a straight-line relation for the early stages of reaction, applies in the continuous esterifications. Long times of contact and attainm ent of esterification mass law equilibrium on a given plate are not needed for a high over-all extent of conversion.
Table I I I summarizes the complete calculations for the experimental data testing Equation 7. Figure 8 shows the relation between X /(A — X) and t for the runs a t 100° C. with a molar
ratio of butanol to acetic acid of approximately 5 to 1 and with varying catalyst concentration. The degree of completion of the esterification of acetic acid is indicated on the right-hand scale. Up to 2 hours a t 100° C. all of the lines are straight and pass through the origin. Run C with 0.00614% catalyst appears to be slightly irregular, showing a deviation a t 3 hours. W ith 0.03% catalyst or higher, a conversion of 85 to 90% of the acetic acid is possible before the curves deviate from Equation 7, as equilibrium sets in and Equation 5 becomes valid.
Figure 9 gives the effect of tem perature on conversion. Here again, a t tem peratures over 100° C., straight-line relations are obtained up to about 85% conversion. I t will be noted th a t the points determined with heating times of 20 and 30 minutes are slightly low; this is probably because of the time required to heat the samples up to the reaction temperature.
Figure 10 illustrates effect of proportions of reactants a t 100° C. A t low catalyst concentrations (0.03% or less), these runs show fairly good agreement with Equation 7. W ith 0.07% sulfuric acid, however, the curves for run Y (10 to 1 ratio) and run Z (20 to 1 ratio) do not pass through the origin; evidently a slight induction effect occurs here. Practically all of these d a ta deviate from straight lines after 2 hours a t 100° C., b u t below 75% conversion, the agreement is good.
REA CTIO N R A TE CONSTANT
D e t e r m i n a t i o n . In a bimolecular reaction the value for k is dependent upon the numbers expressing the concentration; for uniformity, the concentrations are expressed in moles per liter and k in liters/mole-minutes. Equation 7 can be rearranged to give
kA^t = X /{ A - X )
If the units are substituted for each term,
(liter)___ (moles)(mole)(min.) (liter)
(min.) = dimensronless ratio
so th a t if At, in the left-hand member is expressed in moles per liter, the quantities on the right hand, X and A — X (i.e., the amount of acid reacted and the amount of acid unreacted) can be expressed in any units, such as moles, mole fractions, or molea per liter, provided the same units are used for each.
equation s
2 4 6 8TIME. IN HOURS
Figure 6 . R eaction-R ate Equation T ests for Run B
EQUATION 5
EQUATION 7
TIME, IN HOURS
Figure 7. R eaction-R ate Equation T ests for Run iV

972 I N D U S T R I A L A N D E N G I N E E R I N G C H E M I S T R Y Vol. 37, No. 10
T a b l e I I I . R e a c t i o n R a t e E q u a t i o n D a t a
C ata ly s tCorrection, Time,
FreeAcidity,
A ctual Acetic Acid, M oles/100 G. Acetic Converted , R atio ,
R un B, O.i
0 .0197%
/6 < M )5 \ V 94 ) X 0 . 00614 0 .00392%
/ ' 6 0 .0 5 \ V 94 )X 0.0198 0 .0127%
(6 0 .0 5 \
94 )X0-03070 .0196%
/ 6 0 J 0 5 \ V M /X 0 . 1608 0 .10 3 %
/ 6 0 .0 5 \ \ 94 ) X 0.0490
0 .03 1 4%
( 6 0 .0 S \ ^ 94 /X 0 .03160 .0202%
/ OO.OS'y V 94 ) X 0.0211 0 .0135%
/■6 0 .0 5 \ \ 94 ) X 0 .0179 0 .0114%
H r. % Acid, % X X / ( A - .
0.0309% H 2SO4, 100° C„ B / A • 4.978, A = 0.2327
0 13.97 0 .0000 0 .0 0 01 4.673 4 .662 0.15521 2 .0032 2 .730 2 .710 0.18756 4 .1553 1.912 1.892 0.20118 0 .3834 1.584 1.564 0.20665 7 .9335 1.452 1.432 0.20885 8.7576 1 .388 1.368 0.20991 9 .2117 1.327 1.307 0.21093 9 .6898 1.378 1.358 0.21008 9 .287
0.00614% H ïSO*, 100° C., B / A - 4.984, A = 0.2325
0 13.96 0.0000 0 .0001 10.441 10.437 0.0587 0 .33772 8 .374 8 .370 0.0931 0.06793 7 .743 7 .739 0.1036 0.80374 6 .806 0 .802 0.1192 1.0525 6 .541 6 .537 0.1236 1.1356 5.931 5.927 0.13379 1.3557 5 .710 5 .706 0.13747 1.4478 5 .211 5 .207 0.14578 1.6819 5 .167 5.163 0.14651 1.704
. 0.0198% H.SO«, 100° C „ B / A - 5.029, A - 0.2307
0 13.80 0.0000 0 .0001 6 .258 0 .245 0.12675 1.2192 3.937 3 .924 0.16539 2 .5323 2.857 2 .844 0.18336 3 .8734 2.301 2 .288 0.19262 5 .0585 1.904 1.891 0.19922 6 .3286 1.624 1.611 0.20388 7 .6028 1.400 1.387 0.20761 8.9919 1.334 1.321 0.20871 9.491
. 0.0307% H .S 0 4 , 100° C „ B / A - 5.079, A - 0.2287
0 13.73 0 .0000 0 .0001 6 .624 5 .604 0.13535 1.4502 3.454 3 .434 0.17150 2 .9983 2.373 2.353 0.18951 4 .8364 1.896 1.876 0.19745 6 .3185 1.624 1.604 0.20198 7.5596 1 .484 1.464 0.20431 8 .3777 1.409 1.389 0.20556 8 .8838 1.380 1.360 0.20605 9.097
0.1008% H 2SO4, 100° C., B / A - 4.993, A - 0.2318
0 13.92 0.0000 0 .0001 1.514 1.411 0.20830 8 .8642 1.358 1.255 0.21090 10.093 1.357 1.254 0.21092 10.104 1.382 1.279 0.21050 9 .8835 1.371 1.268 0.21065 9 .9600 1.343 1.240 0.21115 10.227 1.363 1.260 0.21082 10.05
1. 0.0490% H 2SO4, 100° C., B / A - 2.998, A - 0.3535
0 21.22 0.0000 0 .0001 6.934 6 .903 0.2385 2 .0742 4 .540 4.509 0.27838 3 .7063 3 .722 3.691 0.29201 4 .7494 3 .442 3.411 0.29668 5.2215 3 .345 3.314 0.29829 5.4036 3 .312 3.281 0.29884 6 .4677 3 .282 3.251 0..29934 5 .5278 3 .298 3.267 0.29908 5 .496
r. 0.0316% HjSC>4, 100° C „ B / A - 5.087, A - 0.2284
0 13.72 0.0000 0 .0001 4.637 4 .617 0.15154 1.9722 2.663 2.643 0.18440 4.1913 1.765 1.745 0.19935 6 .8624 1.491 1.471 0.20391 8 .3266 1.353 1.333 0.20621 9 .2936 1.299 1.279 0.20711 9 .7287 1.256 1.236 0.20782 10.108 1.245 1.226 0.20801 10.20
r, 0.0211% H 1SO4, 100° C., B / A - 8.030, A - 0.15240 9 .151 0 .0000 0 .0001 3 .682 3 .668 0.09131 1.4952 2.117 2.104 0.11740 3 .3543 1.267 1.253 0.13153 6 .3024 1.053 1.039 0.13510 7 .8095 0 .797 0 .783 0.13936 10.696 0.731 0.717 0.14046 11.767 0.070 0 .656 0.14148 12.968 0.029 0 .615 0.14210 13.88
r, 0 .0179% H jS04, 100° C.. B / A - 9.619, A - 0.1292
0 7.756 0.0000 0 .0001 3 .390 3 .379 0.07291 1.2952 2 .028 2.017 0.09560 2 .8463 1.298 1.287 0.10776 5 .0264 0 .880 0 .875 0.11462 7 .861e 0.093 0 .682 0.11784 10.370 0 .612 0.601 0.11919 11.917 0 .540 0 .529 0.12039 13.668 0.506 0 .495 0.12095 14.66
C ata ly s tCorrection,
None
Free A ctualTime, Acidity, Acetic
Hr. % Acid, %
, 0.000% H jS04, 100° C., B / A •0 14.051 13.06 13.062 12.40 12.403 11.84 11.844 11.32 11.325 10.79 10.796 10.38 10.387 9.933 9 .9338 9 .591 9.591
Acetic Acid, M oles/100 G."Converted,
XRatio,
X / ( A - X)
. 4.965, A = 0.2332
0.00000.016360.027320.030020.045250.054050.060800.068330.07398
0.0000.075480.13270.18630 .24080.30170.35310.41440.4646
R u n L, 0.0322% HiSOi, 0° C., B / A - 4.972, A ~ 0.2329
/ 6 0 .0 5 X V49.04y X 0.0322 0 .0394%
/ 6 0 . 0 5 \ V 49 .Ö 4 / X 0 .0 322 0 .0394%
R u n N, 0.1
/ 6 0 . 0 5 \ ^ 94 ) X 0.0322 0 .0 2 06 %
0 .0206%
/ 6 0 .0 5 \ V 94 ) X 0.0322 0 .0206%
0.0206%
/ ' 6 0 .0 5 \ V 94 ) X 0 .01 4 7 0 .0094%
/ ' 6 0 .0 5 \ V »4 j X 0 .0418
0 .0267%
/ 60.05\ V 94 ) X 0.0 6 79 0 .0434%
0 13.99 0 .0000 0 .0002 13.02 13.58 0.00682 0.030174 13.53 13.49 0.00842 0.037496 13.41 13.37 0.01032 0.046368 13.35 13.31 0.01132 0.05109
, 0.0322% H2SO4, 30° C.. B / A - 4.972, A = 0.2329
0 13.99 0 .0000 0 .0001 13.35 13.31 0.01132 0.051092 13.03 12.99 0.01664 0.070944 12.40 12.42 0.02613 0 .12646 11.95 11.91 0.03462 0.17468 11.44 11.40 0.04311 0.2271
0.0322% H1SO4, 100° C „ B / A - 4.972, A - 0.2329
0 13.99 0 .0000 0 .0000 .5 7 .095 7 .674 0.10514 0.82291 5.151 5 .130 0.14750 1.7272 3 .035 3 .014 0.18272 3.6413 2.221 2 .200 0.19627 5.3584 1.777 1 .756 0.20307 6.9685 1.594 1.573 0.20671 7.8938 1.345 1 .324 0 .21086 9 .567
0.0322% H1SO4, 110° C „ B / A - 4.972, A = 0.2329
0 13.99 0.0000 0 .0000 .5 5 .943 5 .922 0.13431 1.3621 3 .502 3 .481 0.17495 3 .0191 .5 2 .422 2 .401 0.19293 4.8272 1.915 1.894 0.20137 6.3873 1.493 1.472 0 .20839 8.5024 1.319 1.298 0.21129 9.7779 1.188 1.167 0.21347 10.89
0.0322% H¡SO<, 115° C „ B / A » 4.972, A - 0.2329
0 13.99 0.0000 0 .0000 .3 3 0 .350 6 .335 0.12744 1.2060 .67 3 .927 3 .906 0.16787 2.5811 2.743 2 .722 0.18758 4 .1391 .5 1.952 1.931 0.20075 6 .2442 1.010 1.595 0 .20635 7 .7723 1.293 1.272 0.21172 9 .996
0.0322% H1SO4, 120° C., B / A - 4.972, A - 0.2329
0 13.99 0.0000 0 .0000 .33 5.637 5 .610 0.13940 1.4910 .6 7 3 .2 8 0 3 .259 0 .17864 3 .2921 2.201 2 .180 0.19601 5 .4181 .6 1 .623 1.602 0 .20623 7.7332 1 .378 1.357 0.21031 9 .3105 1.186 1 .165 0.21351 11.01
0.0147% H2SO4, 100° C., B / A - 4.960, A - 0.2355
0 . 14.02 0 .0000 0 .0000 .5 10.86 10.85 0.05279 0.29211 9 .532 9 .523 0.07489 0.47222 7 .308 7 .299 0.11194 0.92093 6 .003 5 .994 0.13367 1.3394 5 .060 6 .051 0 .14938 1 .7766 3 .891 3 .8 8 2 0 .16885 2 .6128 3 .567 3 .558 0 .17424 2 .940
0.0418% H1SO4, 100° C., B / A - 5.001, A - 0.2318
0 13.92 0.0000 0 .0 0 00 .5 6Í4Ó2 6 .376 0.12564 1 .1831 4 .045 4 .018 0.16489 2 .4642 2 .297 2 .270 0.19400 5 .1323 1 .614 1.587 0.20537 7 .7704 1 .464 1 .427 0.20804 8 .7560 1.264 1.237 0.21120 10.258 1.221 1.194 0.21192 10.66
0.0079% H2SO4, 100° C., B / A - 4.992, A -> 0.23210 13.94 0 .0000 0 .0 0 00 .5 4 .970 4 .927 0.15007 1 .8291 2 .724 2.681 0.18746 4 .1991 .6 1 .896 1.853 0.20125 6 .5242 1.452 1.409 0.20864 8^8933 1.239 1.196 0.21219 10.664 1.234 1.191 0.21227 10.700 1.212 1.169 0.21264 10 938 1.217 1.174 0.21255 10! 87
(<Continued on page 97S)
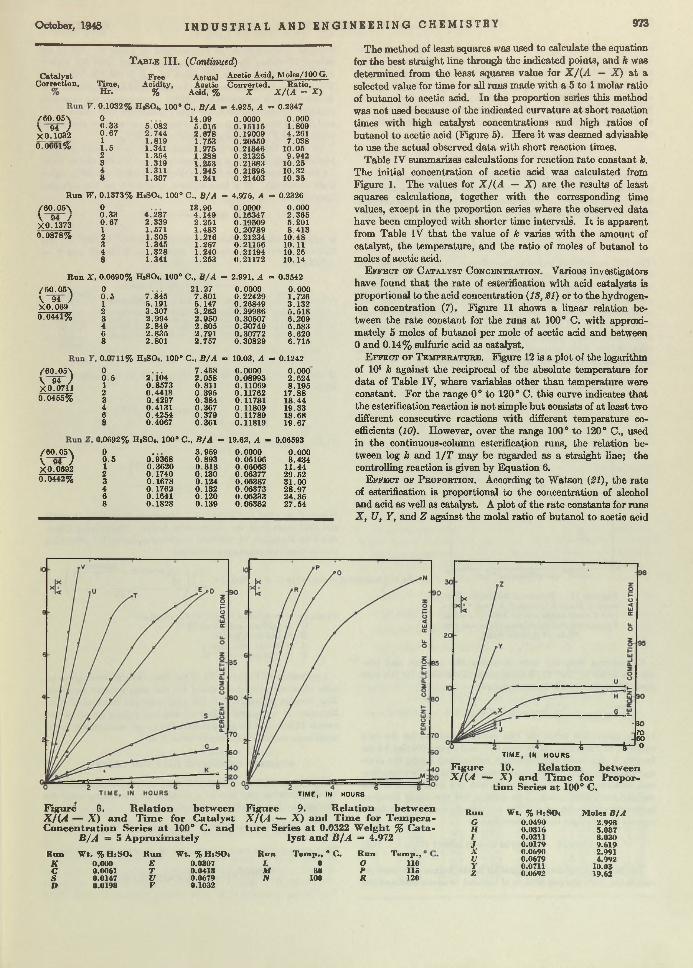
O ctober, 1345 I N D U S T R I A L A N D E N G I N E E R I N G C H E M I S T R Y 973
T a b l e I I I . (Continued)
CatalyBtCorrection,
/6CM>5\ V 94 ) X 0.1032 0 .0 6 6 1 ^
Time,Free
Acidity,AotualAoetic
Acetic Acid, M oles/100G . (Converted, Ratio,
H r. % Acid, % X X / U - X)
. 0.1032% HiSO», 100° C „ B / A ■- 4.925, A =• 0.2347
0 14.09 0.0000 0.0000 .33 5.082 5.010 0.15115 1.8090 .6 7 2.744 2.678 0.19009 4.2611 1.819 1.7S3 0.20550 7.0381 .5 1.341 1.975 0.21346 10.052 1.354 1.28.8 0.21325 9.9423 1.319 1.253 0.21383 10.254 1.811 1.245 0.21396 10.328 1.307 1.241 0.21403 10.35
R u n W, 0.1373% HjSC>4, 100° C., B / A - 4.975, A - 0.2326
/ 60 .05 \V 94 /X 0.1373 0 .0878%
0 13.96 0.0000 0.0000 .33 4 .237 4.149 0.16347 2.3650.67 2.339 2.251 0.19509 5.2011 1.571 1.483 0.20789 8.4132 1.305 1.216 0.21234 10.483 1.345 1.257 0.21166 10.114 1.328 1.240 0.21194 10.268 1.341 1.253 0.21172 10.14
R u n X, 0.0690% HiSO., 100° C., B / A - 2.991, A = 0.3542
/ 60 .05 \V M JX 0.0690.0441%
/ '6 0 .05’\ V 94 ) X0.0711 0.0455%
/ 6 0 .05 \ V 94 ) X 0.0692 0.0442%
0 21.27 0.0000 0.0000 .5 7 .845 7.801 0. 22429 1.7261 5.191 5.147 0.26849 3 .1322 3.307 3.263 0.39986 5.5183 2.994 2.950 0.30607 6.2094 2 .849 2.805 0.30749 6.6836 2.835 2.791 0,30772 6.6208 2.801 2.757 0.30829 6.715
oooCOW£imo©
° C., B / A ~■ 10.03, A = 0.1242
0 7 .458 0.0000 0 .0000 .5 2 .104 2 .058 0.08993 2 .6241 0.8573 0.811 0.11069 8 .1952 0.4413 0 .395 0.11762 17.883 0.4297 0.384 0.11781 18.444 0.4131 0 .367 0.11809 19.336 0.4254 0 .379 0.11789 18.688 0.4067 0 .361 0.11819 19.67
>.0692% H,SO<, 100° C., B / A - 19.62, A - 0.06593
0 ; . 3.969 0.0000 0.0000 .5 o!9368 0.893 0.06106 3.4341 0.3620 0 .318 0.06063 11.442 0.1740 0.130 0.06377 29.523 0.1678 0.124 0.06387 31 .004 0.1762 0.132 0.06373 28 .976 0.1641 0 .120 0.06333 24.368 0.1828 0.139 0.06362 27.54
The m ethod of least squares was used to calculate the equation for the best straight line through the indicated points, and k was determined from the least squares value for X / ( A — X ) a t a selected value for tim e for all runs made with a 5 to 1 molar ratio of butanol to acetic acid. In the proportion series this method was not used because of the indicated curvature a t short reaction times with high catalyst concentrations and high ratios of butanol to acetic acid (Figure 5). Here i t was deemed advisable to use the actual observed d a ta with short reaction times.
Table IV summarizes calculations for reaction ra te constant k. The initial concentration of acetic acid was calculated from Figure 1. The values for X /( A — X ) are the results of least squares calculations, together with the corresponding time values, except in the proportion series where the observed data have been employed with shorter time intervals. I t is apparent from Table IV th a t the value of k varies with the amount of catalyst, the tem perature, and the ratio of moles of butanol to moles of acetic acid.
E f f e c t o f C a t a l y s t C o n c e n t r a t i o n . Various investigators have found th a t the ra te of esterification with acid catalysts is proportional to the acid concentration (13,21) or to the hydrogen- ion concentration (7). Figure 11 shows a linear relation between the rate constant for the runs a t 100° C . with approximately 5 moles of butanol per mole of acetic acid and between0 and 0.14% sulfuric acid as catalyst.
E f f e c t o f T e m p e r a t u r e . Figure 12 is a plot of the logarithm of 10s k against the reciprocal of the absolute tem perature for data of Table IV, where variables other than tem perature were constant. For the range 0° to 120° C . th is curve indicates th a t the esterification reaction is not simple bu t consists of a t least two different consecutive reactions w ith different tem perature coefficients (10). However, over the range 100° to 120° C . , used in the continuous-column esterification runs, the relation between log k and 1 /T m ay be regarded as a straight line; the controlling reaction is given by Equation 6.
E f f e c t o f P r o p o r t i o n . According to W atson (21), the ra te of esterification is proportional to the concentration of alcohol and acid as well as catalyst. A plot of the ra te constants for runs X , U, Y, and Z against the molal ratio of butanol to aoetic acid
-80 - ro-50
t------------ H 0TIME, IN HOURS
F ig u re 10. R e la tio n be tw een X /( A — X ) a n d T im e fo r P ro p o r
tio n Series a t 100° C.
R u n W t. % H:SO< M oles B/AG ».0490 2.998H 0.0316 5.0871 0.0211 8.030J 0.0179 9.619X 0.0690 2.991u 0.0679 4.992Y 0.0711 10.03Z 0.0692 19.62
TIME, IN HOURS
F igure 8. R e la tio n be tw een F ig u re 9. R e la tio n be tw een X /( A — X ) a n d T im e fo r C a ta ly s t X j( A — X ) a n d T im e fo r T em p era - C o n c en tra tio n Series a t 100° C. a n d tu r e Series a t 0.0322 W eigh t % C a ta -
B /A — 5 A pprox im ate ly ly s t a n d B /A = 4.972
Run W t. % H iS O i R un W t. % HîSOa R un T em p., ° C . R u n T e m p . ,K 0.000 E 0.0307 L 0 O 110C 0.0061 T 0.0418 M 30 P 115S 0.0147 U 0.0679 N 100 R 120D 0.0198 V 0.1032

974 I N D U S T R I A L A N D E N G I N E E R I N G C H E M I S T R Y Vol. 37, No. 10
indicated a distinct linear relation; b u t the catalyst concentrations varied about 5% . However, from the catalyst series the ra te constant is directly proportional to the am ount of catalyst. Hence, by dividing the ra te constant by the weight per cent of catalyst and plotting th is quotient against the m olar ratio of reactants, the effects caused solely by the catalyst m ight be expected to be eliminated. Figure 13 shows a linear relation for all of the runs in the proportion series.
R A T E C O N STA N T EQ U ATION
From the relations indicated in Figures 11, 12, and 13, the following empirical equation was deduced to define the constant in term s of catalyst concentration, proportions of reactants, and tem perature for application in the continuous esterification runs:
k = ( a + bC c J
T he first parenthesis indicates the effect, a t 100° C., of catalyst concentration and proportion, with the second parenthesis taken as unity. The second parenthesis gives the tem perature effect, and is evaluated from the d a ta a t constant proportions and catalyst concentration. At 100° C., a should represent the rate of the uncatalyzed esterification—i.e., the rate constant due to acetic acid alone; hence, if the value for k obtained w ith no catalyst (run K) is assumed equal to a, the other four constants can be evaluated from the straight-line relations.
catalyst concentration, as summarized in Table V. All of the calculated values for k are in good agreement w ith the experim ental values, w ith the exception of run S (96.8% too high). The average deviation between the calculated and experimentally determined rate constants is 17.65%. Discounting the runs with catalyst concentrations below 0.015% sulfuric acid (runs if , C, and S) and those with 3 moles of butanol per mole of acetic acid (runs G and X ), the average deviation is 8.92%.
To tie in the results of the tem perature series w ith the pro- portion-catalyst term , i t is necessary to use the calculated value for the ra te constant for run N (calculated value is 6.03% higher than observed). If a least-squares trea tm en t on the straight- line relation
log 100 k T = e + f / T (9)
is applied, using the d a ta for the runs a t 100° to 120° C., the following results are obtained, using e = 9.140142 and / = -3320.0564:
- R a te C o n s ta n t -
RunTemp.,
° C. A ctual kk r from
E q . 9 DifferenceDeviation,
%
N 100 0.01745« 0.01744 -0.00001 - 0 . 0 6O 110 0.03004 0.02978 - 0 .0 0 0 2 6 - 0 . 8 6P 115 0.03775 0.03851 + 0 .0 0 0 7 6 + 2 .0 0S 120 0.04999 0.04947 - 0 .0 0 0 5 2 - 1 . 0 4
° From E q u a tio n S.* 0 .9 9
If the ra te of reaction a t 100° C. is taken as the basis for this series,
100 k T = 10
Then by proportion,
(<U 40142 - 3 3 2 0 0 5 6 4 )
k t _ 1 0
k ito
( 9.140142 -3320.0564>
(10)
(100) (0.01745)
kx = ( ° ,
Where T = 100° C. (373.1° K .), E quation 10 reduces to unity and thus represents the tem perature factor. M ultiplying Equa- tion 8 by E quation 10, the final empirical equation for predicting the reaction ra te constant is obtained:
3 3 2 0 .0 5 6 4 \\
Figure II . R elation betw een Reaction R ate C onstant k and Catalyst C oncentration a t 100° C., w ith Approxim ately 5 M oles B utanol per
M ole o f Acetic Acid
Considering first the term involving the catalyst and proportion series a t 100° C., least-squares calculations for the best straight line were made by the relation:
k — a . , B~ c r = h + c A
In the proportion series the two values calculated for the rate ■constant a t 1 and 2 hours for runs G, I, and J , and 0.5 and 1 hour for run X were used independently, rather than taking the average values in order to give more equal weight to the proportion and catalyst series. R un K with zero per cent catalyst was om itted from these calculations since it was previously involved in determining constant a. The relation obtained for the least- squares best straight line for these data is:
,000618 - 0.376724 C + 0.180917 CA 10
( 9 . 140142 -
1.745( ID
k = 0.000618 0.376724 C + 0.180917 c | (8)
To check the validity of Equation 8, the values of k were recalculated from the molar ratio of butanol to acetic acid and the
where fcr = predicted reaction ra te constant C = sulfuric acid, weight %B = butanol, moles A = acetic acid, moles T = tem perature, ° K.
Application of Equation 11 to the tem perature series gives results identical w ith those listed for the least-squares equation. The average deviation for the ra te constant calculated from E quation 11 compared w ith the observed values for all of the runs is 15.3%, and for those runs in the range encountered in the continuous esterification experiments, 7.46%.
SU M M A R Y O F K IN E T IC DATA AND T H E O R Y
Goldschmidt (8) and Smith (18) showed th a t the free hydrogen ion of a mineral acid acts as a catalyst by combining w ith the alcoholic hydroxyl to form a complex:
RCOOH + R.OHj-t- = RCOORi + H .O
They expressed the rate of formation of ester by the equation:
(R g 9 Q g l) _ ¿(R C O O H X R .O H ^)
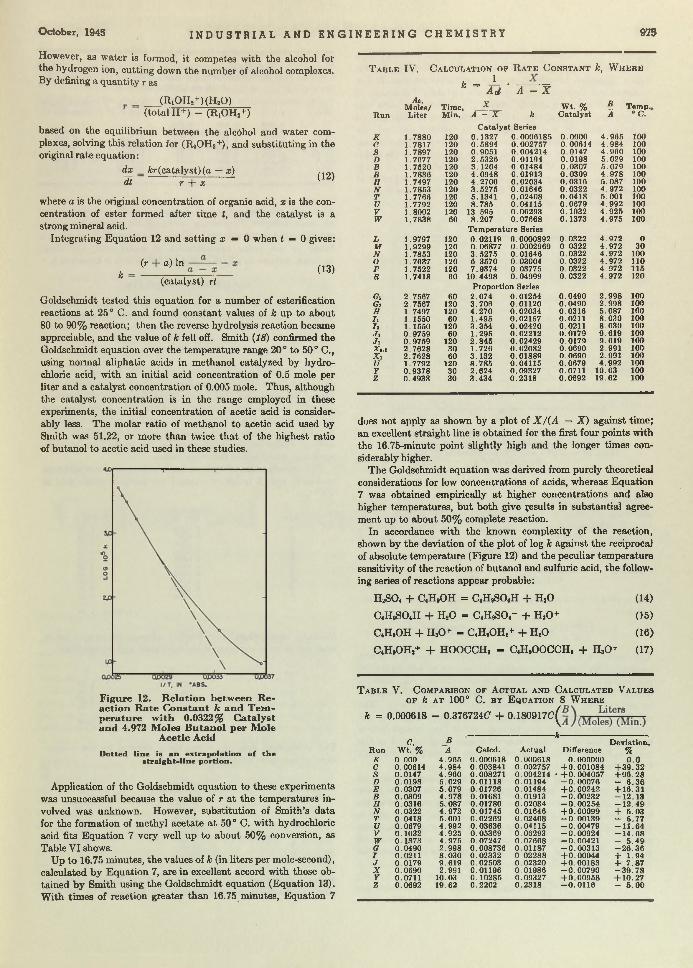
O ctober, 1945 I N D U S T R I A L A N D E N G I N E E R I N G C H E M I S T R Y 975
However, as w ater is formed, i t competes with the alcohol for the hydrogen ion, cutting down the number of alcohol complexes. By defining a quantity r as
(R iC W )(H ,0 )(total H+) - (R,OH2+)
based on the equilibrium between the alcdhol and water complexes, solving this relation for (R iOH2+), and substituting in the original rate equation:
dx _ fcr(catalyst)(q — x) dt r + x
(12)
where a is the original concentration of organic acid, x is the concentration of ester formed after time t, and the catalyst is a strong mineral acid.
Integrating Equation 12 and setting x = 0 when t = 0 gives:
(r + a) Ink
(catalyst) rt(13)
Goldschmidt tested this equation for a number of esterification reactions a t 25° C . and found constant values of k up to about 80 to 90% reaction; then the reverse hydrolysis reaction became appreciable, and the value of k fell off. Smith (18) confirmed the Goldschmidt equation over the tem perature range 20° to 50° C .,
using normal aliphatic acids in methanol catalyzed by hydrochloric acid, with an initial acid concentration of 0.5 mole per liter and a catalyst concentration of 0.005 mole. Thus, although the catalyst concentration is in the range employed in these experiments, the initial concentration of acetic acid is considerably less. The molar ratio of methanol to acetic acid used by Smith was 51.22, or more than twice th a t of the highest ratio of butanol to acetic acid used in these studies.
Figure 12. R elation betw een R eaction R ate C onstant k and T em perature w ith 0.0322% Catalyst and 4.972 M oles B utanol per M ole
Acetic Acid
D otted lin e is a n extrap olation o f th e s tra ig h t-lin e p ortion .
Application of the Goldschmidt equation to these experiments was unsuccessful because the value of r a t the tem peratures involved was unknown. However, substitution of Smith’s data for the formation of methyl acetate a t 50° C . with hydrochloric acid fits Equation 7 very well up to about 50% conversion, as Table VI shows.
Up to 16.75 minutes, the values of k (in liters per mole-second), calculated by Equation 7, are in excellent accord with those obtained by Smith using the Goldschmidt equation (Equation 13). W ith tim es of reaction greater than 16.75 minutes, Equation 7
T a b l e I V . C a l c u l a t i o n o p R a t e C o n s t a n t k, W h e r e
k _ J L .Aol A - X
R un
Ao,M oles/Liter
Time,M in.
XA - X k
W t. % C ata lyst
BA
Temp.° C .
K 1.7880 120C ata ly s t Series
0.1327 0.0006185 0.0000 4 .965 100C 1.7817 120 0.5894 0.002757 0.00614 4 .984 100S 1.7897 120 0.9051 0.004214 0.0147 4 .960 100D 1.7677 120 2.5326 0.01194 0.0198 5.029 100E 1.7520 120 3.1204 0.01484 0.0307 5.079 100B 1.7836 120 4.0948 0.01913 0.0309 4 .978 100H 1.7497 120 4.2700 0.02034 0.0316 5.087 100N 1.7853 120 3.5275 0.01646 0 .0322 4 .972 100T 1.7766 120 5.1341 0.02408 0 .0418 5.001 100U 1.7792 120 8.785 0.04115 0 .0679 4 .992 100V 1.8002 120 13.595 0.06293 0.1032 4 .925 100w 1.7838 60 8.207 0.07668 0.1373 4 .975 100
L 1.9797 120T em perature Series 0.02119 0.0000892 0.0322 4 .972 0
M 1.9299 120 0.06877 0.0002969 0.0322 4 .972 30N 1.7853 120 3.5275 0.01646 0.0322 4.972 100O 1.7637 120 6.3570 0.03004 0.0322 4 .972 110P 1.7522 120 7.9374 0.03775 0.0322 4.972 115R 1.7418 60 10.4498 0.04999 0.0322 4 .972 120
Gi 2.7567 60Proportion Series 2 .074 0.01254 0.0490 2 .998 100
Gi 2.7567 120 3.706 0.01120 0.0490 2 .998 100H 1.7497 120 4.270 0.02034 0.0316 5.087 100Ii 1.1550 60 1.495 0.02157 0.0211 8.030 100It 1.1550 120 3.354 0.02420 0.0211 8.030 100Jx 0.9759 60 1.295 0.02212 0.0179 9 .619 100J 2 0.9759 120 2.845 0.02429 0.0179 9.619 100Xo.t 2.7628 30 1.726 0.02082 0.0690 2.991 100X , 2 .7628 60 3.132 0.01889 0.0690 2.991 100U 1.7792 120 8.785 0.04115 0.0679 4.992 100Y 0.9378 30 2.624 0.09327 0.0711 10.03 100Z 0.4938 30 3 .434 0.2318 0.0692 19.62 100
does not apply as shown by a plot of X /( A — X ) against time; an excellent straight line is obtained for the first four points with the 16.75-minute point slightly high and the longer tim es considerably higher.
The Goldschmidt equation was derived from purely theoretical considerations for low concentrations of acids, whereas Equation 7 was obtained empirically a t higher concentrations and also higher tem peratures, bu t both give Results in substantial agreem ent up to about 50% complete reaction.
In accordance with the known complexity of the reaction, shown by the deviation of the plot of log k against the reciprocal of absolute tem perature (Figure 12) and the peculiar tem perature sensitivity of the reaction of butanol and sulfuric acid, the following series of reactions appear probable:
H 2S 0 4 + C,H,OH = C^HsSO^H + H20 (14)
C4H9S04H + H 20 = ^ H s S O r + H aO + (15)
C<H9OH + H 3O f = C<H 9OH2+ + H 20 (16)
C4H,OH,+ + HOOCCH, = C,H9OOCCH3 + HaO+ (17)
T a b l e V . C o m p a r i s o n o p A c t u a l a n d C a l c u l a t e d V a l u e s o f k a t 100° C . b y E q u a t i o n 8 W h e r e
* - 0.000618 - 0.376724C + 0.I80917C (
c, B-k------------------------
D eviation,R un w t . % A Calcd. Actual Difference %K 0.000 4.965 0.000618 0.000618 0.000000 0 .0C 0.00614 4.984 0.003841 0.002757 + 0 .00 1 08 4 + 3 9 .3 2s 0.0147 4 .960 0.008271 0.004214 * + 0 .0 04 0 57 + 9 6 .2 8D 0.0198 5.029 0.01118 0.01194 - 0 .0 0 0 7 6 - 6 .3 6E 0.0307 5.079 0.01726 0.01484 + 0 .0 0 2 4 2 + 16.31B 0.0309 4 .978 0.01681 0.01913 - 0 .0 0 2 3 2 - 1 2 .1 3H 0.0316 5- 087 0.01780 0.02034 - 0 .0 0 2 5 4 - 1 2 . 4 9N 0.0322 4.972 0.01745 0.01646 + 0 .0 0 0 9 9 + 6 .0 3T 0 .0418 5.001 0.02269 0.02408 - 0 .0 0 1 3 9 - 5 .77U 0.0679 4.992 0.03636 0.04115 -0 .0 0 4 7 9 - 1 1 .6 4V 0.1032 4.925 0.05369 0.06293 -0 .0 0 9 2 4 - 1 4 . 6 8W 0.1373 4.975 0.07247 0.07668 - 0 .0 0 4 2 1 - 5 .4 9Q 0.0490 2.998 0.008736 0.01187 -0 .0 0 3 1 3 - 2 6 .3 6I 0.0211 8.030 0.02332 0.02288 + 0 .0 00 4 4 + 1.94J 0.0179 9.619 0.02503 0.02320 + 0 .0 0 1 8 3 + 7 .87X 0.0690 2.991 0.01196 0.01986 - 0 .0 0 7 9 0 - 3 9 . 7 8Y 0.0711 10.03 0.10285 0.09327 + 0 .0 0 9 6 8 + 10.27Z 0.0692 19.62 0.2202 0.2318 - 0 .0 1 1 6 - 6 .0 0
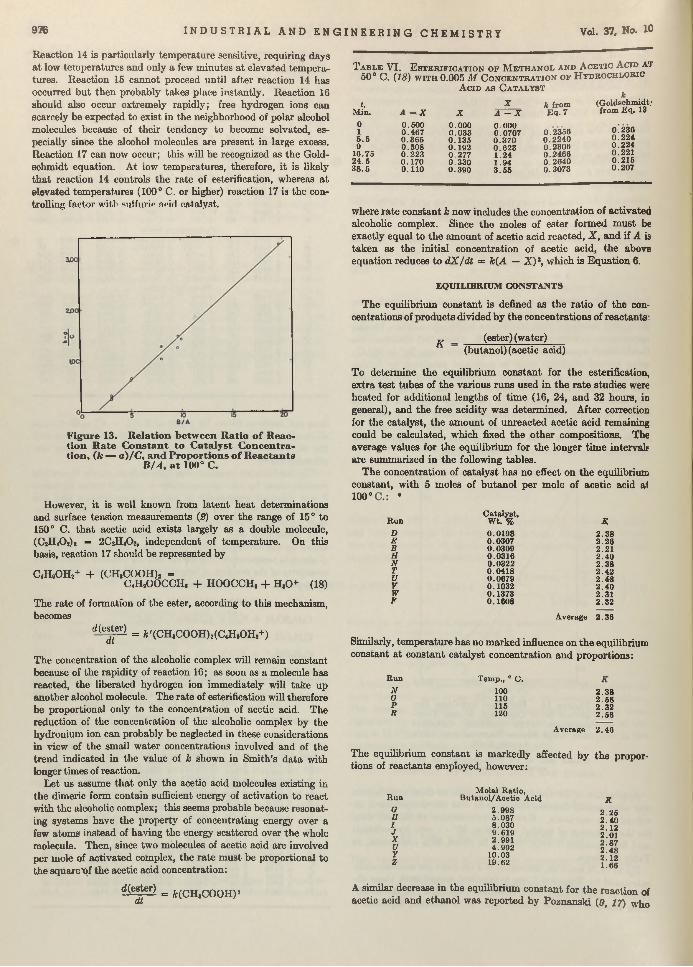
936 I N D U S T R I A L A N D E N G I N E E R I N G C H E M I S T R Y Vol. 37, No. 10
Reaction 14 is particularly tem perature sensitive, requiring days a t low tem peratures and only a few minutes a t elevated tem peratures. Reaction 15 cannot proceed until after reaction 14 has occurred bu t then probably takes place instantly. Reaction 16 should also occur extremely rapidly; free hydrogen ions can scarcely be expected to exist in the neighborhood of polar alcohol molecules because of their tendency to become solvated, especially since the alcohol molecules are present in large excess. Reaction 17 can now occur; this will be recognized as the Goldschm idt equation. At low tem peratures, therefore, it is likely th a t reaction 14 controls the ra te of esterification, whereas a t elevated tem peratures (100° C. or higher) reaction 17 is the controlling factor with sulfuric »''id catalyst.
T a b le VI. E s té r i f ic a t io n o f M e th a n o l an d A c e tic Acid a t 50° C. (18) w ith 0.005 M C o n c e n tra tio n o f H y d ro c h lo r ic
Acid a s C a ta ly s t
t,M in. A - X X
X A - X
0 0 .600 0 .000 0 .0001 0 .46 7 0 .033 0.07075 .6 0 .365 0 .135 0 .3709 0.308 0 .192 0 .6 23
16.75 0 .22 3 0 .2 77 1.2424 .5 0 .170 0 .330 1.943 8 .6 0 .110 0 .390 3 .5 5
k from E q .7
0 .23560 .22400.23060 .24660 .26400.3073
(Goldschmidt.' from E q . 13
0 .2 3 60 .2 2 40 .2240.2210 .2150 .207
where ra te constant k now includes the concentration of activated alcoholic complex. Since the moles of ester formed m ust be exactly equal to the am ount of acetic acid reacted, X , and if A is taken as the initial concentration of acetic acid, the above equation reduces to d X /d t = k(A — X ) 1, which is Equation 6.
E Q U IL IB R IU M C O N S T A N T S
T he equilibrium constant is defined as the ratio of the concentrations of products divided by the concentrations of reactants:
K(ester) (water)
(butanol) (acetic acid)
However, i t is well known from laten t heat determinations and surface tension measurements (2) over the range of 15° to 150° C. th a t acetic acid exists largely as a double molecule, (CVH^CMs = 2 0 ^ ,0 , , independent of tem perature. On this basis, reaction 17 should be represented by
C,H,OH2+ + (CH,COOH)i =CiHsOOCCH, + HOOCCH, + H ,0 + (18)
The rate of formation of the ester, according to this mechanism, becomes
d (ester)dt
= fc'(CH,COOH)2(C4H,OH2+)
The concentration of the alcoholic complex will remain constant because of the rapidity of reaction 16; as soon as a molecule has reacted, the liberated hydrogen ion immediately will take up another alcohol molecule. The ra te of esterification will therefore be proportional only to the concentration of acetic acid. The reduction of the concentration of the alcoholic complex by the hydronium ion can probably be neglected in these considerations in view of the small water concentrations involved and of the trend indicated in the value of k shown in Smith’s data with longer times of reaction.
Let us assume th a t only the acetic acid molecules existing in the dimeric form contain sufficient energy of activation to react with the alcoholic complex; this seems probable because resonating systems have the property of concentrating energy over a few atoms instead of having the energy scattered over the whole molecule. Then, since two molecules of acetic acid are involved per mole of activated complex, the ra te m ust be proportional to the square t>f the acetic acid concentration:
d(e* ^ -r) = fc(CHjCOOH)* dt
To determine the equilibrium constant for the esterification, extra test tubes of the various runs used in the ra te studies were heated for additional lengths of tim e (16, 24, and 32 hours, iD general), and the free acidity was determined. After correction for the catalyst, the am ount of unreacted acetic acid remaining could be calculated, which fixed the o ther compositions. The average values for the equilibrium for the longer tim e intervale are summarized in the following tables.
The concentration of catalyst has no effect on the equilibrium constant, with 5 moles of butanol per mole of acetic acid at 100° •
C ata lys t,Run W t. % KD 0.0198 2 .3 8E 0.0307 2 .2 6B 0.0309 2.21a 0.0316 2 .40N 0.0322 2 .38T 0.0418 2 .4 2U 0.0679 2 .4 8V 0.1032 2 .4 0w 0.1373 2.31F 0.1608 2 .32
Average 2 .36
Similarly, tem perature has no marked influence on the equilibrium constant a t constant catalyst concentration and proportions:
R un
NOPR
Temp., ° C.
100110115120
2 .3 82 .5 82 .3 22 .5 8
Average 2 .4 6
The equilibrium constant is markedly affected by the proportions of reactants employed, however:
RunM olal R atio,
B utanol/A cetic Acid
a 2 .998a 5 .087I 8 .030J 9 .619X 2.991V 4 .992Y 10.03Z 19.62
K2 .2 62 .4 02 .1 22.012 .8 72 .4 82.121.66
A similar decrease in the equilibrium constant for the reaction of acetic acid and ethanol was reported by Poznanski (9, 17) w h o
Figure 13. R elation betw een R atio o f Reaction R ate C onstant to C atalyst C oncentration, (k — a )/C , and Proportions o f R eactants
B/ A , a t 100° C.

O ctobef, 1945 I N D U S T R I A L A N D E N G I N E E R I N G C H E M I S T R Y 977
cites a variation in K from 1.0 to 6.8, depending upon the proportions of reactants used. The average value for the equilibrium constant for the esterification of butanol and acetic acid from the above sum m ary is about 2.35, which is considerably lower than the value of 4.24 reported by Menschutkin (3) for-the uncatalyzed reaction a t 155° C.
CONCLUSIO NS
The controlling reaction involved in the catalytic esterification of butanol and acetic acid a t elevated tem peratures (100° C. or higher) is of the second order kinetically and is proportional to the square of acetic acid concentration up to 75 to 85% completion. The ra te constant is a linear function of the catalyst concentration and the molar ratio of butanol to acetic acid. At temperatures in the range 100° to 120° C., the logarithm of the rate constant is proportional to the reciprocal of absolute temperature.
ACKNOW LEDGM ENT
Appreciation is expressed to the Vulcan Copper and Supply Company for financial assistance, to C. J . Leyes and Isabel Leyes for aid in the experiments, to C. L. Gabriel, of Publicker Commercial Alcohol Company, for supplying the butanol, and to D. G. Zink and associates of U. S. Industrial Chemicals, Inc., for help in the preparation of the manuscript. The authors are also indebted to Richard S. Egly for kind suggestions during the review of this paper.
LITERATURE CITED
/ l) Baekhaus, A. A., U. S. Patents 1,400,849-51 (1921); 1,403,224- 5, 1,425,624r-5 (1922); 1,454,462-3 (1923).
(2) Bennett, G. M., J . Chem. Soc., 107, 351 (1915).(3) Brunjes, A. S., and Furnas, C. C., I n d . E n q . Chem., 27, 396
(1935).(4) Carney, S. C. (to Shell Development Co.), U. S. P a ten t 2,081,-
322 (1937).(5) Evans, P. N ., and Albertson, J. M., J. A m . Chem. Soc., 39, 450
(1917).(0) Getm an, F . H ., and Daniels, F., “Outlines of Theoretical
Chemistry” , 5th ed., New York, John Wiley & Sons, 1931.(7) Goldschmidt, H., Chem.-Ztg., 36, 526 (1913) ; Z. phyaik. Chem.,
94, 233 (1920).(8) Goldschmidt, H ., et al„ Z. phyaik. Chem., 60, 728 (1907) ; 81, 30
(1912); 143,139,278(1929).(9) Groggins, P . H ., "U nit Processes in Organio Synthesis” , 2nd
ed., New York, McGraw-Hill Book Co., Inc., 1938.(10) Hinshelwood, C. N., "T he Kinetics of Chemical Change” ,
London, Oxford Press, 1940.(11) Hodgman, C. D., "H andbook of Chemistry and Physics” , 23rd
ed., Cleveland, Chemical Rubber Publishing Co., 1939.(12) International Critical Tables, Vol. 3, New York, MoGraw-HiU
Book Co., Inc., 1928.(13) Kailan, A., et al., Monatah., 61, 116 (1932); 68, 109 (1936).(14) Keyes, D . B., I n d . E n o . Chem., 24, 1096 (1932).(15) Leyes, C. E ., and Othmer, D . F ., Trana. A m . Inat. Chem.
Engra., 41, 157 (1945).(16) McKeon, T . J ., Pyle, C., and Van Ness, E . J . (to D u P ont Co.),
U. S. P aten t 2,208,769 (1940).(17) Poznanski, S., RoczniH Chem., 8, 377 (1928).(18) Smith, H. A., J . Am . Chem. Soc., 61, 254 (1939).(19) Suter, C. M., “ Organic Compounds of Sulfur” , New York, John
Wiley & Sons, 1944.(20) Suter, C. M „ and Oberg, E ., J. Am . Chem. Soc., 56, 677 (1934).(21) W atson, H. B., “ M odern Theories of Organio Chemistry” ,
London, 2nd ed., Oxford Press, 1937.
Presented as p a r t of the U nit Process Symposium before the Division of Industria l and Engineering C hem istry a t th e 108th M eeting of the A m e r i c a n C h e m i c a l S o c i e t y in N ew York, N. Y.
Viscosity of Carbonated Aluminate Solutions
JAMES M. HALL AND STANLEY J . GREENE a stern E xp e rim e n t S ta tio n ,
U. S . B u rea u o f M in es , College P ark, M d.
Viscosity data are presented for p lant so lution s th a t have been encountered in th e developm ent o f an alkaline process for th e production o f a lum ina. T he solutions represent aqueous m ixtures o f sod ium carbonate, sod ium alum inate , sod ium hydroxide, and m inor constituents. Viscosities were m easured a t 15°, 30°, 45°, 60°, 75°, 90° C. and a t 0-30% dissolved solids. T he com position o f th e dissolved solids was varied from about 43% carbon dioxide- 0% alum ina to 0% carbon dioxide-43% alum ina , w ith th e sodium oxide nearly constan t a t 57%. V iscosity increased as th e ratio o f sod ium oxide to carbon dioxide increased.
IN T H E course of an extended investigation of a lime-soda sintering process for alumina from low-grade bauxites and
clays, a need arose for viscosity d a ta on the p lant liquors. Such d a ta were desired for calculations of heat transfer, fluid flow, etc., for purposes of engineering design. The solutions involved were aqueous mixtures of sodium hydroxide, sodium aluminate, and sodium carbonate w ith small amounts of impurities. For simplicity, the solutions can be considered part of the four-component system NaiO-COj-AUOs-HjO. The range of compositions encountered in p lant operation falls approximately along the line shown in Figure 1, which neglects the component water.
Sodium oxide is nearly constant a t 56-58% ; carbon dioxide and alumina vary reciprocally from 0 to about 43%. This corresponds to sodium carbonate a t one extreme and a mixture of sodium aluminate and sodium hydroxide a t the other end. No viscosity data on the four-component system and relatively little data on related alkaline solutions were found in the literature. Values for solutions containing sodium hydroxide and sodium carbonate together were reported by Hitchcock and Mcllhenny(2). The measurements of viscosity in the present work were carried out with sufficient accuracy for design purposes. The data obtained should be useful for application to similar industrial processes.
An Ostwald-type viscometer was mounted in a water bath consisting of a 4-liter glass beaker, m otor stirrer, electric immersion heater, and calibrated thermometer. The temperature was controlled within ±0.1° C. Time was measured to 0.1 second with a precision electric stop clock. The test solutions were prepared from p lant liquors by concentrating to a point just preceding saturation a t 100° C. (compare the system N a0H -N a2C 0 a-H 20 , 1) and by diluting subsequently with water in the ratios I :1/», 1:1, and 1:3 by weight. Five-milliliter samples were pipetted into the viscometer. Each determination was repeated three or four times. Weighed samples of the solu-
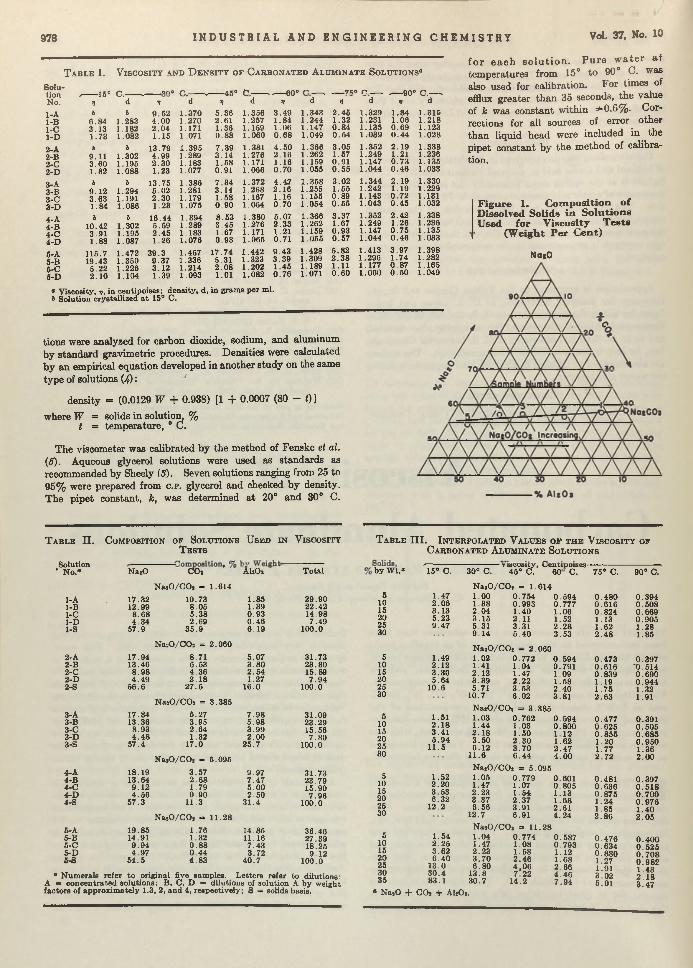
978 I N D U S T R I A L A N D E N G I N E E R I N G C H E M I S T R Y Vol. 37, No. 10
T a b l e I . V i s c o s i t y a n d D e n s i t y o f C a r b o n a t e d A l u m í n a t e S o l u t i o n s “
SolutionNo.
___1 CO p _______ OAO Q __ „_____450 C ____ , *---- 60°1 C ---- . ___t r o n ___ /---- 90c1 C .— . d
f------lOV
V_/.-------d V 'd V d V d V d V
1-A1-B1-C1-D
b6 .843 .131.73
b1.2831.1821.082
9 .5 24 .0 02 .0 41.15
1.3701.2701.1711.071
5 .36 2.611.36 0 .8 8
1.3561.2571.1591.060
3 .4 91.841.060 .6 8
1 .3431.2441.1471.049
2 .4 51.320 .8 40 .5 4
1.329 1.231 1.135 1.039
1 .841.060 .6 90 .4 4
1 .3 1 Í1.2181.1231.028
2-A2-B2-C2-D
b9.113 .6 01.82
b1.3021.1951.088
13.794 .992 .3 01.23
1.3951.2891.1831.077
7 .393 .141 .580.91
1.3811.2761.1711.066
4 .5 02 .1 61.160 .7 0
1.3661.2621.1591.055
3 .0 51.570.910 .5 5
1.3521.2491.1471.044
2 .1 91.210 .730 .46
1.3381.2361.1351.033
3-A3-B3-C3-D
b9.123.631.84
b1.2941.1911.086
13.755.022 .301.23
1.3861.2811.1791.075
7 .343.141.580 .90
1.3721.2681.1671.064
4 .4 72 .1 61.160 .70
1.3581.2561.1551.054
3 .021.550 .890 .55
1.3441.2421.1431.043
2 .191.19 0 .72 0 .45
1.3301.2291.1311.032
4-A4-B4-C4-D
b10.42
3.911.88
b1.3021.1951.087
16.445.592 .451.26
1.3941.2891.1831.076
8 .533 .451.670 .93
1.3801.2761.1711.065
5.072 .331.210.71
1.3661.2621.1591.055
3 .371.670 .930 .57
1.3521.2491.1471.044
2 .421.260 .750 .46
1.3381.2361.1351.033
5-A5-B5-C5-D
115.719.43
5 .222 .10
1.4721.3501.2261.104
39.39.373.121.39
1.4571.3361.2141.093
17.745.312 .0 81.01
1.4421.3231.2021.082
9 .433 .391.450 .76
1.4281.3091.1891.071
5.822 .3 81.110 .60
1.4131.2961.1771.060
3 .971.740 .870 .50
1.3981.2821.1651.049
° Viscosity, iî, in centipoises; density , d, in grams per ml. & Solution crystallized a t 15° C.
tions were analyzed for carbon dioxide, sodium, and aluminum by standard gravimetric procedures. Densities were calculated by an empirical equation developed in another study on the same type of solutions (4):
density = (0.0129 W + 0.938) [1 + 0.0007 (80 — i)]
where W = solids in solution, % t = tem perature, ° C.
The viscometer was calibrated by the m ethod of Fenske et al.(5). Aqueous glycerol solutions were used as standards as recommended by Sheely (3). Seven solutions ranging from 25 to 95% were prepared from c .p . glycerol and checked by density. The pipet constant, k, was determined a t 20° and 30° C.
f o r e a c h s o l u t i o n . P u r e w a t e r a t tem peratures from 15° to 90° C. was also used for calibration. For times of efflux greater than 35 seconds, the value of k was constant within =*=0.6%. Corrections for all sources of error other than liquid head were included in the pipet constant by the m ethod of calibration.
Figure 1. C om p osition o f Dissolved Solids in S o lu tio n s Used for V iscosity T ests
(W eight Per C ent)
NotO
T a b l e II .
Solution ' No.®
C o m p o s i t i o n o p S o l u t i o n s U s e d i n T e s t s
V i s c o s i t y
NaaO CO, ’ ÁUO.
NaaO/COa = 1.614
T o ta l
1-A 17.32 10.73 1.85 29.901-B 12.99 8.05 1.39 22.421-C 8.68 5.38 0 .93 14.981-D 4 .34 2.69 0 .46 7.491-S 57.9 35 .9
NaaO/COa = 2 .060
6 .19 100.0
2-A 17.94 8.71 5.07 31.732-B 13.46 6.53 3 .80 23.802-C 8 .98 4 .36 2.54 15.892-D 4.49 2 .1 8 1.27 7 .942-S 56.6 27 .5
NaaO/COa - 3.385
16.0 100.0
3-A 17.84 5.27 7 .98 31.093-B 13.36 3.95 5 .98 23.293-C 8.93 2.64 3 .99 15.563-D 4 .4 8 1.32 2 .00 7 .8 03-S 57.4 17.0
NaaO/COa = 5.095
25.7 100.0
4-A 18.19 3 .57 9.97 31.734-B 13.64 2 .6 8 7 .47 23.794-C 9 .12 1.79 5 .00 15.904-D 4.56 0 .9 0 2.50 7 .964-S 57.3 11.3
NaaO/COa = 11 .28
3 1 .4 100.0
5-A 19.85 1.76 14.85 36.465-B 14.91 1.32 11.16 27.395-C 9 .94 0 .88 7.43 18.255-D 4.97 0 .4 4 3.72 9 .125-S 5 4 .5 4 .8 3 4 0 .7 100.0
T a b l e III. I n t e r p o l a t e d V a l u e s o p t h e V i s c o s i t y o p C a r b o n a t e d A l u m i n a t e S o l u t i o n s
• N um erals refer to original five samples. Letters refer to dilutions: A »■ concen tra ted solutions; B, C, D — dilutions of solution A by weight factors of approxim ately 1.3, 2, an d 4, respectively; S = solids basis.
by W t.« 15° C. 30° C.- v iacosity, oenwpoises-
45° C. 60 C. 75° C. 90° C.
NaaO/COa ■=■ 1. 6145
1015202530
1.47 2 .06 3 .13 5.239 .47
1.001.382.043.155.319.14
0 .7540 .9931.40 2 .11 3.315 .40
0 .5940 .7771.061.52 2 .2 83 .53
0 .4 800 .6160 .8241.131 .622 .4 8
0 .3940 .5080.6690 .9051.281.85
NaaO/COa — 2. 0605
1015202530
1.492 .123 .305 .64
10.6
1.021.412.123.395.71
10.7
0 .7721.041.472 .223 .536 .02
0 .5940.7911.091 .582 .4 03.81
0 .4730 .6160 .8391.191 .752 .6 3
0.397'0 .5 140 .6900 .9441.321.91
NaaO/COa = 3. 3855
1015202530
1.512 .1 83.415 .94
11.5
1.031.442 .1 83.506.12
11.6
0 .7621.031.502 .3 03 .7 06 .4 4
0 .5940 .8001 .121.622 .4 74 .0 0
0 .4770 .6250 .8 551.201.772 .7 2
0.3910 .5050 .6850 .9501.362 ,0 0
NaaO/COa = 5. 0955
1015202530
1.52 2 .203.53 6 .32
12.2
1.051.472.233 .3 76.56
12.7
0 .7791.071.542 .373 .916.91
0.6010 .8051.131 .682 .614 .2 4
0.4810 .6360 .87 51 .241.852 .8 6
0 .3970 .5 1 80 .7 000 .9 761 .4 02 .0 5
NaaO/COa - 11 .285
101520253035
1.542 .2 53 .626 .4 0
13.0 30 .483.1
1.041.472 .2 33 .7 06 .8 0
13.83 0 .7
0 .774 1.08 1.58 2 .4 6 4 ,0 6 7 22
14.2
0 .5870 .7931.121 .682 .6 64 .4 67 .9 4
0 .4760 .6340 .8 801.271.913 .025.01
0 .4 0 00 .5 2 50 .7 0 80 .9 8 21.432 .1 83 .47
« NaaO + COä + AlsO,.
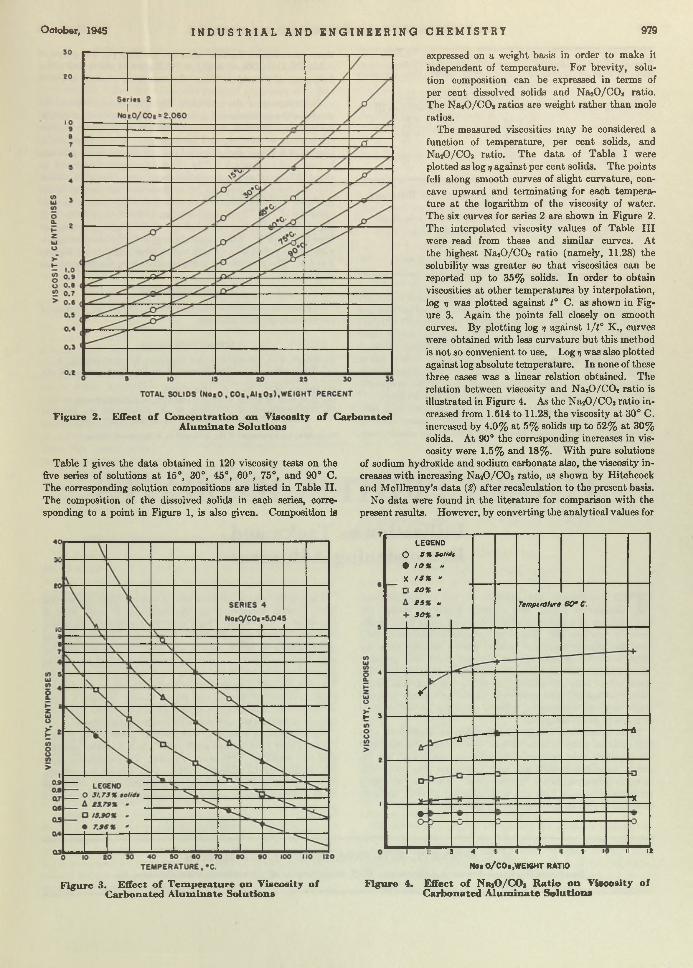
O ctober, 1945 I N D U S T R I A L A N D E N G I N E E R I N G C H E M I S T R Y 979
F ig u re 2. Effect o f C oncentration on V iscosity o f Carbonated A lum ínate So lu tion s
Table I gives the d a ta obtained in 120 viscosity tests on the five series of solutions a t 15°, 30°, 45°, 60°, 75°, and 90° C. The corresponding solution compositions are listed in Table II. The composition of the dissolved solids in each series, corresponding to a point in Figure 1, is also given. Composition is
expressed on a weight basis in order to make it independent of tem perature. For brevity, solution composition can be expressed in terms of per cent dissolved solids and Na^O/COi ratio. The NaiO/COs ratios are weight rather than mole ratios.
The measured viscosities m ay be considered a function of tem perature, per cent solids, and NajO/COj ratio. The d a ta of Table I were plotted as log i] against per cent solids. The points fell along smooth curves of slight curvature, concave upward and term inating for each tem perature a t the logarithm of the viscosity of water. The six curves for series 2 are shown in Figure 2. The interpolated viscosity values of Table III were read from these and similar curves. At the highest N a j0 /C 0 2 ratio (namely, 11.28) the solubility was greater so th a t viscosities can be reported up to 35% solids. In order to obtain viscosities a t other tem peratures by interpolation, log v was plotted against t° C. as shown in Figure 3. Again the points fell closely on smooth curves. By plotting log tj against 1/7° K., curves were obtained with less curvature but this method is not so convenient to use. Log ij was also plotted against log absolute tem perature. In none of these three cases was a linear relation obtained. The relation between viscosity and N a20 /C 0 2 ratio is illustrated in Figure 4. As the Na20 /C 0 2 ratio increased from 1.614 to 11.28, the viscosity a t 30° C. increased by 4.0% at 5% solids up to 52% a t 30% solids. At 90° the corresponding increases in viscosity were 1.5% and 18%. W ith pure solutions
of sodium hydroxide and sodium carbonate also, the viscosity increases with increasing Na20 /C 0 2 ratio, as shown by Hitchcock and M cllhenny’s data (2) after recalculation to the present basis.
No data were found in the literature for comparison with the present results. However, by converting the analytical values for
Í - 3
LEGEND
O 5% Solids
% 10% •>
X 15% -
C £09
25
30%
-
»
•
Tempt rature 60* t
s
■A-2f
-x
# -
3 4 1 i i IS
Figure 3. Effect of Temperature on Viscosity ofCarbonated Alumínate Solutions
Not O/COt,WEIGHT RATIO
Figure 4. Effect o f NajO/COj R atio o n V iscosity o f Carbonated A lum ínate So lu tions
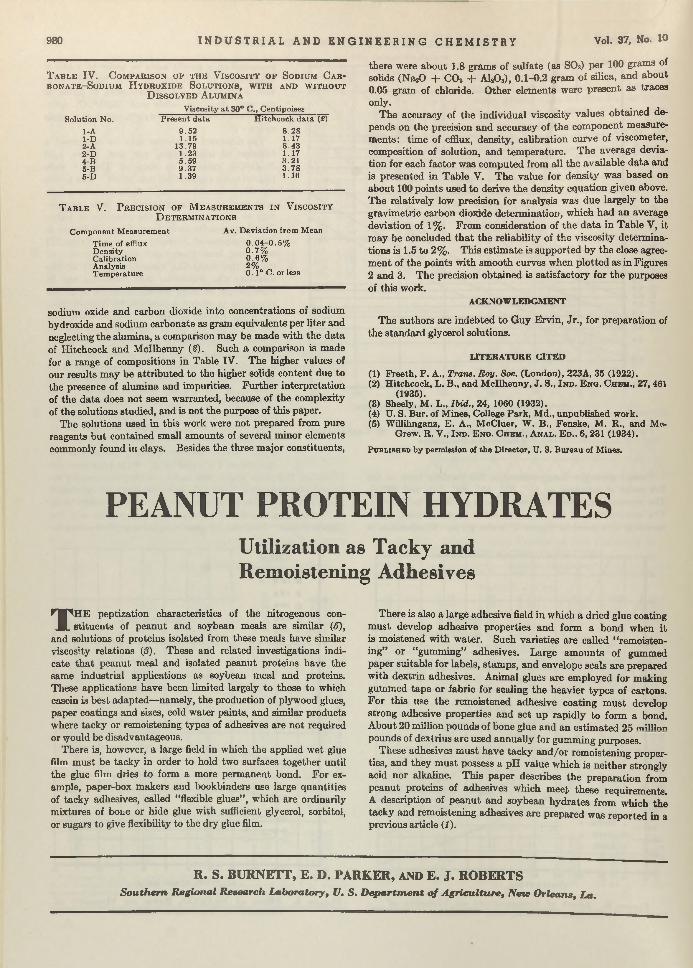
980 I N D U S T R I A L A N D E N G I N E E R I N G C H E M I S T R Y Vol. 37, No. 10
T a b l e IV. C o m p a r i s o n o p t h e V i s c o s i t y o f S o d i u m C a r - b o n a t e —S o d i u m H y d r o x i d e S o l u t i o n s , w i t h a n d w i t h o u t
D i s s o l v e d A l u m i n a
Viscosity a t 30° C .t CentipoiaesSolution No.
1-A1-D 2~A2-D4-B5-B 5-D
P resen t d a ta
9 .521.15
13.791.235 .599 .371.39
H itchcock d a t a (£)
8 .281.17 8 .431.17 3.21 3 .7 8 1.16
T a b l e V . P r e c i s i o n o f M e a s u r e m e n t s i n V i s c o s i t y D e t e r m i n a t i o n s
Com ponent M easurem ent
Tim e of effluxD ensityCalibrationAnalysisT em perature
Av. D evia tion from M ean
0 .0 4 - 0 .5 %0 .7 %0.6%2%0 .1 ° C . or less
sodium oxide and carbon dioxide into concentrations of sodium hydroxide and sodium carbonate as gram equivalents per liter and neglecting the alumina, a comparison m ay be made with the data of Hitchcock and M cllhenny (2). Such a comparison is made for a range of compositions in Table IV. The higher values of our results may be a ttributed to the higher solids content due to the presence of alumina and impurities. Further interpretation of the data does not seem warranted, because of the complexity of the solutions studied, and is not the purpose of this paper.
The solutions used in this work were not prepared from pure reagents bu t contained small amounts of several minor elements commonly found in clays. Besides the three m ajor constituents,
there were about 1.8 grams of sulfate (as SO3) per 100 grams of solids (NajO + CO» + A120 3), 0.1-0.2 gram of silica, and about 0.05 gram of chloride. O ther elements were present as traces only.
The accuracy of the individual viscosity values obtained depends on the precision and accuracy of the component measurem ents: tim e of efflux, density, calibration curve of viscometer, composition of solution, and tem perature. The average deviar tion for each factor was computed from all the available d a ta and is presented in Table V. The value for density was based on about 100 points used to derive th e density equation given above. The relatively low precision for analysis was due largely to the gravim etric carbon dioxide determ ination, which had an average deviation of 1%. From consideration of the d a ta in Table V, it may be concluded th a t the reliability of the viscosity determ inations is 1.5 to 2% . This estim ate is supported by the close agreem ent of the points with smooth curves when plotted as in Figures 2 and 3. The precision obtained is satisfactory for the purposes of this work.
A C K N O W L E D G M E N T
The authors are indebted to Guy Ervin, Jr., for preparation of the standard glycerol solutions.
L IT E R A T U R E C IT E D
(1) F reeth, F. A., Trans. Roy. Soc. (London), 223A, 35 (1922).(2) Hitchcock, L . B ., and M cllhenny, J. S., I n d . E n g . C h e m ., 27, 461
(1936).(3) Sheely, M . L„ Ibid., 24, 1060 (1932).(4) U. 8. Bur. of Mines, College Park, M d., unpublished work.(5) Willihnganz, E. A., M cCluer, W. B., Fenske. M. R., and Mc
G row , R . V ., I n d . E n o . C hem ., A n a l . E d ., 6, 231 (1934).
P u b l i s h e d b y permission of t h e D irector, U. S. B u reau of Mines.
PEANUT PROTEIN HYDRATESUtilization as Tacky and Remoistening Adhesives
TH E peptization characteristics of the nitrogenous constituents of peanut and soybean meals are similar (5),
and solutions of proteins isolated from these meals have similar viscosity relations (S). These and related investigations indicate th a t peanut meal and isolated peanut proteins have the same industrial applications as soybean meal and proteins. These applications have been limited largely to those to which casein is best adapted—namely, the production of plywood glues, paper coatings and sizes, cold water paints, and similar products where tacky or remoistening types of adhesives are no t required or vyould be disadvantageous.
There is, however, a large field in which the applied wet glue film m ust be tacky in order to hold two surfaces together until the glue film dries to form a more perm anent bond. For example, paper-box makers and bookbinders use large quantities of tacky adhesives, called “ flexible glues” , which are ordinarily mixtures of bone or hide glue with sufficient glycerol, sorbitol, or sugars to give flexibility to the dry glue film.
There is also a large adhesive field in which a dried glue coating m ust develop adhesive properties and form a bond when it is moistened w ith water. Such varieties are called “ remoistening” or “gumming” adhesives. Large am ounts of gummed paper suitable for labels, stam ps, and envelope seals are prepared with dextrin adhesives. Animal glues are employed for making gummed tape or fabric for sealing the heavier types of cartons. For this use the remoistened adhesive coating m ust develop strong adhesive properties and set up rapidly to form a bond. About 20 million pounds of bone glue and an estim ated 25 million pounds of dextrins are used annually for gumming purposes.
These adhesives m ust have tacky an d /o r remoistening properties, and they m ust possess a pH value which is neither strongly acid nor alkaline. This paper describes the preparation from peanut proteins of adhesives which m eet these requirements. A description of peanut and soybean hydrates from which the tacky and remoistening adhesives are prepared was reported in a previous article (1).
R. S. BURNETT, E. D. PARKER, AND E. J . ROBERTSS o u th e r n R eg io n a l R esearch L a bora tory , V . S . D e p a r tm e n t o f A g r ic u ltu re , N ew O rleans, La .
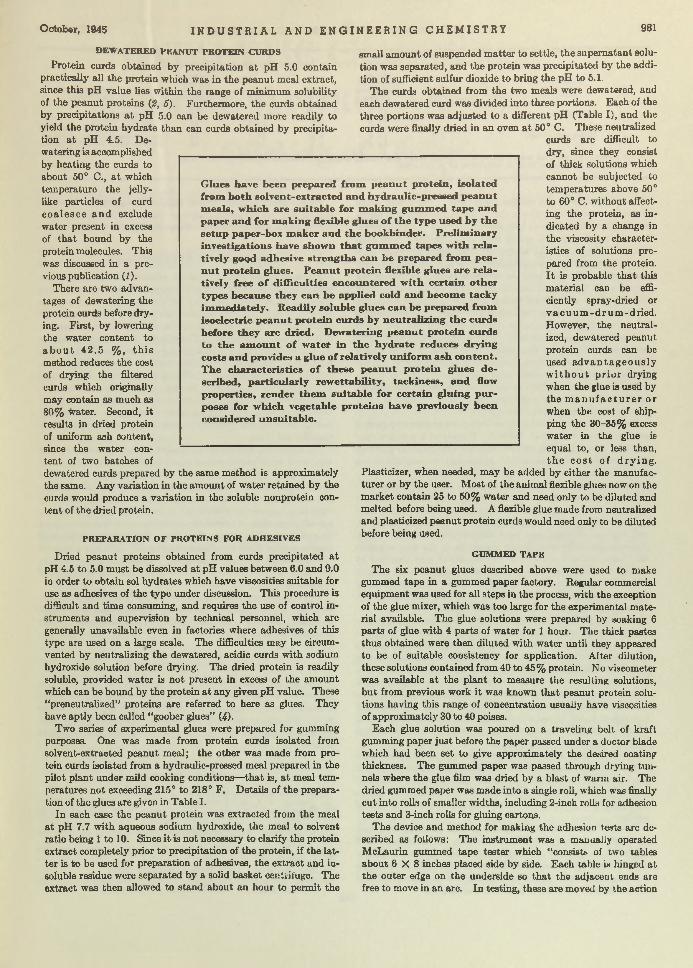
O ctober, 1046 I N D U S T R I A L A N D E N G I N E E R I N G C H E M I S T R Y 981
D E W A T E R E D PEA N U T P R O T E IN C U R D S
Protein curds obtained by precipitation a t pH 5.0 contain practically all the protein which was in the peanut meal extract, since this pH value lies within the range of minimum solubility of the peanut proteins (#, 6). Furthermore, the curds obtained by precipitations a t pH 5.0 can be dewatered more readily to yield the protein hydrate than can curds obtained by precipitation a t pH 4.5. Dewatering is accomplished by heating the curds to about 50° C., a t which temperature the jelly- like particles of curd c o a l e sc e a n d exclude water present in excess of th a t bound by the protein molecules. This was discussed in a previous publication (1).
There are two advantages of dewatering the protein curds before drying. First, by lowering the water content to a b o u t 42 .5 % , t h i s method reduces the cost of drying the filtered curds which originally may contain as much as 80% water. Second, i t results in dried protein of uniform aah content, since the w ater content of two batches of dewatered curds prepared by the same method is approximately the same. Any variation in the am ount of w ater retained by the curds would produce a variation in the soluble nonprotein conten t of the dried protein.
P R EP A R A TIO N O F P R O T E IN S F O R A D H E S IV E S
Dried peanut proteins obtained from curds precipitated a t pH 4.6 to 5.0 m ust be dissolved a t pH values between 6.0 and 9.0 in order to obtain sol hydrates which have viscosities suitable for use as adhesives of the type under discussion. This procedure is difficult and time consuming, and requires the use of control instruments and supervision by technical personnel, which are generally unavailable even in factories where adhesives of this type are used on a large scale. The difficulties m ay be circumvented by neutralizing the dewatered, acidic curds w ith sodium hydroxide solution before drying. The dried protein is readily soluble, provided w ater is no t present in excess of the amount which can be bound by the protein a t any given pH value. These “preneutralized” proteins are referred to here as glues. They have aptly been called “goober glues” (4).
Two series of experimental glues were prepared for gumming purposes. One was made from protein curds isolated from solvent-extracted peanut meal; the other was made from protein curds isolated from a hydraulic-pressed meal prepared in the pilot plant under mild cooking conditions—th a t is, a t meal temperatures no t exceeding 215° to 218° F . Details of the preparation of the glues are givon in Table I.
In each case the peanut protein was extracted from the meal a t pH 7.7 w ith aqueous sodium hydroxide, the meal to solvent ratio being 1 to 10. Since it is not necessary to clarify the protein extract completely prior to precipitation of the protein, if the latter is to be used for preparation of adhesives, the extract and insoluble residue were separated by a solid basket centrifuge. The extract was then allowed to stand about an hour to permit the
«mull am ount of suspended m atte r to settle, the supernatant solution was separated, and the protein was precipitated by the addition of sufficient sulfur dioxide to bring the pH to 5.1.
The curds obtained from the two meals were dewatered, and each dewatered curd was divided into three portions. Each of the three portions was adjusted to a different pH (Table I), and the curds were finally dried in an oven a t 50° C. These neutralized
curds are difficult to dry, since they consist of thick solutions which cannot be subjected to tem peratures above 50° to 60° C. w ithout affecting the protein, as indicated by a change in the viscosity characteristics of solutions prepared from the protein. I t is probable th a t this m aterial can be efficiently spray-dried or v a c u u m - d r u m - d r i e d . However, the neutralized, dewatered peanut protein curds can be used a d v a n t a g e o u s l y w i t h o u t p r i o r drying when the flue is used by the m a n u f a c t u r e r o r when the cost of shipping the 30-35% excess water in the glue is equal to, or less than, th e c o s t of d r y i n g .
Plasticizer, when needed, m ay be added by either the manufactu rer or by the user. M ost of the animal flexible glues now on the m arket contain 25 to 50% water and need only to be diluted and melted before being used. A flexible glue made from neutralized and plasticized peanut protein curds would need only to be diluted before being used.
G U M M E D TA P E
The six peanut glues described above were used to make gummed tape in a gummed paper factory. Regular commercial equipment was used for all steps in the process, with the exception of the glue mixer, which was too large for the experimental m aterial available. The glue solutions were prepared by soaking 6 parts of glue with 4 parts of water for 1 hour. The thick pastes thus obtained were then diluted w ith w ater until they appeared to be of suitable consistency for application. After dilution, these solutions contained from 40 to 45 % protein. N o viscometer was available a t the p lant to measure the resulting solutions, b u t from previous work it was known th a t peanut protein solutions having this range of concentration usually have viscosities of approximately 30 to 40 poises.
Each glue solution was poured on a traveling belt of kraft gumming paper ju st before the paper passed under a doctor blade which had been set to give approximately the desired coating thickness. The gummed paper was passed through drying tunnels where the glue film was dried by a blast of warm air. The dried gummed paper was made into a single roll, which was finally cut into rolls of smaller widths, including 2-inch rolls for adhesion tests and 3-inch rolls for gluing cartons.
The device and method for making the adhesion tests are described as follows: The instrum ent was a manually operated McLaurin gummed tape teeter which “ consist* of two tables about 6 X 8 inches placed side by side. Each table in hinged a t the ou ter edge on the underside so th a t the adjacent ends are free to move in an arc. In testing, these are moved by the action
G lues have been prepared from peanu t protein , iso lated from both solvent-extracted and hydraulic-pressed peanut m eals, w h ich are su itab le for m aking gum m ed tape and paper and for m aking flexible glues o f th e type used by th e setup paper-box m aker and th e bookbinder. Prelim inary investigation s have show n th a t gum m ed tapes w ith relatively goqd adhesive strengths can be prepared from pean u t protein g lues. P eanut protein flexible glues are relatively free o f d ifficu lties encountered w ith certain other types because they can be applied cold and becom e tacky im m ed iately . Readily solub le g lues can be prepared from isoelectric peanu t protein curds by neutraliz ing th e curds before th ey are dried. D ew atering peanut protein curds to th e am o u n t o f w a te i in th e hydrate reduces drying costs and provides a g lue o f relatively un iform ash co n ten t. T he characteristics o f th ese peanu t protein g lues d e scribed, particularly rew ettab ility , tack iness, and flow properties, render th em su itab le for certain g lu ing purposes for w h ich vegetable proteins have previously been considered un su itab le .

982 I N D U S T R I A L A N D E N G I N E E R I N G C H E M I S T R Y Vol. 37, No. 10
T a b l e I . P r e p a k a t i o n a n d T e s t s o f P e a n u t P b o t e i n G l u e s “ a n d G u m m e d T a p e
p H of A verageM eal Used D ew atered M cLaurinas Source p H of pH of C urd before p H of Coating Adhesiveof P ro tein Extn . P p tn . D rying D ried Glue Wt.& Streng th
/ 7 . 3 7 .1 9 .1 75Solvent-extd. 7 .7 5 .1 ( 3 . 6 8 .2 10.0 36
7 9 .6 8 .8 12.2 11\ 7 . 3 7 .3 11.6 66
Hydraulic-pressed 7 .7 5.1 1 8 .4 8 .0 10.7 72\ 9 . 5 9 .3 1 0 .0 60
GlueHo.1 )
3)4)
' For comparison, gumm ed tape prepared with anim al glue h ad a coating w eight of 7.0 an d an adhesive s tren g th of 92. 1 “ Folio b ase” , pounds per ream of 500 sheets, 17 X 22 inches.
P rac tica l T est by T aping No. 102 C artons
B e tte r th a n 2 or 3 Trifle slow se tting Trifle slow se tting L ittle slower se tt ing th a n 5 & 6 B e t te r ta ck th a n an y of others S am e as 5 except s ligh t tendency
of ta p e to le t go a t edges
of a cam on the end of a weighted level arm. The action of the tables is intended to duplicate the action of the flaps of a corrugated case after they have been closed and then the pressure removed, allowing them to spring back to the partially open position. In addition to the above, the machine is equipped with suitable trip levers, graduated scale, brackets to hold the test specimen, and frame to hold the entire assembly. In m aking the tests a sheet of the test paper about 6 X 10 inches is placed across the top of the two tables, and the holding clamps are tightened down securing the ends of the sheet. The test sheet is then slit through the center or directly over the position where the two tables come together. A piece of gummed tape to be tested is moistened and then placed on this test sheet, and after the proper interval of tim e the machine is tripped and the adhesive strength taken directly from the scale reading” (6).
F urther details are given in the paper from which the preceding is quoted and in the recently issued T A PPI Tentative Standard for testing gummed paper tape (7).
Results of the tests conducted on the tapes gummed with peanut protein glues are given in Table I. Results of a practical test made by actually gluing cartons w ith the experimental gummed tapes are also given in this table. In general, results of the carton gluing tests agree w ith those of the McLaurin tests.
Results obtained w ith peanut protein glue approach closely those obtained with animal glue, bu t it would be unsafe to conclude th a t any one of the peanut glues was superior to another, as a large number of factors in this preliminary test were not controlled, and any one of them m ay have adversely affected the results. For example, differences in the viscosities of the glue solutions m ay have caused variations in the amount of glue absorbed by the paper, which would, in turn, cause variations in the am ount of available glue on the surface of the tape. The results may have been affected also by variations in the glue coating applied; too much glue may be as detrim ental as too little.
Although all the advantages and disadvantages of peanut protein glues as compared w ith other gumming adhesives have not yet been investigated, the following advantages of peanut protein glues are apparent: uniformity of product; superiority of color, «specially when produced from special varieties of peanuts (£), hence preferable for gumming white paper; less hygroscopicity than is foúnd in animal glues or dextrins and, consequently, less tendency of the gummed paper to stick in the roll or stack when i t is stored in hot humid atmospheres; highly sanitary product, which is especially im portant where the glue is remoistened with saliva.
A disadvantage of the peanut protein glues tested so far is the tendency for the tape prepared with these glues to blister after it has been on the carton for some time. This tendency is also exhibited by tapes gummed with dextrins and is disadvantageous primarily from the point of view of appearance rather than of utility.
I t is evident, then, th a t a peanut protein gummed tape with good adhes ve strength can be made from the proteins of both sol vent-extracted and hydraulic-pressed peanut meals. A system atic investigation of all the factors involved will probably resu lt in an increase in the adhesive strength of the tapes until they are comparable w ith those made with animal glue.
P eanut glues in their present sta te of development, however, are suitable for gumming purposes where dextrins are now employed and for m any purposes where anim al glue is used.
F L E X IB L E O R N O N W A R P G L U E S
Solutions of the glues used in the gummed tape tests were employed in experimental gluing of the paper wraps on setup paper boxes. Candy boxes were used for the tests, and the glue solutions were applied to the paper wraps by m eans of a small table gummer, ordinarily employed by the bookbinder and paper-box maker in hand operations. These boxes showed a tendency to warp when stored in a relatively dry atm osphere (32% relative hum idity). However, when 50% sorbitol (dry glue basis) was added to the glue solution, the boxes did no t warp when stored under the same conditions. The warping tendency of the boxes prepared with unplasticized peanut glues was much less than that of boxes prepared w ith unplasticized anim al glue. Accordingly, peanut nonwarp glues m ay be expected to require less plasticizer than animal glues.
An im portant advantage of flexible peanut protein glues, as compared w ith flexible anim al glues, lies in the fact th a t peanut protein glues can be applied cold, are tacky as soon as they are applied, and remain tacky long enough to complete a given gluing job. Animal flexible glues m ust be applied ho t and are not tacky until they have cooled sufficiently to s ta rt gelling. Furthermore, animal glues allowed to cool too m uch lose their tackiness, owing to complete gelling of the glue film. F or th is reason users of flexible animal glues experience considerable difficulty whenever changes occur in the atm ospheric tem perature or relative hum idity of sufficient m agnitude to affect the ra te of cooling of the glue film.
Although no extensive investigation has been m ade w ith soybean protein, protein hydrates having properties and uses similar to those of peanut protein can probably be produced from solvent- extracted soybean meal.
A C K N O W L E D G M E N T
T he authors wish to express their appreciation to Irving McHenry and Frank H um phner of the M id-States Gummed Paper Company for their interest and cooperation in th is work, and to K. H . Williams of the same company for his assistance in making and testing gummed tapes prepared w ith the peanut protein glues.
L IT E R A T U R E C IT E D
(1) B urnett, R . S., I n d . E n g . C h e m ., 37, 861 (1945).(2) B urnett, R. S., and Fontaine, T . D ., Ibid., 36, 284-8 (1944).(3) B urnett, R. S., Roberts, E . J ., and P arker, E . D ., Ibid., 37, 276-81
(1945).(4) Chapman, P . W ., Atlanta Journal, M ag. Sect., p. 14, June 25
1944.(5) Fontaine, T . D ., and B urnett, R . S., I n d . E n g . C h e m . 36 164-7
(1944).(6) H arnden, G. H „ A.S.T.M . Bull., 98, 23-7 (1939).(7) Tech. Assoc. Pulp Paper Ind ., T en tative S tandard T463 m-43,
Paper Trade J ., T A PP I Section 116, 267 (1943).
CATALYTIC CRACKING OF
PURE HYDROCARBONS
Cracking
B. S. GREENSFELDER AND H. H. YOGE
C rack ing over a s ilic a -z irc o n ia -a lu m in a c a ta ly s t a t 350— 500° C. o f seven a lip h a tic o lefins, tw o d io lefins, tw o cyclic olefins, a n d two a ro m a tic olefins w as s tu d ie d . T h e p r in c ipa l conversions o f a lip h a tic m ono -o le fin s w ere iso m eriz a tio n , c rack in g , s a tu ra t io n , a n d fo rm a tio n o f h ig h e r- bo iling m a te r ia ls a n d coke. D iolefins a n d a ro m a tic
CRACKING of paraffins over a silica-zireonia-alumina catalyst under conditions similar to those employed in the
commercial cracking of petroleum fractions was described in the first article of this series (6). The behavior of olefins was also studied because olefins are im portant primary products of the cracking of saturated hydrocarbons, and because olefin-containing fractions from either therm al or catalytic cracking are sometimes reprocessed over a cracking catalyst.
The first tests with olefins over a cracking catalyst showed them to be very reactive, in accord with the findings of Egloff and co-workers (4). Because of this high reactivity, the relatively low tem perature of 400° C. was employed for most of the experiments with olefins, ra ther than 500 ° C. which was used for cracking paraffins. The apparatus, catalyst, procedure, and terminology were the same as described previously (<?). The catalyst, obtained from Universal Oil Products Company, analyzed 86.2% silica, 9.4% zirconia, and 4.3% alumina by weight. As stated before (6), it has been found to give essentially the same results as the synthetic silica-alumina catalysts used in present commercial practice.
Properties and sources of hydrocarbons follow, with compounds arranged in the order of increasing molecular weight. Bromine numbers are grams bromine per 100 grams hydrocarbon by the Rosenmund method. Ethylene (Ohio Chemical Company) was over 99% by gas analysis. Butadiene (Shell Development Company’s pilot plant) contained 98.3% conjugated dienes. rc-Butenes were made by dehydration of sec-butyl alcohol; they analyzed 8 .0 % 1 -butene, 92.0% 2-butenes, and 0.0% above C<. Isoprene was a crude m aterial containing 70% conjugated diolefins and 26% other olefins. m-Pentenes were from the dehydration of seo-amyl alcohol over alumina; the boiling range was 30-37° C., d20 0.6519, n2£ 1.3792, bromine number 233. Cyclopentene was derived from cyclopentyl chloride, obtained by chlorination of a petroleum Cs fraction. I t had a boiling point of 44.4° C., u? 0 0.7701, n 2£ 1.4217, and bromine number 237. Cy- clohexene (Dow Chemical Company) had a boiling range of 83.1- 84.2° C., cm0 0.8107, n2S 1.4467, and bromine number 195. Styrene (Dow Chemical Company) had a boiling point of 145.5 ° C., d? 0 0.9055, n2° 1.5455, and bromine number 150.5. Diisobutenes were from “cold acid” polymerization (Shell Chemical Company). The A.S.T.M. 5 and 95% distillation tem peratures were 101.4 °and 104.3° C., <m° 0.7204, n 2S 1.4105, and bromine number 123. n-Octenes (Eastm an K odak Company) were fractionally redistilled. The boiling range was 123.4-126° C., d ? 0 0.7205, n22 1.4135, and bromine number 144. Indene (Kahlbaum) was freshly
of Olefins
S h e ll D eve lo p m en t C o m p a n y , E m eryv ille , C alif.
olefins w ere ex tensively s a tu ra te d a n d tra n s fo rm e d to h ig h e r-b o ilin g m a te r ia ls a n d coke. C a ta ly tic a n d th e rm a l c rack in g o f olefins a t 400-500° C. a re co m p ared . T h e c a ta lyzed re ac tio n s , w h ich a re o f th e o rd e r o f 1,000 to 10,000 tim e s as fa s t , y ield la rg e r f ra g m e n ts , involve m u c h m ore iso m eriz a tio n , a n d lead to g re a te r s a tu ra t io n o f p ro d u c t.
distilled; it boiled a t about 177-182° C., d f 0.9952, n2D° 1.5748, and bromine number 135. Triisobutenes were from “cold acid” polymerization (Shell Chemical Company); they had a Cottrell boiling point of 183° C., df0 0.768, n 2£ 1.4325, and bromine number about 8 6 . Cetene (Bataafsche Petroleum Maatschappij laboratories, Delft) had a boiling point of about 280° C., melting point of 4.05° C., dj° 0.7813, n 2£ 1.4409, and bromine num ber 69.3.
C R A C K IN G BEH A VIO R
Aliphatic olefins with carbon numbers from 2 to 16 were examined, as well as several diolefins and cyclic olefins. The term “carbon nuipber” is employed to designate the number of carbon atoms per molecule. A tem perature of 400° C. was normally used for aliphatics and of 500° C. for others. Discussion of results with the diolefins and cyclics follows th a t for the aliphatic olefins. The basic data for aliphatic mono-olefins are given in Tables I and II , and those for the remaining compounds in Table III .
E t h y l e n e . Ethylene did not react extensively a t 400° C.; there was about 6 % saturation and 3% polymerization to C4. No liquid product was obtained. The carbon deposit was high, 9.6% by weight of the feed. Thus the chief reactions were decomposition to carbon, saturation, and polymerization.
71-Bu t e n e s . Experiments with mixed n-butenes agreed in a general way with those reported by Egloff and co-workers (4 ). The reactions over the catalyst involve cracking, isomerization, saturation, and formation of higher-boiling materials. The run at 500° C. is of interest in showing extensive conversion to isobutane. Isomerization and saturation were less marked at 400 ° C. and the longer process period.
?i - P e n t e n e s . D ata for the cracking of n-pentenes show extensive reaction. Olefin contents of the 20-30° C. and 35-38° C. fractions were 42 and 91%, respectively; since these fractions were 18 and 25 volume % of the to ta l liquid, there was substantial production of isopentane and much less of n-pentane. This provides another example of preferential saturation of iso-olefins(6). The higher-boiling liquid product above 90° C. was 20% of the to ta l liquid and had n2S of 1.4733, which indicates the presence of aromatics. In general, reactions of pentenes resemble those of butenes.
n-O cTE N ES. Products from n-octenes were about equally divided among gas, lower-boiling liquid, and higher-boiling m aterial. Decomposition was extensive, since only 28% of C« m aterial was recovered. The main gas products were propylene, bu-
983
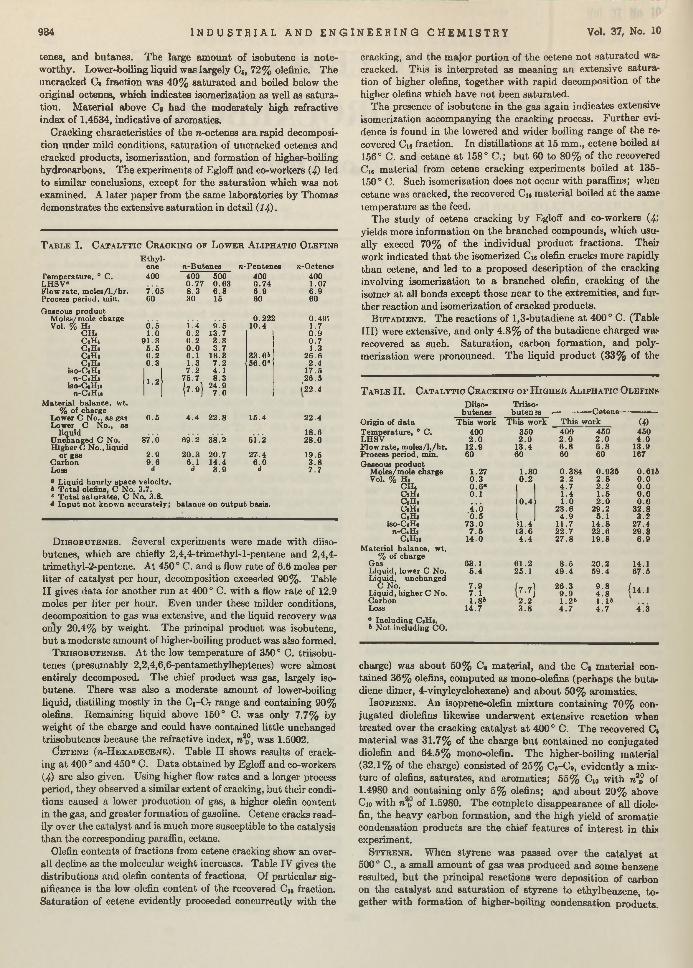
984 I N D U S T R I A L A N D E N G I N E E R I N G C H E M I S T R Y Vol. 37, No. 10
tenes, and butanes. The large am ount of isobutene is noteworthy. Lower-boiling liquid was largely Ci( 72% olefinic. The uncraeked 0« fraction was 40% saturated and boiled below the original octenes, which indicates isomerization as well as saturation. M aterial aJbove C , had the moderately high refractive index of 1.4534, indicative of aromatics.
Cracking characteristics of the w-octenes are. rapid decomposition under mild conditions, saturation of uncracked octenes and cracked products, isomerization, and formation of higher-boiling hydrocarbons. The experiments of Egloff and co-workers (4) led to similar conclusions, except for the saturation which was not examined. A later paper from the same laboratories by Thomas demonstrates the extensive saturation in detail (14) ■
T a b l e I . C a t a l y t ic C r a c k i n g o f L o w e r A l i p h a t i c O l e f i n s
Temperature, 0 C.LHSV*Flow rate , m o les/l./h r .Process period, min.
G aseous product M oles/m ole charge Vol. % H 2
CEU CjHi C jH*C i H*CiH*
iso-CiH« n-C«H»
iso-C*Hie n-C iH u
M aterial balance, wt. % of charge
Lower C No., as gas Lower C No., as
liquid U nchanged C No. Higher C No., liquid
or gas Carbon Loss
E th y lene400
7 .0560
0 .51.0
9 1 .35 .50 . 20 .3
n-Butenea 400 5000 .7 7 0.63 8 .3 6 .830 15
1 . 2
0 .5
8 7 .0
2 .99 .6
1.40 . 20 . 20 .06 . 11 .37 .2
75 .7( 7 .9 }
9 .513.73 .33 .7
18.37 .2 4 .18 .3
2 4 .97 .0
n-Pentenes4000 .746 .960
0.22210.4
33.6b 5 6 .0C
4 .4 22 .8
6 9 .2 38 .2
2 0 .3 20 .76 .1 14.4
à 3 .9
15.4
51.2
27.46 . 0d
n-Octenep4001.07 6 .9 60
O.4 9 ;1.7 0 .9 0 .71 .3
2 6 .62 .4
17.52 6 .5
Í22 .4
22.4
18.62 8 .0
19.5 3 .8 7 .7
0 Liquid hourly space velocity. & T o ta l olefins, C No. 3.7. e T o ta l sa tu ra tes , C No. 3.8. d In p u t no t known accurately; balance on o u tp u t basis.
D i i s o b u t e n e s . Several experiments were made with diiso- butenes, which are chiefly 2,4,4-trimethyl-l-pentene and 2,4,4- trimethyl-2-pentene. At 450° C. and a flow rate of 6.6 moles per liter of catalyst per hour, decomposition exceeded 90%. Table I I gives data for another run a t 400° C. with a flow rate of 12.9 moles per liter per hour. Even under these milder conditions, decomposition to gas was extensive, and the liquid recovery was only 20.4% by weight. The principal product was isobutene, bu t a moderate amount of higher-boiling product was also formed.
T r i i s o b u t e n e s . At the low tem perature of 350° C. triisobu- tenes (presumably 2,2,4,6,6-pentamethylheptenes) were almost entirely decomposed. The chief product was gas, largely isobutene. There was also a moderate amount of lower-boiling liquid, distilling mostly in the Cs-C7 range and containing 90% olefins. Remaining liquid above 150° C. was only 7.7% by weight of the charge and could have contained little unchanged triisobutenes because the refractive index, n™, was 1.5002.
CJe t e n e (ti- H e x a d e c e n e ) . Table I I shows results of cracking a t 400 ° and 450 ° C. D ata obtained by Egloff and co-workers (4) are also given. Using higher flow rates and a longer process period, they observed a similar extent of cracking, but their conditions caused a lower production of gas, a higher olefin content in the gas, and greater formation of gasoline. Cetene cracks readily over the catalyst and is much more susceptible to the catalysis than the corresponding paraffin, cetane.
Olefin contents of fractions from cetene cracking show an overall decline as the molecular weight increases. Table IV gives the distributions and olefin contents of fractions. Of particular significance is the low olefin content of the recovered Cu fraction. Saturation of cetene evidently proceeded concurrently with the
cracking, and the m ajor portion of the cetene not sa tu rated wa.« cracked. This is interpreted as meaning an extensive sa tu ra tion of higher olefins, together with rapid decomposition of the higher olefins which have not been saturated.
The presence of isobutene in the gas again indicates extensive isomerization accompanying the cracking process. F u rther evidence is found in the lowered and wider boiling range of the recovered Cu fraction. In distillations a t 15 mm., cetene boiled at 156° C. and cetane a t 158° C.; but 60 to 80% of the recovered CI6 m aterial from cetene cracking experiments boiled a t 135- 150° C. Such isomerization does not occur with paraffins; when cetane was cracked, the recovered Cie m aterial boiled a t the same tem perature as the feed.
The study of cetene cracking by Egloff and co-workers (4) yields more information on the branched compounds, which usually exceed 70% of the individual product fractions. Their work indicated th a t the isomerized Cie olefin cracks more rapidly than cetene, and led to a proposed description of the cracking involving isomerization to a branched olefin, cracking of the isomer a t all bonds except those near to the extremities, and further reaction and isomerization of cracked products.
B u t a d i e n e . The reactions of 1,3-butadiene a t 400° C. (Table III) were extensive, and only 4.8% of the butadiene charged wa.<- recovered as such. Saturation, carbon formation, and polymerization were pronounced. The liquid product (33% of the
T a b l e I I . C a t a l y t i c C r a c k i n g o f H i g h e r A l i p h a t i c O l e f i n s
Diiso- Triiso-butenes b uten ea /—------ — —C e te n e -
Origin of da ta This work This work This work (4)Tem perature, ° C. LHSV
4002 .0
3502 .9
4M)2 .0
4502 .0
4504 .0
Flow ra te , m olea/l./hr. 12 .9 13.4 6 .8 6 .8 13.9Process period, min. 60 60 60 60 167Gaseous product
M oles/m ole charge 1.27 1 .80 0 .384 0 .935 0.615Vol. % Hi 0 .3 0 .2 2 .2 2 .8 0 .0
C H . 0 .6 ° 4 .7 2 .2 0 .0Ci Hi 0 .1 1 .4 1 .5 0 .0Ci H i 0 .4 1 .0 2 .0 0 .0C ,H . ¿ : ó 2 3 .6 2 9 .2 32 .8CiH , 0 .5 4 .9 5 .1 3 .2
iso-C.Hj 7 3 .0 ;i l . 4 11.7 14 .8 27.47i -C . Hi 7 .5 13.6 22 .7 2 2 .6 29 .8
C .H „ 14.0 4 .4 2 7 .8 19 .8 6 .9M aterial balance, wt.
% of chargeGas 63.1 6 1 .2 8 .5 2 0 .2 14.1Liquid, lower C No. 5 .4 25.1 49 .4 59 .4 67.5Liquid, unchanged
C No. 7 .9 7 .7 ] 2 6 .3 9 .8 Í14 .1Liquid, higher C No. 7 .1 9 .9 4 .8Carbon 1 .8 ‘ 2 .2 1.2» l . l »LoS8 14.7 3 .8 4 .7 4 .7 4Í3
° Including CiHi.& N ot including CO.
charge) was about 50% C8 m aterial, and the C> m aterial contained 36% olefins, computed as mono-olefins (perhaps the butadiene dimer, 4-vinylcyclohexene) and about 50% aromatics.
I s o p r e n e . An isoprene-olefin m ixture containing 70% conjugated diolefins likewise underw ent extensive reaction when treated over the cracking catalyst a t 400 ° C. The recovered C* m aterial was 31.7% of the charge bu t contained no conjugated diolefin and 64.5% mono-olefin. The higher-boiling material (32.1% of the charge) consisted of 25% C8-C», evidently a m ixture of olefins, saturates, and aromatics; 55% Ci0 w ith n2S of 1.4980 and containing only 5% olefins; apd about 20% above Cio with n2n of 1.5980. The complete disappearance of all diolefin, the heavy carbon formation, and the high yield of aromatic condensation products are the chief features of in terest in this experiment.
S t y r e n e . When styrene was passed over the catalyst at 500° C., a small am ount of gas was produced and some benzene resulted, b u t the principal reactions were deposition of carbon on the catalyst and saturation of styrene to ethylbenzene, together with formation of higher-boiling condensation products.
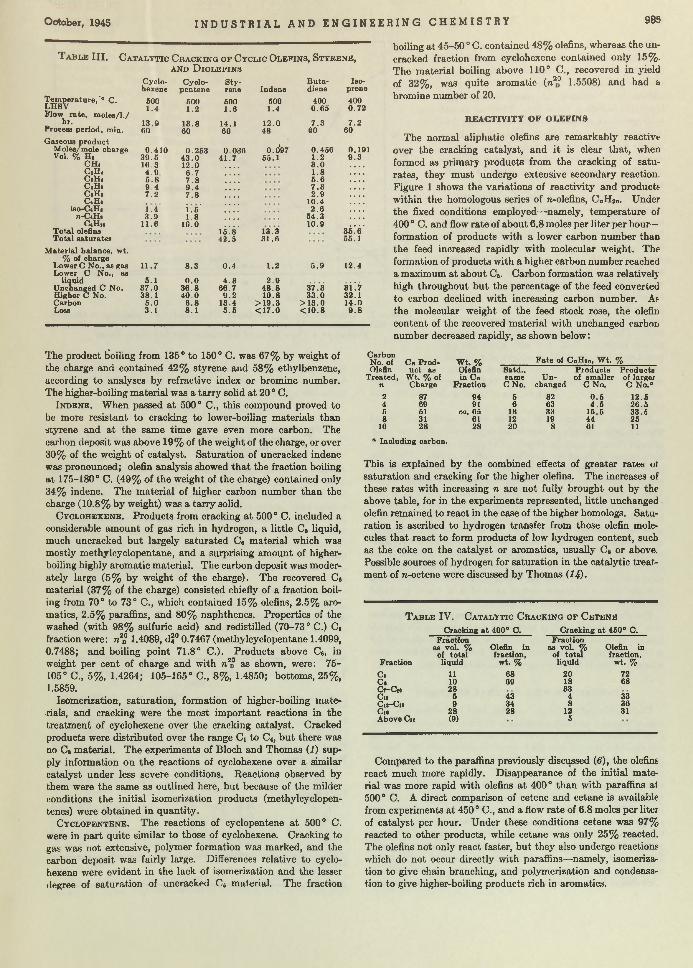
October, 1945 I N D U S T R I A L A N D E N G I N E E R I N G C H E M I S T R Y 985
T a b l e I I I . C a t a l y t i c C r a c k i n g o p C y c l ic O l e f i n s , S t y r e n e , a n d D i o l e f i n s
Cyclo Cyclo S ty B u ta Iso-hexene pentene rene Indene diene prene
Tem perature,*0 C. LHSV
5001 .4
5001.2
5001 .6
5001.4
4000 .6 5
4000 .72
Flow ra te , moles/1./hr. 13 .9 13.8 14.1 12.0 7 .3 7 .2
Process period, min. 60 60 60 48 60 60
Gaseous p roduct M oles/m ole charge 0 .410 0 .253 0 .036 0.0*97 0 .456 0.191Vol. % Hi 3 9 .5 4 3 .0 41 .7 55.1 1 .2 9 .3
C H 4 16.3 12.0 3 .0CaHi 4 .9 6 .7 1 .8CjHe 5 .8 7 .8 5 .6CiH» 9 .4 9 .4 7 .3C .H , 7 .2 7 .8 2 .9CiH« 10.4
iso-CiHi i .4 i . 5* 2 .6n-CiK* 3 .9 1 .8 5 4 .3
CiHi* 11.6 10.0 10.9Tota l olefins 15.8 13.3 3 5 Í6 'Tota l sa tura tes
M aterial balance, wt. % of charge
Lower C No., as gas Lower C No., as
liquid Unchanged C No. Higher C No. Carbon Loss
3 1 .6 55.1
11.7 8 .3 0.4 1.2 5 .9 12.4
5 .1 0 .0 4 .8 2 .93 7 .0 3 6 .8 66 .7 4 8 .8 3 7 .3 3 Ü 738.1 4 0 .0 9 .2 10.8 3 3 .0 32.1
5 .0 6 .8 13.4 > 1 9 .3 > 1 3 .0 14.03 .1 8 .1 5 .5 < 1 7 .0 < 1 0 .8 9 .8
The product toiling from 135° to 150° C. was 67% by weight of the charge and contained 42% styrene and 58% ethylbenzene, according to analyses by refractive index or bromine number. The higher-boiling m aterial was a tarry solid a t 20 0 C.
I n d e n e . W hen passed a t 500° C., this compound proved to be more resistant to cracking to lower-boiling materials than styrene and a t the same tim e gave even more carbon. The carbon deposit was above 19% of the weight of the charge, or over 30% of the weight of catalyst. Saturation of uncracked indene was pronounced; olefin analysis showed th a t the fraction boiling at 175-180° C. (49% of the weight of the charge) contained only 34% indene. The m aterial of higher carbon number than the charge (10.8% by weight) was a tarry solid.
C y c l o h e x e n e . Products from cracking a t 500 ° C . included a considerable amount of gas rich in hydrogen, a little C 6 liquid, much uncracked bu t largely saturated C« m aterial which was mostly methylcyclopentane, and a surprising amount of higher- boiling highly aromatic material. The carbon deposit was moderately large (5% by weight of the charge). The recovered C«
m aterial (37% of the charge) consisted chiefly of a fraction boiling from 70° to 73° C ., which contained 15% olefins, 2.5% aro- matics, 2.5% paraffins, and 80% naphthenes. Properties of the washed (with 98% sulfuric acid) and redistilled (70-73° C.) Cj
fraction were: n2S 1.4089, d j0 0.7467 (methylcyclopentane 1.4099, 0.7488; and boiling point 71.8° C.). Products above C6, in weight per cent of charge and with n™ as shown, were: 75- 105° C ., 5%, 1.4264; 105-165° C ., 8% , 1.4850; bottoms, 25%, 1.5859.
Isomerization, saturation, formation of higher-boiling m aterials, and cracking were the most im portant reactions in the treatm ent of cyclohexene over the cracking catalyst. Cracked products were distributed over the range Ci to C«, b u t there was no Ci m aterial. The experiments of Bloch and Thomas (1) supply information on the reactions of cyclohexene over a similar catalyst under less severe conditions. Reactions observed by them were the same as outlined here, bu t because of the milder conditions the initial isomerization products (methylcyclopen- tenes) were obtained in quantity.
C y c l o p e n t e n e . The reactions of cyclopentene a t 5 0 0 ° C .
were in p a rt quite similar to those of cyclohexene. Cracking to gas was not extensive, polymer formation was marked, and the carbon deposit was fairly large. Differences relative to cyclohexene were evident in the lack of isomerization and the lesser degree of saturation of uncracked Cs material. The fraction
boiling a t 45-50 ° C. contained 48% olefins, whereas the uncracked fraction from cyclohexene contained only 15%. The m aterial boiling above 110° C., recovered in yield of 32%, was quite aromatic (n™ 1.5508) and had a bromine number of 20.
R E A C T IV IT Y O F O L E F IN S
The normal aliphatic olefins are remarkably reactive over the cracking catalyst, and it is clear th a t, when formed as primary products from the cracking of satu rates, they m ust undergo extensive secondary reaction. Figure 1 shows the variations of reactivity and products within the homologous series of n-olefins, CnH2„. Under the fixed conditions employed—namely, tem perature of 400 ° C. and flow ra te of about 6.8 moles per liter per hour— formation of products with a lower carbon number thaD the feed increased rapidly with molecular weight. The formation of products with a higher carbon num ber reached a maximum a t about C6. Carbon formation was relatively high throughout bu t the percentage of the feed converted to carbon declined with increasing carbon number. As the molecular weight of the feed stock rose, the olefin content of the recovered m aterial with unchanged carbon number decreased rapidly, as shown below:
CarbonNo. of Cn Prod- Olefin u c t as
T reated , W t. % of n Charge
2 874 695 618 31
16 28
° Including carbon.
This is explained by the combined effects of greater rates of saturation and cracking for the higher olefins. The increases of these rates with increasing n are not fully brought out by the above table, for in the experiments represented, little unchanged olefin remained to react in the case of the higher homologs. Saturation is ascribed to hydrogen transfer from those olefin molecules th a t react to form products of low hydrogen content, such as the coke on the catalyst or aromatics, usually C, or above. Possible sources of hydrogen for saturation in the catalytic treatm ent of n-octene were discussed by Thomas ( l f j .
T a b l e IV. C a t a l y t i c C r a c k i n g o p C e t e n e
Cracking a t 400° C. Cracking a t 450° C.
Fraction
Fraction as vol. %
of to tal liquid
Olefin in fraction,
w t. %
Fraotion as vol. %
of to ta l liquid
Olefin íd fraction,
wt. %
C. 11 68 20 72C . 10 69 18 68O - C 10 28 33C n 5 43 4 33C , r C n 9 34 8 36Ci. 28 28 12 31Above C» (9) 5
Compared to the paraffins previously discussed (6), the olefins react much more rapidly. Disappearance of the initial m aterial was more rapid with olefins a t 400° than with paraffins af 500° C. A direct comparison of cetene and cetane is available from experiments a t 450° C., and a flow rate of 6.8 moles per liter of catalyst per hour. Under these conditions cetene was 97% reacted to other products, while cetane was only 25% reacted. The olefins not only react faster, but they also undergo reactions which do not occur directly with paraffins—namely, isomerization to give chain branching, and polymerization and condensation to give higher-boiling products rich in aromatics.
W t. % F a te of CnHtn. W t. %Olefin Satd., Products P roductsin Cn same U n of smaller of larger
Fraction C No. changed C No. C No.®
94 5 82 0 .5 12.591 6 63 4 .5 26.5
ca. 65 18 33 15.5 33.661 12 19 44 2528 20 8 61 11
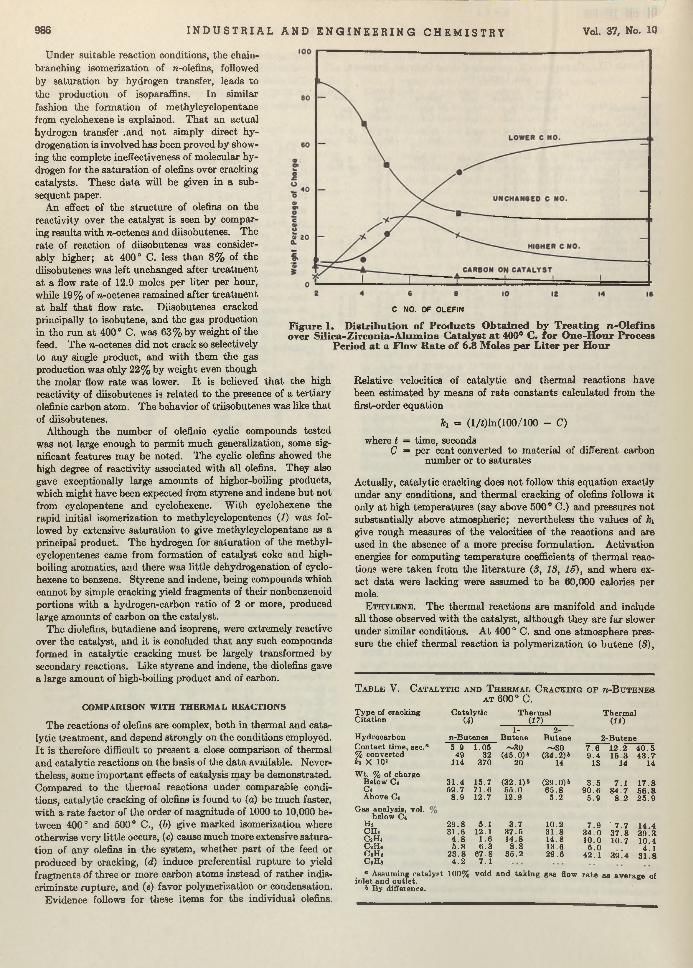
986 I N D U S T R I A L A N D E N G I N E E R I N G C H E M I S T R Y Vol. 37, No. 10
Under suitable reaction conditions, the chain- branching isomerization of »-olefins, followed by saturation by hydrogen transfer, leads to the production of isoparaffins. In similar fashion the formation of methylcyclopentane from cyclohexene is explained. T h at an actual hydrogen transfer .and not simply direct hydrogenation is involved has been proved by showing the complete ineffectiveness of molecular hydrogen for the saturation of olefins over cracking catalysts. These data will be given in a subsequent paper.
An effect of the structure of olefins on the reactivity over the catalyst is seen by comparing results with n-octenes and diisobutenes. The rate of reaction of diisobutenes was considerably higher; a t 400° C. less than 8% of the diisobutenes was left unchanged after treatm ent a t a flow rate of 12.9 moles per liter per hour, while 19% of n-octenes remained after treatm ent a t half th a t flow rate. Diisobutenes cracked principally to isobutene, and the gas production in the run a t 400° C. was 63% by weight of the feed. The n-octenes did not crack so selectively to any single product, and with them the gas production was otily 22% by weight even though the molar flow ra te was lower. I t is believed th a t the high reactivity of diisobutenes is related to the presence of a tertiary olefimc carbon atom. The behavior of triisobutenes was like that of diisobutenes.
Although the number of olefinic cyclic compounds tested was not large enough to perm it much generalization, some significant features may be noted. The cyclic olefins showed the high degree of reactivity associated with all olefins. They also gave exceptionally large amounts of higher-boiling products, which m ight have been expected from styrene and indene bu t not from cyclopentene and cyclohexene. W ith cyclohexene the rapid initial isomerization to methylcyclopentenes (1) was followed by extensive saturation to give methylcyclopentane as a principal product. The hydrogen for saturation of the m ethylcyclopentenes came from formation of catalyst coke and high- boiling aromatics, and there was little dehydrogenation of cyclohexene to benzene. Styrene and indene, being compounds which cannot by simple cracking yield fragments of their nonbenzenoid portions with a hydrogen-carbon ratio of 2 or more, produced large amounts of carbon on the catalyst.
The diolefins, butadiene and isoprene, were extremely reactive over the catalyst, and it is concluded th a t any such compounds formed in catalytic cracking m ust be largely transformed by secondary reactions. Like styrene and indene, the diolefins gave a large amount of high-boiling product and of carbon.
C O M P A R ISO N W IT H T H E R M A L R E A C TIO N S
The reactions of olefins are complex, both in therm al and catalytic treatm ent, and depend strongly on the conditions employed. I t is therefore difficult to present a close comparison of thermal and catalytic reactions on the basis of the d a ta available. Nevertheless, some im portant effects of catalysis may be demonstrated. Compared to the therm al reactions under comparable conditions, catalytic cracking of olefins is found to (a) be much faster, with a ra te factor of the order of magnitude of 1000 to 10,000 between 400° and 500° C., (6) give m arked isomerization where otherwise very little occurs, (c) cause much more extensive saturation of any olefins in the system, whether part of the feed or produced by cracking, (d) induce preferential rupture to yield fragments of three or more carbon atoms instead of rather indiscriminate rupture, and (e) favor polymerization or condensation.
Evidence follows for these items for the individual olefins.
C NO. OF OLEFIN
Figure 1. D istr ibution o f Products O btained by T reating n-O lefins over Silica-Z irconia-A lum ina C atalyst a t 400° C. for O ne-H our Process
Period a t a Flow R ate o f 6 . 8 M oles per L iter per Hour
Relative velocities of catalytic and therm al reactions have been estim ated by means of ra te constants calculated from the first-order equation
h = (l/i)ln(100/100 - C)
where t — time, secondsÇ = per cent converted to m aterial of different carbon
num ber or to saturates
Actually, catalytic cracking does no t follow this equation exactly under any conditions, and therm al cracking of olefins follows it only a t high tem peratures (say above 500° C.) and pressures not substantially above atmospheric; nevertheless the values of h give rough measures of the velocities of the reactions and are used in the absence of a more precise form ulation. Activation energies for computing tem perature coefficients of therm al reactions were taken from the literature (3, 13, 15), and where exact data were lacking were assumed to be 60,000 calories per mole.
E t h y l e n e . The therm al reactions are manifold and include all those observed w ith the catalyst, although they are far slower under similar conditions. A t 400 ° C. and one atm osphere pressure the chief therm al reaction is polymerization to butene (3),
T a b l e V. C a t a l y t i c a n d T h e r m a l C r a c k i n g o p » - B t j t e n e s . a t 600° C .
Type of cracking C itation
Hydrocarbon C ontac t tim e, sec.a % converted ki X 10*
W t, % of charge Below C<C4Above C<
Gas analysis, vol. below C<
H 2 CH4
C 2H4 CsHe CsHe CiHs
a Assuming ca ta lyst 100% void and tak ing gas flow ra te as average of in let and outlet.
& By difference.
C ata ly tic(4)
n-Butenes
Therm al(17)
1- 2- B u tene B utene
T herm alC11)
2-Butene5 .9 1.05 - 3 0 - 3 0 7 .6 12 .2 40.5.
49 32 (45 .0) b (34 .2) & 9 .4 15.3 4 3 .7114 370 20 14 13 14 14
3 1 .4 15.7 (32.1)6 (29.0) b 3 .5 7 .1 1 7 .a5 9 .7 7 1 .6 5 5 .0 6 5 .8 9 0 .6 8 4 .7 5 6 .a
8 .9 12.7 12.9 5 .2 5 .9 8 .2 2 5 .9
2 9 .8 5 .1 3 .7 10.2 7 .9 ' 7 .7 14 .43 1 .6 12.1 3 7 .5 3 1 .8 3 4 .0 3 7 .8 3 9 . a
4 .8 1 .6 14.8 14.8 1 0 .0 10.7 10.45 .8 6 .3 8 .8 13.6 6 .0 4 .1
2 3 .84 .2
6 7 .87 .1
35 .2 2 9 .6 4 2 .1 39! 4 3 1 . a
O ctober, 1945 I N D U S T R I A L A N D E N G I N E E R I N G C H E M I S T R Y 987
but it is only about one thousandth as fast as catalytic polymerization or saturation.
7 1 - B u te n e s . The results of Egloff and co-workcrs (4) from catalytic cracking a t 6 0 0 ° C. are compared to thermal results (11, 17) in Table V. At this tem perature thermal cracking reactions follow the first-order law, and the product composition is not much changed with a change in the conversion. In catalytic cracking, the first-order ra te law is not followed, and product composition depends on conditions. The comparisons outlined in Table V are valid for high flow rates or the lower range of tem peratures in catalytic cracking. The catalytic reaction, compared to the therm al, gives less methane, less ethylene, more propylene, more butane, and more isobutene. The data further show th a t the catalytic rate is six to twenty-nine times the thermal even a t the high tem perature of 6 0 0 ° C. For these reactions a t 4 0 0 ° C. it is estimated th a t the ratio of rates is roughly 1000. This follows from a comparison of the observed catalytic rate with the therm al rate computed from the Arrhenius equation.
b- P e n t e n e s . From the scanty therm al d a ta a t 4 0 0 ° C., it may be said th a t the catalytic reactions are much more rapid. Isomerization is prominent in catalytic treatm ent bu t not in the thermal (4).
n-O cTE N ES. Table VI compares data from a rather limited pyrolytic investigation (8) and from catalytic cracking. The catalytic reaction is much faster. Assuming an activation energy of 60 kg.-cal. per mole, ki (thermal) a t 4 0 0 ° C. is about 0 .02 X L0-3 . Since k, (catalytic) is 170 X 1 0~ 3, the catalytic reaction is indicated to be about eight thousand times as fast.
T a b l e VI. C a t a l y t ic a n d T h e r m a l C r a c k in g o f m-O c t e n e s
, of charge0
Type of cracking CitationT em perature, ° C.C ontac t time, sec.®% converted6 ki X 103
M aterial balance, wt. 1 GasLiquid below Cs CsAbove Cs
Olefins in gas, vol. %
a Assuming ca ta lyst 100% void.6 To material other than Cs olefins. c Yields corrected to no-loss basis.
Cataly tic This work
Therm al (8)
400 440 4859 .5 240 190
81.4 12 32170 0.53 2.03
24.220.1 {7.3 27
30.5 88 .0 6825.2 4 .7 5
71.3 8 .5 20 .5
Other comparisons are: (a) In thermal treatm ent the totalgas contains a higher percentage of saturates. This may be ascribed to preferential splitting out of methane and ethane, rather than by saturation of produced olefins, (b) Polymerization and formation of hydrocarbons of increased carbon number are prominent in catalytic treatm ent, (c) Isomerization of uncracked octenes is observed in both types of reaction. Thus, in thermal cracking a t 4 4 0 ° and 48 5 ° C. (8), 1 5 -2 0 % of the Cs fraction was said to distill from 105° to 121 .5° C. This example of thermal isomerization has not been verified elsewhere as far as is known. In catalytic experiments 8 0 -1 0 0 % of the Cs fraction was lower boiling, (d) The unsaturation of the C8 fraction recovered from therm al cracking was equal to th a t of the feed, while in catalytic cracking the Cs fraction was partially saturated.
C e t e n e ( » - H e x a d e c e n e ) . Table VII compares results from catalytic cracking with therm al results (5). The ratio of thermal rates a t 500 ° and 450 ° C . corresponds to an activation energy of 51 kg.-cal. per mole, and from this, ki (thermal) a t 4 0 0 ° C . = 5 X 10“ 6. Thus the catalytic rate is of the order of six thousand times the therm al a t 400 ° C . and eight hundred times the thermal a t 450 ° C .
Other im portant differences appear. A greater ratio of liquid to gas, a t equal or greater depth of cracking, can be obtained in
catalytic cracking. A t low tem peratures the olefin content of the thermal gas is much lower than the catalytic, as with octenes. However, the therm al gas is chiefly m ethane and ethylene, whereas the catalytic gas is largely propylene, butenes, and butanes. The thermal liquid products are spread over the entire range from C6 to Ci6, while the catalytic are especially rich in C6 and C6. The lower-boiling liquid obtained therm ally al tem peratures below 600° C. contains the equivalent of more than 1 0 0 %'mono-olefins, the catalytic, of the order of 60%.
T a b l e V II. C a t a l y t ic a n d T h e r m a l C r a c k in g o f C e t e n e
This work (6)400 450 450 500 5507 .3 6 .4 75 6 1 .5 5 0 .5
92 97 5 .0 34.1 69.7ca. 340 ca. 550 0 .67 6 .8 23 .6
8 .9 21 .2 0 .3 11.5 3 7 .551.8 62.3 4 .7 2 2 .8 3 2 .239 .3 16.5 9 5 .0 65.7 3 0 .3
2 .2 2 .8 0 3 559.4 68.1 29 58 6538 .4 29.1 71 39 30
49 48 28 31
Type of cracking C ata ly tic Therm alCitationT em perature, ° C.C fn ta c t time, sec.a % converted 6 ki X 10*
M aterial balance, w t. % of charge6 GasLiquid below Cia Rem ainder
Gas .analysis, % vol.H jOlefins Saturates
Mol. wt. of gas
a Assuming ca talyst 100% void, and correcting for expansion with 2 moles product per mole cracked.
To material o ther than C n olefin. c Corrected to no-loss basis.
D i i s o b u t e n e s . The therm al decomposition of diisobutenes was observed (12) a t 492-641 ° C. The data give a first-order rate constant of 0.01 a t 492° C. If an activation energy of 60
kg.-cal. per mole is assumed, k (4 0 0 ° C.) = 4.5 X 10~ s. This is of the order of 1/14 ,000 , the rate found in catalytic cracking. Hence the acceleration by the catalyst seems to be about the same for both re-octenes and diisobutenes, a factor of roughly 10,000 appearing in the rates. There are indications th a t the catalytic acceleration is greater for diisobutenes than for n- octenes, bu t the comparisons are not direct enough to make this certain.
Other differences between thermal and catalytic cracking of diisobutenes are not pronounced, as far as can be judged. The gas analyses are much alike (12). Possibly formation of higher-boiling materials is less prominent and of Cs and C7 a little more so íd
thermal treatm ent a t 4 92° C., compared to catalytic a t 40 0 ° C.C y c l ic O l e f i n s . D ata on the thermal treatm ent of styrene
and cyclopentene under conditions comparable to those used for catalytic cracking are not available. The therm al cracking of indene, like the catalytic, leads to condensation products and indan (7, 16), bu t the relative amount of indan is less. Carbon formation appears to be more pronounced in catalytic treatm ent.
The rate of disappearance of cyclohexene is much slower without a catalyst, for in thermal treatm ent a t 4 5 0 ° C. only 7% was decomposed in 6 hours (2). Comparison w ith a kinetic study a t 485° to 5 65° C. (10) indicates th a t the catalytic reaction is faster by a factor of about 1000 at 5 00° C. The therm al treat- m ent leads to the formation of ethylene and butadiene, bu t in catalytic treatm ent the products are quite different.
D i o l e f i n s . Again there is a marked contrast between catalytic and thermal reactions. Under the conditions of the catalytic experiments there would be little thermal reaction. At somewhat higher temperatures butadiene and isoprene dimerize thermally to cyclohexene derivatives.
While some dimer may form catalytically, there is also marked formation of aromatics and saturates, which are not obtained thermally except a t much higher temperature. The thermal rate of disappearance of butadiene a t about 4 0 0 ° C. (9) is estim ated to be about 1 /6 0 0 of the catalytic rate, comparing second- order rate constants for each.
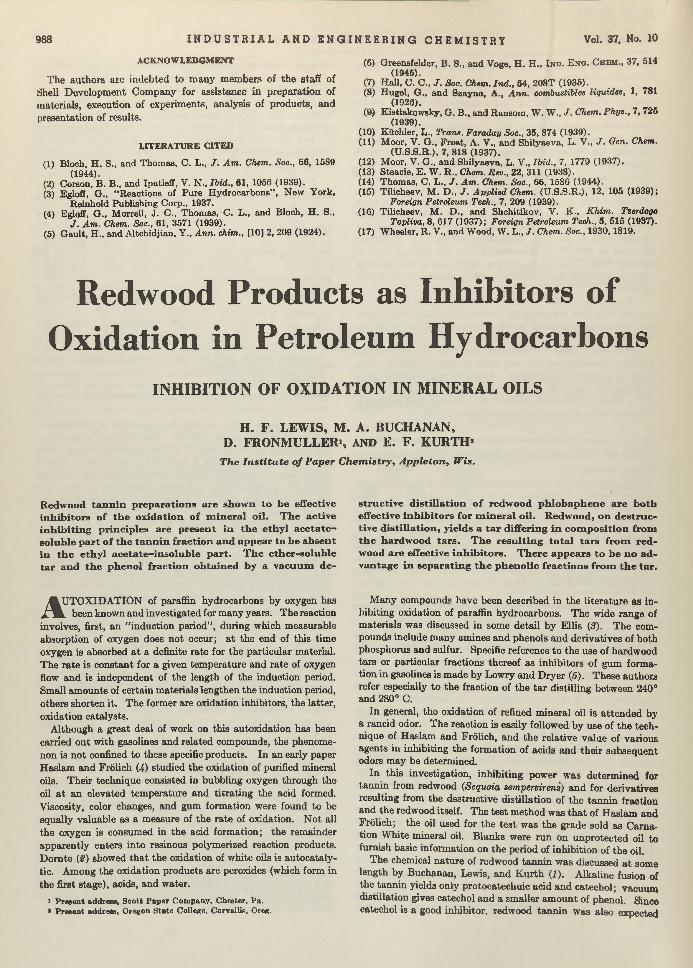
988 I N D U S T R I A L A N D E N G I N E E R I N G C H E M I S T R Y Vol. 37, No. 10
A C K N O W L E D G M E N T
The authors are indebted to m any members of the staff of Shell Development Company for assistance in preparation of materials, execution of experiments, analysis of products, and presentation of results.
L IT E R A T U R E C IT E D
(1) Bloch, H . S., and Thomas, C. L., J , Am. Chern. Soc., 66, 1589(1944).
(2) Corson, B. B., and Ipatieff, V. N ., Ibid., 61, 1056 (1939).(3) Egloff, G ., "R eactions of Pure Hydrocarbons” , New York,
Reinhold Publishing Corp., 1937.(4) Egloff, G ., Morrell, J . C., Thomas, C. L., and Bloch, H . S.,
J . Am. Chem. Soc., 61, 3571 (1939).(5) G ault, H ., and Altchidjian, Y ., Ann. chim., [10] 2, 209 (1924).
(6) Greensfelder, B. 8., and Voge, H . H ., I n d . E n g . Chbm., 37, 514(1945).
(7) Hall, C. C., J . Soc. Chem. Ind., 54, 208T (1935).(8) Hügel, G ., and Szayna, A., Ann. combustibles liquides, 1, 781
(1926).(9) Kistlakowsky, G. B., and Ransom, W . W., J . Chem. Phys., 7, 725
(1939).(10) Küchler, L., Trans. Faraday Soc., 35, 874 (1939).(11) Moor, V. G ., Frost, A. V., and Shilyaeva, L. V., J . Gen. Chem.
(U .S.8.R.), 7, 818 (1937).(12) Moor, V. G., and Shilyaeva, L. V., Ibid., 7, 1779 (1937).(13) Steaoie, E. W. R., Chem. Rev., 22, 311 (1938).(14) Thomas, C, L., J . Am. Chem. Soc., 66, 1586 (1944).(15) Tilicheev, M . D., J . Applied Chem. (U.S.S.R.), 12, 105 (1939);
Foreign Petroleum Tech., 7, 209 (1939).(16) Tilicheev, M . D., and Shchitikov, V. K ., Khim. Tverdogo
Topliva, 8, 617 (1937); Foreign Petroleum Tech., 5, 515 (1937).(17) Wheeler, R . V., and Wood, W. L., J . Chem. Soc., 1930,1819.
Redwood Products as Inhibitors of Oxidation in Petroleum Hydrocarbons
INHIBITION OF OXIDATION IN MINERAL OILS
H. F. LEW IS, M . A. BUCHANAN,D . FRONMULLERs AND E. F . KURTH1
T h e I n s t i tu te o f P aper C h e m is try , A p p le to n , W is.
structive d istilla tio n o f redwood ph lobaphene are both effective inh ib itors for m ineral o il. Redw ood, on destructive d istilla tio n , yields a tar differing in com position from th e hardwood tars. T he resu ltin g to ta l tars from redwood are effective in h ib itors. There appears to be no advantage in separating th e ph en olic fractions from th e tar.
Redwood ta n n in preparations are show n to be effective inh ib itors o f th e oxidation o f m ineral o il. T he active inh ib iting princip les are present in th e ethyl a ce ta te - solub le part o f th e ta n n in fraction and appear to be absent in th e ethy l aceta te-in so lu b le part. T he ether-soluble tar and th e phenol fraction obtained by a vacuum de-
AUTOXIDATION of paraffin hydrocarbons by oxygen has L been known and investigated for many years. The reaction
involves, first, an “ induction period” , during which measurable absorption of oxygen does not occur; a t the end of this time oxygen is absorbed a t a definite rate for the particular material. T he ra te is constant for a given tem perature and rate of oxygen flow and is independent of the length of the induction period. Small amounts of certain m aterials lengthen the induction period, others shorten it. The former are oxidation inhibitors, the latter, oxidation catalysts.
Although a great deal of work on this autoxidation has been carried out w ith gasolines and related compounds, the phenomenon is not confined to these specific products. In an early paper Haslam and Frölich (4) studied the oxidation of purified mineral oils. Their technique consisted in bubbling oxygen through the oil a t an elevated tem perature and titra ting the acid formed. Viscosity, color changes, and gum formation were found to be equally valuable as a measure of the ra te of oxidation. N ot all the oxygen is consumed in the acid formation; the remainder apparently enters into resinous polymerized reaction products. D om te (#) showed th a t the oxidation of white oils is autocataly- tic. Among the oxidation products are peroxides (which form in the first stage), acids, and water.
1 P resen t address. Sco tt P ap er Com pany, Chester, Pa.* P resen t address, Oregon S ta te College, Corvallis, Oreg.
M any compounds have been described in the literature as in- hibiting oxidation of paraffin hydrocarbons. The wide range of m aterials was discussed in some detail by Ellis (3). The compounds include m any amines and phenols and derivatives of both phosphorus and sulfur. Specific reference to the use of hardwood tars or particular fractions thereof as inhibitors of gum formation in gasolines is made by Lowry and D ryer (5). These authors refer especially to the fraction of the ta r distilling between 240° and 280° C.
In general, the oxidation of refined mineral oil is a ttended by a rancid odor. The reaction is easily followed by use of the technique of Haslam and Frölich, and the relative value of various agents in inhibiting the formation of acids and their subsequent odors may be determined.
In this investigation, inhibiting power was determ ined for tannin from redwood {Sequoia sempervir&ns) and for derivatives resulting from the destructive distillation of the tannin fraction and the redwood itself. The test m ethod was th a t of Haslam and Frölich; the oil used for the test was the grade sold as C arnation White mineral oil. Blanks were run on unprotected oil to furnish basic information on the period of inhibition of the oil.
The chemical nature of redwood tann in was discussed a t some length by Buchanan, Lewis, and K urth (1). Alkaline fusion of the tannin yields only protocatechuic acid and catechol; vacuum distillation gives catechol and a smaller am ount of phenol. Since catechol is a good inhibitor, redwood tannin was also expected
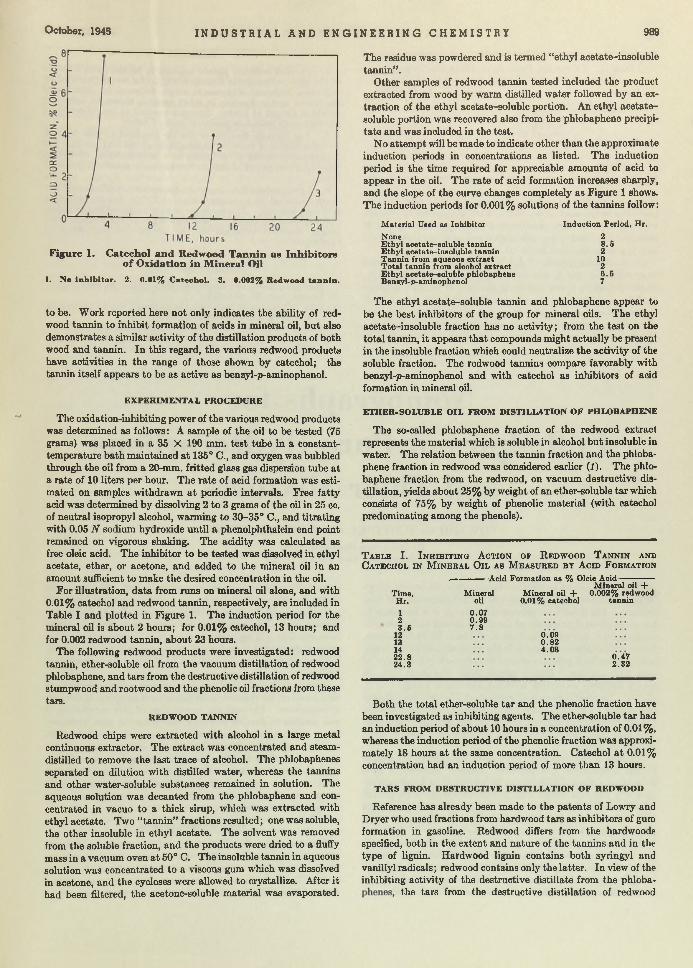
O ctober, 1945 I N D U S T R I A L A N D E N G I N E E R I N G C H E M I S T R Y 989
Figure 1. C atechol and Redwood T ann in as Inhibitors o f O xidation in M ineral Oil
I. N o in h ib ito r . 2. 0.01% C atech o l. 3. 0.002% R edw ood ta n n in .
to be. Work reported here not only indicates the ability of redwood tannin to inhibit formation of acids in mineral oil, bu t also demonstrates a similar activity of the distillation products of both wood and tannin. In this regard, the various redwood products have activities in the range of those shown by catechol; the tannin itself appears to be as active as benzyl-p-aminophenol.
EX PER IM ENTA L PROCEDURE
The oxidation-inhibiting power of the various redwood products was determined as follows: A sample of the oil to be tested (75 grams) was placed in a 35 X 190 mm. test tube in a constant- tem perature ba th m aintained a t 135° C., and oxygen was bubbled through the oil from a 20-mm. fritted glass gas dispersion tube a t a rate of 10 liters per hour. The ra te of acid formation was estimated on samples withdrawn a t periodic intervals. Free fatty acid was determined by dissolving 2 to 3 grams of the oil in 25 cc. of neutral isopropyl alcohol, w anning to 30-35° C., and titrating with 0.05 N sodium hydroxide until a phenolphthalein end point remained on vigorous shaking. The acidity was calculated as free oleic acid. The inhibitor to be tested was dissolved in ethyl acetate, ether, or acetone, and added to the mineral oil in an amount sufficient to make the desired concentration in the oil.
For illustration, data from runs on mineral oil alone, and with0.01% catechol and redwood tannin, respectively, are included in Table I and plotted in Figure 1. The induction period for the mineral oil is about 2 hours; for 0.01% catechol, 13 hours; and for 0.002 redwood tannin, about 23 hours.
The following redwood products were investigated: redwood tannin, ether-soluble oil from the vacuum distillation of redwood phlobaphene, and tars from the destructive distillation of redwood stumpwood and rootwood and the phenolic oil fractions from these tars.
REDWOOD TANNIN
Redwood chips were extracted w ith alcohol in a large m etal continuous extractor. The extract was concentrated and steam- distilled to remove the last trace of alcohol. The phlobaphenes separated on dilution w ith distilled water, whereas the tannins and other water-soluble substances remained in solution. The aqueous solution was decanted from the phlobaphene and concentrated in vacuo to a thick sirup, which was extracted with ethyl acetate. Two “ tannin” fractions resulted; one was soluble, the other insoluble in ethyl acetate. The solvent was removed from the soluble fraction, and the products were dried to a fluffy mass in a vacuum oven a t 50° C. The insoluble tannin in aqueous solution was concentrated to a viscous gum which was dissolved in acetone, and the cycloses were allowed to crystallize. After it had been filtered, the acetone-soluble m aterial was evaporated.
The residue was powdered and is termed “ethyl acetate-insoluble tannin” .
Other samples of redwood tannin tested included the product extracted from wood by warm distilled water followed by an extraction of the ethyl acetate-soluble portion. An ethyl acetate- soluble portion was recovered also from the phlobaphene precipita te and was included in the test.
No attem pt will be made to indicate other than the approximate induction periods in concentrations as listed. The induction period is the tim e required for appreciable amounts of acid to appear in the oil. The ra te of acid formation increases sharply, and the slope of the curve changes completely as Figure 1 shows. The induction periods for 0.001% solutions of the tannins follow:
M aterial Used as Inhib itor
NoneE th y l acetate-soluble tannin E th y l acetate-insoluble tannin T ann in from aqueous extrac t T o ta l tann in from aloohol ex tract E th y l acetate-soluble phlobaphene Beneyl-p-aminophenof
Induction Period, Hr.
28.62
1026 .57
The ethyl acetate-soluble tannin and phlobaphene appear to be the best inhibitors of the group for mineral oils. The ethyl acetate-insoluble fraction has no activity; from the test on the to tal tannin, it appears th a t compounds might actually be present in the insoluble fraction which could neutralize the activity of the soluble fraction. The redwood tannins compare favorably with benzyl-p-aminophenol and w ith catechol as inhibitors of acid formation in mineral oil.
ETH ER-SO LUBLE O IL FROM DISTILLATION O F PHLOBAPHENE
The so-called phlobaphene fraction of the redwood extract represents the m aterial which is soluble in alcohol bu t insoluble in water. The relation between the tannin fraction and the phlobaphene fraction in redwood was considered earlier (/). The phlobaphene fraction from the redwood, on vacuum destructive distillation, yields about 25% by weight of an ether-soluble ta r which consists of 75% by weight of phenolic m aterial (with catechol predominating among the phenols).
T a b l e I . I n h i b i t i n g A c t i o n o f R e d w o o d T a n n i n a n d C a t e c h o l i n M i n e r a l O i l a s M e a s u r e d b y A c id F o r m a t io n
,---------------Acid F orm ation as % Oleic A c id --------------M inera l oil 4-
M ineral oil + 0 .002% redwoodTime,H r.
123 .5
12131422.824 .3
M ineraloil
0.0 70.9 97 .8
0.01% catechol
0.090 .8 24 .08
tannin
0 .4 72 .3 2
Both the to tal ether-soluble ta r and the phenolic fraction have been investigated as inhibiting agents. The ether-soluble ta r had an induction period of about 10 hours in a concentration of 0.01%, whereas the induction period of the phenolic fraction was approximately 18 hours a t the same concentration. Catechol a t 0.01% concentration had an induction period of more than 13 hours.
TARS FROM DESTRUCTIVE DISTILLATIO N O F REDWOOD
Reference has already been made to the patents of Lowry and Dryer who used fractions from hardwood tars as inhibitors of gum formation in gasoline. Redwood differs from the hardwoods specified, both in the extent and nature of the tannins and in the type of lignin. Hardwood lignin contains both syringyl and vanillyl radicals; redwood contains only the latter. In view of the inhibiting activity of the destructive distillate from the phloba-
the tars from the destructive distillation of redwood
990 I N D U S T R I A L A N D E N G I N E E R I N G C H E M I S T R Y Vol. 37, No. 10
T a b l e I I . I n d u c t i o n P e r i o d s o f R e d w o o d T a r s a n d P h e n o l i c F r a c t i o n ( 0 .0 1 % C o n c e n t r a t i o n )
M aterial Used as Inh ib ito r Induction Period, H r.
Stum pw ood ta r ( ta r 3) 11Phenolic fraction 195-203° C. 9-10
203-210° C. 7-8210-220° C. 9-10Above 220° C. 9
Redwood ta r ( ta r 5) 16-17M iddle oil 7Phenolic oil 10
Catechol I s
might be expected to possess the same inhibiting power. This proved to be the case. A number of distillations were carried out with redwoods of varying extractive contents. The wood w' th the highest extractive contents (rootwood) gave the highest yield and, in general, the most active tar.
For illustration, results (Table II) are given for two tars—one from rootwood (tar 5) and the other from stumpwood (tar 3). In the case of ta r 3, the middle oil (fraction of ta r boiling above 150° C.) and the phenolic oil from the middle oil were tested. In the second case, the phenolic oil was separated into four fractions. The crude redwood tars as such appear to be as satisfactory antioxidants as catechol in inhibiting acid formation in mineral oil.
S U M M A RY
1. Purified redwood tannin appears to be the m ost effective of the redwood products tested; 0.001% of a tann in prepared by extracting redwood with warm water, followed by solution of the active tannin fraction in ethyl acetate, shows an induction period of alm ost 11 hours; the same am ount of benzy 1-p-amino- phenol has an induction period of about 7 hours.
2. The phenolic fraction of the ta r prepared by th e destructive distillation of redwood phlobaphene a t reduced pressure has an induction period of 18 hours a t a concentration of 0.01%. The induction period of catechol a t the same concentration is 13 hours.
3. Crude redwood ta r from the destructive distillation of redwood rootwood a t a concentration of 0.01% has an induction period of 16 hours. The crude ta r from stumpwood has an induction period of 11 hours. These ta rs differ in composition from similar products obtained by the destructive distillation of hardwoods.
L IT E R A T U R E C IT E D
(1) B u c h a n a n , Lewis, and K urth , I n d . E n g . C h e m ., 36 , 907 (1944).(2) D ornte, Ibid., 28, 26 (1936).(3) Ellis, "C hem istry of Petroleum D erivatives” , Vol. I I , pp. 912-19,
New York, Reinhold Publishing Corp., 1937.(4) Haslam and Frölich, I n d . E n g . C h e m ., 19, 292 (1927).(5) Lowry and D ryer, U. S. P a ten ts 1,889,835 and 1,889,836 (Dec. 6,
1932); Brit,. P a ten t 410,115 (M ay 9, 1934).
Nomographs for Enthalpies of Pure Hydrocarbons
and Their MixturesEDWARD G. SCHEIBEL AND FRANK J . JENNY
H ydrocarbon R esearch , In c .,115 Broadw ay, N ew Y o rk 6, N . Y .
ON E of the most im portant calculations in the process design of petroleum refining equipment is the preparation of heat
balances. For these heat balance calculations, i t is necessary to know the therm al properties of the hydrocarbons and, more »particularly, the therm al properties of mixtures of hydrocarbons. Considerable d a ta are available in the literature on specific heats, la ten t heats, and pressure-volume-temperature relationships of pure hydrocarbons. During recent years additional d a ta on binary mixtures containing m ethane have been found (1, 2, S, 13, 15). Therm al data on multicomponent mixtures are virtually nonexistent. The multicomponent mixtures encountered in practice are unlimited in number, and in the preparation of universal total heat charts for such mixtures, some generalization of properties is necessary.
For gaseous m ixtures K ay (9) proposed the concept of a pseudo critical tem perature and pressure. General correlations have shown th a t a gaseous mixture can be considered as a pure component w ith a critical tem perature and pressure equal to the pseudo critical properties of the mixture. The pseudo critical constants have been found to be nearly equal to the molal average of the critical constants of the components of the mixture.
Edm ister (5) presented a general correlation of the specific heat d a ta based on a linear variation of specific heat with tem perature. More recent correlations (6) indicated a definite curvature a t high tem peratures. However, over the range of tem peratures used in these nomographs, th s correlation of Edm ister was con
sidered of sufficient accuracy to justify its use. The vapor enthalpy determined from E dm ister’s correlation agreed fairly well w ith th a t found by the correlation recommended by Fallon and W atson (6). The cumulative deviations up to 8 0 0 ° F. varied from less than 1% for m ethane to about 5 % for pentane. This error m ight appear to be large if considered as B .t.u. per pound, b u t i t applies only to the calculated differences on a percentage
Edm ister (5) also correlated the pressure-volum e-tem perature da ta based on the reduced tem peratures and pressures of the pure hydrocarbons. Through the application of this correlation, it was possible to develop enthalpy charts for the pure hydrocarbons. S tudy of these enthalpy charts revealed th a t, if the tem perature scale were calibrated empirically so the vapor enthalpy curve of any of the hydrocarbons a t atmospheric pressure was a straight line, the enthalpy curves of all other hydrocarbons were nearly straight. I t was also found th a t a t a constant enthalpy the pressure was approxim ately a linear function when plo tted against this empirical tem perature scale.
P U R E H Y D R O C A R R O N S
The nomograph for the enthalpy of pure hydrocarbons was constructed using a tem perature scale calibrated from the enthalpy of n-butane vapor and a uniformly calibrated pressure scale. The enthalpy scales for the norm al satu rated paraffins were located and calibrated empirically. The nomograph covers
O ctobor, 1945 I N D U S T R I A L A N D E N G I N E E R I N G C H E M I S T R Y 991
Three nom ographs1 present th e vapor and liquid en th a lpies o f ind ividual hydrocarbons and hydrocarbon m ixtures. T he first gives th e en thalp ies o f norm al saturated paraffins from m eth an e to n -octane; th e construction is such th a t a t a sing le settin g th e enthalpy can be found for all the liqu id com ponents a t a given tem perature and o f all th e com ponents in th e vapor a t a given tem perature and pressure. T he second nom ograph shows th e liquid and vapor en thalp ies o f m ixtures o f ligh t hydrocarbons based on th e average m olecular w eight o f th e m ixture. Joule- T hom son effects determ ined from th is nom ograph agree w ith all available data on hydrocarbon m ixtures w ith in the lim its o f precision o f th e nom ograph and w ith in th e accuracy o f th e data . T he third nom ograph gives the liquid and vapor en thalp ies o f th e heavier petroleum fractions. I t is based on a correlation o f th e properties o f th e various fractions o f an o il w ith a characterization factor o f11.8. T he nom ograph is accurate w ith in th e lim its o f reliability o f th e basic correlation.
the range of conditions usually encountered in petroleum work— namely, pressures up to 1000 pounds per square inch and temperatures from —100° to +800° F. To avoid negative enthalpy values in the heat balances, the datum enthalpy condition chosen for these charts was th a t of liquid a t —200 0 F.
I t was also found th a t a t tem peratures appreciably below the critical, the enthalpy of a liquid hydrocarbon was nearly a straight line when plotted against the empirical tem perature scale. A nomograph based on this principle would be the simplest to construct. However, such a nomograph is not the most convenient to use since it requires several settings to obtain the enthalpy of all components present in the liquid mixture. I t is also possible to have a component present in the liquid as a dissolved gas a t temperatures much greater than the critical, and these dissolved gases follow a different relationship. Accordingly, a nomograph was constructed whereby the liquid enthalpy could be determined for all components a t a given tem perature by a single setting of a line on the nomograph.
The vertical enthalpy scales for the liquid hydrocarbons shown in Figure 1 were calibrated for pure liquids up to a temperature 50° F. below the critical. These scales are shown above the dashed line on Figure 1. The calibration of the scales below this locus gives the enthalpy of the absorbed gas.
Othmer and W hite (11) showed th a t heat of absorption can be calculated from the slope of the partial pressure curve of the component a t given concentrations when plotted against the vapor pressure of water a t the same tem perature on log paper. The slope of this curve is equal to the ratio of the molal heat of absorption to the molal laten t heat of evaporation of water a t the given tem perature. This can be derived from the Clausius- Clapeyron equation. However,
y = p /P = K x
or p — K P x
where y = mole fraction of given component in vapor p = partial pressure of component P = to ta l pressure on systemK = vaporization constantx = mole fraction of component in liquid
Thus the partial pressure is proportional to the K value a t constan t to ta l pressure and constant liquid concentration. The heats of absorption of the hydrocarbons were therefore calculated from the slopes of curves obtained by plotting the K values for the components a t different pressures against the vapor pressure of w ater a t the same tem perature. This method is based on the
l Full-size reproductions (approxim ately 18 X 22 inches) of th e three nomographs described here m ay be obtained from the au thors upon request.
same principle as th a t of Holcomb and Brown (8) and yields essentially the same result. I t is, however, somewhat simpler in application.
The enthalpy of the dissolved gas was the same within the limits of accuracy of the calculations when computed for different to tal pressures on the system. Extrapolation of this enthalpy curve below the critical tem perature showed th a t in the critical region there is an apparent heat of solution of liquids which is a function of concentration. Therefore, in setting up this nomograph, i t was arbitrarily decided to draw a smooth curve for the absorbed gas which intersected the enthalpy of pure liquid 50° F. below the critical. Where the component is considered as a dissolved gas, the quantity actually present in the liquid will be so small th a t an error in the enthalpy will have a minor effect on the enthalpy of the to ta l liquid.
U s e o f N o m o g r a p h . The enthalpy of a hydrocarbon in the liquid state is determined in Figure 1 by connecting the proper point on the tem perature scale at the right with the focal point a t the left and reading the intersection of this line with the proper hydrocarbon scale. A single setting gives the enthalpy of all the hydrocarbons on the different scales.
The enthalpy of a hydrocarbon in a vapor is determined by connecting the proper point on the tem perature scale a t the right with the proper value on the pressure scale a t the left. The enthalpy of vapor is read on the proper component scale.
The heats of absorption determined from the nomograph were compared with the data of Budenholzer, Sage, and Lacey (4) on propane and ethane and with the calculations of Sage and Olds on methane (14). A t temperatures above the critical, the heat of absorption agreed with the data a t very dilute concentrations. A t temperatures below the critical, the heat of absorption corresponds to the data for larger concentrations in the liquid. The nomograph thus covers the range of concentrations as they would probably be encountered in practical design calculations on mixtures.
The enthalpy of the hydrocarbon vapor given by Figure 1 agreed with the original charts almost within the precision of interpolating the scale and certainly within the limits of accuracy of the basic enthalpy correlation.
HYDROCARBON M IX T U R E S
The most reliable method for determining the enthalpy of gaseous mixtures is to calculate the enthalpy of all the components a t the given tem perature and zero pressure and subtract from this value the Joule-Thomson effect determined from a correlation such as th a t of Edmister, using the pseudo critical conditions recommended by Kay.
The nomograph of Figure 1 is valuable in this respect since a single setting a t zero pressure and the given tem perature gives the enthalpy of all the components on the proper scales. The determination of the Joule-Thomson effect as described is fairly tedious. Thus, the over-all calculation requires considerable time, and other generalizations have been developed which eliminate this work.
In all process calculations the molecular weight of all the streams is either known or readily calculable, and it has been found very convenient to use this property as a basis for an enthalpy correlation. To this end it would be desirable to draw lines of constant enthalpy on Figure 1. However, these lines would not yield a readable grid. Thus, it was necessary to adjust the datum enthalpy for all the hydrocarbons. The resulting nomograph is shown in Figure 2. The datum enthalpies for the different mixtures are shown on the scale a t the top. The variable datum enthalpy of the individual components does not alter the final heat balances because in any operation where there is no chemical reaction, the same components enter and leave the system, and the datum enthalpies cancel one another. The datum quantities used in the construction of the nomograph are exactly additive for mixtures of components heavier than propane as can
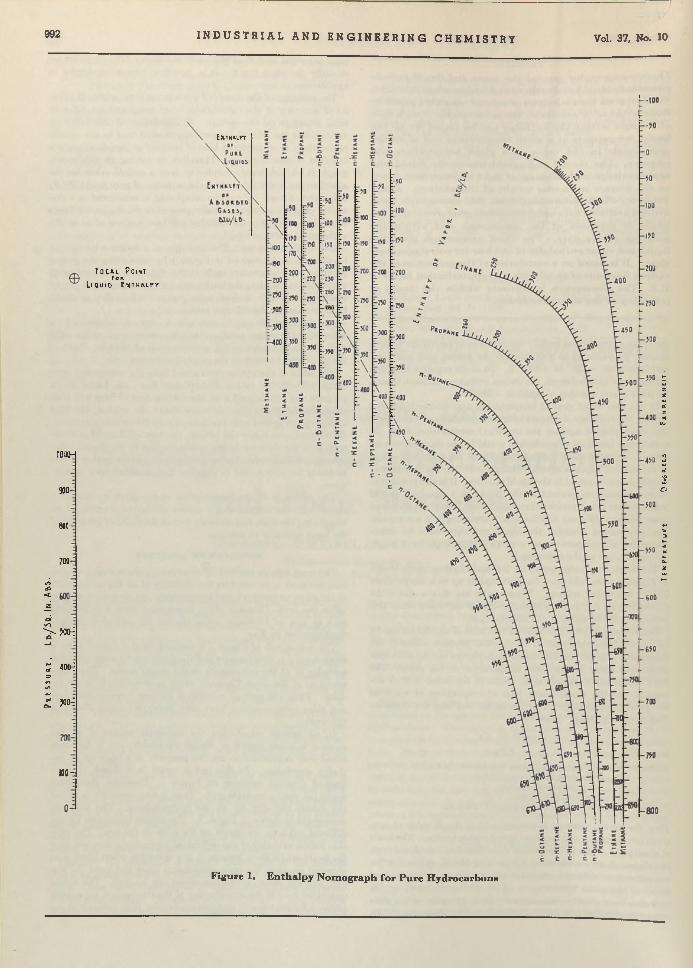
Pit
sju
n
t, L&
./S
a. I
n.
A&
S-
992 I NDUS TRI AL AND E NGI NE E R I NG CHEMI STRY Vol. 37, No. 10
f O C * L P o i ntfo«.
L i q u i d f N T H U P T
I00H
900-
800-
700-
500- i
400-f
JOO-E
100 -=
[ X I H / U P T
Figure 1. Enthalpy Nomograph for Pure Hydrocarbons
TE
MP
tRA
Tu
ei
Dw
i-U
i F
ah
re
mh
eit
.

October, 194S I N D U S T R I A L A N D E N G I N E E R I N G C H E M I S T R Y 993
4-50-
4 0 0 ^
)>0-_
t^ -K -I
2 5 0 ^D -
t> -rr —
^ 200 -;
o ~
t 150«* -iX J*-
100-
1000-
900
800
£ 700-: < IZ -
^ <oQQz c> : - j -
3 W= : « 1 »•
400
300-j
200-i
100
A v i m e t M o n c u i » « . W e i c h t o r M i J C T U n t
20 so 40 50 to 10 ®i> 90 mo moSii<nliii|t|ii 1*11 i‘ i 1 I 1 ‘ I i‘"v
-180- 15O -100 -M -60'r ' n
90-Ar-
D » T U « 1 t N T K M P Y OF L l H U l 6 AT - i 0 0 * F
M 40
hrltM t M ottcmn. WtiGKT of Liquid
MOLICUL&R-W l l C H T J f V t F O S .
Figure 2. Enthalpy Nomograph for Light Hydrocarbons
ICM
Ptf
tfc
TU
Ite
D
tGR
-fC
S
FA
HR
EN
HE
IT

994 I N D U S T R I A L A N D E N G I N E E R I N G C H E M I S T R Y Vol. 37, No. 10
^00-
400-J
d—J -■3
43 300^
o -
5 250 <=* 2_ J “
S a><K
t WK *i - X "
JÜ 100
0 :
1000-
900-j
800-j
»n :S 700-j
É. - e r - »O I> w o -
“ wo4
»j 4 0 0 — u
G H A V I T f
20 30D l í l í l S A . P . I .
4 0 5 0 6 0-+H-V
70<“—i i V i i~-r~i— 1 — i— t—i i—r~
4 4 4 0 3 0 20 10 0 -10 - 2 0 -}0D u t u m E n t h m p t t o f l i q u i c . a t - 2 0 0 ° F.
JO0-Í
Î01H
100t
0 J
G w v i uof
L i q u i b
*■' 40'-500 £
J 0 4 0 4? 50 ?> 60 6^ 70
D t G R - E E i , A . P . I . G Ł A . Y I T Y
Figure 3. E nthalpy N om ograph for Petroleum Fractions (Based on C haracterization F actor 11.8)
--100
--?0
- 0
-50
-100
(—1?0
-?oo
-?>c
-}00 Iz
C»
-?;o <u—
-400 ICt
-450c
—>0fl “ < ot
-5?0 s
-600
-é?f
-70C
-750
-800
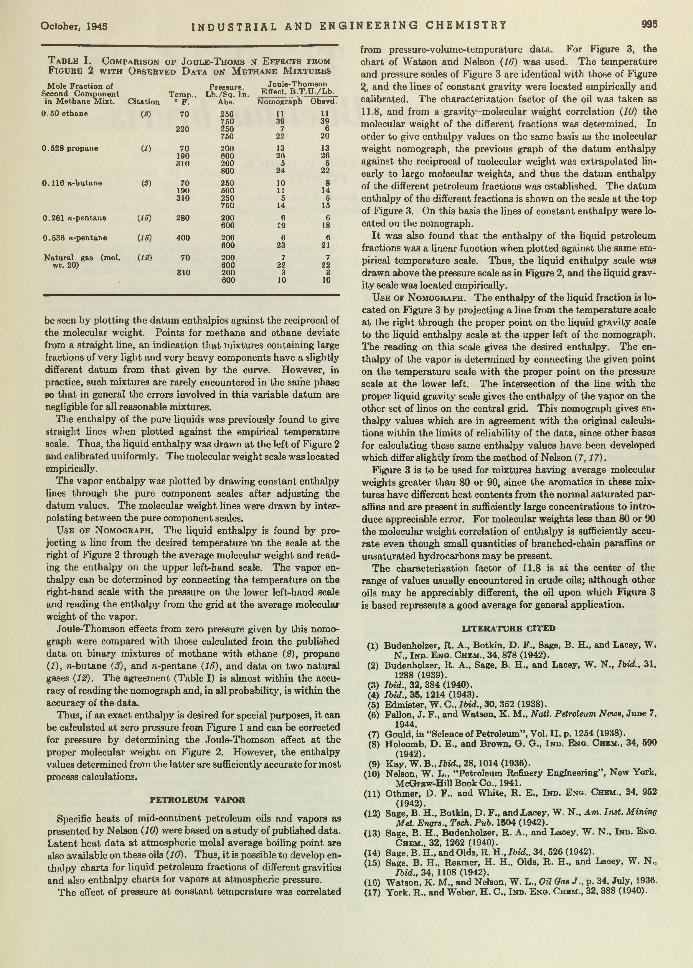
October, 1945 I NDUSTRI AL AND E NGI NEERI NG CHEMI STRY 995
T a b l e I. C o m p a r is o n o f J o u l e - T h o m s n E f f e c t s f r o m F i g u r e 2 w i t h O b s e r v e d D a t a o n M e t h a n e M i x t u r e s
Mole Fraotion of Second Com ponent in M ethane Mixt.
0 .50 ethane
0.528 propane
0 .116 n-butane
0.261 n-pentane
0.536 n-pentane
N atura l gas (mol. wt. 20)
Pressure Joule-ThomsonTem p., L b ./S q . In. Effect, B .T .U ./L b .
C itation ° F. Abs. Nomograph Obsvd,
(«) 70 250 11 11750 39 39
220 250 7 6750 22 20
go 70 200 13 13190 600 26 26310 200 5 5
800 24 22
(S) 70 250 10 8190 500 11 14310 250 5 5
750 14 15
(16) 280 200 6 6600 19 18
(16) 400 200 6 6600 23 21
(IS) 70 200 7 7600 22 22
310 200 3 3600 10 10
be seen by plotting the datum enthalpies against the reciprocal of the molecular weight. Points for methane and ethane deviate from a straight line, an indication th a t mixtures containing large fractions of very light and very heavy components have a slightly different datum from th a t given by the curve. However, in practice, such mixtures are rarely encountered in the same phase so th a t in general the errors involved in this variable datum are negligible for all reasonable mixtures.
The enthalpy of the pure liquids was previously found to give straight lines when plotted against the empirical tem perature scale. Thus, the liquid enthalpy was drawn at the left of Figure 2 and calibrated uniformly. The molecular weight scale was located empirically.
The vapor enthalpy was plotted by drawing constant enthalpy lines through the pure component scales after adjusting the datum values. The molecular weight lines were drawn by interpolating between the pure component scales.
U s e o f N o m o g r a p h . The liquid enthalpy is found by projecting a line from the desired tem perature 'on the scale a t the right of Figure 2 through the average molecular weight and reading the enthalpy on the upper left-hand scale. The vapor enthalpy can be determined by connecting the tem perature on the right-hand scale with the pressure on the lower left-hand scale and reading the enthalpy from the grid a t the average molecular weight of the vapor.
Joule-Thomson effects from zero pressure given by this nomograph were compared With those calculated from the published data on binary mixtures of methane with ethane (2), propane(1), re-butane (3), and re-pentane (15), and data on two natural gases {12). The agreement (Table I) is almost within the accuracy of reading the nomograph and, in all probability, is within the accuracy of the data.
Thus, if an exact enthalpy is desired for special purposes, it can be calculated a t zero pressure from Figure 1 and can be corrected for pressure by determining the Joule-Thomson effect a t the proper molecular weight on Figure 2. However, the enthalpy values determined from the la tte r are sufficiently accurate for most process calculations.
PETROLEUM VAPOR
Specific heats of mid-continent petroleum oils and vapors as presented by Nelson (10) were based on a study of published data. Latent heat data a t atmospheric molal average boiling point are also available on these oils (10). Thus, it is possible to develop en- thalpy charts for liquid petroleum fractions of different gravities and also enthalpy charts for vapors a t atmospheric pressure.
The effect of pressure a t constant tem perature was correlated
from pressure-volume-temperature data. For Figure 3, the chart of W atson and Nelson (16) was used. The tem perature and pressure scales of Figure 3 are identical with those of Figure3, and the lines of constant gravity were located empirically and calibrated. The characterization factor of the oil was taken as11.8, and from a gravity-m olecular weight correlation (10) the molecular weight of the different fractions was determined. In order to give enthalpy values on the same basis as the molecular weight nomograph, the previous graph of the datum enthalpy against the reciprocal of molecular weight was extrapolated linearly to large molecular weights, and thus the datum enthalpy of the different petroleum fractions was established. The datum enthalpy of the different fractions is shown on the scale a t the top of Figure 3. On this basis the lines of constant enthalpy were located on the nomograph.
I t was also found th a t the enthalpy of the liquid petroleum fractions was a linear function when plotted against the same empirical tem perature scale. Thus, the liquid enthalpy scale was drawn above the pressure scale as in Figure 2, and the liquid gravity scale was located empirically.
U s e o f N o m o g r a p h . The enthalpy of the liquid fraction is located on Figure 3 by projecting a line from the tem perature scale a t the right through the proper point on the liquid gravity scale to the liquid enthalpy scale a t the upper left of the nomograph. The reading on this scale gives the desired enthalpy. The enthalpy of the vapor is determined by connecting the given point on the tem perature scale with the proper point on the pressure scale a t the lower left. The intersection of the line with the proper liquid gravity scale gives the enthalpy of the vapor on the other set of lines on the central grid. This nomograph gives enthalpy values which are in agreement with the original calculations within the limits of reliability of the data, since other bases for calculating these same enthalpy values have been developed which differ slightly from the m ethod of Nelson (7 ,17).
Figure 3 is to be used for mixtures having average molecular weights greater than 80 or 90, since the aromatics in these mixtures have different heat contents from the normal saturated paraffins and are present in sufficiently large concentrations to introduce appreciable error. For molecular weights less than 80 or 90 the molecular weight correlation of enthalpy is sufficiently accurate even though small quantities of branched-chain paraffins or unsaturated hydrocarbons may be present.
The characterization factor of 11.8 is a t the center of the range of values usually encountered in crude oils; although other oils may be appreciably different, the oil upon which Figure 3 is based represents a good average for general application.
LITERATURE CITED
(1) Budenholzer, R. A., Botkin, D. F ., Sage, B. H., and Lacey, W.N „ I nd . E ng . C h e m ., 34, 878 (1942).
(2) Budenholzer, R . A., Sage, B. H., and Lacey, W. N., Ibid., 31,1288 (1939).
(3) Ibid., 32, 384 (1940).(4) Ibid., 35, 1214 (1943).(5) Edmister, W. C., Ibid., 30, 352 (1938).(6) Fallon, J . F ., and Watson, K . M., Natl. Petroleum News, June 7,
1944.(7) Gould, in “Science of Petroleum” , Vol. II , p. 1254 (1938).(8) Holcomb, D . E ., and Brown, G . G., I nd . E n q . C h e m ., 34, 590
(1942).(9) Kay, W. B „ Ibid., 2 8 ,1014 (1936).
(10) Nelson, W. L., “ Petroleum Refinery Engineering” , New York,McGraw-Hill Book Co., 1941.
(11) Othmer, D . F., and White, R. E „ I nd . E n g . Ch e m ., 34, 952(1942).
(12) Sage, B. H ., Botkin, D . F ., and Lacey, W. N ., Am. Inst. MiningMet. Engrs., Tech. Pub. 1504 (1942).
(13) Sage, B. H ., Budenholzer, R. A., and Lacey, W. N., I nd . E nq .C h e m ., 32, 1262 (1940).
(14) Sage, B. H ., and Olds, R. tl.,Ib id „ 34, 526 (1942).(15) Sage, B. H., Reamer, H. H., Olds, R . H ., and Lacey, W. N.,
Ibid., 34, 1108 (1942).(16) W atson, K. M ., and Nelson, W, L., OH Gas J ., p. 34, July, 1936.(17) York, R „ and Weber, H . C „ I n d . E n g . C h e m ., 32, 388 (1940).
Production of Tyrothricin in Cultures of Bacillus brevis
J . C. LEW IS, KEENE P. DIM ICK, AND I. C. FEUSTEL
W estern R eg io n a l R esearch L abora tory ,U. S. D e p a r tm e n t o f A g r icu ltu re , A lb a n y , C alif.
Yields o f tyrothric in in excess o f 2 gram s per liter o f m edium were obta ined through th e grow th o f B a cillu s brevis (B .G .) in shallow layers o f m ed iu m . M axim um yields were found after 10 or 16 days o f in cu b ation at abou t 35° C. w ith th e m edium disposed in 11-m m . layers. Com plex sources o f n itrogen , su ch as B acto tryptone, acid hydrolyzate o f casein , corn-steep liquor, tryptic d igest o f soybean m eal, and press ju ic e concentrates from w aste asparagus b u tts , proved m ost su itab le; relatively sim ple su bstan ces, such as g lu tam ic acid , asparagine, or a m m on iu m su lfa te plus c itric or m alic acid , proved m oderately effective in th e presence o f 0.2% B acto tryptone. A bout 3 to 5% o f a ferm entable carbon com pound, su ch as glucose, m an n ito l, or glycerol, was necessary for best y ie ld s; fructose, sucrose, lactose , and m altose proved m uch less effective. R equirem ents for ca lc ium , m agnesium , and m anganese were dem onstrated . U n like the other n itrogen sources m entioned , properly processed asparagus concentrates yielded n u trition a lly com plete m edia w ith ou t addition o f sugar or inorganic e lem en ts.
TY R O TH R IC IN , an antibiotic m aterial formed during the growth of Bacillus brevis, is now produced commercially for
medical and veterinary uses. In the course of investigations of the potential usefulness of press juices from vegetable wastes in industrial microbiological processes (5, 6), shallow-layer cultures on asparagus-butt-juice media gave tyrothricin yields approaching 2 grams per liter (5). The yields reported elsewhere (2, 3, 9) are much lower for both shallow-layer and submerged cultures. This paper deals w ith the cultural and nutritional factors prom oting high yields of tyrothricin in shallow-layer cultures and the use of juice concentrates from waste asparagus bu tts as culture media.
Almost all of the published work on tyrothricin production has been done w ith a strain of Bacillus brevis isolated and designated "B.G.” by Dubos and Hotchkiss (2). The substock of this strain used principally in this study is identical w ith th a t discussed previously (5).
Stock cultures were m aintained on Bacto nutrient agar slants. The slants were incubated a t 35° C. for 24 hours and then stored in the refrigerator. Inoculum cultures were prepared by suspending the surface growth from a freshly incubated nutrient agar slant culture in sterile water, and transferring this to 50 ml. of asparagus juice medium (concentrate E diluted to 0.15% nitrogen was generally used, Figure 7). After incubation for 24 hours a t 35 ° C., the inoculum cultures were pooled and used a t the ra te of 1 ml. per 50 ml. of experimental medium.
The experim ental cultures were usually grown on 50-ml. portions of medium in 250-ml. Pyrex Erlenmeyer flasks. This m ethod gave an 11-mm. depth of medium, which represented a compromise between the m ost rapid production and the need for suitable volumes of culture liquid. The cultures were incubated a t 35° C. in an incubator room m aintained a t about 50% relative hum idity to diminish evaporation. Enough flasks were set up
for each treatm ent so th a t duplicates could be removed for assay a t intervals. Before assays were made, evaporation losses were corrected by addition of w ater, so th a t all yield d a ta are in terms of original volume of medium.
Two types of m edia were used in these investigations: media in which asparagus juice was the sole or principal component, and media based on Bacto tryptone or o ther nitrogenous substances, plus glucose or other fermentable carbon compounds, and inorganic ingredients. Asparagus m edia were sterilized a t about pH 5 (the unaltered pH of the asparagus juice or diluted asparagus juice concentrate) by autoclaving for 20 m inutes under 10 pounds of steam pressure. After the flasks had cooled, the medium was adjusted aseptically to pH 7.5 by the addition of predetermined aliquots of sterile 1 N sodium hydroxide (generally 0.5 to 3 ml. were required). T ryptone media were prepared in the same way, although no difference in results was obtained when they were sterilized a t pH 7.5.
Growth was estim ated turbidim etrically. Suitable dilutions of the whole culture suspension were measured in a Klett-Summer- son photoelectric colorimeter w ith a wide-band filter, w ith maximum transmission a t 660 millimicrons. For convenience the tu rbidity reading was m ultiplied by the dilution factor to give “K lett units’ ’ of bacterial growth. Older cultures w ith heavy or wrinkled pellicles could not be dispersed completely by shaking; such cultures were dispersed in a homogenizer consisting of a square- bottom glass tube and a closely fitting, mechanically driven rubber cylinder. Blanks on the pH -adjusted uninoculated medium were subtracted.
Tyrothricin was determined by a rapid m ethod (1), based on the hemolytic action of tyrothricin on ra t erythrocytes. The decrease in turb id ity on hemolysis was m easured photometrically. All results in this paper are expressed in term s of the standard described by Dimick (1).
T urbidity and tyrothricin determ inations checked closely for replicate cultures. Calculations based on routine assays selected a t random showed th a t th e over-all variation in culturing and assaying gave the following standard deviation for individual cultures: for turb id ity , 50 K le tt units or 3% of th e actual mean values; for tyrothricin production, 0.07 gram per liter or 7% of the actual mean values.
The hemolytic assay was checked by the isolation of tyrothricin in certain experiments. The procedure of Dubos and Hotchkiss (#) was conducted on a scale th a t would perm it the isolation of tyrothricin from 40- to 100-ml. samples of culture suspension. The steps of their procedure were unchanged except th a t the solutions were heated to 50° C. on the steam b a th a fter tyrothricin was precipitated w ith 1% saline; th is modification induced rapid flocculation and aided filtration. The precipitate obtained was dried to constant weight over phosphorus pentoxide in vacuo. The hemolytic activ ity of th is m aterial was determ ined after solution in alcohol.
Yields of tyrothricin for a given trea tm en t were fairly constant from one experiment to another. T hus a control medium containing 1.5% tryptone, 3% glucose, and inorganic salts was tested in connection w ith each of eight experiments carried out to obtain the comparisons given in Figures 7 and 8. T he cultural work extended over a period of 9 weeks. The m ean yields and standard deviations of the individual yields in grams per liter follow: 4 days of incubation, 1.23 =*= 0.09; 10 days, 2.14 =*= 0.11; 16 days, 2.32 ± 0.19. The turbidities developed were equally regular; the corresponding values in K le tt units were: 4 days of incubation’ 1440 =*= 90; 10 days, 2590 =*= 90; 16 days, 3110 =*= 130. Nevertheless, each experiment was designed, as far as possible to be complete within itself so th a t the in terpretation of results’ would not depend on questionable differences in absolute values from one experiment to another.
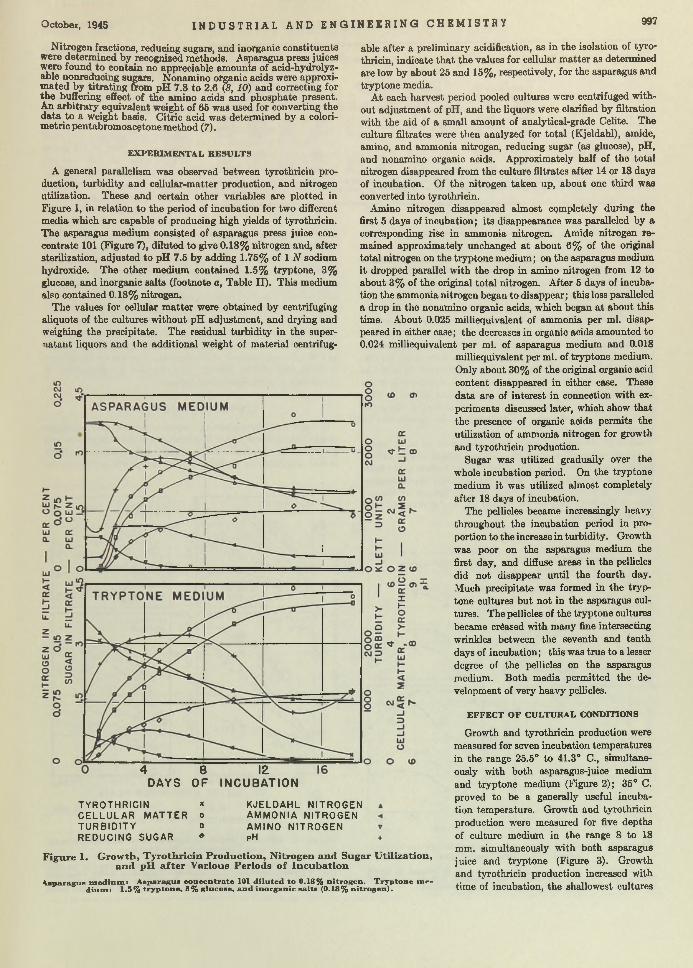
October, 1945 I N D U S T R I A L A N D E N G I N E E R I N G C H E M I S T R Y 997
N itrogen fractions, reducing sugars, and inorganic constituents were determ ined by recognized methods. Asparagus press juices were found to contain no appreciable am ounts of acid-hydrolyzable nonreducing sugars. Nonamino organic acids were approxim ated by titra tin g from pH 7.8 to 2.6 (8, 10) and correcting for the buffering effect of the amino acids and phosphate present. An arb itrary equivalent weight of 65 was used for converting the d a ta to a weight basis. Citric acid was determined by a colorim etric pentabromoacętone m ethod (7).
EXPER IM ENTA L R ESU LTS
A general parallelism was observed between tyrothricin production, turbidity and cellular-m atter production, and nitrogen utilization. These and certain other variables are plotted in Figure 1, in relation to the period of incubation for two different media which are capable of producing high yields of tyrothricin. T he asparagus medium consisted of asparagus press juice concentrate 101 (Figure 7), diluted to give 0.18% nitrogen and, after sterilization, adjusted to pH 7.5 by adding 1.75% of 1 iV sodium hydroxide. The other medium contained 1.5% tryptone, 3% glucose, and inorganic salts (footnote a, Table II) . This medium also contained 0.18% nitrogen.
The values for cellular m atter were obtained by centrifuging aliquots of the cultures without pH adjustm ent, and drying and weighing the precipitate. The residual tu rbid ity in the supernatant liquors and the additional weight of m aterial centrifug-
able after a preliminary acidification, as in the isolation of tyrothricin, indicate th a t the values for cellular m atter as determined are low by about 25 and 15%, respectively, for the asparagus and tryptone media.
A t each harvest period pooled cultures were centrifuged without adjustm ent of pH, and the liquors were clarified by filtration with the aid of a small amount of analytical-grade Celite. The culture filtrates were then analyzed for to ta l (Kjeldahl), amide, amino, and ammonia nitrogen, reducing sugar (as glucose), pH, and nonamino organic acids. Approximately half of the total nitrogen disappeared from the culture filtrates after 14 or 18 days of incubation. Of the nitrogen taken up, about one th ird waa converted into tyrothricin.
Amino nitrogen disappeared almost completely during the first 5 days of incubation; its disappearance was paralleled by a corresponding rise in ammonia nitrogen. Amide nitrogen remained approximately unchanged a t about 6% of the original to ta l nitrogen on the tryptone medium; on the asparagus medium it dropped parallel w ith the drop in amino nitrogen from 12 to about 3% of the original to ta l nitrogen. After 5 days of incubation the ammonia nitrogen began to disappear; this loss paralleled a drop in the nonamino organic acids, which began a t about this time. About 0.025 milliequivalent of ammonia per ml. disappeared in either case; the decreases in organic acids amounted to 0.024 milliequivalent per ml. of asparagus medium and 0.018
milliequivalent per ml. of tryptone medium. Only about 30% of the original organic acid content disappeared in either case. These data are of interest in connection w ith experiments discussed later, which show that the presence of organic acids permits the utilization of ammonia nitrogen for growth and tyrothricin production.
Sugar was utilized gradually over the whole incubation period. On the tryptone medium it was utilized almost completely after 18 days of incubation.
The pellicles became increasingly heavy throughout the incubation period in proportion to the increase in turbidity. Growth was poor on the asparagus medium the first day, and diffuse areas in the pellicles did not disappear until the fourth day. Much precipitate was formed in the tryp tone cultures bu t not in the asparagus cultures. The pellicles of the tryptone cultures became crèased with many fine intersecting wrinkles between the seventh and tenth days of incubation ; this was true to a lesser degree of the pellicles on the asparagus medium. Both media permitted the development of very heavy pellicles.
EFFECT O F CULTURAL CONDITIONS
Growth and tyrothricin production were measured for seven incubation temperatures in the range 25.5° to 41.3° C., simultaneously w ith both asparagus-juice medium and tryptone medium (Figure 2); 35° C. proved to be a generally useful incubation tem perature. Growth and tyrothricin production were measured for five depths of culture medium in the range 8 to 18 mm. simultaneously w ith both asparagus juice and tryptone (Figure 3). Growth and tyrothricin production increased with time of incubation, the shallowest cultures
4 8 12DAYS OF INCUBATION
TYROTHRICIN *C E L L U L A R M A TT E R oT U R B ID IT Y oREDUCING SUGAR ♦
K JE LD A H L NITROGEN A M M O N IA NITROGEN A M IN O NITROGEN pH
Figure 1. G row th, T yrothricin P roduction, N itrogen and Sugar U tilization , and pH after Various Periods o f Incu bation
A sparagus m ed iu m : A sparagus co n ce n tr a te 101 d ilu ted to 0.18% n itro g en . T ryp ton e m e d iu m : 1.5% try p to n e , 3% g lu co se , an d in organ ic sa lts (0.18% n itro g en ).
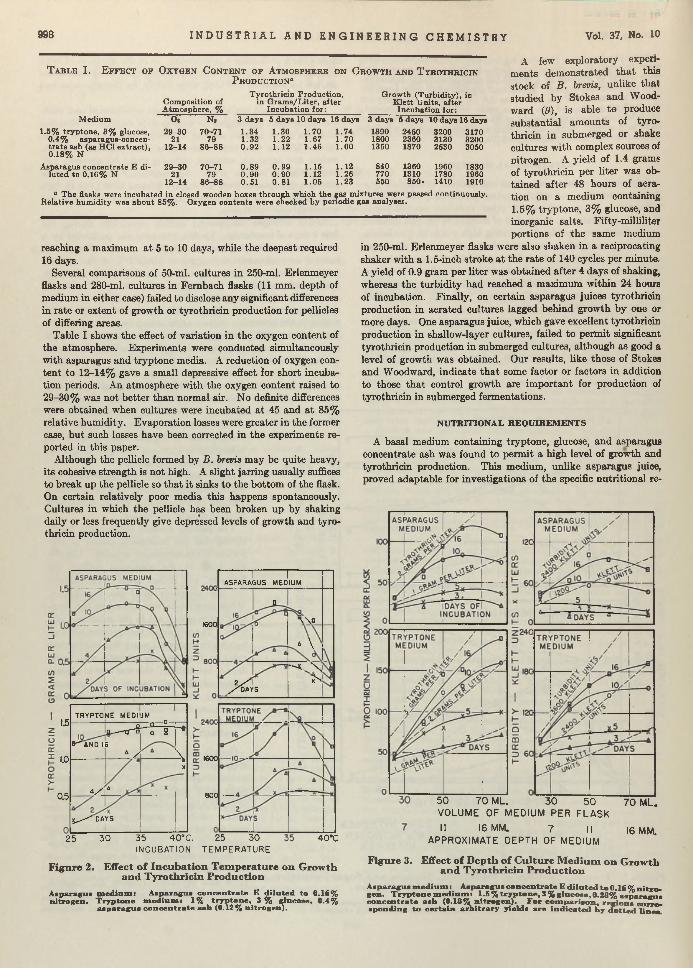
998 I N D U S T R I A L A N D E N G I N E E R I N G C H E M I S T R Y Vol. 37, No. 10
T a b l e I . E f f e c t o f O x y g e n C o n t e n t o f A t m o s p h e r e o n G r o w t h a n d T y r o t h r i c i n P r o d u c t i o n “
Com position of A tm osphere, %
T yro th ric in P roduction, in G ram s/L ite r , after
Incuba tion for:
G row th (T urb id ity ), in K le t t U nits, after
Incuba tion for:0 . N . 3 days 5 days 10 days 16 days 3 days 5 days 10 days 16 days
29-30 70-71 1.34 1.36 1.70 1.74 1890 2450 3200 317021 79 1.32 1.22 1.67 1.70 1800 2360 3130 3200
12-14 86-88 0 .92 1.12 1.46 1 .60 1350 1870 2530 3050
29-30 70-71 0 .89 0 .99 1.15 1.12 840 1360 1960 183021 79 0 .90 0 .90 1.12 1.26 770 1310 1780 1960
12-14 86-88 0.51 0.81 1 .05 1.23 550 850. 1410 1910
M edium
1.5% tryp tone , 3 % glucose,0 .4% asparagus-concen- tra te ash (as HC1 extract),0 .18% N
Asparagus concentrate E dilu ted to 0 .16% N
a The flasks were incubated in closed wooden boxes th rough which th e gas m ixtures were passed continuously.R elative hum id ity was ab o u t 85% . Oxygen contents were checked by periodic gas analyses.
reaching a maximum a t 5 to 10 days, while the deepest required 16 days.
Several comparisons of 50-ml. cultures in 250-ml. Erlenmeyer flasks and 280-ml. cultures in Fem bach flasks (11 mm. depth of medium in either case) failed to disclose any significant differences in ra te or extent of growth or tyrothricin production for pellicles of differing areas.
Table I shows the effect of variation in the oxygen content of the atmosphere. Experiments were conducted simultaneously with asparagus and tryptone media. A reduction of oxygen conten t to 12-14% gave a small depressive effect for short incubation periods. An atmosphere with the oxygen content raised to 29-30% was not better than normal air. No definite differences were obtained when cultures were incubated a t 45 and a t 85% relative hum idity. Evaporation losses were greater in the former case, bu t such losses have been corrected in the experiments reported in this paper.
Although the pellicle formed by B. brevis may be quite heavy, its cohesive strength is not high. A slight jarring usually suffices to break up the pellicle so th a t i t sinks to the bottom of the flask. On certain relatively poor media this happens spontaneously. Cultures in which the pellicle has been broken up by shaking daily or less frequently give depressed levels of growth and tyrothricin production.
A few exploratory experiments dem onstrated th a t this stock of B . brevis, unlike that studied by Stokes and Woodward (9), is able to produce substantial am ounts of tyrothricin in submerged or shake cultures w ith complex sources of nitrogen. A yield of 1.4 grams of tyrothricin per liter was obtained after 48 hours of aeration on a medium containing 1.5% tryptone, 3% glucose, and inorganic salts. Fifty-milliliter portions of the same medium
in 250-ml. Erlenm eyer flasks were also shaken in a reciprocating shaker w ith a 1.5-inch stroke a t the ra te of 140 cycles per minute. A yield of 0.9 gram per liter was obtained after 4 days of shaking, whereas the turb id ity had reached a maximum within 24 hours of incubation. Finally, on certain asparagus juices tyrothricin production in aerated cultures lagged behind growth by one or more days. One asparagus juice, which gave excellent tyrothricin production in shallow-layer cultures, failed to perm it significant tyrothricin production in submerged cultures, although as good a level of growth was obtained. Our results, like those of Stokes and Woodward, indicate th a t some factor or factors in addition to those th a t control growth are im portant for production of tyrothricin in submerged fermentations.
N UTR ITIO NA L R EQ U IR EM EN TS
A basal medium containing tryptone, glucose, and asparagus concentrate ash was found to perm it a high level of growth and tyrothricin production. This medium, unlike asparagus juice, proved adaptable for investigations of the specific nutritional re-
1600
I ......... 1 ...........ASPARAGUS MEDIUM
□
V \ D
L \
2 / 1 / D A Y S _____ 1--------------
' S . \
>
L5
1.0
0.5
1 .............TRYPTONE MEDI JM
— n — ° -
®^AND 1
Qo_-— t r u
sA y
o a - 1
\
4 / jtk
X
^ / D A Y S
1600
25
F igure 2.
30 35 4 0 °C.
INCUBATION
800-----
25 30
TEMPERATURE40°C
50 7 0 ML. 3 0 50 7 0 M L.VOLUME OF MEDIUM PER FLASK
II 16 MM. 7 II
APPROXIMATE DEPTH OF MEDIUM16 MM.
Effect o f Incu bation T em perature on Growth and T yrothricin Production
A sparagus m ed iu m t n itro g en . T ryp ton e
a sp a ra g u s co n c e n tr a te ash
A sparagus co n ce n tr a te E d ilu ted to 0.16% m ed iu m i 1% try p to n e , 3 % g lu cose , 0.4%
*i (©.12 % n itro g en ).
F igure 3. Effect o f D epth o f C ulture M ed iu m o n G row th and T yrothricin P rod uction
A sparagus m e d iu m t A sp aragu s co n c e n tr a te E d ilu te d t o 0.16 % n i tro- g en . T ryp ton e m e d iu m t 1.5 % try p to n e , 3 % g lu co se , 0.28% a sp aragu s c o n ce n tr a te a sh (0.18% n itro g e n ). F or c o m p a r iso n , reg ion « c o m * sp o n d in g to ce r ta in arb itrary y ie ld s are in d ic a te d b y d o tte d lin e s
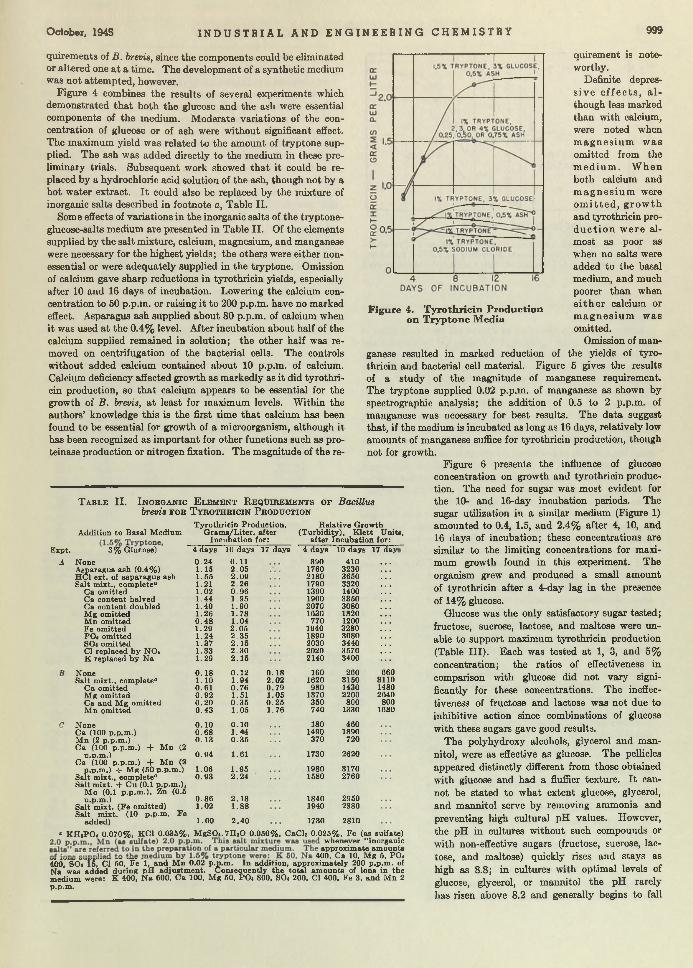
O ctober, 1945 I N D U S T R I A L A N D E N G I N E E R I N G C H E M I S T R Y 999
quirem ents of B. brevis, since the components could be eliminated or altered one a t a time. The development of a synthetic medium was no t attem pted, however.
Figure 4 combines the results of several experiments which dem onstrated th a t both the glucose and the ash were essential components of the medium. M oderate variations of the concentration of glucose or of ash were without significant effect. The maximum yield was related to the am ount of tryptone supplied. The ash was added directly to the medium in these preliminary trials. Subsequent work showed th a t it could be replaced by a hydrochloric acid solution of the ash, though not by a hot water extract. I t could also be replaced by the mixture of inorganic salts described in footnote a, Table II.
Some effects of variations in the inorganic salts of the tryptone- glucose-salts medium are presented in Table I I . Of the elements supplied by the salt mixture, calcium, magnesium, and manganese were necessary for the highest yields; the others were either non- essential or were adequately supplied in the tryptone. Omission of calcium gave sharp reductions in tyrothricin yields, especially after 10 and 16 days of incubation. Lowering the calcium concentration to 50 p.p.m. or raising it to 200 p.p.m. have no marked effect. Asparagus ash supplied about 80 p.p.m. of calcium when it was used a t the 0.4% level. After incubation about half of the calcium supplied remained in solution; the other half was removed on centrifugation of the bacterial cells. The controls without added calcium contained about 10 p.p.m. of calcium. Calcium deficiency affected growth as markedly as it did tyrothricin production, so th a t calcium appears to be essential for the growth of B. brevis, a t least for maximum levels. W ithin the authors’ knowledge this is the first time th a t calcium has been found to be essential for growth of a microorganism, although it has been recognized as im portant for other functions such as proteinase production or nitrogen fixation. The magnitude of the re-
Figure 4. Tyrothricin Production on Tryptone Media
T a b l e II. I n o r g a n i c E l e m e n t R e q u i r e m e n t s o f Bacillus brevis f o r T y r o t h r i c i n P r o d u c t i o n
Addition to Basal M ediumTyrothricin Production,
G ram s/L ite r , after Incuba tion for:
Relative G rowth (Turbid ity), K le tt Units,
after Incuba tion for:Expt.
A3% Glucose) 4 days 10 days 17 days 4 days 10 days 17 day
None 0 .24 0.11 390 410Asparagus ash (0.4%) HC1 ext. of asparagus asb
1.15 2 .05 1760 32301.55 2.09 2180 3650
Salt mixt., complete® 1.21 2 .26 1790 3320C a om itted 1.02 0 .96 1390 1400C a content halved 1.44 1.95 1900 3350C a content doubled 1.40 1.90 2070 3080M g om itted 1.26 1.78 1630 1820M n om itted 0 .48 1.04 770 1200Fe om itted 1.29 2 .05 1940 3280PO4 om itted 1.24 2 .35 1890 3080SO4 om itted 1.37 2 .15 2030 3440Cl replaced by NO* 1.33 2.30 2020 3570K replaced by N a 1.29 2 .15 2140 3400
None 0 .18 0.12 0 .18 160 260 660Salt m ixt., com plete0 1.10 1.94 2.02 1620 3150 3110
C a om itted 0.61 0.76 0.79 980 1430 1480M g om itted 0 .92 1.51 1.05 1370 2200 2640C a and M g omitted 0 .20 0 .35 0 .25 350 800 800M n om itted 0 .43 1.05 1.76 740 1330 1680
None 0 .10 0 .10 180 460C a (100 p.p.m .) 0 .68 1.44 1490 1890M n (2 p.p.m .) 0 .13 0 .35 370 720C a (100 p.p.m .) + M n
p.p.m.)(2
0 .94 1.61 1730 2620Ca (100 p.p.m .) + M n (2
p.p.m.) + M g (50 p.p.m.) 1 .06 1.95 1980 3170Salt m ixt., com plete“ 0 .93 2 .24 * 1580 2760Salt m ixt. + C u (0.1 p.p.m .),
M o (0.1 p.p .m .), Zn (0.5 p.p.m.) 0 .86 2 .18 1840 2950
Salt m ixt. (Fe om itted)Fe
1.02 1 .88 1940 2980Salt m ixt. (10 p.p.m .
added) 1 .00 2 .40 1730 2810
<* K H 1PO 4 0.070% , KC1 0.035% , M g S 04 .7H i0 0.050% , C aCl2 0.025% , Fe (as sulfate)’ whenever “ inorganic approxim ate am ounts
______________________ _ 400, C a 10, M g 5, PO4400, SO4 15, Cl 50, Fe 1, and M n 0.02 p.p.m . In addition, approxim ately 200 p.p.m . of Na was added during p H _adju8tmjent. Consequently th e to ta l amounts_of_ions in the medium were: K 400, Ni p.p.m .
a 600, C a 100, M g 50, PO4 800, SO4 200, Cl 400, Fe 3, and M n 2
quirem ent is note- worthy.
Definite depress iv e e f f e c ts , a l though less marked than with calcium, were noted when m a g n e s iu m w as om itted from the m e d iu m . W h en both calcium and m a g n e s iu m were o m it te d , g ro w th and tyrothricin prod u c tio n w ere a lmost as poor as when no salts were added to the basal medium, and much poorer than when e i th e r calcium or m a g n e s iu m w as omitted.
Omission of manganese resulted in marked reduction of the yields of tyrothricin and bacterial cell material. Figure 5 gives the results of a study of the magnitude of manganese requirement. The tryptone supplied 0.02 p.p.m. of manganese as shown by spectrographic analysis; the addition of 0.5 to 2 p.p.m. of manganese was necessary for best results. The data suggest that, if the medium is incubated as long as 16 days, relatively low amounts of manganese suffice for tyrothricin production, though not for growth.
Figure 6 presents the influence of glucose concentration on growth and tyrothricin production. The need for sugar was most evident for the 10- and 16-day incubation periods. The sugar utilization in a similar medium (Figure 1) amounted to 0.4, 1.5, and 2.4% after 4, 10, and 16 days of incubation; these concentrations are similar to the limiting concentrations for maximum growth found in this experiment. The organism grew and produced a small amount of tyrothricin after a 4-day lag in the presence of 14% glucose.
Glucose was the only satisfactory sugar tested; fructose, sucrose, lactose, and maltose were unable to support maximum tyrothricin production (Table III) . Each was tested a t 1, 3, and 5% concentration; the ratios of effectiveness in comparison w ith glucose did not vary significantly for these concentrations. The ineffectiveness of fructose and lactose was not due to inhibitive action since combinations of glucose with these sugars gave good results.
The polyhydroxy alcohols, glycerol and man- nitol, were as effective as glucose. The pellicles appeared distinctly different from those obtained with glucose and had a fluffier texture. I t cannot be stated to w hat extent glucose, glycerol, and mannitol serve by removing ammonia and preventing high cultural pH values. However, the pH in cultures without such compounds or with non-effective sugars (fructose, sucrose, lactose, and maltose) quickly rises and stays as high as 8.8; in cultures with optimal levels of glucose, glycerol, or mannitol the pH rarely has risen above 8.2 and generally begins to fall
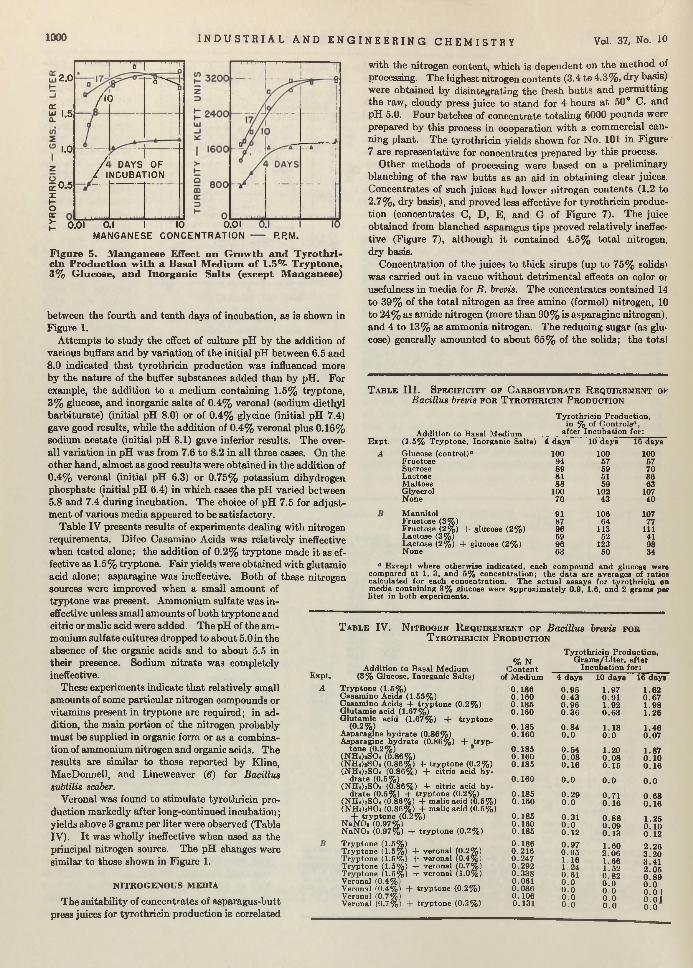
1000 I N D U S T R I A L A N D E N G I N E E R I N G C H E M I S T R Y Vol. 37, No. 10
,2.0
(CUJ 1.5
1.0
EO.5 x t- o er >
T 11 □ ’ '1 1 .......
/ •< 3
o ' — J
/ / 1
DAYSNCUBA1
OFriON
0.01 0.1 I MANGANESE
10 0.01 CONCENTRATION P. P. M.
Figure 5. M anganese Effect on G row th and T yrothri- cin P roduction w ith a Basal M edium o f 1 .5 ^ T ryptone, 3% G lucose, and Inorganic Sa lts (except M anganese)
between the fourth and ten th days of incubation, as is shown in Figure 1.
A ttem pts to study the effect of culture pH by the addition of various buffers and by variation of the initial pH between 6.5 and 8.0 indicated th a t tyrothricin production was influenced more by the nature of the buffer substances added than by pH. For example, the addition to a medium containing 1.5% tryptone, 3% glucose, and inorganic salts of 0.4% veronal (sodium diethyl barbiturate) (initial pH 8.0) or of 0.4% glycine (initial pH 7.4) gave good results, while the addition of 0.4% veronal plus 0.16% sodium acetate (initial pH 8.1) gave inferior results. The overall variation in pH was from 7.6 to 8.2 in all three cases. On the other hand, alm ost as good results were obtained in the addition of 0.4% veronal (initial pH 6.3) or 0.75% potassium dihydrogen phosphate (initial pH 6.4) in which cases the pH varied between 5.8 and 7.4 during incubation. The choice of pH 7.5 for adjustm ent of various media appeared to be satisfactory.
Table IV presents results of experiments dealing with nitrogen requirements. Difco Casamino Acids was relatively ineffective when tested alone; the addition of 0.2% tryptone made it as effective as 1.5 % tryptone. F air yields were obtained w ith glutamic acid alone; asparagine was ineffective. Both of these nitrogen sources were improved when a small am ount of tryptone was present. Ammonium sulfate was ineffective unless small amounts of both tryptone and citric or malic acid were added. The pH of the ammonium sulfate cultures dropped to about 5.0 in the absence of the organic acids and to about 5.5 in their presence. Sodium nitra te was completely ineffective.
These experiments indicate th a t relatively small am ounts of some particular nitrogen compounds or vitam ins present in tryptone are required; in addition, the main portion of the nitrogen probably m ust be supplied in organic form or as a combination of ammonium nitrogen and organic acids. The results are similar to those reported by Kline,MacDonnell, and Lineweaver (6) for Bacillus subtilis scaber.
Veronal was found to stim ulate tyrothricin production markedly after long-continued incubation ; yields above 3 grams per liter were observed (Table IV). I t was wholly ineffective when used as the principal nitrogen source. The pH changes were similar to those shown in Figure 1.
with the nitrogen content, which is dependent on the m ethod of processing. The highest nitrogen contents (3.4 to 4.3% , dry basis) were obtained by disintegrating the fresh b u tts and perm itting the raw, cloudy press juice to stand for 4 hours a t 50° C. and pH 5.0. Four batches of concentrate totaling 6000 pounds were prepared by this process in cooperation w ith a commercial canning plant. The tyrothricin yields shown for No. 101 in Figure 7 are representative for concentrates prepared by this process.
Other methods of processing were based on a preliminary blanching of the raw bu tts as an aid in obtaining clear juices. Concentrates of such juices had lower nitrogen contents (1.2 to 2.7%, dry basis), and proved less effective for tyrothricin production (concentrates C, D, E, and G of Figure 7). The juice obtained from blanched asparagus tips proved relatively ineffective (Figure 7), although it contained 4.5% to ta l nitrogen, dry basis.
Concentration of the juices to thick sirups (up to 75% solids) was carried out in vacuo w ithout detrim ental effects on color or usefulness in media for B. brevis. The concentrates contained 14 to 39% of the to ta l nitrogen as free amino (formol) nitrogen, 10 to 24% as amide nitrogen (more than 90% is asparagine nitrogen), and 4 to 13% as ammonia nitrogen. The reducing sugar (as glucose) generally amounted to about 65% of the solids; the total
T a b l e I I I . S p e c i f i c i t y o f C a r b o h y d r a t e R e q u i r e m e n t ok Bacillus brevis f o r T y r o t h r i c i n P r o d u c t i o n
E xpt.
A
A ddition to Basal M edium
T yro th ric in P roduction, in % of C ontro ls0,
a fte r Incuba tion for:(1.5% Tryp tone, Inorganic Salts) 4 days 10 days 16 days
Glucose (control)“ 100 100 100Fructose 94 57 57Sucrose 89 59 70Lactose 81 51 36M altose 88 59 63Glycerol 100 102 107None 70 43 40
M annito l 91 106 107Fructose (3% ) 87 64 77Fructose (2% ) + glucose (2%) 96 113 111Lactose (3% ) 59 52 41Lactose (2% ) + glucose (2%) 96 123 98None 63 50 34
° E xcept where otherwise indicated , each com pound and glucose were com pared a t 1, 3, and 5% concen tration ; th e d a ta are averages of ratios ca lculated for each concentration . T he ac tu a l assays for ty ro th ric in on m edia containing 3 % glucose were approx im ately 0.9, 1.6, and 2 gram s per liter in bo th experiments.
T a b l e IV. N i t r o g e n R e q u i r e m e n t o f Bacillus brevis f o r T y r o t h r i c i n P r o d u c t i o n
Expt.
A
N IT R O G E N O U S M ED IA
The suitability of concentrates of asparagus-butt press juices for tyrothricin production is correlated
Addition to Basal M edium (3% Glucose, Inorganic Salts)
T ryp tone (1.5%)Casam ino Acids (1.55%)Casam ino Acids + try p to n e (0.2% ) G lutam ic acid (1.67%)G lutam ic acid (1.67% ) + tryp tone
(0 .2 %^Asparagine hy d ra te (0.86% )A sparagine hy d ra te (0.86% ) + tryp
tone (0.2% ) 9(NH4)2S04 (0.86%)(N H ^ S O * (0.86% ) - f try p to n e (0.2% ) (NH.O2SO4 (0.86% ) + citrio ac id h y
d ra te (0.5%)(NKUJaSCV (0.86% ) + citric acid hy
d ra te (0.5% ) 4- try p to n e (0.2%) (N H 4)2S04 (0.86%) + malic acid (0.5% ) (NH4)2S 0 4 (0.86% ) + malic acid (0.5% )
+ try p to n e (0.2%)NaNOa (0.97%)NaNOs (0.97% ) + try p to n e (0.2%)
Tryp tone (1.5%)Tryp tone (1.5%) + veronal (0.2%) Tryp tone (1.5%) + veronal (0.4%) Tryp tone (1.5% ) + veronal (0.7%) Tryp tone (1.5% ) + veronal (1.0%) Veronal (0.4%)Veronal (0.4%) + tryp tone (0.2%) Veronal (0.7%)Veronal (0.7% ) + try p to n e (0.2%)
T yro th ric in P roduction , % N G ram s/L ite r , after
Content Incuba tion for:of M edium 4 days 10 days 16 days
0 .1860 .1600 .1850 .160
0 .9 50 .430 .9 60 .3 6
1.970 .911.920 .63
1.620 .671 .981 .26
0 .1 8 50 .160
0 .8 40 .0
1 .130 .0
1 .460 .07
0 .1 8 50 .1600 .185
0 .540 .0 80 .16
1.200 .0 80 .15
1.870 .1 00 .1 6
0 .160 0 .0 0 .0 0 .0
0 .1850 .160
0 .2 90 .0
0 .710 .1 6
0 .6 80 .1 6
0 .185 0 .160 0 .185
0 .310 .00 .12
0 .8 80 .0 90 .13
1 .250 .1 00 .1 2
0 .1860 .2160 .2470.2920 .3380.0610 .0860.1060.131
0 .9 70 .951.161.240.610 .00 .00 .00 .0
1 .602 .0 61.661.520 .820 .00 .00 .00 .0
2 .2 6 3 .2 0 3 .41 2 .05 0 .8 9 0 .0 0 .0 I 0 .0 1 0 .0
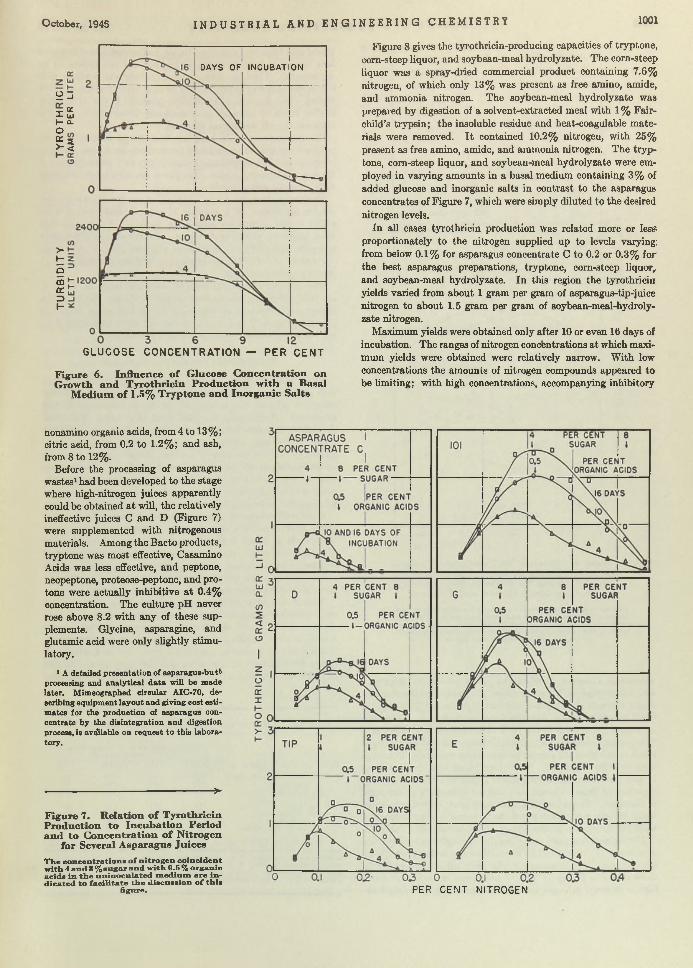
O ctober, 1945 I N D U S T R I A L A N D E N G I N E E R I N G C H E M I S T R Y 1001
>-HOdlCC=>H
GLUCOSE CONCENTRATION — PER CENT
Figure 6. In fluence o f G lucose C oncentration on G row th and T yrothricin Production w ith a Basal
M edium o f 1.5% T ryptone and Inorganic Salts
2 3
I *■ I ujI- Q-
i* >■ <
IDAYS OF INCUBATION
Figure 8 gives the tyrothricin-producing capacities of tryptone, corn-steep liquor, and soybean-meal hydrolyzate. The corn-steep liquor was a spray-dried commercial product containing 7.6% nitrogen, of which only 13% was present as free amino, amide, and ammonia nitrogen. The soybean-meal hydrolyzate was prepared by digestion of a solvent-extracted meal with 1 % Fairchild’s trypsin; the insoluble residue and heat-coagulable m aterials were removed. I t contained 10.2% nitrogen, with 25% present as free amino, amide, and ammonia nitrogen. The tryp tone, corn-steep liquor, and soybean-meal hydrolyzate were employed in varying amounts in a basal medium containing 3% of added glucose and inorganic salts in contrast to the asparagus concentrates of Figure 7, which were simply diluted to the desired nitrogen levels.
In all cases tyrothricin production was related more or les? proportionately to the nitrogen supplied up to levels varying; from below 0.1% for asparagus concentrate C to 0.2 or 0.3% for the best asparagus preparations, tryptone, corn-steep liquor, and soybean-meal hydrolyzate. In this region the tyrothricin yields varied from about 1 gram per gram of asparagus-tip-'j uice nitrogen to about 1.5 gram per gram of soybean-meal-hydroly- zate nitrogen.
Maximum yields were obtained only after 10 or even 16 days of incubation. The ranges of nitrogen concentrations a t which maximum yields were obtained were relatively narrow. W ith low concentrations the amounts of nitrogen compounds appeared to be limiting; w ith high concentrations, accompanying inhibitory
nonamino organic acids, from 4 to 13%; citric acid, from 0.2 to 1.2%; and ash, from 8 to 12%.
Before the processing of asparagus wastes1 had been developed to the stage where high-nitrogen juices apparently could be obtained a t will, the relatively ineffective juices C and D (Figure 7) were supplemented w ith nitrogenous materials. Among the Bacto products, tryptone was most effective, Casamino Acids was less effective, and peptone, neopeptone, proteose-peptone, and pro- tone were actually inhibitive a t 0.4% concentration. The culture pH never rose above 8.2 w ith any of these supplements. Glycine, asparagine, and glutamic acid were only slightly stimulatory.
1 A detailed p resen tation of a sparagus-bu tt processing and analy tical d a ta will be made later. M imeographed circular AIC-70, describing equipm ent layou t and giving cost estim ates for th e production of asparagus concentrate by the d isin tegration and digestion process, is available on request to this laboratory.
-------------------------------------— ----- —>-
Figure 7. R elation o f T yrothricin P roduction to In cu bation Period and to C oncentration o f N itrogen
for Several A sparagus Juices
T h e con cen tration » o f n itro g en c o in c id en t w ith 4 an d 8 % su g a r a n d w ith 0 .5 % organ ic a cid s in th e u n in o cu la ted m ed iu m are in d ica ted to fa c i lita te th e d iscu ss io n o f th is
figure. PER CENT NITROGEN
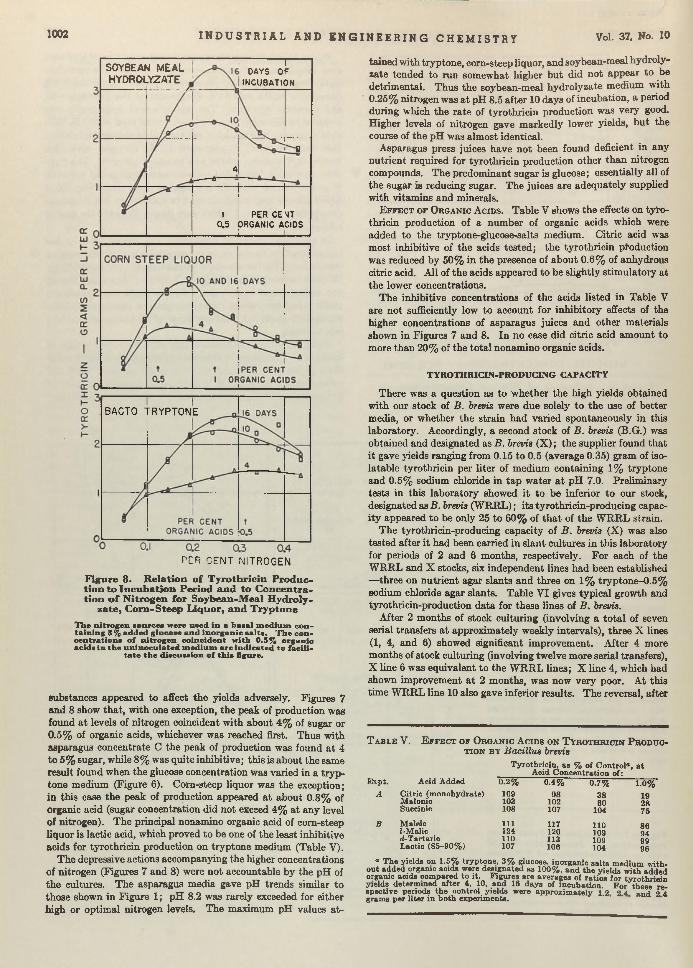
1002 I N D U S T R I A L A N D E N G I N E E R I N G C H E M I S T R Y Vol. 37, No. 10
tained w ith tryptone, corn-steep liquor, and soybean-meal hydroly- zate tended to run somewhat higher b u t did not appear to be detrim ental. Thus the soybean-meal hydrolyzate medium with 0.25% nitrogen was a t pH 8.5 after 10 days of incubation, a period during which the ra te of tyrothricin production was very good. Higher levels of nitrogen gave m arkedly lower yields, bu t the course of the pH was alm ost identical.
Asparagus press juices have not been found deficient in any Dutrient required for tyrothricin production other th an nitrogen compounds. The predom inant sugar is glucose; essentially all of the sugar is reducing sugar. The juices are adequately supplied w ith vitam ins and minerals.
E f f e c t o f O r g a n i c A c i d s . Table V shows th e effects on tyrothricin production of a num ber of organic acids which were added to the tryptone-glucose-salts medium. Citric acid was most inhibitive of the acids tested; the tyrothricin production was reduced by 50% in the presence of about 0.6% of anhydrous citric acid. All of the acids appeared to be slightly stim ulatory a t the lower concentrations.
The inhibitive concentrations of the acids listed in Table V are not sufficiently low to account for inhibitory effects of the higher concentrations of asparagus juices and other materials shown in Figures 7 and 8. In no case did citric acid am ount to more than 20% of the to ta l nonamino organic acids.
substances appeared to affect the yields adversely. Figures 7 and 8 show th a t, w ith one exception, the peak of production was found a t levels of nitrogen coincident with about 4% of sugar or 0.5% of organic acids, whichever was reached first. Thus w ith asparagus concentrate C the peak of production was found a t 4 to 5% sugar, while 8% was quite inhibitive; this is about the same result found when the glucose concentration was varied in a tryp tone medium (Figure 6). Corn-steep liquor was the exception; in th is case the peak of production appeared a t about 0.8% of organic acid (sugar concentration did not exceed 4% a t any level of nitrogen). The principal nonamino organic acid of corn-steep liquor is lactic acid, which proved to be one of the least inhibitive acids for tyrothricin production on tryptone medium (Table V).
The depressive actions accompanying the higher concentrations of nitrogen (Figures 7 and 8) were not accountable by the pH of the cultures. The asparagus media gave pH trends similar to those shown in Figure 1; pH 8.2 was rarely exceeded for either high or optim al nitrogen levels. The maximum pH values at-
TYROTHRICI.N-PRODUCING CAPACITY
There was a question as to whether the high yields obtained w ith our stock of B. brevis were due solely to the use of better media, or whether the strain had varied spontaneously in this laboratory. Accordingly, a second stock of B. brevis (B.G.) was obtained and designated as B. brevis (X ); the supplier found that it gave yields ranging from 0.15 to 0.5 (average 0.35) gram of iso- latable tyrothricin per liter of medium containing 1% tryptone and 0.5% sodium chloride in tap w ater a t pH 7.0. Preliminary tests in this laboratory showed it to be inferior to our stock, designated as B. brevis (W R R L); its tyrothricin-producing capacity appeared to be only 25 to 60% of th a t of the W RRL strain.
The tyrothricin-producing capacity of B . brevis (X) was also tested after i t had been carried in slan t cultures in this laboratory for periods of 2 and 6 months, respectively. For each of the W RRL and X stocks, six independent lines had been established —three on n u trien t agar slants and three on 1% tryptone-0.5% sodium chloride agar slants. Table VI gives typical growth and tyrothricin-production data for these lines of B . brevis.
After 2 months of stock culturing (involving a to ta l of seven serial transfers a t approximately weekly intervals), three X lines (1, 4, and 6) showed significant improvem ent. After 4 more m onths of stock culturing (involving twelve more serial transfers), X line 6 was equivalent to the W RRL lines; X line 4, which had shown improvement a t 2 m onths, was now very poor. A t this time W RRL line 10 also gave inferior results. The reversal, after
T a b l e V. E f f e c t o f O r g a n i c A c i d s o n T y r o t h r i c i n P r o d u c t i o n b y Bacillus brevis
Tyro th ric in , as % of C on tro l“ , a t ________ Acid C oncen tra tion of :
Expt. Acid Added 0.2% 0.4%
A C itric (m onohydrate) 109 98M alonic 103 102Succinic 108 107
B M aleic 111 117Z-Malic 124 120d-T artaric 110 113Lactic (85-90% ) 107 106
0.7% 1.0%
38 1980 28
104 75
110 86109 94109 99104 96
“ T he yields on 1.5% tryp tone , 3 % glucose, inorganic salts m edium w ith ou t added orgamo aoida were designated as 100%, and th e yields w ith added organio acids com pared to it. F igures are averages of ra tios for ty ro th r ic in yields determ ined a fter 4, 10, and 16 days of incubation . F or these respective periods th e contro l yields were approx im ately 1.2 2 4 a n d 2 4 gram s per li te r in b o th experim ents.
SOYBEAfHYDROL
4 MEALy Z A T E ^
-------- r ------,---------
DAYS OF INCUBATION
4—--- ń-----
' fi
t0.5
PER CE ORGANIC A
NTCIOS
BACTO TRYPTONE
pe: r c e n t n it r o g e n
Figure 8. Relation of Tyrothricin Production to Incubation Period and to Concentration o f Nitrogen for Soybean-Meal Hydroly
zate, Corn-Steep Liquor, and Tryptone
T h e n itrogen source* w ere u sed in a b a sa l m ed iu m con ta in in g S % added g lu cose and in organ ic sa lts . T h e co n cen tra tio n s o f n itrogen co in c id en t w ith 0.5% organio acids in th e u n in o cu la ted m ed iu m are in d ica ted to fa c ili
ta te th e d iscu ss io n o f th is figure.
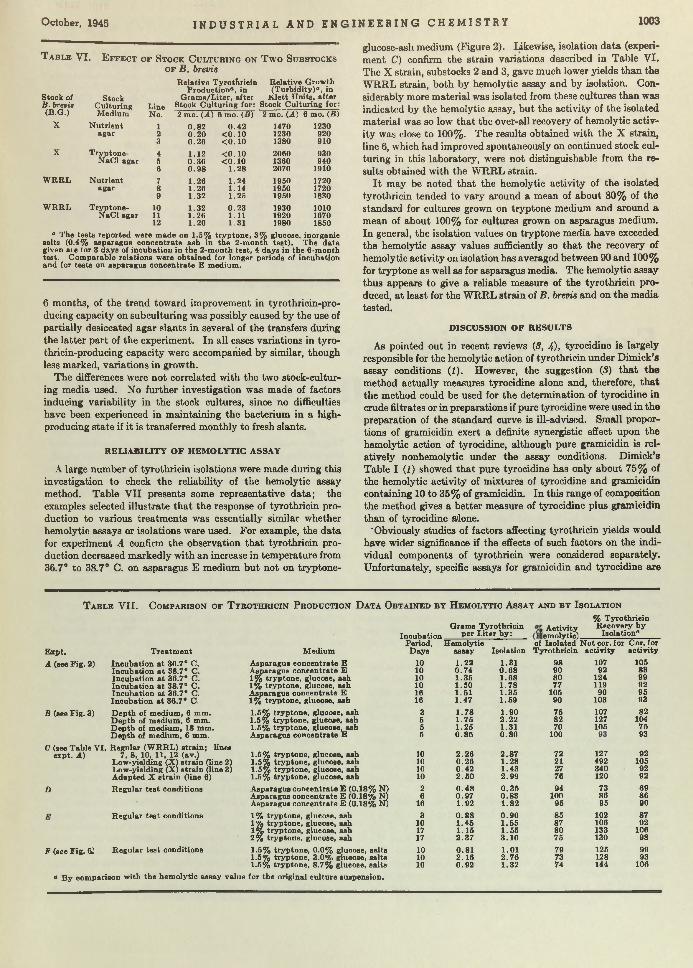
October, 1945 I N D U S T R I A L A N D E N G I N E E R I N G C H E M I S T R Y 1003
T a b l e VI. E f f e c t o f S t o c k C u l t u r i n g o n Tw o S u b s t o c k s o f B. brevis
Stock of B. brevis
StockC ulturing Line
R elative Tyro th ricin R elative G row th Production®, in (T u rb id ity )4*, in
G ram s/L ite r , a fter K le t t U nits, a fter Stook C ulturing for: Stock C ulturing for:
(B.G.) M edium No. 2 mo. (A) 6 mo. (B) 2 mo. (A) 6 mo. (B )X N u trien t 1 0 .82 0 .42 1470 1230
agar 2 0 .20 < 0 .1 0 1230 9203 0 .26 < 0 .1 0 1380 910
X T ryptone- 4 1.12 < 0 .1 0 2060 930N aC l agar 5 0 .36 < 0 .1 0 1360 940
6 0 .98 1.28 2070 1910
W R R L N u tr ien t 7 1 .26 1.24 1950 1720agar 8 1.26 1.14 1950 1720
9 1.32 1.25 1950 1830
W R R L T ryp tone- 10 1.32 0 .23 1930 1010N aC l agar 11 1.26 1.11 1920 1670
12 1 .20 1.31 1980 1850
° The tests reported were m ade on 1.5% tryp tone , 3% gluoose, inorganic salts (0.4% asparagus concentrate ash in th e 2-m onth te st) . The da ta given are tor 3 days of incubation in th e 2-m onth test, 4 days in th e 0-month test. C om parable relations were obta ined for longer periods of incubation and for tests on asparagus concentrate E medium.
6 months, of the trend toward improvement in tyrothricin-pro- ducing capacity on subculturing was possibly caused by the use of partially desiccated agar slants in several of the transfers during the la tter part of the experiment. In all cases variations in tyro- thricin-producing capacity were accompanied by similar, though less marked, variations in growth.
The differences were not correlated w ith the two stock-culturing media used. No further investigation was made of factors inducing variability in the stock cultures, since no difficulties have been experienced in m aintaining the bacterium in a high- producing state if it is transferred m onthly to fresh slants.
R E L IA B IL IT Y O F H E M O L Y T IC ASSAY
A large num ber of tyrothricin isolations were made during this investigation to check the reliability of the hemolytic assay method. Table V II presents some representative da ta ; the examples selected illustrate th a t the response of tyrothricin production to various treatm ents was essentially similar whether hemolytic assays or isolations were used. For example, the data for experiment A confirm the observation th a t tyrothricin production decreased m arkedly with an increase in tem perature from 36.7° to 38.7° C. on asparagus E medium but not on tryptone-
glucose-ash medium (Figure 2). Likewise, isolation d a ta (experim ent C) confirm the strain variations described in Table VI. The X strain, substocks 2 and 3, gave much lower yields than the W RRL strain, both by hemolytic assay and by isolation. Considerably more m aterial was isolated from these cultures than was indicated by the hemolytic assay, bu t the activity of the isolated m aterial was so low th a t the over-all recovery of hemolytic activity was close to 100%. The results obtained with the X strain, line 6, which had improved spontaneously on continued stock culturing in this laboratory, were not distinguishable from the results obtained with the W RRL strain.
I t may be noted th a t the hemolytic activity of the isolated tyrothricin tended to vary around a mean of about 80% of the standard for cultures grown on tryptone medium and around a m ean of about 100% for cultures grown on asparagus medium. In general, the isolation values on tryptone media have exceeded the hemolytic assay values sufficiently so th a t the recovery of hemolytic activity on isolation has averaged between 90 and 100% for tryptone as well as for asparagus media. The hemolytic assay thus appears to give a reliable measure of the tyrothricin produced, a t least for the W RRL strain of B. brevis and on the media tested.
D ISC U S SIO N O F R E S U L T S
As pointed out in recent reviews (3, 4), tyrocidine is largely responsible for the hemolytic action of tyrothricin under Dimick’s assay conditions (1). However, the suggestion (3) th a t the method actually measures tyrocidine alone and, therefore, th a t the m ethod could be used for the determ ination of tyrocidine in crude filtrates or in preparations if pure tyrocidine were used in the preparation of the standard curve is ill-advisod. Small proportions of gramicidin exert a definite synergistic effect upon the hemolytic action of tyrocidine, although pure gramicidin is relatively nonhemolytic under the assay conditions. Dimick’s Table I (1) showed th a t pure tyrocidine has only about 75% of the hemolytic activity of mixtures of tyrocidine and gramicidin containing 10 to 35% of gramicidin. In this range of composition the method gives a better measure of tyrocidine plus gramicidin than of tyrocidine alone.
'Obviously studies of factors affecting tyrothricin yields would have wider significance if the effects of such factors on the individual components of tyrothricin were considered separately. Unfortunately, specific assays for gramicidin and tyrocidine are
T a b l e V II. C o m p a r i s o n o f T y b o t h r i c i n P r o d u c t io n D a t a O b t a i n e d b t H e m o l y t i c A s s a y a n d b y I s o l a t io n
E z p t. T rea tm en t
A (see Fig. 2) Incuba tion a t 36.7° C.Incuba tion a t 38.7° C. Incubation a t 36.7° C. Incubation a t 38.7° C. Incuba tion a t 36.7° C. Incuba tion a t 36.7° C.
B (see Fig. 3) D ep th of m edium, 6 mm .D epth of medium , 6 mm. D ep th of medium» IS mm. D ep th of m edium, 6 mm.
C (see Table VI, R egular (W R R L ) s tra in ; lines expt. A) 7, 8, 10, 11, 12 (av.)
Low-yielding (X) s tra in (line 2) Low-yielding (X ) s tra in (line 3) A dap ted X s tra in (line 6)
D R egular teBt conditions
R egular te s t conditions
F (see Fig. QJ R egular te st conditions
M edium
A sparagus concentrate E Asparagus concentrate E 1% tryp tone , glucose, ash 1% tryp tone , glucose, ash A sparagus concentrate E 1% tryp tone , glucose, ash
1.5% tryp tone , glucose, ash 1.5% tryp tone , glucose, ash 1.5% tryp tone , glucose, ash A sparagus concentrate E
1.5% tryp tone , glucose, ash 1.5% tryp tone , gluoose, ash 1.5% tryp tone , glucose, ash 1 .5% tryp tone , glucose, ash
Asparagus concentrate E (0.18% N) Asparagus concentrate E (0.18% Nj A sparagus concentrate E (0.18% N)
1% tryp tone , glucose, ash 1% tryp tone , glucose, ash 1% tryp tone , glucose, ash 2% tryp tone , glucose, ash
1 .5% tryp tone , 0 .0% gluoose, salts 1.5% tryp tone , 3 .0% gluoose, salts 1.5% tryp tone , 8 .7% glucose, salts
In cu b a tio n __________Period, Hemolytio
G ram s Tyrothricin per L iter b y :
Days
101010101616
3555
10101010
26
16
3101717
101010
1.220 .741.351.501.51 1 .47
1.781.751.25 0 .8 6
2 .26 0 .26 0 .42 2 .50
0 .480 .971.92
0.881 .451.15 2 .37
0.812 .16 0 .92
1.31 0.68 1.68 1 .78 1.35 1.59
1.902.221.31 0 .80
2 .871.281.432 .99
0 .350 .831.82
0 .901.551.55 3 .10
1.012 .761.32
{A ctivity emolytic)_
assay Isolation
% Tyrothricin K ecoveiy by
Iso lation0 of Iso lated N o t cor. for Cor. for Tyro th ricin ac tiv ity ac tiv ity
98 107 10590 92 8380 124 9977 119 92
105 90 9590 103 93
75 82 70
100
72 21 2776
94 100
95
85878075
797374
107127105
127 492 340 120
738695
102106133130
125128 144
82104 75 93
92105
92 92
698690
8792
10698
9993
106
° B y com parison w ith th e hem olytic assay value for th e original culture suspension.
1004 I NDUSTRI AL AND E NGI NE E RI NG CHEMI STRY Vol. 37, No. 10
not yet available. W ithin this lim itation the hemolytic assay has proved to be a useful and convenient method of determining combined tyrocidine-gramicidin.
Asparagus concentrate furnishes a complete medium for the production of tyrothricin in shallow-layer cultures. The asparagus juice should be processed in such a way as to yield a nitrogen content of 3% or higher on the dry-weight basis; the ratio of nitrogen to organic acids (nonamino) should be high. The concentrates deteriorate on storage a t room tem perature, so th a t refrigeration appears to be necessary. A lternative procedures, such as treatm ent of storage-damaged concentrates, chemical stabilization, or stabilization by complete drying, have not been investigated sufficiently.
A C K N O W LE D G M E N T
The authors are indebted to the following members of this laboratory: E. J. Eastm ond for spectrographic determ inations of iron, manganese, and copper; E. F. P o tter for determ ination of nitrogen distribution and citric acid in asparagus concentrates; and various others for interest and advice. Acknowledgment is
m ade to J. H. Thompson of this laboratory, to F lotill Products Company, and to Libby, McNeill, and Libby Com pany for cooperation in the pilot-scale production of asparagus concentrates, and to S. K. Pilcher, of C utter Laboratories, Inc., for the stock ofB. brevis (X). The valuable technical assistance of Alice Mc- Gilvery is also appreciated.
L IT E R A T U R E C IT E D
(1) Dimick, K . P ., J . Biol. Chem., 149, 387 (1943;.(2) Dubos, R. J., and Hotchkiss, R . D., J. Exptl. Med., 73, 629
(1941).(3) Hoogerheide, J . C., Botan. Rev., 10, 599 (1944).(4) Hotchkiss, R. D., Advances in Enzymol., 4, 153 (1944).(5) Humfeld, H arry, and Feustel, I. C., Proc. Soc. Exptl. Biol. Med.,
54, 232 (1943).(6) Kline, L., MacDonnell, L. R., and Lineweaver, H ., I n d . E n q .
C h e m ., 36, 1152 (1944).(7) Perlman, D., Lardy, H. A., and Johnson, M . J., I n d . E n g .
C h e m ., A n a l . Ed., 16, 515 (1944).(8) Pucher, G. W ., Vickery, H . B., and W akeman, A. J ., Ibid., 6,
140 (1934).(9) Stokes, J . L., and Woodward, C. R., Jr ., J . Bact., 46, 83 (1943).
(10) Van Slyke, D . D ., and Palm er, W. W., J. Biol. Chem., 41, 567(1920).
Factors Affecting ... .REINHOLD F. LARSON
U niversity o f Illin o is , U rbana, III.
BOILING IN A LIQUID
EBULLITION, or the formation of vapor bubbles within a liquid or a t a liquid-solid boundary, has received little a t
tention except in connection with the study of heat transfer to a boiling liquid (8, 17, 26, 29, 30, 38, 50). The prediction of heat transfer coefficients suitable for boiler or evaporator design has been difficult and has depended largely upon empirical data obtained from tests on models. Correlation of these data has been along lines suggested by dimensional analysis, and some progress has been made in simplifying and rationalizing the problem. Yet there remain some interesting observable phenomena which probably control the over-all transfer of heat to a large extent and are not well understood. Among these are the large differences in coefficient obtained with various solid heating surfaces tested under similar conditions, and the differences in m anner and extent of bubble formation observed on these surfaces. From the la tter have evolved the terms “nucleate” and “film boiling” which describe the phenomenon bu t contribute little else.
Superheating of a liquid or establishment of a metastable state, whereby the liquid exists a t a tem perature above the normal boiling tem perature and yet does not boil, has been known since 1807, and the extraordinary phenomena of liquids existing under a negative pressure, or in tension, have been demonstrated (42, 43, 60, 63). Philipp and Tiffany (45) reported a case where this phenomenon was seriously interfering with the performance of an evaporator in a commercial refrigerator. They succeeded in solving the problem by finding the proper “ebullator” , a solid substance or surface in the presence of which superheating did not occur.
In investigations of the heat transfer from heated solids to boiling liquids, this superheating has been observed bu t only to a slight extent (30). This superheat, usually less than 1° F., is probably th a t necessary to m aintain the heat flow from the liquid to the rising vapor bubbles. However, considerably more superheat is indicated in the very thin film of liquid adjacent to the heating solid. No means of measuring the tem perature of this liquid film is available, although in some cases it m ight be
T he phen om en a o f liquid su perh eat and o f n u clea te and film boiling in con n ection w ith h ea t transfer are reviewed. On th e basis o f w etta b ility or in terfacia l free adhesion energy, a theory for th e solid ebu lla tor is evolved. An apparatus to te st th e theory is described, and various solids are tested for th e eb u llitio n property.
assumed nearly equal to the heating-solid surface tem perature, which can be estim ated from tem peratures of the solid on its heated side and known coefficients of conductivity for the solid.
In the nucleate type of boiling, the over-all heat transfer coefficient increases (38) w ith the over-all tem perature difference between the main body of the boiling liquid and the heating solid, and with heat transfer rate until a critical tem perature difference is attained a t which the coefficient begins to decrease. In general, this indicates the beginning of film boiling. The heat transfer ra te subsequently decreases as a result of the decrease in coefficient with further increase in tem perature of the heating solid. Experiments (17, 26) indicate th a t the position of this curve differs with different heating solid-liquid combinations, and can be shifted somewhat by various treatm ents of the heating surface and by the addition of a w etting agent to the liquid. In general, the wetted surface gives the highest heat transfer coefficients.
The wetting property is supposed to be indicated by the contac t angle made by the bubble before being released. Physical roughening of the surface has also produced nucleate boiling, which has led to the supposition th a t bubbles originate in cavities having the proper curvature (26, 30). In th is m anner the peculiar phenomenon of bubbles repeatedly forming a t particular spots has been explained. This concept arises from the capillary theory and the Kelvin-Helmholtz equation which has been used to explain the m etastable or supersaturated vapor sta te (31). This equation relates the pressures within and w ithout a drop (or bubble) with the normal vapor pressure, and predicts the radius of the nucleus drop in supposed equilibrium with the m etastable vapor. O ther possible nuclei for condensation of supersaturated
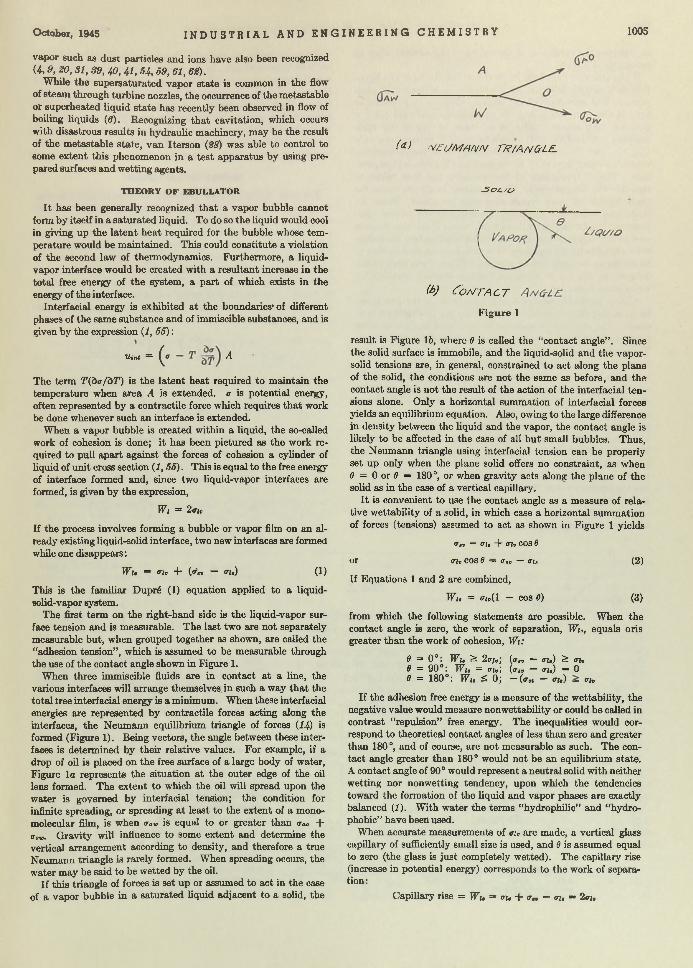
O ctober, 1945 I N D U S T R I A L A N D E N G I N E E R I N G C H E M I S T R Y 1005
vapor such as dust particles and ions have also been recognized (4 ,9 , 20,31, 89, 40, 41, 54,69, 61, 62).
W hile the supersaturated vapor state is common in the flow of steam through turbine nozzles, the occurrence of the m etastable or superheated liquid sta te has recently been observed in flow of boiling liquids (6). Recognizing th a t cavitation, which occurs with disastrous results in hydraulic machinery, may be the result of the m etastable state , van Iterson (28) was able to control to some extent this phenomenon in a tes t apparatus by using prepared surfaces and w etting agents.
T H E O R Y O F EB U LLA TO R
I t has been generally recognized th a t a vapor bubble cannot form by itself in a sa turated liquid. To do so the liquid would cool in giving up the laten t heat required for the bubble whose tem perature would be m aintained. This could constitute a violation of the second law of thermodynamics. Furthermore, a liquid- vapor interface would be created with a resultant increase in the to ta l free energy of the system, a part of which exists in the energy of the interface.
Interfacial energy is exhibited a t the boundaries- of different phases of the same substance and of immiscible substances, and is given by the expression (1,56):
« ,„ = ( * A
The term T(dafdT) is the laten t heat required to m aintain the tem perature when area A is extended. a is potential energy, often represented by a contractile force which requires th a t work be done whenever such an interface is extended.
When a vapor bubble is created within a liquid, the so-called work of cohesion is done; i t has been pictured as the work required to pull apart against the forces of cohesion a cylinder of liquid of unit cross section (1 ,56). This is equal to the free energy of interface formed and, since two liquid-vapor interfaces are formed, is given by the expression,
Wi = 2au
If the process involves forming a bubble or vapor film on an already existing liquid-solid interface, two new interfaces are formed while one disappears:
W u = ai, + (a„ — au) (1)
This is the familiar Dupr6 (1) equation applied to a liquid- solid-vapor system.
The first term on the right-hand side is the liquid-vapor surface tension and is measurable. The last two are not separately measurable but, when grouped together as shown, are called the “adhesion tension” , which is assumed to be measurable through the use of the contact angle shown in Figure 1.
When three immiscible fluids are in contact a t a line, the various interfaces will arrange themselves, in such a way th a t the to ta l free interfacial energy is a minimum. When these interfacial energies are represented by contractile forces acting along the interfaces, the Neum ann equilibrium triangle of forces (14) is formed (Figure 1). Being vectors, the angle between these interfaces is determined by their relative values. For example, if a drop of oil is placed on the free surface of a large body of water, Figure la represents the situation a t the outer edge of the oil lens formed. The extent to which the oil will spread upon the water is governed by interfacial tension; the condition for infinite spreading, or spreading a t least to the extent of a mono- molecular film, is when aav> is equal to or greater than <Tao “f" tiorc. G ravity will influence to some extent and determine the vertical arrangement according to density, and therefore a true Neumann triangle is rarely formed. When spreading occurs, the water may be said to be wetted by the oil.
I f th is triangle of forces is set up or assumed to act in the case of a vapor bubble in a saturated liquid adjacent to a solid, the
<a > 'V£(J/WA/V/V TR/ANCrLE.
S o i . /o
(t>) Co n t a c t
F igure 1
result is Figure 16, where 8 is called the “contact angle” . Since the solid surface is immobile, and the liquid-solid and the vapor- solid tensions are, in general, constrained to act along the plane of the solid, the conditions are not the same as before, and the contact angle is not the result of the action of the interfacial ten sions alone. Only a horizontal summation of interfacial forces yields an equilibrium equation. Also, owing to the large difference in density between the liquid and the vapor, the contact angle is likely to be affected in the ¿ase of all bu t small bubbles. Thus, the Neumann triangle using interfacial tension can be properly set up only when the plane solid offers no constraint, as when 8 = 0 or 8 = 180°, or when gravity acts along the plane of the solid as in the case of a vertical capillary.
I t is convenient to use the contact angle as a measure of rela- tive w ettability of a solid, in which case a horizontal summation of forces (tensions) assumed to act as shown in Figure 1 yields
a , v = a u + a i , COS 8
or <riv cos 8 — a,„ — at, (2)
If Equations 1 and 2 are combined,
Wi, = <ri,( 1 - cos 6) (3)
from which the following statem ents are possible. When the contact angle is zero, the work of separation, WI,, equals oris greater than the work of cohesion, W i:
0 = 0°: W u £ 2a/,; (a„ — au) & au 8 = 90°: Wh = aiv; (atv — au) = 0 8 = 180°: Wu ^ 0; — (aBt — au) ~ au
If the adhesion free energy is a measure of the wettability, the negative value would measure non wettability or could be called in contrast “repulsion” free energy. The inequalities would correspond to theoretical contact angles of less than zero and greater than 180 °, and of course, are not measurable as such. The contact angle greater than 180° would not be an equilibrium state. A contact angle of 90° would represent a neutral solid with neither wetting nor nonwetting tendency, upon which the tendencies toward the formation of the liquid and vapor phases are exactly balanced (1). W ith water the terms “hydrophilic” and “hydro- phobic” have been used.
When accurate measurements of au are made, a vertical glass capillary of sufficiently small size is used, and 8 is assumed equal to zero (the glass is just completely w etted). The capillary rise (increase in potential energy) corresponds to the work of separation:
Capillary rise = W u “ <n, + a„ — au = 2at,
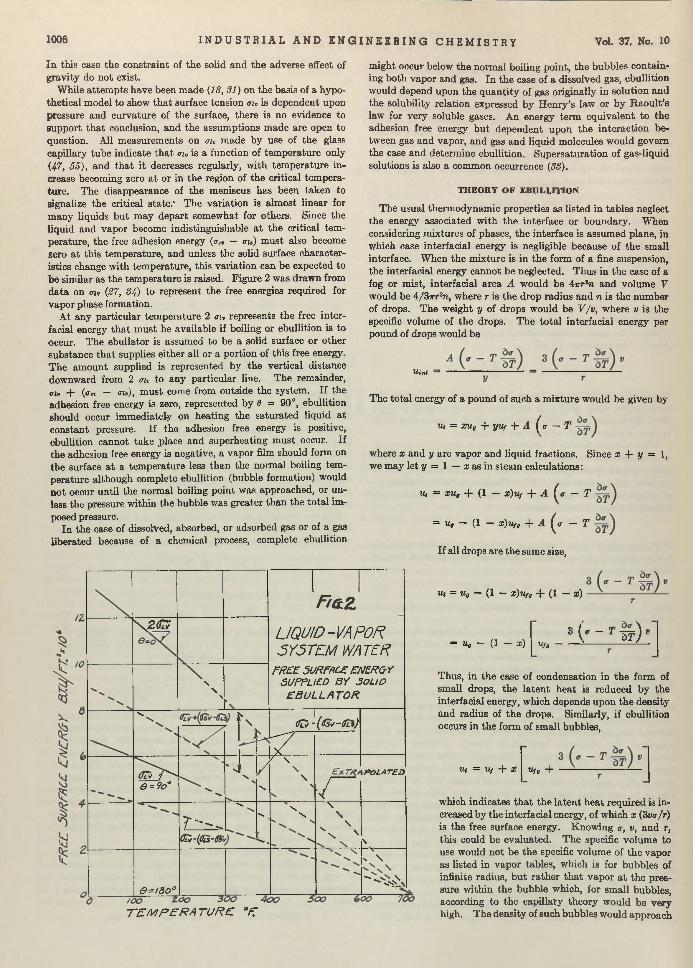
1006 I N D U S T R I A L A N D E N G I N E E R I N G C H E M I S T R Y Vol. 37, No. 10
In this case the constraint of the solid and the adverse effect of gravity do not exist.
While a ttem pts have been made (18, 31) on the basis of a hypothetical model to show th a t surface tension aiv is dependent upon pressure and curvature of the surface, there is no evidence to support th a t conclusion, and the assum ptions made are open to question. All measurements on ah made by use of the glass capillary tube indicate th a t ah is a function of tem perature only (47, 5 5 ) , and th a t it decreases regularly, w ith tem perature increase becoming zero a t or in the region of the critical tem perature. The disappearance of the meniscus has been taken to signalize the critical s ta te / The variation is alm ost linear for m any liquids bu t may depart somewhat for others. Since the liquid and vapor become indistinguishable a t the critical tem perature, the free adhesion energy (<ts* — an) m ust also become zero a t this tem perature, and unless the solid surface characteristics change w ith tem perature, this variation can be expected to be similar as the tem perature is raised. Figure 2 was drawn from data on aiv (27, 34) to represent the free energies required for vapor phase formation.
At any particular tem perature 2 au represents the free interfacial energy th a t m ust be available if boiling or ebullition is to occur. The ebullator is assumed to be a solid surface or other substance th a t supplies either all or a portion of this free energy. T he amount supplied is represented by the vertical distance downward from 2 ah- to any particular line. The remainder, ai, + (a,* — an), m ust come from outside the system. If the adhesion free energy is zero, represented by 0 = 90°, ebullition should occur immediately on heating the saturated liquid a t constant pressure. If the adhesion free energy is positive, ebullition cannot take _place and superheating m ust occur. If the adhesion free energy is negative, a vapor film should form on the surface a t a tem perature less than the normal boiling temperature although complete ebullition (bubble formation) would no t occur until the normal boiling point was approached, or unless the pressure within the bubble was greater than the to ta l imposed pressure.
In the case of dissolved, absorbed, or adsorbed gas or of a gas liberated because of a chemical process, complete ebullition
m ight occur below the normal boiling point, the bubbles containing both vapor and gas. In the case of a dissolved gas, ebullition would depend upon the quan tity of gas originally in solution and the solubility relation expressed by H enry’s law or by R aoult’s law for very soluble gases. An energy term equivalent to the adhesion free energy bu t dependent upon the interaction between gas and vapor, and gas and liquid molecules would govern the case and determine ebullition. Supersaturation of gas-liquid solutions is also a common occurrence (33).
T H E O R Y O F E B U L L IT IO N
The usual thermodynamic properties as listed in tables neglect the energy associated w ith the interface or boundary. When considering m ixtures of phases, the interface is assumed plane, in which case interfacial energy is negligible because of the small interface. W hen the m ixture is in the form of a fine suspension, the interfacial energy cannot be neglected. Thus in the case of a fog or m ist, interfacial area A would be Airrhi and volume V would be 4/3?rr8ra, where r is the drop radius and n is the number of drops. The weight y of drops would be V /v, where v is the specific volume of the drops. The to ta l interfacial energy per pound of drops would be
Uint
The to ta l energy of a pound of such a m ixture would be given by
u, = xu , + yuf + A ( o - T
where x and y are vapor and liquid fractions. Since x + y = 1,we may let y = I — x as in steam calculations:
ut = xu , + (1 - x)ut + A ( * - T
- u , - (1 - x ) ^ , + A (<r - T
If all drops are the same size,
« 1 = u , — (1 — x)uf, + (1 — a;)
= Ug — (1 — x) UfQ 3 ( r ^ w t
Thus, in the case of condensation in the form of small drops, the laten t heat is reduced by the interfacial energy, which depends upon the density and radius of the drops. Similarly, if ebullition occurs in the form of small bubbles,
Ut = Uf + x Uf, +
which indicates th a t the laten t heat required is increased by the interfacial energy, of which x (Zva/r) is the free surface energy. Knowing a, v, and r, this could be evaluated. The specific volume to use would not be the specific volume of the vapor as listed in vapor tables, which is for bubbles of infinite radius, bu t ra ther th a t vapor a t the pressure within the bubble which, for sm all bubbles, according to the capillary theory would be very high. The density of such bubbles would approach
........... 1
1F t a . Z
\2 Æ 7L I Q U I D - V A P O f t
5 Y 5 T E 1 M W A T E R
\\
>t
f r e e : s u r f a c e e n e r g y
S U P P L IE D S Y S O L ID
E B U L L A T O R
'S»
> • h
1
< f£ i -
- 7
(S s v -IT ls)
(7Tv 7^
e * 9 o *
.
'S»'s.
* J\
>/
N
/ \
\>
• /
\P O L A T E D
7 - ^
O tV -(pL»-03'
■V."s.
L .
\\
s
\\
\
NX N\
& - / ô o °
■>. \
" - ' - A
TEMPERATURE °E
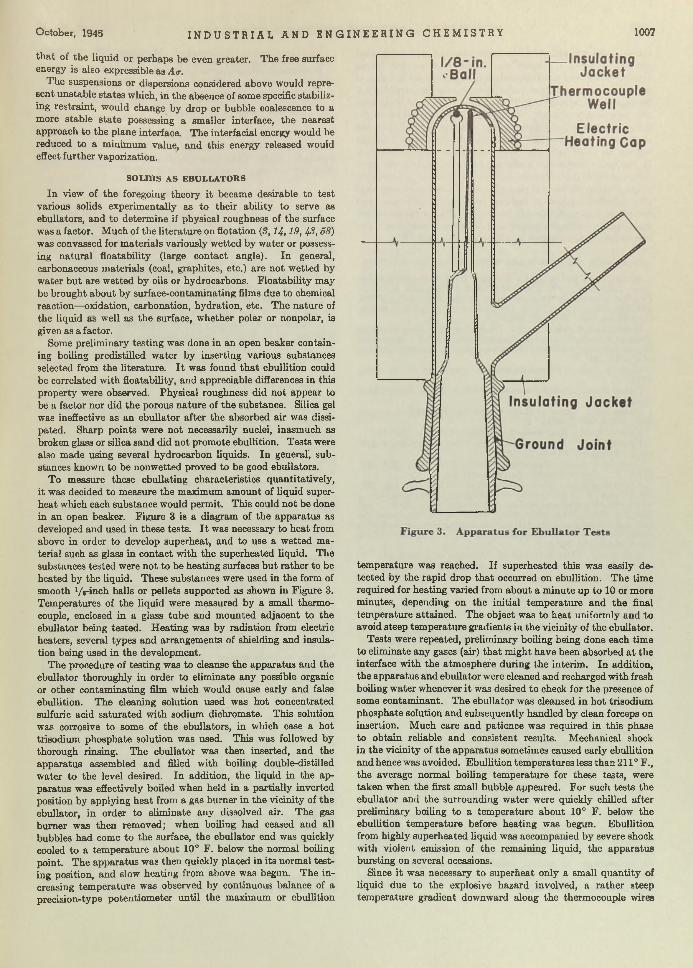
O ctober, 1945 I N D U S T R I A L A N D E N G I N E E R I N G C H E M I S T R Y 1007
th a t of the liquid or perhaps be even greater. The free surface energy is also expressible as A<r.
The suspensions or dispersions considered above would represent unstable sta tes which, in the absence of some specific stabilizing restraint, would change by drop or bubble coalescence to a more stable sta te possessing a smaller interface, the nearest approach to the plane interface. The interfacial energy would be reduced to a minimum value, and this energy released would effect further vaporization.
S O L ID S A S EB U L L A T O R S
In view of the foregoing theory it became desirable to test various solids experimentally as to their ability to serve as ebullators, and to determine if physical roughness of the surface was a factor. M uch of the literature on flotation (3, H , 19, 43,58) was convassed for m aterials variously w etted by water or possessing natural floatability (large contact angle). In general, carbonaceous m aterials (coal, graphites, etc.) are not wetted by water bu t are w etted by oils or hydrocarbons. F loatability may be brought about by surface-contaminating films due to chemical reaction—oxidation, carbonation, hydration, etc. The nature of the liquid as well as the surface, whether polar or nonpolar, is given as a factor.
Some preliminary testing was done in an open beaker containing boiling predistilled w ater by inserting various substances selected from the literature. I t was found th a t ebullition could be correlated w ith floatability, and appreciable differences in this property were observed. Physical roughness did not appear to be a factor nor did the porous nature of the substance. Silica gel was ineffective as an ebullator after the absorbed air was dissipated. Sharp points were not necessarily nuclei, inasmuch as broken glass or silica sand did not promote ebullition. Tests were also made using several hydrocarbon liquids. In general', substances known to be nonwetted proved to be good ebullators.
To measure these ebullating characteristics quantitatively, it was decided to measure the maximum am ount of liquid superheat which each substance would permit. This could not be done in an open beaker. Figure 3 is a diagram of the apparatus as developed and used in these tests. I t was necessary to heat from above in order to develop superheat, and to use a wetted material such as glass in contact w ith the superheated liquid. The substances tested were not to be heating surfaces bu t rather to be heated by the liquid. These substances were used in the form of smooth Vs-inch balls or pellets supported as shown in Figure 3. Temperatures of the liquid were measured by a small thermocouple, enclosed in a glass tube and mounted adjacent to the ebullator being tested. Heating was by radiation from electric heaters, several types and arrangements of shielding and insulation being used in the development.
The procedure of testing was to cleanse the apparatus and the ebullator thoroughly in order to eliminate any possible organic or other contam inating film which would cause early and false ebullition. The cleaning solution used was hot concentrated sulfuric acid saturated w ith sodium dichromate. This solution was corrosive to some of the ebullators, in which case a hot trisodium phosphate solution was used. This was followed by thorough rinsing. The ebullator was then inserted, and the apparatus assembled and filled w ith boiling double-distilled water to the level desired. In addition, the liquid in the apparatus was effectively boiled when held in a partially inverted position by applying heat from a gas burner in the vicinity of the ebullator, in order to eliminate any dissolved air. The gas burner was then removed; when boiling had ceased and all bubbles had come to the surface, the ebullator end was quickly cooled to a tem perature about 10° F. below the normal boiling point. The apparatus was then quickly placed in its normal testing position, and slow heating from above was begun. The increasing tem perature was observed by continuous balance of a precision-type potentiom eter until the maximum or ebullition
tem perature was reached. If superheated this was easily detected by the rapid drop th a t occurred on ebullition. The time required for heating varied from about a m inute up to 10 or more minutes, depending on the initial tem perature and the final tem perature attained. The object was to heat uniformly and to avoid steep tem perature gradients in the vicinity of the ebullator.
Tests were repeated, preliminary boiling being done each time to eliminate any gases (air) th a t might have been absorbed a t the interface w ith the atmosphere during the interim. In addition, the apparatus and ebullator were cleaned and recharged w ith fresh boiling water whenever it was desired to check for the presence of some contam inant. The ebullator was cleansed in hot trisodium phosphate solution and subsequently handled by clean forceps on insertion. M uch care and patience was required in this phase to obtain reliable and consistent results. Mechanical shock in the vicinity of the apparatus sometimes caused early ebullition and hence was avoided. Ebullition tem peratures less than 211° F., the average normal boiling tem perature for these tests, were taken when the first small bubble appeared. For such tests the ebullator and the surrounding w ater were quickly chilled after preliminary boiling to a tem perature about 10° F. below the ebullition tem perature before heating was begun. Ebullition from highly superheated liquid was accompanied by severe shock w ith violent emission of the remaining liquid, the apparatus bursting on several occasions.
Since i t was necessary to superheat only a small quantity of liquid due to the explosive hazard involved, a rather steep tem perature gradient downward along the thermocouple wires
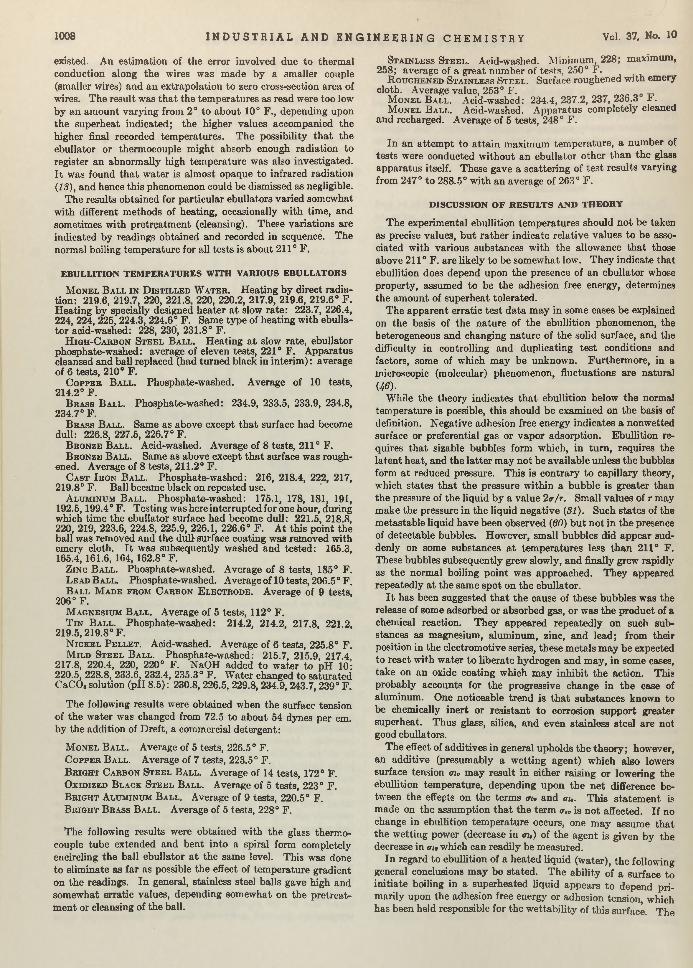
1008 I N D U S T R I A L A N D E N G I N E E R I N G C H E M I S T R Y Vol. 37, No. 10
existed. An estim ation of the error involved due to therm al conduction along the wires was m ade by a smaller couple (smaller wires) and an extrapolation to zero cross-section area of wires. The result was th a t the tem peratures as read were too low by an am ount varying from 2° to about 10° F., depending upon the superheat indicated; the higher values accompanied the higher final recorded tem peratures. The possibility th a t the ebullator or thermocouple m ight absorb enough radiation to register an abnormally high tem perature was also investigated. I t was found th a t w ater is alm ost opaque to infrared radiation (18), and hence this phenomenon could be dismissed as negligible.
The results obtained for particular ebullators varied somewhat with different m ethods of heating, occasionally w ith time, and sometimes w ith pretreatm ent (cleansing). These variations are indicated by readings obtained and recorded in sequence. The normal boiling tem perature for all tests is about 211° F.
EBULLITION TEM PERA TU RES W ITH VARIOUS EBULLATORS
M o n e l B a l l i n D i s t i l l e d W a t e r . H eating by direct radiation: 219.6, 219.7, 220, 221.8 220, 220.2, 217.9, 219.6, 219.6° F. H eating by specially designed heater a t slow ra te : 223.7, 226.4, 224, 224, 225, 224.3, 224.6° F. Same type of heating with ebullato r acid-washed: 228, 230, 231.8° F.
H i g h - C a b b o n S t e e l B a l l . Heating a t slow rate, ebullator phosphate-washed: average of eleven tests, 221° F. A pparatus cleansed and ball replaced (had turned black in in terim ): average of 6 tests, 210° F.
C o p p e r B a l l . Phosphate-washed. Average of 10 tests, 214.2° F.
B r a s s B a l l . Phosphate-washed: 234.9, 233.5, 233.9, 234.8, 234.7° F.
B r a s s B a l l . Same as above except th a t surface had become dull: 226.8, 227.5, 226.7° F.
B r o n z e B a l l . Acid-washed. Average of 8 tests, 211° F.B r o n z e B a l l . Same as above except th a t surface was rough
ened. Average of 8 tests, 211.2° F.C a s t I r o n B a l l . Phosphate-washed: 216, 218.4, 222, 217,
219.8° F. Ball became black on repeated use.A l u m i n u m B a l l . Phosphate-washed: 175.1, 178, 181, 191,
192.5,199.4° F. Testing was here interrupted for one hour, during which tim e the ebullator surface had become dull: 221.5, 218.8, 220, 219, 223.6, 224.8, 225.9, 226.1, 226.6° F. A t this point the ball was removed and the dull surface coating was removed with emery cloth. I t was subsequently washed and tested: 165.3,165.4, 161.6, 164, 162.8° F.
Z i n c B a l l . Phosphate-w a s h e d . Average of 8 tests, 185° F.L e a d B a l l . Phosphate-washed. Averageof 1 0 te s ts ,2 0 6 . 5 ° F .B a l l M a d e f r o m C a r b o n E l e c t r o d e . Average o f 9 tests,
206° F.M a g n e s i u m B a l l . Average of 5 tests, 112° F.T i n B a l l . Phosphate-washed: 214.2, 214.2, 217.8, 221.2,
219.5,219.8° F.N i c k e l P e l l e t . Acid-washed. Average of 6 tests, 225.8° F.M i l d S t e e l B a l l . Phosphate-washed: 215.7, 215.9, 217.4
217.8, 220.4, 220, 220° F. NaOH added to w ater to pH 10:220.5, 228.8, 233.6, 232.4, 235.3° F. W ater changed to saturated C aC 03 solution (pH 8.5): 230.8,226.5, 229.8,234.9,243.7,239° F.
The following results were obtained when the surface tension of the water was changed from 72.5 to about 54 dynes per cm. by the addition of Dreft, a commercial detergent:
M o n e l Ball. Average of 5 tests, 226.5° F.C o p p e r B a l l . Average of 7 tests, 223.5° F.B r i g h t C a r b o n S t e e l B a l l . Average of 14 tests, 172° F.O x i d i z e d B l a c k S t e e l B a l l . Average o f 5 tests, 2 2 3 ° F.B r i g h t A l u m i n u m B a l l . Average o f 9 tests, 2 2 0 .5 ° F.B r i g h t B r a s s B a l l . Average of 5 tests, 228° F.
The following results were obtained with the glass thermocouple tube extended and bent into a spiral form completely encircling th e ball ebullator a t the same level. This was done to eliminate as far as possible the effect of tem perature gradient on the readings. In general, stainless steel balls gave high and somewhat erratic values, depending somewhat on the pretreatm ent or cleansing of the ball.
S t a i n l e s s S t e e l . Acid-washed. Minimum, 228; maximum, 258; average o f a great num ber o f tests, 250° F. .
R o u g h e n e d S t a i n l e s s S t e e l . Surface roughened w ith emery cloth. Average' value, 253° F. „ _
M o n e l B a l l . Acid-washed: 234.4,237.2,237,236.3 F .M o n e l B a l l . Acid-washed. A pparatus completely cleaned
and recharged. Average of 5 tests, 248° F.
In an a ttem pt to a tta in maximum tem perature, a num ber of tests were conducted w ithout an ebullator other th an th e glass apparatus itself. These gave a scattering of tes t results varying from 247° to 288.5° w ith an average of 263° F.
D ISC U SSIO N O F R E SU L T S AND TH EO RY
The experimental ebullition tem peratures should no t be taken as precise values, b u t ra ther indicate relative values to be associated w ith various substances w ith the allowance th a t those above 2 1 1 ° F. are likely to be somewhat low. They indicate that ebullition does depend upon the presence of an ebullator whose property, assumed to be the adhesion free energy, determines the am ount of superheat tolerated.
The apparent erratic tes t d a ta m ay in some cases be explained on the basis of the nature of the ebullition phenomenon, the heterogeneous and changing nature of the solid surface, and the difficulty in controlling and duplicating tes t conditions and factors, some of which m ay be unknown. Furtherm ore, in a microscopic (molecular) phenomenon, fluctuations are natural (46).
While the theory indicates th a t ebullition below the normal tem perature is possible, this should be examined on the basis of definition. Negative adhesion free energy indicates a nonwetted surface or preferential gas or vapor adsorption. Ebullition requires th a t sizable bubbles form which, in tu rn , requires the laten t heat, and the la tte r may no t be available unless the bubbles form a t reduced pressure. This is contrary to capillary theory, which states th a t the pressure within a bubble is greater than the pressure of the liquid by a value 2a / r . Small values of r may m ake the pressure in the liquid negative (31). Such states of the m etastable liquid have been observed (60) b u t no t in the presence of detectable bubbles. However, small bubbles did appear suddenly on some substances a t tem peratures less than 2 1 1 ° F. These bubbles subsequently grew slowly, and finally grew rapidly as the normal boiling point was approached. They appeared repeatedly a t the same spot on the ebullator.
I t has been suggested th a t the cause of these bubbles was the release of some adsorbed or absorbed gas, or was th e product of a chemical reaction. They appeared repeatedly on such substances as magnesium, aluminum, zinc, and lead; from their position in the electromotive series, these m etals m ay be expected to react w ith w ater to liberate hydrogen and m ay, in some cases, take on an oxide coating which m ay inhibit the action. This probably accounts for the progressive change in the case of aluminum. One noticeable trend is th a t substances known to be chemically inert or resistant to corrosion support greater superheat. Thus glass, silica, and even stainless steel are not good ebullators.
The effect of additives in general upholds the theory; however, an additive (presumably a w etting agent) which also lowers surface tension oi, m ay result in either raising or lowering the ebullition tem perature, depending upon the n e t difference between the effepts on the term s <ri, and <ru. T his sta tem ent is m ade on the assum ption th a t the term <rn is no t affected. If no change in ebullition tem perature occurs, one m ay assume th a t the w etting power (decrease in <ru) of the agent is given by the decrease in <ri, which can readily be measured.
In regard to ebullition of a heated liquid (water), the following general conclusions m ay be stated. The ability of a surface to in itiate boiling in a superheated liquid appears to depend prim arily upon the adhesion free energy or adhesion tension, which has been held responsible for the w ettability of this surface. The

October, 194S I N D U S T R I A L A N D E N G I N E E R I N G C H E M I S T R Y 1009
usual physical roughness does no t appear to be a factor. Physical roughness in the range of molecular radii and curvatures of proper aspect m ay account for the heterogeneous character observed. This is in accordance with capillary theory for small bubbles. If, however, the rough surface is also a heating surface, bubble initiation can be expected to occur in surface cavities or capillaries because of the effect of such a cavity on the local superheating of the liquid contained in th a t cavity. The ebullition phenomenon requires th a t the thermodynamic requirements of the vapor phase, as it m ust first appear, shall be satisfied. The ebullator may supply all or a portion of the free surface energy required; the remainder m ust then be made up by the mechanism of superheating.
N O M EN C LA TU R E
Hint = energy associated with an interface <r = free interfacial energy per unit area of interface
(surface tension)A = area of interface T = tem perature on absolute scale
Wi = work of cohesion; free interfacial energy created when a cylinder of unit cross-section area is ruptured to produce the vapor phase between the interfaces formed
Wi, = work of liquid-solid separation producing the vapor phase between them , per unit of initial liquid- solid interface
<ru = free interfacial energy per unit area of liquid-vapor interface
oj, = free interfacial energy per unit area of liquid-solid interface
<r„ = free interfacial energy per unit area of solid-vapor interface
e = contact angle measured through liquid for a vapor bubble on a solid surface (Figure 1)
x = vapor fraction by weight in a m ixture of liquid and vapor
y = liquid fraction by weight in a m ixture of liquid and vapor
u i = to ta l (internal) energy of a pound of mixture Uj = internal energy of saturated liquid per poundu , — internal energy of saturated vapor per pound Uf, = internal laten t heat per pound, u , — Uf
v = volume per pound (specific volume)V = to ta l volume
r = radius of bubble or drop s = entropy per pound
T — tem peraturen = number of bubbles th a t form initially h — enthalpy per pound
,(u — Ts), = change in free energy occurring in passing from state 2 to sta te 3
p = pressureui, = energy of liquid-vapor interface formation per unit
interfacial area
B IB L IO G R A P H Y ON E B U L L IT IO N AND SU PER SA TU R A T IO N IN LIQ U ID S AND VAPORS
(1) Adam, N. K., “Physics and Chemistry of Surfaces” , 3rd ed.,Chap. I & V, Oxford Univ. Press, 1941.
(2) Baker, H . B., J . Chem. Soc., 121, 568 (1922).(3) Bartell, F. E., and Bartell, L. S., J . Am . Chem. Soc., 56, 2205
(1934).(4) Barus, Carl, Phil. Mag., [5] 38, 34 (1894).(6) Blodgett, K. B„ J . A m . Chem. Soc., 56, 495 (1934); 57, 1007
(1935).(6) Bottomly, W. T., Trans. North East Coast Inst. Engrs. and Ship
builders, 53, 65-D21 (1936-7).(7) Bridgman, P . W., “Physics of High Pressure” , pp. 130, 188,
New York, Macmillan Co., 1931.(8) Brooks, C. H „ and Badger, W. L., Imrans. Am . Inst. Chem.
Engrs., 33, 392 (1937).(9) Callendar, H . L., Proc. Inst. Mech. Engrs. (London), 1915, 53.
(10) Callendar, H . L., Proc. Roy. Soc. (London), A120, 460 (1928).(11) Caraelley, Thos., iVoiure, 22, 434(1880); 23,341 (1881).(12) Cassel, H . M., J . Applied Phys., 15, 792-8 (1944).(13) Coblentz, W. W., “ Investigations of Infra-Red Spectra” , Vol. 1,
p. 56, Carnegie Inst. Wash., 1905.(14) Coghill and Anderson, U. S. Bur. Mines, Tech. Paper 262, 23
(1923).
(15) Dean, R. B., J . Applied Phys., 15, 446-51 (1944).(16) Dorsey, N . E., “ Properties of Ordinary W ater” , pp. 167, 614,
New York, Reinhold Pub. Corp., 19-10.(17) Drew, T . B., and Mueller, A. C., Trans. Am. Inst. Chem.
Engrs., 33, 449 (1937).(18) Epstein, P. S., “Textbook of Thermodynamics” , Chap. 12,
New York, John Wiley & Sons, 1937.(19) Gaudin, A. M., “ Principles of Mineral Dressing” , 1st ed., p.
338, New York, McGraw-Hill Book Co., 1939.(20) Goodenough, G. A., Power, 66, 466 (1927).(21) Grosse, A. V., I n d . E n g . C h e m ., 35, 762 (1943).(22) Hammick, D. L„ Phil. Mag., [6] 38, 240 (1919).(23) Harkins, W. D., and Roberts, L. E., ./. Am. Chem. Soc., 44, 653
(1922).(24) Harvey, E. N., and others, J . Cellular Comp. Physiol., 24, No. 1,
1-22 (1944).(25) Hougen, O. A., and Watson, K . M., “ Industrial Chemical Calcu
lations” , 1st ed., New York, John Wiley & Sons, 1931.(26) Insinger, H . I., and Bliss, H ., Trans. Am. Inst. Chem. Engrs., 35,
491 (1940).(27) International Critical Tables, New York, McGraw-Hill Book
Co., 1926.(28) Iterson, F. K . T . van, Engineering, 142, 95 (1936).(29) Jakob, M., Mech. Eng., 58, 643 (1936); Univ. III. Eng. Expt.
Sta., Bull. 34, No. 37 (1937).(30) Jakob, M., Research Pub. III. Inst. Tech., Vol. 2, No. 3 (1942).(31) Keenan, J . H ., “Thermodynamics” , pp. 431, 435, New York,
John Wiley & Sons, 1941.(32) Kendrick, F . B., Gilbert, C. S., and Wismer, K. L., J . Phys.
Chem., 28, 1297 (1924).(33) Kendrick, F. B., Wismer, K. L., and W yatt, K. S., Ibid., 28,
1308 (1924).(34) L andolt,H .H .,B ornstein , R . ,and Roth, W .A .,Tabellen, Berlin,
J . Springer, 1923.(35) Langmuir, I., J . Am . Chem. Soc., 38, 2225 (1916).(36) Loeb, L. B., “Kinetic Theory of Gases” , p. 643, New York,
McGraw-Hill Book Co., 1927.(37) Maas, O., and Geddes, A. L., Trans. Roy. Soc. (London), A236,
303 (1927).(38) McAdams, W. H., “H eat Transmission” , 2nd ed., New York,
McGraw-Hill Book Co., 1942.(39) M artin, H . M., Engineering, 106, 1 (1918).(40) Ibid., 115, 607 (1923).(41) Ibid., 137, 303 (1934).(42) Maxwell, J. C., “Theory of H eat” , p. 291, New York, Longmans,
Green and Co., 1894.(43) Mayer, E. W., and Schranz, H., “Flotation” , p. 8, Leipzig, S.
Hirzel, 1931.(44) Schumb, W. C., Peters, H ., Milligan, L. H., Metals & Alloys, 8,
126 (May, 1937).(45) Philipp, L. A., and Tiffany, B. E., Refrig. Eng., 25, 140 (March,
1933).(46) Planck, M., “Treatise on Thermodynamics” , New York, Long
mans, Green and Co., 1903.(47) Ramsay, W., and Shields, J., J . Chem. Soc., 63, 10S9 (1893).(48) Reinold, A. W., and Rücker, A. W .t Trans. Roy. Soc. (London),
177, 627 (1886).(49) Reynolds, Osborne, “Scientific Papers” , Vol. 1, p. 231 (1900).(50) Rhodes, F. H ., and Bridges, C. H., Trans. Am. Inst. Chem.
Engrs., 35, 73 (1939).(51) Roberts, J . K „ “H eat and Thermodynamics” , 3rd ed., p. 101,
London, Blackie & Son, Ltd., 1940.(52) Rodebush, W. H., “ Introductory Physical Chemistry", p. 114,
New York, D. Van Nostrand Co., 1932.(53) Schwab, G. M., Taylor, H. S., and Spence, R., "Catalysis” ,
Chap. I I & I II , New York, D. Van Nostrand Co., 1937.(54) Stodola, A., “ Steam and Gas Turbines” , Vol. II , New York,
McGraw-Hill Book Co., 1927.(55) Taylor, H . S., “ Treatise on Physical Chemistry” , Vol. 2, p. 1632,
New York, D. Van Nostrand Co., 1942.(56) Taylor, Wilson, “ New View of Surface Forces” , Univ. Toronto
Press, 1925.(57) Thomson, J. W., Proc. Roy. Soc. Edinburg, 20, 65 (1870).(58) W ark, I. W., “Principles of F lotation” , p. 52, Australasian Inst.
of Mining and Met., 1938.(59) Wilson, C. T. R ., Trans. Roy. Soc. (London), A189, 265 (1897).(60) W orthington, A. M., Ibid., A183, 355 (1892).(61) Yellott, J. I., Trans. Am . Soc. Mech. Engrs., 56, 411 (1934).(62) Ibid., 59, 171 (1937).(63) Young, Thomas, “ N atural Philosophy” , Vol. 1, p. 473 (1807).(64) Zemansky, M. W., “ H eat and Thermodynamics” , 2nd ed., p.
261, New York, McGraw-Hill Book Co., 1943.
A b s t r a c t of a thesis for the degree of Ph .D . in engineering, University of Illinois, 1944.
OCCURRENCE OF
METASTABLE STATES OF
LIQUID AND VAPORREINHOLD F. LARSON
U n iversity o f I llin o is , V rb a n a , III.
A therm odynam ic theory is advanced for th e requirem ent and m ech an ism o f bubble form ation in a heated liq u id .. Trial ca lcu lations u sin g estim ated therm odynam ic properties o f superheated w ater ind icate th a t th e n u cleus bubble in th e transform ation sta te con sists o f a single m olecu le . T he general theory is extended to condensing w ater vapor w ith sim ilar resu lts. T he literature is reviewed for supporting evidence. T he sim ilarity betw een th e supposed action o f th e ebullator and o f a ca ta lyst is poin ted o u t.
TH E preceding article pointed out th a t liquids are likely to superheat unless a liquid-vapor interface is already present
or unless an ebullator (assumed a solid) is present, whose contact angle is 90° or more or whose adhesion free energy is zero or negative. Contact angles are difficult to measure accurately; furthermore, solid surfaces will probably be heterogeneous in this respect. Thus the contact angle is likely to be only a rough and probably inaccurate measure of adhesion free energy as the surface area is reduced. However, test results indicate th a t superheating does readily occur, and th a t the extent of superheat is dependent upon some property of the substance or surface of the ebullator, and differs w ith various substances. Ordinary physical roughness does not appear to be a factor. The property th a t lim its the amount of superheat is assumed to be the adhesion free energy, given by the expression <r„ — m,. For thoroughly wetted substances this expression would equal <n„, the liquid-vapor free interfacial energy.
The data for this article were developed concurrently with those for the preceding article. The general theory is extended to include the supersaturated vapor state, and calculations are presented which tend to uphold the theory and give some insight into phase transformations.
T H E O R Y O F EB U L L IT IO N
Ebullition as described above is not a smooth process, bu t is rather explosive as the system passes from a superheated or m etastable state to a more stable state, during which an interface m ust be created. This transform ation appears to be spontaneous and to take place without external aid.
To accomplish this change, it is postulated th a t the system passes through an intermediate, momentary unstable state, a m ixture of liquid and small bubbles, from which it then can pass to the final equilibrium mixture sta te represented by a minimum- phase interface. This would require th a t the ebullition process consist of three steps: (1) superheating of the liquid, (2) transformation where the interface is created, assumed to take place adiabatically and reversibly, and (3) the dissipation of the high interfacial energy and subsequent expansion as the bubbles coalesce and grow.
An a ttem pt to illustrate these changes is made in Figure 1. Num bered sta te points represent: 1, initial liquid a t pressure p%\
2, sa turated liquid (at boiling point for pressure p2); 3, superheated or m etastable liquid a t the same pressure; 4, dispersed vapor bubble m ixture arising from sta te 3; and 5, the final stable equilibrium m ixture state. S tate 3 would no t lie on the characteristic stable sta te surface b u t on a m etastable sta te surface. Having properties p, v, t, etc., i t can properly be shown. S tate 4 is not shown since i t is unstable although the entropy is assumed to be th a t of sta te 3. Clearly, change 3 to 4 involves the formation of a new phase a t the expense of some of the liquid phase.
The free energy (u — Ts) of 2 and 5 are equal since these states are in equilibrium w ith each other; however, 3 and 4 are states of greater free energy by am ount 2(w — Ts), for sta te 3, and by A<t for sta te 4. This increase of free energy could originate only from the same source, heat absorbed 2A3 ; hence they are assumed equal and equivalent1:
•¡{u — Ts), = A<ri, = y X 2iriv
If n bubbles of radius r are formed,
a a 9 i(w — Ts)tA = 4irr2n = ------------- --ou
As a further consequence, i{Ts)3 will represent the la ten t heat required for vaporization in the form of n bubbles whose total volume V would not depend on the surface energy bu t rather on the bulk energy. Thus,
I =v u/lt
where Ufa is the internal bulk la ten t heat, and v is the volume per pound of bubbles as initially formed. Dividing volume by area,
t(Ts) ,vr = 3 F _ Ufa____ _ 3 ,(Ts),V<riv
A 2 i(u — Ts), Ufa 2(w. — Ts),2<ri,
which gives the particular size of bubble th a t serves as a nucleus when ebullition occurs in the bulk superheated liquid—i.e., in the absence of an ebullator.
W ith an ebullator, assumed for the present to be a solid, the am ount of superheating (and hence the increase in free energy) would be governed by the adhesion free energy, <r„ — <n„ In the above expression 2<ri„ would be replaced by <n, + <r„ — au. (See Figure 2 of the preceding article.) This assumes th a t the adhesion free energy is known or could be estim ated. Also the
1 T he use of th e free energy (« — Ts) here m us t n o t be oonfused w ith its use in determ ining th e m axim um external work obta inab le from a reversible iso therm al change. T he change p io tured here is for an ad iabatio system and l ittle external work is involved. T he free energy tran sfo rm ation is entirely in ternal, and (u — T t) and A<r a re th e free energy funetions.
1010
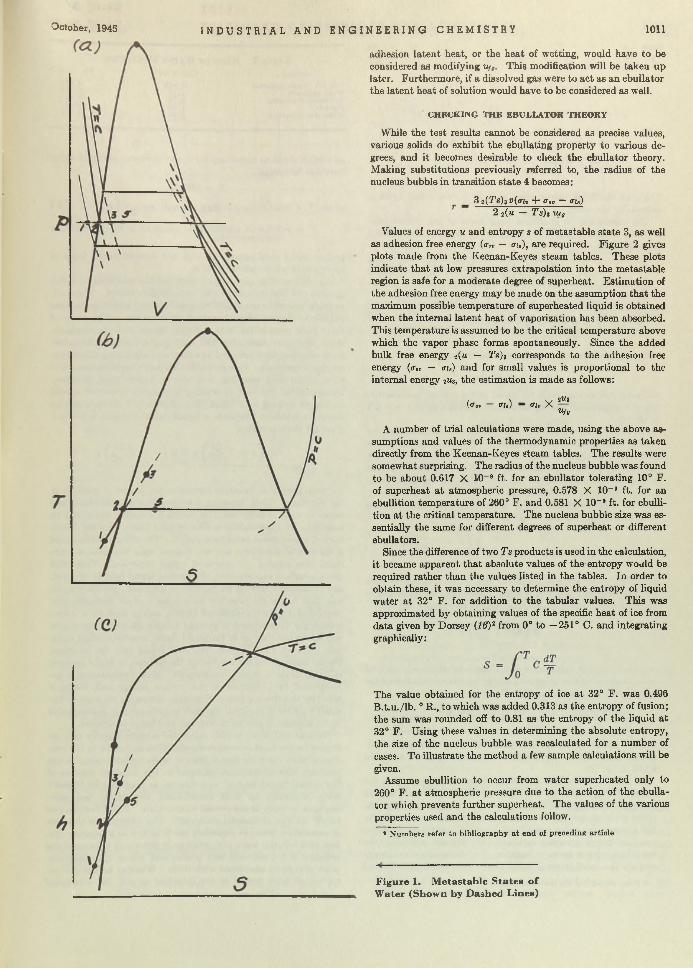
October, 194S I NDUSTRI AL AND ENGI NEERI NG CHEMI STRY 1011
adhesion laten t heat, or the heat of wetting, would have to be considered as modifying u j This modification will be taken up later. Furthermore, if a dissolved gas were to act as an ebullator the latent heat of solution would have to be considered as well.
CHECKING TH E EBULLATOR THEORY
While the test results cannot be considered as precise values, various solids do exhibit the ebullating property to various degrees, and it becomes desirable to check the ebullator theory. Making substitutions previously referred to, the radius of the nucleus bubble in transition state 4 becomes:
_ 3 2(Ts)3 vjaiv + <r,v — <ri,)2 2(li — Ts)s Ufa
Values of energy u and entropy s of m etastable sta te 3, as well as adhesion free energy (<r„ — <ru), are required. Figure 2 gives plots made from the Keenan-Keyes steam tables. These plots indicate th a t a t low pressures extrapolation into the metastable region is safe for a moderate degree of superheat. Estim ation of the adhesion free energy may be made on the assumption th a t the maximum possible tem perature of superheated liquid is obtained when the internal latent heat of vaporization has been absorbed. This tem perature is assumed to be the critical tem perature above which the vapor phase forms spontaneously. Since the added bulk free energy i(u — Ts)a corresponds to the adhesion free energy (<r„ — ai,) and for small values is proportional to the internal energy -¿u3, the estimation is made as follows:
((Taw (Tig) — (Tlv X 2UiUfg
A number of trial calculations were made, using the above assumptions and values of the thermodynamic properties as taken directly from the Keenan-Keyes steam tables. The results were somewhat surprising. The radius of the nucleus bubble was found to be about 0.617 X M)~9 ft. for an ebullator tolerating 10° F. of superheat a t atmospheric pressure, 0.578 X 10“ 9 ft. for an ebullition tem perature of 260° F. and 0.581 X 10“ 9 ft. for ebullition a t the critical temperature. The nucleus bubble size was essentially the same for different degrees of superheat or different ebullators.
Since the difference of two Ts products is used in the calculation, it became apparent th a t absolute values of the entropy would be required rather than the values listed in the tables. In order to obtain these, it was necessary to determine the entropy of liquid water a t 32° F. for addition to the tabular values. This was approximated by obtaining values of the specific heat of ice from data given by Dorsey (16)2 from 0° to —251° C. and integrating graphically:
The value obtained for the entropy of ice a t 32° F. was 0.496 B .t.u ./lb . ° R., to which was added 0.313 as the entropy of fusion; the sum was rounded off to 0.81 as the entropy of the liquid a t 32° F. Using these values in determining the absolute entropy, the size of the nucleus bubble was recalculated for a number of cases. To illustrate the method a few sample calculations will be given.
Assume ebullition to occur from water superheated only to 260° F. a t atmospheric pressure due to the action of the ebullator which prevents further superheat. The values of the various properties used and the calculations follow.
* N um bers refer to bibliography a t end of preceding article.
Figure 1. M etastable S tates o f Water (Show n by Dashed Lines)
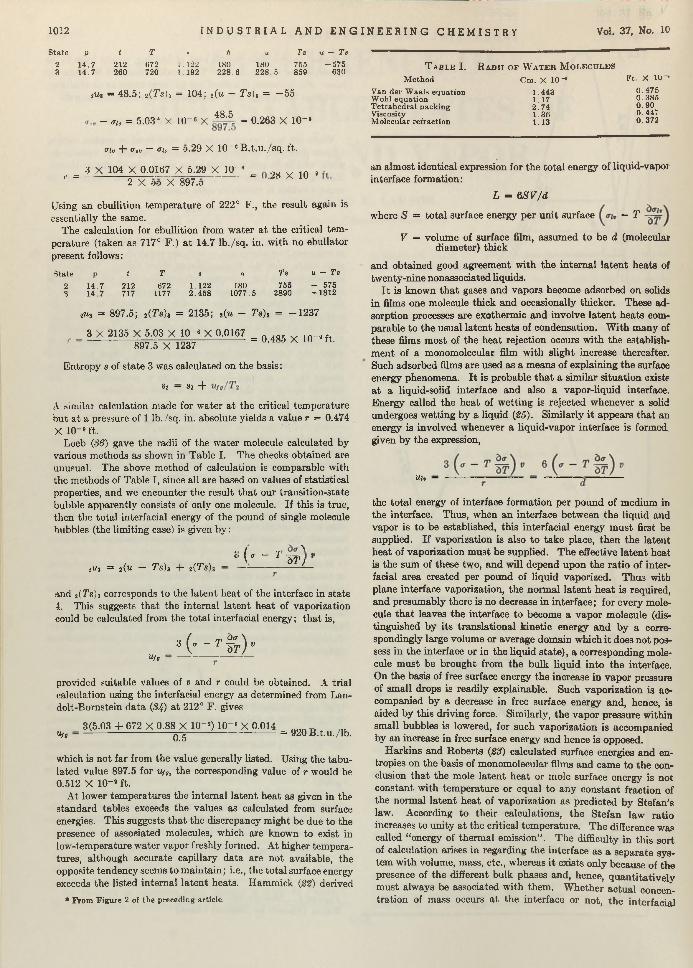
1012 I N D U S T R I A L A N D E N G I N E E R I N G C H E M I S T R Y Vol. 37, No. 10
S ta te p t T e h u Ts u — Ts
2 14 .7 212 672 L. 122 ISO 180 755 -5 7 53 14 .7 260 720 1,192 228.6 228 .5 859 -6 3 0
lUt = 48.5; i{Ts)s = 104; 2(u - T s)3 = - 55
48.5- <7u = 5.03* X 10“ 6 X = 0.263 X 10-«
<rj» + o.v — <m = 0.29 X 10“ 6 B .t.u ./sq . ft.
, . I X 104 X ,0;(mi7 X ^ 2 9 X 10 < = 28 x 1Q_,2 X oo X 897.0
Using an ebullition tem perature of 222° F., the result again is essentially the same.
The calculation for ebullition from w ater a t the critical tem perature (taken as 717° F.) a t 14.7 lb ./sq. in. w ith no ebullator present follows:
t T a u T$ u — TsS tate
23
14.714.7
212717
Ö721177
1.1222 .458
180 1077.5
7552890
- 575 -1 8 1 2
sM, = 897.5 ; 2( 7 ts ) 3 = 2135; , ( w - Ts), = -1 2 3 7
3 X 2135 X 5.03 X 10“ « X 0.0167897.5 X 1237
= 0.485 X 10“ s ft.
Entropy s of state 3 was calculated on the basis:
S3 — S2 +
A similar calculation made for water a t the critical tem perature but a t a pressure of 1 lb. /sq. in. absolute yields a value r = 0.474x 10⁻⁹ ft.
Loeb (36) gave the radii of the water molecule calculated by various methods as shown in Table I. The checks obtained are unusual. The above method of calculation is comparable with the methods of Table I, since all are based on values of statistical properties, and we encounter the result th a t our transition-state bubble apparently consists of only one molecule. If this is true, then the total interfacial energy of the pound of single molecule bubbles (the limiting case) is given by:
¡«3 = 2 ( 1 4 — Ts)¡ + 2(Ts)h —3 ( ' - T w ) ’
and 2(Ts)s corresponds to the latent heat of the interface in state 4. This suggests th a t the internal laten t heat of vaporization could be calculated from the total interfacial energy ; th a t is,
M/s
s ( . - t f T ) ,
provided suitable values of v and r could be obtained. A trial calculation using the interfacial energy as determined from Lan- dolt-Bornstein data (34) a t 212° F. gives
•J/0 ''3(5.03 + 672 X 0.88 X 10"2) 10~6 X 0.014
0.5 = 920 B .t.u ./lb .
T a b l e I. R a d i i o f W a t e r M o l e c u l e s
M ethod Cm . X 10"* Ft. X 1 0 '
Van der W aals equation W ohl equation T e trahedra l packing Viscosity-Molecular refraction
1.4431.172 .741.361.13
0 .4750 .3850 .900.4470.372
an alm ost identical expression for the to ta l energy of liquid-vapor interface formation:
L = 6S V /d
where S = to ta l surface energy per un it surface — T
V = volume of surface film, assumed to be d (molecular diam eter) thick
and obtained good agreement w ith the internal la ten t heats of twenty-nine nonassociated liquids.
I t is known th a t gases and vapors become adsorbed on solids in films one molecule thick and occasionally thicker. These adsorption processes are exothermic and involve laten t heats comparable to the usual laten t heats of condensation. W ith many of these films m ost of the heat rejection occurs w ith the establishm ent of a monomolecular film with slight increase thereafter. Such adsorbed films are used as a means of explaining the surface energy phenomena. I t is probable th a t a similar situation exists a t a liquid-solid interface and also a vapor-liquid interface. Energy called the heat of wetting is rejected whenever a solid undergoes wetting by a liquid (25). Similarly i t appears th a t an energy is involved whenever a liquid-vapor interface is formed, given by the expression,
lilv —
which is not far from the value generally listed. Using the tabu lated value 897.5 for u/e, the corresponding value of r would be 0.512 X 10-» ft.
At lower tem peratures the internal laten t heat as given in the standard tables exceeds the values as calculated from surface energies. This suggests th a t the discrepancy m ight be due to the presence of associated molecules, which are known to exist in low-temperature water vapor freshly formed. At higher temperatures, although accurate capillary data are not available, the opposite tendency seems to m aintain; i.e., the total surface energy exceeds the listed internal laten t heats. Hammick (22) derived
* From F igure 2 of the preceding article.
the to tal energy of interface form ation per pound of medium in the interface. Thus, when an interface between the liquid and vapor is to be established, this interfacial energy m ust first be supplied. If vaporization is also to take place, then the latent heat of vaporization m ust be supplied. The effective laten t heat is the sum of these two, and will depend upon the ratio of interfacial area created per pound of liquid vaporized. Thus with plane interface vaporization, the norm al la ten t heat is required, and presumably there is no decrease in interface; for every molecule th a t leaves the interface to become a vapor molecule (distinguished by its translational kinetic energy and by a correspondingly large volume or average domain which it does not possess in the interface or in the liquid state), a corresponding molecule m ust be brought from the bulk liquid into the interface. On the basis of free surface energy the increase in vapor pressure of small drops is readily explainable. Such vaporization is accompanied by a decrease in free surface energy and, hence, is aided by this driving force. Similarly, the vapor pressure within small bubbles is lowered, for such vaporization is accompanied by an increase in free surface energy and hence is opposed.
H arkins and Roberts (23) calculated surface energies and entropies on the basis of monomolecular films and came to the conclusion th a t the mole laten t heat or mole surface energy is not constant w ith tem perature or equal to any constant fraction of the normal laten t heat of vaporization as predicted by Stefan’s law. According to their calculations, the Stefan law ratio increases to unity a t the critical tem perature. The difference was called “energy of therm al emission” . The difficulty in this sort of calculation arises in regarding the interface as a separate system with volume, mass, etc., whereas it exists only because of the presence of the different bulk phases and, hence, quantitatively m ust always be associated with them. W hether actual concentration of mass occurs a t the interface or not, the interfacia)
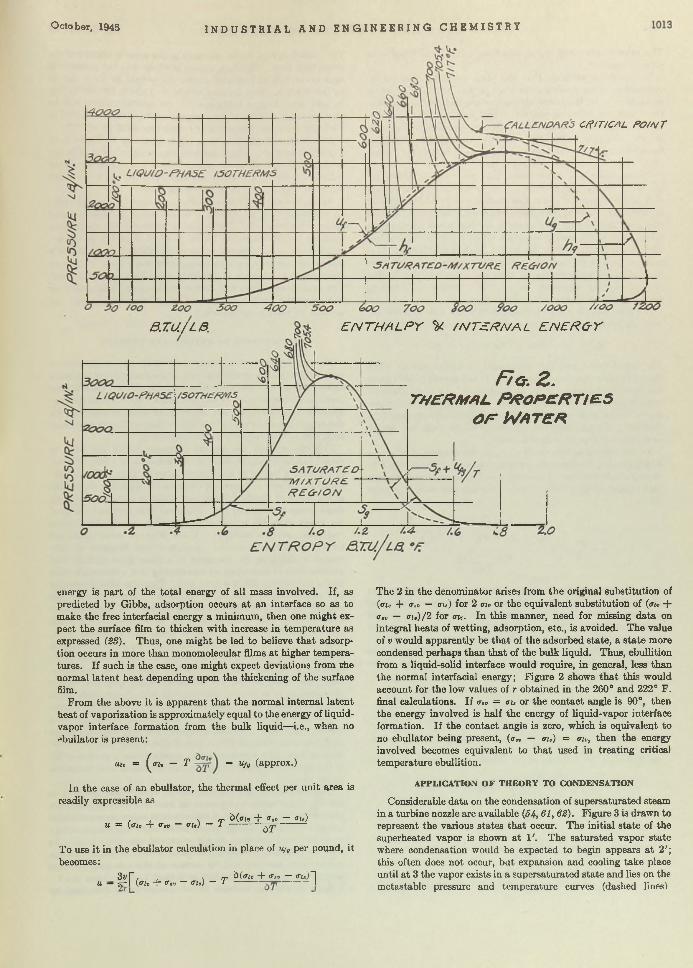
O ctober, 1945 I N D U S T R I A L A N D E N G I N E E R I N G C H E M I S T R Y
CRITICAL P O /w r
ß . T U / L ß .
F/Gr. Z.T H E R M A L P R O P E R T I E S
OE WATER
E N T H A L P Y ^ / N T ^ R N A L E N E R G Y
energy is p a rt of the to ta l energy of all mass involved. If, as predicted by Gibbs, adsorption occurs a t an interface so as to make the free interfacial energy a minimum, then one m ight expect the surface film to thicken w ith increase in tem perature as expressed (S3). Thus, one m ight be led to believe th a t adsorption occurs in more than monomolecular films a t higher temperatures. If such is the case, one might expect deviations from the normal laten t heat depending upon the thickening of the surface film.
From the above it is apparent th a t the normal internal latent heat of vaporization is approximately equal to the energy of liquid- vapor interface formation from the bulk liquid—i.e., when no •»bullator is present:
uu = (a i, - T = Uj, (approx.)
in the case of an ebullator, the therm al effect per unit area is readily expressible as
, . \ rri d(<7!» + a , v ~ 01.)u = (au + <r„ — au) — i ------------ ^rp--------
To use i t in the ebullator calculation in place of u;, per pound, it becomes:
3 » r , , \ rp d(oi, + a„ — au)~\U — ;=H (flls + a,v — a u) — 1 ------------------------ I
The 2 in the denominator arises from th e original substitution of (au + a,v — au) for 2 m, or the equivalent substitution of (aiv + a„ — ai,)/2 for ait. In this manner, need for missing data on integral heats of wetting, adsorption, etc., is avoided. The value of v would apparently be th a t of the adsorbed state, a sta te more condensed perhaps than th a t of the bulk liquid. Thus, ebullition from a liquid-solid interface would require, in general, less than the normal interfacial energy; Figure 2 shows th a t this would account for the low values of r obtained in the 260° and 222° F. final calculations. If a„ = au or the contact angle is 90°, then the energy involved is half the energy of liquid-vapor interface formation. If the contact angle is zero, which is equivalent to no ebullator being present, (a„ — au) = au, then the energy involved becomes equivalent to th a t used in treating critical tem perature ebullition.
A PPLIC A TIO N O F T H E O R Y T O CO ND EN SATION
Considerable data on the condensation of supersaturated steam in a turbine nozzle are available (54, 61, 62). Figure 3 is drawn to represent the various states th a t occur. The initial state of the superheated vapor is shown a t 1'. The saturated vapor state where condensation would be expected to begin appears a t 2 '; this often does not occur, but expansion and cooling take place until a t 3 the vapor exists in a supersaturated state and lies on the metastable pressure and tem perature curves (dashed lines)
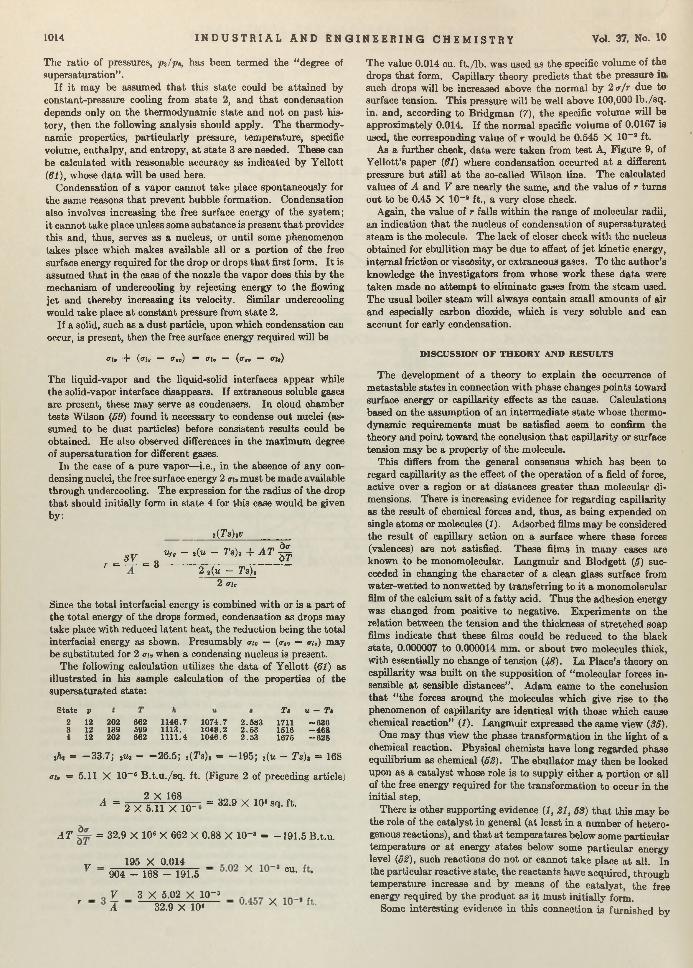
1014 I N D U S T R I A L A N D E N G I N E E R I N G C H E M I S T R Y Vol. 37, No. 10
The ratio of pressures, pj/p«, has been term ed the “ degree of supersaturation’ ’.
If i t may be assumed th a t this sta te could be a ttained by constant-pressure cooling from sta te 2 , and th a t condensation depends only on the therm odynamic sta te and not on past history, then the following analysis should apply. The therm odynamic properties, particularly pressure, tem perature, specific volume, enthalpy, and entropy, a t sta te 3 are needed. These can be calculated w ith reasonable accuracy as indicated by Yellott (61), whose d a ta will be used here.
Condensation of a vapor cannot take place spontaneously for the same reasons th a t prevent bubble formation. Condensation also involves increasing the free surface energy of the system; it cannot take place unless some substance is present th a t provides this and, thus, serves as a nucleus, or until some phenomenon takes place which makes available all or a portion of the free surface energy required for the drop or drops th a t first form. I t is assumed th a t in the case of the nozzle the vapor does this by the mechanism of undercooling by rejecting energy to the flowing je t and thereby increasing its velocity. Similar undercooling would take place a t constant pressure from sta te 2 .
If a solid, such as a dust particle, upon which condensation can occur, is present, then the free surface energy required will be
<ri, + {ait — <r,v) = fit. — (<rn — <Ht)
The liquid-vapor and the liquid-solid interfaces appear while the solid-vapor interface disappears. If extraneous soluble gases are present, these m ay serve as condensers. In cloud chamber tests Wilson (59) found it necessary to condense out nuclei (assumed to be dust particles) before consistent results could be obtained. He also observed differences in the maximum degree of supersaturation for different gases.
In the case of a pure vapor—i.e., in the absence of any condensing nuclei, the free surface energy 2 aiv m ust be made available through undercooling. The expression for the radius of the drop th a t should initially form in state 4 for this case would be given by:
2 ( T s ) 3v __________
3 y Uf, ~ 2 (w - Ts), + A T ^
r = _ = 3 2 2(m - Ts), '
2 <Th
Since the to ta l interfacial energy is combined w ith or is a part of the to ta l energy of the drops formed, condensation as drops may take place w ith reduced laten t heat, the reduction being the total interfacial energy as shown. Presumably cri« — (tr„ — <ru) may be substituted for 2 <rc, when a condensing nucleus is present.
The following calculation utilizes the data of Y ellott (61) as illustrated in his sample calculation of the properties of the supersaturated sta te :
State v T t u - Te
2 12 202 662 1146.7 1074.7 2 .583 1711 - 6 3 63 12 139 599 1113. 1048.2 2 .53 1516 - 4 6 84 12 202 662 1111.4 1046.6 2 .53 1675 - 6 2 8
ih, = -3 3 .7 ; 2u,------26.5; 2(Ts), = -1 9 5 ; 2(u - Ts), = 16S
trir = 5.11 X 10~ 6 B .t.u ./sq . ft. (Figure 2 of preceding article;
2 X 168A =
2 X 5.11 X 10-= 32.9 X 10« sq. ft.
A T = 32.9 X 10« X 662 X 0.88 X 10~ 8 = -1 9 1 .5 B.t.u.
T/ 195 X 0.014 _ v904 - 168 - 191.5 cu- 1
_ V _ 3 X 5.02 X 10- 3 _ _ v . . . . r A 32.9 X 10s X
The value 0.014 cu. ft./lb . was used as the specific volume of the drops th a t form. Capillary theory predicts th a t the pressure itt. such drops will be increased above the norm al by 2 <r/r due to surface tension. This pressure will be well above 100,000 lb ./sq . in. and, according to Bridgman (7), the specific volume will be approximately 0.014. If the norm al specific volume of 0.0167 is used, the corresponding value of r would be 0.545 X 10- ’ ft.
As a further check, d a ta were taken from test A, Figure 9, of Yellott’s paper (61) where condensation occurred a t a different pressure b u t still a t the so-called Wilson line. The calculated values of A and V are nearly the same, and the value of r turns out to be 0.45 X 10~* ft., a very close check.
Again, the value of r falls w ithin the range of molecular radii, an indication th a t the nucleus of condensation of supersaturated steam is the molecule. The lack of closer check w ith the nucleus obtained for ebullition m ay be due to effect of je t kinetic energy, internal friction or viscosity, or extraneous gases. To the author's knowledge the investigators from whose work these data were taken made no a ttem pt to elim inate gases from the steam used. The usual boiler steam will always contain sm all am ounts of air and especially carbon dioxide, which is very soluble and can account for early condensation.
D ISC U SSIO N O F TH EO RY AND R E SU L T S
The development of a theory to explain the occurrence of metastable states in connection w ith phase changes points toward surface energy or capillarity effects as the cause. Calculations based on the assum ption of an interm ediate sta te whose thermodynamic requirements m ust be satisfied seem to confirm the theory and point toward the conclusion th a t capillarity or surface tension m ay be a property of the molecule.
This differs from the general consensus which has been to regard capillarity as the effect of the operation of a field of force, active over a region or a t distances greater than molecular dimensions. There is increasing evidence for regarding capillarity as the result of chemical forces and, thus, as being expended on single atoms or molecules (1). Adsorbed films m ay be considered the result of capillary action on a surface where these forces (valences) are not satisfied. These films in m any cases are known to be mouomolecular. Langmuir and B lodgett (5) succeeded in changing the character of a clean glass surface from water-wetted to nonwetted by transferring to i t a monomolecular film of the calcium salt of a fa tty acid. Thus the adhesion energy was changed from positive to negative. Experim ents on the relation between the tension and the thickness of stretched soap films indicate th a t these films could be reduced to the black state, 0.000007 to 0.000014 mm. or about two molecules thick, with essentially no change of tension (43). La Place’s theory on capillarity was built on the supposition of “molecular forces insensible a t sensible distances” . Adam came to the conclusion th a t “ the forces around the molecules which give rise to the phenomenon of capillarity are identical w ith those which cause chemical reaction” (1). Langmuir expressed the same view (35).
One may thus view the phase transform ation in the light of a chemical reaction. Physical chemists have long regarded phase equilibrium as chemical (52). The ebullator m ay then be looked upon as a catalyst whose role is to supply either a portion or all of the free energy required for the transform ation to occur in the initial step.
There is other supporting evidence (1 ,21, 53) th a t th is m ay be the role of the catalyst in general (at least in a num ber of heterogenous reactions), and th a t a t tem peratures below some particular tem perature or a t energy states below some particu lar energy level (52), such reactions do not or cannot take place a t all. In the particular reactive state, the reactants have acquired, through tem perature increase and by means of the catalyst, the free energy required by the product as i t m ust initially form.
Some interesting evidence in this connection is furnished by
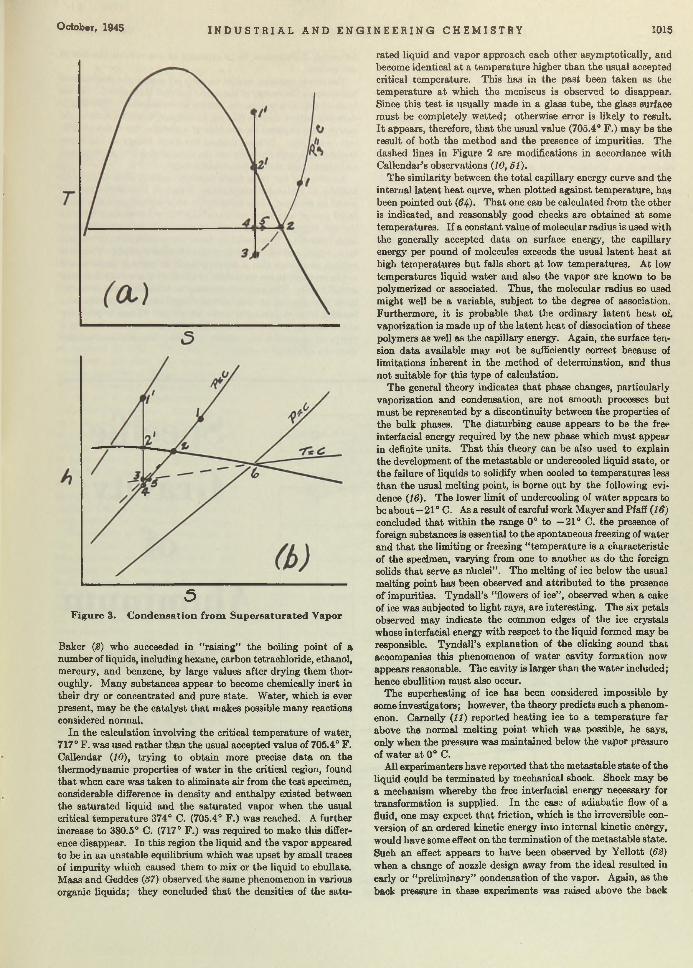
O ctober, 1945 I N D U S T R I A L A N D E N G I N E E R I N G C H E M I S T R Y 1015
5F ig u re 3. C o n d e n sa tio n fro m S u p e rsa tu ra te d V apor
Baker (2) who succeeded in “ raising” the boiling point of a number of liquids, including hexane, carbon tetrachloride, ethanol, mercury, and benzene, by large values after drying them thoroughly. M any substances appear to become chemically inert in their dry or concentrated and pure state. Water, which is ever present, m ay be the catalyst th a t makes possible many reactions considered normal.
In the calculation involving the critical tem perature of water, 717° F. was used rather than the usual accepted value of 705.4° F. Callendar (10), trying to obtain more precise data on the thermodynamic properties of water in the critical region, found th a t when care was taken to eliminate air from the test specimen, considerable difference in density and enthalpy existed between the saturated liquid and the saturated vapor when the usual critical tem perature 374° C. (705.4° F.) was reached. A further increase to 380.5° C. (717° F.) was required to make this difference disappear. In this region the liquid and the vapor appeared to be in an unstable equilibrium which was upset by small traces of im purity which caused them to mix or the liquid to ebullate. Maas and Geddes (37) observed the same phenomenon in various organic liquids; they concluded th a t the densities of the satu
rated liquid and vapor approach each other asymptotically, and become identical a t a tem perature higher than the usual accepted critical tem perature. This has in the past been taken as the tem perature a t which the meniscus is observed to disappear. Since this test is usually made in a glass tube, the glass surface m ust be completely wetted; otherwise error is likely to result. I t appears, therefore, th a t the usual value (705.4° F.) m ay be the result of both the method and the presence of impurities. The dashed lines in Figure 2 are modifications in accordance with Callendar’s observations (10, S I).
The similarity between the total capillary energy curve and the internal latent heat curve, when plotted against tem perature, has been pointed out (64). T h at one can be calculated from the other is indicated, and reasonably good checks are obtained a t some temperatures. If a constant value of molecular radius is used with the generally accepted data on surface energy, the capillary energy per pound of molecules exceeds the usual latent heat a t high tem peratures but falls short a t low tem peratures. At low tem peratures liquid water and also the vapor are known to be polymerized or associated. Thus, the molecular radius so used might well be a variable, subject to the degree of association. Furthermore, it is probable th a t the ordinary latent heat of. vaporization is made up of the latent heat of dissociation of these polymers as well as the capillary energy. Again, the surface tension data available may not be sufficiently correct because of limitations inherent in the method of determination, and thus not suitable for this type of calculation.
The general theory indicates th a t phase changes, particularly vaporization and condensation, are not smooth processes but m ust be represented by a discontinuity between the properties of the bulk phases. The disturbing cause appears to be the free interfacial energy required by the new phase which m ust appear in definite units. T hat this theory can be also used to explain the development of the metastable or undercooled liquid state, or the failure of liquids to solidify when cooled to temperatures less than the usual melting point, is borne out by the following evidence (16). The lower limit of undercooling of w ater appears to be about—21 ° C. As a result of careful work M ayer and Pfaff (16) concluded th a t within the range 0° to —21° C. the presence of foreign substances is essential to the spontaneous freezing of water and th a t the limiting or freezing “tem perature is a characteristic of the specimen, varying from one to another as do the foreign solids th a t serve as n\iclei” . The melting of ice below the usual melting point has been observed and a ttributed to the presence of impurities. Tyndall’s “flowers of ice” , observed when a cake of ice was subjected to light rays, are interesting. The six petals observed may indicate the common edges of the ice crystals whose interfacial energy with respect to the liquid formed may be responsible. Tyndall’s explanation of the clicking sound th a t accompanies this phenomenon of water cavity formation now appears reasonable. The cavity is larger than the water included ; hence ebullition m ust also occur.
The superheating of ice has been considered impossible by some investigators; however, the theory predicts such a phenomenon. Camelly (11) reported heating ice to a tem perature far above the normal melting point which was possible, he says, only when the pressure was maintained below the vapor pressure of water a t 0° C.
All experimenters have reported th a t the m etastable sta te of the liquid could be term inated by mechanical shock. Shock m ay be a mechanism whereby the free interfacial energy necessary for transformation is supplied. In the case of adiabatic flow of a fluid, one may expect th a t friction, which is the irreversible conversion of an ordered kinetic energy into internal kinetic energy, would have some effect on the termination of the metastable state. Such an effect appears to have been observed by Yellott (62) when a change of nozzle design away from the ideal resulted in early or “preliminary” condensation of the vapor. Again, as the back pressure in these experiments was raised above the back
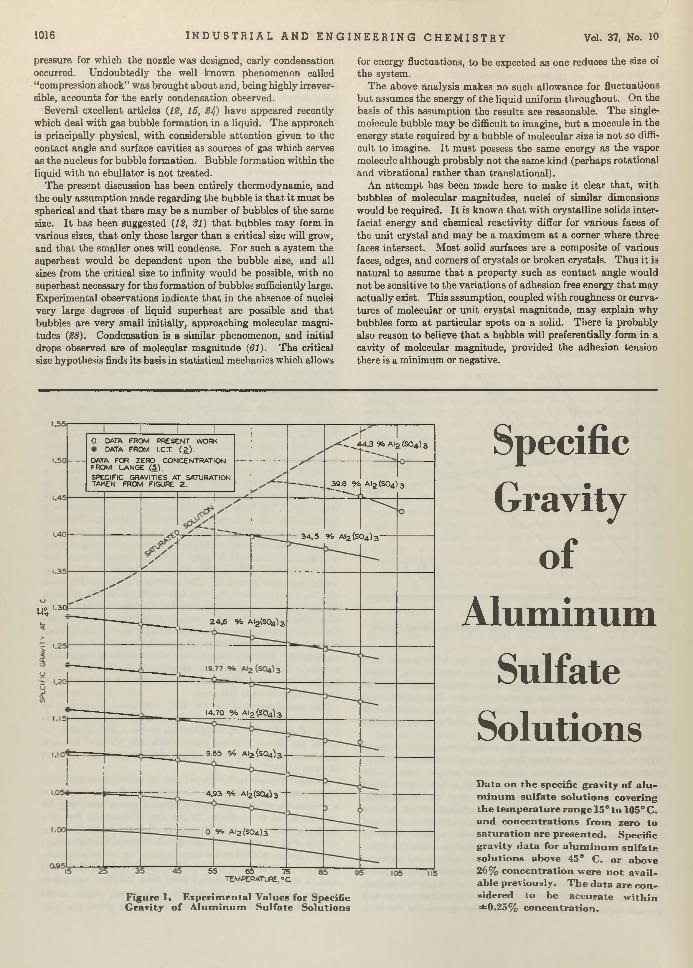
1016 I N D U S T R I A L A N D E N G I N E E R I N G C H E M I S T R Y Vol. 37, No. 10
pressure for which the nozzle was designed, early condensation occurred. Undoubtedly the well known phenomenon called “ compression shock” was brought about and, being highly irreversible, accounts for the early condensation observed.
Several excellent articles (12, 15, 24) have appeared recently which deal w ith gas bubble form ation in a liquid. The approach is principally physical, w ith considerable a tten tion given to the contact angle and surface cavities as sources of gas which serves as the nucleus for bubble formation. Bubble form ation within the liquid w ith no ebullator is not treated.
The present discussion has been entirely therm odynamic, and the only assumption m ade regarding the bubble is th a t i t m ust be spherical and th a t there m ay be a num ber of bubbles of the same size. I t has been suggested (12, 31) th a t bubbles m ay form in various sizes, th a t only those larger than a critical size will grow, and th a t the smaller ones will condense. For such a system the superheat would be dependent upon the bubble size, and all sizes from the critical size to infinity would be possible, w ith no superheat necessary for the formation of bubbles sufficiently large. Experimental observations indicate th a t in the absence of nuclei very large degrees of liquid superheat are possible and th a t bubbles are very small initially, approaching molecular magnitudes (28). Condensation is a similar phenomenon, and initial drops observed are of molecular m agnitude (61). The critical size hypothesis finds its basis in statistical mechanics which allows
for energy fluctuations, to be expected as one reduces the size of the system.
The above analysis makes no such allowance for fluctuations b u t assumes the energy of the liquid uniform throughout. On the basis of th is assum ption the results are reasonable. The singlemolecule bubble m ay be difficult to imagine, b u t a moecule in the energy sta te required by a bubble of molecular size is no t so difficult to imagine. I t m ust possess the same energy as the vapor molecule although probably not the same kind (perhaps rotational and vibrational rather th an translational).
An a ttem pt has been m ade here to m ake i t clear th at, w ith bubbles of molecular magnitudes, nuclei of sim ilar dimensions would be required. I t is known th a t w ith crystalline solids in terfacial energy and chemical reactivity differ for various faces of the unit crystal and m ay be a maximum a t a comer where three faces intersect. M ost solid surfaces are a composite of various faces, edges, and corners of crystals or broken crystals. Thus it is natural to assume th a t a property such as contact angle would not be sensitive to the variations of adhesion free energy th a t may actually exist. This assumption, coupled with roughness or curvatures of molecular or un it crystal m agnitude, m ay explain why bubbles form a t particular spots on a solid. There is probably also reason to believe th a t a bubble will preferentially form in a cavity of molecular m agnitude, provided the adhesion tension there is a minimum or negative.
Specific
Gravity
ofAluminum
SulfateSolutionsD ata on th e specific gravity o f a lu m in u m su lfa te so lu tio n s covering th e tem perature range 15° to 105° C. and concen trations from zero to satu ration are presented . Specific gravity data for a lu m in u m su lfa te so lu tion s above 45° C. or above 26% concen tration were n o t available previously. T he data are con sidered to be accurate w ith in ±0.25% concen tration .
24.6 % AI2(S04)3
14.70 % AI2(SÖ4)3
9.85 % AI2(S04)3
4.93 % AI2(S04)3
0 <*> A l 2 ( S 0 4 ) 3
O DATA FROM PRESENT WORK. DATA FROM I.CT. (¿).
DATA FOR ZERO CONCENTRATION FROM LANGE (S').SPECIFIC GRAVITIES AT SATURATION TAKEN FROM FIGURE 2.
-^ 4 4 .3 % Alj> (SO4) 3
_39.8 % Al2 (S04) 3~~~~ A.
34.5 Yo AI2(S04)3
o io 1.30 hI*
55 65 75TEMPERATURE, °C
Figure 1« E xperim ental V alues for Specific G ravity o f A lum inu m Su lfa te Solu tion s
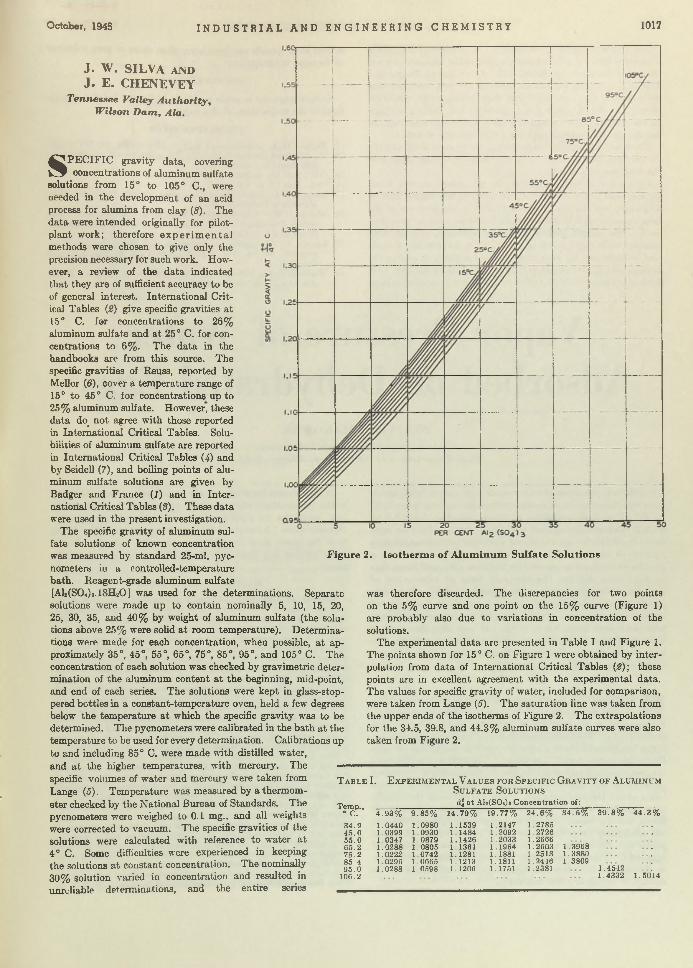
October, 1945 I N D U S T R I A L A N D E N G I N E E R I N G C H E M I S T R Y 1017
J . W. SILVA AND
J . E. CHENEVEYT ennessee V alley A u th o r ity ,
W ilson D a m , A la .
SP E C IF IC gravity data, covering concentrations of aluminum sulfate
solutions from 15° to 105° C., were needed in the development of an acid process for alumina from clay (S). The d a ta were intended originally for pilot- plant work; therefore e x p e r im e n ta l methods were chosen to give only the precision necessary for such work. However, a review of the d a ta indicated that they are of sufficient accuracy to be of general interest. International Critical Tables (2) give specific gravities a t 15° C. for concentrations to 26% aluminum sulfate and a t 25° C. for concentrations to 6%. The data in the handbooks are from this source. The specific gravities of Reuss, reported by Mellor (6), cover a tem perature range of 15° to 45° C. for concentrations up to 25% aluminum sulfate. However, these d a ta do_ not agree with those reported in International Critical Tables. Solubilities of aluminum sulfate are reported in International Critical Tables (4) and by Seidell (7), and boiling points of aluminum sulfate solutions are given by Badger and France (1) and in In ternational Critical Tables (8). These data were used in the present investigation.
The specific gravity of aluminum sulfate solutions of known concentration was measured by standard 25-ml. pyc- nometers in a controlled-temperature bath. Reagent-grade aluminum sulfate [A1î(S0»)j.18H20 ] was used for the determinations. Separate solutions were made up to contain nominally 5, 10, 15, 20, 25, 30, 35, and 40% by weight of aluminum sulfate (the solutions above 25% were solid a t room tem perature). Determ inations were made for each concentration, when possible, a t approximately 35°, 45°, 55°, 65°, 75°, 85°, 95°, and 105° C. The concentration of each solution was checked by gravimetric determination of the aluminum content a t the beginning, mid-point, and end of each series. The solutions were kept in glass-stoppered bottles in a constant-tem perature oven, held a few degrees below the tem perature a t which the specific gravity was to be determined. The pycnometers were calibrated in the bath a t the tem perature to be used for every determination. Calibrations up to and including 85° C. were made with distilled water, and a t the higher tem peratures, with mercury. The — specific volumes of water and mercury were taken from Lange (.5). Tem perature was measured by a therm om eter checked by the National Bureau of Standards. The pycnometers were weighed to 0.1 mg., and all weights were corrected to vacuum. The specific gravities of the solutions were calculated with reference to water a t 4° C. Some difficulties were experienced in keeping the solutions a t constant concentration. The nominally 30% solution varied in concentration and resulted in unreliable determinations, and the entire series
Figure 2. Isotherm s o f A lum inu m Su lfate So lu tions
was therefore discarded. The discrepancies for two points on the 5% curve and one point on the 15% curve (Figure 1) are probably also due to variations in concentration ot the solutions.
The experimental d a ta are presented in Table I and Figure 1. The points shown for 15° C. on Figure 1 were obtained by in terpolation from d ata of International Critical Tables (2); these points are in excellent agreement with the experimental data. The values for specific gravity of water, included for comparison, were taken from Lange (-5). The saturation line was taken from the upper ends of the isotherms of Figure 2. The extrapolations for the 34.5, 39.8, and 44.3% aluminum sulfate curves were also taken from Figure 2.
T a b l e I . E x p e r i m e n t a l V a l u e s f o r S p e c i f i c G r a v it y o f A l u m in u m S u l f a t e S o l u t io n s
Temp., ° C.
d j a t AhCSO«)* Concentration of:
4 .9 3 % 9.8 5 % 14.79% 19.77% 24 .6 % 34 .5 % 39 .8 % 4 4 .3 %
34.9 1.0440 1.0980 1.1539 1.2147 1.278545 .0 1.0399 1.0930 1.1484 1.2092 1.272655.0 1.0347 1.0879 1.1426 1.2033 1.266665.2 1.0288 1.0805 1.1361 1.1964 1.2603 1.396875.2 1.0222 1.0742 1.1281 1.1881 1.2513 1.388085.4 1.0296 1.0665 1.1213 1.1811 1.2446 1.380995 .0 1.0288 1.0598 1.1206 1.1751 1.2381 1.4542
106.2 1.4332 1.5014
1018 I N D U S T R I A L A N D E N G I N E E R I N G C H E M I S T R Y Vol. 37, No. 10
T he curves of Figure 2 were derived from the curves of Figure 1. T he upper lim its of the isotherm s represent the concentrations a t saturation as given by Seidell (7). According to Badger and France (1), aluminum sulfate solution of 44% concentration boils a t 105° C .; they sta te th a t their boiling point values are accurate to =*=1° C., w ith results probably low ra ther than high. In th e present work no sign of boiling was observed during the specific gravity determ ination for a 40% solution a t 106° C.
T he specific gravities determ ined in the present work and the values from International Critical Tables (2) do not agree with the d a ta from Mellor (6).
Figure 2 was used extensively in pilot-plant control work. On the basis of the precision of the tem perature measurements, weighings, and chemical analyses (Table I), the accuracy of the d a ta is considered to be within =*= 0.25 % concentration for pure solu-t tions. The specific gravity of impure solutions, such as those obtained from the reaction between clay or bauxite and sulfuric acid, is influenced by the excess of either alum ina or ac d in the solution and by the presence of iron and other im purit es. According to d a ta from Mellor (6), solutions of commercial aluminum
sulfate have specific gravities lower than those of pure solutions of th e same concentration.
A C K N O W L E D G M E N T
Acknowledgment is m ade to Philip M iller for helpful suggestions in the preparation of th is paper.
L IT E R A T U R E C IT E D
(1) Badger, W. L., and France, J. S., I n d . E n q . C h u m ., 15, 364 (1923).(2) International Critical Tables, Vol. I l l , p. 70, New York, McGraw-
Hill Book Co., 1928.(3) Ibid., Vol. I l l , p. 325.(4) Ibid., Vol. IV, p. 226.(5) Lange, N. A., Handbook of Chemistry, 5th ed., Sandusky, Ohio,
Handbook Publishers, 1944.(0) Mellor, J. W., “Comprehensive Treatise on Inorganic and Theo
retical Chemistry” , Vol. V, pp. 333—4, London, Longmans, Green and Co., 1929.
(7) Seidell, A., "Solubilities of Inorganic and Metal Organic Compounds” , 3rd ed., Vol. I, p. 97, New York, D. Van Nostrand Co., 1940.
(8) Walthall, J. H., Miller, Philip, and Striplin, M. M., Jr., Tram.Am. Inst. Chem. Engrs., 41, 53-140 (1945).
Vapor Pressure of Water Adsorbed on Dehydrated Eggs
BENJAMIN MAKOWERW estern R eg io n a l R esearch L abora tory ,
V . S. D e p a r tm e n t o f A g ricu ltu re , A lb a n y , C alif.
E quilibrium pressure o f w ater vapor over spray-dried w hole eggs w as determ ined a t six tem peratures varying from 17.1° to 70® C. and a t m oistu re co n ten ts ranging from 0.5 to 5.5% . T he resu lts agreed w ell w ith sim ilar data on eggs dried from th e frozen sta te and w ith th e less extensive data p ublished by G ane (6). T h e resu lts were analyzed by a graphical m ethod suggested by O thm er (10), and from th is analysis w as derived th e isosteric h ea t o f adsorption o f w ater o n dried eggs a t various m oisture levels. T he ratio o f th e isosteric h ea t to th e la ten t h ea t o f condensation o f w ater vapor increases from 1.1 to 2.1 as th e m oisture con te n t decreases from 5.5 to 0.5%* I t was a lso show n th a t th e adsorption isotherm s can be represented, w ith in certa in lim its , by th e Brunauer, E m m ett, and Teller theory(4) o f adsorption o f gases on solids.
K N OW LEDGE of the vapor pressure of w ater over dehydrated eggs is essential in the design of drying equipment
for eggs and in the selection of packaging m aterial for the dry product (11). The recent trend in drying toward lower moisture levels has brought about a need for vapor pressure d a ta for eggs th a t contain less th an 2% of water. The d a ta in the literature for th is m oisture region are meager. Measurements previously obtained in th is laboratory (9) and by S tuart et al. (14) were taken a t one tem perature only. Gane (6) measured the equilibrium m oisture content a t various tem peratures and moisture levels, b u t the vapor pressure d a ta derivable from his d a ta do n o t adequately cover th e region below 2% of water. As Gane points out, his results apply only to the sample of spray-dried eggs used. Vapor pressure m ay vary w ith different lots of eggs, as a result of differences in composition or differences in the m ethod of drying or other treatm ent.
In the present investigation the measurements were extended to the low-moisture region and also repeated at-the higher moisture levels, for the purpose of comparing m aterials prepared in different ways. A sample of dried whole eggs, prepared by drying from the frozen state (lyophilizing), was also included. In the latter method any deteriorative changes are likely to be minimized.
M A T E R IA L S AND M E T H O D
Spray-dried eggs obtained from a commercial source contained initially about 5% of water. The lyophilized eggs prepared in this laboratory had a m oisture content of abou t 2% . Ten samples of each kind of powder were ad justed to m oisture conten ts covering a range from 0.5 to 5.5% . The samples were adjusted in one of two ways. One m ethod involved addition of a known weight of w ater to a weighed sample th a t had been vacuum-dried a t room tem perature to a m oisture level of about0.2%. The w ater was evaporated from one vessel and adsorbed from the vapor phase by the powder in another vessel. The transfer was effected in a closed system , in the absence of air. The other m ethod consisted in placing the sample in a vacuum desiccator th a t served as a constant-hum idity cham ber. The hum idity was controlled by an aqueous sulfuric acid solution of known concentration (8). T he sample either lost or gained water until equilibrium m oisture content had been reached.
The m oisture contents of the samples were determ ined by drying in a vacuum oven a t 100° C. for 5 hours a t a pressure of2 to 5 mm. of m ercury. This procedure is sim ilar to the A.O.A.C. m ethod (1) and is generally used in the industry. (Passage of dry a ir through the oven, as specified in the A.O.A.C. m ethod, had no appreciable effect on results and was not included.) Vapor pressure m easurements are expressed in term s of results obtained by this procedure, although actual w ater contents are believed to have Deen somewhat lower. W hen w ater contents of a num ber of samples were determ ined by drying to constant weight a t room tem perature (to minimize decomposition) in evacuated desiccators th a t contained magnesium perchlorate as the desiccant, it was found th a t the results were about 0.15% lower than those obtained by the vacuum-oven m ethod. If i t is as-
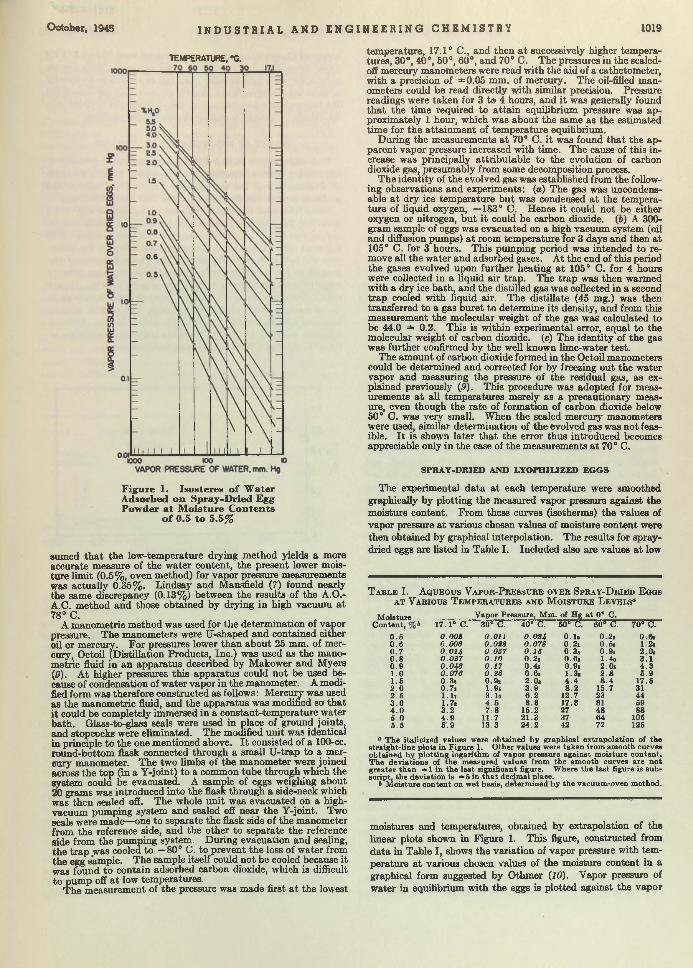
TEMPERATURE, *C.
O ctober, 1945 I N D U S T R I A L A N D
Figure 1. Isosteres o f W ater Adsorbed on Spray-Dried Egg Powder at M oisture C ontents
o f 0.5 to 5.5%
sumed th a t the low-temperature drying m ethod yields a more accurate measure of the water content, the present lower moisture lim it (0.5%, oven method) for vapor pressure measurements was actually 0.35%. Lindsay and Mansfield (7) found nearly the same discrepancy (0.13%) between the results of the A.O.- A.C. m ethod and those obtained by drying in high vacuum a t 78° C.
A manometrie m ethod was used for the determ ination of vapor pressure. The manometers were U-shaped and contained either oil or mercury. For pressures lower than about 25 mm. of mercury, Octoil (Distillation Products, Inc.) was used as the manometrie fluid in an apparatus described by Makower and Myers (9). A t higher pressures this apparatus could not be used because of condensation of w ater vapor in the manometer. A modified form was therefore constructed as follows: Mercury was used as the manometrie fluid, and the apparatus was modified so th a t it could be completely immersed in a constant-tem perature water bath. Glass-to-glass seals were used in place of ground joints, and stopcocks were eliminated. The modified unit was identical in principle to the one mentioned above. I t consisted of a 100-cc. round-bottom flask connected through a small U-trap to a mercury manometer. The two limbs of the manometer were joined across the top (in a Y-joint) to a common tube through which the system coula be evacuated. A sample of eggs weighing about 20 grams was introduced into the flask through a side-neck which was then sealed off. The whole unit was evacuated on a high- vacuum pumping system and sealed off near the Y-joint. Two seals were made— one to separate the flask side of the manometer from the reference side, and the other to separate the reference side from the pumping system. During evacuation and sealing, the trap was cooled to — 80° C. to prevent the loss of w ater from the egg sample. The sample itself could not be cooled because it was found to contain adsorbed carbon dioxide, which is difficult to pump off a t low temperatures.
The measurement of the pressure was made first a t the lowest
tem perature, 17.1° C., and then a t successively higher temperatures, 30°, 40°, 50°, 60°, and 70° C. The pressures in the sealed- off mercury manometers were read with the aid of a cathetometer, w ith a precision of ±0.05 mm. of mercury. The oil-filled manometers could be read directly w ith similar precision. Pressure readings were taken for 3 to 4 hours, and it was generally found th a t the time required to a tta in equilibrium pressure was approximately 1 hour, which was about the same as the estimated tim e for the a ttainm ent of tem perature equilibrium.
During the measurements a t 70“ C. i t was found th a t the apparent vapor pressure increased with time. The cause of this increase was principally attributable to the evolution of carbon dioxide gas, presum ably from some decomposition process.
The identity of the evolved gas was established from the following observations and experiments: (a) The gas was uncondens- able a t dry ice tem perature bu t was condensed a t the temperature of liquid oxygen, —183° C. Hence it could not be either oxygen or nitrogen, bu t i t could be carbon dioxide, (b) A 300- gram sample of eggs was evacuated on a high vacuum system (oil and diffusion pumps) a t room tem perature for 3 days and then a t 105° C. for 3 hours. This pumping period was intended to remove all the water and adsorbed gases. A t the end of this period the gases evolved upon further heating a t 105° C. for 4 hours were collected in a liquid a ir trap. The trap was then warmed with a dry ice bath, and the distilled gas was collected in a second trap cooled with liquid air. The distillate (45 mg.) was then transferred to a gas buret to determine its density, and from this measurement the molecular weight of the gas was calculated to be 44.0 =*= 0.2. This is within experimental error, equal to the molecular weight of carbon dioxide, (c) The identity of the gas was further confirmed by the well known lime-water test.
The am ount of carbon dioxide formed in the Octoil manometers could be determined and corrected for by freezing out the water vapor and measuring the pressure of the residual gas, as explained previously (9). This procedure was adopted for measurements a t all tem peratures merely as a precautionary measure, even though the rate of formation of carbon dioxide below 50° C. was very small. When the sealed mercury manometers were used, similar determination of the evolved gas was not feasible. I t is shown later th a t the error thus introduced becomes appreciable only in the case of the measurements a t 70° C.
S PR A Y -D R IE D AND L Y O P H IL IZ E D E G G S
The experimental d a ta a t each tem perature were smoothed graphically by plotting the measured vapor pressure against the moisture content. From these curves (isotherms) the values of vapor pressure a t various chosen values of moisture content were then obtained by graphical interpolation. The results for spray- dried eggs are listed in Table I. Included also are values a t low
E N G I N E E R I N G C H E M I S T R Y 1019
T a b l e I. A q u e o u s V a p o r - P r e s s u r e o v e r S p r a t - D r i e d E g g s a t V a r i o u s T e m p e r a t u r e s a n d M o i s t u r e L e v e l s *
M oisture Vapor Pressure, M m . of H g a t 0° C.Content, 17 .1° C. 30° C. 40° C. 50° C. 60° C. 70° C.
0 .6 0.002 0.011 0.094 0 .1 . 0.2s 0 .«r0 .6 0.006 0.028 0.078 0 .2 i 0 . 5i 1 2 ,0 .7 0.014 0.067 0.15 0.3$ 0.9« 2 .0 i0 .8 0.027 0.10 0.2« 0.6a 1 .40 3 .10 .9 0.0Ą6 0.17 0.4» 0.9« 2.0» 4 .31 .0 0.076 0.26 0 .6 i 1.3« 2 .8 5 .91.6 0.3» 0.9a 2.0« 4 .4 8 .4 17.52 .0 0.7« 1.96 3 .9 8 .2 15.7 312 .6 1.1» 3. lo 6 .2 12.7 23 443 .0 1.7« 4 .5 8 .8 17.3 31 504 .0 3 .2 7 :8 15.2 27 48 885 .0 4 .9 11.7 21.3 37 64 1056 .5 5 .9 13.3 2 4 .2 42 72 125
° The italicized values were obtained by graphical ex trapolation of the straight-line plots in Figure 1. O ther values were taken from sm ooth curves obtained by p lo tting logarithm of vapor pressure against moisture content. The deviations of the measured values from th e smooth curves are not grea ter th a n =*= 1 in th e la st significant figure. W here th e la st figure is sub script, the deviation is ± 5 in th a t decimal place.
b M oisture con ten t on wet basis, determ ined by the vacuum-oven method.
" ' ■ 111 ..- ... I ■
moistures and temperatures, obtained by extrapolation of the linear plots shown in Figure 1. This figure, constructed from data in Table I, shows the variation of vapor pressure with temperature a t various chosen values of the moisture content in a graphical form suggested by Othmer (10). Vapor pressure of water in equilibrium with the eggs is plotted against the vapor
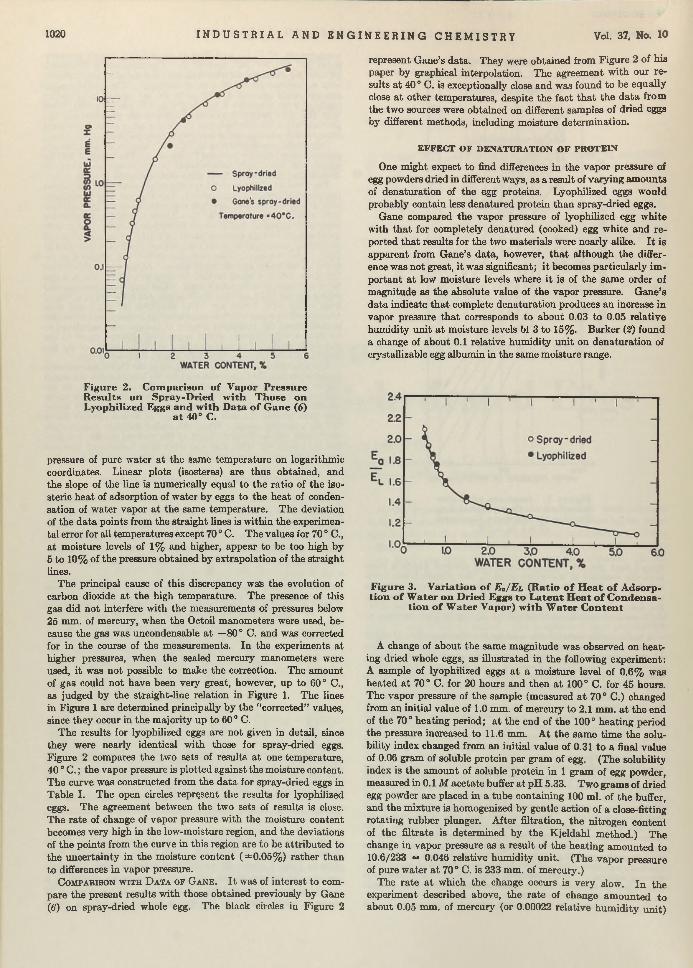
1020 I N D U S T R I A L A N D E N G I N E E R I N G C H E M I S T R Y Vol. 37, No. 10
Figure 2. Com parison o f Vapor Pressure R esu lts on Spray-D ried w ith T hose on L vophilized Eggs and w ith D ata o f G ane (6)
at 40° C.
pressure of pure water a t the same tem perature on logarithmic coordinates. Linear plots (isosteres) are thus obtained, and the slope of the line is numerically equal to the ra tio of the iso- steric heat of adsorption of water by eggs to the heat of condensation of water vapor a t the same tem perature. T he deviation of the d a ta points from the straight lines is within the experimental error for all tem peratures except 70 ° C. The values for 70 ° C., a t moisture levels of 1% and higher, appear to be too high by 5 to 10% of the pressure obtained by extrapolation of the straight lines.
The principal cause of this discrepancy was the evolution of carbon dioxide a t the high tem perature. The presence of this gas did not interfere w ith the measurements of pressures below 25 mm. of mercury, when the Octoil manometers were used, because the gas was uncondensable a t — 80° C. and was corrected for in the course of the measurements. In the experiments a t higher pressures, when the sealed mercury manometers were used, it was not possible to make the correction. The amount of gas could not have been very great, however, up to 60° C., as judged by the straight-line relation in Figure 1. The lines in Figure 1 are determined principally by the “corrected” values, since they occur in the m ajority up to 60° C.
The results for lyophilized eggs are not given in detail, since they were nearly identical w ith those for spray-dried eggs. Figure 2 compares the two sets of results a t one tem perature, 40 ° C .; the vapor pressure is plotted against the moisture content. The curve was constructed from the d a ta for spray-dried eggs in Table I. The open circles represent the results for lyophilized eggs. The agreement between the two sets of results is close. The ra te of change of vapor pressure with the moisture content becomes very high in the low-moisture region, and the deviations of the points from the curve in this region are to be attribu ted to the uncertainty in the moisture content (± 0.05% ) rather than to differences in vapor pressure.
C o m p a r i s o n w i t h D a t a o f G a n e . I t was of interest to compare the present results w ith those obtained previously by Gane (6) on spray-dried whole egg. The black circles in Figure 2
represent Gane’s data. They were obtained from Figure 2 of his paper by graphical interpolation. The agreement w ith our re sults a t 40° C. is exceptionally close and was found to be equally close a t other tem peratures, despite the fact th a t the d a ta from the tw o sources were obtained on different samples of dried eggs by different methods, including moisture determ ination.
E F F E C T O F D EN A T U R A TIO N O F P R O T E IN
One m ight expect to find differences in the vapor pressure of egg powders dried in different ways, as a result of varying am ounts of dénaturation of the egg proteins. Lyophilized eggs would probably contain less denatured protein than spray-dried eggs.
Gane compared the vapor pressure of lyophilized egg white with th a t for completely denatured (cooked) egg white and reported th a t results for the two m aterials were nearly alike. I t is apparent from Gane’s data, however, th a t although the difference was not great, i t was significant; i t becomes particularly im portan t a t low moisture levels where it is of the same order of m agnitude as the absolute value of the vapor pressure. Gane’s data indicate th a t complete dénaturation produces an increase in vapor pressure th a t corresponds to about 0.03 to 0.05 relative humidity unit a t moisture levels bt 3 to 15%. B arker (2) found a change of about 0.1 relative hum idity unit on dénaturation of crystallizable egg albumin in the same moisture range.
Figure 3. V ariation o f Eo/E l (R atio o f H eat o f Adsorption o f W ater on Dried Eggs to L aten t H eat o f C ondensa
tio n o f W ater Vapor) w ith W ater C on ten t
A change of about the same m agnitude was observed on heating dried whole eggs, as illustrated in the following experiment: A sample of lyophilized eggs a t a m oisture level of 0.6% was heated a t 70° C. for 20 hours and then a t 100° C. for 45 hours. The vapor pressure of the sample (measured a t 70° C.) changed from an initial value of 1.0 mm. of m ercury to 2.1 mm. a t the end of the 70° heating period; a t the end of the 100° heating period the pressure increased to 11.6 mm. A t the sam e tim e the solubility index changed from an initial value of 0.31 to a final value of 0.06 gram of soluble protein per gram of egg. (The solubility index is the am ount of soluble protein in 1 gram of egg powder, measured in 0 .1 M acetate buffer a t pH 5.33. Two gram s of dried egg powder are placed in a tube containing 100 ml. of the buffer, and the m ixture is homogenized by gentle action of a close-fitting rotating rubber plunger. After filtration, the nitrogen content of the filtrate is determ ined by the K jeldahl m ethod.) The change in vapor pressure as a result of the heating am ounted to 10.6/233 = 0.046 relative hum idity unit. (The vapor pressure of pure water a t 70° C. is 233 mm. of mercury.)
The ra te a t which the change occurs is very slow. In the experiment described above, the ra te of change am ounted to about 0.05 mm. of mercury (or 0.00022 relative hum idity unit)
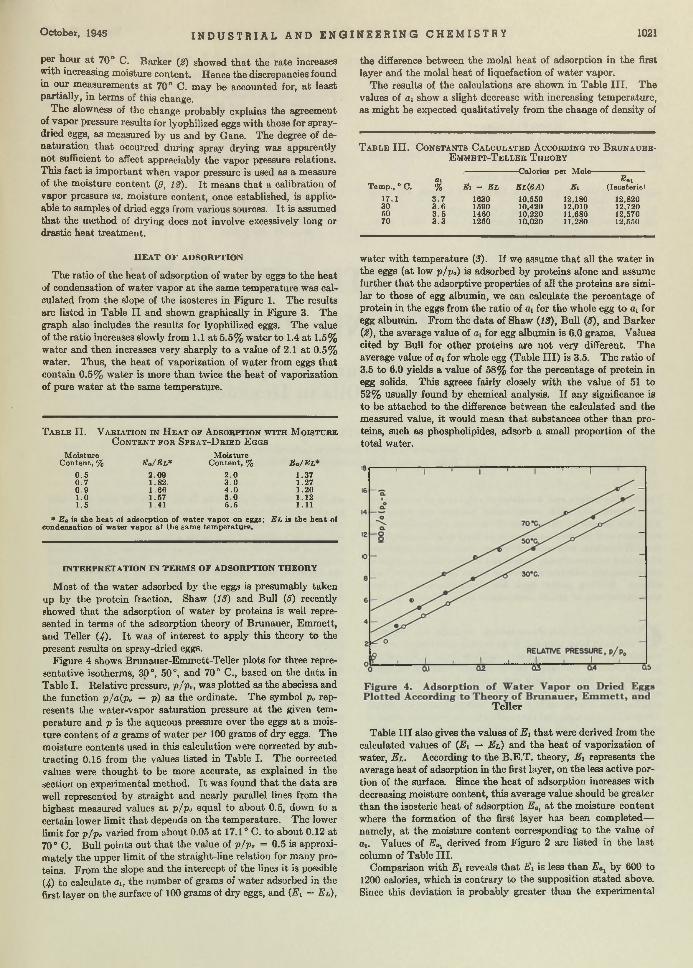
O ctober, 1945 I N D U S T R I A L A N D E N G I N E E R I N G C H E M I S T R Y 1021
per hour a t 70° C. Barker (2) showed th a t the ra te increases with increasing moisture content. Hence the discrepancies found in our measurements a t 70° C. m ay be accounted for, a t least partially, in terms of this change.
The slowness of the change probably explains the agreement of vapor pressure results for lyophilized eggs with those for spray- dried eggs, as measured by us and by Gane. The degree of de- naturation th a t occurred during spray drying was apparently not sufficient to affect appreciably the vapor pressure relations. This fact is im portant when vapor pressure is used as a measure of the moisture content (9, 12). I t means th a t a calibration of vapor pressure vs. moisture content, once established, is applicable to samples of dried eggs from various sources. I t is assumed that the method of drying does not involve excessively long or drastic heat treatm ent.
H E A T O F A D SO R PT IO N
The ratio of the heat of adsorption of water by eggs to the heat of condensation of water vapor a t the same tem perature was calculated from the slope of the isosteres in Figure 1. The results are listed in Table I I and shown graphically in Figure 3. The graph also includes the results for lyophilized eggs. The value of the ratio increases slowly from 1.1 a t 5.5% w ater to 1.4 a t 1.5% water and then increases very sharply to a value of 2.1 a t 0.5% water. Thus, the heat of vaporization of water from eggs th a t contain 0.5% w ater is more than twice the heat of vaporization of pure w ater a t the same tem perature.
T a b l e II . V a r i a t i o n i n H e a t o f A d s o r p t i o n w i t h M o i s t u r e C o n t e n t f o r S p r a t - D r i e d E g g s
M oisture C on ten t, % Ea/ E l *
M oisture C on ten t, % Eo/ E l*
0 .5 2 .09 2 .0 1.370 .7 1.82. 3 .0 1.270 .9 1 .66 4 .0 1.201.0 1.57 5 .0 1.121.5 1.41 5 .5 1.11
* Ea is the h ea t of adsorp tion of w ater vapor on eggs; E l is the hea t of condensation of w ater vapor a t the sam e tem pera ture.
IN T E R P R E T A T IO N IN T E R M S O F A D SO R PT IO N T H E O R Y
M ost of the w ater adsorbed by the eggs is presumably taken up by the protein fraction. Shaw (13) and Bull (6) recently showed th a t the adsorption of water by proteins is well represented in terms of the adsorption theory of Brunauer, Emm ett, and Teller (4). I t was of interest to apply this theory to the present results on spray-dried eggs.
Figure 4 shows Brunauer-Emmett-Teller plots for three representative isotherms, 30°, 50°, and 70° C., based on the data in Table I. Relative pressure, p/po, was plotted as the abscissa and the function p/a (p0 — p) as the ordinate. The symbol p„ represents the water-vapor saturation pressure a t the given temperature and p is the aqueous pressure over the eggs a t a moisture content of a grams of water per 100 grams of dry eggs. The moisture contents used in this calculation were corrected by subtracting 0.15 from the values listed in Table I. The corrected values were thought to be more accurate, as explained in the section on experimental method. I t was found th a t the data are well represented by straight and nearly parallel lines from the highest measured values a t p/po equal to about 0.5, down to a certain lower lim it th a t depends on the tem perature. The lower limit-, for plpo varied from about 0.05 a t 17.1° C. to about 0.12 a t 70° C. Bull points out th a t the value of p/po = 0.5 is approximately the upper lim it of the straight-line relation for many proteins. From the slope and the intercept of the lines it is possible(4) to calculate ah the number of grams of water adsorbed in the first layer on the surface of 100 grams ot dry eggs, and (E x - E l),
the difference between the molal heat of adsorption in the first layer and the molal heat of liquefaction of water vapor.
The results of the calculations are shown in Table I I I . The values of ai show a slight decrease w ith increasing tem perature, as m ight be expected qualitatively from the change of density of
T a b l e I I I . C o n s t a n t s C a l c u l a t e d A c c o r d i n g t o B r u n a u e r - E m m e t t - T e l l e r T h e o r y
— Calories per Mole—ai Ea\
Tem p., ° C. % Ei — E l E l (6A) Ex (Isosteric)
17.1 3 .7 1630 10,550 12,180 12,82030 3 .6 1590 10,420 12,010 12,72050 3 .5 1460 10,220 11,680 12,57070 3 .3 1260 10,020 11,280 12,550
water with tem perature (3). If we assume th a t all the water in the eggs (at low p/p») is adsorbed by proteins alone and assume further th a t the adsorptive properties of ail the proteins are similar to those of egg albumin, we can calculate the percentage of protein in the eggs from the ratio of aj for the whole egg to ai for egg albumin. From the d a ta of Shaw (13), Bull (5), and Barker(2), the average value of for egg albumin is 6.0 grams. Values cited by Bull for other proteins are not very different. The average value of oi for whole egg (Table I I I ) is 3.5. The ratio of 3.5 to 6.0 yields a value of 58% for the percentage of protein in egg solids. This agrees fairly closely with the value of 51 to 52% usually found by chemical analysis. If any significance is to be attached to the difference between the calculated and the measured value, i t would mean th a t substances other than proteins, such as phospholipides, adsorb a small proportion of the total water.
Teller
Table I I I also gives the values of E i th a t were derived from the calculated values of (Ei — E l) and the heat of vaporization of water, E l . According to the B.E.T. theory, E x represents the average heat of adsorption in the first layer, on the less active portion of the surface. Since the heat of adsorption increases with decreasing moisture content, th is average value should be greater than the isosteric heat of adsorption Eat a t the moisture content where the formation of the first layer has been completed— namely, a t the moisture content corresponding to the value of (h. Values of Eai derived from Figure 2 are listed in the last column of Table III .
Comparison w ith Ei reveals th a t 2?i is less than EQl by 600 to 1200 calories, which is contrary to the supposition stated above. Since this deviation is probably greater than the experimental
1022 I N D U S T R I A L A N D E N G I N E E R I N G C H E M I S T R Y Vol. 37, No. 10
error in E ai, it m ust be assumed th a t the source of the discrepancy lies in certain simplifying assumptions inherent in the B .E.T. calculations. The discrepancy m ay be due to the fact th a t in the theory Ea, is assumed to be equal to E l, while the experimental results show th a t E ai is actually about 25% higher th an E l .
ACKNOW LEDGM ENT
Acknowledgment is made to M arjory Galvin for assistance with m easurements and to T. M. Shaw and F. S titt for helpful suggestions.
LITERATURE C ITED
(1) Assoc, of Official Agr. Chem., M ethods of Analysis, 5th ed., p.308 (1940).
(2) Barker, H . A., J . Gen. Physiol., 17, 32 (1933).(3) Brunauer, S., “ Adsorption of Gases and Vapors” , Vol. I, p. 161,
Princeton Univ. Press, 1943.
(4) Brunauer, S., Em m ett, P . H ., and Teller, E ., J . A m . Chem. Soe.,60, 309 (1938).
(5) Bull, H . B., Ibid., 66, 1499 (1944).(6) Gane, R „ J. Soc. Chem. Ind ., 62, 185 (1943).(6A) International Critical Tables, Vol. V, p. 138 (1929).(7) Lindsay, W . N ., and Mansfield, T ., I n d . E n g . Ch em ., A n a l .
E d ., 16, 628 (1944).(8) M akower, B,, and D ehority, G. L., I n d . E n g . Chem ., 35, 193
(1943).(9) Makower, B., and M yers, S., Proc. Inst. Food Tech., 1943, 156.
(10) Othmer, D ., and Sawyer, F . G., I n d . E n g . Chem., 35, 1269(1943).
(11) P itm an, A. L., R abak, W ., and Yee, H ., Food Industries, 15, 49(1943).
(12) Q uarterm aster Corps, T en tative Specifications for Dried Eggs,C.QJ). No. 117A, Jan . 28, 1944.
(13) Shaw, T. M „ J . Chem. Phys., 12, 391 (1944).(14) S tuart, L. S., Hall, H . H ., and Dicks, E . E „ U. S. Egg Poultry
Mag., 48, 629 (1942).
SOLVENT EXTRACTION OF
COTTONSEED AND PEANUT OILSBoiling Point—Vapor Pressure—Composition Relations
for Miscellas of Oils in Hexane
E. F . POLLARD, H. L. E. VIX, AND E. A. GASTROCKS o u th e r n R eg io n a l R esea rch L abora tory ,
U. S . D e p a r tm e n t o f A g r icu ltu re , N etc O rleans, La.
T he boiling p o in ts and d en sities o f m ixtures o f cottonseed and p ean u t o ils w ith com m ercial hexane are reported. T hey are u sefu l in th e design o f vacuum evaporators and strippers and for control operations involving tem perature, tim e o f h ea tin g , and con cen tra tion o f o il-so lven t m ixtures o f various com p osition s, to prevent or m in im ize fixation o f objection ab le coloring m a tter or other deteriorative h eat effects. B oiling p o in t data are determ ined a t various con cen tra tion s o f crude co ttonseed o il and crude pean u t
o il, over a range o f pressures from 160 to 760 m m . absolute in com m ercial hexane. T he reported d ata sh ou ld b e o f value in th e further develop m en t o f th e tech n o logy o f th e solvent extraction o f vegetab le o ils . O bservations o f th e effect o f a g ita tio n in estab lish in g equ ilib r iu m cond itions o f th e o il-so lven t m ixtures are n o ted . T he R a o u lt law and th e D uhring ru le ca n n o t be applied for p red icting data o f th e necessary accuracy w ith in th e critica l operating region.
CONTINUOUS solvent-extraction methods for vegetable oils have been adopted, to an increasing extent in new in
stallations, particularly in the soybean industry (1, 4, 6), and to a lim ited extent in laboratory and pilot-plant work for obtaining tung oil (5). Some viscosity and density data on soybean oil- solvent mixtures have been published (S). Cottonseed meal or cake has been commercially extracted both in Europe and South America for some time, bu t the possibility of solvent extraction of oil from cottonseed and peanut meal has received little a tten tion in the United States except during the last few years. M any technical and engineering problems in applying solvent extraction have no t been satisfactorily solved. Some of the difficulties are .summarized by Olcott (6).
D ata obtained in the present study are im portant in determining the maximum safe tem perature, tim e of heating, and vacuum stripping conditions for cottonseed and peanut miscellas of various concentrations w ithout fixation of the objectionable coloring m atter and other deteriorative effects which would impair the value of the oil. Boiling point curves are useful in designing engineering equipm ent for pilot-plant or full-scale operation. Although some work is reported in related fields (1, 6, 8), fundam ental engineering d a ta are no t generally available for the
design of vacuum evaporation and stripping apparatus. Experim ental data have been published for separating and recovering solvents such as N aphtha E and ethylene dichloride from cottonseed oil (£) in which distillation ranges, a t atm ospheric pressure, of m ixtures containing 50% solvent and 50% cottonseed oil, are compared w ith the distillation ranges of the pure solvents.
In this investigation the boiling points of various m ixtures of crude cottonseed and peanut oils in commercial hexane were determined over a range of pressures from 160 to 760 mm. absolute. The hexane was a commercial solvent (Skellysolve B) with the following specifications: gravity a t 60° F ., 74.4° A .P .I.; boiling range, 140-160° F .; vapor pressure a t 100° F . (Reid), 5.1 pounds per square inch; evaporation residue by weight, 0.0016%; color, water-white. Petroleum fractions which have approxim ately the characteristics of n-hexane are widely used and are generally available a t low cost. F o r these reasons a commercial grade of petroleum hexane fraction was chosen for th is work.
Refining tqst d a ta of the crude cottonseed and peanut oils were as follows: (a) crude cottonseed oil: free fa tty acids (as oleic)3.5% , specific gravity a t 30° O. 0.913, refining loss 12.5%, m oisture 0.093%; (6) refined cottonseed oil from crude: iodine num ber 105.5, color 35Y-14.4R, color of bleached oil 35Y-5.5R;
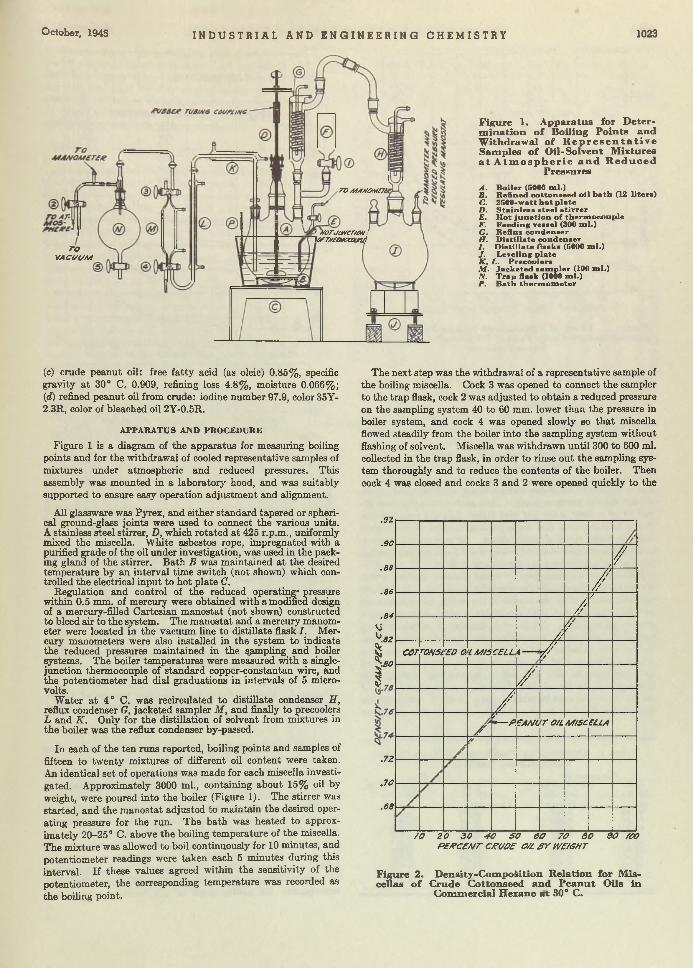
October, 1945 I N D U S T R I A L A N D E N G I N E E R I N G C H E M I S T R Y 1023
70MAA/0Mm
> Horjcwcr/£W\ yofTj/sa/ûcoumj
roVACUUM
Figure 1. A pparatus for D eterm in a tio n o f B oiling P o in ts and W ithdrawal o f R e p r e s e n t a t i v e Sam ples o f O il-Solvent M ixtures a t A t m o s p h e r i c a n d R e d u c e d
Pressures
A . B o iler (5040 m l.)B . R efined co tto n seed o il b a th (12 li ter s )C. 2509-w a tt h o t p la teD . S ta in le s s s te e l stirrerE. H ot ju n c t io n o f th erm ocou p leF. F eed in g vesse l (300 m l.)G . Reflux con d en ser f f . D is tilla te con d en ser/ . D is tilla te flask s (5000 m l.)J . Leveling: p la teK , L. P recoolersM . Jack eted sam p ler (100 m l.)N. T rap flask (1000 m l.)P. B ath th erm o m eter
(e) crude peanut oil: free fa tty acid (as oleic) 0.85%, specific gravity a t 30° C. 0.909, refining loss 4.8%, moisture 0.066%; (d) refined peanut oil from crude: iodine num ber 97.9, color 35Y- 2.3R, color of bleached oil 2Y-0.5R.
APPARATUS AND PROCEDURE
Figure 1 is a diagram of the apparatus for measuring boiling points and for the withdrawal of cooled representative samples of mixtures under atmospheric and reduced pressures. This assembly was mounted in a laboratory hood, and was suitably supported to ensure easy operation adjustm ent and alignment.
All glassware was Pyrex, and either standard tapered or spherical ground-glass joints were used to connect the various units. A stainless steel stirrer,, D, which rotated a t 425 r.p.m., uniformly mixed the miscella. W hite asbestos rope, impregnated with a purified grade of the oil under investigation, was used in the packing gland of the stirrer. B ath B was m aintained a t the desired tem perature by an interval time switch (not shown) which controlled the electrical input to ho t plate C.
Regulation and control of the reduced operating' pressure within 0.5 mm. of mercury were obtained with a modified design of a mercury-filled Cartesian m anostat (not shown) constructed to bleed air to the system. The m anostat and a mercury manometer were located in the vacuum line to distillate flask I . Mercury manometers were also installed in the system to indicate the reduced pressures m aintained in the sampling and boiler systems. The boiler tem peratures were measured w ith a singlejunction thermocouple of standard copper-constantan wire, and the potentiom eter had dial graduations in intervals of 5 microvolts.
W ater a t 4° C. was recirculated to distillate condenser H, reflux condenser G, jacketed sampler M , and finally to precoolers L and K . Only for the distillation of solvent from mixtures in the boiler was the reflux condenser by-passed.
In each of the ten runs reported, boiling points and samples of fifteen to tw enty mixtures of different oil content were taken. An identical set of operations was made for each miscella investigated. Approximately 3000 ml., containing about 15% oil by weight, were poured into the boiler (Figure 1). The stirrer was started, and the m anostat adjusted to m aintain the desired operating pressure for the run. The bath was heated to approximately 20-25° C. above the boiling tem perature of the miscella. The m ixture was allowed to boil continuously for 10 minutes, and potentiom eter readings were taken each 5 minutes during this interval. If these values agreed within the sensitivity of the potentiometer, the corresponding tem perature was recorded as
the boiling point.
The next step was the withdrawal of a representative sample of the boiling miscella. Cock 3 was opened to connect the sampler to the trap flask, cock 2 was adjusted to obtain a reduced pressure on the sampling system 40 to 60 mm. lower than the pressure in boiler system, and cock 4 was opened slowly so th a t miscella flowed steadily from the boiler into the sampling system without flashing of solvent. Miscella was withdrawn until 300 to 600 ml. collected in the trap flask, in order to rinse out the sampling system thoroughly and to reduce the contents of the boiler. Then cock 4 was closed and cocks 3 and 2 were opened quickly to the
.32
.9 0
.88
.8 6
.8 4
ViV 82
S' *.*>
I
.7 2
.7 0
.68
/ / /
// // /
>
/ ///
/ ///s
COTrONSi 'ED a I M /S CELL 4----/ // /
7 ''/
/ // // ///
/
/C—p ÇANL ro/L M/SC€LLA
r
/O 2 0 3 0 4 0 5 0 6 0 7 0 0 0 SO /COP E R C E N T C/?OOE O/L 3 Y WE/<SHT
Figure 2. D ensity-C om poèition R elation for Mis* ceUas o f Crude C ottonseed and P ean ut O ils in
Com m ercial H exane at 30° C.

1024 I N D U S T R I A L A N D E N G I N E E R I N G C H E M I S T R Y Vol. 37, No. 10
PERCENT CRUOE PEANUT OIL ô ï VZE/6HT
CURVE ABSOLUTE PRESSURE MM. Ho
6' ° \sTIRRER460 J —I--------1------
} WITHOUT ST/RRER
Figure 3. Effect o f A gitation on B oiling P o in t o f C om m ercial H exane-C rude P ean ut Oil M iscellas a t C onstant
Vapor Pressures
atmosphere. This sample was cooled to about 30° C., and by properly opening three-way stopcock 4, appropriate portions were withdrawn for analysis.
A quantity of vegetable oil (300 to 600 ml.) was slowly added to the boiling miscella to increase its oil concentration sufficiently for the next point on the curve. This addition of oil readjusted the volume of oil-solvent mixture to approximately 3000 ml. Then the interval tim e switch was regulated to raise the bath tem perature slightly. W hen boiling equilibrium for this miscella was established, the same m anipulations were repeated as described for the previous point. Thus each succeeding miscella had an oil content a few per cent higher than the previous one. Hence boiling points and corresponding samples were obtained over the entire range of compositions. As soon as the contents of the boiler reached 93 to 95% oil by weight, solvent was distilled from miscella to increase the percentage of oiL
Preliminary investigations revealed several factors which were considered in establishing a suitable procedure: (a) N atural agitation produced by the motion of the boiling miscella was not sufficient and did not yield duplicable results; consequently a stirrer was installed. (6) To avoid flashing of solvent while a sample was withdrawn, especially a t low absolute pressures, precoolers were installed and arranged. The m aintainance of a pressure differential of not over 40-60 mm. between boiler and sampling systems also assisted in eliminating flashing, (c) Foaming was eliminated throughout the peanut oil and m ost of the cottonseed oil runs by m aintaining a 20-25° C. differential in tem perature between boiler and bath. Only for the cottonseed
Figure 4. Boiling P o in t-C om position Curves o f Com m ercial H exane-C rude V egetable O il M iscellas a t Con
sta n t Vapor Pressures
T a b l e I. D e n s i t i e s o p C o m m e r c ia l H e x a n e - C r u d e V e g e t a b l e O i l M i s c e l l a s
C ottonseed Oil________ __________P ean u t Oil% oil D ensity a t 30° C., % oil D ensity a t 30° C.,
by wt. g ram /cc . by wt. g ram /ee .
100 0.9116 100 0 .90819 1 .06 0 .883 90.71 0 .88278.84 0 .853 79.61 0 .85268.71 0 .8 2 6 69 .38 0 .82558.61 0.801 57 .79 0 .79749 .33 0 .778 49.62 0 .77739.81 0 .756 41.33 0 .75729.42 0 .733 32 .09 0 .73819.80 0 .709 19.10 0 .7108 .95 0 .6 8 8 10.24 0 .6920 .0 0 .6719 0 .0 0 .6719
oil runs a t the lower operating pressures was i t necessary to reduce the tem perature differential to 10° C. to minimize and control foaming. Observations indicated th a t the boiling points were independent of the differential in tem perature between b a th and boiler for a range of 10° to 30° C. Higher tem perature differentials were no t investigated, (d) Commercial hexane was used in making up the initial miscella for a run, and further addition of this solvent was no t required, (e) D istillation of solvent for increasing the oil content could not be used for miscella containing less than 92 to 95% oil by weight because the lower- boiling-point components in the commercial hexane distilled off in a higher proportion th an the higher-boiling-point fractions- consequently the boiling point of the resulting m ixture was
CURVE
/O 20 30 40 50 60 70 80 90 /OOPERCENT CRUOf COTfONSEEO 0/1 â / WEIGHT
B . PEANUT O/L
10 ZO SO 40 SO 60 70 eoPERCENT CRUDE PEANUT OIL BY W E/6HT
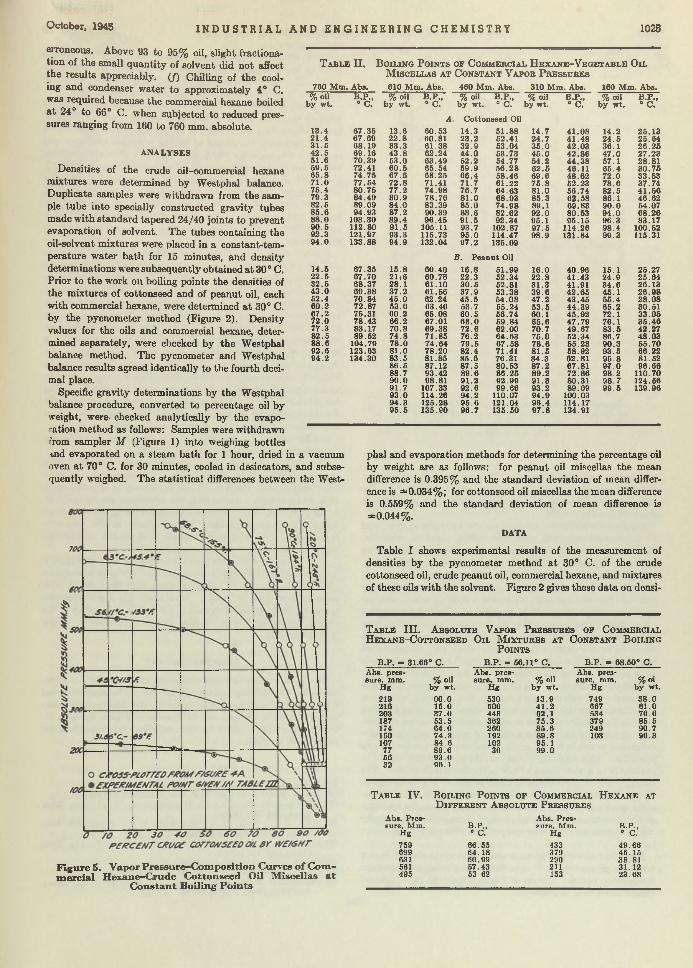
O ctober, 1945 I N D U S T R I A L A N D E N G I N E E R I N G C H E M I S T R Y 1025
erroneous. Above 93 to 95% oil, slight fractionation of the small quantity of solvent did not affect T a b l e II.the results appreciably. (/) Chilling of the cooling and condenser w ater to approximately 4° C. was required because the commercial hexane boiled a t 24° to 66° C. when subjected to reduced pressures ranging from 160 to 760 mm. absolute.
A N A LY SES
Densities of the crude oil—commercial hexane mixtures were determined by W estphal balance.Duplicate samples were withdrawn from the sample tube into specially constructed gravity tubes made w ith standard tapered 24/40 joints to prevent evaporation of solvent. The tubes containing the oil-solvent mixtures were placed in a constant-tem- perature water ba th for 15 minutes, and density determinations were subsequently obtained a t 30° C.Prior to the work on boiling points the densities of the mixtures of cottonseed and of peanut oil, each with commercial hexane, were determined a t 30° C. by the pycnometer m ethod (Figure 2). Density values for the oils and commercial hexane, determined separately, were checked by the W estphal balance method. The pycnometer and W estphal balance results agreed identically to the fourth decimal place.
Specific gravity determinations by the W estphal balance procedure, converted to percentage oil by weight, were- checked analytically by the evaporation method as follows: Samples were withdrawn from sampler M (Figure 1) into weighing bottles ind evaporated on a steam bath for 1 hour, dried in a vacuum oven a t 70° C. for 30 minutes, cooled in desiccators, and subsequently weighed. The statistical differences between the West-
B o i l i n g P o i n t s o p C o m m e r c i a l H e x a n e - V e g e t a b l e O i l M i s c e l l a s a t C o n s t a n t V a p o r P r e s s u r e s
760 Mm., Abs. 610 M m . Abs. 460 M m. Abs. 310 M m . Abs. 160 M m. Abs.% oil B .P .. % oil B.P77 % o il B .P ., % oil B .P., % oil B .P ..
by wt. 0 C. by wt. ° c. b y wt. 0 C. by wt. » C. by wt. « C.
A. Cottonseed Oil
13.4 67 .35 13.6 60.53 14.3 51 .88 14.7 41 .08 14.2 25 .1321 .4 67.69 2 2 .8 60.81 23 .2 52.41 2 4 .7 41 .48 2 4 .5 25 .043 1 .6 68 .19 33 .3 61 .38 32 .9 63.04 35 .0 42 .03 36 .1 26 .254 2 .5 69 .16 4 3 .8 62.24 44 .0 53.73 45 .0 42 .86 4 7 .0 27 .2351 .6 70 .39 53 .0 63.49 52.2 54.77 64 .2 44.38 67.1 28.8169 .6 72.41 60 .6 65.54 59 .9 5 0 .28 6 2 .6 40.11 6 5 .4 30 .756 5 .8 74 .75 67 .6 68.25 66.4 58.46 6 9 .6 48 .02 7 2 .0 33 .537 1 .0 77 .54 72 .8 71.41 71 .7 61.22 7 6 .8 52.23 78 .6 37.7475 .4 80 .75 77 .2 74 .98 70 .7 64.63 81 .0 56.74 8 2 .5 41 .5679 .3 84.49 8 0 .9 78.76 81 .0 68.93 85 .3 62.58 86.1 46.6282 .5 89.09 8 4 .0 83.39 85 .0 74 .98 89.1 69.83 9 0 .0 54.078 5 .6 94 .93 87.2 90.39 88 .6 82.62 92 .0 80.53 9 4 .0 68 .208 8 .0 103.30 89 .4 96 .45 91 .5 92.34 95.1 96 .15 96 .3 83 .179 0 .5 112.80 91 .5 105.11 93 .7 102.87 97 .5 114.26 98 .4 100.5292 .3 121.97 93.3 115.73 95 .0 114.47 98 .9 131.84 99 .3 115.319 4 .0 133.88 94 .9 132.04 97 .2 135.09
B. P eanu t Oil
14 .5 67.35 15.8 60 .40 16.8 61.99 16.0 40 .96 15.1 25.2722 .5 67.70 21 .6 60.76 22 .3 52.34 2 2 .8 41.43 24 .9 25 .0432 .5 68.37 28.1 61.10 30 .5 62.81 31 .3 41.91 3 4 .6 26 .134 3 .0 69 .38 37 .2 61.56 37 .9 53.38 3 9 .6 42 .65 45 .1 26 .9852.4 70.84 4 5 .0 62.24 4 5 .5 54 .08 47 .2 43 .45 55 .4 28 .0860 .2 72.87 53.0 63.40 53.7 55.24 53 .5 44.39 65 .2 30.5167 .2 75.31 60 .2 65.08 60 .5 56.74 60.1 45.92 72.1 33.0672 .0 78.43 66.2 67.01 6 8 .0 69.84 06 .6 47 .79 76 .1 35 .4677.3 83.17 70 .8 69 .38 72 .6 62.00 70 .7 49.67 8 3 .6 42 .2782 .5 89.52 7 4 .8 71.85 76.2 64.63 75 .0 62.34 80 .7 48 .0388 .6 104.79 78 .0 74 .64 79 .5 67 .68 7 8 .0 65.23 90 .3 55 .7092 .6 123.63 81 .0 78 .20 82 .4 71.41 8 1 .5 58.92 93 .5 66.2294.2 134.30 83 .5 81.85 85 .6 76.31 84.3 62 .81 95 .8 81.52
86 .5 87.12 8 7 .5 80.53 87 .2 67.81 9 7 .0 96.6088 .7 93.42 8 9 .6 86 .25 89 .2 72 .86 98.2 110.709 0 .0 98.81 91.2 92.99 91 .3 80.31 98 .7 124.5091 .7 107.33 92 .6 99.66 93 .2 89.09 99 .5 139.969 3 .0 114.26 94 .2 110.07 94 .9 100.0394 .3 125.28 9 5 .6 121.04 9 6 .4 114.179 5 .5 135.90 9 6 .7 135.50 9 7 .8 134.91
phal and evaporation methods for determining the percentage oil by weight are as follows: for peanut oil miscellas the mean difference is 0.395% and the standard deviation of mean difference is ±0.034% ; for cottonseed oil miscellas the mean difference is 0.559% and the standard deviation of mean difference is ±0.044% .
DATA
Table I shows experimental results of the measurement of densities by the pycnometer m ethod a t 30° C. of the crude cottonseed oil, crude peanut oil, commercial hexane, and mixtures of these oils with the solvent. Figure 2 gives these data on densi-
Figure 5. Vapor Pressure-C om position Curves o f Com m ercia l H exane-C rude C ottonseed Oil M iscellas at
C onstant B oiling P oin ts
T a b l e II I . A b s o l u t e V a p o r P r b s s u b e s o f C o m m e r c ia l
H e x a n e - C o t t o n s e e d O i l M i x t u r e s a t C o n s t a n t B o i l i n g
P o i n t s
B.P . - 31.00 0 C. B .P. - 56.11° c. B .P . - 188.50° C.Abs. pres Abs. pres Abs. pressure, mm. % oil sure. mm. % oil sure, mm. % o i
H g by wt. È g by wt. Hg by wt.
219 00.0 530 13.9 749 3 8 .0216 15.0 500 4 1 .2 667 61 .0203 37 .0 448 62.1 534 76 .6187 53 .5 362 75 .3 379 85 .5174 64 .0 260 85 .6 249 90 .7150 74 .3 192 89 .8 103 96 .3107 84 .6 102 95.177 89.6 30 99 .056 93 .032 96.1
T a b l e IV. B o i l i n g P o i n t s o f C o m m e r c i a l H e x a n e a t
D i f f e r e n t A b s o l u t e P r e s s u r e s
Abs. P res Abs. Pressure, M m. B.P ., sure, Mm. B.P.,
H g ° C. Hg 0 C.
759 66.55 433 49.66699 64.18 379 46.15631 60.99 290 38 .81561 57.43 211 31.12495 53.62 153 23 .68

1026 I N D U S T R I A L A N D E N G I N E E R I N G C H E M I S T R Y Vol. 37, No. 10
Figure 6. B oiling P oint-V apor Pressure Curves o f C om m ercial H exane-C rude C ottonseed Oil M iscellas a t C onstant C om positions (Per Cent
Oil by W eight)
ties plotted against composition. The smoothed curves served as satisfactory work charts in this investigation for converting the specific gravities obtained by the W estphal balance procedure to percentage oil by weight.
Figure 3 illustrates the effect of natural agitation as compared to mechanical agitation upon the boiling point of miscellas. Prelim inary investigations showed th a t reliable data can be obtained only under equilibrium conditions of constant stirring.
Table IL1 gives data for cottonseed oil-solvent m ixtures a t five absolute pressures. The results were plotted as weight per cent oil (W estphal) against tem perature (boiling point), and the smoothed curves are shown in Figure 4A . The weight per cent (W estphal) values were used in plotting these curves because they were considered to be more uniformly reliable than the values obtained by the evaporation m ethod; they were performed on larger samples (25 ml. compared w ith 1 or 2 ml.), could be m ade more prom ptly, were subjected to fewer m anipulative steps, and yielded smoother curves. Table I IS gives experimental results for peanut oil-solvent m ixtures a t five absolute pressures. Smoothed curves (Figure 4B) were obtained by plotting the data given in Table I1B. Boiling point curves for cottonseed and peanu t oil m ixtures a t the same absolute pressure are practically congruent, which indicates similar physical properties for the two miscellas. This sim ilarity shows th a t the reported data should be applicable to a wide range of oils of similar specifications. The boiling point d a ta should be of value in the further development of the technology of solvent extraction of vegetable oils. Apparently there are no published d a ta on boiling points for miscellas of either cottonseed oil or peanut oil in commercial hexane under reduced pressures; therefore comparisons w ith other work cannot be made.
Smoothed curves in Figures 5 and 6 present the data of Figure 4A , cross-plotted to show constant boiling point and constant composition curves. Curves in Figure 5 required the additional experimental data in Table I I I .
Table IV gives experimental determ inations of the boiling point of the commercial hexane used a t different absolute pressures. The vapor-pressure values for 100% solvent p lo tted in Figures 3 to 6 were interpolated from these determ inations.
T he d a ta presented in Figures 4A , 5, and 6 for cottonseed oil indicate the wide spread in boiling pressures over the range of tem peratures from 30° to 120° C. for th e pure solvent; as the oil content increases, the spread of boiling pressures decreases and reaches a minimum for 100% oil. Very low absolute pressures are required to boil m ixtures w ith an oil content from 95 to 100% by weight in order to avoid excessive tem peratures. A t lower tem peratures the spread of boiling pressures over the whole range of compositions is small compared to the spread a t the higher tem peratures. This group of figures is particularly valuable for designing steam stripping equipm ent and vacuum evaporators.
Figure 6 shows th a t for miscellas w ith an oil content from 0 to 50% by weight, there is a small change in the boiling tem perature a t a given pressure. However, above 50% oil by weight there is a more pronounced tem perature rise, and after 85% oil by weight there is a rapid rise in boiling tem perature a t a given pressure for any increase in oil content. The slope of the curves gradually increases as the percentage of oil in the miscella is increased; for the curves representing 95 to 100% oil, the slope approaches a constant value over the range of pressures investigated. Although no points are given below 160 mm. absolute pressure in Figure 6, i t is possible to predict from Figure 5 th a t, over the entire range of compositions, there is a rapid lowering in boiling tem perature w ith a further reduction of pressure, particularly for the miscellas of higher oil content. The slope of the curves approaches an infinite value as the pressure is fu rther reduced.
Similar curves can be obtained for peanut oil miscellas by cross plotting the d a ta obtained in Figure 48.
The data obtained in this investigation were compared with values calculated from R aoult’s law. The agreem ent between the observed and calculated values is good up to approximately 50% oil by weight. Above 50% the deviations are appreciable; as the oil content of the miscella approaches 100%, th e deviations become increasingly greater. U nfortunately in the operating region where the boiling point d a ta are m ost needed, calculations based on R aoult’s law yield erroneous results.
The values from the constant composition curves in Figure 6 were cross-plotted against pure hexane and w ater in accordance with Diihring’s rule (7). S traight lines were obtained in both cases up to 80% oil by weight. H ere again th is empirical device cannot be used for predicting d a ta of the necessary accuracy in the critical operating region; consequently, experimental values m ust be applied.
A CKNOW LEDGM ENT
The authors wish to acknowledge the assistance of B. Ashby Smith for the refining tests m ade on the crude vegetable oils; Evald L. Skau and Frank C. M agne for the density determ inations reported in Table I and the curves of Figure 2; John D. Guthrie and Claire Leslie for the analytical determ inations for per cent oil by weight.
LITERA TU RE C ITED
(1) Beckel, A. C., Oil & Soap, 21, 264 (1944).(2) Harris, W. D., Bull. Agr. Mech. Coll. Texas, 12, 1 (1941).(3) Johnstone, H . F ., Spoor, I . H., and Goss, W. H ., I n d . E n g .
Chem ., 32, 832 (1940).(4) King, C. O., K atz, D . L., and Brier, J. C., Trans. A m . Inst.
Chem. Engrs., 40, 533 (1944).(6) McKinney, R. S., Rose, W. G., and Kennedy, A. B., I n d . E n o .
C h e m ., 36, 138 (1944).(6) Olcott, H . S., Ibid., 33, 611 (1941).(7) Perry, J . H ., and Smith, E. R., Ibid., 25, 195 (1933).(8) Schoenborn, E. M., Koffolt, J . H ., and W ithrow, J. R ., Trans.
Am . Inst. Chem. Engrs., 37, 997 (1941).

Events during tlie M onth, of In te rest to Chemists, Chemical Engineers, Executives
i ^ e v i e w e d l u t h e ( f l d t t
1f S e p t e m b e r 2. Japan surrenders finally and unconditionally to United States and its allied powers.
If S e p t e m b e r 5. W PB removes im port controls from about 40 raw m aterials and says industrial capacity increased 40% during war bu t much of i t cannot be converted to civilian production. ~ ~ W . S. C arpenter, Jr., president of du Pont, disclaims any desire for control of atomic bomb developments and protests news broadcast charging United States move to give company control. ~ ~ N e w actions m ay be instituted under Webb Act against export associations and alkali case is held law’s te s t.~ ~ W P B removes all restrictions on production of passenger car, m otorcycle, and bicycle tires. ~ ~ J o h n W. Thomas, chairm an Firestone, urges creation of large government-owned stockpile of natural rubber and continuance of broad synthetic rubber research p ro g ram .~ ~ M eta lsa lts Corp. announces formation of M etal Organics jointly w ith Edwal Laboratories to produce phenyl mercury metallo-organic compounds1.~ ~ P re s id e n t Trum an asks Congress to rescind $3,500,000,000 of its 1946 appropriations not needed by war agencies.-~~B ernard M. Baruch, adviser to President in mobilization of resources during two wars, urges appointm ent of a work director and says national job plan is vital to veterans and th a t one group cannot be protected alone.
T S e p t e m b e r 6 . President Trum an tells Congress he will make recommendations late r on atomic energy plan. Meanwhile Senator Vandenberg in resolution suggests th a t joint committee of six each from House and Senate be authorized for full and complete study of development and control of atomic bomb. Senator McMahon introduces bill providing th a t use and application of atomic energy be controlled by Federal Government. ~ ~ P re s i- dent Trum an recommends to Congress creation of single federal agency to cdrrelate and promote developments for federal scientific research and the promotion and support of private research and to provide financial assistance in scholarships and grants for young men and women of proved scientific ability. ~ ~ H . F. Sinclair, president Sinclair Oil, says E thiopia has conceded its oil to corporation for a term of 50 years. ~ ~ N a v y reveals th a t it has virtually completed $20,000,000 double pipeline across Isthm us of f’a n am a .~ ~ G en e ra l Council of League of Nations Union adopts resolution asking U nited Nations Organization to establish agency to control atomic energy. '~ ~ H ercu les announces Reconstruction Finance Corp. approves company purchase of nitrocellulose p lant in Parlin, N. J.
1] S e p t e m b e r 7 . Alcoa says government-owned aluminum reduction p lants will be taken over by R FC Nov. l .~ ~ W P B lifts quota restrictions on glass containers.-~~D irector of W ar Mobilization and Reconversion Snyder creates interagency policy committee on rubber under chairmanship of William L. B att.
1f S e p t e m b e r 9 . Sixty-four members of University of Chicago faculty sign recommendation th a t United States share secret of atom ic bomb w ith other n a tio n s .~ ~ R . R. Sayers, director, Bureau of Mines, reveals details of test for presence of uranium.
l o t *
~ ~ W P B says industry advisory committees will be retained “on call” basis until WPB is liquidated. ~ ~ N a tio n a l Patent Planning Commission submits report to President recommending 8-point guide to new committee. ~ ~ R . E. Wilson, chairman, and A. W. Peake, president, Standard Oil (Ind.), say construction of new laboratories a t Hammond, Ind., has s ta rted2.
If S e p t e m b e r 10. Sewell L. Avery, chairman Montgomery Ward, protests to Secretary Stimson against Army’s continued holding of company p roperty .~ '~ C harles Adams, chairman, and Charles S . Munson, president, say Air Reduction plans spending $25,000,000 for plant improvements and expansion.
If S e p t e m b e r 11. National Association of Manufacturers News says Secretary Wallace’s plans to reorganize D epartm ent of Commerce have received President Trum an’s approval and business leaders given a confidential preview are favorably impressed.Wm. H . Milton, Jr., manager, plastics division, General Electric, says new plant for m anufacture of lam inated plastics will be built a t Coshocton, Ohio. WPB lifts controls over delivery and use of wood pulp.
f S e p t e m b e r 13. President Trum an in executive order bars disposition of all public lands containing radioactive mineral substances. ~ ~ C u b a n Government makes use of alcohol in gasoline obligatory. ~ ~ W P B grants m anufacturers permission to make any size tire of a single quality standard. ~ ~ M o n - santo’s vice president, Francis J. Curtis, says company plans to spend $48,400,000 on 151 construction and expansion projects. ~ ~ A ra b ia n American Oil Co., jointly owned by Standard Oil of California and Texas Co., starts operation of its new 50,000- barrel daily capacity oil refinery in Saudi A ra b ia .~ ~ E . J. Thomas, president Goodyear Tire and Rubber, says by year’s end company will reach its prewar peak of passenger tire production.
If S e p t e m b e r 14. J. W. Krug, W PB chairman, tells New England Council th a t survey shows 42 industries expect their production by June 1946 to be 87% above 1939-40 base period. ~ ~ W P B assures industries engaged in reconversion th a t part of Government’s 187,000-ton zinc stockpile will be available for civilian production during next six months. ~ ~ U . S. Group Control Council reveals th a t I. G. Farben prepared an economic blitz program in 1940 armed as a “trade offensive” against Latin America and excluding key United States exports to Europe.
f S e p t e m b e r 15. Secretary of State James F. Byrnes says Russia has not asked United States to be let in on atomic bomb secret and th a t he and President Trum an have not even discussed possibility of entrusting it to United Nations Organization.
f S e p t e m b e r 16. F irst trickle of rubber reclaimed from Japs in M alaya goes to England. -~'~Jefferson Chemical will erect large chemical p lant a t Neches, Texas, for production of intermediate chemicals. ~ ~ A m erican Cyanamid purchases about 900 acres east of Jefferson site for chemical plant which will utilize some of Jefferson’s products. ~ ~ W P B says U. S . newsprint production
» Chtm. Eng. News, 23, 1676 (Sept. 25, 1945). * Ibid., 1634 (Sept. 25, 1945).
1027

1028 I N D U S T R I A L A N D E N G I N E E R I N G C H E M I S T R Y Vol. 37, No. 10
has fallen 56% in past 20 years. ~ ~ A lf re d P. Sloan F o u n d a t i o n
plans projects in economic education to reach masses.
1f S e p t e m b e r 17. M. W. Kellogg Co. reveals th a t more than 5000 new products and procedures are available to industry as result of Governm ent’s atomic bomb research. ~ ~ A tto rn e y General Clark asks Congress to split up Alcoa into a num ber of competing companies. ~ ~ S e c re ta ry of Interior Ickes says he does not expect American-British oil agreement to provide price or production control. ~ ~ J o h n S. Knight, editor and publisher Knight newspapers, says he is convinced of necessity of establishing a government departm ent of scientific research.
If S e p t e m b e r 18. President T rum an announces that W ar Labor Board, W ar M anpower Commission, and U. S . Employment Service have been pu t under D epartm ent of Labor. ~ ~ F .. W. Litchfield, chairm an Goodyear, says company has perfected most im portant development in tire m aking sincJ the cord tire 30 years ago. New tire is built of rayon, is capable of greatly increased mileage, saves gasoline, and brings into prospect tires that will last longer than usual car ownership by an individual.
H S e p t e m b e r 19. British M ilitary Adm inistration sets up Malayan rubber and produce organization with sole authority to buy rubber in M a lay a .~ ~ S ecre ta ry of Interior Ickes takes steps to reserve Alamogordo air base in New Mexico, where atomic bomb was first tested, as national m onument commemorating a “forceful influence toward world peace” .
1f S e p t e m b e r 2 0 . American Viscose completes expansion plans th a t will increase its rayon production by about 100,000,000 pounds annually. ~ ~ A ss is ta n t Attorney General Wendell Berge a t a Boston conference on employment urges industry to J‘assume a venturesome lead in prom oting peacetime economic activ ity” and warns th a t building up international cartels would be fatal to our prosperity .~ '~C ongressm an Lyle H. Boren, chairm an House Newsprint Committee, states committee has recommended th a t WPB lift all newsprint restrictions effective December 31. ~ ~ W PB’s rubber bureau says M alayan rubber when available and landed in New York will cost about 2 5 .5 cents per pound which is only slightly below cost of synthetic ru b b er.~ ~ O ffice of W ar Mobilization and Reconversion rejects W PB recommendation to set up interagency tin committee to alleviate tin shortage.
IT S e p t e m b e r 21. W est Coast receives first shipm ent of rubber from overseas since Pearl H arbor. ~ ~ R o b e r t W. Hutchins, chancellor, University of Chicago, says university has established an institu te to apply discoveries of atomic research to such problems as cancer, heredity, and aging. ~ ~ G e n e ra l Leslie R. Groves, officer in charge of atomic bomb development, urges complete U. S . control of secret a t least for next few years.
f S e p t e m b e r 22. General James B. Newman, Jr., head W ar D epartm ent Atomic Bomb Mission, says no sign of radioactivity was found in Nagasaki by 17 allied scientists and doctors now in Japan completing observations of effect of second atomic bomb.
1f S e p t e m b e r 23. President T rum an says he will take full responsibility for future development of atomic bombs and atomic energy and denies Secretary Wallace had recommended a t F riday 's Cabinet meeting th a t bomb secrets be turned over to Soviet Union. ~ ~ S e n a to r Bridges calls on President T rum an to end war agencies im m edia te ly .~ ~ D av ison Chemical plans big p lant modernization program, Chester F. Hockley, president, s a y s .~ ~ Standard Oil of California announces through its president, H. D. Collier, construction program totaling more than $20,'000,000. ~ ~ Chemicals Bureau, W PB, says chemical output rose 90% in war and th a t i t directed allocation of approximately 10 billion dollars worth of chemicals. ~ ~ P la n to solicit substantial am ounts from western industries by end of year to establish $5,000,000 Pacific Research Foundation to prom ote W est’s economic and scientific future laid before Chairmen of Commissions on In ter-S ta te Cooperation of W estern States.
IT S e p t e m b e r 24. R epresentative Arends introduces bill in House to create committee of scientists, industrialists, and others to study and recommend defenses against atom ic b o m b .~ ~ United States and B ritain after six days’ deliberation sign docum ent providing for equal access'to world’s oil resources and calling for world agreement on international oil questions. Pact would create commission of six members, three from each governm ent. ~ ~ E x e c u tiv e Committee of American Association for U nited N ations advocates form ulation of term s by U. S . for sharing secrets of atomic energy w ith U nited N ations Organization.
IT S e p t e m b e r 25. Theodore C. Klum pp, president W inthrop Chemical, says company will construct new research laboratories costing more th an $2,000,000 a t Rensselaer, N. Y .~ ~ H e rc u le s Powder announces $1,250,000 addition to its Brunswick, Ga., naval stores p lan t.-~ '~ A ttorney General Clark, following luncheon of the Commerce and Industry Association of New York, says D epartm ent of Justice plans to proceed w ith 27 cases involving alleged an titru st law violations. ~ ~ S u rp lu s Property Adm inistration says Reynolds M etals has offered to lease four government aluminum plants now operated by Alcoa. ~ ~ A u - thoritative reports from British circles in W ashington say shortage of labor is only bar to producing M alayan rubber. D epartm ent of Interior urges careful conservation in use of many commercial minerals. ~ -~ G eneral Eisenhower says five war production plants in U. S . zone of occupation in Germany will be dism antled immediately and turned over to U nited N ations as part paym ent of Germ an reparations.
S e p t e m b e r 26. Surplus Property Board advocates sale of aluminum plants owned by Governm ent to com petitors of Aluminum Co. of America. ~ ~ N a t io n a l Engineers Com mittee of Engineers Joint Council makes public detailed plan for industrial control of Germany by eliminating or controlling critical war potential elements in Germ an industry. ~ ~ G e n e ra l Electric announces plans for first flying laboratory for experim entation in jet propulsion, gas turbines, and all types of aerial innovations. ~ ~ W PB says its Rubber Bureau has stream lined its rubber control order to conform w ith rubber conservation needs of reconversion period. ~ ~ H e rc u le s discloses work in production of VT-Fuse which autom atically detonates a projectile when it reaches correct proximity of target. ~ ~ U . S. D epartm ent of Agriculture eases controls for linseed o il.~ ~ G eo rg e W. Dolan, president M athie- son Alkali, says a new p lant which will double sodium chlorite output is being added to N iagara Falls production facilities. ~ ~ Chemical Unit, D epartm ent of Commerce, urges greatest sales promotion activity by m anufacturers and exporters to increase this country’s share of to ta l world trade in chemicals.
IT S e p t e m b e r 27. Form er President Hoover, in statem ent to N orth American Newspaper Alliance, says U nited States and G reat B ritain should keep atom bomb sec ret.'~ ~ A lm o st unanimous Congressional opposition to disclosure of atomic bomb secret is shown in answers to telegram s of inquiry. ■~ '~ Z ay Jeffries, vice president General Electric, says Chemical Engineering Division will be established as p a rt of G. E .’s Chemical D epartm ent, Oct. l . ~ ~ U . S. Senate unanim ously approves and sends to House resolution to set up jo in t comm ittee to study development, control, and use of atom ic energy.
If S e p t e m b e r 28. President T rum an, by proclam ation, asserts exclusive rights of U. S . to all m ineral resources in the 759,600 square miles of “C ontinental Shelf” running to an off-shore depth of 600 feet from U. S . m ainland.
1f S e p t e m b e r 29. S tandard Oil (Ind.) says work on largest construction program ever undertaken a t its refinery in Sugar Creek, Mo., has begun.
1f S e p t e m b e r 30. W PB bids farewell to its Controlled M aterials Plan governing distribution of steel, copper, and alum inum, and retains simplified priorities ra ting system for few m aterials in critically short supply.
t
EQUIPMENT AND DESIGN
< ~ r~ ^)iJc i4 .4 ieJ l u C ^ i ia t le * Q w e n I L ^ to w n
/ J v e r y o n e joins this writer in a feeling of grateful relief that the war is over. Scientific and practical efforts
have won a war and established peace for the second time in one generation. Even more, our gross scientific assets have shortened the duration of tragic years, reduced the cost in lives, and alleviated the huge financial burden. Those who have seen the waste of war may be slow to believe this. The strength of Japan was unbelievably overrated, but the waste could have been greater.
To understand our postwar opportunities we must look at the results of technical progress during the last three and a half years. There are two aspects of interest to every scientist or layman: We want to know first about new methods used and about the new products made. A more difficult phase— what should be done with the new plants and facilities available—will be discussed in this column next month.
Arming for war was undertaken by commerce and industry. Administrative judgment came from the Commander-in-Chief and the War Department. How much our war needs expanded our productive capacity can only be estimated, since the record is not definite or accurate. The last year unaffected by the war was 1939, and in 1943 the “gross national product” had risen 175% over 1939 to 155 billion dollars; 47 to 49% of this amount was spent directly for war activities. The only hope in this record is that these successful developments can be preserved and devoted to help expand and support a better economy. But most of the enlargement and advances made were in materials needed directly for war. Civilian progress was not only stopped but deliberately set back (for example, the ordered shortening of the tails on men’s shirts). The war accelerated the rate at which improvements were finished; but since almost all were military, these developments must be carefully screened to find those helpful in civil life.
Technical and practical improvements in methods were directed more to saving time than to saving labor, more to improving accuracy and quality. In this way wastefulness of time and material was cut. Production was increased but waste decreased. This type of process improvement always can be used at full face value.
The last three years have seen the birth of many new products. Many of them are better known to the readers of this article than to the writer, but several should be mentioned briefly as a measure of the rate of scientific advancement. In 1942 a few scientists had imperfect knowledge of the processes for synthetic rubber, but synthetic rubber was in tires and at the front in 1944 backed up by an annual production of over 950,000 tons. Equally amazing is the vast scale of production of 100-octane gasoline. Plastics developed so rapidly that the results are difficult to describe. It should be noted that recent uses have frequently replaced steel, a field almost untouched by plastics formerly. Finished products of
steel and nonferrous metals are now often made with certain essential parts of plastics—the handwheel on valves and light bomber turrets, for example. The binders for file papers and bayonets for training purposes have been made entirely of plastics. Ten years of normal progress in plywood have been crowded into the last three; plywood flows to a heavier and broader market than do plastics; for example, it is made into complete houses, boats, and bomber planes. Methods have also changed, for now finished articles are made from the plies and adhesive resins direct without first forming a board Curved objects such as plane wing tips and elevator assemblies are put into a strong rubber bag which is then placed in a metal pressure chamber with one small opening at a neutral point in the bag, passing through the chamber wall to atmosphere. When pressure is applied to the chamber, the air is expelled from the inside of the rubber bag and an even pressure is exerted all over the object. Magnesium was a production problem as complicated as rubber, but in two and one-half years the 1939 production of 3,980,000 pounds grew to 500,000,000 pounds of this metal, which is stronger than aluminum and 35% lighter. The history of magnesium production, however, has not been entirely happy; the oldest process has now proved to be the cheapest and the best.
Methods of assembly of large objects such as bomber planes, cargo boats, and blast furnaces were radically changed. Perhaps as much as one-quarter of the whole has been completed in four different places, moved to the assembly line or the ways, and then put together and finished. A steel company, forced to replace a blast furnace, built the new furnace near by; when it was completed, the old one was shut down and demolished, the new one moved into the same place, and the connections to the auxiliary equipment were then completed. Ninety-six days of full production by the old furnace were saved by this carefully planned engineering. The main electrical wiring for a large plane was done by painting the wiring diagram on a long table; the wires were placed in proper position on pegs and bound together for strength, and the bundle was given protective coatings and a cover. It could then be placed quickly in the body of the plane as a rugged unit.
Packard 'decided to redraw the two thousand left-handed British designs of the Rolls-Royce Company; this was completed without impairing top performance of the wartime tested-in-line Merlin engine. Surgical instruments were often used to remove foreign matter from complicated oil ducts. Wind tunnels to prove the fast-changing types of planes grew to 700 feet in length, and wind velocities of 600 miles per hour were created by a 40,000 horsepower motor; an additional 3600-horsepower motor and refrigerating compressor lowered the air temperature to —67° F-., although the larger part of the temperature (Continued on page 94)
93

drop was obtained by changing static, pressure into velocity, which expands the air and lowers its temperature. Liquid carbon dioxide is used as a source of energy in planes to operate auxiliaries when the main power source has been damaged; about 30,050 foot-pounds of energy are available per pound of gas.
Two newcomers have appeared in the inorganic list, sulfamic acid and ammonium sulfamate. Ethyl alcohol is produced by fermenting the wood sugars in waste sulfite liquors, and glycerol has been produced by fermentation and also synthetically from a cracked gasoline fraction. Tricalcium phosphate, substantially citrate soluble, is now made on a large scale by a one-step blast furnace process using a catalyst, even though the temperature is about 1600° C. Ethyl mercaptan injected in the ventilating air to mines warns miners more promptly than any sound alarm yet used. A new “ballast” in fluorescent lighting fixtures saved 23,750 pounds of copper, 81,000 pounds of steel, 325 pounds of aluminum, and 303 kilowatt-hours in the lighting system of one airplane plant. The iron penny was unsuccessful, but the Administration permitted several million pounds of mint silver to be leased for use in heavy-amperage bus bars, on the condition that it should all be returned. By better hardening and heat-tempering methods, the cement industry in 1944 saved 5860 tons of steel grinding slugs per year.
The dingy foundry also deserves recognition. Good ship propellers have been cast in permanent cement, not sand cores, and wooden core boxes are now protected from sand abrasion with a sprayed metal coating. Some of the most important munitions were made of “N.E.” steels, in which the alloying elements were reduced to meet the national emergency. Copper tube ends have been sealed in less than one second by revolving the tube at high speed against a steel die; friction heat anneals the copper, melts and centrifugally casts the end closed. The degree of fineness of metal powders, once determined by the amount which settled in three to seven hours in glycerol, is now determined in a few minutes; a beam of light is passed through an air-borne suspension while the current is measured from an electric eye energized by the light pickup passing through the metal powder suspension. A new x-ray was produced for the first time from the 100,000,000-volt discharge created by electron acceleration. Blood plasma, Freon insecticide bombs, fresh water from sea water plants, maps mounted on thin steel sheets which hold small magnet markers without marring the map surface, 108,000-kilowatt hydroelectric generators—all are typical of new processes and products now available.
Statistical analysis is widely used in sampling materials which are produced by the million, and also to interpret the results of inspections and the control of rejections. A new professional society of men devoting their talents to this type of work may become permanent.
Let us not forget, however, that the last three years have not shown a net gain on balance. The entropy of the United States has decreased at a rapid increment rate. We have exhausted our best iron ores, Michigan copper is nearer a memory, petroleum reserves have been lowered, and our forest supplies are most seriously depleted. Basic costs are at a much higher level. Next month’s article will deal with a wise and logical program for disposing of these facilities.
94
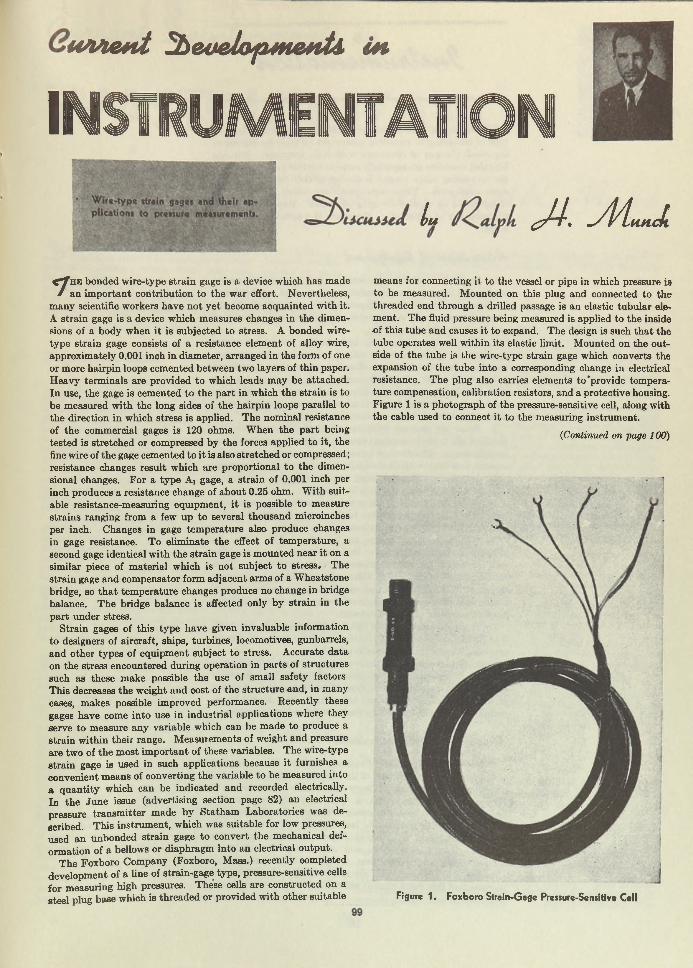
< ^ hb bonded wire-type stra in gage is a device which has made/ an im portant contribution to the war effort. Nevertheless,
m any scientific workers have no t yet become acquainted w ith it. A strain gage is a device which measures changes in the dimensions of a body when it is subjected to stress. A bonded wire- type strain gage consists of a resistance elem ent of alloy wire, approxim ately 0.001 inch in diam eter, arranged in the form of one or more hairpin loops cemented between two layers of th in paper. Heavy term inals are provided to which leads m ay be attached. In use, the gage is cem ented to the p a rt in which the strain is to be measured w ith the long sides of the hairpin loops parallel to the direction in which stress is applied. The nominal resistance of the commercial gages is 120 ohms. W hen the p a rt being tested is stretched or compressed by the forces applied to it, the fine wire of the gage cemented to i t is also stretched or compressed; resistance changes result which are proportional to the dimensional changes. For a type Ai gage, a stra in of 0.001 inch per inch produces a resistance change of about 0.25 ohm. W ith suitable resistance-measuring equipm ent, i t is possible to measure strains ranging from a few up to several thousand microinches per inch. Changes in gage tem perature also produce changes in gage resistance. To elim inate the effect of tem perature, a second gage identical w ith the strain gage is m ounted near it on a similar piece of m aterial which is not subject to stress. The stra in gage and compensator form adjacent arms of a W heatstone bridge, so th a t tem perature changes produce no change in bridge balance. The bridge balance is affected only by strain in the pa rt under stress.
Strain gages of th is type have given invaluable information to designers of aircraft, ships, turbines, locomotives, gunbarrels, and other types of equipm ent subject to stress. Accurate data on the stress encountered during operation in parts of structures such as these m ake possible the use of small safety factors This decreases the weight and cost of the structure and, in many cases, makes possible improved performance. Recently these gages have come in to use in industrial applications where they serve to m easure any variable which can be made to produce a strain within their range. M easurem ents of weight and pressure are two of the m ost im portant of these variables. The wire-type stra in gage is used in such applications because i t furnishes a convenient means of converting the variable to be measured into a quan tity which can be indicated and recorded electrically. In the June issue (advertising section page 82) an electrical pressure transm itter made by Statham Laboratories was described. This instrum ent, which was suitable for low pressures, used an unbonded strain gage to convert the mechanical deform ation of a bellows or diaphragm Into an electrical output.
The Foxboro Company (Foxboro, Mass.) recently completed developm ent of a line of strain-gage type, pressure-sensitive cells for measuring high pressures. These cells are constructed on a steel plug base which is threaded or provided w ith other suitable
means for connecting it to the vessel or pipe in which pressure is to be measured. M ounted on this plug and connected to th e threaded end through a drilled passage is an elastic tubular element. The fluid pressure being measured is applied to the inside ■of th is tube and causes it to expand. The design is such th a t the tube operates well within its elastic limit. M ounted on the outside of the tube is the wire-type strain gage which converts the expansion of the tube into a corresponding change in electrical resistance. The plug also carries elements to 'provide temperar ture compensation, calibration resistors, and a protective housing. Figure 1 is a photograph of the pressure-sensitive cell, along with the cable used to connect it to the measuring instrum ent.
(Continued on page 100)
Figure 1. Foxboro Strain-Gsge Pressure-Sensitive Cell
M W ie tti j b e a e l o f t m a n U m
INSTRUMENTATION
lu ¿ J ~ l. J /L u L
9 H ^ in 4 4 4 f te 4 iia ti< u t
The m easuring instrum ent used w ith these cells can be any type of indicating or recording equipm ent suitable for determ ining small changes of resistance w ith high accuracy. Foxboro Dynalog recorders are especially suitable for th is purpose because the m easuring range needed is similar to th a t used for general strain-gage work. These instrum ents are suited for measuring either sta tic or slowly changing pressures. R apidly changing pressures can be indicated on the screen of a cathode ray oscilloscope.
/¡dueutieufei. of €ytupjne*U
1. I t can be used where pressure pulsation or flu tter m akes m echanical instrum ents unsatisfactory because of rapid wear or inaccurate readings. The only p a rt subject to the effect of pressure pulsations is th e elastic tube. Since there is no system of gears or links, there is no wear.
2. The equipm ent is safer and cheaper for high-pressure applications. The measuring cell is m ounted on the pressure vessel and connected to the indicating or recording instrum ent by electrical cable. The instrum ent board, therefore, does not carry any high-pressure connections, and long runs of tubing to the board are eliminated. Problems of sedim entation or freezing of liquids in these lines are not encountered.
3. Since the pressure m easurement is transm itted from the sensitive cell to the instrum ent electrically, the response is alm ost instantaneous. The distance between cell and instrum ent can be as m uch as 500 feet w ith no change in m easuring speed or accuracy.
4. M ultipoint measuring using a single indicating or recording instrum ent and a selector switch is possible.
5. No auxiliary electric power supply is needed a t the m easuring point. The only connection to the sensitive cell is the cable connecting it to the measuring instrum ent.
6. Cells in standard ranges are interchangeable. They are adjusted during m anufacture so th a t the electrical ou tpu ts of the cells for each of the various pressure ranges are the same. Thus the instrum ent can be used on different ranges merely by changing the chart to the new range and substitu ting a pressure cell calibrated to correspond. No electrical changes are needed w ith the possible exception of zero adjustm ent.
7. S tandard ranges are 0 to 500,0 to 1000,0 to 2000,0 to 5000, 0 to 10,000, and 0 to 20,000 pounds per square inch. Maximum operating tem perature of th e cells is 200° F .
Pressure gages of th is kind should have m any applications in the field of high-pressure technology. C atalytic hydrogenation and synthetic ammonia p lants should find them useful. Because of their small physical size and low volume, they should be especially valuable in laboratory work involving high pressures.
M c u u tfa d u w iA . P u i l u x M o n i.
Fisher & Porter Company (Hatboro, Pa.) recently announced th a t a new edition of “Theory of the R otam eter” is now ready for distribution. I t covers the history and technical developm ent of flowmeters of the variable-area type, and explains how the patented Ultra-Stablvis R otam eter overcomes the effects of viscosity and density in flow ra te measurement. T he accuracy of R otam eters is compared w ith th a t of other types of flow-measuring devices. Complete technical and engineering data , together w ith diagrams and illustrations, are given in th is comparison. Chemists and engineers who are interested in a good technical discussion of flow m easurem ent will find th is an interesting book.
100
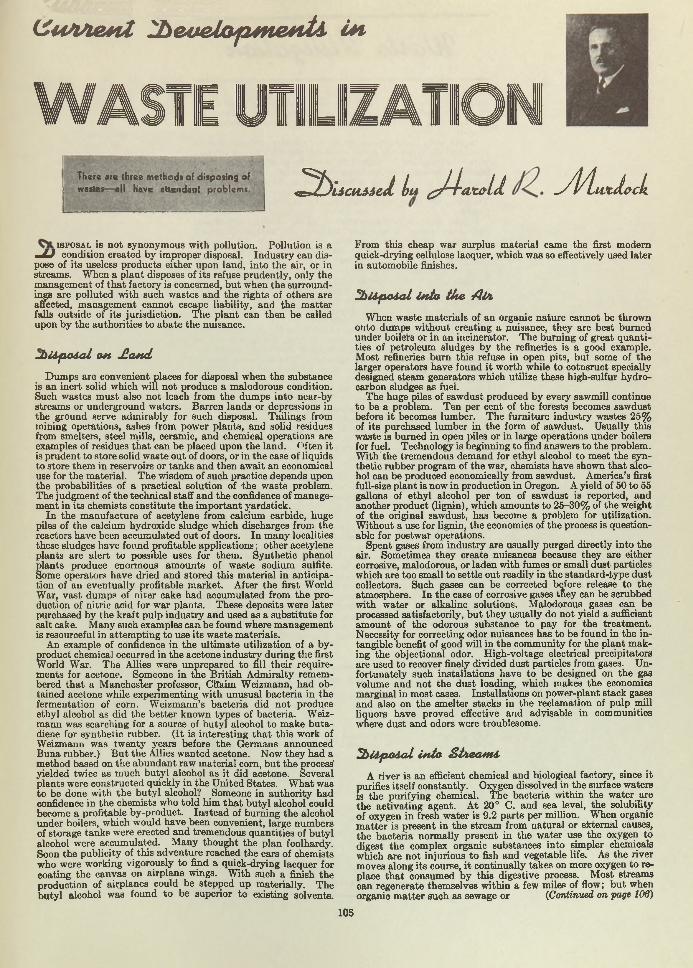
(¿ 44/is u e * U 2 b & u e l& p s n e M ti I n
WASTE UTILIZATIONThere «re three method» of ¿¡»posing of wastes ail have attendant < ^ t)U c u à â e l ( u ¿ J - la x û ll y 't / lu . t lo c k
i s p o s a l is not synonymous w ith pollution. Pollution is a m U condition created by improper disposal. Industry can dispose of its useless products either upon land, into the air, or in streams. W hen a plant disposes of its refuse prudently, only the management of th a t factory is concerned, bu t when the surroundings are polluted w ith such wastes and the rights of others are affected, management cannot escape liability, and the m atter falls outside of its jurisdiction. The p lan t can then be called upon by the authorities to abate the nuisance.
From this cheap war surplus m aterial came the first modem quick-drying cellulose lacquer, which was so effectively used later in automobile finishes.
j b H f u U a l 041. jH a 4 td
Dum ps are convenient places for disposal when the substance is an inert solid which will not produce a malodorous condition. Such wastes m ust also not leach from the dumps into near-by streams or underground waters. Barren lands or depressions in the ground serve admirably for such disposal. Tailings from mining operations, ashes from power plants, and solid residues from smelters, steel mills, ceramic, and chemical operations are examples of residues th a t can be placed upon the land. Often it is prudent to store solid waste out of doors, or in the case of liquids to store them in reservoirs or tanks and then await an economical use for the material. The wisdom of such practice depends upon the probabilities of a practical solution of -the waste problem. The judgment of the technical staff and the confidence of management in its chemists constitute the im portant yardstick.
In the m anufacture of acetylene from calcium carbide, huge piles of the calcium hydroxide sludge which discharges from the reactors have been accumulated out of doors. In m any localities these sludges have found profitable applications ■ other acetylene plants are alert to possible uses for them . Synthetic phenol plants produce enormous amounts of waste sodium sulfite. Some operators have dried and stored this m aterial in anticipation of an eventually profitable m arket. After the first World War, vast dumps of niter cake had accumulated from the production of nitric acid for war plants. These deposits were later purchased by the kraft pulp industry and used as a substitute for salt cake. Many such examples can be found where management is resourceful in attem pting to use its waste materials.
An example of confidence in the ultim ate utilization of a byproduct chemical occurred in the acetone industry during the first World War. The Allies were unprepared to fill their requirements for acetone. Someone in the British Adm iralty remembered th a t a Manches’ter professor, CBaim Weizmann, had obtained acetone while experimenting w ith unusual bacteria in the fermentation of corn. W eizmann’s bacteria did not produce ethyl alcohol as did the better known types of bacteria. Weizmann was searching for a source of bu ty l alcohol to make buta diene for synthetic rubber. (I t is interesting th a t this work of Weizmann was tw enty years before the Germans announced Buna rubber.) B ut the Allies wanted acetone. Now they had a method based on the abundant raw m aterial com, bu t the process yielded twice as much butyl alcohol as it did acetone. Several plants were constructed quickly in the U nited States. W hat was to be done with th e buty l alcohol? Someone in authority had confidence in th e chemists who to ld him th a t butyl alcohol could become a profitable by-product. Instead of burning the alcohol under boilers, which would have been convenient, large numbers of storage tanks were erected and tremendous quantities of butyl alcohol were accumulated. M any thought the plan foolhardy. Soon the publicity of this adventure reached the ears of chemists who were working vigorously to find a quick-drying lacquer for coating the canvas on airplane wings. W ith such a finish the production of airplanes could be stepped up materially. The buty l alcohol was found to be superior to existing solvents.
S b U p o A a l i tU a t h e A i k
When waste m aterials of an organic nature cannot be thrown onto dumps without creating a puisance, they are best burned under boilers or in an incinerator. The burning of great quantities of petroleum sludges by the refineries is a good example. M ost refineries bum this refuse in open pits, but some of the larger operators have found it worth while to cotnsruct specially designed steam generators which utilize these high-sulfur hydrocarbon sludges as fuel.
The huge piles of sawdust produced by every sawmill continue to be a problem. Ten per cent of the forests becomes sawdust before i t becomes lumber. The furniture industry wastes 25% of its purchased lumber in the form of sawdust. Usually this waste is burned in open piles or in large operations under boilers for fuel. Technology is beginning to find answers to the problem. W ith the tremendous demand for ethyl alcohol to meet the synthetic rubber program of the war, chemists have shown th a t alcohol can be produced economically from sawdust. America’s first full-size plant is now in production in Oregon. A yield of 50 to 55 gallons of ethyl alcohol per ton of sawdust is reported, and another product (lignin), which amounts to 25-30% of the weight of the original sawdust, has become a problem for utilization. W ithout a use for lignin, the economics of the process is questionable for postwar operations.
Spent gases from industry are usually purged directly into the air. Sometimes they create nuisances because they are either corrosive, malodorous, or laden with fumes or small dust particles which are too small to settle out readily in the standard-type dust collectors. Such gases can be corrected before release to the atmosphere. In the case of corrosive gases t.fiey can be scrubbed w ith water or alkaline solutions. Malodorous gases can be processed satisfactorily, bu t they usually do not yield a sufficient am ount of the odorous substance to pay for the treatm ent. Necessity for correcting odor nuisances has to be found in the intangible benefit of good will in the community for the plant making the objectional odor. High-voltage electrical precipitators are used to recover finely divided dust particles from gases. Unfortunately such installations have to be designed on the gas volume and not the dust loading, which makes the economics marginal in most cases. Installations on power-plant stack gases and also on the smelter stacks in the reclamation of pulp mill liquors have proved effective and advisable in communities where dust and odors were troublesome.
^ b U p o A a L i*U a S b ie a tn i.
A river is an efficient chemical and biological factory, since it purifies itself constantly. Oxygen dissolved in the surface waters is the purifying chemical. The bacteria within the water are the activating agent. A t 20° C. and sea level, the solubility of oxygen in fresh w ater is 9.2 parts per million. When organic m atter is present in the stream from natural or external causes, the bacteria normally present in the water use the oxygen to digest the complex organic substances into simpler chemicals which are not injurious to fish and vegetable life. As the river moves along its course, i t continually takes on more oxygen to replace th a t consumed by this digestive process. M ost streams can regenerate themselves within a few miles of flow; b u t when organic m atter such as sewage or (Continued on page 106)
105
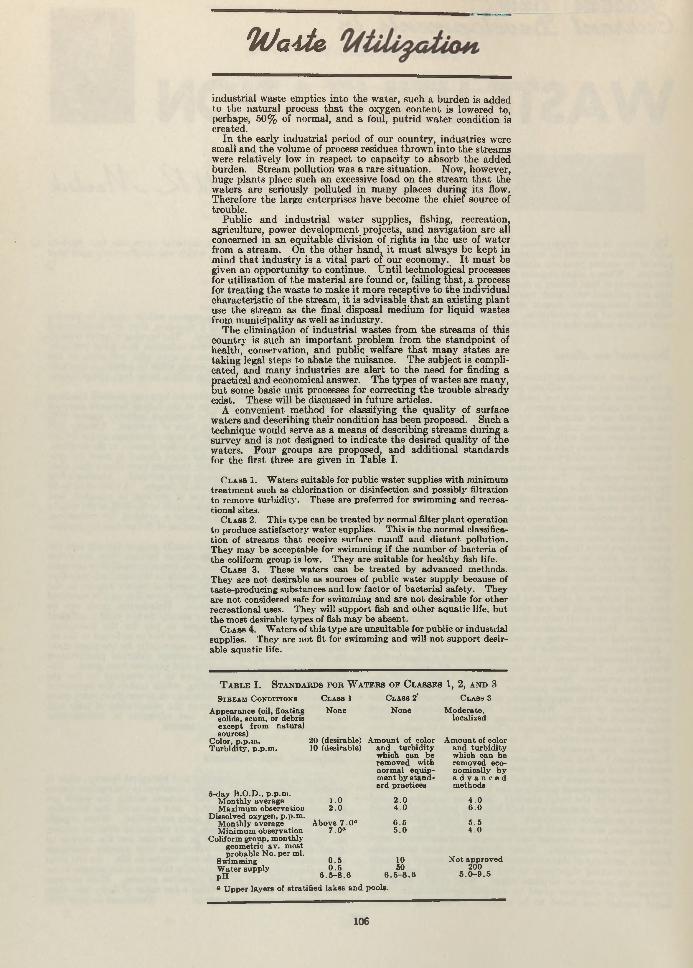
W a ^ i e
industrial waste empties into the water, such a burden is added to the natural process th a t the oxygen content is lowered to, perhaps, 50% of normal, and a foul, putrid w ater condition is created.
In the early industrial period of our country, industries were small and the volume of process residues throw n into the stream s were relatively low in respect to capacity to absorb the added burden. Stream pollution was a rare situation. Now, however, huge plants place such an excessive load on the stream th a t the waters are seriously polluted in m any places during its flow. Therefore the large enterprises have become the chief source of trouble.
Public and industrial w ater supplies, fishing, recreation, agriculture, power development projects, and navigation are all concerned m an equitable division of rights in the use of water from a stream . On the other hand, it m ust always be kept in m ind th a t industry is a v ital part of our economy. I t m ust be given an opportunity to continue. Until technological processes for utilization of the m aterial are found or, failing th a t, a process for treating the waste to make it more receptive to the individual characteristic of the stream, i t is advisable th a t an existing plant use the stream as the final disposal medium for liquid wastes from municipality as well as industry.
The elimination of industrial wastes from the stream s of this country is such an im portant problem from the standpoint of health, conservation, and public welfare th a t m any states are taking legal steps to abate the nuisance. The subject is complicated, and m any industries are alert to the need for finding a practical and economical answer. The types of wastes are many, bu t some basic unit processes for correcting the trouble already exist. These will be discussed in future articles.
A convenient m ethod for classifying the quality of surface waters and describing their condition has been proposed. Such a technique would serve as a means of describing stream s during a survey and is not designed to indicate the desired quality of the waters. Pour groups are proposed, and additional standards for the first three are given in Table I.
C l a ss 1. W aters suitable for public water supplies w ith minimum treatm ent such as chlorination or disinfection and possibly filtration to remove turbidity . These are preferred for swimming and recreational sites.
C l a ss 2. This type can be treated by normal filter plant operation to produce satisfactory water supplies. This is the normal classification of streams th a t receive surface runoff and d istan t pollution. They may be acceptable for swimming if the number of bacteria of the coliform group is low. They are suitable for healthy fish life.
C l a ss 3 . These waters can be treated by advanced methods. They are not desirable as sources of public water supply because of taste-producing substances and low factor of bacterial safety. They are not considered safe for swimming and are not desirable for other recreational uses. They will support fish and other aquatic life, but the most desirable types of fish may be absent.
C l a ss 4. W aters of th is type are unsuitable for public or industrial supplies. They are not fit for swimming and will not support desirable aquatic life.
T a b l e I . S t a n d a r d s f o r W a t e r s o f C l a s s e s 1, 2, a n d 3S t b e a m C o n d i t i o n s C l a s s 1
A ppearance (oil, floating None solids, BCum, or debris except from natu ral sources)
Color, p .p .m . 20 (desirable)T urb id ity , p .p .m . 10 (desirable)
o-day B .O .D., p .p.m . M onthly average M axim um observation
Dissolved oxygen, p .p .m . M onthly average M inim um observation
Coliform group, monthly geometric av . most probable N o. per ml.
Swimming W ater supply p H
1.02 . 0
Above 7 .0 ° 7 .0«
0 .5 0 . 6
6 .5 - 8 .6
C l a s s 2 '
None
A m ount of color and tu rb id ity which can be rem oved with norm al equipm ent by s ta n d a rd practices
2.04 .0
6 .55 .0
10 5 0
6 . 6- 8.6
C l a s s 3
M oderate,localized
A m ount of color and tu rb id ity which can be rem oved economically by a d v a n c e d m ethods
4 .06.0
5 .54 .0
N ot approved 200
5 .0 - 9 .5
° U pper layers of stratified lakes an d pools.
106
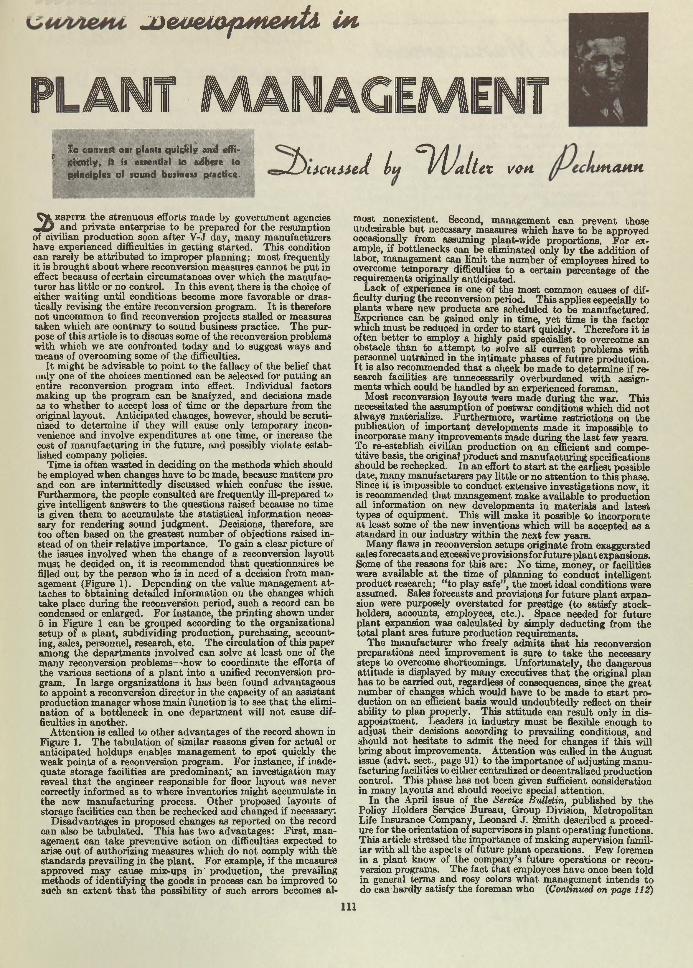
J O e 4ß e 4J0 f^ m e 4 i t i u t
P ANT MANAGEMENTTo convert our plants quickly and effi-
! çtently, it is ewentlsl to adhere to principles of tound busmess practice. < ~ > J ^ L J c u j J e d !u <=l/L/allet von m a u n
ÇJL e s p i t e the strenuous efforts made by government agencies m/ j and private enterprise to be prepared for the resumption of civilian production soon after V-J day, m any m anufacturers have experienced difficulties in getting started. This condition can rarely be a ttribu ted to improper planning; m ost frequently it is brought about where reconversion measures cannot be pu t in effect because of certain circumstances over which the manufacturer has little or no control. In this event there is the choice of either waiting until conditions become more favorable or drastically revising the entire reconversion program. I t is therefore not uncommon to find reconversion projects stalled or measures taken which are contrary to sound business practice. The purpose of this article is to discuss some of the reconversion problems with which we are confronted today and to suggest ways and means of overcoming some of the difficulties.
I t m ight be advisable to point to the fallacy of the belief that only one of the choices mentioned can be selected for putting an entire reconversion program into effect. Individual factors making up the program can be Analyzed, and decisions made as to whether to accept loss of tim e or the departure from the original layout. Anticipated changes, however, should be scrutinized to determine if they will cause only temporary inconvenience and involve expenditures a t one time, or increase the cost of m anufacturing in the future, and possibly violate established company policies.
Time is often wasted in deciding on the m ethods which should be employed when changes have to be made, because m atters pro and con are interm ittedly discussed whicn confuse the issue. Furthermore, the people consulted are frequently ill-prepared to give intelligent answers to the questions raised because no time is given them to accumulate the statistical information necessary for rendering sound judgm ent. Decisions, therefore, are too often based on the greatest num ber of objections raised instead of on their relative importance. To gain a clear picture of the issues involved when the change of a reconversion layout must be decided on, i t is recommended th a t questionnaires be filled out by the person who is in need of a decision from m anagement (Figure 1). Depending on the value management a ttaches to Obtaining detailed information on the changes which take place during the reconversion period, such a record can be condensed or enlarged. For instance, the printing shown under 5 in Figure 1 can be grouped according to the organizational setup of a plant, subdividing production, purchasing, accounting, sales, personnel, research, etc. The circulation of this paper among the departm ents involved can solve a t least one of the m any reconversion problems—how to coordinate the efforts of the various sections of a p lan t into a unified reconversion program. In large organizations i t has been found advantageous to appoint a reconversion director in the capacity of an assistant production manager whose m ain function is to see th a t the elimination of a bottleneck in one departm ent will not cause difficulties in another.
A ttention is called to other advantages of the record shown in Figure 1. The tabulation of similar reasons given for actual or anticipated holdups enables management to spot quickly the weak points of a reconversion program. For instance, if inadequate storage facilities are predom inant; an investigation may reveal th a t the engineer responsible for floor layout was never correctly informed as to where inventories m ight accumulate in the new m anufacturing process. Other proposed layouts of storage facilities can then be rechecked and changed if necessary.
D isadvantages in proposed changes as reported on the record can also be tabulated. This has two advantages: First, m anagement can take preventive action on difficulties expected to arise out of authorizing measures which do not comply w ith this standards prevailing in the plant. For example, if the measures approved m ay cause mix-ups in ' production, the prevailing methods of identifying the goods in process can be improved to such an extent th a t the possibility of such errors becomes al
most nonexistent. Second, management can prevent those undesirable bu t necessary measures which have to be approved occasionally from assuming plant-wide proportions. F o r example, if bottlenecks can be eliminated only by the addition of labor, management can lim it the num ber of employees hired to overcome tem porary difficulties to a certain percentage of the requirements originally anticipated.
Lack of experience is one of the m ost common causes of difficulty during the reconversion period. This applies especially to plants where new products are scheduled to be m anufactured. Experience can be gained only in time, yet tim e is the factor which m ust be reduced in order to s ta rt quickly. Therefore i t is often better to employ a highly paid specialist to overcome an obstacle than to a ttem pt to solve all current problems with personnel untrained in the intim ate phases of future production. I t is also recommended th a t a check be m ade to determine if research facilities are unnecessarily overburdened w ith assignm ents which could be handled by an experienced foreman.
M ost reconversion layouts were made during the war. This necessitated the assumption of postwar conditions which did not always materialize. Furtherm ore, wartime restrictions on the publication of im portant developments made it impossible to incorporate many improvements made during the last few years. To re-establish civilian production on an efficient and competitive basis, the original product and m anufacturing specifications should be rechecked. In an effort to s ta rt a t the earliest possible date, many manufacturers pay little or no a ttention to this phase. Since it is impossible to conduct extensive investigations now, it is recommended th a t management make available to production all information on new developments in m aterials and latest types of equipment. This will make it possible to incorporate a t least some of the new inventions which will be accepted as a standard in our industry within the next few years.
M any flaws in reconversion setups originate from exaggerated sales forecasts,and excessive provisions for future p lan t expansions. Some of the reasons for this are: No time, money, or facilities were available a t the time of planning to conduct intelligent product research; “ to play safe , the m ost ideal conditions were assumed. Sales forecasts and provisions for future p lan t expansion were purposely overstated for prestige (to satisfy stockholders, accounts, employees, etc.). Space needed for future plant expansion was calculated by simply deducting from the to ta l p lant area future production requirements.
The m anufacturer who freely adm its th a t his reconversion preparations need improvement is sure to take the necessary steps to overcome shortcomings. Unfortunately, the dangerous attitude is displayed by m any executives th a t the original plan has to be earned out, regardless of consequences, since the great number of changes which would have to be made to s ta rt production on an efficient basis would undoubtedly reflect on their ability to plan properly. This attitude can result only in disappointment. Leaders in industry m ust be flexihle enough to adjust their decisions according to prevailing conditions, and should not hesitate to adm it the need for changes if th is will bring about improvements. A ttention was called in the August issue (advt. sect., page 91) to the importance of adjusting m anufacturing facilities to either centralized or decentralized production control. This phase has not been given Sufficient consideration in many layouts and should receive special attention.
In the April issue of the Service Bulletin, published by the Policy Holders Service’ Bureau, Group Division, M etropolitan Life Insurance Company, Leonard J. Sm ith described a procedure for the orientation of supervisors in p lant operating functions. This article stressed the importance of making supervision familiar with all the aspects of future plant operations. Few foremen in a plant know of the company's future operations or reconversion programs. The fact th a t employees have once been told in general terms and rosy colors what management intends to do can-hardly satisfy the foreman who (Continued on page 112)
111
P l a n t M o M G U f& m e tU
has to answer daily questions raised by employees who become increasingly “ layoff conscious” . O rientation courses no t only keep supervision informed of the present sta tus of reconversion, bu t also teach th a t successful reconversion depends to a great degree on all departm ents working together harmoniously.
I t is suggested th a t a discussion on current reconversion problems follow each meeting. This is a simple and efficient means to m ake the foreman appreciate the problems of his associates. Furtherm ore, when improvem ents m ade in one section of the p lan t are brought to light, interest is stim ulated for general acceptance where feasible.
TO: FR O M : D A TE:CC:
Re: Reconversion Project No.______
Title____________________________
1. T his is to inform you th a t the above numbered reconversionhas been
project tem porarily held up for reasons as follows:
2. I t is estim ated th a t th is project will be behind schedule :
________days _______ m onths
------------ weeks _______ until further action is ta k e n
3. I have taken the following actions :
4. I recommend th a t management take the following ac tion :
5. This recommendation will or m ay (check):
I I E lim inate th is bottleneck w ithout any disadvantages.
I I Lower quality of the product, j j Call for the revi-sion of product specifications.
I 1 Increase the cost of m anufacture.
I i Require additional labor.
I 1 Require special training of employees.
j j Increase the num ber of tests for quality control.
j j Require new testing methods.
I j Call for the revision of layout an d /o r flow of production
j | C onstitute a m anufacturing hazard.
\ j Call for the revision of operating standards.
1 | Cause “m ix-ups” .
1 M ake the standardization of equipment:— -—J impossible
] Require new source of energy.
] Be opposed by employees.
3 O ther reasons (explain):
S IG N A T U R E :_______________________
W rite your rem arks on plain sheet of paper in the event no t sufficient space is available. Give number.
Fisure 1
J l a A t - M i n u t e , rf-la<ei
FROM THE EDITOR'S DESK< ^ he chemical industry slipped in its safety record for 1944.
/ Statistics show th a t frequency of accidents was up over the previous year; as compared w ith other industries, the chemical field dropped to eleventh place from seventh.
★ Salvage of tin cans by the public during the past three years added some 6000 tons to the scrap pile.
i f Bethlehem Steel Company is planning huge expansion of its bar production facilities. The bars m ade will be used in autom otive applications.
i f Less than 20% of our original deposits of silver and lead is still unmined.
★ Penicillin, sprayed as an aerosol, is being found effective by the doctors in combating respiratory diseases such as sinusitis.
★ Australia prospected and found deposits of uranium ore which have come in for considerable development.
★ Canada may obtain considerable relief from the spruce bud- worm, a serious economic pest to the forests, through the use of D D T sprayed from airplanes.
★ Tsetse flies, infecting agents in sleeping sickness, are-killed by D D T and may be effective in ridding Africa of this scourge.
★ Over four million dollars were appropriated last year by the N ational Foundation for Infantile Paralysis as an aid to scientific investigation and research on this disease.
★ During the war the sta te of Texas alone added more than five thousand producing oil wells to its total.
i f The com crop for this year will be one of the largest ever, according to estim ates of the U.S. D epartm ent of Agriculture.
i f New rotenone plantations are beginning in Brazil.
i f Uranium deposits on public lands have caused certain tracts to be withdrawn from sale.
i f R etreating Germans were prevented from damaging the electrochemical plants a t R jukan, Norway, and the plants are now said to be in production.
i f Disposal of immense stores of auto parts is the first m ajor disposal task tackled by the Government.
i f New cobalt mines and recovery un its are reported in operation in the Belgian Congo.
★ New waste problems have been created by the synthetic rubber industry, and processing difficulties are being experienced a t disposal and w ater plants.
i f T in is in short supply, bu t the processing kinks learned by our mechanical industries during the war will stand them in good stead during the tem porary reconversion shortage.
i f The oil refineries a t Balikpapan have been so b a d l y d a m a g e d b y bombings th a t production cannot be reached for well over a year.
i f The gas generators th a t were pu t on m any of the m otor cars in Brazil during the war m ay rem ain for some time, for it has been decided to continue the Gasogenio or- nization in force. I
112158
Top Related
Copyright © 2022 FDOKUMEN

