


Bahasa
Halaman
Hukum

IN‐PLANE CYCLIC SHEAR PERFORMANCE OF INTERLOCKING
COMPRESSED EARTH BLOCK WALLS
A Thesis
presented to
the Faculty of California Polytechnic State University,
San Luis Obispo
In Partial Fulfillment
of the Requirements for the Degree
Master of Science in Civil and Environmental Engineering
by
David William Bland
2011

ii
© 2011
David William Bland
ALL RIGHTS RESERVED

iii
Committee Membership
TITLE: In-Plane Cyclic Performance of Interlocking
Compressed Earth Block Shear Walls
AUTHOR: David William Bland
DATE SUBMITTED: April 2011
COMMITTEE CHAIR: Daniel C. Jansen, Associate Professor CEEN
COMMITTEE MEMBER: Bing Qu, Assistant Professor CEEN
COMMITTEE MEMBER: Peter T. Laursen, Assistant Professor ARCE

iv
Abstract
In-Plane Cyclic Performance of Interlocking
Compressed Earth Block Shear Walls
David William Bland
This thesis presents results from testing of interlocking compressed earth block
(CEB) masonry shear walls. CEBs are low strength earth masonry units sometimes
stabilized with cement or lime. The interlocking compressed earth blocks (ICEBs) used
in this experiment are dry stacked interlocking hollow units, which can be reinforced and
grouted after they are laid. Although significant research has been undertaken to
optimize the material properties of CEBs, little has been done to investigate the
performance of structural systems currently being built using this technology.
Test results are reported for three 1800 mm x 1800 mm wall specimens
constructed with cement stabilized ICEBs and subjected to cyclic in-plane lateral loading.
Wall specifications were varied to identify the shear performance of partial and fully
grouted walls, and to observe the performance of a flexure dominated wall panel. It was
determined that the shear strength of fully grouted walls is significantly higher than that
of partially grouted walls and calculation of capacity based on current ACI 530-08
masonry provisions significantly overestimates the shear strength of ICEB wall panels.
Based on the observed performance, recommendations are made for limiting the
calculated nominal shear strength in design. Results also indicate that calculations based
on simple bending theory conservatively predict the flexural strength of a fully grouted
ICEB wall. Discussion of ICEB material properties and recommendations for design and
construction procedures are included.
Keywords: Interlocking Dry Stack Masonry, Compressed Earth, Shear Wall Testing

v
Acknowledgments
This project was influenced by the dedication and effort of many individuals, all of which
have my deep gratitude and appreciation.
Thank you to Clayton Proto and Brad Stirling, who have dedicated countless hours to this
project; from making blocks to building walls. Your hard work and friendship are truly
appreciated.
I would like to thank my advisor, Daniel Jansen, for your guidance, helpful ideas,
enthusiasm, and dedication. It is an honor to have worked on this project with you, and I
will never forget your passion and commitment to excellence. Much thanks to Peter
Laursen, Bing Qu, and Charles Chadwell for all of your help and valuable insight into
structural testing and engineering principles.
Much thanks to my family for their support throughout my entire education.
To my beautiful wife, Carly: Thank you for your unconditional love, strength, and
encouragement, I am truly blessed. I love you.

vi
Table of Contents
List of Tables .................................................................................................................. viii List of Figures ................................................................................................................... ix Chapter 1. Introduction ................................................................................................. 1
1.1 Background ....................................................................................................... 1 1.2 Objectives and Scope ........................................................................................ 4 1.3 Organization of contents ................................................................................... 5
Chapter 2. Literature Review ....................................................................................... 7 2.1 Compressed Earth Blocks ................................................................................. 7
2.1.1 Compressed Earth Block Presses .............................................................. 7 2.1.2 CEB Material Properties ........................................................................ 13 2.1.3 CEB Experimental Testing ...................................................................... 14
2.2 Masonry Shear Walls ...................................................................................... 17 2.2.1 Building Code .......................................................................................... 18 2.2.2 Lateral Force Resistance Mechanisms ................................................... 18 2.2.3 Experimental Testing of Shear Walls ...................................................... 23
Chapter 3. Materials .................................................................................................... 27 3.1 ICEBs .............................................................................................................. 27
3.1.1 Materials ................................................................................................. 28 3.1.2 Manufacturing ......................................................................................... 29
3.2 Grout ............................................................................................................... 38 3.2.1 Grout Preparation ................................................................................... 39
3.3 Tested Material Properties .............................................................................. 39 3.3.1 ICEB Compressive Strength .................................................................... 39 3.3.2 Grout Compressive Strength ................................................................... 40 3.3.3 Masonry Prism Strength.......................................................................... 42 3.3.4 Reinforcing Steel ..................................................................................... 45
Chapter 4. ICEB Shear Wall Construction and Test Setup .................................... 46 4.1 Construction of Walls ..................................................................................... 46
4.1.1 Installation of Longitudinal Reinforcing Steel ........................................ 46 4.1.2 Lower Bond Beam Installation ................................................................ 47 4.1.3 Intermediate Course Stacking ................................................................. 48 4.1.4 Grout Lifts ............................................................................................... 49 4.1.5 Installation of Transverse Reinforcing Steel ........................................... 50 4.1.6 Upper Bond Beam Construction ............................................................. 50 4.1.7 Installation of Loading Beam .................................................................. 52 4.1.8 Quality Control and Wall Curing ............................................................ 53
4.2 Test Setup........................................................................................................ 53 4.3 Instrumentation ............................................................................................... 54
4.3.1 Strain Gages ............................................................................................ 55 4.4 Data Reduction................................................................................................ 56
4.4.1 Shear Deformation .................................................................................. 56 4.4.2 Bending Deformation .............................................................................. 57 4.4.3 Rocking Deformation .............................................................................. 58 4.4.4 Base Sliding ............................................................................................. 58

vii
4.5 Loading Protocol ............................................................................................. 59 4.6 Failure Criteria ................................................................................................ 61 4.7 Prediction of Wall Capacity ............................................................................ 61
4.7.1 Shear Capacity ........................................................................................ 62 4.7.2 Flexural Capacity .................................................................................... 62
Chapter 5. ICEB Shear Wall Testing ......................................................................... 63 5.1 Wall 1 .............................................................................................................. 64
5.1.1 Wall 1 Testing Results ............................................................................. 65 5.2 Wall 2 .............................................................................................................. 68
5.2.1 Wall 2 Testing Results ............................................................................. 70 5.3 Wall 3 .............................................................................................................. 72
5.3.1 Wall 3(a) Testing Results ........................................................................ 73 5.3.2 Wall 3 Repair .......................................................................................... 75 5.3.3 Wall 3(b) Results ..................................................................................... 77
Chapter 6. Experimental Results and Analysis ......................................................... 81 6.1 Introduction ..................................................................................................... 81 6.2 Shear Behavior ................................................................................................ 83
6.2.1 ICEB Masonry Shear Resisting Mechanisms .......................................... 85 6.2.2 Effective Shear Area Correction Factor ................................................. 87 6.2.3 Contribution of Transverse Reinforcement ............................................. 89
6.3 Flexural Capacity ............................................................................................ 89 6.4 Wall Displacement .......................................................................................... 90
6.4.1 Wall Stiffness Calculation-Elastic Analysis ............................................ 90 6.4.2 Measured Wall Displacement Components ............................................ 92
6.5 Static Non-Linear Analysis ............................................................................. 94 6.5.1 Moment-Curvature Analysis ................................................................... 95 6.5.2 Inelastic Static Pushover ......................................................................... 96
Chapter 7. Conclusions and Recommendations ...................................................... 100 7.1 Conclusions ................................................................................................... 100
7.1.1 ICEB Materials and Testing Conclusions: ............................................ 100 7.1.2 ICEB Shear Wall Testing Conclusions.................................................. 101 7.1.3 ICEB Wall Construction ........................................................................ 104
7.2 Recommendations for Future Work .............................................................. 105 References ...................................................................................................................... 107 Appendix A. Shear and Flexural Displacement Components ............................... 110 Appendix B. Correction of Lateral Displacement Data ......................................... 118 Appendix C. Material Testing Data ......................................................................... 122 Appendix D. Instrumentation Layout ...................................................................... 125 Appendix E. Wall Displacement Components ........................................................ 128 Appendix F. Wall 2 .................................................................................................... 132

viii
List of Tables
Table 3.1: Soil plasticity per ASTM D4318-05 ................................................................ 28 Table 3.2: ICEB batch proportions (8 Block) ................................................................... 31 Table 3.3: Block charge weights (wet) ............................................................................. 34 Table 3.4: Model BP6 Press ICEB variations ................................................................... 35 Table 3.5: Material compressive strengths ....................................................................... 39 Table 3.6: Grout cylinder dimensions ............................................................................... 41 Table 4.1: Imposed experimental cyclic loading protocol ................................................ 60 Table 5.1: ICEB Shear Wall Specifications ...................................................................... 63 Table 5.2: ICEB shear wall testing experimental results .................................................. 64 Table 6.1: Alternative ICEB Shear Areas ......................................................................... 86 Table 6.2: Nominal masonry shear strength calculation alternatives (P=4.5 kN) ............ 87 Table 6.3: Back calculated “effective shear area” ............................................................ 88 Table 6.4: Dimensions for displacement component calculations .................................... 93 Table C.1: ICEB prism compressive strength ................................................................. 122 Table C.2: Grout compressive strength .......................................................................... 123 Table C.3: ICEB compressive strength ........................................................................... 123 Table C.4: Rebar tensile test data ................................................................................... 124
ix
List of Figures
Figure 2.1: CINVA Ram press (from Maini 2010b) ........................................................... 8 Figure 2.2: Aurum 3000 block variations (from Maini 2010b) ........................................ 10 Figure 2.3: Hydraform dry stacking system (Hydraform) ................................................ 11 Figure 2.4: ICEB block dimensions in cm (from Wheeler 2005) ..................................... 12 Figure 2.5: ICEB block variations (Wheeler 2005) .......................................................... 13 Figure 2.6: Assumed flexural strain and stress ................................................................. 21 Figure 3.1: Grain size distribution for soil and sand ......................................................... 29 Figure 3.2: Soeng Thai Model SP3 pulverizer.................................................................. 30 Figure 3.3: Wet mixing ICEB batch ................................................................................. 32 Figure 3.4: Drop test (from Proto et al. 2010) .................................................................. 33 Figure 3.5: Loading Soeng Thai Model BP6 manual press .............................................. 34 Figure 3.6: 1st lift pre-compression by hand ..................................................................... 36 Figure 3.7: Pocket penetrometer test ................................................................................ 37 Figure 3.8: Initial curing rack ........................................................................................... 37 Figure 3.9: ICEB compressive failure mode ..................................................................... 40 Figure 3.10: Grout cylinder (porous) compressive failure ................................................ 41 Figure 3.11: Masonry prism test setup .............................................................................. 43 Figure 3.12: Masonry prism compression stress vs. strain ............................................... 43 Figure 4.1: Installation of vertical rebar ........................................................................... 47 Figure 4.2: Lower bond beam rebar installation ............................................................... 48 Figure 4.3: Ratchet straps used to stabilize wall before grouting ..................................... 49 Figure 4.4: Roofing nail used to improve vertical alignment of block courses ................ 49 Figure 4.5: Partially grouted ICEB wall (Wall 1) ............................................................. 50 Figure 4.6: Anchor installation with #3 and #4 longitudinal rebar ................................... 51 Figure 4.7: Upper bond beam with #3 longitudinal reinforcement .................................. 52 Figure 4.8: Loading beam installed at top of wall ............................................................ 53 Figure 4.9: Out-of-plane bracing frame ............................................................................ 54 Figure 4.10: Wall instrumentation .................................................................................... 56 Figure 4.11: Wall dimensions used for calculating deformation components .................. 57 Figure 4.12: Rocking displacement .................................................................................. 58 Figure 4.13: Imposed experimental cyclic loading protocol ............................................ 60 Figure 4.14: Testing failure criteria .................................................................................. 61 Figure 5.1: Wall 1 detail (units in mm) ............................................................................. 65 Figure 5.2: Force-displacement response of Wall 1 ......................................................... 66 Figure 5.3: Initial failure of Wall 1 after 4.0 mm pull (0.22 % drift) ............................... 67 Figure 5.4: Shear cracking initiated at upper corner after 8.0 mm cycle .......................... 68 Figure 5.5: Wall 1 damage ................................................................................................ 68 Figure 5.6: Wall 2 details (units in mm) ........................................................................... 69 Figure 5.7: Force-displacement response of Wall 2 ......................................................... 70 Figure 5.8: Damage to Wall 2 after testing ....................................................................... 71 Figure 5.9: Wall 2 damage ................................................................................................ 72 Figure 5.10: Wall 3 detail (units in mm)........................................................................... 73 Figure 5.11: Force-displacement response of Wall 3(a) ................................................... 74 Figure 5.12: Local failure of Wall 3(a) at 20 mm pull (1.11% drift) ................................ 75

x
Figure 5.13: Wall 3(a) local damage after ± 20 mm ......................................................... 75 Figure 5.14: Loose blocks removed in preparation for grouting repair ............................ 76 Figure 5.15: Grout repaired corner and epoxy surface coating ........................................ 77 Figure 5.16: External wooden shear panel (both sides) .................................................... 77 Figure 5.17: Force-displacement response of Wall 3(b) ................................................... 78 Figure 5.18: Spalling of masonry due to buckling of longitudinal rebar .......................... 79 Figure 5.19: Wall 3(b) damage pattern ............................................................................. 80 Figure 6.1: Force-displacement histories .......................................................................... 82 Figure 6.2: Force-displacement envelopes ....................................................................... 83 Figure 6.3: Shear cracking mechanism (Wall 2 at 16mm push) ....................................... 84 Figure 6.4: Transformed elastic stiffness predictions ....................................................... 92 Figure 6.5: Measured displacement components .............................................................. 93 Figure 6.6: Moment-Curvature plot for ICEB wall specimen .......................................... 96 Figure 6.7: Static pushover analysis dimensions .............................................................. 97 Figure 6.8: Non linear static pushover (Wall 1) ............................................................... 99 Figure 6.9: Non linear static pushover (Wall 2, Wall 3) ................................................... 99 Figure A.1: Wall panel section ....................................................................................... 110 Figure A.2: Nodal displacement of a panel section ........................................................ 111 Figure A.3: Components of panel deformation .............................................................. 112 Figure B.1: Actuator to LVDT displacement “gap” vs actuator displacement ............... 119 Figure B.2: Corrected Wall 1 force-displacement response ........................................... 120 Figure B.3: Corrected Wall 2 force-displacement response ........................................... 120 Figure B.4: Corrected Wall 3(a) force-displacement response ....................................... 121 Figure B.5: Corrected Wall 3(b) force-displacement response ...................................... 121 Figure C.1: Steel rebar tensile test data .......................................................................... 124 Figure D.1: Instrumentation layout [Wall 1] .................................................................. 125 Figure D.2: Instrumentation layout[Wall 2 and Wall 3(a)] ............................................ 126 Figure D.3: Instrumentation layout [Wall 3(b)] .............................................................. 127 Figure E.1: Decoupled force-displacement envelope [Wall 1] ....................................... 128 Figure E.2: Decoupled force-displacement envelope [Wall 2] ....................................... 129 Figure E.3: Decoupled force-displacement envelope [Wall 3(a)] .................................. 130 Figure E.4: Decoupled force-displacement envelope [Wall 3(b)] .................................. 131 Figure F.1: Wall 2 force-displacement history ............................................................... 132 Figure F.2: Initial shear crack [W2-1st 8mm PULL cycle @ +43.0 kN, +5.25 mm] ...... 133 Figure F.3: Initial shear crack [W2-1st 8mm PUSH cycle @ -39.5 kN, -5.5 mm] ......... 134

Chapter 1. Introduction
1.1 Background
Interlocking compressed earth block (ICEB) masonry is a building technology
that has the potential to provide affordable and sustainable home building materials to
many people throughout the globe. Worldwide, the high cost of materials and
experienced labor has prevented many people from building with appropriate, safe
building methods.
Earth is one of the oldest building materials, with documented use as far back as
2500 BC (Maini 2010a). Today, the most common uses of earth as a construction
material are adobe, compressed earth masonry, and rammed earth. Historically, adobe
construction has been implemented without the use of stabilizers, while both compressed
earth and rammed earth construction often employ the use of soil stabilization with
cement, lime, fly ash or other materials. Earth construction is used extensively around
the world due to the sustainable and economical use of indigenous soils as well as the
significant reduction in manufactured materials required. A typical stabilized
compressed earth block consists of less than 10% portland cement by weight which

Chapter 1. Introduction 2
significantly reduces the amount of cement necessary to build a masonry structure
(Walker 1999). From an environmental perspective, earth construction allows for a large
reduction in embodied energy as compared to building with concrete or kiln fired clay
masonry (Walker 1999).
Masonry construction is commonly used due to its inherent durability, aesthetic
appeal and ability to resist gravity loads. However, it relies heavily on the use of skilled
craftsmen, and in regions of moderate to high seismicity requires significant attention to
reinforcing steel detailing to provide sufficient earthquake resistance. Hollow
interlocking dry-stacked masonry provides a significant labor advantage over traditional
mortared masonry because the interlocking mechanism of the blocks allow mortarless
construction (Jaafar et al. 2006). Reductions in labor cost up to 80% are realized due to
the increased output and constructability of hollow dry-stacked reinforced masonry
systems (Anand and Ramamurthy 2005).
In developed countries, extensive research and testing have driven advances in
masonry building codes which have led to improved earthquake performance and safety.
ICEB masonry is progressing as a building technology, but has not been the subject of
any significant structural testing to evaluate its overall performance as a building method.
Although significant research has been done to optimize the material properties,
manufacturing and availability of ICEB technology, little has been done to investigate the
performance of structural systems currently being built using this technology. The
underlying goal of this research is to observe and evaluate the in-plane performance of
shear walls built with ICEBs. Cyclic testing of shear wall units provides very good
insight into the expected seismic performance of current structures incorporating ICEB

Chapter 1. Introduction 3
technology and in addition, will contribute to more accurate and reliable prediction of the
strength and performance of ICEB walls.
This research builds upon an existing relationship between the Cal Poly San Luis
Obispo Engineers Without Borders (EWB) chapter and the Center for Vocational
Building Technology (CVBT) in Thailand. Cal Poly students have worked with the
CVBT from afar, and also in Thailand during internships. Previous students from various
departments have worked with the CVBT to improve ICEB system, including:
Cal Poly Mechanical Engineering:
• Students worked on a project to improve the design of the Soeng Thai BP6
manual block press used to produce ICEBs, specifically the handle
latching mechanism.
• Students worked on optimizing the design and operation of the Soeng Thai
SP3 soil pulverizer, which is used to prepare soil for manufacturing.
• Students designed and manufactured low cost pocket penetrometers for
more economical quality control of ICEB manufacturing.
Cal Poly Civil Engineering:
• Students worked to provide example structural engineering calculations
and recommendations for several ICEB structures
• Students conducted research and performed experimental testing to
quantify the basic material properties of ICEB masonry, including
compressive strength, durability and bond strength (Bales et al. 2009).

Chapter 1. Introduction 4
• Students organized an ICEB manufacturing and construction manual
aimed at helping promote safer building practices with ICEB masonry
(Proto et al. 2010).
1.2 Objectives and Scope
The objective of this experimental program was to conduct cyclic in-plane testing
of ICEB shear walls to observe the failure modes and performance. Recommendations
for acceptable structural design and construction techniques should be based on
experimental results from testing. The primary goals for the initial wall testing were to
identify and quantify the lateral force resisting mechanisms and behavior of ICEB shear
walls, namely flexure and shear.
The ICEB shear wall testing program was initially proposed to include the
experimental testing of six ICEB shear walls. Phase 1, which is reported in this thesis,
consisted of the first three walls and included:
• Development of a suitable compressed earth block mixture for manufacture
of ICEBs for construction of test specimens, based on single block
compressive strength, appearance, quality, and ease of manufacture.
• Development of an ICEB shear wall testing program, including necessary
testing fixtures, procedures and instrumentation.
• Testing of three ICEB shear walls with 1:1 aspect ratio (H/L=1.0). The goal
was to observe shear and flexural capacity and performance.
• Comparison of shear and flexural capacity to nominal strengths predicted
by current masonry design methods.
Chapter 1. Introduction 5
1.3 Organization of contents
This thesis presents the results of the first phase of experimental testing of ICEB
shear walls. It is organized to provide the reader with an understanding of the
background, testing methods and results, and analysis procedures used for the initial
experimental evaluation of the ICEB building system.
Chapter 2 provides background in the context of compressed earth masonry and
masonry shear wall mechanics. A review of published literature is provided which
covers previous research of compressed earth block material properties and testing, and
experimental testing of in-plane masonry shear and flexural behavior.
Chapter 3 covers the material properties and processes used to prepare and
manufacture the ICEBs and other materials used in this experiment. Results from
material testing are presented and discussed in relation to previous experimental studies
and their influence on structural performance.
Chapter 4 describes the shear wall test setup, instrumentation and testing
procedure. Methods used for reduction of experimentally measured displacement data
are discussed, in addition to the procedure used to initially predict the shear and flexural
wall capacities. The procedures and details used for construction of the ICEB shear wall
specimens are covered. Discussion of specific testing goals, details, specifications and
testing results are provided for individual wall specimens.
Chapter 5 presents the experimental results of Phase 1 of the ICEB shear wall
testing program, and provides discussion and analysis of general performance and
behavior. Observed experimental results of shear dominated ICEB wall panels are

Chapter 1. Introduction 6
discussed and compared to predictions from common reinforced masonry design
methods, and an alternative method for predicting the shear strength of ICEB wall panels
is suggested. Also, observed flexural failure mechanisms and capacities are discussed
and compared to conventional theory. Measured force displacement response is
compared to conventional design methods for predicting initial and cracked wall
stiffness. Wall panel shear, bending and rocking displacement components are calculated
and compared to observed results, and effectiveness of the wall instrumentation scheme
is discussed. Finally, the result of a non linear static “pushover” analysis is compared to
the experimentally observed wall response.
Chapter 6 summarizes the conclusions and recommendations from Phase 1 of the
ICEB shear wall testing experimental program, including comments on material
properties and testing, ICEB shear wall testing and performance, ICEB wall construction
and recommendations for future research with ICEB structural systems.

Chapter 2. Literature Review
This chapter presents background to the subjects of compressed earth masonry
technology and masonry shear wall design. A review of published research relevant to
the experimental testing of ICEB shear wall specimens is provided within the context of
compressed earth block (CEB) masonry construction and conventional masonry shear
walls.
2.1 Compressed Earth Blocks
Compressed earth block technology takes advantage of the natural properties of
highly compressed or compacted soil. Depending on the type of soil, compaction method
and use of binders like portland cement, compressed earth blocks can be produced which
are suitable for construction of load bearing structures. The most common uses of CEBs
today are for bearing or non bearing shear wall systems, and as infill in confined masonry
type structures.
2.1.1 Compressed Earth Block Presses
The idea of compressed earth blocks (CEB) has been around since the early 19th
century. French architect Francois Cointeraux developed pre-cast compacted earth bricks

Chapter 2. Literature Review 8
in small wooden molds in 1803 (Maini 2010b). The first modern version of this
technology, the CINVA Ram press, was developed in 1956 in Columbia by Paul Ramirez
(Wheeler 2005). Figure 2.1 shows the CINVA Ram press.
Figure 2.1: CINVA Ram press (from Maini 2010b)
Since the invention of the CINVA Ram many modifications have been made to
the original idea resulting in different variations of block sizes and types, as well as
mechanical automation to increase manufacturing productivity. Manually operated
presses are most commonly used for smaller production runs due to their mobility and
ability to be used without a source of electricity or fuel. However, large scale
manufacturing of compressed earth demands the higher productivity inherent with
hydraulic powered presses. Several companies currently manufacture their own version
of compressed earth block press. Aside from mechanical design, the major differences
between the different press types are the size and style of blocks which can be pressed.
For the purposes of this review, only three specific brands of block presses are discussed;
Aurum Press 3000, Hydraform M7, and Soeng Thai Model BP6. Many other presses are

Chapter 2. Literature Review 9
currently available worldwide, but these three presses produce the most commonly used
types of interlocking CEBs.
Current compressed earth block presses use either vertical or horizontal press
action to form and eject the blocks. This orientation of pressing is important due to the
significant effect it has on finished product tolerances. Due to the inherent variability of
soil as a material and the design of the press, finished pressed block dimensions can vary
as much as 5mm. A vertically pressed block will have tight dimensions in the horizontal
plane, but the block height can vary depending on the press type, quality control methods
and soil type. Conversely, a horizontally pressed block will have tight dimensions in its
vertical cross section, but the length of the block will vary.
The Aurum 3000 is a manual vertical block press manufactured by Aureka in
Tamil Nadu, India. It can be used with 15 different molds to produce about 75 different
regular and interlocking block variations, some of which are shown in Figure 2.2. The
Aurum block system has been designed to allow for installation of reinforcing steel for
earthquake resistant construction. Most blocks are meant to be used with mortar between
joints, but the Series 300 dry interlocking blocks are designed to be dry stacked and filled
with fluid grout after.
The Hydraform M7 series of block presses are manufactured by Hydraform in
Johannesburg, South Africa. Different press models are available for different budgets
and manufacturing goals. The Hydraform compressed earth blocks are horizontally
pressed earth blocks which interlock in two planes. Shown in Figure 2.3, the Hydraform
block system is designed to be mostly dry stacked. Hydraform dry stacking blocks are

Chapter 2. Literature Review 10
commonly used as infill for confined masonry structures, but can also be constructed for
use with vertical and horizontal reinforcing bars by means of a special press insert.
Figure 2.2: Aurum 3000 block variations (from Maini 2010b)

Chapter 2. Literature Review 11
Figure 2.3: Hydraform dry stacking system (Hydraform)
The Soeng Thai BP6 press is a modern descendent of the original CINVA Ram
press. The BP6 is a manually operated vertical block press manufactured by the CVBT
in Thailand. A typical building block is shown in Figure 2.4, and Figure 2.5 shows the 9
variations of block which can be manufactured using the BP6 press, and the common
uses for the different types of blocks. The ICEB system is a combination between a
typical CEB (or “CINVA Brick”) and an interlocking dry stack masonry unit. The
interlocking dowels are intended to provide ease of block alignment during construction
and resistance to lateral in and out-of-plane forces. The round reinforcement holes are
provided to allow use of grouted vertical reinforcement, and the rectangular holes or
“grout key channels” are provided to help ensure wall stability and proper load
distribution. The grout key channels also help minimize cracking of blocks due to

Chapter 2. Literature Review 12
uneven load distribution across gaps. This style of block was originally introduced in
1983 by the Thailand Institute of Scientific and Technological Research (TISTR) and
later modified by the Asian Institute of Technology (Pathum Thani, Thailand) and Soil
Block Development Company (Chiang Rai, Thailand) into the block which today is
commonly called the “Rhino Block” or ICEB (interlocking compressed earth
block)(Wheeler 2005). The ICEB variations allow for reinforced dry stacked masonry
construction which can be grouted after stacking.
Figure 2.4: ICEB block dimensions in cm (from Wheeler 2005)
Reinforcement hole
Grout key channel

Chapter 2. Literature Review 13
Figure 2.5: ICEB block variations (Wheeler 2005)
2.1.2 CEB Material Properties
Significant research has been done to understand and optimize the material
properties of stabilized and un-stabilized CEBs. Although many resources are available
to help determine the suitability of soil for CEB manufacturing, Shildkamp (2009)
presents the most comprehensive guide to soil selection, stabilization and CEB
manufacturing techniques. More geared to ICEB construction, Proto et al. (2010)
describes manufacturing processes and tips which are specific to the Soeng Thai BP6

Chapter 2. Literature Review 14
press. Both of these papers were consulted for development of a suitable soil mixture for
this experimental program, further described in Section 3.1.
2.1.3 CEB Experimental Testing
In order to have a good amount of confidence in the safety and durability of
structures built using CEBs, it is critical to understand the material properties and
behavior as gathered from experimental testing of specimens. This section summarizes
published research which is most relevant to the experimental testing of CEB material
properties and performance.
Bei and Papayianni (2003) conducted experimental testing to determine the
effect of soil to sand mixture proportions on the compressive strength of un-stabilized
CEBs at a constant compaction level. Test specimens included single blocks, doublet and
triplet block prisms with aspect ratio h/L of 1.4 and 2.2, respectively, and small walls
with dimensions 770mm (height) x 800mm (width) x 120 mm (thickness). Block prisms
and walls were constructed using a 10mm soil cement mortar. The experimental testing
indicated that the mode of failure in compression of earth blocks is dependent on the h/L
ratio. For doublet and triplet block prisms (stacked prisms of two or three blocks), the
failure mode is similar to observed crushing of masonry walls, with noticeable hourglass
shape. Most notable is that the measured stress strain response of compressed earth
masonry under compressive loading is non-linear with very little elastic behavior.
Measured strains of 0.007 at peak compressive stress were significantly high compared to
typical strains for concrete or fired brick masonry, which commonly are closer to 0.0025
and 0.0035, respectively.

Chapter 2. Literature Review 15
Perera and Jayasinghe (2003) performed experimental compressive strength
testing to determine the performance of CEB wall panels of dimension 890mm (length)
by 590mm (height) by 140mm (thickness). The testing was aimed at determining the
load-deflection behavior, stress at first cracking and ultimate compressive strength of
twenty axially loaded CEB wall panels. Experimental results were evaluated using limit
state principals from BS 5628: Part 1 1992. The variables in the experiment were the
fines content of the soil (20%-45%) and the cement content per block (2%-8%).
Experimental results showed that the compressive strength of compressed earth blocks is
dependent on the fines content of the soil used, the mixture cement content and the
compaction ratio. The authors noted that for (tested) soils with fines percentages below
30% and cement content between 4% and 8%, walls constructed using Aurum blocks
meet the requirements of BS 5628: Part 1 1992 based on serviceability and ultimate limit
states for axial loading.
Heathcote (1991) performed compressive testing on cement stabilized CEBs in
order to better quantify the effects of soil type, cement content and density on material
strength. It was found that measured compressive strength of block units is dependent on
confinement during testing, and an aspect ratio factor of 0, 0.5, 0.76 and 1.0 was used for
height to thickness ratios of 0, 0.4, 1.0 and ≥5, respectively. This factor is used to adjust
the measured compressive strength to account for confinement due to platen effects.
Based on the experimental results, a simple formula was created to predict the
compressive strength of CEBs based on cement content and density. This formula cannot
be extrapolated to earth block mixtures based on other soil types, and further work is
necessary to introduce a formula which also considers soil clay content.

Chapter 2. Literature Review 16
Pave (2007) conducted a series of experimental testing using the Hydraform dry
stack CEB system. The author conducted testing to determine the influence of cement
and moisture contents in addition to the general performance of the system. Several dry
stack wall systems with dimensions 3000mm by 2500mm were tested under centric axial
loading. Individual block units and small wallets, consisting of 4 or 8 blocks, were also
tested.
In order to determine if the blocks were manufactured with consistent density,
cube specimens were cut from various locations of the pressed blocks. The measured
compressive strength of cube specimens cut from the top of the pressed earth block was
approximately 78% of specimens cut from the bottom. Recommendations were made
specific to the Hydraform dry stacking system regarding use of half and corner blocks
which would be more susceptible to failures because of this non uniform strength.
The experimental results indicated that the wall panel strength of dry-stack
systems is directly proportional to the strength of the masonry units with a ratio of panel
compressive strength to unit compressive strength of 0.3 for the dry stacked system.
Under uniform compression loading the Hydraform dry-stacked panels typically failed by
development of vertical cracks through the center.
Out of plane flexural strength of dry-stack masonry/composite reinforced concrete
beams was evaluated by testing. Beams were constructed with dry stack blocks and
reinforcing steel, with or without reinforced concrete bond beam sections. Experimental
results indicated that simple flexural theory accurately predicted the flexural capacity of
the reinforced beams and lintels, and that more work is necessary to validate shear
capacity calculations.

Chapter 2. Literature Review 17
Bales et al. (2009) performed a series of experiments which were originally
aimed at preceding experimental in-plane lateral testing of ICEB shear wall specimens.
The experimental program was designed to examine properties of ICEBs which would be
relevant to shear wall mechanics. The authors initially manufactured compressed earth
blocks with varying soil types and cement stabilization to determine influences on
durability, compaction and compressive strength of dry and soaked ICEB specimens.
Once a satisfactory earth block mixture was developed the authors conducted
compressive testing of individual blocks to determine the unit compressive strength (f’cb),
and testing of grouted and un-grouted masonry prisms consisting of 3 ICEBs stacked
vertically. The masonry prisms were tested surrounded by a wooden form to provide
lateral confinement as would be provided by surrounding masonry wall. This masonry
prism testing was determined to be the most accurate way of determining the actual
compressive strength of the masonry (f’cp). The panel strength reduction is attributed to
platen effects for low aspect ratios, and is given by the ratio of unit compressive strength
to prism compressive strength (f’cp /f’cb), which was an average of 0.43 and 0.37 for fully
grouted and ungrouted prism specimens, respectively. This strength reduction is fairly
consistent with previous compressive testing of dry stack panels by Pave (2007) and
Jaafar et al. (2006). The typical compressive failure mode for ICEB masonry prisms was
characterized by splitting of blocks around the grout column.
2.2 Masonry Shear Walls
Shear walls are generally used as part of a structural lateral force resisting system,
often simultaneously resisting vertical gravity loads and lateral loads from horizontal
diaphragms due to wind or earthquakes. Shear walls for buildings located in regions of

Chapter 2. Literature Review 18
moderate to high seismicity require reinforcing steel to provide the strength and ductility
necessary to perform well under seismic loading.
This section is arranged to provide an overview of the failure modes and resistance
mechanisms of reinforced masonry shear walls subjected to lateral in-plane loading.
Then, a review of previous experimental shear wall testing is provided. Although no
research has been published regarding the in-plane lateral performance of ICEB shear
walls, the mechanisms of resistance and building methods used are generally similar to
conventional concrete masonry shear walls. Consequently, this chapter covers theory and
research from a conventional reinforced concrete and masonry background.
2.2.1 Building Code
Analysis and design methods for reinforced masonry structures are dependent on
the applicable building codes and specific requirements set forth by local government and
building officials. Although codes and requirements for masonry design and construction
vary depending on the locale, the methods of design are generally based on the same
basic principles of mechanics. This thesis refers to the design requirements and theory
provided by the Building Code Requirements and Specification for Masonry Structures
(TMS 402-08/ACI 530-08/ASCE 5-08 and TMS 602-08/ACI 530.1-08/ASCE 6-08), a
standard reported by the Masonry Standards Joint Committee (MSJC).
2.2.2 Lateral Force Resistance Mechanisms
Aside from failure of lap splices, debonding of rebar or bed joint sliding,
cantilever masonry shear walls subject to lateral in plane loading and restrained from out
of plane movement by support or connection conditions typically fail in one of two

Chapter 2. Literature Review 19
different modes: flexure or shear (Voon 2007). This section covers the mechanisms of
in-plane resistance provided by a concrete masonry shear wall.
2.2.2.1 Flexural Resistance
Flexural failure is characterized by yielding of longitudinal reinforcing steel in
tension and/or crushing of masonry in compression due to bending stresses which result
from overturning moment. Generally, flexural failure is preferred for seismic design due
to the increased ductility and energy dissipation provided by tensile yielding of the steel
(Voon and Ingham 2006).
Flexural resistance of member can be calculated according to basic principles of
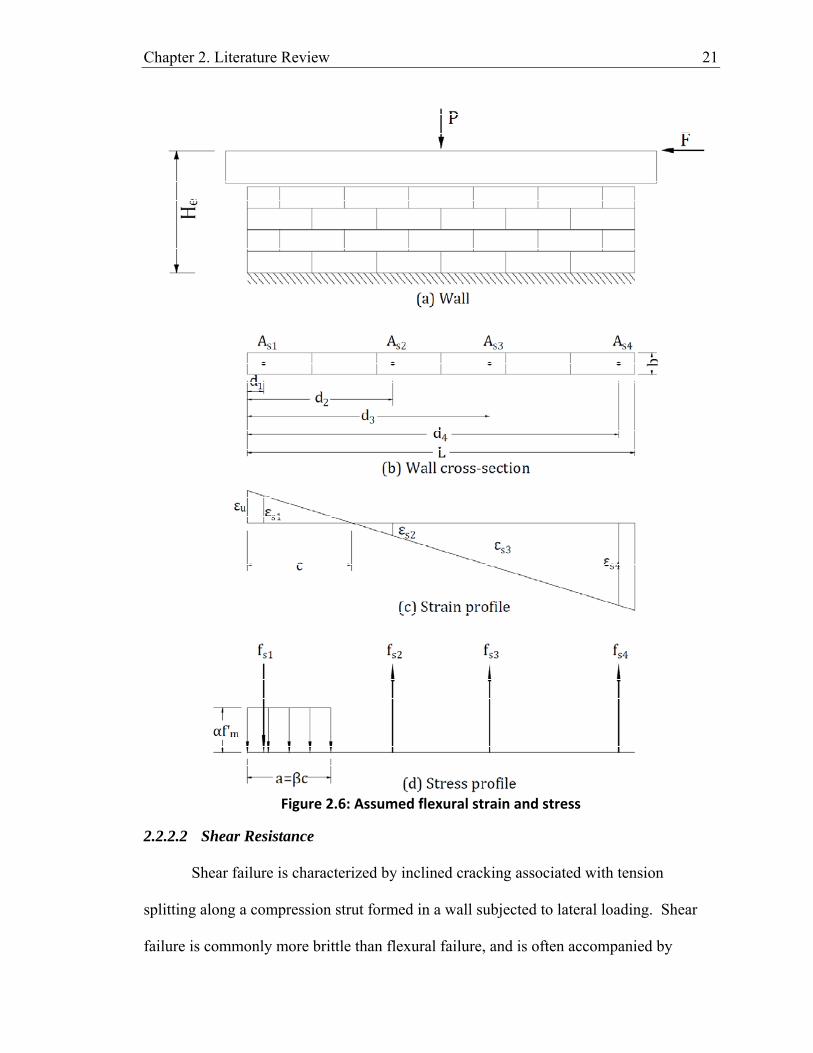
mechanics. Figure 2.6 shows the assumed strain and stress distributions which
correspond with the following assumptions (MSJC 2008 Section 3.3.2):
1. The reinforcement, grout and masonry are assumed to resist loads in a
composite action with strain continuity.
2. The nominal resistance of reinforced masonry to combined flexural and axial
loads shall be based on equilibrium conditions.
3. Maximum usable strain in the extreme masonry compression fiber, εu, shall be
taken as 0.0035 for clay masonry and 0.0025 for concrete masonry.
4. Strain in reinforcement and masonry are assumed to be directly proportional
to the distance from the neutral axis (i.e. plane sections remain plane).
5. Compressive and tensile stress in reinforcement shall be taken as Es multiplied
by the steel strain, but no greater than yield fy.
6. The tensile strength of masonry shall be neglected for calculation of flexural
strength but shall be considered for calculation of deflections.

Chapter 2. Literature Review 20
7. Masonry compressive stress shall be assumed to be 0.8f’m over an equivalent
rectangular stress block with depth a= 0.80c , where c is the depth from
neutral axis to extreme compressive fiber.
For a section as shown in Figure 2.6 with externally applied concentric axial load P, the
nominal moment capacity can be calculated as follows:
( ) ( ) ⎟⎠⎞
⎜⎝⎛ −+−+−+⎟
⎠⎞
⎜⎝⎛ −= ∑∑ cLPcdTdcCacCM
n
iisi
n
iisimn 22 (2‐1)
where Csi and Tsi represent the compressive and tensile forces in the longitudinal steel,
with Fsi=AsEsεsi ≤Asfy, and P is the applied axial load. For longitudinal steel which is
unconfined, which is common for masonry shear walls, the contribution of steel in
compression can be neglected. The compression in the masonry, Cm, can be calculated
using an equivalent uniform rectangular stress block with width, b and depth, a= βc,
where β is taken to be 0.8. The masonry compressive stress over this area is taken to be
αf’m where α is assumed to be 0.8. The neutral axis depth c can be found by strain
compatibility based on equilibrium of vertical forces. The nominal lateral strength, Fn of
a masonry shear wall with effective height He can be expressed as:
e
nn H
MF =
(2‐2)
Chapter 2. Literature Review 21
Figure 2.6: Assumed flexural strain and stress
2.2.2.2 Shear Resistance
Shear failure is characterized by inclined cracking associated with tension
splitting along a compression strut formed in a wall subjected to lateral loading. Shear
failure is commonly more brittle than flexural failure, and is often accompanied by

Chapter 2. Literature Review 22
sudden degradation of strength and stiffness (Voon and Ingham 2006). The shear
strength of masonry is complex, and no theoretical method exists which predicts it.
Research has shown that shear resistance is a combination of several mechanisms
including tension of horizontal reinforcement, dowel action of vertical reinforcement,
applied axial stress and aggregate interlocking (Voon and Ingham 2006). Based on
empirical research, ACI 530-08 allows strength calculation of shear capacity by means of
Equation 2-3 (MSJC 2008 Eqn. 3-19).
nsnmn VVV += (2‐3)
The contribution of masonry is calculated as:
PfAdV
MV mnvu
unm 25.0'75.10.4083.0 +⎥
⎦
⎤⎢⎣
⎡⎟⎟⎠
⎞⎜⎜⎝
⎛−=
(2‐4)
where An is the net cross sectional wall area (mm2), Mu is the factored moment (N-mm),
Vu is the factored shear force (N), dv is the shear depth of the wall (mm), f’m is the
specified masonry compressive strength, and P is the vertically applied axial load (N).
The contribution of transverse reinforcing steel is calculated as:
vyv
ns dfsAV ⎟⎠⎞
⎜⎝⎛= 5.0
(2‐5)
where Av is the area (mm2), s is the spacing (mm), and fy is the yield strength (MPa) of
transverse reinforcing steel.
In order to reduce the chances of brittle shear failure, the nominal shear strength Vn is
limited by Equations 2-6 and 2-7:

Chapter 2. Literature Review 23
For Mu/Vudv ≤0.25:
mnn fAV '6≤ (2‐6)
Where Mu/Vudv ≥1.00:
mnn fAV '4≤ (2‐7)
For 0.25 ≤Mu/Vudv ≤1.00, linear interpolation between Equations 2-6 and 2-7 is
permitted.
2.2.3 Experimental Testing of Shear Walls
This section contains a summary of published research which is relevant to the
lateral in-plane experimental testing of shear wall performance and capacity. The
following experimental studies were done using conventional CMU or clay fired brick
masonry.
Shing et al. (1990) conducted in-plane cyclic testing of twenty-two 1830mm by
1830mm reinforced masonry walls in order to compare actual flexural and shear capacity
to code based predictions. Sixteen specimens were constructed with hollow concrete
blocks and six with hollow clay bricks. All walls were fully grouted with uniformly
distributed horizontal and vertical reinforcement. All horizontal steel was hooked 180o
around continuous vertical bars. Open face bond beam units were used throughout each
wall for grout continuity. One specimen had wire mesh confinement in bed joints. The
walls were constructed with varying reinforcing steel contents; 0.38 to 0.74% vertical
reinforcing and 0.14 to 0.26% horizontal reinforcing. Uniform axial load, between 0 and
1.93 MPa, was applied with two servo controlled actuators.

Chapter 2. Literature Review 24
The results indicated that simple flexural beam theory can closely predict the
flexural capacity of reinforced masonry shear walls. The actual flexural strength can be
increased by strain hardening of flexural steel due to large displacements. This effect is
shown to reduce as the applied axial load increases. Also, the extent of post peak
strength degradation for shear dominated wall specimens depends on the applied axial
stress, the amount of vertical reinforcement and the compressive strength of the masonry.
Sucuoglu and McNiven (1991) investigated the experimental results from testing
of eighteen 1400 mm high by 1200 mm wide single wythe concrete and clay brick
masonry walls. The walls were chosen from a larger set of thirty experimental specimens
because they exhibited a shear dominated failure mode. Wall testing parameters were
varied to determine the influence of axial compressive stress and horizontal
reinforcement. The authors concluded that axial compressive stresses have a significant
effect on both the cracking and ultimate strengths of shear dominated shear panels. Also,
no correlation was shown between the amount of shear reinforcement and the residual
shear strength after diagonal cracking.
Voon and Ingham (2006) conducted in-plane cyclic testing of ten single-story
reinforced concrete masonry cantilever shear walls in order to compare actual shear
strength to predicted values based on code based requirements. The walls were
constructed with standard production 15 series CMUs. All walls had uniformly
distributed horizontal and vertical reinforcement. Horizontal steel was hooked 180o
around continuous vertical bars. Open face bond beam units were used throughout each
wall for grout continuity. The variables between walls were:

Chapter 2. Literature Review 25
1. Horizontal reinforcing steel content between 0 and 0.14%.
2. Applied axial stress was varied from 0 to 0.50 MPa.
3. Eight walls were fully grouted, two partially grouted.
4. Eight walls were 1.8m x 1.8m (H/L=1.0), one was 3.6m x 1.8m (H/L=0.5) and
one was 1.8m x 3.6m (H/L=2.0).
5. All walls except one were designed to fail in a shear dominated manner.
The authors noted that the ACI 530-08 method (Equation 2-3) for calculating
nominal shear capacity reasonably predicted the shear strength of walls with aspect ratio
(H/L) of 1 or less, but over-predicted the strength of the wall with an aspect ratio of 2.
This indicates that masonry shear strength is inversely proportional to aspect ratio.
Experimental results also showed that uniformly distributed shear reinforcement can
increase the strength and ductility of shear failures by redistributing stresses. In addition,
shear capacity increases with additional axial stress, but the post peak behavior is more
brittle. These findings are consistent with previous research (Shing et al. 1990). Testing
results from partially grouted walls showed significantly lower strength capacities than
fully grouted walls. Calculations using the net shear area were shown to predict the
lower strengths.
Shedid et al. (2009) conducted a series of experimental testing in order to
quantify the ductility and energy dissipation of flexure dominated reinforced concrete
masonry shear walls. Six walls, with He/L of 2.0, were subjected to reversed cyclic
loading. Walls were subjected to varying vertical (0.29 to 1.31%) and horizontal (0.08 to
1.13%) reinforcing steel ratios. The testing program was designed so that ordinary,
intermediate and special reinforced shear wall detailing could be represented and

Chapter 2. Literature Review 26
evaluated. The experimental results were reduced to identify parameters such as shear
and flexural displacement components, displacement ductility and energy dissipation.
For flexure dominated walls with He/L of 2.0, shear displacements were
approximately 32% of total lateral displacement at first yielding of outer vertical
reinforcement. At maximum load, shear displacements accounted for 20% of the total
displacement. Tested walls reached 1.0% drift with little to no strength degradation, and
about 1.5% drift at roughly 20% strength degradation. Increasing vertical reinforcement
ratios resulted in decreasing drift capacities. It is noted that instrumentation set up to
measure the strain profile along the wall showed that the strain was essentially linear for
walls which were not subjected to axial stresses, but minor non linearity was shown for
walls which were subjected to axial compressive stresses.

Chapter 3. Materials
This chapter covers the materials used for construction of the three ICEB shear wall
specimens tested in this experimental program. It includes specifications, manufacturing
processes, quality control methods, and measured material properties for the compressed
stabilized blocks, grout material, and reinforcing steel used in the experimental program.
3.1 ICEBs
The Interlocking Compressed Earth Blocks used in this experiment (see Figure 2.4)
were all constructed by student volunteers at Cal Poly using the following methods and
materials. Determination of the specific mixture used for the blocks was done following
procedures common to the current use of stabilized compressed earth technology.
Presented here is the final iteration of several block mixtures, which was chosen based on
ease of manufacture, block compressive strength and visual appearance.

Chapter 3. Materials 28
3.1.1 Materials
3.1.1.1 Soil
The soil used for manufacturing of the ICEBs was procured from a local
excavation site. The grain size distribution and plasticity of the soil was determined from
a soil sample using applicable ASTM testing procedures. Figure 3.1 shows a soil grain
size distribution based on sieve and hydrometer analyses conforming to ASTM D422-63.
The soil consists of approximately 21% clay (particles finer than 0.002 mm). The
plasticity of the soil was determined according to ASTM D4318-05, and is shown in
Table 3.1.
Table 3.1: Soil plasticity per ASTM D4318‐05
3.1.1.2 Sand
The sand used for ICEB manufacturing was medium-fine sand obtained Sisquoc
river and had been cleaned and sieved for use in concrete. It was further screened to
remove particles larger than 4 mm, and stored dry in bins. A grain size distribution based
on an ASTM D422-63 sieve analysis is presented in Figure 3.1.
3.1.1.3 Cement
Commonly available Type I/II portland cement was used for manufacturing of all
ICEBs, mortar, and grout.
Liquid Limit(%)
Plastic Limit(%)
PI(%)
36 15 21

Chapter 3. Materials 29
Figure 3.1: Grain size distribution for soil and sand
3.1.2 Manufacturing
3.1.2.1 Material Preparation
Air dried soil was prepared for manufacture of compressed earth using a Soeng
Thai Model SP3 soil pulverizer. The SP3 pulverizer, shown in Figure 3.2, uses rotating
hammers to break down the chunky dry soil, allowing it to pass through a 4 mm screen.
The pulverized soil was stored dry in bins. Sand was also air dried and stored in bins.
0
10
20
30
40
50
60
70
80
90
100
0.0000.0010.0100.1001.00010.000
Percen
t Passing
Grain Size (mm)
Sieve Analysis‐Soil
Hydrometer Analysis‐Soil
Sieve Analysis ‐ Sand

Chapter 3. Materials 30
Figure 3.2: Soeng Thai Model SP3 pulverizer
3.1.2.2 Material Quantities
Soil batches were prepared for eight blocks at a time, which provided adequate
time to finish pressing the blocks without excessive retention time. The batch
proportions are presented in Table 3.2. In order to provide consistency, all materials
were stored and weighed dry. Materials were weighed to the nearest 0.1 kg on digital
scales. The proportion of water shown in Table 3.2 is approximate because the water was
not added by mass, but rather to specific performance and visual specifications as
discussed in Section 3.1.2.4.

Chapter 3. Materials 31
Table 3.2: ICEB batch proportions (8 Block)
3.1.2.3 Dry Mix
Once weighed, the materials were placed into a portable cement mixer for an
initial dry mix. Use of the cement mixer allowed for uniform material consistency with a
significant reduction in manual labor. Due to the cohesive nature of the clayey soil, it is
not feasible to use a cement mixer with wet or moist soil mixtures.
3.1.2.4 Wet Mix
The uniformly blended dry mixture was dumped onto a flat concrete surface to
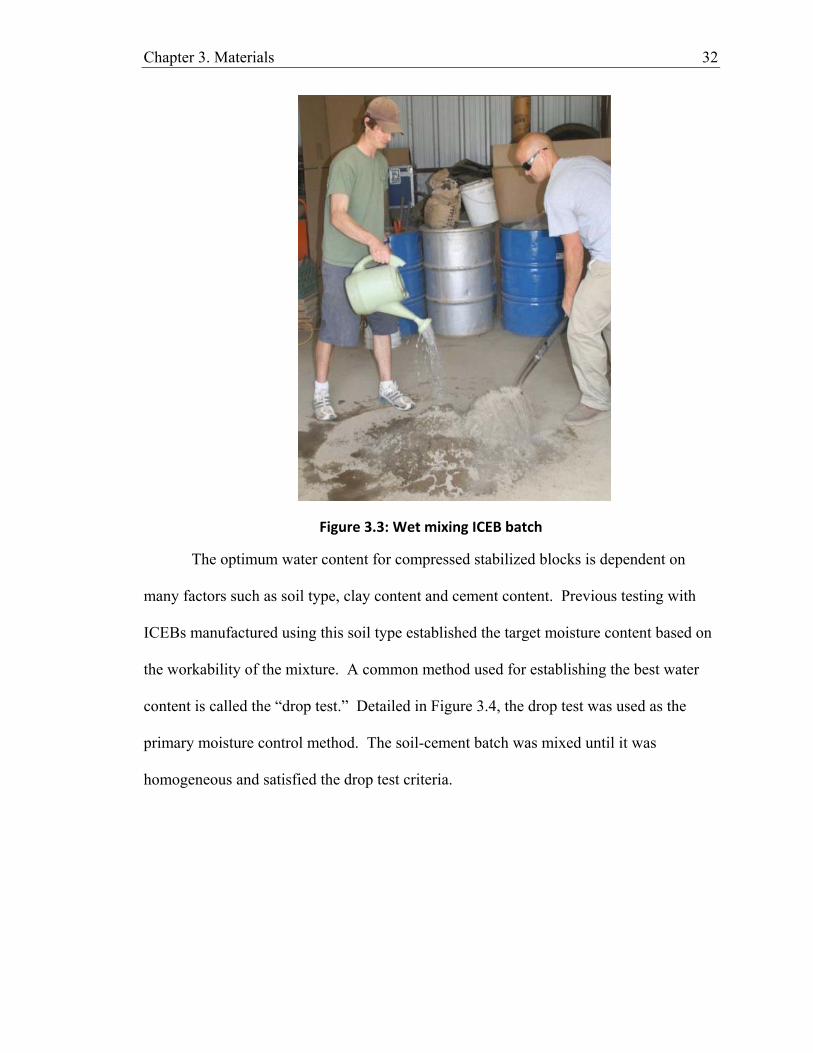
begin wet mixing. The mixture was watered uniformly with a watering can while being
blended with a shovel (See Figure 3.3). Care was taken to avoid watering too fast, as this
tends to clump the soil and leads to non uniform soil moisture.
Weight (kg) % of TotalSoil 50.0 74.3Sand 6.7 10.0Cement 4.2 6.2Water ~ 6.4 9.5Total 67.3 100.0
Chapter 3. Materials 32
Figure 3.3: Wet mixing ICEB batch
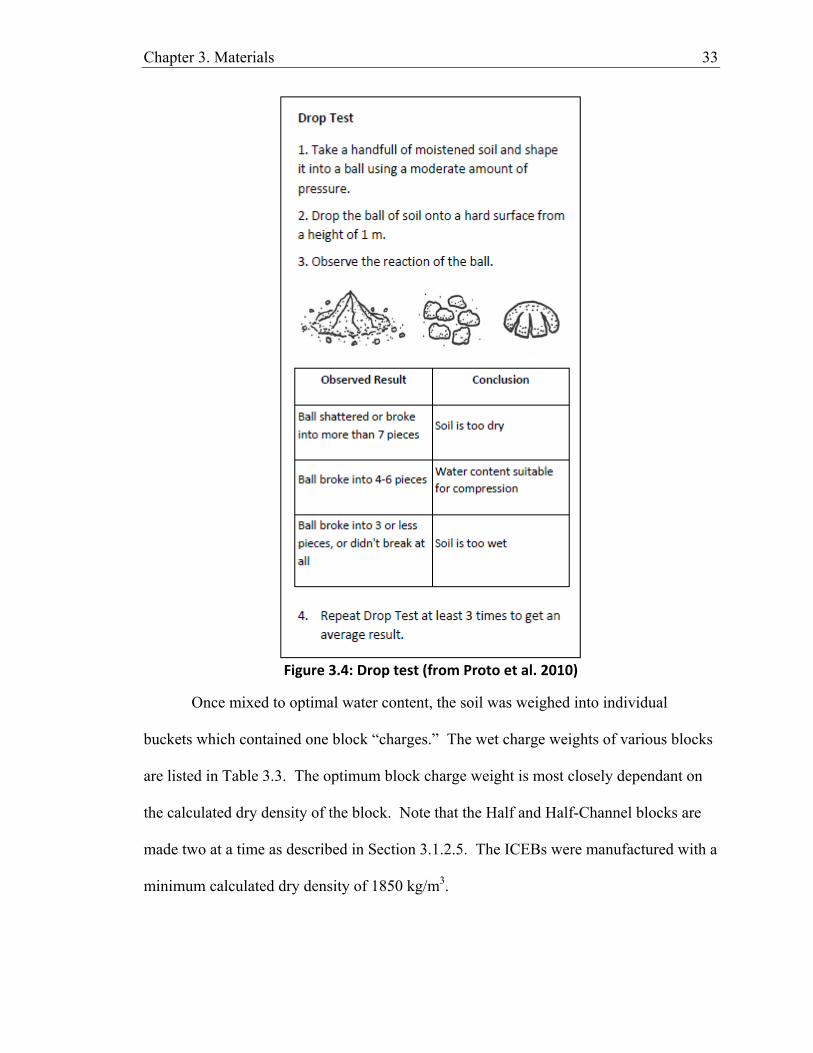
The optimum water content for compressed stabilized blocks is dependent on
many factors such as soil type, clay content and cement content. Previous testing with
ICEBs manufactured using this soil type established the target moisture content based on
the workability of the mixture. A common method used for establishing the best water
content is called the “drop test.” Detailed in Figure 3.4, the drop test was used as the
primary moisture control method. The soil-cement batch was mixed until it was
homogeneous and satisfied the drop test criteria.
Chapter 3. Materials 33
Figure 3.4: Drop test (from Proto et al. 2010)
Once mixed to optimal water content, the soil was weighed into individual
buckets which contained one block “charges.” The wet charge weights of various blocks
are listed in Table 3.3. The optimum block charge weight is most closely dependant on
the calculated dry density of the block. Note that the Half and Half-Channel blocks are
made two at a time as described in Section 3.1.2.5. The ICEBs were manufactured with a
minimum calculated dry density of 1850 kg/m3.

Chapter 3. Materials 34
Table 3.3: Block charge weights (wet)
3.1.2.5 Press Inserts
The ICEBs were compressed using a Soeng Thai Model BP6 manual block press,
shown in Figure 3.5. Table 3.4 lists the 8 different block types used for the different
walls. Manufacturing different block shapes is accomplished by simply adding or
removing press inserts to change the form shape. Wall 1 was constructed using corner
blocks at the ends for aesthetic purposes, which was determined to be unnecessary for
subsequent walls.
Figure 3.5: Loading Soeng Thai Model BP6 manual press
Block Charge Weight (kg)Standard 8.0Channel 7.3Half (2) 8.0
Half‐Channel (2) 7.3

Chapter 3. Materials 35
Table 3.4: Model BP6 Press ICEB variations
Block Description Used for Wall
Standard Full size, 5 holes 1,2,3
Channel Full size, 5 holes‐ with channel insert 1,2,3
Half Block Standard block with divider insert 2,3
Half Channel Channel block with divider insert 2,3
Corner Full size, 4 holes‐ remove one end insert and change bottom plate 1
Channel Corner Full size, 4 holes‐ remove one end insert, change bottom plate and add channel insert 1
Half Corner Change bottom plate, add divider insert, remove both end inserts 1
Half Channel Corner Change bottom plate, add divider insert, remove both end inserts, add channel insert 1
3.1.2.6 Block Pressing
Once the soil cement mixture was weighed into buckets and the appropriate press
inserts were installed, the charges were loaded into the BP6 press. For manufacturing of
half blocks the press divider insert was sprayed with WD-40 to ensure clean block
separation. In order to reach the target block dry density, the charges were poured into
the block press in two separate lifts. This was done because the loose volume of soil
would not fit into the press without initial compression by hand, shown in Figure 3.6.
The compression stroke was a minimum of 2 seconds, and the compression was held at
maximum compression for another 2 seconds.

Chapter 3. Materials 36
Figure 3.6: 1st lift pre‐compression by hand
3.1.2.7 Pocket Penetrometer
Care must be taken during manufacturing to ensure final product quality and
consistency. One of the most common checks for consistency and proper charge weight
is the use of the pocket penetrometer. Shown in Figure 3.7, the pocket penetrometer
measures the bearing strength of the pressed soil block immediately after pressing.
Although the bearing strength is not a very useful property for compressed earth block
manufacturing, the pocket penetrometer test is a good indicator of material consistency
and block density, and a good way to identify charges which were too small or big.

Chapter 3. Materials 37
Figure 3.7: Pocket penetrometer test
3.1.2.8 Initial Cure
After ejection, the ICEBs were carefully moved from the press to the indoor
curing rack (see Figure 3.8). The blocks were stored there for a maximum of one day,
and watered at least two times. The benefit of this initial cure was a lower incidence of
broken blocks because they had sufficient time to cure before handling and stacking.
Figure 3.8: Initial curing rack

Chapter 3. Materials 38
3.1.2.9 Humid Covered Curing
Once allowed to cure indoors for 24 hours, the blocks were moved outside onto
pallets and stacked 7 blocks high. The blocks were covered with plastic sheet, which was
removed for watering daily for a minimum of 7 days. After humid curing, the blocks
were transported to the structural testing lab to prepare for construction.
3.2 Grout
Due to the limited cavity space available for reinforcement and grouting it is
important for the grout to be fine and have a very high slump. To produce a workable
grout mixture at this pourable consistency, it is necessary to increase the fines content in
order to prevent bleeding and segregation of aggregates. However, simply adding more
cement to the mix decreases the water to cement ratio and will result in a grout which is
much stronger than the soil block.
Previous compressive strength testing of ICEB prisms (Bales et al. 2009) indicates
that large differences in material properties between cement/sand grout and stabilized
compressed soil lead to a brittle failure mode dominated by splitting of the soil block
around the grout at the interface and that the grout and soil were taking the load
separately. For this testing program, it was decided to use a weaker grout mixture (closer
in compressive strength to that of the blocks). The grout used for construction of the
shear walls had approximate proportions of 1:0.4:2.6:4.2 (portland cement:lime:water:
sand) by dry volume.

Chapter 3. Materials 39
3.2.1 Grout Preparation
Grout was prepared to the above dry volume proportions in 20 liter batches. The
dry materials were slowly blended with small amounts of water until a uniform
consistency was reached. Water was added until the grout was a flowing consistency,
which was necessary for pouring the grout through a funnel with an opening of 20 mm.
3.3 Tested Material Properties
Material compressive strengths were experimentally determined by compressive
testing. Table 3.5 summarizes the compressive strengths for the individual ICEBs,
grouted prisms and grout cylinder specimens, where prism samples were subjected to
either load controlled (denoted σ) or strain rate compressive loading (denoted ε).
Appendix C presents the material testing data.
Table 3.5: Material compressive strengths
3.3.1 ICEB Compressive Strength
ICEB compressive strength was determined by testing of individual ICEBs using
a universal testing machine. Individual ICEBs were tested with the top and bottom press
plates from the BP6 press used to distribute the load to the block. This was determined to
be the most effective method of uniformly compressing the ICEBs. For stress
Number of CoefficientSamples Gross Net of Variation
ICEB 8 6.6 7.6 9%Partially Grouted Prism (σ) 2 3.3 2.5 19%Partially Grouted Prism (ε) 4 2.1 1.6 5%Fully Grouted Prism (σ) 4 4.2 ‐ 9%Fully Grouted Prism (ε) 4 3.0 ‐ 7%Grout Cylinder (Porous) 6 9.2 ‐ 21%
Grout Cylinder (Non‐Porous) 4 5.1 ‐ 4%
Sample TypeCompressive Strength, MPa

Chapter 3. Materials 40
calculations, the net and gross areas of an ICEB are 39300 mm2 and 45000 mm2,
respectively. The common failure mode for single ICEBs in compression was a conical
break where the sides fall off, as shown in Figure 3.9. This type of break is consistent
with previous experimental compressive testing of ICEBs (Bales et al. 2009).
Figure 3.9: ICEB compressive failure mode
3.3.2 Grout Compressive Strength
Grout compressive strength was determined by testing of cylinders cast in plastic
molds (denoted non-porous grout sample) as well as directly into the round reinforcement
hole of spare blocks (porous grout sample). At the time of testing the porous grout
sample, the cylinder was removed from the surrounding soil block. These two different
types of samples were tested to determine the effect of the absorption of water by the
surrounding blocks. Final grout strength is dependent on the amount of moisture

Chapter 3. Materials 41
absorbed by the ICEBs at time of construction, and can be better determined by this
quality control method. The values in Table 3.5 show the relative variability of the
material strengths for the porous samples (COV 21%) compared to the non-porous grout
samples (COV 4%). The higher variance in material strengths is indicative of the nature
of CEBs. Varying water content and block density likely influenced the curing
conditions for the grout cast into CEB material. Table 3.6 shows the dimensions of both
the porous and non-porous cylinders. Cylinders were capped with a sulfur capping
compound before testing. Figure 3.10 shows a porous grout cylinder compression test.
Table 3.6: Grout cylinder dimensions
Figure 3.10: Grout cylinder (porous) compressive failure
Sample TypeDimensions
(mm)
Area
(mm2)
Porous 45 x 100 1590
Non‐Porous 51 x 102 2043

Chapter 3. Materials 42
3.3.3 Masonry Prism Strength
The average masonry compressive strength (f’m) was determined by testing of
grouted prisms under stress rate compression loading (samples denoted as Fully Grouted
Prism (σ) in Table 3.5). The prisms, consisting of three ICEBs stacked vertically, were
constructed at the same time as the shear walls and subjected to the same curing
conditions. Masonry prisms were also tested under strain rate compression as shown in
Figure 3.11, with external confinement provided by thread rods which were hand
tightened. The ratio of height to minimum width was 2.0, and reported compressive
strength values are not modified for aspect ratio. The top and bottom surfaces were
capped with plaster. Material strains were measured with both external extensometers
and LVDTs. The extensometers provided the most accurate strain readings until
compressive failure caused external cracking, at which point they were removed. The
LVDTs were left on for the entire test.
The masonry prisms exhibited fairly large strains at ultimate failure. Figure 3.12
shows a plot of the stress strain curve for four fully grouted masonry prism (strain rate
controlled) compression tests. As can be seen in the plot, the ICEB masonry prisms
experience a very ductile compressive failure mode with strains above 0.01.

Chapter 3. Materials 43
Figure 3.11: Masonry prism test setup
Figure 3.12: Masonry prism compression stress vs. strain

Chapter 3. Materials 44
ACI 530-08 Section 1.8.2.2.1 recommends that the modulus of elasticity may be
estimated from the chord modulus of elasticity taken between 0.05 and 0.33 of the
maximum compressive strength from prism testing. Following this procedure, the mean
ICEB masonry modulus of elasticity was calculated to be 575 MPa. This is
approximately equal to 137 f’m, which is significantly lower than the values commonly
assumed for clay and concrete masonry of 700 f’m and 900 f’m, respectively. The
measured stress-strain behavior does not differentiate between masonry strains and
displacements caused by closing gaps at the dry stack interfaces. Further compressive
testing of ICEB stacked prisms and panels should be conducted to better identify the
The compressive strength reduction from individual block (f’cb) to prism (f’cp),
expressed as a ratio of f’cp/f’cb, was 0.43 to 0.55 for partially and fully grouted prisms,
respectively. This strength reduction, associated with the increase in aspect ratio, is
slightly lower than for values of 0.37 and 0.43 reported by Bales et al. (2009).
3.3.3.1 Modified Hognestad Model
For later non-linear analysis, a modified Hognestad model was fitted to the stress-
strain data as shown in Figure 3.12. The modified Hognestad model uses a second-
degree parabola with apex at strain εo, followed by a downward sloping line terminating
at the maximum compressive strain limit, εcu (MacGregor and Wight 2005). The
parameters of the model were modified to match the experimental data from the masonry
prism testing.
⎟⎟
⎠
⎞
⎜⎜
⎝
⎛⎟⎟⎠
⎞⎜⎜⎝
⎛−=
22
'o
c
o
cmom ff
εε
εε
(for εc≤εo) (3‐1)

Chapter 3. Materials 45
For strain values between the strain at maximum stress and the maximum compressive
strain limit
⎟⎟⎠
⎞⎜⎜⎝
⎛−−
−=0
000 '25.0'
εεεε
cu
cmc fff (for ε0 ≤ εc ≤ εcu) (3‐2)
The model depicted in Figure 3.12 was created for f’mo = 3.0 MPa, assuming εo to be
0.012 and εcu limited at 0.025.
3.3.4 Reinforcing Steel
Samples of the steel reinforcement used for wall construction were subjected to
tensile testing, with average yield strength (fy) for the #3 and #4 bars of 378 MPa and 565
MPa, respectively. Appendix C includes data from tensile testing of steel rebar.

46
Chapter 4. ICEB Shear Wall Construction and Test Setup
This chapter covers the specifics of the ICEB construction procedures used to build
the specimens as well as the details of the test setup, instrumentation, and displacement
controlled loading protocol. Also, a description of the processes used for data reduction
of displacement measurements is provided. Finally, an overview of the methods used to
predict the nominal shear and flexural strength capacities of the walls is detailed.
4.1 Construction of Walls
Walls were constructed to the design specifications following common ICEB
building practices, which were determined from the “Interlocking Compressed Earth
Blocks Volume II. Manual of Construction” (Wheeler 2005) published by Geoffrey
Wheeler at CVBT. The chosen detailing and wall specifications, which are covered in
Chapter 5, were based on previously established testing goals and objectives as well as
interpretation of currently used construction details.
4.1.1 Installation of Longitudinal Reinforcing Steel
Vertical bars were installed to the moveable concrete footing using a common two
part epoxy construction adhesive. 4 mm oversize diameter holes were drilled into the

Chapter 4 – ICEB Shear Wall Construction and Test Setup 47
reinforced concrete footing and cleaned out prior to installation per the epoxy
manufacturer instructions. Figure 4.1 shows installed longitudinal reinforcing bars, which
were intentionally left long to be cut after installation of the top block course. Strain
gages were installed onto the rebar prior to installation into the footing.
Figure 4.1: Installation of vertical rebar
4.1.2 Lower Bond Beam Installation
The lower bond beam was installed to the foundation on a 20 mm bed of Type S
mortar. Subsequent courses were not installed until the mortar had sufficient time to set
up, which allowed for better ability to keep the wall level and plumb during construction.
No. 3 transverse steel was installed into the bond beam typical as shown in Figure 4.2,
with a 90 degree hook on each end. An alternate construction method would be a 180
degree hook around the longitudinal reinforcing bar, but minimum inner bend radius

Chapter 4 – ICEB Shear Wall Construction and Test Setup 48
requirements would prohibit proper fitment of the hook into the width of the ICEB
channel block. Disadvantages of the “bent over” detailing as used are discussed in
Chapter 5.
Figure 4.2: Lower bond beam rebar installation
4.1.3 Intermediate Course Stacking
ICEBs were stacked in running bond pattern, in low lifts of maximum 4 courses.
Before installation of grout, blocks were clamped in place with ratchet straps after being
leveled and adjusted to final position, as shown in Figure 4.3. Consistent with CVBT
construction practice, nails were used to make minor adjustments to the height and
alignment of block courses. Figure 4.4 shows a nail being used to adjust the height of an
ICEB course.

Chapter 4 – ICEB Shear Wall Construction and Test Setup 49
Figure 4.3: Ratchet straps used to stabilize wall before grouting
Figure 4.4: Roofing nail used to improve vertical alignment of block courses
4.1.4 Grout Lifts
The low strength fine grout was installed in low lift application every 4 courses of
block. Details on grout mixture, preparation and quality control are in Section 3.2. The
grout was poured into the wall cavities through a funnel, and rodded quickly after
pouring.
Wall 1 was partially grouted, which consisted of filling grout in every rectangular
vertical grout channel, horizontal bond beam channel, and any vertical round hole which
contained reinforcing steel. Wall 2 and Wall 3 were fully grouted, which consisted of

Chapter 4 – ICEB Shear Wall Construction and Test Setup 50
filling grout in every cavity. Figure 4.5 shows an intermediate course of Wall 1, which
was partially grouted.
Figure 4.5: Partially grouted ICEB wall (Wall 1)
4.1.5 Installation of Transverse Reinforcing Steel
For Wall 3, transverse reinforcing steel was installed in intermediate bond beam
courses in the same manner as the lower bond beam, as described in section 4.1.2. The
intermediate bond beams were placed at the 5th, 9th, and 13th courses.
4.1.6 Upper Bond Beam Construction
The upper bond beam was constructed two different ways, depending on the size
of the longitudinal reinforcing steel. Figure 4.6(a) shows the detail for anchor installation

Chapter 4 – ICEB Shear Wall Construction and Test Setup 51
used on Wall 1. With #4 (13mm) longitudinal bars, it was decided to not bend the bar
due to the risk of damage to the wall; the transverse reinforcement was bent down at each
end and installed with the anchors. 12.7 mm (1/2 in) anchors, provided for connection to
the loading beam, were installed at each longitudinal rebar before the final grout lift.
Figure 4.6: Anchor installation with #3 and #4 longitudinal rebar
For Wall 2 and Wall 3, the #3 longitudinal bars can be bent in place without local
damage to the blocks. Figure 4.6(b) shows the detail for anchor installation with #3
longitudinal bar bent 90 degrees into the upper channel. This installation method allows
for better grout continuity in the upper channel. The wall was left so that the grout could
harden overnight before bending the longitudinal rebar into the channel. The final grout
lift was terminated at mid height of the upper bond beam in order to reduce the effect of a
cold joint. Figure 4.7 shows the upper bond beam channel just prior to installation of the
loading beam. Reinforcing bar tails were cut at a minimum of 200 mm for 90 degree
bends.

Chapter 4 – ICEB Shear Wall Construction and Test Setup 52
Figure 4.7: Upper bond beam with #3 longitudinal reinforcement
4.1.7 Installation of Loading Beam
The steel loading beam, consisting of two steel channels welded together, was
installed onto the upper bond beam with a 20 mm bed of Type S mortar (1.0:0.4:4.5).
The four anchors cast into the upper bond beam were bolted through the loading beam as
shown in Figure 4.8. The anchors were left hand tight while the mortar set, and fully
tightened once the mortar had hardened.

Chapter 4 – ICEB Shear Wall Construction and Test Setup 53
Figure 4.8: Loading beam installed at top of wall
4.1.8 Quality Control and Wall Curing
After construction, the walls were watered twice daily for at least 3 days to
maintain humidity. Samples of grout, mortar, and grouted prisms were constructed at the
same time as the walls for testing of material properties. A summary of these material
properties is included in Section 3.3.
4.2 Test Setup
The laboratory facilities for shear wall testing consisted of a +240/-365 kN servo
controlled actuator mounted to a rigid concrete strong wall, which transferred lateral load
to the top of the wall via a steel box section, herein referred to as the “loading beam.”
The walls were built on a moveable reinforced concrete footing which was mounted to
the rigid strong floor using eight 38.1 mm (1.5 inch) bolts. The walls were braced out of
plane by four steel rollers attached to an adjustable steel reaction frame. A schematic of

Chapter 4 – ICEB Shear Wall Construction and Test Setup 54
the out of plane bracing system is shown in Figure 4.9. The axial load distributed to the
wall was approximately 4.5 kN, which consisted of the self weight of the loading beam
and actuator in addition to approximately 3.6 kN of steel angle which was stacked on the
loading beam as shown in Figure 4.9.
Figure 4.9: Out‐of‐plane bracing frame
4.3 Instrumentation
The wall specimens were typically instrumented as shown in Figure 4.10. All data
was collected using a computer data acquisition system. Although exact locations of
some instruments were changed slightly for each wall, the general layout of the
instrumentation was installed as shown in Figure 4.10. Dimensions of specific
instrumentation layouts for different walls are provided in Appendix D. The
instrumentation was generally intended to measure the following displacements:

Chapter 4 – ICEB Shear Wall Construction and Test Setup 55
• The applied lateral force and displacement at the actuator were measured by the
integrated load cell and displacement transducer (denoted as instrument 0 in
Figure 4.10.).
• In-plane lateral deflections at the top and mid-height locations were measured by
both string potentiometers and LVDTs (instruments 1,2, and 3). Between Wall 1
and Wall 2 the upper LVDT location was changed to measure from the loading
beam in order to reduce errors due to block spalling.
• Vertical panel displacement components were measured at each end (wall face) of
the walls using string potentiometers (instruments 4 and 5).
• Diagonal panel displacements were measured using string potentiometers
(instruments 6 and 7). The string potentiometers were all mounted to common
studs that were mounted onto the face of the wall.
• Rocking or uplift at the wall base was measured by LVDTs (instruments 8 and 9)
• Relative slippage between loading beam and wall, wall and footing, footing and
floor were measured with LVDTs (instruments 10,11, and 12)
4.3.1 Strain Gages
Strain gages were installed at the base of the outermost longitudinal rebar,
approximately 100 mm (4 in) from the surface of the concrete footing.

Chapter 4 – ICEB Shear Wall Construction and Test Setup 56
Figure 4.10: Wall instrumentation
4.4 Data Reduction
The wall panel displacements for a cantilevered shear wall which is instrumented as
shown in Figure 4.10 can be separated into 3 separate components: Rocking, flexural and
shear/sliding deformations. Figure 4.11 shows the dimensions used for calculation of
individual wall component deformations, which was done using a simplified procedure
modified after Voon (2007); Appendix A provides a detailed description of the process
used to separate the flexural and shear deformation components.
4.4.1 Shear Deformation
The shear deformation was calculated using measured relative displacements
between points on the wall panel face as:

Chapter 4 – ICEB Shear Wall Construction and Test Setup 57
Lhdh
Ld
u vv
u
dds
)()2(62
)( 212
21 δδδδ −+
−−
=. (4‐1)
where δ is the displacement measured at specific transducers, with extension
corresponding to positive displacement, and compression as negative.
Figure 4.11: Wall dimensions used for calculating deformation components
4.4.2 Bending Deformation
The bending deformation is calculated based on the measured rotation of the wall
panel by:
⎟⎟⎟⎟
⎠
⎞
⎜⎜⎜⎜
⎝
⎛
++
+−= u
u
uvv
b dhd
hdh
Lu
23
2)( 21 δδ
(4‐2)

Chapter 4 – ICEB Shear Wall Construction and Test Setup 58
4.4.3 Rocking Deformation
The rocking component of displacement was determined by calculating the
rotation, θr of the wall, as shown in Figure 4.12:
sw
rrr lL 2
21
+−
=δδ
θ
(4‐3)
where dr1 and dr2 are the deformations measured by LVDTs at the base of the wall
(instruments 8 and 9 in Figure 4.10) and ls is the distance from the end of the wall and the
center of the instrument. The rocking displacement is calculated by:
err hu θ=
(4‐4)
Figure 4.12: Rocking displacement
4.4.4 Base Sliding
The sliding deformation was measured by LVDTs, shown in Figure 4.10 as
instruments 10-12. The foundation and loading beam were purposely roughened to
reduce the occurrence of slippage.
Chapter 4 – ICEB Shear Wall Construction and Test Setup 59
4.5 Loading Protocol
The pseudo-static cyclic loading protocol used for the ICEB shear wall testing
program is shown in Figure 4.13 and Table 4.1. This protocol consisted of two
(pull/push) cycles to each target displacement. The actuator was programmed to start
with a pull displacement for each cycle. The target displacements are based on the
actuator displacement transducer, and do not necessarily reflect the actual displacement
of the wall panel (See Appendix B for more information). This loading protocol is
preferred for cyclic testing of masonry shear walls for two reasons (Voon 2007):
• To avoid a high level of dependency on instrument readings during the process
of testing. This protocol can be run regardless of changes during testing.
• The non-ductile nature of the shear dominated wall specimens means that small
displacement increments are necessary to avoid specimen failure at an early
stage of testing. This was more important for the ICEB walls because no
experimental testing results exist which could indicate possible structural
response.

Chapter 4 – ICEB Shear Wall Construction and Test Setup 60
Figure 4.13: Imposed experimental cyclic loading protocol
Table 4.1: Imposed experimental cyclic loading protocol
-16
-12
-8
-4
0
4
8
12
16
Late
ral D
ispl
acem
ent (
mm
)
Displacement Cycles
Pull
Push
# of CyclesDeflection
(mm)Deflection
(in)Loading Rate
(in/sec) % Drift
2 0.5 0.0197 0.003 0.03%2 1 0.0394 0.004 0.06%2 2 0.0787 0.006 0.11%2 4 0.1575 0.009 0.22%2 6 0.2362 0.013 0.33%2 8 0.3150 0.013 0.44%2 10 0.3937 0.013 0.56%2 12 0.4724 0.013 0.67%2 14 0.5512 0.013 0.78%2 16 0.6299 0.013 0.89%2 20 0.7874 0.017 1.11%2 24 0.9449 0.020 1.33%2 28 1.1024 0.023 1.56%2 32 1.2598 0.027 1.78%2 36 1.4173 0.030 2.00%2 40 1.5748 0.033 2.22%

Chapter 4 – ICEB Shear Wall Construction and Test Setup 61
4.6 Failure Criteria
This thesis defines failure at the point where wall lateral strength is reduced to 80%
of the maximum measured lateral force. Figure 4.14 shows the definitions of the yield
(δy) and ultimate (δu) displacement capacities which were reported in this thesis. For
calculation of the yield displacement, an equivalent elastoplastic curve is fitted to the
measured force-displacement envelope where area a1 is equal to a2.
Figure 4.14: Testing failure criteria
4.7 Prediction of Wall Capacity
Predictions of wall strength were based on ACI 530-08 strength design
methodology. The specified masonry strength, f’m was taken as the average compressive
strength determined by stacked masonry prism testing, covered in Section 3.3.3. Table
5.2 summarizes the predictions for the ICEB wall specimens. For calculation of shear

Chapter 4 – ICEB Shear Wall Construction and Test Setup 62
stresses, the effective shear areas used for partially grouted (Wall 1) and fully grouted
(Wall 2 and Wall 3) walls were 246x103 mm2 and 259x103 mm2, respectively.
4.7.1 Shear Capacity
The lateral in-plane shear capacities of the ICEB shear walls were predicted
according to Equation 2-4. For the wall geometry used, (Mu/Vudv) is taken as 1.0. An is
the width of the wall (150 mm) times dv (1725 mm) less any un-grouted reinforcement
holes. The steel area Av is 71 mm2 (0.11 in2) and steel spacing s is 500 mm or 400 mm.
The steel yield strength, fy, was taken as the average measured yield strength for #3 bars
of 378 MPa.
4.7.2 Flexural Capacity
The lateral in-plane flexural capacities, Fn, of the ICEB shear walls were predicted
using classical flexural mechanics according to the requirements of ACI 530-08 as
described in Section 2.2.2.1.

63
Chapter 5. ICEB Shear Wall Testing
Three 1800 mm x 1800 mm cantilever shear walls were constructed using ICEBs
and subjected to cyclic in-plane loading. This chapter provides details, specifications,
and testing results for individual walls. The variables between the three walls included
full or partial grouting, longitudinal reinforcement content, and transverse reinforcement
content. Table 5.1 summarizes the general specifications and intended failure modes of
the three shear walls.
Table 5.1: ICEB Shear Wall Specifications
Table 5.2 presents the predicted nominal shear (Vn) and flexural (Fn) capacities
for each wall, in addition to the experimental results. The masonry prism strength, f’m,
used for each calculation was taken as the average measured compressive strength
determined by load controlled compressive testing of fully grouted ICEB prisms (see
WallH
(mm)L
(mm)Intended
Failure ModeVert.Rebar
Horz.Rebar
GroutingAxial Load
(kN)
1 1800 1800 Shear (4) #4 ‐ Partial 4.52 1800 1800 Shear (4) #3 ‐ Full 4.53 1800 1800 Flexure (4) #3 (3) #3 Full 4.5

Chapter 5 – ICEB Shear Wall Testing 64
Section 3.3.3), and An is the net shear area of the wall (see Section 4.7.1). The
experimentally determined maximum lateral force (Vmax) is reported for both pull (+) and
push (-) directions, and δvmax is the corresponding displacement at maximum lateral force.
The measured yield (δy) and ultimate (δu) displacements are also reported in mm and %
drift. For comparative purposes, the ratio of experimentally determined strength to
predicted nominal strength is reported for both shear and flexure. Wall 3 was subjected
to two separate loading conditions, which are described further in Section 5.3. Unless
otherwise noted, all displacements reported in this thesis are modified from the measured
actuator (ACT) and LVDT displacements as described in Appendix B.
Table 5.2: ICEB shear wall testing experimental results
5.1 Wall 1
Wall 1 was constructed June 14, 2010 and tested 28 days later on August 11, 2010.
The testing goal for Wall 1 was to produce a shear dominated failure of a partially
grouted wall with 1:1 aspect ratio. Initial calculations for the flexural and shear capacity
of the wall predicted (see Table 5.2 for a summary of predictions and results) that four #4
vertical bars would provide sufficient flexural strength to induce a shear failure for a wall
(mm) (%) (mm) (%) (mm) (%)
Pull 21.8 0.23 ‐ 2.3 0.13 3.9 0.22 6.5 0.36Push 27.3 0.29 ‐ 3.0 0.17 5.4 0.30 7.7 0.43Pull 43.0 0.43 ‐ 5.6 0.31 5.6 0.31 8.8 0.49Push 41.8 0.42 ‐ 5.2 0.29 5.2 0.29 7.0 0.39
3(a) 4.2 259x103 146.5 50.3 Pull 51.6 ‐ 1.03 9.8 0.54 12.2 0.68 15.7 0.87 Flexure
Pull 49.9 ‐ 0.99 8.1 0.45 11.4 0.63 22.4 1.24
Push 48.1 ‐ 0.96 11.0 0.61 11.0 0.61 28.1 1.56
f'm(MPa)
An(mm2)
Vmax
(kN)Vmax/Vn Vmax/Fn
246x103
259x103
259x103
Prediction
Shear
δ vmax
Shear
δ u FailureMode
δ y
Test Result
Wall
2 4.2 100.2 50.3
1 4.2 95.3 107
Vn(kN)
Fn(kN)
3(b) 4.2 158.0 50.3 Flexure
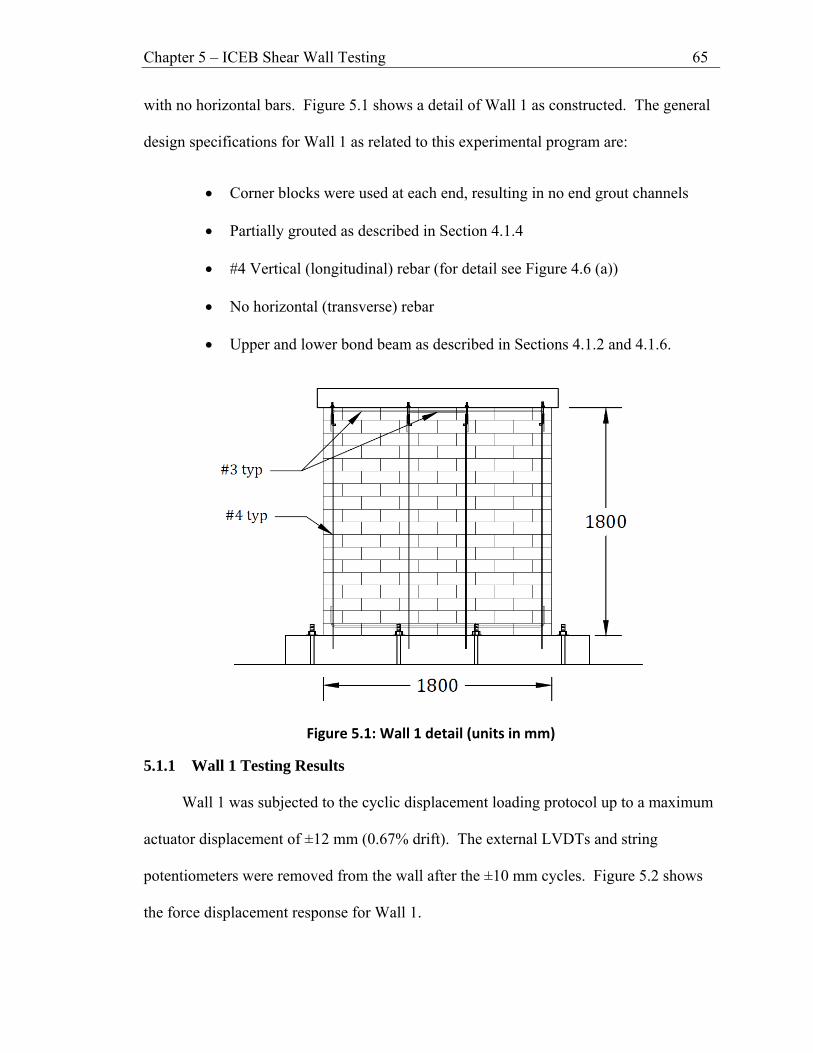
Chapter 5 – ICEB Shear Wall Testing 65
with no horizontal bars. Figure 5.1 shows a detail of Wall 1 as constructed. The general
design specifications for Wall 1 as related to this experimental program are:
• Corner blocks were used at each end, resulting in no end grout channels
• Partially grouted as described in Section 4.1.4
• #4 Vertical (longitudinal) rebar (for detail see Figure 4.6 (a))
• No horizontal (transverse) rebar
• Upper and lower bond beam as described in Sections 4.1.2 and 4.1.6.
Figure 5.1: Wall 1 detail (units in mm)
5.1.1 Wall 1 Testing Results
Wall 1 was subjected to the cyclic displacement loading protocol up to a maximum
actuator displacement of ±12 mm (0.67% drift). The external LVDTs and string
potentiometers were removed from the wall after the ±10 mm cycles. Figure 5.2 shows
the force displacement response for Wall 1.
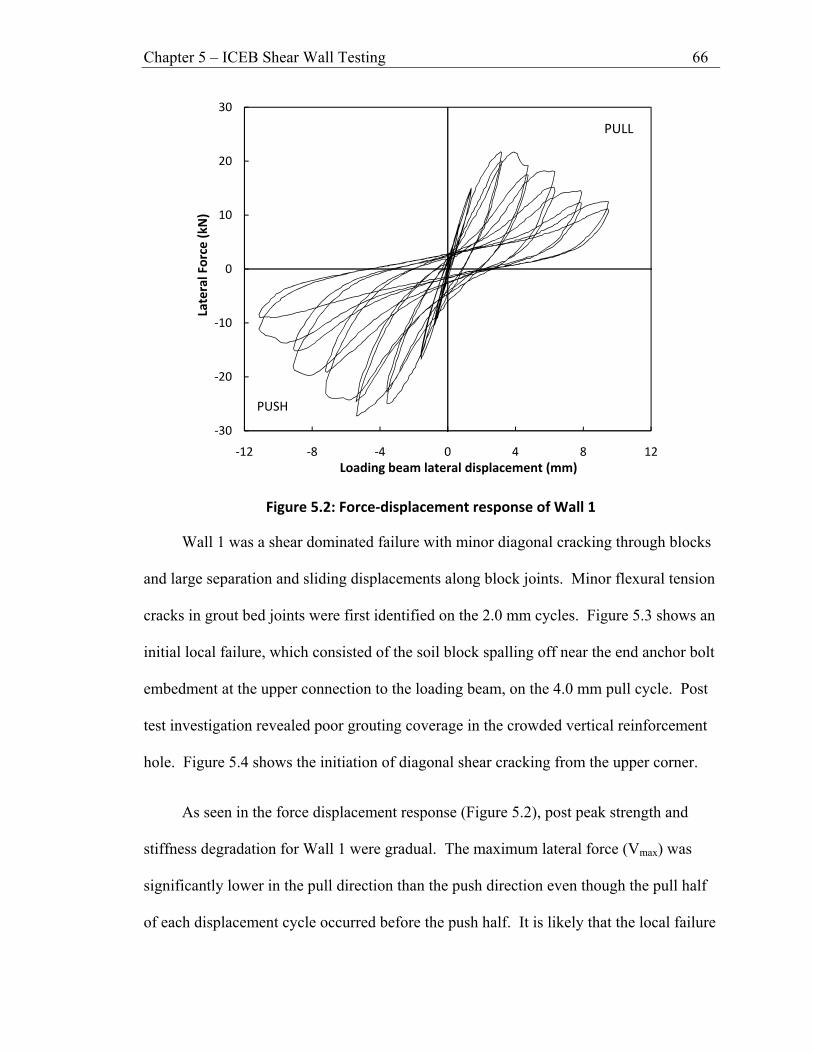
Chapter 5 – ICEB Shear Wall Testing 66
Figure 5.2: Force‐displacement response of Wall 1
Wall 1 was a shear dominated failure with minor diagonal cracking through blocks
and large separation and sliding displacements along block joints. Minor flexural tension
cracks in grout bed joints were first identified on the 2.0 mm cycles. Figure 5.3 shows an
initial local failure, which consisted of the soil block spalling off near the end anchor bolt
embedment at the upper connection to the loading beam, on the 4.0 mm pull cycle. Post
test investigation revealed poor grouting coverage in the crowded vertical reinforcement
hole. Figure 5.4 shows the initiation of diagonal shear cracking from the upper corner.
As seen in the force displacement response (Figure 5.2), post peak strength and
stiffness degradation for Wall 1 were gradual. The maximum lateral force (Vmax) was
significantly lower in the pull direction than the push direction even though the pull half
of each displacement cycle occurred before the push half. It is likely that the local failure
‐30
‐20
‐10
0
10
20
30
‐12 ‐8 ‐4 0 4 8 12
Lateral Force (k
N)
Loading beam lateral displacement (mm)
PULL
PUSH

Chapter 5 – ICEB Shear Wall Testing 67
due to improper grout installation significantly weakened the wall in the pull direction.
Figure 5.5 shows the damage Wall 1 upon completion of testing. The damage pattern is
consistent with shear failure of wall panels, characterized by diagonal cracking associated
with tension splitting along the diagonal compression strut. As seen in Table 5.2, the
ultimate shear strength of Wall 1 was significantly below the shear strength predicted by
ACI 530-08.
Figure 5.3: Initial failure of Wall 1 after 4.0 mm pull (0.22 % drift)
Pull
Push
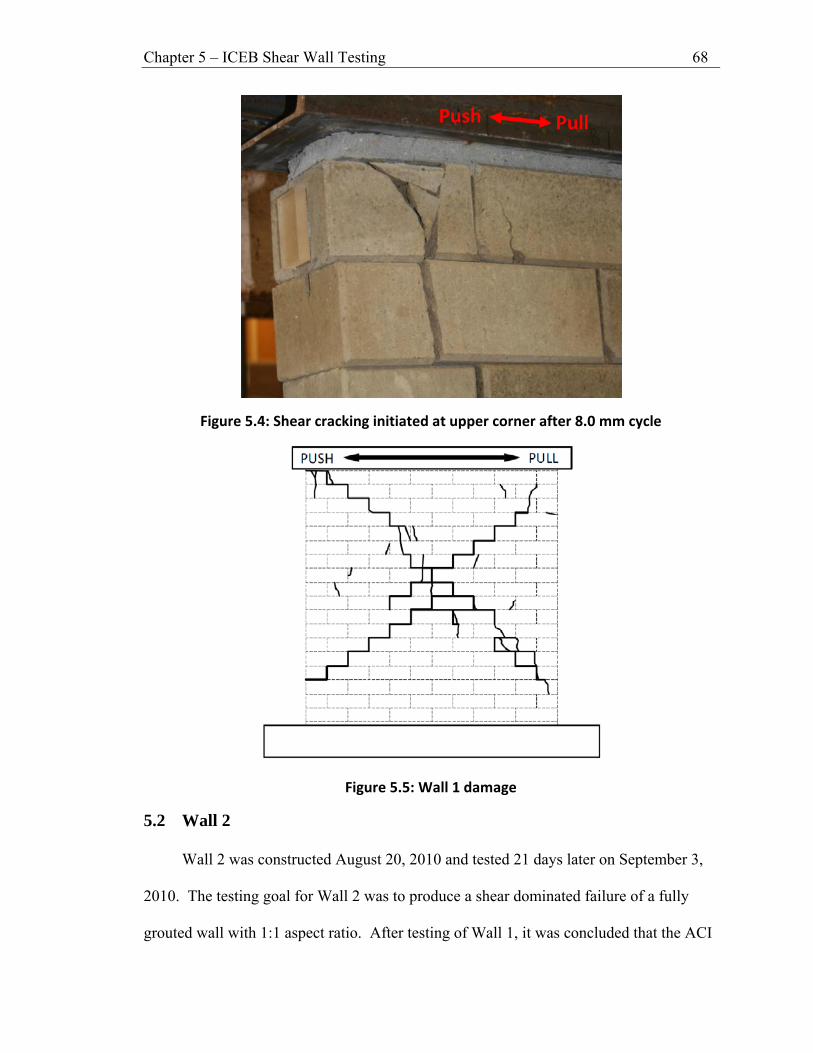
Chapter 5 – ICEB Shear Wall Testing 68
Figure 5.4: Shear cracking initiated at upper corner after 8.0 mm cycle
Figure 5.5: Wall 1 damage
5.2 Wall 2
Wall 2 was constructed August 20, 2010 and tested 21 days later on September 3,
2010. The testing goal for Wall 2 was to produce a shear dominated failure of a fully
grouted wall with 1:1 aspect ratio. After testing of Wall 1, it was concluded that the ACI
Pull Push

Chapter 5 – ICEB Shear Wall Testing 69
530-08 method for predicting in plane shear strength significantly overestimates the
nominal capacity. Consequently, the nominal flexural capacity required to force a shear
failure is lower; for Wall 2, #3 longitudinal reinforcing bars were used. Figure 5.6 shows
a detail of Wall 2 as constructed. The general design specifications for Wall 2 as related
to this experimental program are:
• Standard blocks were used at the ends, resulting in end grout channels
• Fully grouted
• #3 Vertical (longitudinal) rebar (for anchor detail see Figure 4.6 (b))
• No horizontal (transverse) rebar
• Upper and lower bond beam as described in Sections 4.1.2 and 4.1.6
Figure 5.6: Wall 2 details (units in mm)

Chapter 5 – ICEB Shear Wall Testing 70
5.2.1 Wall 2 Testing Results
Wall 2 was subjected to the cyclic displacement loading protocol up to a maximum
actuator displacement of ±16 mm (0.89% drift). The external LVDTs and string
potentiometers were removed from the wall after the ±10 mm cycles. Figure 5.7 shows
the force displacement response for Wall 2.
Figure 5.7: Force‐displacement response of Wall 2
Wall 2 was dominated by extensive diagonal cracking through blocks and along
joints. Minor flexural cracking was first observed on the 2 mm cycle, followed by
sudden formation of diagonal shear cracking during the first 8 mm pull cycle. Strength
degradation did not immediately occur, and very extensive diagonal shear cracking
occurred on the first Figure 5.8 shows the damage to Wall 2 upon completion of testing,
which is consistent on both wall faces. The damage pattern is consistent with shear
‐50
‐40
‐30
‐20
‐10
0
10
20
30
40
50
‐16 ‐12 ‐8 ‐4 0 4 8 12 16
Lateral Force (k
N)
Loading beam lateral displacement (mm)
PULL
PUSH

Chapter 5 – ICEB Shear Wall Testing 71
failure of wall panels, characterized by diagonal cracking associated with tension splitting
along the diagonal compression strut. As shown in Figure 5.9, diagonal cracking was
observed to initiate and terminate along lines of vertical reinforcement.
a.) Back b.) Front
Figure 5.8: Damage to Wall 2 after testing
Pull Push Pull Push

Chapter 5 – ICEB Shear Wall Testing 72
Figure 5.9: Wall 2 damage
5.3 Wall 3
Wall 3 was constructed September 10, 2010 and initially tested 21 days later on
October 1, 2010. The testing goal for Wall 3 was to produce a flexure dominated failure
of a fully grouted wall with 1:1 aspect ratio. The only difference from Wall 2 was the
addition of 3 layers of #3 transverse reinforcing bars. Figure 5.10 shows a detail of Wall
3 as constructed. Due to the geometry of the wall, symmetrical uniform distribution of
horizontal rebar was not possible. The lower four bars (including bond beam) were
spaced at 400 mm with the top two bars spaced at 500 mm. The general design
specifications for Wall 3 as related to this experimental program are:
• Standard blocks were used at the ends, resulting in end grout channels
• Fully grouted
• #3 vertical (longitudinal) rebar (for anchor detail see Figure 4.6)
• #3 horizontal (transverse) rebar (for detail see Section 4.1.5)

Chapter 5 – ICEB Shear Wall Testing 73
• Upper and lower bond beam as described in Sections 4.1.2 and 4.1.6
Figure 5.10: Wall 3 detail (units in mm)
5.3.1 Wall 3(a) Testing Results
Wall 3(a) was subjected to the cyclic displacement loading protocol up to the ± 1.0
mm cycles, at which point an input error resulted in a pull displacement of 20 mm (1.11%
drift) at the actuator. The hydraulic actuator was paused at 13 mm while it was returning
to zero displacement. At that point it was decided to manually control the wall
displacement to 20 mm in the push direction in order to quantify the damage from the
initial excursion. Figure 5.11 shows the force displacement response for Wall 3(a).

Chapter 5 – ICEB Shear Wall Testing 74
Figure 5.11: Force‐displacement response of Wall 3(a)
On the initial 20 mm pull displacement, Wall 3(a) was determined to be a flexure
dominated failure, characterized by tensile flexural cracking and yielding of vertical
rebar, followed immediately by a local failure at the upper section of the wall between the
bond beam and fourth layer of horizontal reinforcement. Figure 5.12 shows the cracking
at the upper connection level at 20 mm displacement. Upon load reversal, the wall
failure was characterized by shear sliding along the previously cracked section. Figure
5.13 shows the final damage to Wall 3(a) after completion of pull and push (± 20 mm)
displacement cycles.
‐60
‐40
‐20
0
20
40
60
‐25 ‐20 ‐15 ‐10 ‐5 0 5 10 15 20 25
Lateral Force (k
N)
Loading beam lateral displacement (mm)
PULL
PUSH
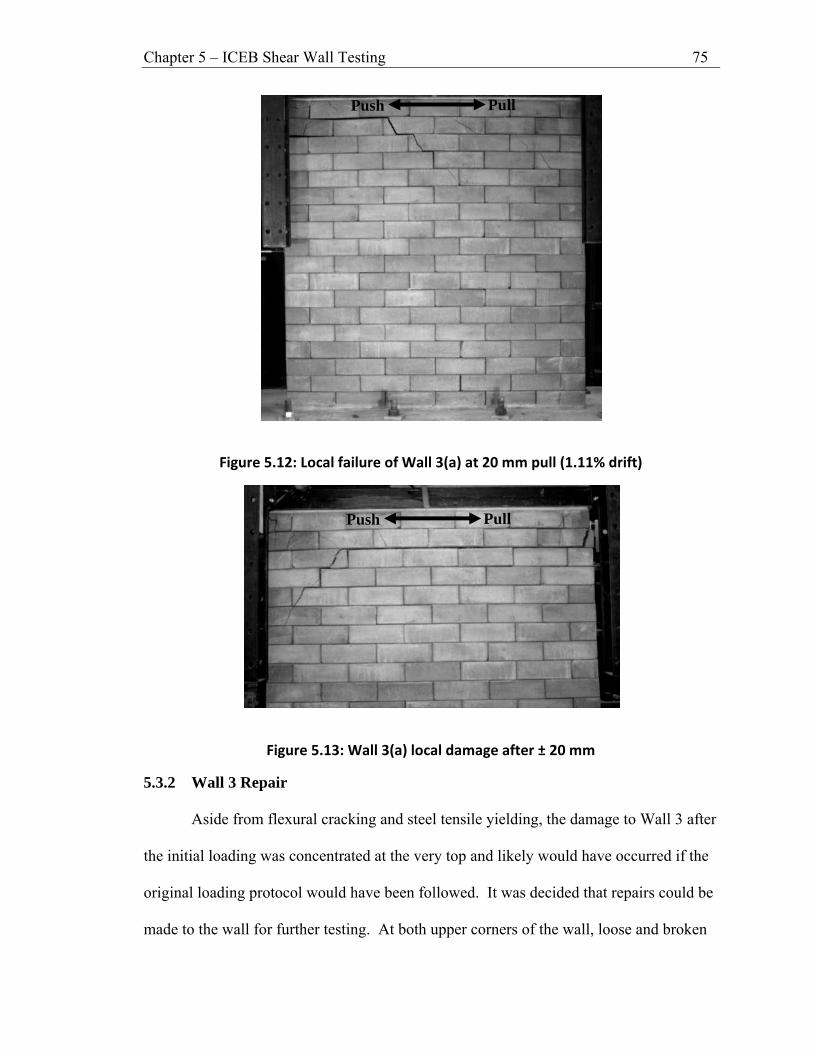
Chapter 5 – ICEB Shear Wall Testing 75
Figure 5.12: Local failure of Wall 3(a) at 20 mm pull (1.11% drift)
Figure 5.13: Wall 3(a) local damage after ± 20 mm
5.3.2 Wall 3 Repair
Aside from flexural cracking and steel tensile yielding, the damage to Wall 3 after
the initial loading was concentrated at the very top and likely would have occurred if the
original loading protocol would have been followed. It was decided that repairs could be
made to the wall for further testing. At both upper corners of the wall, loose and broken
Push Pull
Push Pull

Chapter 5 – ICEB Shear Wall Testing 76
blocks which could be easily removed were pulled off from both upper corners of the
wall. Figure 5.14 shows an upper corner of the wall after all loose material was cleaned
out. Forms were installed at each end, and the voids at the corners were filled with
concrete grout.
Figure 5.14: Loose blocks removed in preparation for grouting repair
Wooden shear panels were built to attach to both sides of the wall. Before
installing the shear panels, a two part epoxy construction adhesive was applied to both
sides of the wall in order to ensure proper shear transfer between the wooden shear panels
and the damaged masonry wall panel. Figure 5.15 shows the surface epoxy application
and grout filled corner voids of Wall 3 prior to installation of the wooden shear panels.
The external shear panels were installed to the wall with six 12.7 mm (1/2 in) threaded
rods which were thru bolted. Figure 5.16 shows the installed external shear panel.
Pull Push

Chapter 5 – ICEB Shear Wall Testing 77
Figure 5.15: Grout repaired corner and epoxy surface coating
Figure 5.16: External wooden shear panel (both sides)
5.3.3 Wall 3(b) Results
After repair, Wall 3 was subjected to the cyclic displacement loading protocol up to
a maximum displacement of ±40 mm (2.22% drift). The external LVDTs and string

Chapter 5 – ICEB Shear Wall Testing 78
potentiometers were removed from the wall after the ±20 mm cycles. Figure 5.17 shows
the force displacement response for Wall 3(b).
Figure 5.17: Force‐displacement response of Wall 3(b)
The repaired Wall 3(b) failed in flexure, characterized by yielding of longitudinal
steel followed by buckling of longitudinal steel in compression. The wall had existing
flexural cracks along bed joints from previous testing, and separation of blocks along the
existing cracks was identified but not measured. Wall 3(b) exhibited a much more
ductile failure mode compared to previous walls, which is attributed to the tensile
yielding of longitudinal reinforcing bars, until the first 20 mm (1.11% drift) push
displacement, at which point buckling longitudinal steel in compression caused spalling
of masonry at the base of the wall, shown in Figure 5.18(a). Figure 5.18(b) shows the
buckled longitudinal rebar after the masonry spalled off completely. At further
‐60
‐40
‐20
0
20
40
60
‐40 ‐35 ‐30 ‐25 ‐20 ‐15 ‐10 ‐5 0 5 10 15 20 25 30 35 40
Lateral Force (kN)
Loading beam lateral displacement (mm)
PUSH
PULL

Chapter 5 – ICEB Shear Wall Testing 79
displacement levels, the buckling and subsequent masonry spalling moved inwards
towards the middle of the wall panel. Figure 5.19 shows a diagram of the damage to
Wall 3(b) upon completion of testing. After spalling of the masonry a significant portion
of wall panel displacement due to shear sliding at the third and fourth course of blocks
was identified.
(a) At 20mm (1.11% drift) (b) After 24 mm (1.22% drift)
Figure 5.18: Spalling of masonry due to buckling of longitudinal rebar
Push Push

Chapter 5 – ICEB Shear Wall Testing 80
Figure 5.19: Wall 3(b) damage pattern

81
Chapter 6. Experimental Results and Analysis
This chapter provides an overview of the behavior of the tested shear wall specimens
and compares the observed behavior to predictions using conventional methods of
analysis, including discussion of shear capacity and flexural capacity in the context of
ICEB material properties. The experimentally observed force-displacement response is
compared to predictions using common elastic analysis methods for cracked and un-
cracked sections. Also, experimentally measured shear and flexural displacement
components are presented and related to observed results. Observations from material
and structural testing indicate that the ICEB shear wall behaves in a non-linear manner
under even low level loading, so the results from a non linear static analysis are compared
to the experimental results.
6.1 Introduction
Shear wall test results are summarized in Table 5.2, and Figure 6.1 shows the force
displacement histories for each wall specimen. Measured force displacement (loading
beam level) envelopes for all wall specimens are shown in Figure 6.2.

Chapter 6 - Experimental Results and Analysis 82
(a) Wall 1 (b) Wall 2
(c) Wall 3(a) (d) Wall 3(b)
Figure 6.1: Force‐displacement histories
‐30
‐20
‐10
0
10
20
30
‐12 ‐8 ‐4 0 4 8 12
Lateral Force (k
N)
Loading beam lateral displacement (mm)
PULL
PUSH‐50
‐40
‐30
‐20
‐10
0
10
20
30
40
50
‐16 ‐12 ‐8 ‐4 0 4 8 12 16
Lateral Force (k
N)
Loading beam lateral displacement (mm)
PULL
PUSH
‐60
‐40
‐20
0
20
40
60
‐25 ‐20 ‐15 ‐10 ‐5 0 5 10 15 20 25
Lateral Force (k
N)
Loading beam lateral displacement (mm)
PULL
PUSH‐60
‐40
‐20
0
20
40
60
‐40 ‐30 ‐20 ‐10 0 10 20 30 40
Lateral Force (k
N)
Loading beam lateral displacement (mm)
PULL
PUSH

Chapter 6 - Experimental Results and Analysis 83
Figure 6.2: Force‐displacement envelopes
6.2 Shear Behavior
The cyclic loading response of shear dominated ICEB wall panels is similar to that
of partially and fully grouted CMU shear walls tested (Voon and Ingham 2006),
characterized by in cycle strength and stiffness degradation in addition to rapid post peak
strength loss. The diagonal cracking behavior is also consistent with observed shear
failure modes for shear wall panels. A significant portion of the shear cracking was not
directly visible at the finish of testing due to the nature of the ICEB system. Figure 6.3
shows that while some cracking occurs through the face of blocks, much of the cracking
is internal to the wall, which is evident by dry stacked bed joint sliding. Upon load
‐60
‐40
‐20
0
20
40
60
‐40 ‐30 ‐20 ‐10 0 10 20 30 40
Actuator Force (kN)
Lateral Displacement (mm)
W1W2W3(a)W3(b)PUSH
PULL
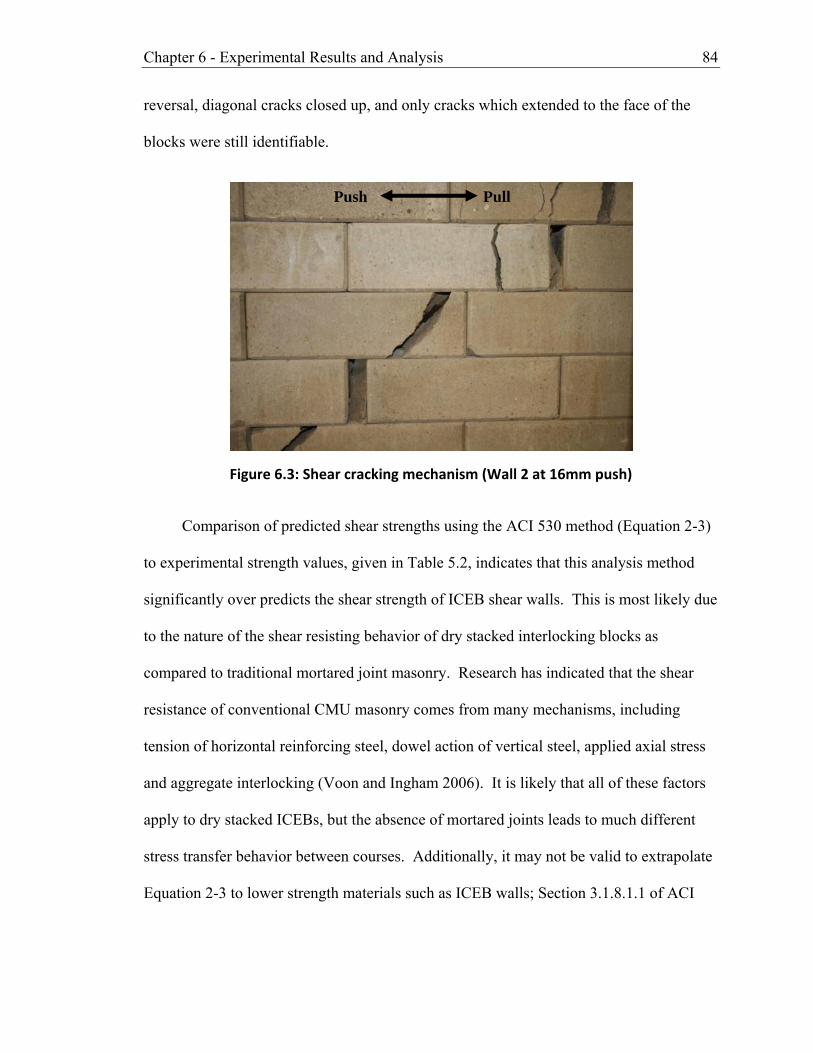
Chapter 6 - Experimental Results and Analysis 84
reversal, diagonal cracks closed up, and only cracks which extended to the face of the
blocks were still identifiable.
Figure 6.3: Shear cracking mechanism (Wall 2 at 16mm push)
Comparison of predicted shear strengths using the ACI 530 method (Equation 2-3)
to experimental strength values, given in Table 5.2, indicates that this analysis method
significantly over predicts the shear strength of ICEB shear walls. This is most likely due
to the nature of the shear resisting behavior of dry stacked interlocking blocks as
compared to traditional mortared joint masonry. Research has indicated that the shear
resistance of conventional CMU masonry comes from many mechanisms, including
tension of horizontal reinforcing steel, dowel action of vertical steel, applied axial stress
and aggregate interlocking (Voon and Ingham 2006). It is likely that all of these factors
apply to dry stacked ICEBs, but the absence of mortared joints leads to much different
stress transfer behavior between courses. Additionally, it may not be valid to extrapolate
Equation 2-3 to lower strength materials such as ICEB walls; Section 3.1.8.1.1 of ACI
Pull Push

Chapter 6 - Experimental Results and Analysis 85
530-08 requires a minimum specified masonry compressive strength of 10.3 MPa which
is significantly higher than that of the ICEBs used in this investigation.
6.2.1 ICEB Masonry Shear Resisting Mechanisms
ICEB construction differs considerably from conventional mortared CMU masonry
construction. Most significant is the dry stacked interlocking mechanism which is aimed
at providing ease of installation and construction. The secondary intent is that the
interlocking bumps will also provide resistance to in and out-of-plane lateral forces.
Depending on the quality control of the ICEB manufacturing and construction processes
the finished fit of an ICEB structure can vary, and continuous vertical grouting is
installed to help overcome the inadequacies of dry stacked construction by providing a
more “solid” or continuous core. Conventional design methods for mortared masonry
would rely on the assumption that the net cross-sectional wall area provides shear
resistance, but the mechanics of the ICEB system and results from this experimental
testing program indicate otherwise.
It is suggested that the entire wall cross section does not provide shear resistance,
but perhaps only the grouted core region with a lesser contribution from friction between
dry stacked block interfaces and “interlocking action.” It should be noted that while the
net area of partially grouted Wall 1 was 95% of fully grouted Wall 2, the shear strength
was between 51 and 65 % of Wall 2. This suggests that the shear strength contribution of
the ICEB masonry does not increase linearly with the net area.
For comparative purposes, Table 6.1 shows some alternative “effective shear
areas” for use in calculating the nominal shear strength of the ICEB shear walls tested in

Chapter 6 - Experimental Results and Analysis 86
this experiment. Pre-testing predictions of shear strength reported in Table 5.2 were
calculated using Method A, which assumes that the f’m used in Equation 2-4 is the
masonry prism compressive strength acting over the entire net cross-sectional area.
Similarly, Method B uses the measured masonry prism compressive strength, but
assumes that shear stresses are not resisted by the full width of the ICEB wall, but only a
portion. The “effective width” (50 mm) used for Method B was arbitrarily chosen to be
1/3 of the total wall thickness. Alternatively, Method C assumes that only the vertically
continuous grouting contributes to the nominal masonry shear strength. This approach
uses the measured compressive strength of the porous grout samples.
Table 6.1: Alternative ICEB Shear Areas
Table 6.2 shows the calculated nominal shear strengths for Wall 1 and Wall 2
using Equation 2-4, for each alternative shear area. The experimental results compared in
Table 6.2 indicate that the nominal shear strength of ICEB shear walls is not directly
proportional to the net cross sectional area as assumed by Method A. In addition, use of
an “effective width” by Method B does not capture the strength reduction due to partial
grouting. This indicates that continuous vertical grouting does more than provide shear
Wall 1 Wall 2
AMeasured masonry prism strength acting over net "shear" area of
ll
246027 258750
BMeasured masonry prism strength acting over net "shear" area of wall using "effective width", b =
73527 86250
CMeasured (porous) grout strength acting over net area of grout
21362 34085
An (mm2)
DescriptionMethod

Chapter 6 - Experimental Results and Analysis 87
strength in terms of providing “shear continuity.” A common way to calculate the
nominal masonry shear strength for partially grouted conventional masonry is to only
consider the contribution of the face shell thickness (Voon and Ingham 2006). The shear
cracking mechanisms observed from experimental ICEB shear wall testing (see Figure
6.3) indicate that this assumption is not appropriate for partially grouted ICEB walls.
This is due to the nature of the dry stacked interlocking system, which provides stress
transfer primarily through the core of the wall (not the face). It should also be noted that
while Method C provides the most conservative estimate of the shear strength, it
introduces another variable (porous grout compressive strength) which is highly
dependent on the grout mixture, quality control and construction techniques used.
Table 6.2: Nominal masonry shear strength calculation alternatives (P=4.5 kN)
6.2.2 Effective Shear Area Correction Factor
It is proposed that for the calculation of ICEB masonry shear contribution using
Equation 2-4, the shear area (An) should be reduced by an appropriate correction factor to
account for the different mechanisms of shear resistance inherent in the ICEB system.
Back calculation of the “effective shear area” from experimental results can be
accomplished by rearranging Equation 2-4:
Pull (+) Push (‐) min max
A 246027 3.4 85.8 0.25 0.32
B 73527 3.4 26.4 0.82 1.03
C 21362 9 13.1 1.67 2.09
A 258750 3.4 90.2 0.46 0.48
B 86250 3.4 30.8 1.36 1.39
C 34085 9 20.2 2.07 2.13
Wall MethodAn
(mm2)
f'm(MPa)
Vnm
(kN)
Vexp/VnmVexp (kN)
1 21.8 27.3
2 43.0 41.8

Chapter 6 - Experimental Results and Analysis 88
mvu
ueff
fdV
M
PVA
'75.10.4083.0
25.0exp
⎥⎥⎦
⎤
⎢⎢⎣
⎡⎟⎟⎠
⎞⎜⎜⎝
⎛−
−=
(5‐1)
where Aeff is the effective shear area, and Mu/Vudv is taken as 1.0. Use of Equation 5-1
with the experimentally determined maximum shear forces for the pull and push
directions results in effective shear areas shown in Table 6.3.
Table 6.3: Back calculated “effective shear area”
Table 6.3 suggests that modification of An by correction factors of 0.2 and 0.4 for
partially and fully grouted walls, respectively, would conservatively predict the shear
strength for the experimental specimens from this testing program. Note that this is for
calculation of nominal shear capacity, and results are still subject to further reduction by
an applicable strength reduction factor, typically 0.8 for shear. It should also be noted
that this area reduction is calculated for the specific block strengths, wall geometry, and
imposed axial load used in this experimental program. Further testing should be
completed to verify the correction factors for walls with different grout or CEB
compressive strength properties.
Pull (+) 21.8 60041 0.24
Push (‐) 27.3 76013 0.31
Pull (+) 41.8 118121.1 0.46
Push (‐) 43.0 121606 0.47
WallAeff
(mm2)
f'm(MPa)
Aeff/An
3.4
3.4
Vexp (kN)
2
1

Chapter 6 - Experimental Results and Analysis 89
6.2.3 Contribution of Transverse Reinforcement
Horizontal steel reinforcing bars are typically referred to as “shear” or “transverse”
reinforcement. Building code commonly require transverse reinforcement to be hooked
around the extreme longitudinal reinforcing bars with a 180 degree bend. Because of
rebar bend radius requirements, the transverse steel installed in the ICEB wall specimens
was not hooked 180 due to limited width in the channel blocks, but instead bent 90
degrees into the vertical reinforcing holes as described in Section 4.1.2. From the
experimental results of the monotonic Wall 3 testing, it is noted that the local failure
mode which initiated at the top of the wall was most likely due to the stresses resulting
from this reinforcement detail. Consequently, it is suggested that horizontal reinforcing
bars be hooked 180 degrees around extreme vertical rebar at the expense of not meeting
minimum bend radius requirements. Further experimental shear wall testing with varying
horizontal reinforcing steel contents is necessary to better understand the shear
contribution of reinforcing steel for ICEB shear walls.
6.3 Flexural Capacity
Under monotonic loading Wall 3 initially failed in flexure, characterized by tensile
yielding of longitudinal reinforcing bars until a sudden shear type failure was initiated at
the upper section due to improper reinforcement detailing. After repair, the failure mode
was again dominated by tensile yielding of longitudinal reinforcing steel. The force
displacement response was significantly more ductile than the previous walls, with
negligible in-cycle strength reduction until compression rebar buckling resulted in block
spalling at the toes of the wall as shown in Figure 5.18. The buckling failure of rebar is
likely due to the effects of reversed cyclic loading, which causes extensional yielding of

Chapter 6 - Experimental Results and Analysis 90
longitudinal rebar in tension. Upon load reversal, the lengthened section of rebar will be
subject to buckling. Table 5.2 shows that the classical flexural theory used to predict the
nominal flexural capacity of Wall 3 is fairly accurate and slightly conservative, consistent
with previous experimental results for flexure dominated conventional masonry shear
wall panels (Shing et al. 1990).
6.4 Wall Displacement
Modern design methodology of reinforced concrete or masonry requires the
designer to check the structural component capacity versus ultimate loading demand, and
then verify that the component can satisfy certain displacement or cracking limits under
service loading conditions. This section covers displacement calculations which are
commonly used for in-plane masonry shear wall design and compares the results of these
analyses to experimental data from ICEB shear wall specimen testing. Also,
displacement data for the ICEB shear wall specimens is reduced into component
displacements.
6.4.1 Wall Stiffness Calculation-Elastic Analysis
The stiffness of shear walls is used for both deflection checks and distribution of
lateral diaphragm forces to shear walls. Distribution of lateral forces to shear walls is
dependent on the relative stiffness of the wall panels, and un-cracked section analysis is
often used for simplicity. For computation of lateral drift or deflection, however, ACI
530-08 Section 3.1.5.3 specifically requires calculations to account for the effect of
cracking and reinforcement on stiffness. According to the MDG-5 (TMS 2007), for the
case of a solid cantilever shear wall subjected to a single point load at the tip, P, the
deflection can be calculated as:

Chapter 6 - Experimental Results and Analysis 91
⎟⎟⎠
⎞⎜⎜⎝
⎛+=Δ
AEh
IEhP
vmc
2.13
3
(5‐2)
where the two terms refer to the flexural and shear deformation components. The shear
modulus, Ev, is taken as 0.4Em. The wall stiffness can be represented as:
cc
PkΔ
= (5‐3)
The experimental results were compared to deflection predictions from an elastic
analysis procedure done for Wall 2 and Wall 3, which have an identical solid cross
section. The procedure for calculation of uncracked and cracked transformed moment of
inertias is available in most reinforced concrete design textbooks. Transformed sections
were created using the following parameters: Es=200 GPa, fy=378 MPa, Em=575 MPa,
L=1800 mm, b=150 mm. Because of the relatively low modulus of the masonry, the
uncracked section moment of inertia was calculated using an uncracked transformed
section which accounts for the effect of reinforcing steel on stiffness.
For simplicity, the cracked section moment of inertia was calculated without
recognizing the contribution of compressive reinforcement. In addition, for calculation
of cracked stiffness, the wall was assumed to be fully cracked for simplicity. Figure 6.4
shows the measured force displacement backbones and equivalent elastoplastic stiffness
for each wall test in the pull direction with the calculated uncracked and cracked stiffness
predictions. In Figure 6.4(d), comparison of the calculated cracked stiffness to the force
displacement envelope for Wall 3(b) shows that this method over predicts the stiffness of
the wall, which is most likely due to extensive stiffness degradation as a result of
previous testing.

Chapter 6 - Experimental Results and Analysis 92
(a) Wall 1 (b) Wall 2
(c) Wall 3(a) (d) Wall 3(b)
Figure 6.4: Transformed elastic stiffness predictions
6.4.2 Measured Wall Displacement Components
Measured displacement data for each wall was reduced to rocking, sliding, shear
and bending deformation components following the procedures modified from Voon
(2007), which are discussed in Section 4.4 and Appendix A. Displacement component
plots corresponding to the force displacement envelope are shown in Figure 6.5.
Although the layout of wall instrumentation was generally the same for all walls, minor
changes were made as necessary to improve the accuracy of the measurements; Table 6.4
lists the measurements used for calculation of each displacement component plot in
0
5
10
15
20
25
0 1 2 3 4 5
Actuator F
orce (kN)
Lateral Displacement (mm)
W1W1 ElastoplasticCalc. Initial StiffnessCalc. Cracked Stiffness
PULLPULL
0
10
20
30
40
50
0 2 4 6 8 10
Actuator F
orce (kN)
Lateral Displacement (mm)
W2W2 ElastoplasticCalc. Initial StiffnessCalc. Cracked Stiffness
PULL
0
10
20
30
40
50
60
0 2 4 6 8 10 12 14
Actuator F
orce (kN)
Lateral Displacement (mm)
W3(a)W3(a) ElastoplasticCalc. Initial StiffnessCalc. Cracked Stiffness
PULL
0
10
20
30
40
50
60
0 2 4 6 8 10 12 14
Actuator F
orce (kN)
Lateral Displacement (mm)
W3(b)W3(b) ElastoplasticCalc. Cracked Stiffness
PULL

Chapter 6 - Experimental Results and Analysis 93
Figure 6.5 (see Figure 4.11 for instrumentation layout). In order to salvage the data from
testing errors, the reference “tip” displacement was measured from either the upper
LVDT (Wall 2 and 3) or upper string potentiometer as necessary (Wall 1). Appendix E
presents decoupled force-displacement envelope plots.
Table 6.4: Dimensions for displacement component calculations
(a) Wall 1 (b) Wall 2
(c) Wall 3(a) (d) Wall 3(b)
Figure 6.5: Measured displacement components
Wall h (mm) du (mm) L (mm) d (mm)
1 1700 150 1650 23692 1700 150 1600 2335
3(a) 1700 150 1600 23353(b) 900 1050 1600 1836
‐7‐6‐5‐4‐3‐2‐101234567
‐7.00E+00‐6.00E+00‐5.00E+00‐4.00E+00‐3.00E+00‐2.00E+00‐1.00E+000.00E+001.00E+002.00E+003.00E+004.00E+005.00E+006.00E+007.00E+00
Displacem
ent C
ompo
nent (m
m)
Overall Displacement (mm)
SlidingRockingShearBendingRocking+Sliding+Shear+Bending
‐10
‐8
‐6
‐4
‐2
0
2
4
6
8
10
‐10 ‐8 ‐6 ‐4 ‐2 0 2 4 6 8 10
Displacem
ent C
ompo
nent (m
m)
Overall Displacement (mm)
SlidingRockingShearBendingRocking+Sliding+Shear+Bending
0
2
4
6
8
10
12
14
16
0 2 4 6 8 10 12 14 16
Displacem
ent C
ompo
nent (m
m)
Overall Displacement (mm)
RockingSlidingShearBendingSliding+Rocking+Shear+Bending
‐15
‐10
‐5
0
5
10
15
‐15 ‐10 ‐5 0 5 10 15
Displacem
ent C
ompo
nent (m
m)
Overall Displacement (mm)
RockingSlidingShearBendingRocking+Sliding+Shear+Bending

Chapter 6 - Experimental Results and Analysis 94
As shown in Figure 6.5, The displacement component calculations for Wall 2 and
Wall 3(a) provided the best approximation of total displacement. The displacement
measurements for Wall 1 were influenced by the local spalling failure which permanently
offset the upper measuring point. The best method for measuring flexural curvature is by
arranging multiple vertical transducers with shorter gage lengths at the ends of the wall,
but limited availability of transducers resulted in the simple arrangement which was
utilized. It is recognized that the large gage length of the vertical displacement
transducers used for this experiment will probably not capture the true curvature
distribution of the wall specimens, affecting the reliability of the presented displacement
component plots. This is reflected in Figure 6.5 (c) and (d) for the flexurally dominated
walls. However, the displacement component plot behavior for Wall 2 is consistent with
observed specimen behavior: As the testing progressed towards larger imposed
displacements, shear strength and stiffness degradation a resulted in increased shear
sliding between block courses and widening of existing shear cracks. Figure 6.5 (b)
shows the reduction in bending displacement contribution at larger displacements. For
Wall 2, this behavior was most likely captured because shear failure occurred quickly
before flexural curvature could increase due to non-linear bending response.
6.5 Static Non-Linear Analysis
Consistent with conventional reinforced concrete or masonry structures, the force
displacement response of ICEB shear walls was observed to be non linear with very little
linear elastic behavior. In order to check the validity of the measured prism compressive
testing data, a static non linear moment curvature analysis was performed.

Chapter 6 - Experimental Results and Analysis 95
6.5.1 Moment-Curvature Analysis
A discretized layer or “fibre” model was created in Excel to represent the cross
section of a fully grouted ICEB wall with dimensions identical to the tested specimens.
Non linear material constitutive properties were assumed for the wall materials based on
data from available testing and common values. The wall section was divided into 60
layers which were 30 mm thick by 150 mm wide. The ICEB masonry was modeled
using a modified Hognestad stress strain relationship as discussed in Section 3.3.3.
Typically, for static nonlinear analysis, masonry (or concrete) tensile capacity is
conservatively assumed to be zero. In the interest of comparison to experimental data,
the masonry tensile strength was assumed to be 0.4 MPa. This tensile strength value was
based on best fit of experimental results, and would better be determined by indirect
tensile testing. The reinforcing steel was modeled using an elastic-perfectly plastic stress
strain curve which ignored the effects of strain hardening. #3 reinforcing bars (fy=378
MPa) with area As=71.0mm2 (0.11 in2) or #4 bars (fy=565 MPa) with area As=123 mm2
(0.2 in2) were distributed at spacing identical to that from the ICEB wall specimens (75,
675, 1125 and 1725 mm from extreme compression end).
A non linear moment curvature analysis was performed by systematically assuming
a curvature (starting from zero) and solving for the moment capacity. For an assumed
extreme compressive strain, a linear strain distribution was assigned to the section and
material stresses were calculated based on the assumed material models. Once vertical
equilibrium of forces was achieved by iteration of neutral axis depth, section curvature
(κ) and the associated moment (M) were calculated and plotted as a point on the moment-
curvature plot. In the interest of comparison to experimental results, a limiting

Chapter 6 - Experimental Results and Analysis 96
compressive strain was not set for the moment-curvature relationship. Figure 6.6 shows
moment-curvature plots for two different wall sections; partially grouted with #4
longitudinal bars (Wall 1) and fully grouted with #3 longitudinal bars (Wall 2, Wall 3).
Figure 6.6: Moment‐Curvature plot for ICEB wall specimen
6.5.2 Inelastic Static Pushover
For walls with the section moment curvature relationships shown in Figure 6.6, a
distributed plasticity “static pushover” analysis was performed, as further described in
Chen and Scawthorn (2003). As shown in Figure 6.7, the wall height was divided into 18
sections, each of which were subjected to a constant axial load comprised of the self
weight or superimposed vertical axial load above. For increasing values of applied lateral
load (Fv), the moment demand at each layer was calculated as:
( )ievi HHFM −= (5‐4)
0
50000
100000
150000
200000
250000
0.000000 0.000002 0.000004 0.000006 0.000008 0.000010 0.000012 0.000014
Mom
ent, M
(kN‐m
m)
Curvature , κ (1/mm)
Wall 1
Wall 2 and Wall 3

Chapter 6 - Experimental Results and Analysis 97
Curvature at each layer was computed from the moment-curvature relationship, and a
corresponding rotation (θi) was calculated:
iii hκθ = (5‐5)
The total lateral bending deformation due to the static lateral force was calculated as:
∑=
=n
iiibn h
1θδ (5‐6)
Total shear deformations were assumed to be elastic, and were calculated as:
nv
vv AE
F2.1=δ (5‐7)
Figure 6.7: Static pushover analysis dimensions
Figure 6.8 shows the predicted static pushover curve for Wall 1 with the
experimentally observed force displacement envelope in the pull (+) direction. Similarly,
Figure 6.9 shows the pushover curve for the wall sections next to the experimentally
observed force displacement envelopes for Wall 2, Wall 3 (monotonic) and Wall 3

Chapter 6 - Experimental Results and Analysis 98
(cyclic). For both figures, the nominal flexural strength (Fn) calculated by using the
method from Section 2.2.2.1 is plotted as a horizontal line.
Initially, the predicted static pushover curve for Wall 1 is close to the
experimentally observed wall displacement, but diverges at higher levels of lateral load.
This is likely due to significant shear stiffness degradation as a result of the partial
grouting. The results of the non linear analysis plotted in Figure 6.9 are very close to the
experimentally observed wall panel lateral force displacement response for Wall 2 and
Wall 3. This validates the use of the use of the stacked masonry prism compressive
stress-strain data for the fully grouted wall. It is recognized that this simple model does
not include more complex material behavior such as non-linear shear deformations or
failure, masonry spalling, steel strain hardening or compressive buckling. However, the
intent of this analysis was to match theoretical predictions to experimental behavior; it
should be noted that this model can be applied to reasonably predict specimen behavior
up to the limits of flexural tensile yielding for future ICEB shear wall specimens.

Chapter 6 - Experimental Results and Analysis 99
Figure 6.8: Non linear static pushover (Wall 1)
Figure 6.9: Non linear static pushover (Wall 2, Wall 3)
0
20
40
60
80
100
120
0 5 10 15 20 25
Actuator Force (kN)
Lateral Displacement (mm)
W1W1 Nominal Flexural StrengthStatic Pushover
PULL
0
10
20
30
40
50
60
0 5 10 15 20 25 30
Actuator Force (kN)
Lateral Displacement (mm)
W2W3 (monotonic)W3 (cyclic)Static PushoverNominal Flexural Strength
PULL
100
Chapter 7. Conclusions and Recommendations
This project was intended to provide valuable insight into the structural
performance of ICEB shear wall systems subjected to cyclic in-plane loading, and also
provide a basis for future research of this technology. It was shown that reinforced ICEB
shear walls behave similarly to conventional reinforced CMU shear walls, and that some
of the theory that is used for design conventional reinforced masonry or concrete can be
applied to ICEB structures. However, experimental results also indicated some
significant differences between the expected and actual shear capacity. Further research
and testing can provide a strong foundation for the use of modern performance based
engineering methods for the design of ICEB structures.
7.1 Conclusions
7.1.1 ICEB Materials and Testing Conclusions:
• Grout samples were subjected to compressive testing to determine the effect of
the rapid rate at which water is absorbed from the grout by the soil blocks, and
compressive strength of grout cast into the wall material was measured to be

Chapter 7. - Conclusions and Recommendations 101
approximately 80% higher than grout cast into non porous cylinder molds. This
behavior should be noted when taking grout quality control samples
• The common failure mode for single ICEBs loaded in compression was a conical
break where the sides fell off, which is consistent with previous material testing of
ICEBs.
• Fully and partially grouted stacked masonry prisms were tested in compression to
determine the masonry compressive strength. Measured behavior indicates a very
ductile stress strain response, with very little linear elastic behavior.
• The compressive strength ratio of prism to individual block was measured to be
0.44 and 0.55 for partially and fully grouted ICEB prisms, respectively. This
strength reduction due mainly to aspect ratio is consistent with previous research.
• From experimental testing of grouted ICEB prisms, the average modulus of
elasticity was measured to be 575 MPa, which is significantly lower than the
modulus predicted by common methods based on masonry compressive strength.
It is likely that the dry-stacked mechanism influences this behavior.
7.1.2 ICEB Shear Wall Testing Conclusions
7.1.2.1 Shear Performance
• The hysteretic behavior of shear dominated ICEB wall panels is similar to that of
shear dominated CMU wall panels, characterized by in-cycle strength and
stiffness degradation in addition to brittle post peak strength loss
• Observed wall shear damage patterns indicate that much of the shear cracking
occurs in the grouted core of the wall, and that sliding between block courses and

Chapter 7. - Conclusions and Recommendations 102
widening of head joints contributes significantly to overall displacements, but is
not visible once the wall has been returned to “zero” displacement position.
• The ACI 530-08 method for predicting in-plane masonry shear strength
significantly overestimates the capacity of ICEB shear walls. It is suggested that
the shear resistance of ICEB masonry does not increase linearly with the net area,
and that calculations which include a correction factor for the “effective shear
area” can provide conservative estimates.
• The shear strength of fully grouted ICEB walls is significantly higher than that of
partially grouted walls. This also suggests that ICEB shear strength is not directly
proportional to net area, and is attributed to more continuous distribution of
grouting, and better “shear continuity”.
• Calculations of ICEB masonry shear strength which ignore the compressed earth
material and only consider the contribution of the continuous vertical grouting
provide a very conservative prediction of capacity.
• The contribution of transverse reinforcing steel to shear strength was not properly
determined from testing. The local shear type failure which occurred at the top of
Wall 3 under monotonic loading was determined to be due to the reinforcement
detail at the upper bond beam.
7.1.2.2 Flexural Performance
• Flexural failure of the ICEB shear wall specimen was characterized by tensile
yielding of the longitudinal reinforcing steel. The observed hysteretic behavior
was characteristic of a ductile tensile yielding failure with stiffness degradation,
but no strength loss until compressive rebar buckling.

Chapter 7. - Conclusions and Recommendations 103
• Simple flexural theory, based on the assumptions that plane sections remain plane
and an equivalent rectangular masonry stress block, provides a fairly close
prediction of the flexural capacity of ICEB shear walls based on tensile yielding
of longitudinal reinforcement.
7.1.2.3 Wall Stiffness and Displacement
• The displacement characteristics of ICEB shear walls under cyclic lateral in-plane
loading are consistent with the mechanisms which resist lateral forces. The
combination of the interlocking mechanism and lack of mortar leads to large
sliding deformations once shear cracking or stiffness degradation occurs.
• Calculation of the stiffness of an ICEB shear wall panel using un-cracked
transformed section properties underpredicts the stiffness. This could indicate
that the measured masonry elastic modulus (Em) is not accurate.
• Displacements were decoupled into shear, bending and rocking components. For
flexure dominated walls, the method used underpredicts the bending displacement
because the assumed distribution of curvature along the height of the wall is not
accurate. For accurate evaluation of section curvature, additional instruments are
necessary. However, for shear dominated panels the analysis method properly
represents the observed behavior.
7.1.2.4 Static Non-Linear Analysis
• Results from a static analysis using non linear material properties for the ICEB
masonry and steel reinforcing are reasonably close to the experimentally observed
force displacement response of ICEB shear wall specimens. The masonry tensile
stress strain behavior was assumed based on best fit of force displacement data.

Chapter 7. - Conclusions and Recommendations 104
This suggests that use of measured masonry prism compressive stress-strain
response for bending analysis is validated.
7.1.3 ICEB Wall Construction
• The dry stacked interlocking mechanism of the ICEB system provides for
simplified construction, but finished block dimensions vary as a result of the
manufacturing process. This dimensional variance will negatively affect the
constructability of the system and may result in uneven and inefficient load
distribution along the wall. Full grouting of all cavities will improve the load
carrying capabilities and reduce occurrence of cracking under service loads.
• Grout must be very fluid, but must not contain excessive water content which will
result in bleeding of cement or other fines. For this experiment, lime was added
to the grout mixture to reduce excessive bleeding without significantly increasing
the strength of the grout. Other materials such as fly or rice husk ash may serve
the same purpose.
• Although the dimensions of the ICEB channel blocks require tighter bending
dimensions than allowed by many building codes, transverse reinforcement
should be hook 180 degrees around the extreme longitudinal reinforcement. This
construction detail should allow for better shear resistance by the horizontal
reinforcement.
• Reinforced concrete bond beams installed at the top of walls will provide more
space for proper reinforcement detail and installation, but will require use of
external formwork.

Chapter 7. - Conclusions and Recommendations 105
7.2 Recommendations for Future Work
• Further material testing should be done to better determine ICEB masonry
compressive stress-strain behavior at higher aspect ratios with varying grout
strengths for partially and fully grouted walls. The differences between
compressed earth and grout material properties probably contribute to the
observed failure modes.
• Testing aimed at better quantification of ICEB shear resisting mechanisms needs
to be pursued. This thesis suggests that the in-plane shear capacity of ICEB shear
walls is proportional to an “effective shear area”, but further testing is necessary
to better understand the individual contributions of grout shear strength,
interlocking action, and sliding friction.
• The contribution of transverse reinforcing to in-plane shear strength needs to be
evaluated by further testing of ICEB shear walls with varying horizontal
reinforcing steel ratios. Experimental testing with a goal to observe “ductile”
shear failure would provide valuable insight into the performance of shear
dominated ICEB shear walls.
• Performance based seismic design of reinforced masonry shear walls depends on
shear capacity design to guarantee a ductile flexural failure. The ductility
capacity of flexurally dominated ICEB shear walls should be evaluated by further
testing. Research should be also be done to identify a better experimental loading
protocol for use with ductile specimens.
• The displacements from the transducer built into the actuator were up to 25%
higher than the displacements measured by an LVDT at the same elevation. This

Chapter 7. - Conclusions and Recommendations 106
error is attributed to play within the actuator and its mounting system. Before
further testing, a new upper LVDT mounting point for the loading beam should be
fabricated which can be left in place even while all other instruments are removed
from the wall.

107
References
Anand, K.B., and Ramamurthy, K. (2005). “Development and Evaluation of Hollow Concrete Interlocking Block Masonry System.” The Masonry Society Journal, 23(1), 11-19.
Bales, C., Donahue, C.; Fisher, M, Mellbom, A., and Pearson, T. (2009). “Interlocking
Compressed Earth Blocks: From Soil to Structure.” Senior Project, Cal Poly San Luis Obispo, California.
Bei, G., and Papayianni, I., (2003). “Compressive Strength of Compressed Earth Block
Masonry.” Structural Studies, Repairs and Maintenance of Heritage Architecture VIII, 15, 367-375.
Chen, W., and Scawthron, C. (2003). Earthquake Engineering Handbook. Boca Raton,
FL: CRC Press. Heathcote, K. (1991). “Compressive Strength of Cement Stabilized Pressed Earth
Blocks.” Building Research and Information, 19(2), 101-105. Jaafar, M.S., Thanoon, W.A., Najm, A.M.S., Abdulkadir, M.R., Ali, A.A.A. (2006).
“Strength Correlation Between Individual Block, Prism and Basic Wall Panel for Load Bearing Interlocking Mortarless Hollow Block Masonry.” Construction and Building Materials, 20, 492-498.
MacGregor, J.G., and Wight, J.K. (2005). Reinforced Concrete: Mechanics and Design.
4th ed. Upper Saddle River, NJ: Prentice Hall. Maini, S. (2010a). “Earthen Architecture in the World,” Auroville Earth Institute
Retrieved from http://www.earth-auroville.com/?nav=menu&pg=earthworld&id1=26&lang_code=en Date accessed: 8/25/2010.

References 108
Maini, S. (2010b). “Earthen Architecture in the World,” Auroville Earth Institute Retrieved from http://www.earth-auroville.com/?nav=menu&pg=technologies&id1=33&lang_code=en Date accessed: 8/25/2010.
The Masonry Society (TMS) (2007). Masonry Designers’ Guide. 4th ed. Boulder, CO. Masonry Standards Joint Committee (MSJC) (2008). “Building Code Requirements for
Masonry Structures,” TMS 402-08/ACI 530-08/ASCE5-08, USA Pave, R.O., (2007). “Strength Evaluation of Dry-Stack Masonry.” M.S. Thesis.
University of the Witwatersrand, Johannesburg, South Africa. Retrieved from http://wiredspace.wits.ac.za/handle/10539/5691 Date accessed: 1/25/2011.
Perera, A., and Jayasinghe, C. (2003). “Strength Characteristics and Structural Design
Methods for Compressed Earth Block Walls.” Masonry International, 16(1), 34-38.
Proto, C., Sanchez, D., Rowley, K., Thompson, R. (2010). “ICEB: Design and
Construction Manual.” Senior Project, Cal Poly San Luis Obispo, California. Shedid, M.T., El-Dakhakhni, W.W., Drysdale, R.G. (2009). “Behavior of fully grouted
reinforced concrete masonry shear walls failing in flexure: Analysis.” Engineering Structures, 31, 2032-2044.
Shildkamp, M. (2009). Suitability of Local Soil for Cost Saving Construction Techniques
V.2. Smart Shelter Foundation. Retrieved from http://cvbt-web.org/uploads/Pubs/Suitability%20of%20Local%20Soil%20for%20Cost%20Saving%20Construction%20Techniques.pdf Date accessed: 10/20/2010.
Shing, P.B., Schuller, M., Hoskere, V.S. (1990). “In-Plane Resistance of Reinforced
Masonry Shear Walls.” Journal of Structural Engineering, 116(3), 619-640. Sucuoglu, H., McNiven, H.D. (1991). “Seismic Shear Capacity of Reinforced Masonry
Piers.” Journal of Structural Engineering, 117(7), 2166-2186. Voon, K.C. (2007). “In-plane Seismic Design of Concrete Masonry Structures.” Ph.D.
Thesis. University of Auckland: NZ. Retrieved from http://hdl.handle.net/2292/580
Voon, K.C., and Ingham, J.M. (2006). “Experimental In-Plane Shear Strength
Investigation of Reinforced Concrete Masonry Walls.” Journal of Structural Engineering (ASCE), 123(3), 400-408.
Walker, P. (1999). “Bond Characteristics of Earth Block Masonry.” Journal of Materials
in Civil Engineering, 11(3), 249-256.

References 109
Wheeler, G. (2005). Interlocking Compressed Earth Blocks Volume II. Manual of Construction. Center for Vocational Building Technology, Thailand.

110
Appendix A. Shear and Flexural Displacement Components
The panel deformation components were separated using a simplified method originally
developed by Voon (2007) after Brammer (1995) and Hirashi (1984). Data was collected
during testing with the typical setup as shown in Figure A.1. This appendix describes the
calculation of shear and flexural displacement components, following the procedure
presented in Voon (2007).
Figure A.1: Wall panel section
Figure A.2 shows the considered deformation of a panel section. It is assumed that the
two upper points, A and B, may transmit horizontally by ul and ur, and vertically by the
amounts vl and vr. The lower points, C and D, are assumed to remain fixed in position
because of the support condition at the foundation. The subscripts ‘l’ and ‘r’ refer to left
and right sides. Extensional deformation components in the vertical and horizontal
direction due to axial load are considered to be negligible for this situation. The sign

Appendix A – Shear and Flexural Displacement Components 111
convention is assumed positive for displacements to the right and upward. From Figure
A.1, δd1 and δd2 are the elongations of the diagonal transducers, while δv1 and δv2 are the
elongations of the vertical transducers. The wall dimensions are defined by length, L,
height, h, and diagonal length, d. The dimension from the top of the wall panel section to
the top of the wall is given as du.
:
Figure A.2: Nodal displacement of a panel section
As shown in Figure A.3, the wall panel section deformation is assumed to consist of two
components: shear and flexure. These deformations are represented by the coordinates
ul, ur, vl and vr, where u and v represent the horizontal and diagonal deformation
components, respectively. The subscripts “s” and “b” represent shear and flexural
deformation components, respectively.

Appendix A – Shear and Flexural Displacement Components 112
Figure A.3: Components of panel deformation
The primary purpose of the following derivation is to calculate the horizontal
displacement at the top of the wall due to shear deformation, Us, by relating the
measured elongation (δ’s) to individual displacement components: u’s and v’s. The
following assumptions are used:
1. The left and right horizontal shear deformation components are equal.
2. The left and right horizontal flexural deformation components are equal.

Appendix A – Shear and Flexural Displacement Components 113
3. The vertical shear deformation components are zero.
The above assumptions are represented as follows:
a) uls = urs =us
b) ulb = urb =ub (A-1)
The relationships between these displacements and those shown in Figure A.3 are as
follows:
a) ul = us + ub
b) ur = us + ub
c) vl = vlb
d) vr = vrb (A-3)
The measured relative deformations can be expressed in terms of global deformations by
the following geometric relationships:
a) )()(1 lld vdhu
dL
+−=δ
b) )()(2 rrd vdhu
dL
+=δ
c) lv v=1δ
d) rvr v=δ (A-3)
Substituting Equation A-2 into A-3:
a) )()(1 lbbsd vdhuu
dL
+−−=δ
b) )()(2 rbbsd vdhuu
dL
++=δ

Appendix A – Shear and Flexural Displacement Components 114
c) lbv v=1δ
d) rbvr v=δ (A-4)
Inserting Equations A-4(c ) and (d) into Equations A-4(a) and (b), and then subtracting
A-4(a) from (b) gives:
)()22( 1212 vvbsdd dhuu
dL δδδδ −++=−
(A-5)
Rearranging Equation A-5:
bvvdds uLh
Ldu −−+−= )(
2)(
2 2112 δδδδ (A-6)
Equation A-6 can be solved by defining an equation relating the flexural deformation
component to the measured relative displacement:
αθhub = (A-7)
where:
Lvv 21 δδθ −
=
Equation A-7 states that the flexural deformation is equal to the rotation at the top of the
panel section multiplied by the panel section height and by α. When taking α as 2/3, the
equation represents the exact flexural displacement of an elastic prismatic cantilever with

Appendix A – Shear and Flexural Displacement Components 115
a concentrated horizontal force applied at the top, with θ representing the rotation at the
top of the wall. For reinforced concrete masonry and concrete walls, α is generally
higher than 2/3 since the wall flexural cracking tends to concentrate rotation towards the
bottom of the wall, therefore resulting in higher hα and higher ub.
The flexural deflection ub for a section of wall was calculated rotation that occurs within
the section. This rotation is calculated from the bending moment diagram. The bending
moment at the top (Mup) and the bottom (Mlw) of a panel section is known to vary linearly
according to the vertical location as shown in Figure A-1(b).
The moment (M)-curvature (φ) relationship for an elastic section is given by:
M=φEI (A-8)
where E and I are the modulus of elasticity and moment of inertia. As the curvature is a
linear function of the moment, the total rotation of the panel section between du and du+h
can be calculated from the average bending moment:
EIMMh lwup
2)( +
=θ (A-9)
The panel flexural deformation, ub, is evaluated by integration of curvature along the
height of the panel section with the following result:

Appendix A – Shear and Flexural Displacement Components 116
⎟⎟⎟⎟
⎠
⎞
⎜⎜⎜⎜
⎝
⎛
+
+=⎟⎟
⎠
⎞⎜⎜⎝
⎛+=
hd
hdh
MMEIhu
u
uuplw
b 23
2
63
2
θ (A-10)
where ⎟⎟⎟⎟
⎠
⎞
⎜⎜⎜⎜
⎝
⎛
+
+=
hd
hd
u
u
23
2
α
The α in Equation A-10 is defined with respect to the top of the investigated panel
section.
ub can be evaluated by incorporating Equation A-7:
⎟⎟⎟⎟
⎠
⎞
⎜⎜⎜⎜
⎝
⎛
+
+−=
hd
hd
Lh
uu
uvv
b 23
2)( 21 δδ
(A-11)
Subsequently, the shear deformation for the panel section can be evaluated by
substituting Equation A-11 into Equation A-6:
⎟⎟⎟⎟
⎠
⎞
⎜⎜⎜⎜
⎝
⎛
+
+−−−+−=
hd
hd
Lh
Lh
Ldu
u
uvv
vvdds 23
2)(
)(2
)(2
212112
δδδδδδ
(A-12)
Rearranging Equation A-12 gives:

Appendix A – Shear and Flexural Displacement Components 117
Lhdh
Ldu vv
udds
)()2(6
)(2
212
12δδ
δδ−
+−−=
(A-13)
In addition, the total flexural displacement can be evaluated as follows. The deformation
at the top of the wall, u’b, due to flexural deformation of the investigated panel section is
evaluated as:
⎟⎟⎟⎟
⎠
⎞
⎜⎜⎜⎜
⎝
⎛
++
+−=+= u
u
uvv
ub dhd
hdh
Ldhu
23
2)(
)(' 21 δδαθ
(A-14)
118
Appendix B. Correction of Lateral Displacement Data
This section includes a description of the process used to modify the force displacement
hysteresis data to account for the discrepancy between the displacements measured by the
Actuator displacement transducer and the upper LVDT measuring device, which should
read the same measurement. Because the LVDT instrument was most recently calibrated,
it is assumed to offer superior measurement accuracy and precision. However, the
transducers were removed mid-testing to avoid any damage, and only partial data was
recorded by the LVDTs. Consequently, the measured actuator displacement data is
modified to correspond with the last measured LVDT data for each test.
From examination of the data, it was determined that the error in measurement was
different for pull (+) and push (-) displacements. Figure B.1 shows a plot of the
difference in actuator and LVDT displacement (dACT – dLVDT) versus the total measured
actuator displacement, dACT, for all wall testing results. The plot suggests that there are
upper and lower limits to the measurement differences, which is indicative of slop or play
within the actuator and/or its mounting points. From Figure B.1, the upper limits to the
“slop” are approximately 2.5 mm and 0.9 mm in the pull (+) and push (-) directions,
respectively. All lateral displacement data at the actuator level was modified to more
closely represent the actual response of the walls. Figure B.2 through Figure B.5 are
plots which show the original and modified force-displacement data. Generally, the
initial LVDT displacement data is unmodified but data at further displacements is
modified according to the following method:

119
1. Initial displacement data recorded from the LVDTs is used until the point
at which the instruments were removed from the wall. This occurred at
different drift levels for separate walls.
2. Actuator displacement data from after removal of the instruments was
modified by a scalar (0.8 and 0.9 for pull (+) and push (-), respectively) to
smoothly match the transition from pull to push “slop”. The modified
displacements were limited to be within 2.5 and 0.9 mm of the measured
actuator displacement for pull and push directions, respectively. The
modified data can be identified in Figure B.1 through Figure B.5 as that
fitting under the dashed “modified envelope” portion of the curves.
Figure B.1: Actuator to LVDT displacement “gap” vs actuator displacement
‐1.0
‐0.5
0.0
0.5
1.0
1.5
2.0
2.5
3.0
‐20 ‐15 ‐10 ‐5 0 5 10 15 20
d ACT
‐d L
VDT (m
m)
Actuator Lateral Displacement, dACT (mm)
W1W2W3 monotonicW3 cyclic

120
Figure B.2: Corrected Wall 1 force‐displacement response
Figure B.3: Corrected Wall 2 force‐displacement response
‐30
‐20
‐10
0
10
20
30
‐14 ‐12 ‐10 ‐8 ‐6 ‐4 ‐2 0 2 4 6 8 10 12 14
Lateral Force (kN)
Lateral Displacement (mm)
ACT HysteresisACT EnvelopeLVDT HysteresisLVDT EnvelopeModified Envelope
‐50
‐40
‐30
‐20
‐10
0
10
20
30
40
50
‐20 ‐15 ‐10 ‐5 0 5 10 15 20
Lateral Force (kN)
Lateral Displacement (mm)
ACT HysteresisACT EnvelopeLVDT HysteresisLVDT EnvelopeModified Envelope

121
Figure B.4: Corrected Wall 3(a) force‐displacement response
Figure B.5: Corrected Wall 3(b) force‐displacement response
‐60
‐50
‐40
‐30
‐20
‐10
0
10
20
30
40
50
60
‐30 ‐25 ‐20 ‐15 ‐10 ‐5 0 5 10 15 20 25 30
Lateral Force (kN)
Lateral Displacement (mm)
ACT HysteresisACT EnvelopeLVDT HysteresisLVDT Envelope
‐60
‐50
‐40
‐30
‐20
‐10
0
10
20
30
40
50
60
‐50 ‐40 ‐30 ‐20 ‐10 0 10 20 30 40 50
Lateral Force (kN)
Lateral Displacement (mm)
ACT HysteresisACT EnvelopeLVDT HysteresisLVDT EnvelopeModified Envelope

122
Appendix C. Material Testing Data
This appendix presents the measured compressive strength data from experimental
testing. Table C.1presents the data from testing of partially and fully grouted prisms,
where samples were subjected to load or displacement controlled compression. Prisms
were tested at a load controlled rate of (2.0 MPa/min), or displacement controlled rate of
(0.45 mm/min). Loading type is denoted as σ or ε for load or displacement control,
respectively. To provide a better representation of the material properties, tested material
strengths are reported from additional walls which are part of a later project. Table C.2
includes compressive strengths of porous and non-porous grout samples, and Table
C.3includes measured compressive strengths of individual ICEBs.
Table C.1: ICEB prism compressive strength
Wall Grouting LoadingArea
(mm2)Mean St Dev COV
1 Partial σ 41819 2.881 Partial σ 41819 3.752 Partial ε 41819 2.126 Partial ε 41819 2.144 Partial ε 41819 2.05
6 Partial ε 41819 1.91
1 Full σ 45000 4.571 Full σ 45000 3.672 Full σ 45000 4.312 Full σ 45000 4.093 Full ε 45000 2.883 Full ε 45000 3.194 Full ε 45000 2.775 Full ε 45000 3.166 Full ε 45000 2.37
Compressive Strength (MPa)
0.62
0.10
19%
5%
9%
7%3.00
4.16 0.38
0.21
3.31
2.06

123
Table C.2: Grout compressive strength
Table C.3: ICEB compressive strength
Wall SamplePorous or Non‐Porous
Area
(mm2)Mean Std. Dev COV
1 cube NP 2581 4.611 cube NP 2581 4.391 cube NP 2581 5.561 cube NP 2581 4.672 cylinder NP 2027 5.162 cylinder NP 2027 5.332 cylinder NP 2027 4.892 cylinder NP 2027 4.901 cylinder P 1590 6.851 cylinder P 1590 9.382 cylinder P 1590 7.142 cylinder P 1590 11.582 cylinder P 1590 10.682 cylinder P 1590 9.39
4.94 0.39 0.080
9.17 1.88 0.205
Compressive Strength (MPa)
WallArea
(mm2)Average Std. Dev COV
1 39319 7.641 39319 7.422 39319 6.962 39319 7.80‐ 39319 7.39‐ 39319 7.36‐ 39319 9.03‐ 39319 6.93
0.088
Compressive Strength (MPa)
7.57 0.66

124
Table C.4 and Figure C.1 shows the results of rebar tensile testing. Only yield and
ultimate strength values were recorded for sample 3A.
Table C.4: Rebar tensile test data
Figure C.1: Steel rebar tensile test data
fy(MPa)
fu(MPa)
3A #3 Gr. 40 10 407.4 574.33B #3 Gr. 40 10 348.9 507.74A #4 Gr. 60 13 479.6 1051.64B #4 Gr. 60 13 651.3 1315.1
Measured Tensile StrengthSample Specification
Diameter(mm)
0
100
200
300
400
500
600
700
800
0 20 40 60 80
Stress (M
Pa)
Displacement (mm)
3B4A4B

125
Appendix D. Instrumentation Layout
Wall 1 was instrumented as shown in Figure D.1. During testing, the upper block which
was connected to DTR0 and 2” LVDT-A spalled off, which effected the measured
displacements. LVDT7 did not measure data during the test.
Figure D.1: Instrumentation layout [Wall 1]

126
Wall 2 and Wall 3(a) were instrumented as shown in Figure D.2. The 2” LVDT-A was
moved to measure off of the loading beam, and rocking was measured with 0.5” LVDTs.
Figure D.2: Instrumentation layout[Wall 2 and Wall 3(a)]

127
After repair, Wall 3(b) was instrumented as shown in Figure D.3.
Figure D.3: Instrumentation layout [Wall 3(b)]

128
Appendix E. Wall Displacement Components
This section provides force-displacement plots with decoupled shear and bending
components. The procedure used to decouple the components is presented in Appendix
A. Figure E.1 through Figure E.4 show the force-displacement plots for W1, W2, W3(a),
and W3(b).
Figure E.1: Decoupled force‐displacement envelope [Wall 1]
‐30
‐20
‐10
0
10
20
30
‐8 ‐6 ‐4 ‐2 0 2 4 6 8
Actuator Force (kN)
Lateral Displacement (mm)
W1 Shear Displacement
W1 Bending DisplacementPUSH
PULL

129
Figure E.2: Decoupled force‐displacement envelope [Wall 2]
‐50
‐40
‐30
‐20
‐10
0
10
20
30
40
50
‐10 ‐8 ‐6 ‐4 ‐2 0 2 4 6 8 10
Actuator Force (kN)
Lateral Displacement (mm)
W2 Shear Displacement
W2 Bending DisplacementPUSH
PULL

130
Figure E.3: Decoupled force‐displacement envelope [Wall 3(a)]
0
10
20
30
40
50
60
0 2 4 6 8 10
Actua
tor Force (kN)
Lateral Displacement (mm)
W3(a) Shear Displacement
W3(a) Bending Displacement
PULL

131
Figure E.4: Decoupled force‐displacement envelope [Wall 3(b)]
‐60
‐40
‐20
0
20
40
60
‐10 ‐8 ‐6 ‐4 ‐2 0 2 4 6 8 10
Actua
tor Force (kN)
Lateral Displacement (mm)
W3(b) Shear Displacement
W3(b) Bending Displacement
PULL

132
Appendix F. Wall 2
This appendix reports the specific failure mode for Wall 2, which experienced sudden
diagonal shear cracks initiated on the ±8mm (actuator displacement) cycles. Figure F.1
indicates the individual failure points for the force-displacement history for Wall 2.
Figure F.2 and Figure F.3 show the initial shear crack formation for the pull and push
directions.
Figure F.1: Wall 2 force‐displacement history
‐50
‐40
‐30
‐20
‐10
0
10
20
30
40
50
‐16 ‐14 ‐12 ‐10 ‐8 ‐6 ‐4 ‐2 0 2 4 6 8 10 12 14 16
Lateral Force (kN)
Loading beam lateral displacement (mm)
W2First Pull Crack (5.25 mm, 43 kN)First Push Crack (‐5.5 mm, ‐39.5 kN)
PULL
PUSH

133
Figure F.2: Initial shear crack [W2‐1st 8mm PULL cycle @ +43.0 kN, +5.25 mm]
Push (-) Pull (+)

134
Figure F.3: Initial shear crack [W2‐1st 8mm PUSH cycle @ ‐39.5 kN, ‐5.5 mm]
Push (-) Pull (+)
Top Related
Copyright © 2022 FDOKUMEN

