


Bahasa
Halaman
Hukum

Improving The Reliability Of Ship MachineryA Step Towards UnmannedShipping
E. M. Brocken

Improving TheReliability Of Ship
MachineryA Step Towards Unmanned Shipping
by
E. M. Brockento obtain the degree of Master of Scienceat the Delft University of Technology,
to be defended publicly on Wednesday November 16, 2016 at 09:30 AM.
Student number: 4104811Project duration: January 18, 2016 – November 16, 2016Thesis committee: Prof. ir. J.J. Hopman TU Delft
Ir. R.G. Hekkenberg TU Delft, supervisorDr. R.R. Negenborn TU DelftDr. ir. P.R. Wellens TU Delft
SDPO.16.031.m
An electronic version of this thesis is available at http://repository.tudelft.nl/.

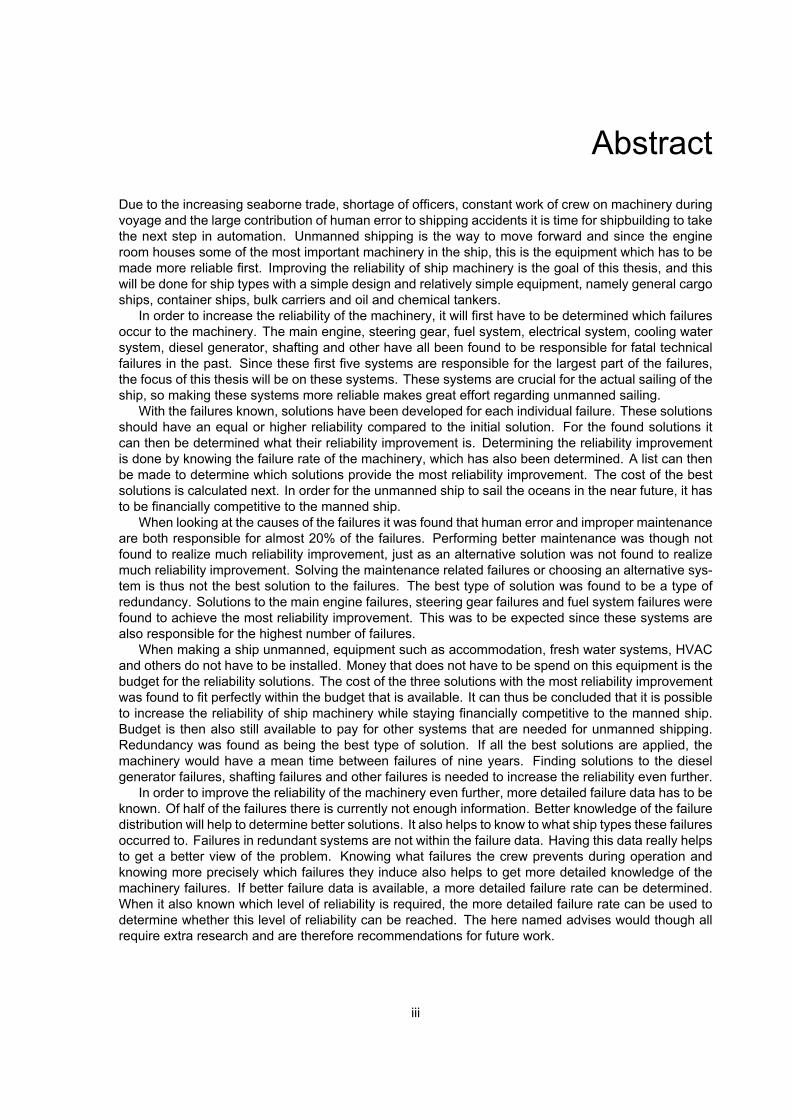
AbstractDue to the increasing seaborne trade, shortage of officers, constant work of crew on machinery duringvoyage and the large contribution of human error to shipping accidents it is time for shipbuilding to takethe next step in automation. Unmanned shipping is the way to move forward and since the engineroom houses some of the most important machinery in the ship, this is the equipment which has to bemade more reliable first. Improving the reliability of ship machinery is the goal of this thesis, and thiswill be done for ship types with a simple design and relatively simple equipment, namely general cargoships, container ships, bulk carriers and oil and chemical tankers.
In order to increase the reliability of the machinery, it will first have to be determined which failuresoccur to the machinery. The main engine, steering gear, fuel system, electrical system, cooling watersystem, diesel generator, shafting and other have all been found to be responsible for fatal technicalfailures in the past. Since these first five systems are responsible for the largest part of the failures,the focus of this thesis will be on these systems. These systems are crucial for the actual sailing of theship, so making these systems more reliable makes great effort regarding unmanned sailing.
With the failures known, solutions have been developed for each individual failure. These solutionsshould have an equal or higher reliability compared to the initial solution. For the found solutions itcan then be determined what their reliability improvement is. Determining the reliability improvementis done by knowing the failure rate of the machinery, which has also been determined. A list can thenbe made to determine which solutions provide the most reliability improvement. The cost of the bestsolutions is calculated next. In order for the unmanned ship to sail the oceans in the near future, it hasto be financially competitive to the manned ship.
When looking at the causes of the failures it was found that human error and improper maintenanceare both responsible for almost 20% of the failures. Performing better maintenance was though notfound to realize much reliability improvement, just as an alternative solution was not found to realizemuch reliability improvement. Solving the maintenance related failures or choosing an alternative sys-tem is thus not the best solution to the failures. The best type of solution was found to be a type ofredundancy. Solutions to the main engine failures, steering gear failures and fuel system failures werefound to achieve the most reliability improvement. This was to be expected since these systems arealso responsible for the highest number of failures.
When making a ship unmanned, equipment such as accommodation, fresh water systems, HVACand others do not have to be installed. Money that does not have to be spend on this equipment is thebudget for the reliability solutions. The cost of the three solutions with the most reliability improvementwas found to fit perfectly within the budget that is available. It can thus be concluded that it is possibleto increase the reliability of ship machinery while staying financially competitive to the manned ship.Budget is then also still available to pay for other systems that are needed for unmanned shipping.Redundancy was found as being the best type of solution. If all the best solutions are applied, themachinery would have a mean time between failures of nine years. Finding solutions to the dieselgenerator failures, shafting failures and other failures is needed to increase the reliability even further.
In order to improve the reliability of the machinery even further, more detailed failure data has to beknown. Of half of the failures there is currently not enough information. Better knowledge of the failuredistribution will help to determine better solutions. It also helps to know to what ship types these failuresoccurred to. Failures in redundant systems are not within the failure data. Having this data really helpsto get a better view of the problem. Knowing what failures the crew prevents during operation andknowing more precisely which failures they induce also helps to get more detailed knowledge of themachinery failures. If better failure data is available, a more detailed failure rate can be determined.When it also known which level of reliability is required, the more detailed failure rate can be used todetermine whether this level of reliability can be reached. The here named advises would though allrequire extra research and are therefore recommendations for future work.
iii

AcknowledgementsThis project has been carried out for the Ship Design Production and Operation faculty of the DelftUniversity of Technology in order to obtain the MSc degree in Maritime Technology. Within this thesisit has been investigated how the reliability of ship machinery can be increased, which is a step towardsunmanned shipping. Without the help of others, I could not have finished this project. I therefore wouldlike to thank these persons.
First, I would like to thank Robert Hekkenberg for being my daily supervisor. Due to his efforts Iwas able to learn a lot during the process of graduating. His critical feedback helped me to constantlyimprove my master thesis.
Thanks also go to Job Pannekoek Loois, Ronald G.M. Nels and Gaby Steentjes of Flinter for an-swering questions about for instance crew and maintenance. These answers provided a small insightin the operations of a manned ship.
I also want to thank my parents for their support throughout my study. Special thanks go to my sisterfor taking the time to check my English writing while studying for her own exams. I would also like tothank my girlfriend for all her support throughout my graduation and her critical view on the design ofmy figures and total thesis.
Finally I want to thank my roommates Menno, Stan, Thijs and Patrick. Their (usually bad) jokesand good atmosphere at home really helped me to take my mind of my thesis during the evenings andweekends.
E. M. BrockenDelft, October 2016
v

Contents
Abstract iii
Acknowledgments v
List Of Figures xi
List Of Tables xiii
List Of Symbols xv
1 Introduction 11.1 Thesis Outline . . . . . . . . . . . . . . . . . . . . . . . . . . . . . . . . . . . . . . . . . 2
1.1.1 Ship Types Within Scope . . . . . . . . . . . . . . . . . . . . . . . . . . . . . . . 21.1.2 Unmanned Ship Concepts . . . . . . . . . . . . . . . . . . . . . . . . . . . . . . . 31.1.3 Research Questions . . . . . . . . . . . . . . . . . . . . . . . . . . . . . . . . . . 4
1.2 Previous Work . . . . . . . . . . . . . . . . . . . . . . . . . . . . . . . . . . . . . . . . . 51.2.1 On Unmanned Vessels. . . . . . . . . . . . . . . . . . . . . . . . . . . . . . . . . 51.2.2 On Ship Machinery . . . . . . . . . . . . . . . . . . . . . . . . . . . . . . . . . . . 51.2.3 On Machinery Failure . . . . . . . . . . . . . . . . . . . . . . . . . . . . . . . . . 6
2 Machinery Problems 92.1 Fault Tree Analysis . . . . . . . . . . . . . . . . . . . . . . . . . . . . . . . . . . . . . . . 9
2.1.1 Fault Tree Symbols. . . . . . . . . . . . . . . . . . . . . . . . . . . . . . . . . . . 92.1.2 Rules For Setting Up The Fault Tree . . . . . . . . . . . . . . . . . . . . . . . . . 112.1.3 Calculations Within A Fault Tree. . . . . . . . . . . . . . . . . . . . . . . . . . . . 11
2.2 System Overview . . . . . . . . . . . . . . . . . . . . . . . . . . . . . . . . . . . . . . . . 122.3 Main Engine . . . . . . . . . . . . . . . . . . . . . . . . . . . . . . . . . . . . . . . . . . 14
2.3.1 Failures In Starting, Reversing And Regulating Device. . . . . . . . . . . . . . . . 142.3.2 Standard Failures. . . . . . . . . . . . . . . . . . . . . . . . . . . . . . . . . . . . 142.3.3 Turbocharger Failures . . . . . . . . . . . . . . . . . . . . . . . . . . . . . . . . . 15
2.4 Steering Gear. . . . . . . . . . . . . . . . . . . . . . . . . . . . . . . . . . . . . . . . . . 192.4.1 Failure Of Electrical Supply . . . . . . . . . . . . . . . . . . . . . . . . . . . . . . 192.4.2 Short-Term Failures . . . . . . . . . . . . . . . . . . . . . . . . . . . . . . . . . . 192.4.3 Other Steering Gear Failure Research . . . . . . . . . . . . . . . . . . . . . . . . 19
2.5 Fuel System . . . . . . . . . . . . . . . . . . . . . . . . . . . . . . . . . . . . . . . . . . 232.5.1 Insufficient Fuel Care. . . . . . . . . . . . . . . . . . . . . . . . . . . . . . . . . . 232.5.2 Fuel Of Poor Quality . . . . . . . . . . . . . . . . . . . . . . . . . . . . . . . . . . 232.5.3 Broken Fuel Pipe . . . . . . . . . . . . . . . . . . . . . . . . . . . . . . . . . . . . 242.5.4 Air In The Fuel System . . . . . . . . . . . . . . . . . . . . . . . . . . . . . . . . . 242.5.5 Fuel Intolerance . . . . . . . . . . . . . . . . . . . . . . . . . . . . . . . . . . . . 242.5.6 Fuel Filter Failures . . . . . . . . . . . . . . . . . . . . . . . . . . . . . . . . . . . 25
2.6 Electrical System . . . . . . . . . . . . . . . . . . . . . . . . . . . . . . . . . . . . . . . . 272.7 Cooling Water System . . . . . . . . . . . . . . . . . . . . . . . . . . . . . . . . . . . . . 29
2.7.1 Failure Of Cooling Water Pumps . . . . . . . . . . . . . . . . . . . . . . . . . . . 292.7.2 Ice In Seawater Filter. . . . . . . . . . . . . . . . . . . . . . . . . . . . . . . . . . 29
2.8 Contribution Of Human Error To Machinery Failures . . . . . . . . . . . . . . . . . . . . . 312.8.1 Definitions. . . . . . . . . . . . . . . . . . . . . . . . . . . . . . . . . . . . . . . . 312.8.2 Steering Gear. . . . . . . . . . . . . . . . . . . . . . . . . . . . . . . . . . . . . . 312.8.3 Fuel System . . . . . . . . . . . . . . . . . . . . . . . . . . . . . . . . . . . . . . 322.8.4 Electrical System . . . . . . . . . . . . . . . . . . . . . . . . . . . . . . . . . . . . 322.8.5 Human Error In A Fault Tree. . . . . . . . . . . . . . . . . . . . . . . . . . . . . . 32
vii
viii Contents
2.9 Contribution Of Improper Maintenance To Machinery Failures . . . . . . . . . . . . . . . 342.9.1 Main Engine . . . . . . . . . . . . . . . . . . . . . . . . . . . . . . . . . . . . . . 342.9.2 Steering Gear. . . . . . . . . . . . . . . . . . . . . . . . . . . . . . . . . . . . . . 352.9.3 Electrical System . . . . . . . . . . . . . . . . . . . . . . . . . . . . . . . . . . . . 352.9.4 Fault Tree Improper Maintenance . . . . . . . . . . . . . . . . . . . . . . . . . . . 35
2.10 Conclusion . . . . . . . . . . . . . . . . . . . . . . . . . . . . . . . . . . . . . . . . . . . 35
3 Generating Solutions 373.1 Failures By Severity . . . . . . . . . . . . . . . . . . . . . . . . . . . . . . . . . . . . . . 373.2 Requirements To The Solutions . . . . . . . . . . . . . . . . . . . . . . . . . . . . . . . . 383.3 Types Of Redundancy . . . . . . . . . . . . . . . . . . . . . . . . . . . . . . . . . . . . . 393.4 Determining Solutions . . . . . . . . . . . . . . . . . . . . . . . . . . . . . . . . . . . . . 393.5 Solutions To The Main Engine Failures . . . . . . . . . . . . . . . . . . . . . . . . . . . . 39
3.5.1 Solutions To Unknown, Main Engine . . . . . . . . . . . . . . . . . . . . . . . . . 403.5.2 Solutions To The Starting, Reversing And Regulating Device Failures . . . . . . . 413.5.3 Solutions To The Standard Failures . . . . . . . . . . . . . . . . . . . . . . . . . . 423.5.4 Solutions To The Turbocharger Failures . . . . . . . . . . . . . . . . . . . . . . . 43
3.6 Solutions To The Steering Gear Failures . . . . . . . . . . . . . . . . . . . . . . . . . . . 433.6.1 Solutions To A Failure Of Electrical Supply And Control Devices . . . . . . . . . . 433.6.2 Solutions To Unknown, Steering Gear . . . . . . . . . . . . . . . . . . . . . . . . 433.6.3 Solutions To Other, Steering Gear. . . . . . . . . . . . . . . . . . . . . . . . . . . 44
3.7 Solutions To The Fuel System Failures . . . . . . . . . . . . . . . . . . . . . . . . . . . . 443.7.1 Solutions To Unknown, Fuel System . . . . . . . . . . . . . . . . . . . . . . . . . 443.7.2 Solutions To Fuel Intolerance . . . . . . . . . . . . . . . . . . . . . . . . . . . . . 46
3.8 Solutions To The Failures In The Electrical System . . . . . . . . . . . . . . . . . . . . . 483.8.1 Solutions To A Blackout . . . . . . . . . . . . . . . . . . . . . . . . . . . . . . . . 483.8.2 Solutions To Unknown, Electrical System. . . . . . . . . . . . . . . . . . . . . . . 48
3.9 Solutions To The Cooling Water System Failures . . . . . . . . . . . . . . . . . . . . . . 483.9.1 Solutions To Unknown, Cooling Water System . . . . . . . . . . . . . . . . . . . . 483.9.2 Solutions To Ice In Seawater Filter . . . . . . . . . . . . . . . . . . . . . . . . . . 49
3.10 Conclusion . . . . . . . . . . . . . . . . . . . . . . . . . . . . . . . . . . . . . . . . . . . 49
4 Reliability Improvement Of Solutions 534.1 Failure Rate Machinery . . . . . . . . . . . . . . . . . . . . . . . . . . . . . . . . . . . . 53
4.1.1 Length Of A Ship Movement . . . . . . . . . . . . . . . . . . . . . . . . . . . . . . 534.1.2 Speed During A Ship Movement. . . . . . . . . . . . . . . . . . . . . . . . . . . . 554.1.3 Failure Rate Calculations . . . . . . . . . . . . . . . . . . . . . . . . . . . . . . . 55
4.2 Reliability Improvement Main Engine . . . . . . . . . . . . . . . . . . . . . . . . . . . . . 574.2.1 Reliability Improvement Unknown Distribution . . . . . . . . . . . . . . . . . . . . 574.2.2 Reliability Improvement Starting, Reversing And Regulating Device . . . . . . . . 604.2.3 Reliability Improvement Standard Failure . . . . . . . . . . . . . . . . . . . . . . . 604.2.4 Reliability Improvement Turbocharger Failure . . . . . . . . . . . . . . . . . . . . 614.2.5 Summary Main Engine Reliability Improvement . . . . . . . . . . . . . . . . . . . 61
4.3 Reliability Improvement Steering Gear . . . . . . . . . . . . . . . . . . . . . . . . . . . . 634.3.1 Reliability Improvement Unknown Distribution And Other . . . . . . . . . . . . . . 634.3.2 Reliability Improvement Electrical Supply And Control Devices . . . . . . . . . . . 644.3.3 Summary Steering Gear Reliability Improvement. . . . . . . . . . . . . . . . . . . 65
4.4 Reliability Improvement Fuel System . . . . . . . . . . . . . . . . . . . . . . . . . . . . . 664.4.1 Reliability Improvement Unknown Distribution . . . . . . . . . . . . . . . . . . . . 664.4.2 Reliability Improvement Fuel Intolerance . . . . . . . . . . . . . . . . . . . . . . . 674.4.3 Summary Fuel System Reliability Improvement . . . . . . . . . . . . . . . . . . . 68
4.5 Reliability Improvement Electrical System . . . . . . . . . . . . . . . . . . . . . . . . . . 694.5.1 Reliability Improvement Blackout . . . . . . . . . . . . . . . . . . . . . . . . . . . 704.5.2 Reliability Improvement Unknown Distibution . . . . . . . . . . . . . . . . . . . . . 714.5.3 Summary Electrical System Reliability Improvement . . . . . . . . . . . . . . . . . 71
Contents ix
4.6 Reliability Improvement Cooling Water System. . . . . . . . . . . . . . . . . . . . . . . . 724.6.1 Reliability Improvement Unknown Distribution . . . . . . . . . . . . . . . . . . . . 734.6.2 Reliability Improvement Ice In Seawater Filter . . . . . . . . . . . . . . . . . . . . 734.6.3 Summary Cooling Water System Reliability Improvement . . . . . . . . . . . . . . 74
4.7 Conclusion . . . . . . . . . . . . . . . . . . . . . . . . . . . . . . . . . . . . . . . . . . . 74
5 Cost Of Solutions With Highest Reliability Improvement 795.1 Reference Ship And Route. . . . . . . . . . . . . . . . . . . . . . . . . . . . . . . . . . . 795.2 Available Money For Solutions. . . . . . . . . . . . . . . . . . . . . . . . . . . . . . . . . 795.3 Cost Of Main Engine Solutions . . . . . . . . . . . . . . . . . . . . . . . . . . . . . . . . 80
5.3.1 Cost Of Full-Backup Solution . . . . . . . . . . . . . . . . . . . . . . . . . . . . . 815.3.2 Cost Of Dividing Of Power . . . . . . . . . . . . . . . . . . . . . . . . . . . . . . . 825.3.3 Cost Of Power Take In . . . . . . . . . . . . . . . . . . . . . . . . . . . . . . . . . 825.3.4 Conclusions On Cost Of Main Engine Solutions . . . . . . . . . . . . . . . . . . . 83
5.4 Cost Of Steering Gear Solutions. . . . . . . . . . . . . . . . . . . . . . . . . . . . . . . . 845.4.1 Cost Of Splitting The Steering Gear Into Separate Systems . . . . . . . . . . . . . 845.4.2 Cost Of Installing A Retractable Stern Thruster As A Backup . . . . . . . . . . . . 855.4.3 Conclusions On Cost Of Steering Gear Solutions . . . . . . . . . . . . . . . . . . 86
5.5 Cost Of Fuel System Solutions . . . . . . . . . . . . . . . . . . . . . . . . . . . . . . . . 865.6 Conclusion . . . . . . . . . . . . . . . . . . . . . . . . . . . . . . . . . . . . . . . . . . . 88
6 Conclusion 916.1 Recommendations . . . . . . . . . . . . . . . . . . . . . . . . . . . . . . . . . . . . . . . 92
6.1.1 If A Fatal Technical Failure Occurs . . . . . . . . . . . . . . . . . . . . . . . . . . 93
Bibliography 95
A Technical Failures in System Groups 103
B Complete Initial Fault Tree 105
C Other Steering Gear Research 115
D MARPOL Annex VI 117D.1 Sulphur Oxide . . . . . . . . . . . . . . . . . . . . . . . . . . . . . . . . . . . . . . . . .118D.2 Nitrous Oxide . . . . . . . . . . . . . . . . . . . . . . . . . . . . . . . . . . . . . . . . . .118D.3 Particulate Matter. . . . . . . . . . . . . . . . . . . . . . . . . . . . . . . . . . . . . . . .118
E Solutions By Reliability Improvement 119

List Of Figures
1.1 The six possible failure rate patterns . . . . . . . . . . . . . . . . . . . . . . . . . . . . . 7
2.1 Different events within a fault tree analysis . . . . . . . . . . . . . . . . . . . . . . . . . . 102.2 Different gates within a fault tree analysis . . . . . . . . . . . . . . . . . . . . . . . . . . 102.3 Transfer symbol . . . . . . . . . . . . . . . . . . . . . . . . . . . . . . . . . . . . . . . . 102.4 Fault tree with all system groups . . . . . . . . . . . . . . . . . . . . . . . . . . . . . . . 132.5 Fault tree of the main engine (1 of 3) . . . . . . . . . . . . . . . . . . . . . . . . . . . . . 162.6 Fault tree of the main engine (2 of 3) . . . . . . . . . . . . . . . . . . . . . . . . . . . . . 172.7 Fault tree of the main engine (3 of 3) . . . . . . . . . . . . . . . . . . . . . . . . . . . . . 182.8 Fault tree of the steering gear (1 of 2) . . . . . . . . . . . . . . . . . . . . . . . . . . . . 212.9 Fault tree of the steering gear (2 of 2) . . . . . . . . . . . . . . . . . . . . . . . . . . . . 222.10 Fault tree of the fuel system . . . . . . . . . . . . . . . . . . . . . . . . . . . . . . . . . . 262.11 Fault tree of the electrical system . . . . . . . . . . . . . . . . . . . . . . . . . . . . . . . 282.12 Fault tree of the cooling water system . . . . . . . . . . . . . . . . . . . . . . . . . . . . 302.13 Fault tree of the failures due to human error . . . . . . . . . . . . . . . . . . . . . . . . . 332.14 Fault tree of the failures due to improper maintenance . . . . . . . . . . . . . . . . . . . 36
4.1 Exclusive Economic Zone (EEZ) of Germany in North and Baltic Sea . . . . . . . . . . . 54
5.1 The reference ship, type M-Borg, sailing from Rotterdam to Halifax . . . . . . . . . . . . 80
B.1 Sheet 1 of 8 from the initial fault tree . . . . . . . . . . . . . . . . . . . . . . . . . . . . . 106B.2 Sheet 2 of 8 from the initial fault tree . . . . . . . . . . . . . . . . . . . . . . . . . . . . . 107B.3 Sheet 3 of 8 from the initial fault tree . . . . . . . . . . . . . . . . . . . . . . . . . . . . . 108B.4 Sheet 4 of 8 from the initial fault tree . . . . . . . . . . . . . . . . . . . . . . . . . . . . . 109B.5 Sheet 5 of 8 from the initial fault tree . . . . . . . . . . . . . . . . . . . . . . . . . . . . . 110B.6 Sheet 6 of 8 from the initial fault tree . . . . . . . . . . . . . . . . . . . . . . . . . . . . . 111B.7 Sheet 7 of 8 from the initial fault tree . . . . . . . . . . . . . . . . . . . . . . . . . . . . . 112B.8 Sheet 8 of 8 from the initial fault tree . . . . . . . . . . . . . . . . . . . . . . . . . . . . . 113
D.1 Existing emission control areas and possible future ECAs . . . . . . . . . . . . . . . . . 117
xi

List Of Tables
1.1 Distribution of world fleet by number and tonnage . . . . . . . . . . . . . . . . . . . . . . 31.2 Technical failures in the system groups . . . . . . . . . . . . . . . . . . . . . . . . . . . 6
2.1 Distribution of the main engine failures . . . . . . . . . . . . . . . . . . . . . . . . . . . . 142.2 Distribution of the steering gear failures . . . . . . . . . . . . . . . . . . . . . . . . . . . 192.3 Distribution of the fuel system failures . . . . . . . . . . . . . . . . . . . . . . . . . . . . 232.4 Distribution of the electrical system failures . . . . . . . . . . . . . . . . . . . . . . . . . 272.5 Distribution of the cooling water system failures . . . . . . . . . . . . . . . . . . . . . . . 29
3.1 Different failure types ordered by their severity . . . . . . . . . . . . . . . . . . . . . . . 383.2 All failures and whether a generated solution is a possible option . . . . . . . . . . . . . 50
4.1 Failure distribution, failure rate and mean time between failure per system . . . . . . . . 564.2 Reliability improvement of main engine solutions . . . . . . . . . . . . . . . . . . . . . . 624.3 Reliability improvement of steering gear solutions . . . . . . . . . . . . . . . . . . . . . . 664.4 Reliability improvement of fuel system solutions . . . . . . . . . . . . . . . . . . . . . . . 694.5 Reliability improvement of electrical system solutions . . . . . . . . . . . . . . . . . . . . 724.6 Reliability improvement of cooling water system solutions . . . . . . . . . . . . . . . . . 744.7 The initial, maximum prevented and minimal remaining failure rate for each system . . . 754.8 The three best solutions based on reliability improvement . . . . . . . . . . . . . . . . . 764.9 Different failure types ordered by their severity and whether they are solved or not . . . 77
5.1 Main engine solutions: cost and speed after failure . . . . . . . . . . . . . . . . . . . . . 835.2 Best solutions per system, together with their price . . . . . . . . . . . . . . . . . . . . . 88
A.1 Technical failures in the system groups for the years 2001 and 2002 . . . . . . . . . . . 103A.2 Technical failures in the system groups for the years 2003 and 2004 . . . . . . . . . . . 103A.3 Technical failures in the system groups for the years 2010 and 2011 . . . . . . . . . . . 104
D.1 Sulphur Oxide limits . . . . . . . . . . . . . . . . . . . . . . . . . . . . . . . . . . . . . . 118
E.1 Reliability improvement for all solutions listed from high to low . . . . . . . . . . . . . . . 119
xiii

List Of Symbols
Symbol Meaning Unit
e Euler’s number, mathematical constant, 2.71828 [-]
𝜆(t) Failure rate [-]
𝜌 Density of the fluid [kg/m ]
𝑐 Constant [-]
𝑘 The number of input events in the OR gate [-]
𝑛 The number of input events in the AND gate [-]
𝑡 Time interval. For instance the length of a ship journey [h]
𝑣 Ship speed [m/s]
𝐴 Rudder area [m ]𝐶 Drag coefficient [-]
𝐶 Lift coefficient [-]
𝐷 Drag force [N]
𝐿 Lift force [N]
𝑃 Unreliability or probability of failure [-]
𝑃 Effective towing power [W]
𝑃(𝑥 ) The probability of occurrence of the AND gate output event, 𝑥 [-]
𝑃(𝑥 ) The probability of the input event in the AND gate, 𝑥 [-]
𝑃(𝑦 ) The probability of occurrence of the OR gate output event, 𝑦 [-]
𝑃(𝑦 ) The probability of the input event in the OR gate, 𝑦 [-]
𝑉 The free stream incident velocity [m/s]
CPP Controllable Pitch Propeller
MTBF Mean Time Between Failures
PTI Power Take In
xv

1Introduction
Over the past years the amount of tonnage moved by ships has been growing significantly. In the year2000 a seaborne trade of 30,823 billions of ton-miles was shipped whereas in the year 2013 a total of50,374 billions of ton-miles was transported [95]. According to the estimation for 2014 and the forecastfor 2015 the amount of ton-miles to be transported will continue to rise. If more cargo will be shippedthis means that the demand for skilled crew members will rise as well. This can be stated by assumingthat ships will not get much bigger in size in order to fill this gap of skilled crewmembers. It can be foundfrom the manpower study of 2010 by BIMCO (Baltic and International Maritime Council) et al. that thesupply of skilled crew does not match the demand which causes a shortage of skilled crew members.In the year of 2010 the supply of crew members was estimated to be 624,000 officers and 747,000ratings while the demand was estimated to be 637,000 officers and 747,000 ratings. This means anoverall shortage of about 2% [10]. Looking at the benchmark estimates for the years 2015, 2020 and2025 it can be found that there is a surplus of ratings, but a shortage of officers of 2.1%, 11.7% and18.3% for respectively the years 2015, 2020 and 2025 [11].
The new generation of employees starting in the maritime sector are called generation Y or Millen-nials. Born between the 1980s and late 1990s they grew up with a constant access to technology [46].They are more educated and better adapted to technology than their parents when entering the work-force. It is said that many of the new generation do not want to spend all their life at sea, but want touse their skills onshore [18]. This will create a shortage of young crew members, since the numberof new seafarers will be lower than it used to be. The same can be said for the older generation ofseafarers. When having a family they might want to have a regular 9 to 5 job in order to spend moretime with their family. This causes extra manning problems since there already is a shortage.
Another problem related to manning is human error. About 80% of all accidents at sea are causedby human error [34]. There are several causes for human error such as fatigue, stress, health, com-munications and language and cultural variance.
In order to decrease the number of seafarers needed and to be able to give them amore regular job,automation can be used. This will help to limit the amount of human error. Having more automationmight also lower the expenses of the ship owners if the cost of automation is less than the ’normal’expenses.
The engine room houses most of the important machinery in the ship. It is said that the machineryin the current engine rooms is error-prone and that crew has to do a lot of work to keep it running.The engineers for instance have to inspect the machinery, make sure that the machinery can operateproperly and maintain and repair the equipment. This includes checking the level of lubrication oil,adapting the systems to the weather conditions, cleaning filters, cleaning turbochargers, pumping fuelfrom one tank to another and more. Having more automation or redundancy in an engine room mighttherefore be a good solution to the current problems. However, before solutions can be determined, itwill have to be understood where the problems in the ship originate from. This will make it possible todetermine which systems in the ship are the most error-prone. For each of these systems it can thenalso be determined what causes the failures. When the errors are known, a list of solutions can bedeveloped. For all of these solutions it will then have to be determined whether they are feasible or not.This will be done by investigating whether a solution can realize a reliability improvement, although other
1
2 1. Introduction
factors may also determine the feasibility. The reliability improvement of all feasible solutions will thenhave to be calculated. Before this can be done, the failure rate of the ship will have to be determined.When the reliability improvements of all solutions are known it can be seen which solutions give thelargest improvement. For these solutions it will then have to be determined what their financial impactis. If solutions are found that make the machinery more reliable and are financially viable at the sametime this can help to make ships autonomous or remote operated in the future. Ships sailing withoutcrew will not be affected by the shortage of skilled crew members. These ships will also not be proneto human error on board the vessel.
1.1. Thesis OutlineThis thesis will focus on the problems that will occur when making an engine room unmanned forcommercial ships trading at sea. During the voyage there will be no engineers on board to work onthe machinery. Since this thesis is a step towards unmanned sailing it is chosen that no other crewmembers are present on the ship as well. An unmanned engine room1 might be implemented first ona manned ship. If that is the case, the ship is still steered by humans but the machinery runs withoutinterference of the crew. Implementing an unmanned engine room on a ship which also has crewmight be chosen as a transit solution to the unmanned ship. The practicalities of implementing theunmanned engine room fall outside the scope of this thesis since these decisions will have to be madeby operational experts of the shipowner. Every shipowner has to decide for themselves how far theywant to go with the automation of the ship.
The machinery of a ship includes systems to sail the vessel, to generate electrical power, to con-dition cargo, to provide living conditions for the crew, and others [90]. Systems to sail the ship refersin this case to the propulsion of the ship. Systems on the bridge will get their power from the gener-ation of electrical power. The machinery in this thesis will focus on the machinery which has led totechnical failures in the past [30]. These machinery systems are; steering gear, main engine, dieselgenerator, shafting, electrical system, fuel system and cooling water system. This is roughly equal tothe propulsion and auxiliary systems of the ship.
Other systems on the ship can also fail during operation, but the named systems are crucial for thetransport from A to B. For the systems that are responsible for the actual sailing of the ship it is a mustto be reliable since the ship is difficult to retrieve when a fatal error occurs. Other systems that mightfail do not have such a drastic effect. For instance, if a ship has a crane installed which fails duringvoyage, the ship can still continue its route, if no disastrous things occurred to the crane. The ship isthen not lost at sea without propulsion. For this type of specific equipment, increased reliability is niceto have but not vital for unmanned operation. Determining failures and solutions for the (ship) specificequipment is something that is nice for future work, but is too specific for this thesis. Other systems,such as bridge systems might be controlled from shore. When a failure occurs to these systems, ashore control centre might be able to reset those systems.
1.1.1. Ship Types Within ScopeThe function of a ship determines the required level of auxiliary systems. The auxiliary systems there-fore differ from ship type to ship type since one type of ship requires much more auxiliary systemsfor it to be operational than another ship type needs. For example, a bulker does not require muchauxiliary systems whereas a pipe layer requires much more auxiliary systems due to the complexity ofits operation. Merchant ships transporting cargo from A to B all have a roughly similar requirement forthe auxiliary systems, which is rather small since these ships are not very complex. This means thatthey are very suitable for having an unmanned engine room because there is not much equipment forwhich failures have to be solved. Due to the complexity of the equipment for the ship types passengerships, offshore vessels and service ships they do not fit within the scope of this project. Their machin-ery is too complex and specialized to belong to the first vessels to have an unmanned engine room.Although gas tankers are merchant ships, they are also excluded from the scope of this project due totheir specialized systems such as pressurized and/or refrigeration systems.
1An unmanned engine room is defined as an engine room in which no engineers are present during voyage. These engineersare also not able to access the engine room via computers outside the engine room. If an engineer has to take action regardingmachinery in the engine room, this has to be done from for example a shore control centre. Otherwise, the only option to accessthe engine room is when the ship is in port.
1.1. Thesis Outline 3
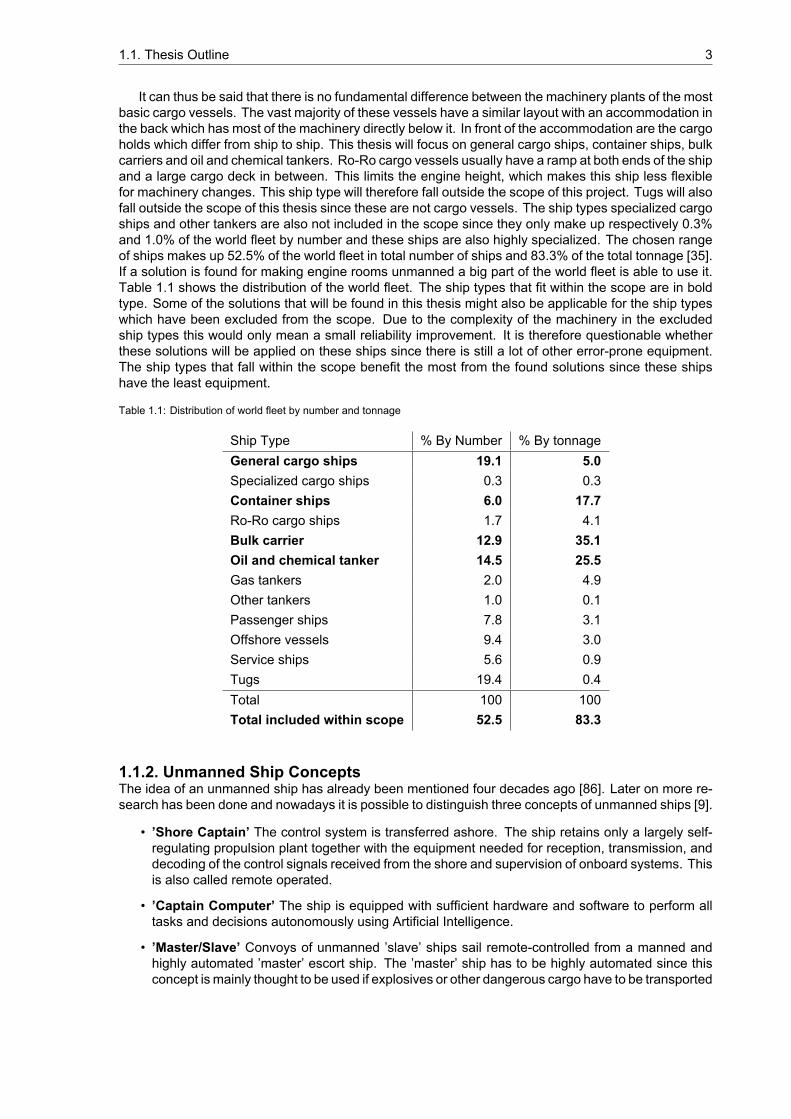
It can thus be said that there is no fundamental difference between the machinery plants of the mostbasic cargo vessels. The vast majority of these vessels have a similar layout with an accommodation inthe back which has most of the machinery directly below it. In front of the accommodation are the cargoholds which differ from ship to ship. This thesis will focus on general cargo ships, container ships, bulkcarriers and oil and chemical tankers. Ro-Ro cargo vessels usually have a ramp at both ends of the shipand a large cargo deck in between. This limits the engine height, which makes this ship less flexiblefor machinery changes. This ship type will therefore fall outside the scope of this project. Tugs will alsofall outside the scope of this thesis since these are not cargo vessels. The ship types specialized cargoships and other tankers are also not included in the scope since they only make up respectively 0.3%and 1.0% of the world fleet by number and these ships are also highly specialized. The chosen rangeof ships makes up 52.5% of the world fleet in total number of ships and 83.3% of the total tonnage [35].If a solution is found for making engine rooms unmanned a big part of the world fleet is able to use it.Table 1.1 shows the distribution of the world fleet. The ship types that fit within the scope are in boldtype. Some of the solutions that will be found in this thesis might also be applicable for the ship typeswhich have been excluded from the scope. Due to the complexity of the machinery in the excludedship types this would only mean a small reliability improvement. It is therefore questionable whetherthese solutions will be applied on these ships since there is still a lot of other error-prone equipment.The ship types that fall within the scope benefit the most from the found solutions since these shipshave the least equipment.
Table 1.1: Distribution of world fleet by number and tonnage
Ship Type % By Number % By tonnageGeneral cargo ships 19.1 5.0Specialized cargo ships 0.3 0.3Container ships 6.0 17.7Ro-Ro cargo ships 1.7 4.1Bulk carrier 12.9 35.1Oil and chemical tanker 14.5 25.5Gas tankers 2.0 4.9Other tankers 1.0 0.1Passenger ships 7.8 3.1Offshore vessels 9.4 3.0Service ships 5.6 0.9Tugs 19.4 0.4Total 100 100Total included within scope 52.5 83.3
1.1.2. Unmanned Ship ConceptsThe idea of an unmanned ship has already been mentioned four decades ago [86]. Later on more re-search has been done and nowadays it is possible to distinguish three concepts of unmanned ships [9].
• ’Shore Captain’ The control system is transferred ashore. The ship retains only a largely self-regulating propulsion plant together with the equipment needed for reception, transmission, anddecoding of the control signals received from the shore and supervision of onboard systems. Thisis also called remote operated.
• ’Captain Computer’ The ship is equipped with sufficient hardware and software to perform alltasks and decisions autonomously using Artificial Intelligence.
• ’Master/Slave’ Convoys of unmanned ’slave’ ships sail remote-controlled from a manned andhighly automated ’master’ escort ship. The ’master’ ship has to be highly automated since thisconcept is mainly thought to be used if explosives or other dangerous cargo have to be transported
4 1. Introduction
away from the crew. All tasks for the ’slave’ ships have to be performed from the ’master’ ship soautomation can help to keep the number of crew members down.
Since the terms of these three concepts are often used incorrectly they are shown here for betterunderstanding. In this thesis, unmanned is used to describe all of these three concepts in one word.For the outline of this thesis it is namely not important which of these three concepts is used, as longas no engineer is on board for the machinery. With the Master/Slave configuration help is close by,this concept will therefore have to be excluded from the scope of this thesis. The ship will have to sailthe journey without physical human interference during the voyage.
1.1.3. Research QuestionsThis section will show the research questions. First the main question will be mentioned after whichthe subquestions are determined. These subquestions are necessary to answer the main question.
Main question
• What are the machinery related problems regarding an unmanned engine room? How to solvethese problems such that the reliability2 is equal or better compared to the manned engine roomwhile being financially competitive at the same time?
Sub-questions
• What are the current problems with machinery and where do they originate from?This question will determine the failures that are currently occurring to machinery in the engineroom on board vessels. After it is determined what machinery the failures occur to, it has to beinvestigated in which components the causes of the problems are. This gives insight in what hasto be solved and where to look for the solution.
• How many of the problems have non-human causes?What is the impact of human error in the failures to ship machinery? The problems caused byhumans no longer occur on board the ship if it comes to operating the ship unmanned. Humanerror related to installing or maintaining machinery might still be present. This question has to beanswered in order to be able to develop solutions for problems that still exist when there are nohumans on board.
• What are possible solutions to the non-human problems?This question is set to develop a set of solutions for the non-human related problems. In this stageall options are ”good” options, as long as they meet the reliability criterion. The best solution willbe chosen in a later stage.
• What is the best solution for the non-human problems?It is case specific which solution is the best solution. This can be a function of speed of the ship,range of the ship, required maintenance interval or cost of the solution and will be investigatedlater on.
• Is the reliability of the unmanned engine room equal or better to the manned engine room?In order for an unmanned engine room to be implemented in a ship is has to be of equal quality asthe current engine rooms. This can be determined by checking if the reliability is equal or betterto a manned engine room.
2Reliability is defined as: ”The ability of an apparatus, machine, or system to consistently perform its intended or required functionor mission, on demand and without degradation or failure” [16].
1.2. Previous Work 5
1.2. Previous WorkThis section will deal with some of the research that has already been conducted on unmanned ships.First, some relevant work on unmanned vessels will be shown after which previous work on ship ma-chinery will be presented. Finally the literature on machinery failures will be dealt with.
1.2.1. On Unmanned VesselsOver the past years the attention for ships without crew has grown significantly. Several companieshave already made concepts for unmanned vessels. DNV-GL has developed a concept for an un-manned, zero emission, short sea ship of the future which will sail along the coast of Norway in order todecrease road transport [33]. Rolls-Royce has also shown their vision on the intelligent ship [69] and iscurrently leading an Autonomous Ship Research Project [82]. The MUNIN (Maritime Unmanned Navi-gation through Intelligence in Networks) project was a research project for an unmanned merchant shipwhich checked its technical, economic and legal feasibility. It was co-funded by the European Commis-sion and was a collaboration between different institutes [63]. There are more examples of crewlessships, such as the Autonomous Work Boat [87] and the US Navy Unmanned Surface Vehicle [71].
So far, there are no merchant ships which are operated without crew in an autonomous way butTNO has developed a shore support system so that less engineers can be aboard a vessel [76]. Thismeans that for Dutch coasters the Chief Engineer is replaced with a beginning Maritime Officer. Hehas both navigational and engineering tasks. This means that the persons on board have less skillsthan they used to have. This is compensated by having support from shore, available every hour ofthe day.
1.2.2. On Ship MachineryRegarding ship machinery there has not been much research yet. Two students of the RotterdamMainport University of Applied Sciences have done a study for Imtech Marine & Offshore to design theship-shore information flow in order to control an engine room, but this did not involve any changesregarding the machinery [57].
The MUNIN project has done more research on actual redesign of the ship machinery in their de-liverables 6.2 (Specification concept of the general technical system redesign) and 8.7 (Final Report:Autonomous Engine Room) [64] [66]. This research involved the redesign of a bulk carrier with themost commonly installed propulsion plant, a two-stroke low speed diesel engine directly coupled to afixed pitch propeller.
Regarding the redesign of the machinery there were several changes. The most important designchange is the change of fuel type, since switching between fuels is prone to errors. The fuel changedfrom a residual to distillate. This is quite a drastic change since the ship is sailing on open sea, so it is notfinancially competitive to ships who do switch between fuels. But since the ship also sails in emissioncontrol areas it is necessary to use the more expensive fuel type. Further on, more redundancy wasadded to the system. Deliverable 6.2 also describes the possibilities of operation with faulty systems.MUNIN deliverable 8.7 concludes by saying that an unmanned engine room is technically feasible.Since MUNIN did not do any financial calculations on their design it is not possible to directly implementtheir work on a ship. It was also not determined by MUNIN what the reliability improvement of theirsolutions is.
MUNIN has taken great effort in designing amaintenance strategy for the unmanned engine room [65].It has investigated the current way of performing maintenance and has identified the gap betweenmain-tenance on a manned ship and the unmanned ship. With this information known it has determined amaintenance framework for the unmanned engine room which is run out of the shore support centre.The information on maintenance can be useful for this thesis, since machinery and maintenance areclosely linked.
When designing the ReVolt, DNV-GL have also taken the fuel/engine type of the ship in considera-tion. After considering MGO, LNG, hydrogen and batteries they chose the batteries due to its well-to-propeller efficiency and zero emissions [33]. This was the best option for this design, but not necessarilyfor all unmanned vessels.
6 1. Introduction
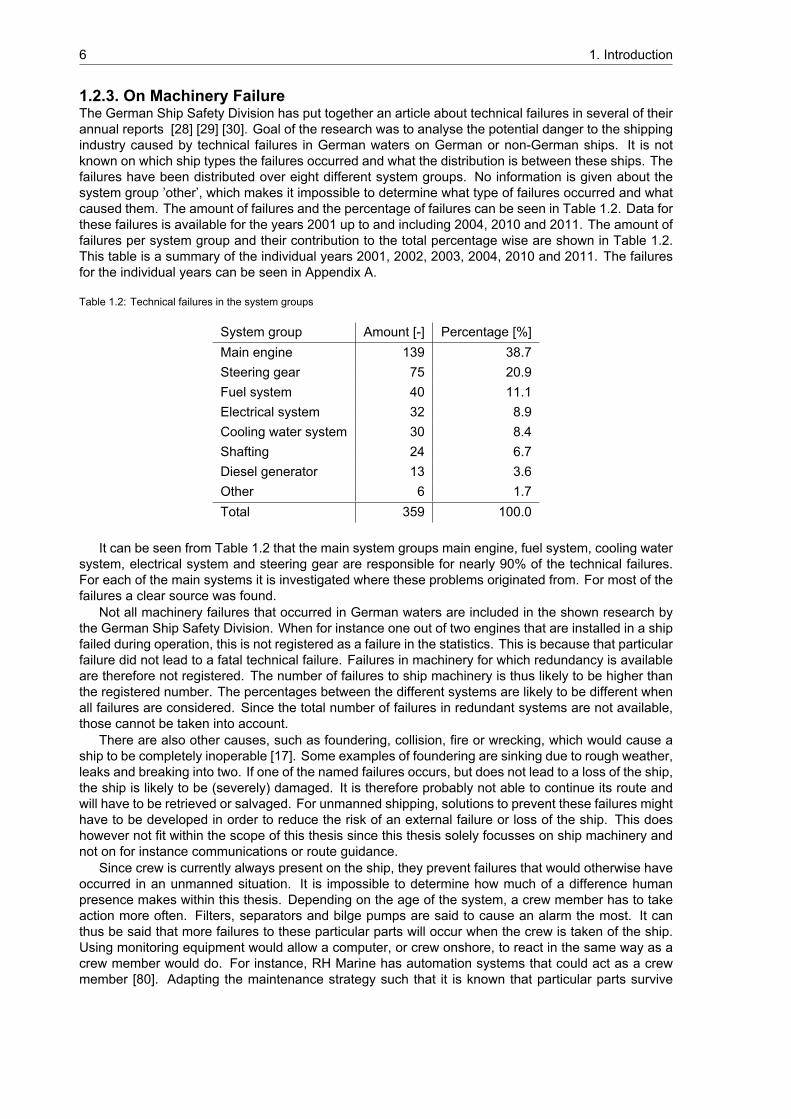
1.2.3. On Machinery FailureThe German Ship Safety Division has put together an article about technical failures in several of theirannual reports [28] [29] [30]. Goal of the research was to analyse the potential danger to the shippingindustry caused by technical failures in German waters on German or non-German ships. It is notknown on which ship types the failures occurred and what the distribution is between these ships. Thefailures have been distributed over eight different system groups. No information is given about thesystem group ’other’, which makes it impossible to determine what type of failures occurred and whatcaused them. The amount of failures and the percentage of failures can be seen in Table 1.2. Data forthese failures is available for the years 2001 up to and including 2004, 2010 and 2011. The amount offailures per system group and their contribution to the total percentage wise are shown in Table 1.2.This table is a summary of the individual years 2001, 2002, 2003, 2004, 2010 and 2011. The failuresfor the individual years can be seen in Appendix A.
Table 1.2: Technical failures in the system groups
System group Amount [-] Percentage [%]Main engine 139 38.7Steering gear 75 20.9Fuel system 40 11.1Electrical system 32 8.9Cooling water system 30 8.4Shafting 24 6.7Diesel generator 13 3.6Other 6 1.7Total 359 100.0
It can be seen from Table 1.2 that the main system groups main engine, fuel system, cooling watersystem, electrical system and steering gear are responsible for nearly 90% of the technical failures.For each of the main systems it is investigated where these problems originated from. For most of thefailures a clear source was found.
Not all machinery failures that occurred in German waters are included in the shown research bythe German Ship Safety Division. When for instance one out of two engines that are installed in a shipfailed during operation, this is not registered as a failure in the statistics. This is because that particularfailure did not lead to a fatal technical failure. Failures in machinery for which redundancy is availableare therefore not registered. The number of failures to ship machinery is thus likely to be higher thanthe registered number. The percentages between the different systems are likely to be different whenall failures are considered. Since the total number of failures in redundant systems are not available,those cannot be taken into account.
There are also other causes, such as foundering, collision, fire or wrecking, which would cause aship to be completely inoperable [17]. Some examples of foundering are sinking due to rough weather,leaks and breaking into two. If one of the named failures occurs, but does not lead to a loss of the ship,the ship is likely to be (severely) damaged. It is therefore probably not able to continue its route andwill have to be retrieved or salvaged. For unmanned shipping, solutions to prevent these failures mighthave to be developed in order to reduce the risk of an external failure or loss of the ship. This doeshowever not fit within the scope of this thesis since this thesis solely focusses on ship machinery andnot on for instance communications or route guidance.
Since crew is currently always present on the ship, they prevent failures that would otherwise haveoccurred in an unmanned situation. It is impossible to determine how much of a difference humanpresence makes within this thesis. Depending on the age of the system, a crew member has to takeaction more often. Filters, separators and bilge pumps are said to cause an alarm the most. It canthus be said that more failures to these particular parts will occur when the crew is taken of the ship.Using monitoring equipment would allow a computer, or crew onshore, to react in the same way as acrew member would do. For instance, RH Marine has automation systems that could act as a crewmember [80]. Adapting the maintenance strategy such that it is known that particular parts survive
1.2. Previous Work 7
another journey would also allow to prevent these failures. For instance the dynamic maintenanceplanning of Wärtsilä that uses condition based monitoring can be used [101]. This helps to reschedulemaintenance in a maintenance window by predicting the actual condition of the equipment. Whensystems are installed that monitor the equipment and therefore substitute the crew it can be stated thatthe failures that are now prevented by the crew are being prevented by a monitoring system. No extrafailures due to the absence of crew will thus occur.
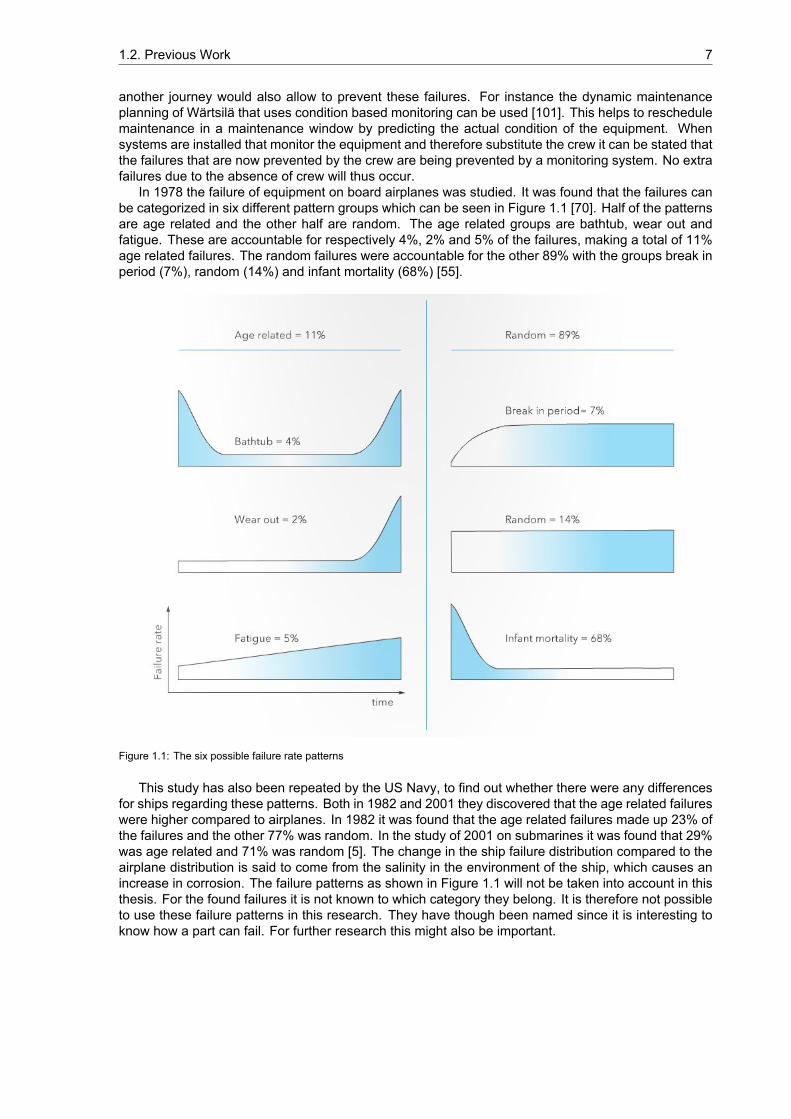
In 1978 the failure of equipment on board airplanes was studied. It was found that the failures canbe categorized in six different pattern groups which can be seen in Figure 1.1 [70]. Half of the patternsare age related and the other half are random. The age related groups are bathtub, wear out andfatigue. These are accountable for respectively 4%, 2% and 5% of the failures, making a total of 11%age related failures. The random failures were accountable for the other 89% with the groups break inperiod (7%), random (14%) and infant mortality (68%) [55].
Figure 1.1: The six possible failure rate patterns
This study has also been repeated by the US Navy, to find out whether there were any differencesfor ships regarding these patterns. Both in 1982 and 2001 they discovered that the age related failureswere higher compared to airplanes. In 1982 it was found that the age related failures made up 23% ofthe failures and the other 77% was random. In the study of 2001 on submarines it was found that 29%was age related and 71% was random [5]. The change in the ship failure distribution compared to theairplane distribution is said to come from the salinity in the environment of the ship, which causes anincrease in corrosion. The failure patterns as shown in Figure 1.1 will not be taken into account in thisthesis. For the found failures it is not known to which category they belong. It is therefore not possibleto use these failure patterns in this research. They have though been named since it is interesting toknow how a part can fail. For further research this might also be important.

2Machinery Problems
This chapter will analyse the reports of the German Ship Safety Division regarding the failures of shipmachinery in order to put the machinery faults into a fault tree to be able to give a better overview ofthe problems and their causes.
Firstly, the theory of the fault tree analysis will be dealt with in Section 2.1 after which a systemoverview is given in Section 2.2 and it is chosen on which systems this thesis will focus. Then for allconsidered systems, main engine, steering gear, fuel system, electrical system and cooling water sys-tem their failures will be dealt with on an individual basis in respectively Section 2.3, 2.4, 2.5, 2.6 and 2.7.It will also be determined what the effect of human error (Section 2.8) and improper maintenance (Sec-tion 2.9) is on the total number of failures. In Section 2.10 a conclusion regarding the cause of thefailures will be drawn.
2.1. Fault Tree AnalysisThroughout the industrial sector a fault tree analysis is a widely used method to do reliability analysisof engineering systems. It was developed in the early 1960s by the Bell Telephone Laboratories. It isa logical representation of the relationship of basic fault events that may cause a specified undesirableevent. This undesirable event (failure of the system, in which failure is well defined) is the top eventof the tree and is the thing that should not happen [27]. From the top undesired event the fault treegraphically develops all potential causes of that event.
The fault tree analysis considers component failures, subassembly failures, normal conditions, hu-man errors, and combinations of these items [8]. Systems are almost always made up of subsystemswhich on their part consist of components. In order to determine the reliability of a system it is nec-essary to determine the influence of the subsystems and components in the system. A fault tree isa logic diagram and by means of logic gates, such as AND and OR, indicate which subsystems andcomponents lead to the undesirable top event.
2.1.1. Fault Tree SymbolsThere are three categories of symbols used in the fault tree: events, gates and transfer symbols.Events are things that can happen, either in isolation or in combination with other events, and inducean undesired top event. Gates show the relationships between events. Transfer symbols are used fortransferring portions of the fault tree from one sheet to another [8].
Event types• Command event The rectangular shaped box is the top or intermediate event. It results from thecombination of fault events in the tree below it. See Figure 2.1a, page 10.
• Basic failure event The basic event is the lowest part in the tree and shown in Figure 2.1b onpage 10. A basic fault event or the failure of an elementary part or a component is shown by acircle.
9

10 2. Machinery Problems
• Human error or undeveloped event A human error or an undeveloped event is representedby a diamond. An undeveloped event is one that requires no further development. This can forinstance be events that are highly unlikely. These are shown as undeveloped events in order toshow that they have been taken in consideration. It is shown in Figure 2.1c.
Gate types• OR gate If any of the lower events occurs, an output fault event will occur. Its symbol is shownin Figure 2.2a.
• AND gate If all of the lower events occur this gate gives an output fault event. It can be seen inFigure 2.2b.
• INHIBIT gate An INHIBIT gate, Figure 2.2c, is a special version of the AND gate. It places aconstraint on the event below the INHIBIT gate. If the condition is satisfied and the event belowoccurs, the event above the INHIBIT gate occurs.
Transfer SymbolsThe transfer symbol is a triangle. It has a number inside the triangle which indicates to which sheet, orfrom which sheet, the information is transferred. It can be seen in Figure 2.3. A transfer symbol whichis shown on top of a command event shows to which sheet the tree transfers. If it continues to anothersheet, it is shown at the bottom of a command event.
(a) Command event (b) Basic failure event (c) Human error or undevelopedevent
Figure 2.1: Different events within a fault tree analysis
(a) OR gate (b) AND gate (c) INHIBIT gate
Figure 2.2: Different gates within a fault tree analysis
Figure 2.3: Transfer symbol
2.1. Fault Tree Analysis 11
2.1.2. Rules For Setting Up The Fault TreeThere are several rules when it comes to setting up the fault tree and performing the analysis [51].
• Define the system and the assumptions pertaining to it.
• Identify the system top fault event (i.e., the system undesirable event to be investigated).
• Identify all possible causes that can cause the top event to occur, by using fault tree symbols andthe logic tree format.
• Develop the fault tree to the lowest detail as per the requirements.
• Perform analysis of the completed fault tree in regard to factors such as understanding the properlogic and the interrelationships among various fault paths and gaining proper insight into theunique modes of product/item faults.
• Identify the most appropriate corrective measures.
• Document the analysis with care and follow up on the identified corrective measures.
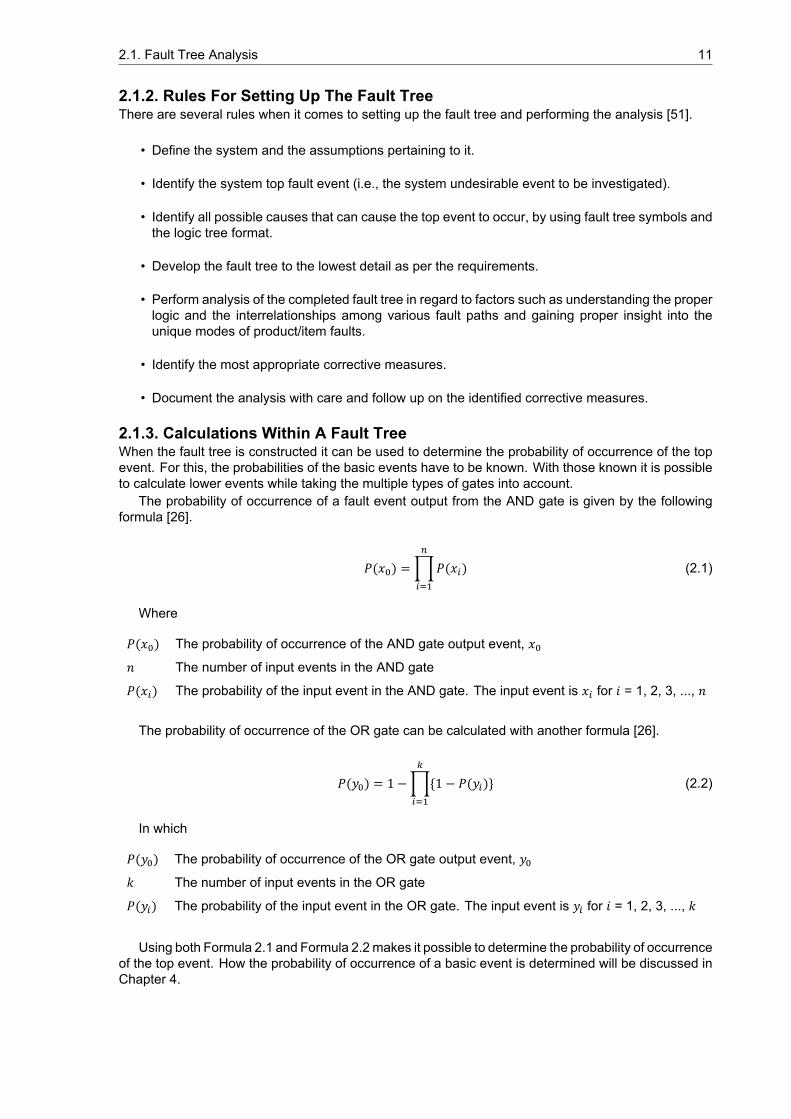
2.1.3. Calculations Within A Fault TreeWhen the fault tree is constructed it can be used to determine the probability of occurrence of the topevent. For this, the probabilities of the basic events have to be known. With those known it is possibleto calculate lower events while taking the multiple types of gates into account.
The probability of occurrence of a fault event output from the AND gate is given by the followingformula [26].
𝑃(𝑥 ) =∏𝑃(𝑥 ) (2.1)
Where
𝑃(𝑥 ) The probability of occurrence of the AND gate output event, 𝑥𝑛 The number of input events in the AND gate
𝑃(𝑥 ) The probability of the input event in the AND gate. The input event is 𝑥 for 𝑖 = 1, 2, 3, ..., 𝑛
The probability of occurrence of the OR gate can be calculated with another formula [26].
𝑃(𝑦 ) = 1 −∏{1 − 𝑃(𝑦 )} (2.2)
In which
𝑃(𝑦 ) The probability of occurrence of the OR gate output event, 𝑦𝑘 The number of input events in the OR gate
𝑃(𝑦 ) The probability of the input event in the OR gate. The input event is 𝑦 for 𝑖 = 1, 2, 3, ..., 𝑘
Using both Formula 2.1 and Formula 2.2makes it possible to determine the probability of occurrenceof the top event. How the probability of occurrence of a basic event is determined will be discussed inChapter 4.
12 2. Machinery Problems
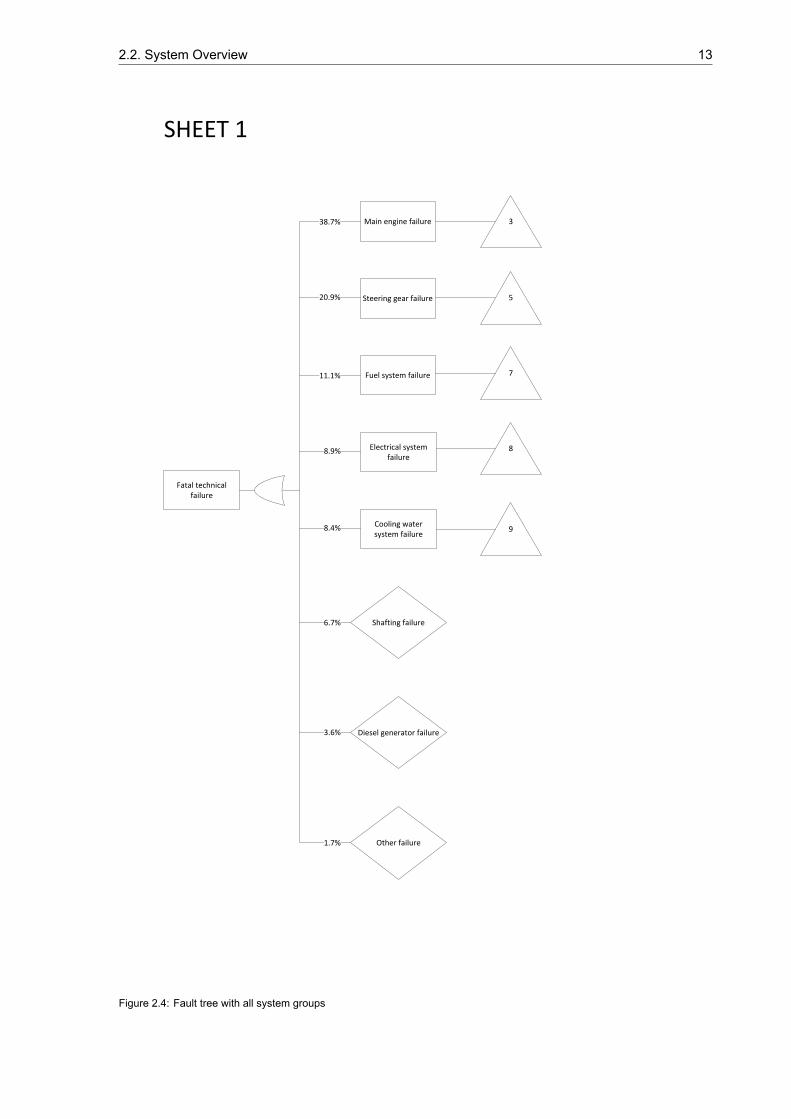
2.2. System OverviewThe failure reports of six years are available, namely 2001, 2002, 2003, 2004, 2010 and 2011. Overthese years a total of 359 failures have occurred. The systems as mentioned in Chapter 1 will now bediscussed on an individual basis. Since the main engine, steering gear, fuel system, electrical systemand cooling water system make up 88.0% of all technical failures only these systems have been dealtwith by the German Ship Safety Division. The causes of the failures in the systems diesel generatorand shafting have not been explained. Since these two system groups, together with the group ’other’,are accountable for only 12.0% of the failures these are not the groups that give the best chance for areliability improvement. Therefore only the five failure groups for which the cause of failure have beennamed will be considered for this thesis. The other systems will be neglected.
The claims about the failure origins asmade by theGerman Ship Safety Division will be checked withdifferent sources in order to confirm the problem and get more information on their origin. Unfortunatelynot all origins of the machinery failures have been explained by the Ship Safety Division. Only if a failureoccurred multiple times or has a very clear cause it has been named. Each system therefore shows alarge group of failures with unknown distribution. It is sometimes known which failures are or are notpart of this group but the failure distribution between them is never known.
Before a fault tree can be constructed of the ship machinery, the top event has to determined. Thetop event of the ship machinery fault tree is ’fatal technical failure’. This is the event that should nothappen and has to be avoided. Each of the system groups can lead to a fatal technical failure, whichmakes that they are all connected to the top event with an OR gate. The percentage of failures forwhich an event responsible is shown in the fault tree, with the event above it being a 100%. If thisinformation is not available, a question mark is shown.
The first fivemachinery systems are all dealt with in detail in later sections so these therefore transferto other sheets. The fault tree with all basic events is also far too large to put on a single piece of paper.The top part of the fault tree can be seen in Figure 2.4. For visual representation the top event is locatedon the left side of the paper and the fault tree continues to the right side. This makes it possible to readthe events without having to turn the page. All other fault trees in this chapter are constructed in thesame way.
In Appendix B all fault trees of the individual systems are put together as close to each other aspossible, which makes it possible to view the fault tree as a whole. In the appendix the fault tree is alsoconstructed with the top event on top of the page and all other events below it.
2.2. System Overview 13
Fatal technical failure
Main engine failure
Steering gear failure
Fuel system failure
Electrical system failure
Shafting failure
Cooling water system failure
Diesel generator failure
Other failure
3
SHEET 1
5
7
8
9
8.9%
11.1%
20.9%
38.7%
8.4%
6.7%
3.6%
1.7%
Figure 2.4: Fault tree with all system groups
14 2. Machinery Problems
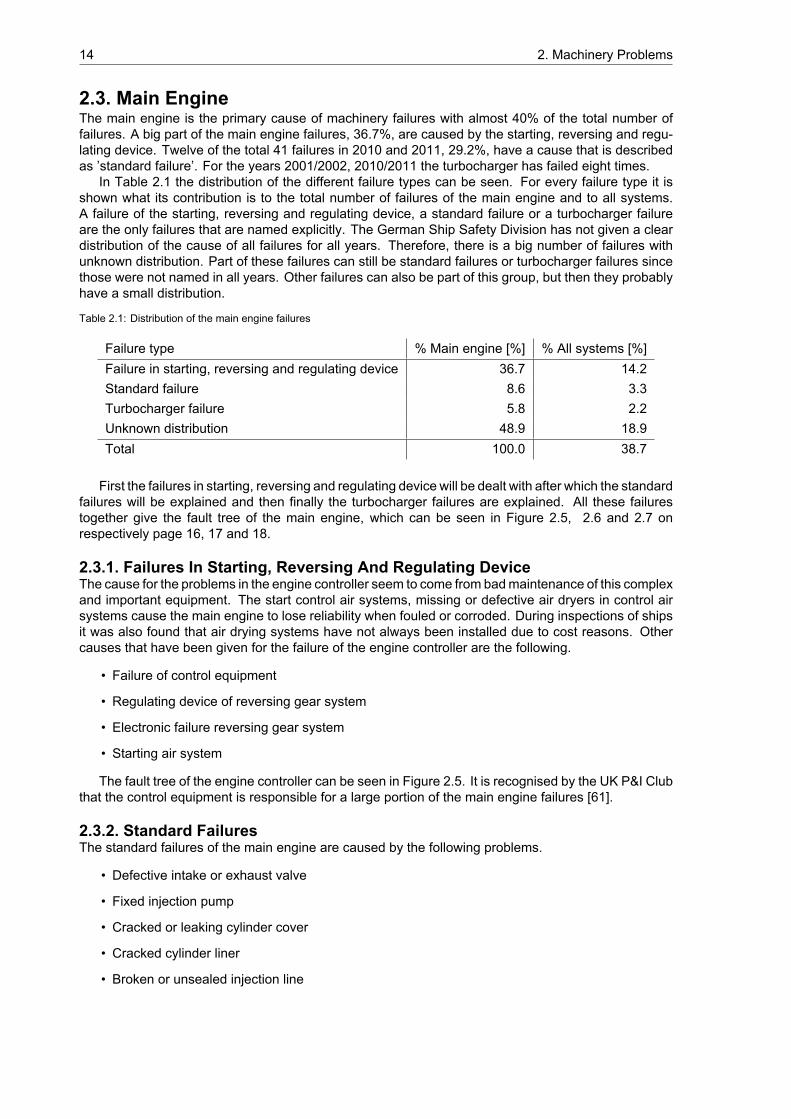
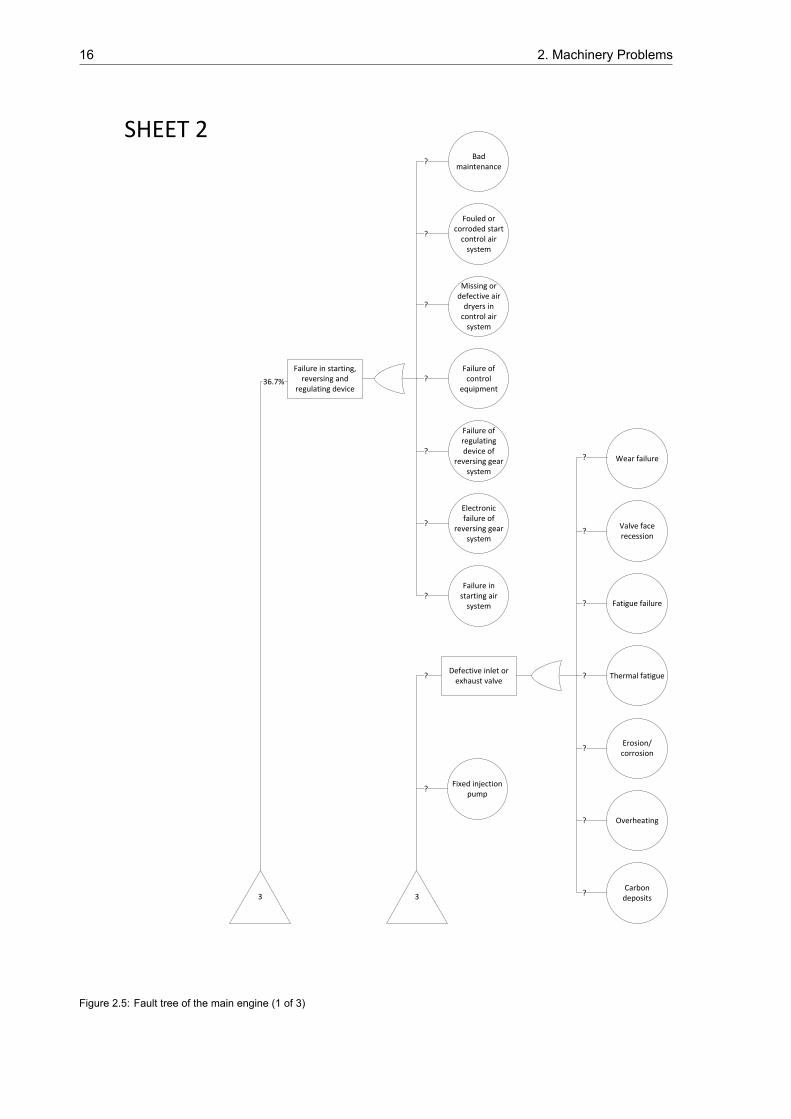
2.3. Main EngineThe main engine is the primary cause of machinery failures with almost 40% of the total number offailures. A big part of the main engine failures, 36.7%, are caused by the starting, reversing and regu-lating device. Twelve of the total 41 failures in 2010 and 2011, 29.2%, have a cause that is describedas ’standard failure’. For the years 2001/2002, 2010/2011 the turbocharger has failed eight times.
In Table 2.1 the distribution of the different failure types can be seen. For every failure type it isshown what its contribution is to the total number of failures of the main engine and to all systems.A failure of the starting, reversing and regulating device, a standard failure or a turbocharger failureare the only failures that are named explicitly. The German Ship Safety Division has not given a cleardistribution of the cause of all failures for all years. Therefore, there is a big number of failures withunknown distribution. Part of these failures can still be standard failures or turbocharger failures sincethose were not named in all years. Other failures can also be part of this group, but then they probablyhave a small distribution.
Table 2.1: Distribution of the main engine failures
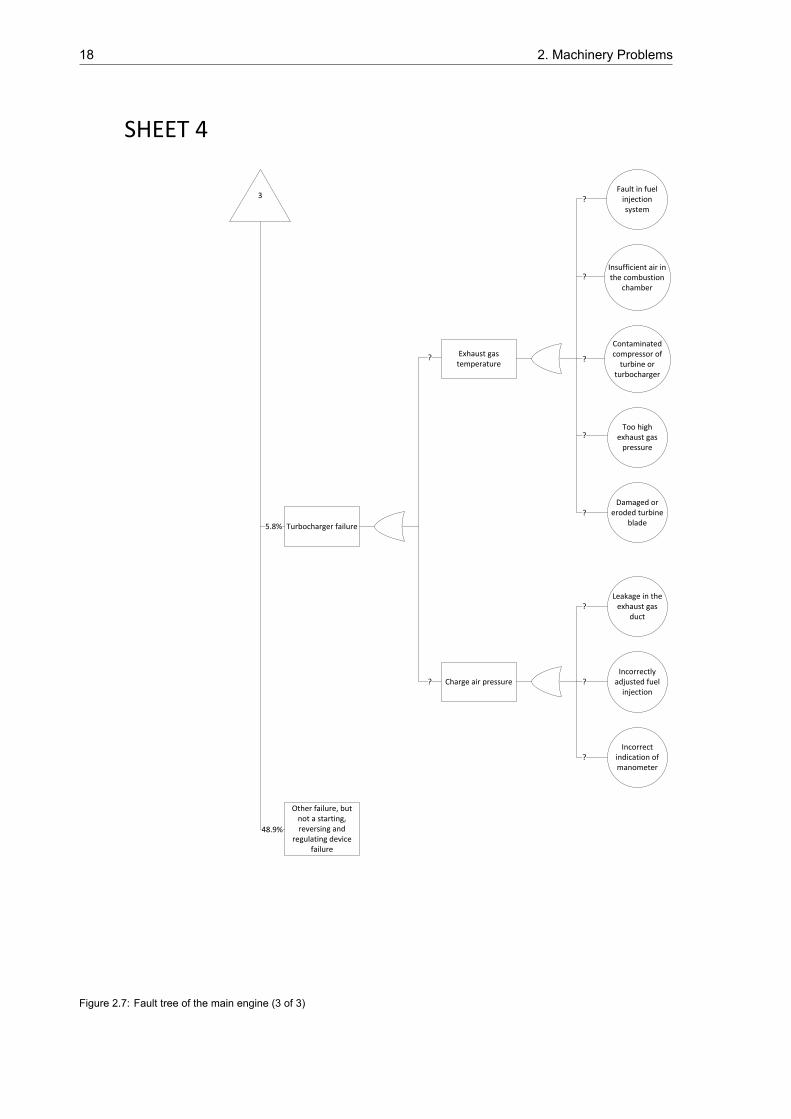
Failure type % Main engine [%] % All systems [%]Failure in starting, reversing and regulating device 36.7 14.2Standard failure 8.6 3.3Turbocharger failure 5.8 2.2Unknown distribution 48.9 18.9Total 100.0 38.7
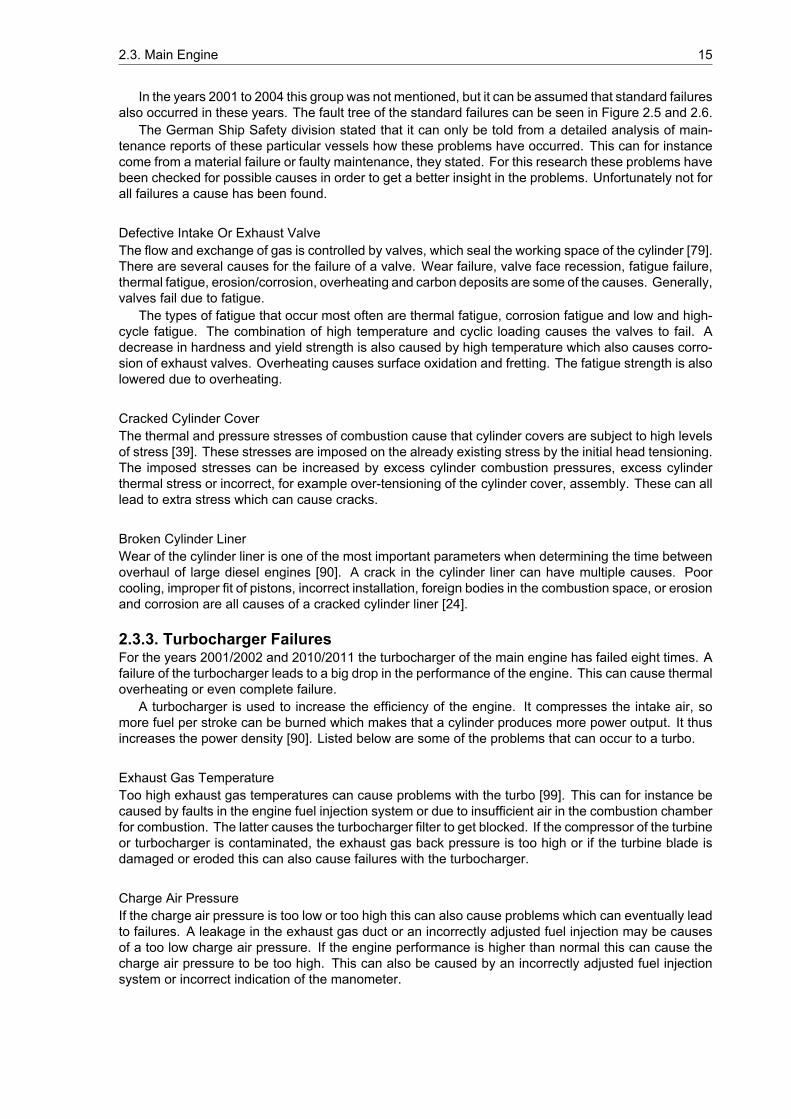
First the failures in starting, reversing and regulating device will be dealt with after which the standardfailures will be explained and then finally the turbocharger failures are explained. All these failurestogether give the fault tree of the main engine, which can be seen in Figure 2.5, 2.6 and 2.7 onrespectively page 16, 17 and 18.
2.3.1. Failures In Starting, Reversing And Regulating DeviceThe cause for the problems in the engine controller seem to come from badmaintenance of this complexand important equipment. The start control air systems, missing or defective air dryers in control airsystems cause the main engine to lose reliability when fouled or corroded. During inspections of shipsit was also found that air drying systems have not always been installed due to cost reasons. Othercauses that have been given for the failure of the engine controller are the following.
• Failure of control equipment
• Regulating device of reversing gear system
• Electronic failure reversing gear system
• Starting air system
The fault tree of the engine controller can be seen in Figure 2.5. It is recognised by the UK P&I Clubthat the control equipment is responsible for a large portion of the main engine failures [61].
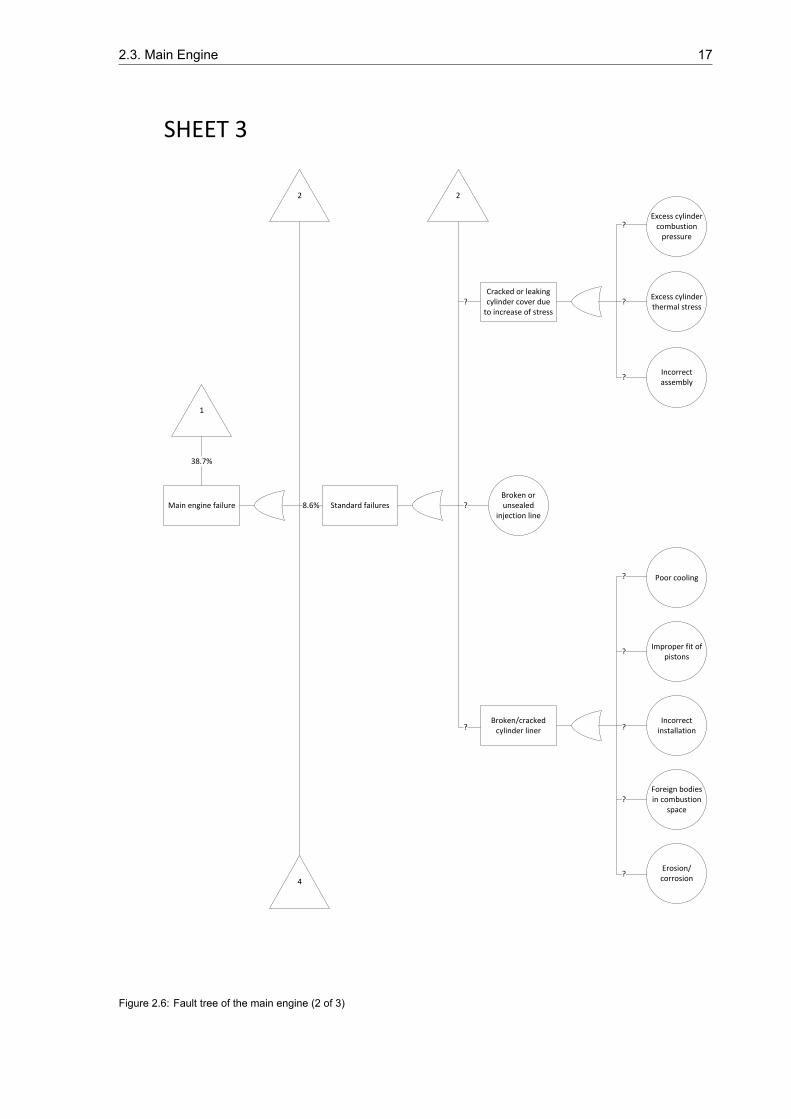
2.3.2. Standard FailuresThe standard failures of the main engine are caused by the following problems.
• Defective intake or exhaust valve
• Fixed injection pump
• Cracked or leaking cylinder cover
• Cracked cylinder liner
• Broken or unsealed injection line
2.3. Main Engine 15
In the years 2001 to 2004 this group was not mentioned, but it can be assumed that standard failuresalso occurred in these years. The fault tree of the standard failures can be seen in Figure 2.5 and 2.6.
The German Ship Safety division stated that it can only be told from a detailed analysis of main-tenance reports of these particular vessels how these problems have occurred. This can for instancecome from a material failure or faulty maintenance, they stated. For this research these problems havebeen checked for possible causes in order to get a better insight in the problems. Unfortunately not forall failures a cause has been found.
Defective Intake Or Exhaust ValveThe flow and exchange of gas is controlled by valves, which seal the working space of the cylinder [79].There are several causes for the failure of a valve. Wear failure, valve face recession, fatigue failure,thermal fatigue, erosion/corrosion, overheating and carbon deposits are some of the causes. Generally,valves fail due to fatigue.
The types of fatigue that occur most often are thermal fatigue, corrosion fatigue and low and high-cycle fatigue. The combination of high temperature and cyclic loading causes the valves to fail. Adecrease in hardness and yield strength is also caused by high temperature which also causes corro-sion of exhaust valves. Overheating causes surface oxidation and fretting. The fatigue strength is alsolowered due to overheating.
Cracked Cylinder CoverThe thermal and pressure stresses of combustion cause that cylinder covers are subject to high levelsof stress [39]. These stresses are imposed on the already existing stress by the initial head tensioning.The imposed stresses can be increased by excess cylinder combustion pressures, excess cylinderthermal stress or incorrect, for example over-tensioning of the cylinder cover, assembly. These can alllead to extra stress which can cause cracks.
Broken Cylinder LinerWear of the cylinder liner is one of the most important parameters when determining the time betweenoverhaul of large diesel engines [90]. A crack in the cylinder liner can have multiple causes. Poorcooling, improper fit of pistons, incorrect installation, foreign bodies in the combustion space, or erosionand corrosion are all causes of a cracked cylinder liner [24].
2.3.3. Turbocharger FailuresFor the years 2001/2002 and 2010/2011 the turbocharger of the main engine has failed eight times. Afailure of the turbocharger leads to a big drop in the performance of the engine. This can cause thermaloverheating or even complete failure.
A turbocharger is used to increase the efficiency of the engine. It compresses the intake air, somore fuel per stroke can be burned which makes that a cylinder produces more power output. It thusincreases the power density [90]. Listed below are some of the problems that can occur to a turbo.
Exhaust Gas TemperatureToo high exhaust gas temperatures can cause problems with the turbo [99]. This can for instance becaused by faults in the engine fuel injection system or due to insufficient air in the combustion chamberfor combustion. The latter causes the turbocharger filter to get blocked. If the compressor of the turbineor turbocharger is contaminated, the exhaust gas back pressure is too high or if the turbine blade isdamaged or eroded this can also cause failures with the turbocharger.
Charge Air PressureIf the charge air pressure is too low or too high this can also cause problems which can eventually leadto failures. A leakage in the exhaust gas duct or an incorrectly adjusted fuel injection may be causesof a too low charge air pressure. If the engine performance is higher than normal this can cause thecharge air pressure to be too high. This can also be caused by an incorrectly adjusted fuel injectionsystem or incorrect indication of the manometer.
16 2. Machinery Problems
Failure in starting, reversing and
regulating device
Bad maintenance
Fouled or corroded start
control air system
Missing or defective air
dryers in control air
system
Failure of control
equipment
Failure of regulating device of
reversing gear system
Electronic failure of
reversing gear system
Failure in starting air
system
Defective inlet or exhaust valve
Valve face recession
Thermal fatigue
Erosion/corrosion
Fatigue failure
Wear failure
Overheating
Carbon deposits
Fixed injection pump
3 3
SHEET 2
?
??
?
36.7%
?
?
?
?
?
?
?
?
?
?
?
?
Figure 2.5: Fault tree of the main engine (1 of 3)
2.3. Main Engine 17
Main engine failure Standard failures
Cracked or leaking cylinder cover due
to increase of stress
Excess cylinder thermal stress
Incorrect assembly
Excess cylinder combustion
pressure
Broken/cracked cylinder liner
Improper fit of pistons
Foreign bodies in combustion
space
Erosion/corrosion
Incorrect installation
Poor cooling
Broken or unsealed
injection line
2 2
1
4
SHEET 3
8.6%
?
?
?
?
?
?
?
?
38.7%
?
?
?
Figure 2.6: Fault tree of the main engine (2 of 3)
18 2. Machinery Problems
Turbocharger failure
Exhaust gas temperature
Fault in fuel injection system
Contaminated compressor of
turbine or turbocharger
Too high exhaust gas
pressure
Insufficient air in the combustion
chamber
Damaged or eroded turbine
blade
Charge air pressure
Leakage in the exhaust gas
duct
Incorrect indication of manometer
Incorrectly adjusted fuel
injection
3
SHEET 4
?
?
?
?
?
?
?
?
?
?
5.8%
Other failure, but not a starting, reversing and
regulating device failure
48.9%
Figure 2.7: Fault tree of the main engine (3 of 3)
2.4. Steering Gear 19
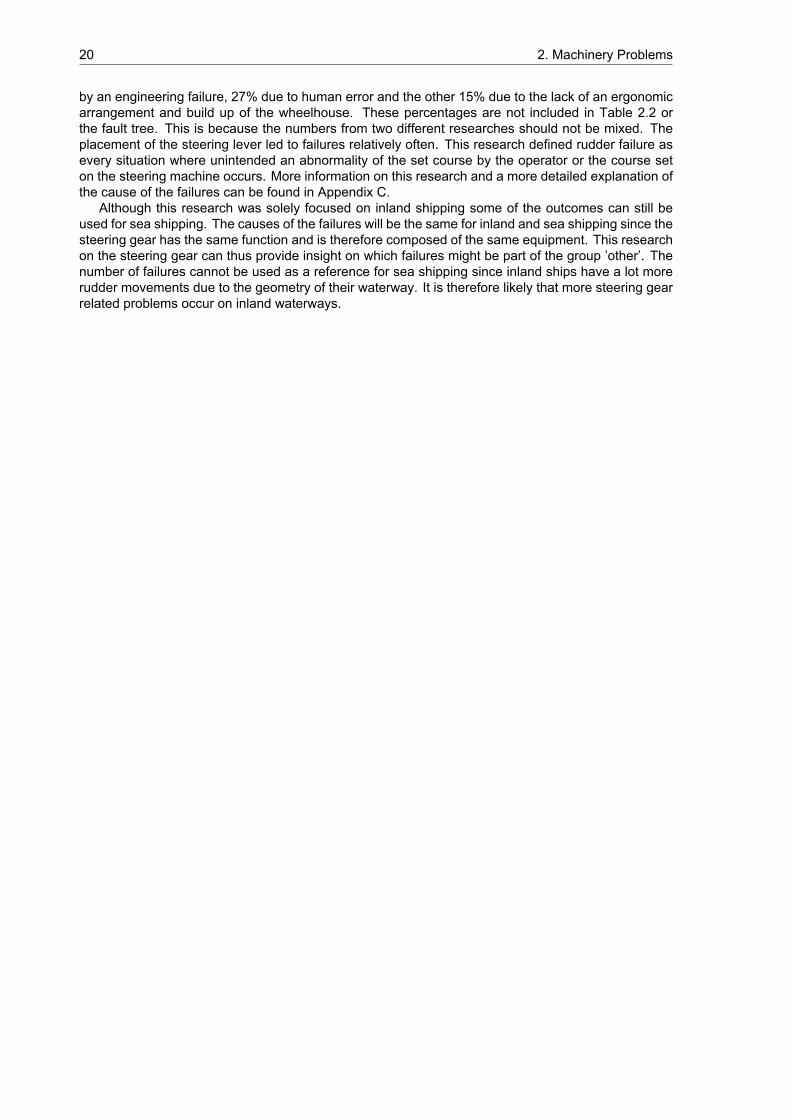
2.4. Steering GearThe steering gear comes at the second place regarding the number of failures over the six years thatare considered. A total of 75 failures, 20.9% of the total number, was registered. For the years 2010and 2011 a significant lower number of failures was registered compared to the years 2001 up to 2004but no clear cause for this reduction was found. The following reasons for failure of the steering gearwere given in the reports.
• Failure of electrical supply and control devices
• Others, with unknown cause
The distribution of the different types of failures can be seen in Table 2.2. The two failures as statedabove make up the biggest part of the number of failures. Their distribution of the steering gear failurescan be seen in the second column, whereas their contribution to the failures in all systems can be seenin the third column. There is also a big portion of failures with unknown distribution. These failures canbe part of the failure ’other failure’ or can be of an entirely different kind. This cannot be determinedfrom the reports by the German Ship Safety Division.
Table 2.2: Distribution of the steering gear failures
Failure type % Steering gear [%] % All systems [%]Failure of electrical supply and control devices 45.3 9.5Other failure 13.3 2.8Unknown distribution 41.3 8.6Total 100.0 20.9
There are two types of steering gear systems available: a hydraulic and an electrical system [40].It is not known from the failure statistics whether one of the two is more vulnerable to failures than theother. Unfortunately no causes for the failure of control devices are given. No other sources have beenfound which explain this failure type. It is therefore not possible to determine the causes of the failureof control devices.
First, the failure of electrical supply will be dealt with after which short-term failure will be discussed.Finally other steering gear failure research will be discussed and all failures are put in a fault tree, seeFigure 2.8 and 2.9 on respectively page 21 and page 22.
2.4.1. Failure Of Electrical SupplyA review of steering gear failures by The Washington State Department of Ecology shows that theelectrical components of the steering gear are responsible for just over half (20 of 34) of the failuresthey recorded [93]. Of these twenty failures six are caused by loose or broken electrical connections.Other reasons for the breakdowns of either the steering gear or the electrical system are not given.Still, this report shows that a failure of electrical supply has a big impact and that part of the cause lieswith loose or broken connections.
2.4.2. Short-Term FailuresThe failure statistics show that human error is for a great part responsible for the failures to the steeringgear. Terms such as ’short-term control failure’, ’rudder did not respond’ or ’short-term electrical supplyfailure’ were given by crew members to describe failures, but these were often not reproducible byauthorities and classification societies [30]. If these terms are stated it is clear that human error is inplay.
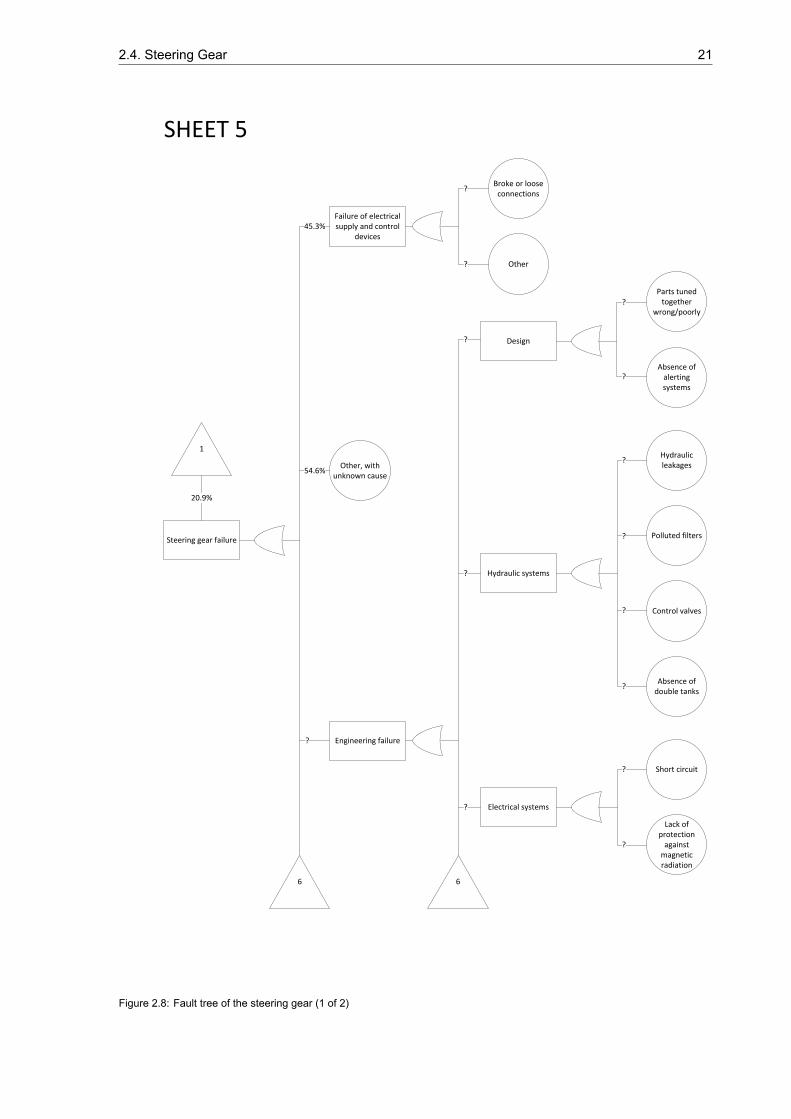
2.4.3. Other Steering Gear Failure ResearchA research on rudder failure on inland ships states that about every week a failure occurs that is causedby problems with the steering gear [54]. This failure rate applies to ships sailing on inland waterwaysthat fall within the Dutch management area. It is not known how many ships are sailing in this area onaverage. Their research found out that 58% of the accidents related to steering gear failure are caused
20 2. Machinery Problems
by an engineering failure, 27% due to human error and the other 15% due to the lack of an ergonomicarrangement and build up of the wheelhouse. These percentages are not included in Table 2.2 orthe fault tree. This is because the numbers from two different researches should not be mixed. Theplacement of the steering lever led to failures relatively often. This research defined rudder failure asevery situation where unintended an abnormality of the set course by the operator or the course seton the steering machine occurs. More information on this research and a more detailed explanation ofthe cause of the failures can be found in Appendix C.
Although this research was solely focused on inland shipping some of the outcomes can still beused for sea shipping. The causes of the failures will be the same for inland and sea shipping since thesteering gear has the same function and is therefore composed of the same equipment. This researchon the steering gear can thus provide insight on which failures might be part of the group ’other’. Thenumber of failures cannot be used as a reference for sea shipping since inland ships have a lot morerudder movements due to the geometry of their waterway. It is therefore likely that more steering gearrelated problems occur on inland waterways.
2.4. Steering Gear 21
Steering gear failure
Failure of electrical supply and control
devices
Broke or loose connections
Other
Other, with unknown cause
Engineering failure
Design
Parts tuned together
wrong/poorly
Absence of alerting systems
Hydraulic systems
Hydraulic leakages
Polluted filters
Control valves
Absence of double tanks
Electrical systems
Short circuit
Lack of protection
against magnetic radiation
1
6 6
?
?
?
?
?
?
?
?
?
?
?
?
?
?
45.3%
20.9%
54.6%
SHEET 5
Figure 2.8: Fault tree of the steering gear (1 of 2)
22 2. Machinery Problems
Human error
Failure due to ergonomics
Stand and control that do
not meet ergonomic standards
Wrong placement
steering lever
Alarm systems
Absence of an alarm
Acoustic alarm did not function
properly
Faulty light
Cut electric wires
Mechanical systems
Other
Play in gears, rollers and
bearings due to bad maintenance
5 5
SHEET 6
?
?
?
?
?
?
?
?
?
?
?
?
Figure 2.9: Fault tree of the steering gear (2 of 2)
2.5. Fuel System 23
2.5. Fuel SystemA failure in the fuel system has serious consequences since it often leads to an abrupt loss of propulsionand manoeuvrability of the vessel due to the stop of main engine(s) and generator(s). For the years2001 and 2002 some of the causes were: insufficient fuel care, fuel of poor quality and strong vibrationsof fuel lines which causes material fatigue or fractures. A broken fuel line, air in the fuel system, fuelintolerance and the fuel filter were some of the other main causes.
Secondary causes to the fuel system failures are due to the interpretation of building codes. Costsavings for new build ships were achieved by combining the fuel systems for the main engine andauxiliary engines. A problem in the fuel system than affects both engines.
For the years 2010 and 2011 the fuel system is responsible for more failures compared to 2001 upto 2004. For the years 2001 up to 2004 the fuel system was responsible for 9.2% of the total failureswhereas it was responsible for 15.5% of the failures for the later years. The biggest part of the failureswith the fuel system in 2010/2011, 58.8%, have a direct link to the MARPOL rules regarding the use oflow-sulphur fuels.
Only for the fuel intolerance some numbers are available to determine its contribution to the totalnumber of failures of the fuel system and all systems. These percentages can be seen in Table 2.3.Of the failures in the fuel system 75.0% has a unknown distribution. This can come from all failures asmentioned earlier, insufficient fuel care, fuel of poor quality, strong vibrations of the fuel line, a brokenfuel line, air in the fuel system and the fuel filter. It can also be that the influence of fuel intoleranceis bigger, due to the fact that specific numbers were only given for one year. Since a big part of thefailures has an unknown distribution it is difficult to use these number for further calculations.
Table 2.3: Distribution of the fuel system failures
Failure type % Fuel system [%] % All systems [%]Fuel intolerance 25.0 2.8Unknown distribution 75.0 8.4Total 100.0 11.1
First insufficient fuel care will be dealt with, after which fuel of poor quality is discussed. Then thecauses for a broken fuel pipe, air in the fuel system and fuel intolerance will be explained. At last, fuelfilter failures are discussed. This all leads to the fault tree of the fuel system, which can be seen inFigure 2.10 on page 26.
2.5.1. Insufficient Fuel CareBefore fuel can be delivered to the engine for combustion it has to be transferred from the storagetanks through heaters, filters and purifiers in order to meet the specifications as set by the enginemanufacturer. If the fuel is not taken care of in a sufficient way, problems can arise during this process.The need for low sulphur fuels has caused changes in the fuel refining process, which has resultedin lower quality HFO being delivered to ships [41]. Different oil components are mixed in order tooptimise the sulphur content. This can create side effects such as instability, incompatibility, ignitionand combustion difficulties.
When the fuel is according to the specifications, problems can still occur. Sediment can build upin the tanks, which causes new fuel to contaminate. The mixing of fuel from different bunker locationscan lead to unstable fuel. Unstable fuels are subject to asphaltene settlement which can be whirled upduring rough weather. This can cause blockages and engine failures [96].
2.5.2. Fuel Of Poor QualityFuel with poor properties has a negative effect on the reliability [7]. Marine diesel fuel is supposed tocool and lubricate the injection system. When this is not properly done it can lead to excessive wear andpremature failure of either the injectors or the fuel pump. Some of the contaminants found in marinefuel oil are: water, Sodium, sediment, Alumina/Silica, sludge, fibres and oxidation products [6].
An example of the effect of poor fuel quality is given by Gard [42]. A ship had bunkered HFO in theFar East. It had received samples to test it, but none of them were analysed. It was scheduled to sailto Europe, therefore it was bunkered to almost full capacity. When the ship had just left port the new
24 2. Machinery Problems
fuel was being used for the first time. Soon an abnormal sludge generation was experienced whichresulted in excessive water-sludge content in settling and service tanks. This caused problems in theperformance of the main engine. Due to this performance problem the speed was lowered. During theday they had to stop several times in order to replace fuel valves, fuel pumps and to clean filters andchange exhaust valves. When arriving in port several days late, a lot of repairs had to be done. All thefuel bunkered in the Far East was pumped out and all pistons were dismantled and repaired, as well asthe piston rings. Some piston top rings were broken or badly worn and one of the cylinder liners wascracked. The fuel system of the engine also had to be overhauled, as well as the turbocharger. If thefuel would have been tested they would have found that it did not meet specifications.
It is very clear that fuel of poor quality can have a very strong effect on the machinery. When thefuel is not within the limits as specified by the engine manufacturer it can result in a total overhaul of allcomponents in the engine room. This is an expensive operation.
2.5.3. Broken Fuel PipeA broken fuel pipe obviously causes a problem since no fuel can be delivered to the engine. Corrosion-induced weakness is the most common cause of a pipe failure [67]. Pipes corrode both on the insideand on the outside. On the inside the pipes may be subject to erosion, fatigue and galvanic action,while they are mainly subject to corrosion due to atmospheric conditions on the outside. They can alsocorrode locally on the outside due to the dripping of liquids onto them. If clamps have loosened pipescan also erode if fretting occurs.
Some pipes are forced into alignment which causes stress in the pipe. This can cause a failurewhen other stresses are induced, for instance due to thermal expansion or impulse loading.
2.5.4. Air In The Fuel SystemWhen fuel is stored and at rest air is not visible in the fuel. The air will separate from the fuel, as the fuelstarts to move. The air collects at the high points along its path. If the air bubbles are not separatedfrom the fuel it can reach the fuel injection system, causing an Interrupted Exhaust Beat (IEB) [72].Depending on the amount of air that enters the engine this can cause the engine to shut down. Thishappens if multiple cylinders get a wrong mix of fuel to air.
Air can only come in the engine if the fuel is not properly filtered before reaching the engine. It canthus be said that this problem is caused due to a flaw in the design of the fuel system.
2.5.5. Fuel IntoleranceSwitching between two fuels is a very delicate process, causing fuel intolerance to be the problem inten out of seventeen failures for the years 2010/2011. For the years 2010 and 2011 fuel intolerancehas a larger failure distribution than for the years 2001 through 2004 which is caused by MARPOLAnnex VI since it limits the exhaust gasses. MARPOL Annex VI also named four areas to be emissioncontrol areas. More information on MARPOL Annex VI can be found in Appendix D. In emission controlareas HFO cannot be used, if no exhaust gas treatment system is installed, since it contains too muchSulphur. Sailing on cleaner fuel is the most used solution for this problem. Since this is more expen-sive, the fuel type is changed only just before entering or directly after leaving the emission controlarea. Fuel intolerance often has serious consequences such as abrupt fatal technical failure, loss ofmanoeuvrability or even a blackout, in case of an auxiliary engine.
The California Office of Spill Prevention confirms that the MARPOL rule causes incidents regardingthe fatal technical failure. They claim that a third of the total fatal technical failure cases have to do withthis new MARPOL Annex VI rule [81].
Timing is crucial in a fuel change-over when mixing fuels with different sulphur contents. The tem-perature changes can cause problems when mixing is done incorrectly. Drastic temperature changescan result in thermal expansions which may result in irregular fuel pump operation, ultimately causingseizures in the worst case. MAN has recommended a 2 ∘C per minute increase during fuel change.The viscosity of the fuel also affects the process. Both lowering the temperature of HFO as well as rais-ing the temperature of MGO are impractical. This can respectively risk overloading of the fuel pump orgassing of the system.
High temperature in both the fuel system and engine room cause a reduction of the viscosity of theMGO. This can have internal leakage in the engine fuel pump as a consequence, which can causedifficulties when starting the engine, astern operation or when the engine is used at low load. In the
2.5. Fuel System 25
fuel system several pumps, such as the engine fuel pump, transfer pump, circulating pump and supplypumps require a minimum viscosity of 2 cSt for proper operation.
The State of California recognizes six categories when it comes to a fatal technical failure [92].Three of these categories apply to the fuel system. One category is for all problems that occur withcontrolling the temperature of the distillate fuel. The heating of either MGO or MDO may cause theso called flashing, the vaporising of the lighter fuel. The fuel injectors do not work when the fuel hasflashed. This flashing causes a loss of power in a cylinder. When this occurs in multiple cylinders thiscould result in a fatal technical failure.
Another fatal technical failure category involves incidents regarding the loss of fuel oil pressure. Thiscan occur either to the fuel pumps or fuel injectors. The heavy fuel can only be used when it is heatedto 150 ∘C in order to get it flowing. This expands the metal that the fuel runs through. When the fuel isswitched to distillate there is a big temperature drop since these do not need to be heated and can beburned at about 40 ∘C. This causes the metal to contract, causing a loss of fuel pressure. It also causesa marginal spray pattern and leaks at the injector. Any leaks can cause external combustion, or evenfire. The recommended interval for replacing O-rings is 10,000 hours according to the manufacturer,but has been found to be 2,000 hours in reality.
The last fuel related category involves the loss of fuel oil pressure or the loss of flow. HFO of a lowergrade has high amounts of asphaltenes. These settle in the fuel lines and other components. WhenMGO is later run trough the system this releases the asphaltenes. This causes strainers and filters toclog.
2.5.6. Fuel Filter FailuresThe problems from the fuel filter originate for a great part from the quality of the fuel. If there are a lot ofsediments in the fuel those will be separated in the fuel filter. If the amount of contaminants in the fuelis higher than the specifications of the manufacturer allow, the filter is full within less hours of service.A clogged filter can stop the supply of fuel to the engine which causes it to stop.
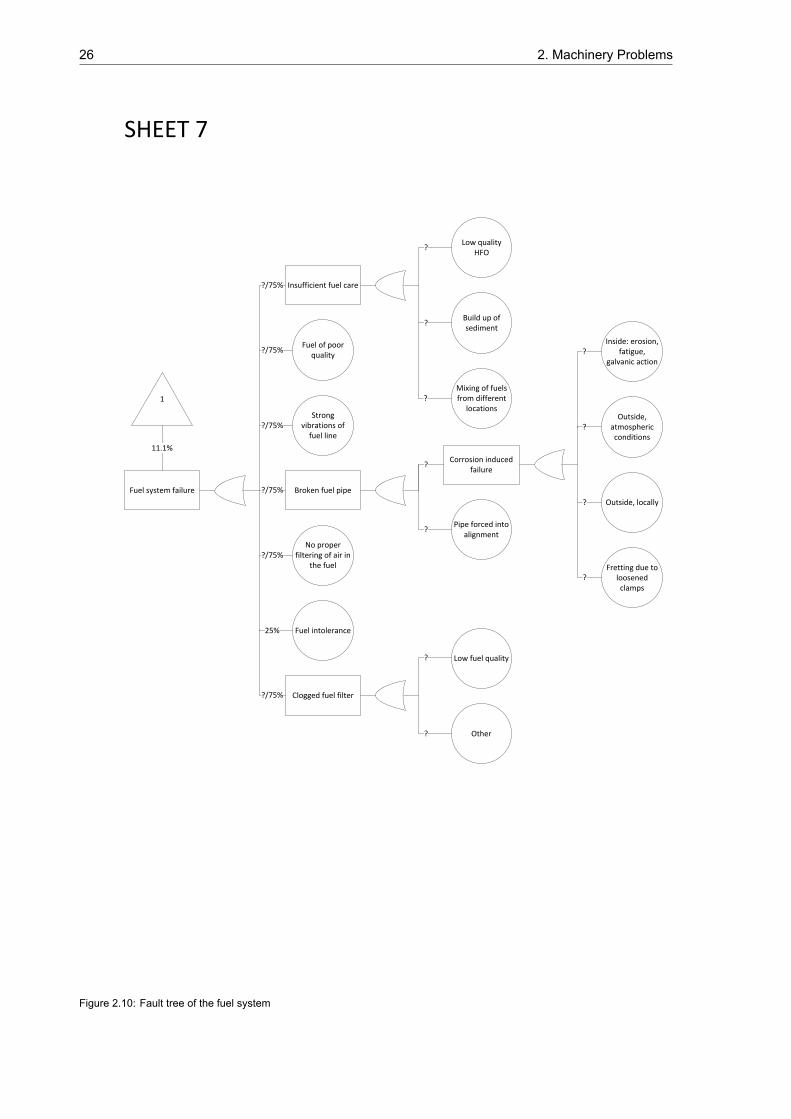
26 2. Machinery Problems
Fuel of poor quality
No proper filtering of air in
the fuel
Low fuel quality
Build up of sediment
Mixing of fuels from different
locationsStrong
vibrations of fuel line
Broken fuel pipe
Fuel intolerance
Clogged fuel filter
Corrosion induced failure
Pipe forced into alignment
Inside: erosion, fatigue,
galvanic action
Outside, atmospheric conditions
Outside, locally
Other
Fretting due to loosened clamps
1
Fuel system failure
Insufficient fuel care
Low quality HFO
11.1%
?/75%
?
SHEET 7
25%
?/75%
?/75%
?/75%
?/75%
?/75%
?
?
?
?
?
?
?
?
?
?
Figure 2.10: Fault tree of the fuel system
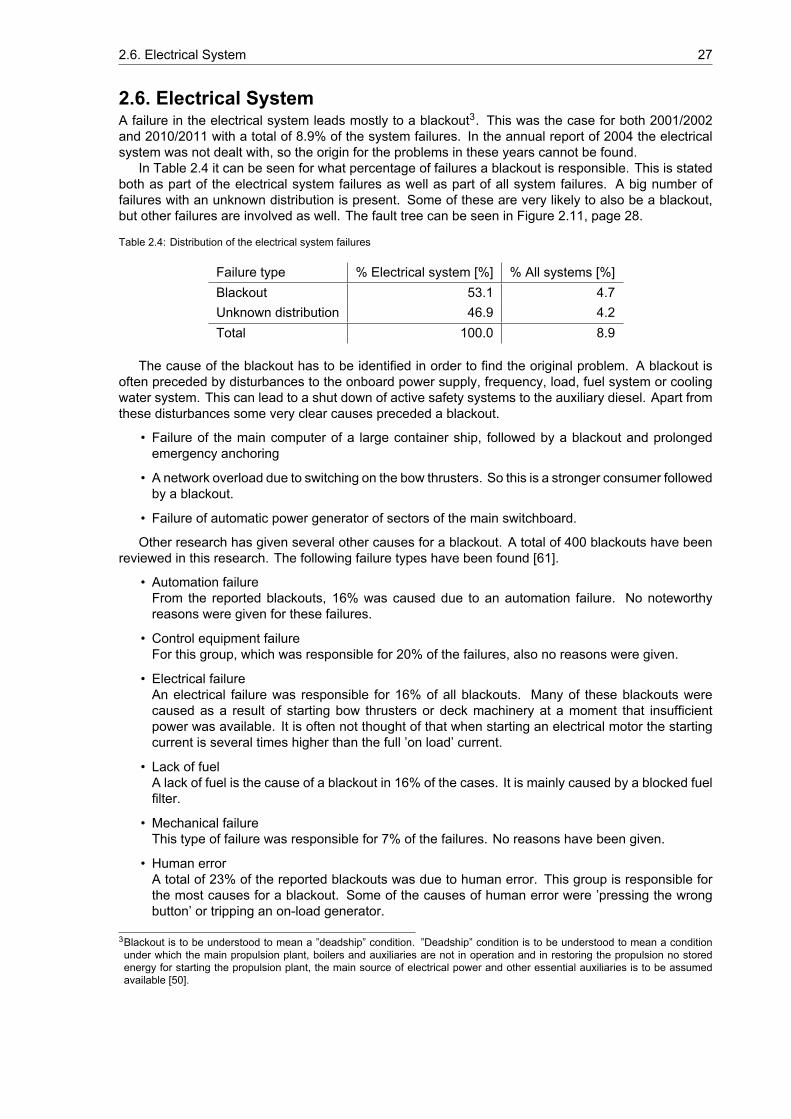
2.6. Electrical System 27
2.6. Electrical SystemA failure in the electrical system leads mostly to a blackout3. This was the case for both 2001/2002and 2010/2011 with a total of 8.9% of the system failures. In the annual report of 2004 the electricalsystem was not dealt with, so the origin for the problems in these years cannot be found.
In Table 2.4 it can be seen for what percentage of failures a blackout is responsible. This is statedboth as part of the electrical system failures as well as part of all system failures. A big number offailures with an unknown distribution is present. Some of these are very likely to also be a blackout,but other failures are involved as well. The fault tree can be seen in Figure 2.11, page 28.
Table 2.4: Distribution of the electrical system failures
Failure type % Electrical system [%] % All systems [%]Blackout 53.1 4.7Unknown distribution 46.9 4.2Total 100.0 8.9
The cause of the blackout has to be identified in order to find the original problem. A blackout isoften preceded by disturbances to the onboard power supply, frequency, load, fuel system or coolingwater system. This can lead to a shut down of active safety systems to the auxiliary diesel. Apart fromthese disturbances some very clear causes preceded a blackout.
• Failure of the main computer of a large container ship, followed by a blackout and prolongedemergency anchoring
• A network overload due to switching on the bow thrusters. So this is a stronger consumer followedby a blackout.
• Failure of automatic power generator of sectors of the main switchboard.
Other research has given several other causes for a blackout. A total of 400 blackouts have beenreviewed in this research. The following failure types have been found [61].
• Automation failureFrom the reported blackouts, 16% was caused due to an automation failure. No noteworthyreasons were given for these failures.
• Control equipment failureFor this group, which was responsible for 20% of the failures, also no reasons were given.
• Electrical failureAn electrical failure was responsible for 16% of all blackouts. Many of these blackouts werecaused as a result of starting bow thrusters or deck machinery at a moment that insufficientpower was available. It is often not thought of that when starting an electrical motor the startingcurrent is several times higher than the full ’on load’ current.
• Lack of fuelA lack of fuel is the cause of a blackout in 16% of the cases. It is mainly caused by a blocked fuelfilter.
• Mechanical failureThis type of failure was responsible for 7% of the failures. No reasons have been given.
• Human errorA total of 23% of the reported blackouts was due to human error. This group is responsible forthe most causes for a blackout. Some of the causes of human error were ’pressing the wrongbutton’ or tripping an on-load generator.
3Blackout is to be understood to mean a ”deadship” condition. ”Deadship” condition is to be understood to mean a conditionunder which the main propulsion plant, boilers and auxiliaries are not in operation and in restoring the propulsion no storedenergy for starting the propulsion plant, the main source of electrical power and other essential auxiliaries is to be assumedavailable [50].
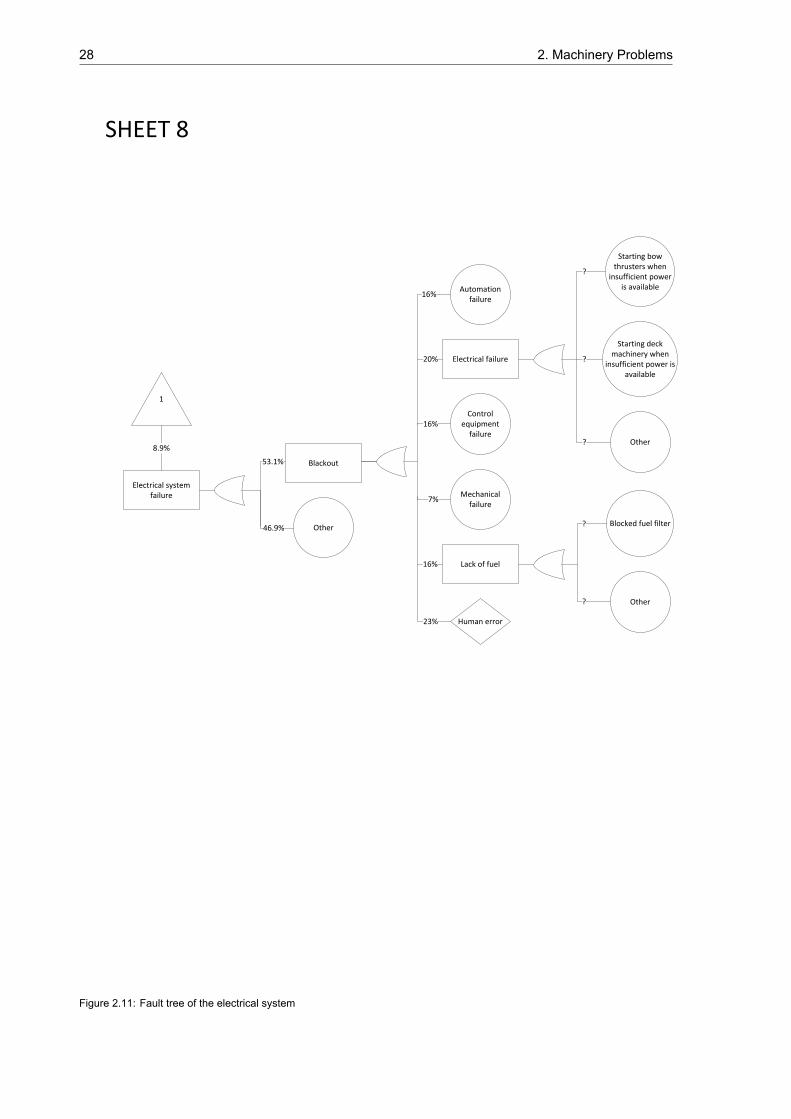
28 2. Machinery Problems
Electrical system failure
Blackout
Other
Automation failure
Electrical failure
Control equipment
failure
Mechanical failure
Lack of fuel
Human error
Starting bow thrusters when
insufficient power is available
Starting deck machinery when
insufficient power is available
Other
Blocked fuel filter
Other
?
1
8.9%
SHEET 8
46.9%
53.1%
16%
20%
16%
7%
16%
23%
?
?
?
?
Figure 2.11: Fault tree of the electrical system
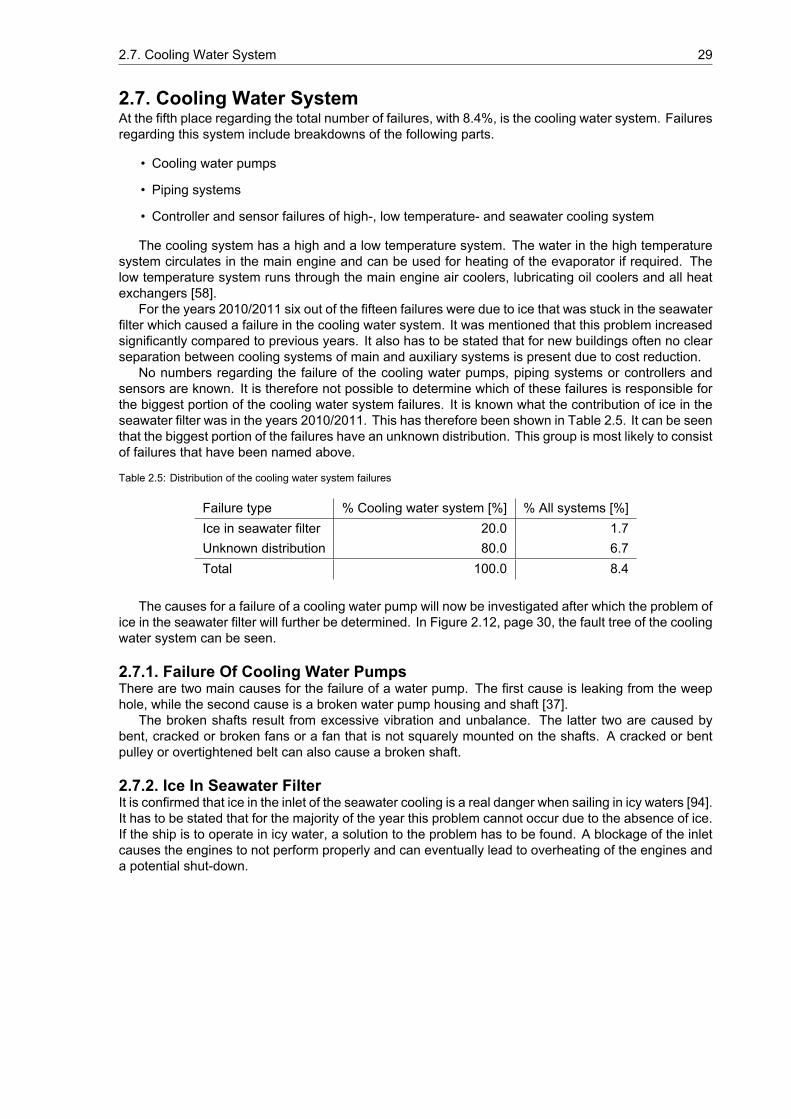
2.7. Cooling Water System 29
2.7. Cooling Water SystemAt the fifth place regarding the total number of failures, with 8.4%, is the cooling water system. Failuresregarding this system include breakdowns of the following parts.
• Cooling water pumps
• Piping systems
• Controller and sensor failures of high-, low temperature- and seawater cooling system
The cooling system has a high and a low temperature system. The water in the high temperaturesystem circulates in the main engine and can be used for heating of the evaporator if required. Thelow temperature system runs through the main engine air coolers, lubricating oil coolers and all heatexchangers [58].
For the years 2010/2011 six out of the fifteen failures were due to ice that was stuck in the seawaterfilter which caused a failure in the cooling water system. It was mentioned that this problem increasedsignificantly compared to previous years. It also has to be stated that for new buildings often no clearseparation between cooling systems of main and auxiliary systems is present due to cost reduction.
No numbers regarding the failure of the cooling water pumps, piping systems or controllers andsensors are known. It is therefore not possible to determine which of these failures is responsible forthe biggest portion of the cooling water system failures. It is known what the contribution of ice in theseawater filter was in the years 2010/2011. This has therefore been shown in Table 2.5. It can be seenthat the biggest portion of the failures have an unknown distribution. This group is most likely to consistof failures that have been named above.
Table 2.5: Distribution of the cooling water system failures
Failure type % Cooling water system [%] % All systems [%]Ice in seawater filter 20.0 1.7Unknown distribution 80.0 6.7Total 100.0 8.4
The causes for a failure of a cooling water pump will now be investigated after which the problem ofice in the seawater filter will further be determined. In Figure 2.12, page 30, the fault tree of the coolingwater system can be seen.
2.7.1. Failure Of Cooling Water PumpsThere are two main causes for the failure of a water pump. The first cause is leaking from the weephole, while the second cause is a broken water pump housing and shaft [37].
The broken shafts result from excessive vibration and unbalance. The latter two are caused bybent, cracked or broken fans or a fan that is not squarely mounted on the shafts. A cracked or bentpulley or overtightened belt can also cause a broken shaft.
2.7.2. Ice In Seawater FilterIt is confirmed that ice in the inlet of the seawater cooling is a real danger when sailing in icy waters [94].It has to be stated that for the majority of the year this problem cannot occur due to the absence of ice.If the ship is to operate in icy water, a solution to the problem has to be found. A blockage of the inletcauses the engines to not perform properly and can eventually lead to overheating of the engines anda potential shut-down.
30 2. Machinery Problems
Cooling water system failure
Cooling water pump failure
Leaking from weep hole
Piping systems failure
Controller and sensor failure of high-, low
temperature and seawater cooling system
Ice in seawater filter
Broken water pump housing and shaft
Bent, cracked or broken fan
A fan that is not squarely
mounted on the shafts
Cracked or bent pulley
Overtightened belt
1
?/80%
8.4%
SHEET 9
?/80%
?/80%
20%
?
?
?
?
?
?
Figure 2.12: Fault tree of the cooling water system

2.8. Contribution Of Human Error To Machinery Failures 31
2.8. Contribution Of Human Error To Machinery FailuresIn Section 2.4 through Section 2.7 it was found that human error was the cause for multiple failures.This section will review the type of faults that are connected to human error to get an rough numberon the percentage of machinery failures caused by humans. For the failures which occur due to man-made errors no solutions have to be found since these will no longer occur on board if the ship is madeautonomous. If certain tasks are moved ashore, and done by humans, this might make that new humaninduced failures occur. However, that does not fall within the scope of this thesis.
For each of the five systems it will be reviewed what the impact of human error is. The calculationsin this section are rough calculations since no accurate data is available for all specific failures. Forsome failures human error will be held totally responsible although it is only part of the cause. For otherfailures human error will have to be neglected since no numbers are available. It is assumed that thismethod is roughly correct and levels out over the systems. The number that is eventually determinedshould therefore be taken as a ballpark figure and not as an exact number. These human inducedfailures can be placed in a fault tree, for better understanding of the problem.
For each of the failures caused by human error it is determined what their contribution is to the totalnumber of failures in a specific system group. This number is then multiplied with the contribution ofthat system to the total number of failures over all system groups. This way the contribution of a specificbasic event as a part of the entire system can be determined.
𝑃Event as part of all failures = 𝑃Contribution of event to system failures ∗ 𝑃Contribution of system failures to all failures (2.3)
It was found that for the main engine and cooling water system no failures were caused by humanerror. Human error causes failures in the steering gear, fuel system and electrical system. For thesethree systems it will be explained what the influence of human error is.
2.8.1. DefinitionsIn order to work with the term human error it is necessary to state the definition. The definition of humanerror is found to be [27].
’This is the failure to carry out a specified task (or the performance of a forbidden action) thatcould lead to disruption of scheduled operations or result in damage to property and equipment.’
Another term that is often used in combination with human error is human factors. The definition ofhuman factors is.
’This is a study of the interrelationships between humans, the tools they utilize, and the surround-ing environment in which they live and work.’
For this thesis it is both important to know how often human error occurs, but it is also important toknow within which systems it occurs. Therefore both human error and human factors are relevant.
2.8.2. Steering GearIt was found earlier that short-term failures in the steering gear are very likely to be caused by humanerror. These failures cannot be reproduced by authorities which showed that human error was in play.Other research confirmed that human error has a direct link with steering gear incidents in 27% of thecases. With the steering gear being responsible for 20.9% of the total number of failures it can bedetermined that human error in the steering gear is responsible for 5.6% of the total failures. This partof the failures will no longer occur on board if the ship is sailing autonomous, but can move ashoredependent on the automation form of the ship.
The failures due to ergonomics are also human error. These are responsible for 15% of the totalnumber of rudder failures as determined by other rudder research. This makes that the failures due toergonomics are responsible for 3.1% of the total number of failures.
32 2. Machinery Problems
2.8.3. Fuel SystemHuman error is not directly responsible for failures in the fuel system. Insufficient fuel care, fuel of poorquality, a broken fuel pipe and the fuel filter though all have a connection with human error either in thedecision making process or maintenance wise. It is not known how much these failures contribute toall failures in the fuel system, so it is assumed that their contribution is 0.0%.
In case of fuel intolerance human error contributes to the failure. Switching between fuels is a verydelicate process which is obviously affected by human interference. In 2010/2011 fuel intolerance wasresponsible for 58.8% of the failures. With the fuel system being responsible for 11.1% of the failures,this makes that fuel intolerance is responsible for 6.5% of the total number of failures over all systemgroups. This form of human error will no longer be present on board but might move ashore, if fuelswitching can be used for unmanned sailing.
2.8.4. Electrical SystemA blackout is the main cause for a failure in the electrical system. It is found that 23% of the blackoutsare directly caused by human error. Since the electrical system is responsible for 8.9% of the failuresit can be determined that human error in the electrical system is the cause for 2.1% of all failures. Thisgroup will no longer exist when the ship is sailing unmanned.
The electrical failures which led to a blackout were mostly caused by an overload of the net whenswitching on machinery. The decision to switch on machinery is made by humans, who also madethe decision not to switch off other machinery or generate more power. It can thus be said that thesefailures are also caused by human error. With this failure type being responsible for 16% of the causesof the blackouts it is responsible for 1.4% of the total failures. Depending on the operating modus ofthe ship this failure will still be present in an unmanned modus.
2.8.5. Human Error In A Fault TreeAdding the contribution of human error to failures in steering gear, fuel system and electrical systemgives the total percentage of human error in all systems. It can thus be determined that human error isresponsible for 18.7% of the total number of failures. In Figure 2.13 the fault tree of the entire systemis shown, with all events that are caused by human error next to the corresponding systems.
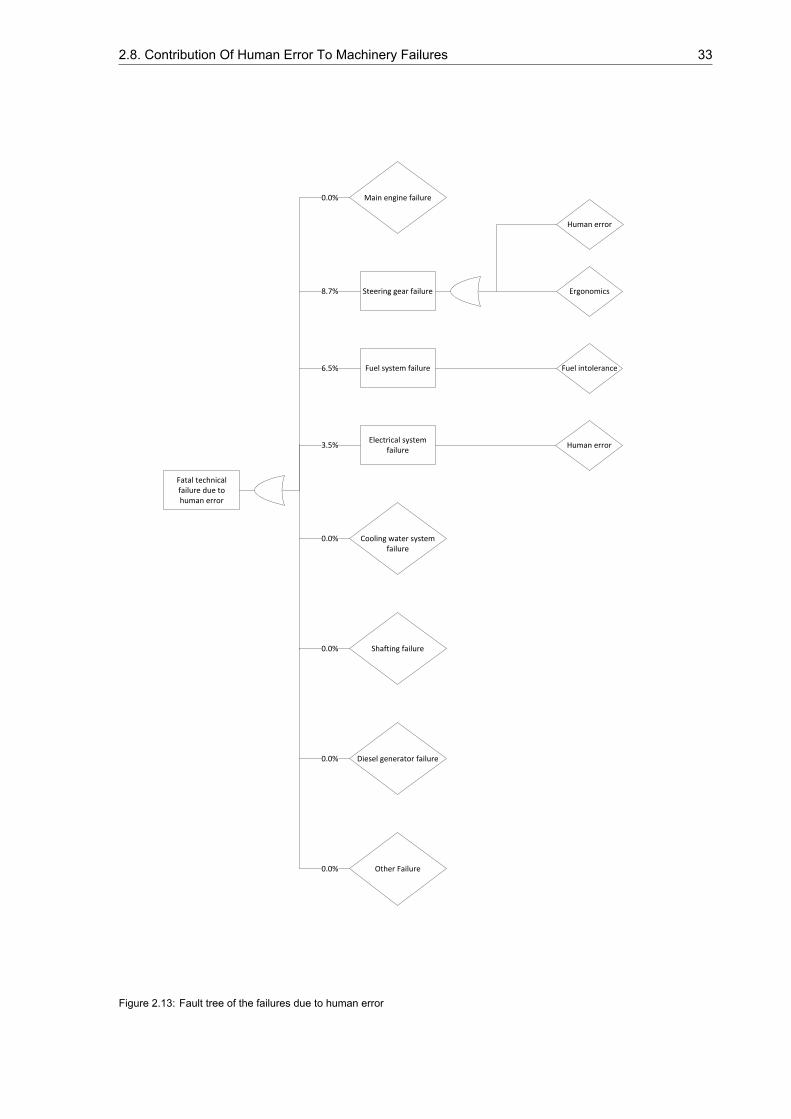
2.8. Contribution Of Human Error To Machinery Failures 33
Fatal technical failure due to human error
Steering gear failure
Fuel system failure
Electrical system failure
Shafting failure
Diesel generator failure
Other Failure
Main engine failure
Human error
Ergonomics
Fuel intolerance
Human error
Cooling water system failure
0.0%
8.7%
6.5%
3.5%
0.0%
0.0%
0.0%
0.0%
Figure 2.13: Fault tree of the failures due to human error
34 2. Machinery Problems
2.9. Contribution Of Improper Maintenance To Machinery FailuresFor multiple failures it was said that improper maintenance was (partly) the cause of a failure. This wasthe case for multiple systems which means that improper maintenance has a high impact on causingfailures.
Maintenance has a high vulnerability to errors since it can be complex and involves the frequentreplacement of various parts. A high level of skills is necessary in order to detect faults that are difficultto spot or occur infrequently [75]. Human error in maintenance can occur in several ways.
• Omission errorComponent/part not installed or replaced
• Incorrect action errorWrong component/part installed or replaced; wrong check carried out
• Not restored to operational state errorSystem not reactivated/deactivated
• Procedural errorFailure to carry out inspection
In the past, maintenance errors have led to big incidents such as the Piper Alpha oil productionplatform explosion (maintenance error which led to a leak and eventually caused the explosion) andthe Erika oil spill (a poor organisation of maintenance tasks and procedures caused one of the worst oilspills ever in Europe). Improper maintenance is also found to be the main cause of fires and explosionsin ships [78].
Maintenance is a cost that ship owners want to minimize as much as possible. If a ship is beingmaintained it does not make money, in an unmanned setting. Unnecessary costs due to maintenancetaking longer than expected or due to a lower maintenance interval have to be avoided. The push formaintenance to be done quickly and within budget can thus cause problems at a later moment.
The design of equipment and maintenance tasks influences the maintenance performance. Equip-ment that is difficult to maintain is likely to contribute to maintenance errors. A poor design of equipmentis a causal factor in one-third of the marine casualties [100].
A study on maintenance manuals reviewed whether the manuals were good enough [21]. It wasfound that seafarers are estimated to be able to work quickly with different types of equipment anddeliver high standards. They are often switched between ship types, so they have to be flexible. Whenswitching from one ship type to another, theymight encounter equipment they have not been specificallytrained for. This has contributed to marine accidents in the past.
It was also found that the manuals provided to the seafarers are varying in quality consideringspecificity, content, language and presentation. The language provided is not always one that the crewhas sufficient knowledge of. If the manual is of poor quality this leads to an increase of human error.
Since there is no standard for technical and/or operational documentation this is a process thatcosts money. Only a few owners and operators invest in reports since this is a costly option. The riskof human error would be reduced if standards for documentation are available.
The next subsection will determine what the impact of improper maintenance is on the total numberof failures. It was found that improper maintenance has an effect on the main engine, steering gear,and electrical system, but not on the fuel system and cooling water system.
2.9.1. Main EngineThis system group is responsible for 38.7% of the total failures. The cause for the problems with thestarting, reversing and regulating device seem to come from bad maintenance. Since 36.7% of theengine failures are caused by this device, this means that the starting, reversing and regulating deviceis responsible for 14.2% of the total number of failures. This failure might still occur when the ship isunmanned.
From the standard failures only the broken cylinder liner seems to be connected to a maintenanceerror. No numbers for this part are available though, so it is impossible to determine for what percentageof the total number of failures it is responsible. Since a broken cylinder liner is one of many standardfailures it is likely that it has almost no contribution to the total number of failures.
2.10. Conclusion 35
2.9.2. Steering GearLoose or broken connections are partly the cause for the failure of electrical supply in the steering gear.The only reason given for this cause is a lack of maintenance. It is therefore assumed that all six ofthese twenty failures are caused by human error. According to this research, 20 out of 34 failures aredue to electrical supply. This means that 58.8% of the steering gear failures are due to electrical supply.Of this 58.8%, 30% is caused by human error. As a part of the total failures, the contribution of humanerror in the electrical supply is therefore 3.7%. If the ship is unmanned, these failures can still occursince maintenance will still be done by humans.
2.9.3. Electrical SystemA lack of fuel was the cause in 16% of the blackout failures. It was mainly caused by a blocked fuelfilter. This was found to be caused by contaminants in the fuel which is greatly dependent on thefuel quality and level of maintenance. This failure can therefore either be caused by human error orimproper maintenance. It is chosen to hold improper maintenance responsible for this error since lowfuel quality does not have to be a problem if the filter is cleaned properly and regularly. This failure isresponsible for 1.4% of the total failures. Since the contribution of this failure to the total number offailures is small, it is also not really important if this is a human error or an improper maintenance error,because the calculations are rough. This failure is probably still present when the ship is unmanned.
2.9.4. Fault Tree Improper MaintenanceWhen the individual contributions of improper maintenance are added, it can be found that it is respon-sible for 19.3% of all failures. This is almost equal to the contribution of human error. This clearlyshows that improper maintenance is a large cause to the total number of failures and thus that im-proving maintenance has as much as an effect as removing the crew from the ship. It also shows thatproper maintenance might be the first step to making the engine room unmanned. The fault tree inFigure 2.14 (page 36) shows the involved systems and events regarding improper maintenance.
2.10. ConclusionIn all of the system groups main engine, steering gear, fuel system, electrical system and cooling watersystem different technical failures occur. The fault trees for the individual systems can be seen in thecorresponding section and the fault tree of the entire system can be seen in Appendix B.
Technical faults with the main engine (38.7%) occur to the starting, reversing and regulating device,are standard failures or are turbocharger related. Problems with the steering gear (20.9%) come fromthe failure of electrical supply, an engineering failure, human error or a failure due to ergonomics.Insufficient fuel care, fuel of poor quality, a broken fuel pipe, fuel intolerance and a clogged fuel filterare some of the causes of a fuel system failure (11.1%). Several causes for a blackout have beenfound, which is the main cause for an electrical system failure (8.9%). In the cooling water system(8.4%) a cooling water pump failure or ice in the seawater filter are some causes for a failure.
Human error and improper maintenance were both named as being responsible for multiple fail-ures. It has been determined for both what their failure contribution is. It was found that human erroris responsible for 18.7% of all failures, divided over the systems steering gear, fuel system and theelectrical system. Improper maintenance was found to be responsible for 19.3% of all failures. Thesystems in which improper maintenance occurred are main engine, steering gear and the electricalsystem. The only system that is not affected by either human error or improper maintenance is thecooling water system.
With all failures known, solutions can be determined. For all failures on the first row of the fault tree ofa system, solutions will be determined. This means that for for instance the main engine, solutions willonly be found for the starting, reversing and regulating device, standard failures, turbocharger failuresand the failures with unknown distribution. For these failures, the percentage to the total number offailures is known, so it can be determined how much of a reliability improvement can be gained witheach individual solution. When only solutions to for instance the main engine failures as a whole arefound, the solutions can become a bit to general. Solutions that solve for instance only two out of fourfailures would then no longer be taken into consideration although they might have a high reliabilityimprovement. Developing solutions to the failures on the first row of the fault tree of a system will thusprovide for more detailed solutions.
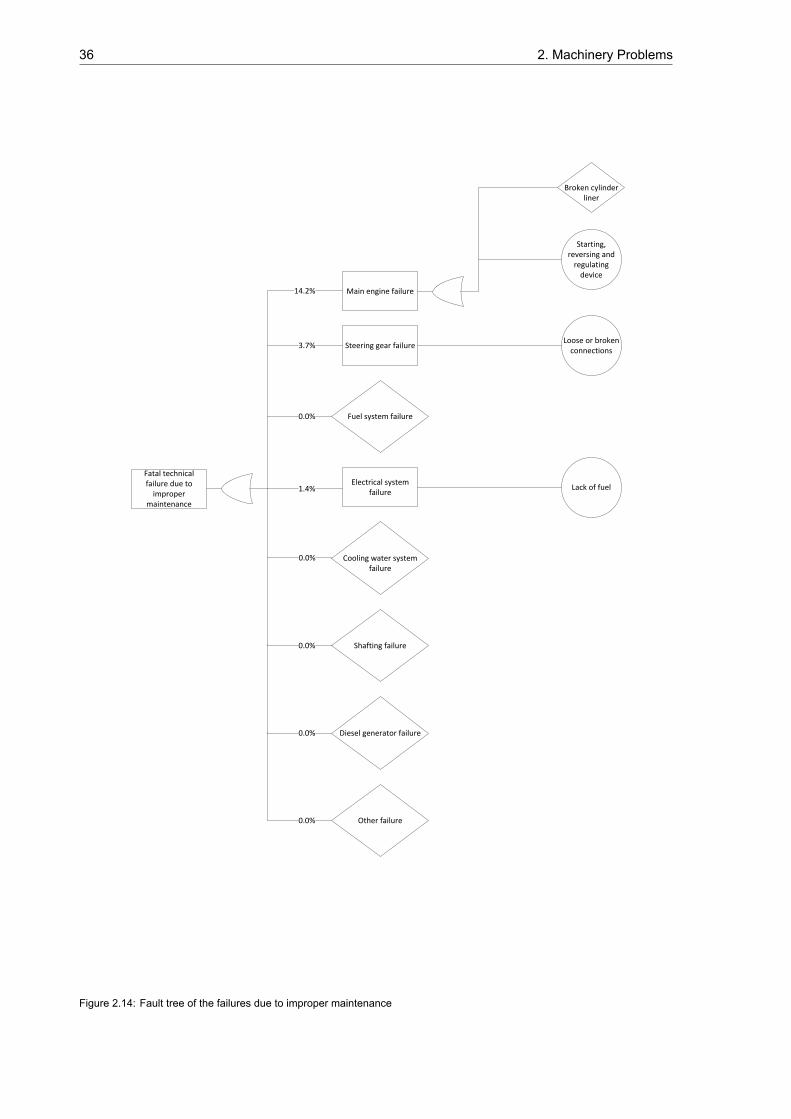
36 2. Machinery Problems
Fatal technical failure due to
improper maintenance
Steering gear failure
Electrical system failure
Shafting failure
Diesel generator failure
Other failure
Cooling water system failure
Main engine failure
Starting, reversing and
regulating device
Broken cylinder liner
Loose or broken connections
Fuel system failure
Lack of fuel1.4%
14.2%
3.7%
0.0%
0.0%
0.0%
0.0%
0.0%
Figure 2.14: Fault tree of the failures due to improper maintenance
3Generating Solutions
In this chapter solutions will be generated for the machinery failures determined in Chapter 2. Solvingthese failures increases the reliability of the machinery systems. That is a big step towards unmannedsailing, since having machinery that is more reliable is one way to make the ship able to sail crewless.
The failures that were defined in the previous chapter will first be sorted by their severity in Sec-tion 3.1. This makes it possible to see which failures have the largest impact on the total number offailures. Then it will be established what the requirements are for the possible solutions in Section 3.2and Section 3.3 will state which types of redundancy there are. These requirements will have to betaken into account when generating solutions. After the requirements are set, solutions will be gener-ated for each of the systems. This gives a better picture of what is going on in all systems and makesit possible to determine alternatives for an entire system at once, if necessary. It will be assessed forall systems what the influence of maintenance is on the reliability. Adding redundancy is the secondpoint of attention and finally an alternative for (part of) the system will be investigated.
3.1. Failures By SeverityDeveloping solutions to failures with the highest contribution to the total number of failures has thelargest impact. Making the systems in which these failures occur more reliable gives the highest im-provement on the total reliability. It is also important to find solutions to the failures with a lower con-tribution, but these solutions might be expensive compared to the reliability improvement. Later on itwill have to be determined what the cost is of the developed solutions. The ultimate goal is to meetthe required level of reliability for the least amount of money. How much the required level of reliabilityis, will not be determined in this thesis. To determine what the required level of reliability has to be, ithas to be known what the current reliability level is and how much extra reliability is required in orderto have a sufficient level of reliability. This a task for future work. For some solutions it might be knownthat a solution meets a certain required level of reliability. For instance, when the mean time betweenfailures is now found to be two years, this means that once every two years a failure occurs. Whenthe mean time between failures is increased to for instance 50 years, it can be stated that this meetsthe required reliability. After all, the lifetime of the ship is 20 to 25 years, so having a mean time of 50years between failures ensures that a failure only occurs to about half of the ships. This thus meets arequired level of reliability.
This section states all failures found in Chapter 2 and lists them by severity. Table 2.1, 2.2, 2.3, 2.4and 2.5 have been reorganised based on the severity of the failures. This list can be seen in Table 3.1.Thirteen failures represent the five main systems which together combine for 88.0% of the failures.Adding the failures for the systems ’shafting’, ’diesel generator’ and ’other’ gives a total of a 100%.A list of all failures can be seen in Table 3.1, which is organized from high to low contribution to thetotal number of failures. The systems in which the failures occurred have been added to the table: MEstands for main engine, SG for steering gear, FS for the fuel system, ES for the electrical system, CWfor the cooling water, SH for shafting, DG for the diesel generator system and OT is used for the failurethat occurred in the system ’other’.
37
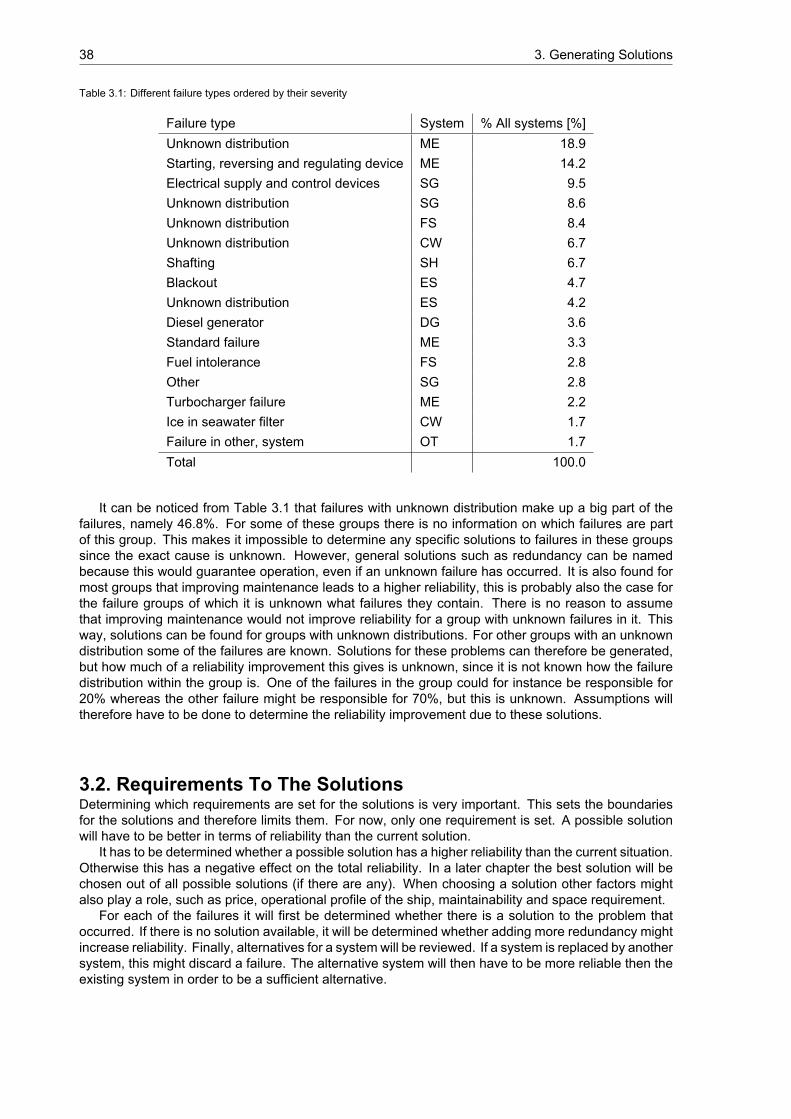
38 3. Generating Solutions
Table 3.1: Different failure types ordered by their severity
Failure type System % All systems [%]Unknown distribution ME 18.9Starting, reversing and regulating device ME 14.2Electrical supply and control devices SG 9.5Unknown distribution SG 8.6Unknown distribution FS 8.4Unknown distribution CW 6.7Shafting SH 6.7Blackout ES 4.7Unknown distribution ES 4.2Diesel generator DG 3.6Standard failure ME 3.3Fuel intolerance FS 2.8Other SG 2.8Turbocharger failure ME 2.2Ice in seawater filter CW 1.7Failure in other, system OT 1.7Total 100.0
It can be noticed from Table 3.1 that failures with unknown distribution make up a big part of thefailures, namely 46.8%. For some of these groups there is no information on which failures are partof this group. This makes it impossible to determine any specific solutions to failures in these groupssince the exact cause is unknown. However, general solutions such as redundancy can be namedbecause this would guarantee operation, even if an unknown failure has occurred. It is also found formost groups that improving maintenance leads to a higher reliability, this is probably also the case forthe failure groups of which it is unknown what failures they contain. There is no reason to assumethat improving maintenance would not improve reliability for a group with unknown failures in it. Thisway, solutions can be found for groups with unknown distributions. For other groups with an unknowndistribution some of the failures are known. Solutions for these problems can therefore be generated,but how much of a reliability improvement this gives is unknown, since it is not known how the failuredistribution within the group is. One of the failures in the group could for instance be responsible for20% whereas the other failure might be responsible for 70%, but this is unknown. Assumptions willtherefore have to be done to determine the reliability improvement due to these solutions.
3.2. Requirements To The SolutionsDetermining which requirements are set for the solutions is very important. This sets the boundariesfor the solutions and therefore limits them. For now, only one requirement is set. A possible solutionwill have to be better in terms of reliability than the current solution.
It has to be determined whether a possible solution has a higher reliability than the current situation.Otherwise this has a negative effect on the total reliability. In a later chapter the best solution will bechosen out of all possible solutions (if there are any). When choosing a solution other factors mightalso play a role, such as price, operational profile of the ship, maintainability and space requirement.
For each of the failures it will first be determined whether there is a solution to the problem thatoccurred. If there is no solution available, it will be determined whether adding more redundancy mightincrease reliability. Finally, alternatives for a system will be reviewed. If a system is replaced by anothersystem, this might discard a failure. The alternative system will then have to be more reliable then theexisting system in order to be a sufficient alternative.
3.3. Types Of Redundancy 39
3.3. Types Of RedundancyRedundancy will be one of the solutions in this chapter that will be named as a solution to increase theoverall reliability. Redundancy plays an important role when designing machinery plants. The need forredundancy is for a big part driven by economic and environmental damage. Having more redundancyensures safety and at the same time ensures the availability to fulfil a mission [90]. There are severalways to gain more redundancy in a system.
• Full-backup redundancy. This ensures full availability of a function. A failure of a componentdoes not cause a loss of performance. This is established by installing two components whenonly one is necessary for operation. The second component is called the cold spare.
• Two or more components are used to fulfil a function. If one of them fails, the function is stillavailable. Losing one of the components might have degraded the performance. There are twolevels of degradation.
– Degradation of full capacity to a lower level. This is the case when one of several identicalcomponents fails. If for instance one out of four components fails, the other three will stillperform their desired function, but their overall performance is of a lower level than before.
– Degradation of capacity under extreme conditions only. This is when multiple componentsof a certain type are installed, but all of them are only operated under extreme conditions.Then, if one of the components fails, the ship is still operable under normal conditions, butno longer under extreme conditions.
• Two or more equivalent systems operating under different working principles, but still fulfillingone function. These systems work differently, so this will cause degradation in case one of thesesystems fail. This has to be accepted and this principle is called hot spare. An example of this isthe generation of 24 volts DC with a converter being backed up by batteries.
All types of redundancy as stated above are examples of functional redundancy. Another formof redundancy, spatial redundancy, can be achieved when equipment is placed in separate compart-ments. For instance, machinery for twin propeller ships can be arranged this way [104]. The furtheraway from each other, the better the spatial redundancy. When a ship is struck by an external factorthe equipment is less likely to fail at the same time.
The downside of redundancy is that it is expensive and requires space and weight. It is one of thelarger cost drivers for ships that require high levels of redundancy [90]. Since the unmanned engineroom requires more redundancy it is an expensive design.
3.4. Determining SolutionsIn the following sections, Section 3.5 through Section 3.9, solutions will be generated for the differentsubsystems. The subsystems will be dealt with in order of magnitude of their contribution to the failures.First, the main engine failures will be dealt with, then the steering gear failures, fuel system failures,electrical failures and finally the cooling water system failures. Each of the subsystems containsmultiplefailures. Those will also be dealt with in order of magnitude.
As stated previously, for each of the failures it will be determined whether a direct solution is avail-able. Then, it will be checked whether more redundancy can be added and if there are any alternatives.
3.5. Solutions To The Main Engine FailuresThis section will deal with the solutions to improve the reliability of the main engine. First, solutions willbe generated for the failures with unknown distribution, after which solutions to the starting, reversingand regulating device failures will be generated. Solutions to the other failures can then be determined,namely the standard failures and the turbocharger failures. For all failures, individual solutions aregenerated. In reality, a combination of solutions might be applied, if this gives a better reliability. Thiswill later be determined.
40 3. Generating Solutions
3.5.1. Solutions To Unknown, Main EngineIt is not known what type of failures are part of the group of main engine failures with unknown distribu-tion. Generating solutions to these specific failures is thus impossible. It will therefore be determinedwhether improved maintenance is an option, how to gain more redundancy in the main engine and ifthere are any alternatives to it.
Improvement Of MaintenanceAn improvement of maintenance is a solution to the failures with unknown distribution. For all othermain engine failures, an improvement of the maintenance is named as a solution. Considering that itis a solution to all other main engine failures, it can be assumed that it also is a solution to the failureswith unknown distribution, although this was not specifically mentioned.
Engine RedundancyRedundancy in the main engines can be gained by installing more engines as a full-backup. Each ofthe engines should then be able to deliver the required power. One engine takes over for another incase of an engine failure. Installing an extra engine requires a lot of space and has a big impact on themachinery weight. This can cause the engine room to be bigger than usual. If this goes at the expenseof the cargo space this option does not come cheap.
Dividing the required power over multiple engines is also an option to improve redundancy. Whenone of the engines fails there is still enough power left to sail the ship safely to its destination. Afterarriving in the desired port repairs can be performed to the broken engine. Having more enginesavailable makes it possible to monitor them closely and to shut one off if it gives strange values fromthe sensors. This might prevent big failures.
A power take in (PTI) adds redundancy and is also a backup solution. A power take in can be usedto propel the ship (with limited speed) by a generator or battery pack. The main engines are decoupledfrom the shafting, so the PTI has limited resistance.
The use of a PTI might only be a decent solution for ships sailing close to shore. When sailing onthe PTI, the ship has limited power. So when it is halfway across the ocean between America andEurope, it takes longer for the ship to reach shore. A battery pack has to be big in order to get the shipto shore, although the third power relationship of speed and power works as an advantage. Sailing athalf the speed only requires one eights of the power. The speed should not be decreased too much,since the wind and current will otherwise dominate the direction of the ship.
If the moment comes that one engine fails and another has to take over this has to be a smoothoperation. An engine failure can take place at any time. In the heat of the moment the backup enginehas to be operational instantly. Every second the ship is sailing on limited power it has less manoeu-vrability and it becomes more vulnerable to accidents. This is of course mostly the case when sailingin port, locks or other areas with high traffic density.
AlternativesThere are several alternatives to the ’regular’ diesel engine. These are listed below. For all of thealternatives it is determined whether they meet the requirement as set earlier. These alternatives havebeen taken into consideration since they might prove to be a better solution.
• The gas turbine There are several types of ships that are a candidate for using gas turbines:cruise ships, ferries, LNG carriers and fast container ships [107]. From this classical point of viewa gas turbine might therefore not be a direct solution for all ships within the scope of this thesis.The gas turbine has a modular construction which means that repair by replacement is easydue to the multiple exchangeable sub-units. It has a high reliability and maintainability [90]. Un-fortunately, no data was found to compare the reliability of a diesel engine and a gas turbine.Compared to a diesel engine, a gas turbine has a higher power density and is more environmen-tal friendly but it has a lower efficiency, a higher fuel consumption and it needs fuel of a higherquality [107]. As gas turbines are highly reliable, they are an alternative to the diesel engine.
• Steam turbine plant Due to its low power density, lower fuel economy and high initial costs thesteam turbine has lost ground. It is sometimes used together with a gas turbine. The thermal en-ergy in the exhaust gases of the gas turbine is then used to generate steam for the steam turbine.This has a negative effect on the initial capital cost but also increases overall efficiency. They
3.5. Solutions To The Main Engine Failures 41
are said to have good operational reliability and only lost ground due to their lower efficiency [52].Again, no information is available to compare the reliability of a diesel engine with that of a steamturbine plant. For now, the steam turbine is thus an alternative for the diesel engine.
• Nuclear reactor A nuclear reactor can be powered by a steam plant or an oil-fired boiler [19].The reactors mostly use uranium as their fuel type, with Thorium being another option. Duringoperation, a nuclear ship does not emit CO , NO , SO and particulate matter.
Even if nuclear propulsion is a more reliable option than a diesel engine, this is not a feasibleoption. It will therefore not be taken into consideration. An unmanned ship on itself already startsthe debate whether that is a good idea, let alone an unmanned ship sailing with nuclear fuel. Thiswill simply not be accepted by the general public. A nuclear reactor will therefore no longer be analternative.
• Fuel cell A fuel cell converts chemical energy into electric energy. No combustion engines orgenerators are required for this process. There are also no moving parts involved in the fuel cell,but only in the support systems such as pumps, fans and humidifiers. Since this system has lessmoving parts than a conventional propulsion system it is more quiet. The reactants hydrogen andoxygen are mostly used in a fuel cell. They react to form water and both electrical and thermalenergy. Methane can also be used as an alternative to hydrogen. As long as the reactants areavailable, this system can run. In the medium to long term a fuel cell might be a possible way topropel the ship. They do not emit SO and NO . If hydrogen is used, it also does not emit CO .
With hydrogen not being widely available, this is a huge disadvantage. First, this infrastructurehas to be developed before ships can use hydrogen. Compared to diesel engines they also havelower specific powers and lower power densities. The long term reliability regarding the fuel cellhas never been tested [77]. Since the reliability of a fuel cell is unknown, it cannot be consideredas an alternative to the diesel engine. The fact that the infrastructure is not widely available isalso a major disadvantage.
• Batteries There are three common types of batteries: lead acid, zinc-carbon and nickel cadmium.When DNV-GL designed the ReVolt they chose batteries as the propulsion system due to the lowspeed of their ship and its small size. If solely batteries are used they will have to be charged inport. When the ship is sailing on batteries, no emissions are emitted, which is useful when sailingin emission control areas. Downside of batteries is that they need replacement once every severalyears since they lose performance over time. Since the batteries are still being developed it mightbecome a feasible solution in the mid or long term. Due to the size of these battery packs it mightonly be feasible for small ships sailing close to shore [19]. There are no moving parts in a batteryso it is likely that the reliability is equal or better than a diesel engine. Batteries are therefore seenas an alternative to the diesel engine.
• Diesel-Electric Although not really being an alternative to the diesel engine, its concept is stilldifferent. It is therefore included in this list. When using a diesel-electric propulsion, generatorsets are used to generate the required power, both for propulsion and auxiliary purposes. Thispropulsion concept therefore has two tasks which means that loading can be optimized, resultingin lower fuel consumption and emissions [59]. Due to the multiple engine redundancy this conceptis said to have high reliability. When one of the generator sets malfunctions the other set will haveenough power to sail the ship into port on a lower speed. The engines can be placed anywherein the ship and be connected to the propulsors by cables. If this type of propulsion will be usedthe failures in the main engine and the diesel generators will overlap. Diesel-electric propulsionis thus an ’alternative’ to the regular diesel engine.
3.5.2. Solutions To The Starting, Reversing And Regulating Device FailuresEngine redundancy is one solution to prevent a failure due to the starting, reversing and regulatingdevice. Every engine is controlled by its own engine controller, so when engine redundancy is applied,two controllers have to fail before a fatal technical failure occurs. Engine redundancy can be gained byeither having the availability of a full-backup engine or by dividing the power over multiple engines. Apower take in as a backup is also an option.
42 3. Generating Solutions
The problems with the starting, reversing and regulating device mostly come from improper main-tenance, as explained in Subsection 2.3.1. It has been stated by the German Ship Safety Division thatonly qualified personnel should carry out maintenance and repairs. While doing this they should useoriginal parts from the manufacturer. A failure of the starting, reversing and regulating device is mostlikely to happen close to shore, since that is the moment that the motor controller is used most.
The quality of the parts can play a big role in the reliability of the machinery. A new part mightbe cheaper but if it breaks more often it becomes more expensive eventually, especially if it causesproblems to other components at the same time. There are two types of spare parts: original equipmentmanufacturer parts (OEM) or non-OEM parts.
• The definition of OEM is not well defined within the maritime industry. Some companies state thatOEM parts are parts that are supplied by the supplier of the equipment or by licensed companies.Other companies state that a supplier of a supplier is also an OEM. Sometimes even the supplierof the supplier of the supplier is stated as being an OEM [85]. Spare parts from an OEM will havesimilar serial numbers to the old parts. All schemes will therefore stay accurate, which preventsmaintenance errors.
• Non-OEM parts (sometimes also referred to as ’pirate’ parts, replacement parts, after marketparts or ’re-engineered’ parts) are parts that are not supplied by the original manufacturer ofcertain equipment. Since these parts come from a different supplier, a different serial numberingsystem is used. This can lead to difficulties when reading schemes.
According to Wärtsilä, OEM parts are the most competitive choice in the long run [102]. This isnot really surprising considering that they are an OEM company. Wärtsilä states that non-OEM partsincrease the risk of a breakdown due to a malfunction of a single part. This can also be the casefor parts of a previous revision. Due to the possible unreliability of non-OEM parts they can lead tohigh repair costs. With the contribution of the spare parts being around 5-15% of the operationalexpenses depending on the ship type (the other operational expenses are crew, stores, insuranceand administration [62]) it can therefore be discussed whether saving on OEM parts gives the biggestcost savings. Wärtsilä also states that inferior non-OEM parts might lead to an increase in costs dueto an higher consumption of lube oil or fuel oil.
One reason for buying non-OEM parts instead of OEM parts is the after sales services of the OEMcompanies. Due to new-buildings their focus might shift to those ships instead of after sales service.This service is something the non-OEM companies are very good at, since that is their only busi-ness [85]. The quality of non-OEM parts is not necessarily of a lower quality than that of OEM parts.
It cannot be told from these sources whether OEM or non-OEM parts are better. It is clear thatOEM parts are more expensive, but also come with guarantees regarding quality. Non-OEM parts arecheaper but it can only be told from experience whether these parts can guarantee the same level ofreliability. It can take years to find out which non-OEM parts are perfectly compatible to OEM parts [13].It is therefore advisable to only use OEM parts for the machinery of an unmanned ship, unless certainnon-OEM parts have found to be suitable as well. This limits the chance of a failure due to impropermaintenance or improper replacement parts.
A combination of the two named solutions is also an option, since this increases reliability. It willlater be determined how much of an extra reliability this gives and whether combining two solutions isfinancially viable.
3.5.3. Solutions To The Standard FailuresThe group of standard failures in the main engine is responsible for just 3.3% of the total number offailures. This group consists of parts that can fail on an engine such as valves, pumps, cylinder covers,injection lines and cylinder liners. According to the German Ship Safety Division a material failure orfaulty maintenance are likely to have caused these failures. This can only be told from maintenancereports of the ships to which these failures occurred. But this statement shows that paying attention tothe maintenance increases reliability.
The goal of this thesis is not to redesign an engine on the level of these failures. That is a taskfor engine manufacturers and someone with a better knowledge of engines. It is still questionablewhether somebody with a detailed knowledge of engines is able to increase the reliability of the overallship significantly by redesigning these parts. Faults will eventually always occur to one of these parts.
3.6. Solutions To The Steering Gear Failures 43
Using a different type of engine leads to other standard failures. These specific failures might be gone,but the new machinery will also be prone to failures. So switching to another type of main engine is notnecessarily a solution to increase reliability.
For this failure, multiple solutions can be determined. Applying engine redundancy solves theseproblems. If one of the engines fails due to a standard failure, there is still enough power available toget to shore. Installing a power take in also increases the redundancy of the main engines.
3.5.4. Solutions To The Turbocharger FailuresA turbocharger is a delicate piece of machinery. Maintenance therefore has to be strictly performedbased on the schedule provided by the turbocharger manufacturer [30]. Maintenance of it should onlybe carried out by qualified personnel and parts for it should also come from the original manufacturerin order to guarantee reliability of the system [28]. Proper maintenance is thus the first solution to theturbocharger failures.
It is not the goal of this thesis to redesign the engine or in specific the turbocharger. When engineredundancy is applied, or when a power take in is installed, a turbocharger failure will not lead to a fataltechnical failure since the other engine still functions properly. As this solves the problem, no other,more detailed, solutions are suggested.
3.6. Solutions To The Steering Gear FailuresThis section will determine solutions to the steering gear failures. These failures, being responsiblefor 20.9% of all failures, will be dealt with in order of magnitude. First the solutions to the failure ofelectrical supply and control devices will be generated, after which solutions to the failures with unknowndistribution can be determined. Finally, solutions to the other failures will be generated.
3.6.1. Solutions To A Failure Of Electrical Supply And Control DevicesThis steering gear failure is for a big part caused by broken or loose connections. There is also a largeshare of which the causes are unknown. For these failures it is difficult to find a solution. Loose orbroken connections are stated to be caused by improper maintenance. It should therefore again bestated that maintenance should only be performed by qualified personnel. This keeps the maintenanceat a known quality since people with decent knowledge are working on the ship. Compared to landbased electrics a lot more rules are set regarding the material and methods due to the salinity of thewater [74]. Only qualified personnel should therefore perform the maintenance.
Another solution for the loose or broken connections is to double all wires. This way, if one con-nection fails there is another connection which takes over. The vessel can thus continue its journeyon the other wire. In the next port the failed connection can then be replaced or reconnected. Addingredundancy can also be done by splitting the steering gear into two systems. These will then both haveto fail before this becomes fatal.
Any alternatives to electric wires are not available. For wireless communication, Bluetooth mightbe an option, since it is a replacement for wires and is able to transfer data at the same time. Althoughit might be an option to use Bluetooth, it is not yet used for this application in the marine industry. Itshould therefore first be properly tested before it can be implemented in an unmanned ship.
3.6.2. Solutions To Unknown, Steering GearFor this group it is not known what the failures are. Solutions to the causes of these failures can thusnot be found. It is very likely that better maintenance is a solution to these failures. This has alreadybeen proven to be a solution for multiple other failures so it can be assumed to be effective for thisfailure as well. The reliability of the steering gear can also be improved by adding redundancy. Whenhaving a steering gear installation with multiple rudders, these rudders can be separated into multiplesystems. A failure in one of the steering gear systems then does not affect the other system. Splittingthe steering gear into two separate systems would mean that everything has to be doubled.
Sailing the ship with one broken steering gear system limits the manoeuvrability of the ship, as longas the broken rudder is not stuck in a steering direction. If the broken rudder remains in the positionin which it broke, it can still have a steering effect causing the ship to no longer be able to continue itsroute. A mechanism should thus be included to get the rudder in the zero degrees position. This can forinstance be done by removing the hydraulic pressure of that rudder, such that the forces on the rudder
44 3. Generating Solutions
bring it back in neutral position. Limited manoeuvrability can lead to difficulties when sailing in port or inother areas where high manoeuvrability is required. Extra manoeuvrability can be gained by installinga stern thruster or by making the rudders larger than required. Making the rudder area larger thanrequired induces extra resistance, which leads to a higher fuel consumption. This is therefore a costlyoption. The stern thruster can be made retractable. This way it has no hydrodynamic disadvantages.When needed it can be lowered and used for extra manoeuvrability. The azimuthing thrusters can bothbe used with electric and diesel drive. According to Rolls Royce they have a high operational reliabilityand easy maintenance [83]. This azimuthing thruster can also be used as a ’get you home’ device.
In case azipods are used for propulsion no rudders are required. The azipods provide the ma-noeuvrability of the ship. In order to power the azipods, an electric propulsion system is needed, sodiesel-electric propulsion is usually chosen. Using azipods will require more wiring, which also hasbeen proven prone to errors. If maintenance of these electrical connections is done correctly thisshould prevent these failures. Azipods have a high reliability, require low maintenance but are morecapital intensive [3]. Compared to the traditional propulsion they are said to have a better fuel effi-ciency. Azipods seem to be a plausible alternative, although it cannot be stated how their reliabilitycompares to that of regular steering gear. Regular steering gear has less parts, so therefore mightbe more reliable. Whether an azipod has an equal or better reliability than regular steering gear canthus not be stated. Installing one azipod is therefore a questionable solution, but installing two azipodswould be a solution with a higher reliability. The option to install two azipods can therefore be takeninto consideration.
3.6.3. Solutions To Other, Steering GearThe group ’other’ is responsible for 2.8% of all failures. But what is actually responsible for these failuresis unknown. Options in order to improve the redundancy of the steering gear or possible alternativesfor it have already been discussed in Subsection 3.6.2.
3.7. Solutions To The Fuel System FailuresThis section will deal with the solutions to all fuel system failures. If necessary, also redundancy im-provements and alternatives will be determined. First solutions to the failures with unknown distributionwill be dealt with after which solutions to the fuel intolerance can be determined.
3.7.1. Solutions To Unknown, Fuel SystemThe failures in the fuel system with an unknown distribution are responsible for 8.4% of all failures.This group consists at least of the following failures; insufficient fuel care, fuel of poor quality, strongvibrations of fuel line, broken fuel pipe, no proper filtering of air in the fuel and a clogged fuel filter.
First, the failures insufficient fuel care, fuel of poor quality and the clogged fuel filter will be dealtwith. Those have more or less the same cause and will therefore have the same solution. A solution willthen be found for respectively the strong vibrations of the fuel line, a broken fuel pipe and the improperfiltering of air in the fuel.
Fuel QualityThe failures insufficient fuel care, fuel of poor quality and the clogged fuel filter all seem to be causedmainly by the quality of the fuel and the mixing of fuel from different locations. Therefore a solution orplan of approach has to be developed in order to make sure that proper fuel is bunkered.
It is recommended to have the quality of the fuel checked before bunkering [29]. A sample of thefuel should be send to a laboratory and if the properties of the fuel are found to be in order, the fuelcan be bunkered. It is then known that the fuel is of sufficient quality before entering the ship, whichis of course the most ideal scenario. Since checking a sample of fuel in a lab takes a lot of time,fuel is mostly checked after bunkering, if it is checked. It is said that only one third of the fuels oninternationally sailing ships are tested. A lot of improvement can thus be gained. If the fuel is checkedafter bunkering, enough fuel of a known and decent quality should still be available. The ship can thensail on this proper fuel until it knows the quality of the bunkered fuel [42]. If low quality fuel is bunkeredthis should be kept separate from the other fuel and the rest of the fuel system. It has to be off-loadedin the next port in order to bunker clean fuel instead [30]. If improper fuel is removed from the ship allparts that came in contact with the bad fuel have to be cleaned. No contaminants will then stay aboard.
3.7. Solutions To The Fuel System Failures 45
The quality of fuel is different all over the world. One of the most basic parameters of fuel is thedensity. A difference between the given and measured density can be used to determine whether thebehaviour of a supplier is good, medium or bad. Of course a measured difference in fuel density doesnot say anything about the quality of the fuel, but companies who are honest about their fuel are not likelyto hide something. In order to know something about the quality of the fuel from a supplier, a fuel testingagency can be used, such as Veritas Petroleum Services (http://www.v-p-s.com/index.html).
It has been stated that a clear separation of fuels from different locations should be present. Mixingof fuels from different locations can potentially lead to a fuel system failure. Therefore each of the fuelsshould have its own settling tank and storage tank [30]. Fuel is still present in the ship both when fuelis checked before bunkering or checked before using since a ship cannot arrive in port with all tanksempty. Two fuel systems are therefore required to keep the fuel separated. It is advisable not to saveany money by installing one fuel system, but spend the money on making these tanks separate. If itis possible to always bunker fuel on one location this is the best scenario. Fuel from one location willlikely be of the same quality most of the times. When always bunkering on one location, the fuel shouldstill be checked. Bunkering in one harbour is only possible for short sea shipping with a constant routeand sufficient range to make their round trip.
Vibrating Fuel LineExcessive vibrations in the fuel line can lead to a fuel system failure. These vibrations will thereforehave to be avoided. The natural frequency of a fuel line should thus be outside of the range thatcan be expected from the machinery. No excessive vibrations will then be caused due to the naturalfrequency. The natural frequency of the fuel line can be changed by changing its stiffness, mass orby adding dampers or springs. This failure or its solution will not be reviewed any further in this thesissince it requires a detailed study and its failure distribution is expected to be small.
Broken Fuel PipeThe most common problem that causes a broken fuel pipe is corrosion induced weakness either onthe inside or outside of the pipe. When a pipe is forced into alignment this can also cause a failureof the pipe. There are multiple measures to prevent corrosion in pipelines and therefore extend itslifetime. Four common techniques are protective coatings and linings, cathodic protection, materialselection and corrosion inhibitors [68]. A combination of protective coatings and linings in combinationwith cathodic protection is often found to be the most cost-effective solution.
An effective monitoring and maintenance program can be a very good insurance against pre-ventable corrosion problems. Pipes should also be replaced when they are severely damaged bycorrosion. Even if measures are applied to limit the speed of the corrosion a pipe will eventually cor-rode. Their thickness should be measured and checked with the rules on a regular basis, which wouldbe very expensive since every part of the pipe would then have to be monitored. This way, if corrosionoccurs this does not directly have a failure as a consequence when the pipe gets thinner.
Backup pipes can also be installed as a solution to a failure by a broken pipe. In case one of thepipes fails, a backup pipe can take over the task of the original pipe. The broken pipe will then beclosed down. Having a backup pipe available means that all pipes have to be doubled in order for thisoption to work. Many valves will also have to be installed in order to shut off parts of the pipe that havebroken. This is a costly and spacious option.
The fretting of loosened clamps can be prevented by checking these clamps on a regular basis.Clamps loosen over time so it is important to check whether they loosen or not, so they can be retight-ened if needed. If fretting has already occurred it is best to replace the pipe and make sure to check itmore often. As mentioned earlier, forcing a pipe into alignment also caused failures. During the build,or when repairing a broken pipe this can occur. It is advisable not to force a pipe into alignment, buttake the time to properly connect pipes to one another.
The broken fuel pipe will not be taken into consideration for the rest of this thesis. Monitoring everypart of a pipe is simply too expensive and would require too many sensors. This failure is also expectedto have a small contribution in the total number of failures. Installing pipes properly is given as an advicebut will also not be taken into consideration any further.
46 3. Generating Solutions
Filtering Of Air From The FuelAir can only come in the engine if fuel is not properly filtered, which then leads to a failure. To preventair from getting in the engine a simple solution can be used. A filter head should be used that has theoutlet line directly on top of it. With the outlet line exiting directly above the filter there is no place forair bubbles to collect [72]. The filter will therefore take all the air out. The problem of improper filteringcan thus be solved by making sure that a correct filter is installed and that there are no areas for air tocollect in the fuel lines leading to the injection system.
To be absolutely sure that the air is filtered from the fuel, a second filter can be installed. If two filtersare positioned close after another, this adds redundancy. Any air that accidentally got through the firstfilter will be separated in the second filter. In case of a failure of one of the filters, there is already abackup filter in place.
3.7.2. Solutions To Fuel IntoleranceThe cause of fuel intolerance lies within the fuel change-over as a result of entering or leaving anemission control area. It should be noted that this failure only occurs to ships who sail both inside andoutside emission control areas and use two or more types of fuel. Ships sailing outside these areas,for instance from Africa to South America or Australia to Asia do not have to switch fuel, since thoseare not sailing in ECAs. When sailing outside ECAs no solution to this problem has to be found sinceit simply does not exist. Those ships can just sail on one type of fuel, most likely HFO since it is thecheapest fuel. As long as this fuel type complies with the global limits no different fuel has to be used.
Ships sailing only in emission control areas are likely to sail on marine diesel. This way, they complywith the emission rules and use only one type of fuel at the same time. Fuel intolerance can thereforenot occur, when the fuel is properly controlled. All ships in the emission control areas have to complyto the emission requirements, so there is no financial disadvantage with this solution.
When fuel switching is necessary the mixing of different fuels (and possibly from different locations)should be avoided, as stated already in Subsection 3.7.1. The systems for the heavy fuel oil and marinediesel oil should thus be separated as much as possible, which requires two fuel systems.
Ships sailing partly inside, partly outside the emission control areas can also go with only one typeof fuel in order to solve fuel intolerance. But for these ships there is a big financial disadvantage whendoing so. This might therefore not be the best solution for these vessels. For these ships another typeof fuel might be an option. A selection of a new fuel is based on its advantages and disadvantages. Fordifferent ships and operational profiles another fuel might be the best alternative. DNV-GL has statedthat for a possible alternative fuel to play an important role in the future it should meet the followingconditions; affordability, sustainability and safety and reliability [22]. Affordability is the most importantparameter, since low fuel prices give more room for profit than high fuel prices. New fuel types and fueltechnologies tend to be more expensive than conventional fuel types. The fuels LNG, methanol andelectricity will be discussed. This Subsection will end with information on the scrubber. This equipmentcleans the exhaust gasses and can therefore also be used to be able to use one type of fuel.
• Liquid Natural Gas LNG (Liquid Natural Gas) is a possible fuel alternative. Using this fuel pre-vents SO in the emissions and heavily reduces NO and particulate matter. It does not reducethe emission of CO [31]. It is currently available for bunkering in several ports in Europe, Incheon(Korea) and Buenos Aires in Argentina. LNG is a developing market, so more bunker locationswill follow. Although being a developing market it is already a proven and available solution [22].The extraction of schale gas in North America gives competitive natural gas prices while givingmore energy security at the same time [22]. For LNG, a different type of engine is required,namely a gas engine or dual fuel engine.LNG fuelled engines are available for the full power range, with capacities ranging from 5 to 50MW. Compared to a conventional machinery installation, a LNG installation is about 30% moreexpensive. This is due to another type of engine, tanks, new piping and other equipment. Thesize of the LNG tanks are about three to four times bigger compared to conventional tanks. Thisis due to energy density of LNG and the extra insulation. This has effect on the carrying capacityor range of the vessel. Compared to a diesel engine it might have a 1-3% higher efficiency.During the production, transportation and use of the natural gas methane slip may occur. Thisgreenhouse gas has 25 times more impact compared to CO . This leakage would possibly cancelout the benefits from changing fuel. Calculations by DNV-GL estimate that there is a methane
3.7. Solutions To The Fuel System Failures 47
leakage of 5.5%, which would make the emissions of LNG and diesel fuel almost equivalent. Theleakage of methane should therefore be reduced. Techniques are available to limit the methaneslip in marine engines. For diesel cycle engines a high pressure injection, dual fuel concept canbe used. This system produces a bit more NO , but it limits the methane slip to 0.2 gCH /kWh,which is about 0.1%. This eliminates the problem almost completely. In total, using LNG reducesthe emissions by up to 25%, when no slip occurs. In reality, the reduction is more in the rangeof 10-20%. The use of LNG might be a bridge towards a further reduction of emissions. LNG isfossil-based, so it is not a sustainable fuel.
• Methanol Methanol is a biofuel. Biofuels are made by converting biomass, or biomass residuesinto a liquid fuel [22]. It is mainly produced from natural gas or coal. In a sustainable way, itcan also be made from black liquor in pulp and paper mills. When produced from natural gas ithas almost the same emissions as diesel. When generated from coal, it has two times as manyemissions. If it is generated from the black liquor, the emissions are slightly higher than when itis generated from natural gas.Biofuels are currently generated in small factories. It is difficult to scale these up to the requiredlevel. This is partly due to technical issues and the availability of biomass. The market demandalso plays a role. The investments and developing of this fuel will determine whether this fuel willbe widely used. So far, only one ship is using methanol as a fuel [91]. For this thesis it will not befurther investigated because it first needs to be further developed, in order to become a provenconcept.
• Electricity There are two forms of electric propulsion: a pure electric and a hybrid propulsion sys-tem. The latter was already dealt with in 3.5.1. For a pure electric system, electricity is generatedonshore and then stored on board until it is used for propulsion or auxiliary purposes. The mostcommon way to store electricity are batteries. Ships powered by electricity do not produce directemissions. These emissions are produced at shore, when the electricity is generated. Batteriesare significantly more efficient than marine engines. With the maximum efficiency of a marineengine being 50%, batteries charge and discharge with an efficiency of 95% or higher [22]. Thistherefore decreases the efficiency losses and also the emissions. Dependent on the way theelectricity is generated this actually limits the emissions significantly. If the electricity is gener-ated in a sustainable way, this limits the emissions. Electricity generated with coal or oil producethe same level of emissions, apart from the efficiency difference.If the price of electricity is competitive with those of marine fuels, the cost of operation is similar.Before the ship can become operational, high capital costs have to be invested in batteries. Thiscan be upwards of $1,000/kWh [32]. This can be recovered by lower maintenance requirementsand operational savings. The initial costs might become lower when the production of batteriesincreases.The infrastructure in port has to develop in order to make electricity a widely used fuel. Electricitygrids have to be upgraded, as well as storage systems on shore. When in port, electricity fromshore can also be used to power the ship. This is called cold ironing. For cold ironing to befinancially viable, fuel must be around $900/ton.
ScrubberExhaust Gas Cleaning Systems (EGCS), also called scrubbers are an option for removing SO fromthe exhaust gases. Instead of using an alternative and/or cleaner fuel, the exhaust gases are beingwashed. This means that HFO can still be used in ECAs, since the exhaust gases are treated aftercombustion. There are three types of scrubbers: open-loop, closed-loop and hybrid. The hybrid scrub-ber is a combination of the open-loop and closed-loop scrubber [60]. In scrubbers, the exhaust gas iscleaned on its way to the funnel. This is done by water which is injected in the exhaust gas stream.When the chemical reaction has occurred, the water will leave at the bottom of the scrubber. SO andSO react with H O to form respectively H SO and H SO .
There is an increased capital cost when using a scrubber. A scrubber is cheaper with an increasingengine size. For engines with a power lower than 5,000 kW the scrubber system will cost around$370/kW. With an engine output of around 10,000 kW this cost will decrease to around $250/kW andfor larger engines this can even drop to $120/kW [22]. A scrubber does not filter the NO out of the air.
48 3. Generating Solutions
In case the ship is sailing in ECA area 3 or 4 (North American Area or United States Caribbean SeaArea) an extra system is thus required to comply with the IMO emission rules.
In case the ship has a failed scrubber, it would not be allowed in the emission control areas. Witha failed scrubber, the ship will have to sail in port and it will have to be explained why the ship did notmeet the regulations. The scrubber will then have to be repaired in port before the ship can continue itsoperation. A backup scrubber can be installed to increase redundancy, but this requires a lot of spaceand is also an expensive solution. For this thesis, a scrubber is not seen as a feasible alternative. It isexpensive and requires much space. It can also not be stated whether it is more reliable than decentfuel switching. With the global emission limits it would also mean that a scrubber might have to runduring the entire voyage, which increases operational costs and challenges. Choosing one fuel type,or separating the two types sufficiently is thus a better solution, from a reliability, financial and spacerequirement standpoint
3.8. Solutions To The Failures In The Electrical SystemIn this section, solutions to the failures in the electrical system will be generated. The biggest failurein this system is the blackout, so this failure will be dealt with first. Then the failures with unknowndistribution will be dealt with.
3.8.1. Solutions To A BlackoutFor only two of the causes of a blackout a reason was given, these are an electrical failure and alack of fuel. For the causes automation failure, control equipment failure and mechanical failure nocauses were given. This makes it impossible to come up with solutions to these failures. For the othertwo failures it is possible to determine solutions. Human error was also responsible for some of theblackouts that occurred. With some of these causes being ’pressing the wrong button’ or ’tripping anon-load’ generator it is determined that these particular failures will no longer exist.
A blackout due to an electrical failure was caused by switching on machinery when insufficientpower was available. This can easily be avoided by making sure that enough power is available.Before (heavy) machinery is switched on, it should be determined whether this is the case. If not,an extra generator has to be started in order to fulfil the power requirements. The impact of heavyequipment should be known in order to determine whether extra power is needed.
A lack of fuel has also lead to a blackout multiple times. It was mainly caused by a blocked fuel filter.Performing maintenance on the fuel filter more often can avoid this problem from occurring. A blockedfuel filter can also be caused by sediments in the fuel. Making sure that the fuel is clean therefore alsohelps to avoid a blocked fuel filter and thus a blackout. The quality of the fuel again seems to have aninfluence on the reliability.
3.8.2. Solutions To Unknown, Electrical SystemIt is not known which failures are present in this group. These are all the failures in the electricalsystem that were not caused by a blackout. What these failures are is not known. No specific solutionscan therefore be developed. Some of these failures might be broken or loose connections, as seenpreviously. This failure group may therefore partly be caused by improper maintenance.
One way to increase the reliability of the electrical system is to increase the redundancy of thesystem. This means that the system will be doubled. This is a costly operation, but would be the onlyoption in this case. Any alternatives for the entire system are just not available.
3.9. Solutions To The Cooling Water System FailuresThis section will deal with all failures that occurred to the cooling water system. First, the failures withunknown distribution will be dealt with, after which solutions can be found for ice in the seawater filter.
3.9.1. Solutions To Unknown, Cooling Water SystemThe failures with unknown distribution consist at least of the following failures; cooling water pumpfailure, piping systems failure and controller and sensor failure of high-, low temperature and seawatercooling system. More types of failures might also be present in this group, but this is unknown. Thisgroup is this big because only data is known for the failure ’ice in seawater filter’.
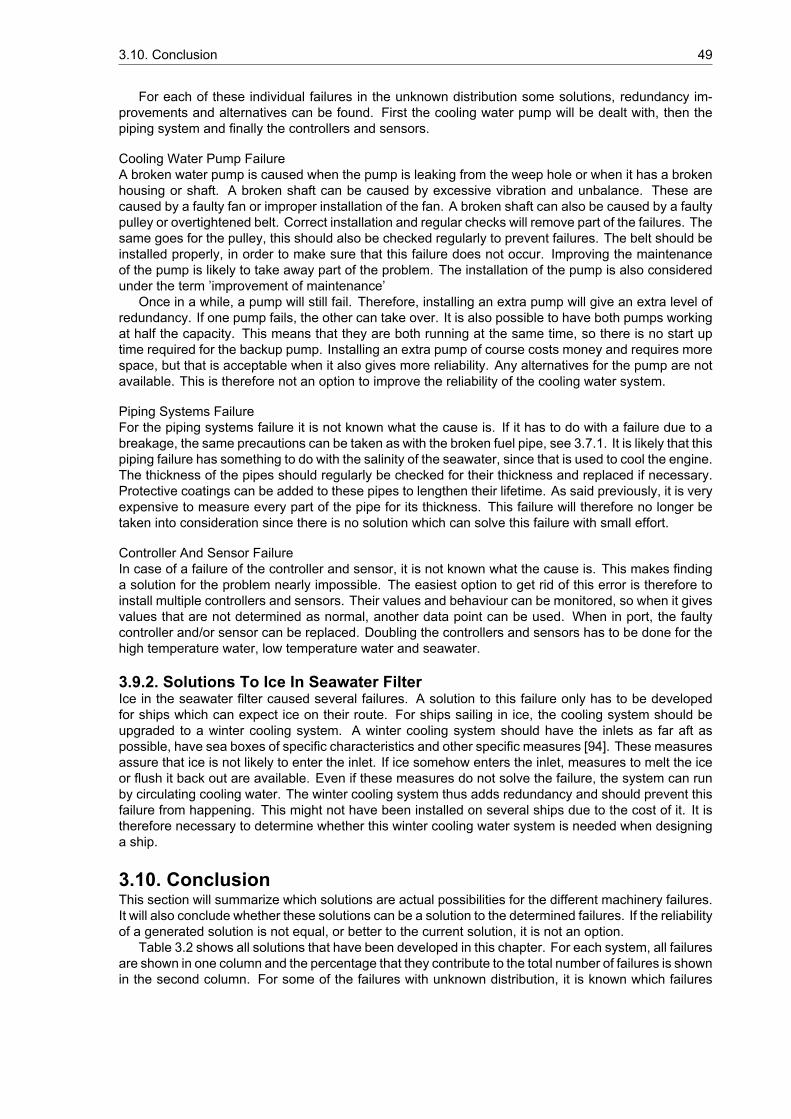
3.10. Conclusion 49
For each of these individual failures in the unknown distribution some solutions, redundancy im-provements and alternatives can be found. First the cooling water pump will be dealt with, then thepiping system and finally the controllers and sensors.
Cooling Water Pump FailureA broken water pump is caused when the pump is leaking from the weep hole or when it has a brokenhousing or shaft. A broken shaft can be caused by excessive vibration and unbalance. These arecaused by a faulty fan or improper installation of the fan. A broken shaft can also be caused by a faultypulley or overtightened belt. Correct installation and regular checks will remove part of the failures. Thesame goes for the pulley, this should also be checked regularly to prevent failures. The belt should beinstalled properly, in order to make sure that this failure does not occur. Improving the maintenanceof the pump is likely to take away part of the problem. The installation of the pump is also consideredunder the term ’improvement of maintenance’
Once in a while, a pump will still fail. Therefore, installing an extra pump will give an extra level ofredundancy. If one pump fails, the other can take over. It is also possible to have both pumps workingat half the capacity. This means that they are both running at the same time, so there is no start uptime required for the backup pump. Installing an extra pump of course costs money and requires morespace, but that is acceptable when it also gives more reliability. Any alternatives for the pump are notavailable. This is therefore not an option to improve the reliability of the cooling water system.
Piping Systems FailureFor the piping systems failure it is not known what the cause is. If it has to do with a failure due to abreakage, the same precautions can be taken as with the broken fuel pipe, see 3.7.1. It is likely that thispiping failure has something to do with the salinity of the seawater, since that is used to cool the engine.The thickness of the pipes should regularly be checked for their thickness and replaced if necessary.Protective coatings can be added to these pipes to lengthen their lifetime. As said previously, it is veryexpensive to measure every part of the pipe for its thickness. This failure will therefore no longer betaken into consideration since there is no solution which can solve this failure with small effort.
Controller And Sensor FailureIn case of a failure of the controller and sensor, it is not known what the cause is. This makes findinga solution for the problem nearly impossible. The easiest option to get rid of this error is therefore toinstall multiple controllers and sensors. Their values and behaviour can be monitored, so when it givesvalues that are not determined as normal, another data point can be used. When in port, the faultycontroller and/or sensor can be replaced. Doubling the controllers and sensors has to be done for thehigh temperature water, low temperature water and seawater.
3.9.2. Solutions To Ice In Seawater FilterIce in the seawater filter caused several failures. A solution to this failure only has to be developedfor ships which can expect ice on their route. For ships sailing in ice, the cooling system should beupgraded to a winter cooling system. A winter cooling system should have the inlets as far aft aspossible, have sea boxes of specific characteristics and other specific measures [94]. These measuresassure that ice is not likely to enter the inlet. If ice somehow enters the inlet, measures to melt the iceor flush it back out are available. Even if these measures do not solve the failure, the system can runby circulating cooling water. The winter cooling system thus adds redundancy and should prevent thisfailure from happening. This might not have been installed on several ships due to the cost of it. It istherefore necessary to determine whether this winter cooling water system is needed when designinga ship.
3.10. ConclusionThis section will summarize which solutions are actual possibilities for the different machinery failures.It will also conclude whether these solutions can be a solution to the determined failures. If the reliabilityof a generated solution is not equal, or better to the current solution, it is not an option.
Table 3.2 shows all solutions that have been developed in this chapter. For each system, all failuresare shown in one column and the percentage that they contribute to the total number of failures is shownin the second column. For some of the failures with unknown distribution, it is known which failures
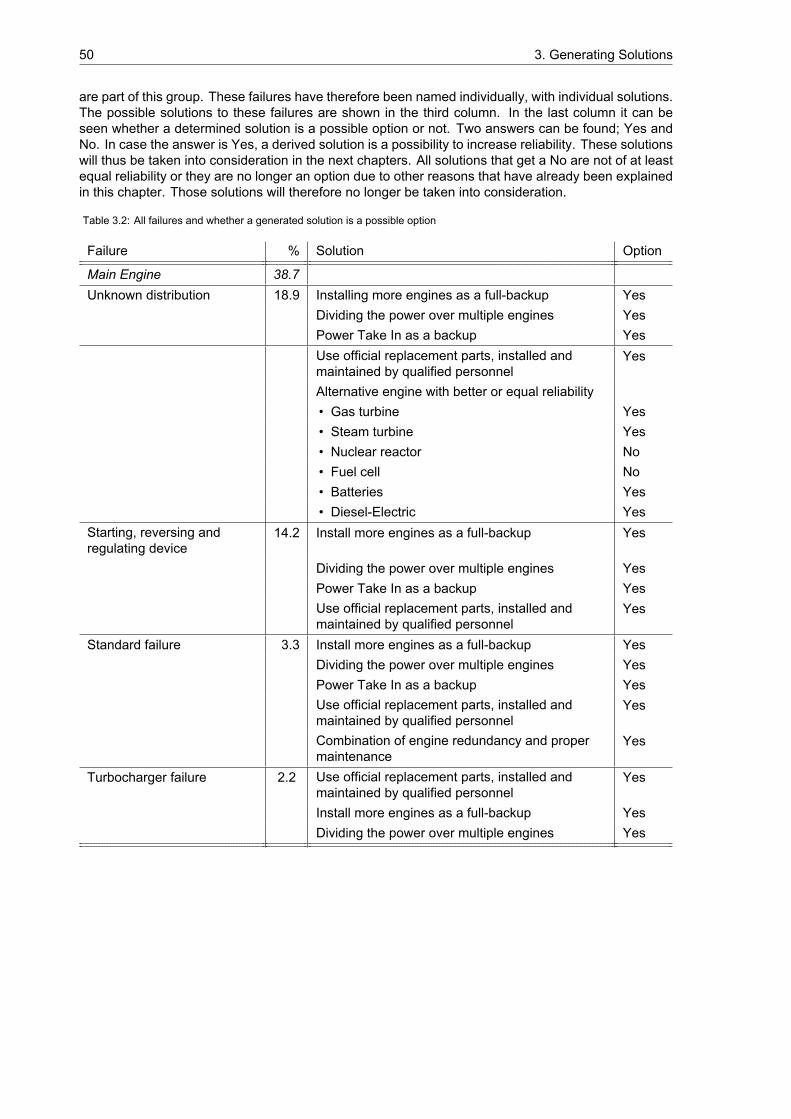
50 3. Generating Solutions
are part of this group. These failures have therefore been named individually, with individual solutions.The possible solutions to these failures are shown in the third column. In the last column it can beseen whether a determined solution is a possible option or not. Two answers can be found; Yes andNo. In case the answer is Yes, a derived solution is a possibility to increase reliability. These solutionswill thus be taken into consideration in the next chapters. All solutions that get a No are not of at leastequal reliability or they are no longer an option due to other reasons that have already been explainedin this chapter. Those solutions will therefore no longer be taken into consideration.
Table 3.2: All failures and whether a generated solution is a possible option
Failure % Solution Option
Main Engine 38.7Unknown distribution 18.9 Installing more engines as a full-backup Yes
Dividing the power over multiple engines YesPower Take In as a backup YesUse official replacement parts, installed andmaintained by qualified personnel
Yes
Alternative engine with better or equal reliability• Gas turbine Yes• Steam turbine Yes• Nuclear reactor No• Fuel cell No• Batteries Yes• Diesel-Electric Yes
Starting, reversing andregulating device
14.2 Install more engines as a full-backup Yes
Dividing the power over multiple engines YesPower Take In as a backup YesUse official replacement parts, installed andmaintained by qualified personnel
Yes
Standard failure 3.3 Install more engines as a full-backup YesDividing the power over multiple engines YesPower Take In as a backup YesUse official replacement parts, installed andmaintained by qualified personnel
Yes
Combination of engine redundancy and propermaintenance
Yes
Turbocharger failure 2.2 Use official replacement parts, installed andmaintained by qualified personnel
Yes
Install more engines as a full-backup YesDividing the power over multiple engines Yes
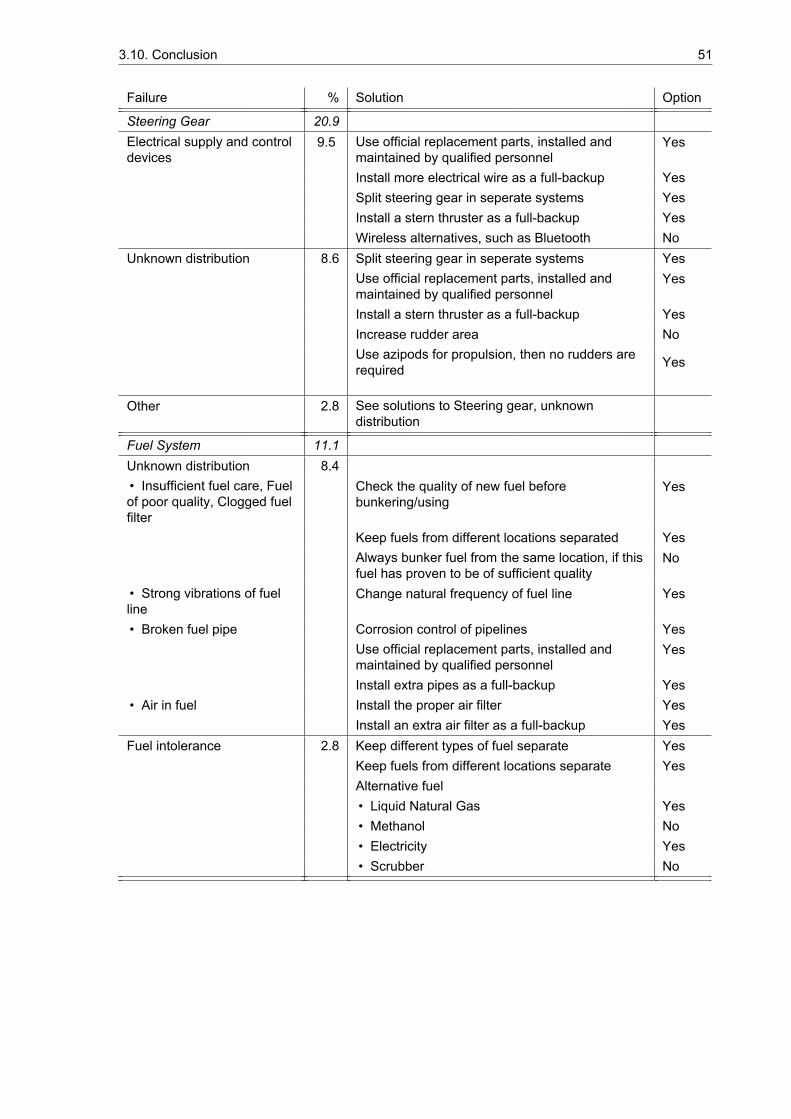
3.10. Conclusion 51
Failure % Solution Option
Steering Gear 20.9Electrical supply and controldevices
9.5 Use official replacement parts, installed andmaintained by qualified personnel
Yes
Install more electrical wire as a full-backup YesSplit steering gear in seperate systems YesInstall a stern thruster as a full-backup YesWireless alternatives, such as Bluetooth No
Unknown distribution 8.6 Split steering gear in seperate systems YesUse official replacement parts, installed andmaintained by qualified personnel
Yes
Install a stern thruster as a full-backup YesIncrease rudder area NoUse azipods for propulsion, then no rudders arerequired Yes
Other 2.8 See solutions to Steering gear, unknowndistribution
Fuel System 11.1Unknown distribution 8.4• Insufficient fuel care, Fuelof poor quality, Clogged fuelfilter
Check the quality of new fuel beforebunkering/using
Yes
Keep fuels from different locations separated YesAlways bunker fuel from the same location, if thisfuel has proven to be of sufficient quality
No
• Strong vibrations of fuelline
Change natural frequency of fuel line Yes
• Broken fuel pipe Corrosion control of pipelines YesUse official replacement parts, installed andmaintained by qualified personnel
Yes
Install extra pipes as a full-backup Yes• Air in fuel Install the proper air filter Yes
Install an extra air filter as a full-backup YesFuel intolerance 2.8 Keep different types of fuel separate Yes
Keep fuels from different locations separate YesAlternative fuel• Liquid Natural Gas Yes• Methanol No• Electricity Yes• Scrubber No
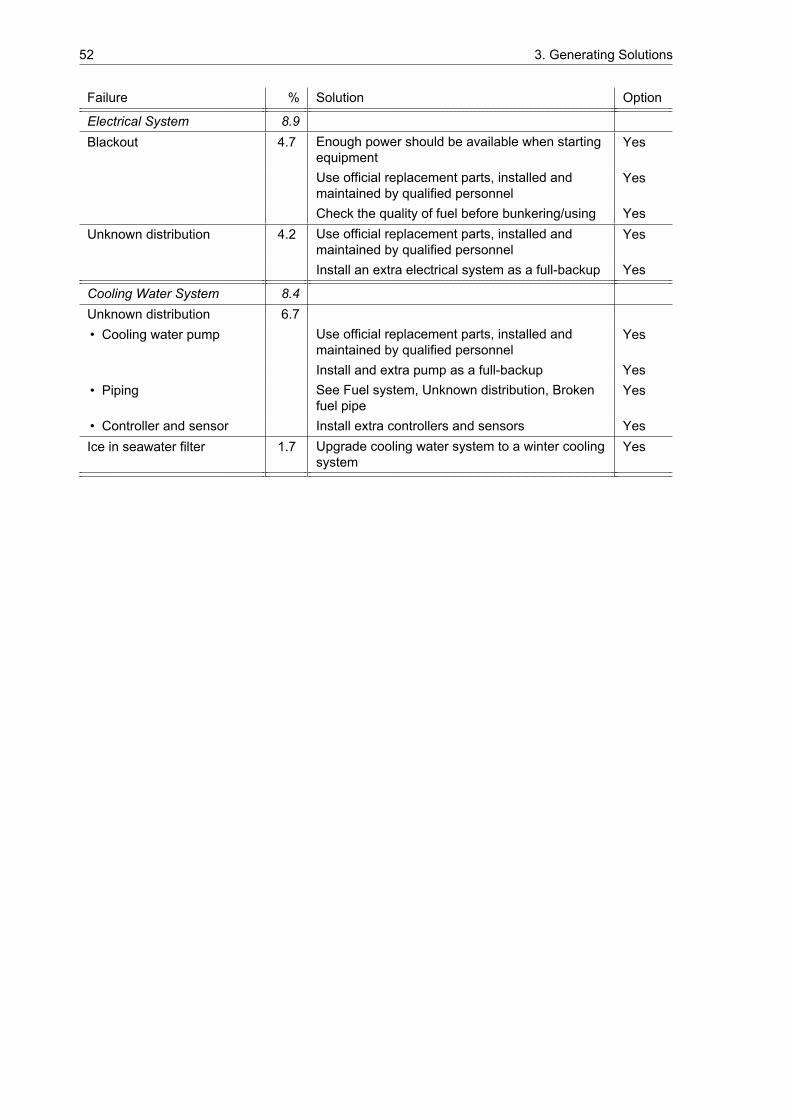
52 3. Generating Solutions
Failure % Solution Option
Electrical System 8.9Blackout 4.7 Enough power should be available when starting
equipmentYes
Use official replacement parts, installed andmaintained by qualified personnel
Yes
Check the quality of fuel before bunkering/using YesUnknown distribution 4.2 Use official replacement parts, installed and
maintained by qualified personnelYes
Install an extra electrical system as a full-backup Yes
Cooling Water System 8.4Unknown distribution 6.7• Cooling water pump Use official replacement parts, installed and
maintained by qualified personnelYes
Install and extra pump as a full-backup Yes• Piping See Fuel system, Unknown distribution, Broken
fuel pipeYes
• Controller and sensor Install extra controllers and sensors YesIce in seawater filter 1.7 Upgrade cooling water system to a winter cooling
systemYes
4Reliability Improvement Of Solutions
This chapter will determine how much of a reliability improvement can be gained for all possible solu-tions as found in Chapter 3. Before this can be determined, the failure rate of the machinery has tobe determined. This is needed to perform the reliability calculations and will be done in Section 4.1.When the reliability improvements of all possible solutions are known, a list can be made of the high-est reliability improvements. Subsequently, the costs of these improvements can be calculated. Thisway, it can be determined how much of a reliability improvement can be gained for a certain amount ofmoney. The financial aspect will eventually determine whether a solution will be implemented or not.
All solutions will be dealt with in order of magnitude of the failure distribution of the systems. So firstthe reliability improvement of the solutions to the main engine failures will be dealt with in Section 4.2.In Section 4.3 it will then be determined how much of a reliability improvement can be gained in thesteering gear. This will also be determined for the fuel system, electrical system and cooling watersystem in respectively Section 4.4, 4.5 and 4.6. After the possible reliability improvements have beendetermined, this can be summarized for all systems and conclusions can be deducted in Section 4.7.
4.1. Failure Rate MachineryIn order to determine the reliability improvement of each individual solution, the failure rate of the ma-chinery has to be determined. This will show how often the machinery fails as a function of time. Withthe failure rate known, it can also be determined what the mean time between failure is. The definitionsof the failure rate and mean time between failure are the following.
• Failure rate, 𝜆(𝑡), is the probability of failure per unit of time, wherein the probability refers to thesituation where, up to and including time 𝑡, not a failure has occurred [53].
• Mean time between failure (MTBF), ( ) , describes the amount of failures of a product as a func-tion of time.
In order to determine the failure rate, it has to be determined how long a ship movement of a shipin German waters is. The original failure data consists of failures that occurred in German waters. Itis therefore important to determine the duration of a ship movement in German waters. To determinethis, the length of a ship movement and the speed during this movement have to be determined. Thismakes it possible to determine how long the ship has been in German waters. Both for the length of aship movement and the speed during a ship movement, estimations will have to be done since there isno available data on the length or speed during a ship movement.
4.1.1. Length Of A Ship MovementIn order to be able to determine the failure rate of the ship machinery, the length of a ship movementwithin German waters has to be determined. It is considered a movement when a ship sails from or toa port in Germany or when a ship passes through German waters while both its port of departure anddestination are located outside Germany. The waters in which the ship movements are counted is theterritorial sea or 12 nm zone. Both the North Sea and the Baltic Sea run along the German coast. In
53
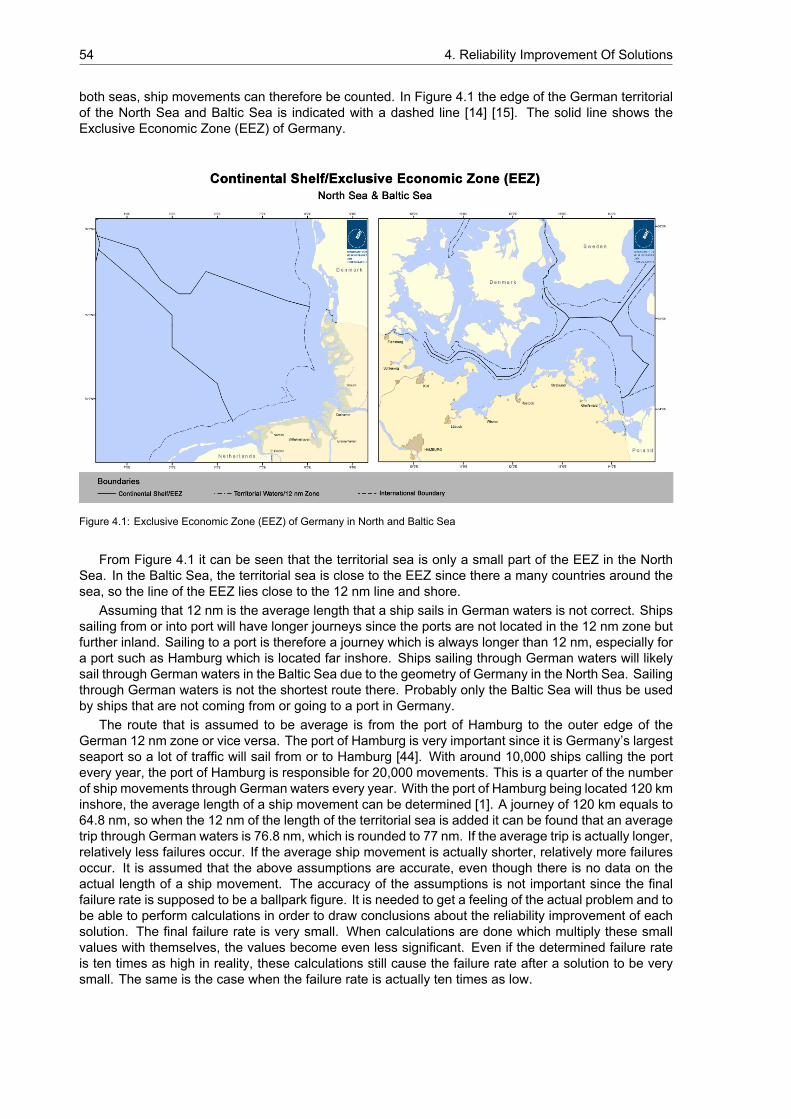
54 4. Reliability Improvement Of Solutions
both seas, ship movements can therefore be counted. In Figure 4.1 the edge of the German territorialof the North Sea and Baltic Sea is indicated with a dashed line [14] [15]. The solid line shows theExclusive Economic Zone (EEZ) of Germany.
Figure 4.1: Exclusive Economic Zone (EEZ) of Germany in North and Baltic Sea
From Figure 4.1 it can be seen that the territorial sea is only a small part of the EEZ in the NorthSea. In the Baltic Sea, the territorial sea is close to the EEZ since there a many countries around thesea, so the line of the EEZ lies close to the 12 nm line and shore.
Assuming that 12 nm is the average length that a ship sails in German waters is not correct. Shipssailing from or into port will have longer journeys since the ports are not located in the 12 nm zone butfurther inland. Sailing to a port is therefore a journey which is always longer than 12 nm, especially fora port such as Hamburg which is located far inshore. Ships sailing through German waters will likelysail through German waters in the Baltic Sea due to the geometry of Germany in the North Sea. Sailingthrough German waters is not the shortest route there. Probably only the Baltic Sea will thus be usedby ships that are not coming from or going to a port in Germany.
The route that is assumed to be average is from the port of Hamburg to the outer edge of theGerman 12 nm zone or vice versa. The port of Hamburg is very important since it is Germany’s largestseaport so a lot of traffic will sail from or to Hamburg [44]. With around 10,000 ships calling the portevery year, the port of Hamburg is responsible for 20,000 movements. This is a quarter of the numberof ship movements through German waters every year. With the port of Hamburg being located 120 kminshore, the average length of a ship movement can be determined [1]. A journey of 120 km equals to64.8 nm, so when the 12 nm of the length of the territorial sea is added it can be found that an averagetrip through German waters is 76.8 nm, which is rounded to 77 nm. If the average trip is actually longer,relatively less failures occur. If the average ship movement is actually shorter, relatively more failuresoccur. It is assumed that the above assumptions are accurate, even though there is no data on theactual length of a ship movement. The accuracy of the assumptions is not important since the finalfailure rate is supposed to be a ballpark figure. It is needed to get a feeling of the actual problem and tobe able to perform calculations in order to draw conclusions about the reliability improvement of eachsolution. The final failure rate is very small. When calculations are done which multiply these smallvalues with themselves, the values become even less significant. Even if the determined failure rateis ten times as high in reality, these calculations still cause the failure rate after a solution to be verysmall. The same is the case when the failure rate is actually ten times as low.
4.1. Failure Rate Machinery 55
4.1.2. Speed During A Ship MovementWhen the speed during a ship movement is known, the time per ship movement can be determined. Nodata of the speed during a ship movement is available from the used research, so this will have to beestimated. Different types of ships are concerned in this thesis, which all sail on different speeds. Forinstance, a bulk carrier sails on low speed whereas a container ship sails on a high speed. Thereforean average for all these ships has to be determined.
The speed of the ships is estimated to be twelve knots on average. This value is chosen becauseboth the North Sea and Baltic Sea are heavily trafficked. Ships are therefore not likely to sail on theirmaximum speed. Since the going to and coming from a port is a big part of the ship movements thelower speed in harbour has to be accounted for. The average speed at sea may be closer to fifteenknots but since manoeuvring in port is done at lower speeds and takes much time, the average speedis lower when this is taken into account. When the speeds of the ships that are sailing from or to theport of Hamburg are checked with MarineTraffic, it can be seen that these ships average around twelveknots. If the speed was found to be lower in reality, this would mean that relatively less failures perhour occur. A higher speed would lead to shorter ship movements which would lead to relatively morefailures per hour. Again, the accuracy of the speed during a ship movement is of no importance. Thegained result is accurate enough to perform calculations and get a feeling of the size of the problem.
4.1.3. Failure Rate CalculationsIt is known for the years 2003 and 2004 that 107 failures have occurred during 160,000 shipmovements.Assuming that the other years have the same number of failures per ship movement makes it possibleto determine that the recorded 359 failures were caused in 537,000 movements during six years. It waspreviously stated in Chapter 1 that age has a significant influence on the failure rate. It is assumed thatships of all ages sail through German waters. Since 80,000 ships move through German waters everyyear, it can be expected that ships of all ages are represented in an equal manner. The determinedfailure rate will therefore be for a ship which is halfway through its lifetime and the failure rate is assumedto be constant. With the lifetime of a ship being around 20 to 25 years, the failure rate is thus determinedfor a ship that is around ten to twelve and a half years old.
Knowing that about 537,000 ship movements caused 359 failures makes it possible to determine,on average, how many movements are sailed per one failure. This can be determined by dividing thenumber of ship movements by the number of failures. For Equation 4.1, the ship movement and failurevalues for all six years are taken.
Ship movements between failures = 537, 000359 = 1, 495 ≈ 1, 500 𝑚𝑜𝑣𝑒𝑚𝑒𝑛𝑡𝑠 (4.1)
From the above equation it can be seen that roughly once every 1,500 movements a failure occurs.It can now also be determined how many movements are registered per day and what the intervalis between two failures. First, the number of movements per day will be determined by dividing thenumber of movements by the number of days. For each year it is assumed that the ships sail 365days. When the movements per day are known, it can be determined how many days are in betweena failure by dividing the ship movements per failure by the ship movements per day.
Ship movements per day = 537, 0006 × 365 = 245 𝑚𝑜𝑣𝑒𝑚𝑒𝑛𝑡𝑠 (4.2)
Days between failure = 1500245 = 6.1 ≈ 6 𝑑𝑎𝑦𝑠 (4.3)
From Equation 4.2 it can be seen that 245 ship movements per day take place in German waters.Knowing that once every 1,500 ship movements a failure occurs, it can be seen from Equation 4.3 thatonce every six days a fatal technical failure occurs due to a failure in one of the systems.
It has previously been determined what the average length is of a ship movement as well as theaverage speed during this movement. Those were respectively found to be 77 nm and twelve knots.It can now be determined what the duration of a ship movement is. First, both the distance and thespeed have to be translated to the metric system. The distance is therefore multiplied with 1,852, toget the amount of meters per ship movement. The speed is multiplied with 1,852/3,600 to get a speedin 𝑚/𝑠.
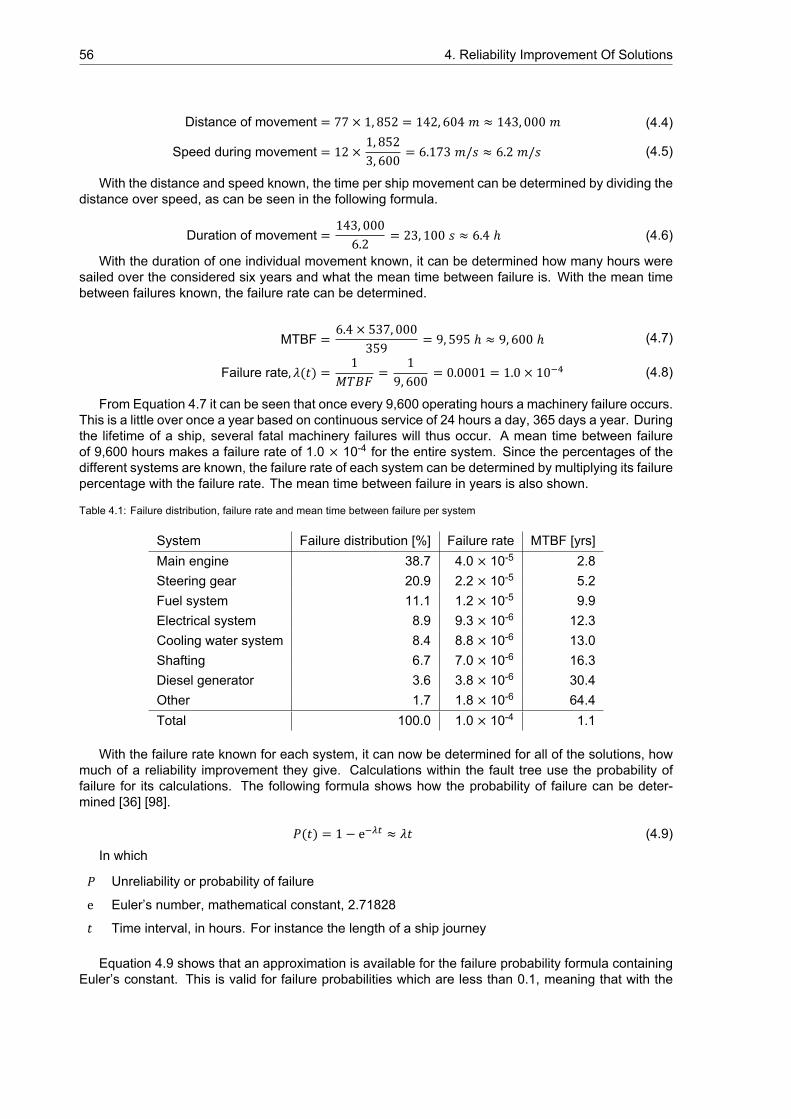
56 4. Reliability Improvement Of Solutions
Distance of movement = 77 × 1, 852 = 142, 604 𝑚 ≈ 143, 000 𝑚 (4.4)
Speed during movement = 12 × 1, 8523, 600 = 6.173 𝑚/𝑠 ≈ 6.2 𝑚/𝑠 (4.5)
With the distance and speed known, the time per ship movement can be determined by dividing thedistance over speed, as can be seen in the following formula.
Duration of movement = 143, 0006.2 = 23, 100 𝑠 ≈ 6.4 ℎ (4.6)
With the duration of one individual movement known, it can be determined how many hours weresailed over the considered six years and what the mean time between failure is. With the mean timebetween failures known, the failure rate can be determined.
MTBF = 6.4 × 537, 000359 = 9, 595 ℎ ≈ 9, 600 ℎ (4.7)
Failure rate, 𝜆(𝑡) = 1𝑀𝑇𝐵𝐹 =
19, 600 = 0.0001 = 1.0 × 10 (4.8)
From Equation 4.7 it can be seen that once every 9,600 operating hours a machinery failure occurs.This is a little over once a year based on continuous service of 24 hours a day, 365 days a year. Duringthe lifetime of a ship, several fatal machinery failures will thus occur. A mean time between failureof 9,600 hours makes a failure rate of 1.0 × 10⁻⁴ for the entire system. Since the percentages of thedifferent systems are known, the failure rate of each system can be determined by multiplying its failurepercentage with the failure rate. The mean time between failure in years is also shown.
Table 4.1: Failure distribution, failure rate and mean time between failure per system
System Failure distribution [%] Failure rate MTBF [yrs]Main engine 38.7 4.0 × 10⁻⁵ 2.8Steering gear 20.9 2.2 × 10⁻⁵ 5.2Fuel system 11.1 1.2 × 10⁻⁵ 9.9Electrical system 8.9 9.3 × 10⁻⁶ 12.3Cooling water system 8.4 8.8 × 10⁻⁶ 13.0Shafting 6.7 7.0 × 10⁻⁶ 16.3Diesel generator 3.6 3.8 × 10⁻⁶ 30.4Other 1.7 1.8 × 10⁻⁶ 64.4Total 100.0 1.0 × 10⁻⁴ 1.1
With the failure rate known for each system, it can now be determined for all of the solutions, howmuch of a reliability improvement they give. Calculations within the fault tree use the probability offailure for its calculations. The following formula shows how the probability of failure can be deter-mined [36] [98].
𝑃(𝑡) = 1 − e ≈ 𝜆𝑡 (4.9)In which
𝑃 Unreliability or probability of failure
e Euler’s number, mathematical constant, 2.71828
𝑡 Time interval, in hours. For instance the length of a ship journey
Equation 4.9 shows that an approximation is available for the failure probability formula containingEuler’s constant. This is valid for failure probabilities which are less than 0.1, meaning that with the
4.2. Reliability Improvement Main Engine 57
calculated failure rate, the ship can sail 960 hours or about 40 days. It is assumed that the simplifiedformula can therefore be used. For the time interval 𝑡, a value of one hour is used. This way, the effectof time is isolated and only the effect of the changing failure rate is shown. All calculations thereforeshow the failure rate instead of the probability of failure.
4.2. Reliability Improvement Main EngineThere are four groups of failures in the main engine. For each of these failures, solutions have beendeveloped which give a certain reliability improvement. These solutions have been shown in Chapter 3.A solution will have to give a significant reliability improvement before it will be with the first solutionsto be applied. First, for all solutions that solve the failures with unknown distribution, the reliabilityimprovement will be determined. This group has a failure rate of 2.0 × 10⁻⁵ and a MTBF of 5.8 years.Then, the same will be done for the solutions to the starting, reversing and regulating device failures(1.5 × 10⁻⁵ and 7.7 years), the standard failures (3.5 × 10⁻⁶, 32.9 years) and turbocharger failures(2.3 × 10⁻⁶ and 48.8 years between failures). After the reliability improvements for all groups havebeen determined a conclusion can be drawn to which solutions give the best improvements for themain engine failures. The solution with the highest reliability improvement in the main engine is verylikely to be investigated financially, since themain engine is responsible for themost failures. Therefore,this solution is very likely to be with the solutions with the highest reliability improvement.
4.2.1. Reliability Improvement Unknown DistributionThe first solution to increase the redundancy is by either installing more engines as a full-backup orto divide the power over multiple engines. It will first be determined for these solutions how muchof a reliability improvement they give. Improving the maintenance also gives a reliability improvement.Then, the reliability improvement of the alternative engines will be determined. Finally, the improvementof the power take in will be dealt with.
Engine RedundancyEngine redundancy involves another engine with equal power as the failed one, or multiple enginesthat have the total power divided over them. When an engine fails there is enough power availableto continue the route of the ship in both cases. In case a full-backup engine is available, the ship cancontinue with the same speed since the same power will remain available. Cargo and ship are thennot delayed. When the power is divided over more engines, the speed of the ship will drop. The shipwill then continue its journey with a lower speed since less power is available and a delay of ship andcargo occurs. With a backup engine being available, or with multiple engines being available, a failureof one engine is not fatal. Failures to two engines are necessary before this leads to a fatal technicalfailure. If three or more engines are installed in the ship, a loss of two engines does not have to befatal. It is though assumed that a failure of two engines will influence the performance of the ship to alevel where it is no longer fully operational. A failure of two engines is thus assumed to be fatal.
Due to the failures with unknown distribution, engine number 1 has a failure rate of 2.0 × 10⁻⁵. Asecond engine, engine number 2, which would serve as a full-backup or which would provide enoughpower at lower speed will also have a failure rate of 2.0 × 10⁻⁵ for the same failure. Multiplying theserates gives a value for a failure rate of both engines at the same time due to this particular failure. Ifthis new failure rate is calculated, the improvement due to these two solutions can be determined.
𝜆Both engines = 𝜆Engine #1 × 𝜆Engine #2= 2.0 × 10 × 2.0 × 10 = 3.9 × 10 (4.10)
Reliability improvement = 𝑀𝑇𝐵𝐹After solution −𝑀𝑇𝐵𝐹Before solution
= 13.9 × 10 − 1
2.0 × 10 ≈ 293, 500 𝑦𝑒𝑎𝑟𝑠(4.11)
The results of Equation 4.10 indicate that the failure rate of a main engine failure due to the failureswith unknown distribution is reduced from 2.0 × 10⁻⁵ to only 3.9 × 10⁻¹⁰ with both engine redundancysolutions. As can be seen from Equation 4.11 this gives a MTBF improvement of 293,500 years foreach of these solutions. It can thus be said that these solutions increase the reliability to a level whichcan be considered to be save.
58 4. Reliability Improvement Of Solutions
Power Take InA power take in has also been named as a solution to the failures with unknown distribution. The PTIwill come into action when insufficient power is available from the main engines. It will then sail the shiphome with a lower speed. It does thus not really solve the failure, but gives a reliable alternative. Sinceno official values for the failure rate of a PTI are known, it will be assumed that it has the same effectas a full-backup engine and dividing the power over multiple engines. This means that it is assumedthat a PTI has the same failure rate as another second engine. It is thus assumed that a PTI gives areliability improvement of 293,500 years.
Improvement Of MaintenanceAnother solution that improves the redundancy of the engine, is to perform better maintenance. It wasfound that the level of maintenance is sometimes insufficient, which causes failures. Proper mainte-nance will reduce the occurrence of failures by 19.3%. The failure rate of a main engine due to a failurewith unknown distribution, while being properly serviced can now be found.
𝜆After proper maintenance = 𝜆Before maitenance × 𝐹Reduction maintenance= 2.0 × 10 × 0.807 = 1.6 × 10 (4.12)
Reliability improvement = 𝑀𝑇𝐵𝐹After solution −𝑀𝑇𝐵𝐹Before solution
= 11.6 × 10 − 1
2.0 × 10 = 1.4 𝑦𝑒𝑎𝑟𝑠(4.13)
Equation 4.12 shows that the failure rate reduces from 2.0 × 10⁻⁵ to 1.6 × 10⁻⁵. This is a MTBFimprovement of only 1.4 years, as shown in Equation 4.13. This is a significant smaller improvementthan the one due to the redundancy solution. Only improving the maintenance thus does not seem tobe the best solution for the failures with unknown distribution.
Engine Redundancy Plus Improvement Of MaintenanceThe solutions as stated previously can also be combined to increase reliability. The new failure rateand the reliability improvement will be determined in the following equations. First, the effect of propermaintenance on one engine will be calculated. This value will then be used to determine the failure rateof a main engine failure, although engine redundancy has been applied and the engines have beenproperly maintained.
𝜆After pm = 𝜆Before maitenance × 𝐹Reduction maintenance= 2.0 × 10 × 0.807 = 1.6 × 10 (4.14)
𝜆Both engines after pm = 𝜆Engine #1 × 𝜆Engine #2= 1.6 × 10 × 1.6 × 10 = 2.5 × 10 (4.15)
Reliability improvement = 𝑀𝑇𝐵𝐹After solution −𝑀𝑇𝐵𝐹Before solution
= 12.5 × 10 − 1
2.0 × 10 ≈ 450, 500 𝑦𝑒𝑎𝑟𝑠(4.16)
Combining the two measures reduces the failure rate to only 2.5 × 10⁻¹⁰, so this solution is foundto give a reliability improvement of 450,500 years. This is 157,000 years more than only applyingengine redundancy as a solution. The combination of both solutions thus improves reliability evenfurther. Since the engine redundancy solutions already increases the MTBF to 293,500 it can be saidthat combining the two measures is not necessary to increase reliability. A MTBF of 293,500 can beconsidered to be sufficient and the combination of the solutions is therefore no longer considered.
4.2. Reliability Improvement Main Engine 59
Alternative EngineThe alternative engines gas turbine, steam turbine, batteries and diesel-electric have all been statedto have a high reliability, although no data to compare them to the diesel engine was found. Since nofailure rates of the alternative engines are known, it is impossible to determine the improvement gain.However, it can be determined whether installing another engine gives a reliability improvement thatcan compete with other solutions and is also a realistic improvement. If one of the proposed alternativeengines is for instance 10% more reliable than the diesel engine, this only prevents 2.0 × 10⁻⁶ ofthe failures, which is a MTBF increase of 0.6 years. An improvement of only 0.6 years is very smallcompared to an engine redundancy solution. For an alternative engine to be a competitor to engineredundancy it has to give the same reliability improvement. This is an improvement of 293,500 years.For one type of alternative engine to give the same reliability improvement it has to be much morereliable, to a point which is no longer realistic. Using only one alternative engine as a solution to thefailures with unknown distribution is thus not a realistic option.
For the previous statement, the effect of engine redundancy and proper maintenance have notbeen taken into account. If it is assumed that proper maintenance also has a positive influence on thereliability of the alternative engine, this will improve reliability of that engine with 19.3%. Two caseswill be examined in order to determine whether alternative engines with a higher reliability show asignificant lower failure rate than improving the engine redundancy of the diesel engine. First, the newfailure rate of an alternative engine with a 10% failure rate reduction compared to the diesel engine willbe determined. The second case is for an alternative engine with a failure rate reduction of 20%. Forcase one the failure rate of 2.0 × 10⁻⁵ is thus multiplied with 0.90 whereas the failure rate is multipliedwith 0.80 for the second case. These factors compensate for the reduction of the failure rate. The sameequations as used previously are being used. In order to shorten the equations, some of the terms havebeen abbreviated to their initials. This means that proper maintenance has been abbreviated to pmand reliability improvement has been reduced to ri. It has again to be stated for clarity that it is unknownwhether there are engines available with the lower failure rates as chosen in both cases.
𝜆After pm and ri = 𝜆Before maitenance × 𝐹Reduction alternative engine × 𝐹Reduction maintenance= 2.0 × 10 × 0.90 × 0.807 = 1.4 × 10 (4.17)
𝜆Both engines after pm and ri = 𝜆Engine #1 × 𝜆Engine #2= 1.4 × 10 × 1.4 × 10 = 2.1 × 10 (4.18)
Reliability improvement = 𝑀𝑇𝐵𝐹After solution −𝑀𝑇𝐵𝐹Before solution
= 12.1 × 10 − 1
2.0 × 10 ≈ 556, 500 𝑦𝑒𝑎𝑟𝑠(4.19)
For an alternative engine that is assumed to have a 10% lower failure rate, the reliability improve-ment is found to be 556,500 years. Compared to the reliability improvement gained by the diesel engineredundancy, this is an improvement of 262,500 years and an improvement of 106,000 years comparedto the combination of engine redundancy and improved maintenance. This is a small improvementcompared to what the other solutions already achieved.
Installing two alternative engines, which both have a reliability improvement of 20% compared tothe diesel engine increases the MTBF with 704,000 years. Compared to engine redundancy, this is animprovement of 410,500 years and an improvement of 253,500 years compared to the combination ofengine redundancy and improved maintenance. It is questionable whether there are engines availablewhich can give a reliability improvement of 20%. If these are available, it is not necessarily worth itto install those. The engine redundancy measures already reduce the risk of this failure to a levelwhere only one in about 11,750 ships will be struck with this failure during its lifetime of an assumed 25years. Since those solutions already have such a significant impact, it can thus be said that installinga different engine is not chosen for improving reliability, but may be chosen for a different reason,such as maintainability or its space requirement. Installing an alternative engine, or multiple alternativeengines, is thus not the best way to reduce the failures with unknown distribution. When the solutionsthat involve an alternative engine are beyond the solutions with the highest reliability improvement,those will not be taken into consideration financially. The reasons for this are: it is not clear whetherthese engines exist, they do not give a significant improvement and integrating another engine involvesa lot of work, also in other systems.
60 4. Reliability Improvement Of Solutions
4.2.2. Reliability Improvement Starting, Reversing And Regulating DeviceThis Subsection will deal with the reliability improvement calculations of the starting, reversing andregulating device. Two specific solutions have been found, namely engine redundancy and the im-provement of maintenance. A combination of these two is also an option. The reliability improvementsof all solutions will be determined, just as the remaining failure rate.
Engine RedundancyThe first solution to increase the reliability of the engine controller is to apply redundancy by eitherinstalling an engine as a full-backup or by dividing the power over multiple engines. Two engines wouldthen have to fail due to a failure of the starting, reversing and regulating device before this becomesfatal. With both engine controllers having a failure rate of 1.5 × 10⁻⁵, it can be determined that the failurerate of a fatal technical failure due to a failure of the engine controller for both engines is 2.2 × 10⁻¹⁰.This is a reduction of 521,000 years compared to the initial failure rate, which is a significant reliabilityincrease.
Improvement Of MaintenanceThe second solution is to improvemaintenance. The failure rate of the starting, reversing and regulatingdevice after proper maintenance can be found with the equations as shown previously. It can bededucted that the reliability improvement due to proper maintenance is only 1.8 years. A failure rate of1.2 × 10-5 will remain for this failure, which is still significant. This solution can thus already be said tohave too little impact.
Combination Of Engine Redundancy Plus Improvement Of MaintenanceA combination of the engine redundancy solution and the improvement of maintenance improves thereliability even further. It can be calculated that the failure rate of two engines due to a engine controllerfailure, although those have been properly serviced is 1.4 × 10⁻¹⁰. This is an improvement of 800,000years compared to the initial failure rate, but only an improvement of 279,000 years to the sole solutionof engine redundancy. It can thus be said that combining the two measures is financially not viablesince the mean time between failures of the engine redundancy measure is already satisfying.
4.2.3. Reliability Improvement Standard FailureIn order to reduce the standard failures, several options are available. Installing more engines or divid-ing the power over multiple engines is one option. These engine redundancy options have previouslyalso been seen as a solution to the engine failures with unknown distribution and will later also beseen for the turbocharger failures. These solutions thus benefit multiple failures. Another option is toimprove the maintenance or accept that these failures occur, since it is only accountable for 3.3% ofall failures. Accepting that this failure occurs is not a real solution though, as it does not improve thereliability.
If none of the proposed solutions proves to give a high reliability improvement, the solution to thestandard failures will not be with the solutions to be applied. In that case, the possibility of occurrenceof a failure will remain present and is thus accepted. Considering the acceptance of the failure on anindividual basis is therefore no longer necessary.
This means that three options are left, engine redundancy, improving the maintenance and a com-bination of those. The reliability improvement gain due to engine redundancy solutions will first bedetermined. Then the effect of proper maintenance will be calculated. At last it will be assessed howmuch of an improvement the two solutions give combined.
Engine RedundancyThe first solution to be checked for its impact is the engine redundancy. As explained previously,this solution will either install a full-backup engine or divide the power over multiple engines. In bothsolutions, in case a failure occurs due to a standard failure, enough power is available so that the shipcan continue its route.
It has been calculated that 1.2 × 10⁻¹¹ of the initial failure rate of 3.5 × 10⁻⁶ will remain. This meansthat engine redundancy reduces the failure rate due to a standard failure from once every 32.9 yearsto once every 9,488,000 years. Applying engine redundancy thus has a significant effect.
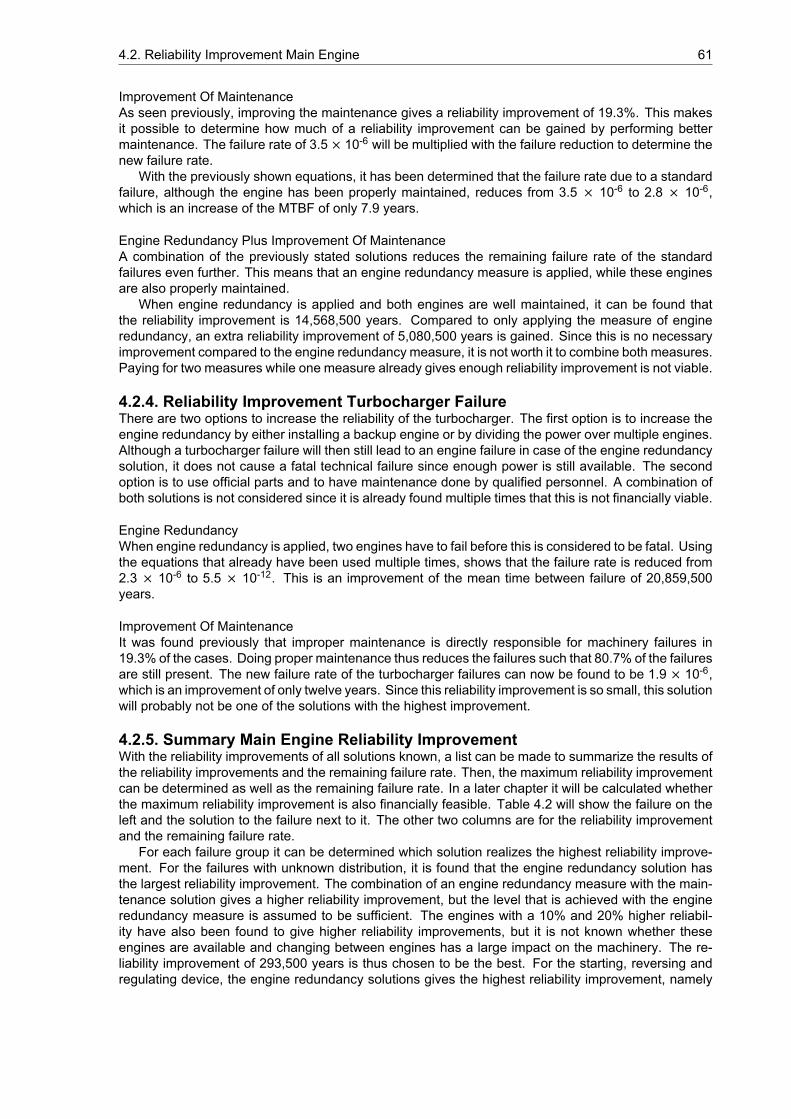
4.2. Reliability Improvement Main Engine 61
Improvement Of MaintenanceAs seen previously, improving the maintenance gives a reliability improvement of 19.3%. This makesit possible to determine how much of a reliability improvement can be gained by performing bettermaintenance. The failure rate of 3.5 × 10⁻⁶ will be multiplied with the failure reduction to determine thenew failure rate.
With the previously shown equations, it has been determined that the failure rate due to a standardfailure, although the engine has been properly maintained, reduces from 3.5 × 10⁻⁶ to 2.8 × 10⁻⁶,which is an increase of the MTBF of only 7.9 years.
Engine Redundancy Plus Improvement Of MaintenanceA combination of the previously stated solutions reduces the remaining failure rate of the standardfailures even further. This means that an engine redundancy measure is applied, while these enginesare also properly maintained.
When engine redundancy is applied and both engines are well maintained, it can be found thatthe reliability improvement is 14,568,500 years. Compared to only applying the measure of engineredundancy, an extra reliability improvement of 5,080,500 years is gained. Since this is no necessaryimprovement compared to the engine redundancy measure, it is not worth it to combine both measures.Paying for two measures while one measure already gives enough reliability improvement is not viable.
4.2.4. Reliability Improvement Turbocharger FailureThere are two options to increase the reliability of the turbocharger. The first option is to increase theengine redundancy by either installing a backup engine or by dividing the power over multiple engines.Although a turbocharger failure will then still lead to an engine failure in case of the engine redundancysolution, it does not cause a fatal technical failure since enough power is still available. The secondoption is to use official parts and to have maintenance done by qualified personnel. A combination ofboth solutions is not considered since it is already found multiple times that this is not financially viable.
Engine RedundancyWhen engine redundancy is applied, two engines have to fail before this is considered to be fatal. Usingthe equations that already have been used multiple times, shows that the failure rate is reduced from2.3 × 10-6 to 5.5 × 10⁻¹². This is an improvement of the mean time between failure of 20,859,500years.
Improvement Of MaintenanceIt was found previously that improper maintenance is directly responsible for machinery failures in19.3% of the cases. Doing proper maintenance thus reduces the failures such that 80.7% of the failuresare still present. The new failure rate of the turbocharger failures can now be found to be 1.9 × 10⁻⁶,which is an improvement of only twelve years. Since this reliability improvement is so small, this solutionwill probably not be one of the solutions with the highest improvement.
4.2.5. Summary Main Engine Reliability ImprovementWith the reliability improvements of all solutions known, a list can be made to summarize the results ofthe reliability improvements and the remaining failure rate. Then, the maximum reliability improvementcan be determined as well as the remaining failure rate. In a later chapter it will be calculated whetherthe maximum reliability improvement is also financially feasible. Table 4.2 will show the failure on theleft and the solution to the failure next to it. The other two columns are for the reliability improvementand the remaining failure rate.
For each failure group it can be determined which solution realizes the highest reliability improve-ment. For the failures with unknown distribution, it is found that the engine redundancy solution hasthe largest reliability improvement. The combination of an engine redundancy measure with the main-tenance solution gives a higher reliability improvement, but the level that is achieved with the engineredundancy measure is assumed to be sufficient. The engines with a 10% and 20% higher reliabil-ity have also been found to give higher reliability improvements, but it is not known whether theseengines are available and changing between engines has a large impact on the machinery. The re-liability improvement of 293,500 years is thus chosen to be the best. For the starting, reversing andregulating device, the engine redundancy solutions gives the highest reliability improvement, namely
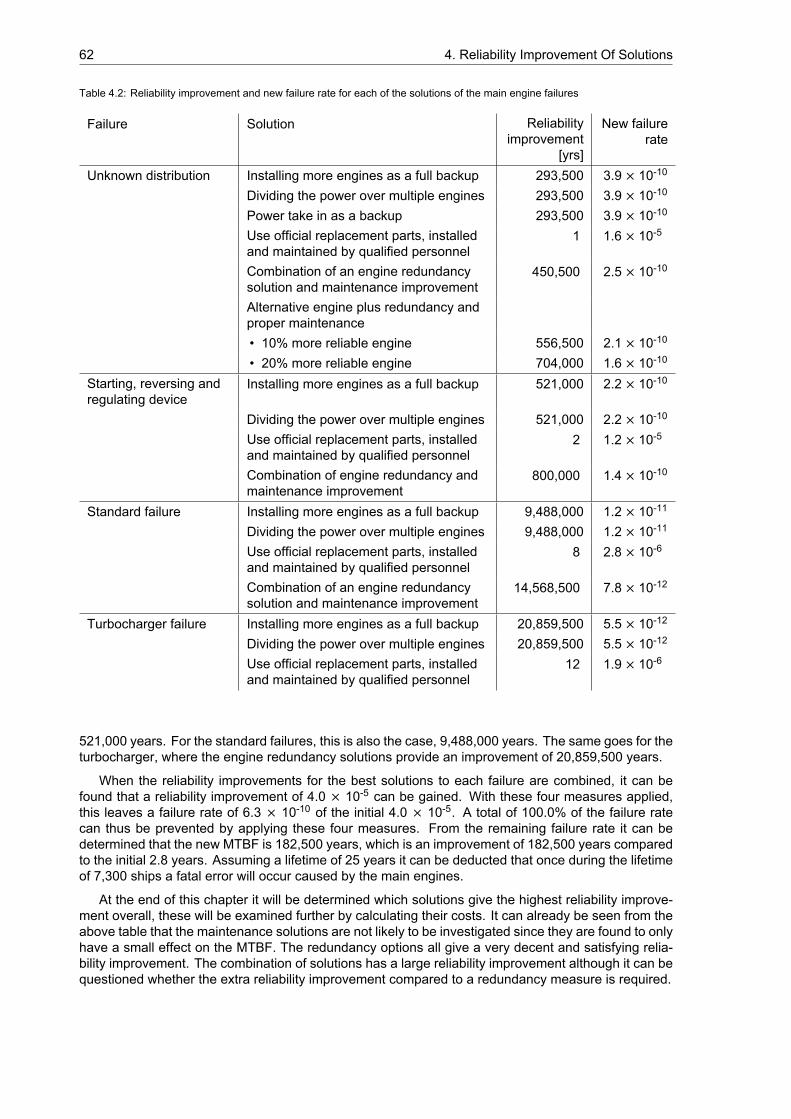
62 4. Reliability Improvement Of Solutions
Table 4.2: Reliability improvement and new failure rate for each of the solutions of the main engine failures
Failure Solution Reliabilityimprovement
[yrs]
New failurerate
Unknown distribution Installing more engines as a full backup 293,500 3.9 × 10⁻¹⁰
Dividing the power over multiple engines 293,500 3.9 × 10⁻¹⁰
Power take in as a backup 293,500 3.9 × 10⁻¹⁰
Use official replacement parts, installedand maintained by qualified personnel
1 1.6 × 10⁻⁵
Combination of an engine redundancysolution and maintenance improvement
450,500 2.5 × 10⁻¹⁰
Alternative engine plus redundancy andproper maintenance• 10% more reliable engine 556,500 2.1 × 10⁻¹⁰
• 20% more reliable engine 704,000 1.6 × 10⁻¹⁰
Starting, reversing andregulating device
Installing more engines as a full backup 521,000 2.2 × 10⁻¹⁰
Dividing the power over multiple engines 521,000 2.2 × 10⁻¹⁰
Use official replacement parts, installedand maintained by qualified personnel
2 1.2 × 10⁻⁵
Combination of engine redundancy andmaintenance improvement
800,000 1.4 × 10⁻¹⁰
Standard failure Installing more engines as a full backup 9,488,000 1.2 × 10⁻¹¹
Dividing the power over multiple engines 9,488,000 1.2 × 10⁻¹¹
Use official replacement parts, installedand maintained by qualified personnel
8 2.8 × 10⁻⁶
Combination of an engine redundancysolution and maintenance improvement
14,568,500 7.8 × 10⁻¹²
Turbocharger failure Installing more engines as a full backup 20,859,500 5.5 × 10⁻¹²
Dividing the power over multiple engines 20,859,500 5.5 × 10⁻¹²
Use official replacement parts, installedand maintained by qualified personnel
12 1.9 × 10⁻⁶
521,000 years. For the standard failures, this is also the case, 9,488,000 years. The same goes for theturbocharger, where the engine redundancy solutions provide an improvement of 20,859,500 years.
When the reliability improvements for the best solutions to each failure are combined, it can befound that a reliability improvement of 4.0 × 10⁻⁵ can be gained. With these four measures applied,this leaves a failure rate of 6.3 × 10⁻¹⁰ of the initial 4.0 × 10⁻⁵. A total of 100.0% of the failure ratecan thus be prevented by applying these four measures. From the remaining failure rate it can bedetermined that the new MTBF is 182,500 years, which is an improvement of 182,500 years comparedto the initial 2.8 years. Assuming a lifetime of 25 years it can be deducted that once during the lifetimeof 7,300 ships a fatal error will occur caused by the main engines.
At the end of this chapter it will be determined which solutions give the highest reliability improve-ment overall, these will be examined further by calculating their costs. It can already be seen from theabove table that the maintenance solutions are not likely to be investigated since they are found to onlyhave a small effect on the MTBF. The redundancy options all give a very decent and satisfying relia-bility improvement. The combination of solutions has a large reliability improvement although it can bequestioned whether the extra reliability improvement compared to a redundancy measure is required.
4.3. Reliability Improvement Steering Gear 63
4.3. Reliability Improvement Steering GearThe steering gear failures are responsible for 20.9% of all machinery failures (a failure rate of 2.2 × 10⁻⁵and a MTBF of 5.2 years). Being the second largest group of failures, there are two main groups offailures that cause a steering gear failure. The largest group is the group which contains the group’other’ and the failures with unknown distribution. Since it is not known which failures are present inboth the failures with unknown distribution as in the failure group other, their solutions are equal. Theycombine for 54.6% of all failures and have a failure rate of 1.2 × 10⁻⁵ and a MTBF of 9.6 years. Afailure in the electrical supply and control devices is the second failure group (9.5%, 9.9 × 10⁻⁶ and11.6 years). For each of the failure groups it will be determined how much of a reliability improvementis achieved by their solutions. This makes it possible to determine which solutions are the best from thestandpoint of reliability improvement. It will also be determined how much of the failure rate remainsafter a solution has been applied. This section ends with a summary of all solutions and their reliabilityimprovements and new failure rates.
4.3.1. Reliability Improvement Unknown Distribution And OtherThis Subsection will deal with both the reliability improvement for the failures with unknown distributionand the failure group other since they have the same solutions. Together, these groups have a higherinitial failure distribution and failure rate than the failures due to the electrical supply and control devices.
The solutions to these failures will be dealt with in the following order. First, it will be determined whatthe effect of splitting the steering gear is after which the effects of proper maintenance will be dealt with.Then, the instalment of a stern thruster as a full-backup will be discussed. At last, the reliability effectsdue to the switching from rudders to redundant azipods will be discussed. It will also be determinedwhether a combination of solutions might prove to give even higher reliability improvements.
Steering Gear RedundancyWhen the steering gear is divided into separate systems, two systems have to fail before a steeringgear failure becomes fatal. This will thus significantly increase the reliability of the steering gear. Theremaining failure rate and the reliability improvement of this solution will be determined in the followingtwo equations. It is assumed that one steering gear system is sufficient to continue the route of theship or return it to port. The steering gear systems will then have to be designed in such a way that afailed steering gear system does not influence the manoeuvrability in a negative way.
𝜆Both steering gear sets = 𝜆Steering gear set #1 × 𝜆Steering gear set #2= 1.2 × 10 × 1.2 × 10 = 1.4 × 10 (4.20)
Reliability improvement = 𝑀𝑇𝐵𝐹After solution −𝑀𝑇𝐵𝐹Before solution
= 11.4 × 10 − 1
1.2 × 10 ≈ 807, 000 𝑦𝑒𝑎𝑟𝑠(4.21)
When two separate systems are installed it is found from Equation 4.20 that only 1.4 × 10⁻¹⁰ of thefailure rate remains. This means that an improvement of 807,000 years can be gained by installingmultiple systems.
Improvement Of MaintenanceThe effect of maintenance has already be seen for multiple other failures. It is thus very likely that thiswill also have an effect on the failure groups with unknown distribution. The reliability improvement dueto the proper maintenance can be determined with the following equations.
𝜆After proper maintenance = 𝜆Before maitenance × 𝐹Reduction maintenance= 1.2 × 10 × 0.807 = 9.6 × 10 (4.22)
Reliability improvement = 𝑀𝑇𝐵𝐹After solution −𝑀𝑇𝐵𝐹Before solution
= 19.6 × 10 − 1
1.2 × 10 = 2.3 𝑦𝑒𝑎𝑟𝑠(4.23)
64 4. Reliability Improvement Of Solutions
After proper maintenance has been performed, the failure rate lowers with 2.3 × 10⁻⁶ to 9.6 × 10⁻⁶.The mean time between failures is extended with only 2.3 years. When only better maintenance is per-formed, there is still a high failure rate present. This was to be expected, since improper maintenanceis only responsible for 19.3% of all failures. More measures are thus needed to lower the failure rate ofthe unknown distribution more significantly. The steering gear redundancy solution was already foundto have much more improvement and is thus a better solution.
Install A Stern ThrusterWhen a stern thruster is installed, this serves as a full-backup of the steering gear. In case the steeringgear fails, the stern thruster is lowered. This will then provide the steering capacity of the ship (ifnecessary together with a bow thruster). In order to determine the effect of adding a stern thruster, thefailure rate of the stern thruster has to be estimated, since it is unavailable.
When the influence of a power take in was investigated, also no failure rate was present. It wasthen chosen to assume that the PTI had the same failure rate as the failure it was trying to solve. Forthe stern thruster, the same method will be used. It is thus assumed that the stern thruster has a failurerate of 1.2 × 10⁻⁵. With this value known, the new failure rate can be calculated with the formulasas seen previously. From these formulas it can be found that installing a stern thruster has a positiveeffect on the failure rate. Only 1.4 × 10⁻¹⁰ of the initial 1.2 × 10⁻⁵ remains after the stern thruster hasbeen installed. This means that a reliability improvement of 807,000 years can be gained.
Install Redundant AzipodsOf the azipods, also no failure rate is available. It will therefore be assumed, just as with the sternthruster, that its failure rate is the same as the failure rate of the unknown and other steering gearfailures. This means that the reliability improvement due to the azipods is also 807,000 years and thatit has a remaining failure rate of 1.4 × 10⁻¹⁰. The effects of the steering gear redundancy, stern thrusterand the instalment of a redundant set of azipods are thus all the same.
Combination Of Multiple SolutionsSince several different solutions have been found, multiple combinations of solutions can be made.Four solutions are present, of which three have the same effect. Proper maintenance has the leasteffect of the four solutions. The maintenance solution can thus be combined with one of the othersolutions, for instance the engine redundancy. The measures with the same result can also be com-bined. For instance engine redundancy and the stern thruster can be combined to achieve a higherimprovement. Compared to their sole improvement each of these combinations will improve reliabilityeven further. First the results of the combination of maintenance and steering gear redundancy will bedetermined. After that, the results of the other combination will be calculated. The chosen measuresin the combinations are examples, those have not been determined as being the best solution.
It can be found that a combination of proper maintenance and one of the other solutions lowers thefailure rate to only 9.2 × 10⁻¹¹. This is an improvement of 1,239,500 years. Compared to the reliabilityimprovement of the engine redundancy, this is an improvement of 432,500 years. Applying both mea-sures thus has an effect, but this extra reliability is not necessary since the reliability improvement ofthe steering gear redundancy already is sufficient.
The effect of applying both the steering gear redundancy solution as well as installing a stern thrustercan now be determined by calculating the failure rate of the steering gear to the power of three. It is thenfound that only 1.7 × 10⁻¹⁵ of the failure rate remains, which means that the reliability improvement is67,860,360,000 years. This is 67,859,553,000 years more than one of these measures did individually.This new reliability improvement is very high and not necessary. This solution will thus not be financiallyinvestigated when it is found to be with the best solutions.
4.3.2. Reliability Improvement Electrical Supply And Control DevicesThe failures in the electrical supply and control devices are found to be responsible for 9.5% of allfailures. Two solutions can be found to the failures of the electrical supply and control devices. Thefirst solution is to duplicate all wires and thus create more steering gear redundancy. The other solutionis to perform better maintenance, as has also been seen for many other failures. A combination of thetwo solutions might also prove to be an alternative. This will also be calculated.
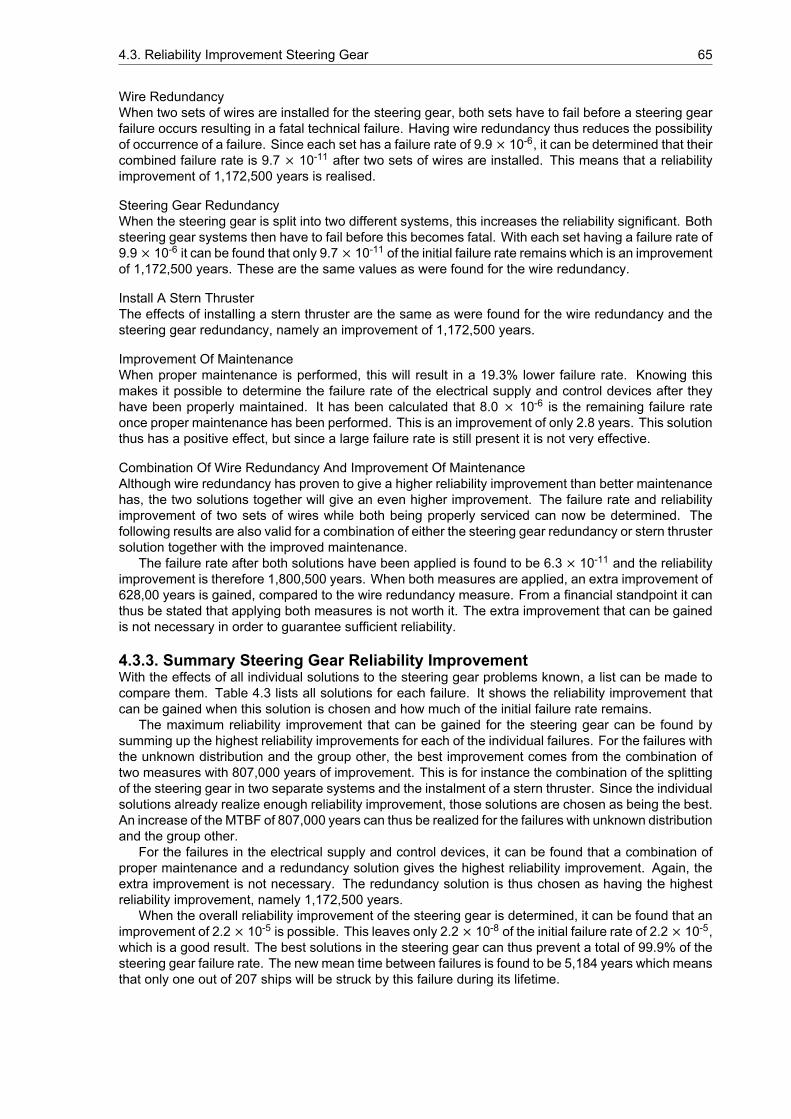
4.3. Reliability Improvement Steering Gear 65
Wire RedundancyWhen two sets of wires are installed for the steering gear, both sets have to fail before a steering gearfailure occurs resulting in a fatal technical failure. Having wire redundancy thus reduces the possibilityof occurrence of a failure. Since each set has a failure rate of 9.9 × 10⁻⁶, it can be determined that theircombined failure rate is 9.7 × 10⁻¹¹ after two sets of wires are installed. This means that a reliabilityimprovement of 1,172,500 years is realised.
Steering Gear RedundancyWhen the steering gear is split into two different systems, this increases the reliability significant. Bothsteering gear systems then have to fail before this becomes fatal. With each set having a failure rate of9.9 × 10-6 it can be found that only 9.7 × 10⁻¹¹ of the initial failure rate remains which is an improvementof 1,172,500 years. These are the same values as were found for the wire redundancy.
Install A Stern ThrusterThe effects of installing a stern thruster are the same as were found for the wire redundancy and thesteering gear redundancy, namely an improvement of 1,172,500 years.
Improvement Of MaintenanceWhen proper maintenance is performed, this will result in a 19.3% lower failure rate. Knowing thismakes it possible to determine the failure rate of the electrical supply and control devices after theyhave been properly maintained. It has been calculated that 8.0 × 10⁻⁶ is the remaining failure rateonce proper maintenance has been performed. This is an improvement of only 2.8 years. This solutionthus has a positive effect, but since a large failure rate is still present it is not very effective.
Combination Of Wire Redundancy And Improvement Of MaintenanceAlthough wire redundancy has proven to give a higher reliability improvement than better maintenancehas, the two solutions together will give an even higher improvement. The failure rate and reliabilityimprovement of two sets of wires while both being properly serviced can now be determined. Thefollowing results are also valid for a combination of either the steering gear redundancy or stern thrustersolution together with the improved maintenance.
The failure rate after both solutions have been applied is found to be 6.3 × 10⁻¹¹ and the reliabilityimprovement is therefore 1,800,500 years. When both measures are applied, an extra improvement of628,00 years is gained, compared to the wire redundancy measure. From a financial standpoint it canthus be stated that applying both measures is not worth it. The extra improvement that can be gainedis not necessary in order to guarantee sufficient reliability.
4.3.3. Summary Steering Gear Reliability ImprovementWith the effects of all individual solutions to the steering gear problems known, a list can be made tocompare them. Table 4.3 lists all solutions for each failure. It shows the reliability improvement thatcan be gained when this solution is chosen and how much of the initial failure rate remains.
The maximum reliability improvement that can be gained for the steering gear can be found bysumming up the highest reliability improvements for each of the individual failures. For the failures withthe unknown distribution and the group other, the best improvement comes from the combination oftwo measures with 807,000 years of improvement. This is for instance the combination of the splittingof the steering gear in two separate systems and the instalment of a stern thruster. Since the individualsolutions already realize enough reliability improvement, those solutions are chosen as being the best.An increase of the MTBF of 807,000 years can thus be realized for the failures with unknown distributionand the group other.
For the failures in the electrical supply and control devices, it can be found that a combination ofproper maintenance and a redundancy solution gives the highest reliability improvement. Again, theextra improvement is not necessary. The redundancy solution is thus chosen as having the highestreliability improvement, namely 1,172,500 years.
When the overall reliability improvement of the steering gear is determined, it can be found that animprovement of 2.2 × 10⁻⁵ is possible. This leaves only 2.2 × 10⁻⁸ of the initial failure rate of 2.2 × 10⁻⁵,which is a good result. The best solutions in the steering gear can thus prevent a total of 99.9% of thesteering gear failure rate. The new mean time between failures is found to be 5,184 years which meansthat only one out of 207 ships will be struck by this failure during its lifetime.
66 4. Reliability Improvement Of Solutions
Table 4.3: Reliability improvement and new failure rate for each of the solutions of the steering gear failures
Failure Solution Reliabilityimprovement
[yrs]
New failurerate
Unknown distributionplus Other
Split steering gear into separate systems 807,000 1.4 × 10⁻¹⁰
Install a stern thruster as a full backup 807,000 1.4 × 10⁻¹⁰
Use azipods for propulsion, then norudders are required
807,000 1.4 × 10⁻¹⁰
Use official replacement parts, installedand maintained by qualified personnel
2 9.6 × 10⁻⁶
Combination of maintenanceimprovement and one of the measureswith a 1.2 × 10⁻⁵ improvement
1,239,500 9.2 × 10⁻¹¹
Combination of two measures with a1.2 × 10-5 improvement
67.9 × 10⁹ 1.7 × 10⁻¹⁵
Electrical supply andcontrol devices
Install more electrical wire as a fullbackup
1,172,500 9.7 × 10⁻¹¹
Split steering gear in separate systems 1,172,500 9.7 × 10⁻¹¹
Install a stern thruster as a full-backup 1,172,500 9.7 × 10⁻¹¹
Use official replacement parts, installedand maintained by qualified personnel
3 8.0 × 10⁻⁶
Combination of maintenanceimprovement and a measure with a9.9 × 10-6 improvement
1,800,500 6.3 × 10⁻¹¹
4.4. Reliability Improvement Fuel SystemThe fuel system is the system that is responsible for the third most number of failures, namely 11.1%(1.2 × 10⁻⁵ and aMTBF of 9.9 years). Two groups of failures can be distinguished within the fuel systemfailures. The first group is a group of failures with unknown distribution. This group is responsible for8.4% (8.7 × 10⁻⁶ and a MTBF of 13 years) of all failures and includes the following failures: insufficientfuel care, fuel of poor quality, clogged fuel filter, strong vibrations of fuel line, broken fuel pipe and airin the fuel. Fuel intolerance is the second group of fuel system failures and is responsible for 2.8% ofall failures (2.9 × 10⁻⁶ and 39 years MTBF). The failures and their solutions will be dealt with in orderof their failure contribution, so first the failures with unknown distribution will be dealt with after whichthe fuel intolerance solutions will be discussed. For all solutions it will be determined how much of areliability improvement they give. It will also be determined how much of the initial failure rate remainsafter a solution has been applied. At the end of this section a list will be presented which shows theresults for each of the solutions.
4.4.1. Reliability Improvement Unknown DistributionThe failures with unknown distribution are responsible for most of the fuel system failures. There aremultiple causes for the failures in this group. For most of the solutions to these failures, no failure rate isavailable. Only for the maintenance related solutions, an effect is known. The absence of failure ratesmakes it impossible to determine the reliability improvement of every solution in detail. Therefore thesefailure rates have to be estimated. For every solution, it is estimated that they have the same failurerate as the failure that they are trying to solve. This means that all solutions that are not maintenancerelated are estimated to have a failure rate of 8.7 × 10⁻⁶. First, all these failures will be dealt with.The given example is to check the quality of the fuel. After the effects of these solutions have beendetermined, the effect of all maintenance related solutions will be examined.
4.4. Reliability Improvement Fuel System 67
Check Quality Of Fuel Before Bunkering And OthersThe quality of the fuel has to be checked before bunkering. Only when the fuel is found to be of sufficientquality it should be used, or in the best case bunkered. When low quality fuel is used, this can havea disastrous effect on the machinery. Knowing the quality of the fuel is thus an absolute must. Thegroup of failures with unknown distribution has a failure rate of 8.7 × 10⁻⁶. This failure rate will also beassumed to be representative for the solution to check the fuel. The failure rate of a fuel quality failurealthough it has been checked can now be determined with the following equations.
𝜆Fuel system due to fuel quality and failed check = 𝜆Fuel quality × 𝜆Fuel check= 8.7 × 10 × 8.7 × 10 = 7.5 × 10 (4.24)
Reliability improvement = 𝑀𝑇𝐵𝐹After solution −𝑀𝑇𝐵𝐹Before solution
= 17.5 × 10 − 1
8.7 × 10 ≈ 1, 516, 500 𝑦𝑒𝑎𝑟𝑠(4.25)
Although this solution is calculated to give a reliability improvement of 1,516,500 years, as can beseen from Equation 4.25, this solution does not solve all failures in the group with unknown distribution.Six failures are found in the group with unknown distribution and five non maintenance related solutionshave been proven to be a solution. The six failures are thus responsible for all of the failures in thisgroup. When determining the best solutions based on their reliability improvement, this should be takeninto account. There are a lot of uncertainties regarding the failure rate of the failures and its solutions.Spending money on solutions with a slightly lower reliability improvement might therefore be favourableover investing money in a reliability improvement with a high uncertainty.
The solutions to most other failures in this group give exactly the same failure reduction. This isbecause the failure rate of their solutions is also not known. The same failure rate will thus be assumed,which results in the same failure reduction. The solutions that have the same failure reduction are thefollowing: ’keep fuel from different locations separate’, ’proper instalment’, ’proper filter’ and ’air filterredundancy’.
Improvement Of MaintenanceOne of the mentioned solutions is that the fuel system should be better maintained as a whole. Thiswould mean a reduction in the failure rate of 19.3%. The reliability improvement that is gained byperforming better maintenance can now be calculated.
𝜆After proper maintenance = 𝜆Before maitenance × 𝐹Reduction maintenance= 8.7 × 10 × 0.807 = 7.0 × 10 (4.26)
Reliability improvement = 𝑀𝑇𝐵𝐹After solution −𝑀𝑇𝐵𝐹Before solution
= 17.0 × 10 − 1
8.7 × 10 = 3 𝑦𝑒𝑎𝑟𝑠(4.27)
From the above two equations it can be found that improving the maintenance results in a 1.7 × 10⁻⁶smaller failure rate, which is an improvement of 3.1 years. When the maintenance of the entire fuelsystem is performed better, this reliability improvement might be more realistic than the reliability im-provements for the failures in the previous part, but the reliability improvement is not sufficient.
4.4.2. Reliability Improvement Fuel IntoleranceFuel intolerance is responsible for 2.8% of all failures and has a failure rate of 2.9 × 10⁻⁶. Two solutionshave been found to cure this problem. The first solution is to keep different types of fuel separateand/or to keep fuel(s) from different locations separate. The last solution that was found is to switchto an alternative fuel. The two fuels that have been found as an alternative are liquid natural gas andelectricity.
68 4. Reliability Improvement Of Solutions
Keep Different Types Of Fuel Or Fuel From Different Locations SeparateThe solution to keep different fuel types separately and the solution to keep fuels from different locationsseparately is practically the same. In both cases, two fuel systems have to be installed. Then, it is notimportant what fuel is used for the first and second system. It also does not matter where these fuelscome from.
If a ship sails only on one type of fuel, fuel intolerance due to the mixing of two types of fuel cannotoccur. When different types of fuel are used in the ship, they should be kept separate at all times. Aslong as this is the case, no failures should occur. When these measures are taken, part of the fuelintolerance failures will no longer be present. But even when the fuels are kept separate, there will bea small chance that a failure occurs. Therefore, the reduction of the failure rate due to separation ofthe fuels will have to be determined.
It is difficult to determine the reduction in the failure rate due to appliance of this solution. Therefore,an assumption has to be done. Just as with other solutions for which the failure rate was not known, itwill be assumed that it has the same failure rate as the failure that it tries to cure. The failure rate of twodifferent types of fuel or fuel from two different locations coming in contact and causing a failure whilethey are stored separately can now be determined. It can be deducted that 8.4 × 10⁻¹² of the failurerate remains after this solution is applied, which is a negligible value since the reliability improvementis 13,647,500 years.
Alternative FuelWhen an alternative fuel is used, also an alternative engine has to be used. It was found in section 4.2that an alternative engine does not give a high reliability improvement compared to a regular dieselengine. An alternative engine which is for instance 10% more reliable only realizes 4.8 × 10⁻¹¹ morereliability, while a 20% more reliable engine only realizes 9.1 × 10⁻¹¹ more reliability. When an alter-native fuel in combination with an alternative engine proves to give more reliability in multiple facets,the alternative engine might prove to be an interesting option. Otherwise it is questionable whether analternative engine is a good option.
Two fuels were found that can be used as an alternative. The first one is liquid natural gas. If thisfuel is used, one type of fuel is sufficient to sail in all areas. Therefore fuel intolerance failures thatoccur because multiple types of fuel mix will not occur with LNG. Failures that occur because fuel isbunkered at multiple locations can still occur. When new fuel is bunkered, this should thus be keptseparate from the already bunkered fuel. For LNG, this can have a significant negative effect on thespace requirement, since LNG requires a lot of extra equipment. When the fuels from different locationsare kept separately, both diesel and LNG have the same reliability improvement. Using LNG can thusbe said to increase the reliability with 13,647,500 years, but only when the fuels are kept in separatelocations.
The second fuel that proved to be an alternative is electricity. If electricity is generated on board,this is done with generators. These are most likely to run on diesel. Therefore, the possibility of fuelintolerance is still present. The generators will only run on one type of fuel, so only the failure rate ofthe mixing of fuel from different locations remains. If electricity is generated on board and the fuel fromdifferent locations is kept separately, a reliability improvement of 13,647,500 years is gained. Whenthe electricity is loaded from shore when in port, the electricity is stored on board. The risk of a fuelintolerance failure is then transferred to the company who generates the electricity onshore. In casethe energy is bunkered from shore, there is no chance of a fuel intolerance failure. A 0.0 failure rate isthen left and the entire initial failure rate of 2.9 × 10⁻⁶ is prevented. This causes the mean time betweenfailure to be infinity.
4.4.3. Summary Fuel System Reliability ImprovementWith the reliability improvements known for all solutions, a list can be made to summarize them. Itcan then be determined which of the solutions realizes the highest reliability improvement. For eachof the solutions, a reliability improvement was calculated and it has been determined how much of theinitial failure rate remains after a solution has been applied. Table 4.4 shows the failure or group offailures that occurred in the fuel system in the first column, the second column shows the solution tothese failures, whereas the third and fourth column show respectively the reliability improvement andthe new failure rate.
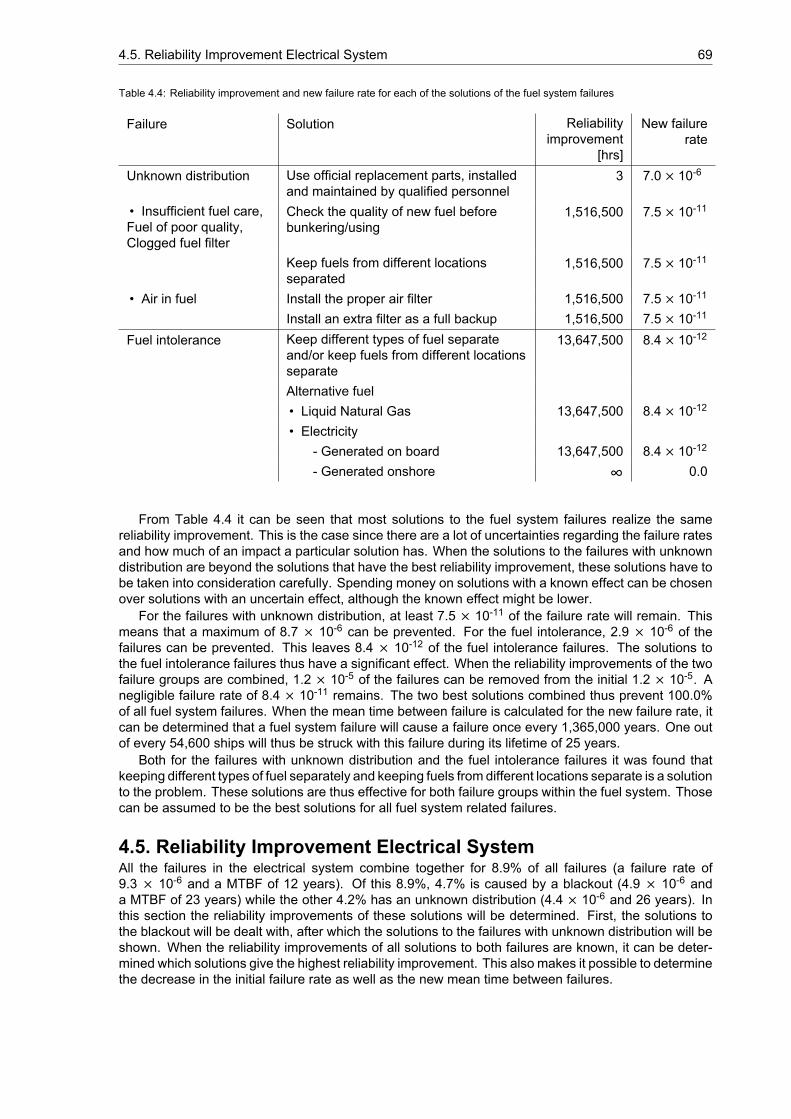
4.5. Reliability Improvement Electrical System 69
Table 4.4: Reliability improvement and new failure rate for each of the solutions of the fuel system failures
Failure Solution Reliabilityimprovement
[hrs]
New failurerate
Unknown distribution Use official replacement parts, installedand maintained by qualified personnel
3 7.0 × 10⁻⁶
• Insufficient fuel care,Fuel of poor quality,Clogged fuel filter
Check the quality of new fuel beforebunkering/using
1,516,500 7.5 × 10⁻¹¹
Keep fuels from different locationsseparated
1,516,500 7.5 × 10⁻¹¹
• Air in fuel Install the proper air filter 1,516,500 7.5 × 10⁻¹¹
Install an extra filter as a full backup 1,516,500 7.5 × 10⁻¹¹
Fuel intolerance Keep different types of fuel separateand/or keep fuels from different locationsseparate
13,647,500 8.4 × 10⁻¹²
Alternative fuel• Liquid Natural Gas 13,647,500 8.4 × 10⁻¹²
• Electricity- Generated on board 13,647,500 8.4 × 10⁻¹²
- Generated onshore ∞ 0.0
From Table 4.4 it can be seen that most solutions to the fuel system failures realize the samereliability improvement. This is the case since there are a lot of uncertainties regarding the failure ratesand how much of an impact a particular solution has. When the solutions to the failures with unknowndistribution are beyond the solutions that have the best reliability improvement, these solutions have tobe taken into consideration carefully. Spending money on solutions with a known effect can be chosenover solutions with an uncertain effect, although the known effect might be lower.
For the failures with unknown distribution, at least 7.5 × 10⁻¹¹ of the failure rate will remain. Thismeans that a maximum of 8.7 × 10⁻⁶ can be prevented. For the fuel intolerance, 2.9 × 10⁻⁶ of thefailures can be prevented. This leaves 8.4 × 10⁻¹² of the fuel intolerance failures. The solutions tothe fuel intolerance failures thus have a significant effect. When the reliability improvements of the twofailure groups are combined, 1.2 × 10⁻⁵ of the failures can be removed from the initial 1.2 × 10⁻⁵. Anegligible failure rate of 8.4 × 10⁻¹¹ remains. The two best solutions combined thus prevent 100.0%of all fuel system failures. When the mean time between failure is calculated for the new failure rate, itcan be determined that a fuel system failure will cause a failure once every 1,365,000 years. One outof every 54,600 ships will thus be struck with this failure during its lifetime of 25 years.
Both for the failures with unknown distribution and the fuel intolerance failures it was found thatkeeping different types of fuel separately and keeping fuels from different locations separate is a solutionto the problem. These solutions are thus effective for both failure groups within the fuel system. Thosecan be assumed to be the best solutions for all fuel system related failures.
4.5. Reliability Improvement Electrical SystemAll the failures in the electrical system combine together for 8.9% of all failures (a failure rate of9.3 × 10-6 and a MTBF of 12 years). Of this 8.9%, 4.7% is caused by a blackout (4.9 × 10⁻⁶ anda MTBF of 23 years) while the other 4.2% has an unknown distribution (4.4 × 10⁻⁶ and 26 years). Inthis section the reliability improvements of these solutions will be determined. First, the solutions tothe blackout will be dealt with, after which the solutions to the failures with unknown distribution will beshown. When the reliability improvements of all solutions to both failures are known, it can be deter-mined which solutions give the highest reliability improvement. This also makes it possible to determinethe decrease in the initial failure rate as well as the new mean time between failures.
70 4. Reliability Improvement Of Solutions
4.5.1. Reliability Improvement BlackoutThere are three possible solutions to prevent a blackout from happening. The first solution is to improvethe maintenance. Making sure that enough power is available when new equipment is started is thesecond way to get a higher reliability. The last measure is to check the quality of the fuel beforebunkering or using. In this order, the solutions will be dealt with. Possible combinations of solutionswill be dealt with at the very end.
Improvement Of MaintenanceThe effects of proper maintenance can quite easily be determined since it is known that 19.3% ofall failures are caused by improper maintenance. Multiplying the failure rate of the blackout with thefailure reduction due to the better maintenance determines howmuch of the initial failure rate will remainpresent. It is determined that the failure rate lowers from 4.9 × 10⁻⁶ to 4.0 × 10⁻⁶. This is a reliabilityimprovement of only 5.5 years.
Availability Of PowerBefore new equipment is started, it has to be made sure that enough power is available. When this isalways the case, this failure will no longer occur. Since this will never be the case in reality, there willbe a (small) chance that this condition is somehow not satisfied. A small failure rate will thus remainpresent when this solution is applied.
Since the lack of availability of power is only one of many failures that cause a blackout, it is notentirely responsible for the failure rate of 4.9 × 10⁻⁶. It is responsible for this rate together with all otherfailures that cause a blackout. This means that when the solution is applied to solve the availability ofpower, this does not solve any of the other failures. Although this solution might reduce the failure rateof a blackout heavily, the other failures that cause a blackout might still be present.
In previous cases when no failure rate was available, the failure rate of a measure which has noavailable data was assumed to be equal to the failure rate of the failure it has to solve. This wouldmean, that the failure rate of the software that has to check whether enough power is available isassumed to be 4.9 × 10⁻⁶. When this measure is installed, two failures have to occur before this leadsto a fatal technical failure in the electrical system. The failure rate will thus decrease sharply. Withthe new failure rate of this solution determined, it can be determined how much of the failure rate willremain after it is applied. It is found that the new failure rate is 2.4 × 10⁻¹¹, which is an improvement of4,705,500 years.
In case the failure rate of the availability of power is found to be responsible for, for example, onlyhalf of the blackout failures, a different answer is found. In this example, the remaining failure ratewould reduce to 6.1 × 10⁻¹¹ since the failure rate of the power availability failure would be reduced to2.5 × 10-6.
Although the exact failure rates of the failures leading to a blackout are unknown, it can be seenthat a 50% difference in the failure rate has a negligible influence on the reliability improvement. Thisproves that although the chosen values of the failure rates are rough, the solutions can be said to beaccurate since the values do not differ much when different failure rates are used.
Fuel QualityThe quality of the fuel is partially responsible for the cause of a blackout. Just as for the unavailability ofpower it is not solely responsible for all blackout failures, but the combination of all failures is responsiblefor the failure rate. For the reliability calculations though, the entire blackout failure rate will be usedsince no detailed failure rates are known.
The failure rate of the fuel quality is thus assumed to be 4.9 × 10⁻⁶. The new failure rate of a failurethat occurs although the fuel is being tested before bunkering or using will now have to be calculated.When the fuel is tested before bunkering and when only fuel that has the decent properties is used,a smaller amount of failures will occur. There is always a chance that something goes wrong, so thishas to be accounted for. When the failure rate of a failure despite checking the fuel is assumed to beequal to the failure rate of a blackout, the reliability improvement can be determined, in case the fuelquality is always verified. With this failure rate, the reliability improvement due to this solution can becalculated.
The new failure rate is found to be 2.4 × 10⁻¹¹, which is an improvement of 4,705,500 years com-pared to the initial 23 years. These values are the same as for the availability of power since thecalculations use the same values.
4.5. Reliability Improvement Electrical System 71
Combination Of Multiple SolutionsAlthough both the solution to the availability of power and the lack of fuel quality have the same effect,their effect can still be increased by combining them with the proper maintenance solution. While thissolution might not be financially competitive, it is still good to know how much of a reliability improve-ment can be gained. The results from these equations are both for the combination maintenance plusavailability of power and the combination maintenance plus fuel quality.
It can be found that the combination of two measures give a reliability improvement of 7,225,500years. This means that a failure rate of only 1.6 × 10⁻¹¹ is left after both measures have been applied.This is an increase of 2,520,000 years compared to the best individual solutions. Combining bothmeasures thus increases the reliability even further. A single measure reduces the failure rate to alevel which is almost negligible and can be considered sufficient. Combining two measures is thus notrequired from a reliability standpoint and is definitely not financially viable.
4.5.2. Reliability Improvement Unknown DistibutionFor this group of failures with a failure rate of 4.4 × 10⁻⁶, two solutions were determined. The firstsolution is to improve the quality of the maintenance. The second option is to install an extra electricalsystem as a full-backup. A combination of the two solutions is also an option. First, the impact of theproper maintenance will be reviewed, then the improvement due to the electrical system redundancy.Finally, the impact of a combination of the two solutions will be determined.
Improvement Of MaintenanceThe maintenance can be improved by making sure that official replacement parts are used, whichare installed by qualified personnel. This will lower the failure rate with 19.3%. The new failure rateand the reliability improvement can easily be determined as respectively 3.5 × 10⁻⁶ and 6.3 years. Itcan again be seen that improving the maintenance does not have a significant effect on the reliabilityimprovement.
Electrical System RedundancyWhen the entire electrical system is doubled, it has a full-backup. Both systems then have to fail beforethis becomes fatal. Doubling the entire electrical system is a costly operation that will also require space.If this proves to be the solution with the most improvement, it will have to be determined whether thisis also a good solution from a financial standpoint. Though first it has to be determined how much of areliability improvement can be gained when this solution is applied.
It can be found from the previous shown equations that installing an extra electrical system has asignificant beneficial effect on the new failure rate. The failure rate is reduced to only 1.9 × 10⁻¹¹, whichis an improvement of 6,032,000 years for the MTBF.
Combination Of Improvement Of Maintenance And Electrical System RedundancyThe reliability improvements for the two individual solutions improvement of maintenance and electricalsystem redundancy have been found. When the two solutions to the failures with unknown distributionare applied, an even higher reliability improvement can be gained. If the reliability improvement of thecombined solution is known, it can be determined whether this extra reliability improvement is significantand necessary compared to the improvement of a sole solution.
When both measures are applied, a very small and negligible failure rate of 1.2 × 10⁻¹¹ remains.This means that the MTBF is increased with 9,262,000 years. Although the remaining failure rate isalready negligible when the electrical system redundancy is applied, this failure rate is 6.6 × 10⁻¹²lower. It can already be stated though that this extra improvement of 3,230,000 is financially not worththe effort. Only applying the electrical system redundancy is thus sufficient.
4.5.3. Summary Electrical System Reliability ImprovementWith the reliability improvements of all solutions determined a list can be made which will show foreach individual failure the available solutions as well as the reliability improvement in years. It is alsoshown how much of the failure rate remains after the solution has been applied. In the left column ofthe table, the failures are shown, the second column shows the solutions to these failures. The thirdcolumn shows the reliability improvement and the last column shows the remaining failure rate.
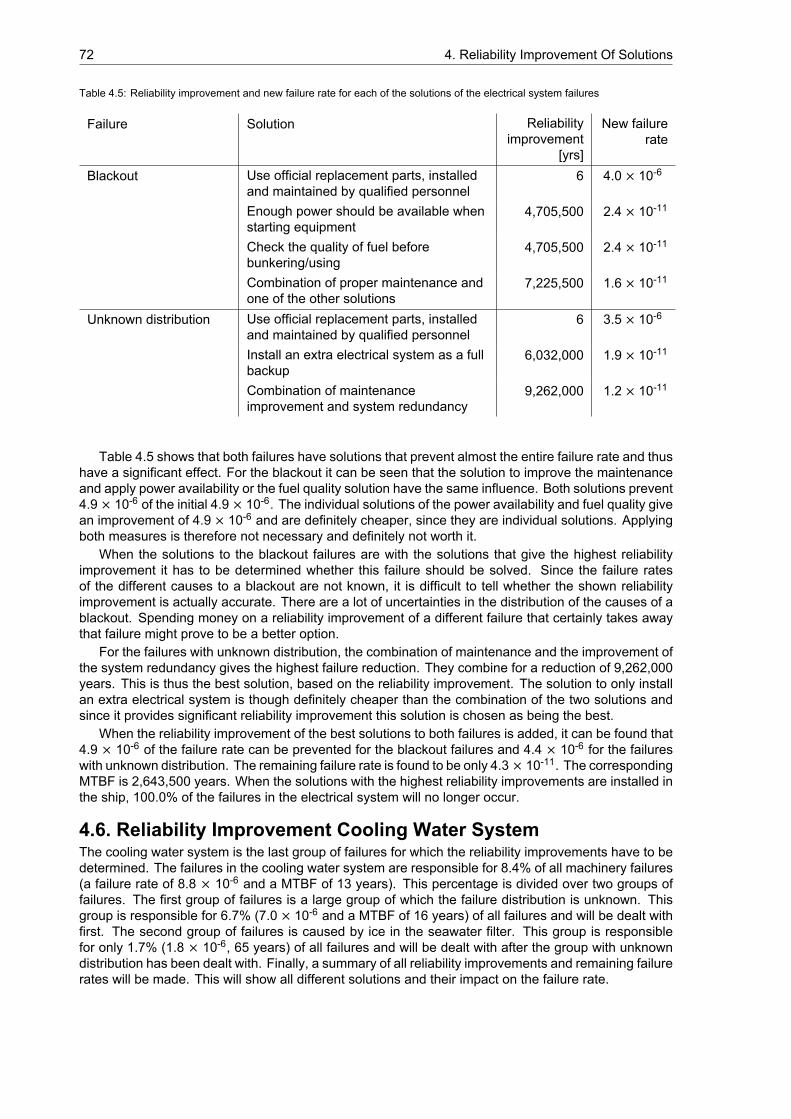
72 4. Reliability Improvement Of Solutions
Table 4.5: Reliability improvement and new failure rate for each of the solutions of the electrical system failures
Failure Solution Reliabilityimprovement
[yrs]
New failurerate
Blackout Use official replacement parts, installedand maintained by qualified personnel
6 4.0 × 10⁻⁶
Enough power should be available whenstarting equipment
4,705,500 2.4 × 10⁻¹¹
Check the quality of fuel beforebunkering/using
4,705,500 2.4 × 10⁻¹¹
Combination of proper maintenance andone of the other solutions
7,225,500 1.6 × 10⁻¹¹
Unknown distribution Use official replacement parts, installedand maintained by qualified personnel
6 3.5 × 10⁻⁶
Install an extra electrical system as a fullbackup
6,032,000 1.9 × 10⁻¹¹
Combination of maintenanceimprovement and system redundancy
9,262,000 1.2 × 10⁻¹¹
Table 4.5 shows that both failures have solutions that prevent almost the entire failure rate and thushave a significant effect. For the blackout it can be seen that the solution to improve the maintenanceand apply power availability or the fuel quality solution have the same influence. Both solutions prevent4.9 × 10-6 of the initial 4.9 × 10⁻⁶. The individual solutions of the power availability and fuel quality givean improvement of 4.9 × 10⁻⁶ and are definitely cheaper, since they are individual solutions. Applyingboth measures is therefore not necessary and definitely not worth it.
When the solutions to the blackout failures are with the solutions that give the highest reliabilityimprovement it has to be determined whether this failure should be solved. Since the failure ratesof the different causes to a blackout are not known, it is difficult to tell whether the shown reliabilityimprovement is actually accurate. There are a lot of uncertainties in the distribution of the causes of ablackout. Spending money on a reliability improvement of a different failure that certainly takes awaythat failure might prove to be a better option.
For the failures with unknown distribution, the combination of maintenance and the improvement ofthe system redundancy gives the highest failure reduction. They combine for a reduction of 9,262,000years. This is thus the best solution, based on the reliability improvement. The solution to only installan extra electrical system is though definitely cheaper than the combination of the two solutions andsince it provides significant reliability improvement this solution is chosen as being the best.
When the reliability improvement of the best solutions to both failures is added, it can be found that4.9 × 10-6 of the failure rate can be prevented for the blackout failures and 4.4 × 10⁻⁶ for the failureswith unknown distribution. The remaining failure rate is found to be only 4.3 × 10⁻¹¹. The correspondingMTBF is 2,643,500 years. When the solutions with the highest reliability improvements are installed inthe ship, 100.0% of the failures in the electrical system will no longer occur.
4.6. Reliability Improvement Cooling Water SystemThe cooling water system is the last group of failures for which the reliability improvements have to bedetermined. The failures in the cooling water system are responsible for 8.4% of all machinery failures(a failure rate of 8.8 × 10⁻⁶ and a MTBF of 13 years). This percentage is divided over two groups offailures. The first group of failures is a large group of which the failure distribution is unknown. Thisgroup is responsible for 6.7% (7.0 × 10⁻⁶ and a MTBF of 16 years) of all failures and will be dealt withfirst. The second group of failures is caused by ice in the seawater filter. This group is responsiblefor only 1.7% (1.8 × 10⁻⁶, 65 years) of all failures and will be dealt with after the group with unknowndistribution has been dealt with. Finally, a summary of all reliability improvements and remaining failurerates will be made. This will show all different solutions and their impact on the failure rate.
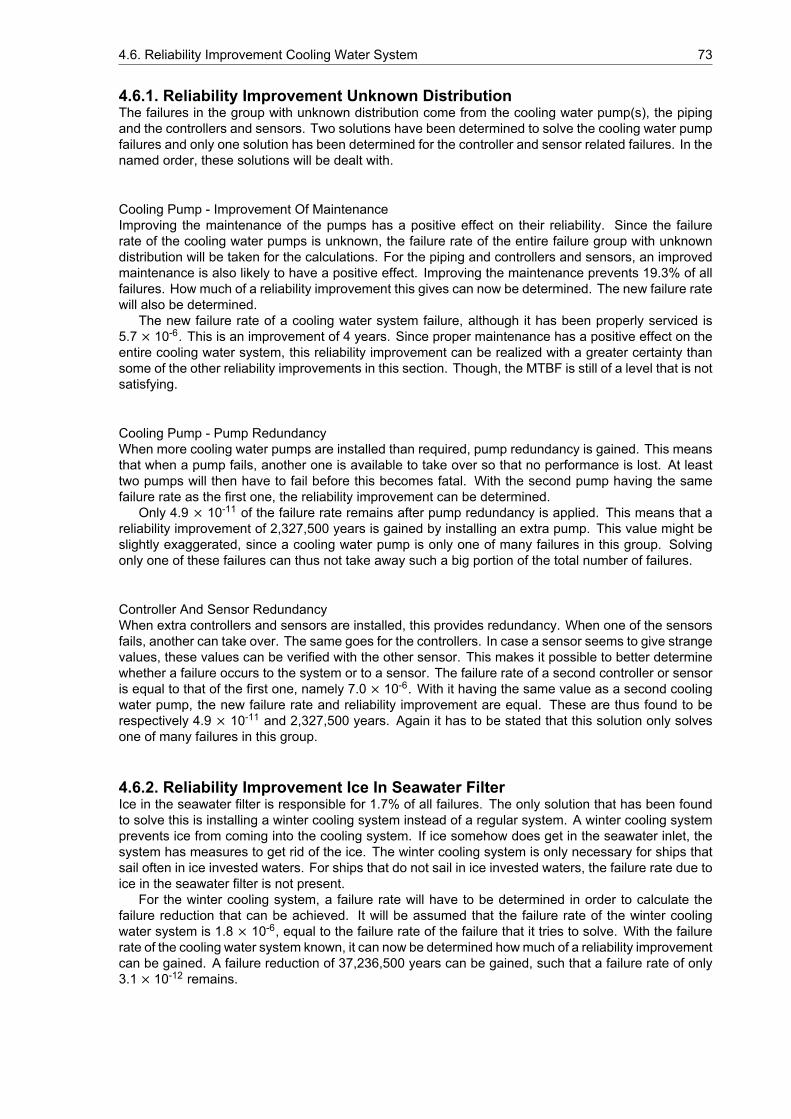
4.6. Reliability Improvement Cooling Water System 73
4.6.1. Reliability Improvement Unknown DistributionThe failures in the group with unknown distribution come from the cooling water pump(s), the pipingand the controllers and sensors. Two solutions have been determined to solve the cooling water pumpfailures and only one solution has been determined for the controller and sensor related failures. In thenamed order, these solutions will be dealt with.
Cooling Pump - Improvement Of MaintenanceImproving the maintenance of the pumps has a positive effect on their reliability. Since the failurerate of the cooling water pumps is unknown, the failure rate of the entire failure group with unknowndistribution will be taken for the calculations. For the piping and controllers and sensors, an improvedmaintenance is also likely to have a positive effect. Improving the maintenance prevents 19.3% of allfailures. How much of a reliability improvement this gives can now be determined. The new failure ratewill also be determined.
The new failure rate of a cooling water system failure, although it has been properly serviced is5.7 × 10-6. This is an improvement of 4 years. Since proper maintenance has a positive effect on theentire cooling water system, this reliability improvement can be realized with a greater certainty thansome of the other reliability improvements in this section. Though, the MTBF is still of a level that is notsatisfying.
Cooling Pump - Pump RedundancyWhen more cooling water pumps are installed than required, pump redundancy is gained. This meansthat when a pump fails, another one is available to take over so that no performance is lost. At leasttwo pumps will then have to fail before this becomes fatal. With the second pump having the samefailure rate as the first one, the reliability improvement can be determined.
Only 4.9 × 10⁻¹¹ of the failure rate remains after pump redundancy is applied. This means that areliability improvement of 2,327,500 years is gained by installing an extra pump. This value might beslightly exaggerated, since a cooling water pump is only one of many failures in this group. Solvingonly one of these failures can thus not take away such a big portion of the total number of failures.
Controller And Sensor RedundancyWhen extra controllers and sensors are installed, this provides redundancy. When one of the sensorsfails, another can take over. The same goes for the controllers. In case a sensor seems to give strangevalues, these values can be verified with the other sensor. This makes it possible to better determinewhether a failure occurs to the system or to a sensor. The failure rate of a second controller or sensoris equal to that of the first one, namely 7.0 × 10⁻⁶. With it having the same value as a second coolingwater pump, the new failure rate and reliability improvement are equal. These are thus found to berespectively 4.9 × 10⁻¹¹ and 2,327,500 years. Again it has to be stated that this solution only solvesone of many failures in this group.
4.6.2. Reliability Improvement Ice In Seawater FilterIce in the seawater filter is responsible for 1.7% of all failures. The only solution that has been foundto solve this is installing a winter cooling system instead of a regular system. A winter cooling systemprevents ice from coming into the cooling system. If ice somehow does get in the seawater inlet, thesystem has measures to get rid of the ice. The winter cooling system is only necessary for ships thatsail often in ice invested waters. For ships that do not sail in ice invested waters, the failure rate due toice in the seawater filter is not present.
For the winter cooling system, a failure rate will have to be determined in order to calculate thefailure reduction that can be achieved. It will be assumed that the failure rate of the winter coolingwater system is 1.8 × 10⁻⁶, equal to the failure rate of the failure that it tries to solve. With the failurerate of the cooling water system known, it can now be determined howmuch of a reliability improvementcan be gained. A failure reduction of 37,236,500 years can be gained, such that a failure rate of only3.1 × 10-12 remains.
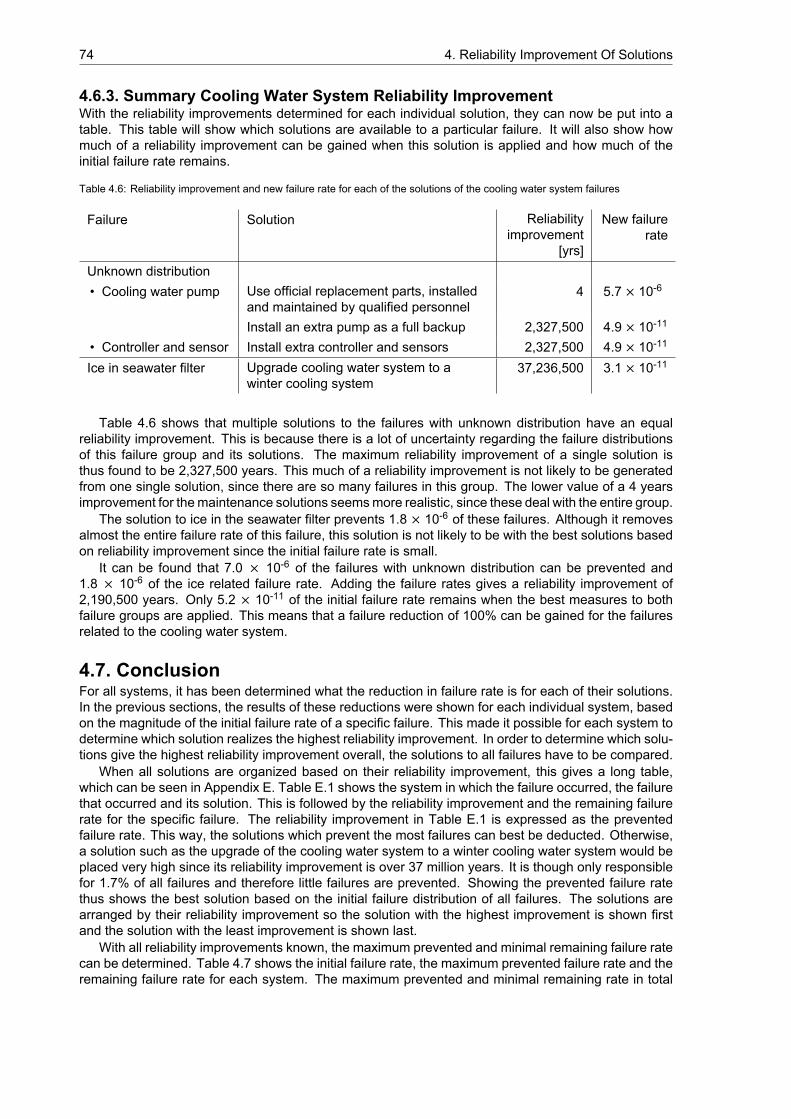
74 4. Reliability Improvement Of Solutions
4.6.3. Summary Cooling Water System Reliability ImprovementWith the reliability improvements determined for each individual solution, they can now be put into atable. This table will show which solutions are available to a particular failure. It will also show howmuch of a reliability improvement can be gained when this solution is applied and how much of theinitial failure rate remains.
Table 4.6: Reliability improvement and new failure rate for each of the solutions of the cooling water system failures
Failure Solution Reliabilityimprovement
[yrs]
New failurerate
Unknown distribution• Cooling water pump Use official replacement parts, installed
and maintained by qualified personnel4 5.7 × 10⁻⁶
Install an extra pump as a full backup 2,327,500 4.9 × 10⁻¹¹
• Controller and sensor Install extra controller and sensors 2,327,500 4.9 × 10⁻¹¹
Ice in seawater filter Upgrade cooling water system to awinter cooling system
37,236,500 3.1 × 10⁻¹¹
Table 4.6 shows that multiple solutions to the failures with unknown distribution have an equalreliability improvement. This is because there is a lot of uncertainty regarding the failure distributionsof this failure group and its solutions. The maximum reliability improvement of a single solution isthus found to be 2,327,500 years. This much of a reliability improvement is not likely to be generatedfrom one single solution, since there are so many failures in this group. The lower value of a 4 yearsimprovement for themaintenance solutions seemsmore realistic, since these deal with the entire group.
The solution to ice in the seawater filter prevents 1.8 × 10⁻⁶ of these failures. Although it removesalmost the entire failure rate of this failure, this solution is not likely to be with the best solutions basedon reliability improvement since the initial failure rate is small.
It can be found that 7.0 × 10⁻⁶ of the failures with unknown distribution can be prevented and1.8 × 10-6 of the ice related failure rate. Adding the failure rates gives a reliability improvement of2,190,500 years. Only 5.2 × 10⁻¹¹ of the initial failure rate remains when the best measures to bothfailure groups are applied. This means that a failure reduction of 100% can be gained for the failuresrelated to the cooling water system.
4.7. ConclusionFor all systems, it has been determined what the reduction in failure rate is for each of their solutions.In the previous sections, the results of these reductions were shown for each individual system, basedon the magnitude of the initial failure rate of a specific failure. This made it possible for each system todetermine which solution realizes the highest reliability improvement. In order to determine which solu-tions give the highest reliability improvement overall, the solutions to all failures have to be compared.
When all solutions are organized based on their reliability improvement, this gives a long table,which can be seen in Appendix E. Table E.1 shows the system in which the failure occurred, the failurethat occurred and its solution. This is followed by the reliability improvement and the remaining failurerate for the specific failure. The reliability improvement in Table E.1 is expressed as the preventedfailure rate. This way, the solutions which prevent the most failures can best be deducted. Otherwise,a solution such as the upgrade of the cooling water system to a winter cooling water system would beplaced very high since its reliability improvement is over 37 million years. It is though only responsiblefor 1.7% of all failures and therefore little failures are prevented. Showing the prevented failure ratethus shows the best solution based on the initial failure distribution of all failures. The solutions arearranged by their reliability improvement so the solution with the highest improvement is shown firstand the solution with the least improvement is shown last.
With all reliability improvements known, the maximum prevented and minimal remaining failure ratecan be determined. Table 4.7 shows the initial failure rate, the maximum prevented failure rate and theremaining failure rate for each system. The maximum prevented and minimal remaining rate in total
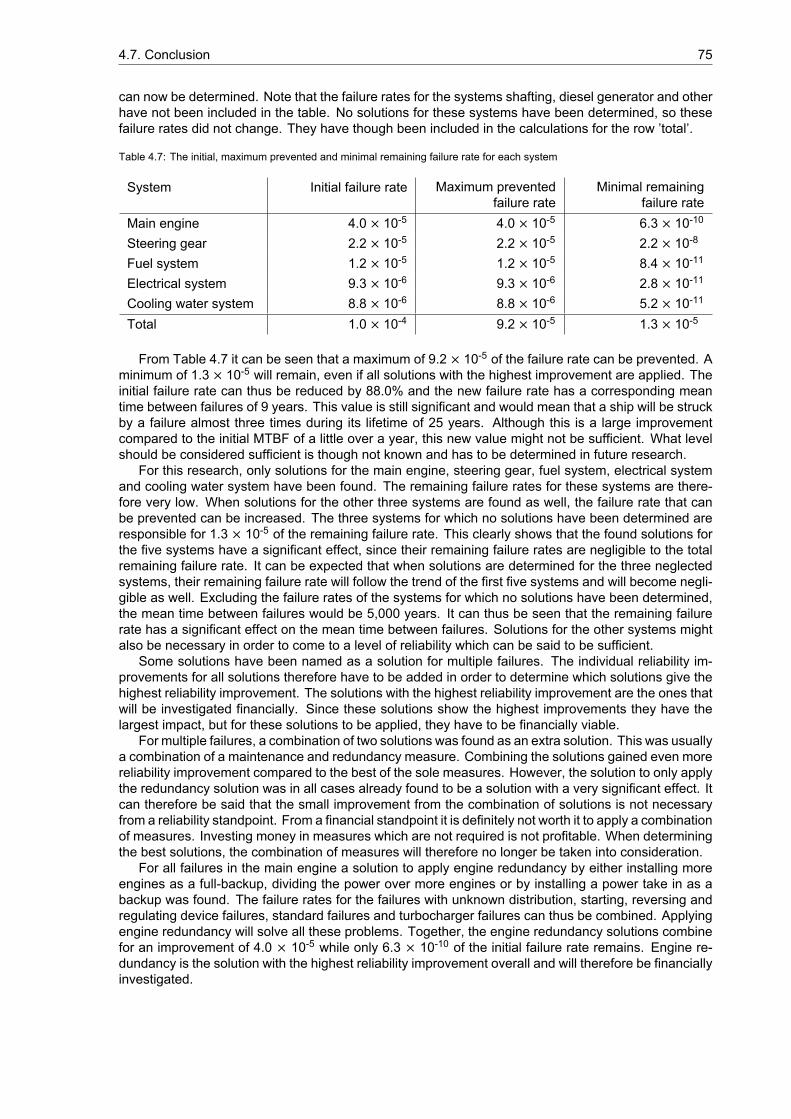
4.7. Conclusion 75
can now be determined. Note that the failure rates for the systems shafting, diesel generator and otherhave not been included in the table. No solutions for these systems have been determined, so thesefailure rates did not change. They have though been included in the calculations for the row ’total’.
Table 4.7: The initial, maximum prevented and minimal remaining failure rate for each system
System Initial failure rate Maximum preventedfailure rate
Minimal remainingfailure rate
Main engine 4.0 × 10⁻⁵ 4.0 × 10⁻⁵ 6.3 × 10⁻¹⁰
Steering gear 2.2 × 10⁻⁵ 2.2 × 10⁻⁵ 2.2 × 10⁻⁸
Fuel system 1.2 × 10⁻⁵ 1.2 × 10⁻⁵ 8.4 × 10⁻¹¹
Electrical system 9.3 × 10⁻⁶ 9.3 × 10⁻⁶ 2.8 × 10⁻¹¹
Cooling water system 8.8 × 10⁻⁶ 8.8 × 10⁻⁶ 5.2 × 10⁻¹¹
Total 1.0 × 10⁻⁴ 9.2 × 10⁻⁵ 1.3 × 10⁻⁵
From Table 4.7 it can be seen that a maximum of 9.2 × 10⁻⁵ of the failure rate can be prevented. Aminimum of 1.3 × 10⁻⁵ will remain, even if all solutions with the highest improvement are applied. Theinitial failure rate can thus be reduced by 88.0% and the new failure rate has a corresponding meantime between failures of 9 years. This value is still significant and would mean that a ship will be struckby a failure almost three times during its lifetime of 25 years. Although this is a large improvementcompared to the initial MTBF of a little over a year, this new value might not be sufficient. What levelshould be considered sufficient is though not known and has to be determined in future research.
For this research, only solutions for the main engine, steering gear, fuel system, electrical systemand cooling water system have been found. The remaining failure rates for these systems are there-fore very low. When solutions for the other three systems are found as well, the failure rate that canbe prevented can be increased. The three systems for which no solutions have been determined areresponsible for 1.3 × 10⁻⁵ of the remaining failure rate. This clearly shows that the found solutions forthe five systems have a significant effect, since their remaining failure rates are negligible to the totalremaining failure rate. It can be expected that when solutions are determined for the three neglectedsystems, their remaining failure rate will follow the trend of the first five systems and will become negli-gible as well. Excluding the failure rates of the systems for which no solutions have been determined,the mean time between failures would be 5,000 years. It can thus be seen that the remaining failurerate has a significant effect on the mean time between failures. Solutions for the other systems mightalso be necessary in order to come to a level of reliability which can be said to be sufficient.
Some solutions have been named as a solution for multiple failures. The individual reliability im-provements for all solutions therefore have to be added in order to determine which solutions give thehighest reliability improvement. The solutions with the highest reliability improvement are the ones thatwill be investigated financially. Since these solutions show the highest improvements they have thelargest impact, but for these solutions to be applied, they have to be financially viable.
For multiple failures, a combination of two solutions was found as an extra solution. This was usuallya combination of a maintenance and redundancy measure. Combining the solutions gained even morereliability improvement compared to the best of the sole measures. However, the solution to only applythe redundancy solution was in all cases already found to be a solution with a very significant effect. Itcan therefore be said that the small improvement from the combination of solutions is not necessaryfrom a reliability standpoint. From a financial standpoint it is definitely not worth it to apply a combinationof measures. Investing money in measures which are not required is not profitable. When determiningthe best solutions, the combination of measures will therefore no longer be taken into consideration.
For all failures in the main engine a solution to apply engine redundancy by either installing moreengines as a full-backup, dividing the power over more engines or by installing a power take in as abackup was found. The failure rates for the failures with unknown distribution, starting, reversing andregulating device failures, standard failures and turbocharger failures can thus be combined. Applyingengine redundancy will solve all these problems. Together, the engine redundancy solutions combinefor an improvement of 4.0 × 10⁻⁵ while only 6.3 × 10⁻¹⁰ of the initial failure rate remains. Engine re-dundancy is the solution with the highest reliability improvement overall and will therefore be financiallyinvestigated.
76 4. Reliability Improvement Of Solutions
For the steering gear, it can be found that the redundancy option is a solution to both the failures withunknown distribution as well as to the failures in the electrical supply and control devices. Splitting thesteering gear into separate systems or installing a stern thruster as a backup can be found as a solution.Together, they combine for an improvement of 2.2 × 10⁻⁵. The remaining failure rate when one of thesesolutions is applied is 2.4 × 10⁻¹⁰. Redundancy of the steering gear is found to be the solution with thesecond highest improvement. The cost of this solution will therefore also be determined later on.
In the fuel system, redundancy is also a solution for both failures, namely the failures with unknowndistribution and the fuel intolerance. Fuel system redundancy prevents 1.2 × 10⁻⁵ of the failure rate,with only 8.4 × 10⁻¹¹ of the initial failure rate remaining. This solution is the third best when it comesto reliability improvement and will therefore also be considered for its financial aspect. In the failureswith unknown distribution, other failures such as air in the fuel are also present. These are not solvedby applying redundancy. The calculations of the failure rate prevention might therefore be a little onthe positive side. However, it is still a valid solution for the fuel intolerance and most of the failures withunknown distribution. There is also no other solution that comes close to the reliability improvementof this solution. It is therefore assumed that this solution, even if the actual reliability improvement is alittle lower, still comes at the third place regarding the total reliability improvement.
The three redundancy options can now be placed into one table as a small summary. Table 4.8shows the system in which the failure occurred and also names the failure. It then shows the re-dundancy solutions and their reliability improvement. It ends with the failure rate that remains after asolutions has been applied. The solutions in this table are the ones of which the costs will be determinedin the next chapter.
Table 4.8: The three best solutions based on reliability improvement
System Failure Solution Reliabilityimprovement
[yrs]
Newfailure rate
ME Unknowndistribution, starting,reversing andregulating device,standard failuresand turbochargerfailures
’Installing more engines as afull-backup’ or ’Dividing the powerover multiple engines’ or ’Powertake in as a backup’
182,450 6.3 × 10⁻¹⁰
SG Unknowndistribution plusother and electricalsupply and controldevices
’Split steering gear into separatesystems’ or ’Install a stern thrusteras a backup’
5,200 2.4 × 10⁻¹⁰
FS Unknowndistribution and fuelintolerance
Keep different types of fuelseparate and/or keep fuels fromdifferent locations separate
1,364,800 8.4 × 10⁻¹¹
Table 4.8 shows the three best solutions based on their reliability improvement. It can be seen thatfor all three systems, the failure rate is heavily reduced. Since the main engine, steering gear and fuelsystem are the three systems that are responsible for the highest failure rate, it was to be expectedthat the solutions in these systems would be with the best solutions.
It is interesting to notice that the improvement of maintenance has not been named in Table 4.8as a solution with one of the highest reliability improvements. Although improper maintenance wasfound responsible for 19.3% of all failures, the solution to do proper maintenance only has a smalleffect on all solutions instead of much impact on a few solutions. When all improvements due to theimprovement of maintenance are added, it can be found to reduce the failure rate by 1.7 × 10⁻⁵, butit also has a remaining failure rate of 7.0 × 10⁻⁵, which is an improvement of the MTBF of only halfa year. Maintenance is thus found to be responsible for a big portion of the failures, but only solvingmaintenance is not the solution to increase the reliability of ship machinery significant.
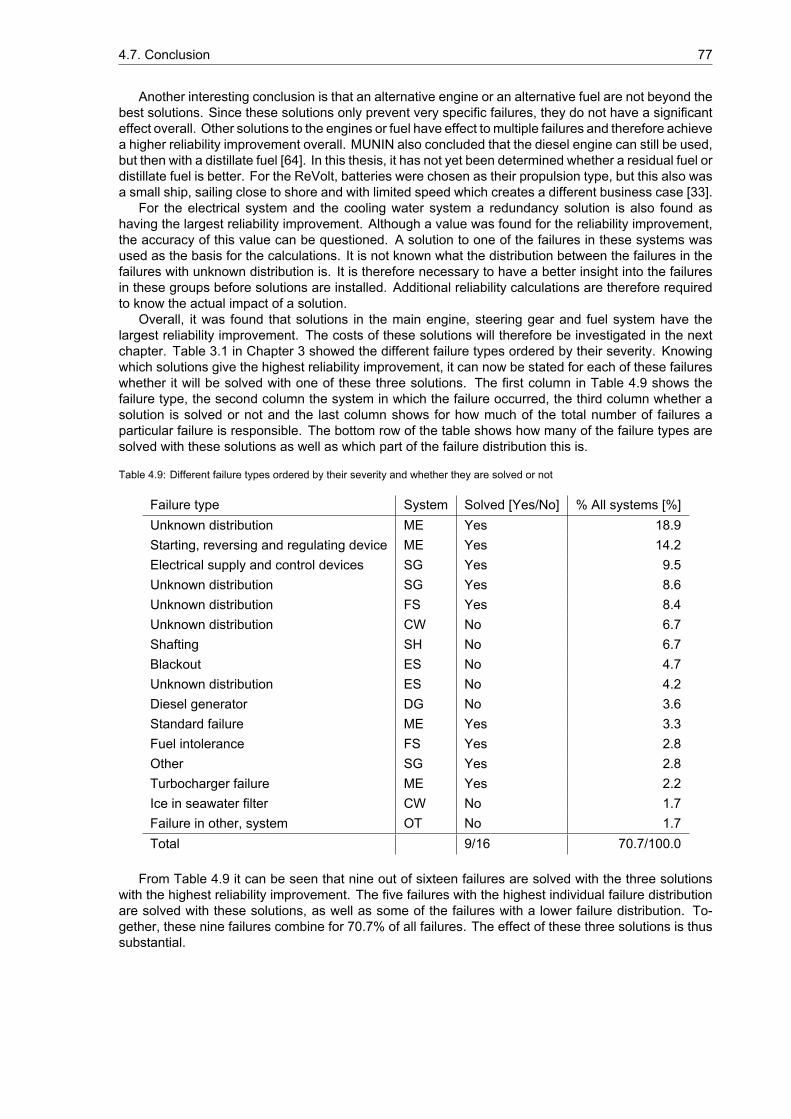
4.7. Conclusion 77
Another interesting conclusion is that an alternative engine or an alternative fuel are not beyond thebest solutions. Since these solutions only prevent very specific failures, they do not have a significanteffect overall. Other solutions to the engines or fuel have effect to multiple failures and therefore achievea higher reliability improvement overall. MUNIN also concluded that the diesel engine can still be used,but then with a distillate fuel [64]. In this thesis, it has not yet been determined whether a residual fuel ordistillate fuel is better. For the ReVolt, batteries were chosen as their propulsion type, but this also wasa small ship, sailing close to shore and with limited speed which creates a different business case [33].
For the electrical system and the cooling water system a redundancy solution is also found ashaving the largest reliability improvement. Although a value was found for the reliability improvement,the accuracy of this value can be questioned. A solution to one of the failures in these systems wasused as the basis for the calculations. It is not known what the distribution between the failures in thefailures with unknown distribution is. It is therefore necessary to have a better insight into the failuresin these groups before solutions are installed. Additional reliability calculations are therefore requiredto know the actual impact of a solution.
Overall, it was found that solutions in the main engine, steering gear and fuel system have thelargest reliability improvement. The costs of these solutions will therefore be investigated in the nextchapter. Table 3.1 in Chapter 3 showed the different failure types ordered by their severity. Knowingwhich solutions give the highest reliability improvement, it can now be stated for each of these failureswhether it will be solved with one of these three solutions. The first column in Table 4.9 shows thefailure type, the second column the system in which the failure occurred, the third column whether asolution is solved or not and the last column shows for how much of the total number of failures aparticular failure is responsible. The bottom row of the table shows how many of the failure types aresolved with these solutions as well as which part of the failure distribution this is.
Table 4.9: Different failure types ordered by their severity and whether they are solved or not
Failure type System Solved [Yes/No] % All systems [%]Unknown distribution ME Yes 18.9Starting, reversing and regulating device ME Yes 14.2Electrical supply and control devices SG Yes 9.5Unknown distribution SG Yes 8.6Unknown distribution FS Yes 8.4Unknown distribution CW No 6.7Shafting SH No 6.7Blackout ES No 4.7Unknown distribution ES No 4.2Diesel generator DG No 3.6Standard failure ME Yes 3.3Fuel intolerance FS Yes 2.8Other SG Yes 2.8Turbocharger failure ME Yes 2.2Ice in seawater filter CW No 1.7Failure in other, system OT No 1.7Total 9/16 70.7/100.0
From Table 4.9 it can be seen that nine out of sixteen failures are solved with the three solutionswith the highest reliability improvement. The five failures with the highest individual failure distributionare solved with these solutions, as well as some of the failures with a lower failure distribution. To-gether, these nine failures combine for 70.7% of all failures. The effect of these three solutions is thussubstantial.

5Cost Of Solutions With Highest
Reliability ImprovementIn Chapter 4 three groups of failures were found of which the solutions give the highest reliability im-provement overall. In this chapter, it will be determined which of these solutions is the cheapest andwhich of the solutions is the best. For each solution it will have to be determined what it costs and itwill also be determined what the effect of this solution is on the design of the ship. Before both thecost and design change(s) can be determined, a reference ship and route have to be chosen. Withthe cost of all solutions known, it is easy to determine which solutions are the cheapest. From otherresearch, it is known how much money becomes available when the ship is made unmanned. Withthe cost of the machinery solutions known, it can thus be determined whether an unmanned ship canremain financially competitive after applying these solutions.
First, the reference ship and reference route will be introduced in Section 5.1 after which the avail-able money for solutions is discussed in Section 5.2. Then, the solutions to the main engine failures,steering gear failures and fuel system failures will be financially investigated in respectively Section 5.3,5.4 and 5.5. In Section 5.6 conclusions will be drawn to which solutions are the best and how much ofthe available budget is used for these solutions.
5.1. Reference Ship And RouteIn order to determine the cost of the solutions, a reference ship has to be chosen. With a known refer-ence ship, a value for for instance the needed power is available. This makes it possible to determinethe cost of the engines. Without a reference ship this would not have been possible. The route of theship is necessary to determine for instance the fuel cost or the required range of the batteries when theship fails halfway during its voyage.
The ship that will be chosen as a reference ship comes from another research regarding unmannedshipping. A general cargo ship, type M-Borg and designed by Conoship, is taken as a reference [38].This ship was chosen in the other thesis since it was believed that small ships are more suitable forunmanned shipping. For this particular ship it has been determined how much money becomes avail-able when the ship is made unmanned. Using this ship therefore makes it possible to state whetherthe cost of the solutions are within the budget or far outside the budget. A route from Rotterdam toHalifax (Canada) was chosen in the other research to include both the heavily trafficked North Sea aswell as the open Atlantic Ocean. The route has a length of 3,150 nautical miles [38]. The referenceship can be seen in Figure 5.1. It has a length of 134.5 meters, a breadth of 16.5 meters, a draught of7.0 meters, a displacement of 11,986 tonnes and a deadweight of 8,950 tonnes.
5.2. Available Money For SolutionsWhen a ship is sailing unmanned, apart from not needing crew, some equipment is no longer required.Accommodation, fresh water systems, sanitary systems, HVAC, deck equipment such as the free-falllifeboat and other equipment can be removed [38]. With these systems not being needed, money be-
79
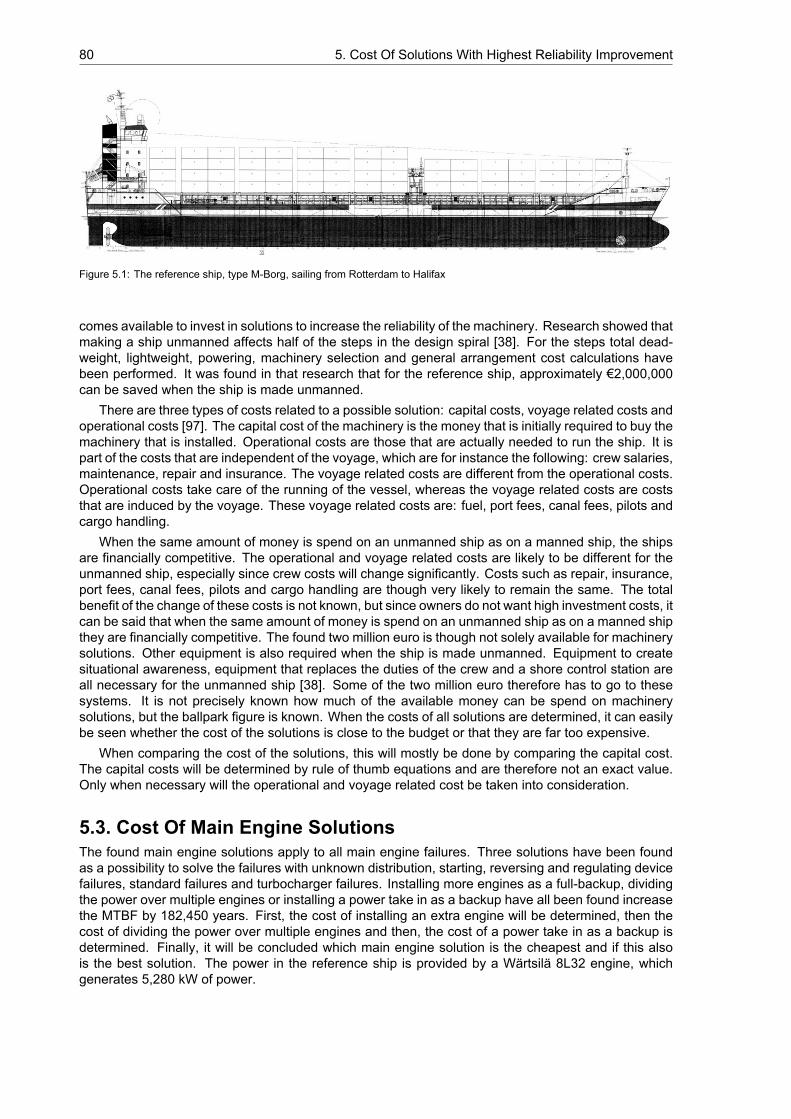
80 5. Cost Of Solutions With Highest Reliability Improvement
Figure 5.1: The reference ship, type M-Borg, sailing from Rotterdam to Halifax
comes available to invest in solutions to increase the reliability of the machinery. Research showed thatmaking a ship unmanned affects half of the steps in the design spiral [38]. For the steps total dead-weight, lightweight, powering, machinery selection and general arrangement cost calculations havebeen performed. It was found in that research that for the reference ship, approximately €2,000,000can be saved when the ship is made unmanned.
There are three types of costs related to a possible solution: capital costs, voyage related costs andoperational costs [97]. The capital cost of the machinery is the money that is initially required to buy themachinery that is installed. Operational costs are those that are actually needed to run the ship. It ispart of the costs that are independent of the voyage, which are for instance the following: crew salaries,maintenance, repair and insurance. The voyage related costs are different from the operational costs.Operational costs take care of the running of the vessel, whereas the voyage related costs are coststhat are induced by the voyage. These voyage related costs are: fuel, port fees, canal fees, pilots andcargo handling.
When the same amount of money is spend on an unmanned ship as on a manned ship, the shipsare financially competitive. The operational and voyage related costs are likely to be different for theunmanned ship, especially since crew costs will change significantly. Costs such as repair, insurance,port fees, canal fees, pilots and cargo handling are though very likely to remain the same. The totalbenefit of the change of these costs is not known, but since owners do not want high investment costs, itcan be said that when the same amount of money is spend on an unmanned ship as on a manned shipthey are financially competitive. The found two million euro is though not solely available for machinerysolutions. Other equipment is also required when the ship is made unmanned. Equipment to createsituational awareness, equipment that replaces the duties of the crew and a shore control station areall necessary for the unmanned ship [38]. Some of the two million euro therefore has to go to thesesystems. It is not precisely known how much of the available money can be spend on machinerysolutions, but the ballpark figure is known. When the costs of all solutions are determined, it can easilybe seen whether the cost of the solutions is close to the budget or that they are far too expensive.
When comparing the cost of the solutions, this will mostly be done by comparing the capital cost.The capital costs will be determined by rule of thumb equations and are therefore not an exact value.Only when necessary will the operational and voyage related cost be taken into consideration.
5.3. Cost Of Main Engine SolutionsThe found main engine solutions apply to all main engine failures. Three solutions have been foundas a possibility to solve the failures with unknown distribution, starting, reversing and regulating devicefailures, standard failures and turbocharger failures. Installing more engines as a full-backup, dividingthe power over multiple engines or installing a power take in as a backup have all been found increasethe MTBF by 182,450 years. First, the cost of installing an extra engine will be determined, then thecost of dividing the power over multiple engines and then, the cost of a power take in as a backup isdetermined. Finally, it will be concluded which main engine solution is the cheapest and if this alsois the best solution. The power in the reference ship is provided by a Wärtsilä 8L32 engine, whichgenerates 5,280 kW of power.
5.3. Cost Of Main Engine Solutions 81
5.3.1. Cost Of Full-Backup SolutionThe full-backup solution involves installing a second Wärtsilä 8L32 engine. In this case, more power isinstalled than is required for normal operation. When one of the engines fails, the backup engine willbe started to take over for the first one. The speed of the ship will then not have to be reduced andservice can be resumed as before the engine failure.
When two engines are placed in the ship instead of one, this will have an effect on the layout of theengine room. The drive train of the reference ship consists of one engine which is connected, througha gearbox, to a controllable pitch propeller (CPP). All these components are in line with one another.When two engines are installed, those will need to be placed next to each other, with sufficient spacingto allow maintenance. Placing them in line would require a longer engine room, which costs cargospace and is therefore not an option. When the engines are placed next to one another, it is likely thatthey need to be installed higher in the ship than the single engine. This is due to the geometry of theaft body of the ship. The shape of the ship could also be changed in order to accommodate for twoengines. Extra engine foundation is necessary to support both engines. They will still be connectedwith the CPP through a gearbox. Two shafts will thus enter the gearbox and one shaft will leave thegearbox. Because only one of the engines will be running at all times, the size of the gears can remainthe same since the maximum power to be transferred through the gearbox is the same at all times.The only design change to the gearbox is therefore the change from one to two entry shafts. From thegearbox to the CPP, the shafting will remain the same in case two engines are installed. Extra pipingand wiring is needed when installing a second engine since the original piping and wiring is only suitablefor one engine. More piping and wiring thus have to be installed in order to guarantee that both engineshave access to for instance fuel, lubrication and cooling water. This increases the need for space inthe engine room. The changes to the engine room are only stated here to get an impression of thedesign changes but are not put into new drawings of the engine room. For this thesis, it is interestingto know the cost of the solution and the changes that occur due to this solution, but the detailed designof these changes falls outside the scope.
The extra engine costs money, as well as the extra structural foundation and the required extrapiping and wiring. The gearbox might also be a little bit more expensive due to the extra inlet shaft. Ifall these costs are determined, it can be found what the cost of this solution is. It can be found that$4, 700×𝑃 . is a rule of thumb for the entire power generation system, in which 𝑃 is the installed powerin kW. This rule of thumb also includes the cost of the fuel system, lubricating system, cooling system,air system and exhaust system [2]. A substantial part of the cost of the power generation come fromthese named auxiliary systems. The provided rule of thumb of $4, 700 × 𝑃 . can thus not be useddirectly since only the cost of the main engine has to be known. The same research also providesanother rule of thumb, namely $200 to $300 per kW of power [2]. For a first quote of the engine price,the average of $200/kW and $300/kW can be used, $250/kW. This does however not take into accountthe price of equipment that also changes and the found relationship of engine power to the power of0.79. The other costs that are induced due to the change of the engines are estimated at $50/kW, sothe engine cost combined with the cost of the changes equals the upper limit of the engines, $300/kW.For a 5,280 kW engine, this would mean a cost of $1,584,000. Using this value, the coefficient of 4,700in the power generation cost formula can be recalculated for only the main engine and its changes.The formula that includes the power 0.79 is thought to be more precise since this accounts for the factthat large engines are relatively cheaper. Knowing that the engine has a size of 5,280 kW and costs$1,584,000 with the simple rule of thumb it can be found that the new coefficient is 1,618, which isrounded to 1,600. The formula that will be used to determine the cost of the engine plus the cost of thedesign change is thus $1, 600 × 𝑃 . . It is not known in which year these rule of thumbs have beendetermined, so inflation cannot be taken into account.
Having determined a rule of thumb, the cost of the full-backup solution can be determined. Twoengines of 5,280 kW are installed. For each of these engines it can be found that they cost $1,396,371,so together they combine for a cost of $2,792,742. It is not known for which year these numbers havebeen established, so the corresponding exchange rate is not known. The exchange rate of today4 istherefore taken in order to find that €1,244,865 is the extra cost due to the second engine. The budgetfor solutions is €2,000,000 so this solution falls within the budget, although it already uses 62% of it.
423 September 2016, $1.00 = €0.8915 [106]
82 5. Cost Of Solutions With Highest Reliability Improvement
5.3.2. Cost Of Dividing Of PowerWhen the power is divided, two smaller engines are installed which combine for 5,280 kW of power.Each engine thus delivers 2,640 kW. When one of the engines fails, enough power is available tocontinue the route of the ship. Since the power is reduced, the speed will drop. Due to the third powerrelation of speed and power, the speed will still be significant when 50% of the power remains, whichcan be calculated with the following formula [90]. A reduction of the power to 50% is the result of oneengine failure, when two engines are installed.
𝑃 = 𝑐 ∗ 𝑣 (5.1)
In which
𝑃 Effective towing power [W]
𝑐 Constant
𝑣 Ship speed [m/s]
When the power in Equation 5.1 is chosen to be a 100% and a speed of a 100% is assumed for 𝑣, itcan be determined that 𝑐 is equal to 1.0. If the power is reduced to 50%, it can be determined with theknown value of 𝑐 that the new 𝑣 is 79.4%. This means that when the ship only has 50% of the powerremaining, it can still sail on 79.4% of its initial speed. A speed of 79.4% of the initial speed should besufficient to proceed with the service of the ship.
The same equipment changes when the power is divided as would when the full-backup solutionis applied. Since the engines with less power are smaller, their position in the engine room might bea little different compared to the backup solution, however this is only a minor detail. It was previouslydetermined that the cost of an engine is $1, 600×𝑃 . . The price of two 2,640 kW engines can thus befound as $1,615,166 or €1,439,920. This is an extra €195,056 on top of the original installation. Sincethis solution only uses 10% of the budget, it fits perfectly into the budget.
5.3.3. Cost Of Power Take InIn this Subsection, it will be determined what the cost of the power take in solution is. The power forthe power take in can come from either a diesel engine or a battery pack. First, the cost of a dieselengine as a PTI will be determined, after which the cost of a battery pack will be calculated. Before thiscan be done, it will have to be determined what size the power take in will have to be in order to get theship to shore. For the dividing of power it was determined that 50% of the power would lead to a speedof 79.4% of the initial speed. For the power take in it is assumed that it has to be of sufficient powerin order to realize a speed which is 50% of the original speed, namely 7 knots. It is assumed that withthis speed, the ship is still able to continue its route and sail to shore, though with a significant delay,or sail to the nearest port in order to get the problem fixed. For further research it might be advisable todetermine whether 50% of the speed is enough to reach shore. The solution of a PTI is one in whichthe ship is not always at the desired port after a failure has occurred. The corresponding power with aspeed of 50% is found to be 12.5%, which is 660 kW.
Diesel Engine As PTIThe cost of an extra engine of 660 kW can now be determined with the previously shown equations.A 660 kW engine is small, so this engine might be placed a little off centre on the side of the shaft thatleaves the gearbox. This would mean that the main engine can still be placed on the centreline andthat the change in the engine room is rather small. With the previously shown rate for the engine priceit can be found that a PTI has an additional cost of €240,814, or 12% of the budget of €2,000,000. Thissolution thus fits within the set budget but it is more expensive than the previously solution and its resultis less satisfactory.
Battery Pack As PTIThe power take in can also be powered from a battery pack. In order to determine the cost of thissolution, the needed capacity of the battery pack has to be determined. Knowing the time to get to thenearest port and the required power to do so makes it possible to determine the capacity of the batterypack. When sailing on the PTI, the ship sails at half the initial speed. The reference journey was found
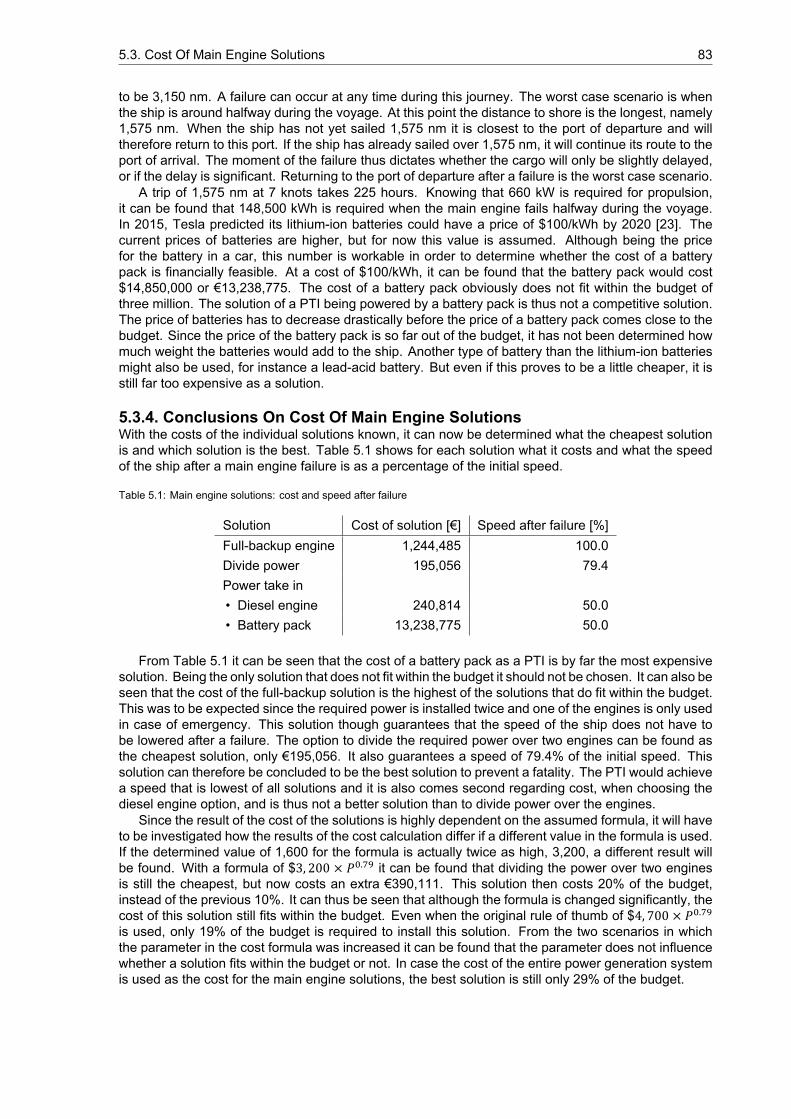
5.3. Cost Of Main Engine Solutions 83
to be 3,150 nm. A failure can occur at any time during this journey. The worst case scenario is whenthe ship is around halfway during the voyage. At this point the distance to shore is the longest, namely1,575 nm. When the ship has not yet sailed 1,575 nm it is closest to the port of departure and willtherefore return to this port. If the ship has already sailed over 1,575 nm, it will continue its route to theport of arrival. The moment of the failure thus dictates whether the cargo will only be slightly delayed,or if the delay is significant. Returning to the port of departure after a failure is the worst case scenario.
A trip of 1,575 nm at 7 knots takes 225 hours. Knowing that 660 kW is required for propulsion,it can be found that 148,500 kWh is required when the main engine fails halfway during the voyage.In 2015, Tesla predicted its lithium-ion batteries could have a price of $100/kWh by 2020 [23]. Thecurrent prices of batteries are higher, but for now this value is assumed. Although being the pricefor the battery in a car, this number is workable in order to determine whether the cost of a batterypack is financially feasible. At a cost of $100/kWh, it can be found that the battery pack would cost$14,850,000 or €13,238,775. The cost of a battery pack obviously does not fit within the budget ofthree million. The solution of a PTI being powered by a battery pack is thus not a competitive solution.The price of batteries has to decrease drastically before the price of a battery pack comes close to thebudget. Since the price of the battery pack is so far out of the budget, it has not been determined howmuch weight the batteries would add to the ship. Another type of battery than the lithium-ion batteriesmight also be used, for instance a lead-acid battery. But even if this proves to be a little cheaper, it isstill far too expensive as a solution.
5.3.4. Conclusions On Cost Of Main Engine SolutionsWith the costs of the individual solutions known, it can now be determined what the cheapest solutionis and which solution is the best. Table 5.1 shows for each solution what it costs and what the speedof the ship after a main engine failure is as a percentage of the initial speed.
Table 5.1: Main engine solutions: cost and speed after failure
Solution Cost of solution [€] Speed after failure [%]Full-backup engine 1,244,485 100.0Divide power 195,056 79.4Power take in• Diesel engine 240,814 50.0• Battery pack 13,238,775 50.0
From Table 5.1 it can be seen that the cost of a battery pack as a PTI is by far the most expensivesolution. Being the only solution that does not fit within the budget it should not be chosen. It can also beseen that the cost of the full-backup solution is the highest of the solutions that do fit within the budget.This was to be expected since the required power is installed twice and one of the engines is only usedin case of emergency. This solution though guarantees that the speed of the ship does not have tobe lowered after a failure. The option to divide the required power over two engines can be found asthe cheapest solution, only €195,056. It also guarantees a speed of 79.4% of the initial speed. Thissolution can therefore be concluded to be the best solution to prevent a fatality. The PTI would achievea speed that is lowest of all solutions and it is also comes second regarding cost, when choosing thediesel engine option, and is thus not a better solution than to divide power over the engines.
Since the result of the cost of the solutions is highly dependent on the assumed formula, it will haveto be investigated how the results of the cost calculation differ if a different value in the formula is used.If the determined value of 1,600 for the formula is actually twice as high, 3,200, a different result willbe found. With a formula of $3, 200 × 𝑃 . it can be found that dividing the power over two enginesis still the cheapest, but now costs an extra €390,111. This solution then costs 20% of the budget,instead of the previous 10%. It can thus be seen that although the formula is changed significantly, thecost of this solution still fits within the budget. Even when the original rule of thumb of $4, 700 × 𝑃 .
is used, only 19% of the budget is required to install this solution. From the two scenarios in whichthe parameter in the cost formula was increased it can be found that the parameter does not influencewhether a solution fits within the budget or not. In case the cost of the entire power generation systemis used as the cost for the main engine solutions, the best solution is still only 29% of the budget.
84 5. Cost Of Solutions With Highest Reliability Improvement
If the considered ship would have a different engine size, the result of the cost calculation wouldbe different. The drawn conclusion would though be the same. When a ship with a smaller enginesize was to be considered, the cost of the solutions would lie closer to one another and the differenceswill thus be smaller. For a ship with a larger engine, the costs of all solutions would be higher andthe differences between them larger. In all cases, the full-backup engine will be the most expensive,followed by the power take in. The option to divide the power over multiple engines will always be thecheapest. Since it only costs 10% of the budget in this case, it can be said that this solution can beapplied.
Before the 195 thousand euro is invested in the ship, a fatal main engine failure will occur oncealmost every three years. After the investment, a fatal technical failure due to two engine failuresduring the same voyage is once every 182,450 years. So this is just over an euro per extra yearbetween failures.
5.4. Cost Of Steering Gear SolutionsFor the steering gear failures, the solutions to split the steering gear into separate systems or to installa stern thruster as a backup have both been found as a solution with a high reliability improvement.The cost of these solutions will therefore be investigated in the following subsections. First, the costof two steering gear systems is calculated after which the cost of a stern thruster will be determined.Then, it can be concluded which solution is the best solution to increase the steering gear reliability.
5.4.1. Cost Of Splitting The Steering Gear Into Separate SystemsWhen two steering gear systems are installed, this will have a significant effect on the design of theship. In the design of the reference vessel one controllable pitch propeller (CPP) is installed, togetherwith one rudder. If two sets of steering gear are installed, this means that two rudders are installed,while only one propeller is present. Both rudders will thus be placed off centre in order to guarantee asymmetrical steering. Placing both rudders off centre causes them to no longer be in the direct wakeof the propeller, which lowers their steering capacity. This is because the speed of the water behindthe propeller is higher than outside the slipstream. When a ship owner decides to apply this measure,it will have to be calculated how large the rudder area will have to be when they are placed in waterwith a lower velocity. Using the following formula, the rudder area for a configuration with two steeringgears can be determined [20]. The lift of the rudders has to be same for both configurations in order tohave the same manoeuvrability.
𝐿 = 12𝐶 𝜌𝐴𝑉 (5.2)
In which
𝐿 Lift force [N]
𝐶 Lift coefficient [-]
𝜌 Density of the fluid, 1,025 for sea water [kg/m ]
𝐴 Rudder area [m2]
𝑉 The free stream incident velocity [m/s]
It can be seen from Equation 5.2 that when the speed of the water is for instance half of the speedas in the initial configuration, the rudder area has to be four times as high in order to have the samelift. Since the drag formula for the rudder is 𝐷 = 𝐶 𝜌𝐴𝑉 , with 𝐷 the drag force [N] and 𝐶 the dragcoefficient [-] it can be seen that the drag of the rudder will remain the same. Increasing the size of therudders therefore does not have a negative effect.
It is not known what the speed of the water is after the propeller in the reference configuration.Since it is also unknown what the speed of the water at the rudder will be in the new arrangement, thenew size of the rudders cannot be determined. The speed of the water at the rudder will have to bedetermined for both configurations with a hydrodynamical analysis, which falls outside the scope of thisthesis.
5.4. Cost Of Steering Gear Solutions 85
Knowing what the effect of a second set of steering gear is makes it possible to determine thecost of the second steering gear. Based on an actual quotation, it is found that the cost of one set ofsteering gear, including rudders, is found to be €50,000 in 2012 for a ship sailing on inland waters [45].A quotation for a steering gear of an ocean going vessel is likely to be different, but a better numberis not available. With a price of €50,000 it is only 2.5% of the budget, so if the actual price is twice ashigh, it would still only be 5% of the budget. The working principle of the steering gear is the same forinland ships as for ocean going ships so that is not a problem. Since the forces on the rudders of oceangoing ships are likely to be larger, the steering gear is likely to be larger and therefore more expensivefor ocean going ships. The first set of steering gear will also become a little more expensive in a tworudder configuration since the rudder will be larger. It is though assumed that the extra cost due to theincrease of rudder area is negligible compared to the cost of the steering gear. The total cost of anextra steering gear is thus found to be €50,000 although it has to be stated that this is probably on thelow side.
5.4.2. Cost Of Installing A Retractable Stern Thruster As A BackupInstalling a stern thruster is done next to the controllable pitch propeller that is already present. Withthe CPP placed on the centreline, the stern thruster can only be placed on the centreline with greatdifficulty. There is hardly any space to install it since it cannot be placed in front of the CPP, andinstalling it in between the propeller and the rudder is also not an option, due to the limited space. Theonly option to place the stern thruster on centreline is by placing it behind the rudder. This might bechallenging in the design of the machinery though since the rudder will then have to be placed forwardin order to allow this design.
Another option is to place the stern thruster off centre. It would then be placed either on port orstarboard side of the ship. When the steering gear fails, the stern thruster is lowered and this will thenprovide steering by turning the thruster. With it being placed off centre, it will constantly have a steeringeffect, when in the zero position. In order to neutralize this steering effect, the stern thruster can beplaced at an angle or the bow thruster can be used to compensate the yaw effect that is created by anoff centre stern thruster.
When the steering gear fails, the stern thruster will not have to deliver the full 5,280 kW of propulsionpower. After all, the propeller remains functional in case of a steering gear failure and is therefore stillable to perform its task. The stern thruster only needs to deliver the power that is required to be ableto manoeuvre the ship. The required power is assumed to be equal to the size of the bow thruster, 650kW [84]. Since the stern thruster is located almost at the very end of the ship, it has large leverage andtherefore much steering effect. Especially since the stern thruster can be placed at -90/90 degrees,which a rudder would not be able to do. When the full power of the stern thruster is used, this poweris no longer available for propulsion. A total of 4,630 kW would thus remain available for propulsion,assuming that the bow thruster and stern thruster always combine for a maximum of 650 kW. With4,630 kW of power being available for propulsion, a speed of 95.7% of the initial speed can be sailed,so steering with a stern thruster only has a small influence on the performance of the vessel.
For the price of a propeller (and shafting), several rules of thumb are available. These rules of thumbdepend on the type of propeller and the required operating speed of the propeller. For a fixed pitchpropeller, €55/kW can be used for propellers operating at a 100 rpm, whereas €65/kW should be usedfor propellers with a speed of 250 rpm. For controllable pitch propellers, which are more complicated,values of €70/kW for 100 rpm propellers and €110/kW for propellers of 250 rpm can be used [25]. Astern thruster, especially one that is retractable is a complicated piece of machinery. The stern thrusteris most likely to be of a fixed pitch configuration. Due to the complexity of the equipment to make thestern thruster retractable it is chosen to assume the average value of the CPP propeller cost. Thesepropellers are most sophisticated and their rules of thumb are therefore more likely to represent theactual cost. An average value of €90/kW makes that the cost of the stern thruster is €58,500, a valuethat falls inside the budget. These rule of thumb values do not include the electric motor of the sternthruster. The previously determined price will therefore be doubled in order to accommodate for thecost of the electric motor. This brings the total cost to €117,000, still only 6% of the available budget.The cost calculation of both steering gear solutions can thus be found to be relatively rough.
86 5. Cost Of Solutions With Highest Reliability Improvement
5.4.3. Conclusions On Cost Of Steering Gear SolutionsFor both individual steering gear solutions it has now been determined what their cost is. The costand impact on the design can now be compared for both solutions in order to determine what the bestsolution is. Splitting the steering gear into two separate systems results in an additional cost of at least€50,000. It also dictates that the rudders will become larger, but this does not have extra drag as aconsequence. Installing a stern thruster has a more drastic effect on the design, due to its placement.The cost of the stern thruster was estimated at €117,000.
The cost of both solutions fall perfectly into the set budget of €2,000,000 so both of them are anoption within this budget. Even when the costs are twice as high in reality they are well within budget.It can be seen that the cost of two steering gear systems is smaller than the cost of installing a sternthruster. Due to the rule of thumb calculations and the quote of the steering gear, it is difficult to say howaccurate these calculations are. Choosing the best solution based only on the calculated cost wouldtherefore not be wise, especially due to the small difference. Also taking other arguments into account,such as the operational practicalities, may therefore be the better option. Splitting the steering gearinvolves two rudders, which are both operational at all times. Both sets therefore need to be maintainedat the same interval. This solution thus requires extra maintenance compared to the stern thruster. Thestern thruster is namely only lowered when the steering gear has failed. With fewer operating hours,it needs little maintenance. On the other hand, the placement of the stern thruster is difficult. For aWärtsilä thruster it is found that ten minutes are needed to retract the thruster [103]. Depending on thecase, this might be too long in order to get the ship operational again.
Considering that the stern thruster can be placed behind the rudder, so on the centreline, it is chosenas the best solution. Although it is a little more expensive, it has the least effect on the ship design.Installing two sets of steering gear requires two larger rudders, which are operational at all times. Witha stern thruster installed, one small rudder can still be used in high velocity water instead of two largerudders in low velocity water. The time to retract the stern thruster is the only real downside of thestern thruster, but this can be considered acceptable. In cooperation with a manufacturer it is maybepossible to design a stern thruster with a shorter retraction time.
One of the other reasons to choose for the stern thruster instead of two steering gears is that thestern thruster also provides a backup solution if the shafting fails. If the shafting fails, the ship is nolonger able to propel itself since it cannot use the installed CPP. The stern thruster was estimated at650 kW, which is enough to propel the ship at almost 50% of its initial speed, as was found whendesigning the PTI. So choosing the stern thruster instead of two steering gear systems solves an extrafailure.
5.5. Cost Of Fuel System SolutionsThe solutions to keep fuels from different locations separate and/or to keep different types of fuel sep-arate were found to be the third best solution reliability wise and are therefore investigated financially.These solutions can be seen as one solution since they both require two separate fuel systems. Thecost of an extra fuel system is thus the additional cost for these solutions.
When two fuel systems are being installed, they can both have half the capacity of the initial fuelsystem. This means that the volume of the fuel bunker tanks does not have to be altered. After all, theystill have the same capacity together. One of the only changes is that there should be two places wherefuel can enter the ship. This way, fuel from different locations enters different bunker tanks. When inthe tanks, the fuel should not come in contact with the other fuel before entering the engine. It wasfound that splitting the power of the engine over two engines increases reliability. The engine solutionand the fuel solution can therefore be combined. Each engine can have its own fuel system. The onlyremark to this is that there has to be a valve that somehow connects both systems. This would allowone fuel system to fuel both engines in case of a fuel system failure. A failure in the fuel system shouldnot lead to a ’loss’ of a main engine and therefore speed. This valve would also allow that the systemwith the least fuel is emptied first and that then the fully bunkered fuel system can be used. The emptysystem could then be cleaned in order to get ready for new bunkers. Although one would not want tohave a connection between both fuel systems, it is necessary for practicalities. Placing this valve asclose to the engines as possible reduces the risk of a failure due to the mixing of fuel.
5.5. Cost Of Fuel System Solutions 87
The cost difference within the fuel system is found to be piping, separators, filters and pumps. Nochanges to the tanks are needed. Extra separators, filters and pumps are needed in order to makethose redundant. Since so little adaptations are needed it can be said that the additional cost of twofuel systems compared to one fuel system is very small. The cost of the extra separators, filters andpumps will be accounted for in the cost of the piping. It has to be estimated how much extra piping isneeded in order to determine the cost of this solution.
The material cost of one meter of pipe is found to be €25 [56]. It is unknown how much length ofpipe needs to be added in order to make two individual systems. As a first assumption it is assumedthat twice the length of the ship is needed on top of the already existing piping infrastructure. Withthe ship having an overall length of 134.5 meters, this would mean that 269 meters of piping is added.Assuming that the cost of man-hours is the same as the material cost means that one meter of pipecosts €50, which would make that €13,450 is the cost of the extra 269 meters of pipe.
Since the cost of €13,450 is highly susceptible to the assumption of the length of the extra pipingand the cost of man-hours, it will have to be determined what the cost would be if these factors changesignificantly. If the required piping would actually be five times as high as assumed, a higher cost forthis solution would be found. This solution would then cost 67,250 euro, which still fits perfectly withinthe set budget of €2,000,000 since it is only just over 3% of the budget. If the cost of the man-hourswould be doubled as well, it would cost €100,875 for this solution to be installed. This is still only justover 5% of the original budget and therefore acceptable. Because the cost in case of the extremeconditions are still safely within the budget it can be said that the made assumptions do not influencethe conclusion that can be drawn regarding implementing this solution.
The entire reliability improvement due to these solutions can though only be gained when one typeof fuel is used. When two types of fuel are used, they can be separated in different systems, but fuelfrom different locations will then still have to be stored together. Keeping fuel from different locationsseparate was found to give a higher reliability improvement than keeping different types of fuel separate.It is therefore needed to sail on one type of fuel, unless four fuel systems are installed, but this wouldmake the total fuel system unnecessarily complex and expensive. Having one type of fuel in order toincrease reliability will also increase voyage related costs. A cleaner and more expensive fuel has tobe used, otherwise the sulphur limits for the emission control areas cannot be met. The reference routefor this ship is Rotterdam - Halifax. Both ports lie in an emission control area, so clean fuel needs tobe used. Since the voyage related costs will increase due to sailing on the more expensive fuel, it willhave to be investigated what the additional voyage related costs of this solution are.
The current price of heavy fuel, IFO380, is found to be $246.50/mt [88]. IFO380 is a fuel with amaximum of 3.5% sulphur content. The cleaner ultra low sulphur fuel oil (ULSFO), is found to cost$383.00/mt and has a maximum of 0.1% sulphur content [89]. The price for both fuels has been basedon the price of a metric ton of fuel in the Port of Rotterdam, as of 27-09-2016. In order to determine theprice difference for a journey from Rotterdam to Halifax, the fuel costs for both types of fuel has to bedetermined.
The reference ship has a speed of fourteen knots [84]. With the known distance of 3,150 nm it canbe determined that the journey takes 810,000 seconds (225 hours). The required energy for a one waytrip from Rotterdam to Halifax can then be found by multiplying the engine power with the duration ofthe journey.
𝐸 = 𝑃 × 𝑡 (5.3)
In which
𝐸 Required energy [kJ]
𝑃 Engine power [kW]
𝑡 Duration of the journey [s]
The required energy is found to be 4,276.8 GJ, with Equation 5.3 for an engine running at 100%efficiency. Since an engine operates at an efficiency of around 50%, the actual required energy can befound to be 8,553.6 GJ. Dividing the required energy by the calorific value of the specific fuels makesit possible to determine the weight of the required fuel.
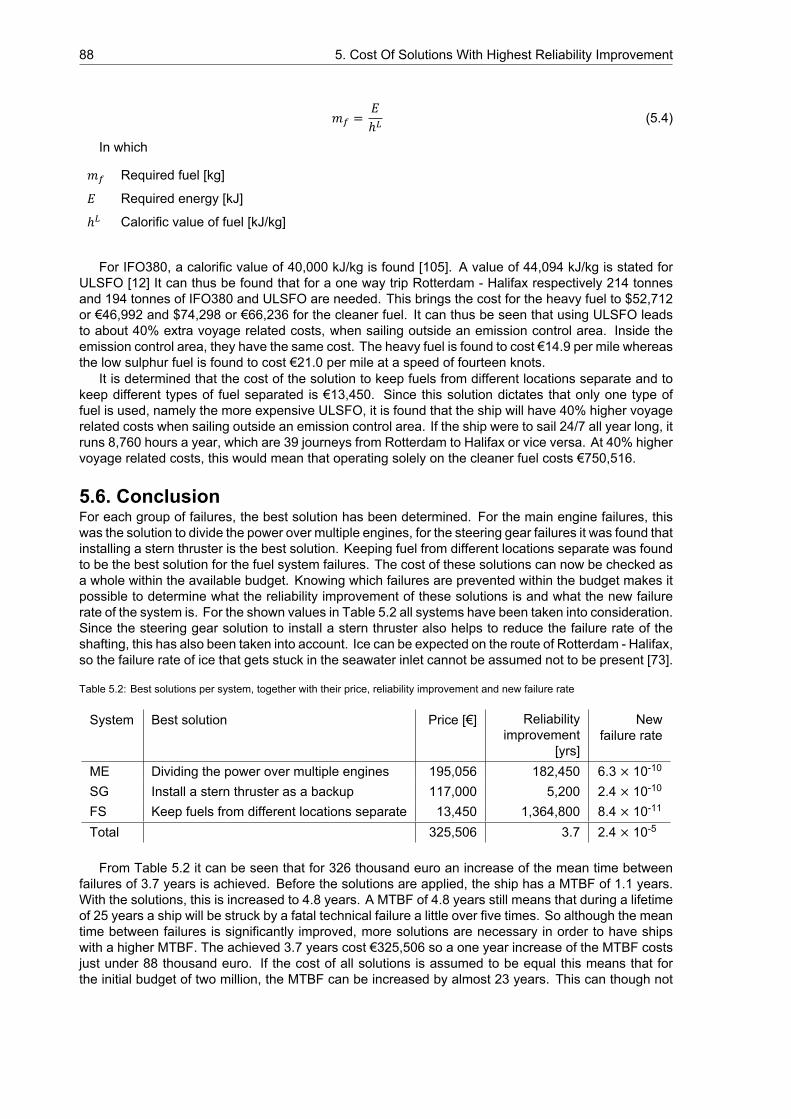
88 5. Cost Of Solutions With Highest Reliability Improvement
𝑚 = 𝐸ℎ (5.4)
In which
𝑚 Required fuel [kg]
𝐸 Required energy [kJ]
ℎ Calorific value of fuel [kJ/kg]
For IFO380, a calorific value of 40,000 kJ/kg is found [105]. A value of 44,094 kJ/kg is stated forULSFO [12] It can thus be found that for a one way trip Rotterdam - Halifax respectively 214 tonnesand 194 tonnes of IFO380 and ULSFO are needed. This brings the cost for the heavy fuel to $52,712or €46,992 and $74,298 or €66,236 for the cleaner fuel. It can thus be seen that using ULSFO leadsto about 40% extra voyage related costs, when sailing outside an emission control area. Inside theemission control area, they have the same cost. The heavy fuel is found to cost €14.9 per mile whereasthe low sulphur fuel is found to cost €21.0 per mile at a speed of fourteen knots.
It is determined that the cost of the solution to keep fuels from different locations separate and tokeep different types of fuel separated is €13,450. Since this solution dictates that only one type offuel is used, namely the more expensive ULSFO, it is found that the ship will have 40% higher voyagerelated costs when sailing outside an emission control area. If the ship were to sail 24/7 all year long, itruns 8,760 hours a year, which are 39 journeys from Rotterdam to Halifax or vice versa. At 40% highervoyage related costs, this would mean that operating solely on the cleaner fuel costs €750,516.
5.6. ConclusionFor each group of failures, the best solution has been determined. For the main engine failures, thiswas the solution to divide the power over multiple engines, for the steering gear failures it was found thatinstalling a stern thruster is the best solution. Keeping fuel from different locations separate was foundto be the best solution for the fuel system failures. The cost of these solutions can now be checked asa whole within the available budget. Knowing which failures are prevented within the budget makes itpossible to determine what the reliability improvement of these solutions is and what the new failurerate of the system is. For the shown values in Table 5.2 all systems have been taken into consideration.Since the steering gear solution to install a stern thruster also helps to reduce the failure rate of theshafting, this has also been taken into account. Ice can be expected on the route of Rotterdam - Halifax,so the failure rate of ice that gets stuck in the seawater inlet cannot be assumed not to be present [73].
Table 5.2: Best solutions per system, together with their price, reliability improvement and new failure rate
System Best solution Price [€] Reliabilityimprovement
[yrs]
Newfailure rate
ME Dividing the power over multiple engines 195,056 182,450 6.3 × 10⁻¹⁰
SG Install a stern thruster as a backup 117,000 5,200 2.4 × 10⁻¹⁰
FS Keep fuels from different locations separate 13,450 1,364,800 8.4 × 10⁻¹¹
Total 325,506 3.7 2.4 × 10⁻⁵
From Table 5.2 it can be seen that for 326 thousand euro an increase of the mean time betweenfailures of 3.7 years is achieved. Before the solutions are applied, the ship has a MTBF of 1.1 years.With the solutions, this is increased to 4.8 years. A MTBF of 4.8 years still means that during a lifetimeof 25 years a ship will be struck by a fatal technical failure a little over five times. So although the meantime between failures is significantly improved, more solutions are necessary in order to have shipswith a higher MTBF. The achieved 3.7 years cost €325,506 so a one year increase of the MTBF costsjust under 88 thousand euro. If the cost of all solutions is assumed to be equal this means that forthe initial budget of two million, the MTBF can be increased by almost 23 years. This can though not
5.6. Conclusion 89
be realized in reality since some money also has to go to the other equipment that is needed to makethe ship unmanned. It was also found that the price per MTBF for the different solutions was quitedifferent, varying from €0.01/yr to €22.5/yr. The calculation of 88 thousand euro per year of MTBFincrease though shows that with the available budget it is possible to create a ship that is much morereliable than is currently sailing the oceans.
The price of €325,506 is found to be only 16.3% of the budget of €2,000,000 so the price of thesolutions stays well within budget. If the price of the solutions was in reality found to be for instance twiceas high the costs are still well within budget. This shows that although there are a lot of assumptionsmade regarding the cost of the solutions, their price will always fall within budget. Even when the costof the solutions are five times as high in reality, the costs fall within budget. This shows that the bestsolutions can always be applied and depending on the cost of the other solutions, more solutions mightbe installed.

6Conclusion
It has been investigated whether it is possible to increase the reliability of ship machinery, since morereliable machinery is a step towards unmanned shipping. Solutions to machinery failures have beengenerated in order to answer the following research question ’What are the machinery related problemsregarding an unmanned engine room? How to solve these problems such that the reliability is equal orbetter compared to the manned engine room while being financially competitive at the same time?’. Inorder to answer this research question it has been investigated what type of machinery failures occurand how those should be solved such that the reliability of the machinery increases. Although it has toinvest in these solutions, the unmanned ship has to stay competitive with the manned ship.
It was found that the fatal technical failures occur to the main engine (38.7%), steering gear (20.9%),fuel system (11.1%), electrical system (8.9%) and cooling water system (8.4%). Failures also occurredto the shafting (6.7%), diesel generator (6.7%) and other systems (1.7%), but the failures in thesethree systems have not been taken into consideration since the five systems with the highest failuredistribution are responsible for nearly 90% of all failures. Solving these failures first therefore hasthe largest effect. The failures were recorded in German waters during six years and all lead to afatal technical error. When investigating the causes of the failures, it was found that human error andimproper maintenance were both named as the cause of a failure multiple times. Human error wasfound to be responsible for 18.7% of all failures and improper maintenance for 19.3% of all failures.
With the failures known, solutions could be developed. Three types of solutions were generated:maintenance, redundancy or an alternative. Since maintenance was found to be responsible for almost20% of all failures, performing better maintenance therefore might increase reliability. Adding redun-dancy ensures that the ship is still operational (although possibly with limited performance) such thatit can reach shore on its own. Alternative solutions were generated if those seemed to have a higherreliability. Combinations of solutions were also found as possibilities. All solutions that were found tohave a higher reliability than the initial solutions were determined to be a possible solution in order toincrease the reliability of the machinery.
Of the possible solutions, it has been determined what the reliability improvement is. In order to doso, the failure rate of the ship and the mean time between failures (MTBF) had to be determined. Itwas found that the failure rate of the ship is 1.0 × 10⁻⁵ and that it has a corresponding MTBF of 1.1years. With the failure rate known it could be determined what the reliability improvement of all solutionsis. Three groups of solutions were found as having the highest reliability improvement, namely mainengine solutions, steering gear solutions and fuel system solutions. It was found from the reliabilityimprovements of all solutions that only doing better maintenance has very little effect on the mean timebetween failures. The MTBF would only increase with half a year if better maintenance is performed.Combining two solutions in order to increase reliability is also not necessary. The redundancy solutionalready has significant impact for most solutions. Applying another measure upon the redundancymeasure is therefore not required.
In order to determine which of the solutions with the highest reliability has to be chosen it has tobe determined what they cost. Knowing what the cost of the solutions is helps to determine whetherapplying the solutions keeps the unmanned ship financially competitive to the manned ship. Fromprevious research it was found that €2,000,000 is available to install measures on an unmanned ship.
91
92 6. Conclusion
For the failures in the main engine it was found that dividing the power over two engines is the bestsolution, costing €195,000. Installing a stern thruster as a backup was found as the best solution tosolve the steering gear failures, at €117,000. The third best solution reliability wise is in the fuel system.Keeping fuels from different locations separate was found to cost €13,450. Only downside of this fuelsystem solution is that the voyage related costs increase with 40% when sailing outside an emissioncontrol area since only one type of fuel is used. For a year of continuous sailing, this would mean anadded cost of €750,516. The three solutions together increase the mean time between failure with 3.7years (from 1.1 years to 4.8 years). Their price of €325,506 stays well within the budget of two millioneuro. This shows that there is still enough money left to invest in other machinery solutions or to buyother required equipment.
It was found that it is possible to increase the reliability of the ship machinery, redundancy measuresare found to have most impact. For the five considered systems almost all failures can be preventedsince there is only a very small remaining failure rate. In order to increase the reliability of the shipfurther, solutions to the systems with the least failure distribution though also have to be developed.For the solutions with the largest reliability improvement it was found that the cost of their solutionswould keep the ship competitive with the manned ships when looking at the capital costs. Improvingthe reliability of the ship is therefore possible without interfering with the competitiveness of the ship.
6.1. RecommendationsFailure DataThis thesis is mostly based on the recorded machinery failures in German waters, of which the data ofsix years is known. For future work it is interesting to get more knowledge of the failures that occurred.Failures with unknown distribution are responsible for 46.8% of all failures. Since no exact numbersof these failures are known, it is difficult to determine the reliability improvement of their solutions.Sometimes it is not even known which failures are part of these groups. The failures with unknowndistribution might come from human error, but it can also be a large group of failures which has beenunrecognised. Having more detailed data, preferably from more years and more locations, will help tobetter identify which failure causes are the largest. The availability of maintenance reports for thesevessels might help to determine the age related causes of the failures.
It is also not known to what type of ships these failures occurred. Some ship types have beenexcluded from this research, but their failures might be beyond the recorded failures. Therefore, forfuture research, it is interesting to know to which ship types these failures occur . When it is also knownwhat the machinery configuration of these ships is, this will provide better insight in the failures. It mightbe the case that a four-stroke engine is much more reliable than a two-stroke engine, but this cannot betold from the available data. More details on the ship type, configuration of the machinery, machineryredundancy and specific cause of failure are necessary to come up with more accurate solutions andtherefore reliability calculations. Determining ship specific failures is also something that might beinteresting for future work. Only the ship types which all are roughly equal and have little machineryhave been included. Other ships such as gas tankers or Ro-Ro cargo ships can also sail unmanned inthe future, but in order to increase their reliability more has to be known about their specific failures.
Job Of CrewFor future work it is also interesting to know what the crew actually does on board the vessel and howoften they have to react to a possible cause of failure. Knowing what type of failures they prevent, orwhich failures they induce, will help to get a better insight in what the effect is of removing the crew.
Failure RateThe failure rate in this thesis is also based on the reports by the German Ship Safety Division. Ifmore accurate data is known of the failures, a more accurate failure rate can be determined. Knowingthe failures that occurred in redundant systems will help to improve the accuracy of the failure rate.When the reports do not help to increase the accuracy of the failure rate, other data to increase theaccuracy of the failure rate can be used. Failure rate databases such as the military handbook (MIL-HDBK), offshore & onshore reliability data (OREDA) or FIDES can be used to get a more accuratefailure rate and mean time between failures. When a more accurate failure rate of the ship machineryis determined, it might also be possible to have a second view at whether there are more reliable mainengines.
6.1. Recommendations 93
Required Level Of ReliabilityIn future work, it will also have to be determined what the required level of reliability is that one wouldwant to achieve for an unmanned ship. This way, it would be easier to check whether a determinedsolution is a possibility or not. If it can easier be told whether a solution meets the required reliability,this limits the amount of work that has to be done.
6.1.1. If A Fatal Technical Failure OccursAlthough precautions have been taken to increase machinery reliability, a fatal technical failure can stilloccur. If this is the case, this will have a large impact on the operation of the ship. Due to this failure,the ship will no longer be able to sail to port using its own machinery. In order to realize unmannedshipping it has to be determined what the impact of a fatal technical failure is and how a ship can beretrieved after a failure has occurred.
The impact of a technical failure differs from area to area. Ships sailing close to shore usually sailin highly trafficked areas. There, a failure can thus have more impact than it would have if the failureoccurred far offshore. The risk of an accident due to a fatal technical failure is much larger when close toshore than would be when far offshore. The rescue scenarios can therefore be put into two categories.The first category is a failure close to shore, the second one is a failure far offshore. The boundariesof an EEZ can for instance be chosen as the line between close to shore and far offshore. In all cases,the ship will have to send out a signal to notify surrounding ships of its new ’condition’. By notifying thenearby ships these can take extra care when passing the ship with failed machinery.
A Failure Close To ShoreWhen a failure occurs close to shore, the ship is likely to sail in a highly trafficked area. The risk ofan accident is therefore high. If a ship suddenly has a technical failure, the other ships in that areamight not have enough time to adapt to the new situation of this ship. Courses of ships intersect a lotin heavily trafficked area, so the chance of an accident is high. Especially a ship adrift in port wouldhave disastrous effects due to the geometry of the port and the presence of many ships. When a failureoccurs, the ship would have to drop anchor. Otherwise, it might run aground such that it becomes asalvage operation to rescue it. The location where the anchor is dropped is though not always an ideallocation, but since the failure has occurred, it cannot sail to a different location. Its only two options aretherefore to drop anchor or go adrift.
Since the ship is close to shore, the response time of a rescue team is small. When a failure hasoccurred, the ship can for instance be towed back to harbour, where the failure will be repaired. Anotheroption is to put a repair crew on board the failed ship, either by ship or by helicopter. This repair crewcan then fix the failure (if possible) and have the ship resume its business. Another option is to have aset of controls available on the ship for the repair crew. After they have fixed the failure, they can thensail the ship to shore. If a failure occurs close to shore, the impact of the failure can be large, but theship can easily be retrieved. Different types of failures may require separate repair strategies. Not allfailures may be possible to repair at sea.
A Failure Far OffshoreIf a failure strikes the machinery of the ship, the ship will not be able to finish its route. It will be left adriftin the middle of the ocean, subject to wind and current. Anchoring is not an option in this case due tothe depth of the water. Until help arrives, the ship will thus be subject to nature’s influences. Due tothe waves, the ship may start rolling, which might cause it to loose some cargo. The probability of anaccident in the middle of the ocean is smaller when compared to coastal waters. On the wide ocean,there is more room to change the route. If a ship was to fail, the other ships can simply sail past it at asafe distance.
Ships close to shore can potentially be rescued with the help of a helicopter. The range of an AirbusH225® helicopter for instance has a range of 613 nm [4]. Since the helicopter might have to fly backto shore, for instance because no helicopter pad is available on the ship or if the weather is too roughto drop crew on board, only half of this range is available. So if a ship is more than 300 nm offshore,it can no longer be rescued with a helicopter. If the machinery has failed far offshore, a helicopter istherefore not a rescue solution. In order to rescue the ship, a ship would have to sail to the unmannedship in order to perform a repair or to tow it to shore. This is an operation that requires a lot of time andwill therefore be expensive.
94 6. Conclusion
Another option might be for the ship to be towed by another cargo ship sailing almost the sameroute. One ship should then be able to connect to the other ship. This can for instance be done byshooting a line from one ship to another, which can then be connected. Naval vessels already usesystems to connect to one another when bunkering fuel at sea, so a small adaptation of this systemmay give it another application. This manned cargo ship that would sail in the direction of the failed shipcould also be used to take a repair crew to the ship. This manned ship will already sail this route, sothis solution is much cheaper than sending a vessel solely to rescue the unmanned ship. The impactof a failure of the machinery when far offshore can thus be said to be very small, but it is difficult toretrieve the ship. This can take days or maybe even weeks.
Bibliography[1] Annual report 2010, 2010. URL http://www.hamburg-port-authority.de/de/presse/
broschueren-und-publikationen/Documents/Annual_Report_2010.pdf.
[2] Aalbers, A. Evaluation of ship design options, Unknown year.
[3] ABB Marine. Abb expands azipod line to boost flexibility, reliability for moreshipping segments, 2015. URL http://www.abb.com/cawp/seitp202/fc1f73ef5b3338e2c1257e0d004db1d5.aspx.
[4] Airbus Helicopters. Civil range, 2016. URL http://www.airbushelicopters.com/website/docs_wsw/RUB_40/tile_2688/CIVILRange-02-2016.pdf.
[5] Allen, Timothy M. Us navy analysis of submarine maintenance data and the development ofage and reliability profiles. Department of the Navy SUBMEPP, 2001. URL http://www.plant-maintenance.com/articles/SubmarineMaintenanceDataRCM.pdf.
[6] American Bureau of Shipping. Notes on heavy fuel oil, 1984. URL https://www.eagle.org/eagleExternalPortalWEB/ShowProperty/BEA%20Repository/Rules&Guides/Current/31_HeavyFuelOil/Pub31_HeavyFuelOil.
[7] AXI International. The disadvantages of poor fuel quality.URL http://www.axi-international.com/resource-center/the-disadvantages-of-poor-fuel-quality/.
[8] Berk, Joseph. Systems Failure Analysis. ASM International, 2009. ISBN 978-1-61503-012-5. URL http://app.knovel.com/hotlink/toc/id:kpSFA00002/systems-failure-analysis/systems-failure-analysis.
[9] Bertram, Volker. Technologies for low-crew/no-crew ships. In Forum Captain Computer IV.Citeseer, 2002.
[10] BIMCO/ISF. Manpower 2010 update, 2010. URL https://www.bimco.org/News/2010/11/~/media/About/Press/2010/Manpower_Study_handout_2010.ashx.
[11] BIMCO/ISF. Manpower report, 2015. URL https://www.bimco.org/~/media/News/2016/Manpower_Report_2015_Executive_Summary_Final.ashx.
[12] Biomass Energy Data Book. Section: Appendix A, Lower and Higher Heating Values of Gas,Liquid and Solid Fuels. 2011. URL http://cta.ornl.gov/bedb/appendix_a/Lower_and_Higher_Heating_Values_of_Gas_Liquid_and_Solid_Fuels.pdf.
[13] Brandt, Henning. A fast moving supply chain is more im-portant than ever. URL http://impasingapore.com/news/a-fast-moving-supply-chain-is-more-important-than-ever/.
[14] Bundesamt für seeschiffahrt und hydrographie. North sea: Continental shelf/exclusive economiczone (eez), 2006. URL http://www.bsh.de/en/Marine_uses/Industry/CONTIS_maps/NorthSeaGermanContinentalShelfExclusiveEconomicZone.pdf.
[15] Bundesamt für seeschiffahrt und hydrographie. Baltic sea: Continental shelf/exclusive economiczone (eez), 2010. URL http://www.bsh.de/en/Marine_uses/Industry/CONTIS_maps/BalticSeaGermanContinentalShelfExclusiveEconomicZone.pdf.
[16] BusinessDictionary. Reliability - definitions. URL http://www.businessdictionary.com/definition/reliability.html. (Accessed on 03/22/2016).
95
96 Bibliography
[17] Butt, Nickie and Johnson, David and Pike, Kate and Pryce-Roberts, Nicola and Vigar, Natalie.15 years of shipping accidents: A review for wwf, 2012. URL http://awsassets.panda.org/downloads/15_years_of_shipping_accidents_a_review_for_wwf_.pdf.
[18] Cahoon, Dr. Stephen and Haugstetter, Hillary. Shipping, shortages and generation y.In Proceedings of the Maritime Technology and Training conference (MarTech), 2008.URL http://www.he-alert.org/filemanager/root/site_assets/standalone_article_pdfs_0605-/he00760.pdf.
[19] Carlton, J and Aldwinkle, J and Anderson, J and others. Future ship powering op-tions: exploring alternative methods of ship propulsion. London: Royal Academyof Engineering, 2013. URL http://www.raeng.org.uk/publications/reports/future-ship-powering-options.
[20] Carlton, John S. Marine Propellers and Propulsion. Butterworth-Heinemann, second edi-tion, 2007. ISBN 978-07506-8150-6. URL https://app.knovel.com/web/toc.v/cid:kpMPPE0011/viewerType:toc/root_slug:marine-propellers-and.
[21] CHIRP. Marine operating & maintenance manuals - are they good enough? URLhttps://www.chirp.co.uk/upload/docs/Maritime%20Publications/Marine%20Ops%20and%20Mnce%20Manual_%20Good%20enough.pdf.
[22] Chryssakis, Christos and Brinks, Hendrik and King, Tobias. The fuel trilemma: Next genera-tion of marine fuels. 2015. URL https://www.dnvgl.com/Images/DNV%20GL_Position%20Paper%20on%20Fuel%20Trilemma_tcm8-25973.PDF.
[23] Cobb, J. Tesla pproject battery costs could drop to $100/kwh by 2020, 2015. URL http://www.hybridcars.com/tesla-projects-battery-costs-could-drop-to-100kwh-by-2020/.
[24] Costex. How do i know when to replace the cylinder liner? URL http://www.costex.com/Library/articles/IT03.pdf.
[25] Delft University of Technology. Project MTP103 Machine Installatie A. 2009.
[26] Dhillon, Balbir S. Design reliability: fundamentals and applications. CRC press, 1999.ISBN 978-0-8493-1465-0. URL http://www.crcnetbase.com.tudelft.idm.oclc.org/isbn/978-1-4200-5014-1.
[27] Dhillon, Balbir S. Human reliability and error in transportation systems. Springer Science & Busi-ness Media, 2007. ISBN 978-1-84628-811-1. URL http://link.springer.com.tudelft.idm.oclc.org/book/10.1007%2F978-1-84628-812-8.
[28] Dienststelle Schiffssicherheit der BG Verkehr. Jahresbericht 2002, 2002.
[29] Dienststelle Schiffssicherheit der BG Verkehr. Jahresbericht 2004, 2004.
[30] Dienststelle Schiffssicherheit der BG Verkehr. Jahresbericht 2011, 2011. URL http://www.deutsche-flagge.de/de/download/deutsche-flagge/flaggenstaat/bg-verkehr/jahresbericht-2011-dienststelle-schiffssicherheit.
[31] DNV GL. Alternative fuels for shipping. DNV GL Strategic Research & Innovation,2014. URL http://www.billionmilessg.com/sites/billionmilessg.com/files/PositionPaper_AltFuels_280214_tcm4-592866_0.pdf.
[32] DNV GL. In focus - the future is hybrid, 2015. URL https://issuu.com/dnvgl/docs/in_focus-the_future_is_hybrid.
[33] DNV GL. Revolt report, February 2015. URL https://www.dnvgl.com/Images/ReVolt_%20main%20report_tcm8-42046.pdf.
[34] El Ashmamy, M.E. The maritime industry and the human element phenomenon.pages 277–288. URL http://iamu-edu.org/wp-content/uploads/2014/07/The-Maritime-Industry-and-the-Human-Element-Phenomenon.pdf.
Bibliography 97
[35] Equasis. The world merchant fleet in 2014, 2014. URL http://www.emsa.europa.eu/emsa-documents/latest/download/3640/472/23.html.
[36] Finkelstein, Maxim. Failure rate modelling for reliability and risk. Springer Science & BusinessMedia, 2008. ISBN 978-1-84800-986-8. URL http://link.springer.com.tudelft.idm.oclc.org/book/10.1007%2F978-1-84800-986-8.
[37] FlowKooler. Common water pump failures & their causes. URL https://www.flowkoolerwaterpumps.com/info/common_waterpump_failures.html.
[38] Frijters, T. Ships of the future - design and operation of unmanned ships. Master’s thesis, 2016.
[39] Frozee, J. Cylinder cover cracking in main engine - marine engineering, 2015. URL http://marineengineeringonline.com/cylinder-cover-cracking-in-main-engine/.
[40] Frozee, J. Steering gear systems on ships - marine engineering, October 2015. URL http://marineengineeringonline.com/steering-gear-systems-on-ships/.
[41] Gard AS. Fuel handling and treatment on board. May 2012. URL http://www.gard.no/Content/20723653/Circular%2005-12%20Fuel%20handling%20and%20treatment%20on%20board.pdf.
[42] Gard AS. Bunkers and bunkering, 2014. URL http://www.gard.no/Content/72669/Bunkers%20and%20bunkering%20January%202014.pdf.
[43] Gossett, T. North american eca will change shipping forever,May 2012. URL http://www.amnautical.com/blogs/news/5833134-north-american-eca-will-change-shipping-forever#.VwevNPmLRD8.
[44] Hafen Hamburg Marketing E.V. Port of hamburg: Welcome to the official website of germany’sbiggest seaport, 2016. URL https://www.hafen-hamburg.de/.
[45] Hekkenberg, Robertus Gerardus. Inland ships for efficient transport chains. TU Delft, DelftUniversity of Technology, 2012. ISBN 978-94-6186-099-6.
[46] Hobart, J.W. Understanding generation y - what you need to know about the millenials. Prince-tonOneWhite Paper, 2008. URL http://www.princetonone.com/news/PrincetonOne%20White%20Paper2.pdf.
[47] International Maritime Organization. Sulpur oxides (sox) - regulation 14, . URL http://www.imo.org/en/OurWork/Environment/PollutionPrevention/AirPollution/Pages/Sulphur-oxides-(SOx)-%E2%80%93-Regulation-14.aspx.
[48] International Maritime Organization. Nitrogen oxides (nox) - regulation 13, . URL http://www.imo.org/en/OurWork/Environment/PollutionPrevention/AirPollution/Pages/Nitrogen-oxides-(NOx)-%E2%80%93-Regulation-13.aspx.
[49] International Maritime Organization. International convention forthe prevention of pollution from ships (marpol), . URL http://www.imo.org/en/About/Conventions/ListOfConventions/Pages/International-Convention-for-the-Prevention-of-Pollution-from-Ships-(MARPOL).aspx.
[50] International Maritime Organization. SOLAS Regulation II-1/42 and II-1/43, 2005. URL http://imo.udhb.gov.tr/dosyam/EKLER/SOLAS__BOLUM_II_1_EK(21).pdf.
[51] Ireson, William Grant and Coombs, Clyde F. and Moss, Richard Y. Handbook of reliability engi-neering and management. McGraw-Hill Professional, 1996.
[52] Ito, Makoto and Hiraoka, Kazuyoshi. and Matsumoto, Shoichi. and Tsumira, Kenji. Developmentof high efficiency marine propulsion plant (ultra steam turbine). 2007. URL https://www.mhi.co.jp/technology/review/pdf/e443/e443015.pdf.
98 Bibliography
[53] Klein Woud, Prof.ir. J. Maritieme Werktuigkunde IV. 1999.
[54] Klumper, H.J., Koning, Ing. G.Th. Themastudie naar roeruitval op binnenschepen, 2004. URLhttp://informatie.binnenvaart.nl/documenten/doc_view/10-roeruitval.
[55] Knutsen, K.E., Manno, G. and Vartdal, B.J. Beyond condition monitoring in the maritime industry.Technical report, DNV GL Strategic Research & Innovation, July 2014. URL https://issuu.com/dnvgl/docs/dnv_gl_pospaper__6-2014_beyond_cond.
[56] Lamb, Thomas and others. Ship design and construction, volume 2. Society ofNaval Architects and Marine Engineers Jersey City, NJ, 2004. ISBN 0-939773-40-6. URL https://app.knovel.com/web/toc.v/cid:kpSDCV0001/viewerType:toc/root_slug:ship-design-and.
[57] Lucas, Martijn and Van Zon, Martijn. A guide towards remotely operated engine rooms.Technical report, Rotterdam Mainport University of Applied Sciences (RMU) and Imtech Ma-rine, 2012. URL http://www.maritimesymposium-rotterdam.nl/uploads/Route/Remote-controlled%20engine%20rooms.pdf.
[58] Machinery Spaces.com. Cooling of ships engine - how it works , requirement of fresh water &sea water cooling system. URL http://www.machineryspaces.com/cooling.html.
[59] MAN. Diesel-electric propulsion plants. URL https://marine.man.eu/docs/librariesprovider6/marine-broschures/diesel-electric-drives-guideline.pdf?sfvrsn=0.
[60] MAN Diesel & Turbo. Emission project guide - man b&w two-stroke marine en-gines, 2015. URL https://marine.man.eu/applications/projectguides/2stroke/content/special_pg/7020-0145_uk.pdf.
[61] Miller, Thomas. Risk focus: Loss of power. URL http://www.ukpandi.com/fileadmin/uploads/uk-pi/Documents/Brochures/Risk%20Focus%20-%20Loss%20of%20Power.pdf.
[62] Moore Stephens. Ship operating costs: Current and future trends, 2014.URL http://greece.moorestephens.com/SE/Document.aspx?ID=B43A0EA423CC0B2C928B4404C14954D1.
[63] MUNIN. Research in maritime autonomous systems project results and technology poten-tials. URL http://www.unmanned-ship.org/munin/wp-content/uploads/2016/02/MUNIN-final-brochure.pdf.
[64] MUNIN. D6.2: Specification concept of the general technical system redesign, July 2013.URL http://www.unmanned-ship.org/munin/wp-content/uploads/2013/11/MUNIN-D-6-2-General-technical-system-redesign-concept-HSW-Final1.pdf.
[65] MUNIN. D6.7: Maintenance indicators andmaintenancemanagement principles for autonomousengine room, 2014.
[66] MUNIN. D8.7: Final report: Autonomous engine room, August 2015. URLhttp://www.unmanned-ship.org/munin/wp-content/uploads/2015/09/MUNIN-D8-7-Final-Report-Autonomous-Engine-Room-MSoft-final.pdf.
[67] Murdoch MSc, Eric. A master’s guide to ships’ piping, 2012. URL http://www.standard-club.com/media/24158/AMastersGuidetoShipsPiping2ndedition.pdf.
[68] NACE International. Pipeline corrosion. URL https://www.nace.org/uploadedFiles/Corrosion_Central/Pipeline%20Corrosion.pdf.
[69] Norman, Justin. A vision of the intelligent ship. Technical report, Rolls-Royce, 2015.
Bibliography 99
[70] Nowlan, F Stanley. and Heap, Howard F. Reliability-centered maintenance. Technical report,DTIC Document, December 1978.
[71] Office of Naval Research. The future is now: Navy’s autonomous swarmswarm can overwhelmadversaries, 2014. URL http://www.onr.navy.mil/Media-Center/Press-Releases/2014/autonomous-swarm-boat-unmanned-caracas.aspx.
[72] Parker Hannifin Corporation. The phenomena of air separation in diesel fuel. URL http://www.parker.com/literature/Racor/Mobile_Air_Separation_In_Diesel_Fuel.pdf.
[73] Parkinson, Claire L and Cavalieri, Donald J and Gloersen, Per and Zwally, H Jay and Comiso,Josefino C. Arctic sea ice extents, areas, and trends, 1978–1996. 104(C9):20837–20856,1999. doi: 10.1029/1999JC900082. URL http://onlinelibrary.wiley.com/doi/10.1029/1999JC900082/full.
[74] Pascoe, David. Tips on electrical system use and maintenance, 1998. URL http://www.yachtsurvey.com/ElectricalSystems.htm.
[75] Pennie, D.J. and Brook-Carter, N. and Gibson, W.H. Human factors guidance formaintenance. In Human Factors in Ship Design, Safety and Operation Interna-tional Conference, Royal Institution of Naval Architects, London, March, 2007. URLhttp://www.he-alert.org/filemanager/root/site_assets/standalone_article_pdfs_0605-/HE00630.pdf.
[76] Post, Dr. W.M. and Langefeld, J.J. Safety consequences onboard shortsea ships due to anew way of working. Technical report, TNO Behavioural and Societal Sciences, March 2011.URL http://www.nvkk.nl/files/3713/6223/9634/Artikel20110708_TNO_Final_Report_Shore_Support.pdf.
[77] Princeton. Part two: Marine uses of fuel cells. URL https://www.princeton.edu/~ota/disk2/1986/8612/861205.PDF.
[78] Quinn, P.T. and Scott, S.M. The Human Element in Shipping Casualties. London: HMSO, 1991.ISBN 0 11 551004 4.
[79] Raghuwanshi, Naresh K. and Pandey, Ajay. and Mandloi, R.K. Failure analysis of internal com-bustion engine valves: a review. International Journal of Innovative Research in Science, En-gineering and Technology, 1(2):173–181, 2012. URL http://www.ijirset.com/upload/december/7-Failure%20Analysis%20of%20Internal.pdf.
[80] RH Marine. Ship automation, 2016. URL https://www.rhmarine.com/product-lines/ship-automation/.
[81] Rojgaard, Charlotte. Changing between hfo and mgo brings operational challenges. TheVoice of Asian Shipping, page 10, February 2012. URL http://www.swedishclub.com/upload/Loss%20Prevention1050/Seatrade%20Asia%20Week_Feb2012_Changing%20between%20HFO%20and%20MGO%20brings%20operational%20challenges.pdf.
[82] Rolls-Royce. Rolls-royce to lead autonomous ship research project, July 2015.URL http://www.rolls-royce.com/media/press-releases/yr-2015/pr-02-07-15-rolls-royce-to-lead-autonomous-ship-research-project.aspx.
[83] Rolls-Royce Marine. Propulsion. 2014. URL http://www.rolls-royce.com/~/media/Files/R/Rolls-Royce/documents/customers/marine/propulsion-brochure.pdf.
[84] Royal Wagenborg. Medemborg. URL https://www.wagenborg.com/nl/ons-materieel/vlootlijst/medemborg.
100 Bibliography
[85] Scharff, Rob. Procurement strategy for spare parts and services ”the continu-ous story”, 2013. URL http://readmt.com/analysis/article/2013/07/01/procurement-strategy-for-spare-parts-and-services-the-continuous-story/.
[86] Schönknecht, Rolf and Bertholdt, Jochen. Ships and shipping of tomorrow. Cornell MaritimePr/Tidewater Pub, 1983. Translation of the book Schiffe und Shiffahrt vonMorge by Schönknecht,Rolf.,1973.
[87] Sea Machines. Home, 2015. URL http://sea-machines.com/.
[88] Ship&Bunker. Rotterdam bunker prices - ifo380, 2016. URL http://shipandbunker.com/prices/emea/nwe/nl-rtm-rotterdam#IFO380.
[89] Ship&Bunker. Rotterdam bunker prices - ulsfo, 2016. URL http://shipandbunker.com/prices/emea/nwe/nl-rtm-rotterdam#ULSFO.
[90] Stapersma, Douwe and Woud, Hans Klein and Institute of Marine Engineering, Science andTechnology (United Kingdom). Design of Propulsion and Electric Power Generation Systems.London (United Kingdom): IMarEST, 2008. ISBN 1-902536-47-9.
[91] StenaLine. Methanol project van stena line twee keer in ÉÉn week bekroond, 2016. URL http://www.stenaline.nl/persberichten/methanol-project-bekroond.
[92] The State of California. Preventing loss of propulsion after fuel switch to low sulphur distillate fueloil. URL https://nrm.dfg.ca.gov/filehandler.ashx?documentversionid=75544.
[93] The Washington State Department of Ecology. Steering gear failures. URL http://www.nautinst.org/en/forums/mars/search-all-mars-reports.cfm/steeringgear.
[94] Transport Canada. Winter navigation on the river and gulf of st. lawrence, 2011.URL http://www.bape.gouv.qc.ca/sections/mandats/installation_gaz_naturel-becancour/documents/DQ2.1.2(anglais).pdf.
[95] United Nations Conference on Trade and Development. Chapter 1: Development in internationalseaborne trade, review of maritime transport 2015, 2015. URL http://unctad.org/en/PublicationsLibrary/rmt2015_en.pdf.
[96] Van den Berg, Frans. Trends and challenges in fuel-oil quality. URL http://www.shell.com/content/dam/shell/static/marine-products/downloads/pdf/news-and-library/conference-papers/hart-rfo.pdf.
[97] Van der Burg, P. and Engelsman, A. and Geerling, E. et al. Ship Finance - Lecture Notes for theCourse MT724. 2014.
[98] Vesely, Bill. Fault tree analysis (fta): Concepts and applications. URL https://www.hq.nasa.gov/office/codeq/risk/docs/ftacourse.pdf.
[99] Vignesh, Guru. Operating faults in turbochargers, May 2011. URLhttp://www.brighthubengineering.com/marine-engines-machinery/72117-operating-faults-in-turbochargers/.
[100] Wagenaar, Willem A and Groeneweg, Jop. Accidents at sea: Multiple causes and impossibleconsequences. International Journal of Man-Machine Studies, 27(5):587–598, 1987.
[101] Wärtsilä. Wärtsilä dynamic maintenance planning (dmp) and condition based mainte-nance (cbm). URL http://www.wartsila.com/static/studio/assets/content/ss1/cbm-presentation.pdf.
[102] Wärtsilä. High quality spare parts for reliable operations. 2014. URL http://www.wartsila.com/docs/default-source/services-documents/White-papers/wartsila-bwp-oem-spare-parts.pdf?sfvrsn=6.
Bibliography 101
[103] Wärtsilä. Wärtsilä Steerable Thruster Rectractable Underwater Mountable. 2015.URL http://cdn.wartsila.com/docs/default-source/product-files/gears-propulsors/thrusters/leaflet-o-p-thruster-wst-ru.pdf?sfvrsn=4.
[104] Watson, David G.M. Practical Ship Design, volume 1 of Elsevier ocean engineering book series.Elsevier, 1998. URL http://www.engineeringvillage.com/controller/servlet/OpenURL?genre=book&isbn=0080429998.
[105] Wild, Dr.-Ing. Yves. Determination of energy cost of electrical energy on board sea-going vessels.2005. URL http://www.effship.com/PartnerArea/MiscPresentations/Dr_Wild_Report.pdf.
[106] Wisselkoers.nl. Populaire wisselkoersen, 2016. URL http://www.wisselkoers.nl/.
[107] Woodyard, Doug. Pounder’s marine diesel engines and gas turbines. Butterworth-Heinemann,2009. ISBN 978-0-7506-8984-7.

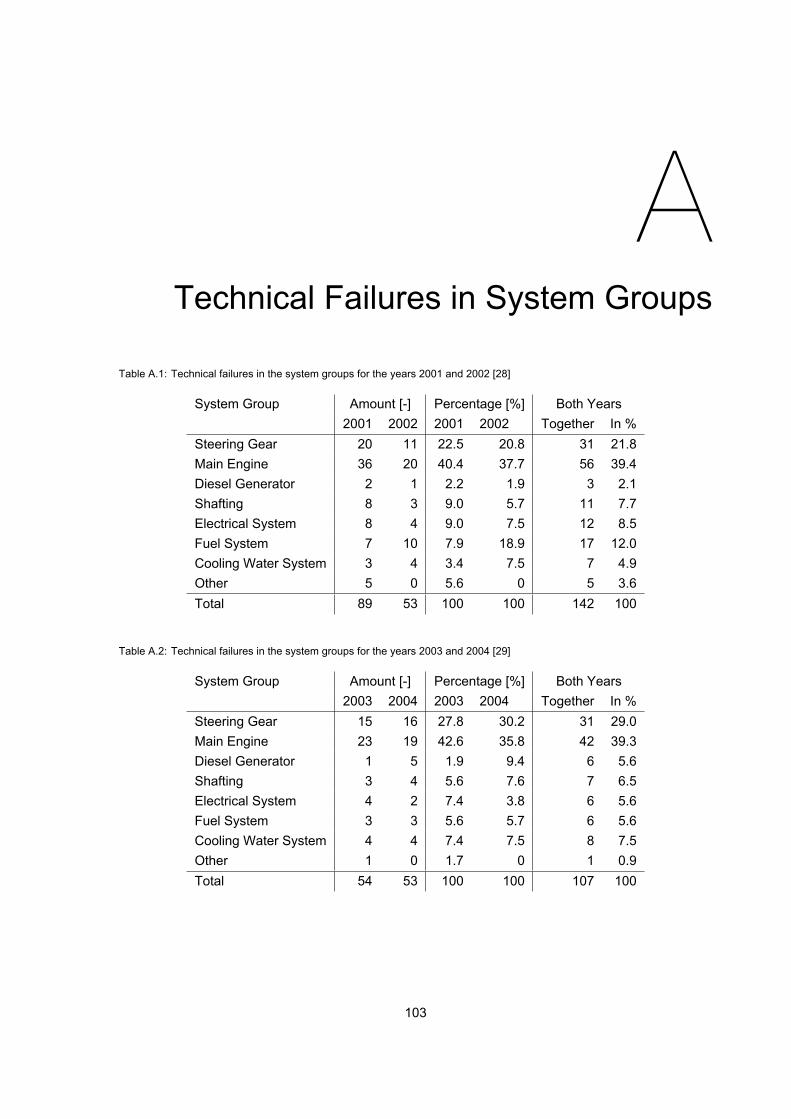
ATechnical Failures in System Groups
Table A.1: Technical failures in the system groups for the years 2001 and 2002 [28]
System Group Amount [-] Percentage [%] Both Years2001 2002 2001 2002 Together In %
Steering Gear 20 11 22.5 20.8 31 21.8Main Engine 36 20 40.4 37.7 56 39.4Diesel Generator 2 1 2.2 1.9 3 2.1Shafting 8 3 9.0 5.7 11 7.7Electrical System 8 4 9.0 7.5 12 8.5Fuel System 7 10 7.9 18.9 17 12.0Cooling Water System 3 4 3.4 7.5 7 4.9Other 5 0 5.6 0 5 3.6Total 89 53 100 100 142 100
Table A.2: Technical failures in the system groups for the years 2003 and 2004 [29]
System Group Amount [-] Percentage [%] Both Years2003 2004 2003 2004 Together In %
Steering Gear 15 16 27.8 30.2 31 29.0Main Engine 23 19 42.6 35.8 42 39.3Diesel Generator 1 5 1.9 9.4 6 5.6Shafting 3 4 5.6 7.6 7 6.5Electrical System 4 2 7.4 3.8 6 5.6Fuel System 3 3 5.6 5.7 6 5.6Cooling Water System 4 4 7.4 7.5 8 7.5Other 1 0 1.7 0 1 0.9Total 54 53 100 100 107 100
103
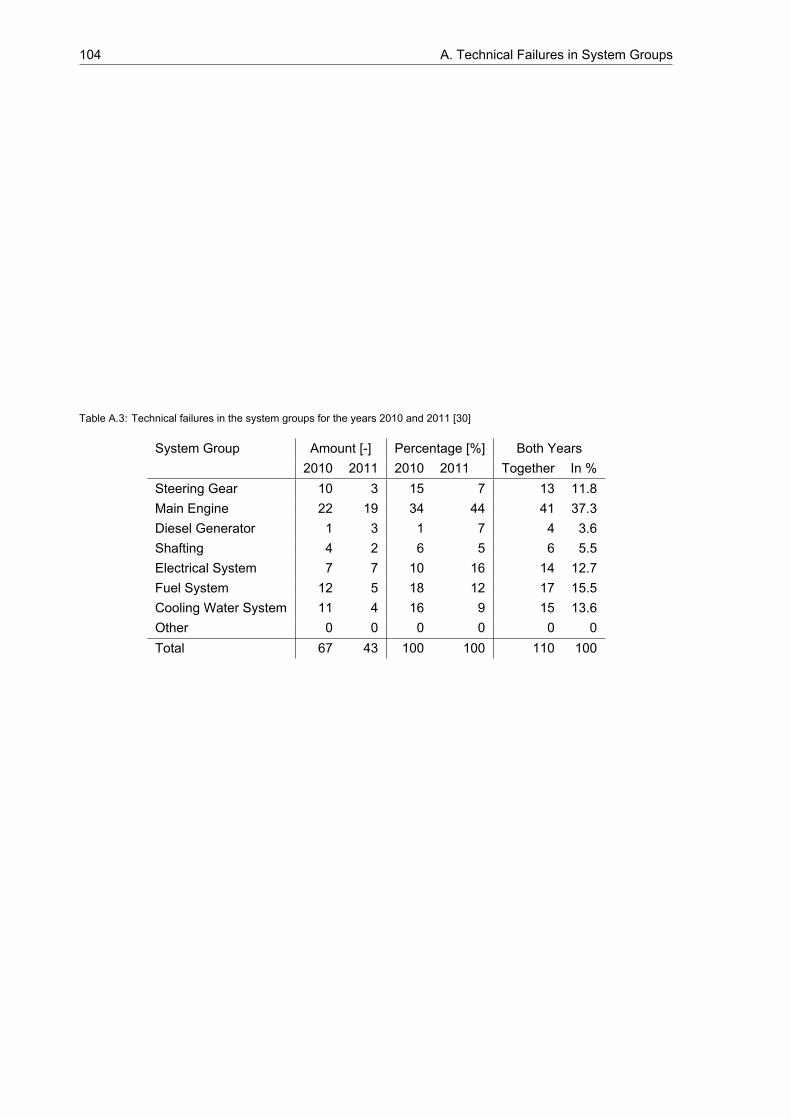
104 A. Technical Failures in System Groups
Table A.3: Technical failures in the system groups for the years 2010 and 2011 [30]
System Group Amount [-] Percentage [%] Both Years2010 2011 2010 2011 Together In %
Steering Gear 10 3 15 7 13 11.8Main Engine 22 19 34 44 41 37.3Diesel Generator 1 3 1 7 4 3.6Shafting 4 2 6 5 6 5.5Electrical System 7 7 10 16 14 12.7Fuel System 12 5 18 12 17 15.5Cooling Water System 11 4 16 9 15 13.6Other 0 0 0 0 0 0Total 67 43 100 100 110 100

BComplete Initial Fault Tree
105
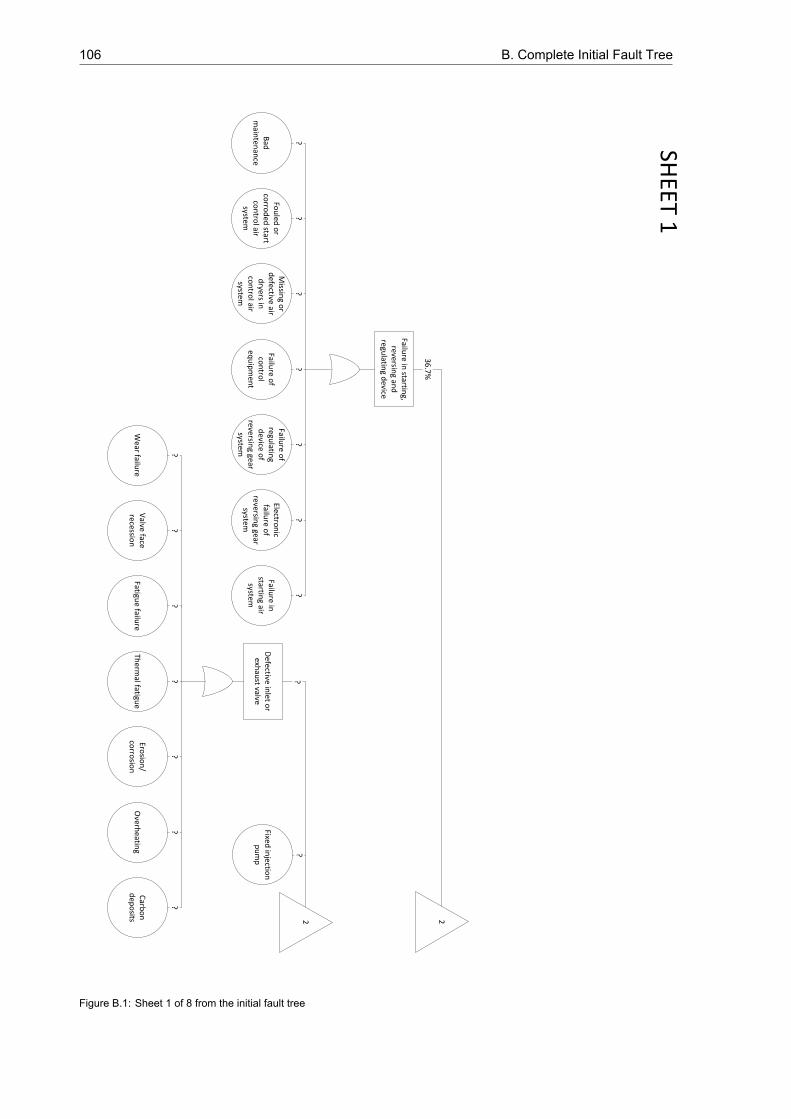
106 B. Complete Initial Fault Tree
Failure in
starting,
reversing an
d
regulatin
g device
Bad
m
ainten
ance
Fou
led o
r co
rrod
ed start
con
trol air
system
Missin
g or
defective air d
ryers in
con
trol air
system
Failure o
f co
ntro
l eq
uip
men
t
Failure o
f regu
lating
device o
f reversin
g gear system
Electron
ic failu
re of
reversing gear
system
Failure in
startin
g air system
Defective in
let or
exhau
st valve
Valve face
recession
Therm
al fatigue
Erosio
n/
corro
sion
Fatigue failu
reW
ear failure
Overh
eating
Carb
on
d
epo
sits
Fixed in
jection
p
um
p
22
SHEET 1
36
.7%
??
??
??
??
?
??
??
??
?
Figure B.1: Sheet 1 of 8 from the initial fault tree
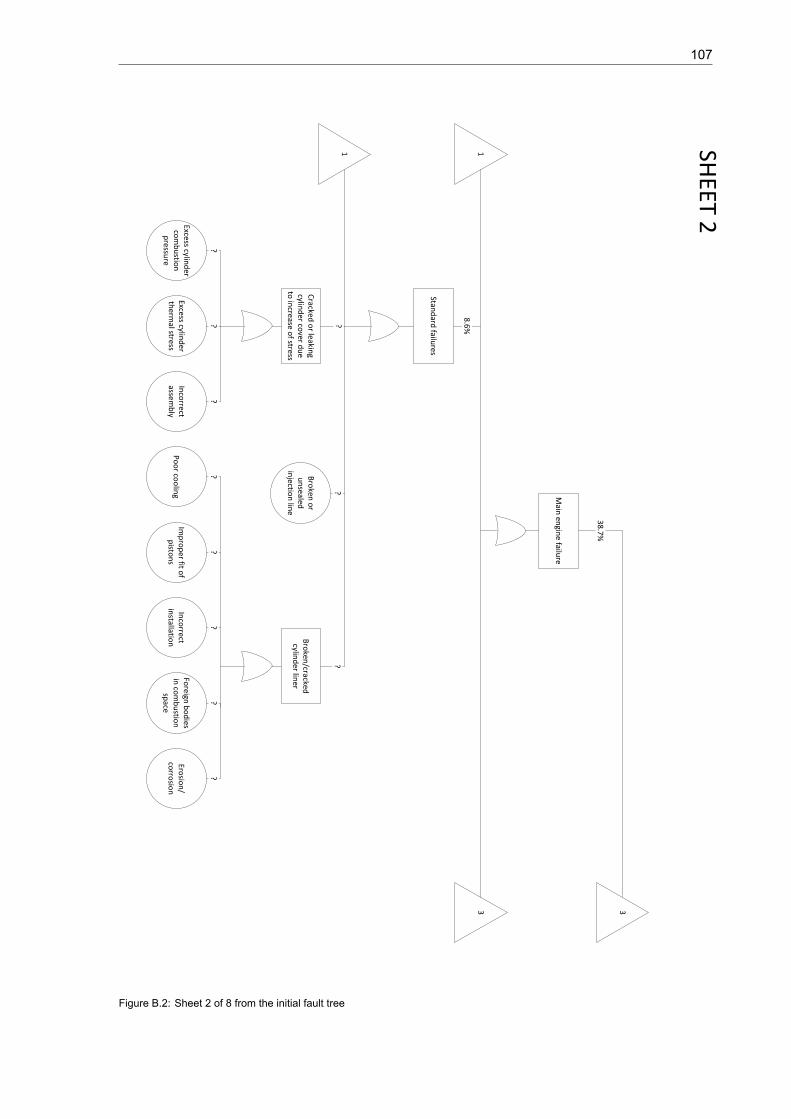
107
Main
engin
e failure
Stand
ard failu
res
Cracked
or leakin
g cylin
der co
ver du
e to
increase o
f stress
Excess cylind
er th
ermal stress
Inco
rrect assem
bly
Excess cylind
er co
mb
ustio
n
pressu
re
Bro
ken/cracked
cylin
der lin
er
Imp
rop
er fit of
pisto
ns
Foreign
bo
dies
in co
mb
ustio
n
space
Erosio
n/
corro
sion
Inco
rrect in
stallation
Po
or co
olin
g
Bro
ken o
r u
nsealed
in
jection
line
11
33
SHEET 2
38
.7%
8.6
%??
?
??
??
??
??
Figure B.2: Sheet 2 of 8 from the initial fault tree
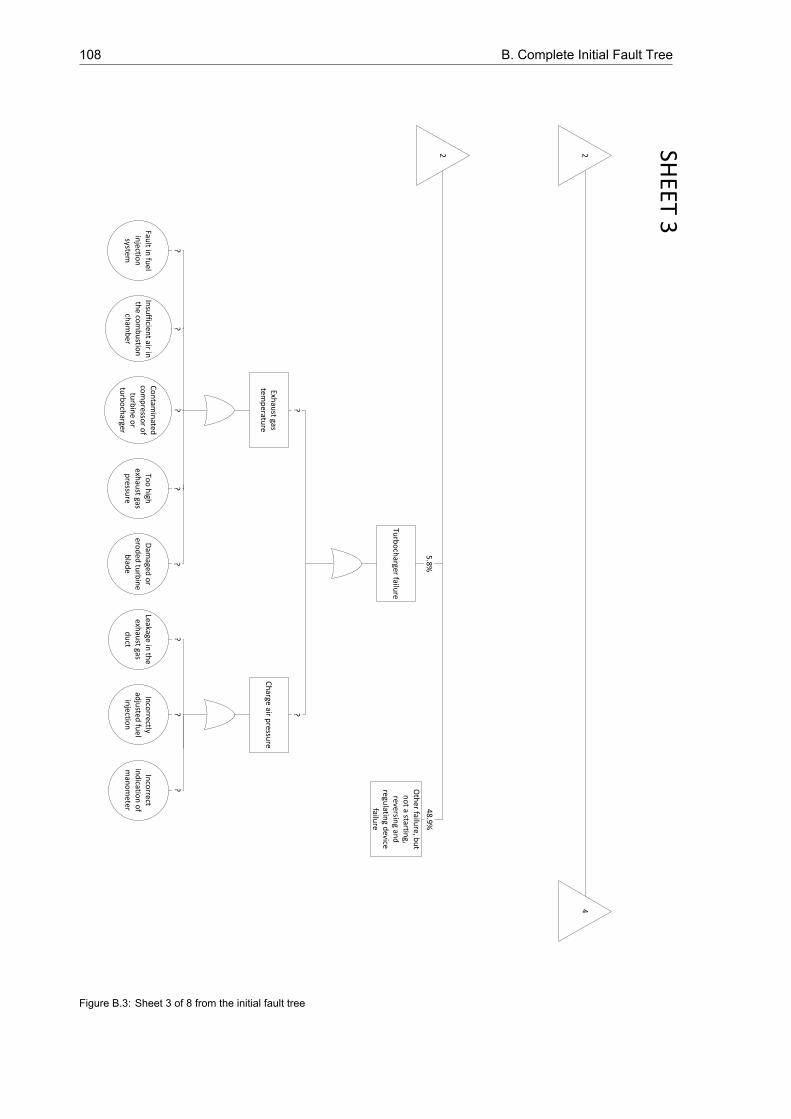
108 B. Complete Initial Fault Tree
Turb
och
arger failure
Exhau
st gas tem
peratu
re
Fault in
fuel
injectio
n
system
Co
ntam
inated
co
mp
ressor o
f tu
rbin
e or
turb
och
arger
Too
high
exh
aust gas
pressu
re
Insu
fficient air in
th
e com
bu
stion
ch
amb
er
Dam
aged o
r ero
ded
turb
ine
blad
e
Ch
arge air pressu
re
Leakage in th
e exh
aust gas
du
ct
Inco
rrect in
dicatio
n o
f m
ano
meter
Inco
rrectly ad
justed
fuel
injectio
n
2 24
SHEET 3
5.8
%
Oth
er failure, b
ut
no
t a starting,
reversing an
d
regulatin
g device
failure
48
.9%
??
??
??
??
??
Figure B.3: Sheet 3 of 8 from the initial fault tree
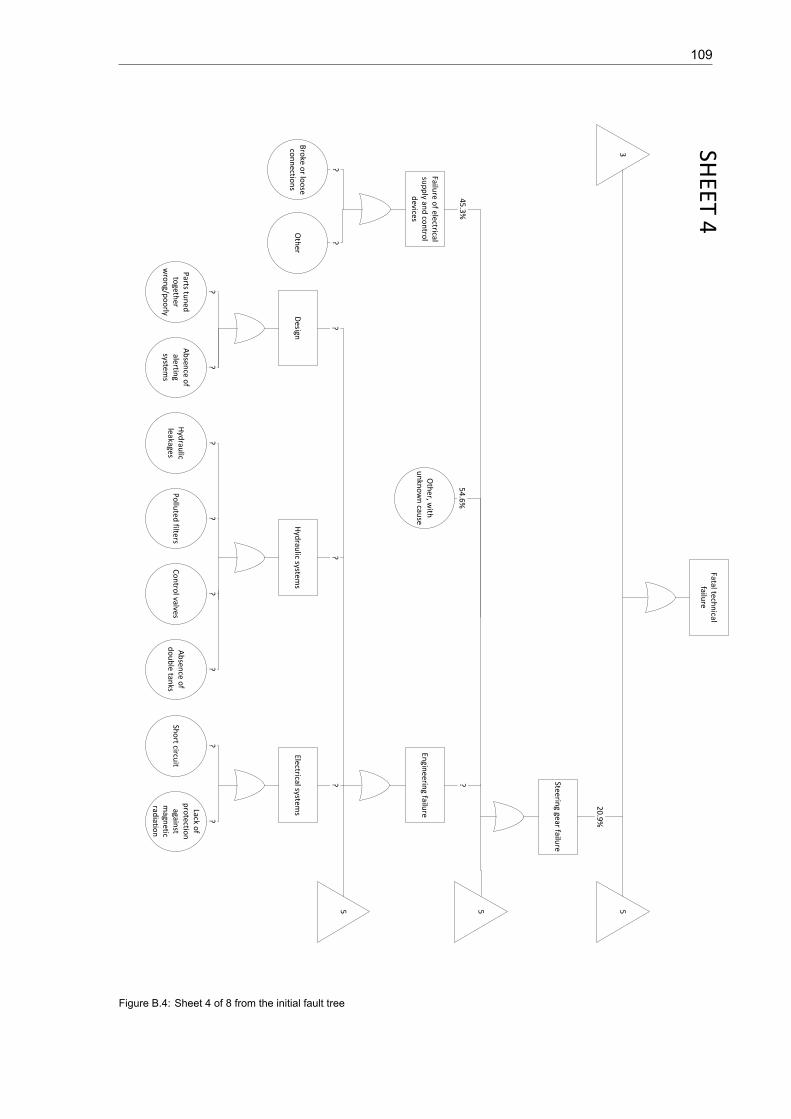
109
Steering gear failu
re
Failure o
f electrical su
pp
ly and
con
trol
devices
Bro
ke or lo
ose
con
nectio
ns
Oth
er
Oth
er, with
u
nkn
ow
n cau
seEn
gineerin
g failure
Design
Parts tu
ned
to
gether
wro
ng/p
oo
rly
Ab
sence o
f alertin
g system
s
Hyd
raulic system
s
Hyd
raulic
leakagesP
ollu
ted filters
Co
ntro
l valvesA
bsen
ce of
do
ub
le tanks
Electrical systems
Sho
rt circuit
Lack of
pro
tection
again
st m
agnetic
radiatio
n
Fatal techn
ical failu
re
20
.9%
3555
SHEET 4
45
.3%
54
.6%
?
??
??
?
??
??
??
??
Figure B.4: Sheet 4 of 8 from the initial fault tree
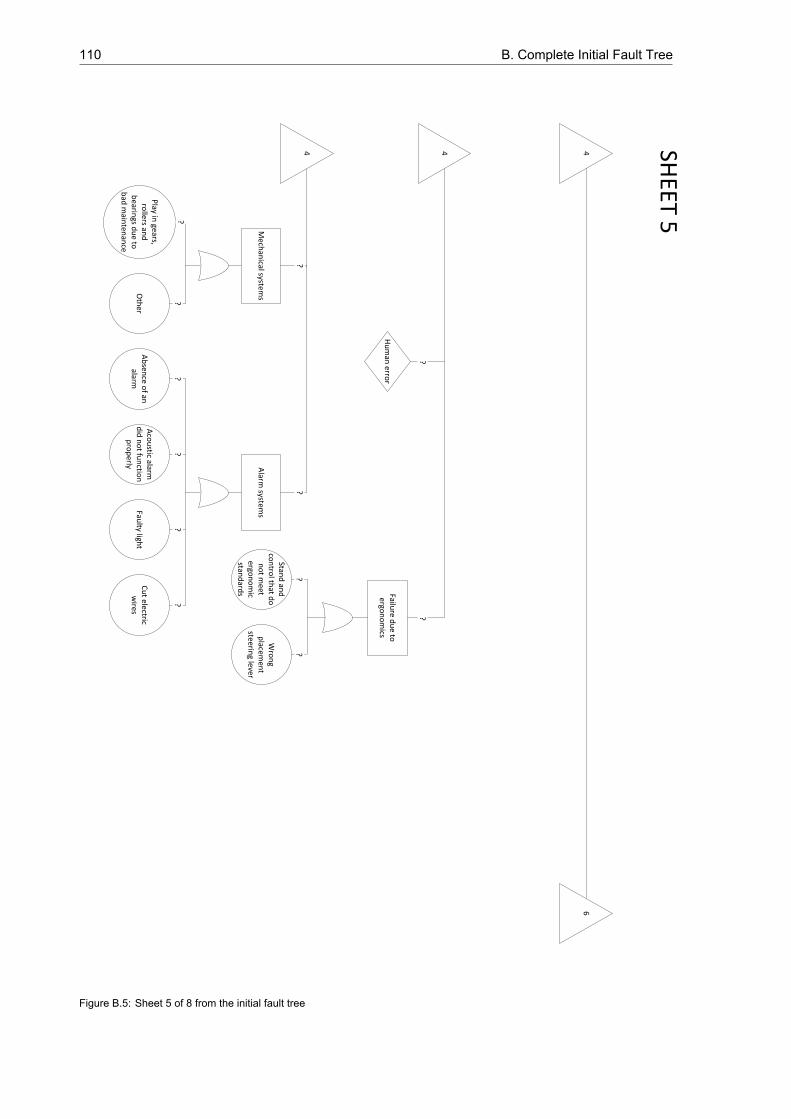
110 B. Complete Initial Fault Tree
Hu
man
error
Failure d
ue to
ergo
no
mics
Stand
and
co
ntro
l that d
o
no
t meet
ergon
om
ic stan
dard
s
Wro
ng
placem
ent
steering lever
Alarm
systems
Ab
sence o
f an
alarm
Aco
ustic alarm
d
id n
ot fu
nctio
n
pro
perly
Faulty ligh
tC
ut electric w
ires
?
Mech
anical system
sOth
er
Play in
gears, ro
llers and
b
earings d
ue to
b
ad m
ainten
ance
444
6
SHEET 5
??
??
??
??
??
?
Figure B.5: Sheet 5 of 8 from the initial fault tree
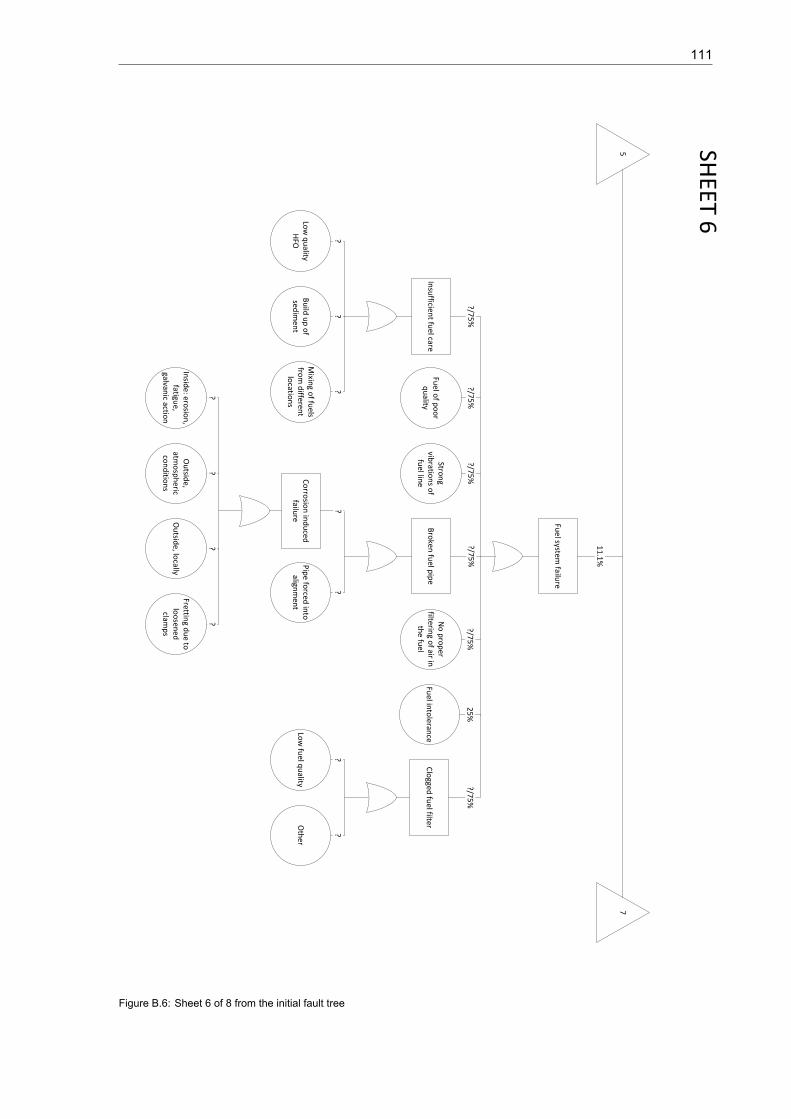
111
Fuel system
failure
Insu
fficient fu
el care
Low
qu
ality H
FO
Fuel o
f po
or
qu
ality
No
pro
per
filtering o
f air in
the fu
el
Low
fuel q
uality
Bu
ild u
p o
f sed
imen
t
Mixin
g of fu
els fro
m d
ifferent
locatio
ns
Stron
g vib
ration
s of
fuel lin
eB
roken
fuel p
ipe
Fuel in
toleran
ceC
logged
fuel filter
Co
rrosio
n in
du
ced
failure
Pip
e forced
into
align
men
t
Insid
e: erosio
n,
fatigue,
galvanic actio
n
Ou
tside,
atmo
sph
eric co
nd
ition
sO
utsid
e, locally
Oth
er
?/75
%
Fretting d
ue to
lo
osen
ed
clamp
s
11
.1%
57
SHEET 6
?/75
%?/7
5%
?/75
%?/7
5%
25
%?/7
5%
??
??
??
??
??
?
Figure B.6: Sheet 6 of 8 from the initial fault tree
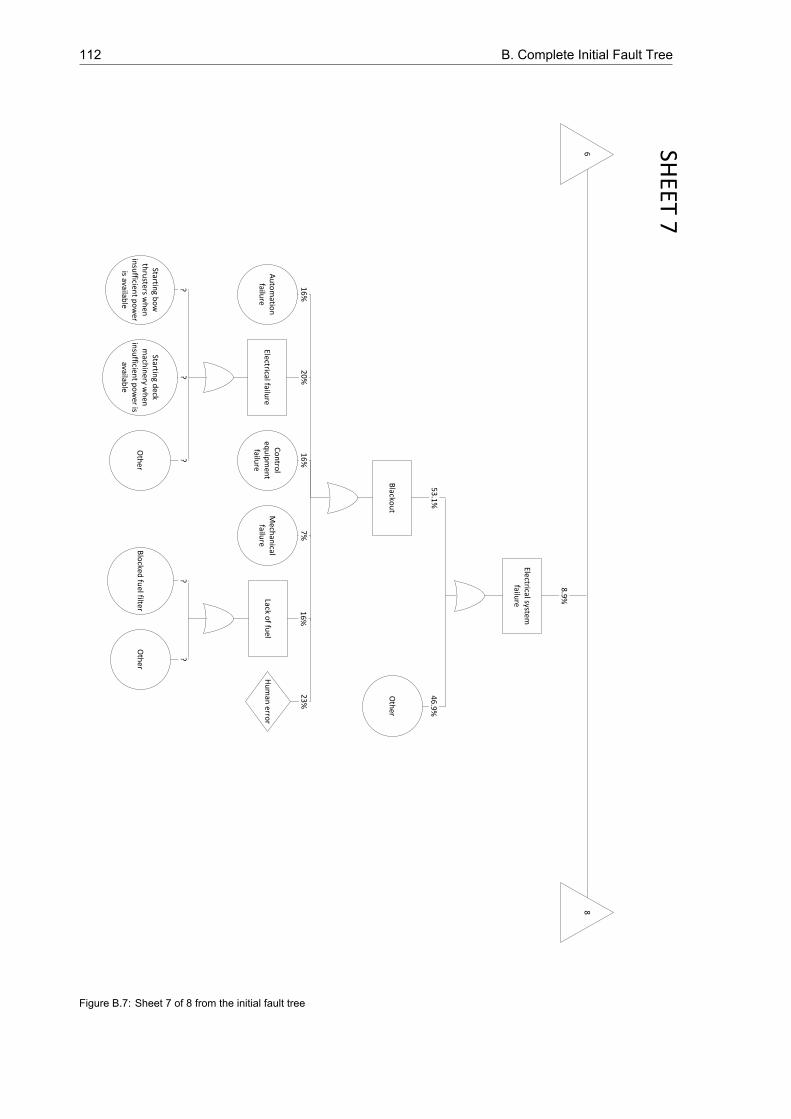
112 B. Complete Initial Fault Tree
Electrical system
failure
Blacko
ut
Au
tom
ation
failu
re
Oth
er
Electrical failure
Starting b
ow
th
rusters w
hen
in
sufficien
t po
wer
is available
Starting d
eck m
achin
ery wh
en
insu
fficient p
ow
er is availab
le
Oth
er
?
Co
ntro
l eq
uip
men
t failu
re
Mech
anical
failure
Lack of fu
el
Blo
cked fu
el filterO
ther
Hu
man
error
8.9
%
68
SHEET 7
46
.9%
53
.1%
16
%2
0%
16
%7
%1
6%
23
%
??
??
Figure B.7: Sheet 7 of 8 from the initial fault tree
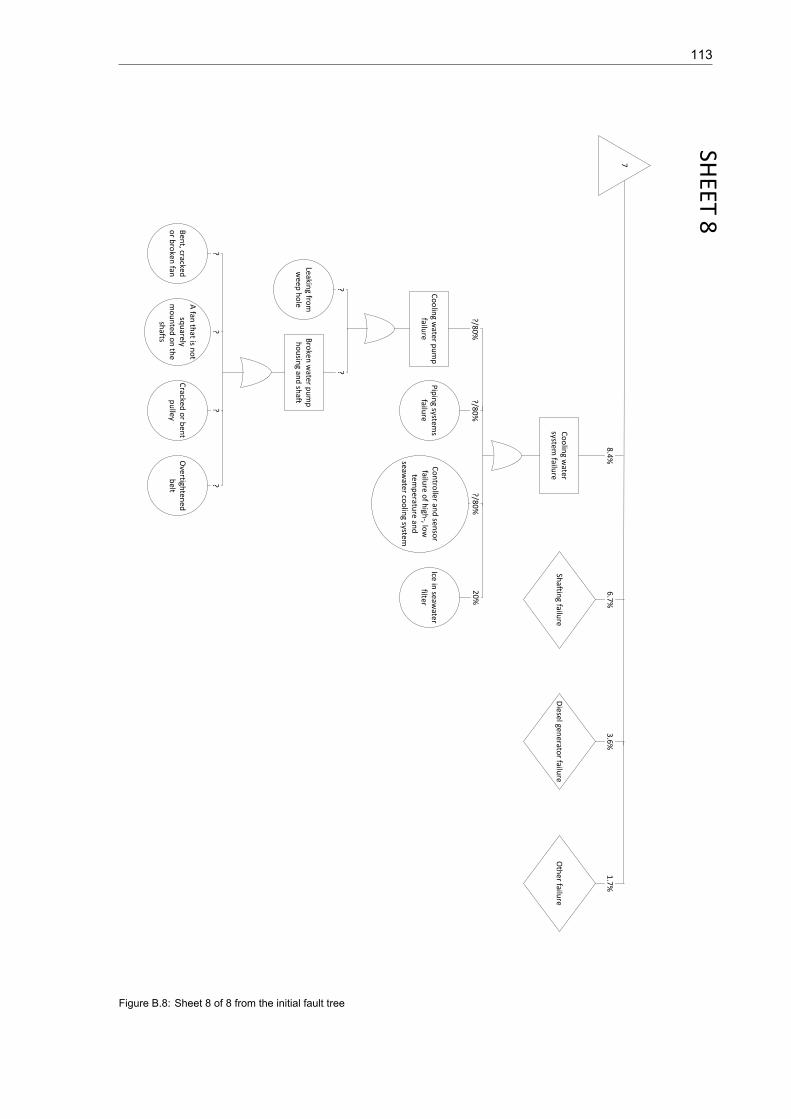
113
Shaftin
g failure
Co
olin
g water
system failu
re
Co
olin
g water p
um
p
failure
Leaking fro
m
weep
ho
le
Pip
ing system
s failu
re
Co
ntro
ller and
senso
r failu
re of h
igh-, lo
w
temp
erature an
d
seawater co
olin
g system
Ice in seaw
ater filter
Bro
ken w
ater pu
mp
h
ou
sing an
d sh
aft
Ben
t, cracked
or b
roken
fan
A fan
that is n
ot
squ
arely m
ou
nted
on
the
shafts
Cracked
or b
ent
pu
lleyO
vertighten
ed
belt
Diesel gen
erator failu
reO
ther failu
re
8.4
%
7
6.7
%
SHEET 8
3.6
%1
.7%
20
%?/8
0%
?/80
%?/8
0%
??
??
??
Figure B.8: Sheet 8 of 8 from the initial fault tree

COther Steering Gear Research
Over the course of the year 2001, 33 rudder related accidents were registered. Four main categorieshave been reviewed for a factual research. These have all been reviewed on an individual basis.
• Engineering
• Issues with the infrastructure
• Ergonomics
• Human error
EngineeringThis part of the research focused on the technical aspects of the steering gear, such as quality of usedmaterial, maintenance and failure sensitivity. The faults in the engineering category have been dividedinto five subcategories. For each of these categories it is determined howmuch they directly contributedto a failure. Note that the total amount goes over a 100%. This is because multiple problems have beenfound in some ships.
1. DesignFor a number of vessels the existing old installation has been renewed partly or entirely duringits lifetime. This caused multiple components to no longer be properly tuned to one another. Partof the system gave up by a power that was too high or too low. Parts of the alerting systemswere absent on multiple ships. It is determined that in 43% of the cases the design has directlycontributed to the failure.
2. Hydraulic systemsIn ten ships hydraulic leakages of at least one litre per twelve hours was found. Another frequentproblem are polluted filters. The control valves and absence of double tanks have contributed torudder failures respectively three and two times. The hydraulic systems has directly contributedto a failure in 19% of the time.
3. Electrical systemsIn several cases a short circuit caused a rudder failure. It was also found that protection againstelectromagnetic radiation was lacking both between mutual devices and external devices. In onecase the rudder indicator was five degrees off due to this electromagnetic radiation. This systemcontributed in 62% of the cases directly to the rudder failure.
4. Mechanical systemsPlay in gears, chains, rollers and bearings was in certain cases substantial enough to cause failureof the rudder. From the state of these parts it was found that maintenance to these parts was notdone, or not properly. In 29% of the cases the mechanical systems were directly responsible forthe failure.
115
116 C. Other Steering Gear Research
5. Alarm systemsThe absence of an alarm was the cause of a rudder failure in three cases. In one case no alarmwas given to indicate that the steering gear was not responding to the given rudder commando.The skipper only noticed the malfunction from the behaviour of his ship, after which he turned onthe second set of operating devices. Due to this rudder failure the ship caused a collision. In theother cases it occurred that the acoustic alarm did not function properly or that faulty lights andcut electric wires were found. The alarm systems are responsible for 16% of the failures.
Issues With The InfrastructureThe infrastructure was found to only be involved as a secondary factor in the rudder failure. Theaccidents have been divided into categories, based on where they were caused, on open water, riveror canal. It was also noted whether or not the failure occurred when passing a bridge, lock or otherengineered structure. It was found to be responsible for 0% of all rudder failures.
ErgonomicsOn board ships it has often been found that stands and controls did not meet the ergonomic standardsand were either the primary or secondary cause to the rudder failure. The working environment is, froman ergonomic view, determined by how the wheelhouse is divided and where equipment is located. Theplacement of the steering lever has caused multiple problems because it was placed in such a way thatit was accidentally changed when officers hit it when walking by. The ergonomics are responsible for15% of the total rudder failures. Since failures due to ergonomics are not technical failures they are ahuman error of some sort. It can be argued whether the error is made in the design or that accidentallywalking into equipment is more an operational type of human error.
Human ErrorIn 27% of the cases there is a direct link between human error and an incident with the ship. Fallingasleep, misjudgement, black-out and being on the phone are the given causes for these accidents witha human related cause.
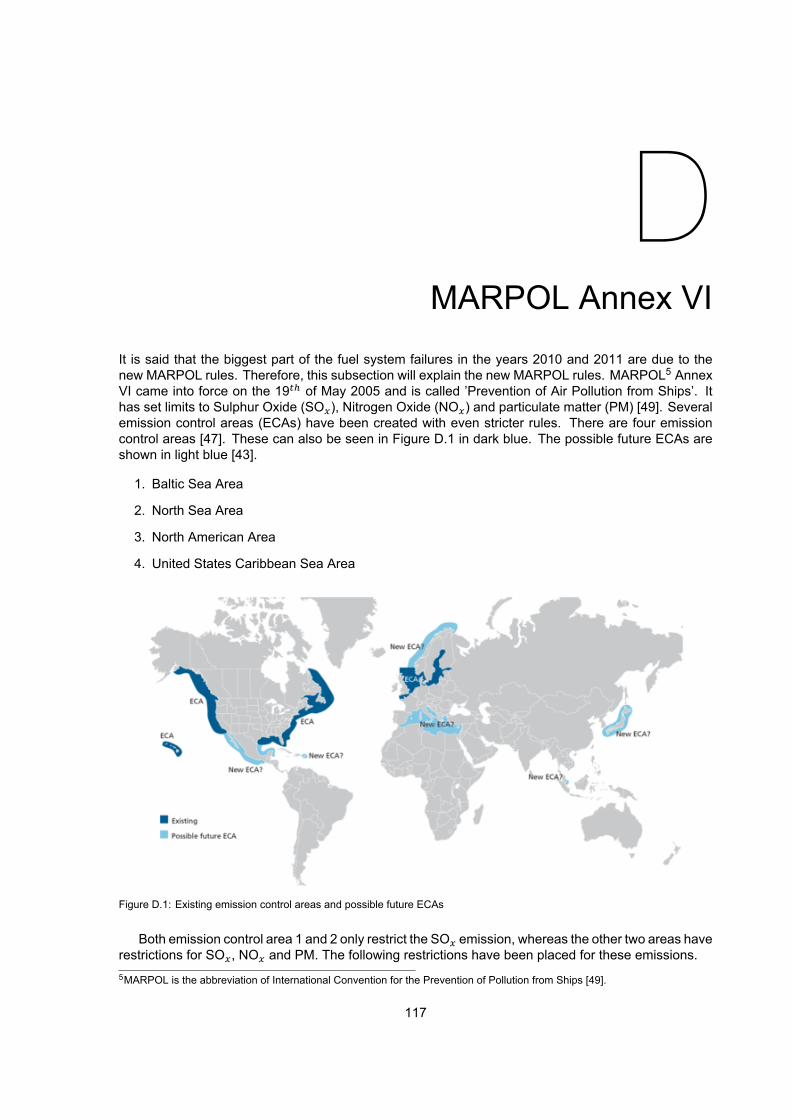
DMARPOL Annex VI
It is said that the biggest part of the fuel system failures in the years 2010 and 2011 are due to thenew MARPOL rules. Therefore, this subsection will explain the new MARPOL rules. MARPOL5 AnnexVI came into force on the 19 of May 2005 and is called ’Prevention of Air Pollution from Ships’. Ithas set limits to Sulphur Oxide (SO ), Nitrogen Oxide (NO ) and particulate matter (PM) [49]. Severalemission control areas (ECAs) have been created with even stricter rules. There are four emissioncontrol areas [47]. These can also be seen in Figure D.1 in dark blue. The possible future ECAs areshown in light blue [43].
1. Baltic Sea Area
2. North Sea Area
3. North American Area
4. United States Caribbean Sea Area
Figure D.1: Existing emission control areas and possible future ECAs
Both emission control area 1 and 2 only restrict the SO emission, whereas the other two areas haverestrictions for SO , NO and PM. The following restrictions have been placed for these emissions.5MARPOL is the abbreviation of International Convention for the Prevention of Pollution from Ships [49].
117
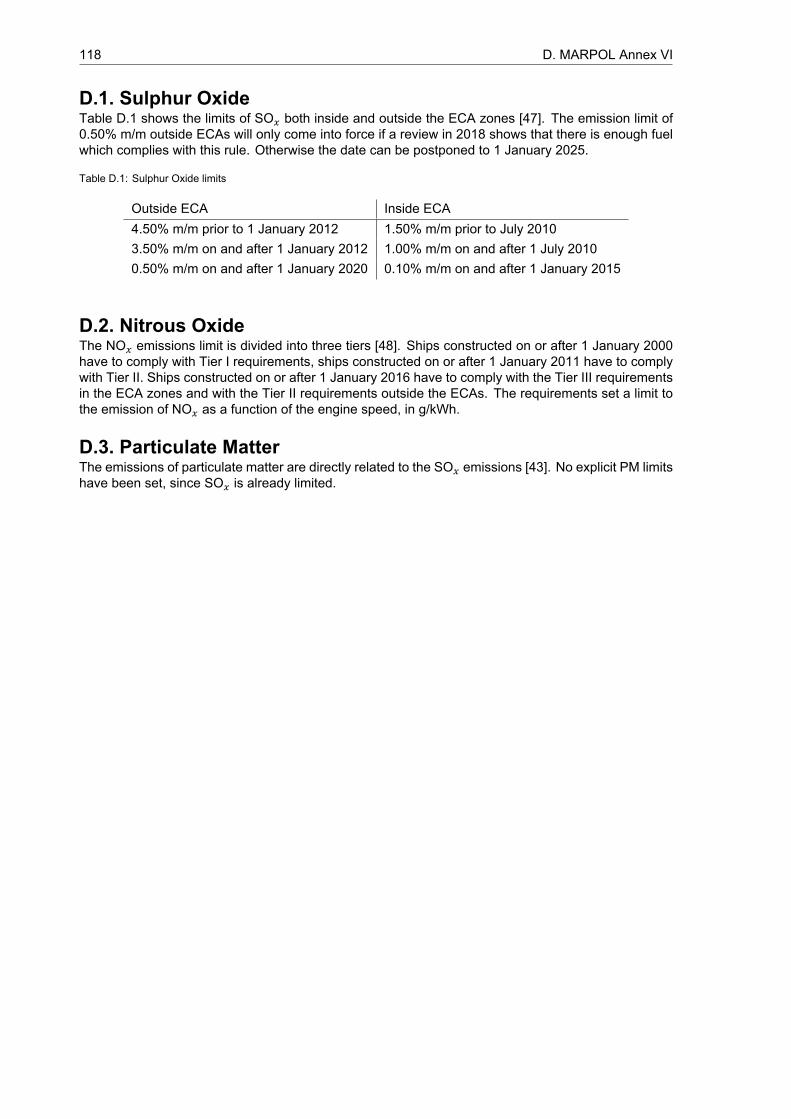
118 D. MARPOL Annex VI
D.1. Sulphur OxideTable D.1 shows the limits of SO both inside and outside the ECA zones [47]. The emission limit of0.50% m/m outside ECAs will only come into force if a review in 2018 shows that there is enough fuelwhich complies with this rule. Otherwise the date can be postponed to 1 January 2025.
Table D.1: Sulphur Oxide limits
Outside ECA Inside ECA4.50% m/m prior to 1 January 2012 1.50% m/m prior to July 20103.50% m/m on and after 1 January 2012 1.00% m/m on and after 1 July 20100.50% m/m on and after 1 January 2020 0.10% m/m on and after 1 January 2015
D.2. Nitrous OxideThe NO emissions limit is divided into three tiers [48]. Ships constructed on or after 1 January 2000have to comply with Tier I requirements, ships constructed on or after 1 January 2011 have to complywith Tier II. Ships constructed on or after 1 January 2016 have to comply with the Tier III requirementsin the ECA zones and with the Tier II requirements outside the ECAs. The requirements set a limit tothe emission of NO as a function of the engine speed, in g/kWh.
D.3. Particulate MatterThe emissions of particulate matter are directly related to the SO emissions [43]. No explicit PM limitshave been set, since SO is already limited.
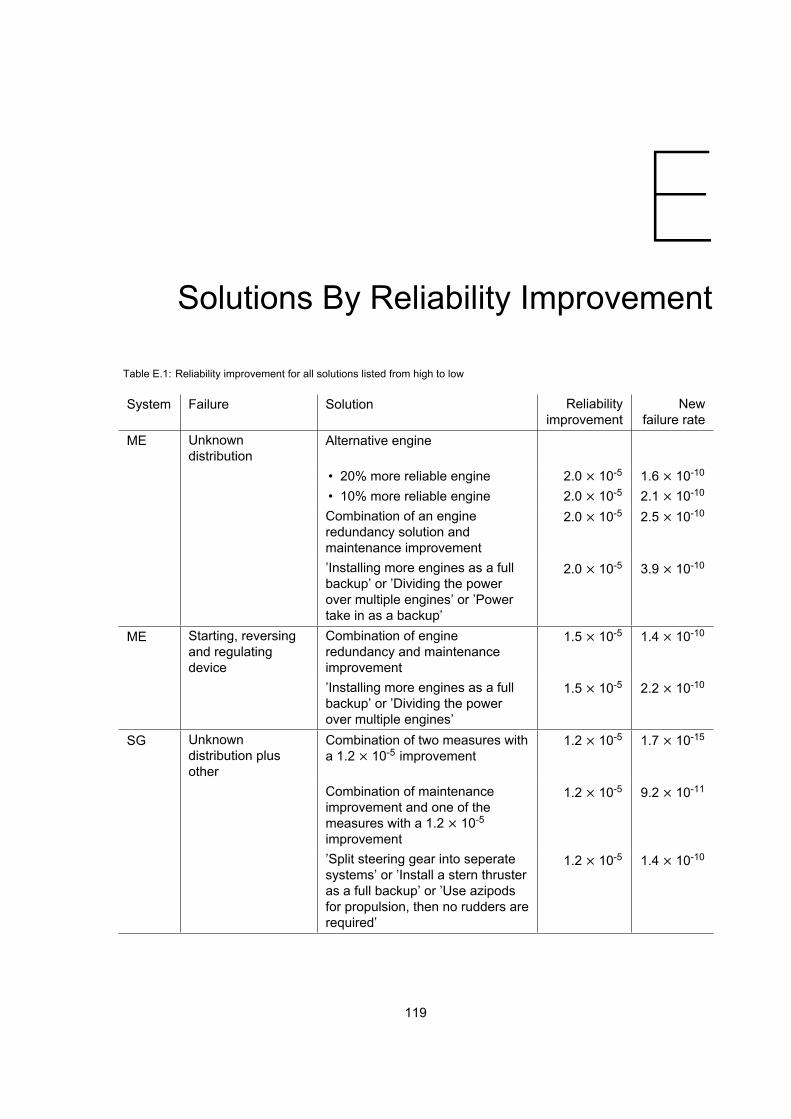
ESolutions By Reliability Improvement
Table E.1: Reliability improvement for all solutions listed from high to low
System Failure Solution Reliabilityimprovement
Newfailure rate
ME Unknowndistribution
Alternative engine
• 20% more reliable engine 2.0 × 10⁻⁵ 1.6 × 10⁻¹⁰
• 10% more reliable engine 2.0 × 10⁻⁵ 2.1 × 10⁻¹⁰
Combination of an engineredundancy solution andmaintenance improvement
2.0 × 10⁻⁵ 2.5 × 10⁻¹⁰
’Installing more engines as a fullbackup’ or ’Dividing the powerover multiple engines’ or ’Powertake in as a backup’
2.0 × 10⁻⁵ 3.9 × 10⁻¹⁰
ME Starting, reversingand regulatingdevice
Combination of engineredundancy and maintenanceimprovement
1.5 × 10⁻⁵ 1.4 × 10⁻¹⁰
’Installing more engines as a fullbackup’ or ’Dividing the powerover multiple engines’
1.5 × 10⁻⁵ 2.2 × 10⁻¹⁰
SG Unknowndistribution plusother
Combination of two measures witha 1.2 × 10⁻⁵ improvement
1.2 × 10⁻⁵ 1.7 × 10⁻¹⁵
Combination of maintenanceimprovement and one of themeasures with a 1.2 × 10⁻⁵improvement
1.2 × 10⁻⁵ 9.2 × 10⁻¹¹
’Split steering gear into seperatesystems’ or ’Install a stern thrusteras a full backup’ or ’Use azipodsfor propulsion, then no rudders arerequired’
1.2 × 10⁻⁵ 1.4 × 10⁻¹⁰
119
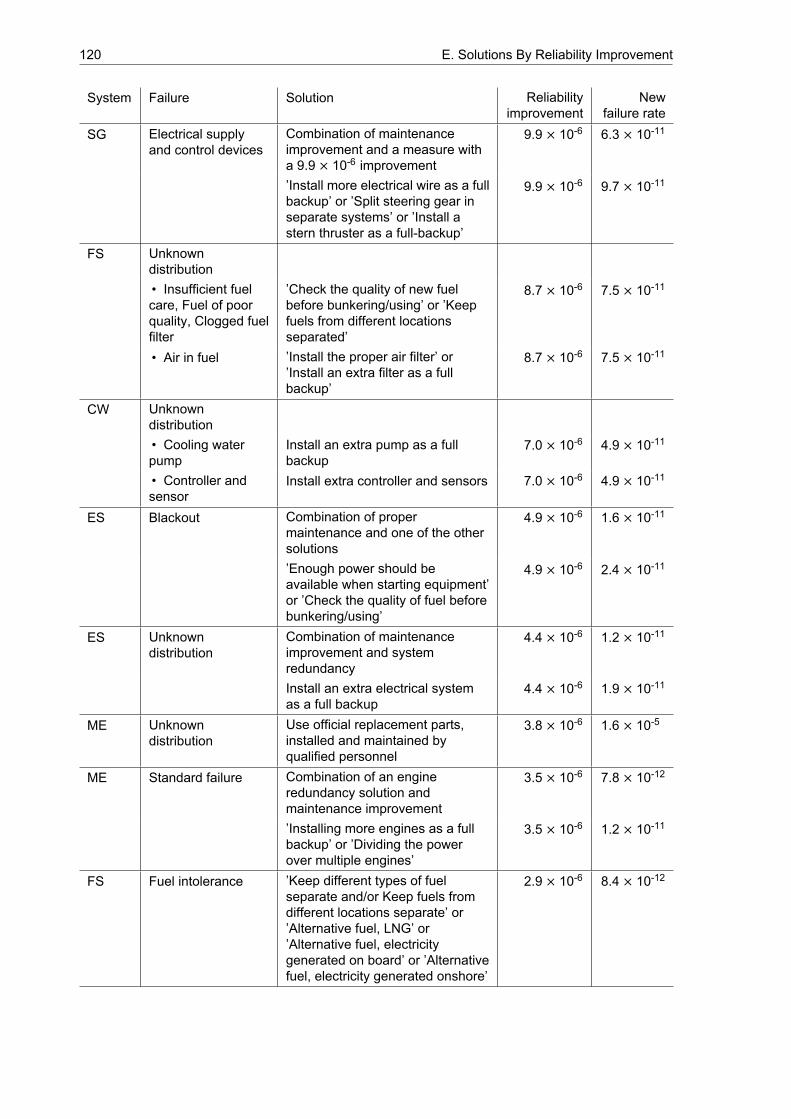
120 E. Solutions By Reliability Improvement
System Failure Solution Reliabilityimprovement
Newfailure rate
SG Electrical supplyand control devices
Combination of maintenanceimprovement and a measure witha 9.9 × 10⁻⁶ improvement
9.9 × 10⁻⁶ 6.3 × 10⁻¹¹
’Install more electrical wire as a fullbackup’ or ’Split steering gear inseparate systems’ or ’Install astern thruster as a full-backup’
9.9 × 10⁻⁶ 9.7 × 10⁻¹¹
FS Unknowndistribution• Insufficient fuelcare, Fuel of poorquality, Clogged fuelfilter
’Check the quality of new fuelbefore bunkering/using’ or ’Keepfuels from different locationsseparated’
8.7 × 10⁻⁶ 7.5 × 10⁻¹¹
• Air in fuel ’Install the proper air filter’ or’Install an extra filter as a fullbackup’
8.7 × 10⁻⁶ 7.5 × 10⁻¹¹
CW Unknowndistribution• Cooling waterpump
Install an extra pump as a fullbackup
7.0 × 10⁻⁶ 4.9 × 10⁻¹¹
• Controller andsensor
Install extra controller and sensors 7.0 × 10⁻⁶ 4.9 × 10⁻¹¹
ES Blackout Combination of propermaintenance and one of the othersolutions
4.9 × 10⁻⁶ 1.6 × 10⁻¹¹
’Enough power should beavailable when starting equipment’or ’Check the quality of fuel beforebunkering/using’
4.9 × 10⁻⁶ 2.4 × 10⁻¹¹
ES Unknowndistribution
Combination of maintenanceimprovement and systemredundancy
4.4 × 10⁻⁶ 1.2 × 10⁻¹¹
Install an extra electrical systemas a full backup
4.4 × 10⁻⁶ 1.9 × 10⁻¹¹
ME Unknowndistribution
Use official replacement parts,installed and maintained byqualified personnel
3.8 × 10⁻⁶ 1.6 × 10⁻⁵
ME Standard failure Combination of an engineredundancy solution andmaintenance improvement
3.5 × 10⁻⁶ 7.8 × 10⁻¹²
’Installing more engines as a fullbackup’ or ’Dividing the powerover multiple engines’
3.5 × 10⁻⁶ 1.2 × 10⁻¹¹
FS Fuel intolerance ’Keep different types of fuelseparate and/or Keep fuels fromdifferent locations separate’ or’Alternative fuel, LNG’ or’Alternative fuel, electricitygenerated on board’ or ’Alternativefuel, electricity generated onshore’
2.9 × 10⁻⁶ 8.4 × 10⁻¹²
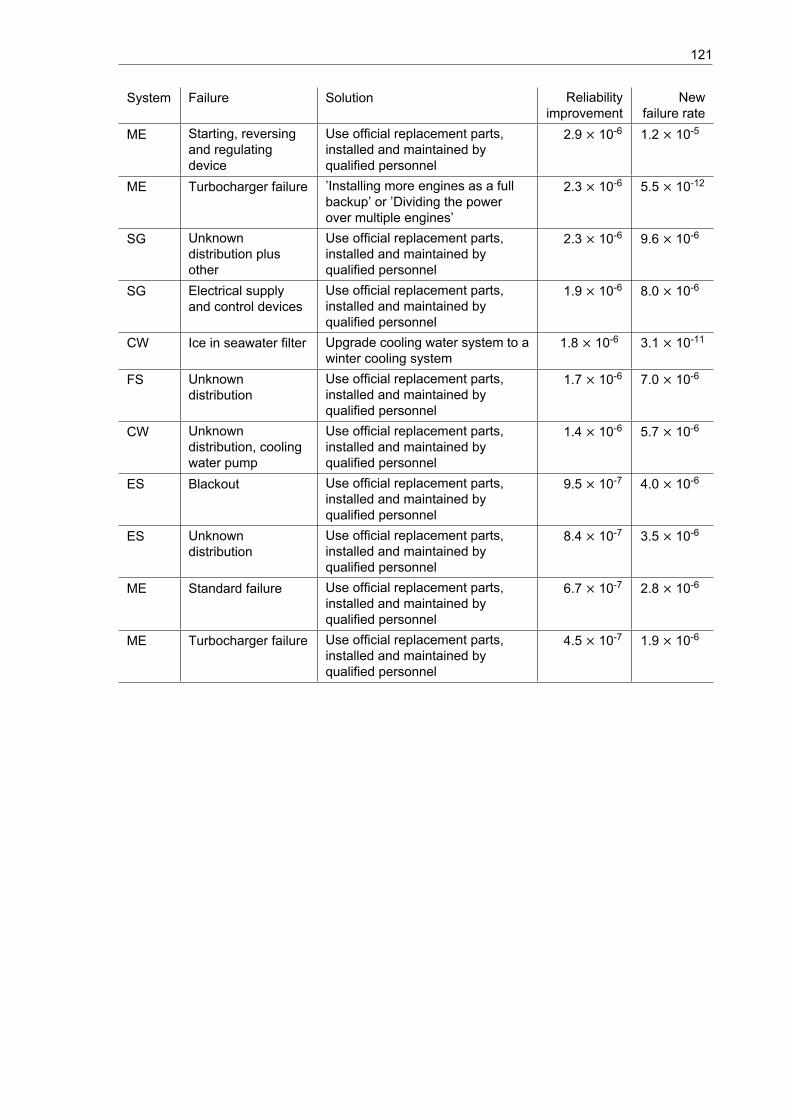
121
System Failure Solution Reliabilityimprovement
Newfailure rate
ME Starting, reversingand regulatingdevice
Use official replacement parts,installed and maintained byqualified personnel
2.9 × 10⁻⁶ 1.2 × 10⁻⁵
ME Turbocharger failure ’Installing more engines as a fullbackup’ or ’Dividing the powerover multiple engines’
2.3 × 10⁻⁶ 5.5 × 10⁻¹²
SG Unknowndistribution plusother
Use official replacement parts,installed and maintained byqualified personnel
2.3 × 10⁻⁶ 9.6 × 10⁻⁶
SG Electrical supplyand control devices
Use official replacement parts,installed and maintained byqualified personnel
1.9 × 10⁻⁶ 8.0 × 10⁻⁶
CW Ice in seawater filter Upgrade cooling water system to awinter cooling system
1.8 × 10⁻⁶ 3.1 × 10⁻¹¹
FS Unknowndistribution
Use official replacement parts,installed and maintained byqualified personnel
1.7 × 10⁻⁶ 7.0 × 10⁻⁶
CW Unknowndistribution, coolingwater pump
Use official replacement parts,installed and maintained byqualified personnel
1.4 × 10⁻⁶ 5.7 × 10⁻⁶
ES Blackout Use official replacement parts,installed and maintained byqualified personnel
9.5 × 10⁻⁷ 4.0 × 10⁻⁶
ES Unknowndistribution
Use official replacement parts,installed and maintained byqualified personnel
8.4 × 10⁻⁷ 3.5 × 10⁻⁶
ME Standard failure Use official replacement parts,installed and maintained byqualified personnel
6.7 × 10⁻⁷ 2.8 × 10⁻⁶
ME Turbocharger failure Use official replacement parts,installed and maintained byqualified personnel
4.5 × 10⁻⁷ 1.9 × 10⁻⁶

Top Related
Copyright © 2022 FDOKUMEN

