

Bahasa
Halaman
Hukum

processes
Article
Implementation of Technical and Technological Progress inDairy Production
Marek Gaworski
�����������������
Citation: Gaworski, M.
Implementation of Technical and
Technological Progress in Dairy
Production. Processes 2021, 9, 2103.
https://doi.org/10.3390/pr9122103
Academic Editor: Giacobbe Braccio
Received: 5 October 2021
Accepted: 16 November 2021
Published: 23 November 2021
Publisher’s Note: MDPI stays neutral
with regard to jurisdictional claims in
published maps and institutional affil-
iations.
Copyright: © 2021 by the author.
Licensee MDPI, Basel, Switzerland.
This article is an open access article
distributed under the terms and
conditions of the Creative Commons
Attribution (CC BY) license (https://
creativecommons.org/licenses/by/
4.0/).
Department of Production Engineering, Institute of Mechanical Engineering,Warsaw University of Life Sciences—SGGW, 02-787 Warsaw, Poland; [email protected];Tel.: +48-22-593-4583
Abstract: The involvement of people and technical devices is a characteristic feature of technologicalprocesses in agriculture. Human access to modernized and more efficient technical equipmentdetermines the differentiation of the proportions of the contributions of human labor and technicalequipment to the implementation of production technology on farms. Taking into account the dataon manual and machine work inputs, the methodology of determining the technological indexlevel (TL) was presented. The aim of the present study was to present the scope of use of thetechnological index level to assess the effects of technological progress in the dairy productionsystem, with particular emphasis on cow milking. For the value range of the technological index level(0–100%), changes in the milkman’s work efficiency were presented based on research carried outon farms equipped with milking equipment at different levels of technical advancement. Moreover,the course of changes in electricity and water consumption per liter of milk was determined inassociation with the technological index level. The issue of simultaneous implementation of variousforms of progress was developed based on the example of milking cows with a milking robot. Fivecategories (ranges) of cows’ milk yield were distinguished and compared with the current yields ofcows in the European Union. On this basis, a discussion was initiated on the factors that facilitateand limit the implementation of technical and technological progress in dairy production.
Keywords: dairy; engineering; farm; labor; process; progress
1. Introduction
Taking up and implementing production processes in agriculture is a key elementin securing stable access to food products for the growing global population [1]. Hence,production processes in agriculture generate a wide spectrum of practical knowledgeand scientific interests related to the improvement of food production. Improvement isa feature that distinguishes each area of agricultural activity, and dairy production inparticular [2]. This is because milk plays a special role in feeding the population as one ofthe basic sources of protein, fat, and other nutrients [3–5]. Dairy production is an importantarea for the conversion of plant feed to human edible animal products in the food supplychain [6]. For many farms, milk production is an important source of income, which variesdepending on biological, technical, and technological factors, as well as the market and thesocioeconomic environment [7].
Providing consumers with access to high-quality milk and its products depends on thecreation of an efficiently organized, sustainable dairy production system (DPS), reflectingthe systemic approach identified in the fields of agriculture [8,9] and food economy. In ageneral sense, the dairy production system is a semantic description of an autonomous setof elements of a social, natural, and technical nature, synergistically interacting with oneanother [10] in order to transform various forms of energy and environmental componentsinto products suitable for metabolic processing in living organisms [11].
The large number of objects and the relationships between them in the dairy produc-tion system (DPS) inspire the development of modeling research. The dairy production
Processes 2021, 9, 2103. https://doi.org/10.3390/pr9122103 https://www.mdpi.com/journal/processes
Processes 2021, 9, 2103 2 of 21
system and its evaluation are sustainability issues encompassing three pillars, i.e., eco-nomic, environmental, and social [12]. The growing importance attached to the economicprofitability, social welfare, and environmental impact of dairy production systems isan incentive to search for research tools for modeling considerations [13]. The link be-tween dairy production and sustainability and modeling is demonstrated, for example,by the SIMSDAIRY (sustainable and integrated management systems for dairy production)model [14]. A feature of this model is the study of various interactions between internal(management, genetics, and others) and external factors, such as environmental condi-tions. Another WLGP (weighted linear goal programming model for dairy farms) modelexamines the interdependencies between biophysical, economic, and social processes indairy farms [15], taking into account the maintenance of sustainable development. In turn,the GAMEDE (global activity model for evaluation of the sustainability of dairy enterprises)model presents an approach based on the analysis of the stock-flow, taking into accountthe operations and management of the dairy farm, which affect the sustainable incomeand profitability of production [16]. The approach involving intermediate products in theactivity of dairy farms was the basis for the development of a model using a non-parametrictechnique to measure various forms of productivity [17]. One of the stages of modelingdairy production—especially in the earlier period—was the creation of optimization mod-els with a specific range of analyzed data. The purpose of modeling was, for example,to assess the relationship between cows’ feeding costs and their milk yield and incomefrom milk production [18]. Another empirical economic model was developed to assessthe effects of asset replacement in dairy production [19]. Economic indicators—includingfarm profitability in connection with biological, technical, and physical processes—wereconsidered in the stochastic budget simulation model of a dairy farm [20]. An exampleof an approach to modeling an entire dairy farm is the DairyWise model; this model wasbased on the simulation of technical, environmental, and financial processes in a dairy farm,taking into account the supporting role of the FeedSupply and DairyHerd models [21].In the nonlinear optimization model developed for the needs of the New Zealand dairyproduction system, mass flows in the area of dairy cattle feeding were assumed to be akey factor in making management decisions [22]. The approach that takes into account thebalancing of the available feed on a dairy farm—related to the selection of the best feedproduction strategy for a given dairy herd, as in the DAFOSYM model [23]—confirms thespecial role of feed in modeling dairy farm production. Developing alternative solutionsin the field of cow feeding, a whole-farm model (WFM) was proposed with the dominantshare of feeding cows on pasture [24]. In the overall assessment of farms included in thedairy production system, significant emphasis is placed on the impact of dairy productionon the environment; hence, the models of ammonia emissions [25] and nitrogen flow [26]in dairy farms make an important contribution to the assessment of dairy production man-agement. Thus, dairy production and its evaluation are part of the circular economy [27]as a source of potential threats to the environment. The essence of the LCA (life cycleassessment) method is not only the assessment of the final result of the technologicalprocess, but also the estimation and assessment of the consequences of the process forthe environment.
A characteristic feature of the formulated models of dairy farms and dairy productionsystems is the selection of a set of parameters (indicators); these are measurable, calculated,and descriptive indicators, classified as economic, social, and environmental categoriesthat make up the three pillars of sustainable dairy production [13]. In practice, the conceptof technical indicators is also used [28], which generally cover a broad set of factors,depending on the scope of the analysis. A question can be asked: what is the premise forcreating such indicators? The main premises for creating new research indicators, and usingpreviously known ones, can be the specificity of the research conducted, the goal(s) set forthem, and the possibility of making comparisons with the results of other studies.
The aim of the present study was to present the scope of use of the technologicalindex level to assess the effects of technological progress in the dairy production system,
Processes 2021, 9, 2103 3 of 21
with particular emphasis on cow milking. A characteristic feature of technological processesin dairy production—and in agriculture in general—is the inclusion of technical facilitiesand people in their implementation. It is these two pillars—i.e., the operation of technicalequipment, and the work of people—that are the essence of the technological index level.
In general, the problem of assessing the use of machines and tractors, as well as theeffects of their implementation in agricultural production, has been discussed in studies formany years [29,30], and has been formulated in terms of mechanization. The question ishow to use the scientific aspect of research on the mechanization of technological processes,which is so closely related to agricultural practice [31]. The present study is an attemptto use the technological index level to present the problems of implementing progress or,rather, various forms of progress in dairy production. In addition to technical progress inagriculture [32], detailed studies also consider the issues of technological and constructionalprogress [33]. The authors of [34] linked technological progress with energy consumptionin agricultural production. Taking up the issues of progress in the present study requiresthe definition of individual categories of progress. Technological progress consists ofreplacing manpower (manual labor) with technical means of work (technical devices).Technical/constructional progress includes the implementation of new devices, as well asthe modernization of previously used ones.
Overall, progress is a concept that expresses the quantitative and qualitative changes inthe state of an area over a period of time. In the discussion on progress, several characteristictrends have emerged, emphasizing the complexity of classifying basic forms of progressand the need to search for indicators for their assessment.
2. Materials and Methods2.1. Identification of the Technological Process in Dairy Production Systems
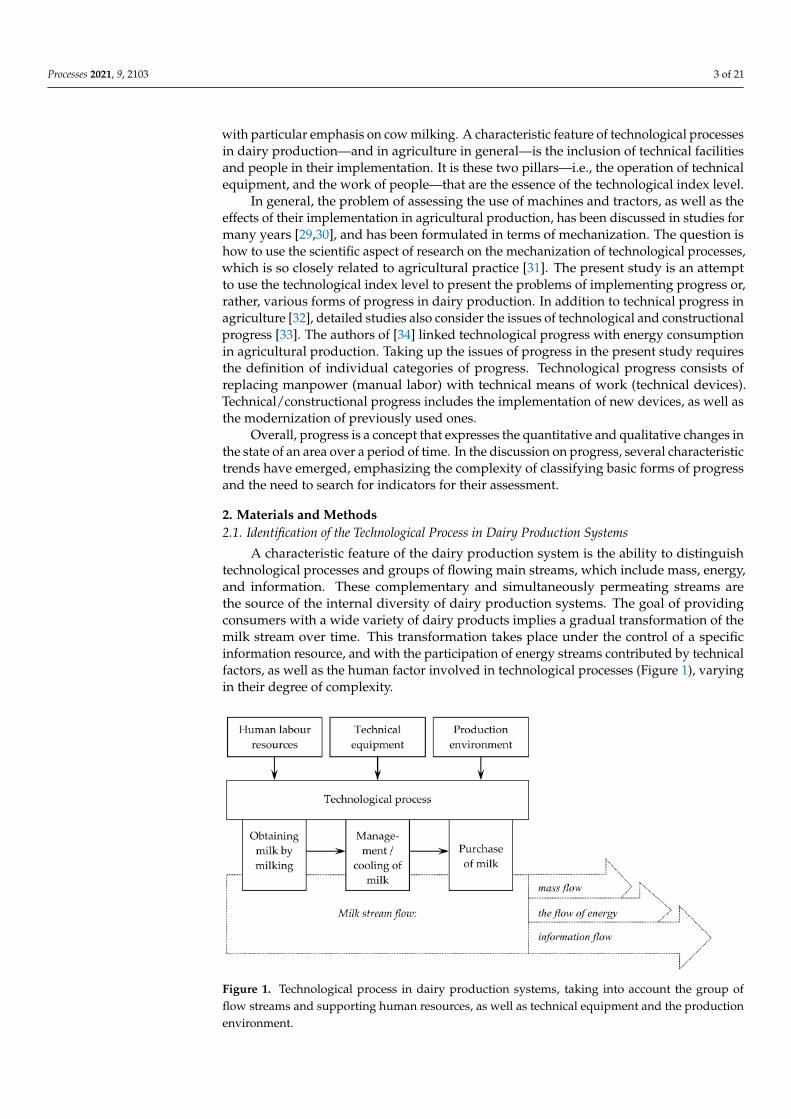
A characteristic feature of the dairy production system is the ability to distinguishtechnological processes and groups of flowing main streams, which include mass, energy,and information. These complementary and simultaneously permeating streams arethe source of the internal diversity of dairy production systems. The goal of providingconsumers with a wide variety of dairy products implies a gradual transformation of themilk stream over time. This transformation takes place under the control of a specificinformation resource, and with the participation of energy streams contributed by technicalfactors, as well as the human factor involved in technological processes (Figure 1), varyingin their degree of complexity.
Figure 1. Technological process in dairy production systems, taking into account the group offlow streams and supporting human resources, as well as technical equipment and the productionenvironment.
Processes 2021, 9, 2103 4 of 21
The diversity of the features characterizing individual objects and tasks in the pro-cesses of dairy production and management justifies the use of an appropriate researchmethodology [35]. Previous studies have distinguished many approaches to the analysisof dairy production and its diversification in terms of technical, technological, and otherfactors that make up the structure of the dairy production field. The technological ap-proach, taking into account the possibility of using various organizational solutions in dairyproduction, creates conditions for making comparisons and selecting the most rationalmethods of operation using human and technical resources under the given economic andproduction conditions.
2.2. The Procedure for Calculating the Technological Index Level
The involvement of human resources and technical devices in the implementation oftechnological processes on farms has become a premise for the formulation of the term“technological level” [11]. The introduction of this concept to the analysis of a givenresearch area implies the determination of the value of the technological level of a processor processes based on human work and technical devices. This value can be referred to asan index. Thus, the concept of the technological index level was used in our analysis.
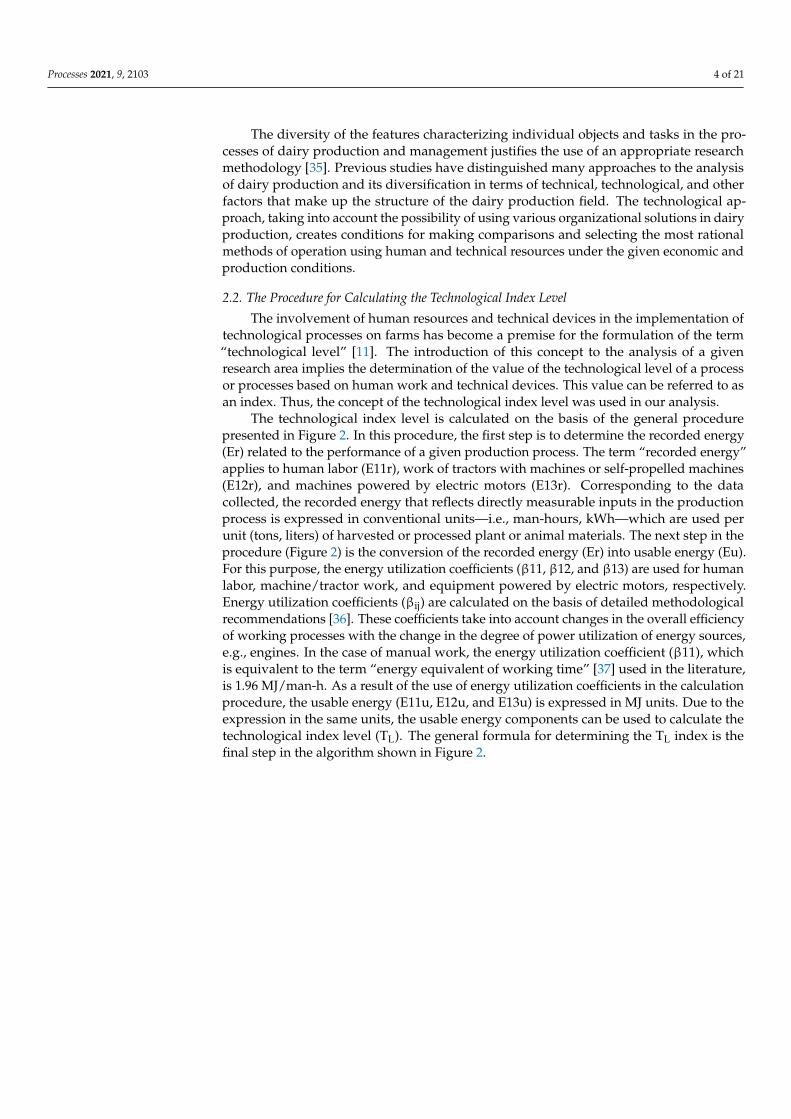
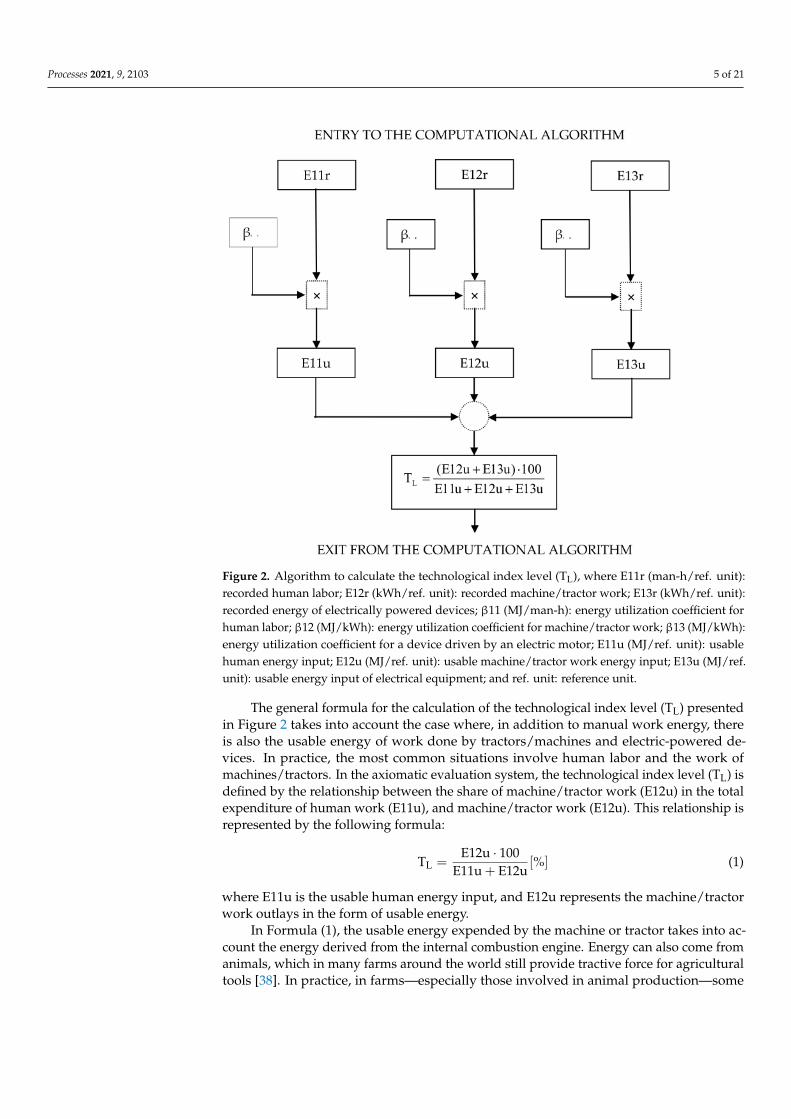
The technological index level is calculated on the basis of the general procedurepresented in Figure 2. In this procedure, the first step is to determine the recorded energy(Er) related to the performance of a given production process. The term “recorded energy”applies to human labor (E11r), work of tractors with machines or self-propelled machines(E12r), and machines powered by electric motors (E13r). Corresponding to the datacollected, the recorded energy that reflects directly measurable inputs in the productionprocess is expressed in conventional units—i.e., man-hours, kWh—which are used perunit (tons, liters) of harvested or processed plant or animal materials. The next step in theprocedure (Figure 2) is the conversion of the recorded energy (Er) into usable energy (Eu).For this purpose, the energy utilization coefficients (β11, β12, and β13) are used for humanlabor, machine/tractor work, and equipment powered by electric motors, respectively.Energy utilization coefficients (βij) are calculated on the basis of detailed methodologicalrecommendations [36]. These coefficients take into account changes in the overall efficiencyof working processes with the change in the degree of power utilization of energy sources,e.g., engines. In the case of manual work, the energy utilization coefficient (β11), whichis equivalent to the term “energy equivalent of working time” [37] used in the literature,is 1.96 MJ/man-h. As a result of the use of energy utilization coefficients in the calculationprocedure, the usable energy (E11u, E12u, and E13u) is expressed in MJ units. Due to theexpression in the same units, the usable energy components can be used to calculate thetechnological index level (TL). The general formula for determining the TL index is thefinal step in the algorithm shown in Figure 2.
Processes 2021, 9, 2103 5 of 21
Figure 2. Algorithm to calculate the technological index level (TL), where E11r (man-h/ref. unit):recorded human labor; E12r (kWh/ref. unit): recorded machine/tractor work; E13r (kWh/ref. unit):recorded energy of electrically powered devices; β11 (MJ/man-h): energy utilization coefficient forhuman labor; β12 (MJ/kWh): energy utilization coefficient for machine/tractor work; β13 (MJ/kWh):energy utilization coefficient for a device driven by an electric motor; E11u (MJ/ref. unit): usablehuman energy input; E12u (MJ/ref. unit): usable machine/tractor work energy input; E13u (MJ/ref.unit): usable energy input of electrical equipment; and ref. unit: reference unit.
The general formula for the calculation of the technological index level (TL) presentedin Figure 2 takes into account the case where, in addition to manual work energy, thereis also the usable energy of work done by tractors/machines and electric-powered de-vices. In practice, the most common situations involve human labor and the work ofmachines/tractors. In the axiomatic evaluation system, the technological index level (TL) isdefined by the relationship between the share of machine/tractor work (E12u) in the totalexpenditure of human work (E11u), and machine/tractor work (E12u). This relationship isrepresented by the following formula:
TL =E12u · 100
E11u + E12u[%] (1)
where E11u is the usable human energy input, and E12u represents the machine/tractorwork outlays in the form of usable energy.
In Formula (1), the usable energy expended by the machine or tractor takes into ac-count the energy derived from the internal combustion engine. Energy can also come fromanimals, which in many farms around the world still provide tractive force for agriculturaltools [38]. In practice, in farms—especially those involved in animal production—some
Processes 2021, 9, 2103 6 of 21
technical devices are powered by electric motors. Taking this into account, the formula fordetermining the technological index level may be given as follows:
TL =E13u · 100
E11u + E13u[%] (2)
where E11u—is the usable human energy input, and E13u is the usable energy from theelectric motor.
The definition of the technological index level shows that its value covers the rangeTL ∈ < 0, 100 > (%). A technological index level of TL = 0% means that no machine worksin the considered process. On the other hand, a TL index value of 100% indicates that theprocess does not involve personnel work, i.e., it is a fully automated process.
2.3. Using the Technological Index Level to Analyze Technological Processes in the DairyProduction System
The TL index can be widely used as a modeling variable describing the dynamicsof changes in the considered parameters of the energy–technological state of objects orprocesses. This makes it possible to evaluate the obtained results of energy–technologicalanalysis via national and international comparisons; it also allows for the assessment ofstructural changes in the studied area from a retrospective and prognostic perspective.The technological index level can be used to interpret many general phenomena in the fieldof food production, taking into account the use of human resources and technical potentialunder various production conditions [11].
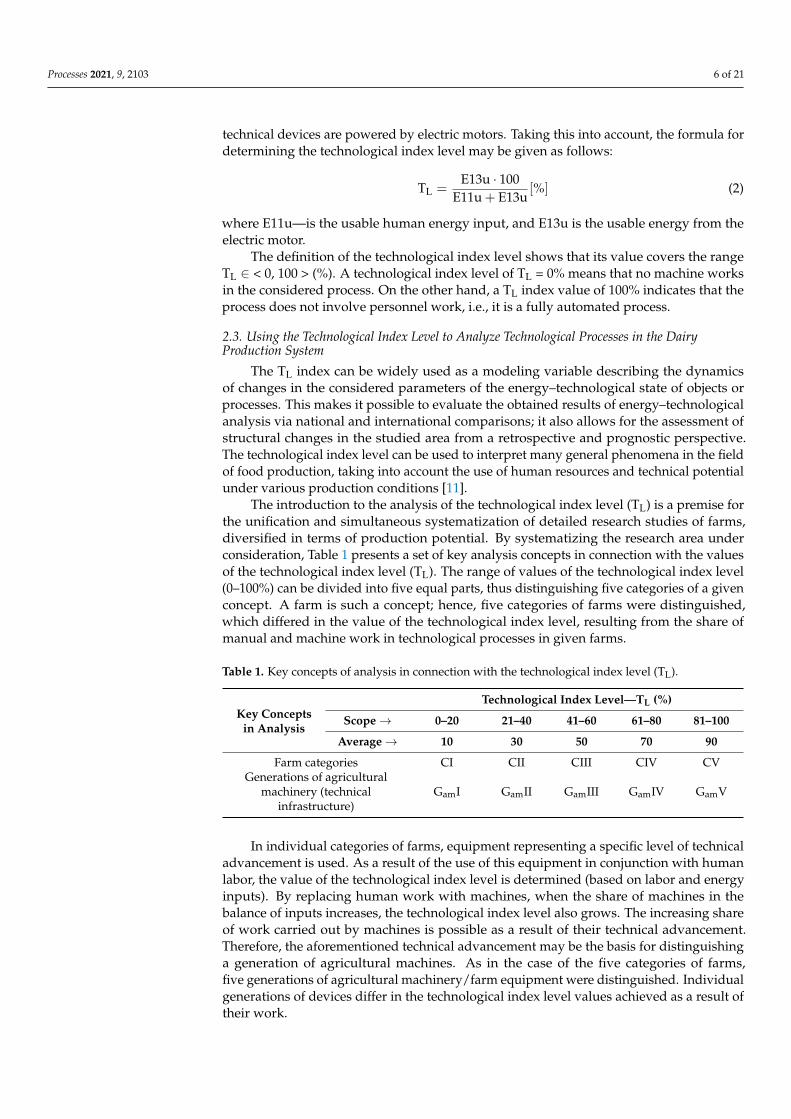
The introduction to the analysis of the technological index level (TL) is a premise forthe unification and simultaneous systematization of detailed research studies of farms,diversified in terms of production potential. By systematizing the research area underconsideration, Table 1 presents a set of key analysis concepts in connection with the valuesof the technological index level (TL). The range of values of the technological index level(0–100%) can be divided into five equal parts, thus distinguishing five categories of a givenconcept. A farm is such a concept; hence, five categories of farms were distinguished,which differed in the value of the technological index level, resulting from the share ofmanual and machine work in technological processes in given farms.
Table 1. Key concepts of analysis in connection with the technological index level (TL).
Key Conceptsin Analysis
Technological Index Level—TL (%)
Scope→ 0–20 21–40 41–60 61–80 81–100
Average→ 10 30 50 70 90
Farm categories CI CII CIII CIV CVGenerations of agricultural
machinery (technicalinfrastructure)
GamI GamII GamIII GamIV GamV
In individual categories of farms, equipment representing a specific level of technicaladvancement is used. As a result of the use of this equipment in conjunction with humanlabor, the value of the technological index level is determined (based on labor and energyinputs). By replacing human work with machines, when the share of machines in thebalance of inputs increases, the technological index level also grows. The increasing shareof work carried out by machines is possible as a result of their technical advancement.Therefore, the aforementioned technical advancement may be the basis for distinguishinga generation of agricultural machines. As in the case of the five categories of farms,five generations of agricultural machinery/farm equipment were distinguished. Individualgenerations of devices differ in the technological index level values achieved as a result oftheir work.
Processes 2021, 9, 2103 7 of 21
The key concepts in the analysis—i.e., farm categories and generations of agriculturalmachinery—are summarized in Table 1. This summary includes the links between cate-gories and generations with the technological index level (TL), its five ranges, and averagevalues for given ranges.
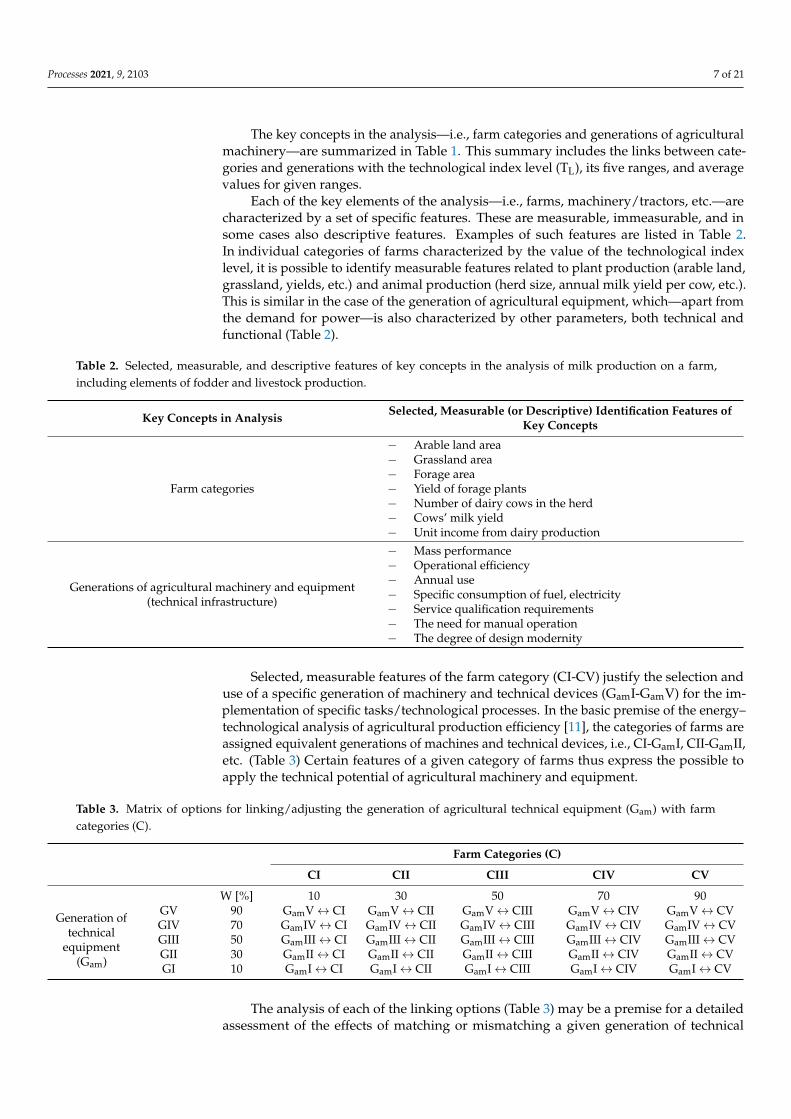
Each of the key elements of the analysis—i.e., farms, machinery/tractors, etc.—arecharacterized by a set of specific features. These are measurable, immeasurable, and insome cases also descriptive features. Examples of such features are listed in Table 2.In individual categories of farms characterized by the value of the technological indexlevel, it is possible to identify measurable features related to plant production (arable land,grassland, yields, etc.) and animal production (herd size, annual milk yield per cow, etc.).This is similar in the case of the generation of agricultural equipment, which—apart fromthe demand for power—is also characterized by other parameters, both technical andfunctional (Table 2).
Table 2. Selected, measurable, and descriptive features of key concepts in the analysis of milk production on a farm,including elements of fodder and livestock production.
Key Concepts in Analysis Selected, Measurable (or Descriptive) Identification Features ofKey Concepts
Farm categories
− Arable land area− Grassland area− Forage area− Yield of forage plants− Number of dairy cows in the herd− Cows’ milk yield− Unit income from dairy production
Generations of agricultural machinery and equipment(technical infrastructure)
− Mass performance− Operational efficiency− Annual use− Specific consumption of fuel, electricity− Service qualification requirements− The need for manual operation− The degree of design modernity
Selected, measurable features of the farm category (CI-CV) justify the selection anduse of a specific generation of machinery and technical devices (GamI-GamV) for the im-plementation of specific tasks/technological processes. In the basic premise of the energy–technological analysis of agricultural production efficiency [11], the categories of farms areassigned equivalent generations of machines and technical devices, i.e., CI-GamI, CII-GamII,etc. (Table 3) Certain features of a given category of farms thus express the possible toapply the technical potential of agricultural machinery and equipment.
Table 3. Matrix of options for linking/adjusting the generation of agricultural technical equipment (Gam) with farmcategories (C).
Farm Categories (C)
CI CII CIII CIV CV
W [%] 10 30 50 70 90
Generation oftechnical
equipment(Gam)
GV 90 GamV↔ CI GamV↔ CII GamV↔ CIII GamV↔ CIV GamV↔ CVGIV 70 GamIV↔ CI GamIV↔ CII GamIV↔ CIII GamIV↔ CIV GamIV↔ CVGIII 50 GamIII↔ CI GamIII↔ CII GamIII↔ CIII GamIII↔ CIV GamIII↔ CVGII 30 GamII↔ CI GamII↔ CII GamII↔ CIII GamII↔ CIV GamII↔ CVGI 10 GamI↔ CI GamI↔ CII GamI↔ CIII GamI↔ CIV GamI↔ CV
The analysis of each of the linking options (Table 3) may be a premise for a detailedassessment of the effects of matching or mismatching a given generation of technical
Processes 2021, 9, 2103 8 of 21
devices to a given farm category. Individual categories (or generations) are identified bymeasurable features with a specific range of values. Hence, they can be confronted withone another, and conclusions can be drawn regarding the positive or negative effects oflinking farm categories and their features with the generations of technical equipment.
2.4. Linking the Technological Level with the Assessment of the Implementation of Various Formsof Progress
The value of the technological level related to the implementation of tasks on the farmreflects the level of technical advancement of the agricultural equipment used. The transi-tion from the lowest to the highest categories of farms is accompanied by the use of moreand more modern technical equipment. The features of modern equipment are the mainfactor identifying technical progress. In practice, technical progress is implemented viaincreasingly higher generation equipment used on farms.
In addition to technical progress, other forms of progress can also be distinguishedin the dairy farm. One such form is biological progress, as identified by the milk yield ofcows showing a systematic upward trend over the past decades. Cows’ milk yield is one ofthe measurable features characterizing the farm categories included in Table 2. Technicalprogress can be interrelated with biological progress in dairy farms, using milking robots.The following cases may accompany the simultaneous implementation of these two formsof progress:
• Biological progress is ahead of technical progress;• Technical progress is ahead of biological progress;• Biological progress and technological progress converge in terms of specific, measur-
able features.
Various forms of progress accompanying dairy production are an inspiration to evalu-ate the effects and consequences of their simultaneous implementation.
2.5. Research Materials in the Area of Dairy Production
The data needed to conduct an energy–technological analysis of milk production—with particular emphasis on milking—were collected during visits to 30 dairy farmslocated mainly in Poland. During visits to the farms, data on cow milking were collected.The power of the engines that powered the milking unit and vacuum pump, along with thecompressor (if used) and the associated devices (washers), were identified. It was assumedthat the engines were selected by the producers of individual milking installations, takinginto account the same power reserves.
The data collected on farms included the number of cows in the herd, the milkingtime of the herd, and the amount of milk milked. The number of milkers was taken intoaccount for the calculation of the milking efficiency indices. In each farm, observationswere made for morning and afternoon milking (only farms with two milkings per day werevisited). In farms using milking robots, the time of employee involvement, the amount ofmilk harvested during the day, and the number of cows in the herd were determined inorder to calculate the performance evaluation indicators. The amount of water used in themilking and washing process was estimated for each of the farms.
In order to standardize the collection of data on farms, an appropriate questionnairesheet was developed, taking into account the division of information into categoriescovering farms, barns, milking equipment, employees, and cows.
The visited farms used bucket and pipeline milking machines, tandem milking parlors,herringbone, side-by-side, and carousel milking parlors, as well as single- and double-stallmilking robots; farms keeping a few hand-milked cows were also visited. The size of thedairy cow herds in the farms visited ranged from 2 to 285 cows. The age of the cows andtheir lactation were collected, but the data were not included in the calculations.
The data collected on the farms were used to calculate the technological index level(TL), and in the next stage, in order to present the changes of the considered cow milkingindicators along with the increase in TL, the Statistica v.13 program [39] was used to plot
Processes 2021, 9, 2103 9 of 21
the course of changes in the analyzed parameters. The course of changes in variables wasapproximated by a linear fit, taking into account the regression interval with the forecastof 0.95.
3. Results and Discussion3.1. Milkman’s Work Productivity
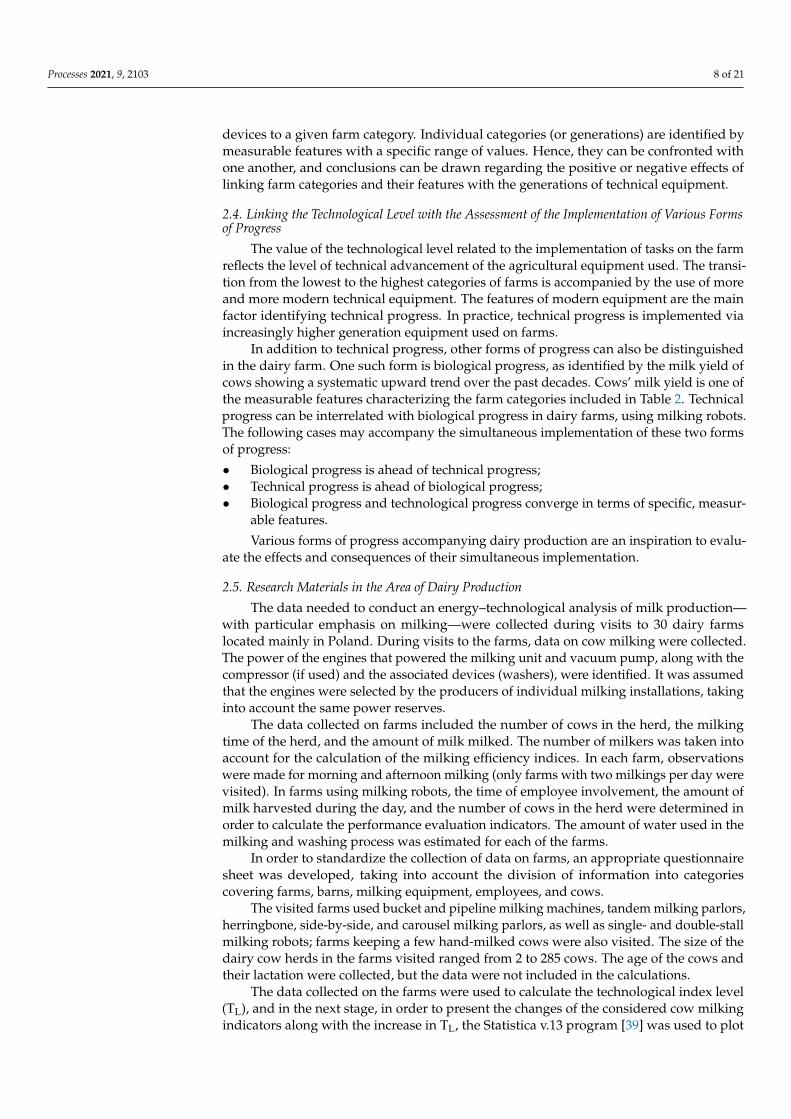
The milkman’s work productivity is one of the key indicators for assessing the ef-ficiency of the milk production process in a dairy farm. The number of animals milkedand the amount milked per hour play important roles in the evaluation of the milkman’swork productivity.
Figure 3 shows the changes in the milkman’s work productivity (Pc), expressed interms of the number of cows handled per hour (c/m-h). In the analyzed range of variabilityof the technological index level (TL), from 10% to 90%, an over 20-fold increase in thenumber of animals that can be handled during one man-hour was observed.
Figure 3. Changes in the milkman’s work productivity (Pc) with an increase in the technologicalindex level (TL).
Reducing the manual labor input in the milking process is accompanied by a gradualre-evaluation of the role of employees, as well as growing requirements for their qualifica-tions. These are requirements related to the ability to operate and supervise the increasinglycomplex and technically sophisticated devices that are standard equipment in modernmilking parlors. The implementation of technical progress in the cow milking processimplies the need for systematic improvement of the milkman’s knowledge, which allowsfor full use of the functions of the milking equipment/technical systems on the farm.
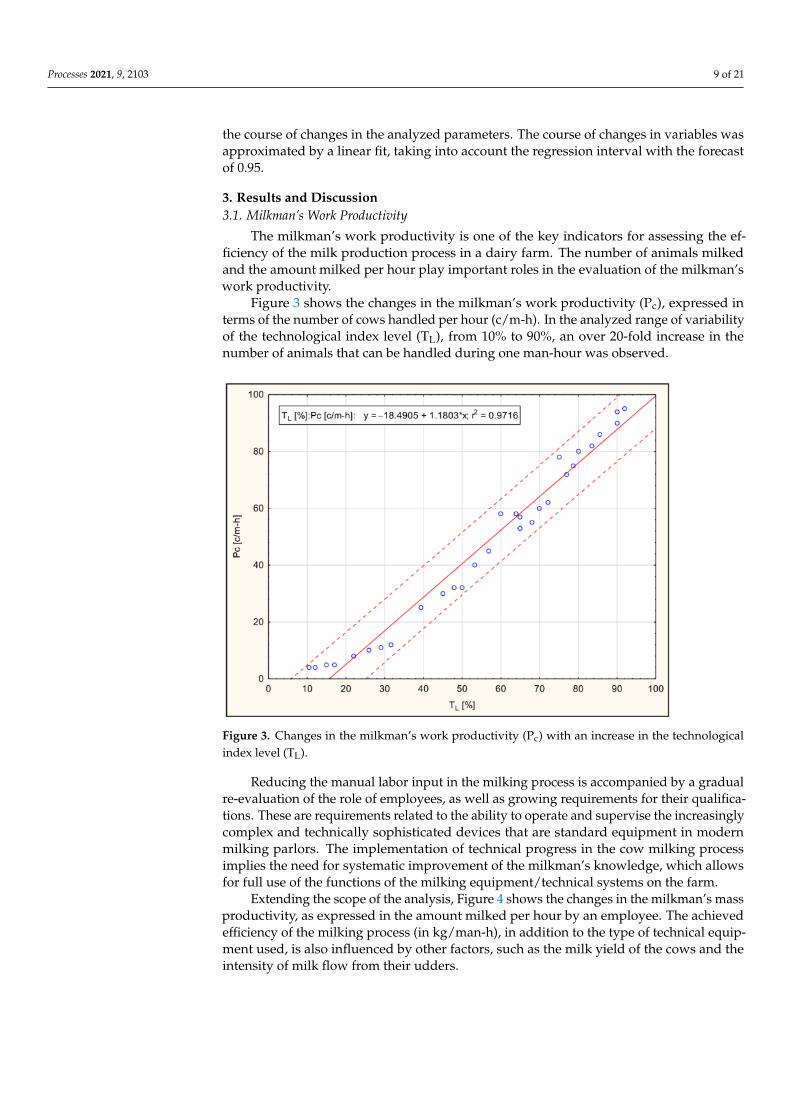
Extending the scope of the analysis, Figure 4 shows the changes in the milkman’s massproductivity, as expressed in the amount milked per hour by an employee. The achievedefficiency of the milking process (in kg/man-h), in addition to the type of technical equip-ment used, is also influenced by other factors, such as the milk yield of the cows and theintensity of milk flow from their udders.
Processes 2021, 9, 2103 10 of 21
Figure 4. Changes in the milkman’s mass productivity (Pm) with an increase in the technologicalindex level (TL).
The increase in the technological index level (TL) in the range of 10–90% is accom-panied by a more than 50-fold increase in the amount milked by the worker per hour,from ~20 to ~1100 L per man-hour. This highlights the benefits of using more and moremodern technical equipment in the cow milking process. The increasing technical sophisti-cation of the milking systems reflects technical progress. Examples of milking equipmentrepresenting the latest generation of equipment used on dairy farms include automaticmilking systems (AMSs) and automatic milking rotary (AMR).
In addition to the number of cows and the amount of milk per milkman per hour,other indicators can also be used to analyze and compare various milking solutions. Theseinclude the milking efficiency per milking stall—including the number of cows per milkingstall (heads/stall) and the amount of milk flowing through one milking stall (L/stall)—aswell as the stall load index [40]. However, such indicators are mainly used in the case ofmilking parlors, representing a more advanced generation of technical equipment.
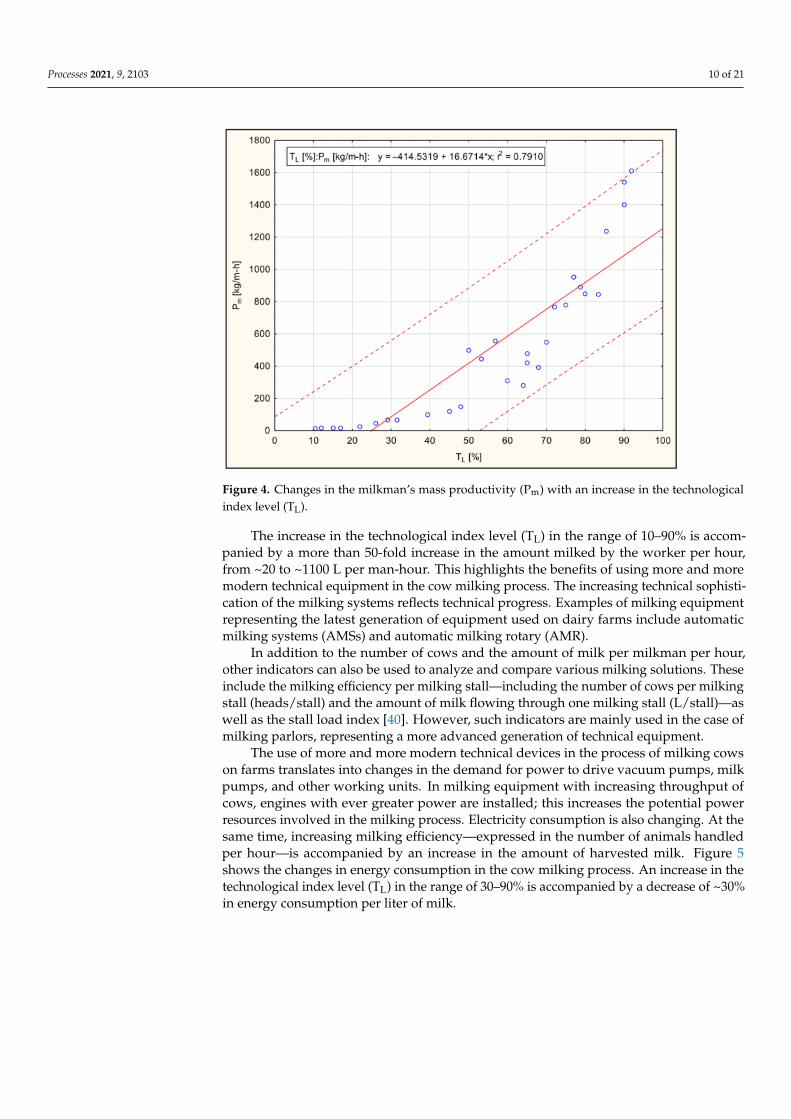
The use of more and more modern technical devices in the process of milking cowson farms translates into changes in the demand for power to drive vacuum pumps, milkpumps, and other working units. In milking equipment with increasing throughput ofcows, engines with ever greater power are installed; this increases the potential powerresources involved in the milking process. Electricity consumption is also changing. At thesame time, increasing milking efficiency—expressed in the number of animals handledper hour—is accompanied by an increase in the amount of harvested milk. Figure 5shows the changes in energy consumption in the cow milking process. An increase in thetechnological index level (TL) in the range of 30–90% is accompanied by a decrease of ~30%in energy consumption per liter of milk.
Processes 2021, 9, 2103 11 of 21
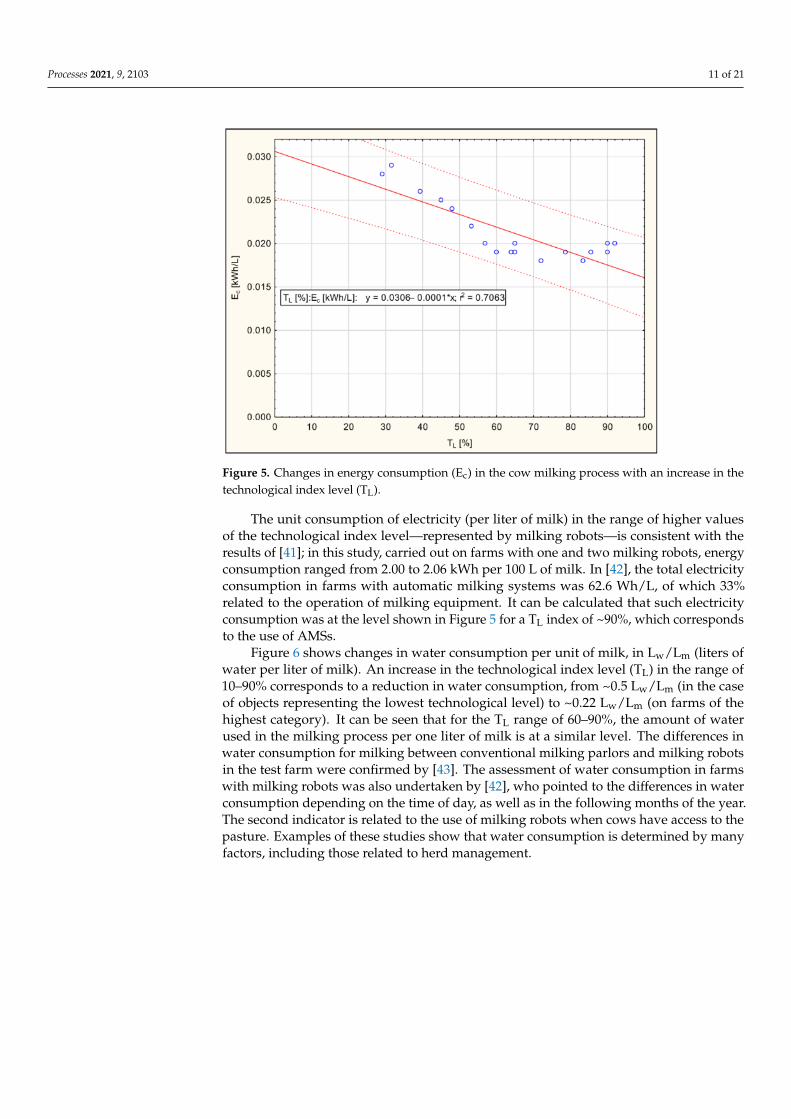
Figure 5. Changes in energy consumption (Ec) in the cow milking process with an increase in thetechnological index level (TL).
The unit consumption of electricity (per liter of milk) in the range of higher valuesof the technological index level—represented by milking robots—is consistent with theresults of [41]; in this study, carried out on farms with one and two milking robots, energyconsumption ranged from 2.00 to 2.06 kWh per 100 L of milk. In [42], the total electricityconsumption in farms with automatic milking systems was 62.6 Wh/L, of which 33%related to the operation of milking equipment. It can be calculated that such electricityconsumption was at the level shown in Figure 5 for a TL index of ~90%, which correspondsto the use of AMSs.
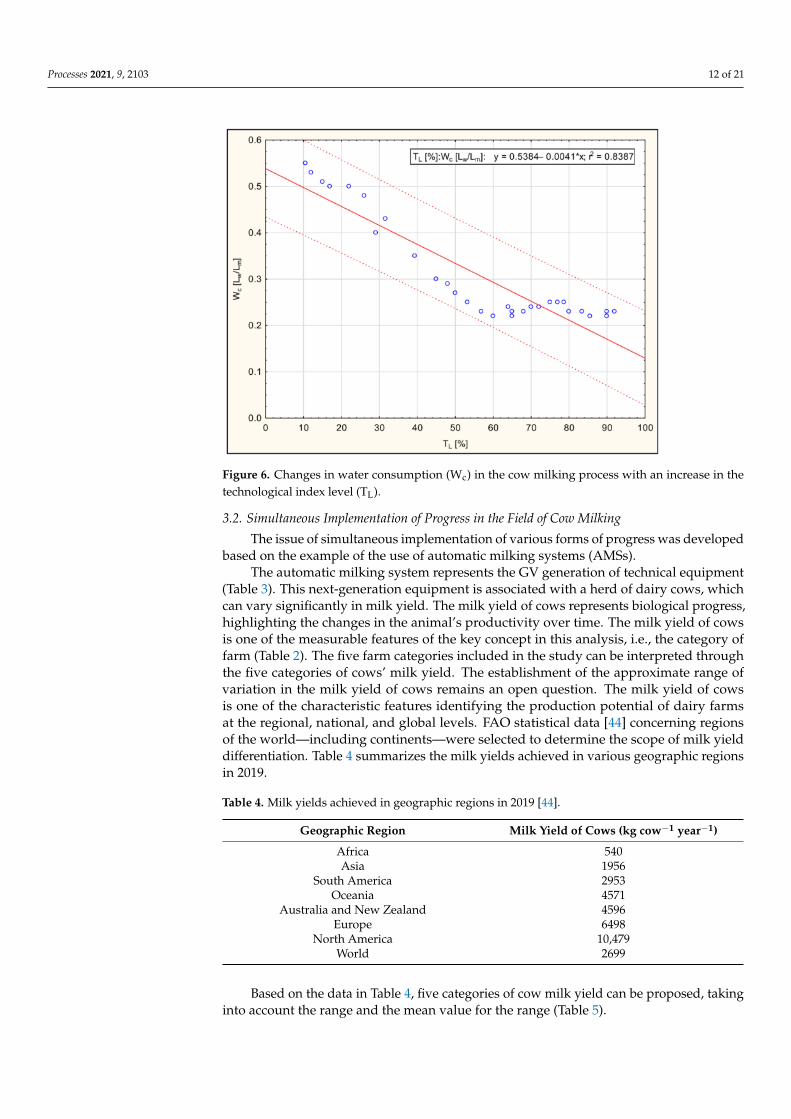
Figure 6 shows changes in water consumption per unit of milk, in Lw/Lm (liters ofwater per liter of milk). An increase in the technological index level (TL) in the range of10–90% corresponds to a reduction in water consumption, from ~0.5 Lw/Lm (in the caseof objects representing the lowest technological level) to ~0.22 Lw/Lm (on farms of thehighest category). It can be seen that for the TL range of 60–90%, the amount of waterused in the milking process per one liter of milk is at a similar level. The differences inwater consumption for milking between conventional milking parlors and milking robotsin the test farm were confirmed by [43]. The assessment of water consumption in farmswith milking robots was also undertaken by [42], who pointed to the differences in waterconsumption depending on the time of day, as well as in the following months of the year.The second indicator is related to the use of milking robots when cows have access to thepasture. Examples of these studies show that water consumption is determined by manyfactors, including those related to herd management.
Processes 2021, 9, 2103 12 of 21
Figure 6. Changes in water consumption (Wc) in the cow milking process with an increase in thetechnological index level (TL).
3.2. Simultaneous Implementation of Progress in the Field of Cow Milking
The issue of simultaneous implementation of various forms of progress was developedbased on the example of the use of automatic milking systems (AMSs).
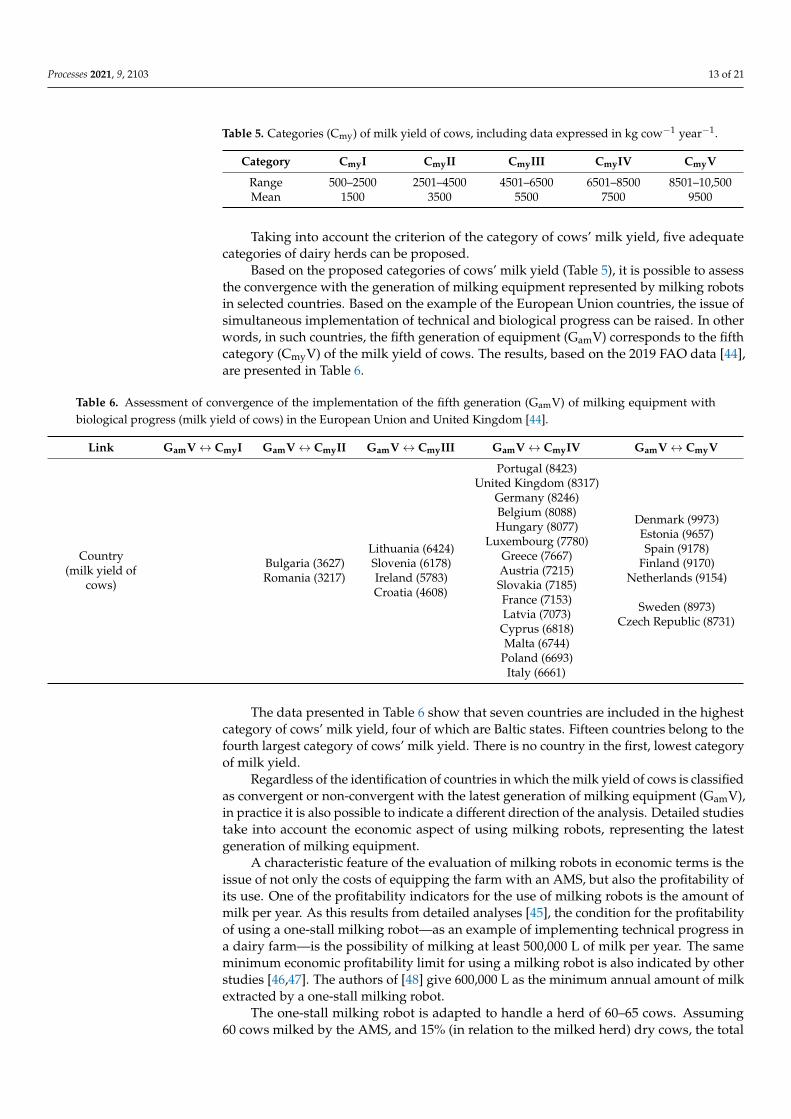
The automatic milking system represents the GV generation of technical equipment(Table 3). This next-generation equipment is associated with a herd of dairy cows, whichcan vary significantly in milk yield. The milk yield of cows represents biological progress,highlighting the changes in the animal’s productivity over time. The milk yield of cowsis one of the measurable features of the key concept in this analysis, i.e., the category offarm (Table 2). The five farm categories included in the study can be interpreted throughthe five categories of cows’ milk yield. The establishment of the approximate range ofvariation in the milk yield of cows remains an open question. The milk yield of cowsis one of the characteristic features identifying the production potential of dairy farmsat the regional, national, and global levels. FAO statistical data [44] concerning regionsof the world—including continents—were selected to determine the scope of milk yielddifferentiation. Table 4 summarizes the milk yields achieved in various geographic regionsin 2019.
Table 4. Milk yields achieved in geographic regions in 2019 [44].
Geographic Region Milk Yield of Cows (kg cow−1 year−1)
Africa 540Asia 1956
South America 2953Oceania 4571
Australia and New Zealand 4596Europe 6498
North America 10,479World 2699
Based on the data in Table 4, five categories of cow milk yield can be proposed, takinginto account the range and the mean value for the range (Table 5).
Processes 2021, 9, 2103 13 of 21
Table 5. Categories (Cmy) of milk yield of cows, including data expressed in kg cow−1 year−1.
Category CmyI CmyII CmyIII CmyIV CmyV
Range 500–2500 2501–4500 4501–6500 6501–8500 8501–10,500Mean 1500 3500 5500 7500 9500
Taking into account the criterion of the category of cows’ milk yield, five adequatecategories of dairy herds can be proposed.
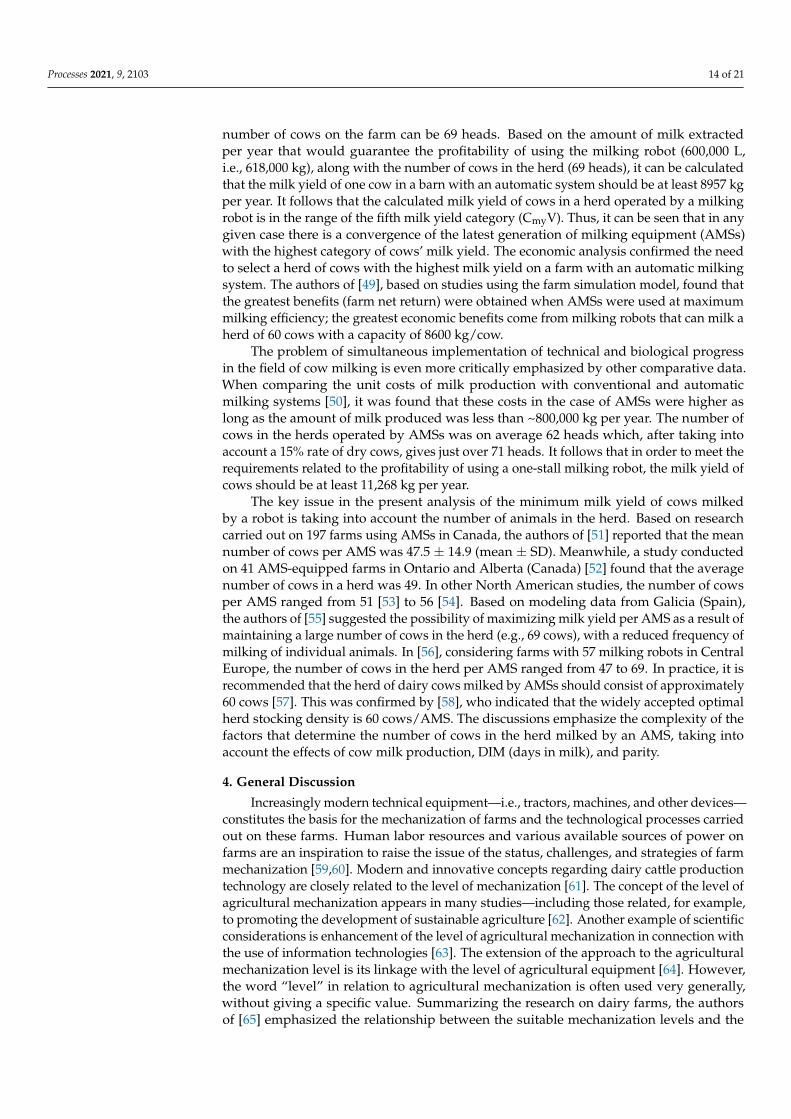
Based on the proposed categories of cows’ milk yield (Table 5), it is possible to assessthe convergence with the generation of milking equipment represented by milking robotsin selected countries. Based on the example of the European Union countries, the issue ofsimultaneous implementation of technical and biological progress can be raised. In otherwords, in such countries, the fifth generation of equipment (GamV) corresponds to the fifthcategory (CmyV) of the milk yield of cows. The results, based on the 2019 FAO data [44],are presented in Table 6.
Table 6. Assessment of convergence of the implementation of the fifth generation (GamV) of milking equipment withbiological progress (milk yield of cows) in the European Union and United Kingdom [44].
Link GamV↔ CmyI GamV↔ CmyII GamV↔ CmyIII GamV↔ CmyIV GamV↔ CmyV
Country(milk yield of
cows)
Bulgaria (3627)Romania (3217)
Lithuania (6424)Slovenia (6178)Ireland (5783)Croatia (4608)
Portugal (8423)United Kingdom (8317)
Germany (8246)Belgium (8088)Hungary (8077)
Luxembourg (7780)Greece (7667)Austria (7215)Slovakia (7185)France (7153)Latvia (7073)Cyprus (6818)Malta (6744)
Poland (6693)Italy (6661)
Denmark (9973)Estonia (9657)Spain (9178)
Finland (9170)Netherlands (9154)
Sweden (8973)Czech Republic (8731)
The data presented in Table 6 show that seven countries are included in the highestcategory of cows’ milk yield, four of which are Baltic states. Fifteen countries belong to thefourth largest category of cows’ milk yield. There is no country in the first, lowest categoryof milk yield.
Regardless of the identification of countries in which the milk yield of cows is classifiedas convergent or non-convergent with the latest generation of milking equipment (GamV),in practice it is also possible to indicate a different direction of the analysis. Detailed studiestake into account the economic aspect of using milking robots, representing the latestgeneration of milking equipment.
A characteristic feature of the evaluation of milking robots in economic terms is theissue of not only the costs of equipping the farm with an AMS, but also the profitability ofits use. One of the profitability indicators for the use of milking robots is the amount ofmilk per year. As this results from detailed analyses [45], the condition for the profitabilityof using a one-stall milking robot—as an example of implementing technical progress ina dairy farm—is the possibility of milking at least 500,000 L of milk per year. The sameminimum economic profitability limit for using a milking robot is also indicated by otherstudies [46,47]. The authors of [48] give 600,000 L as the minimum annual amount of milkextracted by a one-stall milking robot.
The one-stall milking robot is adapted to handle a herd of 60–65 cows. Assuming60 cows milked by the AMS, and 15% (in relation to the milked herd) dry cows, the total
Processes 2021, 9, 2103 14 of 21
number of cows on the farm can be 69 heads. Based on the amount of milk extractedper year that would guarantee the profitability of using the milking robot (600,000 L,i.e., 618,000 kg), along with the number of cows in the herd (69 heads), it can be calculatedthat the milk yield of one cow in a barn with an automatic system should be at least 8957 kgper year. It follows that the calculated milk yield of cows in a herd operated by a milkingrobot is in the range of the fifth milk yield category (CmyV). Thus, it can be seen that in anygiven case there is a convergence of the latest generation of milking equipment (AMSs)with the highest category of cows’ milk yield. The economic analysis confirmed the needto select a herd of cows with the highest milk yield on a farm with an automatic milkingsystem. The authors of [49], based on studies using the farm simulation model, found thatthe greatest benefits (farm net return) were obtained when AMSs were used at maximummilking efficiency; the greatest economic benefits come from milking robots that can milk aherd of 60 cows with a capacity of 8600 kg/cow.
The problem of simultaneous implementation of technical and biological progressin the field of cow milking is even more critically emphasized by other comparative data.When comparing the unit costs of milk production with conventional and automaticmilking systems [50], it was found that these costs in the case of AMSs were higher aslong as the amount of milk produced was less than ~800,000 kg per year. The number ofcows in the herds operated by AMSs was on average 62 heads which, after taking intoaccount a 15% rate of dry cows, gives just over 71 heads. It follows that in order to meet therequirements related to the profitability of using a one-stall milking robot, the milk yield ofcows should be at least 11,268 kg per year.
The key issue in the present analysis of the minimum milk yield of cows milkedby a robot is taking into account the number of animals in the herd. Based on researchcarried out on 197 farms using AMSs in Canada, the authors of [51] reported that the meannumber of cows per AMS was 47.5 ± 14.9 (mean ± SD). Meanwhile, a study conductedon 41 AMS-equipped farms in Ontario and Alberta (Canada) [52] found that the averagenumber of cows in a herd was 49. In other North American studies, the number of cowsper AMS ranged from 51 [53] to 56 [54]. Based on modeling data from Galicia (Spain),the authors of [55] suggested the possibility of maximizing milk yield per AMS as a result ofmaintaining a large number of cows in the herd (e.g., 69 cows), with a reduced frequency ofmilking of individual animals. In [56], considering farms with 57 milking robots in CentralEurope, the number of cows in the herd per AMS ranged from 47 to 69. In practice, it isrecommended that the herd of dairy cows milked by AMSs should consist of approximately60 cows [57]. This was confirmed by [58], who indicated that the widely accepted optimalherd stocking density is 60 cows/AMS. The discussions emphasize the complexity of thefactors that determine the number of cows in the herd milked by an AMS, taking intoaccount the effects of cow milk production, DIM (days in milk), and parity.
4. General Discussion
Increasingly modern technical equipment—i.e., tractors, machines, and other devices—constitutes the basis for the mechanization of farms and the technological processes carriedout on these farms. Human labor resources and various available sources of power onfarms are an inspiration to raise the issue of the status, challenges, and strategies of farmmechanization [59,60]. Modern and innovative concepts regarding dairy cattle productiontechnology are closely related to the level of mechanization [61]. The concept of the level ofagricultural mechanization appears in many studies—including those related, for example,to promoting the development of sustainable agriculture [62]. Another example of scientificconsiderations is enhancement of the level of agricultural mechanization in connection withthe use of information technologies [63]. The extension of the approach to the agriculturalmechanization level is its linkage with the level of agricultural equipment [64]. However,the word “level” in relation to agricultural mechanization is often used very generally,without giving a specific value. Summarizing the research on dairy farms, the authorsof [65] emphasized the relationship between the suitable mechanization levels and the
Processes 2021, 9, 2103 15 of 21
reduction in the required amount of labor. The proposal to use the technological indexlevel (TL) in research is an attempt to quantify—i.e., quantitatively (in the form of a numberor percentage value)—the phenomena presented descriptively, and related to the determi-nation of the level of mechanization—especially when the description of the research usesthe terms low, medium, or high level of mechanization. For example, the statement that ahigh level of mechanization in dairy farms determines both the possibility of achievingcomfortable working conditions and the production of high-quality milk [61] requiresclarification as to what is meant by the term “high level”, and what is the line betweenhigh and medium levels of mechanization.
The essence of the technological index level is the comparison of mechanical workinputs with manual work inputs incurred in a given technological process. Of course,other factors, including descriptive ones—relating to, for example, various aspects ofmodernity—can also be selected for the assessment of production technology. Precisiondairy technologies constitute one such example [66]. The purpose of implementing thesetechnologies is to reduce the labor demand [67]. The demand for manual work is includedin the formula for determining the technological index level, which thus confirms theusefulness of this index—for example to assess the modernity of technology, includingdairy production technology.
In the discussions and research studies undertaken, attention should be drawn to thefact that one of the conditions for increasing the level of agricultural mechanization is theinclusion of IT elements in the construction, along with use of agricultural machinery [63].The question remains as to how to accurately assess the impact of computerization onchanges in the level of agricultural mechanization. The same question applies to theissue of innovative processes and their management [68], considered as an element of theassessment of technological progress.
The implementation of production technology in agriculture involves the consump-tion of various forms of energy. The present study of energy–technological analysis isan example of the use of labor and energy inputs to develop a technological index level.The essence of energy use in the assessment of production processes was confirmed by [69],who developed the “flow energy value map”. This approach made it possible to planproduction on a dairy farm, taking into account the criteria of the best economic, environ-mental, and social efficiency. The relationship between efficiency and energy consumptionin dairy production systems is the subject of many studies, including those involvingsmall dairy production systems [70]. These are studies showing the consumption of var-ious forms of energy not only in dairy farms, but also in milk processing. The resultof these and other studies [71] is to determine energy consumption (in MJ), as well ascarbon dioxide emissions per kilogram of milk at the farm or processing stage. The energyconsumption found in this research is the basis for looking for savings in dairy produc-tion and processing technologies. Addressing the issue of the energy intensity of milkproduction, the authors of [72] emphasized the need to formulate recommendations forthe management of livestock production operations that will reduce energy consumptionin dairy farms. The presented results of this research are based on a different approach.Information on the energy used was taken to calculate the technological index level (TL) asan independent variable to evaluate the course of various parameters characterizing dairyproduction. The effect of using the technological index level was to indicate the possibilityof introducing categories of farms differing in terms of production potential and otherparameters. The proposed classification created in the agricultural production area on thebasis of the TL index is consistent with the tendency to develop typological classificationsin the dairy sector, which can be used, for example, to assess the sustainability of farms [73]and identify the differences in dairy management priorities [74].
The proposed classification of cows’ milk yield based on five categories can be con-sidered as an example of an approach to assess the differentiation of production potentialon dairy farms. Every day this production potential is confronted on farms, in termsof the technical potential of the milking equipment. The result of this confrontation is
Processes 2021, 9, 2103 16 of 21
the achievement of specific milking efficiency indicators, including the milkman’s workproductivity, as well as energy and water consumption.
The present study indicates the essence of cows’ milk yield in a herd operated by anautomatic milking system. In farms using milking robots, it can be expected that cows withhigh (the highest) milk yield will be selected for the herd [75]. In practice, as shown byprevious studies [76], farms with milking robots achieved higher milk yields compared tocows in farms using conventional (pipeline) milking systems. Similar trends were observedin other groups of researched farms; where milking parlors were used, the milk yield ofcows was higher compared to herds on farms with bucket milking systems [77]. In otherwords, more sophisticated on-farm milking equipment can lead to higher milk yields [78].Such a statement, however, requires confirmation in additional studies based on a largernumber of dairy farms.
Another observation also requires confirmation with a larger number of dairy herds:Examples of analyses [79] indicate a tendency towards an increase in the milk yield ofcows along with an increase in the number of cows in the herd. An increase in size of theherd justifies the selection of milking equipment with ever-greater milking capacity [80].This is due to the transition to more and more advanced milking equipment. Thus, one ofthe observations presented in this study can be confirmed—that the latest generation ofmilking equipment (GamV) may correspond to the highest category of milk yield (CmyV).
In previous studies [81], the production characteristics of dairy cows—including milkyield—were used for segmentation (grouping) of a herd operated by an automatic milkingsystem. The evaluation of milk yield can therefore be considered not only in the context ofdifferent milking systems, but also within a single milking system (AMS).
The range of the considered milk yield of cows proposed in this study was establishedon the basis of data from 2019. The year of generation of the data for the analysis isimportant in this case, taking into account the tendency for the increase in the milk yield ofcows over the years. For example, the research conducted in [82] compared the dynamicsof the increase in cows’ milk yield in three countries over two decades. In one country(Estonia), attention was paid to increasing the growth rate, while in the other two countries(Latvia and Poland), the focus was on reducing the growth rate of cows’ milk yield.
The range of cows’ milk yield proposed in this study was developed on the basis ofdata from various geographical regions of the world. The scope of the data can of coursebe limited to a selected region and, as a result, create a basis for comparing the milk yieldof cows in that region.
The problem of differences in the milk yield of cows in comparison with the sophistica-tion of milking equipment, as considered in this analysis, is part of the problem presentedin the literature—referred to as the “yield gap”. The concept of the yield gap—i.e., the dif-ference between the theoretical maximum production and the current production of dairycows—was the premise for the development of the dairy production systems analysismodel [83].
The milk yield of cows is one of the key elements in the evaluation of dairy productionon farms, and is the result of the breed and genetic potential of the animals, the specificityof the feeding system, including the type of feed, and the age, health status, and lactationperiod of the cow, among other factors [84]. A large number of factors relating to cowsand the dairy production environment provide inspiration for forecasting the milk yieldof cows, taking into account the herds milked via robotic systems. As a result of usingappropriate statistical tools, including the decision tree technique [85], the most importantfactors responsible for the milk yield of cows can be identified. In the case of cows milkedby AMSs, these factors were milking frequency, lactation number, and DIM (days in milk).
The problem of the diversification of agricultural production space has become apremise for attempts to classify agricultural facilities, including farms, their equipment,and agricultural production technologies. The creation of this type of classification allowsthe organization of the research area in order to, for example, adapt a development strategyfor dairy production systems [86]. The question remains the choice of the farm classifica-
Processes 2021, 9, 2103 17 of 21
tion criteria and the number of distinguished groups of farms; in the mentioned studies,the latter consisted of six homogeneous groups of dairy farms. The research conductedby [87] defined three groups of farms in the typology of dairy production systems (DPSs),based on the assessment of economic, social, and environmental factors. As a result of thestatistical analysis, the authors of [88] identified four groups of dairy farms differentiatedby different levels of technology. The present study covers five categories of farms; size isthe key criterion for distinguishing those five categories. Size refers to the characteristicsunder consideration, including area and number of animals (herd size). Moving to higherand higher categories of farms corresponds to an increase in the number of animals in theherd. The tendency towards an increasing share of dairy cows kept in larger herds wasnoted in [89]; however, the dynamics of this phenomenon vary between countries.
The effects of dairy farm enlargement were noted in [90], linking farm size withprofessionalization; the authors indicated that on larger farms, workers may be betterpaid, better trained, and may have more specialized skills; they can also achieve highersatisfaction [91] and work efficiency [92]. According to [93], with increasing farm size,the importance of manual (family) labor relatively decreases. The authors of [94] expressedthe opinion that increasing the size of dairy farms is accompanied by a shift from familylabor to external labor.
Human work in the dairy production system is subject to quantitative and qualitativeassessment. As a result of the implementation of technical and technological progress,the quantitative human contribution to tasks in dairy farms decreases. Technical supportfor people translates to an increase in the quality of work performed, as well as its safety.Changing the proportion between quantitative and qualitative values in job evaluationshould contribute to increasing the satisfaction of dairy farm owners in the process oftransforming the food chain [95].
5. Conclusions
The technological index level can be considered as a tool for assessing productionprocesses in agriculture, along with the effects of implementing technological progress.The effect of technological progress, taking into account the growing share of work inputsfrom technical devices in the total input of manual and machine work, is an increase inhuman work efficiency. In the case of cow milking, an increase in the technological indexlevel in the range of 10–90% was accompanied by an approximately 20-fold increase in thenumber of cows milked. There was also an over 50-fold increase in the amount of milk permilkman. Technological progress, identified by an increase in the technological index level,is also expressed in a reduction in electricity and water consumption per liter of milk.
The essence of implementing technical progress in dairy production is to fully use thepotential of modernity in the designed and modernized technical equipment. Rational useof the potential of milking robots, representing technical progress, is conditioned by themilking of a herd of dairy cows with an appropriate milk yield, representing biologicalprogress. In this context, it is justified to develop further research showing the effects ofthe simultaneous implementation of various related forms of progress—not only in dairyproduction, but also in other areas of agricultural activity.
Funding: APC was partially funded by the Institute of Mechanical Engineering, Warsaw Universityof Life Sciences.
Institutional Review Board Statement: Not applicable.
Informed Consent Statement: Informed consent was obtained from all subjects involved in the study.
Data Availability Statement: Not applicable.
Acknowledgments: The author would like to thank all dairy farm owners for the opportunity tocarry out the observations and measurements used to prepare the research study, as well as for all ofthe discussions that inspired him to consider the problem of evaluating dairy production systems.
Conflicts of Interest: The author declares no conflict of interest.
Processes 2021, 9, 2103 18 of 21
References1. Pawlak, K.; Kołodziejczak, M. The role of agriculture in ensuring food security in developing countries: Considerations in the
context of the problem of sustainable food production. Sustainability 2020, 12, 5488. [CrossRef]2. Zegar, J.S. Współczesne Wyzwania Rolnictwa (Contemporary Challenges of Agriculture); Polish Scientific Publishers: Warsaw, Poland,
2012. (In Polish)3. Gerosa, S.; Skoet, J. Milk Availability. Trends in Production and Demand and Medium-Term Outlook; ESA Working Paper No 12-01;
Agricultural Development Economics Division, FAO: Rome, Italy, 2012; p. 38.4. Bakke, A.J.; Shehan, C.V.; Hayes, J.E. Type of milk typically consumed, and stated preference, but not health consciousness affect
revealed preferences for fat in milk. Food Qual. Prefer. 2016, 49, 92–99. [CrossRef] [PubMed]5. Canavari, M.; Coderoni, S. Consumer stated preferences for dairy products with carbon footprint labels in Italy. Agric. Food Econ.
2020, 8, 4. [CrossRef]6. Ertl, P.; Klocker, H.; Hörtenhuber, S.; Knaus, W.; Zollitsch, W. The net contribution of dairy production to human food supply:
The case of Austrian dairy farms. Agric. Syst. 2015, 137, 119–125. [CrossRef]7. Gloy, B.A.; Hyde, J.; LaDue, E.L. Dairy farm management and long-term farm financial performance. Agric. Res. Econ. Rev. 2002,
31, 233–247. [CrossRef]8. Hanson, J.D.; Franzluebbers, A. Principles of integrated agricultural systems. Renew. Agric. Food Syst. 2008, 23, 263–264.
[CrossRef]9. Walters, J.P.; Archer, D.W.; Sassenrath, G.F.; Hendrickson, J.R.; Hanson, J.D.; Halloran, J.M.; Vadas, P.; Alarcon, V.J. Exploring
agricultural production systems and their fundamental components with system dynamics modelling. Ecol. Model. 2016, 333,51–65. [CrossRef]
10. Hendrickson, J.R.; Sassenrath, G.F.; Archer, D.W.; Hanson, J.D.; Halloran, J.M. Interactions in integrated agricultural systems: Thepast, present and future. Renew. Agric. Food Syst. 2008, 23, 314–324. [CrossRef]
11. Nowacki, T. Paradygmaty Energotechnologicznej Efektywnosci Transformacji Gospodarki Zywnosciowej [Paradigms of Energy EffectivenessEvaluation in Food Economy Transformation]; Institute of Rural and Agricultural Development; Polish Academy of Sciences: Warsaw,Poland, 1999; p. 124. (In Polish)
12. Von Keyserlingk, M.A.G.; Martin, N.P.; Kebreab, E.; Knowlton, K.F.; Grant, R.J.; Stephenson, M.; Sniffen, C.J.; Harner, J.P.; Wright,A.D.; Smith, S.I. Invited review: Sustainability of the US dairy industry. J. Dairy Sci. 2013, 96, 5405–5425. [CrossRef]
13. Díaz de Otálora, X.; del Prado, A.; Dragoni, F.; Estellés, F.; Amon, B. Evaluating three-pillar sustainability modelling approachesfor dairy cattle production systems. Sustainability 2021, 13, 6332. [CrossRef]
14. Del Prado, A.; Scholefield, D. Use of SIMSDAIRY modelling framework system to compare the scope on the sustainability of adairy farm of animal and plant genetic-based improvements with management-based changes. J. Agric. Sci. 2008, 146, 195–211.[CrossRef]
15. Van Calker, K.J.; Berentsen, P.B.M.; Giesen, G.W.J.; Huirne, R.B.M. Maximising sustainability of Dutch dairy farming systems fordifferent stakeholders: A modelling approach. Ecol. Econ. 2008, 65, 407–419. [CrossRef]
16. Vayssières, J.; Guerrin, F.; Paillat, J.M.; Lecomte, P. GAMEDE: A global activity model for evaluating the sustainability of dairyenterprises Part I-Whole-farm dynamic model. Agric. Syst. 2009, 101, 128–138. [CrossRef]
17. Färe, R.; Whittaker, G. An intermediate input model of dairy production using complex survey data. J. Agricult. Econ. 1995, 46,201–213. [CrossRef]
18. Reyes, A.A.; Blake, R.W.; Shumway, C.R.; Long, J.T. Multistage optimization model for dairy production. J. Dairy Sci. 1981, 64,2003–2016. [CrossRef]
19. Miranda, M.J.; Schnitkey, G.D. An empirical model of asset replacement in dairy production. J. Appl. Econom. 1995, 10, S41–S55.[CrossRef]
20. Shalloo, L.; Dillon, P.; Rath, M.; Wallace, M. Description and validation of the Moorepark Dairy System Model. J. Dairy Sci. 2004,87, 1945–1959. [CrossRef]
21. Schils, R.L.M.; de Haan, M.H.A.; Hemmer, J.G.A.; van den Pol-van Dasselaar, A.; de Boer, J.A.; Evers, A.G.; Holshof, G.; vanMiddelkoop, J.C.; Zom, R.L.G. DairyWise, A Whole-Farm Dairy Model. J. Dairy Sci. 2007, 90, 5334–5346. [CrossRef]
22. Doole, G.J.; Romera, A.J.; Adler, A.A. An optimization model of a New Zealand dairy farm. J. Dairy Sci. 2013, 96, 2147–2160.[CrossRef]
23. Rotz, C.A.; Black, J.R.; Mertens, D.R.; Buckmaster, D.R. DAFOSYM: A Model of the Dairy Forage System. J. Product. Agric. 1989,2, 83–91. [CrossRef]
24. Beukes, P.C.; Palliser, C.C.; Macdonald, K.A.; Lancaster, J.A.S.; Levy, G.; Thorrold, B.S.; Wastney, M.E. Evaluation of a Whole-FarmModel for pasture-based dairy systems. J. Dairy Sci. 2008, 91, 2353–2360. [CrossRef] [PubMed]
25. Rotz, C.A.; Montes, F.; Hafner, S.D.; Heber, A.J.; Grant, R.H. Ammonia emission model for whole farm evaluation of dairyproduction systems. J. Environ. Qual. 2014, 43, 1143–1158. [CrossRef] [PubMed]
26. Dou, Z.; Kohn, R.A.; Ferguson, J.D.; Boston, R.C.; Newbold, J.D. Managing nitrogen on dairy farms: An integrated approach I.Model description. J. Dairy Sci. 1996, 79, 2071–2080. [CrossRef]
27. Ghisellini, P.; Protano, G.; Viglia, S.; Gaworski, M.; Setti, M.; Ulgiati, S. Integrated agricultural and dairy production within acircular economy framework. A comparison of Italian and Polish farming systems. J. Environ. Account. Manag. 2014, 2, 367–384.[CrossRef]
Processes 2021, 9, 2103 19 of 21
28. Salinas-Martínez, J.A.; Posadas-Domínguez, R.R.; Morales-Díaz, L.D.; Rebollar-Rebollar, S.; Rojo-Rubio, R. Cost analysis andeconomic optimization of small-scale dairy production systems in Mexico. Livest. Sci. 2020, 237, 104028. [CrossRef]
29. Binswanger, H. Agricultural mechanization: A comparative historical perspective. World Bank Res. Obs. 1986, 1, 27–56. [CrossRef]30. Olmstead, A.L.; Rhode, P. An overview of California agricultural mechanization, 1870–1930. Agric. Hist. 1988, 62, 86–112.
Available online: http://www.jstor.org/stable/3743209 (accessed on 15 July 2021).31. Sims, B.; Kienzle, J. Sustainable agricultural mechanization for smallholders: What is it and how can we implement it? Agriculture
2017, 7, 50. [CrossRef]32. Michałek, R.; Kowalski, J. Technical progress in agriculture. Ann. Rev. Agric. Eng. 2000, 2, 67–80.33. Michałek, R. (Ed.) Uwarunkowania Technicznej Rekonstrukcji Rolnictwa [Conditions for the Technical Reconstruction of Agriculture];
PTIR: Cracow, Poland, 1998. (In Polish)34. Wójcicki, Z. Technological progress and consumption of energy in the agricultural production in Poland. Probl. Rol. Swiat. 2006,
15, 95–103. (In Polish)35. Creswell, J.W. Research Design: Qualitative, Quantitative, and Mixed Methods Approaches, 1st ed.; Wyd. UJ: Cracow, Poland, 2013.
(In Polish)36. Nowacki, T.; Nowacki, J.K. Changes and Trends in the Quality and Balance of Energy Consumption in Agriculture (General Methodology);
AGRI/MECH Report No. 105; United Nations: Geneva, Switzerland, 1984.37. Šarauskis, E.; Naujokiene, V.; Lekaviciene, K.; Kriauciuniene, Z.; Jotautiene, E.; Jasinskas, A.; Zinkeviciene, R. Application of
granular and non-granular organic fertilizers in terms of energy, environmental and economic efficiency. Sustainability 2021, 13,9740. [CrossRef]
38. Mota-Rojas, D.; Braghieri, A.; Álvarez-Macías, A.; Serrapica, F.; Ramírez-Bribiesca, E.; Cruz-Monterrosa, R.; Masucci, F.; Mora-Medina, P.; Napolitano, F. The use of draught animals in rural labour. Animals 2021, 11, 2683. [CrossRef]
39. Statistica v.13 Software; StatSoft Polska: Cracow, Poland, 2021. Available online: www.statsoft.pl (accessed on 2 September 2021).40. Gaworski, M.; Kaminska, N.; Kic, P. Evaluation and optimization of milking in some Polish dairy farms differed in milking
parlours. Agron. Res. 2017, 15, 112–122.41. Calcante, A.; Tangorra, F.M.; Oberti, R. Analysis of electric energy consumption of automatic milking systems in different
configurations and operative conditions. J. Dairy Sci. 2016, 99, 4043–4047. [CrossRef]42. Shortall, J.; O’Brien, B.; Sleator, R.D.; Upton, J. Daily and seasonal trends of electricity and water use on pasture-based automatic
milking dairy farms. J. Dairy Sci. 2018, 101, 1565–1578. [CrossRef]43. Rasmussen, J.B.; Pedersen, J. Electricity and Water Consumption at Milking; Farm Test–Cattle nr. 17, 1–42; Danish Agricultural
Advisory Service: Aarhus, Denmark, 2004.44. FAOstat. Available online: http://www.fao.org/faostat/en/#data/QI (accessed on 20 September 2021).45. Meskens, L.; Vandermersch, M.; Mathijs, E. Implication of the Introduction of Automatic Milking on Dairy Farms. Literature Review on
the Determinants and Implications of Technology Adoption; Internal Report; Catholic University: Leuven, Belgium, 2001.46. Kaufmann, R.; Ammann, H.; Hilty, R.; Nosal, D.; Schick, M. Automatisches Melken-Systeme, Einsatzgrenzen, Wirtschaftlichkeit;
FAT-Berichte Nr. 579; Forschungsanstalt für Agrarwirtschaft und Landtechnik FAT: Tänikon, Switzerland, 2001; p. 579. (InGerman)
47. Harms, J.; Wendl, G. Analyze von Kapazitätsreserven bei Automatischen Melksystemen. Landtechnik 2009, 6, 432–435. (InGerman) [CrossRef]
48. Bonsels, T.; Schmitz, M. Roboter: Zu viel Leerlauf. Top Agrar. 2013, 1, 22–24. (In German)49. Rotz, C.A.; Coiner, C.U.; Soder, K.J. Automatic milking systems, farm size, and milk production. J. Dairy Sci. 2003, 86, 4167–4177.
[CrossRef]50. Heikkilä, A.M.; Vanninen, L.; Manninen, E. Economics of small-scale dairy farms having robotic milking. In Proceedings of the
First North American Conference on Precision Dairy Management, Toronto, ON, Canada, 2–5 March 2010.51. Matson, R.D.; King, M.T.M.; Duffield, T.F.; Santschi, D.E.; Orsel, K.; Pajor, E.A.; Penner, G.B.; Mutsvangwa, T.; DeVries, T.J.
Benchmarking of farms with automated milking systems in Canada and associations with milk production and quality. J. DairySci. 2021, 104, 7971–7983. [CrossRef]
52. King, M.T.M.; Pajor, E.A.; LeBlanc, S.J.; DeVries, T.J. Associations of herd-level housing, management, and lameness prevalencewith productivity and cow behavior in herds with automated milking systems. J. Dairy Sci. 2016, 99, 9069–9079. [CrossRef]
53. Tremblay, M.; Hess, J.P.; Christenson, B.M.; McIntyre, K.K.; Smink, B.; van der Kamp, A.J.; de Jong, L.G.; Dopfer, D. Factorsassociated with increased milk production for automatic milking systems. J. Dairy Sci. 2016, 99, 3824–3837. [CrossRef] [PubMed]
54. Siewert, J.M.; Salfer, J.A.; Endres, M.I. Factors associated with productivity on automatic milking system dairy farms in the UpperMidwest United States. J. Dairy Sci. 2018, 101, 8327–8334. [CrossRef] [PubMed]
55. Castro, A.; Pereira, J.M.; Amiama, C.; Bueno, J. Estimating efficiency in automatic milking systems. J. Dairy Sci. 2012, 95, 929–936.[CrossRef] [PubMed]
56. Gaworski, M.; Leola, A.; Sada, O.; Kic, P.; Priekulis, J. Effect of cow traffic system and herd size on cow performance and automaticmilking systems capacity. Agron. Res. 2016, 14, 33–40.
57. Jacobs, J.A.; Siegford, J.M. Invited review: The impact of automatic milking systems on dairy cow management, behavior, health,and welfare. J. Dairy Sci. 2012, 95, 2227–2247. [CrossRef]
Processes 2021, 9, 2103 20 of 21
58. Deming, J.A.; Bergeron, R.; Leslie, K.E.; DeVries, T.J. Associations of housing, management, milking activity, and standing andlying behavior of dairy cows milked in automatic systems. J. Dairy Sci. 2013, 96, 344–351. [CrossRef]
59. Mehta, C.R.; Chandel, N.S.; Senthilkumar, T. Status, challenges and strategies for farm mechanization in India. Agric. Mech. AsiaAfr. Lat. Am. 2014, 45, 43–50.
60. Priekulis, J.; Laurs, A. Development trends of milk production mechanisation in Latvia. In Proceedings of the Conference onEngineering for Rural Development, Jelgava, Latvia, 20–22 May 2020; Volume 19, pp. 270–275. [CrossRef]
61. Romaniuk, W.; Mazur, K.; Borek, K.; Borusiewicz, A.; Wardal, W.J.; Tabor, S.; Kubon, M. Biomass energy technologies frominnovative dairy farming systems. Processes 2021, 9, 335. [CrossRef]
62. Luo, X.; Liao, J.; Hu, L.; Zang, Y.; Zhou, Z. Improving agricultural mechanization level to promote agricultural sustainabledevelopment. Trans. Chin. Soc. Agric. Eng. 2016, 32, 1–11.
63. Luo, X.; Liao, J.; Zou, X.; Zhang, Z.; Zhou, Z.; Zang, Y.; Hu, L. Enhancing agricultural mechanization level through informationtechnology. Trans. Chin. Soc. Agric. Eng. 2016, 32, 1–14.
64. Li, W.; Wei, X.; Zhu, R.; Guo, K. Study on factors affecting the agricultural mechanization level in China based on structuralequation modeling. Sustainability 2019, 11, 51. [CrossRef]
65. Næss, G.; Bøe, K.E. Labour input in small cubicle dairy barns with different layouts and mechanisation levels. Biosyst. Eng. 2011,110, 83–89. [CrossRef]
66. John, A.J.; Clark, C.E.F.; Freeman, M.J.; Kerrisk, K.L.; Garcia, S.C.; Halachmi, I. Review: Milking robot utilization, a successfulprecision livestock farming evolution. Animal 2016, 10, 1484–1492. [CrossRef]
67. Gargiulo, J.I.; Eastwood, C.R.; Garcia, S.C.; Lyons, N.A. Dairy farmers with larger herd sizes adopt more precision dairytechnologies. J. Dairy Sci. 2018, 101, 5466–5473. [CrossRef]
68. Borowski, P.F. Innovative processes in managing an enterprise from the energy and food sector in the Era of Industry 4.0. Processes2021, 9, 381. [CrossRef]
69. Ramos, M.C.; Campos, A.T.; Júnior, T.Y.; da Silva, K.C.P. Milk production sustainability: Energy balance in intensive dairylivestock farming focused on processes. Eng. Agrícola 2014, 34, 473–484. [CrossRef]
70. Egas, D.; Ponsá, S.; Llenas, L.; Colón, J. Towards energy-efficient small dairy production systems: An environmental and economicassessment. Sustain. Prod. Consump. 2021, 28, 39–51. [CrossRef]
71. Shine, P.; Upton, J.; Sefeedpari, P.; Murphy, M.D. Energy consumption on dairy farms: A review of monitoring, predictionmodelling, and analyses. Energies 2020, 13, 1288. [CrossRef]
72. Kraatz, S. Energy intensity in livestock operations—Modeling of dairy farming systems in Germany. Agric. Syst. 2012, 110,90–106. [CrossRef]
73. Masi, M.; Vecchio, Y.; Pauselli, G.; Di Pasquale, J.; Adinolfi, F. A typological classification for assessing farm sustainability in theItalian bovine dairy sector. Sustainability 2021, 13, 7097. [CrossRef]
74. Tramontini, R.C.M.; Bánkuti, F.I.; Pozza, M.S.S.; Massuda, E.M.; Damasceno, J.C.; Dias, A.M.; Ítavo, C.C.B.F.; Ítavo, L.C.V.; Santos,G.T. Typology of dairy production systems based on management strategies in Paraná State, Brazil. Trop. Anim. Sci. J. 2021, 44,123–130. [CrossRef]
75. Davis, K.L.; Jago, J.G.; Wieliczko, R.; Copeman, P.J.A.; Bright, K.; Woolford, M.W. Factors influencing milk harvesting efficiency inan automatic milking system. Proc. N. Z. Soc. Anim. Prod. 2005, 65, 271–275.
76. Gaworski, M.; Leola, A.; Kiiman, H.; Sada, O.; Kic, P.; Priekulis, J. Assessment of dairy cow herd indices associated with differentmilking systems. Agron. Res. 2018, 16, 83–93.
77. Abhijeet, K.; Prasanna, S.B.; Mahesh, P.S.; Gouri, M.D.; Vivek, M.P.; Bhandekar, S.K.; Ali, S.M.; Masood, K.D.; Karan, P.Comparative study of automation and conventional system on production performance in dairy farms. Asian J. Dairy Food Res.2021, 40, 25–29. [CrossRef]
78. Gaworski, M.; Priekulis, J. Analysis of milking system development on example of two Baltic countries. In Proceedings of theConference on Engineering for Rural Development, Jelgava, Latvia, 29–30 May 2014; Volume 13, pp. 79–84.
79. Gaworski, M.; Leola, A. Effect of technical and biological potential on dairy production development. Agron. Res. 2014,12, 215–222.
80. Chiumenti, A.; da Borso, F.; Chiumenti, R.; Kic, P. Applying a mathematical model to compare, choose, and optimize themanagement and economics of milking parlors in dairy farms. Agriculture 2020, 10, 472. [CrossRef]
81. Bonora, F.; Benni, S.; Barbaresi, A.; Tassinari, P.; Torreggiani, D. A cluster-graph model for herd characterisation in dairy farmsequipped with an automatic milking system. Biosyst. Eng. 2018, 167, 1–7. [CrossRef]
82. Gaworski, M.; Leola, A.; Priekulis, J. Comparative analysis on effectiveness of AMS use on an example of three Europeancountries. Agron. Res. 2013, 11, 231–238.
83. van der Linden, A.; Oosting, S.J.; van de Ven, G.W.J.; Zom, R.; van Ittersum, M.K.; Gerber, P.J.; de Boer, I.J.M. Yield gap analysis indairy production systems using the mechanistic model LiGAPS-dairy. J. Dairy Sci. 2021, 104, 5689–5704. [CrossRef]
84. Luik-Lindsaar, H.; Põldaru, R.; Roots, J. Estonian dairy farms’ technical efficiency and factors predicting it. Agron. Res. 2019, 17,593–607. [CrossRef]
85. Piwczynski, D.; Sitkowska, B.; Kolenda, M.; Brzozowski, M.; Aerts, J.; Schork, P.M. Forecasting the milk yield of cows on farmsequipped with automatic milking system with the use of decision trees. Anim. Sci. J. 2020, 91, e13414. [CrossRef]
Processes 2021, 9, 2103 21 of 21
86. Toro-Mujica, P.; Vera, R.; Pinedo, P.; Bas, F.; Enríquez-Hidalgo, D.; Vargas-Bello-Pérez, E. Adaptation strategies based on thehistorical evolution for dairy production systems in temperate areas: A case study approach. Agric. Syst. 2020, 182, 102841.[CrossRef]
87. Kuwahara, K.C.; Damasceno, J.C.; Bánkuti, F.I.; Prizon, R.C.; Rossoni, D.F.; Eckstein, I.I. Sustainability and typology of dairyproduction systems. Ciências Agrárias 2018, 39, 2081–2092. [CrossRef]
88. Chávez-Pérez, L.M.; Soriano-Robles, R.; Espinosa-Ortiz, V.E.; Miguel-Estrada, M.; Rendón-Rendón, M.C.; Jiménez-Jiménez, R.A.Does small-scale livestock production use a high technological level to survive? Evidence from dairy production in NortheasternMichoacán, Mexico. Animals 2021, 11, 2546. [CrossRef]
89. Leola, A.; Priekulis, J.; Cesna, J.; Gaworski, M. Trend of cow herd size in Baltic states. Agron. Res. 2021, 19, 1052–1059. [CrossRef]90. Robbins, J.A.; von Keyserlingk, M.A.G.; Fraser, D.; Weary, D.M. Invited review: Farm size and animal welfare. J. Anim. Sci. 2016,
94, 5439–5455. [CrossRef]91. Wagner, A.; Palmer, R.W.; Bewley, J.; Jackson-Smith, D.B. Producer satisfaction, efficiency, and investment cost factors of different
milking systems. J. Dairy Sci. 2001, 84, 1890–1898. [CrossRef]92. Carreira, X.; Mariño, R.; Perez-Cancio, X.; Fernández, M. Design of algorithms for evaluating the efficiency of labour and
variability of some group milking parlour parameters. Livest. Sci. 2013, 151, 252–263. [CrossRef]93. Hadley, G.L.; Harsh, S.B.; Wolf, C.A. Managerial and financial implications of major dairy farm expansions in Michigan and
Wisconsin. J. Dairy Sci. 2002, 85, 2053–2064. [CrossRef]94. Mills, K.E.; Weary, D.M.; von Keyserlingk, M.A.G. Graduate Student Literature Review: Challenges and opportunities for human
resource management on dairy farms. J. Dairy Sci. 2021, 104, 1192–1202. [CrossRef]95. Gaworski, M. Ethics and transformation of Polish food chain. In Ethics and the Politics of Food: Preprints of the 6th Congress of the
European Society for Agricultural and Food Ethics; Kaiser, M., Lien, M.E., Eds.; Wageningen Academic Publisher: Oslo, Norway,2006; pp. 270–273.
Top Related
Copyright © 2022 FDOKUMEN

