


Bahasa
Halaman
Hukum

International Journal of Advanced Research in
Management and Social Sciences ISSN: 2278-6236
Vol. 1 | No. 6 | December 2012 www.garph.co.uk IJARMSS | 120
IMPACT OF INFLATION AND GDP ON STOCK MARKET RETURNS IN INDIA D. V. Lokeswar Reddy*
Abstract: The market reacts differently to various factors ranging from economic political,
and socio-cultural. The stock prices of quoted companies are affected either positively or
negatively by a number of factors occurring within or without the economic system. The
impact of Real Gross Domestic Product (RGDP), Interest Rate (INT) and Inflation Rate (INF)
on stock prices of quoted companies from 1997 – 2009. Stock prices were represented by
Stock Market Value Index in the model. A regression analysis showed that the explanatory
variables accounted for 95.6% of the variation in stock prices. While a reduction in interest
and inflation rate resulted in increased stock prices, increased RDGP has a positive impact.
Government should therefore implement policies that will reduce inflation rate and improve
the standard of living of its citizens. The interest rate should be made moderate so as to
encourage investment and transactions in stock.
*Asst. Professor, Jntua College of Engineering, Pulivendla, Kadapa(D), Andhra Pradesh,
India.

International Journal of Advanced Research in
Management and Social Sciences ISSN: 2278-6236
Vol. 1 | No. 6 | December 2012 www.garph.co.uk IJARMSS | 121
INTRODUCTION
The stock market is a general term used to refer to an organized exchange where shares of
stock are traded. The movement of stock market depends on the rational well as the
irrational behavior of the investor.
The returns in the stock market could because of the micro economic factors like profits,
business growth (new orders), P/E, dividend announced and the like which are pertaining to
a particular company. Macro economic factors like inflation, GDP would also affect the over-
all returns in the stock market.
Hence a study will be undertaken to observe the impact of inflation, GDP and interest rates
on stock market returns and unearth the nature and strength of relationship between
variable under study .
OBJECTIVE OF THE STUDY
The thesis aims to achieve the following objectives.
1. To study the relationship between stock market returns with respect to inflation,
GDP and interest rates.
2. To find the strength of the relation between stock market returns with respect to
inflation and GDP.
SCOPE
The scope of the project is restricted to find nature and strength of relation between stock
market returns with respect to inflation and GDP.
RESEARCH METHODOLOGY
The titled thesis project shall follow the methodology mentioned below.
1. Nature of the Study:
a. The research carried out will be descriptive in nature for the better understanding of
the undertaken research analysis.
b. The research will also use regression, correlation to find out the nature and strength
of the relationship between the variables under study.
c. The data regarding stock market returns, inflation, GDP, interest rates will be taken
for the last 10 to15 years for the study.

International Journal of Advanced Research in
Management and Social Sciences ISSN: 2278-6236
Vol. 1 | No. 6 | December 2012 www.garph.co.uk IJARMSS | 122
2. Tools Used for the collection of data:
Data:
i. Information regarding inflation, GDP, Stock market returns and interest rates would
be collected from the websites of the Ministry of finance, economic survey of India,
BSE India and RBI.
ii. Books will be referred to support the formation of certain conceptual definitions and
depth knowledge of the subject.
iii. Journals, Magazines and newspapers will be used to accumulate the latest
information about the variable under study in the research.
iv. Interviews with experts will be undertaken if necessary to tap the unknown facts
and figures of what I think might have been missing in the data.
LIMITATIONS
The project is limited to “Impact of inflation, interest rates and GDP on stock
market returns in India”
The data regarding stock market returns, inflation and GDP will be taken for the last
10 to15 years only for the study.
Time perspective to conduct the study is yet another constraint.
INDIAN ECONOMY
Fourth largest economy (US$ 3 trillion GDP) in terms of Purchasing Power Parity
after USA, China and Japan.
The fundamentals of the Indian economy have become strong and stable. The
macro-economic indicators are at present the best in the history of independent
India with high growth, healthy foreign exchange reserves, and foreign investment
and robust increase in exports and low inflation and interest rates.
A unique feature of the transition of the Indian economy is that it has become the
second fastest growing economy of the world in the year 2003 - 10. In the financial
year 2008 - 09 the GDP growth has averaged 6.9% (estimated). India has recorded
one of the highest growth rates in the 1990s. The target of the 10th Five Year Plan
(2002-07) is 8% growth rate. India's services sector grew by 9.4% in 2008-09.
International Journal of Advanced Research in
Management and Social Sciences ISSN: 2278-6236
Vol. 1 | No. 6 | December 2012 www.garph.co.uk IJARMSS | 123
The unique feature of Indian economy has been high growth with stability. The
Indian economy has proven its strength and resilience when there have been crisis in
other parts of the world including in Asia in recent years.
The foreign exchange reserves have reached a record level of US$ 300 billion in June,
2009. The comfortable situation of Forex reserves has facilitated further relaxation
of foreign exchange restrictions and a gradual move towards greater capital account
convertibility. According to IMF (2009 report) India's Forex Policies are in line with
global best practices.
Foreign Exchange Reserves (US$ 138.84 bn) now far exceed Foreign Debt (US$ 300
bn as on September, 2009).
Short-term debt is less than 4 per cent of the reserves.
In March 1991 Forex Reserves including gold stood at $5.8bn as against external
debt of $83 billion.
The external debt to GDP ratio has improved significantly from 38.7% in 1992 to
17.8% in the end of March 2004. This is one of the lowest among developing
economies. External debt in December 2004 was 120.9 billion US dollars. Of this
long-term NRI deposit is $ 27 billion, commercial borrowings $ 24 billion, multilateral
debt $ 31 billion, and bilateral debt $ 18 billion.
After a surplus in Current account for two fiscal years, 2002-03 and 2003-04, the
current account showed a deficit of US$ 6.4 bn in 2008-09.
Given the large foreign exchange reserves, the Government has made a premature
repayment of US$ 3 billion of 'high-cost' loans to the World Bank and Asian
Development Bank and is considering further premature repayment of other loans.
The Government has decided to (i) discontinue receiving aid from other countries
except the following nine: Japan, UK, Germany, USA, EU, France, Italy, Canada and
the Russian Federation and (ii) to make pre-payment of all bilateral debt owed to all
the countries except the ones mentioned above.
Since July 2003, India has become a net creditor to the IMF, after having been a
borrower in the past.
The Government has written off debts of US$ 30 million due from seven heavily
indebted countries as part of the "India Development Initiative" announced in

International Journal of Advanced Research in
Management and Social Sciences ISSN: 2278-6236
Vol. 1 | No. 6 | December 2012 www.garph.co.uk IJARMSS | 124
February 2003. The interest rate continues to be reduced and is around 6%. This is
the lowest in the last thirty years and it is stimulating consumption and investment.
After reaching an all-time low of Rs.49.06 per US dollar in May, 2002, the rupee has
strengthened against the dollar reaching a rate of US$ 1 = Rs.43.51 in June 30, 2009.
The inflation rate has been contained at 5.5 percent in 2003-04.The inflation rate in
2004-5 has been slightly higher at 6% but has slowed down at the beginning of the
current year 2008 - 09 at 9%.
ECONOMY
The seventh largest and second most populous country in the world, India has long been
considered a country of unrealised potential. A new spirit of economic freedom is now
stirring in the country, bringing sweeping changes in its wake. A series of ambitious
economic reforms aimed at deregulating the country and stimulating foreign investment has
moved India firmly into the front ranks of the rapidly growing Asia Pacific region and
unleashed the latent strengths of a complex and rapidly changing nation.
India's process of economic reform is firmly rooted in a political consensus that spans her
diverse political parties. India's democracy is a known and stable factor, which has taken
deep roots over nearly half a century. Importantly, India has no fundamental conflict
between its political and economic systems. Its political institutions have fostered an open
society with strong collective and individual rights and an environment supportive of free
economic enterprise.
India's time tested institutions offer foreign investors a transparent environment that
guarantees the security of their long term investments. These include a free and vibrant
press, a judiciary which can and does overrule the government, a sophisticated legal and
accounting system and a user friendly intellectual infrastructure. India's dynamic and highly
competitive private sector has long been the backbone of its economic activity. It accounts
for over 75% of its Gross Domestic Product and offers considerable scope for joint ventures
and collaborations.
Today, India is one of the most exciting emerging markets in the world. Skilled managerial
and technical manpower that match the best available in the world and a middle class
whose size exceeds the population of the USA or the European Union, provide India with a
distinct cutting edge in global competition.

International Journal of Advanced Research in
Management and Social Sciences ISSN: 2278-6236
Vol. 1 | No. 6 | December 2012 www.garph.co.uk IJARMSS | 125
GDP
Economic growth is measured in terms of an increase in the size of a nation’s economy. A
broad measure of an economy’s output. A most widely used measure of economic output is
the Gross Domestic Product.
Gross Domestic Product (GDP), a calculation method in national accounting is defined as
the total value of final goods and services produced within a country's borders in a year,
regardless of ownership. GDP measures only final goods and services, that is those goods
and services that are consumed by their final user, and not used as an input into other
goods. Measuring intermediate goods and services would lead to double counting of
economic activity within a country. This distinction also removes transfers between
individuals and companies from GDP.
There are three approaches to calculating GDP with al rendering same results.
Expenditure Approach: Calculates the final spending on goods and services.
Product Approach: Calculates the market value of goods and service produced.
Income Approach: Sums the income received by all products in the country.
Expenditure Approach to determine GDP:
GDP = private consumption + government purchases + investment + net
exports
Consumption is calculated by adding durable and non - durable and service
expenditures. It is unaffected by the estimated value of imported goods.
The investment includes investment in fixed assets and increase in inventory.
Government purchases are equal to the government expenditures less government
transfer payments.
Net Exports are exports minus imports.
NOMINAL GDP AND REAL GDP
Without any adjustment, the GDP calculation is distorted by inflation. This unadjusted GDP
is known as the nominal GDP. In practice, GDP is adjusted by dividing the nominal GDP by a
price deflator to arrive at the real GDP.

International Journal of Advanced Research in
Management and Social Sciences ISSN: 2278-6236
Vol. 1 | No. 6 | December 2012 www.garph.co.uk IJARMSS | 126
In an inflationary environment, the nominal GDP is greater than the real GDP. If the price
deflator is not known, an implicit price deflator can be calculated by dividing the nominal
GDP by the real GDP:
Implicit Price Deflator = Nominal GDP / Real GDP
The composition of this deflator is different from that of the consumer price index in that
the GDP deflator includes government goods, investment goods, and exports rather than
the traditional consumer-oriented basket of goods.GDP usually is reported each quarter on
a seasonally adjusted annualized basis.
GDP GROWTH
Countries seek to increase their GDP in order to increase their standard of living. Note that
growth in GDP does not result in increased purchasing power if the growth is due to
inflation or population increase. For purchasing power, it is the real, per capita GDP that is
important.
While investment is an important factor in a nation's GDP growth, even more important is
greater respect for laws and contracts.
GDP versus GNP
GDP measures the output of goods and services within the borders of the country. Gross
National Product (GNP) measures the output of a nation's factors of production, regardless
of whether the factors are located within the country's borders. For example, the output of
workers located in another country would be included in the workers' home country GNP
but not its GDP. The Gross National Product can be either larger or smaller than the
country's GDP depending on the number of its citizens working outside its borders and the
number of other country's citizens working within its borders.
International Journal of Advanced Research in
Management and Social Sciences ISSN: 2278-6236
Vol. 1 | No. 6 | December 2012 www.garph.co.uk IJARMSS | 127
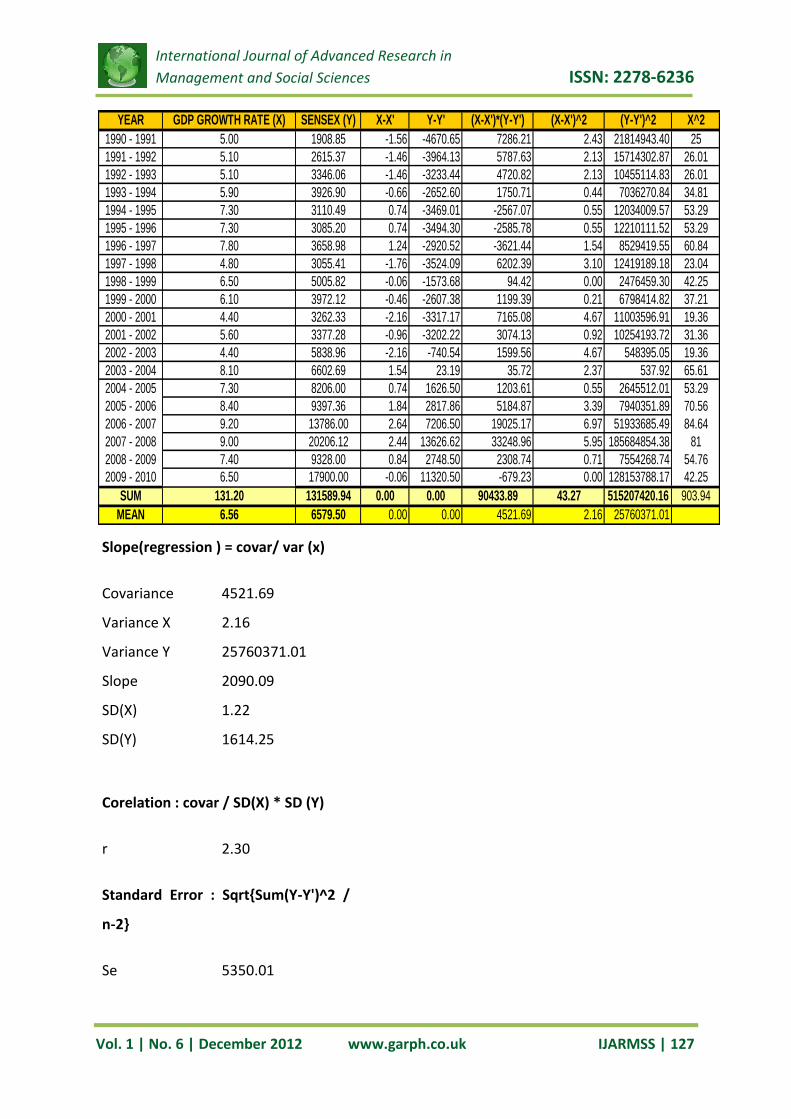
Slope(regression ) = covar/ var (x)
Covariance 4521.69
Variance X 2.16
Variance Y 25760371.01
Slope 2090.09
SD(X) 1.22
SD(Y) 1614.25
Corelation : covar / SD(X) * SD (Y)
r 2.30
Standard Error : Sqrt{Sum(Y-Y')^2 /
n-2}
Se 5350.01
YEAR GDP GROWTH RATE (X) SENSEX (Y) X-X' Y-Y' (X-X')*(Y-Y') (X-X')^2 (Y-Y')^2 X^2
1990 - 1991 5.00 1908.85 -1.56 -4670.65 7286.21 2.43 21814943.40 25
1991 - 1992 5.10 2615.37 -1.46 -3964.13 5787.63 2.13 15714302.87 26.01
1992 - 1993 5.10 3346.06 -1.46 -3233.44 4720.82 2.13 10455114.83 26.01
1993 - 1994 5.90 3926.90 -0.66 -2652.60 1750.71 0.44 7036270.84 34.81
1994 - 1995 7.30 3110.49 0.74 -3469.01 -2567.07 0.55 12034009.57 53.29
1995 - 1996 7.30 3085.20 0.74 -3494.30 -2585.78 0.55 12210111.52 53.29
1996 - 1997 7.80 3658.98 1.24 -2920.52 -3621.44 1.54 8529419.55 60.84
1997 - 1998 4.80 3055.41 -1.76 -3524.09 6202.39 3.10 12419189.18 23.04
1998 - 1999 6.50 5005.82 -0.06 -1573.68 94.42 0.00 2476459.30 42.25
1999 - 2000 6.10 3972.12 -0.46 -2607.38 1199.39 0.21 6798414.82 37.21
2000 - 2001 4.40 3262.33 -2.16 -3317.17 7165.08 4.67 11003596.91 19.36
2001 - 2002 5.60 3377.28 -0.96 -3202.22 3074.13 0.92 10254193.72 31.36
2002 - 2003 4.40 5838.96 -2.16 -740.54 1599.56 4.67 548395.05 19.36
2003 - 2004 8.10 6602.69 1.54 23.19 35.72 2.37 537.92 65.61
2004 - 2005 7.30 8206.00 0.74 1626.50 1203.61 0.55 2645512.01 53.29
2005 - 2006 8.40 9397.36 1.84 2817.86 5184.87 3.39 7940351.89 70.56
2006 - 2007 9.20 13786.00 2.64 7206.50 19025.17 6.97 51933685.49 84.64
2007 - 2008 9.00 20206.12 2.44 13626.62 33248.96 5.95 185684854.38 81
2008 - 2009 7.40 9328.00 0.84 2748.50 2308.74 0.71 7554268.74 54.76
2009 - 2010 6.50 17900.00 -0.06 11320.50 -679.23 0.00 128153788.17 42.25
SUM 131.20 131589.94 0.00 0.00 90433.89 43.27 515207420.16 903.94
MEAN 6.56 6579.50 0.00 0.00 4521.69 2.16 25760371.01
International Journal of Advanced Research in
Management and Social Sciences ISSN: 2278-6236
Vol. 1 | No. 6 | December 2012 www.garph.co.uk IJARMSS | 128
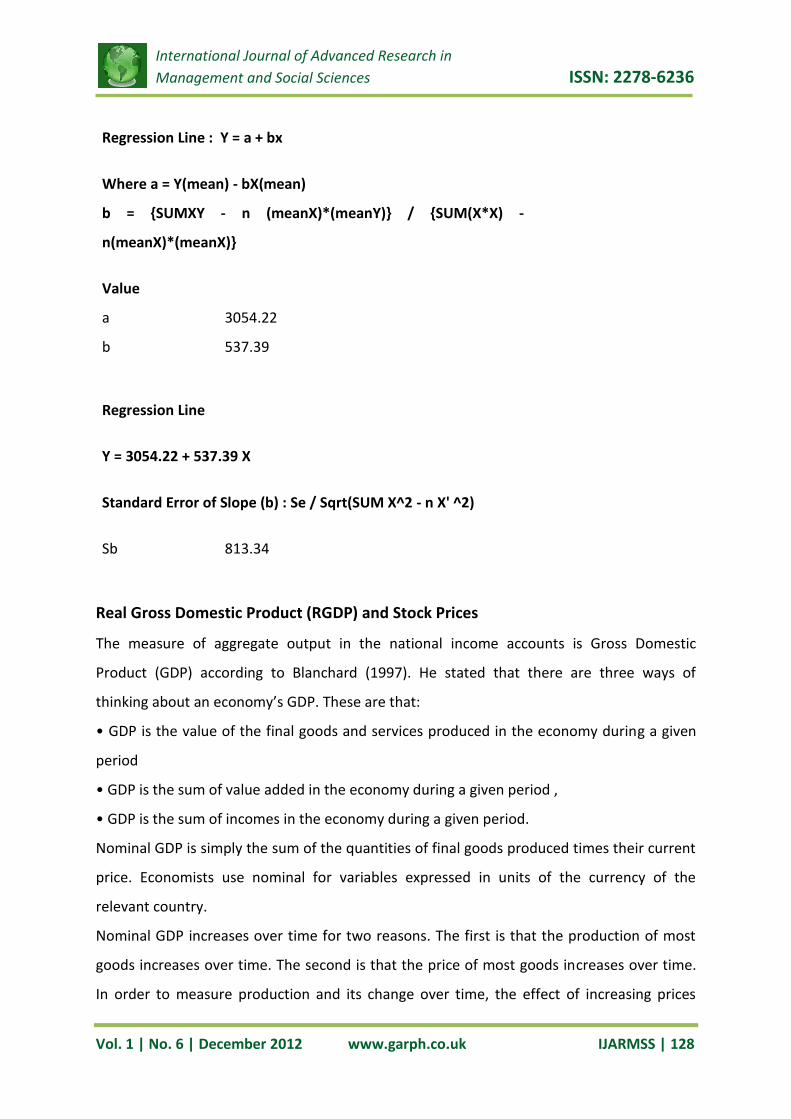
Regression Line : Y = a + bx
Where a = Y(mean) - bX(mean)
b = {SUMXY - n (meanX)*(meanY)} / {SUM(X*X) -
n(meanX)*(meanX)}
Value
a 3054.22
b 537.39
Regression Line
Y = 3054.22 + 537.39 X
Standard Error of Slope (b) : Se / Sqrt(SUM X^2 - n X' ^2)
Sb 813.34
Real Gross Domestic Product (RGDP) and Stock Prices
The measure of aggregate output in the national income accounts is Gross Domestic
Product (GDP) according to Blanchard (1997). He stated that there are three ways of
thinking about an economy’s GDP. These are that:
• GDP is the value of the final goods and services produced in the economy during a given
period
• GDP is the sum of value added in the economy during a given period ,
• GDP is the sum of incomes in the economy during a given period.
Nominal GDP is simply the sum of the quantities of final goods produced times their current
price. Economists use nominal for variables expressed in units of the currency of the
relevant country.
Nominal GDP increases over time for two reasons. The first is that the production of most
goods increases over time. The second is that the price of most goods increases over time.
In order to measure production and its change over time, the effect of increasing prices

International Journal of Advanced Research in
Management and Social Sciences ISSN: 2278-6236
Vol. 1 | No. 6 | December 2012 www.garph.co.uk IJARMSS | 129
need to be eliminated. Hence, focus is on real GDP rather than nominal. Carstrom (2002)
expressed that stock prices and future RGDP growth are related. He gave two prominent
explanations for this; the first explanation was that changes in information about the future
course of RGDP cause prices to change in the stock market today.
He also said that changes in stock prices, no matter what the source is, will reduce firms’
asset positions and affect the cost of their borrowing. When it costs more for firms to
borrow money, they borrow and invest less, RGDP growth slows. Changes in information
about the future course of RGDP may cause prices to change in the stock market. This
explanation suggests that while stock prices are used to predict future economic activity,
the actual causality is from future GDP growth in current stock prices.
INFLATION
Simply put, inflation is a situation in the economy where, there is more money chasing less
of goods and services. In other words, it means there is more supply/availability of money in
the economy and there are less of goods and services to buy with that increased money.
Thus goods and services commands a higher price than actual as more people are willing to
pay a higher value to buy the same goods. In this inflationary situation, there is no real
growth in the output of the economy per se. It’s simply more money chasing few goods and
services. For a brief moment let us suspend belief and imagine that all the money in the
1908.852615.37
3346.063926.903110.493085.203658.983055.41
5005.823972.12
3262.333377.28
5838.966602.69
8206.009397.36
13786.00
20206.12
9328.00
17900.00
5.00 5.10 5.10 5.90 7.30 7.30 7.80 4.80 6.50 6.10 4.40 5.60 4.40 8.10 7.30 8.40 9.20 9.00 7.40 6.500
5000
10000
15000
20000
25000
1 2 3 4 5 6 7 8 9 10 11 12 13 14 15 16 17 18 19 20
YEARS
GDP - SENSEX
SENSEX (Y) GDP GROWTH RATE (X)

International Journal of Advanced Research in
Management and Social Sciences ISSN: 2278-6236
Vol. 1 | No. 6 | December 2012 www.garph.co.uk IJARMSS | 130
country is just Rs100. And all the goods produced in the country are just five apples.
Naturally, each apple will fetch Rs20. Next year, the money doubles to Rs200 but the total
goods produced are again five apples. Each apple will now fetch Rs40. That is what inflation
is all about — too much money chasing too few goods. Inflation is a hydra-headed monster,
which has a desirable as well as an undesirable effect. The desirable part is that when prices
are high, businessmen get more value for their goods, which entices them to produce more.
The undesirable part is that when prices shoot up, people are forced to restrict their
purchases, which can lead to recession. Rising oil prices have been one of the main causes of
inflation though that is not all. A weak monsoon till recently brought about a shortage in
food items and some commodities. There had also been a surge in foreign exchange inflows
and to keep the price of the rupee stable, the RBI has been purchasing dollars — and that
means pumping in rupees into the system.
To suck out the excess rupees from the system, the RBI follows a policy of sterile
intervention — which translates into the RBI issuing government securities. There is a limit
to the quantum of government securities the RBI can issue and its stock of securities at the
moment is insignificant. The RBI can tighten the monetary policy by raising interest rates,
however, higher interest rates will hit the balance sheet of banks that have large interest
rate exposures. Moreover, the RBI is also the banker to the government by virtue of which,
it tends to keep the interest rate low so that the government's interest cost remains in
control.
Types of inflation:
Inflation is caused by a combination of four factors.
The supply of money goes up.
The supply of goods goes down.
Demand for money goes down.
Demand for goods goes up.
"Inflation can result from a decrease in aggregate supply. The two main sources of decrease
in aggregate supply are
An increase in wage rates
An increase in the prices of raw materials

International Journal of Advanced Research in
Management and Social Sciences ISSN: 2278-6236
Vol. 1 | No. 6 | December 2012 www.garph.co.uk IJARMSS | 131
These sources of a decrease in aggregate supply operate by increasing costs, and the
resulting inflation is called cost-push inflation.
YEAR INFLATION CPI (X)SENSEX (Y) X-X' Y-Y' (X-X')*(Y-Y') (X-X')^2 (Y-Y')^2 X^2
1990 - 1991 13.70 1908.85 5.78 -6863.81 -39672.84 33.41 47111924.32 187.7
1991 - 1992 13.5 2615.37 5.58 -6157.29 -34357.69 31.14 37912252.98 182.3
1992 - 1993 9.6 3346.06 1.68 -5426.60 -9116.69 2.82 29448016.50 92.16
1993 - 1994 7.5 3926.90 -0.42 -4845.76 2035.22 0.18 23481415.82 56.25
1994 - 1995 10.10 3110.49 2.18 -5662.17 -12343.54 4.75 32060199.31 102
1995 - 1996 9.20 3085.20 1.28 -5687.46 -7279.95 1.64 32347231.58 84.64
1996 - 1997 7.20 3658.98 -0.72 -5113.68 3681.85 0.52 26149750.42 51.84
1997 - 1998 13.10 3055.41 5.18 -5717.25 -29615.37 26.83 32686978.05 171.6
1998 - 1999 4.70 5005.82 -3.22 -3766.84 12129.23 10.37 14189103.68 22.09
1999 - 2000 4.00 3972.12 -3.92 -4800.54 18818.13 15.37 23045209.89 16
2000 - 2001 3.80 3262.33 -4.12 -5510.33 22702.57 16.97 30363766.10 14.44
2001 - 2002 4.30 3377.28 -3.62 -5395.38 19531.29 13.10 29110154.12 18.49
2002 - 2003 4.10 5838.96 -3.82 -2933.70 11206.74 14.59 8606611.34 16.81
2003 - 2004 5.50 6602.69 -2.42 -2169.97 5251.33 5.86 4708781.37 30.25
2004 - 2005 4.30 8206.00 -3.62 -566.66 2051.32 13.10 321106.58 18.49
2005 - 2006 4.20 9397.36 4.20 624.70 2623.73 17.64 390246.76 17.64
2006 - 2007 4.80 13786.00 4.80 5013.34 24064.02 23.04 25133551.22 23.04
2007 - 2008 9.00 20206.12 9.00 11433.46 102901.12 81.00 130723946.59 81
2008 - 2009 11.49 9328.00 3.57 555.34 1982.55 12.74 308399.55 132
2009 - 2010 12.00 17900.00 4.08 9127.34 37239.54 16.65 83308286.80 144
SUM 118.80 131589.94 0.00 0.00 -34978.40 190.65 371542502.07 1083
MEAN 7.92 8772.66 0.00 0.00 -2331.89 12.71 24769500.14
Slope(regression ) = covar/ var (x)
Covariance -1748.92
Variance X 9.5326
Variance Y 18577125.10
Slope -183.47
SD(X) 3.55
SD(Y) 1614.25
Corelation : covar / SD(X) * SD (Y)
r -0.30
Standard Error : Sqrt {Sum(Y-Y')^2 / n-2}
International Journal of Advanced Research in
Management and Social Sciences ISSN: 2278-6236
Vol. 1 | No. 6 | December 2012 www.garph.co.uk IJARMSS | 132
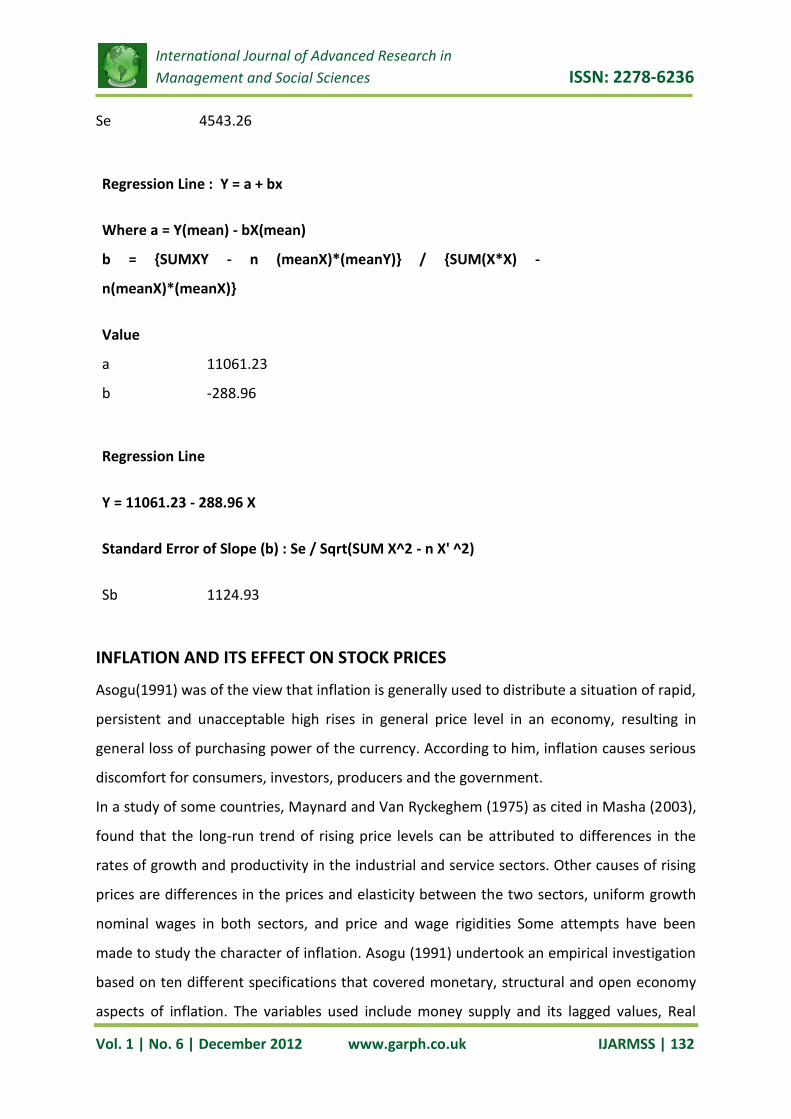
Regression Line : Y = a + bx
Where a = Y(mean) - bX(mean)
b = {SUMXY - n (meanX)*(meanY)} / {SUM(X*X) -
n(meanX)*(meanX)}
Value
a 11061.23
b -288.96
Regression Line
Y = 11061.23 - 288.96 X
Standard Error of Slope (b) : Se / Sqrt(SUM X^2 - n X' ^2)
Sb 1124.93
INFLATION AND ITS EFFECT ON STOCK PRICES
Asogu(1991) was of the view that inflation is generally used to distribute a situation of rapid,
persistent and unacceptable high rises in general price level in an economy, resulting in
general loss of purchasing power of the currency. According to him, inflation causes serious
discomfort for consumers, investors, producers and the government.
In a study of some countries, Maynard and Van Ryckeghem (1975) as cited in Masha (2003),
found that the long-run trend of rising price levels can be attributed to differences in the
rates of growth and productivity in the industrial and service sectors. Other causes of rising
prices are differences in the prices and elasticity between the two sectors, uniform growth
nominal wages in both sectors, and price and wage rigidities Some attempts have been
made to study the character of inflation. Asogu (1991) undertook an empirical investigation
based on ten different specifications that covered monetary, structural and open economy
aspects of inflation. The variables used include money supply and its lagged values, Real
Se 4543.26
International Journal of Advanced Research in
Management and Social Sciences ISSN: 2278-6236
Vol. 1 | No. 6 | December 2012 www.garph.co.uk IJARMSS | 133
Gross Domestic Product (RGDP) and its lagged values, aggregate domestic credit to the
economy and its lagged values, government expenditure and its lagged values. Others are
industrial production index, the import price index and an official exchange rate in all, the
models were estimated and the character of inflation seems to be well captured.
In summary, the results of the estimations suggested that real output, especially industrial
output, net exports, current money supply, domestic food prices and exchange rate changes
were the major determinants of inflation. The study, therefore, confirms the importance of
structural character of the economy; open economy and monetary aspects of an inflationary
trend. Who argued that inflation is dependent on growth in broad money, the rate of
exchange the growth of real income, the level of anticipated inflation, which is based on the
previous year’s level of inflation. Causes of inflation can however be broadly categorized
into the ‘fiscal’ and ‘balance of payment’ views. Proponents of the fiscal view have argued
that continuous expansion of base money essentially arises from a fiscal disequilibrium.
Attempts have been made to show that the economy will be characterized by two inflation
equilibria if there is an exogenous real fiscal deficit; a change in Cagan semi-logarithmic
money demand function and rational expectations. The high inflation equilibrium will be
stable and the low inflation equilibrium unstable.
It is a common belief that inflation is advantageous to common stock. This is majorly
because it is argued that inflation increases the returns to shareholders since price of
products rise faster than wage rates. The expected relationship between inflation and
returns to owners of equity would be valid if business firms were debtors and if the current
interest rates on debt finance failed to reflect the future changes in the price level.
According to Jhingan (1997), when there is inflation, most prices are rising, though some
price rise faster than others. Have shown from their studies that there is a relationship
between inflation and rising prices. A positively in relation to changes in prices Therefore, in
assessing the impact of inflation on the performance of stock prices of quoted companies; if
there is a relationship, one should expect a positive association between inflation and the
variation in stock prices.
International Journal of Advanced Research in
Management and Social Sciences ISSN: 2278-6236
Vol. 1 | No. 6 | December 2012 www.garph.co.uk IJARMSS | 134
13.7013.5 9.6 7.5 10.109.20 7.20 13.104.70 4.00 3.80 4.30 4.10 5.50 4.30 4.20 4.80 9.00 11.4912.00
1908.852615.37
3346.063926.903110.493085.203658.983055.41
5005.823972.12
3262.333377.28
5838.966602.69
8206.009397.36
13786.00
20206.12
9328.00
17900.00
0
5000
10000
15000
20000
25000
1 2 3 4 5 6 7 8 9 10 11 12 13 14 15 16 17 18 19 20
YEARS
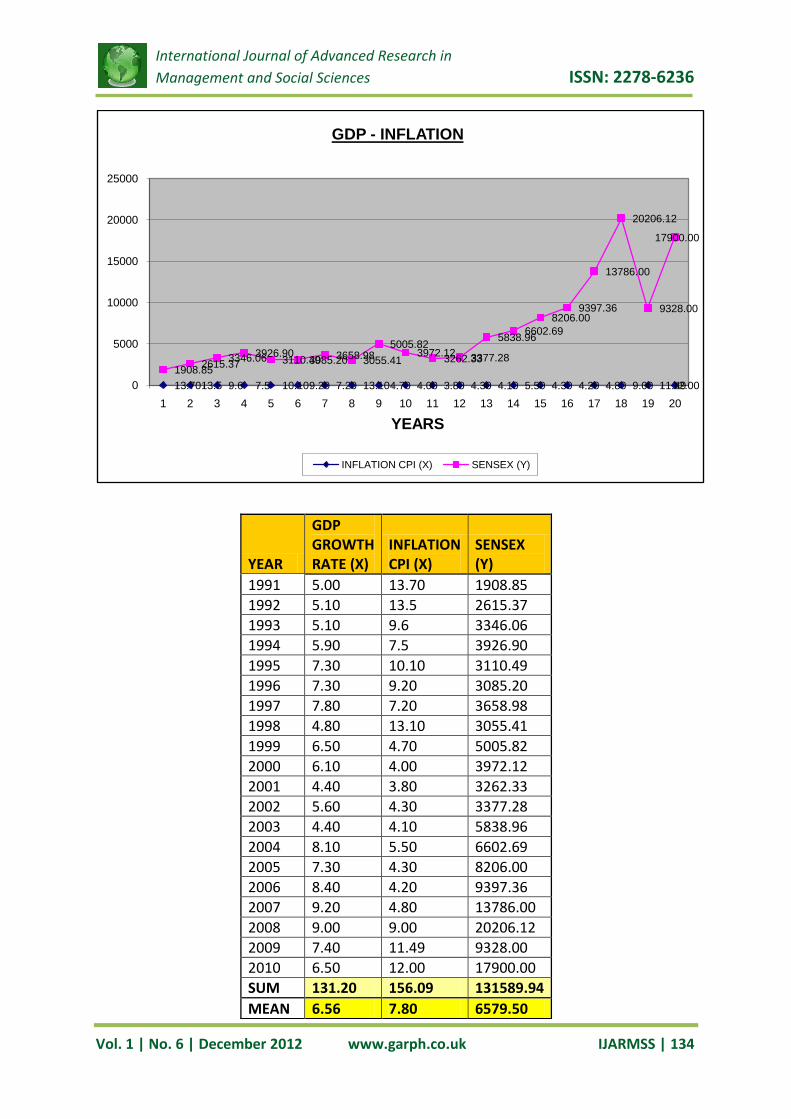
GDP - INFLATION
INFLATION CPI (X) SENSEX (Y)
YEAR
GDP GROWTH RATE (X)
INFLATION CPI (X)
SENSEX (Y)
1991 5.00 13.70 1908.85
1992 5.10 13.5 2615.37
1993 5.10 9.6 3346.06
1994 5.90 7.5 3926.90
1995 7.30 10.10 3110.49
1996 7.30 9.20 3085.20
1997 7.80 7.20 3658.98
1998 4.80 13.10 3055.41
1999 6.50 4.70 5005.82
2000 6.10 4.00 3972.12
2001 4.40 3.80 3262.33
2002 5.60 4.30 3377.28
2003 4.40 4.10 5838.96
2004 8.10 5.50 6602.69
2005 7.30 4.30 8206.00
2006 8.40 4.20 9397.36
2007 9.20 4.80 13786.00
2008 9.00 9.00 20206.12
2009 7.40 11.49 9328.00
2010 6.50 12.00 17900.00
SUM 131.20 156.09 131589.94
MEAN 6.56 7.80 6579.50
International Journal of Advanced Research in
Management and Social Sciences ISSN: 2278-6236
Vol. 1 | No. 6 | December 2012 www.garph.co.uk IJARMSS | 135
RECOMMENDATIONS
An investor who actively invests in the stock market should take macro economic
factors like GDP and inflation into consideration.
These are the vital factors that will show the long term trend of the stocks and the
economy of any country.
Currently India’s GDP is growing at a healthy pace and inflation is under control as a
result of this, there is an increased stock market return but the threat of rising oil
prices could turn down the market sentiment.
India is one of the promising and rising economy according to BRIC reports as a
result of this many FII’s invested in India to take advantage of the rising return on
investment and the difference in the currency rate.
One should take a close watch of these FII’s as they quite capable of creating a
financial crisis in any economy.
CONCLUSIONS
The impact of RGDP, interest and inflation rates on stock prices of quoted companies. The
findings were in line with a priori expectation expressed by Blanchard and Tamtom. An
important finding is that the explanatory variables in the model result in 95.6% influence on
the stock prices of quoted companies for the period 1997 – 2006. It also provides
preliminary evidence regarding the relative importance of the explanatory variables on
stock prices of quoted companies. Specifically, the findings suggest that RDGP was the most
important variable influencing stock prices. Conclusively, government should implement
policies that will reduce inflation rate and poverty level through infrastructural development
and improved standard of living. Also, interest rates should be made moderate in order to
encourage investment and transactions in the stock market.
BIBLIOGRAPHY
1. Adrangi, B., Chatrath, A., & Sanvicente, A. Z. (2002). Inflation, output, and stock
prices: Evidence from Brazil. Journal of Applied Business Research, 18, 1, 61-76.
2. Abdullah, D. A. & Hayworth, S. C. (1983). Macroeconometrics of stock price
fluctuations. Quarterly Journal of Business and Economics, 32, 1, 49-63.

International Journal of Advanced Research in
Management and Social Sciences ISSN: 2278-6236
Vol. 1 | No. 6 | December 2012 www.garph.co.uk IJARMSS | 136
3. Akbar, Y. H. & Samii, M. (2005). Emerging markets and international business: A
research agenda. Thunderbird International Business Review, 47, 4, 389-396.
4. Anderlini, J. (2007). Chinese bourses eclipse all of Asia. Financial Times, May 10,
2007,1.
5. Asia: Clipping the dragon's wings: Recalculating China's GDP. The Economist,
December 22, 2007, 385, 8560, 98.
6. Basher, S. A. & Sadorsky, P. (2006). Oil price risk and emerging stock markets. Global
Finance Journal, 17, 224-251.
7. Burmeister, E. & Wall, K. D. (1986). The arbitrage pricing theory and the
macroeconomic factor measures. Financial Review, 21, 1-20.
8. Chen, N. F. (1991). Financial investment opportunities and the macroeconomy.
Journal of Finance, 46, 529-554.
9. Chen, N. F., Roll, R., & Ross, S. (1986). Economic forces and the stock market. Journal
of Business, 59, 383-403.
10. DA Costa, M. M. N. & Foo, J. P. N. (2002). China’s financial system: Two decades of
gradual reforms. Managerial Finance, 28, 10, 3-18.
Top Related
Copyright © 2022 FDOKUMEN

