
![[Jean Cardinet, Sandra Johnson, Gianreto Pini] App(Book Fi org) (2)](https://static.fdokumen.com/doc/165x107/6320048d962ed4ca8e03f7a7/jean-cardinet-sandra-johnson-gianreto-pini-appbook-fi-org-2.jpg)

![[Grammatik Deutsche] Duden(Book ZZ org)](https://static.fdokumen.com/doc/165x107/631996dfd4191f2f9307acd6/grammatik-deutsche-dudenbook-zz-org.jpg)


Bahasa
Halaman
Hukum


IJCBS RESEARCH PAPER VOL. 1 [ISSUE 1] April, 2014 ISSN:- 2349–2724
© Virtu and Foi 7
www.ijcbs.org
Optimization of Water-Allocation Networks with Multiple Contaminants using Genetic Algorithm
*Md. Alauddin Department of Petroleum Studies,
F/o Engineering & Technology, AMU, Aligarh, UP, India.
Email: [email protected]
ABSTRACT: This is to show that Genetic Algorithm can be used effectively to solve water allocation network problems. In this paper a multi-contaminant problem discussed by Li & Chang [1] has been taken and Genetic Algorithm is used to optimize the model for minimization of freshwater consumption. The freshwater consumption was found to be 104.91 (t/h) which is comparative to Li & Chang that reported as 105.67 (t/h). The model has been written in a different way to reduce the number of effective variables. In Li & Chang paper, there were 40 continuous variable in NLP and 40 continuous and 15 binary variables in MINLP while this paper requires only 12 continuous variable in NLP and 12 continuous and 12 binary variables in MINLP. In addition to this Chang used GAMS environment where it is necessary to initialize and the choice of this initialization has a wide role on the convergence of the solution, where as in this paper GA is used, where no initialization of the variable s is needed, its automatically set by the algorithm, we have to select some parameters like cross over fraction, mutation etc.
Keywords: Evolutionary Technique, GA, GAMS, MINLP, Multi Objective Optimization, Water Allocation Network 1. INTRODUCTION
Water is one of the most important natural
resource. It is widely used in most of the
industrial operations particularly in chemical,
petrochemical and paper & pulp industries.
Water is used in two types of operations. One is
mass transfer based operation in which
contaminants are transferred from process
stream to water streams e.g, in pulp washing in
paper mills. The second is non-mass transfer
operation in which water is generated or
consumed e.g, steam generation. The huge
volume of water usage can be figure out with
following data1.
To produce one kg of paper,
approximately 300 lit of water is
required
To manufacture one complete car,
including tires, 147,972 lit of water is
used.
It takes 215,000 lit of water to produce
one ton of steel
Figure 1.1 shows a typical water network
with m sources WW1, WW2,........WWm, n
processing units P1,P2....Pn, k treatment
units TTP1,TTP2,.......TTPk discharge units
and their interconnections.1
Fig. 1.1: Typical water network
Optimization can be defined as the search
for the best possible solution(s) to a given

IJCBS RESEARCH PAPER VOL. 1 [ISSUE 1] April, 2014 ISSN:- 2349–2724
© Virtu and Foi 8
problem while satisfying all the constraints
[1]. Practical optimization problems,
especially the engineering design
optimization problems, seem to have a multi
objective nature much more frequently than
a single objective one. Typically, some
structural performance criteria are to be
maximized, while some others like weight of
the structure and the implementation costs
should be minimized simultaneously. For
example, consider designing a car, the
comfort for the passenger should be
maximized, while simultaneously cost is to
be minimized. But these two objectives are
conflicting to each other. If we want to
minimize the cost then comfort level should
be compromised and vice-versa. Hence
there is a trade-off between cost and
comfort level, as shown in fig 1.2 [2].
Fig. 1.2: Trade-off between cost and comfort
level
In MOP we have to deal with two types of
spaces: decision space as well as objective
space, as shown in fig. 1.3. These types of
problems result in a set of optimal solution
called Pareto Optimal Front, which is locus of
non-dominated points. That is, none of the
points from the set is the best with respect to all
objectives, there is no single optimal, rather,
and there exist a number of solutions which are
all optimal. Fig 1.4 shows a Pareto front of two
objectives – objective 1 and objective2, both are
to be minimized. Solutions A and B are non-
dominated solutions and therefore, they reside
on the non- dominated Pareto-optimal front.
Solution A dominates solution C because
Solution A results in an improvement in
Objective 1 with no change in Objective 2 when
compared with Solution C. Solution B dominates
solution C because Solution B results in an
improvement in Objective 2 with no change in
Objective 1 when compared with Solution C. As
a result, Solution C is dominated and thus, is not
part of the Pareto-optimal front.
Fig. 1.3 Decision and objective space
Fig. 1.4 Pareto front
2. Literature survey
Researchers in the field of water network, since
one and half a decade, a nice review is
presented in this regard by Bagajewicz [4], Foo
[5] and Jacek Jez’owski [6]. It is to minimize the
fresh water consumption that will result not
only the processing cost but also capital cost.
Saveleski and Bagajewics [7] reported, higher
the flow rate through the process, larger the
equipment size. Das et al.[8], shows simple
structure with fewest possible inter connection
IJCBS RESEARCH PAPER VOL. 1 [ISSUE 1] April, 2014 ISSN:- 2349–2724
© Virtu and Foi 9
will result in high level of controllability,
operability and safety.
There are broadly two conventional methods
for design of water network as shown in figure
(2.1). One is graphical method associated with
pinch design and the other is mathematical
programming (Optimization based).
Fig. 2.1: Classification of design method of
water networks
The basis of pinch analysis for water network
was put forward by Wang & Smith [9]. This
focuses on to maximize water reuse and recycle
strategy. In this the limitation is that as the
number of contaminants increases, it becomes
more and more difficult. Mathematical
modeling, on the other hand handle multi
component problems and produce global or
near optimal solution. Takama et. al [10]
established a super structure of all possible
reuse and regeneration opportunities which
was then optimized by series of workers. Polley
[11], Yang et.al [12] and Poplewski et.al [13]
optimized the networks for fixed flow operation
and single component. These models were
linear in nature .The model were minimized
using LP for fresh water and MILP for minimum
interconnection. Smith ([14],[15]), Chang( [16],
[17],[18]) come up with multi-component
problems and NLP & MINLP as solution
strategies.
In this paper a multi contaminant problem
discussed by Chang[17] has been presented and
Genetic Algorithm is used to optimize the
model. GA is used prior to optimize over all
water network by some workers. Lavric[19]
that deals with the multi contaminant in which
every unit operation was recieving streams
from previous operations only. Motension [20]
used modified GA in water distribution
network. Wan [21] used advanced GA to reduce
the cost of water supply under the constraint
with hydraulic condition in annular pipe.
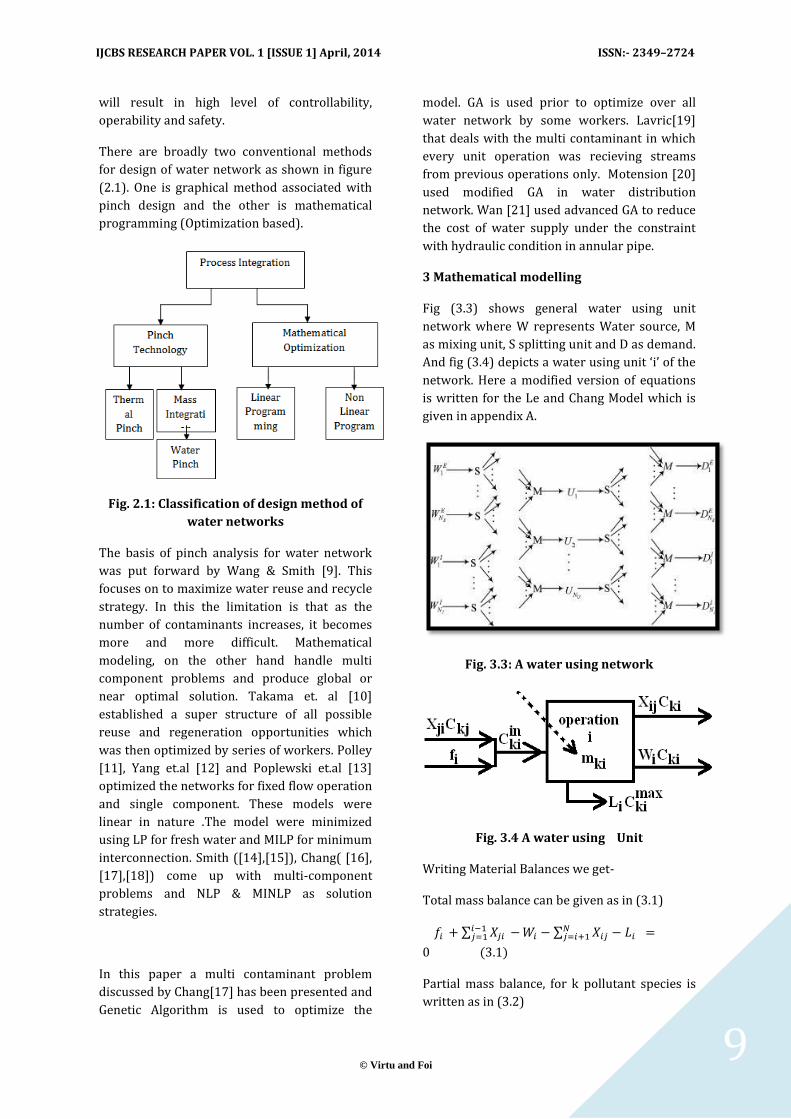
3 Mathematical modelling
Fig (3.3) shows general water using unit
network where W represents Water source, M
as mixing unit, S splitting unit and D as demand.
And fig (3.4) depicts a water using unit ‘i’ of the
network. Here a modified version of equations
is written for the Le and Chang Model which is
given in appendix A.
Fig. 3.3: A water using network
Fig. 3.4 A water using Unit
Writing Material Balances we get-
Total mass balance can be given as in (3.1)
∑ ∑
Partial mass balance, for k pollutant species is
written as in (3.2)

IJCBS RESEARCH PAPER VOL. 1 [ISSUE 1] April, 2014 ISSN:- 2349–2724
© Virtu and Foi 10
∑
( ∑ )
The first set of constraints can be given as in
(3.3)
∑
∑
∑
∑
And the second set of constraints can be written
as in (3.4)
∑
∑
Objective Functions:
There are two objective functions one is
minimization of fresh water consumption ( )
and another is minimization of number of inter
connections (
Minimization of fresh water consumption-
∑
Minimization of number of interconnections-
=min[∑ ∑
∑ ∑
∑ ∑ ∑ ∑
] (3.6)
Indices
Sets
Parameters
Binary Variable
Positive Variables
Pollutant concentration k going to
operation i
Pollutant concentration of k coming
from operation j
Exit flow from unit operation i
Water flow from j to i operation (likewise
Xij)
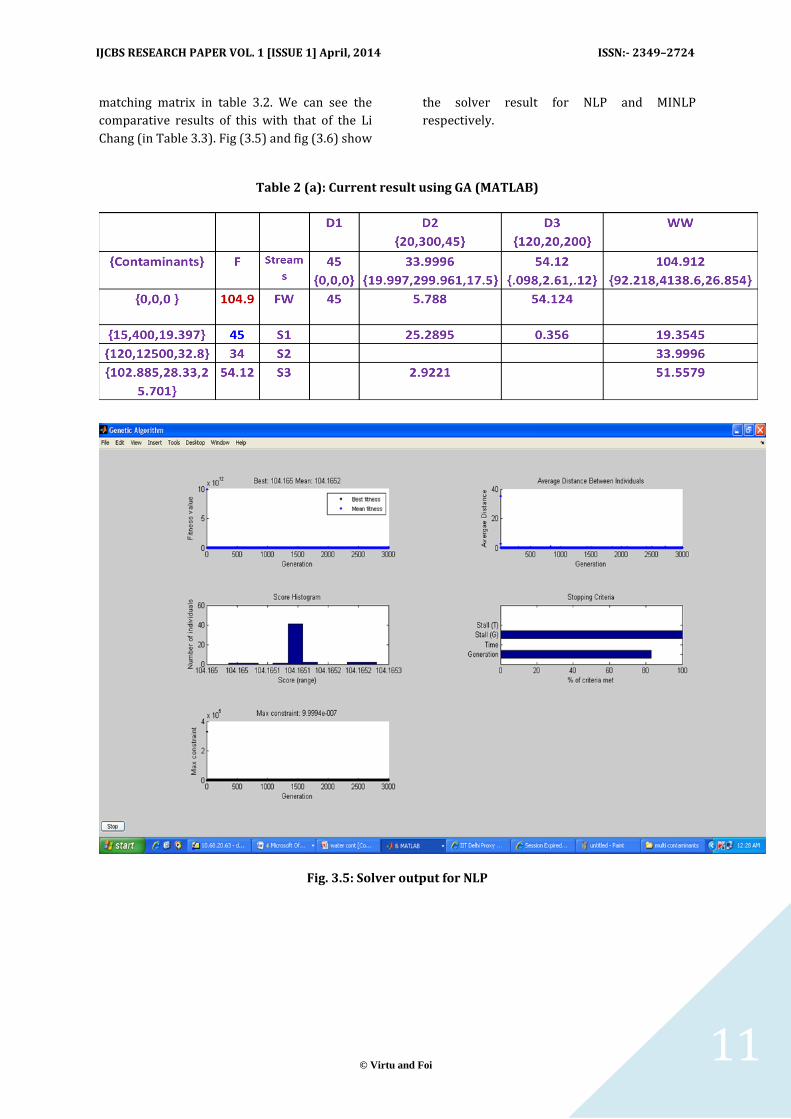
3.4 Result & Discussion
The model was tested on a well-known
petroleum refining problem (given in table 3.1),
studied by many workers and currently by Li
Chang (2007 & 2011). The example was
modelled and executed on MATLAB 7.15a
(2008) using optimtool, GA- Genetic Algorithm
as solver. The parameters used were population
size as 120, number of generation as 100, Cross
over fraction as 0.8 and all the others are listed
in the table 4.2. The freshwater consumption
was found to be 104.91 t/h and there were 9
inter connections. The result is shown in
IJCBS RESEARCH PAPER VOL. 1 [ISSUE 1] April, 2014 ISSN:- 2349–2724
© Virtu and Foi 11
matching matrix in table 3.2. We can see the
comparative results of this with that of the Li
Chang (in Table 3.3). Fig (3.5) and fig (3.6) show
the solver result for NLP and MINLP
respectively.
Table 2 (a): Current result using GA (MATLAB)
Fig. 3.5: Solver output for NLP

IJCBS RESEARCH PAPER VOL. 1 [ISSUE 1] April, 2014 ISSN:- 2349–2724
© Virtu and Foi 12
Fig. 3.6: Solver output for MINLP
Table 3.1: Process limiting data
Table 3.2: GA Parameters settings

IJCBS RESEARCH PAPER VOL. 1 [ISSUE 1] April, 2014 ISSN:- 2349–2724
© Virtu and Foi 13
5 Conclusions
The freshwater consumption was found
to be 104.91 t/h almost same as 105.67
as reported in Li & Chang [32] and
Number of interconnection was same as
in Li Chang.
In Li & Chang paper, there were 40
continuous variable in NLP and 40
continuous and 15 binary variables in
MINLP while this paper requires only
12 continuous variable in NLP and 12
continuous & 12 binary variables in
MINLP
In addition to this Chang used GAMS
environment where it is necessary to
initialize and the choice of this
initialization has a wide role on the
convergence of the solution, where as in
this paper GA is used, where no
initialization of the variable s is needed,
its automatically set by the algorithm,
we have to select some parameters like
cross over fraction, mutation etc.
The convergence is highly susceptible
on the choice of the parameter to be
selected particularly on Population size,
Ellite Counts, cross over fractions.
We cannot access the same random
number voluntarily if we want i,e., we
do not have control on the random
number
The constraints is not 100 % meet
though very small degree of violation
9.99*e-7.
We are not getting Pareto fronts- What
we are doing is that First minimization
of Fresh water and assuming the
obtained value as an additional
constraint we are minimizing the
Number of interconnections.
References
1. Thomas, B., Fogel, D. B., and
Michalewicz, Z.; editors. Handbook of Evolutionary Computation. Institute of Physics Publishing and Oxford University Press, 1997.
2. Deb, K.; Multi-objective optimization
using evolutionary algorithms. Wiley,
Chichester, UK, 2001.
3. Bleuler, S., Laumanns, M., Thiele, L., and Zitzler, E.; PISA - a platform and programming language independent interface for search algorithms. Technical Report 154, Computer Engineering and Networks Laboratory (TIK), Swiss Federal Institute of Technology (ETH) Zurich, Gloriastrasse 35, CH-8092 Zurich, Switzerland, October 2002. Submitted to the Second International Conference on Evolutionary Multi-Criterion Optimization (EMO 2003).
4. Bagajewicz, M., “ A review of recent
design procedures for water networks in refineries and process plants” Comp. Chem. Eng., 24, (9-10), pp. 2093-2113, 2000.
5. Foo, D. C. Y., “State-of-the-art
review of pinch analysis techniques for water network synsthesis.” Ind. Eng. Chem. Res., 48, pp.5125–5159, 2009.
6. Jezowski, J., “ Review of water
network design methods with literature annotations” Ind. Eng. Chem. Res. 49, pp. 4475–4516, 2010.
7. Bagajewicz, M., Savelski, M., “On use
of linear models for the design of water utilization systems in process plants with a single contaminant” Trans IchemE Part A 79, pp. 600–610, Jul. 2001.
8. Das, A. K., Shenoy, U. V.,
Bandyopadhyay, S., “Evolution of resource allocation networks” Ind. Eng. Chem. Res., 48, pp. 7152–7167, 2009.
9. Wang, P. Y., Smith, R., “Wastewater
minimization” Chem. Eng. Sci., 49 (7), pp. 981–1006, 1994.
10. Takama, N., Kuriyama, Y., Shiroko, K., “Optimal planning of water allocation in industry” J Chem Eng Jpn, , 13(6): pp. 478-483, 1980.
11. Polley, G. T., Polley, H. L., “ Design better water networks” Chem. Eng. Prog., 96, pp. 47–52, 2000.

IJCBS RESEARCH PAPER VOL. 1 [ISSUE 1] April, 2014 ISSN:- 2349–2724
© Virtu and Foi 14
12. Liu, Z. Y., Yang, Y., Wan, L. Z., Wang,
X., Hou, K. H., “A heuristic design procedure for water-using networks with multiple contaminants” AIChE J., 55 (2), pp. 374–382, 2009.
13. Poplewski, G., Walczyk, K., Jezowski,
J., “ Optimization-based method for calculating water networks with user specified characteristics” Chem. Eng. Res. Des., 88, pp. 109–120, 2010.
14. Doyle, S. J., Smith, R., “ Targeting
water reuse with multiple contaminant” Trans IChemE Part B, 75, pp. 181–189, Aug. 1997.
15. Alva-Arga´ez, A., Kokossis, A., Smith
R., “The design of water-using system in petroleum refining using a water-pinch decomposition” Chem Eng J., 128, pp. 33–46, 2007.
16. Li, B. H., Chang C. T., “ A simple and
efficient initialization strategy for optimizing water-using network design” Ind. Eng. Chem. Res., 46, pp. 8781–8786, 2007.
17. Li, B. H., Chang, C. T., “ Multi
objective optimization of water using networks with multiple contaminants” Ind. Eng .Chem. Res., 50, pp. 5651–5660, 2011a.
18. Li, B. H., and Chang, C.T, “Heuristic
evolution strategies for simplifying water using networks with multiple contaminants” Chem. Eng. Sci., 66, pp. 558-562, 2011b.
19. Tudor, R., Lavric, V., “Optimization
of Overall Network of Water-Using and Treatment Units” 20th European Symposium on Computer Aided Process Engineering – ESCAPE20.
20. Montesinos, P., Guzman, A.G., and
Ayuso, J.L., “Water distribution network optimization using a modified genetic algorithm” Water Resour. Res., 35, pp. 3467-3473, 1999.
21. Wan, S., Ying, H., Cheng, L.,
“Research on Water Supply Network Optimization Using Advanced GA,
International Conference on Intelligence Computing, 1, pp.243, 2009.
Top Related
Copyright © 2022 FDOKUMEN

