


Bahasa
Halaman
Hukum

IBM Netcool Operations InsightVersion 1 Release 6
Integration Guide
IBM
SC27-8601-15

Note
Before using this information and the product it supports, read the information in Appendix B,“Notices,” on page 725.
This edition applies to version 1.6.3 of IBM® Netcool® Operations Insight® (product number 5725-Q09) and to allsubsequent releases and modifications until otherwise indicated in new editions.© Copyright International Business Machines Corporation 2020, 2020.US Government Users Restricted Rights – Use, duplication or disclosure restricted by GSA ADP Schedule Contract withIBM Corp.

Contents
About this publication..........................................................................................viiAccessing terminology online.................................................................................................................... viiTechnical training........................................................................................................................................viiTypeface conventions ................................................................................................................................ vii
Chapter 1. What's new...........................................................................................1
Chapter 2. Solution Overview.................................................................................3Cloud systems.............................................................................................................................................. 5
Components............................................................................................................................................7Architecture............................................................................................................................................ 8System requirements............................................................................................................................. 9
Hybrid systems.......................................................................................................................................... 10Components......................................................................................................................................... 12Architecture..........................................................................................................................................13System requirements........................................................................................................................... 14
On-premises systems................................................................................................................................ 15Components......................................................................................................................................... 17Architecture..........................................................................................................................................23System requirements........................................................................................................................... 29
Security and Privacy by Design (SPbD)..................................................................................................... 29
Chapter 3. Deployment........................................................................................ 31Scenarios for Operations Management.....................................................................................................31
Deployment considerations................................................................................................................. 31Scenarios.............................................................................................................................................. 32
Chapter 4. Installing............................................................................................ 37Installing on-premises...............................................................................................................................37
Preparing.............................................................................................................................................. 37Installing...............................................................................................................................................50Uninstalling on premises................................................................................................................... 105Uninstalling Event Analytics.............................................................................................................. 106
Installing on Red Hat OpenShift..............................................................................................................108Preparing............................................................................................................................................ 108Installing.............................................................................................................................................118Post-installation tasks........................................................................................................................133Uninstalling.........................................................................................................................................140
Installing on hybrid..................................................................................................................................141Preparing............................................................................................................................................ 142Installing.............................................................................................................................................161Post-installation tasks........................................................................................................................197Uninstalling.........................................................................................................................................205
Deployment guidelines for GDPR readiness........................................................................................... 207Tracking license consumption of IBM Netcool Operations Insight........................................................211Troubleshooting.......................................................................................................................................212
On-premises systems........................................................................................................................ 212Cloud systems.................................................................................................................................... 213Hybrid systems...................................................................................................................................229
iii

Chapter 5. Upgrading.........................................................................................237Upgrading on-premises........................................................................................................................... 237
Updated versions in the V1.6.3 release............................................................................................ 237Downloading product and components............................................................................................ 238Applying the latest fix packs.............................................................................................................. 240Roll back on-premises Netcool Operations Insight from V1.6.3 to V1.6.2......................................240Upgrading Event Analytics................................................................................................................. 241Installing and upgrading on-premises Agile Service Manager......................................................... 245
Upgrading on Red Hat OpenShift............................................................................................................ 248Upgrading with the OLM UI................................................................................................................248Upgrading with the OLM UI and CASE............................................................................................... 250Upgrading offline (airgap).................................................................................................................. 252Rolling back........................................................................................................................................ 256
Upgrading on hybrid................................................................................................................................ 257Upgrading hybrid with the OLM UI.................................................................................................... 258Upgrading hybrid with the OLM UI and CASE....................................................................................260Upgrading hybrid offline (airgap)....................................................................................................... 262Rolling back hybrid.............................................................................................................................266
Troubleshooting.......................................................................................................................................268Cloud systems.................................................................................................................................... 268Hybrid systems...................................................................................................................................270
Chapter 6. Configuring....................................................................................... 271Cloud and hybrid systems....................................................................................................................... 271
Enabling SSL communications from Netcool/Impact on OpenShift........................................... 271Connecting a Cloud system to event sources....................................................................................272Configuring incoming integrations.....................................................................................................283Configuring automation types............................................................................................................330Configuring Netcool subsystems using the REST API.......................................................................347Trying out cloud native analytics....................................................................................................... 353Configuring analytics..........................................................................................................................364
On-premises systems..............................................................................................................................376Connecting event sources..................................................................................................................376Configuring Operations Management................................................................................................378
Troubleshooting.......................................................................................................................................455Cloud and hybrid systems..................................................................................................................455On-premises systems........................................................................................................................ 458
Chapter 7. Getting started..................................................................................459Cloud and hybrid systems....................................................................................................................... 459
Which GUI to log into......................................................................................................................... 459Logging into Netcool Operations Insight........................................................................................... 459Accessing the main navigation menu................................................................................................ 462Accessing the Getting started page...................................................................................................464
On-premises systems..............................................................................................................................464Getting started with Netcool Operations Insight.............................................................................. 464Getting started with Networks for Operations Insight......................................................................465
Chapter 8. Administering................................................................................... 467Cloud and hybrid systems....................................................................................................................... 467
Administering users........................................................................................................................... 467Administering the Events page......................................................................................................... 475Administering topology......................................................................................................................476Administering policies........................................................................................................................476Managing runbooks and automations............................................................................................... 485Backup and restore............................................................................................................................ 515
iv
On-premises systems..............................................................................................................................527Administering Event Analytics........................................................................................................... 527
Troubleshooting.......................................................................................................................................595Cloud and hybrid systems..................................................................................................................595On-premises systems........................................................................................................................ 601
Chapter 9. Operations........................................................................................619Cloud and hybrid systems....................................................................................................................... 619
Resolving events................................................................................................................................ 619Managing incidents............................................................................................................................ 638Working with topology....................................................................................................................... 645Dashboards........................................................................................................................................ 659
On-premises systems..............................................................................................................................663Managing events with IBM Netcool/OMNIbus Web GUI.................................................................. 663Using Event Search............................................................................................................................ 663Networks for Operations Insight....................................................................................................... 669
Troubleshooting.......................................................................................................................................691Cloud and hybrid systems..................................................................................................................691On-premises systems........................................................................................................................ 697
Chapter 10. Reference....................................................................................... 701Accessibility features.............................................................................................................................. 701Service monitor cloud native analytics service.......................................................................................702Example Security Context Constraint..................................................................................................... 702Audit log files........................................................................................................................................... 702Config maps............................................................................................................................................. 703
Primary Netcool/OMNIbus ObjectServer configmap........................................................................ 703Backup Netcool/OMNIbus ObjectServer configmap.........................................................................704Netcool/Impact core server configmap............................................................................................ 706Netcool/Impact GUI server configmap............................................................................................. 708Proxy configmap.................................................................................................................................709LDAP Proxy configmap....................................................................................................................... 710Dashboard Application Services Hub configmap ............................................................................. 710Gateway for Message Bus configmap ...............................................................................................711Configuration share configmap..........................................................................................................713Cassandra configmap.........................................................................................................................713ASM-UI configmap............................................................................................................................. 714cloud native analytics gateway configmap........................................................................................714CouchDB configmap...........................................................................................................................714Kafka configmap.................................................................................................................................714Zookeeper configmap........................................................................................................................ 714
Event reference........................................................................................................................................714Column data from the ObjectServer..................................................................................................714Column data from other sources....................................................................................................... 714
Insight packs............................................................................................................................................718Notices..................................................................................................................................................... 718
Trademarks.........................................................................................................................................720
Appendix A. Release Notes................................................................................ 721
Appendix B. Notices.......................................................................................... 725Trademarks.............................................................................................................................................. 726
v

vi
About this publication
This guide contains information about how to integrate the components of the IBM Netcool OperationsInsight solution.
Accessing terminology onlineThe IBM Terminology Web site consolidates the terminology from IBM product libraries in one convenientlocation. You can access the Terminology Web site at the following Web address:
http://www.ibm.com/software/globalization/terminology.
Technical trainingFor technical training information, refer to the following IBM Skills Gateway site at https://www-03.ibm.com/services/learning/ites.wss/zz-en?pageType=page&c=a0011023 .
Typeface conventionsThis publication uses the following typeface conventions:
Bold
• Lowercase commands and mixed case commands that are otherwise difficult to distinguish fromsurrounding text
• Interface controls (check boxes, push buttons, radio buttons, spin buttons, fields, folders, icons, listboxes, items inside list boxes, multicolumn lists, containers, menu choices, menu names, tabs,property sheets), labels (such as Tip and Operating system considerations)
• Keywords and parameters in text
Italic
• Citations (examples: titles of publications, diskettes, and CDs)• Words defined in text (example: a nonswitched line is called a point-to-point line)• Emphasis of words and letters (words as words example: "Use the word that to introduce a
restrictive clause."; letters as letters example: "The LUN address must start with the letter L.")• New terms in text (except in a definition list): a view is a frame in a workspace that contains data• Variables and values that you must provide: ... where myname represents ...
Monospace
• Examples and code examples• File names, programming keywords, and other elements that are difficult to distinguish from
surrounding text• Message text and prompts addressed to the user• Text that the user must type• Values for arguments or command options
Bold monospace
• Command names, and names of macros and utilities that you can type as commands• Environment variable names in text• Keywords
© Copyright IBM Corp. 2020, 2020 vii

• Parameter names in text: API structure parameters, command parameters and arguments, andconfiguration parameters
• Process names• Registry variable names in text• Script names
viii IBM Netcool Operations Insight: Integration Guide
Chapter 1. What's newNetcool Operations Insight V1.6.3 includes a range of new features and functions.
This description of new features and functions is also available in the Release notes.
New product features and functions in V1.6.3New features in V1.6.3
The following features and functions are available in the Netcool Operations Insight V1.6.3 product:Edit Temporal Pattern policies
Event Analytics Temporal Pattern policies can now be edited to modify or enhance the eventsgrouped by these policies. For more information, see “Editing policies” on page 481.
DashboardsImproved integration of Grafana dashboards with Netcool Operations Insight.Data retention policy: data older than 90 days is not displayed on Netcool Operations Insightdashboards. For more information, see “Dashboards” on page 659.
DashboardsThe Runbook dashboard provides usage statistics on your runbooks. The dashboard also indicatesthe level of runbook automation maturity, from manual runbooks to fully automated runbooks,over time.The Operational efficiency dashboard allows you to review and monitor incident resolutionefficiency within your operations.
Incident managementAn incident is made up of one or more events and models a single real-life incident in yourmonitored environment. Using the new incident management capability, your Operations teamscan perform a series of incident resolution activities, including listing current incidents, viewing allincidents, or viewing user or group assigned incidents. They can also take ownership of incidents,and work with teams and tools to resolve incidents.For more information, see “Managing incidents” on page 638.
OpenShift®Support for deploying Netcool Operations Insight on Red Hat® OpenShift V4.6 was added inV1.6.3.
Probable cause custom labels and classification column namesYou can add your own and customized classification label and customize the classification columnname that is used for classification when using probable cause. For more information, see“Configuring probable cause” on page 366.
Updated product versions in V1.6.3
The Netcool Operations Insight V1.6.3 solution includes features delivered by the products andversions listed in the following topics:
• “On-premises components” on page 17• “Cloud components” on page 7
The on-premises products are available for download from Passport Advantage® and Fix Central.
For more information about the new features in these products and components, see the followingtopics:
What's new in... Link
Red Hat OpenShift https://access.redhat.com/documentation/en-us/openshift_container_platform/4.6/html/release_notes/index
© Copyright IBM Corp. 2020, 2020 1
What's new in... Link
The cloud event managementservice
https://www.ibm.com/support/knowledgecenter/en/SSURRN/com.ibm.cem.doc/em_whatsnew.html
The runbook automationservice
https://www.ibm.com/support/knowledgecenter/SSZQDR/com.ibm.rba.doc/GS_whatsnew.html
IBM Agile Service Manager https://www.ibm.com/support/knowledgecenter/en/SS9LQB_latest/ProductOverview/r_asm_whatsnew.html
IBM Tivoli® Netcool/OMNIbus https://www.ibm.com/support/knowledgecenter/SSSHTQ_latest/com.ibm.netcool_OMNIbus.doc_8.1.0/omnibus/wip/install/reference/omn_prodovr_whatsnew.html
IBM Tivoli Netcool/Impact https://www.ibm.com/support/knowledgecenter/SSSHYH_latest/com.ibm.netcoolimpact.doc/whatsnew.html
IBM Operations Analytics - LogAnalysis
https://www.ibm.com/support/knowledgecenter/SSPFMY_latest/com.ibm.scala.doc/overview/ovr-whats_new.html
IBM Tivoli Network Manager https://www.ibm.com/support/knowledgecenter/SSSHRK_latest/overview/concept/ovr_whatsnew.html
IBM Tivoli NetcoolConfiguration Manager
https://www.ibm.com/support/knowledgecenter/SS7UH9_latest/ncm/wip/common/reference/ncm_ovr_whatsnew.html
2 IBM Netcool Operations Insight: Integration Guide
Chapter 2. Solution OverviewLearn about the possible deployment modes for IBM Netcool Operations Insight, and the differentcapabilities offered by them.
Netcool Operations Insight offers the flexibility of three deployment modes. It can be deployed onpremises, on the cloud with Red Hat OpenShift, or in a hybrid deployment.
On-premisesIn this mode, all of the Netcool Operations Insight products and components are installed onto servers,and use the native computing resources of those servers. For more information, see “Installing on-premises” on page 37.
CloudIn this mode, Netcool Operations Insight is fully installed on OpenShift. Netcool Operations Insightservices are containerized, and communication between pods and containers is managed andorchestrated by OpenShift and Kubernetes. For more information, see “Installing on Red Hat OpenShift”on page 108.
HybridIn this mode, Netcool Operations Insight is installed with some components on-premises, and somecomponents on OpenShift. A new or existing on-premises installation can be configured to work withcloud native Netcool Operations Insight components on OpenShift. A hybrid deployment minimizes thefootprint of the cloud deployment while still providing the power of Netcool Operations Insight's cloudnative components. For more information, see “Installing on a hybrid architecture” on page 141.
Comparison of capabilitiesThe capabilities of Netcool Operations Insight vary depending on the deployment mode that is selected.The cloud and hybrid modes offer more sophisticated cloud native analytics and automations. For moreinformation, see:
• “Cloud system overview” on page 5• “Hybrid system overview” on page 10• “On-premises system overview” on page 15
Table 1. Comparison of the capabilities of the different NOI deployment modes
Capability Cloud Hybrid On-premises
Infrastructure andservice discovery
Yes“Service and topologymanagement” on page5
Yes“Service and topologymanagement” on page10
Yes“Service and topologymanagement” on page16“Network management”on page 15
Topology visualization Yes“Service and topologymanagement” on page5
Yes“Service and topologymanagement” on page10
Yes“Service and topologymanagement” on page16
© Copyright IBM Corp. 2020, 2020 3
Table 1. Comparison of the capabilities of the different NOI deployment modes (continued)
Capability Cloud Hybrid On-premises
Seasonal events Yes“Cloud native analytics”on page 6
Yes“Cloud native analytics”on page 11
Yes“Event analytics” onpage 16
Temporal grouping Yes“Cloud native analytics”on page 6
Yes“Cloud native analytics”on page 11
Yes“Event analytics” onpage 16(related events)
Temporal patterns Yes“Cloud native analytics”on page 6
Yes“Cloud native analytics”on page 11
Yes“Event analytics” onpage 16
Patterns (namesimilarity andregular expressionmatching)
No No Yes“Event analytics” onpage 16
Scope-based correlation Yes“Cloud native analytics”on page 6
Yes“Cloud native analytics”on page 11
Yes“Event analytics” onpage 16
Topological correlation Yes“Cloud native analytics”on page 6
Yes“Cloud native analytics”on page 11
No
Scheduled analyticstraining
Yes“Cloud native analytics”on page 6
Yes“Cloud native analytics”on page 11
Yes“Event analytics” onpage 16
Topology analytics Yes“Topology analytics” onpage 6
Yes“Topology analytics” onpage 11
No
Policy management Yes“Event management” onpage 6
Yes“Event management” onpage 10
Yes“Event analytics” onpage 16 (rules)
Incident management Yes“Incident management”on page 6
Yes“Incident management”on page 11
No
Incident diagnosis Yes“Probable cause” onpage 6
Yes“Probable cause” onpage 11
Yes“Network management”on page 15(limited topology-basedRCA)“Event analytics” onpage 16
Incident resolution andrunbooks
Yes“Runbook automation”on page 7
Yes“Runbook automation”on page 11
No
Search Yes“Search (Humio)” onpage 7
Yes“Search (Humio and LogAnalysis)” on page 12
Yes“Search (Log Analysis)”on page 17
4 IBM Netcool Operations Insight: Integration Guide
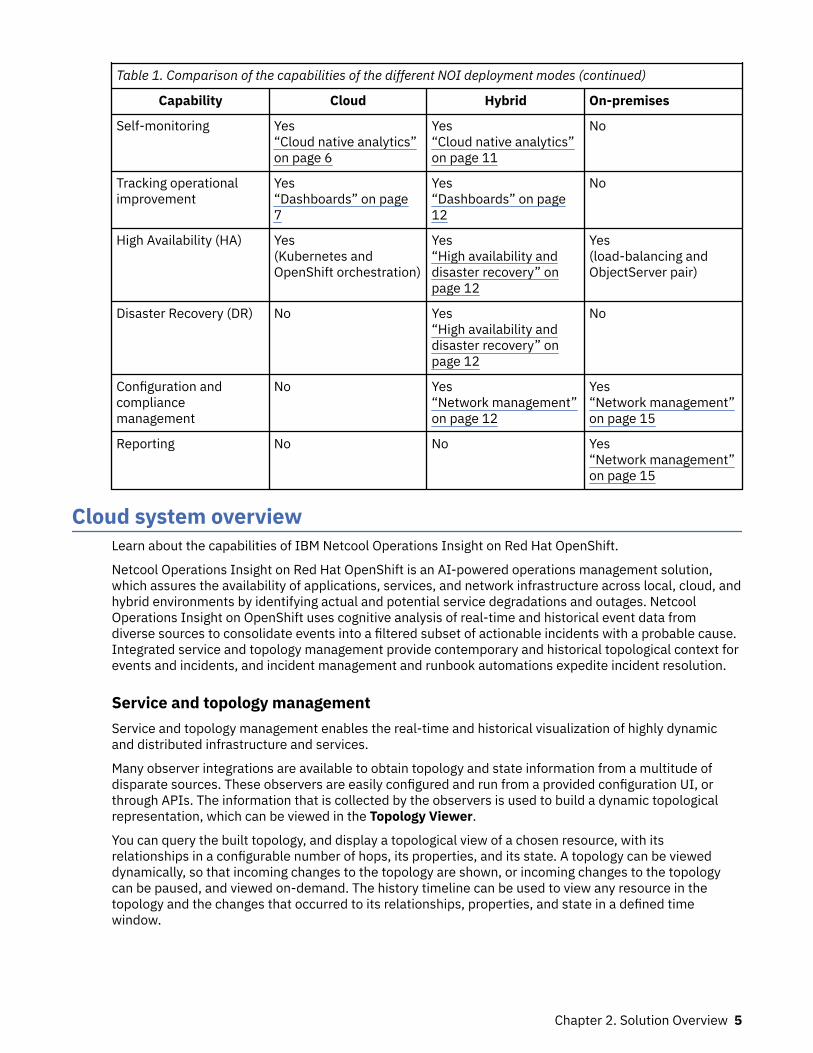
Table 1. Comparison of the capabilities of the different NOI deployment modes (continued)
Capability Cloud Hybrid On-premises
Self-monitoring Yes“Cloud native analytics”on page 6
Yes“Cloud native analytics”on page 11
No
Tracking operationalimprovement
Yes“Dashboards” on page7
Yes“Dashboards” on page12
No
High Availability (HA) Yes(Kubernetes andOpenShift orchestration)
Yes“High availability anddisaster recovery” onpage 12
Yes(load-balancing andObjectServer pair)
Disaster Recovery (DR) No Yes“High availability anddisaster recovery” onpage 12
No
Configuration andcompliancemanagement
No Yes“Network management”on page 12
Yes“Network management”on page 15
Reporting No No Yes“Network management”on page 15
Cloud system overviewLearn about the capabilities of IBM Netcool Operations Insight on Red Hat OpenShift.
Netcool Operations Insight on Red Hat OpenShift is an AI-powered operations management solution,which assures the availability of applications, services, and network infrastructure across local, cloud, andhybrid environments by identifying actual and potential service degradations and outages. NetcoolOperations Insight on OpenShift uses cognitive analysis of real-time and historical event data fromdiverse sources to consolidate events into a filtered subset of actionable incidents with a probable cause.Integrated service and topology management provide contemporary and historical topological context forevents and incidents, and incident management and runbook automations expedite incident resolution.
Service and topology managementService and topology management enables the real-time and historical visualization of highly dynamicand distributed infrastructure and services.
Many observer integrations are available to obtain topology and state information from a multitude ofdisparate sources. These observers are easily configured and run from a provided configuration UI, orthrough APIs. The information that is collected by the observers is used to build a dynamic topologicalrepresentation, which can be viewed in the Topology Viewer.
You can query the built topology, and display a topological view of a chosen resource, with itsrelationships in a configurable number of hops, its properties, and its state. A topology can be vieweddynamically, so that incoming changes to the topology are shown, or incoming changes to the topologycan be paused, and viewed on-demand. The history timeline can be used to view any resource in thetopology and the changes that occurred to its relationships, properties, and state in a defined timewindow.
Chapter 2. Solution Overview 5

Event managementIf pre-defined attributes for incoming events are the same, then these events are related events, and theyare correlated into an incident. The incident priority is determined by the highest severity event that theincident contains. If an event occurs multiple times (the resource bundle and eventType are the same),then deduplication adds only one of these events to the owning incident, and increments the count forthis event.
You can create event policies that perform actions against events, such as enriching events withadditional information, suppressing events under specific conditions, or assigning runbooks to events toaid resolution. Incident policies can be created to assign incidents to specified groups automatically,notify users, or escalate incidents that do not have an investigation in progress after a configured time.
Cloud native analyticsHistoric and live event data is analyzed to identify patterns and correlations, and policies are thensuggested that can be used to group events together into incidents. Policies can be auto-deployed, or canbe set to require manual review first. Scheduled training runs ensure that grouping policies maintain theirrelevance to the stream of incoming events.
Events are grouped by the following:
• Seasonality - events that occur at a particular time.• Temporal grouping - events that are related because they usually occur within a short time of each
other.• Temporal patterns - events that match a temporal pattern. Temporal patterns are patterns of behavior
that occur among temporal groups, which are similar, but occur on different resources.• Topological correlation - events that occur on resources that are topologically related, or on a defined
part of the topology.• Scope-based correlation - events that are grouped together by a user-defined scope-based policy,
which groups events that have a common attribute, such as a particular resource or sub topology, and aspecific time window.
Deployed policies automatically group incoming events together into incidents where they match theconditions of the policy, reducing noise and presenting actionable incidents in the Events page. Theseincidents, which are composed of events that the user can examine individually, present a holistic view ofthe problem instead of a much larger volume of isolated single events.
Cloud native analytics generates a heartbeat event to self-monitor the health of its own services.
Probable causeOn the Events page, a weighted probable cause is shown for each of the events in an incident to helpidentify which event has the greatest probability of being the cause. Probable cause ratings are calculatedfor each of the events in the incident by using text classification and topological information. The way thatprobable cause ratings are calculated is configurable.
Topology analyticsEvents that have an associated resource in the topology are enriched with topological information, andthe Events page indicates when an event has an associated topology that can be launched to.
This dynamic topology mapping provides topological context when investigating an incident. Operatorscan drill down into an incident's topology, and see a timeline of recent changes on the event's associatedtopological resource to assist faster identification and resolution of the incident cause.
Incident managementThe Incidents page displays all of the current incidents, and can be filtered to show only incidents thatare assigned to a group or the current user. You can add events to an incident, assign it to an operator,
6 IBM Netcool Operations Insight: Integration Guide
change its state (for example to 'In Progress', or 'Resolved'), view the events in the incident, view atimeline of the incident's history, and see suggested runbooks.
Runbook automationYou can create and manage runbooks that provide full and partial automation of common operationsprocedures. When an incident is identified, AI models match the incident with previous similar incidentsand their successful resolution actions, and suggest a runbook automation that can be used to resolve theissue. The runbook automations use tested and trusted procedures from similar incidents to provide afast, reliable, and traceable resolution.
Search (Humio)An integration with Humio can be configured to enable searching for events and topological resources inlogs. Humio can also be used to search logs and create alerts if the specified search criteria are matched.
DashboardsDashboards are provided which display the % reduction in events, the mean time to resolve and respondto incidents, and statistics on the usage and maturity of runbooks.
Cloud componentsLearn about the components of a deployment of IBM Netcool Operations Insight on OpenShift.
Download documentIBM Netcool Operations Insight on OpenShift: Download Netcool Operations Insight V1.6.3 on Red HatOpenShift
The operator images for Netcool Operations Insight on Red Hat OpenShift are in the freely accessibleDockerHub (docker.io/ibmcom), and the operand images are in the IBM Entitled Registry (cp.icr.io), forwhich you require an entitlement key. The CASE bundle is available from IBM cloudPaks. For moreinformation, see “Installing on Red Hat OpenShift” on page 108.
Optional parts for IBM Tivoli Netcool/OMNIbus IntegrationsIf you want to use IBM Tivoli Netcool/OMNIbus Integrations, you can download the following parts fromthe CJ8KBEN Netcool Operations Insight V1.6.3 Cloud Paks eAssembly, depending on your requirements.
• Optional: IBM Netcool Operations Insight Event Integrations Linux® containers. For more informationabout the Netcool Operations Insight Event Integrations operator, and the integrations that you can usethe operator to deploy, see https://www.ibm.com/support/knowledgecenter/SSSHTQ/omnibus/operators/all_operators/ops_intro.html.
• Optional: IBM Tivoli Netcool/OMNIbus Netcool Netcool/OMNIBus Gateway for Cloud EventManagement Integration Red Hat Linux container
• Optional: IBM Tivoli Netcool/OMNIbus Netcool Probe for Cloud Monitoring Integration Red Hat Linuxcontainer x86-64 Multilingual
For more information about probes and gateways, see the IBM Tivoli Netcool/OMNIbus integrations IBMKnowledge Center: https://www.ibm.com/support/knowledgecenter/SSSHTQ/omnibus/common/kc_welcome-444.html
Chapter 2. Solution Overview 7
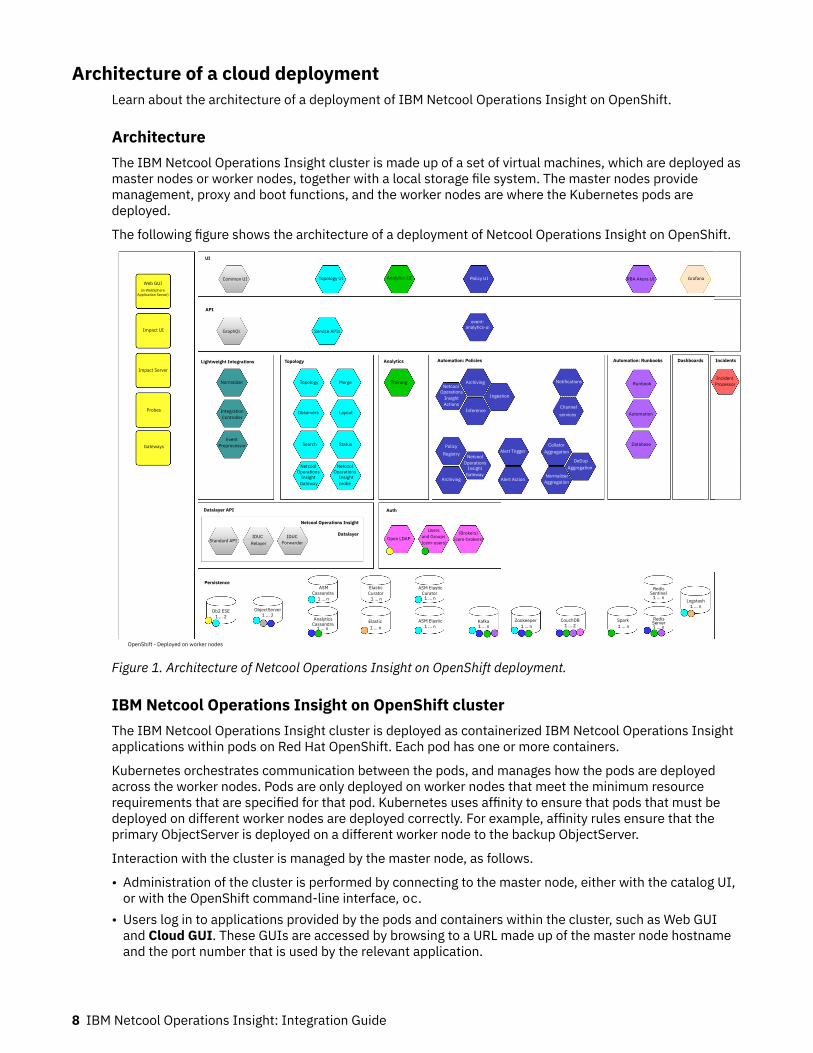
Architecture of a cloud deploymentLearn about the architecture of a deployment of IBM Netcool Operations Insight on OpenShift.
ArchitectureThe IBM Netcool Operations Insight cluster is made up of a set of virtual machines, which are deployed asmaster nodes or worker nodes, together with a local storage file system. The master nodes providemanagement, proxy and boot functions, and the worker nodes are where the Kubernetes pods aredeployed.
The following figure shows the architecture of a deployment of Netcool Operations Insight on OpenShift.
Web GUI(in WebSphere
Application Server)
Impact UI
Impact Server
Probes
Gateways
OpenShift - Deployed on worker nodes
Persistence
Netcool Operations Insight
Datalayer
Datalayer API Auth
UI
API
Lightweight Integrations Topology Analytics Automation: Policies Automation: Runbooks Dashboards
Common UI Topology UI Analytics UI Policy UI RBA Akora UI Grafana
GraphQL Service APIs
Normalizer
IntegrationController
EventPreprocessor
Standard APIIDUC
ForwarderIDUC
RelayerOpen LDAP and Groups
(Brokers)(cem-brokers)
Users
(cem-users)
Topology
Observers
Search
OperationsInsight
Gateway
Netcool NetcoolOperations
Insightprobe
Status
Layout
Merge Training Archiving
InferenceActions
Ingestion
Notifications
Channel
Normalizer
AggregationOperations
Policy
Archiving Alert Action
Alert TriggerNetcool
InsightGateway
Registry
NetcoolOperations
Insight
services
DeDup
CollatorAggregation
Aggregation
Runbook
Automation
Database
Db2 ESE
Analytics
Cassandra
Cassandra
Elastic
Elastic CouchDB
Curator Curator1 ... n
1 ... n 1 ... n 1 ... n 1 ... n 1 ... n 1 ... n 1 ... n
1 ... n
1 ... n1 ... n 1 ... n
1 ... 2 1 ... 2
1 ... 2
ObjectServer
ASM ASM Elastic
ASM Elastic Kafka Zookeeper Spark
SentinelRedis
RedisServer
Logstash
Incidents
ProcessorIncident
event-analytics-ui
Figure 1. Architecture of Netcool Operations Insight on OpenShift deployment.
IBM Netcool Operations Insight on OpenShift clusterThe IBM Netcool Operations Insight cluster is deployed as containerized IBM Netcool Operations Insightapplications within pods on Red Hat OpenShift. Each pod has one or more containers.
Kubernetes orchestrates communication between the pods, and manages how the pods are deployedacross the worker nodes. Pods are only deployed on worker nodes that meet the minimum resourcerequirements that are specified for that pod. Kubernetes uses affinity to ensure that pods that must bedeployed on different worker nodes are deployed correctly. For example, affinity rules ensure that theprimary ObjectServer is deployed on a different worker node to the backup ObjectServer.
Interaction with the cluster is managed by the master node, as follows.
• Administration of the cluster is performed by connecting to the master node, either with the catalog UI,or with the OpenShift command-line interface, oc.
• Users log in to applications provided by the pods and containers within the cluster, such as Web GUIand Cloud GUI. These GUIs are accessed by browsing to a URL made up of the master node hostnameand the port number that is used by the relevant application.
8 IBM Netcool Operations Insight: Integration Guide
If you require multiple independent installations of IBM Netcool Operations Insight, then you can createnamespaces within your cluster and deploy each instance into a separate namespace.
For more information, see Red Hat Product Documentation for OpenShift Container Platform V4.6 https://access.redhat.com/documentation/en-us/openshift_container_platform/4.6/ .
RoutesA Netcool Operations Insight on OpenShift deployment requires several routes to be created; to directtraffic from clients such as web browsers to the Netcool Operations Insight services, and also for servicesto communicate internally. For a full list of routes, run the command oc get routes on a deployedinstance of Netcool Operations Insight.
Commonly used URLs:
• Cloud GUI: https://netcool.release_name.fqdn• Web GUI: https://netcool.release_name.fqdn/ibm/console• Netcool/Impact GUI: https://impact.release_name.fqdn/ibm/console
Where
• release_name is the name of your deployment, as specified by the value used for name (OLM UI Formview), or name in the metadata section of the noi.ibm.com_noihybrids_cr.yaml ornoi.ibm.com_nois_cr.yaml files (YAML view).
• fqdn is the fully qualified domain name (FQDN) of the cluster's master node. The FQDN takes the formapps.clustername.*.*.com
For more information, see “Logging into Netcool Operations Insight” on page 459.
StorageStorage must be created before you deploy Netcool Operations Insight on OpenShift. For moreinformation, see “Storage” on page 110.
Note: Operations Analytics - Log Analysis is not available on cloud-based systems. It is only available on-premises, or on-premises in a hybrid installation.
System requirements on cloudLearn about supported platforms for an IBM Netcool Operations Insight on OpenShift deployment.
For detailed system requirements, search for version 1.6.3 of the Netcool Operations Insight product inthe Software Product Compatibility Reports website, https://www.ibm.com/software/reports/compatibility/clarity/softwareReqsForProduct.html .
OpenShift supportThe current version of Netcool Operations Insight, 1.6.3, is compatible with Red Hat OpenShift version4.5 and 4.6. All of the documentation links point to that version of the OpenShift documentation: https://access.redhat.com/documentation/en-us/openshift_container_platform/4.6/
Platform supportNetcool Operations Insight on OpenShift is supported on the same platforms that OpenShift supports. Formore information, see https://docs.openshift.com/container-platform/4.6/welcome/index.html#cluster-installer-activities.
A Netcool Operations Insight on OpenShift deployment is also supported on the following platforms:
• Amazon Web Services (AWS)• Google Cloud Platform
Chapter 2. Solution Overview 9
• Microsoft Azure• IBM Managed Red Hat OpenShift - Also called Red Hat OpenShift Kubernetes Service (ROKS) cluster,
which can be provisioned from the IBM Cloud® catalog: https://cloud.ibm.com/kubernetes/catalog/OpenShiftcluster
SizingFor more information about sizing for a full cloud deployment of Netcool Operations Insight on OpenShift,see “Sizing for a Netcool Operations Insight on Red Hat OpenShift deployment” on page 108.
StorageFor more information about storage options for a full cloud deployment of Netcool Operations Insight onOpenShift, see “Storage” on page 110.
Hybrid system overviewLearn about the capabilities of a hybrid deployment of Netcool Operations Insight.
Netcool Operations Insight on Red Hat OpenShift is an AI-powered operations management solution,which assures the availability of applications, services, and network infrastructure across local, cloud, andhybrid environments by identifying actual and potential service degradations and outages. NetcoolOperations Insight on OpenShift uses cognitive analysis of real-time and historical event data fromdiverse sources to consolidate events into a filtered subset of actionable incidents with a probable cause.Integrated service and topology management provide contemporary and historical topological context forevents and incidents, and incident management and runbook automations expedite incident resolution.
Service and topology managementService and topology management enables the real-time and historical visualization of highly dynamicand distributed infrastructure and services.
Many observer integrations are available to obtain topology and state information from a multitude ofdisparate sources. These observers are easily configured and run from a provided configuration UI, orthrough APIs. The information that is collected by the observers is used to build a dynamic topologicalrepresentation, which can be viewed in the Topology Viewer.
You can query the built topology, and display a topological view of a chosen resource, with itsrelationships in a configurable number of hops, its properties, and its state. A topology can be vieweddynamically, so that incoming changes to the topology are shown, or incoming changes to the topologycan be paused, and viewed on-demand. The history timeline can be used to view any resource in thetopology and the changes that occurred to its relationships, properties, and state in a defined timewindow.
Note: Integration with on-premises IBM Agile Service Manager is not supported for hybrid deployments.
Event managementIf pre-defined attributes for incoming events are the same, then these events are related events, and theyare correlated into an incident. The incident priority is determined by the highest severity event that theincident contains. If an event occurs multiple times (the resource bundle and eventType are the same),then deduplication adds only one of these events to the owning incident, and increments the count forthis event.
You can create event policies that perform actions against events, such as enriching events withadditional information, suppressing events under specific conditions, or assigning runbooks to events toaid resolution. Incident policies can be created to assign incidents to specified groups automatically,notify users, or escalate incidents that do not have an investigation in progress after a configured time.
10 IBM Netcool Operations Insight: Integration Guide
Cloud native analyticsHistoric and live event data is analyzed to identify patterns and correlations, and policies are thensuggested that can be used to group events together into incidents. Policies can be auto-deployed, or canbe set to require manual review first. Scheduled training runs ensure that grouping policies maintain theirrelevance to the stream of incoming events.
Events are grouped by the following:
• Seasonality - events that occur at a particular time.• Temporal grouping - events that are related because they usually occur within a short time of each
other.• Temporal patterns - events that match a temporal pattern. Temporal patterns are patterns of behavior
that occur among temporal groups, which are similar, but occur on different resources.• Topological correlation - events that occur on resources that are topologically related, or on a defined
part of the topology.• Scope-based correlation - events that are grouped together by a user-defined scope-based policy,
which groups events that have a common attribute, such as a particular resource or sub topology, and aspecific time window.
Deployed policies automatically group incoming events together into incidents where they match theconditions of the policy, reducing noise and presenting actionable incidents in the Events page. Theseincidents, which are composed of events that the user can examine individually, present a holistic view ofthe problem instead of a much larger volume of isolated single events.
Cloud native analytics generates a heartbeat event to self-monitor the health of its own services.
Probable causeOn the Events page, a weighted probable cause is shown for each of the events in an incident to helpidentify which event has the greatest probability of being the cause. Probable cause ratings are calculatedfor each of the events in the incident by using text classification and topological information. The way thatprobable cause ratings are calculated is configurable.
Topology analyticsEvents that have an associated resource in the topology are enriched with topological information, andthe Events page indicates when an event has an associated topology that can be launched to.
This dynamic topology mapping provides topological context when investigating an incident. Operatorscan drill down into an incident's topology, and see a timeline of recent changes on the event's associatedtopological resource to assist faster identification and resolution of the incident cause.
Incident managementThe Incidents page displays all of the current incidents, and can be filtered to show only incidents thatare assigned to a group or the current user. You can add events to an incident, assign it to an operator,change its state (for example to 'In Progress', or 'Resolved'), view the events in the incident, view atimeline of the incident's history, and see suggested runbooks.
Runbook automationYou can create and manage runbooks that provide full and partial automation of common operationsprocedures. When an incident is identified, AI models match the incident with previous similar incidentsand their successful resolution actions, and suggest a runbook automation that can be used to resolve theissue. The runbook automations use tested and trusted procedures from similar incidents to provide afast, reliable, and traceable resolution.
Chapter 2. Solution Overview 11
Search (Humio and Log Analysis)The search and analysis capabilities of on-premises Operations Analytics - Log Analysis can be runagainst selected events, for example to search for similar events, events from the same node, or eventswith a matching keyword.
On OpenShift, an integration with Humio can be configured to enable searching for events and topologicalresources in logs. Humio can also be used to search logs and create alerts if the specified search criteriaare matched.
DashboardsDashboards are provided which display the % reduction in events, the mean time to resolve and respondto incidents, and statistics on the usage and maturity of runbooks.
High availability and disaster recoveryHigh availability (HA) and disaster recovery (DR) are configurable for hybrid deployments.
Network managementNetwork Manager displays availability, performance, event, and configuration data for network views.Netcool Configuration Manager provides configuration and compliance management capabilities fornetwork devices, and reports devices that violate user-defined rules. Topology Search is an extension ofthe Networks for Operations Insight feature. It provides insight into network performance by analyzingevents that have been enriched with network data and determining the lowest cost routes between twoendpoints on the network over time.
Users can run a discovery to find all the devices and interfaces on their network, determine theirconnectivity and build a topological representation. Polling can be configured to monitor any scope of thediscovered topology, and to generate events if configured thresholds on certain values are violated, or thepolled device or interface is unresponsive.
The discovered topology can be visualized, with its alert status, in standard network views, and in a hopview of a chosen device with a configurable number of its connections. The Network Health Dashboardcan be used to display availability, performance, event, and configuration data for monitored devices andinterfaces in user selected network views. Devices can be examined in more detail with the StructureBrowser, MIB Browser, and MIB Grapher, and reports can be run to retrieve data about the network andits performance.
Events are received from OMNIBus probes and from polls. The Active Event List can be used to view andfilter these events, and launch to any associated topology. If events occur on topologically linked devices,then Network Manager identifies the root cause event, and highlights it in the network and eventvisualizations.
Components on hybrid systemsLearn about the components of a hybrid deployment of IBM Netcool Operations Insight.
For on-premises components, see “On-premises components” on page 17.
For cloud components, see “Cloud components” on page 7.
12 IBM Netcool Operations Insight: Integration Guide
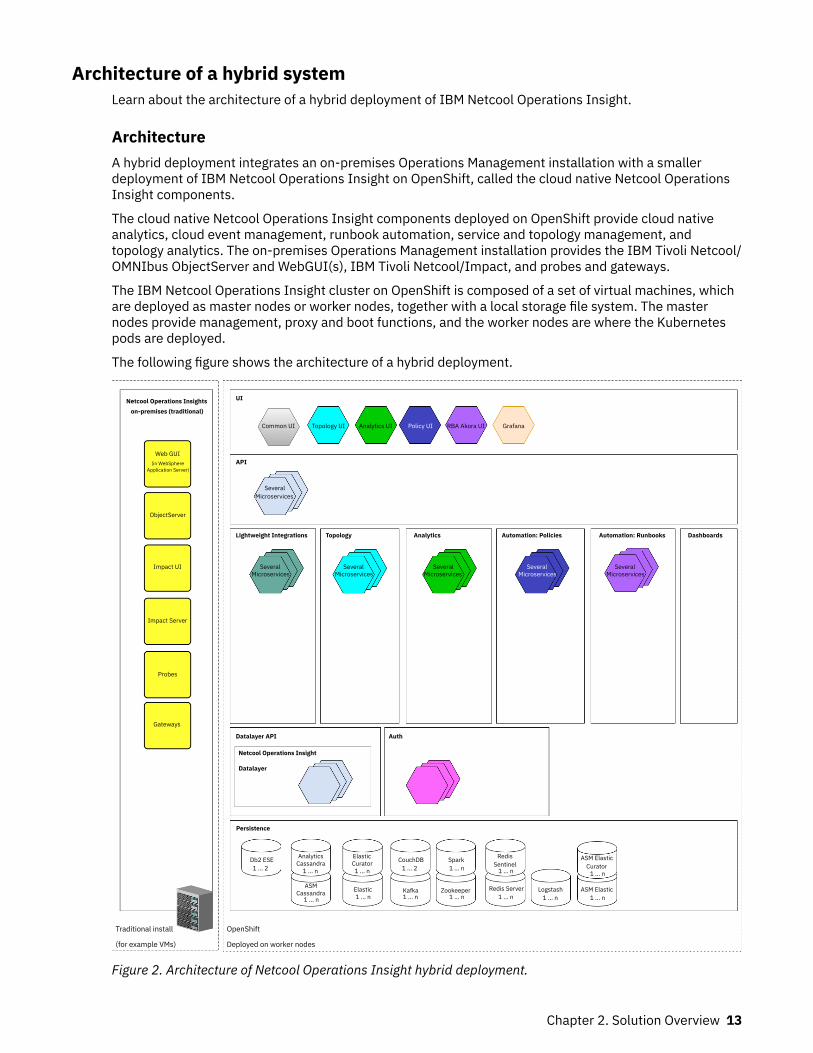
Architecture of a hybrid systemLearn about the architecture of a hybrid deployment of IBM Netcool Operations Insight.
ArchitectureA hybrid deployment integrates an on-premises Operations Management installation with a smallerdeployment of IBM Netcool Operations Insight on OpenShift, called the cloud native Netcool OperationsInsight components.
The cloud native Netcool Operations Insight components deployed on OpenShift provide cloud nativeanalytics, cloud event management, runbook automation, service and topology management, andtopology analytics. The on-premises Operations Management installation provides the IBM Tivoli Netcool/OMNIbus ObjectServer and WebGUI(s), IBM Tivoli Netcool/Impact, and probes and gateways.
The IBM Netcool Operations Insight cluster on OpenShift is composed of a set of virtual machines, whichare deployed as master nodes or worker nodes, together with a local storage file system. The masternodes provide management, proxy and boot functions, and the worker nodes are where the Kubernetespods are deployed.
The following figure shows the architecture of a hybrid deployment.
Netcool Operations Insights UI
API
Lightweight Integrations Topology Analytics Automation: Policies Automation: Runbooks Dashboards
Datalayer API
Netcool Operations Insight
Datalayer
Auth
Persistence
Traditional install
(for example VMs)
OpenShift
Deployed on worker nodes
Db2 ESE Analytics Elastic CouchDB SparkSentinel
Redis ServerZookeeperKafkaElasticCassandra Logstash ASM Elastic
Curator1 ... 2 1 ... n
1 ... n 1 ... n
1 ... n 1 ... 2
1 ... n 1 ... n
1 ... n 1 ... n
1 ... n 1 ... n 1 ... n
1 ... nCassandra
ASM
ASM ElasticRedisCurator
Gateways
Probes
Impact Server
Impact UI
ObjectServer
Web GUI(in WebSphere
Application Server)
SeveralMicroservices
SeveralMicroservices Microservices Microservices Microservices Microservices
Several Several Several Several
Common UI Topology UI Analytics UI Policy UI RBA Akora UI Grafana
on-premises (traditional)
Figure 2. Architecture of Netcool Operations Insight hybrid deployment.
Chapter 2. Solution Overview 13
On-premises IBM Netcool Operations InsightThe on-premises Operations Management installation is composed of the ObjectServer(s), WebGUI, theImpact server and UI, and the probes and gateways. Extra authentication is configured at installation toallow on-premises services and cloud services mutual access. The hybrid solution can be deployed withmultiple on-premises WebGUI instances in High Availability (HA) mode to provide redundancy.
IBM Netcool Operations Insight on OpenShift clusterThe IBM Netcool Operations Insight cluster is deployed as containerized IBM Netcool Operations Insightapplications within pods on Red Hat OpenShift. Each pod has one or more containers.
Kubernetes orchestrates communication between the pods, and manages how the pods are deployedacross the worker nodes. Pods are only deployed on worker nodes that meet the minimum resourcerequirements that are specified for that pod. Kubernetes uses affinity to ensure that pods that must bedeployed on different worker nodes are deployed correctly.
Interaction with the cluster is managed by the master node, as follows.
• Administration of the cluster is performed by connecting to the master node, either with the catalog UI,or with the OpenShift command-line interface, oc.
• Users log in to applications provided by the pods and containers within the cluster, with the on-premises Web GUI, and the Cloud GUI. These GUIs are accessed by browsing to a URL made up of thehostname and the port number that is used by the relevant application.
If you require multiple independent installations of IBM Netcool Operations Insight, then you can createnamespaces within your cluster and deploy each instance into a separate namespace.
For more information, see Red Hat Product Documentation for OpenShift Container Platform V4.6 https://access.redhat.com/documentation/en-us/openshift_container_platform/4.6/ .
RoutesA Netcool Operations Insight on OpenShift deployment requires several routes to be created; to directtraffic from clients, such as web browsers, to the Netcool Operations Insight services, and also forservices to communicate internally. For a full list of routes, run the command oc get routes on adeployed instance of Netcool Operations Insight.
StorageStorage for the cloud native Netcool Operations Insight components must be created before you deployNetcool Operations Insight on OpenShift. For more information, see “Storage” on page 144.
System requirements of a hybrid deploymentLearn about the system requirements for a hybrid deployment of IBM Netcool Operations Insight.
For detailed system requirements on the on-premises and cloud portions of a hybrid deployment, searchfor version 1.6.3 of the Netcool Operations Insight product in the Software Product Compatibility Reportswebsite: https://www.ibm.com/software/reports/compatibility/clarity/softwareReqsForProduct.html
The cloud portion of a hybrid installation, the cloud native Netcool Operations Insight components on RedHat OpenShift, has the following requirements.
OpenShift supportThe current version of Netcool Operations Insight, 1.6.3, is compatible with Red Hat OpenShift version4.5 and 4.6. All of the documentation links point to that version of the OpenShift documentation: https://access.redhat.com/documentation/en-us/openshift_container_platform/4.6/
14 IBM Netcool Operations Insight: Integration Guide
Platform supportNetcool Operations Insight on OpenShift is supported on the same platforms that OpenShift supports. Formore information, see https://docs.openshift.com/container-platform/4.6/welcome/index.html#cluster-installer-activities.
A Netcool Operations Insight on OpenShift deployment is also supported on the following platforms:
• Amazon Web Services (AWS)• Google Cloud Platform• Microsoft Azure• IBM Managed Red Hat OpenShift - Also called Red Hat OpenShift Kubernetes Service (ROKS) cluster,
which can be provisioned from the IBM Cloud catalog: https://cloud.ibm.com/kubernetes/catalog/OpenShiftcluster
SizingFor more information about sizing for the cloud components of a hybrid deployment, see “Sizing for ahybrid deployment” on page 142.
StorageFor more information about storage options for the cloud components of a hybrid deployment, see“Storage” on page 144.
On-premises system overviewLearn about the capabilities of an on-premises deployment of IBM Netcool Operations Insight.
Operations Management monitors the health and performance of network infrastructure across local,cloud, and hybrid environments. It also incorporates strong event management and search capabilities,and uses real-time and historic alarm and alert analytics.
On-premises Netcool Operations Insight consists of a base operations management solution, OperationsManagement for Operations Insight, which can be extended by integrating the Network Management, andService Management solution extensions. Operations Management is made up of the following productsand components:
• IBM Tivoli Netcool/OMNIbus• Tivoli Netcool/OMNIbus Web GUI• IBM Tivoli Netcool/Impact• IBM Operations Analytics - Log Analysis• Event Analytics• Event Search
Optional extensions:
• Network Management for Operations Insight. This extension adds the “Network management” on page15 capability and is provided by integrating Network Manager, Netcool Configuration Manager, andTopology Search.
• Service Management for Operations Insight. This extension adds the “Service and topologymanagement” on page 16 capability, and is provided by integrating the Agile Service Manager product.
Network managementNetwork Manager displays availability, performance, event, and configuration data for network views.Netcool Configuration Manager provides configuration and compliance management capabilities fornetwork devices, and reports devices that violate user-defined rules. Topology Search is an extension of
Chapter 2. Solution Overview 15
the Networks for Operations Insight feature. It provides insight into network performance by analyzingevents that have been enriched with network data and determining the lowest cost routes between twoendpoints on the network over time.
Users can run a discovery to find all the devices and interfaces on their network, determine theirconnectivity and build a topological representation. Polling can be configured to monitor any scope of thediscovered topology, and to generate events if configured thresholds on certain values are violated, or thepolled device or interface is unresponsive.
The discovered topology can be visualized, with its alert status, in standard network views, and in a hopview of a chosen device with a configurable number of its connections. The Network Health Dashboardcan be used to display availability, performance, event, and configuration data for monitored devices andinterfaces in user selected network views. Devices can be examined in more detail with the StructureBrowser, MIB Browser, and MIB Grapher, and reports can be run to retrieve data about the network andits performance.
Events are received from OMNIBus probes and from polls. The Active Event List can be used to view andfilter these events, and launch to any associated topology. If events occur on topologically linked devices,then Network Manager identifies the root cause event, and highlights it in the network and eventvisualizations.
Service and topology managementTopology and service management enable the real-time and historical visualization of highly dynamic anddistributed infrastructure and services.
Many different observer integrations are available to obtain topology and state information from disparatesources. These observers are easily configured and run from a configuration UI, or through APIs. Theinformation that is collected by the observers is used to build a topological representation, which can beviewed in the Topology Viewer.
You can query the built topology, and display a topological view of a chosen resource, its relationships in aconfigurable number of hops, its properties, and its state. Users can view a topology dynamically so thatincoming changes to the topology are shown, or they can pause the topology and view incoming changesto the displayed topology on-demand. The history timeline can be used to view any resource in thetopology and the changes that occurred to its relationships, properties, and state in a defined timewindow.
Event analyticsEvent Analytics analyzes historic and live event data to identify seasonality, related events, and patterns.From this analysis, operators can build and deploy rules that can enrich, suppress, and group events. Theroot cause (parent) event can be chosen when the rule is created. The deployed rules correlate and groupevents, and reduce the number of events that are presented to the operator in the Event Viewer.
Events are grouped by the following rules:
• Seasonality - events that occur at a particular time.• Related events - events that usually occur within a short time of each other.• Temporal patterns - events that match a temporal pattern. Temporal patterns are patterns of behavior
that occur in temporal groups, which are similar, but occur on different resources. Patterns canoptionally be configured to use non-exact matching where there is name similarity or a regularexpression match.
• Scope-based correlation - events that are grouped together by a user-defined event policy, whichgroups events that have a common attribute, such as a resource.
Configuration scans to generate analytics based on your event data can be scheduled, or can be run ondemand. You can view data on seasonal events in graphs and charts.
16 IBM Netcool Operations Insight: Integration Guide

Search (Log Analysis)The search and analysis capabilities of Operations Analytics - Log Analysis can be run against selectedevents, for example to search for similar events, events from the same node, or events with a matchingkeyword.
On-premises componentsLearn about the products and components of an installation of on-premises Netcool Operations Insight.
Download documentNetcool Operations Insight V1.6.3 on premises: Download Netcool Operations Insight (on premises)V1.6.3
Product and component versionsThe following table lists the products and components that are supported in the current release of on-premises Netcool Operations Insight, which is version 1.6.3. Only this combination of product andcomponent releases is supported in Netcool Operations Insight V1.6.3.
Install Netcool Operations Insight V1.6.3 with IBM Installation Manager V1.9.2.
Table 2. Netcool Operations Insight on premises V1.6.3 product and component versions
Product orcomponent Version
Change fromprevious release?
Download fromPassportAdvantage
Download from FixCentral
IBM Tivoli Netcool/OMNIbus corecomponents
V8.1.0.24 Yes CJ8KCEN V8.1.0 Fix Pack 24
Tivoli Netcool/OMNIbus Web GUI
V8.1.0.21 Yes V8.1.0 Fix Pack 21
IBM Tivoli Netcool/OMNIbus 8 PlusGateway forMessage Bus
V8.0 No CC8Y3EN
IBM Tivoli Netcool/OMNIbus 8 PlusGateway for JDBC
V8.0 No CC8XSEN
IBM Tivoli Netcool/OMNIbus 8 PlusJDBC GatewayConfigurationScripts
V8.0 No CC8XQEN
IBM Tivoli Netcool/Impact
V7.1.0.20 No CJ8KDEN V7.1.0 Fix Pack 20
Chapter 2. Solution Overview 17

Table 2. Netcool Operations Insight on premises V1.6.3 product and component versions (continued)
Product orcomponent Version
Change fromprevious release?
Download fromPassportAdvantage
Download from FixCentral
Db2® V11.1
Db2 V11.1AdvancedWorkgroup ServerEdition for IBM TivoliNetcool/OMNIbusand IBM TivoliNetcool/ImpacteAssembly. For usewith OperationsManagementcomponents
V11.5
IBM Db2 ServerEdition V11.5 forNetcool OperationsInsight V1.6.3
No CJ8KIML
CJ8KJEN
Operations Analytics- Log Analysis
V1.3.6 No CJ8KEEN
Operations Analytics- Log AnalysisService DeskExtension
V1.1.0 No CJ8KFEN
Note: Only availablewith CJ8KEEN
IBM OperationsAnalytics AdvancedInsightsMultiplatformEnglish eAssembly
V1.3.6 No CJ8KGEN
Event Analytics IBM Tivoli Netcool/Impact ServerExtensions for IBMNetcool OperationsInsight_7.1.0.20
Yes Included in Netcool/Impact V7.1.0.20
IBM NetcoolOperations InsightExtension for IBMTivoli Netcool/OMNIbus WebGUI_8.1.0.21
Yes Included in Web GUIV8.1.0.21
18 IBM Netcool Operations Insight: Integration Guide
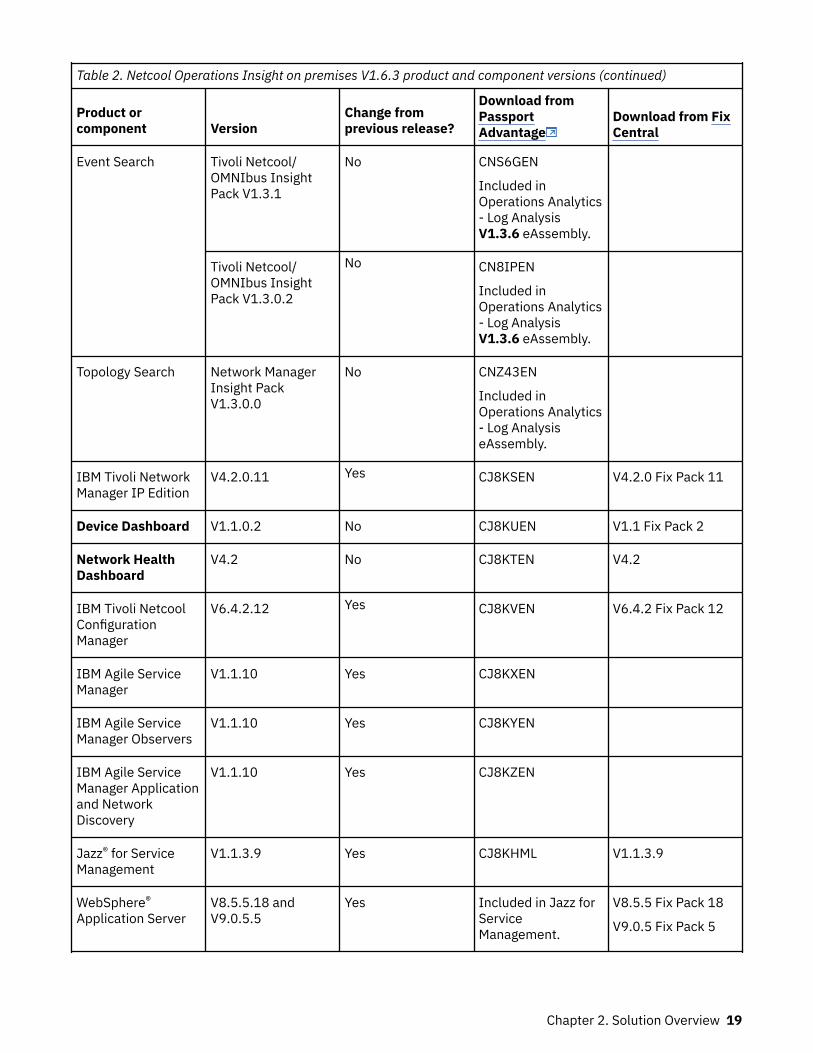
Table 2. Netcool Operations Insight on premises V1.6.3 product and component versions (continued)
Product orcomponent Version
Change fromprevious release?
Download fromPassportAdvantage
Download from FixCentral
Event Search Tivoli Netcool/OMNIbus InsightPack V1.3.1
No CNS6GEN
Included inOperations Analytics- Log AnalysisV1.3.6 eAssembly.
Tivoli Netcool/OMNIbus InsightPack V1.3.0.2
No CN8IPEN
Included inOperations Analytics- Log AnalysisV1.3.6 eAssembly.
Topology Search Network ManagerInsight PackV1.3.0.0
No CNZ43EN
Included inOperations Analytics- Log AnalysiseAssembly.
IBM Tivoli NetworkManager IP Edition
V4.2.0.11 Yes CJ8KSEN V4.2.0 Fix Pack 11
Device Dashboard V1.1.0.2 No CJ8KUEN V1.1 Fix Pack 2
Network HealthDashboard
V4.2 No CJ8KTEN V4.2
IBM Tivoli NetcoolConfigurationManager
V6.4.2.12 Yes CJ8KVEN V6.4.2 Fix Pack 12
IBM Agile ServiceManager
V1.1.10 Yes CJ8KXEN
IBM Agile ServiceManager Observers
V1.1.10 Yes CJ8KYEN
IBM Agile ServiceManager Applicationand NetworkDiscovery
V1.1.10 Yes CJ8KZEN
Jazz® for ServiceManagement
V1.1.3.9 Yes CJ8KHML V1.1.3.9
WebSphere®
Application ServerV8.5.5.18 andV9.0.5.5
Yes Included in Jazz forServiceManagement.
V8.5.5 Fix Pack 18
V9.0.5 Fix Pack 5
Chapter 2. Solution Overview 19
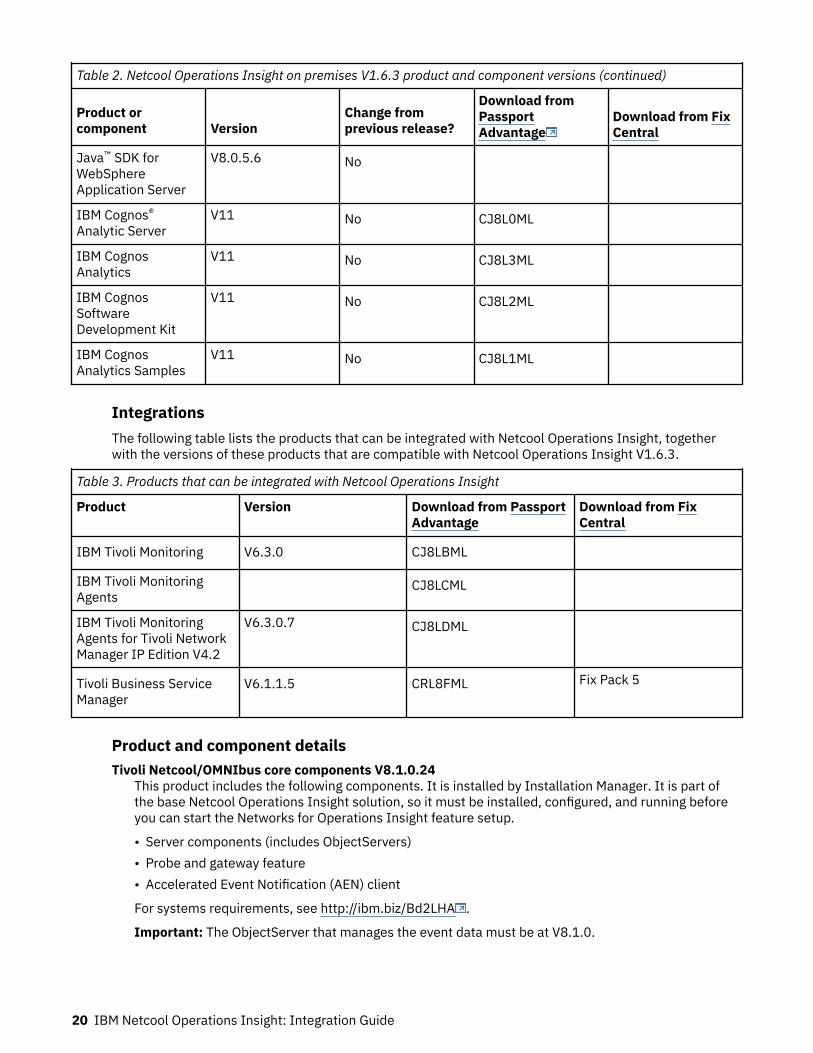
Table 2. Netcool Operations Insight on premises V1.6.3 product and component versions (continued)
Product orcomponent Version
Change fromprevious release?
Download fromPassportAdvantage
Download from FixCentral
Java™ SDK forWebSphereApplication Server
V8.0.5.6 No
IBM Cognos®
Analytic ServerV11 No CJ8L0ML
IBM CognosAnalytics
V11 No CJ8L3ML
IBM CognosSoftwareDevelopment Kit
V11 No CJ8L2ML
IBM CognosAnalytics Samples
V11 No CJ8L1ML
IntegrationsThe following table lists the products that can be integrated with Netcool Operations Insight, togetherwith the versions of these products that are compatible with Netcool Operations Insight V1.6.3.
Table 3. Products that can be integrated with Netcool Operations Insight
Product Version Download from PassportAdvantage
Download from FixCentral
IBM Tivoli Monitoring V6.3.0 CJ8LBML
IBM Tivoli MonitoringAgents
CJ8LCML
IBM Tivoli MonitoringAgents for Tivoli NetworkManager IP Edition V4.2
V6.3.0.7 CJ8LDML
Tivoli Business ServiceManager
V6.1.1.5 CRL8FML Fix Pack 5
Product and component detailsTivoli Netcool/OMNIbus core components V8.1.0.24
This product includes the following components. It is installed by Installation Manager. It is part ofthe base Netcool Operations Insight solution, so it must be installed, configured, and running beforeyou can start the Networks for Operations Insight feature setup.
• Server components (includes ObjectServers)• Probe and gateway feature• Accelerated Event Notification (AEN) client
For systems requirements, see http://ibm.biz/Bd2LHA .
Important: The ObjectServer that manages the event data must be at V8.1.0.
20 IBM Netcool Operations Insight: Integration Guide
Tivoli Netcool/OMNIbus Web GUI V8.1.0.21This component includes the following subcomponents and add-ons. It is installed by InstallationManager. It is part of the base Netcool Operations Insight solution. The following extensions to theWeb GUI are supplied in Netcool Operations Insight:
• Tools and menus for integration with Operations Analytics - Log Analysis.• Extensions for Netcool Operations Insight: This supports the Event Analytics capability.
Important: Both the Impact Server Extensions and the Web GUI extensions must be installed forthe Event Analytics capability to work.
The Web GUI is installed into Dashboard Application Services Hub, which is part of Jazz for ServiceManagement. Jazz for Service Management is distributed as separate installation features inInstallation Manager. For systems requirements, see http://ibm.biz/Bd2LHt .
Db2 Enterprise Server Edition databaseDb2 is the default database that is used for Netcool Operations Insight. Other types of databases arealso possible.
• Db2 Enterprise Server Edition V11.1 is for use with Operations Management components. Forsystems requirements, see http://ibm.biz/Bd2L4E .
• Db2 Enterprise Server Edition V11.5 is also available.
Gateway for JDBCThis product is needed for the base Netcool Operations Insight solution. It is installed by InstallationManager. The system requirements are the same as for Tivoli Netcool/OMNIbus V8.1. It is required forthe transfer of event data from the ObjectServer to the IBM Db2 database.
Netcool/Impact V7.1.0.20This product includes the following components. It is part of the base Netcool Operations Insightsolution. It is installed by Installation Manager.
• Impact server• GUI server• Impact Server extensions: Includes the policies that are used to create the event analytics
algorithms and the integration to IBM Connections.
Important: Both the Impact Server Extensions and the Web GUI extensions must be installed forthe Event Analytics capability to work.
For system requirements, see http://ibm.biz/Bd2L4Y .IBM Operations Analytics - Log Analysis V1.3.6
Netcool Operations Insight works with IBM Operations Analytics - Log Analysis V1.3.6. IBMOperations Analytics - Log Analysis is part of the base Netcool Operations Insight solution. It isinstalled by Installation Manager. For system requirements, search for "Hardware and softwarerequirements" within the relevant version of IBM Operations Analytics - Log Analysis at https://www.ibm.com/support/knowledgecenter/SSPFMY .
Note: Operations Analytics - Log Analysis Service Desk Extension V1.1.0 is available with IBMOperations Analytics - Log Analysis V1.3.6.
Note: Operations Analytics - Log Analysis Standard Edition is included in Netcool Operations Insight.For more information about Operations Analytics - Log Analysis editions, search for "Editions" at theOperations Analytics - Log Analysis Knowledge Center, at https://www.ibm.com/support/knowledgecenter/SSPFMY .
OMNIbusInsightPack_v1.3.1 for IBM Operations Analytics - Log AnalysisThis product is part of the base Netcool Operations Insight solution. It is required to enable the eventsearch capability in Operations Analytics - Log Analysis. The Insight Pack is installed into OperationsAnalytics - Log Analysis.
Chapter 2. Solution Overview 21
Gateway for Message Bus V8.0This product is part of the base Netcool Operations Insight solution. It is installed by InstallationManager. The system requirements are the same as for Tivoli Netcool/OMNIbus V8.1.0.24. It is usedfor the following purposes:
• Transferring event data to the IBM Operations Analytics - Log Analysis product.• Supports the transfer of event data to Agile Service Manager by integrating with the Agile Service
Manager Event Observer.
Jazz for Service Management V1.1.3.9This component provides the GUI framework for the Netcool Operations Insight solution. It isinstalled by Installation Manager, and it includes the following subcomponents.
• Dashboard Application Services Hub V3.1.3.x• Reporting Services (previously called Tivoli Common Reporting)
Note: For the cumulative patch to use for this version of Jazz for Service Management, see the webpage for the relevant version of Netcool Operations Insight at this location: https://www.ibm.com/developerworks/community/wikis/home?lang=en#!/wiki/Tivoli%20Netcool%20OMNIbus/page/Release%20details
For the system requirements for Dashboard Application Services Hub, see http://ibm.biz/BdiVYN. Theinstance of Dashboard Application Services Hub hosts the V8.1 Web GUI and the Seasonal EventReports portlet. Jazz for Service Management is included in the Web GUI installation package but isinstalled as separate features.You can set up Network Manager and Netcool Configuration Manager to work with Reporting Servicesby installing their respective reports when installing the products. Netcool/OMNIbus V8.1.0.24 andlater can be integrated with Reporting Services V3.1 to support reporting on events. To configure thisintegration, connect Reporting Services to a relational database through a gateway. Then, import thereport package that is supplied with Netcool/OMNIbus into Reporting Services. For more informationabout event reporting, see the Netcool/OMNIbus documentation, http://www-01.ibm.com/support/knowledgecenter/SSSHTQ_8.1.0/com.ibm.netcool_OMNIbus.doc_8.1.0/omnibus/wip/install/task/omn_con_ext_deploytcrreports.html .
Network Manager IP Edition V4.2.0.11This product includes the core and GUI components for the optional Networks for Operations Insightfeature.
For system requirements, see the following links:
• http://www-01.ibm.com/support/knowledgecenter/SSSHRK_4.2.0/itnm/ip/wip/install/task/nmip_pln_planninginst.html
• http://ibm.biz/Bd2L4h
Network Manager Insight Pack V1.3.0.0 for IBM Operations Analytics - Log AnalysisThis product is part of the Networks for Operations Insight feature. It is required to enable thetopology search capability in Operations Analytics - Log Analysis. The Insight Pack is installed intoOperations Analytics - Log Analysis. It requires that the OMNIbusInsightPack_v1.3.1 is installed.
Note: The Network Manager Insight Pack V1.3.0.0 can share a data source with theOMNIbusInsightPack_v1.3.1 only. It cannot share a data source with previous versions of the TivoliNetcool/OMNIbus Insight Pack.
Probe for SNMPThis product is optional for the base Netcool Operations Insight solution. It is used in environmentsthat have SNMP traps. It is required for the Networks for Operations Insight feature. For installationsof the probe on the Tivoli Netcool/OMNIbus V8.1 server, use the instance of the probe that installswith IBM Installation Manager.
Syslog ProbeThis product is optional for the base Netcool Operations Insight solution. It is required for theNetworks for Operations Insight feature. For installations of the probe on the Tivoli Netcool/OMNIbusV8.1 server, use the instance of the probe that installs with IBM Installation Manager.
22 IBM Netcool Operations Insight: Integration Guide
Netcool Configuration Manager V6.4.2.12This product has the following components. It is part of the optional Networks for Operations Insightfeature.
• Core components• Drivers• OOBC component
For system requirements, see http://ibm.biz/Bd2L4J .
More informationFor more information about the component products of Netcool Operations Insight, see the websites thatare listed in the following table.
Table 4. Product information
Product Website
IBM Netcool OperationsInsight
http://www.ibm.com/support/knowledgecenter/SSTPTP/welcome
IBM Tivoli Netcool/OMNIbusand Web GUI
http://www-01.ibm.com/support/knowledgecenter/SSSHTQ/landingpage/NetcoolOMNIbus.html
IBM Tivoli Netcool/Impact http://www-01.ibm.com/support/knowledgecenter/SSSHYH/welcome
IBM Operations Analytics -Log Analysis
http://www-01.ibm.com/support/knowledgecenter/SSPFMY/welcome
Jazz for Service Management http://www.ibm.com/support/knowledgecenter/SSEKCU/welcome
IBM Tivoli Network Manager Network Manager Knowledge Center
IBM Tivoli NetcoolConfiguration Manager
http://www-01.ibm.com/support/knowledgecenter/SS7UH9/welcome
Agile Service Manager https://www-01.ibm.com/support/knowledgecenter/SS9LQB/welcome
runbook automation http://www-01.ibm.com/support/knowledgecenter/SSZQDR/com.ibm.rba.doc/RBA_welcome.html
Architecture of an on-premises installationLearn about the architecture of an on-premises physical deployment of Operations Management.
The architecture that is described in this example can be scaled up and extended for failover, amultitiered architecture, load balancing, and clustering. For further scenarios and architecture examples,see “On-premises scenarios for Operations Management” on page 32. The following figure shows thearchitecture of a basic on-premises installation of Operations Management.
Chapter 2. Solution Overview 23
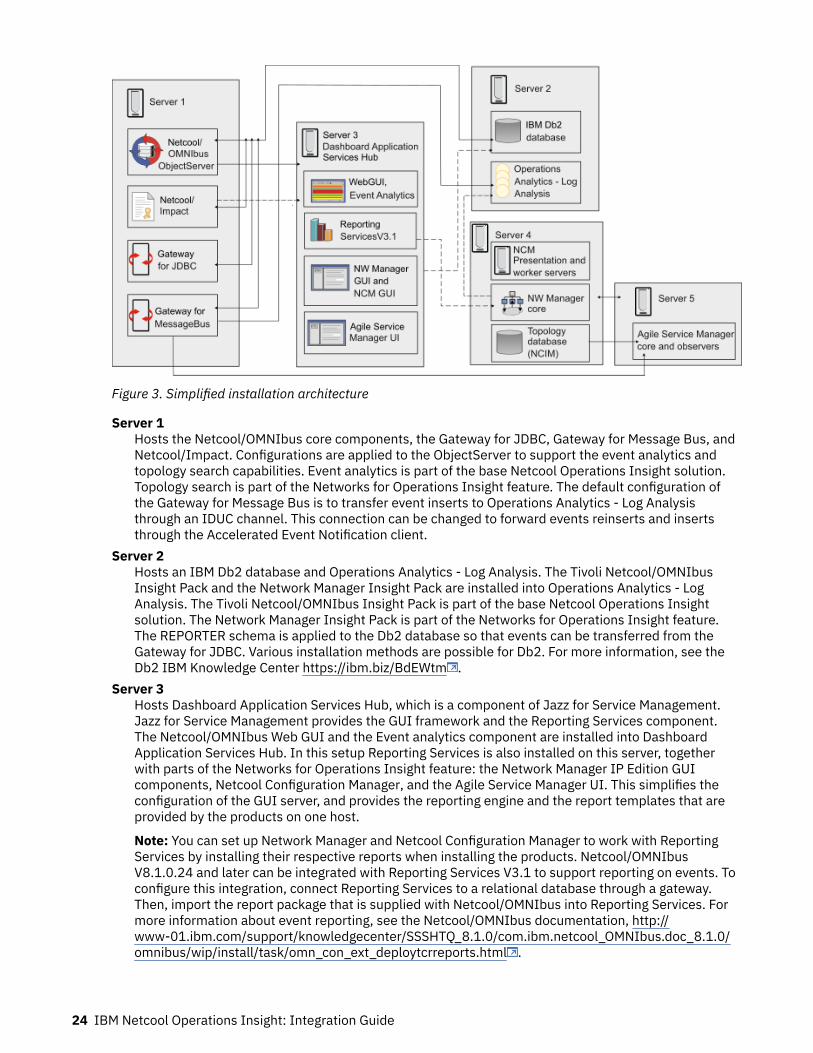
Figure 3. Simplified installation architecture
Server 1Hosts the Netcool/OMNIbus core components, the Gateway for JDBC, Gateway for Message Bus, andNetcool/Impact. Configurations are applied to the ObjectServer to support the event analytics andtopology search capabilities. Event analytics is part of the base Netcool Operations Insight solution.Topology search is part of the Networks for Operations Insight feature. The default configuration ofthe Gateway for Message Bus is to transfer event inserts to Operations Analytics - Log Analysisthrough an IDUC channel. This connection can be changed to forward events reinserts and insertsthrough the Accelerated Event Notification client.
Server 2Hosts an IBM Db2 database and Operations Analytics - Log Analysis. The Tivoli Netcool/OMNIbusInsight Pack and the Network Manager Insight Pack are installed into Operations Analytics - LogAnalysis. The Tivoli Netcool/OMNIbus Insight Pack is part of the base Netcool Operations Insightsolution. The Network Manager Insight Pack is part of the Networks for Operations Insight feature.The REPORTER schema is applied to the Db2 database so that events can be transferred from theGateway for JDBC. Various installation methods are possible for Db2. For more information, see theDb2 IBM Knowledge Center https://ibm.biz/BdEWtm .
Server 3Hosts Dashboard Application Services Hub, which is a component of Jazz for Service Management.Jazz for Service Management provides the GUI framework and the Reporting Services component.The Netcool/OMNIbus Web GUI and the Event analytics component are installed into DashboardApplication Services Hub. In this setup Reporting Services is also installed on this server, togetherwith parts of the Networks for Operations Insight feature: the Network Manager IP Edition GUIcomponents, Netcool Configuration Manager, and the Agile Service Manager UI. This simplifies theconfiguration of the GUI server, and provides the reporting engine and the report templates that areprovided by the products on one host.
Note: You can set up Network Manager and Netcool Configuration Manager to work with ReportingServices by installing their respective reports when installing the products. Netcool/OMNIbusV8.1.0.24 and later can be integrated with Reporting Services V3.1 to support reporting on events. Toconfigure this integration, connect Reporting Services to a relational database through a gateway.Then, import the report package that is supplied with Netcool/OMNIbus into Reporting Services. Formore information about event reporting, see the Netcool/OMNIbus documentation, http://www-01.ibm.com/support/knowledgecenter/SSSHTQ_8.1.0/com.ibm.netcool_OMNIbus.doc_8.1.0/omnibus/wip/install/task/omn_con_ext_deploytcrreports.html .
24 IBM Netcool Operations Insight: Integration Guide
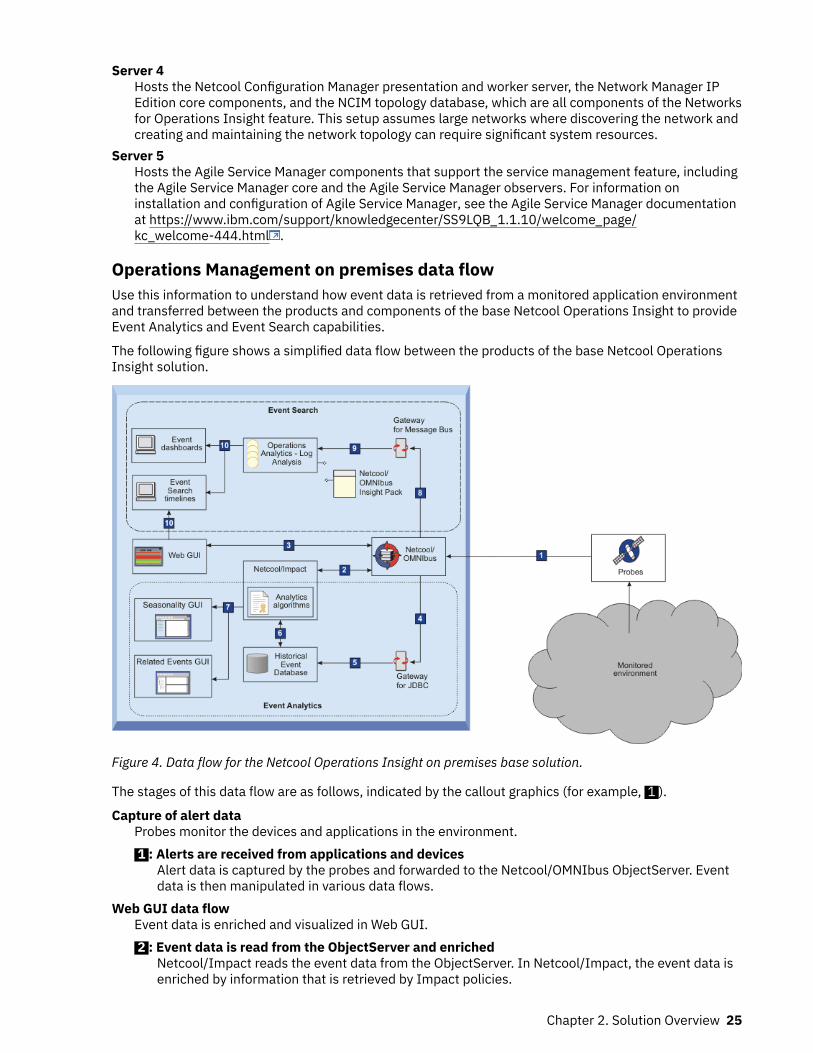
Server 4Hosts the Netcool Configuration Manager presentation and worker server, the Network Manager IPEdition core components, and the NCIM topology database, which are all components of the Networksfor Operations Insight feature. This setup assumes large networks where discovering the network andcreating and maintaining the network topology can require significant system resources.
Server 5Hosts the Agile Service Manager components that support the service management feature, includingthe Agile Service Manager core and the Agile Service Manager observers. For information oninstallation and configuration of Agile Service Manager, see the Agile Service Manager documentationat https://www.ibm.com/support/knowledgecenter/SS9LQB_1.1.10/welcome_page/kc_welcome-444.html .
Operations Management on premises data flowUse this information to understand how event data is retrieved from a monitored application environmentand transferred between the products and components of the base Netcool Operations Insight to provideEvent Analytics and Event Search capabilities.
The following figure shows a simplified data flow between the products of the base Netcool OperationsInsight solution.
Figure 4. Data flow for the Netcool Operations Insight on premises base solution.
The stages of this data flow are as follows, indicated by the callout graphics (for example, 1 ).
Capture of alert dataProbes monitor the devices and applications in the environment. 1 : Alerts are received from applications and devices
Alert data is captured by the probes and forwarded to the Netcool/OMNIbus ObjectServer. Eventdata is then manipulated in various data flows.
Web GUI data flowEvent data is enriched and visualized in Web GUI. 2 : Event data is read from the ObjectServer and enriched
Netcool/Impact reads the event data from the ObjectServer. In Netcool/Impact, the event data isenriched by information that is retrieved by Impact policies.
Chapter 2. Solution Overview 25
3 : Event data is visualized and managed in the Web GUIThe Web GUI displays the application events that are in the ObjectServer. From the event lists, youcan run tools that change the event data; these changes are synchronized with the data in theObjectServer.
Event Analytics data flowEvent data is archived and historical event data is used to generate analytics data. 4 : Events are read from the ObjectServer by the Gateway for JDBC
The Gateway for JDBC reads events from the ObjectServer. 5 : Event data is archived
The Gateway for JDBC sends the event data via an HTTP interface to the Historical Eventdatabase. The figure shows an IBM Db2 database but any supported database can be used. Thegateway must be configured in reporting mode. This data flow is a prerequisite for the eventanalytics capability.
6 : Event analytics algorithms run on archived event dataAfter a set of historical alerts is archived, the seasonality algorithms of the Netcool/Impactpolicies can generate seasonal reports. The related events function analyzes Netcool/OMNIbushistorical event data to determine which events have a statistical tendency to occur together andcan therefore be grouped into related event groups. Pattern functions analyze the statisticallyrelated event groups to determine whether the groups have any generic patterns that can beapplied to events on other network resources.
7 : Analytics data is visualized and managedThe seasonality function helps you identify and examine seasonal trends while monitoring andmanaging events. This capability is delivered in a Seasonal Events Report portlet in DashboardApplication Services Hub. The portlet contains existing seasonal reports, which can be used toidentify the seasonal pattern of the events in the Event Viewer. You can create new seasonalreports and edit existing ones. Statistically related groups can be analyzed in the Related EventsGUI. Validated event groups can be deployed as Netcool/Impact correlation rules. Patterns in thestatistically related event groups can also be analyzed in the Related Events GUI. These patternscan be extracted and deployed as Netcool/Impact generalized patterns.
Event Search data flowEvent data is indexed in Operations Analytics - Log Analysis and used to display event dashboard andtimelines. 8 : Events are read from the ObjectServer by Gateway for Message Bus
The Gateway for Message Bus reads events from the ObjectServer. 9 : Event data is transferred for indexing to Operations Analytics - Log Analysis
The Gateway for Message Bus sends the event data via an HTTP interface to the OperationsAnalytics - Log Analysis product where the event data is indexed. The Tivoli Netcool/OMNIbusInsight Pack V1.3.0.0 parses the event data into a format suitable for use by Operations Analytics- Log Analysis. The diagram shows the default IDUC connection, which sends only event inserts.For event inserts and reinserts, the Accelerated Event Notification client can be deployed, whichcan handle greater event volumes. See “On-premises scenarios for Operations Management” onpage 32.
10 : Event search data is visualizedEvent search results are visualized in Operations Analytics - Log Analysis event dashboards andtimelines by performing right-click tools from event lists in Web GUI.
Related informationTivoli Netcool/OMNIbus architectureIBM Operations Analytics - Log Analysis architectureOverview of Netcool/Impact deployments
26 IBM Netcool Operations Insight: Integration Guide
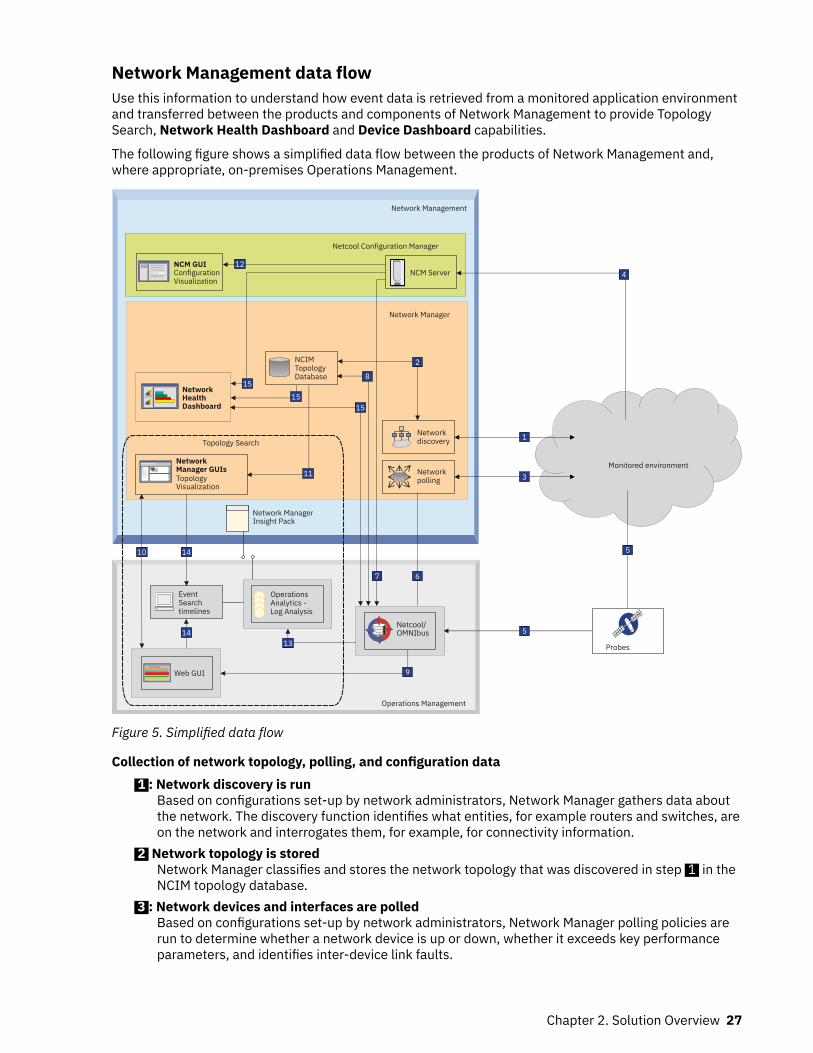
Network Management data flowUse this information to understand how event data is retrieved from a monitored application environmentand transferred between the products and components of Network Management to provide TopologySearch, Network Health Dashboard and Device Dashboard capabilities.
The following figure shows a simplified data flow between the products of Network Management and,where appropriate, on-premises Operations Management.
1
NCIM Topology Database
3
4
5
67
2
8
9
10
11
12
13
14
14
5
1515
15
Monitored environment
Network Management
Operations Management
Network Manager
Operations Analytics - Log Analysis
Network discovery
Network Manager Insight Pack
Netcool Configuration Manager
Topology Search
NCM ServerNCM GUIConfiguration Visualization
Network Health Dashboard
Network Manager GUIsTopology Visualization
Network polling
Probes
Netcool/ OMNIbus
Web GUI
Event Search timelines
Figure 5. Simplified data flow
Collection of network topology, polling, and configuration data 1 : Network discovery is run
Based on configurations set-up by network administrators, Network Manager gathers data aboutthe network. The discovery function identifies what entities, for example routers and switches, areon the network and interrogates them, for example, for connectivity information.
2 Network topology is storedNetwork Manager classifies and stores the network topology that was discovered in step 1 in theNCIM topology database.
3 : Network devices and interfaces are polledBased on configurations set-up by network administrators, Network Manager polling policies arerun to determine whether a network device is up or down, whether it exceeds key performanceparameters, and identifies inter-device link faults.
Chapter 2. Solution Overview 27
4 : Changes to device configuration and policy changes are detectedNetcool Configuration Managerdiscovers whether there are any changes to device configuration orpolicy violations.
Collection and enrichment of alert data 5 : Alerts are received from applications and devices
Alert data is captured by probes and forwarded to the ObjectServer. 6 : Network events are generated if polls fail
Network Manager generates fault alerts if device and interface polls (step 2 ) fail. NetworkManager converts the results of the relevant polls into events, and sends these network events tothe ObjectServer.
7 : Network configuration events are generated if device configurations changeNetcool Configuration Manager generates events for the configuration changes and policyviolations (referred to from now as network configuration events) that were detected in step 3 .Configuration change and policy violation events are sent via the Probe for SNMP to theObjectServer.
8 : Events are enriched with topology dataNetwork events (generated in step 6 ) and network configuration events (generated in step 7 ) arepassed to the Event Gateway, where they are enriched with network topology data. For example,the system location, contact information, and product serial number can be added to the events.The events are returned to the ObjectServer.
When steps 5 - 8 are complete the Netcool/OMNIbus ObjectServer contains the application events fromthe probes, network events from Network Manager, and the network configuration events from NetcoolConfiguration Manager.Visualization of events and topology
9 Events are visualized and monitoredThe Tivoli Netcool/OMNIbus Web GUI displays the application events, network events, andnetwork configuration events that are in the ObjectServer.
10 Event information is sharedThe event information is shared between the Web GUI and the Network Manager GUIs, forexample, the Network Views and Hop View.
11 Network topology is visualizedThe Network Manager GUIs display the network topology data that is in the NCIM database. Thisdata is enriched by the configuration change and policy event information from the ObjectServer.
12 Network configuration events are analyzedConfiguration changes and policy violations are displayed for further analysis in the followingGUIs:
• Network Manager GUIs• Web GUI Event Viewer• Netcool Configuration Manager Activity Viewer, wizards, and other Netcool Configuration
Manager user interfaces
Using the right-click menus, operators can optionally launch-in-context across into ReportingServices, if it is installed. Reporting Services is not shown on this figure.
Topology search data flow 13 Event data is transferred for indexing to Operations Analytics - Log Analysis
The Gateway for Message Bus sends the event data via an HTTP interface to the OperationsAnalytics - Log Analysis product where the event data is indexed. The Network Manager InsightPack parses the event data into a format suitable for use by Operations Analytics - Log Analysis.
14 Topology search data is visualizedTopology search results are visualized in Operations Analytics - Log Analysis event dashboardsand timelines by performing right-click actions on two nodes in the network between which theanalysis is required. This is done in one of the following ways: either select two network nodes in a
28 IBM Netcool Operations Insight: Integration Guide

network map within one of the Network Manager GUIs, or two events in the Web GUI EventViewer.
Dashboard data flow 15 Network health information is visualized
In the Network Health Dashboard, selection of a network view enables you to visualizeavailability summary data, top 10 performance data, and configuration timeline data for thedevices in that network view. Data used to populate the Network Health Dashboard is retrievedfrom the ObjectServer, Network Manager polling databases, and Netcool Configuration Manager.
Related conceptsNetcool Configuration Manager events
System requirements for an on-premises systemLearn about supported platforms for on-premises IBM Netcool Operations Insight.
For more information about the system requirements and platform support for each component of youron-premises system, search for version 1.6.3 of the Netcool Operations Insight product in the SoftwareProduct Compatibility Reports website https://www.ibm.com/software/reports/compatibility/clarity/softwareReqsForProduct.html .
Security and Privacy by Design (SPbD)Security and Privacy by Design (SPbD) at IBM® is an agile set of focused security and privacy practices,including threat models, privacy assessments, security testing, and vulnerability management.
This document is intended to help you in your preparations for GDPR readiness. It provides informationabout features of IBM Netcool Operations Insight that you can configure, and aspects of the product’suse, to consider for GDPR readiness. This information is not an exhaustive list, due to the many ways thatclients can choose and configure features, and the large variety of ways that the product can be used initself and with third-party applications and systems.
IBM developed a set of SPbD processes and tools that are used by all of its business units. For moreinformation about the IBM Secure Engineering Framework (SEF) and SPbD, see the IBM Redbooks®®
Security in Development - The IBM Secure Engineering Framework available in PDF format.
IBM also provides information about the features of IBM Netcool Operations Insight that you canconfigure, how to use the product securely, and what to consider to help your organization with GDPRreadiness. For more information, see “Deployment guidelines for GDPR readiness” on page 207.
For information about container security, see the Red Hat documentation: https://access.redhat.com/documentation/en-us/openshift_container_platform/4.6/html/security_and_compliance/index
Chapter 2. Solution Overview 29

30 IBM Netcool Operations Insight: Integration Guide
Chapter 3. DeploymentPlan your deployment of Netcool Operations Insight
Deployment scenarios for Operations ManagementWhen you plan a deployment, it is important to consider the relationship between the event volumes thatare supported by Netcool/OMNIbus and the capacity of Operations Analytics - Log Analysis to analyzeevents. The scenarios available depend on whether you are installing Operations Management onpremises or in a private cloud using Red Hat OpenShift.
Deployment considerations for on premises Operations ManagementThe desired volume of events determines whether a basic, failover, or desktop architecture or a multitierarchitecture is deployed. The Gateway for Message Bus can be configured to support event inserts only orboth inserts and reinserts.
The following explains the architecture and event volume, and the event analysis capacity of OperationsAnalytics - Log Analysis in more detail.
Note: Operations Analytics - Log Analysis Standard Edition is included in Netcool Operations Insight. Formore information about Operations Analytics - Log Analysis editions, search for "Editions" at theOperations Analytics - Log Analysis Knowledge Center, at https://www.ibm.com/support/knowledgecenter/SSPFMY .
Event volumeEvent inserts are the first occurrence of each event and reinserts are every occurrence of each event.By default, the Gateway for Message Bus is configured to accept only event inserts fromObjectServers through an IDUC channel. To support event inserts and reinserts, you can configureevent forwarding through the Accelerated Event Notification (AEN) client.
Note: Event Search functionality varies as follows depending on the choice of channel:
• IDUC channel: Event Search functionality is limited. Chart display functionality is fully available, butyou will not be able to perform a deep dive into events or search for event modifications.
• AEN channel: All Event Search functionality is available. However, as part of your Netcool/OMNIbusconfiguration you will also have to install triggers in the ObjectServer.
For more information, search for Integrating with Operations Analytics - Log Analysis in the Gatewayfor Message Bus documentation.
Architecture of Netcool/OMNIbusBasic, failover, and desktop architectures support low and medium capacity for analyzing events.Multitiered architectures support higher Operations Analytics - Log Analysis capacities. In a multitierarchitecture, the connection to the Gateway for Message Bus supports higher capacity at thecollection layer than at the aggregation layer.For more information about these architectures, see the Netcool/OMNIbus documentation and alsothe Netcool/OMNIbus Best Practices Guide.
Capacity of Operations Analytics - Log AnalysisThe volume of events that Operations Analytics - Log Analysis is able to handle. For the hardwarelevels that are required for expected event volumes, see the Operations Analytics - Log Analysisdocumentation at http://www-01.ibm.com/support/knowledgecenter/SSPFMY/welcome . If capacityis limited, you can use the deletion tool to remove old data.
Connection layerThe connection layer is the layer of the multitier architecture to which the Gateway for Message Bus isconnected. This consideration applies only when the Netcool/OMNIbus product is deployed in amultitier architecture. The connection layer depends on the capacity of Operations Analytics - Log
© Copyright IBM Corp. 2020, 2020 31
Analysis. For more information about multitier architectures, see the Netcool/OMNIbusdocumentation and also the Netcool/OMNIbus Best Practices Guide.
Related informationNetcool/OMNIbus Best Practices guideFor provisioning and sizing advice, refer to the planning chapter inthe Netcool/OMNIbus Best Practices Guide.
On-premises scenarios for Operations ManagementThis topic presents the scenarios available in a deployment of Operations Management on premisestogether with the associated architectures.
The deployment scenarios and associated architecture diagrams are shown below.
• “Deployment scenarios” on page 32• “Illustrations of architectures” on page 34
Deployment scenariosThis section describes possible deployment scenarios.
• “Deployment scenario 1: low capacity with IDUC channel” on page 32• “Deployment scenario 2: medium capacity with AEN channel” on page 32• “Deployment scenario 3: medium capacity with IDUC channel” on page 33• “Deployment scenario 4: high capacity with IDUC channel” on page 33• “Deployment scenario 5: high capacity with AEN channel” on page 33• “Deployment scenario 6: very high capacity with AEN channel” on page 33
Deployment scenario 1: low capacity with IDUC channelTable 5. Inserts only, standard architecture, low capacity
Event volume Architectureof Netcool/OMNIbus
Capacity ofOperationsAnalytics -Log Analysis
Connectionlayer
IDUC or AEN Illustration ofthisarchitecture
Inserts only Basic, failover,and desktoparchitecture
Low Not applicable IDUC See Figure 6 onpage 34.Disregard thereference toreinserts in item 1 .
Deployment scenario 2: medium capacity with AEN channelTable 6. Inserts and reinserts, standard architecture, medium capacity
Event volume Architectureof Netcool/OMNIbus
Capacity ofOperationsAnalytics -Log Analysis
Connectionlayer
IDUC or AEN Illustration ofthisarchitecture
Inserts andreinserts
Basic, failover,and desktoparchitecture
Medium Not applicable AEN See Figure 6 onpage 34.
32 IBM Netcool Operations Insight: Integration Guide
Deployment scenario 3: medium capacity with IDUC channelTable 7. Inserts only, multitier architecture, medium capacity
Event volume Architectureof Netcool/OMNIbus
Capacity ofOperationsAnalytics -Log Analysis
Connectionlayer
IDUC or AEN Illustration ofthisarchitecture
Inserts only Multitier Medium Aggregationlayer
IDUC See Figure 7 onpage 35.Disregard thereference toreinserts in item 1 .
Deployment scenario 4: high capacity with IDUC channelTable 8. Inserts only, multitier architecture, high capacity
Event volume Architectureof Netcool/OMNIbus
Capacity ofOperationsAnalytics -Log Analysis
Connectionlayer
IDUC or AEN
Inserts only Multitier High Collection layer IDUC See Figure 8 onpage 36.Disregard thereference toreinserts in item 1 .
Deployment scenario 5: high capacity with AEN channelTable 9. Inserts and reinserts, multitier architecture, high capacity
Event volume Architectureof Netcool/OMNIbus
Capacity ofOperationsAnalytics -Log Analysis
Connectionlayer
IDUC or AEN
Inserts andreinserts
Multitier High Aggregationlayer
AEN See Figure 7 onpage 35.
Deployment scenario 6: very high capacity with AEN channelTable 10. Inserts and reinserts, multitier architecture, very high capacity
Event volume Architectureof Netcool/OMNIbus
Capacity ofOperationsAnalytics -Log Analysis
Connectionlayer
IDUC or AEN
Inserts andreinserts
Multitier Very high Collection layer AEN See Figure 8 onpage 36.
Chapter 3. Deployment 33
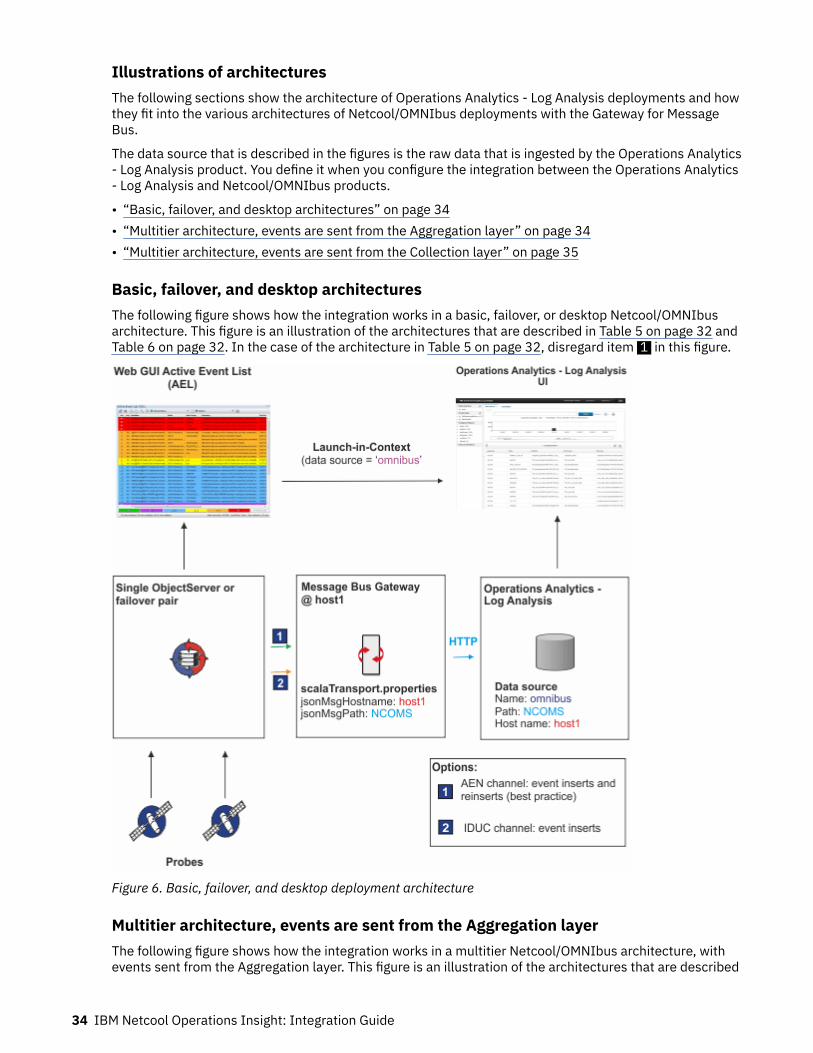
Illustrations of architecturesThe following sections show the architecture of Operations Analytics - Log Analysis deployments and howthey fit into the various architectures of Netcool/OMNIbus deployments with the Gateway for MessageBus.
The data source that is described in the figures is the raw data that is ingested by the Operations Analytics- Log Analysis product. You define it when you configure the integration between the Operations Analytics- Log Analysis and Netcool/OMNIbus products.
• “Basic, failover, and desktop architectures” on page 34• “Multitier architecture, events are sent from the Aggregation layer” on page 34• “Multitier architecture, events are sent from the Collection layer” on page 35
Basic, failover, and desktop architecturesThe following figure shows how the integration works in a basic, failover, or desktop Netcool/OMNIbusarchitecture. This figure is an illustration of the architectures that are described in Table 5 on page 32 andTable 6 on page 32. In the case of the architecture in Table 5 on page 32, disregard item 1 in this figure.
Figure 6. Basic, failover, and desktop deployment architecture
Multitier architecture, events are sent from the Aggregation layerThe following figure shows how the integration works in a multitier Netcool/OMNIbus architecture, withevents sent from the Aggregation layer. This figure is an illustration of the architectures that are described
34 IBM Netcool Operations Insight: Integration Guide
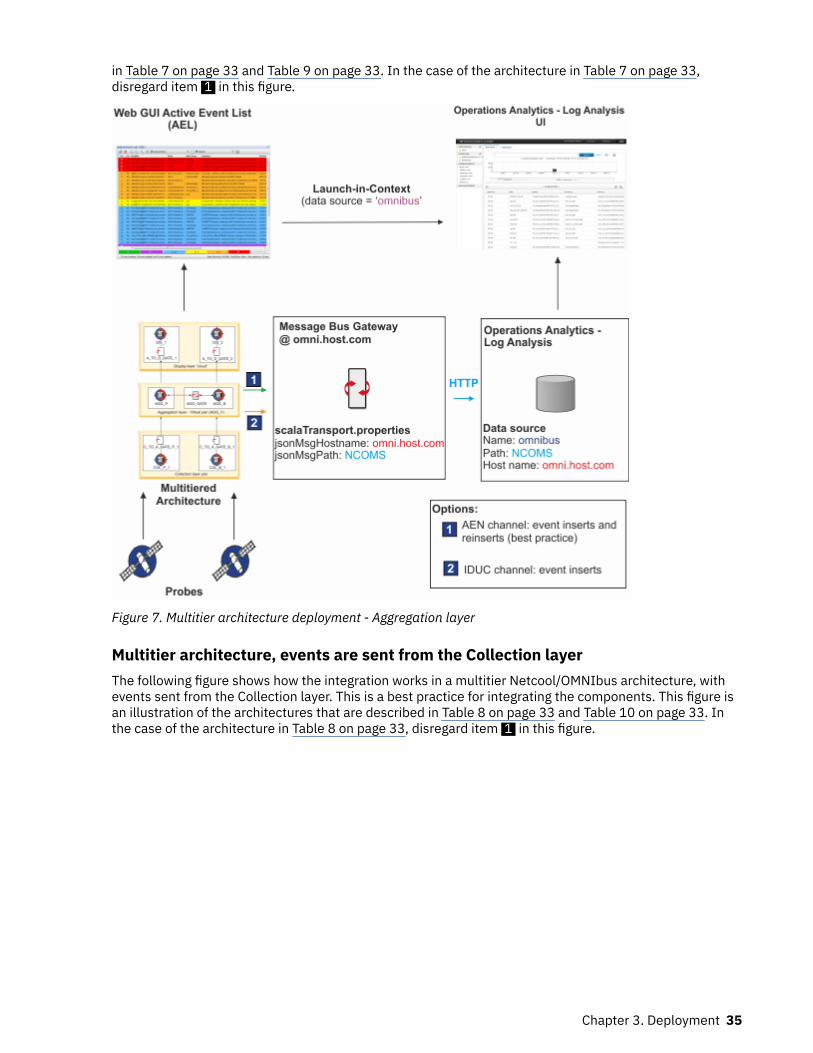
in Table 7 on page 33 and Table 9 on page 33. In the case of the architecture in Table 7 on page 33,disregard item 1 in this figure.
Figure 7. Multitier architecture deployment - Aggregation layer
Multitier architecture, events are sent from the Collection layerThe following figure shows how the integration works in a multitier Netcool/OMNIbus architecture, withevents sent from the Collection layer. This is a best practice for integrating the components. This figure isan illustration of the architectures that are described in Table 8 on page 33 and Table 10 on page 33. Inthe case of the architecture in Table 8 on page 33, disregard item 1 in this figure.
Chapter 3. Deployment 35
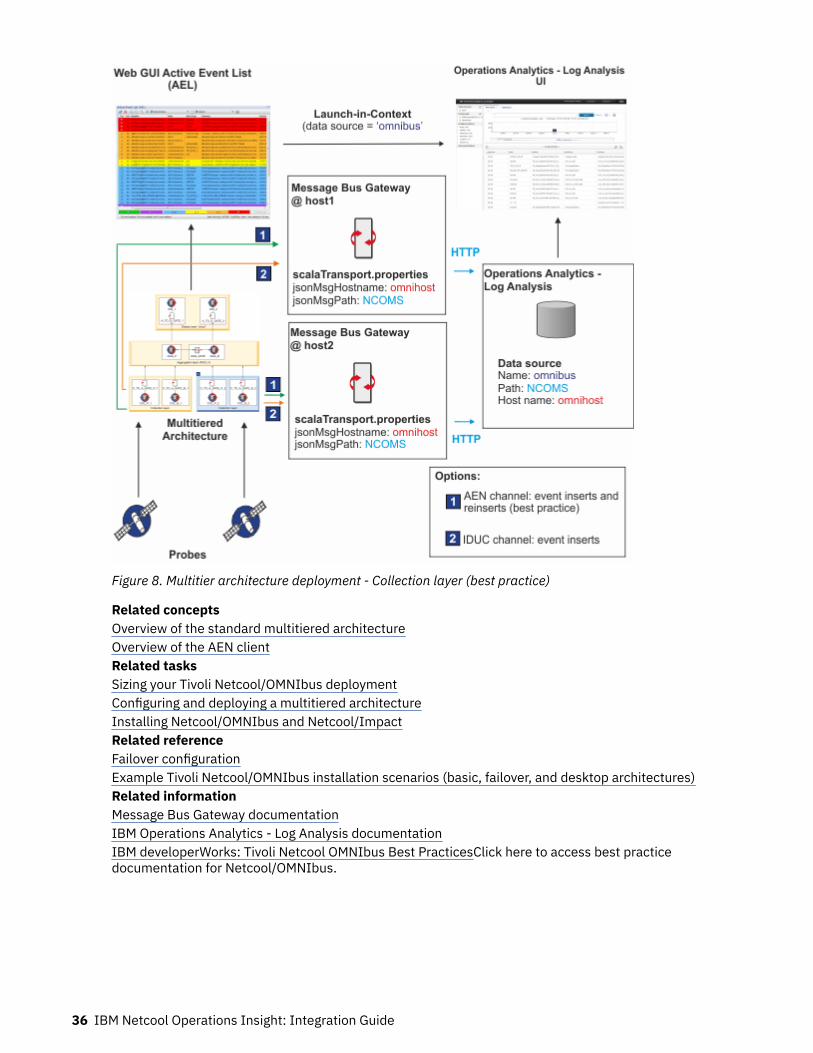
Figure 8. Multitier architecture deployment - Collection layer (best practice)
Related conceptsOverview of the standard multitiered architectureOverview of the AEN clientRelated tasksSizing your Tivoli Netcool/OMNIbus deploymentConfiguring and deploying a multitiered architectureInstalling Netcool/OMNIbus and Netcool/ImpactRelated referenceFailover configurationExample Tivoli Netcool/OMNIbus installation scenarios (basic, failover, and desktop architectures)Related informationMessage Bus Gateway documentationIBM Operations Analytics - Log Analysis documentationIBM developerWorks: Tivoli Netcool OMNIbus Best PracticesClick here to access best practicedocumentation for Netcool/OMNIbus.
36 IBM Netcool Operations Insight: Integration Guide
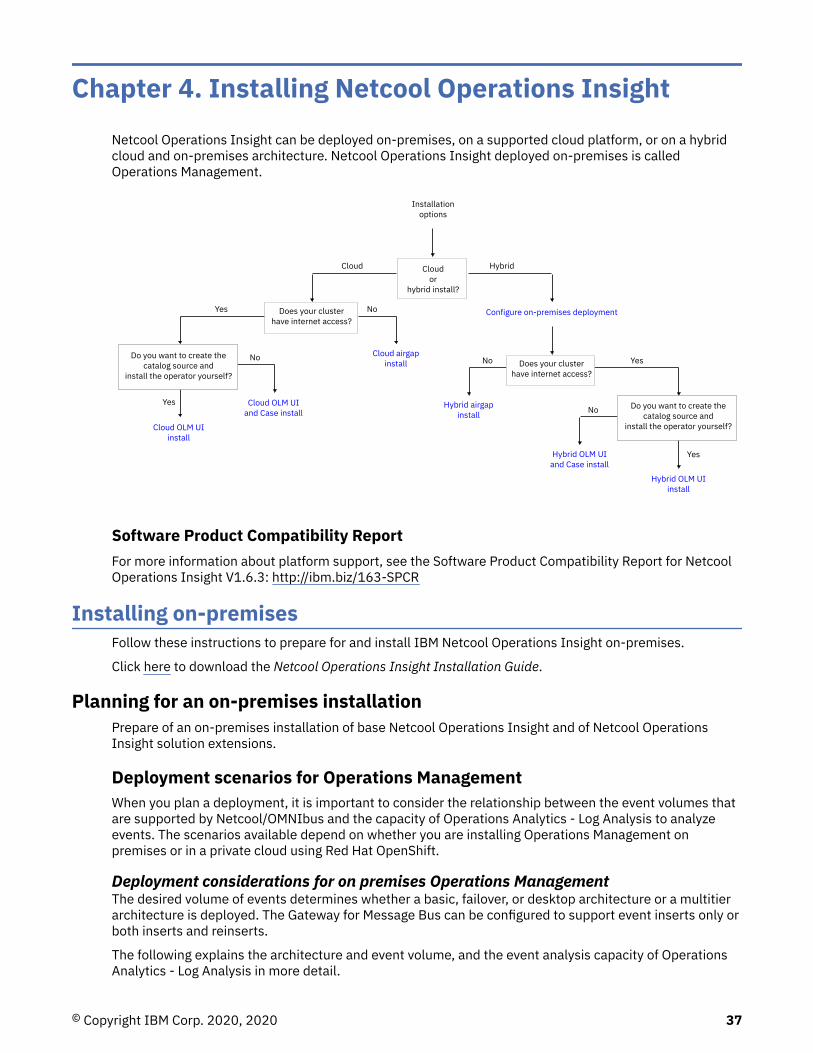
Chapter 4. Installing Netcool Operations InsightNetcool Operations Insight can be deployed on-premises, on a supported cloud platform, or on a hybridcloud and on-premises architecture. Netcool Operations Insight deployed on-premises is calledOperations Management.
Installationoptions
Cloudor
hybrid install?
Cloud Hybrid
Does your clusterhave internet access?
Does your clusterhave internet access?
Yes No
No YesCloud airgap
install
Hybrid airgapinstall
Do you want to create the catalog source and
install the operator yourself?
Do you want to create the catalog source and
install the operator yourself?
No
No
Hybrid OLM UIand Case install
Hybrid OLM UIinstall
Configure on-premises deployment
Cloud OLM UIand Case install
Cloud OLM UIinstall
Yes
Yes
Software Product Compatibility ReportFor more information about platform support, see the Software Product Compatibility Report for NetcoolOperations Insight V1.6.3: http://ibm.biz/163-SPCR
Installing on-premisesFollow these instructions to prepare for and install IBM Netcool Operations Insight on-premises.
Click here to download the Netcool Operations Insight Installation Guide.
Planning for an on-premises installationPrepare of an on-premises installation of base Netcool Operations Insight and of Netcool OperationsInsight solution extensions.
Deployment scenarios for Operations ManagementWhen you plan a deployment, it is important to consider the relationship between the event volumes thatare supported by Netcool/OMNIbus and the capacity of Operations Analytics - Log Analysis to analyzeevents. The scenarios available depend on whether you are installing Operations Management onpremises or in a private cloud using Red Hat OpenShift.
Deployment considerations for on premises Operations ManagementThe desired volume of events determines whether a basic, failover, or desktop architecture or a multitierarchitecture is deployed. The Gateway for Message Bus can be configured to support event inserts only orboth inserts and reinserts.
The following explains the architecture and event volume, and the event analysis capacity of OperationsAnalytics - Log Analysis in more detail.
© Copyright IBM Corp. 2020, 2020 37
Note: Operations Analytics - Log Analysis Standard Edition is included in Netcool Operations Insight. Formore information about Operations Analytics - Log Analysis editions, search for "Editions" at theOperations Analytics - Log Analysis Knowledge Center, at https://www.ibm.com/support/knowledgecenter/SSPFMY .
Event volumeEvent inserts are the first occurrence of each event and reinserts are every occurrence of each event.By default, the Gateway for Message Bus is configured to accept only event inserts fromObjectServers through an IDUC channel. To support event inserts and reinserts, you can configureevent forwarding through the Accelerated Event Notification (AEN) client.
Note: Event Search functionality varies as follows depending on the choice of channel:
• IDUC channel: Event Search functionality is limited. Chart display functionality is fully available, butyou will not be able to perform a deep dive into events or search for event modifications.
• AEN channel: All Event Search functionality is available. However, as part of your Netcool/OMNIbusconfiguration you will also have to install triggers in the ObjectServer.
For more information, search for Integrating with Operations Analytics - Log Analysis in the Gatewayfor Message Bus documentation.
Architecture of Netcool/OMNIbusBasic, failover, and desktop architectures support low and medium capacity for analyzing events.Multitiered architectures support higher Operations Analytics - Log Analysis capacities. In a multitierarchitecture, the connection to the Gateway for Message Bus supports higher capacity at thecollection layer than at the aggregation layer.For more information about these architectures, see the Netcool/OMNIbus documentation and alsothe Netcool/OMNIbus Best Practices Guide.
Capacity of Operations Analytics - Log AnalysisThe volume of events that Operations Analytics - Log Analysis is able to handle. For the hardwarelevels that are required for expected event volumes, see the Operations Analytics - Log Analysisdocumentation at http://www-01.ibm.com/support/knowledgecenter/SSPFMY/welcome . If capacityis limited, you can use the deletion tool to remove old data.
Connection layerThe connection layer is the layer of the multitier architecture to which the Gateway for Message Bus isconnected. This consideration applies only when the Netcool/OMNIbus product is deployed in amultitier architecture. The connection layer depends on the capacity of Operations Analytics - LogAnalysis. For more information about multitier architectures, see the Netcool/OMNIbusdocumentation and also the Netcool/OMNIbus Best Practices Guide.
Related informationNetcool/OMNIbus Best Practices guideFor provisioning and sizing advice, refer to the planning chapter inthe Netcool/OMNIbus Best Practices Guide.
On-premises scenarios for Operations ManagementThis topic presents the scenarios available in a deployment of Operations Management on premisestogether with the associated architectures.
The deployment scenarios and associated architecture diagrams are shown below.
• “Deployment scenarios” on page 38• “Illustrations of architectures” on page 40
Deployment scenariosThis section describes possible deployment scenarios.
• “Deployment scenario 1: low capacity with IDUC channel” on page 39• “Deployment scenario 2: medium capacity with AEN channel” on page 39• “Deployment scenario 3: medium capacity with IDUC channel” on page 39
38 IBM Netcool Operations Insight: Integration Guide

• “Deployment scenario 4: high capacity with IDUC channel” on page 40• “Deployment scenario 5: high capacity with AEN channel” on page 40• “Deployment scenario 6: very high capacity with AEN channel” on page 40
Deployment scenario 1: low capacity with IDUC channelTable 11. Inserts only, standard architecture, low capacity
Event volume Architectureof Netcool/OMNIbus
Capacity ofOperationsAnalytics -Log Analysis
Connectionlayer
IDUC or AEN Illustration ofthisarchitecture
Inserts only Basic, failover,and desktoparchitecture
Low Not applicable IDUC See Figure 9 onpage 41.Disregard thereference toreinserts in item 1 .
Deployment scenario 2: medium capacity with AEN channelTable 12. Inserts and reinserts, standard architecture, medium capacity
Event volume Architectureof Netcool/OMNIbus
Capacity ofOperationsAnalytics -Log Analysis
Connectionlayer
IDUC or AEN Illustration ofthisarchitecture
Inserts andreinserts
Basic, failover,and desktoparchitecture
Medium Not applicable AEN See Figure 9 onpage 41.
Deployment scenario 3: medium capacity with IDUC channelTable 13. Inserts only, multitier architecture, medium capacity
Event volume Architectureof Netcool/OMNIbus
Capacity ofOperationsAnalytics -Log Analysis
Connectionlayer
IDUC or AEN Illustration ofthisarchitecture
Inserts only Multitier Medium Aggregationlayer
IDUC See Figure 10 onpage 42.Disregard thereference toreinserts in item 1 .
Chapter 4. Installing Netcool Operations Insight 39
Deployment scenario 4: high capacity with IDUC channelTable 14. Inserts only, multitier architecture, high capacity
Event volume Architectureof Netcool/OMNIbus
Capacity ofOperationsAnalytics -Log Analysis
Connectionlayer
IDUC or AEN
Inserts only Multitier High Collection layer IDUC See Figure 11 onpage 43.Disregard thereference toreinserts in item 1 .
Deployment scenario 5: high capacity with AEN channelTable 15. Inserts and reinserts, multitier architecture, high capacity
Event volume Architectureof Netcool/OMNIbus
Capacity ofOperationsAnalytics -Log Analysis
Connectionlayer
IDUC or AEN
Inserts andreinserts
Multitier High Aggregationlayer
AEN See Figure 10 onpage 42.
Deployment scenario 6: very high capacity with AEN channelTable 16. Inserts and reinserts, multitier architecture, very high capacity
Event volume Architectureof Netcool/OMNIbus
Capacity ofOperationsAnalytics -Log Analysis
Connectionlayer
IDUC or AEN
Inserts andreinserts
Multitier Very high Collection layer AEN See Figure 11 onpage 43.
Illustrations of architecturesThe following sections show the architecture of Operations Analytics - Log Analysis deployments and howthey fit into the various architectures of Netcool/OMNIbus deployments with the Gateway for MessageBus.
The data source that is described in the figures is the raw data that is ingested by the Operations Analytics- Log Analysis product. You define it when you configure the integration between the Operations Analytics- Log Analysis and Netcool/OMNIbus products.
• “Basic, failover, and desktop architectures” on page 40• “Multitier architecture, events are sent from the Aggregation layer” on page 41• “Multitier architecture, events are sent from the Collection layer” on page 42
Basic, failover, and desktop architecturesThe following figure shows how the integration works in a basic, failover, or desktop Netcool/OMNIbusarchitecture. This figure is an illustration of the architectures that are described in Table 11 on page 39
40 IBM Netcool Operations Insight: Integration Guide

and Table 12 on page 39. In the case of the architecture in Table 11 on page 39, disregard item 1 in thisfigure.
Figure 9. Basic, failover, and desktop deployment architecture
Multitier architecture, events are sent from the Aggregation layerThe following figure shows how the integration works in a multitier Netcool/OMNIbus architecture, withevents sent from the Aggregation layer. This figure is an illustration of the architectures that are describedin Table 13 on page 39 and Table 15 on page 40. In the case of the architecture in Table 13 on page 39,disregard item 1 in this figure.
Chapter 4. Installing Netcool Operations Insight 41
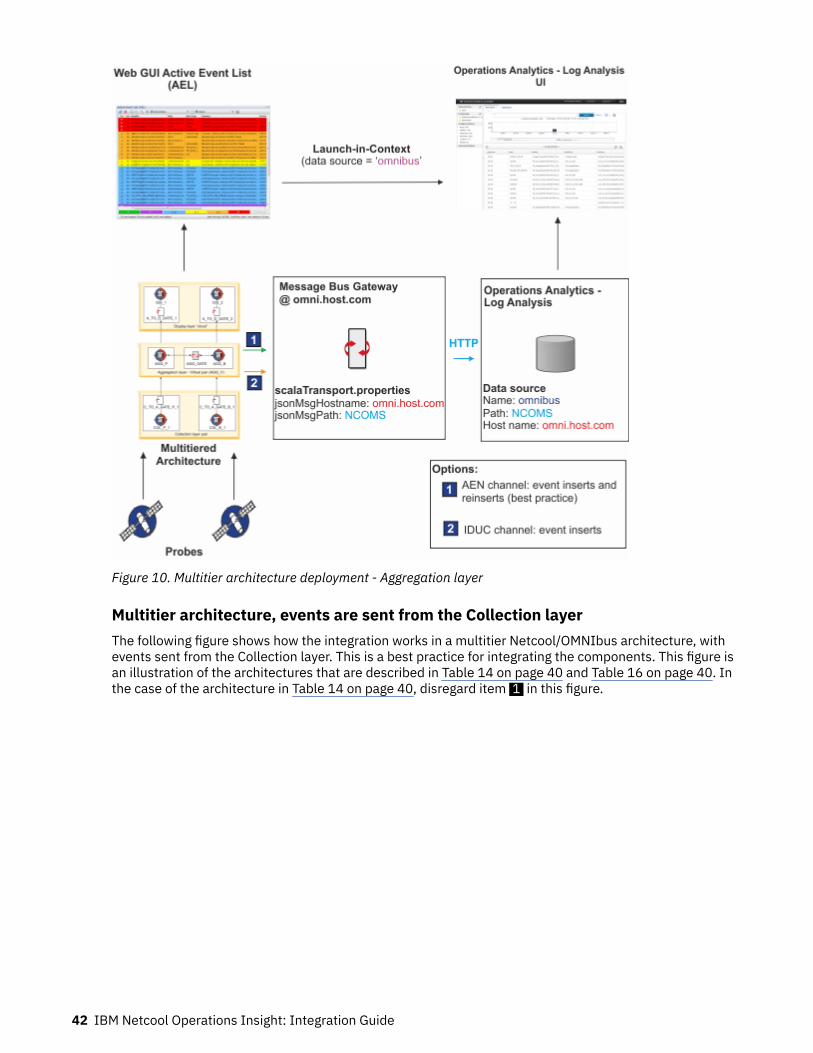
Figure 10. Multitier architecture deployment - Aggregation layer
Multitier architecture, events are sent from the Collection layerThe following figure shows how the integration works in a multitier Netcool/OMNIbus architecture, withevents sent from the Collection layer. This is a best practice for integrating the components. This figure isan illustration of the architectures that are described in Table 14 on page 40 and Table 16 on page 40. Inthe case of the architecture in Table 14 on page 40, disregard item 1 in this figure.
42 IBM Netcool Operations Insight: Integration Guide
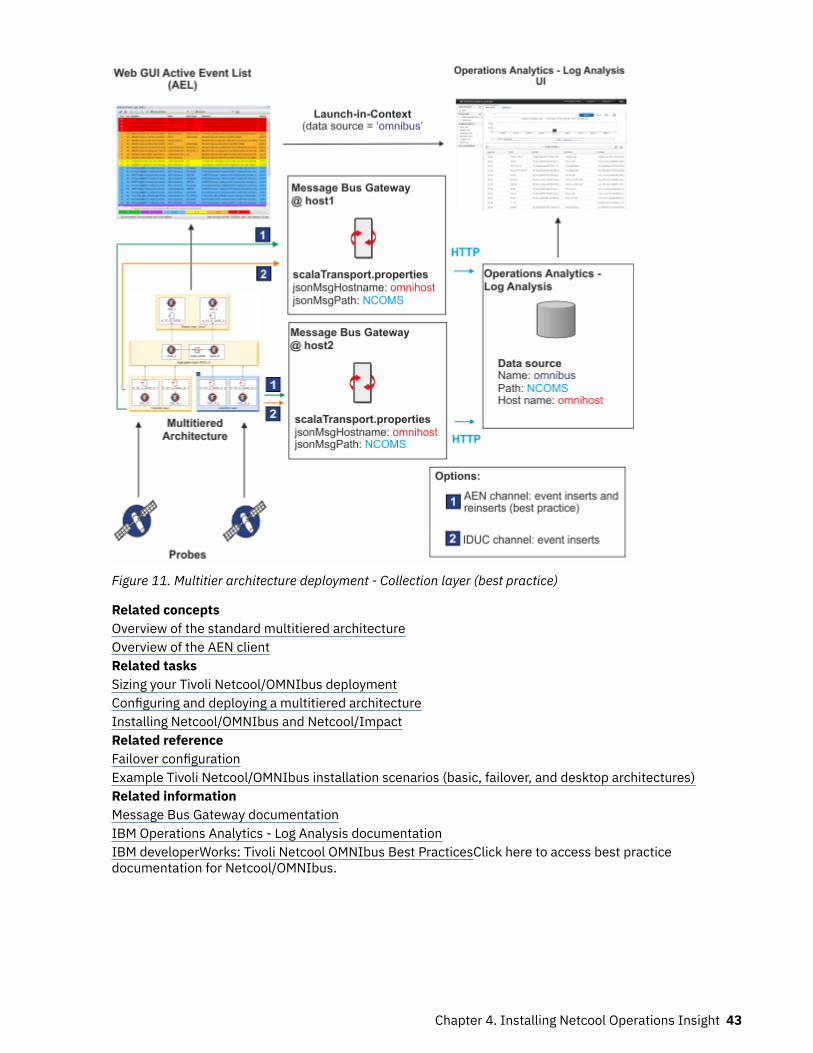
Figure 11. Multitier architecture deployment - Collection layer (best practice)
Related conceptsOverview of the standard multitiered architectureOverview of the AEN clientRelated tasksSizing your Tivoli Netcool/OMNIbus deploymentConfiguring and deploying a multitiered architectureInstalling Netcool/OMNIbus and Netcool/ImpactRelated referenceFailover configurationExample Tivoli Netcool/OMNIbus installation scenarios (basic, failover, and desktop architectures)Related informationMessage Bus Gateway documentationIBM Operations Analytics - Log Analysis documentationIBM developerWorks: Tivoli Netcool OMNIbus Best PracticesClick here to access best practicedocumentation for Netcool/OMNIbus.
Chapter 4. Installing Netcool Operations Insight 43
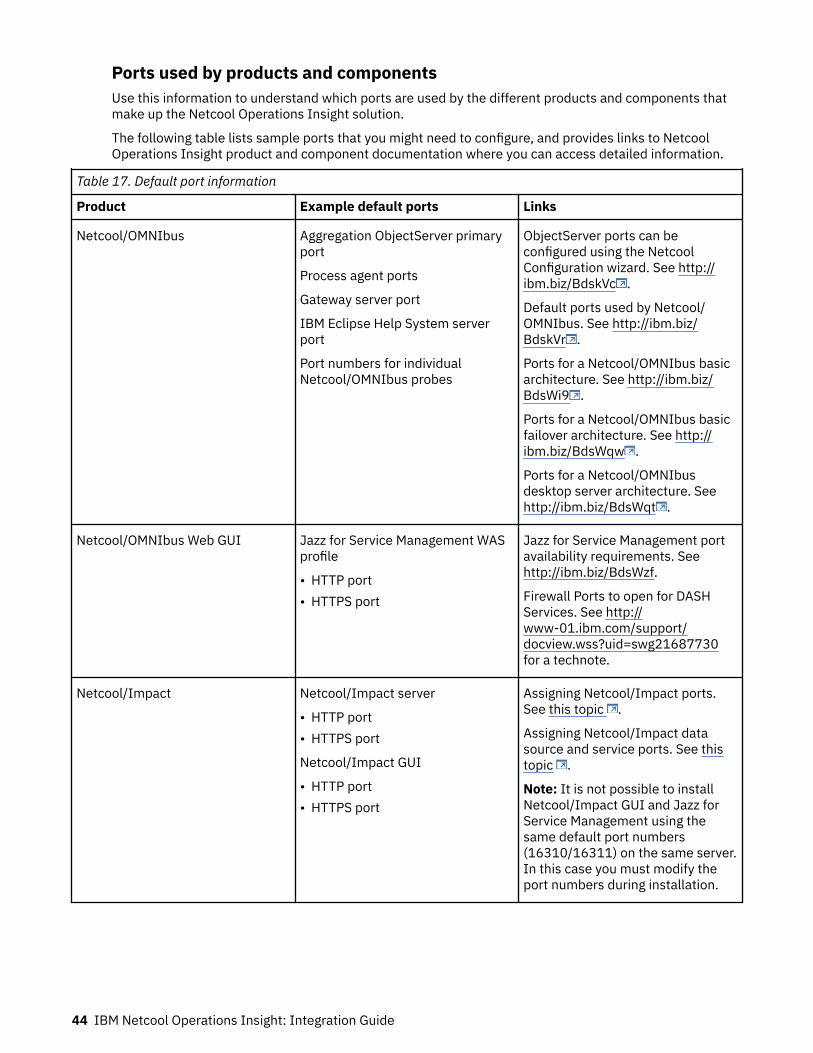
Ports used by products and componentsUse this information to understand which ports are used by the different products and components thatmake up the Netcool Operations Insight solution.
The following table lists sample ports that you might need to configure, and provides links to NetcoolOperations Insight product and component documentation where you can access detailed information.
Table 17. Default port information
Product Example default ports Links
Netcool/OMNIbus Aggregation ObjectServer primaryport
Process agent ports
Gateway server port
IBM Eclipse Help System serverport
Port numbers for individualNetcool/OMNIbus probes
ObjectServer ports can beconfigured using the NetcoolConfiguration wizard. See http://ibm.biz/BdskVc .
Default ports used by Netcool/OMNIbus. See http://ibm.biz/BdskVr .
Ports for a Netcool/OMNIbus basicarchitecture. See http://ibm.biz/BdsWi9 .
Ports for a Netcool/OMNIbus basicfailover architecture. See http://ibm.biz/BdsWqw .
Ports for a Netcool/OMNIbusdesktop server architecture. Seehttp://ibm.biz/BdsWqt .
Netcool/OMNIbus Web GUI Jazz for Service Management WASprofile
• HTTP port• HTTPS port
Jazz for Service Management portavailability requirements. Seehttp://ibm.biz/BdsWzf.
Firewall Ports to open for DASHServices. See http://www-01.ibm.com/support/docview.wss?uid=swg21687730for a technote.
Netcool/Impact Netcool/Impact server
• HTTP port• HTTPS port
Netcool/Impact GUI
• HTTP port• HTTPS port
Assigning Netcool/Impact ports.See this topic .
Assigning Netcool/Impact datasource and service ports. See thistopic .
Note: It is not possible to installNetcool/Impact GUI and Jazz forService Management using thesame default port numbers(16310/16311) on the same server.In this case you must modify theport numbers during installation.
44 IBM Netcool Operations Insight: Integration Guide
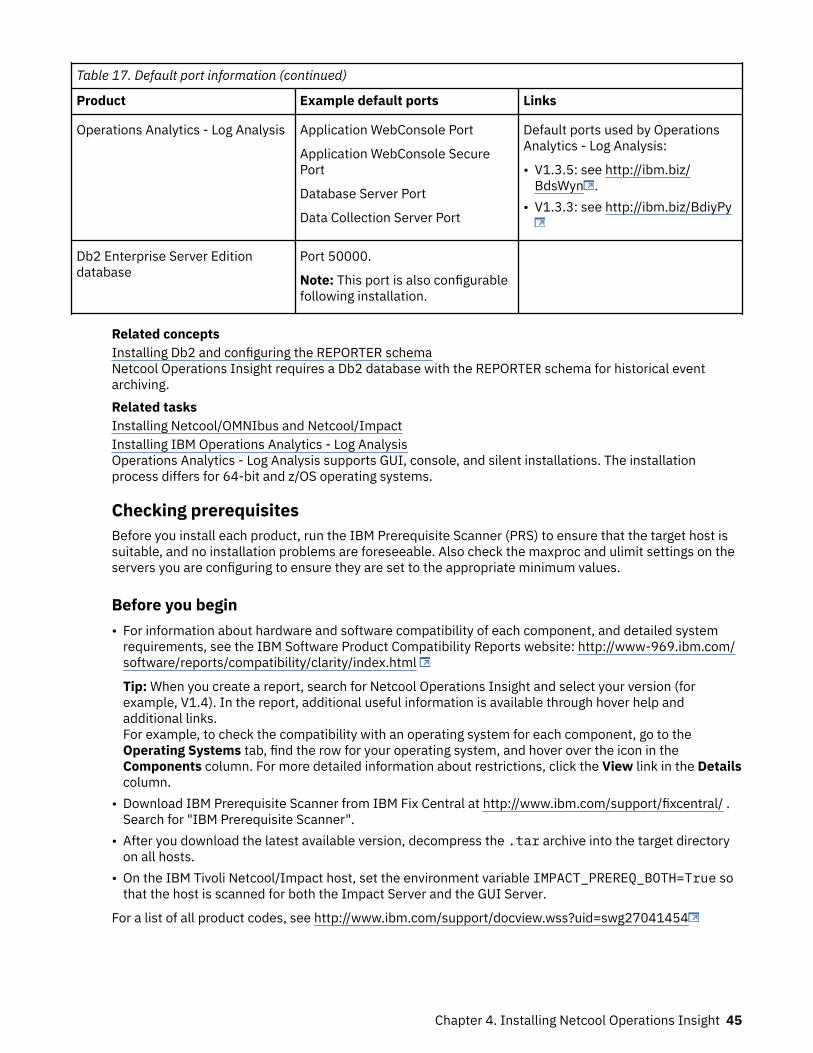
Table 17. Default port information (continued)
Product Example default ports Links
Operations Analytics - Log Analysis Application WebConsole Port
Application WebConsole SecurePort
Database Server Port
Data Collection Server Port
Default ports used by OperationsAnalytics - Log Analysis:
• V1.3.5: see http://ibm.biz/BdsWyn .
• V1.3.3: see http://ibm.biz/BdiyPy
Db2 Enterprise Server Editiondatabase
Port 50000.
Note: This port is also configurablefollowing installation.
Related conceptsInstalling Db2 and configuring the REPORTER schemaNetcool Operations Insight requires a Db2 database with the REPORTER schema for historical eventarchiving.Related tasksInstalling Netcool/OMNIbus and Netcool/ImpactInstalling IBM Operations Analytics - Log AnalysisOperations Analytics - Log Analysis supports GUI, console, and silent installations. The installationprocess differs for 64-bit and z/OS operating systems.
Checking prerequisitesBefore you install each product, run the IBM Prerequisite Scanner (PRS) to ensure that the target host issuitable, and no installation problems are foreseeable. Also check the maxproc and ulimit settings on theservers you are configuring to ensure they are set to the appropriate minimum values.
Before you begin• For information about hardware and software compatibility of each component, and detailed system
requirements, see the IBM Software Product Compatibility Reports website: http://www-969.ibm.com/software/reports/compatibility/clarity/index.html
Tip: When you create a report, search for Netcool Operations Insight and select your version (forexample, V1.4). In the report, additional useful information is available through hover help andadditional links.For example, to check the compatibility with an operating system for each component, go to theOperating Systems tab, find the row for your operating system, and hover over the icon in theComponents column. For more detailed information about restrictions, click the View link in the Detailscolumn.
• Download IBM Prerequisite Scanner from IBM Fix Central at http://www.ibm.com/support/fixcentral/ .Search for "IBM Prerequisite Scanner".
• After you download the latest available version, decompress the .tar archive into the target directoryon all hosts.
• On the IBM Tivoli Netcool/Impact host, set the environment variable IMPACT_PREREQ_BOTH=True sothat the host is scanned for both the Impact Server and the GUI Server.
For a list of all product codes, see http://www.ibm.com/support/docview.wss?uid=swg27041454
Chapter 4. Installing Netcool Operations Insight 45
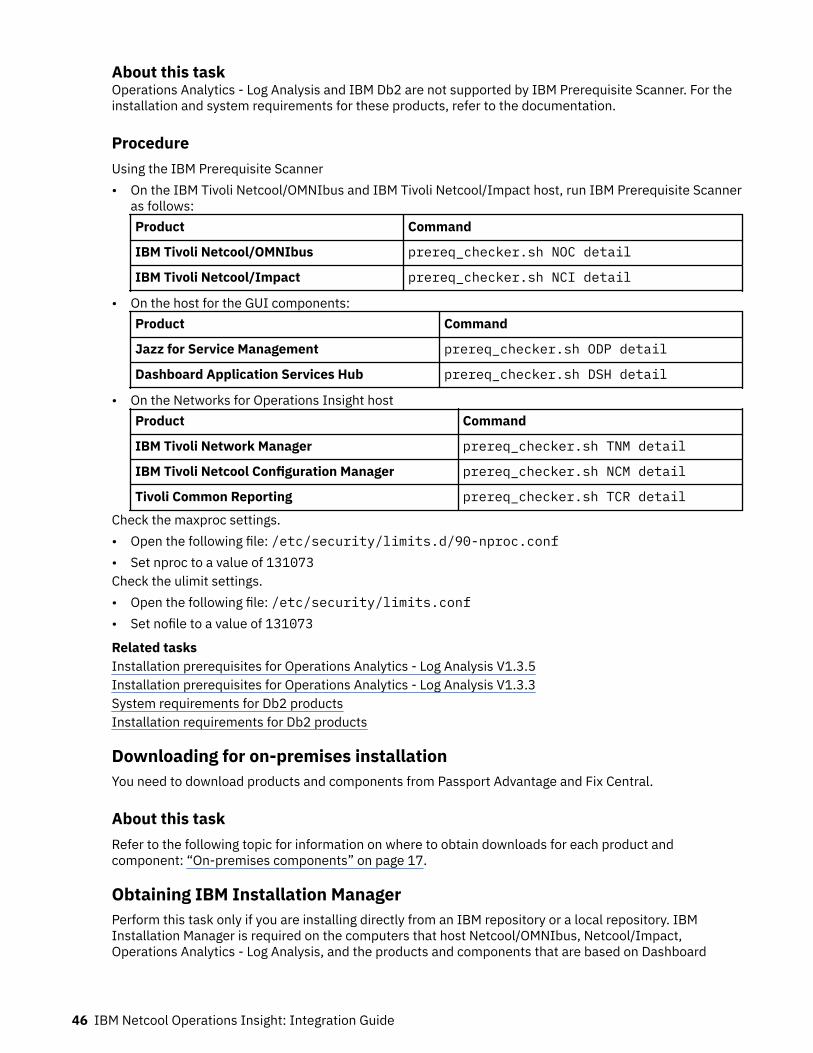
About this taskOperations Analytics - Log Analysis and IBM Db2 are not supported by IBM Prerequisite Scanner. For theinstallation and system requirements for these products, refer to the documentation.
ProcedureUsing the IBM Prerequisite Scanner• On the IBM Tivoli Netcool/OMNIbus and IBM Tivoli Netcool/Impact host, run IBM Prerequisite Scanner
as follows:Product Command
IBM Tivoli Netcool/OMNIbus prereq_checker.sh NOC detail
IBM Tivoli Netcool/Impact prereq_checker.sh NCI detail
• On the host for the GUI components:Product Command
Jazz for Service Management prereq_checker.sh ODP detail
Dashboard Application Services Hub prereq_checker.sh DSH detail
• On the Networks for Operations Insight hostProduct Command
IBM Tivoli Network Manager prereq_checker.sh TNM detail
IBM Tivoli Netcool Configuration Manager prereq_checker.sh NCM detail
Tivoli Common Reporting prereq_checker.sh TCR detail
Check the maxproc settings.• Open the following file: /etc/security/limits.d/90-nproc.conf• Set nproc to a value of 131073Check the ulimit settings.• Open the following file: /etc/security/limits.conf• Set nofile to a value of 131073
Related tasksInstallation prerequisites for Operations Analytics - Log Analysis V1.3.5Installation prerequisites for Operations Analytics - Log Analysis V1.3.3System requirements for Db2 productsInstallation requirements for Db2 products
Downloading for on-premises installationYou need to download products and components from Passport Advantage and Fix Central.
About this taskRefer to the following topic for information on where to obtain downloads for each product andcomponent: “On-premises components” on page 17.
Obtaining IBM Installation ManagerPerform this task only if you are installing directly from an IBM repository or a local repository. IBMInstallation Manager is required on the computers that host Netcool/OMNIbus, Netcool/Impact,Operations Analytics - Log Analysis, and the products and components that are based on Dashboard
46 IBM Netcool Operations Insight: Integration Guide
Application Services Hub. In this scenario, that is servers 1, 2, and 3. The installation packages of theproducts include Installation Manager.
Before you beginCreate an IBM ID at http://www.ibm.com . You need an IBM ID to download software from IBM FixCentral.
Note:
On Red Hat Enterprise Linux, the GUI mode of the Installation Manager uses the libcairo UI libraries. Thelatest updates for RHEL 6 contain a known issue that causes the Installation Manager to crash. BeforeinstallingInstallation Manager on Red Hat Enterprise Linux 6, follow the instructions in the followingtechnote to configure libcairo UI libraries to a supported version: http://www.ibm.com/support/docview.wss?uid=swg21690056
Remember: The installation image of Netcool/OMNIbus V8.1.0.24 available from IBM PassportAdvantage and on DVD includes Installation Manager. You only need to download Installation Managerseparately if you are installing Netcool/OMNIbus directly from an IBM repository or from a localrepository.
You can install Installation Manager in one of three user modes: Administrator mode, Nonadministratormode, or Group mode. The user modes determine who can run Installation Manager and where productdata is stored. The following table shows the supported Installation Manager user modes for products inIBM Netcool Operations Insight.
Table 18. Supported Installation Manager user modes
Product Administrator mode Nonadministrator mode Group mode
IBM Tivoli Netcool/OMNIbus 1 X X X
IBM Tivoli Netcool/Impact X X X
IBM OperationsAnalytics - LogAnalysis 2
X
ProcedureThe IBM Fix Central website offers two approaches to finding product files: Select product and Findproduct. The following instructions apply to the Find product option.1. Go to IBM Fix Central at http://www.ibm.com/support/fixcentral/ and search for IBM Installation
Manager.a) On the Find product tab, enter IBM Installation Manager in the Product selector field.b) Select V1.9.2 from the Installed Version list.c) Select your intended host operating system from the Platform list and click Continue.
2. On the Identity Fixes page, choose Browse for fixes and Show fixes that apply to this version(1.X.X.X). Click Continue.
3. On the Select Fixes page, select the installation file appropriate to your intended host operatingsystem and click Continue.
4. When prompted, enter your IBM ID and password.5. If your browser has Java enabled, choose the Download Director option. Otherwise, select the HTTP
download option.
1 Includes OMNIbus Core, Web GUI, and the Gateways.2 Insight Packs are installed by the Operations Analytics - Log Analysis pkg_mgmt command.
Chapter 4. Installing Netcool Operations Insight 47

6. Start the installation file download. Make a note of the download location.
What to do nextInstall Installation Manager. See http://www.ibm.com/support/docview.wss?uid=swg24034941.Related informationIBM Installation Manager overview
Installing Installation Manager (GUI or console example)You can install Installation Manager V1.9.2 with a wizard-style GUI or an interactive console, as depictedin this example.
Before you beginTake the following actions:
• Extract the contents of the Installation Manager installation file to a suitable temporary directory.• Ensure that the necessary user permissions are in place for your intended installation, data, and shared
directories.• The console installer does not report required disk space. Ensure that you have enough free space
before you start a console installation.
Before you run the Installation Manager installer, create the following target directories and set the filepermissions for the designated user and group that Installation Manager to run as, and any subsequentproduct installations:Main installation directory
Location to install the product binary files.Data directory
Location where Installation Manager stores information about installed products.Shared directory
Location where Installation Manager stores downloaded packages that are used for rollback.Ensure that these directories are separate. For example, run the following commands:
mkdir /opt/IBM/NetcoolIMmkdir /opt/IBM/NetcoolIM/IBMIMmkdir /opt/IBM/NetcoolIM/IBMIMDatamkdir /opt/IBM/NetcoolIM/IBMIMSharedchown -R netcool:ncoadmin /opt/IBM/NetcoolIM
About this taskThe initial installation steps are different depending on which user mode you use. The steps forcompleting the installation are common to all user modes and operating systems.
Installation Manager takes account of your current umask settings when it sets the permissions mode ofthe files and directories that it installs. Using Group mode, Installation Manager ignores any group bitsthat are set and uses a umask of 2 if the resulting value is 0.
Procedure1. Install in Group mode:
a) Use the id utility to verify that your current effective user group is suitable for the installation. Ifnecessary, use the following command to start a new shell with the correct effective group:newgrp group_name
b) Use the umask utility to check your umask value. If necessary, change the umask value.c) Change to the temporary directory that contains the Installation Manager installation files.
48 IBM Netcool Operations Insight: Integration Guide

d) Use the following command to start the installation:GUI installation
./groupinst -dL data_locationConsole installation
./groupinstc -c -dL data_locationIn this command, data_location specifies the data directory. You must specify a datadirectory that all members of the group can access.
Remember: Each instance of Installation Manager requires a different data directory.2. Follow the installer instructions to complete the installation.
The installer requires the following input at different stages of the installation:GUI installation
• In the first page, select the Installation Manager package.• Read and accept the license agreement.• When prompted, enter an installation directory or accept the default directory.• Verify that the total installation size does not exceed the available disk space.• When prompted, restart Installation Manager.
Console installation
• Read and accept the license agreement.• When prompted, enter an installation directory or accept the default directory.• If required, generate a response file. Enter the directory path and a file name with a .xml
extension. The response file is generated before installation completes.• When prompted, restart Installation Manager.
ResultsInstallation Manager is installed and can now be used to install IBM Netcool Operations Insight.
Note: If it is not possible for you to install Netcool Operations Insight components in GUI mode (forexample, security policies at your site might limit the display of GUI pages) then you can use theInstallation Manager web application to install the Netcool Operations Insight base solution components,which are as follows:
• IBM Tivoli Netcool/OMNIbus core components• IBM Tivoli Netcool/OMNIbus 8 Plus Gateway for Message Bus• Tivoli Netcool/OMNIbus Web GUI and the Web GUI extensions for Event Analytics• IBM Tivoli Netcool/Impact and the Netcool/Impact extensions for Event Analytics
However, note that the following Netcool Operations Insight base solution components cannot beinstalled by using the Installation Manager web application:
• Dashboard Application Services Hub• Operations Analytics - Log Analysis
Dashboard Application Services Hub also cannot be installed in console mode.
What to do nextIf required, add the Installation Manager installation directory path to your PATH environment variable.Related informationIBM Installation Manager V1.8.5 documentation: Working from a web browserClick here for informationon how to use the Installation Manager web server to manage your installations.
Chapter 4. Installing Netcool Operations Insight 49
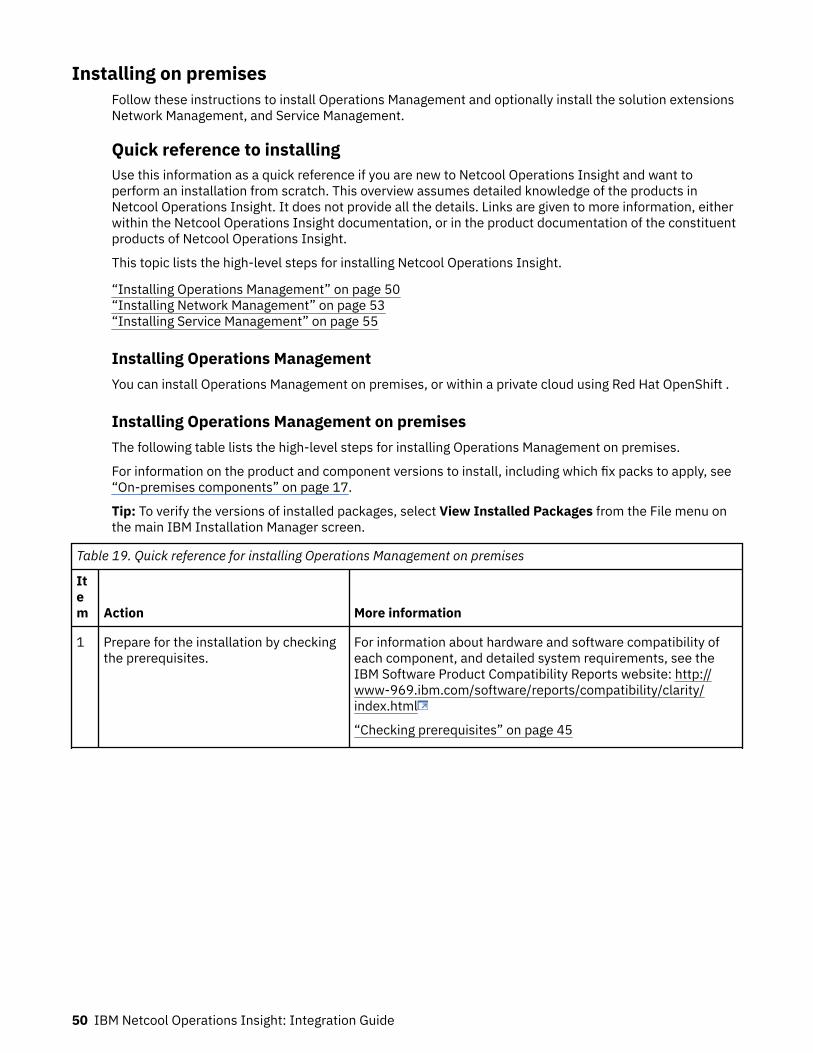
Installing on premisesFollow these instructions to install Operations Management and optionally install the solution extensionsNetwork Management, and Service Management.
Quick reference to installingUse this information as a quick reference if you are new to Netcool Operations Insight and want toperform an installation from scratch. This overview assumes detailed knowledge of the products inNetcool Operations Insight. It does not provide all the details. Links are given to more information, eitherwithin the Netcool Operations Insight documentation, or in the product documentation of the constituentproducts of Netcool Operations Insight.
This topic lists the high-level steps for installing Netcool Operations Insight.
“Installing Operations Management” on page 50“Installing Network Management” on page 53 “Installing Service Management” on page 55
Installing Operations ManagementYou can install Operations Management on premises, or within a private cloud using Red Hat OpenShift .
Installing Operations Management on premisesThe following table lists the high-level steps for installing Operations Management on premises.
For information on the product and component versions to install, including which fix packs to apply, see“On-premises components” on page 17.
Tip: To verify the versions of installed packages, select View Installed Packages from the File menu onthe main IBM Installation Manager screen.
Table 19. Quick reference for installing Operations Management on premises
Item Action More information
1 Prepare for the installation by checkingthe prerequisites.
For information about hardware and software compatibility ofeach component, and detailed system requirements, see theIBM Software Product Compatibility Reports website: http://www-969.ibm.com/software/reports/compatibility/clarity/index.html
“Checking prerequisites” on page 45
50 IBM Netcool Operations Insight: Integration Guide
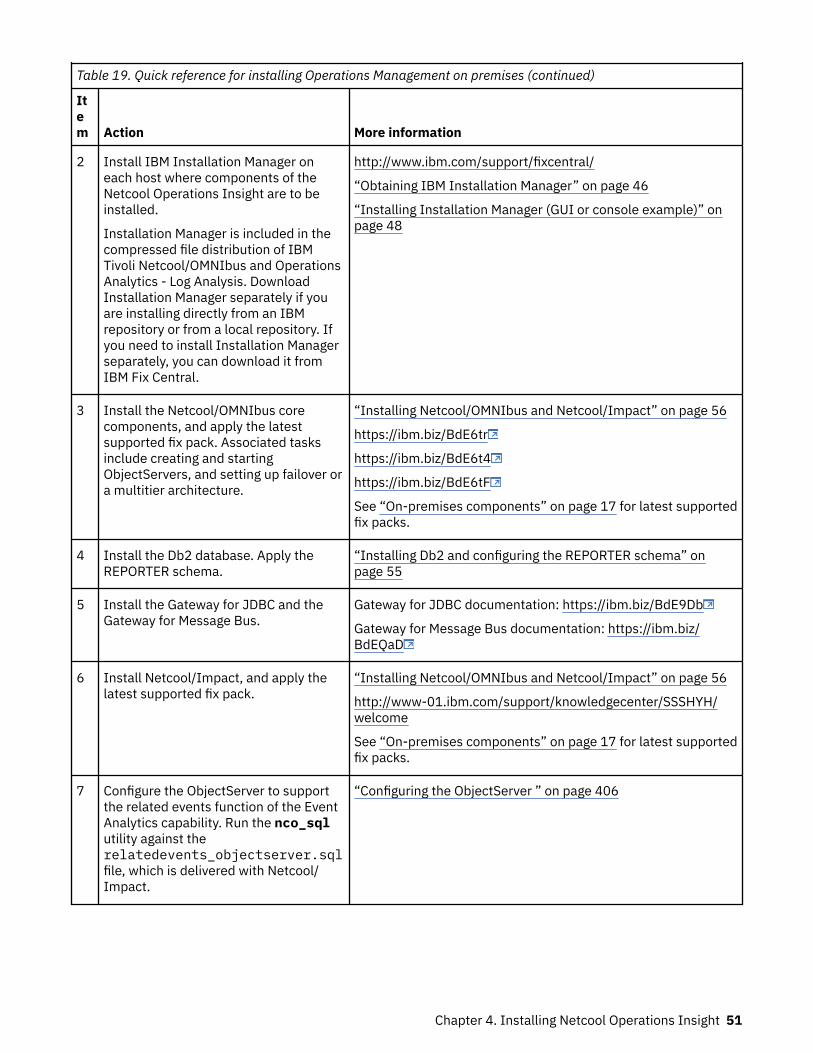
Table 19. Quick reference for installing Operations Management on premises (continued)
Item Action More information
2 Install IBM Installation Manager oneach host where components of theNetcool Operations Insight are to beinstalled.
Installation Manager is included in thecompressed file distribution of IBMTivoli Netcool/OMNIbus and OperationsAnalytics - Log Analysis. DownloadInstallation Manager separately if youare installing directly from an IBMrepository or from a local repository. Ifyou need to install Installation Managerseparately, you can download it fromIBM Fix Central.
http://www.ibm.com/support/fixcentral/
“Obtaining IBM Installation Manager” on page 46
“Installing Installation Manager (GUI or console example)” onpage 48
3 Install the Netcool/OMNIbus corecomponents, and apply the latestsupported fix pack. Associated tasksinclude creating and startingObjectServers, and setting up failover ora multitier architecture.
“Installing Netcool/OMNIbus and Netcool/Impact” on page 56
https://ibm.biz/BdE6tr
https://ibm.biz/BdE6t4
https://ibm.biz/BdE6tF
See “On-premises components” on page 17 for latest supportedfix packs.
4 Install the Db2 database. Apply theREPORTER schema.
“Installing Db2 and configuring the REPORTER schema” onpage 55
5 Install the Gateway for JDBC and theGateway for Message Bus.
Gateway for JDBC documentation: https://ibm.biz/BdE9Db
Gateway for Message Bus documentation: https://ibm.biz/BdEQaD
6 Install Netcool/Impact, and apply thelatest supported fix pack.
“Installing Netcool/OMNIbus and Netcool/Impact” on page 56
http://www-01.ibm.com/support/knowledgecenter/SSSHYH/welcome
See “On-premises components” on page 17 for latest supportedfix packs.
7 Configure the ObjectServer to supportthe related events function of the EventAnalytics capability. Run the nco_sqlutility against therelatedevents_objectserver.sqlfile, which is delivered with Netcool/Impact.
“Configuring the ObjectServer ” on page 406
Chapter 4. Installing Netcool Operations Insight 51
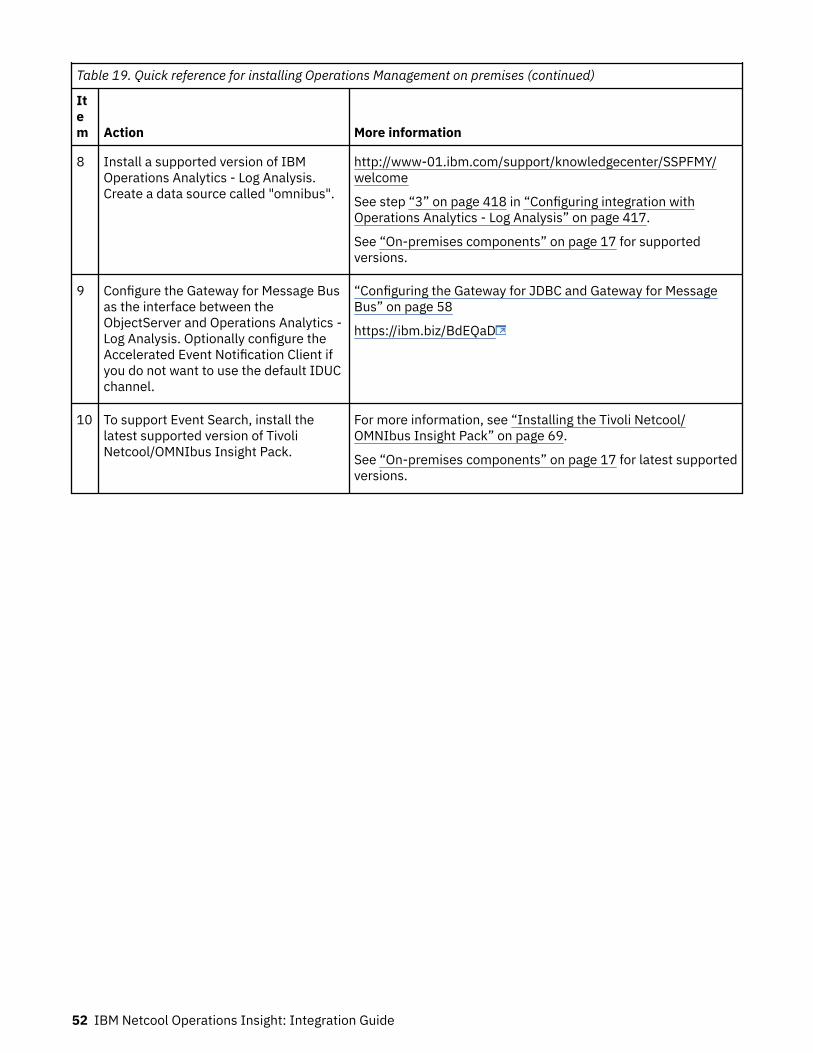
Table 19. Quick reference for installing Operations Management on premises (continued)
Item Action More information
8 Install a supported version of IBMOperations Analytics - Log Analysis.Create a data source called "omnibus".
http://www-01.ibm.com/support/knowledgecenter/SSPFMY/welcome
See step “3” on page 418 in “Configuring integration withOperations Analytics - Log Analysis” on page 417.
See “On-premises components” on page 17 for supportedversions.
9 Configure the Gateway for Message Busas the interface between theObjectServer and Operations Analytics -Log Analysis. Optionally configure theAccelerated Event Notification Client ifyou do not want to use the default IDUCchannel.
“Configuring the Gateway for JDBC and Gateway for MessageBus” on page 58
https://ibm.biz/BdEQaD
10 To support Event Search, install thelatest supported version of TivoliNetcool/OMNIbus Insight Pack.
For more information, see “Installing the Tivoli Netcool/OMNIbus Insight Pack” on page 69.
See “On-premises components” on page 17 for latest supportedversions.
52 IBM Netcool Operations Insight: Integration Guide
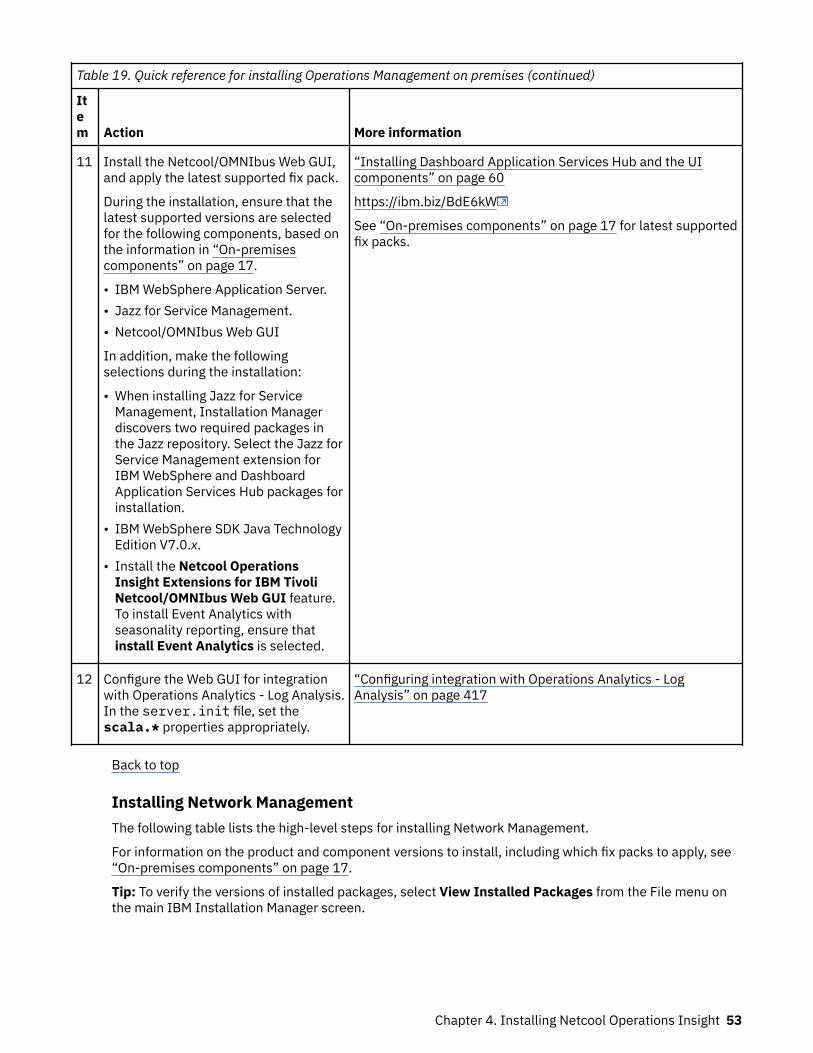
Table 19. Quick reference for installing Operations Management on premises (continued)
Item Action More information
11 Install the Netcool/OMNIbus Web GUI,and apply the latest supported fix pack.
During the installation, ensure that thelatest supported versions are selectedfor the following components, based onthe information in “On-premisescomponents” on page 17.
• IBM WebSphere Application Server.• Jazz for Service Management.• Netcool/OMNIbus Web GUI
In addition, make the followingselections during the installation:
• When installing Jazz for ServiceManagement, Installation Managerdiscovers two required packages inthe Jazz repository. Select the Jazz forService Management extension forIBM WebSphere and DashboardApplication Services Hub packages forinstallation.
• IBM WebSphere SDK Java TechnologyEdition V7.0.x.
• Install the Netcool OperationsInsight Extensions for IBM TivoliNetcool/OMNIbus Web GUI feature.To install Event Analytics withseasonality reporting, ensure thatinstall Event Analytics is selected.
“Installing Dashboard Application Services Hub and the UIcomponents” on page 60
https://ibm.biz/BdE6kW
See “On-premises components” on page 17 for latest supportedfix packs.
12 Configure the Web GUI for integrationwith Operations Analytics - Log Analysis.In the server.init file, set thescala.* properties appropriately.
“Configuring integration with Operations Analytics - LogAnalysis” on page 417
Back to top
Installing Network ManagementThe following table lists the high-level steps for installing Network Management.
For information on the product and component versions to install, including which fix packs to apply, see“On-premises components” on page 17.
Tip: To verify the versions of installed packages, select View Installed Packages from the File menu onthe main IBM Installation Manager screen.
Chapter 4. Installing Netcool Operations Insight 53
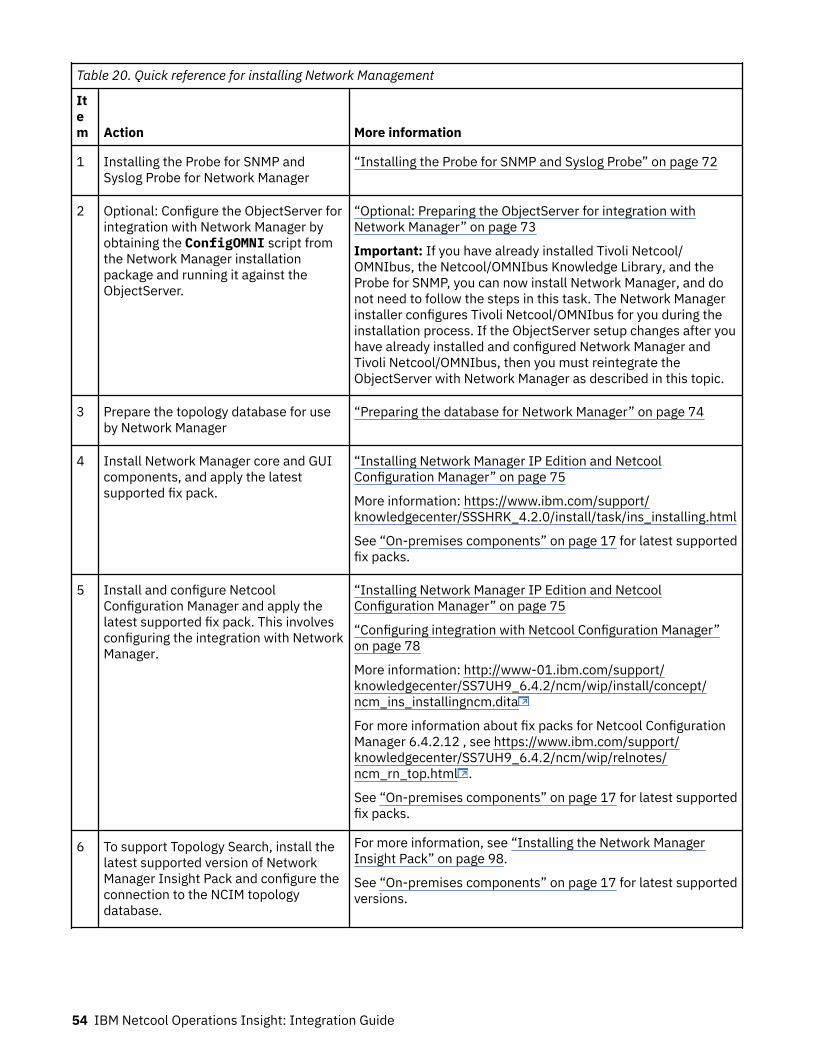
Table 20. Quick reference for installing Network Management
Item Action More information
1 Installing the Probe for SNMP andSyslog Probe for Network Manager
“Installing the Probe for SNMP and Syslog Probe” on page 72
2 Optional: Configure the ObjectServer forintegration with Network Manager byobtaining the ConfigOMNI script fromthe Network Manager installationpackage and running it against theObjectServer.
“Optional: Preparing the ObjectServer for integration withNetwork Manager” on page 73
Important: If you have already installed Tivoli Netcool/OMNIbus, the Netcool/OMNIbus Knowledge Library, and theProbe for SNMP, you can now install Network Manager, and donot need to follow the steps in this task. The Network Managerinstaller configures Tivoli Netcool/OMNIbus for you during theinstallation process. If the ObjectServer setup changes after youhave already installed and configured Network Manager andTivoli Netcool/OMNIbus, then you must reintegrate theObjectServer with Network Manager as described in this topic.
3 Prepare the topology database for useby Network Manager
“Preparing the database for Network Manager” on page 74
4 Install Network Manager core and GUIcomponents, and apply the latestsupported fix pack.
“Installing Network Manager IP Edition and NetcoolConfiguration Manager” on page 75
More information: https://www.ibm.com/support/knowledgecenter/SSSHRK_4.2.0/install/task/ins_installing.html
See “On-premises components” on page 17 for latest supportedfix packs.
5 Install and configure NetcoolConfiguration Manager and apply thelatest supported fix pack. This involvesconfiguring the integration with NetworkManager.
“Installing Network Manager IP Edition and NetcoolConfiguration Manager” on page 75
“Configuring integration with Netcool Configuration Manager”on page 78
More information: http://www-01.ibm.com/support/knowledgecenter/SS7UH9_6.4.2/ncm/wip/install/concept/ncm_ins_installingncm.dita
For more information about fix packs for Netcool ConfigurationManager 6.4.2.12 , see https://www.ibm.com/support/knowledgecenter/SS7UH9_6.4.2/ncm/wip/relnotes/ncm_rn_top.html .
See “On-premises components” on page 17 for latest supportedfix packs.
6 To support Topology Search, install thelatest supported version of NetworkManager Insight Pack and configure theconnection to the NCIM topologydatabase.
For more information, see “Installing the Network ManagerInsight Pack” on page 98.
See “On-premises components” on page 17 for latest supportedversions.
54 IBM Netcool Operations Insight: Integration Guide
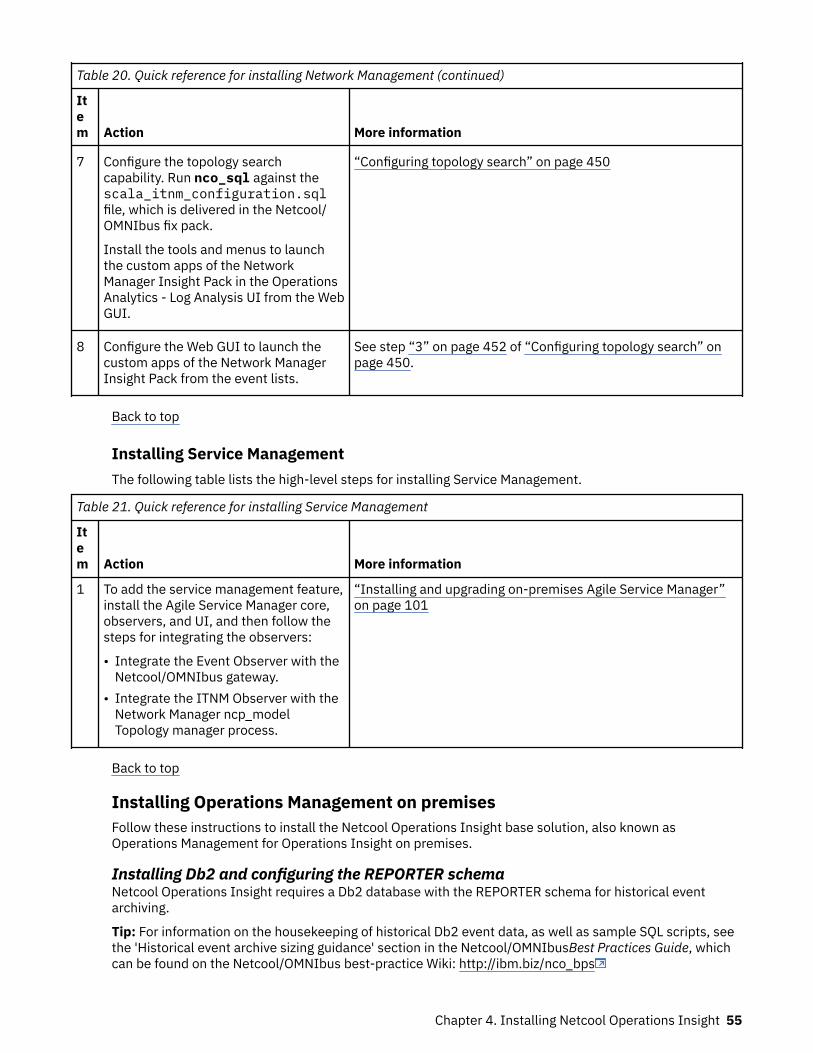
Table 20. Quick reference for installing Network Management (continued)
Item Action More information
7 Configure the topology searchcapability. Run nco_sql against thescala_itnm_configuration.sqlfile, which is delivered in the Netcool/OMNIbus fix pack.
Install the tools and menus to launchthe custom apps of the NetworkManager Insight Pack in the OperationsAnalytics - Log Analysis UI from the WebGUI.
“Configuring topology search” on page 450
8 Configure the Web GUI to launch thecustom apps of the Network ManagerInsight Pack from the event lists.
See step “3” on page 452 of “Configuring topology search” onpage 450.
Back to top
Installing Service ManagementThe following table lists the high-level steps for installing Service Management.
Table 21. Quick reference for installing Service Management
Item Action More information
1 To add the service management feature,install the Agile Service Manager core,observers, and UI, and then follow thesteps for integrating the observers:
• Integrate the Event Observer with theNetcool/OMNIbus gateway.
• Integrate the ITNM Observer with theNetwork Manager ncp_modelTopology manager process.
“Installing and upgrading on-premises Agile Service Manager”on page 101
Back to top
Installing Operations Management on premisesFollow these instructions to install the Netcool Operations Insight base solution, also known asOperations Management for Operations Insight on premises.
Installing Db2 and configuring the REPORTER schemaNetcool Operations Insight requires a Db2 database with the REPORTER schema for historical eventarchiving.
Tip: For information on the housekeeping of historical Db2 event data, as well as sample SQL scripts, seethe 'Historical event archive sizing guidance' section in the Netcool/OMNIbusBest Practices Guide, whichcan be found on the Netcool/OMNIbus best-practice Wiki: http://ibm.biz/nco_bps
Chapter 4. Installing Netcool Operations Insight 55
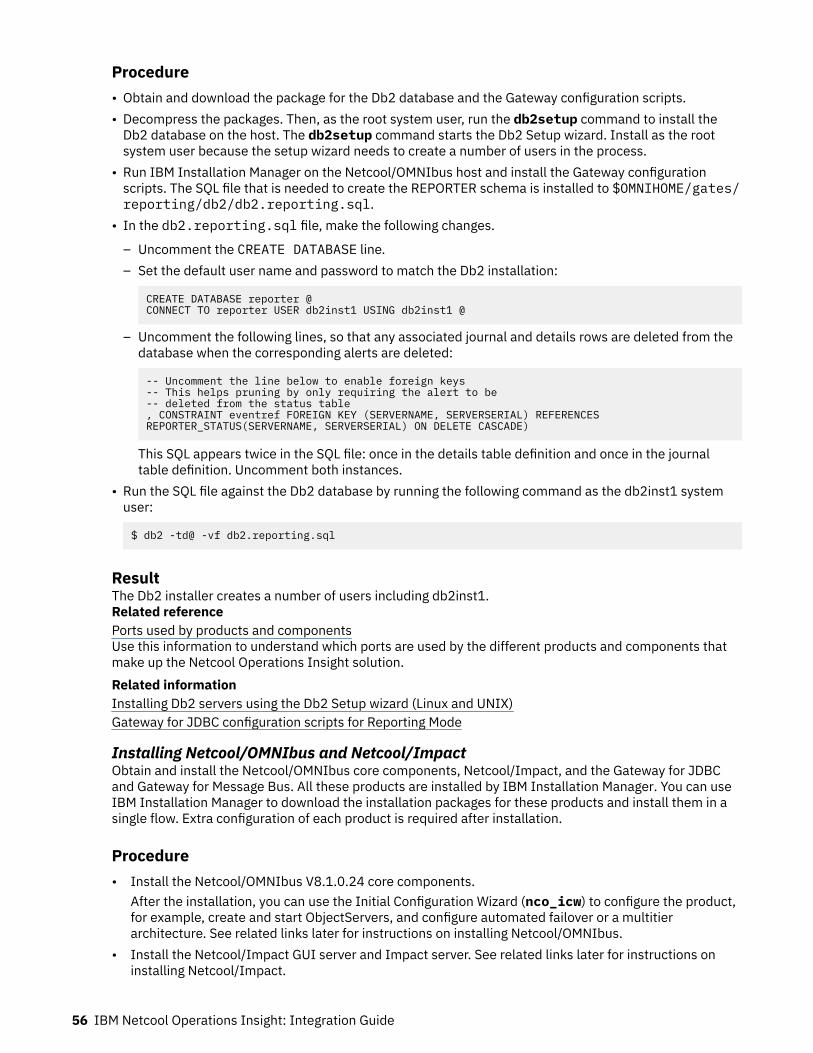
Procedure• Obtain and download the package for the Db2 database and the Gateway configuration scripts.• Decompress the packages. Then, as the root system user, run the db2setup command to install the
Db2 database on the host. The db2setup command starts the Db2 Setup wizard. Install as the rootsystem user because the setup wizard needs to create a number of users in the process.
• Run IBM Installation Manager on the Netcool/OMNIbus host and install the Gateway configurationscripts. The SQL file that is needed to create the REPORTER schema is installed to $OMNIHOME/gates/reporting/db2/db2.reporting.sql.
• In the db2.reporting.sql file, make the following changes.
– Uncomment the CREATE DATABASE line.– Set the default user name and password to match the Db2 installation:
CREATE DATABASE reporter @CONNECT TO reporter USER db2inst1 USING db2inst1 @
– Uncomment the following lines, so that any associated journal and details rows are deleted from thedatabase when the corresponding alerts are deleted:
-- Uncomment the line below to enable foreign keys-- This helps pruning by only requiring the alert to be-- deleted from the status table, CONSTRAINT eventref FOREIGN KEY (SERVERNAME, SERVERSERIAL) REFERENCES REPORTER_STATUS(SERVERNAME, SERVERSERIAL) ON DELETE CASCADE)
This SQL appears twice in the SQL file: once in the details table definition and once in the journaltable definition. Uncomment both instances.
• Run the SQL file against the Db2 database by running the following command as the db2inst1 systemuser:
$ db2 -td@ -vf db2.reporting.sql
ResultThe Db2 installer creates a number of users including db2inst1.Related referencePorts used by products and componentsUse this information to understand which ports are used by the different products and components thatmake up the Netcool Operations Insight solution.Related informationInstalling Db2 servers using the Db2 Setup wizard (Linux and UNIX)Gateway for JDBC configuration scripts for Reporting Mode
Installing Netcool/OMNIbus and Netcool/ImpactObtain and install the Netcool/OMNIbus core components, Netcool/Impact, and the Gateway for JDBCand Gateway for Message Bus. All these products are installed by IBM Installation Manager. You can useIBM Installation Manager to download the installation packages for these products and install them in asingle flow. Extra configuration of each product is required after installation.
Procedure• Install the Netcool/OMNIbus V8.1.0.24 core components.
After the installation, you can use the Initial Configuration Wizard (nco_icw) to configure the product,for example, create and start ObjectServers, and configure automated failover or a multitierarchitecture. See related links later for instructions on installing Netcool/OMNIbus.
• Install the Netcool/Impact GUI server and Impact server. See related links later for instructions oninstalling Netcool/Impact.
56 IBM Netcool Operations Insight: Integration Guide
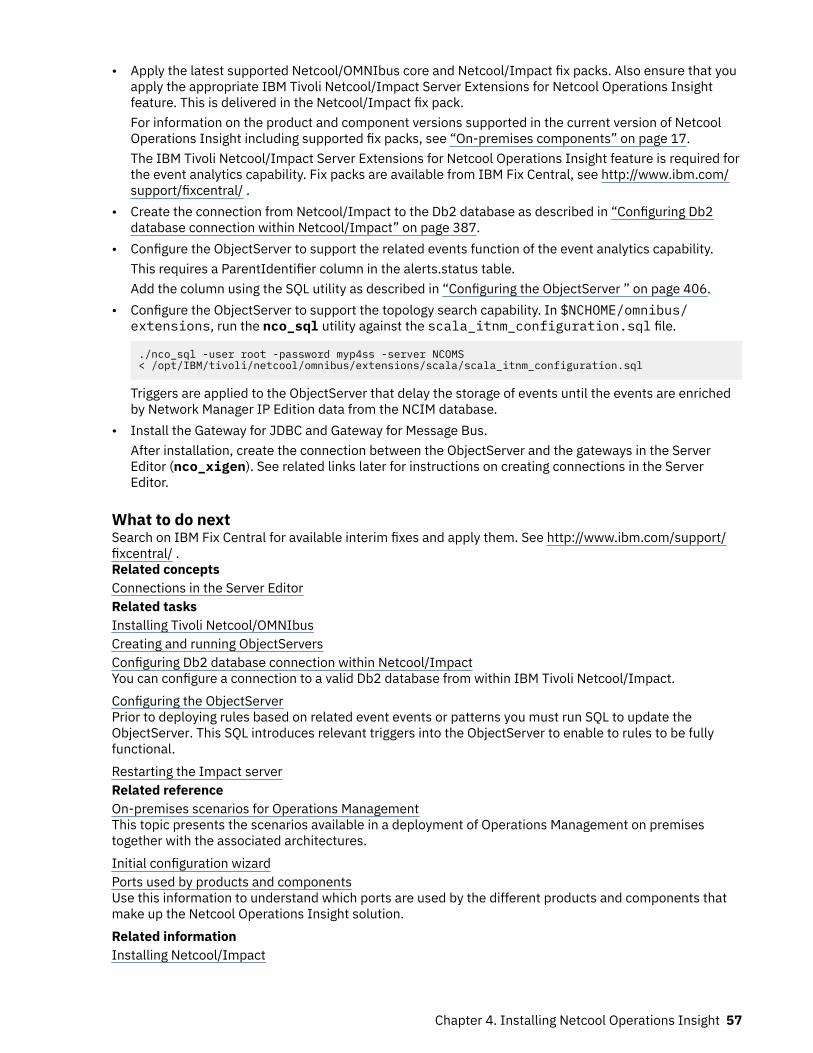
• Apply the latest supported Netcool/OMNIbus core and Netcool/Impact fix packs. Also ensure that youapply the appropriate IBM Tivoli Netcool/Impact Server Extensions for Netcool Operations Insightfeature. This is delivered in the Netcool/Impact fix pack.For information on the product and component versions supported in the current version of NetcoolOperations Insight including supported fix packs, see “On-premises components” on page 17.The IBM Tivoli Netcool/Impact Server Extensions for Netcool Operations Insight feature is required forthe event analytics capability. Fix packs are available from IBM Fix Central, see http://www.ibm.com/support/fixcentral/ .
• Create the connection from Netcool/Impact to the Db2 database as described in “Configuring Db2database connection within Netcool/Impact” on page 387.
• Configure the ObjectServer to support the related events function of the event analytics capability.This requires a ParentIdentifier column in the alerts.status table.Add the column using the SQL utility as described in “Configuring the ObjectServer ” on page 406.
• Configure the ObjectServer to support the topology search capability. In $NCHOME/omnibus/extensions, run the nco_sql utility against the scala_itnm_configuration.sql file.
./nco_sql -user root -password myp4ss -server NCOMS < /opt/IBM/tivoli/netcool/omnibus/extensions/scala/scala_itnm_configuration.sql
Triggers are applied to the ObjectServer that delay the storage of events until the events are enrichedby Network Manager IP Edition data from the NCIM database.
• Install the Gateway for JDBC and Gateway for Message Bus.After installation, create the connection between the ObjectServer and the gateways in the ServerEditor (nco_xigen). See related links later for instructions on creating connections in the ServerEditor.
What to do nextSearch on IBM Fix Central for available interim fixes and apply them. See http://www.ibm.com/support/fixcentral/ .Related conceptsConnections in the Server EditorRelated tasksInstalling Tivoli Netcool/OMNIbusCreating and running ObjectServersConfiguring Db2 database connection within Netcool/ImpactYou can configure a connection to a valid Db2 database from within IBM Tivoli Netcool/Impact.Configuring the ObjectServerPrior to deploying rules based on related event events or patterns you must run SQL to update theObjectServer. This SQL introduces relevant triggers into the ObjectServer to enable to rules to be fullyfunctional.Restarting the Impact serverRelated referenceOn-premises scenarios for Operations ManagementThis topic presents the scenarios available in a deployment of Operations Management on premisestogether with the associated architectures.Initial configuration wizardPorts used by products and componentsUse this information to understand which ports are used by the different products and components thatmake up the Netcool Operations Insight solution.Related informationInstalling Netcool/Impact
Chapter 4. Installing Netcool Operations Insight 57

Installing IBM Operations Analytics - Log AnalysisOperations Analytics - Log Analysis supports GUI, console, and silent installations. The installationprocess differs for 64-bit and z/OS operating systems.
ProcedureOperations Analytics - Log Analysis can be installed by IBM Installation Manager or you can run theinstall.sh wrapper script.
Tip: The best practice is to install the Web GUI and Operations Analytics - Log Analysis on separate hosts.
Restriction: Operations Analytics - Log Analysis does not support installation in Group mode of IBMInstallation Manager.
What to do next• If the host locale is not set to English United States, set the locale of the command shell to exportLANG=en_US.UTF-8 before you run any Operations Analytics - Log Analysis scripts.
• Install the Tivoli Netcool/OMNIbus Insight Pack into Operations Analytics - Log Analysis to enableingestion of event data into Operations Analytics. For more information, see “Installing the TivoliNetcool/OMNIbus Insight Pack” on page 69.
• (Optional) Install the Network Manager Insight Pack into Operations Analytics - Log Analysis to use thetopology search capability. For more information, see “Installing the Network Manager Insight Pack” onpage 98.
• Search on IBM Fix Central for available interim fixes and apply them. See http://www.ibm.com/support/fixcentral/ .
Related tasksInstalling Operations Analytics - Log Analysis V1.3.5Installing Operations Analytics - Log Analysis V1.3.3Related referencePorts used by products and componentsUse this information to understand which ports are used by the different products and components thatmake up the Netcool Operations Insight solution.
Configuring the Gateway for JDBC and Gateway for Message BusConfigure the Gateway for JDBC to run in reporting mode, so it can forward event data to the Db2database for archiving. Configure the Gateway for Message Bus gateway to forward event data toOperations Analytics - Log Analysis and run it in Operations Analytics - Log Analysis mode.
Before you begin• Install the Db2 database and configure the REPORTER schema so that the Gateway for JDBC can
connect.• Install the gateways on the same host as Tivoli Netcool/OMNIbus core components (that is, server 1).• Install Operations Analytics - Log Analysis and obtain the URL for the connection to the Gateway for
Message Bus.
Procedure• Configure the Gateway for JDBC.
This involves the following steps:
– Obtain the JDBC driver for the target database from the database vendor and install it according tothe vendor's instructions. The drivers are usually provided as .jar files.
58 IBM Netcool Operations Insight: Integration Guide
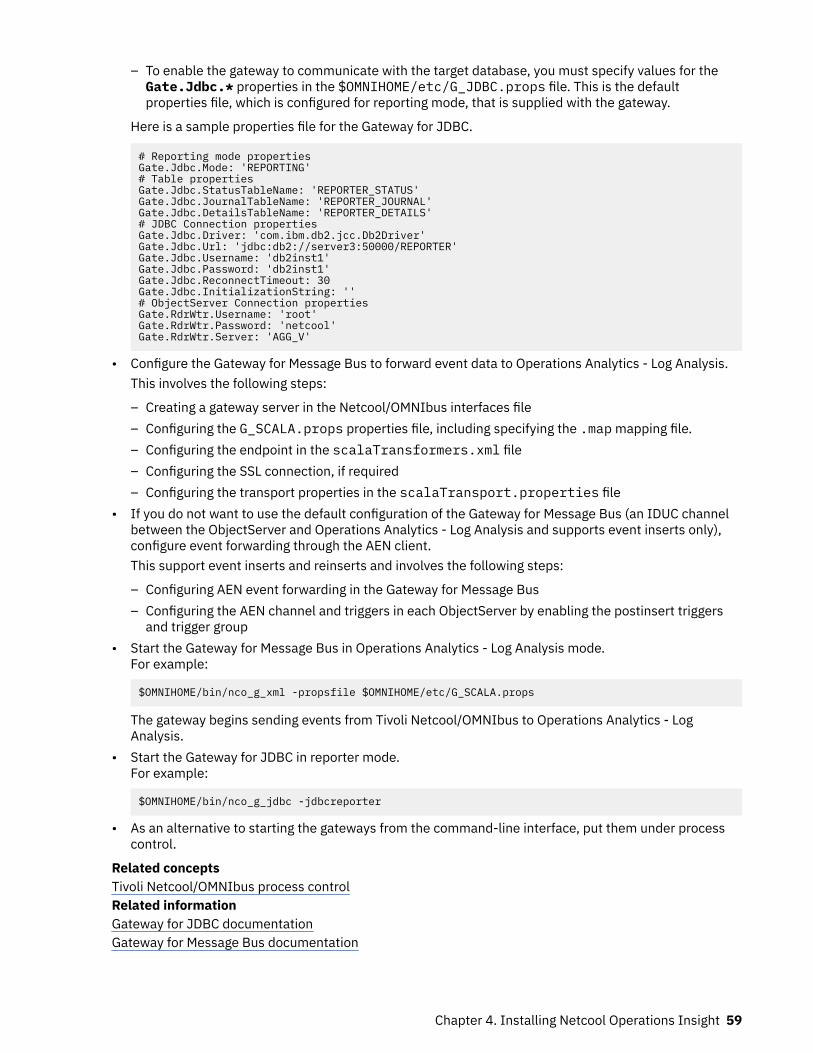
– To enable the gateway to communicate with the target database, you must specify values for theGate.Jdbc.* properties in the $OMNIHOME/etc/G_JDBC.props file. This is the defaultproperties file, which is configured for reporting mode, that is supplied with the gateway.
Here is a sample properties file for the Gateway for JDBC.
# Reporting mode propertiesGate.Jdbc.Mode: 'REPORTING'# Table propertiesGate.Jdbc.StatusTableName: 'REPORTER_STATUS'Gate.Jdbc.JournalTableName: 'REPORTER_JOURNAL'Gate.Jdbc.DetailsTableName: 'REPORTER_DETAILS'# JDBC Connection propertiesGate.Jdbc.Driver: 'com.ibm.db2.jcc.Db2Driver'Gate.Jdbc.Url: 'jdbc:db2://server3:50000/REPORTER'Gate.Jdbc.Username: 'db2inst1'Gate.Jdbc.Password: 'db2inst1'Gate.Jdbc.ReconnectTimeout: 30Gate.Jdbc.InitializationString: ''# ObjectServer Connection propertiesGate.RdrWtr.Username: 'root'Gate.RdrWtr.Password: 'netcool'Gate.RdrWtr.Server: 'AGG_V'
• Configure the Gateway for Message Bus to forward event data to Operations Analytics - Log Analysis.This involves the following steps:
– Creating a gateway server in the Netcool/OMNIbus interfaces file– Configuring the G_SCALA.props properties file, including specifying the .map mapping file.– Configuring the endpoint in the scalaTransformers.xml file– Configuring the SSL connection, if required– Configuring the transport properties in the scalaTransport.properties file
• If you do not want to use the default configuration of the Gateway for Message Bus (an IDUC channelbetween the ObjectServer and Operations Analytics - Log Analysis and supports event inserts only),configure event forwarding through the AEN client.This support event inserts and reinserts and involves the following steps:
– Configuring AEN event forwarding in the Gateway for Message Bus– Configuring the AEN channel and triggers in each ObjectServer by enabling the postinsert triggers
and trigger group• Start the Gateway for Message Bus in Operations Analytics - Log Analysis mode.
For example:
$OMNIHOME/bin/nco_g_xml -propsfile $OMNIHOME/etc/G_SCALA.props
The gateway begins sending events from Tivoli Netcool/OMNIbus to Operations Analytics - LogAnalysis.
• Start the Gateway for JDBC in reporter mode.For example:
$OMNIHOME/bin/nco_g_jdbc -jdbcreporter
• As an alternative to starting the gateways from the command-line interface, put them under processcontrol.
Related conceptsTivoli Netcool/OMNIbus process controlRelated informationGateway for JDBC documentationGateway for Message Bus documentation
Chapter 4. Installing Netcool Operations Insight 59
Installing Dashboard Application Services Hub and the UI componentsInstall the Dashboard Application Services Hub and all the UI components. This applies to the Netcool/OMNIbus Web GUI, the Event Analytics component, fix packs, and optionally Reporting Services.
The UI components are installed in two stages. First, IBM WebSphere Application Server and Jazz forService Management are installed, which provide the underlying UI technology. Then, the Web GUI andthe extension packages that support the Event Analytics component and the event search capability areinstalled. After installation, configure the Web GUI to integrate with Operations Analytics - Log Analysisand support the topology search capability.
You can optionally install Reporting Services V3.1 into Dashboard Application Services Hub. You can setup Network Manager and Netcool Configuration Manager to work with Reporting Services by installingtheir respective reports when installing the products. Netcool/OMNIbus V8.1.0.24 and later can beintegrated with Reporting Services V3.1 to support reporting on events. To configure this integration,connect Reporting Services to a relational database through a gateway. Then, import the report packagethat is supplied with Netcool/OMNIbus into Reporting Services. For more information about eventreporting, see the Netcool/OMNIbus documentation, http://www-01.ibm.com/support/knowledgecenter/SSSHTQ_8.1.0/com.ibm.netcool_OMNIbus.doc_8.1.0/omnibus/wip/install/task/omn_con_ext_deploytcrreports.html .
Before you begin• Obtain the packages from IBM Passport Advantage. For information about the eAssembly numbers you
need for the packages, see this IBM Support document, http://www-01.ibm.com/support/docview.wss?uid=swg24043698 .
• To install Reporting Services V3.1, ensure that the host meets the extra requirements at Jazz for ServiceManagement Knowledge Center, http://www.ibm.com/support/knowledgecenter/SSEKCU_1.1.3.0/com.ibm.psc.doc/install/tcr_c_install_prereqs.html .
Procedure1. Start Installation Manager and install Jazz for Service Management.
The packages that you need to install are as follows.
Package Description
IBM WebSphere Application ServerV8.5.5.18 for Jazz for ServiceManagement
Select V8.5.5.18. If V8.0.5 is also identified, clear it.
IBM WebSphere SDK Java TechnologyEdition V7.0.x.
Jazz for Service Management V1.1.3.9 Select the following items for installation.
• Jazz for Service Management extension for IBMWebSphere V8.5.
• Dashboard Application Services Hub V3.1.3.x.
Reporting Services V3.1 This package is optional. Select it if you want to runreports for events and network management.
2. Install the packages that constitute the Web GUI and extensions.Package Description
Netcool/OMNIbus Web GUI This is the base component that installs the WebGUI.
Install tools and menus for event search withIBM SmartCloud Analytics - Log Analysis
This package installs the tools that launch thecustom apps of the Tivoli Netcool/OMNIbusInsight Pack from the event lists.
60 IBM Netcool Operations Insight: Integration Guide
Package Description
Netcool Operations Insight Extensions for IBMTivoli Netcool/OMNIbus Web GUI
This package installs the Event Analytics GUIs.
Netcool/OMNIbus
Web GUI fix pack, as specified in “On-premises components” on page 17.
This is the fix pack that contains the extensions forthe topology search capability.
3. Configure the Web GUI.For example, the connection to a data source (ObjectServer), users, groups, and so on.You can use the Web GUI configuration tool to do this. For more information, see https://ibm.biz/BdXqcP .
4. Configure the integration with Operations Analytics - Log Analysis.Ensure that the server.init file has the following properties set:
scala.app.keyword=OMNIbus_Keyword_Searchscala.app.static.dashboard=OMNIbus_Static_Dashboardscala.datasource=omnibusscala.url=protocol://host:portscala.version=1.2.0.3
If you need to change any of these values, restart the Web GUI server.5. Set up the Web GUI Administration API client.6. Install the tools and menus to launch the custom apps of the Network Manager Insight Pack in the
Operations Analytics - Log Analysis UI from the Web GUI.In $WEBGUI_HOME/extensions/LogAnalytics, run the runwaapi command against thescalaEventTopology.xml file.
$WEBGUI_HOME/waapi/bin/runwaapi -user username -password password -file scalaEventTopology.xml
Where username and password are the credentials of the administrator user that are defined in the$WEBGUI_HOME/waapi/etc/waapi.init properties file that controls the WAAPI client.
What to do next• Search on IBM Fix Central for available interim fixes and apply them. See http://www.ibm.com/support/fixcentral/ .
• Reconfigure your views in the Web GUI event lists to display the NmosObjInst column. The tools thatlaunch the custom apps of the Network Manager Insight Pack work only against events that have avalue in this column. For more information, see http://www-01.ibm.com/support/knowledgecenter/SSSHTQ_8.1.0/com.ibm.netcool_OMNIbus.doc_8.1.0/webtop/wip/task/web_cust_settingupviews.html
.
Related conceptsInstalling Event AnalyticsRead the following topics before you install Event Analytics.Related tasksInstalling the Web GUIRestarting the serverRelated referenceserver.init propertiesPorts used by products and components
Chapter 4. Installing Netcool Operations Insight 61
Use this information to understand which ports are used by the different products and components thatmake up the Netcool Operations Insight solution.
Installing Event AnalyticsRead the following topics before you install Event Analytics.
Installing Event AnalyticsYou can install Event Analytics with the IBM Installation Manager GUI or console, or do a silentinstallation. Event Analytics supports IBM Installation Manager 1.7.2 up to 1.8.4.
IBM Installation ManagerFor more information about installing and using IBM Installation Manager, see the following IBMKnowledge Center: http://www-01.ibm.com/support/knowledgecenter/SSDV2W/im_family_welcome.html
PrerequisitesBefore you install Event Analytics you must complete the following preinstallation tasks.
Event ArchivingYou must be running a database with archived events. Event Analytics supports the Db2 and Oracledatabases. Event Analytics support of MS SQL requires a minimum of IBM Tivoli Netcool/Impact 7.1.0.1.
You can use a gateway to archive events to a database. In reporting mode, the gateway archives events toa target database. For more information, see http://www.ibm.com/support/knowledgecenter/SSSHTQ/omnibus/gateways/jdbcgw/wip/concept/jdbcgw_intro.html .
Note: The gateway can operate in two modes: audit mode and reporting mode. Event Analytics onlysupports reporting mode.
Browser RequirementsTo display the Seasonal Event Graphs in Microsoft Internet Explorer, you must install the MicrosoftSilverlight plug-in.
Reduced MemoryIf you are not running Event Analytics on Solaris, remove the comment from or add the following entry inthe jvm.options file:
#-Xgc:classUnloadingKickoffThreshold=100
Removing the comment from or adding that entry dynamically reduces memory requirements.
Netcool/Impact installation componentsSelect the components of Netcool/Impact that you want to install.
If you purchased IBM Netcool Operations Insight the Impact Server Extensions component is displayed inthe list and is selected automatically. This component contains extra Impact Server features that workwith IBM Netcool Operations Insight.
If you accept the default selection, both the GUI Server and the Impact Server are installed on the samecomputer. In a production environment, install the Impact Server and the GUI Server on separatecomputers. So, for example, if you already installed the Impact Server on another computer, you canchoose to install the GUI Server alone.
The component Installation Manager is selected automatically on the system that is not already installedwith Installation Manager.
62 IBM Netcool Operations Insight: Integration Guide

Netcool/Impact does not support Arabic or Hebrew, therefore Event Analytics users, who are working inArabic or Hebrew, see some English text.
Installing Event Analytics (GUI)You can install Event Analytics with the IBM Installation Manager GUI.
Before you begin• Determine which Installation Manager user mode you require.• Ensure that the necessary user permissions are in place for your intended installation directories.• Configure localhost on the computer where Event Analytics packages are to be installed.
About this taskThe installation of Event Analytics requires you to install product packages for the following productgroups:
• IBM Tivoli Netcool/Impact• IBM Tivoli Netcool/OMNIbus• IBM Netcool.
The steps for starting Installation Manager are different depending on which user mode you installed it in.The steps for completing the Event Analytics installation with the Installation Manager wizard arecommon to all user modes and operating systems.
Installation Manager takes account of your current umask settings when it sets the permissions mode ofthe files and directories that it installs. If you use Administrator mode or Non-administrator mode andyour umask is 0, Installation Manager uses a umask of 22. If you use Group mode, Installation Managerignores any group bits that are set and uses a umask of 2 if the resulting value is 0.
To install the packages and features, complete the following steps.
Procedure1. Start Installation Manager. Change to the /eclipse subdirectory of the Installation Manager
installation directory and use the following command to start Installation Manager:
./IBMIM
To record the installation steps in a response file for use with silent installations on other computers,use the -record response_file option. For example:
./IBMIM -record /tmp/install_1.xml
2. Configure Installation Manager to point to either a local repository or an IBM Passport Advantagerepository, where the download packages are available. Within the IBM Knowledge Center content forInstallation Manager, see the topic that is called Installing packages by using wizard mode.
3. In the main Installation Manager window, click Install and follow the installation wizard instructions tocomplete the installation.
4. In the Install tab select the following installation packages, and then click Next.
• Packages for IBM Tivoli Netcool/Impact:
IBM Tivoli Netcool/Impact GUI Server_7.1.0.20IBM Tivoli Netcool/Impact Server_7.1.0.20IBM Tivoli Netcool/Impact Server Extensions for Netcool Operations Insight_7.1.0.20
• Packages for IBM Tivoli Netcool/OMNIbus:
IBM Tivoli Netcool/OMNIbus_8.1.0.24• Packages for IBM Tivoli Netcool/OMNIbus Web GUI:
Chapter 4. Installing Netcool Operations Insight 63
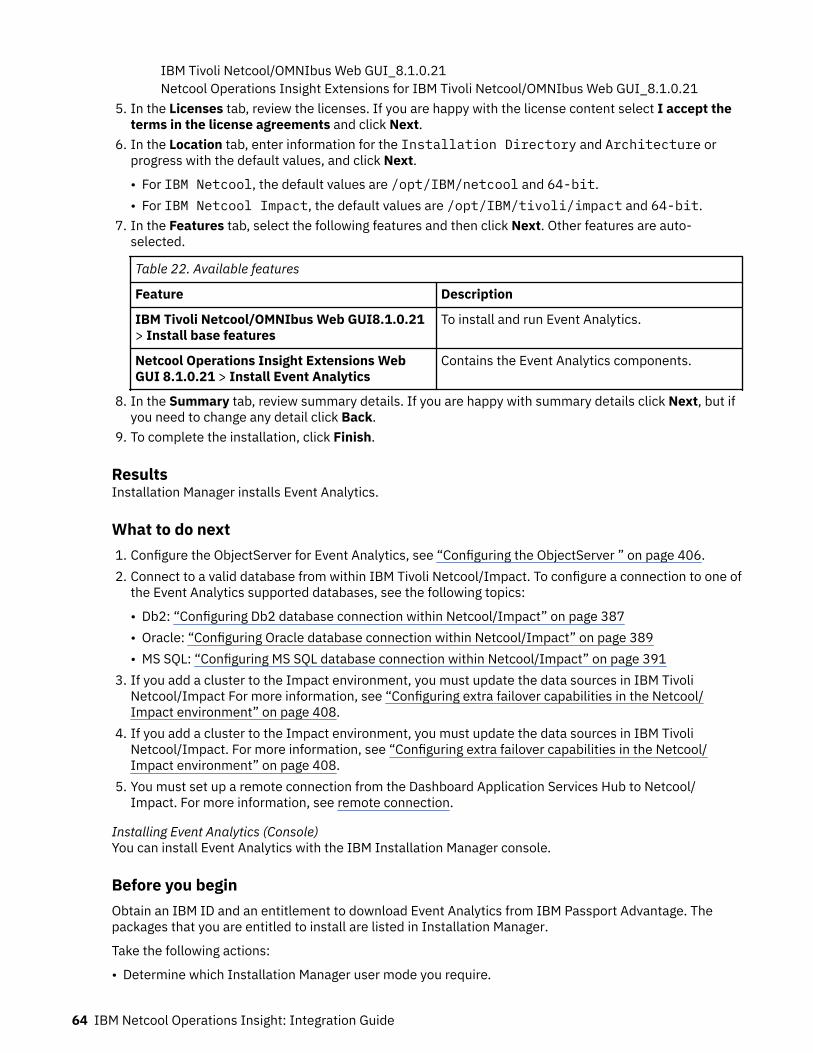
IBM Tivoli Netcool/OMNIbus Web GUI_8.1.0.21Netcool Operations Insight Extensions for IBM Tivoli Netcool/OMNIbus Web GUI_8.1.0.21
5. In the Licenses tab, review the licenses. If you are happy with the license content select I accept theterms in the license agreements and click Next.
6. In the Location tab, enter information for the Installation Directory and Architecture orprogress with the default values, and click Next.
• For IBM Netcool, the default values are /opt/IBM/netcool and 64-bit.• For IBM Netcool Impact, the default values are /opt/IBM/tivoli/impact and 64-bit.
7. In the Features tab, select the following features and then click Next. Other features are auto-selected.
Table 22. Available features
Feature Description
IBM Tivoli Netcool/OMNIbus Web GUI8.1.0.21> Install base features
To install and run Event Analytics.
Netcool Operations Insight Extensions WebGUI 8.1.0.21 > Install Event Analytics
Contains the Event Analytics components.
8. In the Summary tab, review summary details. If you are happy with summary details click Next, but ifyou need to change any detail click Back.
9. To complete the installation, click Finish.
ResultsInstallation Manager installs Event Analytics.
What to do next1. Configure the ObjectServer for Event Analytics, see “Configuring the ObjectServer ” on page 406.2. Connect to a valid database from within IBM Tivoli Netcool/Impact. To configure a connection to one of
the Event Analytics supported databases, see the following topics:
• Db2: “Configuring Db2 database connection within Netcool/Impact” on page 387• Oracle: “Configuring Oracle database connection within Netcool/Impact” on page 389• MS SQL: “Configuring MS SQL database connection within Netcool/Impact” on page 391
3. If you add a cluster to the Impact environment, you must update the data sources in IBM TivoliNetcool/Impact For more information, see “Configuring extra failover capabilities in the Netcool/Impact environment” on page 408.
4. If you add a cluster to the Impact environment, you must update the data sources in IBM TivoliNetcool/Impact. For more information, see “Configuring extra failover capabilities in the Netcool/Impact environment” on page 408.
5. You must set up a remote connection from the Dashboard Application Services Hub to Netcool/Impact. For more information, see remote connection.
Installing Event Analytics (Console)You can install Event Analytics with the IBM Installation Manager console.
Before you beginObtain an IBM ID and an entitlement to download Event Analytics from IBM Passport Advantage. Thepackages that you are entitled to install are listed in Installation Manager.
Take the following actions:
• Determine which Installation Manager user mode you require.
64 IBM Netcool Operations Insight: Integration Guide
• Ensure that the necessary user permissions are in place for the installation directories.• Decide which features that you want to install from the installation packages and gather the information
that is required for those features.• Configure localhost on the computer where Event Analytics is to be installed.
About this taskThe steps for starting Installation Manager are different depending on which user mode you installed it in.The steps for completing the Event Analytics installation with the Installation Manager console arecommon to all user modes and operating systems.
Installation Manager takes account of your current umask settings when it sets the permissions mode ofthe files and directories that it installs. If you use Administrator mode or Non-administrator mode andyour umask is 0, Installation Manager uses a umask of 22. If you use Group mode, Installation Managerignores any group bits that are set and uses a umask of 2 if the resulting value is 0.
Procedure1. Change to the /eclipse/tools subdirectory of the Installation Manager installation directory.2. Use the following command to start Installation Manager:
• ./imcl -c OR ./imcl -consoleMode3. Configure Installation Manager to download package repositories from IBM Passport Advantage:
a) From the Main Menu, select Preferences.b) In the Preferences menu, select Passport Advantage.c) In the Passport Advantage menu, select Connect to Passport Advantage.d) When prompted, enter your IBM ID user name and password.e) Return to the Main Menu.
4. From the options that are provided on the installer, add the repository that you want to install.5. From the Main Menu, select Install.
Follow the installer instructions to complete the installation. The installer requires the following inputsat different stages of the installation:
• Select Event Analytics• When prompted, enter an Installation Manager shared directory or accept the default directory.• When prompted, enter an installation directory or accept the default directory.• Clear the features that you do not require.• If required, generate a response file for use with silent installations on other computers. Enter the
directory path and a file name with a .xml extension. The response file is generated beforeinstallation completes.
6. When the installation is complete, select Finish.
ResultsInstallation Manager installs Event Analytics.
What to do nextIf you add a cluster to the Impact environment, you must update the data sources in IBM Tivoli Netcool/Impact 7.1. For more information, see “Configuring extra failover capabilities in the Netcool/Impactenvironment” on page 408.
Chapter 4. Installing Netcool Operations Insight 65
Silently installing Event AnalyticsYou can install Event Analytics silently with IBM Installation Manager. This installation method is useful ifyou want identical installation configurations on multiple workstations. Silent installation requires aresponse file that defines the installation configuration.
Before you beginTake the following actions:
• Create or record an Installation Manager response file.
You can specify a local or remote IBM Tivoli Netcool/OMNIbus package and a Netcool OperationsInsight Extensions Web GUI package with a repository in the response file. You can also specify thatInstallation Manager downloads the packages from IBM Passport Advantage. For more informationabout specifying authenticated repositories in response files, search for the Storing credentials topic inthe Installation Manager information center:
http://www-01.ibm.com/support/knowledgecenter/SSDV2W/im_family_welcome.html
A default response file is included in the Event Analytics installation package in responsefiles/platform, where platform can be unix or windows.
When you record a response file, you can use the -skipInstall argument to create a response file foran installation process without performing the installation. For example:
– Create or record a skipInstall:
IBMIM.exe -record C:\response_files\install_1.xml -skipInstall C:\Temp\skipInstall
• Determine which Installation Manager user mode you require.• Read the license agreement. The license agreement file, license.txt, is stored in the /native/license_version.zip archive, which is contained in the installation package.
• Ensure that the necessary user permissions are in place for your intended installation directories.• Configure localhost on the computer where Event Analytics is to be installed.
Procedure1. Change to the /eclipse/tools subdirectory of the Installation Manager installation directory.2. To encrypt the password that is used by the administrative user for the initial log-in to Dashboard
Application Services Hub, run the following command:
• ./imutilsc encryptString password
Where password is the password to be encrypted.3. To install Event Analytics, run the following command:
• ./imcl -input response_file -silent -log /tmp/install_log.xml -acceptLicense
Where response_file is the directory path to the response file.
ResultsInstallation Manager installs Event Analytics.
What to do nextIf you add a cluster to the Impact environment, you must update the data sources in IBM Tivoli Netcool/Impact 7.1. For more information, see “Configuring extra failover capabilities in the Netcool/Impactenvironment” on page 408.
66 IBM Netcool Operations Insight: Integration Guide
Post-installation tasksYou must perform these tasks following installation of Event Analytics.
Ensuring sufficient SQL connections on Derby data sourcesTo ensure smooth running of Event Analytics, ensure you have sufficient SQL connections on the fourDerby data sources. Do this by increasing the maximum number of SQL connections for each data source.
About this taskTo avoid running out of SQL connections for the Derby database and resultant slowing down of GUIresponse, increase the maximum number of SQL connections on the four Derby data sources from 5 to50.
The four Derby data sources are the following:
• ImpactDB• NOIReportDataSource• RelatedEventsDataSourceseasonality• ReportDataSource
For information on how to increase the maximum number of SQL connections on these data sources, seethe Netcool/Impact topic at the bottom of the page.
Avoiding stack overflow errors on Derby data sourcesIn order to avoid stack overflow errors on the four Derby data sources, lower the trace level.
Before you beginBefore you begin this task, perform the following activities:
• Ensure that the IMPACT_HOME environment variable is correctly set.• Ensure that you know the name of the Netcool/Impact server. If you have a clustered Netcool/Impact
server environment, ensure that you know the name of the primary server.
About this taskYou are modifying backend settings for the four Derby data sources.
The four Derby data sources are the following:
• ImpactDB• NOIReportDataSource• RelatedEventsDataSourceseasonality• ReportDataSource
In a clustered Netcool/Impact server environment, make these changes on the primary server only. Thereis no need to make the changes on every server. Changes will be automatically replicated to non-primarymembers of the cluster.
Procedure1. Access the command line of the Netcool/Impact server.2. Update the trace settings for the ImpactDB Derby data source.
a) Edit the following file: $IMPACT_HOME/etc/servername_ImpactDB.ds
Where servername is the name of the Netcool/Impact server. In a clustered Netcool/Impactserver environment, servername is the name of the primary server.
b) Add the following lines to the file:
Chapter 4. Installing Netcool Operations Insight 67
ImpactDB.Derby.DSPROPERTY.1.NAME=traceLevelImpactDB.Derby.DSPROPERTY.1.VALUE=0ImpactDB.Derby.NUMDSPROPERTIES=1
c) Save and close the file.3. Update the trace settings for the NOIReportDataSource Derby data source.
a) Edit the following file: $IMPACT_HOME/etc/servername_NOIReportDataSource.ds
Where servername is the name of the Netcool/Impact server. In a clustered Netcool/Impactserver environment, servername is the name of the primary server.
b) Add the following lines to the file:
ImpactDB.Derby.DSPROPERTY.1.NAME=traceLevelImpactDB.Derby.DSPROPERTY.1.VALUE=0ImpactDB.Derby.NUMDSPROPERTIES=1
c) Save and close the file.4. Update the trace settings for the RelatedEventsDataSourceseasonality Derby data source.
a) Edit the following file: $IMPACT_HOME/etc/servername_RelatedEventsDataSourceseasonality.ds
Where servername is the name of the Netcool/Impact server. In a clustered Netcool/Impactserver environment, servername is the name of the primary server.
b) Add the following lines to the file:
ImpactDB.Derby.DSPROPERTY.1.NAME=traceLevelImpactDB.Derby.DSPROPERTY.1.VALUE=0ImpactDB.Derby.NUMDSPROPERTIES=1
c) Save and close the file.5. Update the trace settings for the ReportDataSource Derby data source.
a) Edit the following file: $IMPACT_HOME/etc/servername_ReportDataSource.ds
Where servername is the name of the Netcool/Impact server. In a clustered Netcool/Impactserver environment, servername is the name of the primary server.
b) Add the following lines to the file:
ImpactDB.Derby.DSPROPERTY.1.NAME=traceLevelImpactDB.Derby.DSPROPERTY.1.VALUE=0ImpactDB.Derby.NUMDSPROPERTIES=1
c) Save and close the file.6. Restart the Netcool/Impact server. In a clustered Netcool/Impact server environment, restart all of the
servers in the cluster.
Managing event regroupingOne of the key features of Event Analytics is the ability to correlate events together, either based onregular occurrence of the events closely together in time (related events grouping) or based on patternanalysis, and to present these events to the operators in the Event Viewer as an event group. If theparent event within this event group is deleted for any reason, then by default all of the children eventsbecome ungrouped. Follow the instructions in this topic to ensure that the events are automaticallyregrouped
About this taskNetcool/Impact includes a policy activator service called LookForPatternOrphans. The associatedpolicy regularly checks to see if any event group parent events have been deleted. If it finds that this hasoccurred, it identifies the orphan events and determines which of these events is the next most importantevent. It then proceeds to group these events under that next most important event.
68 IBM Netcool Operations Insight: Integration Guide
To ensure that the LookForPatternOrphans policy activator service picks the most important childevent as the new parent in the case of where the two-minute pattern time window has passed and theoriginal parent event has been cleared, you must select a field in the in the ObjectServer alerts.statustable to store the pattern name for each event. If this is done, then the LookForPatternOrphans policyactivator service will always pick the most important child event.
Procedure1. Select a field in the in the ObjectServer alerts.status table to store the pattern name for each
event. Then, perform the following steps:a) Export the configuration using the command in step 1 of “Exporting the Event Analytics
configuration” on page 383.b) Modify the exported configuration by adding the following line to the configuration file:
pattern_name_field=name_of_selected_field
Where name_of_selected_field is the name of the field in the in the ObjectServeralerts.status table you selected to store the pattern name for each event
c) Import the configuration using the command in step 2 of “Exporting the Event Analyticsconfiguration” on page 383.
2. Activate the LookForPatternOrphans policy activator service.a) Log into the Netcool/Impact UI.b) Click Services.c) Click LookForPatternOrphans from the list of services on the left.d) Click Starts automatically when server starts.
e) Click Save .
Installing the Tivoli Netcool/OMNIbus Insight PackThis topic explains how to install the Netcool/OMNIbus Insight Pack into the Operations Analytics - LogAnalysis product. Operations Analytics - Log Analysis can be running while you install the Insight Pack.This Insight Pack ingests event data into Operations Analytics - Log Analysis and installs custom apps.
Before you begin• Install the Operations Analytics - Log Analysis product. The Insight Pack cannot be installed without the
Operations Analytics - Log Analysis product.• Download the relevant Insight Pack installation package from IBM Passport Advantage, ensuring that
the downloaded version is compatible with the installed versions of Netcool Operations Insight andOperations Analytics - Log Analysis.
• Install Python 2.6 or later with the simplejson library, which is required by the Custom Apps that areincluded in Insight Packs.
Procedure1. Create a new OMNIbus directory under $UNITY_HOME/unity_content.2. Copy the Netcool/OMNIbus Insight Pack installation package to $UNITY_HOME/unity_content/OMNIbus.
3. Unpack and install the Insight Pack, using the following command as an example:
$UNITY_HOME/utilities/pkg_mgmt.sh -install $UNITY_HOME/unity_content/OMNIbus/OMNIbusInsightPack_v1.3.0.2.zip
4. On the Operations Analytics - Log Analysis UI, use the Data Source Wizard to create a data source intowhich the event data is ingested.
Chapter 4. Installing Netcool Operations Insight 69
The "omnibus1100" data source can ingest data for both the Tivoli Netcool/OMNIbus Insight Pack andthe Network Manager Insight Pack.a) In the Select Location panel, select Custom and type the Netcool/OMNIbus server host name.
Enter the same host name that was used for the JsonMsgHostname transport property of theGateway for Message Bus.
b) In the Select Data panel, enter the following field values:
Field Value
File path NCOMS. This is the default value of the jsonMsgPath transport property of theGateway for Message Bus. If you changed this value from the default, change thevalue of the File path field accordingly.
Type This is the name of the data source type on which this data source is based.
• To use the default data source type, specify OMNIbus1100.• To use a customized data source type, specify the name of the customized data
source type; for example: customOMNIbus
Collection OMNIbus1100-Collection
c) In the Set Attributes panel, enter the following field values:
Field Value
Name omnibus. Ensure that the value that you type is the same as the value of thescala.datasource property in the Web GUI server.init file. If the Name fieldhas a value other than omnibus, use the same value for the scala.datasourceproperty.
Group Leave this field blank.
Description Type a description of your choice.
ResultsThe Insight Pack is installed to the directory specified in step 3. After the installation is completed, theRule Set, Source Type, and Collection required for working with Netcool/OMNIbus events is in place. Youcan view these resources in the Administrative Settings page of the Operations Analytics - Log AnalysisUI.
What to do next• Use the pkg_mgmt command to verify the installations of the Insight Pack. See Verifying the Tivoli
Netcool/OMNIbus Insight Pack.• If you have several ObjectServers, use separate instances of the Gateway for Message Bus to connect to
each ObjectServer. The best practice is for each gateway to send events to a single data source. Formore information about configuring the gateway to send events to Operations Analytics - Log Analysis,see the Gateway for Message Bus documentation at https://ibm.biz/BdEQaD and search forIntegrating with Operations Analytics - Log Analysis.
Related conceptsData Source creation in Operations Analytics - Log Analysis V1.3.5Data Source creation in Operations Analytics - Log Analysis V1.3.3Related tasksInstalling the Tivoli Netcool/OMNIbus Insight Pack
70 IBM Netcool Operations Insight: Integration Guide
This topic explains how to install the Netcool/OMNIbus Insight Pack into the Operations Analytics - LogAnalysis product. Operations Analytics - Log Analysis can be running while you install the Insight Pack.This Insight Pack ingests event data into Operations Analytics - Log Analysis and installs custom apps.Installing the Network Manager Insight PackThis topic explains how to install the Network Manager Insight Pack into the Operations Analytics - LogAnalysis product and make the necessary configurations. The Network Manager Insight Pack is requiredonly if you deploy the Networks for Operations Insight feature and want to use the topology searchcapability. For more information, see “Network Manager Insight Pack” on page 449. Operations Analytics- Log Analysis can be running while you install the Insight Pack.Related informationGateway for Message Bus documentation
Installing Network ManagementThis installation scenario describes how to set up the Networks for Operations Insight feature in theNetcool Operations Insight solution. A sample system topology is given on which the installation tasks arebased. It is assumed that the core products of the Netcool Operations Insight solution are alreadyinstalled and running.
Networks for Operations Insight is an optional feature that integrates network management products withthe products of the base Netcool Operations Insight solution. The Networks for Operations Insight featureincludes Network Manager IP Edition and Netcool Configuration Manager. Deploying these productsdepends on your environment and the size and complexity of your network. For guidance on deploymentoptions, see guidance provided in the respective product documentation:
• Network Manager IP Edition: https://www.ibm.com/support/knowledgecenter/SSSHRK_4.2.0/install/concept/ovr_deploymentofitnm.html
• Netcool Configuration Manager: https://www.ibm.com/support/knowledgecenter/SS7UH9_6.4.2/ncm/wip/planning/concept/ncm_plan_planninginstallation.html
The information supplied in this scenario is high-level and covers the most salient points and possibleissues you might encounter that are specific to the Networks for Operations Insight feature in the NetcoolOperations Insight solution. This scenario is end-to-end and you should perform the tasks in the specifiedorder.
For more information, see the Related concept, task, and information links at the bottom of this topic.
Before you begin• Install the components of Netcool Operations Insight as described in “On-premises components” on
page 17. The Networks for Operations Insight solution requires that the following products are installed,configured, and running as follows:
– The Tivoli Netcool/OMNIbus V8.1 server components are installed and an ObjectServer is createdand running. Ensure that the administrator user of the ObjectServer was changed from the default.
– The Tivoli Netcool/OMNIbus V8.1 Web GUI is installed and running in an instance of DashboardApplication Services Hub. The ObjectServer is defined as the Web GUI data source.
– An IBM Db2 database is installed and configured for event archiving, and the Gateway for JDBC isinstalled and configured to transfer and synchronize the events from the ObjectServer.
– IBM Operations Analytics - Log Analysis is installed and running, and configured so that events areforwarded from Tivoli Netcool/OMNIbus to Operations Analytics - Log Analysis via the Gateway forMessage Bus. See “Configuring integration with Operations Analytics - Log Analysis” on page 417.
• Obtain the following information about the ObjectServer:
– Host name and port number– Installation directory (that is, the value of the $OMNIHOME environment variable)– Name, for example, NCOMS
Chapter 4. Installing Netcool Operations Insight 71
– Administrator password• Install and configure the event search and event seasonality features.
If any of the above products are not installed, or features not configured, they must be configured beforeyou can set up the Networks for Operations Insight feature.
About this taskThis task and the sub-tasks describe the scenario of a fresh deployment of the products in the Networksfor Operations Insight feature. The system topology is a logical sample. It is not the only system topologythat can be used. It is intended for reference and to help you plan your deployment. The system topologyis as follows:
• Tivoli Netcool/OMNIbus and Network Manager are installed on separate hosts (that is, a distributedinstallation). The version of Tivoli Netcool/OMNIbus is 8.1.
• The ObjectServer is configured to be the user repository for the products.
Note: All the products of the Netcool Operations Insight solution also support the use of an LDAPdirectory as the user repository.
• Network Manager and Netcool Configuration Manager both use the V8.1 ObjectServer to store andmanage events.
• In this topology, the default Db2 v10.5 Enterprise Server Edition database is used.
Related conceptsNetwork Management data flowUse this information to understand how event data is retrieved from a monitored application environmentand transferred between the products and components of Network Management to provide TopologySearch, Network Health Dashboard and Device Dashboard capabilities.Related referenceSupported products for Networks for Operations InsightRelease notesIBM Netcool Operations Insight V1.6.3 is available. Compatibility, installation, and other getting-startedissues are addressed in these release notes.
Installing the Probe for SNMP and Syslog ProbeThe Networks for Operations Insight feature requires the Probe for SNMP and the Syslog Probe. It isimportant that you install the probes that are included in the entitlement for the Tivoli Netcool/OMNIbusV8.1 product. Although the probes are also available in the Network Manager IP Edition entitlement, donot install them from Network Manager IP Edition. The instances of the probes that are available withTivoli Netcool/OMNIbus V8.1 are installed by IBM Installation Manager.
Procedure1. Change to the /eclipse/tools subdirectory of the Installation Manager installation directory and
run the following command to start Installation Manager:
./IBMIM
To record the installation steps in a response file for use with silent installations on other computers,use the -record option. For example, to record to the /tmp/install_1.xml file:
./IBMIM -record /tmp/install_1.xml
2. Configure Installation Manager to download package repositories from IBM Passport Advantage.3. In the main Installation Manager pane, click Install and follow the installation wizard instructions to
complete the installation.The installer requires the following inputs at different stages of the installation:
72 IBM Netcool Operations Insight: Integration Guide

• If prompted, enter your IBM ID user name and password.• Read and accept the license agreement.• Specify an Installation Manager shared directory or accept the default directory.
Select the nco-p-syslog feature for the Syslog Probe, and select the nco-p-mttrapd feature forthe Probe for SNMP.After the installation completes, click Finish.
ResultsIf the installation is successful, Installation Manager displays a success message and the installationhistory is updated to record the successful installation. If not, you can use Installation Manager touninstall or modify the installation.
What to do nextEnsure that both probes are configured:
• For more information about configuring the Probe for SNMP, see the Tivoli Netcool/OMNIbusKnowledgeCenter, http://www-01.ibm.com/support/knowledgecenter/SSSHTQ/omnibus/probes/snmp/wip/reference/snmp_config.html .
• For more information about configuring the Syslog Probe, see see the Tivoli Netcool/OMNIbusKnowledge Center http://www-01.ibm.com/support/knowledgecenter/SSSHTQ/omnibus/probes/syslog/wip/concept/syslog_intro.html .
Related tasksNetcool/OMNIbus V8.1 documentation: Obtaining IBM Installation Manager You can install IBMInstallation Manager with a GUI or console, or do a silent installation. Before installation, you mustdetermine which user mode you require.Installing Tivoli Netcool/OMNIbus V8.1Related referenceTivoli Netcool/OMNIbus V8.1 installable features
Optional: Preparing the ObjectServer for integration with Network ManagerIf you have already installed Tivoli Netcool/OMNIbus, the Netcool/OMNIbus Knowledge Library, and theProbe for SNMP, you can now install Network Manager, and do not need to follow the steps in this task.The Network Manager installer configures Tivoli Netcool/OMNIbus for you during the installation process.If the ObjectServer setup changes after you have already installed and configured Network Manager andTivoli Netcool/OMNIbus, then you must reintegrate the ObjectServer with Network Manager as describedin this topic.
To reintegrate the Network Manager product with the existing Tivoli Netcool/OMNIbus V8.1 ObjectServer,run the ConfigOMNI script against the ObjectServer.
Procedure1. Use the ConfigOMNI script to configure an ObjectServer to run with Network Manager.
The script creates the Network Manager triggers and GUI account information. If the ObjectServer ison a remote server, then copy the $NCHOME/precision/install/scripts/ConfigOMNI scriptand the support script $NCHOME/precision/scripts/create_itnm_triggers.sql and putthem into the same directory on the remote ObjectServer. If the ObjectServer is local to NetworkManager, then you can use both scripts as is.
2. On the ObjectServer host, change to the scripts directory and run the ConfigOMNI script.
For example, the following configures the ObjectServer called NCOMS2 using the administrativepassword NC0M5password, or creates the ObjectServer called NCOMS2 if it does not exist, in the
Chapter 4. Installing Netcool Operations Insight 73
specified directory (OMNIHOME), and creates or modifies the itnmadmin and itnmuser users in theObjectServer.
./ConfigOMNI -o NCOMS2 -p NC0M5password -h /opt/ibm/tivoli/netcool -u ITNMpassword
3. You might also need to update the Network Manager core settings and the Web GUI data sourcesettings. For more information, see the Network Manager Knowledge Center https://www.ibm.com/support/knowledgecenter/SSSHRK_4.2.0/install/task/ins_installingandconfiguringomnibus.html .
Related tasksInstalling and configuring Tivoli Netcool/OMNIbus
Preparing the database for Network ManagerAfter a supported database has been installed, you must install and run the database scripts to configurethe topology database for use by Network Manager IP Edition. You must run the scripts before installingNetwork Manager IP Edition.
About this taskIf you downloaded the compressed software package from Passport Advantage, the database creationscripts are included at the top level of the uncompressed software file. Copy the scripts to the databaseserver and use them.
You can also install the Network Manager IP Edition topology database creation scripts using InstallationManager by selecting the Network Manager topology database creation scripts package. The databasescripts are installed by default in the precision/scripts/ directory in the installation directory (bydefault, /opt/IBM/netcool/core/precision/scripts/).
Procedure1. Log in to the server where you installed Db2.2. Change to the directory where your Db2 instance was installed and then change to the sqllib
subdirectory.3. Set up the environment by typing the following command:
Shell Command
Bourne . ./db2profile
C source db2cshrc
The Network Manager IP Edition application wrapper scripts automatically set up the Db2environment.
4. Locate the compressed database creation file db2_creation_scripts.tar.gz and copy it to theserver where Db2 is installed. Decompress the file.
5. Change to the precision/scripts/ directory and run the create_db2_database.sh script asthe Db2 administrative user for the instance (db2inst1):
./create_db2_database.sh database_name user_name -force
Where database_name is the name of the database, user_name is the Db2 user to use to connect tothe database, and -force an argument that forces any Db2 users off the instance before the databaseis created.
Important: The user_name must not be the administrative user. This user must be an existingoperating system and Db2 user.
For example, to create a Db2 database that is called ITNM for the Db2 user ncim, type:
./create_db2_database.sh ITNM ncim
74 IBM Netcool Operations Insight: Integration Guide

6. After you run create_db2_database.sh, restart the database as the Db2 administrative user asfollows: run db2stop and then run db2start.
7. When running the Network Manager IP Edition installer later on, make sure you select the option toconfigure an existing Db2 database. The Network Manager IP Edition installer can then create thetables in the database either on the local or a remote host, depending on where your database isinstalled.
The installer populates the connection properties in the following files, you can check these files forany problems with your connection to the database:
• The DbLogins.DOMAIN.cfg and MibDbLogin.cfg files in $NCHOME/etc/precision. Thesefiles are used by the Network Manager IP Edition core processes.
• The tnm.properties file in $NMGUI_HOME/profile/etc/tnm. These files are used by theNetwork Manager IP Edition GUI.
Installing Network Manager IP Edition and Netcool Configuration ManagerInstall Network Manager IP Edition and Netcool Configuration Manager to form the basis of the Networksfor Operations Insight feature.
Before you begin• Ensure you have installed and configured the base products and components of Netcool Operations
Insight, including Tivoli Netcool/OMNIbus, Netcool/Impact, and Operations Analytics - Log Analysis,and the associated components and configurations. See Supported products for Networks forOperations Insight.
• Obtain the following information about the ObjectServer:
– ObjectServer name, for example, NCOMS– Host name and port number– Administrator user ID– Administrator password
• Obtain the following information about your Db2 database:
– Database name– Host name and port number– Administrator user ID with permissions to create tables– Administrator user password
• Obtain the packages from IBM Passport Advantage. For information about the eAssembly numbers youneed for the packages, see http://www-01.ibm.com/support/docview.wss?uid=swg24043698 .
• Obtain the latest supported fix packs for Network Manager IP Edition and Netcool ConfigurationManager from IBM Fix Central, at http://www.ibm.com/support/fixcentral/ . For information on theproduct and component versions supported in the current version of Netcool Operations Insightincluding supported fix packs, see “On-premises components” on page 17.
• Ensure that a compatible version of Python is installed on this server before you start. On Linux,Network Manager IP Edition core components require version 2.6 or 2.7 of Python to be installed on theserver where the core components are installed. On AIX®, Network Manager IP Edition requires version2.7.5 of Python.
About this taskThese instructions describe the options that are presented in the Installation Manager in wizard mode.Other modes are also available with equivalent options.
Chapter 4. Installing Netcool Operations Insight 75

Procedure1. Start Installation Manager and install the following packages:
Package Description
NetworkManager CoreComponentsVersionV4.2.0.11
Installs the Network Manager IP Edition core components, sets up connection tothe specified ObjectServer, sets up connection to the database to be used for theNCIM topology and creates the tables (needs to be selected), creates NetworkManager IP Edition default users, sets up network domain, and configures thedetails for the poller aggregation.
For more information, see https://www.ibm.com/support/knowledgecenter/SSSHRK_4.2.0/install/task/ins_installingcorecomponents.html .
The Network Manager IP Edition core components can be installed on server 4 ofthe scenario described in Performing a fresh installation.
NetworkManager GUIComponentsVersionV4.2.0.11
Installs the Network Manager IP Edition GUI components, sets up connection tothe specified ObjectServer, sets up connection to the NCIM topology database,and sets up the default users.
For more information, see https://www.ibm.com/support/knowledgecenter/SSSHRK_4.2.0/install/task/ins_installingguicomponents.html .
The Network Manager IP Edition GUI components can be installed on server 3 ofthe scenario described in Performing a fresh installation. The GUI components ofother products in the solution, Netcool Configuration Manager, and ReportingServices would also be on this host.
Network HealthDashboardV4.2.0.11
Installs the Network Health Dashboard.
Installing the Network Health Dashboard installs the following roles, which allowusers to work with the Network Health Dashboard:
• ncp_networkhealth_dashboard• ncp_networkhealth_dashboard_admin• ncp_event_analytics
The new Network Health Dashboard is only available if you have NetworkManager as part of Netcool Operations Insight. The Network Health Dashboardmonitors a selected network view, and displays device and interface availabilitywithin that network view. It also reports on performance by presenting graphs,tables, and traces of KPI data for monitored devices and interfaces. A dashboardtimeline reports on device configuration changes and event counts, enabling you tocorrelate events with configuration changes. The dashboard includes the EventViewer, for more detailed event information.
Note: The Network Health Dashboard must be installed on the same host as theNetwork Manager IP Edition GUI components.
NetworkManagerReportsV4.2.0.11
Installs the reports provided by Network Manager IP Edition that you can use aspart of the Reporting Services feature.
Reporting Services requires a Db2 database to store its data. This database mustbe running during installation. If the database is installed on the same server asReporting Services, the installer configures the database during installation. If thedatabase is on a different server, you must configure the database before youinstall Reporting Services. In the scenario described in Performing a freshinstallation, where the Db2 database is on a different server, you must set up theremote Db2 database for Reporting Services as follows:
76 IBM Netcool Operations Insight: Integration Guide
Package Description
a. From the Jazz for Service Management package, copy theTCR_generate_content_store_db2_definition.sh script to the server where Db2 is installed.
b. Run the following command:
./TCR_generate_content_store_db2_definition.sh database_name db2_username
Where database_name is the name you want for the Reporting Servicesdatabase, and db2_username is the user name to connect to the content store,that is, the database owner (db2inst1).
c. Copy the generated SQL script to a temporary directory and run it against yourDb2 instance as the Db2 user (db2inst1), for example:
$ cp tcr_create_db2_cs.sql /tmp/tcr_create_db2_cs.sql$ su – db2inst1 –c "db2 -vtf /tmp/tcr_create_db2_cs.sql"
NetcoolConfigurationManagerV6.4.2.12
Installs the Netcool Configuration Manager components and loads the requireddatabase schema. For Server Installation Type, select Presentation Server andWorker Server to install both the GUI and worker servers.
For more information, see http://www-01.ibm.com/support/knowledgecenter/SS7UH9_6.4.2/ncm/wip/install/task/ncm_ins_installingncm.html .
The Netcool Configuration Manager components can be installed on server 3 of thescenario described in Performing a fresh installation.
For more information about fix pack 2, see http://www.ibm.com/support/knowledgecenter/SS7UH9_6.4.2/ncm/wip/relnotes/ncm_rn_6422.html .
ReportingServicesenvironment
Installs the reports provided by Netcool Configuration Manager (ITNCM-Reports)that you can use as part of the Reporting Services feature.
2. Apply the latest supported Network Manager IP Edition and Netcool Configuration Manager fix packs.For information on the product and component versions supported in the current version of NetcoolOperations Insight including supported fix packs, see “On-premises components” on page 17.
3. On the host where the Network Manager GUI components are installed, install the tools and menus tolaunch the custom apps of the Network Manager Insight Pack in the Operations Analytics - LogAnalysis GUI from the Network Views.a) In $NMGUI_HOME/profile/etc/tnm/topoviz.properties, set thetopoviz.unity.customappsui property, which defines the connection to Operations Analytics -Log Analysis.For example:
# Defines the LogAnalytics custom App launcher URL topoviz.unity.customappsui=https://server3:9987/Unity/CustomAppsUI
b) In the $NMGUI_HOME/profile/etc/tnm/menus/ncp_topoviz_device_menu.xml file, definethe Event Search menu item.Add the item <menu id="Event Search"/> in the file as shown:
<tool id="showConnectivityInformation"/> <separator/> <menu id="Event Search"/>
Chapter 4. Installing Netcool Operations Insight 77
4. Optional: Follow the steps to configure the integration between Network Manager IP Edition andNetcool Configuration Manager as described in “Configuring integration with Netcool ConfigurationManager” on page 78.
ResultsThe ports used by each installed product or component are displayed. The ports are also written to the$NCHOME/log/install/Configuration.log file.
What to do next• To set up the Device Dashboard for the network performance monitoring feature, see Installing the.• Search on IBM Fix Central for available interim fixes and apply them. See http://www.ibm.com/support/fixcentral/ .
Related referenceInstalling Network ManagerRelated informationInstalling Netcool Configuration ManagerV4.2 download document
Configuring integration with Netcool Configuration ManagerAfter installing the products, you can configure the integration between Network Manager and NetcoolConfiguration Manager.Related tasksInstalling Netcool Configuration ManagerRelated referenceNetcool Configuration Manager release notesInstallation information checklistRelated informationPreparing Db2 databases for Netcool Configuration Manager
User role requirementsCertain administrative user roles are required for the integration.
Note: For single sign-on information, see the related topic links.
DASH user rolesThe following DASH roles are required for access to the Netcool Configuration Manager components thatare launched from within DASH, such as the Netcool Configuration Manager Wizards and the NetcoolConfiguration Manager - Base and Netcool Configuration Manager - Compliance clients.
Either create a DASH user with the same name as an existing Netcool Configuration Manager user whoalready has the ‘IntellidenUser' role, or use an appropriate Network Manager user, such as itnmadmin,who is already set up as a DASH user. If you use the Network Manager user, create a corresponding newNetcool Configuration Manager user with the same name (password can differ), and assign the‘IntellidenUser' role to this new user.
Important: If a DASH user is being created on Network Manager with the same name as an existingNetcool Configuration Manager user. then they also need to be added to an appropriate Network Manageruser group, or alternatively be granted any required Network Manager roles manually.
Additionally, assign the following roles to your DASH user:
• ncp_rest_api• ncmConfigChange• ncmConfigSynch
78 IBM Netcool Operations Insight: Integration Guide
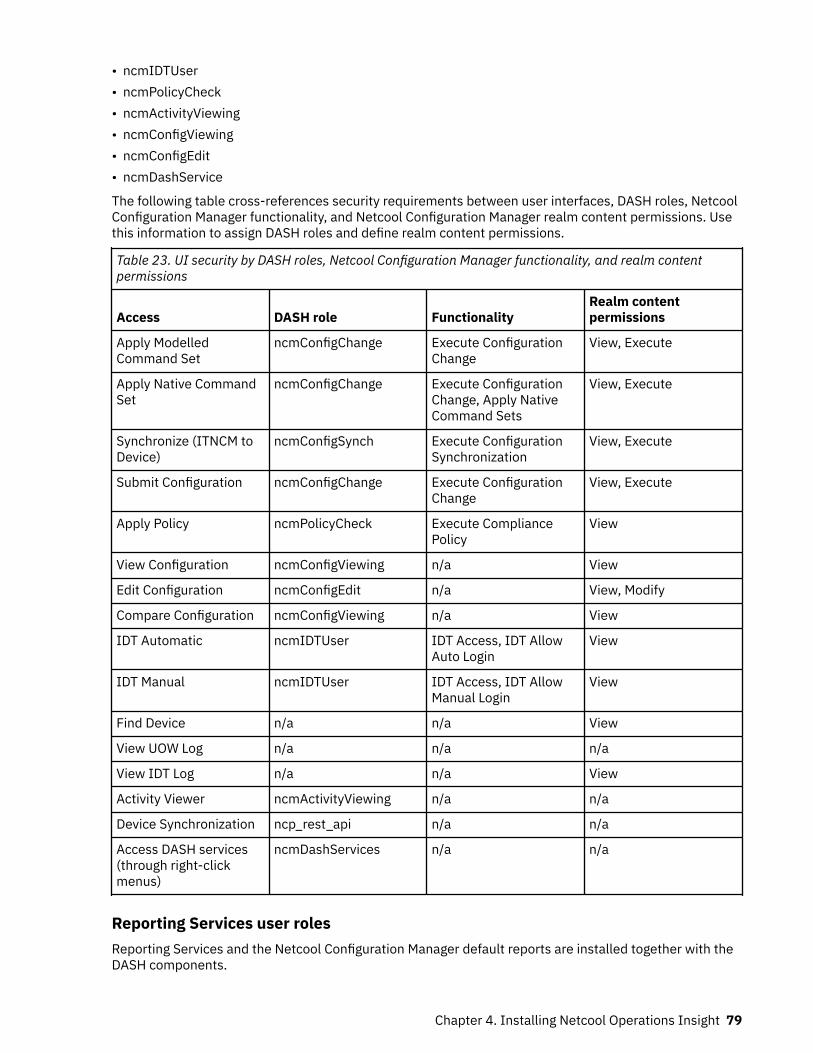
• ncmIDTUser• ncmPolicyCheck• ncmActivityViewing• ncmConfigViewing• ncmConfigEdit• ncmDashService
The following table cross-references security requirements between user interfaces, DASH roles, NetcoolConfiguration Manager functionality, and Netcool Configuration Manager realm content permissions. Usethis information to assign DASH roles and define realm content permissions.
Table 23. UI security by DASH roles, Netcool Configuration Manager functionality, and realm contentpermissions
Access DASH role FunctionalityRealm contentpermissions
Apply ModelledCommand Set
ncmConfigChange Execute ConfigurationChange
View, Execute
Apply Native CommandSet
ncmConfigChange Execute ConfigurationChange, Apply NativeCommand Sets
View, Execute
Synchronize (ITNCM toDevice)
ncmConfigSynch Execute ConfigurationSynchronization
View, Execute
Submit Configuration ncmConfigChange Execute ConfigurationChange
View, Execute
Apply Policy ncmPolicyCheck Execute CompliancePolicy
View
View Configuration ncmConfigViewing n/a View
Edit Configuration ncmConfigEdit n/a View, Modify
Compare Configuration ncmConfigViewing n/a View
IDT Automatic ncmIDTUser IDT Access, IDT AllowAuto Login
View
IDT Manual ncmIDTUser IDT Access, IDT AllowManual Login
View
Find Device n/a n/a View
View UOW Log n/a n/a n/a
View IDT Log n/a n/a View
Activity Viewer ncmActivityViewing n/a n/a
Device Synchronization ncp_rest_api n/a n/a
Access DASH services(through right-clickmenus)
ncmDashServices n/a n/a
Reporting Services user rolesReporting Services and the Netcool Configuration Manager default reports are installed together with theDASH components.
Chapter 4. Installing Netcool Operations Insight 79
Any user who needs to access reports requires the following permissions:
• The relevant Reporting Services roles for accessing the Reporting node in the DASH console. Assignthese roles to enable users to run reports to which they are authorized from the Reporting Services GUI.
• The authorization to access the report set, and the relevant Reporting Services roles for working withthe reports. Assign these permissions to enable users to run Netcool Configuration Manager reportsfrom Network Manager topology displays, the Active Event List, and the Reporting Services GUI.
For information about authorizing access to a report set and assigning roles by user or group, go to theIBMTivoli Systems Management Information Center at http://www-01.ibm.com/support/knowledgecenter/SS3HLM/welcome , locate the Reporting Services documentation node, and search forauthorization and user roles.
Other user rolesTo configure the Alerts menu in the Web GUI, the ncw_admin role is required.
Installing the Dashboard Application Services Hub componentsFor integrated scenarios, Netcool Configuration Manager provides the following Dashboard ApplicationServices Hub components: The Activity Viewer, the Dashboard Application Services Hub wizards, and theNetcool Configuration Manager thick-client launch portal.
Before you beginFrom Version 6.4.2 onwards, Netcool Configuration Manager reporting is no longer installed as part of theDashboard Application Services Hub components installation, but rather as part of the NetcoolConfiguration Manager main installation.
Important: Before installing the Dashboard Application Services Hub components, install NetcoolConfiguration Manager using the 'Integrated' option.
About this taskRestriction: The Netcool Configuration Manager Dashboard Application Services Hub components mustbe installed as the same user who installed Network Manager.
Procedure1. Log onto the Dashboard Application Services Hub server.2. Change to the /eclipse subdirectory of the Installation Manager Group installation directory and use
the following command to start Installation Manager:./IBMIMTo record the installation steps in a response file for use with silent installations on other computers,use the '-record response_file' option. For example:
IBMIM -record C:\response_files\install_1.xml
3. Configure Installation Manager to download package repositories from IBM Passport Advantage:a) From the main menu, choose File > Preferences.
You can set preferences for proxy servers in IBM Installation Manager. Proxy servers enableconnections to remote servers from behind a firewall.
b) In the Preferences window, expand the Internet node and select one of the following options:FTP Proxy
Select this option to specify a SOCKS proxy host address and a SOCKS proxy port number.HTTP Proxy
Select this option to enable an HTTP or SOCKS proxy.c) Select Enable proxy server.d) In the Preferences window, select the Passport Advantage panel.
80 IBM Netcool Operations Insight: Integration Guide
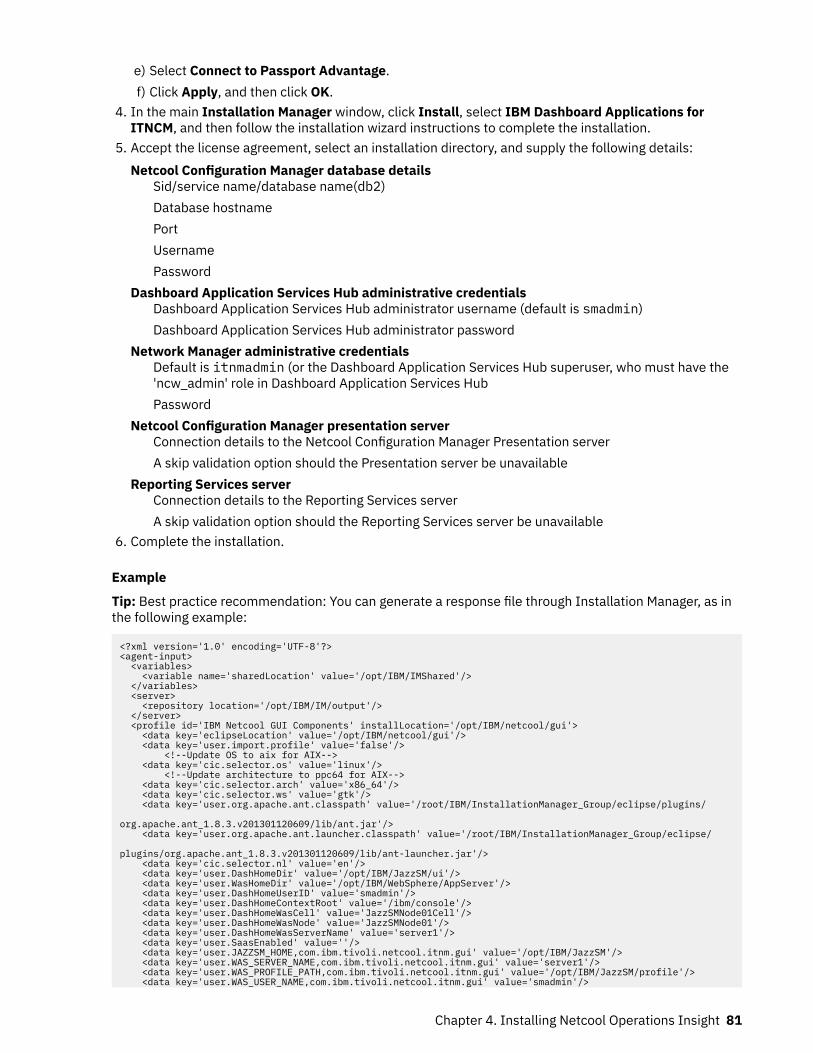
e) Select Connect to Passport Advantage.f) Click Apply, and then click OK.
4. In the main Installation Manager window, click Install, select IBM Dashboard Applications forITNCM, and then follow the installation wizard instructions to complete the installation.
5. Accept the license agreement, select an installation directory, and supply the following details:Netcool Configuration Manager database details
Sid/service name/database name(db2)Database hostnamePortUsernamePassword
Dashboard Application Services Hub administrative credentialsDashboard Application Services Hub administrator username (default is smadmin)Dashboard Application Services Hub administrator password
Network Manager administrative credentialsDefault is itnmadmin (or the Dashboard Application Services Hub superuser, who must have the'ncw_admin' role in Dashboard Application Services HubPassword
Netcool Configuration Manager presentation serverConnection details to the Netcool Configuration Manager Presentation serverA skip validation option should the Presentation server be unavailable
Reporting Services serverConnection details to the Reporting Services serverA skip validation option should the Reporting Services server be unavailable
6. Complete the installation.
Example
Tip: Best practice recommendation: You can generate a response file through Installation Manager, as inthe following example:
<?xml version='1.0' encoding='UTF-8'?><agent-input> <variables> <variable name='sharedLocation' value='/opt/IBM/IMShared'/> </variables> <server> <repository location='/opt/IBM/IM/output'/> </server> <profile id='IBM Netcool GUI Components' installLocation='/opt/IBM/netcool/gui'> <data key='eclipseLocation' value='/opt/IBM/netcool/gui'/> <data key='user.import.profile' value='false'/> <!--Update OS to aix for AIX--> <data key='cic.selector.os' value='linux'/> <!--Update architecture to ppc64 for AIX--> <data key='cic.selector.arch' value='x86_64'/> <data key='cic.selector.ws' value='gtk'/> <data key='user.org.apache.ant.classpath' value='/root/IBM/InstallationManager_Group/eclipse/plugins/
org.apache.ant_1.8.3.v201301120609/lib/ant.jar'/> <data key='user.org.apache.ant.launcher.classpath' value='/root/IBM/InstallationManager_Group/eclipse/
plugins/org.apache.ant_1.8.3.v201301120609/lib/ant-launcher.jar'/> <data key='cic.selector.nl' value='en'/> <data key='user.DashHomeDir' value='/opt/IBM/JazzSM/ui'/> <data key='user.WasHomeDir' value='/opt/IBM/WebSphere/AppServer'/> <data key='user.DashHomeUserID' value='smadmin'/> <data key='user.DashHomeContextRoot' value='/ibm/console'/> <data key='user.DashHomeWasCell' value='JazzSMNode01Cell'/> <data key='user.DashHomeWasNode' value='JazzSMNode01'/> <data key='user.DashHomeWasServerName' value='server1'/> <data key='user.SaasEnabled' value=''/> <data key='user.JAZZSM_HOME,com.ibm.tivoli.netcool.itnm.gui' value='/opt/IBM/JazzSM'/> <data key='user.WAS_SERVER_NAME,com.ibm.tivoli.netcool.itnm.gui' value='server1'/> <data key='user.WAS_PROFILE_PATH,com.ibm.tivoli.netcool.itnm.gui' value='/opt/IBM/JazzSM/profile'/> <data key='user.WAS_USER_NAME,com.ibm.tivoli.netcool.itnm.gui' value='smadmin'/>
Chapter 4. Installing Netcool Operations Insight 81
<data key='user.itnm.ObjectServerUsername,com.ibm.tivoli.netcool.itnm.gui' value='root'/> <data key='user.itnm.ObjectServer.skip.validation,com.ibm.tivoli.netcool.itnm.gui' value='false'/> <data key='user.itnm.ObjectServerHostname,com.ibm.tivoli.netcool.itnm.gui' value='NMGUIServerLocation'/> <data key='user.itnm.ObjectServerName,com.ibm.tivoli.netcool.itnm.gui' value='NCOMS'/> <data key='user.itnm.ObjectServer.create.instance,com.ibm.tivoli.netcool.itnm.gui' value='false'/> <data key='user.itnm.ObjectServerMainPort,com.ibm.tivoli.netcool.itnm.gui' value='4105'/> <data key='user.itnm.database.server.type,com.ibm.tivoli.netcool.itnm.gui' value='db2'/> <data key='user.itnm.database.skip.validation,com.ibm.tivoli.netcool.itnm.gui' value='false'/> <data key='user.itnm.database.name,com.ibm.tivoli.netcool.itnm.gui' value='NCIM'/> <data key='user.itnm.database.hostname,com.ibm.tivoli.netcool.itnm.gui' value='DatabaseServerLocation'/> <data key='user.itnm.database.username,com.ibm.tivoli.netcool.itnm.gui' value='db2inst1'/> <data key='user.itnm.database.create.tables,com.ibm.tivoli.netcool.itnm.gui' value='false'/> <data key='user.itnm.database.tables.prefix,com.ibm.tivoli.netcool.itnm.gui' value=''/> <data key='user.itnm.database.port,com.ibm.tivoli.netcool.itnm.gui' value='50001'/> <data key='user.WAS_USER_NAME' value='smadmin'/> <data key='user.itnm.ObjectServerItnmAdminUsername,com.ibm.tivoli.netcool.itnm.gui' value='itnmadmin'/> <data key='user.itnm.ObjectServerItnmAdminUsername' value='itnmadmin'/> <data key='user.itncm.database.port' value='1521'/> <data key='user.itncm.database.schema' value='itncm'/> <data key='user.itncm.database.type' value='ORACLE_12'/> <data key='user.itncm.database.username' value='DBUSER'/> <data key='user.itncm.database.hostname' value='DatabaseServerLocation'/> <data key='user.itncm.pres.server.port' value='16311'/> <data key='user.itncm.pres.server.hostname' value='PresentationServerLocation'/> <data key='user.itncm.pres.server.skip.conn.check' value='true'/> <data key='user.itncm.pres.server.scheme' value='https'/> <data key='user.itncm.reports.path' value='/tarf/servlet/dispatch'/> <data key='user.itncm.reports.skip.conn.check' value='true'/> <data key='user.itncm.reports.port' value='16311'/> <data key='user.itncm.reports.hostname' value='TCRServerLocation'/> <data key='user.itncm.reports.scheme' value='https'/> <data key='user.WAS_PASSWORD,com.ibm.tivoli.netcool.itnm.gui' value=''/> <data key='user.itnm.ObjectServerItnmUserPassword,com.ibm.tivoli.netcool.itnm.gui' value=''/> <data key='user.WAS_PASSWORD' value=''/> <data key='user.itnm.ObjectServerItnmUserPassword' value=''/> <data key='user.itncm.database.password' value=''/> </profile> <install modify='false'> <!-- IBM Dashboard Applications for ITNCM 6.4.2 --> <offering profile='IBM Netcool GUI Components' id='com.ibm.tivoli.netcool.itncm.ui.dash' version='6.4.2.20160202_1049' features='main.feature.activityviewer,main.feature.wizard' installFixes='none'/> </install> <preference name='com.ibm.cic.common.core.preferences.eclipseCache' value='${sharedLocation}'/> <preference name='com.ibm.cic.common.core.preferences.connectTimeout' value='30'/> <preference name='com.ibm.cic.common.core.preferences.readTimeout' value='45'/> <preference name='com.ibm.cic.common.core.preferences.downloadAutoRetryCount' value='0'/> <preference name='offering.service.repositories.areUsed' value='false'/> <preference name='com.ibm.cic.common.core.preferences.ssl.nonsecureMode' value='false'/> <preference name='com.ibm.cic.common.core.preferences.http.disablePreemptiveAuthentication' value='false'/> <preference name='http.ntlm.auth.kind' value='NTLM'/> <preference name='http.ntlm.auth.enableIntegrated.win32' value='true'/> <preference name='com.ibm.cic.common.core.preferences.preserveDownloadedArtifacts' value='true'/> <preference name='com.ibm.cic.common.core.preferences.keepFetchedFiles' value='false'/> <preference name='PassportAdvantageIsEnabled' value='false'/> <preference name='com.ibm.cic.common.core.preferences.searchForUpdates' value='false'/> <preference name='com.ibm.cic.agent.ui.displayInternalVersion' value='false'/> <preference name='com.ibm.cic.common.sharedUI.showErrorLog' value='true'/> <preference name='com.ibm.cic.common.sharedUI.showWarningLog' value='true'/> <preference name='com.ibm.cic.common.sharedUI.showNoteLog' value='true'/></agent-input>
What to do nextBefore you can access the Netcool Configuration Manager Dashboard Application Services Hubcomponents, you must set up the Netcool Configuration Manager Dashboard Application Services Hubusers and provide them with appropriate access permission.
Once users have been set up, you access the Netcool Configuration Manager Dashboard ApplicationServices Hub components, that is, the Activity Viewer, the Dashboard Application Services Hub wizards,and the thick-client launch portal in the following ways:
• You launch the stand-alone Netcool Configuration Manager UIs (sometimes referred to as the thick-client UIs), from the Dashboard Application Services Hub thick-client launch portal.
• You access the Activity Viewer, the Dashboard Application Services Hub wizards, and a subset of reportsin context from Network Manager and Tivoli Netcool/OMNIbus.
• You access the complete reports using the Dashboard Application Services Hub Reporting Services GUI.
82 IBM Netcool Operations Insight: Integration Guide
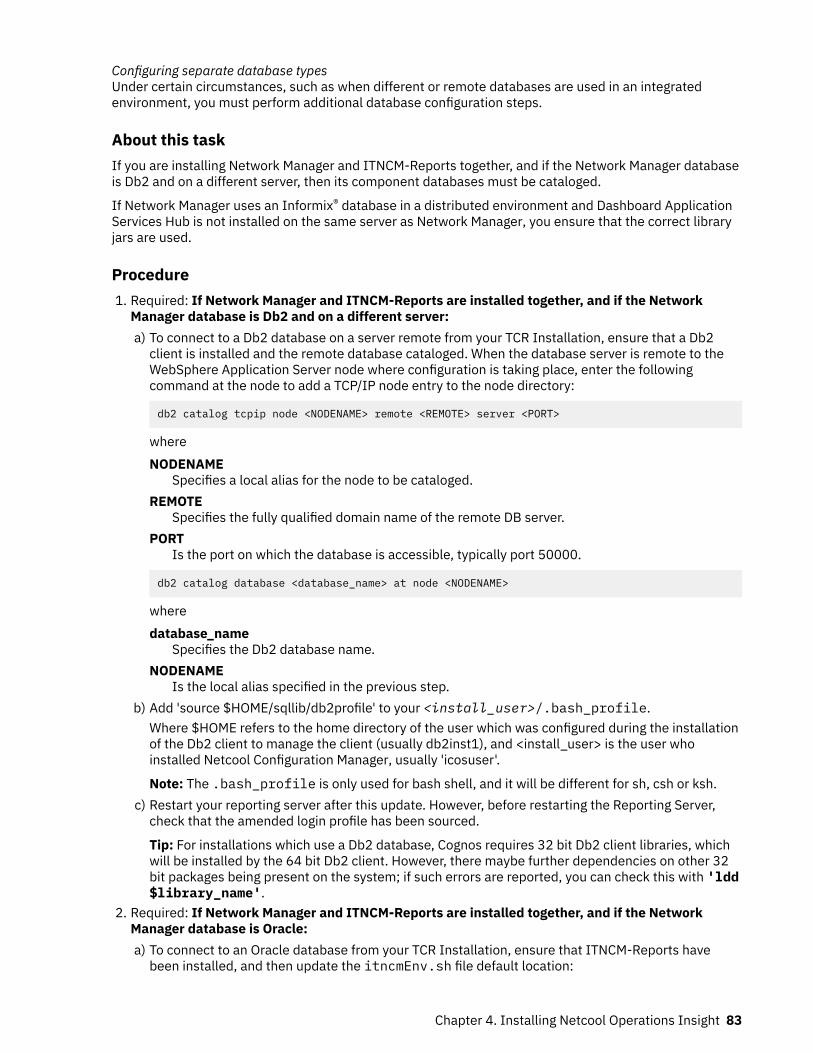
Configuring separate database typesUnder certain circumstances, such as when different or remote databases are used in an integratedenvironment, you must perform additional database configuration steps.
About this taskIf you are installing Network Manager and ITNCM-Reports together, and if the Network Manager databaseis Db2 and on a different server, then its component databases must be cataloged.
If Network Manager uses an Informix® database in a distributed environment and Dashboard ApplicationServices Hub is not installed on the same server as Network Manager, you ensure that the correct libraryjars are used.
Procedure1. Required: If Network Manager and ITNCM-Reports are installed together, and if the Network
Manager database is Db2 and on a different server:a) To connect to a Db2 database on a server remote from your TCR Installation, ensure that a Db2
client is installed and the remote database cataloged. When the database server is remote to theWebSphere Application Server node where configuration is taking place, enter the followingcommand at the node to add a TCP/IP node entry to the node directory:
db2 catalog tcpip node <NODENAME> remote <REMOTE> server <PORT>
whereNODENAME
Specifies a local alias for the node to be cataloged.REMOTE
Specifies the fully qualified domain name of the remote DB server.PORT
Is the port on which the database is accessible, typically port 50000.
db2 catalog database <database_name> at node <NODENAME>
wheredatabase_name
Specifies the Db2 database name.NODENAME
Is the local alias specified in the previous step.b) Add 'source $HOME/sqllib/db2profile' to your <install_user>/.bash_profile.
Where $HOME refers to the home directory of the user which was configured during the installationof the Db2 client to manage the client (usually db2inst1), and <install_user> is the user whoinstalled Netcool Configuration Manager, usually 'icosuser'.
Note: The .bash_profile is only used for bash shell, and it will be different for sh, csh or ksh.c) Restart your reporting server after this update. However, before restarting the Reporting Server,
check that the amended login profile has been sourced.
Tip: For installations which use a Db2 database, Cognos requires 32 bit Db2 client libraries, whichwill be installed by the 64 bit Db2 client. However, there maybe further dependencies on other 32bit packages being present on the system; if such errors are reported, you can check this with 'ldd$library_name'.
2. Required: If Network Manager and ITNCM-Reports are installed together, and if the NetworkManager database is Oracle:a) To connect to an Oracle database from your TCR Installation, ensure that ITNCM-Reports have
been installed, and then update the itncmEnv.sh file default location:
Chapter 4. Installing Netcool Operations Insight 83
/opt/IBM/tivoli/netcool/ncm/reports/itncmEnv.sh
Export the following variables ( where <install directory> is the Netcool Configuration Managerinstallation directory):ORACLE_HOME
ORACLE_HOME=<install directory>/reports/oracle export ORACLE_HOME
TNS_ADMIN
TNS_ADMIN=<install directory>/reports/oracle/network/admin export TNS_ADMIN
LD_LIBRARY_PATH
LD_LIBRARY_PATH=<install directory>/reports/oracle:$LD_LIBRARY_PATH export LD_LIBRARY_PATH
b) Create a tnsnames.ora file located in <install directory>/reports/oracle/network/admin/
c) Add the NCIM database to the tnsnames.ora file.For example: NCIM = (DESCRIPTION = (ADDRESS_LIST = (ADDRESS = (PROTOCOL =TCP)(Host = <Database Server>)(Port = 1521)) ) (CONNECT_DATA =(SERVICE_NAME = NCIM) ))
d) Add 'source <install directory>/reports/itncmEnv.sh' to your <install_user>/.bash_profile.
Note: The .bash_profile is only used for bash shell, and it will be different for sh, csh or ksh.e) Restart your reporting server after this update. However, before restarting the Reporting Server,
check that the amended login profile has been sourced.
Configuring integration with Tivoli Netcool/OMNIbusEnsure that you have Netcool/OMNIbus Knowledge Library (NcKL) Enhanced Probe Rules for NetcoolConfiguration Manager installed on your Tivoli Netcool/OMNIbus server.
Before you beginDeploy rules specific to Netcool Configuration Manager. These rules have been bundled with NetcoolConfiguration Manager and deployed on the Netcool Configuration Manager Presentation server duringinstallation, and are located in the <NCM-INSTALL-DIR>/nckl-rules directory.
Note: This procedure is no longer required for device synchronization with Network Manager, and themapping of devices between Netcool Configuration Manager and Network Manager.
The standard Netcool/OMNIbus Knowledge Library configuration must have been applied to theObjectServer and to the Probe for SNMP as part of the prerequisite tasks for the integration. The$NC_RULES_HOME environment variable must also have been set on the computer where the probe isinstalled. This environment variable is set to $NCHOME/etc/rules on UNIX or Linux.
Tip: To source the Network Manager environment script, run the following script:./opt/IBM/tivoli/netcool/env.sh where opt/IBM/tivoli/netcool is the default NetworkManager directory.
Note: If you have existing Probe for SNMP custom rules that you want to preserve, create backups asrequired before deploying the Netcool/OMNIbus Knowledge Library rules in step two.
About this taskThe location denoted by $NC_RULES_HOME holds a set of Netcool/OMNIbus Knowledge Library lookupfiles and rules files within a number of sub-directories. In particular, the $NC_RULES_HOME/include-
84 IBM Netcool Operations Insight: Integration Guide
snmptrap/ibm subdirectory contains files that can be applied to the Probe for SNMP. To support theintegration, you must add customized rules for Netcool Configuration Manager to this subdirectory.
Remember: If you have installed Netcool/OMNIbus Knowledge Library (NcKL) Enhanced Probe RulesVersion 4.4 Multiplatform English (NcKL4.4) on your Tivoli Netcool/OMNIbus server, which is therecommended option, you do not need to install the ITNCM-specific Rules files, as documented here.
ProcedureInstalling rules files specific to Netcool Configuration Manager (not the recommended option)1. From the server where you have installed Netcool Configuration Manager, copy the following files:
• ncm_install_dir/nckl_rules/nckl_rules.zip
where ncm_install_dir represents the installation location of Netcool Configuration Manager, forexample /opt/IBM/tivoli/netcool/ncm
Copy these files to a temporary location on the computer where the Probe for SNMP is installed.2. Extract the contents of the nckl_rules.zip file, and then copy the extracted files to the$NC_RULES_HOME/include-snmptrap/ibm subdirectory.
3. If object server failover has already been configured, proceed to step 4. Otherwise, perform thefollowing steps:a) Go to the folder in which the mttrapd.props has been placed, for example $NCHOME/omnibus/probes/AIX5, where AIX5 is specific to your operating system.
b) Edit the mttrapd.props file by commenting out the backup object server reference:#ServerBackup : ''
4. To ensure that the probe can reference the enhanced lookup and rules files, edit the$NC_RULES_HOME/snmptrap.rules file by uncommenting the following include statements, asshown:
include "$NC_RULES_HOME/include-snmptrap/ibm/ibm.master.include.lookupinclude "$NC_RULES_HOME/include-snmptrap/ibm/ibm.master.include.rules"include "$NC_RULES_HOME/include-snmptrap/ibm/ibm-preclass.include.snmptrap.rules"
5. Run the probe. If the probe was already running, force the probe to re-read the rules file so that thechanges can take effect, for example:Locate the PID of the probe by running the following command on the server running the probe. Lookfor a process named - nco_p_mttrapd
ps -eaf | grep mttrapdkill -9 PID
Note: If the probe is installed on a different computer from Network Manager or the DASH portal, youmust restart the probe manually.
Configuring integration with Network ManagerCopy a number of jar files from the Network Manager GUI server into the Netcool Configuration Managerinstance of WebSphere.
About this taskNote: The following default locations may differ depending on where WebSphere was installed on yourNetwork Manager and Netcool Configuration Manager servers.
ProcedureCopy the following jars from the Network Manager GUI server into the corresponding folder in the NetcoolConfiguration Manager WebSphere instance.
• /opt/IBM/WebSphere/AppServer/etc/vmm4ncos.jks
Chapter 4. Installing Netcool Operations Insight 85
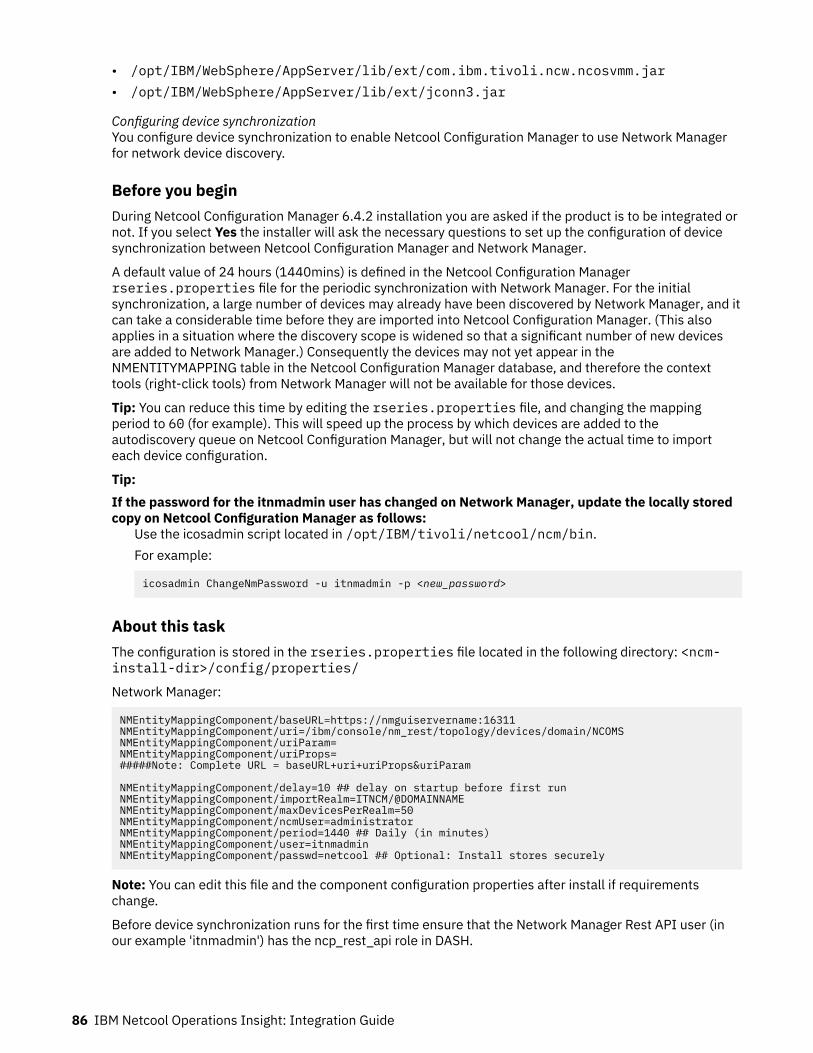
• /opt/IBM/WebSphere/AppServer/lib/ext/com.ibm.tivoli.ncw.ncosvmm.jar• /opt/IBM/WebSphere/AppServer/lib/ext/jconn3.jar
Configuring device synchronizationYou configure device synchronization to enable Netcool Configuration Manager to use Network Managerfor network device discovery.
Before you beginDuring Netcool Configuration Manager 6.4.2 installation you are asked if the product is to be integrated ornot. If you select Yes the installer will ask the necessary questions to set up the configuration of devicesynchronization between Netcool Configuration Manager and Network Manager.
A default value of 24 hours (1440mins) is defined in the Netcool Configuration Managerrseries.properties file for the periodic synchronization with Network Manager. For the initialsynchronization, a large number of devices may already have been discovered by Network Manager, and itcan take a considerable time before they are imported into Netcool Configuration Manager. (This alsoapplies in a situation where the discovery scope is widened so that a significant number of new devicesare added to Network Manager.) Consequently the devices may not yet appear in theNMENTITYMAPPING table in the Netcool Configuration Manager database, and therefore the contexttools (right-click tools) from Network Manager will not be available for those devices.
Tip: You can reduce this time by editing the rseries.properties file, and changing the mappingperiod to 60 (for example). This will speed up the process by which devices are added to theautodiscovery queue on Netcool Configuration Manager, but will not change the actual time to importeach device configuration.
Tip:If the password for the itnmadmin user has changed on Network Manager, update the locally storedcopy on Netcool Configuration Manager as follows:
Use the icosadmin script located in /opt/IBM/tivoli/netcool/ncm/bin.For example:
icosadmin ChangeNmPassword -u itnmadmin -p <new_password>
About this taskThe configuration is stored in the rseries.properties file located in the following directory: <ncm-install-dir>/config/properties/
Network Manager:
NMEntityMappingComponent/baseURL=https://nmguiservername:16311NMEntityMappingComponent/uri=/ibm/console/nm_rest/topology/devices/domain/NCOMSNMEntityMappingComponent/uriParam=NMEntityMappingComponent/uriProps=#####Note: Complete URL = baseURL+uri+uriProps&uriParam
NMEntityMappingComponent/delay=10 ## delay on startup before first run NMEntityMappingComponent/importRealm=ITNCM/@DOMAINNAME NMEntityMappingComponent/maxDevicesPerRealm=50 NMEntityMappingComponent/ncmUser=administrator NMEntityMappingComponent/period=1440 ## Daily (in minutes) NMEntityMappingComponent/user=itnmadmin NMEntityMappingComponent/passwd=netcool ## Optional: Install stores securely
Note: You can edit this file and the component configuration properties after install if requirementschange.
Before device synchronization runs for the first time ensure that the Network Manager Rest API user (inour example 'itnmadmin') has the ncp_rest_api role in DASH.
86 IBM Netcool Operations Insight: Integration Guide

Device synchronization is now done by a new core component of Netcool Configuration Manager, and istherefore part of Netcool Configuration Manager Component configuration and started automaticallywhen Netcool Configuration Manager starts. Component start up is configured in <ncm-install-dir>/config/server/config.xml
<component><name>NMEntityMappingComponent</name><class>com.intelliden.nmentitymapping.NMEntityMappingComponent</class></component>
Note: The NMEntityMappingComponent is configured by default so if you wish to stop it being started onNetcool Configuration Manager startup you can comment it out in the config.xml file.
Note: There is a limit of 50 imported devices per Realm in Netcool Configuration Manager. If there aremore devices than this in a Network Manager domain, they will be added to sub-realms (labeled 001,002, etc) in Netcool Configuration Manager.
Example
Troubleshooting NM ComponentVerify that the component has started in file:
<NCM_INSTALL_DIR>/logs/Server.out Fri Jul 31 13:30:06 GMT+00:00 2015 - Starting component : NMEntityMappingComponent Fri Jul 31 13:30:06 GMT+00:00 2015 - All components started
Verify that the config.xml file has the component specified for startupVerify that the NMEntityMapping table has the new columns required for the new componentimplementation:
"NMENTITYMAPPING" ("UNIQUEKEY" BIGINT NOT NULL,"ENTITYID" BIGINT NOT NULL DEFAULT 0,"RESOURCEBROWSERID" BIGINT NOT NULL DEFAULT 0,"DOMAINNAME" VARCHAR(64),"JPAVERSION" BIGINT NOT NULL DEFAULT 1,"ENTITYNAME" VARCHAR(255),"ACCESSIPADDRESS" VARCHAR(64),"SERIALNUMBER" VARCHAR(64),"VENDORTYPE" VARCHAR(64),"MODELNAME" VARCHAR(64),"OSVERSION" VARCHAR(64),"OSIMAGE" VARCHAR(255),"OSTYPE" VARCHAR(64),"HARDWAREVERSION" VARCHAR(64))
Ensure that the Network Manager Rest API user has the ncp_rest_api role in DASH.
Configuring the Alerts menu of the Active Event ListYou must add access to the Activity Viewer from the Active Event List by configuring the Alerts menu.
Procedure1. From the navigation pane, click Administration > Event Management Tools > Menu Configuration.2. From the Available menus list on the right, select alerts and click Modify.3. From the Menus Editor window, select <separator> from the drop-down list under Available items,
and then click Add selected item to add the item to the Current items list.The <separator> item is added as the last item.
4. Under Available items, select menu from the drop-down list.The list of all menu items that can be added to the Alerts menu is shown.
5. Select the Configuration Management item and click Add selected item.The item is added below the <separator> item in the Current items list.
Chapter 4. Installing Netcool Operations Insight 87
6. Click Save and then click OK.
ResultsThe Configuration Management submenu and tools are now available in the Alerts menu of the ActiveEvent List, for use with Netcool Configuration Manager events.
Note: Reports Menu options will not be displayed if the selected event is not enriched.
What to do nextYou can optionally create a global filter to restrict the events displayed in the Active Event List to NetcoolConfiguration Manager events only. You can add this filter to the Web GUI either by using the WAAPI clientor by using the Filter Builder. When creating the filter, specify a meaningful name (for example,ITNCMEvents) and define the filter condition by specifying the following SQL WHERE clause:
where Class = 87724
Migrating reportsIf you have custom Reporting Services reports in an existing Netcool Configuration Manager installation,and are integrating with Network Manager, which has its own Reporting Services solution, you migrateyour custom reports from the stand-alone to the integrated version of Reporting Services.
Before you beginIf you are installing Network Manager on the same server as your existing Netcool Configuration Managerinstallation, you must export your custom reports before installing Network Manager.
About this taskThe report migration procedure is different for single and multiple server integrations.If you are installing Netcool Configuration Manager and Network Manager on the same server
1. Export the custom reports from the existing Netcool Configuration Manager version of ReportingServices and copy them to a safe location.
Note: You export your custom reports before installing Network Manager to prevent the existingreports from being overwritten.
2. Disable and uninstall the existing Netcool Configuration Manager version of Reporting Services.3. Install Network Manager and integrate it with the existing version of Netcool Configuration
Manager as documented.4. Import the custom reports into the Network Manager version of Reporting Services.
If you are installing Netcool Configuration Manager and Network Manager on different servers
1. Install Network Manager and integrate it with the existing version of Netcool ConfigurationManager as documented.
2. Export the custom reports from the existing Netcool Configuration Manager version of ReportingServices and copy them to the Network Manager server.
3. Import the custom reports into the Network Manager version of Reporting Services.4. Disable the existing Netcool Configuration Manager version of Reporting Services.
Exporting custom reports (distributed integration architecture)After you have installed Network Manager on a server other than your existing Netcool ConfigurationManager installation and performed all integration tasks, you export your custom Reporting Services
88 IBM Netcool Operations Insight: Integration Guide
reports. You also disable and uninstall the existing Netcool Configuration Manager version of ReportingServices.
Before you beginYou export reports after installing Network Manager when all of the following circumstances apply to yourscenario:
• You are already running Reporting Services as part of an existing, non-integrated Netcool ConfigurationManager installation.
• You are deploying a distributed integration architecture and have already installed Network Manager ona server other than your existing version of Netcool Configuration Manager.
• You have customized Netcool Configuration Manager reports that need to be migrated into your plannedintegrated solution.
About this taskWhen you install the Network Manager version of Reporting Services on a server other than your existingversion of Netcool Configuration Manager, the previous reports as well as the previous version ofReporting Services remain on the Netcool Configuration Manager server. To migrate such reports into anintegrated solution, you perform the following tasks:If you are installing Netcool Configuration Manager and Network Manager on different servers
1. Install Network Manager and integrate it with the existing version of Netcool ConfigurationManager as documented.
2. Export the custom reports from the existing Netcool Configuration Manager version of ReportingServices and copy them to the Network Manager server.
3. Import the custom reports into the Network Manager version of Reporting Services.4. Disable the existing Netcool Configuration Manager version of Reporting Services.
Remember: You do not have to migrate the standard Netcool Configuration Manager reports, becausethese will be installed together with the Network Manager version of Reporting Services (in addition to anumber of Network View reports). You only migrate reports you have customized since installing thestandard reports, or new reports you have created.
Procedure1. Log into the Netcool Configuration Manager version of Reporting Services using the following URL:http://hostname:16310/ibm/consolewhere hostname is the name of your Netcool Configuration Manager server and 16310 is the defaultport number for Reporting Services.
2. Click Reporting > Common Reporting.3. Click Launch on the toolbar, and then select Administration from the drop-down menu.4. Select the Configuration tab, then click Content Administration.5. Click New Export to launch the New Export wizard.6. Enter a name and description for the report export, then click Next.7. Accept the default deployment method and click Next.8. Click the Add link and select the ITNCM Reports checkbox, then move ITNCM Reports to the
Selected Entries list.9. Click OK, then Next > Next > Next, accepting the default values.
10. Select New archive, then Next > Next, accepting the default values..11. Click Finish > Run > OK.
The reports are exported and the new export archive is displayed.12. Navigate to the following directory:
Chapter 4. Installing Netcool Operations Insight 89

/opt/IBM/tivoli/netcool/ncm/tipv2Components/TCRComponent/cognos/deployment,where you can view the report archive, for example:-rw-r--r-- 1 icosuser staff 262637 23 Feb 10:27 ncm_export.zipwhere ncm_export.zip is the report archive.
13. Copy the file to the following directory on the Network Manager server:$TIP_HOME/../TCRComponent/cognos/deployment
ResultsYou have exported the custom reports and copied them to the Network Manager server.
What to do nextNext, you import the archived reports into the Network Manager version of Reporting Services, and thendisable the Netcool Configuration Manager version of Reporting Services.
Importing reports (distributed integration architecture)After exporting the custom reports and copying them to the Network Manager server, you import thearchived reports into the Network Manager version of Reporting Services, and then disable the NetcoolConfiguration Manager version of Reporting Services.
Before you beginYou must have exported the custom reports and copied them to the Network Manager server.
About this task
Procedure1. Log into the Network Manager Dashboard Application Services Hub.2. Click Reporting > Common Reporting.3. Click Launch on the toolbar, and then select Administration from the drop-down menu.4. Select the Configuration tab, then click Content Administration.5. Click New Import to launch the New Import wizard.
A list of available report archives will be displayed.6. Select the archive that you exported earlier and click Next.7. Select ITNCM Reports, then Next and Next again, accepting the default values.8. Click Finish > Run > OK.
The reports are imported and the new archive is displayed in the list of archives.9. Close the Common Reporting tab and click the Common Reporting link in the navigation pane.
The custom reports will now be available in the Netcool Configuration Manager version of ReportingServices.
10. Navigate to the following directory:/opt/IBM/tivoli/netcool/ncm/bin/utils/support
11. Run the setPlatform.sh script:bash-3.2$ ./setPlatform.sh and disable Reporting, thenexit.When the Netcool Configuration Manager server is restarted, Reporting Services will no longer berunning.
ResultsYou have now completed the migration of custom reports in your distributed custom environment.
90 IBM Netcool Operations Insight: Integration Guide
Importing reports (single server integration architecture)After exporting the custom reports, disabling and uninstalling the Netcool Configuration Manager versionof Reporting Services, and completing all other integration steps, you import the report archive into theNetwork Manager version of Reporting Services,
Before you beginYou must have exported the custom reports before installing Network Manager on the same server asyour existing Netcool Configuration Manager installation.
About this task
Procedure1. Log into the Network Manager Dashboard Application Services Hub.2. Click Reporting > Common Reporting.3. Click Launch on the toolbar, and then select Administration from the drop-down menu.4. Select the Configuration tab, then click Content Administration.5. Click New Import to launch the New Import wizard.
A list of available report archives will be displayed.6. Select the archive that you exported earlier and click Next.7. Select ITNCM Reports, then Next and Next again, accepting the default values.8. Click Finish > Run > OK.
The reports are imported and the new archive is displayed in the list of archives.9. Close the Common Reporting tab and click the Common Reporting link in the navigation pane.
ResultsThe custom reports will now be available in the Netcool Configuration Manager version of ReportingServices.
Configuring Single Sign-On for Netcool Configuration ManagerThe single sign-on (SSO) capability in Tivoli® products means that you can log on to one Tivoli applicationand then launch to other Tivoli web-based or web-enabled applications without having to re-enter youruser credentials.
The repository for the user IDs is the Tivoli Netcool/OMNIbus ObjectServer. A user logs on to one of theparticipating applications, at which time their credentials are authenticated at a central repository. Withthe credentials authenticated to a central location, the user can then launch from one application toanother to view related data or perform actions. Single sign-on can be achieved between applicationsdeployed to DASH servers on multiple machines.
Single sign-on capabilities require that the participating products use Lightweight Third PartyAuthentication (LTPA) as the authentication mechanism. When SSO is enabled, a cookie is createdcontaining the LTPA token and inserted into the HTTP response. When the user accesses other Webresources in any other application server process in the same Domain Name Service (DNS) domain, thecookie is sent with the request. The LTPA token is then extracted from the cookie and validated. If therequest is between different cells of application servers, you must share the LTPA keys and the userregistry between the cells for SSO to work. The realm names on each system in the SSO domain are casesensitive and must match exactly. See Managing LTPA keys from multiple WebSphere® Application Servercells on the WebSphere Application Server Information Center.
When configuring ITNCM-Reports for an integrated installation, ensure you configure single sign-on (SSO)on the Reporting Services server. Specifically, you must configure SSO between the instance ofWebSphere that is hosting the Network Manager GUI, and the instance of WebSphere that is hostingITNCM Reports. This will prevent unwanted login prompts when launching reports from within NetworkManager. For more information, see the related topic links.
Chapter 4. Installing Netcool Operations Insight 91
Creating user groups for DASHTo configure single sign-on (SSO) between DASH and Netcool Configuration Manager, you must createNetcool Configuration Manager groups and roles for DASH.
Before you beginNote: For SSO between DASH and Netcool Configuration Manager to work, the user groups specified inthis procedure must exist in both DASH and Netcool Configuration Manager.
Network Manager and Netcool Configuration Manager users in DASH should use the same authenticationtype, for example, ObjectServer.
Note: The IntellidenUser role needs to be assigned to the IntellidenUser group. Similarly, theIntellidenAdminUser role needs to be given to the IntellidenAdminUser group.
About this task
Procedure1. Log onto the WebSphere Administrative console of the Network Manager GUI server as the profile
owner (for example, smadmin).2. Create a group by selecting Users and Groups > Manage Groups > Create.3. Enter IntellidenUser in the Group name field.4. Click Create, then click Create Like.5. Enter IntellidenAdminUser in the Group name field.
IntellidenAdminUser is required for access to Account Management in Netcool ConfigurationManager.
6. Click Create, then click Close.7. Log off from the WebSphere Administrative console, then log on to the DASH GUI.8. Select Console Settings > Roles > IntellidenUser.9. Click Users and Groups > Add Groups > Search, then select the IntellidenUser group, and then
click Add.10. Select Console Settings > Roles > IntellidenAdminUser.11. Click Users and Groups > Add Groups > Search, then select the IntellidenAdminUser group, and
then click Add.
What to do nextAfter creating Netcool Configuration Manager groups and roles for DASH, you create NetcoolConfiguration Manager users for DASH.
Creating users for DASHThis section explains how to create the Netcool Configuration Manager Intelliden super-user as wellas the default users: administrator, operator, and observer for DASH.
Before you beginFor single sign-on (SSO) between DASH and Netcool Configuration Manager to work, a user must exist(that is, have an account) in both DASH and Netcool Configuration Manager.
At install time Netcool Configuration Manager automatically creates four users: Intelliden,administrator, operator, and observer. Of these users, only the Intelliden user must be createdin DASH. However, it is advisable that the other users are also created.
Note: Only the username must match, it is not necessary that the passwords also match. After single-signon configuration is complete, the user password entered in DASH will be used to authenticate a NetcoolConfiguration Manager login.
92 IBM Netcool Operations Insight: Integration Guide
About this taskThis task describes how to create the previously listed Netcool Configuration Manager users for DASH.
Procedure1. Log onto the WebSphere console of the Network Manager GUI server as the profile owner (foe
example, smadmin).2. Click Users and Groups > Manage Users, then click Create.3. Enter Intelliden in the User ID, First name, and Last Name fields.4. Enter the Intelliden user's password in the Password and Confirm Password fields.5. Click on Group Membership and select Search.6. Highlight the IntellidenAdminUser and IntellidenUser groups in the matching groups list,
and click Add, then click Close.7. Click Create, then click Create Like.8. Enter administrator in the following fields:
• User ID• First name• Last Name• Password• Confirm password
9. Click on Group Membership and select Search.10. Highlight the IntellidenAdminUser and IntellidenUser groups in the matching groups list,
and click Add, then click Close.11. Click Create and then Close.12. Click Create.13. Enter operator in the following fields:
• User ID• First name• Last Name• Password• Confirm password
14. Click on Group Membership and select Search.15. Highlight the IntellidenUser group in the matching groups list, and click Add and then Close.16. Click Create, then click Create Like.17. Enter observer in the following fields:
• User ID• First name• Last Name• Password• Confirm password
18. Click on Group Membership and select Search.19. Highlight the IntellidenUser group in the matching groups list, and click Add, then click Close.20. Click Create and then Close.
What to do nextAfter you have created the Netcool Configuration Manager users for DASH, you export the LTPA keystoreto the Netcool Configuration Manager server.
Chapter 4. Installing Netcool Operations Insight 93
Exporting the DASH LTPA keystoreFor added security the contents of the LTPA token are encrypted and decrypted using a keystore (referredto in the subsequent procedure as the LTPA keystore) maintained by WebSphere. In order for twoinstances of WebSphere to share authentication information via LTPA tokens they must both use the sameLTPA keystore. The IBM Admin Console makes this a simple process of exporting the LTPA keystore onone instance of WebSphere and importing it into another.
About this taskThis task describes how to export the LTPA keystore from the instance of WebSphere running on theNetwork Manager DASH server to the instance of WebSphere running on the Netcool ConfigurationManager server for keystore synchronization.
Procedure1. Launch the DASH Admin Console. For example: http://www.nm_gui_server_ip.com:16310/ibm/console.
2. Navigate to Settings > WebSphere Administrative Console.3. Click Security > Global security.4. Under the Authentication mechanisms and expiration tab, click LTPA.5. Under the Cross-cell single sign-on tab, enter a password in the Password and Confirm password
fields.The password will subsequently be used to import the LTPA keystore on the Netcool ConfigurationManager server.
6. Enter the directory and filename you want the LTPA keystore to be exported to in the Fully qualifiedkey file name field.
7. Complete by clicking Export keys.8. Transfer the LTPA keystore to the Netcool Configuration Manager server.
ResultsYou will receive a message indicating that the LTPA keystore has been exported successfully.
What to do nextYou now configure the SSO attributes for DASH.Related tasksImporting the DASH LTPA keystore to the Netcool Configuration Manager serverFor added security the contents of the LTPA token are encrypted and decrypted using a keystoremaintained by WebSphere. In order for two instances of WebSphere to share authentication informationvia LTPA tokens they must both use the same keystore. The IBM admin console makes this a simpleprocess of exporting the keystore on one instance of WebSphere and importing it into another.
Configuring Single Sign-On for Netcool Configuration ManagerConfiguring SSO is a prerequisite to integrating products that are deployed on multiple servers. All DASHserver instances must point to the central user registry.
About this taskUse these instructions to configure single sign-on attributes for the DASH.
Procedure1. Launch the DASH Admin Console. For example: http://www.nm_gui_server_ip.com:16310/ibm/console .
2. Navigate to Settings > WebSphere Administrative Console.3. Select Security, then click Global Security > Web and SIP Security > Single sign on (SSO).
94 IBM Netcool Operations Insight: Integration Guide
4. In the Authentication area, expand Web security, then click Global Security > Web and SIPSecurity (on the Authentication area) > Single sign on (SSO).
5. Select the Enabled option if SSO is disabled.6. Deselect Requires SSL.7. Enter the fully-qualified domain names in the Domain name field where SSO is effective. If the
domain name is not fully qualified, the DASH server does not set a domain name value for theLTPAToken cookie and SSO is valid only for the server that created the cookie. For SSO to work acrossTivoli® applications, their application servers must be installed in the same domain (use the samedomain name). See below for an example.
8. Deselect the Interoperability Mode option.9. Deselect the Web inbound security attribute propagation option.
10. Click OK, then save your changes.11. Stop and restart all the DASH server instances. Log out of the WebSphere Administrative Console.
ExampleIf DASH is installed on server1.ibm.com and Netcool Configuration Manager is installed onserver2.ibm.com, then enter a value of .ibm.com.
What to do nextYou enable SSO on Netcool Configuration Manager next.Related tasksImporting the DASH LTPA keystore to the Netcool Configuration Manager serverFor added security the contents of the LTPA token are encrypted and decrypted using a keystoremaintained by WebSphere. In order for two instances of WebSphere to share authentication informationvia LTPA tokens they must both use the same keystore. The IBM admin console makes this a simpleprocess of exporting the keystore on one instance of WebSphere and importing it into another.
Enabling SSO for Netcool Configuration ManagerBoth Netcool Configuration Manager and Netcool Configuration Manager WebSphere must be configuredto enable SSO.
About this taskThis task describes how to enable SSO for Netcool Configuration Manager if it was not enabled duringinstallation.
Procedure1. Navigate to $NCM_installation_dir/utils .2. Run the configSSO.sh script, for example:
cd /opt/IBM/tivoli/netcool/ncm/bin/utils ./configSSO.sh enable
What to do nextWhen SSO is enabled, the interface to Netcool Configuration Manager must accept an LTPA token as ameans of authentication. This is achieved by importing the LTPA keystore to the Netcool ConfigurationManager server.
Importing the DASH LTPA keystore to the Netcool Configuration Manager serverFor added security the contents of the LTPA token are encrypted and decrypted using a keystoremaintained by WebSphere. In order for two instances of WebSphere to share authentication informationvia LTPA tokens they must both use the same keystore. The IBM admin console makes this a simpleprocess of exporting the keystore on one instance of WebSphere and importing it into another.
Chapter 4. Installing Netcool Operations Insight 95
Before you beginYou must have exported the LTPA keystore from the instance of WebSphere running on the NetworkManager DASH server and copied it to the Netcool Configuration Manager server in a previous task.
About this taskIn this procedure you will import that LTPA keystore to the instance of WebSphere running on the NetcoolConfiguration Manager server.
Procedure1. Logon to the WebSphere Administrative Console for the Netcool Configuration Manager Presentation
Server using the superuser name and password specified at install time (typically Intelliden).
For example: http://NCM_presentation_server:16316/ibm/console2. Click Security > Global security.3. Under Authentication mechanisms and expiration, click LTPA.4. Under Cross-cell single sign-on, enter the password in the Password and Confirm password fields.
This password is the one that was used when the LTPA keystore was exported from DASH.5. Enter the LTPA keystore file name in the Fully qualified key file name field. This is the LTPA keystore
that was exported from DASH.6. Click Import keys.7. Click Save directly to the master configuration.
What to do nextYou should now configure single sign-on attributes for the WebSphere instance running on the NetcoolConfiguration Manager server.Related tasksExporting the DASH LTPA keystoreFor added security the contents of the LTPA token are encrypted and decrypted using a keystore (referredto in the subsequent procedure as the LTPA keystore) maintained by WebSphere. In order for twoinstances of WebSphere to share authentication information via LTPA tokens they must both use the sameLTPA keystore. The IBM Admin Console makes this a simple process of exporting the LTPA keystore onone instance of WebSphere and importing it into another.Configuring single sign-on attributes for DASHConfiguring SSO is a prerequisite to integrating products that are deployed on multiple servers. All DASHserver instances must point to the central user registry.
Configuring single sign-on attributes for Netcool Configuration Manager WebSphereConfiguring SSO is a prerequisite to integrating products that are deployed on multiple servers. All eWASserver instances must point to the central user registry.
About this taskThis procedure is performed on the Netcool Configuration Manager eWAS instance running on the NetcoolConfiguration Manager server.
Procedure1. Logon to the WebSphere Administrative Console for the Netcool Configuration Manager Presentation
Server using the superuser name and password specified at install time (typically Intelliden).
For example http://NCM_presentation_server:16316/ibm/console 2. In the Authentication area, expand Web security then click Single sign-on.3. Select the Enabled option if SSO is disabled.4. Deselect Requires SSL.
96 IBM Netcool Operations Insight: Integration Guide

5. Leave the domain name blank in the Domain name field.6. Deselect the Interoperability Mode option.7. Deselect the Web inbound security attribute propagation option.8. Click Apply to save your changes.9. Click Save Directly to the Master Configuration.
What to do nextYou create a federated user repository for Netcool Configuration Manager next.
Creating and configuring a federated user repository for Netcool Configuration ManagerThe first step for authenticating by using a Tivoli Netcool/OMNIbus ObjectServer is to create a federateduser repository for Netcool Configuration Manager.
Before you beginImportant: Before attempting this procedure, complete the following task: “Configuring integration withNetwork Manager” on page 85
About this taskA federated user repository is built on Virtual Member Manager (VMM), which provides the ability to mapentries from multiple individual user repositories into a single virtual repository. The federated userrepository consists of a single named realm, which is a set of independent user repositories. Each userrepository may be an entire external user repository.
This task describes how to create and configure a federated user repository for Netcool ConfigurationManager.
Procedure1. Launch the WebSphere Administrative Console from http://<ncmserver-hostname-ip>:<16316>/ibm/console and login using the Netcool Configuration Manager superuser nameand password specified during installation.
Note: The port number may be different for a non-standard installation.2. Select Security > Global security.3. Under the User account repository, select Federated repositories from the Available realm
definitions field, and click Configure.4. Under Repositories in the realm, select Add repositories (LDAP, custom, etc).5. Under General Properties, select New Repository > Custom Repository6. Update the ObjectServer VMM properties as described here (or per your custom repository):
Repository identifierNetcoolObjectServer
Repository adapter class namecom.ibm.tivoli.tip.vmm4ncos.ObjectServerAdapter
Custom PropertiesAdd the following four properties:
Note: Find the exact details from the repository viewable on the Network Manager GuiAdministrative Console.
Table 24. Custom Properties
Name (case-sensitive Value
username ObjectServer administrator user name
Chapter 4. Installing Netcool Operations Insight 97
Table 24. Custom Properties (continued)
Name (case-sensitive Value
password ObjectServer encrypted administrator userpassword
port1 Object Server port number
host1 Object Server hostname/IP address
7. Click Apply and save your changes directly to the master configuration.8. Under General properties of Repository Reference, update the Unique distinguished name too=netcoolObjectServerRepository
9. Click OK and save your changes directly to the master configuration, then click OK again.10. The local repository may not contain IDs that are also in Netcool Configuration Manager. To mitigate,
perform one of the following steps:
• Remove the local file repository from the federation of repositories.• Remove all the conflicting users from the local file repository.
11. If prompted, enter the WebSphere Administrator user password in the Password and ConfirmPassword fields, and click OK.
12. In Global security under the User account repository, select Federated Repositories from theAvailable realm definitions field, and click Set as current.
13. Click Apply and save your changes directly to the master configuration.14. Log out of the Administrative Console.15. Stop the Netcool Configuration Manager server using the ./itncm.sh stop command. Then start
the Netcool Configuration Manager server using the ./itncm.sh start command.
What to do nextNetcool Configuration Manager will now authenticate with the ObjectServer VMM.
The Netcool Configuration Manager Superuser has been reverted to the user created during the Dashprofile Installation (which is smadmin by default)
Installing the Network Manager Insight PackThis topic explains how to install the Network Manager Insight Pack into the Operations Analytics - LogAnalysis product and make the necessary configurations. The Network Manager Insight Pack is requiredonly if you deploy the Networks for Operations Insight feature and want to use the topology searchcapability. For more information, see “Network Manager Insight Pack” on page 449. Operations Analytics- Log Analysis can be running while you install the Insight Pack.
Before you beginYou already completed some of these prerequisites when you installed the Tivoli Netcool/OMNIbusInsight Pack. See “Installing the Tivoli Netcool/OMNIbus Insight Pack” on page 69 for more details.
• Install the Operations Analytics - Log Analysis product. For upgrades, migrate the data from previousinstances of the product.
• Ensure that the Tivoli Netcool/OMNIbus Insight Pack is installed before a data source is created. Formore information, see “Netcool/OMNIbus Insight Pack” on page 426.
• Download the Network Manager Insight Pack from IBM Passport Advantage. The Insight Pack image iscontained within the Operations Analytics - Log Analysis download, see information about Event Searchintegration and Topology Search integration in http://www-01.ibm.com/support/docview.wss?uid=swg24043698. The file name of the Insight Pack isNetworkManagerInsightPack_V1.3.0.0.zip.
98 IBM Netcool Operations Insight: Integration Guide
• Install Python 2.6 or later with the simplejson library, which is required by the custom apps that areincluded in the Insight Pack.
• Over large network topologies, the topology search can be performance intensive. It is thereforeimportant to determine which parts of your network you want to use the topology search on. You candefine those parts of the network into a single domain. Alternatively, implement the cross-domaindiscovery function in Network Manager IP Edition to create a single aggregation domain of the domainsthat you want to search. You can restrict the scope of the topology search to that domain or aggregationdomain. To do so, set the ncp.dla.ncim.domain property to the name of the domain. If you stillanticipate a detrimental impact on performance, you can also set thencp.spf.multipath.maxLinks property. This property sets a threshold on the number of links thatare processed when the paths between the two end points are retrieved. If the threshold number isbreached, only the first identified route between the two end points is retrieved. Make these settings instep “Installing the Network Manager Insight Pack” on page 98 of this task. For more information aboutdeploying Network Manager IP Edition to monitor networks of small, medium, and larger networks, seehttps://www.ibm.com/support/knowledgecenter/SSSHRK_4.2.0/install/concept/ovr_deploymentseg.html . For more information about the cross-domain discovery function, seehttps://www.ibm.com/support/knowledgecenter/SSSHRK_4.2.0/disco/task/dsc_configuringcrossdomaindiscoveries.html .
• Obtain the details of the NCIM database that is used to store the network topology for the NetworkManager IP Edition product.
Procedure1. Copy the NetworkManagerInsightPack_V1.3.0.0.zip installation package to $UNITY_HOME/unity_content.
Tip: For better housekeeping, create a new $UNITY_HOME/unity_content/NetworkManagerdirectory and copy the installation package there.
2. Use the $UNITY_HOME/utilities/pkg_mgmt.sh command to install the Insight Pack.For example, to install into $UNITY_HOME/unity_content/NetworkManager, run the command asfollows:
$UNITY_HOME/utilities/pkg_mgmt.sh -install $UNITY_HOME/unity_content//NetworkManagerNetworkManagerInsightPack_V1.3.0.0.zip
3. In $UNITY_HOME/AppFramework/Apps/NetworkManagerInsightPack_V1.3.0.0/Network_Topology_Search/NM_EndToEndSearch.properties, specify the details of the NCIMdatabase.
Tip: You can obtain most of the information that is required from the $NCHOME/etc/precision/DbLogins.cfg or DbLogins.DOMAIN.cfg files (where DOMAIN is the name of the domain).
ncp.dla.ncim.domainLimits the scope of the topology search capability to a single domain in your topology. For multipledomains, implement the cross-domain discovery function in Network Manager IP Edition andspecify the name of the aggregation domain. For all domains in the topology, comment out thisproperty. Do not leave it blank.
ncp.spf.multipath.maxLinksSets a limit on the number of links that are processed when the paths between the two end pointsare retrieved. If the number of links exceeds the limit, only the first identified path is returned. Forexample, you specify ncp.spf.multipath.maxLinks = 1000. If 999 links are processed, allpaths between the two end points are retrieved. If 1001 links are processed, one path is calculatedand then processing stops.
ncp.dla.datasource.typeThe type of database used to store the Network Manager IP Edition topology. Possible values aredb2 or oracle.
Chapter 4. Installing Netcool Operations Insight 99
ncp.dla.datasource.driverThe database driver. For Db2, type com.ibm.db2.jcc.Db2Driver. For Oracle, typeoracle.jdbc.driver.OracleDriver.
ncp.dla.datasource.urlThe database URL. For Db2, the URL is as follows:
jdbc:db2://host:port/name
For Oracle the URL is as follows:
jdbc:oracle:thin:@host:port:name
In each case, host is the database host name, port is the port number, and name is the databasename, for example, NCIM.
ncp.dla.datasource.schemaType the NCIM database schema name. The default is ncim.
ncp.dla.datasource.ncpgui.schemaType the NCPGUI database schema name. The default is ncpgui.
ncp.dla.datasource.usernameType the database user name.
ncp.dla.datasource.password.Type the database password.
ncp.dla.datasource.encryptedIf the password is encrypted, type true. If not, type false.
ncp.dla.datasource.keyfileType the name of and path to the cryptographic key file, for example $UNITY_HOME/wlp/usr/servers/Unity/keystore/unity.ks.
ncp.dla.datasource.loginTimeoutChange the number of seconds until the login times out, if required.
Optionally change the logging information, which is specified by the java.util.logging.*properties.
Results• The NetworkManagerInsightPack_V1.3.0.0 Insight Pack is installed into the directory that you
selected in step 2.• The Rule Set, Source Type, and Collection are in place. You can view these resources in the
Administrative Settings page of Operations Analytics - Log Analysis.
What to do next• Use the pkg_mgmt command to verify the installation of the Insight Pack. See Verifying the Network
Manager Insight Pack.• If you are using an Oracle database, make the extra configurations that are required to support Oracle.
See “Configuring topology search apps for use with Oracle databases” on page 454. Configure theproducts to support the topology search capability. See “Configuring Topology Search” on page 448.
Related conceptsData Source creation in Operations Analytics - Log Analysis V1.3.5Data Source creation in Operations Analytics - Log Analysis V1.3.3Related tasksInstalling the Tivoli Netcool/OMNIbus Insight Pack
100 IBM Netcool Operations Insight: Integration Guide
This topic explains how to install the Netcool/OMNIbus Insight Pack into the Operations Analytics - LogAnalysis product. Operations Analytics - Log Analysis can be running while you install the Insight Pack.This Insight Pack ingests event data into Operations Analytics - Log Analysis and installs custom apps.Installing the Network Manager Insight PackThis topic explains how to install the Network Manager Insight Pack into the Operations Analytics - LogAnalysis product and make the necessary configurations. The Network Manager Insight Pack is requiredonly if you deploy the Networks for Operations Insight feature and want to use the topology searchcapability. For more information, see “Network Manager Insight Pack” on page 449. Operations Analytics- Log Analysis can be running while you install the Insight Pack.Configuring topology searchBefore you can use the topology search capability, configure the Tivoli Netcool/OMNIbus core and WebGUI components, the Gateway for Message Bus and Network Manager IP Edition.Related informationGateway for Message Bus documentation
Installing and upgrading on-premises Agile Service ManagerLearn how to upgrade to the latest version of Agile Service Manager.
About this taskYou install a new version or upgrade an existing version of Agile Service Manager (on-premises) using thestandard installation procedures for all components. When using the IBM® Installation Manager to installthe Netcool Hybrid Deployment Option Integration Kit, you must install a new version.
After completing the installation, you may have to migrate the configuration settings. Previousconfiguration settings are preserved during installation, but you may need to manually transfer settingsfrom your previous to your current configuration files.
The yum upgrade (install) process preserves existing configuration settings in two ways.Replace previous configuration files
If a previous configuration file can be replaced without disabling the Agile Service Manager system,the install process will do so, and save the old version with the .rpmsave extension.For example the old version of poll_docker.sh will be replaced with a new version, and backed upas poll_docker.sh.rpmsave
Preserve current configuration fileIf a previous configuration file can not be replaced without disabling the Agile Service Managersystem, the install process will keep the old configuration file in place, and save the new version withthe .rpmnew suffix.For example the old version of docker-compose.yml will be kept in place, and the new version willbe deployed as docker-compose.yml.rpmnew
ProcedureObtain the Agile Service Manager software1. Obtain the Agile Service Manager installation images for the user interface and core services from the
Passport Advantage site, and extract them to a temporary directory.More detailed information can be found in the download document here: http://www-01.ibm.com/support/docview.wss?uid=swg24043717
Note: You need an IBM ID to access the download document.Backup custom UI configuration settings2. To preserve customized UI configuration settings such as user preferences, topology tools, custom
icons, relationship types, and global settings, perform a backup of these settings, as described in theExporting configuration data (on-premises) topic of the Administration section in the Agile ServiceManager Knowledge Center:
Chapter 4. Installing Netcool Operations Insight 101
https://www.ibm.com/support/knowledgecenter/SS9LQB_1.1.10/Administering/t_asm_exportingconfig.html
Install (upgrade) Agile Service Manager3. Stop any Agile Service Manager services that are running:
/opt/ibm/netcool/asm/bin/asm_stop.sh
4. Install a new version of Agile Service Manager, or update an existing installation.Follow the standard installation procedure as described in the following topics:
• Install Agile Service Manager core and observers: https://www.ibm.com/support/knowledgecenter/SS9LQB_1.1.10/Installing/t_asm_installingcore.html#t_asm_installingcore
Tip: Using the wildcard installation command (sudo yum install nasm-*.rpm) will initiate anupgrade of changed or new packages only.
• Install the Netcool Hybrid Deployment Option Integration Kit: If this is an upgrade, first uninstallthe hybrid kit that is already installed in DASH.https://www.ibm.com/support/knowledgecenter/SS9LQB_1.1.10/Installing/t_asm_installinghybridintegrationkit.html
After the upgrade, the yum install process lists all changed configuration files.Transfer your configuration settings
Remember: If you have upgraded an existing installation of Agile Service Manager, you must upgradeyour configuration files.5. Manually migrate your backed up configuration settings to the new configuration files.
Tip:
• You can search for affected configuration files with the .rpmsave or .rpmnew extensions.• You can compare configuration file versions using a Diff tool, before migrating the requiredconfiguration setting to the new configuration files.
6. Import any previously backed up UI configuration settings into your new system, as described in thefollowing topic:https://www.ibm.com/support/knowledgecenter/SS9LQB_1.1.10/Administering/t_asm_importingconfig.html#t_asm_importingconfig
Additional configuration7. Depending on your deployment, you may need to perform some of the following configuration tasks:
Edge types migrationTo migrate any existing edge types from Agile Service Manager 1.1.3 to Version 1.1.5 (or later), usethe following curl command:
curl -k -X POST -u asm:asm --header 'Content-Type: application/json' --header 'Accept: application/json' --header 'X-TenantID: cfd95b7e-3bc7-4006-a4a8-a73a79c71255' -d '{}' 'https://localhost:8080/1.0/topology/crawlers/migrateEdgeTypes'
Match token migration to lowercaseTo convert older resource matchTokens from Agile Service Manager Version 1.1.3 or 1.1.4 (but not1.1.4.1) to Version 1.1.5 (or later) to lowercase, use the following curl command:
curl -k -X POST -u asm:asm --header 'Content-Type: application/json' --header 'Accept: application/json' --header 'X-TenantID: cfd95b7e-3bc7-4006-a4a8-a73a79c71255' -d '{}' 'https://localhost:8080/1.0/topology/crawlers/lowercaseMatchTokens'
Composite end time migrationTo allow composite vertices to show status within the search results you must migrate any existingcomposites to the latest version of Agile Service Manager.To do so, use the following curl command:
curl -k -X POST -u asm:asm --header 'Content-Type: application/json' --header
102 IBM Netcool Operations Insight: Integration Guide
'Accept: application/json' --header 'X-TenantID: cfd95b7e-3bc7-4006-a4a8-a73a79c71255' -d '{}' 'https://localhost:8080/1.0/topology/crawlers/compositeEndTime'
Restrict the Transport Layer Security (TLS) version to 1.2 onlyTo enforce TLS 1.2 in nginx, change the ssl_protocols setting in the $ASM_HOME/etc/nginx/nginx.conf file:
server {listen 8443 ssl;server_name localhost;ssl_certificate /opt/ibm/netcool/asm/security/asm-nginx.crt;ssl_certificate_key /opt/ibm/netcool/asm/security/asm-nginx.key;ssl_protocols TLSv1.2;
Docker Observer
When updating from Agile Service Manager Version 1.1.7 (or earlier) with existing Docker Observerjob data, run the following migration script to avoid the creation of duplicate observer recordsbefore running any new Docker Observer jobs:
$ASM_HOME/bin/execute_crawler.sh -c docker_provider_transfer
Failing to run this script before running any new Docker Observer jobs can result in duplicateresources, as can running an older Docker Observer job after running the crawler.
Kubernetes ObserverWhen updating from Agile Service Manager Version 1.1.4.1 (or earlier), ensure that your WeaveScope jobs are running before you update your system.
• The location of the Weave Scope listen job changes from Agile Service Manager Version 1.1.5onwards, but existing Weave Scope jobs that are running during an upgrade will have their pathsautomatically renamed when the observer starts.
• However, Weave Scope jobs that are not running (stopped) will not be recognized, and so will nothave their path renamed. As a consequence, the UI will be unable to restart them.
ITNM ObserverWhen updating from Agile Service Manager Version 1.1.3 (or earlier) to the latest version, you mustrun a migration script to avoid the creation of duplicate ITNM Observer records before running anyITNM Observer jobs:
cd $ASM_HOME/bin/execute_crawler.sh -c itnm_provider_transfer
• Running this script before making any new observations with the ITNM Observer prevents thecreation of duplicate records.
• Running this script after making new observations with the ITNM Observer removes duplicaterecords, but may not preserve some historical topology data previously gathered by the ITNMObserver.
The script, which may take some time to complete on large topologies, creates a managementartifact in the topology. You can monitor its progress by querying the artifact via Swagger.
Related informationNetcool Agile Service Manager Knowledge Center
Post-installation tasksPerform the following post-installation tasks of Netcool Operations Insight on-premises deployment.
Note: After installing Netcool Operations Insight components, change the default passwords. For moreinformation, see the following Knowledge Center links:
• IBM Tivoli Netcool/OMNIbus: https://www.ibm.com/support/knowledgecenter/SSSHTQ_8.1.0/com.ibm.netcool_OMNIbus.doc_8.1.0/tip/ttip_admin_password.html and https://www.ibm.com/
Chapter 4. Installing Netcool Operations Insight 103
support/knowledgecenter/SSSHTQ_8.1.0/com.ibm.netcool_OMNIbus.doc_8.1.0/webtop/wip/task/web_con_chguserpasswords.html
• IBM Operations Analytics - Log Analysis: https://www.ibm.com/support/knowledgecenter/SSPFMY_1.3.6/com.ibm.scala.doc/config/iwa_config_pinstall_changepasswd_r.html
• IBM Agile Service Manager: https://www-03preprod.ibm.com/support/knowledgecenter/SS9LQB_1.1.10/Installing/c_asm_installingabout.html
Integrating with components on Red Hat OpenShiftYou can integrate your on-premises IBM Netcool Operations Insight installation with deployments of AgileService Manager on Red Hat OpenShift.
Integrating with Agile Service Manager on Red Hat OpenShiftLearn how to integrate your on-premises IBM Netcool Operations Insight installation with a deploymentof Agile Service Manager on Red Hat OpenShift.
Before you beginYou must have on-premises IBM Netcool Operations Insight successfully installed.
Procedure1. Install Agile Service Manager on Red Hat OpenShift. For more information, see the Agile Service
Manager Knowledge Center https://www.ibm.com/support/knowledgecenter/SS9LQB_1.1.10/Installing/t_asm_ocp_installing.html .
2. Install the Agile Service Manager UI on your on-premises DASH server. For more information, see theAgile Service Manager Knowledge Center https://www.ibm.com/support/knowledgecenter/SS9LQB_1.1.10/Installing/t_asm_installingui_viainstaller.html .
3. Add Agile Service Manager roles in your on-premises DASH server. For more information, see the AgileService Manager Knowledge Center https://www.ibm.com/support/knowledgecenter/SS9LQB_1.1.10/Installing/t_asm_configuring.html .
4. Configure on-premises ASM UI with ASM core on OCP using https://www.ibm.com/support/knowledgecenter/SS9LQB_1.1.10/Installing/c_asm_hybrid_installing.html from the Agile ServiceManager Knowledge Center.
Configuring Single Sign-OnSingle Sign-On (SSO) can be configured to support the launch of tools between the products andcomponents of Netcool Operations Insight. Different SSO handshakes are supported; which handshake toconfigure for which capability is described here. Each handshake must be configured separately.
ProcedureSet up the SSO handshake as described in the following table.The table lists which products and components are connected by SSO, which capabilities require whichSSO handshake and additional useful information. See the related tasks at the end of the page for links tomore information.
104 IBM Netcool Operations Insight: Integration Guide

Table 25. SSO handshakes for Netcool Operations Insight
SSO handshake can be configured betweenthese products or components
Handshake isconfigured tosupport thiscapability Additional notes
Operations Analytics -Log Analysis
Dashboard ApplicationServices Hub
Event search Supports the launch of right-click tools from the event lists3
of the Netcool/OMNIbus WebGUI to the custom apps of theTivoli Netcool/OMNIbus InsightPack.
Operations Analytics -Log Analysis
Dashboard ApplicationServices Hub
Topology search Supports the launch of right-click tools from the Web GUIevent lists to the custom appsof the Network Manager InsightPack.
Supports the launch of right-click tools from the NetworkViews in the Network Managerproduct for the custom apps inthe Network Manager InsightPack.
Netcool ConfigurationManager
Dashboard ApplicationServices Hub
Networks forOperationsInsight
Supports the launch of right-click tools from the NetworkViews to the NetcoolConfiguration Manager GUIs.
Related tasksConfiguring single sign-on for the event search capabilityConfigure single sign-on (SSO) between Web GUI and Operations Analytics - Log Analysis so that userscan switch between the two products without having to log in each time.Configuring single sign-on for the topology search capabilityConfiguring SSO between Operations Analytics - Log Analysis V1.3.5 and Dashboard Application ServicesHubConfiguring SSO between Operations Analytics - Log Analysis V1.3.3 and Dashboard Application ServicesHubConfiguring Single Sign-On for Netcool Configuration ManagerConfiguring SSO is a prerequisite to integrating products that are deployed on multiple servers. All DASHserver instances must point to the central user registry.Related informationConfiguring Jazz for Service Management for SSO
Uninstalling on premisesUse this information to learn how to uninstall on-premises Netcool Operations Insight.
To uninstall the components of Netcool Operations Insight, refer to the uninstallation guides for each ofits components. Be sure to follow any dependency matrices and prerequisites that are given because theorder of uninstallation is significant as some components depend on others.
3 That is, the Event Viewer and Active Event List.
Chapter 4. Installing Netcool Operations Insight 105
Component Reference
Netcool/OMNIbuscore
https://www.ibm.com/support/knowledgecenter/SSSHTQ_8.1.0/com.ibm.netcool_OMNIbus.doc_8.1.0/omnibus/wip/install/task/omn_ins_im_removing_omn.html
Netcool/OMNIbusWebGUI
https://www.ibm.com/support/knowledgecenter/SSSHTQ_8.1.0/com.ibm.netcool_OMNIbus.doc_8.1.0/webtop/wip/task/web_ins_removing.html
Netcool/Impact:
https://www.ibm.com/support/knowledgecenter/SSSHYH_7.1.0/com.ibm.netcoolimpact.doc/admin/imag_install_uninstalling_t.html
Db2 https://www.ibm.com/support/knowledgecenter/SSEPGG_11.5.0/com.ibm.db2.luw.qb.server.doc/doc/c0059726.html
OperationsAnalysis
https://www.ibm.com/support/knowledgecenter/en/SSPFMY_1.3.6/com.ibm.scala.doc/install/iwa_uninstall_oview_c.html
IBM TivoliNetworkManager
https://www.ibm.com/support/knowledgecenter/SSSHRK_4.2.0/install/task/ins_uninstallingandmaintainingtheproduct.html
ITNCM https://www.ibm.com/support/knowledgecenter/SS7UH9_6.4.2/ncm/wip/install/task/ncm_ins_uninstallingncm.html
ASM UI https://www.ibm.com/support/knowledgecenter/SS9LQB_1.1.10/Installing/t_asm_uninstallinguiim.html
ASM Coreservices
https://www.ibm.com/support/knowledgecenter/SS9LQB_1.1.10/Installing/t_asm_uninstallingcore.html
JazzSMFixpacks
https://www.ibm.com/support/knowledgecenter/SSEKCU_1.1.3.0/com.ibm.psc.doc/install/psc_t_rollback_fp3_oview.html
JazzSM andassociatedsoftware
https://www.ibm.com/support/knowledgecenter/SSEKCU_1.1.3.0/com.ibm.psc.doc/install/psc_c_install_uninstall_oview.html
InstallationManager
https://www.ibm.com/support/knowledgecenter/en/SSDV2W_1.8.5/com.ibm.silentinstall12.doc/topics/r_uninstall_cmd.html
Uninstalling Event AnalyticsYou can uninstall Event Analytics with the IBM Installation Manager GUI or console, or do a silentuninstall.
For more information about installing and using IBM Installation Manager, see the following IBMinformation center:
https://www.ibm.com/support/knowledgecenter/SSDV2W_1.8.5/com.ibm.cic.agent.ui.doc/helpindex_imic.html
Uninstalling Event AnalyticsUse IBM Installation Manager to remove Event Analytics .
Before you beginTake the following actions:
• Stop all Event Analytics processes.• Back up any data or configuration files that you want to retain.
106 IBM Netcool Operations Insight: Integration Guide

• To do a silent removal, create or record an Installation Manager response file.
Use the -record response_file option.
To create a response file without installing the product, use the -skipInstall option. For example:
1. Create or record a skipInstall:
IBMIM.exe -record C:\response_files\install_1.xml -skipInstall C:\Temp\skipInstall
2. To create an uninstall response file, using the created skipInstall:
IBMIM.exe -record C:\response_files\uninstall_1.xml -skipInstall C:\Temp\skipInstall
About this taskNote: To uninstall Tivoli Netcool/OMNIbus Web GUI 8.1.0.21, you must first uninstall the NetcoolOperations Insight Extensions for IBM Tivoli Netcool/OMNIbus Web GUI_8.1.0.21, including the EventAnalytics feature.
ProcedureGUI removal1. To remove Event Analytics with the Installation Manager GUI:
a) Change to the /eclipse subdirectory of the Installation Manager installation directory.b) Use the following command to start the Installation Manager wizard:
./IBMIMc) In the main Installation Manager window, click Uninstall.d) Select the offerings that you want to remove and follow the Installation Manager wizard
instructions to complete the removal.Console removal2. To remove Event Analytics with the Installation Manager console:
a) Change to the /eclipse/tools subdirectory of the Installation Manager installation directory.b) Use the following command to start the Installation Manager:
./imcl -cc) From the Main Menu, select Uninstall.d) Select the offerings that you want to remove and follow the Installation Manager instructions to
complete the removal.Silent removal3. To silently remove Event Analytics:
a) Change to the /eclipse/tools subdirectory of the Installation Manager installation directory.b) Use the following command to start the Installation Manager:
./imcl -input response_file -silent -log /tmp/install_log.xml -acceptLicense
Where response_file is the directory path to the response file that defines the removal configuration
ResultsInstallation Manager removes the files and directories that it installed.
Chapter 4. Installing Netcool Operations Insight 107
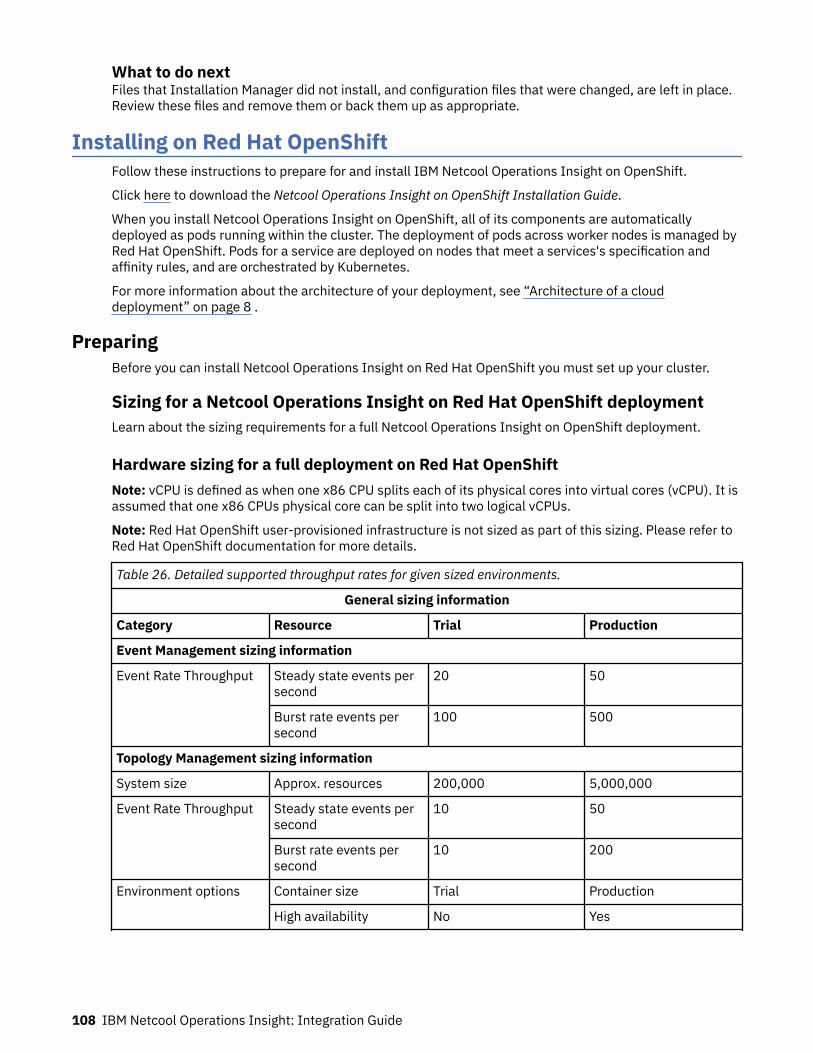
What to do nextFiles that Installation Manager did not install, and configuration files that were changed, are left in place.Review these files and remove them or back them up as appropriate.
Installing on Red Hat OpenShiftFollow these instructions to prepare for and install IBM Netcool Operations Insight on OpenShift.
Click here to download the Netcool Operations Insight on OpenShift Installation Guide.
When you install Netcool Operations Insight on OpenShift, all of its components are automaticallydeployed as pods running within the cluster. The deployment of pods across worker nodes is managed byRed Hat OpenShift. Pods for a service are deployed on nodes that meet a services's specification andaffinity rules, and are orchestrated by Kubernetes.
For more information about the architecture of your deployment, see “Architecture of a clouddeployment” on page 8 .
PreparingBefore you can install Netcool Operations Insight on Red Hat OpenShift you must set up your cluster.
Sizing for a Netcool Operations Insight on Red Hat OpenShift deploymentLearn about the sizing requirements for a full Netcool Operations Insight on OpenShift deployment.
Hardware sizing for a full deployment on Red Hat OpenShiftNote: vCPU is defined as when one x86 CPU splits each of its physical cores into virtual cores (vCPU). It isassumed that one x86 CPUs physical core can be split into two logical vCPUs.
Note: Red Hat OpenShift user-provisioned infrastructure is not sized as part of this sizing. Please refer toRed Hat OpenShift documentation for more details.
Table 26. Detailed supported throughput rates for given sized environments.
General sizing information
Category Resource Trial Production
Event Management sizing information
Event Rate Throughput Steady state events persecond
20 50
Burst rate events persecond
100 500
Topology Management sizing information
System size Approx. resources 200,000 5,000,000
Event Rate Throughput Steady state events persecond
10 50
Burst rate events persecond
10 200
Environment options Container size Trial Production
High availability No Yes
108 IBM Netcool Operations Insight: Integration Guide
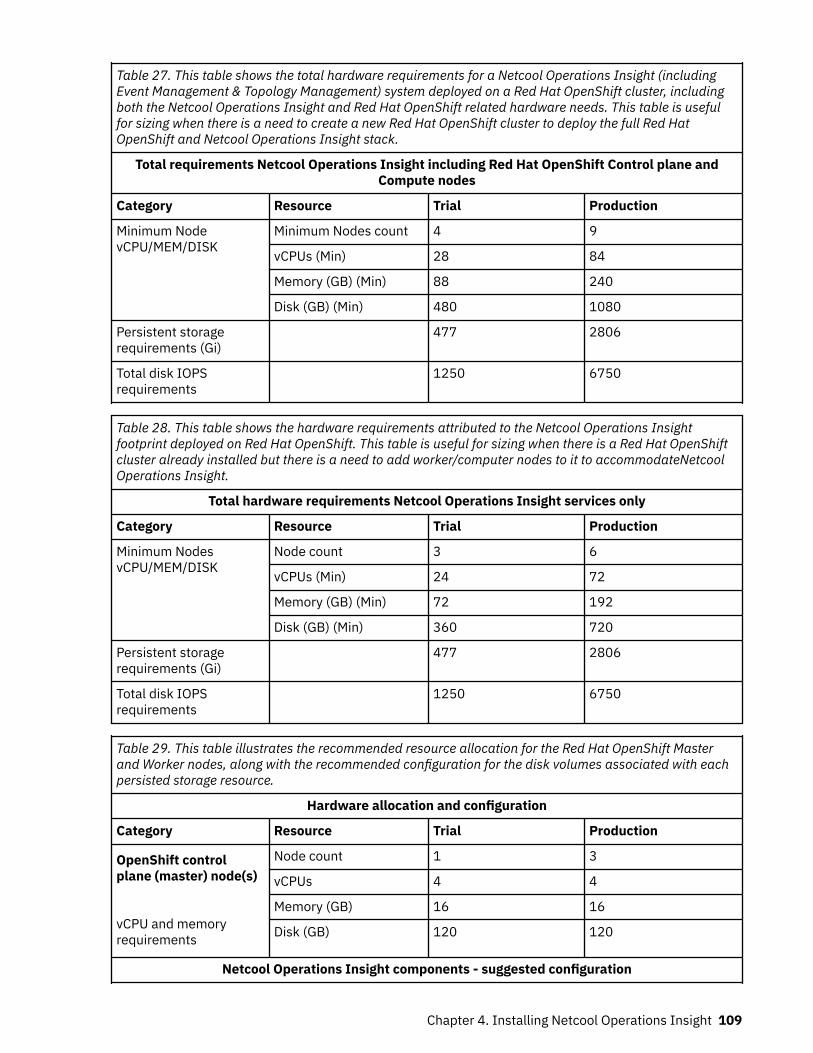
Table 27. This table shows the total hardware requirements for a Netcool Operations Insight (includingEvent Management & Topology Management) system deployed on a Red Hat OpenShift cluster, includingboth the Netcool Operations Insight and Red Hat OpenShift related hardware needs. This table is usefulfor sizing when there is a need to create a new Red Hat OpenShift cluster to deploy the full Red HatOpenShift and Netcool Operations Insight stack.
Total requirements Netcool Operations Insight including Red Hat OpenShift Control plane andCompute nodes
Category Resource Trial Production
Minimum NodevCPU/MEM/DISK
Minimum Nodes count 4 9
vCPUs (Min) 28 84
Memory (GB) (Min) 88 240
Disk (GB) (Min) 480 1080
Persistent storagerequirements (Gi)
477 2806
Total disk IOPSrequirements
1250 6750
Table 28. This table shows the hardware requirements attributed to the Netcool Operations Insightfootprint deployed on Red Hat OpenShift. This table is useful for sizing when there is a Red Hat OpenShiftcluster already installed but there is a need to add worker/computer nodes to it to accommodateNetcoolOperations Insight.
Total hardware requirements Netcool Operations Insight services only
Category Resource Trial Production
Minimum NodesvCPU/MEM/DISK
Node count 3 6
vCPUs (Min) 24 72
Memory (GB) (Min) 72 192
Disk (GB) (Min) 360 720
Persistent storagerequirements (Gi)
477 2806
Total disk IOPSrequirements
1250 6750
Table 29. This table illustrates the recommended resource allocation for the Red Hat OpenShift Masterand Worker nodes, along with the recommended configuration for the disk volumes associated with eachpersisted storage resource.
Hardware allocation and configuration
Category Resource Trial Production
OpenShift controlplane (master) node(s)
vCPU and memoryrequirements
Node count 1 3
vCPUs 4 4
Memory (GB) 16 16
Disk (GB) 120 120
Netcool Operations Insight components - suggested configuration
Chapter 4. Installing Netcool Operations Insight 109
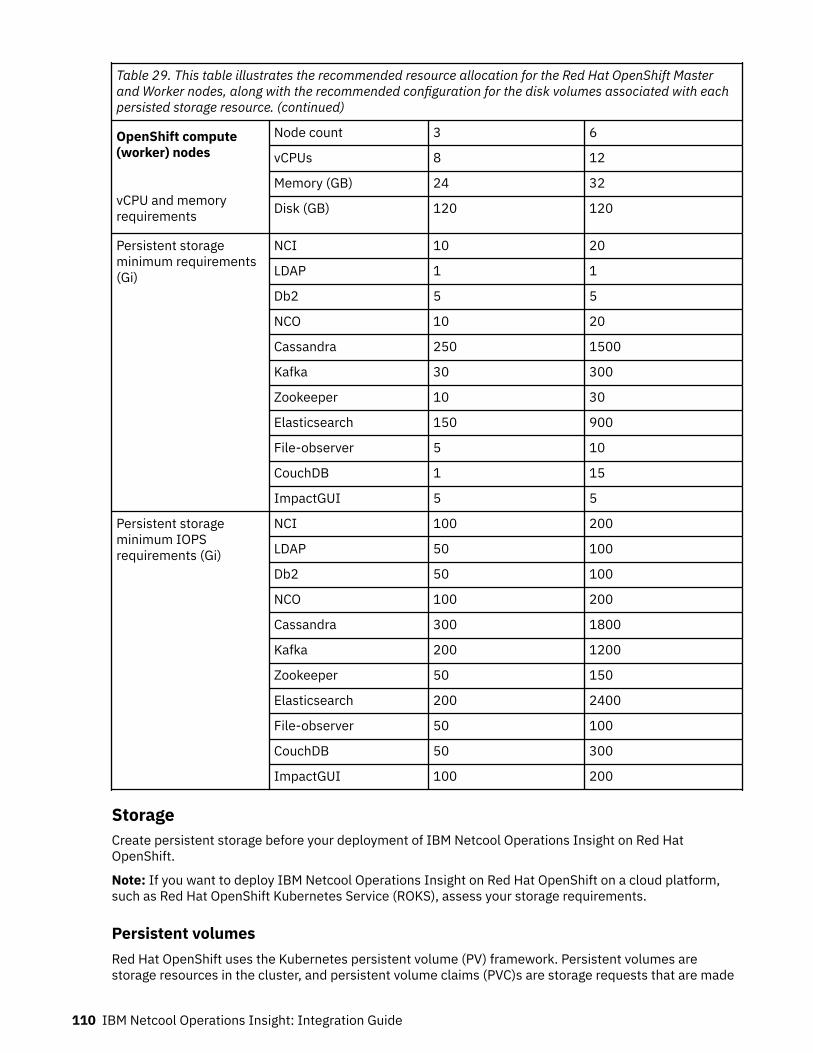
Table 29. This table illustrates the recommended resource allocation for the Red Hat OpenShift Masterand Worker nodes, along with the recommended configuration for the disk volumes associated with eachpersisted storage resource. (continued)
OpenShift compute(worker) nodes
vCPU and memoryrequirements
Node count 3 6
vCPUs 8 12
Memory (GB) 24 32
Disk (GB) 120 120
Persistent storageminimum requirements(Gi)
NCI 10 20
LDAP 1 1
Db2 5 5
NCO 10 20
Cassandra 250 1500
Kafka 30 300
Zookeeper 10 30
Elasticsearch 150 900
File-observer 5 10
CouchDB 1 15
ImpactGUI 5 5
Persistent storageminimum IOPSrequirements (Gi)
NCI 100 200
LDAP 50 100
Db2 50 100
NCO 100 200
Cassandra 300 1800
Kafka 200 1200
Zookeeper 50 150
Elasticsearch 200 2400
File-observer 50 100
CouchDB 50 300
ImpactGUI 100 200
StorageCreate persistent storage before your deployment of IBM Netcool Operations Insight on Red HatOpenShift.
Note: If you want to deploy IBM Netcool Operations Insight on Red Hat OpenShift on a cloud platform,such as Red Hat OpenShift Kubernetes Service (ROKS), assess your storage requirements.
Persistent volumesRed Hat OpenShift uses the Kubernetes persistent volume (PV) framework. Persistent volumes arestorage resources in the cluster, and persistent volume claims (PVC)s are storage requests that are made
110 IBM Netcool Operations Insight: Integration Guide

on those PV resources by Netcool Operations Insight. For Netcool Operations Insight, these PVs can belocal volumes or vSphere volumes. For more information on persistent storage in OpenShift clusters, see
Understanding persistent storage.
Configuring storage classesDuring the installation, you are asked to specify the storage classes for components that requirepersistence. If you are configuring persistent volumes with local storage, then the installationautomatically provides scripts to create persistent volumes and storage classes. If you are not using localstorage, then you must create the persistent volumes and storage classes yourself, or use a preexistingstorage class.
Check which storage classes are configured on your cluster by using the command oc get sc. Thiscommand lists all available classes to choose from on the cluster. If no storage classes exist, then askyour cluster administrator to configure a storage class by following the guidance in the OpenShiftdocumentation, at the following links.
• Dynamic provisioning.
• Defining a StorageClass.
Configuring storage Security Context Constraint (SCC)Before configuring storage, you need to determine and declare your storage SCC for a chart running in anon-root environment across a number of storage solutions. For more information about how to secureyour storage environment, see the OpenShift documentation: Managing security context constraints .
Persistent volume size requirementsTable 1 shows information about persistent volume size and access mode requirements for a fulldeployment.
Table 30. Persistent volume size requirements
Name Trial Production Recommendedsize perreplica(trial)
Recommended size perreplica(production)
Accessmode
User fsGroup
cassandra 1 3 50Gi 150Gi ReadWriteOnce
1001 2001
cassandra-bak 1 3 50Gi 100Gi ReadWriteOnce
1001 2001
cassandra-topology
1 3 50Gi 150Gi ReadWriteOnce
1001 2001
cassandra-topology-bak
1 3 50Gi 100Gi ReadWriteOnce
1001 2001
kafka 3 6 50Gi 50Gi ReadWriteOnce
1001 2001
zookeeper 1 3 5Gi 10Gi ReadWriteOnce
1001 2001
couchdb 1 3 20Gi 20Gi ReadWriteOnce
1001 2001
db2 1 1 5Gi 5Gi ReadWriteOnce
1001 2001
Chapter 4. Installing Netcool Operations Insight 111
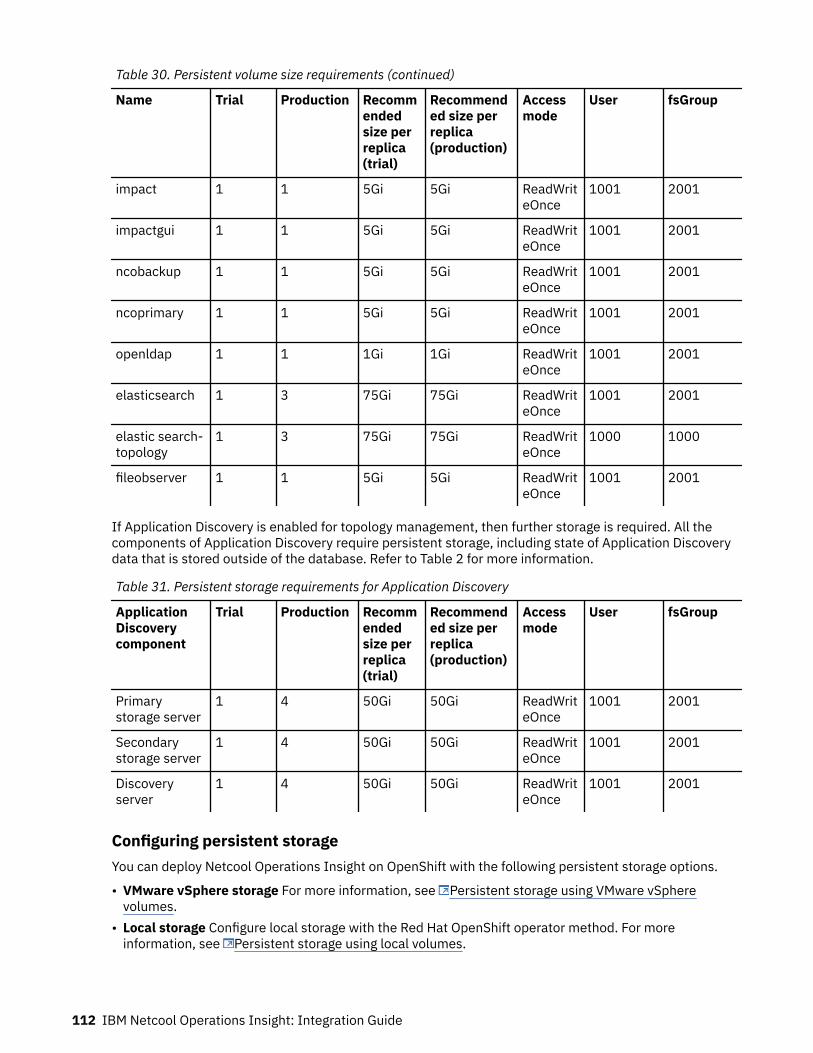
Table 30. Persistent volume size requirements (continued)
Name Trial Production Recommendedsize perreplica(trial)
Recommended size perreplica(production)
Accessmode
User fsGroup
impact 1 1 5Gi 5Gi ReadWriteOnce
1001 2001
impactgui 1 1 5Gi 5Gi ReadWriteOnce
1001 2001
ncobackup 1 1 5Gi 5Gi ReadWriteOnce
1001 2001
ncoprimary 1 1 5Gi 5Gi ReadWriteOnce
1001 2001
openldap 1 1 1Gi 1Gi ReadWriteOnce
1001 2001
elasticsearch 1 3 75Gi 75Gi ReadWriteOnce
1001 2001
elastic search-topology
1 3 75Gi 75Gi ReadWriteOnce
1000 1000
fileobserver 1 1 5Gi 5Gi ReadWriteOnce
1001 2001
If Application Discovery is enabled for topology management, then further storage is required. All thecomponents of Application Discovery require persistent storage, including state of Application Discoverydata that is stored outside of the database. Refer to Table 2 for more information.
Table 31. Persistent storage requirements for Application Discovery
ApplicationDiscoverycomponent
Trial Production Recommendedsize perreplica(trial)
Recommended size perreplica(production)
Accessmode
User fsGroup
Primarystorage server
1 4 50Gi 50Gi ReadWriteOnce
1001 2001
Secondarystorage server
1 4 50Gi 50Gi ReadWriteOnce
1001 2001
Discoveryserver
1 4 50Gi 50Gi ReadWriteOnce
1001 2001
Configuring persistent storageYou can deploy Netcool Operations Insight on OpenShift with the following persistent storage options.
• VMware vSphere storage For more information, see Persistent storage using VMware vSpherevolumes.
• Local storage Configure local storage with the Red Hat OpenShift operator method. For moreinformation, see Persistent storage using local volumes.
112 IBM Netcool Operations Insight: Integration Guide
• Any storage that implements the Container Storage Interface (CSI) or Red Hat OpenShift ContainerStorage (OCS)For more information, see Configuring CSI volumes, and Red Hat OpenShift Container Storage.
Note: if local storage is used, the noi-cassandra-* and noi-cassandra-bak-* PVs must be on the samelocal node. Cassandra pods fail to bind to their PVCs if this requirement is not met.
Non-production deployments only: configuring persistent volumes with the localstorage scriptFor trial, demonstration or development systems, you can download the createStorageAllNodes.shscript from the IT Operations Management Developer Center http://ibm.biz/local_storage_script. Thisscript must not be used in production environments.
The script facilitates the creation of local storage PVs. The PVs are mapped volumes, which are mapped todirectories off the root file system on the parent node. The script also generates example SSH scripts thatcreate the directories on the local file system of the node. The SSH scripts create directories on the localhard disk that is associated with the virtual machine and are only suitable for proof of concept ordevelopment work.
Note: If local storage is used, the noi-cassandra-* and noi-cassandra-bak-* PVs must be on the samelocal node. Cassandra pods fail to bind to their PVCs if this requirement is not met.
Preparing your clusterPrepare your cluster for the installation of Netcool Operations Insight on Red Hat OpenShift.
Follow the steps in the table to prepare your cluster.
Table 32. Preparing your cluster
Step Action
1 Provision the required machines.The hardware architecture on which Netcool Operations Insight is installed must be AMD64.Kubernetes can have a mixture of worker nodes with different architectures, like AMD64, s390x (Linuxon System z®), and ARM8. For operating system and other detailed system requirements, search for thelatest version of the Netcool Operations Insight product in the Software Product Compatibility Reportswebsite: https://www.ibm.com/software/reports/compatibility/clarity/softwareReqsForProduct.html .
2 Download and install Red Hat OpenShift.Netcool Operations Insight must be installed by a user with administrative access on the cluster, soensure that you have access to an administrator account on the target Red Hat OpenShift cluster.
For Red Hat OpenShift documentation, see https://access.redhat.com/documentation/en-us/openshift_container_platform/4.6/
For Red Hat OpenShift videos, see: https://www.youtube.com/user/rhopenshift/videos
3 Create a custom namespace to deploy into.
oc create namespace namespace
Where namespace is the name of the custom namespace that you want to create.Optional: If you want multiple independent installations of Netcool Operations Insight within thecluster, then create multiple namespaces within your cluster. Run each installation in a separatenamespace. Additional disk space and worker nodes are required to support multiple installations.
Chapter 4. Installing Netcool Operations Insight 113
Table 32. Preparing your cluster (continued)
Step Action
4 You can restrict the Netcool Operations Insight pods in the namespace to run only on worker nodes witha specific tag. You can tag the workernodes adding the tag env=test or app=noi to the workernodes.For example, you can run the command:
oc label nodes <yournode> app=noi
and then edit the YAML on the Netcool Operations Insight namespace by adding the node-selectorto the annotations section. You can run the following command to edit the YAML:
oc edit ns <noi-instance-name>
The result is:
apiVersion: v1kind: Namespacemetadata: name: <noi-instance-name> annotations: scheduler.alpha.kubernetes.io/node-selector: app=noispec: {}status: {}
5 The Security Context Constraint (SCC) is created automatically but if it needs to be created manuallydue to cluster permission issues, you can:
• Create a service account named noi-service-account.
oc create serviceaccount noi-service-account -n namespace
Where namespace is the name of the custom namespace that you will deploy into.• Create a custom SCC. The Netcool Operations Insight operator requires a Security Context Constraint
(SCC) to be bound to the target service account prior to installation. All pods will use this SCC. An SCCconstrains the actions that a pod can perform. You can use either the predefined SCC, privileged,or you can create your own custom SCC. For more information on creating your own custom SCC, see“Example Security Context Constraint” on page 702.
If you create the SCC manually, when creating the custom resource for Netcool Operations Insight, youcan specify the following property to tell the operator not to create the SCC automatically:
helmValuesNOI: "global.rbac.createSCC": false
You also need to add permissions to the service account:
oc adm policy add-scc-to-user SCC system:serviceaccount:namespace:noi-service-account
Where
• SCC is either privileged or your own custom SCC.• namespace is the namespace that you want to deploy Netcool Operations Insight in.
114 IBM Netcool Operations Insight: Integration Guide
Table 32. Preparing your cluster (continued)
Step Action
6 Create a docker registry secret to enable your deployment to pull Netcool Operations Insight imagesfrom the IBM Entitled Registry.
1. Obtain the entitlement key that is assigned to your IBM ID which will grant you access to the IBMEntitled Registry. Log into https://myibm.ibm.com/products-services/containerlibrary with theaccount (username and password) that has entitlement to IBM software. The key that is displayed isthe key that will be used when accessing the Entitled Registry.
2. Select Copy key to copy the entitlement key to the clipboard, in the Entitlement keys section.3. Run the following command to create the docker registry secret:
oc create secret docker-registry noi-registry-secret --docker-username=cp--docker-password=entitlement_key --docker-server=cp.icr.io--namespace=namespace
Where:
• noi-registry-secret is the name of the secret that you are creating. Suggested value is noi-registry-secret.
• entitlement_key is the entitlement key that you copied in the previous step.• namespace is the namespace that you want to deploy Netcool Operations Insight in.
Note: This step assumes that the cluster has internet access to: cp.icr.io, which is IBM's EntitledRegistry. An exemption is typically made available for this along with other registries such asdocker.io. If a connection to these registries is not permitted due to security constraints, then aproduction grade Docker V2 compatible image registry must be provided and an airgap installationperformed to mirror the external image registries internally. For more information, see “InstallingNetcool Operations Insight in an offline environment (airgap)” on page 121 for a full cloud install, or“Installing cloud native components in an offline environment (airgap)” on page 165 for a hybrid install.
7 If you manually created the SCC in step 5, complete this step:
Add the registry secret to your service account
oc patch serviceaccount noi-service-account -p '{"imagePullSecrets": [{"name": "noi-registry-secret"}]}' -n namespace
Where
• noi-registry-secret is the name of the Docker registry secret that you created in the previous step.Suggested value is noi-registry-secret
• namespace is the namespace that you want to deploy Netcool Operations Insight in.
Chapter 4. Installing Netcool Operations Insight 115
Table 32. Preparing your cluster (continued)
Step Action
8 Ensure that your Red Hat OpenShift environment is updated to allow network policies to functioncorrectly.In some Red Hat OpenShift environments an additional configuration is required to allow external trafficto reach the routes. This is due to the required addition of network policies to secure podcommunication traffic. For example, if you are attempting to access a route which returns a "503Application Not Available" error, then a network policy may be blocking the traffic. Check if theingresscontroller is configured with the endpointPublishingStrategy: HostNetwork valueby running the command
oc get ingresscontroller default -n openshift-ingress-operator -o yaml
If endpointPublishingStrategy.type is set to HostNetwork, then the network policy will notwork against routes unless the default namespace contains the selector label. To allow traffic, add alabel to the default namespace by running the command:
oc patch namespace default --type=json -p '[{"op":"add","path":"/metadata/labels","value":{"network.openshift.io/policy-group":"ingress"}}]'
For more information, see https://docs.openshift.com/container-platform/4.5/networking/network_policy/about-network-policy.html .
Configuring authenticationPasswords are stored in secrets. Manually create the passwords and secrets that are required by IBMNetcool Operations Insight prior to install, or let the installer generate the required passwords andsecrets for you.
Overview of required secretsThe following secrets are required for the IBM Netcool Operations Insight installation.
Users requiring password Corresponding secret Data key(s) in secret
smadmin release_name-was-secret WAS_PASSWORD
impactadmin release_name-impact-secret IMPACT_ADMIN_PASSWORD
icpadmin release_name-icpadmin-secret ICP_ADMIN_PASSWORD
OMNIbus root release_name-omni-secret OMNIBUS_ROOT_PASSWORD
LDAP admin release_name-ldap-secret LDAP_BIND_PASSWORD
couchdb release_name-couchdb-secret password username=rootsecret=couchdb
internal user release_name-ibm-hdm-common-ui-session-secret
session
internal user release_name-systemauth-secret password username=system
hdm release_name-cassandra-auth-secret
username password
redis release_name-ibm-redis-authsecret
username password
kafka release_name-kafka-admin-secret
username password
116 IBM Netcool Operations Insight: Integration Guide
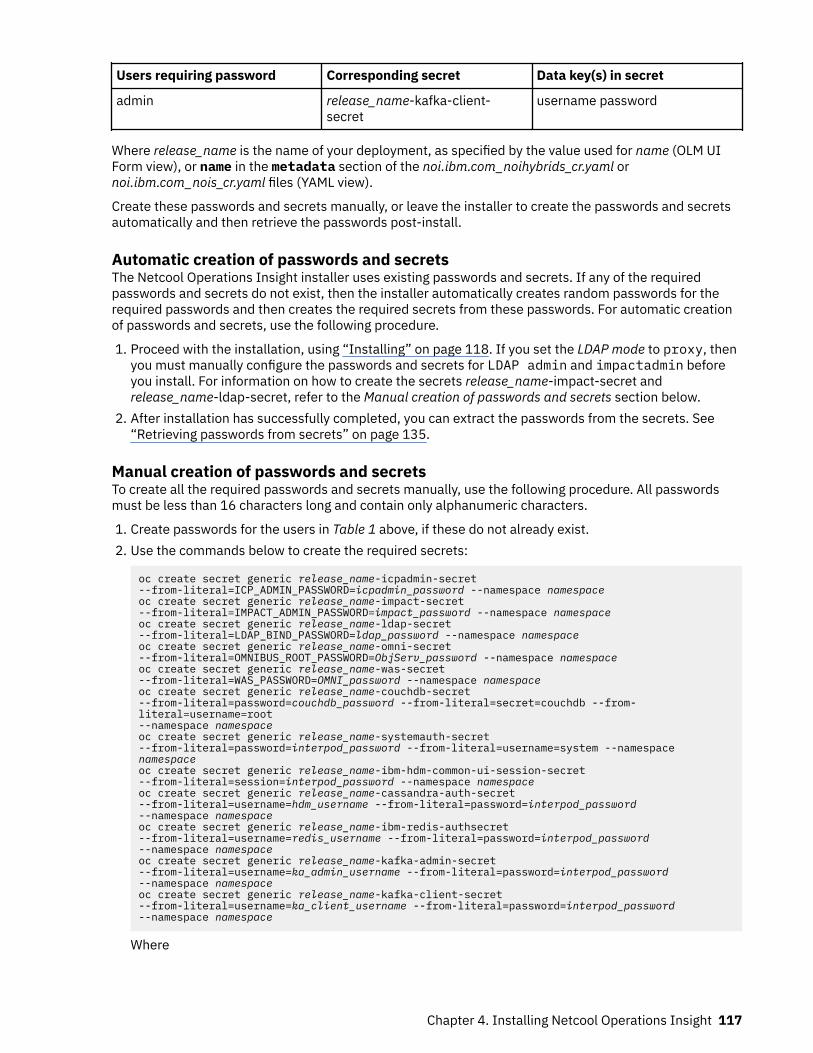
Users requiring password Corresponding secret Data key(s) in secret
admin release_name-kafka-client-secret
username password
Where release_name is the name of your deployment, as specified by the value used for name (OLM UIForm view), or name in the metadata section of the noi.ibm.com_noihybrids_cr.yaml ornoi.ibm.com_nois_cr.yaml files (YAML view).
Create these passwords and secrets manually, or leave the installer to create the passwords and secretsautomatically and then retrieve the passwords post-install.
Automatic creation of passwords and secretsThe Netcool Operations Insight installer uses existing passwords and secrets. If any of the requiredpasswords and secrets do not exist, then the installer automatically creates random passwords for therequired passwords and then creates the required secrets from these passwords. For automatic creationof passwords and secrets, use the following procedure.
1. Proceed with the installation, using “Installing” on page 118. If you set the LDAP mode to proxy, thenyou must manually configure the passwords and secrets for LDAP admin and impactadmin beforeyou install. For information on how to create the secrets release_name-impact-secret andrelease_name-ldap-secret, refer to the Manual creation of passwords and secrets section below.
2. After installation has successfully completed, you can extract the passwords from the secrets. See“Retrieving passwords from secrets” on page 135.
Manual creation of passwords and secretsTo create all the required passwords and secrets manually, use the following procedure. All passwordsmust be less than 16 characters long and contain only alphanumeric characters.
1. Create passwords for the users in Table 1 above, if these do not already exist.2. Use the commands below to create the required secrets:
oc create secret generic release_name-icpadmin-secret --from-literal=ICP_ADMIN_PASSWORD=icpadmin_password --namespace namespaceoc create secret generic release_name-impact-secret --from-literal=IMPACT_ADMIN_PASSWORD=impact_password --namespace namespaceoc create secret generic release_name-ldap-secret --from-literal=LDAP_BIND_PASSWORD=ldap_password --namespace namespaceoc create secret generic release_name-omni-secret --from-literal=OMNIBUS_ROOT_PASSWORD=ObjServ_password --namespace namespaceoc create secret generic release_name-was-secret --from-literal=WAS_PASSWORD=OMNI_password --namespace namespaceoc create secret generic release_name-couchdb-secret --from-literal=password=couchdb_password --from-literal=secret=couchdb --from-literal=username=root --namespace namespaceoc create secret generic release_name-systemauth-secret --from-literal=password=interpod_password --from-literal=username=system --namespace namespaceoc create secret generic release_name-ibm-hdm-common-ui-session-secret --from-literal=session=interpod_password --namespace namespaceoc create secret generic release_name-cassandra-auth-secret --from-literal=username=hdm_username --from-literal=password=interpod_password --namespace namespaceoc create secret generic release_name-ibm-redis-authsecret --from-literal=username=redis_username --from-literal=password=interpod_password --namespace namespaceoc create secret generic release_name-kafka-admin-secret --from-literal=username=ka_admin_username --from-literal=password=interpod_password --namespace namespaceoc create secret generic release_name-kafka-client-secret --from-literal=username=ka_client_username --from-literal=password=interpod_password --namespace namespace
Where
Chapter 4. Installing Netcool Operations Insight 117
• icpadmin_password is the password for icpadmin. For more information, see “Default users” onpage 468.
• impact_password is the password for impactadmin.• ldap_password is the password of your organization's LDAP server.• ObjServ_password is the root password to set for the Netcool/OMNIbus ObjectServer.• OMNI_password is the password for OMNIbus admin user.• couchdb_password is the password for the internal couch.• interpod_password is the password for communication between pods.• hdm_username default is hdm. Do not use cassandra.• redis_username default is redis.• ka_admin_username default is kafka.• ka_client_username default is admin.• release_name is the name that you will use for your Netcool Operations Insight on OpenShift
deployment in name (OLM UI Form view), or name in the metadata section of thenoi.ibm.com_nois_cr.yaml file (YAML view).
• namespace is the name of the namespace into which you want to install Netcool Operations Insight.3. Proceed with the installation, using “Installing” on page 118.
If you want to change a password after installation, see “Changing passwords and recreating secrets” onpage 136.
InstallingFollow these instructions to install Netcool Operations Insight on Red Hat OpenShift. You can install withthe Operator Lifecycle Manager (OLM) UI, or with the OLM UI and Netcool Operations Insight (CASE). Youcan also install offline in an airgapped environment. If you plan to install the optional topologymanagement extension, then this should be installed when Netcool Operations Insight is installed.
Installing Netcool Operations Insight with the Operator Lifecycle Manager(OLM) user interfaceUse these instructions to install IBM Netcool Operations Insight, using the Red Hat OpenShift OperatorLifecycle Manager (OLM) user interface (UI).
Before you beginEnsure that you have completed all the steps in “Preparing” on page 108.
The operator images for Netcool Operations Insight on Red Hat OpenShift are in the freely accessibleDockerHub (docker.io/ibmcom), and the operand images are in the IBM Entitled Registry (cp.icr.io), forwhich you require an entitlement key.
If you want to verify the origin of the catalog, then use the OLM UI and CASE install method instead. Formore information, see “Installing Netcool Operations Insight with the Operator Lifecycle Manager (OLM)user interface and CASE (Container Application Software for Enterprises)” on page 120.
For more information about the OLM, see https://access.redhat.com/documentation/en-us/openshift_container_platform/4.6/html/operators/understanding-operators#operator-lifecycle-manager-olm .
ProcedureCreate a Catalog source for Netcool Operations Insight
1. From the Red Hat OpenShift OLM UI, navigate to Administration > Cluster Settings, and then selectthe OperatorHub configuration resource under the Global Configuration tab.
118 IBM Netcool Operations Insight: Integration Guide
2. Click the Create Catalog Source button under the Sources tab. Provide the Netcool OperationsInsight catalog source name and the image URL, docker.io/ibmcom/ibm-operator-catalog:latest. Then select the Create button.
3. The noi catalog source appears. Refresh the screen after a few minutes, and ensure that the # ofoperators count is 1.
4. Edit the catalog source by adding the following lines to the spec:
updateStrategy: registryPoll: interval: 45m
Install the Netcool Operations Insight Operator5. Navigate to Operators > OperatorHub, and then search for and select the Netcool Operations Insight
operator. Select the Install button.6. Select the namespace that you created in “Preparing your cluster” on page 113 to install the operator
into. Do not use namespaces that are owned by Kubernetes or OpenShift, such as kube-system ordefault.
7. Click the Install button.8. Navigate to Operators > Installed Operators, and view the Netcool Operations Insight operator. It
takes a few minutes to install. Ensure that the status of the installed Netcool Operations Insightoperator is Succeeded before continuing.
Create a Netcool Operations Insight instance9. From the Red Hat OpenShift OLM UI, navigate to Operators > Installed Operators, and select the
Netcool Operations Insight operator. Under Provided APIs > Cloud Deployment select CreateInstance.
10. From the Red Hat OpenShift OLM UI, use the YAML view or the Form view to configure the propertiesfor the Netcool Operations Insight deployment. For more information about configurable propertiesfor a cloud only deployment, see “Cloud operator properties” on page 127.
11. Select the Create button.12. Under the All Instances tab, a Netcool Operations Insight instance appears.
To monitor the status of the installation, see “Monitoring cloud installation progress” on page 125.
Note:
• Changing an existing deployment from a Trial deployment type to a Production deployment type isnot supported.
• Changing an instance's deployment parameters in the Form view is not supported post deployment.• If you update custom secrets in the OLM console, the crypto key is corrupted and the command to
encrypt passwords does not work. Only update custom secrets with the CLI. For more informationabout storing a certificate as a secret, see https://www.ibm.com/support/knowledgecenter/SS9LQB_1.1.10/LoadingData/t_asm_obs_configuringsecurity.html
What to do next• To enable or disable a feature or observer after installation edit the Netcool Operations Insight instance
by running the command:
oc edit noi <noi-instance-name>
Where <noi-instance-name> is the name of the deployment that you want to change.
You can then select to enable or disable the feature or observer. When you disable features postinstallation, the resource is not automatically deleted. To find out if the feature is deleted, you mustcheck the operator log.
Chapter 4. Installing Netcool Operations Insight 119
Installing Netcool Operations Insight with the Operator Lifecycle Manager(OLM) user interface and CASE (Container Application Software forEnterprises)Use these instructions to install IBM Netcool Operations Insight, with the Container Application Softwarefor Enterprises (CASE) and the Red Hat OpenShift Operator Lifecycle Manager (OLM) user interface (UI).This installation method is similar to installing with the OLM UI, but CASE creates the Netcool OperationsInsight Catalog source and installs the Netcool Operations Insight Operator for you.
Before you beginEnsure that you have completed all the steps in “Preparing” on page 108.
The operator images for Netcool Operations Insight on Red Hat OpenShift are in the freely accessibleDockerHub (docker.io/ibmcom), and the operand images are in the IBM Entitled Registry (cp.icr.io), forwhich you require an entitlement key. The CASE bundle is available from IBM cloudPaks.
For more information about the OLM, see https://access.redhat.com/documentation/en-us/openshift_container_platform/4.6/html/operators/understanding-operators#operator-lifecycle-manager-olm .
ProcedureGet the Netcool Operations Insight CASE.
1. Download the command-line tool cloudctl version 3.4.x or 3.5.x.Download IBM® Cloud Pak CLI (cloudctl) from https://github.com/IBM/cloud-pak-cli/releases.cloudctl verifies the integrity of the Netcool Operations Insight CASE's digital signature by default.If you want to verify the cloudctl binary, follow the instructions in https://github.com/IBM/cloud-pak-cli#check-certificatekey-validity. Extract the cloudctl binary, give it executable permissions,and ensure that it is in your PATH.
2. Download the Netcool Operations Insight CASE bundle (ibm-netcool-prod) to your Red HatOpenShift cluster.
cloudctl case save --case ibm-netcool-prod --outputdir destination_dir --repo https://raw.githubusercontent.com/IBM/cloud-pak/master/repo/case
Where destination_dir is a directory of your choosing, for example /tmp/cases.
3. Extract the Netcool Operations Insight CASE bundle.
tar -xvf destination_dir/ibm-netcool-prod*.tgz
where destination_dir is the directory that you downloaded the CASE bundle into in the previous step.Install the Netcool Operations Insight Catalog and Operator
4. Install the Catalog using CASE.
cloudctl case launch \ --case ibm-netcool-prod \ --namespace namespace \ --inventory noiOperatorSetup \ --action install-catalog
Where namespace is the custom namespace to be used for your deployment, that you created whenyou prepared your cluster.
5. Verify the Netcool Operations Insight Catalog Source.From the Red Hat OpenShift OLM UI, navigate to Administration > Cluster Settings, and then selectthe OperatorHub configuration resource under the Global Configuration tab. Verify that the ibm-noi-catalog catalog source is present.
6. Install the Netcool Operations Insight operator using CASE.
120 IBM Netcool Operations Insight: Integration Guide
cloudctl case launch \ --case ibm-netcool-prod \ --namespace namespace \ --inventory noiOperatorSetup \ --action install-operator \ --args "--secret noi-registry-secret"
Where
• namespace is the custom namespace to be used for your deployment.• noi-registry-secret is the secret for accessing the IBM Entitled Registry that you created when you
prepared your cluster.7. Verify the Netcool Operations Insight operator.
From the Red Hat OpenShift OLM UI, navigate to Operators > Installed Operators, and verify thatthe status of the Netcool Operations Insight operator is Succeeded.
Create a Netcool Operations Insight instance.8. From the Red Hat OpenShift OLM UI, navigate to Operators > Installed Operators, and select the
Netcool Operations Insight operator. Under Provided APIs > Cloud Deployment select CreateInstance.
9. From the Red Hat OpenShift OLM UI, use the YAML view or the Form view to configure the propertiesfor the Netcool Operations Insight deployment. For more information about configurable propertiesfor a cloud only deployment, see “Cloud operator properties” on page 127.
10. Select the Create button.11. Under the All Instances tab, a Netcool Operations Insight instance appears.
To monitor the status of the installation, see “Monitoring cloud installation progress” on page 125.
Note:
• Changing an existing deployment from a Trial deployment type to a Production deployment type isnot supported.
• Changing an instance's deployment parameters in the Form view is not supported post deployment.• If you update custom secrets in the OLM console, the crypto key is corrupted and the command to
encrypt passwords does not work. Only update custom secrets with the CLI. For more informationabout storing a certificate as a secret, see https://www.ibm.com/support/knowledgecenter/SS9LQB_1.1.10/LoadingData/t_asm_obs_configuringsecurity.html
What to do next• To enable or disable a feature or observer after installation edit the Netcool Operations Insight instance
by running the command:
oc edit noi <noi-instance-name>
Where <noi-instance-name> is the name of the deployment that you want to change.
You can then select to enable or disable the feature or observer. When you disable features postinstallation, the resource is not automatically deleted. To find out if the feature is deleted, you mustcheck the operator log.
Installing Netcool Operations Insight in an offline environment (airgap)Follow these instructions to deploy an installation of Netcool Operations Insight on an offlineenvironment, using Container Application Software for Enterprises (CASE) and the Red Hat OpenShiftOperator Lifecycle Manager (OLM) .
Before you beginEnsure that you have completed all the steps in “Preparing” on page 108.
Chapter 4. Installing Netcool Operations Insight 121
The operator images for Netcool Operations Insight on Red Hat OpenShift are in the freely accessibleDockerHub (docker.io/ibmcom), and the operand images are in the IBM Entitled Registry (cp.icr.io), forwhich you require an entitlement key. The CASE bundle is available from IBM cloudPaks.
For more information about the OLM, see https://access.redhat.com/documentation/en-us/openshift_container_platform/4.6/html/operators/understanding-operators#operator-lifecycle-manager-olm .
ProcedureCreate a target registry to store all the images locally
1. Install and start a production grade Docker V2 compatible registry, such as Quay Enterprise, JFrogArtifactory, or Docker Registry.The target registry must be accessible by the Red Hat OpenShift cluster and the bastion host. TheRed Hat OpenShift internal registry is not supported.
2. Create a secret for access to the target registryRun the following command on your Red Hat OpenShift cluster.
oc create secret docker-registry target-registry-secret \ --docker-server=target_registry \ --docker-username=user \ --docker-password=password \ --namespace=target_namespace
Where:
• target_registry is the target registry that you created.• target-registry-secret is the name of the secret that you are creating. Suggested value is target-registry-secret.
• user and password are the credentials to access your target registry.• namespace is the namespace that you want to deploy Netcool Operations Insight in.
Prepare the bastion server3. Verify the bastion server's access.
Logon to the bastion machine and verify that it has access to:
• the public internet - to download the Netcool Operations Insight CASE and images from the sourceregistries.
• the target registry - where the images will be mirrored.• the target Red Hat OpenShift cluster - to install the Netcool Operations Insight operator.
4. Download and install the following onto the bastion server.
• cloudctl - Download IBM® Cloud Pak CLI (cloudctl) versions 3.4.x or 3.5.x from https://github.com/IBM/cloud-pak-cli/releases. cloudctl verifies the integrity of the Netcool OperationsInsight CASE's digital signature by default. If you want to verify the cloudctl binary, follow theinstructions in https://github.com/IBM/cloud-pak-cli#check-certificatekey-validity. Extract thecloudctl binary, give it executable permissions, and ensure that it is in your PATH.
• oc - Download and install the Openshift CLI (oc), V4.4.9 or higher. For more information, seehttps://docs.openshift.com/container-platform/4.5/cli_reference/openshift_cli/getting-started-cli.html#installing-the-cli .
• Docker - Install docker version 1.13.1 or above, and start the docker daemon. For moreinformation, see https://docs.docker.com/install/ .
Download the CASE bundle onto the bastion server5. Download the Netcool Operations Insight CASE bundle, (ibm-netcool-prod), into a local directory
on your bastion server.
cloudctl case save --case ibm-netcool-prod --outputdir destination_dir --repo https://raw.githubusercontent.com/IBM/cloud-pak/master/repo/case
122 IBM Netcool Operations Insight: Integration Guide
Where destination_dir is a directory of your choosing, for example ./CASES6. Extract the Netcool Operations Insight CASE bundle.
tar -xvf destination_dir/ibm-netcool-prod*.tgz
where destination_dir is the directory that you downloaded the CASE bundle into in the previous step.7. Verify that the Netcool Operations Insight CASE bundle, images.csv, and charts.csv have been
successfully downloaded on your bastion server, with the following command:
find destination_dir -type f
Where destination_dir is a directory of your choosing, for example ./CASESConfigure bastion server authentication
8. Set up access to the IBM Entitled Registry, cp.icr.io, which you will be pulling images from.Run the following command on your bastion server:
$ cloudctl case launch \ --case ibm-netcool-prod \ --namespace namespace \ --inventory noiOperatorSetup \ --action configure-creds-airgap \ --args "--registry cp.icr.io --user cp --pass password"
Where
• namespace is the custom namespace that you want to deploy Netcool Operations Insight into.• password is your IBM Entitled Registry entitlement key, as found when you prepared your cluster.
9. Set the target registry environment variable $TARGET_REGISTRYRun the following command on your bastion server:
export TARGET_REGISTRY=target_registry
Where target_registry is the docker registry where the images are stored.10. Set up access to the target image registry, which you will be copying images into.
Run the following command on your bastion server:
cloudctl case launch \ --case ibm-netcool-prod \ --namespace namespace \ --inventory noiOperatorSetup \ --action configure-creds-airgap \ --args "--registry $TARGET_REGISTRY --user username --pass password"
Where
• namespace is the custom namespace that you want to deploy Netcool Operations Insight into, ascreated when you prepared your cluster earlier.
• username and password are the credentials for accessing the target registry that you created.
The credentials are saved to ~/.airgap/secrets/<registry-name>.jsonMirror images from CASE to the target registry in the airgap environment11. Before mirroring images, set CLOUDCTL_CASE_USE_CATALOG_DIGEST by running the command:
export CLOUDCTL_CASE_USE_CATALOG_DIGEST=1
12. Mirror images from CASE to the target registry. This can take up to 2 hours.Run the following command on your bastion server:
$ cloudctl case launch \ --case ibm-netcool-prod \ --namespace namespace \ --inventory noiOperatorSetup \
Chapter 4. Installing Netcool Operations Insight 123
--action mirror-images \ --args "--registry $TARGET_REGISTRY --inputDir inputDir"
Where
• namespace is the custom namespace that you want to deploy Netcool Operations Insight into.• inputDir is the directory that you downloaded the CASE bundle into.
The images listed in the downloaded CASE, (images.csv), are copied to the target registry in theairgap environment.
Configure Red Hat OpenShift cluster for airgap13. Configure your Red Hat OpenShift Cluster for airgap. This step can take 90+ minutes.
Run the following command on your bastion server to create a global image pull secret for the targetregistry, and create a ImageSourceContentPolicy.
$ cloudctl case launch \ --case ibm-netcool-prod \ --namespace namespace \ --inventory noiOperatorSetup \ --action configure-cluster-airgap \ --args "--registry $TARGET_REGISTRY --inputDir inputDir"
Where
• namespace is the custom namespace to be used for your deployment.• inputDir is the directory containing the CASE bundle.
Warning:
• Cluster resources must adjust to the new pull secret, which can temporarily limit theusability of the cluster. Authorization credentials are stored in $HOME/.airgap/secretsand /tmp/airgap* to support this action.
• Applying ImageSourceContentPolicy causes cluster nodes to recycle.Install the Netcool Operations Insight catalog and operator14. Install the Catalog using CASE.
Run the following command on your bastion server:
cloudctl case launch \ --case ibm-netcool-prod \ --namespace namespace \ --inventory noiOperatorSetup \ --action install-catalog \ --args "--registry $TARGET_REGISTRY"
Where namespace is the custom namespace to be used for your deployment, that you created whenyou prepared your cluster.
15. Verify the Netcool Operations Insight Catalog Source.From the Red Hat OpenShift OLM UI, navigate to Administration > Cluster Settings, and then selectthe OperatorHub configuration resource under the Global Configuration tab. Verify that the ibm-noi-catalog catalog source is present.
16. Install the Netcool Operations Insight operator using CASE.Run the following command on your bastion server:
cloudctl case launch \ --case ibm-netcool-prod \ --namespace namespace \ --inventory noiOperatorSetup \ --action install-operator \ --args "--secret target-registry-secret"
Where
• namespace is the custom namespace to be used for your deployment.
124 IBM Netcool Operations Insight: Integration Guide
• target-registry-secret is the secret for accessing the target registry that you created in step 2.17. Verify the Netcool Operations Insight operator.
From the Red Hat OpenShift OLM UI, navigate to Operators > Installed Operators, and verify thatthe status of the Netcool Operations Insight operator is Succeeded.
Create a Netcool Operations Insight instance.18. From the Red Hat OpenShift OLM UI, navigate to Operators > Installed Operators, and select the
Netcool Operations Insight operator. Under Provided APIs > Cloud Deployment select CreateInstance.
19. From the Red Hat OpenShift OLM UI, use the YAML view or the Form view to configure the propertiesfor the Netcool Operations Insight deployment. For more information about configurable propertiesfor a cloud only deployment, see “Cloud operator properties” on page 127. If you are using Red HatOpenShift V4.4.5 or earlier, then you cannot use the Form view and you must use the YAML view.
20. Edit the Netcool Operations Insight properties to provide access to the target registry.a) Update spec.advanced.imagePullRepository so that it points to the target registry that you
created.b) Set spec.entitlementSecret to the target registry secret.
21. Select the Create button.22. Under the All Instances tab, a Netcool Operations Insight instance appears.
To monitor the status of the installation, see “Monitoring cloud installation progress” on page 125.
Note:
• Changing an existing deployment from a Trial deployment type to a Production deployment type isnot supported.
• Changing an instance's deployment parameters in the Form view is not supported post deployment.• If you update custom secrets in the OLM console, the crypto key is corrupted and the command to
encrypt passwords does not work. Only update custom secrets with the CLI. For more informationabout storing a certificate as a secret, see https://www.ibm.com/support/knowledgecenter/SS9LQB_1.1.10/LoadingData/t_asm_obs_configuringsecurity.html
What to do next• To enable or disable a feature or observer after installation edit the Netcool Operations Insight instance
by running the command:
oc edit noi <noi-instance-name>
Where <noi-instance-name> is the name of the deployment that you want to change.
You can then select to enable or disable the feature or observer. When you disable features postinstallation, the resource is not automatically deleted. To find out if the feature is deleted, you mustcheck the operator log.
Monitoring cloud installation progressUse this information as a guide to monitoring your cloud installation progress and validating the successof the installation.
About this taskDuring the cloud installation process various pods start up and move into Running or Completed state.The order of startup depends on the service with which the pod is associated. The order of startup isshown below. Examples of pod names within the different category are provided. Only a subset of pods isshown. The numbers shown in the pod name examples are purely random.
Chapter 4. Installing Netcool Operations Insight 125
Table 33. Order of pod startup
Order of pod startup Example pods
1 Pods associated with the noi cloud installationoperator and with core Netcool Operations Insightstateful sets and components
noi-operator-7bfd6554f9-tf448
noi-openldap-0
noi-ncoprimary-0
2 Pods associated with cloud native analyticscomponents
noi-register-cnea-mgmt-artifact-1601978700-7qscn
3 Pods associated with Incident managementfunctionality
cem-operator-8685947556-zsbvb
noi-ibm-cem-cem-users-796b97b896-m6s2w
noi-ibm-cem-eventpreprocessor-854cc57b9c-gd68c
noi-ibm-cem-incidentprocessor-7bf6dd4c94-4zq4c
4 Pods associated with topology managementfunctionality
asm-operator-69f968c985-5bk6d
The installation can take a number of hours depending on your network connection and the speed withwhich packages can be downloaded. Use this procedure to ensure that the installation progress isproceeding correctly and that it completes successfully.
Procedure1. After clicking the Create button to start the installation of your NOI instance, in the OLM user interface,
navigate to Operators > Installed Operators, and check that the status of your Netcool OperationsInsight instance is Phase: OK. Click on Netcool Operations Insight > All Instances to check it. Thismeans that the Netcool Operations Insight operator has started and is now in the process of startingup the various pods.
2. Check the progress of the pod startup operations by running the following command:
oc get pod
3. Once pods in all of the installation phases listed in Table 1: Order of pod startup have Ready orCompleted status, then retrieve the URLs for various Netcool Operations Insight components byrunning the following command and retrieving the URLs at the end of the output.
oc describe noi
or
oc describe noihybrid
4. Log into each of the URLs and confirm that are able to log into the associated user interfaces.
Service name at the end of the oc describecommand output
Corresponding Netcool Operations Insight GUIor component
WebGUI IBM Netcool/OMNIbus Web GUI
WAS Console WebSphere Application Server
Impact GUI Netcool/Impact GUI
126 IBM Netcool Operations Insight: Integration Guide
Service name at the end of the oc describecommand output
Corresponding Netcool Operations Insight GUIor component
Impact Servers Netcool/Impact servers
AIOPS Cloud GUI
Note: For a hybrid deployment, the only service available is AIOPS.
Cloud operator propertiesThis topic lists the operator properties for your pure Cloud-based IBM Netcool Operations Insightinstallation.
The following tables presents the properties in alphabetical order. Where no value is given for the default,this means that the default for that operator in the YAML file is empty.
Note: Ensure you use the correct format when inserting the storage sizes. The correct format is, forexample, "100Gi". Invalid characters or incorrect syntax for the parameters are not allowed.
Table 34. Installation properties
Property Description Default
backupRestore.enableAnalyticsBackups
If set to true, the cronjob that does the backups isactivated.
false
clusterDomain Use the fully qualified domain name (FQDN) toformulate the clusterDomain property, using thefollowing formula:
apps.clustername.*.*.com.
Note: The apps prefix must be included in theFQDN. For more information see this Red HatOpenShift documentation: https://docs.openshift.com/container-platform/4.5/installing/installing_bare_metal/installing-bare-metal-network-customizations.html#installation-dns-user-infra_installing-bare-metal-network-customizations
deploymentType Deployment type (trial or production). trial
entitlementSecret Entitlement secret to pull images.
license.accept Agreement to license. false
version Version. 1.6.3
global.networkpolicies.enabled
Set this property to false if you want to omit thenetwork policies from the installation.
true
advanced.antiAffinity
To prevent primary and backup server pods frombeing installed on the same worker node, set thisoption to true.
false
advanced.imagePullPolicy
The default pull policy is IfNotPresent, whichcauses the kubelet to skip pulling an image thatalready exists.
IfNotPresent
Chapter 4. Installing Netcool Operations Insight 127
Table 34. Installation properties (continued)
Property Description Default
advanced.imagePullRepository
Docker registry that all component images arepulled from. Defaults to the IBM Entitled Registry,cp.icr.io
Note: Trailing forward slash in the Image PullRepository parameters causes datalayer not todeploy. A blockage occurs in the installationprocess because the datalayer pod fails due tothe invalid image name. To fix the issue, you haveto uninstall and reinstall without the trailingforward slash.
cp.icr.io/cp/noi
helmValuesNOI.ibm-noi-bkuprestore.noibackuprestore.backupDestination.hostname
The destination hostname of the machine wherethe backups are copied to. (Optional)
false
helmValuesNOI.ibm-noi-bkuprestore.noibackuprestore.backupDestination.username
The username on the destination hostname thatdoes the SCP copy.
(Optional)
false
helmValuesNOI.ibm-noi-bkuprestore.noibackuprestore.backupDestination.directory
The directory on the destination hostname thatreceives the backups. (Optional)
false
helmValuesNOI.ibm-noi-bkuprestore.noibackuprestore.backupDestination.secretName
The Kubernetes secret name, which contains theprivate ssh key that is used to do the SCP. Thesecret key privatekey must be used to store thessh private key. (Optional)
It needs to be set up up front if you want to useSCP before the installation of Netcool OperationsInsight.
false
helmValuesNOI.ibm-noi-bkuprestore.noibackuprestore.schedule
It is the Cron schedule format that is used todetermine how often the backups are taken. See https://en.wikipedia.org/wiki/Cron for more detailson this used approach for running scheduled runs.
Every 3 minutes
helmValuesNOI.ibm-noi-bkuprestore.noibackuprestore.claimName
The PVC claim name that is used to store thebackups. An empty value implies no use ofKubernetes persistent storage. (Optional)
The PVC needs to be set up up front before the NOIdeployment if Kubernetes persistent storage isrequired.
false
128 IBM Netcool Operations Insight: Integration Guide
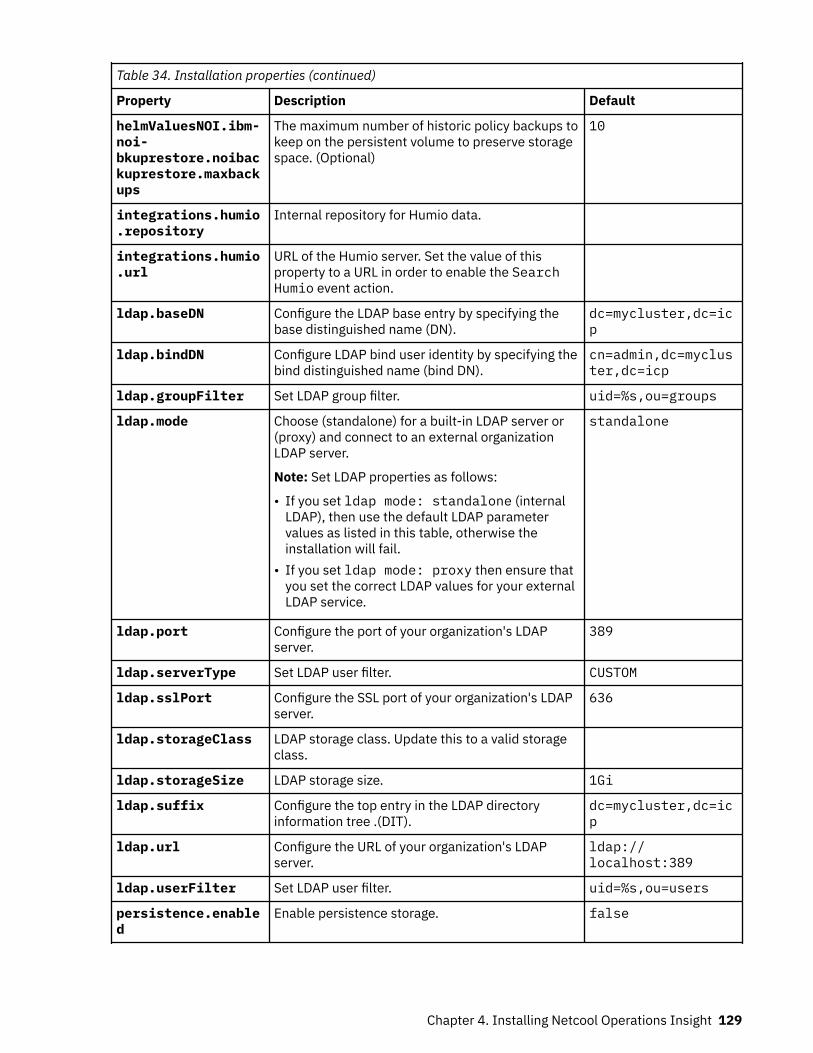
Table 34. Installation properties (continued)
Property Description Default
helmValuesNOI.ibm-noi-bkuprestore.noibackuprestore.maxbackups
The maximum number of historic policy backups tokeep on the persistent volume to preserve storagespace. (Optional)
10
integrations.humio.repository
Internal repository for Humio data.
integrations.humio.url
URL of the Humio server. Set the value of thisproperty to a URL in order to enable the SearchHumio event action.
ldap.baseDN Configure the LDAP base entry by specifying thebase distinguished name (DN).
dc=mycluster,dc=icp
ldap.bindDN Configure LDAP bind user identity by specifying thebind distinguished name (bind DN).
cn=admin,dc=mycluster,dc=icp
ldap.groupFilter Set LDAP group filter. uid=%s,ou=groups
ldap.mode Choose (standalone) for a built-in LDAP server or(proxy) and connect to an external organizationLDAP server.
Note: Set LDAP properties as follows:
• If you set ldap mode: standalone (internalLDAP), then use the default LDAP parametervalues as listed in this table, otherwise theinstallation will fail.
• If you set ldap mode: proxy then ensure thatyou set the correct LDAP values for your externalLDAP service.
standalone
ldap.port Configure the port of your organization's LDAPserver.
389
ldap.serverType Set LDAP user filter. CUSTOM
ldap.sslPort Configure the SSL port of your organization's LDAPserver.
636
ldap.storageClass LDAP storage class. Update this to a valid storageclass.
ldap.storageSize LDAP storage size. 1Gi
ldap.suffix Configure the top entry in the LDAP directoryinformation tree .(DIT).
dc=mycluster,dc=icp
ldap.url Configure the URL of your organization's LDAPserver.
ldap://localhost:389
ldap.userFilter Set LDAP user filter. uid=%s,ou=users
persistence.enabled
Enable persistence storage. false
Chapter 4. Installing Netcool Operations Insight 129
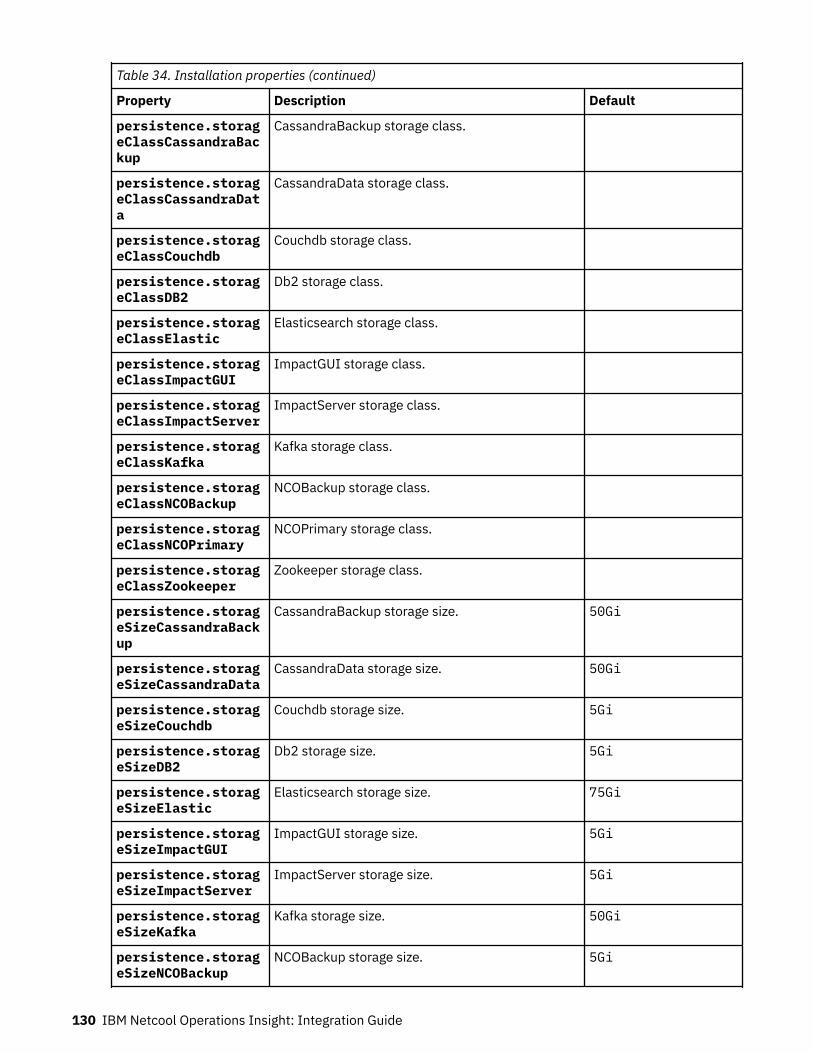
Table 34. Installation properties (continued)
Property Description Default
persistence.storageClassCassandraBackup
CassandraBackup storage class.
persistence.storageClassCassandraData
CassandraData storage class.
persistence.storageClassCouchdb
Couchdb storage class.
persistence.storageClassDB2
Db2 storage class.
persistence.storageClassElastic
Elasticsearch storage class.
persistence.storageClassImpactGUI
ImpactGUI storage class.
persistence.storageClassImpactServer
ImpactServer storage class.
persistence.storageClassKafka
Kafka storage class.
persistence.storageClassNCOBackup
NCOBackup storage class.
persistence.storageClassNCOPrimary
NCOPrimary storage class.
persistence.storageClassZookeeper
Zookeeper storage class.
persistence.storageSizeCassandraBackup
CassandraBackup storage size. 50Gi
persistence.storageSizeCassandraData
CassandraData storage size. 50Gi
persistence.storageSizeCouchdb
Couchdb storage size. 5Gi
persistence.storageSizeDB2
Db2 storage size. 5Gi
persistence.storageSizeElastic
Elasticsearch storage size. 75Gi
persistence.storageSizeImpactGUI
ImpactGUI storage size. 5Gi
persistence.storageSizeImpactServer
ImpactServer storage size. 5Gi
persistence.storageSizeKafka
Kafka storage size. 50Gi
persistence.storageSizeNCOBackup
NCOBackup storage size. 5Gi
130 IBM Netcool Operations Insight: Integration Guide

Table 34. Installation properties (continued)
Property Description Default
persistence.storageSizeNCOPrimary
NCOPrimary storage size. 5Gi
persistence.storageSizeZookeeper
Zookeeper storage size. 5Gi
serviceContinuity.enableAnalyticsBackup
If set to true, the cronjob that does the backups isactivated.
false
topology.appDisco.db2database
Name of Db2 instance. Default value: taddm
topology.appDisco.db2archuser
Name of database archive user. Default value:archuser
topology.appDisco.dbport
Post of Db2 server. Default value: 50000
topology.appDisco.db2user
Name of database user. Default value: db2inst1
topology.appDisco.scaleSSS
Value must be greater than 0. Default value: 1
topology.appDisco.scaleDS
Value must be greater than 0. Default value: 1
topology.appDisco.enabled
Enable Application Discovery services and itsobserver.
false
topology.appDisco.dburl
Db2 Host URL for Application Discovery.
topology.appDisco.dbsecret
Db2 secret for Application Discovery.
topology.appDisco.secure
Enable secure connection to Db2 Host URL forApplication Discovery.
false
topology.appDisco.certSecret
This secret must contain the Db2 certificate by thename tls.crt Applicable only if the propertyname is secure.
topology.enabled Enable topology. true
topology.netDisco Enable Network Discovery services and itsobserver.
false
Chapter 4. Installing Netcool Operations Insight 131
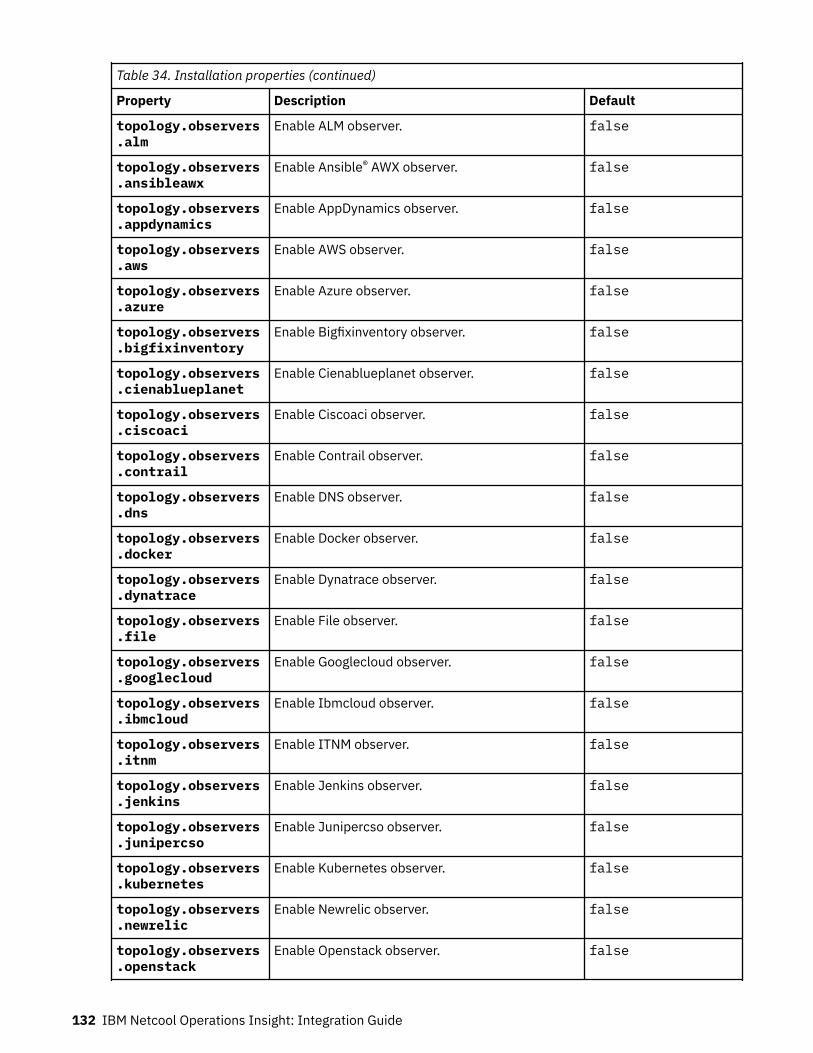
Table 34. Installation properties (continued)
Property Description Default
topology.observers.alm
Enable ALM observer. false
topology.observers.ansibleawx
Enable Ansible® AWX observer. false
topology.observers.appdynamics
Enable AppDynamics observer. false
topology.observers.aws
Enable AWS observer. false
topology.observers.azure
Enable Azure observer. false
topology.observers.bigfixinventory
Enable Bigfixinventory observer. false
topology.observers.cienablueplanet
Enable Cienablueplanet observer. false
topology.observers.ciscoaci
Enable Ciscoaci observer. false
topology.observers.contrail
Enable Contrail observer. false
topology.observers.dns
Enable DNS observer. false
topology.observers.docker
Enable Docker observer. false
topology.observers.dynatrace
Enable Dynatrace observer. false
topology.observers.file
Enable File observer. false
topology.observers.googlecloud
Enable Googlecloud observer. false
topology.observers.ibmcloud
Enable Ibmcloud observer. false
topology.observers.itnm
Enable ITNM observer. false
topology.observers.jenkins
Enable Jenkins observer. false
topology.observers.junipercso
Enable Junipercso observer. false
topology.observers.kubernetes
Enable Kubernetes observer. false
topology.observers.newrelic
Enable Newrelic observer. false
topology.observers.openstack
Enable Openstack observer. false
132 IBM Netcool Operations Insight: Integration Guide
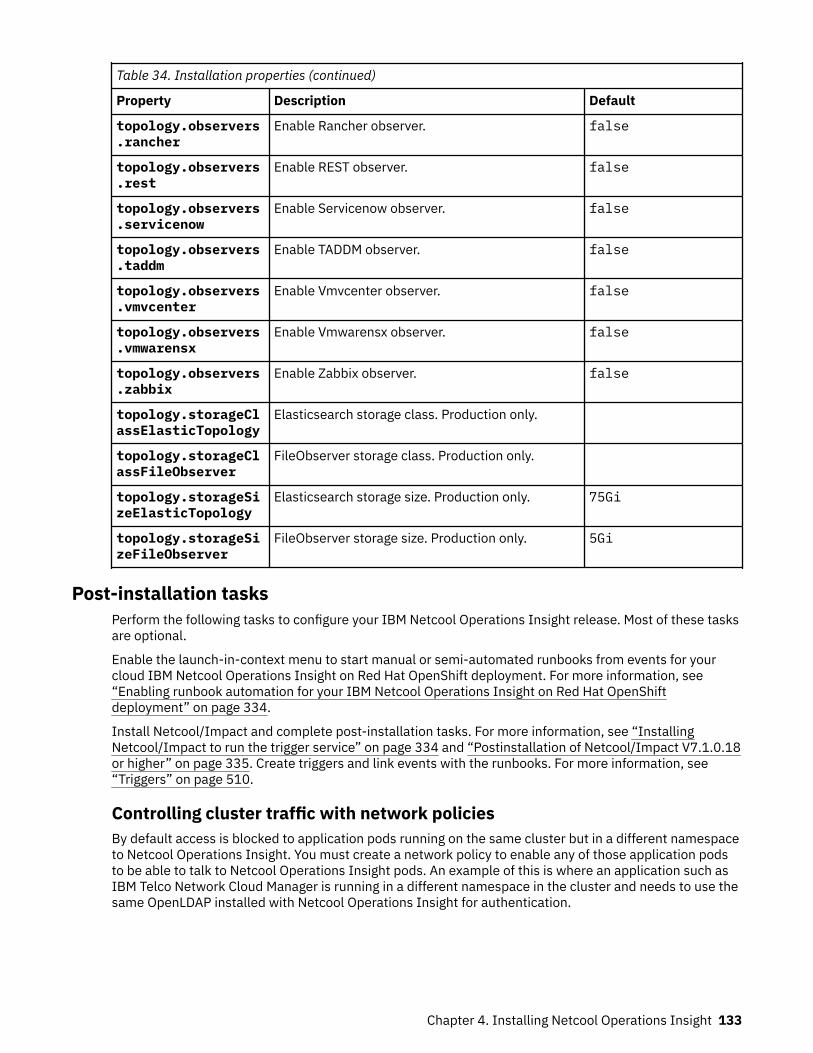
Table 34. Installation properties (continued)
Property Description Default
topology.observers.rancher
Enable Rancher observer. false
topology.observers.rest
Enable REST observer. false
topology.observers.servicenow
Enable Servicenow observer. false
topology.observers.taddm
Enable TADDM observer. false
topology.observers.vmvcenter
Enable Vmvcenter observer. false
topology.observers.vmwarensx
Enable Vmwarensx observer. false
topology.observers.zabbix
Enable Zabbix observer. false
topology.storageClassElasticTopology
Elasticsearch storage class. Production only.
topology.storageClassFileObserver
FileObserver storage class. Production only.
topology.storageSizeElasticTopology
Elasticsearch storage size. Production only. 75Gi
topology.storageSizeFileObserver
FileObserver storage size. Production only. 5Gi
Post-installation tasksPerform the following tasks to configure your IBM Netcool Operations Insight release. Most of these tasksare optional.
Enable the launch-in-context menu to start manual or semi-automated runbooks from events for yourcloud IBM Netcool Operations Insight on Red Hat OpenShift deployment. For more information, see“Enabling runbook automation for your IBM Netcool Operations Insight on Red Hat OpenShiftdeployment” on page 334.
Install Netcool/Impact and complete post-installation tasks. For more information, see “InstallingNetcool/Impact to run the trigger service” on page 334 and “Postinstallation of Netcool/Impact V7.1.0.18or higher” on page 335. Create triggers and link events with the runbooks. For more information, see“Triggers” on page 510.
Controlling cluster traffic with network policiesBy default access is blocked to application pods running on the same cluster but in a different namespaceto Netcool Operations Insight. You must create a network policy to enable any of those application podsto be able to talk to Netcool Operations Insight pods. An example of this is where an application such asIBM Telco Network Cloud Manager is running in a different namespace in the cluster and needs to use thesame OpenLDAP installed with Netcool Operations Insight for authentication.
Chapter 4. Installing Netcool Operations Insight 133
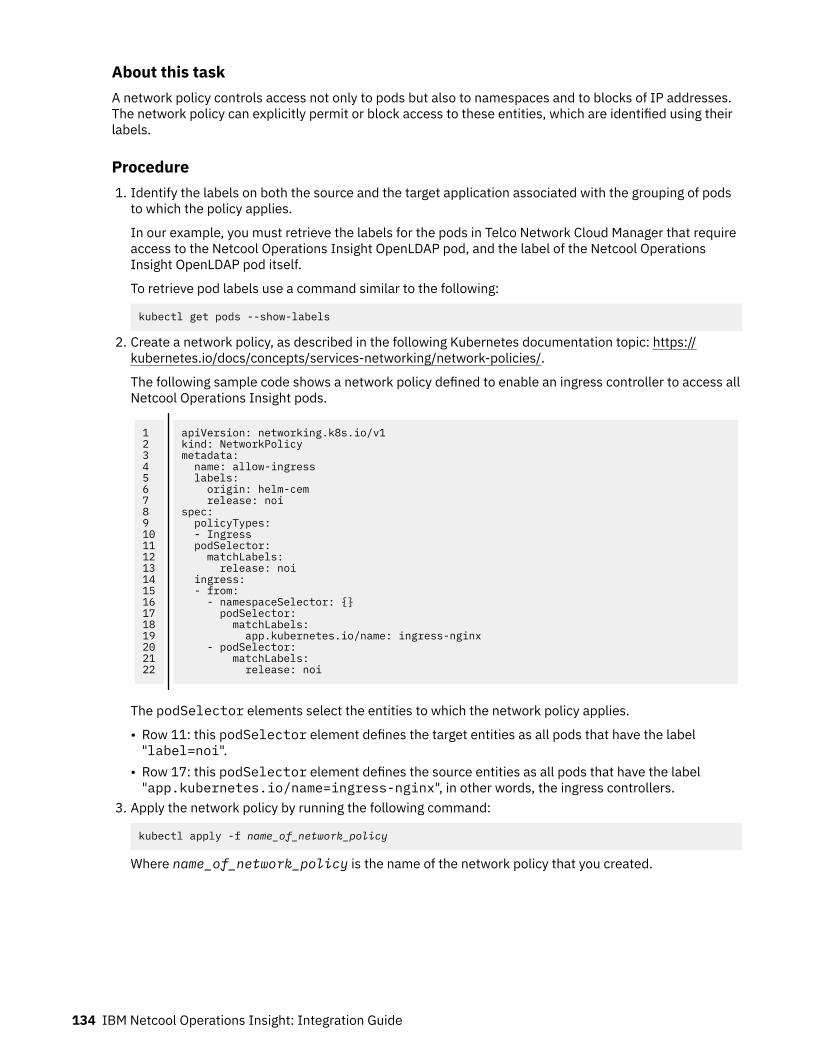
About this taskA network policy controls access not only to pods but also to namespaces and to blocks of IP addresses.The network policy can explicitly permit or block access to these entities, which are identified using theirlabels.
Procedure1. Identify the labels on both the source and the target application associated with the grouping of pods
to which the policy applies.
In our example, you must retrieve the labels for the pods in Telco Network Cloud Manager that requireaccess to the Netcool Operations Insight OpenLDAP pod, and the label of the Netcool OperationsInsight OpenLDAP pod itself.
To retrieve pod labels use a command similar to the following:
kubectl get pods --show-labels
2. Create a network policy, as described in the following Kubernetes documentation topic: https://kubernetes.io/docs/concepts/services-networking/network-policies/.
The following sample code shows a network policy defined to enable an ingress controller to access allNetcool Operations Insight pods.
12345678910111213141516171819202122
apiVersion: networking.k8s.io/v1kind: NetworkPolicymetadata: name: allow-ingress labels: origin: helm-cem release: noispec: policyTypes: - Ingress podSelector: matchLabels: release: noi ingress: - from: - namespaceSelector: {} podSelector: matchLabels: app.kubernetes.io/name: ingress-nginx - podSelector: matchLabels: release: noi
The podSelector elements select the entities to which the network policy applies.
• Row 11: this podSelector element defines the target entities as all pods that have the label"label=noi".
• Row 17: this podSelector element defines the source entities as all pods that have the label"app.kubernetes.io/name=ingress-nginx", in other words, the ingress controllers.
3. Apply the network policy by running the following command:
kubectl apply -f name_of_network_policy
Where name_of_network_policy is the name of the network policy that you created.
134 IBM Netcool Operations Insight: Integration Guide
Retrieving passwords from secrets(Optional) After a successful installation of IBM Netcool Operations Insight, passwords can be retrievedfrom the secrets that contain them.
About this taskTo retrieve a password from Netcool Operations Insight, use the following procedure.
icpadmin password
oc get secret release_name-icpadmin-secret -o json -n namespace | grep ICP_ADMIN_PASSWORD | cut -d : -f2 | cut -d '"' -f2 | base64 -d;echo
sysadmin password
oc get secret release_name-was-secret -o json -n namespace | grep WAS_PASSWORD | cut -d : -f2 | cut -d '"' -f2 | base64 -d;echo
impact admin password
oc get secret release_name-impact-secret -o json -n namespace | grep IMPACT_ADMIN_PASSWORD | cut -d : -f2 | cut -d '"' -f2 | base64 -d;echo
omnibus password
oc get secret release_name-omni-secret -o json -n namespace | grep OMNIBUS_ROOT_PASSWORD | cut -d : -f2 | cut -d '"' -f2 | base64 -d;echo
couchdb password
oc get secret release_name-couchdb-secret -o json -n namespace | grep password | cut -d : -f2 | cut -d '"' -f2 | base64 -d;echo
LDAP admin password
oc get secret release_name-ldap-secret -o json -n namespace | grep LDAP_BIND_PASSWORD | cut -d : -f2 | cut -d '"' -f2 | base64 -d;echo
Where
• release_name is the name of your deployment, as specified by the value used for name (OLM UI Formview), or name in the metadata section of the noi.ibm.com_noihybrids_cr.yaml ornoi.ibm.com_nois_cr.yaml files (YAML view).
• namespace is the name of the namespace in which Netcool Operations Insight is installed.
Creating users(Optional) In Netcool Operations Insight on OpenShift, all users must be created either in the openLDAPuser interface if you are running on the standalone LDAP pod that comes with Netcool Operations Insighton OpenShift, or on your enterprise LDAP server if you are running the LDAP proxy option. Users must notbe created in other Netcool Operations Insight components as these users will not be recognized inNetcool Operations Insight on OpenShift.
About this taskFor more information on how to create users using the openLDAP user interface, see “Administeringusers” on page 467.
Chapter 4. Installing Netcool Operations Insight 135
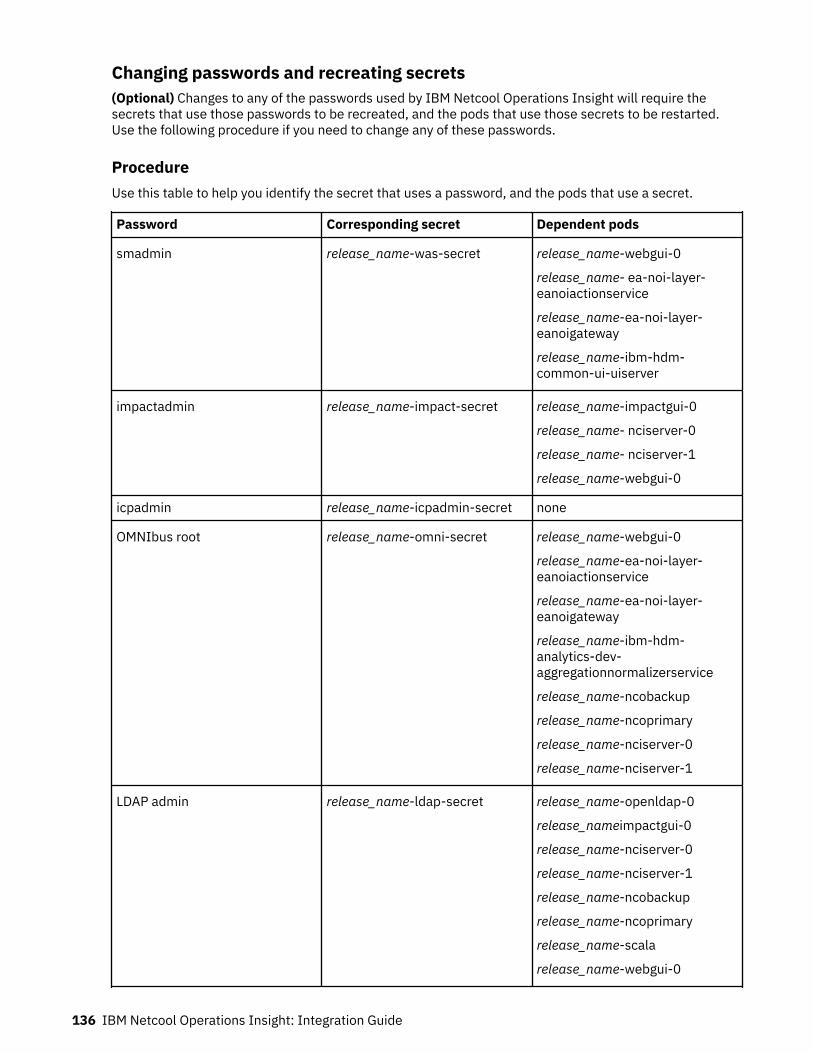
Changing passwords and recreating secrets(Optional) Changes to any of the passwords used by IBM Netcool Operations Insight will require thesecrets that use those passwords to be recreated, and the pods that use those secrets to be restarted.Use the following procedure if you need to change any of these passwords.
ProcedureUse this table to help you identify the secret that uses a password, and the pods that use a secret.
Password Corresponding secret Dependent pods
smadmin release_name-was-secret release_name-webgui-0
release_name- ea-noi-layer-eanoiactionservice
release_name-ea-noi-layer-eanoigateway
release_name-ibm-hdm-common-ui-uiserver
impactadmin release_name-impact-secret release_name-impactgui-0
release_name- nciserver-0
release_name- nciserver-1
release_name-webgui-0
icpadmin release_name-icpadmin-secret none
OMNIbus root release_name-omni-secret release_name-webgui-0
release_name-ea-noi-layer-eanoiactionservice
release_name-ea-noi-layer-eanoigateway
release_name-ibm-hdm-analytics-dev-aggregationnormalizerservice
release_name-ncobackup
release_name-ncoprimary
release_name-nciserver-0
release_name-nciserver-1
LDAP admin release_name-ldap-secret release_name-openldap-0
release_nameimpactgui-0
release_name-nciserver-0
release_name-nciserver-1
release_name-ncobackup
release_name-ncoprimary
release_name-scala
release_name-webgui-0
136 IBM Netcool Operations Insight: Integration Guide
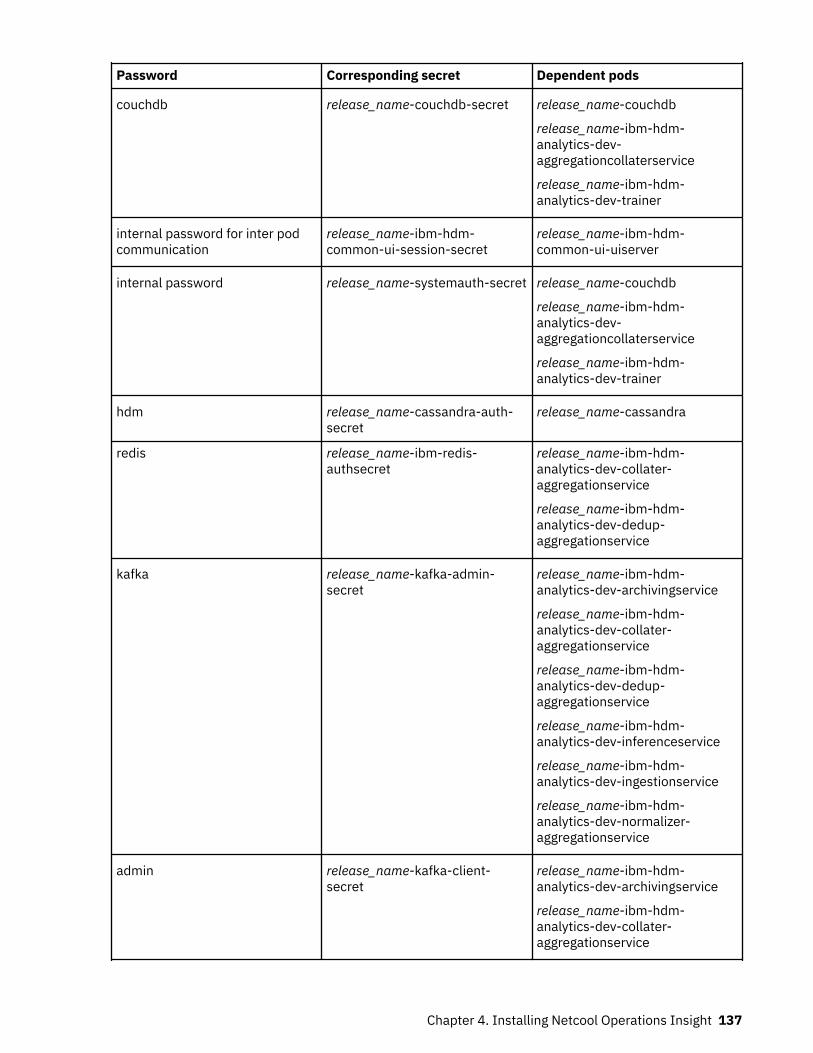
Password Corresponding secret Dependent pods
couchdb release_name-couchdb-secret release_name-couchdb
release_name-ibm-hdm-analytics-dev-aggregationcollaterservice
release_name-ibm-hdm-analytics-dev-trainer
internal password for inter podcommunication
release_name-ibm-hdm-common-ui-session-secret
release_name-ibm-hdm-common-ui-uiserver
internal password release_name-systemauth-secret release_name-couchdb
release_name-ibm-hdm-analytics-dev-aggregationcollaterservice
release_name-ibm-hdm-analytics-dev-trainer
hdm release_name-cassandra-auth-secret
release_name-cassandra
redis release_name-ibm-redis-authsecret
release_name-ibm-hdm-analytics-dev-collater-aggregationservice
release_name-ibm-hdm-analytics-dev-dedup-aggregationservice
kafka release_name-kafka-admin-secret
release_name-ibm-hdm-analytics-dev-archivingservice
release_name-ibm-hdm-analytics-dev-collater-aggregationservice
release_name-ibm-hdm-analytics-dev-dedup-aggregationservice
release_name-ibm-hdm-analytics-dev-inferenceservice
release_name-ibm-hdm-analytics-dev-ingestionservice
release_name-ibm-hdm-analytics-dev-normalizer-aggregationservice
admin release_name-kafka-client-secret
release_name-ibm-hdm-analytics-dev-archivingservice
release_name-ibm-hdm-analytics-dev-collater-aggregationservice
Chapter 4. Installing Netcool Operations Insight 137
Password Corresponding secret Dependent pods
release_name-ibm-hdm-analytics-dev-dedup-aggregationservice
release_name-ibm-hdm-analytics-dev-inferenceservice
release_name-ibm-hdm-analytics-dev-ingestionservice
release_name-ibm-hdm-analytics-dev-normalizer-aggregationservice
Where release_name is the name that you will use for your Netcool Operations Insight deployment inname (OLM UI install), or metadata.name in noi.ibm.com_noihybrids_cr.yaml (CLI install).
To change a password use the following procedure.1. Change the password that you wish to change.2. Use the table at the start of this topic to find the secret that corresponds to the password that has
been changed, and delete this secret.
oc delete secret secretname --namespace namespace
Where
• secretname is the name of the secret to be recreated.• namespace is the name of the namespace in which the secret to be recreated exists.
3. Recreate the secret with the desired new password.4. Use the table at the start of this topic to find which pods depend on the secret that you have recreated
and will require restarting.5. Restart the required pods using
oc delete pod podname
Where podname is the name of the pod that requires restarting.
Using custom certificates for routes(Optional) Red Hat OpenShift automatically generates TLS certificates for external routes, but you canuse your own certificate instead. Learn how to update external routes to use custom certificates onOpenShift. Internal TLS microservice communications are not affected.
You can update the OpenShift ingress to use a custom certificate for all external routes across the cluster.For more information, see https://docs.openshift.com/container-platform/4.5/authentication/certificates/replacing-default-ingress-certificate.html.
If required, you can add a custom certificate for a single external route. For more information, see https://docs.openshift.com/container-platform/4.5/networking/routes/secured-routes.html.
138 IBM Netcool Operations Insight: Integration Guide

Exposing an ObjectServer port in a Netcool Operations Insight on Red HatOpenShift deployment(Optional) Use this information to learn how to expose an ObjectServer port, and then verify that the portis exposed by sending events to it via a REST API.
Procedure1. Find the ConfigMap for the primary ObjectServer, as in the following example:
oc get configmap |grep objserv-agg-primarym101-objserv-agg-primary-config 2 5h24m
2. Edit the primary ObjectServer's ConfigMap.
oc edit configmap release_name-objserv-agg-primary-config
Where release_name is the name of your deployment, as specified by the value used for name (OLM UIForm view), or name in the metadata section of the noi.ibm.com_noihybrids_cr.yaml ornoi.ibm.com_nois_cr.yaml files (YAML view)..Edit the primary ObjectServer's ConfigMap to include the following:
data: agg-p-props-append: | NRestOS.Enable: TRUE NHttpd.EnableHTTP: TRUE NHttpd.ListeningPort: 8080
3. Restart the ncoprimary pod.
oc delete pod release_name-ncoprimary-0
Where release_name is the name of your deployment, as specified by the value used for name (OLM UIForm view), or name in the metadata section of the noi.ibm.com_noihybrids_cr.yaml ornoi.ibm.com_nois_cr.yaml files (YAML view).
4. Expose port 8080.
oc expose po release_name-ncoprimary-0 --port=8080 --type=NodePort --name=objserve-http-client-external-portforward
Where release_name is the name of your deployment, as specified by the value used for name (OLM UIForm view), or name in the metadata section of the noi.ibm.com_noihybrids_cr.yaml ornoi.ibm.com_nois_cr.yaml files (YAML view).
5. Check that port 8080 is exposed.
oc get svc | grep objserve-http-client-external-portforward objserve-http-client-external-portforward NodePort 10.0.43.199 <none> 8080:31729/TCP 169m
6. Send events to the ObjectServer with CURL.
$ curl -X POST -v -u root:object_server_password -H "Accept: application/json" -H "Content-Type: application/json" -d @server1.json http://objserve-http-client-external-portforward.{master server}:31729/objectserver/restapi/alerts/status;
Where object_server_password is the password for the ObjectServer.7. Check that the ObjectServer received the events.
http://objserve-http-client-external-portforward.{cluster_hostname}:31729/objectserver/restapi/alerts/status
Chapter 4. Installing Netcool Operations Insight 139
Uninstalling Netcool Operations InsightUse this information to uninstall your Netcool Operations Insight deployment with the Operator LifecycleManager (OLM) user interface (UI), or with the command line. If you installed Netcool Operations Insightwith the OLM UI, then follow “Uninstalling with the OLM UI” on page 140. If you installed NetcoolOperations Insight with the OLM UI and Container Application Software for Enterprises (CASE), thenfollow “Uninstalling with the OLM UI and CASE” on page 140.
Uninstalling with the OLM UI1. If Application Discovery is enabled, delete the Application Discovery instance. Go to Administration >
Custom Resource Definitions > AppDisco > Instances. Delete the <noi-operator-instance-name>-topology instance.
2. Delete the Netcool Operations Insight operator instance.Go to Operator > Installed Operators. Select the project where you installed Netcool OperationsInsight. Click Netcool Operations Insight > All Instances. Select Delete NOI from the menu toremove a cloud deployment, or Delete NOIHybrid to remove a hybrid deployment.
3. Delete the Netcool Operations Insight operator.Go to Operator > Installed Operators. Select the options menu for the Netcool Operations Insightoperator entry, and select Uninstall Operator.
4. Remove the catalog entry.Go to Administration > Cluster Settings > Global Configuration > OperatorHub > Sources. SelectDelete CatalogSource
5. Delete the Custom Resource Definitions (CRDs).Go to Administration > Custom Resource Definitions. Select the CRDs that were created by theNetcool Operations Insight installation. Delete all the CRDs that start with noi, asm, and cem.
6. Delete the secrets that were created for your deployment.Go to Workloads > Secrets. Select the project where you installed Netcool Operations Insight. Deleteall secrets that start with <noi-operator-instance-name>.
7. Delete the ConfigMaps that were created by Netcool Operations Insight.Go to Workloads > Config Maps. Select the project where you installed Netcool Operations Insight.Delete all config maps that start with <noi-operator-instance-name>.
8. Go to Networking > Routes, and remove the routes.9. Delete the persistent volume claims, persistent volumes, and storage classes:
a. Go to Storage > Persistent Volume Claims. Delete all Persistent Volume Claims for NetcoolOperations Insight.
b. Go to Storage > Persistent Volume. Delete all Persistent Volumes for Netcool Operations Insight.c. Go to Storage > Storage Classes. Delete all storage classes for Netcool Operations Insight.
Uninstalling with the OLM UI and CASEUse this section for offline airgap deployments, as well as online deployments.
1. If Application Discovery is enabled, delete the Application Discovery instance. Run the followingcommand:
oc delete appdisco <noi-operator-instance-name>-topology
2. Delete the Netcool Operations Insight operator instance.For a cloud deployment, use oc delete noi <noi-operator-instance-name>For a hybrid deployment, use oc delete noihybrid <noi-operator-instance-name>.
3. Delete the Netcool Operations Insight operator by running the following command:
cloudctl case launch \ --case ibm-netcool-prod \ --namespace <target namespace> \
140 IBM Netcool Operations Insight: Integration Guide
--inventory noiOperatorSetup \ --action uninstall-operator
4. Delete the catalog by running the following command:
cloudctl case launch \ --case ibm-netcool-prod \ --namespace <target namespace> \ --inventory noiOperatorSetup \ --action uninstall-catalog
5. Delete the Custom Resource Definitions (CRDs).Go to Administration > Custom Resource Definitions. Select the CRDs that were created by theNetcool Operations Insight installation. Delete all the CRDs that start with noi, asm, and cem.
6. Delete the secrets that were created for your deployment.Go to Workloads > Secrets. Select the project where you installed Netcool Operations Insight. Deleteall secrets that start with <noi-operator-instance-name>.
7. Delete the ConfigMaps that were created by Netcool Operations Insight.Go to Workloads > Config Maps. Select the project where you installed Netcool Operations Insight.Delete all config maps that start with <noi-operator-instance-name>.
8. Go to Networking > Routes, and remove the routes.9. Delete the persistent volume claims, persistent volumes, and storage classes:
a. Go to Storage > Persistent Volume Claims. Delete all Persistent Volume Claims for NetcoolOperations Insight.
b. Go to Storage > Persistent Volume. Delete all Persistent Volumes for Netcool Operations Insight.c. Go to Storage > Storage Classes. Delete all storage classes for Netcool Operations Insight.
Installing on a hybrid architectureUse these instructions to prepare and install a hybrid deployment, which is composed of cloud nativeNetcool Operations Insight components on Red Hat OpenShift, and an on-premises OperationsManagement installation.
Click here to download the Netcool Operations Insight Hybrid Installation Guide.
When you install cloud native Netcool Operations Insight components on Red Hat OpenShift, all of thecomponents are automatically deployed as pods running within the cluster. The deployment of podsacross worker nodes is managed by Red Hat OpenShift. Pods for a service are deployed on nodes thatmeet a services's specification and affinity rules, and are orchestrated by Kubernetes.
The hybrid deployment configuration leverages the power of Netcool Operations Insight's cloud nativecomponents, without the need to deploy the full Netcool Operations Insight on Red Hat OpenShiftsolution. You can deploy only the cloud native Netcool Operations Insight components from the NetcoolOperations Insight package on Red Hat OpenShift, and connect them to an on-premises OperationsManagement installation. The cloud native Netcool Operations Insight components provide cloud nativeevent analytics, cloud native event integrations, runbook automations, and optionally topologymanagement. The on-premises Operations Management installation provides the ObjectServer and WebGUI(s).
The hybrid solution can be deployed in high availability (HA) mode, or non-HA mode.
• HA mode: A HA hybrid deployment is composed of cloud native Netcool Operations Insight componentson Red Hat OpenShift and an on-premises Operations Management installation that has multipleWebGUI instances to provide redundancy.
Additional deployment steps, which are tagged with the icon, are required fora HA hybrid deployment:
– “Configuring load balancing for on-premises Web GUI or Dashboard Application Services Hub nodes(HA only)” on page 156
Chapter 4. Installing Netcool Operations Insight 141
– “Setting up persistence for the OAuth service (HA only)” on page 159– “Completing hybrid HA setup (HA only)” on page 195
• Non-HA mode: A non-HA hybrid deployment is composed of cloud native Netcool Operations Insightcomponents on Red Hat OpenShift and an on-premises Operations Management installation that hasonly one Web GUI. For a non-HA hybrid deployment, ignore the steps tagged with the
icon.
Note: Integration with on-premises IBM Agile Service Manager is not supported for hybrid deployments.
PreparingFollow these instructions to prepare a hybrid Netcool Operations Insight deployment.
Sizing for a hybrid deploymentLearn about the sizing requirements for a hybrid deployment on Red Hat OpenShift.
Hardware sizing for a hybrid deployment on Red Hat OpenShiftNote: vCPU is defined as when one x86 CPU splits each of its physical cores into virtual cores (vCPU). It isassumed that one x86 CPUs physical core can be split into two logical vCPUs.
Note: Red Hat OpenShift user-provisioned infrastructure is not sized as part of this sizing. Please refer toRed Hat OpenShift documentation for more details.
Table 35. Detailed supported throughput rates for given sized environments.
General sizing information
Category Resource Trial Production
Event Management sizing information
Event Rate Throughput Steady state events persecond
20 50
Burst rate events persecond
100 500
Topology Management sizing information
System size Approx. resources 200,000 5,000,000
Event Rate Throughput Steady state events persecond
10 50
Burst rate events persecond
10 200
Environment options Container size Trial Production
High availability No Yes
Table 36. This table shows the total hardware requirements for a Netcool Operations Insight (includingEvent Management & Topology Management) system deployed on a Red Hat OpenShift cluster, includingboth the Netcool Operations Insight and Red Hat OpenShift related hardware needs. This table is usefulfor sizing when there is a need to create a new Red Hat OpenShift cluster to deploy the full Red HatOpenShift and Netcool Operations Insight stack.
Total requirements Netcool Operations Insight including Red Hat OpenShift Control plane andCompute nodes
142 IBM Netcool Operations Insight: Integration Guide

Table 36. This table shows the total hardware requirements for a Netcool Operations Insight (includingEvent Management & Topology Management) system deployed on a Red Hat OpenShift cluster, includingboth the Netcool Operations Insight and Red Hat OpenShift related hardware needs. This table is usefulfor sizing when there is a need to create a new Red Hat OpenShift cluster to deploy the full Red HatOpenShift and Netcool Operations Insight stack. (continued)
Category Resource Trial Production
Minimum NodevCPU/MEM/DISK
Minimum Nodes count 4 9
vCPUs (Min) 25 78
Memory (GB) (Min) 82 216
Disk (GB) (Min) 480 1080
Persistent storagerequirements (Gi)
446 2755
Total disk IOPSrequirements
850 5950
Table 37. This table shows the hardware requirements attributed to the Netcool Operations Insightfootprint deployed on Red Hat OpenShift. This table is useful for sizing when there is a Red Hat OpenShiftcluster already installed but there is a need to add worker/computer nodes to it to accommodateNetcoolOperations Insight.
Total hardware requirements Netcool Operations Insight services only
Category Resource Trial Production
Minimum Nodes/vCPU/MEM/DISK
Minimum Nodes count 3 6
vCPUs (Min) 21 66
Memory (GB) (Min) 66 168
Disk (GB) (Min) 360 720
Persistent storagerequirements (Gi)
446 2755
Total disk IOPSrequirements
850 5950
Table 38. This table illustrates the recommended resource allocation for the Red Hat OpenShift Masterand Worker nodes, along with the recommended configuration for the disk volumes associated with eachpersisted storage resource.
Hardware Sizing Requirements
Category Resource Trial Production
OpenShift ControlPlane
vCPU, disk and memoryrequirements
Nodes count 1 3
vCPUs 4 4
Memory (GB) 16 16
Disk (GB) 120 120
Netcool Operations Insight components - suggested configuration
Chapter 4. Installing Netcool Operations Insight 143

Table 38. This table illustrates the recommended resource allocation for the Red Hat OpenShift Masterand Worker nodes, along with the recommended configuration for the disk volumes associated with eachpersisted storage resource. (continued)
OpenShift compute(worker) nodes
vCPU, disk and memoryrequirements
Nodes count 3 6
vCPUs 7 11
Memory (GB) 22 28
Disk (GB) 120 120
Persistent storageminimum requirements(Gi)
Cassandra 250 1500
Kafka 30 300
Zookeeper 10 30
Elasticsearch 150 900
File-observer 5 10
CouchDB 1 15
Persistent storageminimum IOPSrequirements (Gi)
Cassandra 300 1800
Kafka 200 1200
Zookeeper 50 150
Elasticsearch 200 2400
File-observer 50 100
CouchDB 50 300
StorageCreate persistent storage before your deployment of IBM Netcool Operations Insight on Red HatOpenShift.
Note: If you want to deploy IBM Netcool Operations Insight on Red Hat OpenShift on a cloud platform,such as Red Hat OpenShift Kubernetes Service (ROKS), assess your storage requirements.
Persistent volumesRed Hat OpenShift uses the Kubernetes persistent volume (PV) framework. Persistent volumes arestorage resources in the cluster, and persistent volume claims (PVC)s are storage requests that are madeon those PV resources by Netcool Operations Insight. For Netcool Operations Insight, these PVs can belocal volumes or vSphere volumes. For more information on persistent storage in OpenShift clusters, see
Understanding persistent storage.
Configuring storage classesDuring the installation, you are asked to specify the storage classes for components that requirepersistence. If you are configuring persistent volumes with local storage, then the installationautomatically provides scripts to create persistent volumes and storage classes. If you are not using localstorage, then you must create the persistent volumes and storage classes yourself, or use a preexistingstorage class.
Check which storage classes are configured on your cluster by using the command oc get sc. Thiscommand lists all available classes to choose from on the cluster. If no storage classes exist, then askyour cluster administrator to configure a storage class by following the guidance in the OpenShiftdocumentation, at the following links.
144 IBM Netcool Operations Insight: Integration Guide
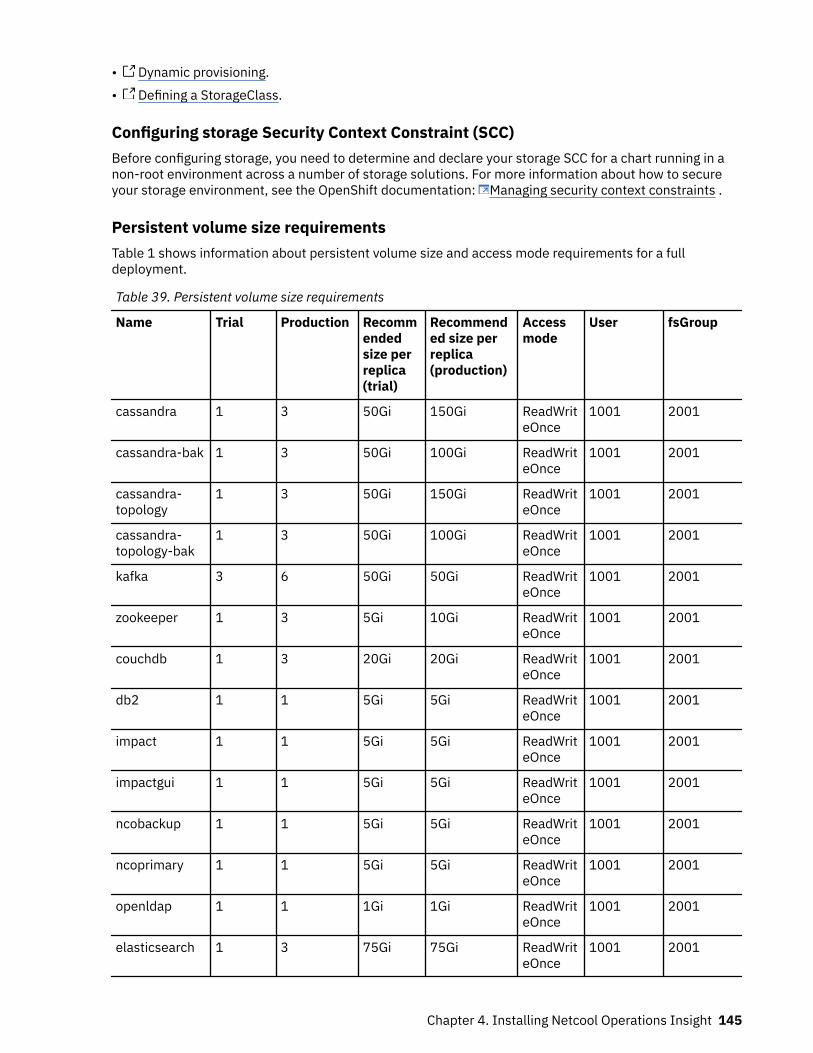
• Dynamic provisioning.
• Defining a StorageClass.
Configuring storage Security Context Constraint (SCC)Before configuring storage, you need to determine and declare your storage SCC for a chart running in anon-root environment across a number of storage solutions. For more information about how to secureyour storage environment, see the OpenShift documentation: Managing security context constraints .
Persistent volume size requirementsTable 1 shows information about persistent volume size and access mode requirements for a fulldeployment.
Table 39. Persistent volume size requirements
Name Trial Production Recommendedsize perreplica(trial)
Recommended size perreplica(production)
Accessmode
User fsGroup
cassandra 1 3 50Gi 150Gi ReadWriteOnce
1001 2001
cassandra-bak 1 3 50Gi 100Gi ReadWriteOnce
1001 2001
cassandra-topology
1 3 50Gi 150Gi ReadWriteOnce
1001 2001
cassandra-topology-bak
1 3 50Gi 100Gi ReadWriteOnce
1001 2001
kafka 3 6 50Gi 50Gi ReadWriteOnce
1001 2001
zookeeper 1 3 5Gi 10Gi ReadWriteOnce
1001 2001
couchdb 1 3 20Gi 20Gi ReadWriteOnce
1001 2001
db2 1 1 5Gi 5Gi ReadWriteOnce
1001 2001
impact 1 1 5Gi 5Gi ReadWriteOnce
1001 2001
impactgui 1 1 5Gi 5Gi ReadWriteOnce
1001 2001
ncobackup 1 1 5Gi 5Gi ReadWriteOnce
1001 2001
ncoprimary 1 1 5Gi 5Gi ReadWriteOnce
1001 2001
openldap 1 1 1Gi 1Gi ReadWriteOnce
1001 2001
elasticsearch 1 3 75Gi 75Gi ReadWriteOnce
1001 2001
Chapter 4. Installing Netcool Operations Insight 145

Table 39. Persistent volume size requirements (continued)
Name Trial Production Recommendedsize perreplica(trial)
Recommended size perreplica(production)
Accessmode
User fsGroup
elastic search-topology
1 3 75Gi 75Gi ReadWriteOnce
1000 1000
fileobserver 1 1 5Gi 5Gi ReadWriteOnce
1001 2001
If Application Discovery is enabled for topology management, then further storage is required. All thecomponents of Application Discovery require persistent storage, including state of Application Discoverydata that is stored outside of the database. Refer to Table 2 for more information.
Table 40. Persistent storage requirements for Application Discovery
ApplicationDiscoverycomponent
Trial Production Recommendedsize perreplica(trial)
Recommended size perreplica(production)
Accessmode
User fsGroup
Primarystorage server
1 4 50Gi 50Gi ReadWriteOnce
1001 2001
Secondarystorage server
1 4 50Gi 50Gi ReadWriteOnce
1001 2001
Discoveryserver
1 4 50Gi 50Gi ReadWriteOnce
1001 2001
Configuring persistent storageYou can deploy Netcool Operations Insight on OpenShift with the following persistent storage options.
• VMware vSphere storage For more information, see Persistent storage using VMware vSpherevolumes.
• Local storage Configure local storage with the Red Hat OpenShift operator method. For moreinformation, see Persistent storage using local volumes.
• Any storage that implements the Container Storage Interface (CSI) or Red Hat Openshift ContainerStorage (OCS)For more information, see Configuring CSI volumes, and Red Hat OpenShift Container Storage.
Note: if local storage is used, the noi-cassandra-* and noi-cassandra-bak-* PVs must be on the samelocal node. Cassandra pods fail to bind to their PVCs if this requirement is not met.
Non-production deployments only: configuring persistent volumes with the localstorage scriptFor trial, demonstration or development systems, you can download the createStorageAllNodes.shscript from the IT Operations Management Developer Center http://ibm.biz/local_storage_script. Thisscript must not be used in production environments.
The script facilitates the creation of local storage PVs. The PVs are mapped volumes, which are mapped todirectories off the root file system on the parent node. The script also generates example SSH scripts thatcreate the directories on the local file system of the node. The SSH scripts create directories on the local
146 IBM Netcool Operations Insight: Integration Guide
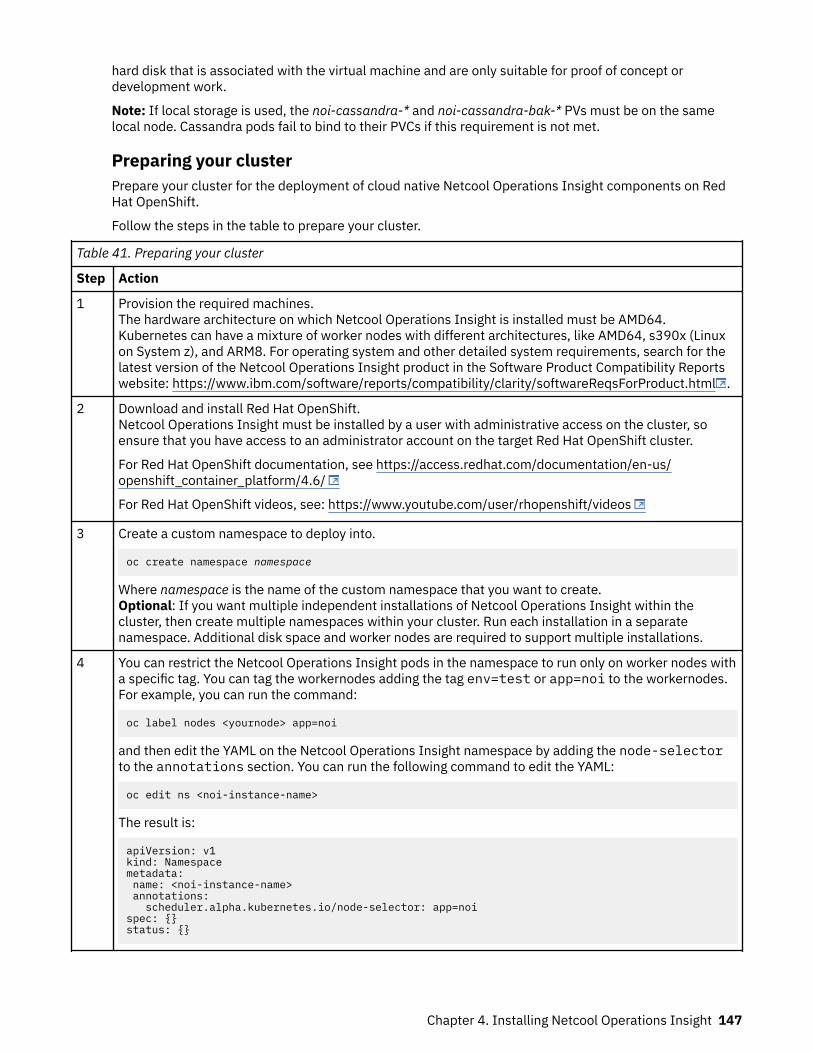
hard disk that is associated with the virtual machine and are only suitable for proof of concept ordevelopment work.
Note: If local storage is used, the noi-cassandra-* and noi-cassandra-bak-* PVs must be on the samelocal node. Cassandra pods fail to bind to their PVCs if this requirement is not met.
Preparing your clusterPrepare your cluster for the deployment of cloud native Netcool Operations Insight components on RedHat OpenShift.
Follow the steps in the table to prepare your cluster.
Table 41. Preparing your cluster
Step Action
1 Provision the required machines.The hardware architecture on which Netcool Operations Insight is installed must be AMD64.Kubernetes can have a mixture of worker nodes with different architectures, like AMD64, s390x (Linuxon System z), and ARM8. For operating system and other detailed system requirements, search for thelatest version of the Netcool Operations Insight product in the Software Product Compatibility Reportswebsite: https://www.ibm.com/software/reports/compatibility/clarity/softwareReqsForProduct.html .
2 Download and install Red Hat OpenShift.Netcool Operations Insight must be installed by a user with administrative access on the cluster, soensure that you have access to an administrator account on the target Red Hat OpenShift cluster.
For Red Hat OpenShift documentation, see https://access.redhat.com/documentation/en-us/openshift_container_platform/4.6/
For Red Hat OpenShift videos, see: https://www.youtube.com/user/rhopenshift/videos
3 Create a custom namespace to deploy into.
oc create namespace namespace
Where namespace is the name of the custom namespace that you want to create.Optional: If you want multiple independent installations of Netcool Operations Insight within thecluster, then create multiple namespaces within your cluster. Run each installation in a separatenamespace. Additional disk space and worker nodes are required to support multiple installations.
4 You can restrict the Netcool Operations Insight pods in the namespace to run only on worker nodes witha specific tag. You can tag the workernodes adding the tag env=test or app=noi to the workernodes.For example, you can run the command:
oc label nodes <yournode> app=noi
and then edit the YAML on the Netcool Operations Insight namespace by adding the node-selectorto the annotations section. You can run the following command to edit the YAML:
oc edit ns <noi-instance-name>
The result is:
apiVersion: v1kind: Namespacemetadata: name: <noi-instance-name> annotations: scheduler.alpha.kubernetes.io/node-selector: app=noispec: {}status: {}
Chapter 4. Installing Netcool Operations Insight 147
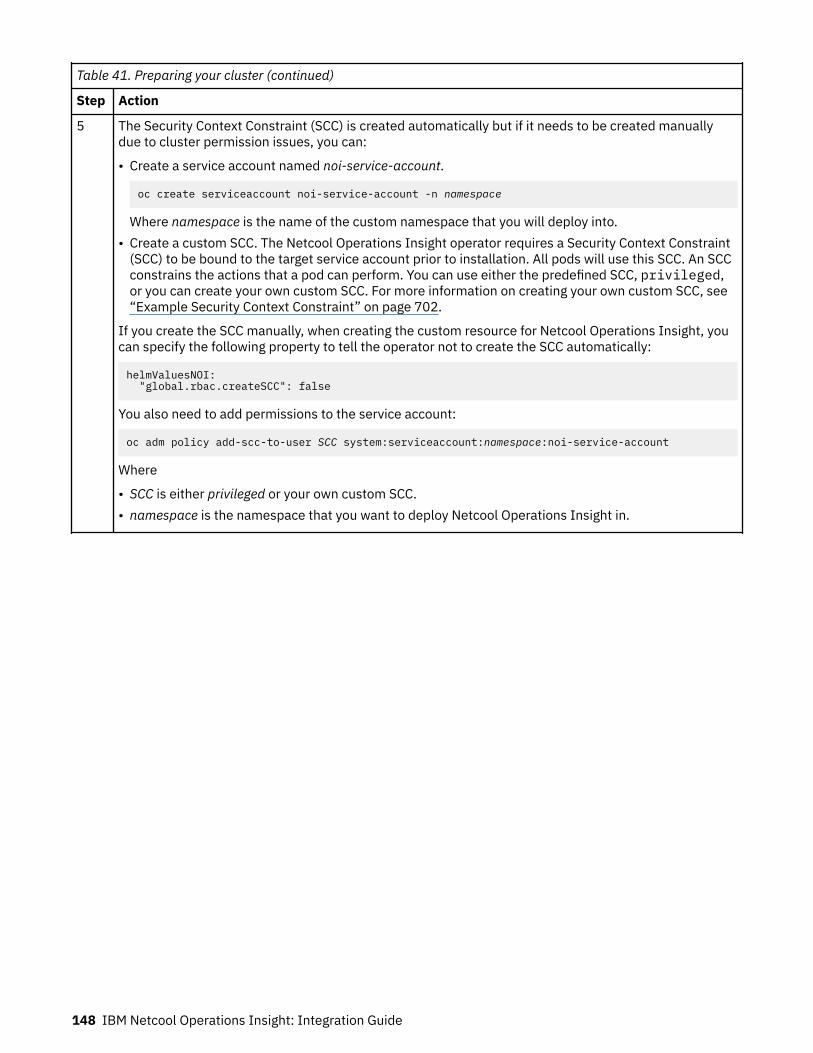
Table 41. Preparing your cluster (continued)
Step Action
5 The Security Context Constraint (SCC) is created automatically but if it needs to be created manuallydue to cluster permission issues, you can:
• Create a service account named noi-service-account.
oc create serviceaccount noi-service-account -n namespace
Where namespace is the name of the custom namespace that you will deploy into.• Create a custom SCC. The Netcool Operations Insight operator requires a Security Context Constraint
(SCC) to be bound to the target service account prior to installation. All pods will use this SCC. An SCCconstrains the actions that a pod can perform. You can use either the predefined SCC, privileged,or you can create your own custom SCC. For more information on creating your own custom SCC, see“Example Security Context Constraint” on page 702.
If you create the SCC manually, when creating the custom resource for Netcool Operations Insight, youcan specify the following property to tell the operator not to create the SCC automatically:
helmValuesNOI: "global.rbac.createSCC": false
You also need to add permissions to the service account:
oc adm policy add-scc-to-user SCC system:serviceaccount:namespace:noi-service-account
Where
• SCC is either privileged or your own custom SCC.• namespace is the namespace that you want to deploy Netcool Operations Insight in.
148 IBM Netcool Operations Insight: Integration Guide

Table 41. Preparing your cluster (continued)
Step Action
6 Create a docker registry secret to enable your deployment to pull Netcool Operations Insight imagesfrom the IBM Entitled Registry.
1. Obtain the entitlement key that is assigned to your IBM ID which will grant you access to the IBMEntitled Registry. Log into https://myibm.ibm.com/products-services/containerlibrary with theaccount (username and password) that has entitlement to IBM software. The key that is displayed isthe key that will be used when accessing the Entitled Registry.
2. Select Copy key to copy the entitlement key to the clipboard, in the Entitlement keys section.3. Run the following command to create the docker registry secret:
oc create secret docker-registry noi-registry-secret --docker-username=cp--docker-password=entitlement_key --docker-server=cp.icr.io--namespace=namespace
Where:
• noi-registry-secret is the name of the secret that you are creating. Suggested value is noi-registry-secret.
• entitlement_key is the entitlement key that you copied in the previous step.• namespace is the namespace that you want to deploy Netcool Operations Insight in.
Note: This step assumes that the cluster has internet access to: cp.icr.io, which is IBM's EntitledRegistry. An exemption is typically made available for this along with other registries such asdocker.io. If a connection to these registries is not permitted due to security constraints, then aproduction grade Docker V2 compatible image registry must be provided and an airgap installationperformed to mirror the external image registries internally. For more information, see “InstallingNetcool Operations Insight in an offline environment (airgap)” on page 121 for a full cloud install, or“Installing cloud native components in an offline environment (airgap)” on page 165 for a hybrid install.
7 If you manually created the SCC in step 5, complete this step:
Add the registry secret to your service account
oc patch serviceaccount noi-service-account -p '{"imagePullSecrets": [{"name": "noi-registry-secret"}]}' -n namespace
Where
• noi-registry-secret is the name of the Docker registry secret that you created in the previous step.Suggested value is noi-registry-secret
• namespace is the namespace that you want to deploy Netcool Operations Insight in.
Chapter 4. Installing Netcool Operations Insight 149

Table 41. Preparing your cluster (continued)
Step Action
8 Ensure that your Red Hat OpenShift environment is updated to allow network policies to functioncorrectly.In some Red Hat OpenShift environments an additional configuration is required to allow external trafficto reach the routes. This is due to the required addition of network policies to secure podcommunication traffic. For example, if you are attempting to access a route which returns a "503Application Not Available" error, then a network policy may be blocking the traffic. Check if theingresscontroller is configured with the endpointPublishingStrategy: HostNetwork valueby running the command
oc get ingresscontroller default -n openshift-ingress-operator -o yaml
If endpointPublishingStrategy.type is set to HostNetwork, then the network policy will notwork against routes unless the default namespace contains the selector label. To allow traffic, add alabel to the default namespace by running the command:
oc patch namespace default --type=json -p '[{"op":"add","path":"/metadata/labels","value":{"network.openshift.io/policy-group":"ingress"}}]'
For more information, see https://docs.openshift.com/container-platform/4.5/networking/network_policy/about-network-policy.html .
Preparing on-premises Operations ManagementPrepare an on-premises Operations Management installation, in which Event Analytics is disabled.
Before you beginThe following requirements are met:
• The primary and backup ObjectServers in the on-premises Operations Management installation arerunning, and are listening on external IP addresses.
Note: Integration with on-premises IBM Agile Service Manager is not supported for hybrid deployments.
Procedure1. Install on-premises Operations Management.
If Operations Management V1.6.3 is not already installed, then install it, or upgrade to it. For moreinformation, see “Installing Operations Management on premises” on page 55.
2. Disable Event Analytics.In a hybrid installation, the on-premises Event Analytics capability must be disabled before the cloudnative Netcool Operations Insight components are installed.a) Remove the ncw_analytics_admin role from each of your users.
1) Select Console Settings->User Roles and select your user from the users who are listed inAvailable Users.
2) Remove the role ncw_analytics_admin for your user and save the changes.3) Repeat for each of your users, and then log out and back in again.
b) Delete theImpactUI data provider from Dashboard Application Services Hub.
1) Open Console Settings->Connections.2) Find the entry for ImpactUI and delete it.
c) Remove the ObjectServer source for cloud native analytics from the IBM Tivoli Netcool/Impact datamodel.
150 IBM Netcool Operations Insight: Integration Guide
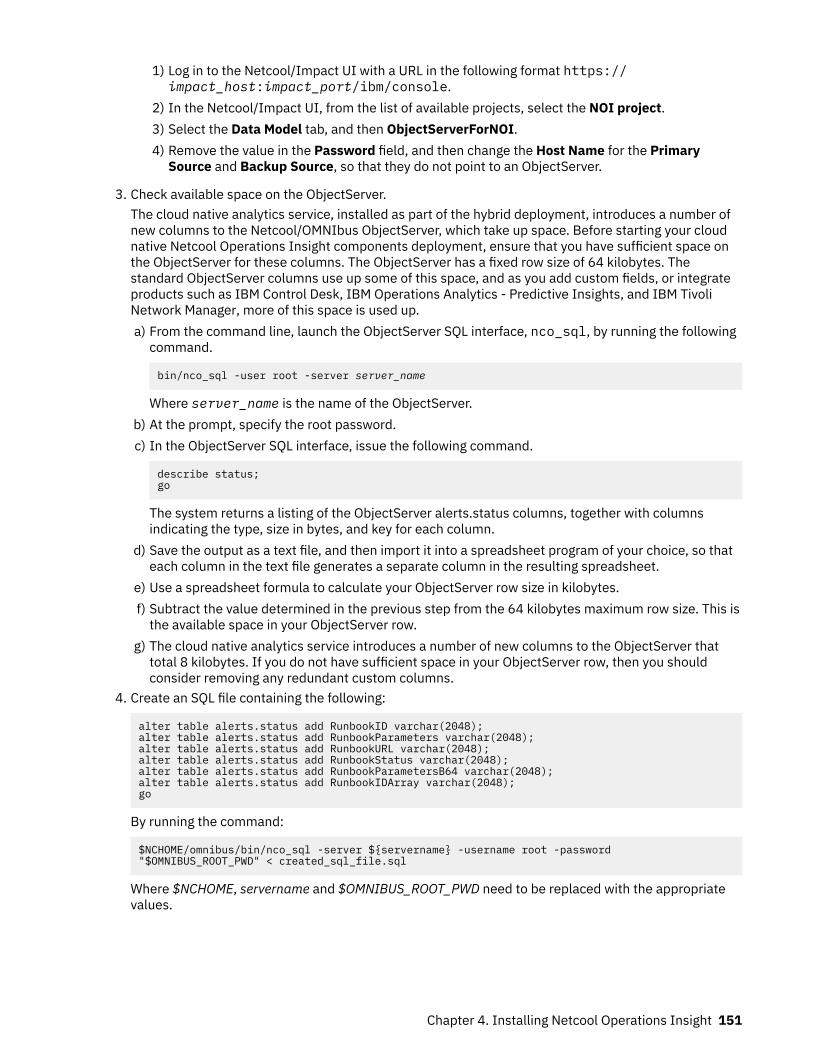
1) Log in to the Netcool/Impact UI with a URL in the following format https://impact_host:impact_port/ibm/console.
2) In the Netcool/Impact UI, from the list of available projects, select the NOI project.3) Select the Data Model tab, and then ObjectServerForNOI.4) Remove the value in the Password field, and then change the Host Name for the Primary
Source and Backup Source, so that they do not point to an ObjectServer.
3. Check available space on the ObjectServer.The cloud native analytics service, installed as part of the hybrid deployment, introduces a number ofnew columns to the Netcool/OMNIbus ObjectServer, which take up space. Before starting your cloudnative Netcool Operations Insight components deployment, ensure that you have sufficient space onthe ObjectServer for these columns. The ObjectServer has a fixed row size of 64 kilobytes. Thestandard ObjectServer columns use up some of this space, and as you add custom fields, or integrateproducts such as IBM Control Desk, IBM Operations Analytics - Predictive Insights, and IBM TivoliNetwork Manager, more of this space is used up.a) From the command line, launch the ObjectServer SQL interface, nco_sql, by running the following
command.
bin/nco_sql -user root -server server_name
Where server_name is the name of the ObjectServer.b) At the prompt, specify the root password.c) In the ObjectServer SQL interface, issue the following command.
describe status;go
The system returns a listing of the ObjectServer alerts.status columns, together with columnsindicating the type, size in bytes, and key for each column.
d) Save the output as a text file, and then import it into a spreadsheet program of your choice, so thateach column in the text file generates a separate column in the resulting spreadsheet.
e) Use a spreadsheet formula to calculate your ObjectServer row size in kilobytes.f) Subtract the value determined in the previous step from the 64 kilobytes maximum row size. This is
the available space in your ObjectServer row.g) The cloud native analytics service introduces a number of new columns to the ObjectServer that
total 8 kilobytes. If you do not have sufficient space in your ObjectServer row, then you shouldconsider removing any redundant custom columns.
4. Create an SQL file containing the following:
alter table alerts.status add RunbookID varchar(2048);alter table alerts.status add RunbookParameters varchar(2048);alter table alerts.status add RunbookURL varchar(2048);alter table alerts.status add RunbookStatus varchar(2048);alter table alerts.status add RunbookParametersB64 varchar(2048);alter table alerts.status add RunbookIDArray varchar(2048);go
By running the command:
$NCHOME/omnibus/bin/nco_sql -server ${servername} -username root -password "$OMNIBUS_ROOT_PWD" < created_sql_file.sql
Where $NCHOME, servername and $OMNIBUS_ROOT_PWD need to be replaced with the appropriatevalues.
Chapter 4. Installing Netcool Operations Insight 151
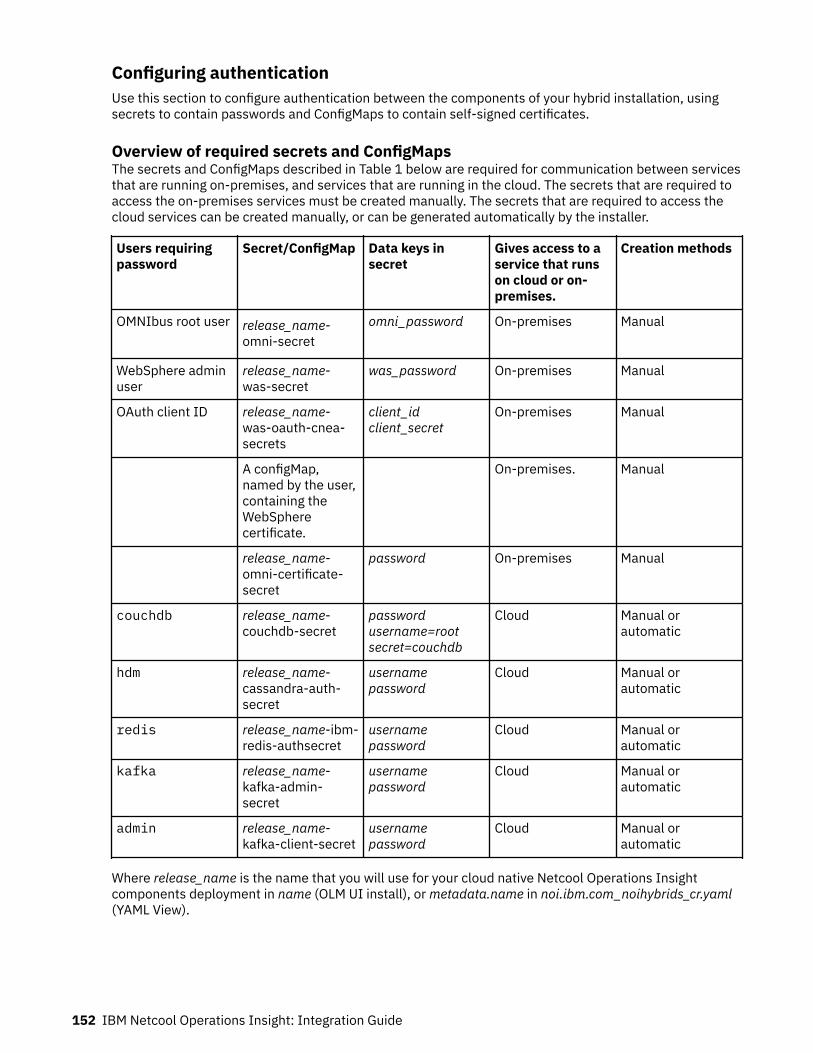
Configuring authenticationUse this section to configure authentication between the components of your hybrid installation, usingsecrets to contain passwords and ConfigMaps to contain self-signed certificates.
Overview of required secrets and ConfigMapsThe secrets and ConfigMaps described in Table 1 below are required for communication between servicesthat are running on-premises, and services that are running in the cloud. The secrets that are required toaccess the on-premises services must be created manually. The secrets that are required to access thecloud services can be created manually, or can be generated automatically by the installer.
Users requiringpassword
Secret/ConfigMap Data keys insecret
Gives access to aservice that runson cloud or on-premises.
Creation methods
OMNIbus root user release_name-omni-secret
omni_password On-premises Manual
WebSphere adminuser
release_name-was-secret
was_password On-premises Manual
OAuth client ID release_name-was-oauth-cnea-secrets
client_idclient_secret
On-premises Manual
A configMap,named by the user,containing theWebSpherecertificate.
On-premises. Manual
release_name-omni-certificate-secret
password On-premises Manual
couchdb release_name-couchdb-secret
passwordusername=rootsecret=couchdb
Cloud Manual orautomatic
hdm release_name-cassandra-auth-secret
usernamepassword
Cloud Manual orautomatic
redis release_name-ibm-redis-authsecret
usernamepassword
Cloud Manual orautomatic
kafka release_name-kafka-admin-secret
usernamepassword
Cloud Manual orautomatic
admin release_name-kafka-client-secret
usernamepassword
Cloud Manual orautomatic
Where release_name is the name that you will use for your cloud native Netcool Operations Insightcomponents deployment in name (OLM UI install), or metadata.name in noi.ibm.com_noihybrids_cr.yaml(YAML View).
152 IBM Netcool Operations Insight: Integration Guide
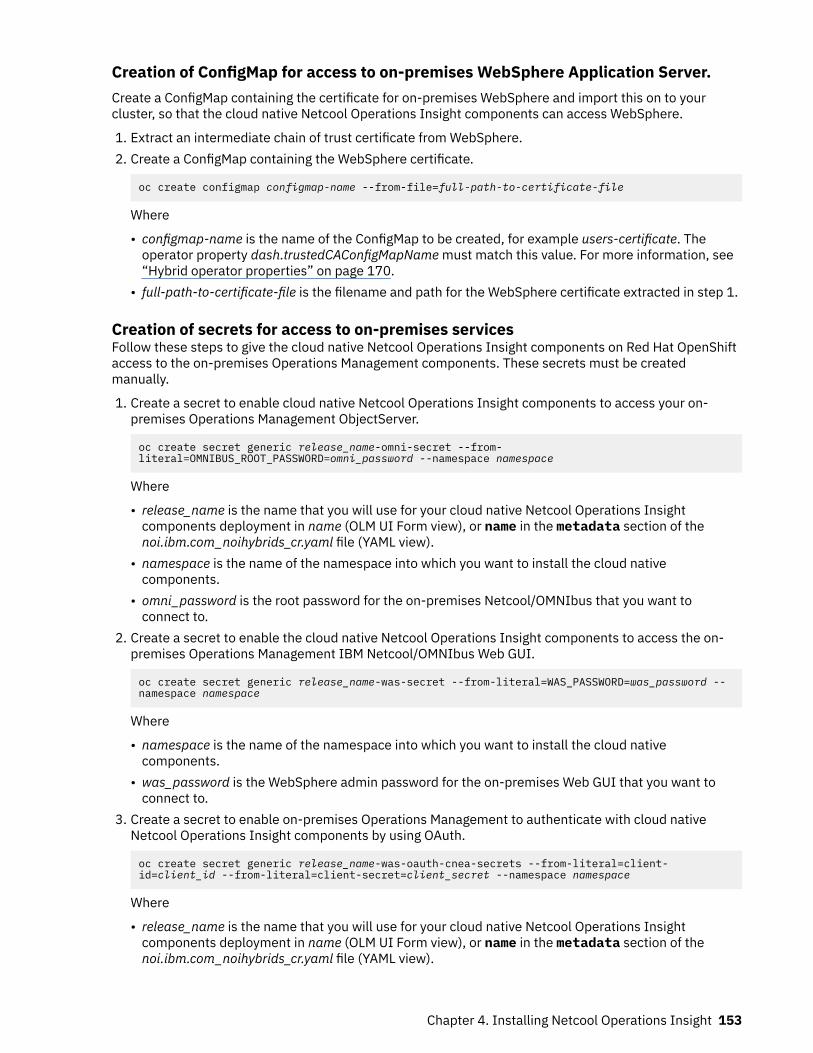
Creation of ConfigMap for access to on-premises WebSphere Application Server.Create a ConfigMap containing the certificate for on-premises WebSphere and import this on to yourcluster, so that the cloud native Netcool Operations Insight components can access WebSphere.
1. Extract an intermediate chain of trust certificate from WebSphere.2. Create a ConfigMap containing the WebSphere certificate.
oc create configmap configmap-name --from-file=full-path-to-certificate-file
Where
• configmap-name is the name of the ConfigMap to be created, for example users-certificate. Theoperator property dash.trustedCAConfigMapName must match this value. For more information, see“Hybrid operator properties” on page 170.
• full-path-to-certificate-file is the filename and path for the WebSphere certificate extracted in step 1.
Creation of secrets for access to on-premises servicesFollow these steps to give the cloud native Netcool Operations Insight components on Red Hat OpenShiftaccess to the on-premises Operations Management components. These secrets must be createdmanually.
1. Create a secret to enable cloud native Netcool Operations Insight components to access your on-premises Operations Management ObjectServer.
oc create secret generic release_name-omni-secret --from-literal=OMNIBUS_ROOT_PASSWORD=omni_password --namespace namespace
Where
• release_name is the name that you will use for your cloud native Netcool Operations Insightcomponents deployment in name (OLM UI Form view), or name in the metadata section of thenoi.ibm.com_noihybrids_cr.yaml file (YAML view).
• namespace is the name of the namespace into which you want to install the cloud nativecomponents.
• omni_password is the root password for the on-premises Netcool/OMNIbus that you want toconnect to.
2. Create a secret to enable the cloud native Netcool Operations Insight components to access the on-premises Operations Management IBM Netcool/OMNIbus Web GUI.
oc create secret generic release_name-was-secret --from-literal=WAS_PASSWORD=was_password --namespace namespace
Where
• namespace is the name of the namespace into which you want to install the cloud nativecomponents.
• was_password is the WebSphere admin password for the on-premises Web GUI that you want toconnect to.
3. Create a secret to enable on-premises Operations Management to authenticate with cloud nativeNetcool Operations Insight components by using OAuth.
oc create secret generic release_name-was-oauth-cnea-secrets --from-literal=client-id=client_id --from-literal=client-secret=client_secret --namespace namespace
Where
• release_name is the name that you will use for your cloud native Netcool Operations Insightcomponents deployment in name (OLM UI Form view), or name in the metadata section of thenoi.ibm.com_noihybrids_cr.yaml file (YAML view).
Chapter 4. Installing Netcool Operations Insight 153
• namespace is the name of the namespace into which you want to install the cloud nativecomponents.
• client_id is the name to use as your client-id. This value is used later in “Installing the integration kit”on page 190 when you configure your on-premises Operations Management installation to connectto your cloud native components.
• client_secret is the name to use for your client secret. This value is used later in “Installing theintegration kit” on page 190 when you configure your on-premises Operations Managementinstallation to connect to your cloud native components.
4. Create a secret to enable communication between the OMNIbus component of your on-premisesOperations Management installation and the cloud native Netcool Operations Insight components.This secret is created differently depending on whether you require an SSL or non-SSL connection.Choose from the options below.
No SSL connectionIf you do not require an SSL connection, then follow this step to configure a non-SSL connectionbetween the OMNIbus component of your on-premises Operations Management installation and thecloud native Netcool Operations Insight components.
oc create secret generic release_name-omni-certificate-secret --from-literal=PASSWORD=password --from-literal=ROOTCA="" --from-literal=INTERMEDIATECA="" --namespace namespace
Where
• release_name is the name that you will use for your cloud native Netcool Operations Insightcomponents deployment in name (OLM UI Form view), or name in the metadata section of thenoi.ibm.com_noihybrids_cr.yaml file (YAML view).
• password is a password of your choice.• namespace is the name of the namespace into which you want to install the cloud native
components.
Note: The ROOTCA and INTERMEDIATECA strings are null strings.
SSL connectionIf you require an SSL connection because the OMNIbus component of your on-premises OperationsManagement installation uses SSL, or you want to have an SSL connection between the cloud nativeNetcool Operations Insight components and the on-premises Operations Management installation'sObjectServer, then follow these steps to configure authentication:
a. Configure OMNIbus on your on-premises Operations Management installation to use SSL, if it is notdoing so already. To check, run the command oc get secrets -n namespace and check if thesecret release_name-omnicertificate-secret exists. If the secret does not exist and theOMNIbus components are using SSL, the following steps must be completed.
b. Extract the certificate from your on-premises Operations Management installation.
$NCHOME/bin/nc_gskcmd -cert -extract -db "key_db" -pw password -label "cert_name" -target "ncomscert.arm"
Where
• key_db is the name of the key database file.• password is the password to your key database.• cert_name is the name of your certificate.
c. Copy the extracted certificate, ncomscert.arm, over to the infrastructure node of your Red HatOpenShift cluster, or to the node on your cluster where the oc CLI is installed.
d. Create a secret for the certificate.
154 IBM Netcool Operations Insight: Integration Guide
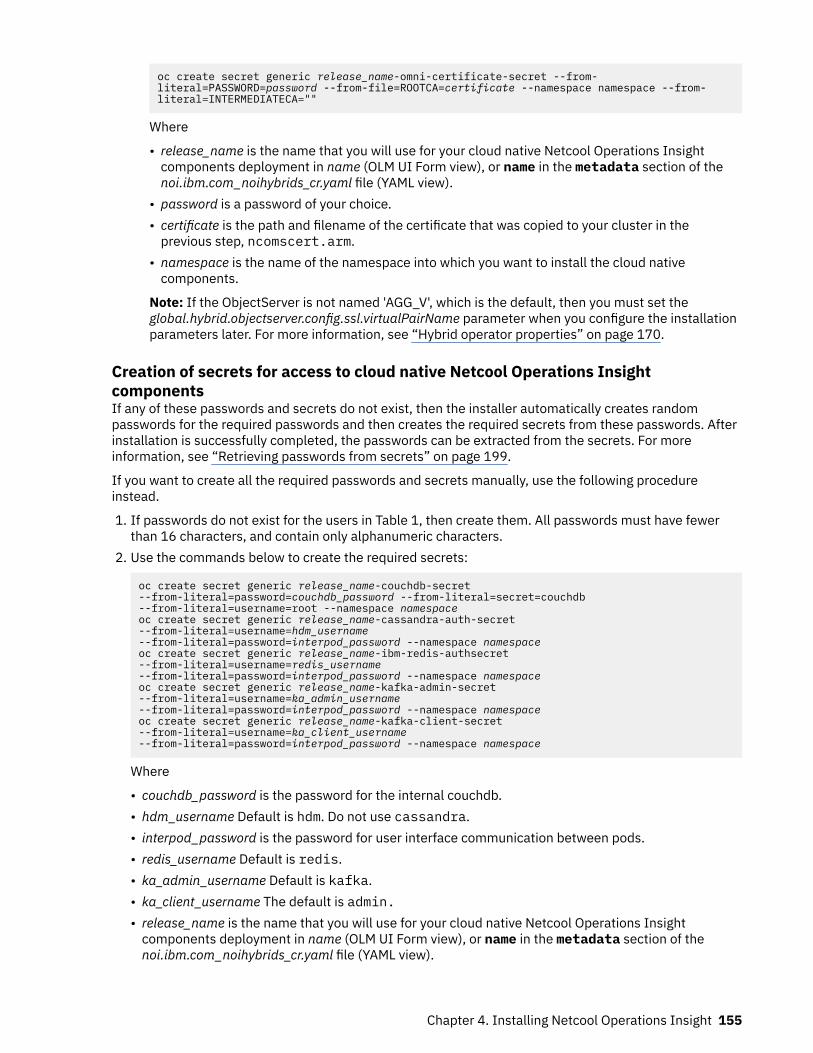
oc create secret generic release_name-omni-certificate-secret --from-literal=PASSWORD=password --from-file=ROOTCA=certificate --namespace namespace --from-literal=INTERMEDIATECA=""
Where
• release_name is the name that you will use for your cloud native Netcool Operations Insightcomponents deployment in name (OLM UI Form view), or name in the metadata section of thenoi.ibm.com_noihybrids_cr.yaml file (YAML view).
• password is a password of your choice.• certificate is the path and filename of the certificate that was copied to your cluster in the
previous step, ncomscert.arm.• namespace is the name of the namespace into which you want to install the cloud native
components.
Note: If the ObjectServer is not named 'AGG_V', which is the default, then you must set theglobal.hybrid.objectserver.config.ssl.virtualPairName parameter when you configure the installationparameters later. For more information, see “Hybrid operator properties” on page 170.
Creation of secrets for access to cloud native Netcool Operations InsightcomponentsIf any of these passwords and secrets do not exist, then the installer automatically creates randompasswords for the required passwords and then creates the required secrets from these passwords. Afterinstallation is successfully completed, the passwords can be extracted from the secrets. For moreinformation, see “Retrieving passwords from secrets” on page 199.
If you want to create all the required passwords and secrets manually, use the following procedureinstead.
1. If passwords do not exist for the users in Table 1, then create them. All passwords must have fewerthan 16 characters, and contain only alphanumeric characters.
2. Use the commands below to create the required secrets:
oc create secret generic release_name-couchdb-secret --from-literal=password=couchdb_password --from-literal=secret=couchdb --from-literal=username=root --namespace namespaceoc create secret generic release_name-cassandra-auth-secret --from-literal=username=hdm_username --from-literal=password=interpod_password --namespace namespaceoc create secret generic release_name-ibm-redis-authsecret --from-literal=username=redis_username --from-literal=password=interpod_password --namespace namespaceoc create secret generic release_name-kafka-admin-secret --from-literal=username=ka_admin_username --from-literal=password=interpod_password --namespace namespaceoc create secret generic release_name-kafka-client-secret --from-literal=username=ka_client_username --from-literal=password=interpod_password --namespace namespace
Where
• couchdb_password is the password for the internal couchdb.• hdm_username Default is hdm. Do not use cassandra.• interpod_password is the password for user interface communication between pods.• redis_username Default is redis.• ka_admin_username Default is kafka.• ka_client_username The default is admin.• release_name is the name that you will use for your cloud native Netcool Operations Insight
components deployment in name (OLM UI Form view), or name in the metadata section of thenoi.ibm.com_noihybrids_cr.yaml file (YAML view).
Chapter 4. Installing Netcool Operations Insight 155

• namespace is the name of the namespace into which you want to install the cloud nativecomponents.
If you want to change a password after installation, see “Changing passwords and recreating secrets” onpage 199
Configuring load balancing for on-premises Web GUI or DashboardApplication Services Hub nodes (HA only)
Learn how to configure load balancing for the on-premises IBM Netcool/OMNIbus Web GUI or Dashboard Application Services Hub nodes in a hybrid high availability deployment,where there is more than one on-premises Web GUI node.
About this taskThe on-premises Web GUI or DASH servers must be set up with load balancing by using an HTTP Serverthat balances the UI load. If you do not already have load balancing configured for your on-premises WebGUI or DASH nodes, then follow these steps.
Procedure1. Install Db2.
If you do not have a Db2 instance, install it on one of your on-premises servers. For more information,see https://www.ibm.com/support/knowledgecenter/SSSHTQ_8.1.0/com.ibm.netcool_OMNIbus.doc_8.1.0/webtop/wip/task/web_con_downloaddb2.html
2. Install IBM HTTP Server.If you do not have IBM HTTP Server then install it on one of your on-premises server. For moreinformation, see https://www.ibm.com/support/knowledgecenter/SSEQTJ_8.5.5/com.ibm.websphere.ihs.doc/ihs/welc6miginstallihsdist.html
3. Configure WebSphere certificates.
a. Generate a Certificate Signing Request (CSR) on the second WebSphere node.
On WebSphere node 2, use the WebSphere Administration console to navigate to Security - SSLcertificate and key management - Key stores and certificates - NodeDefaultKeyStore -Personal certificate requests - New, and fill in the required fields, using the DASH domain nameas the common name parameter value.
b. Copy the generated certificate request file from WebSphere node 2 to WebSphere node 1.
c. Generate a signed server certificate.
Use the intermediate certificate on WebSphere node 1 to sign the CSR that was created in theprevious step. For example
openssl ca -config /opt/dash/IBM/ca-certs/intermediate/openssl.cnf -extensions server_cert -days 375 -notext -md sha256 -in /opt/IBM/HTTPServer/bin/http-server-lb.csr -out /opt/IBM/HTTPServer/bin/http-server-lb1.crt
d. Import the signed server certificate into WebSphere node 2's keystore.
Copy the signed server certificate created in the previous step back to WebSphere node 2, andimport it into WebSphere node 2's keystore, and then use the WebSphere Administration consoleto navigate to Security - SSL certificate and key management - Key stores and certificates -NodeDefaultKeyStore - Personal certificates - Recieve from certificate authority
e. Add WebSphere node 1 intermediate CA certificate to WebSphere node 2's keystore.
Copy the WebSphere node 1 intermediate certificate to WebSphere node 2, and then useWebSphere node 2's WebSphere Administration console to add this certificate to WebSpherenode 2's keystore. Navigate to Security - SSL certificate and key management - Key stores and
156 IBM Netcool Operations Insight: Integration Guide
certificates - NodeDefaultKeyStore - Signer certificates -> Add and then add the intermediateCA certificate.
f. Add WebSphere node 1 root CA certificate to WebSphere node 2's truststore.
Copy the WebSphere node 1 root certificate to WebSphere node 2, and then use WebSphere node2's WebSphere Administration console to add this certificate to WebSphere node 2''s keystore.Navigate to Security - SSL certificate and key management - Key stores and certificates -NodeDefaultKeyStore - Signer certificates -> Add and then add the root CA certificate.
g. Update WebSphere node 2 to use the new certificate.
Use WebSphere node 2'S WebSphere Administration console and navigate to SSL certificate andkey management - Manage endpoint security configurations - JazzSMNode01. For inboundconnections, set the Certificate alias in key store to the certificate that was added to the keystorein the previous step.
4. Configure single sign-on for the DASH servers.Export the LPTA keys from the first DASH server, and then import them on to the other DASHserver(s). For more information, see https://www.ibm.com/support/knowledgecenter/SSSHTQ_8.1.0/com.ibm.netcool_OMNIbus.doc_8.1.0/webtop/wip/task/web_con_ssoprocedures.html.
5. Create a database to manage load balancing, and then enable WebSphere to connect to thedatabase.Create a database in Db2, and then from DASH, click Console Settings > WebSphere Administrativeconsole > Launch WebSphere Administrative console, and then Resources > JDBC > JDBCproviders and add an entry for Db2. For more information, see https://www.ibm.com/support/knowledgecenter/SSEKCU_1.1.3.0/com.ibm.psc.doc/tip_original/ttip_config_ha_setup.html.
6. Create a WebSphere datasource to enable connection to the load-balancing Db2 database:In DASH, click Console Settings > WebSphere Administrative console > WebSphereAdministrative console, and then Resources > JDBC > Data Sources and add an entry for the loadbalancing Db2 database that you created.
7. Create a key database for IBM HTTP Server to store keys and certificates in.
• cd /space/ibm/netcool/httpserver/bin./gskcapicmd -keydb -create -db ~/http-server-keys -pw WebAS -stash
For more information, see https://www.ibm.com/support/knowledgecenter/SS7K4U_8.5.5/com.ibm.websphere.ihs.doc/ihs/tihs_createkeydb390.html
• Add root CA cert to the IBM HTTP Server keystore.
./gskcmd -cert -add -db ~/http-server-keys.kdb -pw WebAS -file ~/root-ca.pem -label root-ca
• Add intermediate cert to the IBM HTTP Server keystore.
./gskcmd -cert -add -db ~/http-server-keys.kdb -pw WebAS -file ~/intermediate-ca.pem -label intermediate
• Create CSR
./gskcapicmd -certreq -create -db ~/http-server-keys.kdb -pw WebAS -dn "C=GB,ST=England,O=IBM,OU=HDM,CN=noi-on-prem1.fyre.ibm.com" -size 2048 -file ~/http-server-lb.csr -label http-server-lb
• Sign the CSR with your intermediate cert to create http-server-lb.crt.
openssl ca -config /opt/dash/IBM/ca-certs/intermediate/openssl.cnf -extensions server_cert -days 375 -notext -md sha256 -in /opt/IBM/HTTPServer/bin/http-server-lb.csr -out /opt/IBM/HTTPServer/bin/http-server-lb1.crt
• Add the signed cert to the IBM HTTP Server keystore.
./gskcmd -cert -receive -file ~/http-server-lb.crt -db ~/http-server-keys.kdb -pw WebAS
Chapter 4. Installing Netcool Operations Insight 157
• Assign the root CA certificate to be the default certificate.https://www.ibm.com/support/knowledgecenter/SSEQTJ_8.5.5/com.ibm.websphere.ihs.doc/ihs/tihs_selfsigned.htmlAlternatively, the user can use the ikeyman utility provided with IBM HTTP server to assign the rootCA certificate as the default
8. Configure SSL for IBM HTTP serverLocate the line # End of example SSL configuration in HTTP_server_install_dir/conf/httpd.conf, and then append the following, ensuring that your KeyFile and SSLStashfilevalues reference the key database file that you created for IBM HTTP Server.
# End of example SSL configurationLoadModule ibm_ssl_module modules/mod_ibm_ssl.soListen 443<VirtualHost *:443>SSLEnableSSLProtocolDisable SSLv2ErrorLog "/home/test/sslerror.log"TransferLog "/home/test/sslaccess.log"KeyFile "/home/test/http-server-keys.kdb"SSLStashfile "/home/test/http-server-keys.sth"</VirtualHost>SSLDisable
9. Tell IBM HTTP Server where the plugin-cfg.xml will beAdd the following to the end of HTTP_server_install_dir/conf/httpd.conf
LoadModule was_ap22_module "HTTP_server_install_dir/bin/64bits/mod_was_ap22_http.so"WebSpherePluginConfig "HTTP_server_install_dir/config/plugin-cfg.xml"
10. Configure the WebSphere Application Server plugin for IBM HTTP Server.Generate plugin-cfg.xml, and copy it to your IBM HTTP Server installation.
JazzSM_Profile/bin/GenPluginCfg.shcp /space/ibm/netcool/jazz/profile/config/cells/plugin-cfg.xml HTTP_web_server_install_dir/plugins/config/webserver1/plugin-cfg.xml
Edit plugin-cfg.xml to point to your key store and stashfile (http-server-keys.kdb andhttp-server-keys.sth), and add entries for each of your DASH servers. For more information,see https://www.ibm.com/support/knowledgecenter/en/SSEKCU_1.1.3.0/com.ibm.psc.doc/tip_original/ttip_config_loadbal_plugin_cfg.html
11. Edit HTTP_web_server_install_dir/plugins/config/webserver1/plugin-cfg.xmlFind the section called <UriGroup Name="server1_Cluster_URIs"> and append this line:
<Uri AffinityCookie="JSESSIONID_ibm_console_16310" AffinityURLIdentifier="jsessionid" Name="/oauth2/*"/>
12. Start the HTTP Server
HTTP_web_server_install_dir/bin/apachectl start
13. Stop and restart the Jazz for Service Management application server
cd JazzSM_WAS_Profile/bin./stopServer.sh server1 -username smadmin -password password./startServer.sh server1
where JazzSM_WAS_Profile is the location of the application server profile that is used for Jazz forService Management. This is usually /opt/IBM/JazzSM/profile.
14. Stop secondary DASH nodes and run the following command on the primary DASH node:
<JazzSM_Home>/ui/bin/consolecli.sh ForceHAUpdate --username <smadmin_user> --password <smadmin_password>
158 IBM Netcool Operations Insight: Integration Guide

ResultsWhen you have load balancing correctly configured, you are able to access DASH without providing a portin the URL, for example: https://http_server_hostname/ibm/console.
Setting up persistence for the OAuth service (HA only)
Use this topic to create a database to persist OAuth tokens and clients for use byall the WebGUI nodes.
Procedure1. Create Db2 database
Follow the instructions in this link: https://www.ibm.com/support/knowledgecenter/en/SSAW57_8.5.5/com.ibm.websphere.nd.multiplatform.doc/ae/cwbs_oauthdb2.html .You can use the same Db2 instance that you use for your load-balancing database.When instructed to create a client in the Db2 database, use the following values:
INSERT INTO OAuthDBSchema.OAUTH20CLIENTCONFIG( COMPONENTID, CLIENTID, CLIENTSECRET, DISPLAYNAME, REDIRECTURI, ENABLED)VALUES( 'NetcoolOAuthProvider', 'client_id', 'client_secret', 'My Client', 'redirect_url', 1)
Where
• client_id is the value of client-id in custom-resource-was-oauth-cnea-secrets. For more information,see “Configuring authentication” on page 152.
• client_secret is the value of client-secret in custom-resource-was-oauth-cnea-secrets. For moreinformation, see “Configuring authentication” on page 152.
• redirect_url is the value that you specified for Redirect URL when you installed the integration kit.For more information, see “Installing the integration kit” on page 190.
2. Create a JDBC entry to enable connection to your Db2 instance from WebSphere®.In DASH, click Console Settings > WebSphere Administrative console > WebSphere Administrativeconsole, and then Resources > JDBC > JDBC providers and add an entry for Db2.
3. Create a WebSphere datasource that has the credentials to connect to the OAuth Db2 database:In DASH, click Console Settings > WebSphere Administrative console > WebSphere Administrativeconsole, and then Resources > JDBC > Data Sources and add an entry for the OAuth Db2 databasethat you created. This datasource must have a different name to the datasource created for the load-balancing feature. jdbc/oauthProvider is the suggested value. The value of JNDI name for thedatasource must match the value of the oauthjdbc.JDBCProvider parameter inNetcoolOAuthProvider.xml.
Chapter 4. Installing Netcool Operations Insight 159
Configuring the probe and gateway servicesThe topology analytics probe and gateway containers are installed together with the other components.Once configured, resource information generated from IBM Tivoli Netcool/OMNIbus events is displayed.
Before you beginProbe and gateway configuration overview:
You stop the probe and gateway, and restart topology analytics, after each step:
1. You apply the $ASM_HOME/integrations/omnibus/*.sql files to the ObjectServer(s).2. You configure your ObjectServer(s) in the $ASM_HOME/intergations/omnibus/omni.dat file (do
not add the gateway to this file)3. Optionally, you add ObjectServer usernames and passwords.4. Optionally, you add an ObjectServer certificate for TLS.
This topic describes these probe and gateway configuration steps in more detail.
The topology analytics integration with an existing Netcool/OMNIbus system requires updates to theschema and automation (triggers) of that system. A sample configuration is provided, which a Netcool/OMNIbus administrator can reference to update their system.
The topology analytics integration also requires connectivity information about the Netcool/OMNIbussystem, which the Netcool/OMNIbus administrator should provide.
Important: To configure the probe and gateway services, the topology analytics and Netcool/OMNIbusadministrators should work together.
Remember: You configure the deployed probe and gateway services after installing the core topologyanalytics containers (including the probe and gateway containers), but before starting the topologyanalytics services.
About this taskThe probe service receives status from topology analytics, and generates corresponding events in theNetcool/OMNIbus Event Viewer. These events are then fed back to topology analytics by the gatewayservice, which updates the topology analytics status by the status service with the eventId.
ProcedurePerform the following updates to the target Netcool/OMNIbus ObjectServers.
Remember: Work with the Netcool/OMNIbus administrator to apply these changes.
a) Set the sub-second clearance mechanism.Sub-second clearance mechanism
This mechanism allows the correct clearance of event updates that occur in the same second.A new field is added to the alerts.status schema, which works in conjunction with the coreNetcool/OMNIbus field @LastOccurrence; @LastOccurrenceUSec.This mechanism is set via the topology analytics probe rules file and referred to in an updatedgeneric clear trigger.
b) Define the topology analytics status events clearance.Specific clearance
A new Netcool/OMNIbus SQL trigger handles the specific clearance of topology analytics statusevents.
Examples of these updates are provided with topology analytics and are located in the $ASM_HOME/integrations/omnibus directory.
160 IBM Netcool Operations Insight: Integration Guide

asm-alert-fields.sqlDefines two new fields:LastOccurrenceUSec
Allows sub-second clearingAsmStatusId
Stores the topology service status IDWithout these fields, the probe and gateway services cannot connect.
asm-trigger.sqlClears up events generated by topology analytics when resources are deleted.These events will not be cleared if this trigger has not been applied.
updated-generic-clear.sqlUpdates generic_clear automation to allow sub-second clearing.
Warning: The sample updates supplied with topology analytics should not be applied to anexisting Netcool/OMNIbus deployment without a review by the Netcool/OMNIbusadministrator, asthey overwrite core Netcool/OMNIbus functions, which may have been customized in an existingNetcool/OMNIbus system. In this case the Netcool/OMNIbus administrator may need to developcustom updates for this integration.
Hybrid scenario: If topology analytics is deployed on Red Hat OpenShift and connecting to an existingNetcool/OMNIbus or IBM Netcool Operations Insight system, you can obtain the sample SQL files via thefollowing steps:
a. Log into the OpenShift system.b. Extract the asm-trigger.sql file:
oc get configmap asm-noi-gateway-config -o jsonpath="{.data.asm-trigger\.sql}" > asm-trigger.sql
c. Extract the 'updated-generic-clear.sql file:
oc get configmap asm-noi-gateway-config -o jsonpath="{.data.updated-generic-clear\.sql }" > updated-generic-clear.sql
d. Recreate asm-alert-fields.sql:
echo -e "alter table alerts.status add column AsmStatusId varchar(64);\nalter table alerts.status add column LastOccurrenceUSec int;\ngo\n" > asm-alert-fields.sql
InstallingFollow these instructions to deploy a hybrid Netcool Operations Insight solution.
Installing cloud native components on hybridTo create a hybrid installation, you must install the cloud native Netcool Operations Insight componentson Red Hat OpenShift, and configure them to access your on-premises ObjectServer and on-premisesWeb GUI. You can install the cloud native Netcool Operations Insight components using the OperatorLifecycle Manager (OLM) UI, or with the OLM UI and Netcool Operations Insight (CASE). You can alsoinstall offline in an airgapped environment.
Installing cloud native components with the Operator Lifecycle Manager (OLM) userinterfaceUse these instructions to install the cloud native Netcool Operations Insight components for a hybriddeployment, using the Red Hat OpenShift Operator Lifecycle Manager (OLM) user interface (UI).
Before you beginEnsure that you have completed all the steps in “Preparing” on page 142.
Chapter 4. Installing Netcool Operations Insight 161
The operator images for Netcool Operations Insight on Red Hat OpenShift are in the freely accessibleDockerHub (docker.io/ibmcom), and the operand images are in the IBM Entitled Registry (cp.icr.io), forwhich you require an entitlement key.
If you want to verify the origin of the catalog, then use the OLM UI and CASE install method instead. Formore information, see “Installing cloud native components with the Operator Lifecycle Manager (OLM)user interface and CASE (Container Application Software for Enterprises)” on page 163.
For more information about the OLM, see https://access.redhat.com/documentation/en-us/openshift_container_platform/4.6/html/operators/understanding-operators#operator-lifecycle-manager-olm .
ProcedureCreate a Catalog source for noi
1. From the Red Hat OpenShift OLM UI, navigate to Administration > Cluster Settings, and then selectthe OperatorHub configuration resource under the Global Configuration tab.
2. Click the Create Catalog Source button under the Sources tab. Provide the Netcool OperationsInsight catalog source name and the image URL, docker.io/ibmcom/ibm-operator-catalog:latest. Then select the Create button.
3. The noi catalog source appears. Refresh the screen after a few minutes, and ensure that the # ofoperators count is 1.
4. Edit the catalog source by adding the following lines to the spec:
updateStrategy: registryPoll: interval: 45m
Install the Netcool Operations Insight Operator5. Navigate to Operators > OperatorHub, and then search for and select the Netcool Operations Insight
operator. Select the Install button.6. Select the namespace that you created in “Preparing your cluster” on page 147 to install the operator
into. Do not use namespaces that are owned by Kubernetes or OpenShift, such as kube-system ordefault.
7. Click the Install button.8. Navigate to Operators > Installed Operators, and view the Netcool Operations Insight operator. It
takes a few minutes to install. Ensure that the status of the installed Netcool Operations Insightoperator is Succeeded before continuing.
Create a Netcool Operations Insight instance for a hybrid deployment.9. From the Red Hat OpenShift OLM UI, navigate to Operators > Installed Operators, and select the
Netcool Operations Insight operator. Under Provided APIs > Hybrid Deployment, select CreateInstance.
10. From the Red Hat OpenShift OLM UI, use the YAML or the Form view to configure the properties forthe cloud native Netcool Operations Insight components deployment. For more information aboutconfigurable properties for a hybrid deployment, see “Hybrid operator properties” on page 170.
11. Select the Create button.12. Under the All Instances tab, a Netcool Operations Insight hybrid instance appears.
To monitor the status of the installation, see “Monitoring cloud installation progress” on page 125.
Note:
• Changing an existing deployment from a Trial deployment type to a Production deployment type isnot supported.
• Changing an instance's deployment parameters in the Form view is not supported post deployment.• If you update custom secrets in the OLM console, the crypto key is corrupted and the command to
encrypt passwords does not work. Only update custom secrets with the CLI. For more information
162 IBM Netcool Operations Insight: Integration Guide

about storing a certificate as a secret, see https://www.ibm.com/support/knowledgecenter/SS9LQB_1.1.10/LoadingData/t_asm_obs_configuringsecurity.html
What to do nextTo enable or disable a feature or observer after installation edit the hybrid Netcool Operations Insightinstance by running the command:
oc edit noihybrid noi-instance-name
Where noi-instance-name is the name of the deployment of cloud native Netcool Operations Insightcomponents that you want to change.
You can then select to enable or disable the feature or observer. When you disable features postinstallation, the resource is not automatically deleted. To find out if the feature is deleted, you must checkthe operator log.
Installing cloud native components with the Operator Lifecycle Manager (OLM) userinterface and CASE (Container Application Software for Enterprises)Use these instructions to install the cloud native Netcool Operations Insight components for a hybriddeployment, using Container Application Software for Enterprises (CASE) and the Red Hat OpenShiftOperator Lifecycle Manager (OLM) user interface (UI). CASE creates the Netcool Operations InsightCatalog source and installs the Netcool Operations Insight Operator for you.
Before you beginEnsure that you have completed all the steps in “Preparing” on page 142.
The operator images for Netcool Operations Insight on Red Hat OpenShift are in the freely accessibleDockerHub (docker.io/ibmcom), and the operand images are in the IBM Entitled Registry (cp.icr.io), forwhich you require an entitlement key. The CASE bundle is available from IBM cloudPaks.
For more information about the OLM, see https://access.redhat.com/documentation/en-us/openshift_container_platform/4.6/html/operators/understanding-operators#operator-lifecycle-manager-olm .
ProcedureGet the Netcool Operations Insight CASE
1. Download the command-line tool cloudctl version 3.4.x or 3.5.x.Download IBM® Cloud Pak CLI (cloudctl) from https://github.com/IBM/cloud-pak-cli/releases.cloudctl verifies the integrity of the Netcool Operations Insight CASE's digital signature by default.If you want to verify the cloudctl binary, follow the instructions in https://github.com/IBM/cloud-pak-cli#check-certificatekey-validity. Extract the cloudctl binary, give it executable permissions,and ensure that it is in your PATH.
2. Download the Netcool Operations Insight CASE bundle (ibm-netcool-prod) to your Red HatOpenShift cluster.
cloudctl case save --case ibm-netcool-prod --outputdir destination_dir --repo https://raw.githubusercontent.com/IBM/cloud-pak/master/repo/case
Where destination_dir is a directory of your choosing, for example /tmp/cases.
3. Extract the Netcool Operations Insight CASE bundle.
tar -xvf destination_dir/ibm-netcool-prod*.tgz
where destination_dir is the directory that you downloaded the CASE bundle into in the previous step.Install the Netcool Operations Insight Catalog and Operator
4. Install the Catalog using CASE.
Chapter 4. Installing Netcool Operations Insight 163

cloudctl case launch \ --case ibm-netcool-prod \ --namespace namespace \ --inventory noiOperatorSetup \ --action install-catalog
Where namespace is the custom namespace to be used for your deployment, that you created whenyou prepared your cluster.
5. Verify the Netcool Operations Insight Catalog Source.From the Red Hat OpenShift OLM UI, navigate to Administration > Cluster Settings, and then selectthe OperatorHub configuration resource under the Global Configuration tab. Verify that the ibm-noi-catalog catalog source is present.
6. Install the Netcool Operations Insight operator using CASE.
cloudctl case launch \ --case ibm-netcool-prod \ --namespace namespace \ --inventory noiOperatorSetup \ --action install-operator \ --args "--secret noi-registry-secret"
Where
• namespace is the custom namespace to be used for your deployment.• noi-registry-secret is the secret for accessing the IBM Entitled Registry that you created when you
prepared your cluster.7. Verify the Netcool Operations Insight operator.
From the Red Hat OpenShift OLM UI, navigate to Operators > Installed Operators, and verify thatthe status of the Netcool Operations Insight operator is Succeeded.
Create a Netcool Operations Insight instance for a hybrid deployment.8. From the Red Hat OpenShift OLM UI, navigate to Operators > Installed Operators, and select the
Netcool Operations Insight operator. Under Provided APIs > Hybrid Deployment, select CreateInstance.
9. From the Red Hat OpenShift OLM UI, use the YAML or the Form view to configure the properties forthe cloud native Netcool Operations Insight components deployment. For more information aboutconfigurable properties for a hybrid deployment, see “Hybrid operator properties” on page 170.
10. Select the Create button.11. Under the All Instances tab, a Netcool Operations Insight hybrid instance appears.
To monitor the status of the installation, see “Monitoring cloud installation progress” on page 125.
Note:
• Changing an existing deployment from a Trial deployment type to a Production deployment type isnot supported.
• Changing an instance's deployment parameters in the Form view is not supported post deployment.• If you update custom secrets in the OLM console, the crypto key is corrupted and the command to
encrypt passwords does not work. Only update custom secrets with the CLI. For more informationabout storing a certificate as a secret, see https://www.ibm.com/support/knowledgecenter/SS9LQB_1.1.10/LoadingData/t_asm_obs_configuringsecurity.html
What to do nextTo enable or disable a feature or observer after installation edit the hybrid Netcool Operations Insightinstance by running the command:
oc edit noihybrid noi-instance-name
Where noi-instance-name is the name of the deployment of cloud native Netcool Operations Insightcomponents that you want to change.
164 IBM Netcool Operations Insight: Integration Guide
You can then select to enable or disable the feature or observer. When you disable features postinstallation, the resource is not automatically deleted. To find out if the feature is deleted, you must checkthe operator log.
Installing cloud native components in an offline environment (airgap)Follow these instructions to deploy an installation of cloud native Netcool Operations Insight componentsfor a hybrid deployment on an offline environment, using Container Application Software for Enterprises(CASE) and the Red Hat OpenShift Operator Lifecycle Manager (OLM)
Before you beginEnsure that you have completed all the steps in “Preparing” on page 142.
The operator images for Netcool Operations Insight on Red Hat OpenShift are in the freely accessibleDockerHub (docker.io/ibmcom), and the operand images are in the IBM Entitled Registry (cp.icr.io), forwhich you require an entitlement key. The CASE bundle is available from IBM cloudPaks.
For more information about the OLM, see https://access.redhat.com/documentation/en-us/openshift_container_platform/4.6/html/operators/understanding-operators#operator-lifecycle-manager-olm .
About this taskYou can install cloud native Netcool Operations Insight components on an offline Red Hat OpenShiftcluster that has no internet connectivity by using an airgapped environment. This is done by creating anonline bastion host that can download the Netcool Operations Insight CASE bundle, access the requiredimages in the IBM Entitled Registry, and mirror them to a registry on the Red Hat OpenShift cluster. TheRed Hat OpenShift cluster can then be used to install the Netcool Operations Insight operator, and createa cloud native Netcool Operations Insight components instance for a hybrid deployment.
ProcedureCreate a target registry to store all the images locally
1. Install and start a production grade Docker V2 compatible registry, such as Quay Enterprise, JFrogArtifactory, or Docker Registry.The target registry must be accessible by the Red Hat OpenShift cluster and the bastion host. TheRed Hat OpenShift internal registry is not supported.
2. Create a secret for access to the target registry
oc create secret docker-registry target-registry-secret \ --docker-server=target_registry \ --docker-username=user \ --docker-password=password \ --namespace=target_namespace
Where:
• target_registry is the target local registry that you created in step 1.• target-registry-secret is the name of the secret that you are creating. Suggested value is target-registry-secret.
• user and password are the credentials to access your target registry.• namespace is the namespace that you want to deploy Netcool Operations Insight in.
Prepare the bastion host3. Verify the bastion server's access.
Logon to the bastion machine and verify that it has access to:
• the public internet - to download the Netcool Operations Insight CASE and images from the sourceregistries.
• the target registry - where the images will be mirrored.
Chapter 4. Installing Netcool Operations Insight 165
• the target Red Hat OpenShift cluster - to install the Netcool Operations Insight operator.4. Download and install the following onto the bastion server.
• cloudctl - Download IBM® Cloud Pak CLI (cloudctl) versions 3.4.x or 3.5.x from https://github.com/IBM/cloud-pak-cli/releases. cloudctl verifies the integrity of the Netcool OperationsInsight CASE's digital signature by default. If you want to verify the cloudctl binary, follow theinstructions in https://github.com/IBM/cloud-pak-cli#check-certificatekey-validity. Extract thecloudctl binary, give it executable permissions, and ensure that it is in your PATH.
• oc - Download and install the Openshift CLI (oc), V4.4.9 or higher. For more information, seehttps://docs.openshift.com/container-platform/4.5/cli_reference/openshift_cli/getting-started-cli.html#installing-the-cli .
• Docker - Install docker version 1.13.1 or above, and start the docker daemon. For moreinformation, see https://docs.docker.com/install/ .
Download CASE bundle onto the bastion server5. Download the Netcool Operations Insight CASE bundle, (ibm-netcool-prod), into a local directory
on your bastion server.
cloudctl case save --case ibm-netcool-prod --outputdir destination_dir --repo https://raw.githubusercontent.com/IBM/cloud-pak/master/repo/case
Where destination_dir is a directory of your choosing, for example ./CASES6. Extract the Netcool Operations Insight CASE bundle.
tar -xvf destination_dir/ibm-netcool-prod*.tgz
where destination_dir is the directory that you downloaded the CASE bundle into in the previous step.7. Verify that the Netcool Operations Insight CASE bundle, images.csv, and charts.csv have been
successfully downloaded on your bastion server, with the following command:
find destination_dir -type f
Where destination_dir is a directory of your choosing, for example ./CASESConfigure bastion server authentication
8. Set up access to the IBM Entitled Registry, cp.icr.io, which you will be pulling images from.Run the following command on your bastion server:
$ cloudctl case launch \ --case ibm-netcool-prod \ --namespace namespace \ --inventory noiOperatorSetup \ --action configure-creds-airgap \ --args "--registry cp.icr.io --user cp --pass password"
Where
• namespace is the custom namespace that you want to deploy Netcool Operations Insight into.• password is your IBM Entitled Registry entitlement key, as found when you prepared your cluster.
9. Set the target registry environment variable $TARGET_REGISTRYRun the following command on your bastion server:
export TARGET_REGISTRY=target_registry
Where target_registry is the docker registry where the images are stored.Mirror images from CASE to the target registry in the airgap environment10. Before mirroring images, set CLOUDCTL_CASE_USE_CATALOG_DIGEST by running the command:
export CLOUDCTL_CASE_USE_CATALOG_DIGEST=1
11. Mirror images from CASE to the target registry. This can take up to 2 hours.
166 IBM Netcool Operations Insight: Integration Guide
Run the following command on your bastion server:
$ cloudctl case launch \ --case ibm-netcool-prod \ --namespace namespace \ --inventory noiOperatorSetup \ --action mirror-images \ --args "--registry $TARGET_REGISTRY --inputDir inputDir"
Where
• namespace is the custom namespace that you want to deploy Netcool Operations Insight into.• inputDir is the directory that you downloaded the CASE bundle into.
The images listed in the downloaded CASE, (images.csv), are copied to the target registry in theairgap environment.
Configure Red Hat OpenShift Cluster for airgap12. Configure your Red Hat OpenShift Cluster for airgap. This step can take 90+ minutes.
Run the following command on your bastion server to create a global image pull secret for the targetregistry, and create a ImageSourceContentPolicy.
$ cloudctl case launch \ --case ibm-netcool-prod \ --namespace namespace \ --inventory noiOperatorSetup \ --action configure-cluster-airgap \ --args "--registry $TARGET_REGISTRY --inputDir inputDir"
Where
• namespace is the custom namespace to be used for your deployment.• inputDir is the directory containing the CASE bundle.
Warning:
• Cluster resources must adjust to the new pull secret, which can temporarily limit theusability of the cluster. Authorization credentials are stored in $HOME/.airgap/secretsand /tmp/airgap* to support this action.
• Applying ImageSourceContentPolicy causes cluster nodes to recycle.Install the Netcool Operations Insight Catalog and Operator13. Install the Catalog using CASE.
Run the following command on your bastion server:
cloudctl case launch \ --case ibm-netcool-prod \ --namespace namespace \ --inventory noiOperatorSetup \ --action install-catalog \ --args "--registry $TARGET_REGISTRY"
Where namespace is the custom namespace to be used for your deployment, that you created whenyou prepared your cluster.
14. Verify the Netcool Operations Insight Catalog Source.From the Red Hat OpenShift OLM UI, navigate to Administration > Cluster Settings, and then selectthe OperatorHub configuration resource under the Global Configuration tab. Verify that the ibm-noi-catalog catalog source is present.
15. Install the Netcool Operations Insight operator using CASE.Run the following command on your bastion server:
cloudctl case launch \ --case ibm-netcool-prod \ --namespace namespace \ --inventory noiOperatorSetup \
Chapter 4. Installing Netcool Operations Insight 167

--action install-operator \ --args "--secret target-registry-secret"
Where
• namespace is the custom namespace to be used for your deployment.• target-registry-secret is the secret for accessing the target registry that you created in step 2.
16. Verify the Netcool Operations Insight operator.From the Red Hat OpenShift OLM UI, navigate to Operators > Installed Operators, and verify thatthe status of the Netcool Operations Insight operator is Succeeded.
Create a cloud native Netcool Operations Insight components instance for a hybrid deployment.17. From the Red Hat OpenShift OLM UI, navigate to Operators > Installed Operators, and select the
Netcool Operations Insight operator. Under Provided APIs > Hybrid Deployment, select CreateInstance.
18. From the Red Hat OpenShift OLM UI, use the YAML or the Form view to configure the properties forthe cloud native Netcool Operations Insight components deployment. For more information aboutconfigurable properties for a hybrid deployment, see “Hybrid operator properties” on page 170. Ifyou are using Red Hat OpenShift V4.4.5 or earlier, then you cannot use the Form view and you mustuse the CLI to directly edit the .yaml file.
19. Edit the Netcool Operations Insight properties to provide access to the target registry.a) Update spec.advanced.imagePullRepository so that it points to the target registry that you
created.b) Set spec.entitlementSecret to the target registry secret.
20. Select the Create button.21. Under the All Instances tab, a Netcool Operations Insight hybrid instance appears.
To monitor the status of the installation, see “Monitoring cloud installation progress” on page 125.
Note:
• Changing an existing deployment from a Trial deployment type to a Production deployment type isnot supported.
• Changing an instance's deployment parameters in the Form view is not supported post deployment.• If you update custom secrets in the OLM console, the crypto key is corrupted and the command to
encrypt passwords does not work. Only update custom secrets with the CLI. For more informationabout storing a certificate as a secret, see https://www.ibm.com/support/knowledgecenter/SS9LQB_1.1.10/LoadingData/t_asm_obs_configuringsecurity.html
What to do nextTo enable or disable a feature or observer after installation edit the hybrid Netcool Operations Insightinstance by running the command:
oc edit noihybrid noi-instance-name
Where noi-instance-name is the name of the deployment of cloud native Netcool Operations Insightcomponents that you want to change.
You can then select to enable or disable the feature or observer. When you disable features postinstallation, the resource is not automatically deleted. To find out if the feature is deleted, you must checkthe operator log.
168 IBM Netcool Operations Insight: Integration Guide
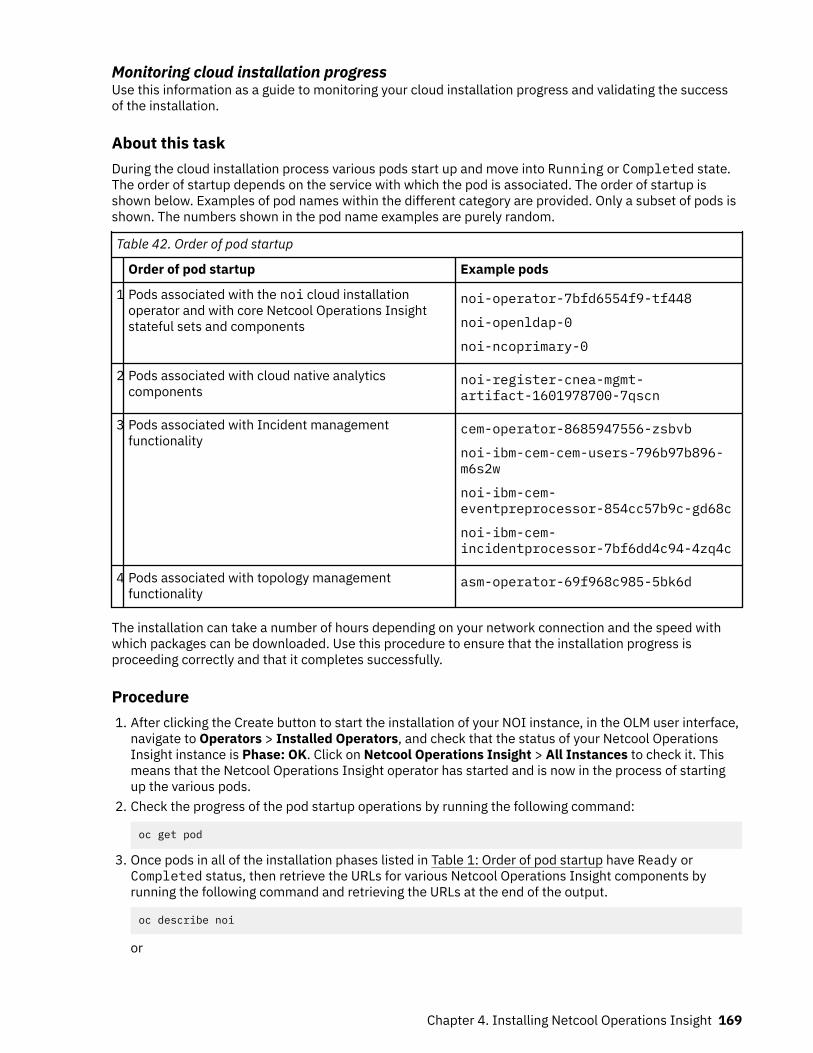
Monitoring cloud installation progressUse this information as a guide to monitoring your cloud installation progress and validating the successof the installation.
About this taskDuring the cloud installation process various pods start up and move into Running or Completed state.The order of startup depends on the service with which the pod is associated. The order of startup isshown below. Examples of pod names within the different category are provided. Only a subset of pods isshown. The numbers shown in the pod name examples are purely random.
Table 42. Order of pod startup
Order of pod startup Example pods
1 Pods associated with the noi cloud installationoperator and with core Netcool Operations Insightstateful sets and components
noi-operator-7bfd6554f9-tf448
noi-openldap-0
noi-ncoprimary-0
2 Pods associated with cloud native analyticscomponents
noi-register-cnea-mgmt-artifact-1601978700-7qscn
3 Pods associated with Incident managementfunctionality
cem-operator-8685947556-zsbvb
noi-ibm-cem-cem-users-796b97b896-m6s2w
noi-ibm-cem-eventpreprocessor-854cc57b9c-gd68c
noi-ibm-cem-incidentprocessor-7bf6dd4c94-4zq4c
4 Pods associated with topology managementfunctionality
asm-operator-69f968c985-5bk6d
The installation can take a number of hours depending on your network connection and the speed withwhich packages can be downloaded. Use this procedure to ensure that the installation progress isproceeding correctly and that it completes successfully.
Procedure1. After clicking the Create button to start the installation of your NOI instance, in the OLM user interface,
navigate to Operators > Installed Operators, and check that the status of your Netcool OperationsInsight instance is Phase: OK. Click on Netcool Operations Insight > All Instances to check it. Thismeans that the Netcool Operations Insight operator has started and is now in the process of startingup the various pods.
2. Check the progress of the pod startup operations by running the following command:
oc get pod
3. Once pods in all of the installation phases listed in Table 1: Order of pod startup have Ready orCompleted status, then retrieve the URLs for various Netcool Operations Insight components byrunning the following command and retrieving the URLs at the end of the output.
oc describe noi
or
Chapter 4. Installing Netcool Operations Insight 169
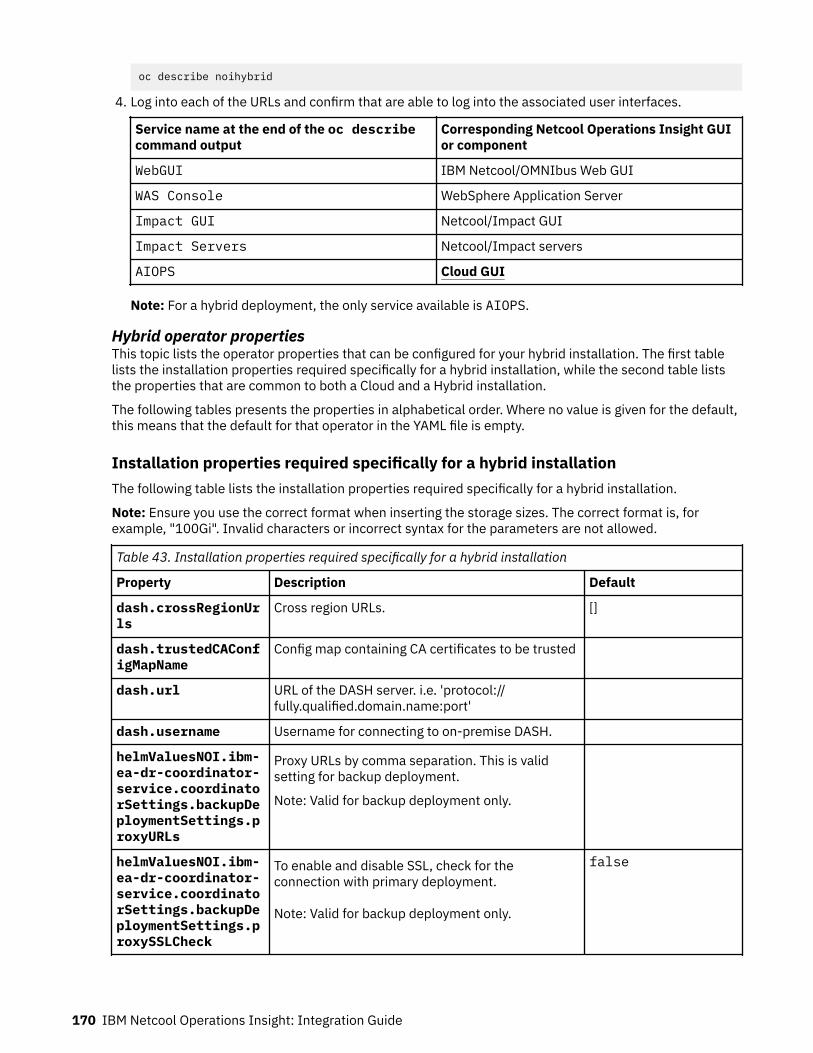
oc describe noihybrid
4. Log into each of the URLs and confirm that are able to log into the associated user interfaces.
Service name at the end of the oc describecommand output
Corresponding Netcool Operations Insight GUIor component
WebGUI IBM Netcool/OMNIbus Web GUI
WAS Console WebSphere Application Server
Impact GUI Netcool/Impact GUI
Impact Servers Netcool/Impact servers
AIOPS Cloud GUI
Note: For a hybrid deployment, the only service available is AIOPS.
Hybrid operator propertiesThis topic lists the operator properties that can be configured for your hybrid installation. The first tablelists the installation properties required specifically for a hybrid installation, while the second table liststhe properties that are common to both a Cloud and a Hybrid installation.
The following tables presents the properties in alphabetical order. Where no value is given for the default,this means that the default for that operator in the YAML file is empty.
Installation properties required specifically for a hybrid installationThe following table lists the installation properties required specifically for a hybrid installation.
Note: Ensure you use the correct format when inserting the storage sizes. The correct format is, forexample, "100Gi". Invalid characters or incorrect syntax for the parameters are not allowed.
Table 43. Installation properties required specifically for a hybrid installation
Property Description Default
dash.crossRegionUrls
Cross region URLs. []
dash.trustedCAConfigMapName
Config map containing CA certificates to be trusted
dash.url URL of the DASH server. i.e. 'protocol://fully.qualified.domain.name:port'
dash.username Username for connecting to on-premise DASH.
helmValuesNOI.ibm-ea-dr-coordinator-service.coordinatorSettings.backupDeploymentSettings.proxyURLs
Proxy URLs by comma separation. This is validsetting for backup deployment.
Note: Valid for backup deployment only.
helmValuesNOI.ibm-ea-dr-coordinator-service.coordinatorSettings.backupDeploymentSettings.proxySSLCheck
To enable and disable SSL, check for theconnection with primary deployment.
Note: Valid for backup deployment only.
false
170 IBM Netcool Operations Insight: Integration Guide
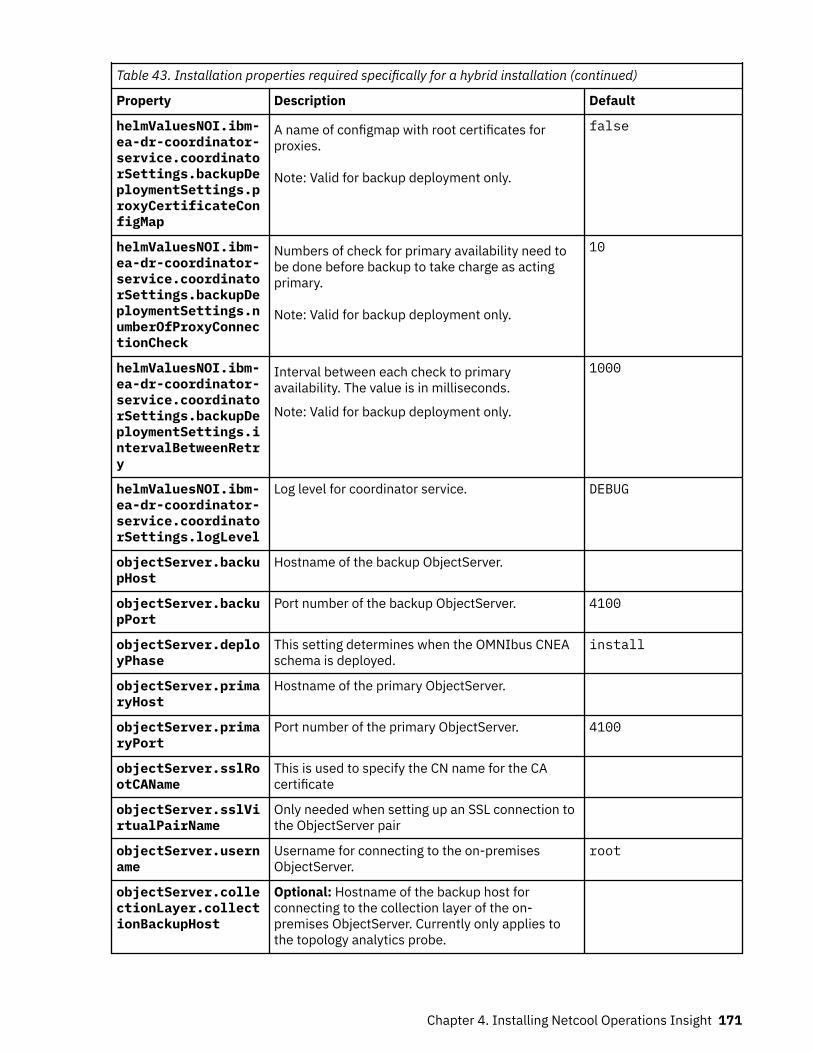
Table 43. Installation properties required specifically for a hybrid installation (continued)
Property Description Default
helmValuesNOI.ibm-ea-dr-coordinator-service.coordinatorSettings.backupDeploymentSettings.proxyCertificateConfigMap
A name of configmap with root certificates forproxies.
Note: Valid for backup deployment only.
false
helmValuesNOI.ibm-ea-dr-coordinator-service.coordinatorSettings.backupDeploymentSettings.numberOfProxyConnectionCheck
Numbers of check for primary availability need tobe done before backup to take charge as actingprimary.
Note: Valid for backup deployment only.
10
helmValuesNOI.ibm-ea-dr-coordinator-service.coordinatorSettings.backupDeploymentSettings.intervalBetweenRetry
Interval between each check to primaryavailability. The value is in milliseconds.
Note: Valid for backup deployment only.
1000
helmValuesNOI.ibm-ea-dr-coordinator-service.coordinatorSettings.logLevel
Log level for coordinator service. DEBUG
objectServer.backupHost
Hostname of the backup ObjectServer.
objectServer.backupPort
Port number of the backup ObjectServer. 4100
objectServer.deployPhase
This setting determines when the OMNIbus CNEAschema is deployed.
install
objectServer.primaryHost
Hostname of the primary ObjectServer.
objectServer.primaryPort
Port number of the primary ObjectServer. 4100
objectServer.sslRootCAName
This is used to specify the CN name for the CAcertificate
objectServer.sslVirtualPairName
Only needed when setting up an SSL connection tothe ObjectServer pair
objectServer.username
Username for connecting to the on-premisesObjectServer.
root
objectServer.collectionLayer.collectionBackupHost
Optional: Hostname of the backup host forconnecting to the collection layer of the on-premises ObjectServer. Currently only applies tothe topology analytics probe.
Chapter 4. Installing Netcool Operations Insight 171
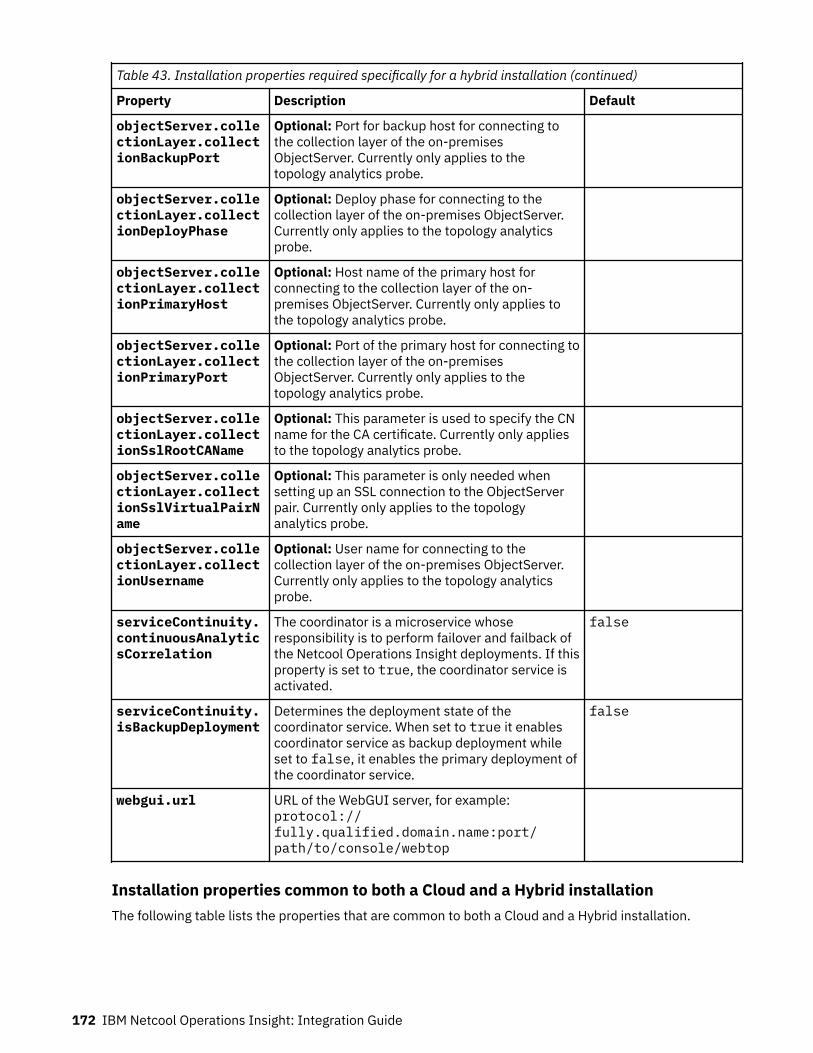
Table 43. Installation properties required specifically for a hybrid installation (continued)
Property Description Default
objectServer.collectionLayer.collectionBackupPort
Optional: Port for backup host for connecting tothe collection layer of the on-premisesObjectServer. Currently only applies to thetopology analytics probe.
objectServer.collectionLayer.collectionDeployPhase
Optional: Deploy phase for connecting to thecollection layer of the on-premises ObjectServer.Currently only applies to the topology analyticsprobe.
objectServer.collectionLayer.collectionPrimaryHost
Optional: Host name of the primary host forconnecting to the collection layer of the on-premises ObjectServer. Currently only applies tothe topology analytics probe.
objectServer.collectionLayer.collectionPrimaryPort
Optional: Port of the primary host for connecting tothe collection layer of the on-premisesObjectServer. Currently only applies to thetopology analytics probe.
objectServer.collectionLayer.collectionSslRootCAName
Optional: This parameter is used to specify the CNname for the CA certificate. Currently only appliesto the topology analytics probe.
objectServer.collectionLayer.collectionSslVirtualPairName
Optional: This parameter is only needed whensetting up an SSL connection to the ObjectServerpair. Currently only applies to the topologyanalytics probe.
objectServer.collectionLayer.collectionUsername
Optional: User name for connecting to thecollection layer of the on-premises ObjectServer.Currently only applies to the topology analyticsprobe.
serviceContinuity.continuousAnalyticsCorrelation
The coordinator is a microservice whoseresponsibility is to perform failover and failback ofthe Netcool Operations Insight deployments. If thisproperty is set to true, the coordinator service isactivated.
false
serviceContinuity.isBackupDeployment
Determines the deployment state of thecoordinator service. When set to true it enablescoordinator service as backup deployment whileset to false, it enables the primary deployment ofthe coordinator service.
false
webgui.url URL of the WebGUI server, for example:protocol://fully.qualified.domain.name:port/path/to/console/webtop
Installation properties common to both a Cloud and a Hybrid installationThe following table lists the properties that are common to both a Cloud and a Hybrid installation.
172 IBM Netcool Operations Insight: Integration Guide
Table 44. Installation properties
Property Description Default
backupRestore.enableAnalyticsBackups
If set to true, the cronjob that does the backups isactivated.
false
clusterDomain Use the fully qualified domain name (FQDN) toformulate the clusterDomain property, using thefollowing formula:
apps.clustername.*.*.com.
Note: The apps prefix must be included in theFQDN. For more information see this Red HatOpenShift documentation: https://docs.openshift.com/container-platform/4.5/installing/installing_bare_metal/installing-bare-metal-network-customizations.html#installation-dns-user-infra_installing-bare-metal-network-customizations
deploymentType Deployment type (trial or production). trial
entitlementSecret Entitlement secret to pull images.
license.accept Agreement to license. false
version Version. 1.6.3
global.networkpolicies.enabled
Set this property to false if you want to omit thenetwork policies from the installation.
true
advanced.antiAffinity
To prevent primary and backup server pods frombeing installed on the same worker node, set thisoption to true.
false
advanced.imagePullPolicy
The default pull policy is IfNotPresent, whichcauses the kubelet to skip pulling an image thatalready exists.
IfNotPresent
advanced.imagePullRepository
Docker registry that all component images arepulled from. Defaults to the IBM Entitled Registry,cp.icr.io
Note: Trailing forward slash in the Image PullRepository parameters causes datalayer not todeploy. A blockage occurs in the installationprocess because the datalayer pod fails due tothe invalid image name. To fix the issue, you haveto uninstall and reinstall without the trailingforward slash.
cp.icr.io/cp/noi
helmValuesNOI.ibm-noi-bkuprestore.noibackuprestore.backupDestination.hostname
The destination hostname of the machine wherethe backups are copied to. (Optional)
false
Chapter 4. Installing Netcool Operations Insight 173

Table 44. Installation properties (continued)
Property Description Default
helmValuesNOI.ibm-noi-bkuprestore.noibackuprestore.backupDestination.username
The username on the destination hostname thatdoes the SCP copy.
(Optional)
false
helmValuesNOI.ibm-noi-bkuprestore.noibackuprestore.backupDestination.directory
The directory on the destination hostname thatreceives the backups. (Optional)
false
helmValuesNOI.ibm-noi-bkuprestore.noibackuprestore.backupDestination.secretName
The Kubernetes secret name, which contains theprivate ssh key that is used to do the SCP. Thesecret key privatekey must be used to store thessh private key. (Optional)
It needs to be set up up front if you want to useSCP before the installation of Netcool OperationsInsight.
false
helmValuesNOI.ibm-noi-bkuprestore.noibackuprestore.schedule
It is the Cron schedule format that is used todetermine how often the backups are taken. See https://en.wikipedia.org/wiki/Cron for more detailson this used approach for running scheduled runs.
Every 3 minutes
helmValuesNOI.ibm-noi-bkuprestore.noibackuprestore.claimName
The PVC claim name that is used to store thebackups. An empty value implies no use ofKubernetes persistent storage. (Optional)
The PVC needs to be set up up front before the NOIdeployment if Kubernetes persistent storage isrequired.
false
helmValuesNOI.ibm-noi-bkuprestore.noibackuprestore.maxbackups
The maximum number of historic policy backups tokeep on the persistent volume to preserve storagespace. (Optional)
10
integrations.humio.repository
Internal repository for Humio data.
integrations.humio.url
URL of the Humio server. Set the value of thisproperty to a URL in order to enable the SearchHumio event action.
ldap.baseDN Configure the LDAP base entry by specifying thebase distinguished name (DN).
dc=mycluster,dc=icp
ldap.bindDN Configure LDAP bind user identity by specifying thebind distinguished name (bind DN).
cn=admin,dc=mycluster,dc=icp
ldap.groupFilter Set LDAP group filter. uid=%s,ou=groups
174 IBM Netcool Operations Insight: Integration Guide

Table 44. Installation properties (continued)
Property Description Default
ldap.mode Choose (standalone) for a built-in LDAP server or(proxy) and connect to an external organizationLDAP server.
Note: Set LDAP properties as follows:
• If you set ldap mode: standalone (internalLDAP), then use the default LDAP parametervalues as listed in this table, otherwise theinstallation will fail.
• If you set ldap mode: proxy then ensure thatyou set the correct LDAP values for your externalLDAP service.
standalone
ldap.port Configure the port of your organization's LDAPserver.
389
ldap.serverType Set LDAP user filter. CUSTOM
ldap.sslPort Configure the SSL port of your organization's LDAPserver.
636
ldap.storageClass LDAP storage class. Update this to a valid storageclass.
ldap.storageSize LDAP storage size. 1Gi
ldap.suffix Configure the top entry in the LDAP directoryinformation tree .(DIT).
dc=mycluster,dc=icp
ldap.url Configure the URL of your organization's LDAPserver.
ldap://localhost:389
ldap.userFilter Set LDAP user filter. uid=%s,ou=users
persistence.enabled
Enable persistence storage. false
persistence.storageClassCassandraBackup
CassandraBackup storage class.
persistence.storageClassCassandraData
CassandraData storage class.
persistence.storageClassCouchdb
Couchdb storage class.
persistence.storageClassDB2
Db2 storage class.
persistence.storageClassElastic
Elasticsearch storage class.
persistence.storageClassImpactGUI
ImpactGUI storage class.
persistence.storageClassImpactServer
ImpactServer storage class.
Chapter 4. Installing Netcool Operations Insight 175
Table 44. Installation properties (continued)
Property Description Default
persistence.storageClassKafka
Kafka storage class.
persistence.storageClassNCOBackup
NCOBackup storage class.
persistence.storageClassNCOPrimary
NCOPrimary storage class.
persistence.storageClassZookeeper
Zookeeper storage class.
persistence.storageSizeCassandraBackup
CassandraBackup storage size. 50Gi
persistence.storageSizeCassandraData
CassandraData storage size. 50Gi
persistence.storageSizeCouchdb
Couchdb storage size. 5Gi
persistence.storageSizeDB2
Db2 storage size. 5Gi
persistence.storageSizeElastic
Elasticsearch storage size. 75Gi
persistence.storageSizeImpactGUI
ImpactGUI storage size. 5Gi
persistence.storageSizeImpactServer
ImpactServer storage size. 5Gi
persistence.storageSizeKafka
Kafka storage size. 50Gi
persistence.storageSizeNCOBackup
NCOBackup storage size. 5Gi
persistence.storageSizeNCOPrimary
NCOPrimary storage size. 5Gi
persistence.storageSizeZookeeper
Zookeeper storage size. 5Gi
serviceContinuity.enableAnalyticsBackup
If set to true, the cronjob that does the backups isactivated.
false
topology.appDisco.db2database
Name of Db2 instance. Default value: taddm
topology.appDisco.db2archuser
Name of database archive user. Default value:archuser
176 IBM Netcool Operations Insight: Integration Guide
Table 44. Installation properties (continued)
Property Description Default
topology.appDisco.dbport
Post of Db2 server. Default value: 50000
topology.appDisco.db2user
Name of database user. Default value: db2inst1
topology.appDisco.scaleSSS
Value must be greater than 0. Default value: 1
topology.appDisco.scaleDS
Value must be greater than 0. Default value: 1
topology.appDisco.enabled
Enable Application Discovery services and itsobserver.
false
topology.appDisco.dburl
Db2 Host URL for Application Discovery.
topology.appDisco.dbsecret
Db2 secret for Application Discovery.
topology.appDisco.secure
Enable secure connection to Db2 Host URL forApplication Discovery.
false
topology.appDisco.certSecret
This secret must contain the Db2 certificate by thename tls.crt Applicable only if the propertyname is secure.
topology.enabled Enable topology. true
topology.netDisco Enable Network Discovery services and itsobserver.
false
topology.observers.alm
Enable ALM observer. false
topology.observers.ansibleawx
Enable Ansible AWX observer. false
topology.observers.appdynamics
Enable AppDynamics observer. false
topology.observers.aws
Enable AWS observer. false
topology.observers.azure
Enable Azure observer. false
topology.observers.bigfixinventory
Enable Bigfixinventory observer. false
topology.observers.cienablueplanet
Enable Cienablueplanet observer. false
Chapter 4. Installing Netcool Operations Insight 177
Table 44. Installation properties (continued)
Property Description Default
topology.observers.ciscoaci
Enable Ciscoaci observer. false
topology.observers.contrail
Enable Contrail observer. false
topology.observers.dns
Enable DNS observer. false
topology.observers.docker
Enable Docker observer. false
topology.observers.dynatrace
Enable Dynatrace observer. false
topology.observers.file
Enable File observer. false
topology.observers.googlecloud
Enable Googlecloud observer. false
topology.observers.ibmcloud
Enable Ibmcloud observer. false
topology.observers.itnm
Enable ITNM observer. false
topology.observers.jenkins
Enable Jenkins observer. false
topology.observers.junipercso
Enable Junipercso observer. false
topology.observers.kubernetes
Enable Kubernetes observer. false
topology.observers.newrelic
Enable Newrelic observer. false
topology.observers.openstack
Enable Openstack observer. false
topology.observers.rancher
Enable Rancher observer. false
topology.observers.rest
Enable REST observer. false
topology.observers.servicenow
Enable Servicenow observer. false
topology.observers.taddm
Enable TADDM observer. false
topology.observers.vmvcenter
Enable Vmvcenter observer. false
topology.observers.vmwarensx
Enable Vmwarensx observer. false
topology.observers.zabbix
Enable Zabbix observer. false
178 IBM Netcool Operations Insight: Integration Guide
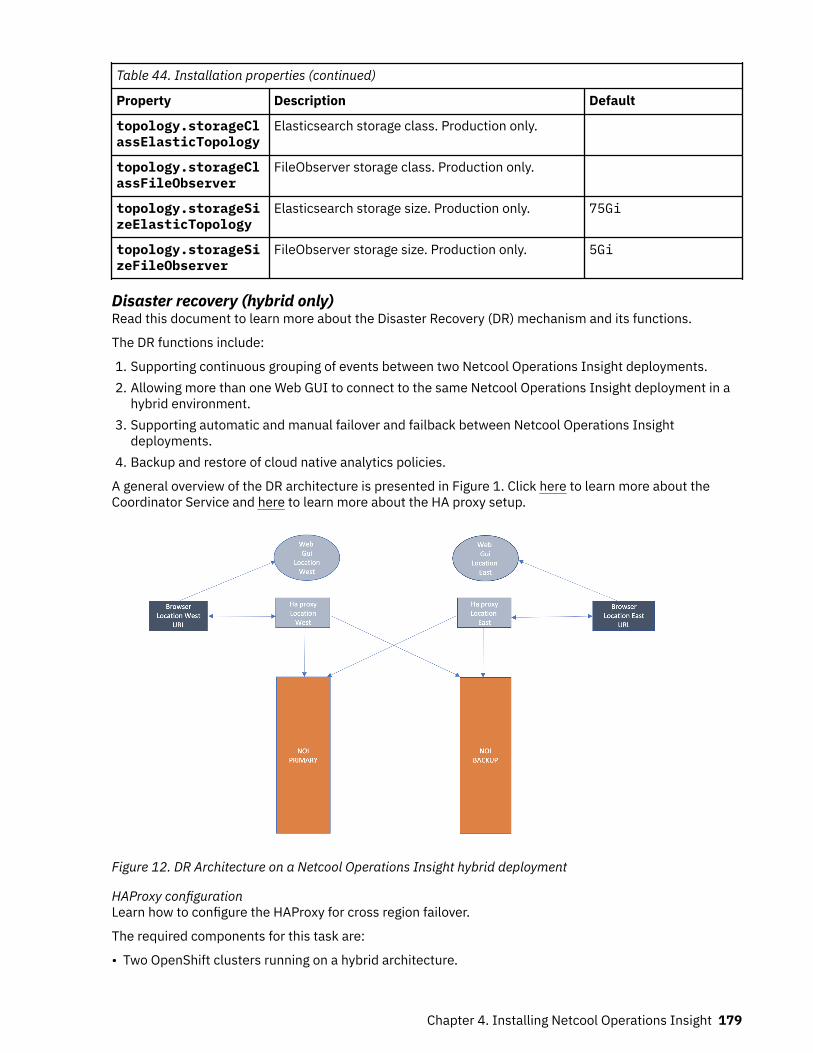
Table 44. Installation properties (continued)
Property Description Default
topology.storageClassElasticTopology
Elasticsearch storage class. Production only.
topology.storageClassFileObserver
FileObserver storage class. Production only.
topology.storageSizeElasticTopology
Elasticsearch storage size. Production only. 75Gi
topology.storageSizeFileObserver
FileObserver storage size. Production only. 5Gi
Disaster recovery (hybrid only)Read this document to learn more about the Disaster Recovery (DR) mechanism and its functions.
The DR functions include:
1. Supporting continuous grouping of events between two Netcool Operations Insight deployments.2. Allowing more than one Web GUI to connect to the same Netcool Operations Insight deployment in a
hybrid environment.3. Supporting automatic and manual failover and failback between Netcool Operations Insight
deployments.4. Backup and restore of cloud native analytics policies.
A general overview of the DR architecture is presented in Figure 1. Click here to learn more about theCoordinator Service and here to learn more about the HA proxy setup.
Figure 12. DR Architecture on a Netcool Operations Insight hybrid deployment
HAProxy configurationLearn how to configure the HAProxy for cross region failover.
The required components for this task are:
• Two OpenShift clusters running on a hybrid architecture.
Chapter 4. Installing Netcool Operations Insight 179
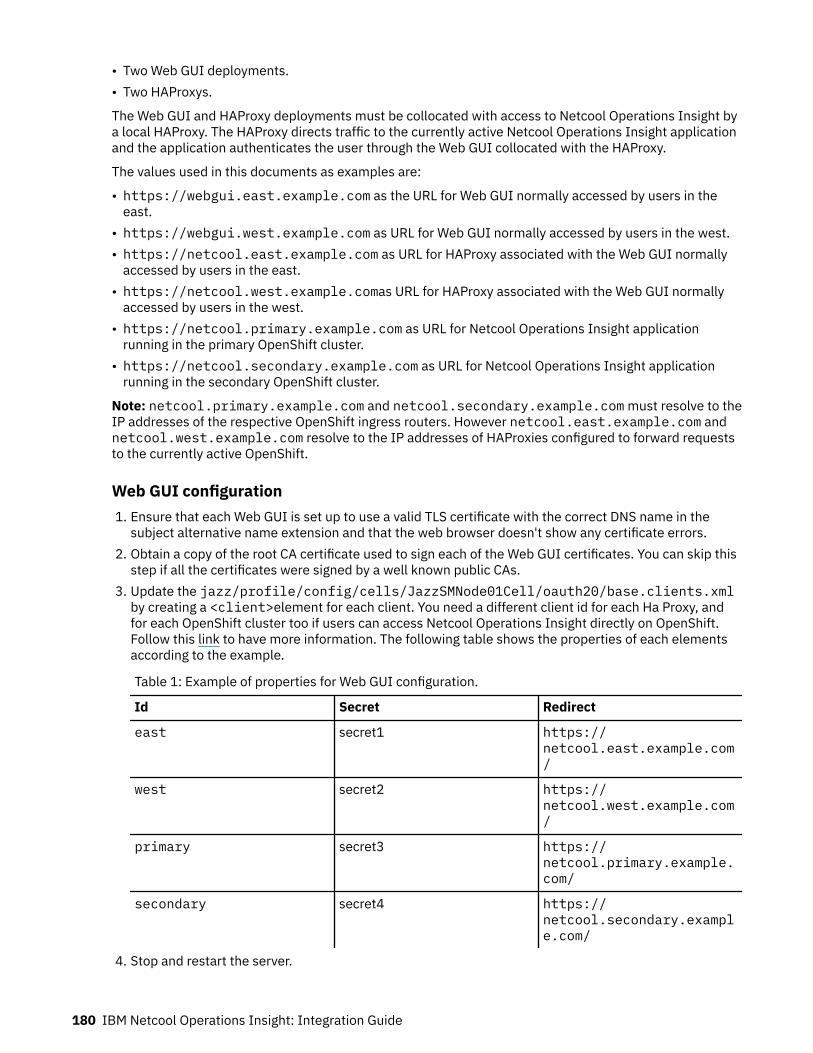
• Two Web GUI deployments.• Two HAProxys.
The Web GUI and HAProxy deployments must be collocated with access to Netcool Operations Insight bya local HAProxy. The HAProxy directs traffic to the currently active Netcool Operations Insight applicationand the application authenticates the user through the Web GUI collocated with the HAProxy.
The values used in this documents as examples are:
• https://webgui.east.example.com as the URL for Web GUI normally accessed by users in theeast.
• https://webgui.west.example.com as URL for Web GUI normally accessed by users in the west.• https://netcool.east.example.com as URL for HAProxy associated with the Web GUI normally
accessed by users in the east.• https://netcool.west.example.comas URL for HAProxy associated with the Web GUI normally
accessed by users in the west.• https://netcool.primary.example.com as URL for Netcool Operations Insight application
running in the primary OpenShift cluster.• https://netcool.secondary.example.com as URL for Netcool Operations Insight application
running in the secondary OpenShift cluster.
Note: netcool.primary.example.com and netcool.secondary.example.com must resolve to theIP addresses of the respective OpenShift ingress routers. However netcool.east.example.com andnetcool.west.example.com resolve to the IP addresses of HAProxies configured to forward requeststo the currently active OpenShift.
Web GUI configuration1. Ensure that each Web GUI is set up to use a valid TLS certificate with the correct DNS name in the
subject alternative name extension and that the web browser doesn't show any certificate errors.2. Obtain a copy of the root CA certificate used to sign each of the Web GUI certificates. You can skip this
step if all the certificates were signed by a well known public CAs.3. Update the jazz/profile/config/cells/JazzSMNode01Cell/oauth20/base.clients.xml
by creating a <client>element for each client. You need a different client id for each Ha Proxy, andfor each OpenShift cluster too if users can access Netcool Operations Insight directly on OpenShift.Follow this link to have more information. The following table shows the properties of each elementsaccording to the example.
Table 1: Example of properties for Web GUI configuration.
Id Secret Redirect
east secret1 https://netcool.east.example.com/
west secret2 https://netcool.west.example.com/
primary secret3 https://netcool.primary.example.com/
secondary secret4 https://netcool.secondary.example.com/
4. Stop and restart the server.
180 IBM Netcool Operations Insight: Integration Guide
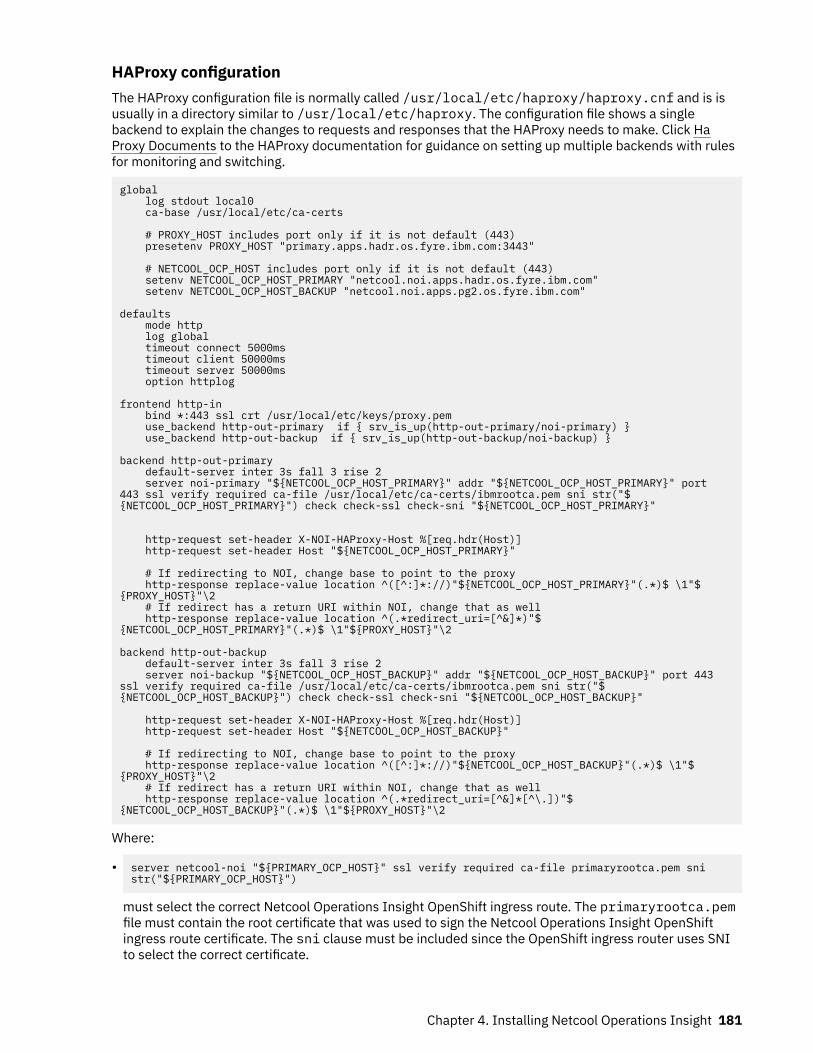
HAProxy configurationThe HAProxy configuration file is normally called /usr/local/etc/haproxy/haproxy.cnf and is isusually in a directory similar to /usr/local/etc/haproxy. The configuration file shows a singlebackend to explain the changes to requests and responses that the HAProxy needs to make. Click HaProxy Documents to the HAProxy documentation for guidance on setting up multiple backends with rulesfor monitoring and switching.
global log stdout local0 ca-base /usr/local/etc/ca-certs
# PROXY_HOST includes port only if it is not default (443) presetenv PROXY_HOST "primary.apps.hadr.os.fyre.ibm.com:3443"
# NETCOOL_OCP_HOST includes port only if it is not default (443) setenv NETCOOL_OCP_HOST_PRIMARY "netcool.noi.apps.hadr.os.fyre.ibm.com" setenv NETCOOL_OCP_HOST_BACKUP "netcool.noi.apps.pg2.os.fyre.ibm.com"
defaults mode http log global timeout connect 5000ms timeout client 50000ms timeout server 50000ms option httplog
frontend http-in bind *:443 ssl crt /usr/local/etc/keys/proxy.pem use_backend http-out-primary if { srv_is_up(http-out-primary/noi-primary) } use_backend http-out-backup if { srv_is_up(http-out-backup/noi-backup) }
backend http-out-primary default-server inter 3s fall 3 rise 2 server noi-primary "${NETCOOL_OCP_HOST_PRIMARY}" addr "${NETCOOL_OCP_HOST_PRIMARY}" port 443 ssl verify required ca-file /usr/local/etc/ca-certs/ibmrootca.pem sni str("${NETCOOL_OCP_HOST_PRIMARY}") check check-ssl check-sni "${NETCOOL_OCP_HOST_PRIMARY}"
http-request set-header X-NOI-HAProxy-Host %[req.hdr(Host)] http-request set-header Host "${NETCOOL_OCP_HOST_PRIMARY}"
# If redirecting to NOI, change base to point to the proxy http-response replace-value location ^([^:]*://)"${NETCOOL_OCP_HOST_PRIMARY}"(.*)$ \1"${PROXY_HOST}"\2 # If redirect has a return URI within NOI, change that as well http-response replace-value location ^(.*redirect_uri=[^&]*)"${NETCOOL_OCP_HOST_PRIMARY}"(.*)$ \1"${PROXY_HOST}"\2
backend http-out-backup default-server inter 3s fall 3 rise 2 server noi-backup "${NETCOOL_OCP_HOST_BACKUP}" addr "${NETCOOL_OCP_HOST_BACKUP}" port 443 ssl verify required ca-file /usr/local/etc/ca-certs/ibmrootca.pem sni str("${NETCOOL_OCP_HOST_BACKUP}") check check-ssl check-sni "${NETCOOL_OCP_HOST_BACKUP}"
http-request set-header X-NOI-HAProxy-Host %[req.hdr(Host)] http-request set-header Host "${NETCOOL_OCP_HOST_BACKUP}"
# If redirecting to NOI, change base to point to the proxy http-response replace-value location ^([^:]*://)"${NETCOOL_OCP_HOST_BACKUP}"(.*)$ \1"${PROXY_HOST}"\2 # If redirect has a return URI within NOI, change that as well http-response replace-value location ^(.*redirect_uri=[^&]*[^\.])"${NETCOOL_OCP_HOST_BACKUP}"(.*)$ \1"${PROXY_HOST}"\2
Where:
• server netcool-noi "${PRIMARY_OCP_HOST}" ssl verify required ca-file primaryrootca.pem sni str("${PRIMARY_OCP_HOST}")
must select the correct Netcool Operations Insight OpenShift ingress route. The primaryrootca.pemfile must contain the root certificate that was used to sign the Netcool Operations Insight OpenShiftingress route certificate. The sni clause must be included since the OpenShift ingress router uses SNIto select the correct certificate.
Chapter 4. Installing Netcool Operations Insight 181
• http-request set-header X-NOI-HAProxy-Host
is used by Netcool Operations Insight to identify which HAProxy the request passed through. This isused to identify the correct Web GUI.
• http-request set-header Host
is used to update the Host header, in order for the OpenShift ingress router to direct the request to thecorrect pod.
• http-response replace-value location
updates any redirect responses so that the client continues to use the HAProxy and does not getredirected to the OpenShift router.
Netcool Operations Insight hybrid configuration1. Use the following command based on the example in Table 1 to create a secret containing the client id
and secret values required:
kubectl create secret generic RELEASE-was-oauth-cnea-secrets \ --from-literal=client-id=primary \ --from-literal=client-secret=secret3 \ --from-literal=netcool.east.example.com.id=east \ --from-literal=netcool.east.example.com.secret=secret1 \ --from-literal=netcool.west.example.com.id=west \ --from-literal=netcool.west.example.com.secret=secret2
Where RELEASE needs to be replaced with the name of the Netcool Operations Insight hybriddeployment.
Note: The values called client-id and client-secret must contain the values for the localinstance. When you run this command for the secondary instance of your Netcool Operations Insighthybrid deployment, the values change to secondary and secret4. The other values are named afterthe FQDN of the HAProxies. Do not include the port numbers even if they are not default. For eachproxy there is a .id and a .secret value.
2. You can either create the RELEASE-was-oauth-cnea-secrets secret before the NetcoolOperations Insight hybrid is installed or patch it after the installation. Read the kubectl documentation,Install kubectl and kubectl CLI for more information.
3. When Netcool Operations Insight hybrid is created, include the following:
• dash.url as the URL of the default Web GUI.• dash.username as the username for connecting to on-premise Web GUI.• dash.trustedCAConfigMapName as the name of a configuration map that contains the CAcertificates that were used to sign all of the Web GUI certificates. If all certificates were signed bywell known public CAs this may be omitted.
• dash.crossRegionUrls as an array of the HAProxy and Web GUI pairs in the format below.Remember to include port numbers if they are not the default (443).
dash:
....
crossRegionUrls: - proxy: https://netcool.east.example.com dash: https://webgui.east.example.com - proxy: https://netcool.west.example.com dash: https://webgui.west.example.com
Coordinator ServiceFind out more about the coordinator service.
182 IBM Netcool Operations Insight: Integration Guide

The coordinator is a microservice whose responsibility is to perform failover and failback of the NetcoolOperations Insightdeployments. Both primary and backup Netcool Operations Insight deploymentsshould have coordinator service running for successful failover and failback between them. Therefore, theprimary deployment must run the coordinator in primary state while the backup deployment must run thecoordinator in default backup state. Find out more about different states in the “States” on page 183section.
The coordinator service in backup deployment tries to connect to the primary coordinator service throughthe HAProxy to determine the state of the backup deployment. If the primary is not reachable, the backupcoordinator service does the failover, which means it changes its state to Acting Primary. It keeps pollingthe primary when in Acting Primary state so that it can do failback when primary is reachable again in thefuture. The backup coordinator service can be configured to use multiple proxies to communicate with theprimary service to mitigate against proxy failures. All those proxy endpoints can be mentioned at the timeof backup deployment set up.
Ensure you created the correct secrets and configuration map to run the coordinator service. Read the“Setting up the coordinator service” on page 185 section for more information.
StatesThe Netcool Operations Insight deployment can be in different states. The Primary Deployment ServiceStates are:
• Primary: when the grouping and enrichment of live events is enabled.• Primary Maintenance: when the grouping and enrichment of live events that are disabled and system in
maintenance mode.
The Backup Deployment Service States are:
• Backup: when the backup system is not grouping and enriching events and is checking the status of theprimary deployment for liveness.
• Acting Primary: when the backup system is grouping and enriching events and is checking when to autofailback.
• Acting Primary No Auto Fail Back: when the backup system is Acting Primary but is not checking for autofailback. Useful when in maintenance mode.
The relationships between the states are explained in Figure 1 and 2. You can see that the Primary Statescommunicate by using manual API and the Backup States can use both manual or automatic API.Figure 13. Primary Deployment Service States onNetcool Operations Insight hybrid deployment
Chapter 4. Installing Netcool Operations Insight 183
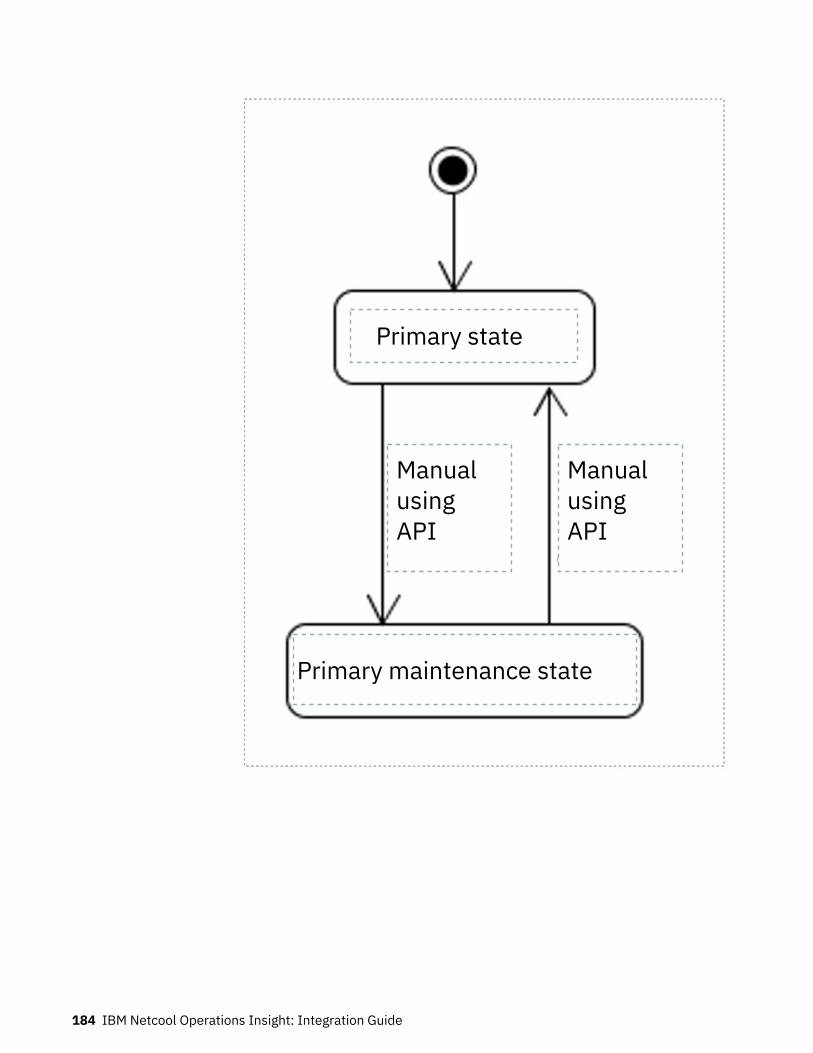
Primary state
Primary maintenance state
ManualusingAPI
ManualusingAPI
PrimaryDeploymentService states
184 IBM Netcool Operations Insight: Integration Guide
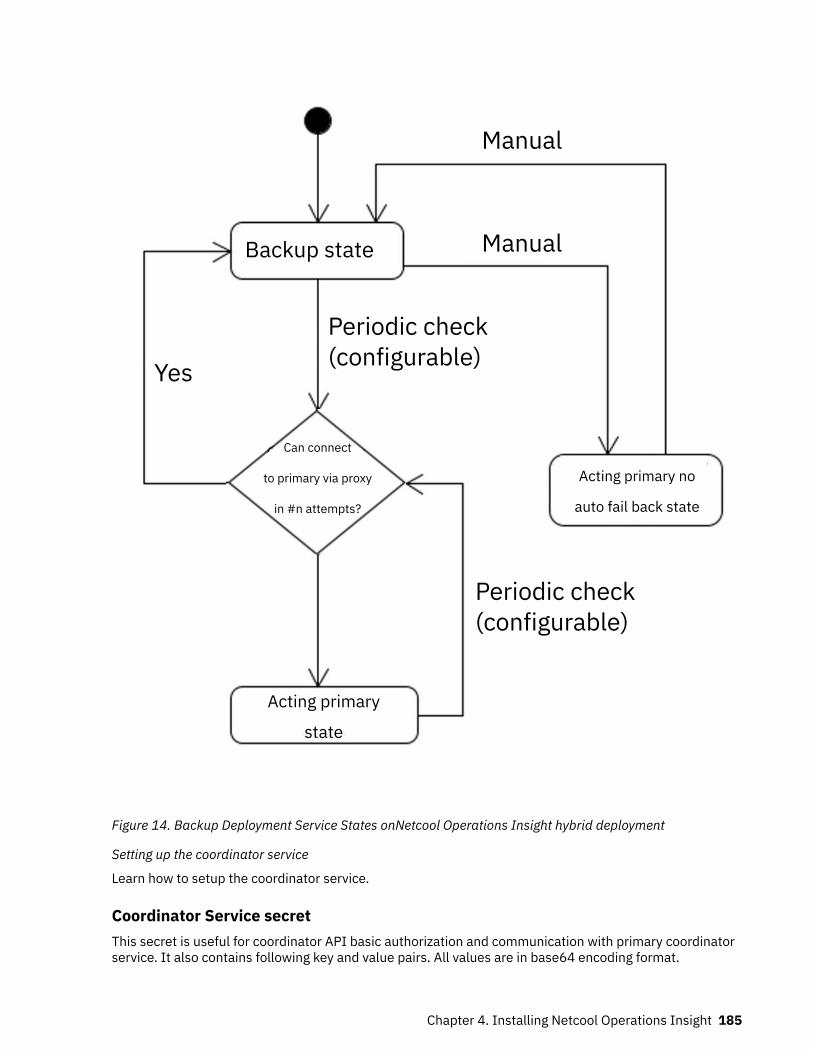
Back upDeploymentServiceStates
Backup state
Yes
Manual
Manual
Periodic check(configurable)
Acting primary
state
Periodic check(configurable)
Acting primary no
auto fail back state
Can connect
to primary via proxy
in #n attempts?
Figure 14. Backup Deployment Service States onNetcool Operations Insight hybrid deployment
Setting up the coordinator service
Learn how to setup the coordinator service.
Coordinator Service secretThis secret is useful for coordinator API basic authorization and communication with primary coordinatorservice. It also contains following key and value pairs. All values are in base64 encoding format.
Chapter 4. Installing Netcool Operations Insight 185
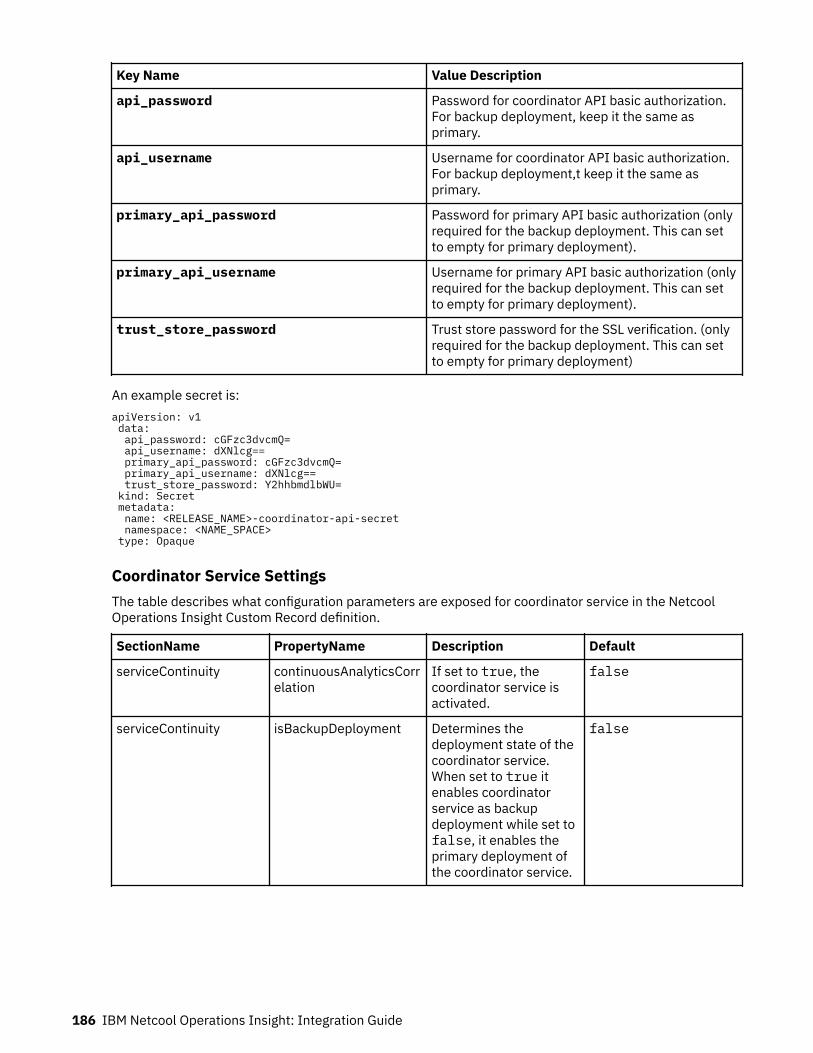
Key Name Value Description
api_password Password for coordinator API basic authorization.For backup deployment, keep it the same asprimary.
api_username Username for coordinator API basic authorization.For backup deployment,t keep it the same asprimary.
primary_api_password Password for primary API basic authorization (onlyrequired for the backup deployment. This can setto empty for primary deployment).
primary_api_username Username for primary API basic authorization (onlyrequired for the backup deployment. This can setto empty for primary deployment).
trust_store_password Trust store password for the SSL verification. (onlyrequired for the backup deployment. This can setto empty for primary deployment)
An example secret is:apiVersion: v1 data: api_password: cGFzc3dvcmQ= api_username: dXNlcg== primary_api_password: cGFzc3dvcmQ= primary_api_username: dXNlcg== trust_store_password: Y2hhbmdlbWU= kind: Secret metadata: name: <RELEASE_NAME>-coordinator-api-secret namespace: <NAME_SPACE> type: Opaque
Coordinator Service SettingsThe table describes what configuration parameters are exposed for coordinator service in the NetcoolOperations Insight Custom Record definition.
SectionName PropertyName Description Default
serviceContinuity continuousAnalyticsCorrelation
If set to true, thecoordinator service isactivated.
false
serviceContinuity isBackupDeployment Determines thedeployment state of thecoordinator service.When set to true itenables coordinatorservice as backupdeployment while set tofalse, it enables theprimary deployment ofthe coordinator service.
false
186 IBM Netcool Operations Insight: Integration Guide
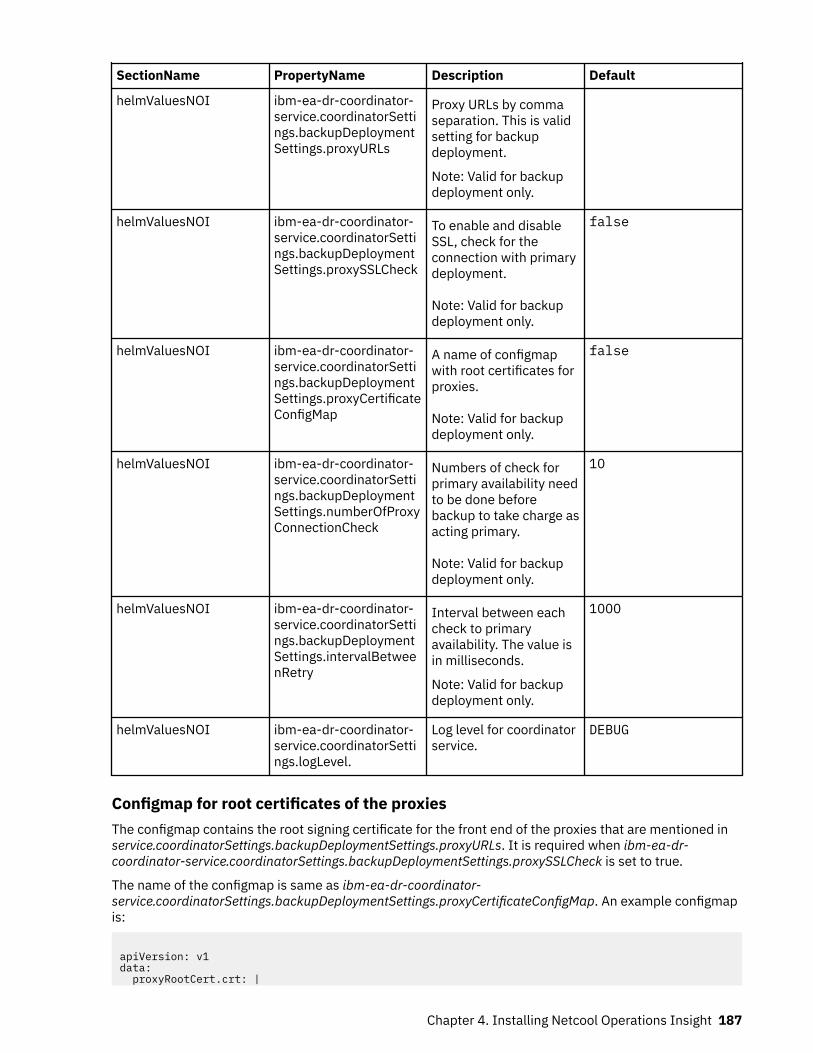
SectionName PropertyName Description Default
helmValuesNOI ibm-ea-dr-coordinator-service.coordinatorSettings.backupDeploymentSettings.proxyURLs
Proxy URLs by commaseparation. This is validsetting for backupdeployment.
Note: Valid for backupdeployment only.
helmValuesNOI ibm-ea-dr-coordinator-service.coordinatorSettings.backupDeploymentSettings.proxySSLCheck
To enable and disableSSL, check for theconnection with primarydeployment.
Note: Valid for backupdeployment only.
false
helmValuesNOI ibm-ea-dr-coordinator-service.coordinatorSettings.backupDeploymentSettings.proxyCertificateConfigMap
A name of configmapwith root certificates forproxies.
Note: Valid for backupdeployment only.
false
helmValuesNOI ibm-ea-dr-coordinator-service.coordinatorSettings.backupDeploymentSettings.numberOfProxyConnectionCheck
Numbers of check forprimary availability needto be done beforebackup to take charge asacting primary.
Note: Valid for backupdeployment only.
10
helmValuesNOI ibm-ea-dr-coordinator-service.coordinatorSettings.backupDeploymentSettings.intervalBetweenRetry
Interval between eachcheck to primaryavailability. The value isin milliseconds.
Note: Valid for backupdeployment only.
1000
helmValuesNOI ibm-ea-dr-coordinator-service.coordinatorSettings.logLevel.
Log level for coordinatorservice.
DEBUG
Configmap for root certificates of the proxiesThe configmap contains the root signing certificate for the front end of the proxies that are mentioned inservice.coordinatorSettings.backupDeploymentSettings.proxyURLs. It is required when ibm-ea-dr-coordinator-service.coordinatorSettings.backupDeploymentSettings.proxySSLCheck is set to true.
The name of the configmap is same as ibm-ea-dr-coordinator-service.coordinatorSettings.backupDeploymentSettings.proxyCertificateConfigMap. An example configmapis:
apiVersion: v1data: proxyRootCert.crt: |
Chapter 4. Installing Netcool Operations Insight 187
-----BEGIN CERTIFICATE----- <Signing Root Certificate for Proxy Frontend> -----END CERTIFICATE-----kind: ConfigMapmetadata: name: <Configmap Name> namespace: <name space>
Manual failover and failback
The coordinator service allows you to do manual failback and failover by using its APIs. For the manualfailover, primary and backup service states must be in Primary Maintenance and Acting Primary No AutoFailback states.
The steps to perform manual failover are:
1. Set the primary state to Primary Maintenance by running the command:
curl -u <api_username>:<api_password> -X POST https://<primary_coordinator_route_url>/coordinator/operationalState?state=PRIMARY_MAINTENANCE
and verify the state by running the command:
curl -X -u <api_username>:<api_password> GET http://<primary_coordinator_route_url>/coordinator/operationalState
2. Set the backup state to Acting Primary No Auto Failback by running the command:
curl -u <api_username>:<api_password> -X POST https://<backup_coordinator_route_url>/coordinator/operationalState?state=ACTING_PRIMARY_NO_AUTO_FAILBACK
and verify the state by running the command:
curl -X -u <api_username>:<api_password> GET http://<backup_coordinator_route_url>/coordinator/operationalState
For the manual failback primary and backup service states should be in Primary and Backup state.
The steps to perform manual failback are :
1. Set the backup state to Backup by running the command:
curl -u <api_username>:<api_password> -X POST https://<backup_coordinator_route_url>/coordinator/operationalState?state=BACKUP
and verify the state by running the command:
curl -X -u <api_username>:<api_password> GET http://<backup_coordinator_route_url>/coordinator/operationalState
2. Set the primary state to Primary by running the command:
curl -u <api_username>:<api_password> -X POST https://<primary_coordinator_route_url>/coordinator/operationalState?state=PRIMARY
and verify the state by running the command:
curl -X -u <api_username>:<api_password> GET http://<primary_coordinator_route_url>/coordinator/operationalState
Health CheckThe coordinator service health can be checked by running the curl command:
curl -X GET http://<primary/backup_coordinator_route_url>/coordinator/status/health
188 IBM Netcool Operations Insight: Integration Guide
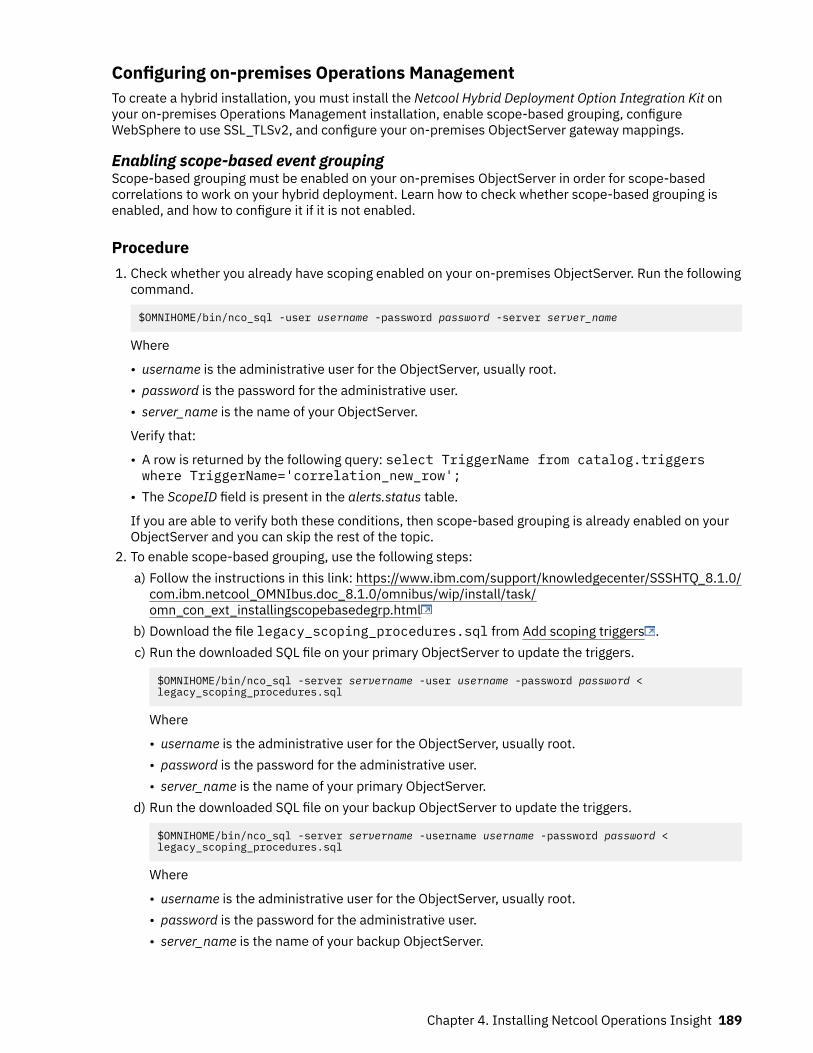
Configuring on-premises Operations ManagementTo create a hybrid installation, you must install the Netcool Hybrid Deployment Option Integration Kit onyour on-premises Operations Management installation, enable scope-based grouping, configureWebSphere to use SSL_TLSv2, and configure your on-premises ObjectServer gateway mappings.
Enabling scope-based event groupingScope-based grouping must be enabled on your on-premises ObjectServer in order for scope-basedcorrelations to work on your hybrid deployment. Learn how to check whether scope-based grouping isenabled, and how to configure it if it is not enabled.
Procedure1. Check whether you already have scoping enabled on your on-premises ObjectServer. Run the following
command.
$OMNIHOME/bin/nco_sql -user username -password password -server server_name
Where
• username is the administrative user for the ObjectServer, usually root.• password is the password for the administrative user.• server_name is the name of your ObjectServer.
Verify that:
• A row is returned by the following query: select TriggerName from catalog.triggerswhere TriggerName='correlation_new_row';
• The ScopeID field is present in the alerts.status table.
If you are able to verify both these conditions, then scope-based grouping is already enabled on yourObjectServer and you can skip the rest of the topic.
2. To enable scope-based grouping, use the following steps:a) Follow the instructions in this link: https://www.ibm.com/support/knowledgecenter/SSSHTQ_8.1.0/
com.ibm.netcool_OMNIbus.doc_8.1.0/omnibus/wip/install/task/omn_con_ext_installingscopebasedegrp.html
b) Download the file legacy_scoping_procedures.sql from Add scoping triggers .c) Run the downloaded SQL file on your primary ObjectServer to update the triggers.
$OMNIHOME/bin/nco_sql -server servername -user username -password password < legacy_scoping_procedures.sql
Where
• username is the administrative user for the ObjectServer, usually root.• password is the password for the administrative user.• server_name is the name of your primary ObjectServer.
d) Run the downloaded SQL file on your backup ObjectServer to update the triggers.
$OMNIHOME/bin/nco_sql -server servername -username username -password password < legacy_scoping_procedures.sql
Where
• username is the administrative user for the ObjectServer, usually root.• password is the password for the administrative user.• server_name is the name of your backup ObjectServer.
Chapter 4. Installing Netcool Operations Insight 189

Set WebSphere protocol to SSL_TLSv2WebSphere Application Server, as part of the on-premises Operations Management installation, needs tobe able to import certificates from the cloud native Netcool Operations Insight components deploymenton Red Hat OpenShift. To do this, WebSphere must be configured to use SSL_TLSv2. Use this procedure tohelp you verify or change this setting. If you have more than one WebGUI/DASH node, then this procedureshould be run on each WebGUI/DASH node.
Procedure1. In DASH, click Console Settings > WebSphere Administrative console > WebSphere Administrative
console.2. Click Security > SSL certificate and key management, and under Related Items select SSL
configurations.3. Select the NodeDefaultSSLSettings from the list. Under Additional Properties, click Quality of
protection (QoP) settings.4. From the protocol menu, select SSL_TLSv2 if it is not already selected, and save this configuration.5. Restart Dashboard Application Services Hub on your Operations Management on premises installation.
cd JazzSM_WAS_Profile/bin ./stopServer.sh server1 -username smadmin -password password./startServer.sh server1
Installing the integration kitTo create a hybrid installation, you must use IBM Installation Manager to install the Netcool HybridDeployment Option Integration Kit on your on-premises Operations Management installation.
Prerequisites• The primary and backup ObjectServers are both running, and are listening on external IP addresses.• Installation Manager V1.9 or later can be run in GUI mode. If you are running an older version of
Installation Manager, the following log error is displayed in the Installation Manager logs:
javax.net.ssl.SSLException: Connection has been shutdown: javax.net.ssl.SSLHandshakeException: Received fatal alert: handshake_failure
• On-premises Operations Management must be at the same version as Netcool Operations Insight onRed Hat OpenShift. For more information, see Chapter 2, “Solution Overview,” on page 3.
• The cloud native components of Netcool Operations Insight on Red Hat OpenShift are successfullydeployed.
InstallingUse the following steps to configure OAuth authentication between an on-premises OperationsManagement installation and a deployment of cloud native Netcool Operations Insight components onRed Hat OpenShift. If you have more than one WebGUI/DASH node, then this procedure must be run oneach WebGUI/DASH node.
1. Use Installation Manager to install the Netcool Hybrid Deployment Option Integration Kit.
a. Start Installation Manager in GUI mode with the following commands:
cd IM_dir/eclipse./IBMIM
where IM_dir is the Installation Manager Group installation directory, for example /home/netcool/IBM/InstallationManager/eclipse.
b. In Installation Manager, navigate to Preferences->Repositories->Add Repository, and add thelocation for the cloud repository that was automatically created when you installed the cloud nativeNetcool Operations Insight components.
190 IBM Netcool Operations Insight: Integration Guide
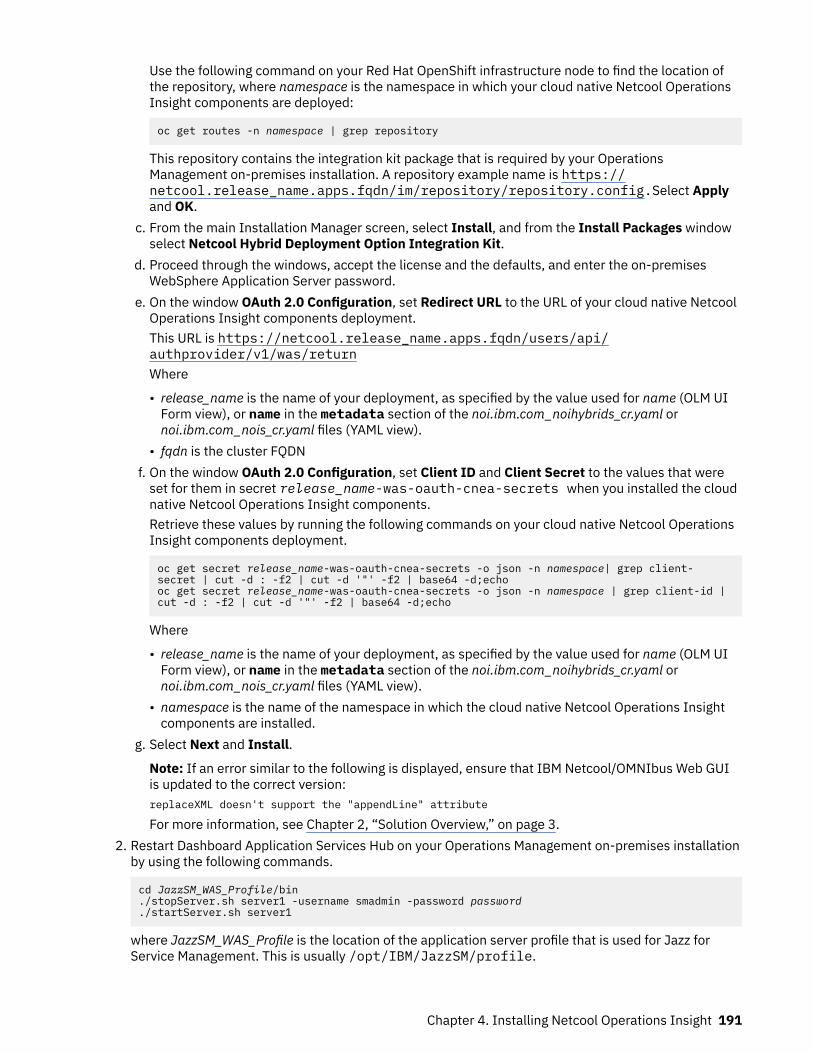
Use the following command on your Red Hat OpenShift infrastructure node to find the location ofthe repository, where namespace is the namespace in which your cloud native Netcool OperationsInsight components are deployed:
oc get routes -n namespace | grep repository
This repository contains the integration kit package that is required by your OperationsManagement on-premises installation. A repository example name is https://netcool.release_name.apps.fqdn/im/repository/repository.config.Select Applyand OK.
c. From the main Installation Manager screen, select Install, and from the Install Packages windowselect Netcool Hybrid Deployment Option Integration Kit.
d. Proceed through the windows, accept the license and the defaults, and enter the on-premisesWebSphere Application Server password.
e. On the window OAuth 2.0 Configuration, set Redirect URL to the URL of your cloud native NetcoolOperations Insight components deployment.This URL is https://netcool.release_name.apps.fqdn/users/api/authprovider/v1/was/returnWhere
• release_name is the name of your deployment, as specified by the value used for name (OLM UIForm view), or name in the metadata section of the noi.ibm.com_noihybrids_cr.yaml ornoi.ibm.com_nois_cr.yaml files (YAML view).
• fqdn is the cluster FQDNf. On the window OAuth 2.0 Configuration, set Client ID and Client Secret to the values that were
set for them in secret release_name-was-oauth-cnea-secrets when you installed the cloudnative Netcool Operations Insight components.Retrieve these values by running the following commands on your cloud native Netcool OperationsInsight components deployment.
oc get secret release_name-was-oauth-cnea-secrets -o json -n namespace| grep client-secret | cut -d : -f2 | cut -d '"' -f2 | base64 -d;echooc get secret release_name-was-oauth-cnea-secrets -o json -n namespace | grep client-id | cut -d : -f2 | cut -d '"' -f2 | base64 -d;echo
Where
• release_name is the name of your deployment, as specified by the value used for name (OLM UIForm view), or name in the metadata section of the noi.ibm.com_noihybrids_cr.yaml ornoi.ibm.com_nois_cr.yaml files (YAML view).
• namespace is the name of the namespace in which the cloud native Netcool Operations Insightcomponents are installed.
g. Select Next and Install.
Note: If an error similar to the following is displayed, ensure that IBM Netcool/OMNIbus Web GUIis updated to the correct version:replaceXML doesn't support the "appendLine" attribute
For more information, see Chapter 2, “Solution Overview,” on page 3.2. Restart Dashboard Application Services Hub on your Operations Management on-premises installation
by using the following commands.
cd JazzSM_WAS_Profile/bin./stopServer.sh server1 -username smadmin -password password./startServer.sh server1
where JazzSM_WAS_Profile is the location of the application server profile that is used for Jazz forService Management. This is usually /opt/IBM/JazzSM/profile.
Chapter 4. Installing Netcool Operations Insight 191
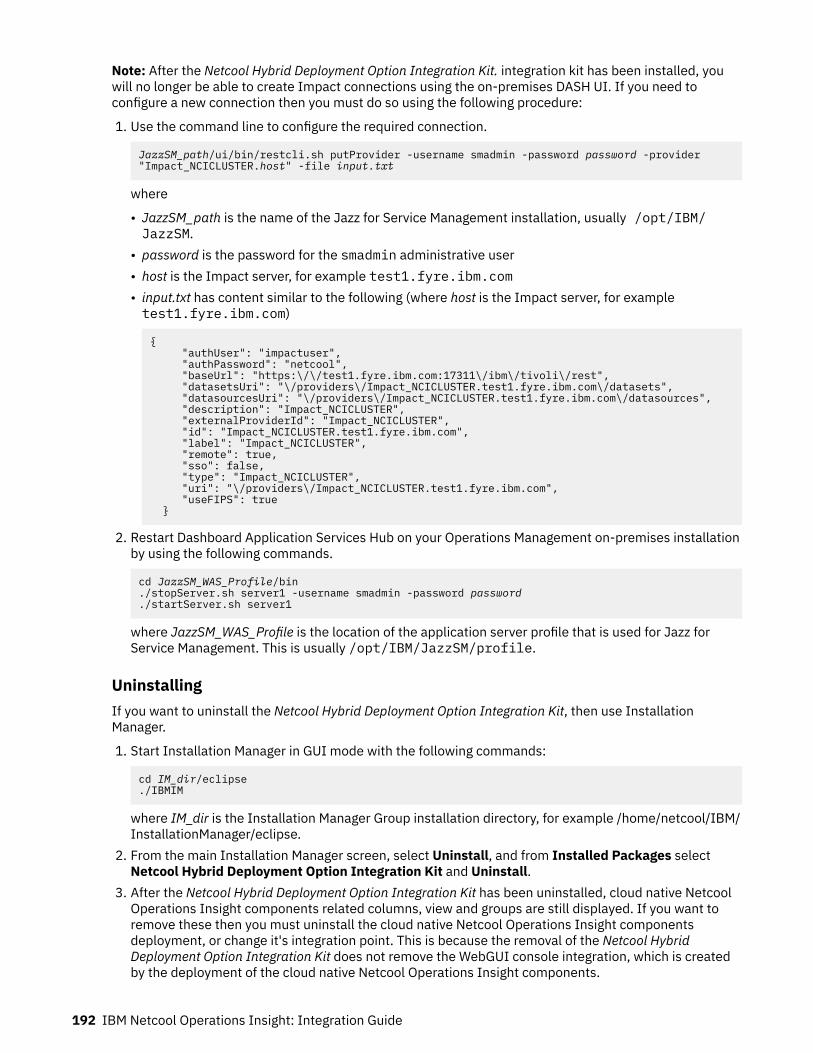
Note: After the Netcool Hybrid Deployment Option Integration Kit. integration kit has been installed, youwill no longer be able to create Impact connections using the on-premises DASH UI. If you need toconfigure a new connection then you must do so using the following procedure:
1. Use the command line to configure the required connection.
JazzSM_path/ui/bin/restcli.sh putProvider -username smadmin -password password -provider "Impact_NCICLUSTER.host" -file input.txt
where
• JazzSM_path is the name of the Jazz for Service Management installation, usually /opt/IBM/JazzSM.
• password is the password for the smadmin administrative user• host is the Impact server, for example test1.fyre.ibm.com• input.txt has content similar to the following (where host is the Impact server, for exampletest1.fyre.ibm.com)
{ "authUser": "impactuser", "authPassword": "netcool", "baseUrl": "https:\/\/test1.fyre.ibm.com:17311\/ibm\/tivoli\/rest", "datasetsUri": "\/providers\/Impact_NCICLUSTER.test1.fyre.ibm.com\/datasets", "datasourcesUri": "\/providers\/Impact_NCICLUSTER.test1.fyre.ibm.com\/datasources", "description": "Impact_NCICLUSTER", "externalProviderId": "Impact_NCICLUSTER", "id": "Impact_NCICLUSTER.test1.fyre.ibm.com", "label": "Impact_NCICLUSTER", "remote": true, "sso": false, "type": "Impact_NCICLUSTER", "uri": "\/providers\/Impact_NCICLUSTER.test1.fyre.ibm.com", "useFIPS": true }
2. Restart Dashboard Application Services Hub on your Operations Management on-premises installationby using the following commands.
cd JazzSM_WAS_Profile/bin./stopServer.sh server1 -username smadmin -password password./startServer.sh server1
where JazzSM_WAS_Profile is the location of the application server profile that is used for Jazz forService Management. This is usually /opt/IBM/JazzSM/profile.
UninstallingIf you want to uninstall the Netcool Hybrid Deployment Option Integration Kit, then use InstallationManager.
1. Start Installation Manager in GUI mode with the following commands:
cd IM_dir/eclipse./IBMIM
where IM_dir is the Installation Manager Group installation directory, for example /home/netcool/IBM/InstallationManager/eclipse.
2. From the main Installation Manager screen, select Uninstall, and from Installed Packages selectNetcool Hybrid Deployment Option Integration Kit and Uninstall.
3. After the Netcool Hybrid Deployment Option Integration Kit has been uninstalled, cloud native NetcoolOperations Insight components related columns, view and groups are still displayed. If you want toremove these then you must uninstall the cloud native Netcool Operations Insight componentsdeployment, or change it's integration point. This is because the removal of the Netcool HybridDeployment Option Integration Kit does not remove the WebGUI console integration, which is createdby the deployment of the cloud native Netcool Operations Insight components.
192 IBM Netcool Operations Insight: Integration Guide
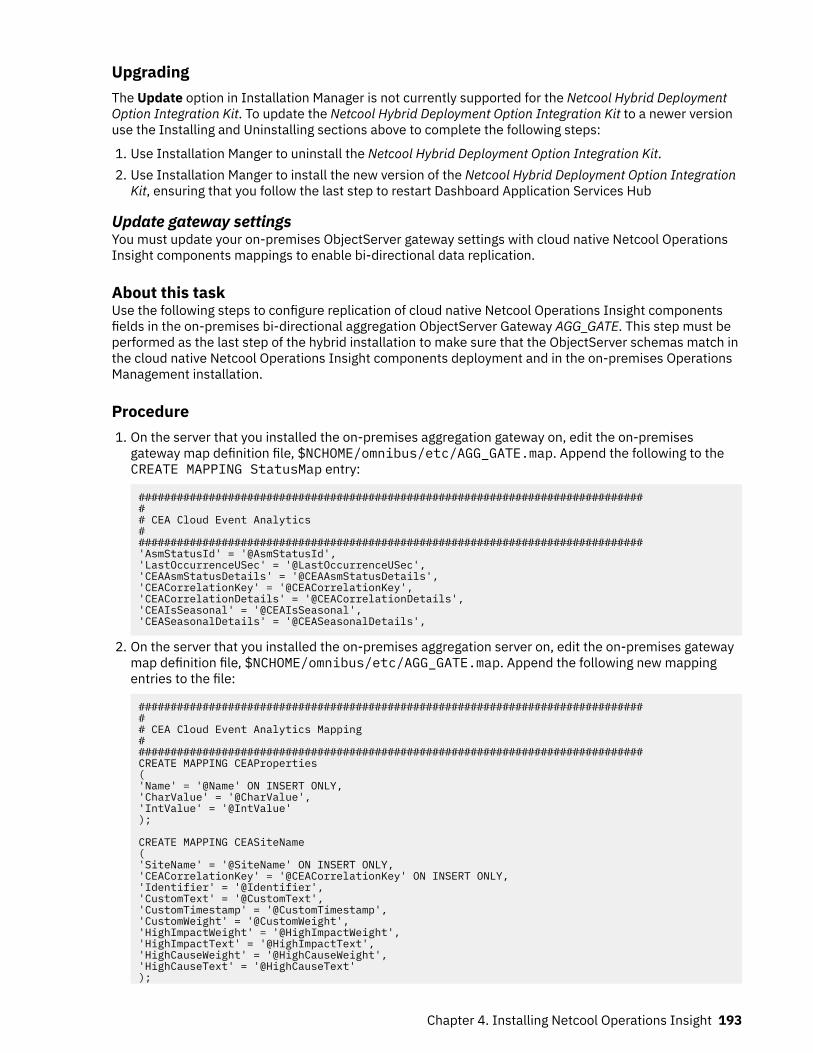
UpgradingThe Update option in Installation Manager is not currently supported for the Netcool Hybrid DeploymentOption Integration Kit. To update the Netcool Hybrid Deployment Option Integration Kit to a newer versionuse the Installing and Uninstalling sections above to complete the following steps:
1. Use Installation Manger to uninstall the Netcool Hybrid Deployment Option Integration Kit.2. Use Installation Manger to install the new version of the Netcool Hybrid Deployment Option Integration
Kit, ensuring that you follow the last step to restart Dashboard Application Services Hub
Update gateway settingsYou must update your on-premises ObjectServer gateway settings with cloud native Netcool OperationsInsight components mappings to enable bi-directional data replication.
About this taskUse the following steps to configure replication of cloud native Netcool Operations Insight componentsfields in the on-premises bi-directional aggregation ObjectServer Gateway AGG_GATE. This step must beperformed as the last step of the hybrid installation to make sure that the ObjectServer schemas match inthe cloud native Netcool Operations Insight components deployment and in the on-premises OperationsManagement installation.
Procedure1. On the server that you installed the on-premises aggregation gateway on, edit the on-premises
gateway map definition file, $NCHOME/omnibus/etc/AGG_GATE.map. Append the following to theCREATE MAPPING StatusMap entry:
################################################################################# CEA Cloud Event Analytics################################################################################'AsmStatusId' = '@AsmStatusId','LastOccurrenceUSec' = '@LastOccurrenceUSec','CEAAsmStatusDetails' = '@CEAAsmStatusDetails','CEACorrelationKey' = '@CEACorrelationKey','CEACorrelationDetails' = '@CEACorrelationDetails','CEAIsSeasonal' = '@CEAIsSeasonal','CEASeasonalDetails' = '@CEASeasonalDetails',
2. On the server that you installed the on-premises aggregation server on, edit the on-premises gatewaymap definition file, $NCHOME/omnibus/etc/AGG_GATE.map. Append the following new mappingentries to the file:
################################################################################# CEA Cloud Event Analytics Mapping################################################################################CREATE MAPPING CEAProperties('Name' = '@Name' ON INSERT ONLY,'CharValue' = '@CharValue','IntValue' = '@IntValue');
CREATE MAPPING CEASiteName('SiteName' = '@SiteName' ON INSERT ONLY,'CEACorrelationKey' = '@CEACorrelationKey' ON INSERT ONLY,'Identifier' = '@Identifier','CustomText' = '@CustomText','CustomTimestamp' = '@CustomTimestamp','CustomWeight' = '@CustomWeight','HighImpactWeight' = '@HighImpactWeight','HighImpactText' = '@HighImpactText','HighCauseWeight' = '@HighCauseWeight','HighCauseText' = '@HighCauseText');
Chapter 4. Installing Netcool Operations Insight 193

CREATE MAPPING CEACKey('CEACorrelationKey' = '@CEACorrelationKey' ON INSERT ONLY,'LastOccurrence' = '@LastOccurrence','Identifier' = '@Identifier','ExpireTime' = '@ExpireTime','CustomText' = '@CustomText','CustomTimestamp' = '@CustomTimestamp','CustomWeight' = '@CustomWeight','HighImpactWeight' = '@HighImpactWeight','HighImpactText' = '@HighImpactText','HighCauseWeight' = '@HighCauseWeight','HighCauseText' = '@HighCauseText');
CREATE MAPPING CEACKeyAliasMembers('CEACorrelationKey' = '@CEACorrelationKey' ON INSERT ONLY,'CorrelationKeyAlias' = '@CorrelationKeyAlias');
CREATE MAPPING CEAPriorityChildren('Identifier' = '@Identifier' ON INSERT ONLY,'CustomText' = '@CustomText','CustomTimestamp' = '@CustomTimestamp','CustomWeight' = '@CustomWeight','HighImpactWeight' = '@HighImpactWeight','HighImpactText' = '@HighImpactText','HighCauseWeight' = '@HighCauseWeight','HighCauseText' = '@HighCauseText');
3. On the server that you installed the on-premises aggregation server on, edit the gateway tablereplication definition file $NCHOME/omnibus/etc/AGG_GATE.tblrep.def. Append the followingreplication statements to the file:
################################################################################# # CEA Cloud Event Analytics Replication Definition################################################################################REPLICATE ALL FROM TABLE 'master.cea_properties'USING map 'CEAProperties';
REPLICATE ALL FROM TABLE 'master.cea_sitename'USING map 'CEASiteName';
REPLICATE ALL FROM TABLE 'master.cea_ckey'USING map 'CEACKey';
REPLICATE ALL FROM TABLE 'master.cea_ckey_alias_members'USING map 'CEACKeyAliasMembers';
REPLICATE ALL FROM TABLE 'master.cea_priority_children'USING map 'CEAPriorityChildren';
4. Restart the aggregation gateway for the changes to take effect.a) Stop the Gateway by killing it:
kill -9 $(ps -ef | grep nco_g_objserv_bi | grep .props | awk -F ' ' {'print $2'})
b) Start the Gateway with the following command:
$NCHOME/omnibus/bin/nco_g_objserv_bi -propsfile $NCHOME/omnibus/etc/AGG_GATE.props &
For more information, see https://www.ibm.com/support/knowledgecenter/en/SSSHTQ_8.1.0/com.ibm.netcool_OMNIbus.doc_8.1.0/omnibus/wip/probegtwy/concept/omn_gtw_runninggtwys.html .
194 IBM Netcool Operations Insight: Integration Guide
Completing hybrid HA setup (HA only)
Use this topic to configure the Tivoli Netcool/OMNIbus Web GUI nodes to usethe OAuth database, and restart the required services.
About this task
Procedure1. Configure Web GUI with OAuth database.
On each Web GUI node, update the file $JazzSM_Profile_Home/config/cells/JazzSMNode01Cell/oauth20/NetcoolOAuthProvider.xml with the changes that are made tothe OAuthConfigSample.xml file here: https://www.ibm.com/support/knowledgecenter/en/SSAW57_8.5.5/com.ibm.websphere.nd.multiplatform.doc/ae/cwbs_oauthsql.html .The value of the oauthjdbc.JDBCProvider parameter in NetcoolOAuthProvider.xml must matchthe JNDI name used for the datasource in “Setting up persistence for the OAuth service (HA only)” onpage 159.To avoid potential conflict, move the base.clients.xml file with the following command:
cd $JazzSM_Profile_Home/config/cells/JazzSMNode01Cell/oauth20mv base.clients.xml base.clients.xml.backup
Note: Complete this step each time that the Netcool Hybrid Deployment OptionIntegration Kit is redeployed.
2. Restart on-premises Dashboard Application Services Hub instances.Restart all Dashboard Application Services Hub instances on your Operations Management on-premises installation by using the following commands:
cd JazzSM_WAS_Profile/bin./stopServer.sh server1 -username smadmin -password password./startServer.sh server1
where JazzSM_WAS_Profile is the location of the application server profile that is used for Jazz forService Management. This is usually /opt/IBM/JazzSM/profile.
3. Restart the common-ui and cem-users pods on your Operations Management deployment.
a. Find the names of the common-ui pod and cem-users pods on your Operations Managementdeployment with the following command:
oc get pod | grep common-uioc get pod | grep cem-users
b. Restart these pods with the following command:
oc delete pod pod_name
where pod_name is the name of the pod to be restarted.
What to do nextComplete the post installation steps in “Post installation setup and verification” on page 196.
Chapter 4. Installing Netcool Operations Insight 195
Post installation setup and verificationFollow these steps to add the required roles to your user, and to verify that your hybrid installation isworking.
Procedure1. Log in to your on premises DASH web application. If you have used the default root location of /ibm/
console and the default secure port of 16311, then the URL will be in the following format https://<dash_host>:16311/ibm/console.jsp.For more information, see “Getting started with Netcool Operations Insight” on page 464.
2. Trust the certificate for the cloud native Netcool Operations Insight components deployment server.The first time that you log in to your Operations Management installation after configuring your hybriddeployment, you will be presented with an additional security screen. You will need to trust thecertificate from the cloud native Netcool Operations Insight components server to enable on-premisesDashboard Application Services Hub to authenticate with it.
3. Add additional roles for your user.a) Select Console Settings->User Roles->Search and select your user from those listed in Available
Users.b) Add these roles to each user who requires access to the UI: noi_lead, noi_engineer, and
noi_operatorc) Log out and back in again.
4. Go to Console Settings -> Console Integration and verify that an integration with a ConsoleIntegration Name of Cloud Analytics is present.
5. (Optional) Verify that the Insights->Cloud Analytics->Manage Policies option is showing on the UI.6. (Optional) Verify that OAuth authentication between the cloud native Netcool Operations Insight
components deployment and Operations Management is working.a) From the cloud native Netcool Operations Insight components deployment cluster, issue a CURL
command to get an access token from your on-premises installation.
curl -k -H "Content-Type: application/x-www-form-urlencoded;charset=UTF-8" -d "grant_type=password&client_id=client-id&client_secret=client-secret&username=user&password=pass" https://host.domain:16311/oauth2/endpoint/NetcoolOAuthProvider/token | sed -e 's/[{}\,]/\n/g'
where
• client_id is the value of client_id in secret release_name-was-oauth-cnea-secrets. If this is notknown, it can be retrieved using kubectl get secrets release_name-was-oauth-cnea-secrets -o json -n default | jq -r ".data[\"client-id\"]" | base64 -d --where release_name is the name of the cloud native Netcool Operations Insight componentscustom resource.
• client_secret is the value of client_secret in secret release_name-was-oauth-cnea-secrets. If thisis not known, it can be retrieved using kubectl get secrets release_name-was-oauth-cnea-secrets -o json -n default | jq -r ".data[\"client-secret\"]" |base64 -d -- where release_name is the name of the cloud native Netcool Operations Insightcomponents custom resource
• user is the DASH administrator username• pass is the DASH administrator password• host.domain is the fully qualified hostname of the Jazz® for Service Management application
server.
For example:
$ curl -k -H "Content-Type: application/x-www-form-urlencoded;charset=UTF-8" -d "grant_type=password&client_id=my-client-id&client_secret=my-client-secret&username=smadmin&password=password" https://testserver1.test:16311/oauth2/endpoint/
196 IBM Netcool Operations Insight: Integration Guide
NetcoolOAuthProvider/token | sed -e 's/[{}\,]/\n/g'{ "access_token": "AccessTokenExample", "token_type": "Bearer", "expires_in": 3600, "scope": "", "refresh_token": "RefreshTokenExample"}
b) From your cloud native Netcool Operations Insight components cluster, verify that access to the on-premises installation is authorized with the access token that was returned in the previous step.
curl -k -H 'Accept: application/json' -H "Authorization: Bearer access_token" https://host.domain:16311/ibm/console/dashauth/DASHUserAuthServlet
where
• access_token is the value of access_token, as returned in the previous step.• host.domain is the fully qualified hostname of the Jazz® for Service Management application
server.
For example:
$ curl -k -H 'Accept: application/json' -H "Authorization: Bearer AccessTokenExample" https://testserver1.test.com:16311/ibm/console/dashauth/DASHUserAuthServlet'{ "user": { "firstname": "smadmin", "surname": "smadmin", "roles": [ "iscadmins", "noi_engineer", "ncw_user", "suppressmonitor", "netcool_rw", "monitor", "chartAdministrator", "ncw_gauges_viewer", "operator", "samples", "netcool_ro", "iscusers", "ncw_admin", "configurator", "administrator", "chartCreator", "chartViewer", "noi_operator", "ncw_gauges_editor", "noi_lead", "ncw_dashboard_editor", "noi_administrator" ], "id": "smadmin", "username": "uid=smadmin,o=defaultWIMFileBasedRealm" }}
7. (Optional) Open the Event Viewer.A new view called Example_IBM_CloudAnalytics has been created on your on-premises installation,with three columns: Grouping, Seasonal and Topology.
Post-installation tasksPerform the following tasks to verify and configure your cloud native Netcool Operations Insightcomponents deployment. Most of these tasks are optional.
Enable the launch-in-context menu to start manual or semi-automated runbooks from events for yourhybrid IBM Netcool Operations Insight on Red Hat OpenShift deployment. For more information, see“Installing Netcool/Impact to run the trigger service” on page 334.
Chapter 4. Installing Netcool Operations Insight 197
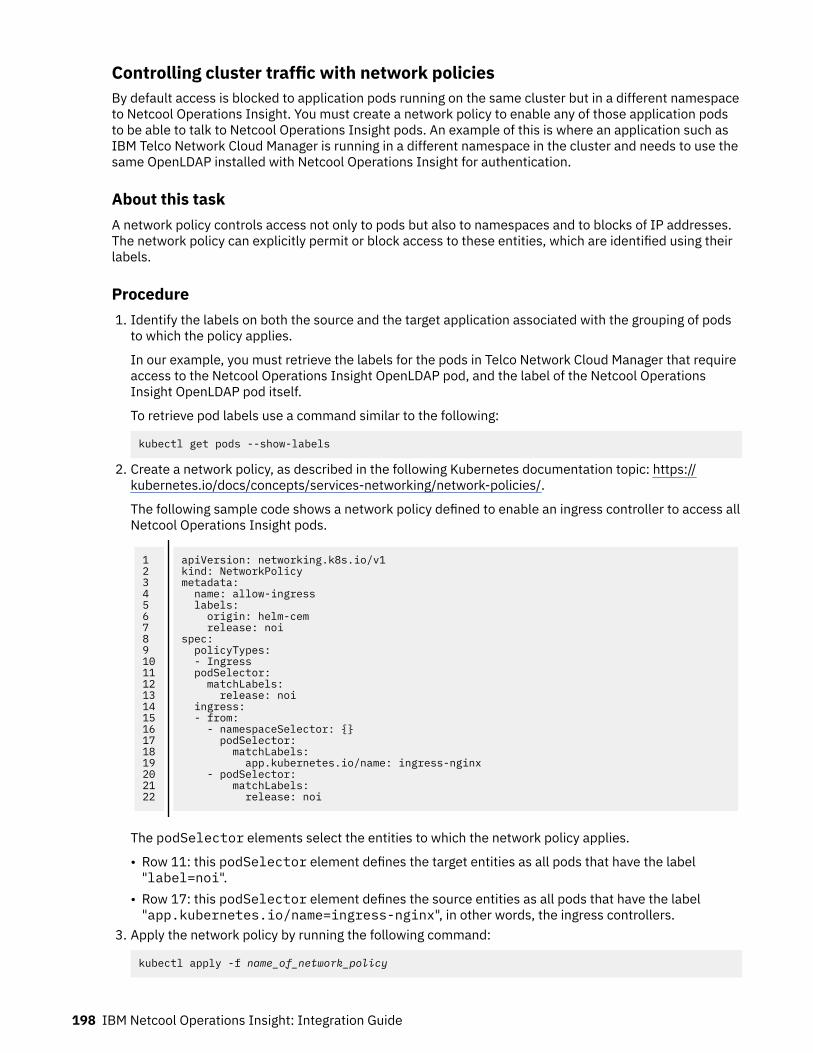
Controlling cluster traffic with network policiesBy default access is blocked to application pods running on the same cluster but in a different namespaceto Netcool Operations Insight. You must create a network policy to enable any of those application podsto be able to talk to Netcool Operations Insight pods. An example of this is where an application such asIBM Telco Network Cloud Manager is running in a different namespace in the cluster and needs to use thesame OpenLDAP installed with Netcool Operations Insight for authentication.
About this taskA network policy controls access not only to pods but also to namespaces and to blocks of IP addresses.The network policy can explicitly permit or block access to these entities, which are identified using theirlabels.
Procedure1. Identify the labels on both the source and the target application associated with the grouping of pods
to which the policy applies.
In our example, you must retrieve the labels for the pods in Telco Network Cloud Manager that requireaccess to the Netcool Operations Insight OpenLDAP pod, and the label of the Netcool OperationsInsight OpenLDAP pod itself.
To retrieve pod labels use a command similar to the following:
kubectl get pods --show-labels
2. Create a network policy, as described in the following Kubernetes documentation topic: https://kubernetes.io/docs/concepts/services-networking/network-policies/.
The following sample code shows a network policy defined to enable an ingress controller to access allNetcool Operations Insight pods.
12345678910111213141516171819202122
apiVersion: networking.k8s.io/v1kind: NetworkPolicymetadata: name: allow-ingress labels: origin: helm-cem release: noispec: policyTypes: - Ingress podSelector: matchLabels: release: noi ingress: - from: - namespaceSelector: {} podSelector: matchLabels: app.kubernetes.io/name: ingress-nginx - podSelector: matchLabels: release: noi
The podSelector elements select the entities to which the network policy applies.
• Row 11: this podSelector element defines the target entities as all pods that have the label"label=noi".
• Row 17: this podSelector element defines the source entities as all pods that have the label"app.kubernetes.io/name=ingress-nginx", in other words, the ingress controllers.
3. Apply the network policy by running the following command:
kubectl apply -f name_of_network_policy
198 IBM Netcool Operations Insight: Integration Guide
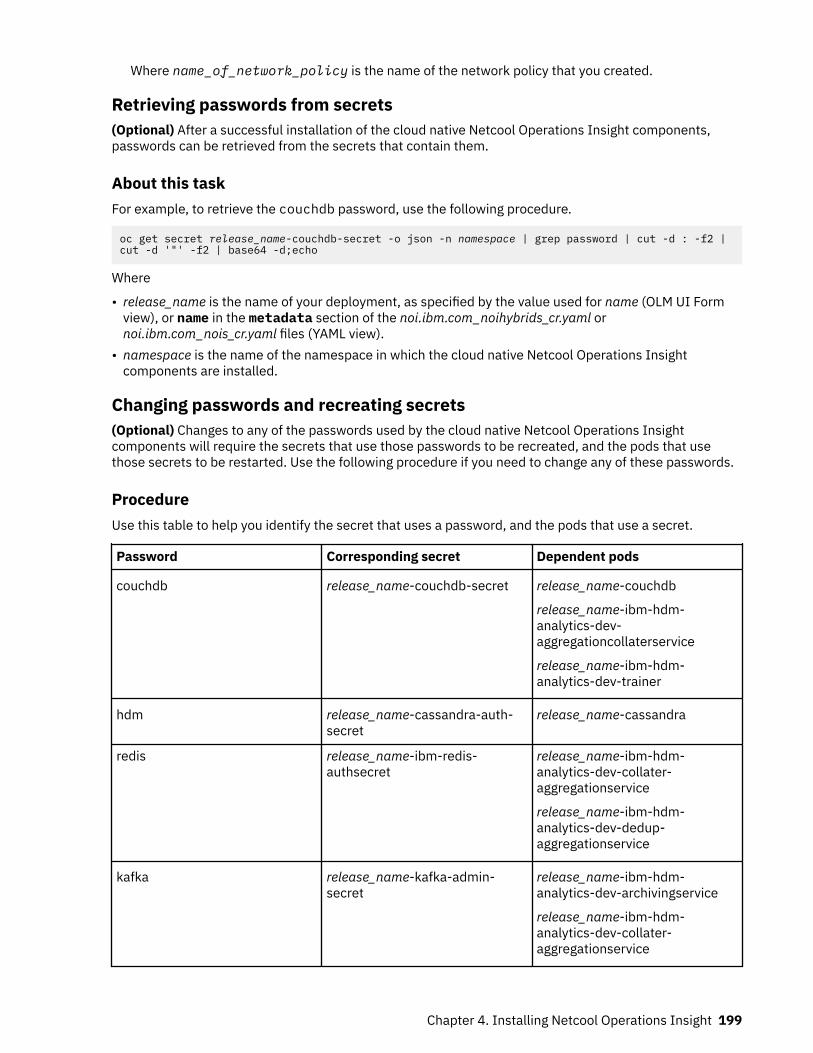
Where name_of_network_policy is the name of the network policy that you created.
Retrieving passwords from secrets(Optional) After a successful installation of the cloud native Netcool Operations Insight components,passwords can be retrieved from the secrets that contain them.
About this taskFor example, to retrieve the couchdb password, use the following procedure.
oc get secret release_name-couchdb-secret -o json -n namespace | grep password | cut -d : -f2 | cut -d '"' -f2 | base64 -d;echo
Where
• release_name is the name of your deployment, as specified by the value used for name (OLM UI Formview), or name in the metadata section of the noi.ibm.com_noihybrids_cr.yaml ornoi.ibm.com_nois_cr.yaml files (YAML view).
• namespace is the name of the namespace in which the cloud native Netcool Operations Insightcomponents are installed.
Changing passwords and recreating secrets(Optional) Changes to any of the passwords used by the cloud native Netcool Operations Insightcomponents will require the secrets that use those passwords to be recreated, and the pods that usethose secrets to be restarted. Use the following procedure if you need to change any of these passwords.
ProcedureUse this table to help you identify the secret that uses a password, and the pods that use a secret.
Password Corresponding secret Dependent pods
couchdb release_name-couchdb-secret release_name-couchdb
release_name-ibm-hdm-analytics-dev-aggregationcollaterservice
release_name-ibm-hdm-analytics-dev-trainer
hdm release_name-cassandra-auth-secret
release_name-cassandra
redis release_name-ibm-redis-authsecret
release_name-ibm-hdm-analytics-dev-collater-aggregationservice
release_name-ibm-hdm-analytics-dev-dedup-aggregationservice
kafka release_name-kafka-admin-secret
release_name-ibm-hdm-analytics-dev-archivingservice
release_name-ibm-hdm-analytics-dev-collater-aggregationservice
Chapter 4. Installing Netcool Operations Insight 199
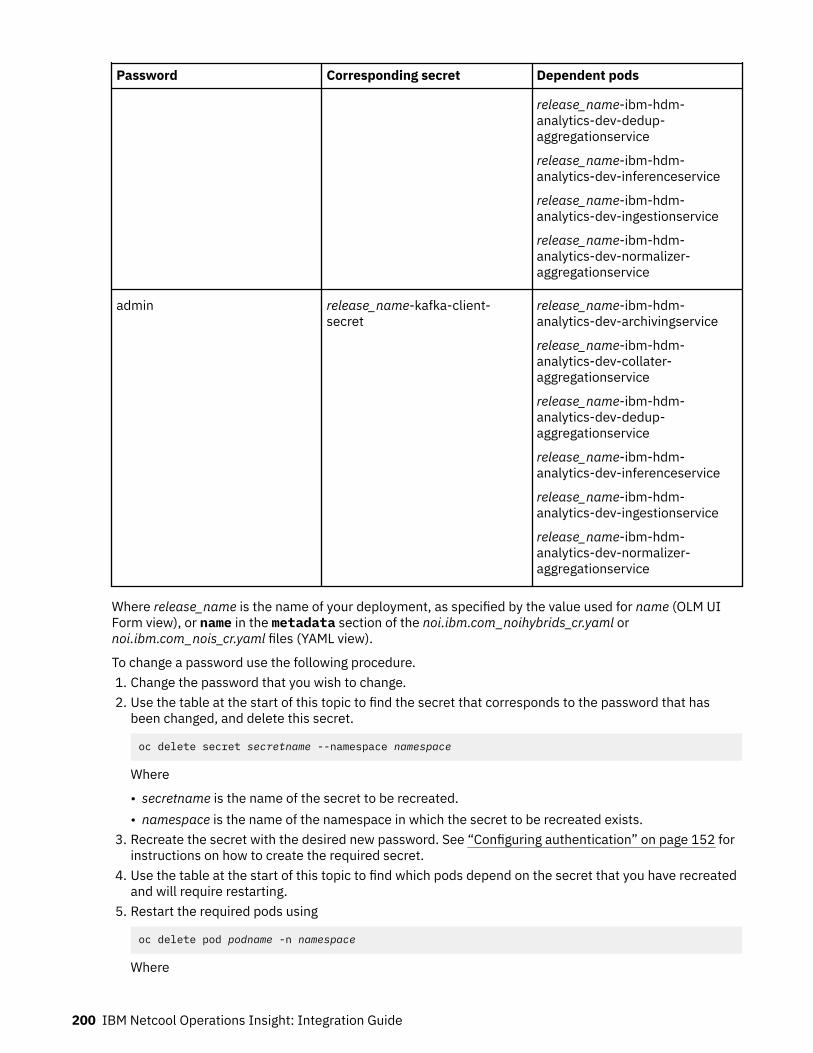
Password Corresponding secret Dependent pods
release_name-ibm-hdm-analytics-dev-dedup-aggregationservice
release_name-ibm-hdm-analytics-dev-inferenceservice
release_name-ibm-hdm-analytics-dev-ingestionservice
release_name-ibm-hdm-analytics-dev-normalizer-aggregationservice
admin release_name-kafka-client-secret
release_name-ibm-hdm-analytics-dev-archivingservice
release_name-ibm-hdm-analytics-dev-collater-aggregationservice
release_name-ibm-hdm-analytics-dev-dedup-aggregationservice
release_name-ibm-hdm-analytics-dev-inferenceservice
release_name-ibm-hdm-analytics-dev-ingestionservice
release_name-ibm-hdm-analytics-dev-normalizer-aggregationservice
Where release_name is the name of your deployment, as specified by the value used for name (OLM UIForm view), or name in the metadata section of the noi.ibm.com_noihybrids_cr.yaml ornoi.ibm.com_nois_cr.yaml files (YAML view).
To change a password use the following procedure.1. Change the password that you wish to change.2. Use the table at the start of this topic to find the secret that corresponds to the password that has
been changed, and delete this secret.
oc delete secret secretname --namespace namespace
Where
• secretname is the name of the secret to be recreated.• namespace is the name of the namespace in which the secret to be recreated exists.
3. Recreate the secret with the desired new password. See “Configuring authentication” on page 152 forinstructions on how to create the required secret.
4. Use the table at the start of this topic to find which pods depend on the secret that you have recreatedand will require restarting.
5. Restart the required pods using
oc delete pod podname -n namespace
Where
200 IBM Netcool Operations Insight: Integration Guide
• podname is the name of the pod that requires restarting.• namespace is the name of the namespace in which the pod to be restarted exists.
Using custom certificates for routes(Optional) Red Hat OpenShift automatically generates TLS certificates for external routes, but you canuse your own certificate instead. Learn how to update external routes to use custom certificates onOpenShift. Internal TLS microservice communications are not affected.
You can update the OpenShift ingress to use a custom certificate for all external routes across the cluster.For more information, see https://docs.openshift.com/container-platform/4.5/authentication/certificates/replacing-default-ingress-certificate.html.
If required, you can add a custom certificate for a single external route. For more information, see https://docs.openshift.com/container-platform/4.5/networking/routes/secured-routes.html.
Installing the connection layer operator with the CLI(Optional) Learn how to install the connection layer operator with the command line interface (CLI). Eachconnection layer operator establishes a connection to an additional ObjectServer in your hybridenvironment.
Before you beginYou must first deploy IBM Netcool Operations Insight on Red Hat OpenShift in a hybrid environment. Formore information, see “Installing cloud native components on hybrid” on page 161. This installationconnects an ObjectServer aggregation pair to a Netcool Operations Insight on OpenShift instance.
Before you deploy the connection layer, create two secrets:
1. Create a secret to enable cloud native Netcool Operations Insight components to access your on-premises Operations Management ObjectServer.
oc create secret generic release_name-omni-secret --from-literal=OMNIBUS_ROOT_PASSWORD=omni_password --namespace namespace
Where
• release_name is the name that you will use for your cloud native Netcool Operations Insightcomponents deployment in name (OLM UI Form view), or name in the metadata section of thenoi.ibm.com_noihybrids_cr.yaml file (YAML view).
• namespace is the name of the namespace into which you want to install the cloud nativecomponents.
• omni_password is the root password for the on-premises Netcool/OMNIbus that you want toconnect to.
2. Create a secret to enable SSL communication between the OMNIbus component of your on-premisesOperations Management installation and the cloud native Netcool Operations Insight components. Ifyou do not require an SSL connection, create the secret with blank entries. Complete the followingsteps to configure authentication:
a. Configure OMNIbus on your on-premises Operations Management installation to use SSL, if it is notdoing so already. To check, run the command oc get secrets -n namespace and check if thesecret release_name-omnicertificate-secret exists. If the secret does not exist and theOMNIbus components are using SSL, the following steps must be completed.
b. Extract the certificate from your on-premises Operations Management installation.
$NCHOME/bin/nc_gskcmd -cert -extract -db "key_db" -pw password -label "cert_name" -target "ncomscert.arm"
Where
• key_db is the name of the key database file.
Chapter 4. Installing Netcool Operations Insight 201
• password is the password to your key database.• cert_name is the name of your certificate.
c. Copy the extracted certificate, ncomscert.arm, over to the infrastructure node of your Red HatOpenShift cluster, or to the node on your cluster where the oc CLI is installed.
d. Create a secret for the certificate.
oc create secret generic release_name-omni-certificate-secret --from-literal=PASSWORD=password --from-file=ROOTCA=certificate --namespace namespace --from-literal=INTERMEDIATECA=""
Where
• release_name is the name that you will use for your cloud native Netcool Operations Insightcomponents deployment in name (OLM UI Form view), or name in the metadata section of thenoi.ibm.com_noihybrids_cr.yaml file (YAML view).
• password is a password of your choice.• certificate is the path and filename of the certificate that was copied to your cluster in the
previous step, ncomscert.arm.• namespace is the name of the namespace into which you want to install the cloud native
components.
Note: If the ObjectServer is not named 'AGG_V', which is the default, then you must set theglobal.hybrid.objectserver.config.ssl.virtualPairName parameter when you configure the installationparameters later. For more information, see “Hybrid operator properties” on page 170.
About this taskLearn about the properties that can be specified for each connection layer:
Table 45. Connection layer properties
Property Description
noiReleaseName Provide the release name to be associated with theObjectServer properties. The noiReleaseNameproperty is the release name of the hybrid or cloudinstance that must be connected with theObjectServer aggregation pair.
objectServer.backupHost Hostname of the backup ObjectServer
objectServer.backupPort Port number of the backup ObjectServer
objectServer.deployPhase This setting determines when the OMNIbusNetcool Operations Insight on OpenShift schema isdeployed
objectServer.primaryHost Hostname of the primary ObjectServer
objectServer.primaryPort Port number of the primary ObjectServer
objectServer.sslRootCAName This property is used to specify the common name(CN) name for the certificate authority (CA)certificate
objectServer.sslVirtualPairName This property is only needed when setting up anSSL connection
objectServer.username User name for connecting to an on-premisesObjectServer
The operator has cluster scope permissions. It requires role-based access control (RBAC) authorization ata cluster level because it deploys and modifies Custom Resource Definitions (CRDs) and cluster roles.
202 IBM Netcool Operations Insight: Integration Guide
Create and deploy a custom resource for the connection layer by completing the following steps:
Procedure1. Note: Specify a unique release name for each connection layer.
For each connection layer, create the custom resource by editing the parameters in the deploy/crds/<custom_resource_file_name>.yamlfile, where <custom_resource_file_name> is thename of your custom resource YAML file for your cloud or hybrid deployment. Specify the connectionlayer release name and the ObjectServer details. For more information, see Table 45 on page 202.
2. Run the following command:
kubectl apply -f deploy/crds/<custom_resource_file_name>.yaml
What to do nextDeploy a connection layer for each separate aggregation pair that you want to connect to a single NetcoolOperations Insight on OpenShift instance.
Installing the connection layer operator with the Operator Lifecycle Managerconsole(Optional) Learn how to install the connection layer operator with the Operator Lifecycle Manager (OLM)console. Each connection layer operator establishes a connection to an additional ObjectServer in yourhybrid environment.
Before you beginYou must first deploy IBM Netcool Operations Insight on Red Hat OpenShift in a hybrid environment. Formore information, see “Installing cloud native components with the Operator Lifecycle Manager (OLM)user interface” on page 161 and “Installing Netcool Operations Insight with the Operator LifecycleManager (OLM) user interface” on page 118. This installation connects an ObjectServer aggregation pairto a Netcool Operations Insight on OpenShift instance.
Before you deploy the connection layer, create two secrets:
1. Create a secret to enable cloud native Netcool Operations Insight components to access your on-premises Operations Management ObjectServer.
oc create secret generic release_name-omni-secret --from-literal=OMNIBUS_ROOT_PASSWORD=omni_password --namespace namespace
Where
• release_name is the name that you will use for your cloud native Netcool Operations Insightcomponents deployment in name (OLM UI Form view), or name in the metadata section of thenoi.ibm.com_noihybrids_cr.yaml file (YAML view).
• namespace is the name of the namespace into which you want to install the cloud nativecomponents.
• omni_password is the root password for the on-premises Netcool/OMNIbus that you want toconnect to.
2. Create a secret to enable SSL communication between the OMNIbus component of your on-premisesOperations Management installation and the cloud native Netcool Operations Insight components. Ifyou do not require an SSL connection, create the secret with blank entries. Complete the followingsteps to configure authentication:
a. Configure OMNIbus on your on-premises Operations Management installation to use SSL, if it is notdoing so already. To check, run the command oc get secrets -n namespace and check if thesecret release_name-omnicertificate-secret exists. If the secret does not exist and theOMNIbus components are using SSL, the following steps must be completed.
Chapter 4. Installing Netcool Operations Insight 203
b. Extract the certificate from your on-premises Operations Management installation.
$NCHOME/bin/nc_gskcmd -cert -extract -db "key_db" -pw password -label "cert_name" -target "ncomscert.arm"
Where
• key_db is the name of the key database file.• password is the password to your key database.• cert_name is the name of your certificate.
c. Copy the extracted certificate, ncomscert.arm, over to the infrastructure node of your Red HatOpenShift cluster, or to the node on your cluster where the oc CLI is installed.
d. Create a secret for the certificate.
oc create secret generic release_name-omni-certificate-secret --from-literal=PASSWORD=password --from-file=ROOTCA=certificate --namespace namespace --from-literal=INTERMEDIATECA=""
Where
• release_name is the name that you will use for your cloud native Netcool Operations Insightcomponents deployment in name (OLM UI Form view), or name in the metadata section of thenoi.ibm.com_noihybrids_cr.yaml file (YAML view).
• password is a password of your choice.• certificate is the path and filename of the certificate that was copied to your cluster in the
previous step, ncomscert.arm.• namespace is the name of the namespace into which you want to install the cloud native
components.
Note: If the ObjectServer is not named 'AGG_V', which is the default, then you must set theglobal.hybrid.objectserver.config.ssl.virtualPairName parameter when you configure the installationparameters later. For more information, see “Hybrid operator properties” on page 170.
About this taskLearn about the properties that can be specified for each connection layer:
Table 46. Connection layer properties
Property Description
noiReleaseName Provide the release name to be associated with theObjectServer properties. The noiReleaseNameproperty is the release name of the hybrid or cloudinstance that must be connected with theObjectServer aggregation pair.
objectServer.backupHost Hostname of the backup ObjectServer
objectServer.backupPort Port number of the backup ObjectServer
objectServer.deployPhase This setting determines when the OMNIbusNetcool Operations Insight on OpenShift schema isdeployed
objectServer.primaryHost Hostname of the primary ObjectServer
objectServer.primaryPort Port number of the primary ObjectServer
objectServer.sslRootCAName This property is used to specify the common name(CN) name for the certificate authority (CA)certificate
204 IBM Netcool Operations Insight: Integration Guide

Table 46. Connection layer properties (continued)
Property Description
objectServer.sslVirtualPairName This property is only needed when setting up anSSL connection
objectServer.username User name for connecting to an on-premisesObjectServer
The operator has cluster scope permissions. It requires role-based access control (RBAC) authorization ata cluster level because it deploys and modifies Custom Resource Definitions (CRDs) and cluster roles.
Procedure1. Log in to the OLM console with a URL of the following format:
https://console-openshift-console.apps.<master-hostname>/
Where <master-hostname> is the host name of the master node.2. To install a connection layer on your cloud architecture, select the Create Instance link under the
hybrid or cloud custom resource.3. Note: Set the objectServer.deployPhase property to install and do not change.
Use the YAML or Form view and provide the required values to install a connection layer. For moreinformation, see Table 46 on page 204.
4. Select the Create button and specify a release name for the connection layer.5. Under the All Instances tab, a connection layer instance appears. View the status for updates on the
installation. When the instance state shows OK then the connection layer is fully deployed.
What to do nextDeploy a connection layer for each separate aggregation pair that you want to connect to a single NetcoolOperations Insight on OpenShift instance.
Uninstalling a hybrid installationUse this information to uninstall your hybrid deployment, or to uninstall just the cloud native NetcoolOperations Insight components of your hybrid deployment and retain a working on-premises OperationsManagement installation. If you installed the cloud native Netcool Operations Insight components withthe Operator Lifecycle Manager (OLM) user interface (UI), then you must uninstall your deployment usingthe OLM UI. If you installed the cloud native Netcool Operations Insight components of your hybriddeployment with the OLM UI and Container Application Software for Enterprises (CASE), then you mustuninstall your deployment with the OLM UI and CASE.
Uninstalling with the OLM UI1. If Application Discovery is enabled, delete the Application Discovery instance. Go to Administration >
Custom Resource Definitions > AppDisco > Instances. Delete the <noi-operator-instance-name>-topology instance.
2. Delete the Netcool Operations Insight operator instance.Go to Operator > Installed Operators. Select the project where you installed Netcool OperationsInsight. Click Netcool Operations Insight > All Instances. Select Delete NOI from the menu toremove a cloud deployment, or Delete NOIHybrid to remove a hybrid deployment.
3. Delete the Netcool Operations Insight operator.Go to Operator > Installed Operators. Select the options menu for the Netcool Operations Insightoperator entry, and select Uninstall Operator.
4. Remove the catalog entry.
Chapter 4. Installing Netcool Operations Insight 205
Go to Administration > Cluster Settings > Global Configuration > OperatorHub > Sources. SelectDelete CatalogSource
5. Delete the Custom Resource Definitions (CRDs).Go to Administration > Custom Resource Definitions. Select the CRDs that were created by theNetcool Operations Insight installation. Delete all the CRDs that start with noi, asm, and cem.
6. Delete the secrets that were created for your deployment.Go to Workloads > Secrets. Select the project where you installed Netcool Operations Insight. Deleteall secrets that start with <noi-operator-instance-name>.
7. Delete the ConfigMaps that were created by Netcool Operations Insight.Go to Workloads > Config Maps. Select the project where you installed Netcool Operations Insight.Delete all config maps that start with <noi-operator-instance-name>.
8. Go to Networking > Routes, and remove the routes.9. Delete the persistent volume claims, persistent volumes, and storage classes:
a. Go to Storage > Persistent Volume Claims. Delete all Persistent Volume Claims for NetcoolOperations Insight.
b. Go to Storage > Persistent Volume. Delete all Persistent Volumes for Netcool Operations Insight.c. Go to Storage > Storage Classes. Delete all storage classes for Netcool Operations Insight.
Uninstalling with the OLM UI and CASEUse this section for offline airgap deployments, as well as online deployments.
1. If Application Discovery is enabled, delete the Application Discovery instance. Run the followingcommand:
oc delete appdisco <noi-operator-instance-name>-topology
2. Delete the Netcool Operations Insight operator instance.For a cloud deployment, use oc delete noi <noi-operator-instance-name>For a hybrid deployment, use oc delete noihybrid <noi-operator-instance-name>.
3. Delete the Netcool Operations Insight operator by running the following command:
cloudctl case launch \ --case ibm-netcool-prod \ --namespace <target namespace> \ --inventory noiOperatorSetup \ --action uninstall-operator
4. Delete the catalog by running the following command:
cloudctl case launch \ --case ibm-netcool-prod \ --namespace <target namespace> \ --inventory noiOperatorSetup \ --action uninstall-catalog
5. Delete the Custom Resource Definitions (CRDs).Go to Administration > Custom Resource Definitions. Select the CRDs that were created by theNetcool Operations Insight installation. Delete all the CRDs that start with noi, asm, and cem.
6. Delete the secrets that were created for your deployment.Go to Workloads > Secrets. Select the project where you installed Netcool Operations Insight. Deleteall secrets that start with <noi-operator-instance-name>.
7. Delete the ConfigMaps that were created by Netcool Operations Insight.Go to Workloads > Config Maps. Select the project where you installed Netcool Operations Insight.Delete all config maps that start with <noi-operator-instance-name>.
8. Go to Networking > Routes, and remove the routes.9. Delete the persistent volume claims, persistent volumes, and storage classes:
206 IBM Netcool Operations Insight: Integration Guide
a. Go to Storage > Persistent Volume Claims. Delete all Persistent Volume Claims for NetcoolOperations Insight.
b. Go to Storage > Persistent Volume. Delete all Persistent Volumes for Netcool Operations Insight.c. Go to Storage > Storage Classes. Delete all storage classes for Netcool Operations Insight.
Uninstalling on-premises Operations Management integration1. Start IBM Installation Manager in your preferred mode. For more information, see https://
www.ibm.com/support/knowledgecenter/SSDV2W/im_family_welcome.html . Use IBM InstallationManager (IM) to uninstall the Netcool Hybrid Deployment Option Integration Kit. Select Uninstall >Netcool Hybrid Deployment Option Integration Kit 3.1.59.
2. If you want to also remove your on-premises Operations Management installation, follow theseinstructions, “Uninstalling on premises” on page 105.
Deployment guidelines for GDPR readinessInformation to help your organization with GDPR readiness.
This document is intended to help you in your preparations for GDPR readiness. It provides informationabout features of IBM Netcool Operations Insight that you can configure, and aspects of the product’suse, to consider for GDPR readiness. This information is not an exhaustive list, due to the many ways thatclients can choose and configure features, and the large variety of ways that the product can be used initself and with third-party applications and systems.
Clients are responsible for ensuring their own compliance with various laws and regulations, including theEuropean Union General Data Protection Regulation. Clients are solely responsible for obtaining advice ofcompetent legal counsel as to the identification and interpretation of any relevant laws and regulationsthat may affect the clients’ business and any actions the clients may need to take to comply with suchlaws and regulations.
The products, services, and other capabilities described herein are not suitable for all client situations andmay have restricted availability. IBM® does not provide legal, accounting, or auditing advice or representor warrant that its services or products will ensure that clients are in compliance with any law orregulation.
Contents• “GDPR” on page 207• “Product Configuration - Considerations for GDPR Readiness” on page 208• “Data lifecycle” on page 209• “Data collection” on page 209• “Data storage” on page 209• “Data access” on page 210• “Data processing” on page 210• “Data deletion” on page 210• “Data monitoring” on page 211• “Responding to data subject rights” on page 211• “GDPR PDFs” on page 211
GDPRGeneral Data Protection Regulation (GDPR) has been adopted by the European Union (EU) and appliesfrom May 25, 2018.
Why is GDPR important?
Chapter 4. Installing Netcool Operations Insight 207
GDPR establishes a stronger data protection regulatory framework for processing of personal data ofindividuals. GDPR brings:
• New and enhanced rights for individuals• Widened definition of personal data• New obligations for companies and organizations handling personal data• Potential for significant financial penalties for non-compliance• Compulsory data breach notification
Product Configuration - Considerations for GDPR ReadinessData handling in Netcool Operations Insight
In Netcool Operations Insight, data resides in the following databases or directory services:
• The customer's directory service, or the Lightweight Directory Access Protocol (LDAP). The customershould manage users, passwords, and other attributes in their own directory service (or LDAP), andperform an integration between Netcool Operations Insight and LDAP by using the integrationfunctionality provided the application server.
In addition, user data and configuration data can be located in other files, for example:
• Other resource or property files. They can be configured or updated when users want to isolatecredential or configuration information in these files to add more protection.
• Log files. Some log files that are generated by Netcool Operations Insight might contain personallyidentifiable information (PII) for debugging purpose. A user (user name) can be often identified as theauthor of certain actions, which is traced or logged. Aside from the user name, the PII should not be inthe log files, but the customer must verify their content.
Data privacy and security
The customer is responsible for data privacy and security of their LDAP and should follow the secureprivacy and protection guidelines.
General privacy and security rules
• Access control must be effective and enforced properly.• Credential strength must be high and strong.• Default passwords should be removed or at least changed.
Customer's directory service
• Access control must be effective and enforced properly.• Encryption or hashing of credential information, such as passwords, should be implemented orconfigured.
• Backups and restoration tests must be conducted regularly.
Databases
• Secure the connection between the application and the database.• Access control must be in place and effective.• Credential strength must be high and strong.• Encryption should be implemented at database or file system level.• Backups and restoration tests should be conducted regularly.
Personally identifiable information (PII) in files
Any PII, credential information, or configuration information that is personal or sensitive should beisolated in specific files. Files that might contain PII, such as resource or property files, must be protectedby setting file permissions. Implementing additional controls, such as access controls, logging, orencryption, are required to provide appropriate level of protection.
208 IBM Netcool Operations Insight: Integration Guide
Netcool Operations Insight
For Netcool Operations Insight, the security framework provides various security functions, such as:
• Authenticating and authorizing users• Protecting system resources• Logging accesses to protected systems and resources• Certificate management
Data lifecycleNetcool Operations Insight processes the following types of personal data:
• Authentication credentials (such as user names and passwords)• Basic personal information (such as name, address, phone number, and email)• Technically identifiable personal information (such as device IDs, usage based identifiers, static IP
address, etc. - when linked to an individual)
This offering is not designed to process any special categories of personal data.
Netcool Operations Insight users can provide personal data through online comments/feedback/requests, as in the following examples:
• Public comments area on pages of Netcool Operations Insight documentation in IBM Knowledge Center• Public comments in the Netcool Operations Insight space of dWAnswers• Feedback forms in the Netcool Operations Insight community
Typically, only the client name and email address are used, to enable personal replies for the subject ofthe contact, and the use of personal data conforms to the IBM Online Privacy Statement.
Data collectionIn general, data used for basic authentication is brought by the customer's directory service or LDAP. Thisdata is required when the customer uses Netcool Operations Insight. LDAP is managed outside of NetcoolOperations Insight, and any changes will be synchronized with Netcool Operations Insight.
Databases are provisioned by the customer. Netcool Operations Insight stores event data in thesedatabases. The databases evolve with the deployment of services:
• The databases must be maintained throughout the lifecycle of the product use.• Data must be backed up regularly, based on the customer's business needs and risk level.• When Netcool Operations Insight is no longer used, the databases can be securely deleted or backed up
for future use. The customer is responsible for deleting and backing up the databases.• As a data controller, the customer should provide means to satisfy data access requests for personal
information or other compliance requests.
Netcool Operations Insight requires basic personal data for authentication in its applications.
In Netcool Operations Insight, certain user information is collected, including:
• User name• User's role and assigned permissions
User activities can be tracked during rule authoring and governance phases.
Data storageThe databases and LDAP should be protected by using appropriate security controls. This includes but isnot limited to:
Chapter 4. Installing Netcool Operations Insight 209

• Encryption at rest, with keys stored separately in a secure location with a key management tool. Formore information, see the Db2 Knowledge Center: https://www.ibm.com/support/knowledgecenter/SSEPGG_11.5.0/com.ibm.db2.luw.admin.sec.doc/doc/c_encrypt_static.html
• Access controls to the databases.• The customer's IT infrastructure and security topology should implement:
– Tracking and logging of user activities– A security event management system (SIEM) to monitor the connections and security events
• Encryption of the data backups
Data accessThe customer should implement protective measures concerning data access.
• Access control to databases should be in place and effective. The customer should considerimplementing certain protections, including:
– Use of HTTPS for all the connections– Use of basic authentication or other authentication methods– Proper authorization, so that only authorized roles can use the corresponding API
Data processingThe following security guidelines are provided by default when invoking the REST APIs with NetcoolOperations Insight:
• HTTPS with secure ciphers should be used.• The security infrastructure should protect against DOS attacks.
Data processing activities, with regards to personal data within this offering, include the followingactivities:
• Receipt of data from data subjects and/or third parties• Computer processing of data, including data transmission, data retrieval, data access, and network
access to allow data transfer if required• Storage and associated deletion of data
This offering can integrate with the following IBM offerings, which might process personal data content:
• IBM WebSphere Application Server• IBM Db2• IBM Security Directory Server
Data deletionRight to Erasure
Article 17 of the GDPR states that data subjects have the right to have their personal data removed fromthe systems of controllers and processors - without undue delay - under a set of circumstances.
The customer should implement appropriate controls and tools to satisfy the right to erasure.
The Netcool Operations Insight offering does not require any special method for data deletion. Thecustomer is responsible for implementing appropriate methods for their storage media to securely deletedata, which includes media zeroization if necessary. The customer is also responsible for deleting data.
210 IBM Netcool Operations Insight: Integration Guide
Data monitoringThe customer should regularly test, assess, and evaluate the effectiveness of their technical andorganizational measures to comply with GDPR. These measures should include ongoing privacyassessments, threat modeling, centralized security logging, and monitoring among others.
Responding to data subject rightsThe personal data stored and processed by Netcool Operations Insight falls under the followingcategories:
• Basic personal data, such as names, user names, and passwords• Technically identifiable personal information, such as IP addresses and host names to which user
activity could potentially linked
This data is essential to the operation of an effective monitoring system. The customer should considerand implement methods so that they can respond to a request to:
• Delete data• Correct data• Modify data• Extract specific data for export to another system• Restrict the use of the data within the overall system, securely and responsibly
GDPR PDFsEach of the following PDF documents present considerations for General Data Protection Regulation(GDPR) readiness. A PDF document is provided for each product in the Netcool suite.
Table 47. GDPR documentation
Product or component PDF
IBM Agile Service Manager here
IBM Operations Analytics - Log Analysis here
IBM Tivoli Netcool/Impact here
IBM Tivoli Netcool/OMNIbus here
IBM Tivoli Netcool Configuration Manager here
IBM Tivoli Network Manager here
For PDFs of other products in the Netcool suite, see: https://www.ibm.com/support/knowledgecenter/SSTPTP_1.6.2/com.ibm.netcool_ops.doc/noi/gdpr_noi.html
Tracking license consumption of IBM Netcool Operations InsightLicense Service is required for monitoring and measuring license usage of Netcool Operations Insight inaccord with the pricing rule for containerized environments. Manual license measurements are notallowed. Deploy License Service on all clusters where Netcool Operations Insight is installed.
OverviewThe integrated licensing solution collects and stores the license usage information which can be used foraudit purposes and for tracking license consumption in cloud environments. The solution works in thebackground and does not require any configuration. Only one instance of the License Service is deployedper cluster regardless of the number of Cloud Paks and containerized products that you have installed onthe cluster.
Chapter 4. Installing Netcool Operations Insight 211

Deploying License ServiceDeploy License Service on each cluster where Netcool Operations Insight is installed. License Service canbe deployed on any Kubernetes cluster. For more information about License Service, how to install anduse it, see the License Service documentation: https://github.com/IBM/ibm-licensing-operator/blob/master/docs/License_Service_main.md
Validating if License Service is deployed on the clusterTo ensure license reporting continuity for license compliance purposes make sure that License Service issuccessfully deployed. It is recommended to periodically verify whether it is active.
To validate whether License Service is deployed and running on the cluster, you can, for example, log in tothe cluster and run the following command:
kubectl get pods --all-namespaces | grep ibm-licensing | grep -v operator
The following response is a confirmation of successful deployment:
1/1 Running
Troubleshooting installationUse the entries in this section to troubleshoot installation problems.
Troubleshooting installation on-premisesUse these troubleshooting entries to help resolve problems and to see known issues for on-premisesinstallations.
Derby database corruptedThe Derby database can be corrupted during the installation of Event Analytics.
ProblemThe Derby database is corrupted, and must be reset.
ResolutionDuring the installation of Event Analytics, if the Derby database becomes corrupted then you must reset itto default state by performing the following steps:
1. Navigate to $IMPACT_HOME/install/dbcore and find the zip archive namedImpactDB_NOI_FP15.zip.
2. Stop all of the Netcool/Impact servers in the cluster, including the primary and secondary serversrunning the Derby database.
3. Back up the existing directory structure in $IMPACT_HOME/db/Server_Name/derby, whereServer_Name is the name of the Netcool/Impact server. Once the backup is complete, remove thedirectory structure.
4. Copy the ImpactDB_NOI_FP15.zip zip file found in step 1 to $IMPACT_HOME/db/Server_Name/derby and unzip it there.
5. Start the primary Netcool/Impact server and allow it enough time to fully initialize.6. Start the secondary Netcool/Impact server and allow it to resynchronize from the primary server.
212 IBM Netcool Operations Insight: Integration Guide
Installation Manager console mode restrictionsIBM Installation Manager console mode cannot install Netcool/OMNIbus core and Web GUI or Netcool/Impact at the same time.
ProblemWhen you install Netcool/OMNIbus core and Web GUI or Netcool/Impact at the same time withInstallation Manager in console mode, the installation fails.
CauseThe installation paths for Web GUI and Netcool/Impact are not prompted for and the installation fails.
ResolutionIf you are performing the installation with Installation Manager in console mode, you must install thecomponents separately.
Note: Installing Jazz for Service Management and IBM WebSphere Application Server is not supported forInstallation Manager in console mode.
Troubleshooting installation on Red Hat OpenShiftUse these troubleshooting entries to help resolve problems and to see known issues for installations onRed Hat OpenShift.
Cassandra pods not binding to PVCsCassandra Persistent Volume Claims (PVCs) are left with status 'Pending' when Cassandra PersistentVolumes (PVs) are not on the same local node.
ProblemCassandra pods with local storage do not come up, due to inability to bind to their PVCs.
CauseIf local storage is used, the noi-cassandra-* and noi-cassandra-bak-* PVs must be on the same localnode. Cassandra pods fail to bind to their PVCs if noi-cassandra-* and noi-cassandra-bak-* PVs are not onthe same local node.
ResolutionEnsure that the noi-cassandra-* and noi-cassandra-bak-* PVs are on the same local node
Cannot launch WebSphere Application Server from Dashboard ApplicationServices Hub on an OpenShift environmentIf you encounter an error when trying to WebSphere Application Server from Dashboard ApplicationServices Hub on an OpenShift environment, then you moot launch WebSphere Application Server with apredefined URL format.
ProblemIf your deployment is on a Red Hat OpenShift environment and you attempt to access Console Settings ->Websphere Application Server Console, then the following error is returned:
"502 Bad Gateway The server returned an invalid or incomplete response."
Chapter 4. Installing Netcool Operations Insight 213
ResolutionAccess WebSphere Application Server directly with a URL in this format:
https://was.release_name.master_node_name:<port>/ibm/console
Where
• release_name is the name of your deployment, as specified by the value used for name (OLM UI Formview), or name in the metadata section of the noi.ibm.com_noihybrids_cr.yaml ornoi.ibm.com_nois_cr.yaml files (YAML view).
• master_node_name is the hostname of the master node.• port is the value that you specified for ingress_https_port in your configuration yaml file when you
installed Netcool Operations Insight on Red Hat OpenShift.
Communication between the proxy server and the ObjectServer dropsThe proxy server and the object server on the Netcool Operations Insight on Red Hat OpenShift aredisconnected after 15 minutes.
ProblemThe proxy server and the object server on the Netcool Operations Insight on Red Hat OpenShift aredisconnected.
ResolutionThe default timeout value for communication to the Netcool Operations Insight on Red Hat OpenShift'sObjectServer is 15 minutes. You can modify the default value through the proxy server configmap. Set theconnectionTimeoutMs value in milliseconds.
Customizations to the default Netcool/Impact are not persistedWhen Netcool/Impact is restarted, customizations to the Netcool/Impact connection are lost.
ProblemWhen Netcool Operations Insight is running on a container platform, any customizations to the defaultNetcool/Impact connection are not persisted. The default connection is recreated every time the webguicontainer is restarted.
Resolution1. To connect with a customized Netcool/Impact connection, you must create a new connection. Any
additional Netcool/Impact connection that you create is preserved.
Note: This workaround requires you to connect to an external on-premises Netcool/Impact connectionand not to the Netcool/Impact container in your Netcool Operations Insight on Red Hat OpenShiftdeployment.
Datasources are not persistentWhen you create a new datasource, on restart of the Dashboard Application Services Hub container(webgui), the datasource is no longer present.
ProblemAfter you create a new datasource by clicking Administration > Datasources in the DashboardApplication Services Hub GUI, when you restart the Dashboard Application Services Hub container(webgui), the datasource is no longer present.
214 IBM Netcool Operations Insight: Integration Guide

ResolutionIf you want to visualize the contents of an on-premises ObjectServer in a Web GUI instance running on acontainer platform, then set up a gateway between your on-premises ObjectServer and the ObjectServerrunning on your Netcool Operations Insight on Red Hat OpenShift deployment.
ENOTFOUND errorHow to workaround an ENOTFOUND error.
ProblemFor any connectivity issues, either during or after a deployment of IBM Netcool Operations Insight on RedHat OpenShift, there might be an underlying Red Hat OpenShift issue.
SolutionCheck the pods running in the openshift-dns namespace and restart any pods that are in trouble.
Errors on command line after installationIf you receive the command line response Errors when you run the oc get command following a Cloudor Hybrid deployment, then you must run a series of checks to determine if there is an error, and wherethat error is.
SymptomCloud: Following a cloud deployment, run a command similar to the following:
oc get my_deployment noi -o yaml
Where my_deployment is the name of your deployment, for example, noi1.
Hybrid: Following a hybrid deployment, run a command similar to the following:
oc get my_deployment noihybrid -o yaml
Where my_deployment is the name of your deployment, for example, noi2.
If you see the following response fragment on the command line, then you need to investigate further:
status:phase: Error
Investigating the problemRun the following commands to investigate further.
Table 48. Further investigation
Item to check Command
Ensure all jobs are in the correctstate.
oc get jobs --all-namespaces
Ensure correct version. oc describe noi om193 | egrep ^build
Check status of importantparameters; some examples aregiven in the cell to the right.
noi, noitransformations, nohybrid
Check noi_operator pods. oc logs noi-operator-566b845789-kzfrc
Chapter 4. Installing Netcool Operations Insight 215
Table 48. Further investigation (continued)
Item to check Command
If there are noi_operator podstartup issues, get more details. oc describe pod noi-operator-566b845789-kzfrc | egrep Events
-A 100oc get events
Extra checks for OperatorLifecycle Manager (OLM)deployments.
oc get catalogsource --all-namespacesoc get subscription --all-namespaces
Related reference“Cannot launch WebSphere Application Server from Dashboard Application Services Hub on an OpenShiftenvironment” on page 213If you encounter an error when trying to WebSphere Application Server from Dashboard ApplicationServices Hub on an OpenShift environment, then you moot launch WebSphere Application Server with apredefined URL format.
Event Query service pod does not startWhen installing Netcool Operations Insight on OpenShift the ibm-hdm-analytics-dev-eventsqueryservice pod fails to start.
ProblemThe ibm-hdm-analytics-dev-eventsqueryservice pod has not started, or is taking a long time tostart.
CauseThe ibm-hdm-analytics-dev-eventsqueryservice is waiting for the eventsquery-checkforschema container.
1. Inspect the Event query service log file by running the following command:
oc logs name-ibm-hdm-analytics-dev-eventsqueryservice-random-string -c eventsquery-checkforschema
Where:
• name is the name of your installation instance.• random-string is a random string of numbers and letters.
2. Look for a line that contains text similar to the following.
{"name":"checkdb","hostname":"noi-204-ibm-hdm-analytics-dev-eventsqueryservice-574cd4bc78ws2g","pid":22,"level":30,"requirements":{"keyspace":true,"events":true,"events_byid":false},"msg":"Requirements not met, re-check timer started.","time":"2020-06-29T22:30:08.610Z","v":0}
This log entry indicates that the required schema has only been partially created, causing theconnection to the schema to time out, with the result that the dependent ibm-hdm-analytics-dev-eventsqueryservice pod fails to start.
ResolutionTo resolve this issue, proceed as follows:
1. From the Kubernetes command line, issue the following command to list all of the pods on yourcluster.
216 IBM Netcool Operations Insight: Integration Guide
oc get pod
2. Find the archiving service pod. This pod has a name similar to the following:
name-ibm-hdm-analytics-dev-archivingservice-random-string
Where:
• name is the name of your installation instance.• random-string is a random string of numbers and letters.
For example:
mynoi-ibm-hdm-analytics-dev-archivingservice-8656c4dc8b-hxkzh
3. Copy the pod name from the previous step for use in the next command.4. Issue the following command to enter the archiving service and create the missing elements of the
schema.
oc exec -it name-of-archiving-service-pod /app/entrypoint.sh -- npm run setup
Where name-of-archiving-service-pod is the name of the archiving service pod.
Note: This command will generate a number of harmless errors, which can be ignored.
Humio tool for topology analytics not createdThe Humio topology tool is not created after installation.
ProblemThe Humio topology tool for topology analytics is not created after the installation with the followingexample log error:
INFO [2020-12-04 10:37:25.707] [main] [HNAUA0128I] factoryDataLoader.start - Loading factory configuration dataERROR [2020-12-04 10:37:55.753] [main] [HNAUA0079E] httpRequest.throwCustomError - Failed to send GET request to https://noi1-topology-topology:8080/1.0/topology/metadata?_field=name&_type=ASM_UI_TOPOLOGY_TOOL&_filter=name%3DsearchHumio due to an application exception: network timeout at: https://noi1-topology-topology:8080/1.0/topology/metadata?_field=name&_type=ASM_UI_TOPOLOGY_TOOL&_filter=name%3DsearchHumioERROR [2020-12-04 10:37:55.754] [main] [HNAUA0125E] factoryDataLoader.topologyToolExists - Failed to send Topology Service metadata request to find tool with name "searchHumio": network timeout at: https://noi1-topology-topology:8080/1.0/topology/metadata?_field=name&_type=ASM_UI_TOPOLOGY_TOOL&_filter=name%3DsearchHumioINFO [2020-12-04 10:37:55.754] [main] [HNAUA0129I] factoryDataLoader.start - No configuration data was modified
ResolutionRestart the topology-ui-api pod and check the topology tool UI again.
ibm-cem-brokers pod fails to startThe ibm-cem-brokers pod fails to start due to kafka topic issues.
ProblemWhen deploying the offering in your production environment, the ibm-cem-brokers pod does not fullystart with one of the following log error messages:
• Failed to fetch existing topics• Failed to initialize topics
Chapter 4. Installing Netcool Operations Insight 217

ResolutionTo check the log errors, first run the following command:
oc get pods | grep broker
The pod name is returned, as in the following example:
m242-ibm-cem-brokers-74dfd57645-2knvb 1/1 Running 0 5d17h
Check the log errors with the pod name, as in the following example:
oc logs po/m242-ibm-cem-brokers-74dfd57645-2knvb
If any of the topic errors are displayed, run the following command to restart the DNS:
oc delete pods --all -n openshift-dns
ImageRepository field is emptyThe ImageRepository field in the Operations Management UI is not pre-populated.
ProblemIf you are installing Netcool Operations Insight on Red Hat OpenShift, the ImageRepository field mightbe empty.
ResolutionUse the following command to help you find the value that you need to supply.
oc get route image-repository
Use the value of host that is returned by this command, with the namespace of your Netcool OperationsInsight on Red Hat OpenShift deployment appended as the value for ImageRepository.
Installation hangs with nciserver-0 pod in CreateContainerConfigError stateInstallation hangs with nciserver-0 pod in CreateContainerConfigError state
ProblemThe nciserver-0 pod will not start and has a status of CreateContainerConfigError. The log forthe nciserver-0 pod shows: Error: secret “noi-cem-cemusers-cred-secret” not found.
The ibm-hdm-analytics-dev-setup pod has not fully started, and its logs show failures connecting toCassandra: Warning BackoffLimitExceeded Job has reached the specified backofflimit.
ResolutionUse the following command to restart the ibm-hdm-analytics-dev-setup pod, which will cause it toreattempt to connect to the Cassandra database:
oc delete release_name-ibm-hdm-analytics-dev-setup
Where release_name is the name of your deployment, as specified by the value used for name (OLM UIForm view), or name in the metadata section of the noi.ibm.com_noihybrids_cr.yaml ornoi.ibm.com_nois_cr.yaml files (YAML view).
218 IBM Netcool Operations Insight: Integration Guide
Netcool/OMNIbus cannot connectIf you want to use the secrets that are automatically created by Netcool Operations Insight on OpenShift,then you must disable FIPS mode.
ProblemThe Netcool/OMNIbus client fails to make a connection, and the CT-LIBRARY error error message isdisplayed.
CauseThe certificate is automatically generated, and FIPS mode is specified with the $NCHOME/etc/security/fips.conf file.
ResolutionIf you want to use the secrets that are automatically created, then you must disable FIPS mode. Do thisby removing the following file: $NCHOME/etc/security/fips.conf.
New user does not inherit roles from assigned groupNew user created with WebSphere Application Server Console does not have the correct roles.
ProblemWhen a new user is created and added to a group with WebSphere Application Server Console, the user isnot assigned the roles for that group as they should be.
ResolutionYou must add the roles that are required for that user with Web GUI.
1. Select Console Settings->User Roles and search for your user in Available Users.2. Select the new user with the missing roles from the displayed results, and then select the required
roles for your user.
NoHostAvailable errorWhen you restart all cassandra pods with the kubectl delete pod command, they should be availablewith no errors.
ProblemAfter you restart all cassandra pods, log in to cassandra, and run a query, the NoHostAvailable error isdisplayed.
ResolutionList the cassandra pods and restart one of them, as in the following example:
kubectl get pod |grep cassnoi-cassandra-0 1/1 Running 0 75mnoi-cassandra-1 1/1 Running 0 2m6snoi-cassandra-2 1/1 Running 0 76mkubectl delete pod noi-cassandra-1
Chapter 4. Installing Netcool Operations Insight 219
Pods cannot restart if secret expiresPods that restart after the expiration of Docker registry secrets created during deployment do not haveaccess to pull images.
ProblemIf you created a Docker registry secret during deployment to enable Netcool Operations Insight to accessthe internal OpenShift image repository, then any pods that restart when this secret has expired will nothave access to pull images, and ImagePullBackoff errors will occur.
ResolutionTo resolve this, you must recreate the secret that the pods rely on by using the following command:
oc create secret docker-registry noi-registry-secret --docker-username=docker_user--docker-password=docker_pass --docker-server=docker-reg.reg_namespace.svc:5000/namespace
Where:
• noi-registry-secret is the name of the secret that you are creating. Suggested value is noi-registry-secret
• docker_user is the Docker user, for example kubeadmin• docker_pass is the Docker password• docker-reg is your Docker registry• reg_namespace is the namespace that your Docker registry is in.• namespace is the name of the namespace that you want to deploy to.
Re-install with appDisco observer failsRe-installing Netcool Operations Insight on OpenShift with the topology analytics application discoveryobserver enabled causes the installation to fail.
ProblemNetcool Operations Insight on OpenShift has previously been installed, and uninstalled. When attemptingto reinstall Netcool Operations Insight on OpenShift with the topology analytics application discoveryservice enabled, the installation fails.
CauseThe appDisco observer is not uninstalled properly, and residual processes from the original NetcoolOperations Insight on OpenShift deployment continue to run and cause the new installation to fail.
Resolution1. Remove the residual elements:
oc get configmap,secret,route -o name | grep app-disco | xargs oc delete
2. Delete the topology-secret-manager job:
kubectl delete job <release-name>-topology-secret-manager
220 IBM Netcool Operations Insight: Integration Guide
3. Check that a new topology-secret-manager job is created and completes successfully. This should takeno longer than ten minutes. Use the oc get jobs command to confirm that the topology-secret-manager job has run:
oc get jobs <release-name>-topology-secret-manager
Example system output (where <release-name> is noi):
NAME COMPLETIONS DURATION AGE...noi-topology-secret-manager 1/1 14s 4m...
4. If the topology services are still not running, then the topology analytics operator may not be awarethat the noi-topology-secret-manager job has run, and that it needs to be triggered manually to restartthe topology services, and you will need to perform the following additional steps.
5. Confirm that the topology services are not running:
oc get pods | grep topology
System output should indicate that no services are running.6. Check the topology analytics operator logs. The following errors may be erroneously recorded:
• Secret-manager job not finished• Cassandra secret generator job not finished• App Disco init job not finished• Statefulsets not ready
7. Use the oc edit NOI command, then save the configuration file. This triggers the topology analyticsoperator to restart the topology analytics services, which you can confirm using:
oc get pods | grep topology
All topology analytics services should be running after a maximum of ten minutes.
Restart of all Cassandra pods causes errors for connecting servicesIf the Cassandra pods restart, then some services may have problems re-connecting.
ProblemWhen all the Cassandra pods go down simultaneously, the following error is displayed by the cloud nativeanalytics user interface when the pods come back up:
An error occurred while fetching data from the server. The response from the server was '500'. Please try again later.
kubectl get events also outputs a warning:
Warning FailedToUpdateEndpoint Endpoints Failed to update endpoint
ResolutionUse the following procedure to resolve this problem.
1. Check the state of the Cassandra nodes. From the Cassandra container, use the Cassandra CLInodetool, as in the following example:
kubectl exec -ti release_name-cassandra-0 bash[cassandra@m76-cassandra-0 /]$ nodetool statusDatacenter: datacenter1=======================Status=Up/Down|/ State=Normal/Leaving/Joining/Moving-- Address Load Tokens Owns (effective) Host
Chapter 4. Installing Netcool Operations Insight 221
ID RackUN 10.1.106.37 636.99 KiB 256 100.0% d439ea16-7b55-4920-a9a3-22e878feb844 rack1
Where release_name is the name of your deployment, as specified by the value used for name (OLM UIForm view), or name in the metadata section of the noi.ibm.com_noihybrids_cr.yaml ornoi.ibm.com_nois_cr.yaml files (YAML view)..
Note: If none of the nodes are in DN status, skip the scaling down steps and proceed to step 8, torestart the pods.
2. Scale Cassandra down to 0 instances with this command:
kubectl scale --replicas=0 StatefulSet/release_name-cassandra
Where release_name is the name of your deployment, as specified by the value used for name (OLM UIForm view), or name in the metadata section of the noi.ibm.com_noihybrids_cr.yaml ornoi.ibm.com_nois_cr.yaml files (YAML view).
3. Use kubectl get pods | grep cass to verify that there are no Cassandra pods running.4. Scale Cassandra back up to one instance.
kubectl scale --replicas=1 StatefulSet/release_name-cassandra
Where release_name is the name of your deployment, as specified by the value used for name (OLM UIForm view), or name in the metadata section of the noi.ibm.com_noihybrids_cr.yaml ornoi.ibm.com_nois_cr.yaml files (YAML view).
5. Use kubectl get pods | grep cass to verify that there is one Cassandra pod running.6. Repeat step 3, incrementing replicas each time until the required number of Cassandra pods are
running. Wait for each Cassandra pod to come up before incrementing the replica count to startanother.
7. Verify that the cluster is running with this command:
kubectl exec -ti release_name-cassandra-0 bash[cassandra@m86-cassandra-0 /]$ nodetool status
where release_name is the name of your deployment, as specified by the value used for name (OLM UIForm view), or name in the metadata section of the noi.ibm.com_noihybrids_cr.yaml ornoi.ibm.com_nois_cr.yaml files (YAML view).Expect to see UN for all nodes in cluster, as in this example:
Datacenter: datacenter1
Status=Up/Down|/ State=Normal/Leaving/Joining/Moving-- Address Load Tokens Owns (effective) Host ID RackUN 10.1.26.101 598.28 KiB 256 100.0% bbd34cab-9e91-45c1-bfcb-1fe59855d9b3 rack1UN 10.1.150.13 654.78 KiB 256 100.0% 555f00c8-c43d-4962-a8a0-72eed028d306 rack1UN 10.1.228.111 560.28 KiB 256 100.0% 8741a69b-acdb-4736-bc74-905d18ebdafa rack1
8. Restart the pods that connect to Cassandra with the following commands
kubectl delete release_name-ibm-hdm-analytics-dev-policyregistryservicekubectl delete release_name-ibm-hdm-analytics-dev-eventsqueryservicekubectl delete release_name-ibm-hdm-analytics-dev-archivingservice
Where release_name is the name of your deployment, as specified by the value used for name (OLM UIForm view), or name in the metadata section of the noi.ibm.com_noihybrids_cr.yaml ornoi.ibm.com_nois_cr.yaml files (YAML view).
9. Relogin to the UI.
222 IBM Netcool Operations Insight: Integration Guide
Runbook Automation event fields not displaying in Netcool/Impact UIRunbook Automation event fields are not visible in Netcool/Impact after an installation on Red HatOpenShift.
SymptomsWhen configuring and testing the RBA_ObjectServer data source connection, the Runbook Automationevent fields are not showing up in the Netcool/Impact UI.
EnvironmentRed Hat OpenShift
Resolving the problemIn the Table Description area, click Refresh Fields for the alerts.status base table.
StatefulSet pods with local storage are stuck in Pending stateStatefulSet pods using local storage remain bound to failed nodes.
ProblemIf you are using local storage and a node in the cluster goes down, then StatefulSet pods remain bound tothat node. These pods are unable to restart on another node and are stuck in Pending state because theyhave a Persistent Volume on the node that is down.
ResolutionThe persistent volumes and persistent volume claims for these pods must be removed to allow the podsto be reassigned to other nodes. There is a script here https://www.ibm.com/support/pages/node/6245762 that can be used to do this.
Run the script with the following command:
./cleanPVCandPV.sh
System goes into maintenance modeThe system goes into maintenance mode.
ProblemThis situation can occur when you login to IBM Netcool/OMNIbus Web GUI as an administrative user andonly the Console integration menu is displayed in the menu bar. This situation can also occur, when youlogin as an smadmin user and try to assign a role to a user or group using the WebSphere ApplicationServer console. The following error message is displayed:
The system is in maintenance mode. Please contact your administrator or try again later.
ResolutionThis is a known issue. To force the system out of maintenance mode, first log in to the pod with thefollowing command:
kubectl exec -ti {release name}-webgui-0 bash
Then, run the following command from the JazzSM/ui/bin/ directory:
consolecli.sh ForceHAUpdate --username console_admin_user_ID --password console_admin_password
Chapter 4. Installing Netcool Operations Insight 223
The ForceHAUpdate command pushes the local configuration to the database and updates the modulestable to match the local node's module versions. Notifications are sent to other nodes to synchronize.Notified nodes with module versions that match those of the originating node are synchronized. Notifiednodes with module versions that do not match, go into maintenance mode until an administrator updatestheir modules accordingly.
Restart the db2 pod by exiting the pod and then running the following command:
kubectl delete pod {release-name}-db2ese-0
Wait for the db2 pod to be running, then restart the webgui pod by running the following command:
kubectl delete pod {release-name}-webgui-0
Unable to add new groups using WebSphere Application ServerCreate new groups in LDAP, not WAS.
ProblemThe following error message is displayed if you try to add a new group using WebSphere ApplicationServer console:
CWWIM4520E The 'javax.naming.directory.SchemaViolationException: [LDAP: error code 65 - object class 'groupOfNames' requires attribute 'member']
ResolutionAs a workaround, create the group in LDAP instead using the following procedure.
1. Log in to the LDAP Proxy Server pod.
kubectl exec -it release_name-openldap-0 /bin/bash
Where release_name is the name of your deployment, as specified by the value used for name (OLM UIForm view), or name in the metadata section of the noi.ibm.com_noihybrids_cr.yaml ornoi.ibm.com_nois_cr.yaml files (YAML view).
2. Create the new group
a. Create an LDAP Data Interchange Format file to define the new group.For example:
vi test-group.ldif
b. Define the contents of the LDIF file that you created by using a format similar to this example:
dn: cn=newgroup,ou=groups,dc=mycluster,dc=icpcn: newgroupowner: uid=newgroup,ou=users,dc=mycluster,dc=icpdescription: newgroup testobjectClass: groupOfNamesmember: uid=icpadmin,ou=users,dc=mycluster,dc=icp
Where:
• the value of uid and cn are the name of the new group• the value of dc is the domain components that were specified for the suffix and baseDN. By
default the value of this parameter is dc=mycluster,dc=icp.c. Run the following command to create the new group
ldapadd -h localhost -p 389 -D "cn=admin,dc=mycluster,dc=icp" -w password -f ./test-group.ldif
224 IBM Netcool Operations Insight: Integration Guide
Uninstall CASE action fails prereq checkUsing the CASE uninstall action to uninstall NOI causes some prerequisite checks to fail falsely.
ProblemOn Openshift 4.4, when the uninstall CASE action checks prerequisites, there are two extra line of textshown: Kubernetes version must be false. For example:
Cluster Kubernetes version must be >=1.14.6 trueKubernetes node resource must match a set of expressions defined in prereqs.yaml true Kubernetes version must be false Kubernetes version must be falseopenshift Kubernetes version must be >=1.14.6 true
ResolutionThe extra lines of text can be safely ignored.
Version information for pods running on OpenShiftYou need to send version numbers when reporting a support issue to IBM Support L2 or L3.
Generate version and image information by running the following command.
for P in $(oc get po|awk '{print $1}'|grep -v NAME); do echo $P; echo; oc describe po $P|egrep "Image|product[NV]"; echo; echo "==============================="; echo; done | tee /tmp/NOI_version_info.txt
This produces an output file that can be attached to a support case.
The following code snippets provide examples of the content of this file:
Example 1:
===============================noi-operator-7fbfd7dc48-k55hg
productName: IBM Netcool Operations Insight productVersion: 1.6.1 Image: docker.io/ibmcom/noi-operator@sha256:976fe419feb8735379cd5100c0012cc5749b5c98a1f452c89a81fc852e7f9987 Image ID: docker.io/ibmcom/noi-operator@sha256:976fe419feb8735379cd5100c0012cc5749b5c98a1f452c89a81fc852e7f9987
===============================
Example 2:
===============================om204-topology-status-669cb6c44-ksw9w productName: IBM Netcool Operations Insight Agile Service Manager productVersion: 1.1.8 Image: hyc-hdm-staging-docker-virtual.artifactory.swg-devops.com/nasm-ubi-base-layer:3.2.0-202006121630-L-PPAN-BNYCMS Image ID: hyc-hdm-staging-docker-virtual.artifactory.swg-devops.com/nasm-ubi-base-layer@sha256:a245018c2cef2712335ea50c3b074767d8ee2476d7bb86940734026daa98d3ff Image: hyc-hdm-staging-docker-virtual.artifactory.swg-devops.com/nasm-status-service:1.0.0.11808-L-PPAN-BNYCMS Image ID: hyc-hdm-staging-docker-virtual.artifactory.swg-devops.com/nasm-status-service@sha256:d2ebac219adc762ab8bb87450e8c6af72c55b1c2268953841fc0b72888e99969===============================
Viewing Kubernetes logsTo view logging information, run the oc logs command from the command line.
There are three levels of detail at which you can report on the progress of pod and container installation:Displaying pod status
Run the following command to see overall status for each pod.
Chapter 4. Installing Netcool Operations Insight 225

oc get pods
Run the following command if the namespace is non-default.
oc get pods --n namespace
Where namespace is the name of the non-default namespace.Displaying a log file
Run the following command to display log files for a specific pod or container within that pod.
oc logs name_of_pod [-c name_of_container]
The following section lists the relevant commands for the different pods and containers.Primary ObjectServer
oc logs name_of_objserv-primary-pod
Backup ObjectServer
oc logs name_of_objserv-backup-pod -c ncobackup-agg-b
Failover gateway
oc logs name_of_objserv-backup-pod -c ncobackup-agg-gate
WebGUI
oc logs name_of_webgui-pod -c webgui
Log Analysis
oc logs name_of_log-analysis-pod -c unity
XML gateway
oc logs name_of_log-analysis-pod -c gateway
Primary Impact Server
oc logs name_of_impactcore-primary-pod -c nciserver
Backup Impact Server
oc logs name_of_impactcore-backup-pod -c nciserver
Impact GUI Server
oc logs name_of_impactgui-pod -c impactgui
Db2
oc logs name_of_db2ese-pod -c db2ese
Proxy
oc logs name_of_proxy-pod
OpenLDAP
oc logs name_of_openLDAP-pod
226 IBM Netcool Operations Insight: Integration Guide
cloud native analytics
oc logs name_of_cassandra-pod
oc logs name_of_couchdb-pod
oc logs name_of_ea-noi-layer-eanoigateway-pod
oc logs name_of_ea-noi-layer-eanoiactionservice-pod
oc logs name_of_ibm-hdm-analytics-dev-inferenceservice-pod
oc logs name_of_ibm-hdm-analytics-dev-eventsqueryservice-pod
oc logs name_of_ibm-hdm-analytics-dev-archivingservice-pod
oc logs name_of_ibm-hdm-analytics-dev-servicemonitorservice-pod
oc logs name_of_ibm-hdm-analytics-dev-policyregistryservice-pod
oc logs name_of_ibm-hdm-analytics-dev-ingestionservice-pod
oc logs name_of_ibm-hdm-analytics-dev-trainer-pod
oc logs name_of_ibm-hdm-analytics-dev-collater-aggregationservice-pod
oc logs name_of_ibm-hdm-analytics-dev-normalizer-aggregationservice-pod
oc logs name_of_ibm-hdm-analytics-dev-dedup-aggregationservice-pod
oc logs name_of_spark-master-pod
oc logs name_of_spark-slave-pod
oc logs name_of_ea-ui-api-graphql-pod
oc logs name_of_ibm-hdm-common-ui-uiserver-pod
oc logs name_of_kafka-pod
oc logs name_of_zookeeper-pod
oc logs name_of_redis-sentinel-pod
oc logs name_of_redis-server-pod
Following a log fileRun the following command to stream a log file for a specific pod or container within that pod.
oc logs -f name_of_pod [-c name_of_container]
The following section lists the relevant commands for the different pods and containers.Primary ObjectServer
oc logs -f --tail=1 name_of_objserv-primary-pod
Chapter 4. Installing Netcool Operations Insight 227
Backup ObjectServer
oc logs -f --tail=1 name_of_objserv-backup-pod -c ncobackup-agg-b
Failover gateway
oc logs -f --tail=1 name_of_objserv-backup-pod -c ncobackup-agg-gate
WebGUI
oc logs -f --tail=1 name_of_webgui-pod -c webgui
Log Analysis
oc logs -f --tail=1 name_of_log-analysis-pod -c unity
XML gateway
oc logs -f --tail=1 name_of_log-analysis-pod -c gateway
Primary Impact Server
oc logs -f --tail=1 name_of_impactcore-primary-pod -c nciserver
Backup Impact Server
oc logs -f --tail=1 name_of_impactcore-backup-pod -c nciserver
Impact GUI Server
oc logs -f --tail=1 name_of_impactgui-pod -c impactgui
Db2
oc logs -f --tail=1 name_of_db2ese-pod -c db2ese
Proxy
oc logs -f --tail=1 name_of_proxy-pod
OpenLDAP
oc logs -f --tail=1 name_of_openLDAP-pod
cloud native analytics
oc logs -f --tail=1 name_of_cassandra-pod
oc logs -f --tail=1 name_of_couchdb-pod
oc logs -f --tail=1 name_of_ea-noi-layer-eanoigateway-pod
oc logs -f --tail=1 name_of_ea-noi-layer-eanoiactionservice-pod
oc logs -f --tail=1 name_of_ibm-hdm-analytics-dev-inferenceservice-pod
oc logs -f --tail=1 name_of_ibm-hdm-analytics-dev-eventsqueryservice-pod
oc logs -f --tail=1 name_of_ibm-hdm-analytics-dev-archivingservice-pod
oc logs -f --tail=1 name_of_ibm-hdm-analytics-dev-servicemonitorservice-pod
228 IBM Netcool Operations Insight: Integration Guide
oc logs -f --tail=1 name_of_ibm-hdm-analytics-dev-policyregistryservice-pod
oc logs -f --tail=1 name_of_ibm-hdm-analytics-dev-ingestionservice-pod
oc logs -f --tail=1 name_of_ibm-hdm-analytics-dev-trainer-pod
oc logs -f --tail=1 name_of_ibm-hdm-analytics-dev-collater-aggregationservice-pod
oc logs -f --tail=1 name_of_ibm-hdm-analytics-dev-normalizer-aggregationservice-pod
oc logs -f --tail=1 name_of_ibm-hdm-analytics-dev-dedup-aggregationservice-pod
oc logs -f --tail=1 name_of_spark-master-pod
oc logs -f --tail=1 name_of_spark-slave-pod
oc logs -f --tail=1 name_of_ea-ui-api-graphql-pod
oc logs -f --tail=1 name_of_ibm-hdm-common-ui-uiserver-pod
oc logs -f --tail=1 name_of_ea-ui-api-graphql-pod
oc logs -f --tail=1 name_of_kafka-pod
oc logs -f --tail=1 name_of_zookeeper-pod
oc logs -f --tail=1 name_of_redis-sentinel-pod
oc logs -f --tail=1 name_of_redis-server-pod
Related informationKubernetes documentation: kubectl command referenceThis documentation lists all Kubernetescommands and provides examples.
Troubleshooting installation on hybridUse these troubleshooting entries to help resolve problems and to see known issues for hybridinstallations.
About this taskThese troubleshooting entries only address installation issues encountered when you are integrating yourcloud and on-premises deployments.
• If you are looking for troubleshooting issues that are associated with installing any of the on-premisescomponents of your hybrid deployment, such as OMNIbus, Impact, or WebGUI, then see the“Troubleshooting installation on-premises ” on page 212 topic.
• If you are looking for troubleshooting issues that are associated with deploying any of the cloud nativeNetcool Operations Insight components of your hybrid deployment, then see the “Troubleshootinginstallation on Red Hat OpenShift” on page 213 topic.
Chapter 4. Installing Netcool Operations Insight 229
Console integration fails in hybrid deploymentConsole integration is failing in a hybrid deployment due to missing certificate in Dashboard ApplicationServices Hub.
ProblemWhen your hybrid deployment is complete, under Console Settings -> Console Integration in DashboardApplication Services Hub the Cloud Analytics entry is missing, or connection to it is failing.
CauseIf this console integration is not present, or the connection to it is failing, then this might be because theTLS certificate was not imported from the cloud native Netcool Operations Insight componentsdeployment correctly.
Resolution1. Re-import the TLS certificate for cloud native analytics on Red Hat OpenShift into your on-premises
Dashboard Application Services Hub installation with the following command:
JazzSM_Profile_home/bin/wsadmin.sh -lang jython -username was_admin_user -password was_admin_password -f integ_kit_dir/dash-authz/scripts/importTLSCertificate.py CNEA_cluster_url
Where
• was_admin_user is the WebSphere administrative user, for example smadmin.• was_admin_password is the password for the WebSphere administrative user.• integ_kit_dir is the directory where your Netcool Hybrid Deployment Option Integration Kit is
installed.• CNEA_cluster_URL is the master node of the cluster on which Cloud Native Analytics is deployed, for
example https://netcool.noi.apps.abc102-ocp42.os.fyre.xyz.com.
Creating an Impact connection failsIn hybrid deployments, new Impact connections must be created manually, and not with the DASH UI.
ProblemIn a hybrid deployment, attempting to create an Impact connection with the on-premises DASH UI causes'Path specified has an invalid formatting' to be displayed.
If you need to configure a new connection then you must do so using the following procedure:
CauseThe UI can no longer be used to create new connections to Impact, and the command line must be usedinstead.
Resolution1. Use the command line to configure the required connection.
JazzSM_path/ui/bin/restcli.sh putProvider -username smadmin -password password -provider "Impact_NCICLUSTER.host" -file input.txt
where
• JazzSM_path is the name of the Jazz for Service Management installation, usually /opt/IBM/JazzSM.
230 IBM Netcool Operations Insight: Integration Guide
• password is the password for the smadmin administrative user• host is the Impact server, for example test1.fyre.ibm.com• input.txt has content similar to the following (where host is the Impact server, for exampletest1.fyre.ibm.com)
{ "authUser": "impactuser", "authPassword": "netcool", "baseUrl": "https:\/\/test1.fyre.ibm.com:17311\/ibm\/tivoli\/rest", "datasetsUri": "\/providers\/Impact_NCICLUSTER.test1.fyre.ibm.com\/datasets", "datasourcesUri": "\/providers\/Impact_NCICLUSTER.test1.fyre.ibm.com\/datasources", "description": "Impact_NCICLUSTER", "externalProviderId": "Impact_NCICLUSTER", "id": "Impact_NCICLUSTER.test1.fyre.ibm.com", "label": "Impact_NCICLUSTER", "remote": true, "sso": false, "type": "Impact_NCICLUSTER", "uri": "\/providers\/Impact_NCICLUSTER.test1.fyre.ibm.com", "useFIPS": true }
2. Restart Dashboard Application Services Hub on your Operations Management on-premises installationby using the following commands.
cd JazzSM_WAS_Profile/bin./stopServer.sh server1 -username smadmin -password password./startServer.sh server1
where JazzSM_WAS_Profile is the location of the application server profile that is used for Jazz forService Management. This is usually /opt/IBM/JazzSM/profile.
Error opening Incident Viewer (hybrid HA)If you deploy the Netcool Hybrid Deployment Option Integration Kit on a high availability (HA) hybriddeployment but forget to update NetcoolOAuthProvider.xml, and an error is displayed, then it meansthat the extra instructions for a HA hybrid deployment have not been successfully completed.
ProblemIf you deploy the Netcool Hybrid Deployment Option Integration Kit on a high availability (HA) hybriddeployment but forget to update NetcoolOAuthProvider.xml, then the following error message isdisplayed if you attempt to open the Incident viewer or other cloud native analytics pages in the on-premises DASH deployment:
{"code":0,"message":"expected 200 OK, got: 401 Unauthorized","level":"fatal"}
CauseThe extra instructions for a HA hybrid deployment have not been successfully completed.
ResolutionEnsure that these extra instructions for a HA hybrid installation: “Completing hybrid HA setup (HA only)”on page 195 Hybrid (High Availability mode) were followed. Step 1 has instructions on how to update yourNetcoolOAuthProvider.xml file, and this step must be completed following each redeployment of theNetcool Hybrid Deployment Option Integration Kit.
Chapter 4. Installing Netcool Operations Insight 231
Error sorting columns in Event ViewerChanging the on-premises ObjectServer in a hybrid installation causes errors because the newObjectServer does not have the columns and triggers that are needed by the cloud native NetcoolOperations Insight components.
ProblemSorting by seasonal or temporal groups in the Event Viewer fails with the following error: "Event dataseterror HEMDP0389E: e is undefined. Recovery will be attempted automatically on the next refresh".
CauseWhen a hybrid installation of on-premises Operations Management and cloud native Netcool OperationsInsight components is installed, the cloud native Netcool Operations Insight components create newcolumns and triggers on the on-premises ObjectServer. If you change the on-premises ObjectServer thatthe cloud native Netcool Operations Insight components are pointing to, or re-create your on-premisesObjectServer, then these columns and triggers are missing. These missing columns are:
ScopeIDAsmStatusIdCEACorrelationKeyCEACorrelationDetailsCEAIsSeasonalCEASeasonalDetailsCEAAsmStatusDetailsNormalisedAlarmNameNormalisedAlarmGroup NormalisedAlarmCodeParentIdentifierQuietPeriodCustomTextJournalSentSiteNameCauseWeightImpactWeightTTNumber
ResolutionTo integrate your hybrid deployment with a different on-premises ObjectServer to the one that it wasoriginally configured with, you must update the on-premises ObjectServer's schema with the columnsthat are needed by the cloud native Netcool Operations Insight components.
1. Find the pod name for the cloud native Netcool Operations Insight components action service.
oc get pods -l app.kubernetes.io/component=eanoiactionservice
2. Get the ObjectServer schema changes that are needed by the cloud native Netcool Operations Insightcomponents from the cloud native Netcool Operations Insight components action service pod.
oc cp actionservice_pod:ea-noiomnibus-config/objectserver/cea_aggregation_schema.sql cea_aggregation_schema.sql
Where actionservice_pod is the name of the cloud native Netcool Operations Insight componentsaction service pod that was retrieved in step 1.
3. Get the ObjectServer triggers that are needed by the cloud native Netcool Operations Insightcomponents from the cloud native Netcool Operations Insight components action service pod.
oc cp actionservice_pod:ea-noiomnibus-config/objectserver/cea_aggregation_triggers.sql cea_aggregation_triggers.sql
Where actionservice_pod is the name of the cloud native Netcool Operations Insight componentsaction service pod that was retrieved in step 1.
232 IBM Netcool Operations Insight: Integration Guide
4. Copy the extracted SQL files, cea_aggregation_schema.sql andcea_aggregation_triggers.sql, to the servers that are hosting your primary and backupObjectServers.
5. Run cea_aggregation_schema.sql on the primary ObjectServer.
$OMNIHOME/bin/nco_sql -U root -P password -S OSname < cea_aggregation_schema.sql
Where
• password is the password for the root user on the ObjectServer.• OSname is the name of the ObjectServer.
6. Run cea_aggregation_triggers.sql on the primary ObjectServer.
$OMNIHOME/bin/nco_sql -U root -P password -S OSname < cea_aggregation_triggers.sql
Where
• password is the password for the root user on the ObjectServer.• OSname is the name of the ObjectServer.
7. Run cea_aggregation_schema.sql on the backup ObjectServer.
$OMNIHOME/bin/nco_sql -U root -P password -S OSname < cea_aggregation_schema.sql
Where
• password is the password for the root user on the ObjectServer.• OSname is the name of the ObjectServer.
8. Run cea_aggregation_triggers.sql on the backup ObjectServer.
$OMNIHOME/bin/nco_sql -U root -P password -S OSname < cea_aggregation_triggers.sql
Where
• password is the password for the root user on the ObjectServer.• OSname is the name of the ObjectServer.
Inactive topology management linksInactive Topology and Topology Dashboard navigation links are shown on hybrid deployments when theyshould not be shown at all.
ProblemRoles that are associated with topology management are available even if topology.enabled is set to falsein the operator properties file. If a topology management role is assigned to a user when topology is notenabled, then the user is able to see Topology and Topology Dashboard navigation links, but these linksare not active.
ResolutionNo action is needed.
Chapter 4. Installing Netcool Operations Insight 233
Netcool Hybrid Deployment Option Integration Kit breaks existing GoogleOpenID user authentication on DASHIf you already have Google OpenID set up for user authentication on your DASH-based on-premises NOIsystem, then installing the Netcool Hybrid Deployment Option Integration Kit breaks this configuration.
ProblemThis issue occurs when you configure DASH on premises with Google OpenID for authentication. After theinstallation of the integration kit for integration with Event Analytics on OpenShift, the DASH configurationis missing and you are not able to reconfigure
Resolution
Temporal group justification page does not loadWhen installed on a hybrid deployment with an on-premises Web GUI, which has a TLS certificate that isnot trusted by a well known authority, the temporal group information page does not load and displays anunknown error.
ProblemTemporal group justification page does not load.
CauseThis error is caused by ea-ui-api not trusting the on-premises Web GUI certificate. There is a configurationoption that allows a user to trust extra certificates, but this option is not currently used by this service.
ResolutionAs a workaround, set some helm value overrides to make this service use these certificates, as in thefollowing example:
apiVersion: noi.ibm.com/v1beta1kind: NOIHybridmetadata: name: noispec: helmValuesNOI: global.integrations.cneaUiApi.configMaps.trustCAsUser.template: '{{ default (printf "%s-trusted-cas" .releaseName) .Values.global.hybrid.trustedCAsConfigMapName }}' ibm-ea-ui-api.integrations.cneaUiApi.directories.configMaps.trustCAsUser: '/ca-certs/user' # .... rest of CR
Unable to access noi-proxy due to network-policyYou are unable to send data from an on-premises system, for example a probe, to Netcool OperationsInsight on OpenShift.
ProblemThis issue occurs when the you send event data from an on-premises system, a probe for example, toNetcool Operations Insight on OpenShift. For example, if you install a network load balancer to forwardprobe data to noi-proxy, data is not transferred.
CauseBy default, noi-proxy is not externally accessible due to the content of the default network-policy.
234 IBM Netcool Operations Insight: Integration Guide

ProblemTo enable the data flow, disable the network-policy.
Chapter 4. Installing Netcool Operations Insight 235

236 IBM Netcool Operations Insight: Integration Guide
Chapter 5. Upgrading and rolling backPlan the upgrade and complete any pre-upgrade tasks before upgrading or rolling back OperationsManagement.
Before you beginNote:
Application Discovery Service upgrade prerequisite for cloud and hybrid deployments
Before upgradingBefore upgrading a system that includes the application discovery service (that is, before runningupgrade-topology-nasm-app-disco-init-job) you must delete any existing applicationdiscovery configmaps, secrets, and routes:
oc get configmap,secret,route -o name | grep app-disco | xargs oc delete
After deleting these configmaps, secrets, and routes, upgrade your system.After upgrading
Once these secrets have been deleted, passwords will no longer be encrypted with the correct key,and therefore any existing Application Discovery Observer jobs must be recreated.
Upgrading and rolling back on premisesFollow these instructions to upgrade or roll back Netcool Operations Insight on premises.
Before you beginBack up all products and components in the environment.Related conceptsConnections in the Server EditorRelated tasksRestarting the Web GUI serverConfiguring Reporting Services for Network ManagerRelated referenceWeb GUI server.init fileRelated informationGateway for Message Bus documentationOperations Analytics - Log Analysis Welcome pageWithin the Operations Analytics - Log AnalysisWelcome page, proceed as follows: (1) Select the version of interest. (2) For information on backing upand restoring Operations Analytics - Log Analysis data, or on installing Operations Analytics - Log Analysis,perform a relevant search.
Updated versions in the V1.6.3 releaseIn order to perform the most recent upgrade of Netcool Operations Insight, from V1.6.2 to V1.6.3, youmust download the software described in this table, from either Passport Advantage or from Fix Central.
Note: If a table cell in either the Download from Passport Advantage column or the Download from FixCentral column is empty then there is nothing to download from that location for that particular productor component.
© Copyright IBM Corp. 2020, 2020 237

Table 49. Software downloads for upgrade from Netcool Operations Insight from V1.6.2 to V1.6.3
Product or component Target releaseDownload from PassportAdvantage
Download from FixCentral
IBM Tivoli Netcool/OMNIbus corecomponents
V8.1.0.24 CJ8KCEN V8.1 Fix Pack 24
Tivoli Netcool/OMNIbusWeb GUI
V8.1.0.21 V8.1 Fix Pack 21
IBM Tivoli Netcool/Impact V7.1.0.20 CJ8KDEN V7.1 Fix Pack 20
Db2 V11.1
V11.5
CJ8KIML
CJ8KJEN
Operations Analytics - LogAnalysis
V1.3.6 CJ8KEEN
IBM Tivoli NetworkManager IP Edition
V4.2.0.11 CJ8KSEN V4.2 Fix Pack 11
Network HealthDashboard
V4.2 CJ8KTEN V4.2
IBM Tivoli NetcoolConfiguration Manager
V6.4.2.12 CJ8KVEN V6.4.2 Fix Pack 12
IBM Agile ServiceManager
V1.1.10 CJ8KXEN
IBM Agile ServiceManager Observers
V1.1.10 CJ8KYEN
Jazz for ServiceManagement
V1.1.3.9 CJ8KHML
Downloading product and componentsIn order to upgrade to V1.6.3, you must download software from Passport Advantage and Fix Central.
About this taskThis scenario describes how to upgrade Netcool Operations Insight from V1.6.2 to the current version,V1.6.3. The scenario assumes that Netcool Operations Insight is deployed as shown in the simplifiedarchitecture in the following figure. Depending on how your Netcool Operations Insight system isdeployed, you will need to download the software and run the upgrade on different servers.
238 IBM Netcool Operations Insight: Integration Guide
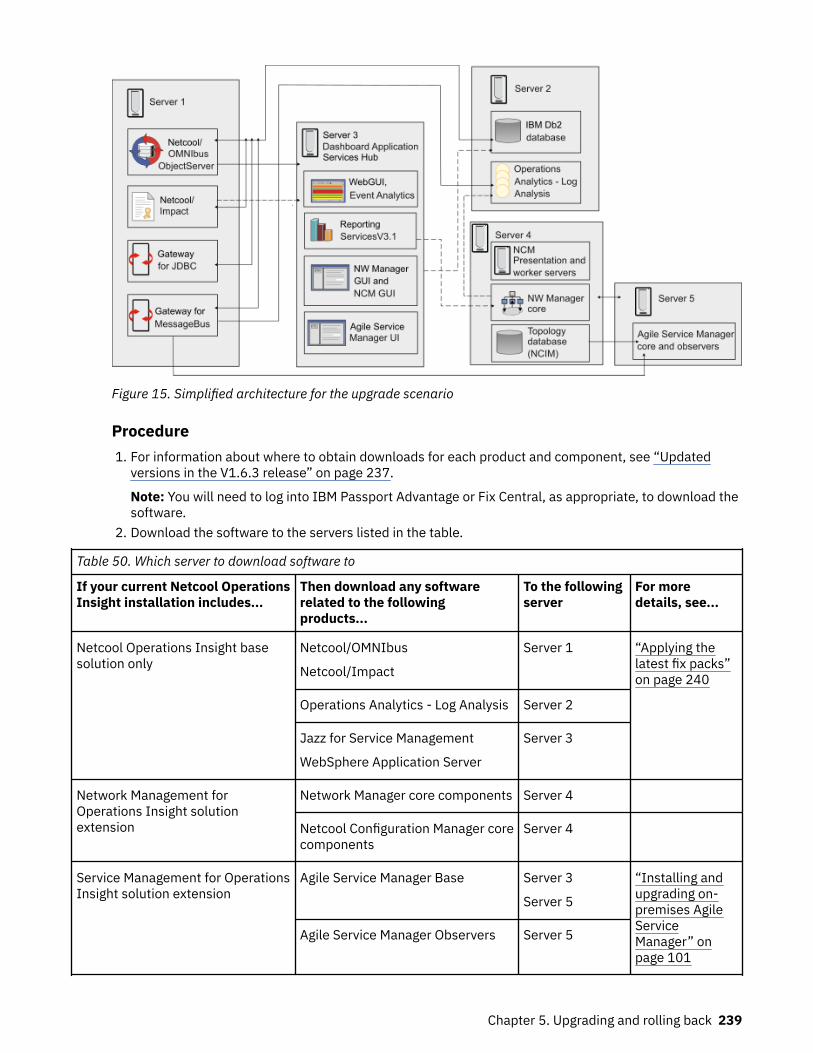
Figure 15. Simplified architecture for the upgrade scenario
Procedure1. For information about where to obtain downloads for each product and component, see “Updated
versions in the V1.6.3 release” on page 237.
Note: You will need to log into IBM Passport Advantage or Fix Central, as appropriate, to download thesoftware.
2. Download the software to the servers listed in the table.
Table 50. Which server to download software to
If your current Netcool OperationsInsight installation includes...
Then download any softwarerelated to the followingproducts...
To the followingserver
For moredetails, see...
Netcool Operations Insight basesolution only
Netcool/OMNIbus
Netcool/Impact
Server 1 “Applying thelatest fix packs”on page 240
Operations Analytics - Log Analysis Server 2
Jazz for Service Management
WebSphere Application Server
Server 3
Network Management forOperations Insight solutionextension
Network Manager core components Server 4
Netcool Configuration Manager corecomponents
Server 4
Service Management for OperationsInsight solution extension
Agile Service Manager Base Server 3
Server 5
“Installing andupgrading on-premises AgileServiceManager” onpage 101
Agile Service Manager Observers Server 5
Chapter 5. Upgrading and rolling back 239
Related informationPassport AdvantageClick here to go to the IBM Passport Advantage website.Fix CentralClick here to go to the Fix Central website.
Applying the latest fix packsApply any latest available fix packs to upgrade to the latest version of Netcool Operations Insight.
About this taskFix packs can be full image fix packs containing the full product image, or upgrade fix packs, containingjust the code for fix updates from the last release. Full image fix packs are made available on PassportAdvantage. Upgrade fix packs are made available on Fix Central. For a list of fix packs required forupgrade to the latest version of Netcool Operations Insight, see “Updated versions in the V1.6.3 release”on page 237.
Procedure1. For each fix pack upgrade, start Installation Manager and configure it to point to therepository.config file for the fix pack.
2. In the main Installation Manager window, click Update and complete wizard instructions similar to thefollowing:a) In the Update Packages tab, select the product group to find related update packages, and click
Next. A list of the available update packages displays.b) From the list of available update packages, select the relevant version, and click Next.c) In the Licenses tab, review the licenses. Select I accept the terms in the license agreements and
click Next.d) In the Features tab, select the features for your update package, and click Next.e) Complete the configuration details, and click Next.f) In the Summary tab, review summary details. If you need to change any detail click Back, but if
you are happy with summary details click Update and wait for the installation of the updatepackage to complete.
g) When the installation of the update package completes, the window updates with details of theinstallation. Click Finish.
Related informationFix CentralClick here to go to the Fix Central website.
Roll back on-premises Netcool Operations Insight from V1.6.3 to V1.6.2To roll back an on-premises install, use Installation Manager's roll back functionality to roll back each ofthe fix packs that you applied during your Netcool Operations Insight upgrade.
Before you beginThe components that must be rolled back are the components that were upgraded for the V1.6.2 toV1.6.3 upgrade. For more information, see “Updated versions in the V1.6.3 release” on page 237.
Procedure1. Start IBM Installation Manager in your preferred mode. For more information, see https://
www.ibm.com/support/knowledgecenter/SSDV2W/im_family_welcome.html .
240 IBM Netcool Operations Insight: Integration Guide
Note: Not all products and components support all installation modes, and some products may requireprocesses to be stopped. Order of rollback may also be significant. See individual product orcomponent documentation for information on this.
2. In Installation Manager, click or select Roll Back.3. From the Package Group Name list, select the package group that contains the packages that you
want to roll back. Click or select Next.4. Select the version of the package that you want to roll back to, and then click or select Next.5. Review the Summary information and then click or select Roll Back.6. Repeat until all the required packages have been rolled back.
Upgrading Event AnalyticsFollow these instructions to upgrade Event Analytics to the latest version.
Upgrading Event AnalyticsYou can upgrade the IBM Netcool Operations Insight packages for Event Analytics by applying the latestfix packs.
About this taskTo perform the upgrade, use the IBM Installation Manager Update functions to locate update packages,and update your environment with the following product update packages:
• Packages for IBM Tivoli Netcool/Impact:
IBM Tivoli Netcool/Impact GUI Server_7.1.0.20IBM Tivoli Netcool/Impact Server_7.1.0.20IBM Tivoli Netcool/Impact Server Extensions for Netcool Operations Insight_7.1.0.20
• Packages for IBM Tivoli Netcool/OMNIbus:
IBM Tivoli Netcool/OMNIbus_8.1.0.24• Packages for IBM Tivoli Netcool/OMNIbus Web GUI:
IBM Tivoli Netcool/OMNIbus Web GUI_8.1.0.21Netcool Operations Insight Extensions for IBM Tivoli Netcool/OMNIbus Web GUI_8.1.0.21
ProcedureThe product update packages must be updated individually. Complete steps 1 - 3 for each product updatepackage.1. Start Installation Manager. Change to the /eclipse subdirectory of the Installation Manager
installation directory and enter the following command to start Installation Manager:
./IBMIM2. Configure Installation Manager to point to either a local repository or an IBM Passport Advantage
repository, where the download package is available. Within the IBM Knowledge Center content forInstallation Manager, see the topic that is called Installing packages by using wizard mode.See the following URL within the IBM Knowledge Center content for Installation Manager:
http://www-01.ibm.com/support/knowledgecenter/SSDV2W/im_family_welcome.html3. In the main Installation Manager window, click Update and complete the following type of installation
wizard instructions to complete the installation of your update package:a) In the Update Packages tab, select the product group to find related update packages, and click
Next. A list of the available update packages displays.b) From the list of available update packages, select one update package that you want to install, and
click Next. Remember you can install only one update package at a time.
Chapter 5. Upgrading and rolling back 241

c) In the Licenses tab, review the licenses. Select I accept the terms in the license agreements andclick Next.
d) In the Features tab, select the features for your update package, and click Next.e) Complete the configuration details, and click Next.f) In the Summary tab, review summary details. If you need to change any detail click Back, but if
you are happy with summary details click Update and wait for the installation of the updatepackage to complete.
g) When the installation of the update package completes, the window updates with details of theinstallation. Click Finish.
4. To ensure that the seasonal event reports that were created before upgrading are visible, you must runthe SE_CLEANUPDATA policy as follows.a) Login as the administrator to the server where IBM Tivoli Netcool/Impact is stored and running.b) Navigate to the policies tab and search for the SE_CLEANUPDATA policy.c) To open the policy, double-click on the policy.d) To run the policy, select the run button on the policy screen toolbar.
5. To view the event configurations in the View Seasonal Events portlet, rerun the configurations. Formore information about running event configurations, see the “Administering analytics configurations”on page 528 topics.
What to do next1. Verify that the correct packages are installed. After you update each package, and to ensure that you
have the correct environment, verify that the following packages are installed.
• Packages for IBM Tivoli Netcool/Impact:
IBM Tivoli Netcool/Impact GUI Server_7.1.0.20IBM Tivoli Netcool/Impact Server_7.1.0.20IBM Tivoli Netcool/Impact Server Extensions for Netcool Operations Insight_7.1.0.20
• Packages for IBM Tivoli Netcool/OMNIbus:
IBM Tivoli Netcool/OMNIbus_8.1.0.24• Packages for IBM Tivoli Netcool/OMNIbus Web GUI:
IBM Tivoli Netcool/OMNIbus Web GUI_8.1.0.21Netcool Operations Insight Extensions for IBM Tivoli Netcool/OMNIbus Web GUI_8.1.0.21
2. Configure the ObjectServer for Event Analytics. For more information about configuring theObjectServer for Event Analytics, see “Configuring the ObjectServer ” on page 406.
3. Connect to a valid database from within IBM Tivoli Netcool/Impact. To configure a connection to one ofthe Event Analytics supported databases, see the following topics:
• Db2: “Configuring Db2 database connection within Netcool/Impact” on page 387• Oracle: “Configuring Oracle database connection within Netcool/Impact” on page 389• MS SQL: “Configuring MS SQL database connection within Netcool/Impact” on page 391
4. If you add a cluster to the Impact environment, you must update the data sources in IBM TivoliNetcool/Impact 7.1. For more information, see “Configuring extra failover capabilities in the Netcool/Impact environment” on page 408.
5. If you want to make use of the pattern generalization feature in Event Analytics, you must configurethe type properties used for event pattern creation in IBM Tivoli Netcool/Impact. For more informationabout configuring the type properties used for event pattern creation in IBM Tivoli Netcool/Impact, see“Configuring event pattern processing” on page 398.
242 IBM Netcool Operations Insight: Integration Guide
Upgrading Event Analytics from stand-alone installations of Netcool/OMNIbus and Netcool/ImpactIf you have stand-alone installations of Netcool/OMNIbus with Web GUI and Netcool/Impact, you canperform the upgrade.
Before you beginEnsure that the following product packages are already installed:
• IBM Tivoli Netcool/Impact packages:
IBM Tivoli Netcool/Impact GUI Server_7.1.0.20IBM Tivoli Netcool/Impact Server_7.1.0.20
• IBM Tivoli Netcool/OMNIbus packages:
IBM Tivoli Netcool/OMNIbus_8.1.0.24• IBM Netcool packages:
IBM Tivoli Netcool/OMNIbus Web GUI_8.1.0.21
About this taskThis upgrade scenario is for users who already use Tivoli Netcool/OMNIbus and Netcool/Impact but donot have the Netcool Operations Insight packages that are needed for the Event Analytics function, andnow want the Event Analytics function.
For this upgrade scenario, you must use IBM Installation Manager to Install the product packages thatare required for the Event Analytics function, then Update the product packages. The Install of productpackages locates and installs the following two packages:
IBM Tivoli Netcool/Impact Server Extensions for Netcool Operations Insight_7.1.0.20Netcool Operations Insight Extensions for IBM Tivoli Netcool/OMNIbus Web GUI_8.1.0.21
To perform the upgrade, complete the following steps.
Procedure1. Start Installation Manager. Change to the /eclipse subdirectory of the Installation Manager
installation directory and enter the following command to start Installation Manager:
./IBMIM2. Configure Installation Manager to point to either a local repository or an IBM Passport Advantage
repository, where the download package is available. Within the IBM Knowledge Center content forInstallation Manager, see the topic that is called Installing packages by using wizard mode.See the following URL within the IBM Knowledge Center content for Installation Manager:
http://www-01.ibm.com/support/knowledgecenter/SSDV2W/im_family_welcome.html3. To install your packages in the main Installation Manager, click Install and complete the steps in the
installation wizard to complete the installation of your packages:a) In the Install tab, select the following product groups and product installation packages, and click
Next.
• IBM Tivoli Netcool/Impact Server Extensions for Netcool Operations Insight_7.1.0.20• Tivoli Netcool/OMNIbus Web GUI Version 8.1.0.21• Netcool Operations Insight Extensions for IBM Tivoli Netcool/OMNIbus Web GUI_8.1.0.21
b) In the Licenses tab, review the licenses. When you are happy with the license content select Iaccept the terms in the license agreements and click Next.
c) In the Location tab, use the existing package group and location.d) In the Features tab, select the features for your packages, and click Next.
Chapter 5. Upgrading and rolling back 243
e) In the Summary tab, review summary details. If you need to change any detail click Back, but ifyou are happy with summary details click Install and wait for installation of the package tocomplete.
f) When installation of the packages completes, the window updates with details of the installation.Click Finish.
4. Migrate the rollup configuration. For more information about updating the rollup configuration, see“Adding columns to seasonal and related event reports” on page 392.
What to do next1. Verify that the correct packages are installed. After you update each package, and to ensure that you
have the correct environment, verify that the following packages are installed.
• Packages for IBM Tivoli Netcool/Impact:
IBM Tivoli Netcool/Impact GUI Server_7.1.0.20IBM Tivoli Netcool/Impact Server_7.1.0.20IBM Tivoli Netcool/Impact Server Extensions for Netcool Operations Insight_7.1.0.20
• Packages for IBM Tivoli Netcool/OMNIbus:
IBM Tivoli Netcool/OMNIbus_8.1.0.24• Packages for IBM Tivoli Netcool/OMNIbus Web GUI:
IBM Tivoli Netcool/OMNIbus Web GUI_8.1.0.21Netcool Operations Insight Extensions for IBM Tivoli Netcool/OMNIbus Web GUI_8.1.0.21
2. Configure the ObjectServer for Event Analytics. For more information about configuring theObjectServer for Event Analytics, see “Configuring the ObjectServer ” on page 406.
3. Connect to a valid database from within IBM Tivoli Netcool/Impact. To configure a connection to one ofthe Event Analytics supported databases, see the following topics:
• Db2: “Configuring Db2 database connection within Netcool/Impact” on page 387• Oracle: “Configuring Oracle database connection within Netcool/Impact” on page 389• MS SQL: “Configuring MS SQL database connection within Netcool/Impact” on page 391
4. If you add a cluster to the Impact environment, you must update the data sources in IBM TivoliNetcool/Impact. For more information, see “Configuring extra failover capabilities in the Netcool/Impact environment” on page 408.
5. If you want to make use of the pattern generalization feature in Event Analytics, you must configurethe type properties used for event pattern creation in IBM Tivoli Netcool/Impact. For more informationabout configuring the type properties used for event pattern creation in IBM Tivoli Netcool/Impact, see“Configuring event pattern processing” on page 398.
Migration of rollups in Netcool/Impact v7.1.0.13 and laterFix pack v7.1.0.13 uses a new format for the creation of rollups that is different to previous versions ofNetcool/Impact. A migration script is automatically executed during the install or upgrade process toconvert pre-existing rollups to the v7.1.0.13 format. Run the Event Analytics configuration wizard afterthe upgrade to v7.1.0.13 to verify and save your configuration (see note below).
• In v7.1.0.12 (or earlier) the rollup display names are free-form text with no formatting applied. Forexample:
reevent_rollup_1_column_name=ORIGINALSEVERITYreevent_rollup_1_type=MAXreevent_rollup_1_display_name=MaxSeverity
In this scenario, Netcool Operations Insight creates a new column in the database calledMaxSeverity. The display name in Dashboard Application Services Hub will be MaxSeverity, orwhatever is defined in the customization directory in the Netcool/Impact uiprovider directory.
244 IBM Netcool Operations Insight: Integration Guide
With the introduction of the Event Analytics configuration wizard in v7.1.0.13, it was necessary to applya new format to rollup display names.
• In v7.1.0.13 a format of <column_name>_<type> is applied to rollup display names: For example:
reevent_rollup_1_column_name=ORIGINALSEVERITYreevent_rollup_1_type=MAXreevent_rollup_1_display_name=ORIGINALSEVERITY_MAX
Using the wizard, you can apply any display name to a column, in any language. Because creatingdatabase columns in any language could have been error prone, the format of the names for rollupdatabase columns is now set to <column_name>_<type>. The display name is stored in thecustomization directory and files in the uiproviderconfig directory. This format makes it is possibleto change display names using the Event Analytics configuration wizard. For this reason, a migrationscript is executed during install/upgrade to transform all pre-existing rollups to the v7.1.0.13 format.
Note: You must run the Event Analytics configuration wizard after upgrading to Netcool/Impact v7.1.0.13.The following artifacts will be changed as a result of the rollup migration script in Netcool/Impactv7.1.0.13:
• Stored metadata for rollups in configuration• Database columns (renamed)• Output parameters for policies• Properties files• Properties files rendered into a non-English language
Complete the steps of the wizard as described in “Configuring Event Analytics using the wizard” on page378 after upgrading to v7.1.0.13 to verify and save any customizations to your configuration. Backup filescontaining previous customizations are stored in $IMPACT_HOME/backup/install/gui_backup/<pre-FP13 fp name>/uiproviderconfig/.
Installing and upgrading on-premises Agile Service ManagerLearn how to upgrade to the latest version of Agile Service Manager.
About this taskYou install a new version or upgrade an existing version of Agile Service Manager (on-premises) using thestandard installation procedures for all components. When using the IBM® Installation Manager to installthe Netcool Hybrid Deployment Option Integration Kit, you must install a new version.
After completing the installation, you may have to migrate the configuration settings. Previousconfiguration settings are preserved during installation, but you may need to manually transfer settingsfrom your previous to your current configuration files.
The yum upgrade (install) process preserves existing configuration settings in two ways.Replace previous configuration files
If a previous configuration file can be replaced without disabling the Agile Service Manager system,the install process will do so, and save the old version with the .rpmsave extension.For example the old version of poll_docker.sh will be replaced with a new version, and backed upas poll_docker.sh.rpmsave
Preserve current configuration fileIf a previous configuration file can not be replaced without disabling the Agile Service Managersystem, the install process will keep the old configuration file in place, and save the new version withthe .rpmnew suffix.For example the old version of docker-compose.yml will be kept in place, and the new version willbe deployed as docker-compose.yml.rpmnew
Chapter 5. Upgrading and rolling back 245
ProcedureObtain the Agile Service Manager software1. Obtain the Agile Service Manager installation images for the user interface and core services from the
Passport Advantage site, and extract them to a temporary directory.More detailed information can be found in the download document here: http://www-01.ibm.com/support/docview.wss?uid=swg24043717
Note: You need an IBM ID to access the download document.Backup custom UI configuration settings2. To preserve customized UI configuration settings such as user preferences, topology tools, custom
icons, relationship types, and global settings, perform a backup of these settings, as described in theExporting configuration data (on-premises) topic of the Administration section in the Agile ServiceManager Knowledge Center:https://www.ibm.com/support/knowledgecenter/SS9LQB_1.1.10/Administering/t_asm_exportingconfig.html
Install (upgrade) Agile Service Manager3. Stop any Agile Service Manager services that are running:
/opt/ibm/netcool/asm/bin/asm_stop.sh
4. Install a new version of Agile Service Manager, or update an existing installation.Follow the standard installation procedure as described in the following topics:
• Install Agile Service Manager core and observers: https://www.ibm.com/support/knowledgecenter/SS9LQB_1.1.10/Installing/t_asm_installingcore.html#t_asm_installingcore
Tip: Using the wildcard installation command (sudo yum install nasm-*.rpm) will initiate anupgrade of changed or new packages only.
• Install the Netcool Hybrid Deployment Option Integration Kit: If this is an upgrade, first uninstallthe hybrid kit that is already installed in DASH.https://www.ibm.com/support/knowledgecenter/SS9LQB_1.1.10/Installing/t_asm_installinghybridintegrationkit.html
After the upgrade, the yum install process lists all changed configuration files.Transfer your configuration settings
Remember: If you have upgraded an existing installation of Agile Service Manager, you must upgradeyour configuration files.5. Manually migrate your backed up configuration settings to the new configuration files.
Tip:
• You can search for affected configuration files with the .rpmsave or .rpmnew extensions.• You can compare configuration file versions using a Diff tool, before migrating the requiredconfiguration setting to the new configuration files.
6. Import any previously backed up UI configuration settings into your new system, as described in thefollowing topic:https://www.ibm.com/support/knowledgecenter/SS9LQB_1.1.10/Administering/t_asm_importingconfig.html#t_asm_importingconfig
Additional configuration7. Depending on your deployment, you may need to perform some of the following configuration tasks:
Edge types migrationTo migrate any existing edge types from Agile Service Manager 1.1.3 to Version 1.1.5 (or later), usethe following curl command:
curl -k -X POST -u asm:asm --header 'Content-Type: application/json' --header 'Accept: application/json' --header 'X-TenantID: cfd95b7e-3bc7-4006-a4a8-a73a79c71255' -d '{}'
246 IBM Netcool Operations Insight: Integration Guide
'https://localhost:8080/1.0/topology/crawlers/migrateEdgeTypes'
Match token migration to lowercaseTo convert older resource matchTokens from Agile Service Manager Version 1.1.3 or 1.1.4 (but not1.1.4.1) to Version 1.1.5 (or later) to lowercase, use the following curl command:
curl -k -X POST -u asm:asm --header 'Content-Type: application/json' --header 'Accept: application/json' --header 'X-TenantID: cfd95b7e-3bc7-4006-a4a8-a73a79c71255' -d '{}' 'https://localhost:8080/1.0/topology/crawlers/lowercaseMatchTokens'
Composite end time migrationTo allow composite vertices to show status within the search results you must migrate any existingcomposites to the latest version of Agile Service Manager.To do so, use the following curl command:
curl -k -X POST -u asm:asm --header 'Content-Type: application/json' --header 'Accept: application/json' --header 'X-TenantID: cfd95b7e-3bc7-4006-a4a8-a73a79c71255' -d '{}' 'https://localhost:8080/1.0/topology/crawlers/compositeEndTime'
Restrict the Transport Layer Security (TLS) version to 1.2 onlyTo enforce TLS 1.2 in nginx, change the ssl_protocols setting in the $ASM_HOME/etc/nginx/nginx.conf file:
server {listen 8443 ssl;server_name localhost;ssl_certificate /opt/ibm/netcool/asm/security/asm-nginx.crt;ssl_certificate_key /opt/ibm/netcool/asm/security/asm-nginx.key;ssl_protocols TLSv1.2;
Docker Observer
When updating from Agile Service Manager Version 1.1.7 (or earlier) with existing Docker Observerjob data, run the following migration script to avoid the creation of duplicate observer recordsbefore running any new Docker Observer jobs:
$ASM_HOME/bin/execute_crawler.sh -c docker_provider_transfer
Failing to run this script before running any new Docker Observer jobs can result in duplicateresources, as can running an older Docker Observer job after running the crawler.
Kubernetes ObserverWhen updating from Agile Service Manager Version 1.1.4.1 (or earlier), ensure that your WeaveScope jobs are running before you update your system.
• The location of the Weave Scope listen job changes from Agile Service Manager Version 1.1.5onwards, but existing Weave Scope jobs that are running during an upgrade will have their pathsautomatically renamed when the observer starts.
• However, Weave Scope jobs that are not running (stopped) will not be recognized, and so will nothave their path renamed. As a consequence, the UI will be unable to restart them.
ITNM ObserverWhen updating from Agile Service Manager Version 1.1.3 (or earlier) to the latest version, you mustrun a migration script to avoid the creation of duplicate ITNM Observer records before running anyITNM Observer jobs:
cd $ASM_HOME/bin/execute_crawler.sh -c itnm_provider_transfer
• Running this script before making any new observations with the ITNM Observer prevents thecreation of duplicate records.
Chapter 5. Upgrading and rolling back 247

• Running this script after making new observations with the ITNM Observer removes duplicaterecords, but may not preserve some historical topology data previously gathered by the ITNMObserver.
The script, which may take some time to complete on large topologies, creates a managementartifact in the topology. You can monitor its progress by querying the artifact via Swagger.
Related informationNetcool Agile Service Manager Knowledge Center
Upgrading and rolling back on Red Hat OpenShiftFollow these instructions to upgrade Netcool Operations Insight on Red Hat OpenShift.
Before you beginNote:
If you are using Netcool Operations Insight V1.6.1 you must first upgrade to V1.6.2 before upgrading toV1.6.3. Click https://www.ibm.com/support/knowledgecenter/SSTPTP_1.6.2/com.ibm.netcool_ops.doc/soc/integration/task/soc_int_upgrade_cloud.html to learn how to upgradeNetcool Operations Insight from V1.6.1 to V1.6.2.
About this taskNote:
Application Discovery Service upgrade prerequisite for cloud and hybrid deployments
Before upgradingBefore upgrading a system that includes the application discovery service (that is, before runningupgrade-topology-nasm-app-disco-init-job) you must delete any existing applicationdiscovery configmaps, secrets, and routes:
oc get configmap,secret,route -o name | grep app-disco | xargs oc delete
After deleting these configmaps, secrets, and routes, upgrade your system.After upgrading
Once these secrets have been deleted, passwords will no longer be encrypted with the correct key,and therefore any existing Application Discovery Observer jobs must be recreated.
You can upgrade using the Operator Lifecycle Manager (OLM) UI, or with the OLM UI and ContainerApplication Software for Enterprises (CASE). You can also upgrade offline in an airgapped environment.
Upgrading Netcool Operations Insight on Red Hat OpenShift using theOperator Lifecycle Manager (OLM) user interface
Use these instructions to upgrade an existing Netcool Operations Insight deployment from V1.6.2 toV1.6.3, using the Red Hat OpenShift Operator Lifecycle Manager (OLM) user interface (UI).
Before you begin• Ensure that you have completed all the steps in “Preparing your cluster” on page 113. Most of these
steps should already have been completed as part of your Netcool Operations Insight V1.6.2deployment.
• Ensure that you have an adequately sized cluster. For more information, see “Sizing for a NetcoolOperations Insight on Red Hat OpenShift deployment” on page 108.
• Your deployment must have persistent storage configured. Only V1.6.2 deployments with persistenceenabled are supported for upgrade to V1.6.3.
248 IBM Netcool Operations Insight: Integration Guide
• If you want to upgrade from Red Hat OpenShift 4.4 to Red Hat OpenShift 4.5, and you also want toupgrade from Netcool Operations Insight V1.6.2 to V1.6.3, then you must perform the NetcoolOperations Insight upgrade first.
• Before upgrading a system that includes the application discovery service (that is, before running'upgrade-topology-nasm-app-disco-init-job'), you must delete any existing application discoveryConfigMaps, secrets, and routes: oc get configmap,secret,route -o name | grep app-disco | xargs oc delete.
If you want to verify the origin of the catalog, then use the OLM UI and CASE upgrade method instead. Formore information, see “Upgrading Netcool Operations Insight on Red Hat OpenShift using the OperatorLifecycle Manager (OLM) user interface and CASE (Container Application Software for Enterprises)” onpage 250.
All the required images for V1.6.3 are either in the freely accessible DockerHub (docker.io/ibmcom), or inthe IBM Entitled Registry (cp.icr.io) for which you will require an entitlement key.
ProcedureUpgrade the Catalog source
1. From the Red Hat OpenShift OLM UI, navigate to Administration > Cluster Settings, and then selectthe OperatorHub configuration resource under the Global Configurations tab.
2. Under the Sources tab, click the existing Netcool Operations Insight catalog source.3. Edit the catalog source YAML and replace spec.image with the Netcool Operations Insight catalog
source name and image for V1.6.3, docker.io/ibmcom/ibm-operator-catalog:latest.Select the Save button.
4. When you edit the YAML, ensure that the following lines are set within the spec:
updateStrategy: registryPoll: interval: 45m
Upgrade the Netcool Operations Insight operator5. Navigate to Operators > Installed Operators, select Project and then search for the Netcool
Operations Insight V1.6.2 operator.6. Select the Netcool Operations Insight operator and edit the Channel under the Subscription tab.7. In the Change Subscription Update Channel panel, change the channel from v1.1 to v1.2. Select
the Save button.8. Navigate to Operators > Installed Operators and view the Netcool Operations Insight operator. It
takes a few minutes to upgrade. Ensure that the status of the upgraded Netcool Operations Insight isSucceeded.
Upgrade the Netcool Operations Insight instance9. Navigate to Operators > Installed Operators, select Project, and search for and select the Netcool
Operations Insight operator.10. Edit the Netcool Operations Insight instance YAML under the All instances tab. It is recommended
that you take a copy of the instance YAML before changing it, in case you later decide to rollback. Formore information about configurable properties, see “Cloud operator properties” on page 127 for afull cloud deployment, and “Hybrid operator properties” on page 170 for a hybrid deployment.a) Update spec.version: 1.6.2 to spec.version: 1.6.3b) For production systems, add a flag to indicate non-sharing of a Cassandra instance in the upgrade.
Services sharing a Cassandra instance is only supported for new V1.6.3 installs, not upgrade.
spec: helmValuesNOI: global.shareCassandra: false
c) (Optional) Add required integrations:
Chapter 5. Upgrading and rolling back 249
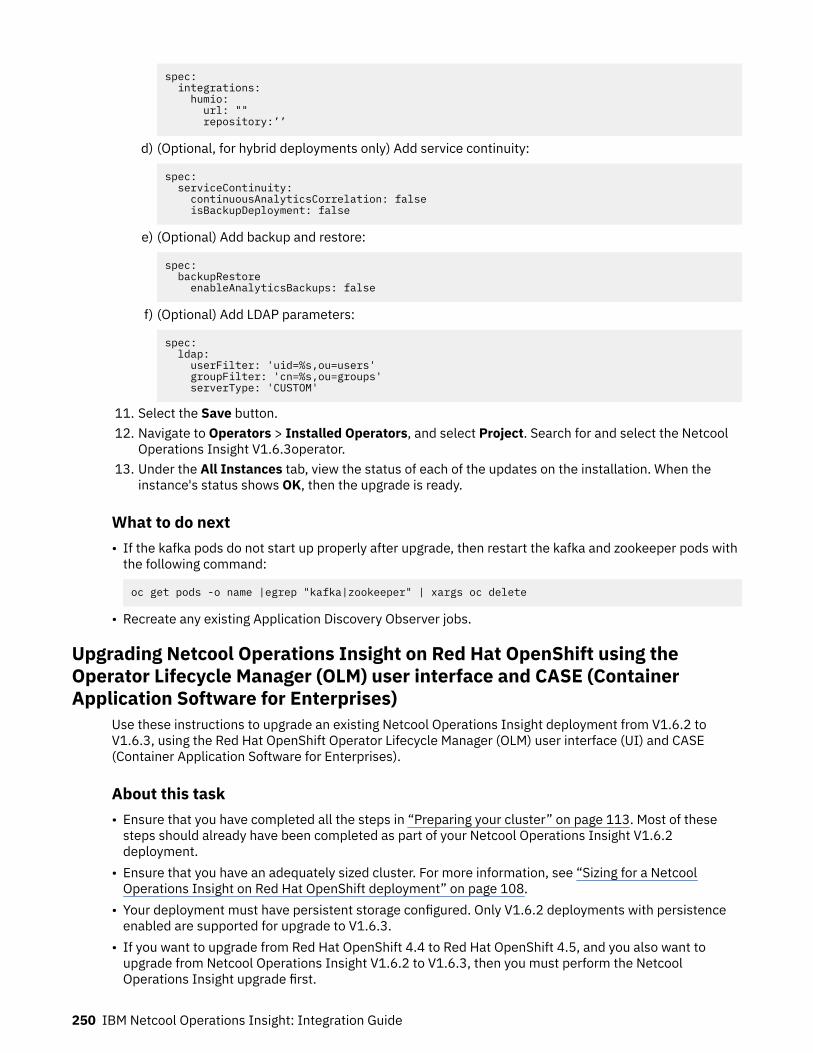
spec: integrations: humio: url: "" repository:’’
d) (Optional, for hybrid deployments only) Add service continuity:
spec: serviceContinuity: continuousAnalyticsCorrelation: false isBackupDeployment: false
e) (Optional) Add backup and restore:
spec: backupRestore enableAnalyticsBackups: false
f) (Optional) Add LDAP parameters:
spec: ldap: userFilter: 'uid=%s,ou=users' groupFilter: 'cn=%s,ou=groups' serverType: 'CUSTOM'
11. Select the Save button.12. Navigate to Operators > Installed Operators, and select Project. Search for and select the Netcool
Operations Insight V1.6.3operator.13. Under the All Instances tab, view the status of each of the updates on the installation. When the
instance's status shows OK, then the upgrade is ready.
What to do next• If the kafka pods do not start up properly after upgrade, then restart the kafka and zookeeper pods with
the following command:
oc get pods -o name |egrep "kafka|zookeeper" | xargs oc delete
• Recreate any existing Application Discovery Observer jobs.
Upgrading Netcool Operations Insight on Red Hat OpenShift using theOperator Lifecycle Manager (OLM) user interface and CASE (ContainerApplication Software for Enterprises)
Use these instructions to upgrade an existing Netcool Operations Insight deployment from V1.6.2 toV1.6.3, using the Red Hat OpenShift Operator Lifecycle Manager (OLM) user interface (UI) and CASE(Container Application Software for Enterprises).
About this task• Ensure that you have completed all the steps in “Preparing your cluster” on page 113. Most of these
steps should already have been completed as part of your Netcool Operations Insight V1.6.2deployment.
• Ensure that you have an adequately sized cluster. For more information, see “Sizing for a NetcoolOperations Insight on Red Hat OpenShift deployment” on page 108.
• Your deployment must have persistent storage configured. Only V1.6.2 deployments with persistenceenabled are supported for upgrade to V1.6.3.
• If you want to upgrade from Red Hat OpenShift 4.4 to Red Hat OpenShift 4.5, and you also want toupgrade from Netcool Operations Insight V1.6.2 to V1.6.3, then you must perform the NetcoolOperations Insight upgrade first.
250 IBM Netcool Operations Insight: Integration Guide
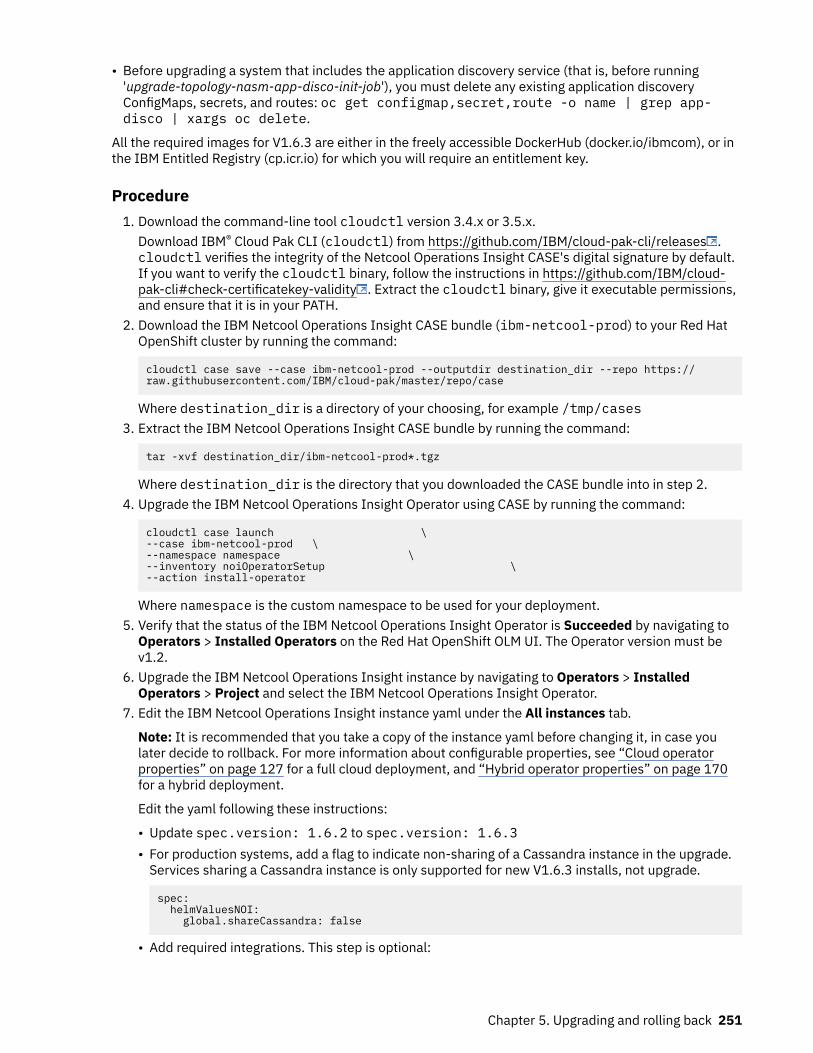
• Before upgrading a system that includes the application discovery service (that is, before running'upgrade-topology-nasm-app-disco-init-job'), you must delete any existing application discoveryConfigMaps, secrets, and routes: oc get configmap,secret,route -o name | grep app-disco | xargs oc delete.
All the required images for V1.6.3 are either in the freely accessible DockerHub (docker.io/ibmcom), or inthe IBM Entitled Registry (cp.icr.io) for which you will require an entitlement key.
Procedure1. Download the command-line tool cloudctl version 3.4.x or 3.5.x.
Download IBM® Cloud Pak CLI (cloudctl) from https://github.com/IBM/cloud-pak-cli/releases .cloudctl verifies the integrity of the Netcool Operations Insight CASE's digital signature by default.If you want to verify the cloudctl binary, follow the instructions in https://github.com/IBM/cloud-pak-cli#check-certificatekey-validity . Extract the cloudctl binary, give it executable permissions,and ensure that it is in your PATH.
2. Download the IBM Netcool Operations Insight CASE bundle (ibm-netcool-prod) to your Red HatOpenShift cluster by running the command:
cloudctl case save --case ibm-netcool-prod --outputdir destination_dir --repo https://raw.githubusercontent.com/IBM/cloud-pak/master/repo/case
Where destination_dir is a directory of your choosing, for example /tmp/cases3. Extract the IBM Netcool Operations Insight CASE bundle by running the command:
tar -xvf destination_dir/ibm-netcool-prod*.tgz
Where destination_dir is the directory that you downloaded the CASE bundle into in step 2.4. Upgrade the IBM Netcool Operations Insight Operator using CASE by running the command:
cloudctl case launch \--case ibm-netcool-prod \ --namespace namespace \--inventory noiOperatorSetup \--action install-operator
Where namespace is the custom namespace to be used for your deployment.5. Verify that the status of the IBM Netcool Operations Insight Operator is Succeeded by navigating to
Operators > Installed Operators on the Red Hat OpenShift OLM UI. The Operator version must bev1.2.
6. Upgrade the IBM Netcool Operations Insight instance by navigating to Operators > InstalledOperators > Project and select the IBM Netcool Operations Insight Operator.
7. Edit the IBM Netcool Operations Insight instance yaml under the All instances tab.
Note: It is recommended that you take a copy of the instance yaml before changing it, in case youlater decide to rollback. For more information about configurable properties, see “Cloud operatorproperties” on page 127 for a full cloud deployment, and “Hybrid operator properties” on page 170for a hybrid deployment.
Edit the yaml following these instructions:
• Update spec.version: 1.6.2 to spec.version: 1.6.3• For production systems, add a flag to indicate non-sharing of a Cassandra instance in the upgrade.
Services sharing a Cassandra instance is only supported for new V1.6.3 installs, not upgrade.
spec: helmValuesNOI: global.shareCassandra: false
• Add required integrations. This step is optional:
Chapter 5. Upgrading and rolling back 251
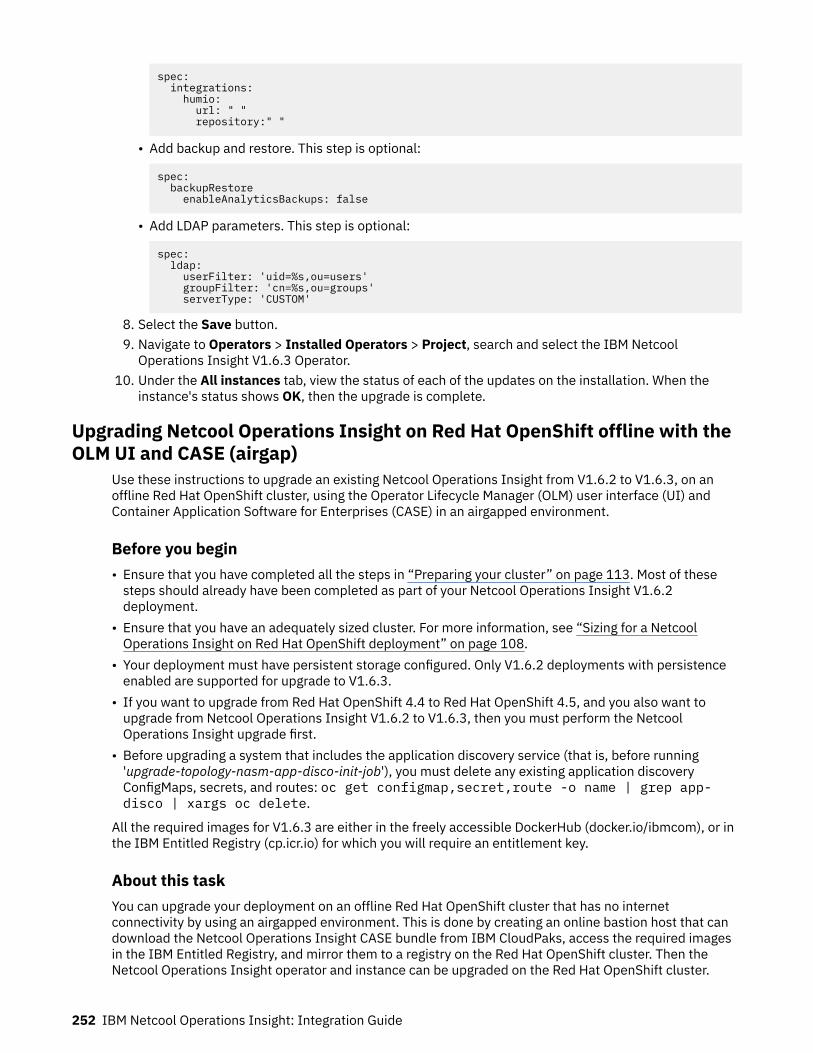
spec: integrations: humio: url: " " repository:" "
• Add backup and restore. This step is optional:
spec: backupRestore enableAnalyticsBackups: false
• Add LDAP parameters. This step is optional:
spec: ldap: userFilter: 'uid=%s,ou=users' groupFilter: 'cn=%s,ou=groups' serverType: 'CUSTOM'
8. Select the Save button.9. Navigate to Operators > Installed Operators > Project, search and select the IBM Netcool
Operations Insight V1.6.3 Operator.10. Under the All instances tab, view the status of each of the updates on the installation. When the
instance's status shows OK, then the upgrade is complete.
Upgrading Netcool Operations Insight on Red Hat OpenShift offline with theOLM UI and CASE (airgap)
Use these instructions to upgrade an existing Netcool Operations Insight from V1.6.2 to V1.6.3, on anoffline Red Hat OpenShift cluster, using the Operator Lifecycle Manager (OLM) user interface (UI) andContainer Application Software for Enterprises (CASE) in an airgapped environment.
Before you begin• Ensure that you have completed all the steps in “Preparing your cluster” on page 113. Most of these
steps should already have been completed as part of your Netcool Operations Insight V1.6.2deployment.
• Ensure that you have an adequately sized cluster. For more information, see “Sizing for a NetcoolOperations Insight on Red Hat OpenShift deployment” on page 108.
• Your deployment must have persistent storage configured. Only V1.6.2 deployments with persistenceenabled are supported for upgrade to V1.6.3.
• If you want to upgrade from Red Hat OpenShift 4.4 to Red Hat OpenShift 4.5, and you also want toupgrade from Netcool Operations Insight V1.6.2 to V1.6.3, then you must perform the NetcoolOperations Insight upgrade first.
• Before upgrading a system that includes the application discovery service (that is, before running'upgrade-topology-nasm-app-disco-init-job'), you must delete any existing application discoveryConfigMaps, secrets, and routes: oc get configmap,secret,route -o name | grep app-disco | xargs oc delete.
All the required images for V1.6.3 are either in the freely accessible DockerHub (docker.io/ibmcom), or inthe IBM Entitled Registry (cp.icr.io) for which you will require an entitlement key.
About this taskYou can upgrade your deployment on an offline Red Hat OpenShift cluster that has no internetconnectivity by using an airgapped environment. This is done by creating an online bastion host that candownload the Netcool Operations Insight CASE bundle from IBM CloudPaks, access the required imagesin the IBM Entitled Registry, and mirror them to a registry on the Red Hat OpenShift cluster. Then theNetcool Operations Insight operator and instance can be upgraded on the Red Hat OpenShift cluster.
252 IBM Netcool Operations Insight: Integration Guide
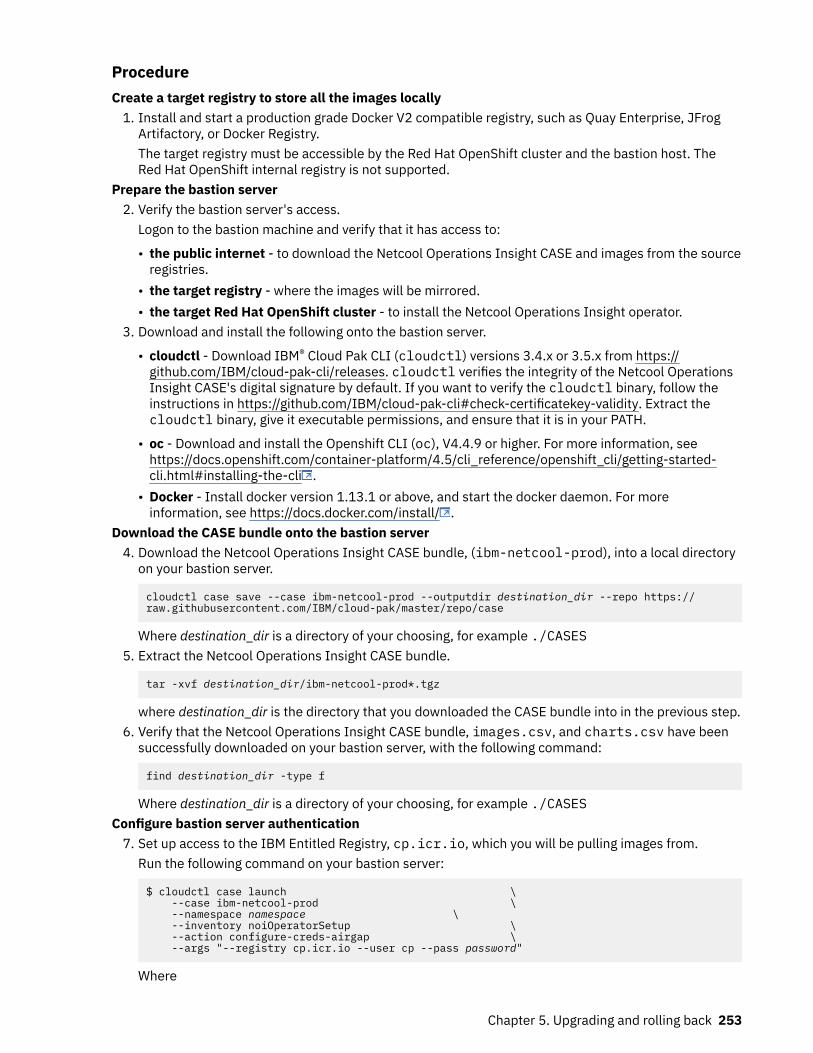
ProcedureCreate a target registry to store all the images locally
1. Install and start a production grade Docker V2 compatible registry, such as Quay Enterprise, JFrogArtifactory, or Docker Registry.The target registry must be accessible by the Red Hat OpenShift cluster and the bastion host. TheRed Hat OpenShift internal registry is not supported.
Prepare the bastion server2. Verify the bastion server's access.
Logon to the bastion machine and verify that it has access to:
• the public internet - to download the Netcool Operations Insight CASE and images from the sourceregistries.
• the target registry - where the images will be mirrored.• the target Red Hat OpenShift cluster - to install the Netcool Operations Insight operator.
3. Download and install the following onto the bastion server.
• cloudctl - Download IBM® Cloud Pak CLI (cloudctl) versions 3.4.x or 3.5.x from https://github.com/IBM/cloud-pak-cli/releases. cloudctl verifies the integrity of the Netcool OperationsInsight CASE's digital signature by default. If you want to verify the cloudctl binary, follow theinstructions in https://github.com/IBM/cloud-pak-cli#check-certificatekey-validity. Extract thecloudctl binary, give it executable permissions, and ensure that it is in your PATH.
• oc - Download and install the Openshift CLI (oc), V4.4.9 or higher. For more information, seehttps://docs.openshift.com/container-platform/4.5/cli_reference/openshift_cli/getting-started-cli.html#installing-the-cli .
• Docker - Install docker version 1.13.1 or above, and start the docker daemon. For moreinformation, see https://docs.docker.com/install/ .
Download the CASE bundle onto the bastion server4. Download the Netcool Operations Insight CASE bundle, (ibm-netcool-prod), into a local directory
on your bastion server.
cloudctl case save --case ibm-netcool-prod --outputdir destination_dir --repo https://raw.githubusercontent.com/IBM/cloud-pak/master/repo/case
Where destination_dir is a directory of your choosing, for example ./CASES5. Extract the Netcool Operations Insight CASE bundle.
tar -xvf destination_dir/ibm-netcool-prod*.tgz
where destination_dir is the directory that you downloaded the CASE bundle into in the previous step.6. Verify that the Netcool Operations Insight CASE bundle, images.csv, and charts.csv have been
successfully downloaded on your bastion server, with the following command:
find destination_dir -type f
Where destination_dir is a directory of your choosing, for example ./CASESConfigure bastion server authentication
7. Set up access to the IBM Entitled Registry, cp.icr.io, which you will be pulling images from.Run the following command on your bastion server:
$ cloudctl case launch \ --case ibm-netcool-prod \ --namespace namespace \ --inventory noiOperatorSetup \ --action configure-creds-airgap \ --args "--registry cp.icr.io --user cp --pass password"
Where
Chapter 5. Upgrading and rolling back 253
• namespace is the custom namespace that you want to deploy Netcool Operations Insight into.• password is your IBM Entitled Registry entitlement key, as found when you prepared your cluster.
8. Set the target registry environment variable $TARGET_REGISTRYRun the following command on your bastion server:
export TARGET_REGISTRY=target_registry
Where target_registry is the docker registry where the images are stored.Mirror images from CASE to the target registry in the airgap environment
9. Mirror images from CASE to the target registry. This can take up to 2 hours.Run the following command on your bastion server:
$ cloudctl case launch \ --case ibm-netcool-prod \ --namespace namespace \ --inventory noiOperatorSetup \ --action mirror-images \ --args "--registry $TARGET_REGISTRY --inputDir inputDir"
Where
• namespace is the custom namespace that you want to deploy Netcool Operations Insight into.• inputDir is the directory that you downloaded the CASE bundle into.
The images listed in the downloaded CASE, (images.csv), are copied to the target registry in theairgap environment.
Configure Red Hat OpenShift Cluster for airgap10. Configure your Red Hat OpenShift Cluster for airgap. This step can take 90+ minutes.
Run the following command on your bastion server to create a global image pull secret for the targetregistry, and create a ImageSourceContentPolicy.
$ cloudctl case launch \ --case ibm-netcool-prod \ --namespace namespace \ --inventory noiOperatorSetup \ --action configure-cluster-airgap \ --args "--registry $TARGET_REGISTRY --inputDir inputDir"
Where
• namespace is the custom namespace to be used for your deployment.• inputDir is the directory containing the CASE bundle.
Warning:
• Cluster resources must adjust to the new pull secret, which can temporarily limit theusability of the cluster. Authorization credentials are stored in $HOME/.airgap/secretsand /tmp/airgap* to support this action.
• Applying ImageSourceContentPolicy causes cluster nodes to recycle.Upgrade the Netcool Operations Insight Catalog11. Install the Catalog using CASE.
Run the following command on your bastion server:
cloudctl case launch \ --case ibm-netcool-prod \ --namespace namespace \ --inventory noiOperatorSetup \ --action install-catalog \ --args "--registry $TARGET_REGISTRY"
Where namespace is the custom namespace to be used for your deployment, that you created whenyou prepared your cluster.
254 IBM Netcool Operations Insight: Integration Guide
12. Verify the Netcool Operations Insight Catalog Source.From the Red Hat OpenShift OLM UI, navigate to Administration > Cluster Settings, and then selectthe OperatorHub configuration resource under the Global Configuration tab. Verify that the ibm-noi-catalog catalog source is present.
Upgrade the Netcool Operations Insight Operator13. Upgrade the NOI Operator using case
Run the following command on your bastion server:
cloudctl case launch \ --case ibm-netcool-prod \ --namespace namespace \ --inventory noiOperatorSetup \ --action install-operator
Where namespace is the custom namespace to be used for your deployment.14. Verify the Netcool Operations Insight operator.
From the Red Hat OpenShift OLM UI, navigate to Operators > Installed Operators, and verify thatthe status of the Netcool Operations Insight operator is Succeeded.
Upgrade the NOI instance to NOI16315. Create a secret for access to the target registry
Run the following command on your Red Hat OpenShift cluster.
oc create secret docker-registry target-registry-secret \ --docker-server=target_registry \ --docker-username=user \ --docker-password=password \ --namespace=target_namespace
Where:
• target_registry is the target registry that you created.• target-registry-secret is the name of the secret that you are creating. Suggested value is target-registry-secret.
• user and password are the credentials to access your target registry.• namespace is the namespace that you want to deploy Netcool Operations Insight in.
16. From the Red Hat OpenShift OLM UI, navigate to Operators > Installed Operators, select Projectand search for and select the Netcool Operations Insight operator.
17. Edit the Netcool Operations Insight instance YAML under the All instances tab. It is recommendedthat you take a copy of the instance YAML before changing it, in case you later decide to rollback. Formore information about configurable properties, see “Cloud operator properties” on page 127 for afull cloud deployment, and “Hybrid operator properties” on page 170 for a hybrid deployment.a) Update spec.version: 1.6.2 to spec.version: 1.6.3b) For production systems, add a flag to indicate non-sharing of a Cassandra instance in the upgrade.
Services sharing a Cassandra instance is only supported for new V1.6.3 installs, not upgrade.
spec: helmValuesNOI: global.shareCassandra: false
c) (Optional) Add required integrations:
spec: integrations: humio: url: "" repository:’’
d) (Optional, for hybrid deployments only) Add service continuity:
spec: serviceContinuity:
Chapter 5. Upgrading and rolling back 255
continuousAnalyticsCorrelation: false isBackupDeployment: false
e) (Optional) Add backup and restore:
spec: backupRestore enableAnalyticsBackups: false
f) (Optional) Add LDAP parameters:
spec: ldap: userFilter: 'uid=%s,ou=users' groupFilter: 'cn=%s,ou=groups' serverType: 'CUSTOM'
18. Edit the Netcool Operations Insight properties to provide access to the target registry.a) Update spec.advanced.imagePullRepository so that it points to the target registry that you
created.b) Set spec.entitlementSecret to the target registry secret.
19. Select the Save button.20. Navigate to Operators > Installed Operators, and select Project. Search for and select the Netcool
Operations Insight V1.6.3 operator.21. Under the All Instances tab, view the status of each of the updates on the installation. When the
instance's status shows OK, then the upgrade is ready.
What to do next• If the kafka pods do not start up properly after upgrade, then restart the kafka and zookeeper pods with
the following command:
oc get pods -o name |egrep "kafka|zookeeper" | xargs oc delete
• Recreate any existing Application Discovery Observer jobs.
Rolling back Netcool Operations Insight on Red Hat OpenShiftUse these instructions to roll back from V1.6.3 of Netcool Operations Insight to a previously deployedV1.6.2, using the Red Hat OpenShift Operator Lifecycle Manager (OLM) user interface (UI), or thecommand line.
Before you beginIf you are attempting to roll back a failed upgrade, then the redis pods may become stuck. If this occurs,then manually restart the redis pods with the following command oc delete pod redis*
Note:
If you want to rollback to Netcool Operations Insight V1.6.1 you must first rollback to V1.6.2 before rollingback to V1.6.1. Click https://www.ibm.com/support/knowledgecenter/SSTPTP_1.6.2/com.ibm.netcool_ops.doc/soc/integration/task/soc_int_rollback_cloud.html to learn how to rollbackNetcool Operations Insight from V1.6.2 to V1.6.1.
Procedure1. If Netcool Operations Insight V1.6.2 was upgraded to V1.6.3using airgap, then, before you rollback
from V1.6.3 to V1.6.2 you must set the image registry back to the V1.6.2 Docker image repository.Otherwise the cem-operator and asm-operator pods will fail with ImagePullError errors.a) Edit the noi-operator deployment, and find the key-value pair for OPERATOR_REPO. The value of
this is set to the V1.6.3 airgap target registry. Replace this value with the Netcool OperationsInsight V1.6.2 image registry where the Netcool Operations Insight V1.6.2 Passport Advantage
256 IBM Netcool Operations Insight: Integration Guide

(PPA) package is uploaded, for example image-registry.openshift-image-registry.svc:5000/<namespace>.
oc edit deploy noi-operator
b) If the Netcool Operations Insight V1.6.2 image registry is authenticated and requires a pull secret,then edit the noi-operator serviceaccount and add this secret in the imagePullSecrets section.
oc edit serviceaccount noi-operator
2. Rollback can be performed from the command line or from the OLM UI.To rollback from the command line, use: oc edit noi and change the version back to V1.6.2.To rollback from the OLM UI, navigate to Operators > Installed Operators > NOI and then select theCloud Deployment tab if your deployment is only on Red Hat OpenShift, or the Hybrid Deploymenttab if you have a hybrid deployment that is on Red Hat OpenShift and on-premises. Select Edit NOIand then the YAML tab. Change the version back to V1.6.2 and save the changes.
3. Delete the noi-topology-system-health-scheduledjob job and the noi-full-topology-system-health-cronjob cronjob by running the commands:
oc delete job noi-topology-system-health-scheduledjob
oc delete cronjob noi-full-topology-system-health-cronjob
Verify that the cronjob is recreated by running oc get cronjob. The output should be:
NAME SCHEDULE SUSPEND ACTIVE LAST SCHEDULE AGEnoi-full-curator-pattern-metrics 0 0 * * * False 0 <none> 143mnoi-full-healthcron 1 * * * * False 0 28m 143mnoi-full-register-cnea-mgmt-artifact 1,*/5 * * * * False 0 4m10s 143mnoi-full-topology-system-health-cronjob */5 * * * * True 0 <none> 44m
4. Delete the5. Obtain the metrics deployment by running the command:
oc get deployment | grep -i metric
The output is the following:
noi-metric-action-service-metricactionservice 0/0 0 0 34hnoi-metric-api-service-metricapiservice 0/0 0 0 34hnoi-metric-ingestion-service-metricingestionservice 0/0 0 0 34hnoi-metric-trigger-service-metrictriggerservice 0/0 0 0 34h
Delete the metrics deployments by using the command:
oc delete deploy <deployment name>
Upgrading and rolling back on a hybrid architectureLearn how to upgrade or rollback your hybrid installation.
Before you beginNote:
If you are using Netcool Operations Insight V1.6.1 you must first upgrade to V1.6.2 before upgrading toV1.6.3. Click https://www.ibm.com/support/knowledgecenter/SSTPTP_1.6.2/
Chapter 5. Upgrading and rolling back 257
com.ibm.netcool_ops.doc/soc/integration/task/soc_int_upgrade_hybrid.html to learn how to upgradeNetcool Operations Insight from V1.6.1 to V1.6.2.
About this taskNote:
Application Discovery Service upgrade prerequisite for cloud and hybrid deployments
Before upgradingBefore upgrading a system that includes the application discovery service (that is, before runningupgrade-topology-nasm-app-disco-init-job) you must delete any existing applicationdiscovery configmaps, secrets, and routes:
oc get configmap,secret,route -o name | grep app-disco | xargs oc delete
After deleting these configmaps, secrets, and routes, upgrade your system.After upgrading
Once these secrets have been deleted, passwords will no longer be encrypted with the correct key,and therefore any existing Application Discovery Observer jobs must be recreated.
You can upgrade using the Operator Lifecycle Manager (OLM) UI, or with the OLM UI and ContainerApplication Software for Enterprises (CASE). You can also upgrade offline in an airgapped environment.
Upgrading a hybrid deployment using the Operator Lifecycle Manager (OLM)user interface
Use these instructions to upgrade an existing hybrid deployment from V1.6.2 to V1.6.3, using the Red HatOpenShift Operator Lifecycle Manager (OLM) user interface (UI).
Before you begin• Ensure that you have completed all the steps in “Preparing your cluster” on page 147. Most of these
steps should already have been completed as part of your hybrid V1.6.2 deployment.• Ensure that you have an adequately sized cluster. For more information see “Sizing for a hybrid
deployment” on page 142.• Your deployment must have persistent storage configured. Only V1.6.2 deployments with persistence
enabled are supported for upgrade to V1.6.3.• If you want to upgrade from Red Hat OpenShift 4.4 to Red Hat OpenShift 4.5, and you also want to
upgrade from Netcool Operations Insight V1.6.2 to V1.6.3, then you must perform the NetcoolOperations Insight upgrade first.
• Before upgrading a system that includes the application discovery service (that is, before running'upgrade-topology-nasm-app-disco-init-job') you must delete any existing application discoveryConfigMaps, secrets, and routes: oc get configmap,secret,route -o name | grep app-disco | xargs oc delete.
If you want to verify the origin of the catalog, then use the OLM UI and CASE install method instead. Formore information, see “Upgrading hybrid Netcool Operations Insight on Red Hat OpenShift using theOperator Lifecycle Manager (OLM) user interface and CASE (Container Application Software forEnterprises)” on page 260.
All the required images for V1.6.3 are either in the freely accessible DockerHub (docker.io/ibmcom), or inthe IBM Entitled Registry (cp.icr.io) for which you will require an entitlement key.
ProcedureUpgrade on-premises Operations Management
1. Use IBM Installation Manager to upgrade on-premises Operations Management to V1.6.3. For moreinformation, see “Upgrading and rolling back on premises” on page 237.
258 IBM Netcool Operations Insight: Integration Guide
Upgrade the Netcool Hybrid Deployment Option Integration Kit.2. Use of Installation Manager's upgrade facility is not supported for upgrading the Netcool Hybrid
Deployment Option Integration Kit. Use Installation Manager to uninstall V1.3.32 of the Netcool HybridDeployment Option Integration Kit, and then install V3.1.31 of the Netcool Hybrid Deployment OptionIntegration Kit. For more information on installing the integration kit, see “Installing the integrationkit” on page 190.
Upgrade the Catalog source3. From the Red Hat OpenShift OLM UI, navigate to Administration > Cluster Settings, and then select
the OperatorHub configuration resource under the Global Configurations tab.4. Under the Sources tab, click the existing Netcool Operations Insight catalog source.5. Edit the catalog source YAML and replace spec.image with the Netcool Operations Insight catalog
source name and image for V1.6.3, docker.io/ibmcom/ibm-operator-catalog:latest.Select the Save button.
6. When you edit the YAML, ensure that the following lines are set within the spec:
updateStrategy: registryPoll: interval: 45m
Upgrade the Netcool Operations Insight operator7. Navigate to Operators > Installed Operators, select Project and then search for the Netcool
Operations Insight V1.6.2 operator.8. Select the Netcool Operations Insight operator and edit the Channel under the Subscription tab.9. In the Change Subscription Update Channel panel, change the channel from v1.1 to v1.2. Select
the Save button.10. Navigate to Operators > Installed Operators and view the Netcool Operations Insight operator. It
takes a few minutes to upgrade. Ensure that the status of the upgraded Netcool Operations Insight isSucceeded.
Upgrade the Netcool Operations Insight instance11. Navigate to Operators > Installed Operators, select Project, and search for and select the Netcool
Operations Insight operator.12. Edit the Netcool Operations Insight instance YAML under the All instances tab. It is recommended
that you take a copy of the instance YAML before changing it, in case you later decide to rollback. Formore information about configurable properties, see “Cloud operator properties” on page 127 for afull cloud deployment, and “Hybrid operator properties” on page 170 for a hybrid deployment.a) Update spec.version: 1.6.2 to spec.version: 1.6.3b) For production systems, add a flag to indicate non-sharing of a Cassandra instance in the upgrade.
Services sharing a Cassandra instance is only supported for new V1.6.3 installs, not upgrade.
spec: helmValuesNOI: global.shareCassandra: false
c) (Optional) Add required integrations:
spec: integrations: humio: url: "" repository:’’
d) (Optional, for hybrid deployments only) Add service continuity:
spec: serviceContinuity: continuousAnalyticsCorrelation: false isBackupDeployment: false
Chapter 5. Upgrading and rolling back 259

e) (Optional) Add backup and restore:
spec: backupRestore enableAnalyticsBackups: false
f) (Optional) Add LDAP parameters:
spec: ldap: userFilter: 'uid=%s,ou=users' groupFilter: 'cn=%s,ou=groups' serverType: 'CUSTOM'
13. Select the Save button.14. Navigate to Operators > Installed Operators, and select Project. Search for and select the Netcool
Operations Insight V1.6.3operator.15. Under the All Instances tab, view the status of each of the updates on the installation. When the
instance's status shows OK, then the upgrade is ready.16. If the CEAEventScore column is missing from the alert list for the Example_IBM_CloudAnalytics
system view, manually add the column to see probable root cause information for events in the alertlist.
What to do next• If the kafka pods do not start up properly after upgrade, then restart the kafka and zookeeper pods with
the following command:
oc get pods -o name |egrep "kafka|zookeeper" | xargs oc delete
• Recreate any existing Application Discovery Observer jobs.
Upgrading hybrid Netcool Operations Insight on Red Hat OpenShift using theOperator Lifecycle Manager (OLM) user interface and CASE (ContainerApplication Software for Enterprises)
Use these instructions to upgrade an existing Netcool Operations Insight deployment from V1.6.2 toV1.6.3, using the Red Hat OpenShift Operator Lifecycle Manager (OLM) user interface (UI) and CASE(Container Application Software for Enterprises).
Before you begin• Ensure that you have completed all the steps in “Preparing your cluster” on page 147. Most of these
steps should already have been completed as part of your hybrid V1.6.2 deployment.• Ensure that you have an adequately sized cluster. For more information see “Sizing for a hybrid
deployment” on page 142.• Your deployment must have persistent storage configured. Only V1.6.2 deployments with persistence
enabled are supported for upgrade to V1.6.3.• If you want to upgrade from Red Hat OpenShift 4.4 to Red Hat OpenShift 4.5, and you also want to
upgrade from Netcool Operations Insight V1.6.2 to V1.6.3, then you must perform the NetcoolOperations Insight upgrade first.
• Before upgrading a system that includes the application discovery service (that is, before running'upgrade-topology-nasm-app-disco-init-job') you must delete any existing application discoveryConfigMaps, secrets, and routes: oc get configmap,secret,route -o name | grep app-disco | xargs oc delete.
All the required images for V1.6.3 are either in the freely accessible DockerHub (docker.io/ibmcom), or inthe IBM Entitled Registry (cp.icr.io) for which you will require an entitlement key.
260 IBM Netcool Operations Insight: Integration Guide
Procedure1. Use IBM Installation Manager to upgrade on-premises Operations Management to V1.6.3. For more
information, see “Upgrading and rolling back on premises” on page 237.2. Use of Installation Manager's upgrade facility is not supported for upgrading the Netcool Hybrid
Deployment Option Integration Kit. Use Installation Manager to uninstall V1.3.32 of the Netcool HybridDeployment Option Integration Kit, and then install V3.1.31 of the Netcool Hybrid Deployment OptionIntegration Kit. For more information on installing the integration kit, see “Installing the integrationkit” on page 190.
3. Download the command-line tool cloudctl version 3.4.x or 3.5.x.Download IBM® Cloud Pak CLI (cloudctl) from https://github.com/IBM/cloud-pak-cli/releases .cloudctl verifies the integrity of the Netcool Operations Insight CASE's digital signature by default.If you want to verify the cloudctl binary, follow the instructions in https://github.com/IBM/cloud-pak-cli#check-certificatekey-validity . Extract the cloudctl binary, give it executable permissions,and ensure that it is in your PATH.
4. Download the IBM Netcool Operations Insight CASE bundle (ibm-netcool-prod) to your Red HatOpenShift cluster by running the command:
cloudctl case save --case ibm-netcool-prod --outputdir destination_dir --repo https://raw.githubusercontent.com/IBM/cloud-pak/master/repo/case
Where destination_dir is a directory of your choosing, for example /tmp/cases5. Extract the IBM Netcool Operations Insight CASE bundle by running the command:
tar -xvf destination_dir/ibm-netcool-prod*.tgz
Where destination_dir is the directory that you downloaded the CASE bundle into in step 2.6. Upgrade the IBM Netcool Operations Insight Operator using CASE by running the command:
cloudctl case launch \--case ibm-netcool-prod \ --namespace namespace \--inventory noiOperatorSetup \--action install-operator
Where namespace is the custom namespace to be used for your deployment.7. Verify that the status of the IBM Netcool Operations Insight Operator is Succeeded by navigating to
Operators > Installed Operators on the Red Hat OpenShift OLM UI. The Operator version must bev1.2.
8. Upgrade the IBM Netcool Operations Insight instance by navigating to Operators > InstalledOperators > Project and select the IBM Netcool Operations Insight Operator.
9. Edit the IBM Netcool Operations Insight instance yaml under the All instances tab.
Note: It is recommended that you take a copy of the instance yaml before changing it, in case youlater decide to rollback. For more information about configurable properties, see “Cloud operatorproperties” on page 127 for a full cloud deployment, and “Hybrid operator properties” on page 170for a hybrid deployment.
Edit the yaml following these instructions:
• Update spec.version: 1.6.2 to spec.version: 1.6.3• For production systems, add a flag to indicate non-sharing of a Cassandra instance in the upgrade.
Services sharing a Cassandra instance is only supported for new V1.6.3 installs, not upgrade.
spec: helmValuesNOI: global.shareCassandra: false
• Add required integrations. This step is optional:
Chapter 5. Upgrading and rolling back 261
spec: integrations: humio: url: " " repository:" "
• Add service continuity. This step is optional:
spec: serviceContinuity: continuousAnalyticsCorrelation: false isBackupDeployment: false
• Add backup and restore. This step is optional:
spec: backupRestore enableAnalyticsBackups: false
10. Select the Save button.11. Navigate to Operators > Installed Operators > Project, search and select the IBM Netcool
Operations Insight V1.6.3 Operator.12. Under the All instances tab, view the status of each of the updates on the installation. When the
instance's status shows OK, then the upgrade is complete.13. If the CEAEventScore column is missing from the alert list for the Example_IBM_CloudAnalytics
system view, manually add the column to see probable root cause information for events in the alertlist.
Upgrading a hybrid deployment offline with the OLM UI and CASE (airgap)Use these instructions to upgrade an existing hybrid deployment from V1.6.2 to V1.6.3, on an offline RedHat OpenShift cluster, using the Operator Lifecycle Manager (OLM) user interface (UI) and ContainerApplication Software for Enterprises (CASE) in an airgapped environment.
Before you begin• Ensure that you have completed all the steps in “Preparing your cluster” on page 147. Most of these
steps should already have been completed as part of your hybrid V1.6.2 deployment.• Ensure that you have an adequately sized cluster. For more information see “Sizing for a hybrid
deployment” on page 142.• Your deployment must have persistent storage configured. Only V1.6.2 deployments with persistence
enabled are supported for upgrade to V1.6.3.• If you want to upgrade from Red Hat OpenShift 4.4 to Red Hat OpenShift 4.5, and you also want to
upgrade from Netcool Operations Insight V1.6.2 to V1.6.3, then you must perform the NetcoolOperations Insight upgrade first.
• Before upgrading a system that includes the application discovery service (that is, before running'upgrade-topology-nasm-app-disco-init-job') you must delete any existing application discoveryConfigMaps, secrets, and routes: oc get configmap,secret,route -o name | grep app-disco | xargs oc delete.
All the required images for V1.6.3 are either in the freely accessible DockerHub (docker.io/ibmcom), or inthe IBM Entitled Registry (cp.icr.io) for which you will require an entitlement key.
About this taskYou can upgrade your deployment on an offline Red Hat OpenShift cluster that has no internetconnectivity by using an airgapped environment. This is done by creating an online bastion host that candownload the Netcool Operations Insight CASE bundle from IBM CloudPaks, access the required imagesin the IBM Entitled Registry, and mirror them to a registry on the Red Hat OpenShift cluster. Then theNetcool Operations Insight operator and instance can be upgraded on the Red Hat OpenShift cluster.
262 IBM Netcool Operations Insight: Integration Guide
ProcedureUpgrade on-premises Operations Management
1. Use IBM Installation Manager to upgrade on-premises Operations Management to V1.6.3.Upgrade the Netcool Hybrid Deployment Option Integration Kit
2. Use of Installation Manager's upgrade facility is not supported for upgrading the Netcool HybridDeployment Option Integration Kit. Use Installation Manager to uninstall V1.3.32 of the Netcool HybridDeployment Option Integration Kit, and then install V3.1.31 of the Netcool Hybrid Deployment OptionIntegration Kit. For more information on installing the integration kit, see “Installing the integrationkit” on page 190.
Create a target registry to store all the images locally3. Install and start a production grade Docker V2 compatible registry, such as Quay Enterprise, JFrog
Artifactory, or Docker Registry.The target registry must be accessible by the Red Hat OpenShift cluster and the bastion host. TheRed Hat OpenShift internal registry is not supported.
Prepare the bastion server4. Verify the bastion server's access.
Logon to the bastion machine and verify that it has access to:
• the public internet - to download the Netcool Operations Insight CASE and images from the sourceregistries.
• the target registry - where the images will be mirrored.• the target Red Hat OpenShift cluster - to install the Netcool Operations Insight operator.
5. Download and install the following onto the bastion server.
• cloudctl - Download IBM® Cloud Pak CLI (cloudctl) versions 3.4.x or 3.5.x from https://github.com/IBM/cloud-pak-cli/releases. cloudctl verifies the integrity of the Netcool OperationsInsight CASE's digital signature by default. If you want to verify the cloudctl binary, follow theinstructions in https://github.com/IBM/cloud-pak-cli#check-certificatekey-validity. Extract thecloudctl binary, give it executable permissions, and ensure that it is in your PATH.
• oc - Download and install the Openshift CLI (oc), V4.4.9 or higher. For more information, seehttps://docs.openshift.com/container-platform/4.5/cli_reference/openshift_cli/getting-started-cli.html#installing-the-cli .
• Docker - Install docker version 1.13.1 or above, and start the docker daemon. For moreinformation, see https://docs.docker.com/install/ .
Download the CASE bundle onto the bastion server6. Download the Netcool Operations Insight CASE bundle, (ibm-netcool-prod), into a local directory
on your bastion server.
cloudctl case save --case ibm-netcool-prod --outputdir destination_dir --repo https://raw.githubusercontent.com/IBM/cloud-pak/master/repo/case
Where destination_dir is a directory of your choosing, for example ./CASES7. Extract the Netcool Operations Insight CASE bundle.
tar -xvf destination_dir/ibm-netcool-prod*.tgz
where destination_dir is the directory that you downloaded the CASE bundle into in the previous step.8. Verify that the Netcool Operations Insight CASE bundle, images.csv, and charts.csv have been
successfully downloaded on your bastion server, with the following command:
find destination_dir -type f
Where destination_dir is a directory of your choosing, for example ./CASESConfigure bastion server authentication
Chapter 5. Upgrading and rolling back 263
9. Set up access to the IBM Entitled Registry, cp.icr.io, which you will be pulling images from.Run the following command on your bastion server:
$ cloudctl case launch \ --case ibm-netcool-prod \ --namespace namespace \ --inventory noiOperatorSetup \ --action configure-creds-airgap \ --args "--registry cp.icr.io --user cp --pass password"
Where
• namespace is the custom namespace that you want to deploy Netcool Operations Insight into.• password is your IBM Entitled Registry entitlement key, as found when you prepared your cluster.
10. Set the target registry environment variable $TARGET_REGISTRYRun the following command on your bastion server:
export TARGET_REGISTRY=target_registry
Where target_registry is the docker registry where the images are stored.Mirror images from CASE to the target registry in the airgap environment11. Mirror images from CASE to the target registry. This can take up to 2 hours.
Run the following command on your bastion server:
$ cloudctl case launch \ --case ibm-netcool-prod \ --namespace namespace \ --inventory noiOperatorSetup \ --action mirror-images \ --args "--registry $TARGET_REGISTRY --inputDir inputDir"
Where
• namespace is the custom namespace that you want to deploy Netcool Operations Insight into.• inputDir is the directory that you downloaded the CASE bundle into.
The images listed in the downloaded CASE, (images.csv), are copied to the target registry in theairgap environment.
Configure Red Hat OpenShift Cluster for airgap12. Configure your Red Hat OpenShift Cluster for airgap. This step can take 90+ minutes.
Run the following command on your bastion server to create a global image pull secret for the targetregistry, and create a ImageSourceContentPolicy.
$ cloudctl case launch \ --case ibm-netcool-prod \ --namespace namespace \ --inventory noiOperatorSetup \ --action configure-cluster-airgap \ --args "--registry $TARGET_REGISTRY --inputDir inputDir"
Where
• namespace is the custom namespace to be used for your deployment.• inputDir is the directory containing the CASE bundle.
Warning:
• Cluster resources must adjust to the new pull secret, which can temporarily limit theusability of the cluster. Authorization credentials are stored in $HOME/.airgap/secretsand /tmp/airgap* to support this action.
• Applying ImageSourceContentPolicy causes cluster nodes to recycle.Upgrade the Netcool Operations Insight Catalog
264 IBM Netcool Operations Insight: Integration Guide
13. Install the Catalog using CASE.Run the following command on your bastion server:
cloudctl case launch \ --case ibm-netcool-prod \ --namespace namespace \ --inventory noiOperatorSetup \ --action install-catalog \ --args "--registry $TARGET_REGISTRY"
Where namespace is the custom namespace to be used for your deployment, that you created whenyou prepared your cluster.
14. Verify the Netcool Operations Insight Catalog Source.From the Red Hat OpenShift OLM UI, navigate to Administration > Cluster Settings, and then selectthe OperatorHub configuration resource under the Global Configuration tab. Verify that the ibm-noi-catalog catalog source is present.
Upgrade the Netcool Operations Insight Operator15. Upgrade the NOI Operator using case
Run the following command on your bastion server:
cloudctl case launch \ --case ibm-netcool-prod \ --namespace namespace \ --inventory noiOperatorSetup \ --action install-operator
Where namespace is the custom namespace to be used for your deployment.16. Verify the Netcool Operations Insight operator.
From the Red Hat OpenShift OLM UI, navigate to Operators > Installed Operators, and verify thatthe status of the Netcool Operations Insight operator is Succeeded.
Upgrade the NOI instance to NOI16317. Create a secret for access to the target registry
Run the following command on your Red Hat OpenShift cluster.
oc create secret docker-registry target-registry-secret \ --docker-server=target_registry \ --docker-username=user \ --docker-password=password \ --namespace=target_namespace
Where:
• target_registry is the target registry that you created.• target-registry-secret is the name of the secret that you are creating. Suggested value is target-registry-secret.
• user and password are the credentials to access your target registry.• namespace is the namespace that you want to deploy Netcool Operations Insight in.
18. Navigate to Operators > Installed Operators, select Project and search for and select the NetcoolOperations Insight operator.
19. Edit the Netcool Operations Insight instance YAML under the All instances tab. It is recommendedthat you take a copy of the instance YAML before changing it, in case you later decide to rollback. Formore information about configurable properties, see “Cloud operator properties” on page 127 for afull cloud deployment, and “Hybrid operator properties” on page 170 for a hybrid deployment.a) Update spec.version: 1.6.2 to spec.version: 1.6.3b) For production systems, add a flag to indicate non-sharing of a Cassandra instance in the upgrade.
Services sharing a Cassandra instance is only supported for new V1.6.3 installs, not upgrade.
spec: helmValuesNOI: global.shareCassandra: false
Chapter 5. Upgrading and rolling back 265
c) (Optional) Add required integrations:
spec: integrations: humio: url: "" repository:’’
d) (Optional, for hybrid deployments only) Add service continuity:
spec: serviceContinuity: continuousAnalyticsCorrelation: false isBackupDeployment: false
e) (Optional) Add backup and restore:
spec: backupRestore enableAnalyticsBackups: false
20. Edit the Netcool Operations Insight properties to provide access to the target registry.a) Update spec.advanced.imagePullRepository so that it points to the target registry that you
created.b) Set spec.entitlementSecret to the target registry secret.
21. Select the Save button.22. Navigate to Operators > Installed Operators, and select Project. Search for and select the noi
V1.6.3 operator.23. Under the All Instances tab, view the status of each of the updates on the installation. When the
instance's status shows OK, then the upgrade is ready.24. If the CEAEventScore column is missing from the alert list for the Example_IBM_CloudAnalytics
system view, manually add the column to see probable root cause information for events in the alertlist.
What to do next• If the kafka pods do not start up properly after upgrade, then restart the kafka and zookeeper pods with
the following command:
oc get pods -o name |egrep "kafka|zookeeper" | xargs oc delete
• Recreate any existing Application Discovery Observer jobs.
Rolling back a hybrid deploymentUse these instructions to roll back V1.6.3 of a hybrid deployment to V1.6.2, using the Red Hat OpenShiftOperator Lifecycle Manager (OLM) user interface (UI), or the command line.
Before you beginNote:
If you want to rollback to Netcool Operations Insight V1.6.1 you must first rollback to V1.6.2 before rollingback to V1.6.1. Click https://www.ibm.com/support/knowledgecenter/SSTPTP_1.6.2/com.ibm.netcool_ops.doc/soc/integration/task/soc_int_rollback_hybrid.html to learn how to rollbackNetcool Operations Insight from V1.6.2 to V1.6.1.
ProcedureRoll back on-premises Operations Management
266 IBM Netcool Operations Insight: Integration Guide
1. Use of Installation Manager's rollback facility is not supported for rolling back the Netcool HybridDeployment Option Integration Kit. Use Installation Manager to uninstall V3.1.32 of the Netcool HybridDeployment Option Integration Kit, and then install V1.3.59 of the Netcool Hybrid Deployment OptionIntegration Kit. For more information on installing the integration kit, see “Installing the integration kit”on page 190.
2. Roll back on-premises Operations Management.Use Installation Manager to roll back on-premises Operations Management to V1.6.2. For moreinformation, see “Roll back on-premises Netcool Operations Insight from V1.6.3 to V1.6.2” on page240.
Roll back cloud native Netcool Operations Insight components3. If the V1.6.3 deployment of cloud native Netcool Operations Insight components was upgraded from
V1.6.2 using airgap, then before you rollback from V1.6.3 to V1.6.2 you must set the image registryback to the V1.6.2 Docker image repository, otherwise the cem-operator and asm-operator pods willfail with ImagePullError errors.a) Edit the noi-operator deployment, and find the key-value pair for OPERATOR_REPO. The value of
this is set to the V1.6.3 airgap target registry. Replace this value with the Netcool OperationsInsight V1.6.2 image registry where the Netcool Operations Insight V1.6.2 Passport Advantage(PPA) package is uploaded, for example image-registry.openshift-image-registry.svc:5000/<namespace>.
oc edit deploy noi-operator
b) If the Netcool Operations Insight V1.6.2 image registry is authenticated and requires a pull secret,then edit the noi-operator serviceaccount and add this secret in the imagePullSecrets section.
oc edit serviceaccount noi-operator
4. Rollback can be performed from the command line or from the OLM UI.To rollback from the command line, use: oc edit noi and change the version back to V1.6.2.To rollback from the OLM UI, navigate to Operators > Installed Operators > NOI and then select theCloud Deployment tab if your deployment is only on Red Hat OpenShift, or the Hybrid Deploymenttab if you have a hybrid deployment that is on Red Hat OpenShift and on-premises. Select Edit NOIand then the YAML tab. Change the version back to V1.6.2 and save the changes.
5. Delete the noi-topology-system-health-scheduledjob job and the noi-full-topology-system-health-cronjob cronjob by running the commands:
oc delete job noi-topology-system-health-scheduledjob
oc delete cronjob noi-full-topology-system-health-cronjob
Verify that the cronjob is recreated by running oc get cronjob. The output should be:
NAME SCHEDULE SUSPEND ACTIVE LAST SCHEDULE AGEnoi-full-curator-pattern-metrics 0 0 * * * False 0 <none> 143mnoi-full-healthcron 1 * * * * False 0 28m 143mnoi-full-register-cnea-mgmt-artifact 1,*/5 * * * * False 0 4m10s 143mnoi-full-topology-system-health-cronjob */5 * * * * True 0 <none> 44m
6. Obtain the metrics deployment by running the command:
oc get deployment | grep -i metric
The output is the following:
noi-metric-action-service-metricactionservice 0/0 0 0 34hnoi-metric-api-service-metricapiservice 0/0 0 0 34h
Chapter 5. Upgrading and rolling back 267
noi-metric-ingestion-service-metricingestionservice 0/0 0 0 34hnoi-metric-trigger-service-metrictriggerservice 0/0 0 0 34h
Delete the metrics deployments by using the command:
oc delete deploy <deployment name>
Troubleshooting upgradeUse the entries in this section to troubleshoot installation problems.
Troubleshooting upgrade on Red Hat OpenShiftUse these troubleshooting entries to help resolve problems and to see known issues for upgrade on RedHat OpenShift.
Missing roles after upgradeSome roles are no longer assigned to users after upgrade.
ProblemAfter upgrading Netcool Operations Insight on OpenShift, users who had the inasm_* roles assigned tothem no longer have these roles assigned.
ResolutionAdd back the inasm_* user roles to the required users.
Pod failures after upgradeAfter upgrade, the kafka pods do not start up, and the cassandra pods crash.
ProblemAfter Netcool Operations Insight on OpenShift has been upgraded, the kafka pod does not start up, andthe cassandra pods may repeatedly crash.
Resolution1. Restart the zookeeper and kafka pods.
oc get pod |egrep "zoo|kafka" | awk '{print "kubectl delete pod "$1}'
2. If the cassandra pods keep crashing, gracefully restart all of them by following the procedure in“Restart of all Cassandra pods causes errors for connecting services” on page 221.
3. If the topology-cassandra pods are crashing, restart these with the following command:
oc delete pod release_name-topology-cassandra-number
where release_name is the name of your deployment, as specified by the value used for name (OLM UIForm view), or name in the metadata section of the noi.ibm.com_noihybrids_cr.yaml ornoi.ibm.com_nois_cr.yaml files (YAML view).
268 IBM Netcool Operations Insight: Integration Guide
OpenShift upgrade failsOn demo/trial deployments, PodDisruptionBudgets (PDBs) block the upgrade of Red Hat OpenShift
ProblemThe upgrade of Red Hat OpenShift is blocked on size0 demo/trial deployments. The OpenShift: UI informsyou that the OpenShift: upgrade was successful, but running oc get nodes reveals that the workernodes are not uplifted.
CauseThe Netcool Operations Insight PDBs block the upgrade of OpenShift.
ResolutionThe Netcool Operations Insight PDBs must be deleted by running the following commands beforeupgrading OpenShift:
oc get pdb | grep <helm-release>oc delete pdb -l release=noi-release-name --all
The oc get pdb command returns the PDB names, for example: noi-cassandra-pdb. Each PDB mustbe deleted with the oc delete pdb command.
Training does not complete after upgradeTraining fails after upgrade because the policyset table has extraneous rows which slow processing.
ProblemWhen Netcool Operations Insight on OpenShift is upgraded from V1.6.2 to V1.6.3, training sometimesfails, with the following error in the policy registry service logs.
Server timeout during read query at consistency LOCAL_ONE (0 replica(s) responded over 1 required)
CauseTraining cannot complete because the policyset table has too many rows. The policy registryservice de-deduplicates entries on insertion, and the queries for this are affected by the number ofrows in the policyset table.
ResolutionClean up the data in the policyset and policy table with the following procedure.
1. As an administrator user, log in to one of the Cassandra pods.
oc exec -ti release_name-cassandra-0 bash
Where release_name is the name of your deployment, as specified by the value used for name (OLM UIForm view), or name in the metadata section of the noi.ibm.com_noihybrids_cr.yaml ornoi.ibm.com_nois_cr.yaml files (YAML view).
2. Start Cassandra query language.
CASSANDRA_HOME/bin>./cqlsh
3. Get the policyset names with the following query:
select policyset from ea_policies.policyset where tenantid='cfd95b7e-3bc7-4006-a4a8-a73a79c71255' and groupid='analytics.temporal-patterns';
Chapter 5. Upgrading and rolling back 269
4. Delete unwanted policy entries from the policies table.
delete from ea_policies.policies where tenantid='cfd95b7e-3bc7-4006-a4a8-a73a79c71255' and partitionid in (0,1,2,3,4,5,6,7,8,9) and policyset in ('name1','name2',...,'nameN');
Where 'name1','name2',...,'nameN' are the policyset names that were returned by the previous step.5. Delete unwanted rows from the policyset table.
delete from ea_policies.policyset where tenantid='cfd95b7e-3bc7-4006-a4a8-a73a79c71255' and groupid='analytics.temporal-patterns';
Troubleshooting upgrade on hybrid systemsUse these troubleshooting entries to help resolve problems and to see known issues for upgrade onhybrid systems.
About this taskThese troubleshooting entries address upgrade issues encountered only on hybrid deployments. If youare looking for troubleshooting issues that are associated with upgrading any of the cloud native NetcoolOperations Insight components of your hybrid deployment, then also see the “Troubleshooting upgradeon Red Hat OpenShift” on page 268 topic.
Upgraded hybrid install has missing columnsUpgraded hybrid deployment is missing the Incident, Probable Cause, and Runbook columns.
ProblemAfter upgrading a hybrid deployment, the Incident, Probable Cause, and Runbook columns are missingfrom the Events page. If you already have the view before installing or updating the hybrid enablement kit,the new columns are not added.
ResolutionThe view/columns must be added back manually to see the analytics information.
270 IBM Netcool Operations Insight: Integration Guide
Chapter 6. ConfiguringPerform the following tasks to configure the components of Netcool Operations Insight.
Configuring Cloud and hybrid systemsPerform the following tasks to configure your Cloud or hybrid Netcool Operations Insight system.
Enabling SSL communications from Netcool/Impact on OpenShiftLearn how to configure Secure Sockets Layer (SSL) communications from IBM Tivoli Netcool/Impact onRed Hat OpenShift.
About this taskFor information about enabling SSL communications from an on-premises deployment of Netcool/Impact,see https://www.ibm.com/support/knowledgecenter/en/SSSHYH_7.1.0/com.ibm.netcoolimpact.doc/admin/imag_enablingssl_for_external_servers.html .
To enable SSL communications from an Netcool Operations Insight on OpenShift deployment, completethe following steps:
Procedure1. Add your external certificate to the YAML file:
vi <release-name>-nciserver-external-cacerts.yaml
For example:
Note: You must indent the certificate in the YAML file.
apiVersion: v1kind: ConfigMapmetadata: name: <release-name>-nciserver-external-cacertsdata: file.crt: | -----BEGIN CERTIFICATE----- MIIDRTCCAi2gAwIBAgIJAMWULciaKp4bMA0GCSqGSIb3DQEBCwUAMBQxEjAQBgNV .. WkUE81/qflUaSOVZRneo3xvkmYNfiYBkpw== -----END CERTIFICATE-----
Where <release-name> is your deployed release name.2. Generate the configmap from the YAML file, by running the kubectl create command, as in the
following example:
kubectl create -f <release-name>-nciserver-external-cacerts.yaml
The configmap can also be created from the certificate, as in the following example:
kubectl create configmap <release-name>-nciserver-external-cacerts --from-file=./cert.pem
3. If you deployed Netcool Operations Insight on OpenShiftwith the Operator Lifecycle Manager (OLM)console, as described in the “Installing Netcool Operations Insight with the Operator LifecycleManager (OLM) user interface” on page 118 topic, complete the following steps:a) Edit the deployment from the OLM console. Edit and save the YAML file directly in the console. Your
changes are auto-deployed.4. Delete the Netcool/Impact core server pod with the kubectl delete command:
© Copyright IBM Corp. 2020, 2020 271
kubectl delete pod <release-name>-nciserver-0
The Netcool/Impact core server pod is restarted with the external certs in the trust.jks file. SSLcommunications from the Netcool/Impact core server pod is enabled.
Connecting a Cloud system to event sourcesLearn how to connect to event sources.
Connecting event sources to Netcool Operations Insight on a ClouddeploymentAfter you successfully deploy Netcool Operations Insight, you can connect to an on-premises eventsource such as an IBM Tivoli Netcool/OMNIbus probe or gateway. You can connect directly to theObjectServer NodePort or you can connect with a proxy NodePort.
You can configure connections to Netcool Operations Insight in two ways. The primary method to connectyour event sources is to make a direct Transmission Control Protocol (TCP) connection to theObjectServer NodePort. This method supports plain text connections. If Transport Layer Security (TLS)encryption is required, you can connect with a proxy NodePort. This method supports plain text and TLSencrypted connections.
Connecting with the proxy NodePortLearn how to connect to the ObjectServer from outside the OpenShift deployment by using the secureconnection proxy with Transport Layer Security (TLS) encryption.
The proxy provides a secure TLS encrypted connection for clients that require a direct TransmissionControl Protocol (TCP) connection to the ObjectServer instance running on OpenShift. Typically, clientssuch as Netcool/OMNIbus Probes and Gateways require this type of connection. The clients can beinstalled in a traditional on-premise installation or deployed in another OpenShift cluster.
The proxy is deployed automatically as part of the ibm-netcool-prod deployment. By default, the proxy isdeployed with a TLS certificate, which is automatically created and signed by the OpenShift clusterCertificate Authority (CA) during deployment. However, it is also possible to use a custom certificate thathas been signed by an external CA.
For more information about configuring the proxy and the proxy config map, see “Proxy configmap” onpage 709.
Identifying the proxy listening portTo connect to the IBM Tivoli Netcool/OMNIbus Object Server pair from outside the OpenShift cluster withTransport Layer Security (TLS) encryption, you must identify the externally accessible NodePort where theproxy listens for connections.
About this taskThe proxy defines a Kubernetes service, called release_name-proxy, where release_name is the name ofthe custom resource for your deployment. The release_name-proxy service defines the NodePorts thatclients must use when connecting to the Object Server pair.
Procedure1. Describe the proxy service by running the following command:
kubectl get service -o yaml release_name-proxy -n namespace
Where
• release_name is the name of your deployment, as specified by the value used for name (OLM UIForm view), or name in the metadata section of the noi.ibm.com_noihybrids_cr.yaml ornoi.ibm.com_nois_cr.yaml files (YAML view).
272 IBM Netcool Operations Insight: Integration Guide
• namespace is the name of the namespace in which Operations Management is installed.2. Identify the NodePorts from the command output, for example:
ports: - name: aggp-proxy-port nodePort: 30135 port: 6001 protocol: TCP targetPort: 6001 - name: aggb-proxy-port nodePort: 30456 port: 6002 protocol: TCP targetPort: 6002
In the example, the NodePort for the primary Object Server is 30135 and the NodePort for the backupObject Server is 30456.
ResultsMake a note of the NodePorts that you identified. This information is required when configuring theclient's Transport Layer Security (TLS) connection.
Configuring TLS encryption with Red Hat OpenShiftFollow this procedure when the proxy certificate has been automatically created and signed by the RedHat OpenShift cluster CA during deployment.
Procedure1. From the event source client, ensure that a connection can be made to a cluster master node. For
example:
ping ${OCP_MASTER_ADDRESS}
Where ${OCP_MASTER_ADDRESS} is resolvable network address for a cluster master node, forexample master0.ocp42.ibm.com.
Note: Only a single master node is specified in this example. For production environments, it can bedesirable to configure a load balancer between the master nodes to enable high availability andprevent a single point of failure.
2. Using OpenSSL from the event source client, identify the certificate common name (CN), from yourIBM Netcool Operations Insight on-premises deployment:
# openssl s_client -connect ${OCP_MASTER_ADDRESS}:${AGG_PROXY_PORT}CONNECTED(00000003)depth=1 CN = openshift-service-serving-signer@1578571170verify error:num=19:self signed certificate in certificate chain---Certificate chain 0 s:/CN=m125-proxy.default.svc <<<<<<<<<<<<<< i:/CN=openshift-service-serving-signer@1578571170 1 s:/CN=openshift-service-serving-signer@1578571170 i:/CN=openshift-service-serving-signer@1578571170---
Where:
• ${OCP_MASTER_ADDRESS} is the address of a cluster master node from step 1.• ${AGG_PROXY_PORT} is the cluster NodePort identified by “Identifying the proxy listening port” on
page 272
In the example above, the Common Name of the certificate that is presented by the proxy is m125-proxy.default.svc.
3. Using the OpenShift Cluster CLI, extract the OpenShiftcluster signer certificate by running thecommand:
Chapter 6. Configuring 273
oc get secrets/signing-key -n openshift-service-ca -o template='{{index .data "tls.crt"}}' | base64 --decode > cluster-ca-cert.pem
4. Run the ping ${PROXY_COMMON_NAME} command. If this command fails, because the name cannotbe resolved, ask your DNS administrator to add this entry or use the following commands to add thishost to your /etc/hosts file. On the event source client, in the network hosts file, map the certificatecommon name to the IP address of an OpenShift master node, running, for example:
echo "${OCP_MASTER_ADDRESS} ${PROXY_COMMON_NAME}" >> /etc/hosts
Where:
• ${OCP_MASTER_ADDRESS} is the address of a cluster master node from step 1.• ${PROXY_COMMON_NAME} is the proxy certificate common name from step 2.
5. Import the OpenShift cluster signer certificate that is obtained in step 3 into the event source clientkeystore as a trusted certificate. Complete the following steps:a) If necessary, create the keystore by using one of the following commands:
$NCHOME/bin/nc_ikeyman
Or
$NCHOME/bin/nc_gskcmd -keydb -create -db "$NCHOME/etc/security/keys/omni.kdb" -pw password -stash -expire 366
For more information about creating a keystore, see https://www.ibm.com/support/knowledgecenter/en/SSSHTQ_8.1.0/com.ibm.netcool_OMNIbus.doc_8.1.0/omnibus/wip/install/task/omn_con_ssl_creatingkeydbase.html Netcool/OMNIbus Knowledge Center.
b) Import a privacy enhanced mail (PEM) encoded signer certificate by running one of the followingcommands:
$NCHOME/bin/nc_ikeyman
Or
$NCHOME/bin/nc_gskcmd -cert -add -file cluster-ca-cert.pem -db $NCHOME/etc/security/keys/omni.kdb -stashed
For more information about adding certificates from CA, see https://www.ibm.com/support/knowledgecenter/en/SSSHTQ_8.1.0/com.ibm.netcool_OMNIbus.doc_8.1.0/omnibus/wip/install/task/omn_con_ssl_addingcerts.html Netcool/OMNIbus Knowledge Center..
6. Note: To successfully complete the TLS handshake and establish a secure TLS connection, theObjectServer address, which is specified in the omni.dat file, must exactly match the certificatesubject CN value.
Edit the client's omni.dat file to configure a Secure Sockets Layer (SSL) connection. Add the proxyCommon Name value from step 2 as the server address and the proxy NodePort port number in theomni.dat file, as displayed in the following example:
[OCP_AGG_P_TLS]{ Primary: ${PROXY_COMMON_NAME} ssl ${AGGP_PROXY_PORT}}[OCP_AGG_B_TLS]{ Primary: ${PROXY_COMMON_NAME} ssl ${AGGB_PROXY_PORT}}
For more information, see “Identifying the proxy listening port” on page 272.7. Run the following command to generate the interfaces file:
274 IBM Netcool Operations Insight: Integration Guide
$NCHOME/bin/nco_igen
Configuring TLS encryption with a custom certificate on Red Hat OpenShiftThe proxy requires a public certificate and private key pair to be supplied through a Kubernetes secretcalled {{ .Release.Name }}-proxy-tls-secret. If you want to use a custom certificate, forexample, one signed by your own public key infrastructure Certificate Authority (CA), create your ownproxy secret, containing the public certificate and private key pair, before deployment. To enable asuccessful Transport Layer Security (TLS) handshake, import the CA signer certificate into the keystore ofany client application as a trusted source.
Before you beginNote: If you deployed IBM Netcool Operations Insight on OpenShift V3.2.1, configure TLS encryption withthe default certificate. For more information, see “Configuring TLS encryption with Red Hat OpenShift” onpage 273.
Before deploying on Red Hat OpenShift, you can create your own certificate key pair and create the proxyTLS secret by completing the following steps:
About this task|Follow this procedure when the public certificate and private key have already been created and signedby an external CA. When creating the certificate, it is important to ensure that the subject Common Name(CN) field matches the following format:
proxy.release_name.fqdn
Where
• fqdn is the fully qualified domain name (FQDN) of the cluster's master node.• release_name is the name of your deployment, as specified by the value used for name (OLM UI Form
view), or name in the metadata section of the noi.ibm.com_noihybrids_cr.yaml ornoi.ibm.com_nois_cr.yaml files (YAML view).
Procedure1. Set the global.tls.certificate.useExistingSecret global property in the Helm chart.2. Create the proxy TLS secret by running the following command:
kubectl create secret tls release_name-proxy-tls-secret --cert=certificate.pem --key=key.pem [--namespace namespace]
Where:
• release_name is the name of your deployment, as specified by the value used for name (OLM UIForm view), or name in the metadata section of the noi.ibm.com_noihybrids_cr.yaml ornoi.ibm.com_nois_cr.yaml files (YAML view).
• certificate.pem is the signed certificate returned by the CA.• key.pem is the private key corresponding to the signed certificate.
3. To establish a successful TLS connection, import the CA public certificate, which is used in step “2” onpage 275. Complete the following steps:
a. If necessary, create the keystore using one of the following commands:
$NCHOME/bin/nc_ikeyman
or
Chapter 6. Configuring 275
• $NCHOME/bin/nc_gskcmd -keydb -create -db "$NCHOME/etc/security/keys/omni.kdb" -pw password -stash -expire 366
For more information about creating a keystore, see the Netcool/OMNIbus Knowledge Center,https://www.ibm.com/support/knowledgecenter/en/SSSHTQ_8.1.0/com.ibm.netcool_OMNIbus.doc_8.1.0/omnibus/wip/install/task/omn_con_ssl_creatingkeydbase.html .
b. Import a privacy enhanced mail (PEM) encoded signer certificate by running one of the followingcommands:
$NCHOME/bin/nc_ikeyman
or
• $NCHOME/bin/nc_gskcmd -cert -add -file mycert.pem -db $NCHOME/etc/security/keys/omni.kdb -stashed
For more information about adding certificates from CAs, see the Netcool/OMNIbus KnowledgeCenter, https://www.ibm.com/support/knowledgecenter/en/SSSHTQ_8.1.0/com.ibm.netcool_OMNIbus.doc_8.1.0/omnibus/wip/install/task/omn_con_ssl_addingcerts.html .
4. Note: To successfully complete the TLS handshake and establish a secure TLS connection, theObjectServer address, which is specified in the omni.dat file, must exactly match the certificatesubject Common Name (CN) value. Certificates that are manually created must have a subject CNvalue in the following format:
proxy.release_name.fqdn
Edit the client's omni.dat file to configure a Secure Sockets Layer (SSL) connection. Specify the SSLfor each Object Server entry and add the server address and port number in the omni.dat file, asdisplayed in the following example:
[AGG_P]{Primary: proxy.release_name.fqdn ssl 3XXXX}[AGG_B]{Primary: proxy.release_name.fqdn ssl 3XXXX}
For more information, see “Identifying the proxy listening port” on page 272.5. Run the following command to generate the interfaces file:
$NCHOME/bin/nco_igen
Disabling TLS encryptionTo disable Transport Layer Security (TLS) encryption, edit the proxy configmap.
Procedure1. Open the proxy configmap for editing.
kubectl edit configmap release_name-proxy-config -n namespace
Where
• release_name is the name of the custom resource for your deployment.• namespace is the name of the namespace in which Netcool Operations Insight on Red Hat OpenShift
is deployed.2. Find the tlsEnabled flag and set it to false. Save and exit the configmap.
276 IBM Netcool Operations Insight: Integration Guide
tlsEnabled: "false"
3. Find the proxy pod using the command
kubectl get pods --namespace namespace | grep proxy
Where namespace is the name of the namespace in whichNetcool Operations Insight on Red HatOpenShift is deployed.
4. Restart the proxy pod.
kubectl delete pod proxy-pod -n namespace
Where
• proxy-pod is the name of the proxy pod in your Netcool Operations Insight on Red Hat OpenShiftdeployment.
• namespace is the name of the namespace in which Netcool Operations Insight on Red Hat OpenShiftis deployed.
Connecting with the ObjectServer NodePortLearn how to connect to the IBM Tivoli Netcool/OMNIbus ObjectServer failover pair from outside theNetcool Operations Insight on Red Hat OpenShift deployment.
Before you beginThe ObjectServer NodePorts do not support Transport Layer Security (TLS) encryption. If TLS encryptionis required, connect with a proxy NodePort. For more information, see “Connecting with the proxyNodePort” on page 272.
About this taskLearn how to make a direct plain text Transmission Control Protocol (TCP) connection to the ObjectServerfailover pair running in a IBM Netcool Operations Insight on Red Hat OpenShift deployment. Typicallyclients such as Netcool/OMNIbus Probes and Gateways require this type of connection to write event datainto the deployment. Connection to the ObjectServer pair is enabled with cluster No Deports, which aredefined by the following services:
release_name-objserv-agg-primary-nodeportrelease_name-objserv-agg-backup-nodeport
Where release_name is the name of your deployment, as specified by the value used for name (OLM UIForm view), or name in the metadata section of the noi.ibm.com_noihybrids_cr.yaml ornoi.ibm.com_nois_cr.yaml files (YAML view).
Procedure1. Describe the primary ObjectServer service by running the following command:
kubectl get service release_name-objserv-agg-primary-nodeport -n namespace
Where
• release_name is the name of your deployment, as specified by the value used for name (OLM UIForm view), or name in the metadata section of the noi.ibm.com_noihybrids_cr.yaml ornoi.ibm.com_nois_cr.yaml files (YAML view).
• namespace is the name of the namespace in which Netcool Operations Insight on Red Hat OpenShiftis installed.
2. Describe the backup ObjectServer service by running the following command:
kubectl get service release_name-objserv-agg-backup-nodeport -n namespace
Chapter 6. Configuring 277
Where
• release_name is the name of your deployment, as specified by the value used for name (OLM UIForm view), or name in the metadata section of the noi.ibm.com_noihybrids_cr.yaml ornoi.ibm.com_nois_cr.yaml files (YAML view).
• namespace is the name of the namespace in which Netcool Operations Insight on Red Hat OpenShiftis installed.
3. Identify the NodePorts from the command output, for example:
NAME TYPE CLUSTER-IP EXTERNAL-IP PORT(S) AGErelease_name-objserv-agg-primary-nodeport NodePort 10.0.0.18 <none> 4100:32312/TCP,31581:31581/TCP 3h
and
NAME TYPE CLUSTER-IP EXTERNAL-IP PORT(S) AGErelease_name-objserv-agg-backup-nodeport NodePort 10.0.0.162 <none> 4100:30404/TCP,30302:30302/TCP 3h
In the examples, the NodePort for the primary ObjectServer is 32312 and the NodePort for the backupObjectServer is 30404.
Note: Ensure you have configured the cluster networking so that the NodePorts can be accessed fromthe client machine. For more information, consult the documentation for your cluster.
4. Combine the NodePort values with the public domain name or IP address of the cluster to form theaddress of the ObjectServer. Edit the client's omni.dat file to add entries for the primary and backupObjectServer, as described in the following example:
[AGG_P]{ Primary: mycluster.icp 32312}[AGG_B]{ Primary: mycluster.icp 30404}
Where mycluster.icp is the public domain name of the cluster.5. Run the following command to generate the interfaces file:
$NCHOME/bin/nco_igen
Connecting an on-premises Operations Management ObjectServer to NetcoolOperations Insight on a Cloud deploymentLearn how to configure a connection between an on-premises ObjectServer and a deployment of NetcoolOperations Insight on Red Hat OpenShift.
After you successfully deploy Netcool Operations Insight on Red Hat OpenShift, you can connect to anexisting on-premises installation to create an event feed between your on-premises and cloudinstallations. A uni-directional gateway allows event data to flow in a single direction, either from on-premises to cloud, or from cloud to on-premises. A bidirectional gateway can be configured to allow eventdata to flow in both directions at the same time.
The following figure shows the architecture.
Figure 16. Architecture of an on-premises ObjectServer connected to an Netcool Operations Insight on RedHat OpenShift deployment.
278 IBM Netcool Operations Insight: Integration Guide
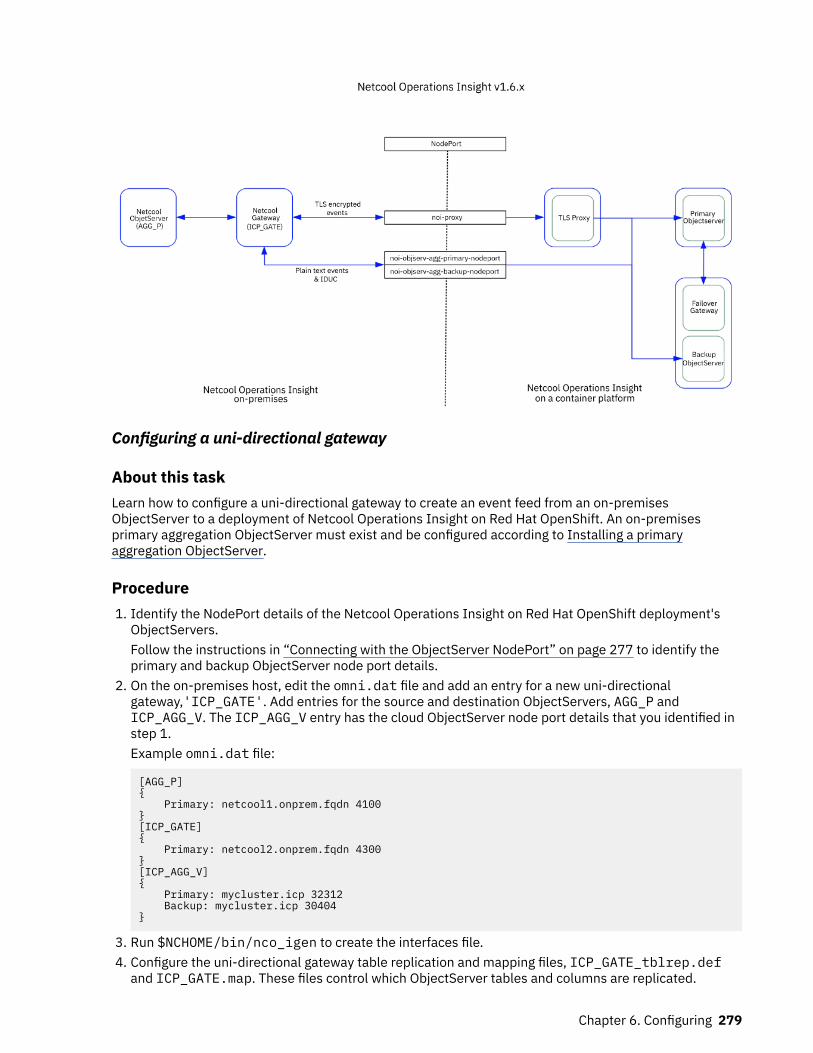
Configuring a uni-directional gateway
About this taskLearn how to configure a uni-directional gateway to create an event feed from an on-premisesObjectServer to a deployment of Netcool Operations Insight on Red Hat OpenShift. An on-premisesprimary aggregation ObjectServer must exist and be configured according to Installing a primaryaggregation ObjectServer.
Procedure1. Identify the NodePort details of the Netcool Operations Insight on Red Hat OpenShift deployment's
ObjectServers.Follow the instructions in “Connecting with the ObjectServer NodePort” on page 277 to identify theprimary and backup ObjectServer node port details.
2. On the on-premises host, edit the omni.dat file and add an entry for a new uni-directionalgateway,'ICP_GATE'. Add entries for the source and destination ObjectServers, AGG_P andICP_AGG_V. The ICP_AGG_V entry has the cloud ObjectServer node port details that you identified instep 1.Example omni.dat file:
[AGG_P]{ Primary: netcool1.onprem.fqdn 4100}[ICP_GATE]{ Primary: netcool2.onprem.fqdn 4300}[ICP_AGG_V]{ Primary: mycluster.icp 32312 Backup: mycluster.icp 30404}
3. Run $NCHOME/bin/nco_igen to create the interfaces file.4. Configure the uni-directional gateway table replication and mapping files, ICP_GATE_tblrep.def
and ICP_GATE.map. These files control which ObjectServer tables and columns are replicated.
Chapter 6. Configuring 279
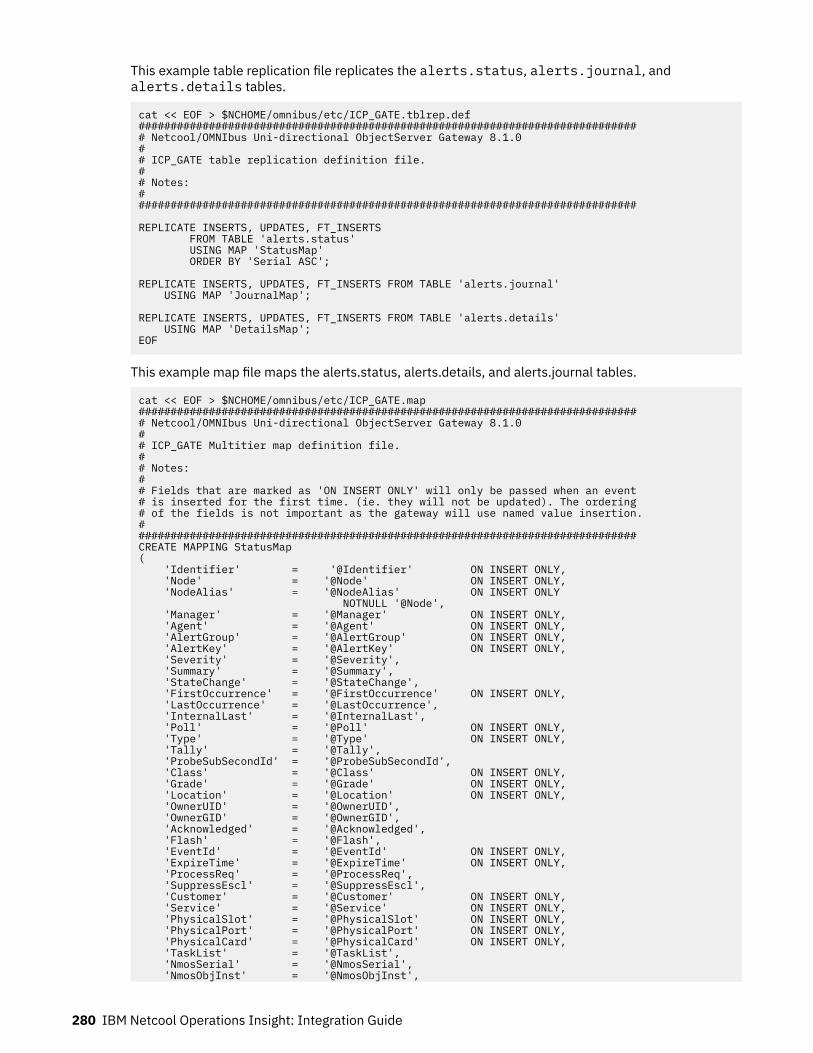
This example table replication file replicates the alerts.status, alerts.journal, andalerts.details tables.
cat << EOF > $NCHOME/omnibus/etc/ICP_GATE.tblrep.def############################################################################### Netcool/OMNIbus Uni-directional ObjectServer Gateway 8.1.0## ICP_GATE table replication definition file.## Notes:###############################################################################
REPLICATE INSERTS, UPDATES, FT_INSERTS FROM TABLE 'alerts.status' USING MAP 'StatusMap' ORDER BY 'Serial ASC';
REPLICATE INSERTS, UPDATES, FT_INSERTS FROM TABLE 'alerts.journal' USING MAP 'JournalMap';
REPLICATE INSERTS, UPDATES, FT_INSERTS FROM TABLE 'alerts.details' USING MAP 'DetailsMap';EOF
This example map file maps the alerts.status, alerts.details, and alerts.journal tables.
cat << EOF > $NCHOME/omnibus/etc/ICP_GATE.map############################################################################### Netcool/OMNIbus Uni-directional ObjectServer Gateway 8.1.0## ICP_GATE Multitier map definition file.## Notes:## Fields that are marked as 'ON INSERT ONLY' will only be passed when an event# is inserted for the first time. (ie. they will not be updated). The ordering# of the fields is not important as the gateway will use named value insertion.###############################################################################CREATE MAPPING StatusMap( 'Identifier' = '@Identifier' ON INSERT ONLY, 'Node' = '@Node' ON INSERT ONLY, 'NodeAlias' = '@NodeAlias' ON INSERT ONLY NOTNULL '@Node', 'Manager' = '@Manager' ON INSERT ONLY, 'Agent' = '@Agent' ON INSERT ONLY, 'AlertGroup' = '@AlertGroup' ON INSERT ONLY, 'AlertKey' = '@AlertKey' ON INSERT ONLY, 'Severity' = '@Severity', 'Summary' = '@Summary', 'StateChange' = '@StateChange', 'FirstOccurrence' = '@FirstOccurrence' ON INSERT ONLY, 'LastOccurrence' = '@LastOccurrence', 'InternalLast' = '@InternalLast', 'Poll' = '@Poll' ON INSERT ONLY, 'Type' = '@Type' ON INSERT ONLY, 'Tally' = '@Tally', 'ProbeSubSecondId' = '@ProbeSubSecondId', 'Class' = '@Class' ON INSERT ONLY, 'Grade' = '@Grade' ON INSERT ONLY, 'Location' = '@Location' ON INSERT ONLY, 'OwnerUID' = '@OwnerUID', 'OwnerGID' = '@OwnerGID', 'Acknowledged' = '@Acknowledged', 'Flash' = '@Flash', 'EventId' = '@EventId' ON INSERT ONLY, 'ExpireTime' = '@ExpireTime' ON INSERT ONLY, 'ProcessReq' = '@ProcessReq', 'SuppressEscl' = '@SuppressEscl', 'Customer' = '@Customer' ON INSERT ONLY, 'Service' = '@Service' ON INSERT ONLY, 'PhysicalSlot' = '@PhysicalSlot' ON INSERT ONLY, 'PhysicalPort' = '@PhysicalPort' ON INSERT ONLY, 'PhysicalCard' = '@PhysicalCard' ON INSERT ONLY, 'TaskList' = '@TaskList', 'NmosSerial' = '@NmosSerial', 'NmosObjInst' = '@NmosObjInst',
280 IBM Netcool Operations Insight: Integration Guide
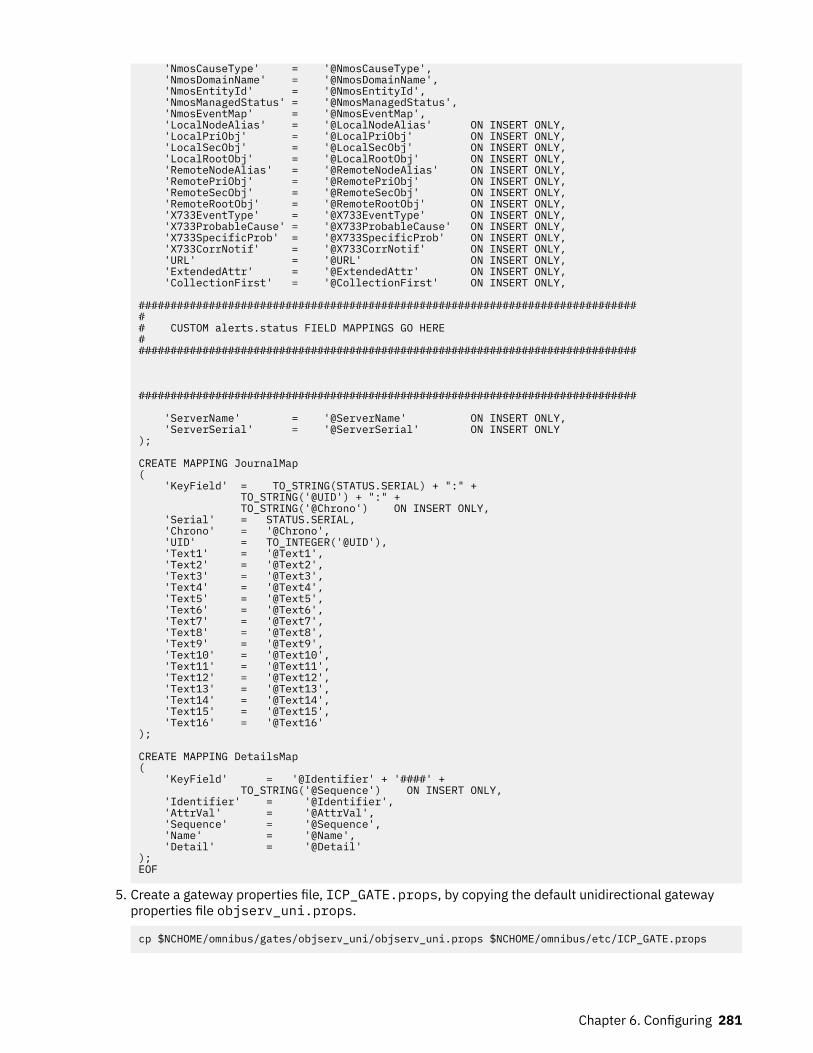
'NmosCauseType' = '@NmosCauseType', 'NmosDomainName' = '@NmosDomainName', 'NmosEntityId' = '@NmosEntityId', 'NmosManagedStatus' = '@NmosManagedStatus', 'NmosEventMap' = '@NmosEventMap', 'LocalNodeAlias' = '@LocalNodeAlias' ON INSERT ONLY, 'LocalPriObj' = '@LocalPriObj' ON INSERT ONLY, 'LocalSecObj' = '@LocalSecObj' ON INSERT ONLY, 'LocalRootObj' = '@LocalRootObj' ON INSERT ONLY, 'RemoteNodeAlias' = '@RemoteNodeAlias' ON INSERT ONLY, 'RemotePriObj' = '@RemotePriObj' ON INSERT ONLY, 'RemoteSecObj' = '@RemoteSecObj' ON INSERT ONLY, 'RemoteRootObj' = '@RemoteRootObj' ON INSERT ONLY, 'X733EventType' = '@X733EventType' ON INSERT ONLY, 'X733ProbableCause' = '@X733ProbableCause' ON INSERT ONLY, 'X733SpecificProb' = '@X733SpecificProb' ON INSERT ONLY, 'X733CorrNotif' = '@X733CorrNotif' ON INSERT ONLY, 'URL' = '@URL' ON INSERT ONLY, 'ExtendedAttr' = '@ExtendedAttr' ON INSERT ONLY, 'CollectionFirst' = '@CollectionFirst' ON INSERT ONLY,
################################################################################ CUSTOM alerts.status FIELD MAPPINGS GO HERE###############################################################################
##############################################################################
'ServerName' = '@ServerName' ON INSERT ONLY, 'ServerSerial' = '@ServerSerial' ON INSERT ONLY);
CREATE MAPPING JournalMap( 'KeyField' = TO_STRING(STATUS.SERIAL) + ":" + TO_STRING('@UID') + ":" + TO_STRING('@Chrono') ON INSERT ONLY, 'Serial' = STATUS.SERIAL, 'Chrono' = '@Chrono', 'UID' = TO_INTEGER('@UID'), 'Text1' = '@Text1', 'Text2' = '@Text2', 'Text3' = '@Text3', 'Text4' = '@Text4', 'Text5' = '@Text5', 'Text6' = '@Text6', 'Text7' = '@Text7', 'Text8' = '@Text8', 'Text9' = '@Text9', 'Text10' = '@Text10', 'Text11' = '@Text11', 'Text12' = '@Text12', 'Text13' = '@Text13', 'Text14' = '@Text14', 'Text15' = '@Text15', 'Text16' = '@Text16');
CREATE MAPPING DetailsMap( 'KeyField' = '@Identifier' + '####' + TO_STRING('@Sequence') ON INSERT ONLY, 'Identifier' = '@Identifier', 'AttrVal' = '@AttrVal', 'Sequence' = '@Sequence', 'Name' = '@Name', 'Detail' = '@Detail');EOF
5. Create a gateway properties file, ICP_GATE.props, by copying the default unidirectional gatewayproperties file objserv_uni.props.
cp $NCHOME/omnibus/gates/objserv_uni/objserv_uni.props $NCHOME/omnibus/etc/ICP_GATE.props
Chapter 6. Configuring 281
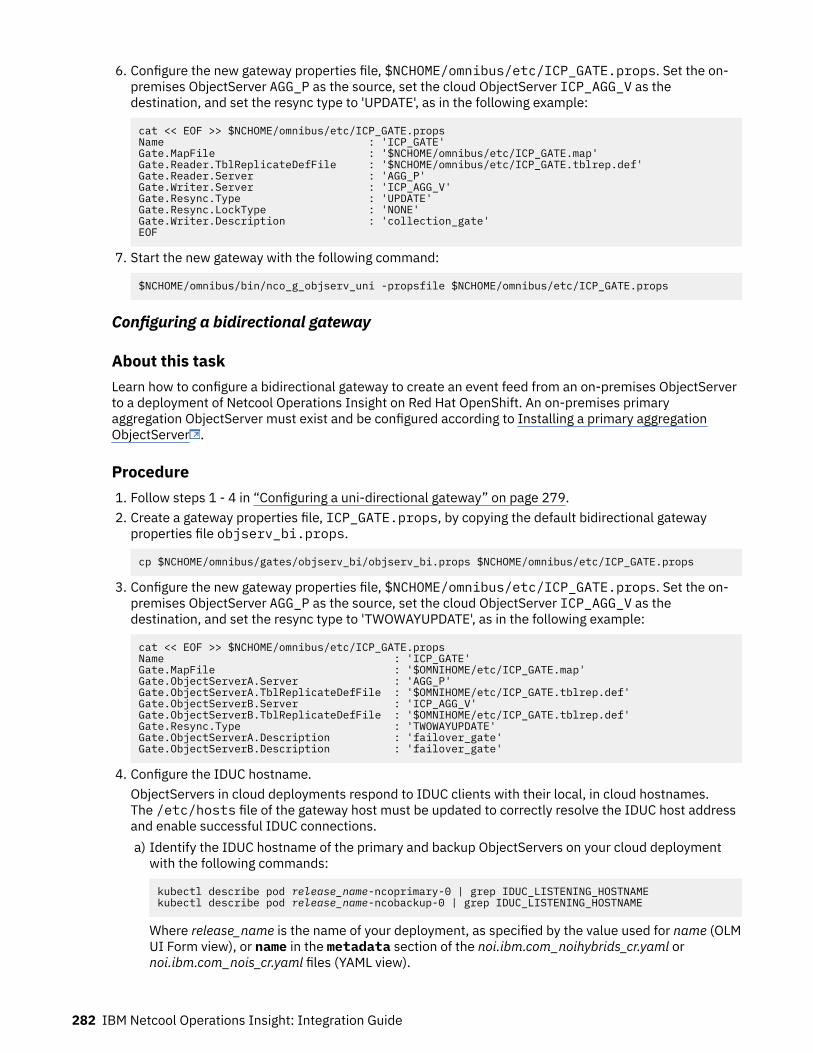
6. Configure the new gateway properties file, $NCHOME/omnibus/etc/ICP_GATE.props. Set the on-premises ObjectServer AGG_P as the source, set the cloud ObjectServer ICP_AGG_V as thedestination, and set the resync type to 'UPDATE', as in the following example:
cat << EOF >> $NCHOME/omnibus/etc/ICP_GATE.propsName : 'ICP_GATE'Gate.MapFile : '$NCHOME/omnibus/etc/ICP_GATE.map'Gate.Reader.TblReplicateDefFile : '$NCHOME/omnibus/etc/ICP_GATE.tblrep.def'Gate.Reader.Server : 'AGG_P'Gate.Writer.Server : 'ICP_AGG_V'Gate.Resync.Type : 'UPDATE'Gate.Resync.LockType : 'NONE'Gate.Writer.Description : 'collection_gate'EOF
7. Start the new gateway with the following command:
$NCHOME/omnibus/bin/nco_g_objserv_uni -propsfile $NCHOME/omnibus/etc/ICP_GATE.props
Configuring a bidirectional gateway
About this taskLearn how to configure a bidirectional gateway to create an event feed from an on-premises ObjectServerto a deployment of Netcool Operations Insight on Red Hat OpenShift. An on-premises primaryaggregation ObjectServer must exist and be configured according to Installing a primary aggregationObjectServer .
Procedure1. Follow steps 1 - 4 in “Configuring a uni-directional gateway” on page 279.2. Create a gateway properties file, ICP_GATE.props, by copying the default bidirectional gateway
properties file objserv_bi.props.
cp $NCHOME/omnibus/gates/objserv_bi/objserv_bi.props $NCHOME/omnibus/etc/ICP_GATE.props
3. Configure the new gateway properties file, $NCHOME/omnibus/etc/ICP_GATE.props. Set the on-premises ObjectServer AGG_P as the source, set the cloud ObjectServer ICP_AGG_V as thedestination, and set the resync type to 'TWOWAYUPDATE', as in the following example:
cat << EOF >> $NCHOME/omnibus/etc/ICP_GATE.propsName : 'ICP_GATE'Gate.MapFile : '$OMNIHOME/etc/ICP_GATE.map'Gate.ObjectServerA.Server : 'AGG_P'Gate.ObjectServerA.TblReplicateDefFile : '$OMNIHOME/etc/ICP_GATE.tblrep.def'Gate.ObjectServerB.Server : 'ICP_AGG_V'Gate.ObjectServerB.TblReplicateDefFile : '$OMNIHOME/etc/ICP_GATE.tblrep.def'Gate.Resync.Type : 'TWOWAYUPDATE'Gate.ObjectServerA.Description : 'failover_gate'Gate.ObjectServerB.Description : 'failover_gate'
4. Configure the IDUC hostname.ObjectServers in cloud deployments respond to IDUC clients with their local, in cloud hostnames.The /etc/hosts file of the gateway host must be updated to correctly resolve the IDUC host addressand enable successful IDUC connections.a) Identify the IDUC hostname of the primary and backup ObjectServers on your cloud deployment
with the following commands:
kubectl describe pod release_name-ncoprimary-0 | grep IDUC_LISTENING_HOSTNAMEkubectl describe pod release_name-ncobackup-0 | grep IDUC_LISTENING_HOSTNAME
Where release_name is the name of your deployment, as specified by the value used for name (OLMUI Form view), or name in the metadata section of the noi.ibm.com_noihybrids_cr.yaml ornoi.ibm.com_nois_cr.yaml files (YAML view).
282 IBM Netcool Operations Insight: Integration Guide

For example:
%> kubectl describe pod noi-ncoprimary-0 | grep IDUC_LISTENING_HOSTNAME NCO_IDUC_LISTENING_HOSTNAME: noi-objserv-agg-primary-nodeport
%> kubectl describe pod noi-ncobackup-0 | grep IDUC_LISTENING_HOSTNAME NCO_IDUC_LISTENING_HOSTNAME: noi-objserv-agg-backup-nodeport
b) Find the release FQDN, as in the following example:
%> helm get values --tls release_name | grep fqdn fqdn: mycluster.icp
Where release_name is the name of your deployment, as specified by the value used for name (OLMUI Form view), or name in the metadata section of the noi.ibm.com_noihybrids_cr.yaml ornoi.ibm.com_nois_cr.yaml files (YAML view).
c) Use the host command on the returned FQDN value to find the cluster IP address, as in thefollowing example:
%> host mycluster.icpmycluster.icp has address 1.2.3.4
d) Edit the /etc/hosts file on the gateway host to map the cluster IP address to the cluster FQDN.
sudo cat << EOF >> /etc/hosts1.2.3.4 noi-objserv-agg-primary-nodeport noi-objserv-agg-backup-nodeportEOF
5. Start the gateway with the following command:
$NCHOME/omnibus/bin/nco_g_objserv_bi -propsfile $NCHOME/omnibus/etc/ICP_GATE.props
Configuring incoming integrationsConfigure incoming integrations from a wide range of Cloud event sources to provide event data to helpmonitor your environment.
Before you beginYou must already have the event source set up and monitoring your resources, with event informationavailable.
Important: If you are configuring incoming integrations for event management in a cloud environment, aTLS certificate for the fully qualified domain name must be obtained from a well known and trustedcertificate authority. If a valid signed certificate is not available, please refer to the productdocumentation of the event source to determine how to configure a self signed certificate.
Normalized event structureNetcool Operations Insight is able to easily ingest data from a wide range of Cloud environments, such asAmazon Web Services, Data dog, and Dynatrace.
When ingesting data from Cloud environments, Netcool Operations Insight first converts the payload to anormalized event structure, referred to in a number of the topics in this section of the documentation.Subsequently this normalized event structure is converted to a flat event structure that is compatible withthe ObjectServer.
Integrating with Alert NotificationThis event source is intended to receive alerts previously sent to Alert Notification.
Before you beginWhen Alert Notification is integrated with Netcool Operations Insight the responses returned are differentto those returned for an alert sent to the stand-alone version of Alert Notification. Instead of the
Chapter 6. Configuring 283
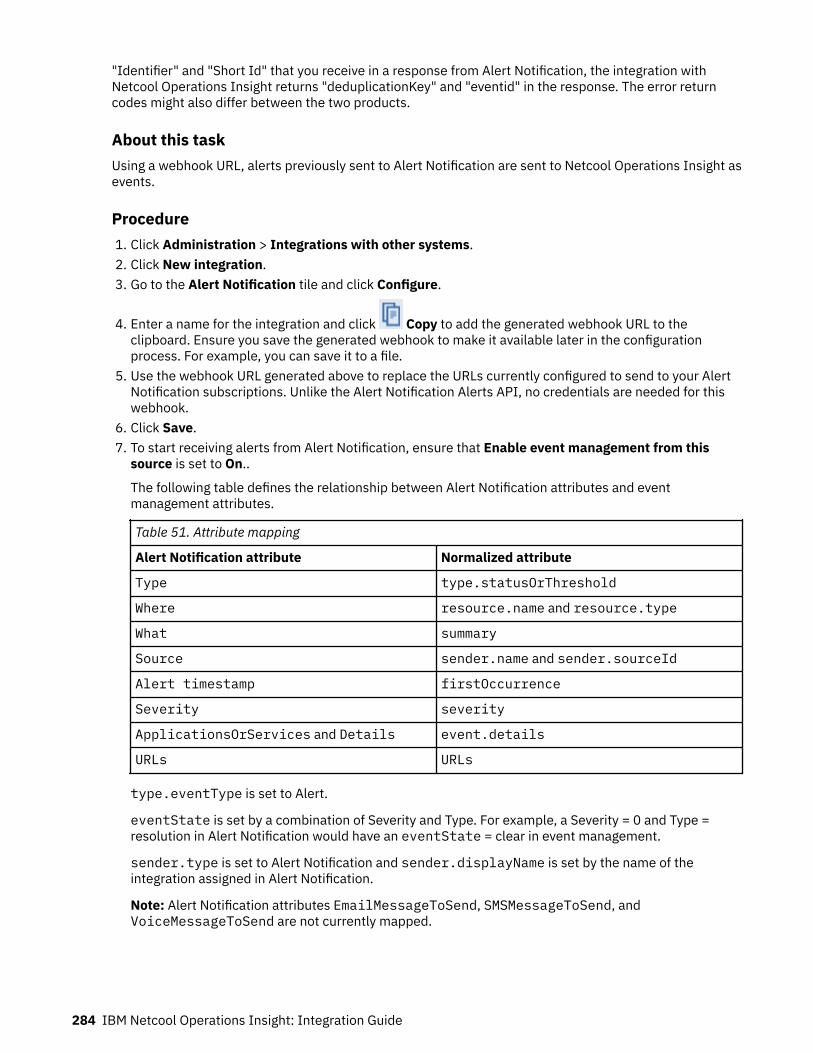
"Identifier" and "Short Id" that you receive in a response from Alert Notification, the integration withNetcool Operations Insight returns "deduplicationKey" and "eventid" in the response. The error returncodes might also differ between the two products.
About this taskUsing a webhook URL, alerts previously sent to Alert Notification are sent to Netcool Operations Insight asevents.
Procedure1. Click Administration > Integrations with other systems.2. Click New integration.3. Go to the Alert Notification tile and click Configure.
4. Enter a name for the integration and click Copy to add the generated webhook URL to theclipboard. Ensure you save the generated webhook to make it available later in the configurationprocess. For example, you can save it to a file.
5. Use the webhook URL generated above to replace the URLs currently configured to send to your AlertNotification subscriptions. Unlike the Alert Notification Alerts API, no credentials are needed for thiswebhook.
6. Click Save.7. To start receiving alerts from Alert Notification, ensure that Enable event management from this
source is set to On..
The following table defines the relationship between Alert Notification attributes and eventmanagement attributes.
Table 51. Attribute mapping
Alert Notification attribute Normalized attribute
Type type.statusOrThreshold
Where resource.name and resource.type
What summary
Source sender.name and sender.sourceId
Alert timestamp firstOccurrence
Severity severity
ApplicationsOrServices and Details event.details
URLs URLs
type.eventType is set to Alert.
eventState is set by a combination of Severity and Type. For example, a Severity = 0 and Type = resolution in Alert Notification would have an eventState = clear in event management.
sender.type is set to Alert Notification and sender.displayName is set by the name of the integration assigned in Alert Notification.
Note: Alert Notification attributes EmailMessageToSend, SMSMessageToSend, andVoiceMessageToSend are not currently mapped.
284 IBM Netcool Operations Insight: Integration Guide
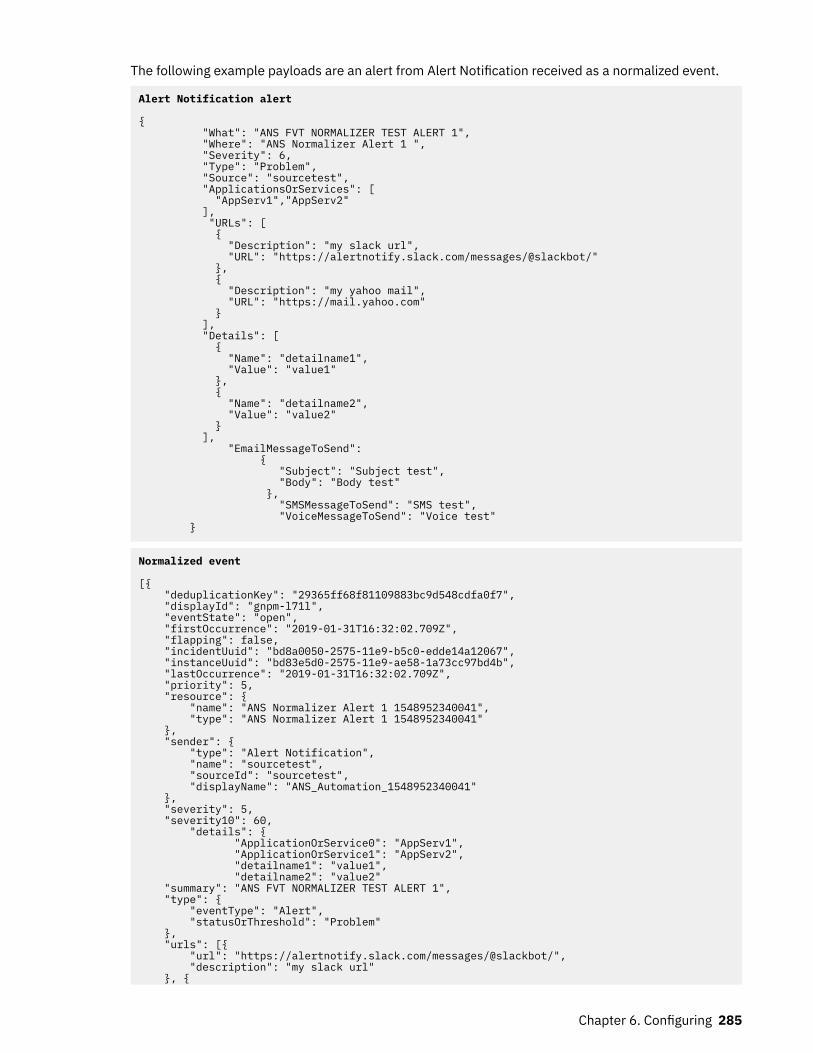
The following example payloads are an alert from Alert Notification received as a normalized event.
Alert Notification alert
{ "What": "ANS FVT NORMALIZER TEST ALERT 1", "Where": "ANS Normalizer Alert 1 ", "Severity": 6, "Type": "Problem", "Source": "sourcetest", "ApplicationsOrServices": [ "AppServ1","AppServ2" ], "URLs": [ { "Description": "my slack url", "URL": "https://alertnotify.slack.com/messages/@slackbot/" }, { "Description": "my yahoo mail", "URL": "https://mail.yahoo.com" } ], "Details": [ { "Name": "detailname1", "Value": "value1" }, { "Name": "detailname2", "Value": "value2" } ], "EmailMessageToSend": { "Subject": "Subject test", "Body": "Body test" }, "SMSMessageToSend": "SMS test", "VoiceMessageToSend": "Voice test" }
Normalized event
[{ "deduplicationKey": "29365ff68f81109883bc9d548cdfa0f7", "displayId": "gnpm-l71l", "eventState": "open", "firstOccurrence": "2019-01-31T16:32:02.709Z", "flapping": false, "incidentUuid": "bd8a0050-2575-11e9-b5c0-edde14a12067", "instanceUuid": "bd83e5d0-2575-11e9-ae58-1a73cc97bd4b", "lastOccurrence": "2019-01-31T16:32:02.709Z", "priority": 5, "resource": { "name": "ANS Normalizer Alert 1 1548952340041", "type": "ANS Normalizer Alert 1 1548952340041" }, "sender": { "type": "Alert Notification", "name": "sourcetest", "sourceId": "sourcetest", "displayName": "ANS_Automation_1548952340041" }, "severity": 5, "severity10": 60, "details": { "ApplicationOrService0": "AppServ1", "ApplicationOrService1": "AppServ2", "detailname1": "value1", "detailname2": "value2" "summary": "ANS FVT NORMALIZER TEST ALERT 1", "type": { "eventType": "Alert", "statusOrThreshold": "Problem" }, "urls": [{ "url": "https://alertnotify.slack.com/messages/@slackbot/", "description": "my slack url" }, {
Chapter 6. Configuring 285
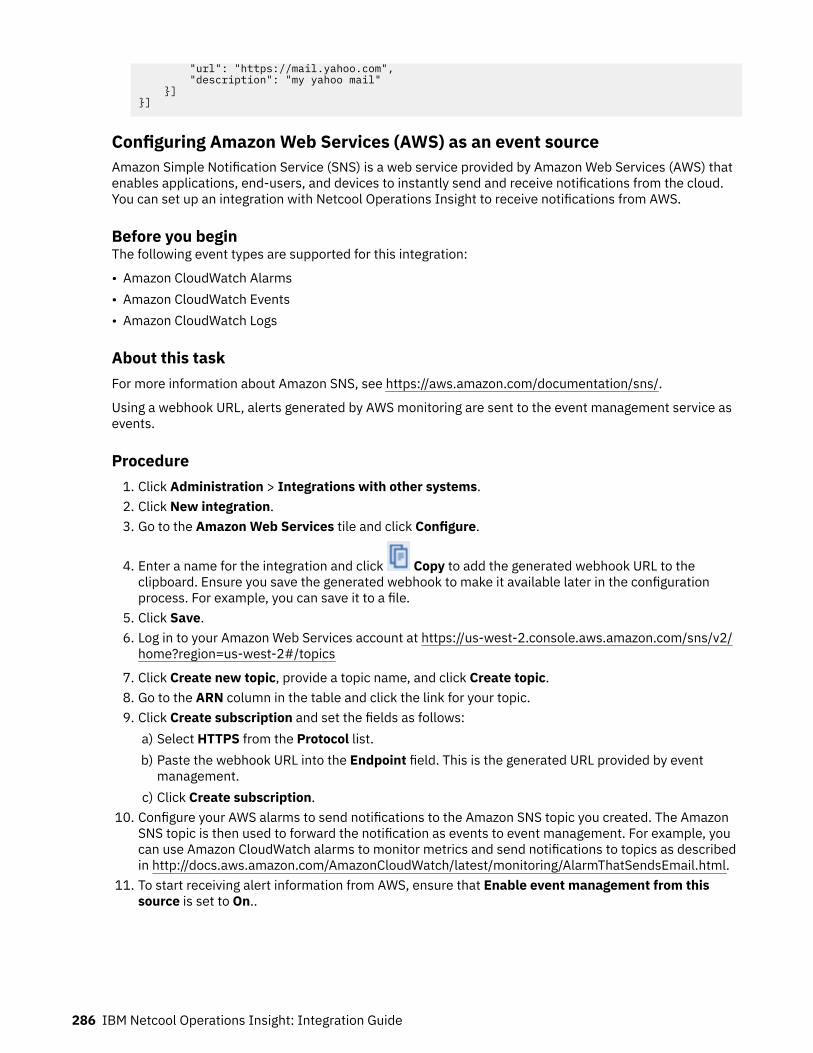
"url": "https://mail.yahoo.com", "description": "my yahoo mail" }]}]
Configuring Amazon Web Services (AWS) as an event sourceAmazon Simple Notification Service (SNS) is a web service provided by Amazon Web Services (AWS) thatenables applications, end-users, and devices to instantly send and receive notifications from the cloud.You can set up an integration with Netcool Operations Insight to receive notifications from AWS.
Before you beginThe following event types are supported for this integration:
• Amazon CloudWatch Alarms• Amazon CloudWatch Events• Amazon CloudWatch Logs
About this taskFor more information about Amazon SNS, see https://aws.amazon.com/documentation/sns/.
Using a webhook URL, alerts generated by AWS monitoring are sent to the event management service asevents.
Procedure1. Click Administration > Integrations with other systems.2. Click New integration.3. Go to the Amazon Web Services tile and click Configure.
4. Enter a name for the integration and click Copy to add the generated webhook URL to theclipboard. Ensure you save the generated webhook to make it available later in the configurationprocess. For example, you can save it to a file.
5. Click Save.6. Log in to your Amazon Web Services account at https://us-west-2.console.aws.amazon.com/sns/v2/
home?region=us-west-2#/topics
7. Click Create new topic, provide a topic name, and click Create topic.8. Go to the ARN column in the table and click the link for your topic.9. Click Create subscription and set the fields as follows:
a) Select HTTPS from the Protocol list.b) Paste the webhook URL into the Endpoint field. This is the generated URL provided by event
management.c) Click Create subscription.
10. Configure your AWS alarms to send notifications to the Amazon SNS topic you created. The AmazonSNS topic is then used to forward the notification as events to event management. For example, youcan use Amazon CloudWatch alarms to monitor metrics and send notifications to topics as describedin http://docs.aws.amazon.com/AmazonCloudWatch/latest/monitoring/AlarmThatSendsEmail.html.
11. To start receiving alert information from AWS, ensure that Enable event management from thissource is set to On..
286 IBM Netcool Operations Insight: Integration Guide
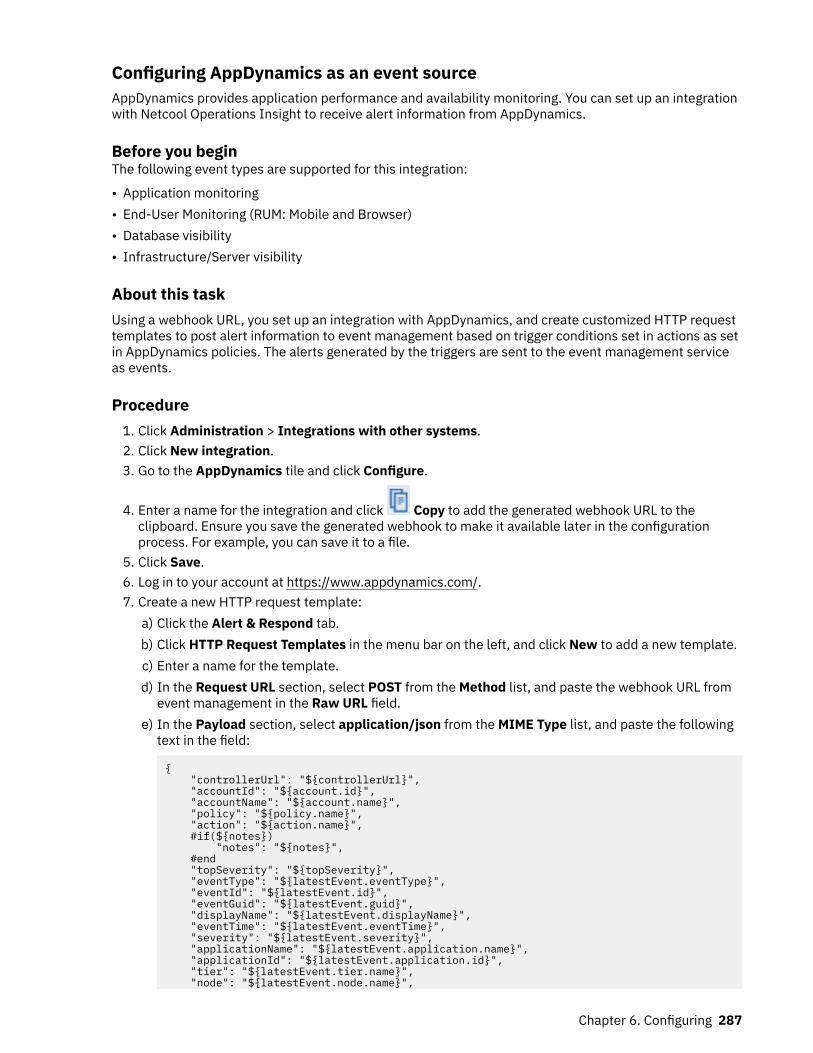
Configuring AppDynamics as an event sourceAppDynamics provides application performance and availability monitoring. You can set up an integrationwith Netcool Operations Insight to receive alert information from AppDynamics.
Before you beginThe following event types are supported for this integration:
• Application monitoring• End-User Monitoring (RUM: Mobile and Browser)• Database visibility• Infrastructure/Server visibility
About this taskUsing a webhook URL, you set up an integration with AppDynamics, and create customized HTTP requesttemplates to post alert information to event management based on trigger conditions set in actions as setin AppDynamics policies. The alerts generated by the triggers are sent to the event management serviceas events.
Procedure1. Click Administration > Integrations with other systems.2. Click New integration.3. Go to the AppDynamics tile and click Configure.
4. Enter a name for the integration and click Copy to add the generated webhook URL to theclipboard. Ensure you save the generated webhook to make it available later in the configurationprocess. For example, you can save it to a file.
5. Click Save.6. Log in to your account at https://www.appdynamics.com/.7. Create a new HTTP request template:
a) Click the Alert & Respond tab.b) Click HTTP Request Templates in the menu bar on the left, and click New to add a new template.c) Enter a name for the template.d) In the Request URL section, select POST from the Method list, and paste the webhook URL from
event management in the Raw URL field.e) In the Payload section, select application/json from the MIME Type list, and paste the following
text in the field:
{ "controllerUrl": "${controllerUrl}", "accountId": "${account.id}", "accountName": "${account.name}", "policy": "${policy.name}", "action": "${action.name}", #if(${notes}) "notes": "${notes}", #end "topSeverity": "${topSeverity}", "eventType": "${latestEvent.eventType}", "eventId": "${latestEvent.id}", "eventGuid": "${latestEvent.guid}", "displayName": "${latestEvent.displayName}", "eventTime": "${latestEvent.eventTime}", "severity": "${latestEvent.severity}", "applicationName": "${latestEvent.application.name}", "applicationId": "${latestEvent.application.id}", "tier": "${latestEvent.tier.name}", "node": "${latestEvent.node.name}",
Chapter 6. Configuring 287
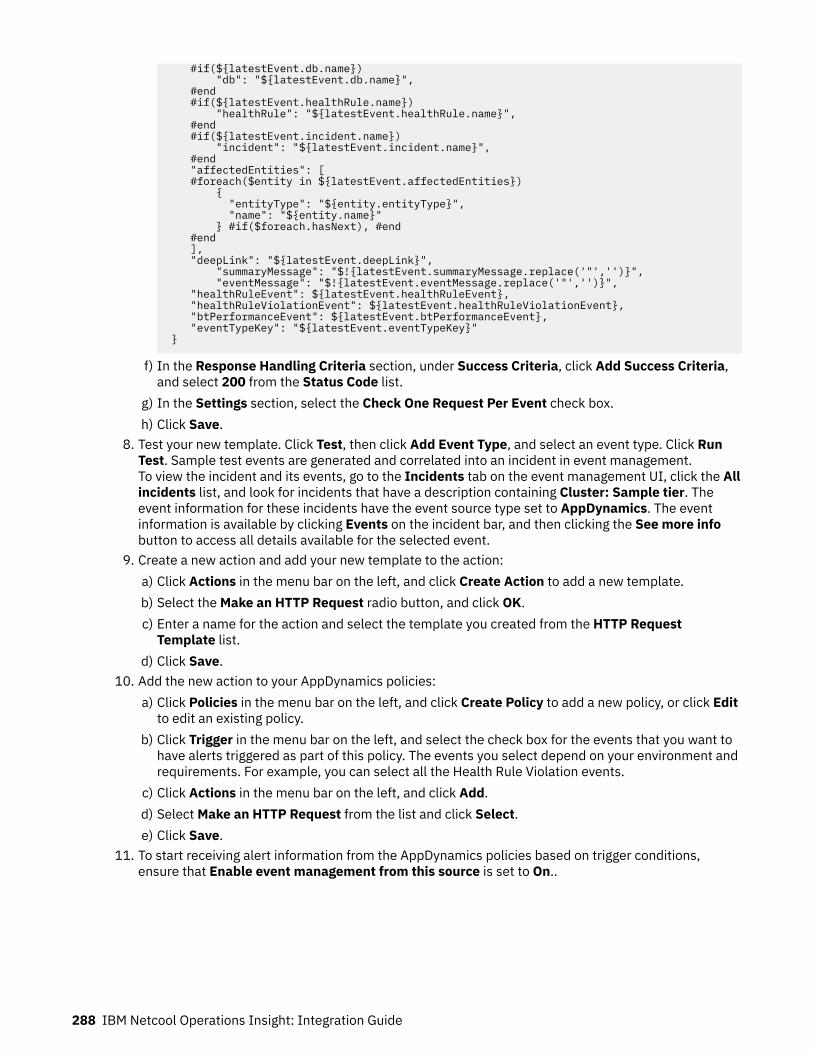
#if(${latestEvent.db.name}) "db": "${latestEvent.db.name}", #end #if(${latestEvent.healthRule.name}) "healthRule": "${latestEvent.healthRule.name}", #end #if(${latestEvent.incident.name}) "incident": "${latestEvent.incident.name}", #end "affectedEntities": [ #foreach($entity in ${latestEvent.affectedEntities}) { "entityType": "${entity.entityType}", "name": "${entity.name}" } #if($foreach.hasNext), #end #end ], "deepLink": "${latestEvent.deepLink}", "summaryMessage": "$!{latestEvent.summaryMessage.replace('"','')}", "eventMessage": "$!{latestEvent.eventMessage.replace('"','')}", "healthRuleEvent": ${latestEvent.healthRuleEvent}, "healthRuleViolationEvent": ${latestEvent.healthRuleViolationEvent}, "btPerformanceEvent": ${latestEvent.btPerformanceEvent}, "eventTypeKey": "${latestEvent.eventTypeKey}" }
f) In the Response Handling Criteria section, under Success Criteria, click Add Success Criteria,and select 200 from the Status Code list.
g) In the Settings section, select the Check One Request Per Event check box.h) Click Save.
8. Test your new template. Click Test, then click Add Event Type, and select an event type. Click RunTest. Sample test events are generated and correlated into an incident in event management.To view the incident and its events, go to the Incidents tab on the event management UI, click the Allincidents list, and look for incidents that have a description containing Cluster: Sample tier. Theevent information for these incidents have the event source type set to AppDynamics. The eventinformation is available by clicking Events on the incident bar, and then clicking the See more infobutton to access all details available for the selected event.
9. Create a new action and add your new template to the action:a) Click Actions in the menu bar on the left, and click Create Action to add a new template.b) Select the Make an HTTP Request radio button, and click OK.c) Enter a name for the action and select the template you created from the HTTP Request
Template list.d) Click Save.
10. Add the new action to your AppDynamics policies:a) Click Policies in the menu bar on the left, and click Create Policy to add a new policy, or click Edit
to edit an existing policy.b) Click Trigger in the menu bar on the left, and select the check box for the events that you want to
have alerts triggered as part of this policy. The events you select depend on your environment andrequirements. For example, you can select all the Health Rule Violation events.
c) Click Actions in the menu bar on the left, and click Add.d) Select Make an HTTP Request from the list and click Select.e) Click Save.
11. To start receiving alert information from the AppDynamics policies based on trigger conditions,ensure that Enable event management from this source is set to On..
288 IBM Netcool Operations Insight: Integration Guide
Configuring Datadog as an event sourceDatadog provides a monitoring service for your cloud infrastructure. You can set up an integration withNetcool Operations Insight to receive alert information from Datadog.
Before you beginThe following event types are supported for this integration:
• service_check
– Host - Check alert (event per host)– Host - Cluster alert (event per cluster/group)– Process - Check alert (event per host, per process)– Process - Cluster alert (event per process)– Network service - Check alert (event per host, per service)– Network service - Cluster alert (event per network)
• metric_alert_monitor (over single host)• metric_alert_monitor (over cluster/tag)• query_alert_monitor (complex query when configure Metric alert)
Log management events from Datadog are not currently supported.
About this taskUsing a webhook URL, alerts generated by Datadog monitors are sent to Netcool Operations Insight asevents.
Procedure1. Click Administration > Integrations with other systems.2. Click New integration.3. Go to the Datadog tile and click Configure.
4. Enter a name for the integration and click Copy to add the generated webhook URL to theclipboard. Ensure you save the generated webhook to make it available later in the configurationprocess. For example, you can save it to a file.
5. Click Save.6. Log in to your account at http://www.datadoghq.com.7. Click Integrations in the navigation menu.8. Go to the webhooks tile and click Install, or click Configure if you already have other webhooks set
up.9. Click the Configuration tab, and add a name for the webhook integration in the first available field of
the Name and URL section at the bottom of the form.10. Paste the webhook URL into the second field. This is the field after the one where you added the
name. This is the generated URL provided by event management.11. Click Install Integration or Update Configuration, and close the window.12. Set the webhook for each monitor you want to receive alerts from as follows:
a) Click Monitors > Manage Monitors in the navigation menu on the left side of the window.b) For existing monitors, hover over the monitor you want to receive alerts from and click Edit, or
click New Monitor if you are setting up a new monitor.
Chapter 6. Configuring 289
c) Go to the Say what's happening section and ensure you enter a title for your events in the headertext field. For Cluster Alerts, enter a title that includes the following: [Cluster:resource_monitored]. Enter the title in the following format:
Title text [Cluster: resource monitored]
For example: Some of [Cluster: http_service on redhat] is down.
This title is required for the correlation of your Datadog events into incidents.d) Go to the main body text field of the Say what's happening section, and type @. The available
webhook names are listed. Select the name of your webhook integration. The name is also addedto the Notify your team section.
Tip: You can also select your webhook name from the drop-down list in the Notify your teamsection. You can also select users to notify. The selected webhook and users are added to themessage in the Say what's happening section.
e) Click Save.f) Repeat these steps for each monitor you want to receive alerts from.
13. To start receiving alert information from the Datadog monitors, ensure that Enable eventmanagement from this source is set to On..
Configuring Dynatrace as an event sourceDynatrace provides application performance monitoring. You can set up an integration with NetcoolOperations Insight to receive problem notifications from Dynatrace.
Before you beginThe following event types are supported for this integration:
• Applications• Synthetic (browser/availability)• Transactions and services• Databases• Hosts• Network
About this taskUse a webhook URL and a custom payload to set up the integration between Dynatrace and eventmanagement.
Procedure1. Click Administration > Integrations with other systems.2. Click New integration.3. Go to the Dynatrace tile and click Configure.
4. Enter a name for the integration and click Copy to add the generated webhook URL to theclipboard. Ensure you save the generated webhook to make it available later in the configurationprocess. For example, you can save it to a file.
5. Go to step 3 and click Copy to add the custom payload to the clipboard. Ensure you save thecustom payload to make it available later in the configuration process. For example, you can save it toa file.
6. Click Save.
290 IBM Netcool Operations Insight: Integration Guide
7. Log in to your account at https://www.dynatrace.com/ and set up a custom integration:a) Go to Settings > Integration > Problem notifications.b) Click Set up notifications, and select Custom integration.c) On the Set up custom integration page, paste the webhook URL from event management in the
Webhook URL field.d) Paste the custom payload from event management in the Custom payload field.e) Click Save.
For more information about setting up custom integrations in Dynatrace, see https://www.dynatrace.com/support/help/problem-detection/problem-notification/how-can-i-set-up-outgoing-problem-notifications-using-a-webhook/.
8. Set the alerting rules for Availability, Error, Slowdown, Resource and Custom alerts in Dynatrace asdescribed in https://www.dynatrace.com/support/help/problem-detection/problem-notification/how-can-i-filter-problem-notifications-with-alerting-profiles/. The alerting rules determine whatproblem notifications are sent to event management as events.
9. Set the anomaly detection sensitivity for infrastructure components in Dynatrace as described inhttps://www.dynatrace.com/support/help/problem-detection/anomaly-detection/how-do-i-adjust-anomaly-detection-for-infrastructure-components/. The detection sensitivity and alert thresholdsdetermine what problem notifications are sent to Netcool Operations Insight as events.
10. To start receiving problem notifications as events from Dynatrace, ensure that Enable eventmanagement from this source is set to On..
Configuring Elasticsearch as an event sourceElasticsearch is a distributed, RESTful search and analytics engine that stores data as part of the ElasticStack. You can set up an integration with Elasticsearch to send log information to Netcool OperationsInsight as events.
Before you beginThe Elasticsearch event source is only supported when event management is deployed in an IBM CloudPrivate environment.
Ensure you have the X-Pack extension for the Elastic Stack installed as described in https://www.elastic.co/guide/en/x-pack/current/installing-xpack.html.
The following event types are supported for this integration:
• X-Pack Alerting
About this taskUsing the X-Pack Alerting (via Watcher) feature, you configure watches to send event information to eventmanagement. For information about X-Pack Alerting via Watcher, see https://www.elastic.co/guide/en/x-pack/current/how-watcher-works.html.
Procedure1. Click Administration > Integrations with other systems.2. Click New integration.3. Go to the Elasticsearch tile and click Configure.
4. Enter a name for the integration and click Copy to add the generated webhook URL to theclipboard. Ensure you save the generated webhook to make it available later in the configurationprocess. For example, you can save it to a file.
5. Click Save.
Chapter 6. Configuring 291
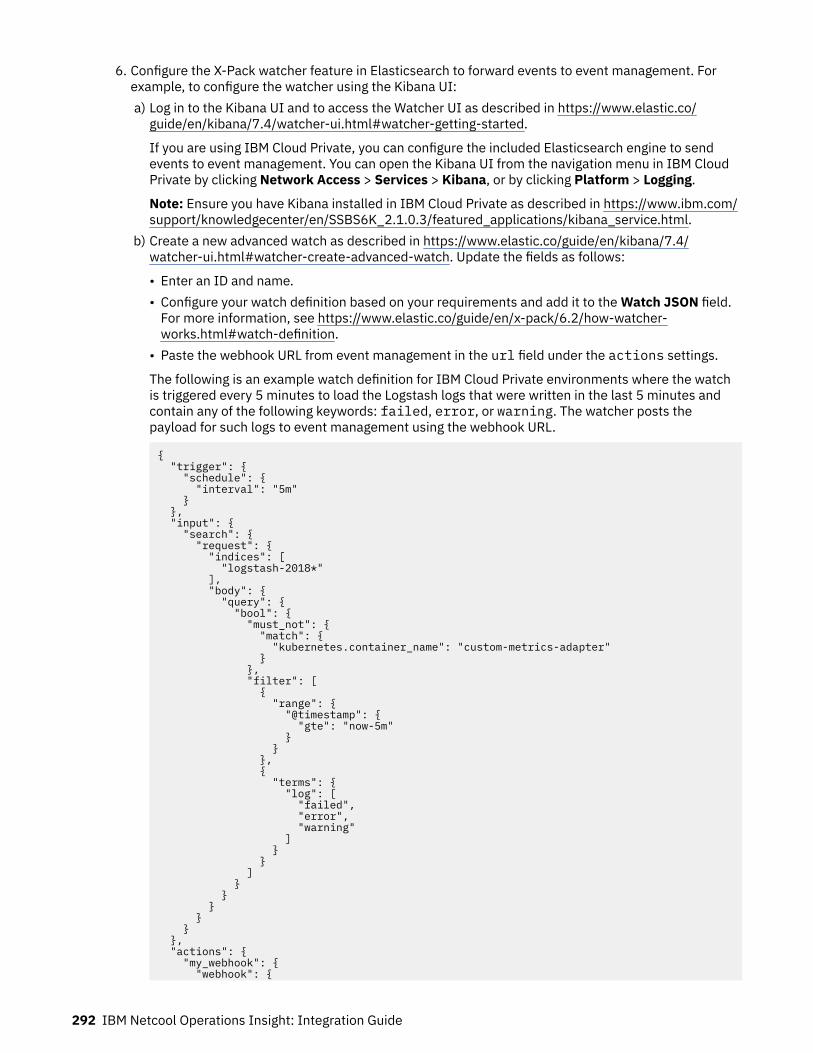
6. Configure the X-Pack watcher feature in Elasticsearch to forward events to event management. Forexample, to configure the watcher using the Kibana UI:a) Log in to the Kibana UI and to access the Watcher UI as described in https://www.elastic.co/
guide/en/kibana/7.4/watcher-ui.html#watcher-getting-started.
If you are using IBM Cloud Private, you can configure the included Elasticsearch engine to sendevents to event management. You can open the Kibana UI from the navigation menu in IBM CloudPrivate by clicking Network Access > Services > Kibana, or by clicking Platform > Logging.
Note: Ensure you have Kibana installed in IBM Cloud Private as described in https://www.ibm.com/support/knowledgecenter/en/SSBS6K_2.1.0.3/featured_applications/kibana_service.html.
b) Create a new advanced watch as described in https://www.elastic.co/guide/en/kibana/7.4/watcher-ui.html#watcher-create-advanced-watch. Update the fields as follows:
• Enter an ID and name.• Configure your watch definition based on your requirements and add it to the Watch JSON field.
For more information, see https://www.elastic.co/guide/en/x-pack/6.2/how-watcher-works.html#watch-definition.
• Paste the webhook URL from event management in the url field under the actions settings.
The following is an example watch definition for IBM Cloud Private environments where the watchis triggered every 5 minutes to load the Logstash logs that were written in the last 5 minutes andcontain any of the following keywords: failed, error, or warning. The watcher posts thepayload for such logs to event management using the webhook URL.
{ "trigger": { "schedule": { "interval": "5m" } }, "input": { "search": { "request": { "indices": [ "logstash-2018*" ], "body": { "query": { "bool": { "must_not": { "match": { "kubernetes.container_name": "custom-metrics-adapter" } }, "filter": [ { "range": { "@timestamp": { "gte": "now-5m" } } }, { "terms": { "log": [ "failed", "error", "warning" ] } } ] } } } } } }, "actions": { "my_webhook": { "webhook": {
292 IBM Netcool Operations Insight: Integration Guide
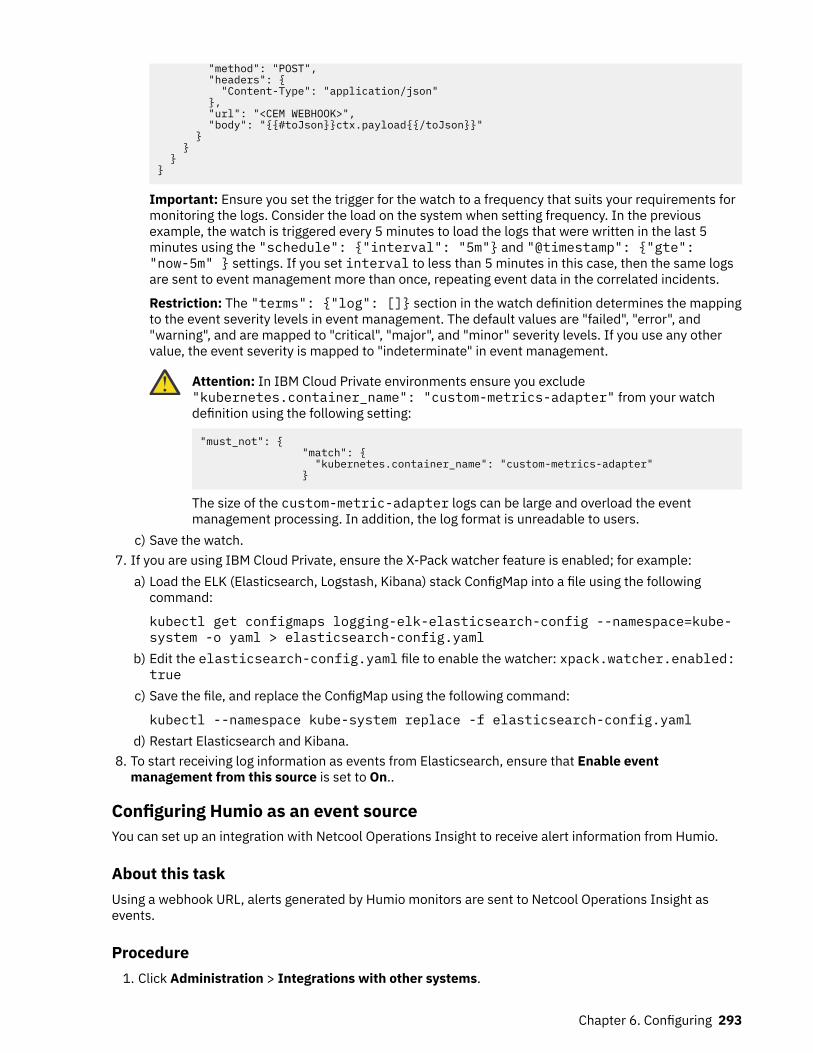
"method": "POST", "headers": { "Content-Type": "application/json" }, "url": "<CEM WEBHOOK>", "body": "{{#toJson}}ctx.payload{{/toJson}}" } } }}
Important: Ensure you set the trigger for the watch to a frequency that suits your requirements formonitoring the logs. Consider the load on the system when setting frequency. In the previousexample, the watch is triggered every 5 minutes to load the logs that were written in the last 5minutes using the "schedule": {"interval": "5m"} and "@timestamp": {"gte":"now-5m" } settings. If you set interval to less than 5 minutes in this case, then the same logsare sent to event management more than once, repeating event data in the correlated incidents.
Restriction: The "terms": {"log": []} section in the watch definition determines the mappingto the event severity levels in event management. The default values are "failed", "error", and"warning", and are mapped to "critical", "major", and "minor" severity levels. If you use any othervalue, the event severity is mapped to "indeterminate" in event management.
Attention: In IBM Cloud Private environments ensure you exclude"kubernetes.container_name": "custom-metrics-adapter" from your watchdefinition using the following setting:
"must_not": { "match": { "kubernetes.container_name": "custom-metrics-adapter" }
The size of the custom-metric-adapter logs can be large and overload the eventmanagement processing. In addition, the log format is unreadable to users.
c) Save the watch.7. If you are using IBM Cloud Private, ensure the X-Pack watcher feature is enabled; for example:
a) Load the ELK (Elasticsearch, Logstash, Kibana) stack ConfigMap into a file using the followingcommand:
kubectl get configmaps logging-elk-elasticsearch-config --namespace=kube-system -o yaml > elasticsearch-config.yaml
b) Edit the elasticsearch-config.yaml file to enable the watcher: xpack.watcher.enabled:true
c) Save the file, and replace the ConfigMap using the following command:
kubectl --namespace kube-system replace -f elasticsearch-config.yamld) Restart Elasticsearch and Kibana.
8. To start receiving log information as events from Elasticsearch, ensure that Enable eventmanagement from this source is set to On..
Configuring Humio as an event sourceYou can set up an integration with Netcool Operations Insight to receive alert information from Humio.
About this taskUsing a webhook URL, alerts generated by Humio monitors are sent to Netcool Operations Insight asevents.
Procedure1. Click Administration > Integrations with other systems.
Chapter 6. Configuring 293
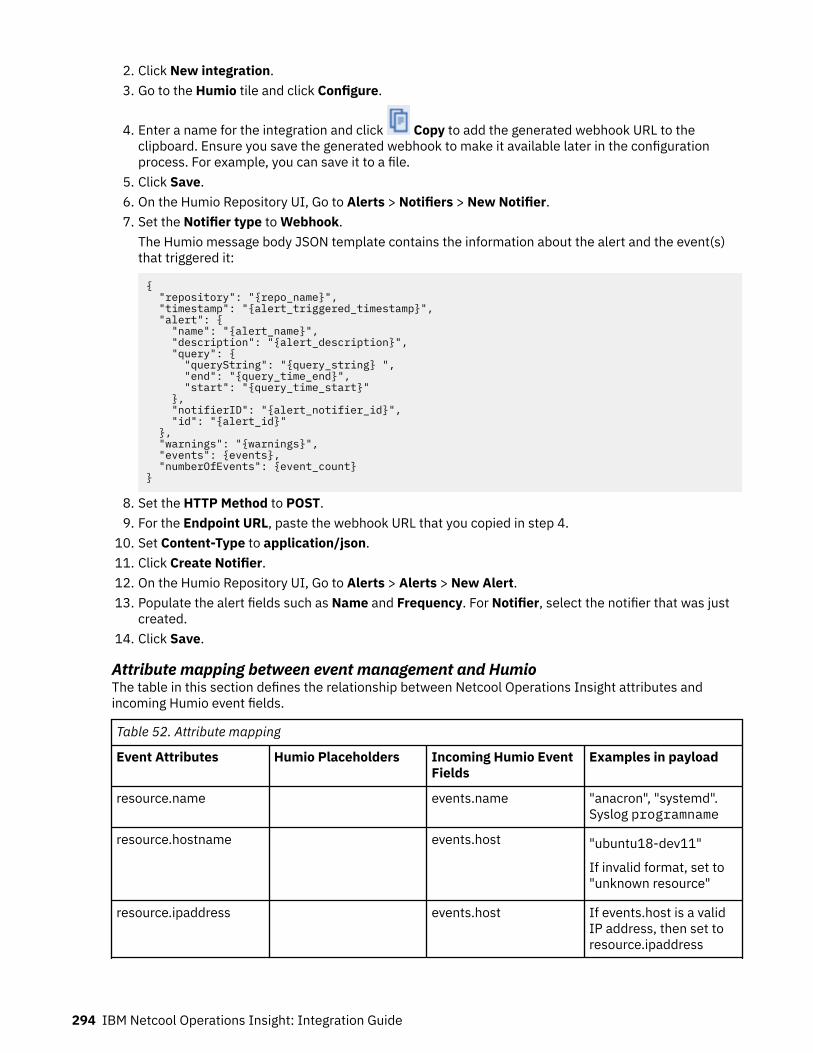
2. Click New integration.3. Go to the Humio tile and click Configure.
4. Enter a name for the integration and click Copy to add the generated webhook URL to theclipboard. Ensure you save the generated webhook to make it available later in the configurationprocess. For example, you can save it to a file.
5. Click Save.6. On the Humio Repository UI, Go to Alerts > Notifiers > New Notifier.7. Set the Notifier type to Webhook.
The Humio message body JSON template contains the information about the alert and the event(s)that triggered it:
{ "repository": "{repo_name}", "timestamp": "{alert_triggered_timestamp}", "alert": { "name": "{alert_name}", "description": "{alert_description}", "query": { "queryString": "{query_string} ", "end": "{query_time_end}", "start": "{query_time_start}" }, "notifierID": "{alert_notifier_id}", "id": "{alert_id}" }, "warnings": "{warnings}", "events": {events}, "numberOfEvents": {event_count}}
8. Set the HTTP Method to POST.9. For the Endpoint URL, paste the webhook URL that you copied in step 4.
10. Set Content-Type to application/json.11. Click Create Notifier.12. On the Humio Repository UI, Go to Alerts > Alerts > New Alert.13. Populate the alert fields such as Name and Frequency. For Notifier, select the notifier that was just
created.14. Click Save.
Attribute mapping between event management and HumioThe table in this section defines the relationship between Netcool Operations Insight attributes andincoming Humio event fields.
Table 52. Attribute mapping
Event Attributes Humio Placeholders Incoming Humio EventFields
Examples in payload
resource.name events.name "anacron", "systemd".Syslog programname
resource.hostname events.host "ubuntu18-dev11"
If invalid format, set to"unknown resource"
resource.ipaddress events.host If events.host is a validIP address, then set toresource.ipaddress
294 IBM Netcool Operations Insight: Integration Guide
Table 52. Attribute mapping (continued)
Event Attributes Humio Placeholders Incoming Humio EventFields
Examples in payload
resource.type Server, if syslogtag isnot empty
resource.sourceId events.pid 24719
resource.service events.facility "cron", "daemon"
type.eventType {alert_name} alert.name "RSyslog Event"
type.statusOrThreshold {query_string} alert.query.queryString "#type=syslog-utc |severity!=info"
summary events.message "Normal exit (0 jobsrun)"
"Anacron 2.3 started on2020-07-21"
"Job `cron.daily'terminated"
severity events.severity If the severity is notdefined in the Humioalert description field,Netcool OperationsInsight will set theseverity according to theSyslogd Probe defaultrules file. For moreinformation, see SyslogdProb.
timestamp events.@timestamp 1595227508103
urls.url {url} linkURL
urls.description "URL to open Humiowith the alert’s query"
sender.name "Humio"
sender.type "Humio"
sender.service events.name
details.event JSON.stringing (events) Stringify each event inevents for the relatedevent
details.alert JSON.stringing (alert) Exclude the events
Configuring the Humio alert description fieldYou can use the Humio alert description field to provide attributes for the event management API. Forexample, you can specify severity=Major in the description field so that all events triggered by thatalert have a severity of major in event management.
The table in this section shows the configurable event management payload attributes. Multiple fields canbe populated and separated by a space, as in the following example:
Chapter 6. Configuring 295
summary=\"A problem on the host myhost.com\" severity=Critical resource.hostname=myhost.com
Table 53. Configurable event management payload attributes
Event managementevent payload
Type Expected format inHumio alert descriptionfield
Examples/notes
resource sender object resource.name
resource.application
resource.cluster
resource.components
resource.controller
resource.correlationKey
resource.displayName
resource.displayName
resource.hostname
resource.interface
resource.ipaddress
resource.location
resource.port
resource.service
resource.sourceId
resource.type
resource.name=\"newname\"
severity string severity severity=Major
Allowable values:
• Critical• Major• Minor• Information• Indeterminate
summary string summary summary=\"Thesummary of issue\"
type object type.eventType
type.statusOrThreshold
type.eventType=\"alertname\"
deduplicationKey string deduplication deduplicationKey=dedupKey
details object details.<sample> details.additionalDetails=\"Additionalinformation about thealert\"
expiryTime integer expiryTime expiryTime=60, meansexpiring in 60 seconds
296 IBM Netcool Operations Insight: Integration Guide

Table 53. Configurable event management payload attributes (continued)
Event managementevent payload
Type Expected format inHumio alert descriptionfield
Examples/notes
relatedResources array relatedResources.#.name
relatedResources.#.application
relatedResources.#.cluster
relatedResources.#.component
relatedResources.#.controller
relatedResources.#.correlationKey
relatedResources.#.displayName
relatedResources.#.hostname
relatedResources.#.interface
relatedResources.#.ipaddress
relatedResources.#.location
relatedResources.#.hostname
relatedResources.#.location
relatedResources.#.port
relatedResources.#.relationship
relatedResources.#.service
relatedResources.#.sourceId
relatedResources.#.type
The hash tag "#" refersto the numbering. Allfields with the samenumbering are groupedtogether under onerelatedResoucesobject in eventmanagement.
Examples:
• relatedResources.1.name="related resourcename 1"
• relatedResources.2.name="related resourcesname 2"
resolution boolean resolution resolution=true
timestamp integer timestamp timestamp=1595402850247
Chapter 6. Configuring 297
Table 53. Configurable event management payload attributes (continued)
Event managementevent payload
Type Expected format inHumio alert descriptionfield
Examples/notes
urls array urls.#.url
urls.#.description
The hash tag "#" refersto the numbering. Allfields with the samenumbering are groupedtogether under oneurls object in eventmanagement.
Examples:
• urls.1.url=https://www.bluemix.net
• urls.1.description=\"blumix url\"
The description of each payload attribute is available in the Event Management Event API.
The following two scenarios show how this feature might be used.
Scenario 1: Expire the Humio informational events in event managementUse the expiryTime attribute to specify the expiry time in seconds to expire the events.
For example, specify expiryTime=3600 in the Humio alert description field to expire the events in eventmanagement after 3600 seconds (1 hour).
Scenario 2: Deduplicate problem and resolution events in event managementThe resource bundle and eventType must be the same in event management to deduplicate Humioproblem and resolution events. In event management, the eventType is populated with the Humio alertname. If the Humio alert name is not the same, you can modify in the Humio alert description field inHumio.
In this example, lets create two alerts with two different alert names to retrieve the problem andresolution logs for the same resource in Humio. Then, we must define the same eventType in both alertdescriptions. See the following examples:
Table 54. Deduplicate problem and resolution events
Humio alert name Function
Monitor problems in host 123. To query the logs that contain problems in host123.
Monitor resolutions in host 123. To query the logs that contain resolutions in host123.
The 2 alerts are monitoring problem and resolution events in host 123. Now, we need to define the sameeventType value in both alert description fields. For example, specify type.eventType=\"monitorlogs in host 123\" in both alert description fields in Humio. These events will then be deduplicatedand cleared automatically in event management.
298 IBM Netcool Operations Insight: Integration Guide
Example: Monitoring Syslog events from a Humio integrationYou can use Rsyslog with minimal configuration to send Syslog logs to Humio. The Rsyslog log processoris shipped with most popular Linux distributions.
Procedure1. Follow the recommended configuration to forward all logs to Humio. For more information, see the
Humio product documentation: https://docs.humio.com/integrations/data-shippers/rsyslog/.2. Create a webhook notifier to send events to Netcool Operations Insight, as described in steps 1 to 11
of “Configuring Humio as an event source” on page 293..3. Create an alert with the query "syslogtag=*" to monitor the logs in Humio repository.
a) On the Humio UI, select Search.b) Enter syslogtag=* in the field provided and click Run.c) Click Save as > Alert.d) Populate the alert fields such as Name and Frequency. For Notifier, select the notifier that was just
created.e) Click Save.
Configuring IBM UrbanCode Deploy as an event sourceYou can set up an integration with Netcool Operations Insight to receive notifications created by IBMUrbanCode® Deploy. IBM UrbanCode Deploy is a tool for automating application deployments throughyour environments. It facilitates rapid feedback and continuous delivery in agile development, whileproviding the audit trails, versioning, and approvals needed in production. Emails are sent to NetcoolOperations Insight as events.
Before you beginYou must have a docker account.
The following event types are supported for this integration:
• IBM UrbanCode Deploy email notifications
About this taskIBM UrbanCode Deploy sends email notifications when user-defined trigger events occur on the server.You must configure the email probe container to retrieve emails from the email account and perform thenormalization. After the normalization, the probe will send the events to event management.
Procedure1. Click Administration > Integrations with other systems.2. Click New integration.3. Go to the IBM UrbanCode Deploy tile and click Configure.4. Enter a name for the integration.5. Click Download file to download and decompress the email-probe-package.zip file.
Important: The download file contains credential information and should be stored in a securelocation.
6. Extract the package into a docker environment where docker and docker compose are installed.a) In the location where you extracted the download package, identify the file interfaces.http.b) Edit interfaces.http and find the line that reads as follows:
"hostname" : "netcool.release_name.ingress_fqdn/normlundefined"
c) Modify this line to read as follows:
Chapter 6. Configuring 299

"hostname" : "netcool.release_name.ingress_fqdn/norml"
7. Grant execution rights to integration.sh, for example chmod 755 integration.sh.8. Go to https://store.docker.com/images/ibm-netcool-probe-email to read the description and then
click Proceed to checkout on the right of the page. Enter the required contact information and clickGet Content.
9. Run docker login in your docker environment.10. Uncomment LICENSE=accept in probe.env to accept the license agreement.11. Update probe.env to populate EMAIL_SERVER_HOSTNAME, USERNAME, PASSWORD, and FILTER.
• EMAIL_SERVER_HOSTNAME is used to specify the email server host name, such as gmail.com.• USERNAME is used to specify the user name of the email account.• PASSWORD is used to specify the plain password to access the email account. The plain password
will be encrypted when the container is running. Note: do not set a password that starts withENCRYPTED as this keyword is used to determine whether it is a plain or encrypted password.
• FILTER is used to specify the UCD sender email address. The sender email address can be found inUCD Home > Settings > System Settings > Mail Server Settings > Mail Server Sender Address.
• Optionally, you can update POLLINTERVAL to specify the frequency in seconds for the probe toretrieve new emails. The default value is 600 seconds.
12. Run docker-compose up to start the probe.
Note:
a. The probe only connects to the IMAP mail server over a TLS connection so the email server musthave a valid certificate.
b. The probe only supports the default UCD notification template.c. The probe deletes emails from the mail server after retrieving them.d. For the probe to run smoothly, avoid updating other probe properties in email.props.
Unsupported Events
There are four mandatory normalized fields required to publish an event in Netcool OperationsInsight. The attributes are Resource Name, Summary, Event Type and Severity. If an Unknown -<cause> error is displayed for any of these fields, you will need to update the UCD email notificationtemplate. This might happen if you have used a custom notification template.
The following table contains some error messages, possible causes and resolutions.
Table 55. Mandatory CEM field error messages
Normalized Field Messages Possible Causes Resolutions
Summary Unknown - Missing theSubject field in UCDemail.
Missing the Subjectfield in UCD email.
Update the notificationtemplate to addSubject field.
Resource Name Unknown - Missing theexpected format ofApplication name inUCD email.
The Application field inthe UCD email is notfollowing the format indefault emailnotification template.
Follow the exact formatused in the defaultnotification templates.
Resource Name Unknown - Missing theexpected format ofProcess name in UCDemail.
The Process field in theUCD email is notfollowing the format indefault emailnotification template.
Follow the exact formatused in the defaultnotification templates.
300 IBM Netcool Operations Insight: Integration Guide
Table 55. Mandatory CEM field error messages (continued)
Normalized Field Messages Possible Causes Resolutions
Resource Name Unknown - Missing theApplication or Processname in UCD email.
Missing the Applicationor Process field in UCDemail.
Update the notificationtemplate to addApplication or Processfield.
Event Type Unknown - Missing thekeyword of Process orApproval at the Subjectfield in UCD email toindicate the event type.
Missing the keyword ofProcess or Approval atthe Subject field in UCDemail to indicate theevent type.
Update the notificationtemplate to addkeyword of Process orApproval at the Subjectfield.
13. To start receiving alert notifications from IBM UrbanCode Deploy, ensure that Enable eventmanagement from this source is set to On..
If you feel that the current webhook URL for the email probe has been compromised in some way, you candownload the email probe zip file again to regenerate the webhook. This invalidates the existing webhookURL and replaces it with a new one. In this scenario, you must repeat the configuration steps to save thezip file in a docker environment and rerun docker compose to start the email probe with new webhook.
Configuring Jenkins as an event sourceJenkins helps automate software development processes such as builds to allow continuous integration.You can set up an integration with Netcool Operations Insight to receive notifications about jobs fromJenkins projects.
Before you begin
If your Netcool Operations Insight installation is using a certificate authority (CA) that is not well known,then you will need to ensure that your CA is trusted by Jenkins. Complete these steps to convert your CAcertificate into the correct format and import it into the Jenkins trust store.
1. Run the following command:
openssl pkcs7 -in cert.pem -out cert.crt -print_certs
2. Import your certificate to the JVM keystore as a trusted certificate:
keytool -storepass <store_password> -import -noprompt -trustcacerts -alias <certificate_alias> -keystore cacerts -file cert.crt
3. Restart your Jenkins server process to pick up the new certificate.4. Ensure your Jenkins server host can resolve the domain name of your Cloud Event Management
installation.5. Modify the DNS server or add the host and domain name to the hosts file.
About this taskNotifications can be sent for single job stages or all stages of a job. Configure each project separately fromwhich you want to receive notifications. The notifications are raised in event management as events. Theevents are then correlated into incidents.
Important: The Jenkins server needs the Notification Plug-in to send the notifications.
Procedure1. Click Administration > Integrations with other systems.2. Click New integration.
Chapter 6. Configuring 301
3. Go to the Jenkins tile and click Configure.
4. Enter a name for the integration and click Copy to add the generated webhook URL to theclipboard. Ensure you save the generated webhook to make it available later in the configurationprocess. For example, you can save it to a file.
5. Click Save.6. Log into your Jenkins server as administrator.7. Ensure that the Notification Plug-in is installed on your Jenkins server.
Tip: Check first whether the plug-in is installed by clicking Jenkins > Manage Jenkins > ManagePlugins . Go to the Installed tab and look for the Notification plugin. If not in the list of installed plug-ins, go to the Available tab and search for Notification plugin. Select the check box for the plug-in andclick Install.
8. Configure the Jenkins project you want to receive notifications from as follows:a) Click the project name and then click Configure.b) Click the Job Notifications tab, and click Add Endpoint.c) Set up the connection as follows:
• Select JSON from the Format list.• Select HTTP from the Protocol list.• Select when you want to receive notifications about the job from the Event list. For example, All
Events sends a notification for each job phase, while Job Finalized only triggers a notificationwhen the job has completed, including post-build activities. Select All Events to receive detailedinformation about the jobs.
• Paste the webhook URL into the URL field. This is the generated URL provided by eventmanagement.
• Enter 5 in the Log field. This determines the number of lines to include from the log in themessage.
d) Click Savee) Repeat the steps for each project you want to receive notification from.
9. To start receiving notifications about Jenkins jobs, ensure that Enable event management from thissource is set to On..
Configuring Logstash as an event sourceWhen Netcool Operations Insight is deployed in an IBM Cloud Private environment, you can forward logdata to Netcool Operations Insight from Logstash.
Before you beginBy default, the IBM Cloud Private installer deploys an Elasticsearch, Logstash and Kibana (ELK) stack tocollect system logs for the IBM Cloud Private managed services, including Kubernetes and Docker. Formore information, see https://www.ibm.com/support/knowledgecenter/en/SSBS6K_2.1.0.2/manage_metrics/logging_elk.html
The following event types are supported for this integration:
• Logs
Note: Ensure you meet the prerequisites for IBM Cloud Private, such as installing and configuring thekubectl, the Kubernetes command line tool.
About this taskThe log data collected and stored by Logstash for your IBM Cloud Private environment can be configuredto be forwarded to event management as event information and then correlated into incidents.
302 IBM Netcool Operations Insight: Integration Guide
Procedure1. Click Administration > Integrations with other systems.2. Click New integration.3. Go to the Logstash tile and click Configure.
4. Enter a name for the integration and click Copy to add the generated webhook URL to theclipboard. Ensure you save the generated webhook to make it available later in the configurationprocess. For example, you can save it to a file.
5. Click Save.6. Modify the default Logstash configuration in IBM Cloud Private to add event management as a receiver.
To do this, edit the Logstash pipeline ConfigMap to add the webhook URL in the output section asfollows:a) Load the ConfigMap into a file using the following command:
kubectl get configmaps logstash-pipeline --namespace=kube-system -o yaml >logstash-pipeline.yaml
Note: The default Logstash deployment ConfigMap name in IBM Cloud Private is logstash-pipeline in the kube-system namespace. If your IBM Cloud Private logging uses a differentLogstash deployment, modify the ConfigMap name and namespace as required for thatdeployment.
b) Edit the logstash-pipeline.yaml file and add an HTTP section to specify event managementas a destination using the generated webhook URL. Paste the webhook URL into the url field:
output { elasticsearch { index => "logstash-%{+YYYY.MM.dd}" hosts => "elasticsearch:9200" } http { url => "<Cloud_Event_Management_webhook_URL>" format => "json" http_method => "post" pool_max_per_route => "5" } }
Note: The pool_max_per_route value is set to 5 by default. It limits the number of concurrentconnections to event management to avoid data overload from Logstash. You can modify thissetting as required.
c) Save the file, and replace the ConfigMap using the following command:
kubectl --namespace kube-system replace -f logstash-pipeline.yamld) Check the update is complete at https://<icp_master_ip_address>:8443/console/configuration/configmaps/kube-system/logstash-pipeline
Note: It can take up to a minute for the configuration changes to take affect.7. To start receiving log data from Logstash, ensure that Enable event management from this source is
set to On..
Configuring Microsoft Azure as an event sourceMicrosoft Azure provides monitoring services for Azure resources. You can set up an integration withNetcool Operations Insight to receive alert information from Microsoft Azure.
Before you beginThe following event types are supported for this integration:
• Azure Classic Metrics and Azure Metrics
Chapter 6. Configuring 303

• Azure Activity Log Alerts• Azure Auto-shutdown notification• Azure Auto-scales notification• Azure Log Search Alerts:
About this task• Using a webhook URL, alerts generated by Microsoft Azure monitoring are sent to the event
management service as events.• No expiry time is set for Azure Log Alerts in event management.
Procedure1. Click Administration > Integrations with other systems.2. Click New integration.3. Go to the Microsoft Azure tile and click Configure.
4. Enter a name for the integration and click Copy to add the generated webhook URL to theclipboard. Ensure you save the generated webhook to make it available later in the configurationprocess. For example, you can save it to a file.
5. Click Save.6. Log in to your Microsoft Azure account at https://portal.azure.com/.7. Go to the Dashboard and select the resource you want event information from. Click the resource
name.8. Go to MONITORING in the navigation menu and click Alerts.9. Click New alert rule at the top of the page.
10. Set up the rule as follows:
Remember: For Azure Log Search Alerts select Application Insight or Log Analytics Workspacesunder the Resource section.
a) Enter a name for the rule and add a description.b) Select the metric that you want this alert rule to monitor for the selected resource.c) Set a condition and enter a threshold value for the metric. When the threshold value for the set
condition is reached, an alert is generated and sent as an event to event management.d) Select the time period to monitor the metric data.e) Optional: Set up email notification.f) Paste the webhook URL into the Webhook field. This is the generated URL provided by event
management.g) Click OK.
11. To start receiving alert information from Microsoft Azure, ensure that Enable event managementfrom this source is set to On..
Configuring Microsoft System Center Operations Manager as an event sourceSystem Center Operations Manager (SCOM) is a cross-platform data center monitoring system foroperating systems and hypervisors. You can set up an integration with Netcool Operations Insight toreceive notifications created by SCOM.
About this taskDownload the integration package from event management and import the scripts into your SCOM server.Sample commands are provided for Windows operating systems. Copy the notification script scom-
304 IBM Netcool Operations Insight: Integration Guide

cem.ps1 to any accessible directory on your SCOM server. A channel, a subscriber, and a subscription arerequired in SCOM to use the scom-cem.ps1 script to forward notifications to event management.
The default resource type is "Server". "Database", "Application", and "Service" are also supported.
Procedure1. Click Administration > Integrations with other systems.2. Click New integration.3. Go to the Microsoft System Center Operations Manager tile and click Configure.4. Enter a name for the integration.5. Click Download file to download the scom-cem.ps1 script file.6. Copy the script to any accessible directory on your SCOM server. Use the following command (on
Windows) to copy scom-cem.ps1 to any directory on your SCOM server:
copy scom-cem.ps1 C:\<cem-scom>\
Replacing <cem-scom> with your chosen directory.7. To prevent malicious scripts from running on your machine, Windows prevents downloaded internet
files from being runnable. Complete these steps to unblock the file:a) Browse to the scom-cem.ps1 file using Windows Explorer.b) Right-click the file and select Properties.c) On the General tab, under Security, click the Unblock check box.d) Click OK.
8. Edit the scom-cem.ps1 script file and locate the following line:
Import-Module "C:\Program Files\Microsoft System Center 2016\Operations Manager\Powershell\OperationsManager\OperationsManager.psm1"
Replace the file path with the location of OperationsManager.psm1 on your environment.9. Open the SCOM Operations Console to create a command channel, subscriber, and subscription for
event management to integrate with the scom-cem.ps1 script file.
To create a command channel:
a) In the SCOM Console, go to Administrator > Notifications > Channels > New > Command.b) Enter a name for the channel and click Next.c) The following sample input is entered on the Settings tab:
Full path of the command line:
C:\Windows\System32\WindowsPowerShell\v1.0\powershell.exe
Command line parameters:
"C:\cem-scom\scom-cem.ps1" -AlertID "$Data[Default='NotPresent']/Context/DataItem/AlertId$" -CreatedByMonitor "$Data[Default='NotPresent']/Context/DataItem/CreatedByMonitor$" -ManagedEntitySource "$Data[Default='NotPresent']/Context/DataItem/ManagedEntityDisplayName$" -WorkflowId "$Data[Default='NotPresent']/Context/DataItem/WorkflowId$" -DataItemCreateTimeLocal "$Data[Default='NotPresent']/Context/DataItem/DataItemCreateTimeLocal$" -ManagedEntityPath "$Data[Default='NotPresent']/Context/DataItem/ManagedEntityPath$" -ManagedEntity "$Data[Default='NotPresent']/Context/DataItem/ManagedEntity$" -MPElement "$MPElement$"
Startup folder for the command line:
C:\Windows\System32\WindowsPowerShell\v1.0\
d) Click Finish and Close.
Chapter 6. Configuring 305

10. Create a notification subscriber and subscription in Microsoft System Center Operations Manager forevent management. In the SCOM Console, go to Administrator > Notifications > Subscribers > New.
For new subscriptions click Administrator > Notifications > Subscription > New.11. Save the integration in event management. To start receiving notifications from Microsoft System
Center Operations Manager, ensure that Enable event management from this source is set to On..
What to do nextBecause the SCOM notification does not track the script execution history, a log has been added to thepowershell script to track if the script has been called and executed successfully. Therefore, you mustcreate a tmp directory and log files on the SCOM server for the script to write to.
Complete the following steps to create a tmp directory and log files on the SCOM server:
1. By default, the powershell script writes the log to C:\tmp\postResultCEM.text.2. Create the C:\tmp directory. If you want to set a different directory, change the following line inscom-cem.ps1:
## Temp directory to capture the raw event$tmpdir = "C:\tmp"
3. Create the C:\tmp\postResultCEM.txt file. If you want to set a different file, change the followingline in scom-cem.ps1:
$postFile = "$tmpdir\postResultCEM.txt"
4. Add read and execute permission for directory and file that you created in steps 2 and 3.5. If you want to disable logs, make the following changes in scom-cem.ps1:
## Comment out the two lines below:#$postFile = "$tmpdir\postResultCEM.txt"#Add-content $postFile -value $json
## Change the following line as below:Invoke-RestMethod -Verbose -Method Post -ContentType "application/json" -Body $json -Uri $Url
Configuring Nagios XI as an event sourceNagios XI provides network monitoring products. You can set up an in integration with Netcool OperationsInsight to receive alert information from Nagios XI products.
Before you beginThe following event types are supported for this integration:
• Service Notifications• Host Notifications
About this taskUsing a package of configuration files provided by event management, you set up an integration withNagios XI. The alerts generated by Nagios XI are sent to the event management service as events.
Note: Event management supports integration with the server monitoring and web monitoringcomponents of the Nagios XI product.
Procedure1. Ensure that the Nagios Plugins are installed into your instance of Nagios XI. Depending on how the
plugins are controlled, you can check their status as follows:
• If you use xinetd for controlling the plugins: service xinetd status
306 IBM Netcool Operations Insight: Integration Guide
• If you use a dedicated daemon for controlling the plugins:service nrpe status2. Click Administration > Integrations with other systems.3. Click New integration.4. Go to the Nagios XI tile and click Configure.5. Enter a name for the integration.6. Click Download file to download the nagios-cem.zip file. The compressed file contains three files
to set up the integration with event management:
• The file cem.cfg needs to be imported into Nagios XI.• The file nagios-cem-webhook.sh includes the unique webhook URL generated for this
integration.• The file import-cem.sh copies the cem.cfg and nagios-cem-webhook.sh files to Nagios XI
destination directory.
Important: The download file contains credential information and should be stored in a securelocation.
7. Click Save to save the integration in event management.8. Extract the files to any directory, and copy the files to the Nagios XI server.9. Run the import-cem.sh command to copy the cem.cfg and nagios-cem-webhook.sh files to
the correct Nagios XI destination directory.
For example, if you are logged in as a non-root user, run the command as follows to ensure it runs asroot and copies the files as required: sudo bash ./import-cem.sh.
10. Log in to the Nagios XI UI as an administrator, and use the Core Config Manager to import thecem.cfg file:a) Go to Configure in the menu bar at the top of the window and select Core Config Manager from
the list.b) Select Tools > Import Config Files from the menu on the left side of the window.c) Select cem.cfg and click Import.
11. Enable the environment variable macro:a) In Core Config Manager, select CCM Admin > Core Configs from the menu on the left side of the
window.b) On the General tab enter 1 for the enable_environment_macros parameter.c) Click Save Changes.
12. Ensure the cemwebhook contact is added to the set of hosts and services you monitor:
Note: Remember to enable the cemwebhook contact when setting up a source to monitor. To enablethe cemwebhook contact for the host and all services for that host, ensure you select CEM Webhook-Contact under Send Alert notification To in Step 4 of the Configuration Wizard.
To check that cemwebhook is among the contacts included in alerts for a host:
a) In Core Config Manager, select Monitoring > Hosts from the menu on the left side of the window.b) Click a host name to edit its settings.c) Click the Alert Settings tab and then click Manage Contacts.d) Ensure that cemwebhook is in the Assigned column. If not, then select it and click Add Selected.e) Click Close and then Save.
Note: This example is for checking host settings, but the same steps can be followed to checkservices.
13. Change the command type for the notify-cem-host and notify-cem-service commands:a) In Core Config Manager, select Commands > _Commands from the menu on the left side of the
window.
Chapter 6. Configuring 307
b) Locate and click notify-cem-host to edit its settings.c) Select misc command from the Command Type list.d) Click Save.e) Repeat for notify-cem-service.
14. Select Quick Tools > Apply Configuration from the menu on the left side of the window and clickApply Configuration.
15. To start receiving alert information from Nagios XI, ensure that Enable event management from thissource is set to On..
Configuring New Relic as an event sourceNew Relic monitors mobile and web applications in real-time, helping users diagnose and fix applicationperformance problems. You can receive New Relic alerts through the incoming webhooks of NetcoolOperations Insight.
Before you beginThe following event types are supported for this integration:
• APM• Servers• Plugins• Synthetics• Infrastructure• Browser
About this taskYou can configure integration with both New Relic Legacy or New Relic Alerts systems. Both configurationprocedures are documented here. The first step is to generate the webhook URL within eventmanagement.
Procedure1. Generate an incoming webhook for New Relic:
a) Click Administration > Integrations with other systems.b) Click New integration.c) Depending on the version you use, go to the New Relic Legacy or New Relic Alerts tile, and click
Configure.
d) Enter a name for the integration and click Copy to add the generated webhook URL to theclipboard. Ensure you save the generated webhook to make it available later in the configurationprocess. For example, you can save it to a file.
e) Click Save.2. Use the incoming webhook to:
• “Configure New Relic Legacy” on page 309 as source.• “Configure New Relic Alerts” on page 309 as source.
308 IBM Netcool Operations Insight: Integration Guide
Configure New Relic AlertsConfigure integration with New Relic Alerts.
About this taskConfigure New Relic Alerts as source:
Procedure1. Generate an incoming webhook as described in “1” on page 308.2. Log in to New Relic at https://alerts.newrelic.com/ as an administrator.3. From the New Relic menu bar, select Alerts > Notification channels.4. Click New notification channel.5. In the Channel details section, select Webhook for channel type.6. Enter a name for the channel and paste the webhook URL into the Base URL field. This is the
generated URL provided by event management.7. Click Create channel.8. Associate the webhook channel with all of the New Relic policies that you want to receive events
from. For more information about associating channels with policies, see the New Relicdocumentation at https://docs.newrelic.com/docs/alerts/new-relic-alerts/managing-notification-channels/add-or-remove-policy-channels.
9. Ensure you set the incident preference to By condition and entity. This is required to sendnotifications to event management every time a policy violation occurs. event management uses thisinformation to accurately correlate events into incidents, and clear them when applicable.a) From the New Relic menu bar, select Alerts > Alert policies.b) Select your alert policy and click Incident preference.c) Select By condition and entity, and click Save.d) Repeat for each alert policy that sends notifications to event management.
For more information about incident preferences in New Relic, see https://docs.newrelic.com/docs/alerts/new-relic-alerts/configuring-alert-policies/specify-when-new-relic-creates-incidents.
10. To start receiving events from New Relic, ensure that Enable event management from this source isset to On..
Configure New Relic LegacyConfigure integration with New Relic Legacy.
About this taskConfigure New Relic Legacy as source:
Procedure1. Generate an incoming webhook as described in “1” on page 308.2. Log in to New Relic at https://rpm.newrelic.com/ as an administrator.3. From the New Relic menu bar, select Alerts > Channels and groups.4. In the Channel details section, click Create channel > Webhook.5. Enter a name for the channel and paste the incoming webhook URL into the Webhook URL field. This
is the generated URL provided by event management. Add an optional description.6. Select your Notification level.7. Click Integrate with Webhooks.8. Associate the webhook channel with all of the New Relic policies that you want to receive events from.
For more information about associating channels with policies, see the New Relic documentation at
Chapter 6. Configuring 309
https://docs.newrelic.com/docs/alerts/new-relic-alerts/managing-notification-channels/add-or-remove-policy-channels.
9. To start receiving events from New Relic, ensure that Enable event management from this source isset to On..
Configuring Pingdom as an event sourcePingdom provides web performance and availability monitoring. You can set up an integration withNetcool Operations Insight to receive alert information from Pingdom.
About this taskUsing a webhook URL, you set up an integration with Pingdom, and associate the integration with theuptime and transaction checks. The alerts generated by the checks are sent to the event managementservice as events.
Procedure1. Click Administration > Integrations with other systems.2. Click New integration.3. Go to the Pingdom tile and click Configure.
4. Enter a name for the integration and click Copy to add the generated webhook URL to theclipboard. Ensure you save the generated webhook to make it available later in the configurationprocess. For example, you can save it to a file.
5. Click Save.6. Log in to your account at https://my.pingdom.com/.7. Set up the integration:
a) Select Integrations > Integrations.b) Click Add new in the upper-right corner of the window.c) Ensure Webhook is selected from the Type list.d) In the Name field, enter a name for the integration.e) In the URL field, paste the webhook URL from event management.f) Ensure the Active check box is selected.g) Click Save integration.
Tip: For more information about setting up webhook integrations in Pingdom, see https://help.pingdom.com/hc/en-us/articles/207081599.
8. Enable the integration for the checks you want to receive alert information from:a) Go to https://my.pingdom.com/dashboard.b) Select Montioring > Uptime.c) Open a check, and select the check box next to your webhook integration. This enables the posting
of alerts to the URL when, for example, a site goes down.
Tip: If you don't have checks set up, you can add them by clicking Add new in the upper-rightcorner of the window. For more information about checks in Pingdom and how to set them up, seehttps://help.pingdom.com/hc/en-us/articles/203749792-What-is-a-check-.
d) Repeat the steps for each check you want to receive alert information from.9. To start receiving alert information from the Pingdom checks, ensure that Enable event management
from this source is set to On..
310 IBM Netcool Operations Insight: Integration Guide

Configuring Prometheus as an event sourcePrometheus is an open-source systems monitoring and alerting toolkit. You can set up an integration withNetcool Operations Insight to receive alert information from Prometheus.
About this taskFor information about configuring the Prometheus server parameters, see Configuring the Prometheusserver in the IBM Cloud Private Knowledge Center.
Configuring Sensu as an event sourceYou can set up an integration with Netcool Operations Insight to receive notifications created by Sensu.Sensu can monitor servers, services, application health, and business KPIs.
Before you beginThe following event types are supported for this integration:
• event management supports the default Sensu events. The use of mutators is not recommended.• Sensu Core 2.0 Beta is not supported.
The following criteria applies to configuring Sensu as an event source:
• The CEM event handler plugin must be installed in the location from where it will be used to send eventsto event management.
• You must install Ruby before using the CEM event handler. When installing Sensu, Ruby can beembedded and found under the following directory (example): /opt/sensu/embedded/bin/ruby--version.
Procedure1. Click Administration > Integrations with other systems.2. Click New integration.3. Go to the Sensu tile and click Configure.4. Enter a name for the integration.5. Click Download file to download and decompress the cem-event-handler-plugin.zip file.
Important: The download file contains credential information and should be stored in a securelocation.
6. Copy cem.json to /etc/sensu/conf.d.7. Copy cem.rb to /etc/sensu/plugins.8. Run sudo chmod +x /etc/sensu/plugins/cem.rb.
Example: copy cem-event-handler-plugin.zip to a directory and then run the followingcommand at the directory to unzip all files and grant execution permission to cem.rb (for thisexample unzip must be installed and permission to run sudo is required):
unzip cem-event-handler-plugin.zip 'cem.rb' -d /etc/sensu/plugins; unzip cem-event-handler-plugin.zip 'cem.json' -d /etc/sensu/conf.d; sudo chmod +x /etc/sensu/plugins/cem.rb
9. Add the CEM event handler to each Sensu check definition to send events to event management.
Example:
{ "checks": { "check_mem": { "command": "check-memory-percent.rb -w 50", "interval": 60, "subscribers" : [ "dev" ],
Chapter 6. Configuring 311

"handler": "cem" } }}
10. Restart the Sensu services.11. To start receiving alert notifications from Sensu, ensure that Enable event management from this
source is set to On..
Configuring SolarWinds Orion as an event sourceThe SolarWinds Orion platform provides network and system management products. You can set up anintegration with Netcool Operations Insight to receive alert information from SolarWinds Orion.
Before you beginEvent management supports integration with the Network Performance Monitor and Server andApplication Monitor products of the SolarWinds Orion platform. Event management supports Out-Of-The-Box Alerts (OOTBA) for the following common objects in SolarWinds:
• Application• Component• Group• Interface• Node• Volume
You can check the object type of each alert in Alert Manager by looking at the Property to Monitorcolumn for an alert.
If you enable an unsupported alert type, event information might still be sent to event management, butthe event title will state "Unsupported SolarWinds object".
About this taskUsing an XML file, you set up an integration with SolarWinds Orion, and define trigger and reset actions foralerts. The alerts generated by SolarWinds Orion are sent to Netcool Operations Insight as events.
Procedure1. Click Administration > Integrations with other systems.2. Click New integration.3. Go to the SolarWinds tile and click Configure.4. Enter a name for the integration.5. Click Download file to download the send-alert-cem.xml file. This file contains the settings
required for the integration with Netcool Operations Insight, including the webhook URL.
Note:
• If you edit the integration later and click to download the file again, the current integration will nolonger be valid. You will need to set up the integration again.
• The download file contains credential information and should be stored in a secure location.6. Click Save to save the integration in Netcool Operations Insight.7. Upload the XML file to the Alert Manager in SolarWinds Orion:
a) Log in to your SolarWinds Orion account as an administrator.b) Go to ALERTS & ACTIVITY in the menu bar at the top of the window and select Alerts from the
list.c) Click Manage alerts.
312 IBM Netcool Operations Insight: Integration Guide
d) Go to EXPORT/IMPORT in the menu bar at the top of the window and select Import Alert fromthe list.
e) Upload the send-alert-cem.xml you downloaded earlier from event management.
Note: A new alert called Notify CEM - timestamp is created, together with the associated triggerand reset actions Post Problem Event to CEM - timestamp and Post Resolution Events to CEM -timestamp, where timestamp is in the UTC format. The Notify CEM alert contains settings for theintegration between event management and SolarWinds. It is disabled by default and is notintended to be enabled.
8. Define trigger and reset actions for the alerts you want event management to receive eventinformation from:a) In Alert Manager, click the alert you want to edit, and go to the TRIGGER ACTIONS tab.b) Click the Assign Action(s) button.c) Select the Post Problem Event to CEM - timestamp check box and click ASSIGN.d) Click Next to go to the RESET ACTION tab.e) Click the Assign Action(s) button.f) Select the Post Resolution Events to CEM - timestamp check box and click ASSIGN.g) Click Next and then click Submit.
Attention: If you create more than one SolarWinds integration instance, ensure you select theright trigger and reset actions for each integration. For example, for your first integrationselect Post Problem Event to CEM - timestamp1 and Post Resolution Events to CEM -timestamp1, while for your second integration select Post Problem Event to CEM -timestamp2 and Post Resolution Events to CEM - timestamp2.
Tip: You can also define the trigger and reset actions for more than one alert at the same time. Forthe trigger action, select the check box for the alerts and select Assign Trigger Action from theASSIGN ACTION list. Then select the Post Problem Event to CEM - timestamp check box and clickASSIGN. For the reset action, select the check box for the same alerts and select Assign ResetAction from the ASSIGN ACTION list. Then select the Post Resolution Events to CEM - timestampcheck box and click ASSIGN.
9. To enable the alert, set Enabled (On/Off) to On in the appropriate rows for the alerts you want toreceive event information from.
10. To start receiving alert information from the SolarWinds Orion triggers and reset actions, ensure thatEnable event management from this source is set to On..
Configuring Splunk Enterprise as an event sourceSplunk Enterprise is an on-premises version of Splunk that you can use to monitor and analyze machinedata from various sources. You can set up an integration with Netcool Operations Insight to receive alertinformation from Splunk Enterprise.
Before you beginThe following event types are supported for this integration:
• Splunk App for Infrastructure Monitoring
– Monitoring for Linux/UNIX– Monitoring for Windows
Note: You can use the Splunk App to define the mapping of Splunk fields with event management fields.
Warning: Splunk Enterprise does not provide a means of downgrading to previous versions. If youwant to revert to an older Splunk release, uninstall the upgraded version and reinstall the versionyou want. The Splunk App for UNIX/Linux is currently not supported beyond version 7.2.x.
Chapter 6. Configuring 313

About this taskUsing a package of installation and configuration files provided by Netcool Operations Insight, you set upan integration with Splunk Enterprise. The alerts generated by Splunk Enterprise are sent to the NetcoolOperations Insight service as events.
Procedure1. Click Administration > Integrations with other systems.2. Click New integration.3. Go to the Splunk Enterprise tile and click Configure.4. Enter a name for the integration.5. Click Download file to download and decompress the ibm-cem-splunk.zip file. The compressed
file contains the savedsearches.conf file for both the UNIX and Windows systems, and the ibm-cem-alert.zip file which contains the file for installing the Splunk App for Netcool OperationsInsight.
• splunk_app_for_nix/local/savedsearches.conf• splunk_app_windows_infrastructure/local/savedsearches.conf• ibm-cem-alert.zip
Important: The download file contains credential information and should be stored in a securelocation.
6. Install the Splunk App using the ibm-cem-alert.zip file.a) Log in to your Splunk Enterprise browser UI as an administrator.b) Select App then click Manage Apps.c) Click Install app from file.d) Click Browse to locate the ibm-cem-alert.zip file.e) Click Upload.
7. Log in to your Splunk Enterprise server host and copy the savedsearches.conf file to$SPLUNK_HOME/etc/apps/<app_name>/local.UNIX:
sudo cp ibm-cem-splunk/splunk_app_for_nix/local/savedsearches.conf $SPLUNK_HOME/etc/apps/splunk_app_for_nix/local/savedsearches.conf
Windows:
copy ibm-cem-splunk\splunk_app_windows_infrastructure\local\savedsearches.conf %SPLUNK_HOME%\etc\apps\splunk_app_windows_infrastructure\local
Important: If you already have an existing Splunk app installed, then you already have settingsdefined in a savedsearches.conf file. Merge your existing savedsearches.conf file with theone downloaded from Netcool Operations Insight. You can merge the files manually, or use theSplunk Enterprise browser UI by clicking the Alerts tab at the top, expanding the selected alertsection, clicking Edit > Edit Alerts, and editing the fields under section IBM Cloud EventManagement Alert. You can use the savedsearches.conf file to check the mapping for the valuesof the fields.
8. Restart the Splunk Enterprise instance to ensure the new alerts are available.UNIX:
sudo $SPLUNK_HOME/bin/splunk restart
Windows:
%SPLUNK_HOME%\bin\splunk.exe restart
314 IBM Netcool Operations Insight: Integration Guide
9. Log in to the Splunk Enterprise UI as an administrator and check that the alerts defined insavedsearches.conf are available:
For UNIX systems, go to Search & Reporting > Splunk App for Unix > Core Views > Alerts.
For Windows systems, go to Search & Reporting > Splunk App for Windows Infrastructure > CoreViews > Alerts.
Note: If you modify the trigger conditions for the alerts, ensure you do not set a trigger interval that istoo frequent. For example, if you set the Edit > Edit Alerts > Trigger Conditions to trigger an alertonce every minute when the result count is greater than 0, the resulting number of events canoverload event management. To limit the trigger frequency, set the greater than value to a highernumber than 0, and set it to be triggered 5 times in every hour, for example. You can also use theThrottle option to suspend the triggering of events for a set period after an event is triggered.
10. Optional: To receive resolution events from Splunk Enterprise, add the resolution:true value tothe action.ibm_cem_alert.param.cem_custom parameter in the savedsearches.conf file,for example:
# Example## Automation mapping for IO Utilization Exceeds Threshold Alert## using IBM Event Management custom webhook alert[IO_Utilization_Exceeds_Threshold]action.ibm_cem_alert = 1action.ibm_cem_alert.param.cem_custom = statusOrThreshold:$result.bandwidth_util$,resolution:trueaction.ibm_cem_alert.param.cem_event_type = $name$action.ibm_cem_alert.param.cem_resource_name = $result.host$action.ibm_cem_alert.param.cem_resource_type = Serveraction.ibm_cem_alert.param.cem_severity = Majoraction.ibm_cem_alert.param.cem_summary = $result.host$: IO utilization exceeds $bandwidth_util$ thresholdaction.ibm_cem_alert.param.cem_webhook = {{WEBHOOK_URL}}/{{WEBHOOK_USER}}/{{WEBHOOK_PASSWORD}}disabled = 0
Tip: You can also add the resolution setting using the UI. Open Edit > Edit Alerts under section IBMCloud Event Management Alert, and add resolution:true to the Additional mapping (optional)field.
11. Click Save to save the integration in Netcool Operations Insight.12. To start receiving alert notifications from Splunk Enterprise, ensure that Enable event management
from this source is set to On..
Configuring Sumo Logic as an event sourceYou can set up an integration with Netcool Operations Insight to receive notifications created by SumoLogic. Sumo Logic is a cloud log management and metrics monitoring solution.
Before you beginClear events are never sent from Sumo Logic. However, you can set the expiryTime attribute in thepayload to automatically clear the resulting event management incidents after a specified time period (inseconds) has elapsed.
The following event types are supported for this integration:
• All Sumo Logic notifications via the webhook connection.
About this taskUsing a webhook URL, alerts generated by Sumo Logic are sent to the event management service asevents.
Procedure1. Click Administration > Integrations with other systems.
Chapter 6. Configuring 315
2. Click New integration.3. Go to the Sumo Logic tile and click Configure.
4. Enter a name for the integration and click Copy to add the generated webhook URL to theclipboard. Ensure you save the generated webhook to make it available later in the configurationprocess. For example, you can save it to a file.
5. Click Save.6. Open the Sumo Logic app and go to Manage Data > Settings > Connections.7. On Connections, click Add > Webhook.8. In the Create Connection window, enter the connection Name and (optionally) a description.9. In the field provided, paste the webhook URL that you copied in step 4.
10. Copy and paste the sample payload from this step into the Payload section. Please note thefollowing:
• Attributes with curly brackets {{ }} are Sumo Logic payload variables that do not require updating.• For attributes with angle brackets < > you must provide a valid name or description, as appropriate.• You can customize the payload if required. For more information about the available Webhook
payload variables, see the Sumo Logic user guide: https://help.sumologic.com/Manage/Connections-and-Integrations/Webhook-Connections/Set-Up-Webhook-Connections. If you arecustomizing the payload, you must include the four mandatory fields in your customized payload(see Table 56 on page 316 for mandatory fields).
Sample payload:
{ "resource": { "name":"<name of the resource that triggered the alert>", "type":"<type of the resource that triggered the alert>" }, "type": { "eventType":"<type of the event. E.g. Utilization, System status, Threshold breach>", "statusOrThreshold":"{{AlertThreshold}}" }, "summary":"<description of the event condition>", "severity":"{{AlertStatus}}", "urls": [ { "url":"{{SearchQueryUrl}}", "description":"Search Query Url" } ], "sender": { "name":"Sumo Logic" }, "expiryTime":300, "searchName":"{{SearchName}}", "searchDescription":"{{SearchDescription}}", "searchQuery":"{{SearchQuery}}", "numRawResults":"{{NumRawResults}}"}
The following table describes the attributes in the payload:
Table 56. Payload attributes
Attributes Type Description Required
resource.name String The name of theresource that causedthe event.
Mandatory
resource.type String The type of resourcethat caused the event.
Optional
316 IBM Netcool Operations Insight: Integration Guide
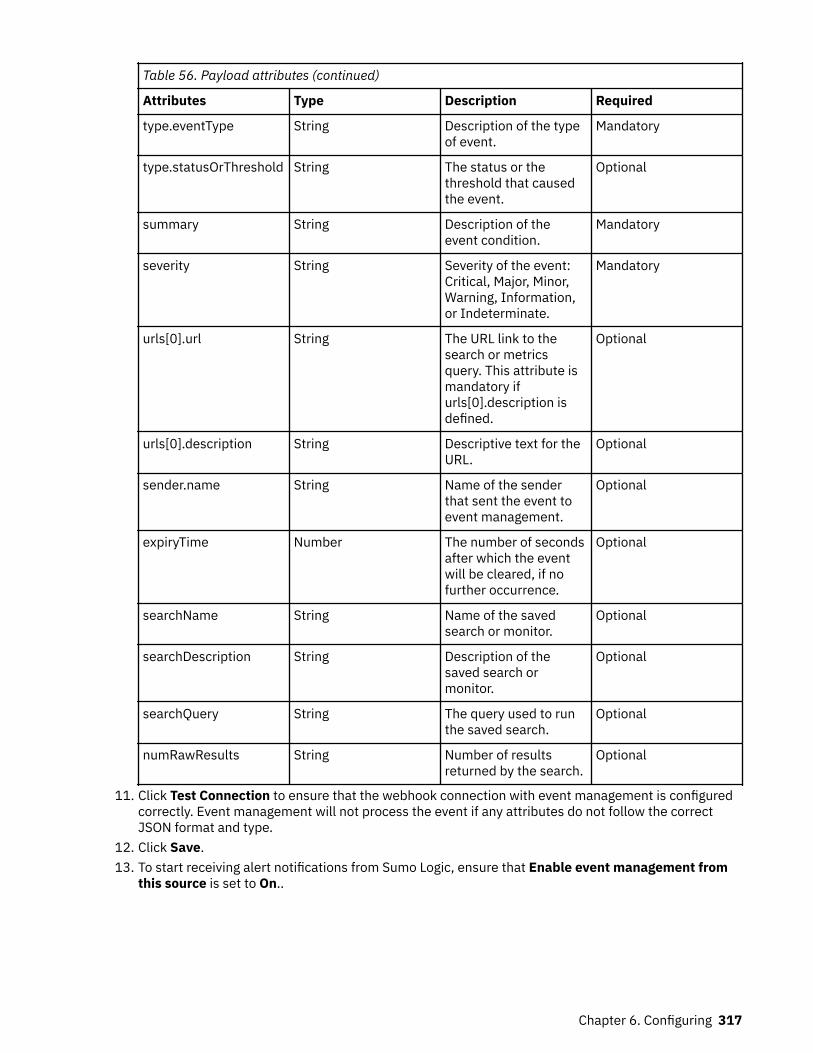
Table 56. Payload attributes (continued)
Attributes Type Description Required
type.eventType String Description of the typeof event.
Mandatory
type.statusOrThreshold String The status or thethreshold that causedthe event.
Optional
summary String Description of theevent condition.
Mandatory
severity String Severity of the event:Critical, Major, Minor,Warning, Information,or Indeterminate.
Mandatory
urls[0].url String The URL link to thesearch or metricsquery. This attribute ismandatory ifurls[0].description isdefined.
Optional
urls[0].description String Descriptive text for theURL.
Optional
sender.name String Name of the senderthat sent the event toevent management.
Optional
expiryTime Number The number of secondsafter which the eventwill be cleared, if nofurther occurrence.
Optional
searchName String Name of the savedsearch or monitor.
Optional
searchDescription String Description of thesaved search ormonitor.
Optional
searchQuery String The query used to runthe saved search.
Optional
numRawResults String Number of resultsreturned by the search.
Optional
11. Click Test Connection to ensure that the webhook connection with event management is configuredcorrectly. Event management will not process the event if any attributes do not follow the correctJSON format and type.
12. Click Save.13. To start receiving alert notifications from Sumo Logic, ensure that Enable event management from
this source is set to On..
Chapter 6. Configuring 317
Configuring VMware vCenter Server as an event sourceVMware vSphere is a centralized management application that lets you manage virtual machines and ESXihosts centrally. You can set up an integration with Netcool Operations Insight to receive notificationscreated by VMware vSphere.
Before you begin• You must have permission to run Python 3 on vCenter Server Appliance (VCSA) or PowerShell on
Windows.• There is no mechanism in VMware to apply the script in this procedure to multiple alarm definitions at a
time. The path to the script must be entered manually in the alarms.
The following event types are supported for this integration:
• All VMware alarms via the webhook connection.
Procedure1. Click Administration > Integrations with other systems.2. Click New integration.3. Go to the VMware vSphere tile and click Configure.4. Enter a name for the integration.5. Click Download file to download and decompress the vmware-alarm-action-scripts-for-cem.zip file.
6. Create the following directory:
• On Linux/Photon OS: /root/cem• On Windows: C:\cem
7. Transfer and unzip the package to /root/cem or C:\cem.
Note:
To transfer the package to VCenter Server installed on Linux/Photon you must first run the chshcommand to set bash for the login shell before transferring the package. Example:
root@9 [ ~ ]# chshChanging the login shell for rootEnter the new value, or press ENTER for the defaultLogin Shell [/bin/appliancesh]: /usr/bin/bash
8. For information about creating an alarm in the vSphere client, see https://docs.vmware.com/en/VMware-vSphere/6.7/com.vmware.vsphere.monitoring.doc/GUID-E30ED662-D851-4230-9AFE-1BBBC55C98D6.html.
9. For information about running a script or a command as an alarm action, see https://docs.vmware.com/en/VMware-vSphere/6.7/com.vmware.vsphere.monitoring.doc/GUID-AB74502C-5F01-478D-AF66-672AB5B8065C.html.
Note:
You must identify the path to run Python 3 or cmd.exe in vCenter Server.
If the vCenter Server is running on Linux/Photon OS, you can run 'which python' to get the path toPython 3. For example, /usr/bin/python. Run /usr/bin/python --version to verify it isPython 3.
If the vCenter Server is running on Windows, then you must identify the path to cmd.exe. Forexample, C:\Windows\System32\cmd.exe.
10. To send an alarm to event management, you must specify the following as an alarm action:
• Linux/Photon OS: /usr/bin/python /root/cem/vmware-alarm-action-scripts-for-cem/sendEventToCEM.py
318 IBM Netcool Operations Insight: Integration Guide

• Windows: C:\Windows\System32\cmd.exe "/c echo.|powershell -NonInteractive -File c:\cem\vmware-alarm-action-scripts-for-cem\sendEventToCEM.ps1
Note:
You can specify /usr/bin/python /root/cem/vmware-alarm-action-scripts-for-cem/sendEventToCEM.py --expirytime <time in seconds> or C:\Windows\System32\cmd.exe "/c echo.|powershell -NonInteractive -File c:\cem\vmware-alarm-action-scripts-for-cem\sendEventToCEM.ps1 --expirytime <time inseconds> as an alarm action to send an alarm to CEM and the CEM event will be cleared after the --expirytime <time in seconds> if there is no further event. This is required if you cannot define thereset rule or reset the alarms.
You must repeat the alarm action as an interval under the alarm rule in vCenter Server and the valueshould be less than --expirytime. For example, repeat action every 60 minutes untilacknowledged or reset to green. Then, the expirytime should be set to 14400 (14400 seconds isequivalent to 4 hours). This implementation is a workaround to a current VMware limitation.
11. Save the integration in event management. To start receiving notifications from VMware vSphere,ensure that Enable event management from this source is set to On..
What to do nextThe same script can be used to clear the alarm. In VMware, go to Edit Alarm Definition > Reset Rule >Run script and specify the path from step 10 in the Run this field. Note: due to VMware limitations thisdoes not always get executed.
Creating custom event sources with JSONYou can insert event information into Netcool Operations Insight from any event source that can send theinformation in JSON format.
About this taskUsing a webhook URL, set your event source to send event information to Netcool Operations Insight.Using an example incoming request in JSON format, define the mapping between the event attributesfrom your source and the event attributes in Netcool Operations Insight.
Procedure1. Click Administration > Integrations with other systems.2. Click New integration.3. Go to the Webhook tile and click Configure.
4. Enter a name for the integration and click Copy to add the generated webhook URL to theclipboard. Ensure you save the generated webhook to make it available later in the configurationprocess. For example, you can save it to a file.
Tip: Enter a name that identifies the event source you want to receive event information from. Adescriptive name will help you identify the event source integration later.
5. Go to your event source and use the generated webhook URL to configure the event source to sendevent information to Netcool Operations Insight.
Note: When Netcool Operations Insight is deployed in an Red Hat OpenShift environment, thehostname used in the webhook address (which might be an internal Red Hat OpenShift alias) must beresolvable in DNS or the local hosts file where the JSON alerts are being sent from.
6. Copy an incoming JSON request from the event source you are integrating with, and paste it in theExample incoming request field of your event source integration in the Netcool Operations Insight UI.
7. To populate the correct normalized event fields from the incoming request, define the mappingbetween the JSON request attributes and the normalized event attributes.
Chapter 6. Configuring 319
Note: Four attributes are mandatory as mentioned in this step. You can also set additional attributes tobe mapped, as described in the following step.
In the Netcool Operations Insight UI, go to your event source integration and enter values for the eventattributes in the Event attributes section. Based on this mapping, the Event Management API thentakes values from the incoming request to populate the event information that is inserted into NetcoolOperations Insight. For more information about the Event Management API, see Developer Tools athttps://console.cloud.ibm.com/apidocs/.
The following attributes must have a value for an event to be processed by Netcool Operations Insight.Set the mapping in Event attributes > Mandatory event attributes:
• Severity: The event severity level, which indicates how the perceived capability of the managedobject has been affected. Values are objects and can be one of the following severity levels:"Critical", "Major", "Minor", "Warning", "Information", "Indeterminate", 60, 50, 40, 30, 20, 10 (60 isthe highest and 10 is the lowest severity level).
• Summary: String that contains text to describe the event condition.• Resource name: String that identifies the primary resource affected by the event.• Event type: String to help classify the type of event, for example, Utilization, System status,
Threshold breach, and other type descriptions.
See later for mapping examples.
Note: The event attributes are validated against the mapping to the incoming request example. If thevalidation is successful, the output is displayed in the Result field.
Important:
Ensure you are familiar with the JSON format, see https://www.json.org/.
For more complex mappings, use JSONATA functions, see http://docs.jsonata.org/object-functions.html.
8. Optional: In addition to the mandatory attributes, you can set other event attributes to be used, anddefine the mappings for them. Click Event attributes > Optional event attributes, select theadditional attributes, and click Confirm selections. Then define the mapping between the additionalnormalized event attributes and the JSON request attributes to have the correct values populated forthe events in Netcool Operations Insight.
See later for mapping examples.
Note: Most optional attributes can only be added once. Other attributes such as URLs and Relatedresources can be added more than once. To remove optional attributes, clear the check box for theattribute, or click delete if it has more than one attribute set (for example, URLs), and click Confirmselections.
9. Click Save to save the event source integration.
Mapping JSON attributes to normalized attributes
Ensure you are familiar with the JSON format, see https://www.json.org/.
For more complex mappings, use JSONATA functions, see http://docs.jsonata.org/object-functions.html.
The following example demonstrates the mapping of mandatory event attributes from a JSON request toNetcool Operations Insight:
320 IBM Netcool Operations Insight: Integration Guide
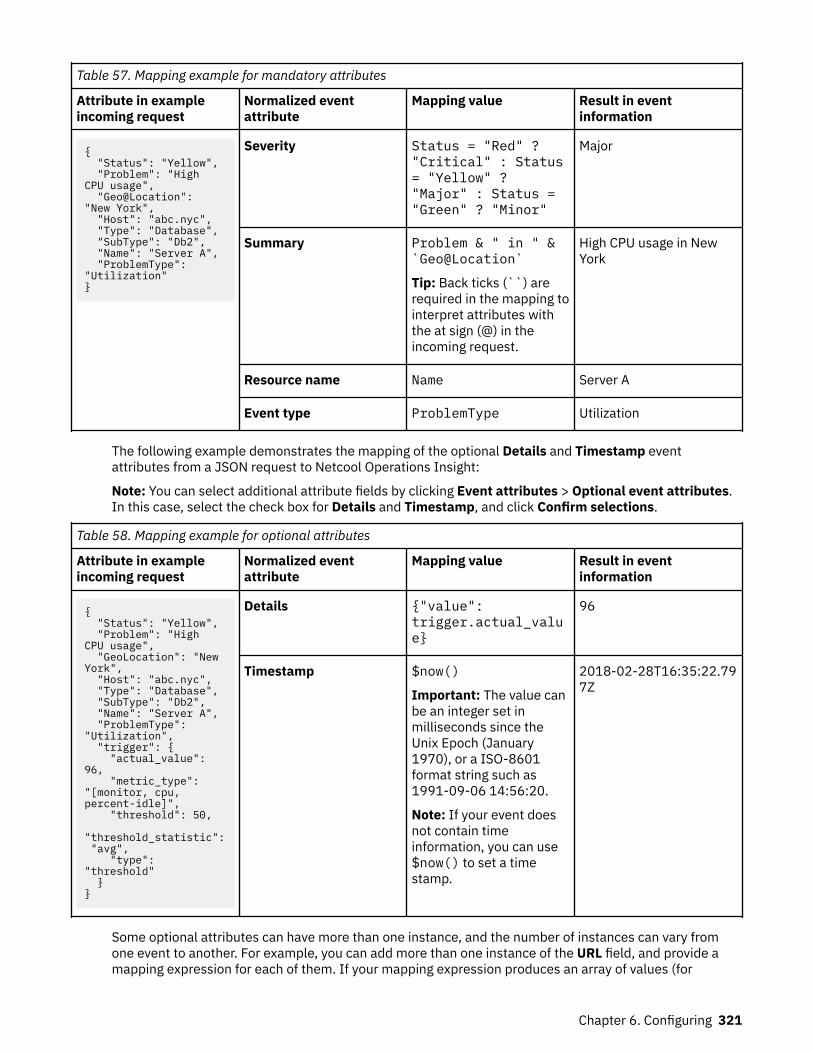
Table 57. Mapping example for mandatory attributes
Attribute in exampleincoming request
Normalized eventattribute
Mapping value Result in eventinformation
{ "Status": "Yellow", "Problem": "High CPU usage", "Geo@Location": "New York", "Host": "abc.nyc", "Type": "Database", "SubType": "Db2", "Name": "Server A", "ProblemType": "Utilization"}
Severity Status = "Red" ?"Critical" : Status= "Yellow" ?"Major" : Status ="Green" ? "Minor"
Major
Summary Problem & " in " &`Geo@Location`
Tip: Back ticks (``) arerequired in the mapping tointerpret attributes withthe at sign (@) in theincoming request.
High CPU usage in NewYork
Resource name Name Server A
Event type ProblemType Utilization
The following example demonstrates the mapping of the optional Details and Timestamp eventattributes from a JSON request to Netcool Operations Insight:
Note: You can select additional attribute fields by clicking Event attributes > Optional event attributes.In this case, select the check box for Details and Timestamp, and click Confirm selections.
Table 58. Mapping example for optional attributes
Attribute in exampleincoming request
Normalized eventattribute
Mapping value Result in eventinformation
{ "Status": "Yellow", "Problem": "High CPU usage", "GeoLocation": "New York", "Host": "abc.nyc", "Type": "Database", "SubType": "Db2", "Name": "Server A", "ProblemType": "Utilization", "trigger": { "actual_value": 96, "metric_type": "[monitor, cpu, percent-idle]", "threshold": 50, "threshold_statistic": "avg", "type": "threshold" } }
Details {"value":trigger.actual_value}
96
Timestamp $now()
Important: The value canbe an integer set inmilliseconds since theUnix Epoch (January1970), or a ISO-8601format string such as1991-09-06 14:56:20.
Note: If your event doesnot contain timeinformation, you can use$now() to set a timestamp.
2018-02-28T16:35:22.797Z
Some optional attributes can have more than one instance, and the number of instances can vary fromone event to another. For example, you can add more than one instance of the URL field, and provide amapping expression for each of them. If your mapping expression produces an array of values (for
Chapter 6. Configuring 321

example, selecting fields from within a list in the incoming request), the corresponding number ofinstances of the event attribute will automatically be created.
The following example demonstrates the mapping of the optional URL event attribute from a JSONrequest to Netcool Operations Insight:
Note: You can select additional attribute fields by clicking Event attributes > Optional event attributes.In this case, click add for URL, and click Confirm selections.
Table 59. Mapping example for optional array type attribute, using the URL attribute
Attribute in exampleincoming request
Normalized eventattribute
Mapping value Result in eventinformation
{ "Status": "Yellow", "Problem": "High CPU usage", "GeoLocation": "New York", "Host": "abc.nyc", "Type": "Database", "SubType": "Db2", "Name": "Server A", "ProblemType": "Utilization", "trigger": { "actual_value": 96, "metric_type": "[monitor, cpu, percent-idle]", "threshold": 50, "threshold_statistic": "avg", "type": "threshold" }, "urls": [ {"url": "http://abcmonitoring.com"}, {"url": "http://xyzmonitoring.com"} ] }
URL 1 > URL
URL 1 > Description
urls[0].url
"Launch to ABCMonitoring"
URLs
http://abcmonitoring.com
Launch to ABC Monitoring
URL 2 > URL
URL 2 > Description
urls[1].url
"Launch to XYZMonitoring"
URLs
http://xyzmonitoring.com
Launch to XYZ Monitoring
The following example is also for an array, but using the optional Details attribute, and shows how tochange the mapping from the first list within the array to the second list within the array.
322 IBM Netcool Operations Insight: Integration Guide

Table 60. Mapping example for optional array type attribute, using the Details attribute
Attribute in exampleincoming request
Normalized eventattribute
Mapping value Result in eventinformation
"alarm_detail": [ { "apm@proc_user_cpu_norm": "-0.02", "apm@vm_exe_size_mb": "0", "apm@text_resident_size": "1", "apm@proc_user_cpu_norm_enum": "Not_Collected", "apm@total_busy_cpu_pct": "0", "apm@total_cpu_time": "000d 00h 02m 57s", "apm@proc_cpu": "2", "apm@vm_lib_size": "22116", "apm@total_size_memory": "994599", "apm@vm_stack": "88", "apm@tot_minor_faults": "199", "apm@vm_lock_mb": "0", "apm@vm_data_mb": "3627.8", "apm@proc_system_cpu_norm_enum": "Not_Collected", "apm@busy_cpu_pct": "104.05", "apm@priority": "20", "apm@user_sys_cpu_pct": "0", "apm@session_id": "7331", "apm@cpu_seconds": "177", "apm@vm_size": "3978396", "apm@threads": "430", "apm@process_filter": " ", "apm@resident_set_size": "140867", "apm@process_id": "28967", "apm@vm_size_mb": "3885.1", "apm@proc_busy_cpu_norm_enum": "Not_Collected", "apm@time": "00002:57", "apm@state": "0", "apm@vm_data": "3714920", "apm@shared_lib_set_size": "0", "apm@data_set_size": "928752", "apm@vm_lock": "0", "apm@total_cpu_percent": "4.27", "apm@state_enum": "Sleeping", "apm@process_command_name": "java", "apm@vm_stack_mb": "0", "apm@system_cpu_time": "000d 00h 00m 07s", "apm@proc_busy_cpu_norm": "-0.02", "apm@vm_lib_size_mb": "21.5", "apm@timestamp": "1150727144822000", "apm@vm_exe_size": "4", "apm@dirty_pages": "0", "apm@tot_proc_user_cpu": "0", "apm@user_cpu_time": "000d 00h 02m 50s", "apm@tot_proc_system_cpu": "0", "apm@shared_memory": "18042", "apm@system_name": "nc9042036139:LZ", "apm@proc_user_cpu": "99.45", "apm@proc_system_cpu_norm": "-0.02", "apm@process_count": "1", "apm@parent_process_id": "1", "apm@nice": "0", "apm@process_group_leader_id": "28856", "apm@proc_system_cpu": "4.60", "apm@tot_major_faults": "0" }, { "vm_stack": "88", "parent_process_id": "1", "proc_system_cpu": "4.60", "process_group_leader_id": "28856", "tot_minor_faults": "199", "vm_lock_mb": "0", "vm_data_mb": "3627.8", "proc_user_cpu_norm_enum": "Not_Collected", "vm_lib_size": "22116", "busy_cpu_pct": "104.05", "priority": "20", "total_size_memory": "994599", "session_id": "7331", "user_sys_cpu_pct": "0", "proc_system_cpu_norm_enum": "Not_Collected", "cpu_seconds": "177", "process_filter": " ", "vm_size": "3978396", "threads": "430", "process_id": "28967", "vm_size_mb": "3885.1", "time": "00002:57", "resident_set_size": "140867", "process_command_name": "java", "state_enum": "Sleeping", "proc_busy_cpu_norm_enum": "Not_Collected", "proc_busy_cpu_norm": "-0.02", "state": "0", "vm_lib_size_mb": "21.5", "vm_data": "3714920", "shared_lib_set_size": "0", "total_cpu_percent": "4.27", "vm_lock": "0", "data_set_size": "928752", "system_cpu_time": "000d 00h 00m 07s", "vm_stack_mb": "0", "timestamp": "1150727144822000", "vm_exe_size": "4", "dirty_pages": "0", "tot_proc_user_cpu": "0", "user_cpu_time": "000d 00h 02m 50s", "proc_system_cpu_norm": "-0.02", "tot_proc_system_cpu": "0", "shared_memory": "18042", "system_name": "nc9042036139:LZ", "tot_major_faults": "0", "proc_user_cpu": "99.45", "nice": "0", "proc_user_cpu_norm": "-0.02", "text_resident_size": "1", "vm_exe_size_mb": "0", "proc_cpu": "2", "total_cpu_time": "000d 00h 02m 57s", "total_busy_cpu_pct": "0", "process_count": "1" } ]
Details alarm_detail[0] "apm@proc_user_cpu_norm": "-0.02", "apm@vm_exe_size_mb": "0", "apm@text_resident_size": "1", "apm@proc_user_cpu_norm_enum": "Not_Collected", "apm@total_busy_cpu_pct": "0", "apm@total_cpu_time": "000d 00h 02m 57s", "apm@proc_cpu": "2", "apm@vm_lib_size": "22116", "apm@total_size_memory": "994599", "apm@vm_stack": "88", "apm@tot_minor_faults": "199", "apm@vm_lock_mb": "0", "apm@vm_data_mb": "3627.8", "apm@proc_system_cpu_norm_enum": "Not_Collected", "apm@busy_cpu_pct": "104.05", "apm@priority": "20", "apm@user_sys_cpu_pct": "0", "apm@session_id": "7331", "apm@cpu_seconds": "177", "apm@vm_size": "3978396", "apm@threads": "430", "apm@process_filter": " ", "apm@resident_set_size": "140867", "apm@process_id": "28967", "apm@vm_size_mb": "3885.1", "apm@proc_busy_cpu_norm_enum": "Not_Collected", "apm@time": "00002:57", "apm@state": "0", "apm@vm_data": "3714920", "apm@shared_lib_set_size": "0", "apm@data_set_size": "928752", "apm@vm_lock": "0", "apm@total_cpu_percent": "4.27", "apm@state_enum": "Sleeping", "apm@process_command_name": "java", "apm@vm_stack_mb": "0", "apm@system_cpu_time": "000d 00h 00m 07s", "apm@proc_busy_cpu_norm": "-0.02", "apm@vm_lib_size_mb": "21.5", "apm@timestamp": "1150727144822000", "apm@vm_exe_size": "4", "apm@dirty_pages": "0", "apm@tot_proc_user_cpu": "0", "apm@user_cpu_time": "000d 00h 02m 50s", "apm@tot_proc_system_cpu": "0", "apm@shared_memory": "18042", "apm@system_name": "nc9042036139:LZ", "apm@proc_user_cpu": "99.45", "apm@proc_system_cpu_norm": "-0.02", "apm@process_count": "1", "apm@parent_process_id": "1", "apm@nice": "0", "apm@process_group_leader_id": "28856", "apm@proc_system_cpu": "4.60", "apm@tot_major_faults": "0"
Details alarm_detail[1] "vm_stack": "88", "parent_process_id": "1", "proc_system_cpu": "4.60", "process_group_leader_id": "28856", "tot_minor_faults": "199", "vm_lock_mb": "0", "vm_data_mb": "3627.8", "proc_user_cpu_norm_enum": "Not_Collected", "vm_lib_size": "22116", "busy_cpu_pct": "104.05", "priority": "20", "total_size_memory": "994599", "session_id": "7331", "user_sys_cpu_pct": "0", "proc_system_cpu_norm_enum": "Not_Collected", "cpu_seconds": "177", "process_filter": " ", "vm_size": "3978396", "threads": "430", "process_id": "28967", "vm_size_mb": "3885.1", "time": "00002:57", "resident_set_size": "140867", "process_command_name": "java", "state_enum": "Sleeping", "proc_busy_cpu_norm_enum": "Not_Collected", "proc_busy_cpu_norm": "-0.02", "state": "0", "vm_lib_size_mb": "21.5", "vm_data": "3714920", "shared_lib_set_size": "0", "total_cpu_percent": "4.27", "vm_lock": "0", "data_set_size": "928752", "system_cpu_time": "000d 00h 00m 07s", "vm_stack_mb": "0", "timestamp": "1150727144822000", "vm_exe_size": "4", "dirty_pages": "0", "tot_proc_user_cpu": "0", "user_cpu_time": "000d 00h 02m 50s", "proc_system_cpu_norm": "-0.02", "tot_proc_system_cpu": "0", "shared_memory": "18042", "system_name": "nc9042036139:LZ", "tot_major_faults": "0", "proc_user_cpu": "99.45", "nice": "0", "proc_user_cpu_norm": "-0.02", "text_resident_size": "1", "vm_exe_size_mb": "0", "proc_cpu": "2", "total_cpu_time": "000d 00h 02m 57s", "total_busy_cpu_pct": "0", "process_count": "1"
Chapter 6. Configuring 323
Configuring Zabbix as an event sourceYou can set up an integration with Netcool Operations Insight to receive notifications created by Zabbix.Zabbix is an open source monitoring solution for network monitoring and application monitoring.
Before you beginSupported Zabbix versions are:
• 3.0 LTS• 3.4• 4.0 LTS
The following event types are supported for this integration:
• Host monitoring• Service monitoring• Web monitoring
About this taskDownload the integration package from event management and import the scripts into your Zabbix server.Sample commands are provided for Linux operating systems. Copy the zabbix-notification.shnotification script into the AlertScriptPath directory of your Zabbix server.
Execute the create-zabbix-action.sh script for an out-of-the-box event management integrationwith Zabbix.
Procedure1. Click Administration > Integrations with other systems.2. Click New integration.3. Go to the Zabbix tile and click Configure.4. Enter a name for the integration.5. Click Download file and decompress the zabbix-cem.zip file on the Zabbix server.
Important: The download file contains credential information and should be stored in a securelocation.
6. Copy zabbix-notification.sh into the AlertScriptPath directory. The AlertScriptPathdirectory is specified within the Zabbix server configuration file zabbix_server.conf.
Use the following command to check the AlertScriptPath directory:
$ grep AlertScriptsPath /etc/zabbix/zabbix_server.conf
Example return:
"AlertScriptsPath=/usr/lib/zabbix/alertscripts"
Use the following command to copy the zabbix-notification.sh to the AlertScriptPathdirectory (using the directory defined in the result of the previous command):
$ cp zabbix-notification.sh /usr/lib/zabbix/alertscripts/
7. Execute the create-zabbix-action.sh script to create required configuration. The script willcreate configuration through calling the Zabbix REST API. A new media type, user, and trigger actionwill be created so that Zabbix notifications can be forwarded to event management. Ensure the file isexecutable.
324 IBM Netcool Operations Insight: Integration Guide
Execute the script with --user --password --ip. If username/password are not provided, thescript uses Admin/zabbix by default:
$ ./create-zabbix-action.sh --user Admin --password zabbix --ip 10.0.0.1
Note: The machine where you execute the script (for example the Zabbix server) must be able toconnect to the Zabbix API server. Provide the FQDN or IP address of the Zabbix Web-front (API) serverby --ip (mandatory). To do this, make the following edit in the zabbix-notifications.sh file:
# Define your Zabbix front-end web server IP/FQDN below# else default use zabbix server hostnamehost="myserver.office.com"#host=$(echo `hostname -f`)if [ "${host}" == "" ]then host=$(echo ${HOSTNAME})fi
TO:
Define your Zabbix front-end web server IP/FQDN belowelse default use zabbix server hostnamehost="IP"#host=$(echo `hostname -f`)if [ "${host}" == "" ]then host=$(echo ${HOSTNAME})fi
8. Save the integration in event management. To start receiving notifications from Zabbix, ensure thatEnable event management from this source is set to On..
What to do nextWith this integration the user admin-cem is created under user group Zabbix Administrators. The hostthat you want to monitor must been assigned to the user group Zabbix Administrators or to user admin-cem before notifications can be sent to event management. Define the host and user/user grouppermissions in the Zabbix permissions tab:
• Administration > User groups > Zabbix Administrators > Permissions• Administration > Users > admin-cem > Permissions
Other incoming integrationsThe incoming integrations described in this section are not available from the Cloud GUI but can beconfigured by other means.
Configuring Continuous Delivery as an event sourceIf you use Continuous Delivery for your applications, you can set up a toolchain integration with eventmanagement. The toolchain integration forwards event information from Continuous Delivery to eventmanagement.
Before you beginThe following event types are supported for this integration:
• jobStarted• jobCompleted• stageStarted• stageCompleted
Chapter 6. Configuring 325
About this taskThe integration uses a webhook URL to push notifications from the toolchain to event management asevents. The events are then correlated into incidents.
Procedure1. Click Administration > Integrations.2. Click New integration.3. Go to the IBM Continuous Delivery tile and click Configure.
4. Enter a name for the integration and click Copy to add the generated webhook URL to theclipboard. Ensure you save the generated webhook to make it available later in the configurationprocess. For example, you can save it to a file.
5. Ensure that Enable event management from this source is set to On, and click Save.6. You can use an existing pipeline or create a new one. To use an existing pipeline, navigate to your
toolchain and go to step “7” on page 326. To create a new pipeline:a) Go to https://console.cloud.ibm.com/catalog/ and search for Continuous Delivery.b) Click the Continuous Delivery link under DevOps, and log in.c) Click Create.d) On the Create a Delivery Pipeline page, select the Cloud Foundry check box, and fill in the
settings for the pipeline. For more information, see https://console.cloud.ibm.com/docs/services/ContinuousDelivery/pipeline_working.html.
7. Click Add a Tool.8. Select event management. In the URL field, paste the webhook URL from event management, and
click Create Integration.9. Click the event management tile. The event management Getting started page opens, and you are
notified that a new event source was added. Click the link to see the events and their incidents fromContinuous Delivery.
Creating custom event sources with emailYou can insert event information into event management from an email that is parsed into JSON format.
Before you begin• Two formats are supported, a colon-delimited text format, or the HTML format as sent by the email
client. The colon-delimited format is field:value. See Sample email below. The HTML format that iscopied from the email client should contain HTML tags "<>" around all the text. The parsed output isdisplayed in the Output JSON window and is formatted based on the type of email text used.
Note: For the colon-delimited text format, each field : value pair must be confined to a single line in theemail text area. Text that extends to a second line is not included in the Output JSON.
• Your source email client must support email addresses up to 175 characters in length.• A JSON string in an email will not be parsed as a JSON object. This integration parses plain text and
makes a simple JSON object from it.• Where an event attribute appears more than once in email text, the last occurrence is used .• For security purposes email attachments is ignored.
About this taskA custom email address is generated that you can add (Bcc) to the automated mailing system sendingalert emails to your support staff. Define the mapping between the event attributes from your email andthe event attributes in event management. After the email address is added to your automation, eventmanagement will generate events and incidents based on the specified attributes.
326 IBM Netcool Operations Insight: Integration Guide
Procedure1. Click Administration > Integrations.2. Click New integration.3. Go to the email tile and click Configure.
4. Enter a name for the integration and click Copy to add the generated email address to theclipboard. Ensure you save the generated email address as it will not be visible after you save yourintegration.
5. Paste an email into the Sample email text area. This would be an email that you normally send tosupport staff.
6. To populate the event fields in event management from the incoming email, define the mappingbetween the parsed Output JSON and the event management event attributes. Set a value for each ofthe Mandatory event attributes:
• Severity: The event severity level, which indicates how the perceived capability of the managedobject is affected. Values are objects and can be one of the following severity levels: "Critical","Major", "Minor", "Warning", "Information", "Indeterminate", 60, 50, 40, 30, 20, 10 (60 is the highestand 10 is the lowest severity level).
• Summary: String that contains text to describe the event condition.• Resource name: String that identifies the primary resource that is affected by the event.• Event type: String to help classify the type of event, for example, Utilization, System status,
Threshold breach, and other type descriptions.
The following Optional event attributes are also available:
Table 61. Optional event attributes
Timestamp Resource: Service Resource: Interface Sender: Component
Expiry time Resource: Cluster Sender: Name Sender: Application
Resolution Resource: Display name Sender: Source Sender: Hostname
Status or threshold Resource: Component ID Sender: Location Sender: IP address
Details Resource: Application Sender: Type Sender: Port
Resource: Source Resource: Hostname Sender: Service Sender: Interface
ID Resource: Location Resource: IP address Sender: Cluster URLs
Resource: Type Resource: Port Sender: Display name Related resources
To add optional event attributes:
a. Click Optional event attributes.
b. Select the attributes by selecting the check boxes, or click the symbol to add one or more URLsor Related resources.
c. Confirm your selection.d. Now you can add the JSONata such as the required fields.
The JSONata expression that is entered for each attribute is mapped to a value in the parsed OutputJSON. The mappings that are displayed in the Event Results field is the event that is sent to eventmanagement.
Note:
For more complex mappings, use JSONATA functions, see http://docs.jsonata.org/object-functions.html.
Chapter 6. Configuring 327

Sample email
Product: Application Performance Management (SaaS)Reason: Severity updatedState: CriticalSummary: File system errors detected on datalayer cassandra node 1EventType: Network errorResource: Router 1233Service URL: https://13a59ee87c7230e16d5dce84f9bac346.customers.ap.apm.ibmserviceengage.com
Mandatory event attributes
Severity State
Summary Summary
Resource name Resource
Event type EventType
Sample result
{ "severity": "Critical", "summary": "File system errors detected on datalayer cassandra node 1", "resource": { "name": "Router 1233" }, "type": { "eventType": "Network error" }}
7. Paste the generated email address to the mailing system you use to send alert emails. For example,you could paste it into the Bcc field.
Creating custom event sources with an integration brokerIn addition to the built-in event source integration types provided by event management, you can createcustom integrations to receive event information from other sources by using an integration broker.
About this taskFor example, as a service provider, you might want to set up a custom event source type that yourcustomers can use to integrate with a monitoring system you provide. The custom event source uses anintegration broker to create an event source instance in event management to which you can post eventsvia a webhook.
Event management provides a sample application that demonstrates how to create an integration brokerthat can be used to set up a custom event source integration. Use the sample application and modify it tocreate your own integration broker that suits your needs. For more information, see https://github.com/IBM-Bluemix/cloud-event-management-sample.
Note: The sample application provides an example of how to create a custom event source configurationthat can post event information to event management. The sample is a Node.js application. You can useother methods, but ensure you follow the same high level steps to create and configure your integrationbroker for event management.
To create an integration broker using the sample application:
Procedure1. Develop the integration broker:
a) Go to https://github.com/IBM-Bluemix/cloud-event-management-sample.
328 IBM Netcool Operations Insight: Integration Guide
b) Download the sample application package, extract it, and run the application as described in theREADME.
c) Modify the application to suit your requirements by changing the following settings:
• Set the integration controller host URL in manifest.yml as provided by IBM. The integrationcontroller is a component of event management.
• Set the UI properties for configuring the custom event source integration ineventSourceCatalog.yaml. For example, specify the label and description that is displayedon the UI for configuring the custom event source.
Note: You can have multiple integration brokers. A single broker can support one or moreintegration types. To define more than one event source integration type for a single broker,define each in the eventSourceCatalog.yaml file. You can duplicate the parameters to definethe integrations. Ensure that the value of the id field is unique for each integration type.
Important: While you can have more than one integration type defined for a broker, access to theintegrations is controlled through each broker. This means if a customer is granted access to thebroker, they will have access to all integrations defined for the broker. If you want to grantdifferent customers access to different integrations, then you must create a separate broker foreach event source integration, and set up access per broker as described in step “3” on page 330.
• Define how the event details from your source map to event management events. You define themapping in section // Map a Prometheus event to a Cloud Event Management event of thesample webhook.js file.
Note: Event information processed by event management must comply with the event formatdefined by the event management API as described in the API documentation. For moreinformation about the Cloud Event Management APIs, see Developer Tools at https://console.cloud.ibm.com/apidocs/.
The broker will map the events to a JSON string and posts it to the API at https://integration_controller_hostname/api/events/v1.
2. Register the broker with the event management integration controller using the brokers.jsregister command option, for example:brokers.js register -t "bearer eyJhbGciOiJIUzI1NiIsImtpZCI6Imt" -n "PartnersInc" -r https://prod-integration-controller.mybluemix.net -a"[email protected]" -a "[email protected]" -u https://myapp.mybluemix.net/api/broker -v "CustomerSub1" -v "CustomerSub2"
Where
• -t: The bearer token for the IBM cloud foundry user.• -n: The broker name to register with the integration controller. This is a unique label to designate the
broker.• -r: The integration controller as defined in the manifest.yml file.• -a: Additional user IDs that have access to manage the broker. The user making the register request
is automatically added as an authorized user.• -u: The broker API URL to register with integration controller.• -v: The subscription or tenant IDs for the customers or users that have access to the integrations
managed by the broker.
After registering the broker, the custom event source configuration is displayed on the eventmanagement UI under Administration > Event sources > Configure an event source. Each registeredbroker displays a configuration tile. The UI can then be used to set up an integration with the eventsource.
Note: The broker can be deployed on any host. The event information is then sent to the broker on thathost via the webhook provided when setting up the event source integration. The broker then forwardsthe information to the integration controller, and it gets processed in event management.
Chapter 6. Configuring 329

3. Provide your customers access to the custom event source integration you set up with the broker. Togrant access, add customer subscription or tenant IDs to the broker.You can do this when registering the broker by using the brokers.js register -v option asdescribed in the previous step.You can also do this later using the brokers.js update option as follows: brokers.js update –v string for subscription or tenant ID. You can use the update option to remove accessthe same way.
Note: Event management provides an API to interact with the integration brokers. Use thebrokers.js script to communicate with the API to register your integration, update it, retrieveinformation about it, and remove it. For more information about the brokers.js options, see thebroker.js help command.
ResultsAfter following these steps, your users can set up an integration with the custom event source using theevent management UI, and start receiving events from the source. They can then work with the eventsand their incidents using the event management features.
IBM Multicloud Compliance Manager
About this taskOn the Integrations page, ensure that the enablement is set to On for IBM Multicloud ComplianceManager to allow event management to receive events from Multicloud Compliance Manager.
For more information, see Working with IBM Multi-cloud Manager compliance in the IBM Cloud PrivateKnowledge Center.
Configuring automation typesFor semi-automated and fully-automated runbooks, which use automations of type script or type BigFix®,a connection must be set up to connect to your target endpoints. To trigger runbook executions fromincoming events, set up a trigger connection. You can add, edit, or delete the connection for eachautomation provider or the event trigger provider.
You can perform the following actions on each connection tile in the Connections page:Configure
If you setting up your environment for the first time, or you want to use another automation provider,you can create a new connection. For more information about how to create a connection, see “Createa connection” on page 330.
EditIf your settings changed, for example your username or password, you can edit your connection.Select Edit to open the configuration dialog and apply your changes. You can edit a connection ifyou are an RBA Author or RBA Approver.
Check connection statusEach tile will indicate if the connection is working or if it has failed.
DeleteIf you no longer need a connection, click Delete to delete the connection. You can delete aconnection if you have the noi_lead role.
For more information about roles, see “Administering users” on page 467.
Create a connectionIBM Runbook Automation connects to your target endpoints, for example your on-premise back-endsystem. If you use automations of type script or BigFix, you must create a Script/BigFix connection to
330 IBM Netcool Operations Insight: Integration Guide

access your target endpoints. If you want to use a trigger, connect to Netcool/Impact also referred to asthe event trigger provider.
You can configure a connection on the Automation type page. To create a new connection, clickConfigure on the corresponding connection tile. To edit an existing connection, click Edit on thecorresponding connection tile. You can configure one connection of each type. For example, you canconfigure one Script automation provider connection. Follow the on-screen instructions in the Newconnection window.
You can create a new connection with the noi_lead role. For more information about roles, see“Administering users” on page 467.
Event Trigger (Netcool/Impact)Create an Event Trigger connection to map runbooks with Netcool/Impact events.
Cloud Event Management does not support the Event Trigger Integration described in this section. Referto the Cloud Event Management documentation for integration options.
You can configure a connection on the Automation type page. In the main navigation menu, select
Administration and click Integration with other systems. Click Configure on the Event Trigger tileto open the configuration window. You can configure one Event Trigger connection. Follow the on-screeninstructions in the New Connection window.
1. Install IBM Netcool/Impact fix pack V7.1.0.18 or higherCheck that the fix pack level of your current Netcool/Impact installation is V7.1.0.18 or higher. ANetcool/Impact license is required.
2. Configure IBM Netcool/ImpactFor more information about how to configure IBM Netcool/Impact, see “Installing Netcool/Impact torun the trigger service” on page 334.
3. Enter IBM Netcool/Impact access informationEnter the URL and credentials for the IBM Netcool/Impact connection. You can specify the certificateof the IBM Netcool/Impact server for additional security. For more details on the connection dialogand the connection parameters, see “Configure a connection to the Netcool/Impact server” on page344.
IBM BigFix automation providerIBM BigFix automation provider connects to your back-end system through your local IBM BigFix setup.
You can configure only one IBM BigFix connection. Follow the step-by-step instructions in the Newconnection window.
1. In the main navigation menu, select Administration and click Integration with othersystems.
2. Click Automation type.3. Click Configure on the BigFix tile to open the configuration window.4. Enter the IBM BigFix access information. It is a requirement that you already have IBM BigFix and Web
Reports installed. Check with your system administrator to obtain access information.
Enter the URL in the following format:
https://<DomainnameOfBigFixServer>:52311/api
You can specify the certificate of the IBM BigFix server for additional security. You must enter thecertificate in PEM format. If the certificate is a self-signed certificate, then just enter the certificateitself. If the IBM BigFix server certificate is signed by a certificate authority (CA), then enter the publiccertificate of the CA. In any case, the CN field of the IBM BigFix server certificate must include thecorrect FQDN of the system where IBM BigFix is installed.
Chapter 6. Configuring 331
SSH script automation providerUse a script automation provider to connect to your back-end system (targets). The SSH Provider isagentless and connects directly to the target machine. It authenticates using public key-basedauthentication in SSH.
The script automation provider works for back-end systems (targets) running UNIX or Windows. For UNIXthe user executing the automation must have sufficient rights to execute these features.
• bash – a shell that is used to wrap and execute the specified commands / script.• mktemp – A utility that is used to create a temporary file, which is required for the script execution with
this automation provider to work.• openssl – A utility that is used on the target system to decrypt the transferred commands / script.
Defining which RBA user is allowed to run an automationThe current public key must be added to all target machines that you plan to execute scripts on via theSSH Provider. Make sure that you add the public key in the correct repository, so that the script can beexecuted:
• By the root user.• By specific user(s) on this target. For example, by putting the key in the authorized_keys file of home
directory of this/these specific user(s).
Depending on the public key used, any RBA user or only members of specific RBA groups will be able toaccess the given target system. See step 5 in the procedure below for more information about creatingpublic keys for specific groups.
Defining which UNIX or Windows user is used to run an automationBy default, scripts are executed on the target machine using the root username. It is possible to run thescript with a different UNIX or Windows user. The username can either be fixed or depend on the RBAuser that is currently logged in. For more information, see “Creating Script automations” on page 503.
Defining an SSH jumpserverAn optional SSH jumpserver can be specified. If chosen, any connections to target systems will be routedthrough this jumpserver. See step 3 for more information about using a jumpserver.
Note: The jumpserver must be a UNIX system (including Linux and AIX). The jumpserver cannot be aWindows system.
About this taskYou can configure a connection on the Connections page. Click Configure on the Script tile to open theconfiguration window and follow the on-screen instructions.
Procedure
1. In the main navigation menu, select Administration and click Integration with othersystems.
2. Click Automation type.3. Click Configure on the Script tile.4. If you are using a jumpserver you must configure it.
Depending on your environment, you might require a jumpserver to access your target endpoints. Ajumpserver is an SSH endpoint that is used to connect to the nested SSH endpoints. This is a commonapproach used to communicate between different network zones. To use a jumpserver with RBA itmust have an SSH server running and the nc command must be available. This is used to connect tonested SSH target endpoints.
332 IBM Netcool Operations Insight: Integration Guide

Click Use a jumpserver and specify the following jumpserver credentials:Jumpserver address
The hostname or IP address of the jumpserver.Jumpserver port
The SSH port of the jumpserver.Jumpserver username
The username for authentication on the jumpserver.Jumpserver password
The password for authentication on the jumpserver.Any connections to SSH target endpoints will use the specified jumpserver.
If you are using the secure gateway client when a jumpserver is specified, the connection between thesecure gateway client and the target endpoint will use the jumpserver.
5. On your target machine, register the default public key to enable access to the target endpoints viaSSH for all users.
Configuring SSH public key authentication for the UNIX root user
The displayed public key must be added to all target machines that you plan to execute scripts on via the SSH Provider. This key enables any RBA user to run script automations on the given target endpoint. The key must be added to the authorized_keys file which is usually found in the /root/.ssh/authorized_keys folder.
Configuring SSH public key authentication for a specific UNIX user
If you want to enforce that only a specific UNIX user can execute the script on this target endpoint you should copy the key to the authorized_keys file in the home directory of the specific user, for example /home/john/.ssh/authorized_keys.
You can choose to regenerate the public key by clicking the refresh button in the upper right corner ofthe public key.
Note: Regenerating the public key will delete the old key pair. If you choose to regenerate the key pairyou must exchange the public key in each target machine that you plan to access via the SSH Provider.
For more information about how to configure which UNIX user is used to run the script, see “CreatingScript automations” on page 503.
6. Optionally, you can generate group-specific keys. Use these if you only want users from a specificgroup to have access to a machine.
In this scenario, the default public key can act as a fallback in the event that none of the other keyswork.
a. Click New public key for groups.b. Select a group, then use the refresh button to create a public key for the selected group.c. The table lists all existing group-specific keys. Use the action buttons on the right to change, delete,
or copy the public keys.
Note: Runbook Automation will try every eligible public key for a given RBA user to access a targetendpoint until it finds an authorized public key. Some target endpoints might have security policies inplace that ban further connection after a certain number of unauthorized connections. Therefore, it isgood practice to either avoid having too many group-specific public keys or avoid having RBA users intoo many different groups.
Ansible Tower automation provider
About this taskComplete the following steps to create a connection to an Ansible Tower Server.
Chapter 6. Configuring 333
Procedure
1. In the main navigation menu, select Administration and click Integration with othersystems.
2. Click Automation type.3. Click Configure on the Ansible Tower tile.4. Enter the base URL of your Ansible Tower server. This URL must contain the protocol, for example:https://ansible-tower-server.mycompany.com:443.
5. Choose an authentication type. You can select Basic Auth to connect with user name and password orAPI Token to use a bearer token, previously created with Write Scope in Ansible Tower.
6. Enter the chosen authentication information.7. Optional: Enter the Ansible Tower server certificate or certificate chain.8. Click Save to store the connection information.
Note: When using the standard Ansible Tower installation a self-signed certificate issued for CNlocalhost might be generated. Make sure to replace that certificate with a certificate issued for theactual domain name you will be using. Otherwise the connection might not work.
Enabling runbook automation for your IBM Netcool Operations Insight on RedHat OpenShift deploymentEnable the launch-in-context menu to start manual or semi-automated runbooks from events for yourcloud IBM Netcool Operations Insight on Red Hat OpenShift deployment.
About this taskTo add the runbook automation entry to the launch-in-context menu for a hybrid deployment, see“Installing Netcool/Impact to run the trigger service” on page 334.
Complete the following steps to add the runbook automation entry to the launch-in-context menu of theNetcool/OMNIbus event list for a cloud deployment.
Procedure1. Log on to Netcool/OMNIbus Web GUI as an administrator.2. Select Administration > Event Management Tools > Menu Configuration.3. Select Alerts > Modify. Netcool/OMNIbus Web GUI displays the Menus Editor dialog box.4. From the available items, select LaunchRunbook.5. Select the arrow to add LaunchRunbook to the Current Items list. You can optionally rename the
menu entry name or add a space between "Launch" and "Runbook".6. Click Save.
What to do nextInstall Netcool/Impact and complete post-installation tasks. For more information, see “InstallingNetcool/Impact to run the trigger service” on page 334 and “Postinstallation of Netcool/Impact V7.1.0.18or higher” on page 335. Create triggers and link events with the runbooks. For more information, see“Triggers” on page 510.
Installing Netcool/Impact to run the trigger serviceTriggers map events to runbooks. Using triggers, an operations analyst can immediately execute therunbook that matches to an event. Netcool/Impact is used to run the trigger service.
Attention: The instructions to configure Netcool/Impact only apply to a hybrid deployment ofNetcool Operations Insight where Netcool/Impact runs on premises. Netcool/Impact is
334 IBM Netcool Operations Insight: Integration Guide
automatically configured in a full deployment of Netcool Operations Insight on Red Hat OpenShift.For more information, see “Installing on Red Hat OpenShift” on page 108.
A trigger specifies which event maps to which runbooks.
All information about a trigger, including the event filters, is stored in Netcool/Impact. Netcool/Impactmonitors the incoming events from Netcool/OMNIbus. If an event is found in Netcool/OMNIbus that isstored in Netcool/Impact, the following actions are run:Manual or semi-automated runbooks
Netcool/Impact stores the ID of the runbook and the matching parameters in the OMNIbusalerts.status table. The operational analyst can then use the right-click context menu to launchthe matching runbook directly from the event.
Fully automated runbooksNetcool/Impact runs the runbook via an API call to IBM Runbook Automation. The result is stored inthe event journal.
Postinstallation of Netcool/Impact V7.1.0.18 or higherConfigure IBM Tivoli Netcool/Impact V7.1.0.18 or higher to integrate IBM Runbook Automation and maprunbooks to events.
Run the following steps on the Impact server. If there are any secondary Impact server(s) installed,ensure that these servers are stopped. The immediate steps below must be completed on the primaryNetcool/Impact server. For secondary Netcool/Impact servers, see “Configuring a secondaryObjectServer” on page 336 and “Configuring a secondary Netcool/Impact server” on page 336.
Set up IBM Tivoli Netcool/Impact V7.1.0.18 or higher:Import the database schema and Runbook Automation project
Run the following command under the same user account that you used to install Netcool/Impact..
On Linux systems:
$IMPACT_HOME/install/cfg_addons/rba/install_rba.sh <derby_password>
On Windows systems:
<IMPACT_INSTALL_LOCATION>/install/cfg_addons/rba/install_rba.bat <derby_password>
Update the ObjectServerIBM Runbook Automation requires additional fields in the alert.status events table. If you have ahigh availability ObjectServer setup you must run the command for both the primary and backupserver. Copy the following file to the ObjectServer:
$IMPACT_HOME/add-ons/rba/db/rba_objectserver_fields_update.sql
Then run the following command:
$OMNIHOME/bin/nco_sql -username <username> -password <password> < rba_objectserver_fields_update.sql
<username> is a placeholder for ObjectServer user name and <password> for ObjectServerpassword.
Note: The < operator is used to pipe the file to the ObjectServer to create the new fields.
Configure and test RBA_ObjectServer data source connection
1. Log in to Netcool/Impact.2. Switch to the RunbookAutomation project from the drop-down menu in the top right corner.3. Click the Data Model tab.4. Right-click RBA_ObjectServer datasource and click Edit.5. Enter the access information for your Netcool/OMNIbus ObjectServer.
Chapter 6. Configuring 335
6. Test the connection.7. Save the changes and close the editor.8. Expand the RBA_ObjectServer data source in the tree view.9. Right-click RBA_Status data type and click Edit.
10. In the Table Description area, click Refresh Fields for the alerts.status base table.11. Ensure that the table row for the Serial item has a value of Yes in the Key Field column. If the
value displayed is No, double-click this table entry to enter edit mode, and select the check boxthat appears in edit mode.
12. Ensure that Identifier is selected in the drop-down box for the Display Name Field.13. Save the changes and close the editor.14. Right-click RBA_Status data type and click View Data Items.15. Verify that some events from Netcool/OMNIbus are listed.16. Close the Data Items: RBA_Status view.
Configure and test RBA_Derby data source connection
1. Log in to Netcool/Impact.2. Switch to the RunbookAutomation project from the drop-down menu in the top right corner.3. Click the Data Model tab.4. Right-click RBA_Derby datasource and click Edit.5. Test the connection to ensure you can communicate successfully with your Derby database.
Note: If you cannot communicate with the Derby database, ensure that the username, password,host, and port are correctly setup in the datasource.
6. Save the changes and close the editor.
Configuring a secondary ObjectServerIf there are multiple ObjectServers, perform the following step on each object server:
Update the ObjectServer
• IBM Runbook Automation requires additional fields in the alert.status events table. If you have ahigh availability ObjectServer setup you must run the command for both the primary and backupserver. Copy the following file to the ObjectServer:
$IMPACT_HOME/add-ons/rba/db/rba_objectserver_fields_update.sql
Then run the following command:
$OMNIHOME/bin/nco_sql -username <username> -password <password> < rba_objectserver_fields_update.sql
<username> is a placeholder for ObjectServer user name and <password> for ObjectServerpassword.
Note: The < operator is used to pipe the file to the ObjectServer to create the new fields.
Configuring a secondary Netcool/Impact serverIf there are any secondary Impact server(s) installed, perform the following steps on the secondaryImpact server(s):
• The Derby Database Failure Policy must be set to Failover/Failback.• Ensure that the following property is set in the primary: NCI1_server.props:
– Add the following property to the $IMPACT_HOME/etc/<ServerName>_server.props file onthe primary impact server:
impact.server.preferredprimary=true
336 IBM Netcool Operations Insight: Integration Guide

When these steps have been completed, start the secondary Impact server(s). The replication inderby will copy across the Runbook Automation configuration to the secondary(s). The impactserver logs can be monitored to confirm that the configuration has been copied to the secondary(s).
Note: The following steps are executed on the primary server only:
1. Import the database schema and Runbook Automation project.2. “Configure and test RBA_ObjectServer data source connection” on page 335.3. “Configure and test RBA_Derby data source connection” on page 336.
Import certificateThe Netcool/Impact servers use SSL connections to communicate with IBM Runbook Automation.Therefore the server certificate for Runbook Automation must be imported into Netcool/Impact'struststore.
Note: Run the following steps on the Impact server, Impact secondary server(s) if you have theminstalled, and Impact GUI server(s).
Import the signed certificate:
1. On Linux systems, enter the following command to receive the correct certificate:
echo -n | openssl s_client -servername <RBA_ACCESS_HOST> -connect <RBA_ACCESS_HOST>:<RBA_ACCESS_PORT> | sed -ne '/-BEGIN CERTIFICATE-/,/-END CERTIFICATE-/p' > file.cert
The values for <RBA_ACCESS_HOST> (2 occurrences) and <RBA_ACCESS_PORT> (1 occurrence) aredetermined as follows:RBA Marketplace (standalone or as part of Cloud Event Management)
<RBA_ACCESS_HOST> is rba-mp.us-south.runbookautomation.cloud.ibm.com.<RBA_ACCESS_PORT> is 443
RBA Private Deployment<RBA_ACCESS_HOST> is the host name of your RBA server.<RBA_ACCESS_PORT> is 3005.
RBA as part of Cloud Event Management on IBM Cloud Private<RBA_ACCESS_HOST> is the host name of CEM.<RBA_ACCESS_PORT> is 443.
RBA as part of Cloud Event Management on IBM Cloud<RBA_ACCESS_HOST> depends on the region used:Sydney: console.au-syd.cloudeventmanagement.cloud.ibm.com.London: console.eu-gb.cloudeventmanagement.cloud.ibm.com.Dallas: console.us-south.cloudeventmanagement.cloud.ibm.com.<RBA_ACCESS_PORT> is 443.
No port needs to be specified for Cloud Event Management or RBA on Cloud. For a RunbookAutomation Private Deployment the port is 3005.
If the command does not work in your environment, use the following variant of the command:
ex +'/BEGIN CERTIFICATE/,/END CERTIFICATE/p' <(echo | openssl s_client -showcerts -servername <RBA_ACCESS_HOST> -connect <RBA_ACCESS_HOST>:<RBA_ACCESS_PORT>) -scq > file.cert
If errors occur, make sure your exported certificate that is stored in file.cert contains a full andvalid certificate. Errors like verify error:num=20:unable to get local issuercertificate occur due to a missing CA root certificate for the DigiCert CA.
The certificate begins and ends as follows:
Chapter 6. Configuring 337
-----BEGIN CERTIFICATE----- ...-----END CERTIFICATE-----
On Windows systems, use your preferred browser to export the certificate.2. Use the following command to import the certificate:
Warning:
• The import_cert script does not only import the certificate but it also restarts the Netcool/Impact server and the Netcool/Impact GUI server. If this is a production environment youshould run this script during planned maintenance only.
• If you have Netcool/Impact running under process control, stop all Netcool/Impact processesin the process control and restart them manually using the stop and start scripts found in$IMPACT_HOME/bin. This is necessary because the import_cert.sh script will start andstop the Netcool/Impact processes. Once the import_cert.sh script completes, stop allNetcool/Impact processes and restart them using the process control.
Note: If you need to change your RBA certificate, you must delete the old certificates before runningthe import script again. Use the following command for the Netcool/Impact server (for example,replace <instance> with NCI) and for the Netcool/Impact GUI server (for example, replace <instance>with ImpactUI) to delete the outdated RBA certificate from the respective keystores:
$IMPACT_HOME/sdk/bin/keytool -delete -alias rba_certificate -keystore $IMPACT_HOME/wlp/usr/servers/<instance>/resources/security/trust.jks -storepass <KEY_STORE_PASSWORD>
On Linux systems:
$IMPACT_HOME/install/cfg_addons/rba/import_cert.sh <KEY_STORE_PASSWORD> <CERTIFICATE_FILE_FULL_PATH>
On Windows systems:
<IMPACT_INSTALL_LOCATION>/install/cfg_addons/rba/import_cert.bat <KEY_STORE_PASSWORD> <CERTIFICATE_FILE_FULL_PATH>
where <KEY_STORE_PASSWORD> is your Netcool/Impact admin password.
Creating a custom certificate for Red Hat OpenShiftA custom certificate is required for the Runbook Automation and Netcool/Impact integration on Red HatOpenShift.
About this taskIf you are still using the default OpenShift ingress certificate, you must update this to a certificate that hasthe correct Subject Alternate Names set. The default certificate has only *.apps.cluster-domain and this is not sufficient for external connections to Netcool Operations Insight to be trusted.
The custom certificate must have at least the following Subject Alternate Names:
• *.apps.cluster-domain• *.noi-cr-name.apps.custer-domain
For full details of how to configure a custom ingress certificate, go to https://docs.openshift.com/container-platform/4.4/networking/ingress-operator.html#nw-ingress-setting-a-custom-default-certificate_configuring-ingress.
The following instructions describe how to create a self-signed certificate that contains the requiredSubject Alternate Names and apply it to the OpenShift ingress configuration.
338 IBM Netcool Operations Insight: Integration Guide
Procedure1. Create an OpenSSL configuration file similar to the following example. Update the fields to your
requirements and update the values for [alt_names] to cover your domain names.
[req]distinguished_name = req_distinguished_namex509_extensions = v3_reqprompt = no[req_distinguished_name]C = USST = VAL = SomeCityO = MyCompanyOU = MyDivisionCN = apps.custer-domain[v3_req]keyUsage = keyEncipherment, dataEnciphermentextendedKeyUsage = serverAuthsubjectAltName = @alt_names[alt_names]DNS.1 = *.apps.custer-domainDNS.2 = *.noi-cr-name.apps.custer-domain
2. Save the file and run it on a system with OpenSSH and run the following command:
openssl req -x509 -nodes -days 730 -newkey rsa:2048 -keyout server.key -out server.crt -config req.conf -extensions 'v3_req'
This creates two files - the key and the certificate.3. Run the following commands to configure OpenShift to use the key and the certificate for ingress:
oc --namespace openshift-ingress create secret tls custom-certs-default--cert=server.crt--key=server.key
oc patch --type=merge --namespace openshift-ingress-operator ingresscontrollers/default--patch '{"spec":{"defaultCertificate":{"name":"custom-certs-default"}}}'
4. Run the following command on the Netcool/Impact server to import server.crt into the Netcool/Impact truststore :
./keytool -import -alias 'certificatealias' -file 'path to server.crt on impactserver' -keystore /opt/IBM/tivoli/impact/wlp/usr/servers/NCIP/resources/security/trust.jks
Configure user access rightsIBM Runbook Automation must be connected to Netcool/Impact for trigger management. This connectionis secured with a user name and a password.
If you want to create a new user, run step 1 and map the role in step 2. You can also add the role to anexisting user and run step 2 only.
1. To create a user, enter:
cd $IMPACT_HOME/install/security ./configUsersGroups.sh -add -user <username> -password <password>
2. Map the impactRBAUser role to an existing user or to the user that you created.
cd $IMPACT_HOME/install/security ./mapRoles.sh -add -user <username> -roles impactRBAUser
Update the Netcool/Impact configurationEdit the default values of the Netcool/Impact derby database to configure launch-in-context support andintegration with IBM Runbook Automation.
Netcool/Impact configuration for fully automated runbooks is stored in the Netcool/Impact derbydatabase in the rbaconfig.defaults table with the exception of the RBAAPIKeyPassword.
Chapter 6. Configuring 339
The table contains the following default values:
Table 62. Default values of Netcool/Impact derby database
Default value Description
RBAHost='' RBA Marketplace (standalone or as part of Cloud Event Management)The base URL is https://rba-mp.us-south.runbookautomation.cloud.ibm.com.
RBA Private DeploymentThe base URL is https://<RBA_SERVER_HOST_NAME>.
RBA as part of Cloud Event Management on IBM Cloud PrivateThe base URL is https://<CEM_HOST_NAME>.
RBA as part of Cloud Event Management on IBM CloudThe base URL depends on the region used:Sydney: https://rba.au-syd.cloudeventmanagement.cloud.ibm.com.London: https://rba.eu-gb.cloudeventmanagement.cloud.ibm.com.Dallas: https://rba.us-south.cloudeventmanagement.cloud.ibm.com.
RBAManualExecHost='' For all deployment types except Cloud, RBAManualExecHost= is thesame value as RBAHost=.
Change the default to the URL you were given as part of yoursubscription.
If you work with the following URL https://ibmopsmanagement.mybluemix.net/index?subscriptionId=EF0E868D1965A2D1E6F64EDFF51BA985778C690A2, specify ibmopsmanagement.mybluemix.net as default value.
RBAPort='443' No changes are required for RBA Application Port.
Change the default value to the port of the runbook service. The defaultvalue of the runbook service port is 3005.
RBAProtocol='https' No changes are required for RBA Application Protocol.
RBARESTPath='/api/rba/' (Netcool/Impact7.1.0.13 or below)
RBARESTPath='/api/v1/rba/' (Netcool/Impact7.1.0.14 or higher)
No changes are required for RBA REST path.
RBARESTPathToView='apipath' (Netcool/Impact7.1.0.13 or below)
RBARESTPathToView='/api/v1/rba/' (Netcool/Impact 7.1.0.14 orhigher)
No changes are required for RBA API path.
340 IBM Netcool Operations Insight: Integration Guide
Table 62. Default values of Netcool/Impact derby database (continued)
Default value Description
RBAAPIKeyName=''
RBAAPIKeyPassword=''
API key to access Runbook Automation from Netcool/Impact. Generatean appropriate API key by using the API Keys page. For moreinformation, see API Keys.The API Key password is not stored in thedatabase but in a separate file, see “Storing the API Key Password” onpage 342.
Notes®:
• For more information about how to create API keys, see API Keys.• All executions of fully automated runbooks are linked to the user ID
that created the API key. It is therefore recommended to use afunctional user ID to create the API keys. The following criteria apply:
– Log in to RBA using the functional user ID to create API keys.– All fully automated runbooks that are executed will be linked to this
functional user ID.– To investigate fully automated runbook logs, login to RBA using the
functional user ID. Runbook executions can be viewed in theExecution page.
RBASubscription='' Your Runbook Automation subscription.
You can find your subscription name in the Runbook Automation URL.For example, the URL https://ibmopsmanagement.mybluemix.net/index?subscriptionId=EF0E868D1965A2D1E6F64EDFF51BA985778C690A2contains the subscriptionIDEF0E868D1965A2D1E6F64EDFF51BA985778C690A2.
You can find your subscription name in the CEM URL. For example, theURL https://<cem base URL>/landing?subscriptionId=EF0E868D1965A2D1E6F64EDFF51BA985778C690A2contains the subscriptionIDEF0E868D1965A2D1E6F64EDFF51BA985778C690A2.
Set this value to "ld".
Beginning with Netcool/Impact 7.1.0.14, you no longer need to set this field.
GetHTTPUseProxy='false'
GetHTTPProxyHost='localhost'
GetHTTPProxyPort='8080'
Required only if your Netcool/Impact server connects to RunbookAutomation through a proxy server.
A proxy server is usually not needed for the Netcool/Impact server toconnect to Runbook Automation.
MaxNumTrialsToUpdateRBAStatus='60' (Netcool/Impact 7.1.0.13 orbelow)
MaxNumTrialsToUpdateRBAStatus='600'(Netcool/Impact7.1.0.14 or higher)
Number of seconds on how long to retry for status of a fully automatedrunbook. The recommended value is 600 (10 minutes). If your fullyautomated runbooks take longer than this time frame to complete,increase the value for this property accordingly.
Chapter 6. Configuring 341

Table 62. Default values of Netcool/Impact derby database (continued)
Default value Description
NumberOfSampleEvents='10'
Number of sample events that are displayed when a new trigger iscreated. Sample events are displayed in the View Sample Events dialogwhen you create a new trigger in IBM Runbook Automation.
Run the following commands to update the fields in the Impact Derby database:
$IMPACT_HOME/bin/nci_db connect
You will be prompted something similar to the following:
ij version 10.8
Connect to your database with the same connection string as identified in “Postinstallation of Netcool/Impact V7.1.0.18 or higher” on page 335. For example:
ij> connect 'jdbc:derby://localhost:1527/ImpactDB;user=impact;password=derbypass;'; ij>
Use the sample commands to update the fields:
update rbaconfig.defaults set FieldValue ='RBADevelopmentTeam/hytmamvirtex' WHERE FieldName='RBAAPIKeyName'; update rbaconfig.defaults set FieldValue = 'rba.mybluemix.net' WHERE FieldName='RBAHost';update rbaconfig.defaults set FieldValue = 'ibmopsmanagement.mybluemix.net' WHERE FieldName='RBAManualExecHost'; ;update rbaconfig.defaults set FieldValue = '600' WHERE FieldName='MaxNumTrialsToUpdateRBAStatus';update rbaconfig.defaults set FieldValue = 'EF0E868D1965A2D1E6F64EDFF51BA985778C690A2' WHERE FieldName='RBASubscription';
Note: Starting with IBM Tivoli Netcool/Impact V7.1.0.17: after you have changed the configuration, openthe Netcool/Impact UI, switch to the Policies tab, and run the "RBA_ResetConnectionParameters" policy(you might need to switch to the Global project view to see this policy listed).
Storing the API Key PasswordThe API key password that Netcool/Impact uses to access Runbook Automation is based on theconfiguration property RBAAPIKeyPassword and must be encrypted by using $IMPACT_HOME/bin/nci_crypt <RBAAPIKeyPassword value >.
For example, an encrypted value can look as follows:
{aes}BE0A8FAB4084D460CBD664FECDE3674A8B728BE7986F56F8B2F542C2056B4A2D1E6F64EDFF51BA985778C690A2E95
This encrypted value must be stored in a text file within the Netcool/Impact install location. Create the file$IMPACT_HOME/etc/RBAAPIKeyPassword.txt and copy the encrypted value into this file.
Note: Starting with IBM Tivoli Netcool/Impact V7.1.0.17: after you have changed the configuration, openthe Netcool/Impact UI, switch to the Policies tab, and run the "RBA_ResetConnectionParameters" policy(you might need to switch to the Global project view to see this policy listed).
Note: If there are any additional secondary Netcool/Impact server(s) installed, repeat all of the steps oneach of the secondary Netcool/Impact server(s). This is necessary because the encrypted value of the APIkey password depends on the individual Netcool/Impact system and cannot be shared by the primary andsecondary Netcool/Impact server(s).
342 IBM Netcool Operations Insight: Integration Guide
Enable the launch-in-context menuYou must enable the launch-in-context menu to start manual or semi-automated runbooks from events.
The launch-in-context (LiC) feature enables the display of the Execute Runbook page with the eventcontext (runbook and parameters) if a trigger for the event has been matched. Enabling this featureprovides the following functionality in the event console:
• The context menu of all events will have an additional entry, named LaunchRunbook.• Click LaunchRunbook to:
– Launch the Runbook Automation application, using the runbook ID and parameter mappings asdefined in the matching trigger.
– Display an alert with an error message, if no trigger has been matched.
For more information about how to create a trigger, see “Create a trigger” on page 511.
Before you beginYou must add Netcool_OMNIbus_Admin and Netcool_OMNIbus_User in groups/group roles underAccess Criteria (step “1.i” on page 344). If a user does not belong to these groups they cannot access theLaunch Runbook launch-in-context menu.
ProcedureUse the Netcool/OMNIbus Web GUI to create the launch-in-context menu.
1. Create a launch-in-context menu and a corresponding menu entry.
a. Log on to Netcool/OMNIbus Web GUI as an administrator.b. Select Administration > Event Management Tools > Tool Configuration.c. Click the Create Tool icon to create a new tool.d. Set the Name field to LaunchRunbook.e. From the Type drop-down field, select Script.f. Make sure the data source, for example OMNIbus, is selected in the data source configuration.
g. In the Script field, enter:
var runbookId = '{$selected_rows.RunbookID}'; var runbookParams = '{$selected_rows.RunbookParametersB64}'; runbookParams = encodeURIComponent(runbookParams); if (runbookId == '' || runbookId == ' ' || runbookId == ', ' || runbookId == '0' || runbookId == 0) { alert('This event is not linked to a runbook'); } else { var url = 'https://<NOI_HOST_NAME>/aiops/<YOUR_SUBSCRIPTION_ID>/alerts/automations/runbooks/run?runbookId=' + runbookId + '&bulk_params=' + runbookParams; var wnd = window.open(url, '_blank');}
Where: <NOI_HOST_NAME> is your Netcool Operations Insight host name.
<YOUR_SUBSCRIPTION_ID> is your subscription ID.
Obtaining the base URL of Runbook AutomationRBA Marketplace (standalone or as part of Cloud Event Management)
The base URL is https://rba-mp.us-south.runbookautomation.cloud.ibm.com.RBA as part of Cloud Event Management on IBM Cloud Private
The base URL is https://<CEM_HOST_NAME>.RBA as part of Cloud Event Management on IBM Cloud
The base URL depends on the region used:Sydney: https://console.au-syd.cloudeventmanagement.cloud.ibm.com.
Chapter 6. Configuring 343
London: https://console.eu-gb.cloudeventmanagement.cloud.ibm.com.Dallas: https://console.us-south.cloudeventmanagement.cloud.ibm.com.
h. Ensure the Execute for each selected row check box is not selected, as only single events can beselected as the context for launching a runbook.
i. Select the appropriate group roles in the Access Criteria section, that isNetcool_OMNIbus_Admin and Netcool_OMNIbus_User.
j. Click Save.
For more information about configuring launch-in-context support, see Configuring launch-in-context integrations with Tivoli products.
2. Complete the following steps to add the Runbook Automation entry to the launch-in-context menu ofthe Netcool/OMNIbus event list:
a. Log on to Netcool/OMNIbus Web GUI as an administrator.b. Select Administration > Event Management Tools > Menu Configuration.c. Select Alerts > Modify. Netcool/OMNIbus Web GUI displays the Menus Editor dialog box.d. Select LaunchRunbook from the available items.e. Log on to Netcool/OMNIbus Web GUI as an administrator.f. Select the arrow to add LaunchRunbook to the Current Items list. You can optionally rename the
menu entry name or add a space between Launch and Runbook.g. Click Save.
Note: It might still be possible to launch a runbook for an event even if a trigger does not exist anymore.This can happen if an event had a runbook ID assigned because a matching filter existed when the eventwas created.
Configure a connection to the Netcool/Impact serverThis section outlines the steps for adding a connection to Netcool/Impact in IBM Runbook Automation.
Before you beginVerify that all prerequisites are met, as described in “Event Trigger (Netcool/Impact)” on page 331.
Procedure
1. In the main navigation menu, select Administration and click Integration with othersystems.
2. Click Automation type.3. Under the Event Trigger (OMNIbus/Impact) tile, click Configure.4. For the IBM Netcool/Impact REST service URL, enter the host name and port, or the IP address and
port, of your local Netcool/Impact GUI server installation, followed by ibm/custom/RBARestUIServlet. For example, https://9.168.48.28:16311/ibm/custom/RBARestUIServlet.
Note: The URL can be a private IP address. The gateway infrastructure routes your request to thegateway connector, from which you can then use IP addresses local to your environment. For the userand password, add the username and password that you configured in “Configure user access rights”on page 339.
In general, you should reference the host name of the Impact server as it is included in the "CommonName (CN)" field of the SSL certificate for the Impact server. For the user and password, add theusername and password that you configured in “Configure user access rights” on page 339.
What to do next(Netcool/Impact V7.1.0.19 only) Configure the RBA_Event Reader
344 IBM Netcool Operations Insight: Integration Guide
1. Log in to Netcool/Impact.2. Switch to the RunbookAutomation project from the drop-down menu in the top right corner.3. Click the Services tab.4. Right-click the RBA_EventReader service and click Edit.5. Switch to the Event Mapping tab.6. In the Event Matching area, select Stop testing after first match.7. In the Event Locking area, ensure that the Expression field is empty, and the Enable checkbox is not
selected.8. Click Save and close the editor.9. Restart the RBA_EventReader service.
10. Enable persistence to preserve the manual configuration after a pod restart.
Upgrading Netcool/Impact to a higher fix pack level when the RBA add-on is alreadyinstalledMigrate the RBA add-on from a previous Netcool/Impact level to a new Netcool/Impact level.
Procedure• If the RBA add-on is installed and configured already within a Netcool/Impact installation, and you
upgrade the Netcool/Impact installation to a higher level, the upgrade also refreshes the RBA add-on.So typically no additional action is required.
• It is recommended to install Netcool/Impact V7.1.0.19 or higher.• Verify the connection to RBA_Derby:
a) Open the Netcool/Impact UI and click Data Model > RBA_Derby > Test Connection.b) If the message says Connection could not be made, complete these additional steps:
a. Edit RBA_Derby.b. In Primary Source / Host Name change localhost to the actual host name.c. Click Test Connection. The message should say Connection OK.d. Save RBA_Derby configuration and close the editor.e. Repeat RBA_Derby > Test Connection. The message should say "Connection OK".
• Some additional configuration steps are required after you have installed Netcool/Impact V7.1.0.19 orhigher:a) Add the new field "RunbookIDArray" to the alerts.status table in the Netcool ObjectServer.
If you have a high availability ObjectServer setup you must run the command for both the primaryand backup server. Copy the following file to the ObjectServer:
$IMPACT_HOME/add-ons/rba/db/rba_objectserver_fields_updateFP19.sql
Then run the following command:
$OMNIHOME/bin/nco_sql -username <username> -password <password> < rba_objectserver_fields_updateFP19.sql
<username> is a placeholder for ObjectServer user name and <password> for ObjectServerpassword.
Note: The < operator is used to pipe the file to the ObjectServer to create the new fields.b) Refresh the fields of the RBA_Status data type.
a. Log in to Netcool/Impact.b. Switch to the RunbookAutomation project from the drop-down menu in the top right corner.c. Click the Data Model tab.
Chapter 6. Configuring 345
d. Expand the RBA_ObjectServer data source in the tree view.e. Right-click the RBA_Status data type and click Edit.f. In the Table Description area, click Refresh Fields for the alerts.status base table.
g. Click Save and close the editor.c) Configure the RBA_Event Reader.
a. Log in to Netcool/Impact.b. Switch to the RunbookAutomation project from the drop-down menu in the top right corner.c. Click the Services tab.d. Right-click the RBA_EventReader service and click Edit.e. Switch to the Event Mapping tab.f. In the Event Matching area, select Stop testing after first match.
g. In the Event Locking area, ensure that the Expression field is empty, and the Enable checkboxis not selected.
h. Click Save and close the editor.i. Restart the RBA_EventReader service.
Migrating from IBM Workload Automation Agent to SSH
Before you begin1. Decide if you need a jump server to access endpoints using SSH.
By default, the SSH calls are executed from the RBA server. If the RBA server has no connection to theendpoints, a jump server is required. For example, use the system where the TWA agent was installedas a jump server.
By default, the SSH calls are executed from the system where the IBM Secure Gateway client isinstalled. If this system has no connection to the endpoints, a jump server is required. For example,use the system where the TWA agent was installed as a jump server.
2. Plan a maintenance window for the migration. Note that after step 1 of the Migration procedure, youcannot execute automations until step 3 is completed.
Note: IBM Workload Automation Agent stores the credentials to access endpoints in a credential vault.Using the SSH provider, this is no longer required. Instead SSH public key authentication is used. This canbe done for specific users or the root user. For more information, see “SSH script automation provider” onpage 332.
Procedure1. Delete the existing TWA script connection.2. Create a new SSH script connection.3. Follow the steps described in the on-screen dialog. For more information, see “SSH script automation
provider” on page 332.4. If an SSH script connection has been set up and script automations are running successfully on the
target endpoints, IBM Workload Automation Agent is no longer required and can be uninstalled.
346 IBM Netcool Operations Insight: Integration Guide
Configuring Netcool subsystems using the REST APIUse the REST API to perform a wide range of configuration tasks on Netcool Operations Insight, includingEvent management, Metric Manager, Probable cause, and Runbook Automation.
About the REST APIUsing the REST API, you can run a wide range of commands on Netcool Operations Insight. Click on thetopics below to learn more about each API.
Event Management APIUsing the Event Management API use the ObjectServer HTTP interface to access event information fromthe ObjectServer.
ObjectServer HTTP interfaceThe HTTP interface is an API that is hosted in the IBM Tivoli Netcool/OMNIbus ObjectServer, from whereyou can access events information. The HTTP interface provides access to table data in the ObjectServerthrough a structured URI format that uses HTTP, POST, PATCH, GET, and DELETE requests. For moreinformation click https://www.ibm.com/support/knowledgecenter/en/SSSHTQ_8.1.0/com.ibm.netcool_OMNIbus.doc_8.1.0/omnibus/wip/api/reference/omn_api_http_httpinterface.html
Probable Cause APIUsing the Probable Cause API, you can perform tasks such as adding and removing classification labels orinteracting with the edges weights that are used for calculating the probable cause within the topology. Towork with the Probable Cause API, you can use the Swagger UI or work with cURL.
Probable Cause APIClick https://www-03preprod.ibm.com/support/knowledgecenter/SSTPTP_1.6.3_test/com.ibm.netcool_ops.doc/soc/config/task/cfg-configuring-probablecause.html to read more informationabout Probable Cause.
You can access the Probable Cause API by clicking the endpoints:
https://server_name/api/mime/
for classification labels or edge weights, or
https://server_name/api/classification
for model training. The variable server_name is the name of the server where Netcool Operations Insightis running.
Using the Probable Cause API, you can:
• Delete the training model.• Get the status for a trained model.• Predict and classify a string or list of strings.• Delete the training data.• Insert new customised training data.• Get the training data used for training a model.• Submit a request to train a model.• Define custom edges weights within topology manager.• Remove custom edges weights and reapply default edges weights.• Add custom event classification labels.• Remove custom event classification labels.
Chapter 6. Configuring 347
Runbooks APIUsing the Runbooks API, you can perform tasks such as create and modify runbooks with special runbookelements, such as parameters, automations, commands, and goto elements. To interact with theRunbooks API, you can use the Swagger UI or cURL.
Runbooks APIYou can access the Runbooks API by clicking a link similar to:
https://server_name/api/v1/rba
Where server_name is the name of the server on which your Netcool Operations Insight deployment isrunning. Using the Runbooks API you can:
1. Create a parameterTo create a parameter, include it in the parameters section of your JSON input. Use the followingsyntax to use it inside the runbook description:<span class="rba-parameter" data-id="parametername"></span>
Where $PARAMETERNAME is the name of the parameter that is chosen in the parameters section of theinput JSON. The following JSON shows an example of a runbook defining one step with a mandatoryparameter:
{ "name": "An example runbook", "steps": [ { "number": 1, "description": "Solve the task to solve the problem in data center <span class="rba-parameter" data-id="dataCentre"></span>." } ], "parameters": [ { "name": "dataCentre", "description": "The data centre in which the operation needs to be done" } ]}
2. Insert a commandUse the following syntax to mark a section of your step description as a command:<section class="rba-command"><span class="rba-command-text">$COMMAND</span></section>
Where $COMMAND is the text you want to be displayed and executed as a command. The followingJSON shows an example of a runbook defining one step with a command:
{ "name": "An example runbook with a command", "steps": [ { "number": 1, "description": "Log in to the system and display the running processes with the following command: <section class="rba-command"><span class="rba-command-text">ps -ef</span></section>." } ]}
3. Insert a GoTo elementUse the following syntax to insert a GoTo element into a runbook:<span class="rba-goto" data-id="step$NUMBER">
Where $NUMBER is the step number that the GoTo element is directing the user to. To go to the end ofthe runbook, use data-id="end". The following JSON shows an example of a runbook definingmultiple steps, with a GoTo to step 3 within the first step:
{ "name": "An example runbook with a GoTo",
348 IBM Netcool Operations Insight: Integration Guide
"steps": [ { "number": 1, "description": "If you are running on a system with SELinux disabled, directly <span class="rba-goto" data-id="step3">." }, { "number": 2, "description": "Disable SELinux." }, { "number": 3, "description": "Issue a command that should prevented by SELinux and make sure it executed okay." } ]}
4. Insert a collapsibile sectionUse the following syntax to insert a collapsible section with a title into a runbook:<section class="rba-collapsible"><h2 class="rba-collapsible-title">$TITLE</h2><div class="rba-collapsible-description">$COLLAPSIBLECONTENT</div></section>
Where $TITLE is the text to always be displayed and $COLLAPSIBLECONTENT is the content onlyvisible when expanded. The following JSON shows an example of a runbook with a collapsible sectionin step 1. The title contains the text Show Details and the text contains additional information:
{ "name": "An example runbook with a collapsible section", "steps" : [ { "number" : 1, "description" : "<p>The system name is server01.mydomain.com</p><section class="rba-collapsible"><h2 class="rba-collapsible-title">Show details:</h2><div class="rba-collapsible-description">The system is has a 4 core CPU and 8 GiB RAM.</div></section>" } ]
5. Changing a RunbookTo change an existing runbook instead of creating a new one, use the API endpointPATCH /api/v1/rba/runbooks/$RUNBOOKID. Where $RUNBOOKID is the runbook ID of therunbook that you want to change. The JSON sent will update the sections present in the JSON andleave the sections not present untouched. The following JSON is sent to /api/v1/rba/runbooks/abcdefabcdefabcdefabcdefabcdefab:
{ "description": "This runbook has been updated with a new description: Use this runbook to resolve issues around the error code \"ARBR108E\"."}
This action will only change the description of the runbook and leave all other properties, for examplename, steps, parameters, and tags unchanged.
The full interface with the complete list of available Runbooks API endpoints can be accessed at: https://rba.us-south.cloudeventmanagement.cloud.ibm.com/apidocs-v1
API usage scenarioThe following example demonstrates how the Runbook Automation API can be applied in a more complexworkflow scenario. In this scenario, a user wants to integrate an external program with IBM RunbookAutomation. The external program should scan the runbook repository and add a new step to all runbookswhere the runbook contains a tag with the content addstep. Additionally, the external program shouldonly consider runbooks that have been published.
1. Get a list of all available runbooks
The application calls the API endpoint GET /api/v1/rba/runbooks to retrieve a list of allrunbooks. Looking at the complete response model of the runbook, it becomes clear that the programmust only evaluate the fields runbookId, steps and tags. Steps and tags are on the root level of the
Chapter 6. Configuring 349
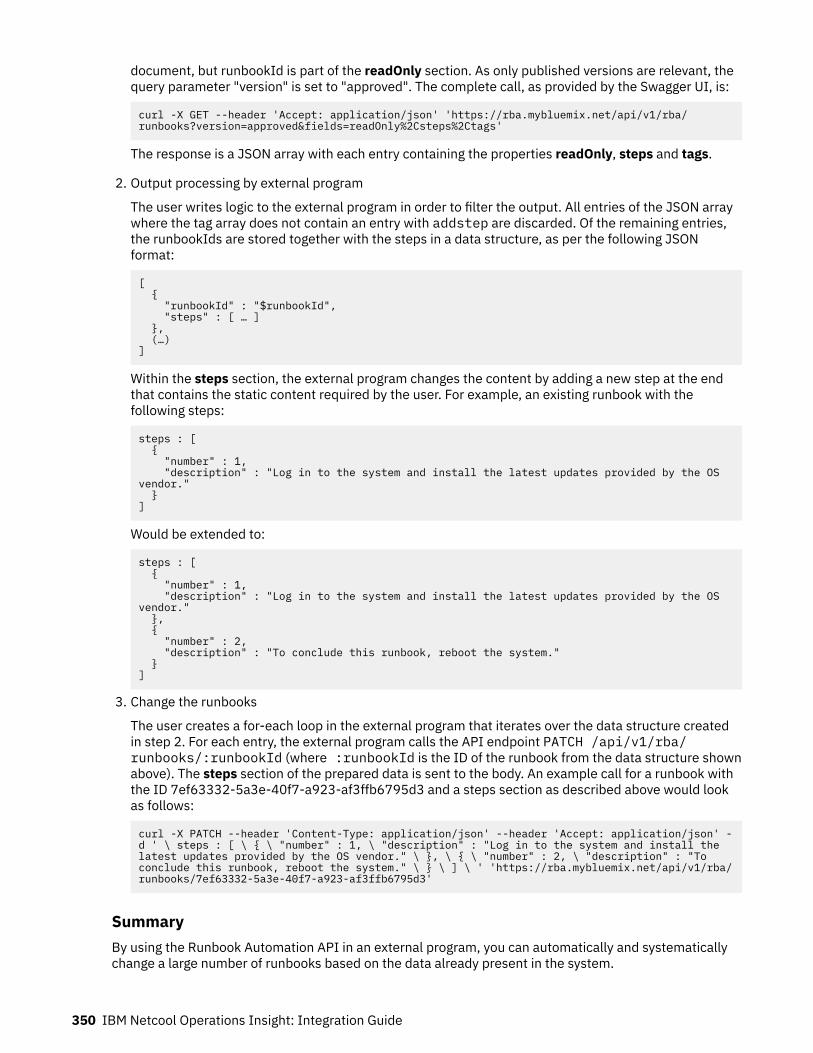
document, but runbookId is part of the readOnly section. As only published versions are relevant, thequery parameter "version" is set to "approved". The complete call, as provided by the Swagger UI, is:
curl -X GET --header 'Accept: application/json' 'https://rba.mybluemix.net/api/v1/rba/runbooks?version=approved&fields=readOnly%2Csteps%2Ctags'
The response is a JSON array with each entry containing the properties readOnly, steps and tags.
2. Output processing by external program
The user writes logic to the external program in order to filter the output. All entries of the JSON arraywhere the tag array does not contain an entry with addstep are discarded. Of the remaining entries,the runbookIds are stored together with the steps in a data structure, as per the following JSONformat:
[ { "runbookId" : "$runbookId", "steps" : [ … ] }, (…)]
Within the steps section, the external program changes the content by adding a new step at the endthat contains the static content required by the user. For example, an existing runbook with thefollowing steps:
steps : [ { "number" : 1, "description" : "Log in to the system and install the latest updates provided by the OS vendor." }]
Would be extended to:
steps : [ { "number" : 1, "description" : "Log in to the system and install the latest updates provided by the OS vendor." }, { "number" : 2, "description" : "To conclude this runbook, reboot the system." }]
3. Change the runbooks
The user creates a for-each loop in the external program that iterates over the data structure createdin step 2. For each entry, the external program calls the API endpoint PATCH /api/v1/rba/runbooks/:runbookId (where :runbookId is the ID of the runbook from the data structure shownabove). The steps section of the prepared data is sent to the body. An example call for a runbook withthe ID 7ef63332-5a3e-40f7-a923-af3ffb6795d3 and a steps section as described above would lookas follows:
curl -X PATCH --header 'Content-Type: application/json' --header 'Accept: application/json' -d ' \ steps : [ \ { \ "number" : 1, \ "description" : "Log in to the system and install the latest updates provided by the OS vendor." \ }, \ { \ "number" : 2, \ "description" : "To conclude this runbook, reboot the system." \ } \ ] \ ' 'https://rba.mybluemix.net/api/v1/rba/runbooks/7ef63332-5a3e-40f7-a923-af3ffb6795d3'
SummaryBy using the Runbook Automation API in an external program, you can automatically and systematicallychange a large number of runbooks based on the data already present in the system.
350 IBM Netcool Operations Insight: Integration Guide
Topology APIUsing the Topology API you can perform several actions on resources, composite, groups and data. Towork with the Topology API you can use the Swagger UI or work with cURL.
Topology APIYou can access the Topology API Swagger UI bly clicking on a link similar to:
https://server_name/1.0/topology/swagger/
Where server_name is the name of your server. For more information about the tasks you can performusing the Topology API, click https://www.ibm.com/support/knowledgecenter/SS9LQB_1.1.10/Reference/r_asm_ckbk_restapi.html .
Configuring the APIsTo visualise and interact with the APIs resources, you can work with the Swagger UI or with cURL.
Swagger is an open source software framework, which includes support for automated documentationand code generation. You can find more information on the Swagger website: https://swagger.io/docs/. Ifyou do not want to use the Swagger UI, or want to script from a shell script, cURL is a good option.
Working with the Swagger UIThe Swagger UI allows you to try out the API calls immediately once you are logged in and authorized.You can use the Swagger UI to work with the Probable Cause API, the Runbooks API and to retrievemetrics data with the Metric Manager API. Complete the following steps to authorize at the Swagger UI.
About this taskThe Swagger UI allows you to try out the API calls immediately once the user is logged in and authorized.Complete the following steps to authorize at the Swagger UI. The interface is documented with Swagger(http://swagger.io) and the Swagger UI (https://swagger.io/swagger-ui/)
Procedure1. Generate an API key:
a) Open the Netcool Operations Insight UI and click API Keys on the event managementAdministration page.
b) Click New API key.c) Enter a description for the key in API key description.d) Specify which part of the event management API the key provides access to. Go to Permissions
and ensure only those check boxes are selected that you want the key to provide access to. All APIsare selected by default. Clear the ones you do not want the API key to provide access to.
Important: Make a note of the APIs the key provides access to. For example, note it in thedescription you enter for the key. You cannot view or change which APIs were selected for the keylater.
e) Click Generate. A new name and password are generated. Make a note of these values.
Important: The password is hidden by default. To view and be able to copy the password, setDisplay password to Show. Ensure you make a note of the password. For security reasons thepassword cannot be retrieved later. If you lose the password, you must delete the API key andgenerate a new one.
f) Click the icon next to Manage API keys to view the base URL for the API.2. Login into Swagger by using the API key you generated. From the Swagger header section, click
Authorize and enter the API key name and API key passwrod in the login dialog and click Authorizeagain.
Chapter 6. Configuring 351
3. Read through the possible actions available on the Swagger UI and choose the one you want toperform.
4. Configure the API action you want to perform by following the API documentation present on theSwagger UI.
5. Run the action and check the resulting response code.
Note: Using the Swagger UI for API calls does not work for an Runbooks Automation PrivateDeployment as the Swagger UI connects to an internet address, not your local environment. For aPrivate Deployment use a HTTP REST client or a tool such as cURL to test your calls.
Working with cURLIf you want to use a command line alternative to the Swagger UI, or want to script from a shell script, youcan use cURL to work with the Metric Manager API, the Probable Cause API, the Runbooks API and theEvent Management API.
About this taskCURL is a command line tool that you can use to work with the APIs. Follow the steps below to learn howto use it.
Procedure1. Generate an API key:
a) Open the Netcool Operations Insight UI and click API Keys on the event managementAdministration page.
b) Click New API key.c) Enter a description for the key in API key description.d) Specify which part of the event management API the key provides access to. Go to Permissions
and ensure only those check boxes are selected that you want the key to provide access to. All APIsare selected by default. Clear the ones you do not want the API key to provide access to.
Important: Make a note of the APIs the key provides access to. For example, note it in thedescription you enter for the key. You cannot view or change which APIs were selected for the keylater.
e) Click Generate. A new name and password are generated. Make a note of these values.
Important: The password is hidden by default. To view and be able to copy the password, setDisplay password to Show. Ensure you make a note of the password. For security reasons thepassword cannot be retrieved later. If you lose the password, you must delete the API key andgenerate a new one.
f) Click the icon next to Manage API keys to view the base URL for the API.2. Run the cURL command with the "-u" option to send data with the generated API key:
curl -u <API Key Name>:<API Key Password>
For example, for the Metric Manager API the command can be:
curl -u "cfd95b7e-3bc7-4006-a4a8-a73a79c71255/cytmiffytryb:N//UllfJ1rMcB7Onm6QH/dI5Xpe0pWtE" -vX POST --header "Content-Type: application/json" --header "Accept: application/json" --header "X-TenantID: cfd95b7e-3bc7-4006-a4a8-a73a79c71255" --data @$DATA_DIR/demo__metrics__training__20200901-0100__20201003-0500.json "https://server_name/api/metricingestion/1.0/metrics" --insecure
Note:
The following items need to be considered when using cURL:
• Runbook Automation does not support charsets other than UTF-8. If a header is specified defininganother charset, the call will fail. This is an example of a failing cURL command:curl (…) --header 'Content-Type: application/json; charset=usascii'
352 IBM Netcool Operations Insight: Integration Guide
• Runbook Automation does not support the HTTP header "Expect: 100-continue". If the inputyou provide is larger than 1024 Bytes, some versions of cURL send this header by default and youmust turn it off. To do this, add the following header to your cURL command: --header'Expect:'.
Trying out cloud native analyticsIn order to process data into useful analytics results, the various cloud native analytics algorithms trainautomatically in the background on a regular basis by processing a predefined set of historical data. If,alternatively, you want to try out cloud native analytics with sample data sets and see the resultsimmediately then you can use the manual procedures provided in this section.
Training with sample dataTo learn about cloud native analytics, you can install a sample data set. Learn how to install and loadsample data, train the system, and see the results.
Before you beginComplete the following prerequisite items:
• The ea-events-tooling container is installed by the operator. It is not started as a pod, and containsscripts to install data on the system, which can be run with the kubectl run command.
• Find the values of image and image_tag for the ea-events-tooling container, from the output of thefollowing command:
kubectl get release_name -o yaml | grep ea-events-tooling
Where release_name is the custom resource release name of your cloud deployment. For example, inthe output below image is ea-events-tooling, and image_tag is 2.0.14-20200120143838GMT.
kubectl get release_name -o yaml | grep ea-events-tooling --env=CONTAINER_IMAGE=image-registry.openshift-image-registry.svc:5000/default/ea-events-tooling:2.0.14-20200120143838GMT \ --image=image-registry.openshift-image-registry.svc:5000/default/ea-events-tooling:2.0.14-20200120143838GMT \
For a hybrid deployment, run the following command:
kubectl get release_name -o yaml | grep ea-events-tooling
Where release_name is the custom resource release name of your hybrid deployment.• If you created your own docker registry secret, as described in “Preparing your cluster” on page 113,
then patch your service account.
kubectl patch serviceaccount default -p '{"imagePullSecrets": [{"name": "noi-registry-secret"}]}'
Where noi-registry-secret is the name of the secret for accessing the Docker repository.
Note: As an alternative to patching the default service account with image pull secrets, you can add thefollowing option to each kubectl run command that you issue:
--overrides='{ "apiVersion": "v1", "spec": { "imagePullSecrets": [{"name": "noi-registry-secret"}] } }'
About this taskYou can use scripts in the ea-events-tooling container to install sample data on the system. Run theloadSampleData.sh script to load data to the ingestion service, train it, create a scope-based policyand load the data into IBM Netcool Operations Insight. This script loads prebuilt data into the ingestionservice and ObjectServer and trains the system for seasonality and related events.
Chapter 6. Configuring 353
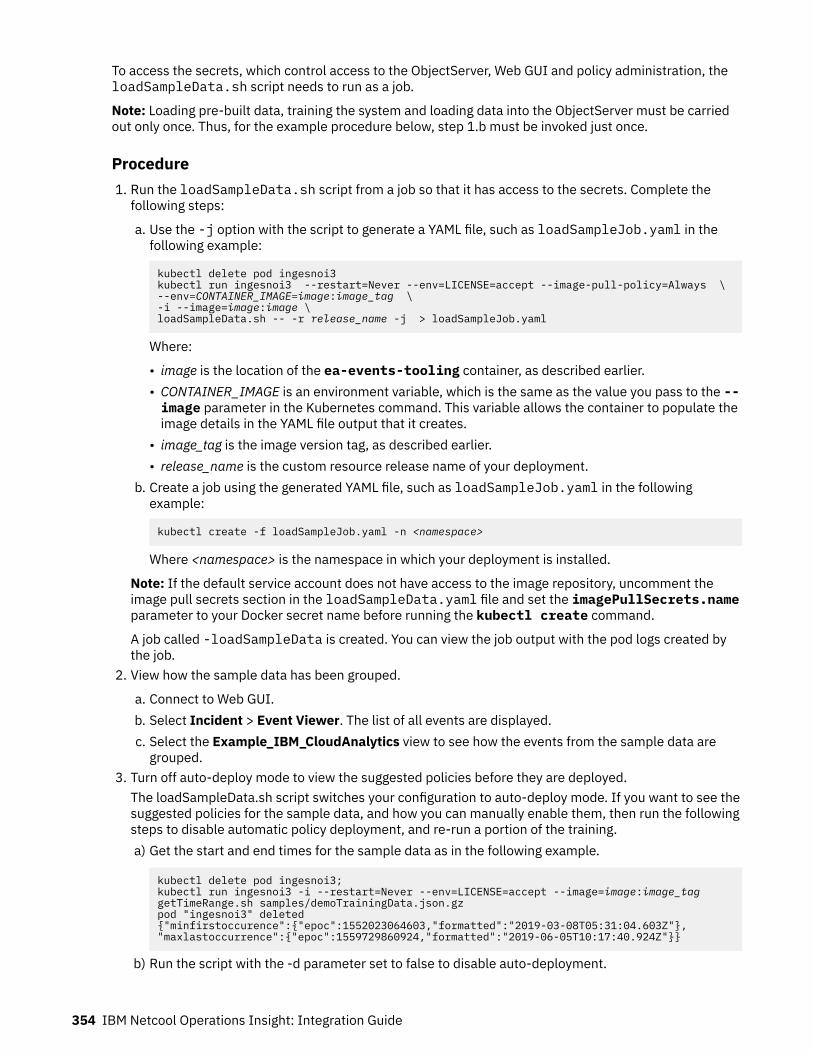
To access the secrets, which control access to the ObjectServer, Web GUI and policy administration, theloadSampleData.sh script needs to run as a job.
Note: Loading pre-built data, training the system and loading data into the ObjectServer must be carriedout only once. Thus, for the example procedure below, step 1.b must be invoked just once.
Procedure1. Run the loadSampleData.sh script from a job so that it has access to the secrets. Complete the
following steps:
a. Use the -j option with the script to generate a YAML file, such as loadSampleJob.yaml in thefollowing example:
kubectl delete pod ingesnoi3kubectl run ingesnoi3 --restart=Never --env=LICENSE=accept --image-pull-policy=Always \--env=CONTAINER_IMAGE=image:image_tag \-i --image=image:image \loadSampleData.sh -- -r release_name -j > loadSampleJob.yaml
Where:
• image is the location of the ea-events-tooling container, as described earlier.• CONTAINER_IMAGE is an environment variable, which is the same as the value you pass to the --image parameter in the Kubernetes command. This variable allows the container to populate theimage details in the YAML file output that it creates.
• image_tag is the image version tag, as described earlier.• release_name is the custom resource release name of your deployment.
b. Create a job using the generated YAML file, such as loadSampleJob.yaml in the followingexample:
kubectl create -f loadSampleJob.yaml -n <namespace>
Where <namespace> is the namespace in which your deployment is installed.
Note: If the default service account does not have access to the image repository, uncomment theimage pull secrets section in the loadSampleData.yaml file and set the imagePullSecrets.nameparameter to your Docker secret name before running the kubectl create command.
A job called -loadSampleData is created. You can view the job output with the pod logs created bythe job.
2. View how the sample data has been grouped.
a. Connect to Web GUI.b. Select Incident > Event Viewer. The list of all events are displayed.c. Select the Example_IBM_CloudAnalytics view to see how the events from the sample data are
grouped.3. Turn off auto-deploy mode to view the suggested policies before they are deployed.
The loadSampleData.sh script switches your configuration to auto-deploy mode. If you want to see thesuggested policies for the sample data, and how you can manually enable them, then run the followingsteps to disable automatic policy deployment, and re-run a portion of the training.a) Get the start and end times for the sample data as in the following example.
kubectl delete pod ingesnoi3;kubectl run ingesnoi3 -i --restart=Never --env=LICENSE=accept --image=image:image_tag getTimeRange.sh samples/demoTrainingData.json.gzpod "ingesnoi3" deleted{"minfirstoccurence":{"epoc":1552023064603,"formatted":"2019-03-08T05:31:04.603Z"},"maxlastoccurrence":{"epoc":1559729860924,"formatted":"2019-06-05T10:17:40.924Z"}}
b) Run the script with the -d parameter set to false to disable auto-deployment.
354 IBM Netcool Operations Insight: Integration Guide
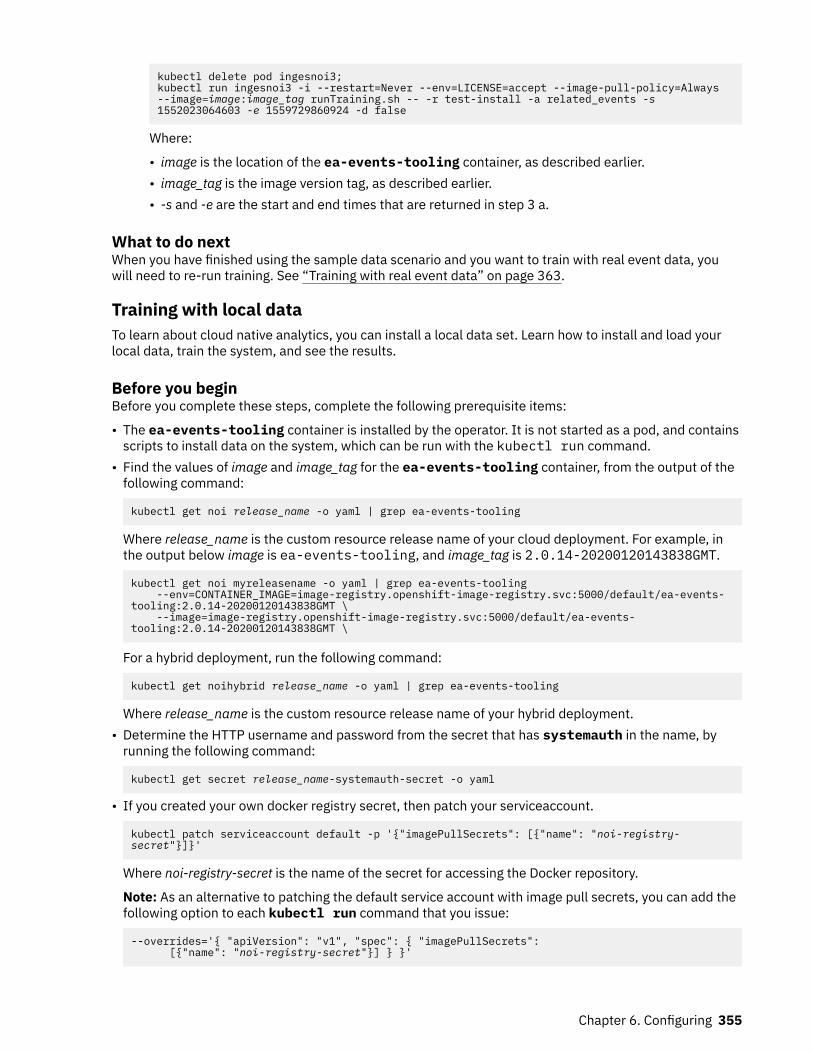
kubectl delete pod ingesnoi3;kubectl run ingesnoi3 -i --restart=Never --env=LICENSE=accept --image-pull-policy=Always --image=image:image_tag runTraining.sh -- -r test-install -a related_events -s 1552023064603 -e 1559729860924 -d false
Where:
• image is the location of the ea-events-tooling container, as described earlier.• image_tag is the image version tag, as described earlier.• -s and -e are the start and end times that are returned in step 3 a.
What to do nextWhen you have finished using the sample data scenario and you want to train with real event data, youwill need to re-run training. See “Training with real event data” on page 363.
Training with local dataTo learn about cloud native analytics, you can install a local data set. Learn how to install and load yourlocal data, train the system, and see the results.
Before you beginBefore you complete these steps, complete the following prerequisite items:
• The ea-events-tooling container is installed by the operator. It is not started as a pod, and containsscripts to install data on the system, which can be run with the kubectl run command.
• Find the values of image and image_tag for the ea-events-tooling container, from the output of thefollowing command:
kubectl get noi release_name -o yaml | grep ea-events-tooling
Where release_name is the custom resource release name of your cloud deployment. For example, inthe output below image is ea-events-tooling, and image_tag is 2.0.14-20200120143838GMT.
kubectl get noi myreleasename -o yaml | grep ea-events-tooling --env=CONTAINER_IMAGE=image-registry.openshift-image-registry.svc:5000/default/ea-events-tooling:2.0.14-20200120143838GMT \ --image=image-registry.openshift-image-registry.svc:5000/default/ea-events-tooling:2.0.14-20200120143838GMT \
For a hybrid deployment, run the following command:
kubectl get noihybrid release_name -o yaml | grep ea-events-tooling
Where release_name is the custom resource release name of your hybrid deployment.• Determine the HTTP username and password from the secret that has systemauth in the name, by
running the following command:
kubectl get secret release_name-systemauth-secret -o yaml
• If you created your own docker registry secret, then patch your serviceaccount.
kubectl patch serviceaccount default -p '{"imagePullSecrets": [{"name": "noi-registry-secret"}]}'
Where noi-registry-secret is the name of the secret for accessing the Docker repository.
Note: As an alternative to patching the default service account with image pull secrets, you can add thefollowing option to each kubectl run command that you issue:
--overrides='{ "apiVersion": "v1", "spec": { "imagePullSecrets": [{"name": "noi-registry-secret"}] } }'
Chapter 6. Configuring 355
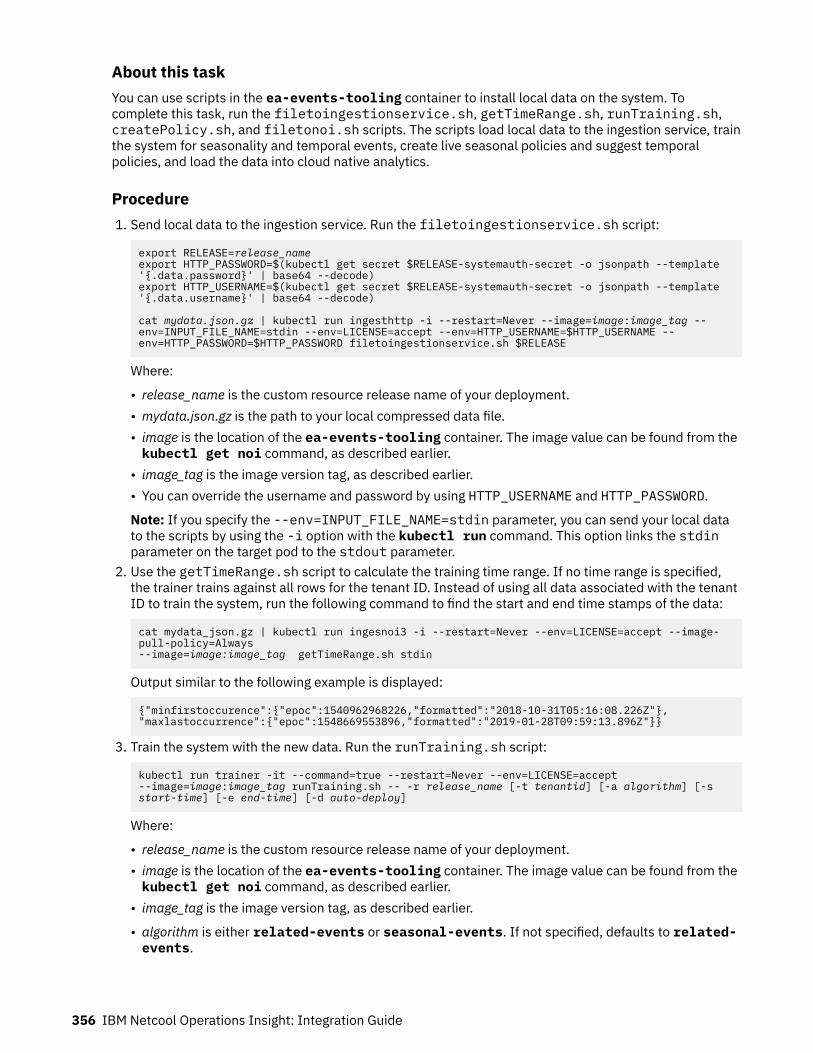
About this taskYou can use scripts in the ea-events-tooling container to install local data on the system. Tocomplete this task, run the filetoingestionservice.sh, getTimeRange.sh, runTraining.sh,createPolicy.sh, and filetonoi.sh scripts. The scripts load local data to the ingestion service, trainthe system for seasonality and temporal events, create live seasonal policies and suggest temporalpolicies, and load the data into cloud native analytics.
Procedure1. Send local data to the ingestion service. Run the filetoingestionservice.sh script:
export RELEASE=release_nameexport HTTP_PASSWORD=$(kubectl get secret $RELEASE-systemauth-secret -o jsonpath --template '{.data.password}' | base64 --decode)export HTTP_USERNAME=$(kubectl get secret $RELEASE-systemauth-secret -o jsonpath --template '{.data.username}' | base64 --decode)
cat mydata.json.gz | kubectl run ingesthttp -i --restart=Never --image=image:image_tag --env=INPUT_FILE_NAME=stdin --env=LICENSE=accept --env=HTTP_USERNAME=$HTTP_USERNAME --env=HTTP_PASSWORD=$HTTP_PASSWORD filetoingestionservice.sh $RELEASE
Where:
• release_name is the custom resource release name of your deployment.• mydata.json.gz is the path to your local compressed data file.• image is the location of the ea-events-tooling container. The image value can be found from thekubectl get noi command, as described earlier.
• image_tag is the image version tag, as described earlier.• You can override the username and password by using HTTP_USERNAME and HTTP_PASSWORD.
Note: If you specify the --env=INPUT_FILE_NAME=stdin parameter, you can send your local datato the scripts by using the -i option with the kubectl run command. This option links the stdinparameter on the target pod to the stdout parameter.
2. Use the getTimeRange.sh script to calculate the training time range. If no time range is specified,the trainer trains against all rows for the tenant ID. Instead of using all data associated with the tenantID to train the system, run the following command to find the start and end time stamps of the data:
cat mydata_json.gz | kubectl run ingesnoi3 -i --restart=Never --env=LICENSE=accept --image-pull-policy=Always --image=image:image_tag getTimeRange.sh stdin
Output similar to the following example is displayed:
{"minfirstoccurence":{"epoc":1540962968226,"formatted":"2018-10-31T05:16:08.226Z"},"maxlastoccurrence":{"epoc":1548669553896,"formatted":"2019-01-28T09:59:13.896Z"}}
3. Train the system with the new data. Run the runTraining.sh script:
kubectl run trainer -it --command=true --restart=Never --env=LICENSE=accept --image=image:image_tag runTraining.sh -- -r release_name [-t tenantid] [-a algorithm] [-s start-time] [-e end-time] [-d auto-deploy]
Where:
• release_name is the custom resource release name of your deployment.• image is the location of the ea-events-tooling container. The image value can be found from thekubectl get noi command, as described earlier.
• image_tag is the image version tag, as described earlier.
• algorithm is either related-events or seasonal-events. If not specified, defaults to related-events.
356 IBM Netcool Operations Insight: Integration Guide
• Optional: tenantid is the tenant ID associated with the data that is ingested, as specified by theglobal.common.eventanalytics.tenantId parameter in the values.yaml file that isassociated with the operator.
• Optional: start-time and end-time are the start and end times to train against. These values areprovided in the command output from step “2” on page 356. You can specify the start or end time,neither, or both. If neither are specified, the current time is used as the end time and the start time is93 days before the end time. You can either specify the start and end times with an integer Epochtime format in milliseconds, or with the default date string formatting for the system. Run the ./runTraining.sh -h command to determine the default date formatting.
• Optional: auto-deploy Set to true to deploy policies immediately. Set to false to review policiesbefore deployment.
4. Create a policy. A policy can be created through the UI, or you can specify a policy by running thecreatePolicy.sh script:
export ADMIN_PASSWORD=$(kubectl get secret release_name-systemauth-secret -o jsonpath --template '{.data.password}' | base64 --decode)kubectl run createpolicy --restart=Never --image=image:image_tag --env=LICENSE=accept --env=ADMIN_PASSWORD=${ADMIN_PASSWORD} createPolicy.sh -- -r release_name
Where:
• release_name is the custom resource release name of your deployment.• image is the location of the ea-events-tooling container. The image value can be found from thekubectl get noi command, as described earlier.
• image_tag is the image version tag, as described earlier.
Note: This step creates a policy that maps the node to resource/name by default. If you want to mapto resource/hostname or resource/ipaddress instead, specify the --env=CONFIGURATION_PROPERTIES=resource/hostname|ipaddress parameter.
5. Send local data to the ObjectServer with the filetonoi.sh script,a) Find the OMNIbus password, if this is not known, with the following command:
export OMNIBUS_ROOT_PASSWORD=$(kubectl get secret omni-secret -o jsonpath --template '{.data.OMNIBUS_ROOT_PASSWORD}' | base64 --decode)
Where omni-secret is the name of the OMNIbus secret as specified by global.omnisecretname inyour installation parameters, usually release_name-omni-secret, where release_name is thecustom resource release name of your deployment.
b) Create the ingesnoi pod.Use this command if you have a hybrid deployment (on-premises Netcool Operations Insight withcloud native analytics on a container platform):
kubectl run ingesnoi -i --restart=Never --image=image:image_tag --env=INPUT_FILE_NAME=stdin --env=LICENSE=accept --env=EVENT_RATE_ENABLED=false --env=EVENT_FILTER_ENABLED=true --env=EVENT_REPLAY_REGULATE=true --env=EVENT_REPLAY_SPEED=60 --env=EVENT_REPLAY_ENACT_DELETIONS=false --env=JDBC_PASSWORD=<ospassword> filetonoi.sh -- <release_name> <oshostname> <osport>
Use this command if you have a full Operations Management deployment on a container platform:
kubectl run ingesnoi -i --restart=Never --image=image:image_tag --env=INPUT_FILE_NAME=stdin --env=LICENSE=accept --env=EVENT_RATE_ENABLED=false --env=EVENT_FILTER_ENABLED=true --env=EVENT_REPLAY_REGULATE=true --env=EVENT_REPLAY_SPEED=60 --env=EVENT_REPLAY_ENACT_DELETIONS=false --env=JDBC_PASSWORD=<ospassword> filetonoi.sh -- <release_name>
Where:
• image is the location of the ea-events-tooling container. The image value can be found fromthe kubectl get noi command, as described earlier.
Chapter 6. Configuring 357
• image_tag is the image version tag, as described earlier.• ospassword is the on-premises ObjectServer password• oshostname is the on-premises ObjectServer host (on hybrid installs only)• osport is the on-premises ObjectServer port (on hybrid installs only)
You can specify a user ID and password by using JDBC_USERNAME and JDBC_PASSWORD. Theseparameters correspond to the user ID and password of the ObjectServer.
Note:
You can view the available overrides and their default values by using the --help command option.c) Copy the file to be replayed into the ingesnoi pod.
kubectl cp mydata.json.gz ingesnoi:/tmp
d) Exec into the ingesnoi pod, and then replay the file into OMNIbus.
kubectl exec -it ingesnoi -- /bin/bashcd bin; cat /tmp/mydata.json.gz | ./filetonoi.sh <release_name>
Where <release_name> is the release name of your deployment.
If you are unable to replay some events, include the following parameters:
--env=INPUT_REPORTERDATA=false--env=EVENT_REPLAY_TEMPORALITY_PRIMARY_TIMING_FIELD=LastOccurrence--env=EVENT_REPLAY_PREEMPTIVE_DELETIONS=false--env=EVENT_REPLAY_SKIP_DELETION=false--env=INPUT_TAG_TOOL_GENERATED_EVENTS=false
If you encounter more data integrity issues, include the following parameters:
--env=EVENT_REPLAY_STRICT_DELETIONS=false
6. View the data.
a. Connect to Web GUI.b. Select Incident > Events > Event Viewer. Select the All Events filter. The list of all events is
displayed.c. Select the Example_IBM_CloudAnalytics view to see how the events from the local data are
grouped.
Training with topology and event dataTo learn about cloud native analytics, you can install topology and event data sets. Learn how to installand load topology and event data, train the system and see the results.
Before you beginThe events can be either on the cloud or on-premises. It is advised to use persistence for the demoscenario. Before you complete these steps, complete the following prerequisite items:
• Ensure that topology management is enabled and deployed on the cloud.• Ensure that the file observer under the topology section of the deployment configuration.• Ensure that the Kube observer is desired and recommended under the topology section on the
deployment configuration.
About this taskInsert data into topology management to trigger status mapping and subtopology correlation.
358 IBM Netcool Operations Insight: Integration Guide
Procedure1. Load the topology sample data: you need to generate an instance of the event-tooling pod to load
demo topology data. You need to provide the topology system username, password, and external APIroutes to the container. To configure and generate this pod:
a. Obtain the topology base route, system username, and password by running the command:
export ASM_USERNAME=$(kubectl get secret $(kubectl get secret | grep topology-asm-credentials | awk '{ print $1 }') -o jsonpath --template '{.data.username}' | base64 --decode)
export ASM_PASSWORD=$(kubectl get secret $(kubectl get secret | grep topology-asm-credentials | awk '{ print $1 }') -o jsonpath --template '{.data.password}' | base64 --decode)
export ASM_HOSTNAME="https://$(oc get routes | grep topology | awk '{ print $2 }' | awk 'NR==1{print $1}')"
export ASM_IMAGE=$(kubectl get noi -o yaml | grep ea-events-tooling | grep "image=" | sed 's/\\//g')
b. Generate the events tooling pod by running the loadTopologyData.sh script. The usage of thescript is as follows:
/app/bin/loadTopologyData.sh
Description: Load data into the topology including resources and templates that correspondTo the loadSampleData.sh script. Note that this script requires a file observer be active inthe asm system.
Usage: /app/bin/loadTopologyData.sh -l <hostname> -u <asm username> -p <asm password>
Required Parameters: -l : The ASM core route or hostname including the protocol definition. Eg: /app/bin/loadTopologyData.sh -l https://my-env-topology.namespace.apps.clustername.os.clusterdomain.com -u : The asm system user name, typically found in the secret releasename-topology-asm-credentials /app/bin/loadTopologyData.sh -l ... -u asm -p asm -p : The asm system user password, typically found in the secret releasename-topology-asm-credentials /app/bin/loadTopologyData.sh -l ... -u asm -p asm
Where the parameters -l, -u, and -p correspond to the values currently in the environmentvariables $ASM_USERNAME, $ASM_PASSWORD, and $ASM_HOSTNAME. You can construct the eventstooling pod with these environment variables, and run the script by using these environmentvariables as arguments. The image must be set for your ea-events-tooling image from yourregistry. To get the correct image name, run the following command:
kubectl get noi -o yaml | grep ea-events-tooling | grep "image=" | sed 's/\\//g'
for a cloud deployment or
kubectl get noihybrid -o yaml | grep ea-events-tooling | grep "image=" | sed 's/\\//g'
for a hybrid deployment.c. Run the script by using the following command:
kubectl run load-topology-sample-data \ -it --restart=Never --env=LICENSE=accept --command=true \ --env=ASM_USERNAME=$ASM_USERNAME \ --env=ASM_PASSWORD=$ASM_PASSWORD \ --env=ASM_HOSTNAME=$ASM_HOSTNAME \ $ASM_IMAGE -- ./entrypoint.sh loadTopologyData.sh -l $ASM_HOSTNAME -p $ASM_PASSWORD -u $ASM_USERNAME
Chapter 6. Configuring 359
d. Override the script to use the registry secret to pull the image. Set the overrides section to containthe correct imagePullSecret as follows:
kubectl run load-topology-sample-data \ -it --restart=Never --env=LICENSE=accept --command=true \ --env=ASM_USERNAME=$ASM_USERNAME \ --env=ASM_PASSWORD=$ASM_PASSWORD \ --env=ASM_HOSTNAME=$ASM_HOSTNAME \ --overrides='{ "apiVersion": "v1", "spec": { "imagePullSecrets": [{"name": "noi-registry-secret"}] } }' \ $ASM_IMAGE -- ./entrypoint.sh loadTopologyData.sh -l $ASM_HOSTNAME -p $ASM_PASSWORD -u $ASM_USERNAME
The script will:
• Upload sample topology sample data through the File Observer REST API calledtopologySampleData.
• Generate a file observer job to upload that data into the topology system.• Generate a dynamic Service to Host sample topology template, which will be used to
demonstrate probable root cause and topology correlation based on the events that are uploadedin the next stage.
2. Load sample events: upload historical events to the EA ingestion service, run training for seasonalityand temporal patterns analytics and insert corresponding live events to display the analytics in theEvent Viewer.
a. Configure the environment variables that the ea-events-tooling pod uses. Update thereleasename value and run the command:
export RELEASE_NAME=yourreleasenameexport HTTP_USERNAME=$(kubectl get secret "$RELEASE_NAME-systemauth-secret" -o jsonpath --template '{.data.username}' | base64 --decode)export HTTP_PASSWORD=$(kubectl get secret "$RELEASE_NAME-systemauth-secret" -o jsonpath --template '{.data.password}' | base64 --decode)export ADMIN_PASSWORD=$(kubectl get secret "$RELEASE_NAME-systemauth-secret" -o jsonpath --template '{.data.password}' | base64 --decode)export OMNIBUS_OS_PASSWORD=$(kubectl get secret "$RELEASE_NAME-omni-secret" -o jsonpath --template '{.data.OMNIBUS_ROOT_PASSWORD}' | base64 --decode)
This command sets the following environment variables that will be used as arguments to the nextstep: HTTP_USERNAME, HTTP_PASSWORD, ADMIN_PASSWORD, OMNIBUS_OS_PASSWORD.
b. Run the loadSampleData.sh script to start a new pod by using the ea-events-tooling imagethat loads the events. This uses the same loadSampleData script as is usually used to loadsample events. An extra argument must be supplied to load live events that correspond to thetopology sample data. The usage of the script is:
/app/bin/loadSampleData.sh -r <releasename> [-t tenant ID] [-h] [-j] [-k] [-o primaryOSHostname] \ [-p primaryOSPort] [-x primaryOSUsername] [-z primaryOSPassword] \ [-s dockerRegistrySecret] \ [-a serviceAccountName] [-s dockerRegistrySecret] \ [-e secretrelease] [-i sourceids] [-d]Where: Training is run on both the related-events and seasonal-events algorithms The tenantid option controls the tenantid that data is trained against. It should only be specified if the tenantid has been changed from the derived default in the noiusers credentials section of the values.yaml. The default tenantid is 'cfd95b7e-3bc7-4006-a4a8-a73a79c71255' if not specified -j generates YAML to define a job to invoke this script instead of running it directly If specifying -j, set --env=CONTAINER_IMAGE= to the same value you specified for --image in the kubectl run command so that the image location is correctly specifed in the job. -k stops all training for patterns / temporal grouping -d enables live events suitable for the topology based data scenario to be inserted. note that this option cannot be used with option -i, as topology does not support the use of multiple sourceIds
360 IBM Netcool Operations Insight: Integration Guide
You need to supply the argument -d to enable the topology data to be loaded. It is suggested thatthe user does not use option -k in this scenario, unless they conducted training for the sample dataalready. An example usage is:
kubectl run load-sample-events \ -it --restart=Never --env=LICENSE=accept \ --command=true \ --env=HTTP_USERNAME=$HTTP_USERNAME \ --env=HTTP_PASSWORD=$HTTP_PASSWORD \ --env=ADMIN_PASSWORD=$ADMIN_PASSWORD \ --env=JDBC_PASSWORD=$OMNIBUS_OS_PASSWORD \ --overrides='{ "apiVersion": "v1", "spec": { "imagePullSecrets": [{"name": "noi-registry-secret"}] } }' \ $ASM_IMAGE -- ./entrypoint.sh loadSampleData.sh -r $RELEASE_NAME -z $OMNIBUS_OS_PASSWORD -t cfd95b7e-3bc7-4006-a4a8-a73a79c71255 -o primaryOSHostname and the -p primaryOSPort -d
The --overrides section is optional, and can be removed in certain circumstances.
ResultsYou successfully loaded demo scenarios that include topology and event data.
Migrating historical data from a reporter database: scenario for cloud nativeanalyticsTo learn about cloud native analytics, you can install a historical data set. Learn how to install and loadhistorical data from a reporter database and train the system.
Before you beginBefore you complete these steps, complete the following prerequisite items:
• The ea-events-tooling container is installed by the operator. It is not started as a pod, and containsscripts to install data on the system, which can be run with the kubectl run command.
• Find the values of image and image_tag for the ea-events-tooling container, from the output of thefollowing command:
kubectl get noi release_name -o yaml | grep ea-events-tooling
Where release_name is the custom resource release name of your deployment. For example, in theoutput below image is ea-events-tooling, and image_tag is 2.0.14-20200120143838GMT.
kubectl get noi myreleasename -o yaml | grep ea-events-tooling --env=CONTAINER_IMAGE=image-registry.openshift-image-registry.svc:5000/default/ea-events-tooling:2.0.14-20200120143838GMT \ --image=image-registry.openshift-image-registry.svc:5000/default/ea-events-tooling:2.0.14-20200120143838GMT \
For a hybrid deployment, run the following command:
kubectl get noihybrid release_name -o yaml | grep ea-events-tooling
Where release_name is the custom resource release name of your hybrid deployment.• If you created your own docker registry secret, then patch your service account.
kubectl patch serviceaccount default -p '{"imagePullSecrets": [{"name": "noi-registry-secret"}]}'
Where noi-registry-secret is the name of the secret for accessing the Docker repository.
Note: As an alternative to patching the default service account with image pull secrets, you can add thefollowing option to each kubectl run command that you issue:
--overrides='{ "apiVersion": "v1", "spec": { "imagePullSecrets": [{"name": "noi-registry-secret"}] } }'
Chapter 6. Configuring 361
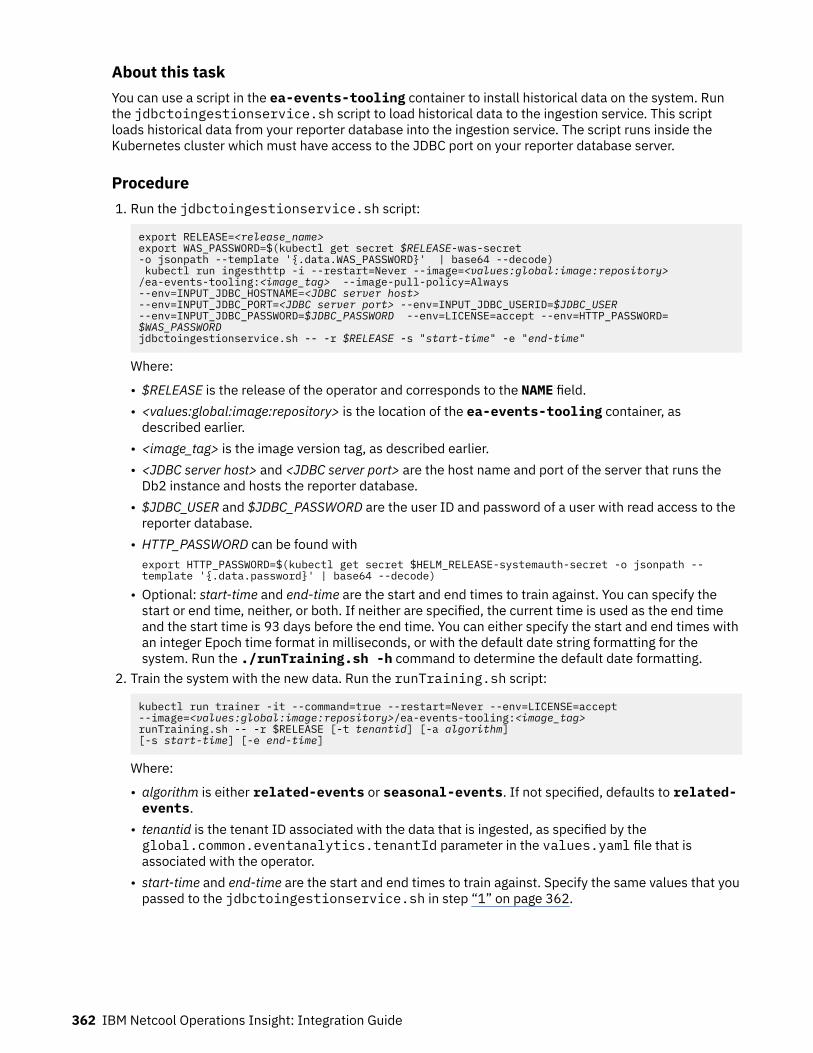
About this taskYou can use a script in the ea-events-tooling container to install historical data on the system. Runthe jdbctoingestionservice.sh script to load historical data to the ingestion service. This scriptloads historical data from your reporter database into the ingestion service. The script runs inside theKubernetes cluster which must have access to the JDBC port on your reporter database server.
Procedure1. Run the jdbctoingestionservice.sh script:
export RELEASE=<release_name>export WAS_PASSWORD=$(kubectl get secret $RELEASE-was-secret -o jsonpath --template '{.data.WAS_PASSWORD}' | base64 --decode) kubectl run ingesthttp -i --restart=Never --image=<values:global:image:repository>/ea-events-tooling:<image_tag> --image-pull-policy=Always --env=INPUT_JDBC_HOSTNAME=<JDBC server host> --env=INPUT_JDBC_PORT=<JDBC server port> --env=INPUT_JDBC_USERID=$JDBC_USER --env=INPUT_JDBC_PASSWORD=$JDBC_PASSWORD --env=LICENSE=accept --env=HTTP_PASSWORD=$WAS_PASSWORD jdbctoingestionservice.sh -- -r $RELEASE -s "start-time" -e "end-time"
Where:
• $RELEASE is the release of the operator and corresponds to the NAME field.• <values:global:image:repository> is the location of the ea-events-tooling container, as
described earlier.• <image_tag> is the image version tag, as described earlier.• <JDBC server host> and <JDBC server port> are the host name and port of the server that runs the
Db2 instance and hosts the reporter database.• $JDBC_USER and $JDBC_PASSWORD are the user ID and password of a user with read access to the
reporter database.• HTTP_PASSWORD can be found withexport HTTP_PASSWORD=$(kubectl get secret $HELM_RELEASE-systemauth-secret -o jsonpath --template '{.data.password}' | base64 --decode)
• Optional: start-time and end-time are the start and end times to train against. You can specify thestart or end time, neither, or both. If neither are specified, the current time is used as the end timeand the start time is 93 days before the end time. You can either specify the start and end times withan integer Epoch time format in milliseconds, or with the default date string formatting for thesystem. Run the ./runTraining.sh -h command to determine the default date formatting.
2. Train the system with the new data. Run the runTraining.sh script:
kubectl run trainer -it --command=true --restart=Never --env=LICENSE=accept --image=<values:global:image:repository>/ea-events-tooling:<image_tag> runTraining.sh -- -r $RELEASE [-t tenantid] [-a algorithm] [-s start-time] [-e end-time]
Where:
• algorithm is either related-events or seasonal-events. If not specified, defaults to related-events.
• tenantid is the tenant ID associated with the data that is ingested, as specified by theglobal.common.eventanalytics.tenantId parameter in the values.yaml file that isassociated with the operator.
• start-time and end-time are the start and end times to train against. Specify the same values that youpassed to the jdbctoingestionservice.sh in step “1” on page 362.
362 IBM Netcool Operations Insight: Integration Guide
Training with real event dataWhen training with real event data, policies are auto-deployed by default. The tooling has optionalsettings, including a default setting for auto-deploying policies, which temporarily overrides the systemsetting used in the automatic scheduled training run.
About this taskOnce you have finished working with the sample data, local data, or migrated data scenarios, run thisprocedure to start processing live event data.
Note: Policies and groups that were created for the sample data, local data, and migrated data scenariosare removed.
The runTraining.sh script overrides most options that are in place for the regular training. Thedeployment setting for manually run training is auto-deploy (policies do not appear in the suggestedpolicies panel). This setting can be changed with the -d command line option. If manual training is runwith the -d false option (review first mode), then the policies created from manual training are notauto-deployed and appear in the suggested policies panel.
ProcedureRun the runTraining.sh script.
kubectl run trainer -it --command=true --restart=Never --env=LICENSE=accept --image=image:image_tag runTraining.sh -- -r release_name [-t tenantid] [-a algorithm] [-s start-time] [-e end-time] [-d auto-deploy]
Where:
• release_name is the custom resource release name of your deployment.• image is the location of the ea-events-tooling container. The image value can be found from thekubectl get noi command, as described earlier.
• image_tag is the image version tag, as described earlier.• algorithm is either related-events or seasonal-events. If not specified, defaults to related-events.
• Optional: tenantid is the tenant ID associated with the data that is processed, as specified by theglobal.common.eventanalytics.tenantId parameter in the values.yaml file that is associatedwith the operator.
• Optional: start-time and end-time are the start and end times to train against. You can specify the startor end time, neither, or both. If neither are specified, the current time is used as the end time and thestart time is 93 days before the end time. You can either specify the start and end times with an integerEpoch time format in milliseconds, or with the default date string formatting for the system. Run ./runTraining.sh -h to determine the default date formatting.
• Optional: auto-deploy Set to true to deploy policies immediately. Set to false to review policies beforedeployment. Running sample data or local data scenarios turns on the auto-deployment of policies,even if you have installed with temporalGroupingDeployFirst set to false.
Chapter 6. Configuring 363

Configuring analyticsYou can switch different analytics algorithms on and off. You can also change settings for activeconfiguration algorithms.
About analyticsRead this document to find out more about analytics, including temporal correlation, seasonality, andprobable cause.
Temporal correlationTemporal correlation helps you to reduce the noise by grouping events, which share a temporalrelationship. Event correlation policies are created, allowing temporal correlation to be applied tosubsequent events that match the discovered temporal profile. Click “Administering policies created byanalytics” on page 476 to read more about policies and how to review them. Temporal correlation isbased on two capabilities:
• Temporal grouping: the temporal grouping analytic identifies related events based on their historic co-occurrences. Subsequent events, which match the temporal profile are correlated together. Withtemporal grouping, you can choose the policy deployment mode that can be Deploy first or Reviewfirst. In Deploy first mode, policies are enabled automatically, without the need for manual review. InReview first mode, policies are not enabled until they are manually reviewed and approved.
• Temporal patterns: the temporal pattern analytic identifies patterns of behavior among temporalgroups, which are similar, but occur on different resources. Subsequent events, which match the patternand occur on a new, common resource are grouped together.
Click “Configure temporal correlation” on page 365 to learn how to configure temporal correlation andchoose the policy deployment mode after installation. Click “Displaying analytics details for an eventgroup” on page 633 to see how temporal events groups are displayed to your operations team in theEvents page.
SeasonalitySeasonal event enrichment helps you to identify events in your environment, which consistently occurwithin a seasonal time window. The seasonal event analytic identifies these characteristics on based onhistorical event occurences. Seasonal events are enriched with a seasonal indicator, which displayswhether an event occurred in, or outside of, an expected seasonal period.
Examples of seasonal time windows include the following:Hour of the day
Between 12:00 and 1:00 pm
Day of the week
On Mondays
Day of the month
On the 3rd of the month
Day of the week at a given hour
On Mondays, between 12:00 and 1:00 pm
Day of the month at a given hour
On the 3rd of the month, between 12:00 and 1:00 pm
364 IBM Netcool Operations Insight: Integration Guide

Click “Configuring seasonality” on page 366 to learn how to configure seasonality and “Displaying eventseasonality” on page 626 to see how seasonal enrichment of events is displayed to your operations teamin the Events page.
Probable causeprobable cause capability is designed to identify the event with the greatest probability of being the causeof the event group, by analyzing the topological information within the events. Learn more about probablecause as part of the Netcool Operations Insight installation.
Click “Configuring probable cause” on page 366 to learn how to configure probable cause and “Displayingprobable cause for an event group” on page 633 to see how probable cause data is displayed to youroperations team in the Events page.
Topological correlationYou can create topology templates to generate defined topologies, which search your topology databasefor instances that match its conditions. Operators see events that are grouped by topology based on thesetopology templates.
Click “Configuring topological correlation” on page 369 to learn how to configure topological correlationand click “Displaying analytics details for an event group” on page 633 to see how topological eventgroups are displayed to your operations team in the Events page.
Scope-based groupingThe scope-based event grouping capability groups events that come from the same place around thesame time as it's most likely that these events relate to the same root problem. Operators see events thatare grouped by scope based on the scope-based groups that are configured. You can define the scope asany one of the event columns; typical examples of scope are the Node or Location columns.
Click “Configuring scope-based grouping” on page 416 to learn how to configure scope-based groupingand “Displaying analytics details for an event group” on page 633 to see how scope-based event groupsare displayed to your operations team in the Events page.
Configure temporal correlationRead this document to learn how to configure temporal correlation.
About this taskFollow these steps to configure temporal correlation to group events, which occurred together historically.
Procedure1. Go to the Administration > Analytics configuration to access the analytics settings page.2. Click Configure on the upper right corner of the Temporal correlation tile to access the temporal
correlation configuration page. There are two temporal correlation capabilities to find temporalcorrelation, Temporal grouping and Temporal patterns.
3. Both capabilities are enabled by default. You can easily disable the capabilities by clicking the greentoggle switch. If you disable Temporal grouping , Temporal patterns is automatically disabled too.However, if you disable Temporal patterns you can still have Temporal Grouping enabled.
4. You can also choose the Deploy policies state for Temporal grouping . Click either Deploy first orReview first to choose how policies are deployed. If you select Deploy first, the policies areautomatically enabled and are added to the Created by analytics tile under Automations > Policies.If you select, Review first the policies are added to Suggested tile and are enabled only once theadministrator decides to activate them.
Chapter 6. Configuring 365
5. In the Temporal Patterns tile, you also have the option to choose resource attributes within the eventswhich you want to be ignored. The ignored attributes aren't considered by the analytic whengenerating pattern policies. Port and Type are ignored by default.
Configuring seasonalityFollow these steps to learn how to configure seasonality to enrich events which occur during cyclic timeperiods.
Procedure1. Go to the Administration > Analytics configuration to access the analytics settings page.2. Click Configure on the upper right corner of the Seasonality tile to access the seasonality
configuration page.3. The seasonality capability is enabled by default. You can easily disable the capability by clicking the
green toggle switch.
Configuring probable causeThe probable cause capability identifies the event with the greatest probability of being the cause of theevent group, by using a combination of text classification and analysis of the topological informationwithin the events. Within the Event Viewer, probable cause ratings are presented for each event in anevent group. You can configure how the system classifies events and performs probable cause scoring.
ObjectServer probable cause columnsNote: Make sure that topology management is enabled to use the probable cause capability. The topologymanagement capability is enabled by default, for more information, see “Cloud operator properties” onpage 127.
Hybrid deployments
The ObjectServer probable cause columns are not displayed by default for a hybrid deployment.
Tip: To display the Probable cause column in the Event Viewer for hybrid deployments, edit theExample_IBM_CloudAnalytics view by adding the CEAEventScore field.
Cloud deployments
The ObjectServer probable cause columns are included by default in theExample_IBM_CloudAnalytics view in the Event Viewer for a cloud deployment. The columns are asfollows:
Table 63. ObjectServer probable cause columns
Column Description
CEAEventScore Contains the calculated score for an event that indicates its probability ofbeing the causal event within an event grouping.
CEAEventClassification
Contains the classification of the event that is used as part of the scoring.Classification can take one of the following values:
ExceptionInformationErrorRateLatencySaturationStateChangeTrafficUnknown
366 IBM Netcool Operations Insight: Integration Guide
Properties of probable causeBy default, the highest "CEAEventScore" is assigned to the name of the whole group. To disable thisfeature, you must disable the "CEAUseSummaryMimeChild" property in the master.cea_propertiestable in the Object Server by using the command:
> update master.properties set IntValue = 0 where Name = 'CEAUseSummaryMimeChild'; > go
You have now disabled the property.
Adding classification labelsYou can add your own and customized classification labels, as long as they do not conflict with theexisting built-in labels. To add a classification label, proceed as follows:
1. Submit the data with the new label by using the API endpoint api/mime/classificaiton/training_data. The header must include the X-TenantID parameter with the tenant ID value touse. The body must be formatted as JSON array of JSON objects. Each object must contain the "Label"and "Text" parameters, for example:
[{"Label":"Network","Text":"some classification about the network"}, {"Label":"Database","Text":"some classification text about the database"}]
Note: The label value is case-sensitive so the API gives an error if some ambiguity about the labels arepresent. You can ignore the ambiguity check by setting the header parameter ignore-labels-validation to true.
Note: Label values don't allow spaces, for example Network Error must be NetworkError.2. Add the label weight to use with the topology correlation and probable cause. The weight can be
added by using the topology management probable cause API end point, api/mime/addLabelWeight. The header must include the X-TenantID parameter with the tenant ID value touse. The body must be JSON array of JSON objects as follows:
[{"label": "Network","weight": 3.68}]
It is recommended to use a decimal value for the weight and that this value doesn't exist for otherlabels to avoid any calculation errors or ambiguity.
3. Request retraining of the machine learning model to use the new label in classification and probablecause. Retraining can be requested by using the API endpoint api/mime/classification/trainmodel. You can also instruct the trainer to train on your data only and skip the built-inclassification data and labels. To do that, send the following parameter {"skip_default":"true"}as JSON object in the post request body. The model uses your custom data and completely ignores thebuilt-in text and labels.
Note: The APIs can also be accessed through the swagger APIs. For loading data, labels, andrequesting model training that you can use api/mime/classification/. For weights, you can useapi/mime/swagger.
Configuring columns used to classify the eventBy default, classification of the event is performed using the text in the Summary column text. You canspecify an alternative ObjectServer column, or a custom ObjectServer column to use for classification.
Do this by using the swagger probable cause customization API POST operation, api/mime/LabelColumn. This POST request allows you to overwrite the default column and add extra fields. Thetenant ID, X-TenantID, is necessary in the header parameter. The POST body must be an array of JSONobjects where each object includes a "column" parameter along with the column name to use. Thecolumn names are case-sensitive and must exactly match the ObjectServer event columns.
Chapter 6. Configuring 367
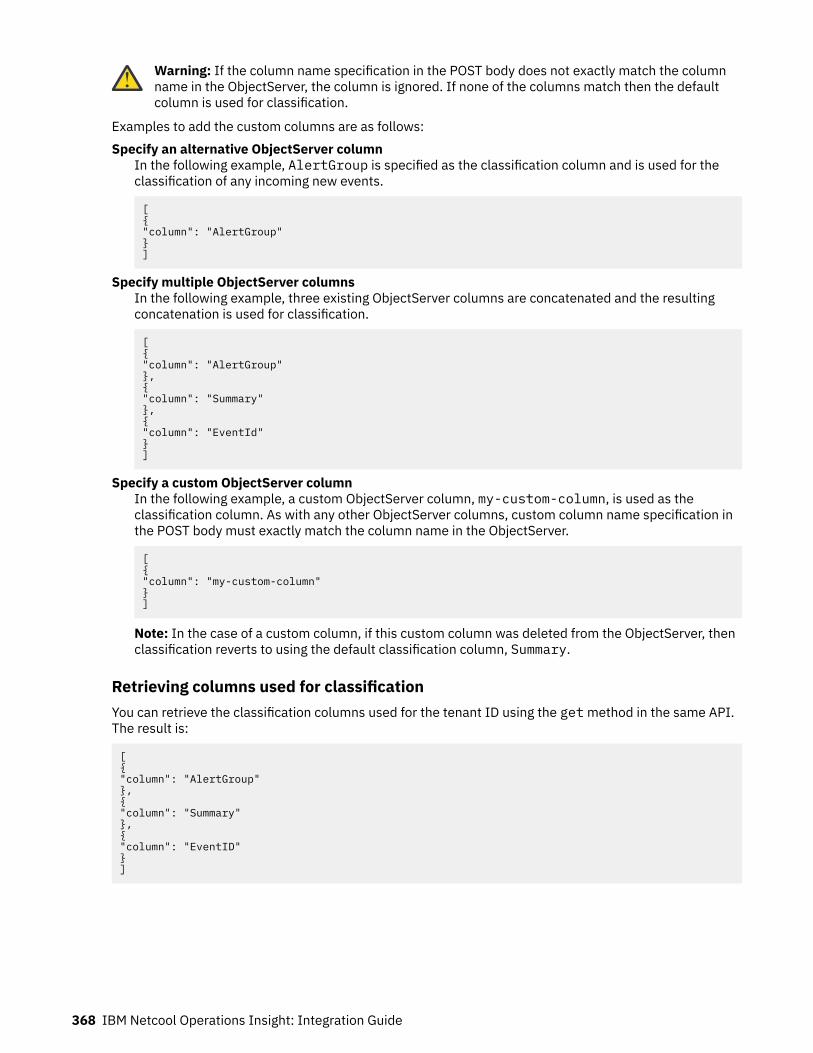
Warning: If the column name specification in the POST body does not exactly match the columnname in the ObjectServer, the column is ignored. If none of the columns match then the defaultcolumn is used for classification.
Examples to add the custom columns are as follows:Specify an alternative ObjectServer column
In the following example, AlertGroup is specified as the classification column and is used for theclassification of any incoming new events.
[{"column": "AlertGroup"}]
Specify multiple ObjectServer columnsIn the following example, three existing ObjectServer columns are concatenated and the resultingconcatenation is used for classification.
[{"column": "AlertGroup"},{"column": "Summary"},{"column": "EventId"}]
Specify a custom ObjectServer columnIn the following example, a custom ObjectServer column, my-custom-column, is used as theclassification column. As with any other ObjectServer columns, custom column name specification inthe POST body must exactly match the column name in the ObjectServer.
[{"column": "my-custom-column"}]
Note: In the case of a custom column, if this custom column was deleted from the ObjectServer, thenclassification reverts to using the default classification column, Summary.
Retrieving columns used for classificationYou can retrieve the classification columns used for the tenant ID using the get method in the same API.The result is:
[{"column": "AlertGroup"},{"column": "Summary"},{"column": "EventID"}]
368 IBM Netcool Operations Insight: Integration Guide
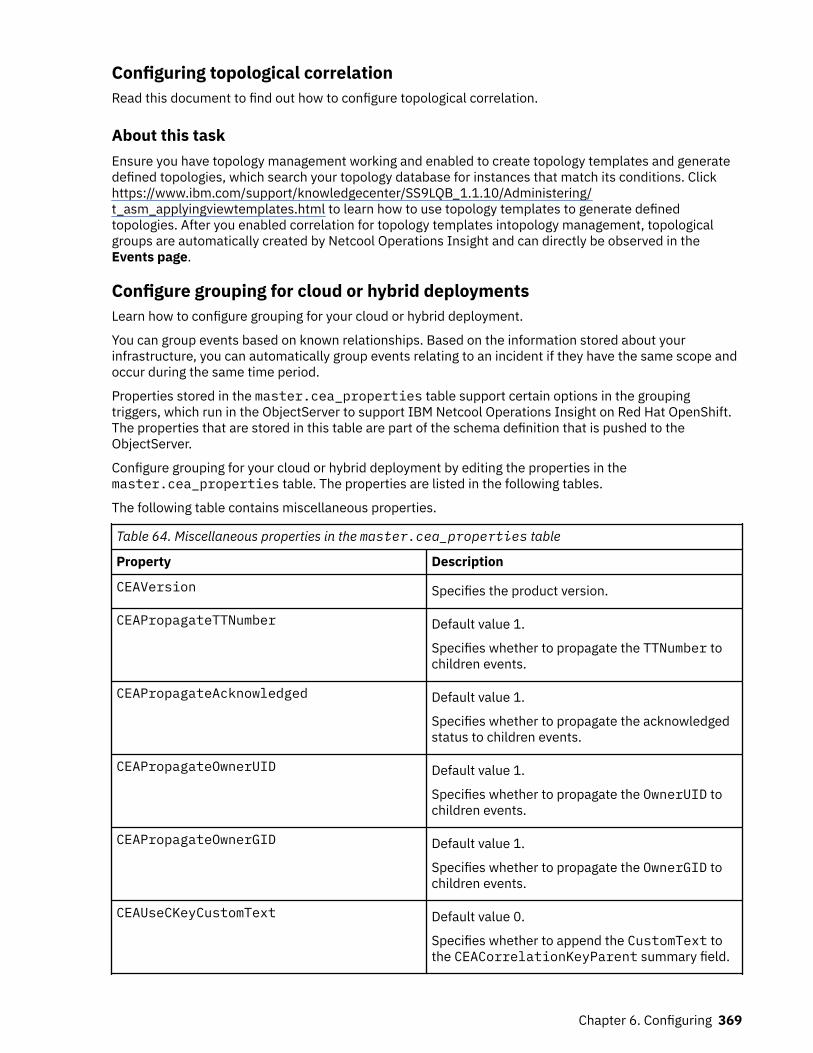
Configuring topological correlationRead this document to find out how to configure topological correlation.
About this taskEnsure you have topology management working and enabled to create topology templates and generatedefined topologies, which search your topology database for instances that match its conditions. Clickhttps://www.ibm.com/support/knowledgecenter/SS9LQB_1.1.10/Administering/t_asm_applyingviewtemplates.html to learn how to use topology templates to generate definedtopologies. After you enabled correlation for topology templates intopology management, topologicalgroups are automatically created by Netcool Operations Insight and can directly be observed in theEvents page.
Configure grouping for cloud or hybrid deploymentsLearn how to configure grouping for your cloud or hybrid deployment.
You can group events based on known relationships. Based on the information stored about yourinfrastructure, you can automatically group events relating to an incident if they have the same scope andoccur during the same time period.
Properties stored in the master.cea_properties table support certain options in the groupingtriggers, which run in the ObjectServer to support IBM Netcool Operations Insight on Red Hat OpenShift.The properties that are stored in this table are part of the schema definition that is pushed to theObjectServer.
Configure grouping for your cloud or hybrid deployment by editing the properties in themaster.cea_properties table. The properties are listed in the following tables.
The following table contains miscellaneous properties.
Table 64. Miscellaneous properties in the master.cea_properties table
Property Description
CEAVersion Specifies the product version.
CEAPropagateTTNumber Default value 1.
Specifies whether to propagate the TTNumber tochildren events.
CEAPropagateAcknowledged Default value 1.
Specifies whether to propagate the acknowledgedstatus to children events.
CEAPropagateOwnerUID Default value 1.
Specifies whether to propagate the OwnerUID tochildren events.
CEAPropagateOwnerGID Default value 1.
Specifies whether to propagate the OwnerGID tochildren events.
CEAUseCKeyCustomText Default value 0.
Specifies whether to append the CustomText tothe CEACorrelationKeyParent summary field.
Chapter 6. Configuring 369

Table 64. Miscellaneous properties in the master.cea_properties table (continued)
Property Description
CEAPropagateTextToCKeyParentCause Default value 0.
Specifies whether to populate the CustomText ofthe CEACorrelationKeyParent event using theCustomText of the underlying child event with thehighest CauseWeight value.
CEAPropagateTextToCKeyParentImpact Default value 0.
Specifies whether to populate the CustomText ofthe CEACorrelationKeyParent event using theCustomText of the underlying child event with thehighest ImpactWeight value.
CEAPropagateTextToCKeyParentFirst Default value 0.
Specifies whether to populate the CustomText ofthe CEACorrelationKeyParent event using theCustomText of the underlying child event with thelowest FirstOccurrence value.
CEAPropagateTextToCKeyParentLast Default value 0.
Specifies whether to populate the CustomText ofthe CEACorrelationKeyParent event using theCustomText of the underlying child event with thehighest LastOccurrence value.
The following table contains global properties that are used in scope-based grouping. These propertiesrelate to how a grouping is done and are applied at the time an event is inserted, or at the time theScopeID of an event is set.
Table 65. Global properties in the master.cea_properties table
Property group Property Description
CEAQuietPeriod Default value 20 * 60.
Defines a global quiet period touse when not defined in theevent.
CEAParentCreationType Default value 1.
Specifies whether syntheticparents are either createdimmediately (0), delayed untilthere are two members (1), orsuppressed (2).
370 IBM Netcool Operations Insight: Integration Guide
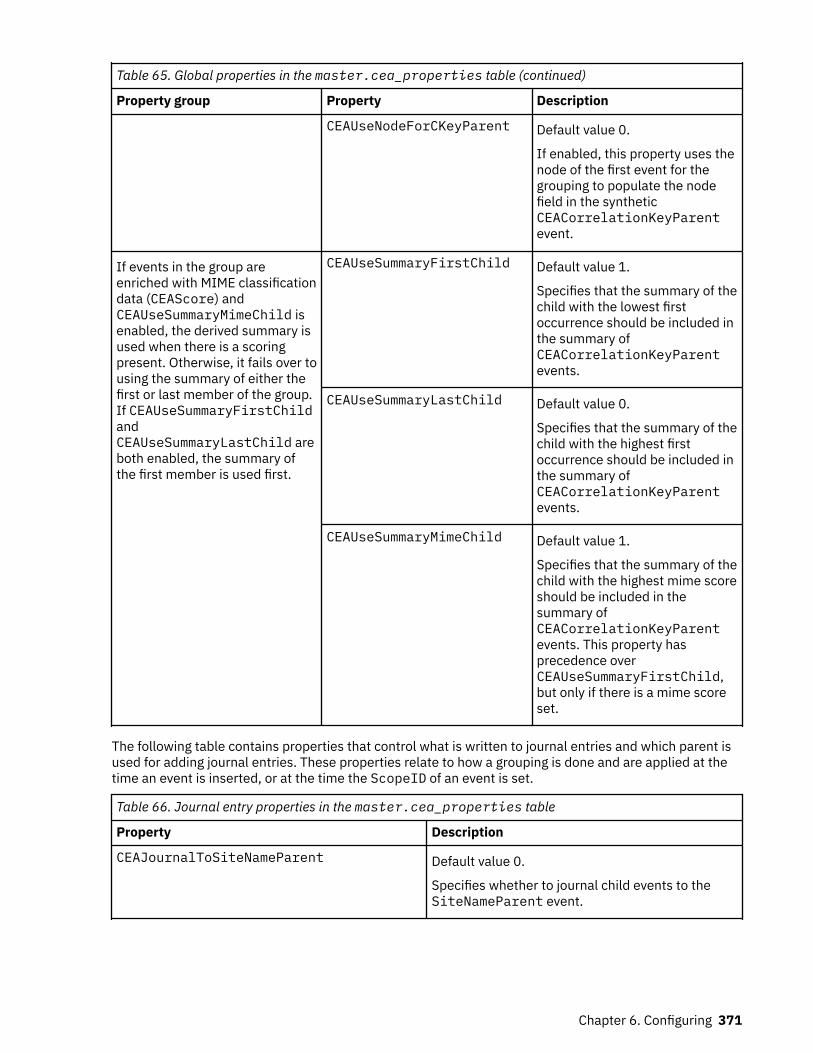
Table 65. Global properties in the master.cea_properties table (continued)
Property group Property Description
CEAUseNodeForCKeyParent Default value 0.
If enabled, this property uses thenode of the first event for thegrouping to populate the nodefield in the syntheticCEACorrelationKeyParentevent.
If events in the group areenriched with MIME classificationdata (CEAScore) andCEAUseSummaryMimeChild isenabled, the derived summary isused when there is a scoringpresent. Otherwise, it fails over tousing the summary of either thefirst or last member of the group.If CEAUseSummaryFirstChildandCEAUseSummaryLastChild areboth enabled, the summary ofthe first member is used first.
CEAUseSummaryFirstChild Default value 1.
Specifies that the summary of thechild with the lowest firstoccurrence should be included inthe summary ofCEACorrelationKeyParentevents.
CEAUseSummaryLastChild Default value 0.
Specifies that the summary of thechild with the highest firstoccurrence should be included inthe summary ofCEACorrelationKeyParentevents.
CEAUseSummaryMimeChild Default value 1.
Specifies that the summary of thechild with the highest mime scoreshould be included in thesummary ofCEACorrelationKeyParentevents. This property hasprecedence overCEAUseSummaryFirstChild,but only if there is a mime scoreset.
The following table contains properties that control what is written to journal entries and which parent isused for adding journal entries. These properties relate to how a grouping is done and are applied at thetime an event is inserted, or at the time the ScopeID of an event is set.
Table 66. Journal entry properties in the master.cea_properties table
Property Description
CEAJournalToSiteNameParent Default value 0.
Specifies whether to journal child events to theSiteNameParent event.
Chapter 6. Configuring 371
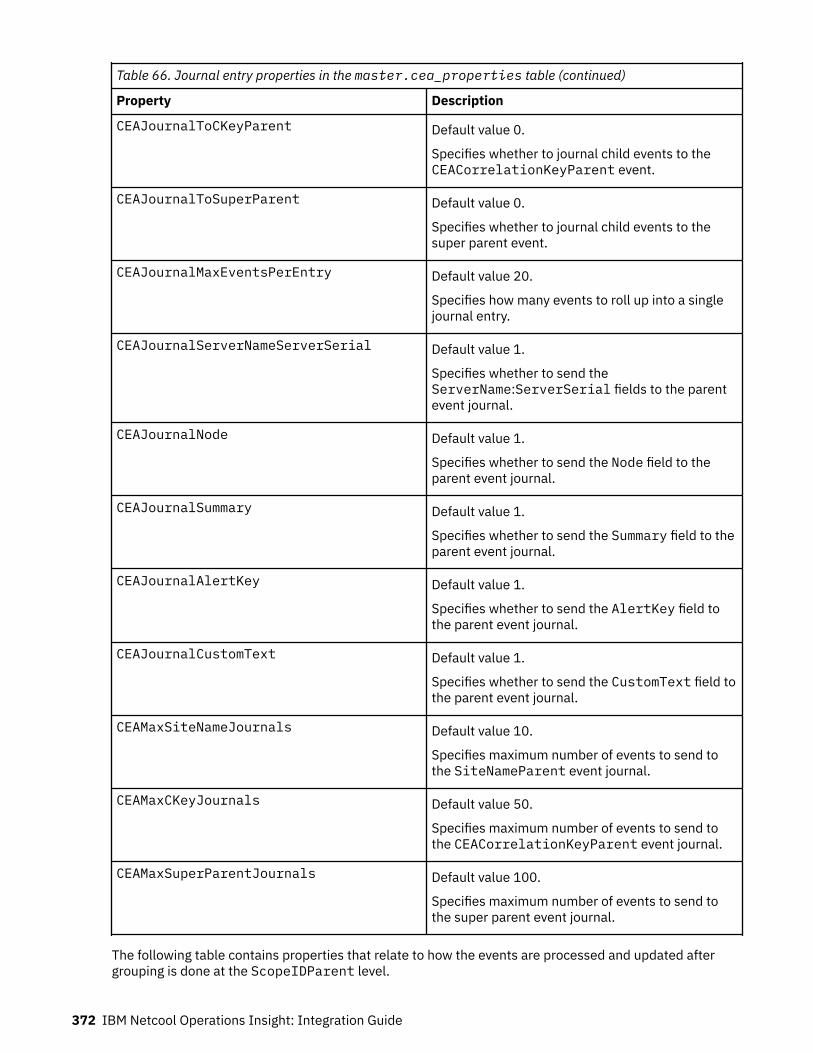
Table 66. Journal entry properties in the master.cea_properties table (continued)
Property Description
CEAJournalToCKeyParent Default value 0.
Specifies whether to journal child events to theCEACorrelationKeyParent event.
CEAJournalToSuperParent Default value 0.
Specifies whether to journal child events to thesuper parent event.
CEAJournalMaxEventsPerEntry Default value 20.
Specifies how many events to roll up into a singlejournal entry.
CEAJournalServerNameServerSerial Default value 1.
Specifies whether to send theServerName:ServerSerial fields to the parentevent journal.
CEAJournalNode Default value 1.
Specifies whether to send the Node field to theparent event journal.
CEAJournalSummary Default value 1.
Specifies whether to send the Summary field to theparent event journal.
CEAJournalAlertKey Default value 1.
Specifies whether to send the AlertKey field tothe parent event journal.
CEAJournalCustomText Default value 1.
Specifies whether to send the CustomText field tothe parent event journal.
CEAMaxSiteNameJournals Default value 10.
Specifies maximum number of events to send tothe SiteNameParent event journal.
CEAMaxCKeyJournals Default value 50.
Specifies maximum number of events to send tothe CEACorrelationKeyParent event journal.
CEAMaxSuperParentJournals Default value 100.
Specifies maximum number of events to send tothe super parent event journal.
The following table contains properties that relate to how the events are processed and updated aftergrouping is done at the ScopeIDParent level.
372 IBM Netcool Operations Insight: Integration Guide
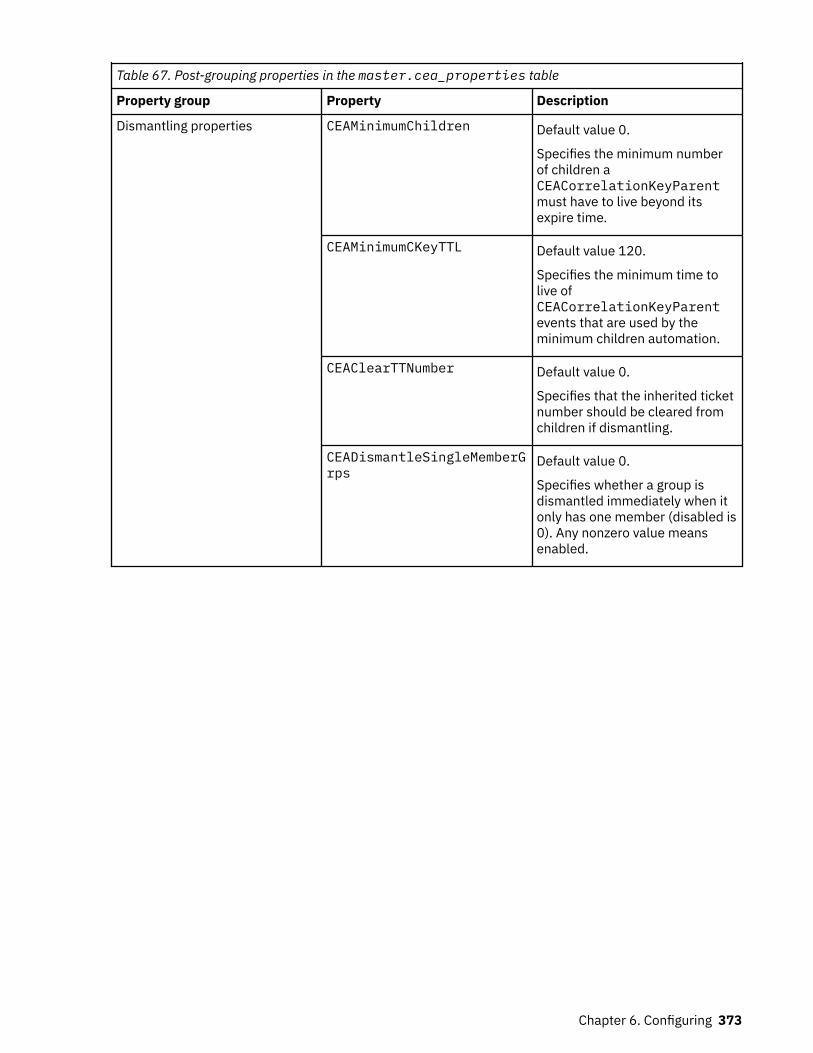
Table 67. Post-grouping properties in the master.cea_properties table
Property group Property Description
Dismantling properties CEAMinimumChildren Default value 0.
Specifies the minimum numberof children aCEACorrelationKeyParentmust have to live beyond itsexpire time.
CEAMinimumCKeyTTL Default value 120.
Specifies the minimum time tolive ofCEACorrelationKeyParentevents that are used by theminimum children automation.
CEAClearTTNumber Default value 0.
Specifies that the inherited ticketnumber should be cleared fromchildren if dismantling.
CEADismantleSingleMemberGrps
Default value 0.
Specifies whether a group isdismantled immediately when itonly has one member (disabled is0). Any nonzero value meansenabled.
Chapter 6. Configuring 373
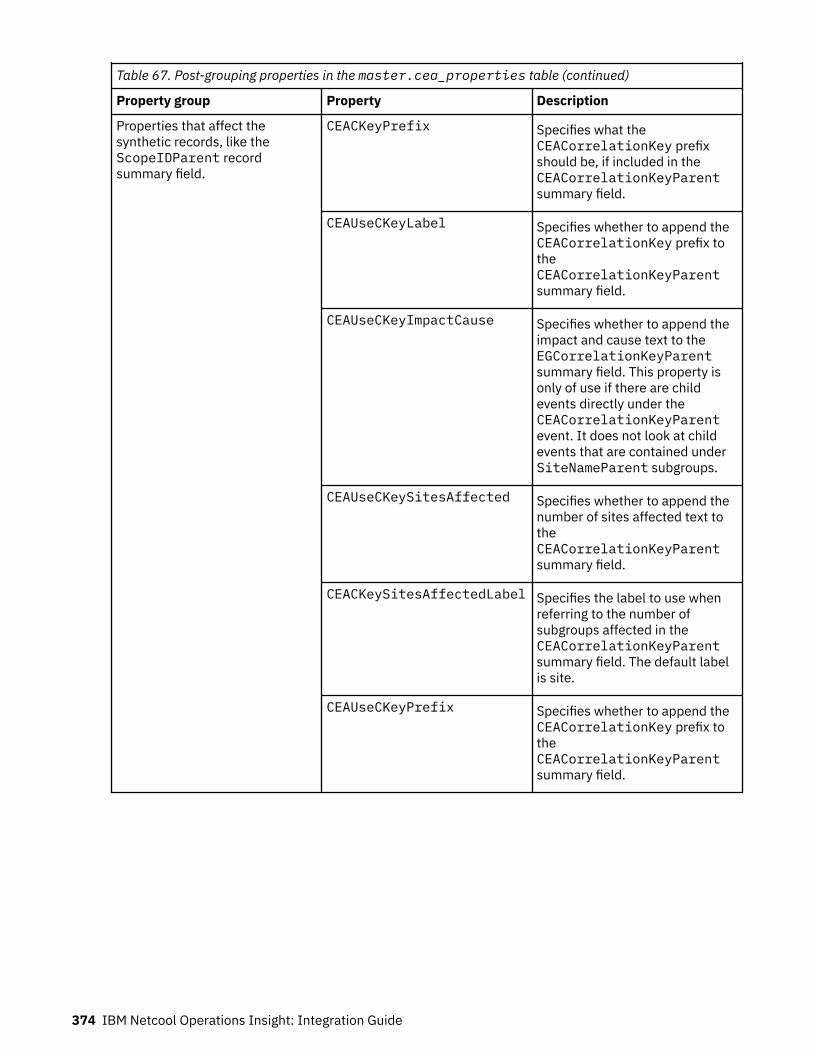
Table 67. Post-grouping properties in the master.cea_properties table (continued)
Property group Property Description
Properties that affect thesynthetic records, like theScopeIDParent recordsummary field.
CEACKeyPrefix Specifies what theCEACorrelationKey prefixshould be, if included in theCEACorrelationKeyParentsummary field.
CEAUseCKeyLabel Specifies whether to append theCEACorrelationKey prefix totheCEACorrelationKeyParentsummary field.
CEAUseCKeyImpactCause Specifies whether to append theimpact and cause text to theEGCorrelationKeyParentsummary field. This property isonly of use if there are childevents directly under theCEACorrelationKeyParentevent. It does not look at childevents that are contained underSiteNameParent subgroups.
CEAUseCKeySitesAffected Specifies whether to append thenumber of sites affected text totheCEACorrelationKeyParentsummary field.
CEACKeySitesAffectedLabel Specifies the label to use whenreferring to the number ofsubgroups affected in theCEACorrelationKeyParentsummary field. The default labelis site.
CEAUseCKeyPrefix Specifies whether to append theCEACorrelationKey prefix totheCEACorrelationKeyParentsummary field.
374 IBM Netcool Operations Insight: Integration Guide

Table 67. Post-grouping properties in the master.cea_properties table (continued)
Property group Property Description
TheCEAUseCKeyNumActiveAlarmsandCEACKeySummaryActiveFirstproperties work together. WhenCEACKeySummaryActiveFirstis enabled, the number of activealarms is displayed at the start ofthe summary instead of at theend of the summary.
CEACKeySummaryActiveFirst Specifies whether the number ofactive alarms appears at the startof theCEACorrelationKeyParentsummary. A value of zero meansdisabled.
CEAUseCKeyNumActiveAlarms Specifies whether to append thenumber of active alarms text totheCEACorrelationKeyParentsummary field.
Disabling cloud native analytics self monitoringThe cloud native analytics self_monitoring service is enabled by default. Follow this procedure if youwish to disable this feature.
When enabled, the cloud native analytics self_monitoring policy causes Netcool/OMNIbus to createan event every minute, with an Identifier field value of Event Analytics Service Monitoring. Thisheartbeat event follows the usual pathway of an event through the backend services of cloud nativeanalytics. At the end of the pathway, the Grade field value of the event is set to the time at which the eventwas processed by the cloud native analytics self_monitoring policy. The heartbeat event is visible inthe Event Viewer, and when cloud native analytics is functioning correctly the time-stamp value in itsGrade field increases every minute. If cloud native analytics self_monitoring is enabled and the time-stamp in the Grade field of the heartbeat event is not incrementing after a few minutes, then there mightbe a failure in one of the cloud native analytics services.
To disable cloud native analytics self_monitoring, you can either use the API or the GUI procedures.
Using the GUI1. Open the Policies page and click Filter and Apply the Self Monitoring filter to the policy table.2. Toggle the policy to Disabled.
Using the API1. Retrieve the password that is required to access the policy registry.
kubectl get secret release_name-systemauth-secret -o=jsonpath='{.data.password}'
Where release_name is the name of your deployment, as specified by the value used for name (OLM UIForm view), or name in the metadata section of the noi.ibm.com_noihybrids_cr.yaml ornoi.ibm.com_nois_cr.yaml files (YAML view).
2. Decode the password.
echo encoded_password | base64 --decode
Where encoded_password is the output from step “1” on page 375.3. Find the ingress point for the policy registry service by running the following command on Red Hat
OpenShift:
kubectl get routes
The value in the HOSTS/PORT column is the ingress point.
Chapter 6. Configuring 375
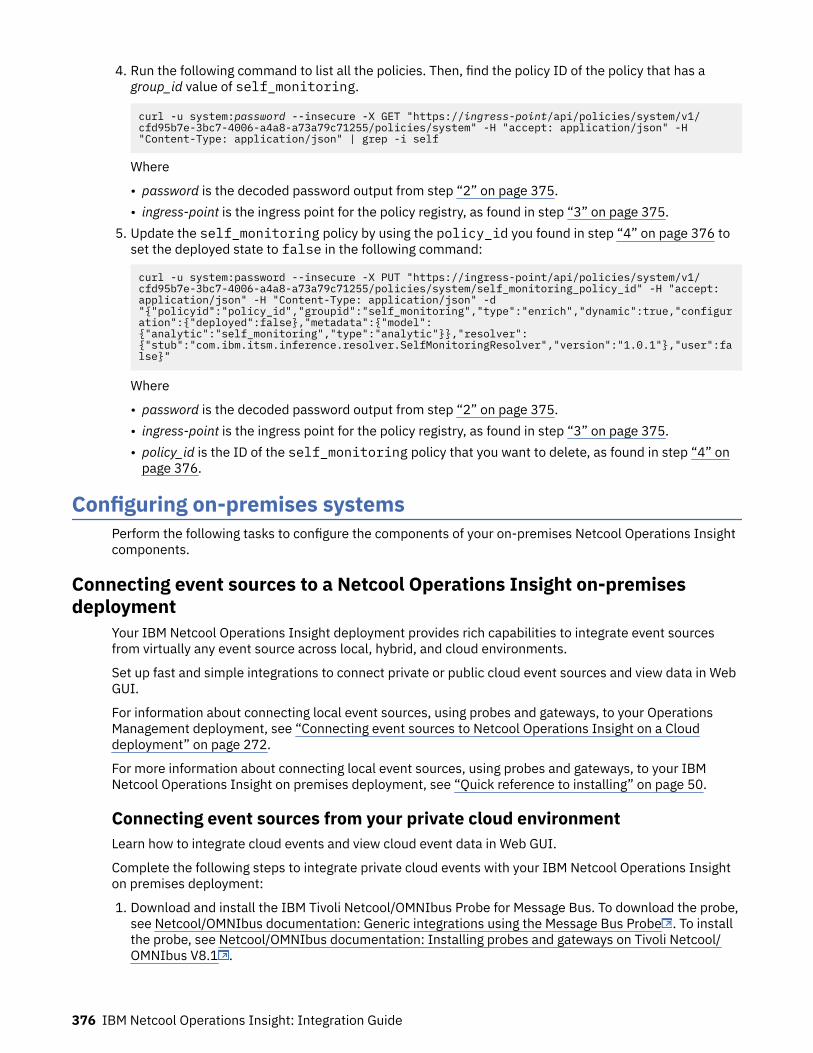
4. Run the following command to list all the policies. Then, find the policy ID of the policy that has agroup_id value of self_monitoring.
curl -u system:password --insecure -X GET "https://ingress-point/api/policies/system/v1/cfd95b7e-3bc7-4006-a4a8-a73a79c71255/policies/system" -H "accept: application/json" -H "Content-Type: application/json" | grep -i self
Where
• password is the decoded password output from step “2” on page 375.• ingress-point is the ingress point for the policy registry, as found in step “3” on page 375.
5. Update the self_monitoring policy by using the policy_id you found in step “4” on page 376 toset the deployed state to false in the following command:
curl -u system:password --insecure -X PUT "https://ingress-point/api/policies/system/v1/cfd95b7e-3bc7-4006-a4a8-a73a79c71255/policies/system/self_monitoring_policy_id" -H "accept: application/json" -H "Content-Type: application/json" -d "{"policyid":"policy_id","groupid":"self_monitoring","type":"enrich","dynamic":true,"configuration":{"deployed":false},"metadata":{"model":{"analytic":"self_monitoring","type":"analytic"}},"resolver":{"stub":"com.ibm.itsm.inference.resolver.SelfMonitoringResolver","version":"1.0.1"},"user":false}"
Where
• password is the decoded password output from step “2” on page 375.• ingress-point is the ingress point for the policy registry, as found in step “3” on page 375.• policy_id is the ID of the self_monitoring policy that you want to delete, as found in step “4” on
page 376.
Configuring on-premises systemsPerform the following tasks to configure the components of your on-premises Netcool Operations Insightcomponents.
Connecting event sources to a Netcool Operations Insight on-premisesdeployment
Your IBM Netcool Operations Insight deployment provides rich capabilities to integrate event sourcesfrom virtually any event source across local, hybrid, and cloud environments.
Set up fast and simple integrations to connect private or public cloud event sources and view data in WebGUI.
For information about connecting local event sources, using probes and gateways, to your OperationsManagement deployment, see “Connecting event sources to Netcool Operations Insight on a Clouddeployment” on page 272.
For more information about connecting local event sources, using probes and gateways, to your IBMNetcool Operations Insight on premises deployment, see “Quick reference to installing” on page 50.
Connecting event sources from your private cloud environmentLearn how to integrate cloud events and view cloud event data in Web GUI.
Complete the following steps to integrate private cloud events with your IBM Netcool Operations Insighton premises deployment:
1. Download and install the IBM Tivoli Netcool/OMNIbus Probe for Message Bus. To download the probe,see Netcool/OMNIbus documentation: Generic integrations using the Message Bus Probe . To installthe probe, see Netcool/OMNIbus documentation: Installing probes and gateways on Tivoli Netcool/OMNIbus V8.1 .
376 IBM Netcool Operations Insight: Integration Guide

2. Configure the Message Bus Probe with the required ObjectServer fields. For more information, seeNetcool/OMNIbus documentation: Integrating cloud event management with Netcool OperationsInsight .
3. Install event management For more information see event management documentation and https://www.ibm.com/support/knowledgecenter/SSURRN/com.ibm.cem.doc/em_cem_install_openshift.html
.4. Create an outgoing integration. For more information, see the Cloud Event Management
documentation event management documentation: Sending incident details to Netcool/OMNIbus .5. Configure an event policy to forward events to Netcool Operations Insight. In the Action section, select
Forward events. For more information, see event management documentation: Setting up eventpolicies .
It may take a moment before event management starts to forward events to Netcool Operations Insight.Verify that event management events appear in the Event List.
Sending events to event managementYou can also view Netcool Operations Insight events in event management, by creating an incomingintegration and installing and configuring the Netcool/OMNIbus Gateway for event management. For moreinformation, see event management documentation: Configuring Netcool/OMNIbus as an event source .
Connecting event sources from your public cloud environmentLearn how to integrate public cloud events and view cloud event data in Web GUI.
Complete the following steps to connect public cloud events with your IBM Netcool Operations Insight onpremises deployment:
1. Download and install the IBM Tivoli Netcool/OMNIbus Probe for Message Bus. To download the probe,see Netcool/OMNIbus documentation: Generic integrations using the Message Bus Probe . To installthe probe, see Netcool/OMNIbus documentation: Installing probes and gateways on Tivoli Netcool/OMNIbus V8.1 .
2. Configure the Message Bus Probe with the required ObjectServer fields. For more information, seeNetcool/OMNIbus documentation: Integrating cloud event management with Netcool OperationsInsight .
3. Subscribe to cloud event management for your public cloud environment. For more information, seeIBM Cloud Event Management on Marketplace .
4. Create an outgoing integration. For more information, see event management documentation: Sendingevents to Netcool/OMNIbus .
5. Configure an event policy to forward events to Netcool Operations Insight. In the Action section, selectForward events. For more information, see event management documentation: Setting up eventpolicies .
6. Configure the secure gateway. For more information, see event management documentation: Sendingevents to Netcool/OMNIbus via the IBM Secure Gateway .
It may take a moment before event management starts to forward events to Netcool Operations Insight.Verify that event management events appear in the Event List.
Sending events to event managementYou can also view Netcool Operations Insight events in event management, by creating an incomingintegration and installing and configuring the Netcool/OMNIbus Gateway for event management. For moreinformation, see event management documentation: Configuring Netcool/OMNIbus as an event source .
Chapter 6. Configuring 377
Configuring Operations ManagementPerform the following tasks to configure the components of Operations Management.
Configuring Event AnalyticsPerform these tasks to configure and optionally customize the system prior to use.
Configuring Event Analytics using the wizardIn Netcool/Impact V7.1.0.13 it is recommended to use the Event Analytics configuration wizard instead ofthe ./nci_trigger command to edit properties in the NOI Shared Configuration properties file. Thesetup wizard guides you through the Event Analytics configuration process. You must run the EventAnalytics configuration wizard after upgrading to Netcool/Impact V7.1.0.13 to verify and save yourconfiguration.
Note: If you are running the wizard within a load-balancing environment, then first perform the followingsteps on each Netcool/Impact UI server:
1. Edit the $IMPACT_HOME/etc/server.props file.2. Set the impact.noi.ui.hostname variable to the hostname of one of the Netcool/Impact UI
servers.
To launch the wizard, click Insights and select Event Analytics Configuration.
The Event Analytics Configuration wizard consists of two parts:
1. Configuring access to the following databases:
• The Tivoli Netcool/OMNIbus Historical Event Database, containing historical event data used toanalyze historical events for Event Analytics.
• The Tivoli Netcool/OMNIbus ObjectServer, containing live event data to be enriched based oninsights derived from Event Analytics processing.
2. Configuring settings to control Event Analytics processing.
Configuring the historical event databaseConfigure access to the Tivoli Netcool/OMNIbus historical event database that contains the data used toanalyze historical events for Event Analytics. On the historical event database window, you specify thedatabase type, connection details, table name, and timestamp format.
Before you beginIf you have custom fields in your Historical Event database, then before doing this task you must first mapthe custom field names to the corresponding standard field names in Netcool/Impact by creating adatabase view, as described in “Mapping customized field names” on page 408. In the appropriate step inthe procedure below, you must specify that database view name instead of the Historical Event databasereporter_status table name.
You can set up an Oracle database as your historical event database with a custom URL. You can alsoconfigure a system identifier (SID) or Service Name in order to connect the database. The SID or ServiceName configuration settings are not available in the Event Analytics Configuration wizard. Instead refer tothe backend configuration instructions: “Configuring Oracle database connection within Netcool/Impact”on page 389.
Procedure1. Specify the database type used for the historical event database:
• Db2• Oracle• MS SQL Server
378 IBM Netcool Operations Insight: Integration Guide
2. Enter the connection details for the database in the fields provided.Hostname
Enter the name of the server hosting the database.Port
Enter the port number to be used to connect to the server that hosts the database.Username
Enter the username for connecting to the database.Password
Enter the password for the specified username.The remaining fields in this section differ depending on the database type selected in step 1.
• If you selected a database type of Db2 or MS SQL Server, then complete the following field:Database Name
In the Database Name field enter the name of the database you want to access. For exampleREPORTER.
• If you selected a database type of Oracle, then complete the following fields:Communication method
Specify whether to use a custom URL, Oracle SID (alphanumeric system identifier), or Oracleservice name.
Custom URLIf you set Communication method to Custom URL, then specify the URL in the<hostname>:<port>:<server> format.
Note: For Real Application Clusters (RAC) servers, see additional information from the TivoliNetcool/OMNIbus Knowledge Center here: https://www.ibm.com/support/knowledgecenter/SSSHYH_7.1.0/com.ibm.netcoolimpact.doc/user/rac_cluster_support.html
SIDIf you set Communication method to SID, then specify the SID.
Service nameIf you set Communication method to Service name, then specify the service name.
3. Click Connect to validate your connection to the historical event database.4. For the table you want to query, select a Database schema and History table or view from the drop-
down lists provided.a) The options available under Database schema are based on the username provided to connect to
the historical event database.b) The options available under History table are based on the selected Database schema.
Important: If you have custom fields in your Historical Event database, and you created a databaseview to map these fields, as described in “Mapping customized field names” on page 408, then youmust select that database view from the History table drop-down list.
5. Specify the timestamp field used in the historical event database to store the first occurrence of anevent.
Specifying the primary and backup ObjectServerOn the ObjectServer window, enter the hostname, port, and user credentials to connect to the primaryand backup ObjectServers.
Procedure1. In the fields provided, enter the connection details to the primary ObjectServer:
HostnameEnter the hostname where the primary ObjectServer is installed.
Chapter 6. Configuring 379
PortSpecify the port number that the primary ObjectServer will use.
UsernameEnter the username to access the ObjectServer.
PasswordEnter the password for the specified username.
2. To enable a backup ObjectServer, select the Enable backup ObjectServer check box and enter theconnection details:
Note: Selecting Enable backup ObjectServer enables the fail back option when Impact cannotconnect to the database. Deselecting this option disables the backup.
HostnameEnter the hostname where the backup ObjectServer is installed.
PortSpecify the port number that the backup ObjectServer will use.
The Username and Password are same as the credentials specified for the primary ObjectServer.
Click Connect to connect to the ObjectServer.
Adding report fieldsSelect report fields to add additional information to seasonal and related event reports, historical eventreports, and instance reports.
Before you beginIf you add any custom columns to any of the reports defined in the Event Analytics Setup Wizard anddefine a column title for this column, then, if you want the column title to appear in a non-Englishlanguage in the relevant Event Analytics report, you must edit the relevant customization files. For moreinformation about rendering column labels in a non-English language, see http://ibm.biz/impact_trans.
If you do not do this, then when the column title is displayed in the relevant Event Analytics report, it willappear in English, regardless of the locale of the browser.
If you encounter a blank screen when you reach this page then there might be missing fields in theHistorical Event Database. To resolve this issue, see the relevant section in “Troubleshooting EventAnalytics configuration” on page 609.
Procedure1. Specify the Aggregate fields.
You can add aggregate fields to the seasonal and related event reports, by applying predefinedaggregate functions to selected fields from the Historical Event Database. These fields are displayed inthe seasonal and related event reports in the same order as they appear below.
Example: To display the maximum severity of all the events that make up a related event group selectthe SEVERITY field, then apply the Max aggregate function, and click Include in reports: Related.
Note: It is highly recommended that you specify the IDENTIFIER field to include in this report. Thisfield will of invaluable assistance in interpreting the report, as it will help you to determine the preciseevent identity of each of the events in the report. If you are using a different field than IDENTIFIER asyour global event identity, then add that field here instead of IDENTIFIER. If, in addition to the globalevent identity field, you are using a different field as the event identity in any specific configuration,then add that field here in addition to IDENTIFIER.
Once you have saved these settings, you must rerun the relevant configuration scans in order for thechanges to become visible in your seasonal and related event reports.
2. Specify the Historical report fields.
380 IBM Netcool Operations Insight: Integration Guide
The fields specified here are displayed in the historical event report, in the same order as they appearbelow. The historical event report is shown when you drill in from a seasonal event to its contributinghistorical events.
Note: It is highly recommended that you specify the IDENTIFIER field to include in this report. Thisfield will of invaluable assistance in interpreting the report, as it will help you to determine the preciseevent identity of each of the events in the report. If you are using a different field than IDENTIFIER asyour global event identity, then add that field here instead of IDENTIFIER. If, in addition to the globalevent identity field, you are using a different field as the event identity in any specific configuration,then add that field here in addition to IDENTIFIER.
When you next open the historical event report, wait 20 seconds for your changes to appear.3. Specify the Instance report fields.
The fields specified here are displayed as additional fields in the instance report for a related eventgroup, in the same order as they appear below. The instance report is shown when you drill into eventdetails from a related event group, to show the instances of that group.
Note: It is highly recommended that you specify the IDENTIFIER field to include in this report. Thisfield will of invaluable assistance in interpreting the report, as it will help you to determine the preciseevent identity of each of the events in the report. If you are using a different field than IDENTIFIER asyour global event identity, then add that field here instead of IDENTIFIER. If, in addition to the globalevent identity field, you are using a different field as the event identity in any specific configuration,then add that field here in addition to IDENTIFIER.
When you next open the instance event report, wait 20 seconds for your changes to appear.4. Click Save to save your changes.
Configuring event suppressionSome events might not be important with respect to monitoring your network environment. For eventsthat do not need to be viewed or acted on, event suppression is available as an action when creating aseasonal event rule.
About this taskFor seasonal event rules, specify the ObjectServer fields to use for suppressing and unsuppressingevents.
Procedure1. To suppress an event, select a Suppression field and Suppression field value from the drop-down
lists provided. The field and value that you define here are used to mark the event for suppressionwhen the incoming event matches the seasonal event rule with event suppression selected as one ofits actions.
2. To unsuppress an event, select an Unsuppression field and Unsuppression field value from the drop-down lists provided. The field and value that you define here are used to unsuppress an event whenthe incoming event matches the seasonal event rule with event suppression selected as one of itsactions.
3. Click Save to save your changes.
Configuring event pattern processingConfigure how patterns are derived from related events using this example-driven wizard panel.
Before you beginTo configure event pattern processing, you must specify Historical Event Database columns to use forsettings such as event type, event identity, and resource, or accept the columns specified as default. Ifyou want to use custom columns, then you must first configure the Impact Event Reader to read thesecustom fields, as described in the following topic: Netcool/Impact Knowledge Center: OMNIbus eventreader service .
Chapter 6. Configuring 381
About this taskAn event pattern is a set of events that typically occur in sequence on a network resource. For example,on a London router LON-ROUTER-1, the following sequence of events might frequently occur: FAN-FAILURE, POWER-SUPPLY-FAILURE, DEVICE-FAILURE, indicating that the router fan needs to be changed.Using the related event group feature, Event Analytics will discover this sequence of events as a relatedevent group on LON-ROUTER-1.Using the event pattern feature, Event Analytics can then detect this related event group on any networkresource. In the example above, the related event group FAN-FAILURE, POWER-SUPPLY-FAILURE,DEVICE-FAILURE detected on the London router LON-ROUTER-1 can be stored as a pattern and thatpattern can be detected on any other network resource, for example, on a router in Dallas, DAL-ROUTER-5.
Procedure1. Select the appropriate Historical Event Database column(s) for the following Global settings:
Default event typeAn event type is a category of event, for example: FAN-FAILURE, POWER-SUPPLY-FAILURE andDEVICE-FAILURE are event types. By default event type information is stored in the followingHistorical Event Database column: ALERTGROUP. If you have another set of events that youcategorize in a different way, then you can specify additional event type columns in section 2below.
Default event identityThe event identity uniquely identifies an event on a specific network resource. By default the eventidentity is stored in the following Historical Event Database column: IDENTIFIER.
ResourceA resource identifies a network resource on which events occur. In the example, LON-ROUTER-1and DAL-ROUTER-5 are examples of resources on which events occur. By default this resourceinformation is stored in the following Historical Event Database column: NODE.
2. If you have another set of events that you categorize in a different way, you can add them asAdditional event types.a) Select the check box to enable Additional event types.b) Click Add new. Add a row for each distinct set of events.c) Specify the filters and fields listed below for each set of events. Event Analytics uses these settings
to determine event patterns for a set of events. Filters are applied from top to bottom, in the orderthat they appear in the table. You can change the order by using the controls at the end of the row.Type name
Specify the type name. Use a name that is easily understandable as it will be used later toidentify this event type when associating specific event types with an event analyticsconfiguration.
Note: If at a later stage you are editing this page, and the event type has been associated withone or more event analytics configurations, then the Type name field is read-only.
Database filterSpecify the filter that matches this set of historical events in the Historical Event Database.
ObjectServer filterSpecify the filter that matches the corresponding set of live events in the ObjectServer. TheObjectServer filter should be semantically identical to the Database filter, except that youshould specify ObjectServer column syntax for the columns.
Event type fieldAn event type is a category of event, for example: FAN-FAILURE, POWER-SUPPLY-FAILURE, andDEVICE-FAILURE are event types. For this set of events, specify the Historical Event Databasecolumn that stores event type information.
382 IBM Netcool Operations Insight: Integration Guide
Event identity field(s)The event identity uniquely identifies an event on a specific network resource. For this set ofevents, specify the Historical Event Database column or columns that stores event identityinformation.
Note: You can delete any of the additional event types by clicking the trash can delete icon. If the typeis already being used in one or more analytics configurations then deleting the type will remove it fromthose configurations. To ensure your analytics results are fully synchronized you should rerun theaffected analytics configurations.
Reviewing the configurationOn the Summary window, review your settings. You can also save the settings here or click Back to makechanges to the settings that you configured.
Procedure1. Review the settings on the Summary window.
Click Back or any of the navigation menu links to modify the settings as appropriate.2. When you are satisfied with the configuration settings, click Save.
Exporting the Event Analytics configurationUse the nci_trigger command to export a saved Event Analytics configuration to another system.
Procedure1. To generate a properties file from the command-line interface, use the following command:
nci_trigger server <UserID>/<password> NOI_DefaultValues_Export FILENAME directory/filename
Where:SERVER
The server where Event Analytics is installed.<UserID>
The user name of the Event Analytics user.<password>
The password of the Event Analytics user.directory
The directory where the file is stored.filename
The name of the properties file.For example:
./nci_trigger NCI impactadmin/impactpass NOI_DefaultValues_Export FILENAME /tmp/eventanalytic.props
2. To import the modified properties file into Netcool/Impact, use the following command:
nci_trigger SERVER <UserID>/<password> NOI_DefaultValues_Configure FILENAME directory/filename
For example:
./nci_trigger NCI impactadmin/impactpass NOI_DefaultValues_Configure FILENAME /tmp/eventanalytic.props
Chapter 6. Configuring 383
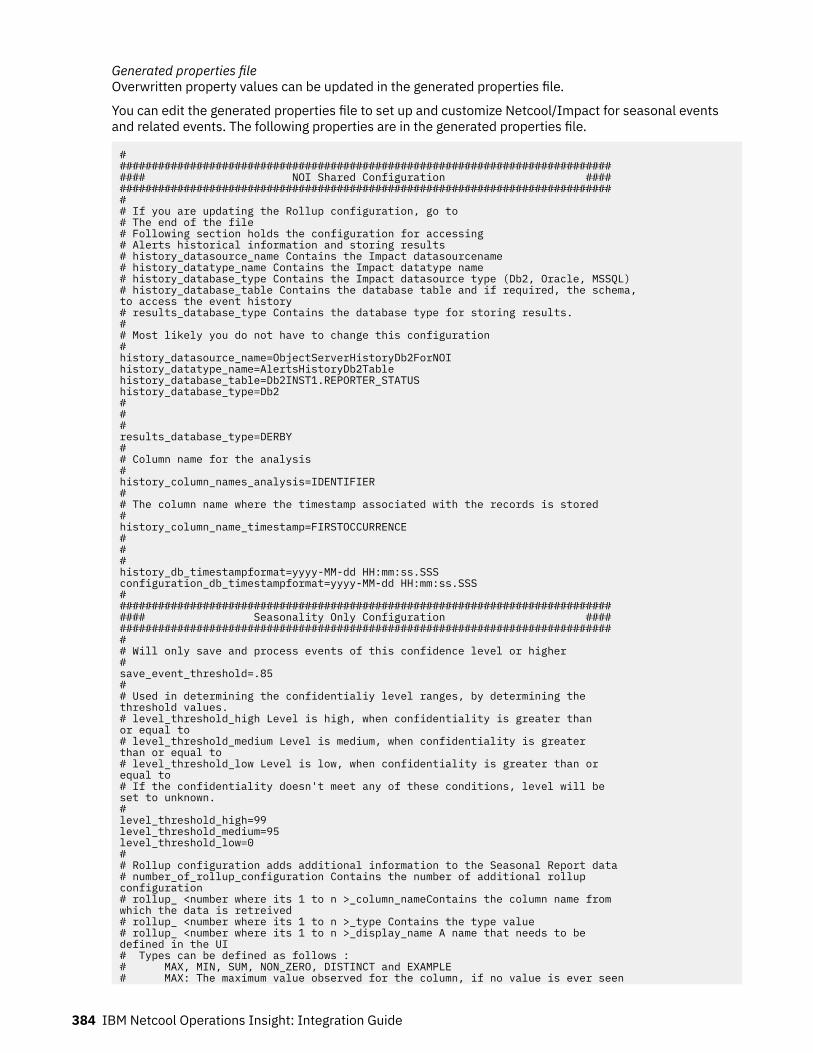
Generated properties fileOverwritten property values can be updated in the generated properties file.
You can edit the generated properties file to set up and customize Netcool/Impact for seasonal eventsand related events. The following properties are in the generated properties file.
################################################################################## NOI Shared Configuration ################################################################################### If you are updating the Rollup configuration, go to# The end of the file# Following section holds the configuration for accessing# Alerts historical information and storing results# history_datasource_name Contains the Impact datasourcename# history_datatype_name Contains the Impact datatype name# history_database_type Contains the Impact datasource type (Db2, Oracle, MSSQL)# history_database_table Contains the database table and if required, the schema, to access the event history# results_database_type Contains the database type for storing results.## Most likely you do not have to change this configuration#history_datasource_name=ObjectServerHistoryDb2ForNOIhistory_datatype_name=AlertsHistoryDb2Tablehistory_database_table=Db2INST1.REPORTER_STATUShistory_database_type=Db2###results_database_type=DERBY## Column name for the analysis#history_column_names_analysis=IDENTIFIER## The column name where the timestamp associated with the records is stored#history_column_name_timestamp=FIRSTOCCURRENCE###history_db_timestampformat=yyyy-MM-dd HH:mm:ss.SSSconfiguration_db_timestampformat=yyyy-MM-dd HH:mm:ss.SSS################################################################################## Seasonality Only Configuration ################################################################################### Will only save and process events of this confidence level or higher#save_event_threshold=.85## Used in determining the confidentialiy level ranges, by determining the threshold values.# level_threshold_high Level is high, when confidentiality is greater than or equal to# level_threshold_medium Level is medium, when confidentiality is greater than or equal to# level_threshold_low Level is low, when confidentiality is greater than or equal to# If the confidentiality doesn't meet any of these conditions, level will be set to unknown.#level_threshold_high=99level_threshold_medium=95level_threshold_low=0## Rollup configuration adds additional information to the Seasonal Report data# number_of_rollup_configuration Contains the number of additional rollup configuration# rollup_ <number where its 1 to n >_column_nameContains the column name from which the data is retreived# rollup_ <number where its 1 to n >_type Contains the type value# rollup_ <number where its 1 to n >_display_name A name that needs to be defined in the UI# Types can be defined as follows :# MAX, MIN, SUM, NON_ZERO, DISTINCT and EXAMPLE# MAX: The maximum value observed for the column, if no value is ever seen
384 IBM Netcool Operations Insight: Integration Guide
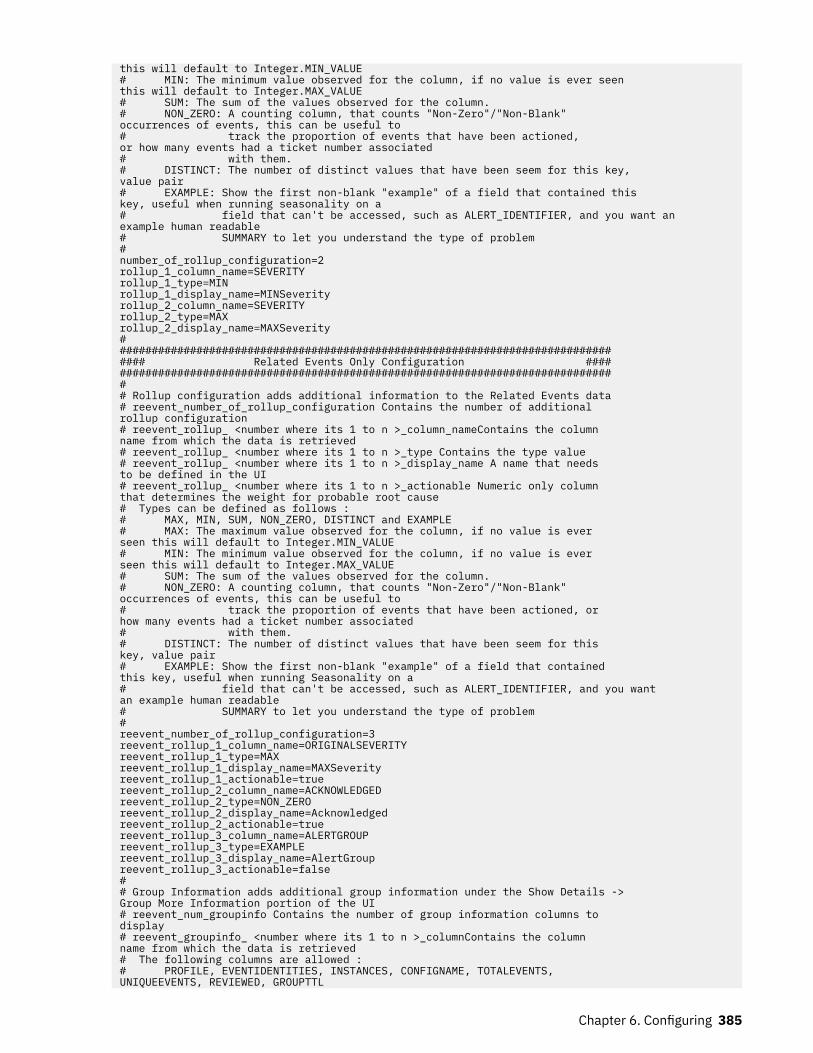
this will default to Integer.MIN_VALUE# MIN: The minimum value observed for the column, if no value is ever seen this will default to Integer.MAX_VALUE# SUM: The sum of the values observed for the column.# NON_ZERO: A counting column, that counts "Non-Zero"/"Non-Blank" occurrences of events, this can be useful to# track the proportion of events that have been actioned, or how many events had a ticket number associated# with them.# DISTINCT: The number of distinct values that have been seem for this key, value pair# EXAMPLE: Show the first non-blank "example" of a field that contained this key, useful when running seasonality on a# field that can't be accessed, such as ALERT_IDENTIFIER, and you want an example human readable# SUMMARY to let you understand the type of problem#number_of_rollup_configuration=2rollup_1_column_name=SEVERITYrollup_1_type=MINrollup_1_display_name=MINSeverityrollup_2_column_name=SEVERITYrollup_2_type=MAXrollup_2_display_name=MAXSeverity################################################################################## Related Events Only Configuration ################################################################################### Rollup configuration adds additional information to the Related Events data# reevent_number_of_rollup_configuration Contains the number of additional rollup configuration# reevent_rollup_ <number where its 1 to n >_column_nameContains the column name from which the data is retrieved# reevent_rollup_ <number where its 1 to n >_type Contains the type value# reevent_rollup_ <number where its 1 to n >_display_name A name that needs to be defined in the UI# reevent_rollup_ <number where its 1 to n >_actionable Numeric only column that determines the weight for probable root cause# Types can be defined as follows :# MAX, MIN, SUM, NON_ZERO, DISTINCT and EXAMPLE# MAX: The maximum value observed for the column, if no value is ever seen this will default to Integer.MIN_VALUE# MIN: The minimum value observed for the column, if no value is ever seen this will default to Integer.MAX_VALUE# SUM: The sum of the values observed for the column.# NON_ZERO: A counting column, that counts "Non-Zero"/"Non-Blank" occurrences of events, this can be useful to# track the proportion of events that have been actioned, or how many events had a ticket number associated# with them.# DISTINCT: The number of distinct values that have been seem for this key, value pair# EXAMPLE: Show the first non-blank "example" of a field that contained this key, useful when running Seasonality on a# field that can't be accessed, such as ALERT_IDENTIFIER, and you want an example human readable# SUMMARY to let you understand the type of problem#reevent_number_of_rollup_configuration=3reevent_rollup_1_column_name=ORIGINALSEVERITYreevent_rollup_1_type=MAXreevent_rollup_1_display_name=MAXSeverityreevent_rollup_1_actionable=truereevent_rollup_2_column_name=ACKNOWLEDGEDreevent_rollup_2_type=NON_ZEROreevent_rollup_2_display_name=Acknowledgedreevent_rollup_2_actionable=truereevent_rollup_3_column_name=ALERTGROUPreevent_rollup_3_type=EXAMPLEreevent_rollup_3_display_name=AlertGroupreevent_rollup_3_actionable=false## Group Information adds additional group information under the Show Details -> Group More Information portion of the UI# reevent_num_groupinfo Contains the number of group information columns to display# reevent_groupinfo_ <number where its 1 to n >_columnContains the column name from which the data is retrieved# The following columns are allowed :# PROFILE, EVENTIDENTITIES, INSTANCES, CONFIGNAME, TOTALEVENTS, UNIQUEEVENTS, REVIEWED, GROUPTTL
Chapter 6. Configuring 385
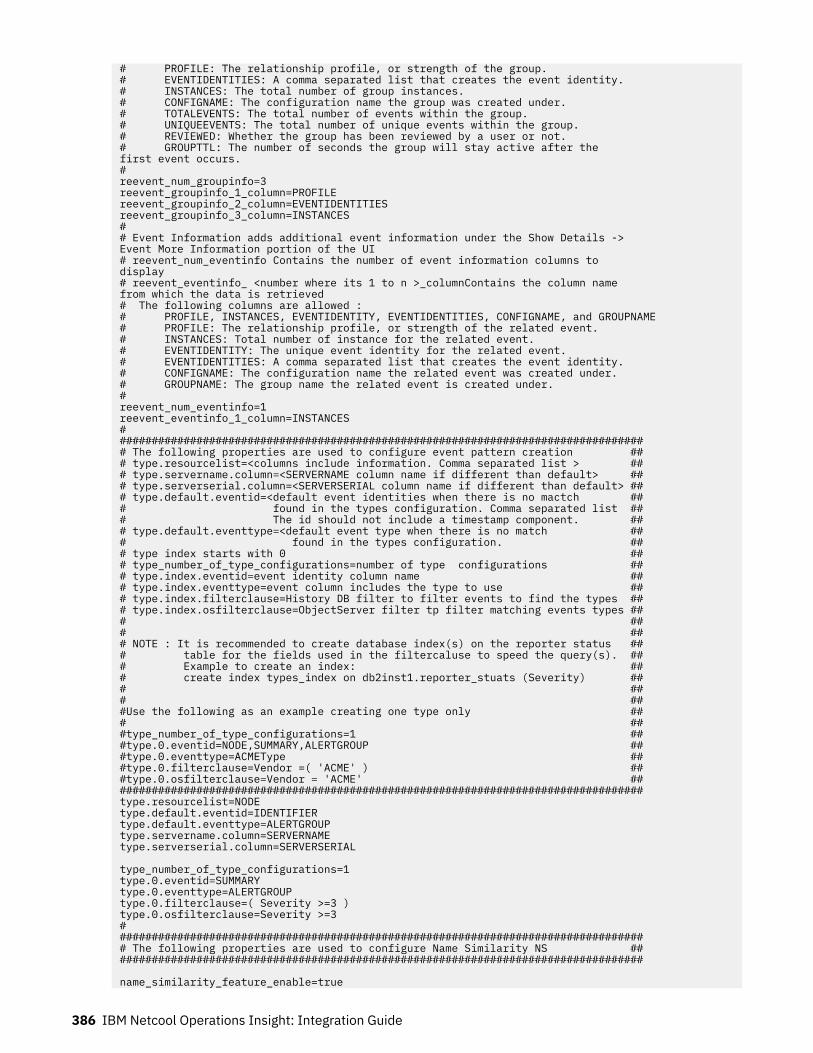
# PROFILE: The relationship profile, or strength of the group.# EVENTIDENTITIES: A comma separated list that creates the event identity.# INSTANCES: The total number of group instances.# CONFIGNAME: The configuration name the group was created under.# TOTALEVENTS: The total number of events within the group.# UNIQUEEVENTS: The total number of unique events within the group.# REVIEWED: Whether the group has been reviewed by a user or not.# GROUPTTL: The number of seconds the group will stay active after the first event occurs.#reevent_num_groupinfo=3reevent_groupinfo_1_column=PROFILEreevent_groupinfo_2_column=EVENTIDENTITIESreevent_groupinfo_3_column=INSTANCES## Event Information adds additional event information under the Show Details -> Event More Information portion of the UI# reevent_num_eventinfo Contains the number of event information columns to display# reevent_eventinfo_ <number where its 1 to n >_columnContains the column name from which the data is retrieved# The following columns are allowed :# PROFILE, INSTANCES, EVENTIDENTITY, EVENTIDENTITIES, CONFIGNAME, and GROUPNAME# PROFILE: The relationship profile, or strength of the related event.# INSTANCES: Total number of instance for the related event.# EVENTIDENTITY: The unique event identity for the related event.# EVENTIDENTITIES: A comma separated list that creates the event identity.# CONFIGNAME: The configuration name the related event was created under.# GROUPNAME: The group name the related event is created under.#reevent_num_eventinfo=1reevent_eventinfo_1_column=INSTANCES#################################################################################### The following properties are used to configure event pattern creation ### type.resourcelist=<columns include information. Comma separated list > ### type.servername.column=<SERVERNAME column name if different than default> ### type.serverserial.column=<SERVERSERIAL column name if different than default> ### type.default.eventid=<default event identities when there is no mactch ### found in the types configuration. Comma separated list ### The id should not include a timestamp component. ### type.default.eventtype=<default event type when there is no match ### found in the types configuration. ### type index starts with 0 ### type_number_of_type_configurations=number of type configurations ### type.index.eventid=event identity column name ### type.index.eventtype=event column includes the type to use ### type.index.filterclause=History DB filter to filter events to find the types ### type.index.osfilterclause=ObjectServer filter tp filter matching events types ### ### ### NOTE : It is recommended to create database index(s) on the reporter status ### table for the fields used in the filtercaluse to speed the query(s). ### Example to create an index: ### create index types_index on db2inst1.reporter_stuats (Severity) ### ### ###Use the following as an example creating one type only ### ###type_number_of_type_configurations=1 ###type.0.eventid=NODE,SUMMARY,ALERTGROUP ###type.0.eventtype=ACMEType ###type.0.filterclause=Vendor =( 'ACME' ) ###type.0.osfilterclause=Vendor = 'ACME' ####################################################################################type.resourcelist=NODEtype.default.eventid=IDENTIFIERtype.default.eventtype=ALERTGROUPtype.servername.column=SERVERNAMEtype.serverserial.column=SERVERSERIAL
type_number_of_type_configurations=1type.0.eventid=SUMMARYtype.0.eventtype=ALERTGROUPtype.0.filterclause=( Severity >=3 )type.0.osfilterclause=Severity >=3#################################################################################### The following properties are used to configure Name Similarity NS ####################################################################################
name_similarity_feature_enable=true
386 IBM Netcool Operations Insight: Integration Guide

name_similarity_default_pattern_enable=falsename_similarity_default_threshold=0.9name_similarity_default_lead_restriction=1name_similarity_default_tail_restriction=0
Configuring Event Analytics using the command lineYou can configure Event Analytics from the command line using the ./nci_trigger utility.
Before you beginIn Netcool/Impact v7.1.0.13 it is recommended to use the Event Analytics configuration wizard instead ofthe ./nci_trigger command to edit properties in the NOI Shared Configuration properties file. Formore information, see “Configuring Event Analytics using the wizard” on page 378.
Configuring the historical event databaseConfigure access to the Tivoli Netcool/OMNIbus historical event database that contains the data used toanalyze historical events for Event Analytics.
Before you beginIn Netcool/Impact v7.1.0.13 it is recommended to use the Event Analytics configuration wizard instead ofthe ./nci_trigger command to edit properties in the NOI Shared Configuration properties file. Formore information, see “Configuring Event Analytics using the wizard” on page 378.
Configuring Db2 database connection within Netcool/ImpactYou can configure a connection to a valid Db2 database from within IBM Tivoli Netcool/Impact.
Before you beginIn Netcool/Impact v7.1.0.13 and later releases, it is recommended to use the Event Analyticsconfiguration wizard instead of the ./nci_trigger command to edit properties in the NOI SharedConfiguration properties file. For more information, see “Configuring Event Analytics using the wizard” onpage 378.
About this taskUsers can run seasonality event reports and related event configurations, specifying the time range andname with Db2. Complete the following steps to configure the ObjectServer data source or data type.
Procedure1. Log in to the Netcool/Impact UI.
https://impacthost:port/ibm/console
2. Configure the ObjectServer data source and data type.a) In the Netcool/Impact UI, from the list of available projects, select the NOI project.b) Select the Data Model tab and select ObjectServerForNOI.
1) Click Edit and enter information for <username>, <password>, <host name>, <port>.2) To save the Netcool/Impact data source, click Test Connection, followed by the Save icon.
c) Edit the data type. Expand the data source and edit the data type to correspond to the ObjectServerevent history database type.For example, AlertsForNOITable
d) For Base Table, select <database table>.e) To update the schema and table, click Refresh and then click Save.f) Select the Data Model tab and select ObjectServerHistoryDb2ForNOI.
1) Click Edit and enter information for <username>, <password>, <host name>, <port>.
Chapter 6. Configuring 387
2) To save the Netcool/Impact data source, click Test Connection, followed by the Save icon.g) Edit the data type. Expand the ObjectServerHistoryDb2ForNOI data source and editAlertsHistoryDb2Table.
h) For Base Table, select <database name> and <database table name>i) To update the schema and table, click Refresh and then click Save.j) Select the Services tab and ensure that the following services are started.
ProcessRelatedEventsProcessSeasonalityEventsProcessRelatedEventConfig
3. Configure the Db2 database connection within Netcool/Impact if it was previously configured forOracle or MSSQL. The following steps configure the report generation to use the Db2 database. Exportthe default properties, change the default configuration, and update the properties.a) Generate a properties file, go to the <Impact install location>/bin directory to locate thenci_trigger, and run the following command from the command-line interface.
nci_trigger <server> <username>/<password> NOI_DefaultValues_Export FILENAME directory/filename
where<server>
The server where Event Analytics is installed.<user name>
The user name of the Event Analytics user.<password>
The password of the Event Analytics user.directory
The directory where the file is stored.filename
The name of the properties file.For example:
./nci_trigger NCI impactadmin/impactpass NOI_DefaultValues_Export FILENAME /tmp/seasonality.props
b) Update the properties file. Some property values are overwritten by the generated properties file,you might need to update other property values in the generated properties file. For a full list ofeffected properties, see “Generated properties file” on page 384.
• If you do not have the following parameter values, update your properties file to reflect theseparameter values.
history_datasource_name=ObjectServerHistoryDb2ForNOIhistory_datatype_name=AlertsHistoryDb2Tablehistory_database_table=<database table name>history_database_type=Db2
c) Import the modified properties file into Netcool/Impact, enter the following command.
nci_trigger <Server> <username>/<password> NOI_DefaultValues_Configure FILENAME directory/filename
For example:
./nci_trigger NCI impactadmin/impactpass NOI_DefaultValues_Configure FILENAME /tmp/seasonality.props
388 IBM Netcool Operations Insight: Integration Guide
Related tasksInstalling Netcool/OMNIbus and Netcool/Impact
Configuring Oracle database connection within Netcool/ImpactYou can configure a connection to a valid Oracle database from within IBM Tivoli Netcool/Impact.
Before you beginIn Netcool/Impact v7.1.0.13 and later releases, it is recommended to use the Event Analyticsconfiguration wizard instead of the ./nci_trigger command to edit properties in the NOI SharedConfiguration properties file. For more information, see “Configuring Event Analytics using the wizard” onpage 378.
To use Oracle as the archive database, you must set up a remote connection to Netcool/Impact. For moreinformation, see remote connection.
About this taskUsers can run seasonality event reports and related event configurations, specifying the time range andname with Oracle. Complete the following steps to configure the ObjectServer data source or data type.
Procedure1. Log in to the Netcool/Impact UI.
https://impacthost:port/ibm/console
2. Configure the ObjectServer data source and data type.a) In the Netcool/Impact UI, from the list of available projects, select the NOI project.b) Select the Data Model tab, and select ObjectServerForNOI.
1) Click Edit and enter information for <username>, <password>, <host name>, and <port>.2) Save the Netcool/Impact data source. Click Test Connection, followed by the Save icon.
c) Edit the data type. Expand the data source ObjectServerForNOI and edit the data type tocorrespond to the ObjectServer event history database type.For example, AlertsForNOITable.
d) For Base Table, select <database table>.e) To update the schema and table, click Refresh and then click Save.f) Select the Data Model tab, and select ObjectServerHistoryOrclForNOI.
1) Click Edit and enter information for <username>, <password>, <host name>, <port>, and <sid>.2) Save the Netcool/Impact data source. Click Test Connection, followed by the Save icon.
g) Edit the data type. Expand the data source ObjectServerHistoryOrclForNOI and edit theAlertsHistoryOrclTable data type.
h) For Base Table, select <database name> and <database table name>.i) To update the schema and table, click Refresh and then click Save.j) Edit the data type. Expand the data source ObjectServerHistoryOrclForNOI and edit theSE_HISTORICALEVENTS_ORACLE data type.
k) For Base Table, select <database name> and <database table name>.l) To update the schema and table, click Refresh and then click Save.
m) Select the Services tab and ensure that following services are started:
ProcessRelatedEventsProcessSeasonalityEventsProcessRelatedEventConfig
Chapter 6. Configuring 389

3. Configure the report generation to use the Oracle database. Export the default properties, change thedefault configuration, and update the properties.a) Generate a properties file. Go to the <Impact install location>/bin directory to locate thenci_trigger utility, and run the following command from the command-line interface:
nci_trigger <server> <username>/<password> NOI_DefaultValues_Export FILENAME directory/filename
Where<server>
The server where Event Analytics is installed.<user name>
The user name of the Event Analytics user.<password>
The password of the Event Analytics user.directory
The directory where the properties file is stored.filename
The name of the properties file.For example:
./nci_trigger NCI impactadmin/impactpass NOI_DefaultValues_Export FILENAME /tmp/seasonality.props
b) You need to modify the property values that are overwritten by the generated properties file. For afull list of properties, see “Generated properties file” on page 384.
• If you do not have the following values for these properties, update your properties file to reflectthese property values:
history_datasource_name=ObjectServerHistoryOrclForNOIhistory_datatype_name=AlertsHistoryOrclTablehistory_database_table=<database table name>history_database_type=Oracle
• Enter the following value, which is the Oracle database timestamp format from the policy, to thehistory_db_timestampformat property:
history_db_timestampformat=yyyy-mm-dd hh24:mi:ss
Note: The history_db_timestampformat property delivers with the properties file with adefault value of yyyy-MM-dd HH:mm:ss.SSS. This default timestamp format for thehistory_db_timestampformat property does not work with Oracle. Thus, you need toperform the previous step to change the default value to the Oracle database timestamp formatfrom the policy (yyyy-mm-dd hh24:mi:ss).
c) Import the modified properties file into Netcool/Impact using the following command:
nci_trigger <Server> <username>/<password> NOI_DefaultValues_Configure FILENAME directory/filename
For example:
./nci_trigger NCI impactadmin/impactpass NOI_DefaultValues_Configure FILENAME /tmp/seasonality.props
390 IBM Netcool Operations Insight: Integration Guide

Configuring MS SQL database connection within Netcool/ImpactYou can configure a connection to a valid MS SQL database from within IBM Tivoli Netcool/Impact.
Before you beginIn Netcool/Impact v7.1.0.13 and later releases, it is recommended to use the Event Analyticsconfiguration wizard instead of the ./nci_trigger command to edit properties in the NOI SharedConfiguration properties file. For more information, see “Configuring Event Analytics using the wizard” onpage 378.
MS SQL support requires, at minimum, IBM Tivoli Netcool/Impact 7.1.0.1.
To use MS SQL as the archive database, you must set up a remote connection to Netcool/Impact. Formore information, see remote connection.
About this taskUsers can run seasonality event reports and related event configurations, specifying the time range andname with MS SQL. Complete the following steps to configure the ObjectServer data source and datatype.
Procedure1. Log in to the Netcool/Impact UI.
https://impacthost:port/ibm/console
2. Configure the ObjectServer data source and data type.a) In the Netcool/Impact UI, from the list of available projects, select the NOI project.b) Select the Data Model tab and select ObjectServerForNOI.
1) Click Edit and enter the following information <username>, <password>, <host name>,<port>.
2) Save the Netcool/Impact data source. Click Test Connection, followed by the Save icon.c) Edit the data type, expand the data source and edit the data type to correspond to the ObjectServer
event history database type.For example, AlertsForNOITable
d) For Base Table, select <database table>.e) To update the schema and table, click Refresh and then click Save.f) Select the Data Model tab and select ObjectServerHistoryMSSQLForNOI.
1) Click Edit and enter the following information <username>, <password>, <host name>,<port>, <sid>.
2) Save the Netcool/Impact data source. Click Test Connection, followed by the Save icon.g) Edit the data type. Expand the data source ObjectServerHistoryMSSQLForNOI and editAlertsHistoryMSSQLTable.
h) For Base Table, select <database table name>.i) To update the schema and table, click Refresh and then click Save.j) Select the Services tab and ensure that the following services are started.
ProcessRelatedEventsProcessSeasonalityEventsProcessRelatedEventConfig
3. Configure the report generation to use the MS SQL database.a) Generate a properties file, go to the <Impact install location>/bin directory to locate thenci_trigger and in the command-line interface enter the following command.
Chapter 6. Configuring 391
nci_trigger <server> <username>/<password> NOI_DefaultValues_Export FILENAME directory/filename
<server>The server where Event Analytics is installed.
<user name>The user name of the Event Analytics user.
<password>The password of the Event Analytics user.
directoryThe directory where the file is stored.
filenameThe name of the properties file.
For example, ./nci_trigger NCI impactadmin/impactpassNOI_DefaultValues_Export FILENAME /tmp/seasonality.props.
b) Update the properties file. Some property values are overwritten by the generated properties file,you might need to update other property values in the generated properties file. For a full list ofeffected properties, see “Generated properties file” on page 384.
• If you do not have the following parameter values, update your properties file to reflect theseparameter values.
history_datasource_name=ObjectServerHistoryMSSQLForNOIhistory_datatype_name=AlertsHistoryMSSQLTablehistory_database_table=<database table name>history_database_type=MSSQL
c) Import the modified properties file into Netcool/Impact, enter the command.
nci_trigger <Server> <username>/<password> NOI_DefaultValues_Configure FILENAME directory/filename
For example,
./nci_trigger NCI impactadmin/impactpass NOI_DefaultValues_Configure FILENAME /tmp/seasonality.props
Adding columns to seasonal and related event reportsYou can add columns to seasonal event reports and related events reports by updating the rollupconfiguration.
Before you beginMake sure that the Historical Event database view that contains the data used to generate these reportscontains the Acknowledged field. If this is not the case, then you must create a Historical Event databaseview and add the Acknowledged field to that view.
In Netcool Operations Insight v1.4.1.2 and later (corresponding to Netcool/Impact v7.1.0.13 and later) itis recommended to use the Event Analytics Configuration Wizard instead of the ./nci_triggercommand to edit properties in the NOI Shared Configuration properties file.
About this taskTo update the rollup configuration, complete the following steps.
Procedure1. Generate a properties file containing the latest Event Analytics system settings.
a) Navigate to the directory $IMPACT_HOME/bin.
392 IBM Netcool Operations Insight: Integration Guide

b) Run the following command to generate a properties file containing the latest Event Analyticssystem settings.
nci_trigger server_name username/password NOI_DefaultValues_Export FILENAME directory/filename
Where:
• server_name is the name of the server where Event Analytics is installed.• user name is the user name of the Event Analytics user.• password is the password of the Event Analytics user.• NOI_DefaultValues_Export is a Netcool/Impact policy that performs an export of the current
Event Analytics system settings to a designated properties file.• directory is the directory where the properties file is stored.• filename is the name of the properties file.
For example:
nci_trigger NCI impactadmin/impactpass NOI_DefaultValues_Export FILENAME /tmp/properties.props
2. Update the properties file that you generated.
a. Specify the number of columns you want to add to the reports:
Increase the value of the number_of_rollup_configuration=2 parameter for seasonalevents.Increase the value of the reevent_number_of_rollup_configuration=2 parameter forrelated events.
For example, to add one column to the reports, increase the parameter value by one from 2 to 3.b. For a new rollup column, add property information.
• For a new Seasonal Event reports column, add the following properties.
rollup_<rollup number>_column_name=<column name>rollup_<rollup number>_display_name=<column_name>_<type>rollup_<rollup number>_type=<type>
• For a new Related Events reports column, add the following properties.
reevent_rollup_<rollup number>_column_name=<column name>reevent_rollup_<rollup number>_display_name=<column_name>_<type>reevent_rollup_<rollup number>_type=<type>reevent_rollup_<rollup number>_actionable=<true/false>
<rollup number>Specifies the new column rollup number.
<column name>Specifies the new column name. The column name must match the column name in the historytable.
<display name>Specifies the new column display name. The display name must match the column name in thereport.
<type>Specifies one of the following types:MAX
The maximum value observed for the column. If no value is observed, the value defaults tothe minimum value of an integer.
Chapter 6. Configuring 393
MINThe minimum value observed for the column. If no value is observed, the value defaults tothe maximum value of an integer.
SUMThe sum of all of the values observed for the column.
NON_ZEROA counting column that counts nonzero occurrences of events. This column can be useful totrack the proportion of actioned events, or how many events had an associated ticketnumber.
DISTINCTThe number of distinct values that are seen for this key-value pair.
EXAMPLEDisplays the first non-blank example of a field that contained this key. The EXAMPLE type isuseful when you are running seasonality on a field that can't be accessed, such asALERT_IDENTIFIER, and you want an example human readable SUMMARY to demonstratethe type of problem.
Note: You cannot change the <type> property of a rollup column once the configurationhas been updated. You must add a new rollup column and specify a different <type> (witha new <display name> if you are keeping the old rollup).
actionable=<true/false>If this property is set to true for a rollup, the rollup is used to determine the probable rootcause of a correlation rule. This root cause determination is based on the rollup that has themost actions that are taken against it. For example, if Acknowledge is part of your rollupconfiguration and has a property value of actionable=true, then the event with the highestoccurrence of Acknowledge is determined to be the probable root cause. Probable root causedetermination uses the descending order of the actionable rollups, that is, the first actionablerollup is a higher priority than the second actionable rollup. Only four of the possible <type>keywords are valid for root cause: MAX, MIN, SUM, NON_ZERO.If this property is set to false for a rollup, the rollup is not used to determine the probable rootcause of a rule. If all rollup configurations have a property value of actionable=false, thefirst event that is found is identified as the parent.To manually change a root cause event for a correlation rule, see “Selecting a root cause eventfor a correlation rule” on page 572.
3. Import the modified properties file into Event Analytics.a) Ensure you are in the directory $IMPACT_HOME/bin.b) Run the following command to perform an import of Event Analytics system settings from a
designated properties file.
nci_trigger server_name username/password NOI_DefaultValues_Configure FILENAME directory/filename
Where:
• server_name is the name of the server where Event Analytics is installed.• user name is the user name of the Event Analytics user.• password is the password of the Event Analytics user.• NOI_DefaultValues_Configure is a Netcool/Impact policy that performs an import of Event
Analytics system settings from a designated properties file.• directory is the directory where the properties file is stored.• filename is the name of the properties file.
394 IBM Netcool Operations Insight: Integration Guide
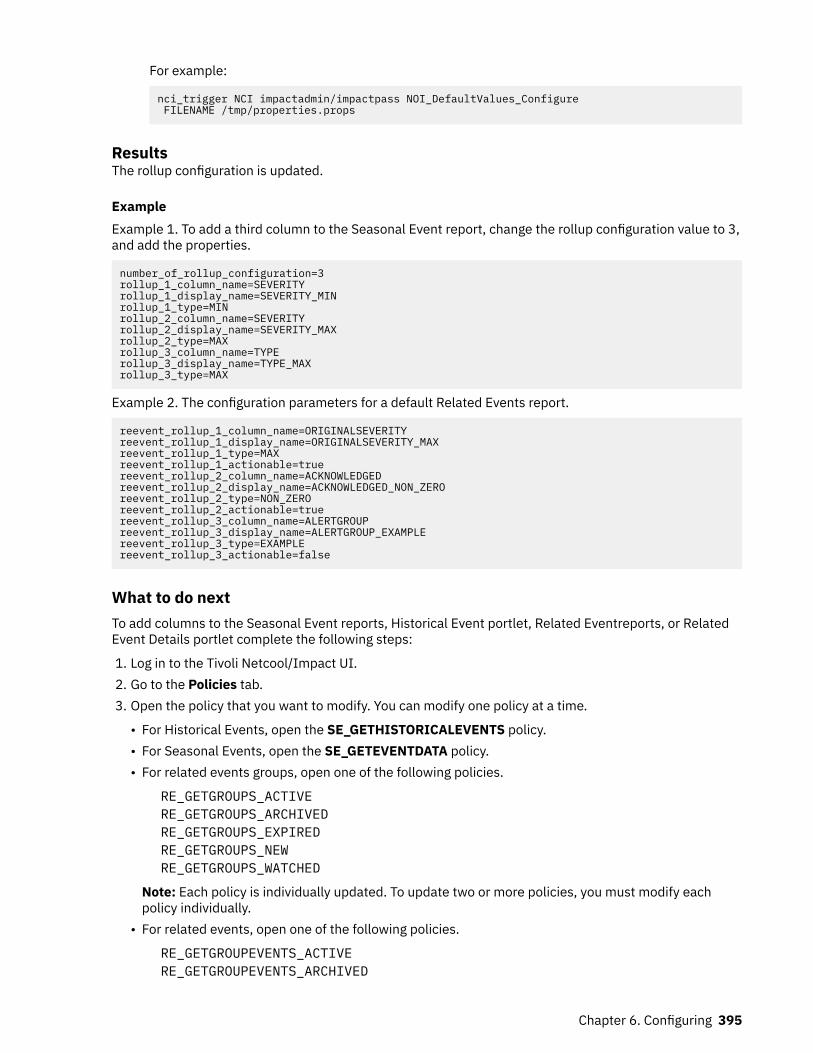
For example:
nci_trigger NCI impactadmin/impactpass NOI_DefaultValues_Configure FILENAME /tmp/properties.props
ResultsThe rollup configuration is updated.
ExampleExample 1. To add a third column to the Seasonal Event report, change the rollup configuration value to 3,and add the properties.
number_of_rollup_configuration=3rollup_1_column_name=SEVERITYrollup_1_display_name=SEVERITY_MINrollup_1_type=MINrollup_2_column_name=SEVERITYrollup_2_display_name=SEVERITY_MAXrollup_2_type=MAXrollup_3_column_name=TYPErollup_3_display_name=TYPE_MAXrollup_3_type=MAX
Example 2. The configuration parameters for a default Related Events report.
reevent_rollup_1_column_name=ORIGINALSEVERITYreevent_rollup_1_display_name=ORIGINALSEVERITY_MAXreevent_rollup_1_type=MAXreevent_rollup_1_actionable=truereevent_rollup_2_column_name=ACKNOWLEDGEDreevent_rollup_2_display_name=ACKNOWLEDGED_NON_ZEROreevent_rollup_2_type=NON_ZEROreevent_rollup_2_actionable=truereevent_rollup_3_column_name=ALERTGROUPreevent_rollup_3_display_name=ALERTGROUP_EXAMPLEreevent_rollup_3_type=EXAMPLEreevent_rollup_3_actionable=false
What to do nextTo add columns to the Seasonal Event reports, Historical Event portlet, Related Eventreports, or RelatedEvent Details portlet complete the following steps:
1. Log in to the Tivoli Netcool/Impact UI.2. Go to the Policies tab.3. Open the policy that you want to modify. You can modify one policy at a time.
• For Historical Events, open the SE_GETHISTORICALEVENTS policy.• For Seasonal Events, open the SE_GETEVENTDATA policy.• For related events groups, open one of the following policies.
RE_GETGROUPS_ACTIVERE_GETGROUPS_ARCHIVEDRE_GETGROUPS_EXPIREDRE_GETGROUPS_NEWRE_GETGROUPS_WATCHED
Note: Each policy is individually updated. To update two or more policies, you must modify eachpolicy individually.
• For related events, open one of the following policies.
RE_GETGROUPEVENTS_ACTIVERE_GETGROUPEVENTS_ARCHIVED
Chapter 6. Configuring 395
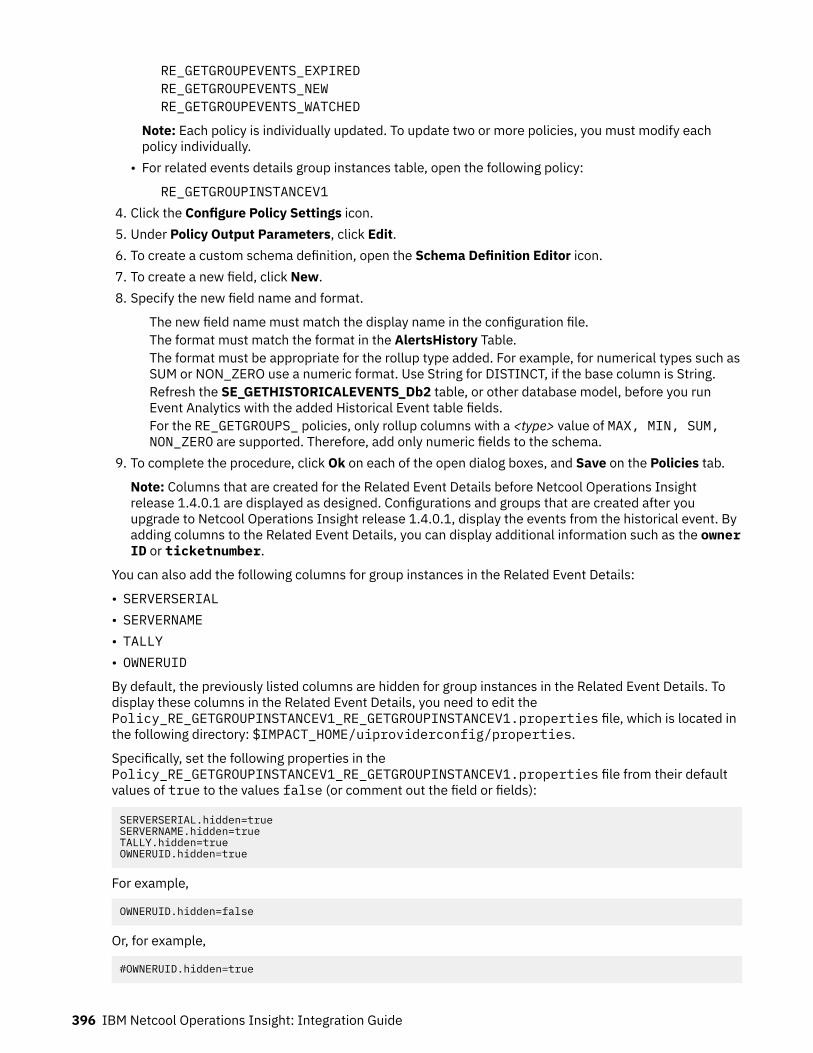
RE_GETGROUPEVENTS_EXPIREDRE_GETGROUPEVENTS_NEWRE_GETGROUPEVENTS_WATCHED
Note: Each policy is individually updated. To update two or more policies, you must modify eachpolicy individually.
• For related events details group instances table, open the following policy:
RE_GETGROUPINSTANCEV14. Click the Configure Policy Settings icon.5. Under Policy Output Parameters, click Edit.6. To create a custom schema definition, open the Schema Definition Editor icon.7. To create a new field, click New.8. Specify the new field name and format.
The new field name must match the display name in the configuration file.The format must match the format in the AlertsHistory Table.The format must be appropriate for the rollup type added. For example, for numerical types such asSUM or NON_ZERO use a numeric format. Use String for DISTINCT, if the base column is String.Refresh the SE_GETHISTORICALEVENTS_Db2 table, or other database model, before you runEvent Analytics with the added Historical Event table fields.For the RE_GETGROUPS_ policies, only rollup columns with a <type> value of MAX, MIN, SUM,NON_ZERO are supported. Therefore, add only numeric fields to the schema.
9. To complete the procedure, click Ok on each of the open dialog boxes, and Save on the Policies tab.
Note: Columns that are created for the Related Event Details before Netcool Operations Insightrelease 1.4.0.1 are displayed as designed. Configurations and groups that are created after youupgrade to Netcool Operations Insight release 1.4.0.1, display the events from the historical event. Byadding columns to the Related Event Details, you can display additional information such as the ownerID or ticketnumber.
You can also add the following columns for group instances in the Related Event Details:
• SERVERSERIAL• SERVERNAME• TALLY• OWNERUID
By default, the previously listed columns are hidden for group instances in the Related Event Details. Todisplay these columns in the Related Event Details, you need to edit thePolicy_RE_GETGROUPINSTANCEV1_RE_GETGROUPINSTANCEV1.properties file, which is located inthe following directory: $IMPACT_HOME/uiproviderconfig/properties.
Specifically, set the following properties in thePolicy_RE_GETGROUPINSTANCEV1_RE_GETGROUPINSTANCEV1.properties file from their defaultvalues of true to the values false (or comment out the field or fields):
SERVERSERIAL.hidden=trueSERVERNAME.hidden=trueTALLY.hidden=trueOWNERUID.hidden=true
For example,
OWNERUID.hidden=false
Or, for example,
#OWNERUID.hidden=true
396 IBM Netcool Operations Insight: Integration Guide
Configuring event suppressionEvent suppression is available as an action when creating a seasonal event rule. You can configure eventsuppression by modifying the NOI_DefaultValues properties file.
Before you beginIn Netcool Operations Insight v1.4.1.2 and later (corresponding to Netcool/Impact v7.1.0.13 and later) itis recommended to use the Event Analytics Configuration Wizard instead of the ./nci_triggercommand to edit properties in the NOI Shared Configuration properties file.
For more information on the relevant section of the wizard, see “Configuring event suppression” on page381.
About this taskTo add details about suppressing and unsuppressing events, you must modify the NOI_DefaultValuesproperties file in the $IMPACT_HOME/bin directory.
Procedure1. Log in to the server where IBM Tivoli Netcool/Impact is stored and running.2. Generate a properties file containing the latest Event Analytics system settings.
a) Navigate to the directory $IMPACT_HOME/bin.b) Run the following command to generate a properties file containing the latest Event Analytics
system settings.
nci_trigger server_name username/password NOI_DefaultValues_Export FILENAME directory/filename
Where:
• server_name is the name of the server where Event Analytics is installed.• user name is the user name of the Event Analytics user.• password is the password of the Event Analytics user.• NOI_DefaultValues_Export is a Netcool/Impact policy that performs an export of the current
Event Analytics system settings to a designated properties file.• directory is the directory where the properties file is stored.• filename is the name of the properties file.
For example:
nci_trigger NCI impactadmin/impactpass NOI_DefaultValues_Export FILENAME /tmp/properties.props
3. Add the following lines of text to the properties file:
seasonality.suppressevent.column.name=SuppressEsclseasonality.suppressevent.column.type=NUMERICseasonality.suppressevent.column.value=4seasonality.unsuppressevent.column.name=SuppressEsclseasonality.unsuppressevent.column.type=NUMERICseasonality.unsuppressevent.column.value=0
4. Import the modified properties file into Event Analytics.a) Ensure you are in the directory $IMPACT_HOME/bin.b) Run the following command to perform an import of Event Analytics system settings from a
designated properties file.
nci_trigger server_name username/password NOI_DefaultValues_Configure FILENAME directory/filename
Chapter 6. Configuring 397
Where:
• server_name is the name of the server where Event Analytics is installed.• user name is the user name of the Event Analytics user.• password is the password of the Event Analytics user.• NOI_DefaultValues_Configure is a Netcool/Impact policy that performs an import of Event
Analytics system settings from a designated properties file.• directory is the directory where the properties file is stored.• filename is the name of the properties file.
For example:
nci_trigger NCI impactadmin/impactpass NOI_DefaultValues_Configure FILENAME /tmp/properties.props
Configuring event pattern processingYou can configure how patterns are derived from related events by editing properties in the generatedNOI Shared Configuration properties file.
Before you beginIn Netcool Operations Insight v1.4.1.2 and later (corresponding to Netcool/Impact v7.1.0.13 and later) itis recommended to use the Event Analytics Configuration Wizard instead of the ./nci_triggercommand to edit properties in the NOI Shared Configuration properties file.
For more information on the relevant section of the wizard, see “Configuring event pattern processing” onpage 381.
Note:
• You should perform this configuration task prior to running any related events configurations that usethe global type properties associated with event pattern creation. It is expected that you will performthis configuration task only when something in your environment changes that affects where typeinformation is found in events.
• Avoid configuring multiple types for the same event. By default, Identifier is used to identify thesame events. This can be overridden, but assuming the default, you should setup the type properties sothat events identified by the same Identifier only have one type value. For example, if there are 10events with Identifier=xxx and you want to use a type=ALERTGROUP then the events should havethe same ALERTGROUP. If events for the same Identifier have many alert group values, the first onewill be picked.
The default NOI Shared Configuration properties file is divided into sections, where each section containsa number of properties that allow you to instruct how Netcool/Impact handles a variety of operations,such as how it should handle event pattern creation. There are three categories of event pattern creationproperties defined in the NOI Shared Configuration properties file:
• Properties related to configuring which table columns in the Historical Event Database that Netcool/Impact should use in performing the event pattern analysis.
• Properties related to configuring the default unique event identifier and event type in the HistoricalEvent Database that you want Netcool/Impact to use when there is no match in the event type indexrelated properties.
• Properties related to configuring one or more event identity and event type indexes.
Table 68 on page 399 describes the event pattern creation properties defined in the NOI SharedConfiguration properties file. Use these descriptions to help you configure the values appropriate for yourenvironment.
398 IBM Netcool Operations Insight: Integration Guide

Table 68. Event pattern creation properties
Global type Description Example
Properties related to configuring table columns in the Historical Event Database
type.resourcelist Specifies the name of the tablecolumn or columns in the HistoricalEvent Database that Netcool/Impact should use in performingthe event pattern analysis.
The NOI Shared Configurationproperties file that you generatewith the nci_trigger commandprovides the following defaultvalue:
type.resourcelist=NODE
Note: You should use the defaultvalue, NODE.
type.servername.column Specifies the name of the tablecolumn in the Historical EventDatabase that contains the name ofthe server associated with anyparticular event that arrives in theHistorical Event Database.
The NOI Shared Configurationproperties file that you generatewith the nci_trigger commandprovides the following defaultvalue:
type.servername.column=SERVERNAME
Note: You should use the defaultvalue, SERVERNAME, wherepossible.
type.serverserial.column Specifies the name of the tablecolumn in the Historical EventDatabase that contains the serverserial number associated with anyparticular event that arrives in theHistorical Event Database. Notethat the server serial numbershould be unique.
The NOI Shared Configurationproperties file that you generatewith the nci_trigger commandprovides the following defaultvalue:
type.serverserial.column=SERVERSERIAL
Note: You should use the defaultvalue, SERVERSERIAL, wherepossible.
Properties related to configuring the default unique event identifier and event type in the Historical EventDatabase
Chapter 6. Configuring 399
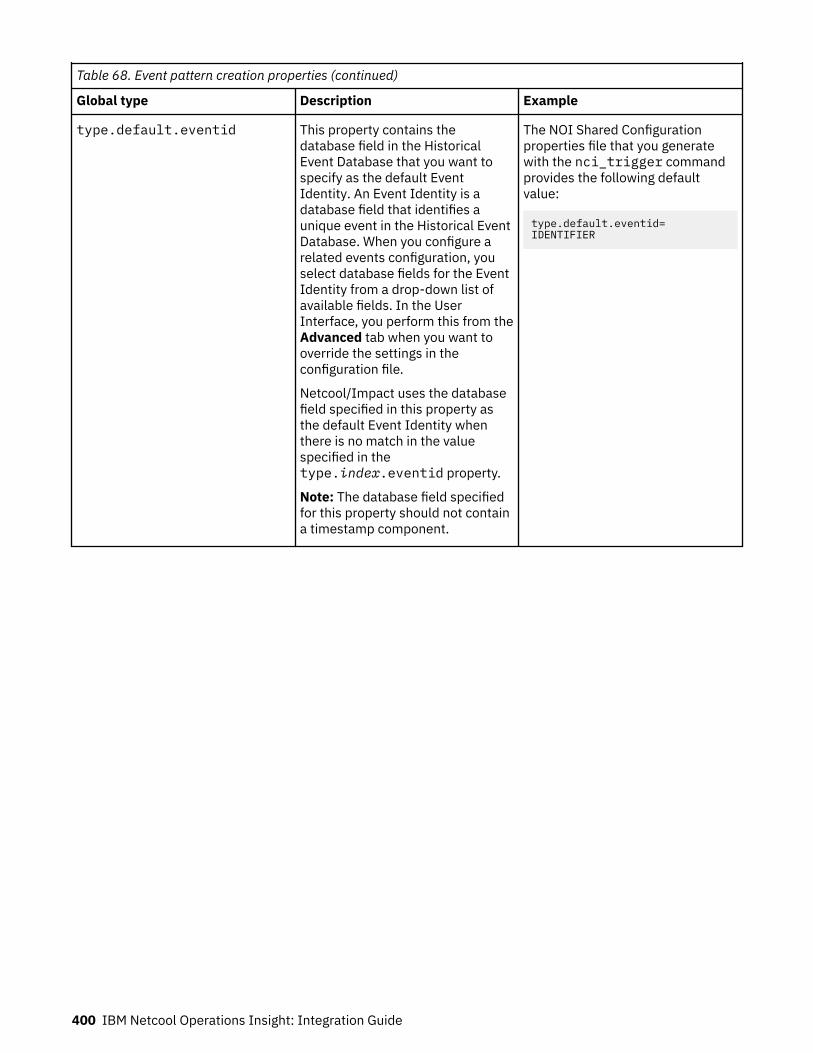
Table 68. Event pattern creation properties (continued)
Global type Description Example
type.default.eventid This property contains thedatabase field in the HistoricalEvent Database that you want tospecify as the default EventIdentity. An Event Identity is adatabase field that identifies aunique event in the Historical EventDatabase. When you configure arelated events configuration, youselect database fields for the EventIdentity from a drop-down list ofavailable fields. In the UserInterface, you perform this from theAdvanced tab when you want tooverride the settings in theconfiguration file.
Netcool/Impact uses the databasefield specified in this property asthe default Event Identity whenthere is no match in the valuespecified in thetype.index.eventid property.
Note: The database field specifiedfor this property should not containa timestamp component.
The NOI Shared Configurationproperties file that you generatewith the nci_trigger commandprovides the following defaultvalue:
type.default.eventid=IDENTIFIER
400 IBM Netcool Operations Insight: Integration Guide
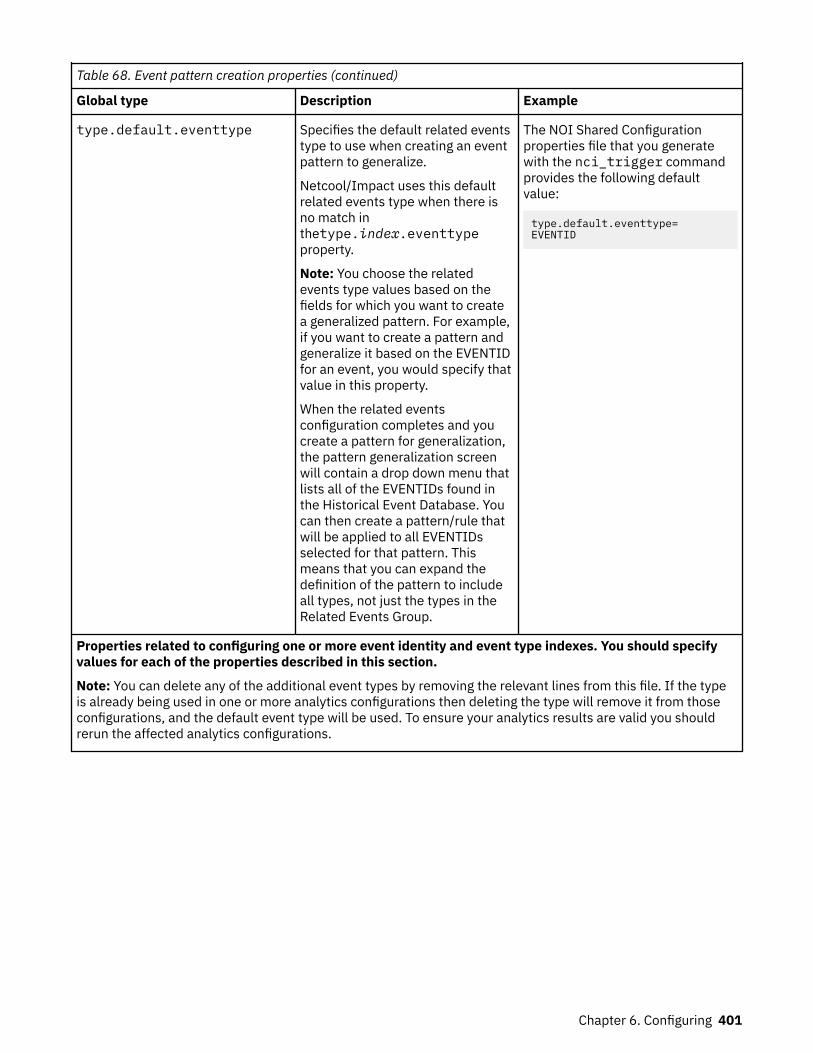
Table 68. Event pattern creation properties (continued)
Global type Description Example
type.default.eventtype Specifies the default related eventstype to use when creating an eventpattern to generalize.
Netcool/Impact uses this defaultrelated events type when there isno match inthetype.index.eventtypeproperty.
Note: You choose the relatedevents type values based on thefields for which you want to createa generalized pattern. For example,if you want to create a pattern andgeneralize it based on the EVENTIDfor an event, you would specify thatvalue in this property.
When the related eventsconfiguration completes and youcreate a pattern for generalization,the pattern generalization screenwill contain a drop down menu thatlists all of the EVENTIDs found inthe Historical Event Database. Youcan then create a pattern/rule thatwill be applied to all EVENTIDsselected for that pattern. Thismeans that you can expand thedefinition of the pattern to includeall types, not just the types in theRelated Events Group.
The NOI Shared Configurationproperties file that you generatewith the nci_trigger commandprovides the following defaultvalue:
type.default.eventtype=EVENTID
Properties related to configuring one or more event identity and event type indexes. You should specifyvalues for each of the properties described in this section.
Note: You can delete any of the additional event types by removing the relevant lines from this file. If the typeis already being used in one or more analytics configurations then deleting the type will remove it from thoseconfigurations, and the default event type will be used. To ensure your analytics results are valid you shouldrerun the affected analytics configurations.
Chapter 6. Configuring 401

Table 68. Event pattern creation properties (continued)
Global type Description Example
type_number_of_type_configurations
Specifies the number of types touse in the NOI Shared Configurationproperties file for the global typeconfiguration. There is no limit onhow many types you can configure.
The following example specifiestwo types for the global typeconfiguration:
type_number_of_type_configurations=2
Thus, you would define the othertype.index related properties asfollows. Note that the indexnumbering starts with 0 (zero).
type.0.eventid=Identifiertype.0.eventtype=ACMETypetype.0.filterclause=Vendor='ACME'type.0.osfilterclause=Vendor='ACME'type.0.typename=Vendor = Type0type.1.eventid=SUMMARY,NODEtype.1.eventtype=TAURUSTypetype.1.filterclause=Vendor = 'TAURUS'type.1.osfilterclause=Vendor = 'TAURUS'type.1.typename=Vendor = Type1
type.index.eventid Specifies the database field in theHistorical Event Database that youwant to specify as the EventIdentity. Multiple fields areseparated by commas.
The following shows an example ofa database field used as the EventIdentity:
type.0.eventid=SUMMARY
The following shows an example ofmultiple database fields used asthe Event Identity:
type.0.eventid=NODE,SUMMARY, ALERTGROUP
type.index.eventtype Specifies the event type to returnfor pattern generalization.
Note: The returned event typesdisplay in the event type drop downmenu in the pattern generalizationscreen.
The following example shows anevent type to return for patterngeneralization:
type.0.eventtype=EVENTID
402 IBM Netcool Operations Insight: Integration Guide
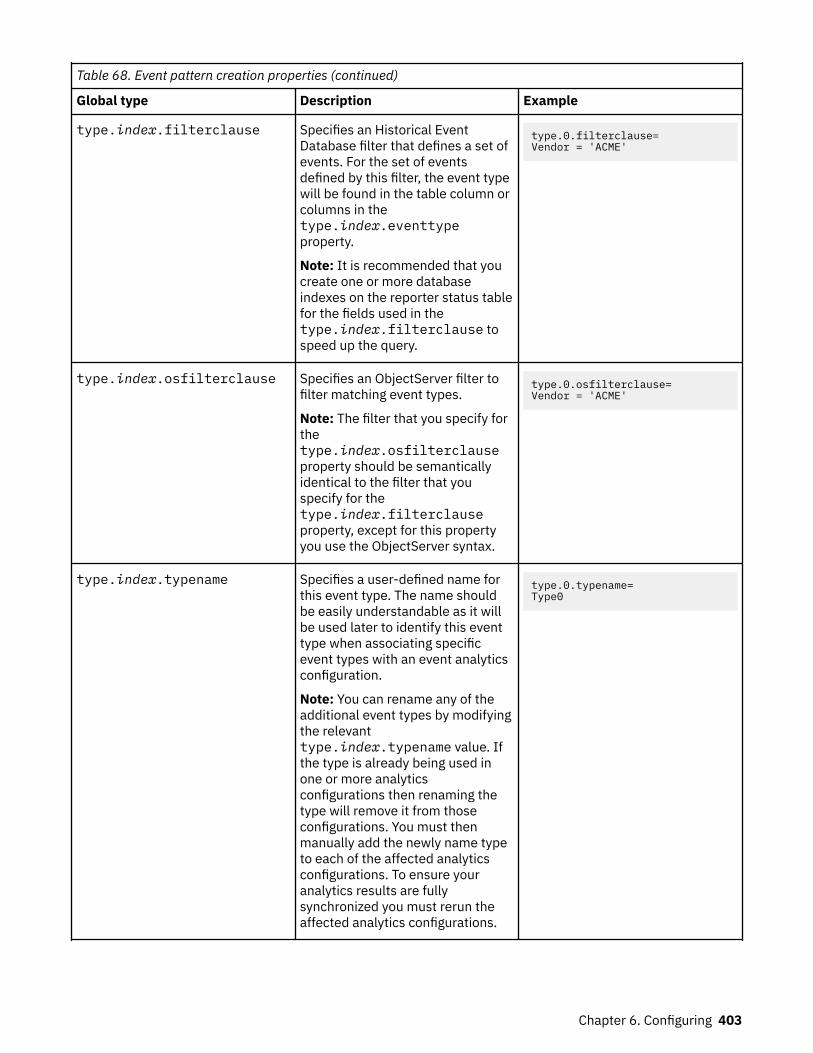
Table 68. Event pattern creation properties (continued)
Global type Description Example
type.index.filterclause Specifies an Historical EventDatabase filter that defines a set ofevents. For the set of eventsdefined by this filter, the event typewill be found in the table column orcolumns in thetype.index.eventtypeproperty.
Note: It is recommended that youcreate one or more databaseindexes on the reporter status tablefor the fields used in thetype.index.filterclause tospeed up the query.
type.0.filterclause=Vendor = 'ACME'
type.index.osfilterclause Specifies an ObjectServer filter tofilter matching event types.
Note: The filter that you specify forthetype.index.osfilterclauseproperty should be semanticallyidentical to the filter that youspecify for thetype.index.filterclauseproperty, except for this propertyyou use the ObjectServer syntax.
type.0.osfilterclause=Vendor = 'ACME'
type.index.typename Specifies a user-defined name forthis event type. The name shouldbe easily understandable as it willbe used later to identify this eventtype when associating specificevent types with an event analyticsconfiguration.
Note: You can rename any of theadditional event types by modifyingthe relevanttype.index.typename value. Ifthe type is already being used inone or more analyticsconfigurations then renaming thetype will remove it from thoseconfigurations. You must thenmanually add the newly name typeto each of the affected analyticsconfigurations. To ensure youranalytics results are fullysynchronized you must rerun theaffected analytics configurations.
type.0.typename=Type0
Chapter 6. Configuring 403
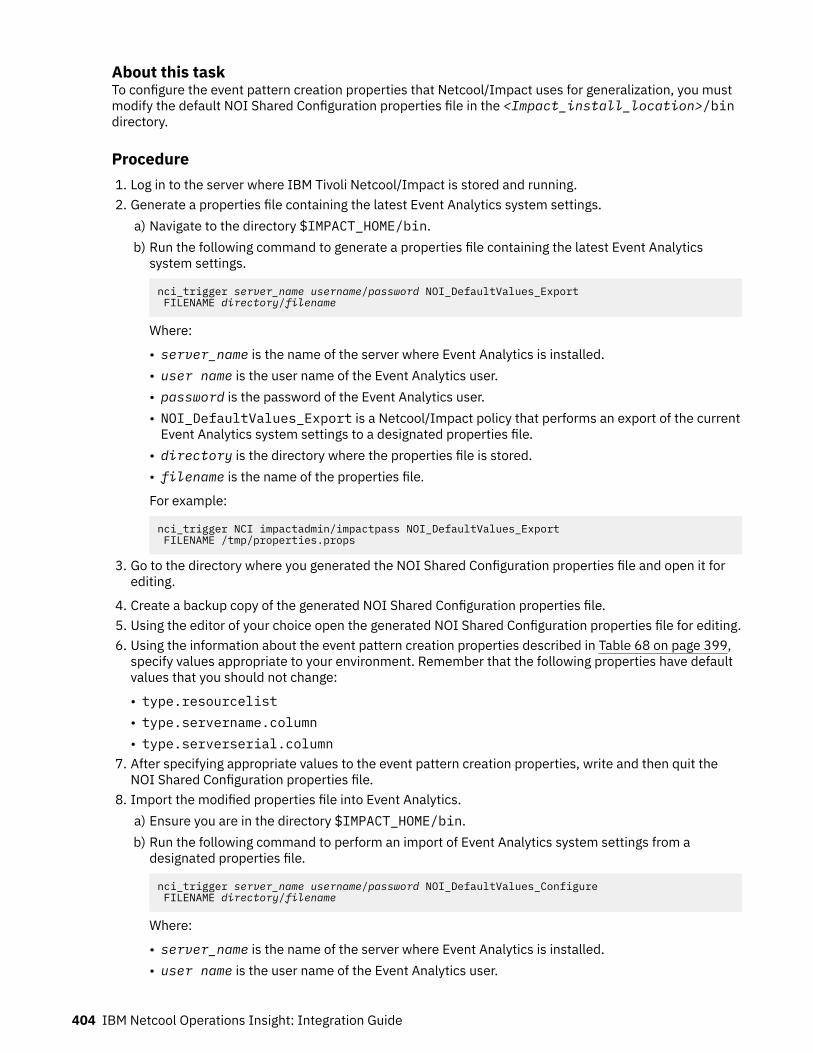
About this taskTo configure the event pattern creation properties that Netcool/Impact uses for generalization, you mustmodify the default NOI Shared Configuration properties file in the <Impact_install_location>/bindirectory.
Procedure1. Log in to the server where IBM Tivoli Netcool/Impact is stored and running.2. Generate a properties file containing the latest Event Analytics system settings.
a) Navigate to the directory $IMPACT_HOME/bin.b) Run the following command to generate a properties file containing the latest Event Analytics
system settings.
nci_trigger server_name username/password NOI_DefaultValues_Export FILENAME directory/filename
Where:
• server_name is the name of the server where Event Analytics is installed.• user name is the user name of the Event Analytics user.• password is the password of the Event Analytics user.• NOI_DefaultValues_Export is a Netcool/Impact policy that performs an export of the current
Event Analytics system settings to a designated properties file.• directory is the directory where the properties file is stored.• filename is the name of the properties file.
For example:
nci_trigger NCI impactadmin/impactpass NOI_DefaultValues_Export FILENAME /tmp/properties.props
3. Go to the directory where you generated the NOI Shared Configuration properties file and open it forediting.
4. Create a backup copy of the generated NOI Shared Configuration properties file.5. Using the editor of your choice open the generated NOI Shared Configuration properties file for editing.6. Using the information about the event pattern creation properties described in Table 68 on page 399,
specify values appropriate to your environment. Remember that the following properties have defaultvalues that you should not change:
• type.resourcelist• type.servername.column• type.serverserial.column
7. After specifying appropriate values to the event pattern creation properties, write and then quit theNOI Shared Configuration properties file.
8. Import the modified properties file into Event Analytics.a) Ensure you are in the directory $IMPACT_HOME/bin.b) Run the following command to perform an import of Event Analytics system settings from a
designated properties file.
nci_trigger server_name username/password NOI_DefaultValues_Configure FILENAME directory/filename
Where:
• server_name is the name of the server where Event Analytics is installed.• user name is the user name of the Event Analytics user.
404 IBM Netcool Operations Insight: Integration Guide

• password is the password of the Event Analytics user.• NOI_DefaultValues_Configure is a Netcool/Impact policy that performs an import of Event
Analytics system settings from a designated properties file.• directory is the directory where the properties file is stored.• filename is the name of the properties file.
For example:
nci_trigger NCI impactadmin/impactpass NOI_DefaultValues_Configure FILENAME /tmp/properties.props
Example
The following example sets the Event Identity, defines a set of events, and finds the type information inthe specified table column or columns in the Historical Event Database:
type_number_of_type_configurations=1type.0.eventid=NODE,SUMMARY,ALERTGROUPtype.0.eventtype=ACMETypetype.0.filterclause=( Vendor = 'ACME' )type.0.osfilterclause=Vendor = 'ACME'
More specifically, the examples shows that if there is an event and the value for Vendor for that event isACME, then look in the table column called ACMEType to find the event type.
The following example expands on the previous example by showing two configurations (as indicated bythe value 2 in the type_number_of_type_configurations property:
type_number_of_type_configurations=2type.0.eventid=NODEtype.0.eventtype=ACMETypetype.0.filterclause=( Vendor = 'ACME' )type.0.osfilterclause=Vendor = 'ACME'type.0.typename=Vendor = Type0type.1.eventid=NODE,SUMMARY,ALERTGROUPtype.1.eventtype=TAURUSTypetype.1.filterclause=( Vendor = 'TAURUS' )type.1.osfilterclause=Vendor = 'TAURUS'type.1.typename=Vendor = Type1
Note: Netcool/Impact attempts to match each event to the filter defined in configuration 0 first. If theevent matches the filter defined in configuration 0, then Netcool/Impact defines the event's type asdefined in the filter. If the event does not match the filter defined in configuration 0, Netcool/Impactattempts to match the event to the filter defined in configuration 1. If the event matches the filter definedin configuration 1, then Netcool/Impact defines the event's type as defined in the filter. Netcool/Impactcontinues this processing sequence for as many configuration types you define.
If no events match the filters defined in the defined configuration types you define, Netcool/Impact usesthe default configuration to determine where type and identity are to be found.
Setting event patterns to identify at least two related eventsBy default, Event Analytics creates synthetic events where only one event in the pattern has beendiscovered. For many customers, this is counter-intuitive as users do not expect to see a group made upof a single event. Use this configuration procedure to force patterns to create synthetic parents with atleast two events.
Procedure1. Log into the Impact Server.2. Navigate to the following location
$IMPACT_HOME/add-ons/RelatedEvents/db
3. Locate the following SQL file in this directory, and run this SQL file on the ObjectServer.
Chapter 6. Configuring 405
supress_synthetic_objectserver.sql
4. Export the configuration by running the following command:
./nci_trigger NCI impactadmin/impactpass NOI_DefaultValues_Export FILENAME $IMPACT_HOME/tmp/ea_defaults_configuration.txt
5. Modify the exported configuration by adding the following line by changing the following property:suppress_synthetic_events=true
6. Save the file.7. Import the file by running the following command:
./nci_trigger NCI impactadmin/impactpass NOI_DefaultValues_Configure FILENAME $IMPACT_HOME/tmp/ea_defaults_configuration.txt
8. Restart the Impact Server.
Other configuration tasksPerform these configuration tasks to further configure your system.
Configuring the ObjectServerPrior to deploying rules based on related event events or patterns you must run SQL to update theObjectServer. This SQL introduces relevant triggers into the ObjectServer to enable to rules to be fullyfunctional.
About this taskThe SQL provides commands for creating and modifying ObjectServer objects and data. Complete thefollowing steps to run the SQL to update the ObjectServer.
Procedure1. Copy the SQL file IMPACT_HOME/add-ons/RelatedEvents/db/relatedevents_objectserver.sql from Netcool/Impact into the tmp directory on yourObjectServer.
2. Run the SQL against your ObjectServer, enter the following command.
On Windows, enter the command %OMNIHOME%\..\bin\redist\isql -U <username> -P<password> -S <server_name> < C:\tmp\relatedevents_objectserver.sqlOn Linux and UNIX, enter the command $OMNIHOME/bin/nco_sql -user <username> -password <password> -server <server_name> < /tmp/relatedevents_objectserver.sql
3. If you have not previously configured the Event Analytics ObjectServer, you must enter the followingcommand.
On Windows, enter the command %OMNIHOME%\..\bin\redist\isql -U <username> -P<password> -S <server_name> < C:\tmp\relatedevents_objectserver.sqlOn Linux and UNIX, enter the command $OMNIHOME/bin/nco_sql -user <username> -password <password> -server <server_name> < /tmp/relatedevents_objectserver.sql
4. All users must run the SQL against your ObjectServer, enter the following command.
On Windows, enter the command %OMNIHOME%\..\bin\redist\isql -U <username> -P<password> -S <server_name> < C:\tmp\relatedevents_objectserver_update_fp5.sqlOn Linux and UNIX, enter the command $OMNIHOME/bin/nco_sql -user <username> -password <password> -server <server_name> < /tmp/relatedevents_objectserver_update_fp5.sql
406 IBM Netcool Operations Insight: Integration Guide
What to do nextEvent correlation for the related events function in Event Analytics, uses a ParentIdentifier columnthat is added the ObjectServer. If the size of this identifier field changes in your installation, you mustchange the value of the ParentIdentifier column within the ObjectServer SQL file that creates theevent grouping automation relatedevents_objectserver.sql, to ensure that both values are thesame. The updated SQL is automatically picked up.Related tasksInstalling Netcool/OMNIbus and Netcool/Impact
Additional configuration for Netcool/Impact server failover for Event AnalyticsThe following additional configuration is required if a seasonality report is running during a Netcool/Impact node failover. Without this configuration the seasonality report might hang in the processing statefollowing the failover. This will give the impression that the report is running, however it will remain stuckin the phase and percentage complete level that is displayed following the failover. Any queued reportswill also not run. This is due to a limitation of the derby database. Use the workaround in this section toavoid this problem.
Procedure1. Locate the jvm.options file in <impact_home>/wlp/usr/servers/<Impact_server _name>/.2. Uncomment the following line in all the nodes of the failover cluster:
#-Xgc:classUnloadingKickoffThreshold=100
3. Restart all nodes in the failover Netcool/Impact cluster.
ResultsFollowing these changes, any currently running seasonality report will terminate correctly during thecluster failover and any queued reports will continue running after the failover has completed.
Configuring extra failover capabilities in the ObjectServerRelated events use standard ObjectServer components to provide a high availability solution. TheseObjectServer components require extra configuration to ensure high availability where there is anObjectServer pair and the primary ObjectServer goes down before the cache on the Netcool/Impact noderefreshes.
In this scenario, if you deploy a correlation rule, the rule is picked up if you have replication setupbetween the ObjectServer tables. Otherwise, the new rule is not picked up and this state continues untilyou deploy another new rule. Complete the following steps to setup replication between the ObjectServertables.
• In the .GATE.map file, add the following lines.
CREATE MAPPING RE_CACHEMAP('name' = '@name' ON INSERT ONLY,'updates' = '@updates');
• If your configuration does not use the standard StatusMap file, add the following line to theStatusMap file that you use to control alerts.status, you can find the StatusMap file inthe .tblrep.def file.
'ParentIdentifier' = '@ParentIdentifier'
• In the .tblrep.def file, add the following lines.
REPLICATE ALL FROM TABLE 'relatedevents.cacheupdates' USING map 'RE_CACHEMAP';
Chapter 6. Configuring 407
For more information about adding collection ObjectServers and displaying ObjectServers to yourenvironment, see the following topics within IBM Knowledge Center for IBM Tivoli Netcool/OMNIbus,Netcool/OMNIbus v8.1.0 Welcome page.
Setting up the standard multitiered environmentConfiguring the bidirectional aggregation ObjectServer GatewayConfiguring the unidirectional primary collection ObjectServer Gateway
Configuring extra failover capabilities in the Netcool/Impact environmentConfigure extra failover capabilities in the Netcool/Impact environment by adding a cluster to theNetcool/Impact environment. To do this you must update the data sources in IBM Tivoli Netcool/Impact.
About this taskUpdate the following data sources when you add a cluster to the Netcool/Impact environment.
seasonalReportDataSourceRelatedEventsDatasourceNOIReportDatasource
Complete the following steps to update the data sources.
Procedure1. In Netcool/Impact, go to the Database Failure Policy.2. Select Fail over or Fail back depending on the high availability type you want. For more information,
see the failover and failback descriptions.3. Go to Backup Source.4. Enter the secondary Impact Server's Derby Host Name, Port, and Database information.
Standard failoverStandard failover is a configuration in which an SQL database DSA switches to a secondarydatabase server when the primary server becomes unavailable and then continues by using thesecondary until Netcool/Impact is restarted.
FailbackFailback is a configuration in which an SQL database DSA switches to a secondary database serverwhen the primary server becomes unavailable and then tries to reconnect to the primary atintervals to determine whether it returned to availability.
What to do nextIf you encounter error ATKRST132E, see details in “Troubleshooting Event Analytics” on page 607
If you want your Netcool/Impact cluster that is processing events to contain the same cache and updatethe cache, at or around the same time, you must run the file relatedevents_objectserver.sql withnco_sql. The relatedevents_objectserver.sql file contains the following commands.
create database relatedevents;create table relatedevents.cacheupdates persistent (name varchar (20) primary key, updates integer);insert into relatedevents.cacheupdates (name, updates) values ('RE_CACHE', 0);
Mapping customized field namesAny customized field names in the Historical Event Database must be mapped to the correspondingstandard field names in Netcool/Impact. You do this by creating a database view to map to the standardfield names.
Before you beginYou must perform this task if you have customized table columns in your Historical Event Database. Forexample, if you have defined columns called SUMMARYTXT and IDENTIFIERID instead of the default
408 IBM Netcool Operations Insight: Integration Guide
names SUMMARY and IDENTIFIER, you must perform this task. You create a database view and map backto the actual field names.
About this taskThe steps documented here are for a Db2 database. The procedure is similar for an Oracle database.
To map customized columns in your Historical Event Database, complete the following steps.
Procedure1. Use the following statement to create the view and point the data types to the new view.
DROP VIEW REPORTER_STATUS_STD;CREATE VIEW REPORTER_STATUS_STD AS SELECT SUMMARYTXT AS SUMMARY, IDENTIFIERID AS IDENTIFIER, * FROM REPORTER_STATUS;
2. Change the data types from REPORTER_STATUS to REPORTER_STATUS_STD. The data types for Db2are AlertsHistoryDb2Table and SE_HISTORICALEVENTS_Db2 underObjectServerHistoryDb2ForNOI data source.
3. Delete RELATEDEVENTS.RE_MAPPINGS records from the table:
DELETE FROM RELATEDEVENTS.RE_MAPPINGS WHERE TRUE;
4. Run the Event Analytics Configuration wizard to configure the Netcool/Impact properties to use forEvent Analytics.
5. On the Historical event database configuration screen, connect to the database and then select theREPORTER_STATUS_STD (view) from the History table drop-down menu as the Table name for EventAnalytics.
6. When using any other columns that were mapped in the view, for example Summary for SUMMARYTXT,use the new value in any of the wizard screens. In this case use Summary.For example, when adding fields to the report in the Configure report fields screen, use the valuesmapped in the view (Identifier or Summary).
7. Save the Event Analytics configuration. You can now use the mapped fields for Event Analytics.
Customizing tables in the Event Analytics UIYou can use the uiproviderconfig files to customize the tables in the Event Analytics UI.
To customize how tables are displayed in the Event Analytics UI, you can update the properties andcustomization files that are specific to the policy or data type that you want to update. These files arestored in the properties and customization directories in the $IMPACT_HOME/uiproviderconfig/directory.
If you want to update the properties and customization files, make a backup of the files before you do anyupdates.
Configuring columns to display in the More Information panelYou can configure the columns that you want to display in the More Information panel.
About this taskThe More Information panel can be started from within the Related Event Details portlet, when you clickthe hyperlink for either the Group Name or the Pivot Event, and the panel provides more details aboutthe Group Name or the Pivot Event. The Event Analytics installation installs a default configuration ofcolumns that display in the More Information panel, but you can change the configuration of columnsthat display. Complete the following steps to configure columns to display in the More Information panel.
Procedure1. Generate a properties file containing the latest Event Analytics system settings.
a) Navigate to the directory $IMPACT_HOME/bin.
Chapter 6. Configuring 409
b) Run the following command to generate a properties file containing the latest Event Analyticssystem settings.
nci_trigger server_name username/password NOI_DefaultValues_Export FILENAME directory/filename
Where:
• server_name is the name of the server where Event Analytics is installed.• user name is the user name of the Event Analytics user.• password is the password of the Event Analytics user.• NOI_DefaultValues_Export is a Netcool/Impact policy that performs an export of the current
Event Analytics system settings to a designated properties file.• directory is the directory where the properties file is stored.• filename is the name of the properties file.
For example:
nci_trigger NCI impactadmin/impactpass NOI_DefaultValues_Export FILENAME /tmp/properties.props
2. Update the properties file with properties for columns you want to display in the More Informationpanel.
• For columns related to the Group Name in the More Information panel, the following properties arethe default properties in the properties file. You can add, remove, and change the default properties.
reevent_num_groupinfo=3reevent_groupinfo_1_column=PROFILEreevent_groupinfo_2_column=EVENTIDENTITIESreevent_groupinfo_3_column=INSTANCES
reevent_num_groupinfo=3This property represents the number of group information columns to display. The default valueis 3 columns. The value can be any number between 1 and 8, as eight columns are allowed.
reevent_groupinfo_1_column=PROFILEEnter this property line item for each column. The variables in this property line item are 1 andPROFILE.1 denotes that this column is your first column. This value can increment up to 8 per propertyline item, as eight columns are allowed.PROFILE represents the column. The following eight columns are allowed.PROFILE
Specifies the relationship profile, or strength of the group.EVENTIDENTITIES
Specifies a comma-separated list that creates the event identity.INSTANCES
Specifies the total number of group instances.CONFIGNAME
Specifies the configuration name under which the group was created.TOTALEVENTS
Specifies the total number of events within the group.UNIQUEEVENTS
Specifies the total number of unique events within the group.REVIEWED
Specifies the review status of a group by a user.GROUPTTL
Specifies the number of seconds the group will stay active after the first event occurs.
410 IBM Netcool Operations Insight: Integration Guide

• For columns related to the Pivot Event in the More Information panel, the following propertiesare the default properties in the properties file. You can add, remove, and change the defaultproperties.
reevent_num_eventinfo=1reevent_eventinfo_1_column=INSTANCES
reevent_num_eventinfo=1This property represents the number of group information columns to display. The default valueis 1 column. The value can be any number between 1 and 6, as six columns are allowed.
reevent_eventinfo_1_column=INSTANCESEnter this property line item for each column. The variables in this property line item are 1 andINSTANCES.1 denotes that this column is your first column. This value can increment up to 6 per propertyline item, as six columns are allowed.INSTANCES represents the column. The following six columns are allowed:INSTANCES
Specifies the total number of instances for the related event.PROFILE
Specifies the relationship profile, or strength of the related event.EVENTIDENTITY
Specifies the unique event identity for the related event.EVENTIDENTITIES
Specifies a comma-separated list that creates the event identity.CONFIGNAME
Specifies the configuration name under which the related event was created.GROUPNAME
Specifies the group name under which the related event was created.3. Import the modified properties file into Event Analytics.
a) Ensure you are in the directory $IMPACT_HOME/bin.b) Run the following command to perform an import of Event Analytics system settings from a
designated properties file.
nci_trigger server_name username/password NOI_DefaultValues_Configure FILENAME directory/filename
Where:
• server_name is the name of the server where Event Analytics is installed.• user name is the user name of the Event Analytics user.• password is the password of the Event Analytics user.• NOI_DefaultValues_Configure is a Netcool/Impact policy that performs an import of Event
Analytics system settings from a designated properties file.• directory is the directory where the properties file is stored.• filename is the name of the properties file.
For example:
nci_trigger NCI impactadmin/impactpass NOI_DefaultValues_Configure FILENAME /tmp/properties.props
Chapter 6. Configuring 411

Configuring name similarityConfigure the name similarity feature by tuning parameters that govern how the system processesmultiple resources when performing pattern matching.
About this taskPattern matching enables Event Analytics to identify types of events that tend to occur together on aspecific network resource. The name similarity feature extends pattern matching by enabling it to identifytypes of events that tend to occur together on more than one resource, where the resources within thepattern have a similar name. For examples of similar resource names that might be discovered by thename similarity feature, see “Examples of name similarity” on page 582.
Depending on how name similarity is configured, pattern matching will see these resource names assimilar and will create a single pattern including events from all of these resource names.
Similarity threshold value: Algorithms are used to determine name similarity. First, an edit distance iscalculated by a third-party algorithm. The edit distance is the minimum number of operations needed totransform one string into the other, where an operation is defined as an insertion, deletion, or substitutionof a single character, or a transposition of two adjacent characters. Then, the algorithm calculates anormalized similarity distance, which lies in the range 0.0 to 1.0. In this range, 0.0 means that the stringsare identical and 1.0 means that the strings are completely different. The normalized similarity distance iscalculated by using a contribution of the edit distance weighted according to the first string length, thesecond string length, and the number of transpositions. Finally, the name similarity algorithm calculates anormalized threshold value (in the range 0.0 to 1.0) by subtracting the normalized similarity distance fromthe value 1.0. A threshold value of 0.0 means strings can be completely different. A threshold value of 1.0means that strings must match exactly.
By default name similarity is configured with values that should enable it to work effectively in mostenvironments. Use this procedure to change these settings.
Note: Only change name similarity settings if you understand the underlying algorithm.
Procedure1. Generate a properties file containing the latest Event Analytics system settings.
a) Navigate to the directory $IMPACT_HOME/bin.b) Run the following command to generate a properties file containing the latest Event Analytics
system settings.
nci_trigger server_name username/password NOI_DefaultValues_Export FILENAME directory/filename
Where:
• server_name is the name of the server where Event Analytics is installed.• user name is the user name of the Event Analytics user.• password is the password of the Event Analytics user.• NOI_DefaultValues_Export is a Netcool/Impact policy that performs an export of the current
Event Analytics system settings to a designated properties file.• directory is the directory where the properties file is stored.• filename is the name of the properties file.
For example:
nci_trigger NCI impactadmin/impactpass NOI_DefaultValues_Export FILENAME /tmp/properties.props
2. Edit the properties file that you generated in the previous step.For example:
412 IBM Netcool Operations Insight: Integration Guide
vi /tmp/properties.props
3. Find the section of the properties file that reads as follows:This code snippet shows the default values of the name similarity parameters.
################################################################################### The following properties are used to configure Name Similarity NS ####################################################################################
name_similarity_feature_enable=truename_similarity_default_pattern_enable=falsename_similarity_default_threshold=0.9name_similarity_default_lead_restriction=1name_similarity_default_tail_restriction=0
4. Update one or more of the name similarity settings.The following table describes each of these settings.
Table 69. Name similarity settings
Parameter Description Values
name_similarity_feature_enable Boolean that switches the name similarityfeature on or off.
Note: This is a global flag that governs allname similarity functionality. For example,if you set this flag to false, then no aspectof name similarity will be enabled, andnone of the other flags in this table willhave any effect.
Possible values:
• true: Namesimilarity isswitched on.
• false: Namesimilarity isswitched off.
Default value: true
name_similarity_default_pattern_enable
Boolean that specifies whether to applyname similarity processing to historicalpatterns, meaning patterns that werecreated before name similarity wasintroduced into the Netcool OperationsInsight solution. Name similarity wasintroduced into Netcool Operations Insightin V1.5.0, which corresponds to Netcool/Impact fix pack 14.
Possible values:
• true: Apply namesimilarityprocessing tohistorical patterns.
• false: Do notapply namesimilarityprocessing tohistorical patterns.
Default value:false
name_similarity_default_threshold
String comparison threshold value, where 0equates to completely dissimilar strings,and 1 equates to identical strings. Thevalue specified in thename_similarity_default_threshold parameter, is used to determine whethertwo strings are similar.
Note: The string similarity test is alsogoverned by the lead and tail restrictionparameters described below.
Possible values: 0 to1 inclusive
Default value: 0.9
Chapter 6. Configuring 413
Table 69. Name similarity settings (continued)
Parameter Description Values
name_similarity_default_lead_restriction
Number of characters at the beginning ofthe strings being compared that must beidentical.
Important: If this number of characters isnot identical then the strings automaticallyfail the similarity test.
Default value: 1
Note: This defaultsetting assumes thatthe front end of thestrings beingcompared is usuallydifferent.
name_similarity_default_tail_restriction
Number of characters at the end of thestrings being compared that must beidentical.
Important: If this number of characters isnot identical then the strings automaticallyfail the similarity test.
Default value: 0
Note: This defaultsetting assumes thatthe tail end of thestrings beingcompared is usuallythe same; forexample ".com".
5. Import the modified properties file into Event Analytics.a) Ensure you are in the directory $IMPACT_HOME/bin.b) Run the following command to perform an import of Event Analytics system settings from a
designated properties file.
nci_trigger server_name username/password NOI_DefaultValues_Configure FILENAME directory/filename
Where:
• server_name is the name of the server where Event Analytics is installed.• user name is the user name of the Event Analytics user.• password is the password of the Event Analytics user.• NOI_DefaultValues_Configure is a Netcool/Impact policy that performs an import of Event
Analytics system settings from a designated properties file.• directory is the directory where the properties file is stored.• filename is the name of the properties file.
For example:
nci_trigger NCI impactadmin/impactpass NOI_DefaultValues_Configure FILENAME /tmp/properties.props
Configuring multiple resource columnsLearn how to configure multiple resource columns.
About this taskThe repattern_multiresource_correlation_logic parameter is used to determine how multipleresources are checked for inclusion in a pattern. It also controls how events with similar resources aregrouped together in the Event Viewer. If resource values are similar, then the corresponding events aregrouped together in a single event group in the Event Viewer. Within EA a similar resources can be any ofthe following:
• Exact match: this is the default setting. The resource names must match exactly.
414 IBM Netcool Operations Insight: Integration Guide
• Regular expression: you can define a regular expression to group together resources that match theregular expression.
• Name similarity: you can configure the system to use the name similarity mechanism. This mechanismdetermines whether two resource names are similar using a pattern matching algorithm that usespredefined parameters. For example, the first three characters in the resource name must be the same,or the last three characters in the resource name must be the same.
The repattern_multiresource_correlation_logic parameter is configured with the OR value bydefault. Use this procedure to change the setting.
Only change the repattern_multiresource_correlation_logic setting if you understand theeffects that this change will have on how the resulting groups are presented in the Event Viewer. When ORlogic is specified, it correlates two events by resource as soon as the pattern is met for just one resource.When AND logic is specified, only "Exact match" resource matching is used and the criteria must be metfor all of the resource values.
Note: If one resource field is selected per event type, the resource fields for each event type can bedifferent. In this case AND logic is the same as OR logic. If more than one resource field is selected, theresource fields for each event type must be the same.
Note: Suggested patterns only use one resource field. They are never generated with multiple resources.
Procedure1. Generate a properties file containing the latest Event Analytics system settings.
a) Navigate to the directory $IMPACT_HOME/bin.b) Run the following command to generate a properties file containing the latest Event Analytics
system settings.
nci_trigger server_name username/password NOI_DefaultValues_Export FILENAME directory/filename
Where:
• server_name is the name of the server where Event Analytics is installed.• user name is the user name of the Event Analytics user.• password is the password of the Event Analytics user.• NOI_DefaultValues_Export is a Netcool/Impact policy that performs an export of the current
Event Analytics system settings to a designated properties file.• directory is the directory where the properties file is stored.• filename is the name of the properties file.
For example:
nci_trigger NCI impactadmin/impactpass NOI_DefaultValues_Export FILENAME /tmp/properties.props
2. Edit the properties file that you generated in the previous step.For example:
vi /tmp/properties.props
3. Find the section of the properties file that reads as follows:This code snippet shows the default values of the name similarity parameters.
repattern_multiresource_correlation_logic=OR
4. Update the repattern_multiresource_correlation_logic setting, as described in thefollowing table.
5. Import the modified properties file into Event Analytics.
Chapter 6. Configuring 415
a) Ensure you are in the directory $IMPACT_HOME/bin.b) Run the following command to perform an import of Event Analytics system settings from a
designated properties file.
nci_trigger server_name username/password NOI_DefaultValues_Configure FILENAME directory/filename
Where:
• server_name is the name of the server where Event Analytics is installed.• user name is the user name of the Event Analytics user.• password is the password of the Event Analytics user.• NOI_DefaultValues_Configure is a Netcool/Impact policy that performs an import of Event
Analytics system settings from a designated properties file.• directory is the directory where the properties file is stored.• filename is the name of the properties file.
For example:
nci_trigger NCI impactadmin/impactpass NOI_DefaultValues_Configure FILENAME /tmp/properties.props
Configuring scope-based groupingRead this document to learn more about scope-based grouping.
You can group events based on known relationships. Based on the information stored about yourinfrastructure, you can automatically group events relating to an incident if they have the same scope andoccur during the same time period. Scope-based event grouping is provided as an extension in IBM TivoliNetcool/OMNIbus. For more information about how to configure the scope-based grouping capability, seehttps://www.ibm.com/support/knowledgecenter/SSSHTQ_8.1.0/com.ibm.netcool_OMNIbus.doc_8.1.0/use/omn_con_concept_extsbgeventswithea.html . For moreinformation about scope-based grouping properties, see https://www.ibm.com/support/knowledgecenter/SSSHTQ_8.1.0/com.ibm.netcool_OMNIbus.doc_8.1.0/omnibus/wip/install/reference/omn_con_ext_propsforscopebasedeventgroup.html .
Configuring Event SearchEvent search applies the search and analysis capabilities of Operations Analytics - Log Analysis to eventsthat are monitored and managed by Tivoli Netcool/OMNIbus.
About Event SearchEvent Search provides an indexing capability to enable your operators to define index-based views of theirevent data.
Events are transferred from the ObjectServer through the Gateway for Message Bus to OperationsAnalytics - Log Analysis, where they are ingested into a datasource and indexed for searching. After theevents are indexed, you can search every occurrence of real-time and historical events. The TivoliNetcool/OMNIbus Insight Pack is installed into Operations Analytics - Log Analysis and provides customapps that search the events based on various criteria. The custom apps can generate dashboards thatpresent event information to show how your monitoring environment is performing over time. Keywordsearches and dynamic drilldown functions allow you to go deeper into the event data for detailedinformation. The apps can be run from the Operations Analytics - Log Analysis. Tooling can be installedinto the Web GUI that launches the apps from the right-click menus of the Event Viewer and the ActiveEvent List. An "event reduction wizard" is also supplied that includes information and apps that can helpyou analyze and reduce volumes of events and minimize the "noise" in your monitored environment.
416 IBM Netcool Operations Insight: Integration Guide
Required products and componentsYou must have the following products and components installed in order to configure Event Search.
Event Search requires the following products and components:
• Operations Analytics - Log Analysis V1.3.3 or V1.3.5. For the system requirements of this product,including supported operating systems, see the following topics:
– Operations Analytics - Log Analysis V1.3.5: https://www.ibm.com/support/knowledgecenter/SSPFMY_1.3.5/com.ibm.scala.doc/install/ins-planning_for_installation.html .
– Operations Analytics - Log Analysis V1.3.3: https://www.ibm.com/support/knowledgecenter/SSPFMY_1.3.3/com.ibm.scala.doc/install/iwa_hw_sw_req_scen_c.html
Note: Operations Analytics - Log Analysis Standard Edition is included in Netcool Operations Insight.For more information about Operations Analytics - Log Analysis editions, search for "Editions" at theOperations Analytics - Log Analysis Knowledge Center, at https://www.ibm.com/support/knowledgecenter/SSPFMY .
• OMNIbusInsightPack_v1.3.1• Gateway for Message Bus V8.0• Netcool/OMNIbus core components V8.1.0.24 fix pack 7 or later• Netcool/OMNIbus Web GUI V8.1.0.24 fix pack 5 or later
For the system requirements of the core components and Web GUI for Netcool/OMNIbus V8.1.0.24, seehttps://ibm.biz/BdRNaT ,
Configuring integration with Operations Analytics - Log AnalysisThis section describes how to configure the integration of the Netcool/OMNIbus and Operations Analytics- Log Analysis products. Events are forwarded from Netcool/OMNIbus to Operations Analytics - LogAnalysis by the Gateway for Message Bus.
Before you begin• Use a supported combination of product versions. For more information, see “Required products and
components” on page 417. The best practice is to install the products in the following order:
1. Netcool/OMNIbus V8.1.0.24 and the Web GUI2. Gateway for Message Bus. Install the gateway on the same host as the Netcool/OMNIbus product.3. Operations Analytics - Log Analysis, see one of the following links:
– V1.3.6: see https://www.ibm.com/support/knowledgecenter/SSPFMY_1.3.5/com.ibm.scala.doc/install/iwa_install_ovw.html
– V1.3.3: see https://www.ibm.com/support/knowledgecenter/SSPFMY_1.3.3/com.ibm.scala.doc/install/iwa_install_ovw.html
https://ibm.biz/BdXeZk4. Netcool/OMNIbus Insight Pack, see “Installing the Tivoli Netcool/OMNIbus Insight Pack” on page
69.
Tip: The best practice is to install the Web GUI and Operations Analytics - Log Analysis on separatehosts.
Restriction: Operations Analytics - Log Analysis does not support installation in Group mode of IBMInstallation Manager.
• Ensure that the ObjectServer that forwards event data to Operations Analytics - Log Analysis has theNmosObjInst column in the alerts.status table. NmosObjInst is supplied by default and is required forthis configuration. You can use ObjectServer SQL commands to check for the column and to add it if it ismissing, as follows.
– Use the DESCRIBE command to read the columns of the alerts.status table.
Chapter 6. Configuring 417
– Use the ALTER COLUMN setting with the ALTER TABLE command to add NmosObjInst to thealerts.status table.
For more information about the alerts.status table, including the NmosObjInst column, see https://ibm.biz/BdXcBF . For more information about ObjectServer SQL commands, see https://ibm.biz/BdXcBX .
• Configure the Web GUI server.init file as follows:
Note: The default values do not have to be changed on Web GUI V8.1.0.24 fix pack 5 or later.
scala.app.keyword=OMNIbus_Keyword_Searchscala.app.static.dashboard=OMNIbus_Static_Dashboardscala.datasource=omnibusscala.url=protocol://host:portscala.version=1.2.0.3
Restart the server if you change any of these values. See https://ibm.biz/BdXcBc .• Select and plan a deployment scenario. See “On-premises scenarios for Operations Management” on
page 32. If your deployment uses the Gateway for Message Bus for forwarding events via the IDUCchannel, you can skip step “5” on page 419. If you use the AEN client for forwarding events, completeall steps.
• Start the Operations Analytics - Log Analysis product.• Familiarize yourself with the configuration of the Gateway for Message Bus. See https://ibm.biz/BdEQaD
. Knowledge of the gateway is required for steps “1” on page 418, “5” on page 419, and “6” on page420 of this task.
ProcedureThe term data source has a different meaning, depending on which product you configure. In the WebGUI, a data source is always an ObjectServer. In the Operations Analytics - Log Analysis product, a datasource is a source of raw data, usually log files. In the context of the event search function, the OperationsAnalytics - Log Analysis data source is a set of Netcool/OMNIbus events.1. Configure the Gateway for Message Bus.
At a high-level, this involves the following:
• Creating a gateway server in the Netcool/OMNIbus interfaces file• Configuring the G_SCALA.props properties file, including specifying the .map mapping file.• Configuring the endpoint in the scalaTransformers.xml file• Configuring the SSL connection, if required• Configuring the transport properties in the scalaTransport.properties file
For more information about configuring the gateway, see the Gateway for Message Bus documentationat https://ibm.biz/BdEQaD .
2. If you are ingesting data that is billable, and do not want data ingested into the Netcool OperationsInsight data source to be included in the usage statistics, you need to set the Netcool OperationsInsight data source as non-billable. Add the path to your data source (default is NCOMS, see followingstep) to a seed file and restart Operations Analytics - Log Analysis as described in one of the followingtopics:
• V1.3.6: see https://www.ibm.com/support/knowledgecenter/SSPFMY_1.3.5/com.ibm.scala.doc/admin/iwa_nonbill_ds_t.html
• V1.3.3: see https://www.ibm.com/support/knowledgecenter/SSPFMY_1.3.3/com.ibm.scala.doc/admin/iwa_nonbill_ds_t.html
Note: Ensure you follow this step before you configure an "omnibus" data source for Netcool/OMNIbusevents.
3. In Operations Analytics - Log Analysis, start the Add Data Source wizard and configure an "omnibus"data source for Netcool/OMNIbus events.
418 IBM Netcool Operations Insight: Integration Guide
Only a single data source is required. The event management tools in the Web GUI support a singledata source only.a) In the Select Location panel, select Custom and type the Netcool/OMNIbus server host name.
Enter the same host name that was used for the JsonMsgHostname transport property of theGateway for Message Bus.
b) In the Select Data panel, enter the following field values:
Field Value
File path NCOMS. This is the default value of the jsonMsgPath transport property of theGateway for Message Bus. If you changed this value from the default, change thevalue of the File path field accordingly.
Type This is the name of the data source type on which this data source is based.
• To use the default data source type, specify OMNIbus1100.• To use a customized data source type, specify the name of the customized data
source type; for example: customOMNIbus
Collection OMNIbus1100-Collection
c) In the Set Attributes panel, enter the following field values:
Field Value
Name omnibus. Ensure that the value that you type is the same as the value of thescala.datasource property in the Web GUI server.init file. If the Name fieldhas a value other than omnibus, use the same value for the scala.datasourceproperty.
Group Leave this field blank.
Description Type a description of your choice.
4. Configure access to the data source you set up in the previous step. This involves the following steps inthe administrative settings for Operations Analytics - Log Analysis:a) Create a role using the Roles tab, for example, noirole, and ensure you assign the role permission
to access the data source.b) Add a user, for example, noiuser, and assign the role you created that has permissions to access
the data source (in this example, noirole).
For information about creating and modifying users and roles in Operations Analytics - Log Analysis,see one of the following links:
• V1.3.6: see https://www.ibm.com/support/knowledgecenter/SSPFMY_1.3.5/com.ibm.scala.doc/config/iwa_config_pinstall_userrole_ovw_c.html
• V1.3.3: see https://www.ibm.com/support/knowledgecenter/SSPFMY_1.3.3/com.ibm.scala.doc/config/iwa_config_pinstall_userrole_ovw_c.html
.
Note: The contents of the Netcool/OMNIbus Insight Pack dashboards are empty unless you log in witha user that has a role assigned with permissions to access the data source.
5. Configure the Accelerated Event Notification (AEN) client:a) Configure AEN event forwarding in the Gateway for Message Bus.b) Configure the AEN channel and triggers in each ObjectServer by enabling the following postinsert
triggers and trigger group:
• scala_triggers• scala_insert
Chapter 6. Configuring 419
• scala_reinsert
These items are included in the default configuration of the ObjectServer, as well as the SQLcommands to configure the AEN channel, but they are disabled by default. For more informationabout configuring the AEN client in an integration with the Operations Analytics - Log Analysisproduct, search for Configuring event forwarding using AEN in the Gateway for Message Busdocumentation.
6. Start the Gateway for Message Bus in SCA-LA mode.The gateway begins sending Netcool/OMNIbus events to Operations Analytics - Log Analysis.
7. Install the Web GUI with the event search feature.
ResultsAfter the configuration is complete, you can search for Netcool/OMNIbus events in Operations Analytics -Log Analysis. You can also use the Web GUI event management tools to launch into Operations Analytics -Log Analysis to display event data.
What to do next• Install any available interim fixes and fix packs for the Operations Analytics - Log Analysis product,
which are available from IBM Fix Central at http://www.ibm.com/support/fixcentral/ .• You can customize event search in the following ways:
– Change the Operations Analytics - Log Analysis index configuration. For more information, see“Customizing events used in Event Search using the DSV toolkit” on page 442. If you change theindex configuration, also change the map file of the Gateway for Message Bus. After the map file ischanged, restart the gateway. For more information, search for Map definition file at https://ibm.biz/BdEQaD .
– Customize the Operations Analytics - Log Analysis custom apps that are in the Insight Pack, or createnew apps. For more information, see “Customizing the Apps” on page 445.
– Customize the Web GUI event list tools. For more information, see “Customizing event managementtools” on page 422.
• If the Web GUI and Operations Analytics - Log Analysis are on the same host, configure single sign-on toprevent browser sessions expiring. See “Configuring single sign-on for the event search capability” onpage 420.
Configuring single sign-on for the event search capabilityConfigure single sign-on (SSO) between Web GUI and Operations Analytics - Log Analysis so that userscan switch between the two products without having to log in each time.
Before you beginBefore performing this task, ensure that the following requirements are met:
• All server instances are in same domain; for example, domain_name.uk.ibm.com.• LTPA keys are the same across all server instances.• The LTPA cookie name that is used in Operations Analytics - Log Analysis must contain the stringltpatoken.
About this taskFirst create dedicated users in your LDAP directory, which must be used by both Web GUI and OperationsAnalytics - Log Analysis for user authentication, and then configure the SSO connection.
420 IBM Netcool Operations Insight: Integration Guide
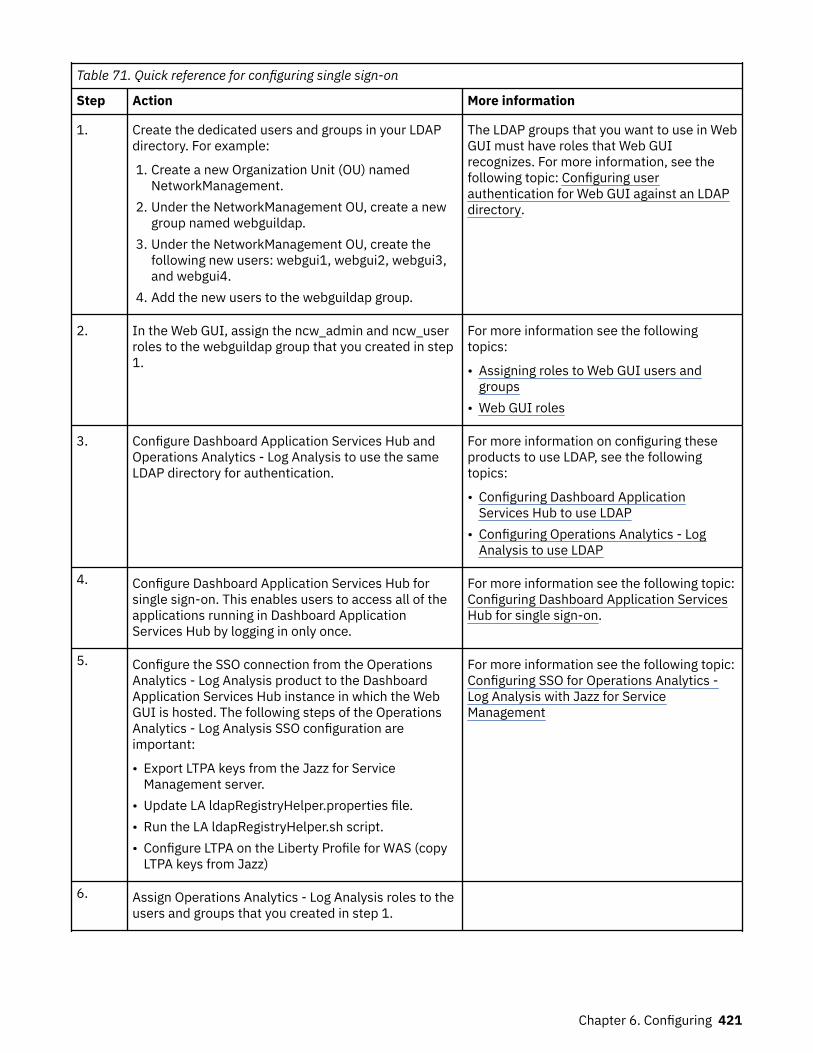
Table 71. Quick reference for configuring single sign-on
Step Action More information
1. Create the dedicated users and groups in your LDAPdirectory. For example:
1. Create a new Organization Unit (OU) namedNetworkManagement.
2. Under the NetworkManagement OU, create a newgroup named webguildap.
3. Under the NetworkManagement OU, create thefollowing new users: webgui1, webgui2, webgui3,and webgui4.
4. Add the new users to the webguildap group.
The LDAP groups that you want to use in WebGUI must have roles that Web GUIrecognizes. For more information, see thefollowing topic: Configuring userauthentication for Web GUI against an LDAPdirectory.
2. In the Web GUI, assign the ncw_admin and ncw_userroles to the webguildap group that you created in step1.
For more information see the followingtopics:
• Assigning roles to Web GUI users andgroups
• Web GUI roles
3. Configure Dashboard Application Services Hub andOperations Analytics - Log Analysis to use the sameLDAP directory for authentication.
For more information on configuring theseproducts to use LDAP, see the followingtopics:
• Configuring Dashboard ApplicationServices Hub to use LDAP
• Configuring Operations Analytics - LogAnalysis to use LDAP
4. Configure Dashboard Application Services Hub forsingle sign-on. This enables users to access all of theapplications running in Dashboard ApplicationServices Hub by logging in only once.
For more information see the following topic:Configuring Dashboard Application ServicesHub for single sign-on.
5. Configure the SSO connection from the OperationsAnalytics - Log Analysis product to the DashboardApplication Services Hub instance in which the WebGUI is hosted. The following steps of the OperationsAnalytics - Log Analysis SSO configuration areimportant:
• Export LTPA keys from the Jazz for ServiceManagement server.
• Update LA ldapRegistryHelper.properties file.• Run the LA ldapRegistryHelper.sh script.• Configure LTPA on the Liberty Profile for WAS (copy
LTPA keys from Jazz)
For more information see the following topic:Configuring SSO for Operations Analytics -Log Analysis with Jazz for ServiceManagement
6. Assign Operations Analytics - Log Analysis roles to theusers and groups that you created in step 1.
Chapter 6. Configuring 421
Table 71. Quick reference for configuring single sign-on (continued)
Step Action More information
7. In the $SCALAHOME/wlp/usr/servers/Unity/server.xml/server.xml file, ensure that the<webAppSecurity> element has ahttpOnlyCookies="false" attribute.
Add this line before the closing </server> element. Forexample:
<webAppSecurity ssoDomainNames="hostname" httpOnlyCookies="false"/></server>
Where The httpOnlyCookies="false" attribute disablesthe httponly flag on the cookie that is generated byOperations Analytics - Log Analysis and is required toenable SSO with the Web GUI
Customizing event management toolsThe tools in the Event Viewer and AEL search for event data based on fields from the Netcool/OMNIbusObjectServer. The fields are specified by URLs that are called when the Operations Analytics - LogAnalysis product is started from the tools. You can change the URLs in the tools from the default eventfields to search on fields of your choice.
For example, the Search for similar events > 15 minutes before event tool filters events on theAlertGroup, Type, and Severity fields. The default URL is:
$(SERVER)/integrations/scala/Search?queryFields=AlertGroup,Type,Severity&queryValuesAlertGroup={$selected_rows.AlertGroup}&queryValuesType={CONVERSION($selected_rows.Type)}&queryValuesSeverity={CONVERSION($selected_rows.Severity)}&firstOccurrences={$selected_rows.FirstOccurrence}&timePeriod=15&timePeriodUnits=minutes
About this taskYou can change the URLs in the following ways:
• Change the scalaIntegration.xml configuration file and apply the changes with the Web GUIrunwaapi command that is included in the Web GUI Administration API (WAAPI) client.
• Change the tool configuration in the Web GUI Administration console page.
ProcedureAs an example, the following steps show how to use each method to change the URLs in the Search forsimilar events > 15 minutes before event tool to search on the AlertKey and Location event fields.• To change the URLs in the scalaIntegration.xml configuration file:
a) In WEBGUI_HOME/extensions/LogAnalytics/scalaIntegration.xml, or the equivalentXML file if you use a different file, locate the following <tool> element:
<tool:tool name="scalaSearchByEvent15Minutes">
b) Change the URL in this element as follows.The changes are shown in bold text:
<tool:cgiurl foreach="true" windowforeach="false" target="_blank" method="GET" url="$(SERVER)/integrations/scala/Search?queryFields=AlertKey,Location&queryValuesAlertKey={$selected_rows.AlertKey}&queryValuesLocation={$selected_rows.Location}
422 IBM Netcool Operations Insight: Integration Guide
&firstOccurrences={$selected_rows.FirstOccurrence}&timePeriod=15&timePeriodUnits=minutes"></tool:cgiurl>
c) Use the runwaapi command to reinstall the tools:
runwaapi -file scalaIntegration.xml
d) Reinstall the following tool menus to the Event Viewer or AEL alerts menu item:
– scalaStaticDashboard– scalaSimilarEvents– scalaEventByNode– scalaKeywordSearch
• To change the URLs on the Administration page:a) In the Web GUI, click Administration > Event Management Tools > Tool Creation. Then, on the
Tool Creation page, locate the scalaSearchByEvent15Minutes tool.b) Change the URL as follows.
The changes are shown in bold text:
$(SERVER)/integrations/scala/Search?queryFields=AlertKey,Location&queryValuesAlertKey={$selected_rows.AlertKey}&queryValuesLocation={$selected_rows.Location}&firstOccurrences={$selected_rows.FirstOccurrence}&timePeriod=15&timePeriodUnits=minutes
c) Refresh the Event Viewer or AEL so that the changes to the tool URL are loaded.
What to do next• The Gateway for Message Bus uses a lookup table to convert the Severity, Type, and Class eventfield integer values to strings. After a tool is changed or created, use the CONVERSION function tochange these field values to the strings that are required by Operations Analytics - Log Analysis.
• Change the other tools in the menu so that they search on the same field. It is more efficient to changethe configuration file and then use the runwaapi command than to change each tool in the UI. Thefollowing table lists the names of the event management menu items and tools that are displayed in theTool Creation and Menu Configuration pages.
Table 72. Web GUI menu and tool names
Menu item Menu item name Tool Tool name
Search for events by node scalaEventByNode 15 minutes before event scalaSearchByNode15Minutes
Chapter 6. Configuring 423
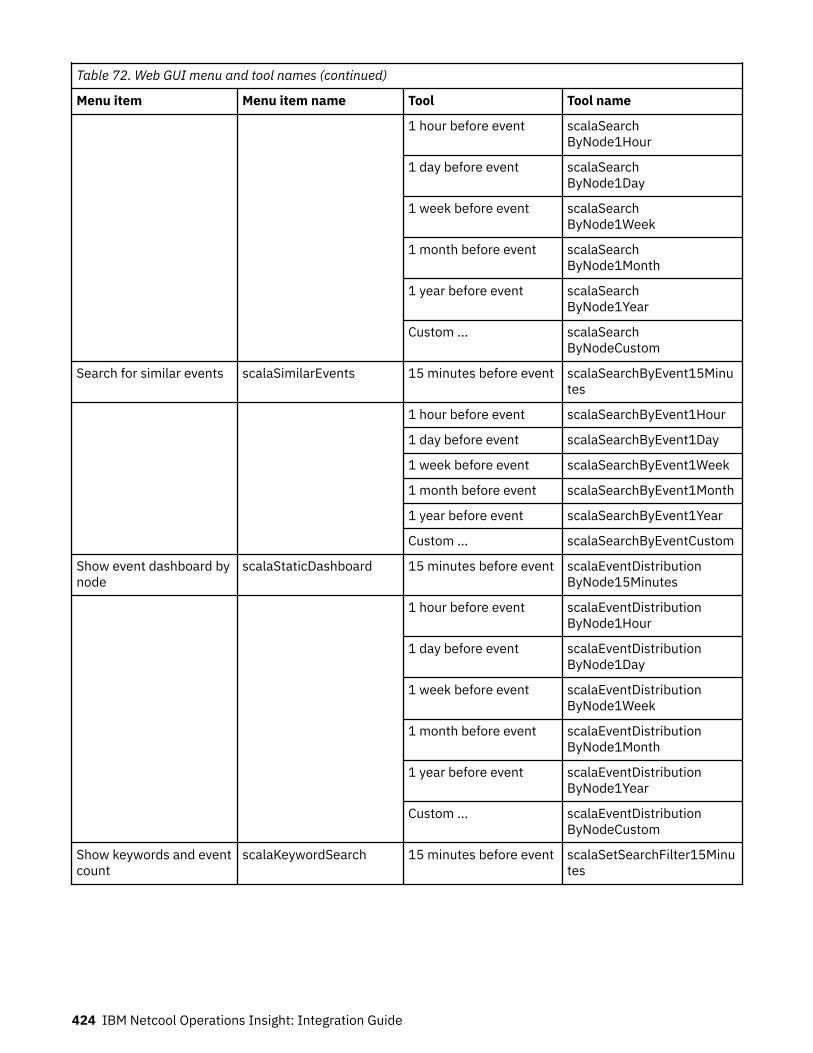
Table 72. Web GUI menu and tool names (continued)
Menu item Menu item name Tool Tool name
1 hour before event scalaSearchByNode1Hour
1 day before event scalaSearchByNode1Day
1 week before event scalaSearchByNode1Week
1 month before event scalaSearchByNode1Month
1 year before event scalaSearchByNode1Year
Custom ... scalaSearchByNodeCustom
Search for similar events scalaSimilarEvents 15 minutes before event scalaSearchByEvent15Minutes
1 hour before event scalaSearchByEvent1Hour
1 day before event scalaSearchByEvent1Day
1 week before event scalaSearchByEvent1Week
1 month before event scalaSearchByEvent1Month
1 year before event scalaSearchByEvent1Year
Custom ... scalaSearchByEventCustom
Show event dashboard bynode
scalaStaticDashboard 15 minutes before event scalaEventDistributionByNode15Minutes
1 hour before event scalaEventDistributionByNode1Hour
1 day before event scalaEventDistributionByNode1Day
1 week before event scalaEventDistributionByNode1Week
1 month before event scalaEventDistributionByNode1Month
1 year before event scalaEventDistributionByNode1Year
Custom ... scalaEventDistributionByNodeCustom
Show keywords and eventcount
scalaKeywordSearch 15 minutes before event scalaSetSearchFilter15Minutes
424 IBM Netcool Operations Insight: Integration Guide
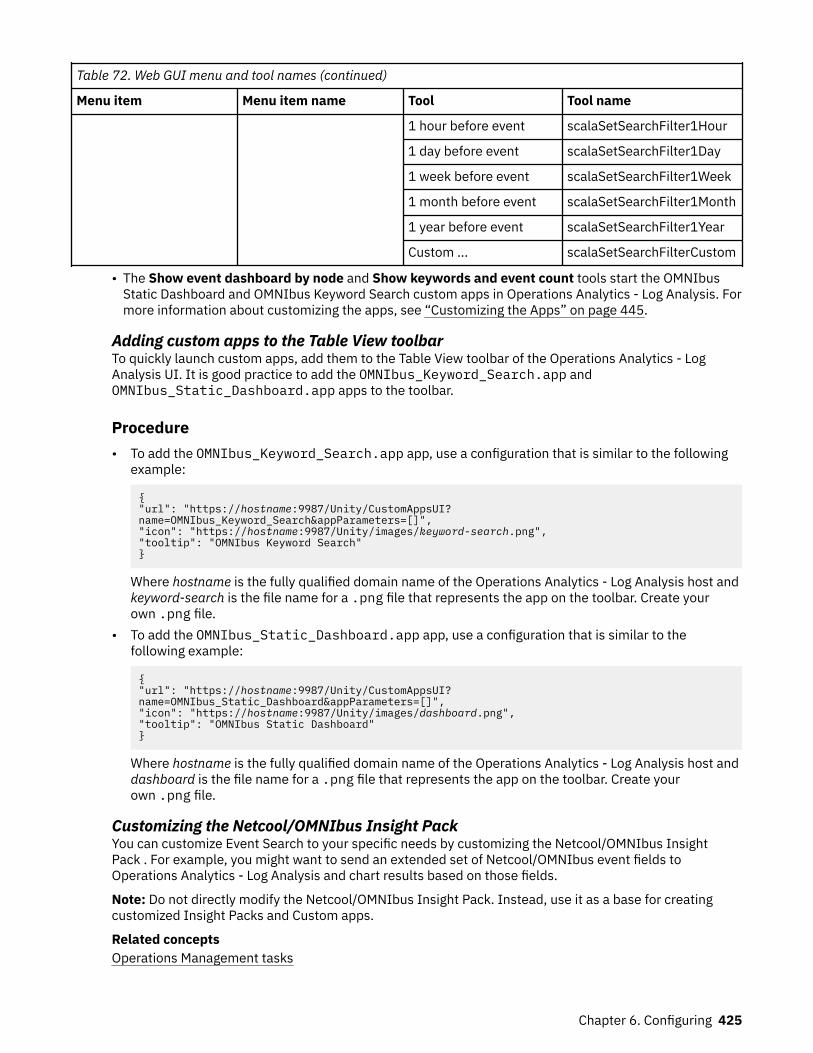
Table 72. Web GUI menu and tool names (continued)
Menu item Menu item name Tool Tool name
1 hour before event scalaSetSearchFilter1Hour
1 day before event scalaSetSearchFilter1Day
1 week before event scalaSetSearchFilter1Week
1 month before event scalaSetSearchFilter1Month
1 year before event scalaSetSearchFilter1Year
Custom ... scalaSetSearchFilterCustom
• The Show event dashboard by node and Show keywords and event count tools start the OMNIbusStatic Dashboard and OMNIbus Keyword Search custom apps in Operations Analytics - Log Analysis. Formore information about customizing the apps, see “Customizing the Apps” on page 445.
Adding custom apps to the Table View toolbarTo quickly launch custom apps, add them to the Table View toolbar of the Operations Analytics - LogAnalysis UI. It is good practice to add the OMNIbus_Keyword_Search.app andOMNIbus_Static_Dashboard.app apps to the toolbar.
Procedure• To add the OMNIbus_Keyword_Search.app app, use a configuration that is similar to the following
example:
{"url": "https://hostname:9987/Unity/CustomAppsUI?name=OMNIbus_Keyword_Search&appParameters=[]","icon": "https://hostname:9987/Unity/images/keyword-search.png","tooltip": "OMNIbus Keyword Search"}
Where hostname is the fully qualified domain name of the Operations Analytics - Log Analysis host andkeyword-search is the file name for a .png file that represents the app on the toolbar. Create yourown .png file.
• To add the OMNIbus_Static_Dashboard.app app, use a configuration that is similar to thefollowing example:
{"url": "https://hostname:9987/Unity/CustomAppsUI?name=OMNIbus_Static_Dashboard&appParameters=[]","icon": "https://hostname:9987/Unity/images/dashboard.png","tooltip": "OMNIbus Static Dashboard"}
Where hostname is the fully qualified domain name of the Operations Analytics - Log Analysis host anddashboard is the file name for a .png file that represents the app on the toolbar. Create yourown .png file.
Customizing the Netcool/OMNIbus Insight PackYou can customize Event Search to your specific needs by customizing the Netcool/OMNIbus InsightPack . For example, you might want to send an extended set of Netcool/OMNIbus event fields toOperations Analytics - Log Analysis and chart results based on those fields.
Note: Do not directly modify the Netcool/OMNIbus Insight Pack. Instead, use it as a base for creatingcustomized Insight Packs and Custom apps.
Related conceptsOperations Management tasks
Chapter 6. Configuring 425

Netcool/OMNIbus Insight PackThe Netcool/OMNIbus Insight Pack enables you to view and search both historical and real time eventdata from Netcool/OMNIbus in the IBM Operations Analytics - Log Analysis product. This documentationis for Tivoli Netcool/OMNIbus Insight Pack V1.3.0.2.
The Insight Pack parses Netcool/OMNIbus event data into a format suitable for use by OperationsAnalytics - Log Analysis. The event data is transferred from Netcool/OMNIbus to Operations Analytics -Log Analysis by the IBM Tivoli Netcool/OMNIbus Gateway for Message Bus (nco_g_xml). For moreinformation about the Gateway for Message Bus, see http://www-01.ibm.com/support/knowledgecenter/SSSHTQ/omnibus/gateways/xmlintegration/wip/concept/xmlgw_intro.html .
Content of the Insight PackThe Insight Pack provides the following data ingestion artifacts:
• A Rule Set (with annotator and splitter) that parses Netcool/OMNIbus event data into DelimiterSeparated Value (DSV) format.
• A Source Type that matches the event fields in the Gateway for Message Bus map file.• A Collection that contains the provided Source Type.• Custom apps, which are described in Table 73 on page 427.• A wizard to help you analyze and reduce event volumes, which is described in “Event reduction wizard”
on page 429. The wizard also contains custom apps, which are described in Table 74 on page 430.
Tip: The data that is shown by the custom apps originates in the alerts.status table of the Netcool/OMNIbus ObjectServer. For example, the Node identifies the entities from which events originate, such ashosts or device names. For more information about the columns of the alerts.status table, see IBMKnowledge Center at http://www-01.ibm.com/support/knowledgecenter/SSSHTQ_8.1.0/com.ibm.netcool_OMNIbus.doc_8.1.0/omnibus/wip/common/reference/omn_ref_tab_alertsstatus.html
.
Custom appsThe following table describes the custom apps. The apps are all launched from the Operations Analytics -Log Analysis UI. Some apps can also be launched from event lists in the Netcool/OMNIbus Web GUI, thatis, the Event Viewer or Active Event List (AEL). The configuration for launching the tools from the Web GUIis not included in this Insight Pack. To obtain this configuration, install the latest fix pack of the Web GUIV8.1.
426 IBM Netcool Operations Insight: Integration Guide
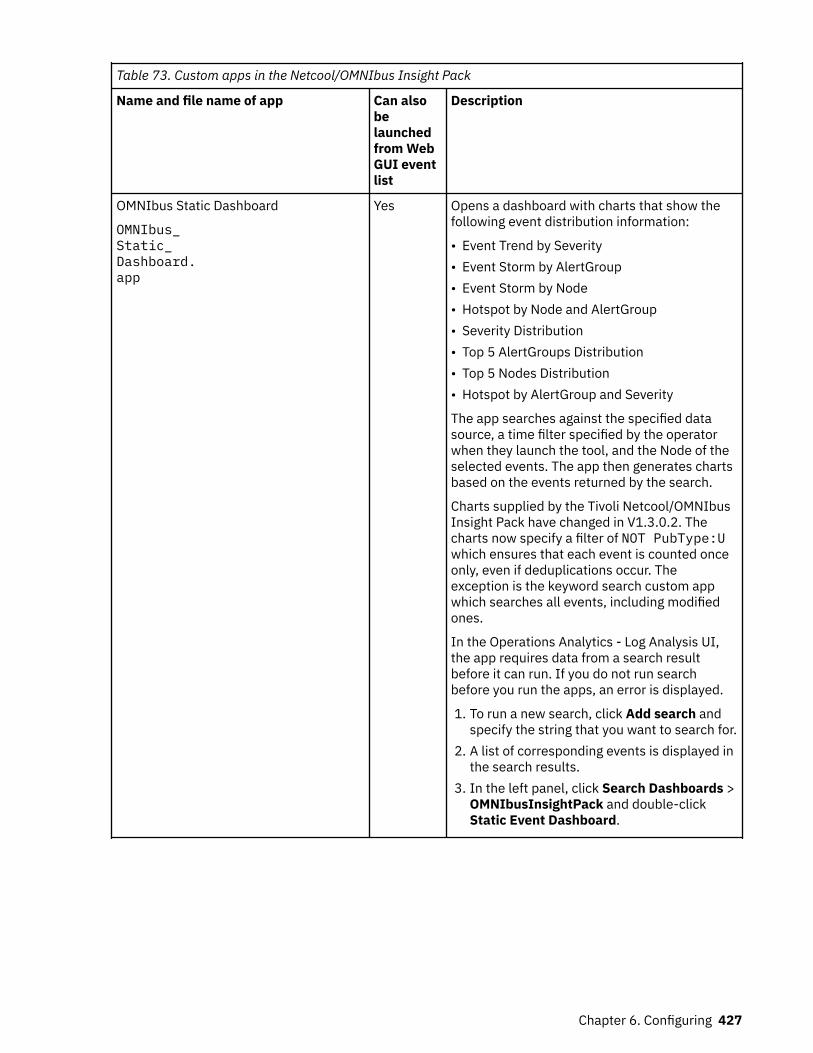
Table 73. Custom apps in the Netcool/OMNIbus Insight Pack
Name and file name of app Can alsobelaunchedfrom WebGUI eventlist
Description
OMNIbus Static Dashboard
OMNIbus_Static_Dashboard.app
Yes Opens a dashboard with charts that show thefollowing event distribution information:
• Event Trend by Severity• Event Storm by AlertGroup• Event Storm by Node• Hotspot by Node and AlertGroup• Severity Distribution• Top 5 AlertGroups Distribution• Top 5 Nodes Distribution• Hotspot by AlertGroup and Severity
The app searches against the specified datasource, a time filter specified by the operatorwhen they launch the tool, and the Node of theselected events. The app then generates chartsbased on the events returned by the search.
Charts supplied by the Tivoli Netcool/OMNIbusInsight Pack have changed in V1.3.0.2. Thecharts now specify a filter of NOT PubType:Uwhich ensures that each event is counted onceonly, even if deduplications occur. Theexception is the keyword search custom appwhich searches all events, including modifiedones.
In the Operations Analytics - Log Analysis UI,the app requires data from a search resultbefore it can run. If you do not run searchbefore you run the apps, an error is displayed.
1. To run a new search, click Add search andspecify the string that you want to search for.
2. A list of corresponding events is displayed inthe search results.
3. In the left panel, click Search Dashboards >OMNIbusInsightPack and double-clickStatic Event Dashboard.
Chapter 6. Configuring 427

Table 73. Custom apps in the Netcool/OMNIbus Insight Pack (continued)
Name and file name of app Can alsobelaunchedfrom WebGUI eventlist
Description
OMNIbus Keyword Search
OMNIbus_Keyword_Search.app
Yes Uses information from the selected events togenerate a keyword list with count, data sourcefilter, and time filter in Operations Analytics -Log Analysis.
The app generates the keyword list from thespecified columns of the selected events. Thedefault columns are Summary, Node, andAlertGroup. The app then creates the datasource filter with the value specified by theevent list tool and creates the time filter withthe value that was selected when the tool waslaunched.
In the Operations Analytics - Log Analysis UI,the app requires data from a search resultbefore it can run. If you do not run searchbefore you run the apps, an error is displayed.
1. To run a new search, click Add search andspecify the string that you want to search for.
2. A list of corresponding events is displayed inthe search results. Switch to the grid viewand select the required entries. Click acolumn header to select the entire column.
3. In the left panel, click Search Dashboards >OMNIbusInsightPack and double-clickKeyword Search.
In the Search Patterns section, a list ofkeywords from the selected data is displayed.The event count associated with thosekeywords is in parentheses ().
OMNIbus Dynamic Dashboard
OMNIbus_Dynamic_Dashboard.app
No Searches the events in the "omnibus" datasource over the last day and generates adashboard with eight charts. The charts aresimilar to the charts generated by the OMNIbusStatic Dashboard app but they also support drilldown. You can double-click any data point inthe chart to open a search workspace that isscoped to the event records that make up thatdata point.
To open the dashboard in the OperationsAnalytics - Log Analysis user interface, clickSearch Dashboards > OMNIbusInsightPack >Last_Day > Dynamic Event Dashboard. Thisdashboard is not integrated with the event listsin the Web GUI.
428 IBM Netcool Operations Insight: Integration Guide
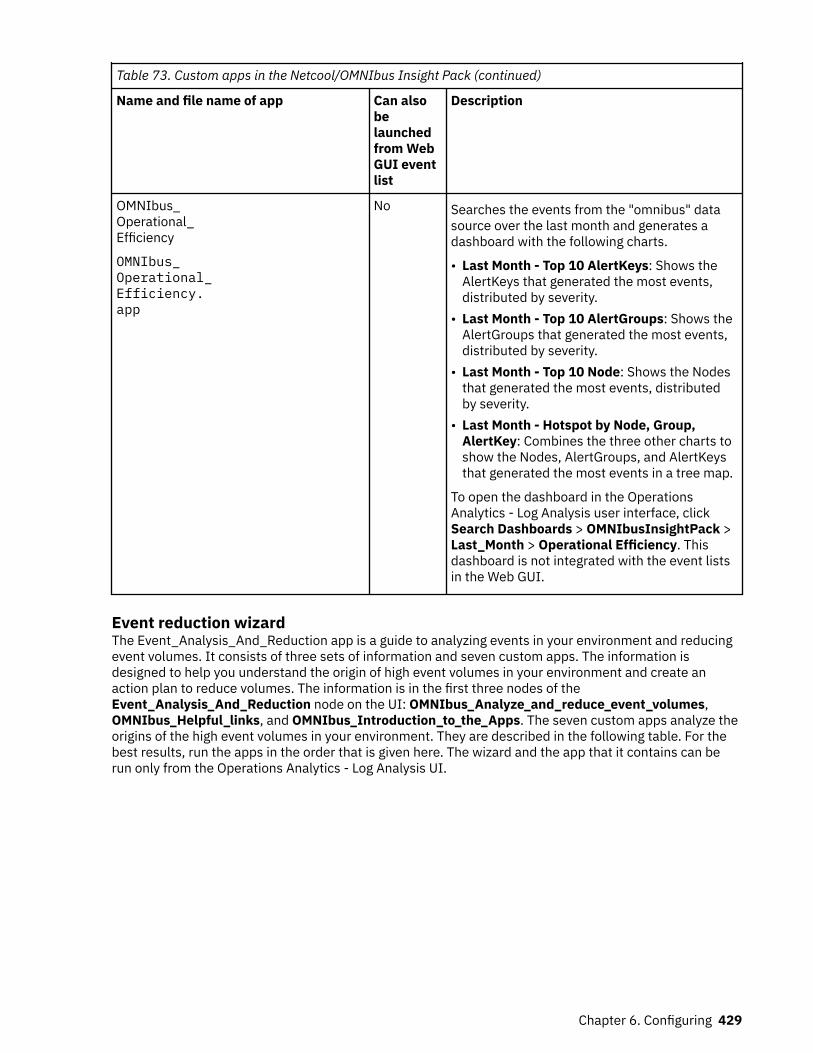
Table 73. Custom apps in the Netcool/OMNIbus Insight Pack (continued)
Name and file name of app Can alsobelaunchedfrom WebGUI eventlist
Description
OMNIbus_Operational_Efficiency
OMNIbus_Operational_Efficiency.app
No Searches the events from the "omnibus" datasource over the last month and generates adashboard with the following charts.
• Last Month - Top 10 AlertKeys: Shows theAlertKeys that generated the most events,distributed by severity.
• Last Month - Top 10 AlertGroups: Shows theAlertGroups that generated the most events,distributed by severity.
• Last Month - Top 10 Node: Shows the Nodesthat generated the most events, distributedby severity.
• Last Month - Hotspot by Node, Group,AlertKey: Combines the three other charts toshow the Nodes, AlertGroups, and AlertKeysthat generated the most events in a tree map.
To open the dashboard in the OperationsAnalytics - Log Analysis user interface, clickSearch Dashboards > OMNIbusInsightPack >Last_Month > Operational Efficiency. Thisdashboard is not integrated with the event listsin the Web GUI.
Event reduction wizardThe Event_Analysis_And_Reduction app is a guide to analyzing events in your environment and reducingevent volumes. It consists of three sets of information and seven custom apps. The information isdesigned to help you understand the origin of high event volumes in your environment and create anaction plan to reduce volumes. The information is in the first three nodes of theEvent_Analysis_And_Reduction node on the UI: OMNIbus_Analyze_and_reduce_event_volumes,OMNIbus_Helpful_links, and OMNIbus_Introduction_to_the_Apps. The seven custom apps analyze theorigins of the high event volumes in your environment. They are described in the following table. For thebest results, run the apps in the order that is given here. The wizard and the app that it contains can berun only from the Operations Analytics - Log Analysis UI.
Chapter 6. Configuring 429
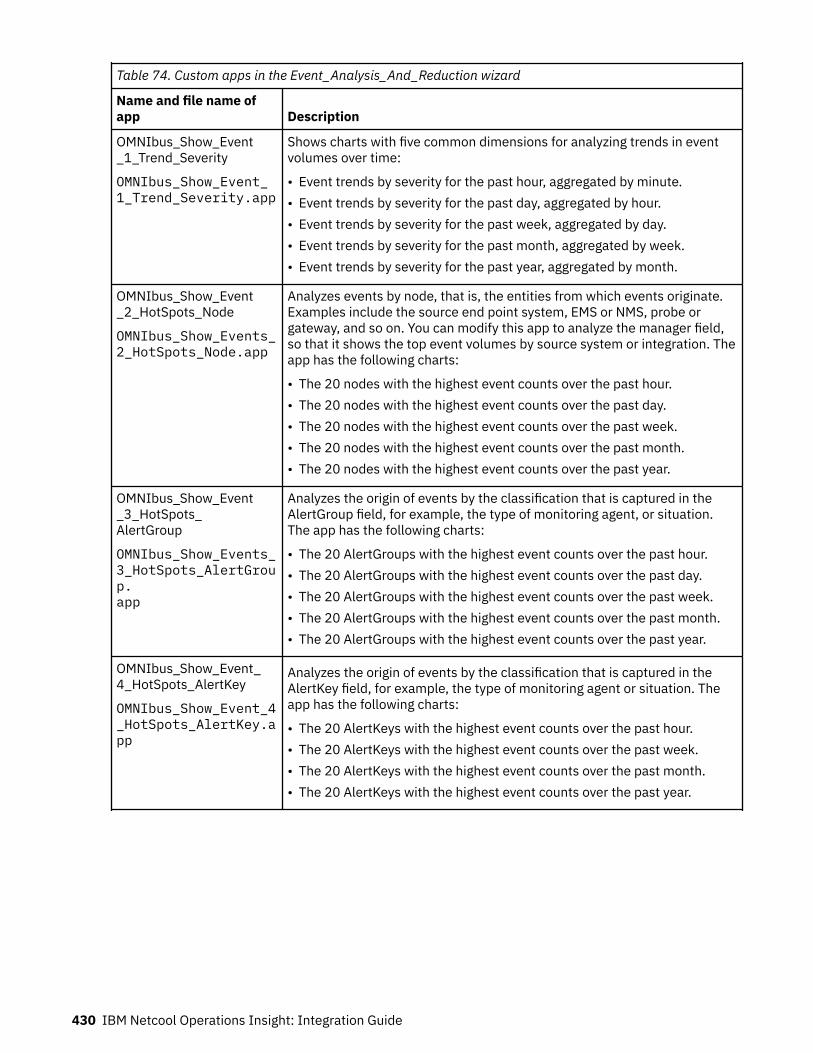
Table 74. Custom apps in the Event_Analysis_And_Reduction wizard
Name and file name ofapp Description
OMNIbus_Show_Event_1_Trend_Severity
OMNIbus_Show_Event_1_Trend_Severity.app
Shows charts with five common dimensions for analyzing trends in eventvolumes over time:
• Event trends by severity for the past hour, aggregated by minute.• Event trends by severity for the past day, aggregated by hour.• Event trends by severity for the past week, aggregated by day.• Event trends by severity for the past month, aggregated by week.• Event trends by severity for the past year, aggregated by month.
OMNIbus_Show_Event_2_HotSpots_Node
OMNIbus_Show_Events_2_HotSpots_Node.app
Analyzes events by node, that is, the entities from which events originate.Examples include the source end point system, EMS or NMS, probe orgateway, and so on. You can modify this app to analyze the manager field,so that it shows the top event volumes by source system or integration. Theapp has the following charts:
• The 20 nodes with the highest event counts over the past hour.• The 20 nodes with the highest event counts over the past day.• The 20 nodes with the highest event counts over the past week.• The 20 nodes with the highest event counts over the past month.• The 20 nodes with the highest event counts over the past year.
OMNIbus_Show_Event_3_HotSpots_AlertGroup
OMNIbus_Show_Events_3_HotSpots_AlertGroup.app
Analyzes the origin of events by the classification that is captured in theAlertGroup field, for example, the type of monitoring agent, or situation.The app has the following charts:
• The 20 AlertGroups with the highest event counts over the past hour.• The 20 AlertGroups with the highest event counts over the past day.• The 20 AlertGroups with the highest event counts over the past week.• The 20 AlertGroups with the highest event counts over the past month.• The 20 AlertGroups with the highest event counts over the past year.
OMNIbus_Show_Event_4_HotSpots_AlertKey
OMNIbus_Show_Event_4_HotSpots_AlertKey.app
Analyzes the origin of events by the classification that is captured in theAlertKey field, for example, the type of monitoring agent or situation. Theapp has the following charts:
• The 20 AlertKeys with the highest event counts over the past hour.• The 20 AlertKeys with the highest event counts over the past week.• The 20 AlertKeys with the highest event counts over the past month.• The 20 AlertKeys with the highest event counts over the past year.
430 IBM Netcool Operations Insight: Integration Guide
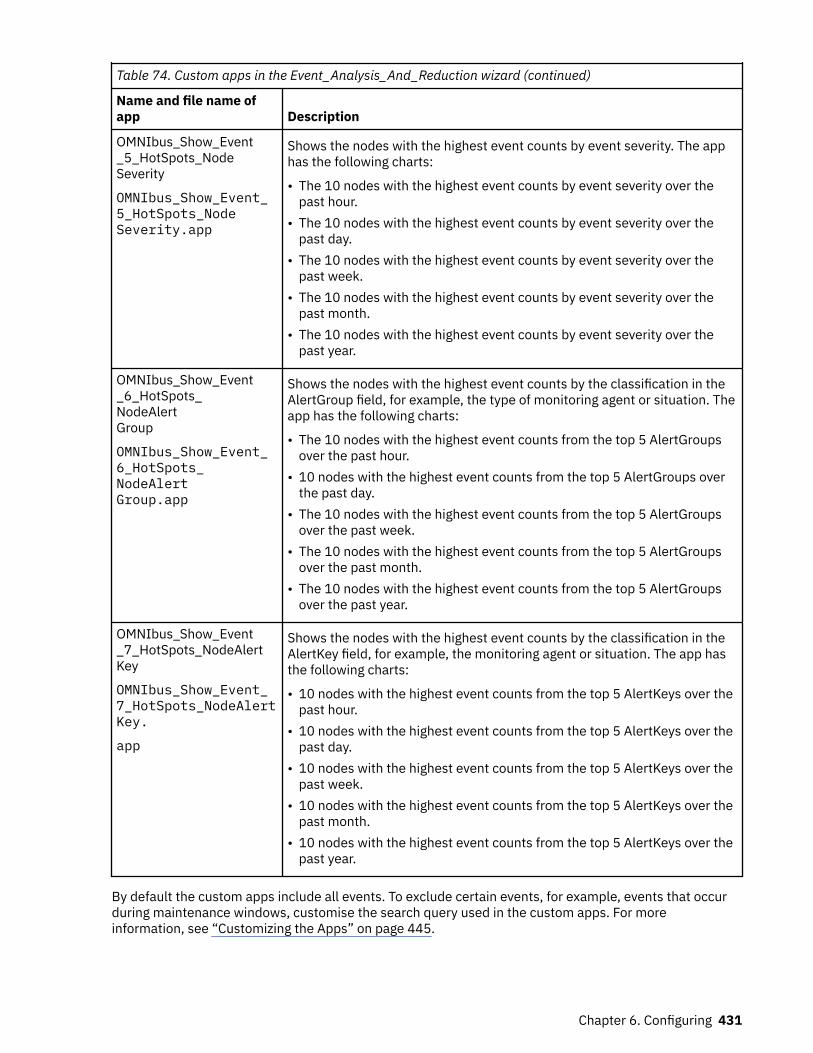
Table 74. Custom apps in the Event_Analysis_And_Reduction wizard (continued)
Name and file name ofapp Description
OMNIbus_Show_Event_5_HotSpots_NodeSeverity
OMNIbus_Show_Event_5_HotSpots_NodeSeverity.app
Shows the nodes with the highest event counts by event severity. The apphas the following charts:
• The 10 nodes with the highest event counts by event severity over thepast hour.
• The 10 nodes with the highest event counts by event severity over thepast day.
• The 10 nodes with the highest event counts by event severity over thepast week.
• The 10 nodes with the highest event counts by event severity over thepast month.
• The 10 nodes with the highest event counts by event severity over thepast year.
OMNIbus_Show_Event_6_HotSpots_NodeAlertGroup
OMNIbus_Show_Event_6_HotSpots_NodeAlertGroup.app
Shows the nodes with the highest event counts by the classification in theAlertGroup field, for example, the type of monitoring agent or situation. Theapp has the following charts:
• The 10 nodes with the highest event counts from the top 5 AlertGroupsover the past hour.
• 10 nodes with the highest event counts from the top 5 AlertGroups overthe past day.
• The 10 nodes with the highest event counts from the top 5 AlertGroupsover the past week.
• The 10 nodes with the highest event counts from the top 5 AlertGroupsover the past month.
• The 10 nodes with the highest event counts from the top 5 AlertGroupsover the past year.
OMNIbus_Show_Event_7_HotSpots_NodeAlertKey
OMNIbus_Show_Event_7_HotSpots_NodeAlertKey.
app
Shows the nodes with the highest event counts by the classification in theAlertKey field, for example, the monitoring agent or situation. The app hasthe following charts:
• 10 nodes with the highest event counts from the top 5 AlertKeys over thepast hour.
• 10 nodes with the highest event counts from the top 5 AlertKeys over thepast day.
• 10 nodes with the highest event counts from the top 5 AlertKeys over thepast week.
• 10 nodes with the highest event counts from the top 5 AlertKeys over thepast month.
• 10 nodes with the highest event counts from the top 5 AlertKeys over thepast year.
By default the custom apps include all events. To exclude certain events, for example, events that occurduring maintenance windows, customise the search query used in the custom apps. For moreinformation, see “Customizing the Apps” on page 445.
Chapter 6. Configuring 431
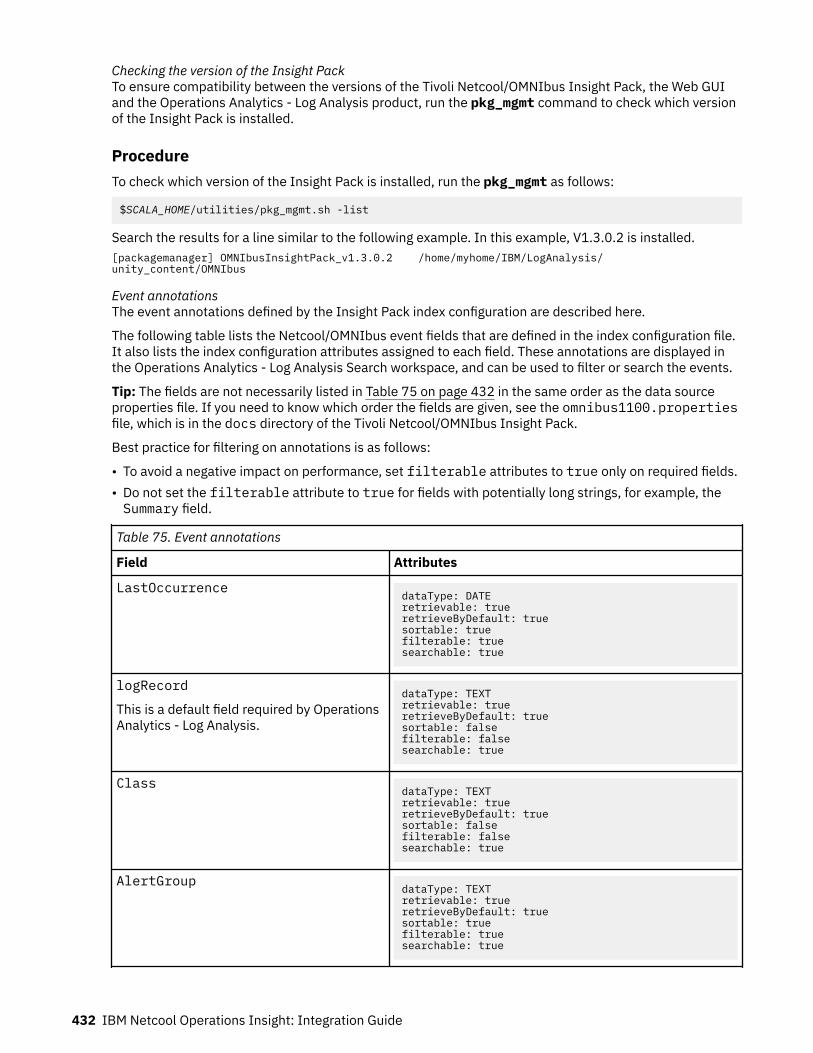
Checking the version of the Insight PackTo ensure compatibility between the versions of the Tivoli Netcool/OMNIbus Insight Pack, the Web GUIand the Operations Analytics - Log Analysis product, run the pkg_mgmt command to check which versionof the Insight Pack is installed.
ProcedureTo check which version of the Insight Pack is installed, run the pkg_mgmt as follows:
$SCALA_HOME/utilities/pkg_mgmt.sh -list
Search the results for a line similar to the following example. In this example, V1.3.0.2 is installed.[packagemanager] OMNIbusInsightPack_v1.3.0.2 /home/myhome/IBM/LogAnalysis/unity_content/OMNIbus
Event annotationsThe event annotations defined by the Insight Pack index configuration are described here.
The following table lists the Netcool/OMNIbus event fields that are defined in the index configuration file.It also lists the index configuration attributes assigned to each field. These annotations are displayed inthe Operations Analytics - Log Analysis Search workspace, and can be used to filter or search the events.
Tip: The fields are not necessarily listed in Table 75 on page 432 in the same order as the data sourceproperties file. If you need to know which order the fields are given, see the omnibus1100.propertiesfile, which is in the docs directory of the Tivoli Netcool/OMNIbus Insight Pack.
Best practice for filtering on annotations is as follows:
• To avoid a negative impact on performance, set filterable attributes to true only on required fields.• Do not set the filterable attribute to true for fields with potentially long strings, for example, theSummary field.
Table 75. Event annotations
Field Attributes
LastOccurrence dataType: DATE retrievable: true retrieveByDefault: true sortable: true filterable: true searchable: true
logRecord
This is a default field required by OperationsAnalytics - Log Analysis.
dataType: TEXT retrievable: true retrieveByDefault: true sortable: false filterable: false searchable: true
Class dataType: TEXT retrievable: true retrieveByDefault: truesortable: false filterable: false searchable: true
AlertGroup dataType: TEXT retrievable: true retrieveByDefault: true sortable: true filterable: true searchable: true
432 IBM Netcool Operations Insight: Integration Guide

Table 75. Event annotations (continued)
Field Attributes
SeveritydataType: TEXT retrievable: true retrieveByDefault: true sortable: true filterable: true searchable: true
AlertKeydataType: TEXT retrievable: true retrieveByDefault: true sortable: true filterable: true searchable: true
TallydataType: TEXT retrievable: true retrieveByDefault: true sortable: false filterable: false searchable: true
NmosObjInst dataType: TEXT retrievable: true retrieveByDefault: true sortable: true filterable: truesearchable: true
NodeAlias dataType: TEXT retrievable: true retrieveByDefault: true sortable: true filterable: truesearchable: true
timestamp dataType: DATE retrievable: true retrieveByDefault: true sortable: true filterable: true searchable: true
Type dataType: TEXT retrievable: true retrieveByDefault: true sortable: true filterable: false searchable: true
Location dataType: TEXT retrievable: true retrieveByDefault: true sortable: true filterable: true searchable: true
Chapter 6. Configuring 433
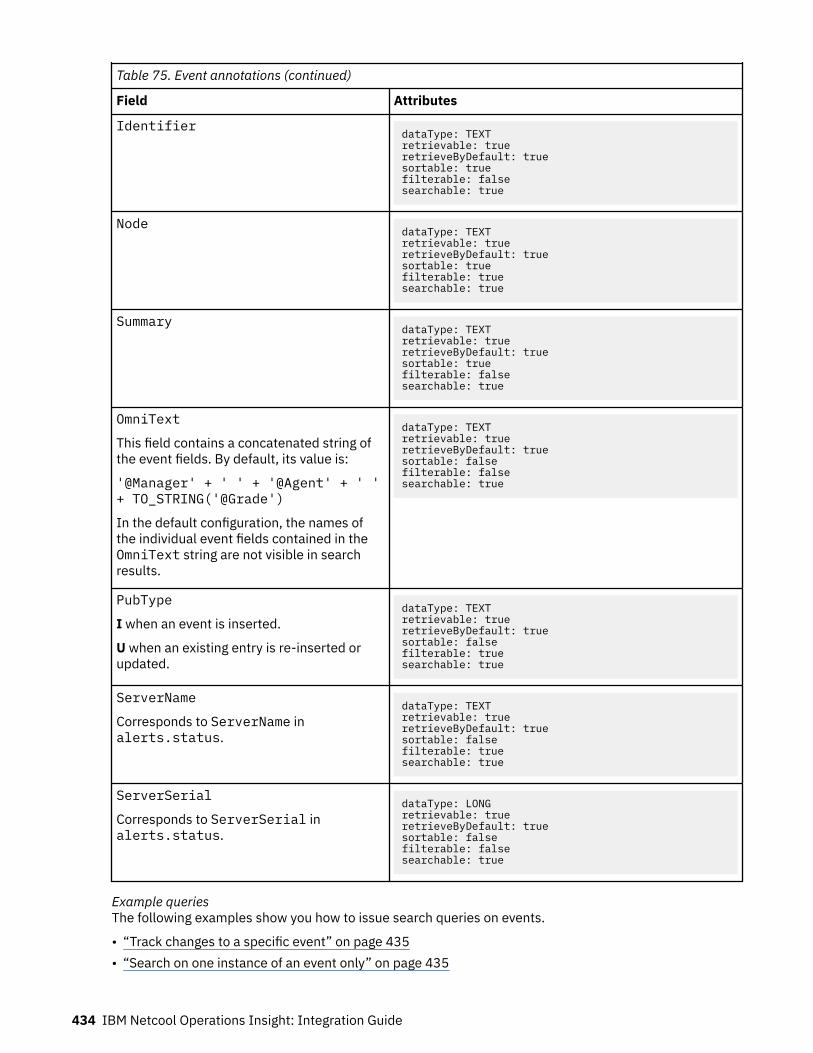
Table 75. Event annotations (continued)
Field Attributes
IdentifierdataType: TEXT retrievable: true retrieveByDefault: true sortable: true filterable: false searchable: true
NodedataType: TEXT retrievable: true retrieveByDefault: true sortable: true filterable: true searchable: true
SummarydataType: TEXT retrievable: true retrieveByDefault: true sortable: true filterable: false searchable: true
OmniText
This field contains a concatenated string ofthe event fields. By default, its value is:
'@Manager' + ' ' + '@Agent' + ' '+ TO_STRING('@Grade')
In the default configuration, the names ofthe individual event fields contained in theOmniText string are not visible in searchresults.
dataType: TEXT retrievable: true retrieveByDefault: true sortable: false filterable: false searchable: true
PubType
I when an event is inserted.
U when an existing entry is re-inserted orupdated.
dataType: TEXT retrievable: true retrieveByDefault: true sortable: false filterable: true searchable: true
ServerName
Corresponds to ServerName inalerts.status.
dataType: TEXT retrievable: true retrieveByDefault: true sortable: false filterable: true searchable: true
ServerSerial
Corresponds to ServerSerial inalerts.status.
dataType: LONG retrievable: true retrieveByDefault: true sortable: false filterable: false searchable: true
Example queriesThe following examples show you how to issue search queries on events.
• “Track changes to a specific event” on page 435• “Search on one instance of an event only” on page 435
434 IBM Netcool Operations Insight: Integration Guide
Track changes to a specific eventIssue the following search to track changes to a specific event:
ServerSerial:NNNN AND ServerName:NCOMS
Where NNNN is the serial number and NCOMS is the name of the server.
Search on one instance of an event onlyIssue the following search to search on one instance of an event only:
NOT PubType:U
Customizing the events used in Event SearchYou can send an extended set of Netcool/OMNIbus event fields to Operations Analytics - Log Analysis andchart results based on those fields.
About this taskIf you are adding or removing fields for the first time, then the OMNIbus insight generator tool can be usedfor adding or removing an extended set of fields to the OMNIbus insight pack. The advantages of usingthis new tool are:
• It upgrades the existing OMNIbus insight pack.• There is no need to delete the existing datasource and its data.• The existing dashboards and any custom dashboards continue to work.
The OMNIbus insight generator tool can be downloaded from here: https://www.ibm.com/support/pages/node/6335269
Note: If you have previously used the addIndex.sh script to add additional fields and created theDSVToolkit based insight pack, then continue to use this instead of the OMNIbus insight generator tool.
What to do nextIf you install a newer version of the OMNIbus Insight pack than your customized one, then it will overwritethe custom fields, and you will need to run the OMNIbus insight generator tool again to restore yourcustomizations.
Customizing events used in Event Search using the addIndex.sh scriptUse the addIndex.sh script if you are running Netcool Operations Insight v1.4.1.2 or later versions. If youare adding or removing fields for the first time, then the OMNIbus insight generator tool can be used foradding or removing an extended set of fields to the OMNIbus insight pack.
Setting up and activating an initial set of custom eventsYou must first create a datasource type containing the extended set of Netcool/OMNIbus event fields tosend to Operations Analytics - Log Analysis, and then update the Netcool/OMNIbus datasource alreadydefined in Operations Analytics - Log Analysis to use this type. You then modify and restart the Gatewayfor Message Bus and Event Search will then chart results based on the custom fields you specified.
Before you beginEnsure that the following prerequisites are in place before performing this task:
• Operations Analytics - Log Analysis 1.3.3 or 1.3.5 is installed.• On the Operations Analytics - Log Analysis server, the $UNITY_HOME environment variable is set to the
directory where Operations Analytics - Log Analysis is installed.• The DSV toolkit is installed in the $UNITY_HOME/unity_content/DSVToolkit_v1.1.0.4 directory
and you have write access to the directory.• A version of python, which is compatible with the Operations Analytics - Log Analysis release, is
installed and is on the system path.
Chapter 6. Configuring 435

• Tivoli Netcool/OMNIbus Insight Pack V1.3.1 is installed on the Operations Analytics - Log Analysisserver.
About this taskYou have added a new custom field to the ObjectServer alerts.status table and you want to updatethe datasource to send this field to Operations Analytics - Log Analysis along with the other fields, so thatEvent Search can present charts and dashboards using this new custom field. For the purposes of thistask, we will assume that the new custom field stores a trouble ticket number, and is calledTicketNumber.
Creating a custom data source typeCreate a custom data source type to include the new custom field in addition to the existing default fields.
About this taskIn Operations Analytics - Log Analysis a data source is an entity that enables Operations Analytics - LogAnalysis to ingest data from a specific source. In order for Operations Analytics - Log Analysis to ingestdata from Netcool/OMNIbus, a data source is required.
A data source type is a template for a data source, and lists out the event fields to send to OperationsAnalytics - Log Analysis, together with relevant control parameters for each field. You can have multipledata source types, each set up with a different set of event fields; the advantage of this is that you caneasily change the events in the data source using a predefined data source type.
The default datasource type is called OMNIbus1100, and this datasource type contains the default set ofevents that are sent to Operations Analytics - Log Analysis.
Procedure1. Log into the Operations Analytics - Log Analysis server and open a terminal there.2. Unzip the contents of Tivoli Netcool/OMNIbus Insight Pack V1.3.1 to a local directory.
This procedure assumes that the archive has been unzipped to the following location:
/home/user/OMNIbusInsightPack_v1.3.1
3. Go to the docs sub-directory within the location to which you unzipped the file.
cd /home/user/OMNIbusINsightPack_v1.3.1/docs
4. Edit the omnibus1100_template.properties file using a text editor of your choice, for example,vi:
vi omnibus1100_template.properties
The omnibus1100_template.properties file contains index definitions corresponding to one ormore fields to be sent using the data source. For the Netcool/OMNIbus data source all of the eventfields must be indexed, so the omnibus1100_template.properties file contains an index entry foreach event field to be sent to Operations Analytics - Log Analysis.
5. Add the new custom field to the end of the omnibus1100_template.properties file.The following code snippet shows the beginning of the file and the end of the file.
# Properties file controlling data source specification# Add new fields at the end of the file # 'moduleName' specifies the name of the data source. # Update the version number if you have created a data source with the same name previously and want # to upgrade it to add an additional field.
<existing index definitions, one for each of the default event fields>
# ----------------------------------------------------------------------------------------------# Insert new fields after this point. # Number each field sequentially, starting with 'field19'. # See the IBM Smart Cloud Log Analytics documentation for the DSV Toolkit for an explanation
436 IBM Netcool Operations Insight: Integration Guide
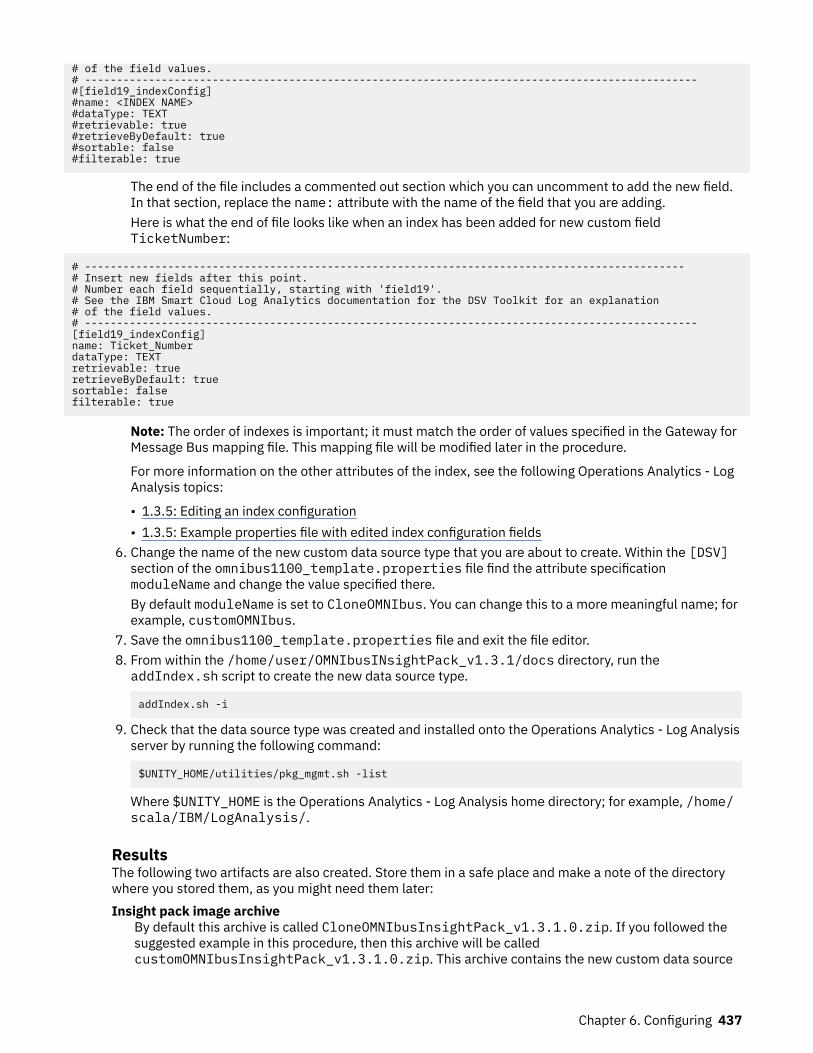
# of the field values. # ------------------------------------------------------------------------------------------------#[field19_indexConfig] #name: <INDEX NAME> #dataType: TEXT #retrievable: true #retrieveByDefault: true #sortable: false #filterable: true
The end of the file includes a commented out section which you can uncomment to add the new field.In that section, replace the name: attribute with the name of the field that you are adding.Here is what the end of file looks like when an index has been added for new custom fieldTicketNumber:
# ----------------------------------------------------------------------------------------------# Insert new fields after this point. # Number each field sequentially, starting with 'field19'. # See the IBM Smart Cloud Log Analytics documentation for the DSV Toolkit for an explanation # of the field values. # ------------------------------------------------------------------------------------------------[field19_indexConfig] name: Ticket_Number dataType: TEXT retrievable: true retrieveByDefault: true sortable: false filterable: true
Note: The order of indexes is important; it must match the order of values specified in the Gateway forMessage Bus mapping file. This mapping file will be modified later in the procedure.
For more information on the other attributes of the index, see the following Operations Analytics - LogAnalysis topics:
• 1.3.5: Editing an index configuration• 1.3.5: Example properties file with edited index configuration fields
6. Change the name of the new custom data source type that you are about to create. Within the [DSV]section of the omnibus1100_template.properties file find the attribute specificationmoduleName and change the value specified there.By default moduleName is set to CloneOMNIbus. You can change this to a more meaningful name; forexample, customOMNIbus.
7. Save the omnibus1100_template.properties file and exit the file editor.8. From within the /home/user/OMNIbusINsightPack_v1.3.1/docs directory, run theaddIndex.sh script to create the new data source type.
addIndex.sh -i
9. Check that the data source type was created and installed onto the Operations Analytics - Log Analysisserver by running the following command:
$UNITY_HOME/utilities/pkg_mgmt.sh -list
Where $UNITY_HOME is the Operations Analytics - Log Analysis home directory; for example, /home/scala/IBM/LogAnalysis/.
ResultsThe following two artifacts are also created. Store them in a safe place and make a note of the directorywhere you stored them, as you might need them later:Insight pack image archive
By default this archive is called CloneOMNIbusInsightPack_v1.3.1.0.zip. If you followed thesuggested example in this procedure, then this archive will be calledcustomOMNIbusInsightPack_v1.3.1.0.zip. This archive contains the new custom data source
Chapter 6. Configuring 437
type; you need a copy of this image if you ever want to delete it from the system in the future. Thearchive is located in the following directory:
/home/user/OMNIbusINsightPack_v1.3.1/dist
Template properties fileThis is the omnibus1100_template.properties file that you edited during this procedure. Keep acopy of this file in case you want to modify the data source type settings at a later time.
Creating a custom data sourceCreate a new data source based on the custom data source type you created earlier.
Before you beginThe Web GUI right click tools and Event Search dashboards and charts are coded to use a data sourcenamed omnibus. The prerequisite for this task varies depending on whether you have ever ingested datainto the existing omnibus data source.
• If you have already ingested data into the existing omnibus data source then you must delete the data.For information on how to do this, see Operations Analytics - Log Analysis 1.3.5 documentation:Deleting data .
• If you have not yet ingested data into the existing omnibus data source then simply delete this datasource.
Procedure1. In Operations Analytics - Log Analysis, start the Add Data Source wizard and configure an "omnibus"
data source for Netcool/OMNIbus events.Only a single data source is required. The event management tools in the Web GUI support a singledata source only.a) In the Select Location panel, select Custom and type the Netcool/OMNIbus server host name.
Enter the same host name that was used for the JsonMsgHostname transport property of theGateway for Message Bus.
b) In the Select Data panel, enter the following field values:
Field Value
File path NCOMS. This is the default value of the jsonMsgPath transport property of theGateway for Message Bus. If you changed this value from the default, change thevalue of the File path field accordingly.
Type This is the name of the data source type on which this data source is based.
• To use the default data source type, specify OMNIbus1100.• To use a customized data source type, specify the name of the customized data
source type; for example: customOMNIbus
Collection OMNIbus1100-Collection
c) In the Set Attributes panel, enter the following field values:
Field Value
Name omnibus. Ensure that the value that you type is the same as the value of thescala.datasource property in the Web GUI server.init file. If the Name fieldhas a value other than omnibus, use the same value for the scala.datasourceproperty.
Group Leave this field blank.
438 IBM Netcool Operations Insight: Integration Guide
Field Value
Description Type a description of your choice.
2. Configure access to the data source you set up in the previous step. This involves the following steps inthe administrative settings for Operations Analytics - Log Analysis:a) Create a role using the Roles tab, for example, noirole, and ensure you assign the role permission
to access the data source.b) Add a user, for example, noiuser, and assign the role you created that has permissions to access
the data source (in this example, noirole).
For information about creating and modifying users and roles in Operations Analytics - Log Analysis,see one of the following links:
• V1.3.6: see https://www.ibm.com/support/knowledgecenter/SSPFMY_1.3.5/com.ibm.scala.doc/config/iwa_config_pinstall_userrole_ovw_c.html
• V1.3.3: see https://www.ibm.com/support/knowledgecenter/SSPFMY_1.3.3/com.ibm.scala.doc/config/iwa_config_pinstall_userrole_ovw_c.html
.
Note: The contents of the Netcool/OMNIbus Insight Pack dashboards are empty unless you log in witha user that has a role assigned with permissions to access the data source.
Modifying the Gateway for Message Bus mappingYou must modify the Gateway for Message Bus mapping to include the new custom field or fields.
Before you beginThe mapping that you configure in this task must match the order of fields configured in your custom datasource type, as specified in “Creating a custom data source type” on page 436.
You must collect the following information prior to performing this task:
• Location of a Gateway for Message Bus mapping file that is compliant with the current version of theNetcool/OMNIbus Insight Pack.
• Name and location of the Gateway for Message Bus properties file.
Procedure1. Copy a Gateway for Message Bus mapping file that is compliant with the current version of the
Netcool/OMNIbus Insight Pack.For example, for Netcool/OMNIbus Insight Pack V1.3.0.2 and above, you can copy the file$OMNIHOME/gates/xml/scala/xml1302.map. In the following example, the file is copied to a filecalled xmlCustom1302.map:
cp $OMNIHOME/gates/xml/scala/xml1302.map $OMNIHOME/gates/xml/scala/xmlCustom1302.map
2. Add a command after the last entry in the CREATE MAPPING StatusMap section of the file.For example, if the last entry is a line specifying the ServerSerial field, then add a comma at the end ofthat line, like this:
'ServerSerial' = '@ServerSerial', );
3. For the purposes of this task, we assume that you are adding a new custom field that stores a troubleticket number, and this field is called TicketNumber. Add this custom field after the last entry in theCREATE MAPPING StatusMap section of the Gateway for Message Bus mapping file, before theterminating parenthesis.
Chapter 6. Configuring 439
'ServerSerial' = '@ServerSerial', 'TicketNumber' = '@TicketNumber' );
4. Save the Gateway for Message Bus mapping file, xmlCustom1302.map.5. Locate the Gateway for Message Bus properties file.
By default this file is called G_SCALA.properties and it is located in the following directory:
$OMNIHOME/gates/xml/scala/G_SCALA.props
Where $OMNIHOME is /opt/IBM/tivoli/netcool/omnibus/.6. Edit the Gateway for Message Bus properties file G_SCALA.properties using a text editor of your
choice; for example, vi.
vi G_SCALA.properties
7. Change the Gate.MapFile parameter to refer to the new mapping file.For example:
Gate.MapFile :'$OMNIHOME/gates/xml/scala/xmlClone1302.map'
8. Save and close the Gateway for Message Bus properties file G_SCALA.properties.9. Restart the Gateway for Message Bus.
Updating the set of custom eventsYou can update the custom events used by Event Search.
Updating the custom data source typeUpdate the custom data source type that you created earlier to include additional fields. All data sourcesbased on this data source type will automatically update to include the fields that you added.
Before you beginYou must have already created a custom data source type, as described in “Creating a custom data sourcetype” on page 436.
About this taskThe following procedure describes how to add a field to an existing data source type.
Restriction: You can add additional fields to the data source type at any time; however, once data hasbeen ingested using a data source based on this type, you cannot modify or delete any of the added fields.
Procedure1. Go to the following location:2. Edit the omnibus1100_template.properties file using a text editor of your choice, for example,
vi:
vi omnibus1100_template.properties
The omnibus1100_template.properties file contains index definitions corresponding to one ormore fields to be sent using the data source. For the Netcool/OMNIbus data source all of the eventfields must be indexed, so the omnibus1100_template.properties file contains an index entry foreach event field to be sent to Operations Analytics - Log Analysis.
3. Add the new custom field to the end of the omnibus1100_template.properties file.The following code snippet shows the beginning of the file and the end of the file.
# Properties file controlling data source specification# Add new fields at the end of the file # 'moduleName' specifies the name of the data source.
440 IBM Netcool Operations Insight: Integration Guide
# Update the version number if you have created a data source with the same name previously and want # to upgrade it to add an additional field.
<existing index definitions, one for each of the default event fields>
# ----------------------------------------------------------------------------------------------# Insert new fields after this point. # Number each field sequentially, starting with 'field19'. # See the IBM Smart Cloud Log Analytics documentation for the DSV Toolkit for an explanation # of the field values. # ------------------------------------------------------------------------------------------------#[field19_indexConfig] #name: <INDEX NAME> #dataType: TEXT #retrievable: true #retrieveByDefault: true #sortable: false #filterable: true
The end of the file includes a commented out section which you can uncomment to add the new field.In that section, replace the name: attribute with the name of the field that you are adding.Here is what the end of file looks like when an index has been added for new custom fieldTicketNumber:
# ----------------------------------------------------------------------------------------------# Insert new fields after this point. # Number each field sequentially, starting with 'field19'. # See the IBM Smart Cloud Log Analytics documentation for the DSV Toolkit for an explanation # of the field values. # ------------------------------------------------------------------------------------------------[field19_indexConfig] name: Ticket_Number dataType: TEXT retrievable: true retrieveByDefault: true sortable: false filterable: true
Note: The order of indexes is important; it must match the order of values specified in the Gateway forMessage Bus mapping file. This mapping file will be modified later in the procedure.
For more information on the other attributes of the index, see the following Operations Analytics - LogAnalysis topics:
• 1.3.5: Editing an index configuration• 1.3.5: Example properties file with edited index configuration fields
4. In the [DSV] section of the file, increase the value of the version parameter.5. Save the omnibus1100_template.properties file and exit the file editor.6. From within the /home/user/OMNIbusINsightPack_v1.3.1/docs directory, run theaddIndex.sh script to update the data source type.
addIndex.sh -u
Restriction: You can add additional fields to the data source type at any time; however, once data hasbeen ingested using a data source based on this type, you cannot modify or delete any of the addedfields.
Modifying the Gateway for Message Bus mappingYou must modify the Gateway for Message Bus mapping to include the new custom field or fields.
Before you beginThe mapping that you configure in this task must match the order of fields configured in your custom datasource type, as specified in “Creating a custom data source type” on page 436.
You must collect the following information prior to performing this task:
Chapter 6. Configuring 441
• Location of a Gateway for Message Bus mapping file that is compliant with the current version of theNetcool/OMNIbus Insight Pack.
• Name and location of the Gateway for Message Bus properties file.
Procedure1. Copy a Gateway for Message Bus mapping file that is compliant with the current version of the
Netcool/OMNIbus Insight Pack.For example, for Netcool/OMNIbus Insight Pack V1.3.0.2 and above, you can copy the file$OMNIHOME/gates/xml/scala/xml1302.map. In the following example, the file is copied to a filecalled xmlCustom1302.map:
cp $OMNIHOME/gates/xml/scala/xml1302.map $OMNIHOME/gates/xml/scala/xmlCustom1302.map
2. Add a command after the last entry in the CREATE MAPPING StatusMap section of the file.For example, if the last entry is a line specifying the ServerSerial field, then add a comma at the end ofthat line, like this:
'ServerSerial' = '@ServerSerial', );
3. For the purposes of this task, we assume that you are adding a new custom field that stores a troubleticket number, and this field is called TicketNumber. Add this custom field after the last entry in theCREATE MAPPING StatusMap section of the Gateway for Message Bus mapping file, before theterminating parenthesis.
'ServerSerial' = '@ServerSerial', 'TicketNumber' = '@TicketNumber' );
4. Save the Gateway for Message Bus mapping file, xmlCustom1302.map.5. Locate the Gateway for Message Bus properties file.
By default this file is called G_SCALA.properties and it is located in the following directory:
$OMNIHOME/gates/xml/scala/G_SCALA.props
Where $OMNIHOME is /opt/IBM/tivoli/netcool/omnibus/.6. Edit the Gateway for Message Bus properties file G_SCALA.properties using a text editor of your
choice; for example, vi.
vi G_SCALA.properties
7. Change the Gate.MapFile parameter to refer to the new mapping file.For example:
Gate.MapFile :'$OMNIHOME/gates/xml/scala/xmlClone1302.map'
8. Save and close the Gateway for Message Bus properties file G_SCALA.properties.9. Restart the Gateway for Message Bus.
Customizing events used in Event Search using the DSV toolkitYou must use the DSV toolkit to add events to Event Search if you are running Netcool Operations Insightv1.4.1.1 or lower, and are therefore using Tivoli Netcool/OMNIbus Insight Pack V1.3.0.2.
Before you beginYou can use the DSV toolkit to generate a customized insight pack. The DSV toolkit is provided with theOperations Analytics - Log Analysis product, in $UNITY_HOME/unity_content/DSVToolkit_v1.1.0.4. In the properties file, you can change the index configurations to meet yourrequirements
442 IBM Netcool Operations Insight: Integration Guide

A new source type with an updated index configuration is created when you install the insight pack. Aninsight pack contains the following elements:
• An index configuration: defines how the fields are indexed in Operations Analytics - Log Analysis.• A splitter: splits the ingested data into individual log entries.• An annotator: splits the log entries into fields to be indexed.
The Netcool/OMNIbus insight pack requires the newlineSplitter.aql custom splitter, and the insightpack can use an annotator built using the DSV toolkit. To modify the index configuration, and generate adata source to ingest the data with the new index, you need to create a new insight pack using the DSVtoolkit and modify it to use the Netcool Operations Insight newlineSplitter.aql.
• See the DSV toolkit documentation in the $UNITY_HOME/unity_content/DSVToolkit_v1.1.0.4/docs directory for information about specifying field properties and generating insight packs.
• See the Gateway for Message Bus documentation for information about mapping event fields to insightpack properties. Testing insight packs requires a Gateway for Message Bus to transfer events fromNetcool/OMNIbus to Operations Analytics - Log Analysis.
About this taskUse the DSV toolkit to generate an insight pack that contains a new rule set (annotator and splitter) for theNetcool/OMNIbus event fields that you want.
The procedure describes how to create an insight pack called ITEventsInsightPack_V1.1.0.1, based onthe Tivoli Netcool/OMNIbus Insight Pack V1.3.0.2. Use your own naming as appropriate.
Procedure1. Make a copy of the omnibus1100.properties file, which is in the docs directory of the Tivoli
Netcool/OMNIbus Insight Pack installation directory ($UNITY_HOME/unity_content/OMNIbusInsightPack_v1.3.0.2), and rename it.For example, rename it to ITEvents.properties.
2. Copy the ITEvents.properties file that you created in step “1” on page 443 to the DSV toolkitdirectory $UNITY_HOME/unity_content/DSVToolkit_v1.1.0.4.
3. Edit the ITEvents.properties file.For example, change the default value of the aqlModuleName field to ITEvents, and add, modify, orremove event field properties as required. To obtain the version number V1.1.0.1, change theversion property to 1.1.0.1.
4. If you added or removed fields from the file, change the value of the totalColumns field so that itspecifies the total number of fields in the file.
5. Use the following command to generate an insight pack:
python dsvGen.py ITEvents.properties -o
The insight pack is named ITEventsInsightPack_V1.1.0.1.6. Add the customized splitter into the insight pack as follows:
a) Create the following directory for the splitter: $UNITY_HOME/unity_content/DSVToolkit_v1.1.0.4/build/ITEventsInsightPack_v1.1.0.1/extractors/ruleset/splitter
b) Extract the Netcool/OMNIbus insight pack and copy the following file:
Insight Pack Extract Directory/OMNIbusInsightPack_v1.3.0.2/extractors/ruleset/splitter/newlineSplitter.aql
to
$UNITY_HOME/unity_content/DSVToolkit_v1.1.0.4/build/ITEventsInsightPack_v1.1.0.1/extractors/ruleset/splitter/
Chapter 6. Configuring 443
c) Open the file $UNITY_HOME/unity_content/DSVToolkit_v1.1.0.4/build/ITEventsInsightPack_v1.1.0.1/metadata/filesets.json and remove the following text:
,{"name":"ITEvents-Split","type":0,"fileType":0,"fileName":"Dsv.jar","className":"com.ibm.tivoli.unity.content.insightpack.dsv.extractor.splitter.DsvSplitter"}
d) Open the file $UNITY_HOME/unity_content/DSVToolkit_v1.1.0.4/build/ITEventsInsightPack_v1.1.0.1/metadata/ruleset.json and add the following text:
[{"name":"ITEvents-Split","type":0,"rulesFileDirectory":"extractors\/ruleset\/splitter"}]
e) Open the file $UNITY_HOME/unity_content/DSVToolkit_v1.1.0.4/build/ITEventsInsightPack_v1.1.0.1/metadata/sourcetypes.json and change the followingtext:
"splitter":{"fileSet":"ITEvents-Split","ruleSet":null,"type":1}
to
"splitter":{"fileSet":null,"ruleSet":"ITEvents-Split","type":1}f) Go to $UNITY_HOME/unity_content/DSVToolkit_v1.1.0.4/build and compress the
contents of the insight pack directory using the zip command utility to create a new insight pack.Ensure you run the command from the /build directory to preserve the directory structure in theresulting .zip file (in this example, the directory is /ITEventsInsightPack_v1.1.0.1, so thefile would be ITEventsInsightPack_v1.1.0.1.zip).
For example:
zip -r ITEventsInsightPack_v1.3.0.2.zip ITEventsInsightPack_v1.3.0.2
g) Install the insight pack using the $UNITY_HOME/utilities/pkg_mgmt.sh command asdescribed in “Installing the Tivoli Netcool/OMNIbus Insight Pack” on page 69.
7. Test the insight pack:a) Create a temporary data source in Operations Analytics - Log Analysis for the new Source Type and
Collection created by the DSV toolkit.b) Change the Gateway for Message Bus map file to match the fields that you defined in theITEvents.properties file.
Important: The order of the column entries must match exactly the order of the alert field entriesin the gateway map file.
See the Gateway for Message Bus documentation for information about configuring the map file.c) In the gateway scalaTransport.properties file, modify the values of the jsonMsgHostname
and jsonMsgLogPath properties to match the attributes of the new data source that you createdin step “7.a” on page 444.
d) Test the new configuration.8. Create a new data source called "omnibus" by using the new source type defined in the ITEvents
Insight Pack.
Important: You cannot rename an existing data source to the default name omnibus or use anexisting data source that is named omnibus. You must delete the existing data source, then create thenew data source and name it omnibus.
What to do nextTest the new insight pack in the Operations Analytics - Log Analysis UI.
444 IBM Netcool Operations Insight: Integration Guide
Customizing the AppsThe following procedure describes how to generate customized versions of the Custom Apps providedwith the Insight Pack.
Before you beginConsult the Operations Analytics - Log Analysis documentation for information about creating CustomApps and building Insight Packs with the Eclipse-based Insight Pack Tooling.
Testing Insight Packs requires a Gateway for Message Bus to transfer events from Netcool/OMNIbus toOperations Analytics - Log Analysis.
About this taskThe procedure is divided into two main parts:
1. Create a new Custom App, based on the Custom App provided with the Insight Pack.2. Use the Operations Analytics - Log Analysis Eclipse-based Insight Pack Tooling to build a new Insight
Pack that contains the new Custom App.
ProcedureCreate a new Custom App
1. Copy all the files in the $UNITY_HOME/AppFramework/Apps/OMNIbusInsightPack_version_number directory to a new directory under $UNITY_HOME/AppFramework/Apps/.
For example, copy them to $UNITY_HOME/AppFramework/Apps/ITEvents.2. In the $UNITY_HOME/AppFramework/Apps/ITEvents directory, rename all the App files fromOMNIbus_*.app to NewName_*.app.
For example, rename OMNIbus_Event_Distribution.app to ITEvents_Distribution.app.3. Modify ITEvents_Distribution.app as required.
For example customizations, see “Example customization: OMNIbus Static Dashboard” on page 446.4. Test the new Custom App.
Build a new Insight Pack with the Eclipse Tooling5. Import the Netcool/OMNIbus Insight Pack, $UNITY_HOME/unity_content/OMNIbusInsightPack_version_number.zip, into the Insight Pack Tooling.
6. Use the Refactor > Rename command to create a new name for the Insight Pack, for example,ITEvents.
7. Import your Custom App files from the $UNITY_HOME/AppFramework/Apps/ITEvents directoryto the src-files/unity_apps/apps Tooling directory.
8. When the files are successfully imported, remove the $UNITY_HOME/AppFramework/Apps/ITEvents directory.
9. Build the Insight Pack.
The new Insight Pack is named ITEventsInsightPack_V1.1.0.1.zip and is located in the distTooling directory.
10. Use the following command to install the new Insight Pack:
pkg_mgtm.sh -install directory_path/ITEventsInsightPack_V1.1.0.1.zip
Where directory_path is the directory path to the dist Tooling directory.
What to do nextTest the new Insight Pack and Custom App.
Chapter 6. Configuring 445
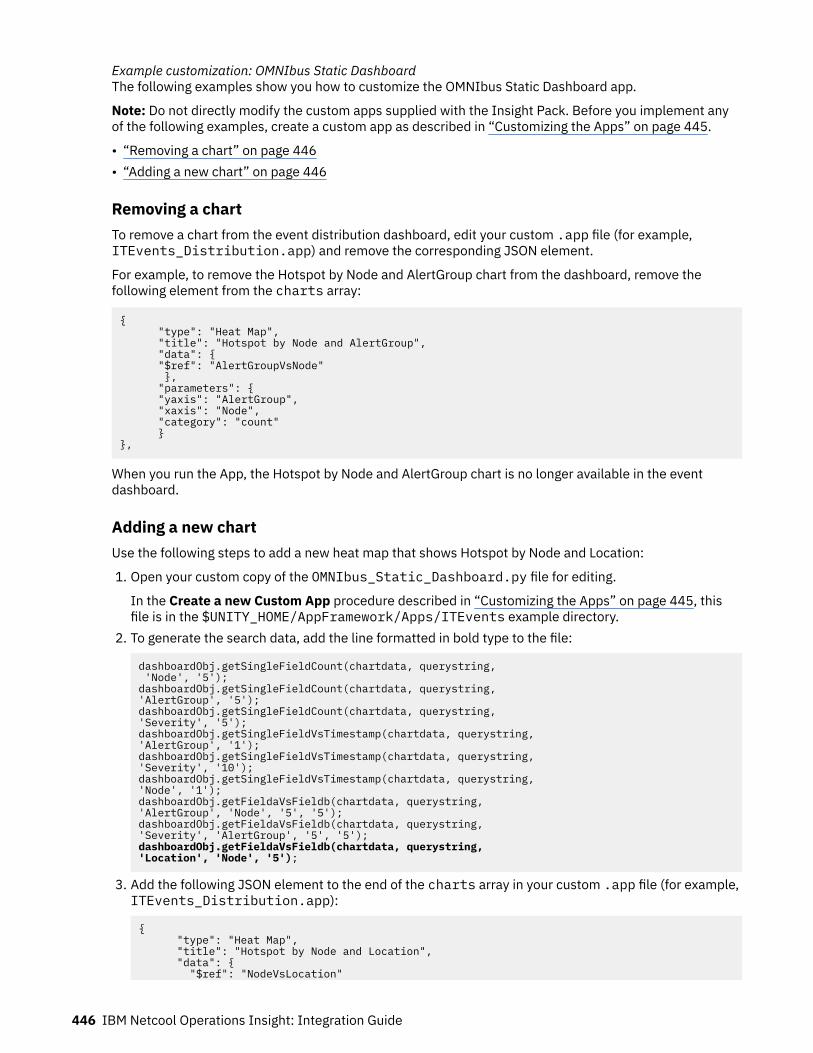
Example customization: OMNIbus Static DashboardThe following examples show you how to customize the OMNIbus Static Dashboard app.
Note: Do not directly modify the custom apps supplied with the Insight Pack. Before you implement anyof the following examples, create a custom app as described in “Customizing the Apps” on page 445.
• “Removing a chart” on page 446• “Adding a new chart” on page 446
Removing a chartTo remove a chart from the event distribution dashboard, edit your custom .app file (for example,ITEvents_Distribution.app) and remove the corresponding JSON element.
For example, to remove the Hotspot by Node and AlertGroup chart from the dashboard, remove thefollowing element from the charts array:
{ "type": "Heat Map", "title": "Hotspot by Node and AlertGroup", "data": { "$ref": "AlertGroupVsNode" }, "parameters": { "yaxis": "AlertGroup", "xaxis": "Node", "category": "count" }},
When you run the App, the Hotspot by Node and AlertGroup chart is no longer available in the eventdashboard.
Adding a new chartUse the following steps to add a new heat map that shows Hotspot by Node and Location:
1. Open your custom copy of the OMNIbus_Static_Dashboard.py file for editing.
In the Create a new Custom App procedure described in “Customizing the Apps” on page 445, thisfile is in the $UNITY_HOME/AppFramework/Apps/ITEvents example directory.
2. To generate the search data, add the line formatted in bold type to the file:
dashboardObj.getSingleFieldCount(chartdata, querystring, 'Node', '5');dashboardObj.getSingleFieldCount(chartdata, querystring, 'AlertGroup', '5');dashboardObj.getSingleFieldCount(chartdata, querystring, 'Severity', '5');dashboardObj.getSingleFieldVsTimestamp(chartdata, querystring, 'AlertGroup', '1');dashboardObj.getSingleFieldVsTimestamp(chartdata, querystring, 'Severity', '10');dashboardObj.getSingleFieldVsTimestamp(chartdata, querystring, 'Node', '1');dashboardObj.getFieldaVsFieldb(chartdata, querystring, 'AlertGroup', 'Node', '5', '5');dashboardObj.getFieldaVsFieldb(chartdata, querystring, 'Severity', 'AlertGroup', '5', '5');dashboardObj.getFieldaVsFieldb(chartdata, querystring, 'Location', 'Node', '5');
3. Add the following JSON element to the end of the charts array in your custom .app file (for example,ITEvents_Distribution.app):
{ "type": "Heat Map", "title": "Hotspot by Node and Location", "data": { "$ref": "NodeVsLocation"
446 IBM Netcool Operations Insight: Integration Guide
}, "parameters": { "yaxis": "Node", "xaxis": "Location", "category": "count" } },
The following table lists the values allowed for each JSON object.
Object Values
type Specifies the chart type.
Depending on the functions that you add toOMNIbus_Static_Dashboard.py, the following chart types are available:
• The getSingleFieldCount function enables the following types: LineChart, Pie Chart, Simple Bar Chart, Point Chart.
• The getSingleFieldVsTimeStamp function enables the following types:Bubble Chart, Bar Chart, Two Series Line Chart, Stacked BarChart, Heat Map, Cluster Bar, Stacked Line Chart.
• The getFieldaVsFieldb function enables the following types: BubbleChart, Bar Chart, Two Series Line Chart, Stacked Bar Chart,Heat Map, Cluster Bar, Stacked Line Chart.
title You can specify a title of your choice.
$ref Specifies the data reference.
Depending on the functions that you add toOMNIbus_Static_Dashboard.py, the following data reference values areavailable:
• The getSingleFieldCount function enables the following value:FieldNameCount
• The getSingleFieldVsTimeStamp function enables the following value:FieldNameVsTime
• The getFieldaVsFieldb function enables the following value:FieldNameAVsFieldNameB
Where FieldName is case-sensitive and matches the event field name in theindex configuration of your source type.
parameters Specifies the yaxis, xaxis, and categories chart parameters.
Depending on the functions that you add toOMNIbus_Static_Dashboard.py, the following chart parameter values areavailable:
• The getSingleFieldCount function enables the following values:FieldName, count.
• The getSingleFieldVsTimeStamp function enables the following values:FieldName, date, count.
• The getFieldaVsFieldb function enables the following values:FieldNameA, FieldNameB, count.
Where FieldName is case-sensitive and matches the event field name in theindex configuration of your source type.
When you run the App, the new Node over AlertGroup chart is displayed in the event dashboard.
Chapter 6. Configuring 447

Customizing dynamic dashboardsYou can create new dynamic dashboards, or customize the OMNIbus Dynamic Dashboard andOMNIbus_Operational_Efficiencyapps, and the apps in the Event_Analysis_And_Reduction wizard. Youcan change the data source and time range filters of these apps.
For more information about creating new dynamic dashboards and customizing the apps, see thefollowing topics, depending on your version of Operations Analytics - Log Analysis:
• V1.3.5: https://www.ibm.com/support/knowledgecenter/SSPFMY_1.3.5/com.ibm.scala.doc/use/scla_extend_create_dboard_t.html .
• V1.3.3: https://www.ibm.com/support/knowledgecenter/SSPFMY_1.3.3/com.ibm.scala.doc/use/scla_extend_create_dboard_t.html
Important: Do not directly modify the custom apps that are supplied with the Insight Pack. Before youcustomize an app, create a custom app as described in “Customizing the Apps” on page 445.
To avoid inconsistent results, change the data source or the time range filter for each chart in yourcustom .app file.
Configuring Topology SearchThe topology search capability is an extension of the Networks for Operations Insight feature. It appliesthe search and analysis capabilities of Operations Analytics - Log Analysis to give insight into networkperformance. Events that have been enriched with network data are analyzed by the Network ManagerInsight Pack and are used to calculate the lowest-cost routes between two endpoints on the networktopology over time. The events that occurred along the routes over the specified time period are identifiedand shown by severity. The topology search requires the Networks for Operations Insight feature to beinstalled and configured. The topology search capability can plot the lowest-cost route across a networkbetween two end points and display all the events that occur on the devices on the routes.
The Network Manager IP Edition product enriches all the event data that is generated by the devices onthe network topology. It is stored in Tivoli Netcool/OMNIbus, so that the Operations Analytics - LogAnalysis product can cross-reference devices and events. The Gateway for Message Bus is used to passevent data from Tivoli Netcool/OMNIbus to Operations Analytics - Log Analysis. Also, the NetworkManager Insight Pack reads topology data from the NCIM database in Network Manager IP Edition toidentify the paths in the topology between the devices.
The scope of the topology search capability is that of the entire topology network, which includes allNCIM domains. To restrict the topology search to a single domain, you can configure a properties file thatis included in the Network Manager Insight Pack.
After the Insight Pack is installed, you can run the apps from the Operations Analytics - Log Analysis UI.With Network Manager IP Edition installed and configured, the apps can also be run as right-click toolsfrom the Network Views. With Tivoli Netcool/OMNIbus Web GUI installed and configured, the apps can berun as right-click tools from the Event Viewer and Active Event List (AEL).
The custom apps use the network-enriched event data and the topology data from the Network ManagerIP Edition NCIM database. They plot the lowest-cost routes across the network between two nodes (thatis, network entities) and count the events that occurred on the nodes along the routes. You can specifydifferent time periods for the route and events. The algorithm uses the speed of the interfaces along theroutes to calculate the routes that are lowest-cost. That is, the fastest routes from start to end alongwhich a packet can be sent. The network topology is based on the most recent discovery. Historical routesare not accounted for. If your network topology is changeable, the routes between the nodes can changeover time. If the network is stable, the routes stay current.
Before you beginEnsure that you have a good knowledge of your network before you implement the topology searchcapability. Over large network topologies, the topology search can be performance intensive. It istherefore important to determine which parts of your network you want to use the topology search on.You can define those parts of the network into a single domain. Alternatively, implement the cross-domain discovery function in Network Manager IP Edition to create a single aggregation domain of the
448 IBM Netcool Operations Insight: Integration Guide
domains that you want to search. You can restrict the scope of the topology search to that domain oraggregation domain. For more information about deploying Network Manager IP Edition to monitornetworks of small, medium, and larger networks, see https://www.ibm.com/support/knowledgecenter/SSSHRK_4.2.0/install/concept/ovr_deploymentseg.html . For more information about the cross-domaindiscovery function, see https://www.ibm.com/support/knowledgecenter/SSSHRK_4.2.0/disco/task/dsc_configuringcrossdomaindiscoveries.html .
Supported products and componentsThe topology search capability is supported on a specific combination of products and components.Ensure that your environment has the requisite support before you enable topology search. Theserequirements apply to both new and upgraded environments.
The topology search capability requires the following products and components.
• Operations Analytics - Log Analysis V1.3 or later with the OMNIbusInsightPack_v1.3.1 and theNetworkManagerInsightPack_V1.3.0.0.
• Tivoli Netcool/OMNIbus Core V8.1.0.2 and Tivoli Netcool/OMNIbus Web GUI V8.1.0.2 or later. Installthe Install tools and menus for event search with IBM SmartCloud Analytics - Log Analysis featureas part of the Web GUI installation.
• Gateway for Message Bus package version 6.0 or later. Earlier package versions do not include theconfigurations that are required for the topology search capability.
• Network Manager V4.1.1.1 or later. The topology search capability requires that the NCIM database forthe network topology is IBM Db2 9.7 or 10.1. Oracle 10g or 11g is also supported, but requires moreconfiguration than Db2. Although the Network Manager product supports other databases for storingthe topology, the topology search capability is supported only on these databases.
Network Manager Insight PackThe Network Manager Insight Pack reads event data and network topology data so that it can be searchedand visualized in the IBM Operations Analytics - Log Analysis product.
The Network Manager IP Edition product enriches all the event data that is generated by the devices onthe network topology. It is stored in Tivoli Netcool/OMNIbus, so that the Operations Analytics - LogAnalysis product can cross-reference devices and events. The Gateway for Message Bus is used to passevent data from Tivoli Netcool/OMNIbus to Operations Analytics - Log Analysis. Also, the NetworkManager Insight Pack reads topology data from the NCIM database in Network Manager IP Edition toidentify the paths in the topology between the devices.
The scope of the topology search capability is that of the entire topology network, which includes allNCIM domains. To restrict the topology search to a single domain, you can configure a properties file thatis included in the Network Manager Insight Pack.
Content of the Insight PackThe data ingestion artifacts that are included in the Network Manager Insight Pack.
• Custom apps, which are described in Table 76 on page 450.
A rule set, source type, and collection are provided in the OMNIbusInsightPack_v1.3.1, which theNetwork Manager Insight Pack uses.
Custom appsThe following table describes the custom apps in the Insight Pack. After the Insight Pack is installed, youcan run the apps from the Operations Analytics - Log Analysis UI. With Network Manager IP Editioninstalled and configured, the apps can also be run as right-click tools from the Network Views. With TivoliNetcool/OMNIbus Web GUI installed and configured, the apps can be run as right-click tools from theEvent Viewer and Active Event List (AEL).
The custom apps use the network-enriched event data and the topology data from the Network ManagerIP Edition NCIM database. They plot the lowest-cost routes across the network between two nodes (thatis, network entities) and count the events that occurred on the nodes along the routes. You can specify
Chapter 6. Configuring 449
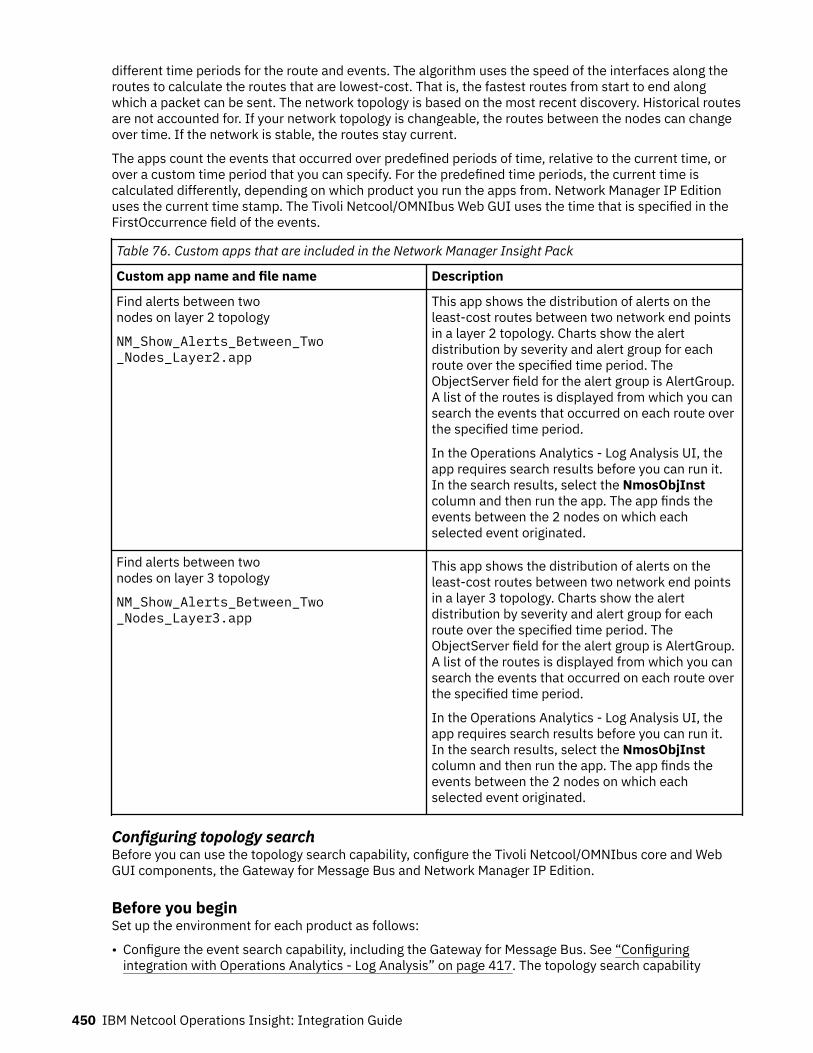
different time periods for the route and events. The algorithm uses the speed of the interfaces along theroutes to calculate the routes that are lowest-cost. That is, the fastest routes from start to end alongwhich a packet can be sent. The network topology is based on the most recent discovery. Historical routesare not accounted for. If your network topology is changeable, the routes between the nodes can changeover time. If the network is stable, the routes stay current.
The apps count the events that occurred over predefined periods of time, relative to the current time, orover a custom time period that you can specify. For the predefined time periods, the current time iscalculated differently, depending on which product you run the apps from. Network Manager IP Editionuses the current time stamp. The Tivoli Netcool/OMNIbus Web GUI uses the time that is specified in theFirstOccurrence field of the events.
Table 76. Custom apps that are included in the Network Manager Insight Pack
Custom app name and file name Description
Find alerts between twonodes on layer 2 topology
NM_Show_Alerts_Between_Two_Nodes_Layer2.app
This app shows the distribution of alerts on theleast-cost routes between two network end pointsin a layer 2 topology. Charts show the alertdistribution by severity and alert group for eachroute over the specified time period. TheObjectServer field for the alert group is AlertGroup.A list of the routes is displayed from which you cansearch the events that occurred on each route overthe specified time period.
In the Operations Analytics - Log Analysis UI, theapp requires search results before you can run it.In the search results, select the NmosObjInstcolumn and then run the app. The app finds theevents between the 2 nodes on which eachselected event originated.
Find alerts between twonodes on layer 3 topology
NM_Show_Alerts_Between_Two_Nodes_Layer3.app
This app shows the distribution of alerts on theleast-cost routes between two network end pointsin a layer 3 topology. Charts show the alertdistribution by severity and alert group for eachroute over the specified time period. TheObjectServer field for the alert group is AlertGroup.A list of the routes is displayed from which you cansearch the events that occurred on each route overthe specified time period.
In the Operations Analytics - Log Analysis UI, theapp requires search results before you can run it.In the search results, select the NmosObjInstcolumn and then run the app. The app finds theevents between the 2 nodes on which eachselected event originated.
Configuring topology searchBefore you can use the topology search capability, configure the Tivoli Netcool/OMNIbus core and WebGUI components, the Gateway for Message Bus and Network Manager IP Edition.
Before you beginSet up the environment for each product as follows:
• Configure the event search capability, including the Gateway for Message Bus. See “Configuringintegration with Operations Analytics - Log Analysis” on page 417. The topology search capability
450 IBM Netcool Operations Insight: Integration Guide
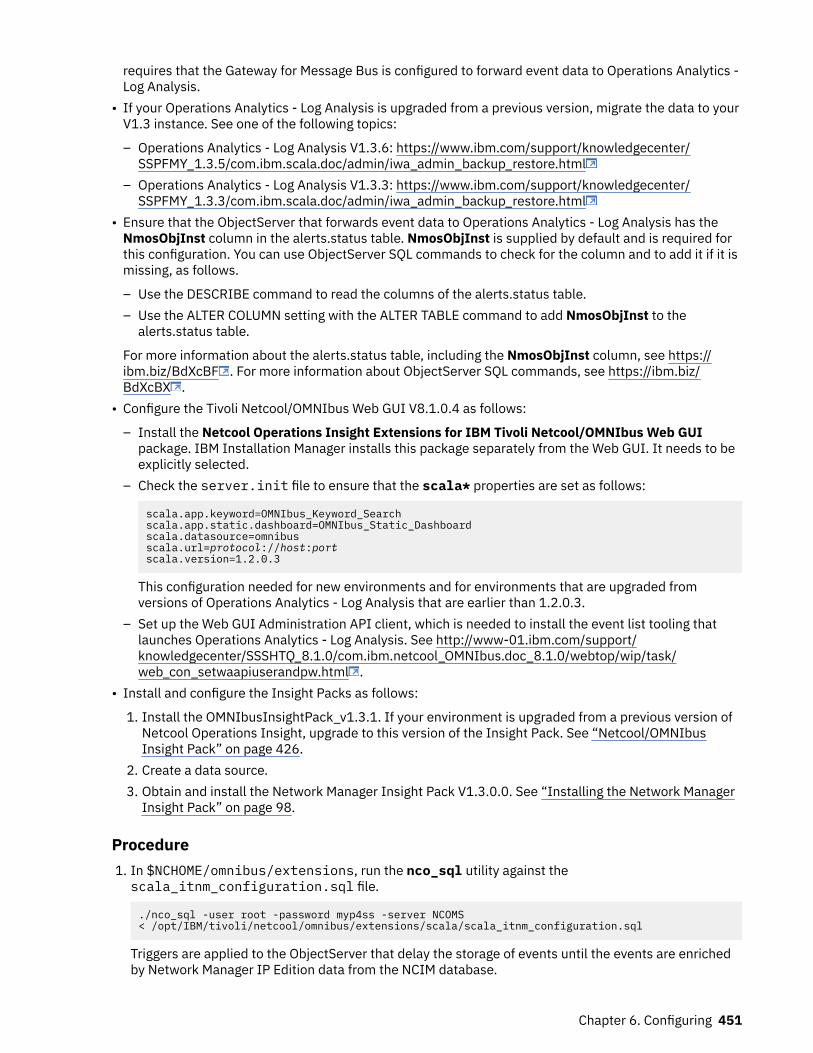
requires that the Gateway for Message Bus is configured to forward event data to Operations Analytics -Log Analysis.
• If your Operations Analytics - Log Analysis is upgraded from a previous version, migrate the data to yourV1.3 instance. See one of the following topics:
– Operations Analytics - Log Analysis V1.3.6: https://www.ibm.com/support/knowledgecenter/SSPFMY_1.3.5/com.ibm.scala.doc/admin/iwa_admin_backup_restore.html
– Operations Analytics - Log Analysis V1.3.3: https://www.ibm.com/support/knowledgecenter/SSPFMY_1.3.3/com.ibm.scala.doc/admin/iwa_admin_backup_restore.html
• Ensure that the ObjectServer that forwards event data to Operations Analytics - Log Analysis has theNmosObjInst column in the alerts.status table. NmosObjInst is supplied by default and is required forthis configuration. You can use ObjectServer SQL commands to check for the column and to add it if it ismissing, as follows.
– Use the DESCRIBE command to read the columns of the alerts.status table.– Use the ALTER COLUMN setting with the ALTER TABLE command to add NmosObjInst to the
alerts.status table.
For more information about the alerts.status table, including the NmosObjInst column, see https://ibm.biz/BdXcBF . For more information about ObjectServer SQL commands, see https://ibm.biz/BdXcBX .
• Configure the Tivoli Netcool/OMNIbus Web GUI V8.1.0.4 as follows:
– Install the Netcool Operations Insight Extensions for IBM Tivoli Netcool/OMNIbus Web GUIpackage. IBM Installation Manager installs this package separately from the Web GUI. It needs to beexplicitly selected.
– Check the server.init file to ensure that the scala* properties are set as follows:
scala.app.keyword=OMNIbus_Keyword_Searchscala.app.static.dashboard=OMNIbus_Static_Dashboardscala.datasource=omnibusscala.url=protocol://host:portscala.version=1.2.0.3
This configuration needed for new environments and for environments that are upgraded fromversions of Operations Analytics - Log Analysis that are earlier than 1.2.0.3.
– Set up the Web GUI Administration API client, which is needed to install the event list tooling thatlaunches Operations Analytics - Log Analysis. See http://www-01.ibm.com/support/knowledgecenter/SSSHTQ_8.1.0/com.ibm.netcool_OMNIbus.doc_8.1.0/webtop/wip/task/web_con_setwaapiuserandpw.html .
• Install and configure the Insight Packs as follows:
1. Install the OMNIbusInsightPack_v1.3.1. If your environment is upgraded from a previous version ofNetcool Operations Insight, upgrade to this version of the Insight Pack. See “Netcool/OMNIbusInsight Pack” on page 426.
2. Create a data source.3. Obtain and install the Network Manager Insight Pack V1.3.0.0. See “Installing the Network Manager
Insight Pack” on page 98.
Procedure1. In $NCHOME/omnibus/extensions, run the nco_sql utility against thescala_itnm_configuration.sql file.
./nco_sql -user root -password myp4ss -server NCOMS < /opt/IBM/tivoli/netcool/omnibus/extensions/scala/scala_itnm_configuration.sql
Triggers are applied to the ObjectServer that delay the storage of events until the events are enrichedby Network Manager IP Edition data from the NCIM database.
Chapter 6. Configuring 451
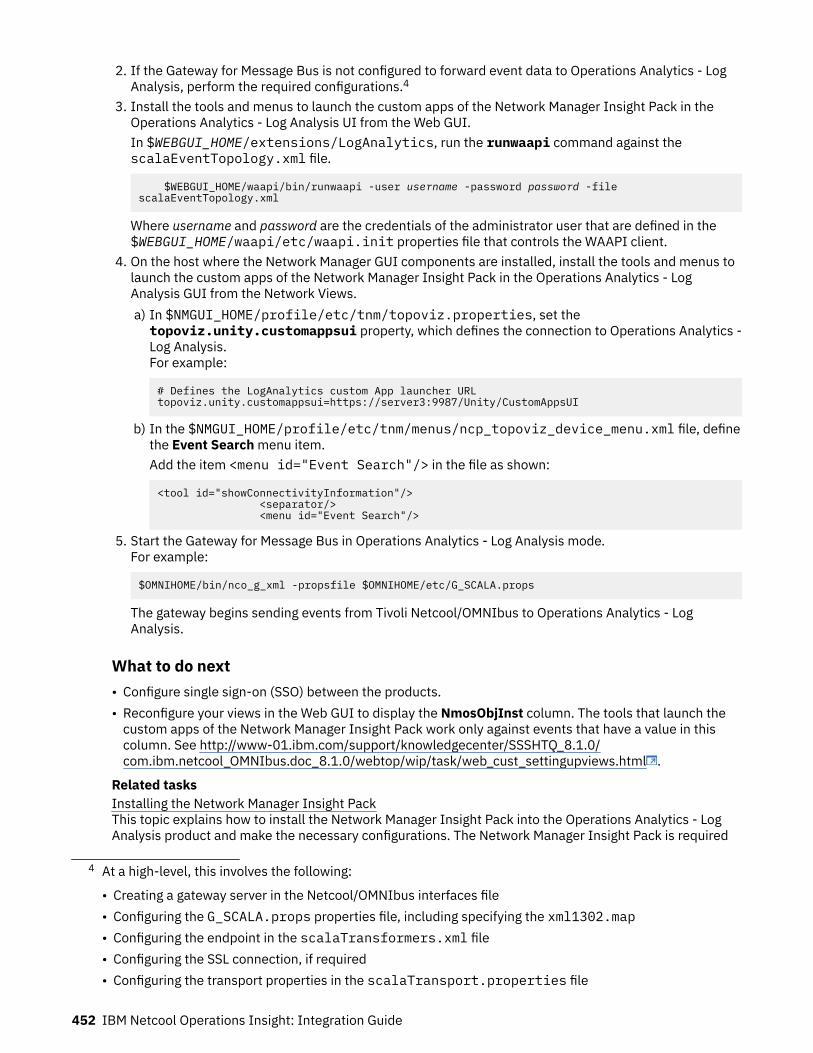
2. If the Gateway for Message Bus is not configured to forward event data to Operations Analytics - LogAnalysis, perform the required configurations.4
3. Install the tools and menus to launch the custom apps of the Network Manager Insight Pack in theOperations Analytics - Log Analysis UI from the Web GUI.In $WEBGUI_HOME/extensions/LogAnalytics, run the runwaapi command against thescalaEventTopology.xml file.
$WEBGUI_HOME/waapi/bin/runwaapi -user username -password password -file scalaEventTopology.xml
Where username and password are the credentials of the administrator user that are defined in the$WEBGUI_HOME/waapi/etc/waapi.init properties file that controls the WAAPI client.
4. On the host where the Network Manager GUI components are installed, install the tools and menus tolaunch the custom apps of the Network Manager Insight Pack in the Operations Analytics - LogAnalysis GUI from the Network Views.a) In $NMGUI_HOME/profile/etc/tnm/topoviz.properties, set thetopoviz.unity.customappsui property, which defines the connection to Operations Analytics -Log Analysis.For example:
# Defines the LogAnalytics custom App launcher URL topoviz.unity.customappsui=https://server3:9987/Unity/CustomAppsUI
b) In the $NMGUI_HOME/profile/etc/tnm/menus/ncp_topoviz_device_menu.xml file, definethe Event Search menu item.Add the item <menu id="Event Search"/> in the file as shown:
<tool id="showConnectivityInformation"/> <separator/> <menu id="Event Search"/>
5. Start the Gateway for Message Bus in Operations Analytics - Log Analysis mode.For example:
$OMNIHOME/bin/nco_g_xml -propsfile $OMNIHOME/etc/G_SCALA.props
The gateway begins sending events from Tivoli Netcool/OMNIbus to Operations Analytics - LogAnalysis.
What to do next• Configure single sign-on (SSO) between the products.• Reconfigure your views in the Web GUI to display the NmosObjInst column. The tools that launch the
custom apps of the Network Manager Insight Pack work only against events that have a value in thiscolumn. See http://www-01.ibm.com/support/knowledgecenter/SSSHTQ_8.1.0/com.ibm.netcool_OMNIbus.doc_8.1.0/webtop/wip/task/web_cust_settingupviews.html .
Related tasksInstalling the Network Manager Insight PackThis topic explains how to install the Network Manager Insight Pack into the Operations Analytics - LogAnalysis product and make the necessary configurations. The Network Manager Insight Pack is required
4 At a high-level, this involves the following:
• Creating a gateway server in the Netcool/OMNIbus interfaces file• Configuring the G_SCALA.props properties file, including specifying the xml1302.map• Configuring the endpoint in the scalaTransformers.xml file• Configuring the SSL connection, if required• Configuring the transport properties in the scalaTransport.properties file
452 IBM Netcool Operations Insight: Integration Guide

only if you deploy the Networks for Operations Insight feature and want to use the topology searchcapability. For more information, see “Network Manager Insight Pack” on page 449. Operations Analytics- Log Analysis can be running while you install the Insight Pack.
Configuring single sign-on for the topology search capabilityConfigure single sign-on (SSO) between the Dashboard Application Services Hub that hosts the NetworkManager IP Edition GUI components and Operations Analytics - Log Analysis so that users can switchbetween the two products without having to log in each time. First, create dedicated users in your LDAPdirectory, which must be used by both products for user authentication, and then configure the SSOconnection.
Procedure1. Create the dedicated users and groups in your LDAP directory.
For example:
a. Create a new Organization Unit (OU) named NetworkManagement.b. Under the NetworkManagement OU, create a new group named itnmldap.c. Under the NetworkManagement OU, create the following new users: itnm1, itnm2, itnm3, and
itnm4.d. Add the new users to the itnmldap group.
2. In Dashboard Application Services Hub, assign the itnmldap group that you created in step “1” onpage 453 to a Network Manager IP Edition user group that can access the Network Views.Network Manager IP Edition user roles are controlled by assignments to user groups. Possible usergroups that can access the Network Views are Network_Manager_IP_Admin andNetwork_Manager_User.
3. Configure the SSO connection from the Operations Analytics - Log Analysis product to the DashboardApplication Services Hub instance in which Network Manager IP Edition is hosted.For more information about configuring SSO for Operations Analytics - Log Analysis, see theOperations Analytics - Log Analysis documentation.The following steps of the Operations Analytics - Log Analysis SSO configuration are important:
• Assign Operations Analytics - Log Analysis roles to the users and groups that you created in step “1”on page 453.
• In the $SCALAHOME/wlp/usr/servers/Unity/server.xml/server.xml file, ensure that the<webAppSecurity> element has a httpOnlyCookies="false" attribute. Add this line before the closing</server> element. For example:
<webAppSecurity ssoDomainNames="hostname" httpOnlyCookies="false"/></server>
The httpOnlyCookies="false" attribute disables the httponly flag on the cookie that is generated byOperations Analytics - Log Analysis and is required to enable SSO with Network Manager IP EditionGUI.
Configuring Topology SearchYou can configure and customize the Network Manager Insight Pack to meet your requirements.Related conceptsNetwork Management tasks
Verifying that the Insight Pack was installedRun the pkg_mgmt command to verify that the Insight Pack was installed, or check the OperationsAnalytics - Log Analysis.
Procedure• Run the pkg_mgmt as follows:
Chapter 6. Configuring 453
$SCALA_HOME/utilities/pkg_mgmt.sh -list
Search the results for a line similar to the following example. In this example, V1.3.0.0 is installed.[packagemanager] NetworkManagerInsightPack_V1.3.0.0 /home/myhome/IBM/LogAnalysis/unity_content/NetworkManager
• On the Operations Analytics - Log Analysis UI, check for the following items in the Search Dashboardsarea: NetworkManagerInsightPack > Find events between two nodes on layer 3 topology orNetworkManagerInsightPack > Find events between two nodes on layer 2 topology
Event annotationsThe event annotations that are defined by the Network Manager Insight Pack index configuration file.These fields are the same as those in the Tivoli Netcool/OMNIbus Insight Pack.
For more information, see “Netcool/OMNIbus Insight Pack” on page 426.
Configuring topology search apps for use with Oracle databasesIf you are using an Oracle database for topology storage (that is, as the NCIM database), obtain the Oracledriver and point to the driver in the custom apps. You can skip this task if you are using a Db2 database.You can make this configuration while the products and Insight Pack are still running.
Before you beginInstall and configure the supported products, and install and configure the Network Manager Insight Pack
Procedure1. Obtain and install the Oracle driver from the Oracle website.2. On the Operations Analytics - Log Analysis host, save the driver to $UNITY_HOME/wlp/usr/servers/Unity/apps/Unity.war/WEB-INF/lib.
3. Point the custom apps to the driver:a) Open the following files for editing:
• $UNITY_HOME/AppFramework/Apps/NetworkManagerInsightPack_v1.3.0.0/Network_Topology_Search/NM_Show_Alerts_Between_Two_Nodes_Layer2.sh
• $UNITY_HOME/AppFramework/Apps/NetworkManagerInsightPack_v1.3.0.0/Network_Topology_Search/NM_Show_Alerts_Between_Two_Nodes_Layer3.sh
b) Insert the path to the Oracle driver into the classpath parameter.For example, change it from this classpath:
$UNITY_LIB_PATH/db2jcc.jar:$UNITY_LIB_PATH/log4j-1.2.16.jar
To this classpath:
To: $UNITY_LIB_PATH/db2jcc.jar:$UNITY_LIB_PATH/ojdbc14.jar:$UNITY_LIB_PATH/log4j-1.2.16.jar
4. In the $UNITY_HOME/AppFramework/Apps/NetworkManagerInsightPack_V1.3.0.0/Network_Topology_Search/NM_EndToEndSearch.properties file, which point the InsightPack to the NCIM database, ensure that the following properties for Oracle are correctly set.ncp.dla.datasource.type
Enter oracle.ncp.dla.datasource.driver
Enter the driver name, for example oracle.jdbc.driver.OracleDriver.ncp.dla.datasource.url
Enter the URL, in the format jdbc:oracle:thin:@host:port:name, where name is the nameof the database. For example, jdbc:oracle:thin:@192.168.1.2:1521:itnm
454 IBM Netcool Operations Insight: Integration Guide
Customizing the index configurationBecause the rule set, source type, and collection are provided in the OMNIbusInsightPack_v1.3.1, anycustomizations must be made to that Insight Pack, not the Network Manager Insight Pack. Refer to theOMNIbusInsightPack_v1.3.1 README for more information about customizing that Insight Pack.
For more information, see “Netcool/OMNIbus Insight Pack” on page 426.
Troubleshooting configurationUse the entries in this section to troubleshoot configuration problems.
Troubleshooting configuration on Cloud and hybrid systemsUse these troubleshooting entries to help resolve problems and to see known issues for configuration onCloud and hybrid systems.
Error 500 on policies screenThis issue occurs on both a hybrid and full stack deployment of Netcool Operations Insight. The policiesscreen is showing an error when you run data ingestion and train commands to get data into Cassandra.
ProblemWhen running data ingestion and training to create policies in the Manage Policies screen, no policies arecreated in Cassandra. In the UI, the Manage Policies screen gives the error 500 and you are unable toproceed.
ResolutionTo solve the issue, perform the following actions:
1. Scale down the policyregistryservice deployment by running the command:
oc scale deployment noi-ibm-hdm-analytics-dev-policyregistryservice -n noi --replicas=0
2. Delete the pods from the list below:
-ibm-hdm-analytics-dev-archivingservice-ibm-ea-asm-mime-eaasmmime-ibm-ea-mime-classification-eaasmmimecls-ibm-hdm-analytics-dev-trainer
by running the command:
oc delete pod <pod_name>
Where <pod_name> needs to be substituted each time with the name of the pods from the list.3. Scale the policyregistryservice back to the original number of instances. Run the command:
oc scale deployment noi-ibm-hdm-analytics-dev-policyregistryservice -n noi --replicas=2
Unable to run loadSampleData.sh script on hybrid systemsAn error is returned when running the loadSampleData.sh script on a hybrid environment on an SSLObjectServer. On hybrid systems in general, the replaying of historic events to an SSL enabledObjectServer is not supported . Attempts to do so result in a write: broken pipe error.
ProblemAn error is returned when running the loadSampleData.sh script on a hybrid environment on an SSLObjectServer.
Chapter 6. Configuring 455
CauseThe ea-events-tooling used to load sample data into a system does not support SSL.
Resolution1. Run the example command that you find after running oc get noihybrid, to get a template calledloadsampleData.yaml
Note: You need to have at least one port exposed on the object server that does not use SSL.2. Make the following changes to load the sample data into the remote object server:
• Remove the volumes block, where $RELEASE_NAME, is the name of your release:
volumes: - name: ca secret: secretName: $RELEASE_NAME-omni-certificate-secret items: - key: ROOTCA path: rootca
• Remove the following ca volume mount section from the container specifications at theinstalldemoeventsfortraining:
volumeMounts: - name: ca mountPath: /ca readOnly: true
• Remove the following parameters at the container installdemoeventsfortraining.$RELEASE_NAME corresponds to your release name.
- name: NOIOMNIBUS_OS_TRUSTSTORE_PASSWORD valueFrom: secretKeyRef: name: $RELEASE_NAME-omni-certificate-secret key: PASSWORD optional: false
- name: NOIOMNIBUS_OS_TRUSTSTORE_PATH value: "/ca/omnibusTrustStore" - name: NOIOMNIBUS_OS_SSL_PROTOCOL value: "TLSv1.2"
• Modify the object server port number from:
- name: $RELEASE_NAME_OBJSERV_AGG_PRIMARY_SERVICE_PORT value: "secure port number"
To a non SSL port number, for example, 9100:
- name: $RELEASE_NAME_OBJSERV_AGG_PRIMARY_SERVICE_PORT value: "9100"
You can find the non SSL port number by referring to the omni.dat file in your remote system. Notethat if there is no none-ssl port number configured you cannot use these utilities.
Runbook Automation: disabled triggers are picked up instead of enabledtriggersChanges are not picked up when a second trigger is created and the original trigger is disabled.
ProblemRunbooks are not being linked to events as defined in the enabled trigger. A disabled trigger is beingactivated instead.
456 IBM Netcool Operations Insight: Integration Guide
ResolutionDelete the disabled trigger to avoid this problem.
Runbook Automation and Netcool/Impact integration: ObjectServermaximum row size errorThis error might be encountered when running the IBM Tivoli Netcool/Impact V7.1.0.20rba_objectserver_fields_updateFP19.sql script to update the ObjectServer with the newRunbookIDArray field. The script is run as part of the runbook automation and Netcool/Impactintegration steps.
SymptomsWhen running the script on the ObjectServer, the following error is displayed:
./nco_sql -username root -password password -server AGG_P < rba_objectserver_fields_updateFP19.sqlERROR=Row size too large on line 34 of statement'----------------------------------------------------------------...', at ornear 'status'
The new RunbookIDArray field is not added when this error occurs.
CausesThe ObjectServer is running close to the maximum row size of 64KB. As a result, it does not allow the newcolumn of varchar(2048) to be added and the error message above is generated.
Resolving the problemTry reducing the varchar to something smaller, for example (1024). Note, this might also reduce thetesting capacity.
Scope-based grouping not workingThe field that is used to set ScopeID is not available at initial event insertion time.
ProblemIf the ScopeID is based on the field values that are available at the event insertion time, then the ScopeBased UI can be used to create a scope-based policy.
If the ScopeID is based on any enrichments (fields that are not available at initial event insertion time),then the ScopeID must be updated manually. Any policy created with the Scope based UI is not effectivefor updating the ScopeID based on enrichments.
ResolutionTo update the scope-based grouping after enrichment, you must update ScopeID manually. For example,if you use the Scope Based UI to define a policy and set ScopeID equal to SiteID. At insertion time, theSiteID value is blank and its value is enriched using IBM Tivoli Netcool/Impact in the aggregation layer.Manually update ScopeID to equal SiteID, either in the Netcool/Impact policy or in the ObjectServertrigger. The scope-based group is then recreated based on the updated scope.
Chapter 6. Configuring 457
Troubleshooting configuration on-premisesUse these troubleshooting entries to help resolve problems and to see known issues for on-premisesconfiguration.
Unable to create new users in LDAP using WebSphere Application ServerWhen a new user is created using the WebSphere Application Server, the UniqueName attributereferences the defaultFileBasedRealm instead of LDAP. This means that the new user cannot be assignedto groups and therefore cannot be assigned roles in LDAP.
ProblemWhen a new user is created using the WebSphere Application Server, the UniqueName attributereferences the defaultFileBasedRealm instead of LDAP. This means that the new user cannot be assignedto groups and therefore cannot be assigned roles in LDAP.
ResolutionYou can add more LDAP details in WebSphere Application Server to allow the user to be added to groups.Here is an example. Note that the details given in this example are repository-specific.
1. Remove the ObjectServer definition.
a. Expand Security and click Global Security.b. Scroll down on the page to the User account repository section and click Configure.c. Scroll down on the page to the Repositories in the realm, select the check box for the ObjectServer
entry, and click Remove.d. Click Save.e. Scroll down on the page to the Related Items section and click Manage repositories.f. Check the box to select the ObjectServer entry and click Delete.
g. Click Save.h. Log out of the administrative console.i. Log out of Dashboard Application Services Hub.j. The ObjectServer is removed as a Virtual Member Manager user repository. You must restart the
Dashboard Application Services Hub to complete the removal.2. Stop the Dashboard Application Services Hub.
cd /opt/IBM/JazzSM/profile/bin./stopServer.sh server1 -username smadmin -password password
Unable to configure event patternUnable to configure an event pattern in the Event Patterns GUI due to empty Trigger Action section
ProblemThis occurs if, during the configuration of event pattern processing that is performed as part of EventAnalytics system setup, the historical event database column that was chosen for the default event typedoes not contain any data.
Resolution
458 IBM Netcool Operations Insight: Integration Guide

Chapter 7. Getting started with Netcool OperationsInsight
After you have installed the product, log into the different components of Netcool Operations Insight.
Getting started with Netcool Operations Insight on the cloudGet started with Netcool Operations Insight on the cloud by logging into the Cloud GUI and the AdvancedGUI.
Which GUI to log intoWithin the Cloud-based and hybrid Netcool Operations Insight systems, capabilities are available in boththe Cloud GUI and the Advanced GUI. Use this information to understand which user GUI to log into toaccess the different Netcool Operations Insight capabilities.
Table 77. Which GUI to log into
Log into... To access this capability...
Cloud GUI • Managing incidents• Monitoring events• Configuring analytics• Administering analytics policies• Configuring lightweight integrations, to easily ingest data from a wide range
of Cloud environments, such as Amazon Web Services, Data dog, andDynatrace
• Accessing topology• Accessing runbooks
The Cloud GUI also provides a launch-out capability to Netcool Web GUI,Netcool/Impact, and the topology management service.
Advanced GUI • Advanced event monitoring and configuration using Netcool/OMNIbus WebGUI
• Administering Impact policies using Netcool/Impact• The topology management service• DASH capabilities
Logging into Netcool Operations InsightUse this information to understand how to access and log into the Cloud GUI and the Advanced GUI.
Before you beginIf you are logging into the Cloud GUI in a hybrid environment, then be aware of the followingprerequisites:
• If you are unable to log into your production deployment, then ensure all your certificates are trusted.• If you are unable to log into a demo, proof of concept, or trial deployment, then first, log into the
Advanced GUI using the URL constructed based on the instructions in this topic, and accept thecertificate error. Then, log into the Cloud GUI.
© Copyright IBM Corp. 2020, 2020 459
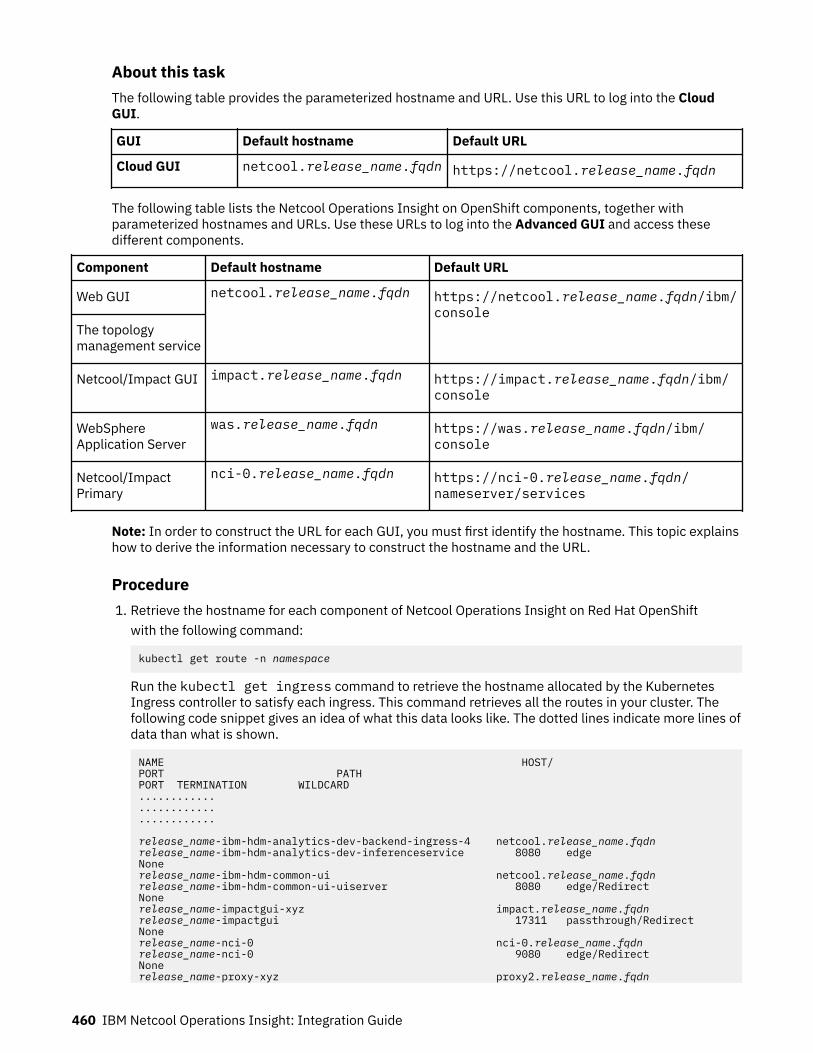
About this taskThe following table provides the parameterized hostname and URL. Use this URL to log into the CloudGUI.
GUI Default hostname Default URL
Cloud GUI netcool.release_name.fqdn https://netcool.release_name.fqdn
The following table lists the Netcool Operations Insight on OpenShift components, together withparameterized hostnames and URLs. Use these URLs to log into the Advanced GUI and access thesedifferent components.
Component Default hostname Default URL
Web GUI netcool.release_name.fqdn https://netcool.release_name.fqdn/ibm/console
The topologymanagement service
Netcool/Impact GUI impact.release_name.fqdn https://impact.release_name.fqdn/ibm/console
WebSphereApplication Server
was.release_name.fqdn https://was.release_name.fqdn/ibm/console
Netcool/ImpactPrimary
nci-0.release_name.fqdn https://nci-0.release_name.fqdn/nameserver/services
Note: In order to construct the URL for each GUI, you must first identify the hostname. This topic explainshow to derive the information necessary to construct the hostname and the URL.
Procedure1. Retrieve the hostname for each component of Netcool Operations Insight on Red Hat OpenShift
with the following command:
kubectl get route -n namespace
Run the kubectl get ingress command to retrieve the hostname allocated by the KubernetesIngress controller to satisfy each ingress. This command retrieves all the routes in your cluster. Thefollowing code snippet gives an idea of what this data looks like. The dotted lines indicate more lines ofdata than what is shown.
NAME HOST/PORT PATH PORT TERMINATION WILDCARD.................................... release_name-ibm-hdm-analytics-dev-backend-ingress-4 netcool.release_name.fqdn release_name-ibm-hdm-analytics-dev-inferenceservice 8080 edge Nonerelease_name-ibm-hdm-common-ui netcool.release_name.fqdn release_name-ibm-hdm-common-ui-uiserver 8080 edge/Redirect Nonerelease_name-impactgui-xyz impact.release_name.fqdn release_name-impactgui 17311 passthrough/Redirect Nonerelease_name-nci-0 nci-0.release_name.fqdn release_name-nci-0 9080 edge/Redirect Nonerelease_name-proxy-xyz proxy2.release_name.fqdn
460 IBM Netcool Operations Insight: Integration Guide
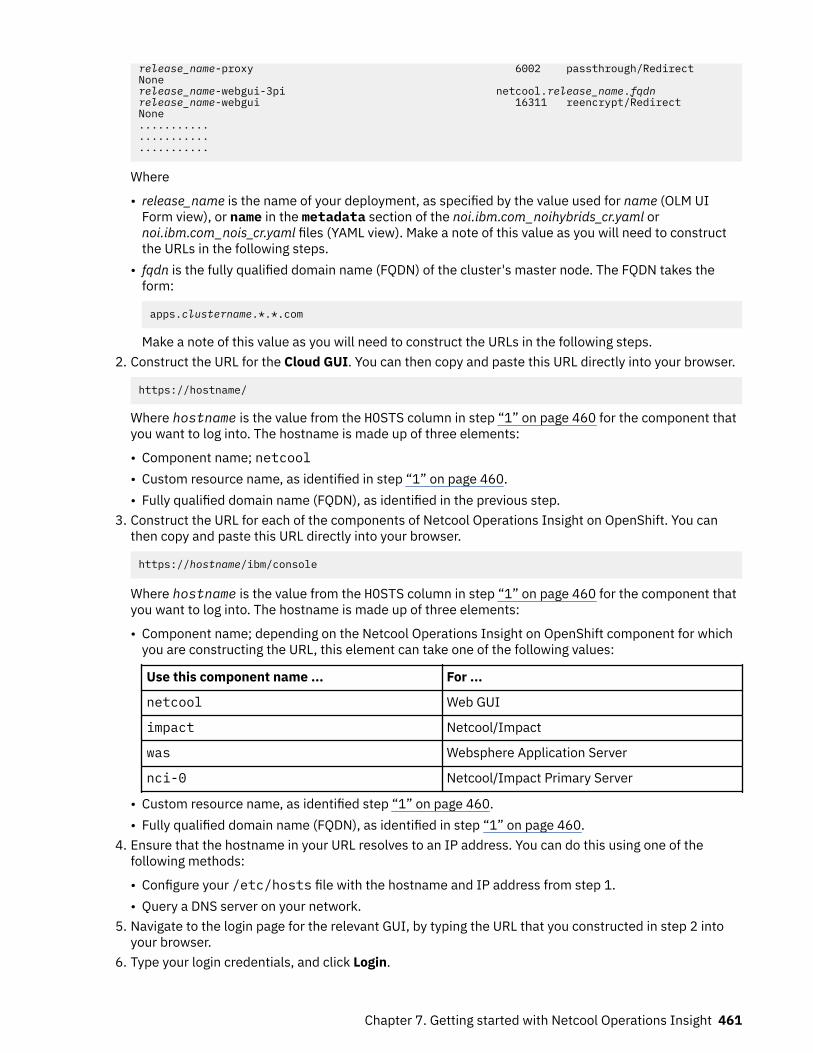
release_name-proxy 6002 passthrough/Redirect Nonerelease_name-webgui-3pi netcool.release_name.fqdn release_name-webgui 16311 reencrypt/Redirect None.................................
Where
• release_name is the name of your deployment, as specified by the value used for name (OLM UIForm view), or name in the metadata section of the noi.ibm.com_noihybrids_cr.yaml ornoi.ibm.com_nois_cr.yaml files (YAML view). Make a note of this value as you will need to constructthe URLs in the following steps.
• fqdn is the fully qualified domain name (FQDN) of the cluster's master node. The FQDN takes theform:
apps.clustername.*.*.com
Make a note of this value as you will need to construct the URLs in the following steps.2. Construct the URL for the Cloud GUI. You can then copy and paste this URL directly into your browser.
https://hostname/
Where hostname is the value from the HOSTS column in step “1” on page 460 for the component thatyou want to log into. The hostname is made up of three elements:
• Component name; netcool• Custom resource name, as identified in step “1” on page 460.• Fully qualified domain name (FQDN), as identified in the previous step.
3. Construct the URL for each of the components of Netcool Operations Insight on OpenShift. You canthen copy and paste this URL directly into your browser.
https://hostname/ibm/console
Where hostname is the value from the HOSTS column in step “1” on page 460 for the component thatyou want to log into. The hostname is made up of three elements:
• Component name; depending on the Netcool Operations Insight on OpenShift component for whichyou are constructing the URL, this element can take one of the following values:
Use this component name ... For ...
netcool Web GUI
impact Netcool/Impact
was Websphere Application Server
nci-0 Netcool/Impact Primary Server
• Custom resource name, as identified step “1” on page 460.• Fully qualified domain name (FQDN), as identified in step “1” on page 460.
4. Ensure that the hostname in your URL resolves to an IP address. You can do this using one of thefollowing methods:
• Configure your /etc/hosts file with the hostname and IP address from step 1.• Query a DNS server on your network.
5. Navigate to the login page for the relevant GUI, by typing the URL that you constructed in step 2 intoyour browser.
6. Type your login credentials, and click Login.
Chapter 7. Getting started with Netcool Operations Insight 461
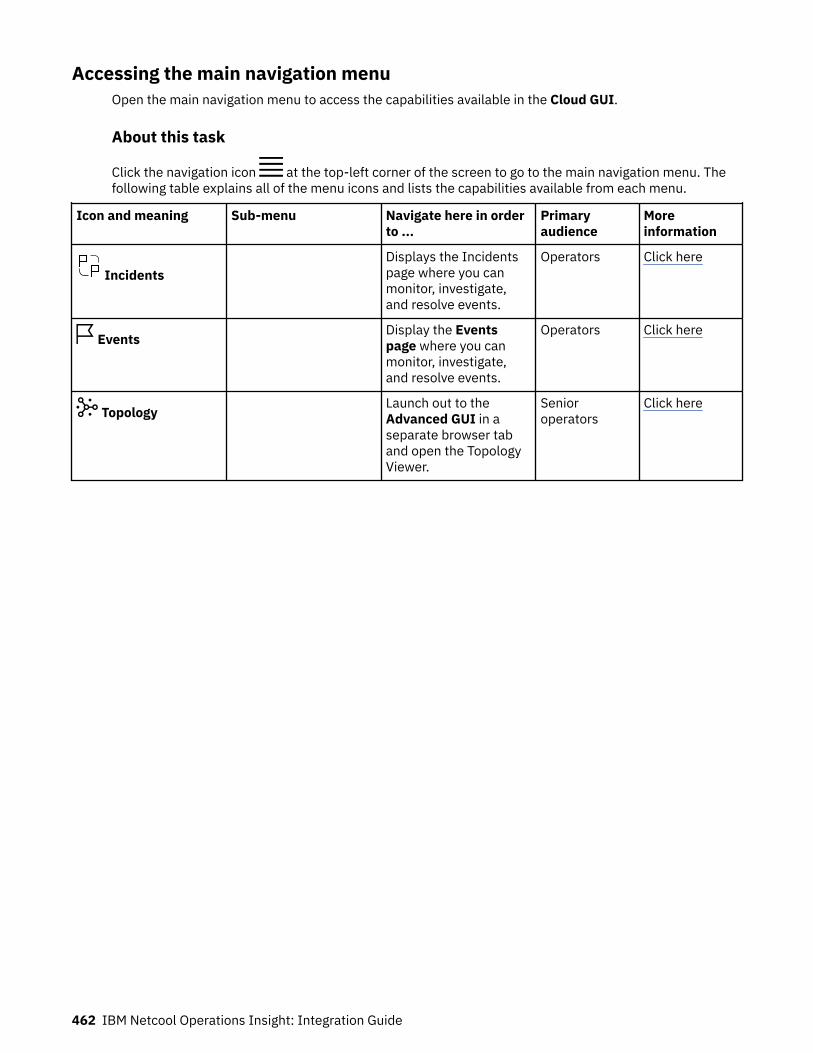
Accessing the main navigation menuOpen the main navigation menu to access the capabilities available in the Cloud GUI.
About this task
Click the navigation icon at the top-left corner of the screen to go to the main navigation menu. Thefollowing table explains all of the menu icons and lists the capabilities available from each menu.
Icon and meaning Sub-menu Navigate here in orderto ...
Primaryaudience
Moreinformation
IncidentsDisplays the Incidentspage where you canmonitor, investigate,and resolve events.
Operators Click here
EventsDisplay the Eventspage where you canmonitor, investigate,and resolve events.
Operators Click here
TopologyLaunch out to theAdvanced GUI in aseparate browser taband open the TopologyViewer.
Senioroperators
Click here
462 IBM Netcool Operations Insight: Integration Guide
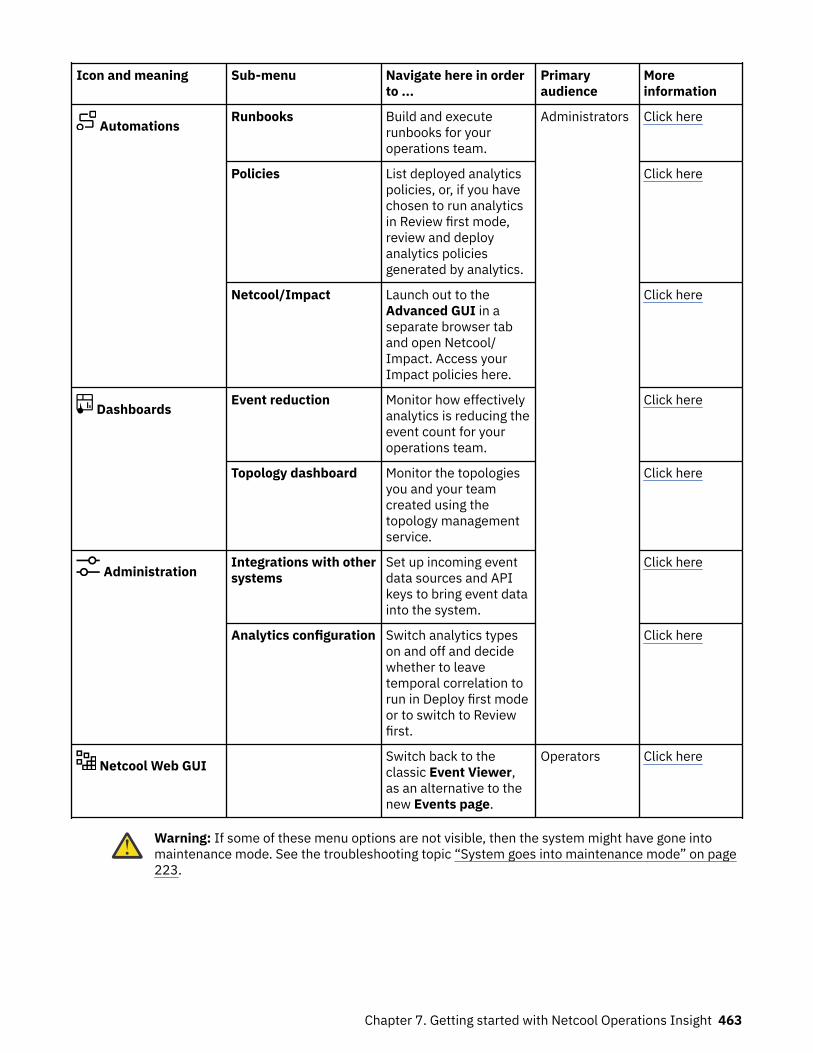
Icon and meaning Sub-menu Navigate here in orderto ...
Primaryaudience
Moreinformation
AutomationsRunbooks Build and execute
runbooks for youroperations team.
Administrators Click here
Policies List deployed analyticspolicies, or, if you havechosen to run analyticsin Review first mode,review and deployanalytics policiesgenerated by analytics.
Click here
Netcool/Impact Launch out to theAdvanced GUI in aseparate browser taband open Netcool/Impact. Access yourImpact policies here.
Click here
DashboardsEvent reduction Monitor how effectively
analytics is reducing theevent count for youroperations team.
Click here
Topology dashboard Monitor the topologiesyou and your teamcreated using thetopology managementservice.
Click here
AdministrationIntegrations with othersystems
Set up incoming eventdata sources and APIkeys to bring event datainto the system.
Click here
Analytics configuration Switch analytics typeson and off and decidewhether to leavetemporal correlation torun in Deploy first modeor to switch to Reviewfirst.
Click here
Netcool Web GUISwitch back to theclassic Event Viewer,as an alternative to thenew Events page.
Operators Click here
Warning: If some of these menu options are not visible, then the system might have gone intomaintenance mode. See the troubleshooting topic “System goes into maintenance mode” on page223.
Chapter 7. Getting started with Netcool Operations Insight 463
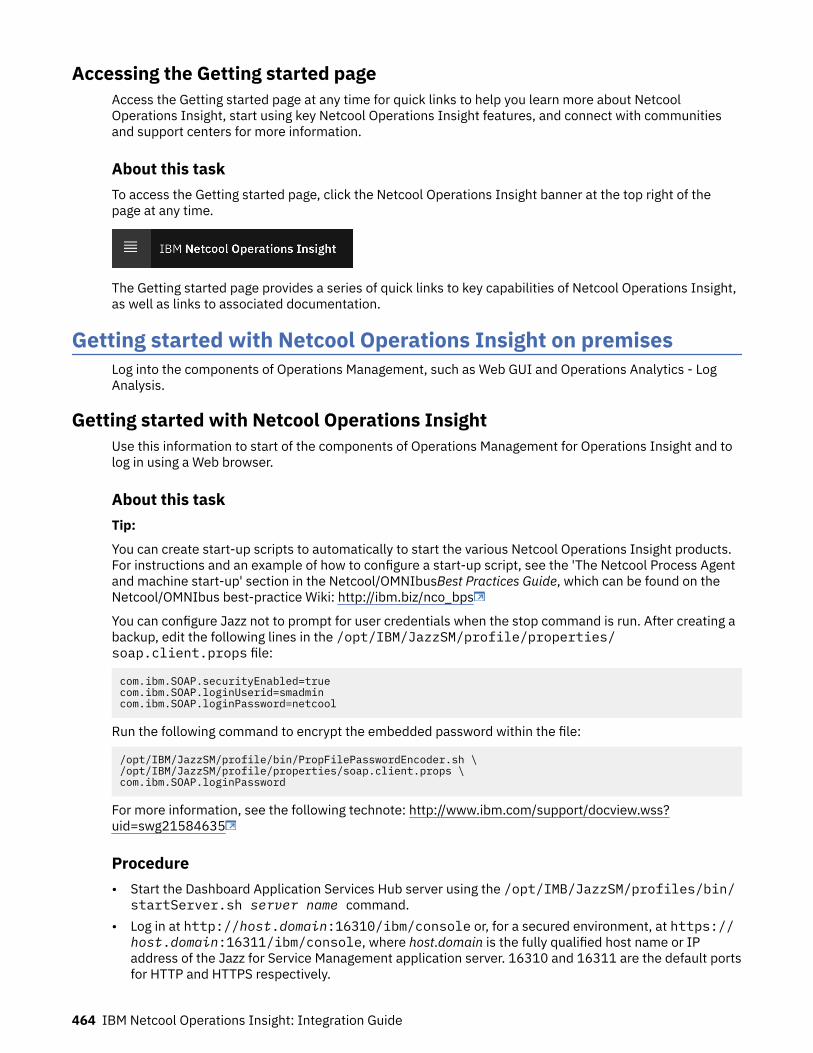
Accessing the Getting started pageAccess the Getting started page at any time for quick links to help you learn more about NetcoolOperations Insight, start using key Netcool Operations Insight features, and connect with communitiesand support centers for more information.
About this taskTo access the Getting started page, click the Netcool Operations Insight banner at the top right of thepage at any time.
The Getting started page provides a series of quick links to key capabilities of Netcool Operations Insight,as well as links to associated documentation.
Getting started with Netcool Operations Insight on premisesLog into the components of Operations Management, such as Web GUI and Operations Analytics - LogAnalysis.
Getting started with Netcool Operations InsightUse this information to start of the components of Operations Management for Operations Insight and tolog in using a Web browser.
About this taskTip:
You can create start-up scripts to automatically to start the various Netcool Operations Insight products.For instructions and an example of how to configure a start-up script, see the 'The Netcool Process Agentand machine start-up' section in the Netcool/OMNIbusBest Practices Guide, which can be found on theNetcool/OMNIbus best-practice Wiki: http://ibm.biz/nco_bps
You can configure Jazz not to prompt for user credentials when the stop command is run. After creating abackup, edit the following lines in the /opt/IBM/JazzSM/profile/properties/soap.client.props file:
com.ibm.SOAP.securityEnabled=truecom.ibm.SOAP.loginUserid=smadmincom.ibm.SOAP.loginPassword=netcool
Run the following command to encrypt the embedded password within the file:
/opt/IBM/JazzSM/profile/bin/PropFilePasswordEncoder.sh \ /opt/IBM/JazzSM/profile/properties/soap.client.props \ com.ibm.SOAP.loginPassword
For more information, see the following technote: http://www.ibm.com/support/docview.wss?uid=swg21584635
Procedure• Start the Dashboard Application Services Hub server using the /opt/IMB/JazzSM/profiles/bin/
startServer.sh server name command.• Log in at http://host.domain:16310/ibm/console or, for a secured environment, at https://
host.domain:16311/ibm/console, where host.domain is the fully qualified host name or IPaddress of the Jazz for Service Management application server. 16310 and 16311 are the default portsfor HTTP and HTTPS respectively.
464 IBM Netcool Operations Insight: Integration Guide
• Assign roles to users. To give users access to the Event Analytics capability, assign thencw_analytics_admin user.
What to do nextUseful information about how to configure your environment is in the Netcool Operations Insight ExampleGuide, which you can download at https://developer.ibm.com/itom/wp-content/uploads/sites/39/2018/05/NOI-Example-Guide.pdf .Related tasksGetting started with Networks for Operations Insight
Getting started with Networks for Operations InsightAfter the installation and configuration steps are completed, you can start the components of theNetworks for Operations Insight feature and log in to the host using a Web browser.
Procedure1. Ensure that Tivoli Netcool/OMNIbus ObjectServer is running, see http://www-01.ibm.com/support/
knowledgecenter/SSSHTQ_8.1.0/com.ibm.netcool_OMNIbus.doc_8.1.0/omnibus/wip/admin/task/omn_con_startingobjserv.html?lang=en .
2. Start the Dashboard Application Services Hub server using the /opt/IMB/JazzSM/profiles/bin/startServer.sh server name command.
3. Source the environment variables. On the server where the Network Manager core components areinstalled, the script is installation_directory/netcool/core/env.sh. On the server wherethe Network Manager GUI components are installed, the script is installation_directory/nmgui_profile.sh, for example, /opt/IBM/netcool/nmgui_profile.sh.
4. Start the back-end processes for the products. Use the itnm_start command to start NetworkManager. Do not use this command to start the ObjectServer. The ObjectServer is started and stoppedby the Tivoli Netcool/OMNIbus commands. Start Netcool Configuration Manager separately by usingthe itncm.sh start script.
5. Log in at http://host.domain:16310/ibm/console or, for a secured environment, at https://host.domain:16311/ibm/console, where host.domain is the fully qualified host name or IPaddress of the Jazz for Service Management application server. 16310 and 16311 are the default portsfor HTTP and HTTPS respectively. Use the supplied itnmadmin user with the password that youspecified during the installation.
6. You can log in to the Netcool Configuration Manager - Base GUI at http://ncmserver-hostname:port-number, where ncmserver-hostname is the host name of the computer on whichyou installed Netcool Configuration Manager. port-number is the port that you specified during theinstallation. Use the default user name and password that you specified during the installation.
Related tasksStarting Network ManagerLogging inLaunching Netcool Configuration Manager - BaseRelated referenceitncm.sh scriptRelated informationGetting started with Network ManagerGetting started with Netcool Configuration Manager
Chapter 7. Getting started with Netcool Operations Insight 465

466 IBM Netcool Operations Insight: Integration Guide
Chapter 8. AdministeringPerform the following tasks to administer the solution.
About this task
Administering Cloud and hybrid systemsPerform the following tasks to administer your Cloud or hybrid Netcool Operations Insight system.
Administering usersUser access to all of the Netcool Operations Insight on Red Hat OpenShift interfaces is provided based ondefault user group settings. You can also optionally create new users and groups.
About this taskYou can manage users using a built-in LDAP server (openLDAP server), or using your organization's LDAPserver. The mechanism available to you was configured at installation time.
Single sign-onSingle sign-on is preconfigured in Netcool Operations Insight on Red Hat OpenShift. Federatedrepositories to support authentication for single sign-on are configured by default.
The following table lists the federated repositories, and list the default users and groups within theserepositories. These default users are enabled by default.
Table 78. Federated repositories for single sign-on
Repository Default groups Default users Capability
InternalFileRepository
None admin
NetcoolObjectServer
This repository links todefault Netcool/OMNIbus groups
root, ncoadmin, ncouser,nobody
Access individualNetcool OperationsInsight components only
ICP_LDAP icpadmins, icpusers icpadmin, icpuser,impactadmin
Perform launch-incontext actions acrossNetcool OperationsInsight components.Needed to access EventAnalytics functionality.
Users defined in any of these repositories can access individual Netcool Operations Insight componentsdirectly based on their role defined within the repository. For example, the ncoadmin user within theNetcoolObjectServer repository can log into Web GUI to perform tasks in the Event Viewer.
However, any user that needs to perform launch in context actions across Netcool Operations Insightcomponents must be defined be in the ICP_LDAP repository and in either one of the groups icpadminsor icpusers.
Defining the user in the ICP_LDAP repository and in either one of the groups icpadmins or icpusersensures that all of the relevant roles in Netcool/OMNIbus, Dashboard Application Services Hub, andNetcool/Impact are assigned to the user in order for launch in context actions to function properly.
© Copyright IBM Corp. 2020, 2020 467
Default usersThe following table describes users that are present after installation, along with their groups.
Users and their groupsThe following table describes users that are present after installation, along with their groups.
Note: impactadmin and unityadmin will not exist by default if you installed with LDAP mode: proxy, andmust be manually created. For more information, see “Creating users on an external LDAP server” onpage 470.
Table 79. Users present after installation
User name Roles Group Description
icpadmin Inherited from the group icpadmins Sample administratoruser for OperationsManagement on acontainer platform.
icpuser Inherited from the group icpusers Sample end user forOperationsManagement on acontainer platform.
impactadmin Netcool/Impact-specific roles:
• impactAdminUser• impactFullAccessUser• impactOpViewUser• impactMWMAdminUser• impactMWMUser• impactSelectedOpViewUser• impactUIDataProviderUser• impactWebServiceUser• ConsoleUser• WriteAdmin• ReadAdmin• impactRBAUser
icpadmins Administrator user forNetcool/Impact.
admin Dashboard Application ServicesHub-specific roles:
• iscadmins• chartAdministrator• samples• administrator
The administrator forDashboard ApplicationServices Hub. In a newinstallation, this userhas permissions toadminister users,groups, roles, andpages.
Default Netcool/OMNIbus users
See Netcool/OMNIbus V8.1.0 documentation: users
Default Web GUI users See Netcool/OMNIbus V8.1.0 documentation: Web GUI users and groups
468 IBM Netcool Operations Insight: Integration Guide

Warning: If you receive an error "System goes into maintenance mode" when trying to add roles toa user, see the troubleshooting topic “System goes into maintenance mode” on page 223.
Default groupsUse groups to organize users into units with common functional goals. Several groups are created atinstallation.
Default user groupsThe following groups are supplied with Netcool Operations Insight on Red Hat OpenShift. Users areassigned to these groups during installation.
Note: icpadmins and icpusers will not exist by default if you installed with LDAP mode: proxy, and must bemanually created. For more information, see “Creating users on an external LDAP server” on page 470.
Table 80. Default user groups
Name Description Roles associated with the group
icpadmins Assign all NetcoolOperations Insight on RedHat OpenShiftadministrators to thisgroup so that they haveadministrativepermissions over all of theNetcool OperationsInsight components.
Dashboard Application Services Hub-specific roles
administrator, chartAdministrator, chartCreator, chartViewer,configurator, iscadmins, monitor, ncw_admin,ncw_dashboard_editor, ncw_gauges_editor, ncw_gauges_viewer,ncw_user, netcool_ro, netcool_rw, operator, samples,suppressmonitor
Netcool/Impact-specific roles
ConsoleUser, impactAdminUser, impactFullAccessUser,impactMWMAdminUser, impactMWMUser, impactOpViewUser,impactRBAUser, impactSelectedOpViewUser,impactUIDataProviderUser, impactWebServiceUser, ReadAdmin,WriteAdmin
icpusers Assign all NetcoolOperations Insight on RedHat OpenShift users andoperators to this group sothat they havepermissions to use theNetcool OperationsInsight components.
Dashboard Application Services Hub-specific roles
chartViewer, configurator, monitor, ncw_gauges_viewer, ncw_user,netcool_rw, netcool_ro, operator, samples
Netcool/Impact-specific roles
ConsoleUser, impactMWMAdminUser, impactMWMUser,impactOpViewUser, impactRBAUser, impactSelectedOpViewUser,impactUIDataProviderUser, impactWebServiceUser, ReadAdmin,WriteAdmin
DefaultNetcool/OMNIbusgroups androles
See Netcool/OMNIbus V8.1.0 documentation: default groups
Default WebGUI groupsand roles
See Netcool/OMNIbus V8.1.0 documentation: Web GUI users and groups
Warning: If you receive an error "System goes into maintenance mode" when trying to add roles toa group, see the troubleshooting topic “System goes into maintenance mode” on page 223.
Chapter 8. Administering 469

Creating users on an external LDAP serverCertain LDAP entries must be created in the target LDAP server that is used by the Netcool OperationsInsight on Red Hat OpenShift deployment if you installed with LDAP mode:proxy. If you installed withLDAP mode:standalone then these mandatory entries will already exist.
If the required LDAP entries are missing, then some pods do not start correctly. There are otherrecommended LDAP entries whose absence would not cause a failure to deploy, but which improve theorganization of entities in a deployment: Users, Groups, and Roles. Before deploying the offering, theLDAP server administrator must provide a base Distinguished Name (DN) value for the destination LDAPserver. Additionally, the LDAP administrator must create the required LDAP entries at the base DN, andalso review and optionally create the recommended LDAP entries.
All LDAP entries are described in the following sections along with their DN and requirement. In all cases,the LDAP_SUFFIX placeholder must be replaced with the base DN value that is provided by the LDAPadministrator.
Organizational Units
Unit name Distinguished Name Requirement
groups ou=groups,LDAP_SUFFIX Required
users ou=users,LDAP_SUFFIX Required
Example LDIF to create organizational unitsIn all LDIF examples, LDAP_SUFFIX is replaced with dc=myldap,dc=org
dn: ou=groups,dc=myldap,dc=orgobjectClass: organizationalUnitobjectClass: topou: groups
dn: ou=users,dc=myldap,dc=orgobjectClass: organizationalUnitobjectClass: topou: users
Users
User Name Distinguished Name Requirement
icpadmin uid=icpadmin,ou=users,LDAP_SUFFIX
Recommended
icpuser uid=icpuser,ou=users,LDAP_SUFFIX
Recommended
impactadmin uid=impactadmin,ou=users,LDAP_SUFFIX
Required
unityadmin uid=unityadmin,ou=users,LDAP_SUFFIX
Required
Example LDIF for creating users
dn: uid=icpuser,ou=users,dc=myldap,dc=orgobjectClass: topobjectClass: personobjectClass: organizationalPersonobjectClass: inetOrgPersoncn: ICP Useruid: icpuser
470 IBM Netcool Operations Insight: Integration Guide
givenName: ICP Usersn: icpuseruserPassword:: password
dn: uid=icpadmin,ou=users,dc=myldap,dc=orgobjectClass: topobjectClass: personobjectClass: organizationalPersonobjectClass: inetOrgPersoncn: ICP Adminuid: icpadmingivenName: ICP Adminsn: icpadminuserPassword:: password
dn: uid=unityadmin,ou=users,dc=myldap,dc=orgobjectClass: topobjectClass: personobjectClass: organizationalPersonobjectClass: inetOrgPersoncn: Unity Adminuid: unityadmingivenName: Unitysn: unityadminuserPassword:: password
dn: uid=impactadmin,ou=users,dc=myldap,dc=orgobjectClass: topobjectClass: personobjectClass: organizationalPersonobjectClass: inetOrgPersoncn: Impact Admin Useruid: impactadmingivenName: Impact Admin Usersn: impactadminuserPassword:: password
Groups
Group name Distinguished Names Members Requirement
icpadmins cn=icpadmins,ou=groups,LDAP_SUFFIX
icpadmin Recommended
icpusers cn=icpusers,ou=groups,LDAP_SUFFIX
icpadmin,icpuser Recommended
unityadmins cn=unityadmins,ou=groups,LDAP_SUFFIX
unityadmin Recommended
impactadmins cn=impactadmins,ou=groups,LDAP_SUFFIX
impactadmin Recommended
Example LDIF for creating groups
dn: cn=icpadmins,ou=groups,dc=myldap,dc=orgcn: icpadminsowner: uid=icpadmin,ou=users,dc=myldap,dc=orgdescription: ICP Admins groupobjectClass: groupOfNamesmember: uid=icpadmin,ou=users,dc=myldap,dc=org
dn: cn=icpusers,ou=groups,dc=myldap,dc=orgcn: icpusersowner: uid=icpuser,ou=users,dc=myldap,dc=orgdescription: ICP Users groupobjectClass: groupOfNamesmember: uid=icpuser,ou=users,dc=myldap,dc=orgmember: uid=icpadmin,ou=users,dc=myldap,dc=org
dn: cn=unityadmins,ou=groups,dc=myldap,dc=orgcn: unityadmins
Chapter 8. Administering 471
owner: uid=unityadmin,ou=users,dc=myldap,dc=orgdescription: Unity Admins groupobjectClass: groupOfNamesmember: uid=unityadmin,ou=users,dc=myldap,dc=org
Managing users with LDAPYou can create users and perform other user management tasks by using LDAP if you selected the optionto use the built-in LDAP server LDAP mode:standalone at installation time, or if you selected LDAPmode:proxy at installation time and the required users and groups exist in your external LDAP server.See “Creating users on an external LDAP server” on page 470
About this taskThe open source OpenLDAP server is installed as part of the Netcool Operations Insight on Red HatOpenShift installation. Access this server to manage users and groups.
Users and groups can also be managed through the WebSphere Application Server UI. For moreinformation, see the OMNIbus Knowledge Center, https://www.ibm.com/support/knowledgecenter/en/SSSHTQ_8.1.0/com.ibm.netcool_OMNIbus.doc_8.1.0/webtop/wip/task/web_adm_createuserwebsphere.html
Creating a user and adding a user to a groupUse LDAP to create a new user and add that user to an existing group. You can also add an existing user toan existing group.
Before you beginDuring the installation of Netcool Operations Insight you must communicate with the cluster from thecommand line, using the Kubernetes command line interface kubectl, You must configure the commandline on your terminal to communicate with the cluster using the Kubernetes command line interfacekubectl.
Procedure1. Run the following command to retrieve the identifier of the LDAP Proxy Server pod.
kubectl get pods | grep release_name-openldap-0
Where release_name is the name of your deployment, as specified by the value used for name (OLM UIForm view), or name in the metadata section of the noi.ibm.com_noihybrids_cr.yaml ornoi.ibm.com_nois_cr.yaml files (YAML view)..
2. Log in to the LDAP Proxy Server pod.
kubectl exec -it openldap_pod_id /bin/bash
Where openldap_pod_id is the identifier of the LDAP Proxy Server pod.Proceed as follows:
If you want to... Then...
Create a new user and add it to a group Go to the next step
Add an existing user to a group Go to step 3
3. Create the new user.a) Create an LDAP Data Interchange Format file to define the new user.
For example:
vi newuser.ldif
472 IBM Netcool Operations Insight: Integration Guide
b) Define the contents of the LDIF file that you created by using a format similar to this example:
dn: uid=icptester,ou=users,dc=mycluster,dc=icpobjectClass: topobjectClass: personobjectClass: organizationalPersonobjectClass: inetOrgPersoncn: ICP Test Useruid: icptestergivenName: ICP Test Usersn: icptesteruserPassword: password
Where:
• uid is the user ID of the new user. For example, icptester.• dc is the domain components that were specified for the suffix and baseDN. By default the value
of this parameter is dc=mycluster,dc=icp.• userPassword is the password for this user.
All other attributes in the file can be defined as shown in the code sample.c) Run the following command to create the new user.
ldapadd -c -x -w LDAP_BIND_PWD -D LDAP_BIND_DN -f filename.ldif
Where:
• LDAP_BIND_PWD is the password for the ldap_bind function, which asynchronouslyauthenticates a client with the LDAP server. By default the value of this parameter is admin.
• LDAP_BIND_DN is an object in LDAP that can carry a password. In the example, the value is:
'cn=admin,dc=mycluster,dc=icp'
• filename is the name of the LDAP Data Interchange Format file that is defined in step 2b. In theexample used there, filename is newuser.
4. Add the user to an existing group.a) Create an LDAP Data Interchange Format file to add the user to a group.
For example:
vi addUsersToGroup.ldif
b) Define the contents of the file by using a format similar to the following:
dn: cn=icpadmins,ou=groups,dc=mycluster,dc=icpchangetype: modifyadd: membermember: uid=icptester,ou=users,dc=mycluster,dc=icp
c) Run the following command to add the user to a group.
ldapmodify -w LDAP_BIND_PWD -D LDAP_BIND_DN -f filename.ldif
Where:
• LDAP_BIND_PWD is the password for the ldap_bind function, which asynchronouslyauthenticates a client with the LDAP server. By default the value of this parameter is admin.
• LDAP_BIND_DN is an object in LDAP that can carry a password. In the example, the value is:
'cn=admin,dc=mycluster,dc=icp'
• filename is the name of the LDAP Data Interchange Format file that is defined in step 2b. In theexample used there, filename is newuser.
5. Check that the users and groups were added to LDAP by running the following command.
Chapter 8. Administering 473

ldapsearch -x -LLL -H ldap:/// -b dc=mycluster,dc=icp
Removing a user from a groupUse LDAP to remove a user from a group.
Procedure1. Create an LDIF file, such as the one in the example that removes the user icptester from the group
icpadmins.
$ cat remove-testuser-from-group.ldifdn: cn=icpadmins,ou=groups,dc=mycluster,dc=icpchangetype: modifydelete:membermember: uid=icptester,ou=users,dc=mycluster,dc=icp
Where
• uid is the user ID of the user to be removed from the group.• cn is the group that the user is to be removed from.• dc is the domain components that were specified for the suffix and baseDN. By default the value of
this parameter is dc=mycluster,dc=icp.2. Run ldapmodify with the LDIF file that you created.
$ ldapmodify -w mypassword -D 'cn=admin,dc=mycluster,dc=icp' -f remove-testuser-from-group.ldif
Deleting a userDelete a user by using LDAP.
ProcedureRun the ldapdelete command to delete a user, as in the following example that deletes the usericptester.
ldapdelete -w mypassword -D 'cn=admin,dc=mycluster,dc=icp' 'uid=icptester,ou=users,dc=mycluster,dc=icp'
Where
• uid is the user ID of the user to be removed from the group.• cn is the group that the user is to be removed from.• dc is the domain components that were specified for the suffix and baseDN. By default the value of this
parameter is dc=mycluster,dc=icp.• mypassword is the password of the user to be deleted.
Authorizing users for ImpactUse this information to add authorization for users to access and view IBM Tivoli Netcool/Impact userinterfaces in a Netcool Operations Insight on Red Hat OpenShift deployment.
Procedure1. Update the maproles ConfigMap to map the required user to a Netcool/Impact role.
Add the required user and Netcool/Impact roles for that user to the ConfigMap, using the same formatas the existing entries: user:role1|role2. For example:
kubectl edit configmap release_name-nciserver-maproles apiVersion: v1 data:
474 IBM Netcool Operations Insight: Integration Guide

allusersandroles: | impactadmin:impactAdminUser|impactOSLCDataProviderUser newuser:impactAdminUser|impactOSLCDataProviderUser kind: ConfigMap
Where
• release_name is the name of your deployment, as specified by the value used for name (OLM UIForm view), or name in the metadata section of the noi.ibm.com_noihybrids_cr.yaml ornoi.ibm.com_nois_cr.yaml files (YAML view).
• newuser is the user that you want to assign the Netcool/Impact roles to.2. Restart the Netcool/Impact core server pod with the following command:
kubectl delete pod release_name-nciserver-0
Where release_name is the name of your deployment, as specified by the value used for name (OLM UIForm view), or name in the metadata section of the noi.ibm.com_noihybrids_cr.yaml ornoi.ibm.com_nois_cr.yaml files (YAML view).
3. Restart the Netcool/Impact GUI server pod with the following command:
kubectl delete pod release_name-impactgui-0
Where release_name is the name of your deployment, as specified by the value used for name (OLM UIForm view), or name in the metadata section of the noi.ibm.com_noihybrids_cr.yaml ornoi.ibm.com_nois_cr.yaml files (YAML view).
4. When the Netcool/Impact server pod and the Netcool/Impact GUI server pods have both restarted,verify that the user and its roles have been added correctly, by running the following command on theNetcool/Impact core server pod:
<IMPACT_HOME>/install/security/mapRoles.sh -list -user newuser
Where newuser is the user that you added to the maproles ConfigMap. For example:
/opt/IBM/tivoli/impact/install/security/mapRoles.sh -list -user newusernewuser roles:impactAdminUserimpactOSLCDataProviderUser
5. You are now able to login to and view Netcool/Impact UIs.
Administering the Events pageAs a senior operator or an administrator, you need to perform administration tasks as part of systemmaintenance and to ensure the correct operation of the Events page.
About this task
All Events page administration tasks are performed by performing the corresponding tasks on the Netcool Web GUI. For more information, see the related link at the bottom of this topic.
Adding the Search Humio actionAdd the Search Humio action, so that operators can query Humio data for an event directly from theEvents page.
Procedure1. When installing or upgrading, set the integrations.humio properties as described in the links at
the bottom of this topic.
• For a Cloud-only installation, click the Cloud operator properties link.
Chapter 8. Administering 475

• For a Hybrid installation, click the Hybrid operator properties link.2. Configure the integration between Netcool Operations Insight and Humio, as described in the
Configuring Humio as an event source link at the bottom of this topic.
Administering topologyAs a senior operator or administrator, you need to administer the topology management system, to ensurethat the topology is kept up to date. Administration tasks include managing observer jobs to ingest thelatest topology updates, and creating and maintaining topology templates to generate defined topologies.
About this task
To access topology management administration tasks click Topology on the main navigationmenu of the Cloud GUI. For more information, see the related topic at the bottom of this page.
Administering policiesUse this information to understand how to administer user-created policies and policies created byanalytics.
Administering policies created by analyticsUse this information to understand how to manage policies that have been created by analytics.
About analytics-created policiesPolicies take action against incoming events.
You can select between three different tabs on the Policies GUI. The Created by analytics tab lists all ofthe policies that are created and deployed by the various Netcool Operations Insight analytics algorithms.
The Suggested policies tab displays policies that are suggested by analytics. Administrators can activatesuggested policies to act on incoming events and reject unwanted policies.
Policies that have been archived by administrators or senior operators are shown in the Archived tab.Archived policies don't act on incoming events.
Figure 17. Policies GUI
476 IBM Netcool Operations Insight: Integration Guide
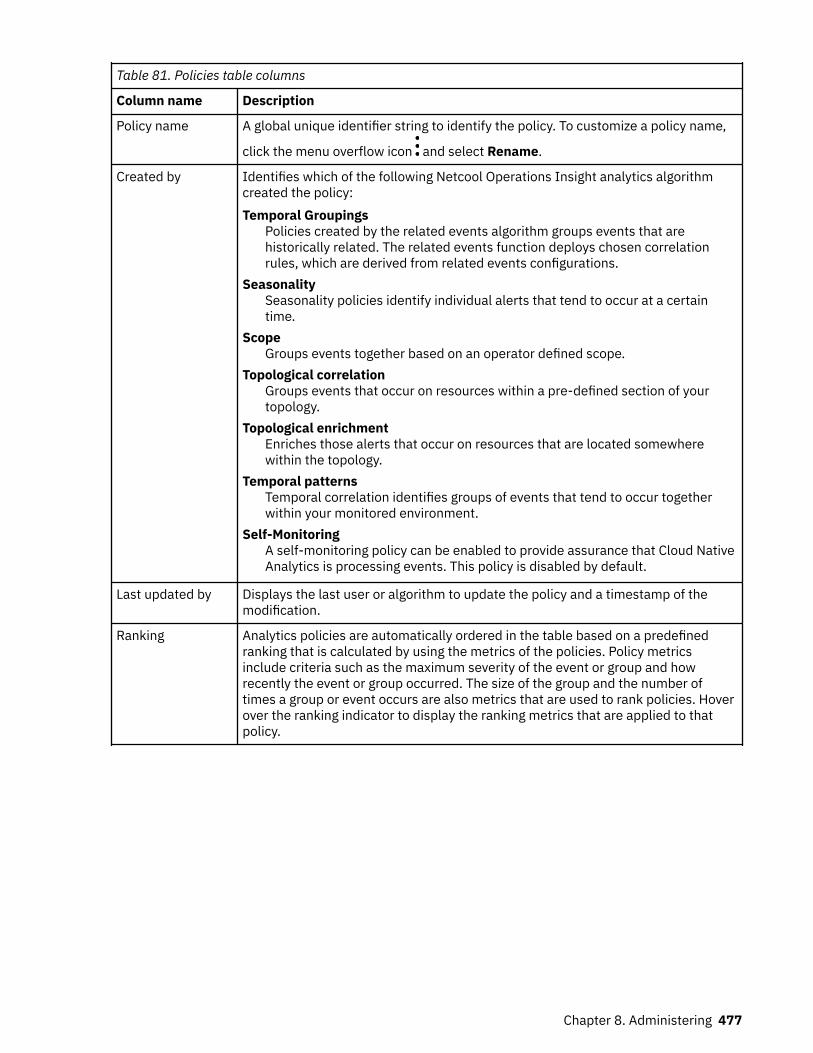
Table 81. Policies table columns
Column name Description
Policy name A global unique identifier string to identify the policy. To customize a policy name,
click the menu overflow icon and select Rename.
Created by Identifies which of the following Netcool Operations Insight analytics algorithmcreated the policy:Temporal Groupings
Policies created by the related events algorithm groups events that arehistorically related. The related events function deploys chosen correlationrules, which are derived from related events configurations.
SeasonalitySeasonality policies identify individual alerts that tend to occur at a certaintime.
ScopeGroups events together based on an operator defined scope.
Topological correlationGroups events that occur on resources within a pre-defined section of yourtopology.
Topological enrichmentEnriches those alerts that occur on resources that are located somewherewithin the topology.
Temporal patternsTemporal correlation identifies groups of events that tend to occur togetherwithin your monitored environment.
Self-MonitoringA self-monitoring policy can be enabled to provide assurance that Cloud NativeAnalytics is processing events. This policy is disabled by default.
Last updated by Displays the last user or algorithm to update the policy and a timestamp of themodification.
Ranking Analytics policies are automatically ordered in the table based on a predefinedranking that is calculated by using the metrics of the policies. Policy metricsinclude criteria such as the maximum severity of the event or group and howrecently the event or group occurred. The size of the group and the number oftimes a group or event occurs are also metrics that are used to rank policies. Hoverover the ranking indicator to display the ranking metrics that are applied to thatpolicy.
Chapter 8. Administering 477
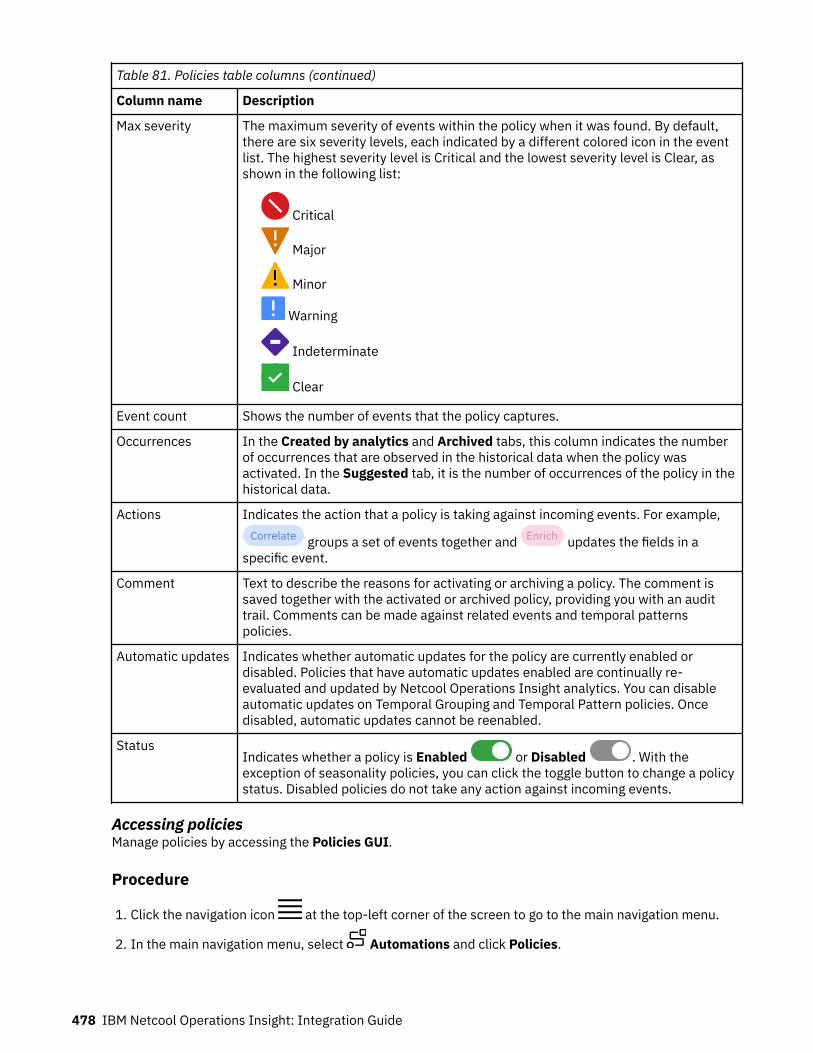
Table 81. Policies table columns (continued)
Column name Description
Max severity The maximum severity of events within the policy when it was found. By default,there are six severity levels, each indicated by a different colored icon in the eventlist. The highest severity level is Critical and the lowest severity level is Clear, asshown in the following list:
Critical
Major
Minor
Warning
Indeterminate
Clear
Event count Shows the number of events that the policy captures.
Occurrences In the Created by analytics and Archived tabs, this column indicates the numberof occurrences that are observed in the historical data when the policy wasactivated. In the Suggested tab, it is the number of occurrences of the policy in thehistorical data.
Actions Indicates the action that a policy is taking against incoming events. For example,Correlate groups a set of events together and Enrich updates the fields in a
specific event.
Comment Text to describe the reasons for activating or archiving a policy. The comment issaved together with the activated or archived policy, providing you with an audittrail. Comments can be made against related events and temporal patternspolicies.
Automatic updates Indicates whether automatic updates for the policy are currently enabled ordisabled. Policies that have automatic updates enabled are continually re-evaluated and updated by Netcool Operations Insight analytics. You can disableautomatic updates on Temporal Grouping and Temporal Pattern policies. Oncedisabled, automatic updates cannot be reenabled.
StatusIndicates whether a policy is Enabled or Disabled . With theexception of seasonality policies, you can click the toggle button to change a policystatus. Disabled policies do not take any action against incoming events.
Accessing policiesManage policies by accessing the Policies GUI.
Procedure
1. Click the navigation icon at the top-left corner of the screen to go to the main navigation menu.
2. In the main navigation menu, select Automations and click Policies.
478 IBM Netcool Operations Insight: Integration Guide
Filtering policiesYou can filter the list of policies based on the policy type or status.
Procedure
1. In the main navigation menu, select Automations and click Policies.
2. Click Filter .3. Select from the following filters:
• Policy type
– Temporal Grouping– Temporal Patterns– Scope– Seasonality– Topological Correlation– Topological Enrichment– Self-Monitoring
• Status
– Enabled– Disabled
4. Click Apply filters.
Activating policiesIf your system is running in Review first mode, then you must manually activate policies to take actionagainst incoming events.
About this taskWith temporal grouping, you can choose a Deploy first or Review first policy deployment mode. InDeploy first mode, policies are enabled automatically, without the need for manual review. In Reviewfirst mode, policies are not enabled until they are manually reviewed and approved. The default mode isDeploy first.
When Cloud Native Analytics temporal correlation is turned on and the policy deployment mode isReview first, suggested temporal patterns appear in the Suggested policies tab.
Restriction: Only Temporal Grouping policies can be activated from the Suggested policies tab.
Procedure
1. In the main navigation menu, select Automations and click Policies.2. Select the Suggested policies tab.
3. In the table row of the policy that you want to activate, click the menu overflow icon and selectActivate.The policy is activated and moved from the Suggested policies tab to the Created by analytics tab.
Related concepts“About analytics” on page 364
Chapter 8. Administering 479

Read this document to find out more about analytics, including temporal correlation, seasonality, andprobable cause.
Refreshing the policies tableYou can refresh the policies table to view all the latest policies at the current point in time. The policiestable does not automatically refresh.
Procedure
1. In the main navigation menu, select Automations and click Policies.2. If any filters are applied to the table, remove them first to view a complete list of policies.
3. Click Refresh .
A refreshed policy count is displayed beside the Filter and Refresh icons.
Managing multiple policiesYou can batch select policies and apply actions to all of your selections at one time.
About this taskThis feature applies only to related events and temporal pattern policies. The checkboxes for all otherpolicy types are grayed out and cannot be selected.
Procedure
1. In the main navigation menu, select Automations and click Policies.2. Select multiple policies from the table by using the checkboxes at the beginning of the table rows.
Tip: You can select all of the eligible policies in the table by clicking the checkbox in the table headerbeside Policy name.
3. A banner above the table displays the number of policies that are selected, together with a menu ofoptions. Depending on the policy type, some of the following actions can be applied to multiplepolicies at the same time:
• Disable automatic updates• Enable• Disable• Archive
Renaming policiesA global unique identifier string is used to identify each policy. You can rename policies to give them moremeaningful names.
About this taskComplete the following steps to rename a policy.
Procedure
1. In the main navigation menu, select Automations and click Policies.
2. In the table row of the policy that you want to rename, click the menu overflow icon and selectRename.
3. Enter a new name in the field that is provided and click Rename.
480 IBM Netcool Operations Insight: Integration Guide
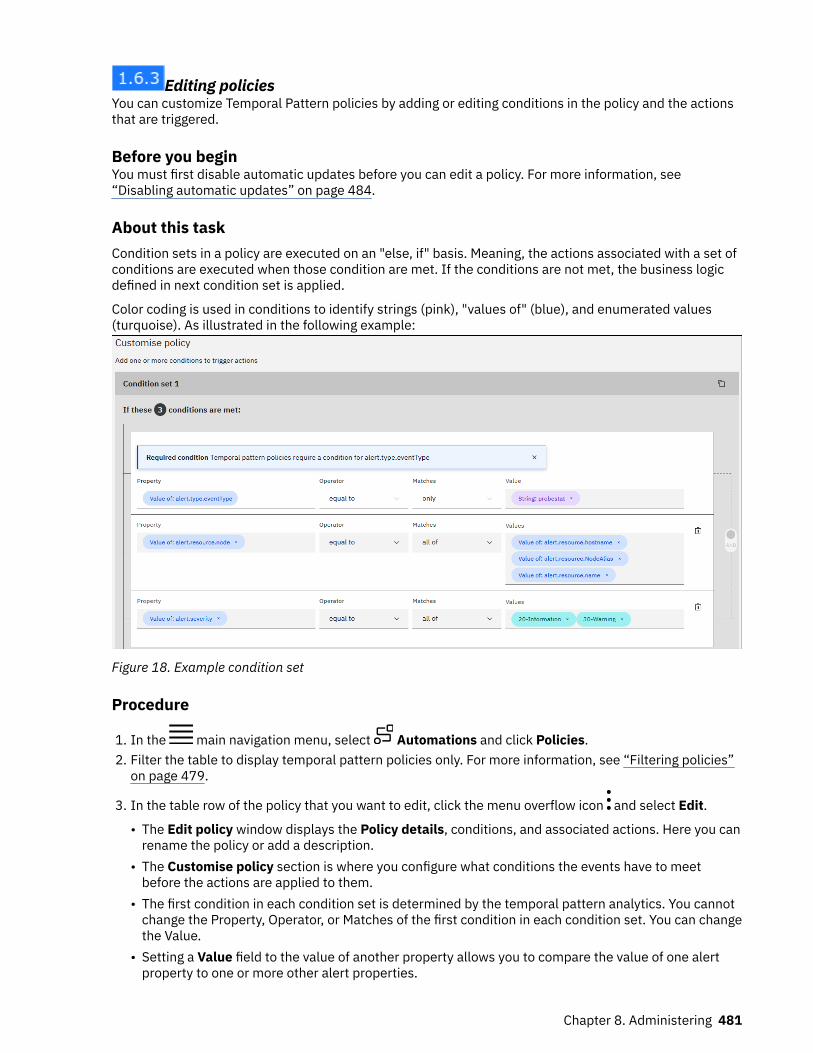
Editing policiesYou can customize Temporal Pattern policies by adding or editing conditions in the policy and the actionsthat are triggered.
Before you beginYou must first disable automatic updates before you can edit a policy. For more information, see“Disabling automatic updates” on page 484.
About this taskCondition sets in a policy are executed on an "else, if" basis. Meaning, the actions associated with a set ofconditions are executed when those condition are met. If the conditions are not met, the business logicdefined in next condition set is applied.
Color coding is used in conditions to identify strings (pink), "values of" (blue), and enumerated values(turquoise). As illustrated in the following example:
Figure 18. Example condition set
Procedure
1. In the main navigation menu, select Automations and click Policies.2. Filter the table to display temporal pattern policies only. For more information, see “Filtering policies”
on page 479.
3. In the table row of the policy that you want to edit, click the menu overflow icon and select Edit.
• The Edit policy window displays the Policy details, conditions, and associated actions. Here you canrename the policy or add a description.
• The Customise policy section is where you configure what conditions the events have to meetbefore the actions are applied to them.
• The first condition in each condition set is determined by the temporal pattern analytics. You cannotchange the Property, Operator, or Matches of the first condition in each condition set. You can changethe Value.
• Setting a Value field to the value of another property allows you to compare the value of one alertproperty to one or more other alert properties.
Chapter 8. Administering 481
4. To define a new condition, click Add condition.5. In the fields provided, select the Property, Operator, Matches, and Value for the new condition.
In the following example, a condition is added so that the policy applies only to events that have aprefix of either "Error" or "Warning" in their Summary field.a) Click Add condition.b) From the Property drop-down list, select alert.summary. You can type "sum" and the system will
show in the property drop-down list all event properties that contain the text "sum", which in thiscase is only alert.summary.
Note: For information on how the event properties map to ObjectServer alerts.status fields, see“Mapping of Policies GUI event properties to ObjectServer fields” on page 482.
c) From the Operator drop-down list, select Contains.d) From the Matches drop-down list, select any of.e) In the Values field, type Error and then click String: Error in the pop-up. In the same field,
type Warning and click String: Warning.
Note: Multiple conditions are joined by the AND operator, which means that events will be matched
only if all of the individual conditions are true. To remove a condition, click Delete.6. To add additional condition sets to a policy, click Add set of conditions. Alternatively, to copy and
paste an existing condition set click Copy condition set.
Tip: Use the sidebar on the left of the window to navigate a policy's condition sets and actions.7. Specify the actions that are triggered. From the drop-down list, select the event properties to use as
the correlation key.You can also start typing in the event properties field to display properties that match your text. Forexample, try typing "name", "node", or "sev" and see what options are provided.Multiple properties can be selected as correlation keys. You can also concatenate event propertieswith strings.
8. Save the policy.
ResultsIt can take up to 60 seconds to fully propagate the updates across Netcool Operations Insight analyticsonce your policy changes are saved.
Mapping of Policies GUI event properties to ObjectServer fieldsUse this information to understand how the event properties that are presented in the Policies GUI whenediting temporal pattern policies, map to legacy Netcool/OMNIbus ObjectServer columns.
Mapping from Policies GUI event properties to ObjectServer fieldsThe following table describes the mapping.
Policies GUI event property ObjectServer column
alert.eventid Identifier
alert.id ServerName:ServerSerial
alert.resource.displayName No mapping
alert.resource.hostname Node
Else NodeAlias if Node is empty
482 IBM Netcool Operations Insight: Integration Guide
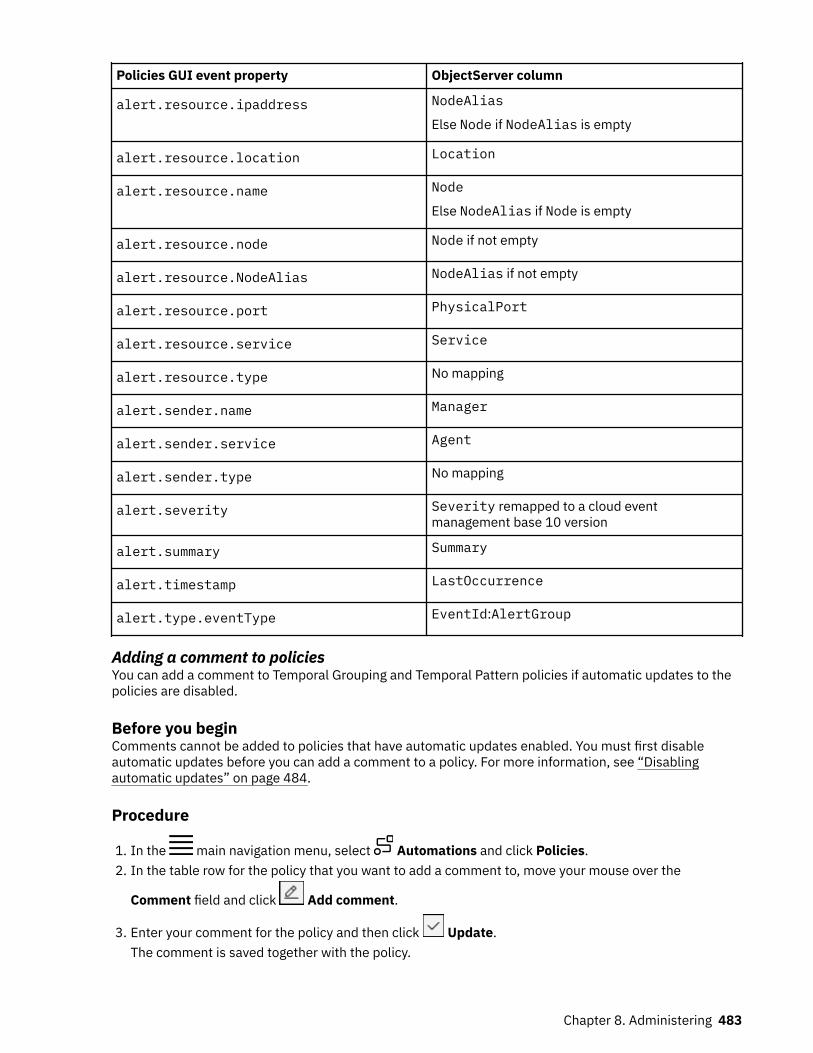
Policies GUI event property ObjectServer column
alert.resource.ipaddress NodeAlias
Else Node if NodeAlias is empty
alert.resource.location Location
alert.resource.name Node
Else NodeAlias if Node is empty
alert.resource.node Node if not empty
alert.resource.NodeAlias NodeAlias if not empty
alert.resource.port PhysicalPort
alert.resource.service Service
alert.resource.type No mapping
alert.sender.name Manager
alert.sender.service Agent
alert.sender.type No mapping
alert.severity Severity remapped to a cloud eventmanagement base 10 version
alert.summary Summary
alert.timestamp LastOccurrence
alert.type.eventType EventId:AlertGroup
Adding a comment to policiesYou can add a comment to Temporal Grouping and Temporal Pattern policies if automatic updates to thepolicies are disabled.
Before you beginComments cannot be added to policies that have automatic updates enabled. You must first disableautomatic updates before you can add a comment to a policy. For more information, see “Disablingautomatic updates” on page 484.
Procedure
1. In the main navigation menu, select Automations and click Policies.2. In the table row for the policy that you want to add a comment to, move your mouse over the
Comment field and click Add comment.
3. Enter your comment for the policy and then click Update.The comment is saved together with the policy.
Chapter 8. Administering 483
Archiving policiesYou can archive policies that are not in use. Archived policies don't act on incoming events.
Procedure
1. In the main navigation menu, select Automations and click Policies.
2. In the table row of the policy that you want to archive, click the menu overflow icon and selectArchive.
3. When you archive a policy, you must add a reason in the comment field provided. The reason forarchiving is saved together with the archived policy, providing you with an audit trail.
4. Click Archive.The policy is moved to the Archived tab.
Disabling automatic updatesPolicies that have automatic updates enabled are continually re-evaluated and updated by NetcoolOperations Insight analytics. You can disable automatic updates on Temporal Grouping and TemporalPattern policies.
Before you beginOnce disabled, automatic updates to a policy cannot be reenabled.
Procedure
1. In the main navigation menu, select Automations and click Policies.2. In the table row of the policy that you want to disable automatic updates for, click the menu overflow
icon and select Disable automatic updates.3. A confirmation dialog is displayed reminding you that once automatic updates are disabled, they
cannot be reenabled. Click Disable updates to continue or Cancel to leave the policy unchanged.
You can now click the toggle button to change the policy status from Enabled or Disabled
. Disabled policies do not take any action against incoming events.
Administering Netcool/Impact policiesYou can manage Netcool/Impact policies directly from the Cloud GUI main navigation menu.
About this task
Procedure
1. Click the navigation icon at the top-left corner of the screen to go to the main navigation menu.2. In the main navigation menu, click Automations > Netcool Impact
The Netcool/Impact GUI is displayed in a separate tab. For more information on managing Netcool/Impact policies, see the related link at the bottom of the topic.
484 IBM Netcool Operations Insight: Integration Guide
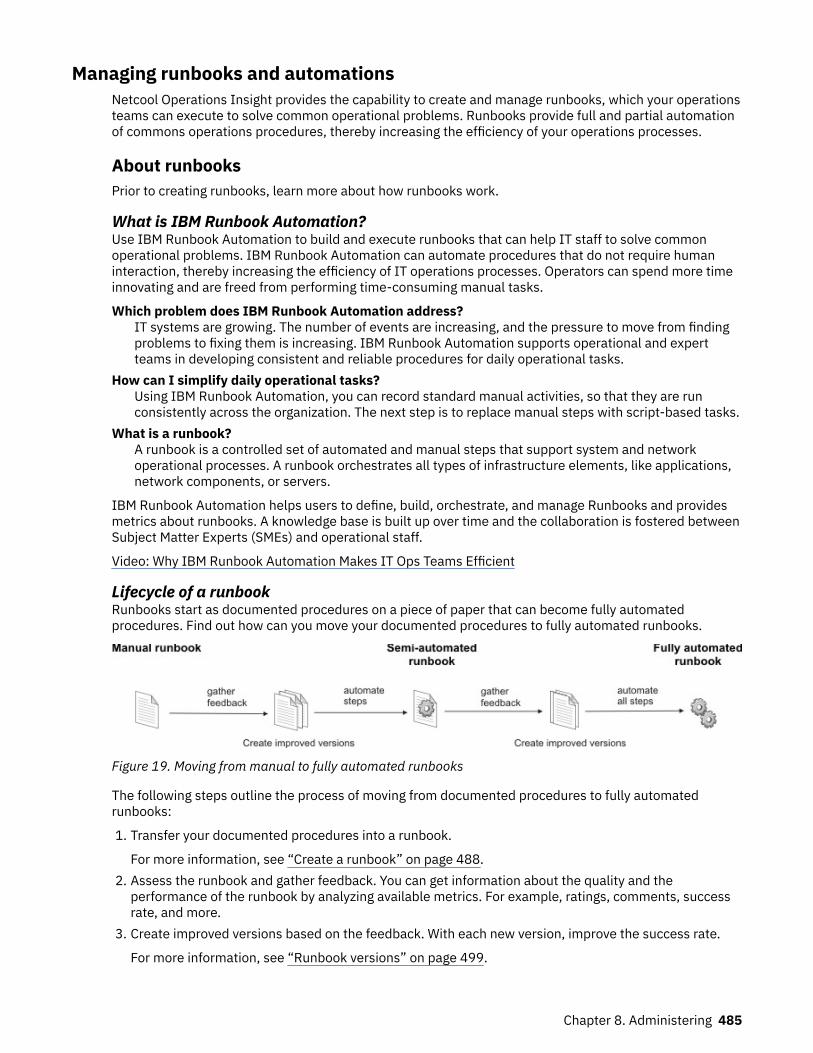
Managing runbooks and automationsNetcool Operations Insight provides the capability to create and manage runbooks, which your operationsteams can execute to solve common operational problems. Runbooks provide full and partial automationof commons operations procedures, thereby increasing the efficiency of your operations processes.
About runbooksPrior to creating runbooks, learn more about how runbooks work.
What is IBM Runbook Automation?Use IBM Runbook Automation to build and execute runbooks that can help IT staff to solve commonoperational problems. IBM Runbook Automation can automate procedures that do not require humaninteraction, thereby increasing the efficiency of IT operations processes. Operators can spend more timeinnovating and are freed from performing time-consuming manual tasks.
Which problem does IBM Runbook Automation address?IT systems are growing. The number of events are increasing, and the pressure to move from findingproblems to fixing them is increasing. IBM Runbook Automation supports operational and expertteams in developing consistent and reliable procedures for daily operational tasks.
How can I simplify daily operational tasks?Using IBM Runbook Automation, you can record standard manual activities, so that they are runconsistently across the organization. The next step is to replace manual steps with script-based tasks.
What is a runbook?A runbook is a controlled set of automated and manual steps that support system and networkoperational processes. A runbook orchestrates all types of infrastructure elements, like applications,network components, or servers.
IBM Runbook Automation helps users to define, build, orchestrate, and manage Runbooks and providesmetrics about runbooks. A knowledge base is built up over time and the collaboration is fostered betweenSubject Matter Experts (SMEs) and operational staff.
Video: Why IBM Runbook Automation Makes IT Ops Teams Efficient
Lifecycle of a runbookRunbooks start as documented procedures on a piece of paper that can become fully automatedprocedures. Find out how can you move your documented procedures to fully automated runbooks.
Figure 19. Moving from manual to fully automated runbooks
The following steps outline the process of moving from documented procedures to fully automatedrunbooks:
1. Transfer your documented procedures into a runbook.
For more information, see “Create a runbook” on page 488.2. Assess the runbook and gather feedback. You can get information about the quality and the
performance of the runbook by analyzing available metrics. For example, ratings, comments, successrate, and more.
3. Create improved versions based on the feedback. With each new version, improve the success rate.
For more information, see “Runbook versions” on page 499.
Chapter 8. Administering 485
4. Investigate which runbooks are suitable for automations. What steps can be put into an automatedprocedure? Not every runbook moves from a manual to a fully automated runbook. Carefully considerwhich steps you want to automate, depending on the comments received, the effort it takes toautomate, the frequency the runbook is used, and the potential impact automated steps could have.
For more information, see “Creating an automation” on page 502.5. Provide a new version with automated steps and see how it runs.
For more information, see “Managing automations” on page 502.
.6. Continue to provide more automations until all steps are automated. Run runbooks that are started by
a trigger.
For more information, see “Create a trigger” on page 511.
LibraryView the available runbooks, find matching runbooks for the events that you need to resolve, and run therunbooks. You can also review the runbooks that you have used to date.
Run your first runbookNote: If you are using IBM Runbook Automation for the first time, it is recommended to load examplerunbooks and then edit and publish a runbook. For more information, see “Load and reset examplerunbooks” on page 487 and “Edit a runbook” on page 489.
1. Click Library.
2. Select a runbook and click the menu overflow icon and select Preview runbook to find out what arunbook consists of:Procedure
The Procedure section displays the runbook steps. For more information about the runbookelements, see “Edit a runbook” on page 489.
InformationThe information tab provides descriptive details of the runbook and contains the following fields:
• Description: shows a description of the runbook.• Runbook ID: ID of the runbook which can be used to identify the runbook using the Runbook
Automation HTTP REST Interface.• Created by: the user who created the runbook.• Last modified at: the date and time the runbook was last modified.• Last modified by: the user who last modified the runbook.• Type: indicates the runbook type, that is manual, semi-automated, or fully automated.• Tags: categorization tags associated with the runbook.
VersionsShows all draft, published, and archived versions of the runbook. You can also see the user thatcreated each version and the creation date.
Close the Preview. Open more example runbooks in preview mode to find out how runbooks aredescribed.
3. Select one of the runbooks and click Run.
4. The Run runbook page opens, which consists of a procedure description on the left side of thewindow and a Details and Information section on the right. Details contains the following collapsiblesections:
486 IBM Netcool Operations Insight: Integration Guide

• parameters – displays a list of the parameters used.• automations – displays a list of the automations used.
5. In the parameters section you are requested to enter parameter values. Click the information icon tosee a description and a reference to where this parameter is used within the runbook. Enter theparameter values, for example host1 for the parameter HOSTNAME and click Start runbook.
Note:
• In some cases, you might not know the parameter value when starting the Runbook. For example,the parameter could be determined by a runbook step during the runbook execution. In thisscenario, as soon as the parameter value is known, go back to the parameter section and enter theparameter value. To apply the value click Update parameters. The Update parameters button isonly displayed if the parameter value has been entered.
• In any step of a runbook, you can select the parameter section of the runbook in the Details on theright of the window. You might need to first expand the section if it is collapsed. The parameter canthen be changed to a new value. To apply the new value click Update parameters (the Updateparameters button is only displayed if the parameter value has been changed). As soon as aparameter has been used by a Runbook step, it cannot be changed.
6. Follow the instructions in the runbook and proceed to the next step by clicking Next step.
7. If the step contains a command, use the Copy button within a command to copy the command toyour clipboard. Open a command-line window and paste the command.
8. If the step contains an automation, click on the automation and select Run to run the automation.The output will be displayed in a text box. If an automation produces JSON output, the JSONdocument is automatically formatted for better readability. Select More info to see description,parameter values, and type information.
9. You can pause or cancel the runbook by clicking Pause or Cancel. Pause temporarily suspends theexecution of the runbook. You can pick up later from where you left off. You can use Pause to handlelong running automations, for example automations that take longer than 10 minutes. Theautomations that are in progress continue while you pause the runbook. If you cancel the runbookyou are prompted to select a reason. This feedback is helpful to the author of the runbook.
10. After you completed all steps, click Complete at the end of the runbook. Provide a rating, a comment(both optional), and a final assessment of the runbook. You are taken back to the Library page.
11. The Execution page provides the Runbook executions table. Here you can find all the runbooks thatwere executed with information such as Status, Start time, Version, Comments, and if the runbook isautomated. Filters such as user, runbook status, runbook type and runbook name can be applied. Formore information, see “Executions” on page 501.
Load and reset example runbooksIBM Runbook Automation provides ready-to-go sample runbooks. Load the examples to explore what youcan do with runbooks.
Before you beginYou can load example runbooks if you have the RBA Author or RBA Manager role. For more informationabout roles, see Creating users.
Load sample runbooksLoad all pre-defined examples. You can also edit the example runbooks and create new versions.
1. Open the Library page.
2. Click Load sample runbooks on the upper right of the window (beside the New runbookbutton) and select Load sample runbooks.
Chapter 8. Administering 487
3. The sample runbooks are shown in the Library page. The runbooks will show up for Operators ifthey are published. The samples are marked by the text "Example:"
4. Click Preview to view the runbook and see what it does.5. Click Run to run your first runbook. For more information about how to run a runbook, see “Run
your first runbook” on page 486.
Reset sample runbooksFollow these steps if you edited the examples and would like to reload the original version:
1. Open the Library page.
2. Click Load sample runbooks and select Load sample runbooks to reload the original versionof the example runbook. Any changes that were made will be overwritten.
Convert a sample runbook to a regular runbookTo save a sample runbook as a regular runbook:
1. Open the Library page.
2. On the runbook that you want to convert, click the menu overflow icon and select Edit runbook.3. Click Save draft > Save as.4. Change the runbook name. You can optionally update the description.5. Click Save.
After saving, the runbook will no longer be tagged as an example.Delete sample runbooks
1. Open the Library page.
2. Click Load sample runbooks and select Delete sample runbooks.3. Confirm that you want to delete the sample runbooks from the Library page.
For more information about using the editor, see “Edit a runbook” on page 489.
Create a runbookDocument your existing operational procedures using the runbook editor. Share the knowledge andexperience that you documented in a runbook with your team members.
Before you beginYou must have user access as an RBA Author or RBA Approver to access the Library page.
About this taskRunbooks are created for one of the following reasons:
• Operators document their daily tasks in documents. Runbooks allow you to document and store theseprocedures in an ordered manner. When a runbook is published the knowledge can be shared betweenall operators.
• A new set of events has occurred and a couple of skilled operators work out a new procedure to solvethe issue that caused these events.
Procedure1. Click Library.2. Click New runbook. The runbook editor opens. For more information about how to use the editor, see
“Edit a runbook” on page 489.3. Provide data to describe the runbook. Make sure that you use a Name for the runbook that describes
what problem this runbook solves.
488 IBM Netcool Operations Insight: Integration Guide
Restriction: Avoid using commas in runbook names. Runbook names containing commas cannot befiltered in the Library or on the Executions page.
4. (Optional): Provide a Description. The description contains information about specific situations thatthis runbook solves. Operators use the description to decide if a runbook meets their requirements.
5. (Optional): Add Tags. These help to filter a large amount of runbooks, as well as group runbooks withthe same content.
6. Start adding steps to the runbook. Click Add manual step or Add automatic step.7. Click inside the editor and describe the first step of your procedure. Use commands, parameters,
automations, or GOTO elements to distinguish between different types of elements within arunbook. Remember to always create a new step if you start to describe a new task that the operatorcan run.
8. When all steps have been documented, click Save draft > Save draft & close.9. Test the runbook. Search for your runbook in the Library dashboard. Click Run to test the execution
of the new runbook. Modify the runbook if necessary.10. Publish your runbook.
a) Click Edit to open the runbook editor.b) Click Publish. The runbook is now available to all operators.
Run a runbookRun all steps that are described in a runbook. When you have completed the runbook you can provide anycomments you might have.
To run a runbook you must be assigned the role RBA User, RBA Author, or RBA Approver.
Follow the steps outlined in “Run your first runbook” on page 486.
Edit a runbookThe runbook editor provides editing capabilities as well as runbook elements that help to documentoperational procedures. Runbook elements are designed to avoid mistakes.
Open the runbook editor and click Library > New runbook to create a new runbook or scroll through the
list of runbooks and click the menu overflow icon and select Edit runbook to open an existing runbook inthe editor.
The editor consists of the following areas:
Figure 20. Working areas of the runbook editor
1. Runbook details: Enter descriptive data about the runbook.
Chapter 8. Administering 489
NameThe name identifies the runbook. Try to be as precise as possible and describe the problem thatthis runbook solves.
DescriptionDescribe the problems that this runbook solves in more detail and sketch out the solution.
TagsProvide tags to filter runbooks. You can select an existing tags from the drop-down list and clickthe plus icon "+" to add them. To create a new tag, type the text into the field, select the text stringdisplayed, and click the plus icon "+".
Runbook IDThis field is generated by Runbook Automation. The Runbook ID can be used to identify therunbook using the Runbook Automation HTTP REST Interface. Use the copy button to copy the IDto the clipboard.
2. Editor: Provides text edit actions and runbook elements to describe operational tasks. Each step hasits own section with an optional title. Manual steps cannot contain automation elements. Automatedsteps must be added for automations.
3. Parameters: Create parameters that are used in this runbook.4. Automations: Add pre-defined automations to the runbook. Automated steps only contain an
automation, no text.5. Save and Publish the runbook.
You can edit a runbook if you are an RBA Author or RBA Approver.
Note: A warning message might be displayed in the runbook editor for Runbooks that have beenconverted from an older data model. Before you save the runbook, review the steps and remove anymanual steps that may have been added during the conversion. This is important for runbooks that arerun in a fully automated context.
Runbook elements and editing actionsUse the editor to describe your daily tasks step by step. The editor provides editing actions and runbookspecific elements to help you write the instructions.
Click Add manual step and use the following runbook elements and text editing actions to edit andformat your operator instructions.
Table 82. Editing actions
Icon Editing action
Add commandClick the editor canvas. Select Add command and enter your command. ClickEnter to quit the command and continue in the next row.
Another way to enter a command is to mark the command and click Addcommand. As the command is still selected, you have to click on the canvas todeselect the command. Click Enter to quit the command and continue in the nextrow.
Keyboard shortcutUse the tab key to move the focus on the canvas. Press Ctrl + 4 and begin typingyour command.
Remove commandYou can remove the command by placing the cursor in the command and clickingRemove.
490 IBM Netcool Operations Insight: Integration Guide
Table 82. Editing actions (continued)
Icon Editing action
Add GOTOClick the editor canvas. Select Add GOTO. A goto element is added with the labelEND. Click the GOTO element and select the step that you want to jump to. Youcan select any subsequent.
Keyboard shortcutUse the tab key to move the focus on the canvas. Press Ctrl + 5. The GOTOelement is added.
Remove GOTOSelect the GOTO element and click Remove.
For more information about how to use the GOTO element, see “Adding a GOTOelement” on page 497.
Add ParameterTo add a parameter, go to the Parameter palette and drag the parameter thatyou require to the canvas.
Or mark the text which should be a parameter name and click Add parameter.
Keyboard shortcutUse the tab key to move the focus on the canvas. Press Ctrl + 8. A parametermenu is added. Click the arrow and select the required parameter.
Remove parameterSelect the parameter and click Remove.
For more information about creating parameters, see “Adding parameters” on page495.
Add collapsible details
To add collapsible details, click Insert collapsible details. Enter atitle for the collapsible section. Then enter the information that you want tocollapse and expand in a section.
Keyboard shortcutNone.
Remove collapsible detailsUse the delete or backspace key to delete collapsible details.
Paragraph or HeadingSwitch between paragraph style or select from the available heading styles.
Bold. Select a text and make it bold by selecting b.
Italic. Select a text and make it italic by selecting i.
Insert Link. If you want to insert a link, click Insert Link and enter in the URL fieldthe link. Do not forget to provide the link text and decide whether you want this linkto be opened in another tab.
Bulleted list. Select text that is spread over a couple of rows and click bulleted list.All lines are indented and bulleted.
Numbered list. Select text that is spread over a couple of rows and click numberedlist. All lines are indented and numbered.
Chapter 8. Administering 491
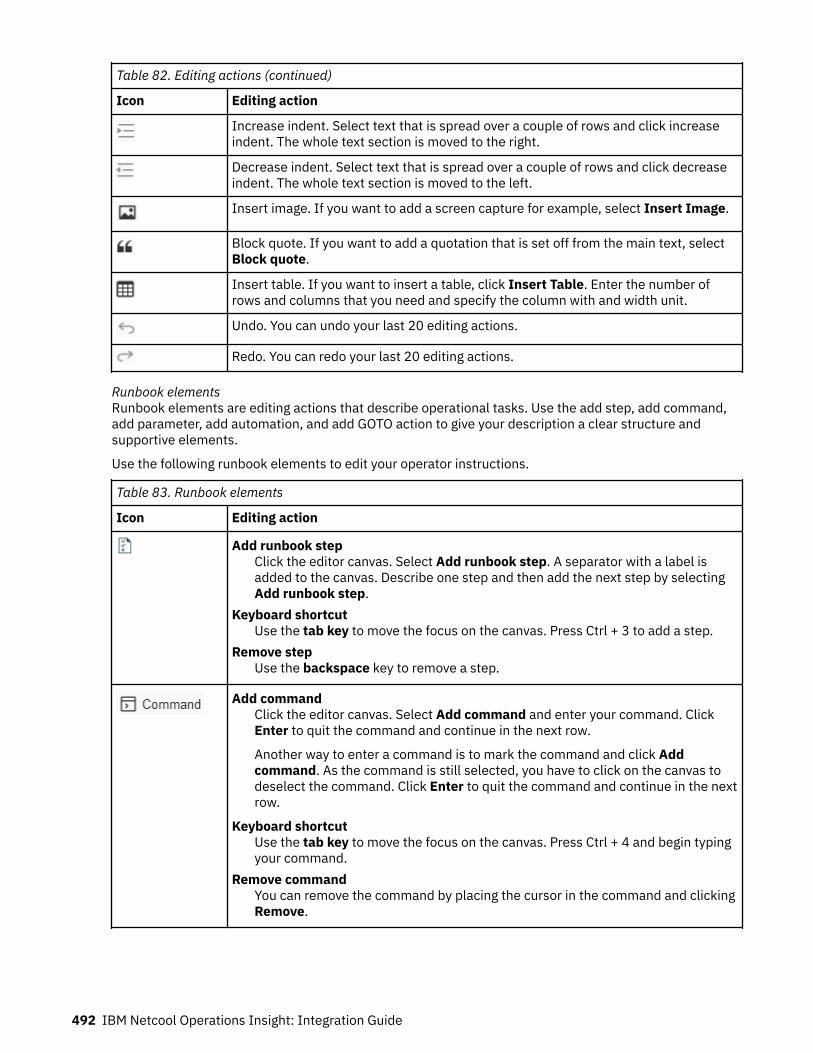
Table 82. Editing actions (continued)
Icon Editing action
Increase indent. Select text that is spread over a couple of rows and click increaseindent. The whole text section is moved to the right.
Decrease indent. Select text that is spread over a couple of rows and click decreaseindent. The whole text section is moved to the left.
Insert image. If you want to add a screen capture for example, select Insert Image.
Block quote. If you want to add a quotation that is set off from the main text, selectBlock quote.
Insert table. If you want to insert a table, click Insert Table. Enter the number ofrows and columns that you need and specify the column with and width unit.
Undo. You can undo your last 20 editing actions.
Redo. You can redo your last 20 editing actions.
Runbook elementsRunbook elements are editing actions that describe operational tasks. Use the add step, add command,add parameter, add automation, and add GOTO action to give your description a clear structure andsupportive elements.
Use the following runbook elements to edit your operator instructions.
Table 83. Runbook elements
Icon Editing action
Add runbook stepClick the editor canvas. Select Add runbook step. A separator with a label isadded to the canvas. Describe one step and then add the next step by selectingAdd runbook step.
Keyboard shortcutUse the tab key to move the focus on the canvas. Press Ctrl + 3 to add a step.
Remove stepUse the backspace key to remove a step.
Add commandClick the editor canvas. Select Add command and enter your command. ClickEnter to quit the command and continue in the next row.
Another way to enter a command is to mark the command and click Addcommand. As the command is still selected, you have to click on the canvas todeselect the command. Click Enter to quit the command and continue in the nextrow.
Keyboard shortcutUse the tab key to move the focus on the canvas. Press Ctrl + 4 and begin typingyour command.
Remove commandYou can remove the command by placing the cursor in the command and clickingRemove.
492 IBM Netcool Operations Insight: Integration Guide

Table 83. Runbook elements (continued)
Icon Editing action
Add ParameterTo add a parameter, go to the Parameter palette and drag the parameter thatyou require to the canvas.
Or mark the text which should be a parameter name and click Add parameter.
Keyboard shortcutUse the tab key to move the focus on the canvas. Press Ctrl + 8. A parametermenu is added. Click the arrow and select the required parameter.
Remove parameterSelect the parameter and click Remove.
For more information about creating parameters, see “Adding parameters” on page495.
Add automationTo add an automation, go to the automation palette and drag the automation thatyou require to the canvas. A dialog opens to map parameter values. Click Applyto add the configured automation to the runbook.
Keyboard shortcutUse the tab key to move the focus on the canvas. Press Ctrl + 7. A dialog openswith all available automations. Select an automation and click Add. A dialogopens to map parameter values. Click Apply to add the configured automation tothe runbook.
Remove automationSelect the automation and click Remove.
Change configurationTo change the configuration of an automation, click the automation and selectConfigure. A dialog opens and you can change the parameter mappings.
For more information about how to add and configure an automation, see “Addingautomations” on page 494.
Add GOTOClick the editor canvas. Select Add GOTO. A goto element is added with the labelEND. Click the GOTO element and select the step that you want to jump to. Youcan select any subsequent.
Keyboard shortcutUse the tab key to move the focus on the canvas. Press Ctrl + 5. The GOTOelement is added.
Remove GOTOSelect the GOTO element and click Remove.
For more information about how to use the GOTO element, see “Adding a GOTOelement” on page 497.
Chapter 8. Administering 493
Table 83. Runbook elements (continued)
Icon Editing action
Add collapsible details
To add collapsible details, click Insert collapsible details. Enter atitle for the collapsible section. Then enter the information that you want tocollapse and expand in a section.
Keyboard shortcutNone.
Remove collapsible detailsUse the delete or backspace key to delete collapsible details.
Adding automationsAutomations are used to run several steps automatically. Use the Automations page to createautomations.
About this taskThe job of an operator can involve repetitive tasks. For example, "logon to DB2®" or "start serverdagobert45". Automations are scripts or IBM BigFix fixlets that document these steps. If you useautomations within your runbook then the operator does not have to manually run these steps. They canrun all steps with one click.
For more information about how to create automations, see “Creating an automation” on page 502.
The runbook editor displays any created automations in the Automations pane.
Manual steps cannot contain automation elements. Automated steps must be added for automations.
It is common practice for automations to contain parameters. When adding automations to a runbook youmust decide how the values of the automation parameters are filled by creating a parameter mapping.Select from the following options:Use a runbook parameter
A runbook parameter, which can be filled via a Trigger from an event or manually by an operatorexecuting the runbook, is used to fill the specific automation parameter. When adding an automationto a runbook, you can select existing runbook parameters or directly create a new runbook parameter.
Define a fixed valueThe automation added to the step of a runbook will always be launched with a fixed value for theparameter. (If the same automation is used in a different runbook – another fixed value could bedefined there.)
Use the default from the automationIf the automation defines a default value for this parameter, it is possible to use that value.
Use the output of a previous automationThe output of an automation that was added to a previous step can be used as input for theautomation of the current step.
Use the logged in userThe parameter value will be filled with the username of the user, who is logged in to RunbookAutomation at the time when the runbook is run.Note: If the username contains the @ symbol, for example because the username is an emailaddress, the @ symbol and all characters that follow it will be removed from the username.
Procedure1. In the New (or edit) runbook editor, click Add automated step.
494 IBM Netcool Operations Insight: Integration Guide
2. Search for the automation. Click the search icon and type in the search term that describes theautomation that you need.
3. Choose the automation that you want and then click Select this automation.4. Select the parameter mapping type. A window opens with automation details and the parameter
definitions. In the Mapping column, select how automation parameters are to be filled with values.You can choose from the following options:New runbook parameter
Add a parameter. If default values are provided, update the default values as required. Enter a newparameter name and description.
Fixed valueAn entry field is provided to enter the parameter value.
(Existing) runbook parameterSelect the parameter from the list of existing parameters.
Use defaultUse the default value set by the automation.
Automation outputChoose the automation from a previous runbook step. The output value of the automation will beused as the parameter value for the current automation. This option is only available if the runbookcontains a previous step with an automation.
Use logged in userSelect this option to fill the parameter value with the username of the user who is logged in toRunbook Automation at the time when the runbook is run.Note: If the username contains the @ symbol, for example because the username is an emailaddress, the @ symbol and all characters that follow it will be removed from the username.
What to do nextEdit parameter configuration
If you want to edit the parameter configuration of your automation, select the automation and clickChange parameter mappings . Change your settings and click Apply.
Automation with errorsIf the automation is decorated with an error symbol, then the parameter settings are not correct. ClickChange parameter mappings to correct the parameter settings.
Delete an automationIf you want to remove the automation, click Remove selection .
Adding parametersParameters are used as general placeholders for values that are used on a frequent basis. Examples ofparameters are DATABASE_NAME, DIRECTORY, HOSTNAME, URL and so on.
Before you beginYou can use runbook parameters in the following scenarios:
• Parameters can be used as variables that get substituted by a value in the text of a runbook step, forexample:
STEP 2In this step you determine the longest running process of system $SYSTEM
• As input to a command defined in a runbook, for example:
STEP 5Now issue the command: cd $DIRECTORY
• Parameters of an automation can be filled with the value of a parameter defined for the runbook.
Chapter 8. Administering 495

• Automations of type BigFix and Script have a system parameter target which defines the targetsystem where the BigFix Fixlet® or script is run.
• Automations of type Script have a system parameter user that specifies the UNIX username which isused to run the script on the target system. This parameter can be mapped automatically to the userwho is currently logged in to Runbook Automation. For more information, see “Adding automations” onpage 494.
About this taskOperators enter values such as username, password, hostname, database name or URL on a frequentbasis. If you have to deal with many different computer systems, you must remember numerous usernames, passwords, host names or database names. In order to avoid typos or having to remember values,you can define parameters. For example, you can define a parameter DATABASE_NAME and either providea default value or enter the value when you run the runbook. Default values are the best fit if you do notwant operators to remember and enter the value.
Parameters are local to the runbook. They are not available for other runbooks.
Parameters are used within runbooks and for automations. Within runbooks, you can use parameterseither standalone, for example URL, or within a command, for example connect to HOSTNAME.
Parameters must be filled with values when executing a runbook. This can be done in the following ways:
• When a runbook is launched by clicking the execute button from the Runbook Automation UI, anoperator must first enter the parameter values. The operator is prompted with the name and descriptionof all parameters defined for the runbook, as well as an optional default value.
• When a runbook is launched from an event, a Trigger defines which values of the event data are mappedto which parameter of the runbook. Values that are entered in this way cannot be changed.
Runbook parameter values can be changed during the execution of a runbook. In any step of a runbook,you can select the parameter section of the runbook in the sidebar on the left. You might need to expandthe section first, if it is collapsed. The parameter can then be changed to a new value. To apply the newvalue click Update (the Update button is only displayed if the parameter value has been changed). Stepsof the runbook that are not yet executed will reflect the new value.
Runbook parameters can be used to define parameter values for automations within the same runbook.Parameter values for automations can be filled using the result of a previously executed automation.
In this way, the parameter Automation output of a previous automation Find large filesystems is an automatic parameter available for automations in the current step. It is possible to use theoutput of any automation that ran before in this runbook.
Procedure
1. Create a parameter. Click Add Parameter .A dialog box opens where you can enter theparameter name, the description, and the default value. If you select Optional you can start therunbook execution without defining a value, and set the parameter value during runbook execution.This setting is useful if the parameter value is not available at the beginning of the execution, butduring execution.
When you enter the runbook parameter name you can use alphanumeric characters, characters fromnational languages, and some special characters. But do not use the special characters ampersand(&), backslash (\), space ( ), greater than (>) or less than (<) when you define runbook parameternames.
As a result, a parameter of the runbook is created and can be used as a variable in the text of a step, asa variable value of a command, or as input of an automation added to a runbook step. For moreinformation about how to use parameters, see “Runbook elements and editing actions” on page 490.
2. Edit a parameter. Click Edit next to the parameter that you want to edit.
496 IBM Netcool Operations Insight: Integration Guide

3. To edit a parameter used by an automation, click Edit for the automation you have added to arunbook step.
Adding a GOTO elementThe GOTO element is used to skip steps or jump to the end of the runbook.
Use the GOTO element in the following scenarios:The execution was successful and you can complete the runbook
For example:
1. Restart the Application Server.2. If this was successful, then go to the END.3. Check your log files.
Run optional steps as result of a checkFor example:
1. Log in to the server where you want to start the application server.2. Check the current CPU consumption. If it is below 80% GOTO Step 5.3. Find the process consuming the most CPU.4. Determine the process.5. Start the application server.6. Check the log file for confirmation that the application server is started.
Configuring runbook creationUse these procedures to define the runbook creation process and control the publication of runbooks.
Configuring runbook approvalDefine whether to use the approval workflow or the direct publish workflow to make runbooks availablefor execution by operators.
Before you beginYou must be assigned the manager role to configure the runbook creation process.
Procedure1. Navigate to Library.2. Expand the drop-down menu.
3. Click Settings next to the New runbook button.4. Select Approve runbooks before publish if you want runbooks to be approved before they are
published.5. If you want to enforce that an approval must be refreshed at a regular interval, select Set expiration
date after xxx days and choose a time interval. If this option is enabled, the runbook approval willexpire after the specified number of days and can no longer be executed until the runbook is reviewed,submitted for approval, and approved again.
The deactivated approval process is described in “Create a runbook” on page 488.
The activated approval process is described in “Runbook approval process” on page 498.
Note: If the approval process is deactivated, all pending approvals are deleted.
Chapter 8. Administering 497
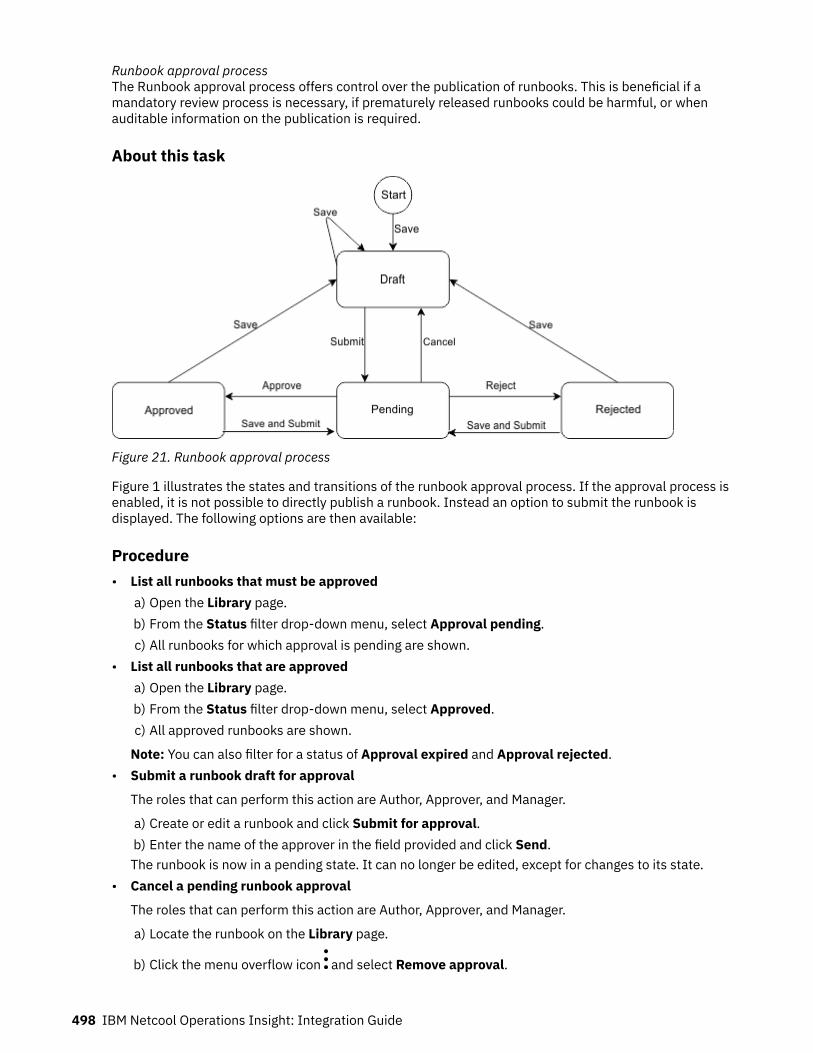
Runbook approval processThe Runbook approval process offers control over the publication of runbooks. This is beneficial if amandatory review process is necessary, if prematurely released runbooks could be harmful, or whenauditable information on the publication is required.
About this task
Figure 21. Runbook approval process
Figure 1 illustrates the states and transitions of the runbook approval process. If the approval process isenabled, it is not possible to directly publish a runbook. Instead an option to submit the runbook isdisplayed. The following options are then available:
Procedure• List all runbooks that must be approved
a) Open the Library page.b) From the Status filter drop-down menu, select Approval pending.c) All runbooks for which approval is pending are shown.
• List all runbooks that are approveda) Open the Library page.b) From the Status filter drop-down menu, select Approved.c) All approved runbooks are shown.
Note: You can also filter for a status of Approval expired and Approval rejected.• Submit a runbook draft for approval
The roles that can perform this action are Author, Approver, and Manager.
a) Create or edit a runbook and click Submit for approval.b) Enter the name of the approver in the field provided and click Send.The runbook is now in a pending state. It can no longer be edited, except for changes to its state.
• Cancel a pending runbook approval
The roles that can perform this action are Author, Approver, and Manager.
a) Locate the runbook on the Library page.
b) Click the menu overflow icon and select Remove approval.
498 IBM Netcool Operations Insight: Integration Guide

The runbook is now in normal draft mode and can be edited. The assignee can no longer approve orreject the runbook.
• Approve a runbook
Only the assigned person from the submission can approve a runbook. The roles that can perform thisaction are Approver and Manager.
a) Locate the runbook on the Library page.
b) Click the menu overflow icon and select Approve.The runbook now has a status of approved, which is the default for execution. New drafts can becreated. Information pertaining to the approval assignee and timestamp is stored within the runbook.
• Reject a runbook
Only the assigned person from the submission can reject a runbook. The roles that can perform thisaction are Approver and Manager.
a) Locate the runbook on the Library page.
b) Click the menu overflow icon and select Reject.The runbook now has a status of rejected and can be edited again. Information pertaining to theapproval assignee and timestamp is stored within the runbook until a new draft version is created andthe old information is deleted.
Runbook versionsYou can use versioning to create incremental improvements to runbooks and monitor the success ofchanges. Subject Matter Experts can continuously improve the quality of runbooks by using the commentsprovided and available run metrics. As a result different versions of a runbook will be created.
All available runbooks are listed on the Library page. Click the menu overflow icon and select Previewrunbook > Versions to display all the versions of a runbook.Draft
The Draft version is a work-in-progress runbook. It is marked with a draft flag. A draft runbook is notyet published and does not run in production. It is not visible to any operator. You can run and test thecurrent draft.
Latest publishedThe latest published version is the version that is running and used by all operators. This is the versionthat the operations analyst can preview and work with.
ArchivedArchived versions are previously used versions. They are not in production and cannot be used by anyoperations analyst. The metrics of the previous versions help the Subject Matter Expert to monitorcontinuous improvements of the runbook. You can run archived version to learn why this runbook didnot run successfully.
You can create different versions of a runbook if you are an RBA Author or RBA Approver. For moreinformation about roles, see Creating users.
Save and publish a runbookCreating a runbook involves documenting complex steps. These steps must be reviewed and testedbefore you can publish the runbook for use in production.
After a runbook is published and used in production, you might improve it based on the feedback that youreceive from comments, success rate, and ratings. The runbook editor provides the following actions:
CancelCancel closes the runbook editor without saving any changes.
Save asUse this action to save a copy of the runbook using a different runbook name.
Chapter 8. Administering 499
Save draftSave draft saves the updates that are added. The editor remains open. Save draft is useful if you areediting a runbook and you want to take a break and continue later. Or you just want to save yourchanges as you go.
Save draft & closeSave draft & close saves your changes and closes the editor. You use this option if you need to workon a different item.
PublishThis button is only available if the approval process has been deactivated. You can publish a runbookif you are an RBA Approver. After a runbook has been published it can be used by all operators in aproduction environment.
Submit for ApprovalThis button is only available if the approval process is enabled.
Filtering runbooksFilter by status, groups or tags to easily locate runbooks.
Procedure• Click Library.• To filter for runbook status, select one or more items in the Status filter. The filter matches any
selected status (or condition).
Note: Filtering for status Draft will display runbooks that have never been published. Draft versions ofalready published runbooks won't be displayed.
• To filter for groups, select one or more items in the Group filter. The filter matches any selected group(or condition).
• To filter for tags, select one or more items in the Tag filter. All tags must match to apply the filter (andcondition).
• To filter for authors, select one or more authors in the Authors filter. The filter matches any selectedAuthors.
• If a combination of several filters are used, all filters must match to apply the filter (and condition).• Additionally, you can filter by runbook name using the Search field.
The search field allows to search using regular expressions. If you want to search for specialcharacters that are used by regular expressions, for example plus (+), asterisk (*), question mark (?),brackets ( () [] {} ), or backslash (\), you must escape those characters. For example, if you want tosearch for (T), you must enter \(T\) as the search string.
Note: The filter drop-down list displays up to 50 available filtering options. You can start typing thename of the filter option that you are looking for. As you type, the list will display only items thatcontain the typed text.
ResultsOnly runbooks that match the specified filter are displayed.
Delete a runbookUsers assigned the RBA Manager role can delete a runbook.
To delete a runbook:
1. Open the Library page.2. Use the check boxes to select one or more runbooks.3. An action bar is displayed showing the available actions and the number of runbooks selected.
500 IBM Netcool Operations Insight: Integration Guide
4. On the action bar, click Delete. If you delete a runbook, all versions and the execution history of therunbook are deleted as well.
ExecutionsSee recently executed runbooks, including runbooks in progress.
On the Execution page, you can find all runbooks that have been started. You can filter your list by thefollowing criteria:Runbook name
Select the Runbook filter and select one or more runbook names. All runbook executions for theselected runbook names are shown.
Runbook typeSelect the filter Type and select Automatic Manual. Fully automated runbooks are runbooks in whicheach step contains an automation. An operator does not need to interact with the runbook.Automated runbooks can be mapped with events by creating a trigger. To see the automated runbooksthat are started by a trigger, click Automatic.
Runbook execution statusSelect the Status filter and choose a status such as Success, Failed, Cancelled, In progress, orCompleted. For example, you can find all runbook executions that are paused by selecting Inprogress. When you are ready to return to the task you can resume the runbook. Select the Canceledstatus if you want to see all canceled runbooks and the reason why they have been canceled.
“Automations” on page 501Create an automation to summarize and automate several steps into a single step.“Triggers” on page 510If you have events that always correspond to the same runbook you can create a trigger and link the eventwith the runbook. Triggers can run with manual and automated runbooks. If the runbook is a manual orsemi-automated runbook, the operator must complete the parameter values. If the runbook is fullyautomated, the trigger runs with pre-defined values. The operator does not even notice that the runbookwas executed.
Monitor runbook historyYou can monitor the runbook history if you are an RBA Author or RBA Approver.
1. Click Library.2. Select a runbook.
3. Click the menu overflow icon and select View history.
The execution history table and runbook details such as description, type, rating, success rate, andexecution statistics are displayed.
4. Use the filter boxes on the page to display only specific runbooks, for example:
a. To see runbook executions of the last seven days only, select Last 7 days.b. To see runbook executions that are still in progress, select In progress from the Status filter. If you
want to resume a runbook execution, click Resume.
AutomationsCreate an automation to summarize and automate several steps into a single step.
In runbooks, an automation is the collection of several manual actions into a single automated entity.Automations use the parameters of the runbook. Customize the parameters for the execution of therunbook. Parameters lower the time needed for the execution of a runbook. Automations eliminate therisk of manual errors that you get repeating the same steps many times.
The Service Delivery Engineer can provide an automation to replace frequently used steps with a singleclick. As the automation needs a target system where it is processed, an existing connection to the local
Chapter 8. Administering 501
environment is required before automations can be added. For more information about how to set up aconnection, see “Create a connection” on page 330.
Managing automationsAs Service Delivery Engineer, you are interested in how the automations run and how to keep themrunning smoothly. Use the Automations page to test automations, view statistics, and administer theavailable automations.
The following types of runbook contain automations:
• Semi-automated runbooks: runbooks that contain one or more automations. These runbooks consist ofmanual and automated steps.
• Fully automated runbooks: runbooks that contain an automation in each step. If fully automatedrunbooks are started by a trigger, you can find their status on the Execution page. Select the filter Typeand select Triggered automatically.
On the Automations page, you can find all available automations with the following information displayedin the table:Name
Name and description of the automation.Type
Automations are either of the type script or IBM BigFix, depending on the connection type used.Invocations
The number of times the automation has been used in runbooks.Success rate
How reliably did this automation run so far? The success rate indicates how well an automation ran.Last modified
A timestamp of when the automation was last modified.Actions
As a Subject Matter Expert you can Preview, Test, Edit, Copy, and Delete an automation.
How is the success rate of an automation calculated?An automation can have the following exit states:
• failed - automation could not even be started, for example because of an invalid hostname,unsuccessful authentication, or incorrect parameters (in case of an Ansible Tower automation).
• unsuccessful - automation could be started but has a return code indicating an error, for example forssh automations the exit code is not 0, for http automations the http return code is >= 400®.
• successful - automation could be started and has a return code indicating success, for example for sshautomations the exit code is 0, for http automations the http return code is <400.
The success rate indicates the quality of an automation. For example, for ssh automations it indicates thequality of the corresponding scripts. For Ansible Tower automations, the success rate indicates the qualityof the corresponding Ansible playbooks.
It does not indicate if the configuration is correct. For example, if an ssh automation cannot be executedbecause of an invalid hostname or authentication failure, you will see this in the success rate of therunbook, but not in the success rate of the automation.
Therefore, the success rate is calculated using the number of unsuccessful and successful automationexecutions. It does not include the number of failed automation executions.
Creating an automationCreate an automation by defining the automation type and configuring the parameters and fields.
Automations are routines that run a task automatically. There are different types of automationsdepending on how tasks are run. Runbook Automation supports automations of type script, BigFix and
502 IBM Netcool Operations Insight: Integration Guide

HTTP. For automations of type script and BigFix a connection needs to be configured. To learn how toconfigure a connection, see “Create a connection” on page 330.
You must be logged on as an RBA Author to create automations.
Creating Script automationsYou can create an automation of type script by using the SSH provider. The Operating System of theendpoint system can be either UNIX (including AIX and Linux) or Windows. For UNIX, the SSH providerexecutes a script using the default shell. Alternatively, a shebang (#!) can be used to execute the script inany scripting language the target system can interpret. The SSH provider does not require an additionalagent as it uses a direct remote execution connection via SSH.
For Windows, the SSH provider can execute a Powershell script.
Note:
• To access the system via SSH you must set up an SSH server on the Windows system, for exampleOpenSSH for Windows Server 2019 or Windows 10. The Windows System must have Powershellinstalled as the default shell of the SSH server.
• If you are using a jumpserver, the jumpserver must be a Linux system. You cannot use a Windowssystem as a jumpserver.
Complete the following steps to enable script automations:
1. Create a Script connection, see “Configuring automation types” on page 330.2. Create an automation of type script. Click Automations > New Automation. Complete the following
fields:Type
Select Script.If you want to run a script as an automation, you must configure a Script Automation Provider onthe Connections page.
NameProvide a name that describes what this automation does. For example, Find large filesystems.
PrerequisitesIf this automation requires prerequisites, add this information. For example, Db2 Version 10.5or higher.
DescriptionProvide any helpful additional information so that the user can immediately understand whichproblem this automation solves.
ShellSelect Bash for scripts that run on UNIX systems.Select Powershell for scripts that run on Windows systems.
ScriptYou can either select Import to select the script from your file system, or you can directly enter thescript into the editor. If you selected Bash the script can only be run on UNIX systems using thedefault shell or the interpreter, which is specified after the shebang #!. If you selected Powershellthe script can only be run on Windows systems using Powershell.Note: imported scripts must be in UTF-8 format if they contain non-ascii characters (for example,Chinese).
ParametersAdd input parameters to run the automation script. Those input parameters are available to thescript as environment variables. For example, a parameter filesystem is used in a Linux script as$filesystem. The $ sign is automatically added to distinguish user-defined parameters fromsystem parameters such as target and user. The parameter is exported without the dollar sign.Note: input parameter names must consist of alphanumeric characters and the underscorecharacter only. The following system parameters exist:
Chapter 8. Administering 503

targetMandatory parameter. Applies to automations of type BigFix and Script. The targetparameter is created to define the target machine where the Bigfix Fixlet or script is running.
userMandatory parameter. Applies to automations of type Script. The user parameter defines theUNIX or Windows username that is used to run the script on the target machine.Note: If the value of the user parameter contains the @ symbol, for example an email address,the @ symbol and all characters that follow it are ignored.
3. Add the automation to the runbook, see “Adding automations” on page 494.4. Run the runbook, see “Run your first runbook” on page 486.
Single and Multi Target AutomationsYou can use single target or multi target automations to execute script automations.
Single TargetThe parameter with the name target has special meaning to script automations as it defines the systemon which the automation will run. The system can be defined by a short hostname, a FQDN, or an IPaddress. When executed a script automation will connect to the system identified by the target andexecute the script there.
The execution result of the script will be reflected in the status of the automation. Possible automationstates are executing, successful, unsuccessful, failed, and unknown. In the case of a fully automatedrunbook execution, this status will also be used to decide whether the runbook will be canceled orcontinued.
Examples:
• An automation which receives prod-server1, as the content of the target variable will execute thisautomation on the system prod-server1. The script exited with return code of zero and the state of theautomation instance is set to successful.
• An automation which receives 192.168.55.56, as the content of the target variable will execute thisautomation on the system with the matching IPv4 adress. The script exited with a non-zero return codeand the state of the automation instance is set to unsuccessful.
• An automation which ran in step 1 of a fully automated runbook failed to reach the endpoint (forexample because the server was not available) and the automation could not be executed at all. Thestatus of the automation instance is failed. This status is reflected in the status of the execution. Theexecution will stop after the first step and report a failure.
Multi Target AutomationsThe other mode of operation of an automation is the Multi Target Automation (MTA). In order to executean automation as an MTA, specify the target string in the following format: [ $target1, $target2, …,$targetN ].
The following rules apply to MTAs:
• The target string must begin with a left square bracket ( [ ) and must end with a right square bracket ( ] ).• Between the square bracket define a list of systems separated by comma (,).• Duplicated entries are detected and ignored. This means specifying the same target multiple times will
have no effect.• An empty list is also allowed.
Multi Target Automations allow you to execute the same automation on any number of targets in parallel,removing the necessity to execute the same automation with different targets sequentially. If the target isspecified in such a way, how the automation is executed and how the results are treated will be different.The following criteria apply to MTAs:
504 IBM Netcool Operations Insight: Integration Guide

1. For every entry in the comma-separated list, the script will be executed on the specified target. Note:you cannot specify the same target more than once.
2. All actions and information are summarized in one log. This log follows a specific format, see “Outputformat of Multi Target Automations” on page 505.
3. The status of the execution will be executing as long as at least one execution is still ongoing andsuccessful once all script processes are finished. The result will be successful even if some or even allautomations reported unsuccessful, failed, or unknown.
4. Specifying an empty array is allowed. This special case is called a Conditional Automation. No actualexecution occurs, but an execution record is still created. The record will always report successful asits state. If the runbook is executed fully automated, the runbook instance will proceed to the nextstep.
Examples:
• An automation receives [prod-server1] as the target. It will execute the script on the system prod-server1. The script exited with a non-zero return code. The status of the execution is successful. Theoutput of the automation instance contains information that this script execution was unsuccesful onprod-server1.
• An automation receives [prod-server1, prod-server2, prod-server3] as the target. It will execute thescript on three systems in parallel. All scripts exit with zero as the return code. The output and status ofeach of the three script executions is written to the output. The status of the overall execution issuccessful.
• An automation receives [] as the target. This triggers the conditional automation workflow No executionwill take place. The execution record will have an almost empty output and the status will besuccessful.
Output format of Multi Target AutomationsDespite being executed on any number of endpoints, the results of Multi Target Automations (MTA) areconsolidated into one execution record. This record combines the information from all executions.
The output is formatted as follows:
• If the script produces output the output is displayed after two prefixes. The first item is the name of thetarget. The second item is either out or err depending on whether the output was written to stdout orstderr.
• The log will group the output by target. So the complete output of the first target will be displayedbefore the output of the second target is displayed and so on. This means the output is not orderedchronologically, although the output by target is.
• At the end of the output a summary is always present. The summary consists of three additional lines.They follow the pattern $status : [ $listOfTargetsWithThisState ]. Where $status is one of thefollowing: unsuccessful, successful, or failed.
• If the target array is an empty array, the output will only contain the summary.
ExampleAn automation has been executed with the target [prod-server1, prod-server2]. The execution on prod-server1 was successful, while the execution on prod-server2 was unsuccessful. The output will look asfollows:
prod-server1 out: Some output from the script to stdout happening at 08:34prod-server1 out: More output from the script to stdout happening at 08:36prod-server1 out: Script prints more to stdoutprod-server1 status: successful
prod-server2 out: Some output from the script happening at 08:35prod-server2 out: More output from the script happening at 08:37prod-server2 err: Script prints output concerning a failure to errprod-server2 status: unsuccessful
unsuccessful: [prod-server2]
Chapter 8. Administering 505
successful: [prod-server1]failed: []
Comparison of Single and Multi Target Automations
The following table outlines the difference between the operation modes:
Table 84. Comparison of Single and Multi Target Automations
Aspect Single Target Multi Target Automation
Number of parallel executions One Number of entries in target array
Final execution status Equal to status of automation Always successful
Failure during fully automatedrunbook (FARB) execution
Aborts the FARB Proceeds the FARB
Specifying an empty target Failure to execute automation Enters special case for emptyarray
Creating BigFix automationsIf you want to use an automation of type BigFix, install the required components to run the automation.
You must complete the following steps before you can use an automation of type BigFix:
1. Create a Script connection, see “Configuring automation types” on page 330.2. Create an automation of type BigFix (you need to know site ID, fixlet/task ID, and action ID). Click
Automations > New Automation. Complete the following fields:Type
Select IBM BigFix.If you want to run an IBM BigFix fixlet or task as an automation, you must configure an IBM BigFixAutomation Provider on the Connections page.
NameProvide a name that describes what this automation does. For example, Find large filesystems.
DescriptionProvide any helpful additional information so that the user can immediately understand whichproblem this automation solves.
PrerequisitesIf this automation requires prerequisites, add this information. For example, Db2 Version 10.5or higher.
Site NameThe Site Name is the location where the fixlet or task runs. For example, BES Support.
Fixlet IDProvide the numerical ID of the fixlet or task. For example, 168.
ActionProvide the action that you want to run within your fixlet or task. For Example, Action1.
Target machineMandatory field. The Target machine parameter is created to define the target machine where thefixlet is running. Each automation must define a target machine.
ParametersAdd input parameters to run the IBM BigFix action. Those input parameters are available to thefixlet as environment variables. For example, a parameter filesystem is used in a Linux fixlet as$filesystem. The $ sign is automatically added to distinguish a user-defined parameter from asystem parameters such as TARGET. The parameter is exported without the dollar sign. ForWindows fixlets, parameters are available in the fixlet with the percentage sign, for example%filesystem%.
506 IBM Netcool Operations Insight: Integration Guide
3. Add the automation to the runbook, see “Adding automations” on page 494.4. Run the runbook, see “Run your first runbook” on page 486.
Creating HTTP automationsThe HTTP automation provider allows to send HTTP requests to a specified web service.
The specified web service must be located in the public internet. It is not possible to connect to yourprivate data center.
The specified web service can be in your private data center or in the public internet provided the RBAserver can reach the destination. Ensure that the network setup, for example firewalls can reach the APIendpoint of the web service.
1. Click Automations > New automation. Complete the following fields:Type
Select HTTP.Name
Provide a name that describes what this automation does. For example, IBM WatsonTranslate.
DescriptionProvide any helpful additional information so that the user can immediately understand whichproblem this automation solves.
PrerequisitesIf this automation requires prerequisites, add this information. For example, Watson servicecredentials are required.
API endpointSpecify the http API endpoint of the web service to which the HTTP request will be sent to. Forexample https://gateway.watsonplatform.net/qagw/service/v1/question/1?TestIt.
METHODChoose the HTTP method. For example POST.
UsernameIf basic authentication is required to use the web service, specify the API user name for basicauthentication.
PasswordIf basic authentication is required to use the web service, specify the API password for basicauthentication.
AcceptSpecify the accept request header. The accept header is used to specify the media types which areacceptable for the response of the request. For example text/html.
Accept-LanguageSpecify the accept-language request header which is used to restrict the set of languages that arepreferred for the response of the request. For example en-US.
Additional headersOptionally, specify any additional request headers that are needed for the request. For exampleaccept-charset: utf-8.
Ignore certificate errorsSelect this check box to ignore certificate errors. Use this option only for test purposes. Inproduction environments, ensure that the correct certificates are installed on the target webservice.
ParametersAdd input parameters to run the automation. Those input parameters can be referred in the entryfields. For example, a parameter text can be referred as $text.
2. Add the automation to the runbook, see “Adding automations” on page 494.
Chapter 8. Administering 507
3. Run the runbook, see “Run a runbook” on page 489.
Ansible Tower AutomationsThe Ansible Tower Automation Provider allows you to create "Ansible Tower" type automations. Theseautomations reference an existing asset from a connected Ansible Tower installation.
Ansible Tower Automations can reference the following:
• Job Templates• Workflow Job Templates
Unlike Script Automations, Ansible Tower Automations do not define new automation content inside IBMRunbook Automation. Instead they point to an existing automation, present in the Ansible Tower server,which is a job or job workflow template.
When an Ansible Tower Automation runs, it calls the specific "launch" operation of that template on theconnected Ansible Tower server. If the template requires prompting for specific variables, these variablesare sent by Runbook Automation. Runbook Automation allows these variables to be defined asAutomation parameters.
See the topics that follow this section for more information about Ansible Tower Automations.
Connecting an Ansible Tower server
About this taskComplete the following steps to create a connection to an Ansible Tower Server.
Procedure1. Open the Connections tab.2. Click Edit on the Ansible Tower card.3. Enter the base URL of your Ansible Tower server. This URL must contain the protocol, for example:https://ansible-tower-server.mycompany.com:443.
4. Choose an authentication type. You can select Basic Auth to connect with user name and password orAPI Token to use a bearer token, previously created with Write Scope in Ansible Tower.
5. Enter the chosen authentication information.6. Optional: Enter the Ansible Tower server certificate or certificate chain.7. Click Save to store the connection information.
Note: When using the standard Ansible Tower installation a self-signed certificate issued for CNlocalhost might be generated. Make sure to replace that certificate with a certificate issued for theactual domain name you will be using. Otherwise the connection might not work.
Job Template parameters and surveys
In Ansible Tower a Job Template or Workflow Job Template can define a number of parameters andproperties. They can be defined directly in Ansible Tower’s template itself, or can be set to "prompt onlaunch". Every parameter that's set to be prompted must be supplied during template launch by IBMRunbook Automation. In the case of an Ansible Tower Automation executed through RunbookAutomation, this translates to automation parameters.
Job Templates in Ansible Tower can accept input for the following parameters:
• diff_mode (type: boolean)• extra_vars (type: string in JSON format)• inventory (type: integer)• credentials (type: array of integers)• limit (type: string)
508 IBM Netcool Operations Insight: Integration Guide
• verbosity (type: integer; range 0-5)• tags (type: string)• skip_tags (type: string)
Workflow Job Templates in Ansible Tower can accept input for the following parameters:
• extra_vars (type: string in JSON format)• inventory (type: integer)
Additionally, you can define any number of additional parameters to be prompted from the user throughthe "survey". Answers to the survey are written into the extra_vars either in YAML or JSON format.
Creating an Ansible Tower Automation always requires you to define parameters for any variables set to"prompt on launch". Runbook Automation prevents the creation and execution of Ansible TowerAutomations where the input parameters do not match the set of parameters set to "prompt on launch".If a referenced Job Template or Workflow Job Template changes in this regard, you must adjust thereferring Ansible Tower Automations as well.
If a parameter is set to "prompt on launch" in Ansible Tower, but also defines a value, RunbookAutomation will import Tower’s default value into the automation parameter.
During execution of Ansible Tower Automations make sure to pass the variables in their proper dataformat. For example, Ansible Tower expects the inventory to be an integer referencing an inventorydefinition. If you enter a string which cannot be converted to such an integer, the execution will fail withan error. The same can apply for surveys, as surveys can define any number of variables in differentformats. If the survey requires prompted values, a good practice is to include instructions in the runbookitself.
Recommendation: Runbook Automation uses automation definitions as mappings to Ansible Tower JobTemplates and Workflow Job Templates. It is recommended to define defaults in Ansible Tower and onlyprompt for parameters which are dependent on the runbook execution, rather than using RunbookAutomation as the primary tools for parameter definitions. For more details on parameters, see theAnsible Tower Documentation for Job Templates or Workflow Job Templates.
Creating Ansible Tower automations
Before you beginTo create an Ansible Tower Automation you must set up a connection to the Ansible Tower.
About this taskComplete the following steps to create an Ansible Tower Automation.
Procedure1. Open the Automations tab.2. Click New automation.3. From the Type drop-down menu, select Ansible Tower.4. Choose values for "name" (required), "prerequisites" (optional), and "description" (optional).5. 5. Select either Job Template or Workflow Job Template as the Template Type.6. Select the asset that you want to reference as the template. This list is directly retrieved from the
connected Ansible Tower server and shows the template names for the selected template type. Youcan enter text to search and narrow down the displayed items.
7. Runbook Automation automatically populates the list of parameters for this template. Optionally, youcan edit each parameter to provide a description, a default value, or both.
8. Click Save to create the Ansible Tower Automation.
Chapter 8. Administering 509
Changing Job Template Parameters after an Ansible Tower Automation has been created
About this taskIf you change a job template, for example select or deselect prompt on launch for a parameter or changethe survey, the change does not automatically get propagated to Runbook Automation.
Complete the following steps to ensure that changes are picked up in Runbook Automation.
Procedure1. Edit the automation that refers to the Ansible job template.2. Reselect the job template. This ensures that the new parameters will be picked up automatically.3. Optionally, review the parameters and their default values.4. Save the automation.5. Edit the runbook that refers to the changed automation.6. Edit the automation configuration and ensure that the parameter mapping is configured correctly.7. Save and publish the runbook.
Testing an automationAs Service Delivery Engineer, you can test an automation before you use it within a runbook. This allowsyou to quickly develop and test automations.
Procedure1. Click Automations.
2. Select an automation and click the menu overflow icon and select Test to start the test procedure forthe automation.
3. Follow the instructions on the Testing automation page.4. Verify the result of the automation.5. You can test the automation multiple times.6. Parameter values can be modified between test runs of the automation.7. When you are finished testing the automation, click Close.
TriggersIf you have events that always correspond to the same runbook you can create a trigger and link the eventwith the runbook. Triggers can run with manual and automated runbooks. If the runbook is a manual orsemi-automated runbook, the operator must complete the parameter values. If the runbook is fullyautomated, the trigger runs with pre-defined values. The operator does not even notice that the runbookwas executed.
You must install Netcool/Impact to run the trigger service. For more information, see “Installing Netcool/Impact to run the trigger service” on page 334.
Managing triggersThe following functions are available on the Triggers page:Create new trigger
Click Create new trigger to open the New trigger window and configure your trigger. For moreinformation, see “Create a trigger” on page 511. You can add a trigger if you are an RBA Author orRBA Approver.
Check if an automatic or manual runbook is usedYou can find out if the trigger is mapped to an automatic or manual runbook in the Execution column.
510 IBM Netcool Operations Insight: Integration Guide

Check the status of the triggerThe Triggers table displays the current status of a trigger. A trigger can have a status of On, Off, orBroken. You can turn a trigger on or off by using the toggle button in the Status column.
Check if the runbook that is assigned to the trigger still existsThe Trigger table displays any triggers that are broken because the assigned runbook has beendeleted.
Edit trigger
In the Triggers table, click the Menu overflow icon and select Edit trigger to change your currentsettings.
Copy trigger
To copy a trigger, click Menu overflow icon and select Copy trigger.Delete trigger
If this trigger is no longer valid, click Menu overflow icon and select Delete trigger. You can delete atrigger if you are an RBA Manager.
For more information about roles, see Creating users.
Create a trigger
Before you beginYou can create a new trigger if you are an RBA Author or RBA Approver.
You must create an Event Trigger connection before you can work with triggers. For more information, see“Event Trigger (Netcool/Impact)” on page 331.
About this taskAs a best practice, define the conditions so they don't overlap with the conditions that are already definedwithin other triggers. In most cases, it's best to create trigger conditions that are all based on a singleevent attribute or a small common set of event attributes, and to use the "equals" operator to describethe exact match that you are looking for.
• Netcool/Impact 7.1.0.18 and earlier: If the conditions from multiple triggers match to a singleNetcool/OMNIbus event, then it's undefined which one of the triggers takes effect, and which one of therelated runbooks is associated with the event. In most cases, the trigger that was defined first takeseffect, but you cannot rely on this rule of thumb. The order might change when triggers are deleted, andtrigger IDs are reused.
• Beginning with Netcool/Impact 7.1.0.19: A new field RunbookIDArray has been added for eachNetcool/OMNIbus event. If the conditions from multiple triggers match to a single event, the runbookIDs from all these triggers are added to the RunbookIDArray field (in JSON format). The first runbookID in the array identifies the runbook that takes effect (also denoted as the "nominated runbook").Again, the order of the runbook IDs in the RunbookIDArray typically reflects the chronological orderwhen the triggers were created. You can use this field to write a custom launch-in-context tool thatlaunches to a runbook other than the nominated runbook. The nominated runbook being the runbookthat gets executed (in the case of a fully automated runbook). Or, the runbook that gets invoked whenyou do a launch-in-context with the standard launch tool for RBA. Note, the set of runbook parametersis defined by the nominated runbook.
• Beginning with Netcool/Impact 7.1.0.20: By default, the system performs as it did previously (withNetcool/Impact 7.1.0.19). However, now you can control the order of the runbook IDs in theRunbookIDArray. In particular, you can control which runbook is the nominated runbook. To facilitatethis, each filter (that is each set of conditions from a trigger) has a new attribute FILTERPRIORITY thatis configurable in the Netcool/Impact UI. The range of supported values is from 1 - 1000, 1 being thelowest priority and 1000 the highest. Think of it as a "weight" applied to the filter. All existing filters areautomatically assigned a default value of 1.
Chapter 8. Administering 511

For Netcool Operations Insight on Red Hat OpenShift environments, see also “Configuring Event Filters toprioritize RBA triggers” on page 514.
Complete the following steps to modify the FILTERPRIORITY value for a filter:
1. Log in to the Netcool/Impact UI.2. Navigate to Data Model > RBA_Derby > EVENT_FILTERS.3. In the context menu of the EVENT_FILTERS data type, click View Data Items.4. You can enter a defining substring from the filter in the Filter retrieved data items field. This narrows
down the list of available filters to the filter that you want to modify.5. Edit the appropriate row and set the value in the FILTERPRIORITY field to a value between 1 and
1000.6. Save the filter.
Example: Lets say that you created "trigger-1" that links events that match filter-1 to the manualrunbook with runbookID-1. Later, you realize that it would be preferable for those events to be handledby a fully automated runbook with runbookID-2. And the manual runbook with runbookID-1 shouldonly be linked to the event as a backup, in case the fully automated runbook fails for some reason.
To achieve this behavior, create a new trigger "trigger-2" with a set of conditions filter-2 and link itto runbookID-2. The filter-2 must be (slightly) different to filter-1, in a way that it still matchesthe desired events. Then, set the FILTERPRIORITY for filter-2 to a non-default value, for example setit to 567. For any new event that matches both filter-1 and filter-2, the fully automated runbookwith runbookID-2 will be executed, and the RunbookIDArray will have the content["runbookID-2","runbookID-1"]. Create a custom Netcool/OMNIbus launch-in-context tool thatpicks the second entry from the RunbookIDArray and invokes the manual runbook.
If the set of runbook parameters for the manual runbook is a subset of the runbook parameters for thefully automated runbook, all runbook parameters will be automatically set when you launch the manualrunbook.
Procedure
1. In the main navigation menu, select Automations and click Runbooks.2. Click Triggers > Create new trigger.3. Enter the Name and Description of the Trigger. Name is a required field. In the description field,
describe what kind of events this trigger is used for. What problem reported by an event does themapped runbook solve?
Warning: The description must not contain newline characters.
4. Add one or more conditions to trigger events. The conditions describe the events that the trigger willact on.a) Enter a Name for the condition.b) Select an Attribute and Operator from the drop-down lists. Depending on the attribute selected,
you either enter a Value or select one from the drop-down list. For example, you enter a value for aSummary attribute and you select a value for a Severity attribute.Generally, it is recommended to use the "equals" operator whenever possible. If you need moreflexibility, you can use the "like" operator on an attribute that supports strings as values. Thefollowing tips give some ideas for writing value patterns with the "like" operator:
• If you only specify a string pattern, then all strings that contain the string pattern will match. Forexample, if you define the value pattern "Status", then "TriggerStatus", "MyStatusLogger","Status", and "StatusLogger" match, but "MemStat" does not match.
• Value patterns are case sensitive.• You can use "[abcd]" or "[a-d]" to match any (single) character in the square brackets or in thedefined range of characters.
512 IBM Netcool Operations Insight: Integration Guide
• You can use the regular expression quantifiers *, +, ?, for example: "[a-d]*" or ".+".
For a full description of the value patterns that can be entered in the value field, see the NETCOOLregular expression library in the Netcool/OMNIbus Knowledge Center.
Tip: When selecting specifying conditions, you can join multiple conditions using the AND and ORoperators. For example, if you select AND the mapping is processed as follows: Event1 is mapped withcondition1 AND condition 2 AND condition 3. If you select OR, the mapping is processed as: Event 1 ismapped with condition 1 OR condition 2 OR condition 3.
Note:
As a best practice recommendation, define the conditions in a way that they do not overlap with theconditions that you already defined within other triggers. In most cases, it is best to use the "equals"operator to describe the exact match that you are looking for. If filters from multiple triggers match toa single Netcool/OMNIbus event, then it is undefined which one of the triggers takes effect, and whichone of the related runbooks is associated with the event.
5. Optional: When selecting specifying conditions, you can check to see how many events would havematched the conditions you set. Go to the end of the Trigger conditions section, and click Run a newtest. The result shows how many events would have matched the trigger conditions.Click Show results to view a list of all the events that would have matched the conditions. Click Run anew test to change the time frame for testing, or if you changed conditions and want to check again formatching events.
6. Assign a runbook that will run when the trigger is active.
In the runbook table, click Type and select if you want to list automatic or manual runbooks. Thedifference is that automatic runbooks do not require any manual interaction from the operator. If theevent occurs, the runbook runs automatically. For manual runbooks, the runbook is added to the event,so that the operator can launch to the runbook from the event viewer. You can also start typing thename of the runbook that you are looking for. As you type, the list will display only runbooks thatcontain the typed text. Select a runbook from the table and click Select this runbook.
7. The parameters of the selected runbook are displayed. Select how you want to enter the parametervalue:Ask user
The user can enter a pattern to extract a subset of the parameter value by entering a regularexpression.
From eventThe parameter value is contained in the event. If the runbook is started, the parameter value isused from the event.
ManualIf the runbook is started, the operator manually enters the parameter values.
The regular expression syntax for the "Ask user" option is based on the Perl regular expression syntax.The syntax is the same as that used in Netcool/Impact. The following conditions apply:
• If the pattern field is empty, then the complete value of the selected event property is copied into therunbook parameter.
• If the pattern field contains a regular expression, the RExtract tool with the default behavior for the"Flag" parameter is used ("true"). For more information about that tool, see the Netcool/Impactproduct documentation RExtract.
• Tips for writing regular expressions:
– Always use groups. For example, specify (\w{4}) instead of \w{4}.– Specify the regular expression itself without adding any modifiers. The "global" modifier gets
applied automatically by RExtract. For example, specify (\w{4}) instead of /(\w{4})/g.– The regular expression (.*) matches no result data, which is the default behavior of RExtract.– If there are multiple matches, the last match is returned. For example:
Chapter 8. Administering 513
Value: omnibus.service.netcool Pattern: ([a-z]{5}) Result: netco
Note: In theory, there are three matches: {omnib, servi, netco}.– If there are multiple concatenated groups, then the first group of the last match is returned. For
example:
Value: omnibus.service.netcool Pattern: ([\w]{4})([a-z]) Result: netc
Note: In theory, there are three matches: {omnib, servi, netco}. The last match is "netco", which isdivided into the two groups "netc" and "o".
– If you copy a regular expression from a document, ensure that all characters are copied as plainletters. For example, use the circumflex accent ^ (U005E) instead of the modifier letter circumflexaccent ˆ (U02C6).
Restriction: If you have IBM Tivoli Netcool/Impact V7.1.0.16 or lower installed: Escaped backslashcharacters (\\) must not be contained in the pattern.If you have IBM Tivoli Netcool/Impact V7.1.0.17 or higher installed: The pattern can containescaped backslash characters (\\).
Note: If you change the corresponding runbook and, for example add or remove a parameter, theparameter mapping will no longer work. Ensure that you edit the trigger again and update theparameter mapping.
8. Select Enable if you want this trigger to be used. Then, the trigger is added to the Triggers table withthe flag "Enabled". If you do not want to use this trigger, toggle the Enable button to off. The trigger isadded with the flag Disabled.
9. Click Save.
Configuring Event Filters to prioritize RBA triggersThe EVENT_FILTERS data type is required to prioritize Runbook Automation triggers.
About this taskCheck if the EVENT_FILTERS data type is listed under the RBA_Derby datasource in Netcool/Impact. Ifnot, then complete the steps in this procedure.
Procedure1. Log in to Netcool/Impact.2. Switch to the RunbookAutomation project from the drop-down menu in the upper right of the page.3. Click the Data Model tab.4. Click the arrow to the left of the RBA_ObjectServer datasource to display the data types.5. Right-click on the EVENT_FILTERS data type and click Delete.6. Right-click RBA_Derby datasource and click New Data Type.7. Complete the following steps on the SQL Data Type Config page:
a) In the Data Type Name field, type EVENT_FILTERS.b) From the Schemas drop-down list, select RBACONFIG.c) From the Tables drop-down list, select, EVENT_FILTERS.d) Click Refresh Fields.
The table rows are displayed.e) Select the FILTERID table row, double-click the entry for the Key Field column, and select the
checkbox when it is displayed.
514 IBM Netcool Operations Insight: Integration Guide
f) Click Save on the upper left of the page.
ResultsThe new data type appears under the RBA_Derby data source.
Backup and restoreLearn how to back up and restore your deployment.
To backup and restore the various components in your cloud or hybrid deployment, see the followingtopics:
• “Backup and restore for cloud native analytics” on page 515• “Backup and restore for event management” on page 518• “Backing up database data for topology management” on page 521• “Backing up and restoring UI configuration data for topology management” on page 520• “Restoring database data for topology management” on page 523
Backup and restore for cloud native analyticsThe backup and restore function provides support for backing up cloud native analytics policies to anexternal location using Secure Copy Protocol (SCP) or storing policies to a persistent volume. It is thenpossible to use those backups to restore them on another deployment, which could reside on anothercluster or even the same cluster. Backup and Restore is implemented using Kubernetes cronjobs. Seehttps://kubernetes.io/docs/tasks/job/automated-tasks-with-cron-jobs/ for more details about cronjobs.
If you require sending backups to an external system using SCP then you need to create a private publickey using ssh-keygen. See https://www.ssh.com/ssh/key gen/ for more details on how it is used. Thepublic key generated by the instructions in the link, need to go in the authorized_keys file on the targetuser directory $HOME/.ssh of the target system. The private key is placed in a Kubernetes secret for useby the cronjob to connect into the target system. It is also possible to store the backups on a persistentvolume. In order to use it you need to create a Kubernetes persistent volume claim and note the name ofthe claim for example claimName. It is possible to use any combination of the above mechanisms
BackupThe table describes what configuration parameters are used for backups in the Netcool OperationsInsight Custom Record definition.
SectionName PropertyName Description Default
serviceContinuity enableAnalyticsBackup If set to true, the cronjobthat does the backups isactivated.
false
helmValuesNOI ibm-noi-bkuprestore.noibackuprestore.backupDestination.hostname
The destinationhostname of themachine where thebackups are copied to.(Optional)
false
helmValuesNOI ibm-noi-bkuprestore.noibackuprestore.backupDestination.username
The username on thedestination hostnamethat does the SCP copy.
(Optional)
false
Chapter 8. Administering 515
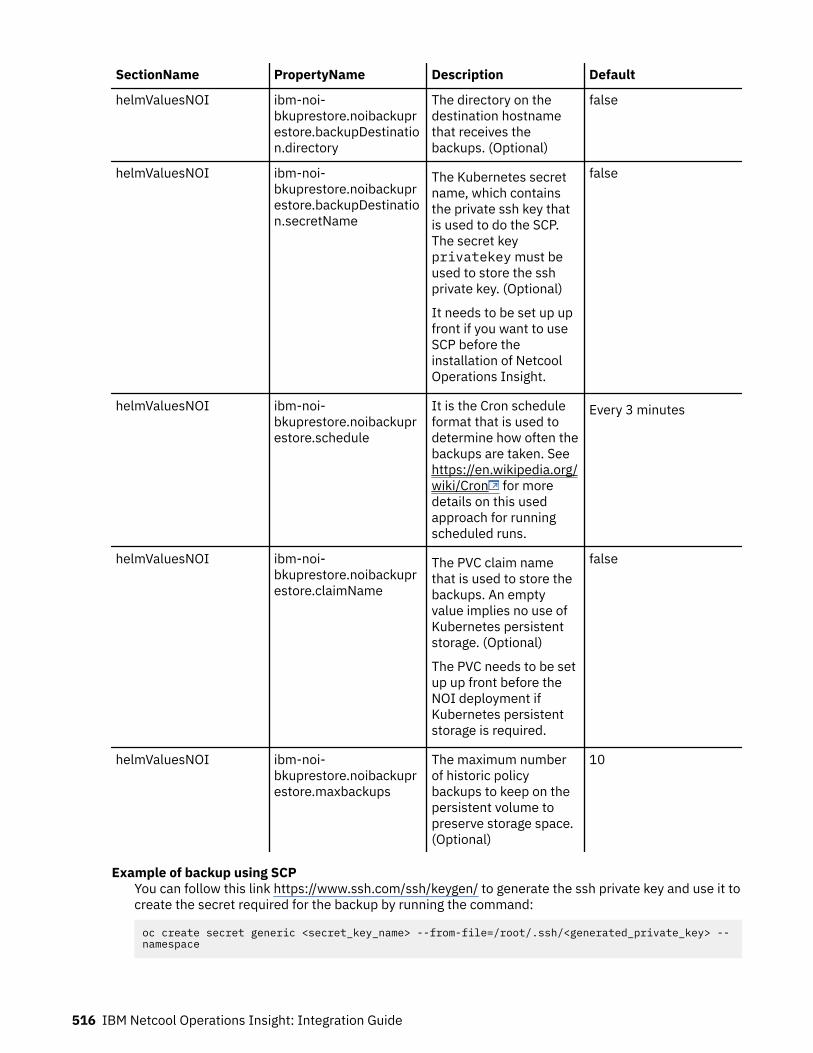
SectionName PropertyName Description Default
helmValuesNOI ibm-noi-bkuprestore.noibackuprestore.backupDestination.directory
The directory on thedestination hostnamethat receives thebackups. (Optional)
false
helmValuesNOI ibm-noi-bkuprestore.noibackuprestore.backupDestination.secretName
The Kubernetes secretname, which containsthe private ssh key thatis used to do the SCP.The secret keyprivatekey must beused to store the sshprivate key. (Optional)
It needs to be set up upfront if you want to useSCP before theinstallation of NetcoolOperations Insight.
false
helmValuesNOI ibm-noi-bkuprestore.noibackuprestore.schedule
It is the Cron scheduleformat that is used todetermine how often thebackups are taken. Seehttps://en.wikipedia.org/wiki/Cron for moredetails on this usedapproach for runningscheduled runs.
Every 3 minutes
helmValuesNOI ibm-noi-bkuprestore.noibackuprestore.claimName
The PVC claim namethat is used to store thebackups. An emptyvalue implies no use ofKubernetes persistentstorage. (Optional)
The PVC needs to be setup up front before theNOI deployment ifKubernetes persistentstorage is required.
false
helmValuesNOI ibm-noi-bkuprestore.noibackuprestore.maxbackups
The maximum numberof historic policybackups to keep on thepersistent volume topreserve storage space.(Optional)
10
Example of backup using SCPYou can follow this link https://www.ssh.com/ssh/keygen/ to generate the ssh private key and use it tocreate the secret required for the backup by running the command:
oc create secret generic <secret_key_name> --from-file=/root/.ssh/<generated_private_key> --namespace
516 IBM Netcool Operations Insight: Integration Guide

Where <secret_key_name> is then used in the deployment yaml file as follows:
ibm-noi-backuprestore-service.noibackuprestore.backupDestination.secretName: <secret_key_name>
An example of the values used in the yaml file of the Netcool Operations Insight deployment is:
helmValuesNOI:
ibm-noi-backuprestore-service.noibackuprestore.backupDestination.directory: /root/tmp/backups
ibm-noi-backuprestore-service.noibackuprestore.backupDestination.hostname: hadr-inf.fyre.ibm.com
ibm-noi-backuprestore-service.noibackuprestore.backupDestination.secretName: noikey
ibm-noi-backuprestore-service.noibackuprestore.backupDestination.username: root
ibm-noi-backuprestore-service.noibackuprestore.schedule: '*/3 * * * *'
The command copies the backups to the host hadr-inf.fyre.ibm.com in the /root/tmp/backups directory by using the root user. The backups occur every 3 minutes.
Restore1. Log in to the Red Hat OpenShift docker registry with your entitlement registry key.2. Restore the file on the target machine can be done by using the docker image:
docker pull cp.icr.io/cp/noi/noi_ noi-backuprestore-service:latest
3. Create a directory that has the configuration and policies you want to upload to the target NetcoolOperations Insight deployment, for example <restoredir>. In the restore directory, create a filecalled target.env. This file creates the credentials of the system you want to talk to. An example is:
export username=system
export password=<NOI deployment system auth password>
export tenantid=cfd95b7e-3bc7-4006-a4a8-a73a79c71255
export policysvcurl=<https://<openshift noi deployment route endpoint>
export inputdir=/input/policies
The policysvcurl is the OpenShift route endpoint fully qualified hostname and can be obtained byrunning the command:
oc get routes -o=jsonpath='{range .items[*]}{.spec.host}{"\n"}{end}' | uniq | grep netcool
The password can be obtained from the key password in the secret <ReleaseName>-systemauth-secret. It needs to be base64 decoded.
4. Copy the policies backup file into the <restoredir>. The file that is generated by the backup has theformat cneapolicies-yyyy-MM-dd-mm:ss:SS:Z.tar.gz.
5. Extract the file in the <restoredir> by running the command:
tar xvf <your backup tar gzip> --force-local --directory policies
So that the <restoredir> has a directory that is called policies and the target.env file.6. Restore by running the docker command:
docker run -t -i --env LICENSE=accept –-network host --user root --privileged –v <restoredir>:dst=/input:ro <docker reference to your backupandrestoreimage> /app/scripts/run.sh
Chapter 8. Administering 517
Note: You need to substitute in your particular restoredir settings and ensure that the OpenShiftroutes are accessible from the machine you run docker from.
Backup and restore for event managementYou can use Velero to backup your Kubernetes clusters. Velero also takes snapshots of your cluster’sPersistent Volumes and can restore your cluster’s objects and Persistent Volumes to a previous state.
Before you beginDownload Velero: https://github.com/vmware-tanzu/velero/releases/tag/v1.1.0.
About this taskThe backup and restore tool is Velero and the event management data is backed up to IBM Cloud ObjectStorage.
Procedure1. Ensure that event management is up and running under your namespace. The namespace used in
this example is kube-system.2. Connect to Netcool Operations Insight on OpenShift under your namespace, for example:
cloudctl login -a https://icp-console.apps.masternode.ibm.com:443 -n kube-system --skip-ssl-validation
3. Annotate the pods that you want to backup. Only the volume names specified are taken for backup,for example:
kubectl annotate pod/helm_release-cassandra-0 backup.velero.io/backup-volumes=datakubectl annotate pod/helm_release-couchdb-0 backup.velero.io/backup-volumes=datakubectl annotate pod/helm_release-ibm-cem-datalayer-0 backup.velero.io/backup-volumes=jobskubectl annotate pod/helm_release-kafka-0 backup.velero.io/backup-volumes=datakubectl annotate pod/helm_release-zookeeper-0 backup.velero.io/backup-volumes=datakubectl annotate pod/helm_release-ibm-redis-server-0 backup.velero.io/backup-volumes=data
4. Use Velero to create a backup.a) Change directory to the Velero installation folder.b) Run the following command:
./velero create backup BACKUP_NAME --selector release=<helm-release> --snapshot-volumes=true
Where <helm-release> is helm release name entered when you installed event management.c) Confirm that the backup has completed:
./velero get backupNAME STATUS CREATED EXPIRES STORAGE LOCATION SELECTORBACKUP_NAME Completed 2019-05-22 16:03:44 +0000 UTC 28d default release=scao
5. Run the following command to backup the event management service instance:
kubectl get serviceinstance <serviceinstance name> -o yaml > bkserviceinstance.yaml
Save the bkserviceinstance.yaml file so that it's available later for the restore process.
Tip: Run this command to list all of the service instances under the current namespace:
kubectl get serviceinstances
Let's assume a disaster scenario where the event management service is down and the pod, services,deployments, ConfigMap, PersistentVolumes and PersistentVolumesClaims are all deleted.
518 IBM Netcool Operations Insight: Integration Guide
6. Install event management with new Persistent Volumes and wait until all event management podsare up and running.
Note: Do not perform the post-installation step of OIDC registration to create the service instance.7. Run the following command to delete the event management statefulsets, deployments, and secrets
(replacing release_name with your release name):
kubectl delete statefulsets,deployments,secrets --selector release=release_name
8. Confirm that all event management pods are down before performing the restore. Then, run thefollowing command:
kubectl get pods -l release=release_name
Make sure that No resource found is displayed.9. To run the Velero restore, change directory to the Velero installation folder and execute the following
command (replacing backup_name with your backup name):
velero restore create --from-backup backup_name --restore-volumes=true
Tip: Run this command to see your backup name:
./velero get backup
10. Confirm that the restore has completed:
./velero get restoreNAME BACKUP STATUS WARNINGS ERRORS CREATED SELECTORBACKUP_NAME-20190523162925 BACKUP_NAME Completed 48 0 2019-05-23 16:29:26 +0000 UTC <none>
Note: If you have more Persistence Volumes created than event management pods currently use therestore might complete with errors but should still work successfully.
11. Confirm that all event management pods are up and running:
kubectl get pods -l release=release_name
12. Restore the event management service instance.
Using the template below, create a YAML file and save it as si.yaml. Replace all instances of<replace me> in the template with values from the bkserviceinstance.yaml file that you saved instep “5” on page 518.
apiVersion: servicecatalog.k8s.io/v1beta1kind: ServiceInstancemetadata: name: <replace me> labels: release: <replace me>spec: clusterServiceClassExternalName: <replace me> clusterServicePlanExternalName: standard externalID: <replace me>
13. Run the following command:
kubectl create –f si.yaml
14. Describe your service instance to get the dashboard URL:
kubectl describe serviceinstance <serviceinstance name>
Chapter 8. Administering 519
Backing up and restoring UI configuration data for topology managementThe topology management functionality includes a backup facility, which lets you backup UI configurationsettings such as user preferences, topology tools, custom icons, relationship types, and global settings.
Procedure1. Find the name of the topology pod, as in the following example:
$ kubectl get pod --namespace default --selector app=topologyNAME READY STATUS RESTARTS AGEasm-topology-577dc5497b-2wbxk 1/1 Running 0 12h
2. Run the backup tool using kubectl exec, as in the following examples:Example A
$ kubectl exec -ti asm-topology-577dc5497b-2wbxk -- /opt/ibm/graph.tools/bin/backup_ui_config -help
usage: backup_ui_config [-config <config_type>] [-out <output_filename>] [-force] [-verbose]
where 'config-type' can be set to one of the following:
all - backup all ASM UI configuration (default) tools - backup topology tools definitions icons - backup custom icon definitions types - backup entity type definitions links - backup relationship type definitions preferences - backup user preferences settings - backup global settings
Example B
$ kubectl exec -ti asm-topology-577dc5497b-2wbxk -- /opt/ibm/graph.tools/bin/backup_ui_config -out backup-20180908.json INFO : Topology Service REST host detected: localhost:8080 INFO : Topology Service tenant ID detected: cfd95b7e-3bc7-4006-a4a8-a73a79c71255 WARNING : No topology tool definitions were found WARNING : No custom icon definitions were found INFO : Backing up entity type: container INFO : Backing up entity type: cpu INFO : Backing up entity type: deployment INFO : Backing up entity type: image INFO : Backing up entity type: namespace INFO : Backing up entity type: namespace INFO : Backing up entity type: networkinterface INFO : Backing up entity type: operatingsystem INFO : Backing up entity type: pod INFO : Backing up entity type: server INFO : Backing up entity type: service INFO : Backing up entity type: volume WARNING : No relationship type definitions were found WARNING : No user preferences definitions were found WARNING : No global settings definitions were found INFO : Output file has been created: /opt/ibm/netcool/asm/data/tools/backup-20180908.json
Program complete.
3. Run the import tool, as in the following example:
$ kubectl exec -ti asm-topology-577dc5497b-2wbxk -- /opt/ibm/graph.tools/bin/import_ui_config -file backup-20180908.json -overwrite INFO : Topology Service REST host detected: localhost:8080 INFO : Topology Service tenant ID detected: cfd95b7e-3bc7-4006-a4a8-a73a79c71255 INFO : Skipping import of entity type because it matches the existing definition: container INFO : Skipping import of entity type because it matches the existing definition: cpu INFO : Skipping import of entity type because it matches the existing definition: deployment INFO : Skipping import of entity type because it matches the existing definition: image INFO : Skipping import of entity type because it matches the existing definition: networkinterface INFO : Skipping import of entity type because it matches the existing definition: psu INFO : Skipping import of entity type because it matches the existing definition: router
520 IBM Netcool Operations Insight: Integration Guide

INFO : Skipping import of entity type because it matches the existing definition: sensor INFO : Skipping import of entity type because it matches the existing definition: server INFO : Skipping import of entity type because it matches the existing definition: service INFO : Skipping import of entity type because it matches the existing definition: subnet INFO : Skipping import of entity type because it matches the existing definition: switch INFO : Skipping import of entity type because it matches the existing definition: vlan INFO : Skipping import of entity type because it matches the existing definition: vpn
Program complete.
4. To save a copy of your backup, copy the file out of the topology container using the kubectl cpcommand.For example:
$ kubectl cp asm-topology-577dc5497b-2wbxk:/opt/ibm/netcool/asm/data/tools/backup-20180908.json /tmp/backup-20180809.json $ find /tmp/backup* /tmp/backup-20180809.json
5. To import files, copy them into the /opt/ibm/netcool/asm/data/tools location inside thecontainer:
$ kubectl cp /tmp/backup-20180809.json asm-topology-577dc5497b-2wbxk:/opt/ibm/netcool/asm/data/tools/backup-20180909.json $ kubectl exec -ti asm-topology-577dc5497b-2wbxk -- find /opt/ibm/netcool/asm/data/tools/ /opt/ibm/netcool/asm/data/tools/backup-20180908.json /opt/ibm/netcool/asm/data/tools/backup-20180909.json
Backing up database data for topology managementYou can back up (and later restore) existing topology data. This can be helpful when updating yoursystem, as part of your company's data management best-practice, or for maintenance reasons.
About this taskTo complete the backup, you complete a number of preparatory steps, then perform a data backup, andthen restore the topology management services.
ProcedurePreparing your system for backup
1. Authenticate into the topology management Kubernetes namespace.2. Deploy the kPodLoop bash shell function.
kPodLoop is a bash shell function that allows a command to be run against matching Kubernetescontainers. You can copy it into the shell.
kPodLoop() { __podPattern=$1 __podCommand=$2 __podList=$( kubectl get pods --no-headers=true --output=custom-columns=NAME:.metadata.name | grep ${__podPattern} ) printf "Pods found: $(echo -n ${__podList})\n" for pod in ${__podList}; do printf "\n===== EXECUTING COMMAND in pod: %-42s =====\n" ${pod} kubectl exec ${pod} -- bash -c "${__podCommand}" printf '_%.0s' {1..80} printf "\n" done;}
3. Make a note of the scaling of topology management pods.
kubectl get pods --no-headers=true --output=custom-columns=CNAME:.metadata.ownerReferences[0].name | grep asm | egrep -v -e 'noi|system-health' | uniq --count
Example output:
3 asm-cassandra1 asm-dns-observer
Chapter 8. Administering 521

3 asm-elasticsearch1 asm-file-observer3 asm-kafka1 asm-kubernetes-observer2 asm-layout2 asm-merge1 asm-rest-observer2 asm-search2 asm-topology2 asm-ui-api3 asm-zookeeper
4. Verify access to each Cassandra database (this command will return a list of keyspaces from eachCassandra node)
kPodLoop asm-cassandra "cqlsh -u \${CASSANDRA_USER} -p \${CASSANDRA_PASS} -e \"DESC KEYSPACES;\""
The username and password variables are present in the container environment.5. Suspend the system health (asm-system-health-cronjob) cronjob(s).
kubectl patch cronjobs.batch/asm-system-health-cronjob -p '{"spec":{"suspend":true}}'
6. Verify that the system health (asm-system-health-cronjob) cronjob is suspended:
kubectl get cronjobs.batch asm-system-health-cronjob
7. Scale down topology management pods.
kubectl scale deployment --replicas=0 asm-dns-observerkubectl scale deployment --replicas=0 asm-file-observerkubectl scale deployment --replicas=0 asm-rest-observerkubectl scale deployment --replicas=0 asm-kubernetes-observerkubectl scale deployment --replicas=0 asm-layoutkubectl scale deployment --replicas=0 asm-mergekubectl scale deployment --replicas=0 asm-searchkubectl scale deployment --replicas=0 asm-ui-apikubectl scale deployment --replicas=0 asm-topology
8. Verify.
kubectl get pods | grep asm | grep -v noi
Note: The asm-cassandra, asm-elasticsearch, asm-kafka and asm-zookeeper pods will remainactive.
Backing up data9. Deploy the pbkc bash shell function.
The pbkc function attempts to backup the Cassandra database on all nodes as close tosimultaneously as possible. You can copy it into the shell.
pbkc() { ## Parallel Backup of Kubernetes Cassandra DATE=$( date +"%F-%H-%M-%S" ) LOGFILEBASE=/tmp/clusteredCassandraBackup-${DATE}- declare -A PIDWAIT declare -A LOG
## get the current list of asm-cassandra pods. podlist=$( kubectl get pods --no-headers=true --output=custom-columns=NAME:.metadata.name | grep asm-cassandra ) for pod in ${podlist}; do LOG[$pod]=${LOGFILEBASE}${pod}.log echo -e "BACKING UP CASSANDRA IN POD ${pod} (logged to ${LOG[$pod]})" kubectl exec ${pod} -- bash -c "/opt/ibm/backup_scripts/backup_cassandra.sh -u \${CASSANDRA_USER} -p \${CASSANDRA_PASS} -f" > ${LOG[$pod]} & PIDWAIT[$pod]=$! done
echo -e "${#PIDWAIT[@]} Backups Active ..."
for pod in ${podlist}; do wait ${PIDWAIT[$pod]} echo -e "Backup of ${pod} completed, please verify via log file (${LOG[$pod]})" done}
10. Run a clean-up on all keyspaces in all Cassandra instances.Example Cassandra keyspaces cleanup:
522 IBM Netcool Operations Insight: Integration Guide
kPodLoop asm-cassandra "nodetool cleanup system_schema"kPodLoop asm-cassandra "nodetool cleanup system"kPodLoop asm-cassandra "nodetool cleanup system_distributed"kPodLoop asm-cassandra "nodetool cleanup system_auth"kPodLoop asm-cassandra "nodetool cleanup janusgraph"kPodLoop asm-cassandra "nodetool cleanup system_traces"
11. Run backup on all Cassandra instances (using the pbkc shell function just deployed).
pbkc
12. Check the final output in the log file for each backup.Adjust the date in the grep command as appropriate.
grep "BACKUP DONE SUCCESSFULLY" /tmp/clusteredCassandraBackup-2019-06-14-14-09-50*/tmp/clusteredCassandraBackup-2019-06-14-14-09-50-asm-cassandra-0.log:Fri Jun 14 14:11:04 UTC 2019 BACKUP DONE SUCCESSFULLY !!!/tmp/clusteredCassandraBackup-2019-06-14-14-09-50-asm-cassandra-1.log:Fri Jun 14 14:11:16 UTC 2019 BACKUP DONE SUCCESSFULLY !!!/tmp/clusteredCassandraBackup-2019-06-14-14-09-50-asm-cassandra-2.log:Fri Jun 14 14:11:16 UTC 2019 BACKUP DONE SUCCESSFULLY !!!
Restore services13. Enable the system health (asm-system-health-cronjob) cronjob(s).
kubectl patch cronjobs.batch/asm-system-health-cronjob -p '{"spec":{"suspend":false}}'
14. Verify that the system health (asm-system-health-cronjob) cronjob is re-enabled:
kubectl get cronjobs.batch asm-system-health-cronjob
15. Scale up the services to the original level.The original level was obtained in a previous step.
kubectl scale deployment --replicas=3 asm-topologykubectl scale deployment --replicas=2 asm-layoutkubectl scale deployment --replicas=2 asm-mergekubectl scale deployment --replicas=2 asm-searchkubectl scale deployment --replicas=2 asm-ui-apikubectl scale deployment --replicas=1 asm-dns-observerkubectl scale deployment --replicas=1 asm-file-observerkubectl scale deployment --replicas=1 asm-rest-observerkubectl scale deployment --replicas=1 asm-kubernetes-observer
What to do nextYou can restore your backed up data as and when required.
Restoring database data for topology managementYou can restore existing topology data, if backed up earlier. This can be helpful when updating yoursystem, or for maintenance reasons.
About this taskTo complete the restoration of your data, you complete a number of preparatory steps, then perform adata restore, and then restore the topology management services.
ProcedurePreparing your system for data restoration
1. Authenticate into the topology management Kubernetes namespace.2. Deploy the kPodLoop bash shell function.
Chapter 8. Administering 523
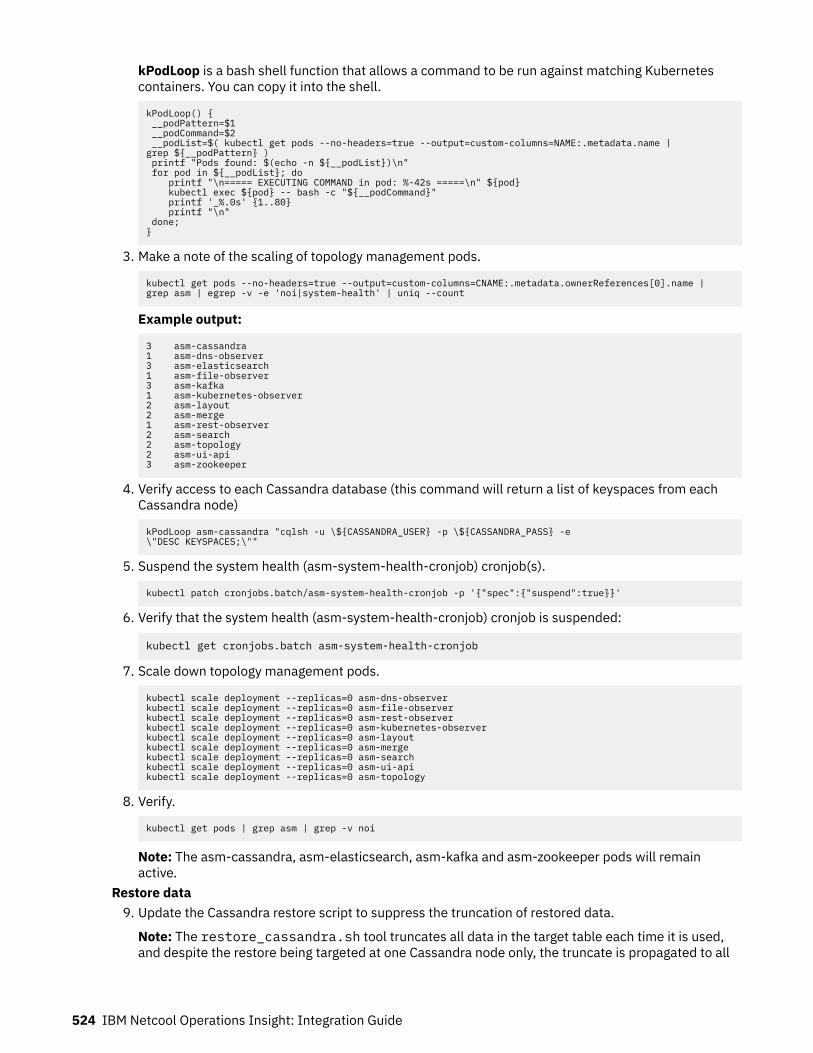
kPodLoop is a bash shell function that allows a command to be run against matching Kubernetescontainers. You can copy it into the shell.
kPodLoop() { __podPattern=$1 __podCommand=$2 __podList=$( kubectl get pods --no-headers=true --output=custom-columns=NAME:.metadata.name | grep ${__podPattern} ) printf "Pods found: $(echo -n ${__podList})\n" for pod in ${__podList}; do printf "\n===== EXECUTING COMMAND in pod: %-42s =====\n" ${pod} kubectl exec ${pod} -- bash -c "${__podCommand}" printf '_%.0s' {1..80} printf "\n" done;}
3. Make a note of the scaling of topology management pods.
kubectl get pods --no-headers=true --output=custom-columns=CNAME:.metadata.ownerReferences[0].name | grep asm | egrep -v -e 'noi|system-health' | uniq --count
Example output:
3 asm-cassandra1 asm-dns-observer3 asm-elasticsearch1 asm-file-observer3 asm-kafka1 asm-kubernetes-observer2 asm-layout2 asm-merge1 asm-rest-observer2 asm-search2 asm-topology2 asm-ui-api3 asm-zookeeper
4. Verify access to each Cassandra database (this command will return a list of keyspaces from eachCassandra node)
kPodLoop asm-cassandra "cqlsh -u \${CASSANDRA_USER} -p \${CASSANDRA_PASS} -e \"DESC KEYSPACES;\""
5. Suspend the system health (asm-system-health-cronjob) cronjob(s).
kubectl patch cronjobs.batch/asm-system-health-cronjob -p '{"spec":{"suspend":true}}'
6. Verify that the system health (asm-system-health-cronjob) cronjob is suspended:
kubectl get cronjobs.batch asm-system-health-cronjob
7. Scale down topology management pods.
kubectl scale deployment --replicas=0 asm-dns-observerkubectl scale deployment --replicas=0 asm-file-observerkubectl scale deployment --replicas=0 asm-rest-observerkubectl scale deployment --replicas=0 asm-kubernetes-observerkubectl scale deployment --replicas=0 asm-layoutkubectl scale deployment --replicas=0 asm-mergekubectl scale deployment --replicas=0 asm-searchkubectl scale deployment --replicas=0 asm-ui-apikubectl scale deployment --replicas=0 asm-topology
8. Verify.
kubectl get pods | grep asm | grep -v noi
Note: The asm-cassandra, asm-elasticsearch, asm-kafka and asm-zookeeper pods will remainactive.
Restore data9. Update the Cassandra restore script to suppress the truncation of restored data.
Note: The restore_cassandra.sh tool truncates all data in the target table each time it is used,and despite the restore being targeted at one Cassandra node only, the truncate is propagated to all
524 IBM Netcool Operations Insight: Integration Guide
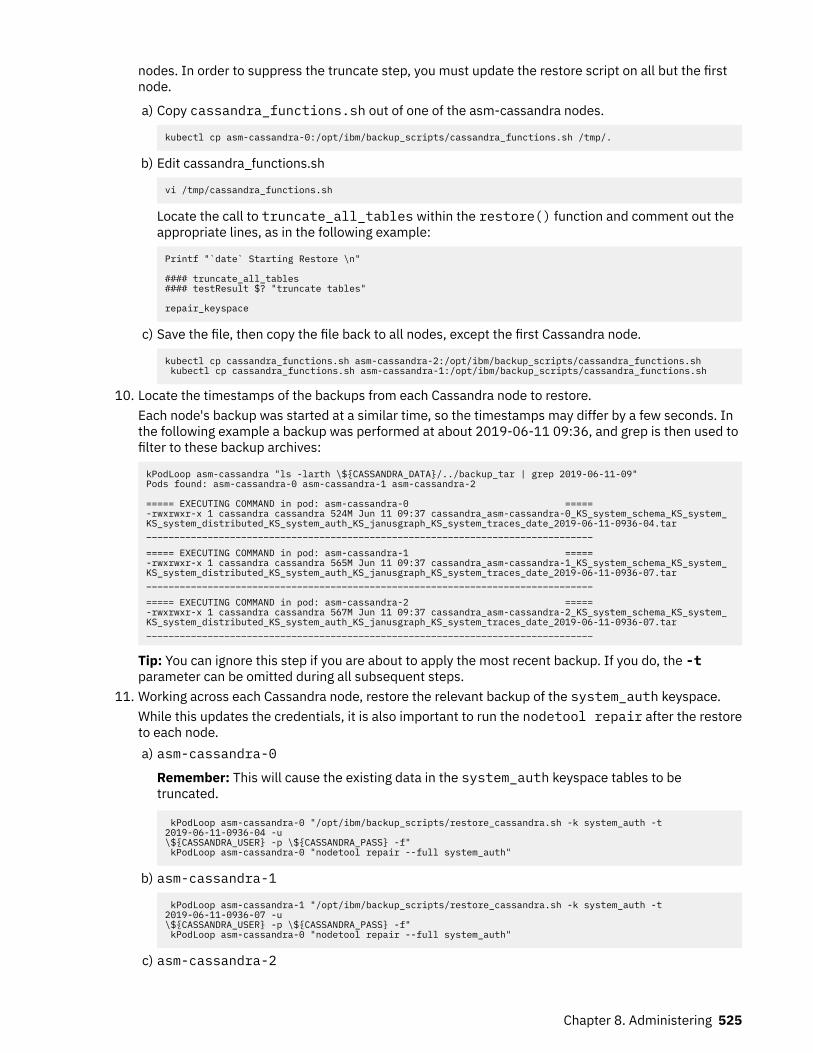
nodes. In order to suppress the truncate step, you must update the restore script on all but the firstnode.
a) Copy cassandra_functions.sh out of one of the asm-cassandra nodes.
kubectl cp asm-cassandra-0:/opt/ibm/backup_scripts/cassandra_functions.sh /tmp/.
b) Edit cassandra_functions.sh
vi /tmp/cassandra_functions.sh
Locate the call to truncate_all_tables within the restore() function and comment out theappropriate lines, as in the following example:
Printf "`date` Starting Restore \n"
#### truncate_all_tables#### testResult $? "truncate tables"
repair_keyspace
c) Save the file, then copy the file back to all nodes, except the first Cassandra node.
kubectl cp cassandra_functions.sh asm-cassandra-2:/opt/ibm/backup_scripts/cassandra_functions.sh kubectl cp cassandra_functions.sh asm-cassandra-1:/opt/ibm/backup_scripts/cassandra_functions.sh
10. Locate the timestamps of the backups from each Cassandra node to restore.Each node's backup was started at a similar time, so the timestamps may differ by a few seconds. Inthe following example a backup was performed at about 2019-06-11 09:36, and grep is then used tofilter to these backup archives:
kPodLoop asm-cassandra "ls -larth \${CASSANDRA_DATA}/../backup_tar | grep 2019-06-11-09"Pods found: asm-cassandra-0 asm-cassandra-1 asm-cassandra-2
===== EXECUTING COMMAND in pod: asm-cassandra-0 =====-rwxrwxr-x 1 cassandra cassandra 524M Jun 11 09:37 cassandra_asm-cassandra-0_KS_system_schema_KS_system_KS_system_distributed_KS_system_auth_KS_janusgraph_KS_system_traces_date_2019-06-11-0936-04.tar________________________________________________________________________________
===== EXECUTING COMMAND in pod: asm-cassandra-1 =====-rwxrwxr-x 1 cassandra cassandra 565M Jun 11 09:37 cassandra_asm-cassandra-1_KS_system_schema_KS_system_KS_system_distributed_KS_system_auth_KS_janusgraph_KS_system_traces_date_2019-06-11-0936-07.tar________________________________________________________________________________
===== EXECUTING COMMAND in pod: asm-cassandra-2 =====-rwxrwxr-x 1 cassandra cassandra 567M Jun 11 09:37 cassandra_asm-cassandra-2_KS_system_schema_KS_system_KS_system_distributed_KS_system_auth_KS_janusgraph_KS_system_traces_date_2019-06-11-0936-07.tar________________________________________________________________________________
Tip: You can ignore this step if you are about to apply the most recent backup. If you do, the -tparameter can be omitted during all subsequent steps.
11. Working across each Cassandra node, restore the relevant backup of the system_auth keyspace.While this updates the credentials, it is also important to run the nodetool repair after the restoreto each node.a) asm-cassandra-0
Remember: This will cause the existing data in the system_auth keyspace tables to betruncated.
kPodLoop asm-cassandra-0 "/opt/ibm/backup_scripts/restore_cassandra.sh -k system_auth -t 2019-06-11-0936-04 -u \${CASSANDRA_USER} -p \${CASSANDRA_PASS} -f" kPodLoop asm-cassandra-0 "nodetool repair --full system_auth"
b) asm-cassandra-1
kPodLoop asm-cassandra-1 "/opt/ibm/backup_scripts/restore_cassandra.sh -k system_auth -t 2019-06-11-0936-07 -u \${CASSANDRA_USER} -p \${CASSANDRA_PASS} -f" kPodLoop asm-cassandra-0 "nodetool repair --full system_auth"
c) asm-cassandra-2
Chapter 8. Administering 525

kPodLoop asm-cassandra-2 "/opt/ibm/backup_scripts/restore_cassandra.sh -k system_auth -t 2019-06-11-0936-07 -u \${CASSANDRA_USER} -p \${CASSANDRA_PASS} -f" kPodLoop asm-cassandra-0 "nodetool repair --full system_auth"
12. Working across each Cassandra node, restore the relevant backup of the janusgraph keyspace.While this updates the credentials, it is also important to run the nodetool repair after the restoreto each node.a) asm-cassandra-0
Remember: This will cause the existing data in the janusgraph keyspace tables to betruncated.
kPodLoop asm-cassandra-0 "/opt/ibm/backup_scripts/restore_cassandra.sh -k janusgraph -t 2019-06-11-0936-04 -u \${CASSANDRA_USER} -p \${CASSANDRA_PASS} -f" kPodLoop asm-cassandra-0 "nodetool repair --full janusgraph"
b) asm-cassandra-1
kPodLoop asm-cassandra-1 "/opt/ibm/backup_scripts/restore_cassandra.sh -k janusgraph -t 2019-06-11-0936-07 -u \${CASSANDRA_USER} -p \${CASSANDRA_PASS} -f" kPodLoop asm-cassandra-1 "nodetool repair --full janusgraph"
c) asm-cassandra-2
kPodLoop asm-cassandra-2 "/opt/ibm/backup_scripts/restore_cassandra.sh -k janusgraph -t 2019-06-11-0936-07 -u \${CASSANDRA_USER} -p \${CASSANDRA_PASS} -f" kPodLoop asm-cassandra-2 "nodetool repair --full janusgraph"
Restore services13. Enable the system health (asm-system-health-cronjob) cronjob(s).
kubectl patch cronjobs.batch/asm-system-health-cronjob -p '{"spec":{"suspend":false}}'
14. Verify that the system health (asm-system-health-cronjob) cronjob is re-enabled:
kubectl get cronjobs.batch asm-system-health-cronjob
15. Scale up the services to the original level.
kubectl scale deployment --replicas=3 asm-topologykubectl scale deployment --replicas=2 asm-layoutkubectl scale deployment --replicas=2 asm-mergekubectl scale deployment --replicas=2 asm-searchkubectl scale deployment --replicas=2 asm-ui-apikubectl scale deployment --replicas=1 asm-dns-observerkubectl scale deployment --replicas=1 asm-file-observerkubectl scale deployment --replicas=1 asm-rest-observerkubectl scale deployment --replicas=1 asm-kubernetes-observer
16. Rebroadcast data to ElasticSearch (that is, re-index Elasticsearch).
526 IBM Netcool Operations Insight: Integration Guide
Administering on-premises systemsPerform the following tasks to administer the components of your on-premises Netcool OperationsInsight components.
Administering Event AnalyticsEvent Analytics allows you to identify seasonal patterns of events and related events within theirmonitored environment.
Seasonal eventsEvent Analytics uses statistical analysis of IBM Tivoli Netcool/OMNIbus historical event data to determinethe seasonality of events, such as when and how frequently events occur. The results of this analysis areoutput in both reports and graphs.
The data that is presented in the event seasonality report helps you to identify seasonal event patternswithin their infrastructure. For example, an event that periodically occurs at an unscheduled specific timeis highlighted. Seasonal Event Rules are grouped by state in the Seasonal Event Rules portlet. You can
• Use the View Seasonal Events UI to analyze seasonal events and associated related events.• Deploy validated seasonal event rules, without writing new code. Rules that are generated in this way
can have various actions applied to them.
Related eventsEvent Analytics uses statistical analysis of Tivoli Netcool/OMNIbus historical event data to determinewhich events have a statistical tendency to occur together. Event Analytics outputs the results of thisstatistical analysis as event groups, on a scheduled basis. You can:
• Use the related events UI to analyze these event groups.• Deploy validated event groups as Netcool/Impact correlation rules with a single click, without the need
to write any code. Correlation rules that are generated in this way act on real-time event data to show asingle synthetic event for the events in the event group.
• Present all events in the group as children of this synthetic event. This view decreases the number ofevents displayed to your operations staff in the Event Viewer.
• Use the Related Event portlet to analyze patterns in groups and deploy correlation rules based oncommon event types between the groups.
The system uses the most actionable event in the group as the parent event to be set by the correlationrule. By default, the most actionable event in the group is the most ticketed or acknowledged event.Before you deploy the correlation rule, you can change the parent event setting. A synthetic event iscreated with some of the properties of the parent event, and all the related events are grouped under thissynthetic event.
Event groups are generated by scheduled runs of related event configurations. A default related eventconfiguration is provided. You can create your own configurations and specify which historical data toanalyze. For example, you can specify a custom time range, an event filter, and schedule. For moreinformation about related events, see “Related events” on page 557.
You can create a pattern based on the related event groups discovered by the related event analytic. Thesystem can also suggest name patterns to you based on the related event groups discovered by therelated event analytic. You can use an event in the group as the parent event to be set by the correlationrule, or create a synthetic event as the parent. You can also test the performance of a pattern before it iscreated to check the number of related events groups and events returned for a pattern.
Chapter 8. Administering 527

Administering analytics configurationsYou can create and run configuration scans on demand or on a scheduled basis to generate analyticsbased on your event data.
Configure Analytics windowThe Configure Analytics window contains a list of existing event configurations, or reports. Use thiswindow to view, create, modify, delete, run, or stop event configurations.
Note: To access the Configure Analytics window, users must be assigned the ncw_analytics_adminrole.
You can use the Configure Analytics window to determine whether an event recurs and when it recursmost frequently. For example, an event occurs frequently at 9 a.m. every Monday. Knowledge of the typeof event and the patterns of recurrence can help to determine the actions that are required to reduce thenumber of events.
The Configure Analytics table displays the following columns of information for each event configuration.Name
Specifies the unique event configuration name.Event Identity
Specifies the database fields that identify a unique event in the database. Event seasonality runs onall events selected from the Event Identity drop-down list. If the Event Identity value is UsingGlobal Settings, the Event Identity is set up in the configuration file.
Seasonality EnabledSpecifies whether the event configuration has seasonality event analytics enabled. This columndisplays one of the following values:
• True: Seasonality analytics is enabled.• False: Seasonality analytics is not enabled.
The column displays the value true if seasonality analytics is enabled.Related Event Enabled
Specifies whether the event configuration has related event analytics enabled. This column displaysone of the following values:
• True: Related event analytics is enabled.• False: Related event analytics is not enabled.
Seasonality StatusSpecifies the status of the seasonality event configuration. The column can display one of thefollowing status icons: Waiting, Running, Completed, or Error.
Related Event StatusSpecifies the status of the related event configuration. The column can display one of the followingstatus icons: Waiting, Running, Completed, or Error.
Start TimeSpecifies the inclusive start date of historical data for the event configuration.
End TimeSpecifies the inclusive end date of historical data for the event configuration.
Seasonality PhaseSpecifies the phase of the seasonality event configuration run. In total, this column displays fivephases during the run of the seasonality event configuration. For example, when the seasonality eventconfiguration completion phase occurs, the value Completed displays in the column.
Seasonality phase progressDisplays the progress of the seasonality event phase, expressed in terms of percentage. For example,when the seasonality event configuration completion phases finishes, the value 100% displays in thecolumn.
528 IBM Netcool Operations Insight: Integration Guide
Related Event PhaseSpecifies the phase of the related event configuration run. In total, this column displays five phasesduring the run of the related event configuration. For example, when the related event configurationcompletion phase occurs, the value Completed displays in the column.
Related Event Phase ProgressDisplays the progress of the related event phase, expressed in terms of percentage. For example,when the related event configuration completion phases finishes, the value 100% displays in thecolumn.
ScheduledIndicates whether the event configuration run is scheduled to run every x number of days, weeks, ormonths. The value Yes displays in the column if the event configuration run is scheduled.
Relationship profileThe entry in this column specifies the strength of the relationship between the events in the eventgroups that are determined by the algorithm. One value is specified.Strong Represents a high confidence level for relationships between events, but fewer events andfewer event groups. Your event groups might be missing weaker related events.Medium Represents medium confidence level for relationships between events, average number ofevents and fewer event groups. Your event groups might be missing weakly related events.Weak You see more events and more event groups but potentially more false positives.
Important: Netcool/Impact does not support Arabic or Hebrew. Event Analytics users who are working inArabic or Hebrew see some English text.
Setting the Impact data provider and other portlet preferencesIf there are multiple connections with the Impact data provider, you must specify which Impact dataprovider to use.
About this taskIf a single connection with the Impact data provider exists, then that connection is used to compile thelist of seasonal reports and display them in a table. If there are multiple connections with the Impact dataprovider, you must edit your portlet preferences to select one of the options.
Procedure1. To edit your portlet preferences, or as an administrator to edit the portlet defaults:
• To edit your portlet preferences, click Page Actions > Personalize Page > Widget >Personalize.
• To edit the portlet defaults of all users, click Page Actions > Edit Page > Widget > Edit.
The Configure Analytics dialog box is displayed.2. Select a data provider from the Data Provider drop-down list.3. In the Bidi Settings tab, specify the settings for the display of bidirectional text.
Component directionSelect the arrangement of items in the portlet, left-to-right, or right-to-left. The default settinguses the value that is defined for the page or the console. If the page and console both use thedefault setting, the locale of your browser determines the layout.
Text directionSelect the direction of text on the portlet. The default settings use the value that is defined for thepage or the console. If the page and console both use the default setting, the locale of yourbrowser determines the text direction. The Contextual Input setting displays text that youenter in the appropriate direction for your globalization settings.
4. To save your changes, complete the following steps.
Chapter 8. Administering 529
a) Select Save in the Configure Analytics dialog box. The Configure Analytics dialog box is closed.b) Select Save, which is in the upper right of the window.
Viewing current analytics configurationsAn Administrator can see the list of current analytics configurations and some basic information about theanalytics (related events and seasonal events) related to those configurations.
About this taskEvent Analytics includes a default analytics configuration for you to run a basic configuration with defaultvalues. You can run, modify, or delete this analytics configuration. To view your analytics configurations,complete the following steps. This task assumes that you have logged into the Dashboard ApplicationServices Hub as a user with the ncw_analytics_admin role.
Procedure1. Start the Configure Analytics portlet.
a) In the Dashboard Application Services Hub navigation menu, go to the Insights menu.b) Select Configure Analytics.
2. In the Configure Analytics portlet, a table presents a list of analytics configurations that are alreadyconfigured. Scroll down the list to view all analytics configurations. The table automatically refreshesevery 60 seconds and displays information for select column headings.
• To view configuration parameters for a specific analytics configuration, select a configuration andthen select the Modify Selected Configuration icon.
• To view progress of the latest action that is taken for an analytics configuration, look at the contentthat is displayed in the following columns:Seasonality Status
Specifies the status of the seasonality event configuration. The column can display one of thefollowing status icons: Waiting, Running, Completed, or Error.
Related Event StatusSpecifies the status of the related event configuration. The column can display one of thefollowing status icons: Waiting, Running, Completed, or Error.
Start TimeSpecifies the inclusive start date of historical data for the event configuration.
End TimeSpecifies the inclusive end date of historical data for the event configuration.
Seasonality PhaseSpecifies the phase of the seasonality event configuration run. In total, this column displays fivephases during the run of the seasonality event configuration. For example, when the seasonalityevent configuration completion phase occurs, the value Completed displays in the column.
Seasonality Phase ProgressDisplays the progress of the seasonality event phase, expressed in terms of percentage. Forexample, when the seasonality event configuration completion phases finishes, the value 100%displays in the column.
Related Event PhaseSpecifies the phase of the related event configuration run. In total, this column displays fivephases during the run of the related event configuration. For example, when the related eventconfiguration completion phase occurs, the value Completed displays in the column.
Related Event Phase ProgressDisplays the progress of the related event phase, expressed in terms of percentage. For example,when the related event configuration completion phases finishes, the value 100% displays in thecolumn.
530 IBM Netcool Operations Insight: Integration Guide
• To view other details about the analytics configuration, look at the information displayed in othercolumns:Name
Specifies the unique event configuration name.Event identity
Specifies the database fields that identify a unique event in the database. Event seasonality runson all events selected from the Event Identity drop-down list.
ScheduledAdvises whether the analytics configuration is scheduled to query the historical events database.
Seasonality EnabledSpecifies whether the event configuration has seasonality event analytics enabled. This columndisplays one of the following values:
– True: Seasonality analytics is enabled.– False: Seasonality analytics is not enabled.
Related Event EnabledSpecifies whether the event configuration has related event analytics enabled. This columndisplays one of the following values:
– True: Related event analytics is enabled.– False: Related event analytics is not enabled.
Relationship ProfileThe entry in this column specifies the strength of the relationship between the events in theevent groups that are determined by the algorithm. One value is specified.Strong Represents a high confidence level for relationships between events, but fewer eventsand fewer event groups. Your event groups might be missing weaker related events.Medium Represents medium confidence level for relationships between events, average numberof events and fewer event groups. Your event groups might be missing weakly related events.Weak You see more events and more event groups but potentially more false positives.
Creating a new or modifying an existing analytics configurationAn Administrator can create a new analytics configuration or modify an existing analytics configuration.You choose the analytics type (related events, seasonal events, or both) you want to run during the createnew analytics configuration operation.
Before you beginWhen you modify an existing analytics configuration, you cannot change the following parameter fields inthe dialog box:
• General > Name• General > Analytics Type• Advanced > Override global event identity > Event identity
Procedure1. Start the Configure Analytics portlet. See “Viewing current analytics configurations” on page 530.2. Select the Create New Configuration icon to create a new analytics configuration, or highlight an
existing analytics configuration and select the Modify Selected Configuration icon to modify anexisting analytics configuration. The UI displays a dialog box that contains parameter fields for the newor existing analytics configuration.
3. Populate the parameter fields in the General tab of the dialog box with the details applicable to theanalytics configuration.
Chapter 8. Administering 531
NameEnter the name of the analytics configuration. The name should reflect the type of analyticsconfiguration you are creating.
For example, TestSeasonality1 and TestRelatedEvents1 might be names you assign toanalytics configurations for seasonality events and related events. The name for an analyticsconfiguration must be unique and not contain certain invalid characters.
The invalid character list is the list of characters listed in the webgui_home/etc/illegalChar.prop file.
Analytics TypeSelect Seasonal event analytics, Related event analytics, or both.
Note: If you select Related event analytics the event pattern processing will automatically beperformed on your data. Pattern processing runs against all specified event types: the defaultevent type, and any additional event types that were specified when the system was set up. If youwant to limit the additional event types used in pattern processing for this configuration, then clickAdvanced > Override global event type.
Event identityFrom the drop-down list, select the database fields that identify a unique event in the database.Event seasonality runs on all events that are selected from the Event Identity drop-down list. Forinformation about how to change the fields in the drop-down list, see “Changing the choice offields for the Event Identity” on page 536.
Date RangeSelect either RelativeFixed date range or FixedRelative date rangeRelative: Enter the time frame that is to be included in the analytics configuration. The relativetime frame is measured in Months, Weeks, or Days.Fixed: The Start date and End date parameter fields are active. Enter an inclusive Start date andEnd date for the analytics configuration.Fixed date range: The Start date and End date parameter fields are active. Enter an inclusiveStart date and End date for the analytics configuration.Relative date range: Enter the time frame that is to be included in the analytics configuration.
Run everyTo schedule the analytics configuration to run at specific time intervals, enter how frequently theconfiguration is to run. When you enter a value greater than zero, the analytics configurationbecomes a scheduled configuration.
Note: This option applies to the relative date range only. You cannot apply this option to the fixeddate range.
FilterDetail any filters that are applicable to the analytics configuration. For example, enter SummaryNOT LIKE '%maintenance%'.
4. Populate the parameter fields in the Related Events tab of the dialog box with the details applicable tothe analytics configuration.Relationship Profile
Select the strength of the relationship between the events in an analytics configuration. If thisvalue is set to Strong, there is more confidence in the result and less number of groups produced.
Automatically deploy rules discovered by this configurationSelect this option to automatically deploy rules that are discovered by this analytics configuration.
Relationship Profile Select the strength of the relationship between the events in an analyticsconfiguration. If this value is set to Strong, there is more confidence in the result and less numberof groups produced.Automatically deploy rules discovered by this configuration Select this option if you want toautomatically deploy rules that are discovered by this analytics configuration.
532 IBM Netcool Operations Insight: Integration Guide
5. Populate the parameter field in the Advanced tab of the dialog box with the details applicable to theanalytics configuration. You can use the defined event identities, select the Override global eventidentity to identify unique events in the database.
Override global event identitySelect this option to enable the Event identity drop-down list.When the Override global event identity check box is selected, you cannot create a pattern from aconfiguration. However, you can deploy a related events group.
Event identityFrom the Event identity drop-down list, select the database fields that identify a unique event inthe database. Event seasonality runs on all events that are selected from the Event Identity drop-down list. For information about how to change the fields in the drop-down list, see “Changing thechoice of fields for the Event Identity” on page 536.
Override global event typeSelect this option to enable the Event type drop-down list.
Event typeSelect one or more event type names from the Event type drop down list, against which to runevent pattern processing.
Note: If none of the event type names are selected, then all of these event types will be used inevent pattern processing.
Override global resourceSelect this option to enable the Resource drop-down list.
ResourceFrom the Resource drop-down list, select the database fields that identify a resource in thedatabase.
6. Click either Save to save the report without running, or click Save & Run to save and run the report.You can also cancel the operation by clicking Cancel.
Results• If no errors are found by the system validation of the analytics configuration content, the new or
updated analytics configuration and its parameters are displayed in the table.• If errors are found by the system validation of the analytics configuration content, you are prevented
from saving the configuration and you are asked to reset the invalid parameter.
Scope-based groupsEvents in a scope-based group are grouped together because they share a common attribute, such as aresource.
Create an event policy to set ScopeID for events that match your defined filter. Scope-based eventgrouping is activated for events that match the filter, based on the ScopeID that you specify. For moreinformation about creating a scope-based grouping policy, see OMNIbus documentation: About scope-based grouping events with Event Analytics .
Manually running an unscheduled analytics configurationAn Administrator can manually run an unscheduled analytics configuration at any stage. You choose theanalytics type (related events or seasonal events) you want to run during the run unscheduled analyticsoperation.
Before you beginThe analytics configuration that you try to manually run cannot have a Related Event Status orSeasonality Status of Running. If you try to manually run an analytics configuration that is alreadyrunning, the GUI displays a warning message.
Chapter 8. Administering 533
Note: Sequentially running reports can take longer to complete than parallel running reports in previousreleases.
Procedure1. Start the Configure Analytics portlet. See “Viewing current analytics configurations” on page 530.2. Within the list of analytics configurations that are displayed, select one configuration.3. From the toolbar, click the Run Selected Configuration icon. Some columns are updated for your
selected analytics configuration.
The icon in the Seasonality Status or Related Event Status column changes to a time glass icon.The text in the Seasonality Phase or Related Event Phase column changes to Waiting toStart.The percentage in the Seasonality Phase Progress or Related Event Phase Progress columnstarts at 0% and changes to reflect the percentage complete for the phase.
ResultsThe analytics configuration is put into the queue for the scheduler to run. As the analytics configuration isrunning, the following columns are updated to communicate the progress of the run:
• Seasonality Status or Related Event Status• Seasonality Phase or Related Event Phase• Seasonality Phase Progress or Related Event Phase Progress
What to do nextIf you want to stop an analytics configuration that is in Running status, from the toolbar click the StopSelected Configuration icon.
Stopping an analytics configurationYou can stop an analytics configuration that is running.
About this taskIf you create an analytics configuration and select to run the configuration, you might realize that someconfiguration values are incorrect while the configuration is still running. In this situation you can chooseto stop the analytics configuration instead of deleting the configuration or waiting for the configuration runto complete. To stop a running analytics configuration, complete the following steps.
Procedure1. Start the related events configuration portlet, see “Viewing current analytics configurations” on page
530.2. Within the list of analytics configurations that are displayed, select the running configuration.3. From the toolbar, click the Stop Selected Configuration icon.
Deleting an analytics configurationAnalytics configurations can be deleted individually, regardless of their status.
Procedure1. Start the Configure Analytics portlet, see “Viewing current analytics configurations” on page 530.2. Select the name of the analytics configuration that you want to delete and from the toolbar click the
Delete Selected Configuration icon.3. Within the confirmation dialog that is displayed, select OK.
534 IBM Netcool Operations Insight: Integration Guide

If you attempt to delete an analytics configuration with one or more rules created for it, a text warningdialog box appears with the current rules status for that analytics configuration. The following exampleillustrates text that the warning dialog box can contain:
Configuration EventAnalytics_Report_1 contains the following rules:
Seasonality Rules: 0 watched rules, 1 active rules, 0 expired rules and 0 archived
Related Event Rules:0 watched rules, 0 active rules, 0 expired rules and 0 archived
Delete the rules manually before deleting the configuration.
As the message indicates, manually delete the rule or rules associated with the specified analyticsconfiguration before deleting the analytics configuration. In the example, the one active ruleassociated with the analytics configuration called EventAnalytics_Report_1 would need to bedeleted first.
Results• The table of analytics configurations refreshes, and the deleted configuration no longer appears in the
list of analytics configurations.• Deleting the analytics configuration does not delete the related results if the results are in the Deployed
or Expired state. However, deleting the analytics configuration does delete the related results that arein the New or Archived state.
• You are unable to reuse the name of a deleted analytics configuration until all related event groups thatcontain the name of the deleted configuration are deleted from the system.
Changing the expiry time for related events groupsYou can modify the expiry time for Active related events groups. When the expiry time is reached, theexpired groups and related events display in the View Related Events portlet, within the Expired tab.
About this taskGroups that contain an expired group or pattern continue to correlate. The system administrator shouldreview the group and expired group or event.
By default the related events expiry time is 6 months. Complete the following steps to change the relatedevents expiry time.
Note: Watched related events groups do not expire.
Procedure1. Log in to the Netcool/Impact UI.2. Select the Related Events project.3. Select the Policies tab.4. Within the Policies tab, select to edit the RE_CONSTANTS policy.5. Within the RE_CONSTANTS policy, change the value for the RE_EXPIRE_TIME constant. Enter your
new value in months.6. Save the policy.
ResultsThis change takes effect only with newly discovered related event groups in the Active tabs.
Chapter 8. Administering 535
What to do nextIf you want to configure the expiry time so that deployed groups never expire, change the value for theRE_EXPIRE_TIME constant to 0 and save the policy for this change to take effect. You do not need torestart the Impact Server.
If you want to enable the expiry time at any stage, set this variable back to a value greater than 0.
Changing the choice of fields for the Event IdentityYou can change which fields, from your event history database, are available for selection as the EventIdentity.
About this taskAn Event Identity is a database field that identifies a unique event in the event history database.When you configure a related events configuration, you select database fields for the Event Identityfrom a drop-down list of available fields. Through configuration of an exception list within Netcool/Impact,you can change the fields available for selection in the drop-down list. Fields included in the exception listdo not appear in the Configure Analytics portlet.
The Netcool/Impact design displays the following default fields in the Event Identity drop-down list
Alert GroupAlert KeyNodeSummaryIdentifierLOCALNODEALIASLOCALPRIOBJLOCALROOTOBJLOCALSECOBJREMOTENODEALIASREMOTEPRIOBJREMOTEROOTOBJREMOTESECOBJ
If you have other database fields that are not in the exception list, these other fields also appear in thedrop-down list. Complete the following steps to modify the exception list.
Procedure1. Log in to Netcool/Impact.2. From the list of available projects, select the RelatedEvents project.3. Select the Policies tab. Within this tab, select and edit the RE_CONSTANTS policy.4. Update the RE_OBJECTSERVER_EXCLUDEDFIELDS variable. Add or remove fields from the static
array. Case sensitivity does not matter.5. Save the policy.6. Run the policy. If there is an error, check your syntax.
ResultsThe changes occur when the policy is saved. No restart of Netcool/Impact is needed.
536 IBM Netcool Operations Insight: Integration Guide
Changing the discovered groupsYou can modify the discovered groups for related events groups.
About this taskBy default all unallocated groups are shown in the group sources for a configuration. Complete thefollowing steps to change the discovered groups.
Procedure1. Log in to the Netcool/Impact UI.2. Select the Related Events project.3. Select the Policies tab.4. Within the Policies tab, select to edit the NOI_CONSTANTS policy.5. Within the NOI_CONSTANTS policy, change the value for the RE_DISCOVERED_GROUPS variable.
6. Save the policy.7. Run the noi_derby_upgradefp15.sql file to upgrade or re-run the configuration to change the
existing data in the views. The default value after upgrade is: Unallocated Groups
Validating analytics and deploying rulesReview and validate the analytics to create rules to apply to the live event stream that the operators see inthe Netcool/OMNIbus Event Viewer.
View Seasonal Events portletThe View Seasonal Events portlet contains a list of configurations, a list of seasonal events, and seasonalevent details.
In addition to viewing the seasonal events, you can mark events as reviewed and identify the events thatwere reviewed by others.
The View Seasonal Events portlet displays the following default columns in the group table:
ConfigurationDisplays a list of the seasonal event configurations.
Event CountDisplays a count of the number of seasonal events for each seasonal event configuration.
NodeDisplays the managed entity from which the seasonal event originated. The managed entity could be adevice or host name, service name, or other entity.
SummaryDisplays the description of the seasonal event.
Alert GroupDisplays the Alert Group to which the seasonal event belongs.
Reviewed byDisplays the list of user names of the users who reviewed the seasonal event.
Confidence LevelDisplays icons and text based on the level of confidence that is associated with the seasonal event.The confidence level is displayed as high, medium, or low, indicating that an event has a high,medium, or low seasonality.
Maximum SeverityDisplays the maximum severity of the events that contribute to the seasonality of the selectedseasonal event.
Rule CreatedDisplays the name of the seasonal event rule that was created for the seasonal event.
Chapter 8. Administering 537
Related Events CountDisplays a count of the number of related events for each seasonal event.
Obsolete Seasonal EventIndicates whether this is an obsolete seasonal event.
By default, if the same seasonality configuration is run a second time and a seasonal event from theprevious run is not found, that seasonal event is deleted. However, if that seasonal event has at leastone associated rule then it is not deleted, but it is marked as an Obsolete seasonal event. Seasonalevents from the previous run that are also found in the current run, are current events, and are notmarked as obsolete.
Table 85. Obsolete and current events
Found in previous run Found in current run Has associated rule Seasonal event is...
Yes No No deleted
Yes No Yes marked as Obsoleteevent
Yes Yes Doesn't matter current
First OccurrenceDisplays the date and time when the seasonal event first occurred. The time stamp is configurable byusers and is displayed in the following format:
YYYY-MM-DD HH:MM:SS
For example:
2012-10-12 09:52:58.0
Viewing a list of seasonal event configurations and eventsYou can view a list of the seasonal event configurations and seasonal events in the View Seasonal Eventsportlet.
Before you beginTo access the View Seasonal Events portlet, users must be assigned the ncw_analytics_admin role.
ProcedureTo view a list of the seasonal event configurations and seasonal events, complete the following steps.1. Open the View Seasonal Events portlet.2. By default, the Seasonal Event configurations are listed in the Configuration table.3. To view a list of seasonal events associated with the configurations, select one of the following options.
a) Select All to view of list of the seasonal events for all of the configurations.b) Select a specific configuration to view a list of the seasonal events for that configuration.
The seasonal events are listed in the Summary table.
ResultsThe seasonal event configurations and associated seasonal events are listed in the View Seasonal Eventsportlet.
538 IBM Netcool Operations Insight: Integration Guide
Reviewing a seasonal eventYou can mark or unmark a seasonal event as reviewed.
About this taskThe Reviewed by column in the View Seasonal Events portlet displays the user name of the reviewer.
ProcedureTo update the review status of an event, complete the following steps.1. Open the View Seasonal Events portlet.2. Select a specific configuration or ALL in the configuration table.3. Select a seasonal event from the events table.4. Right-click the seasonal event and select Mark as Reviewed or Unmark as Reviewed.
Each seasonal event can be reviewed by multiple users. The reviewers are listed in the Reviewed bycolumn.
ResultsThe selected seasonal event is marked or unmarked as Reviewed. The Reviewed by column is updatedto display the user name of the reviewer.
Sorting columns in the View Seasonal Events portletYou can sort the columns in the View Seasonal Events portlet to organize the displayed data.
Before you beginTo access the View Seasonal Events portlet, users must be assigned the ncw_analytics_admin role.
About this taskThe rows in the View Seasonal Events portlet are sorted by the configuration name. You can change theorder of the rows by using the columns to sort the data.
Sorted columns are denoted by an upwards-pointing arrow or downwards-pointing arrow in the columnheader, depending on whether the column is sorted in ascending or descending order.
ProcedureTo sort the rows by column, complete the following steps.1. Open the View Seasonal Events portlet.2. To sort single columns, complete the following steps.
a) To sort a column, click the column header once. The rows are sorted in ascending order.b) To sort in descending order, click the column header again.c) To unsort the column, click the column header a third time.
3. To sort multiple columns, complete the following steps.a) Sort the first column as a single column.b) Move the mouse pointer over the column header of the next column you want to sort. Two icons are
displayed. One is a standard sorting icon and the other is a nested sorting icon. The nested sortingicon has a number that represents how many columns are sorted as a result of selecting the option.For example, if this is the second column that you want to sort the number 2 is displayed.
c) Click the nested sorting icon. The column is sorted with regard to the first sorted column.
Tip: When you move the mouse pointer over the nested sorting icon, the hover help indicates that itis a nested sorting option. For example, the hover help for the icon displays "Nested Sort - Click to
Chapter 8. Administering 539
sort Ascending". The resulting sort order is ascending with regard to the previous columns on whicha sorting order was placed.
d) To reverse the order of the nested sort, click the nested sorting icon again. The order is reversedand the nested sorting icon changes to the remove sorting icon.
e) To remove nested sorting from a column, move the mouse pointer over the column header and clickthe Do not sort icon.
Note: In any sortable column after nested sorting is selected, when you click the standard sorting icon,it becomes the only sorted column in the table and any existing sorting, including nested is removed.
ResultsSorted columns are marked with an upwards-pointing arrow or a downwards-pointing arrow in thecolumn header to indicate whether the column is sorted in ascending or descending order. The sorting istemporary and is not retained.
Deleting obsolete seasonal eventsYou can delete obsolete seasonal events directly from the View Seasonal Events portlet.
About this taskBy default, if the same seasonality configuration is run a second time and a seasonal event from theprevious run is not found, that seasonal event is deleted. However, if that seasonal event has at least oneassociated rule then it is not deleted, but it is marked as an Obsolete seasonal event. Seasonal eventsfrom the previous run that are also found in the current run, are current events, and are not marked asobsolete.
Procedure1. Open the View Seasonal Events portlet.2. Sort the table by the Obsolete Seasonal Event column so that any events that have this column set totrue come to the top of the table.Events with this column set to true are obsolete seasonal events.
3. Review the rule or rules associated with each obsolete seasonal event.Then proceed as follows:
Table 86. Deciding whether to delete an obsolete seasonal event
What do you want to do? Then...
If you want the associated rule or rules tocontinue to be active
Do not delete the obsolete seasonal event
If you no longer require the associated rule orrules to continue to be active
Delete the obsolete seasonal event:
a. Right-click the row containing the relevantobsolete seasonal event.
b. Click Delete Obsolete Seasonal Event.
Exporting all seasonal events for a specific configuration to Microsoft ExcelYou can export all seasonal events for a specific configuration to a Microsoft Excel spreadsheet from asupported browser.
Before you beginYou view seasonal events for one or more configurations in the View Seasonal Events portlet. To accessthe View Seasonal Events portlet, users must be assigned the ncw_analytics_admin role.
540 IBM Netcool Operations Insight: Integration Guide
ProcedureTo export all seasonal events for a specific configuration to a Microsoft Excel spreadsheet, complete thefollowing steps.1. Open the View Seasonal Events portlet.2. Select a specific configuration from the configuration table.3. Click the Export Seasonal Events button in the toolbar.
After a short time, the Download export results link displays.4. Click the link to download and save the Microsoft Excel file.
ResultsThe Microsoft Excel file contains a spreadsheet with the following tabs:
• Report Summary: This tab contains a summary report of the configuration that you selected.• Seasonal Events: This tab contains the seasonal events for the configuration that you selected.• Export Comments: This tab contains any comments relating to the export for informational purposes
(for example, if the spreadsheet headers are truncated, or if the spreadsheet rows are truncated).
Exporting selected seasonal events for a specific configuration to Microsoft ExcelYou can export selected seasonal events for a specific configuration to a Microsoft Excel spreadsheetfrom a supported browser.
Before you beginYou view seasonal events for one or more configurations in the View Seasonal Events portlet. To accessthe View Seasonal Events portlet, users must be assigned the ncw_analytics_admin role.
ProcedureTo export selected seasonal events for a specific configuration to a Microsoft Excel spreadsheet, completethe following steps.1. Open the View Seasonal Events portlet.2. Select a specific configuration from the configuration table.3. Select multiple seasonal events by using the Crtl key and select method. (You can also select
multiple seasonal events by using the click and drag method.)4. After selecting multiple seasonal events, right click on one of the selected seasonal events and select
the Export Selected Events button in the toolbar.After a short time, the Download export results link displays.
5. Click the link to download and save the Microsoft Excel file.
ResultsThe Microsoft Excel file contains a spreadsheet with the following tabs:
• Report Summary: This tab contains a summary report of the configuration that you selected.• Seasonal Events: This tab contains the seasonal events for the configuration that you selected.• Export Comments: This tab contains any comments relating to the export for informational purposes
(for example, if the spreadsheet headers are truncated, or if the spreadsheet rows are truncated).
Seasonal Event RulesYou can use seasonal event rules to apply an action to specific events.
You can choose to apply actions to a selected seasonal event, or to a seasonal event and some or all of itsrelated events.
Chapter 8. Administering 541
You can use seasonal event rules to apply actions to suppress and unsuppress an event, to modify orenrich an event, or to create an event if the selected event does not occur when expected.
Creating a seasonal event ruleYou can create a watched or deployed seasonal event rule from the View Seasonal Events portlet.
Before you beginTo access the View Seasonal Events portlet, users must be assigned the ncw_analytics_admin role.
ProcedureTo create a seasonal event rule in the View Seasonal Events portlet, complete the following steps.1. Open the View Seasonal Events portlet.2. Select a specific configuration or ALL in the configuration table.3. Select a seasonal event from the events table.4. Right-click the seasonal event and select Create Rule.5. Input a unique rule name in the Create Rule window.6. Input the following rule criteria for events and actions in the Create Rule window.
a) To apply rule actions to an event and time condition, see “Applying rule actions to an event andtime condition” on page 542.
b) To apply actions when an event occurs, see “Applying actions when an event occurs” on page 543.c) To Applying actions when an event does not occur, see “Applying actions when an event does not
occur” on page 544.7. To save the seasonal event rule, choose one of the following criteria.
a) Select Watch to monitor the rule's performance before it is deployed.b) Select Deploy to activate the rule.
ResultsA seasonal event rule is created. To view a list of current seasonal event rules, open the Seasonal EventRules portlet.
Applying rule actions to an event and time conditionTo create a seasonal event rule, you must specify the selected events or time conditions, or both in theCreate Rule or Modify Existing Rule window.
Before you beginCreate or modify an existing seasonal event rule. To create a seasonal event rule, see “Creating a seasonalevent rule” on page 542. To modify an existing seasonal event rule, see “Modifying an existing seasonalevent rule” on page 548.
About this taskThe seasonal event that is selected by default in the Event Selection pane is the seasonal event fromwhich the Create Rule or Modify Existing Rule window was opened.
Note: A seasonal event rule suppresses events when they occur for a deployed related event group. Theseasonal rule actions do not apply to the synthetic parent event that is created.
Note: You can create a seasonal event rule to unsuppress an event or alarm. This rule has no actions ifthere are no suppressed alarms.
ProcedureTo specify the selected events and time conditions, complete the following steps in the Create Rulewindow.
542 IBM Netcool Operations Insight: Integration Guide
1. In the Event Selection section of the GUI, hover over Event(s) Selected.The Summary field value of the seasonal event on which the rule is based is displayed in hover help.
2. To select all, or one or more of the events that are related to this seasonal event, complete thefollowing steps.a) To select all of the related events, select the Select all related events check box.b) To select a subset of the related events, click Edit Selection, and then in the dialog box, select one
or more related events and click OK.
Note: One of the events listed in the dialog box is the original seasonal event. This event remainsselected, even if you unselect it in the dialog box.
The number of events selected in total (the number of selected related events plus the one seasonalevent) is now displayed next to Event(s) Selected. Hovering over this field now displays theIdentifier field value of all of the events selected.
3. To select a time condition, complete the following steps.a) Select one of the following time condition filter conditions.
ANDSelect AND to apply rule actions to each of the selected the time conditions.
ORSelect OR to apply rule actions to individual time conditions.
b) Select Minute of the Hour, Hour of the Day, Day of Week, or Day of Month from the drop-downmenu.
c) Select Is or Is Not from the drop-down menu.d) Select the appropriate minute, hour, day, or date from the drop-down menu. You can select
multiple values from this drop-down menu.
Note: High, medium, and low seasonality labels are applied to this time selection drop-down menuto indicate the seasonality of the events occurring at that time.
4. Click the add button to add another time condition.5. To save the event selection and time conditions, choose one of the following criteria.
a) Select Watch to monitor the rule's performance before it is deployed.b) Select Deploy to activate the rule.
ResultsThe seasonal event rule conditions are applied to the selected seasonal event and to any selected relatedevents, if these events occur at the time or times specified in the time conditions.
Applying actions when an event occursYou can apply specific actions to occur when an event occurs in a specific time window.
Before you beginCreate or modify an existing seasonal event rule. To create a seasonal event rule, see “Creating a seasonalevent rule” on page 542. To modify an existing seasonal event rule, see “Modifying an existing seasonalevent rule” on page 548.
Note: To suppress or unsuppress events you must update the noi_default_values file. For moreinformation about the noi_default_values file, see “Configuring event suppression” on page 397.
About this taskThe events that are selected in the Event Selection pane are the events to which the action is appliedwhen the event occurs in a specific time window. For more information about selecting events, see“Applying rule actions to an event and time condition” on page 542.
Chapter 8. Administering 543

You can suppress events that do not require you to take any direct action, and unsuppress the eventsafter a specified time period.
You can set a column value on an event occurrence and again set it again after a specified time period.
ProcedureTo specify the actions to apply when an event occurs, complete the following steps in the Actions WhenEvent(s) Occurs in Specified Time Window(s) pane.1. To suppress an event so that no action is taken when it occurs, complete the following steps.
a) Select the Suppress event(s) check box.b) (Optional) To select a column value, see step 3 below.
2. To unsuppress an event after an action occurs, complete the following steps.a) To select the time after the action occurs to unsuppress the event, select a number from the
Perform Action(s) After list, or type an entry in the field. Select Seconds, Minutes, or Hours fromthe Perform Action(s) After drop-down list.
b) Select the Unsuppress event(s) check box.c) (Optional) To select a column value, see step 4 below.
3. To set the column value after an action occurs, complete the following steps.a) Select the Set Column Values check box and click the Set Column Value button for Perform
Action(s) on Event Occurrence.b) In the Set Column Value page, input values for the ObjectServer columns.c) To save the column values, click Ok.
4. To reset the column value after a specified time period, complete the following steps.a) To specify a time period, select a number from the Perform Action(s) After list, or type an entry in
the field. Select Seconds, Minutes, or Hours from the Perform Action(s) After drop-down list.b) Select the Set Column Values check box and click the Set Column Value button for Perform
Action(s) After.c) In the Set Column Value page, input values for the ObjectServer columns.d) To save the column values, click Ok.
5. To save the seasonal event rule, choose one of the following options.a) Select Watch to monitor the rule's performance before it is deployed.b) Select Deploy to activate the rule.
ResultsThe action to be applied to a rule that occurs in a specific time window is saved.
Applying actions when an event does not occurYou can apply specific actions to occur when an event does not occur in a specific time window.
Before you beginCreate or modify an existing seasonal event rule. To create a seasonal event rule, see “Creating a seasonalevent rule” on page 542. To modify an existing seasonal event rule, see “Modifying an existing seasonalevent rule” on page 548.
About this taskThe events that are selected in the Event Selection pane are the events to which the action is applied ifthe event does not occur in a specific time window. For more information about selecting events, see“Applying rule actions to an event and time condition” on page 542.
544 IBM Netcool Operations Insight: Integration Guide
ProcedureTo specify the actions to apply when an event does not occur, complete the following steps in the ActionsWhen Event(s) Does Not Occur in Specified Time Window(s) pane.1. To select the time after which the event does not occur to apply the action, complete the following
steps.a) Select a number from the Perform Action(s) After list, or type an entry in the field.b) Select Seconds, Minutes, or Hours from the Perform Action(s) After drop-down list.
2. To create a synthetic event on a non-occurrence, select the Create event check box and click Createevent.
3. To define the event, complete the fields in the new Create Event window.4. To save the synthetic event, click Ok.5. To save the seasonal event rule, choose one of the following options.
a) Select Watch to monitor the rule's performance before it is deployed.b) Select Deploy to activate the rule.
ResultsThe action to be applied to a rule that does not occur in a specific time window is saved.
Seasonal event rule statesSeasonal event rules are grouped by state in the Seasonal Event Rules portlet.
Seasonal event rule statesSeasonal event rules are grouped in the following states.Watched
A watched seasonal event rule is not active.
You can watch a seasonal event rule to monitor how the rule performs before you decide whether todeploy it.
Watched seasonal event rules take no actions on events. It is used to collect statistics for rulematches for incoming events.
ActiveA deployed seasonal event rule is active. Active seasonal event rules take defined actions on liveevents.
ExpiredAn expired seasonal event rule remains active. If triggered, the seasonal event rule takes definedactions on live events. The default expiry time is 6 MONTHS. To ensure that seasonal event rules arevalid, regularly review the state and performance of the rules. You can customize the expiry time of aseasonal event rule. For more information, see “Modifying the default seasonal event rule expiry time”on page 546.
ArchivedAn archived seasonal event rule is not active. You can choose to archive a watched, active, or expiredseasonal event rule. To delete a seasonal event rule, it must first be archived.
For more information about changing the state of a seasonal event rule, see “Modifying a seasonal eventrule state” on page 548.
Chapter 8. Administering 545
Modifying the default seasonal event rule expiry timeYou can change the default seasonal event rules expiry time to a specific time or choose no expiry time toensure that a seasonal event rule does not expire.
About this taskTo ensure that seasonal event rules are valid, you should regularly review and update the state of therules.
ProcedureTo modify or remove the default seasonal event rules expiry time, complete the following steps.1. To generate a properties file from the command line interface, use the following command:
./nci_trigger SERVER <UserID>/<Password> NOI_DefaultValues_Export FILENAME directory/filename
WhereSERVER
The server where Event Analytics is installed.<UserID>
The user name of the Event Analytics user.<Password>
The password of the Event Analytics user.directory
The directory where the file is stored.filename
The name of the properties file.For example:
./nci_trigger NCI impactadmin/impact NOI_DefaultValues_Export FILENAME /space/noi_default_values
2. To modify the default seasonal event rules expiry time, edit the default values of the followingparameters.seasonality.rules.expiration.time.value=6
The number of days, hours, or months after which the seasonal event rule expires. The defaultvalue is 6.
seasonality.rules.expiration.time.unit=MONTHThe seasonal event rules expiry time frequency. The default frequency is MONTH. The followingtime units are supported:
• HOUR• DAY• MONTH
3. To import the modified properties file into IBM Tivoli Netcool/Impact, use the following command:
./nci_trigger SERVER <UserID>/<Password> NOI_DefaultValues_Configure FILENAME directory/filename
For example:
./nci_trigger NCI impactadmin/impact NOI_DefaultValues_Configure FILENAME /space/noi_default_values
ResultsThe default seasonal event rules expiry time is modified.
546 IBM Netcool Operations Insight: Integration Guide

Viewing performance statistics for seasonal event rulesYou can view performance statistics for seasonal event rules in the Seasonal Event Rules portlet, withinthe Watched, Active, or Expired tabs of the group table.
Columns in the group tableThe group table in the View Seasonal Events portlet displays the seasonal event rules that you havecreated. The left-side of the group table has these columns:
Configuration: Displays the list of configuration names for which a seasonal event rule has beencreated.Rule Count: Displays the number of seasonal event rules created for each particular configuration.This number also indicates the total number of seasonal event rules created for all configurationsunder the All item.Rule Name: Displays the name of the seasonal event rule.Last Run: Displays the date and time when the seasonal event rule was last executed. If the column isblank, the seasonal event rule has not been executed.Deployed: Displays the date and time when the seasonal event rule was deployed. The term deployedmeans that the seasonal event rule is available for use, is actively accumulating rule statistics, and anyactions applied to the rules are being performed.
Note: For the Last Run and Deployed columns, the date is expressed as month, day, year. Likewise, thetime is expressed as hours:, minutes:, seconds. The time also indicates whether AM or PM. For example:Apr 13, 2015 4:45:17 PM.
Performance statistics in the group table
The performance statistics are displayed in the following columns of the group table in the Watched,Active, or Expired tabs in the Seasonal Event Rules portlet.
Suppressed Events: Displays the total number of events that the seasonal event rule suppressedsince the rule was deployed.Unsuppressed Events: Displays the total number of events that the seasonal event rule unsuppressedsince the rule was deployed.Enriched/Modified Events: Displays the total number of events that the seasonal event rule enrichedor modified since the rule was deployed.Generated Events on Non-occurrence: Displays the total number of events that the seasonal eventrule generated since the rule was deployed for events that do not meet the event selection criteria(that is, for those matching events that fall outside of the event selections condition for the rule).
Reset performance statisticsYou can reset performance statistics to zero for a group in the Watched, Active, or Expired tabs. To resetperformance statistics, right-click on the seasonal event rule name (from the Rule Name column) andfrom the menu select Reset performance statistics. A message displays indicating that the operation willreset statistics data for the selected seasonal event rule. The message also indicates that you will not beable to retrieve this data. Click OK to continue with the operation or Cancel to stop the operation. Asuccess message displays after you select OK.
Resetting performance statistics to zero for a seasonal event rule also causes the following columns to becleared: Last Run and Deployed. Note that performance statistics are not collected for the Archived tab.When a rule is moved between states, the performance statistics are reset. Every time an action istriggered by the rule the performance statistics increase.
Chapter 8. Administering 547

Modifying an existing seasonal event ruleYou can modify an existing seasonal event rule to update or change the event selection criteria or actions.
Before you beginTo access the Seasonal Event Rules portlet, users must be assigned the ncw_analytics_admin role.
Procedure1. Open the Seasonal Event Rules portlet.
The Seasonal Event Rules portlet lists the seasonal event rules configuration in the table on the leftside, and the seasonal event rules are listed in the table in the right side.
2. Select the rule that you want to modify from the rule table.3. Right click and select Edit Rule.4. Modify the event selection criteria or actions in the Modify Existing Rule window.5. To save the seasonal event rule, choose one of the following criteria.
a) Select Watch to monitor the rule's performance before it is deployed.b) Select Deploy to activate the rule.
ResultsThe seasonal event rule is modified. To view a list of current seasonal event rules, open the SeasonalEvent Rules portlet.
Viewing seasonal event rules grouped by stateYou can view seasonal event rules grouped by state in the Seasonal Event Rules portlet.
Before you beginTo access the Seasonal Event Rules portlet, users must be assigned the ncw_analytics_admin role.
ProcedureTo view seasonal event rules grouped by state, complete the following steps.1. Open the Seasonal Event Rules portlet.
The Seasonal Event Rules portlet lists the seasonal event rules configuration in the table on the leftside, and the seasonal event rules are listed in the table in the right side.
2. Select the seasonal event rule state that you want to view from the status tabs.
The seasonal event rules are stored in tabs that relate to their status. For example, to view a list of theactive seasonal event rules configurations and rules, select the Active tab.
ResultsThe seasonal event rules configurations and rules for the chosen status are listed in the Seasonal EventRules portlet.
Modifying a seasonal event rule stateYou can change the state of a seasonal event rule to watched, active, or archived from the Seasonal EventRules portlet.
Before you beginTo access the Seasonal Event Rules portlet, users must be assigned the ncw_analytics_admin role.
548 IBM Netcool Operations Insight: Integration Guide
About this taskThe seasonal event rules are stored in tabs that relate to their state. The total number of rules is displayedon the tabs. For example, when you Archive a Watched rule, the rule moves from the Watched tab to theArchived tab in the Seasonal Event Rules portlet and the rules total is updated.
Performance statistics about the rule are logged. You can use performance statistics to verify that adeployed rule is being triggered and that a monitored rule is collecting statistics for rule matches forincoming events. Performance statistics are reset when you change the state of a seasonal event rule.
ProcedureTo change the state of a seasonal event rule in the Seasonal Event Rules portlet, complete the followingsteps.1. Open the Seasonal Event Rules portlet.
The Seasonal Event Rules portlet lists the seasonal event rules configuration in the table on the leftside, and the seasonal event rules are listed in the table in the right side.
2. To change the state of seasonal event rule, complete one of the following actions:a) To change the state of a watched seasonal event rule, select the Watched tab. Select a rule from
the rule table. To change the state of the rule right-click the rule and select Deploy or Archive.b) To change the state of an active seasonal event rule, select the Active tab. Select a rule from the
rule table. To change the state of the rule right-click the rule and select Watch or Archive.c) To change the state of an expired seasonal event rule, select the Expired tab. Select a rule from the
rule table. To change the state of the rule right-click the rule and select Validate, Watch, orArchive.
d) To change the state of an archived seasonal event rule, select the Archived tab. Select a rule fromthe rule table. To change the state of the rule right-click the rule and select Watch or Deploy.
ResultsThe seasonal event rule state is changed from its current state to its new state. The rule totals areupdated to reflect the new seasonal event rule state.
Applying rule actions to a list of eventsYou can apply defined actions to a list of events while you create a seasonal event rule.
Before you beginTo access the View Seasonal Events portlet, users must be assigned the ncw_analytics_admin role.
About this taskOne of the events in the list on the Related Event Selection window is the seasonal event from which youlaunched the Create Rule dialog box. When the rule you created is fired, the rule is fired on the seasonalevent and the related events that you selected. Because the rule is fired on the seasonal event, it is notpossible for you to deselect this seasonal event from the list of related events displayed in the RelatedEvent Selection window.
ProcedureTo select a list of events to which the defined action applies, complete the following steps.1. Open the View Seasonal Events portlet.2. Select a specific configuration or ALL in the configuration table.3. Select a seasonal event from the events table.4. Right-click the seasonal event and select Create Rule.5. To choose all related events:
Chapter 8. Administering 549
a) In the Event Selection pane of the Create Rule page, click the Select all related events checkbox.6. Or, to choose one or more related events:
a) In the Event Selection pane of the Create Rule page, click the Edit Selection... control button.The Related Event Selection window displays. Note that the seasonal event from which youlaunched the Create Rule dialog box has a check mark that you cannot deselect.
b) Select one or more related events from the list displayed in the Related Event Selection window.c) Click OK.
7. To save your changes, choose one of the following options:a) Select Watch to monitor the rule's performance before it is deployed.b) Select Deploy to activate the rule.
ResultsThe updated seasonal event rule is saved and the defined actions are applied to the selected relatedevents.
Setting the column value for an eventYou can set the column value for an event when you set the actions for a rule.
Before you beginTo access the View Seasonal Events portlet, users must be assigned the ncw_analytics_admin role.
ProcedureTo set the column value, complete the following steps.1. Open the View Seasonal Events portlet.2. Select a specific configuration or ALL in the configuration table.3. Select a seasonal event from the events table.4. Right-click the seasonal event and select Create Rule.5. In the Actions When Event(s) Occurs in Specific Time Window(s) pane, select from the following
options.a) To set the column value to suppress an event, select the Set Column Values check box and click
the Set Column Value button for Perform Action(s) on Event Occurrence.b) To set the column value to unsuppress an event, select the Set Column Values check box and click
the Set Column Value button for Perform Action(s) After.6. In the Set Column Value page, input values for the ObjectServer columns.
a) You can add or remove columns by using the plus and minus buttons.7. To save the column values, click Ok.8. To save the seasonal event rule, choose one of the following options.
a) Select Watch to monitor the rule's performance before it is deployed.b) Select Deploy to activate the rule.
ResultsThe seasonal event rule that modifies the column values is saved.
Seasonal Event GraphsThe seasonal event graphs display bar charts and confidence level event thresholds for seasonal events.
The Seasonal Event Graphs portlet consists of four charts:Minute of the hour
The minute or minutes of the hour that the event occurs.
550 IBM Netcool Operations Insight: Integration Guide

Hour of the dayThe hour or hours of the day that the event occurs.
Day of the weekThe day or days of the week that the event occurs.
Day of the monthThe date or dates of the month that the event occurs.
The confidence level of the data in the charts is displayed in three ways:
1. The overall distribution score of each chart is displayed as high (red), medium (orange), or low (green)seasonality at the top of each chart.
2. The degree of deviation of the events is indicated by the high (red) and medium (orange) seasonalitythreshold lines on the charts.
3. The maximum confidence level of each bar is displayed as high (red), medium (orange), or low (green).
The default confidence level thresholds are as follows:
• High: 99-100%• Medium: 95-99%• Low: 0-95%
To modify the default confidence level thresholds of the charts, see “Editing confidence thresholds ofSeasonal Event Graphs” on page 553.
Understanding graphsThe four seasonal event graphs illustrate event seasonality. The graphs depict independent observations.For example, if the Hour of the day graph indicates a high confidence level for 5 p.m., and the Minute ofthe hour graph indicates a high confidence level for minute 35, it does not necessarily mean that theevents all occur at 5:35 p.m. The 5 p.m. value can contain other minute values.
Note: In some instances, Minute of the hour is indicated as having a high confidence level but the overallconfidence level of seasonality is low. This is due to the high-level statistic that does not include minute ofthe hour due to poll cycle of monitors.
Note: In some instances, the overall confidence level of a chart is indicated as high although none of thebars in the graph are in the red zone. An example of this is a system failure due to high load and peaktimes, with no failure outside of these times.
The seasonal event graphs Count refers to the number of observations that are recorded in each graph.There is a maximum of one observation for each minute, hour, day, and date range. Therefore, the countfor each of the graphs can differ. For example, if an event occurs at the following times:
10:31 a.m., 1 June 201310:31 a.m., 2 June 201310:35 a.m., 2 June 2013
There is a count of two observations for 10 a.m., two observations for minute 31, and one observation forminute 35.
Viewing seasonal event graphs for a seasonal eventYou can view seasonal event graphs for the seasonal events that are displayed in the View SeasonalEvents portlet.
Before you beginTo access the View Seasonal Events portlet, users must be assigned the ncw_analytics_admin role.
ProcedureTo view seasonal event graphs for a seasonal event, complete the following steps.
Chapter 8. Administering 551
1. Open the View Seasonal Events portlet.2. Select a specific configuration or ALL in the configuration table.3. Select a seasonal event from the events table.4. Right-click the seasonal event and select Show Seasonal Event Graphs.
ResultsThe Seasonal Event Graphs portlet displays the bar charts and confidence levels for the selected seasonalevent. For more information about charts and threshold levels, see the “Seasonal Event Graphs” on page550 topic.
Viewing historical events from seasonality graphsYou can view a list of historical events from seasonality graphs.
Before you beginTo access the View Seasonal Events portlet, users must be assigned the ncw_analytics_admin role.
ProcedureTo view a list of historical events from seasonality graphs, complete the following steps.1. Open the View Seasonal Events portlet.2. Select a specific configuration or ALL in the configuration table.3. Select a seasonal event from the events table.4. Right-click the seasonal event and select Show Seasonal Event Graphs.5. In the Seasonal Event Graphs tab, you can choose to view all of the historical events for a seasonal
event, or filter the historical events by selecting bars in a graph.a) To view all of the historical events for a seasonal event, select Show Historical Events in the
Actions drop-down list.b) To view the historical events for specific times, hold down the Ctrl key and click the specific bars in
the graphs. Select Show Historical Events for Selected Bars in the Actions drop-down list.
Multiple bars that are selected from one chart are filtered by the OR condition. For example, if youselect the bars for 9am or 5pm in the Hour of the Day graph, all of the events that occurred between9am and 10am and all events that occurred between 5pm and 6pm are displayed in the HistoricalEvent portlet.
Multiple bar that are selected from more than one graph are filtered by the AND condition. Forexample, if you select the bar for 9am in the Hour of the Day graph and Monday in the Day of theWeek graph, all of the events that occurred between 9am and 10am on Mondays are displayed inthe Historical Event portlet.
ResultsThe historical events are listed in the Historical Event portlet.
Exporting seasonal event graphs for a specified seasonal event to Microsoft ExcelYou can export seasonal event graphs for a specified seasonal event to a Microsoft Excel spreadsheetfrom a supported browser.
Before you beginYou view seasonal event graphs for the seasonal events that are displayed in the View Seasonal Eventsportlet. To access the View Seasonal Events portlet, users must be assigned thencw_analytics_admin role.
552 IBM Netcool Operations Insight: Integration Guide

About this taskIn addition to exporting seasonal event graphs to a Microsoft Excel spreadsheet, you also export thehistorical event data and seasonal event data and confidence levels for the seasonal event that youselected. Currently, there is no way to export only the seasonal event graphs.
ProcedureTo export seasonal event graphs for a specified seasonal event to a Microsoft Excel spreadsheet,complete the following steps.1. Open the View Seasonal Events portlet.2. Select a specific configuration from the configuration table.3. Select a seasonal event from the events table.4. Right-click the seasonal event and select Show Seasonal Event Graphs.5. From the Actions menu, select Export Seasonal Event Graphs.
After a short time, the Download export results link displays.6. Click the link to download and save the Microsoft Excel file.
ResultsThe Microsoft Excel file contains a spreadsheet with the following tabs:
• Seasonal Data: This tab contains the seasonal event data and confidence levels for the seasonalevent that you selected.
• Seasonality Charts: This tab contains the seasonal event graphs for the seasonal event that youselected.
• Historical Events: This tab contains the historical event data for the seasonal event that youselected.
• Export Comments: This tab contains any comments relating to the export for informational purposes(for example, if the spreadsheet headers are truncated, or if the spreadsheet rows are truncated).
For more information about charts and threshold levels, see the “Seasonal Event Graphs” on page 550topic.
Editing confidence thresholds of Seasonal Event GraphsYou can edit the default confidence level thresholds of the Seasonal Event Graphs.
About this taskThe confidence level of the data in the charts is displayed in two ways:
1. The overall distribution score of each chart is displayed as high (red), medium (orange), or low (green)seasonality at the top of each chart.
2. The degree of deviation of the events is indicated by the high (red) and medium (orange) seasonalitythreshold lines on the charts.
3. The maximum confidence level of each bar is displayed as high (red), medium (orange), or low (green).
The default confidence level thresholds are as follows:
• High: 99-100%• Medium: 95-99%• Low: 0-95%
To modify the default confidence level thresholds of the charts, see “Editing confidence thresholds ofSeasonal Event Graphs” on page 553.
Chapter 8. Administering 553
ProcedureTo edit the default confidence level threshold, complete the following steps:1. To generate a properties file from the command-line interface, use the following command:
nci_trigger server <UserID>/<password> NOI_DefaultValues_Export FILENAME directory/filename
whereSERVER
The server where Event Analytics is installed.<UserID>
The user name of the Event Analytics user.<password>
The password of the Event Analytics user.directory
The directory where the file is stored.filename
The name of the properties file.For example:
./nci_trigger NCI impactadmin/impactpass NOI_DefaultValues_Export FILENAME /tmp/seasonality.props
2. To modify the confidence level thresholds, edit the default values of the following parameters:
• level_threshold_high = 99• level_threshold_medium = 95• level_threshold_low = 0
Note: Other property values are overwritten by the generated properties file. You might need to updateother property values. For a full list of properties, see “Generated properties file” on page 384.
3. To import the modified properties file into Netcool/Impact, use the following command:
nci_trigger SERVER <UserID>/<password> NOI_DefaultValues_Configure FILENAME directory/filename
For example:
./nci_trigger NCI impactadmin/impactpass NOI_DefaultValues_Configure FILENAME /tmp/seasonality.props
Historical eventsYou can view a list of historical events for one or more seasonal events in the table that displays in theHistorical Event portlet. You can also export the data associated with the list of historical events for theassociated seasonal events to a spreadsheet.
The Historical Event portlet displays a table with the following default columns:
SummaryDisplays the description of the historical event.
NodeDisplays the managed entity from which the historical event originated. The managed entity could bea device or host name, service name, or other entity.
554 IBM Netcool Operations Insight: Integration Guide
SeverityDisplays the severity of the historical event. The following list identifies the possible values that candisplay in the Severity column:
• 0: Clear• 1: Indeterminate• 2: Warning• 3: Minor• 4: Major• 5: Critical
FirstOccurrenceDisplays the date and time in which the historical event was created or first occurred. The date isexpressed as month, day, year. The time is expressed as hours:, minutes:, seconds. The time alsoindicates whether AM or PM. For example: Apr 13, 2015 4:45:17 PM.
LastOccurrenceDisplays the date and time in which the historical event was last updated. The date is expressed asmonth, day, year. The time is expressed as hours:, minutes:, seconds. The time also indicateswhether AM or PM. For example: Jun 2, 2015 5:54:49 PM.
AcknowledgedIndicates whether the historical event has been acknowledged:
• 0: No• 1: Yes
The historical event can be acknowledged manually or automatically by setting up a correlation rule.
TallyDisplays an automatically maintained count of the number of historical events associated with aseasonal event.
Viewing historical events for a seasonal eventYou can view a list of historical events for a seasonal event in the table that displays in the HistoricalEvent portlet.
Before you beginYou view seasonal events for which you want a list of historical events in the View Seasonal Eventsportlet. To access the View Seasonal Events portlet, users must be assigned thencw_analytics_admin role.
ProcedureTo view a list of historical events for a seasonal event, complete the following steps.1. Open the View Seasonal Events portlet.2. Select a specific configuration or ALL from the configuration table.3. Select a seasonal event from the events table.4. Right-click the seasonal event and select Show Historical Events.
ResultsThe historical events are listed in the table that displays in the Historical Event portlet.
Chapter 8. Administering 555

Exporting historical event dataYou can export historical event data to a spreadsheet from Firefox or Internet Explorer.
Before you beginYou first view seasonal events for which you want a list of historical events in the View Seasonal Eventsportlet. To access the View Seasonal Events portlet, users must be assigned thencw_analytics_admin role.
ProcedureTo export historical event data, complete the following steps.1. Open the View Seasonal Events portlet.2. Select a specific configuration or ALL from the configuration table.3. Select a seasonal event from the events table.4. Right-click the seasonal event and select Show Historical Events.
The historical events are listed in the table that displays in the Historical Event portlet.5. Select one or more historical events from the table that displays in the Historical Event portlet.6. To copy the selected historical events:
a) In Firefox, to copy the data from the displayed clipboard click Ctrl+C followed by Enter.b) In Internet Explorer, to copy the data from the displayed clipboard right-click on the selected
historical event and select Copy Ctrl+C from the drop down menu.7. Paste the historical event data to your spreadsheet.
Exporting historical event data for a specified seasonal event to Microsoft ExcelYou can export historical event data for a specified seasonal event to a Microsoft Excel spreadsheet froma supported browser.
Before you beginYou first view seasonal events for which you want a list of historical events in the View Seasonal Eventsportlet. To access the View Seasonal Events portlet, users must be assigned thencw_analytics_admin role.
About this taskIn addition to exporting historical event data to a Microsoft Excel spreadsheet, you also export theseasonal event charts and seasonal event data and confidence levels for the seasonal event that youselected. Currently, there is no way to export only the historical event data.
ProcedureTo export historical event data to a Microsoft Excel spreadsheet, complete the following steps.1. Open the View Seasonal Events portlet.2. Select a specific configuration from the configuration table.3. Select a seasonal event from the events table.4. Right-click the seasonal event and select Show Seasonal Event Graphs.5. From the Actions menu, select Export Seasonal Event Graphs.
After a short time, the Download export results link displays.6. Click the link to download and save the Microsoft Excel file.
ResultsThe Microsoft Excel file contains a spreadsheet with the following tabs:
556 IBM Netcool Operations Insight: Integration Guide

• Seasonal Data: This tab contains the seasonal event data and confidence levels for the seasonalevent that you selected.
• Seasonality Charts: This tab contains the seasonal event graphs for the seasonal event that youselected.
• Historical Events: This tab contains the historical event data for the seasonal event that youselected.
• Export Comments: This tab contains any comments relating to the export for informational purposes(for example, if the spreadsheet headers are truncated, or if the spreadsheet rows are truncated).
Related eventsUse the related events function to identify and show events that are historically related and to deploychosen correlation rules, which are derived from related events configurations. You can create a patternbased on a related events group. The pattern applies the events in the group, which are specific to aresource, to any resource.
The related events function is accessible through three portlets.
• The Configure Analytics portlet. Use this portlet to create, modify, run, and delete related eventsconfigurations.
• The View Related Events portlet. Use this portlet to review the events and event groups that are derivedfrom a related events configuration and to deploy correlation rules.
• The Related Event Details portlet. Use this portlet to access more detail about an event or an eventgroup.
To access the View Related Events portlet, users must be assigned the ncw_analytics_admin role.
The related events function uses an algorithm with the event database columns you select to determinerelationships between events.
Related events find signatures and patterns that occur together in the historic event stream. Thisdiscovery allows subject matter experts to easily review the detected signatures and derive correlationrules from related events configurations, without having to write correlation triggers or policies.
This diagram shows the relationship between the components for the related events functions.
Chapter 8. Administering 557
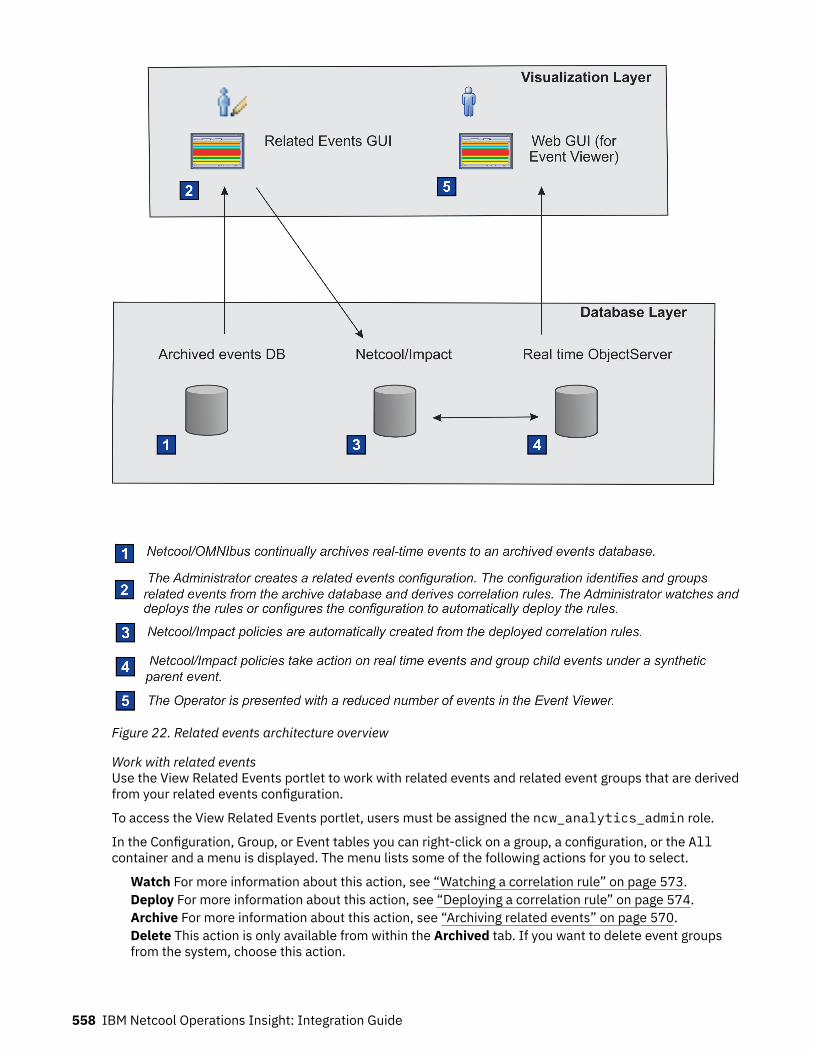
Figure 22. Related events architecture overview
Work with related eventsUse the View Related Events portlet to work with related events and related event groups that are derivedfrom your related events configuration.
To access the View Related Events portlet, users must be assigned the ncw_analytics_admin role.
In the Configuration, Group, or Event tables you can right-click on a group, a configuration, or the Allcontainer and a menu is displayed. The menu lists some of the following actions for you to select.
Watch For more information about this action, see “Watching a correlation rule” on page 573.Deploy For more information about this action, see “Deploying a correlation rule” on page 574.Archive For more information about this action, see “Archiving related events” on page 570.Delete This action is only available from within the Archived tab. If you want to delete event groupsfrom the system, choose this action.
558 IBM Netcool Operations Insight: Integration Guide
Reset performance statistics For more information about this action, see “Viewing performancestatistics for a correlation rule” on page 575.New This action is only available from within the Archived tab. If you choose this action, your selectedrow reinstates into the New tab.Copy Choose this action if you want to copy a row, which you can then paste into another document.
Within the View Related Events portlet, in the New, Watched, Active, Expired, or Archived tabs, fourtables display information about your related events.Configuration table
Displays a list of the related event configurations.Group Sources table
Displays the source information for related event groups based on the configuration and createdpatterns.
Groups tableDisplays the related event groups for a selected configuration.
Events tableDisplays the related events for a selected configuration or a selected group.
A performance improvement implemented in V1.6.3 ensures that the View Related Events portletdisplays Events, Groups, and Groups Sources more quickly once an item is selected. As part of thisupdate, each tab in the View Related Events portlet now lists all configurations in the panel on the left ofthe portlet following the successful run of a configuration. Configurations are displayed in the panel evenif there are no events or groups in a particular state for a given configuration. If no data exists for aparticular state, the panels will display a No items to display message. The configuration will be listed inall five tabs, New, Watched, Active, Expired, and Archived.
Right-click on a configuration in the Configuration table to display a list of menu items. You can select thefollowing actions from the menu list.
Watch For more information about this action, see “Watching a correlation rule” on page 573.Deploy For more information about this action, see “Deploying a correlation rule” on page 574.Archive For more information about this action, see “Archiving related events” on page 570.Copy Choose this action if you want to copy a row, which you can then paste into another document.
Right-click on a pattern in the Group Sources table to display a list of menu items. You can select thefollowing actions from the menu list.
Edit Pattern For more information about this action, see “Editing an existing pattern” on page 583.Delete Pattern For more information about this action, see “Deleting an existing pattern” on page591.Copy Choose this action if you want to copy a row, which you can then paste into another document.
Right-click on a group name in the Groups table to display a list of menu items. You can select thefollowing actions from the menu list.
Show details For more information about this action, see “Viewing related events details for aseasonal event” on page 560.Create Pattern For more information about this action, see “Managing event patterns” on page 577.Unmark as reviewed For more information about this action, see “Marking a related events group asreviewed” on page 562.Mark as reviewed For more information about this action, see “Marking a related events group asreviewed” on page 562.Watch For more information about this action, see “Watching a correlation rule” on page 573.Deploy For more information about this action, see “Deploying a correlation rule” on page 574.Archive For more information about this action, see “Archiving related events” on page 570.Delete This action is only available from within the Archived tab. If you want to delete event groupsfrom the system, choose this action.
Chapter 8. Administering 559
Reset performance statistics For more information about this action, see “Viewing performancestatistics for a correlation rule” on page 575.New This action is only available from within the Archived tab. If you choose this action, your selectedrow reinstates into the New tab.Copy Choose this action if you want to copy a row, which you can then paste into another document.
Right-click on an event in the Events table to display a list of menu items. You can select the followingactions from the menu list.
Show details For more information about this action, see “Viewing related events details for aseasonal event” on page 560.Copy Choose this action if you want to copy a row, which you can then paste into another document.
Within the View Related Events portlet, you can also complete the following types of tasks.
• View related events.• View related events by group.• Sort a related events view.• View performance statistics for a deployed correlation rule.
Within the Related Event Details portlet, you can also complete the following types of tasks.
• Change the pivot event.• Work with correlation rules and related events.• View events that form a correlation rule.• Select a root cause event for a correlation rule
Viewing related eventsIn the View Related Events portlet, you can view a listing of related events as determined by relatedevents configurations that ran.
Procedure1. Log in to the Dashboard Application Services Hub as a user with the ncw_analytics_admin role.2. In the Dashboard Application Services Hub navigation menu, go to the Insights menu.3. Under View Analytics, select View Related Events.4. By default, within the View Related Events portlet the New tab opens, this tab lists related events with
a status of New.
What to do nextIf you want to see related events with another status, select the relevant toolbar button within the ViewRelated Events portlet toolbar.
Viewing related events details for a seasonal eventYou can view related event details for a seasonal event in the Related Event Details portlet.
Before you beginTo access the Seasonal Event Rules portlet, users must be assigned the ncw_analytics_admin role.
ProcedureTo view a list of historical events for a seasonal event, complete the following steps.1. Open the View Seasonal Events portlet.2. Select a specific configuration or ALL in the configuration table.3. Select a seasonal event in the events table.4. Right-click the seasonal event and select Show Related Event Details.
560 IBM Netcool Operations Insight: Integration Guide
ResultsThe Related Event Details portlet displays the related event details.
Viewing related events by groupFrom the full list of related events, you can view only the related events that are associated to a specificgroup.
About this taskA related events configuration can contain one or many related events groups. A related events group isdetermined by a related events configuration and a related events group can be a child of one or morerelated events configurations.
Note:
• Discovered Groups and any “Suggested patterns” on page 590 are displayed in the Group Sourcestable of the View Related Events portlet. Any groups that are covered by a suggested pattern will notappear under the list of groups associated with Discovered Groups. A group that is a member of asuggested patten will only show up under the events of Discovered Groups once the suggested patten isdeleted.
• You might see a different number of Unique Events in a related events group when a RelationshipProfile of Strong has been selected for the events in the configuration. This is caused by the sameevents being repeated more than once.
Procedure1. Start the View Related Events portlet, see “Viewing related events” on page 560.2. Within any tab, in the Configuration table, expand the root node All. The list of related events
configurations display.3. In the Configuration table, select a related events configuration. The list of related events groups
display in the Group Sources and Groups tables and the related events display in the Events table.4. In the Group table, select a group. The Event table updates and displays only the events that are
associated to the selected group.
Viewing related events in the Event ViewerTo see the grouping of related events in the Event Viewer, you must apply a view that uses the IBMRelated Events relationship.
Procedure1. Open the Event Viewer.2. Click Edit Views.3. Select the Relationships tab.4. Select IBM Related events from the drop-down menu.5. Click Save.
ResultsThis relationship is used to present the results of correlations generated by the Related Events Analyticsfunctionality.
Chapter 8. Administering 561
Marking a related events group as reviewedThe review status for a related events group can be updated in the View Related Events portlet.
About this taskIn the View Related Events portlet, within the group table you can modify the review status for a relatedevents group. The review status values that are displayed indicates to Administrators whether relatedevents groups are reviewed or not.
In the View Related Events portlet, in the Groups table you can modify the review status for a relatedevents group. The review status values that are displayed indicates to Administrators the review status ofthe related events groups.
Related events groups can display these review status values.
Yes. The group is reviewed.No. The group is not reviewed.
To mark a related events group as reviewed or not reviewed, complete the following steps.
Procedure1. View related events, see “Viewing related events” on page 560.2. In the View Related Events portlet, within the group table, select a line item, which represents a group,
and right-click. A menu is displayed.3. From the menu, select Mark as Reviewed or Unmark as Reviewed. A success message in a green
dialog box displays.
ResultsThe values in the Reviewed column are updated, to one of the following values Yes, No.
When you enable sorting for the group table, you can sort on the Yes or No values.
Sorting a related events viewWithin a related events view, it is possible to sort the information that is displayed.
Before you beginWithin the View Related Events portlet, select the tab view where you want to apply the sorting.
About this taskSorting by single column or multiple columns is possible within either the Configuration, Group or Eventtable. Sorting within the Group or Event table can be done independently or in parallel by using thesorting arrows that display in the table column headings. When you apply sorting within the Configurationtable the configuration hierarchy disappears, but the configuration hierarchy reappears when you removesorting. For more details about rollup information, see “Adding columns to seasonal and related eventreports” on page 392.
Sorting by single column or multiple columns is possible within the Configuration, Group Sources,Groups or Event table. Sorting within the Groups or Event table can be done independently or in parallelby using the sorting arrows that display in the table column headings. When you apply sorting within theConfiguration table the configuration hierarchy disappears, but the configuration hierarchy reappearswhen you remove sorting. For more details about rollup information, see “Adding columns to seasonaland related event reports” on page 392.
562 IBM Netcool Operations Insight: Integration Guide
Procedure1. In either the Configuration, Group or Event table, hover the mouse over a column heading. Arrows are
displayed, hover the mouse over the arrow, one of the following sort options is displayed.
Click to sort AscendingClick to sort DescendingDo not sort this column
2. In either the Configuration, Group Sources, Groups or Event table, hover the mouse over a columnheading. Arrows are displayed, hover the mouse over the arrow, one of the following sort options isdisplayed.
Click to sort AscendingClick to sort DescendingDo not sort this column
3. Left-click to select and apply your sort option, or left click a second or third time to view and apply oneof the other sort options.
4. For sorting by multiple column, apply a sort option to other column headings. Sorting by multiplecolumns is not limited, as sorting can be applied to all columns.
ResultsThe ordering of your applied sort options, is visible when you hover over column headings. The sortingoptions that you apply are not persistent across portlet sessions when you close the portlet the appliedsorting options are lost.
Filtering related eventsFiltering capability is possible on the list of related events within the View Related Events portlet.
Procedure1. Start the View Related Events portlet, see “Viewing related events” on page 5602. Within the toolbar, in the filter text box, enter the filter text that you want to use. Filtering commences
as you type.
ResultsThe event list is reduced to list only the events that match the filter text in at least one of the displayedcolumns.
What to do nextTo clear the filter text, click the x in the filter text box. After you clear the filter text, the event list displaysall events.
Exporting related events for a specific configuration to Microsoft ExcelYou can export related events for a specific configuration to a Microsoft Excel spreadsheet from asupported browser.
Before you beginYou view related events for one or more configurations in the View Related Events portlet. To access theView Related Events portlet, users must be assigned the ncw_analytics_admin role.
ProcedureTo export related events for a specific configuration to a Microsoft Excel spreadsheet, complete thefollowing steps.1. Open the View Related Events portlet.
Chapter 8. Administering 563
2. Select a specific configuration from the configuration table.3. Click the Export Related Events button in the toolbar.
After a short time, the Download export results link displays.4. Click the link to download and save the Microsoft Excel file.
ResultsThe Microsoft Excel file contains a spreadsheet with the following tabs:
• Report Summary: This tab contains a summary report of the configuration that you selected.• Groups Information: This tab contains the related events groups for the configuration that you
selected.• Groups Instances: This tab contains a list of all the related events instances for all of the related
events groups for the configuration that you selected.• Group Events: This tab contains a list of all the events that occurred in the related events groups for
the configuration that you selected.• Instance Events: This tab contains a list of all the events that occurred in all of the related events
instances for all the related events groups for the configuration that you selected.• Export Comments: This tab contains any comments relating to the export for informational purposes
(for example, if the spreadsheet headers are truncated, or if the spreadsheet rows are truncated).
Exporting selected related events groups to Microsoft ExcelYou can export related events groups for a specific configuration to a Microsoft Excel spreadsheet from asupported browser.
Before you beginYou view related events for one or more configurations in the View Related Events portlet. To access theView Related Events portlet, users must be assigned the ncw_analytics_admin role.
ProcedureTo export related events groups for a specific configuration to a Microsoft Excel spreadsheet, completethe following steps.1. Open the View Related Events portlet.2. Select a specific configuration from the configuration table.3. Select multiple related event groups by using the Ctrl key and select method. (You can also select
multiple related events groups by using the click and drag method.)4. After selecting multiple related event groups, right click on one of the selected groups and select the
Export Selected Groups button in the toolbar.After a short time, the Download export results link displays.
5. Click the link to download and save the Microsoft Excel file.
ResultsThe Microsoft Excel file contains a spreadsheet with the following tabs:
• Report Summary: This tab contains a summary report of the configuration that you selected.• Groups Information: This tab contains the related events groups for the configuration that you
selected.• Groups Instances: This tab contains a list of all the related events instances for all of the related
events groups for the configuration that you selected.• Group Events: This tab contains a list of all the events that occurred in the related events groups for
the configuration that you selected.
564 IBM Netcool Operations Insight: Integration Guide
• Instance Events: This tab contains a list of all the events that occurred in all of the related eventsinstances for all the related events groups for the configuration that you selected.
• Export Comments: This tab contains any comments relating to the export for informational purposes(for example, if the spreadsheet headers are truncated, or if the spreadsheet rows are truncated).
Expired related eventsAn active related event group expires if no live events matching that related event group come into theObject Server for a period of six months. This six-month period is known as the automated expiry time.When the automated expiry time is reached for an active related events group, the group and its relatedevents are moved to the Expired tab within the View Related Events portlet.
Even though the expired groups and related events are visible in the Expired tab, you must acknowledgethat the group is expired. In the Expired tab, right-click on the group that you want to acknowledge. Amenu is displayed, from the menu select Validate. The default automated expiry time for an activeconfiguration is six months. To change the expiry time see “Changing the expiry time for related eventsgroups” on page 535.
To perform other actions on related events within the Expired tab, right-click on a group or event and amenu is displayed. From the menu, select the action that you want to take.
Impacts of newly discovered groups on existing groupsAn existing related events group can be replaced by newly discovered related event group, or the newlydiscovered group can be ignored.
The following bullet points describe the Event Analytics functions for management of newly discoveredgroups and existing groups.
• If a newly discovered group is a subset or same as an existing group within Watched, Active,Expired, or Archived, then Event Analytics ignores the newly discovered group.
• If a newly discovered group is a superset of an existing group within New, then Event Analytics deletesthe existing group and displays the newly discovered group in New. Otherwise, no changes occur withthe existing group.
• If a newly discovered group is a superset of an existing group within Watched, Active, or Expired,then Event Analytics moves the existing group to Archived, and displays the newly discovered group inWatched, Active, or Expired.
• If a newly discovered group is a superset of an existing group within Archived, then Event Analyticsadds the newly discovered group in to New and leaves the Archived group where it is.
Extra details about related eventsUse the Related Event Details portlet to access extra details about related events.
Within the Related Event Details portlet, you can complete the following types of tasks.
• View the occurrence time of an event.• Switch between tabulated and charted event information.• Remove an event from a related events group.
Only one instance of the Related Event Details portlet can be open at any stage. If you select ShowDetails for an event or an event group in the View Related Events portlet and the Related Event Detailsportlet is already open, the detail in the Related Event Details portlet refreshes to reflect your selectedevent or event group.
Viewing the occurrence time of an eventYou can get details about the time that an event occurred.
About this taskWhen you look at the occurrence time of an event, you might be able to relate this event to some otherevents that occurred around the same time. Within a particular event group, the same event might occurmultiple times. For example, if the group occurs 10 times within the time period over which the related
Chapter 8. Administering 565
events report is run, then there are 10 instances of the group. The event might occur in each of thosegroup instances, resulting in 10 occurrence times for that event. Events in strong related events groupsappear in all group instances, but events in medium or weak related events groups might appear in asubset of the group instances. This information is visible in the Related Event Details portlet by switchingbetween different instances in the Event Group Instance Table as explained in the following procedure.
Procedure1. Start the View Related Events portlet, see “Viewing related events” on page 560.2. Within the View Related Events portlet, in the Events table select an event or in the Group table select
an event group, and right-click. A menu is displayed.3. From the menu, select Show Details and a Related Event Details portlet opens.4. Within the Related Event Details portlet, in the Events tab, two tables are displayed.
Related Event Group Instances tableThis table lists instances of the related event group.Date and Time
Date and time when the group instance occurred. The time of the group instance is set to theoccurrence time of the event that you selected.
Unique EventsIndicates the number of unique events within each group instance, where a unique event is anevent with a unique Tivoli Netcool/OMNIbus ObjectServer serial number. The unique events fora selected related event group instance are listed in the Events table to the right.
Note: The number of rows in the Events table is always equal to the number displayed in theUnique Events field.
Within a related group instance, an event with the same event identifier can recur multipletimes, and each time the event will have a different serial number. When the event with thatidentifier first occurs, it is assigned a unique Tivoli Netcool/OMNIbus ObjectServer serialnumber. If that event is deleted and another event with the same identifier occurs again withinthis same group instance, then this new event is assigned a new serial number. At that pointthe Unique Events count in this column would be 2.
Contains Pivot EventIndicates whether this group instance contains the pivot event. For more information about thepivot event, see “Changing the pivot event” on page 571.
Events tableLists the unique events within the group instance selected in the Related Event Group Instancestable.
Note: When you configure Event Analytics using the wizard, it is best practice to add the Identifiercolumn to the Instance report fields list. This ensures that you can see the event identifier valuefor each event unique event listed in this table.
OffsetDisplays offset time relative to the pivot event.
Note: This column displays Not Applicable if the pivot event is not in the selected groupinstance. For more information about the pivot event, see “Changing the pivot event” on page571.
TimeFirst occurrence time of this unique event.
InstancesNumber of related group instances in which this event occurs. For related event groups with astrong profile, all events occur in all related group instances; for example a value of 7/7 in theInstances column denotes that this is a related event groups with a strong profile.
566 IBM Netcool Operations Insight: Integration Guide
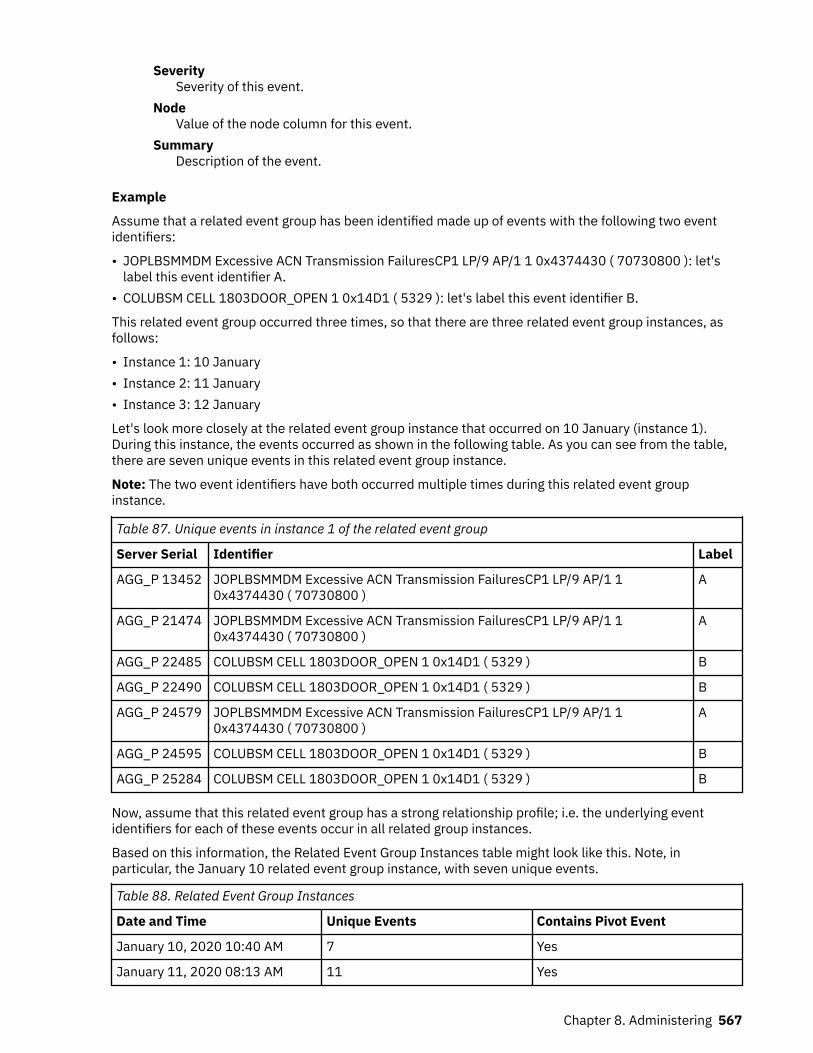
SeveritySeverity of this event.
NodeValue of the node column for this event.
SummaryDescription of the event.
Example
Assume that a related event group has been identified made up of events with the following two eventidentifiers:
• JOPLBSMMDM Excessive ACN Transmission FailuresCP1 LP/9 AP/1 1 0x4374430 ( 70730800 ): let'slabel this event identifier A.
• COLUBSM CELL 1803DOOR_OPEN 1 0x14D1 ( 5329 ): let's label this event identifier B.
This related event group occurred three times, so that there are three related event group instances, asfollows:
• Instance 1: 10 January• Instance 2: 11 January• Instance 3: 12 January
Let's look more closely at the related event group instance that occurred on 10 January (instance 1).During this instance, the events occurred as shown in the following table. As you can see from the table,there are seven unique events in this related event group instance.
Note: The two event identifiers have both occurred multiple times during this related event groupinstance.
Table 87. Unique events in instance 1 of the related event group
Server Serial Identifier Label
AGG_P 13452 JOPLBSMMDM Excessive ACN Transmission FailuresCP1 LP/9 AP/1 10x4374430 ( 70730800 )
A
AGG_P 21474 JOPLBSMMDM Excessive ACN Transmission FailuresCP1 LP/9 AP/1 10x4374430 ( 70730800 )
A
AGG_P 22485 COLUBSM CELL 1803DOOR_OPEN 1 0x14D1 ( 5329 ) B
AGG_P 22490 COLUBSM CELL 1803DOOR_OPEN 1 0x14D1 ( 5329 ) B
AGG_P 24579 JOPLBSMMDM Excessive ACN Transmission FailuresCP1 LP/9 AP/1 10x4374430 ( 70730800 )
A
AGG_P 24595 COLUBSM CELL 1803DOOR_OPEN 1 0x14D1 ( 5329 ) B
AGG_P 25284 COLUBSM CELL 1803DOOR_OPEN 1 0x14D1 ( 5329 ) B
Now, assume that this related event group has a strong relationship profile; i.e. the underlying eventidentifiers for each of these events occur in all related group instances.
Based on this information, the Related Event Group Instances table might look like this. Note, inparticular, the January 10 related event group instance, with seven unique events.
Table 88. Related Event Group Instances
Date and Time Unique Events Contains Pivot Event
January 10, 2020 10:40 AM 7 Yes
January 11, 2020 08:13 AM 11 Yes
Chapter 8. Administering 567

Table 88. Related Event Group Instances (continued)
Date and Time Unique Events Contains Pivot Event
January 12, 2020 03:18 AM 5 Yes
When the January 10 related event group instance is selected. the Events table might look like this. Notethat each of the underlying event identifier for each of these events occurs in all three related event groupinstances, so the Instances column has the value 3/3 for each event.
Table 89. Events table
Offset Time Instances Severity Node Summary
- 00:19:00 January 10,2020 10:40 AM
3/3 Clear Server123 Somedescription
- 00:14:00 January 10,2020 10:45 AM
3/3 Clear Server123 Somedescription
00:00:00 January 10,2020 10:59 AM
3/3 Clear Server 456 Somedescription
00:02:00 January 10,2020 11:01 AM
3/3 Clear Server 456 Somedescription
00:13:00 January 10,2020 11:12 AM
3/3 Clear Server123 Somedescription
00:22:00 January 10,2020 11:21 AM
3/3 Clear Server 456 Somedescription
00:33:00 January 10,2020 11:32 AM
3/3 Clear Server 456 Somedescription
Switching between tabulated and charted event informationEvent information is visible in table or chart format, within the Related Event Details portlet.
About this taskA pivot event is an event that acts as a pivot around which you can extrapolate related event occurrences,in relation to the pivot event occurrence. To view the event distribution of a pivot event, complete thefollowing steps to switch from tabulated event information to charted event information within theRelated Event Details portlet.
Procedure1. Start the View Related Events portlet, see “Viewing current analytics configurations” on page 530.2. Within the View Related Events portlet, in the Events table select an event or in the Group table select
an event group, and right-click. A menu is displayed.3. From the menu, select Show Details and a Related Event Details portlet opens.4. Within the Related Event Details portlet, in the Events tab, two tables are displayed.
Event Group Instance Table: This table lists each instance of the event group and the time atwhich the instance occurred. The time of the group instance is set to the occurrence time of theevent that you selected.Events Table: This table lists the events for a selected group instance.
5. From the Events tab toolbar, select Timeline. The event information displays in chart format.
For information about understanding the timeline chart, see “Understanding the timeline chart” onpage 569
568 IBM Netcool Operations Insight: Integration Guide
Note: The timeline chart scale is displayed as seconds (s), minutes (m), or hours (h). If manytimelines are displayed, users might need to scroll down to view all of the timelines. The timeline chartscale is anchored in place at the top of the Timeline view.
ResultsThe timeline chart shows the event distribution for each event type in the group, relative to the pivotevent. Each comb in the timeline chart represents an event type and the teeth represent the number ofinstances of the event type. The pivot event is not represented by a comb, but the pivot event instance isalways at zero seconds, minutes, or hours. For a selected event group instance, the highlighted tooth oneach comb denotes the event type instance relative to the pivot event, in seconds, minutes, or hours.
The long summary labels under the combs in the timeline chart are truncated. Move the mouse cursorover a truncated summary label to see the tooltip that shows the full summary label.
What to do next• If there are many event types to view, use the pagination function in addition to scrolling. In the
pagination toolbar, select the page to view and the page size.• If you want to change the pivot event, see “Changing the pivot event” on page 571.• If you want to revert to the tabulated event information, select Events from the Events tab toolbar.
Understanding the timeline chartEvent information in the Related Event Details portlet is available in chart format.
You can use the Related Event Details portlet to view more information about related events. For example,you can view charted event information on a timeline chart. For more information about how to view thecharted event information, see “Switching between tabulated and charted event information” on page568
The timeline chart shows the event distribution for each event type in the group, relative to the pivotevent. The pivot event is always at zero seconds, minutes, or hours.
Each comb in the timeline chart represents an event type and the teeth represent the number ofinstances of the event type. The blue event markers represent all the times the event occurred relative tothe pivot event. The red event markers indicate the time that the event occurred in the selected groupinstance.
Removing an event from a related events groupYou can remove an event from a related events group.
About this taskWhen you believe that an event is no longer related to other events in the related events group, you canremove the event from that events group. When you remove an event from a related events group, theevent is hidden from the UI and the correlation process but the event is not deleted from the system.Complete the following steps to remove an event from a related events group.
Procedure1. View event groups and events in the View Related Events portlet, see “Viewing related events” on
page 560 and “Viewing related events by group” on page 561.2. Within the View Related Events portlet, in the Group table select an event group or in the Event table
select an event, and right click. A menu is displayed.3. From the menu, select Show Details and a Related Event Details portlet opens.4. Within the Related Event Details portlet, in either the Events tab on the events table or in the
Correlation Rule tab, right-click on an event. A menu is displayed.5. From the menu, select Remove Event.
Chapter 8. Administering 569

6. A confirmation message is displayed, select Yes or No.
ResultsThe event is removed from the group and no longer appears in the event list in either the Events tab andthe Correlation Rule tab.
Archiving related eventsYou can archive related events by archiving the related events group.
Before you beginView event groups and events in the View Related Events portlet, see “Viewing related events” on page560 and “Viewing related events by group” on page 561.
About this taskWhen you believe that events within a related events group are no longer relevant, you can archive thatgroup. Complete the following steps to archive a related events group.
Procedure• To archive a related events group within the View Related Events portlet, complete the following steps.
1. Within the View Related Events portlet, select the New, Watched, Active, or Expired tab.2. In your chosen tab, within the Group table select an event group and right click. A menu is
displayed.3. From the menu, select Archive.
• To archive a related events group within the Related Event Details portlet, complete the followingsteps.
1. Within the View Related Events portlet, select the New, Watched, Active, or Expired tab.2. In your chosen tab, within the Group table select an event group or within the Event table select an
event, and right click. A menu is displayed.3. From the menu, select Show Details, a Related Event Details portlet opens.4. Within the Related Event Details portlet, in either the Events or Correlation Rule tab, select
Archive. A success message is displayed.
ResultsThe related events group moves into the Archived tab in the View Related Events portlet.
What to do nextWithin the Archived tab, from the list of archived groups you can select a group and right click. A menu isdisplayed with a choice of tasks for your selected group.
• If you want to move a group out of the Archived tab and into the New tab, from the menu select New. Anumber of actions can be performed with groups and events within the New tab, see “Work with relatedevents” on page 558.
• If you want to delete a related events group from the system, from the menu select Delete. This is theonly way to delete a related events group from the system.
570 IBM Netcool Operations Insight: Integration Guide
Changing the pivot eventYou can change a pivot event to view related events that are of interest.
About this taskUse a pivot event as a baseline to determine a sequence of events in the group. A pivot event displays inthe Related Event Details portlet. Within the Related Event Details portlet, a pivot event can be changed.Also, a pivot event history, of the 20 most recent pivot events, is available for you to revisit.
• When you open the Related Event Details portlet from an event in the View Related Events portlet, thatevent becomes the pivot event within the Related Event Details portlet.
• When you open the Related Event Details portlet from a group in the View Related Events portlet, one ofthe events from that group becomes the pivot event within the Related Event Details portlet. The pivotevent is not always the parent event.
Complete the following steps to change the pivot event.
Procedure1. Within the View Related Events portlet, right-click on an event or a group. A menu is displayed.2. From the menu, select Show Details. The Related Event Details portlet opens.3. Within the Related Event Details portlet, information about the pivot event is displayed.
• In the Event Group Instance table, the Contains Pivot Event column reports if a group instancehas a pivot event, or not. Some groups might not have a Pivot Event set because the event identity isdifferent for these events.
• In the Events table, the pivot event is identifiable by a red border.• Next to the Group Name entry, a Pivot Event link displays. To see more details about the pivot
event, click the Pivot Event link and a More Information widow opens displaying details about thepivot event.
4. In the Related Event Details portlet, within the Events tab, in the Events table, right-click on the eventyou want to identify as the pivot event. A menu is displayed.
5. From the menu, select Set as Pivot Event.
ResultsYour selected event becomes the pivot event with a red border. Data updates in the timeline chart, in thePivot Event link, in the Event Group Instance table and in the Events table.
What to do nextWithin the Related Event Details portlet, you can reselect one of your 20 recent pivot events as yourcurrent pivot event. From the Events tab toolbar, select either the forward arrow or back arrow to selectone of the 20 recent pivot events.
Correlation rules and related eventsA correlation rule is a mechanism that enables automatic action on real-time events that are received bythe ObjectServer, if a trigger condition is met. The result is fewer events in the Event Viewer for theoperator to troubleshoot.
Writing a correlation rule in code is complex but the related events function removes the need foradministrators to code a correlation rule. Instead, the related events function derives a correlation rulefrom your related events configuration and deploys a correlation rule, all through the GUI. After thecorrelation rule is deployed in a live environment and if the trigger condition is met, then automatic actionoccurs.
• The trigger condition is the occurrence of one or more related event types, from an event group, on theTivoli Netcool/OMNIbus ObjectServer. Only one event must be the parent event. Related event typesare derived from your related events configuration.
Chapter 8. Administering 571
• The automatic action is the automatic creation of a synthetic event with some of the properties of theparent event, and the automatic grouping of the event group events under this synthetic event.
Viewing events that form a correlation ruleYou can view the related events that form a correlation rule in the Related Event Details portlet.
About this taskAdministrators can view related events that form a correlation rule to understand associations betweenevents. Complete the following steps to view related events that form a correlation rule.
Procedure1. Start the View Related Events portlet, see “Viewing current analytics configurations” on page 530.2. Within the View Related Events portlet, in the Events table select an event or in the Group table select
an event group, and right-click. A menu is displayed.3. From the menu, select Show Details and a Related Event Details portlet opens.4. In the Related Event Details portlet, select the Correlation Rule tab.
ResultsA table displays with a list of the related events that make up the correlation rule.
Selecting a root cause event for a correlation ruleYou can select the root cause event for the correlation rule
About this taskWhen you select the root cause event for the correlation rule, the selected event becomes a parent event.A parent synthetic event is created with some of the properties from the parent event and a parent-childrelationship is created between the parent synthetic event and the related events. When these eventsoccur in a live environment, they display in the Event Viewer within a group as child events of the parentsynthetic event. With this view of events, you can quickly focus on the root cause of the event, rather thanlooking at other related events.
To select the root cause event for the correlation rule, complete the following steps. If you want to seeautomated suggestions about the root cause event for a group, see configuration details in “Addingcolumns to seasonal and related event reports” on page 392.
Procedure1. View all events that form a correlation rule, see “Viewing events that form a correlation rule” on page
5722. In the Related Event Details portlet, within the Correlation Rule tab, right-click an event and selectUse Values in Parent Synthetic Event.
ResultsThe table in the Correlation Rule tab refreshes and the Use Values in Parent Synthetic Eventcolumn for the selected event updates to Yes, which indicates this event is now the parent event.
For a related events group, if all of the children of a parent synthetic event are cleared in the Event Viewer,then the parent synthetic event is also cleared in the Event Viewer. If another related event comes in forthat same group, the parent synthetic event either reopens or re-creates in the Event Viewer, dependingon the status of the parent synthetic event.
572 IBM Netcool Operations Insight: Integration Guide
Watching a correlation ruleYou can watch a correlation rule and monitor the rule performance before you deploy the rule for the ruleto correlate live data.
Before you beginComplete your review of the related events and the parent event that form the correlation rule. Ifnecessary, change the correlation rule or related events configuration.
About this taskWhen you are happy with the correlation rule, you can choose to Watch the correlation rule.
When you choose to Watch the correlation rule, the rule moves out of its existing tab and into theWatched tab within the View Related Events portlet. While the rule is in Watched, the rule is not creatingsynthetic events or correlating but does record performance statistics. You can check the rule'sperformance before you deploy the rule for the rule to correlate live data.
Note: On rerun of a related events configuration scan, a warning message is displayed if any new groupsare discovered that conflict with groups on which an existing watched rule is based.
• Click OK to accept the warning and continue watching the existing rule. The new groups are ignored.• Click Cancel to ignore the warning and replace the existing watched rule with a new rule based on the
newly discovered group.
Note: any NEW groups which conflict with existing non-NEW groupsany already existing patterns cannotbe edited. Only newly discovered patterns can be edited.
Complete the following steps to Watch the correlation rule.
Procedure• Within the View Related Events portlet, perform the following steps:
a) View related events by group, see “Viewing related events by group” on page 561.b) In the View Related Events portlet, within the group table, select either a related events group or a
related events configuration and right click. A menu is displayed.c) From the menu, select Watch.
• Within the Related Event Details portlet for a group or an event, perform the following steps:a) View related events or related event groups, see “Viewing related events” on page 560 and
“Viewing related events by group” on page 561.b) Select an event or a related events group.
– In the View Related Events portlet, within the group table, select a related events group and rightclick. A menu is displayed.
– In the View Related Events portlet, within the event table, select an event and right click. A menuis displayed.
c) From the menu, select Show Details. The Related Event Details portlet opens.d) In the Related Event Details portlet, within any tab, select Watch.
ResultsThe rule displays in the Watched tab.
What to do nextWithin the Watched tab, monitor the performance statistics for the rule. When you are happy with theperformance statistics consider “Deploying a correlation rule” on page 574.
Chapter 8. Administering 573
Deploying a correlation ruleYou can deploy a correlation rule, for the rule to correlate live data.
Before you beginComplete your review of the related events and the parent event that form the correlation rule. Ifnecessary, change the correlation rule or related events configuration.
About this taskWhen you are happy with the correlation rule, you can choose to Deploy the correlation rule.
When you choose to Deploy the correlation rule, the rule moves out of its existing tab and into the Activetab within the View Related Events portlet. Active rule algorithm works to identify the related events inthe live incoming events and correlates them so the operator knows what event to focus on. Performancestatistics about the rule are logged which you can use to verify whether the deployed rule is beingtriggered.
Note: On rerun of a related events configuration scan, a warning message is displayed if any new groupsare discovered that conflict with groups on which an existing deployed rule is based.
• Click OK to accept the warning and continue deploying the existing rule. The new groups are ignored.• Click Cancel to ignore the warning and replace the existing deployed rule with a new rule based on the
newly discovered group.
Complete the following steps to Deploy the correlation rule.
Procedure• Within the View Related Events portlet.
a) View related events by group, see “Viewing related events by group” on page 561.b) In the View Related Events portlet, within the groups table, select either a related events group or a
related events configuration and right click. A menu is displayed.c) From the menu, select Deploy.
• Within the Related Event Details portlet for a group or an event.a) View related events or related event groups, see “Viewing related events” on page 560 and
“Viewing related events by group” on page 561.b) Select an event or a related events group.
– In the View Related Events portlet, within the groups table, select a related events group andright click. A menu is displayed.
– In the View Related Events portlet, within the events table, select an event and right click. Amenu is displayed.
c) From the menu, select Show Details. The Related Event Details portlet opens.d) In the Related Event Details portlet, within any tab, select Deploy.
ResultsThe rule moves out of the New tab and into the Active tab within the View Related Events portlet.
What to do nextWhen you establish confidence with the rules and groups that are generated by a related eventsconfiguration, you might want all the generated groups to be automatically deployed in the future. If youwant all the generated groups to be automatically deployed, return to “Creating a new or modifying anexisting analytics configuration” on page 531 and within the Configure Related Events window, tick theoption Automatically deploy rules discovered by this configuration.
574 IBM Netcool Operations Insight: Integration Guide
Viewing performance statistics for a correlation ruleYou can view performance statistics for a correlation rule in the View Related Events portlet, within theWatched, Active, or Expired tabs.
Performance statistics in the group tableTimes Fired: The total number of times the rule ran since the rule became active.Times Fired in Last Month: The last month time period is counted as 30 days instead of a calendarmonth. The total number of times that the rule is fired in the current 30 days. Time periods arecalculated from the creation date of the group.Last Fired: The last date or time that the rule was fired.Last Occurrence I: The percentage of events that occurred from the group, in the last fired rule.Last Occurrence II: The percentage of events that occurred from the group in the second last firedrule.Last Occurrence III: The percentage of events that occurred from the group in the third last fired rule.
Performance statistics in the event tableOccurrence: The number of times the event occurred, for all the times the rule fired.
Reset performance statisticsYou can reset performance statistics to zero for a group in the Watched, Active, or Expired tabs. To resetperformance statistics, right-click on the group name and from the menu select Reset performancestatistics. A message displays indicating that the operation will reset statistics data for the selectedcorrelation rule. The message also indicates that you will not be able to retrieve this data. Click Yes tocontinue with the operation or No to stop the operation. A success message displays after you select Yes.
Resetting performance statistics to zero for a group also causes the following columns to be cleared:Times Fired, Times Fired in Last Month, and Last Fired. Note that performance statistics are notcollected for the Archived tab. When a rule is moved between states, the performance statistics are reset.Every time an action is triggered by the rule the performance statistics increase.
Related Events statisticsWhen sending some events a synthetic event is created, but the statistics can appear not to be updated.
This is because there are delays in updating the related events statistics. These delays are due to the timewindow during which the related event groups are open, so that events can be correlated.
The statistics (Times Fired, Times Fired in Last Month, Last Fired) are updated only when the Group Timeto Live has expired. The sequence is; synthetic event is triggered, action is done, and the statistics arecalculated later.
Take the following query as an example:
SELECT GROUPTTL FROM RELATEDEVENTS.RE_GROUPS WHERE GROUPNAME = 'XXX';
There was an occurrence of the GROUPTTL being equal to 82800000 milliseconds, this is 23 hours. Inthis instance an update to the statistics wouldn't be visible to the user for 23 hours. If GROUPTTL isreduced to 10 seconds by running the following command:
UPDATE RELATEDEVENTS.RE_GROUPS SET GROUPTTL = 10000 WHERE GROUPNAME = 'XXX';
Subsequent tests will show that the statistics are updated promptly.
An algorithm creates GROUPTTL based on historical occurrences of the events. There is no default valuefor GROUPTTL and no best practice recommendation. GROUPTTL should be determined and set on a percase basis.
Data is displayed for the Times Fired, Times Fired in Last Month, and Last Fired columns for groupsallocated to patterns. In previous versions, the group statistics were only updated for unallocated groups
Chapter 8. Administering 575

and not updated for groups allocated to a pattern. The new statistics represent the total occurrences forevents with an active, watched or expired status.
The Times Fired value increments every time there is an event matching the Event Identifier of a deployedgroup. This statistic is suppressed by default. It can be enabled by turning on thetimesfired_group_stats_enable property.
The Times Fired in Last Month value is the sum of events received in the last 30 days. This statistic issuppressed by default. It can be enabled by turning on the timesfired_group_stats_enableproperty. When the 30 days time period has passed and a new event comes in, this value resets back to 0.When an event is not firing for two or more months, the value persists and is not reset. In this case, thevalue in the Times Fired in Last Month column refers to the 30 days before the timestamp in the LastFired column.
The Last Fired value is the timestamp of the last time such an event was received. This statistic issuppressed by default. It can be enabled by turning on the timesfired_group_stats_enableproperty.
Performance statistics in the group tableThe statistics in the Times Fired column in the Group Sources panel represent the sum of incomingevents, which match a given pattern. The value increments every time there is an incoming event thatmatches a pattern in a watched, active, or expired state. This statistic is active by default, and can't beturned off.
When a group is part of a pattern, the statistics in the Times Fired column in the Groups panel representthe sum of incoming events that are part of the group and match a given pattern. The value incrementsevery time there is an event, which is part of an active group, that matches an active pattern. Thisfunctionality is controlled with the timesfired_group_stats_enable property. By default, thisstatistic is disabled. To enable this functionality, complete the following steps:
1. Export the current default IBM Netcool Operations Insight export property values to a file by runningthe following command:
./nci_trigger <NCI_Cluster_name> <impactadmin_user_name>/<impactadmin_user_pwd> NOI_DefaultValues_Export FILENAME <path/filename>
2. In the new <path/filename> file, change the timesfired_group_stats_enable value from false totrue.
3. Import the updated properties file by running the following command:
./nci_trigger <NCI_Cluster_name> <impactadmin_user_name>/<impactadmin_user_pwd> NOI_DefaultValues_Configure FILENAME <path/filename>
When a group is not part of a pattern, the statistics in the Times Fired column in the Groups panelrepresent the sum of incoming events that are part of a group in active status. The value increments everytime there is an event, which is part of an active group. This statistic is active by default, and can't beturned off
576 IBM Netcool Operations Insight: Integration Guide
Managing event patternsGroups of related events are discovered using Related Event analytics. Automatically discovered groups inthe View Related Events portlet can be used to create patterns.
About event patternsUse this information to understand how patterns are created and how they differ from related eventgroups.
Patterns and related event groupsThe use of patterns allows events with different Event Identifier fields to be grouped in the Event Viewer.
Discovered groups can be deployed independently of a pattern. In this case, incoming events are matchedby using the Event Identifier field and grouped in the Event Viewer by Resource Field.
In contrast, the use of patterns allows events with different Event Identifier fields to be grouped in theEvent Viewer. In this case, incoming events are matched by using the Event Type field. Matching eventsfor deployed patterns are grouped by Resource in the Event Viewer. To allow a group of related events,with different Resource field values, to be allocated to a pattern, use name similarity or specify a regularexpression in the pattern. To allow deployed patterns to group events across multiple resources, usename similarity or specify a regular expression in the pattern.Event Types
By default, the Event Type field is set to the AlertGroup column in the Object Serveralerts.status table. You can configure the system to use a different column or combination ofcolumns by using the Event Analytics configuration wizard, as described in “Configuring event patternprocessing” on page 381.When a pattern is manually created, at least one Event Type must be selected in the drop-down list.There is no maximum number of Event Types. Whichever related event groups are allocated to thepattern must have all the Event Types specified (and no extra ones). For example, if a pattern iscreated with Event Type set to NmosEventType and ITNMMonitor then only groups with relatedevents that have both these event types can be allocated. In this example, if a group contains threerelated events with AlertGroup values of, in turn, NmosEventType, ITNMMonitor, and some othervalue, then this group is not a candidate for allocation to the pattern. It is not a candidate because itsrelated events contain an Event Type that is not part of the pattern.
ResourcesA resource can be a hostname (“server name”), or an IP address.By default the Resource field is set to the Node column in the Object Server alerts.status table.You can configure the system to use a different column by using the Event Analytics configurationwizard, as described in “Configuring event pattern processing” on page 381.If name similarity is disabled and no regular expression is specified for the pattern, then all theresource values for the events within a related events group must be the same.
Note: The check on the Resource field is performed by using the historical event data, not the relatedevent data. However, most of the time the Resource value in the historical event data is the same asthe Resource value in the related event data.
If many related events groups are allocated to a pattern, then the Resource value does not have tomatch across groups; however, the Resource value must match within a group. Name similarity isenabled by default in Netcool Operations Insight V1.5.0 and higher. When name similarity is enabled,the Resource values in the related events group (by default, the contents of the Node column) must besufficiently similar based on the name similarity settings. The default name similarity settings requirethe lead characters to be the same and the text to be 90% similar.
Warning: There is an important exception to this scenario. If the Node column contains IPaddresses, then the different IP address values must match down to the subnet value; that is,the first, second, and third segment of the IP address must be the same. For example:
• 123.456.789.10 matches 123.456.789.11.• 123.456.789.10 does not match 123.456.788.10.
Chapter 8. Administering 577

ExampleFor example, assume that Link up and Link down regularly occurs on Node A. Analytics detects theoccurrence in the historical data and generates a specific grouping of those two events for Node A.Likewise, if Link up and Link down also regularly occurs on Node B, a grouping of those two events isgenerated but specifically for Node B.
With generalization, the association of such events is encapsulated by the system as a pattern: Link up /Link down on any Node. In generalization terms, Link Up / Link Down represents the event type and Node*represents the resource.
Advantages of patternsA created pattern has the following advantages over a related event group:
• For any instance of a pattern, not all of the events in the definition must occur for the pattern to apply.This is dependent on the Trigger Action settings. For more information about Trigger Action setting, see“Creating and editing event patterns” on page 583.
• The pattern definition encompasses groups of events with the defined event types.• A single pattern can capture the occurrence of events on any resource. For example, with discovered
groups, analytics only found historical events that occurred on a specific hostname, and created groupsfor each host name. If real time events happen on different host names in the future, the discoveredgroups will not capture them. However, patterns will discover the events because the event type is thesame.
• A pattern can encompass event groupings that were not previously seen in the event history. An eventgroup that did not previously occur on a specific resource is identified by the pattern, as the pattern isnot resource dependent, but event type specific. Note: when selecting an event type (during the eventtype configuration), the column that identifies the event type should be unique across multiple eventgroups.
• A single pattern definition can encompass multiple event groups. Patterns will act on event types fordifferent host names which might have occurred historically (discovered groups) or will happen in futurereal time events. For example, an event type could be "Server Shutting Down", "Server Starting Up","Interface Ping Failure", and so on. Each group is resource specific, but an event pattern is event typespecific. Therefore, an environment might have multiple groups for different resources, and an eventpattern will encompass all of those different groups since their event type is the same.
Extending patternsUsing regular expressions and name similarity, you can enable the discovery of a pattern instance on morethan one resource.
By default, live events are processed for inclusion in event patterns by means of Exact matching of theresource or resources associated with that event. This means that the resource (or resources) associatedwith that event are checked against the resource values in the pattern. For each resource column, theremust be an exact match between the resource column value in the live event and the expected resourcevalue in the pattern.
You can extend pattern matching functionality using the following methods to enable the discovery of apattern instance on more than one resource:
• Regular expressions• Name similarity
Regular expressionsUsing regular expressions you can define a regular expression to apply to the contents of the resourcefield or fields during pattern matching. Resource names that match the regular expressions arecandidates to be included in a single pattern. You can optionally specify a regular expression when youcreate a pattern.
578 IBM Netcool Operations Insight: Integration Guide
Name similarityName similarity uses a string comparison algorithm to determine whether the resource names containedin two resource fields are similar. Name similarity is enabled by default, and is applied at two points in theprocess:
• When patterns are suggested, as described in “Suggested patterns” on page 590.• When live events are correlated to identify pattern instances, as described in “Examples of name
similarity” on page 582.
The name similarity settings force the lead character to be the same and the main body of the resourcename to be 90% similar. For more information on how to configure name similarity settings, see“Configuring name similarity” on page 412.
Note: There is a notable exception to this. If the Node column (or whichever columns are used to storeresource values) holds IP addresses then the IP address must match down to the subnet value. In anIPv4 environment, this means the first, second and third octets must be the same. For example, thefollowing two IP addresses will match for the purposes of name similarity:
• 123.456.789.10• 123.456.789.11
However, the following two IP addresses will not match.
• 123.456.789.10• 123.456.788.11
Using the methods togetherName similarity and regular expression functionality are not mutually exclusive. If name similarity isconfigured, you can also define regular expressions. Pattern matching is processed in the following order:
1. Exact match2. Regular expression3. Name similarity
Examples of pattern processingThe following examples illustrate how pattern processing is performed.
Examples of multiple resource pattern processingThis topic presents some very simple examples of event pattern processing with multiple resources fields.
Before you beginIn order to process multiple resource columns, you must have configured multiple resource fields in thepattern definitions. For more information on creating pattern definitions, see “Creating and editing eventpatterns” on page 583.
About this taskFor the sake of simplicity, these examples keep the value of the event type constant, in order to presentthe impact of changing the settings associated with multiple resource columns. The event type is held inthe AlertGroup field, and the value of event type used for this example is power, indicating that theevent is associated with a power issue.
Example 1: Single event type value with two resource fieldsThe resource information is distributed across two different event columns:
• Node
Chapter 8. Administering 579

• NodeAlias
Distribution of resource information across two different event columns simulates a scenario whereresource data is held in different event columns. One possible reason for this is consolidation of eventdata from different sources within an organization.
The following event snippet displays the dataset used in this example.
1 Identifier Node NodeAlias AlertGroup FirstOccurrence2 event00000000 node00000000 aliasnode00000000 power 2020-04-07 00:11:003 event00000001 node00000001 aliasnode00000001 power 2020-04-07 00:09:004 event00000002 node00000002 aliasnode00000002 power 2020-04-07 00:07:005 event00000003 node00000003 aliasnode00000003 power 2020-04-07 00:05:006 event00000004 node00000004 aliasnode00000004 power 2020-04-07 00:03:007 event00000005 node00000005 aliasnode00000005 power 2020-04-07 00:01:008 event00000006 node00000006 aliasnode00000006 power 2020-04-06 23:59:009 event00000007 node00000007 aliasnode00000007 power 2020-04-06 23:57:0010 event00000008 node00000008 aliasnode00000008 power 2020-04-06 23:55:0011 event00000009 node00000009 aliasnode00000009 power 2020-04-06 23:53:00
The following configuration settings can be applied to this dataset:Name similarity
Name similarity can be switched ON or OFF. For more information about name similarity, see“Extending patterns” on page 578.
Multiple resource correlation logic parameterThe repattern_multiresource_correlation_logic parameter specifies the Boolean logic tobe applied by the event pattern processing system when resource data is held in multiple eventcolumns. This parameter can take the values OR and AND. For more information about this parameter,see “Configuring multiple resource columns” on page 414.
The following table shows how event pattern results vary when these settings are configured in differentways:
Table 90. Event patterns results
Name similarity Multiple resourcecorrelation logic
Number of eventpattern instances
Number of events ineach pattern instance
1 ON OR 1 10 events
2 ON AND 10 1 event
3 OFF OR 10 1 event
4 OFF AND 10 1 event
The results demonstrate the following rules:
• Name similarity is ignored when AND logic is being applied. This can be seen from row 2, where eventhough name similarity is set to ON, the events are not grouped into a single pattern instance, meaningthat the pattern processing treats all of the Node and NodeAlias values as if they are different, eventhough they meet the name similarity criteria.
Note: The same rule applies to regular expressions. These are also ignored when AND logic is beingapplied.
• AND logic is order specific, meaning that the resource values are strictly matched with the respectiveresource name. This can be seen from row 1, where a single pattern instance is produced, and this is
580 IBM Netcool Operations Insight: Integration Guide
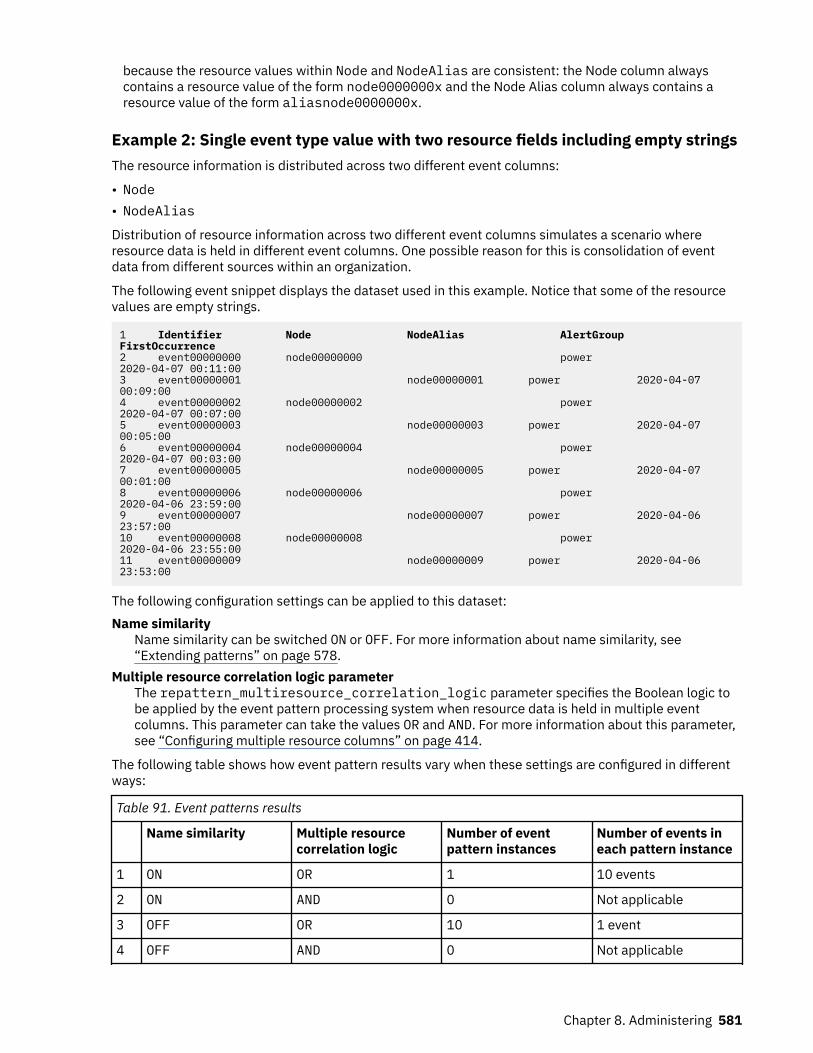
because the resource values within Node and NodeAlias are consistent: the Node column alwayscontains a resource value of the form node0000000x and the Node Alias column always contains aresource value of the form aliasnode0000000x.
Example 2: Single event type value with two resource fields including empty stringsThe resource information is distributed across two different event columns:
• Node• NodeAlias
Distribution of resource information across two different event columns simulates a scenario whereresource data is held in different event columns. One possible reason for this is consolidation of eventdata from different sources within an organization.
The following event snippet displays the dataset used in this example. Notice that some of the resourcevalues are empty strings.
1 Identifier Node NodeAlias AlertGroup FirstOccurrence2 event00000000 node00000000 power 2020-04-07 00:11:003 event00000001 node00000001 power 2020-04-07 00:09:004 event00000002 node00000002 power 2020-04-07 00:07:005 event00000003 node00000003 power 2020-04-07 00:05:006 event00000004 node00000004 power 2020-04-07 00:03:007 event00000005 node00000005 power 2020-04-07 00:01:008 event00000006 node00000006 power 2020-04-06 23:59:009 event00000007 node00000007 power 2020-04-06 23:57:0010 event00000008 node00000008 power 2020-04-06 23:55:0011 event00000009 node00000009 power 2020-04-06 23:53:00
The following configuration settings can be applied to this dataset:Name similarity
Name similarity can be switched ON or OFF. For more information about name similarity, see“Extending patterns” on page 578.
Multiple resource correlation logic parameterThe repattern_multiresource_correlation_logic parameter specifies the Boolean logic tobe applied by the event pattern processing system when resource data is held in multiple eventcolumns. This parameter can take the values OR and AND. For more information about this parameter,see “Configuring multiple resource columns” on page 414.
The following table shows how event pattern results vary when these settings are configured in differentways:
Table 91. Event patterns results
Name similarity Multiple resourcecorrelation logic
Number of eventpattern instances
Number of events ineach pattern instance
1 ON OR 1 10 events
2 ON AND 0 Not applicable
3 OFF OR 10 1 event
4 OFF AND 0 Not applicable
Chapter 8. Administering 581
The results demonstrate the following rules:
• Name similarity is effective when OR logic is being applied. This can be seen from row 1, where theevents are not grouped into a single pattern instance. This happens because the OR logic enables namesimilarity to be applied to all of the events on both resource columns. By eliminating the leading andtrailing edge characters, name similarity determines that all of the resource names are similar and thisresults in a single pattern instance.
Note: The same rule applies to regular expressions. These are also effective when OR logic is beingapplied.
• AND logic is only effective when an event being considered for inclusion in a pattern has more than oneresource defined. This can be seen from rows 2 and 4, where no pattern instances at all are produced.
• NULL and empty strings render the resource specified in the event invalid. This is illustrated by rows 2and 4, where no pattern instances are created when AND logic is applied.
Examples of name similarityThis topic presents examples of similar resource names that might be discovered by using the defaultname similarity settings.
By default, name similarity is configured with the following default settings. For more information onthese configuration parameters, see “Configuring name similarity” on page 412.
Parameter Description Values
name_similarity_default_threshold String comparison threshold. Forexample, a similarity thresholdvalue of 0.9 means that stringsmust match by at least that value tobe considered similar. For moreinformation about the thresholdvalue, see Similarity thresholdvalue.
• 1 equates to identical strings.• 0 equates to completely
dissimilar strings.
0.9
name_similarity_default_lead_restriction Lead restriction. Number ofcharacters at the beginning of thestring that must be identical.
1
name_similarity_default_tail_restriction Tail restriction. Number ofcharacters at the end of the stringthat must be identical.
0
Based on these settings, the following event snippets present an example for resource name similarityanalysis. Note that the resource name is stored in the resource column. NODE is the default resourcecolumn, but can be changed for the pattern event type.
1 NODE SUMMARY ALERTKEY Similar?2 acme.env1.base.adm_chk_probeCheck System Alert SEV2 ABC adm_probe No3 cnz.env2.base.adm_chk_reports System Alert SEV2 ABC adm_report No4 abc.lyf.base.logs1 System Alert SEV2 DEF logs1 No5 abc.gbs.stato.dotnetcore System Alert SEV2 ABC runtime_down No6 caripa.env1.stato.dotnetcore System Alert SEV2 GHI runtime_down Yes7 caripa.env1.stato.TNT System Alert SEV2 GHI runtime_down Yes8 caripa.env1.stato.TNT System Alert SEV2 GHI runtime_down Yes
582 IBM Netcool Operations Insight: Integration Guide
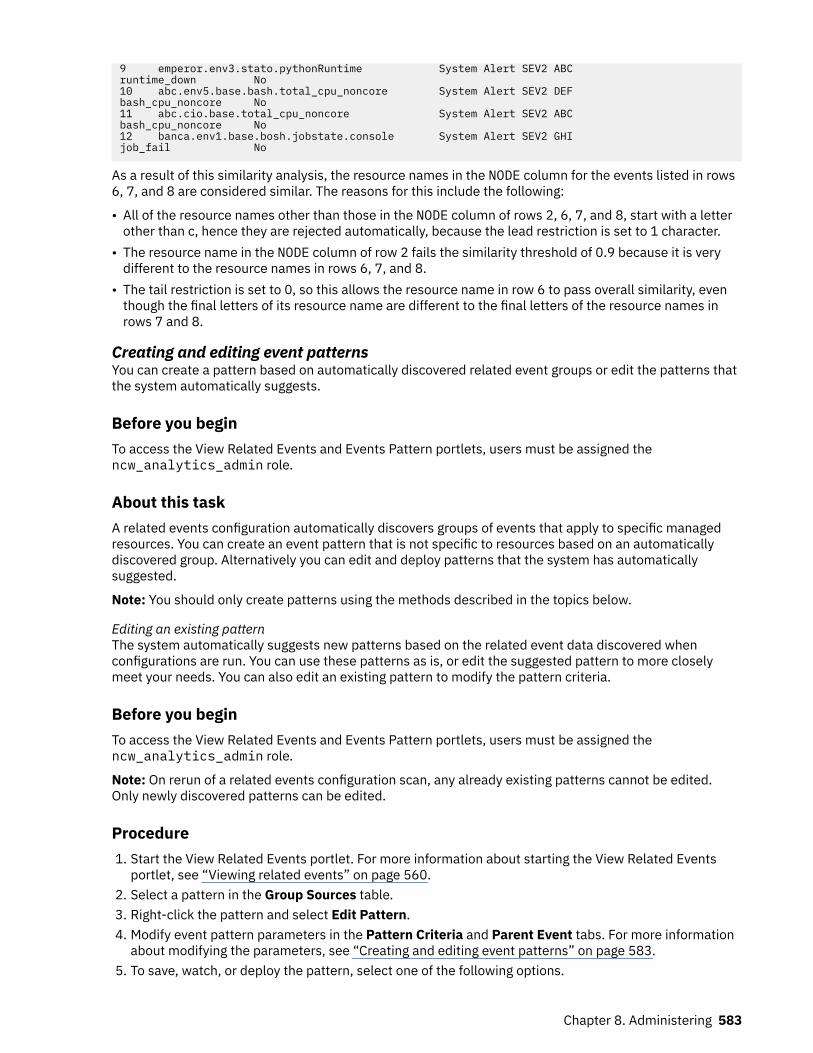
9 emperor.env3.stato.pythonRuntime System Alert SEV2 ABC runtime_down No10 abc.env5.base.bash.total_cpu_noncore System Alert SEV2 DEF bash_cpu_noncore No11 abc.cio.base.total_cpu_noncore System Alert SEV2 ABC bash_cpu_noncore No12 banca.env1.base.bosh.jobstate.console System Alert SEV2 GHI job_fail No
As a result of this similarity analysis, the resource names in the NODE column for the events listed in rows6, 7, and 8 are considered similar. The reasons for this include the following:
• All of the resource names other than those in the NODE column of rows 2, 6, 7, and 8, start with a letterother than c, hence they are rejected automatically, because the lead restriction is set to 1 character.
• The resource name in the NODE column of row 2 fails the similarity threshold of 0.9 because it is verydifferent to the resource names in rows 6, 7, and 8.
• The tail restriction is set to 0, so this allows the resource name in row 6 to pass overall similarity, eventhough the final letters of its resource name are different to the final letters of the resource names inrows 7 and 8.
Creating and editing event patternsYou can create a pattern based on automatically discovered related event groups or edit the patterns thatthe system automatically suggests.
Before you beginTo access the View Related Events and Events Pattern portlets, users must be assigned thencw_analytics_admin role.
About this taskA related events configuration automatically discovers groups of events that apply to specific managedresources. You can create an event pattern that is not specific to resources based on an automaticallydiscovered group. Alternatively you can edit and deploy patterns that the system has automaticallysuggested.
Note: You should only create patterns using the methods described in the topics below.
Editing an existing patternThe system automatically suggests new patterns based on the related event data discovered whenconfigurations are run. You can use these patterns as is, or edit the suggested pattern to more closelymeet your needs. You can also edit an existing pattern to modify the pattern criteria.
Before you beginTo access the View Related Events and Events Pattern portlets, users must be assigned thencw_analytics_admin role.
Note: On rerun of a related events configuration scan, any already existing patterns cannot be edited.Only newly discovered patterns can be edited.
Procedure1. Start the View Related Events portlet. For more information about starting the View Related Events
portlet, see “Viewing related events” on page 560.2. Select a pattern in the Group Sources table.3. Right-click the pattern and select Edit Pattern.4. Modify event pattern parameters in the Pattern Criteria and Parent Event tabs. For more information
about modifying the parameters, see “Creating and editing event patterns” on page 583.5. To save, watch, or deploy the pattern, select one of the following options.
Chapter 8. Administering 583
• Select Save to save the pattern details to the View Related Events New tab.• Select Watch to add the pattern to the View Related Events Watched tab.• Select Deploy to add the pattern to the View Related EventsActive tab.
Creating a pattern from an unallocated groupCreate an event pattern from a related event group when you want to independently review the relatedevent groups for useful patterns.
Before you beginTo access the View Related Events, Related Event Details, and Events Pattern portlets, users must beassigned the ncw_analytics_admin role.
Procedure1. Start the View Related Events portlet. For more information about starting the View Related Events
portlet, see “Viewing related events” on page 560.2. In the Group Sources table, click Unallocated groups.
Unallocated groups are those related event groups for which the system was unable to identify apattern. The Groups table updates to display the unallocated related event groups.
3. Right click a related event group from the Groups table and select Create Pattern.4. Specify event pattern parameters in the Pattern Criteria and Parent Event tabs. For more information
about specifying the parameters, see “Creating and editing event patterns” on page 583.5. To save, watch, or deploy the pattern, select one of the following options.
• Select Save to save the pattern details to the View Related Events New tab.• Select Watch to add the pattern to the View Related Events Watched tab.• Select Deploy to add the pattern to the View Related EventsActive tab.
Creating a pattern after reviewing details of an unallocated groupYou can create an event pattern directly from the screen where you review the details of an unallocatedgroup.
Before you beginTo access the View Related Events, Related Event Details, and Events Pattern portlets, users must beassigned the ncw_analytics_admin role.
Procedure1. Start the View Related Events portlet. For more information about starting the View Related Events
portlet, see “Viewing related events” on page 560.2. In the Group Sources table, click Unallocated groups.
Unallocated groups are those related event groups for which the system was unable to identify apattern. The Groups table updates to display the unallocated related event groups.
3. Right click a related event group from the Groups table and select Related Event Details.In the Related Event Details you can explore the group instances and timeline. You can also modify thegroup; for example, you can change the pivot event.
4. Click Create Pattern... to create a pattern from this group.5. Specify event pattern parameters in the Pattern Criteria and Parent Event tabs. For more information
about specifying the parameters, see “Creating and editing event patterns” on page 583.6. To save, watch, or deploy the pattern, select one of the following options.
• Select Save to save the pattern details to the View Related Events New tab.• Select Watch to add the pattern to the View Related Events Watched tab.
584 IBM Netcool Operations Insight: Integration Guide
• Select Deploy to add the pattern to the View Related EventsActive tab.
Specifying event pattern criteriaSpecify the criteria for your pattern, and the method by which to identify the parent event for any resultingevent groups: synthetic parent or most important event. You can also test the pattern to see what groupsit would generate based on existing live data.
About this task
Procedure1. Start the Events Pattern portlet for a group. For more information about starting the portlet, see
“Creating a pattern from an unallocated group” on page 584.2. Complete the parameter fields in the Pattern Criteria tab of the Events Pattern portlet.
Merge intoMerge a Related Event Group into an existing pattern or select NONE to create new pattern. Tomerge a group into a pattern, select from the list of patterns with one or more event types incommon. NONE is the default option.
NameThe name of the pattern. The name must contain alphanumeric characters. Special characters arenot permitted.
Pattern FilterThe ObjectServer SQL filters that are applied to the pattern. This filter is used to restrict the eventsto which the pattern is applied. For example, enter Summary NOT LIKE '%maintenance%'.
Assuming that a filter was applied to the configuration on which this pattern is based , then it isbest practice to apply the same filter to this pattern as you applied to the configuration. To do this,proceed as follows:
a. Open the configuration on which this pattern is based.b. Review the filter set for this configuration. Note that configuration filters are set against the
historical event database, and therefore use the fields and field format for that database.c. Manually convert the filter from step b into an equivalent filter that can be applied against the
ObjectServer alerts.status table.
• Some fields might have different names in the ObjectServer alerts.status table to thecorresponding names of those same fields in the historical event database. You must alsoconsider case sensitivity as this varies from one database to another.
• In addition to applying the configuration filter in the pattern, it is also advisable to enhancethe pattern filter by adding restriction clauses based on event type values. Adding event typesto the pattern filter avoids unnecessary processing, and thus improves performance, as thefilter will in any event only retrieve events that match the event types in the pattern. Forexample, assume a given pattern only has the following two event types: 'Server UP', and'Server DOWN', and the event type field is AlertGroup, then the following should codeshould be added to the pattern filter
AND AlertGroup in ( 'Server UP' ,'Server DOWN' )
Note: If there is no previous filter code then omit AND from the text.d. Type the filter you formulated in step c into the Pattern Filter text box.
Time between first and last eventThe maximum time that can elapse between the occurrence of the first event and the last event inthis pattern, which is measured in minutes. The default value is determined by the Related EventsGroup on which the pattern is based. Events that occur outside of this time window are notconsidered part of this group.
Chapter 8. Administering 585
Trigger ActionSelect the Trigger Action check box to group the live events when the selected event comes intothe ObjectServer. When an event with the selected event type occurs, the grouping is triggered tostart. The created grouping includes events that contain all of the selected event types.For example, if the following three event types are part of the pattern criteria, A, B, and C, with onlythe Trigger Action check box for event C selected, the grouping only occurs when an event withevent type C occurs. The grouping contains events that contain all three event types.
Note: A group will be triggered even if only one event with the triggering event type occurs. In thiscase a group will be created in the Event Viewer made up of either of a synthetic and the triggeringevent as a child event, or of the triggering event as both parent and child event, depending on howyou configure the Parent Event tab of the Events Pattern portlet, in step 3.
Event TypeThe event type or types that are included in the pattern. The Event Type is prepopulated withexisting event types for the selected pattern, and can be modified.
Note: Origin of event type
Triangle, circle, and square icons signify where the event types originate from, when a group ismerged into an existing pattern.
• Triangle: Common to both the existing pattern and the group.• Circle: Part of the group.• Square: Part of the existing pattern.
Resource Column(s)The resource or resources to which the action is applied. The Resource Column(s) is prepopulatedwith existing event type resources for the selected pattern, and can be modified. To modify theselection, click the drop-down list arrow and select one or more columns from the checklist.Name similarity and regular expressions
In contrast to exact match, name similarity and regular expressions provide the ability toidentify patterns where the names of the resources in the pattern are not exactly the same.
• In the case of name similarity, the resources in the pattern must be sufficiently similar tomeet the name similarity algorithm criteria. By default name similarity is enabled.
Table 92. More information on name similarity
For more information on... See...
How name similarity works “Extending patterns” on page 578
A name similarity example “Examples of name similarity” on page 582
How to configure name similarity “Configuring name similarity” on page 412
• In the case of regular expressions, the resources in the pattern must match the definedregular expression.
Multiple resource columns
If you specify multiple resource columns, then by default these columns will be combinedusing OR logic. You can configure whether multiple resource columns should be combinedusing AND or OR logic. For more information, see “Configuring multiple resource columns” onpage 414.
• OR logic: correlates two events by resource as soon as the criteria are met for just onepattern resource definition.
• AND logic: correlates two events by resource only once criteria are met for all of the patternresource definitions.
586 IBM Netcool Operations Insight: Integration Guide
Only "Exact match" resource matching is used for AND logic. If you specify AND logic, then youcannot specify regular expression or name similarity as the mechanism for matching theresource information from the multiple selected resource columns.
Note: If you configure AND logic, and an event comes in with any one of its multiple resourcecolumns set to NULL, then that event is automatically excluded from pattern processing.
Note: Duplicate Event Type and Resource Columns pairs are not permitted.
Regular Expression
(Optional) Click the regular expression icon to specify a regular expression to test for matcheswithin unstructured resource information in the selected resource column.
To match a string, add the asterisk symbol * before and after the characters. For example, assumeyou want to match the resource information in the following strings:
• "The application abc on myhost.8xyz.com encountered an unrecoverableerror."
• "acme.75xyz.com down."• "Unrecoverable error on server.111xyz.com."
In this case use the following regular expression. Note that the test is binary. The content of theresource column either matches the regular expression, or it does not.
.*[0-9]*xyz.*
Resource names that match the regular expression are identified when the Events Pattern iscreated. A single group in the Event Viewer is created for all events whose resource columnscontain text that matches the regular expression.
Note: A regular expression can only be specified under the following conditions:
• One column has been selected for the resource.• Multiple columns with OR logic have been selected for the resource. OR logic is the default.
A regular expression cannot be specified when multiple columns with AND logic have beenselected for the resource.
For more information about creating and editing regular expressions, see “Applying a regularexpression to the pattern criteria” on page 589.
3. In the Parent Event tab of the Events Pattern portlet, select one of the following parent event options.Most Important Event by Type
The system checks the events as they occur. The events are ranked based on the order defined inthe UI. The highest ranking event is the parent. The parent event changes if a higher ranking eventoccurs after a lower ranking event. To prevent a dynamically changing parent event, selectSynthetic Event.You can manually reorder the ranking by selecting an event and clicking the Move Up and MoveDown arrows.
Synthetic EventCreate an event to act as the parent event or select Use Selected Event as Template to use anexisting event as the parent event.
To create or modify a synthetic event, populate the following parameter fields, as required. All of thesynthetic event fields are optional.Node
The managed entity from which the event originated. Displays the managed entity from which theseasonal event originated.
SummaryThe event description.
Chapter 8. Administering 587
SeverityThe severity of the event. Select one of the following values from the Severity drop-down list.
CriticalMajorMinorWarningIndeterminateClear
Alert GroupThe Alert Group to which the event belongs.
Add additional fieldsSelect the Add additional fields check box to add more fields to the synthetic parent event.
4. In the Test tab of the Events Pattern portlet, you can run a test to display the existing auto-discoveredgroups that match the pattern criteria. The test displays the types of events that are matched by thechosen criteria. To run the test, select Run Test. To cancel the test at any time, select Cancel Test.
5. To save, watch, or deploy the pattern, select one of the following options.
• Select Save to save the pattern details to the View Related Events New tab.• Select Watch to add the pattern to the View Related Events Watched tab.• Select Deploy to add the pattern to the View Related Events Active tab.
ResultsThe events pattern is created and displayed in the Group Sources table in the View Related Eventsportlet.
Note:
• If the patterns display 0 group and 0 events, the pattern creation process might not be finished. Toconfirm that the process is running,
1. Append the policy name to the policy logger file from the Services tab, Policy Logger service. Formore information about configuring the Policy logger, see https://www.ibm.com/support/knowledgecenter/SSSHYH_7.1.0/com.ibm.netcoolimpact.doc/user/policy_logger_service_window.html.
2. Check the following log file.
$IMPACT_HOME/logs/<serverName>_policylogger_PG_ALLOCATE_PATTERNS_GROUPS.log
If the process is not running, see the Event Analytics troubleshooting information.• After creating a new pattern, the allocation of groups to the pattern happens in the background, via a
policy. If the new pattern does not have any groups allocated (this is determined by the data set) thenthe new pattern will be deleted. For more information, see the following technote: http://www.ibm.com/support/docview.wss?uid=swg22012714.
• A pattern will not have any groups allocated under the following conditions:
– Name similarity has been switched off. By default it is on.– No regular expressions have been associated with the pattern.– Resource names identified in any potential groups are different.
588 IBM Netcool Operations Insight: Integration Guide
Applying a regular expression to the pattern criteriaUsing regular expressions you can test for matches within unstructured resource information in theselected resource column..
Before you beginThe Resource field is used for grouping events in the Event Viewer. Event matching occurs in the followingorder:
1. Exact match2. Regular expression3. Name similarity
To access the View Related Events and Events Pattern portlets, users must be assigned thencw_analytics_admin role.
About this taskThe regular expression is used to match specific information from unstructured data in the selectedresource column.
Note: A regular expression can only be specified under the following conditions:
• One column has been selected for the resource.• Multiple columns with OR logic have been selected for the resource. OR logic is the default.
A regular expression cannot be specified when multiple columns with AND logic have been selected forthe resource.
You can configure whether multiple resource columns should be combined using AND or OR logic. Formore information, see “Configuring multiple resource columns” on page 414.
Procedure1. Start the Events Pattern portlet for a group. For more information about starting the portlet, see
“Creating a pattern from an unallocated group” on page 584.2. Proceed as follows:
• To apply a new regular expression, click the regular expression icon in the Pattern Criteria tabof the Events Pattern portlet.
• To modify an existing regular expression, click the Confirm icon in the Pattern Criteria tab of theEvents Pattern portlet.
The Regular Expression dialog box is displayed.3. Insert or edit the regular expression in the Expression field.
To match a string, add the asterisk symbol * before and after the characters. For example, assume youwant to match the resource information in the following strings:
• "The application abc on myhost.8xyz.com encountered an unrecoverableerror."
• "acme.75xyz.com down."• "Unrecoverable error on server.111xyz.com."
In this case use the following regular expression. Note that the test is binary. The content of theresource column either matches the regular expression, or it does not.
.*[0-9]*xyz.*
Chapter 8. Administering 589

Resource names that match the regular expression are identified when the Events Pattern is created. Asingle group in the Event Viewer is created for all events whose resource columns contain text thatmatches the regular expression.
4. To change or select the event type to which the regular expression is applied, select an event typefrom the drop-down list in the Test Data field.
Note: A regular expression only works on multiple resource fields if the fields are combined using ORlogic. If a pattern has two or more event types, and they use more than one resource field, then ensurethat OR logic is configured. For more information on how to do this, see “Configuring multiple resourcecolumns” on page 414.
5. To test the regular expression, select Test. The test results are displayed in the Result field.
Note: If there are multiple matches for the given regular expression, the matches are displayed in theResult field as a comma-separated list.
6. To save and apply the regular expression, select Save. The Regular Expression dialog box is closed. Aconfirm symbol is displayed beside the Resource Column.
Viewing related event details in the Events Pattern portletYou can view the related event details for a selected related events group in the Events Pattern portlet,when you create a new pattern for the group.
Before you beginTo access the View Related Events and Events Pattern portlets, users must be assigned thencw_analytics_admin role.
ProcedureTo view the related event details in the Events Pattern portlet, complete the following steps.1. Open the View Related Events portlet.2. Select a related events group in the Groups table.3. Right-click the related events group and select Create Pattern. The Events Pattern portlet is
displayed.
ResultsThe related event details are displayed in the Group instances and Events tables in the Pattern Criteriatab of the Events Pattern portlet.
Note: The related event details columns in the Pattern Criteria tab of the Events Pattern portlet matchesthe Related Event Details portlet columns.
Suggested patternsSuggested Patterns are automatically created during a Related Events Configuration.
With generalization, the association of events is encapsulated by the system as a pattern. Any SuggestedPatterns that are generated can be viewed in the Group Sources table of the View Related Eventsportlet. For more information, see “Viewing related events by group” on page 561.
Note: Patterns are not created when the Override global event identity option is selected in theConfigure Analytics portlet.
Right-click on a suggested pattern in the Group Sources table to display a list of menu items. You canselect the following actions from the menu list.
Edit Pattern For more information about this action, see “Editing an existing pattern” on page 583.Delete Pattern For more information about this action, see “Deleting an existing pattern” on page591.Watch For more information about this action, see “Watching a correlation rule” on page 573.Deploy For more information about this action, see “Deploying a correlation rule” on page 574.
590 IBM Netcool Operations Insight: Integration Guide
Archive For more information about this action, see “Archiving related events” on page 570.Copy Choose this action if you want to copy a row, which you can then paste into another document.
Deleting an existing patternYou can delete an existing pattern to remove it from the Group Sources table.
Before you beginTo access the View Related Events and Events Pattern portlets, users must be assigned thencw_analytics_admin role.
Procedure1. Start the View Related Events portlet. For more information about starting the View Related Events
portlet, see “Viewing related events” on page 560.2. Select the pattern you want to delete in the Group Sources table.3. Right-click the pattern and select Delete Pattern.4. To delete the pattern, select Yes in the confirmation dialog window.
ResultsThe selected pattern is deleted.
Exporting pattern generalization test results to Microsoft ExcelYou can export pattern generalization test results for a specific configuration to a Microsoft Excelspreadsheet from a supported browser.
Before you beginTo access the View Related Events, Related Event Details, and Events Pattern portlets, users must beassigned the ncw_analytics_admin role.
About this taskYou can start the Events Pattern portlet from the View Related Events portlet or the Related Event Detailsportlet. Starting the Events Pattern portlet directly from the Related Event Details portlet ensures that youdo not need to return to the View Related Events portlet to start the Events Pattern portlet after youreview the details of a group.
ProcedureTo export pattern generalization test results for a specific configuration to a Microsoft Excel spreadsheet,complete the following steps.1. Open the View Related Events portlet.2. Select a specific configuration from the configuration table.3. Enter the pattern criteria and navigate to the Test tab of the Events Pattern portlet and select Run
Test.4. Click the Export Generalization Test Results button in the toolbar.
After a short time, the Download export results link displays.5. Note: The user is restricted to exporting the first 100 groups of the pattern test results to provide a
sample of the results in the exported file.
Click the link to download and save the Microsoft Excel file.
ResultsThe Microsoft Excel file contains a spreadsheet with the following tabs:
Chapter 8. Administering 591
• Groups Information: This tab contains the related events groups for the configuration that youselected.
• Groups Instances: This tab contains a list of all the related events instances for all of the relatedevents groups for the configuration that you selected.
• Group Events: This tab contains a list of all the events that occurred in the related events groups forthe configuration that you selected.
• Instance Events: This tab contains a list of all the events that occurred in all of the related eventsinstances for all the related events groups for the configuration that you selected.
• Export Comments: This tab contains any comments relating to the export for informational purposes(for example, if the spreadsheet headers are truncated, or if the spreadsheet rows are truncated).
Backup and restoreYou can back up and restore all of your Event Analytics configuration and associated data.
About backup and restoreThe backup and restore operations act on configuration data associated with seasonality, related events,and event patterns.
For each configuration, the following data will be backed up and restored by these operations:Related events
• Group sources• Groups• Related events for each group• Event patterns for each group source
Seasonality
• Seasonal events• Seasonal event rules
Backing up configuration dataBack up Event Analytics configuration data by configuring and running theNOI_EA_Export_Configuration Netcool/Impact policy.
Before you beginIdentify the directory into which you want to back up the Event Analytics configuration data.
Procedure1. Click Insights > Configure Analytics to navigate to the Configure Analytics window.2. In the Configure Analytics window identify the configurations that you want to back up.3. Copy and paste the names of these configurations from the Configure Analytics window into a text
file.
Note: You can any number of configurations, from just one configuration up to all of yourconfigurations.
4. Log into the Netcool/Impact GUI.5. Navigate to the Policies tab.6. Locate the NOI_EA_Export_Configuration policy in the list.7. Edit the policy and make the following changes:
• In the Configuration Names section, copy and paste the configurations from the text file thatyou created in step 3, into the configuration array. Here are some examples of how to code this:
592 IBM Netcool Operations Insight: Integration Guide
Example: Back up a single configuration
Assume that you want to back up data associated with the following single configuration:
– Customer_Config-1
In this case, you must code the array as follows, ensuring that you maintain the single quotes.
Configs = [ 'Customer_Config-1' ];
Example: Back up multiple configurations
Assume that you want to back up data associated with the following four configurations:
– Customer_Config-1– Customer_Config-2– Customer_Config-3– Customer_Config-4
In this case, you must code the array as follows, ensuring that you maintain the single quotes.
Configs = [ 'Customer_Config-1', 'Customer_Config-2', 'Customer_Config-3', 'Customer_Config-4' ];
• In the Base Directory section, specify the directory into which you want back up the EventAnalytics configuration data. For example, assume the directory to back up to has the file path asfollows: /opt/IBM/tivoli/impact/ea_backup/. In this case, you must code as follows:
Directory = '/opt/IBM/tivoli/impact/ea_backup/';
8. Save and run the policy.9. Monitor progress of the backup operation by performing the following operations:
• Navigate to the /opt/IBM/tivoli/impact/ directory.• Run the following command to monitor the log file:
tail -f logs/impactserver.log
10. On conclusion of the backup operation, a message is displayed indicating that the operation wassuccessful.The time taken for the operation depends on the amount of data being backed up.
Restoring configuration dataRestore Event Analytics configuration data by configuring and running theNOI_EA_Import_Configuration Netcool/Impact policy.
Before you beginBefore performing this operation, you must perform the following activities:
1. Identify the following parameters:
• Names of the Event Analytics configurations that you want to import.• Path to the directory where the data for these Event Analytics configurations is stored.
To identify these parameters, review the following sections in the NOI_EA_Export_ConfigurationNetcool/Impact policy:
• Configuration names section: lists the names of the Event Analytics configurations that werebacked up.
• Base directory section: contains the path to the directory where the data for these EventAnalytics configurations is stored.
2. Check the following items:
Chapter 8. Administering 593
• The backup logs to see when the backup was last run, and if it was successful.• The base directory, to ensure that the Event Analytics configuration data is present and intact.
Note: The Event Analytics configuration data is stored in sub-directories of the base directory. Forexample, assume the base directory is /opt/IBM/tivoli/impact/ea_backup and you backedup the following four configurations:
– Customer_Config-1– Customer_Config-2– Customer_Config-3– Customer_Config-4
In this case the data for each configuration is stored as follows:
Event Analytics configuration Data stored in the following directory
Customer_Config-1 /opt/IBM/tivoli/impact/ea_backup/Customer_Config-1
Customer_Config-2 /opt/IBM/tivoli/impact/ea_backup/Customer_Config-2
Customer_Config-3 /opt/IBM/tivoli/impact/ea_backup/Customer_Config-3
Customer_Config-4 /opt/IBM/tivoli/impact/ea_backup/Customer_Config-4
3. Ensure that no one is logged onto and working in Event Analytics. For the Event Analyticsconfigurationsthat are being restored, the restore operation deletes each configuration prior to restoring it, so it isbest that no one is working on the system while the restore operation is in progress.
You should also check the following items:
Procedure1. Log into the Netcool/Impact GUI.2. Navigate to the Policies tab.3. Locate the NOI_EA_Export_Configuration policy in the list, and open this policy.4. Locate the NOI_EA_Import_Configuration policy in the list, and open this policy.5. Copy the following sections from the NOI_EA_Export_Configuration policy to theNOI_EA_Import_Configuration policy:
• The array of configuration names, in the Configuration Names section. Here are some examplesof how this might be coded.
Note: You can restore any number of configurations, from just one configuration up to all of yourconfigurations.
Example: Restore a single configuration
Assume that you want to restore data associated with the following single configuration:
– Customer_Config-1
In this case, you must code the array as follows, ensuring that you maintain the single quotes.
Configs = [ 'Customer_Config-1' ];
Example: Restore multiple configurations
Assume that you want to restore data associated with the following four configurations:
– Customer_Config-1
594 IBM Netcool Operations Insight: Integration Guide
– Customer_Config-2– Customer_Config-3– Customer_Config-4
In this case, you must code the array as follows, ensuring that you maintain the single quotes.
Configs = [ 'Customer_Config-1', 'Customer_Config-2', 'Customer_Config-3', 'Customer_Config-4' ];
• The file path of the base directory, in the Base Directory section6. Optional: By default the restore utility will restore both related event and seasonality data from each of
the configurations specified in step 5. You can optionally specify which types of data you want torestore.
• If you want to restore related event data only, then set these parameters:
IS_RELATED_EVENT = true;IS_SEASONALITY = false;
• If you want to seasonality data only, then set these parameters:
IS_RELATED_EVENT = false;IS_SEASONALITY = true;
7. Save and run the policy.Each of the configurations that you have defined to be restored is deleted and restored in turn. For thisreason, the restore process takes significantly longer than the backup process.
8. Monitor progress of the restore operation by performing the following operations:
• Navigate to the /opt/IBM/tivoli/impact/ directory.• Run the following command to monitor the log file:
tail -f logs/impactserver.log
9. On conclusion of the restore operation, a message is displayed indicating that the operation wassuccessful.The time taken for the operation depends on the amount of data being restored.
Troubleshooting administrationUse the entries in this section to troubleshoot administration problems.
Troubleshooting administration on Cloud and hybrid systemsUse these troubleshooting entries to help resolve problems and to see known issues for administration onCloud and hybrid systems.
Archived policies are not displayedAfter archiving a temporal event policy, an Uh, oh, something's not quite working error isdisplayed on the archived policies panel.
ProblemAfter archiving a temporal event policy, an Uh, oh, something's not quite working error isdisplayed on the archived policies panel.
ResolutionTo workaround this issue, filter for temporal policies in the archived policies panel. To avoid futureoccurrences increase the ui-api route timeout to 60 seconds. Update the routes for the <release>-ea-
Chapter 8. Administering 595
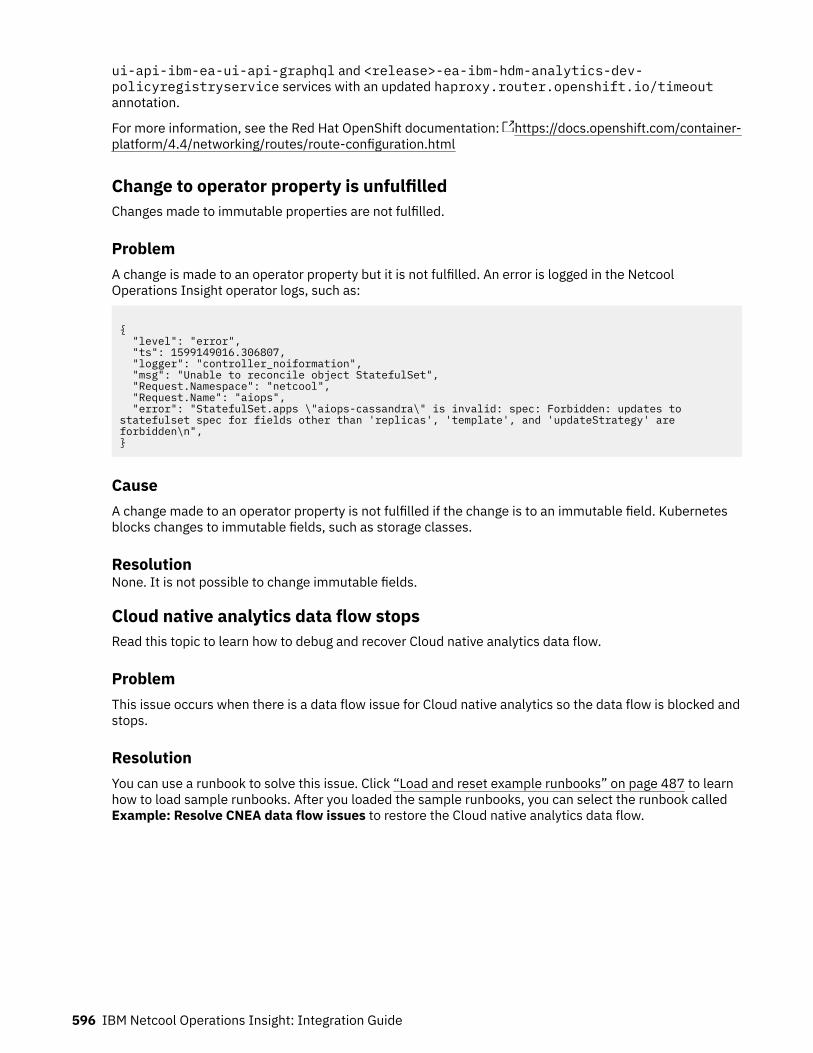
ui-api-ibm-ea-ui-api-graphql and <release>-ea-ibm-hdm-analytics-dev-policyregistryservice services with an updated haproxy.router.openshift.io/timeoutannotation.
For more information, see the Red Hat OpenShift documentation: https://docs.openshift.com/container-platform/4.4/networking/routes/route-configuration.html
Change to operator property is unfulfilledChanges made to immutable properties are not fulfilled.
ProblemA change is made to an operator property but it is not fulfilled. An error is logged in the NetcoolOperations Insight operator logs, such as:
{ "level": "error", "ts": 1599149016.306807, "logger": "controller_noiformation", "msg": "Unable to reconcile object StatefulSet", "Request.Namespace": "netcool", "Request.Name": "aiops", "error": "StatefulSet.apps \"aiops-cassandra\" is invalid: spec: Forbidden: updates to statefulset spec for fields other than 'replicas', 'template', and 'updateStrategy' are forbidden\n",}
CauseA change made to an operator property is not fulfilled if the change is to an immutable field. Kubernetesblocks changes to immutable fields, such as storage classes.
ResolutionNone. It is not possible to change immutable fields.
Cloud native analytics data flow stopsRead this topic to learn how to debug and recover Cloud native analytics data flow.
ProblemThis issue occurs when there is a data flow issue for Cloud native analytics so the data flow is blocked andstops.
ResolutionYou can use a runbook to solve this issue. Click “Load and reset example runbooks” on page 487 to learnhow to load sample runbooks. After you loaded the sample runbooks, you can select the runbook calledExample: Resolve CNEA data flow issues to restore the Cloud native analytics data flow.
596 IBM Netcool Operations Insight: Integration Guide

Console not availableThe console is not available and a couchdb error is displayed.
ProblemThe IBM Netcool Operations Insight console cannot be accessed because the couchdb disk is full. Thefollowing error is displayed:
{"code":500,"message":"undefined","level":"error","description":"couch returned 500"}
ResolutionTo avoid the couchdb disk becoming full, as the amount of stored data continues to grow, complete thefollowing steps:
• Back up your data base files: https://www.ibm.com/support/knowledgecenter/en/SSZQDR/com.ibm.rba.doc/LD_recovery.html#task_l4m_3pr_w3b
• Offload historic runbook executions: https://www.ibm.com/support/knowledgecenter/en/SSZQDR/com.ibm.rba.doc/GS_offloading.html
• Increase your couchdb claim size: https://docs.openshift.com/container-platform/4.6/storage/expanding-persistent-volumes.html
Empty Probable Cause and Topology columnsThe Events page has empty Probable cause and Topology columns.
ProblemAfter an outage, topology-based features such as topology enrichment, topology group-based eventcorrelation, and probable cause are no longer shown.
CauseThis issue occurs when the Netcool Operations Insight cluster experiences an outage, and an error occurswhen the cluster restarts the cnea-mgmt-artifact cron job. The cron job is used to enable topology-based features such as topology enrichment, topology group-based event correlation, and probablecause. If it stops running, these features are hidden.
ResolutionDelete the cron job definition for cnea-mgmt-artifact. Deleting the cron job definition causes theNetcool Operations Insight operator to re-create it.
Failed ncoprimary, which does not restart successfullyThe ncoprimary pod fails liveness and readiness checks and does not start.
ProblemThe ncoprimary pod fails and does not restart successfully. The event log for the container has readinessor liveness probe failures similar to the following example.
Container ncoprimary failed liveness probe, will be restarted
CauseThe pod is failing the liveness and readiness thresholds that are set for it.
Chapter 8. Administering 597

ResolutionIncrease the liveness and readiness with the following command.
oc edit sts <release_name>-ncoprimary-0
Then increase the following values:
initialDelaySeconds: <value>periodSeconds: <value>timeoutSeconds: <value>failureThreshold: <value>
Filtering for analytics policies displays an "Unknown error"In the Policies GUI, filtering by policy type or status sometimes returns an error.
SymptomsYou can Filter the list of policies on the Policies GUI by type or status. When filtering by policy type,you might encounter an "Unknown error".
Resolving the problemClick Refresh or the browser refresh button to see your desired policies.
Inference service might display warning messages when kafka restartsWhen Kafka is restarted, the inference service might display warning messages.
ProblemWhen Kafka is restarted, the inference service might display messages similar to the following:
WARN [2020-08-20 14:47:09,725] org.apache.kafka.clients.NetworkClient: [Producer clientId=producer-1] Connection to node 1 (/192.168.60.210:9092) could not be established. Broker may not be available.WARN [2020-08-20 14:49:20,800] org.apache.kafka.clients.NetworkClient: [Producer clientId=producer-1] Connection to node 2 (/192.168.155.132:9092) could not be established. Broker may not be available.
ResolutionThese messages can be safely ignored.
Information message about untrusted content after loginAfter logging in to Operations Management, an information message is always displayed.
ProblemAfter logging in to Operations Management, an information message is displayed:
This console displays content from the below servers that appear to be using untrusted certificates.Content from untrusted servers cannot be viewed in the console.Please click each link below to open a new window where you may determine if you would like to accept the certificate and allow the content to be displayed.When you are done, you may close the new windows and dismiss this warning.
ResolutionThis is a known issue. The pop up window can be closed without following the links.
598 IBM Netcool Operations Insight: Integration Guide

Large policies can fail to loadWhen selecting a policy from Insights->Manage Policies, some larger policies can fail to load.
ProblemWhen selecting a policy from Insights->Manage Policies, the policy will not load and displays thefollowing error:
An error occurred while fetching data from the server. Please make sure you have an active internet connection. More...
ResolutionYou may sometimes hit this issue if you open a policy which has a large number of event group instances.
Manage Policies screen has broken policy hyperlinksIf the Policies GUI has broken hyperlinks for the policies, then this means that the links have changed,and the Policies GUI has cached the previous hyperlinks.
ProblemThe Policies GUI has broken hyperlinks for the policies.
CauseThis is caused by the links changing, and the UI caching the previous hyperlinks.
ResolutionTo resolve this, clear the browser cache and refresh the page.
No restart for dedup-aggregationservice due to OOMkilledNo new actions or new groupings are displayed for events in the Event Viewer because the de-duplicatorgoes in to crashloopbackoff or fails to restart.
ProblemWhen running the following command:
kubectl describe po -l app.kubernetes.io/component=dedup-aggregationservice
You might see the following output:
Reason: OOMKilledExit Code: 0
A message similar to the following can be seen in the kubectl logs on the de-duplicator:
{"name":"clients.kafka","hostname":"pvt-ibm-hdm-analytics-dev-dedup-aggregationservice-b4df85bmsd4c","pid":17,"level":30,"brokerStates":{"0":"UP","1":"UP","2":"UP","-1":"UP"},"partitionStates":{"ea-actions.0":"UP","ea-actions.1":"UP","ea-actions.2":"UP","ea-actions.3":"UP","ea-actions.4":"UP","ea-actions.5":"UP"},"msg":"lib-rdkafka status","time":"2020-02-28T09:55:11.258Z","v":0}{"name":"clients.kafka","hostname":"pvt-ibm-hdm-analytics-dev-dedup-aggregationservice-b4df85bmsd4c","pid":17,"level":50,"err":{"message":"connect ETIMEDOUT","name":"Error","stack":"Error: connect ETIMEDOUT\n at Socket.<anonymous> (/app/node_modules/ioredis/built/redis/index.js:275:31)\n at Object.onceWrapper (events.js:286:20)\n at Socket.emit (events.js:198:13)\n at Socket._onTimeout
Chapter 8. Administering 599
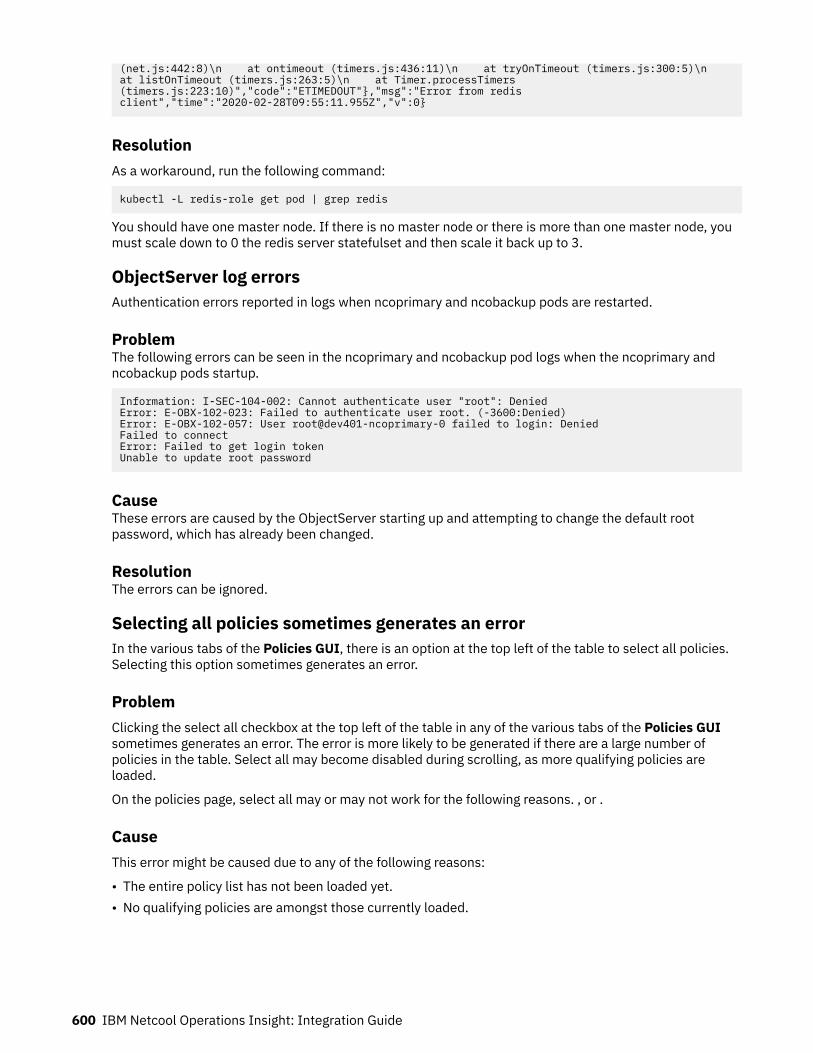
(net.js:442:8)\n at ontimeout (timers.js:436:11)\n at tryOnTimeout (timers.js:300:5)\n at listOnTimeout (timers.js:263:5)\n at Timer.processTimers (timers.js:223:10)","code":"ETIMEDOUT"},"msg":"Error from redis client","time":"2020-02-28T09:55:11.955Z","v":0}
ResolutionAs a workaround, run the following command:
kubectl -L redis-role get pod | grep redis
You should have one master node. If there is no master node or there is more than one master node, youmust scale down to 0 the redis server statefulset and then scale it back up to 3.
ObjectServer log errorsAuthentication errors reported in logs when ncoprimary and ncobackup pods are restarted.
ProblemThe following errors can be seen in the ncoprimary and ncobackup pod logs when the ncoprimary andncobackup pods startup.
Information: I-SEC-104-002: Cannot authenticate user "root": DeniedError: E-OBX-102-023: Failed to authenticate user root. (-3600:Denied)Error: E-OBX-102-057: User root@dev401-ncoprimary-0 failed to login: DeniedFailed to connectError: Failed to get login tokenUnable to update root password
CauseThese errors are caused by the ObjectServer starting up and attempting to change the default rootpassword, which has already been changed.
ResolutionThe errors can be ignored.
Selecting all policies sometimes generates an errorIn the various tabs of the Policies GUI, there is an option at the top left of the table to select all policies.Selecting this option sometimes generates an error.
ProblemClicking the select all checkbox at the top left of the table in any of the various tabs of the Policies GUIsometimes generates an error. The error is more likely to be generated if there are a large number ofpolicies in the table. Select all may become disabled during scrolling, as more qualifying policies areloaded.
On the policies page, select all may or may not work for the following reasons. , or .
CauseThis error might be caused due to any of the following reasons:
• The entire policy list has not been loaded yet.• No qualifying policies are amongst those currently loaded.
600 IBM Netcool Operations Insight: Integration Guide
ResolutionFor best results scroll through the entire list thereby loading all policies into the table before clicking theselect all checkbox.
Slanted line in temporal group details GUIA slanted line appears when two events with a single event instance and the same first and lastoccurrence are displayed in the policy details UI.
ProblemA slanted line appears when two events with a single event instance and the same first and lastoccurrence are displayed in the policy details UI.
ResolutionYou can ignore this error.
Unable to access Impact UI after failbackFollowing Netcool/Impact failback, you are not able to access the Impact UI. This happens becausefollowing failback, the Impact UI is not able to identify which is the active primary cluster.
ProblemAfter Netcool/Impact failback, you are not able to access the Impact UI, and the following error isdisplayed:
Connection Failed: Unable to contact the selected cluster. The primary cluster member may be down or has been switched.
CauseWhen an Impact failback happens, the Impact UI is not able to identify which is the active primary cluster.
ResolutionDelete all Netcool/Impact server pods by using the example command:
oc delete pod <release>-nciserver-0 <release>-nciserver-1 ... <release>-nciserver-n
There is downtime while the Netcool/Impact servers are being restarted. When <release>-nciserver-0 isrunning again, the Netcool/Impact UI is available.
Troubleshooting administration on-premisesUse these troubleshooting entries to help resolve problems and to see known issues for on-premisesadministration.
Blank fields in synthetic eventBlank fields during creation of synthetic event on non-occurrence.
ProblemBlank fields during creation of synthetic event on non-occurrence.
Chapter 8. Administering 601
ResolutionYou are given the option to supply one or more values for additional columns by selecting Set additionalfields. With the exception of the values specified in the Create Event window, only the values of Node andSummary are copied into the synthetic event.
DASH GUIs remain active even after a long periodIn a hybrid system, DASH-based GUIs, such as the Topology Viewer, remain active even after a longperiod of inactivity. This is due to a default timeout setting, which needs to be changed manually in orderto correct this behavior.
ProblemIn a hybrid system, DASH-based GUIs, such as the Topology Viewer, remain active for a default period of24 hours. Consequently it is possible to access the system after several hours of inactivity without havingto specify credentials. This is a potential security issue.
CauseThis activity period is controlled by default settings for DASH and Web GUI session timeout parameters.
TroubleshootingTo resolve this issue, set the LTPA timeout value to 30 (minutes) or similar value, as described in thetechnote link at the bottom of this topic.
Edit selection window hangsEdit selection window hangs when 'selecting all' for a large number of related events during seasonalevent rule creation.
ProblemWhen creating a seasonal event rule for an event with a large number of related events, you can check theSelect all related events check box to associate all the related events with the seasonal event rule. Theproblem occurs when a large number of related events, on the order of 1000 or more, are selected andEdit selection is clicked. The Edit selection window is displayed but it remains in a loading state.
ResolutionTo avoid this issue, split the report into smaller reports and create rules around reports with fewer relatedevents.
Event Analytics configurations deletedEvent Analytics configurations are deleted on Netcool/Impact cluster node failover.
ProblemFollowing a Netcool/Impact cluster node failover, the running configuration will be correctly stopped butany queued configurations will be lost on the secondary node. These configurations cannot be retrievedand must be recreated on the secondary node.
ResolutionFor more information, see the following technote: http://www.ibm.com/support/docview.wss?uid=swg22012656.
602 IBM Netcool Operations Insight: Integration Guide

Event analytics related event groups not being correctly allocated to patternsRelated event groups might not be correctly allocated to event patterns. In this case, start theProcessPatternGroupsAllocation Netcool/Impact service as a workaround while you resolve theissue.
ProblemRelated event groups are allocated to a pattern in the following cases:
• When suggested patterns are created• When a user creates new patterns• When a user edits, saves, deploys, or watches new patterns
Occasionally groups fail to be allocated to patterns or might be allocated to wrong patterns.
ResolutionIf the groups allocated to patterns are missing or unexpected, then first try the following procedure.
1. Open the pattern to which the group was meant to be allocated.2. Edit and save this pattern in the New state. This action should cause the groups to be correctly
reallocated to this pattern.
If group allocation proves to be problematic on a regular basis, then try the following procedure.
1. Start the ProcessPatternGroupsAllocation Netcool/Impact service. This service triggers groupallocation in the background.
2. Investigate and resolve the root cause of the allocation failure.3. Once the root cause has been resolved, stop the ProcessPatternGroupsAllocation service.
Event Analytics synthetic parent events are being clearedAfter configuring event patterns to trigger a synthetic event, you notice that the synthetic parent event isgenerated with the severity chosen in the View Related Events portlet in the Pattern parent tab. However,after a short time the parent event is cleared (severity =clear), and eventually, this synthetic parent eventis deleted when the delete_clear trigger is activated in the ObjectServer.
ProblemThe parent synthetic event should not be cleared. The system has determined that there is an eventpattern and related event groups based on this pattern should continue to be generated in the EventViewer.
CauseThis issue is caused if the ObjectServer gateway is incorrectly set up.
ResolutionPerform the following steps to work around this issue.
1. Edit the AGG_GATE.map file for the bidirectional ObjectServer gateway used for the failover aggregateObjectServer pair.
2. Find the StatusMap table in the file.3. Within this table check that the ParentIdentifier field has been added. There should be a line in the
table that reads as follows:
'ParentIdentifier' = '@ParentIdentifier'
Chapter 8. Administering 603
4. On the secondary (AGG_B) aggregate ObjectServer in the failover pair, disable there_remove_dangling_parentEvent ObjectServer trigger. You can do this in one of the followingways:
• Linux: using the nco_config tool.• Windows: using the Netcool Administrator tool.
Event Analytics View Related Events portlet has issue with right click actionsFollowing a right-click of any of the lists in the View Related Events portlet and of other Event AnalyticsGUIs, the right-click menu can be slow to load. If this occurs, and you try right-clicking again before themenu has loaded, the portlet can become unresponsive. If this occurs you must close and reopen theView Related Events portlet.
ProblemFollowing a right-click of an items in any of thepanes in the View Related Events portlet, the right-clickmenu can be slow to load. This applies to all of the panes in the View Related Events:
• Configurations• Group Sources• Groups• Events
If you try right-clicking again before the menu has loaded, the portlet can become unresponsive, and youwill notice a small grey dot appearing in the item that you were trying to right click.
ResolutionIf this occurs you must close and reopen the View Related Events portlet or whichever other EventAnalytics GUI you were using.
Event pattern sections not displayingWhen testing an event pattern, collapsed sections do not display correctly when reopened.
ProblemFollowing testing of an event pattern, if you collapse the Groups, Group Instances, and Events sectionsin the Test tab of the Events Patten GUI using the splitters provided and then you expand the sectionsagain, the data columns in the Groups and Events panels become very narrow and the data cannot beread.
ResolutionTo work around this issue, you can do one of the following:
• Resize the window frame. This causes the columns to resize so that the data becomes visible.• Manually resize the column widths or refresh the page. Either of these actions causes the columns to be
displayed correctly again
Event summary truncatedEvent summary is truncated.
ProblemThe event summary is occasionally truncated in the Related Events Details portlet Timeline view.
604 IBM Netcool Operations Insight: Integration Guide

ResolutionTo view the event summary, modify the screen resolution temporarily.
Incorrect error messageIncorrectly displaying 'No event selected' error message.
ProblemWhen creating a pattern for related events and clicking Use Selected Event as Template, if you have notselected an event, the system correctly displays the 'No event selected' error message. However, if youthen do select an event and click Use Selected Event as Template again, the error message persists.
ResolutionIn this case, you can disregard and close the error message. It will not affect the creation of the pattern.
JVM memory usage at capacityIf JVM memory usage is at capacity, then you must increase the maximum heap size.
About this taskIf you see an alert similar to
Summary ALERT:JVM memory usage is 768 MB of capacity 768 MB: 100%
then you must increase the WebSphere Application Server Java heap size.
Procedure1. As the administrative user, log in to Dashboard Application Services Hub. If you use the default root
location of /ibm/console, the URL is in the following format: https://<dash-host>:<dash-port>/ibm/console/logon.jsp. For example, https://myserver.domain.com:16311/ibm/console/logon.jsp.
2. From the Console Settings menu, select WebSphere Administration Console.3. Select Servers->Server Types->WebSphere application servers, and click your server name, for
example server1.4. Select Java and process management > Process definition > Java virtual machine.5. There are two associated settings that can be changed: Initial Heap Size and Maximum Heap Size.
Increase the value for the required setting, depending on your issue.6. Select Apply->Save.7. Restart Dashboard Application Services Hub on your Netcool Operations Insight on premises
installation with the following command:
cd JazzSM_Profile/bin ./stopServer.sh server1 -username smadmin -password password./startServer.sh server1
Parts of event pattern screen not displayingParts of the Events Pattern screen not displaying because an invalid group is selected.
ProblemIf you attempt to create an event pattern with groups that have EventID as null, the check boxes forTrigger Action, Event Type and Resource Columns do not appear on the Pattern Criteria tab. An errormessage is displayed if you try to save the pattern.
Chapter 8. Administering 605
ResolutionTo avoid this issue, ensure that only valid groups are used to create patterns.
Right click menu commands appearing in capital lettersIn the View Related Events portlet the Related Event Groups panel right-click menu commandsmomentarily appear in capital letters.
ProblemIn the View Related Events portlet the Related Event Groups panel right-click menu commandsmomentarily appear in capital letters. After a few seconds the commands return to normal and can beselected.
ResolutionWait for a few moments. The commands then return to normal and can be selected., nsure that the noi-cassandra-* and noi-cassandra-bak-* PVs are on the same local node
Seasonal event not matching original selectionSeasonal event not matching original selection when opting to trigger rule off events related to theseasonal event
ProblemWhen you create a rule based on a seasonal event, if that seasonal event has associated related eventsthen you have the option to trigger the rule based on one or more of those related events, by selecting theEdit Selection... button in the Create Rule screen. When you select this option, the originally selectedseasonal event should be in the list and should be selected. Occasionally you might find that the eventselected is not the originally selected seasonal event.
ResolutionIn this case, you need to search for the desired seasonal event and reselect it.
Suggested pattern with blank parameter fieldSuggested pattern with a blank Event Type parameter field.
ProblemWhen editing a suggested pattern, the Event Type parameter field will be empty if the propertytype.0.eventtype is set to a value that is empty in the database.
ResolutionTo avoid this issue, ensure that the type.0.eventtype property is not set to an empty value in theEvent History Database. Selecting an event type field that contains all null values in the history databasewill result in the pattern criteria section of the create or edit pattern screen appearing blank.
606 IBM Netcool Operations Insight: Integration Guide

Troubleshooting Event AnalyticsUse the following troubleshooting information to resolve problems with Event Analytics.
Analytics dataUse the following troubleshooting information to resolve problems with Event Analytics analytics data.
Two or more returned seasonal events appear to be identicalIt is possible for events to have the same Node, Summary, and Alert Group but a different Identifier. Inthis scenario, the event details of two (or more) events can appear to be identical because the Identifieris not displayed in the details.
Error displaying Seasonal Event Graphs in Microsoft Internet Explorer browserThe Seasonal Event Graphs do not display in a Microsoft Internet Explorer browser.
This problem happens because Microsoft Internet Explorer requires the Microsoft Silverlight plug-in todisplay the Seasonal Event Graphs.
To resolve this problem, install the Microsoft Silverlight plug-in.
Within the Event Viewer, you are unable to view seasonal events and errorATKRST103E is loggedWhen you complete the following type of steps, then within the event viewer the seasonal events are notviewable and error ATKRST103E is logged.
1. Open the event viewer and select to edit the widget from the widget menu.2. From the list on the edit screen, select the Impact Cluster data provider.3. Select to view either the seasonality report and the report name.4. Save the configuration.
To resolve the problem, view seasonal events by using the provided seasonal events pages and viewrelated events parent to child relationships by using the Tivoli Netcool/OMNIbus data provider.
Event relationships display in the Event Viewer, only if the parent and child eventsmatch the filterThe Event Viewer is only able to show relationships between events if the parent and the child events areall events that match the filter. There are some use cases for related events where parent or child eventsmight not match the filter.Background
Netcool/OMNIbus Web GUI is able to show the relationships between events in the Event Viewer, ifthe Event Viewer view in use has an associated Web GUI relationship. This relationship defines whichfield in an event contains the identifier of the event's parent, and which field contains the identifier forthe current event. For more information about defining event relationships, see http://www-01.ibm.com/support/knowledgecenter/SSSHTQ_8.1.0/com.ibm.netcool_OMNIbus.doc_8.1.0/webtop/wip/task/web_cust_jsel_evtrelationshipmanage.html .The relationship function works from the set of events that are included in the event list, and the eventlist displays the events that match the relevant Web GUI filter. See the following example. If you havea filter that is called Critical to show all critical events, the filter clause is Severity = 5, thenrelationships between these events are shown provided the parent and child events in therelationships all have Severity = 5. If you have a parent event that matches the filter Severity =5 but has relationships to child events that have a major severity Severity = 4, these childrelations are not seen in the event list because the child events do not match the filter. Furthermore,these child relations are not included in the set of events that are returned to the Event Viewer by theserver.
Chapter 8. Administering 607
Resolution
To resolve this problem, you must define your filter with appropriate filter conditions that ensures thatrelated events are included in the data that is returned to the Event Viewer by the server. Thefollowing example builds on the example that is used in the Background section.
1. Make a copy of the Critical filter and name the copy CriticalAndRelated. You now have twofilters. Use the original filter when you want to see only critical events. You use the new filter to seerelated events, even if events are not critical.
2. Manually modify the filter condition of the CriticalAndRelated filter to include the relatedevents. To manually modify this filter condition, use the advanced mode of the Web GUI filterbuilder. The following example conditions are based on the current example.
The main filter condition is Severity = 5.In an event, the field that denotes the identifier of the parent event is calledParentIdentifier.The value of the ParentIdentifier field, where populated, is the Identifier of an event.If ParentIdentifier is 0, this value is a default value and does not reference another event.
• Including related child events. To include events that are the immediate child events of eventsthat match the main filter, set this filter condition.
Severity = 5ORParentIdentifier IN (SELECT Identifier FROM alerts.status WHERE Severity = 5)
• Including related parent events. To include events that are the immediate parent of events thatmatch the main filter, set this filter condition.
Severity = 5ORIdentifier IN (SELECT ParentIdentifier from alerts.status WHERE Severity = 5)
• Including related sibling events. To include events that are the other child events of theimmediate parents of the event that matches the main filter (the siblings of the events thatmatch the main filter), set this filter condition.
Severity = 5ORParentIdentifier IN (SELECT ParentIdentifier from alerts.status WHERE Severity = 5 AND ParentIdentifier > 0)
• Including related parents, children, and siblings together. Combine the previous types of filterconditions so that the new CriticalAndRelated filter retrieves critical events, and theimmediate children of the critical events, and the immediate parents of the critical events, andthe immediate children of those parent events (the siblings). You must have this filter condition.
Severity = 5ORParentIdentifier IN (SELECT Identifier FROM alerts.status WHERE Severity = 5)ORIdentifier IN (SELECT ParentIdentifier from alerts.status WHERE Severity = 5)ORParentIdentifier IN (SELECT ParentIdentifier from alerts.status WHERE Severity = 5 AND ParentIdentifier > 0)
• Including related events that are more than one generation away. In the previous examples, thenew filter conditions go up to only one level, up or down, from the initial set of critical events.However, you can add more filter conditions to retrieve events that are more than one generationaway from the events that match the main filter. If you want to retrieve grandchildren of thecritical events (that is, two levels down from the events that match the main filter condition) andimmediate children, set this filter condition.
-- The initial set of Critical eventsSeverity = 5OR
608 IBM Netcool Operations Insight: Integration Guide
-- Children of the Critical eventsParentIdentifier IN (SELECT Identifier FROM alerts.status WHERE Severity = 5) -- Children of the previous "child events"ORParentIdentifier IN (SELECT Identifier FROM alerts.status WHERE ParentIdentifier IN (SELECT Identifier FROM alerts.status WHERE Severity = 5) )
Use a similar principal to retrieve parent events that are two levels up, and siblings of the parentevents. To pull this scenario together, set this filter condition.
-- The initial set of Critical eventsSeverity = 5
OR
-- Children of the Critical eventsParentIdentifier IN (SELECT Identifier FROM alerts.status WHERE Severity = 5)
OR
-- Children of the previous "child events"ParentIdentifier IN (SELECT Identifier FROM alerts.status WHERE ParentIdentifier IN (SELECT Identifier FROM alerts.status WHERE Severity = 5) )
OR
-- Parents of the Critical eventsIdentifier IN (SELECT ParentIdentifier from alerts.status WHERE Severity = 5)
OR
-- Parents of the previous "parent events"Identifier IN (SELECT ParentIdentifier from alerts.status WHERE Identifier IN (SELECT ParentIdentifier from alerts.status WHERE Severity = 5) )OR
-- Other children of the Critical events' parentsParentIdentifier IN (SELECT ParentIdentifier from alerts.status WHERE Severity = 5 AND ParentIdentifier > 0)
OR
-- Other children of the Critical events' grandparentsParentIdentifier IN (SELECT ParentIdentifier from alerts.status WHERE Identifier IN (SELECT ParentIdentifier from alerts.status WHERE Severity = 5 AND ParentIdentifier > 0) AND ParentIdentifier > 0)
You can continue this principal to go beyond two levels in the hierarchy. However, with eachadditional clause the performance of the query degrades due to the embedded subquerying.Therefore, there might be a practical limit to how far away the related events can be.
Troubleshooting Event Analytics configurationUse the following troubleshooting information to resolve problems with Event Analytics configurations.
Fields missing from the Historical Event Database.This situation typically occurs when you switch from one Historical Event Database to another, withdifferent fields. Following this change, fields that were in use by Event Analytics, whether standard fieldssuch as Node, Summary, or Acknowledged, or aggregate fields, are no longer present in the newHistorical Event Database. In this case, when you reach the Configure Analytics > Report fields screen,you encounter a blank screen.
To resolve this problem, perform the following steps:
1. Complete one of the following options:
• Add the missing field to the Historical Event Database.
Chapter 8. Administering 609
• Use a database view instead of the Historical Event Database table to add a dummy field for themissing aggregate field. For more information about creating a database view for the Event Analyticswizard, see “Mapping customized field names” on page 408.
2. Open the Event Analytics wizard. and depending on the type of field you added, perform one of thefollowing actions:
• If you added a standard field, then no action is required.• If you added an aggregate field, and this field is no longer needed, then you can delete it. Now save
the configuration.
Seasonal Event configuration stops running before completion.The Seasonal Event configuration does not complete running. No errors are displayed. The reportprogress does not increase.
This problem occurs if a Seasonal Event Report is running when the Netcool/Impact back-end server goesoffline while the Impact UI server is still available. No errors are displayed in the Impact UI and no data isdisplayed in the widgets/dashboards.
To resolve this problem, ensure that the Netcool/Impact servers are running. Edit and rerun the SeasonalEvent Report.
Incomplete, stopped, and uninitiated configurationsConfiguration run operations do not complete, are stalled on the Configure Analytics window, or fail tostart.
These problems occur if the services are not started after Event Analytics is installed, or the Netcool/Impact server is restarted.
To resolve these problems, complete the following steps.
1. In the Netcool/Impact UI, select the Impact Services tab.2. Ensure that each of the following services is started. To start a service, right-click the service and
select Start.
LoadRelatedEventPatternsProcessClosedPatternInstancesProcessRelatedEventConfigProcessRelatedEventPatternsProcessRelatedEventTypesProcessRelatedEventsProcessSeasonalityAfterActionProcessSeasonalityConfigProcessSeasonalityEventsProcessSeasonalityNonOccurrenceUpdateSeasonalityExpiredRules
Event Analytics: Configurations fail to run due to event count queries that take toolong.Configurations fail to run due to large or unoptimized datasets that cause the Netcool/Impact server totimeout and reports fails to complete.
To resolve this issue, increase the Netcool/Impact server timeout value to ensure that the Netcool/Impactserver processes these events before it times out. As a result of increasing this server timeout value, theNetcool/Impact server waits for the events to be counted, thus ensuring that the reports complete anddisplay in the appropriate portlet.
610 IBM Netcool Operations Insight: Integration Guide
Edit the Netcool/Impact impact.server.timeout value, at
$IMPACT_HOME/etc/ServerName_server.props
By default, the impact.server.timeout property is set to 120000 milliseconds, which is equal to 2minutes. The recommendation is to specify a server timeout value of at least 5 minutes. If the issuecontinues, increase the server timeout value until the reports successfully complete and display in theappropriate portlet.
Running a Seasonal Event configuration displays an error message Errorcreating report. Seasonality configuration is invalidThe Seasonal Event configuration does not run. An error message is displayed.Error creating report. Seasonality configuration is invalid. Verify settings and retry.
This problem occurs when Event Analytics is not correctly configured before you run a Seasonal EventReport.
To resolve this problem, review the Event Analytics installation and configuration guides to ensure that allof the prerequisites and configuration steps are complete. Also, if you use a table name that is not thestandard REPORTER_STATUS, you must verify the settings that are documented in the followingconfiguration topics.
“Configuring Db2 database connection within Netcool/Impact” on page 387“Configuring Oracle database connection within Netcool/Impact” on page 389“Configuring MS SQL database connection within Netcool/Impact” on page 391
Seasonality and Related Event configuration runs time out when you use large datasetsBefore the seasonality policy starts to process a report, the seasonality policy issues a database query tofind out how many rows of data need to be processed. This database query has a timeout when thedatabase contains many rows and the database is not tuned to process the query. Within the <impactinstall>/logs/impact_server.log file, the following message is displayed.
02 Sep 2014 13:00:28,485 ERROR [JDBCVirtualConnectionWithFailOver] JDBC Connection Pool recievederror trying to connect to data source at: jdbc:db2://localhost:50000/database02 Sep 2014 13:02:28,500 ERROR [JDBCVirtualStatement] JDBC execute failed twice.com.micromuse.common.util.NetcoolTimeoutException: TransBlock [Executing SQL query: select count(*)as COUNT from Db2INST1.PRU_REPORTER where ((Severity >= 4) AND ( FIRSTOCCURRENCE > '2007-09-02 00:00:00.000' )) AND ( FIRSTOCCURRENCE < '2014-09-02 00:00:00.000')] timed out after120000ms.
Check that you have indexes for the FIRSTOCCURRENCE field and any additional filter fields that youspecified, for example, Severity. Use a database tuning utility, or refresh the database statistics, orcontact your database administrator for help. Increase the impact.server timeout to a value greaterthan the default of 120s.
Seasonal or related events configurations hang, with error ATKRST132EWhen you start cluster members, replication starts and the Netcool/Impact database goes down. Anyrunning seasonality reports or related events configurations hang and this error message is logged in theNetcool/Impact server log.
ATKRST132E An error occurred while transferring a request to the following remote provider: 'Impact_NCICLUSTER.server.company.com'. Error Message is 'Cannot access data provider - Impact_NCICLUSTER.server.company.com'.
Chapter 8. Administering 611
To resolve this problem, do a manual restart or a scheduled restart of the affected reports orconfigurations.
Event Analytics configuration Finished with WarningsThe seasonality report or related events configuration completes with a status of Finished withWarnings. This message indicates that a potential problem was detected but it is not of a critical nature.You should review the log file for more information ($NCHOME/logs/impactserver.log). The followingis an example of a warning found in impactserver.log:
11:12:38,366 WARN [NOIProcessRelatedEvents] WARNING: suggested pattern : RE-sqa122-last36months-Sev3-Default_Suggestion4 includes too many types, could be due to configuration of types/patterns. The size of the data execeeded the column limit. The pattern will be dropped as invalid.
Event Analytics configuration Finished with ErrorsOne reason for an Event Analytics configuration to complete with a status of Finished with Errors isbecause the suggested patterns numbering is not sequential. This can be because, for example, thepattern type found is invalid or the string is too long to be managed by the Derby database. You shouldreview the log file for more information ($NCHOME/logs/impactserver.log).
ExportUse the following troubleshooting information to resolve problems with Event Analytics export operations.
Export of Event Analytics reports causes log out of DASHIf Netcool/Impact and DASH are installed on the same server, a user might be logged out of DASH whenexporting Event Analytics reports from DASH. The problem occurs when the Download export result linkis clicked in DASH. A new browser tab is opened and the DASH user is logged out from DASH.
To avoid this issue, configure SSO between DASH and Netcool/Impact. For more information, see https://www.ibm.com/support/knowledgecenter/SSSHYH_7.1.0/com.ibm.netcoolimpact.doc/admin/imag_configure_single_signon.html .
FailoverUse the following troubleshooting information to resolve failover problems with Event Analytics.
Configuring Netcool/Impact for ObjectServer failoverNetcool/Impact does not process new events for Event Analytics after ObjectServer failover. Seasonalevent rule actions are not applied if the Netcool/Impact server is not configured correctly for ObjectServerfailover as new events are processed. For example, if a seasonal event rule creates a synthetic event, thesynthetic event does not appear in the event list, or if a seasonal event rule changes the column value foran event, the value is unchanged.
This problem occurs when Netcool/Impact is incorrectly configured for ObjectServer failover.
To resolve this problem, extra Netcool/Impact configuration is required for ObjectServer failover. Tocorrectly configure Netcool/Impact, complete the steps in the Managing the OMNIbusEventReader with anObjectServer pair for New Events or Inserts topic in the Netcool/Impact documentation: https://www.ibm.com/support/knowledgecenter/SSSHYH_7.1.0/com.ibm.netcoolimpact.doc/common/dita/ts_serial_value_omnibus_eventreader_failover_failback.html
When configured, Netcool/Impact uses the failover ObjectServer to process the event.
612 IBM Netcool Operations Insight: Integration Guide
PatternsUse the following troubleshooting information to resolve problems with Event Analytics patterns.
The pattern displays 0 groups and 0 eventsThe events pattern that is created and displayed in the Group Sources table in the View Related Eventsportlet displays 0 groups and 0 events
The pattern displays 0 groups and 0 events for one of the following reasons.
• The pattern creation process is not finished. The pattern creation process can take a long time tocomplete due to large datasets and high numbers of suggested patterns.
• The pattern creation process was stopped before it completed.
To confirm the reason that the pattern displays 0 groups and 0 events, complete the following steps.
1. To confirm that the process is running,
a. Append the policy name to the policy logger file from the Services tab, Policy Logger service. Formore information about configuring the Policy logger, see https://www.ibm.com/support/knowledgecenter/SSSHYH_7.1.0/com.ibm.netcoolimpact.doc/user/policy_logger_service_window.html .
b. Check the following log file.
$IMPACT_HOME/logs/<serverName>_policylogger_PG_ALLOCATE_PATTERNS_GROUPS.log
If the log file shows that the process is running, wait for the process to complete. If the log file showsthat the process stopped without completing, proceed to step 2.
2. To force reallocation for all configurations and patterns run thePG_ALLOCATE_PATTERNS_GROUPS_FORCE from Global projects policy with no parameters from theUI.
3. Monitor the $IMPACT_HOME/logs/<serverName>_policylogger_PG_ALLOCATE_PATTERNS_GROUPS_FORCE.log log file to trackthe completion of the process.
Event pattern with the same criteria already exists (error message)An error message is displayed if you create a pattern that has a duplicate pattern criterion selected. Checkthe following log file to determine which pattern is the duplicate:
$IMPACT_HOME/logs/<serverName>_policylogger_PG_SAVEPATTERN.log
PerformanceUse the following troubleshooting information to resolve performance problems with Event Analytics.
Improving Event Analytics performance due to large search resultsIf you are performing an upgrade of Event Analytics from an earlier version, the upgrade repopulates theexisting data from the previous version and aligns this data with the new schema, tables, and views. It ispossible that you might see degradation in the performance of Event Analytics operations. Examples ofdegradation in performance include but are not limited to:
• Reports can hang.• Reports complete, but no data is displaying for seasonal events.
To improve any degradation in the performance of Event Analytics operations due to the upgrade to 1.3.1or later releases, run the SE_CLEANUPDATA policy as follows:
1. Log in to the server where IBM Tivoli Netcool/Impact is stored and running. You must log in as theadministrator (that is, you must be assigned the ncw_analytics_admin role).
Chapter 8. Administering 613
2. Navigate to the policies tab and search for the SE_CLEANUPDATA policy.3. Open this policy by double-clicking it.4. Select to run the policy by using the run button on the policy screen toolbar.
The SE_CLEANUPDATA policy cleans up the data. Specifically, the SE_CLEANUPDATA policy:
• Does not remove or delete any data from the results tables. The results tables hold all the originalinformation about the analysis.
• Provides some additional views and tables on top of the original tables to enhance performance.• Combines some information from related events, seasonal events, rules, and statistics.• Cleans up only the additional tables and views.
Related Event Details page is slow to loadTo avoid this problem, create an index on the Event History Database for the SERVERSERIAL andSERVERNAME columns.
create index myServerIndex on Db2INST1.REPORTER_STATUS (SERVERSERIAL , SERVERNAME )
It is the responsibility of the database administrator to construct (and maintain) appropriate indexes onthe REPORTER history database. The database administrator should review the filter fields for the reportsas a basis for an index, and should also review if an index is required for Identity fields.
Export of large Related Event configuration failsThe export a configuration with more then 2000 Related Event groups fails. An error message isdisplayed.Export failed.An invalid response was received from the server.
To resolve this issue, increase the Java Virtual Machine memory heap size settings from the defaultvalues. For Netcool/Impact the default value of the Xmx is 2400 MB. In JVM, Xmx sets the maximummemory heap size. To improve performance, make the heap size larger than the default setting of 2400MB. For details about increasing the JVM memory heap size, see https://www.ibm.com/support/knowledgecenter/SSSHYH_7.1.0/com.ibm.netcoolimpact.doc/admin/imag_monitor_java_memory_status_c.html .
Troubleshooting event searchHow to resolve problems with your event search configuration.
• “You must log in each time you switch between interfaces” on page 614• “Operations Analytics - Log Analysis session times out after 2 hours” on page 615• “Launch to Operations Analytics - Log Analysis fails on Firefox in non-English locales” on page 615• “Right-click tool fail to start Operations Analytics - Log Analysis from event lists” on page 616• “Error message displayed when dynamic dashboard is run” on page 616• “Error message displayed on Show event dashboard by node tool from event lists” on page 616• “Chart display in Operations Analytics - Log Analysis changes without warning” on page 616• “addIndex script error: Unexpected ant version” on page 617• “addIndex script error: Duplicate fields in template file” on page 617
You must log in each time you switch between interfacesThe problem occurs if single sign-on (SSO) is not configured. If the Web GUI and Operations Analytics -Log Analysis are on the same host computer, you must log in each time you switch between the interfacesin your browser.
614 IBM Netcool Operations Insight: Integration Guide
This problem happens because each instance of WebSphere Application Server uses the same defaultname for the LTPA token cookie: LtpaToken2. When you switch between the interfaces, one WebSphereApplication Server instance overwrites the cookie of the other and your initial session is ended.
The ways of resolving this problem are as follows:
• Customize the domain name in the Web GUI SSO configuration:
1. In the administrative console of the WebSphere Application Server that hosts the Web GUI, clickSecurity > Global security. Then, click Authentication > Web security and click Single sign-on(SSO)..
2. Enter an appropriate domain name for your organization, for example, abc.com. By default, thedomain name field is empty and the cookie's domain is the host name. If you also customize thedomain name in the Operations Analytics - Log Analysis WebSphere Application Server, to avoid anyconflict ensure that the two domain names are different.
3. Restart the Dashboard Application Services Hub server.• Use the fully qualified domain name for accessing one instance of WebSphere Application Server and
the IP address for accessing the other. For example, always access the Web GUI by the fully qualifieddomain name and always access Operations Analytics - Log Analysis by the IP address. To configure theWeb GUI to access Operations Analytics - Log Analysis by the IP address:
1. In the $WEBGUI_HOME/etc/server.init file, change the value of the scala.url property to theIP address of the host, For example:
https://3.127.46.125:9987/Unity
2. Restart the Dashboard Application Services Hub server. See http://www-01.ibm.com/support/knowledgecenter/SSSHTQ_8.1.0/com.ibm.netcool_OMNIbus.doc_8.1.0/webtop/wip/task/web_adm_server_restart.html.
Operations Analytics - Log Analysis session times out after 2 hoursThis problem occurs if SSO is not configured. The first time that you start the Operations Analytics - LogAnalysis product from an event list in the Web GUI, you are prompted to log in to Operations Analytics -Log Analysis. You are automatically logged out after 2 hours and must reenter your login credentials every2 hours. This problem occurs because the default expiration time of the LTPA token is 2 hours.
To resolve this problem, change the session timeout in the Operations Analytics - Log Analysis product asfollows:
1. In the $SCALA_HOME/wlp/usr/servers/Unity/server.xml file, increase the value of the <ltpaexpiration="120m"/> attribute to the required value, in minutes. For example, to change the sessiontimeout to 540 minutes:
</oauthProvider> <ltpa expiration="540"/> <webAppSecurity ssoDomainNames="hostname" httpOnlyCookies="false"/></server>
2. Restart the Operations Analytics - Log Analysis WebSphere Liberty Profile.
Launch to Operations Analytics - Log Analysis fails on Firefox in non-English localesThis problem is a known issue when you launch from the Active Event List (AEL) into the Firefox browser.
If your browser is set to a language other than US English (en_us) or English (en), you might not be able tolaunch into Operations Analytics - Log Analysis from the Web GUI AEL.
This problem happens because Operations Analytics - Log Analysis does not support all the languagesthat are supported by Firefox.
Chapter 8. Administering 615
To work around this problem, try setting your browser language to an alternative language version. Forexample, if the problem arises when the browser language is French[fr], set the language to French[fr-fr].If the problem arises when the browser language is German[de-de], set the language to German[de].
Right-click tool fail to start Operations Analytics - Log Analysis from event listsThe following error is displayed when you start the tools from the right-click menu of an event list:CTGA0026E: The APP name in the query is invalid or it does not exist
This error occurs because the custom app that is defined in the $WEBGUI_HOME/etc/server.init filedoes not match the file names in the Tivoli Netcool/OMNIbus Insight Pack.
To resolve this problem, set the scala.app.keyword and scala.app.static.dashboard propertiesin the server.init file accordingly.
• If the properties are set as follows, the version of the Insight Pack needs to be V1.1.0.2:
scala.app.keyword=OMNIbus_Keyword_Searchscala.app.static.dashboard=OMNIbus_Static_Dashboard
• If the properties are set as follows, the version of the Insight Pack needs to V1.1.0.1 or V1.1.0.0:
scala.app.keyword= OMNIbus_SetSearchFilterscala.app.static.dashbaord=OMNIbus_Event_Distribution
If you need to change the values of these properties, restart the Dashboard Application Services Hubserver afterwards. See http://www-01.ibm.com/support/knowledgecenter/SSSHTQ_8.1.0/com.ibm.netcool_OMNIbus.doc_8.1.0/webtop/wip/task/web_adm_server_restart.html.
Error message displayed when dynamic dashboard is runThe following error is displayed when you run a dynamic dashboard from the Operations Analytics - LogAnalysis product:undefined not found in results data
This error is a known defect in the Operations Analytics - Log Analysis product. To resolve, it close andthen reopen the dynamic dashboard.
Error message displayed on "Show event dashboard by node" tool from event listsAn error message is displayed when you start the Show event dashboard by node tool from an event list.
This error is caused by incompatibility between the version of the Insight Pack and the and the version ofthe Operations Analytics - Log Analysis product.
Ensure that the versions are compatible. See #unique_383/unique_383_Connect_42_requiredproducts.For more information about checking which version of the Insight Pack is installed, see “Checking theversion of the Insight Pack” on page 432.
Chart display in Operations Analytics - Log Analysis changes without warningThe sequence in which charts are displayed on the Operations Analytics - Log Analysis GUI can changesintermittently. This problem is a known defect in the Operations Analytics - Log Analysis product and hasno workaround or solution.
616 IBM Netcool Operations Insight: Integration Guide
addIndex script error: Unexpected ant versionWhen you are running the addIndex script to create or update a data source type, the script fails with anerror that contains text similar to the following: installation does not contain expected antversion.
./addIndex.sh -iPrompt: installation does not contain expected ant version
This error could be caused by any of the following issues:
• Operations Analytics - Log Analysis is not installed on the machine on which you are running theaddIndex script.
• Operations Analytics - Log Analysis is installed on the machine on which you are running the addIndexscript, but the script does not support the version of Operations Analytics - Log Analysis.
To resolve this run the addIndex script on a machine where Operations Analytics - Log Analysis isinstalled. Ensure that Operations Analytics - Log Analysis V1.3.5 is installed.
addIndex script error: Duplicate fields in template fileWhen you are running the addIndex script to create or update a data source type, the script fails with anerror that contains text similar to the following: filesets.json does not exist.
./addIndex.sh -i
.... generatebasedsv: [exec] Duplicate field name: field_name ....BUILD FAILEDfilepath/addIndex.xml:68: Replace: source file filepath/data_source_type_nameInsightPack_v1.3.1.0/metadata/filesets.jsondoes not exist
Where:
• field_name is the name of the duplicate field name.• filepath is the system-dependent path to the script.• data_source_type_name is the name of your custom data source type.
The omnibus1100_template.properties template file is used to define the fields in the data sourcetype. This error is caused by definition of duplicate fields in the omnibus1100_template.propertiesfile.
To resolve this, edit the omnibus1100_template.properties file and remove any duplicate fields.Then rerun the addIndex script.
Chapter 8. Administering 617

618 IBM Netcool Operations Insight: Integration Guide

Chapter 9. OperationsAs a network operator, you can use Netcool Operations Insight to monitor, troubleshoot, and resolvenetwork alerts, and to manage your network topology. You can also manage run books and automation,and review efficiency across operations teams.
Cloud and hybrid systemsPerform the following Netcool Operations Insight tasks on Cloud and Hybrid systems to support youroperations processes.
Resolving eventsNetcool Operations Insight enables you to identify health issues across your application, services, andnetwork infrastructure on a single management console. It provides an event list that brings togetherevent details, event journaling, and event filtering. It also provides the capability to performtroubleshooting, resolution, and run book actions on events directly from the console. Some events in theconsole are presented in event groups, based on analytics. Using the event list you can explore why theseevents were grouped together, and this can further help with event resolution.
Monitoring eventsUse the all new Events page to monitor, investigate, and resolve events.
About event monitoringEvent monitoring provides selected application, service, and network event information, together withgroups of events brought together by intelligent underlying analytics, to help you see the information youneed to perform effective troubleshoot and resolution activities.
About eventsAn event is a record containing structured data summarizing key attributes of an occurrence on amanaged entity, which might be a network resource, some part of that resource, or other key elementassociated with your network, services, or applications. More severe events usually indicate a faultcondition in the managed environment, and require human operator or automated intervention.
The following table lists typical columns present in a standard event. Note that your administrator mighthave added custom fields to the event to meet the needs of your organization. Further information onevents and event columns can be found in event reference link at the bottom of the page.
© Copyright IBM Corp. 2020, 2020 619
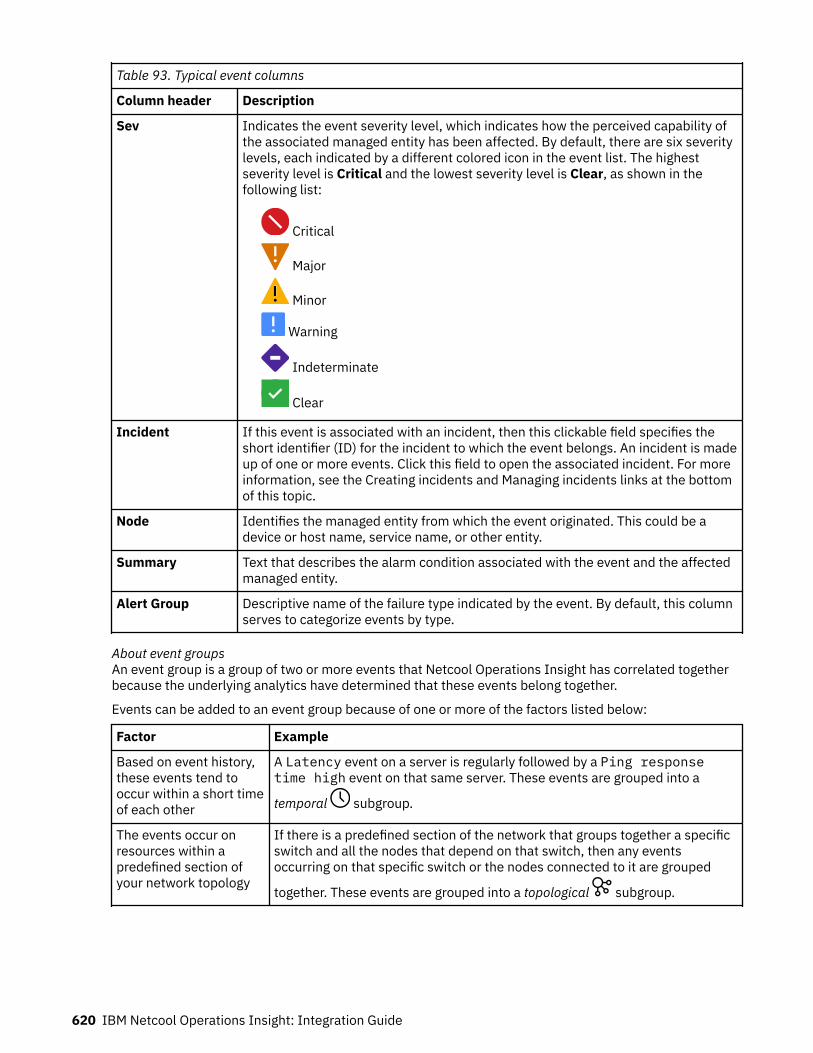
Table 93. Typical event columns
Column header Description
Sev Indicates the event severity level, which indicates how the perceived capability ofthe associated managed entity has been affected. By default, there are six severitylevels, each indicated by a different colored icon in the event list. The highestseverity level is Critical and the lowest severity level is Clear, as shown in thefollowing list:
Critical
Major
Minor
Warning
Indeterminate
Clear
Incident If this event is associated with an incident, then this clickable field specifies theshort identifier (ID) for the incident to which the event belongs. An incident is madeup of one or more events. Click this field to open the associated incident. For moreinformation, see the Creating incidents and Managing incidents links at the bottomof this topic.
Node Identifies the managed entity from which the event originated. This could be adevice or host name, service name, or other entity.
Summary Text that describes the alarm condition associated with the event and the affectedmanaged entity.
Alert Group Descriptive name of the failure type indicated by the event. By default, this columnserves to categorize events by type.
About event groupsAn event group is a group of two or more events that Netcool Operations Insight has correlated togetherbecause the underlying analytics have determined that these events belong together.
Events can be added to an event group because of one or more of the factors listed below:
Factor Example
Based on event history,these events tend tooccur within a short timeof each other
A Latency event on a server is regularly followed by a Ping responsetime high event on that same server. These events are grouped into a
temporal subgroup.
The events occur onresources within apredefined section ofyour network topology
If there is a predefined section of the network that groups together a specificswitch and all the nodes that depend on that switch, then any eventsoccurring on that specific switch or the nodes connected to it are grouped
together. These events are grouped into a topological subgroup.
620 IBM Netcool Operations Insight: Integration Guide
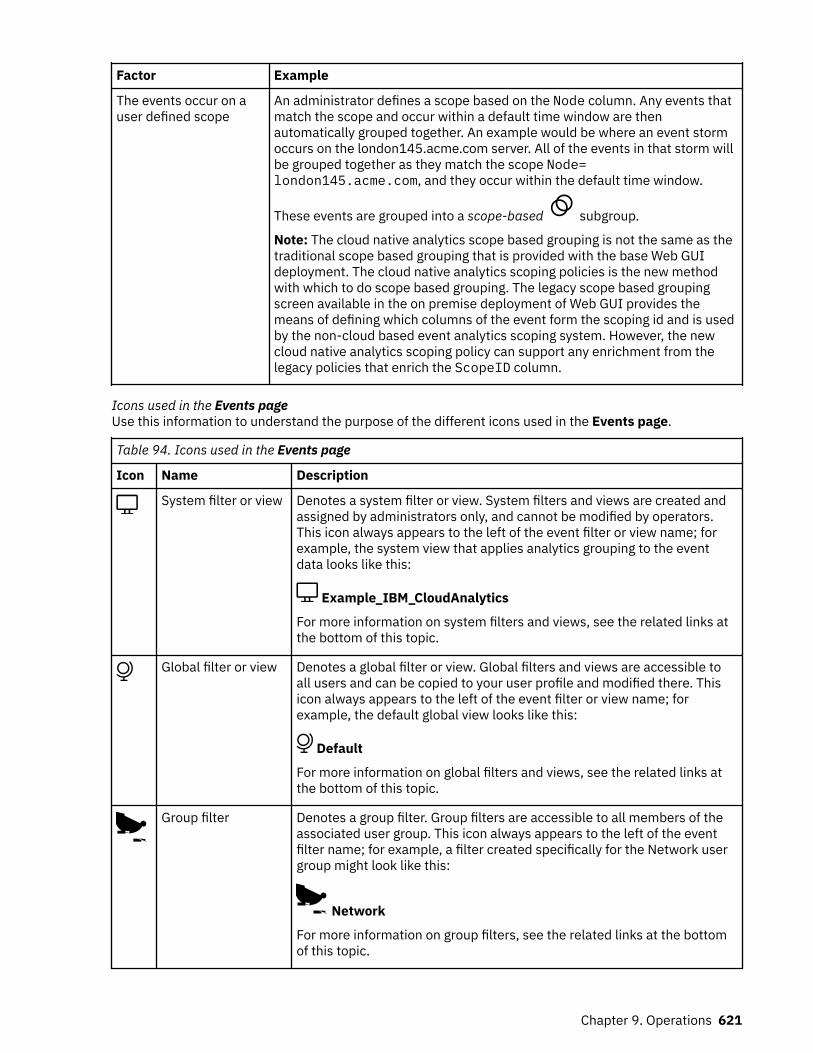
Factor Example
The events occur on auser defined scope
An administrator defines a scope based on the Node column. Any events thatmatch the scope and occur within a default time window are thenautomatically grouped together. An example would be where an event stormoccurs on the london145.acme.com server. All of the events in that storm willbe grouped together as they match the scope Node=london145.acme.com, and they occur within the default time window.
These events are grouped into a scope-based subgroup.
Note: The cloud native analytics scope based grouping is not the same as thetraditional scope based grouping that is provided with the base Web GUIdeployment. The cloud native analytics scoping policies is the new methodwith which to do scope based grouping. The legacy scope based groupingscreen available in the on premise deployment of Web GUI provides themeans of defining which columns of the event form the scoping id and is usedby the non-cloud based event analytics scoping system. However, the newcloud native analytics scoping policy can support any enrichment from thelegacy policies that enrich the ScopeID column.
Icons used in the Events pageUse this information to understand the purpose of the different icons used in the Events page.
Table 94. Icons used in the Events page
Icon Name Description
System filter or view Denotes a system filter or view. System filters and views are created andassigned by administrators only, and cannot be modified by operators.This icon always appears to the left of the event filter or view name; forexample, the system view that applies analytics grouping to the eventdata looks like this:
Example_IBM_CloudAnalytics
For more information on system filters and views, see the related links atthe bottom of this topic.
Global filter or view Denotes a global filter or view. Global filters and views are accessible toall users and can be copied to your user profile and modified there. Thisicon always appears to the left of the event filter or view name; forexample, the default global view looks like this:
Default
For more information on global filters and views, see the related links atthe bottom of this topic.
Group filter Denotes a group filter. Group filters are accessible to all members of theassociated user group. This icon always appears to the left of the eventfilter name; for example, a filter created specifically for the Network usergroup might look like this:
Network
For more information on group filters, see the related links at the bottomof this topic.
Chapter 9. Operations 621
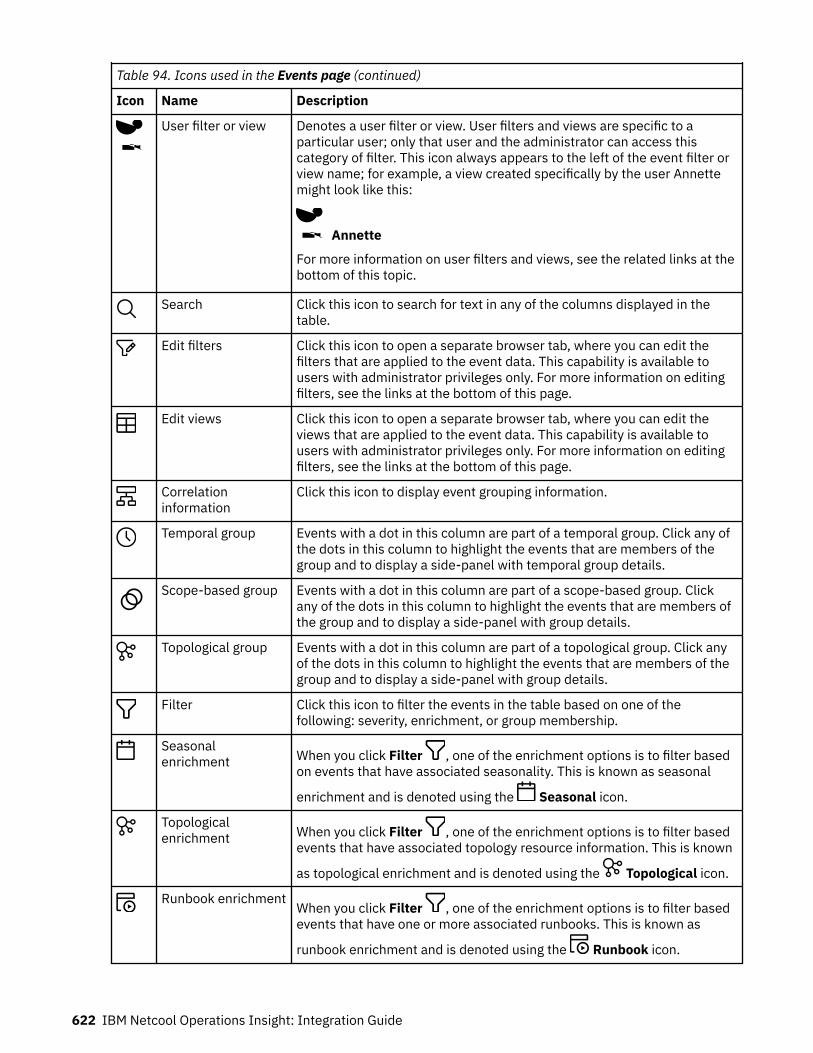
Table 94. Icons used in the Events page (continued)
Icon Name Description
User filter or view Denotes a user filter or view. User filters and views are specific to aparticular user; only that user and the administrator can access thiscategory of filter. This icon always appears to the left of the event filter orview name; for example, a view created specifically by the user Annettemight look like this:
Annette
For more information on user filters and views, see the related links at thebottom of this topic.
Search Click this icon to search for text in any of the columns displayed in thetable.
Edit filters Click this icon to open a separate browser tab, where you can edit thefilters that are applied to the event data. This capability is available tousers with administrator privileges only. For more information on editingfilters, see the links at the bottom of this page.
Edit views Click this icon to open a separate browser tab, where you can edit theviews that are applied to the event data. This capability is available tousers with administrator privileges only. For more information on editingfilters, see the links at the bottom of this page.
Correlationinformation
Click this icon to display event grouping information.
Temporal group Events with a dot in this column are part of a temporal group. Click any ofthe dots in this column to highlight the events that are members of thegroup and to display a side-panel with temporal group details.
Scope-based group Events with a dot in this column are part of a scope-based group. Clickany of the dots in this column to highlight the events that are members ofthe group and to display a side-panel with group details.
Topological group Events with a dot in this column are part of a topological group. Click anyof the dots in this column to highlight the events that are members of thegroup and to display a side-panel with group details.
Filter Click this icon to filter the events in the table based on one of thefollowing: severity, enrichment, or group membership.
Seasonalenrichment When you click Filter , one of the enrichment options is to filter based
on events that have associated seasonality. This is known as seasonal
enrichment and is denoted using the Seasonal icon.
Topologicalenrichment When you click Filter , one of the enrichment options is to filter based
events that have associated topology resource information. This is known
as topological enrichment and is denoted using the Topological icon.
Runbook enrichmentWhen you click Filter , one of the enrichment options is to filter basedevents that have one or more associated runbooks. This is known as
runbook enrichment and is denoted using the Runbook icon.
622 IBM Netcool Operations Insight: Integration Guide
Table 94. Icons used in the Events page (continued)
Icon Name Description
More information Click this icon to display a Help portlet above the table, which providesmore information on the Events page. For more information on the Helpportlet, see the links at the bottom of this page.
Accessing eventsMonitor events by accessing the Events page.
About this taskIf you are an operator, you can set the Events page to be your home page. See the related links at thebottom of this page for more information.
The Events page provides a completely new interface for monitoring and managing events. Itincorporates new ways to access all the features from the classic Event Viewer available in earlierversions of Netcool Operations Insight and in IBM Netcool/OMNIbus Web GUI, and also includes newevent grouping features. If, however, you prefer to work with the classic Event Viewer, you can switchback. See the related links at the bottom of this page for more information.
Procedure
1. Click the navigation icon at the top-left corner of the screen to go to the main navigation menu.
2. In the main navigation menu, click Events.The Events page is displayed. The event data that you see on this page depends on your datasource,filter, and view settings. For more information on how to change these settings, see the related links atthe bottom of this page.
Note: In order to see events groups in the event list, you must have a view selected that has thecorrect relationship assigned. In technical terms the relationship must define a parent-childrelationship between the ParentIdentifier and the Identifier columns. By default, theExample_IBM_Cloud_Analytics view is provided with this relationship predefined.
Switching back to the classic Event ViewerThe classic Event Viewer is the interface that was available in earlier versions of Netcool OperationsInsight and in IBM Netcool/OMNIbus Web GUI. If you prefer to work in the classic Event Viewer then youcan switch back.
About this task
Procedure1. Is there a help portlet above the Events table?
The help portlet looks like this:
New Events page, new look, more power DismissMore info
If the answer is: Then do as follows:
Yes, there is a ahelp portlet abovethe Events table
Go to step 2.
Chapter 9. Operations 623
If the answer is: Then do as follows:
No, there is nohelp portlet abovethe Events table
a. Locate the Help icon, at the far right of the Events table toolbar.
b. Click Help , to display the help portlet above the Events table.
2. Click anywhere on the help portlet to open it.3. In the help portlet, click Switch back.
Changing datasource, filter, and view settingsTo change the events and event columns that you see in the table on the Events page, changedatasource, filter, and view settings.
Procedure1. To modify the range of event data that you can view in the table, click the Datasource drop-down list
and add or remove data sources.You must have at least one data source selected to see data in the table. By default this data sourcesetting is AGG_P, which refers to the primary aggregated ObjectServer.
2. To change the event columns displayed in the table, click the Views drop-down list, which isimmediately to the right of the Datasource drop-down list. and select a different view.Changing the view can also change the sort order of the events and event grouping. For moreinformation, see the related link at the bottom of this topic.
3. To change the event rows displayed in the table, click the Filters drop-down list, which is immediatelyto the right of the Views drop-down list, and select a different filter.Changing the filter changes the event rows that are displayed in the table. For example, if you onlywant to see events from certain network resources and your resource data is held in the Node column,then one way to do this is to select a filter that excludes events where the Node column containsresource values that you do not want to view.
Note: In general, changing the filter changes the data that is retrieved from the server; consequently, afilter that matches less events will give better performance.
What to do nextTo manage the events that you and your operations team can see in the Events page, you can, if you havethe correct system permissions, edit filters and views. For more information, see the related link at thebottom of this topic.
Displaying the event side panelClick any event to display a side panel containing more information about that event.
About this taskAt a minimum, the side panel contains the following sections:Actions
Actions that can be performed on the selected event. In the classic Web GUI Event Viewer, theseactions were available as right-click tools. For more information, see “Troubleshooting events” onpage 630.
InformationFull data associated with the event, and a timeline containing journal information and user comments.For more information, see “Displaying event details” on page 625.
If the event has been enriched with seasonality, topology, or runbook information, then the side panelalso includes one or more of the following sections:
624 IBM Netcool Operations Insight: Integration Guide

SeasonalityOne or more seasonal time windows for the selected event, where a seasonal time window is an hour,day of the week, day of the month, or some other time period when the event tends to occur. For moreinformation, see “Displaying event seasonality” on page 626.
TopologyAn indication that the event can be located on a specific resource in the network topology system. Formore information, see “Displaying event topology” on page 627.
RunbookAn indication that a runbook is associated with the event. For more information, see “Executing arunbook” on page 631.
If the event is part of an event group, then, depending on the type of analysis used to generate the group,the side panel also includes one or more of the following sections. For more information, see “Displayinganalytics details for an event group” on page 633.Temporal correlation
Details of a temporal group in which this event is involved.Scope-based correlation
Details of a scope-based group in which this event is involved.Topology correlation
Details of a topology group in which this event is involved.
Displaying event detailsThe Events page displays the most important columns associated with an event. Click any event todisplay a full set of columns for that event in the sidebar.
Procedure1. Click an event of interest in the table on the Events page..
A side panel containing multiple information sections opens on the right-hand side of the table.The topsection is called the Actions section and displays a set of actions that can be performed on theselected event.
2. Close the Actions section by clicking the upward-pointing chevron at the right of the Actionssection header.
3. Open the Information section by clicking the downward-pointing chevron at the right of theInformation section header.Information for the selected event is shown in the following tabs:Fields
This tab displays the complete set of column data for the selected event, including familiar fields,such as Summary, Node, Severity, and LastOccurrence. Other less familiar fields are alsodisplayed in this tab. For a description of each of these fields, see the related link at the bottom ofthis topic.
DetailsThis tab displays extra data associated with the selected event. If there is no data to display then aNo Data message is shown in the tab area. For a description of this extra data, see the related linkat the bottom of this topic.
TimelineThis tab displays the timeline for the selected event. The timeline includes journal entries for theevent, and comments added by operators, in chronological order.
Chapter 9. Operations 625
Working with the event timelineClick any event to display a timeline for that event in the sidebar. The timeline includes journal entries forthe event, and comments added by operators, in chronological order.
Procedure1. Click an event of interest in the table on the Events page..
A side panel containing multiple information sections opens on the right-hand side of the table.The topsection is called the Actions section and displays a set of actions that can be performed on theselected event.
2. Close the Actions section by clicking the upward-pointing chevron at the right of the Actionssection header.
3. Open the Information section by clicking the downward-pointing chevron at the right of theInformation section header.Information for the selected event is shown in the following tabs:Fields
This tab displays the complete set of column data for the selected event, including familiar fields,such as Summary, Node, Severity, and LastOccurrence. Other less familiar fields are alsodisplayed in this tab. For a description of each of these fields, see the related link at the bottom ofthis topic.
DetailsThis tab displays extra data associated with the selected event. If there is no data to display then aNo Data message is shown in the tab area. For a description of this extra data, see the related linkat the bottom of this topic.
TimelineThis tab displays the timeline for the selected event. The timeline includes journal entries for theevent, and comments added by operators, in chronological order.
4. Click Timeline.The timeline presents a vertical display of journal entries for, and comments on the selected event, inchronological order.
5. Optional: Type a comment and click Add comment at any time to add a comment on this event.Your comment is stored in the timeline in chronological order with the other entries.
Displaying event seasonalityEvents can occur within a seasonal time window. For example, an event might tend to occur on a certainday of the week or a certain time of the day. Events that tend to occur within a seasonal time window arehighlighted on the Events page using a large dot in the event's Seasonal column. Click the dot to findout when the event tends to occur.
About this taskExamples of seasonal time windows include the following:Hour of the day
Between 12:00 and 1:00 pm
Day of the week
On Mondays
Day of the month
On the 3rd of the month
626 IBM Netcool Operations Insight: Integration Guide

Day of the week at a given hour
On Mondays, between 12:00 and 1:00 pm
Day of the month at a given hour
On the 3rd of the month, between 12:00 and 1:00 pm
Procedure1. Identify events that are seasonal.
• Flat events, that is, events that are not part of an event group, that have associated seasonality, havea large dot immediately visible in their Seasonal column.
• Events that are part of an event group that have associated seasonality also have a large dot intheir Seasonal column, but you must first open the event group in order to see the event. Open anevent group by clicking the Down chevron icon on the left of the parent event group row.
2. Click the large dot in the Seasonal column for the event of interest.A side panel containing multiple information sections opens on the right-hand side of the table.TheSeasonality section is open and displays one or more seasonal time windows for the selected event.
3. Click the Down chevron next to each seasonal time window to see a visual representation of thetime window.For example, if the underlying algorithm has identified that the selected event tends to occur between12 noon and 1:00 pm, then this event will have a seasonal time window as follows, and this will bedisplayed using a clock-based representation:
Between 12:00 and 1:00 pm
4. If you have sufficient user permissions, then you can investigate the event seasonality further. bya) Click the More information link at the bottom of the side panel's Seasonality section.
This action displays the Seasonality Details page, which provides a calendar view of all of thehistorical events that contributed to the selected seasonal event. This page contains the followingsections:Seasonal time windows
One or more seasonal time windows are listed in the top left pane, together with a colorednumber square indicating how many historical events occurred within this time window duringthe historical period analyzed. The color of the square is the color code for the respectiveseasonal time window. Select a seasonal time window to filter the Calendar and the Historicalevent table to show just historical events that contributed to that time window.
CalendarA calendar of the historical period analyzed (the last three months or more) showing days onwhich the historical events of interest occurred, and colored with the color code for therespective time window.
Historical event tableTable listing the historical events during the historical period analyzed.
b) Click the Events breadcrumb at the top left of the screen to return to the Events page.
Displaying event topologyIf the resource on which an event occurred can be located in the network topology system, then a largedot is presented in the event's Topology column. Click the large dot to display a topology map forthis event, centered on the resource on which the event occurred.
Procedure1. Identify events that have an associated resource in the network topology.
Chapter 9. Operations 627

• Flat events that is, events that are not part of an event group, that have an associated resource in thenetwork topology, have a large dot immediately visible in their Topology column.
• Events that are part of an event group, that have an associated resource in the network topology alsohave a large dot in their Topology column, but you must first open the event group in order to seethe event. Open an event group by clicking the Down chevron icon on the left of the parent eventgroup row.
2. Click the large dot in the Topology column for the event of interest.A side panel containing multiple information sections opens on the right-hand side of the table.TheTopology section is open.
The Topology section provides the following information:Resource
Name of the resource on which the event of interest occurred.Begin time
Date and time when the topology for this resource was last updated.Observed time
Date and time when the event of interest was observed on this resource.Topology pane
Contains showing a topology map for this event, centered on the resource on which the eventoccurred.
3. If you have sufficient user permissions, then you can investigate the topology further.a) Click the More information link at the bottom of the side panel's Topology section.
This action launches out to the topology management service in a separate browser tab, whichdisplays the same topology map, with the full topology display experience. For more information onhow to use the topology management service to explore topology, see the related link at the bottomof this topic.
b) Click the Events breadcrumb at the top left of the screen to return to the Events page.
Searching eventsYou can search the list of events based on data contained within the event columns. For example, typelondon in the search box to filter the list to display only those events where one or more the eventcolumns contains the string "london".
Procedure
1. In the toolbar above the table, click Search .
An editable search bar is displayed to the left of the Search icon.2. Click inside the search bar and type your search term.
The table now displays only those event rows that meet the criteria specified.
For example, assume you want to find events where any of the displayed columns contains the string"london". To do this, type "london" in the search bar.
Based on this search, the table will display events such as the following:
• Events where the Node column contains resources named server-london-123.• Events where the Summary columns contains text such as:
Memory leak on resource server-london-123
What to do nextTo remove the search criteria and to display all events again in the table, proceed as follows:
628 IBM Netcool Operations Insight: Integration Guide
In the search bar, remove the search term; for example, by clicking Close . This removes the filter orsearch criteria and updates the table to display all events.
Filtering eventsYou can filter the list of events based on severity, enrichment, and grouping.
About this taskFilter the events based on one or more of the following factors:
• Severity: the severity of the event.• Enrichment: has the event been enriched with seasonality, topology, or runbook data?• Grouping: is the event within a temporal, topological, or scope-based group?
Procedure
1. In the toolbar above the table, click Filter .2. Apply any of the following filters:
SeverityClick one or more severity levels to filter on.
EnrichmentClick one or more of the following:
• Seasonal
• Topological
• Runbook
GroupingClick one or more of the following:
• Scope-based
• Temporal
• Topological3. Click Apply Filters.
The table now displays only those event rows that meet the criteria specified.
What to do nextTo remove the filter criteria and to display all events again in the table, proceed as follows:
1. In the toolbar above the table, click Filter .2. Click Reset Filters. This removes the filter or search criteria and updates the table to display all
events.
3. Click Filter to close the filter dialog box.
Chapter 9. Operations 629
Troubleshooting eventsYou can troubleshoot events by running predefined actions on an event, including administrative actionssuch as acknowledging an event and creating a ticket based on an event, and information retrievalactions, such as running ping or traceroute commands against the resource on which the event occurred.
Procedure1. Click an event of interest in the table on the Events page..
A side panel containing multiple information sections opens on the right-hand side of the table.The topsection is called the Actions section and displays a set of actions that can be performed on theselected event.If you to perform actions on multiple events in one go, then select multiple events using Shift-Click.
2. In the Actions section, select the action to perform on the event.The actions available are as follows. For more information on each of these troubleshooting actions,see the links at the bottom of the topic.Acknowledge
Acknowledge an event when you want to begin to work on that event. You must be the eventowner, in order to perform this action.
De-acknowledgeDe-acknowledge an event if you are no longer working on it. You must be the event owner, in orderto perform this action.
Create new incidentIf you believe that multiple events form part of a single real-life incident, then you can create a newNetcool Operations Insight incident based on those events. For more information, see the Creatingincidents link at the bottom of this topic.
Add to incidentIf you believe that one or more events belong together with an existing Netcool Operations Insightincident, then you can add those events to that incident. For more information, see the Creatingincidents link at the bottom of this topic.
PrioritizeUse this command to change the severity of an event. You must be the event owner, in order toperform this action.
Suppress/EscalateSuppress an event to remove it from all operator event lists. Escalate an event to promote it to theEscalated event list filter, where it can get attention from a wider range of support people. Youmust be the event owner, in order to perform these actions.
Take ownershipTake ownership of an event if you want to work on resolving that event. Once you have ownershipof an event, you can perform other actions on it such as Acknowledge, Prioritize, Suppress,Escalate, and Delete.
User AssignUse this command to assign an event to another user. That user then becomes the event owner.
Group AssignUse this command to assign an event to a group.
DeleteDelete an event to remove it from the events list. You must be the event owner, in order to performthis action.
PingUse this command to run the ping command against the network resource specified in the Nodefield of the event.
Event SearchUse this command to perform a historical event search against the selected event.
630 IBM Netcool Operations Insight: Integration Guide

Create ticketUse this command to create a ticket for the selected event.
Search HumioRun this command to retrieve Humio data for this event.
Note: This event is only available if the Humio integration has been set up. For more information,see the Adding the Search Humio action link at the bottom of this topic.
Creating incidentsYou can manually create Netcool Operations Insight incidents from one or more events.
Creating a new incidentIf you believe that multiple events form part of a single real-life incident, then you can create a newNetcool Operations Insight incident based on those events.
1. In the Events page, select one or more events that are not part of an existing incident.
A side panel containing multiple information sections opens on the right-hand side of the table. Thetop section is called the Actions section and displays a set of actions that can be performed on theselected event.
2. In the Actions section, click Create new incident.3. Type a textual description of the incident.4. Assign an incident priority from 1 to 5. The default setting is 5.
Note: The lower the priority value, the more serious the incident. Check with your Operations teamlead which priority value you should assign based on the seriousness of the incident.
5. Click Run, to run the action, which in turn creates the incident.
For information on how to manage incidents, see the Managing incidents link at the bottom of thistopic.
Adding events to an existing incidentIf you believe that one or more events belong together with an existing Netcool Operations Insightincident, then you can add those events to that incident.
1. In the Events page, select one or more events that are not part of an existing incident.
A side panel containing multiple information sections opens on the right-hand side of the table. Thetop section is called the Actions section and displays a set of actions that can be performed on theselected event.
2. In the Actions section, click Add to incident.3. Click Select the incident these events should be added to and select an incident.4. Click Run, to run the action, which in turn adds the event or events to the incident.
For information on how to manage incidents, see the Managing incidents link at the bottom of thistopic.
Executing a runbookA runbook is a set of predefined actions that are meant to resolve a fault condition associated with event.For example, a Memory utilization 100% event might have an associated runbook that automaticallyrestarts the resource associated with that event. If a runbook has been set up for a specific event, thenyou will see a large dot in the event's Runbook column. Click the dot to open the event sidebar, fromwhere you can launch the runbook.
Chapter 9. Operations 631
About this taskA runbook can be fully automatic, which means that clicking a button runs all of the predefined actions inorder. Alternatively, you might be required to manually run some or all of the steps of the runbook.
Procedure1. Identify events that have an associated runbook.
• Flat events, that is, events that are not part of an event group, that have an associated runbook, havea large dot immediately visible in their Runbook column.
• Events that are part of an event group, that have an associated runbook also have a large dot intheir Runbook column, but you must first open the event group in order to see the event. Open anevent group by clicking the Down chevron icon on the left of the parent event group row.
2. Click the large dot in the Runbook column for the event of interest.A side panel containing multiple information sections opens on the right-hand side of the table.TheRunbook section is open.
The Runbook section provides the following information:Name
Name of the runbook.Description
Description of the runbook.Type
Type of runbook; options are:
• Manual: indicates that the runbook is fully manual or semi-automated, requiring you to performat least some of the steps manually.
• Automated: runbook containing automations only. When you execute the runbook, you mustselect the automation and then click Run.
RatingAverage rating out of five provided for this runbook following execution.
Success ratePercentage of successful executions of the runbook, based on operator indication followingrunbook execution.
3. Click Execute runbook.This action displays the Runbook page, where you can check the runbook parameters and then eitherlaunch the entire runbook, if this is an automated runbook, or execute the runbook step by step, if thisis a manual runbook. For more information on how to run a runbook, see the steps 4 to 11 in therelated link at the bottom of this topic.
ResultsOnce the runbook has been executed, you are automatically redirected back to the Events page.
Creating watchlists
About this task
Procedure
632 IBM Netcool Operations Insight: Integration Guide
Displaying an event groupExpand an event group to display the events that have been correlated together within the group.
About this taskAn event group contains two or more events correlated together by the underlying analytics. The group
can include Temporal groups, Topological groups, and Scope-based groups.
Procedure1. Identify an event group within the table.
You can identify a group using the following signs:
• It has a Down chevron icon at the far left of its row in the table, immediately left of the severityicon.
• By default, it has a summary that includes the words: GROUP (n active events), where n is thenumber of the events in the group.
2. Open the event group by clicking the Down chevron icon at the far left of its row in the table.The group's events are now displayed under the parent event.
Displaying probable cause for an event groupWhen you expand an event group, you will see the probable cause ratings for each event in the group. Theevent with the greatest probable cause rating is the most likely cause of these events.
Procedure1. Open an event group as described in the related link at the bottom of this topic.
Probable cause information is displayed in the Probable cause column on the left of the table.
Each of the events in the group has a bar in the Probable cause column indicating the percentageprobability that this is the probable cause event. The probable cause event has the longest bar and itsbar is bright blue. The other events have shorter bars and are shown in a dull blue color.
2. Hover over the bar of the probable cause event to see the percentage probability that this is the rootcause event.
3. Click the bar of the probable cause event.A side panel containing multiple information sections opens on the right-hand side of the table.Theopen section is called the Probable cause section and displays text stating that this event is probablecause. It also provides the following buttons:Reference topology
Click here to show the topology that was used to calculate the probable cause values.Add a comment
Click here comment on whether you think these probable scores are correct.
Displaying analytics details for an event groupTo understand why these events were grouped together, click the option to show group details. Thisoption displays the underlying temporal, topological, and scope-based groups that were brought togetherto form this event group.
Procedure1. Open an event group as described in the related link at the bottom of this topic.
Chapter 9. Operations 633
2. Click Correlation information . The Grouping side panel opens on the right-hand side of the table.This panel shows why the events in the group are related, by showing the different subgroups thatmake up the event group. The panel contains three columns, as follows:
Temporal group columnBased on event history, the events in this column that are marked with a large dot tend to occurwithin a short time of each other.
Note: Dots in this column that are marked with the same letter correspond to events that are partof the same historical temporal group. Dots that are not marked with a letter correspond to eventsthat were brought into the event group by the temporal pattern analytics algorithm based oncommon patterns of behavior, and not based on historical occurrences.
Scope-based group columnThe events in this column that are marked with a large dot occur within a configurable timewindow on an administrator defined scope, such as a location, service, or resource.
Topological group columnThe events in this column that are marked with a large dot occur on resources within apredefined section of your network topology.
These sub-groups are joined together to form an event group if the same event occurs in two or moresub-groups. In this way multiple sub-groups can be joined together.
3. Click a dot to see more details on any of these sub-groups.
Click a link for information on one of these columns:
• Temporal group column
• Scope-based group column
• Topological group column
Temporal group columnClicking a dot in this column opens the sidebar, with the Temporal correlation section open. Thissection contains the following information, to help you assess the validity of the group.Group details or Pattern Details
The title of this tab might be either Group details or Pattern details.
• Group details: the tab has this title if the group is purely based on historical co-occurrence ofevents.
• Pattern details the tab has this title if the temporal pattern analytics algorithm has identifiedpatterns of behavior among temporal groups, which are similar, but occur on differentresources.
For more information on temporal groups and temporal patterns, see the related link at thebottom of this topic.
Group detailsThis tab displays details about the selected temporal group.First group instance
Date and time of first instance of this group.Total group instances
Total number of historical instances of this group. For details of when these instancesoccurred and how many events occurred in each instance, see the Group instanceheatmap.
634 IBM Netcool Operations Insight: Integration Guide
Average instance durationAverage time in seconds that this group instance lasted.
Group instance heatmapTime-based heatmap showing recent historical period in months with a grey square foreach day. Each darker square indicates a day on which there was at least one groupinstance. Hover over the square to see details of this group instance.
Pattern detailsThis tab displays details about the temporal pattern associated with the selected group. Thistab only appears if the temporal pattern analytics algorithm has identified patterns of behavioramong temporal groups, which are similar, but occur on different resources.Total pattern instances
Total number of instances of this pattern across two or more temporal groups. For detailsof when these instances occurred, see the Pattern instance heatmap.
Average instance durationAverage time in seconds that this pattern instance lasted.
Matched resource attributesResources on which this pattern has been identified.
Pattern instance heatmapTime-based heatmap showing:
• In a grey square or triangle, the day(s) when the temporal pattern occurred on theresource associated with the events currently selected in the events table.
• In a blue square or triangle, the day(s) when the temporal pattern occurred on otherresources.
Policy detailsIf you have sufficient permissions, then the Policy details tab is displayed. In this tab you canconfigure the analytics policy that generated this group using the following controls. Anychanges that you make here are visible to the administrator in the Policies GUI. For moreinformation about the Policies GUI, see the related link at the bottom of this topic.Status
By default the policy is enabled, which means that the policy will continue to grouptogether incoming events. Click the toggle to disable the policy. Disabled policies don't acton incoming events. However, as opposed to rejected policies, disabled policies remain inyour administrator's main policy table and can be enabled at the click of a switch.
Lock policy?
Locked policies continue to act on incoming events. However, the analytics algorithmcannot update a locked policy.
CAUTION: Once a policy has been locked it cannot be unlocked, even by anadministrator. The unlock action on a policy will mark it as unlocked in this GUI, andin the Policies GUI, but the policy continues to be locked.
CommentAdd a comment on this policy. Your administrator will be able to see the comment in thePolicies GUI
If you have sufficient permissions, then you also see the following options.
Reject policyIf you don't believe that the events in this temporal group or pattern belong together, then youcan reject the associated analytics policy. Archived policies don't act on incoming events.
More informationClick this link to display the Temporal Details panel, where you can access more details on thehistorical instances of this group. For more details, see Temporal Details panel.
Chapter 9. Operations 635

Scope-based group columnClicking a dot in this column opens the sidebar, with the Scope-based correlation section open.This section contains the following information:Scope
Displays the value of the scope parameter ScopeID used to group these events together. Thisis typically a location, service or resource value.
Number of events in groupNumber of events in the scope-based group; that is, the number of events that have occurredwithin a defined time window on the location, service or resource value in the Scope fieldabove.
Group durationDuration of the scope-based group.
Group timelineShows the start and end times of the scope-based group. Events are marked with a shortvertical line along the timeline. Move the blue ball back and forward along the timeline todisplay elapsed events in the Event table below.
Event tableLists the events that make up this scope-based event group. The content of table updates toshow elapsed events as you move the blue ball back and forward along the Group timeline.
Topological group columnClicking a dot in this column opens the sidebar, with the Topology correlation section open. Thissection contains the following information:Topology group name
Name of the topology defined in the topology management service, on which this topologygroup is based. For more information on how topological groups are defined based on definedtopologies, see the related link at the bottom of this topic.
TopologyPane showing the resources in the topology on which this topology group is based. You canperform the following actions on the topology.
Table 95. Actions on the topology
Item Action Result
Resource Hover over Highlights the event(s) on that resource in the events table tothe left.
Click Displays the relationships between that resource andneighboring resources. The relationships are displayed in texton the lines connecting the resources. Examples ofrelationships include: runsOn, members, exposes.
Right click Displays the following options:Resource details
Lists property values for this resource.Comments
Provide a comment on this resource here.
Connection(linesconnectingtheresources)
Right click Displays the following options:Relationship details
Lists property values for this relationship.
636 IBM Netcool Operations Insight: Integration Guide

What to do nextThe Temporal Details panel displays more details on the historical instances of a temporal group. Thefollowing information is displayed:Toolbar
Search Searches event data in all event group instances shown on this page.
Views Changes the event columns shown in the Overview timeline, the Event group instance timeline,and the Event group instance details sections of this page.
Filter Filters the events shown by severity and other column values.
Overview timelineDisplays event group instances over time and controls the display of event group instance data on therest of the page. By default the time range sliders are open sufficiently to show data on all event groupinstances. Modify the time range by either clicking and dragging over the desired range inside thetimeline, or by dragging the left and right sliders to the desired range. The rest of the screen updatesaccordingly.
Event group instance timelineDisplays all of the events that have historically participated in instances of this temporal event group.To the right of the table is an instance map, providing a graphical view over time of when the variousinstances have occurred.
Event group instance detailsDisplays the following information for each event group instance:Start date and time of event group instance
Indicates the first occurrence value of the first event in the event group instance.Distribution of event severity values
Pie chart providing a visual indication of the event severity values. Hover over the pie chart formore details.
SparklineChart of event occurrence over time.
Duration of event group instanceDuration of the event group instance, in text.
Down chevron icon Click this the Down chevron icon to see an event table showing column details for each eventin this group instance.
Monitoring events using the classic Event ViewerIf you prefer to work with the classic Event Viewer, you can do so directly from the Cloud GUI mainnavigation menu.
Procedure
1. Click the navigation icon at the top-left corner of the screen to go to the main navigation menu.
2. In the main navigation menu, click Netcool Web GUI.
The Netcool Web GUI Event Viewer is displayed in a separate tab. The event data that you see onthis page depends on your datasource, filter, and view settings. For more information on how to changethese settings, see the related links at the bottom of this page.
Chapter 9. Operations 637
Note: In order to see events groups in the event list, you must have a view selected that has thecorrect relationship assigned. In technical terms the relationship must define a parent-childrelationship between the ParentIdentifier and the Identifier columns. By default, theExample_IBM_Cloud_Analytics view is provided with this relationship predefined.
What to do nextFor more information on the classic Event Viewer, see the related link at the bottom of the topic.
Displaying an event groupExpand an event group to display the events that have been correlated together within the group.
About this taskAn event group contains two or more events correlated together by the underlying analytics. The group
can include Temporal groups, Topological groups, and Scope-based groups.
Procedure1. Identify an event group within the table.
You can identify a group using the following signs:
• It has a Down chevron icon at the far left of its row in the table, immediately left of the severityicon.
• It has an Investigate link in the Grouping column.• By default, it has a summary that includes the words: GROUP (n active events), where n is the
number of the events in the group.
2. Click Investigate to open the event group.A second DASH tab opens containing an events table. The group's events are now displayed under theparent event in that table.
What to do nextDisplay analytics details for the event group as described in the related link at the bottom of the topic.
Managing incidentsA Netcool Operations Insight incident models a single real-life incident, and can contain multiple events.
About incidentsAn incident is made up of one or more events and models a single real-life incident in your monitoredenvironment.
Using the Incidents pageUsing the incident management feature, you can list your current incidents. You can view all incidents, orincidents that are assigned to you or groups you are a member of. You can take ownership of incidents,and work with your teams and tools to resolve incidents.
About this taskOverview of the Incidents page.
638 IBM Netcool Operations Insight: Integration Guide
Figure 23. Incidents page
Table 96. Incidents page overview
Region Description
1 Incident lists
• My incidents: You can view incidents that are assigned to you.• Group incidents: You can view incidents that are assigned to groups you are a
member of.• All incidents: You can view all incidents.
Incidents are sorted based on priority level and the last time they changed, with thehighest priority and the latest incident to have changes shown at the top of the list.Incidents of all priority levels are displayed by default.
2 Search and filter fields
Use the Search field to find incidents. You can use spaces when searching for morethan one word, for example, when searching for a specific incident description. Searchworks on the following incident information:
• Short incident identifier at the top left of the incident• Incident description• Owner• Group
Search does not work on the following incident information:
• Open for value• Last changed date
Use the Filter to display incidents that do not have an owner, or to displayincidents in specific states, such as Unassigned, In progress, or Escalated. You canalso filter for incidents based on their priority level. Incidents of all priority levels aredisplayed by default.
Note: Select No owner to display all incidents that do not have a user assigned as theowner, even if the incident is assigned to a group. The No owner filter is mutuallyexclusive with the various Show status filters, such as Unassigned, Assigned, and Onhold. For example, if No owner is selected, and then you select Assigned, the Noowner filter is automatically deselected. Conversely, if Assigned is selected, and thenyou select No owner, the Assigned filter is automatically deselected. The same holdsfor any single or multiple selected of the Show status filters.
Chapter 9. Operations 639
Table 96. Incidents page overview (continued)
Region Description
3 Incident summary
Displays information about the incident, including ID, priority level, short description,and ownership. Also shows the time the incident was last changed, and how long theincident has been open for based on the time elapsed since the first occurrence of theassociated events. The Open for label changes to Duration when the incident is set toresolved.
The incident description is based on the resource data contained in the eventinformation. The same resource data is used to correlate the events into an incident.
To display a list of the top 5 resources affected by the incident, click the informationicon next to Top resources affected.Hover the cursor over the event types count to display the top 5 event types related tothe incident.
Note: When events arrive as resolved (but correlate with an incident) the event will beincluded in the total events count, but not in the resources affected eventype counts.
You can take ownership of incidents or assign them to other groups or users by clicking
Menu overflow > Assign. You have the option of assigning the incident to a group youare a member of, or to another user who is a member of that group. You can also clickShow all to have all groups displayed, and assign the incident to a group you are not amember of. If the incident is assigned to a group already, but not to a user within thatgroup, then all groups are displayed. Alternatively, click the User tab to look for aspecific user to assign the incident to. If you click User and select a user who is amember of more than one group, then you must specify which group the incident isassigned to.
You can also resolve an incident here by clicking Menu overflow > Resolve.
4 Incident bar
Displays the icon for the highest event severity level that occurs in the incident, togetherwith a total count for such events.
On the left, a link shows the total number of events that are part of the incident. Clickingthe link opens the Events tab of the incident details page. On the right, a link opens theResolution view where you can investigate the incident in more detail, and includesoptions for resolving it. For more information, see Table 97 on page 641.
You can also use the grippy to drag the incident to the sidebar on the right, andassign it to a group or user.
5 Sidebar
Shows users or groups, or the incidents assigned to you. Use the drop-down list toswitch between them.
Drag an incident to a user or group to assign it to them. You can also drag a user orgroup from the sidebar to an incident to assign the user or group to the incident.
Use the grippy to drag users, groups, or incidents.
Overview of the incident details UI.
640 IBM Netcool Operations Insight: Integration Guide

Table 97. Incident details
Tab Description
Resolution view Click Investigate on the incident bar in any of the incident lists to accessthe Resolution view.
Provides information about the incident, including priority level,description, ownership, status, the most recent timeline, and a list ofrunbooks available to perform for potential resolution. You can set thestatus of the incident here to In progress, On hold, or Resolved.
If available, a list of runbooks is shown, sorted based on success rate anduser rating. Information is also displayed about whether a runbook is amanual or an automated one. You can select runbooks to run against the
events causing the incident by clicking Menu overflow > Run for therunbook you want to apply. You can also preview the details of the runbook
before running it by clicking Menu overflow > Preview.
The runbooks are associated with the events as set in runbook triggers. Formore information, see the related link at the bottom of this topic.
Note: You can execute runbooks manually as mentioned earlier. You canalso have runbooks that run automatically if they contain only automatedsteps and were selected to run automatically when assigned to events in arunbook trigger. These runbooks show Type: Automated. A statusmessage is shown in the timeline for manual runbooks indicating whetherthey ran successfully, did not work, are in progress, or were paused.
Important: If you take an action against an incident that is not assigned toan owner, such as running a runbook manually, the incident status isautomatically set to In progress, and the incident is assigned to you. Theincident is also automatically assigned to you if you manually set theincident state to In progress. If you are a member of more than one group,then you must choose a group. You will be taking ownership of the incidentand working to resolve it as a member of the selected group.
Re-selecting No owner will clear any other status.
The Resolution view also includes the Collaborate list showing colleaguesyou can assign the incident to.
You can also assign the incident to another group by clicking the Assigngroup link in the Group field. You have the option of assigning the incidentto a group you are a member of, or to another user who is a member of thatgroup. You can also click Show all to have all groups displayed, and assignthe incident to a group you are not a member of. If the incident is assignedto a group already, but not to a user within that group, then all groups aredisplayed. Alternatively, click the User tab to look for a specific user toassign the incident to. If you click User and select a user who is a memberof more than one group, then you must specify which group the incident isassigned to.
Chapter 9. Operations 641
Table 97. Incident details (continued)
Tab Description
Events To access the Events tab, click Events on the incident bar in any of theincident lists, or click the incident assigned to you in the sidebar (availablewhen My incidents is selected from the drop-down menu). You can alsoclick the Events link in the Resolution view to go to the Events tab, or clickthe tab itself.
Lists all the active events and event groups that are part of the incident.
For more information on how the events are presented in this tab, see theMonitoring events link at the bottom of this topic.
Timeline Click the Timeline tab in the Resolution view.
Displays the full history of the incident and its related events, including theevents that are correlated to the incident, time when the incident wasgenerated, state changes such as assignments made, and commentsadded manually. The timeline is sorted from newest to oldest by default.You can optionally flip the timeline. To do this, click the drop-down list atthe top right and select Oldest first.
You can also add comments using the Add comment button.
Resources Click the Resources tab in the Resolution view.
Displays a list of the resources affected, including Resource name, Type ofresource, and the number of Events per resource.
Incident statesAn incident assumes different states as it is processed toward resolution and closure. In the Incidentspage you can filter incident by state.
The following table describes the different incident states in order of a typical workflow.
Table 98. Incident states
Incident state Description
Unassigned
Unassigned
New incidents are automatically given the Unassigned state.
Assigned
Assigned
Once an incident is assigned to an individual user or to a group, it is automaticallymoved to the Assigned state.
Escalated
Escalated
The incident is automatically moved to the Escalated state when another user isnotified about it.
Note: The notification capability and associated Escalated state are not availablein the current release, and will be made available in an upcoming release.
In progress
In progress
To move the incident to the In progress state, click the In progress button in theResolution view.
642 IBM Netcool Operations Insight: Integration Guide
Table 98. Incident states (continued)
Incident state Description
On hold
On hold
Only In progress incidents can be placed on hold. To move an In progress incidentto the On hold state, click the On hold button in the Resolution view.
Resolved
Resolved
To move the incident to the Resolved state, click the Resolve button in theResolution view. The incident stays in the Resolved for 120 seconds. If duringthat time period events are received that correlate with the incident, then theincident remains open and is moved back to the state it was in before the Resolveaction. Otherwise the incident is moved to the Closed state and is removed from allincident lists.
Closed Closed incidents are no longer actionable and do not appear in any incident list.
Creating incidentsYou can manually create Netcool Operations Insight incidents from one or more events.
Creating a new incidentIf you believe that multiple events form part of a single real-life incident, then you can create a newNetcool Operations Insight incident based on those events.
1. In the Events page, select one or more events that are not part of an existing incident.
A side panel containing multiple information sections opens on the right-hand side of the table. Thetop section is called the Actions section and displays a set of actions that can be performed on theselected event.
2. In the Actions section, click Create new incident.3. Type a textual description of the incident.4. Assign an incident priority from 1 to 5. The default setting is 5.
Note: The lower the priority value, the more serious the incident. Check with your Operations teamlead which priority value you should assign based on the seriousness of the incident.
5. Click Run, to run the action, which in turn creates the incident.
For information on how to manage incidents, see the Managing incidents link at the bottom of thistopic.
Adding events to an existing incidentIf you believe that one or more events belong together with an existing Netcool Operations Insightincident, then you can add those events to that incident.
1. In the Events page, select one or more events that are not part of an existing incident.
A side panel containing multiple information sections opens on the right-hand side of the table. Thetop section is called the Actions section and displays a set of actions that can be performed on theselected event.
2. In the Actions section, click Add to incident.3. Click Select the incident these events should be added to and select an incident.4. Click Run, to run the action, which in turn adds the event or events to the incident.
For information on how to manage incidents, see the Managing incidents link at the bottom of thistopic.
Chapter 9. Operations 643
Starting to work with incidentsLearn how to start managing incidents with Netcool Operations Insight.
About this taskIf your Netcool Operations Insight set up is ready, you can start managing incidents. The following is anexample of how to access your incidents and start investigating them.
Procedure1. Go to the Incidents tab of the Netcool Operations Insight user interface.2. View incidents that are assigned to you on the My incidents tab. Administrators and other users might
have already assigned incidents to you. If you do not have any incidents that are assigned to you, clickGo to group incidents to see what incidents are assigned to groups you are member of.
3. Click Filter and select No owner to show incidents that do not have a user assigned as an owneryet. This filter also shows incidents that have been assigned to a group, but not to a user.
4. Take ownership of incidents by dragging the incident to the sidebar on the right, or by clicking Menu
overflow > Assign.5. Click My incidents and click Events to learn more about the events that make up the incident. The
Events tab opens.6. On the Events tab, investigate the information available about the most severe events related to the
incident. For more information on how the events are presented in this tab, see the Monitoring eventslink at the bottom of this topic.
7. Click the Timeline tab to see the history of the incident. You can see that another user from your groupposted a comment. The comment suggests a similar problem occurred not long ago, and the user hasnotes about what steps were taken to resolve the problem.
8. Set the incident status to In progress.
Note: If an incident is manually resolved, any associated events that are still open are set to a Clearstate.
Resolving incidents with runbooksRunbooks provide structured steps to help solve incidents.
Before you beginTo have runbooks available to use for your events, you must first define runbooks as described in theManaging runbooks and automations link at the bottom of this topic. The you must set up triggers whererunbooks are associated with events as described in the Triggers link at the bottom of this topic.
The following is an example of how to use runbooks to address the events that form an incident, and as aresult resolve the incident itself.
Procedure1. Go to the Incidents tab of the event management user interface.2. Go to My incidents and click Investigate to retrieve more information about the incident. The
Resolution view displays suggested runbooks for the type of incident.
3. In the Resolution view, click Menu overflow > Run next to the runbook you want to apply.
If the runbook uses parameters, the parameter values are based on the event policy, and depend onthe events associated with the selected runbook:
644 IBM Netcool Operations Insight: Integration Guide
• If there is only one event, or if there are multiple events all with the same parameter values, then theparameter values for the runbook are taken from a single event, and the runbook is launched usingthose values.
• If multiple events with different parameter values are correlated into an incident, each event'sparameter values are displayed. Select the value you want to run the runbook against and click Run.
Note: It is best practice to only select non-group events to send the context to Runbook Automation.Unless group events are specifically what is wanted. Group events can be enriched to have theparameter values needed by the runbooks, but in most cases will lack this context. You canoptionally set up your trigger to only associate runbooks with raw events, and avoid associatingrunbooks with group events. For example, by avoiding use of the summary field in the triggerconditions.
The Runbook Automation UI is displayed where you can work with the runbook. For moreinformation, see the Run a runbook link at the bottom of this topic.
Tip: You can also apply runbooks associated with the events from the Events tab. Click the Events tab,and identify those events that have a big dot icon in their Runbook column. Click the big dot icon for the runbook that you want to execute. Parameters values for the runbook are derived from theevent, or you might be prompted to enter a value manually either if it requires information such as auser name, or if the runbook is set up to request the value at runtime.
For more information about viewing the available runbooks, reviewing the runbooks that you have usedto date, and running the runbooks, see the Library link at the bottom of this topic.
Important: If you take an action against an incident that is not assigned to an owner, such as running arunbook manually, the incident status is automatically set to In progress, and the incident is assignedto you. The incident is also automatically assigned to you if you manually set the incident state to Inprogress. If you are a member of more than one group, then you must choose a group. You will betaking ownership of the incident and working to resolve it as a member of the selected group.
Re-selecting No owner will clear any other status.4. The runbook completes and solves the underlying problem causing the incident. The events that
formed the incident are then cleared, and in turn the incident is automatically set to resolved andclosed.
What to do nextFor information about creating and managing runbooks, see Runbooks.
Working with topologyUse the Topology management capability within Netcool Operations Insight to visualize your topologydata. First you define a seed resource on which to base your view, then choose the levels of networkedresources around the seed that you wish to display, before rendering the view. You can then furtherexpand or analyze the displayed topology in real time, or compare it to previous versions within ahistorical time window.
The Topology Viewer is the component that visualizes topology data. It has four toolbars and avisualization display area.Navigation toolbar
You use the navigation toolbar to select the seed resource, define the number of relationship hops tovisualize from the seed resource, and specify the type of relationship hop traversal to make (eitherhost-to-host, or element-to-element).
Resource filter toolbarYou use the resource filter toolbar to apply entity- or relationship-type filters to the resourcesdisplayed in the topology.
Visualization toolbarYou use the Visualization toolbar to customize the topology view, for example by zooming in andpanning.
Chapter 9. Operations 645
History toolbarYou use the History toolbar to compare and contrast a current topology with historical versions.
Topology visualization panelYou use the Topology visualization panel to view the topology, and access the resource nodes forfurther analysis performed via the context menu.
Rendering (visualizing) a topologyYou define the scope of the topology that you want to render by specifying a seed resource, the number ofrelationship hops surrounding that resource, as well as the types of hops. The topology service thensupplies the data required to visualize the topology.
Before you beginTo visualize a topology, your topology service must be running, and your Observer jobs must be active.
About this taskYou use this task to render a topology based on a specified seed resource.
Note: The UI has a default timeout set at 30 seconds. If service requests are not received in that time, atimeout message is shown, as in the following example:A time-out has occurred. No response was received from the Proxy Service within30 seconds.See Topology render timeout for more information on addressing this issue.
Procedure1. Access the Topology Viewer.
The Search page is displayed immediately. From here, you search for a seed resource to build yourtopology.
2. Find a resource.Search for a resource
The seed resource of the topology visualization.You define the seed resource around which a topology view is rendered using the Search for aresource field. As you type in a search term related to the resource that you wish to find, such asname or server, a drop-down list is displayed with suggested search terms that exist in thetopology service.If the resource that you wish to find is unique and you are confident that it is the first result in thelist of search results, then instead of selecting a result from the suggested search terms, you canchoose to click the shortcut in the Suggest drop-down, which will render and display the topologyfor the closest matching resource.If you select one of the suggested results, the Search Results page is displayed listing possibleresource results.The Results are listed under separate Resources and Topologies tabs.
Defined topology restriction:
• Defined topologies must be defined by an administrator user before they are listed.• If you are an administrator defining topology templates in the Topology template builder,
search results are listed under separate Resources and Templates tabs.• To add a defined topology search result to the collection of topologies accessible in the Topology
Dashboard, tag it as a favorite by selecting the star icon next to it.
For each result, the name, type and other properties stored in the Elasticsearch engine aredisplayed.
646 IBM Netcool Operations Insight: Integration Guide
If a status other than clear exists for a search result, the maximum severity is displayed in theinformation returned, and a color-coded information bar above each result displays all non-clearstatuses (in proportion).You can expand a result in order to query the resource or defined topology further and displaymore detailed, time-stamped information, such as its state and any associated severity levels, orwhen the resource was previously updated or replaced (or deleted).You can click the View Topology button next to a result to render the topology.
Defined topology restriction:
• When you load a predefined topology, it is displayed in a 'defined topology' version of theTopology Viewer, which has restricted functionality. You are unable to follow its neighbors, orchange its hops, or make use of its advanced filters.
• You can recenter the defined topology from the context menu, which loads it in the TopologyViewer with all its standard functionality.
From the Navigation toolbar, perform the following actions:3. Select a number between one and four to define the number of relationship hops to be visualized.
See the Defining global settings topic for more information on customizing the maximum hop count.4. Choose one of the following hop types:
• The Element to Element hop type performs the traversal using all element types in the graph.• The Host to Host hop type uses an aggregate traversal across elements with the entity type 'host'.• The Element to Host hop type provides an aggregated hop view like the 'Host to Host' type, but
also includes the elements that are used to connect the hosts.5. Filter the topology before rendering it.
Open the Filter toolbar using the Filter toggle, and apply the filters required. For more information onusing filters, see the Filter the topology section in the 'Viewing a topology' topic.
6. Click Render to render the topology.
ResultsThe Topology Viewer connects to the topology service and renders the topology. By default the view isrefreshed every thirty seconds, unless specified otherwise (by an administrator user).
Trouble: Topology render timeout: If you receive a timeout message, this may be due to anumber of reasons:
• Large amounts of data being retrieved for complex topologies• Too many hop counts specified• Issues with the back-end services
Workarounds
• Check that all services are running smoothly. You can verify that the docker containers arerunning using the following command:
$ASM_HOME/bin/docker-compose ps
The system should return text indicating that all containers have a state of Up.• Lower the hop count to reduce the service load. See the Defining global settings topic for
more information on customizing the maximum hop count.• An administrator user can increase the default 30 seconds timeout limit by changing the
following setting in the application.yml file:
proxyServiceTimeout: 30
You must restart DASH for the new timeout value to take effect:
Chapter 9. Operations 647
– To stop the DASH server, run <DASH_PROFILE>/bin/stopServer.sh server1– Once stopped, start the DASH server: <DASH_PROFILE>/bin/startServer.shserver1
What to do nextNext, you can refine and manipulate the view for further analysis.
Viewing a topologyOnce you have rendered a topology, you can refine and manipulate the view.
Before you beginTo refine a topology, you must have previously defined a topology, as described in the “Rendering(visualizing) a topology” on page 646 topic.
Note: You can change a topology if and as required while viewing or refining an existing topology.
About this taskYou can perform the following actions once you have rendered a topology:View the topology
You can zoom in and out of the specific areas of the topology, and pan across it in various ways.You can also auto-fit the topology into the available display window, draw a mini map, or redraw theentire topology.
Use the Update ManagerWith auto-updates turned off, you can work with your current topology until you are ready to integratethe new resources into the view.
Filter resourcesYou can filter the types of resources displayed, or the types of relationships rendered.
ProcedureView a topology (created earlier)1. From the Visualization toolbar below the Navigation toolbar, you can manipulate the topology using a
number of visualization tools.Select tool submenu
When you hover over the Select tool icon, a submenu is displayed from which you can choose theSelect, Pan or Zoom Select tool.Select tool
Use this icon to select individual resources using a mouse click, or to select groups ofresources by creating a selection area (using click-and-drag).
Pan toolUse this icon to pan across the topology using click-and-drag on a blank area of thevisualization panel.
Zoom Select toolUse this icon to zoom in on an area of the topology using click-and-drag.
Zoom InUse this icon to zoom in on the displayed topology.
Zoom OutUse this icon to zoom out of the displayed topology.
Zoom FitUse this icon to fit the entire topology in the current view panel.
648 IBM Netcool Operations Insight: Integration Guide

Overview ToggleUse this icon to create the overview mini map in the bottom right corner.The mini map provides an overview of the entire topology while you zoom in or out of the maintopology. The mini map displays a red rectangle to represent the current topology view.
LayoutUse this icon to recalculate, and then render the topology layout again.You can choose from a number of layout types and orientations.Layout 1
A layout that simply displays all resources in a topology without applying a specific layoutstructure.
Layout 2A circular layout that is useful when you want to arrange a number of entities by type in acircular pattern.
Layout 3A grouped layout is useful when you have many linked entities, as it helps you visualize theentities to which a number of other entities are linked. This layout helps to identify groups ofinterconnected entities and the relationships between them.
Layout 4A hierarchical layout that is useful for topologies that contain hierarchical structures, as itshows how key vertices relate to others with peers in the topology being aligned.
Layout 5A peacock layout is useful when you have many interlinked vertices, which group the otherlinked vertices.
Layout 6A planar rank layout is useful when you want to view how the topology relates to a given vertexin terms of its rank, and also how vertices are layered relative to one another.
Layout 7A rank layout is useful when you want to see how a selected vertex and the verticesimmediately related to it rank relative to the remainder of the topology (up to the specifiedamount of hops). The root selection is automatic.For example, vertices with high degrees of connectivity outrank lower degrees of connectivity.This layout ranks the topology automatically around the specified seed vertex.
Layout 8A root rank layout similar to layout 7, except that it treats the selected vertex as the root. Thislayout is useful when you want to treat a selected vertex as the root of the tree, with othersbeing ranked below it.Ranks the topology using the selected vertex as the root (root selection: Selection)
Layout orientationFor layouts 4, 6, 7 and 8, you can set the following layout orientations:
• Top to bottom• Bottom to top• Left to right• Right to left
History toggleUse this to open and close the Topology History toolbar. The topology is displayed in history modeby default.
Configure Refresh RateWhen you hover over the Refresh Rate icon, a submenu is displayed from which you can configurethe auto-update refresh rate.
Chapter 9. Operations 649
You can pause the topology data refresh, or specify the following values: 10 seconds, thirtyseconds (default), one minute, or five minutes.
Resource display conventionsDeleted: A minus icon shows that a resource has been deleted since last rendered.Displayed when a topology is updated, and in the history views.Added: A purple plus (+) icon shows that a resource has been added since last rendered.Displayed when a topology is updated, and in the history views.Added (neighbors): A blue asterisk icon shows that a resource has been added using the 'getneighbors' function.
Use the Update Manager2. If auto-updates have been turned off, the Update Manager informs you if new resources have been
detected. It allows you to continue working with your current topology until you are ready to integratethe new resources into the view.The Update Manager is displayed in the bottom right of the screen.Show details
Displays additional resource information.Render
Integrates the new resources into the topology.Choosing this option will recalculate the topology layout based on your current display settings,and may therefore adjust the displayed topology significantly.
Cogwheel iconWhen clicked, provides you with quick access to change your user preferences:
• Enable auto-refresh: Switches auto-refresh back on, and disables the Update Manager.• Remove deleted resources: Removes the deleted resources from your topology view when the
next topology update occurs.
HideReduces the Update Manager to a small purple icon that does not obstruct your current topologyview.When you are ready to deal with the new resources, click on the icon to display the UpdateManager again.
Modify a topology3. The displayed topology consists of resource nodes and the relationship links connecting the resources.
You can interact with these nodes and links using the mouse functionality.Dragging a node
Click and drag a node to move it.Selecting a node
Selection of a node highlights the node, and emphasizes its first-order connections by fading allother resources.
Context menu (right-click)You open the context menu using the right-click function. The context menu provides access to theresource-specific actions you can perform.For resource entities, you can perform the following:Resource Details
When selected, displays a dialog that shows all the current stored properties for the specifiedresource in tabular and raw format.When selected while viewing a topology history with Delta mode On, the properties of theresource at both the reference time and at the delta time are displayed.
650 IBM Netcool Operations Insight: Integration Guide
Resource StatusIf statuses related to a specific resource are available, the resource will be marked with an icondepicting the status severity level, and the Resource Status option will appear in the resourcecontext menu.When selected, Resource Status displays a dialog that shows the time-stamped statusesrelated to the specified resource in table format. The Severity and Time columns can be sorted,and the moment that Resource Status was selected is also time-stamped.In addition, if any status tools have been defined, the status tool selector (three dots) isdisplayed next to the resource's statuses. Click the status tool selector to display a list of anystatus tools that have been defined, and then click the specific tool to run it. Status tools areonly displayed for the states that were specified when the tools were defined.The severity of a status ranges from 'clear' (white tick on a green square) to 'critical' (whitecross on a red circle).
Table 99. Severity levels
Icon Severity
clear
indeterminate
information
warning
minor
major
critical
CommentsWhen selected, this displays any comments recorded against the resource.By default, resource comments are displayed by date in ascending order. You can sort them inthe following way:
• Oldest first• Newest first• User Id (A to Z)• User Id (Z to A)
Users with the inasm_operator role can view comments, but cannot add any comments.Users with inasm_editor or inasm_admin roles can also add new comments. See https://www.ibm.com/support/knowledgecenter/SS9LQB_1.1.10/Installing/t_asm_configuring.htmlfor more information on assigning user roles.To add a new comment, enter text into the New Comment field, and then click Add Commentto save.
Get NeighborsWhen selected, opens a menu that displays the resource types of all the neighboringresources. Each resource type lists the number of resources of that type, as well as themaximum severity associated with each type.You can choose to get all neighbors of the selected resource, or only the neighbors of a specifictype. This lets you expand the topology in controlled, incremental steps.Selecting Get Neighbors overrides any existing filters.
Chapter 9. Operations 651

You can Undo the last neighbor request made.Follow Relationship
When selected, opens a menu that displays all adjacent relationship types.Each relationship type lists the number of relationships of that type, as well as the maximumseverity associated with each type.You can choose to follow all relationships, or only the neighbors of a specific type.
Show last change in timelineWhen selected, will display the history timeline depicting the most recent change made to theresource.
Show first change in timelineWhen selected, will display the history timeline depicting the first change made to theresource.
Recenter ViewWhen selected, this updates the displayed topology with the specified resource as seed.
Filter the topology4. Open the Resource Filter toolbar using the Filter toggle in the Topology Visualization toolbar. From
here, you can apply filters to the topology in order to refine the types of resources or relationshipsdisplayed.The Filter toolbar is displayed as a panel on the right-hand side of the page, and consists of a Simpleand an Advanced tab. If selected, each tab provides you with access to lists of Resource types andRelationship types. Only types relevant to your topology are displayed, for example host, ipaddress oroperatingsystem, although you can use the Show all types toggle to view all of them.Simple tab
When you use the Simple tab to filter out resource or relationship types, all specified types areremoved from view, including the seed resource.It only removes the resources matching that type, leaving the resources below, or further out fromthat type, based on topology traversals.By default, all types are On. Use the Off toggle to remove specific types from your view.
Advanced tabThe Advanced tab performs a server-side topology-based filter action.It removes the resources matching that type, as well as all resources below that type.However, the seed resource is not removed from view, even if it is of a type selected for removal.
Tips
Reset or invert all filters: Click Reset to switch all types back on, or click Invert to invert yourselection of types filtered.
Hover to highlight: When a topology is displayed, hover over one of the filtering type options tohighlight them in the topology.
Viewing topology historyYou can view a topology dynamically, or use the history timeline function to compare and contrast thecurrent topology with historical versions.
Before you beginTo refine a topology, you must have previously defined a topology, as described in the “Rendering(visualizing) a topology” on page 646 topic.
Note: You can change a topology if and as required while viewing or refining an existing topology.
About this taskTip: The topology is displayed in history mode by default.
652 IBM Netcool Operations Insight: Integration Guide

Procedure1. Open the Topology History toolbar by clicking the History toggle in the Topology Visualization toolbar
(on the left).2. You can display and refine topology history in a number of ways.
Update modeThe topology is displayed in update mode by default with Delta mode set to Off.While viewing the timeline in update mode with Delta mode set to On, any changes to the topologyhistory are displayed on the right hand side of the timeline, with the time pins moving apart at setintervals. By clicking Render, you reset the endpoint to 'now' and the pins form a single line again.While viewing the timeline in update mode with Delta mode set to Off, only a single pin isdisplayed.
Delta modeYou toggle between delta mode On and Off using the Delta switch above the topology.When Delta mode is On with Update mode also On, differences in topology are displayed via purpleplus or minus symbols next to the affected resource.When Delta mode is On with History mode On (that is, Update mode set to Off), you can comparetwo time points to view differences in topology. Historical change indicators (blue dots) aredisplayed next to each affected resource.
Note: For efficiency reasons, historical change indicators are only displayed for topologies withfifty or fewer resources. You can reduce (but not increase) this default by changing the HistoricalChange Threshold as described in Defining global settings.
Lock time pinClick the Lock icon on a time pin's head to lock a time point in place as a reference point, andthen use the second time slider to view topology changes.
Compare resource propertiesClick Resource Properties on a resource's context menu to compare the resource's data at thetwo selected time points. You can view and compare the resource's property names and valuesin table format, or raw JSON format.
History timelineYou open the Topology History toolbar using the History toggle in the Topology Visualizationtoolbar (on the left).You use the time pins to control the topology shown. When you move the pins, the topologyupdates to show the topology representation at that time.While in delta mode you can move both pins to show a comparison between the earliest pin andthe latest. The timeline shows the historic changes for a single selected resource, which isindicated in the timeline title. You can lock one of the time pins in place to be a reference point.When you first display the history timeline, coach marks (or tooltips) are displayed, which containhelpful information about the timeline functionality. You can scroll through these, or switch themoff (or on again) as required.To view the timeline for a different resource, you click on it, and the heading above the timelinechanges to display the name of the selected resource. If you click on the heading, the topologycenters (and zooms into) the selected resource.The history timeline is displayed above a secondary time bar, which displays a larger time segmentand indicates how much of it is depicted in the main timeline. You can use the jump buttons tomove back and forth along the timeline, or jump to the current time.You can use the time picker, which opens a calendar and clock, to move to a specific second intime.To view changes made during a specific time period, use the two time sliders to set the timeperiod. You can zoom in and out to increase or decrease the granularity using the + and - buttonson the right, or by double-clicking within a time frame. The most granular level you can display is
Chapter 9. Operations 653

an interval of one second. The granularity is depicted with time indicators and parallel bars, whichform 'buckets' that contain the recorded resource change event details.The timeline displays changes to a resource's state, properties, and its relationships with otherresources. These changes are displayed through color-coded bars and dash lines, and areelaborated on in a tooltip displayed when you hover over the change. You can exclude one or moreof these from display.Resource state changes
The timeline displays the number of state changes a resource has undergone.Resource property changes
The timeline displays the number of times that resource properties were changed.Each time that property changes were made is displayed as one property change eventregardless of whether one or more properties were changed at the time.
Resource relationship changesThe number of relationships with neighboring resources are displayed, and whether these werechanged.The timeline displays when relationships with other resources were changed, and also whetherthese changes were the removal or addition of a relationship, or the modification of an existingrelationship.
Rebuilding a topologyOnce you have rendered a topology, you can search for (or define) a new seed resource and build atopology around it, change the number of hops rendered, and switch between element-to-element, host-to-host and element-to-host hop types.
Before you beginTo refine a topology, you must have previously defined a topology, as described in the “Rendering(visualizing) a topology” on page 646 topic.
Note: You can change a topology if and as required while viewing or refining an existing topology.
About this taskTip: For information on re-indexing the Search service, see the 'Re-indexing Search' information in thetask troubleshooting section of this topic.
ProcedureFrom the Navigation toolbar, you can again search for a resource around which to build a topology, changethe number of hops and the type of hop, and re-render the topology.Topology Search
If you conduct a resource search from the navigation toolbar with a topology already loaded, thesearch functionality searches the loaded topology as well as the topology database.As you type in a search term, a drop-down list is displayed that includes suggested search resultsfrom the displayed topology listed under the In current view heading.If you hover over a search result in this section, the resource is highlighted in the topology window.If you click on a search result, the topology view zooms in on that resource and closes the search.
No. HopsThe number of relationship hops to visualize from the seed resource, with the default set at 'one'.You define the number of relationship hops to be performed, which can be from one to four, unlessthis setting has been customized. See the Defining global settings topic for more information oncustomizing the maximum hop count.
654 IBM Netcool Operations Insight: Integration Guide

Type of HopThe type of graph traversal used.The options are:Element to Element hop type
This type performs the traversal using all element types in the graph.Host to Host hop type
This type generates a view showing host to host connections.Element to Host hop type
This type provides an aggregated hop view like the Host to Host type, but also includes theelements that are used to connect the hosts.
Tip: The URL captures the hopType as 'e2h'. When launching a view using a direct URL, you canuse the hopType=e2h URL parameter.
Filter toggleUse this icon to display or hide the filter toolbar. You can filter resources that are displayed in thetopology, or set filters before rendering a topology to prevent a large, resource-intensive topologyfrom being loaded.If a filter has been applied to a displayed topology, the text 'Filtering applied' is displayed in the statusbar at the bottom of the topology.
RenderThis performs the topology visualization action, rendering the topology based on the settings in thenavigation toolbar.Once rendered, the topology will refresh on a 30 second interval by default. You can pause the auto-update refresh, or select a custom interval.
Tip: The UI can time out if a large amount of data is being received. See the timeout troubleshootingsection in the following topic for information on how to address this issue, if a timeout message isdisplayed: “Rendering (visualizing) a topology” on page 646
Performing topology administrationFrom the Topology Viewer, you can obtain direct-launch URLs, perform a system health check, and setuser preferences.
Before you beginAccess the Topology Viewer.
About this taskYou can perform the following admin actions:Share direct launch URL
You can copy and save a URL to quickly access a currently defined topology view.Export a topology snapshot
You can share a snapshot of a topology in either PNG or SVG format.View system health
You can view your system's health.Set user preferences
You can set user preferences that define the default settings for rendering your topology.
ProcedureYou perform the following actions from the Navigation bar > Additional actions or Navigation bar >Sharing options menus.
Chapter 9. Operations 655
Sharing optionsYou can share a topology either by obtaining a direct URL linking to the topology view, or by exportinga view of the topology as an image.Obtain Direct URL
Open the Sharing options drop-down menu, and then use the Obtain Direct URL option to displaythe Direct Topology URL dialog.The displayed URL captures the current topology configuration, including layout type (layoutorientation is not tracked).Click Copy to obtain a direct-launch URL string, then click Close to return to the previous screen.Use the direct-launch URL for quick access to a given topology view within DASH.
Tip: You can share this URL with all DASH users with the required permissions.
Export as PNG / SVGYou can share a snapshot of a topology in either PNG or SVG format, for example with someonewho does not have DASH access.Open the Sharing options drop-down menu, and then use either the Export as PNG or the Exportas SVG option.Specify a name and location, then click Save to create a snapshot of your topology view.You can now share the image as required.
Additional actions > View System HealthOpen the Additional actions drop-down menu, and then use the View System Health option toaccess your Topology management deployment's system health information.
Additional actions > Edit User PreferencesOpen the Additional actions drop-down menu, and then use the Edit User Preferences option toaccess the User Preferences window. Click Save, then Close when done.You can customize the following user preferences to suit your requirements:Updates
Default auto refresh rate (seconds)The rate at which the topology will be updated.The default value is 30.You must reopen the page before any changes to this user preference take effect.
Maximum number of resources to load with auto refresh enabledWhen the resource limit set here is reached, auto-refresh is turned off.The maximum value is 2000, and the default is set to 500.
Tip: If you find that the default value is too high and negatively impacts your topology viewer'sperformance, reduce this value.
Auto render new resourcesEnable this option to display new resources at the next scheduled or ad-hoc refresh as soon asthey are detected.
Remove deleted topology resourcesEnable this option to remove deleted resources at the next scheduled or ad-hoc refresh.
LayoutSet Default layout type including the layout orientation for some of the layout types. You can alsoconfigure a default layout in User Preferences.You can choose from a number of layout types, and also set the orientation for layouts 4, 6, 7 and8.
Tip: A change to a layout type is tracked in the URL (layout orientation is not tracked). You canmanually edit your URL to change the layout type display settings.
The following numbered layout types are available:
656 IBM Netcool Operations Insight: Integration Guide
Layout 1A layout that simply displays all resources in a topology without applying a specific layoutstructure.
Layout 2A circular layout that is useful when you want to arrange a number of entities by type in acircular pattern.
Layout 3A grouped layout is useful when you have many linked entities, as it helps you visualize theentities to which a number of other entities are linked. This layout helps to identify groups ofinterconnected entities and the relationships between them.
Layout 4A hierarchical layout that is useful for topologies that contain hierarchical structures, as itshows how key vertices relate to others with peers in the topology being aligned.
Layout 5A force-directed (or 'peacock') layout is useful when you have many interlinked vertices, whichgroup the other linked vertices.
Layout 6A planar rank layout is useful when you want to view how the topology relates to a given vertexin terms of its rank, and also how vertices are layered relative to one another.
Layout 7A rank layout is useful when you want to see how a selected vertex and the verticesimmediately related to it rank relative to the remainder of the topology (up to the specifiedamount of hops). The root selection is automatic.For example, vertices with high degrees of connectivity outrank lower degrees of connectivity.This layout ranks the topology automatically around the specified seed vertex.
Layout 8A root rank layout similar to layout 7, except that it treats the selected vertex as the root. Thislayout is useful when you want to treat a selected vertex as the root of the tree, with othersbeing ranked below it.Ranks the topology using the selected vertex as the root (root selection: Selection)
Layout orientationFor layouts 4, 6, 7 and 8, you can set the following layout orientations:
• Top to bottom• Bottom to top• Left to right• Right to left
MiscInformation message auto hide timeout (seconds)
The number of seconds that information messages are shown for in the UI.The default value is 3.
Tip: If you are using a screen reader, it may be helpful to increase this value to ensure that youdo not miss the message.
Screen reader support for graphical topologyYou can enable the display of additional Help text on screen elements, which can improve theusability of screen readers.You must reopen the page before any changes to this user preference take effect.
Enhanced client side logging, for problem diagnosisIf enabled, additional debug output is generated, which you can use for defect isolation.
Chapter 9. Operations 657
Tip: Use this for specific defect hunting tasks, and then disable it again. If left enabled, it canreduce the topology viewer's performance.
You must reopen the page before any changes to this user preference take effect.
Using the topology dashboardYou can use the Topology Dashboard to tag, view and access your most commonly used 'favorite' definedtopologies.
About this taskThe Topology Dashboard presents a single view of all defined topologies that have been tagged asfavorites. They are displayed as a collection of circles, each surrounded by a color-coded band thatindicates the states of all the constituent resources in proportional segments. In addition, each definedtopology may display an icon, if assigned by the owner. From here, you can access each defined topologyfor further investigation or action.
ProcedureTagging a defined topology as a favorite1. As the admin user, log into your DASH web application, then select Administration from the DASH
menu.2. Select Topology Dashboard under the Agile Service Management heading.
All defined topologies tagged as 'favorites' are displayed.3. To add defined topologies as favorites, enter a search term in the Search for a defined topology field.
The Search Results page is displayed listing possible results.4. To save a topology as a favorite, click the star icon next to it on theSearch Results page.
You can remove the favorite tag by deselecting the star again.Using the Topology Dashboard to view favorites5. View defined topology information on the Topology Dashboard.
Option Description
At aglance
If you hover over a specific defined topology, an extended tooltip is displayed listing thenumber of resources against their states, which is also proportionally represented by thecolor-coded band.
Moredetails
If you click a defined topology, it is displayed in the bottom half of the screen, and thewindow with the defined topology favorites is moved to the top half of the screen.
For the displayed topology:
• The state of each resource or relationship is displayed in color, and you can use thecontext (right-click) menu to obtain further information.
• In the upper 'favorites' display window, all defined topologies that intersect with theselected topology remain in focus, while the others are grayed out.
• If you select a specific resource in your displayed topology, only the displayed favoritesthat contain the resource remain in focus.
You can remove the favorite tag by deselecting the star displayed in the top right cornerof the displayed topology.
Searching for and viewing defined topologies (or resources) is described in more detail in the Searchsection of the Topology Viewer reference topic, and in the “Working with topology” on page 645 topics.
Remember: Defined topologies are updated automatically when the topology database is updated,and generated dynamically as they are displayed in the Topology Viewer.
658 IBM Netcool Operations Insight: Integration Guide
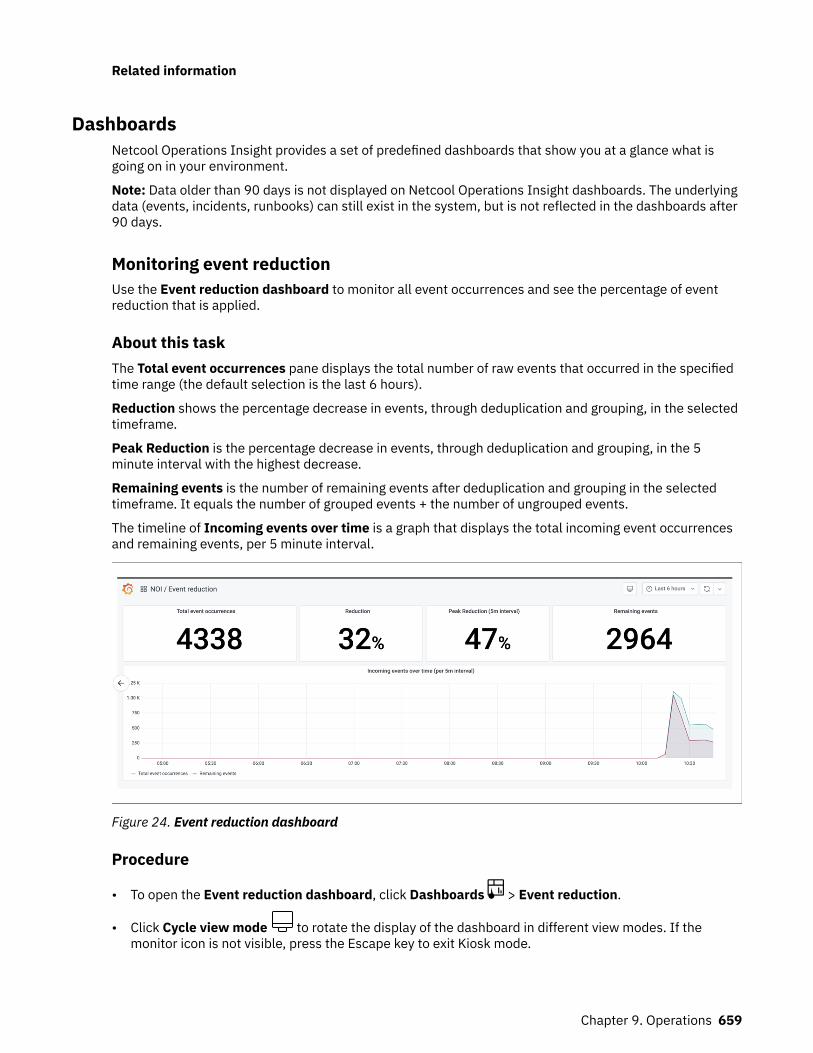
Related information
DashboardsNetcool Operations Insight provides a set of predefined dashboards that show you at a glance what isgoing on in your environment.
Note: Data older than 90 days is not displayed on Netcool Operations Insight dashboards. The underlyingdata (events, incidents, runbooks) can still exist in the system, but is not reflected in the dashboards after90 days.
Monitoring event reductionUse the Event reduction dashboard to monitor all event occurrences and see the percentage of eventreduction that is applied.
About this taskThe Total event occurrences pane displays the total number of raw events that occurred in the specifiedtime range (the default selection is the last 6 hours).
Reduction shows the percentage decrease in events, through deduplication and grouping, in the selectedtimeframe.
Peak Reduction is the percentage decrease in events, through deduplication and grouping, in the 5minute interval with the highest decrease.
Remaining events is the number of remaining events after deduplication and grouping in the selectedtimeframe. It equals the number of grouped events + the number of ungrouped events.
The timeline of Incoming events over time is a graph that displays the total incoming event occurrencesand remaining events, per 5 minute interval.
Figure 24. Event reduction dashboard
Procedure
• To open the Event reduction dashboard, click Dashboards > Event reduction.
• Click Cycle view mode to rotate the display of the dashboard in different view modes. If themonitor icon is not visible, press the Escape key to exit Kiosk mode.
Chapter 9. Operations 659

Note: To create a link or snapshot, or export the panel, access the Share dashboard. Select Cycle viewmode and press the Escape key, then select the Share dashboard icon.
• The default time range for event occurrences is the last 6 hours. Perform any of the following actionsto apply a different time range for incoming events:
– Click Time range Last 6 hours
and enter an absolute time range, or select a relative timerange from the list provided.
– Move your mouse over the timeline graph to view a tooltip of the number of the Total eventoccurrences for that point in time. Click and drag the cursor along the timeline and release it at thedesired time period on the graph.
• To refresh the dashboard, click Refresh .• To set an automatic refresh interval for the dashboard, click Refresh time interval and select an
interval.• You can switch between displaying the Total event occurrences and Remaining events data on the
graph by clicking either legend under the x-axis.
Monitoring operational efficiencyThe Operational efficiency dashboard provides an overview of the mean time to resolve and respond toincidents within your operations. You can also see the total time all incidents have spent on hold within aspecified time frame.
About this taskThe Operational efficiency dashboard displays a number of metrics in different panes. All data relates tothe selected time frame (the default selection is the last 30 days).
The Number of opened incidents pane displays the total number of incidents that were opened in thespecified time range.
Number of closed incidents shows the total number of incidents that were closed in the specified timerange.
Mean time to incident resolution displays the average time between incident creation and resolution forthe incidents in the specified time range.
Mean time to respond to an incident shows the average time between incident creation andacknowledgment in the specified time range.
Time on hold displays the total sum of time that incidents were on hold in the specified time range.
The timeline Opened incidents, by priority is a graph that displays when the incidents were opened, per5 minute interval. The incidents are grouped by their priority.
The timeline Incident metrics is a graph that displays the aforementioned metrics of Mean time toincident resolution, Mean time to respond to an incident, and Time on hold, per 5 minute interval.
660 IBM Netcool Operations Insight: Integration Guide

Figure 25. Efficiency dashboard
Procedure
• To open the Operational efficiency dashboard, click Dashboards > Operational efficiency.
• Click Cycle view mode to rotate the display of the dashboard in different view modes. If themonitor icon is not visible, press the Escape key to exit Kiosk mode.
Note: To create a link or snapshot, or export the panel, access the Share dashboard. Select Cycle viewmode and press the Escape key, then select the Share dashboard icon.
• The default time range for event occurrences is the last 30 days. Perform any of the following actionsto apply a different time range for incoming events:
– Click Time range Last 6 hours
and enter an absolute time range, or select a relative timerange from the list provided.
– Move your mouse over either timeline graph to see a tooltip of metrics for a given point in timedisplayed on each graph. Click and drag the cursor along the timeline and release it at the desiredtime period on the graph.
• To refresh the dashboard, click Refresh .• To set an automatic refresh interval for the dashboard, click Refresh time interval and select an
interval.• You can click the legends under the x-axis on the graphs to change the displayed data.
Monitoring runbook statisticsUse the Runbook statistics dashboard to review and monitor the usage of runbooks and their maturitylevels.
About this taskThe Runbook statistics dashboard is divided into two sections: runbook metrics are displayed on the leftand runbook execution records are shown on the right. The runbook execution numbers, as well as thedata displayed in the graphs, will vary depending on the selected time frame (the default selection is thelast 30 days). The data shown for the number of runbooks in the system is the overall total number. Notealso, executions of deleted runbooks are included in the dashboard data.
The Total runbooks pane displays the total number of runbooks in the runbook library. This numberupdates every 5 minutes.
Chapter 9. Operations 661
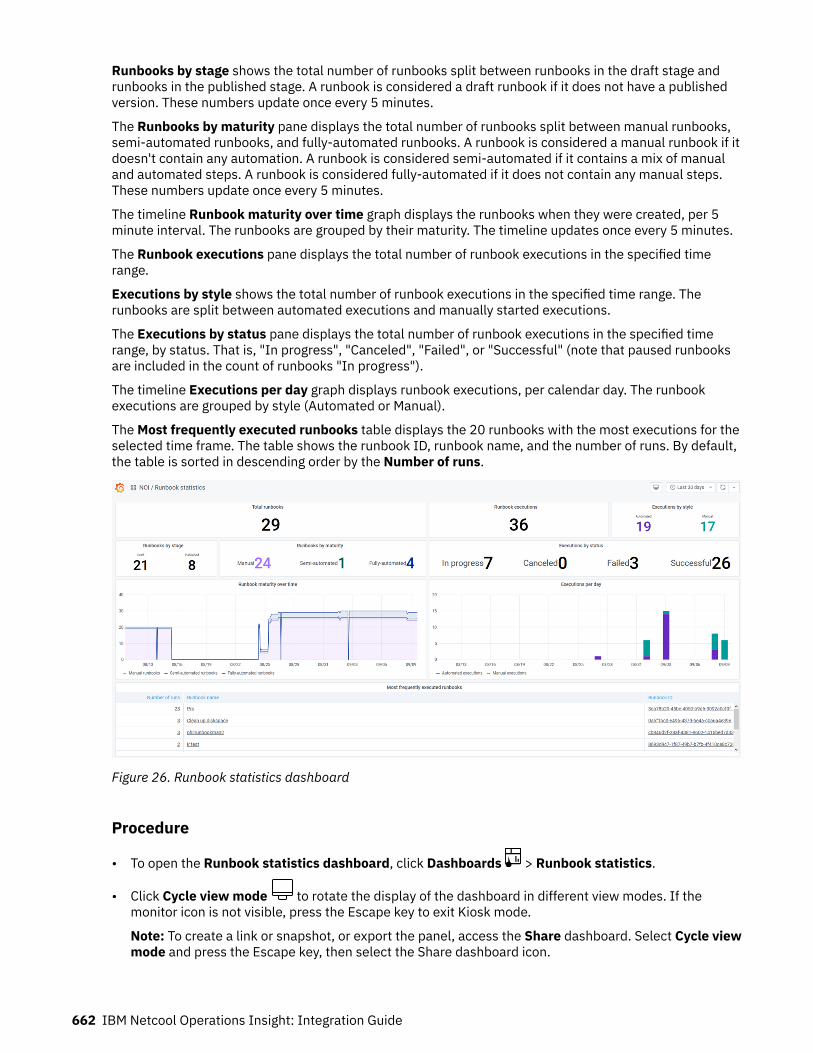
Runbooks by stage shows the total number of runbooks split between runbooks in the draft stage andrunbooks in the published stage. A runbook is considered a draft runbook if it does not have a publishedversion. These numbers update once every 5 minutes.
The Runbooks by maturity pane displays the total number of runbooks split between manual runbooks,semi-automated runbooks, and fully-automated runbooks. A runbook is considered a manual runbook if itdoesn't contain any automation. A runbook is considered semi-automated if it contains a mix of manualand automated steps. A runbook is considered fully-automated if it does not contain any manual steps.These numbers update once every 5 minutes.
The timeline Runbook maturity over time graph displays the runbooks when they were created, per 5minute interval. The runbooks are grouped by their maturity. The timeline updates once every 5 minutes.
The Runbook executions pane displays the total number of runbook executions in the specified timerange.
Executions by style shows the total number of runbook executions in the specified time range. Therunbooks are split between automated executions and manually started executions.
The Executions by status pane displays the total number of runbook executions in the specified timerange, by status. That is, "In progress", "Canceled", "Failed", or "Successful" (note that paused runbooksare included in the count of runbooks "In progress").
The timeline Executions per day graph displays runbook executions, per calendar day. The runbookexecutions are grouped by style (Automated or Manual).
The Most frequently executed runbooks table displays the 20 runbooks with the most executions for theselected time frame. The table shows the runbook ID, runbook name, and the number of runs. By default,the table is sorted in descending order by the Number of runs.
Figure 26. Runbook statistics dashboard
Procedure
• To open the Runbook statistics dashboard, click Dashboards > Runbook statistics.
• Click Cycle view mode to rotate the display of the dashboard in different view modes. If themonitor icon is not visible, press the Escape key to exit Kiosk mode.
Note: To create a link or snapshot, or export the panel, access the Share dashboard. Select Cycle viewmode and press the Escape key, then select the Share dashboard icon.
662 IBM Netcool Operations Insight: Integration Guide
• The default time range for runbook executions is the last 30 days. Perform any of the following actionsto apply a different time range for runbook executions:
– Click Time range Last 6 hours
and enter an absolute time range, or select a relative timerange from the list provided.
– Move your mouse over either timeline graph to see a tooltip of metrics for a given point in timedisplayed on each graph. Click and drag the cursor along the timeline and release it at the desiredtime period on the graph.
• To refresh the dashboard, click Refresh .• To set an automatic refresh interval for the dashboard, click Refresh time interval and select an
interval.• You can click the legends under the x-axis on the graphs to change the displayed data.
On-premises systemsPerform the following Netcool Operations Insight tasks on on-premises systems to support youroperations processes.
Managing events with IBM Netcool/OMNIbus Web GUIUse the Netcool/OMNIbus Web GUI to monitor, investigative, and resolve events.
About this taskFor information on how to use Web GUI, see the related link at the bottom of this topic.
Using Event SearchThe event search tools can find the root cause of problems that are generating large numbers of events inyour environment. The tools can detect patterns in the event data that, for example, can identify the rootcause events that cause event storms. They can save you time that would otherwise be spent manuallylooking for the event that is causing problems. You can quickly pinpoint the most important events andissues.
The tools are built into the Web GUI event lists (AEL and Event Viewer). They run searches against theevent data, based on default criteria, filtered over specific time periods. You can search against largenumbers of events. You can change the search criteria and specify different time filters. When run, thetools start the Operations Analytics - Log Analysis product, where the search results are displayed.
Before you begin• Set up the environment for event search. See “Configuring integration with Operations Analytics - Log
Analysis” on page 417.• Familiarize yourself with the Operations Analytics - Log Analysis search workspace.
– If you are using V1.3.5, then see http://www-01.ibm.com/support/knowledgecenter/SSPFMY_1.3.5/com.ibm.scala.doc/use/iwa_using_ovw.html .
– If you are using V1.3.3, then see http://www-01.ibm.com/support/knowledgecenter/SSPFMY_1.3.3/com.ibm.scala.doc/use/iwa_using_ovw.html .
• To understand the event fields that are indexed for use in event searches, familiarize yourself with theObjectServer alerts.status table. See http://www-01.ibm.com/support/knowledgecenter/SSSHTQ_8.1.0/com.ibm.netcool_OMNIbus.doc_8.1.0/omnibus/wip/common/reference/omn_ref_tab_alertsstatus.html .
Chapter 9. Operations 663
Procedure• To start using the event search tools, select one or more events from an event list and right-click. From
the right-click menu, click Event Search, click a tool, and click a time filter.The tools are as follows:
Tool Description
Show eventdashboard by node
Searches for all events that originate from the same host name, service name,or IP address, which is equivalent to the Node field of the ObjectServeralerts.status table.
Search for similarevents
Searches for all events that have the same failure type, type, and severity asthe selected events. The failure type equates to the AlertGroup field of thealerts.status table. The type equates to the Type field. The severity equates tothe Severity field.
Search for eventsby node
Searches for all events that originate from the same source, that is, host name,service name, or IP address. This is equivalent to the Node field of thealerts.status table. The results are displayed in a list in in the OperationsAnalytics - Log Analysis GUI.
Show keywordsand event count
Extracts a list of keywords from the text of the event summary, event source,and failure type. The event summary text equates to the Summary field of thealerts.status table. The event source equates to the Node field. The failure typeequates to the AlertGroup field.
The time filters are calculated from the time stamp of the selected event or events. The OperationsAnalytics - Log Analysis time stamp is equivalent to the FirstOccurrence field of the ObjectServeralerts.status table. The default time filters are as follows. If you click Custom specify an integer andunit of time, such as 15 weeks.
– 15 minutes before event– 1 hour before event– 1 day before event– 1 week before event– 1 month before event– 1 year before event– Custom ...
If a single event is selected that has the time stamp 8 January 2014 08:15:26 AM, and you clickSearch for events by node > 1 hour before event, the result is filtered on the following time range: (8January 2014 07:15:26 AM) to (8 January 2014 08:15:26 AM).
If multiple events are selected, the time filter is applied from the earliest to the most recent timestamp. For three events that have the time stamps 1 January 2014 8:28:46 AM, 7 January 20148:23:20 AM, and 8 January 2014 8:15:26 AM, the Search for events by node > 1 week before event,returns matching events in the following time range: (25 December 2013 08:28:46 AM) to (08 January2014 08:15:26 AM).
Restriction: The Web GUI and Operations Analytics - Log Analysis process time stamps differently.The Web GUI recognizes hours, minutes, and seconds but Operations Analytics - Log Analysis ignoresseconds. This problem affects the Show event dashboard by node and Search for events by node. Ifthe time stamp 8 January 2014 07:15:26 AM is passed, Operations Analytics - Log Analysis interpretsthis time stamp as 8 January 2014 07:15 AM. So, the results of subsequent searches might differ fromthe search that was originally run.
The results are displayed differently depending on the tool. The time filter has no effect on how theresults are displayed.
664 IBM Netcool Operations Insight: Integration Guide

Tool How search results are displayed
Show eventdashboard bynode
A dashboard is opened for the OMNIbus Static Dashboard custom app thatshows the following information about the distribution of the matching events:
– Event Trend by Severity– Event Storm by AlertGroup– Event Storm by Node– Hotspot by Node and AlertGroup– Severity Distribution– Top 5 AlertGroups Distribution– Top 5 Nodes Distribution– Hotspot by AlertGroup and Severity
For more information about the OMNIbus Static Dashboard custom app, see“Netcool/OMNIbus Insight Pack” on page 426 .
Search forsimilar eventsandSearch for eventsby node
The results are displayed in the search timeline, which shows the distribution ofmatching events over the specified time period. Below the timeline, the list ofresults is displayed. Click Table View or List View to change how the results areformatted. Click > or < to move forward and back in the pages of results.Keywords that occur multiple times in the search results are displayed in theCommon Patterns area of the navigation pane, with the number of occurrencesin parentheses ().
Show keywordsand event count
The keywords are displayed in the Configured Patterns area of the OperationsAnalytics - Log Analysis GUI. Each occurrence of the keyword over the timeperiod is counted and displayed in parentheses () next to the keyword.
• After the results are displayed, you can refine them by performing further searches on the results inthe search workspace.For example, click a keyword from the Configured Patterns list to add it to the Search field.
Important: Because of the difference in handling seconds between the two products, if you run afurther search against the keyword counts that result from the Show keywords and event count tool,you might see a difference in the count that was returned for a keyword under Configured Patternsand in the search that you run in the search workspace.
Above the Search field, a sequence of breadcrumbs is displayed to indicate the progression of yoursearch. Click any of the breadcrumb items to return the results of that search.
ExampleThe Show keywords and event count tool can examine what happened before a problematic event inyour environment. Assume that high numbers of critical events are being generated in an event storm. Apossible work flow is as follows:
• You select a number of critical events and click Event search > Show keywords and event count > 1hour before event so that you can identify any similarities between critical events that occurred in thelast hour.
• The most recent time stamp (FirstOccurrence) of an event is 1 January 2014 8:28:00 AM. In theOperations Analytics - Log Analysis GUI, the search results show all keywords from the Summary, Node,and AlertGroup fields and the number of occurrences.
• You notice that the string "swt0001", which is the host name of a switch in your environment, has a highnumber of occurrences. You click swt0001 and run a further search, which reduces the number ofresults to only the events that contain "swt0001".
Chapter 9. Operations 665
• From this pared-down results list, you quickly notice that one event shows that switch is misconfigured,and that this problem is causing problems downstream in the environment. You can then return to theevent list in the Web GUI and take action against this single event.
What to do nextPerform the actions that are appropriate for your environment against the events that are identified by thesearches. See http://www-01.ibm.com/support/knowledgecenter/SSSHTQ_8.1.0/com.ibm.netcool_OMNIbus.doc_8.1.0/webtop/wip/task/web_use_jsel_manageevents.html? for theEvent Viewer and http://www-01.ibm.com/support/knowledgecenter/SSSHTQ_8.1.0/com.ibm.netcool_OMNIbus.doc_8.1.0/webtop/wip/task/web_use_ael_managingevents.html? for theAEL.Related conceptsOperations Management tasks
Event search workflow for operatorsA typical workflow to show operators how the event search tools can assist triaging and diagnostics fromthe event list.
Assume the following situation: An event storm has been triggered but the cause of the storm is unclear.For the past hour, large numbers of critical events have been generated. Run the event search toolsagainst the critical events.
1. To gain an overview of what has happened since the event storm started, select the critical events.Then, right-click and click Event search > Show event dashboard by node > 1 hour before event. Thecharts that are displayed show how the critical events break down, by node, alert group, severity, andso on.
2. Check whether any nodes stand out on the charts. If so, close the Operations Analytics - Log AnalysisGUI, return to the event list and find an event that originates on that node. For example, type a filter inthe text box on the Event Viewer toolbar like the following example that filters on critical events fromthe mynode node.
SELECT * from alerts.status where Node = mynode; and Severity = 5;
After the event list refreshes to show only matching events, select an event, right-click, and click Eventsearch > Search for events by node > 1 hour before event.
3. In the search results, check whether an event from that node stands out. If so, close the OperationsAnalytics - Log Analysis GUI, return to the event list, locate the event, for example, by filtering on thesummary or serial number:
SELECT * from alerts.status where Node = mynode; and Summary like “Link Down ( FastEthernet0/13 )”;
SELECT * from alerts.status where Node = mynode; and Serial = 4586967;
Action the event.4. If nothing stands out that identifies the cause of the event storm, close the Operations Analytics - Log
Analysis GUI and return to the event list. Select all the critical events again and click Event search >Show keywords and event count > 1 hour before event.
5. From the results, look in the Common Patterns area on the navigation pane. Looks for keywords thatare non generic but have a high occurrence, for instance host name or IP addresses.
6. Refine the search results by clicking relevant keywords to copy them to the Search field and runningthe search. All events in which the keyword occurs are displayed, and the Common Patterns area isupdated.
7. If an event stands out as the cause of the event storm, close the Operations Analytics - Log AnalysisGUI, return to the event list, and action the event. If not, continuously refine the search results bysearching against keywords until a likely root cause event stands out.
666 IBM Netcool Operations Insight: Integration Guide
For possible actions from the Event Viewer see http://www-01.ibm.com/support/knowledgecenter/SSSHTQ_8.1.0/com.ibm.netcool_OMNIbus.doc_8.1.0/webtop/wip/task/web_use_jsel_manageevents.html . For possible actions from the Active Event List, see http://www-01.ibm.com/support/knowledgecenter/SSSHTQ_8.1.0/com.ibm.netcool_OMNIbus.doc_8.1.0/webtop/wip/task/web_use_ael_managingevents.html . Other actions are possible, depending on thetools that are implemented in your environment.
Using Topology SearchAfter the topology search capability is configured, you can have Operations Analytics - Log Analysis showyou the events that occurred within a specific time period on routes between two devices in the networktopology. This capability is useful to pinpoint problems on the network, for example, in response to adenial of service attack on a PE device.
The custom apps of the Network Manager Insight Pack can be run from the Operations Analytics - LogAnalysis and, depending on your configuration, from the Network Views in Network Manager IP Editionand the event lists in the Web GUI. The custom apps support searches on Layer 2 and Layer 3 of thetopology. The custom apps use the network-enriched event data and the topology data from the NetworkManager IP Edition NCIM database. They plot the lowest-cost routes across the network between twonodes (that is, network entities) and count the events that occurred on the nodes along the routes. Youcan specify different time periods for the route and events. The algorithm uses the speed of the interfacesalong the routes to calculate the routes that are lowest-cost. That is, the fastest routes from start to endalong which a packet can be sent. The network topology is based on the most recent discovery. Historicalroutes are not accounted for. If your network topology is changeable, the routes between the nodes canchange over time. If the network is stable, the routes stay current.
Before you begin• Knowledge of the events in your topology is required to obtain meaningful results from the topology
search, for example, how devices are named in your environment, or with what information devices areenriched. Device names are usually indicative of their functions. This level of understanding helps yourun searches in Operations Analytics - Log Analysis.
• Configure the products to enable the topology search capability. See “Configuring topology search” onpage 450.
• To avoid reentering user credentials when launching between products, configure SSO. See “Configuringsingle sign-on for the topology search capability” on page 453.
• Create the network views that visualize the parts of the network that you are responsible for and want tosearch. See https://www.ibm.com/support/knowledgecenter/SSSHRK_4.2.0/admin/task/adm_crtnwview.html .
• Reconfigure your views in the Web GUI to display the NmosObjInst column. The tools that launch thecustom apps of the Network Manager Insight Pack work only against events that have a value in thiscolumn. See http://www-01.ibm.com/support/knowledgecenter/SSSHTQ_8.1.0/com.ibm.netcool_OMNIbus.doc_8.1.0/webtop/wip/task/web_cust_settingupviews.html .
ProcedureThe flow of this procedure is to select the two nodes, select the tool and a time period over which the toolsearches the historical event data. Then, in the Operations Analytics - Log Analysis UI, select the routethat you are interested in and view the events. You can run searches on the events to refine the results.1. Run the topology search from one of the products, as follows:
• Web GUI event lists:
a. In an Event Viewer or AEL, select two rows that have a value in the NmosObjInst column.b. Right click and click Event Search > Find events between two nodes > Layer 2 Topology or
Event Search > Find events between two nodes > Layer 3 Topology, depending on which layerof the topology you want to search.
Chapter 9. Operations 667
c. Click a time filter, or click Custom and select one.• Network Manager IP Edition network views:
a. Select two devices.b. Click Event Search > Find Events Between 2 Nodes > Layer 2 Topology or Event Search >
Find Events Between 2 Nodes > Layer 3 Topology depending on which layer of the topologyyou want to search.
c. Click a time filter, or click Custom and select one.• Operations Analytics - Log Analysis UI. In the Operations Analytics - Log Analysis UI, the app
requires search results before you can run it. In the search results, select the NmosObjInstcolumn. The app finds the events between the two nodes on which each selected event originated.
Important: Select the NmosObjInst cells only. Do not select the entire rows. If you select theentire rows, no results are found, or incorrect routes between the entities on the network are found.
In the Search Dashboards section of the UI, click NetworkManagerInsightPack > Find eventsbetween two nodes on layer 2 topology or Find events between two nodes on layer 3 topology,depending which network layer you want to view.
See “Example” on page 669 for an example of how to run the apps from the Operations Analytics -Log Analysis UI.
The results of the search are displayed on the Operations Analytics - Log Analysis UI as follows:
Find alerts between two nodes on layer 2 topologyThis app shows the distribution of alerts on the least-cost routes between two network end pointsin a layer 2 topology. Charts show the alert distribution by severity and alert group for each routeover the specified time period. The ObjectServer field for the alert group is AlertGroup. A list of theroutes is displayed from which you can search the events that occurred on each route over thespecified time period.
Find alerts between two nodes on layer 3 topologyThis app shows the distribution of alerts on the least-cost routes between two network end pointsin a layer 3 topology. Charts show the alert distribution by severity and alert group for each routeover the specified time period. The ObjectServer field for the alert group is AlertGroup. A list of theroutes is displayed from which you can search the events that occurred on each route over thespecified time period.
The apps count the events that occurred over predefined periods of time, relative to the current time,or over a custom time period that you can specify. For the predefined time periods, the current time iscalculated differently, depending on which product you run the apps from. Network Manager IP Editionuses the current time stamp. The Tivoli Netcool/OMNIbus Web GUI uses the time that is specified inthe FirstOccurrence field of the events.
Restriction: The Web GUI and Operations Analytics - Log Analysis process time stamps differently.The Web GUI recognizes hours, minutes, and seconds but Operations Analytics - Log Analysis ignoresseconds. This problem affects the Show event dashboard by node and Search for events by node. Ifthe time stamp 8 January 2014 07:15:26 AM is passed, Operations Analytics - Log Analysis interpretsthis time stamp as 8 January 2014 07:15 AM. So, the results of subsequent searches might differ fromthe search that was originally run.
2. From the bar charts, identify the route that is of most interest. Then, on the right side of the UI, clickthe link that corresponds to that route.A search result is returned that shows all the events that occurred within the specified time frame onthat network route.
3. Refine the search results.You can use the patterns that are listed in Search Patterns. For example, to search the results forcritical events, click Search Patterns > Severity > Critical. A search string is copied to the search field.Then, click Search.
4. Extend and refine the search as required.
668 IBM Netcool Operations Insight: Integration Guide

For more information about searches in Operations Analytics - Log Analysis, see one of the followinglinks:
• Operations Analytics - Log Analysis V1.3.6: https://www.ibm.com/support/knowledgecenter/SSPFMY_1.3.5/com.ibm.scala.doc/use/iwa_using_ovw.html
• Operations Analytics - Log Analysis V1.3.3: https://www.ibm.com/support/knowledgecenter/SSPFMY_1.3.3/com.ibm.scala.doc/use/iwa_using_ovw.html
ExampleAn example of how to run the custom apps from the Operations Analytics - Log Analysis UI. This examplesearches between 2 IP addresses: 172.20.1.3 and 172.20.1.5.
1. To run a new search, click Add search and type NodeAlias:"172.20.1.3" ORNodeAlias:"172.20.1.5". Operations Analytics - Log Analysis returns all events that have theNodeAlias 172.20.1.3, or the NodeAlias 172.20.1.5.
2. In the results display, switch to grid view. Scroll across until you see the NmosObjInst column.Identify 2 rows that have different NmosObjInst values.
3. For these rows, select the cells in the NmosObjInst column.4. In the Search Dashboards section of the UI, click NetworkManagerInsightPack > Find events
between two nodes on layer 2 topology or Find events between two nodes on layer 3 topology,depending which network layer you want to view.
Related conceptsNetwork Management tasks
IBM Networks for Operations InsightNetworks for Operations Insight adds network management capabilities to the Netcool Operations Insightsolution. These capabilities provide network discovery, visualization, event correlation and root-causeanalysis, and configuration and compliance management that provide service assurance in dynamicnetwork infrastructures. It contributes to overall operational insight into application and networkperformance management.
For documentation that describes how to install Networks for Operations Insight, see Performing a freshinstallation. For documentation that describes how to upgrade from an existing Networks for OperationsInsight, or transition to Networks for Operations Insight, see “Upgrading and rolling back on premises” onpage 237.
Before you beginThe Networks for Operations Insight capability is provided through setting up the following products inNetcool Operations Insight:
• Network Manager IP Edition, see Network Manager Knowledge Center• Netcool Configuration Manager, see http://www-01.ibm.com/support/knowledgecenter/SS7UH9/
welcome
In addition, you can optionally add on performance management capability by setting up the NetworkPerformance Insight product and integrating it with Netcool Operations Insight. Performancemanagement capability includes the ability to display and drill into performance anomaly and flow data.For more information on Network Performance Insight, see the Network Performance Insight KnowledgeCenter, https://www.ibm.com/support/knowledgecenter/SSCVHB .
Chapter 9. Operations 669
About Networks for Operations InsightNetworks for Operations Insight provides dashboard functionality that enables network operators tomonitor the network, and network planners and engineers to track and optimize network performance.
About the Network Health DashboardUse the Network Health Dashboard to monitor a selected network view, and display availability,performance, and event data, as well as configuration and event history for all devices in that networkview.Related conceptsNetwork Management tasks
Monitoring the network using the Network Health DashboardUse this information to understand how to use the Network Health Dashboard to determine if there areany network issues, and how to navigate from the dashboard to other parts of the product for moredetailed information.
The Network Health Dashboard monitors a selected network view, and displays device and interfaceavailability within that network view. It also reports on performance by presenting graphs, tables, andtraces of KPI data for monitored devices and interfaces. A dashboard timeline reports on deviceconfiguration changes and event counts, enabling you to correlate events with configuration changes. Thedashboard includes the event viewer, for more detailed event information.
Monitoring the Network Health DashboardMonitor the Network Health Dashboard by selecting a network view within your area of responsibility,such as a geographical area, or a specific network service such as BGP or VPN, and reviewing the datathat appears in the other widgets on the dashboard. If you have set up a default network view bookmarkthat contains the network views within your area of responsibility, then the network views in thatbookmark will appear in the network view tree within the dashboard.
Before you beginFor more information about the network view tree in the Network Health Dashboard, see “Configuringthe network view tree to display in the Network Health Dashboard” on page 677
About this taskNote: The minimum screen resolution for display of the Network Health Dashboard is 1536 x 864. Ifyour screen is less than this minimum resolution, then you will see scroll bars on one or more of thewidgets in the Network Health Dashboard.
Displaying device and interface availability in a network viewUsing the Unavailable Resources widget you can monitor, within a selected network view, the number ofdevice and interface availability alerts that have been open for more than a configurable amount of time.By default this widget charts the number of device and interface availability alerts that have been open forup to 10 minutes, for more than ten minutes but less than one hour, and for more than one hour.
About this taskTo monitor the number of open device and interface availability alerts within a selected network view,proceed as follows:
Procedure1. Network Health Dashboard2. In the Network Health Dashboard, select a network view from the network view tree in the Network
Views at the top left. The other widgets update to show information based on the network view thatyou selected.
670 IBM Netcool Operations Insight: Integration Guide

In particular, the Unavailable Resources widget updates to show device and interface availability inthe selected network view.A second tab, called "Network View", opens. This tab contains a dashboard comprised of the NetworkViews GUI, the Event Viewer, and the Structure Browser, and it displays the selected network view.You can use this second tab to explore the topology of the network view that you are displaying in theNetwork Health Dashboard.
For information about specifying which network view tree to display in the Network HealthDashboard, see “Configuring the network view tree to display in the Network Health Dashboard” onpage 677.
3. In the Unavailable Resources widget, proceed as follows:
To determine the number of unavailable devices and interface alerts, use the following sections of thechart and note the colors of the stacked bar segments and the number inside each segment.
Restriction: By default, all of the bars described below are configured to display. However, you canconfigure the Unavailable Resources widget to display only specific bars. For example, if youconfigure the widget to display only the Device Ping and the Interface Ping bars, then only those barswill be displayed in the widget.
Note: By default the data in the Unavailable Resources widget is updated every 20 seconds.
SNMP Poll FailUses color-coded stacked bars to display the number of SNMP Poll Fail alerts within the specifiedtimeframe.
SNMP Link StateUses color-coded stacked bars to display the number of SNMP Link State alerts within thespecified timeframe.
Interface PingUses color-coded stacked bars to display the number of Interface Ping alerts within the specifiedtimeframe.
Device PingUses color-coded stacked bars to display the number of Device Ping alerts within the specifiedtimeframe.
Color coding of the stacked bars is as follows:
Table 100. Color coding in the Unavailable Resources widget
Yellow Number of alerts that have been open for up to 10 minutes.
Pink Number of alerts that have been open for more than 10 minutes and up to one hour.
Blue Number of alerts that have been open for more than one hour.
Click any one of these bars to show the corresponding alerts for the devices and interfaces in theEvent Viewer at the bottom of the Network Health Dashboard.
Note: You can change the time thresholds that are displayed in this widget. The default thresholdsettings are 10 minutes and one hour. If your availability requirements are less stringent, then youcould change this, for example, to 30 minutes and 3 hours. The change applies on a per-user basis.
If none of the devices in the current network view is being polled by any one of these polls, then thecorresponding stacked bar will always displays zero values. For example, If none of the devices in thecurrent network view is being polled by the SNMP Poll Fail poll, then the SNMP Poll Fail bar will alwaysdisplays zero values. If you are able to access the Configure Poll Policies panel in the NetworkPolling GUI, then you can use the Device Membership field on that table to see a list all of devicesacross all network views that are polled by the various poll policies.
Chapter 9. Operations 671
Displaying overall network view availabilityYou can monitor overall availability of chassis devices within a selected network view using thePercentage Availability widget.
About this taskTo display overall availability of chassis devices within a selected network view, proceed as follows:
Procedure1. Network Health Dashboard2. In the Network Health Dashboard, select a network view from the network view tree in the Network
Views at the top left. The other widgets update to show information based on the network view thatyou selected.In particular, the Percentage Availability widget updates to show overall availability of chassisdevices in network view. A second tab, called "Network View", opens. This tab contains a dashboardcomprised of the Network Views GUI, the Event Viewer, and the Structure Browser, and it displaysthe selected network view. You can use this second tab to explore the topology of the network viewthat you are displaying in the Network Health Dashboard.
For information about specifying which network view tree to display in the Network HealthDashboard, see “Configuring the network view tree to display in the Network Health Dashboard” onpage 677.
3. In the Percentage Availability widget, proceed as follows:
The Percentage Availability widget displays 24 individual hour bars. Each bar displays a value, whichis an exponentially weighted moving average of ping results in the past hour; the bar only appears onthe completion of the hour. The bar value represents a percentage availability rate rather than a totalcount within that hour. The color of the bar varies as follows:
• Green: 80% or more.• Orange: Between 50% and 80%.• Red: Less than 50%.
Displaying highest and lowest performers in a network viewYou can monitor highest and lowest poll data metrics across all devices and interfaces within a selectednetwork view using the Top Performers widget.
About this taskTo display highest and lowest poll data metrics across all devices and interfaces within a selectednetwork view, proceed as follows:
Procedure1. Network Health Dashboard2. In the Network Health Dashboard, select a network view from the network view tree in the Network
Views at the top left. The other widgets update to show information based on the network view thatyou selected.In particular, the Top Performers widget updates to show overall availability of chassis devices innetwork view. A second tab, called "Network View", opens. This tab contains a dashboard comprisedof the Network Views GUI, the Event Viewer, and the Structure Browser, and it displays the selectednetwork view. You can use this second tab to explore the topology of the network view that you aredisplaying in the Network Health Dashboard.
For information about specifying which network view tree to display in the Network HealthDashboard, see “Configuring the network view tree to display in the Network Health Dashboard” onpage 677.
672 IBM Netcool Operations Insight: Integration Guide
3. In the Top Performers widget, proceed as follows:
Select from the following controls to display chart, table, or trace data in the Top Performers widget.Metric
Click this drop-down list to display a selected set of poll data metrics. The metrics that aredisplayed in the drop-down list depend on which poll policies are enabled for the selected networkview. Select one of these metrics to display associated data in the main part of the window.
OrderClick this drop-down list to display what statistic to apply to the selected poll data metric.
• Statistics available for all metrics, except the SnmpLinkStatus metric.
From Top: Displays a bar chart or table that shows the 10 highest values for the selectedmetric. The devices or interfaces with these maximum values are listed in the bar chart ortable.From Bottom: Displays a bar chart or table that shows the 10 lowest values for the selectedmetric. The devices or interfaces with these minimum values are listed in the bar chart ortable.
• Statistics available for the SnmpLinkStatus metric. In each case, a bar chart or table displaysand shows devices for the selected statistic.
Unavailable: This statistic displays by default. Devices with this statistic are problematic.Admin Down Devices with this statistic are not problematic as Administrators change devicesto this state.Available Devices with this statistic are not problematic.
Note: The widget lists devices or interfaces depending on which metric was selected:
• If the metric selected applies to a device, such as memoryUtilization, then the top 10 listcontains devices.
• If the metric selected applies to an interface, such as ifInDiscards, then the top 10 list containsinterfaces.
Show ChartDisplays a bar chart with the 10 highest or lowest values. Show Chart is the display option whenyou first open the widget.
Show TableDisplays a table of data associated with the 10 highest or lowest values.
Define Filter
This button only appears if you are in Show Table mode. Click here to define a filter to applyto the Top Performers table data.
The main part of the window contains the data in one of the following formats:Chart
Bar chart with the 10 highest or lowest values. Click any bar in the chart to show a time trace forthe corresponding device or interface.
TableTable of data associated with the 10 highest or lowest values. The table contains the followingcolumns:
• Entity Name: Name of the device or interface.• Show Trace: Click a link in one of the rows to show a time trace for the corresponding device or
interface.• Last Poll Time: Last time this entity was polled.
Chapter 9. Operations 673

• Value: Value of the metric the last time this entity was polled.
TraceTime trace of the data for a single device or interface. Navigate within this trace by performing thefollowing operations:
• Zoom into the trace by moving your mouse wheel forward.• Zoom out of the trace by moving your mouse wheel backward.• Double click to restore the normal zoom level.• Click within the trace area for a movable vertical line that displays the exact value at any point in
time.
Click one of the following buttons to specify which current or historical poll data to display in the mainpart of the window. This button updates the data regardless of which mode is currently beingpresented: bar chart, table, or time trace.
Restriction: If your administrator has opted not to store poll data for any of the poll data metrics in theMetric drop-down list, then historical poll data will not be available when you click any of the followingbuttons:
• Last Day• Last Week• Last Month• Last Year
CurrentClick this button to display current raw poll data. When in time trace mode, depending on thefrequency of polling of the associated poll policy, the time trace shows anything up to two hours ofdata.
Last DayClick this button to show data based on a regularly calculated daily average.
• In bar chart or table mode, the top 10 highest or lowest values are shown based on a dailyexponentially weighted moving average (EWMA).
• In time trace mode, a time trace of the last 24 hours is shown, based on the average values.
In the Last Day section of the widget EWMA values are calculated by default every 15 minutes andare based on the previous 15 minutes of raw poll data. The data presented in this section of thewidget is then updated with the latest EWMA value every 15 minutes.
Last WeekClick this button to show data based on a regularly calculated weekly average.
• In bar chart or table mode, the top 10 highest or lowest values are shown based on a weeklyexponentially weighted moving average (EWMA).
• In time trace mode, a time trace of the last 7 days is shown, based on the average values.
In the Last Week section of the widget EWMA values are calculated by default every 30 minutesand are based on the previous 30 minutes of raw poll data. The data presented in this section ofthe widget is then updated with the latest EWMA value every 30 minutes.
Last MonthClick this button to show data based on a regularly calculated monthly average.
• In bar chart or table mode, the top 10 highest or lowest values are shown based on a monthlyexponentially weighted moving average (EWMA).
• In time trace mode, a time trace of the last 30 days is shown, based on the average values.
In the Last Month section of the widget EWMA values are calculated by default every two hoursand are based on the previous two hours of raw poll data. The data presented in this section of thewidget is then updated with the latest EWMA value every two hours.
674 IBM Netcool Operations Insight: Integration Guide
Last YearClick this button to show data based on a regularly calculated yearly average.
• In bar chart or table mode, the top 10 highest or lowest values are shown based on a yearlyexponentially weighted moving average (EWMA).
• In time trace mode, a time trace of the last 365 days is shown, based on the average values.
In the Last Year section of the widget EWMA values are calculated by default every day and arebased on the previous 24 hours of raw poll data. The data presented in this section of the widget isthen updated with the latest EWMA value every day.
Displaying the Configuration and Event TimelineYou can display a timeline showing, for all devices in a selected network view, device configurationchanges and network alert data over a time period of up to 24 hours using the Configuration and EventTimeline widget. Correlation between device configuration changes and network alerts on this timelinecan help you identify where configuration changes might have led to network issues.
About this taskTo display a timeline showing device configuration changes and network alert data for all devices in aselected network view, proceed as follows:
Procedure1. Network Health Dashboard2. In the Network Health Dashboard, select a network view from the network view tree in the Network
Views at the top left. The other widgets update to show information based on the network view thatyou selected.In particular, the Configuration and Event Timeline updates to show configuration change and eventdata for the selected network view. A second tab, called "Network View", opens. This tab contains adashboard comprised of the Network Views GUI, the Event Viewer, and the Structure Browser, andit displays the selected network view. You can use this second tab to explore the topology of thenetwork view that you are displaying in the Network Health Dashboard.
For information about specifying which network view tree to display in the Network HealthDashboard, see “Configuring the network view tree to display in the Network Health Dashboard” onpage 677.
3. In the Configuration and Event Timeline widget, proceed as follows:
Configuration changes displayed in the Configuration and Event Timeline can be any of the following.Move your mouse over the configuration change bars to view a tooltip listing the different types ofconfiguration change made at any time on the timline.
Note: If you do not have Netcool Configuration Manager installed, then no configuration data isdisplayed in the timeline.
Changes managed by Netcool Configuration ManagerThese changes are made under full Netcool Configuration Manager control. The timelinedifferentiates between scheduled or policy-based changes, which can be successful (Applied) orunsuccessful (Not Applied), and one-time changes made using the IDT Audited terminal facilitywithin Netcool Configuration Manager.Applied
A successful scheduled or policy-based set of device configuration changes made under thecontrol of Netcool Configuration Manager.
Not AppliedAn unsuccessful scheduled or policy-based set of device configuration changes made underthe control of Netcool Configuration Manager.
Chapter 9. Operations 675
IDTDevice configuration changes made using the audited terminal facility within NetcoolConfiguration Manager that allows one-time command-line based configuration changes todevices.
Unmanaged changesOOBC
Out-of-band-change. Manual configuration change made to device where that change isoutside of the control of Netcool Configuration Manager.
Events are displayed in the timeline as stacked bars, where the color of each element in the stackedbar indicates the severity of the corresponding events. Move your mouse over the stacked bars to viewa tooltip listing the number of events at each severity level. The X-axis granularity for both events andconfiguration changes varies depending on the time range that you select for the timeline.
Table 101. X axis granularity in the Configuration and Event Timeline
If you select this time range Then the X axis granularity is
6 hours 15 minutes
12 hours 30 minutes
24 hours 1 hour
For more detailed information on the different types of configuration change, see the NetcoolConfiguration Manager knowledge center at http://www-01.ibm.com/support/knowledgecenter/SS7UH9/welcome .
Select from the following controls to define what data to display in the Configuration and EventTimeline.Time
Select the duration of the timeline:
• 6 Hours: Click to set a timeline duration of 6 hours.• 12 Hours: Click to set a timeline duration of 12 hours.• 24 Hours: Click to set a timeline duration of 24 hours.
Events by Occurrence
• First Occurrence: Click to display events on the timeline based on the first occurrence time ofthe events.
• Last Occurrence: Click to display events on the timeline based on the last occurrence time of theevents.
Show TableDisplays the configuration change data in tabular form. The table contains the following columns.
Note: If you do not have Netcool Configuration Manager installed, then this button is not displayed.
• Number: Serial value indicating the row number.• Device: Host name or IP address of the affected device.• Unit of Work (UoW): In the case of automated Netcool Configuration Manager configuration
changes, the Netcool Configuration Manager unit of work under which this configuration changewas processed.
• Result: Indicates whether the change was successful.• Start Time: The time at which the configuration change began.• End Time: The time at which the configuration change completed.
676 IBM Netcool Operations Insight: Integration Guide
• User: The user who applied the change.• Description: Textual description associated with this change.
Show ChartClick here to switch back to the default graph view.
Note: If you do not have Netcool Configuration Manager installed, then this button is not displayed.
Use the sliders under the timeline to zoom in and out of the timeline. The legend under the timelineshows the colors used in the timeline to display the following items:
• Event severity values.• Configuration change types.
Note: If the integration with Netcool Configuration Manager has been set up but there is a problemwith data retrieval from Netcool Configuration Manager, then the configuration change types shownin the legend are marked with the following icon:
Configuring the Network Health DashboardAs an end user, you can configure the Network Health Dashboard to display the data you want to see.
Configuring the network view tree to display in the Network Health DashboardAs a user of the Network Health Dashboard, you can configure a default bookmark to ensure that youlimit the data that is displayed in the Network Health Dashboard to the network views within your area ofresponsibility.
About this taskThe network views tree in the Network Health Dashboard automatically displays the network views inyour default network view bookmark. If there are no network views in your default bookmark, then amessage is displayed with a link to the Network Views GUI, where you can add network views to yourdefault bookmark. The network views that you add to your default bookmark will be displayed in thenetwork tree within the Network Health Dashboard.
Complete the following steps to add network views to your default bookmark.
Procedure1. Within the displayed message, click the link that is provided.
The Network Views GUI opens in a second tab.2. Follow the instructions in the following topic in the Network Manager Knowledge Center: https://
www.ibm.com/support/knowledgecenter/SSSHRK_4.2.0/visualize/task/vis_addingnetworkviewstobookmark.html
ResultsThe network views tree in the Network Health Dashboard displays the network views in your newlyconfigured default bookmark.
Configuring the Unavailable Resources widgetAs a user of the Network Health Dashboard, you can configure which availability data is displayed in theNetwork Health Dashboard by the Unavailable Resources widget. For example you can configure thewidget to display availability data based on ping polls only, and not based on SNMP polls. You can alsoconfigure the time duration thresholds to apply to availability data displayed in this widget. For example,by default the widget charts the number of device and interface availability alerts that have been open forup to 10 minutes, more than 10 minutes, and more than one hour. Yon can change these thresholds.
Chapter 9. Operations 677
About this taskTo configure which availability data is displayed by the Unavailable Resources widget, proceed asfollows:
Procedure1. Network Health Dashboard
2. In the Unavailable Resources widget, click User Preferences .3. To configure the Unavailable Resources widget, use the following checkboxes and number steppers:
DeviceConfigure which device alerts to monitor in the Unavailable Resources widget in order to retrieveinformation on device availability. By default all of these boxes are checked.Device Ping
Check the box to monitor Default Chassis Ping alerts. Selecting this option causes theUnavailable Resources widget to provide an indication of the number of open device ICMP(ping) polling alerts.
SNMP Poll FailCheck the box to monitor SNMP Poll Fail alerts. Selecting this option causes the UnavailableResources widget to provide an indication of the number of open SNMP Poll Fail alerts.
InterfaceConfigure which interface alerts to monitor in the Unavailable Resources widget in order toretrieve information on interface availability. By default all of these boxes are checked.Interface Ping
Check the box to monitor Default Interface Ping alerts. Selecting this option causes theUnavailable Resources widget to provide an indication of the number of open interface ICMP(ping) polling alerts.
Link StateCheck the box to monitor SNMP Link State alerts. Selecting this option causes the UnavailableResources widget to provide an indication of the number of open SNMP Link State alerts.
ThresholdsUpper
Specify an upper threshold in hours and minutes. By default, the upper threshold is set to onehour. This threshold causes the chart in the Unavailable Resources widget to update asfollows: when the amount of time that any availability alert in the selected network viewremains open exceeds the one hour threshold, then the relevant bar in the UnavailableResources chart updates to show this unavailability as a blue color-coded bar section.
LowerSpecify a lower threshold in hours and minutes. By default, the lower threshold is set to 10minutes. This threshold causes the chart in the Unavailable Resources widget to update asfollows: when the amount of time that any availability alert in the selected network viewremains open exceeds the 10 minute threshold, then the relevant bar in the UnavailableResources chart updates to show this unavailability as a as a pink color-coded bar section.
Configuring the Configuration and Event TimelineYou can configure which event severity values to display on the Configuration and Event Timeline.
About this taskTo configure which event severity values to display on the Configuration and Event Timeline:
678 IBM Netcool Operations Insight: Integration Guide

Procedure1. Network Health Dashboard
2. In the Configuration and Event Timeline widget, click User Preferences .3. To configure the Configuration and Event Timeline, use the following lists:
Available SeveritiesBy default, lists all event severity values and these event severity values are all displayed in theConfiguration and Event Timeline.To remove an item from this list, select the item and click the right-pointing arrow. You can selectand move multiple values at the same time.
Selected SeveritiesBy default, no event severity values are displayed in this list. Move items from the AvailableSeverities list to this list to show just those values in the Configuration and Event Timeline. Forexample, to show only Critical and Major in the Configuration and Event Timeline, move theCritical and Major items from the Available Severities list to the Selected Severities list.To remove an item from this list, select the item and click the left-pointing arrow. You can selectand move multiple values at the same time.
Administering the Network Health DashboardPerform these tasks to configure and maintain the Network Health Dashboard for users.
Before you beginDevice configuration change data can only be displayed in the Configuration and Event Timeline if theintegration with Netcool Configuration Manager has been set up. For more information on the integrationwith Netcool Configuration Manager, see the following topic in the Network Manager Knowledge Center:https://www.ibm.com/support/knowledgecenter/SSSHRK_4.2.0/install/task/con_configintegrationwithncm.html
About this taskNote: The minimum screen resolution for display of the Network Health Dashboard is 1536 x 864. Ifyour screen is less than this minimum resolution, then you will see scroll bars on one or more of thewidgets in the Network Health Dashboard.
Configuring the Network Health DashboardAs an administrator, you can configure how data is displayed, and which data is displayed in the NetworkHealth Dashboard.
About this taskTo fit the quantity of widgets onto a single screen, customers need a minimum resolution of 1536 x 864,or higher.
As an administrator, you can configure the Network Health Dashboard in a number of ways to meet theneeds of your operators.Changing the layout of the dashboard
You can change the layout of the dashboard. For example, you can reposition, or resize widgets. Seethe information about Editing dashboard content and layout on the Jazz for Service ManagementKnowledge Center: https://www.ibm.com/support/knowledgecenter/SSEKCU
Change the refresh period for all widgets on the Network Health DashboardThe Network Manager widgets within the Network Health Dashboard update by default every 20seconds. You can change this update frequency by performing the following steps.
Note: The Event Viewer widget updates every 60 seconds by default.
Chapter 9. Operations 679
1. Edit the the following configuration file: $NMGUI_HOME/profile/etc/tnm//nethealth.properties.
2. Find the following line and update the refresh period to the desired value in seconds.
nethealth.refresh.period=60
3. Save the file.4. Close and reopen the Network Health Dashboard tab to put the changes into effect.
Change the colors associated with event severity values used in the Configuration and EventTimeline
You can update the colors associated with event severity values used in the Configuration and EventTimeline, by performing the following steps:
1. Edit the following configuration file: $NMGUI_HOME/profile/etc/tnm/status.properties.2. Find the properties status.color.background.severity_number, where severity_number
corresponds to the severity number. For example 5 corresponds to Critical severity.3. Change the RGB values for the severity values, as desired.4. Save the file.
Disable launch of the Network View tab when selecting a network view in the Network HealthDashboard
When a user selects a network view in the Network Health Dashboard, by default a second tab isopened, called "Network View". This tab contains a dashboard comprised of the Network Views GUI,the Event Viewer, and the Structure Browser, and displaying the selected network view. If yournetwork views are very large, then displaying this second tab can have an impact on systemperformance. To avoid this performance impact, you can disable the launch of the Network View tabby performing the following steps:
1. Edit the following configuration file: $NMGUI_HOME/profile/etc/tnm/topoviz.properties.2. Find the following lines:
# Defines whether the dashboard network view tree fires a launchPage event when the user clicks a view in the treetopoviz.networkview.dashboardTree.launchpage.enabled=true
3. Set the property topoviz.networkview.dashboardTree.launchpage.enabled to false.4. Save the file.
Troubleshooting the Network Health DashboardUse this information to troubleshoot the Network Health Dashboard.
Network Health Dashboard log filesReview the Network Health Dashboard log files to support troubleshooting activity.
The Network Health Dashboard log files can be found at the following locations:
Table 102. Locations of Network Health Dashboard log files
File Location
Log file $NMGUI_HOME/profile/logs/tnm/ncp_nethealth.0.log
Trace file $NMGUI_HOME/profile/logs/tnm/ncp_nethealth.0.trace
680 IBM Netcool Operations Insight: Integration Guide
Data sources for the Network Health Dashboard widgetsUse this information to understand from where the Network Health Dashboard widgets retrieve data.This information might be useful for troubleshooting data presentation issues in the Network HealthDashboard.
Configuration and Event Timeline widgetThis widget is populated by the following integrations:
• Tivoli Netcool/OMNIbus integration that analyzes Tivoli Netcool/OMNIbus events and shows a countbased on event severity in a specified period.
• Netcool Configuration Manager integration that that retrieves configuration change distribution.
Percentage Availability widgetThe data source for this widget is the historical poll data table pdEwmaForDay. The widget displays datafrom the device poll PingResult from the pdEwmaForDay table, scoped as follows:
• Scope is the selected network view if called from the Network Health Dashboard• Scope is the in-context devices or interfaces if called from a right-click command within a topology map.
Note: The widget is updated only at the end of the hour to which the data applies.
Top Performers widgetThe data sources for this widgets are the various historical poll data tables:
• pdEwmaForDay• pdEwmaForWeek• pdEwmaForMonth• pdEwmaForYear
The scope of the data is as follows:
• Scope is the selected network view if called from the Network Health Dashboard• Scope is the in-context devices or interfaces if called from a right-click command within a topology map.
Unavailable Resources widgetThis widget is populated by a Tivoli Netcool/OMNIbus integration that analyzes Tivoli Netcool/OMNIbusevents and uses the event data to determine whether a device or interface is affected, and whether theissue is ICMP or SNMP-based.
Investigating data display issues in the Network Health DashboardIf any of the widgets in the Network Health Dashboard are not displaying data, either there is no data todisplay, or there is an underlying problem that needs to be resolved As an administrator, you can configurepoll policies and poll definition so that users are able to display the data that they need to see in theNetwork Health Dashboard. You can also explore other potential underlying issues, such as problemswith the underlying systems that process and store historical poll data.
About this taskTo configure poll policies, see the following topic in the Network Manager Knowledge Center: https://www.ibm.com/support/knowledgecenter/SSSHRK_4.2.0/poll/task/poll_creatingpollswithmultiplepolldefinitions.html .
When editing a poll policy editor, the following operations in the Poll Policy Editor are important fordetermining whether data from the poll policy will be available for display in the Network HealthDashboard:Poll Enabled
Check this option to enable the poll policy.
Chapter 9. Operations 681
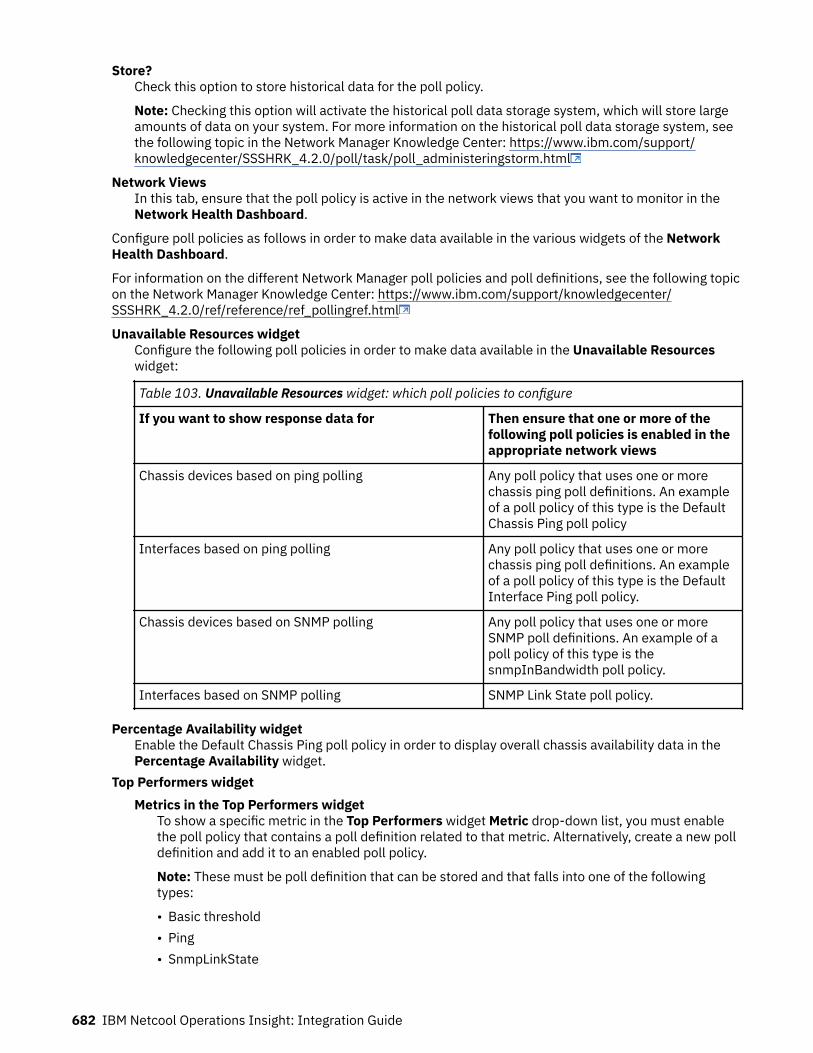
Store?Check this option to store historical data for the poll policy.
Note: Checking this option will activate the historical poll data storage system, which will store largeamounts of data on your system. For more information on the historical poll data storage system, seethe following topic in the Network Manager Knowledge Center: https://www.ibm.com/support/knowledgecenter/SSSHRK_4.2.0/poll/task/poll_administeringstorm.html
Network ViewsIn this tab, ensure that the poll policy is active in the network views that you want to monitor in theNetwork Health Dashboard.
Configure poll policies as follows in order to make data available in the various widgets of the NetworkHealth Dashboard.
For information on the different Network Manager poll policies and poll definitions, see the following topicon the Network Manager Knowledge Center: https://www.ibm.com/support/knowledgecenter/SSSHRK_4.2.0/ref/reference/ref_pollingref.html
Unavailable Resources widgetConfigure the following poll policies in order to make data available in the Unavailable Resourceswidget:
Table 103. Unavailable Resources widget: which poll policies to configure
If you want to show response data for Then ensure that one or more of thefollowing poll policies is enabled in theappropriate network views
Chassis devices based on ping polling Any poll policy that uses one or morechassis ping poll definitions. An exampleof a poll policy of this type is the DefaultChassis Ping poll policy
Interfaces based on ping polling Any poll policy that uses one or morechassis ping poll definitions. An exampleof a poll policy of this type is the DefaultInterface Ping poll policy.
Chassis devices based on SNMP polling Any poll policy that uses one or moreSNMP poll definitions. An example of apoll policy of this type is thesnmpInBandwidth poll policy.
Interfaces based on SNMP polling SNMP Link State poll policy.
Percentage Availability widgetEnable the Default Chassis Ping poll policy in order to display overall chassis availability data in thePercentage Availability widget.
Top Performers widgetMetrics in the Top Performers widget
To show a specific metric in the Top Performers widget Metric drop-down list, you must enablethe poll policy that contains a poll definition related to that metric. Alternatively, create a new polldefinition and add it to an enabled poll policy.
Note: These must be poll definition that can be stored and that falls into one of the followingtypes:
• Basic threshold• Ping• SnmpLinkState
682 IBM Netcool Operations Insight: Integration Guide
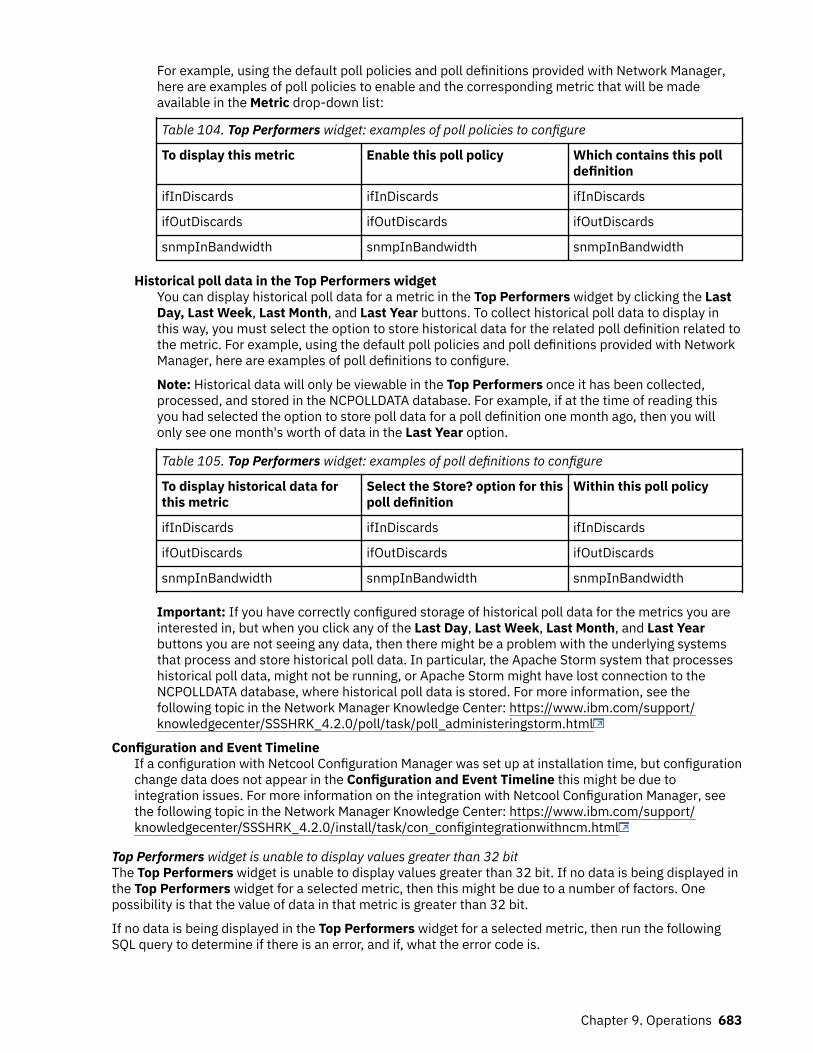
For example, using the default poll policies and poll definitions provided with Network Manager,here are examples of poll policies to enable and the corresponding metric that will be madeavailable in the Metric drop-down list:
Table 104. Top Performers widget: examples of poll policies to configure
To display this metric Enable this poll policy Which contains this polldefinition
ifInDiscards ifInDiscards ifInDiscards
ifOutDiscards ifOutDiscards ifOutDiscards
snmpInBandwidth snmpInBandwidth snmpInBandwidth
Historical poll data in the Top Performers widgetYou can display historical poll data for a metric in the Top Performers widget by clicking the LastDay, Last Week, Last Month, and Last Year buttons. To collect historical poll data to display inthis way, you must select the option to store historical data for the related poll definition related tothe metric. For example, using the default poll policies and poll definitions provided with NetworkManager, here are examples of poll definitions to configure.
Note: Historical data will only be viewable in the Top Performers once it has been collected,processed, and stored in the NCPOLLDATA database. For example, if at the time of reading thisyou had selected the option to store poll data for a poll definition one month ago, then you willonly see one month's worth of data in the Last Year option.
Table 105. Top Performers widget: examples of poll definitions to configure
To display historical data forthis metric
Select the Store? option for thispoll definition
Within this poll policy
ifInDiscards ifInDiscards ifInDiscards
ifOutDiscards ifOutDiscards ifOutDiscards
snmpInBandwidth snmpInBandwidth snmpInBandwidth
Important: If you have correctly configured storage of historical poll data for the metrics you areinterested in, but when you click any of the Last Day, Last Week, Last Month, and Last Yearbuttons you are not seeing any data, then there might be a problem with the underlying systemsthat process and store historical poll data. In particular, the Apache Storm system that processeshistorical poll data, might not be running, or Apache Storm might have lost connection to theNCPOLLDATA database, where historical poll data is stored. For more information, see thefollowing topic in the Network Manager Knowledge Center: https://www.ibm.com/support/knowledgecenter/SSSHRK_4.2.0/poll/task/poll_administeringstorm.html
Configuration and Event TimelineIf a configuration with Netcool Configuration Manager was set up at installation time, but configurationchange data does not appear in the Configuration and Event Timeline this might be due tointegration issues. For more information on the integration with Netcool Configuration Manager, seethe following topic in the Network Manager Knowledge Center: https://www.ibm.com/support/knowledgecenter/SSSHRK_4.2.0/install/task/con_configintegrationwithncm.html
Top Performers widget is unable to display values greater than 32 bitThe Top Performers widget is unable to display values greater than 32 bit. If no data is being displayed inthe Top Performers widget for a selected metric, then this might be due to a number of factors. Onepossibility is that the value of data in that metric is greater than 32 bit.
If no data is being displayed in the Top Performers widget for a selected metric, then run the followingSQL query to determine if there is an error, and if, what the error code is.
Chapter 9. Operations 683

SELECT errorcode, value, datalabelFROM ncpolldata.polldata pdINNER JOIN ncpolldata.monitoredobject mo ON mo.monitoredobjectid = pd.monitoredobjectid WHERE datalabel =poll_of_interest
The error code 112 indicates that metric contains a polled value that was greater than can be stored in a32-bit integer field.
Percentage Availability widget takes a long time to refreshIf the Percentage Availability widget is taking a long time to refresh then one possible solution is toincrease the number of threads available for this widget. This solution is most suitable for customers withlarge networks.
About this taskIncrease the number of threads available by performing the following steps:
Procedure1. Edit the the following configuration file: $NMGUI_HOME/profile/etc/tnm//nethealth.properties.
2. Find the following lines:
## Widget thread count for availability widgetnethealth.threads.availability=5
3. Increase the value of the nethealth.threads.availability property. The maximum possiblevalue is 10.
4. Save the file.
Developing custom dashboardsYou can create pages that act as "dashboards" for displaying information on the status of parts of yournetwork or edit existing dashboards, such as the Network Health Dashboard. You can select from thewidgets that are provided with Network Manager, Tivoli Netcool/OMNIbus Web GUI, and also from otherproducts that are deployed in your Dashboard Application Services Hub environment.
About this taskFor information on creating and editing pages in the Dashboard Application Services Hub, see the Jazz forService Management information center at https://www.ibm.com/support/knowledgecenter/SSEKCU .
Before you begin
• – Determine which widgets you want on the page.– If you want a custom Web GUI gauge on the page, develop the metric that will feed the gauge display.– Decide which users, groups, or user roles you want to have access to the page and assign the roles
accordingly.– If you want the widgets to communicate in a custom wire, develop the wires that will control the
communications between the widgets.
Related conceptsNetwork Management tasks
Displaying an event-driven view of the networkYou can configure a dashboard to contain a Dashboard Network Views widget and other widgets that aredriven by network alert data. Under the configuration described here, when a user clicks a node in thenetwork view tree in the Dashboard Network Views widget, the other widgets in the dashboard update toshow data based on events for entities in the selected network view. This dashboard is useful for networkoperations centers that want to see the real-time situation on the network, as it provides a real-time view
684 IBM Netcool Operations Insight: Integration Guide
of network alerts and of the availability of devices and interfaces. No historical polling data is used by anyof the widgets in this dashboard, so this provides an alternative to the Network Health Dashboard ifpolling data is not being stored.
Before you beginDepending on the requirements you have of the page, perform some or all of the tasks described in“Developing custom dashboards” on page 684.
About this taskTo develop a page that wires a Dashboard Network Views widget and other widgets that are driven bynetwork alert data:
Procedure1. Log in as a user that has the iscadmins role.2. Create the page, assign it to a location in the navigation, and specify the roles that users need to view
the page.The default location is Default, and in this task it is assumed that this default location is used. If youuse a different location, then substitute your chosen location wherever you see the location Defaultused in this task.
3. Add the Dashboard Network Views widget to the page.4. Add the Configuration and Event Timeline to the page.
If you have configured the Network Manager integration with Netcool Configuration Manager then thiswidget displays a timeline up to a period of 24 hours, showing configuration change data and eventdata by first occurrence of the event. If you have not set up the integration, then the widget stilldisplays event data on the timeline.
5. Add the Unavailable Resources widget to the page.This widget displays how many devices and interfaces within the selected network view areunavailable.
6. Add the Event Viewer to the page.7. Click Save and Exit to save the page.
Note: This page does not requires any wires. The Dashboard Network Views widget automaticallybroadcasts the NodeClickedOn event, and the other widgets automatically subscribe to this event andupdate their data accordingly.
ResultsYou can now click a network view in the network view tree in the Dashboard Network Views widget andthe other widgets automatically update to show event data:
• The Unavailable Resources widget displays a bar chart showing how many devices and interfaceswithin the selected network view are unavailable. The exact data shown in this widget depends onwhether the following poll policies are enabled:
– Devices: Default Chassis Ping and SNMP Poll Fail poll policies must be enabled.– Interfaces: Default Interface Ping and SNMP Link State poll policies must be enabled.
• The Configuration and Event Timeline displays a timeline showing events by first occurrence, and, ifthe Netcool Configuration Manager integration is configured, configuration change data, for all entities inthe network view.
• The Event Viewer shows events for all entities in the network view.
Note: Clicking a bar in the Unavailable Resources widget further filters the Event Viewer to show onlythe availability events related to the devices or interfaces in that bar.
Chapter 9. Operations 685

Displaying and comparing top performer data for entities in a network viewCreate a dashboard containing multiple Top Performers widgets to enable you to compare historical polldata across multiple entities and metrics in a selected network view. This dashboard is particularly usefulfor background investigation and analysis in order to determine how devices and interfaces areperforming over time and whether there are any underlying issues.
Before you beginDepending on the requirements you have of the page, perform some or all of the tasks described in“Developing custom dashboards” on page 684.
About this taskTo develop a page that wires a Network Views widget and multiple Top Performers widgets to enableyou to compare historical poll data across multiple entities and metrics in a selected network view:
Procedure1. Log in as a user that has the iscadmins role.2. Create the page, assign it to a location in the navigation, and specify the roles that users need to view
the page.The default location is Default, and in this task it is assumed that this default location is used. If youuse a different location, then substitute your chosen location wherever you see the location Defaultused in this task.
3. Add the Network Views widget to the page.4. Add two Top Performers widgets to the page.
Note: Adding two Top Performers widgets enables you to perform basic comparisons, such asdisplaying metric traces on the same device or interface over two different time periods. You can addmore than two Top Performers widgets, and this will provide the ability to perform comparisonsacross a wider range of data; for example, adding four Top Performers widgets enables you to displaymetric traces on the same device or interface over four different time periods.
5. Click Save and Exit to save the page.
Note: This page does not requires any wires. The Network Views widget automatically broadcasts theNodeClickedOn event, and the other widgets automatically subscribe to this event and update theirdata accordingly.
What to do nextYou can use this dashboard to compare metric traces or charts.
Example: comparing metric traces on the same device or interface over different time periodsUse the custom dashboard that contains the two Top Performers widgets to compare metric traces onthe same device or interface over different time periods; for example, you might see a spike in the currentraw data trace for a metric such as snmpInBandwidth on a specific interface. To determine if this is just anisolated spike or a more serious ongoing issue, you can, on the same dashboard, also display a trace forthe same snmpInBandwidth metric on the same interface over a longer time period, such as the last dayor last week, and then visually determine if there have been continual incidences of highsnmpInBandwidth on this interface over the last day or week.
About this taskTo use the dashboard to compare metric traces on the same device or interface over different timeperiods, proceed as follows:
Procedure1. In the Network Views widget, select a network view.
686 IBM Netcool Operations Insight: Integration Guide
The two Top Performers widgets update to show data for the selected network view.2. From each of the Top Performers widgets, click the Metric drop-down list and select a metric of
interest; for example snmpInBandwidth. Select the same metric on both Top Performers widgets; thisensures that the top entity in both chart is always the same.
3. In one of the Top Performers widgets, click the top bar to show the trace for the entity with the topvalue in that chart.This displays a time-based trace of current raw data for the snmpInBandwidth metric.
4. In the other Top Performers widget, click the top bar to show the trace for the entity with the top valuein that chart.You are now showing the identical time trace in both widgets.
5. In the second Top Performers widget, change the timeframe; for example, click Last Day.You are now showing a current raw data trace of snmpInBandwidth data in the first widget, and a traceof the last day's worth of snmpInBandwidth data for the same interface in the second widget, and youcan compare the more transient raw data in the first widget with data averages over last day.
Example: comparing different metric traces on the same device or interfaceUse the custom dashboard that contains the two Top Performers widgets to compare different metrictraces on the same device or interface; for example, you might see a number of incidences of highsnmpInBandwidth on a specific interface over the last day. To determine if the high incoming SNMPbandwidth usage on this interface is affecting the outgoing SNMP bandwidth usage on that sameinterface, you can, on the same dashboard, also display a trace for the snmpOutBandwidth metric on thesame interface and also over the last day, and then visually compare the two traces.
About this taskTo use the dashboard to compare different metric traces on the same device or interface, proceed asfollows:
Procedure1. In the Network Views widget, select a network view.2. From each of the Top Performers widgets, click the Metric drop-down list and select a metric of
interest; for example snmpInBandwidth. Select the same metric on both Top Performers widgets; thisensures that the top entity in both chart is always the same.
3. In one of the Top Performers widgets, click the top bar to show the trace for the entity with the topvalue in that chart.This displays a time-based trace of current raw data for the snmpInBandwidth metric.
4. In the other Top Performers widget, click the top bar to show the trace for the entity with the top valuein that chart.You are now showing the identical time trace in both widgets.
5. In the second Top Performers widget, click the Metric drop-down list and select snmpOutBandwidth.You are now displaying a trace of incoming SNMP bandwidth usage on the interface with the highestincoming SNMP bandwidth usage in the network view on one widget, and a trace of outgoing SNMPbandwidth usage on that same interface. You can now visually compare the two traces to see if there isany correlation.
Example: comparing different Top 10 metric chartsUse the custom dashboard that contains the two Top Performers widgets to compare different Top 10metric charts. This enables you to see the potential impact of one metric on another across the devicesthat are showing the highest performance degradation on the first metric. For example, you might want tocompare the chart showing those devices showing the highest ten incoming SNMP bandwidth usagevalues, with the chart showing those devices showing the highest ten outgoing SNMP bandwidth usagevalues.
Chapter 9. Operations 687
About this taskTo use the dashboard to compare different Top 10 metric charts, proceed as follows:
Procedure1. In the Network Views widget, select a network view.2. In one of the Top Performers widgets, click the Metric drop-down list and select a metric of interest;
for example snmpInBandwidth.The Top Performers widget updates to show a bar chart of the ten interfaces in the network view withthe highest incoming SNMP bandwidth usage values.
3. In the other Top Performers widget, click the Metric drop-down list and select a second metric ofinterest; for example snmpOutBandwidth.The Top Performers widget updates to show a bar chart of the ten interfaces in the network view withthe highest outgoing SNMP bandwidth usage values.
ResultsYou can now compare the two charts to see if there is any correlation between the data.
Displaying network view event data in a gauge groupYou can use wires to configure a Network Views widget and a Dashboard Application Services Hub gaugegroup to pass data between each other. Under the configuration described here, when a user clicks a nodein the network view tree in the Network Views widget, the gauge group updates to show a number ofstatus gauges: you can configure as many status gauges as desired. In the example described here, threegauges are configured: Severity 3 (minor), Severity 4 (major), and Severity 5 (critical), together with anumber within each status gauge indicating how many events at that severity are currently present on thedevices in that network view. The instructions in this topic describe a possible option for wiring the twowidgets.
Before you beginDepending on the requirements you have of the page, perform some or all of the tasks described in“Developing custom dashboards” on page 684.
About this taskTo develop a page that wires a Network Views widget and a Dashboard Application Services Hub gaugegroup:
Procedure1. Log in as a user that has the iscadmins role.2. Create the page, assign it to a location in the navigation, and specify the roles that users need to view
the page.The default location is Default, and in this task it is assumed that this default location is used. If youuse a different location, then substitute your chosen location wherever you see the location Defaultused in this task.
3. Add the Network Views widget to the page.4. Add the Dashboard Application Services Hub gauge group to the page.5. Edit the gauge group widget.6. Select a dataset for the gauge group. In the Gauge Group: Select a Dataset window, search for the
Netcool/OMNIbus WebGUI > All data > Filter Summary dataset.One way to do this is as follows:a) In the search textbox at the top left of the Gauge Group: Select a Dataset window, type filter.b) Click Search. This search retrieves two Filter Summary datasets.
688 IBM Netcool Operations Insight: Integration Guide

c) Select the dataset that has a provider title labeled Provider: Netcool/OMNIbus WebGUI >Datasource: All data.
7. Configure how you want the gauge group to be displayed. In the Gauge Group: VisualizationSettings window, add three value status gauges by performing the following steps:.a) Click Choose Widget and select ValueStatus Gauge from the drop-down list. Then click Addb) Add two more ValueStatus Gauge widgets, following the instruction in the previous step.There should now be three ValueStatus Gauge widgets listed in the Selected Widgets list.
8. Configure the three value status gauges to show the following:
• First value status gauge will display the number of Severity 3 (minor) events, within the Severity 3(minor) symbol, .
• Second value status gauge will display the number of Severity 4 (major ) events, within the Severity4 (major) symbol, .
• Third value status gauge will display the number of Severity 5 (critical) events, within the Severity 5(critical) symbol, .
Perform the following steps to configure the Severity 3 (minor) value status gauge:a) Select the first value status gauge item in the Selected Widgets list.b) Click Required Settings.c) Click the Value drop-down list and select Severity 3 Event Count from the drop-down list.d) Click Optional Settings.e) Click the Label above Gauge drop-down list and select Severity 3 Event Count Name from the
drop-down list.
f) In the Minor spinner set a threshold value of 0 by typing 0.This threshold value causes any number of Severity 3 (minor) events to generate a Severity 3value status gauge.
Perform the following steps to configure the Severity 4 (major) value status gauge:a) Select the first value status gauge item in the Selected Widgets list.b) Click Required Settings.c) Click the Value drop-down list and select Severity 4 Event Count from the drop-down list.d) Click Optional Settings.e) Click the Label above Gauge drop-down list and select Severity 4 Event Count Name from the
drop-down list.
f) In the Major spinner set a threshold value of 0 by typing 0.This threshold value causes any number of Severity 4 (major) events to generate a Severity 4 valuestatus gauge.
Perform the following steps to configure the Severity 5 (critical) value status gauge:a) Select the first value status gauge item in the Selected Widgets list.b) Click Required Settings.c) Click the Value drop-down list and select Severity 5 Event Count from the drop-down list.d) Click Optional Settings.e) Click the Label above Gauge drop-down list and select Severity 5 Event Count Name from the
drop-down list.
f) In the Critical spinner set a threshold value of 0 by typing 0.This threshold value causes any number of Severity 5 (critical) events to generate a Severity 5value status gauge.
9. Click Save and Exit to save the page.
Chapter 9. Operations 689
10. From the page action list, select Edit Page.
11. Click Show Wires and then, in the Summary of wires section of the window. click New Wire.12. Specify the wires that connect the Network Views widget to the Dashboard Application Services Hub
gauge group.
• In the Select Source Event for New Wire window, click Network Views > NodeClickedOn, andthen click OK.
• In the Select Target for New Wire window, click Default > This page name_of_page > EventViewer , where name_of_page is the name of the page that you created in step 2.
• In the Transformation window, select Show Gauge Events, and then click OK13. Close the Summary of wires section of the window by clicking the X symbol at the top right corner.14. Click Save and Exit to save the page.
ResultsYou can now click a network view in the network view tree in the Network Views widget and have thegauge group update to show three status values: Severity 3 (minor), Severity 4 (major), and Severity 5(critical), together with a number within each status gauge indicating how many events at that severity arecurrently present on the devices in the selected network view.
Event information for Network Health Dashboard widgetsRefer to this table to get information about the publish events and subscribe events for Network HealthDashboard widgets. Use this event information when you create a new custom widget and you want towire your custom widget with an existing Network Health Dashboard widget.
Table 106. Event information for Network Health Dashboard widgets
Widget name Event type Event name Event description
Configuration andEvent Timeline
Subscribe event NodeClickedOn Subscribes to aNodeClickedOn eventand displays data basedon the events ViewIdand the datasource.
Percentage Availability Subscribe event NodeClickedOn Subscribes to aNodeClickedOn eventand displays data basedon the events ViewIdand the datasource.
Network ManagerPolling Chart
Subscribe event NodeClickedOn Subscribes to aNodeClickedOn eventand displays data basedon the events ViewIdand the datasource.
690 IBM Netcool Operations Insight: Integration Guide
Table 106. Event information for Network Health Dashboard widgets (continued)
Widget name Event type Event name Event description
Unavailable Resources Publish event showEvents Click a bar in thedisplayed graph and thewidget publishes ashowEvents event thatcontains the name of thetransient filter.
Subscribe event NodeClickedOn Subscribes to aNodeClickedOn eventand displays data basedon the events ViewIdand the datasource.
Troubleshooting operationsUse the entries in this section to troubleshoot operations problems.
Troubleshooting operations on Cloud and hybrid systemsUse these troubleshooting entries to help resolve problems and to see known issues for operations onCloud and hybrid systems.
Data fetch errorWhen you fetch seasonality data in the Incident Viewer, an error is displayed.
ProblemThe following error occurs when fetching seasonality data in the Incident Viewer.
An error occurred while fetching data from the server. Please make sure you have an active internet connection.Code: FETCH_ERROR_NETWORK
This error happens when there is a cookie conflict with the IBM WebSphere Application Server cookie,LTPAToken2.
ResolutionTo work around this issue, clear your browser cookies.
Incident resources tab returns a spinnerThis issue occurs on a Red Hat OpenShift environment when you create an incident from an event andselect the resources tab.
ProblemIn the AIOPs event list, select an event and create an incident from the actions menu. If you select theresources tab, a spinner is returned.
ResolutionTo fix the issue, you need to manually refresh the incident resources tab.
Chapter 9. Operations 691
Data missing from Event reduction dashboardNo data is displayed in the Event reduction dashboard.
SymptomsNo data is displayed in the Event reduction dashboard. N/A is displayed in the panels.
CausesPossible causes are problems in the networking of Red Hat OpenShift or its DNS service.
Resolving the problemA restart of the data layer pod should resolve this issue.
Empty Probable Cause and Topology columnsThe Events page has empty Probable cause and Topology columns.
ProblemAfter an outage, topology-based features such as topology enrichment, topology group-based eventcorrelation, and probable cause are no longer shown.
CauseThis issue occurs when the Netcool Operations Insight cluster experiences an outage, and an error occurswhen the cluster restarts the cnea-mgmt-artifact cron job. The cron job is used to enable topology-based features such as topology enrichment, topology group-based event correlation, and probablecause. If it stops running, these features are hidden.
ResolutionDelete the cron job definition for cnea-mgmt-artifact. Deleting the cron job definition causes theNetcool Operations Insight operator to re-create it.
Event Viewer severity filter count is not correctThe filter count numbers represented by the colored icons on the toolbar of the Event Viewer, shouldshow the total number of events, including all parent and child events in the list. However, when youselect a filter, child events that match that filter but whose parents events do not, are showing in the listbut not in the count number.
ProblemThe filtering options in the Event Viewer only work on top-level events, so if the other events that matchthe severity are children of a parent that does not have that severity, then they will not show up in thefilter count.
ResolutionThis is a known issue and there is currently no workaround.
692 IBM Netcool Operations Insight: Integration Guide

Event Viewer has missing analytics iconsAnalytics icons,such as the icons under the Seasonality, Topology, and other analytics columns, aremissing on the Event Viewer, even though there are active live policies that have triggered.
ProblemThe Event Viewer is missing analytics icons for events that should have them.
CauseThis is caused by problems with the ea-noi-layer-eanoigateway pod on the cloud native NetcoolOperations Insight components deployment.
Resolution1. Find the name of your ea-noi-layer-eanoigateway pod with the following command:
oc get pod | grep releasename-ea-noi-layer-eanoigateway
where releasename is the name of the custom resource for your cloud native Netcool OperationsInsight components deployment.
2. Restart the ea-noi-layer-eanoigateway pod with the following command:
oc delete pod ea-noi-layer-eanoigateway_pod_name
where ea-noi-layer-eanoigateway_pod_name is the pod name that was returned in step 1.
Inactive topology management linksInactive Topology and Topology Dashboard navigation links are shown on hybrid deployments when theyshould not be shown at all.
ProblemRoles that are associated with topology management are available even if topology.enabled is set to falsein the operator properties file. If a topology management role is assigned to a user when topology is notenabled, then the user is able to see Topology and Topology Dashboard navigation links, but these linksare not active.
ResolutionNo action is needed.
Incident created from partial event group results in faulty probable causedisplayIf you create an incident from a partial event group, that is, from child events in the group but you do notinclude the parent event, then when you view the events in the incident, the probable cause bar for eachof the events shows as an empty cell; however, if you click on this empty cell, this results in a constantlyloading sidebar.
ProblemIf you create an incident from a partial event group, that is, from child events in the group but you do notinclude the parent event, then when you view the events in the incident, the probable cause bar for eachof the events shows as an empty cell; however, if you click on this empty cell, this results in a constantlyloading sidebar.
Chapter 9. Operations 693
ResolutionWhen creating incidents that include event groups, make sure to always include the parent event.
Missing topology analytics menusAn initial user (icpadmin) is created with a new Netcool Operations Insight on Red Hat OpenShiftinstallation, to log in to the Cloud GUI and Web GUI. When logging in to Web GUI with that user, thetopology analytics menus are missing from the navigation (for example, Incident > Agile ServiceManagement Incident > Topology viewer).
About this taskComplete the following steps to view all menus:
Procedure1. Go to Web GUI > Console Settings > User Roles.2. Search for your user.3. Add the inasm_admin role.4. Log out of Web GUI and log back in again.
Missing topology on event-driven topology viewWhen viewing topology from events, the topology at the time that the event occurred is shown. If topologychanges occurred very close in time to the event, then those topology changes are sometimes not visible.
ProblemWhen viewing topology from events, the topology at the time that the event occurred is shown. If topologychanges occurred very close in time to the event, then those topology changes are sometimes not visible.
ResolutionTo ensure that you see all the topological context you may need to select More information so that theTopology Viewer page opens with the timeline bar, and then slightly alter the timeline window.
Searching the Events page by short incident identifier does not workThe short incident identifier field for an event is contained in the Incident column on the Events page.Currently the search functionality does not work for this field.
ProblemThe short incident identifier field for an event is contained in the Incident column on the Events page.Currently the search functionality does not work for this field.
ResolutionThere is currently no resolution for this problem.
694 IBM Netcool Operations Insight: Integration Guide

Slanted line in temporal group details GUIA slanted line appears when two events with a single event instance and the same first and lastoccurrence are displayed in the policy details UI.
ProblemA slanted line appears when two events with a single event instance and the same first and lastoccurrence are displayed in the policy details UI.
ResolutionYou can ignore this error.
Temporal group justification page does not loadWhen installed on a hybrid deployment with an on-premises Web GUI, which has a TLS certificate that isnot trusted by a well known authority, the temporal group information page does not load and displays anunknown error.
ProblemTemporal group justification page does not load.
CauseThis error is caused by ea-ui-api not trusting the on-premises Web GUI certificate. There is a configurationoption that allows a user to trust extra certificates, but this option is not currently used by this service.
ResolutionAs a workaround, set some helm value overrides to make this service use these certificates, as in thefollowing example:
apiVersion: noi.ibm.com/v1beta1kind: NOIHybridmetadata: name: noispec: helmValuesNOI: global.integrations.cneaUiApi.configMaps.trustCAsUser.template: '{{ default (printf "%s-trusted-cas" .releaseName) .Values.global.hybrid.trustedCAsConfigMapName }}' ibm-ea-ui-api.integrations.cneaUiApi.directories.configMaps.trustCAsUser: '/ca-certs/user' # .... rest of CR
Topology analytics failing at slow event ratesTopology analytics failing at slow event rates. This impacts any GUIs that present topology and eventstogether.
ProblemThere is a known problem with topology analytics at low events per second rate.
CauseEvents are buffered in the Event Analytics message gateway before being sent to the ingest service. Thisbuffering of events can cause topology analytics to fail at slow event rates.
Chapter 9. Operations 695
ResolutionThere is no workaround.
Truncation of event field tooltipSome tooltips might not display correctly. The native tooltip in Firefox is truncated on Windows operatingsystems.
ProblemSome tooltips might not display correctly. The native tooltip in Firefox is truncated on Windows operatingsystems.
ResolutionThere is currently no resolution for this issue.
Unable to make annotations in Grafana-based Operations dashboardsOnly users with Admin or Editor roles can make annotations in Grafana-based Operations dashboards.
ProblemYou must be assigned the Admin or Editor role to create annotations on Grafana based dashboards withinNetcool Operations Insight. If a user without these privileges attempts to create an annotation on thedashboard graphs for event reduction, operational efficiency, or runbook statistics, an error message isdisplayed indicating missing access rights.
ResolutionThere is currently no resolution for this issue. The default role for all Netcool Operations Insight userswithin the Grafana-based dashboards is Viewer. The annotations capability is therefore not available toNetcool Operations Insight users, even though the option to annotate appears in the Grafana-baseddashboards.
Unable to open Cloud native analytics-related GUIs on Internet ExplorerWhen working on Internet Explorer on a hybrid deployment you might encounter the issue of not beingable to open Cloud native analytics-related windows.
ProblemWhen trying to open Cloud native analytics-related windows on Internet Explorer on a hybriddeployment , you encounter an certificate error similar to the following:
Content was blocked because it was not signed by a valid security certificate.
ResolutionProceed as follows:
1. On Internet Explorer, navigate to Internet options.2. In the Advanced tab, uncheck Warn about certificate address mismatch3. Log in to Dashboard Application Services Hub.4. In the popup window, click Cloud Analytics. A new window opens.5. Click More Information, and then click Go on to the Webpage' The certificate error is now displayed in
the browser URL bar.
696 IBM Netcool Operations Insight: Integration Guide
6. In the browser URL bar, click Certificate error > View Certificate7. Go to Certificate Path tab > Select 'ingress-operator@' > View Certificate8. Install Certificate > Select 'Place all certificate in the following store' > Browse > Select 'Trusted Root
Certificate Authorities' > OK > Next > Finish9. Click Yes at the prompt: Do you want to install this certificate.
Troubleshooting operations on-premisesUse these troubleshooting entries to help resolve problems and to see known issues for on-premisesoperations.
Event Search count and timestamp hover help translation issuesEvent Search count and timestamp hover help are not rendered into a non-English language in somecharts.
ProblemThis issue affects the OMNIbusInsightPack_v1.3.1. The following texts are not rendered into a non-English language and appear in English only.
• Hover help for time stamp and count in stacked bar charts, heat maps and pie charts• Legend for the Count field in the "Hotspots by Node and AlertGroup" chart and "Hotspots by
AlertGroup and Severity" chart of the xxxOMNIbus Static Dashboard custom app• Legend for the Count field in the "Last Day - Hotspots by AlertGroup and Severity" chart, "'Last Day -
Event Storm by Node" chart, and "Last Day - Hotspots by Node and AlertGroup" of the OMNIbusDynamic Dashboard custom app
ResolutionThere is no resolution for this issue.
Event Search drilldown not returning resultsDrill down does not return results.
ProblemThe drill down function is not available for the type Omnibus Tree Map. This affects some of the charts inthe Operational Efficiency dashboard in the Last Month folder, and in the OMNIbus Operations Managerand OMNIbus Spot Important Alerts dashboards in the Last Hour folder.
ResolutionIf drill down is required for these charts you can use the default Tree Map specification instead. Tochange specification, click the chart settings icon on the right of the chart and change Chart Type fromOMNIbus Tree Map to Tree Map.
Event Search help text not rendered correctlyHelp text not rendered correctly for Event Analysis and Reduction in bi-directional locales.
ProblemThis affects the help text in the Event Analysis and Reduction dashboards for Analyze and ReduceEvent Volumes, Introduction to the Apps, and Helpful Links. The help text is not rendered correctly inthe Arabic and Hebrew locales
Chapter 9. Operations 697
ResolutionYou can view text directly as an HTML file in a browser that supports bi-directional locales. The relevantfiles are Analyze_and_reduce_event_volumes.html, Introduction_to_the_Apps.html,andHelpful_links.html. The files are located in $UNITY_HOME/AppFramework/Apps/OMNIbusInsightPack_v1.3.0.2/locale/<LOCALE>/LC_MESSAGES.
Event Search hotspots not displayingHotspots by Node, AlertKey not displaying.
ProblemIf the Hotspots by Node, Alert Group and AlertKey chart fails to display in the Last_Month->OperationalStatus Dashboard the SOLR heap size might need increasing.
ResolutionIncrease the the SOLR heap size.
Note: The Hotspots by Node, Alert Group and AlertKey chart is CPU intensive and can be slow to renderfor systems with a large amount of data.
For more information see the following documentation:
• https://www.ibm.com/support/knowledgecenter/SSPFMY_1.3.5/com.ibm.scala.doc/tshoot/iwa_solr_heap_issue_c.html
• IBM SmartCloud® Analytics - Log Analysis Performance and Tuning Guide
Event Search hover values not matching axesHover values for the Event Trend by Severity charts do not appear to match the axes.
ProblemWhen hovering over a point on a particular severity the values returned might not appear to match theaxes on the chart. It is because the hover values represent that severity only, whereas the values on theaxes are cumulative. For example, if there are 20 Intermediate severity events and 26 Major severityevents displayed on the line above, the Major events will appear against 46 on the Y-axis.
ResolutionThere is no workaround for this issue.
Only alphanumeric characters working in Event Viewer searchNon-alphanumeric characters do not work in Event Viewer search.
ProblemIf non-alphanumeric characters are used in an event search from the Event Viewer, then these charactersare replaced with their ASCII equivalent. This causes the search to be performed with the incorrectcharacters, and events that should have matched the search term are not returned in the search results.
ResolutionTo resolve this issue, edit the search field and replace the string that has ASCII characters in it with theoriginal search term that you entered.
698 IBM Netcool Operations Insight: Integration Guide

Topology Search error message partially renderedTopology Search: error message only partially rendered into non-English languages.
ProblemThis issue affects the Network Manager Insight Pack V1.3.0.0. If you attempt to run a topology searchbetween two nodes on the same device, the error message that is displayed is only partially rendered intonon-English languages. The error message in full is as follows:An error occurred calculating the path between 'X' and 'X',
The source and destination Node's cannot be the same
(Where X is the value of the NmosObjInst for the device. The first half of the message, An erroroccurred calculating the path between 'X' and 'X', is rendered into non-English languages.The second half of the message The source and destination Node's cannot be the same isnot rendered into non-English languages and always appears in English.
ResolutionThere is no workaround for this issue.
Chapter 9. Operations 699

700 IBM Netcool Operations Insight: Integration Guide
Chapter 10. ReferenceReference information for Netcool Operations Insight.
Accessibility features for Netcool Operations InsightAccessibility features help users who have a disability, such as restricted mobility or limited vision, to useinformation technology products successfully.
The following Netcool Operations Insight components have accessibility features.
• Jazz for Service Management• Netcool/OMNIbus Web GUI• Netcool/Impact• IBM Tivoli Network Manager
See the relevant product Knowledge Centers for more detailed information on accessibility for eachcomponent.
Related informationJazz for Service Knowledge CenterClick here and search for "accessibility" to retrieve more details onaccessibility in Jazz for Service Management.Netcool/OMNIbus WebGUI Knowledge Center: accessibilityClick here for more details on accessibility inNetcool/OMNIbus Web GUI.Network Manager Knowledge Center: accessibilityClick here for more details on accessibility in NetworkManager.Netcool/Impact Knowledge CenterClick here and search for "accessibility" to retrieve more details onaccessibility in Netcool/Impact.
© Copyright IBM Corp. 2020, 2020 701

Service monitor cloud native analytics serviceThe service monitor service provides a single REST API that can be queried to get the current servicehealth status of all other services in the deployment. The service has a list of deployed service endpoints,and queries each one and then returns a consolidated service view to the caller.
Example Security Context ConstraintSee the example YAML for a custom security context constraint.
Table 107. Example SCC
apiVersion: security.openshift.io/v1kind: SecurityContextConstraintsmetadata: name: ibm-noi-sccallowHostDirVolumePlugin: falseallowHostIPC: trueallowHostNetwork: falseallowHostPID: falseallowHostPorts: falseallowPrivilegeEscalation: trueallowPrivilegedContainer: falsedefaultAddCapabilities: []allowedCapabilities:- SETPCAP- AUDIT_WRITE- CHOWN- NET_RAW- DAC_OVERRIDE- FOWNER- FSETID- KILL- SETUID- SETGID- NET_BIND_SERVICE- SYS_CHROOT- SETFCAP- IPC_OWNER- IPC_LOCK- SYS_NICE- DAC_OVERRIDEpriority: 0fsGroup: type: RunAsAnyreadOnlyRootFilesystem: falserequiredDropCapabilities:- MKNODrunAsUser: type: RunAsAnyseLinuxContext: type: RunAsAnysupplementalGroups: type: RunAsAnyvolumes:- configMap- downwardAPI- emptyDir- persistentVolumeClaim- projected- secret
Netcool Operations Insight audit log filesRecords of user activity and report history are contained in the Netcool Operations Insight audit log files.
The log files can be found at the following locations:Audit log
$IMPACT_HOME/logs/NCI_NOI_Audit.log
The audit log is a record of all user interactions with Netcool Operations Insight.
702 IBM Netcool Operations Insight: Integration Guide
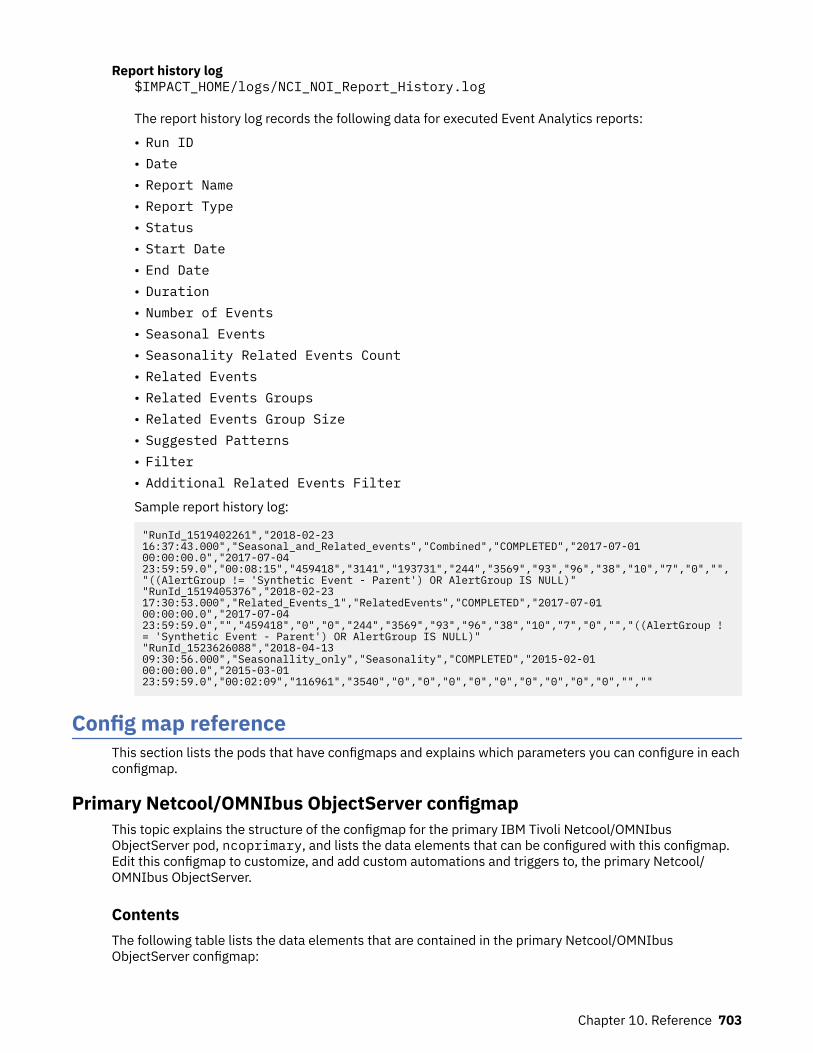
Report history log$IMPACT_HOME/logs/NCI_NOI_Report_History.log
The report history log records the following data for executed Event Analytics reports:
• Run ID• Date• Report Name• Report Type• Status• Start Date• End Date• Duration• Number of Events• Seasonal Events• Seasonality Related Events Count• Related Events• Related Events Groups• Related Events Group Size• Suggested Patterns• Filter• Additional Related Events Filter
Sample report history log:
"RunId_1519402261","2018-02-23 16:37:43.000","Seasonal_and_Related_events","Combined","COMPLETED","2017-07-01 00:00:00.0","2017-07-04 23:59:59.0","00:08:15","459418","3141","193731","244","3569","93","96","38","10","7","0","","((AlertGroup != 'Synthetic Event - Parent') OR AlertGroup IS NULL)""RunId_1519405376","2018-02-23 17:30:53.000","Related_Events_1","RelatedEvents","COMPLETED","2017-07-01 00:00:00.0","2017-07-04 23:59:59.0","","459418","0","0","244","3569","93","96","38","10","7","0","","((AlertGroup != 'Synthetic Event - Parent') OR AlertGroup IS NULL)""RunId_1523626088","2018-04-13 09:30:56.000","Seasonallity_only","Seasonality","COMPLETED","2015-02-01 00:00:00.0","2015-03-01 23:59:59.0","00:02:09","116961","3540","0","0","0","0","0","0","0","0","0","",""
Config map referenceThis section lists the pods that have configmaps and explains which parameters you can configure in eachconfigmap.
Primary Netcool/OMNIbus ObjectServer configmapThis topic explains the structure of the configmap for the primary IBM Tivoli Netcool/OMNIbusObjectServer pod, ncoprimary, and lists the data elements that can be configured with this configmap.Edit this configmap to customize, and add custom automations and triggers to, the primary Netcool/OMNIbus ObjectServer.
ContentsThe following table lists the data elements that are contained in the primary Netcool/OMNIbusObjectServer configmap:
Chapter 10. Reference 703
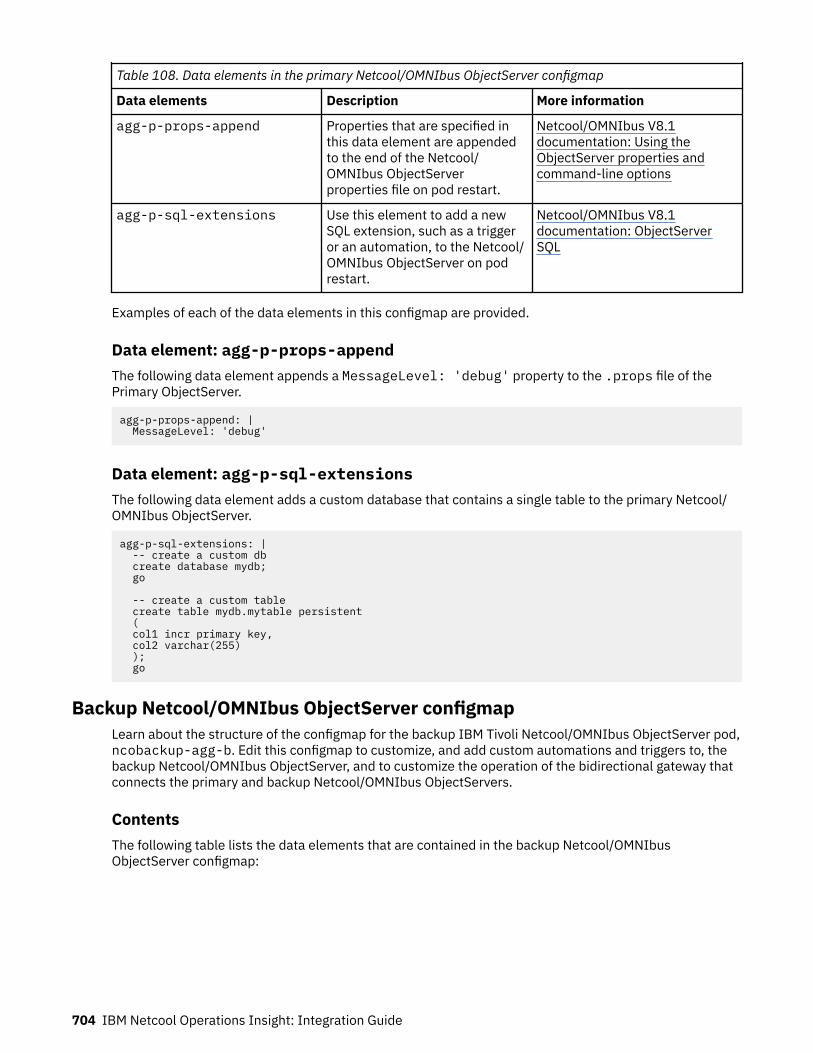
Table 108. Data elements in the primary Netcool/OMNIbus ObjectServer configmap
Data elements Description More information
agg-p-props-append Properties that are specified inthis data element are appendedto the end of the Netcool/OMNIbus ObjectServerproperties file on pod restart.
Netcool/OMNIbus V8.1documentation: Using theObjectServer properties andcommand-line options
agg-p-sql-extensions Use this element to add a newSQL extension, such as a triggeror an automation, to the Netcool/OMNIbus ObjectServer on podrestart.
Netcool/OMNIbus V8.1documentation: ObjectServerSQL
Examples of each of the data elements in this configmap are provided.
Data element: agg-p-props-appendThe following data element appends a MessageLevel: 'debug' property to the .props file of thePrimary ObjectServer.
agg-p-props-append: | MessageLevel: 'debug'
Data element: agg-p-sql-extensionsThe following data element adds a custom database that contains a single table to the primary Netcool/OMNIbus ObjectServer.
agg-p-sql-extensions: | -- create a custom db create database mydb; go
-- create a custom table create table mydb.mytable persistent ( col1 incr primary key, col2 varchar(255) ); go
Backup Netcool/OMNIbus ObjectServer configmapLearn about the structure of the configmap for the backup IBM Tivoli Netcool/OMNIbus ObjectServer pod,ncobackup-agg-b. Edit this configmap to customize, and add custom automations and triggers to, thebackup Netcool/OMNIbus ObjectServer, and to customize the operation of the bidirectional gateway thatconnects the primary and backup Netcool/OMNIbus ObjectServers.
ContentsThe following table lists the data elements that are contained in the backup Netcool/OMNIbusObjectServer configmap:
704 IBM Netcool Operations Insight: Integration Guide
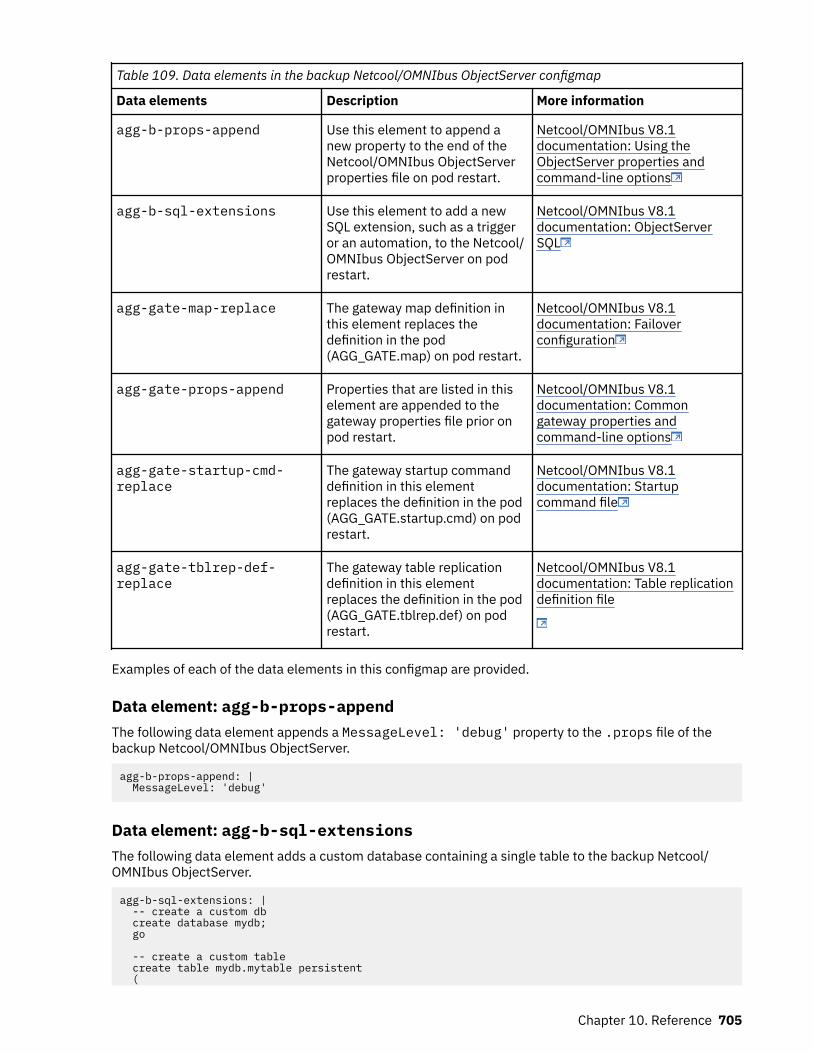
Table 109. Data elements in the backup Netcool/OMNIbus ObjectServer configmap
Data elements Description More information
agg-b-props-append Use this element to append anew property to the end of theNetcool/OMNIbus ObjectServerproperties file on pod restart.
Netcool/OMNIbus V8.1documentation: Using theObjectServer properties andcommand-line options
agg-b-sql-extensions Use this element to add a newSQL extension, such as a triggeror an automation, to the Netcool/OMNIbus ObjectServer on podrestart.
Netcool/OMNIbus V8.1documentation: ObjectServerSQL
agg-gate-map-replace The gateway map definition inthis element replaces thedefinition in the pod(AGG_GATE.map) on pod restart.
Netcool/OMNIbus V8.1documentation: Failoverconfiguration
agg-gate-props-append Properties that are listed in thiselement are appended to thegateway properties file prior onpod restart.
Netcool/OMNIbus V8.1documentation: Commongateway properties andcommand-line options
agg-gate-startup-cmd-replace
The gateway startup commanddefinition in this elementreplaces the definition in the pod(AGG_GATE.startup.cmd) on podrestart.
Netcool/OMNIbus V8.1documentation: Startupcommand file
agg-gate-tblrep-def-replace
The gateway table replicationdefinition in this elementreplaces the definition in the pod(AGG_GATE.tblrep.def) on podrestart.
Netcool/OMNIbus V8.1documentation: Table replicationdefinition file
Examples of each of the data elements in this configmap are provided.
Data element: agg-b-props-appendThe following data element appends a MessageLevel: 'debug' property to the .props file of thebackup Netcool/OMNIbus ObjectServer.
agg-b-props-append: | MessageLevel: 'debug'
Data element: agg-b-sql-extensionsThe following data element adds a custom database containing a single table to the backup Netcool/OMNIbus ObjectServer.
agg-b-sql-extensions: | -- create a custom db create database mydb; go
-- create a custom table create table mydb.mytable persistent (
Chapter 10. Reference 705

col1 incr primary key, col2 varchar(255) ); go
Data element: agg-gate-map-replaceThe following data element replaces the definition in the pod (AGG_GATE.map).
agg-gate-map-replace: | # My test map CREATE MAPPING StatusMap ( 'Identifier' = '@Identifier' ON INSERT ONLY, 'Node' = '@Node' ON INSERT ONLY );
Data element: agg-gate-props-appendThe following data element is appended to the gateway properties file before startup.
agg-gate-props-append: | MessageLevel: 'debug' agg-gate-startup-cmd-replace: | SHOW PROPS;
Data element: agg-gate-startup-cmd-replaceThe gateway startup command definition in this data element replaces the definition in the pod(AGG_GATE.startup.cmd).
agg-gate-startup-cmd-replace: | SHOW PROPS;
Data element: agg-gate-tblrep-def-replaceThe Gateway table replication definition in this data element replaces the definition in the pod(AGG_GATE.tblrep.def).
agg-gate-tblrep-def-replace: | # My test table replication REPLICATE ALL FROM TABLE 'alerts.status' USING MAP 'StatusMap';
Netcool/Impact core server configmapLearn about the structure of the configmap for the Netcool/Impact core server pod, nciserver. Edit thisconfigmap to customize the properties, logging features, and memory status monitoring for the primaryand backup Netcool/Impact core server pods. You can also customize the Derby database that runs insidethe Netcool/Impact server pod.
ContentsThe following table lists the data elements that are contained in the Primary Netcool/Impact core serverconfigmap:
706 IBM Netcool Operations Insight: Integration Guide
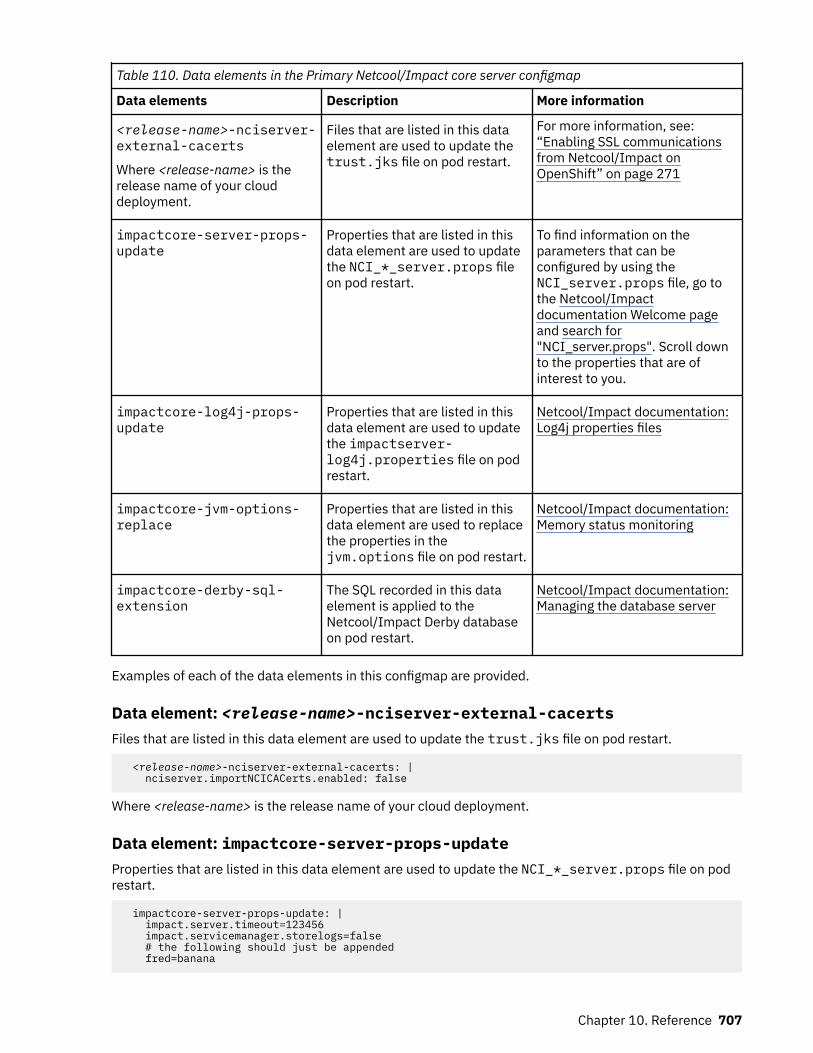
Table 110. Data elements in the Primary Netcool/Impact core server configmap
Data elements Description More information
<release-name>-nciserver-external-cacerts
Where <release-name> is therelease name of your clouddeployment.
Files that are listed in this dataelement are used to update thetrust.jks file on pod restart.
For more information, see:“Enabling SSL communicationsfrom Netcool/Impact onOpenShift” on page 271
impactcore-server-props-update
Properties that are listed in thisdata element are used to updatethe NCI_*_server.props fileon pod restart.
To find information on theparameters that can beconfigured by using theNCI_server.props file, go tothe Netcool/Impactdocumentation Welcome pageand search for"NCI_server.props". Scroll downto the properties that are ofinterest to you.
impactcore-log4j-props-update
Properties that are listed in thisdata element are used to updatethe impactserver-log4j.properties file on podrestart.
Netcool/Impact documentation:Log4j properties files
impactcore-jvm-options-replace
Properties that are listed in thisdata element are used to replacethe properties in thejvm.options file on pod restart.
Netcool/Impact documentation:Memory status monitoring
impactcore-derby-sql-extension
The SQL recorded in this dataelement is applied to theNetcool/Impact Derby databaseon pod restart.
Netcool/Impact documentation:Managing the database server
Examples of each of the data elements in this configmap are provided.
Data element: <release-name>-nciserver-external-cacertsFiles that are listed in this data element are used to update the trust.jks file on pod restart.
<release-name>-nciserver-external-cacerts: | nciserver.importNCICACerts.enabled: false
Where <release-name> is the release name of your cloud deployment.
Data element: impactcore-server-props-updateProperties that are listed in this data element are used to update the NCI_*_server.props file on podrestart.
impactcore-server-props-update: | impact.server.timeout=123456 impact.servicemanager.storelogs=false # the following should just be appended fred=banana
Chapter 10. Reference 707
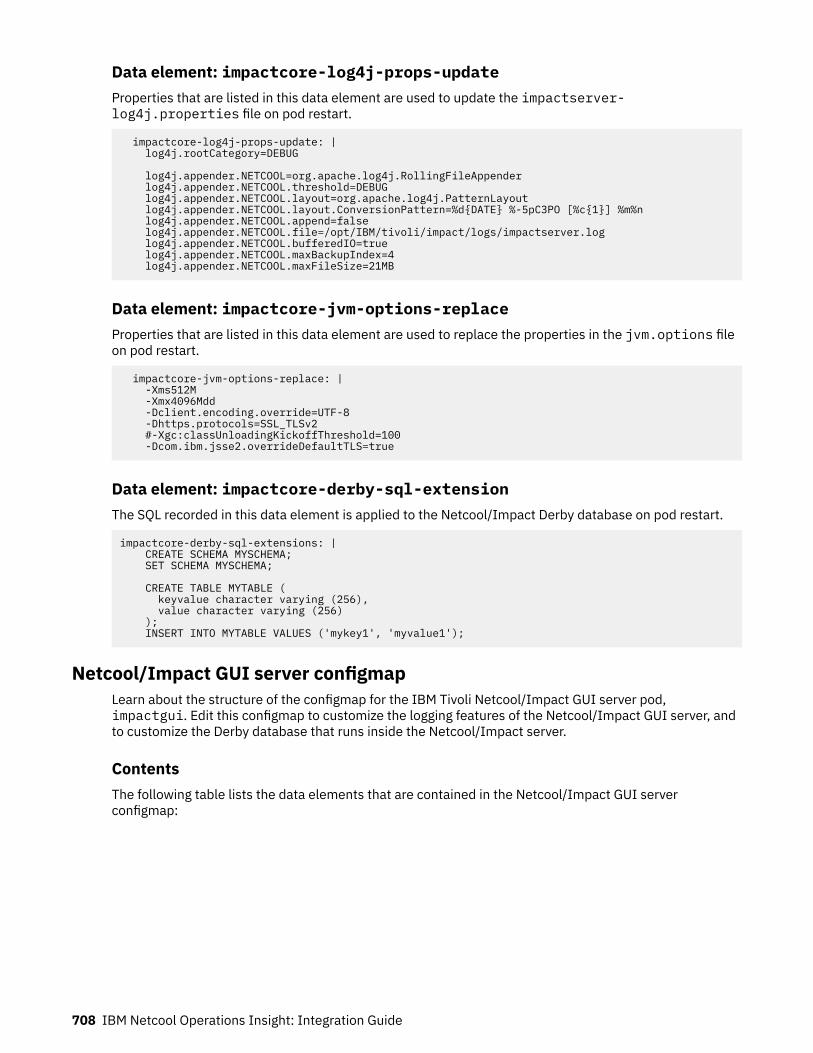
Data element: impactcore-log4j-props-updateProperties that are listed in this data element are used to update the impactserver-log4j.properties file on pod restart.
impactcore-log4j-props-update: | log4j.rootCategory=DEBUG log4j.appender.NETCOOL=org.apache.log4j.RollingFileAppender log4j.appender.NETCOOL.threshold=DEBUG log4j.appender.NETCOOL.layout=org.apache.log4j.PatternLayout log4j.appender.NETCOOL.layout.ConversionPattern=%d{DATE} %-5pC3PO [%c{1}] %m%n log4j.appender.NETCOOL.append=false log4j.appender.NETCOOL.file=/opt/IBM/tivoli/impact/logs/impactserver.log log4j.appender.NETCOOL.bufferedIO=true log4j.appender.NETCOOL.maxBackupIndex=4 log4j.appender.NETCOOL.maxFileSize=21MB
Data element: impactcore-jvm-options-replaceProperties that are listed in this data element are used to replace the properties in the jvm.options fileon pod restart.
impactcore-jvm-options-replace: | -Xms512M -Xmx4096Mdd -Dclient.encoding.override=UTF-8 -Dhttps.protocols=SSL_TLSv2 #-Xgc:classUnloadingKickoffThreshold=100 -Dcom.ibm.jsse2.overrideDefaultTLS=true
Data element: impactcore-derby-sql-extensionThe SQL recorded in this data element is applied to the Netcool/Impact Derby database on pod restart.
impactcore-derby-sql-extensions: | CREATE SCHEMA MYSCHEMA; SET SCHEMA MYSCHEMA;
CREATE TABLE MYTABLE ( keyvalue character varying (256), value character varying (256) ); INSERT INTO MYTABLE VALUES ('mykey1', 'myvalue1');
Netcool/Impact GUI server configmapLearn about the structure of the configmap for the IBM Tivoli Netcool/Impact GUI server pod,impactgui. Edit this configmap to customize the logging features of the Netcool/Impact GUI server, andto customize the Derby database that runs inside the Netcool/Impact server.
ContentsThe following table lists the data elements that are contained in the Netcool/Impact GUI serverconfigmap:
708 IBM Netcool Operations Insight: Integration Guide
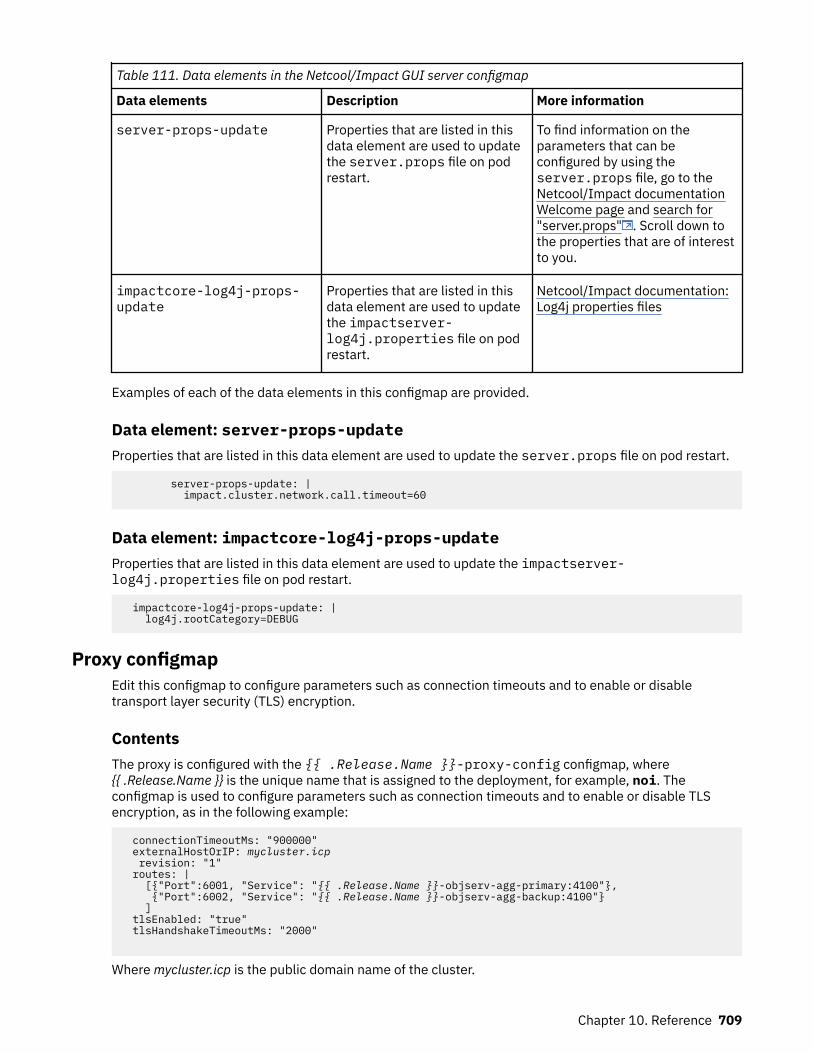
Table 111. Data elements in the Netcool/Impact GUI server configmap
Data elements Description More information
server-props-update Properties that are listed in thisdata element are used to updatethe server.props file on podrestart.
To find information on theparameters that can beconfigured by using theserver.props file, go to theNetcool/Impact documentationWelcome page and search for"server.props" . Scroll down tothe properties that are of interestto you.
impactcore-log4j-props-update
Properties that are listed in thisdata element are used to updatethe impactserver-log4j.properties file on podrestart.
Netcool/Impact documentation:Log4j properties files
Examples of each of the data elements in this configmap are provided.
Data element: server-props-updateProperties that are listed in this data element are used to update the server.props file on pod restart.
server-props-update: | impact.cluster.network.call.timeout=60
Data element: impactcore-log4j-props-updateProperties that are listed in this data element are used to update the impactserver-log4j.properties file on pod restart.
impactcore-log4j-props-update: | log4j.rootCategory=DEBUG
Proxy configmapEdit this configmap to configure parameters such as connection timeouts and to enable or disabletransport layer security (TLS) encryption.
ContentsThe proxy is configured with the {{ .Release.Name }}-proxy-config configmap, where{{ .Release.Name }} is the unique name that is assigned to the deployment, for example, noi. Theconfigmap is used to configure parameters such as connection timeouts and to enable or disable TLSencryption, as in the following example:
connectionTimeoutMs: "900000" externalHostOrIP: mycluster.icp revision: "1" routes: | [{"Port":6001, "Service": "{{ .Release.Name }}-objserv-agg-primary:4100"}, {"Port":6002, "Service": "{{ .Release.Name }}-objserv-agg-backup:4100"} ] tlsEnabled: "true" tlsHandshakeTimeoutMs: "2000"
Where mycluster.icp is the public domain name of the cluster.
Chapter 10. Reference 709

The following table lists the data elements that are contained in the proxy configmap:
Table 112. Data elements in the proxy configmap
Data elements Description
connectionTimeoutMs Use this element to specify the connection timeoutin milliseconds.
externalHostOrIP Use this element to specify the external Host or IPaddress. After deployment, do not edit this value.
revision Version number of configmap. Must beincremented when a change is made to theconfigmap, or the change will not be active. Mustbe an integer greater than 0.
routes Use this element to specify the gateway routes.After deployment, do not edit this value.
tlsEnabled Use this element to enable or disable TLSencryption.
tlsHandshakeTimeoutMs Use this element to specify the TLS handshaketimeout in milliseconds.
After you update the configmap the changes are automatically applied to the existing proxy pod.
LDAP Proxy configmapldap_proxy_configmap is the configmap for the LDAP proxy pod, openldap. Edit this configmap toconfigure connections to your own LDAP server when you have LDAPmode set to proxy rather thanstandalone. This configmap is not used when LDAPmode is set to standalone.
ContentsThe following table lists the data elements that are contained in the openldap configmap:
Table 113. Data elements in the openldap configmap
Data elements Description More information
ldap-proxy-slapd-replace: Replaces the contents of theslapd.conf file, whichconfigures the connection to yourLDAP server.
Dashboard Application Services Hub configmapLearn about the structure of the configmap for the Dashboard Application Services Hub pod, webgui. Editthis configmap to customize the properties of the Web GUI Event Viewer.
ContentsThe following table lists the data elements that are contained in the Dashboard Application Services Hubconfigmap :
710 IBM Netcool Operations Insight: Integration Guide
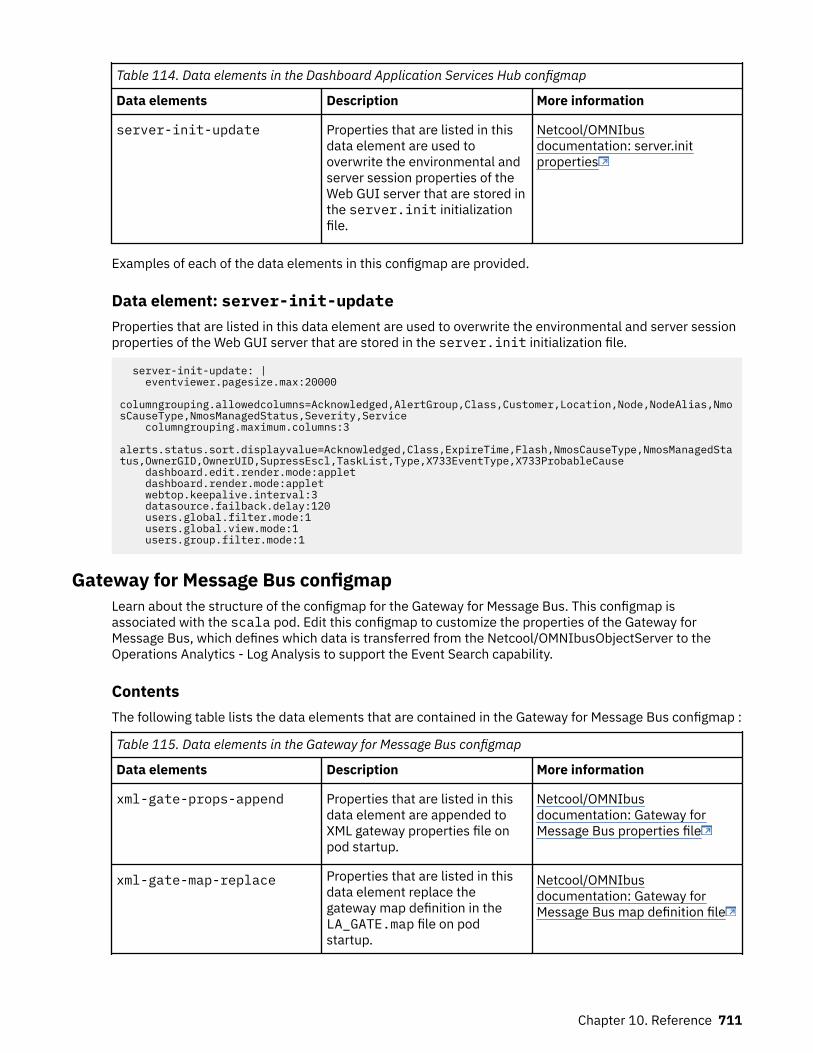
Table 114. Data elements in the Dashboard Application Services Hub configmap
Data elements Description More information
server-init-update Properties that are listed in thisdata element are used tooverwrite the environmental andserver session properties of theWeb GUI server that are stored inthe server.init initializationfile.
Netcool/OMNIbusdocumentation: server.initproperties
Examples of each of the data elements in this configmap are provided.
Data element: server-init-updateProperties that are listed in this data element are used to overwrite the environmental and server sessionproperties of the Web GUI server that are stored in the server.init initialization file.
server-init-update: | eventviewer.pagesize.max:20000 columngrouping.allowedcolumns=Acknowledged,AlertGroup,Class,Customer,Location,Node,NodeAlias,NmosCauseType,NmosManagedStatus,Severity,Service columngrouping.maximum.columns:3 alerts.status.sort.displayvalue=Acknowledged,Class,ExpireTime,Flash,NmosCauseType,NmosManagedStatus,OwnerGID,OwnerUID,SupressEscl,TaskList,Type,X733EventType,X733ProbableCause dashboard.edit.render.mode:applet dashboard.render.mode:applet webtop.keepalive.interval:3 datasource.failback.delay:120 users.global.filter.mode:1 users.global.view.mode:1 users.group.filter.mode:1
Gateway for Message Bus configmapLearn about the structure of the configmap for the Gateway for Message Bus. This configmap isassociated with the scala pod. Edit this configmap to customize the properties of the Gateway forMessage Bus, which defines which data is transferred from the Netcool/OMNIbusObjectServer to theOperations Analytics - Log Analysis to support the Event Search capability.
ContentsThe following table lists the data elements that are contained in the Gateway for Message Bus configmap :
Table 115. Data elements in the Gateway for Message Bus configmap
Data elements Description More information
xml-gate-props-append Properties that are listed in thisdata element are appended toXML gateway properties file onpod startup.
Netcool/OMNIbusdocumentation: Gateway forMessage Bus properties file
xml-gate-map-replace Properties that are listed in thisdata element replace thegateway map definition in theLA_GATE.map file on podstartup.
Netcool/OMNIbusdocumentation: Gateway forMessage Bus map definition file
Chapter 10. Reference 711
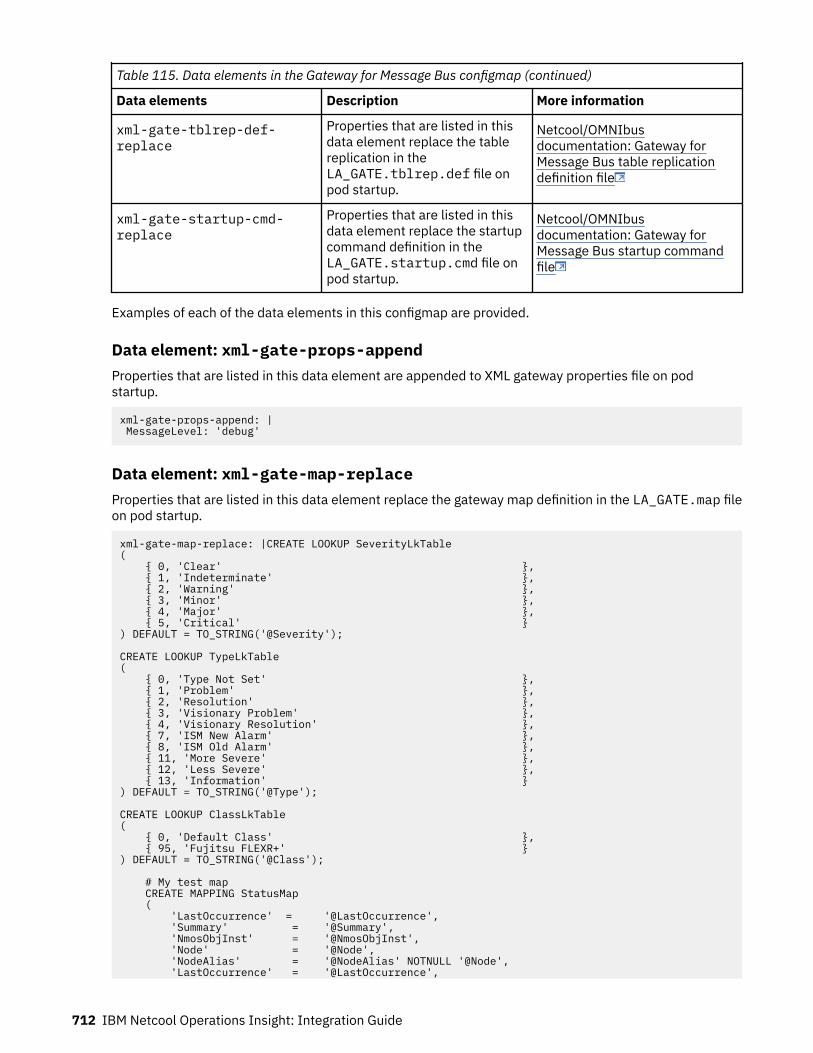
Table 115. Data elements in the Gateway for Message Bus configmap (continued)
Data elements Description More information
xml-gate-tblrep-def-replace
Properties that are listed in thisdata element replace the tablereplication in theLA_GATE.tblrep.def file onpod startup.
Netcool/OMNIbusdocumentation: Gateway forMessage Bus table replicationdefinition file
xml-gate-startup-cmd-replace
Properties that are listed in thisdata element replace the startupcommand definition in theLA_GATE.startup.cmd file onpod startup.
Netcool/OMNIbusdocumentation: Gateway forMessage Bus startup commandfile
Examples of each of the data elements in this configmap are provided.
Data element: xml-gate-props-appendProperties that are listed in this data element are appended to XML gateway properties file on podstartup.
xml-gate-props-append: | MessageLevel: 'debug'
Data element: xml-gate-map-replaceProperties that are listed in this data element replace the gateway map definition in the LA_GATE.map fileon pod startup.
xml-gate-map-replace: |CREATE LOOKUP SeverityLkTable( { 0, 'Clear' }, { 1, 'Indeterminate' }, { 2, 'Warning' }, { 3, 'Minor' }, { 4, 'Major' }, { 5, 'Critical' }) DEFAULT = TO_STRING('@Severity');
CREATE LOOKUP TypeLkTable( { 0, 'Type Not Set' }, { 1, 'Problem' }, { 2, 'Resolution' }, { 3, 'Visionary Problem' }, { 4, 'Visionary Resolution' }, { 7, 'ISM New Alarm' }, { 8, 'ISM Old Alarm' }, { 11, 'More Severe' }, { 12, 'Less Severe' }, { 13, 'Information' }) DEFAULT = TO_STRING('@Type');
CREATE LOOKUP ClassLkTable( { 0, 'Default Class' }, { 95, 'Fujitsu FLEXR+' }) DEFAULT = TO_STRING('@Class');
# My test map CREATE MAPPING StatusMap ( 'LastOccurrence' = '@LastOccurrence', 'Summary' = '@Summary', 'NmosObjInst' = '@NmosObjInst', 'Node' = '@Node', 'NodeAlias' = '@NodeAlias' NOTNULL '@Node', 'LastOccurrence' = '@LastOccurrence',
712 IBM Netcool Operations Insight: Integration Guide
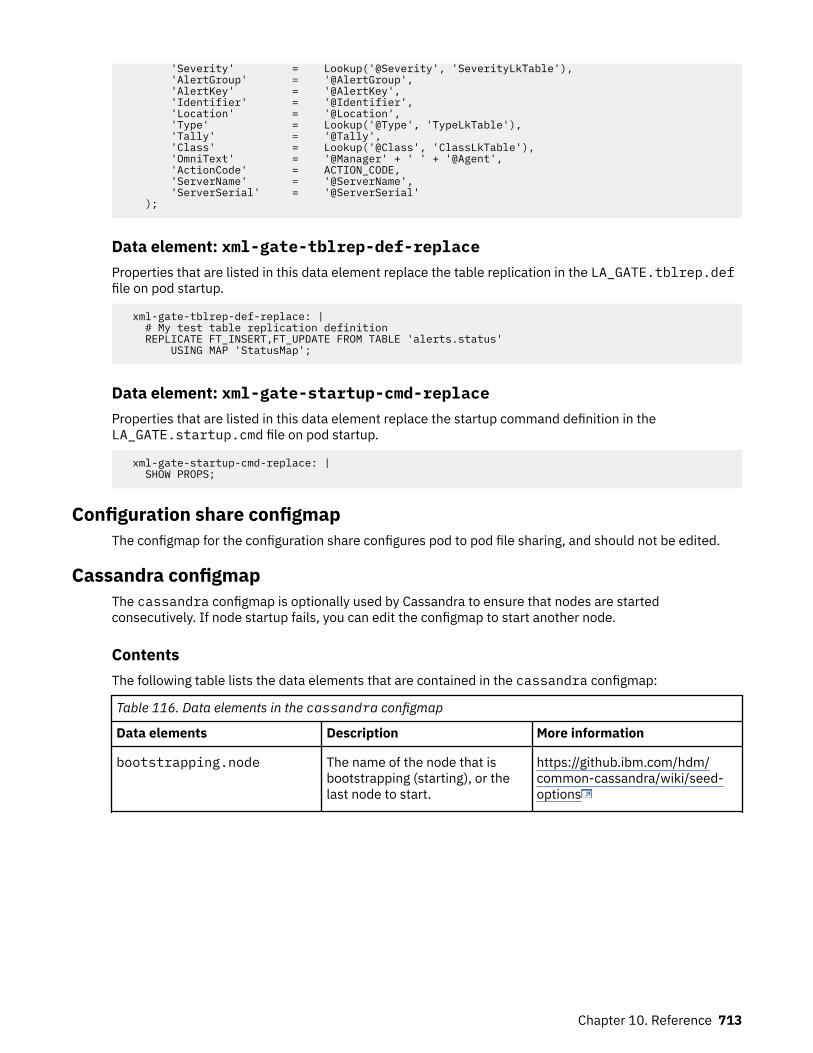
'Severity' = Lookup('@Severity', 'SeverityLkTable'), 'AlertGroup' = '@AlertGroup', 'AlertKey' = '@AlertKey', 'Identifier' = '@Identifier', 'Location' = '@Location', 'Type' = Lookup('@Type', 'TypeLkTable'), 'Tally' = '@Tally', 'Class' = Lookup('@Class', 'ClassLkTable'), 'OmniText' = '@Manager' + ' ' + '@Agent', 'ActionCode' = ACTION_CODE, 'ServerName' = '@ServerName', 'ServerSerial' = '@ServerSerial' );
Data element: xml-gate-tblrep-def-replaceProperties that are listed in this data element replace the table replication in the LA_GATE.tblrep.deffile on pod startup.
xml-gate-tblrep-def-replace: | # My test table replication definition REPLICATE FT_INSERT,FT_UPDATE FROM TABLE 'alerts.status' USING MAP 'StatusMap';
Data element: xml-gate-startup-cmd-replaceProperties that are listed in this data element replace the startup command definition in theLA_GATE.startup.cmd file on pod startup.
xml-gate-startup-cmd-replace: | SHOW PROPS;
Configuration share configmapThe configmap for the configuration share configures pod to pod file sharing, and should not be edited.
Cassandra configmapThe cassandra configmap is optionally used by Cassandra to ensure that nodes are startedconsecutively. If node startup fails, you can edit the configmap to start another node.
ContentsThe following table lists the data elements that are contained in the cassandra configmap:
Table 116. Data elements in the cassandra configmap
Data elements Description More information
bootstrapping.node The name of the node that isbootstrapping (starting), or thelast node to start.
https://github.ibm.com/hdm/common-cassandra/wiki/seed-options
Chapter 10. Reference 713

ASM-UI configmapThis configmap has the configuration for the IBM Agile Service Manager user interface. It should not beedited.
cloud native analytics gateway configmapThe ea-noi-layer-eanoigateway configmap is created during the install and should not be edited.
CouchDB configmapThe couchdb configmap is created during the install and should not be edited.
Kafka configmapThe kafka configmap is created during the install and should not be edited.
Zookeeper configmapThe zookeeper configmap is created during the install and should not be edited.
Event referenceUse this information to understand the Netcool Operations Insight event structure.
The Netcool Operations Insight event structure is a flat structure made up of column data from thefollowing sources: Netcool/OMNIbus ObjectServer alerts.status table, and other sources.
Column data from the ObjectServerThe Netcool/OMNIbus ObjectServer alerts.status table contains status information about problemsthat have been detected by probes.
For a description of each of the columns in the alerts.status table, see the link at the bottom of thistopic.
Column data from other sourcesIn addition to the column data from the Netcool/OMNIbus ObjectServer alerts.status table, NetcoolOperations Insight events also contain column data from other sources.
Columns from cloud native analyticsThe following table describes the content of each of the columns.
Note: Any references in these column descriptions to incidents, incident management, or tenants can beignored during the time frame of the Netcool Operations Insight 1.6.1 release.
Table 117.
Column name Data type Description Source
AdvCorrCauseType
Varchar Field used by the Netcool KnowledgeLibrary.
Netcool KnowledgeLibrary
AdvCorrServerName
Varchar Field used by the Netcool KnowledgeLibrary.
Netcool KnowledgeLibrary
AdvCorrServerSerial
Integer Field used by the Netcool KnowledgeLibrary.
Netcool KnowledgeLibrary
714 IBM Netcool Operations Insight: Integration Guide
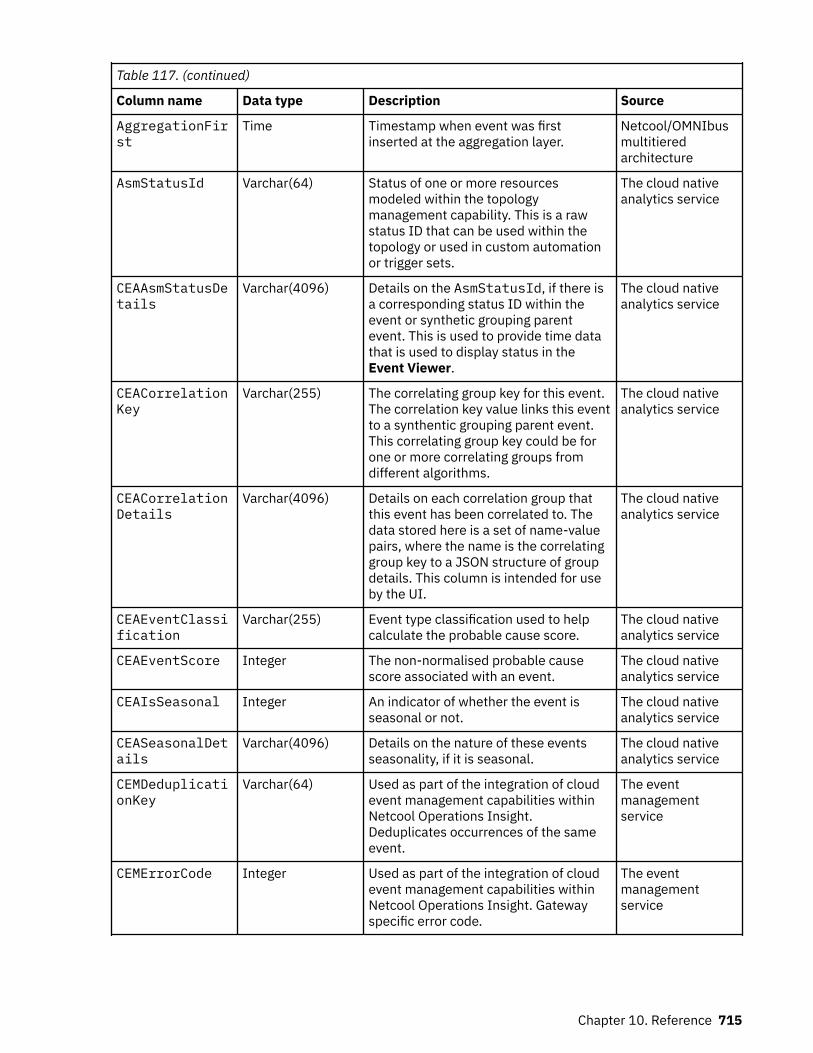
Table 117. (continued)
Column name Data type Description Source
AggregationFirst
Time Timestamp when event was firstinserted at the aggregation layer.
Netcool/OMNIbusmultitieredarchitecture
AsmStatusId Varchar(64) Status of one or more resourcesmodeled within the topologymanagement capability. This is a rawstatus ID that can be used within thetopology or used in custom automationor trigger sets.
The cloud nativeanalytics service
CEAAsmStatusDetails
Varchar(4096) Details on the AsmStatusId, if there isa corresponding status ID within theevent or synthetic grouping parentevent. This is used to provide time datathat is used to display status in theEvent Viewer.
The cloud nativeanalytics service
CEACorrelationKey
Varchar(255) The correlating group key for this event.The correlation key value links this eventto a synthentic grouping parent event.This correlating group key could be forone or more correlating groups fromdifferent algorithms.
The cloud nativeanalytics service
CEACorrelationDetails
Varchar(4096) Details on each correlation group thatthis event has been correlated to. Thedata stored here is a set of name-valuepairs, where the name is the correlatinggroup key to a JSON structure of groupdetails. This column is intended for useby the UI.
The cloud nativeanalytics service
CEAEventClassification
Varchar(255) Event type classification used to helpcalculate the probable cause score.
The cloud nativeanalytics service
CEAEventScore Integer The non-normalised probable causescore associated with an event.
The cloud nativeanalytics service
CEAIsSeasonal Integer An indicator of whether the event isseasonal or not.
The cloud nativeanalytics service
CEASeasonalDetails
Varchar(4096) Details on the nature of these eventsseasonality, if it is seasonal.
The cloud nativeanalytics service
CEMDeduplicationKey
Varchar(64) Used as part of the integration of cloudevent management capabilities withinNetcool Operations Insight.Deduplicates occurrences of the sameevent.
The eventmanagementservice
CEMErrorCode Integer Used as part of the integration of cloudevent management capabilities withinNetcool Operations Insight. Gatewayspecific error code.
The eventmanagementservice
Chapter 10. Reference 715
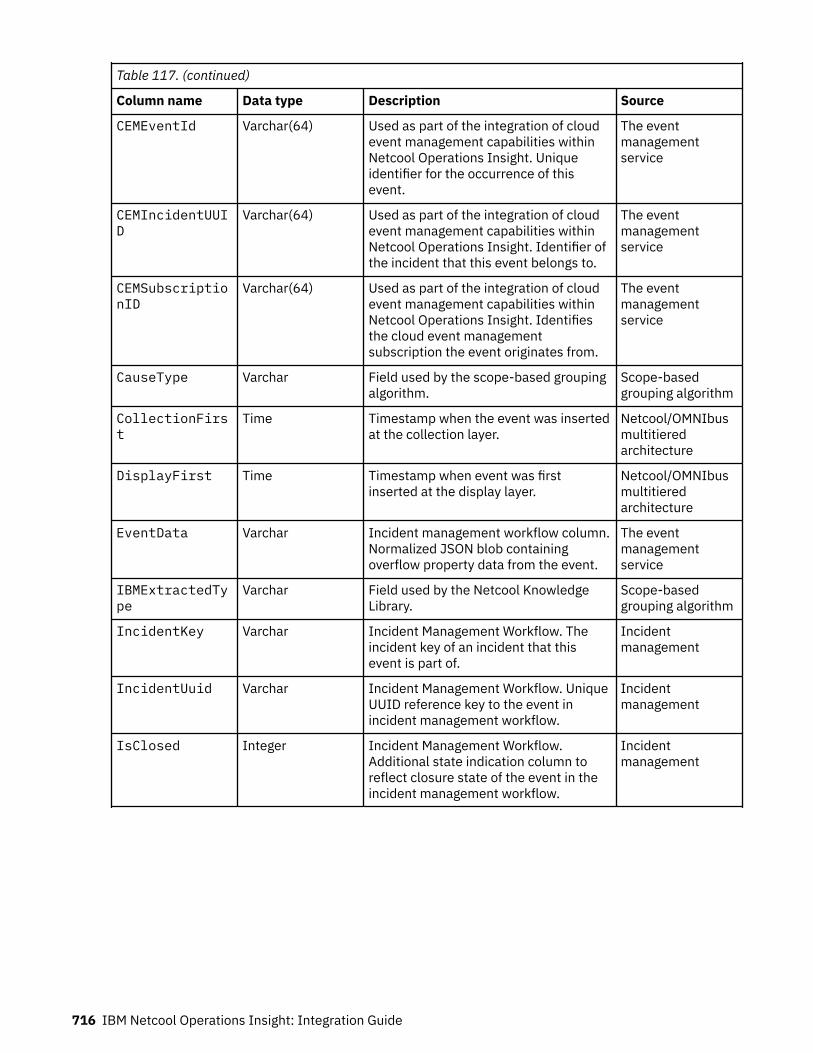
Table 117. (continued)
Column name Data type Description Source
CEMEventId Varchar(64) Used as part of the integration of cloudevent management capabilities withinNetcool Operations Insight. Uniqueidentifier for the occurrence of thisevent.
The eventmanagementservice
CEMIncidentUUID
Varchar(64) Used as part of the integration of cloudevent management capabilities withinNetcool Operations Insight. Identifier ofthe incident that this event belongs to.
The eventmanagementservice
CEMSubscriptionID
Varchar(64) Used as part of the integration of cloudevent management capabilities withinNetcool Operations Insight. Identifiesthe cloud event managementsubscription the event originates from.
The eventmanagementservice
CauseType Varchar Field used by the scope-based groupingalgorithm.
Scope-basedgrouping algorithm
CollectionFirst
Time Timestamp when the event was insertedat the collection layer.
Netcool/OMNIbusmultitieredarchitecture
DisplayFirst Time Timestamp when event was firstinserted at the display layer.
Netcool/OMNIbusmultitieredarchitecture
EventData Varchar Incident management workflow column.Normalized JSON blob containingoverflow property data from the event.
The eventmanagementservice
IBMExtractedType
Varchar Field used by the Netcool KnowledgeLibrary.
Scope-basedgrouping algorithm
IncidentKey Varchar Incident Management Workflow. Theincident key of an incident that thisevent is part of.
Incidentmanagement
IncidentUuid Varchar Incident Management Workflow. UniqueUUID reference key to the event inincident management workflow.
Incidentmanagement
IsClosed Integer Incident Management Workflow.Additional state indication column toreflect closure state of the event in theincident management workflow.
Incidentmanagement
716 IBM Netcool Operations Insight: Integration Guide
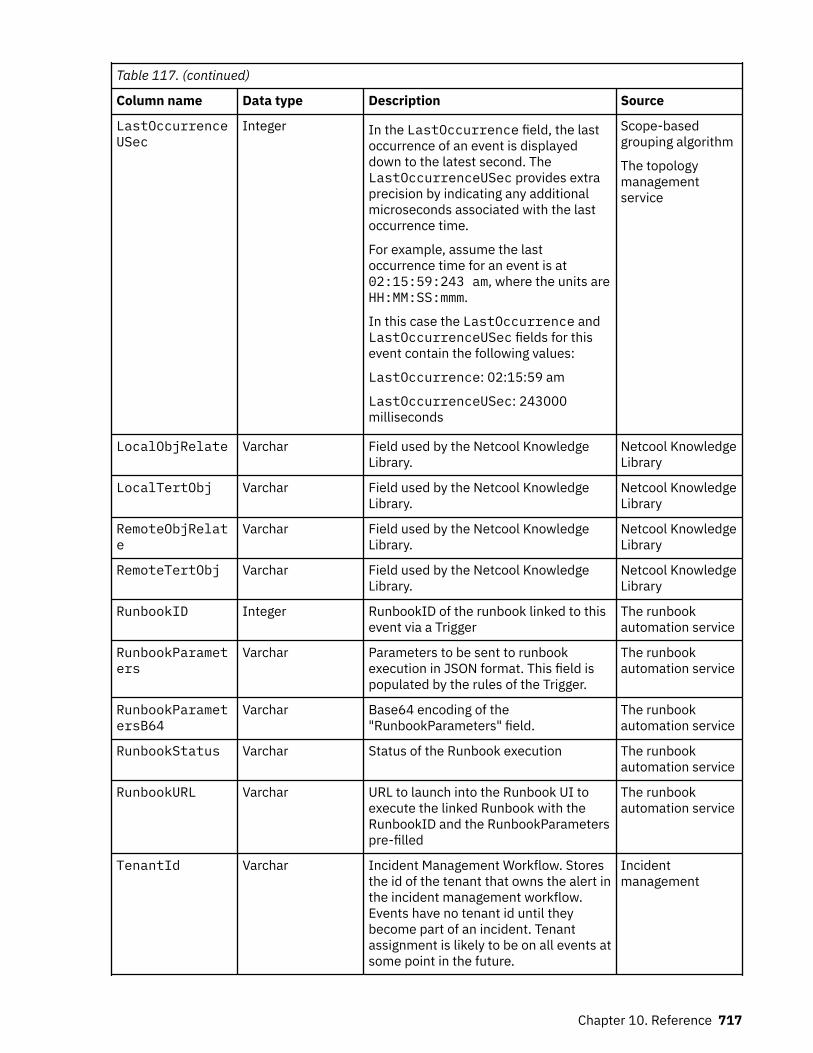
Table 117. (continued)
Column name Data type Description Source
LastOccurrenceUSec
Integer In the LastOccurrence field, the lastoccurrence of an event is displayeddown to the latest second. TheLastOccurrenceUSec provides extraprecision by indicating any additionalmicroseconds associated with the lastoccurrence time.
For example, assume the lastoccurrence time for an event is at02:15:59:243 am, where the units areHH:MM:SS:mmm.
In this case the LastOccurrence andLastOccurrenceUSec fields for thisevent contain the following values:
LastOccurrence: 02:15:59 am
LastOccurrenceUSec: 243000milliseconds
Scope-basedgrouping algorithm
The topologymanagementservice
LocalObjRelate Varchar Field used by the Netcool KnowledgeLibrary.
Netcool KnowledgeLibrary
LocalTertObj Varchar Field used by the Netcool KnowledgeLibrary.
Netcool KnowledgeLibrary
RemoteObjRelate
Varchar Field used by the Netcool KnowledgeLibrary.
Netcool KnowledgeLibrary
RemoteTertObj Varchar Field used by the Netcool KnowledgeLibrary.
Netcool KnowledgeLibrary
RunbookID Integer RunbookID of the runbook linked to thisevent via a Trigger
The runbookautomation service
RunbookParameters
Varchar Parameters to be sent to runbookexecution in JSON format. This field ispopulated by the rules of the Trigger.
The runbookautomation service
RunbookParametersB64
Varchar Base64 encoding of the"RunbookParameters" field.
The runbookautomation service
RunbookStatus Varchar Status of the Runbook execution The runbookautomation service
RunbookURL Varchar URL to launch into the Runbook UI toexecute the linked Runbook with theRunbookID and the RunbookParameterspre-filled
The runbookautomation service
TenantId Varchar Incident Management Workflow. Storesthe id of the tenant that owns the alert inthe incident management workflow.Events have no tenant id until theybecome part of an incident. Tenantassignment is likely to be on all events atsome point in the future.
Incidentmanagement
Chapter 10. Reference 717
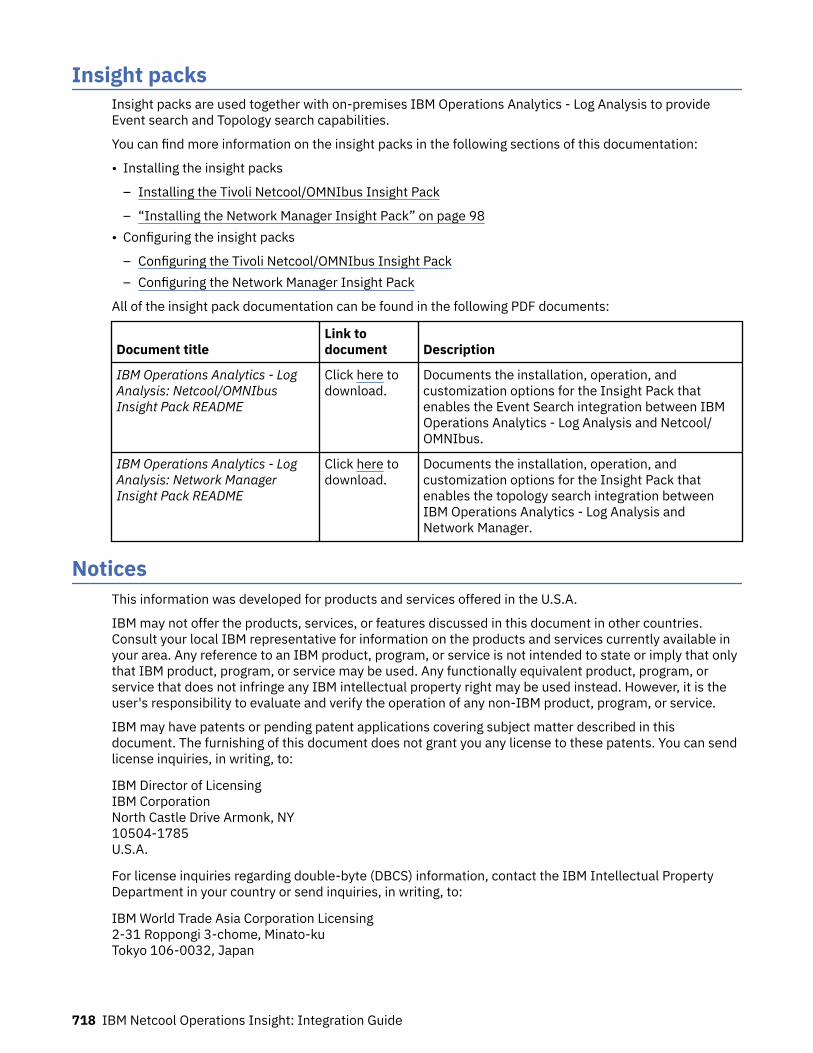
Insight packsInsight packs are used together with on-premises IBM Operations Analytics - Log Analysis to provideEvent search and Topology search capabilities.
You can find more information on the insight packs in the following sections of this documentation:
• Installing the insight packs
– Installing the Tivoli Netcool/OMNIbus Insight Pack
– “Installing the Network Manager Insight Pack” on page 98• Configuring the insight packs
– Configuring the Tivoli Netcool/OMNIbus Insight Pack– Configuring the Network Manager Insight Pack
All of the insight pack documentation can be found in the following PDF documents:
Document titleLink todocument Description
IBM Operations Analytics - LogAnalysis: Netcool/OMNIbusInsight Pack README
Click here todownload.
Documents the installation, operation, andcustomization options for the Insight Pack thatenables the Event Search integration between IBMOperations Analytics - Log Analysis and Netcool/OMNIbus.
IBM Operations Analytics - LogAnalysis: Network ManagerInsight Pack README
Click here todownload.
Documents the installation, operation, andcustomization options for the Insight Pack thatenables the topology search integration betweenIBM Operations Analytics - Log Analysis andNetwork Manager.
NoticesThis information was developed for products and services offered in the U.S.A.
IBM may not offer the products, services, or features discussed in this document in other countries.Consult your local IBM representative for information on the products and services currently available inyour area. Any reference to an IBM product, program, or service is not intended to state or imply that onlythat IBM product, program, or service may be used. Any functionally equivalent product, program, orservice that does not infringe any IBM intellectual property right may be used instead. However, it is theuser's responsibility to evaluate and verify the operation of any non-IBM product, program, or service.
IBM may have patents or pending patent applications covering subject matter described in thisdocument. The furnishing of this document does not grant you any license to these patents. You can sendlicense inquiries, in writing, to:
IBM Director of Licensing IBM Corporation North Castle Drive Armonk, NY 10504-1785 U.S.A.
For license inquiries regarding double-byte (DBCS) information, contact the IBM Intellectual PropertyDepartment in your country or send inquiries, in writing, to:
IBM World Trade Asia Corporation Licensing 2-31 Roppongi 3-chome, Minato-ku Tokyo 106-0032, Japan
718 IBM Netcool Operations Insight: Integration Guide

The following paragraph does not apply to the United Kingdom or any other country where suchprovisions are inconsistent with local law: INTERNATIONAL BUSINESS MACHINES CORPORATIONPROVIDES THIS PUBLICATION "AS IS" WITHOUT WARRANTY OF ANY KIND, EITHER EXPRESS ORIMPLIED, INCLUDING, BUT NOT LIMITED TO, THE IMPLIED WARRANTIES OF NON-INFRINGEMENT,MERCHANTABILITY OR FITNESS FOR A PARTICULAR PURPOSE. Some states do not allow disclaimer ofexpress or implied warranties in certain transactions, therefore, this statement may not apply to you.
This information could include technical inaccuracies or typographical errors. Changes are periodicallymade to the information herein; these changes will be incorporated in new editions of the publication.IBM may make improvements and/or changes in the product(s) and/or the program(s) described in thispublication at any time without notice.
Any references in this information to non-IBM Web sites are provided for convenience only and do not inany manner serve as an endorsement of those Web sites. The materials at those Web sites are not part ofthe materials for this IBM product and use of those Web sites is at your own risk.
IBM may use or distribute any of the information you supply in any way it believes appropriate withoutincurring any obligation to you.
Licensees of this program who wish to have information about it for the purpose of enabling: (i) theexchange of information between independently created programs and other programs (including thisone) and (ii) the mutual use of the information which has been exchanged, should contact:
IBM Corporation 958/NH04IBM Centre, St Leonards601 Pacific HwySt Leonards, NSW, 2069 Australia
IBM Corporation896471/H128B76 Upper GroundLondon SE1 9PZUnited Kingdom
IBM CorporationJBF1/SOM1294 Route 100Somers, NY, 10589-0100United States of America
Such information may be available, subject to appropriate terms and conditions, including in some cases,payment of a fee.
The licensed program described in this document and all licensed material available for it are provided byIBM under terms of the IBM Customer Agreement, IBM International Program License Agreement or anyequivalent agreement between us.
Any performance data contained herein was determined in a controlled environment. Therefore, theresults obtained in other operating environments may vary significantly. Some measurements may havebeen made on development-level systems and there is no guarantee that these measurements will be thesame on generally available systems. Furthermore, some measurements may have been estimatedthrough extrapolation. Actual results may vary. Users of this document should verify the applicable datafor their specific environment.
Information concerning non-IBM products was obtained from the suppliers of those products, theirpublished announcements or other publicly available sources. IBM has not tested those products andcannot confirm the accuracy of performance, compatibility or any other claims related to non-IBMproducts. Questions on the capabilities of non-IBM products should be addressed to the suppliers ofthose products.
Chapter 10. Reference 719

All statements regarding IBM's future direction or intent are subject to change or withdrawal withoutnotice, and represent goals and objectives only.
This information contains examples of data and reports used in daily business operations. To illustratethem as completely as possible, the examples include the names of individuals, companies, brands, andproducts. All of these names are fictitious and any similarity to the names and addresses used by anactual business enterprise is entirely coincidental.
COPYRIGHT LICENSE:
This information contains sample application programs in source language, which illustrate programmingtechniques on various operating platforms. You may copy, modify, and distribute these sample programsin any form without payment to IBM, for the purposes of developing, using, marketing or distributingapplication programs conforming to the application programming interface for the operating platform forwhich the sample programs are written. These examples have not been thoroughly tested under allconditions. IBM, therefore, cannot guarantee or imply reliability, serviceability, or function of theseprograms.
If you are viewing this information softcopy, the photographs and color illustrations may not appear.
TrademarksAIX, Db2, IBM, the IBM logo, ibm.com®, Informix, iSeries, Netcool, OS/390®, Passport Advantage, pSeries,Service Request Manage, System p, System z, Tivoli, the Tivoli logo, Tivoli Enterprise Console®,TotalStorage, WebSphere, xSeries, z/OS, and zSeries are trademarks or registered trademarks ofInternational Business Machines Corporation in the United States, other countries, or both.
Adobe, Acrobat, Portable Document Format (PDF), PostScript, and all Adobe-based trademarks are eitherregistered trademarks or trademarks of Adobe Systems Incorporated in the United States, othercountries, or both.
Intel, Intel logo, Intel Inside, Intel Inside logo, Intel Centrino, Intel Centrino logo, Celeron, Intel Xeon,Intel SpeedStep, Itanium, and Pentium are trademarks or registered trademarks of Intel Corporation orits subsidiaries in the United States and other countries.
Java and all Java-based trademarks and logos are trademarks or registered trademarksof Sun Microsystems, Inc. in the United States, other countries, or both.
The registered trademark Linux® is used pursuant to a sublicense from the Linux Foundation, the exclusivelicensee of Linus Torvalds, owner of the mark on a worldwide basis.
Microsoft, Windows, Windows NT, and the Windows logo are trademarks of Microsoft Corporation in theUnited States, other countries, or both.
UNIX is a registered trademark of The Open Group in the United States and other countries.
Other company, product, or service names may be trademarks or service marks of others.
720 IBM Netcool Operations Insight: Integration Guide
Appendix A. Release notesIBM Netcool Operations Insight V1.6.3 is available. Compatibility, installation, and other getting-startedissues are addressed in these release notes.
Contents• “Description” on page 721• “Compatibility” on page 721• “System requirements” on page 721• “New product features and functions in V1.6.3” on page 721• “Known problems at eGA” on page 723• “Support” on page 723
DescriptionNetcool Operations Insight combines real-time event consolidation and correlation capabilities of NetcoolOperations Insight with Event Search and Event Analytics. It further delivers seasonality analysis to helpdetect regularly occurring issues. Netcool Operations Insight also enables real-time enrichment andcorrelation to enable agile responses to alerts raised across disparate systems, including applicationtopology.
CompatibilityIBM Netcool Operations Insight includes the product and component versions listed in the followingtopics:
• “On-premises components” on page 17. This topic also includes information on the eAssemblies and fixpacks required to download and install.
• “Cloud components” on page 7
System requirementsFor information about hardware and software compatibility of each component, and detailed systemrequirements, see the IBM Software Product Compatibility Reports website:
http://www-969.ibm.com/software/reports/compatibility/clarity/index.html
Tip: When you create a report, search for Netcool Operations Insight and select your version (for example,V1.4). In the report, additional useful information is available through hover help and additional links.For example, to check the compatibility with an operating system for each component, go to theOperating Systems tab, find the row for your operating system, and hover over the icon in theComponents column. For more detailed information about restrictions, click the View link in the Detailscolumn.
New product features and functions in V1.6.3New features in V1.6.3
The following features and functions are available in the Netcool Operations Insight V1.6.3 product:Edit Temporal Pattern policies
Event Analytics Temporal Pattern policies can now be edited to modify or enhance the eventsgrouped by these policies. For more information, see “Editing policies” on page 481.
DashboardsImproved integration of Grafana dashboards with Netcool Operations Insight.
© Copyright IBM Corp. 2020, 2020 721
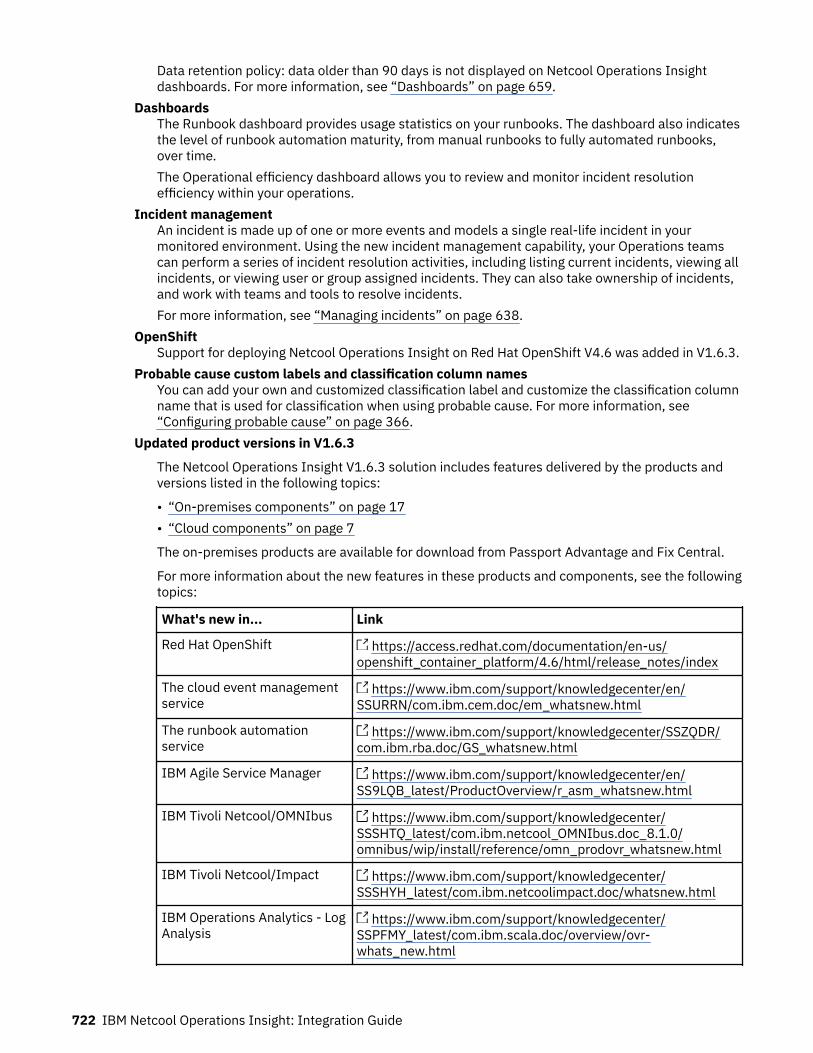
Data retention policy: data older than 90 days is not displayed on Netcool Operations Insightdashboards. For more information, see “Dashboards” on page 659.
DashboardsThe Runbook dashboard provides usage statistics on your runbooks. The dashboard also indicatesthe level of runbook automation maturity, from manual runbooks to fully automated runbooks,over time.The Operational efficiency dashboard allows you to review and monitor incident resolutionefficiency within your operations.
Incident managementAn incident is made up of one or more events and models a single real-life incident in yourmonitored environment. Using the new incident management capability, your Operations teamscan perform a series of incident resolution activities, including listing current incidents, viewing allincidents, or viewing user or group assigned incidents. They can also take ownership of incidents,and work with teams and tools to resolve incidents.For more information, see “Managing incidents” on page 638.
OpenShiftSupport for deploying Netcool Operations Insight on Red Hat OpenShift V4.6 was added in V1.6.3.
Probable cause custom labels and classification column namesYou can add your own and customized classification label and customize the classification columnname that is used for classification when using probable cause. For more information, see“Configuring probable cause” on page 366.
Updated product versions in V1.6.3
The Netcool Operations Insight V1.6.3 solution includes features delivered by the products andversions listed in the following topics:
• “On-premises components” on page 17• “Cloud components” on page 7
The on-premises products are available for download from Passport Advantage and Fix Central.
For more information about the new features in these products and components, see the followingtopics:
What's new in... Link
Red Hat OpenShift https://access.redhat.com/documentation/en-us/openshift_container_platform/4.6/html/release_notes/index
The cloud event managementservice
https://www.ibm.com/support/knowledgecenter/en/SSURRN/com.ibm.cem.doc/em_whatsnew.html
The runbook automationservice
https://www.ibm.com/support/knowledgecenter/SSZQDR/com.ibm.rba.doc/GS_whatsnew.html
IBM Agile Service Manager https://www.ibm.com/support/knowledgecenter/en/SS9LQB_latest/ProductOverview/r_asm_whatsnew.html
IBM Tivoli Netcool/OMNIbus https://www.ibm.com/support/knowledgecenter/SSSHTQ_latest/com.ibm.netcool_OMNIbus.doc_8.1.0/omnibus/wip/install/reference/omn_prodovr_whatsnew.html
IBM Tivoli Netcool/Impact https://www.ibm.com/support/knowledgecenter/SSSHYH_latest/com.ibm.netcoolimpact.doc/whatsnew.html
IBM Operations Analytics - LogAnalysis
https://www.ibm.com/support/knowledgecenter/SSPFMY_latest/com.ibm.scala.doc/overview/ovr-whats_new.html
722 IBM Netcool Operations Insight: Integration Guide
What's new in... Link
IBM Tivoli Network Manager https://www.ibm.com/support/knowledgecenter/SSSHRK_latest/overview/concept/ovr_whatsnew.html
IBM Tivoli NetcoolConfiguration Manager
https://www.ibm.com/support/knowledgecenter/SS7UH9_latest/ncm/wip/common/reference/ncm_ovr_whatsnew.html
Known problems at eGAKnown problems are documented in the following troubleshooting sections.
• “Troubleshooting administration” on page 595• “Troubleshooting configuration” on page 455• “Troubleshooting installation” on page 212• “Troubleshooting operations” on page 691• “Troubleshooting upgrade” on page 268
SupportIBM Electronic Support offers a portfolio of online support tools and resources that providescomprehensive technical information to diagnose and resolve problems and maintain your IBM products.IBM has many smart online tools and proactive features that can help you prevent problems fromoccurring in the first place, or quickly and easily troubleshoot problems when they occur. For moreinformation, see:
https://www.ibm.com/support/home/
Related conceptsSolution overview
Appendix A. Release notes 723

724 IBM Netcool Operations Insight: Integration Guide

Appendix B. Notices
This information was developed for products and services offered in the U.S.A. IBM may not offer theproducts, services, or features discussed in this document in other countries. Consult your local IBMrepresentative for information on the products and services currently available in your area. Any referenceto an IBM product, program, or service is not intended to state or imply that only that IBM product,program, or service may be used. Any functionally equivalent product, program, or service that does notinfringe any IBM intellectual property right may be used instead. However, it is the user's responsibility toevaluate and verify the operation of any non-IBM product, program, or service.
IBM may have patents or pending patent applications covering subject matter described in thisdocument. The furnishing of this document does not give you any license to these patents. You can sendlicense inquiries, in writing, to:
IBM Director of LicensingIBM CorporationNorth Castle DriveArmonk, NY 10504-1785 U.S.A.
For license inquiries regarding double-byte (DBCS) information, contact the IBM Intellectual PropertyDepartment in your country or send inquiries, in writing, to:
Intellectual Property LicensingLegal and Intellectual Property LawIBM Japan, Ltd.1623-14, Shimotsuruma, Yamato-shiKanagawa 242-8502 Japan
The following paragraph does not apply to the United Kingdom or any other country where suchprovisions are inconsistent with local law:
INTERNATIONAL BUSINESS MACHINES CORPORATION PROVIDES THIS PUBLICATION "AS IS"WITHOUT WARRANTY OF ANY KIND, EITHER EXPRESS OR IMPLIED, INCLUDING, BUT NOT LIMITED TO,THE IMPLIED WARRANTIES OF NON-INFRINGEMENT, MERCHANTABILITY OR FITNESS FOR APARTICULAR PURPOSE.
Some states do not allow disclaimer of express or implied warranties in certain transactions, therefore,this statement might not apply to you.
This information could include technical inaccuracies or typographical errors. Changes are periodicallymade to the information herein; these changes will be incorporated in new editions of the publication.IBM may make improvements and/or changes in the product(s) and/or the program(s) described in thispublication at any time without notice.
Any references in this information to non-IBM Web sites are provided for convenience only and do not inany manner serve as an endorsement of those Web sites. The materials at those Web sites are not part ofthe materials for this IBM product and use of those Web sites is at your own risk.
IBM may use or distribute any of the information you supply in any way it believes appropriate withoutincurring any obligation to you.
Licensees of this program who wish to have information about it for the purpose of enabling: (i) theexchange of information between independently created programs and other programs (including thisone) and (ii) the mutual use of the information which has been exchanged, should contact:
IBM Corporation2Z4A/10111400 Burnet RoadAustin, TX 78758 U.S.A.
© Copyright IBM Corp. 2020, 2020 725
Such information may be available, subject to appropriate terms and conditions, including in some casespayment of a fee.
The licensed program described in this document and all licensed material available for it are provided byIBM under terms of the IBM Customer Agreement, IBM International Program License Agreement or anyequivalent agreement between us.
Any performance data contained herein was determined in a controlled environment. Therefore, theresults obtained in other operating environments may vary significantly. Some measurements may havebeen made on development-level systems and there is no guarantee that these measurements will be thesame on generally available systems. Furthermore, some measurement may have been estimatedthrough extrapolation. Actual results may vary. Users of this document should verify the applicable datafor their specific environment.
Information concerning non-IBM products was obtained from the suppliers of those products, theirpublished announcements or other publicly available sources. IBM has not tested those products andcannot confirm the accuracy of performance, compatibility or any other claims related to non-IBMproducts. Questions on the capabilities of non-IBM products should be addressed to the suppliers ofthose products.
All statements regarding IBM's future direction or intent are subject to change or withdrawal withoutnotice, and represent goals and objectives only.
This information contains examples of data and reports used in daily business operations. To illustratethem as completely as possible, the examples include the names of individuals, companies, brands, andproducts. All of these names are fictitious and any similarity to the names and addresses used by anactual business enterprise is entirely coincidental.
If you are viewing this information in softcopy form, the photographs and color illustrations might not bedisplayed.
TrademarksIBM, the IBM logo, and ibm.com are trademarks or registered trademarks of International BusinessMachines Corp., registered in many jurisdictions worldwide. Other product and service names might betrademarks of IBM or other companies. A current list of IBM trademarks is available on the Web at“Copyright and trademark information” at www.ibm.com/legal/copytrade.shtml.
Adobe, Acrobat, PostScript and all Adobe-based trademarks are either registered trademarks ortrademarks of Adobe Systems Incorporated in the United States, other countries, or both.
Java and all Java-based trademarks and logos are trademarks or registered trademarksof Oracle and/or its affiliates.
Linux is a trademark of Linus Torvalds in the United States, other countries, or both.
Microsoft, Windows, Windows NT, and the Windows logo are trademarks of Microsoft Corporation in theUnited States, other countries, or both.
UNIX is a registered trademark of The Open Group in the United States and other countries.
Other product and service names might be trademarks of IBM or other companies.
726 IBM Netcool Operations Insight: Integration Guide


IBM®
Part Number:
Printed in the Republic of Ireland
SC27-8601-15
(1P) P
/N:
Copyright © 2022 FDOKUMEN

