


Bahasa
Halaman
Hukum

Hydrologic-Hydraulic Model for Simulating Dual Drainageand Flooding in Urban Areas: Application to a Catchment
in the Metropolitan Area of ChicagoLeonardo S. Nanía1; Arturo S. Leon, P.E., D.WRE, M.ASCE2; and Marcelo H. García, Dist.M.ASCE3
Abstract: A one-dimensional (1D) hydrologic-hydraulic model for simulating dual drainage in urban areas is presented. It consists of fourmodules: (1) rainfall-runoff transformation, (2) 1D flow routing on a street network, (3) flow interception at street inlets, and (4) flowinteraction between surface water on the streets and the underground storm-water system by interfacing with the EPA-SWMM5 engine(U.S. Environmental Protection Agency-StormWater Management Model). The hydrologic model (first module) transforms rainfall to runoffusing the kinematic wave approximation and simulates the infiltration process with the Green-Ampt method. The street network model(second module) is based on a finite-volume shock-capturing scheme that solves the fully conservative Saint-Venant equations and canbe used to model both subcritical and supercritical flows. The inlet model (third module) computes the amount of water intercepted byinlets. The formulation of boundary conditions at the street crossings is generalized and can be used for any number of streets, any combi-nation of inflowing and outflowing streets, and flow regime (e.g., subcritical and supercritical flows). Flow interaction between surface wateron the streets and underground storm-water system is achieved by interfacing the proposed model with EPA-SWMM5. This interactionallows flow to enter from streets to the underground storm-water system and vice versa. The proposed model has several potential applicationssuch as the identification of critical zones for flooding (e.g., zones with high water depths and flow velocities) in urban developments and canbe used to take appropriate measures for drainage control (e.g., to increase number and/or size of inlets), to determine the consequences ofdifferent degrees of inlet clogging, and to assess flooding hazards through the application of suitable hazard criteria. A summary of criteriaused for storm-water hazard assessment is presented. To demonstrate the dual-drainage model’s potential, an application is performed in acatchment of the metropolitan area of Chicago, Illinois. The results obtained are promising and show that the model can be a useful tool forstorm-water management and flooding hazard assessment in urban areas. DOI: 10.1061/(ASCE)HE.1943-5584.0001080. © 2014 AmericanSociety of Civil Engineers.
Author keywords: Hydrologic model; Hydraulic model; Dual drainage; Urban storm drainage; Coupled model; Stormwater management;Flood hazard; Street network; Street crossing; Hazard criterion.
Introduction
Urban catchments in rainy climates are commonly exposed to floodthreats. In lowland areas urban flooding is often associated with aninadequate drainage system, in most cases attributable to inad-equate inlet capacity. Urban flooding may cause material lossesin the form of public and private property damage and even humancasualties. Furthermore, street flooding may interfere with trafficand in some cases, may jeopardize pedestrian safety. To identifycritical urban flooding areas (e.g., zones with high water depthsand/or flow velocities) so that appropriate measures for flow con-trol and drainage (e.g., to add inlet grates) can be taken, hydrologicand hydraulic (H&H) modeling is often required. In many instances,
H&H modeling could involve large urban catchments, making itnecessary to increase computational efficiency without sacrificingaccuracy. For a flood modeling tool to be practical, the floodinganalysis needs to be done in a relatively short time frame so thatflash flood warnings can be issued and traffic redirected to reduceemergencies and facilitate the work of first responders.
A number of researchers have addressed the problem of mod-eling pluvial flows in urban areas. Although the idea of studyingflows in urban areas involving surface (overland) and subsurface(pipe) components and their interaction has been around for severaldecades, Djordjevic et al. (1999) first advanced it, using theBEMUS model (Radojkovic and Maksimovic 1984) for surfaceflows and a sewer model that allowed for computing pressurizedflows. The interaction consisted in the connection between man-holes and computational cells in the surface. At about the sametime, Hsu et al. (2000) used the SWMM model (Rossman et al.2005) to simulate pipe flow and, when pressurized, to generatethe flows that a two-dimensional (2D)-noninertia model conveyedover the surface. A drawback of this approach is that the flow is notallowed to reenter the sewer system. Schmitt et al. (2004) studiedflooding in urban drainage systems by a combination of 2D modelfor surface flow and one-dimensional (1D) model for pipe flow inwhich manholes were connected to 2D elements. A year later,Djordjevic et al. (2005) presented a 1D/1D model (SIPSON) to sim-ulate dual drainage in two parallel networks (streets and pipes)linked through nodes representing a group of inlets. In this work,
1Associate Professor, Dept. of Structural Mechanics and HydraulicEngineering, Universidad de Granada, Campus de Fuentenueva, 18071Granada, Spain (corresponding author). E-mail: [email protected]
2Assistant Professor, School of Civil and Construction Engineering,Oregon State Univ., 220 Owen Hall, Corvallis, OR 97331-3212.
3Professor and Director, Ven Te Chow Hydrosystems Laboratory, Dept.of Civil and Environmental Engineering, Univ. of Illinois, Urbana, IL61801.
Note. This manuscript was submitted on January 17, 2014; approved onAugust 1, 2014; published online on September 24, 2014. Discussion per-iod open until February 24, 2015; separate discussions must be submittedfor individual papers. This paper is part of the Journal of Hydrologic En-gineering, © ASCE, ISSN 1084-0699/04014071(13)/$25.00.
© ASCE 04014071-1 J. Hydrol. Eng.
J. Hydrol. Eng.
Dow
nloa
ded
from
asc
elib
rary
.org
by
Uni
vers
ity o
f Il
linoi
s A
t Urb
ana
on 1
1/13
/14.
Cop
yrig
ht A
SCE
. For
per
sona
l use
onl
y; a
ll ri
ghts
res
erve
d.
the hydrological component was not described in much detail,and inflows to and from nodes were computed with the help ofweir and orifice formulas. The possibility of a manhole lid to beremoved was also taken into account. Aronica and Lanza (2005)simulated urban flows by using a 2D model addressing only sur-face flows and analyzed the effect of including or not the inlets(i.e., sewer system with assumed unlimited conveyance capacityor with no sewer system). No explanation was given for computinginlet capacity. Dey and Kamioka (2007) combined the EXTRANmodule of SWMM and another 1D module for river flows with a2D model for surface flow, linking them with an interface usingweir formulas. More recently, Chen et al. (2010) studied the com-bined consequences of pluvial and fluvial flooding combining theSIPSON model (Djordjevic et al. 2005) for pluvial flooding and2D, noninertia UIM model for fluvial flooding (Chen et al. 2005).The latest research work has been devoted to the numerical andexperimental study of the flow interaction between the street andthe underground sewer system (Bazin et al. 2013; Djordjevic et al.2013), as well as the hydraulic characterization of storm-water in-lets (Martins et al. 2014).
The model presented herein has characteristics similar to theone presented by Djordjevic et al. (2005) because a street networkconveys surface flows, and interaction is allowed with the under-ground storm-water network. From a modeling standpoint, themain contributions of this work are as follows:1. Rainfall-runoff transformation (hydrological module) is simu-
lated by computing overland flow in two parallel planes,including the infiltration process. Subcatchments are com-posed by the portions of blocks that pour to the adjacent street(Nanía-Escobar 1999; Nanía et al. 2004). The representationof subcatchments is made simple to facilitate its implementa-tion in large urban areas.
2. Runoff generated in the subcatchments (item 1) is incorporateduniformly distributed and routed through the streets. A 1D for-mulation is used to route the flow on the street network.
3. Flow distribution in four-branch crossings of the street net-work involving both supercritical and subcritical flows iscomputed using empirical relationships presented by Naníaet al. (2004, 2006, 2011) when applicable. The formulationof boundary conditions at the street crossings is generalizedand can be used for any number of streets, any combinationof inflowing and outflowing streets and any flow regime.
4. Inlet flows at streets are simulated using the HEC-22 formula-tion (FHA 2001).
5. Flow interaction between surface water on the streets and theunderground storm-water sewers is simulated by interfacingthe street network model with the EPA-SWMM5 engine.
To illustrate the capabilities of the model, it was applied to acatchment in Dolton, a southern suburb of the metropolitan areaof Chicago. The watershed considered in this analysis drains todrop-shaft CDS-51 in the Calumet TARP (Tunnel and ReservoirPlan) system which is managed by the Metropolitan Water Recla-mation District of Greater Chicago (MWRDGC). The topographyof the zone is quite flat and primarily subcritical flows are expectedto take place most of the time.
Model Description
This work aims at developing an integrated model to simulate thehydrology and hydraulics of urban drainage systems. This inte-grated model has four modules. The first module is a hydrologicmodel, which transforms rainfall into effective runoff dependingon surface characteristics (e.g., slope, roughness, paved/unpaved
surface area). The resulting runoff from each block is distributedover the respective street and is used as input for the hydraulic streetmodel (second module). The street module routes the flow over thestreet network. The third module estimates flow interception at in-lets, which conveys street runoff into the underground storm-sewersystem. The intercepted runoff is used as input for the storm-sewer model which is modeled using the EPA-SWMM5 engine.A brief overview of these modules is presented next.
First Module: Hydrologic Model
The hydrologic model transforms rainfall to runoff consideringboth impervious and pervious surfaces and simulates the infiltrationprocess with the Green-Ampt method (Chow et al. 1988). The de-pression storage (initial abstraction) is also considered to obtain theeffective rainfall. The transformation from effective rainfall to run-off is made considering overland flow on two independent equal-length sloping planes, one pervious and one impervious, and usingthe kinematic wave approximation of the Saint Venant equations.The subcatchments are delineated as part of the blocks which arecomputed simply based on polygons defined by the surroundingstreets, which in turn are determined by the position of the streetjunctions (crossings). Runoff is introduced uniformly distributed inthe streets surrounding the blocks; therefore, impervious and per-vious areas are not directly connected to the sewer system.
Second Module: Street Flow Routing
The street module solves the 1D open-channel flow continuity andmomentum equations that for nonprismatic channels or rivers maybe written in vectorial conservative form as follows (e.g., Chaudhry1987; Leon 2007; Leon et al. 2006, 2010a):
∂U∂t þ
∂F∂x ¼ S ð1Þ
where the vector variable U, the flux vector F and the source termvector S are given, respectively, by
U ¼�AQ
�; F ¼
�Q
Q2
A þ Apρ
�; S ¼
�0
Fw þ ðS0 − SfÞgA�
ð2Þ
where A = cross-sectional area of the channel; Q = flow discharge;p = average pressure of the water column over the cross-sectional area; ρ = water density; g = gravitational acceleration;So = slope of the channel bottom; Sf = energy slope, whichmay be estimated using an empirical formula such as Manning’sequation; and Fw = momentum term arising from the longitudinalvariation of the channel width.
The governing Eqs. (1)–(2) are solved using a finite volume(FV) shock-capturing scheme in an identical way to that presentedin Leon et al. (2006, 2010a, 2013). The FV scheme used is thesecond-order MUSCL-Hancock method with the MINMOD totalvariation diminishing (TVD) preprocessing slope limiter. The FV-shock capturing scheme used ensures that mass and momentum areconserved. For the boundary conditions at the street crossings anidentical approach to that presented in Leon et al. (2009a) and Leonet al. (2010b) was used. These boundary conditions use the equa-tion of energy, equation of continuity, and the theory of Riemanninvariants. These boundary conditions can be used for any numberof streets, any combination of inflowing and outflowing streets, andany flow regime (e.g., supercritical flow). For more details aboutthese boundary conditions the reader is referred to Leon et al.(2009a, 2010b). From a hydraulics point of view, the main interestis in estimating the average velocities and water depths in the area
© ASCE 04014071-2 J. Hydrol. Eng.
J. Hydrol. Eng.
Dow
nloa
ded
from
asc
elib
rary
.org
by
Uni
vers
ity o
f Il
linoi
s A
t Urb
ana
on 1
1/13
/14.
Cop
yrig
ht A
SCE
. For
per
sona
l use
onl
y; a
ll ri
ghts
res
erve
d.
under study. Because of this, it is expected that a 1D unsteady flowmodel is appropriate for this application.
Flow distribution in four-branch crossings of the street networkinvolving both supercritical and subcritical flows is computed usingrelations presented by Nanía et al. (2004, 2006, 2011) when appli-cable. This is a relevant new contribution to urban drainage models.
Third Module: Inlets
The third module comprises a model for estimating flow inter-ception at inlets, which leads street runoff into the undergroundstorm-sewer system. The inlet module in the proposed modelwas implemented according to the HEC-22 manual (Federal High-way Administration 2001). The HEC-22 manual comprises a widearray of storm drain inlets. Overall, inlets can be divided into:(1) Grate inlets, (2) Curb-opening inlets, (3) Slotted inlets, and(4) Combination inlets (Federal Highway Administration 2001).Grate inlets consist of an opening in the gutter or ditch coveredby a grate. Curb-opening inlets are vertical openings in the curbcovered by a top slab. Slotted inlets consist of a pipe cut alongthe longitudinal axis with bars perpendicular to the opening tomaintain the slotted opening. Combination inlets consist of botha curb-opening inlet and a grate inlet placed in a side-by-side con-figuration, but the curb opening may be located in part upstream ofthe grate. The inlet module of the current proposed model includesgrate inlets, curb opening, and combination inlets. The grate typesimplemented include P-50, P-30, and curved vane. Any other typeof inlet and grate type can be readily implemented in the model, ifnecessary.
Fourth Module: Storm-Water System
The street network model (first and second modules) so-calledstreet flooding model (SFM) (Leon et al. 2009b) is coupled withthe EPA-SWMM5 engine through a coupling interface whichmanages the flow intercepted by inlets in the following way:1. Intercepted flow by inlets enters in the nodes of the sewer sys-
tem (manholes). By default, it is assumed that every inlet isconnected to the nearest manhole, but it could be configuredby the user.
2. Flow enters the node only if the node is not flooded, this is,if the hydraulic grade line is lower than the ground elevation.
3. If a given node is flooded (hydraulic grade line is either higheror equal to the ground elevation) the flooded volume computedby SWMM5 is incorporated to the street network through theinlets connected to the flooded node. The flooded volume isdistributed evenly between all the inlets connected to that nodeand in the time between interface callings.
The coupling interface calls the SWMM5 at a predefined timestep which could be as low as the computing time step (less than onesecond). However, such small coupling time would increase exces-sively the computing time because a sleeping time of 1 s is allowedafter the calling of the EPA-SWMM5 engine to allow for writing ofsome required files. A coupling time of 10 s was found to be not tooshort to penalize computing time and not too long to have a decisiveinfluence on the results. Therefore, in case of flooding, the floodeddischarge is updated as often as the coupling time. The combinationof SFM with EPA-SWMM5 is called dual drainage model (DDM).
Criteria Used for the Surface Storm-Water HazardAssessment
The main objective of an urban drainage system is to safeguard thesecurity of the citizen’s activities, which indicates: avoiding water
entering buildings and houses, allowing pedestrians to walk unob-structed, and permitting traffic to move safely. In some cases it isalso used to avoid pollution in urban areas with combined sewers.
In principle, urban runoff should be such that the hydraulicparameters i.e., depths, velocities or some combinations of depthand velocities remain below certain advisable limit values. Thereis not much research in the literature about safety criteria for thedrainage flow in urban zones. The following criteria could poten-tially be used to assess flood-induced hazards.
Criteria Based on a Maximum Admissible Depth
Concerning material damage and its minimization, conventionalwisdom can accept as a maximum depth, a flow depth for whichurban runoff does not enter commercial and residential buildings.
Denver’s criterion: The Urban Storm Drainage Criteria Manualof Denver, Colorado (Wright-McLaughlin 1969), establishes that inlocal streets depending on the category of the streets of the studiedsubbasin, a flow depth is allowed so that the free surface of the flowdoes not overcome the level of the ground floor of residential,public, commercial, and industrial buildings unless they are water-proofed, and a maximum 45.7 cm (18 in.) more than the lowestlevel of the street is permitted. This criterion becomes more restric-tive in streets of a higher category. This limit seems to be estab-lished based on the minimization of traffic problems, bearing inmind that driving a car in streets with flow depths larger than45.7 cm would be both dangerous and unsuitable.
Clark County’s criterion: The Hydrologic Criteria and DrainageDesign Manual of Clark County Regional Flood Control District(CCRFCD 1999) establishes for minor storms that local streets,narrower than 24 m, can transport water up to a depth of 30 cm,measured along the gutter flow line.
Austin’s criterion: In other cities, like Austin, Texas (City ofAustin Department of Public Works 1977), the criterion of leavingthe crown of the street free in such a way that emergency vehicles(e.g., fire trucks, ambulances, police cars) will be able to movealong this zone is commonly used. So an implicit maximum depthis defined by establishing a permissible spread of water rangingfrom 0 (not exceed crown level) to 7.2 m depending on thestreet type.
Mendoza’s criterion: Nanía-Escobar (1999) and Nanía et al.(2007) proposed a maximum admissible depth of 30 cm (approx-imately 12 in.) given the characteristics of the city where it wasused (Mendoza, Argentina) and following the city of Denver’scriterion.
Criteria Based on Flow Depth and Flow Velocity as aCombination
Témez’s criterion: Témez (1992) defines a dangerous floodingzone as a zone in which a serious danger of human life loss or sig-nificant personal injury exists. This zone is defined by a flow depthgreater than 1 m, by a flow velocity greater than 1 m=s, and by aproduct of flow depth times flow velocity (i.e., specific flow dis-charge) greater than 0.5 m2=s. This criterion was created to be ap-plied to floodplains. A limit depth of 1 m would be excessive in adensely populated zone like the suburbs of Chicago because sucha depth, even without taking into account the velocity of flow,would most likely cause substantial material losses. In this cri-terion, the product of flow depth times the velocity of 0.5 m2=swould be less restrictive than the product of the maximum depthof both former criteria times the maximum velocity proposed byTémez (i.e., 0.30 m2=s and 0.45 m2=s, for Mendoza and Denver,respectively).
© ASCE 04014071-3 J. Hydrol. Eng.
J. Hydrol. Eng.
Dow
nloa
ded
from
asc
elib
rary
.org
by
Uni
vers
ity o
f Il
linoi
s A
t Urb
ana
on 1
1/13
/14.
Cop
yrig
ht A
SCE
. For
per
sona
l use
onl
y; a
ll ri
ghts
res
erve
d.
Abt’s criterion: Témez’s criterion of Vy < 0.5 m2=s for flowdepths between 0.5 and 1 m was apparently inspired by the experi-ments carried out by Abt et al. (1989) to identify when an adulthuman could not stand or maneuver in a simulated flood flow.Flow velocities of 0.36–3.05 m=s and flow depths of 0.49–1.2 mwere considered in the experiments. For these flow conditions,Abt et al. (1989) found that the product of flow velocity timesdepth which resulted in instabilities was 0.70–2.12 m2=s, depend-ing on the height and weight of subjects. These values imply con-sidering a factor of safety ranging from 1.4 to 4.2, if it is used alimit of 0.5 m2=s independently of the height and weight of agiven subject.
Clark County criterion: The Hydrologic Criteria and DrainageDesign Manual of Clark County Regional Flood Control District(1999) established that for minor storms and local streets (narrowerthan 24 m) that the product of flow depth in the gutter flowline times the average velocity should be less than or equal to0.55 m2=s. This value is a little greater than the value takingin Abt’s criterion, therefore Abt’s criterion is considered as areference.
New South Wales criterion: The Floodplain DevelopmentManual of the New South Wales Government (2005) in Australia,proposed a starting point for the determination of hazard catego-ries in floodplain zones, indicating that zones with floodwaterswhich have either depths greater than 1 m, velocities greater than2 m=s or depths greater than [1 m–3=10 s × velocityðm=sÞ]should be categorized as high hazard zones. In light of this cri-terion, the limiting depths for Mendoza (0.30 m) and Denver(0.45 m) are achieved with velocities of 2.33 and 1.83 m=s, re-spectively, therefore the joint consideration of this criterion andthe limiting depths would be approximately equivalent to a maxi-mum velocity of 2 m=s.
No slipping criterion: Nanía-Escobar (1999) proposed amomentum-based criterion taking into account the stability to slipby a pedestrian in the presence of the urban runoff, which isdefined by
V2y ≤ 1.23m3
s2ð3Þ
Stability to tilt criterion: The Hydraulic and Hydrologic Engi-neering Department (2001) carried out a study to analyze the spac-ing of gutters in the City of Barcelona. In this study, a hazardcriterion taking into account the stability to tilt of a pedestrian (abil-ity to stay upright) in the presence of urban runoff was defined as
Vy ≤ 0.5m2
sð4Þ
Evaluation of the Model
The primary objective of this section is to illustrate potential appli-cations of the model. Four typical applications could be:1. Identifying critical zones that would need attention when
most of the inlets in the urban watershed are clogged withdebris. This would require using the first and second moduleonly (SFM model).
2. Analyzing the hydraulic performance of an actual surface drai-nage system when most of the inlets are well maintained.
3. Determining the optimum surface drainage system (number,type, and position of inlets) to achieve a safety criterionagainst surface storm-water hazards. An optimization algo-rithm would be required.
4. Determining the optimum sizing of a sewer system(e.g., diameter of pipes) for a given inlet system. This wouldalso require an optimization algorithm.
The model was applied to an urban catchment in the Villageof Dolton, a southern suburb of the metropolitan area of Chicago.This watershed was previously used for hydrologic and hydraulicstudies of the Tunnel and Reservoir Plan (TARP) conducted by theVen Te Chow Hydrosystems Laboratory, University of Illinois(Cantone and Schmidt 2011).
Project Storm
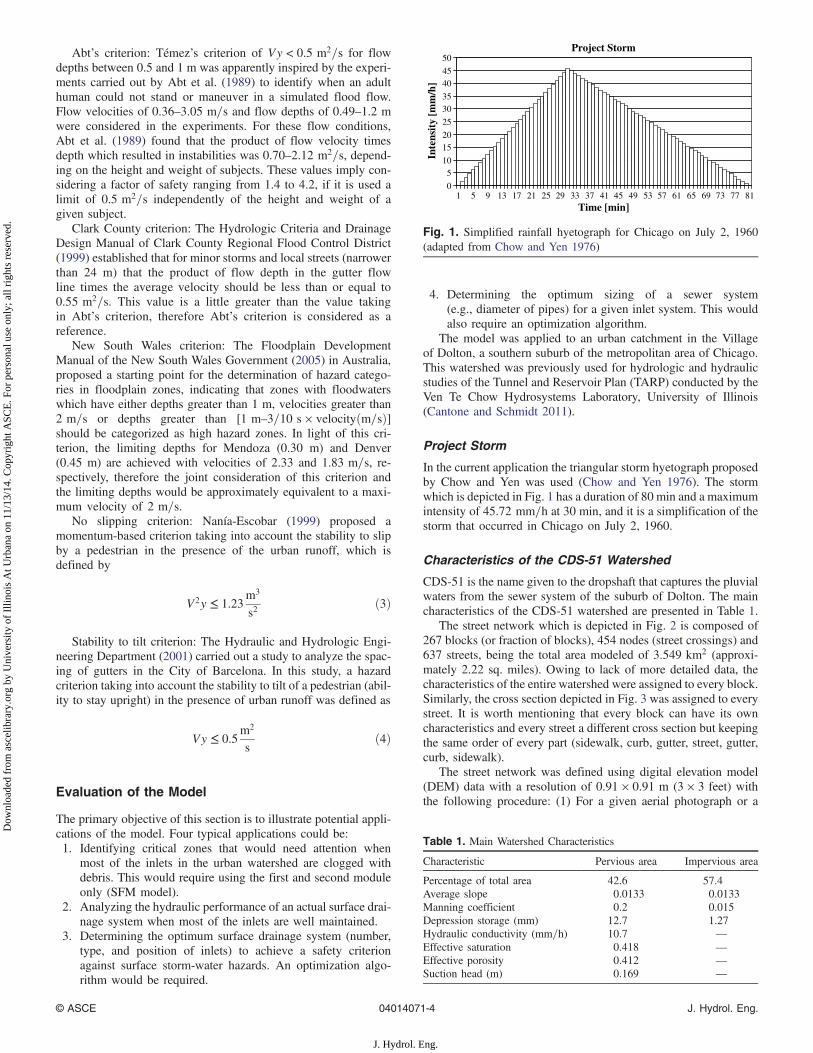
In the current application the triangular storm hyetograph proposedby Chow and Yen was used (Chow and Yen 1976). The stormwhich is depicted in Fig. 1 has a duration of 80 min and a maximumintensity of 45.72 mm=h at 30 min, and it is a simplification of thestorm that occurred in Chicago on July 2, 1960.
Characteristics of the CDS-51 Watershed
CDS-51 is the name given to the dropshaft that captures the pluvialwaters from the sewer system of the suburb of Dolton. The maincharacteristics of the CDS-51 watershed are presented in Table 1.
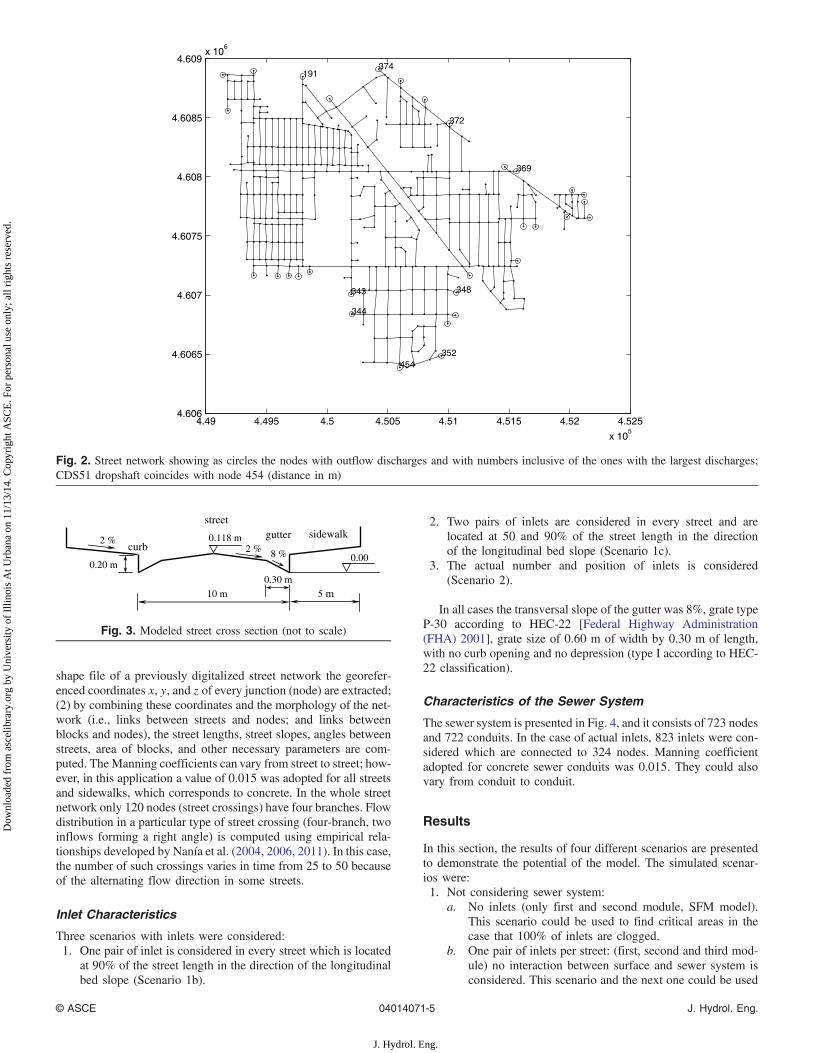
The street network which is depicted in Fig. 2 is composed of267 blocks (or fraction of blocks), 454 nodes (street crossings) and637 streets, being the total area modeled of 3.549 km2 (approxi-mately 2.22 sq. miles). Owing to lack of more detailed data, thecharacteristics of the entire watershed were assigned to every block.Similarly, the cross section depicted in Fig. 3 was assigned to everystreet. It is worth mentioning that every block can have its owncharacteristics and every street a different cross section but keepingthe same order of every part (sidewalk, curb, gutter, street, gutter,curb, sidewalk).
The street network was defined using digital elevation model(DEM) data with a resolution of 0.91 × 0.91 m (3 × 3 feet) withthe following procedure: (1) For a given aerial photograph or a
Project Storm
0
510
1520
25
3035
4045
50
1 5 9 13 17 21 25 29 33 37 41 45 49 53 57 61 65 69 73 77 81Time [min]
Inte
nsit
y [m
m/h
]
Fig. 1. Simplified rainfall hyetograph for Chicago on July 2, 1960(adapted from Chow and Yen 1976)
Table 1. Main Watershed Characteristics
Characteristic Pervious area Impervious area
Percentage of total area 42.6 57.4Average slope 0.0133 0.0133Manning coefficient 0.2 0.015Depression storage (mm) 12.7 1.27Hydraulic conductivity (mm=h) 10.7 —Effective saturation 0.418 —Effective porosity 0.412 —Suction head (m) 0.169 —
© ASCE 04014071-4 J. Hydrol. Eng.
J. Hydrol. Eng.
Dow
nloa
ded
from
asc
elib
rary
.org
by
Uni
vers
ity o
f Il
linoi
s A
t Urb
ana
on 1
1/13
/14.
Cop
yrig
ht A
SCE
. For
per
sona
l use
onl
y; a
ll ri
ghts
res
erve
d.
shape file of a previously digitalized street network the georefer-enced coordinates x, y, and z of every junction (node) are extracted;(2) by combining these coordinates and the morphology of the net-work (i.e., links between streets and nodes; and links betweenblocks and nodes), the street lengths, street slopes, angles betweenstreets, area of blocks, and other necessary parameters are com-puted. TheManning coefficients can vary from street to street; how-ever, in this application a value of 0.015 was adopted for all streetsand sidewalks, which corresponds to concrete. In the whole streetnetwork only 120 nodes (street crossings) have four branches. Flowdistribution in a particular type of street crossing (four-branch, twoinflows forming a right angle) is computed using empirical rela-tionships developed by Nanía et al. (2004, 2006, 2011). In this case,the number of such crossings varies in time from 25 to 50 becauseof the alternating flow direction in some streets.
Inlet Characteristics
Three scenarios with inlets were considered:1. One pair of inlet is considered in every street which is located
at 90% of the street length in the direction of the longitudinalbed slope (Scenario 1b).
2. Two pairs of inlets are considered in every street and arelocated at 50 and 90% of the street length in the directionof the longitudinal bed slope (Scenario 1c).
3. The actual number and position of inlets is considered(Scenario 2).
In all cases the transversal slope of the gutter was 8%, grate typeP-30 according to HEC-22 [Federal Highway Administration(FHA) 2001], grate size of 0.60 m of width by 0.30 m of length,with no curb opening and no depression (type I according to HEC-22 classification).
Characteristics of the Sewer System
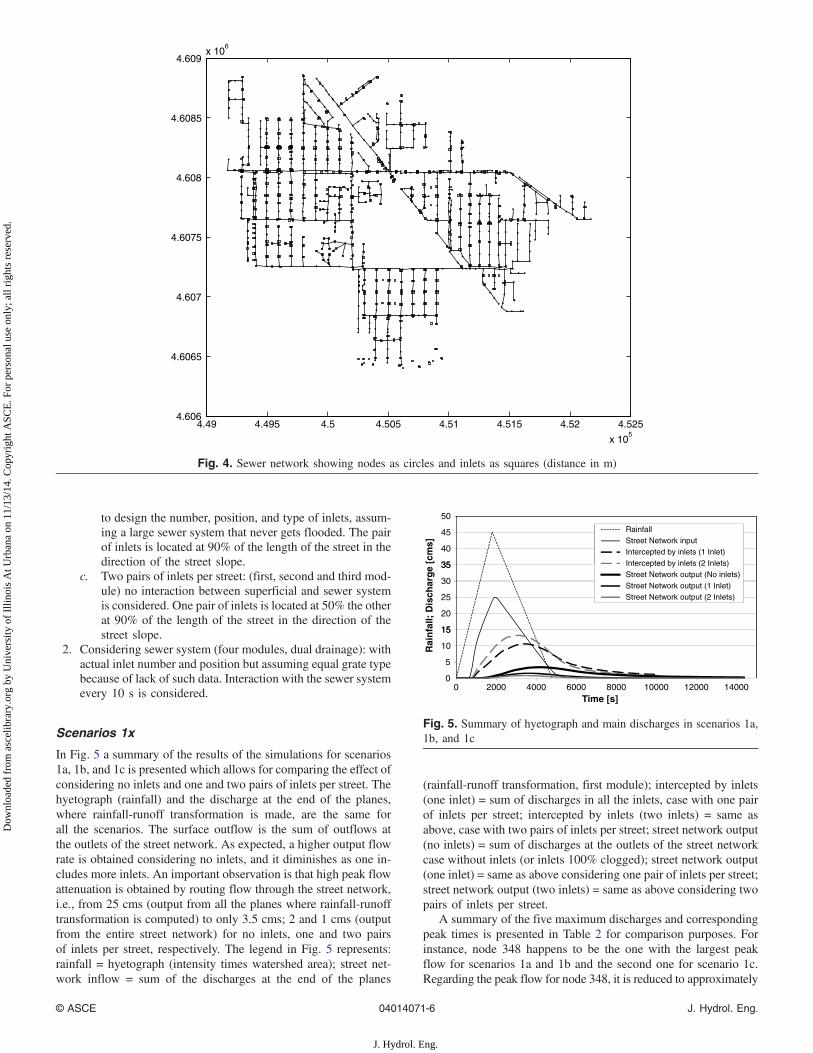
The sewer system is presented in Fig. 4, and it consists of 723 nodesand 722 conduits. In the case of actual inlets, 823 inlets were con-sidered which are connected to 324 nodes. Manning coefficientadopted for concrete sewer conduits was 0.015. They could alsovary from conduit to conduit.
Results
In this section, the results of four different scenarios are presentedto demonstrate the potential of the model. The simulated scenar-ios were:1. Not considering sewer system:
a. No inlets (only first and second module, SFM model).This scenario could be used to find critical areas in thecase that 100% of inlets are clogged.
b. One pair of inlets per street: (first, second and third mod-ule) no interaction between surface and sewer system isconsidered. This scenario and the next one could be used
4.49 4.495 4.5 4.505 4.51 4.515 4.52 4.525
x 105
4.606
4.6065
4.607
4.6075
4.608
4.6085
4.609x 10
6
374
372
369
348
352454
344
343
191
Fig. 2. Street network showing as circles the nodes with outflow discharges and with numbers inclusive of the ones with the largest discharges;CDS51 dropshaft coincides with node 454 (distance in m)
2 %0.118 m
0.00
10 m
street gutter
8 %
0.30 m
sidewalk
5 m
curb
0.20 m
2 %
Fig. 3. Modeled street cross section (not to scale)
© ASCE 04014071-5 J. Hydrol. Eng.
J. Hydrol. Eng.
Dow
nloa
ded
from
asc
elib
rary
.org
by
Uni
vers
ity o
f Il
linoi
s A
t Urb
ana
on 1
1/13
/14.
Cop
yrig
ht A
SCE
. For
per
sona
l use
onl
y; a
ll ri
ghts
res
erve
d.
to design the number, position, and type of inlets, assum-ing a large sewer system that never gets flooded. The pairof inlets is located at 90% of the length of the street in thedirection of the street slope.
c. Two pairs of inlets per street: (first, second and third mod-ule) no interaction between superficial and sewer systemis considered. One pair of inlets is located at 50% the otherat 90% of the length of the street in the direction of thestreet slope.
2. Considering sewer system (four modules, dual drainage): withactual inlet number and position but assuming equal grate typebecause of lack of such data. Interaction with the sewer systemevery 10 s is considered.
Scenarios 1x
In Fig. 5 a summary of the results of the simulations for scenarios1a, 1b, and 1c is presented which allows for comparing the effect ofconsidering no inlets and one and two pairs of inlets per street. Thehyetograph (rainfall) and the discharge at the end of the planes,where rainfall-runoff transformation is made, are the same forall the scenarios. The surface outflow is the sum of outflows atthe outlets of the street network. As expected, a higher output flowrate is obtained considering no inlets, and it diminishes as one in-cludes more inlets. An important observation is that high peak flowattenuation is obtained by routing flow through the street network,i.e., from 25 cms (output from all the planes where rainfall-runofftransformation is computed) to only 3.5 cms; 2 and 1 cms (outputfrom the entire street network) for no inlets, one and two pairsof inlets per street, respectively. The legend in Fig. 5 represents:rainfall = hyetograph (intensity times watershed area); street net-work inflow = sum of the discharges at the end of the planes
(rainfall-runoff transformation, first module); intercepted by inlets(one inlet) = sum of discharges in all the inlets, case with one pairof inlets per street; intercepted by inlets (two inlets) = same asabove, case with two pairs of inlets per street; street network output(no inlets) = sum of discharges at the outlets of the street networkcase without inlets (or inlets 100% clogged); street network output(one inlet) = same as above considering one pair of inlets per street;street network output (two inlets) = same as above considering twopairs of inlets per street.
A summary of the five maximum discharges and correspondingpeak times is presented in Table 2 for comparison purposes. Forinstance, node 348 happens to be the one with the largest peakflow for scenarios 1a and 1b and the second one for scenario 1c.Regarding the peak flow for node 348, it is reduced to approximately
4.49 4.495 4.5 4.505 4.51 4.515 4.52 4.525
x 105
4.606
4.6065
4.607
4.6075
4.608
4.6085
4.609x 10
6
Fig. 4. Sewer network showing nodes as circles and inlets as squares (distance in m)
35
40
45
50
Rai
nfa
ll; D
isch
arg
e [c
ms]
RainfallStreet Network inputIntercepted by inlets (1 Inlet)
15
20
25
30
35Street Network output (No inlets)Street Network output (1 Inlet)Street Network output (2 Inlets)
0
5
10
15
0 2000 4000 6000 8000 10000 12000 14000Time [s]
Intercepted by inlets (2 Inlets)
Fig. 5. Summary of hyetograph and main discharges in scenarios 1a,1b, and 1c
© ASCE 04014071-6 J. Hydrol. Eng.
J. Hydrol. Eng.
Dow
nloa
ded
from
asc
elib
rary
.org
by
Uni
vers
ity o
f Il
linoi
s A
t Urb
ana
on 1
1/13
/14.
Cop
yrig
ht A
SCE
. For
per
sona
l use
onl
y; a
ll ri
ghts
res
erve
d.
half from no inlets to one inlet per street cases and is reduced againto half from one inlet to two inlets per street cases.
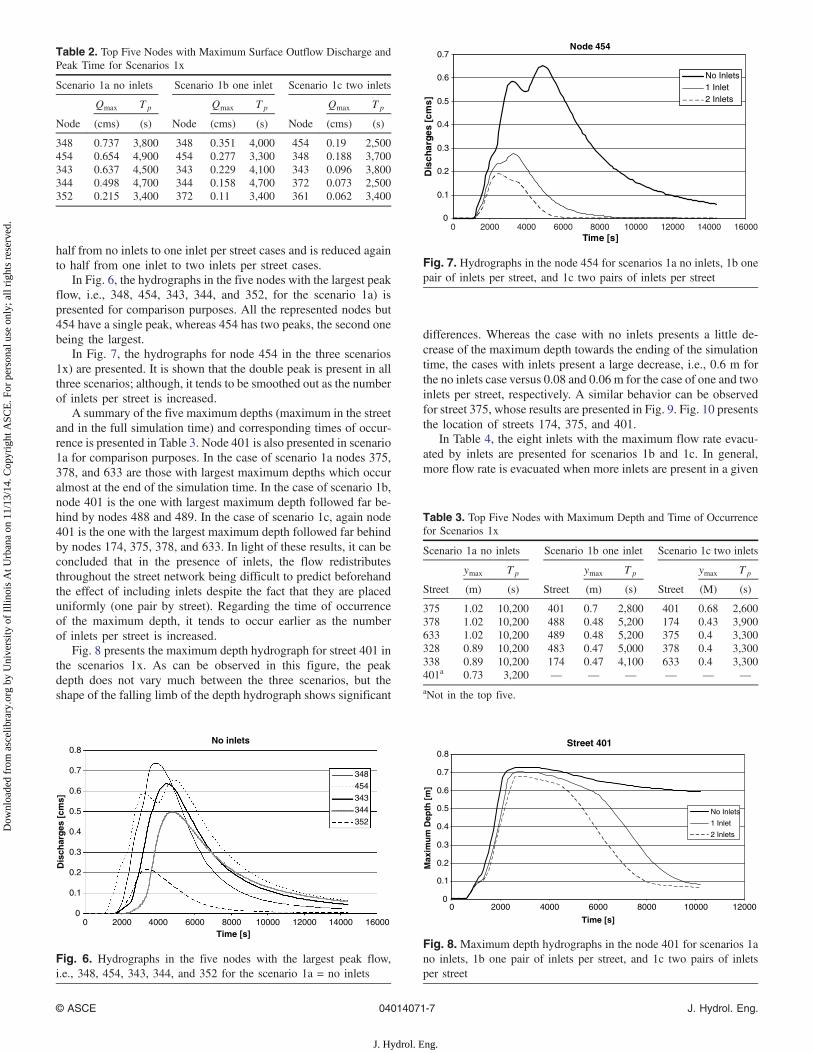
In Fig. 6, the hydrographs in the five nodes with the largest peakflow, i.e., 348, 454, 343, 344, and 352, for the scenario 1a) ispresented for comparison purposes. All the represented nodes but454 have a single peak, whereas 454 has two peaks, the second onebeing the largest.
In Fig. 7, the hydrographs for node 454 in the three scenarios1x) are presented. It is shown that the double peak is present in allthree scenarios; although, it tends to be smoothed out as the numberof inlets per street is increased.
A summary of the five maximum depths (maximum in the streetand in the full simulation time) and corresponding times of occur-rence is presented in Table 3. Node 401 is also presented in scenario1a for comparison purposes. In the case of scenario 1a nodes 375,378, and 633 are those with largest maximum depths which occuralmost at the end of the simulation time. In the case of scenario 1b,node 401 is the one with largest maximum depth followed far be-hind by nodes 488 and 489. In the case of scenario 1c, again node401 is the one with the largest maximum depth followed far behindby nodes 174, 375, 378, and 633. In light of these results, it can beconcluded that in the presence of inlets, the flow redistributesthroughout the street network being difficult to predict beforehandthe effect of including inlets despite the fact that they are placeduniformly (one pair by street). Regarding the time of occurrenceof the maximum depth, it tends to occur earlier as the numberof inlets per street is increased.
Fig. 8 presents the maximum depth hydrograph for street 401 inthe scenarios 1x. As can be observed in this figure, the peakdepth does not vary much between the three scenarios, but theshape of the falling limb of the depth hydrograph shows significant
differences. Whereas the case with no inlets presents a little de-crease of the maximum depth towards the ending of the simulationtime, the cases with inlets present a large decrease, i.e., 0.6 m forthe no inlets case versus 0.08 and 0.06 m for the case of one and twoinlets per street, respectively. A similar behavior can be observedfor street 375, whose results are presented in Fig. 9. Fig. 10 presentsthe location of streets 174, 375, and 401.
In Table 4, the eight inlets with the maximum flow rate evacu-ated by inlets are presented for scenarios 1b and 1c. In general,more flow rate is evacuated when more inlets are present in a given
Table 2. Top Five Nodes with Maximum Surface Outflow Discharge andPeak Time for Scenarios 1x
Scenario 1a no inlets Scenario 1b one inlet Scenario 1c two inlets
Node
Qmax Tp
Node
Qmax Tp
Node
Qmax Tp
(cms) (s) (cms) (s) (cms) (s)
348 0.737 3,800 348 0.351 4,000 454 0.19 2,500454 0.654 4,900 454 0.277 3,300 348 0.188 3,700343 0.637 4,500 343 0.229 4,100 343 0.096 3,800344 0.498 4,700 344 0.158 4,700 372 0.073 2,500352 0.215 3,400 372 0.11 3,400 361 0.062 3,400
No inlets
0
0.1
0.2
0.3
0.4
0.5
0.6
0.7
0.8
0 2000 4000 6000 8000 10000 12000 14000 16000Time [s]
Dis
char
ges
[cm
s]
348454343344352
Fig. 6. Hydrographs in the five nodes with the largest peak flow,i.e., 348, 454, 343, 344, and 352 for the scenario 1a = no inlets
Node 454
0
0.1
0.2
0.3
0.4
0.5
0.6
0.7
0 2000 4000 6000 8000 10000 12000 14000 16000Time [s]
Dis
char
ges
[cm
s]
No Inlets1 Inlet2 Inlets
Fig. 7. Hydrographs in the node 454 for scenarios 1a no inlets, 1b onepair of inlets per street, and 1c two pairs of inlets per street
Table 3. Top Five Nodes with Maximum Depth and Time of Occurrencefor Scenarios 1x
Scenario 1a no inlets Scenario 1b one inlet Scenario 1c two inlets
Street
ymax Tp
Street
ymax Tp
Street
ymax Tp
(m) (s) (m) (s) (M) (s)
375 1.02 10,200 401 0.7 2,800 401 0.68 2,600378 1.02 10,200 488 0.48 5,200 174 0.43 3,900633 1.02 10,200 489 0.48 5,200 375 0.4 3,300328 0.89 10,200 483 0.47 5,000 378 0.4 3,300338 0.89 10,200 174 0.47 4,100 633 0.4 3,300401a 0.73 3,200 — — — — — —aNot in the top five.
Street 401
0
0.1
0.2
0.3
0.4
0.5
0.6
0.7
0.8
0 2000 4000 6000 8000 10000 12000
Time [s]
Max
imu
m D
epth
[m
]
No Inlets
1 Inlet
2 Inlets
Fig. 8. Maximum depth hydrographs in the node 401 for scenarios 1ano inlets, 1b one pair of inlets per street, and 1c two pairs of inletsper street
© ASCE 04014071-7 J. Hydrol. Eng.
J. Hydrol. Eng.
Dow
nloa
ded
from
asc
elib
rary
.org
by
Uni
vers
ity o
f Il
linoi
s A
t Urb
ana
on 1
1/13
/14.
Cop
yrig
ht A
SCE
. For
per
sona
l use
onl
y; a
ll ri
ghts
res
erve
d.
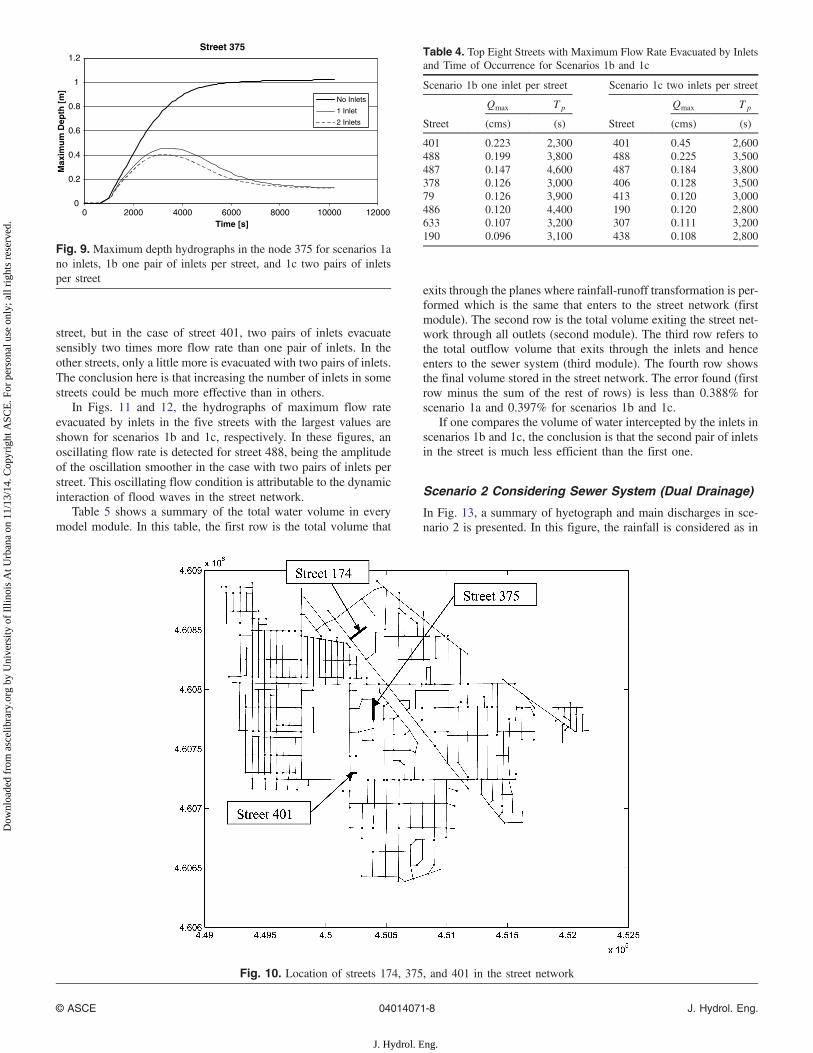
street, but in the case of street 401, two pairs of inlets evacuatesensibly two times more flow rate than one pair of inlets. In theother streets, only a little more is evacuated with two pairs of inlets.The conclusion here is that increasing the number of inlets in somestreets could be much more effective than in others.
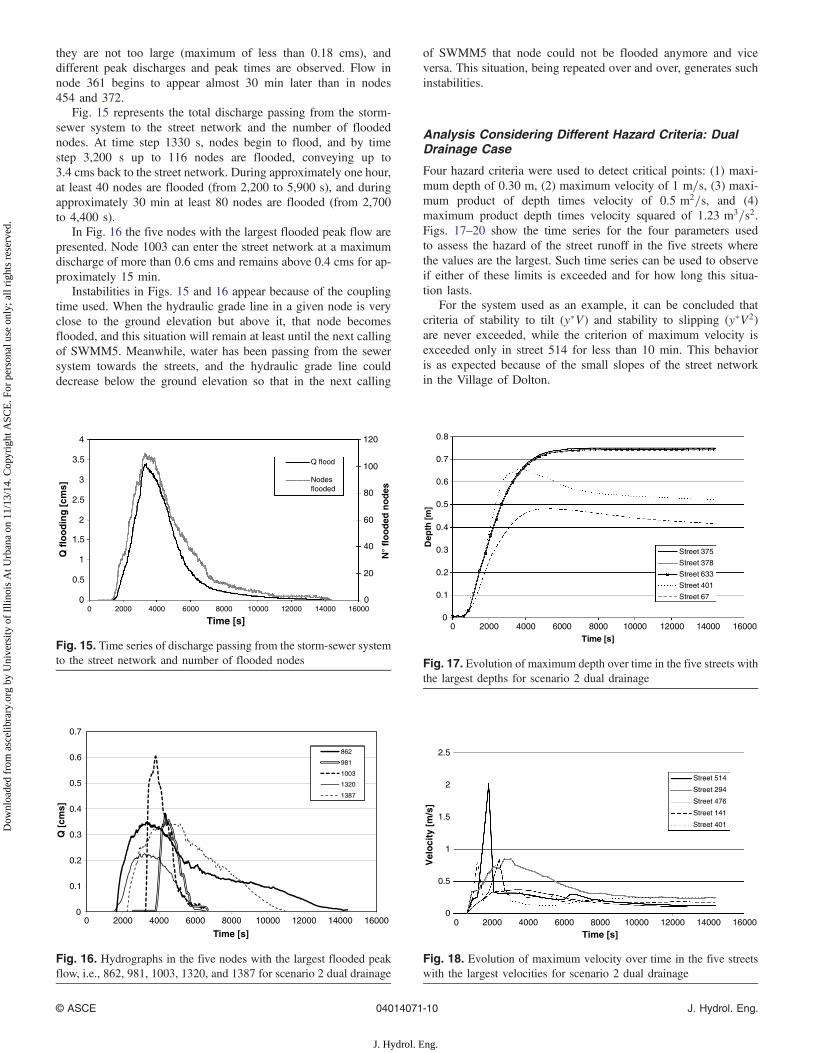
In Figs. 11 and 12, the hydrographs of maximum flow rateevacuated by inlets in the five streets with the largest values areshown for scenarios 1b and 1c, respectively. In these figures, anoscillating flow rate is detected for street 488, being the amplitudeof the oscillation smoother in the case with two pairs of inlets perstreet. This oscillating flow condition is attributable to the dynamicinteraction of flood waves in the street network.
Table 5 shows a summary of the total water volume in everymodel module. In this table, the first row is the total volume that
exits through the planes where rainfall-runoff transformation is per-formed which is the same that enters to the street network (firstmodule). The second row is the total volume exiting the street net-work through all outlets (second module). The third row refers tothe total outflow volume that exits through the inlets and henceenters to the sewer system (third module). The fourth row showsthe final volume stored in the street network. The error found (firstrow minus the sum of the rest of rows) is less than 0.388% forscenario 1a and 0.397% for scenarios 1b and 1c.
If one compares the volume of water intercepted by the inlets inscenarios 1b and 1c, the conclusion is that the second pair of inletsin the street is much less efficient than the first one.
Scenario 2 Considering Sewer System (Dual Drainage)
In Fig. 13, a summary of hyetograph and main discharges in sce-nario 2 is presented. In this figure, the rainfall is considered as in
Street 375
0
0.2
0.4
0.6
0.8
1
1.2
0 2000 4000 6000 8000 10000 12000Time [s]
Max
imu
m D
epth
[m
]
No Inlets
1 Inlet
2 Inlets
Fig. 9. Maximum depth hydrographs in the node 375 for scenarios 1ano inlets, 1b one pair of inlets per street, and 1c two pairs of inletsper street
Fig. 10. Location of streets 174, 375, and 401 in the street network
Table 4. Top Eight Streets with Maximum Flow Rate Evacuated by Inletsand Time of Occurrence for Scenarios 1b and 1c
Scenario 1b one inlet per street Scenario 1c two inlets per street
Street
Qmax Tp
Street
Qmax Tp
(cms) (s) (cms) (s)
401 0.223 2,300 401 0.45 2,600488 0.199 3,800 488 0.225 3,500487 0.147 4,600 487 0.184 3,800378 0.126 3,000 406 0.128 3,50079 0.126 3,900 413 0.120 3,000486 0.120 4,400 190 0.120 2,800633 0.107 3,200 307 0.111 3,200190 0.096 3,100 438 0.108 2,800
© ASCE 04014071-8 J. Hydrol. Eng.
J. Hydrol. Eng.
Dow
nloa
ded
from
asc
elib
rary
.org
by
Uni
vers
ity o
f Il
linoi
s A
t Urb
ana
on 1
1/13
/14.
Cop
yrig
ht A
SCE
. For
per
sona
l use
onl
y; a
ll ri
ghts
res
erve
d.
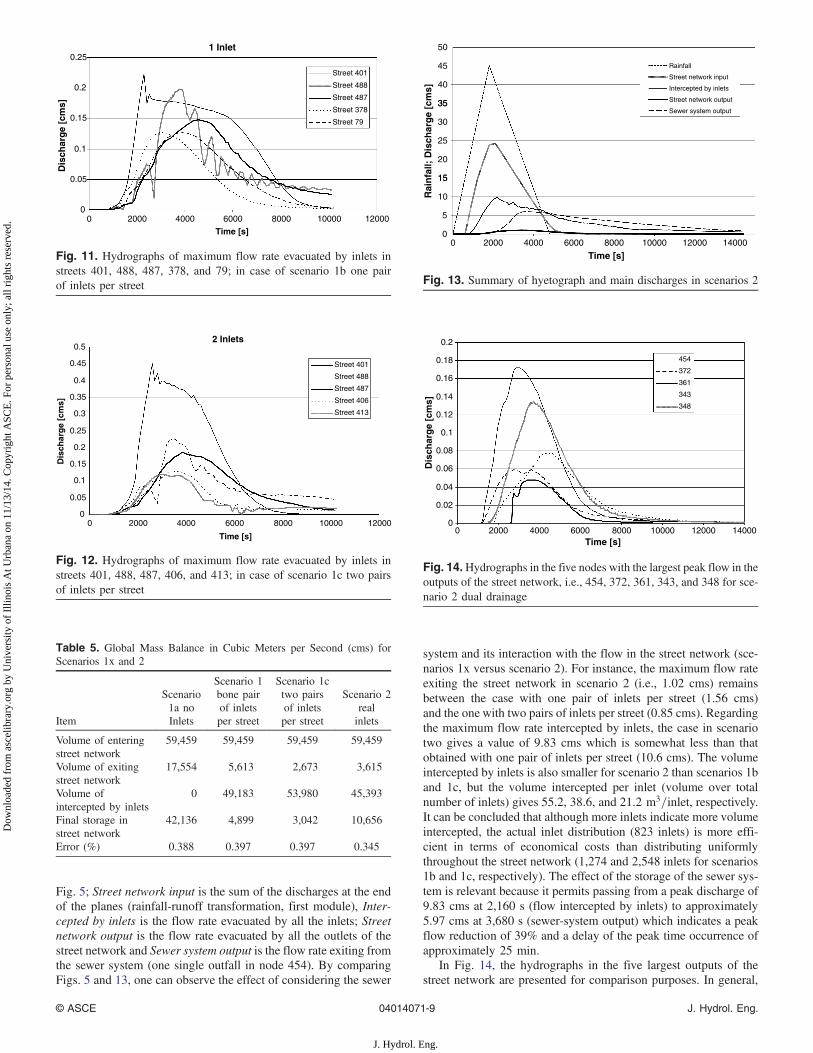
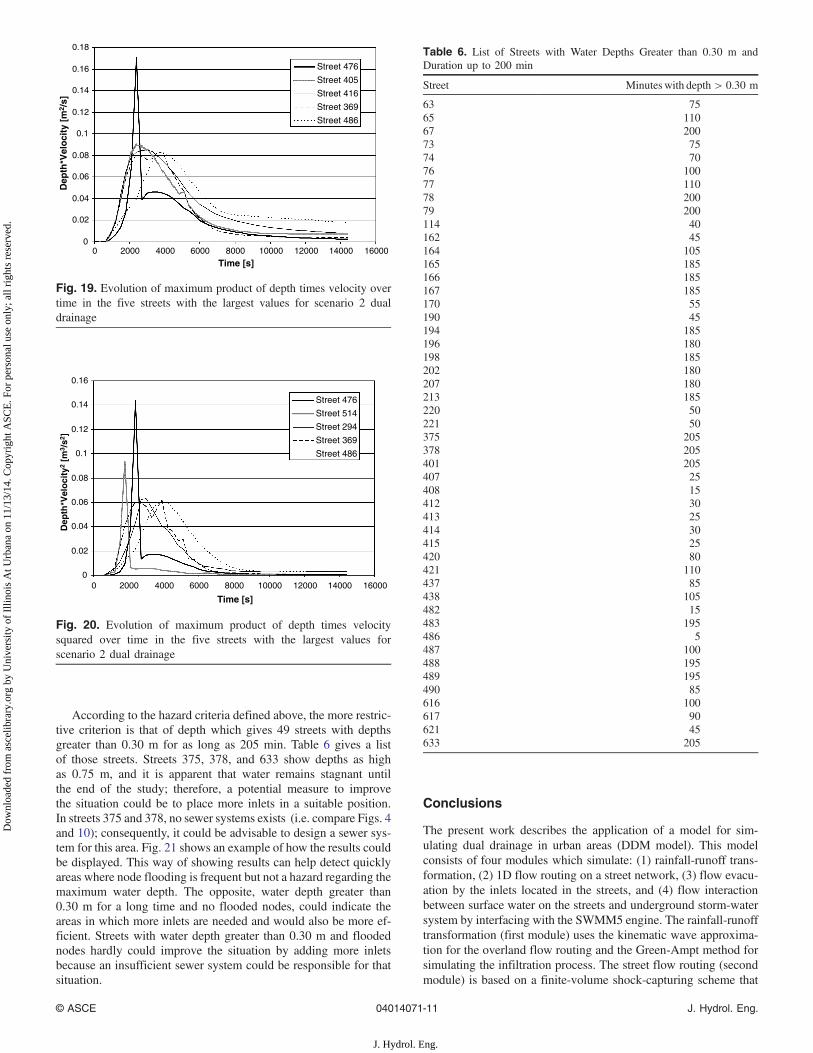
Fig. 5; Street network input is the sum of the discharges at the endof the planes (rainfall-runoff transformation, first module), Inter-cepted by inlets is the flow rate evacuated by all the inlets; Streetnetwork output is the flow rate evacuated by all the outlets of thestreet network and Sewer system output is the flow rate exiting fromthe sewer system (one single outfall in node 454). By comparingFigs. 5 and 13, one can observe the effect of considering the sewer
system and its interaction with the flow in the street network (sce-narios 1x versus scenario 2). For instance, the maximum flow rateexiting the street network in scenario 2 (i.e., 1.02 cms) remainsbetween the case with one pair of inlets per street (1.56 cms)and the one with two pairs of inlets per street (0.85 cms). Regardingthe maximum flow rate intercepted by inlets, the case in scenariotwo gives a value of 9.83 cms which is somewhat less than thatobtained with one pair of inlets per street (10.6 cms). The volumeintercepted by inlets is also smaller for scenario 2 than scenarios 1band 1c, but the volume intercepted per inlet (volume over totalnumber of inlets) gives 55.2, 38.6, and 21.2 m3=inlet, respectively.It can be concluded that although more inlets indicate more volumeintercepted, the actual inlet distribution (823 inlets) is more effi-cient in terms of economical costs than distributing uniformlythroughout the street network (1,274 and 2,548 inlets for scenarios1b and 1c, respectively). The effect of the storage of the sewer sys-tem is relevant because it permits passing from a peak discharge of9.83 cms at 2,160 s (flow intercepted by inlets) to approximately5.97 cms at 3,680 s (sewer-system output) which indicates a peakflow reduction of 39% and a delay of the peak time occurrence ofapproximately 25 min.
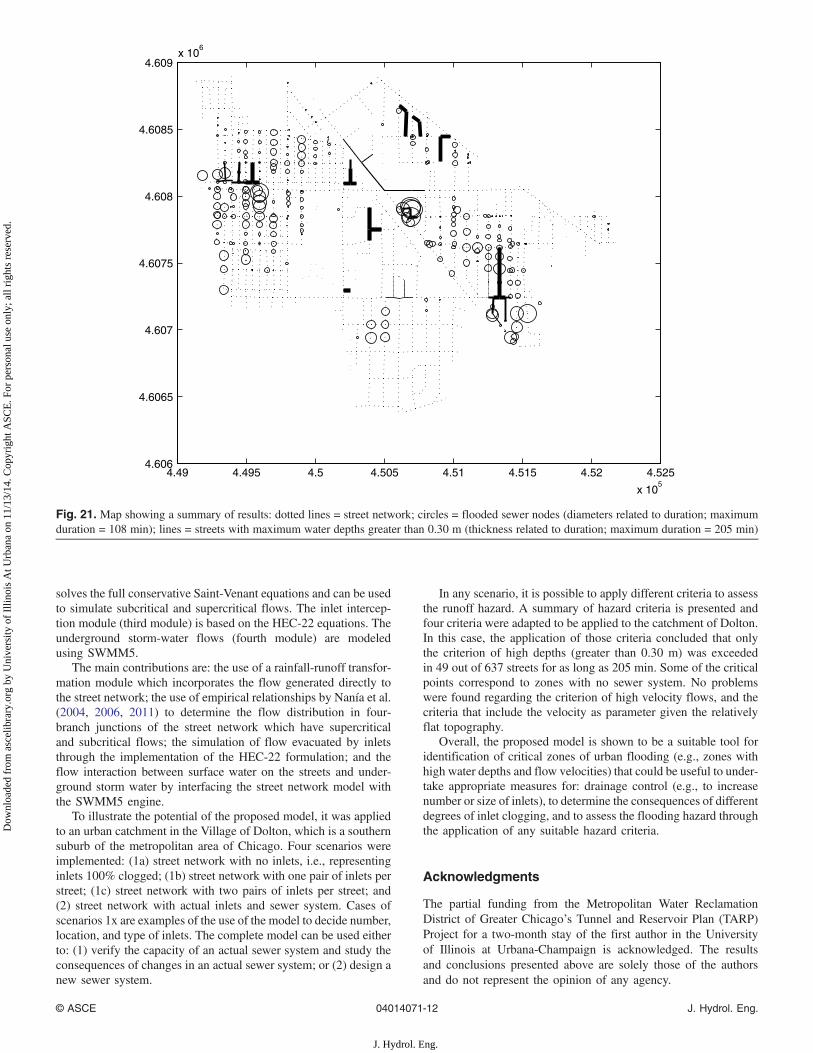
In Fig. 14, the hydrographs in the five largest outputs of thestreet network are presented for comparison purposes. In general,
1 Inlet
0
0.05
0.1
0.15
0.2
0.25
0 2000 4000 6000 8000 10000 12000
Time [s]
Dis
char
ge
[cm
s]Street 401
Street 488
Street 487
Street 378
Street 79
Fig. 11. Hydrographs of maximum flow rate evacuated by inlets instreets 401, 488, 487, 378, and 79; in case of scenario 1b one pairof inlets per street
2 Inlets
0
0.05
0.1
0.15
0.2
0.25
0.3
0.35
0.4
0.45
0.5
0 2000 4000 6000 8000 10000 12000
Time [s]
Dis
char
ge
[cm
s]
Street 401
Street 488
Street 487
Street 406
Street 413
Fig. 12. Hydrographs of maximum flow rate evacuated by inlets instreets 401, 488, 487, 406, and 413; in case of scenario 1c two pairsof inlets per street
Table 5. Global Mass Balance in Cubic Meters per Second (cms) forScenarios 1x and 2
Item
Scenario1a noInlets
Scenario 1bone pairof inletsper street
Scenario 1ctwo pairsof inletsper street
Scenario 2realinlets
Volume of enteringstreet network
59,459 59,459 59,459 59,459
Volume of exitingstreet network
17,554 5,613 2,673 3,615
Volume ofintercepted by inlets
0 49,183 53,980 45,393
Final storage instreet network
42,136 4,899 3,042 10,656
Error (%) 0.388 0.397 0.397 0.345
35
40
45
50
Rai
nfa
ll; D
isch
arg
e [c
ms]
Rainfall
Street network input
Intercepted by inlets
Street network output
15
20
25
30
35Sewer system output
0
5
10
15
0 2000 4000 6000 8000 10000 12000 14000
Time [s]
Fig. 13. Summary of hyetograph and main discharges in scenarios 2
0
0.02
0.04
0.06
0.08
0.1
0.12
0.14
0.16
0.18
0.2
0 2000 4000 6000 8000 10000 12000 14000Time [s]
Dis
char
ge
[cm
s]
454
372
361
343
348
Fig. 14.Hydrographs in the five nodes with the largest peak flow in theoutputs of the street network, i.e., 454, 372, 361, 343, and 348 for sce-nario 2 dual drainage
© ASCE 04014071-9 J. Hydrol. Eng.
J. Hydrol. Eng.
Dow
nloa
ded
from
asc
elib
rary
.org
by
Uni
vers
ity o
f Il
linoi
s A
t Urb
ana
on 1
1/13
/14.
Cop
yrig
ht A
SCE
. For
per
sona
l use
onl
y; a
ll ri
ghts
res
erve
d.
they are not too large (maximum of less than 0.18 cms), anddifferent peak discharges and peak times are observed. Flow innode 361 begins to appear almost 30 min later than in nodes454 and 372.
Fig. 15 represents the total discharge passing from the storm-sewer system to the street network and the number of floodednodes. At time step 1330 s, nodes begin to flood, and by timestep 3,200 s up to 116 nodes are flooded, conveying up to3.4 cms back to the street network. During approximately one hour,at least 40 nodes are flooded (from 2,200 to 5,900 s), and duringapproximately 30 min at least 80 nodes are flooded (from 2,700to 4,400 s).
In Fig. 16 the five nodes with the largest flooded peak flow arepresented. Node 1003 can enter the street network at a maximumdischarge of more than 0.6 cms and remains above 0.4 cms for ap-proximately 15 min.
Instabilities in Figs. 15 and 16 appear because of the couplingtime used. When the hydraulic grade line in a given node is veryclose to the ground elevation but above it, that node becomesflooded, and this situation will remain at least until the next callingof SWMM5. Meanwhile, water has been passing from the sewersystem towards the streets, and the hydraulic grade line coulddecrease below the ground elevation so that in the next calling
of SWMM5 that node could not be flooded anymore and viceversa. This situation, being repeated over and over, generates suchinstabilities.
Analysis Considering Different Hazard Criteria: DualDrainage Case
Four hazard criteria were used to detect critical points: (1) maxi-mum depth of 0.30 m, (2) maximum velocity of 1 m=s, (3) maxi-mum product of depth times velocity of 0.5 m2=s, and (4)maximum product depth times velocity squared of 1.23 m3=s2.Figs. 17–20 show the time series for the four parameters usedto assess the hazard of the street runoff in the five streets wherethe values are the largest. Such time series can be used to observeif either of these limits is exceeded and for how long this situa-tion lasts.
For the system used as an example, it can be concluded thatcriteria of stability to tilt (y�V) and stability to slipping (y�V2)are never exceeded, while the criterion of maximum velocity isexceeded only in street 514 for less than 10 min. This behavioris as expected because of the small slopes of the street networkin the Village of Dolton.
0.3
0.4
0.5
0.6
0.7
Q [
cms]
862
981
1003
1320
1387
0
0.1
0.2
0 2000 4000 6000 8000 10000 12000 14000 16000
Time [s]
Fig. 16. Hydrographs in the five nodes with the largest flooded peakflow, i.e., 862, 981, 1003, 1320, and 1387 for scenario 2 dual drainage
0
0.1
0.2
0.3
0.4
0.5
0.6
0.7
0.8
0 2000 4000 6000 8000 10000 12000 14000 16000Time [s]
Dep
th [m
]
Street 375
Street 378
Street 633
Street 401
Street 67
Fig. 17. Evolution of maximum depth over time in the five streets withthe largest depths for scenario 2 dual drainage
0
0.5
1
1.5
2
2.5
0 2000 4000 6000 8000 10000 12000 14000 16000Time [s]
Vel
oci
ty [
m/s
]
Street 514
Street 294
Street 476
Street 141
Street 401
Fig. 18. Evolution of maximum velocity over time in the five streetswith the largest velocities for scenario 2 dual drainage
0
0.5
1
1.5
2
2.5
3
3.5
4
0 2000 4000 6000 8000 10000 12000 14000 16000
Time [s]
Q f
loo
din
g [
cms]
0
20
40
60
80
100
120
N°
flo
od
ed n
od
es
Q flood
Nodesflooded
Fig. 15. Time series of discharge passing from the storm-sewer systemto the street network and number of flooded nodes
© ASCE 04014071-10 J. Hydrol. Eng.
J. Hydrol. Eng.
Dow
nloa
ded
from
asc
elib
rary
.org
by
Uni
vers
ity o
f Il
linoi
s A
t Urb
ana
on 1
1/13
/14.
Cop
yrig
ht A
SCE
. For
per
sona
l use
onl
y; a
ll ri
ghts
res
erve
d.
According to the hazard criteria defined above, the more restric-tive criterion is that of depth which gives 49 streets with depthsgreater than 0.30 m for as long as 205 min. Table 6 gives a listof those streets. Streets 375, 378, and 633 show depths as highas 0.75 m, and it is apparent that water remains stagnant untilthe end of the study; therefore, a potential measure to improvethe situation could be to place more inlets in a suitable position.In streets 375 and 378, no sewer systems exists (i.e. compare Figs. 4and 10); consequently, it could be advisable to design a sewer sys-tem for this area. Fig. 21 shows an example of how the results couldbe displayed. This way of showing results can help detect quicklyareas where node flooding is frequent but not a hazard regarding themaximum water depth. The opposite, water depth greater than0.30 m for a long time and no flooded nodes, could indicate theareas in which more inlets are needed and would also be more ef-ficient. Streets with water depth greater than 0.30 m and floodednodes hardly could improve the situation by adding more inletsbecause an insufficient sewer system could be responsible for thatsituation.
Conclusions
The present work describes the application of a model for sim-ulating dual drainage in urban areas (DDM model). This modelconsists of four modules which simulate: (1) rainfall-runoff trans-formation, (2) 1D flow routing on a street network, (3) flow evacu-ation by the inlets located in the streets, and (4) flow interactionbetween surface water on the streets and underground storm-watersystem by interfacing with the SWMM5 engine. The rainfall-runofftransformation (first module) uses the kinematic wave approxima-tion for the overland flow routing and the Green-Ampt method forsimulating the infiltration process. The street flow routing (secondmodule) is based on a finite-volume shock-capturing scheme that
Table 6. List of Streets with Water Depths Greater than 0.30 m andDuration up to 200 min
Street Minutes with depth > 0.30 m
63 7565 11067 20073 7574 7076 10077 11078 20079 200114 40162 45164 105165 185166 185167 185170 55190 45194 185196 180198 185202 180207 180213 185220 50221 50375 205378 205401 205407 25408 15412 30413 25414 30415 25420 80421 110437 85438 105482 15483 195486 5487 100488 195489 195490 85616 100617 90621 45633 205
0
0.02
0.04
0.06
0.08
0.1
0.12
0.14
0.16
0.18
0 2000 4000 6000 8000 10000 12000 14000 16000
Time [s]
Dep
th*V
elo
city
[m
2 /s]
Street 476
Street 405
Street 416
Street 369
Street 486
Fig. 19. Evolution of maximum product of depth times velocity overtime in the five streets with the largest values for scenario 2 dualdrainage
0
0.02
0.04
0.06
0.08
0.1
0.12
0.14
0.16
0 2000 4000 6000 8000 10000 12000 14000 16000
Time [s]
Dep
th*V
elo
city
2 [m
3 /s2
]
Street 476
Street 514
Street 294
Street 369
Street 486
Fig. 20. Evolution of maximum product of depth times velocitysquared over time in the five streets with the largest values forscenario 2 dual drainage
© ASCE 04014071-11 J. Hydrol. Eng.
J. Hydrol. Eng.
Dow
nloa
ded
from
asc
elib
rary
.org
by
Uni
vers
ity o
f Il
linoi
s A
t Urb
ana
on 1
1/13
/14.
Cop
yrig
ht A
SCE
. For
per
sona
l use
onl
y; a
ll ri
ghts
res
erve
d.
solves the full conservative Saint-Venant equations and can be usedto simulate subcritical and supercritical flows. The inlet intercep-tion module (third module) is based on the HEC-22 equations. Theunderground storm-water flows (fourth module) are modeledusing SWMM5.
The main contributions are: the use of a rainfall-runoff transfor-mation module which incorporates the flow generated directly tothe street network; the use of empirical relationships by Nanía et al.(2004, 2006, 2011) to determine the flow distribution in four-branch junctions of the street network which have supercriticaland subcritical flows; the simulation of flow evacuated by inletsthrough the implementation of the HEC-22 formulation; and theflow interaction between surface water on the streets and under-ground storm water by interfacing the street network model withthe SWMM5 engine.
To illustrate the potential of the proposed model, it was appliedto an urban catchment in the Village of Dolton, which is a southernsuburb of the metropolitan area of Chicago. Four scenarios wereimplemented: (1a) street network with no inlets, i.e., representinginlets 100% clogged; (1b) street network with one pair of inlets perstreet; (1c) street network with two pairs of inlets per street; and(2) street network with actual inlets and sewer system. Cases ofscenarios 1x are examples of the use of the model to decide number,location, and type of inlets. The complete model can be used eitherto: (1) verify the capacity of an actual sewer system and study theconsequences of changes in an actual sewer system; or (2) design anew sewer system.
In any scenario, it is possible to apply different criteria to assessthe runoff hazard. A summary of hazard criteria is presented andfour criteria were adapted to be applied to the catchment of Dolton.In this case, the application of those criteria concluded that onlythe criterion of high depths (greater than 0.30 m) was exceededin 49 out of 637 streets for as long as 205 min. Some of the criticalpoints correspond to zones with no sewer system. No problemswere found regarding the criterion of high velocity flows, and thecriteria that include the velocity as parameter given the relativelyflat topography.
Overall, the proposed model is shown to be a suitable tool foridentification of critical zones of urban flooding (e.g., zones withhigh water depths and flow velocities) that could be useful to under-take appropriate measures for: drainage control (e.g., to increasenumber or size of inlets), to determine the consequences of differentdegrees of inlet clogging, and to assess the flooding hazard throughthe application of any suitable hazard criteria.
Acknowledgments
The partial funding from the Metropolitan Water ReclamationDistrict of Greater Chicago’s Tunnel and Reservoir Plan (TARP)Project for a two-month stay of the first author in the Universityof Illinois at Urbana-Champaign is acknowledged. The resultsand conclusions presented above are solely those of the authorsand do not represent the opinion of any agency.
4.49 4.495 4.5 4.505 4.51 4.515 4.52 4.525
x 105
4.606
4.6065
4.607
4.6075
4.608
4.6085
4.609x 10
6
Fig. 21. Map showing a summary of results: dotted lines = street network; circles = flooded sewer nodes (diameters related to duration; maximumduration = 108 min); lines = streets with maximum water depths greater than 0.30 m (thickness related to duration; maximum duration = 205 min)
© ASCE 04014071-12 J. Hydrol. Eng.
J. Hydrol. Eng.
Dow
nloa
ded
from
asc
elib
rary
.org
by
Uni
vers
ity o
f Il
linoi
s A
t Urb
ana
on 1
1/13
/14.
Cop
yrig
ht A
SCE
. For
per
sona
l use
onl
y; a
ll ri
ghts
res
erve
d.
References
Abt, S. R., Wittler, R. J., and Taylor, A. (1989). “Predicting humaninstability in flood flows.” Proc., 1989 National Conf. on HydraulicEngineering, ASCE, New York, 70–76.
Aronica, G. T., and Lanza, L. G. (2005). “Drainage efficiency in urbanareas: A case study.” Hydrol. Processes, 19(5), 1105–1119.
Bazin, P.-H., Nakagawa, H., Kawaike, K., Paquier, A., and Mignot, E.(2013). Modeling flow exchanges between a street and an under-ground drainage pipe during urban floods, Novatech 2013: Group deRecherche Rhone-Alpes sur les Infrastructures et l’Eau (GRAIE),Lyon, France.
Cantone, J., and Schmidt, A. R. (2011). “Improved understanding and pre-diction of the hydrologic response of highly urbanized catchmentsthrough development of the Illinois Urban Hydrologic Model.” WaterResour. Res., 47(8), in press.
Chaudhry, M. H. (1987). Applied hydraulic transients, Van NostrandReinhold, New York.
Chen, A. S., Djordjevic, S., Leandro, J., and Savic, D. A. (2010). “Ananalysis of the combined consequences of pluvial and fluvial flooding.”Water Sci. Technol., 62(7), 1491–1498.
Chen, A. S., Hsu, M. H., Chen, T. S., and Chang, T. J. (2005). “An inte-grated inundation model for highly developed urban areas.” Water Sci.Technol. 51(2), 221–229.
Chow, V. T., Maidment, D. R., and Mays, L. W. (1988). Applied hydrology,McGraw-Hill, New York.
Chow, V. T., and Yen, B. C. (1976). “Urban stormwater runoff: Determinationof volumes and flowrates.” Environmental Protection Technology Series,EPA-600/2-76-116, U.S. Environmental Protection Agency, Cincinnati.
City of Austin Department of Public Works. (1977). Drainage criteriamanual, 1st Ed., Austin, TX.
Clark County Regional Flood Control District. (1999). Hydrologic criteriaand drainage design manual, Clark City, NV.
Dey, A. K., and Kamioka, S. (2007). “An integrated modeling approach topredict flooding on urban basin.” Water Sci. Technol., 55(4), 19–29.
Djordjevic, S., et al. (2013). “Experimental and numerical investigationof interactions between above and below ground drainage systems.”Water Sci. Technol., 67(3), 535–542.
Djordjevic, S., Prodanovic, D., and Maksimovic, C. (1999). “An approachto simulation of dual drainage.” Water Sci. Technol., 39(9), 95–103.
Djordjevic, S., Prodanovic, D., Maksimovic, C., Ivetic, M., and Savic, D.(2005). “SIPSON—Simulation of interaction between pipe flow andsurface overland flow in networks.”Water Sci. Technol., 52(5), 275–283.
Federal Highway Administration. (2001). “Urban drainage design manual.”Hydraulic engineering circular No. 22 (HEC-22), 2nd Ed., U.S. Dept.of Transportation, Washington, DC.
Hsu, M. H., Chen, S. H., and Chang, T. J. (2000). “Inundation simulation forurban drainage basin with storm sewer.” J. Hydrol., 234(1–2), 21–37.
Hydraulic and Hydrologic Engineering Department (2001). “Definition ofhazard criteria for street runoff. Inlet spacing analysis in the City ofBarcelona.” School of Civil Engineering, Technical Univ. of Catalonia,Barcelona, Spain.
Leon, A. S. (2007). “Improved modeling of unsteady free surface, pressur-ized and mixed flows in storm-sewer systems.” Ph.D. thesis, Univ. ofIllinois, Urbana-Champaign, IL.
Leon, A. S., Ghidaoui, M. S., Schmidt, A. R., and García, M. H. (2006).“Godunov-type solutions for transient flows in sewers.” J. Hydraul.Eng., 800–813.
Leon, A. S., Ghidaoui, M. S., Schmidt, A. R., and Garcia, M. H. (2009a).“Application of Godunov-type schemes to transient mixed flows.”J. Hydraul. Res., 47(2), 147–156.
Leon, A. S., Ghidaoui, M. S., Schmidt, A. R., and Garcia, M. H. (2010a).“A robust two-equation model for transient-mixed flows.” J. Hydraul.Res., 48(1), 44–56.
Leon, A. S., Gifford-Miears, C. H., and Choi, Y. (2013). “Well-balancedscheme for modelling open-channel and surcharged flows in steep-slope closed conduit systems.” J. Hydraul. Eng., 374–384.
Leon, A. S., Liu, X., Ghidaoui, M. S., Schmidt, A. R., and Garcia, M. H.(2010b). “Junction and drop-shaft boundary conditions for modelingfree-surface, pressurized, and mixed free-surface pressurized transientflows.” J. Hydraul. Eng., 705–715.
Leon, A. S., Nanía, L. S., Schmidt, A., and Garcia, M. H. (2009b) “A robustand fast model for simulating street flooding.” Proc., ASCE, EWRIWorld Environmental and Water Resources Congress, Kansas City, MO.
Martins, R., Leandro, J., and Carvalho, R. F. (2014). “Characterization ofthe hydraulic performance of a gully under drainage conditions.”WaterSci. Technol., 69(12), 2423–2430.
Nanía, L., Gomez, M., and Dolz, J. (2004). “Experimental study of thedividing flow in steep street crossings.” J. Hydraul. Res., 42(4), 406–412.
Nanía, L., Gomez, M., and Dolz, J. (2007). “Surface stormwater hazardassessment in steep urban areas. Case of the city of Mendoza,Argentina.” Urban Water J., 4(2), 119–131.
Nanía, L., Gomez, M., Dolz, J., Comas, P., and Pomares, J. (2011).“Experimental study of subcritical dividing flow in an equal-width,four-branch junction.” J. Hydraul. Eng., 10.1061/(ASCE)HY.1943-7900.0000423, 1298–1305.
Nanía-Escobar, L. S. (1999). “Numerical and experimental methodologyfor danger analysis of urban runoff in a street network.” Ph.D. thesis,E.T.S.I.C.C.P., Universitat Politècnica de Catalunya, Barcelona, Spain(in Spanish).
Nanía-Escobar, L. S., Gomez-Valentín, M., and Dolz-Ripollés, J. (2006).“Danger analysis associated to urban runoff using a numerical andexperimental approach.” Water Technol. Sci., XXI(2), 5–15.
New South Wales Government. (2005). Floodplain development manual,Sydney, Australia.
Radojkovic, M., and Maksimovic, Č. (1984) “Development, testing andapplication of Belgrade urban drainage model.” 3rd Int. Conf. on UrbanDrainage, Göteborg, Sweden, 1431–1443.
Rossman, L. A., Dickinson, R. E., Schade, T., Chan, C., Burgess, E. H.,and Huber, W. C. (2005). “SWMM5: The USEPA’s newest tool forurban drainage analysis.” Proc., 10th Int. Conf. Urban Drainage(ICUD) (CD ROM), Copenhagen, Denmark.
Schmitt, T. G., Thomas, M., and Ettrich, N. (2004). “Analysis and modelingof flooding in urban drainage systems.” J. Hydrol., 299(3–4), 300–311.
Témez, J. R. (1992). “Control of urban development in flooding zones.”In: Flooding and urban drainage networks, J. Dolz, M. Gomez, andJ. P. Martín, eds., Monographs of the Spanish Civil EngineeringInstitution No. 10, Madrid, Spain, 105–115 (in Spanish).
Wright-McLaughlin. (1969). Urban storm drainage criteria manual,Urban Drainage and Flood Control District, Denver.
© ASCE 04014071-13 J. Hydrol. Eng.
J. Hydrol. Eng.
Dow
nloa
ded
from
asc
elib
rary
.org
by
Uni
vers
ity o
f Il
linoi
s A
t Urb
ana
on 1
1/13
/14.
Cop
yrig
ht A
SCE
. For
per
sona
l use
onl
y; a
ll ri
ghts
res
erve
d.
Top Related
Copyright © 2022 FDOKUMEN

