


Bahasa
Halaman
Hukum

ESTCP Final Report: ER-201635 1 August 2021
Hybrid Microbial Fuel Cell-Biofiltration System for Energy-Neutral Wastewater
Treatment
ESTCP Project #ER-201635 Environmental Restoration Projects
August 2021
Don CropekU.S. Army ERDC-CERL
ESTCP Final Report: ER-201635 2 August 2021
REPORT DOCUMENTATION PAGE Form Approved
OMB No. 0704-0188 Public reporting burden for this collection of information is estimated to average 1 hour per response, including the time for reviewing instructions, searching existing data sources, gathering and maintaining the data needed, and completing and reviewing this collection of information. Send comments regarding this burden estimate or any other aspect of this collection of information, including suggestions for reducing this burden to Department of Defense, Washington Headquarters Services, Directorate for Information Operations and Reports (0704-0188), 1215 Jefferson Davis Highway, Suite 1204, Arlington, VA 22202-4302. Respondents should be aware that notwithstanding any other provision of law, no person shall be subject to any penalty for failing to comply with a collection of information if it does not display a currently valid OMB control number. PLEASE DO NOT RETURN YOUR FORM TO THE ABOVE ADDRESS.
1. REPORT DATE (DD-MM-YYYY)06/30/2021
2. REPORT TYPEESTCP Final Report
3. DATES COVERED (From - To)
4. TITLE AND SUBTITLE 5a. CONTRACT NUMBER
Hybrid Microbial Fuel Cell-Biofiltration System for Energy-Neutral Wastewater Treatment
5b. GRANT NUMBER
5c. PROGRAM ELEMENT NUMBER
6. AUTHOR(S) 5d. PROJECT NUMBER
Ruggero Rossi, Andy Hur, Martin Page, Christine Ngan, Alexandra Doody, Marc Schlebusch, Bruce Logan, Don Cropek, and Eva Opitz.
5e. TASK NUMBER
5f. WORK UNIT NUMBER
7. PERFORMING ORGANIZATION NAME(S) AND ADDRESS(ES) 8. PERFORMING ORGANIZATION REPORTNUMBER
US Army ERDC CERL Penn State University CDM-Smith
9. SPONSORING / MONITORING AGENCY NAME(S) AND ADDRESS(ES) EnvironmentalSecurity Technology Certification Program4800 Mark Center Drive, Suite 16F16Alexandria, VA 22350-3605
10. SPONSOR/MONITOR’S ACRONYM(S)ESTCP
11. SPONSOR/MONITOR’S REPORTNUMBER(S)
12. DISTRIBUTION / AVAILABILITY STATEMENT
DISTRIBUTION STATEMENT A. Approved for public release: distribution unlimited.
13. SUPPLEMENTARY NOTES
14. ABSTRACTA wastewater treatment system comprised of microbial fuel cell (MFC) and biofiltrationtechnologies was designed, assembled, and demonstrated at pilot scale Tobyhanna ArmyDepot wastewater treatment facility in Pennsylvania. The resulting data were used todetermine that the treatment system could provide effective secondary wastewatertreatment while requiring less energy than conventional aeration-based approaches. TheMFC technology featured new cathode materials and performed consistently over the testperiod, but physical and economic scalability of the technology may limit utility. Thebiofiltration technology performed consistently in treating the effluent from the MFC.
15. SUBJECT TERMSWastewater, water treatment, microbial fuel cell, biofilter, water reuse
16. SECURITY CLASSIFICATION OF: 17. LIMITATIONOF ABSTRACT
18. NUMBEROF PAGES
19a. NAME OF RESPONSIBLE PERSON
a. REPORT b. ABSTRACT c. THIS PAGE 19b. TELEPHONE NUMBER (include area code)
Standard Form 298 (Rev. 8-98) Prescribed by ANSI Std. Z39.18
ER-201635
ER-201635
UNCLASS UNCLASS UNCLASSUNCLASS 107
Donald Cropek
217-373-6737
ER-201635

ESTCP Final Report: ER-201635 3 August 2021
THIS PAGE INTENTIONALLY LEFT BLANK
ESTCP Final Report: ER-201635 4 August 2021
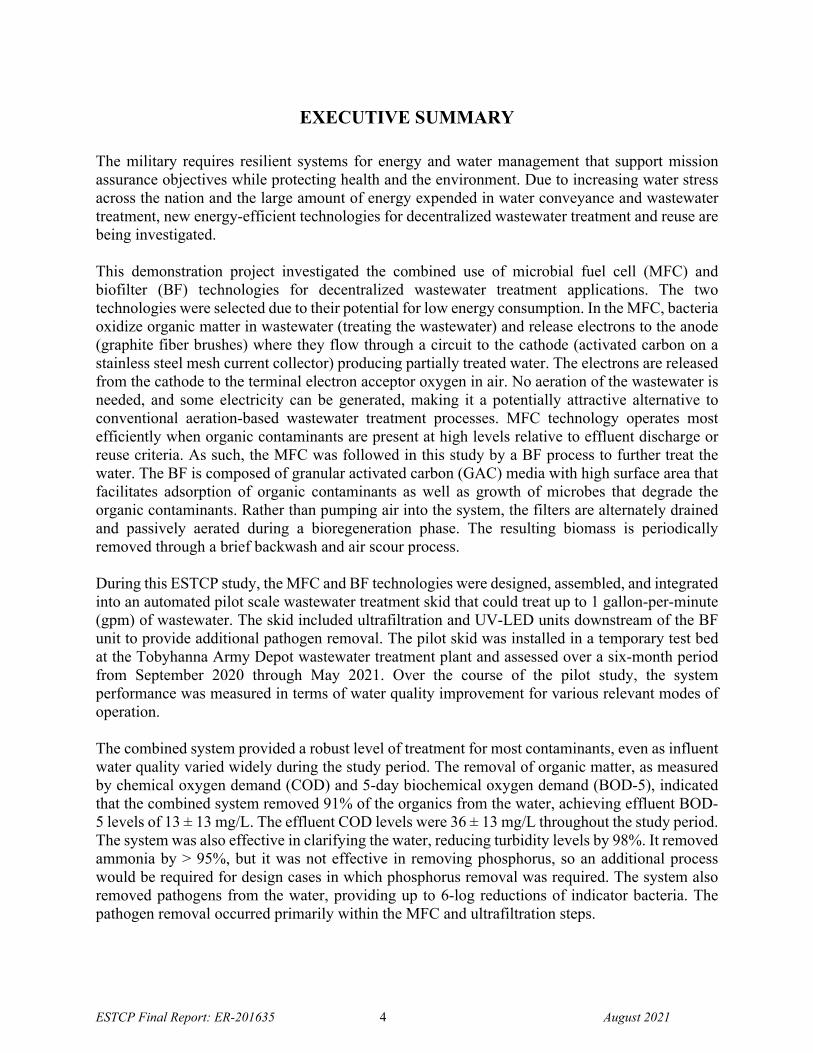
EXECUTIVE SUMMARY
The military requires resilient systems for energy and water management that support mission assurance objectives while protecting health and the environment. Due to increasing water stress across the nation and the large amount of energy expended in water conveyance and wastewater treatment, new energy-efficient technologies for decentralized wastewater treatment and reuse are being investigated.
This demonstration project investigated the combined use of microbial fuel cell (MFC) and biofilter (BF) technologies for decentralized wastewater treatment applications. The two technologies were selected due to their potential for low energy consumption. In the MFC, bacteria oxidize organic matter in wastewater (treating the wastewater) and release electrons to the anode (graphite fiber brushes) where they flow through a circuit to the cathode (activated carbon on a stainless steel mesh current collector) producing partially treated water. The electrons are released from the cathode to the terminal electron acceptor oxygen in air. No aeration of the wastewater is needed, and some electricity can be generated, making it a potentially attractive alternative to conventional aeration-based wastewater treatment processes. MFC technology operates most efficiently when organic contaminants are present at high levels relative to effluent discharge or reuse criteria. As such, the MFC was followed in this study by a BF process to further treat the water. The BF is composed of granular activated carbon (GAC) media with high surface area that facilitates adsorption of organic contaminants as well as growth of microbes that degrade the organic contaminants. Rather than pumping air into the system, the filters are alternately drained and passively aerated during a bioregeneration phase. The resulting biomass is periodically removed through a brief backwash and air scour process.
During this ESTCP study, the MFC and BF technologies were designed, assembled, and integrated into an automated pilot scale wastewater treatment skid that could treat up to 1 gallon-per-minute (gpm) of wastewater. The skid included ultrafiltration and UV-LED units downstream of the BF unit to provide additional pathogen removal. The pilot skid was installed in a temporary test bed at the Tobyhanna Army Depot wastewater treatment plant and assessed over a six-month period from September 2020 through May 2021. Over the course of the pilot study, the system performance was measured in terms of water quality improvement for various relevant modes of operation.
The combined system provided a robust level of treatment for most contaminants, even as influent water quality varied widely during the study period. The removal of organic matter, as measured by chemical oxygen demand (COD) and 5-day biochemical oxygen demand (BOD-5), indicated that the combined system removed 91% of the organics from the water, achieving effluent BOD-5 levels of 13 ± 13 mg/L. The effluent COD levels were 36 ± 13 mg/L throughout the study period. The system was also effective in clarifying the water, reducing turbidity levels by 98%. It removed ammonia by > 95%, but it was not effective in removing phosphorus, so an additional process would be required for design cases in which phosphorus removal was required. The system also removed pathogens from the water, providing up to 6-log reductions of indicator bacteria. The pathogen removal occurred primarily within the MFC and ultrafiltration steps.
ESTCP Final Report: ER-201635 5 August 2021
In addition to water quality improvement measurements, the practical factors of throughput, energy consumption and production, and cost were considered. A detailed analysis was performed for the theoretical case of a 5000-gpd system installed in a building for reuse applications. While the projected costs for the system were relatively high compared to existing technologies such as membrane bioreactors, it is expected that future MFC technology developments and market maturation could reduce costs.
Based on the results of this study, further improvements of MFC technology are needed prior to its transition into use in military installations. Future research should focus on improving the throughput and energy production of the technology, with the goal of reducing capital costs and footprint. The BF technology was determined to be potentially economical for building scale applications, and independent studies using BF followed by membrane filtration for wastewater treatment should be considered. Despite these limitations, several advancements were made during this demonstration study. Prior to this demonstration, MFC technology has been limited to mostly pilot scale demonstrations using less efficient cathodes than those demonstrated in the present study. The patented BF technology had only been tested for gray water treatment, and the present study was the first demonstration of its use for wastewater treatment at pilot scale. Seven peer-reviewed publications were generated during this demonstration study:
Yang, W. et al. 2018. Mitigating external and internal cathode fouling using a polymer bonded separator in microbial fuel cells. Biores. Technol. 249:1080-1084. Myung, J., et al. 2018. Copper current collectors reduce long-term fouling of air cathodes in microbial fuel cells. Environ. Sci. Water Res. Technol. 4:513–519. Rossi, R. et al. 2018. In situ biofilm removal from air cathodes in microbial fuel cells treating domestic wastewater. Bioresour. Technol., 265, 200−206. Logan, B.E. et al. 2018. Impact of ohmic resistance on measured electrode potentials and maximum power production in microbial fuel cells. Environ. Sci. Technol. 52, 8977–8985. Rossi, R. et al. Evaluating a multi-panel air cathode through electrochemical and biotic tests. Water Res. 148, 51–59. Rossi, R. et al. 2019 Impact of flow recirculation and anode dimensions on performance of a large scale microbial fuel cell. J. Power Sources. 412, 294–300. Rossi, R. et al. 2019. Evaluation of electrode and solution area-based resistances enables quantitative comparisons of factors impacting microbial fuel cell performance. Environ. Sci. Technol. 53, 3977–3986. Logan, B.E. et al. 2019. Electroactive microorganisms in bioelectrochemical systems. Nat. Rev. Microbiol. 17, 307-319. Rossi, R. et al. 2019. Impact of cleaning procedures on restoring cathode performance for microbial fuel cells treating domestic wastewater. Bioresour. Technol. 290, 121759. Rossi, R. and Logan, B.E. 2020. Unraveling the contributions of internal resistance components in two-chamber microbial fuel cells using the electrode potential slope analysis. Electrochim. Acta. 348, 136291. Rossi, R. et al. 2020. Quantifying the factors limiting performance and rates in microbial fuel cells using the electrode potential slope analysis combined with electrical impedance spectroscopy. Electrochim. Acta. 348, 136330. Rossi, R. and Logan, B.E. 2020. Impact of external resistance acclimation on charge transfer and diffusion resistance in bench-scale microbial fuel cells. Biores. Technol. 316, 123921.
ESTCP Final Report: ER-201635 6 August 2021
Rossi, R. et al. 2020. High performance flow through microbial fuel cells with anion exchange membrane. J. Power Sources. 475, 228633. Rossi, R. et al. 2020. Chronoamperometry and linear sweep voltammetry reveals the adverse impact of high carbonate buffer concentrations on anode performance in microbial fuel cells. J. Power Sources. 476, 228715. Rossi, R. et al. 2021. Continuous flow microbial flow cell with anion exchange membrane for treating domestic wastewater. ACS Sustain. Chem. Eng. 9, 2946-2954. Rossi, R. and Logan, B.E. 2021. Using an anion exchange membrane for effective hydroxide ion transport enables high power densities in microbial fuel cells. Chem. Eng. J. 422, 130150. Rossi, R.; et al. Pilot scale microbial fuel cells using air cathodes for producing electricity while treating wastewater. In preparation for Water Research.
ESTCP Final Report: ER-201635 7 August 2021
TABLE OF CONTENTS
EXECUTIVE SUMMARY ............................................................................................................ 4
TABLE OF CONTENTS ................................................................................................................ 7
LIST OF FIGURES ........................................................................................................................ 9
LIST OF TABLES ........................................................................................................................ 12
ACKNOWLEDGEMENTS .......................................................................................................... 13
LIST OF ACRONYMS ................................................................................................................ 14
1.0 INTRODUCTION ............................................................................................................. 16
1.1 BACKGROUND ........................................................................................................................ 16
1.2 OBJECTIVE ............................................................................................................................... 18
1.3 REGULATORY DRIVERS ....................................................................................................... 18
2.0 TECHNOLOGY ................................................................................................................ 19
2.1 TECHNOLOGY DESCRIPTION .............................................................................................. 20
2.2 TECHNOLOGY DEVELOPMENT ........................................................................................... 26
2.3 ADVANTAGES AND LIMITATIONS OF THE TECHNOLOGY .......................................... 39
3.0 PERFORMANCE OBJECTIVES ..................................................................................... 40
3.1 DETERMINE TREATMENT EFFECTIVENESS ..................................................................... 41
3.2 DETERMINE ENERGY SAVINGS .......................................................................................... 43
3.3 DETERMINE SLUDGE REDUCTION ..................................................................................... 43
3.4 DETERMINE O&M REQUIREMENTS ................................................................................... 44
3.5 DETERMINE COST SAVINGS ................................................................................................ 44
4.0 SITE DESCRIPTION ........................................................................................................ 46
4.1 SITE SELECTION ..................................................................................................................... 46
4.2 SITE LOCATION AND HISTORY ........................................................................................... 47
5.0 TEST DESIGN .................................................................................................................. 49
5.1 CONCEPTUAL EXPERIMENTAL DESIGN ........................................................................... 49
5.2 BASELINE CHARACTERIZATION ........................................................................................ 50
5.3 TREATABILITY OR LABORATORY STUDY RESULTS .................................................... 52
5.4 DESIGN AND LAYOUT OF TECHNOLOGY COMPONETNS ............................................. 61
5.5 FIELD TESTING ........................................................................................................................ 64
5.6 SAMPLING METHODS ............................................................................................................ 66
5.7 SAMPLING RESULTS .............................................................................................................. 68
ESTCP Final Report: ER-201635 8 August 2021
6.0 PERFORMANCE ASSESSMENT ................................................................................... 75
6.1 TREATMENT EFFECTIVENESS RESULTS .......................................................................... 76
6.2 ENERGY SAVINGS RESULTS ................................................................................................ 77
6.3 SLUDGE REDUCTION RESULTS .......................................................................................... 77
6.4 O&M RESULTS ......................................................................................................................... 78
6.5 DETERMINE COST SAVINGS ................................................................................................ 78
7.0 COST ASSESSMENT ....................................................................................................... 78
7.1 COST MODEL ........................................................................................................................... 79
7.2 COST DRIVERS ........................................................................................................................ 80
7.2.1 Influent Water Quality and Design Flow ................................................................ 81
7.2.2 Reuse Applications ................................................................................................. 81
7.2.3 Chemical Usage ...................................................................................................... 82
7.2.4 Waste Generation, Treatment, and/or Disposal ...................................................... 82
7.2.5 Power Consumption of Ancillary Systems ............................................................. 83
7.2.6 Potential Cost-Drivers Not Considered in Cost Model ........................................... 84
7.3 COST ANALYSIS ...................................................................................................................... 84
7.3.1 Basis of Design ....................................................................................................... 85
7.3.2 Cost Analysis .......................................................................................................... 89
7.3.3 Comparison to Other Decentralized Treatment Systems ........................................ 91
7.3.4 Cost Estimate Discussion ........................................................................................ 92
7.3.5 Life Cycle Cost Assessment Summary ................................................................... 98
8.0 IMPLEMENTATION ISSUES ......................................................................................... 99
9.0 REFERENCES ................................................................................................................ 101
APPENDICES ............................................................................................................................ 104
Appendix A: Health and Safety Plan (HASP) ...................................................................................... 104
Appendix B: 5000 GPD Design Drawings ........................................................................................... 105
Appendix C: Points of Contact ............................................................................................................. 107
ESTCP Final Report: ER-201635 9 August 2021
LIST OF FIGURES
Figure 2.1 Process flow diagram of the DEM/VAL system that includes MFC and BF technologies with supporting components. ................................................................................... 20
Figure 2.2 (a) Laboratory-scale MFC (1.4 L liquid volume, 2.0 L total empty bed volume) constructed in a modular design to contain two anode (wastewater) chambers, A and B. (b) Schematic showing two modules of six brush anodes each, flanking a single cathode module containing two cathodes. ............................................................................................................... 21
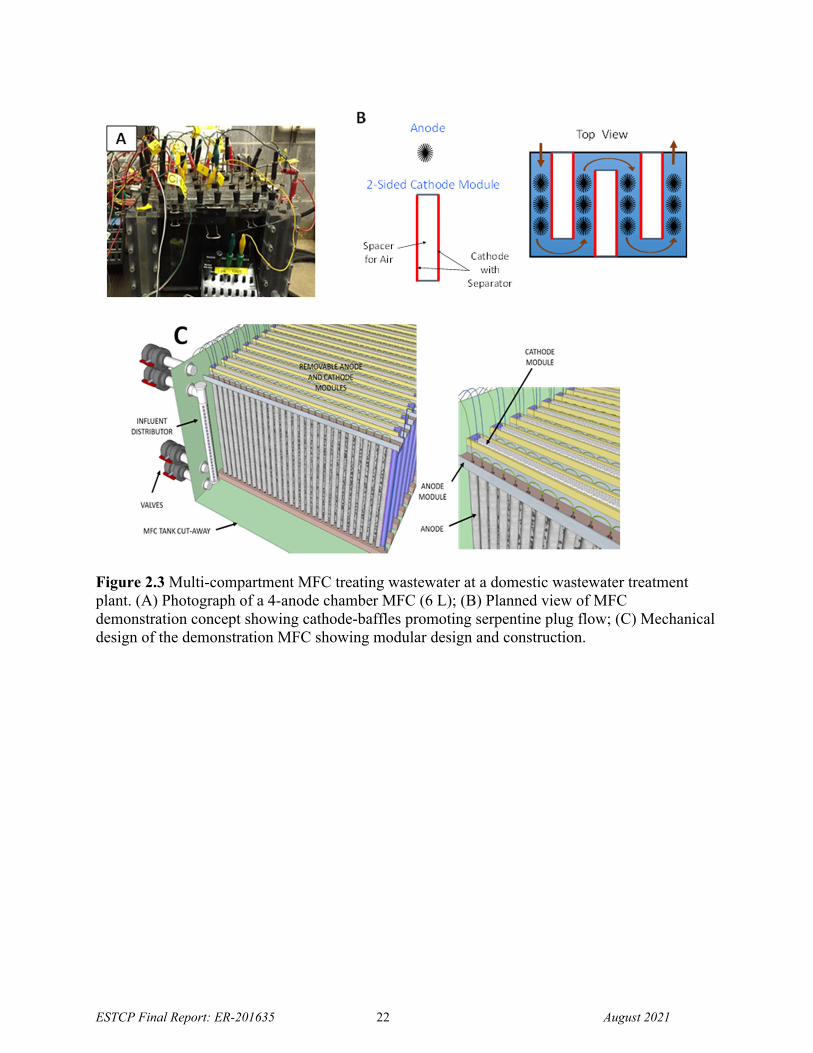
Figure 2.3 Multi-compartment MFC treating wastewater at a domestic wastewater treatment plant. (A) Photograph of a 4-anode chamber MFC (6 L); (B) Planned view of MFC demonstration concept showing cathode-baffles promoting serpentine plug flow; (C) Mechanical design of the demonstration MFC showing modular design and construction. ............................ 22
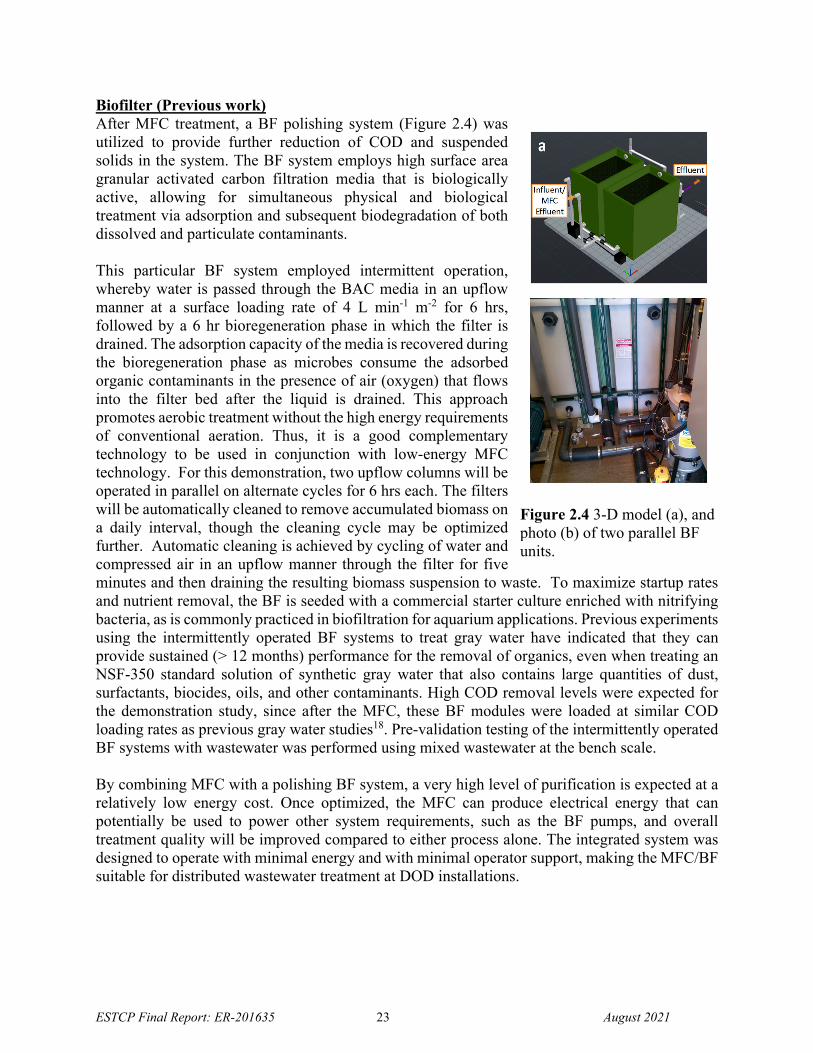
Figure 2.4 3-D model (a), and photo (b) of two parallel BF units. ............................................... 23
Figure 2.5 P&ID for the microbial fuel cell skid. ......................................................................... 26
Figure 2.6 Large test chamber used to evaluate the cathode performance. The plastic spacers balanced the water pressure against the cathode. .......................................................................... 28
Figure 2.7 Cathodes from two manufacturers were subjected to water pressure testing prior to performance testing. ...................................................................................................................... 28
Figure 2.8 Large test chamber filled with 85 L of tap water. ....................................................... 29
Figure 2.9 CP analysis on the two VITO cathodes in the test chamber. ....................................... 29
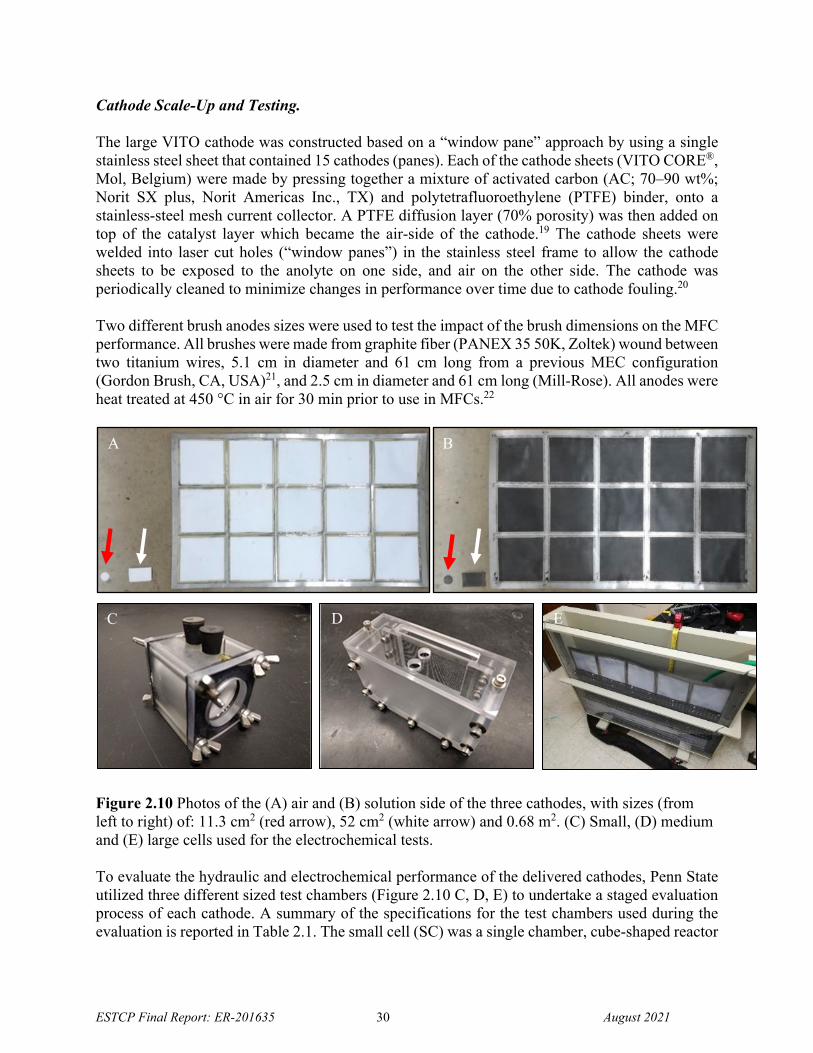
Figure 2.10 Photos of the (A) air and (B) solution side of the three cathodes, with sizes (from left to right) of: 11.3 cm2 (red arrow), 52 cm2 (white arrow) and 0.68 m2. (C) Small, (D) medium and (E) large cells used for the electrochemical tests. ......................................................................... 30
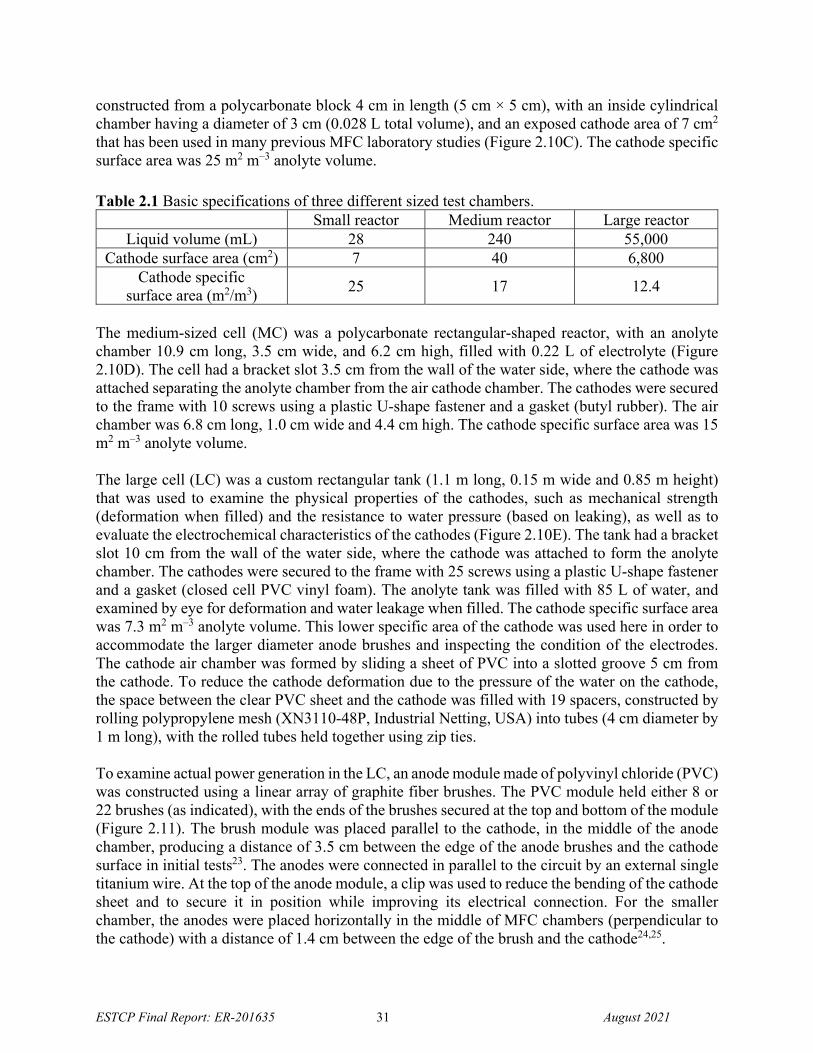
Figure 2.11 Photos of the anode module of the large chamber with (A) 22 anodes and (B) 8 anodes. .......................................................................................................................................... 32
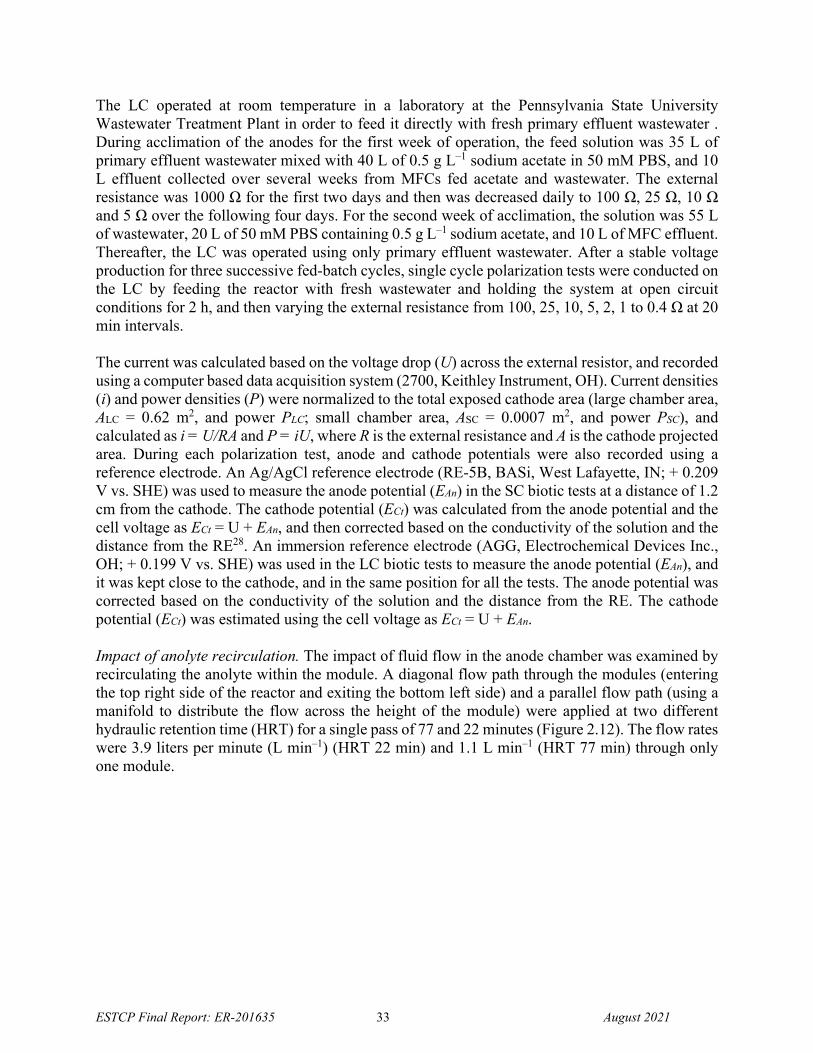
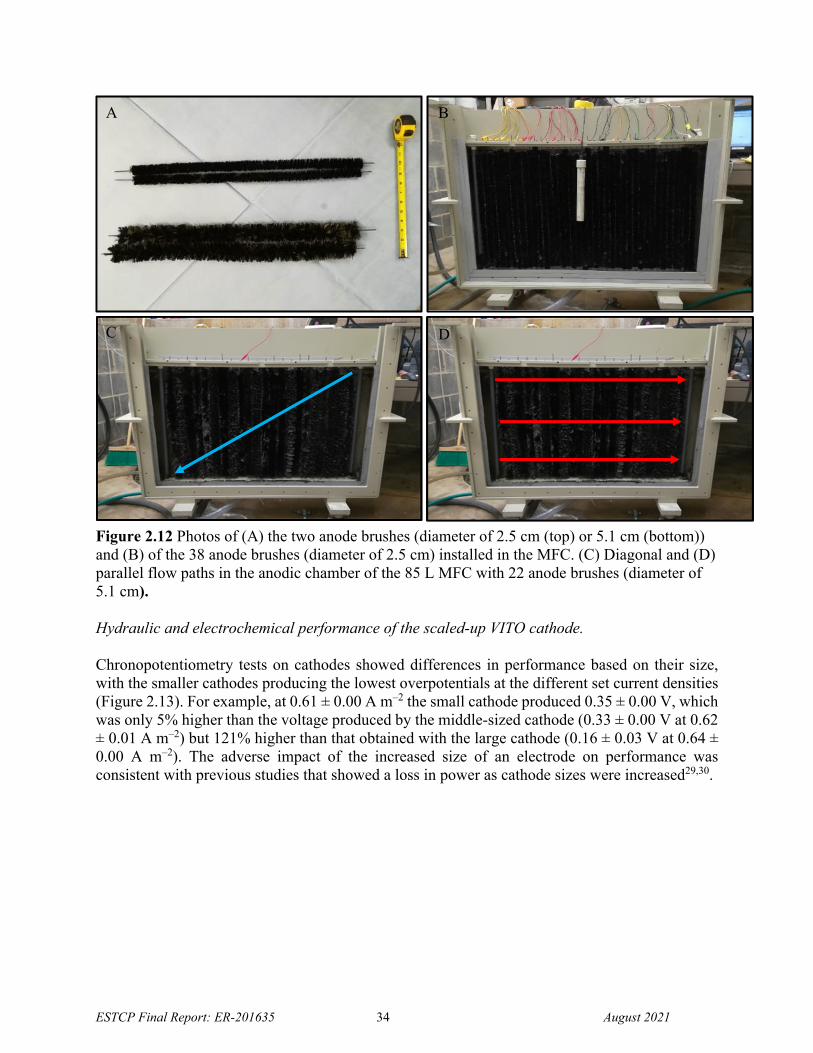
Figure 2.12 Photos of (A) the two anode brushes (diameter of 2.5 cm (top) or 5.1 cm (bottom)) and (B) of the 38 anode brushes (diameter of 2.5 cm) installed in the MFC. (C) Diagonal and (D) parallel flow paths in the anodic chamber of the 85 L MFC with 22 anode brushes (diameter of 5.1 cm). ......................................................................................................................................... 34
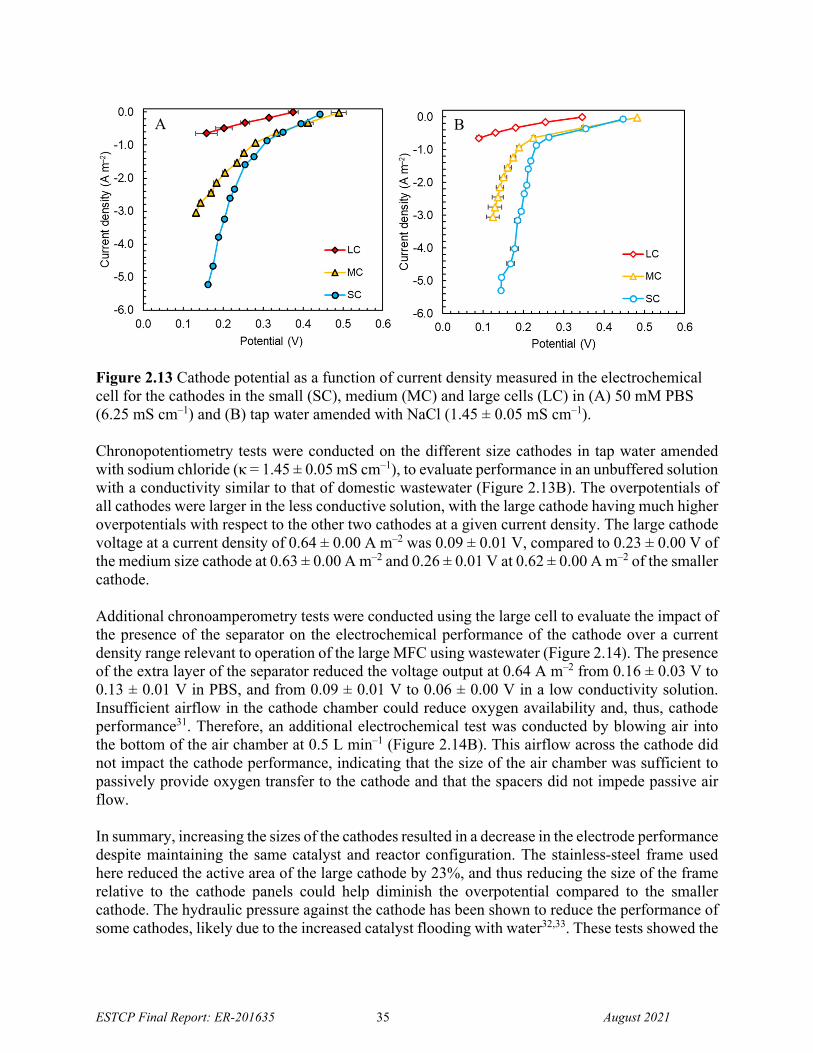
Figure 2.13 Cathode potential as a function of current density measured in the electrochemical cell for the cathodes in the small (SC), medium (MC) and large cells (LC) in (A) 50 mM PBS (6.25 mS cm–1) and (B) tap water amended with NaCl (1.45 ± 0.05 mS cm–1). .......................... 35
Figure 2.14 (A) Chronopotentiograms of cathodes in the large (85 L) chamber in 50 mM PBS and in tap water amended with NaCl (LCS) in the presence (Sp) and the absence (NS) of the separator. (B) Chronopotentiograms of cathodes in the large (85 L) chamber in 50 mM PBS in the absence (NS) of the separator, with and without blowing additional air through the air chamber at a flowrate of 0.5 liters per minute (air 0.5 Lpm). ....................................................... 36
Figure 2.15 P&ID for the biofilter skid. ....................................................................................... 37
ESTCP Final Report: ER-201635 10 August 2021
Figure 2.16 Bench scale BF tests using primary effluent from a local wastewater plant in Urbana, Illinois. Tests were performed at 10oC and 28oC over a four-week period. ................................. 38
Figure 2.17 Schematic of the BF skid (left) and ERDC researcher Andy Hur assembling the pilot BF skid (right). .............................................................................................................................. 38
Figure 4.1 An overview of the Tobyhanna Army Depot located in Tobyhanna, PA. The proximity to Penn State University, where the MFC technology was developed, facilitated a more efficient and effective field demonstration. ......................................................................... 47
Figure 4.2 Photos from the Tobyhanna WWTP utility building where the pilot ESTCP MFC/BF wastewater treatment demonstration was conducted. ................................................................... 48
Figure 5.1 General schematic for the integrated MFC-BF pilot system and its integration at Tobyhanna Army Depot’s wastewater treatment plant. ............................................................... 50
Figure 5.2 Cathode (Ct) potentials from the biotic polarization tests and the abiotic chronopotentiometry (CP) in low conductivity solution (LCS) and anode (An) potentials from the biotic polarization tests in the (A) large and (B) small chamber in wastewater (WW). (C) Biotic power density curves in the small chamber (SC) and large chamber (LC) MFC. (D) Measured anode potentials, not corrected for the ohmic drop, in LC and SC and estimated in SC with an increased electrode spacing of 3.5 cm. ............................................................................ 53
Figure 5.3 (A) Cathode potentials (Ct) and anode potentials (An) with an anode module with 8 (projected area = 0.25 m2) and 22 anode brushes (projected area = 0.60 m2) compared with the abiotic chronopotentiometry data (CP) and (B) corresponding power density curves. ................ 54
Figure 5.4 (A) Cathode potentials (Ct) and anode potentials (An) of the new, cleaned and used (1 month) cathode and (B) corresponding power density curves. ..................................................... 55
Figure 5.5 (A) Power density curve and whole cell potential and (B) corresponding cathode (Cat) and anode (An) potentials using 22 anode brushes (D = 5.1 cm, projected area = 0.60 m2) in the anode module under static conditions. .......................................................................................... 56
Figure 5.6 (A) Power density curves and (B) corresponding cathode (Cat) and anode (An) potentials at an HRT of 22 min or 77 min in a “diagonal” flow path. .......................................... 57
Figure 5.7 (A) Power density curves and (B) corresponding cathode (Cat) and anode (An) potentials at an HRT of 22 min or 77 min in “parallel” flow path. .............................................. 58
Figure 5.8 (A) Power density curves and (B) corresponding cathode (Cat) and anode (An) potentials with anode brushes of 2.5 and 5.1 cm diameter. .......................................................... 59
Figure 5.9 (A) Power density curves and (B) corresponding cathode (Cat) and anode (An) potentials with 38 anode brushes and at an HRT of 22 min or 77 min in a “diagonal” flow path........................................................................................................................................................ 60
Figure 5.10 Photos of the (A) initial influent tank and skimmer tank and (B) top-view of the skimmer tank. The influent tank was later upgraded from 55 to 500 gallons. ............................. 62
Figure 5.11 (A) Top view of the MFC with the (B) anode and (C) cathode modules. ................. 63
Figure 5.12 MFC (A) inlet, (B) outlet and (C) BF sampling points. ............................................ 66
Figure 5.13 MFC total current and power produced over the demonstration period. .................. 69
Figure 5.14 MFC total current and power produced over four consecutive weeks. ..................... 70
ESTCP Final Report: ER-201635 11 August 2021
Figure 5.15 Average current and power produced by each singular module over a 24 h period after (A) 3 months from inoculation and (B) 6 months from inoculation. The modules were numbered from the closer to the MFC inlet (1) to the closer to the MFC outlet (32). ................. 70
Figure 5.16 (A) COD consumption by the MFC and BF and (B) TSS concentration after the MFC. ............................................................................................................................................. 72
Figure 5.17 (A) Photo of a vial containing the BF effluent. No solids and a small amount of COD were detected in the BF effluent during the demonstration. (B) Turbidity measurement of the MFC influent, effluent and BF effluent. ....................................................................................... 72
Figure 5.18 Concentration of (A) ammonia, (B) nitrite and (C) nitrate in the MFC influent, effluent and post BF treatment. ..................................................................................................... 73
Figure 5.19 Concentration of (A) sulfide and (B) phosphorus in the MFC influent, effluent and post BF treatment. ......................................................................................................................... 74
Figure 5.20 (A) BOD, (B) fecal coliforms and (C) E. coli concentration in the MFC influent, effluent and post BF treatment. ..................................................................................................... 75
Figure 7.1 Percentage Break Down of Direct Capital Costs to Construct MFC-BF System. ...... 93
Figure 7.2 Schematic diagram of case studies for comparison of system ROI. ........................... 94
Figure 7.3 Net savings comparison of MFC-BF system (no reuse) (a) to a conventional MBR system with different wastewater hauling cost and (b) to MFC-BF system (25% water reuse) with different potable water cost. .................................................................................................. 95
Figure 7.4 20-Yr Annualized Operation and Maintenance Direct Cost Breakdown for MFC-BF System. .......................................................................................................................................... 96
ESTCP Final Report: ER-201635 12 August 2021
LIST OF TABLES
Table 2.1 Basic specifications of three different sized test chambers. ......................................... 31
Table 3.1 Demonstration Performance Objectives ....................................................................... 41
Table 4.1 Demonstration site selection criteria. ............................................................................ 46
Table 5.1 Demonstration task schedule. ....................................................................................... 49
Table 5.2 Influent wastewater data from over a year of sampling at Tobyhanna WWTP. .......... 51
Table 5.3 Summary of influent water quality data that includes comparison of low load days (holidays) to typical load days (w/out holidays). .......................................................................... 52
Table 5.4 Sample Types and Quantities ....................................................................................... 67
Table 5.5 Sample Analysis Methods ............................................................................................ 68
Table 5.6 Average power and wastewater treated at different time from inoculation. ................. 71
Table 6.1 Demonstration Performance Objectives ....................................................................... 76
Table 7.1 Summary of Direct and Indirect Capital Cost Elements in the Cost Model ................. 80
Table 7.2 Summary of Operational Cost Elements in the Cost Model ......................................... 80
Table 7.3 Average Characteristics for Medium Strength Municipal Wastewater ........................ 85
Table 7.4 Effluent Quality Requirements ..................................................................................... 85
Table 7.5 Summary of Primary Treatment and Equalization Elements ....................................... 86
Table 7.6 Summary of Microbial Fuel Cell Elements .................................................................. 87
Table 7.7 Summary of Biofiltration Elements .............................................................................. 87
Table 7.8 Summary of Tertiary Treatment Elements ................................................................... 88
Table 7.9 Summary of Finished Water System Elements ............................................................ 88
Table 7.10 Summary of Sludge Management Elements ............................................................... 89
Table 7.11 Summary of Chemical Storage Elements ................................................................... 89
Table 7.12 Estimated Capital Cost for 5,000 gpd MFC-BF System ............................................ 90
Table 7.13 Summary of Operational Direct Cost Elements ......................................................... 91
Table 7.14 Summary of 5,000 gpd MFC-BF Project Costs .......................................................... 91
Table 7.15 Major Cost Drivers of MFC-BF System Versus Conventional MBR System ........... 92
ESTCP Final Report: ER-201635 13 August 2021
ACKNOWLEDGEMENTS
This project was financed by the Environmental Security Technology Certification Program, and we are truly grateful for their support through several delays and technological hurdles. Each team member would also like to thank the support staff at each of our institutions, and especially Ms. Kathryn Odell at ERDC CERL for her diligence and financial tracking over the course of this project. We would like to acknowledge and thank the Directorate of Public Works at Tobyhanna Army Depot for providing and preparing their site for this demonstration, and especially the electricians and crane operator (Mr. Joseph Duncan). Finally, we would also like to commend and thank Intuitech for assistance in design, construction and testing of our combined system, and TXL Group for solving our control board electronic issues.
ESTCP Final Report: ER-201635 14 August 2021
LIST OF ACRONYMS
BAC Biologically Activated Carbon BF Biofilter BOD Biochemical Oxygen Demand CERL Construction Engineering Research Laboratory COD Chemical Oxygen Demand CP Chronopotentiometry DEM/VAL Demonstration/Validation DO Dissolved Oxygen DOD Department of Defense ERDC Engineer Research and Development Center ESTCP Environmental Security Technology Certification Program GAC Granular Activated Carbon gpd Gallons per day gpm Gallons per minute HRT Hydraulic Retention Time LCCA Lifecycle Cost Analysis MFC Microbial Fuel Cell O&M Operations and Maintenance ORP Oxidation Reduction Potential P&ID Piping and Instrumentation Diagram PPCPs Pharmaceuticals and Personal Care Products PSU Pennsylvania State University QA/QC Quality Assurance and Quality Control SERDP Strategic Environmental Research and Development Program TC Total Coliform TDS Total Dissolved Solids TMDL Total Maximum Daily Load TOC Total Organic Carbon TSS Total Suspended Solids TYAD Tobyhanna Army Depot UF Ultrafiltration USEPA U.S. Environmental Protection Agency UV-LED Ultraviolet Light Emitting Diode VSS Volatile Suspended Solids WWTP Wastewater Treatment Plant
ASHRAE LEED CRADA OH&P EQ hp DOE GAO USACE MBR MCACES MII OMB CAS LCCA ER SCOD PBS PVC RFP NSF UVT UV TN TP FC NTU C4ISR DPW BOD5

ESTCP Final Report: ER-201635 15 August 2021
THIS PAGE INTENTIONALLY LEFT BLANK
ESTCP Final Report: ER-201635 16 August 2021
1.0 INTRODUCTION This demonstration featured an advanced wastewater treatment system with potential for direct conversion of wastewater into usable electrical energy through the use of microbial fuel cell (MFC) technology. The system also included an intermittently operated biofiltration (BF) process that has been recently developed for distributed wastewater treatment applications for resilient installations and low logistics expeditionary operations. The MFC and BF technologies have complementary features that help achieve effluent water quality targets for reuse or discharge while harvesting electricity. Additionally, the systems have potential for reducing the volume of residual biosolids compared to conventional wastewater treatment processes. 1.1 BACKGROUND Wastewater/water treatment and conveyance currently consume about four percent of the total U.S. energy demand1, with secondary treatment of wastewater comprising up to half of this demand. At military installations, the coupling of these energy demands to ongoing water security and sustainability drivers represents an immediate technical challenge for which innovative solutions are needed. The National Defense Authorization Act of 2021 requires military installations to evaluate their resiliency with respect to energy and water and to assess the potential for implementation of associated net zero capabilities in decentralized or centralized fashion. Executive Orders 13423, 13514, and 13693 mandate that water efficiency and conservation measures be implemented to achieve 2% reduction in water consumption per year from 2007-2025, necessitating a 36% reduction in potable water use intensity relative to the 2007 baseline. Similarly, ASHRAE 189.1-2009, LEED and various Energy Policy Acts require more sustainable use of water. The Army Net Zero Water pilot program envisioned pursuing up to 50% water demand reduction and the Army’s Net Zero policy previously instructed all installations at any location to implement net zero concepts where it is practical. In 2017, the Army Directive 2017-07 directed installations to pursue increased resilience in the form of a 14-day emergency operations capability for water and energy at critical facilities in emergency scenarios. Such initiatives necessitate more than just water conservation, and many installations are exploring water reuse options as an important part of the water security demand reduction plans.2 Water reuse is still an emerging and evolving technical practice. Reuse activities can be as rudimentary as recycling industrial process water with little treatment or as complex as performing advanced treatment of highly contaminated water sources such that this wastewater becomes an alternate to potable water for all applications (direct or indirect potable reuse). CDM Smith, in a CRADA with USEPA, has updated guidelines for water re-use which include options and technologies for implementation.3 Despite the many drivers for better wastewater treatment and reuse capabilities, DOD installations and many of the states in which they reside have exhibited limited adoption of solutions due to cost and staffing challenges associated with retrofitting infrastructure and maintaining additional systems. Better technical solutions, analysis, and guidance are needed. The demonstration and validation of wastewater treatment and reuse technologies at installations present a key bridge for meeting these needs in an energy-efficient and cost-effective manner.
5 Current methods for wastewater treatment at DOD installations typically involve dependence on an off-site publicly owned treatment works or centralized wastewater treatment on post. In most cases, the treatment
ESTCP Final Report: ER-201635 17 August 2021
approach involves energy-intensive aerobic activated sludge and/or oxidation pond processes6 implemented in a centralized municipal scale fashion. The costs and effort required to reclaim and distribute treated water from centralized wastewater plants for reuse activities are often impractical for many installations. However, the strategic application of smaller, distributed wastewater treatment and reuse systems that can simultaneously reduce the energy costs of wastewater treatment and provide a net reduction in potable water demand at the point of need could be highly beneficial and more practical. For example, a small containerized system could be designed to “mine” wastewater from a sewer line or pump station and treat that water to a level such that it is suitable for nearby irrigation or industrial needs. To enable distributed wastewater treatment and reuse at DOD installations, treatment technologies need to be robust, energy-efficient, cost-effective, low maintenance, and scalable. One highly innovative technology with potential to provide an improved capability for reuse of wastewater is the Microbial Fuel Cell (MFC). Coupling an MFC with a simple low-energy polishing system such as a biofilter (BF) could result in an automated, low maintenance wastewater treatment system that can support distributed water reuse applications at installations. However, large scale MFC technology needs to be proven in a relevant DOD environment under realistic operating conditions to validate its utility to installations. The key questions addressed by this demonstration included:
1. How does the integrated MFC/BF system perform in terms of water quality improvement, energy efficiency, and maintenance requirements over a sustained period when treating real wastewater?
2. How long does it take for the system to reach optimal performance? Does it tolerate intermittent operation and/or shock loads?
3. What is the optimal hydraulic residence time (HRT) for the MFC when applied upstream of a biofilter system, when considering water quality requirements and energy efficiency objectives?
4. Is the product water suitable for water reuse? If so, what types of reuse could it safely support?
5. How do the waste streams generated by this system compare to those of conventional wastewater treatment processes, in terms of composition and volume?
6. Are the technologies economically viable compared to conventional wastewater treatment, when considering the entire life cycle and a mature market?
7. At what design scale(s) are the technologies appropriate and economically viable? In which DOD settings would they be most impactful?
8. Due to the request for focus on the MFC, how does the MFC alone perform when treating real wastewater to prepare the effluent for subsequent treatment options?
ESTCP Final Report: ER-201635 18 August 2021
1.2 OBJECTIVE The technical objective of this project was the demonstration/validation (DEM/VAL) of a distributed treatment system for municipal wastewater that integrates newly developed and highly complementary MFC and BF technologies. Specific objectives for the project included:
Complete evaluation (effluent water quality versus influent parameters, cost, longevity, energy efficiency) of large scale MFC as an option for wastewater treatment
Demonstrate the production of high-quality re-usable water that meets USEPA guidelines for restricted reuse.
Demonstrate a reduction in energy consumption of at least 50% relative to conventional aerobic wastewater treatment technology.
Demonstrate a 50% reduction in residuals (sludge) compared to aerobic bioreactors. Successfully integrate the MFC and BF technologies in an operator friendly configuration
that can eventually be maintained at a level comparable to, or less than existing technologies.
Generate life cycle cost data to confirm a payback period of less than 10 years.
1.3 REGULATORY DRIVERS Regulations and directives pertinent to environmental protection and resiliency are key drivers of this study. It is expected that the results from this demonstration will influence future regulations in the water reuse arena. 1.3.1 Environmental Protection and Environmental Health Distributed wastewater treatment systems offer flexibility to installation planners for managing wastewater at off-grid sites or buildings, or in new sections of an installation that might be difficult or inconvenient to service with existing centralized infrastructure. The ability to locally discharge water into the environment rather than connecting to the centralized system or hauling it out by truck could provide considerable cost savings to the training site. Environmental discharge regulations driven by the Clean Water Act are readily available and highly pertinent to this study. On-site treatment systems are typically permitted at the State level through the Department of Natural Resources or an equivalent regulatory body. Because this demonstration is located at a wastewater treatment plant and will return product water to the influent stream, no permitting is required. The site also has a permit already for on-site reuse of product water within the plant. If other reuse opportunities become available, modification of the existing permit to include the demonstration unit will be explored. 1.3.2 Resiliency and Sustainment Several directives geared towards resiliency and sustainment of DOD installations are also key drivers of this demonstration. These include:
2021 National Defense Authorization Act Section 2827. EVALUATION OF INSTALLATIONS FOR POTENTIAL NET ZERO WATER USAGE.
ESTCP Final Report: ER-201635 19 August 2021
(1) The Secretary concerned shall conduct an evaluation of each military installation under the jurisdiction of the Secretary to determine the potential for the military installation, or at a minimum certain installation activities, to achieve net zero water usage. (2) Required elements of each evaluation shall include the following:
(A) An evaluation of alternative water sources to offset use of freshwater, including water recycling and harvested rainwater for use as non-potable water. (B) An evaluation of the feasibility of implementing Department of Energy guidelines for net zero water usage, when practicable, to minimize water consumption and wastewater discharge in buildings scheduled for renovation. (C) An evaluation of the practicality of implementing net zero water usage technology into new construction in water-constrained areas, as determined by water management and security assessments conducted under subsection (b).
Army Directive 2017-07 Water and Energy Security - Installations must maintain water and power to continue critical operations for a two week period during an emergency/off-grid event. Distributed wastewater treatment technologies that generate potential sources of reuse water could alleviate water stress in an emergency situation. Executive Order 13693 mandates that water sustainment technologies and frameworks be implemented to achieve 2% reduction in water consumption per year from 2007-2025, necessitating a 36% reduction in potable water use intensity relative to the 2007 baseline. Army Directive 2014-02 Net Zero Installations Policy- Installations must work towards Net Zero operations, including reducing overall water use, regardless of the source; increasing use of technology that uses water more efficiently; recycling and reusing water, shifting from the use of potable water to non-potable sources as much as possible; and minimizing interbasin transfers of any type of water, potable or non-potable, so that a Net Zero water installation recharges as much water back into the aquifer as it withdraws.
2.0 TECHNOLOGY This ESTCP demonstration featured two innovative MFC and BF wastewater treatment technologies. Key components of the MFC were developed by Penn State and CDM Smith with previous funding from SERDP, and a considerable effort was made as part of the ESTCP project to scale up these technologies prior to integrating them into a pilot scale unit for demonstration. Seven peer reviewed publications resulted from work funded under this ESTCP project, with at least two more in the preparation and submission process. The BF technology demonstrated in this
ESTCP Final Report: ER-201635 20 August 2021
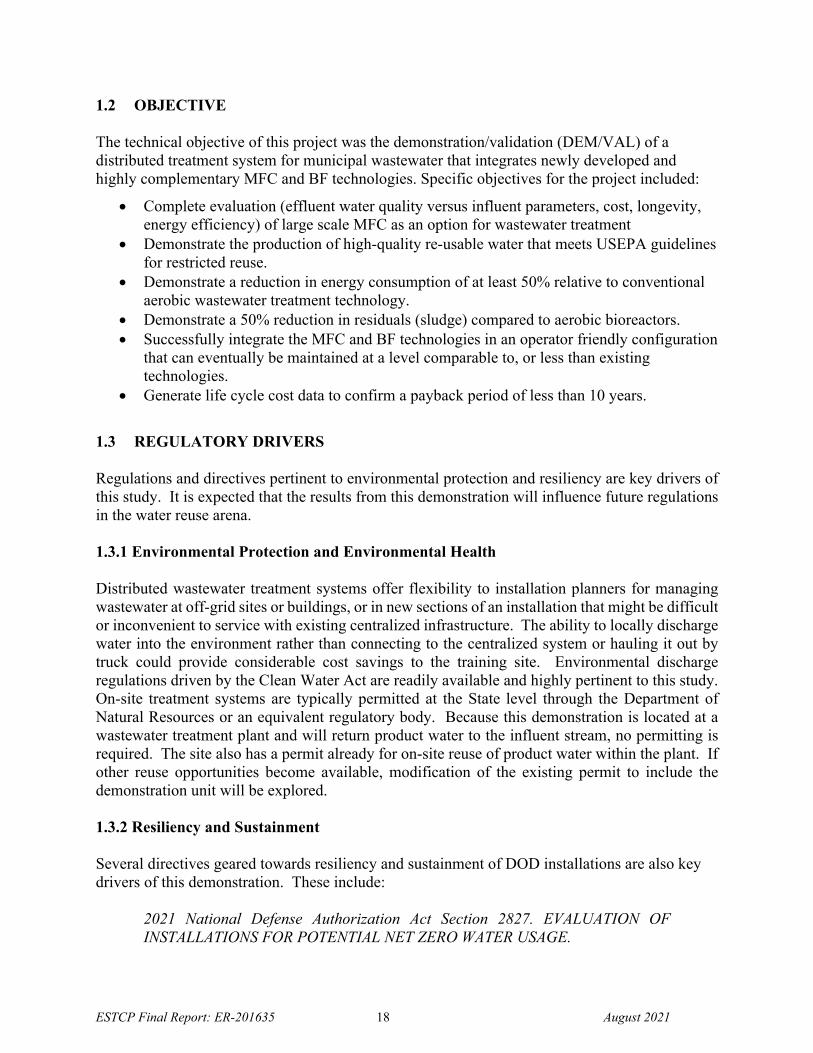
study was also developed with military funding and is patented by US Army ERDC (Self-regenerating biofilter, Patent #10,494,272). 2.1 TECHNOLOGY DESCRIPTION The MFC and BF technologies were integrated into a treatment system designed to enable reuse of the treated wastewater. The treatment system (Figure 2.1) included a screen to remove debris greater than 50 microns, an equalization tank to dampen wastewater variation and shock loads, an oil skimmer, an MFC treatment system to reduce the organic and nutrient content, and a cycled BF system to further reduce the organic content and control suspended solids. Further post-treatment via membrane cartridge filtration and UV-LED disinfection was also included.
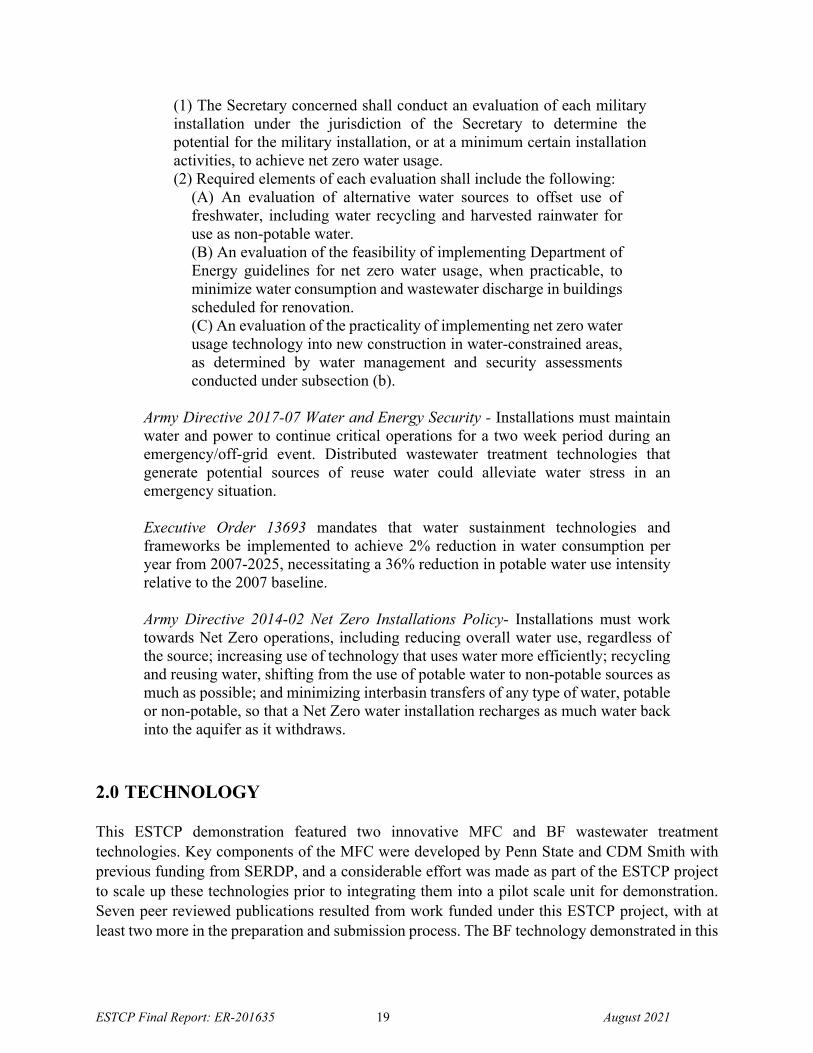
Figure 2.1 Process flow diagram of the DEM/VAL system that includes MFC and BF technologies with supporting components. Microbial Fuel Cell (Prior Work) In the MFC, bacteria oxidize organic matter in wastewater and release electrons to the anode (graphite fiber brushes) where they flow through a circuit to the cathode (activated carbon on a stainless steel mesh current collector) producing treated water (Figure 2.2). 7 The electrons are released from the cathode to the terminal electron acceptor oxygen in air. No aeration of the wastewater is needed. The energy produced by an MFC makes it possible to achieve energy-neutral wastewater treatment and even generate useful electricity.7-10 Although MFCs were proposed for wastewater treatment over a decade ago, they have only recently become ready for deployment due to challenges related to materials, performance, and sufficient experience with wastewater for conducting larger-scale tests. Researchers at Penn State have developed MFCs that do not use any precious metals11,12 or expensive membranes or binders, and that can produce some of the highest power densities with domestic wastewater reported to date13,14. In order for the reactor to produce energy using wastewater, which has a low conductivity, the anodes and cathodes must be placed closely together. However, it was found that when carbon paper, cloth or felt electrodes were placed too closely to the cathodes, oxygen contamination prevented power generation. The new reactor designs with graphite fiber brush anodes, a planar cathode with a controlled oxygen diffusion layer, and a separator between the anode and the cathode alleviated difficulties with oxygen contamination13,14 (Figure 2.2). Activated carbon catalysts have been found suitable for use in cathodes, and this avoided the need for precious metals catalysts such as platinum.
ESTCP Final Report: ER-201635 21 August 2021
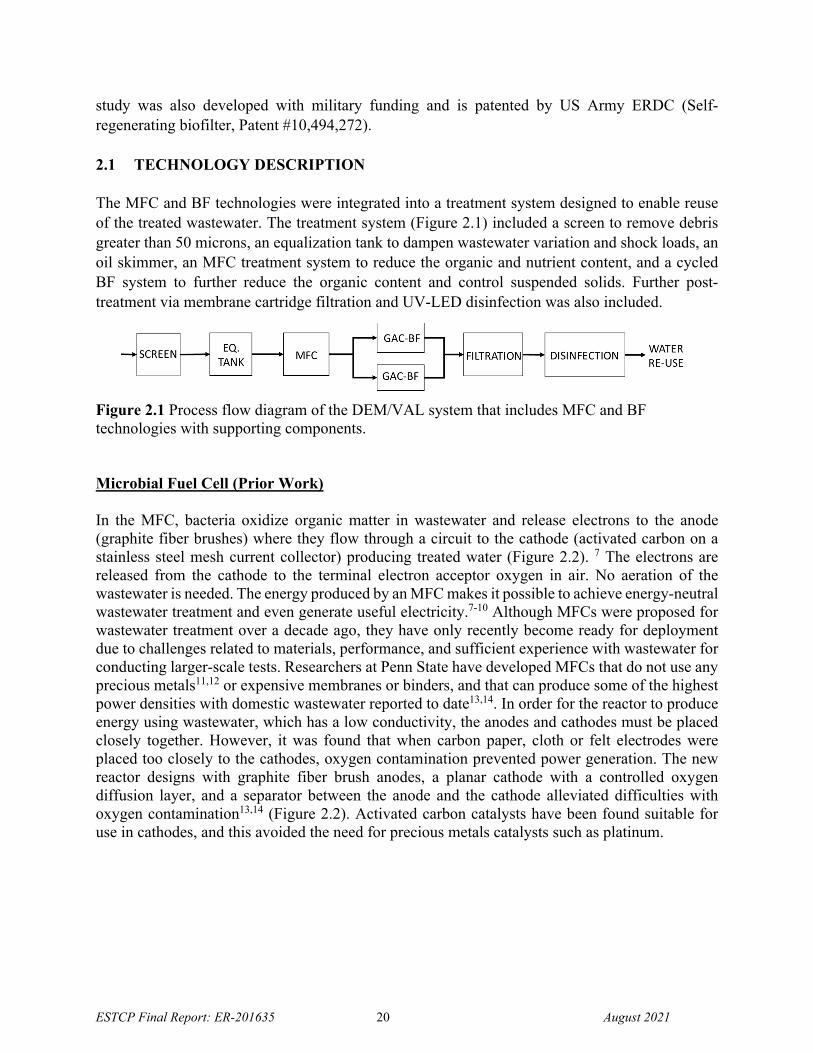
Figure 2.2 (a) Laboratory-scale MFC (1.4 L liquid volume, 2.0 L total empty bed volume) constructed in a modular design to contain two anode (wastewater) chambers, A and B. (b) Schematic showing two modules of six brush anodes each, flanking a single cathode module containing two cathodes. Laboratory-scale experiments with MFCs have now shown good results for wastewater treatment. Reactors now have an excellent electrode packing density, with a total cathode specific surface area of 29 m2 m–3, based on the area of the cathodes per total liquid volume (1.4 L), or 20 m2 m–3 based on total (empty bed) reactor volume (2 L). This high density will allow reactors to operate at retention times of 4-12 h for wastewater strength of 640 mg/L (combined gray water and black water). The MFC will produce electricity, while treating the wastewater and reducing the COD down to ~100-150 mg/L.15,16 With further improvements and integration, the energy could potentially be sufficient to power a downstream polishing treatment process, such as anaerobic fluidized bed membrane bioreactors (AFMBRs)17, biofilters (BF), solids-contact bioreactors (used for post treatment of trickling filters), ultrafiltration, or ozone treatment coupled to BF. Initial scale up of the MFC has been conducted based on the principles and has resulted in larger-scale systems tested at bench-scale and engineering designs for pilot-scale systems (Figure 2.3). The engineering design is based on modular construction that will result in cost-effective construction and ease of maintenance. The preliminary design has been completed by CDM Smith (co-PI Evans, retired) as part of SERDP project ER-2216 led by PSU (co-PI Logan).
ESTCP Final Report: ER-201635 22 August 2021
Figure 2.3 Multi-compartment MFC treating wastewater at a domestic wastewater treatment plant. (A) Photograph of a 4-anode chamber MFC (6 L); (B) Planned view of MFC demonstration concept showing cathode-baffles promoting serpentine plug flow; (C) Mechanical design of the demonstration MFC showing modular design and construction.
ESTCP Final Report: ER-201635 23 August 2021
Biofilter (Previous work) After MFC treatment, a BF polishing system (Figure 2.4) was utilized to provide further reduction of COD and suspended solids in the system. The BF system employs high surface area granular activated carbon filtration media that is biologically active, allowing for simultaneous physical and biological treatment via adsorption and subsequent biodegradation of both dissolved and particulate contaminants. This particular BF system employed intermittent operation, whereby water is passed through the BAC media in an upflow manner at a surface loading rate of 4 L min-1 m-2 for 6 hrs, followed by a 6 hr bioregeneration phase in which the filter is drained. The adsorption capacity of the media is recovered during the bioregeneration phase as microbes consume the adsorbed organic contaminants in the presence of air (oxygen) that flows into the filter bed after the liquid is drained. This approach promotes aerobic treatment without the high energy requirements of conventional aeration. Thus, it is a good complementary technology to be used in conjunction with low-energy MFC technology. For this demonstration, two upflow columns will be operated in parallel on alternate cycles for 6 hrs each. The filters will be automatically cleaned to remove accumulated biomass on a daily interval, though the cleaning cycle may be optimized further. Automatic cleaning is achieved by cycling of water and compressed air in an upflow manner through the filter for five minutes and then draining the resulting biomass suspension to waste. To maximize startup rates and nutrient removal, the BF is seeded with a commercial starter culture enriched with nitrifying bacteria, as is commonly practiced in biofiltration for aquarium applications. Previous experiments using the intermittently operated BF systems to treat gray water have indicated that they can provide sustained (> 12 months) performance for the removal of organics, even when treating an NSF-350 standard solution of synthetic gray water that also contains large quantities of dust, surfactants, biocides, oils, and other contaminants. High COD removal levels were expected for the demonstration study, since after the MFC, these BF modules were loaded at similar COD loading rates as previous gray water studies18. Pre-validation testing of the intermittently operated BF systems with wastewater was performed using mixed wastewater at the bench scale. By combining MFC with a polishing BF system, a very high level of purification is expected at a relatively low energy cost. Once optimized, the MFC can produce electrical energy that can potentially be used to power other system requirements, such as the BF pumps, and overall treatment quality will be improved compared to either process alone. The integrated system was designed to operate with minimal energy and with minimal operator support, making the MFC/BF suitable for distributed wastewater treatment at DOD installations.
Figure 2.4 3-D model (a), and photo (b) of two parallel BF units.
ESTCP Final Report: ER-201635 24 August 2021
System Robustness Biofilm-based systems are inherently resistant to load variation compared to suspended growth systems. Thus, MFC and BF technologies are expected to show good resistance to shock loadings that may be encountered in decentralized systems, such as cleaning chemicals that may be used in buildings. Decentralized systems can also exhibit variability of wastewater strength due to diurnal cycles and seasonal occupation schedules. For the MFC, low COD loadings result in lower current generation, but wastewater treatment can continue in the MFC due to oxygen leaking through the cathode, which results in aerobic COD removal. Transitory high COD concentrations can result in insufficient treatment. To limit these effects, an equalization tank was incorporated to average out high and low COD variations. One of the advantages of the MFC is that the generated voltage and current are direct indicators of system performance. On-line monitoring of these parameters enables rapid assessment of performance. The MFC generated voltage and current can also be used as a biosensor to determine the organic content of wastewater streams, since the bacteria activity will be proportional to the biological oxygen demand (BOD) level. System Maintenance Maintenance of the MFC was anticipated to include cathode chemical cleaning every 6 months, cathode replacement every 5 years, and anode replacement every 10 years. These timeframes will depend on site-specific wastewater quality. Also, these time estimates have a great deal of uncertainty because long-term operation of the MFC has not been conducted. This ESTCP demonstration provided some of these data (i.e., within the 5-7 month demonstration period), enabled some realistic projections, and determined the maintenance requirements. In addition, the MFC has a modular design. Thus, replacement of anode and cathode modules can be conducted simply by disconnecting wires and pulling a module from the tank. This can be done by two people (for safety) with minimal training. Cathode cleaning procedures will be determined during Task 2 (below) but are anticipated to involve use of a dilute acid solution (e.g., acetic, glycolic, or sulfuric) to remove hardness deposits. Finally, the system has no moving parts other than the pumps. The BF system is a standard granular activated carbon contactor. While the filter cleaning cycle is fully automated, technician maintenance may be required for the GAC bed periodically (e.g., once every 2 years) to remove mudballs and manually wash screens and drains. The BF system has robust pneumatically controlled pinch valves that conduct the cycling, which should minimize any downtimes due to valve failure. If a valve does fail, it can be easily replaced and/or repaired. Technology Maturity All MFC component materials have been optimized through SERDP project ER-2216 and were scaled up as a part of this project. The MFC was previously successfully demonstrated for wastewater treatment under continuous flow conditions in the laboratory using a simulated wastewater from the effluent of a primary clarifier at the Pennsylvania State University (PSU) Wastewater Treatment Plant. The influent COD averaged ~500 mg/L (similar to a combined gray water-blackwater stream), and MFC treatment resulted in 57% COD removal and 48% soluble
ESTCP Final Report: ER-201635 25 August 2021
COD (SCOD) removal in the two anode chambers, while producing a relatively stable voltage. Increased COD removal with power production is possible provided the effluent COD is not less than ~150 mg/L. For example, the initial design basis that guided the demonstration assumed an influent COD of 640 mg/L and targeted an effluent COD of 150 mg/L for an overall removal of 77%. Such high COD removals were not observed in the laboratory scale system primarily because: 1) the effluent COD was ~150 mg/L, and 2) the laboratory system had flow short circuiting which will be rectified in the demonstration system. The MFC is also capable of generating power at lower temperatures indicating potential applicability to a variety of wastewaters. The SERDP laboratory results predicted a successful ESTCP demonstration. While the BF could serve as a sole treatment technology, particularly if pretreatment with biodegradable cationic flocculant is applied, this project sought to simultaneously reduce energy and chemical demands. Thus, this system sought to minimize net energy consumption by the MFC while limiting the organic load on the BF, allowing for a reduction in the BF size as well as backwashing frequency. In previous tests, the BF system reduced the COD level of gray water from 400 mg/L of COD to less than 150 mg/L using an 8” column and a volumetric loading rate of 4 L min-1 m-2 for 4 of every 12 hrs. Additional enhancement was achieved through pretreatment with polymeric coagulant at 5 mg/L in a direct filtration mode of operation. Testing at COD loadings of 390 mg/L resulted in effluent COD values of less than 60 mg/L over a 2-month period, and less than 20 mg/L was achieved when polymeric coagulant pretreatment was applied. Tests with pretreated graywater indicated that BF provides a low-logistics option for decentralized treatment, but data for BF treatment of municipal wastewater were limited prior to this ESTCP study.
ESTCP Final Report: ER-201635 26 August 2021
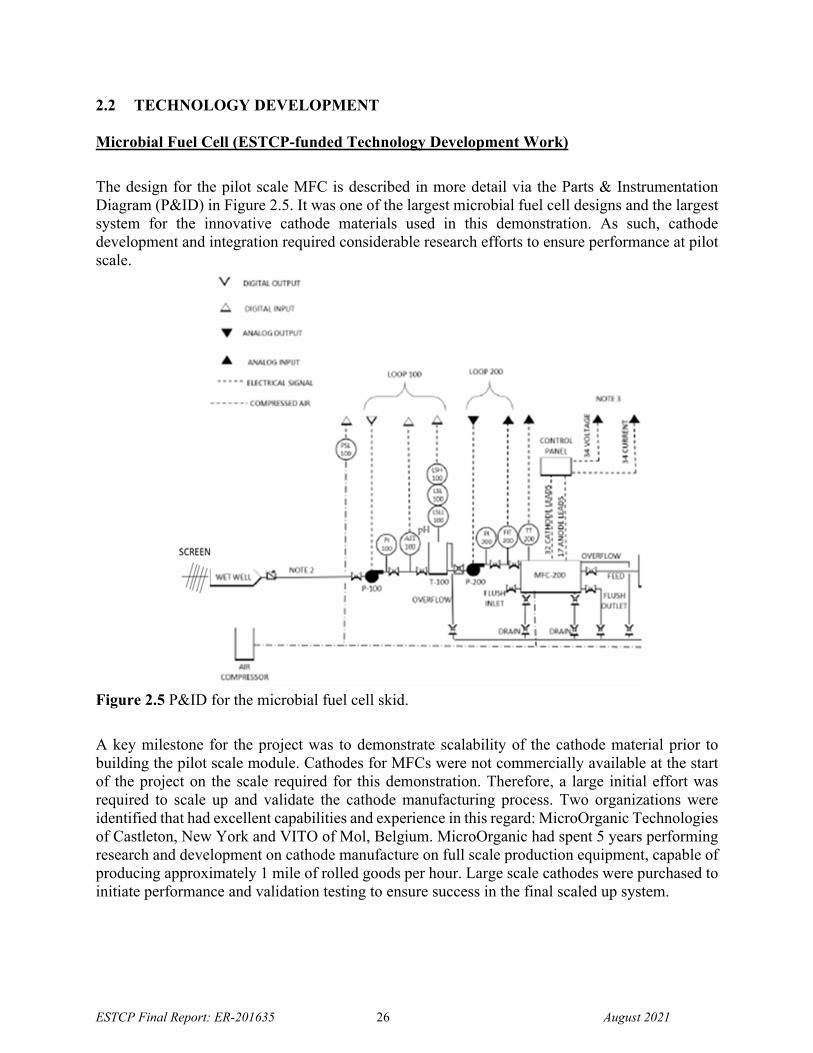
2.2 TECHNOLOGY DEVELOPMENT Microbial Fuel Cell (ESTCP-funded Technology Development Work)
The design for the pilot scale MFC is described in more detail via the Parts & Instrumentation Diagram (P&ID) in Figure 2.5. It was one of the largest microbial fuel cell designs and the largest system for the innovative cathode materials used in this demonstration. As such, cathode development and integration required considerable research efforts to ensure performance at pilot scale.
Figure 2.5 P&ID for the microbial fuel cell skid.
A key milestone for the project was to demonstrate scalability of the cathode material prior to building the pilot scale module. Cathodes for MFCs were not commercially available at the start of the project on the scale required for this demonstration. Therefore, a large initial effort was required to scale up and validate the cathode manufacturing process. Two organizations were identified that had excellent capabilities and experience in this regard: MicroOrganic Technologies of Castleton, New York and VITO of Mol, Belgium. MicroOrganic had spent 5 years performing research and development on cathode manufacture on full scale production equipment, capable of producing approximately 1 mile of rolled goods per hour. Large scale cathodes were purchased to initiate performance and validation testing to ensure success in the final scaled up system.
ESTCP Final Report: ER-201635 27 August 2021
The cathode sheets for initial testing were designed to meet the demonstration reactor dimensional requirements: 3.5 ft by 2.1 ft = 1.07 m wide x 0.64 m long. Because the intended use of the cathodes was an air cathode in a microbial fuel cell treating wastewater, the cathode had to be permeable to air on one side, impermeable to water on the other side, and it needed to be capable of catalytic activity as described below. Each cathode was manufactured to include a 316 stainless steel mesh current collector and an activated carbon catalyst with specifications described below. Samples of the larger-scale manufactured cathodes were tested mechanically and electrochemically to quantify performance and consistency with previous tests. The results of this task culminated in a Go-No Go decision for the project. The cathode material had to pass the following specifications, based on tests at PSU, to pass this Go-No Go decision point:
Current density 0.3 A/m2 using 50 mM phosphate buffer and acetate as fuel. Maximum power density 100 mW/m2 using 50 mM phosphate buffer and acetate as
fuel. Water pressure resistance: will not show visible leaks at a water head pressure of 3 ft
(1 m). Full-scale manufactured cathode performance (current density, power density, and
maximum water pressure resistance) variability ≤ 10%. Precious metals (e.g., platinum) shall not be used in the cathode.
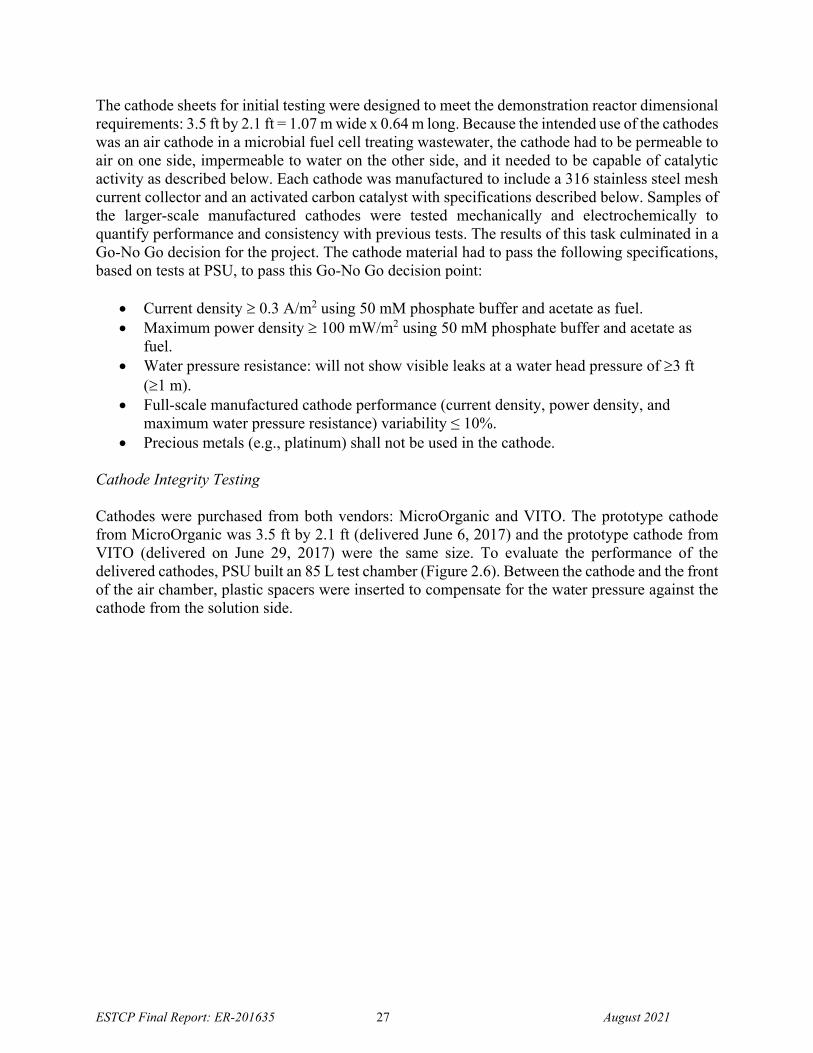
Cathode Integrity Testing Cathodes were purchased from both vendors: MicroOrganic and VITO. The prototype cathode from MicroOrganic was 3.5 ft by 2.1 ft (delivered June 6, 2017) and the prototype cathode from VITO (delivered on June 29, 2017) were the same size. To evaluate the performance of the delivered cathodes, PSU built an 85 L test chamber (Figure 2.6). Between the cathode and the front of the air chamber, plastic spacers were inserted to compensate for the water pressure against the cathode from the solution side.
ESTCP Final Report: ER-201635 28 August 2021
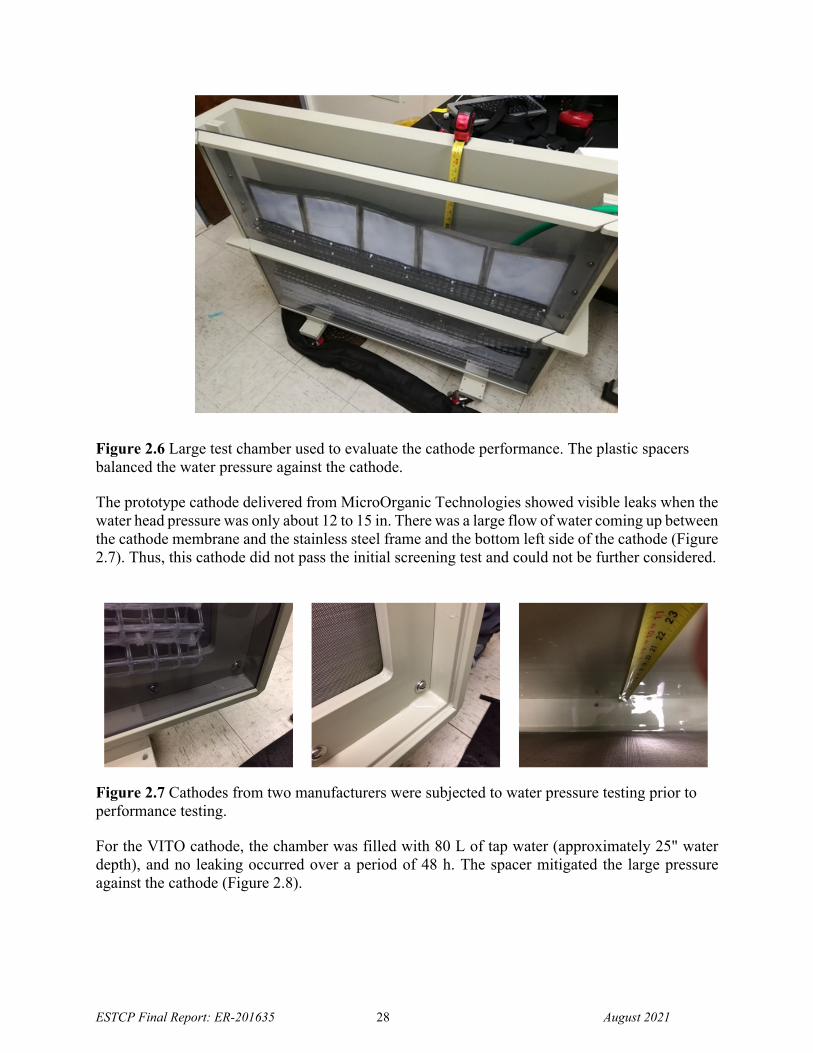
Figure 2.6 Large test chamber used to evaluate the cathode performance. The plastic spacers balanced the water pressure against the cathode. The prototype cathode delivered from MicroOrganic Technologies showed visible leaks when the water head pressure was only about 12 to 15 in. There was a large flow of water coming up between the cathode membrane and the stainless steel frame and the bottom left side of the cathode (Figure 2.7). Thus, this cathode did not pass the initial screening test and could not be further considered.
Figure 2.7 Cathodes from two manufacturers were subjected to water pressure testing prior to performance testing.
For the VITO cathode, the chamber was filled with 80 L of tap water (approximately 25" water depth), and no leaking occurred over a period of 48 h. The spacer mitigated the large pressure against the cathode (Figure 2.8).
ESTCP Final Report: ER-201635 29 August 2021
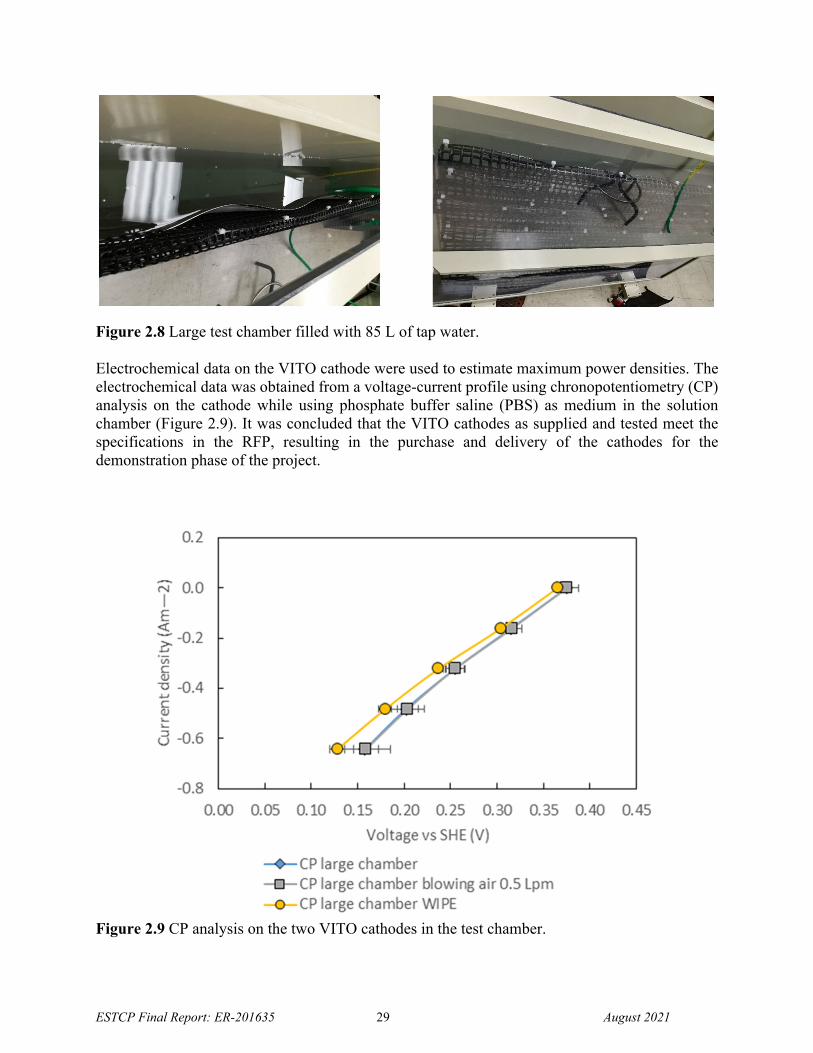
Figure 2.8 Large test chamber filled with 85 L of tap water. Electrochemical data on the VITO cathode were used to estimate maximum power densities. The electrochemical data was obtained from a voltage-current profile using chronopotentiometry (CP) analysis on the cathode while using phosphate buffer saline (PBS) as medium in the solution chamber (Figure 2.9). It was concluded that the VITO cathodes as supplied and tested meet the specifications in the RFP, resulting in the purchase and delivery of the cathodes for the demonstration phase of the project.
Figure 2.9 CP analysis on the two VITO cathodes in the test chamber.
ESTCP Final Report: ER-201635 30 August 2021
Cathode Scale-Up and Testing. The large VITO cathode was constructed based on a “window pane” approach by using a single stainless steel sheet that contained 15 cathodes (panes). Each of the cathode sheets (VITO CORE®, Mol, Belgium) were made by pressing together a mixture of activated carbon (AC; 70–90 wt%; Norit SX plus, Norit Americas Inc., TX) and polytetrafluoroethylene (PTFE) binder, onto a stainless-steel mesh current collector. A PTFE diffusion layer (70% porosity) was then added on top of the catalyst layer which became the air-side of the cathode.19 The cathode sheets were welded into laser cut holes (“window panes”) in the stainless steel frame to allow the cathode sheets to be exposed to the anolyte on one side, and air on the other side. The cathode was periodically cleaned to minimize changes in performance over time due to cathode fouling.20 Two different brush anodes sizes were used to test the impact of the brush dimensions on the MFC performance. All brushes were made from graphite fiber (PANEX 35 50K, Zoltek) wound between two titanium wires, 5.1 cm in diameter and 61 cm long from a previous MEC configuration (Gordon Brush, CA, USA)21, and 2.5 cm in diameter and 61 cm long (Mill-Rose). All anodes were heat treated at 450 °C in air for 30 min prior to use in MFCs.22
Figure 2.10 Photos of the (A) air and (B) solution side of the three cathodes, with sizes (from left to right) of: 11.3 cm2 (red arrow), 52 cm2 (white arrow) and 0.68 m2. (C) Small, (D) medium and (E) large cells used for the electrochemical tests. To evaluate the hydraulic and electrochemical performance of the delivered cathodes, Penn State utilized three different sized test chambers (Figure 2.10 C, D, E) to undertake a staged evaluation process of each cathode. A summary of the specifications for the test chambers used during the evaluation is reported in Table 2.1. The small cell (SC) was a single chamber, cube-shaped reactor
A B
C D E
ESTCP Final Report: ER-201635 31 August 2021
constructed from a polycarbonate block 4 cm in length (5 cm × 5 cm), with an inside cylindrical chamber having a diameter of 3 cm (0.028 L total volume), and an exposed cathode area of 7 cm2 that has been used in many previous MFC laboratory studies (Figure 2.10C). The cathode specific surface area was 25 m2 m–3 anolyte volume.
Table 2.1 Basic specifications of three different sized test chambers. Small reactor Medium reactor Large reactor
Liquid volume (mL) 28 240 55,000 Cathode surface area (cm2) 7 40 6,800
Cathode specific surface area (m2/m3)
25 17 12.4
The medium-sized cell (MC) was a polycarbonate rectangular-shaped reactor, with an anolyte chamber 10.9 cm long, 3.5 cm wide, and 6.2 cm high, filled with 0.22 L of electrolyte (Figure 2.10D). The cell had a bracket slot 3.5 cm from the wall of the water side, where the cathode was attached separating the anolyte chamber from the air cathode chamber. The cathodes were secured to the frame with 10 screws using a plastic U-shape fastener and a gasket (butyl rubber). The air chamber was 6.8 cm long, 1.0 cm wide and 4.4 cm high. The cathode specific surface area was 15 m2 m–3 anolyte volume. The large cell (LC) was a custom rectangular tank (1.1 m long, 0.15 m wide and 0.85 m height) that was used to examine the physical properties of the cathodes, such as mechanical strength (deformation when filled) and the resistance to water pressure (based on leaking), as well as to evaluate the electrochemical characteristics of the cathodes (Figure 2.10E). The tank had a bracket slot 10 cm from the wall of the water side, where the cathode was attached to form the anolyte chamber. The cathodes were secured to the frame with 25 screws using a plastic U-shape fastener and a gasket (closed cell PVC vinyl foam). The anolyte tank was filled with 85 L of water, and examined by eye for deformation and water leakage when filled. The cathode specific surface area was 7.3 m2 m–3 anolyte volume. This lower specific area of the cathode was used here in order to accommodate the larger diameter anode brushes and inspecting the condition of the electrodes. The cathode air chamber was formed by sliding a sheet of PVC into a slotted groove 5 cm from the cathode. To reduce the cathode deformation due to the pressure of the water on the cathode, the space between the clear PVC sheet and the cathode was filled with 19 spacers, constructed by rolling polypropylene mesh (XN3110-48P, Industrial Netting, USA) into tubes (4 cm diameter by 1 m long), with the rolled tubes held together using zip ties. To examine actual power generation in the LC, an anode module made of polyvinyl chloride (PVC) was constructed using a linear array of graphite fiber brushes. The PVC module held either 8 or 22 brushes (as indicated), with the ends of the brushes secured at the top and bottom of the module (Figure 2.11). The brush module was placed parallel to the cathode, in the middle of the anode chamber, producing a distance of 3.5 cm between the edge of the anode brushes and the cathode surface in initial tests23. The anodes were connected in parallel to the circuit by an external single titanium wire. At the top of the anode module, a clip was used to reduce the bending of the cathode sheet and to secure it in position while improving its electrical connection. For the smaller chamber, the anodes were placed horizontally in the middle of MFC chambers (perpendicular to the cathode) with a distance of 1.4 cm between the edge of the brush and the cathode24,25.
ESTCP Final Report: ER-201635 32 August 2021
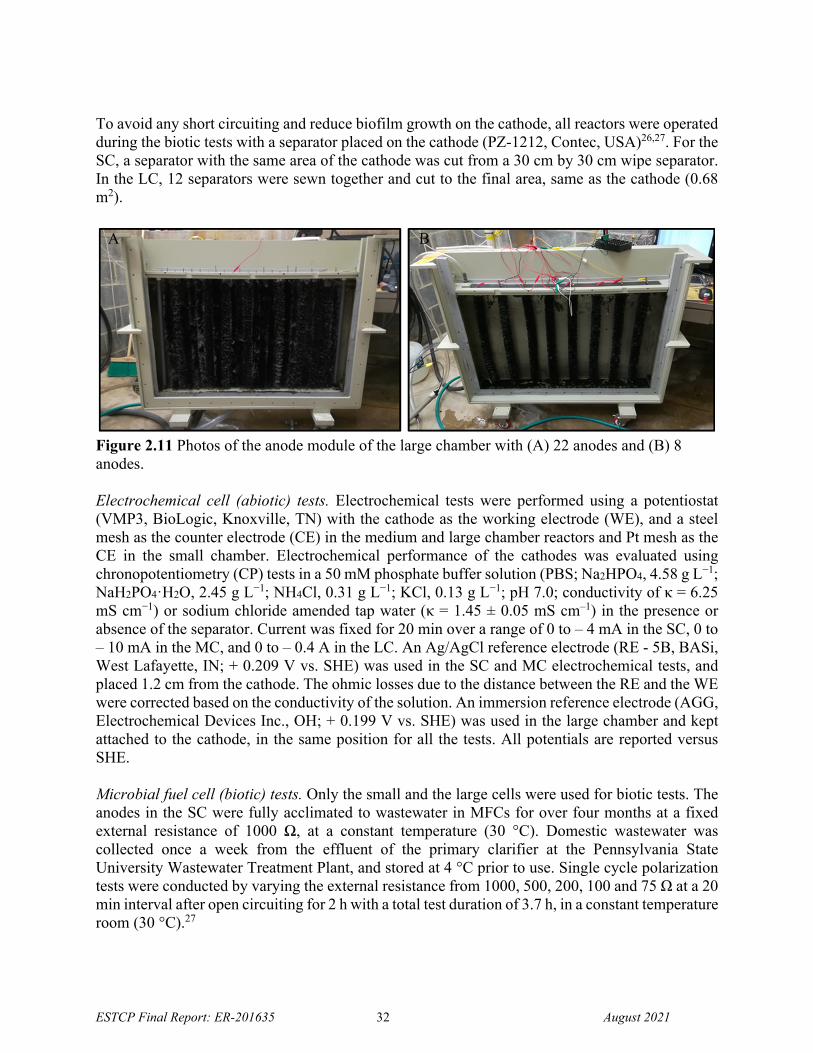
To avoid any short circuiting and reduce biofilm growth on the cathode, all reactors were operated during the biotic tests with a separator placed on the cathode (PZ-1212, Contec, USA)26,27. For the SC, a separator with the same area of the cathode was cut from a 30 cm by 30 cm wipe separator. In the LC, 12 separators were sewn together and cut to the final area, same as the cathode (0.68 m2).
Figure 2.11 Photos of the anode module of the large chamber with (A) 22 anodes and (B) 8 anodes. Electrochemical cell (abiotic) tests. Electrochemical tests were performed using a potentiostat (VMP3, BioLogic, Knoxville, TN) with the cathode as the working electrode (WE), and a steel mesh as the counter electrode (CE) in the medium and large chamber reactors and Pt mesh as the CE in the small chamber. Electrochemical performance of the cathodes was evaluated using chronopotentiometry (CP) tests in a 50 mM phosphate buffer solution (PBS; Na2HPO4, 4.58 g L−1; NaH2PO4ꞏH2O, 2.45 g L−1; NH4Cl, 0.31 g L−1; KCl, 0.13 g L−1; pH 7.0; conductivity of κ = 6.25 mS cm−1) or sodium chloride amended tap water (κ = 1.45 ± 0.05 mS cm–1) in the presence or absence of the separator. Current was fixed for 20 min over a range of 0 to – 4 mA in the SC, 0 to – 10 mA in the MC, and 0 to – 0.4 A in the LC. An Ag/AgCl reference electrode (RE - 5B, BASi, West Lafayette, IN; + 0.209 V vs. SHE) was used in the SC and MC electrochemical tests, and placed 1.2 cm from the cathode. The ohmic losses due to the distance between the RE and the WE were corrected based on the conductivity of the solution. An immersion reference electrode (AGG, Electrochemical Devices Inc., OH; + 0.199 V vs. SHE) was used in the large chamber and kept attached to the cathode, in the same position for all the tests. All potentials are reported versus SHE. Microbial fuel cell (biotic) tests. Only the small and the large cells were used for biotic tests. The anodes in the SC were fully acclimated to wastewater in MFCs for over four months at a fixed external resistance of 1000 Ω, at a constant temperature (30 °C). Domestic wastewater was collected once a week from the effluent of the primary clarifier at the Pennsylvania State University Wastewater Treatment Plant, and stored at 4 °C prior to use. Single cycle polarization tests were conducted by varying the external resistance from 1000, 500, 200, 100 and 75 Ω at a 20 min interval after open circuiting for 2 h with a total test duration of 3.7 h, in a constant temperature room (30 °C).27
A B
ESTCP Final Report: ER-201635 33 August 2021
The LC operated at room temperature in a laboratory at the Pennsylvania State University Wastewater Treatment Plant in order to feed it directly with fresh primary effluent wastewater . During acclimation of the anodes for the first week of operation, the feed solution was 35 L of primary effluent wastewater mixed with 40 L of 0.5 g L–1 sodium acetate in 50 mM PBS, and 10 L effluent collected over several weeks from MFCs fed acetate and wastewater. The external resistance was 1000 Ω for the first two days and then was decreased daily to 100 Ω, 25 Ω, 10 Ω and 5 Ω over the following four days. For the second week of acclimation, the solution was 55 L of wastewater, 20 L of 50 mM PBS containing 0.5 g L–1 sodium acetate, and 10 L of MFC effluent. Thereafter, the LC was operated using only primary effluent wastewater. After a stable voltage production for three successive fed-batch cycles, single cycle polarization tests were conducted on the LC by feeding the reactor with fresh wastewater and holding the system at open circuit conditions for 2 h, and then varying the external resistance from 100, 25, 10, 5, 2, 1 to 0.4 Ω at 20 min intervals. The current was calculated based on the voltage drop (U) across the external resistor, and recorded using a computer based data acquisition system (2700, Keithley Instrument, OH). Current densities (i) and power densities (P) were normalized to the total exposed cathode area (large chamber area, ALC = 0.62 m2, and power PLC; small chamber area, ASC = 0.0007 m2, and power PSC), and calculated as i = U/RA and P = iU, where R is the external resistance and A is the cathode projected area. During each polarization test, anode and cathode potentials were also recorded using a reference electrode. An Ag/AgCl reference electrode (RE-5B, BASi, West Lafayette, IN; + 0.209 V vs. SHE) was used to measure the anode potential (EAn) in the SC biotic tests at a distance of 1.2 cm from the cathode. The cathode potential (ECt) was calculated from the anode potential and the cell voltage as ECt = U + EAn, and then corrected based on the conductivity of the solution and the distance from the RE28. An immersion reference electrode (AGG, Electrochemical Devices Inc., OH; + 0.199 V vs. SHE) was used in the LC biotic tests to measure the anode potential (EAn), and it was kept close to the cathode, and in the same position for all the tests. The anode potential was corrected based on the conductivity of the solution and the distance from the RE. The cathode potential (ECt) was estimated using the cell voltage as ECt = U + EAn. Impact of anolyte recirculation. The impact of fluid flow in the anode chamber was examined by recirculating the anolyte within the module. A diagonal flow path through the modules (entering the top right side of the reactor and exiting the bottom left side) and a parallel flow path (using a manifold to distribute the flow across the height of the module) were applied at two different hydraulic retention time (HRT) for a single pass of 77 and 22 minutes (Figure 2.12). The flow rates were 3.9 liters per minute (L min–1) (HRT 22 min) and 1.1 L min–1 (HRT 77 min) through only one module.
ESTCP Final Report: ER-201635 34 August 2021
Figure 2.12 Photos of (A) the two anode brushes (diameter of 2.5 cm (top) or 5.1 cm (bottom)) and (B) of the 38 anode brushes (diameter of 2.5 cm) installed in the MFC. (C) Diagonal and (D) parallel flow paths in the anodic chamber of the 85 L MFC with 22 anode brushes (diameter of 5.1 cm). Hydraulic and electrochemical performance of the scaled-up VITO cathode. Chronopotentiometry tests on cathodes showed differences in performance based on their size, with the smaller cathodes producing the lowest overpotentials at the different set current densities (Figure 2.13). For example, at 0.61 ± 0.00 A m–2 the small cathode produced 0.35 ± 0.00 V, which was only 5% higher than the voltage produced by the middle-sized cathode (0.33 ± 0.00 V at 0.62 ± 0.01 A m–2) but 121% higher than that obtained with the large cathode (0.16 ± 0.03 V at 0.64 ± 0.00 A m–2). The adverse impact of the increased size of an electrode on performance was consistent with previous studies that showed a loss in power as cathode sizes were increased29,30.
A B
C D
ESTCP Final Report: ER-201635 35 August 2021
Figure 2.13 Cathode potential as a function of current density measured in the electrochemical cell for the cathodes in the small (SC), medium (MC) and large cells (LC) in (A) 50 mM PBS (6.25 mS cm–1) and (B) tap water amended with NaCl (1.45 ± 0.05 mS cm–1).
Chronopotentiometry tests were conducted on the different size cathodes in tap water amended with sodium chloride (κ = 1.45 ± 0.05 mS cm–1), to evaluate performance in an unbuffered solution with a conductivity similar to that of domestic wastewater (Figure 2.13B). The overpotentials of all cathodes were larger in the less conductive solution, with the large cathode having much higher overpotentials with respect to the other two cathodes at a given current density. The large cathode voltage at a current density of 0.64 ± 0.00 A m–2 was 0.09 ± 0.01 V, compared to 0.23 ± 0.00 V of the medium size cathode at 0.63 ± 0.00 A m–2 and 0.26 ± 0.01 V at 0.62 ± 0.00 A m–2 of the smaller cathode. Additional chronoamperometry tests were conducted using the large cell to evaluate the impact of the presence of the separator on the electrochemical performance of the cathode over a current density range relevant to operation of the large MFC using wastewater (Figure 2.14). The presence of the extra layer of the separator reduced the voltage output at 0.64 A m–2 from 0.16 ± 0.03 V to 0.13 ± 0.01 V in PBS, and from 0.09 ± 0.01 V to 0.06 ± 0.00 V in a low conductivity solution. Insufficient airflow in the cathode chamber could reduce oxygen availability and, thus, cathode performance31. Therefore, an additional electrochemical test was conducted by blowing air into the bottom of the air chamber at 0.5 L min–1 (Figure 2.14B). This airflow across the cathode did not impact the cathode performance, indicating that the size of the air chamber was sufficient to passively provide oxygen transfer to the cathode and that the spacers did not impede passive air flow. In summary, increasing the sizes of the cathodes resulted in a decrease in the electrode performance despite maintaining the same catalyst and reactor configuration. The stainless-steel frame used here reduced the active area of the large cathode by 23%, and thus reducing the size of the frame relative to the cathode panels could help diminish the overpotential compared to the smaller cathode. The hydraulic pressure against the cathode has been shown to reduce the performance of some cathodes, likely due to the increased catalyst flooding with water32,33. These tests showed the
A B
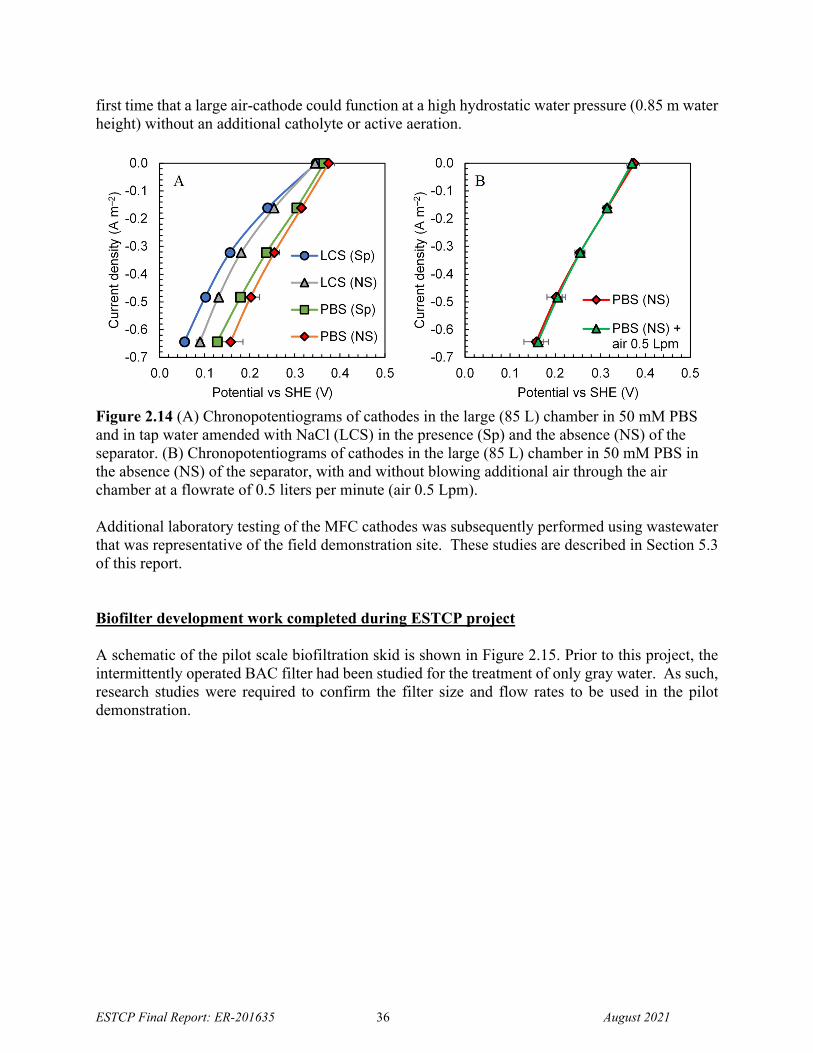
ESTCP Final Report: ER-201635 36 August 2021
first time that a large air-cathode could function at a high hydrostatic water pressure (0.85 m water height) without an additional catholyte or active aeration.
Figure 2.14 (A) Chronopotentiograms of cathodes in the large (85 L) chamber in 50 mM PBS and in tap water amended with NaCl (LCS) in the presence (Sp) and the absence (NS) of the separator. (B) Chronopotentiograms of cathodes in the large (85 L) chamber in 50 mM PBS in the absence (NS) of the separator, with and without blowing additional air through the air chamber at a flowrate of 0.5 liters per minute (air 0.5 Lpm). Additional laboratory testing of the MFC cathodes was subsequently performed using wastewater that was representative of the field demonstration site. These studies are described in Section 5.3 of this report. Biofilter development work completed during ESTCP project A schematic of the pilot scale biofiltration skid is shown in Figure 2.15. Prior to this project, the intermittently operated BAC filter had been studied for the treatment of only gray water. As such, research studies were required to confirm the filter size and flow rates to be used in the pilot demonstration.
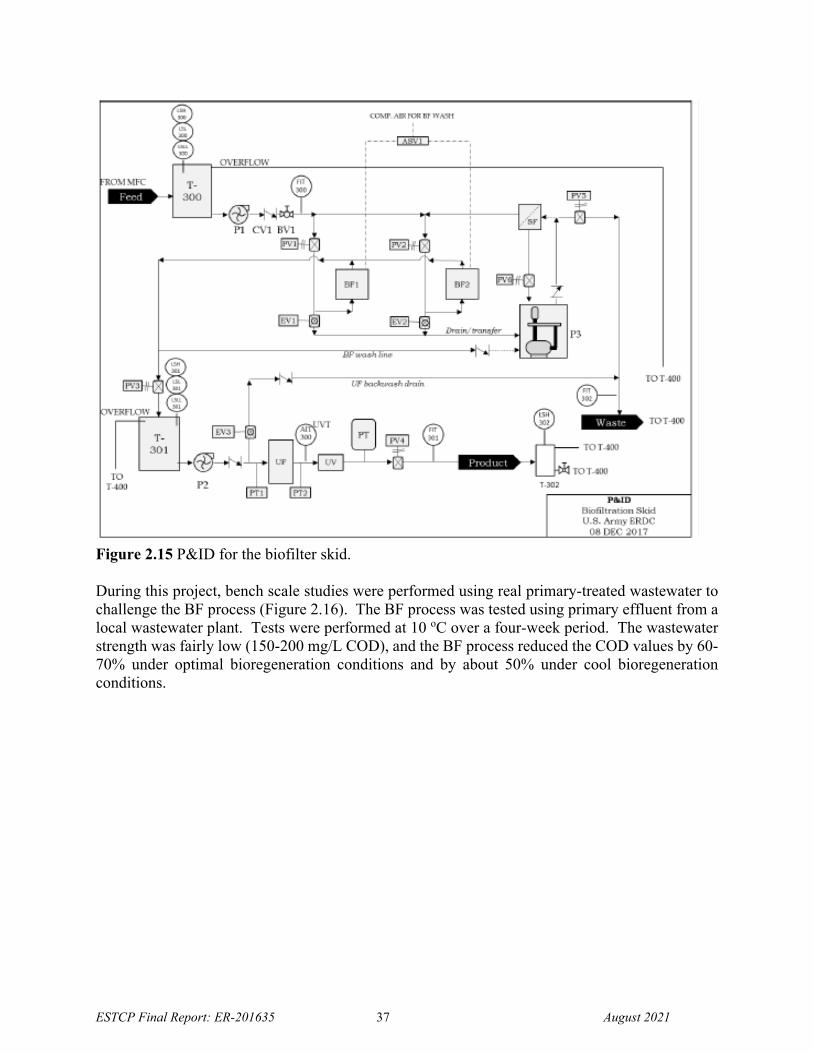
ESTCP Final Report: ER-201635 37 August 2021
Figure 2.15 P&ID for the biofilter skid. During this project, bench scale studies were performed using real primary-treated wastewater to challenge the BF process (Figure 2.16). The BF process was tested using primary effluent from a local wastewater plant. Tests were performed at 10 oC over a four-week period. The wastewater strength was fairly low (150-200 mg/L COD), and the BF process reduced the COD values by 60-70% under optimal bioregeneration conditions and by about 50% under cool bioregeneration conditions.
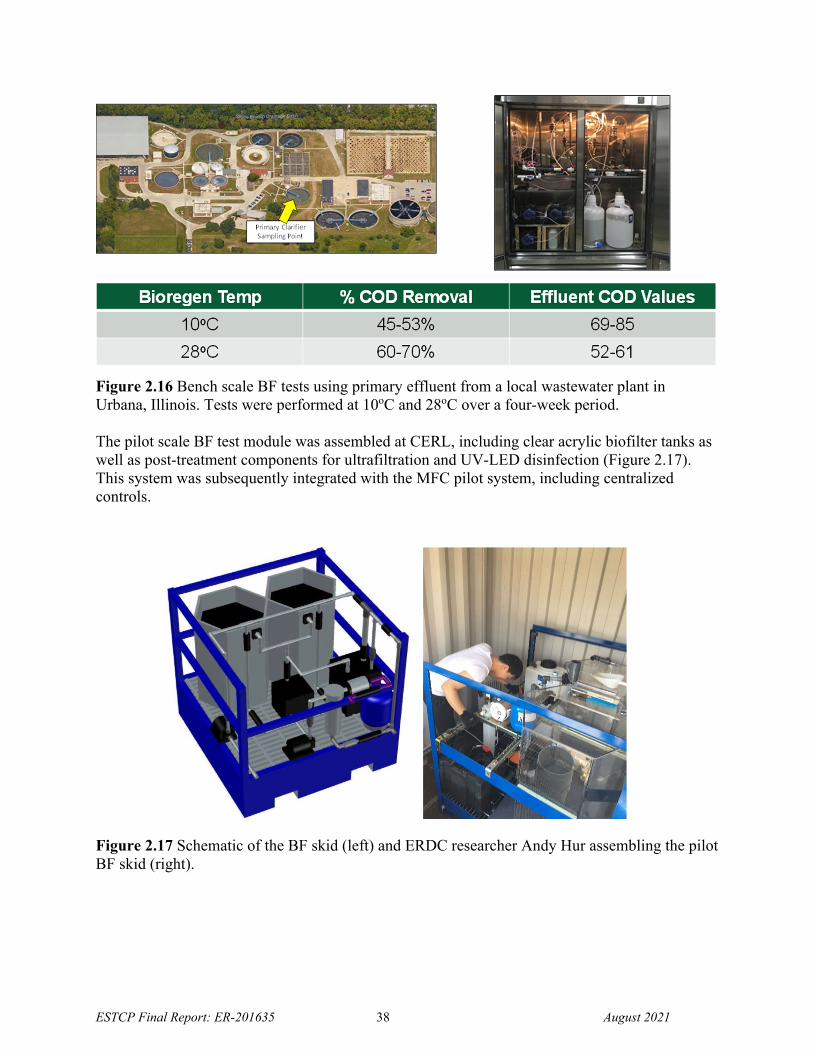
ESTCP Final Report: ER-201635 38 August 2021
Figure 2.16 Bench scale BF tests using primary effluent from a local wastewater plant in Urbana, Illinois. Tests were performed at 10oC and 28oC over a four-week period. The pilot scale BF test module was assembled at CERL, including clear acrylic biofilter tanks as well as post-treatment components for ultrafiltration and UV-LED disinfection (Figure 2.17). This system was subsequently integrated with the MFC pilot system, including centralized controls.
Figure 2.17 Schematic of the BF skid (left) and ERDC researcher Andy Hur assembling the pilot BF skid (right).
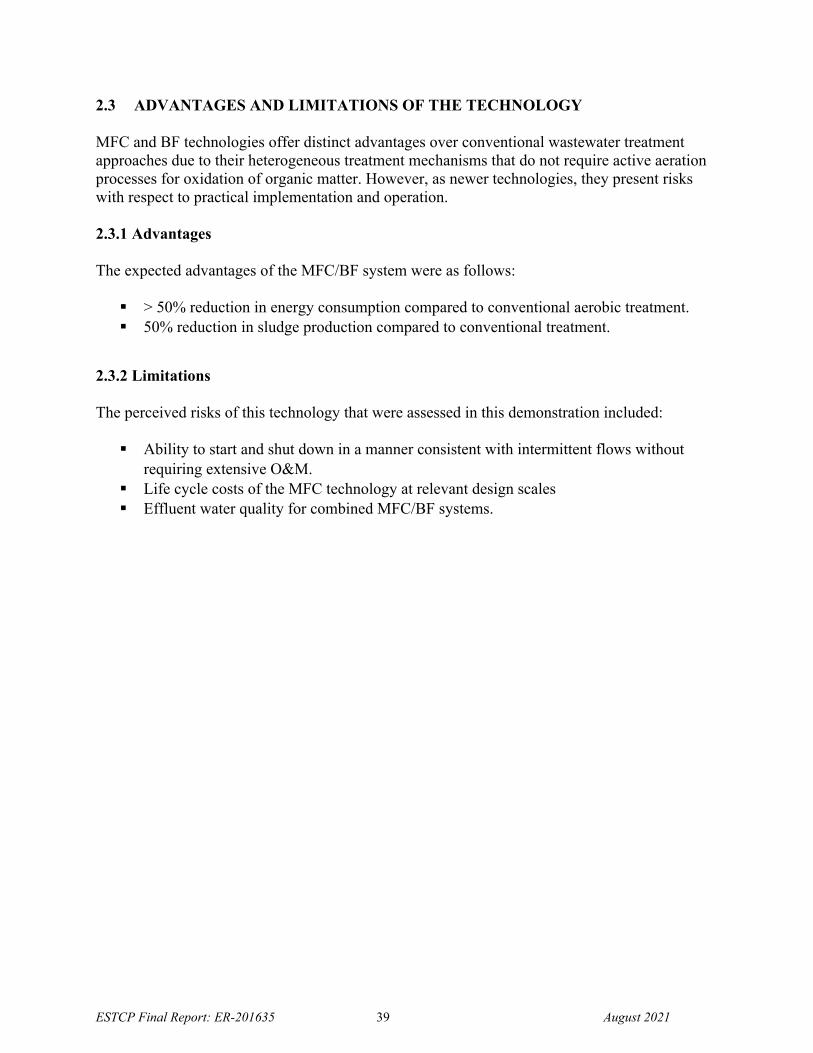
ESTCP Final Report: ER-201635 39 August 2021
2.3 ADVANTAGES AND LIMITATIONS OF THE TECHNOLOGY MFC and BF technologies offer distinct advantages over conventional wastewater treatment approaches due to their heterogeneous treatment mechanisms that do not require active aeration processes for oxidation of organic matter. However, as newer technologies, they present risks with respect to practical implementation and operation. 2.3.1 Advantages The expected advantages of the MFC/BF system were as follows: > 50% reduction in energy consumption compared to conventional aerobic treatment. 50% reduction in sludge production compared to conventional treatment.
2.3.2 Limitations The perceived risks of this technology that were assessed in this demonstration included: Ability to start and shut down in a manner consistent with intermittent flows without
requiring extensive O&M. Life cycle costs of the MFC technology at relevant design scales Effluent water quality for combined MFC/BF systems.
ESTCP Final Report: ER-201635 40 August 2021
3.0 PERFORMANCE OBJECTIVES The performance objectives of this demonstration were designed to assess both the advantages and limitations of the technology in a realistic end-user environment. The data collected in the study were used to assess performance for the following objectives:
Production of high-quality reusable water that meets USEPA guidelines for restricted reuse.
Reduction in energy consumption of at least 50% relative to conventional aerobic wastewater treatment technology.
50% reduction in residuals (sludge) compared to aerobic bioreactors. 20% reduction in required O&M compared to existing technology. Life cycle cost data to confirm a payback period of less than 10 years relative to current
approaches.
Table 3.1 provides a more detailed list of the specific performance objectives that were assessed during the demonstration period and the associated metrics for success. The metrics were developed using existing industry guidelines as well as specifications for existing conventional systems.
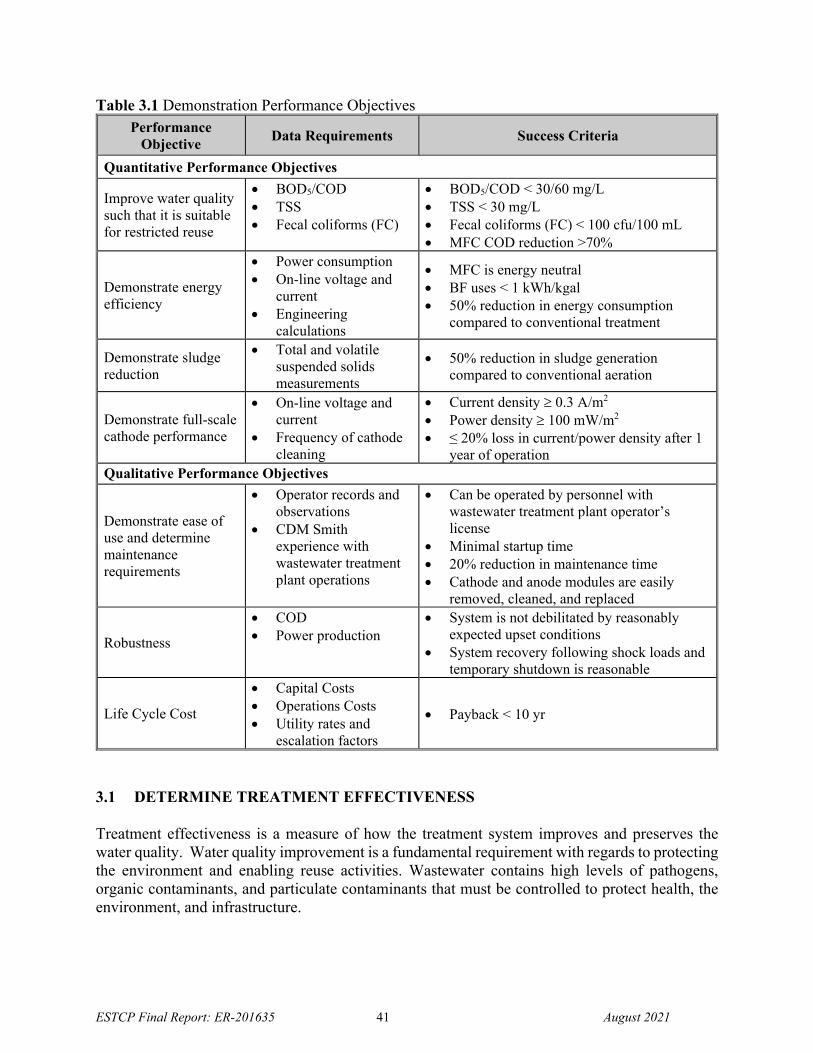
ESTCP Final Report: ER-201635 41 August 2021
Table 3.1 Demonstration Performance Objectives Performance
Objective Data Requirements Success Criteria
Quantitative Performance Objectives
Improve water quality such that it is suitable for restricted reuse
BOD5/COD TSS Fecal coliforms (FC)
BOD5/COD < 30/60 mg/L TSS < 30 mg/L Fecal coliforms (FC) < 100 cfu/100 mL MFC COD reduction >70%
Demonstrate energy efficiency
Power consumption On-line voltage and
current Engineering
calculations
MFC is energy neutral BF uses < 1 kWh/kgal 50% reduction in energy consumption
compared to conventional treatment
Demonstrate sludge reduction
Total and volatile suspended solids measurements
50% reduction in sludge generation compared to conventional aeration
Demonstrate full-scale cathode performance
On-line voltage and current
Frequency of cathode cleaning
Current density 0.3 A/m2 Power density 100 mW/m2 ≤ 20% loss in current/power density after 1
year of operation Qualitative Performance Objectives
Demonstrate ease of use and determine maintenance requirements
Operator records and observations
CDM Smith experience with wastewater treatment plant operations
Can be operated by personnel with wastewater treatment plant operator’s license
Minimal startup time 20% reduction in maintenance time Cathode and anode modules are easily
removed, cleaned, and replaced
Robustness
COD Power production
System is not debilitated by reasonably expected upset conditions
System recovery following shock loads and temporary shutdown is reasonable
Life Cycle Cost
Capital Costs Operations Costs Utility rates and
escalation factors
Payback < 10 yr
3.1 DETERMINE TREATMENT EFFECTIVENESS Treatment effectiveness is a measure of how the treatment system improves and preserves the water quality. Water quality improvement is a fundamental requirement with regards to protecting the environment and enabling reuse activities. Wastewater contains high levels of pathogens, organic contaminants, and particulate contaminants that must be controlled to protect health, the environment, and infrastructure.
ESTCP Final Report: ER-201635 42 August 2021
3.1.1 Data Requirements Influent wastewater quality measurements were performed to characterize the initial load of contaminants before treatment. Influent contaminant levels are important benchmarks by which to assess treatment performance as well as to determine how the results of this demonstration might relate to other design scenarios. Influent wastewater was sampled periodically through grab samples from the equilibration tank upstream of the treatment system. Sampling intervals were chosen to capture potential variability in quality levels. Key influent parameters included Chemical Oxygen Demand (COD), Total Suspended Solids (TSS), 5-day Biochemical Oxygen Demand (BOD-5), pH, Ammonia (NH3), Nitrate (NO3), Phosphate (PO4), turbidity, and total dissolved solids (TDS). Product water quality measurements were performed to characterize the level of purity of the water after treatment. Samples were collected from the MFC effluent as well as the total system (MFC/BF) effluent. The presence and levels of any contaminants in the product water were used to determine the treatment system performance (relative to the influent values) and potential risks associated with environmental discharge or reuse. Periodically, influent samples were monitored hourly throughout a given day to confirm that diurnal loading effects did not have an impact on influent versus effluent data. Key product water parameters included Total Suspended Solids (TSS), Chemical Oxygen Demand (COD), 5-day Biochemical Oxygen Demand (BOD-5), pH, Ammonia (NH3), Phosphate (PO4), Nitrate (NO3) and turbidity. 3.1.2 Success Criteria Effluent criteria included the following for average values, with 95% compliance of individual samples. COD < 60 mg/L
BOD < 30 mg/L
TSS < 10 mg/L
FC < 100 cfu/L
NH3 < 3 mg/L
Total nitrogen (TN), NO3
-, Total phophorus (TP), and PO43- were also assessed with respect to
EPA reuse guidelines for specific restricted activities where environmental discharge may impact eutrophication or water source quality, but criteria levels vary widely by state and are not established at this time for the particular project.
ESTCP Final Report: ER-201635 43 August 2021
3.2 DETERMINE ENERGY SAVINGS Energy savings is a critical metric for this demonstration, as it could provide additional cost savings and resiliency benefits for wastewater treatment systems at DOD installations. 3.2.1 Data Requirements Power consumption. Power consumption of components were measured using induction
power meters. On-line voltage and current. On-line voltage and current measurements were made for the
microbial fuel cell to determine the energy generation. Engineering calculations. Because many of the pumps will be oversized for this pilot scale
system, their energy efficiency was not optimal. Therefore, operation times and pressurization requirements were used to calculate energy efficiency at a larger design scale.
3.2.2 Success Criteria
MFC demonstrates some useful energy input back into the system. We assessed the level of system self-powering that can be expected due to the MFC.
BF uses < 1 kWh/kgal. The amount of energy consumed by the BF pumps and valves is less than 1 Wh/gal.
50% reduction in energy consumption by the integrated system compared to conventional treatment. The total energy consumption of the system was projected to use less than 1.5 Wh/gal.
3.3 DETERMINE SLUDGE REDUCTION Sludge reduction is an important requirement for decentralized and centralized wastewater treatment systems. For decentralized systems, on-site sludge management is a logistical burden, and discharge or transport to centralized infrastructure is to be minimized. For centralized systems, land area requirements for sludge dewatering and drying can be substantial. 3.3.1 Data Requirements Sludge volumes and concentrations for the MFC technology were measured after months of operation. BF wash cycle discharges were assessed but not considered in the analysis as these would be cycled to the headworks of the system. 3.3.2 Success Criteria The metric for sludge reduction was 50% relative to conventional aerobic processes.
ESTCP Final Report: ER-201635 44 August 2021
3.4 DETERMINE O&M REQUIREMENTS Operations and maintenance impacts are a critical factor because they can have a strong impact on tech transfer to the site. If O&M requirements are too time intensive or complex for the on-site personnel, particularly for decentralized applications, then it becomes increasingly likely that the site manager will stop using the system. 3.4.1 Data Requirements Data were collected to assess operations and maintenance requirements, including labor time and type of labor required, consumable costs, hazard levels, and additional training requirements. Cathode cleaning requirements were an important O&M issue to consider. The plan for cathode cleaning was to use hydrochloric acid/acetic acid periodically, as needed, to remove biofilm and salts precipitated on the catalyst layer once the decrease in the cathode potential is larger than 50% of the initial potential. In preparation for the demonstration, other methods were investigated, including the application of in-situ cleaning methodology such as magnetic scrubbing of the biofilm35. While these techniques allowed a partial recovery of the performance during the first phase of the cathode fouling due to the removal of the biofilm on the cathode, their impact is limited after few months, when salt precipitation is the main contributor of the cathode resistance. The MFC system was designed such that it would not need to be taken completely be off-line during cathode cleaning. Each cathode module can be removed without disrupting the MFC operation and the two additional spare cathode modules were procured to cycle into the system when others are removed for cleaning. 3.4.2 Success Criteria A 20% reduction in maintenance time relative to conventional aeration-based systems would demonstrate success. However, given that decentralized wastewater treatment systems with conventional technologies are being adopted in sustainable buildings, achieving similar levels of O&M would likely be acceptable. 3.5 DETERMINE COST SAVINGS Cost is an important factor for this study because WWTP operators will be hesitant to adopt new technologies if there are not substantial operational benefits in terms of cost. As with all organizations, DOD installations must work within fixed budgets while maximizing their mission performance. Decreasing the costs of on-site wastewater systems could increase their implementation and associated water system resiliency benefits. 3.5.1 Data Requirements Data were collected to support a life cycle cost estimate for the case study of a decentralized wastewater treatment system. This included capital costs for the treatment system and infrastructure modifications, consumable costs, labor for operations and maintenance, water costs,
ESTCP Final Report: ER-201635 45 August 2021
and wastewater hauling costs. Local escalation rates, equipment lifetime expectancy, and other factors were considered in assessing life cycle costs and payback period. 3.5.2 Success Criteria The metric for cost savings was a system payback period < 10 yr.
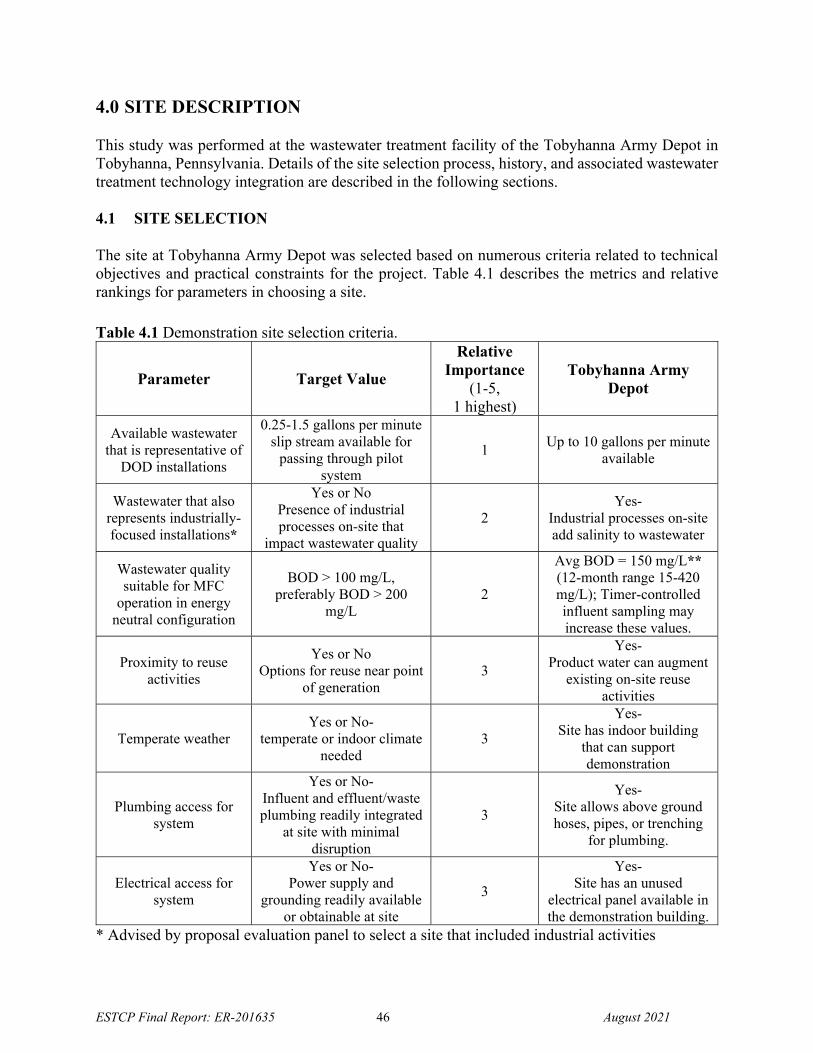
ESTCP Final Report: ER-201635 46 August 2021
4.0 SITE DESCRIPTION This study was performed at the wastewater treatment facility of the Tobyhanna Army Depot in Tobyhanna, Pennsylvania. Details of the site selection process, history, and associated wastewater treatment technology integration are described in the following sections. 4.1 SITE SELECTION The site at Tobyhanna Army Depot was selected based on numerous criteria related to technical objectives and practical constraints for the project. Table 4.1 describes the metrics and relative rankings for parameters in choosing a site.
Table 4.1 Demonstration site selection criteria.
Parameter Target Value
Relative Importance
(1-5, 1 highest)
Tobyhanna Army Depot
Available wastewater that is representative of
DOD installations
0.25-1.5 gallons per minute slip stream available for
passing through pilot system
1 Up to 10 gallons per minute
available
Wastewater that also represents industrially-focused installations*
Yes or No Presence of industrial processes on-site that
impact wastewater quality
2 Yes-
Industrial processes on-site add salinity to wastewater
Wastewater quality suitable for MFC
operation in energy neutral configuration
BOD > 100 mg/L, preferably BOD > 200
mg/L 2
Avg BOD = 150 mg/L** (12-month range 15-420 mg/L); Timer-controlled influent sampling may increase these values.
Proximity to reuse activities
Yes or No Options for reuse near point
of generation 3
Yes- Product water can augment
existing on-site reuse activities
Temperate weather Yes or No-
temperate or indoor climate needed
3
Yes- Site has indoor building
that can support demonstration
Plumbing access for system
Yes or No- Influent and effluent/waste plumbing readily integrated
at site with minimal disruption
3
Yes- Site allows above ground hoses, pipes, or trenching
for plumbing.
Electrical access for system
Yes or No- Power supply and
grounding readily available or obtainable at site
3
Yes- Site has an unused
electrical panel available in the demonstration building.
* Advised by proposal evaluation panel to select a site that included industrial activities
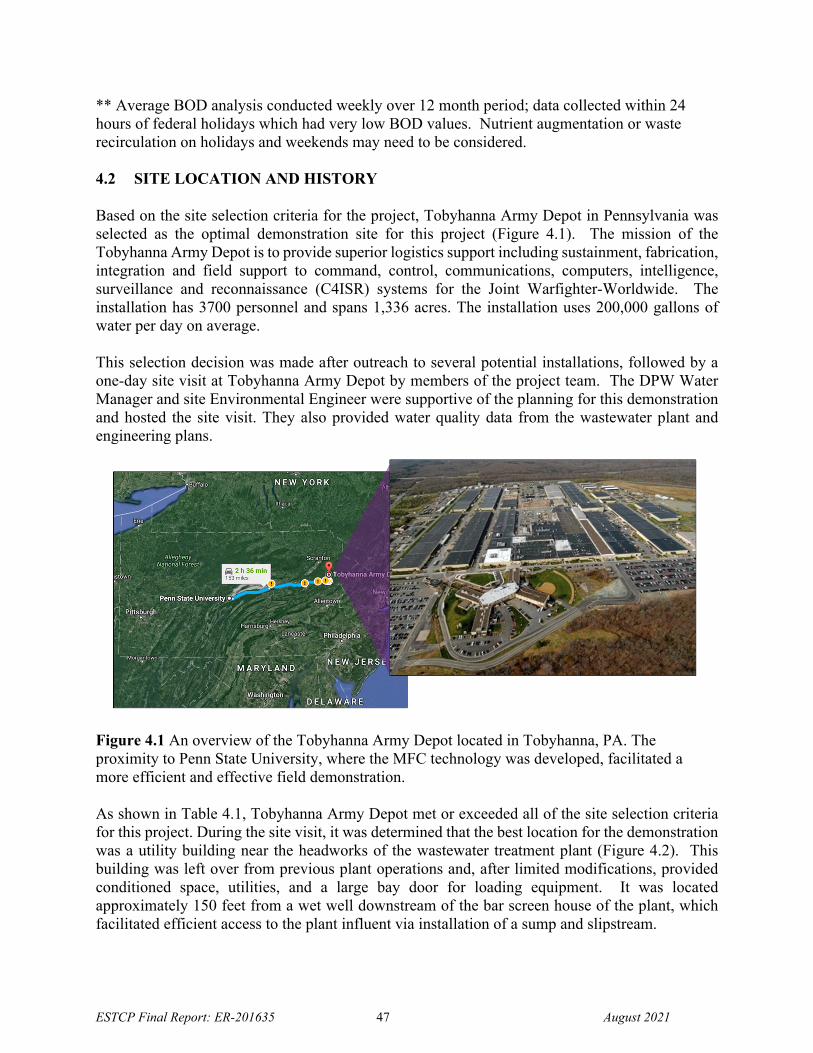
ESTCP Final Report: ER-201635 47 August 2021
** Average BOD analysis conducted weekly over 12 month period; data collected within 24 hours of federal holidays which had very low BOD values. Nutrient augmentation or waste recirculation on holidays and weekends may need to be considered. 4.2 SITE LOCATION AND HISTORY Based on the site selection criteria for the project, Tobyhanna Army Depot in Pennsylvania was selected as the optimal demonstration site for this project (Figure 4.1). The mission of the Tobyhanna Army Depot is to provide superior logistics support including sustainment, fabrication, integration and field support to command, control, communications, computers, intelligence, surveillance and reconnaissance (C4ISR) systems for the Joint Warfighter-Worldwide. The installation has 3700 personnel and spans 1,336 acres. The installation uses 200,000 gallons of water per day on average. This selection decision was made after outreach to several potential installations, followed by a one-day site visit at Tobyhanna Army Depot by members of the project team. The DPW Water Manager and site Environmental Engineer were supportive of the planning for this demonstration and hosted the site visit. They also provided water quality data from the wastewater plant and engineering plans.
Figure 4.1 An overview of the Tobyhanna Army Depot located in Tobyhanna, PA. The proximity to Penn State University, where the MFC technology was developed, facilitated a more efficient and effective field demonstration. As shown in Table 4.1, Tobyhanna Army Depot met or exceeded all of the site selection criteria for this project. During the site visit, it was determined that the best location for the demonstration was a utility building near the headworks of the wastewater treatment plant (Figure 4.2). This building was left over from previous plant operations and, after limited modifications, provided conditioned space, utilities, and a large bay door for loading equipment. It was located approximately 150 feet from a wet well downstream of the bar screen house of the plant, which facilitated efficient access to the plant influent via installation of a sump and slipstream.
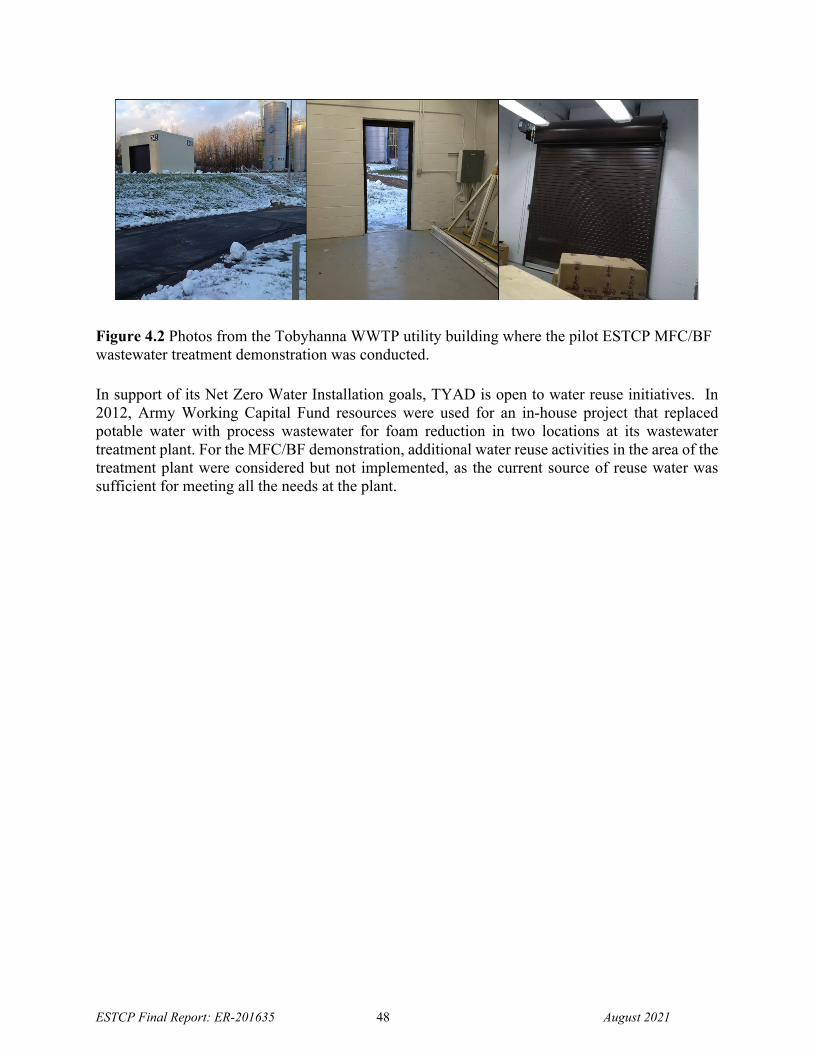
ESTCP Final Report: ER-201635 48 August 2021
Figure 4.2 Photos from the Tobyhanna WWTP utility building where the pilot ESTCP MFC/BF wastewater treatment demonstration was conducted.
In support of its Net Zero Water Installation goals, TYAD is open to water reuse initiatives. In 2012, Army Working Capital Fund resources were used for an in-house project that replaced potable water with process wastewater for foam reduction in two locations at its wastewater treatment plant. For the MFC/BF demonstration, additional water reuse activities in the area of the treatment plant were considered but not implemented, as the current source of reuse water was sufficient for meeting all the needs at the plant.
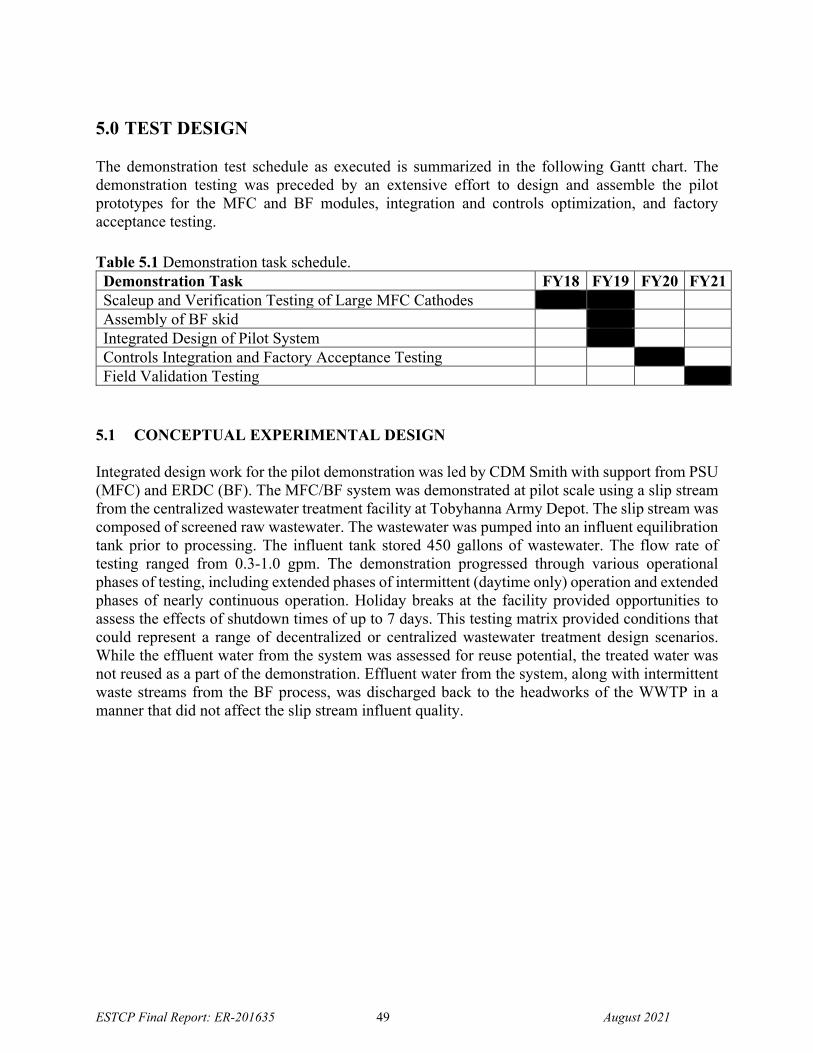
ESTCP Final Report: ER-201635 49 August 2021
5.0 TEST DESIGN The demonstration test schedule as executed is summarized in the following Gantt chart. The demonstration testing was preceded by an extensive effort to design and assemble the pilot prototypes for the MFC and BF modules, integration and controls optimization, and factory acceptance testing.
Table 5.1 Demonstration task schedule. Demonstration Task FY18 FY19 FY20 FY21 Scaleup and Verification Testing of Large MFC Cathodes Assembly of BF skid Integrated Design of Pilot System Controls Integration and Factory Acceptance Testing Field Validation Testing
5.1 CONCEPTUAL EXPERIMENTAL DESIGN
Integrated design work for the pilot demonstration was led by CDM Smith with support from PSU (MFC) and ERDC (BF). The MFC/BF system was demonstrated at pilot scale using a slip stream from the centralized wastewater treatment facility at Tobyhanna Army Depot. The slip stream was composed of screened raw wastewater. The wastewater was pumped into an influent equilibration tank prior to processing. The influent tank stored 450 gallons of wastewater. The flow rate of testing ranged from 0.3-1.0 gpm. The demonstration progressed through various operational phases of testing, including extended phases of intermittent (daytime only) operation and extended phases of nearly continuous operation. Holiday breaks at the facility provided opportunities to assess the effects of shutdown times of up to 7 days. This testing matrix provided conditions that could represent a range of decentralized or centralized wastewater treatment design scenarios. While the effluent water from the system was assessed for reuse potential, the treated water was not reused as a part of the demonstration. Effluent water from the system, along with intermittent waste streams from the BF process, was discharged back to the headworks of the WWTP in a manner that did not affect the slip stream influent quality.
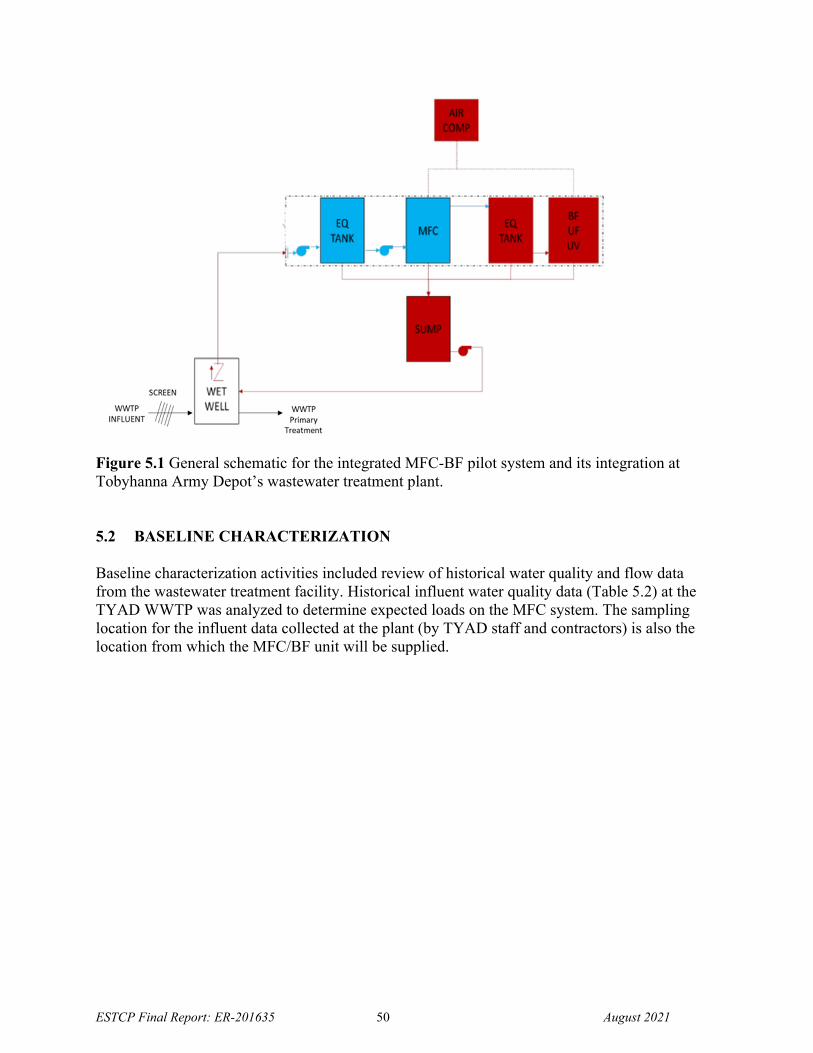
ESTCP Final Report: ER-201635 50 August 2021
Figure 5.1 General schematic for the integrated MFC-BF pilot system and its integration at Tobyhanna Army Depot’s wastewater treatment plant.
5.2 BASELINE CHARACTERIZATION Baseline characterization activities included review of historical water quality and flow data from the wastewater treatment facility. Historical influent water quality data (Table 5.2) at the TYAD WWTP was analyzed to determine expected loads on the MFC system. The sampling location for the influent data collected at the plant (by TYAD staff and contractors) is also the location from which the MFC/BF unit will be supplied.
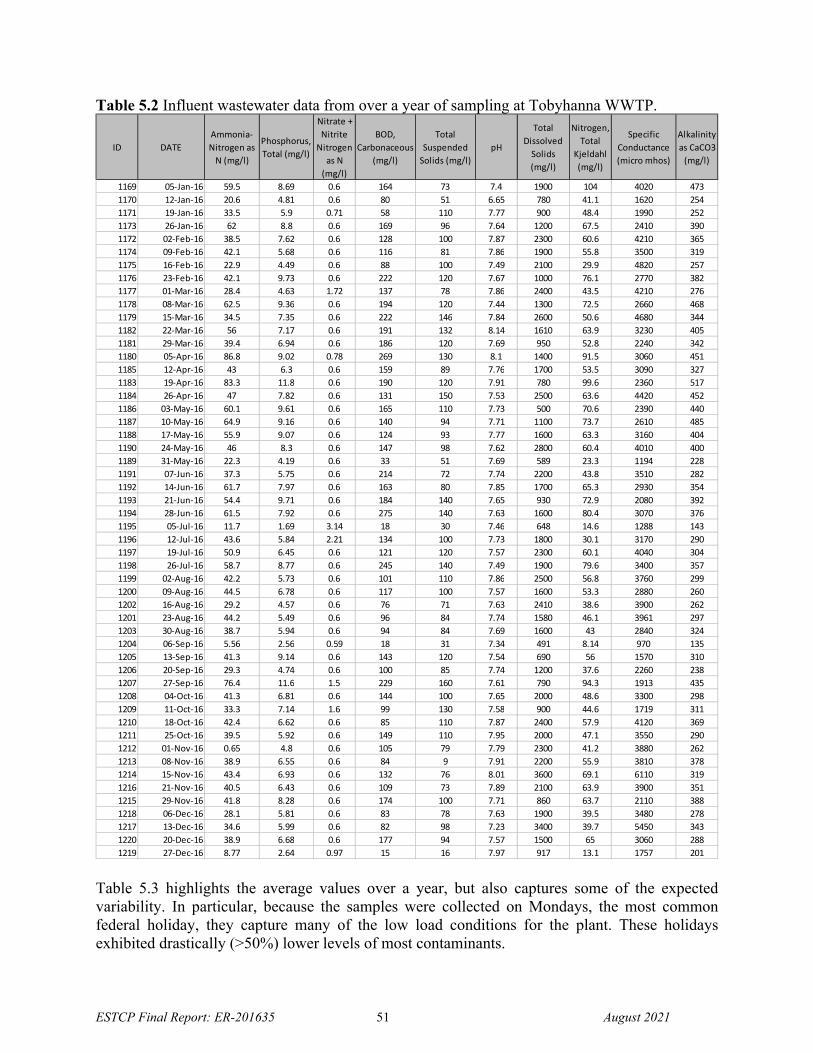
ESTCP Final Report: ER-201635 51 August 2021
Table 5.2 Influent wastewater data from over a year of sampling at Tobyhanna WWTP.
Table 5.3 highlights the average values over a year, but also captures some of the expected variability. In particular, because the samples were collected on Mondays, the most common federal holiday, they capture many of the low load conditions for the plant. These holidays exhibited drastically (>50%) lower levels of most contaminants.
ID DATE
Ammonia‐
Nitrogen as
N (mg/l)
Phosphorus,
Total (mg/l)
Nitrate +
Nitrite
Nitrogen
as N
(mg/l)
BOD,
Carbonaceous
(mg/l)
Total
Suspended
Solids (mg/l)
pH
Total
Dissolved
Solids
(mg/l)
Nitrogen,
Total
Kjeldahl
(mg/l)
Specific
Conductance
(micro mhos)
Alkalinity
as CaCO3
(mg/l)
1169 05‐Jan‐16 59.5 8.69 0.6 164 73 7.4 1900 104 4020 473
1170 12‐Jan‐16 20.6 4.81 0.6 80 51 6.65 780 41.1 1620 254
1171 19‐Jan‐16 33.5 5.9 0.71 58 110 7.77 900 48.4 1990 252
1173 26‐Jan‐16 62 8.8 0.6 169 96 7.64 1200 67.5 2410 390
1172 02‐Feb‐16 38.5 7.62 0.6 128 100 7.87 2300 60.6 4210 365
1174 09‐Feb‐16 42.1 5.68 0.6 116 81 7.86 1900 55.8 3500 319
1175 16‐Feb‐16 22.9 4.49 0.6 88 100 7.49 2100 29.9 4820 257
1176 23‐Feb‐16 42.1 9.73 0.6 222 120 7.67 1000 76.1 2770 382
1177 01‐Mar‐16 28.4 4.63 1.72 137 78 7.86 2400 43.5 4210 276
1178 08‐Mar‐16 62.5 9.36 0.6 194 120 7.44 1300 72.5 2660 468
1179 15‐Mar‐16 34.5 7.35 0.6 222 146 7.84 2600 50.6 4680 344
1182 22‐Mar‐16 56 7.17 0.6 191 132 8.14 1610 63.9 3230 405
1181 29‐Mar‐16 39.4 6.94 0.6 186 120 7.69 950 52.8 2240 342
1180 05‐Apr‐16 86.8 9.02 0.78 269 130 8.1 1400 91.5 3060 451
1185 12‐Apr‐16 43 6.3 0.6 159 89 7.76 1700 53.5 3090 327
1183 19‐Apr‐16 83.3 11.8 0.6 190 120 7.91 780 99.6 2360 517
1184 26‐Apr‐16 47 7.82 0.6 131 150 7.53 2500 63.6 4420 452
1186 03‐May‐16 60.1 9.61 0.6 165 110 7.73 500 70.6 2390 440
1187 10‐May‐16 64.9 9.16 0.6 140 94 7.71 1100 73.7 2610 485
1188 17‐May‐16 55.9 9.07 0.6 124 93 7.77 1600 63.3 3160 404
1190 24‐May‐16 46 8.3 0.6 147 98 7.62 2800 60.4 4010 400
1189 31‐May‐16 22.3 4.19 0.6 33 51 7.69 589 23.3 1194 228
1191 07‐Jun‐16 37.3 5.75 0.6 214 72 7.74 2200 43.8 3510 282
1192 14‐Jun‐16 61.7 7.97 0.6 163 80 7.85 1700 65.3 2930 354
1193 21‐Jun‐16 54.4 9.71 0.6 184 140 7.65 930 72.9 2080 392
1194 28‐Jun‐16 61.5 7.92 0.6 275 140 7.63 1600 80.4 3070 376
1195 05‐Jul‐16 11.7 1.69 3.14 18 30 7.46 648 14.6 1288 143
1196 12‐Jul‐16 43.6 5.84 2.21 134 100 7.73 1800 30.1 3170 290
1197 19‐Jul‐16 50.9 6.45 0.6 121 120 7.57 2300 60.1 4040 304
1198 26‐Jul‐16 58.7 8.77 0.6 245 140 7.49 1900 79.6 3400 357
1199 02‐Aug‐16 42.2 5.73 0.6 101 110 7.86 2500 56.8 3760 299
1200 09‐Aug‐16 44.5 6.78 0.6 117 100 7.57 1600 53.3 2880 260
1202 16‐Aug‐16 29.2 4.57 0.6 76 71 7.63 2410 38.6 3900 262
1201 23‐Aug‐16 44.2 5.49 0.6 96 84 7.74 1580 46.1 3961 297
1203 30‐Aug‐16 38.7 5.94 0.6 94 84 7.69 1600 43 2840 324
1204 06‐Sep‐16 5.56 2.56 0.59 18 31 7.34 491 8.14 970 135
1205 13‐Sep‐16 41.3 9.14 0.6 143 120 7.54 690 56 1570 310
1206 20‐Sep‐16 29.3 4.74 0.6 100 85 7.74 1200 37.6 2260 238
1207 27‐Sep‐16 76.4 11.6 1.5 229 160 7.61 790 94.3 1913 435
1208 04‐Oct‐16 41.3 6.81 0.6 144 100 7.65 2000 48.6 3300 298
1209 11‐Oct‐16 33.3 7.14 1.6 99 130 7.58 900 44.6 1719 311
1210 18‐Oct‐16 42.4 6.62 0.6 85 110 7.87 2400 57.9 4120 369
1211 25‐Oct‐16 39.5 5.92 0.6 149 110 7.95 2000 47.1 3550 290
1212 01‐Nov‐16 0.65 4.8 0.6 105 79 7.79 2300 41.2 3880 262
1213 08‐Nov‐16 38.9 6.55 0.6 84 9 7.91 2200 55.9 3810 378
1214 15‐Nov‐16 43.4 6.93 0.6 132 76 8.01 3600 69.1 6110 319
1216 21‐Nov‐16 40.5 6.43 0.6 109 73 7.89 2100 63.9 3900 351
1215 29‐Nov‐16 41.8 8.28 0.6 174 100 7.71 860 63.7 2110 388
1218 06‐Dec‐16 28.1 5.81 0.6 83 78 7.63 1900 39.5 3480 278
1217 13‐Dec‐16 34.6 5.99 0.6 82 98 7.23 3400 39.7 5450 343
1220 20‐Dec‐16 38.9 6.68 0.6 177 94 7.57 1500 65 3060 288
1219 27‐Dec‐16 8.77 2.64 0.97 15 16 7.97 917 13.1 1757 201
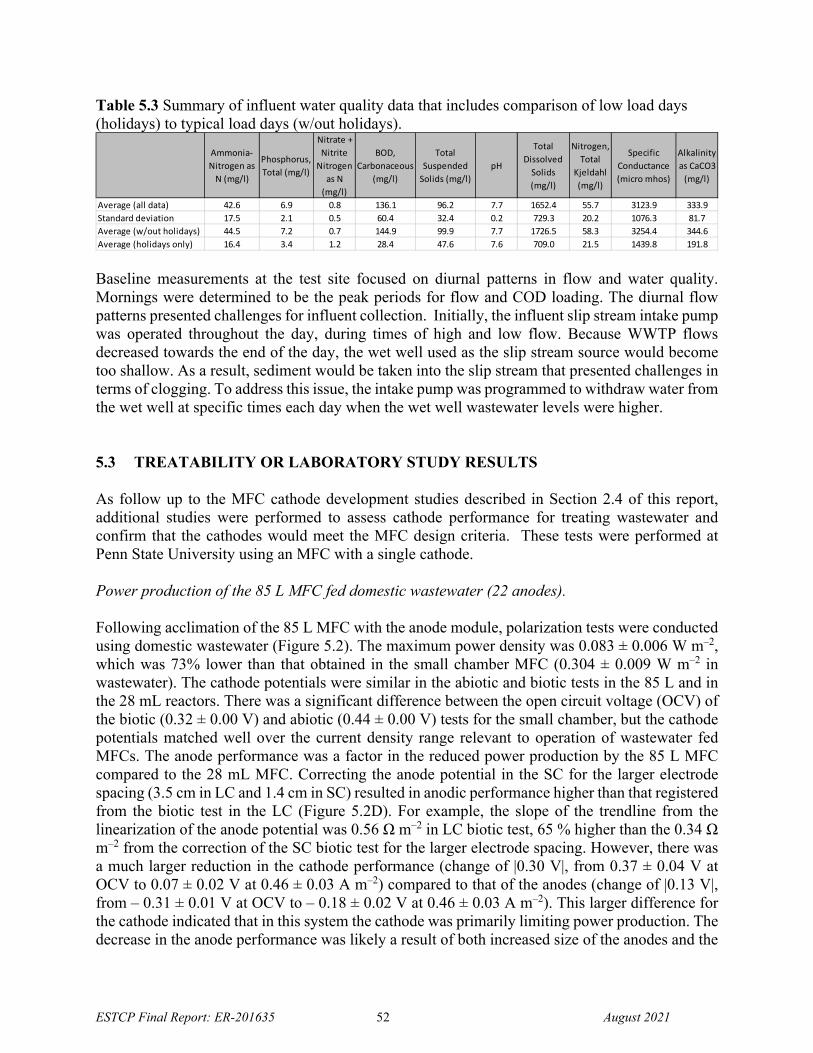
ESTCP Final Report: ER-201635 52 August 2021
Table 5.3 Summary of influent water quality data that includes comparison of low load days (holidays) to typical load days (w/out holidays).
Baseline measurements at the test site focused on diurnal patterns in flow and water quality. Mornings were determined to be the peak periods for flow and COD loading. The diurnal flow patterns presented challenges for influent collection. Initially, the influent slip stream intake pump was operated throughout the day, during times of high and low flow. Because WWTP flows decreased towards the end of the day, the wet well used as the slip stream source would become too shallow. As a result, sediment would be taken into the slip stream that presented challenges in terms of clogging. To address this issue, the intake pump was programmed to withdraw water from the wet well at specific times each day when the wet well wastewater levels were higher. 5.3 TREATABILITY OR LABORATORY STUDY RESULTS As follow up to the MFC cathode development studies described in Section 2.4 of this report, additional studies were performed to assess cathode performance for treating wastewater and confirm that the cathodes would meet the MFC design criteria. These tests were performed at Penn State University using an MFC with a single cathode. Power production of the 85 L MFC fed domestic wastewater (22 anodes). Following acclimation of the 85 L MFC with the anode module, polarization tests were conducted using domestic wastewater (Figure 5.2). The maximum power density was 0.083 ± 0.006 W m–2, which was 73% lower than that obtained in the small chamber MFC (0.304 ± 0.009 W m–2 in wastewater). The cathode potentials were similar in the abiotic and biotic tests in the 85 L and in the 28 mL reactors. There was a significant difference between the open circuit voltage (OCV) of the biotic (0.32 ± 0.00 V) and abiotic (0.44 ± 0.00 V) tests for the small chamber, but the cathode potentials matched well over the current density range relevant to operation of wastewater fed MFCs. The anode performance was a factor in the reduced power production by the 85 L MFC compared to the 28 mL MFC. Correcting the anode potential in the SC for the larger electrode spacing (3.5 cm in LC and 1.4 cm in SC) resulted in anodic performance higher than that registered from the biotic test in the LC (Figure 5.2D). For example, the slope of the trendline from the linearization of the anode potential was 0.56 Ω m–2 in LC biotic test, 65 % higher than the 0.34 Ω m–2 from the correction of the SC biotic test for the larger electrode spacing. However, there was a much larger reduction in the cathode performance (change of |0.30 V|, from 0.37 ± 0.04 V at OCV to 0.07 ± 0.02 V at 0.46 ± 0.03 A m–2) compared to that of the anodes (change of |0.13 V|, from – 0.31 ± 0.01 V at OCV to – 0.18 ± 0.02 V at 0.46 ± 0.03 A m–2). This larger difference for the cathode indicated that in this system the cathode was primarily limiting power production. The decrease in the anode performance was likely a result of both increased size of the anodes and the
Ammonia‐
Nitrogen as
N (mg/l)
Phosphorus,
Total (mg/l)
Nitrate +
Nitrite
Nitrogen
as N
(mg/l)
BOD,
Carbonaceous
(mg/l)
Total
Suspended
Solids (mg/l)
pH
Total
Dissolved
Solids
(mg/l)
Nitrogen,
Total
Kjeldahl
(mg/l)
Specific
Conductance
(micro mhos)
Alkalinity
as CaCO3
(mg/l)
42.6 6.9 0.8 136.1 96.2 7.7 1652.4 55.7 3123.9 333.9
17.5 2.1 0.5 60.4 32.4 0.2 729.3 20.2 1076.3 81.7
44.5 7.2 0.7 144.9 99.9 7.7 1726.5 58.3 3254.4 344.6
Average (holidays only) 16.4 3.4 1.2 28.4 47.6 7.6 709.0 21.5 1439.8 191.8
Average (all data)
Average (w/out holidays)
Standard deviation
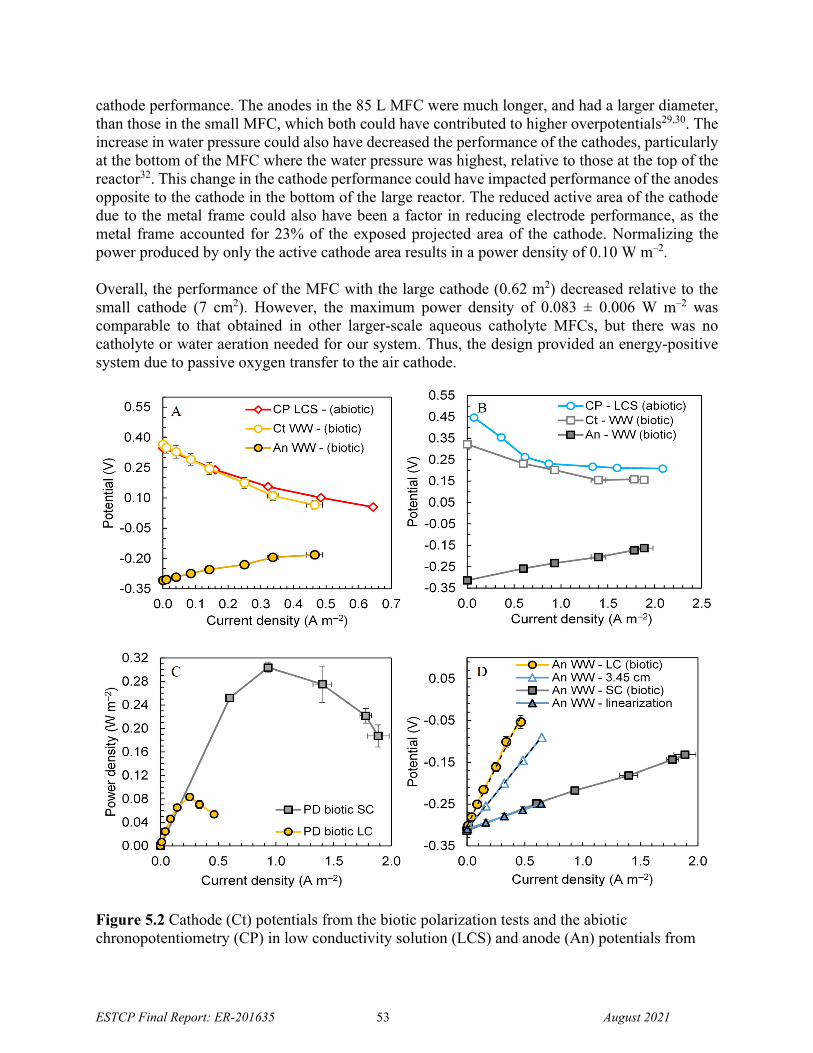
ESTCP Final Report: ER-201635 53 August 2021
cathode performance. The anodes in the 85 L MFC were much longer, and had a larger diameter, than those in the small MFC, which both could have contributed to higher overpotentials29,30. The increase in water pressure could also have decreased the performance of the cathodes, particularly at the bottom of the MFC where the water pressure was highest, relative to those at the top of the reactor32. This change in the cathode performance could have impacted performance of the anodes opposite to the cathode in the bottom of the large reactor. The reduced active area of the cathode due to the metal frame could also have been a factor in reducing electrode performance, as the metal frame accounted for 23% of the exposed projected area of the cathode. Normalizing the power produced by only the active cathode area results in a power density of 0.10 W m–2. Overall, the performance of the MFC with the large cathode (0.62 m2) decreased relative to the small cathode (7 cm2). However, the maximum power density of 0.083 ± 0.006 W m–2 was comparable to that obtained in other larger-scale aqueous catholyte MFCs, but there was no catholyte or water aeration needed for our system. Thus, the design provided an energy-positive system due to passive oxygen transfer to the air cathode.
Figure 5.2 Cathode (Ct) potentials from the biotic polarization tests and the abiotic chronopotentiometry (CP) in low conductivity solution (LCS) and anode (An) potentials from
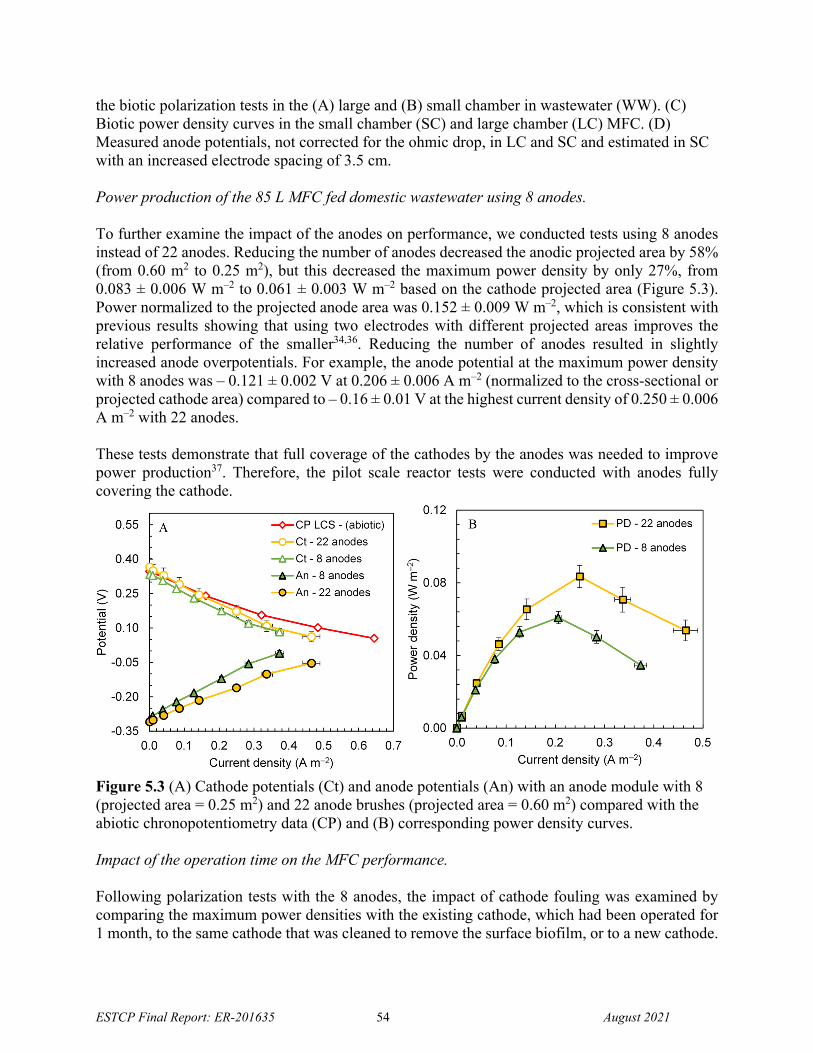
ESTCP Final Report: ER-201635 54 August 2021
the biotic polarization tests in the (A) large and (B) small chamber in wastewater (WW). (C) Biotic power density curves in the small chamber (SC) and large chamber (LC) MFC. (D) Measured anode potentials, not corrected for the ohmic drop, in LC and SC and estimated in SC with an increased electrode spacing of 3.5 cm. Power production of the 85 L MFC fed domestic wastewater using 8 anodes. To further examine the impact of the anodes on performance, we conducted tests using 8 anodes instead of 22 anodes. Reducing the number of anodes decreased the anodic projected area by 58% (from 0.60 m2 to 0.25 m2), but this decreased the maximum power density by only 27%, from 0.083 ± 0.006 W m–2 to 0.061 ± 0.003 W m–2 based on the cathode projected area (Figure 5.3). Power normalized to the projected anode area was 0.152 ± 0.009 W m–2, which is consistent with previous results showing that using two electrodes with different projected areas improves the relative performance of the smaller34,36. Reducing the number of anodes resulted in slightly increased anode overpotentials. For example, the anode potential at the maximum power density with 8 anodes was – 0.121 ± 0.002 V at 0.206 ± 0.006 A m–2 (normalized to the cross-sectional or projected cathode area) compared to – 0.16 ± 0.01 V at the highest current density of 0.250 ± 0.006 A m–2 with 22 anodes. These tests demonstrate that full coverage of the cathodes by the anodes was needed to improve power production37. Therefore, the pilot scale reactor tests were conducted with anodes fully covering the cathode.
Figure 5.3 (A) Cathode potentials (Ct) and anode potentials (An) with an anode module with 8 (projected area = 0.25 m2) and 22 anode brushes (projected area = 0.60 m2) compared with the abiotic chronopotentiometry data (CP) and (B) corresponding power density curves. Impact of the operation time on the MFC performance. Following polarization tests with the 8 anodes, the impact of cathode fouling was examined by comparing the maximum power densities with the existing cathode, which had been operated for 1 month, to the same cathode that was cleaned to remove the surface biofilm, or to a new cathode.
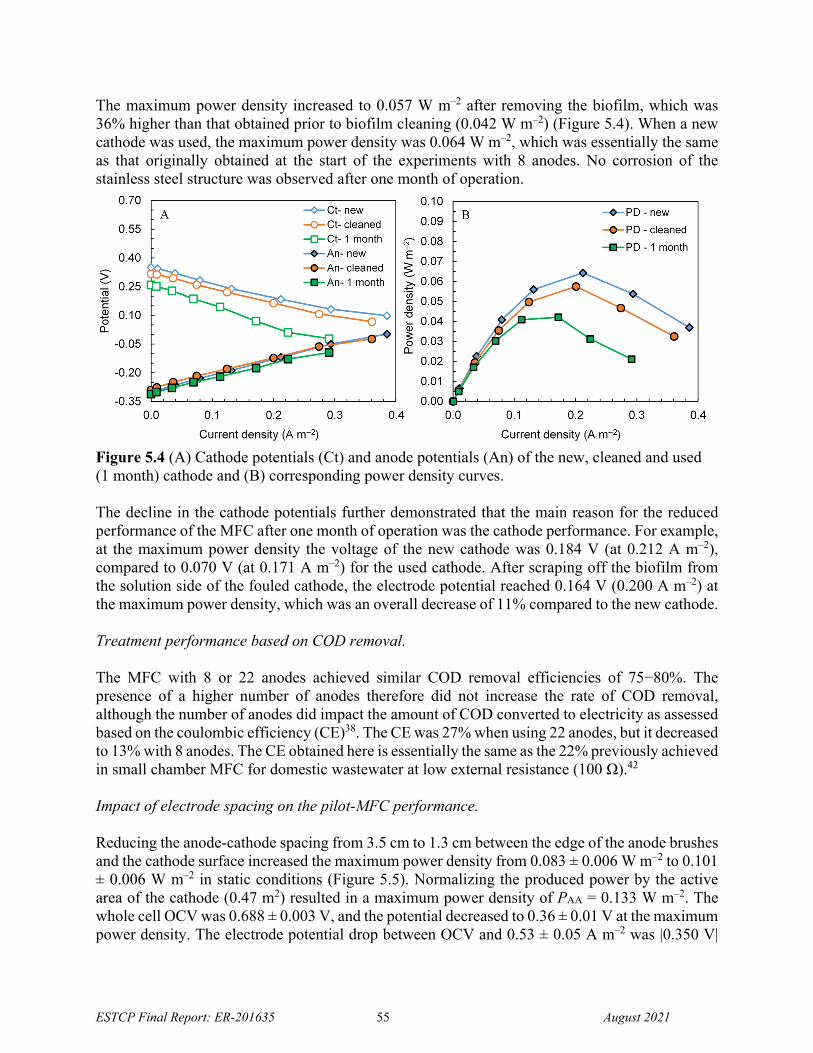
ESTCP Final Report: ER-201635 55 August 2021
The maximum power density increased to 0.057 W m–2 after removing the biofilm, which was 36% higher than that obtained prior to biofilm cleaning (0.042 W m–2) (Figure 5.4). When a new cathode was used, the maximum power density was 0.064 W m–2, which was essentially the same as that originally obtained at the start of the experiments with 8 anodes. No corrosion of the stainless steel structure was observed after one month of operation.
Figure 5.4 (A) Cathode potentials (Ct) and anode potentials (An) of the new, cleaned and used (1 month) cathode and (B) corresponding power density curves.
The decline in the cathode potentials further demonstrated that the main reason for the reduced performance of the MFC after one month of operation was the cathode performance. For example, at the maximum power density the voltage of the new cathode was 0.184 V (at 0.212 A m–2), compared to 0.070 V (at 0.171 A m–2) for the used cathode. After scraping off the biofilm from the solution side of the fouled cathode, the electrode potential reached 0.164 V (0.200 A m–2) at the maximum power density, which was an overall decrease of 11% compared to the new cathode. Treatment performance based on COD removal. The MFC with 8 or 22 anodes achieved similar COD removal efficiencies of 75−80%. The presence of a higher number of anodes therefore did not increase the rate of COD removal, although the number of anodes did impact the amount of COD converted to electricity as assessed based on the coulombic efficiency (CE)38. The CE was 27% when using 22 anodes, but it decreased to 13% with 8 anodes. The CE obtained here is essentially the same as the 22% previously achieved in small chamber MFC for domestic wastewater at low external resistance (100 Ω).42
Impact of electrode spacing on the pilot-MFC performance. Reducing the anode-cathode spacing from 3.5 cm to 1.3 cm between the edge of the anode brushes and the cathode surface increased the maximum power density from 0.083 ± 0.006 W m–2 to 0.101 ± 0.006 W m–2 in static conditions (Figure 5.5). Normalizing the produced power by the active area of the cathode (0.47 m2) resulted in a maximum power density of PAA = 0.133 W m–2. The whole cell OCV was 0.688 ± 0.003 V, and the potential decreased to 0.36 ± 0.01 V at the maximum power density. The electrode potential drop between OCV and 0.53 ± 0.05 A m–2 was |0.350 V|
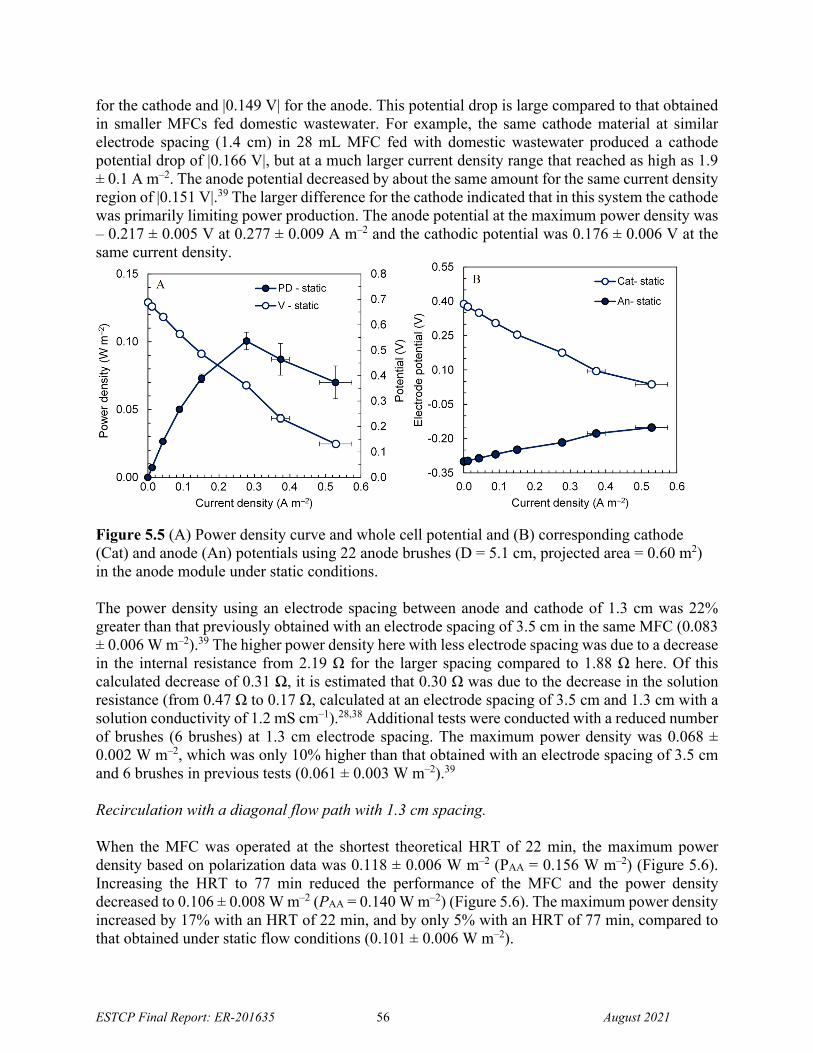
ESTCP Final Report: ER-201635 56 August 2021
for the cathode and |0.149 V| for the anode. This potential drop is large compared to that obtained in smaller MFCs fed domestic wastewater. For example, the same cathode material at similar electrode spacing (1.4 cm) in 28 mL MFC fed with domestic wastewater produced a cathode potential drop of |0.166 V|, but at a much larger current density range that reached as high as 1.9 ± 0.1 A m–2. The anode potential decreased by about the same amount for the same current density region of |0.151 V|.39 The larger difference for the cathode indicated that in this system the cathode was primarily limiting power production. The anode potential at the maximum power density was – 0.217 ± 0.005 V at 0.277 ± 0.009 A m–2 and the cathodic potential was 0.176 ± 0.006 V at the same current density.
Figure 5.5 (A) Power density curve and whole cell potential and (B) corresponding cathode (Cat) and anode (An) potentials using 22 anode brushes (D = 5.1 cm, projected area = 0.60 m2) in the anode module under static conditions.
The power density using an electrode spacing between anode and cathode of 1.3 cm was 22% greater than that previously obtained with an electrode spacing of 3.5 cm in the same MFC (0.083 ± 0.006 W m–2).39 The higher power density here with less electrode spacing was due to a decrease in the internal resistance from 2.19 Ω for the larger spacing compared to 1.88 Ω here. Of this calculated decrease of 0.31 Ω, it is estimated that 0.30 Ω was due to the decrease in the solution resistance (from 0.47 Ω to 0.17 Ω, calculated at an electrode spacing of 3.5 cm and 1.3 cm with a solution conductivity of 1.2 mS cm–1).28,38 Additional tests were conducted with a reduced number of brushes (6 brushes) at 1.3 cm electrode spacing. The maximum power density was 0.068 ± 0.002 W m–2, which was only 10% higher than that obtained with an electrode spacing of 3.5 cm and 6 brushes in previous tests (0.061 ± 0.003 W m–2).39 Recirculation with a diagonal flow path with 1.3 cm spacing. When the MFC was operated at the shortest theoretical HRT of 22 min, the maximum power density based on polarization data was 0.118 ± 0.006 W m–2 (PAA = 0.156 W m–2) (Figure 5.6). Increasing the HRT to 77 min reduced the performance of the MFC and the power density decreased to 0.106 ± 0.008 W m–2 (PAA = 0.140 W m–2) (Figure 5.6). The maximum power density increased by 17% with an HRT of 22 min, and by only 5% with an HRT of 77 min, compared to that obtained under static flow conditions (0.101 ± 0.006 W m–2).
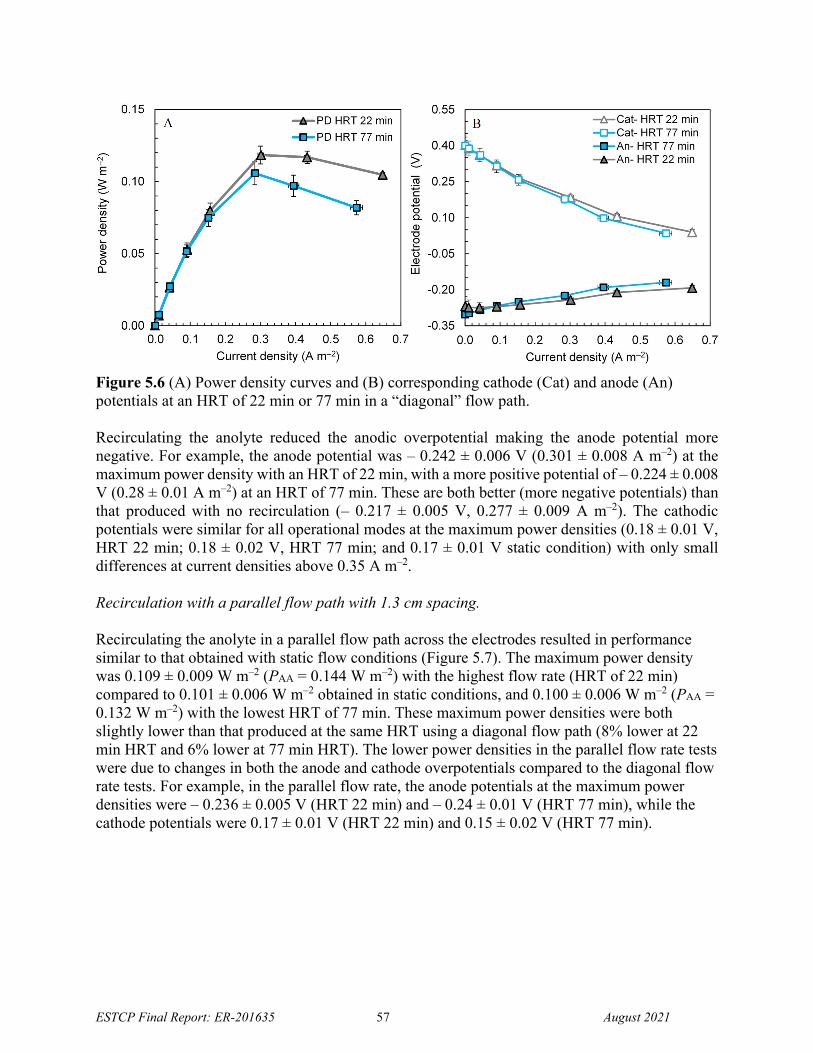
ESTCP Final Report: ER-201635 57 August 2021
Figure 5.6 (A) Power density curves and (B) corresponding cathode (Cat) and anode (An) potentials at an HRT of 22 min or 77 min in a “diagonal” flow path.
Recirculating the anolyte reduced the anodic overpotential making the anode potential more negative. For example, the anode potential was – 0.242 ± 0.006 V (0.301 ± 0.008 A m–2) at the maximum power density with an HRT of 22 min, with a more positive potential of – 0.224 ± 0.008 V (0.28 ± 0.01 A m–2) at an HRT of 77 min. These are both better (more negative potentials) than that produced with no recirculation (– 0.217 ± 0.005 V, 0.277 ± 0.009 A m–2). The cathodic potentials were similar for all operational modes at the maximum power densities (0.18 ± 0.01 V, HRT 22 min; 0.18 ± 0.02 V, HRT 77 min; and 0.17 ± 0.01 V static condition) with only small differences at current densities above 0.35 A m–2. Recirculation with a parallel flow path with 1.3 cm spacing. Recirculating the anolyte in a parallel flow path across the electrodes resulted in performance similar to that obtained with static flow conditions (Figure 5.7). The maximum power density was 0.109 ± 0.009 W m–2 (PAA = 0.144 W m–2) with the highest flow rate (HRT of 22 min) compared to 0.101 ± 0.006 W m–2 obtained in static conditions, and 0.100 ± 0.006 W m–2 (PAA = 0.132 W m–2) with the lowest HRT of 77 min. These maximum power densities were both slightly lower than that produced at the same HRT using a diagonal flow path (8% lower at 22 min HRT and 6% lower at 77 min HRT). The lower power densities in the parallel flow rate tests were due to changes in both the anode and cathode overpotentials compared to the diagonal flow rate tests. For example, in the parallel flow rate, the anode potentials at the maximum power densities were – 0.236 ± 0.005 V (HRT 22 min) and – 0.24 ± 0.01 V (HRT 77 min), while the cathode potentials were 0.17 ± 0.01 V (HRT 22 min) and 0.15 ± 0.02 V (HRT 77 min).
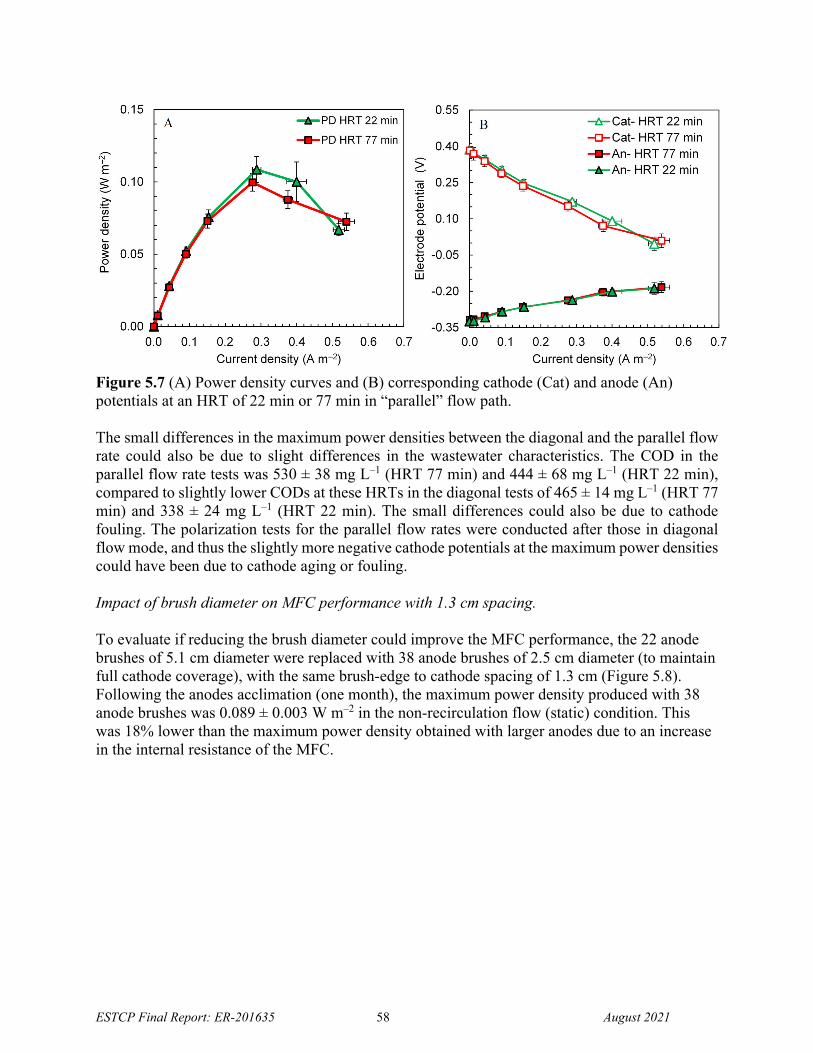
ESTCP Final Report: ER-201635 58 August 2021
Figure 5.7 (A) Power density curves and (B) corresponding cathode (Cat) and anode (An) potentials at an HRT of 22 min or 77 min in “parallel” flow path.
The small differences in the maximum power densities between the diagonal and the parallel flow rate could also be due to slight differences in the wastewater characteristics. The COD in the parallel flow rate tests was 530 ± 38 mg L–1 (HRT 77 min) and 444 ± 68 mg L–1 (HRT 22 min), compared to slightly lower CODs at these HRTs in the diagonal tests of 465 ± 14 mg L–1 (HRT 77 min) and 338 ± 24 mg L–1 (HRT 22 min). The small differences could also be due to cathode fouling. The polarization tests for the parallel flow rates were conducted after those in diagonal flow mode, and thus the slightly more negative cathode potentials at the maximum power densities could have been due to cathode aging or fouling. Impact of brush diameter on MFC performance with 1.3 cm spacing. To evaluate if reducing the brush diameter could improve the MFC performance, the 22 anode brushes of 5.1 cm diameter were replaced with 38 anode brushes of 2.5 cm diameter (to maintain full cathode coverage), with the same brush-edge to cathode spacing of 1.3 cm (Figure 5.8). Following the anodes acclimation (one month), the maximum power density produced with 38 anode brushes was 0.089 ± 0.003 W m–2 in the non-recirculation flow (static) condition. This was 18% lower than the maximum power density obtained with larger anodes due to an increase in the internal resistance of the MFC.
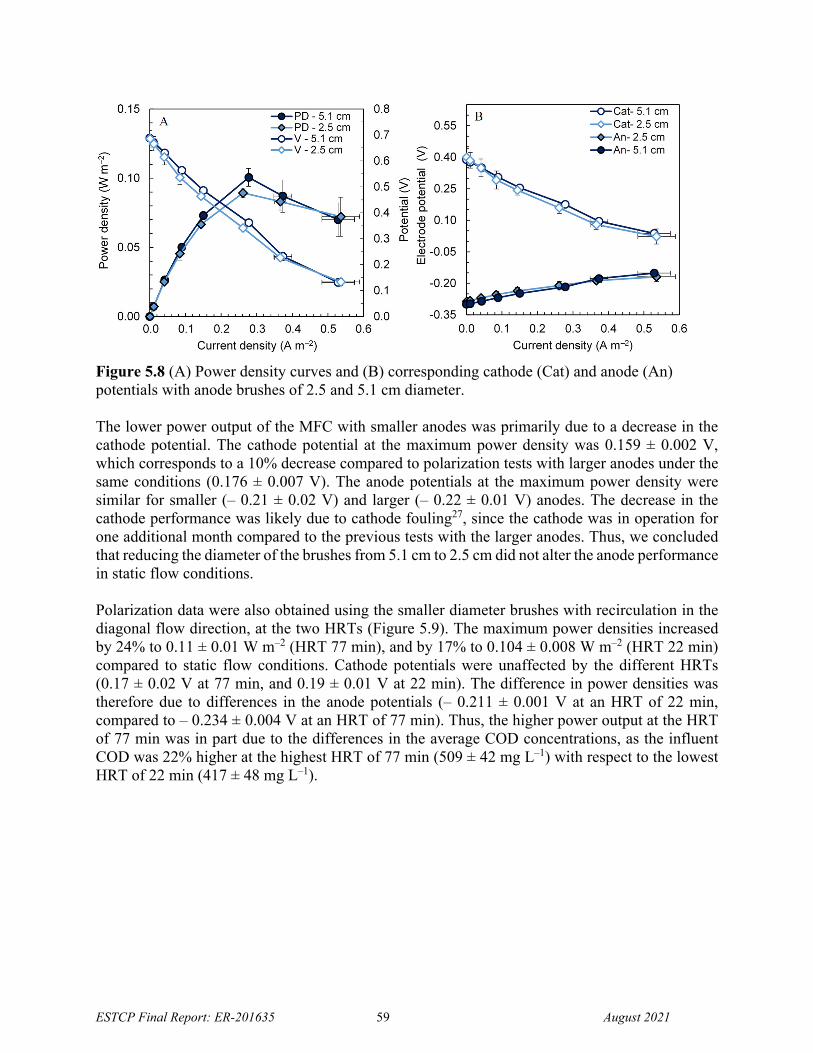
ESTCP Final Report: ER-201635 59 August 2021
Figure 5.8 (A) Power density curves and (B) corresponding cathode (Cat) and anode (An) potentials with anode brushes of 2.5 and 5.1 cm diameter.
The lower power output of the MFC with smaller anodes was primarily due to a decrease in the cathode potential. The cathode potential at the maximum power density was 0.159 ± 0.002 V, which corresponds to a 10% decrease compared to polarization tests with larger anodes under the same conditions (0.176 ± 0.007 V). The anode potentials at the maximum power density were similar for smaller (– 0.21 ± 0.02 V) and larger (– 0.22 ± 0.01 V) anodes. The decrease in the cathode performance was likely due to cathode fouling27, since the cathode was in operation for one additional month compared to the previous tests with the larger anodes. Thus, we concluded that reducing the diameter of the brushes from 5.1 cm to 2.5 cm did not alter the anode performance in static flow conditions. Polarization data were also obtained using the smaller diameter brushes with recirculation in the diagonal flow direction, at the two HRTs (Figure 5.9). The maximum power densities increased by 24% to 0.11 ± 0.01 W m–2 (HRT 77 min), and by 17% to 0.104 ± 0.008 W m–2 (HRT 22 min) compared to static flow conditions. Cathode potentials were unaffected by the different HRTs (0.17 ± 0.02 V at 77 min, and 0.19 ± 0.01 V at 22 min). The difference in power densities was therefore due to differences in the anode potentials (– 0.211 ± 0.001 V at an HRT of 22 min, compared to – 0.234 ± 0.004 V at an HRT of 77 min). Thus, the higher power output at the HRT of 77 min was in part due to the differences in the average COD concentrations, as the influent COD was 22% higher at the highest HRT of 77 min (509 ± 42 mg L–1) with respect to the lowest HRT of 22 min (417 ± 48 mg L–1).
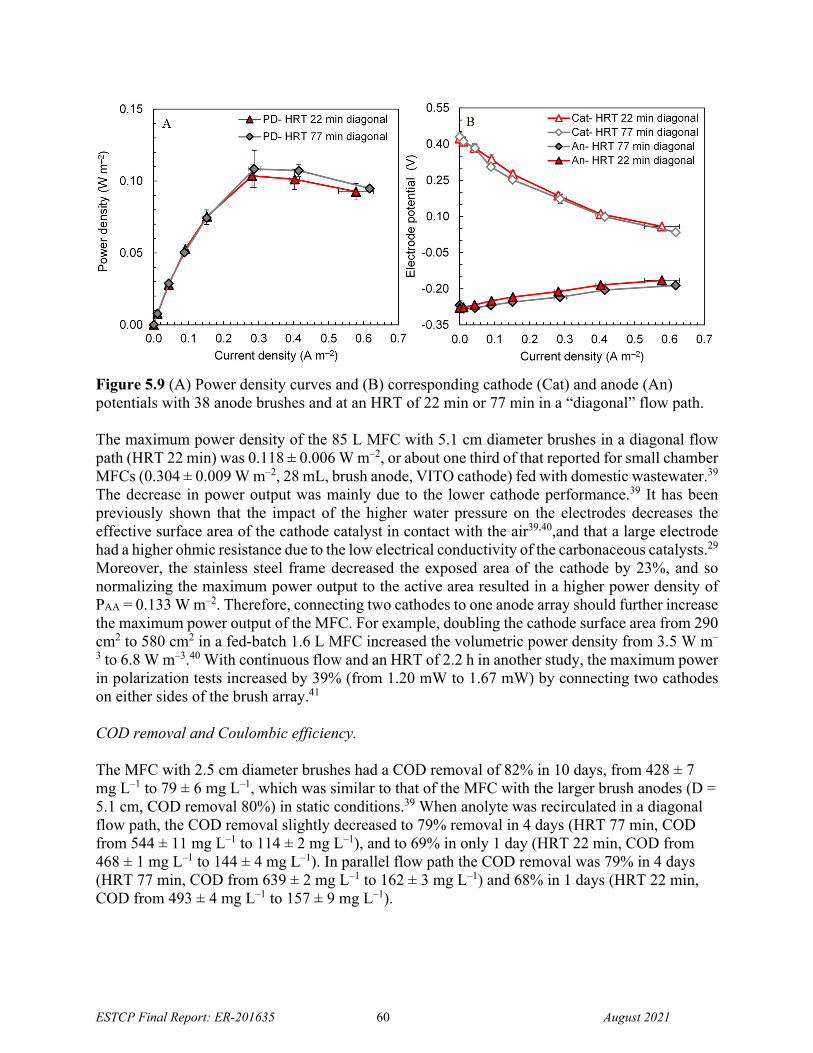
ESTCP Final Report: ER-201635 60 August 2021
Figure 5.9 (A) Power density curves and (B) corresponding cathode (Cat) and anode (An) potentials with 38 anode brushes and at an HRT of 22 min or 77 min in a “diagonal” flow path. The maximum power density of the 85 L MFC with 5.1 cm diameter brushes in a diagonal flow path (HRT 22 min) was 0.118 ± 0.006 W m–2, or about one third of that reported for small chamber MFCs (0.304 ± 0.009 W m–2, 28 mL, brush anode, VITO cathode) fed with domestic wastewater.39 The decrease in power output was mainly due to the lower cathode performance.39 It has been previously shown that the impact of the higher water pressure on the electrodes decreases the effective surface area of the cathode catalyst in contact with the air39,40,and that a large electrode had a higher ohmic resistance due to the low electrical conductivity of the carbonaceous catalysts.29 Moreover, the stainless steel frame decreased the exposed area of the cathode by 23%, and so normalizing the maximum power output to the active area resulted in a higher power density of PAA = 0.133 W m–2. Therefore, connecting two cathodes to one anode array should further increase the maximum power output of the MFC. For example, doubling the cathode surface area from 290 cm2 to 580 cm2 in a fed-batch 1.6 L MFC increased the volumetric power density from 3.5 W m–
3 to 6.8 W m–3.40 With continuous flow and an HRT of 2.2 h in another study, the maximum power in polarization tests increased by 39% (from 1.20 mW to 1.67 mW) by connecting two cathodes on either sides of the brush array.41 COD removal and Coulombic efficiency. The MFC with 2.5 cm diameter brushes had a COD removal of 82% in 10 days, from 428 ± 7 mg L–1 to 79 ± 6 mg L–1, which was similar to that of the MFC with the larger brush anodes (D = 5.1 cm, COD removal 80%) in static conditions.39 When anolyte was recirculated in a diagonal flow path, the COD removal slightly decreased to 79% removal in 4 days (HRT 77 min, COD from 544 ± 11 mg L–1 to 114 ± 2 mg L–1), and to 69% in only 1 day (HRT 22 min, COD from 468 ± 1 mg L–1 to 144 ± 4 mg L–1). In parallel flow path the COD removal was 79% in 4 days (HRT 77 min, COD from 639 ± 2 mg L–1 to 162 ± 3 mg L–1) and 68% in 1 days (HRT 22 min, COD from 493 ± 4 mg L–1 to 157 ± 9 mg L–1).
ESTCP Final Report: ER-201635 61 August 2021
The CE based on conversion of COD to current was 21% in static conditions (27% with 5.1 cm diameter brushes39) but it decreased to only 7% (HRT 77 min) and 2% (HRT 22 min) in dynamic flow conditions with a diagonal flow path. Similar CEs were obtained in a parallel flow path (6% with HRT of 77 min and 3% with HRT of 22 min). This finding that more of the COD was removed with recirculation indicated that flow past the cathode increased the rate of oxygen transport into the wastewater. It has been previously shown that decreasing the HRT in an MFC decreases the final CE.41 The CE obtained here in static condition is similar to the 22% previously achieved in small chamber MFC fed with domestic wastewater at low external resistance (100 Ω), which also has static conditions.42 Cathode selection and manufacturing. Based on these tests, the cathodes manufactured by VITO passed the selection based on three different criteria:
Current density 0.3 A/m2 Power density 100 mW/m2 Full-scale manufactured cathode performance (current density, power density, and
maximum water pressure resistance) variability ≤ 10%
Therefore, 32 cathodes were ordered from VITO and shipped directly to Intuitech to be installed in the final pilot-scale MFC. When these cathodes were delivered it was found that several of the cathodes received from VITO had a lower hydraulic resistance compared to the prototype initially received due to an uneven application of the bicomponent glue between the stainless-steel frame and the active cathode material. The cathodes were repaired by PSU using a glue provided by VITO. 5.4 DESIGN AND LAYOUT OF TECHNOLOGY COMPONETNS The MFC was manufactured by Intuitech under the supervision of PSU and CDM Smith. The BF was assembled by CERL and delivered to Intuitech for implementation of the operating units in the control panel. The MFC/BF units were shipped to its final location on 08/11/2020 and inoculated on 09/11/2020. The MFC control board was developed thereafter and installed in the control panel on 12/07/2020. The raw wastewater was obtained from the Tobyhanna Army Depot wastewater treatment plant after flowing through a screen to limit the presence of large solids in the influent of the MFC. The wastewater was collected with a pump from a wet well and stored in an influent tank (55 gal polyethylene drum) positioned outside of the building in which the MFC and the BF units were installed. A skimmer tank (110 gal) was installed after the influent tank to minimize the content of solids fed to the MFC (Figure 5.10). The wastewater flow and level in the wet well was not sufficient during the holidays and overnight to allow a continuous operation of the MFC, thus the flow was switched off during that period. To overcome this issue of insufficient flow, a 500 gal tank and submersible pump were installed after the initial startup period after one month of operation to ensure sufficient wastewater for operating the MFC overnight. The wastewater flow was varied between 0.2 gpm and 1.0 gpm. Flow rates at the high end of this range resulted in the flooding of the cathode module closer to the influent manifold. The wastewater was heated to approximately 30oC to avoid freezing damage to the reactor during winter months and allow the bacteria to operate close their optimal temperature.
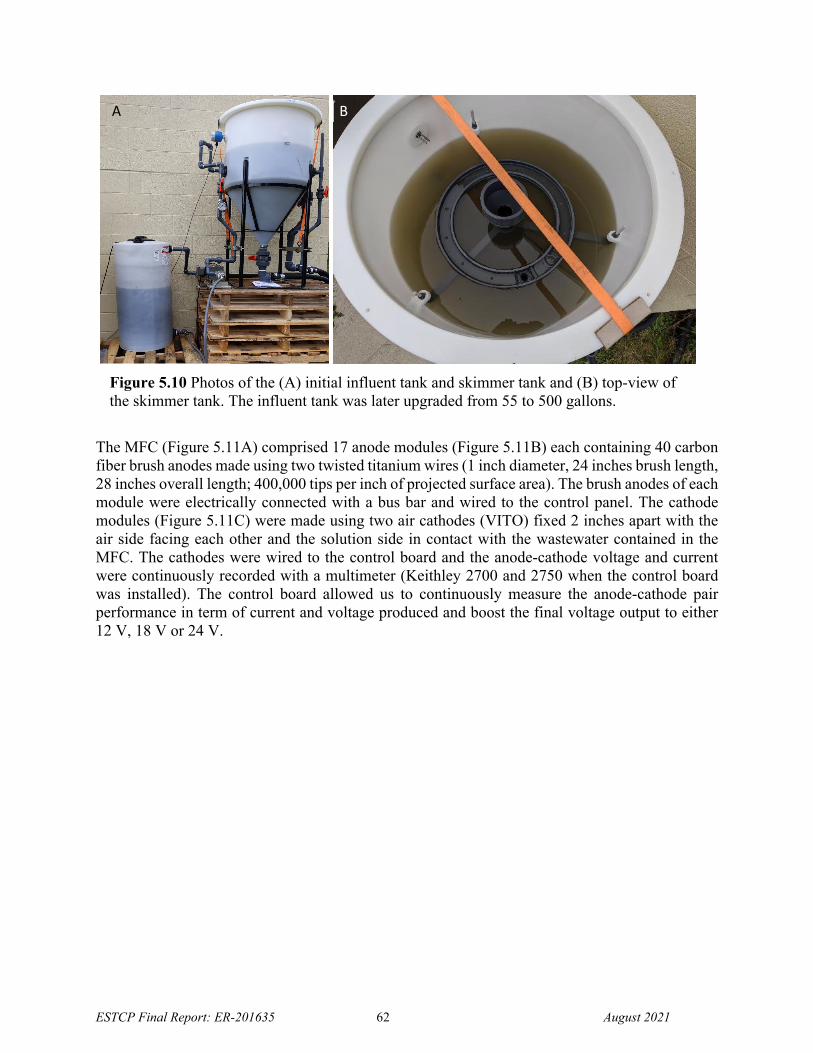
ESTCP Final Report: ER-201635 62 August 2021
The MFC (Figure 5.11A) comprised 17 anode modules (Figure 5.11B) each containing 40 carbon fiber brush anodes made using two twisted titanium wires (1 inch diameter, 24 inches brush length, 28 inches overall length; 400,000 tips per inch of projected surface area). The brush anodes of each module were electrically connected with a bus bar and wired to the control panel. The cathode modules (Figure 5.11C) were made using two air cathodes (VITO) fixed 2 inches apart with the air side facing each other and the solution side in contact with the wastewater contained in the MFC. The cathodes were wired to the control board and the anode-cathode voltage and current were continuously recorded with a multimeter (Keithley 2700 and 2750 when the control board was installed). The control board allowed us to continuously measure the anode-cathode pair performance in term of current and voltage produced and boost the final voltage output to either 12 V, 18 V or 24 V.
Figure 5.10 Photos of the (A) initial influent tank and skimmer tank and (B) top-view of the skimmer tank. The influent tank was later upgraded from 55 to 500 gallons.
A B
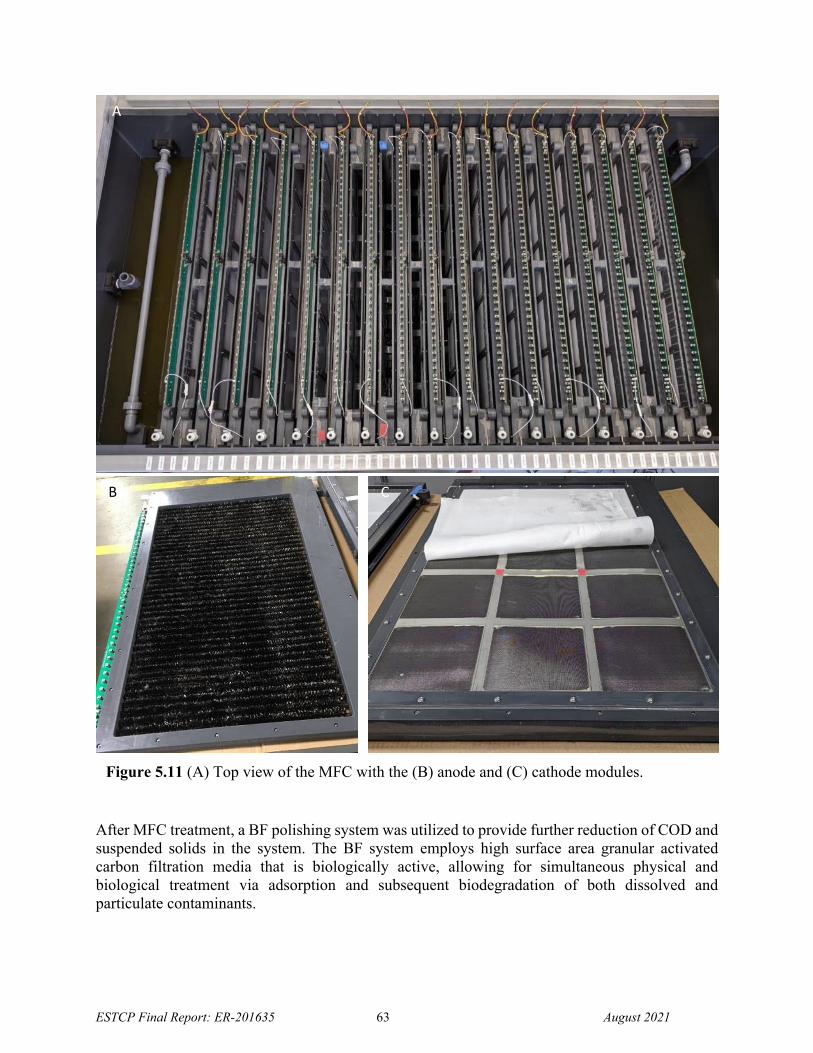
ESTCP Final Report: ER-201635 63 August 2021
After MFC treatment, a BF polishing system was utilized to provide further reduction of COD and suspended solids in the system. The BF system employs high surface area granular activated carbon filtration media that is biologically active, allowing for simultaneous physical and biological treatment via adsorption and subsequent biodegradation of both dissolved and particulate contaminants.
Figure 5.11 (A) Top view of the MFC with the (B) anode and (C) cathode modules.
A
B C
ESTCP Final Report: ER-201635 64 August 2021
The BF system operated intermittently, whereby water is passed through the GAC media in an upflow manner at a surface loading rate of 4 L min-1 m-2 for 6 h, followed by a 6-h bioregeneration phase in which the filter is drained. The adsorption capacity of the media is recovered during the bioregeneration phase as microbes consume the adsorbed organic contaminants in the presence of oxygen that flows into the filter bed during liquid draining. This approach promotes aerobic treatment without the high energy requirements of conventional aeration. Thus, it is a good complementary technology to be used in conjunction with low-energy MFC technology. For the demonstration, two upflow columns were operated in parallel on alternate cycles for 6 h each. The filters will be automatically cleaned to remove accumulated biomass at a daily interval, though the cleaning cycle may be optimized further. Automatic cleaning is achieved by cycling of water and compressed air in an upflow manner through the filter for five minutes and then draining the resulting biomass suspension to waste. The field demonstration was conducted to fully characterize the electrochemical and system performance of the MFC and BF units. The startup included inoculation of the bioreactors and initiation of biological activity. Startup was conducted by inoculating the MFC with a bacterial consortium developed in the Logan laboratory at Penn State by collecting the effluent of several small- and bench-scale bioelectrochemical systems with the combined blackwater/gray water stream. The completion of the startup was assessed by measuring a steady voltage and current output for each MFC module over a three-day period. Once stable operation was achieved the performance of the MFC and BF were evaluated over a six-month period. Wastewater quality was routinely monitored by measuring BOD5/COD/TSS removal, fecal coliforms, E. coli, turbidity, ammonia, nitrate, nitrite, total phosphorus, sulfide, and pH. The voltage and the current produced by the MFC was continuously measured and the mass of sludge produced and its TSS and VSS content were measured before decommissioning the system. Manual grab samples were collected from 3 locations (influent, MFC effluent/BF influent, and BF effluent) and analyzed either immediately or within 24 h. These analyses allow evaluation of system performance and compliance with USEPA standards for secondary treatment and potentially applicable standards for nutrient removal. 5.5 FIELD TESTING The phases of field testing included Mobilization, Installation, Commissioning, Intermittent Operation, Continuous Operation, Shutdown, and Demobilization. Throughout the 6-month test period, there were brief phases of temporary shutdown that occurred due to low occupancy and associated lack of wastewater availability for extended periods, such as holiday breaks. There were also brief periods of inoperability due to slip stream hoses clogging due to debris or freezing conditions. These periods of inoperability were not due to issues with the performance or function of the MFC-BF system. Rather, they were associated with the slip stream system that was temporarily installed by the research team at the wastewater plant facility. Mobilization. The MFC and BF systems were delivered on a 20’ tow-behind trailer to the test site. The two skids were moved into the pilot test building and positioned using an off road forklift with support from Tobyhanna Army Depot.
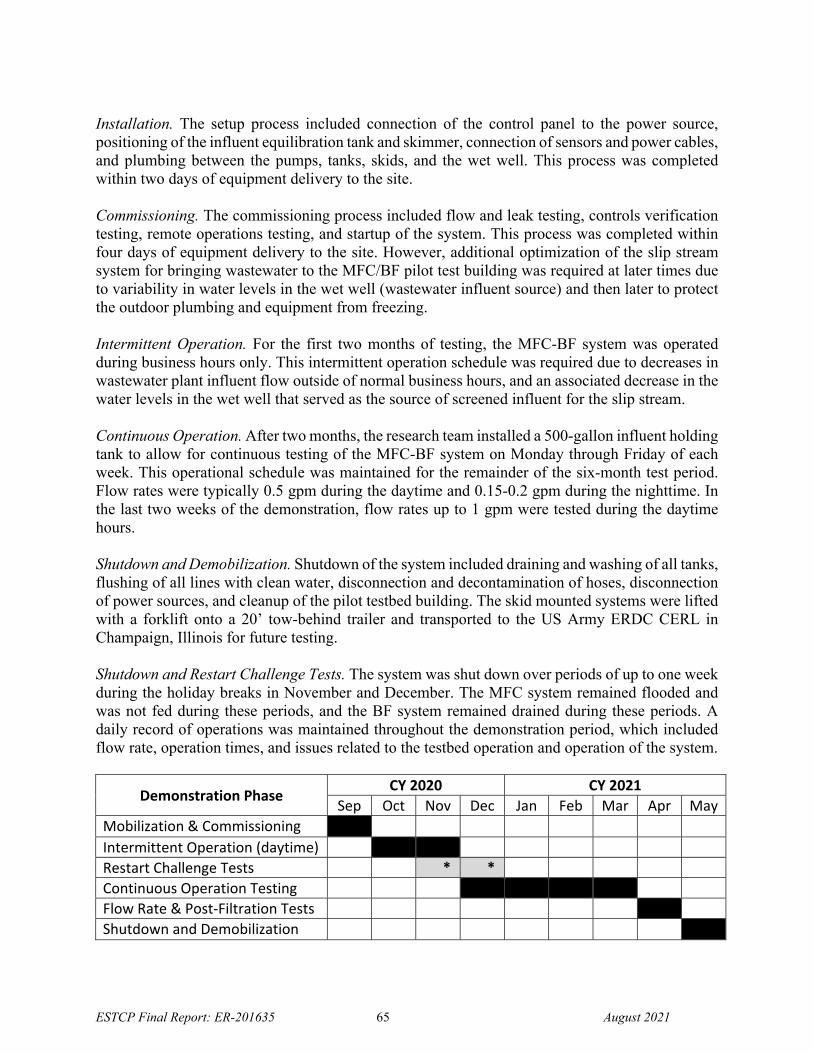
ESTCP Final Report: ER-201635 65 August 2021
Installation. The setup process included connection of the control panel to the power source, positioning of the influent equilibration tank and skimmer, connection of sensors and power cables, and plumbing between the pumps, tanks, skids, and the wet well. This process was completed within two days of equipment delivery to the site. Commissioning. The commissioning process included flow and leak testing, controls verification testing, remote operations testing, and startup of the system. This process was completed within four days of equipment delivery to the site. However, additional optimization of the slip stream system for bringing wastewater to the MFC/BF pilot test building was required at later times due to variability in water levels in the wet well (wastewater influent source) and then later to protect the outdoor plumbing and equipment from freezing. Intermittent Operation. For the first two months of testing, the MFC-BF system was operated during business hours only. This intermittent operation schedule was required due to decreases in wastewater plant influent flow outside of normal business hours, and an associated decrease in the water levels in the wet well that served as the source of screened influent for the slip stream. Continuous Operation. After two months, the research team installed a 500-gallon influent holding tank to allow for continuous testing of the MFC-BF system on Monday through Friday of each week. This operational schedule was maintained for the remainder of the six-month test period. Flow rates were typically 0.5 gpm during the daytime and 0.15-0.2 gpm during the nighttime. In the last two weeks of the demonstration, flow rates up to 1 gpm were tested during the daytime hours. Shutdown and Demobilization. Shutdown of the system included draining and washing of all tanks, flushing of all lines with clean water, disconnection and decontamination of hoses, disconnection of power sources, and cleanup of the pilot testbed building. The skid mounted systems were lifted with a forklift onto a 20’ tow-behind trailer and transported to the US Army ERDC CERL in Champaign, Illinois for future testing. Shutdown and Restart Challenge Tests. The system was shut down over periods of up to one week during the holiday breaks in November and December. The MFC system remained flooded and was not fed during these periods, and the BF system remained drained during these periods. A daily record of operations was maintained throughout the demonstration period, which included flow rate, operation times, and issues related to the testbed operation and operation of the system.
Demonstration Phase CY 2020 CY 2021
Sep Oct Nov Dec Jan Feb Mar Apr May
Mobilization & Commissioning
Intermittent Operation (daytime)
Restart Challenge Tests * *
Continuous Operation Testing
Flow Rate & Post‐Filtration Tests
Shutdown and Demobilization
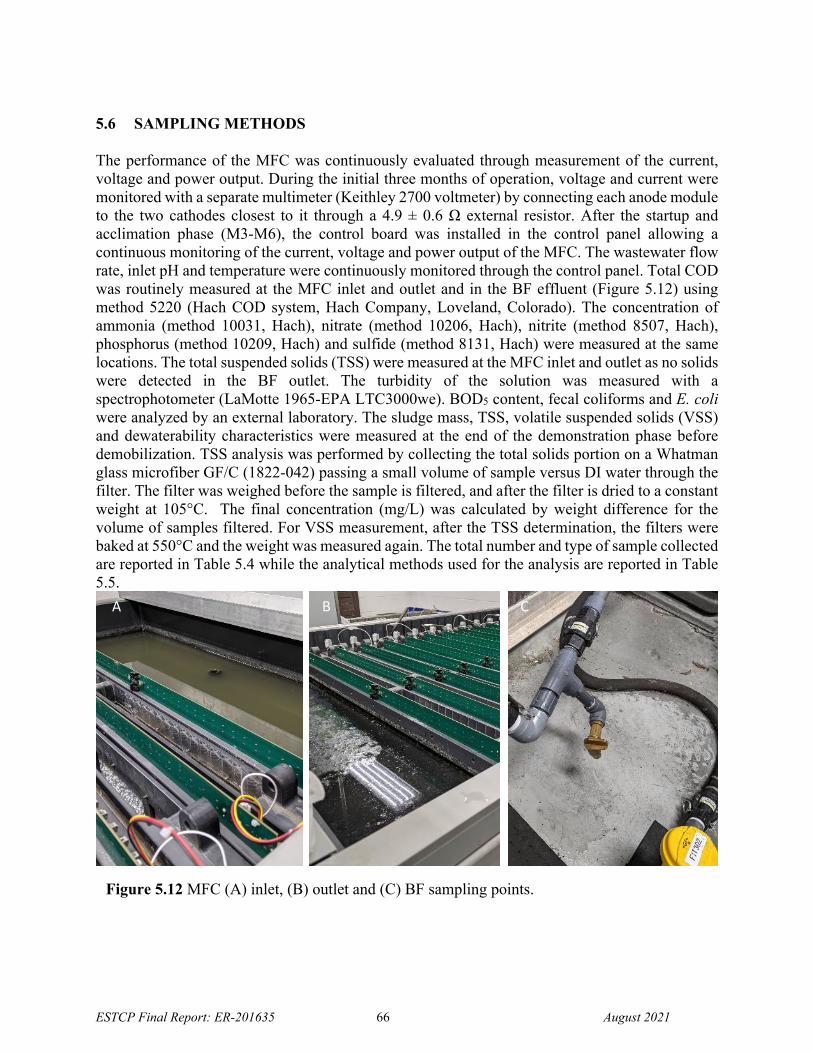
ESTCP Final Report: ER-201635 66 August 2021
5.6 SAMPLING METHODS
The performance of the MFC was continuously evaluated through measurement of the current, voltage and power output. During the initial three months of operation, voltage and current were monitored with a separate multimeter (Keithley 2700 voltmeter) by connecting each anode module to the two cathodes closest to it through a 4.9 ± 0.6 Ω external resistor. After the startup and acclimation phase (M3-M6), the control board was installed in the control panel allowing a continuous monitoring of the current, voltage and power output of the MFC. The wastewater flow rate, inlet pH and temperature were continuously monitored through the control panel. Total COD was routinely measured at the MFC inlet and outlet and in the BF effluent (Figure 5.12) using method 5220 (Hach COD system, Hach Company, Loveland, Colorado). The concentration of ammonia (method 10031, Hach), nitrate (method 10206, Hach), nitrite (method 8507, Hach), phosphorus (method 10209, Hach) and sulfide (method 8131, Hach) were measured at the same locations. The total suspended solids (TSS) were measured at the MFC inlet and outlet as no solids were detected in the BF outlet. The turbidity of the solution was measured with a spectrophotometer (LaMotte 1965-EPA LTC3000we). BOD5 content, fecal coliforms and E. coli were analyzed by an external laboratory. The sludge mass, TSS, volatile suspended solids (VSS) and dewaterability characteristics were measured at the end of the demonstration phase before demobilization. TSS analysis was performed by collecting the total solids portion on a Whatman glass microfiber GF/C (1822-042) passing a small volume of sample versus DI water through the filter. The filter was weighed before the sample is filtered, and after the filter is dried to a constant weight at 105°C. The final concentration (mg/L) was calculated by weight difference for the volume of samples filtered. For VSS measurement, after the TSS determination, the filters were baked at 550°C and the weight was measured again. The total number and type of sample collected are reported in Table 5.4 while the analytical methods used for the analysis are reported in Table 5.5.
Figure 5.12 MFC (A) inlet, (B) outlet and (C) BF sampling points.
A B C
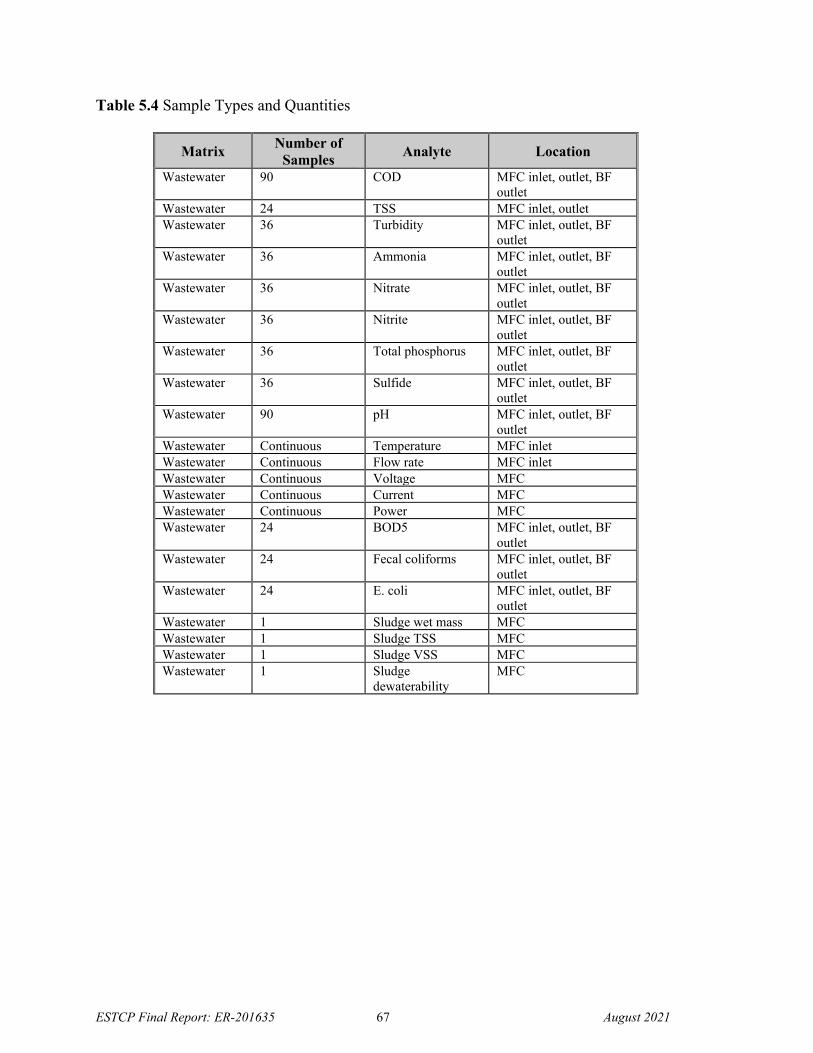
ESTCP Final Report: ER-201635 67 August 2021
Table 5.4 Sample Types and Quantities
Matrix Number of
Samples Analyte Location
Wastewater 90 COD MFC inlet, outlet, BF outlet
Wastewater 24 TSS MFC inlet, outlet Wastewater 36 Turbidity MFC inlet, outlet, BF
outlet Wastewater 36 Ammonia MFC inlet, outlet, BF
outlet Wastewater 36 Nitrate MFC inlet, outlet, BF
outlet Wastewater 36 Nitrite MFC inlet, outlet, BF
outlet Wastewater 36 Total phosphorus MFC inlet, outlet, BF
outlet Wastewater 36 Sulfide MFC inlet, outlet, BF
outlet Wastewater 90 pH MFC inlet, outlet, BF
outlet Wastewater Continuous Temperature MFC inlet Wastewater Continuous Flow rate MFC inlet Wastewater Continuous Voltage MFC Wastewater Continuous Current MFC Wastewater Continuous Power MFC Wastewater 24 BOD5 MFC inlet, outlet, BF
outlet Wastewater 24 Fecal coliforms MFC inlet, outlet, BF
outlet Wastewater 24 E. coli MFC inlet, outlet, BF
outlet Wastewater 1 Sludge wet mass MFC Wastewater 1 Sludge TSS MFC Wastewater 1 Sludge VSS MFC Wastewater 1 Sludge
dewaterability MFC
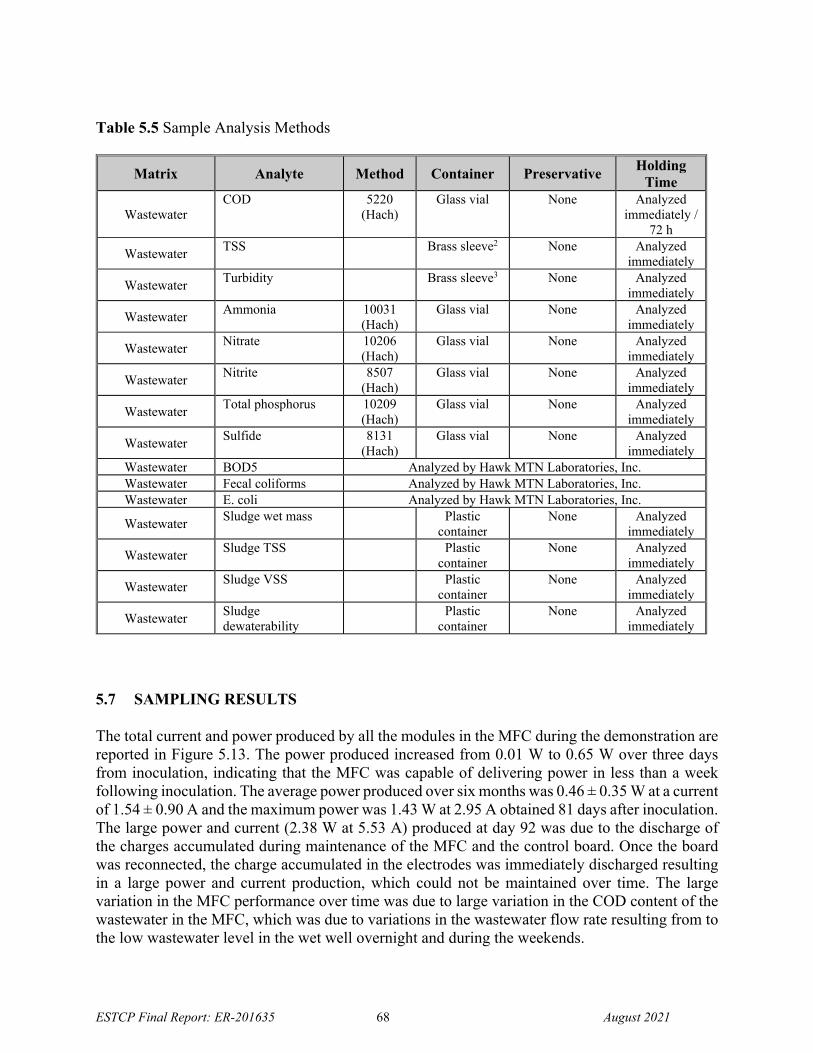
ESTCP Final Report: ER-201635 68 August 2021
Table 5.5 Sample Analysis Methods
Matrix Analyte Method Container Preservative Holding
Time
Wastewater COD 5220
(Hach) Glass vial None Analyzed
immediately / 72 h
Wastewater TSS Brass sleeve2 None Analyzed
immediately
Wastewater Turbidity Brass sleeve3 None Analyzed
immediately
Wastewater Ammonia 10031
(Hach) Glass vial None Analyzed
immediately
Wastewater Nitrate 10206
(Hach) Glass vial None Analyzed
immediately
Wastewater Nitrite 8507
(Hach) Glass vial None Analyzed
immediately
Wastewater Total phosphorus 10209
(Hach) Glass vial None Analyzed
immediately
Wastewater Sulfide 8131
(Hach) Glass vial None Analyzed
immediately Wastewater BOD5 Analyzed by Hawk MTN Laboratories, Inc. Wastewater Fecal coliforms Analyzed by Hawk MTN Laboratories, Inc. Wastewater E. coli Analyzed by Hawk MTN Laboratories, Inc.
Wastewater Sludge wet mass Plastic
container None Analyzed
immediately
Wastewater Sludge TSS Plastic
container None Analyzed
immediately
Wastewater Sludge VSS Plastic
container None Analyzed
immediately
Wastewater Sludge dewaterability
Plastic container
None Analyzed immediately
5.7 SAMPLING RESULTS
The total current and power produced by all the modules in the MFC during the demonstration are reported in Figure 5.13. The power produced increased from 0.01 W to 0.65 W over three days from inoculation, indicating that the MFC was capable of delivering power in less than a week following inoculation. The average power produced over six months was 0.46 ± 0.35 W at a current of 1.54 ± 0.90 A and the maximum power was 1.43 W at 2.95 A obtained 81 days after inoculation. The large power and current (2.38 W at 5.53 A) produced at day 92 was due to the discharge of the charges accumulated during maintenance of the MFC and the control board. Once the board was reconnected, the charge accumulated in the electrodes was immediately discharged resulting in a large power and current production, which could not be maintained over time. The large variation in the MFC performance over time was due to large variation in the COD content of the wastewater in the MFC, which was due to variations in the wastewater flow rate resulting from to the low wastewater level in the wet well overnight and during the weekends.
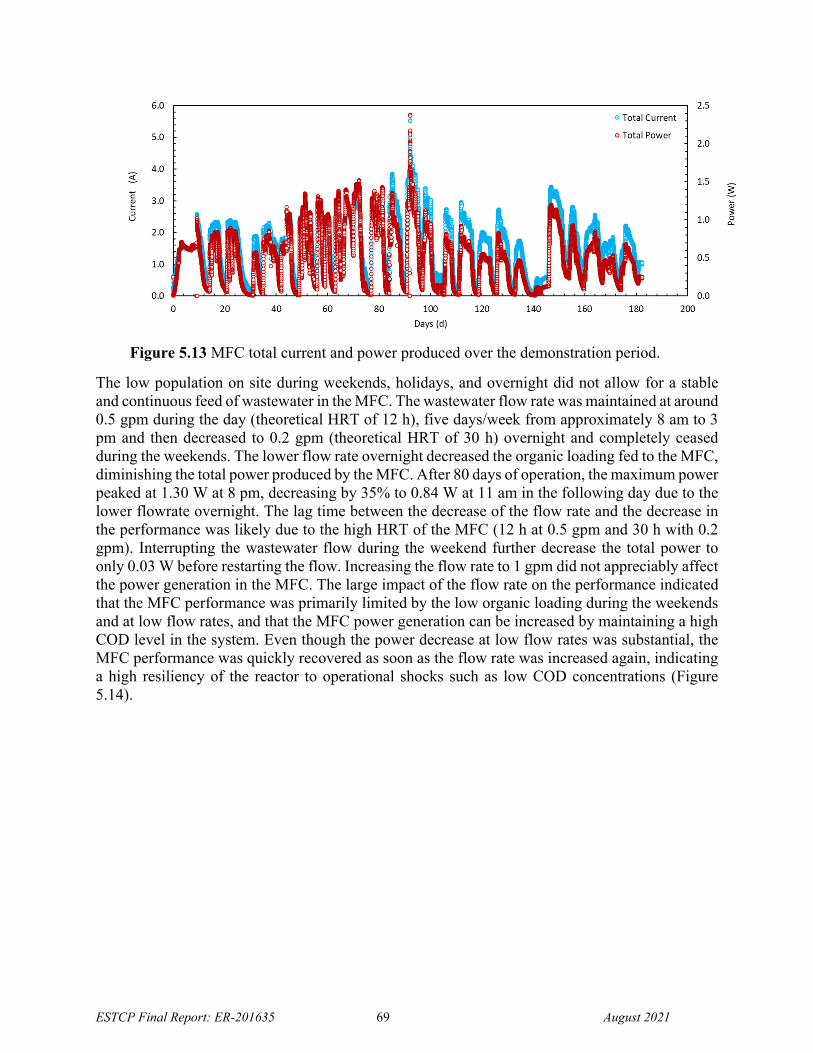
ESTCP Final Report: ER-201635 69 August 2021
The low population on site during weekends, holidays, and overnight did not allow for a stable and continuous feed of wastewater in the MFC. The wastewater flow rate was maintained at around 0.5 gpm during the day (theoretical HRT of 12 h), five days/week from approximately 8 am to 3 pm and then decreased to 0.2 gpm (theoretical HRT of 30 h) overnight and completely ceased during the weekends. The lower flow rate overnight decreased the organic loading fed to the MFC, diminishing the total power produced by the MFC. After 80 days of operation, the maximum power peaked at 1.30 W at 8 pm, decreasing by 35% to 0.84 W at 11 am in the following day due to the lower flowrate overnight. The lag time between the decrease of the flow rate and the decrease in the performance was likely due to the high HRT of the MFC (12 h at 0.5 gpm and 30 h with 0.2 gpm). Interrupting the wastewater flow during the weekend further decrease the total power to only 0.03 W before restarting the flow. Increasing the flow rate to 1 gpm did not appreciably affect the power generation in the MFC. The large impact of the flow rate on the performance indicated that the MFC performance was primarily limited by the low organic loading during the weekends and at low flow rates, and that the MFC power generation can be increased by maintaining a high COD level in the system. Even though the power decrease at low flow rates was substantial, the MFC performance was quickly recovered as soon as the flow rate was increased again, indicating a high resiliency of the reactor to operational shocks such as low COD concentrations (Figure 5.14).
Figure 5.13 MFC total current and power produced over the demonstration period.
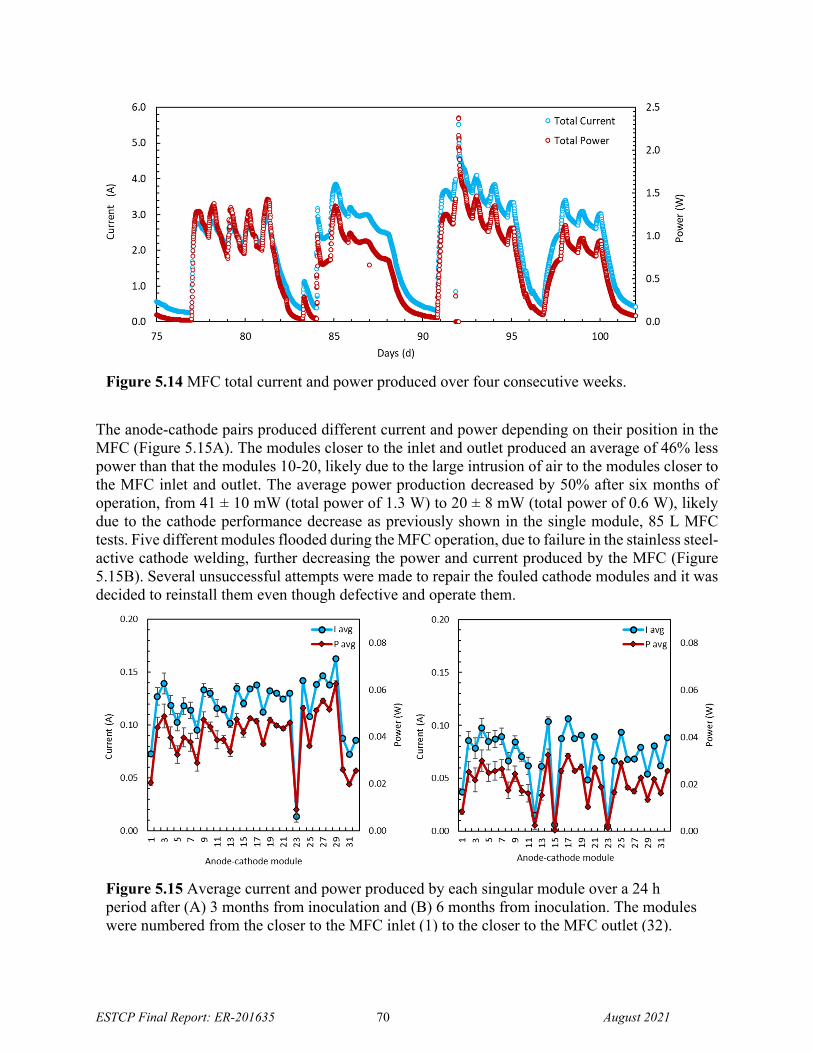
ESTCP Final Report: ER-201635 70 August 2021
The anode-cathode pairs produced different current and power depending on their position in the MFC (Figure 5.15A). The modules closer to the inlet and outlet produced an average of 46% less power than that the modules 10-20, likely due to the large intrusion of air to the modules closer to the MFC inlet and outlet. The average power production decreased by 50% after six months of operation, from 41 ± 10 mW (total power of 1.3 W) to 20 ± 8 mW (total power of 0.6 W), likely due to the cathode performance decrease as previously shown in the single module, 85 L MFC tests. Five different modules flooded during the MFC operation, due to failure in the stainless steel-active cathode welding, further decreasing the power and current produced by the MFC (Figure 5.15B). Several unsuccessful attempts were made to repair the fouled cathode modules and it was decided to reinstall them even though defective and operate them.
Figure 5.14 MFC total current and power produced over four consecutive weeks.
Figure 5.15 Average current and power produced by each singular module over a 24 h period after (A) 3 months from inoculation and (B) 6 months from inoculation. The modules were numbered from the closer to the MFC inlet (1) to the closer to the MFC outlet (32).
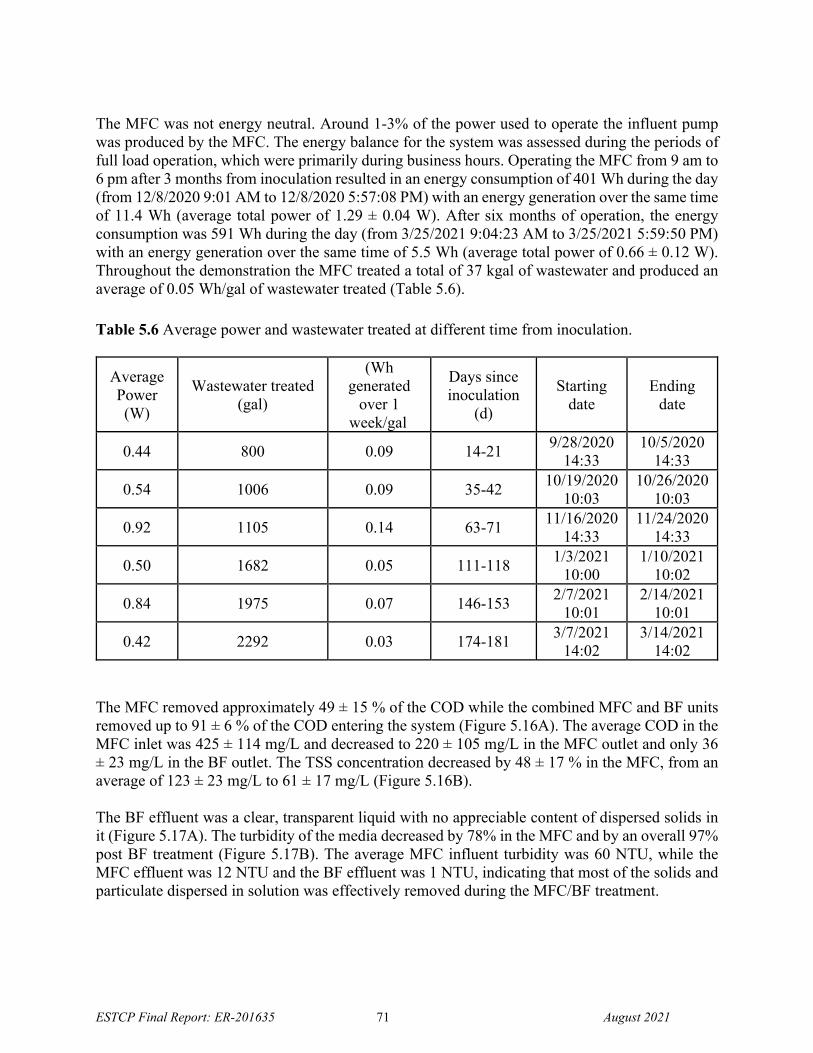
ESTCP Final Report: ER-201635 71 August 2021
The MFC was not energy neutral. Around 1-3% of the power used to operate the influent pump was produced by the MFC. The energy balance for the system was assessed during the periods of full load operation, which were primarily during business hours. Operating the MFC from 9 am to 6 pm after 3 months from inoculation resulted in an energy consumption of 401 Wh during the day (from 12/8/2020 9:01 AM to 12/8/2020 5:57:08 PM) with an energy generation over the same time of 11.4 Wh (average total power of 1.29 ± 0.04 W). After six months of operation, the energy consumption was 591 Wh during the day (from 3/25/2021 9:04:23 AM to 3/25/2021 5:59:50 PM) with an energy generation over the same time of 5.5 Wh (average total power of 0.66 ± 0.12 W). Throughout the demonstration the MFC treated a total of 37 kgal of wastewater and produced an average of 0.05 Wh/gal of wastewater treated (Table 5.6).
Table 5.6 Average power and wastewater treated at different time from inoculation.
Average Power (W)
Wastewater treated (gal)
(Wh generated
over 1 week/gal
Days since inoculation
(d)
Starting date
Ending date
0.44 800 0.09 14-21 9/28/2020
14:33 10/5/2020
14:33
0.54 1006 0.09 35-42 10/19/2020
10:03 10/26/2020
10:03
0.92 1105 0.14 63-71 11/16/2020
14:33 11/24/2020
14:33
0.50 1682 0.05 111-118 1/3/2021
10:00 1/10/2021
10:02
0.84 1975 0.07 146-153 2/7/2021
10:01 2/14/2021
10:01
0.42 2292 0.03 174-181 3/7/2021
14:02 3/14/2021
14:02 The MFC removed approximately 49 ± 15 % of the COD while the combined MFC and BF units removed up to 91 ± 6 % of the COD entering the system (Figure 5.16A). The average COD in the MFC inlet was 425 ± 114 mg/L and decreased to 220 ± 105 mg/L in the MFC outlet and only 36 ± 23 mg/L in the BF outlet. The TSS concentration decreased by 48 ± 17 % in the MFC, from an average of 123 ± 23 mg/L to 61 ± 17 mg/L (Figure 5.16B).
The BF effluent was a clear, transparent liquid with no appreciable content of dispersed solids in it (Figure 5.17A). The turbidity of the media decreased by 78% in the MFC and by an overall 97% post BF treatment (Figure 5.17B). The average MFC influent turbidity was 60 NTU, while the MFC effluent was 12 NTU and the BF effluent was 1 NTU, indicating that most of the solids and particulate dispersed in solution was effectively removed during the MFC/BF treatment.
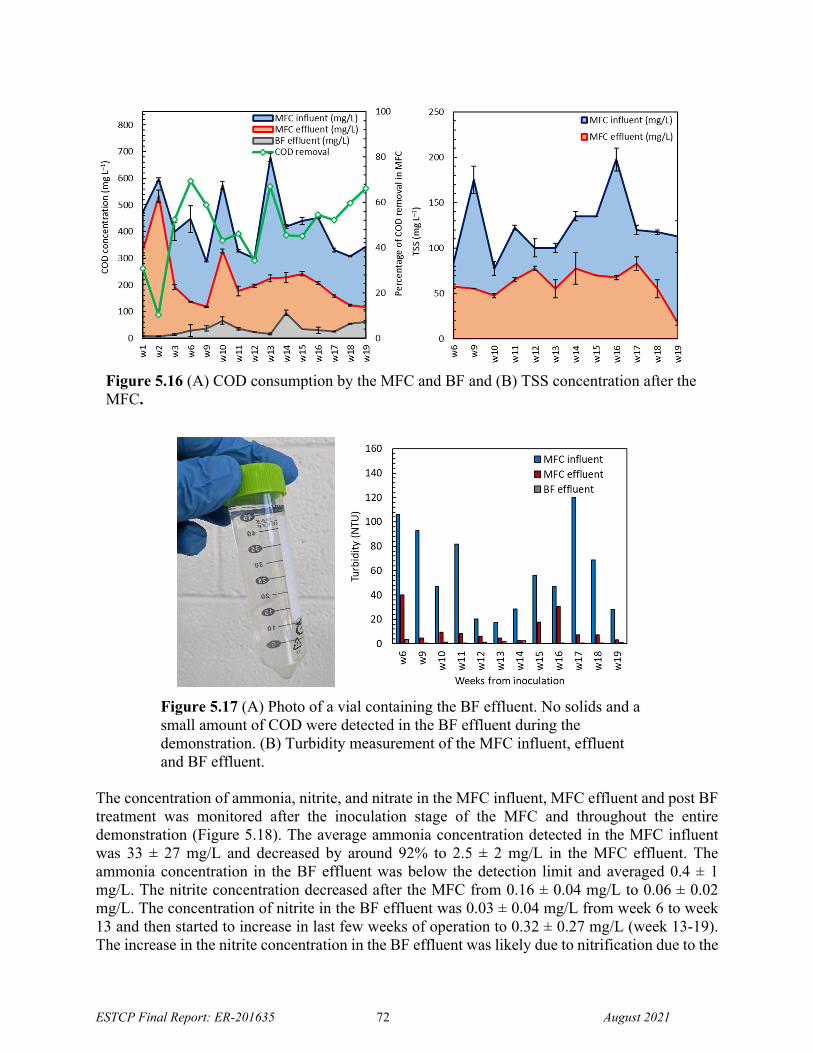
ESTCP Final Report: ER-201635 72 August 2021
The concentration of ammonia, nitrite, and nitrate in the MFC influent, MFC effluent and post BF treatment was monitored after the inoculation stage of the MFC and throughout the entire demonstration (Figure 5.18). The average ammonia concentration detected in the MFC influent was 33 ± 27 mg/L and decreased by around 92% to 2.5 ± 2 mg/L in the MFC effluent. The ammonia concentration in the BF effluent was below the detection limit and averaged 0.4 ± 1 mg/L. The nitrite concentration decreased after the MFC from 0.16 ± 0.04 mg/L to 0.06 ± 0.02 mg/L. The concentration of nitrite in the BF effluent was 0.03 ± 0.04 mg/L from week 6 to week 13 and then started to increase in last few weeks of operation to 0.32 ± 0.27 mg/L (week 13-19). The increase in the nitrite concentration in the BF effluent was likely due to nitrification due to the
Figure 5.16 (A) COD consumption by the MFC and BF and (B) TSS concentration after the MFC.
Figure 5.17 (A) Photo of a vial containing the BF effluent. No solids and a small amount of COD were detected in the BF effluent during the demonstration. (B) Turbidity measurement of the MFC influent, effluent and BF effluent.
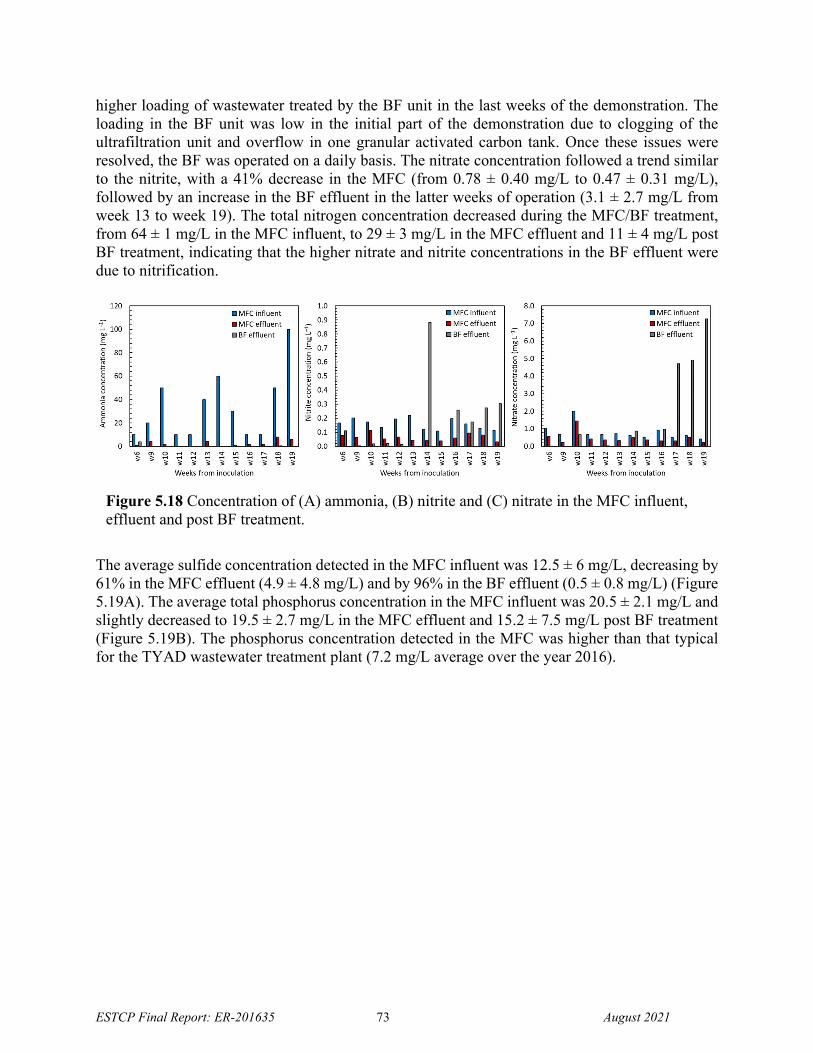
ESTCP Final Report: ER-201635 73 August 2021
higher loading of wastewater treated by the BF unit in the last weeks of the demonstration. The loading in the BF unit was low in the initial part of the demonstration due to clogging of the ultrafiltration unit and overflow in one granular activated carbon tank. Once these issues were resolved, the BF was operated on a daily basis. The nitrate concentration followed a trend similar to the nitrite, with a 41% decrease in the MFC (from 0.78 ± 0.40 mg/L to 0.47 ± 0.31 mg/L), followed by an increase in the BF effluent in the latter weeks of operation (3.1 ± 2.7 mg/L from week 13 to week 19). The total nitrogen concentration decreased during the MFC/BF treatment, from 64 ± 1 mg/L in the MFC influent, to 29 ± 3 mg/L in the MFC effluent and 11 ± 4 mg/L post BF treatment, indicating that the higher nitrate and nitrite concentrations in the BF effluent were due to nitrification.
The average sulfide concentration detected in the MFC influent was 12.5 ± 6 mg/L, decreasing by 61% in the MFC effluent (4.9 ± 4.8 mg/L) and by 96% in the BF effluent (0.5 ± 0.8 mg/L) (Figure 5.19A). The average total phosphorus concentration in the MFC influent was 20.5 ± 2.1 mg/L and slightly decreased to 19.5 ± 2.7 mg/L in the MFC effluent and 15.2 ± 7.5 mg/L post BF treatment (Figure 5.19B). The phosphorus concentration detected in the MFC was higher than that typical for the TYAD wastewater treatment plant (7.2 mg/L average over the year 2016).
Figure 5.18 Concentration of (A) ammonia, (B) nitrite and (C) nitrate in the MFC influent, effluent and post BF treatment.
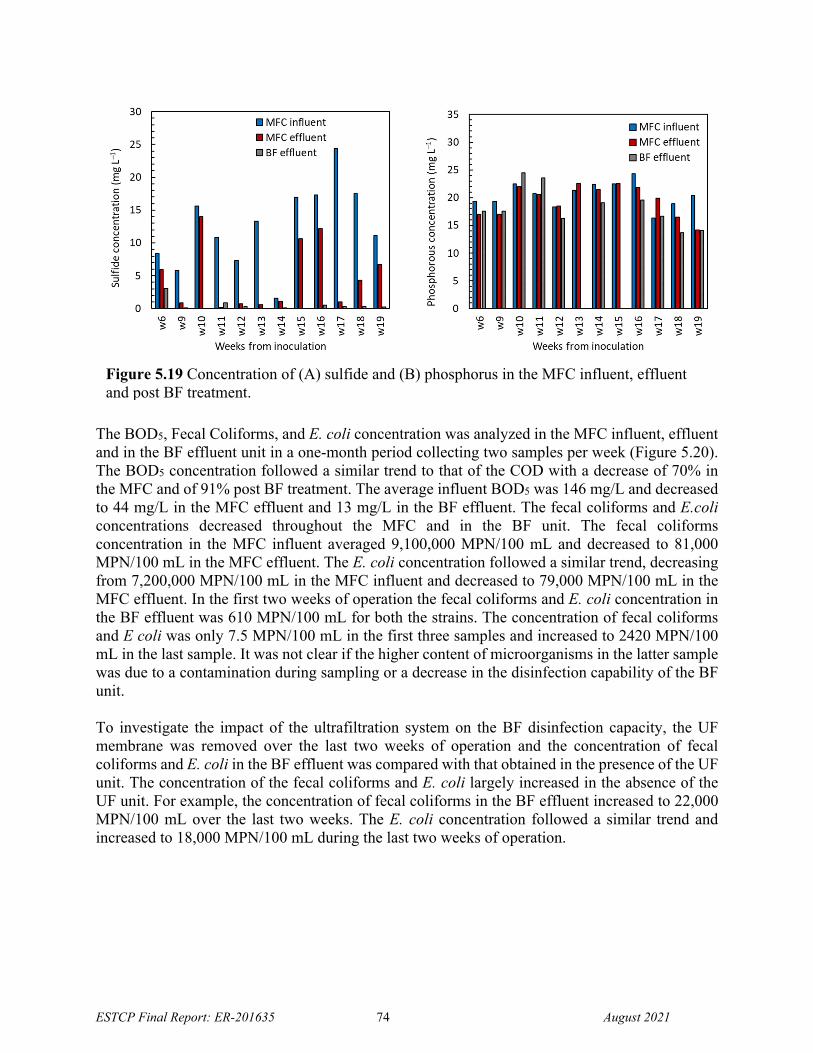
ESTCP Final Report: ER-201635 74 August 2021
The BOD5, Fecal Coliforms, and E. coli concentration was analyzed in the MFC influent, effluent and in the BF effluent unit in a one-month period collecting two samples per week (Figure 5.20). The BOD5 concentration followed a similar trend to that of the COD with a decrease of 70% in the MFC and of 91% post BF treatment. The average influent BOD5 was 146 mg/L and decreased to 44 mg/L in the MFC effluent and 13 mg/L in the BF effluent. The fecal coliforms and E.coli concentrations decreased throughout the MFC and in the BF unit. The fecal coliforms concentration in the MFC influent averaged 9,100,000 MPN/100 mL and decreased to 81,000 MPN/100 mL in the MFC effluent. The E. coli concentration followed a similar trend, decreasing from 7,200,000 MPN/100 mL in the MFC influent and decreased to 79,000 MPN/100 mL in the MFC effluent. In the first two weeks of operation the fecal coliforms and E. coli concentration in the BF effluent was 610 MPN/100 mL for both the strains. The concentration of fecal coliforms and E coli was only 7.5 MPN/100 mL in the first three samples and increased to 2420 MPN/100 mL in the last sample. It was not clear if the higher content of microorganisms in the latter sample was due to a contamination during sampling or a decrease in the disinfection capability of the BF unit. To investigate the impact of the ultrafiltration system on the BF disinfection capacity, the UF membrane was removed over the last two weeks of operation and the concentration of fecal coliforms and E. coli in the BF effluent was compared with that obtained in the presence of the UF unit. The concentration of the fecal coliforms and E. coli largely increased in the absence of the UF unit. For example, the concentration of fecal coliforms in the BF effluent increased to 22,000 MPN/100 mL over the last two weeks. The E. coli concentration followed a similar trend and increased to 18,000 MPN/100 mL during the last two weeks of operation.
Figure 5.19 Concentration of (A) sulfide and (B) phosphorus in the MFC influent, effluent and post BF treatment.
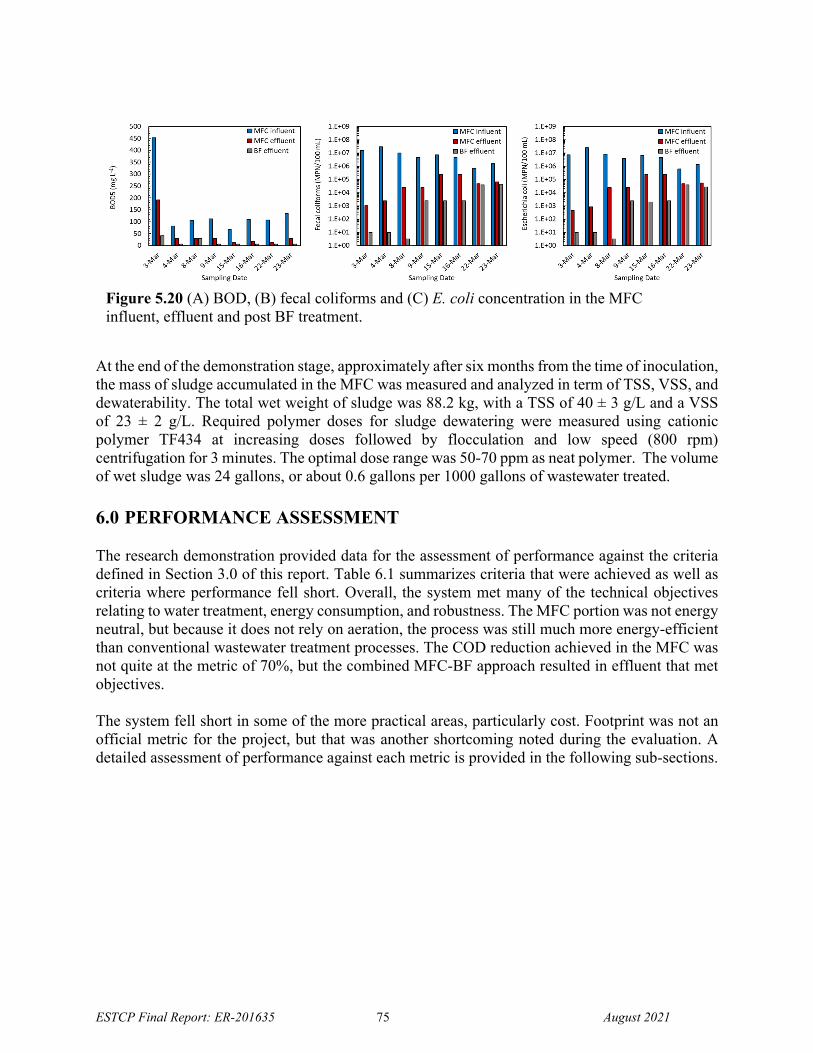
ESTCP Final Report: ER-201635 75 August 2021
At the end of the demonstration stage, approximately after six months from the time of inoculation, the mass of sludge accumulated in the MFC was measured and analyzed in term of TSS, VSS, and dewaterability. The total wet weight of sludge was 88.2 kg, with a TSS of 40 ± 3 g/L and a VSS of 23 ± 2 g/L. Required polymer doses for sludge dewatering were measured using cationic polymer TF434 at increasing doses followed by flocculation and low speed (800 rpm) centrifugation for 3 minutes. The optimal dose range was 50-70 ppm as neat polymer. The volume of wet sludge was 24 gallons, or about 0.6 gallons per 1000 gallons of wastewater treated. 6.0 PERFORMANCE ASSESSMENT The research demonstration provided data for the assessment of performance against the criteria defined in Section 3.0 of this report. Table 6.1 summarizes criteria that were achieved as well as criteria where performance fell short. Overall, the system met many of the technical objectives relating to water treatment, energy consumption, and robustness. The MFC portion was not energy neutral, but because it does not rely on aeration, the process was still much more energy-efficient than conventional wastewater treatment processes. The COD reduction achieved in the MFC was not quite at the metric of 70%, but the combined MFC-BF approach resulted in effluent that met objectives. The system fell short in some of the more practical areas, particularly cost. Footprint was not an official metric for the project, but that was another shortcoming noted during the evaluation. A detailed assessment of performance against each metric is provided in the following sub-sections.
Figure 5.20 (A) BOD, (B) fecal coliforms and (C) E. coli concentration in the MFC influent, effluent and post BF treatment.
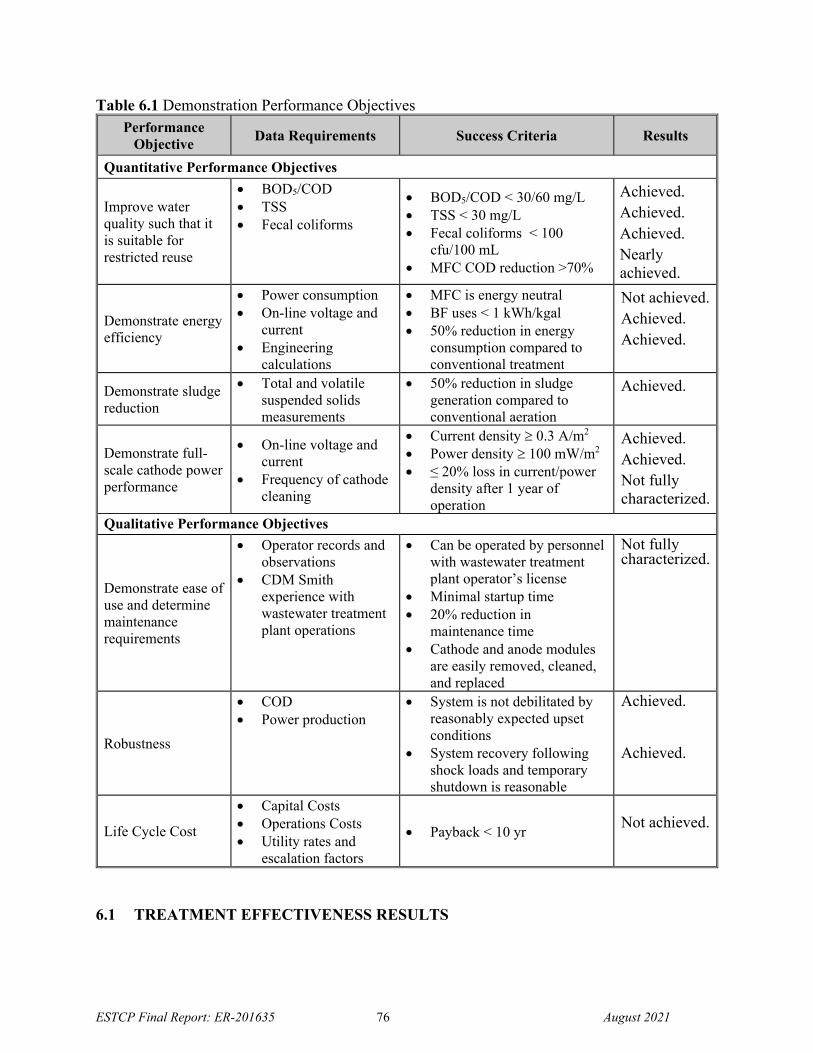
ESTCP Final Report: ER-201635 76 August 2021
Table 6.1 Demonstration Performance Objectives Performance
Objective Data Requirements Success Criteria Results
Quantitative Performance Objectives
Improve water quality such that it is suitable for restricted reuse
BOD5/COD TSS Fecal coliforms
BOD5/COD < 30/60 mg/L TSS < 30 mg/L Fecal coliforms < 100
cfu/100 mL MFC COD reduction >70%
Achieved. Achieved. Achieved. Nearly achieved.
Demonstrate energy efficiency
Power consumption On-line voltage and
current Engineering
calculations
MFC is energy neutral BF uses < 1 kWh/kgal 50% reduction in energy
consumption compared to conventional treatment
Not achieved. Achieved. Achieved.
Demonstrate sludge reduction
Total and volatile suspended solids measurements
50% reduction in sludge generation compared to conventional aeration
Achieved.
Demonstrate full-scale cathode power performance
On-line voltage and current
Frequency of cathode cleaning
Current density 0.3 A/m2 Power density 100 mW/m2 ≤ 20% loss in current/power
density after 1 year of operation
Achieved. Achieved. Not fully characterized.
Qualitative Performance Objectives
Demonstrate ease of use and determine maintenance requirements
Operator records and observations
CDM Smith experience with wastewater treatment plant operations
Can be operated by personnel with wastewater treatment plant operator’s license
Minimal startup time 20% reduction in
maintenance time Cathode and anode modules
are easily removed, cleaned, and replaced
Not fully characterized.
Robustness
COD Power production
System is not debilitated by reasonably expected upset conditions
System recovery following shock loads and temporary shutdown is reasonable
Achieved. Achieved.
Life Cycle Cost
Capital Costs Operations Costs Utility rates and
escalation factors
Payback < 10 yr
Not achieved.
6.1 TREATMENT EFFECTIVENESS RESULTS
ESTCP Final Report: ER-201635 77 August 2021
The source water in this study met requirements for being representative of municipal wastewater in terms of organic and particulate contamination levels. The effluent water met the water quality criteria that were based in part on guidelines for restricted water reuse. The MFC and BF technologies each contributed significantly to the overall treatment performance.
Objective Metrics Results
Improve water quality such that it is suitable for restricted reuse
BOD5 < 30 mg/L COD < 60 mg/L TSS < 30 mg/L Fecal coliforms < 100 cfu/100 mL MFC COD reduction >70% Turbidity < 5 NTU
BOD5 = 13 ± 13 mg/L COD = 36 ± 23 mg/L TSS < 5 mg/L FC = 11 cfu/100mL* MFC COD red = 49 ± 15% Turbidity ≤ 1 NTU
*FC measurements metrics were achieved only when UF polishing filter was online.
The MFC-BF system was also partially effective in removal of ammonia and total nitrogen. The total nitrogen concentration decreased during the MFC/BF treatment, from 64 ± 1 mg/L in the MFC influent, to 29 ± 3 mg/L in the MFC effluent and 11 ± 4 mg/L post BF treatment, indicating that the higher nitrate and nitrite concentrations in the BF effluent were due to nitrification. The average ammonia concentration detected in the MFC influent was 33 ± 27 mg/L and decreased by around 92% to 2.5 ± 2 mg/L in the MFC effluent. The ammonia concentration in the BF effluent was below the detection limit and averaged 0.4 ± 1 mg/L. The MFC-BF system also removed 92% of sulfide, but it was not effective for removal of phosphorus. 6.2 ENERGY SAVINGS RESULTS Energy savings was a critical metric for this demonstration, as it could provide additional cost savings and resiliency benefits for wastewater treatment systems at DOD installations, in addition to reducing environmental impact. The energy consumption of the MFC-BF system was estimated to be 0.51 Wh/gal, which is more than 50% lower than conventional wastewater treatment. While the MFC system was not energy neutral, it was still very efficient relative to conventional aeration process, and the BF system was similarly efficient.
Objective Metrics Results
Reduce the energy consumption of wastewater treatment by 50% or more.
MFC energy recovery = 100% System energy cons. ≤ 1
Wh/gal
MFC energy recovery = 2% System energy cons. = 0.5 Wh/gal
6.3 SLUDGE REDUCTION RESULTS The metric for sludge reduction was 50% relative to conventional aerobic processes, which typically generate 0.32 kg TSS per kg COD removed43. The sludge generation rate in the MFC was 0.6 gal per 1000 gal treated wastewater, at a TSS concentration of 4% (40 g/L), which equates to 0.09 kg TSS. The amount of COD removed by the MFC per 1000 gallons treated was 0.76 kg. Therefore, the MFC process generated 85% less sludge than conventional treatment.
ESTCP Final Report: ER-201635 78 August 2021
6.4 O&M RESULTS Data were collected to assess operations and maintenance requirements, including labor time and type of labor required, consumable costs, hazard levels, and additional training requirements. While the testbed required O&M for maintaining a consistent supply of wastewater to the MFC-BF systems, particularly during below-freezing conditions, the MFC system itself required limited operations and maintenance over the duration of the demonstration. The power density decreased by half over a three months period (from 0.122 ± 0.004 W m–2 after 3 months from inoculation to 0.060 ± 0.007 W m–2 – normalized by anode cross-sectional area), requiring a cathode cleaning step after approximately three months. This compares favorably to aerobic MBR systems which need to have their membranes chemically cleaned with sodium hypochlorite typically two to three times weekly and more intensive heated chemical cleanings with both sodium hypochlorite and acid on a monthly basis. The cleaning process for the cathodes and MFC components is likely more time intensive and is not yet automated. It involves removing each cathode from the reactor and washing them in an acid bath, a process that may take several hours even for a small system. A few cathodes in the MFC required an intermittent removal of the wastewater accumulated in the module due to flooding. Improving the water resistance of the cathodes will minimize this operation. The BF system did not require operation and maintenance for the biofilters, but the downstream UF membranes proved problematic from an operations standpoint. The ultrafiltration membranes fouled and the water flux was not recoverable through physical backwash. This rapid fouling may be attributable to the intermittent flows in the system, with biofilms growing on the membranes during sustained periods of no flow, which were common during the initial phases of testing. Breakthrough of fine GAC particles over time may have also attributed to premature fouling and possibly damage of the ultrafilter membranes. A 20% reduction in maintenance time relative to conventional aeration-based systems would demonstrate success. However, given that decentralized wastewater treatment systems with conventional technologies are being adopted in sustainable buildings, achieving similar levels of O&M would likely be acceptable. Additional studies of the MFC and BF systems over periods of years will be necessary to confirm that less maintenance is required. 6.5 DETERMINE COST SAVINGS Life cycle costs were carefully analyzed in the context of a decentralized (building scale) wastewater treatment system for an off-grid site. For most buildings or sites at DOD facilities, it is unlikely that the payback period will be < 10 years or that the system will even reach a break even point. There may be niche scenarios, such as training areas where water and wastewater are hauled to and from the site, respectively, which can be quite costly. However, the MFC-BF system was relatively expensive when compared to conventional technology. The detailed cost analysis is provided in Section 7.0. 7.0 COST ASSESSMENT
ESTCP Final Report: ER-201635 79 August 2021
A life cycle cost assessment (LCCA) was developed for the MFC-BF treatment technology when scaled to a decentralized system with a treatment capacity of 5,000 gallons per day, which is approximately five times larger than our ESTCP pilot scale demonstration system. Refer to Appendix B for a process flow diagram of the scaled-up system. The life cycle costs of the novel MFC-BF system were also compared to a state-of-the-art aerobic membrane bioreactor (MBR) treatment system. MBR is a more mature conventional activated sludge (CAS) treatment technology that is often employed for small-scale on-site wastewater systems, particularly those desiring to produce reclaimed water for beneficial use. 7.1 COST MODEL The cost model was developed with two main categories: capital costs and operating costs. The capital costs were divided into two separate categories of direct costs and indirect costs. Direct costs included the capital cost of equipment, tanks, valves, instruments, media, and other materials needed for the treatment system. The indirect costs included such items as taxes and fees, overhead and profit (OH&P) for the contractor and their subcontractors, construction contingency, and engineering design services. Where possible, actual incurred costs from the demonstration pilot skid and equipment supplier budget quotations were projected for a larger system. Costs for select components were developed using engineering judgment based on past projects of similar scale. The costs were developed, maintained, and documented in a manner consistent with methods and best practices identified in Cost Estimating Guide, DOE G 413.3-21A, April 2018; Cost Estimating Handbook (PM-HBK-08-2017), April 2017; and GAO Cost Estimating and Assessment Guide (GAO-09-3SP), March 2009. Detailed unit costs were prepared using the U.S. Army Corps of Engineers (USACE) Micro Computer Aided Cost Engineering System (MCACES) Second Generation (MII) software (MII 4.4.2). The USACE cost guidance was used primarily for developing the structure and methodology used in the MII estimate. Some of the unit costs were developed using detailed, unit-cost, or activity-based; parametric; and specific analogy cost estimate techniques. These methodologies are described further below:
Detailed, unit-cost, or activity-based cost estimates are the most definitive of the estimating techniques and use information down to the lowest level of detail available.
Parametric estimating produces higher-level estimates when little information, other than basic parameters, is known about a project.
Specific analogies use a scaled and adjusted cost of a known system with a similar design and level of complexity.
Table 7.1 below summarizes the different cost elements for implementing the scaled-up MFC-BF technology.
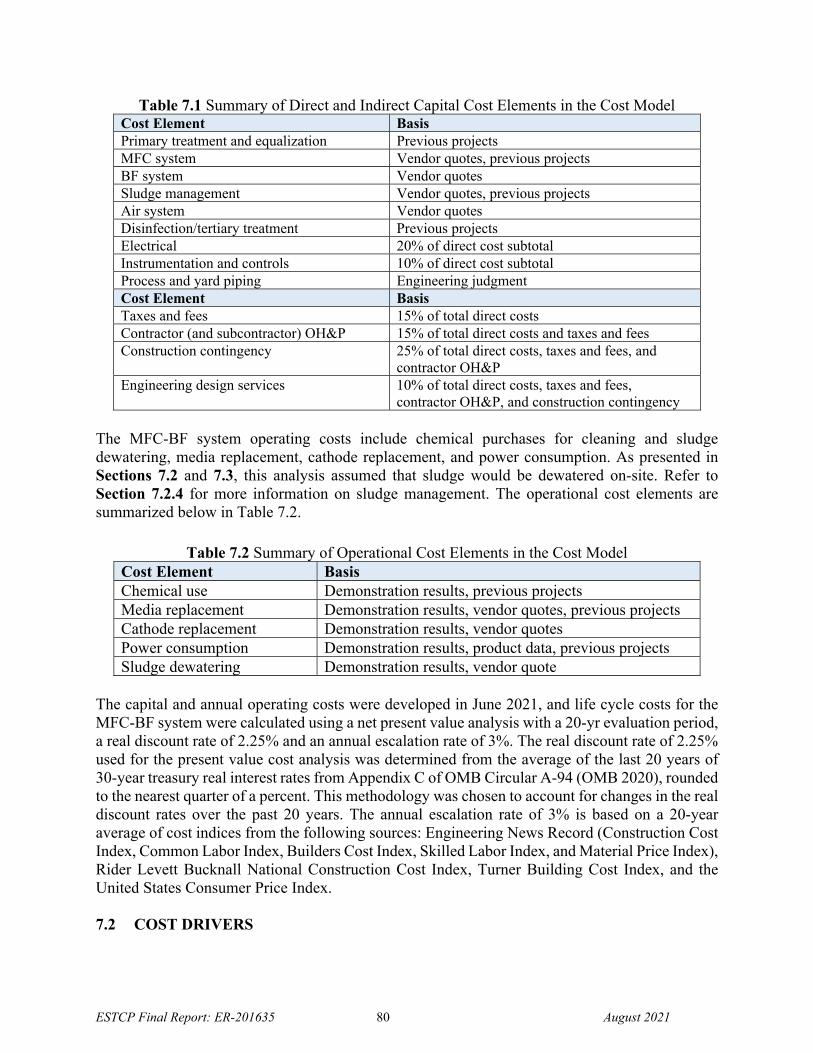
ESTCP Final Report: ER-201635 80 August 2021
Table 7.1 Summary of Direct and Indirect Capital Cost Elements in the Cost Model Cost Element Basis Primary treatment and equalization Previous projects MFC system Vendor quotes, previous projects BF system Vendor quotes Sludge management Vendor quotes, previous projects Air system Vendor quotes Disinfection/tertiary treatment Previous projects Electrical 20% of direct cost subtotal Instrumentation and controls 10% of direct cost subtotal Process and yard piping Engineering judgment Cost Element Basis Taxes and fees 15% of total direct costs Contractor (and subcontractor) OH&P 15% of total direct costs and taxes and fees Construction contingency 25% of total direct costs, taxes and fees, and
contractor OH&P Engineering design services 10% of total direct costs, taxes and fees,
contractor OH&P, and construction contingency The MFC-BF system operating costs include chemical purchases for cleaning and sludge dewatering, media replacement, cathode replacement, and power consumption. As presented in Sections 7.2 and 7.3, this analysis assumed that sludge would be dewatered on-site. Refer to Section 7.2.4 for more information on sludge management. The operational cost elements are summarized below in Table 7.2.
Table 7.2 Summary of Operational Cost Elements in the Cost Model Cost Element Basis Chemical use Demonstration results, previous projects Media replacement Demonstration results, vendor quotes, previous projects Cathode replacement Demonstration results, vendor quotes Power consumption Demonstration results, product data, previous projects Sludge dewatering Demonstration results, vendor quote
The capital and annual operating costs were developed in June 2021, and life cycle costs for the MFC-BF system were calculated using a net present value analysis with a 20-yr evaluation period, a real discount rate of 2.25% and an annual escalation rate of 3%. The real discount rate of 2.25% used for the present value cost analysis was determined from the average of the last 20 years of 30-year treasury real interest rates from Appendix C of OMB Circular A-94 (OMB 2020), rounded to the nearest quarter of a percent. This methodology was chosen to account for changes in the real discount rates over the past 20 years. The annual escalation rate of 3% is based on a 20-year average of cost indices from the following sources: Engineering News Record (Construction Cost Index, Common Labor Index, Builders Cost Index, Skilled Labor Index, and Material Price Index), Rider Levett Bucknall National Construction Cost Index, Turner Building Cost Index, and the United States Consumer Price Index. 7.2 COST DRIVERS
ESTCP Final Report: ER-201635 81 August 2021
There are several anticipated cost drivers that should be considered in selecting the MFC-BF technology for future implementation. The specific drivers are listed below and their impact on the implementation cost of the MFC-BF treatment technology will be discussed as follows:
Influent water quality and design flow Reuse applications Chemical usage Waste generation, treatment, and/or disposal Power consumption of ancillary systems Potential cost drivers not considered in this analysis
7.2.1 Influent Water Quality and Design Flow The design of the MFC must provide the minimum hydraulic residence time established during the demonstration testing and it must also have a sufficient number of anode-cathode assemblies to provide the desired COD removal. As described in previous sections, the MFC demonstration unit included 32 cathodes and 17 anode assemblies. Each anode has a pair of cathodes. The demonstration facility was operated during the winter months with relatively cold wastewater temperatures, and thus a water heater was used to maintain the water at 95 degrees Fahrenheit. The 5,000 gpd scaled-up MFC-BF system was assumed to operate at ambient temperatures in a building where the average water temperature is 60 degrees F. Prior bench-scale testing has indicated that current generation varies as a function of temperature, but the overall COD removal rates are not as influenced by temperature because the COD removal for current generation is not the only mechanism for COD removal. For the purposes of this analysis, the COD removal rates established during the pilot study were downrated by 10 percent to account for operation at ambient temperatures, but this needs to be validated as part of future research efforts. Therefore, the 5,000 gpd MFC was sized based on the downrated average COD removal per cathode from the demonstration results (5.8 mg/L per cathode), an assumed medium strength influent municipal wastewater (Metcalf and Eddy, 5th edition), and the desired COD effluent level for optimum MFC performance.1 When considering using the MFC-BF technology, the influent characteristics and the design flow of the application must be evaluated and the cost for the required cathodes and anodes must be considered. While the influent water quality dictates the number of anode-cathode pairs that must be installed in series, the design flow dictates the number of MFC-BF units in parallel. Based on the demonstration results, each MFC-BF unit can be rated for up to 1 gpm (1,440 gpd). 7.2.2 Reuse Applications The intended reuse application (if any) will impact the type of tertiary treatment or additional chemicals required to meet the effluent quality objectives. Depending on the reuse effluent
1. Based on the demonstration results, the MFC effluent COD level should be maintained at no less than 200 mg/L.
ESTCP Final Report: ER-201635 82 August 2021
requirements, additional chemicals and/or treatment systems may be needed for disinfection and/or for phosphorus removal. The cost of these additional systems and operational costs must be considered in the overall cost model for a given scenario. These systems and additional chemicals, though, would be common for both the new MFC-BF technology and for MBR treatment systems. Additional chemicals for phosphorus removal were not considered since not all applications are required to remove phosphorus (see Section 7.2.6), while costs for a disinfection system were included since disinfection will always be required. In this particular case, ultraviolet disinfection was assumed for both the MFC-BF system and the MBR system. For the life cycle cost analysis, it was assumed that the finished water effluent would be pumped to a leaching field for on-site disposal. Alternatively, the finished water could be sent to a water reuse system for toilet flushing and site irrigation. The costs and benefits resulting from implementation of water reuse were not included in the detailed cost analysis of the MFC-BF and MBR treatment systems, though potential water reuse costs and benefits are discussed in subsequent sections. 7.2.3 Chemical Usage The MFC-BF system itself does not require chemicals on a continuous basis but it does require the use of cleaning chemicals at periodic intervals for maintenance. For the maintenance cleaning process, the demonstration testing period indicated the cathodes must be cleaned with a dilute acid (100 mM HCl or dilute acetic acid) once per month to maintain performance. For comparison, an MBR system would require cleaning on the order of four times per month at a minimum with both a dilute acid (e.g. citric acid) for inorganic fouling and sodium hypochlorite for organic fouling. Assuming the same amount of acid is used at each cleaning, an MBR treatment system would require four times the amount of dilute acid. The amount of chemical is one cost consideration, but there are ancillary impacts associated with the amount of chemicals needed. For instance, the amount of chemical needed for each cleaning and how often cleanings are needed impacts the storage requirements (i.e. size of chemical totes) and chemical delivery. These types of operational costs should be considered when comparing the different treatment technologies. If acetic acid is chosen as the cleaning chemical, it can provide multiple benefits. Primarily, acetic acid will be used for cleaning and the wastewater produced can be fed safely back to the head of the treatment process. Additionally, it is an inherently safer chemical to work with when compared with concentrated hydrochloric acid, which is a benefit to operator health and safety. Second, in periods of low strength wastewater, acetic acid can be fed to the process to supplement the carbon loading to the MFC to maintain the biological activity. For these reasons, acetic acid was chosen for this cost analysis. 7.2.4 Waste Generation, Treatment, and/or Disposal Typically, residual streams generated by the different unit processes either need to be sent to a sanitary system, collected for sludge hauling, or stabilized/dewatered on site. The scaled-up MFC-
ESTCP Final Report: ER-201635 83 August 2021
BF system was assumed to be installed in a remote location that may have little to no access to a wastewater collection system or sanitary system, thus requiring on-site sludge dewatering. The specific site conditions and available services will determine if the sludge must be dewatered and stabilized or if the biosolids can be hauled offsite for disposal. Additionally, the sludge should be tested for pathogen content so that proper disposal practices can be determined. If land is available to land apply, the owner should determine if it is economical to dewater the sludge and stabilize the biosolids on site, including additional chemicals like lime or stabilization treatment systems. Alternatively, if site conditions do not allow for land application, the owner needs to determine if the sludge can be hauled offsite or if it needs to be dewatered first prior to hauling the biosolids offsite. The available services at each location will determine the level of treatment needed. Because land and available services like sludge hauling or access to certified landfills for biosolids collection are specific to the site chosen, this cost analysis will only evaluate the cost of dewatering the solids for later collection. Packaged dewatering units that are commercially available should be integrated into the system, with biosolids sent to a storage bin for collection, and the filtrate is sent back to the head of the treatment process. The cost for any required chemicals needed for dewatering such as polymer should be considered as well. The quantities of residuals requiring handling and dewatering and their associated costs were estimated based on the demonstration results for the MFC-BF system, whereas sludge production for the aerobic MBR was based on typical empirical net sludge yields for CAS systems. The residual streams from the MFC-BF include the settled sludge from the EQ tank, the MFC system, the BF bio-regeneration cycles, any tertiary process waste streams, and the cathode cleaning process. Where possible, and if site selection allows, residual streams will be recycled to the EQ tank. If sludge hauling to a regional sludge processing facility is a feasible option, then only the sludge holding tank and aeration/mixing system should be included in the cost analysis. Conveyance or hauling to a centralized municipal wastewater treatment plant is the lowest capital cost option. Note that the cost for waste generation and the potential treatment and/or disposal of the waste is a common cost item for both the MFC-BF treatment system and MBR packaged system. The cost benefit of one system versus another is in the quantities produced by each system, which dictates the size of the holding tank, the size of the dewatering packaged system, and/or the size of the drain lines. Preliminary results indicate that the MFC-BF treatment system produces roughly half the sludge of CAS systems. However, note that the MFC-BF sludge quantities were estimated based on a single sludge sample collected at the end of the demonstration period after the tank was drained, and thus further testing of this item is merited to confirm these results at larger scale. 7.2.5 Power Consumption of Ancillary Systems The energy evaluation of the MFC-BF system considered both energy consumption and the potential of producing enough energy from the MFC to offset electrical costs. While the energy
ESTCP Final Report: ER-201635 84 August 2021
density produced by the MFC and the efficiency of converting that power into a useful voltage still needs improvement, there is one other energy cost driver to consider when comparing the MFC-BF treatment system to a conventional treatment system, as discussed further below. In this comparison, we assumed that the energy demands of pumping the influent and effluent water, as well as the energy demands for tertiary treatment and/or a dewatering system would be similar for both the MFC-BF system and the MBR system. The main differentiator with respect to energy demand is the air requirement. A conventional activated sludge aerobic MBR system requires continuous aeration and the continuous operation of a blower needed for aeration and scouring of a CAS MBR system incurs a significant energy cost. The MFC-BF system on the other hand only requires intermittent air during the scour step of the BF bio-regeneration process. The main energy demand for the MFC-BF system would then be pumping, the sludge holding tank mixer, and ancillary instruments and valves. While the demonstration of the MFC-BF system heated the influent water to 95°F for optimum biodegradation at the anode interface during the cold temperatures that occurred during the testing period, this is not a requirement for MFC performance. As such, a performance reduction factor was applied and the assumption of a constant water temperature of 60°F was used for MFC sizing. No energy costs for water heating were included for the 5,000 gpd MFC-BF system, but in colder climates, a designer would want to account for heat tracing non-buried piping. 7.2.6 Potential Cost-Drivers Not Considered in Cost Model There are several potential cost drivers that were not considered in this cost evaluation because their relative impact is specific to a particular case. The potential cost-drivers that should also be considered to understand the full cost implications of implementing the MFC-BF technology for a particular project are as follows:
- Land cost and site work - Effluent pump stations (as needed) - Cost of pipeline connection to sewer interceptor - Access to laboratory support and equipment - Site-specific phosphorus and nitrate discharge limits - Reliability of energy and potable water sources - Tax incentives or rate incentives to reduce potable water usage - Desired end uses for water reuse, if any
7.3 COST ANALYSIS This section includes a description of the 5,000 gpd MFC-BF treatment system, the MFC-BF basis of design, and a life cycle cost analysis of the system. Other process flow diagrams or system configurations could be considered. Refer to Section 7.2.6 for cost drivers not considered in this analysis. The MFC-BF treatment system was then compared to a decentralized aerobic MBR system, which is referred to as the ‘conventional’ decentralized treatment system.
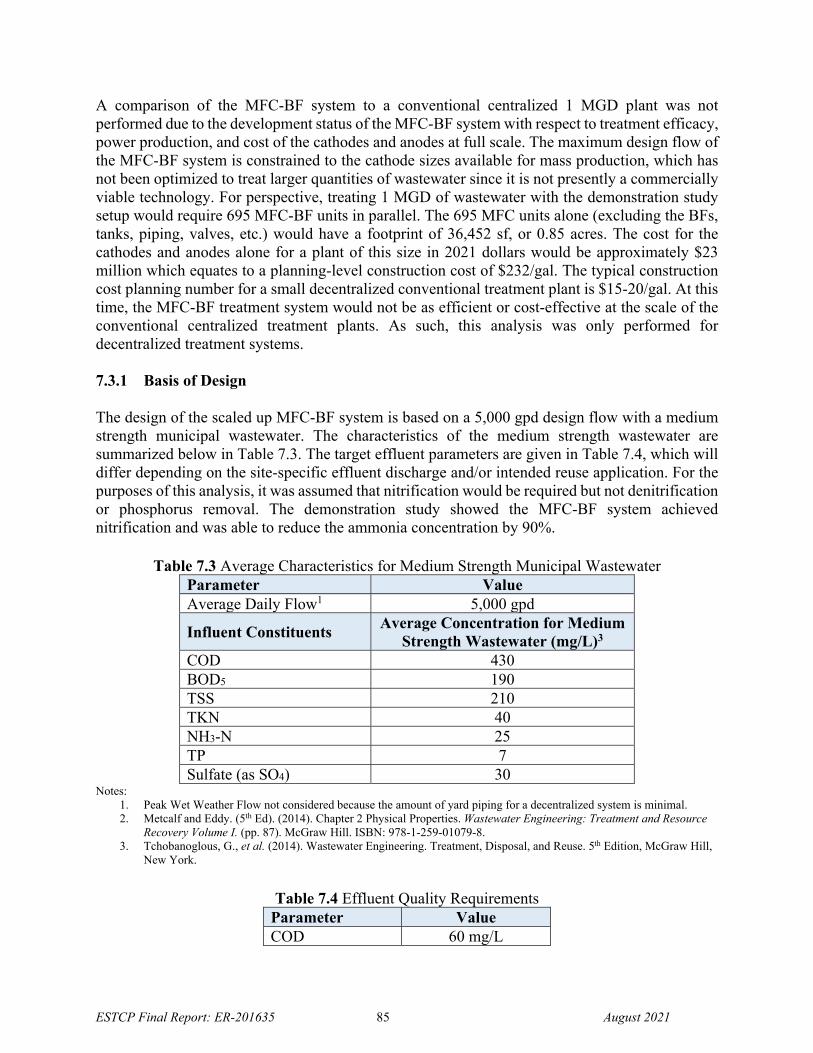
ESTCP Final Report: ER-201635 85 August 2021
A comparison of the MFC-BF system to a conventional centralized 1 MGD plant was not performed due to the development status of the MFC-BF system with respect to treatment efficacy, power production, and cost of the cathodes and anodes at full scale. The maximum design flow of the MFC-BF system is constrained to the cathode sizes available for mass production, which has not been optimized to treat larger quantities of wastewater since it is not presently a commercially viable technology. For perspective, treating 1 MGD of wastewater with the demonstration study setup would require 695 MFC-BF units in parallel. The 695 MFC units alone (excluding the BFs, tanks, piping, valves, etc.) would have a footprint of 36,452 sf, or 0.85 acres. The cost for the cathodes and anodes alone for a plant of this size in 2021 dollars would be approximately $23 million which equates to a planning-level construction cost of $232/gal. The typical construction cost planning number for a small decentralized conventional treatment plant is $15-20/gal. At this time, the MFC-BF treatment system would not be as efficient or cost-effective at the scale of the conventional centralized treatment plants. As such, this analysis was only performed for decentralized treatment systems. 7.3.1 Basis of Design The design of the scaled up MFC-BF system is based on a 5,000 gpd design flow with a medium strength municipal wastewater. The characteristics of the medium strength wastewater are summarized below in Table 7.3. The target effluent parameters are given in Table 7.4, which will differ depending on the site-specific effluent discharge and/or intended reuse application. For the purposes of this analysis, it was assumed that nitrification would be required but not denitrification or phosphorus removal. The demonstration study showed the MFC-BF system achieved nitrification and was able to reduce the ammonia concentration by 90%.
Table 7.3 Average Characteristics for Medium Strength Municipal Wastewater Parameter Value Average Daily Flow1 5,000 gpd
Influent Constituents Average Concentration for Medium
Strength Wastewater (mg/L)3
COD 430 BOD5 190 TSS 210 TKN 40 NH3-N 25 TP 7 Sulfate (as SO4) 30
Notes: 1. Peak Wet Weather Flow not considered because the amount of yard piping for a decentralized system is minimal. 2. Metcalf and Eddy. (5th Ed). (2014). Chapter 2 Physical Properties. Wastewater Engineering: Treatment and Resource
Recovery Volume I. (pp. 87). McGraw Hill. ISBN: 978-1-259-01079-8. 3. Tchobanoglous, G., et al. (2014). Wastewater Engineering. Treatment, Disposal, and Reuse. 5th Edition, McGraw Hill,
New York.
Table 7.4 Effluent Quality Requirements Parameter Value COD 60 mg/L
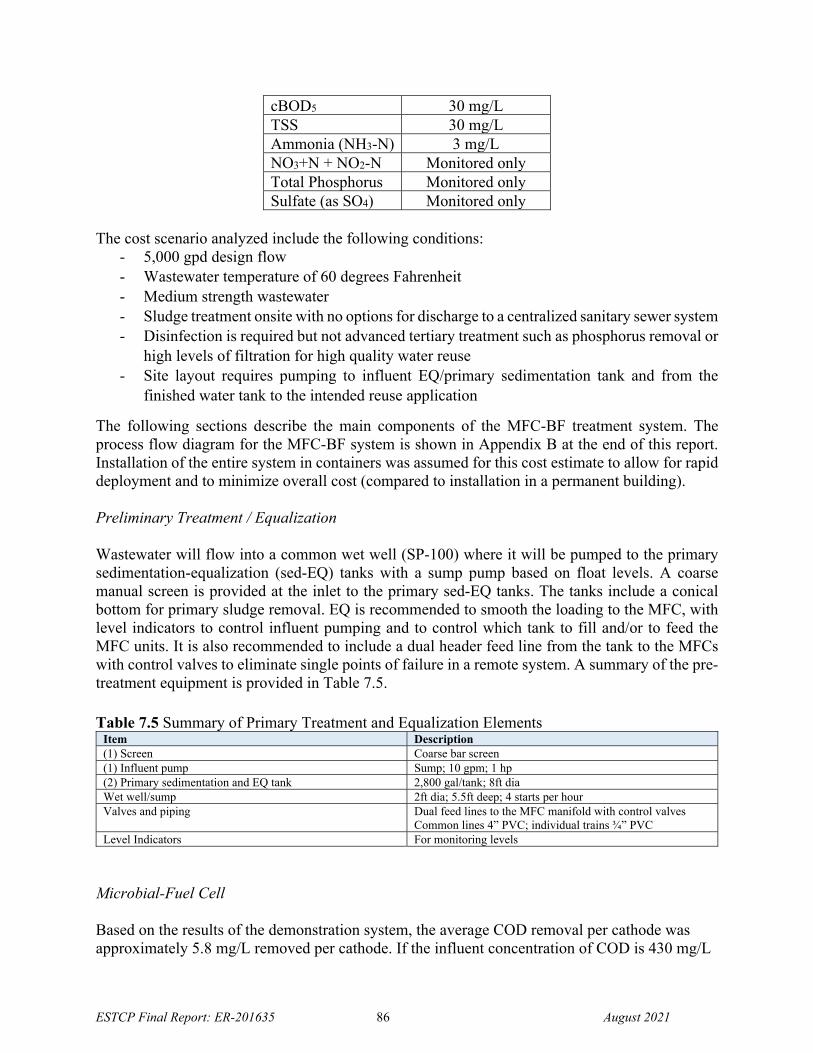
ESTCP Final Report: ER-201635 86 August 2021
cBOD5 30 mg/L TSS 30 mg/L Ammonia (NH3-N) 3 mg/L NO3+N + NO2-N Monitored only
Total Phosphorus Monitored only Sulfate (as SO4) Monitored only
The cost scenario analyzed include the following conditions:
- 5,000 gpd design flow - Wastewater temperature of 60 degrees Fahrenheit - Medium strength wastewater - Sludge treatment onsite with no options for discharge to a centralized sanitary sewer system - Disinfection is required but not advanced tertiary treatment such as phosphorus removal or
high levels of filtration for high quality water reuse - Site layout requires pumping to influent EQ/primary sedimentation tank and from the
finished water tank to the intended reuse application
The following sections describe the main components of the MFC-BF treatment system. The process flow diagram for the MFC-BF system is shown in Appendix B at the end of this report. Installation of the entire system in containers was assumed for this cost estimate to allow for rapid deployment and to minimize overall cost (compared to installation in a permanent building). Preliminary Treatment / Equalization Wastewater will flow into a common wet well (SP-100) where it will be pumped to the primary sedimentation-equalization (sed-EQ) tanks with a sump pump based on float levels. A coarse manual screen is provided at the inlet to the primary sed-EQ tanks. The tanks include a conical bottom for primary sludge removal. EQ is recommended to smooth the loading to the MFC, with level indicators to control influent pumping and to control which tank to fill and/or to feed the MFC units. It is also recommended to include a dual header feed line from the tank to the MFCs with control valves to eliminate single points of failure in a remote system. A summary of the pre-treatment equipment is provided in Table 7.5.
Table 7.5 Summary of Primary Treatment and Equalization Elements Item Description (1) Screen Coarse bar screen (1) Influent pump Sump; 10 gpm; 1 hp (2) Primary sedimentation and EQ tank 2,800 gal/tank; 8ft dia Wet well/sump 2ft dia; 5.5ft deep; 4 starts per hour Valves and piping Dual feed lines to the MFC manifold with control valves
Common lines 4” PVC; individual trains ¾” PVC Level Indicators For monitoring levels
Microbial-Fuel Cell Based on the results of the demonstration system, the average COD removal per cathode was approximately 5.8 mg/L removed per cathode. If the influent concentration of COD is 430 mg/L
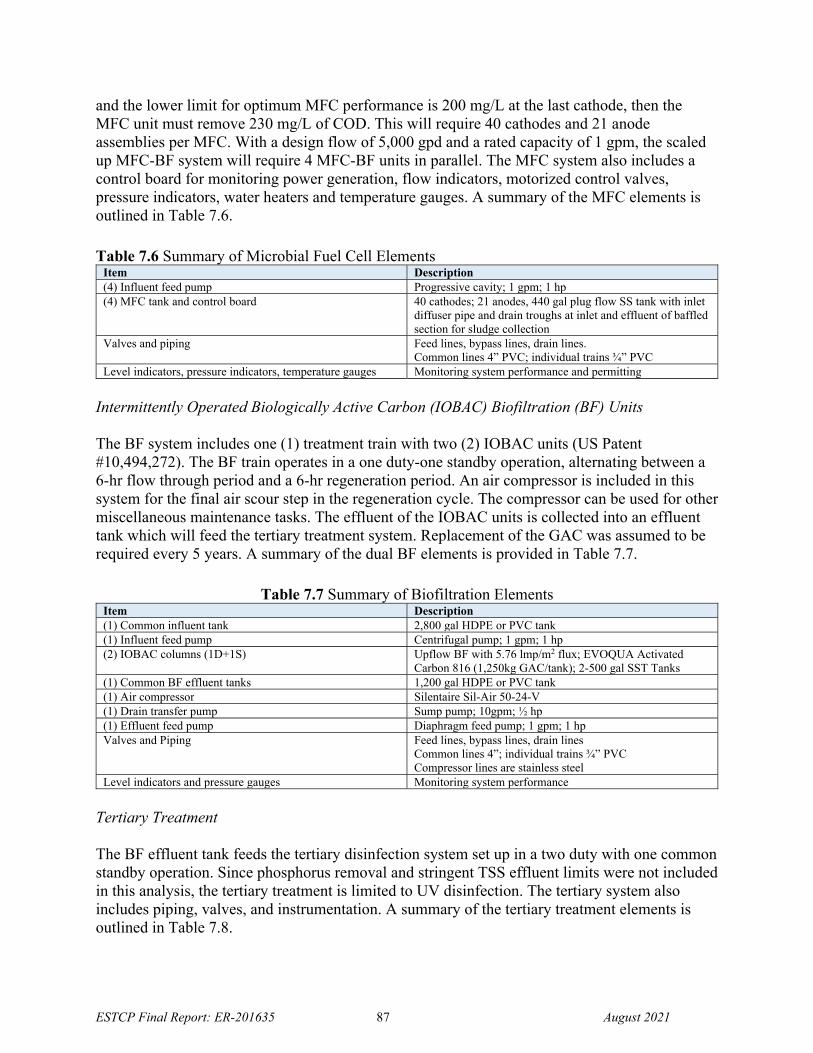
ESTCP Final Report: ER-201635 87 August 2021
and the lower limit for optimum MFC performance is 200 mg/L at the last cathode, then the MFC unit must remove 230 mg/L of COD. This will require 40 cathodes and 21 anode assemblies per MFC. With a design flow of 5,000 gpd and a rated capacity of 1 gpm, the scaled up MFC-BF system will require 4 MFC-BF units in parallel. The MFC system also includes a control board for monitoring power generation, flow indicators, motorized control valves, pressure indicators, water heaters and temperature gauges. A summary of the MFC elements is outlined in Table 7.6.
Table 7.6 Summary of Microbial Fuel Cell Elements Item Description (4) Influent feed pump Progressive cavity; 1 gpm; 1 hp (4) MFC tank and control board 40 cathodes; 21 anodes, 440 gal plug flow SS tank with inlet
diffuser pipe and drain troughs at inlet and effluent of baffled section for sludge collection
Valves and piping Feed lines, bypass lines, drain lines. Common lines 4” PVC; individual trains ¾” PVC
Level indicators, pressure indicators, temperature gauges Monitoring system performance and permitting
Intermittently Operated Biologically Active Carbon (IOBAC) Biofiltration (BF) Units The BF system includes one (1) treatment train with two (2) IOBAC units (US Patent #10,494,272). The BF train operates in a one duty-one standby operation, alternating between a 6-hr flow through period and a 6-hr regeneration period. An air compressor is included in this system for the final air scour step in the regeneration cycle. The compressor can be used for other miscellaneous maintenance tasks. The effluent of the IOBAC units is collected into an effluent tank which will feed the tertiary treatment system. Replacement of the GAC was assumed to be required every 5 years. A summary of the dual BF elements is provided in Table 7.7.
Table 7.7 Summary of Biofiltration Elements Item Description (1) Common influent tank 2,800 gal HDPE or PVC tank (1) Influent feed pump Centrifugal pump; 1 gpm; 1 hp (2) IOBAC columns (1D+1S) Upflow BF with 5.76 lmp/m2 flux; EVOQUA Activated
Carbon 816 (1,250kg GAC/tank); 2-500 gal SST Tanks (1) Common BF effluent tanks 1,200 gal HDPE or PVC tank (1) Air compressor Silentaire Sil-Air 50-24-V (1) Drain transfer pump Sump pump; 10gpm; ½ hp (1) Effluent feed pump Diaphragm feed pump; 1 gpm; 1 hp Valves and Piping Feed lines, bypass lines, drain lines
Common lines 4”; individual trains ¾” PVC Compressor lines are stainless steel
Level indicators and pressure gauges Monitoring system performance
Tertiary Treatment The BF effluent tank feeds the tertiary disinfection system set up in a two duty with one common standby operation. Since phosphorus removal and stringent TSS effluent limits were not included in this analysis, the tertiary treatment is limited to UV disinfection. The tertiary system also includes piping, valves, and instrumentation. A summary of the tertiary treatment elements is outlined in Table 7.8.
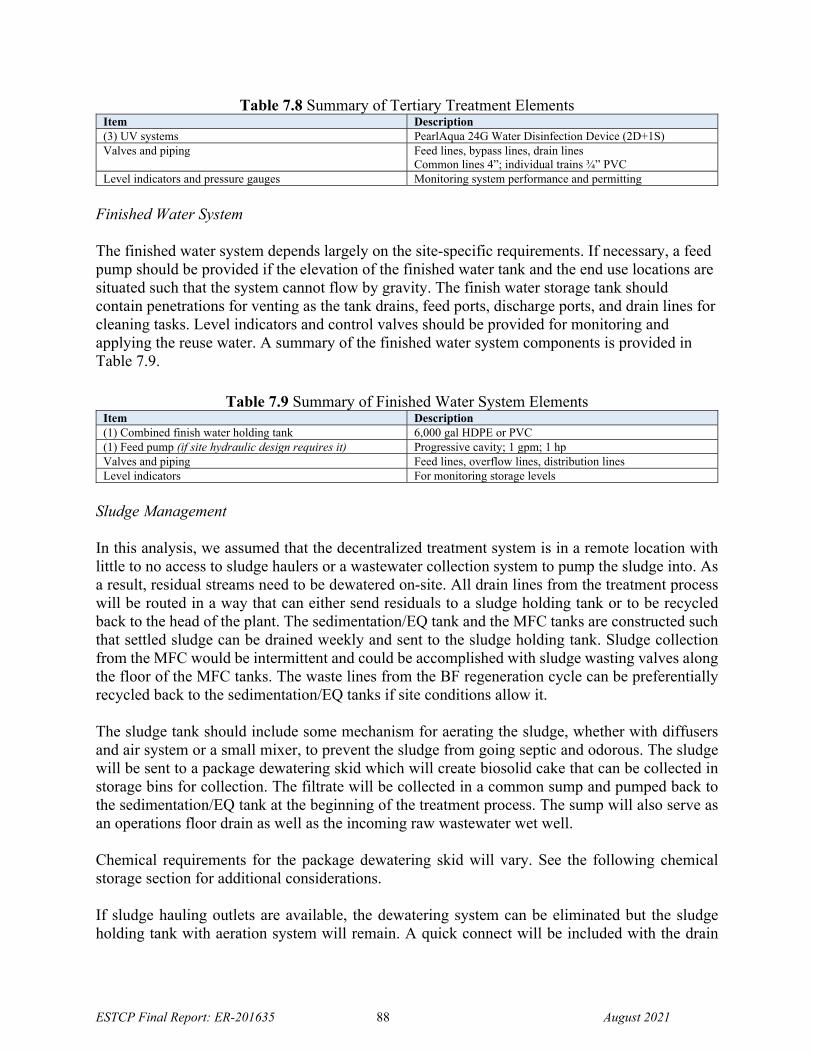
ESTCP Final Report: ER-201635 88 August 2021
Table 7.8 Summary of Tertiary Treatment Elements Item Description (3) UV systems PearlAqua 24G Water Disinfection Device (2D+1S) Valves and piping Feed lines, bypass lines, drain lines
Common lines 4”; individual trains ¾” PVC Level indicators and pressure gauges Monitoring system performance and permitting
Finished Water System The finished water system depends largely on the site-specific requirements. If necessary, a feed pump should be provided if the elevation of the finished water tank and the end use locations are situated such that the system cannot flow by gravity. The finish water storage tank should contain penetrations for venting as the tank drains, feed ports, discharge ports, and drain lines for cleaning tasks. Level indicators and control valves should be provided for monitoring and applying the reuse water. A summary of the finished water system components is provided in Table 7.9.
Table 7.9 Summary of Finished Water System Elements Item Description (1) Combined finish water holding tank 6,000 gal HDPE or PVC (1) Feed pump (if site hydraulic design requires it) Progressive cavity; 1 gpm; 1 hp Valves and piping Feed lines, overflow lines, distribution lines Level indicators For monitoring storage levels
Sludge Management In this analysis, we assumed that the decentralized treatment system is in a remote location with little to no access to sludge haulers or a wastewater collection system to pump the sludge into. As a result, residual streams need to be dewatered on-site. All drain lines from the treatment process will be routed in a way that can either send residuals to a sludge holding tank or to be recycled back to the head of the plant. The sedimentation/EQ tank and the MFC tanks are constructed such that settled sludge can be drained weekly and sent to the sludge holding tank. Sludge collection from the MFC would be intermittent and could be accomplished with sludge wasting valves along the floor of the MFC tanks. The waste lines from the BF regeneration cycle can be preferentially recycled back to the sedimentation/EQ tanks if site conditions allow it. The sludge tank should include some mechanism for aerating the sludge, whether with diffusers and air system or a small mixer, to prevent the sludge from going septic and odorous. The sludge will be sent to a package dewatering skid which will create biosolid cake that can be collected in storage bins for collection. The filtrate will be collected in a common sump and pumped back to the sedimentation/EQ tank at the beginning of the treatment process. The sump will also serve as an operations floor drain as well as the incoming raw wastewater wet well. Chemical requirements for the package dewatering skid will vary. See the following chemical storage section for additional considerations. If sludge hauling outlets are available, the dewatering system can be eliminated but the sludge holding tank with aeration system will remain. A quick connect will be included with the drain
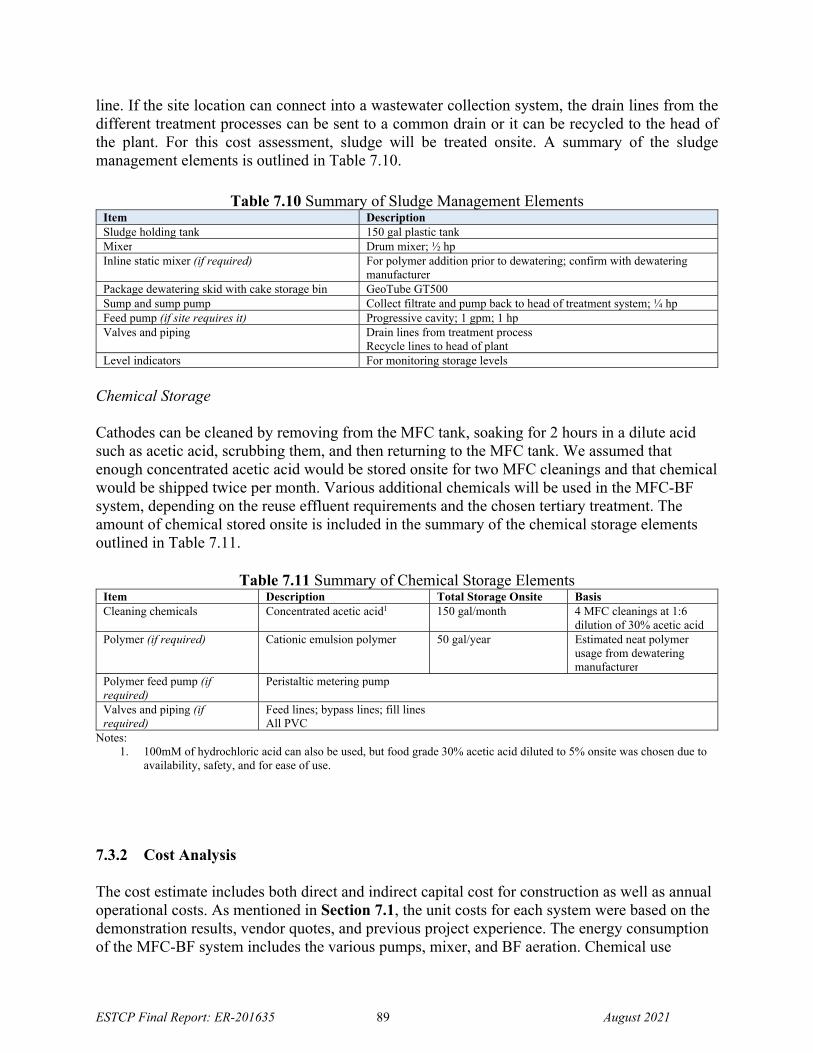
ESTCP Final Report: ER-201635 89 August 2021
line. If the site location can connect into a wastewater collection system, the drain lines from the different treatment processes can be sent to a common drain or it can be recycled to the head of the plant. For this cost assessment, sludge will be treated onsite. A summary of the sludge management elements is outlined in Table 7.10.
Table 7.10 Summary of Sludge Management Elements Item Description Sludge holding tank 150 gal plastic tank Mixer Drum mixer; ½ hp Inline static mixer (if required) For polymer addition prior to dewatering; confirm with dewatering
manufacturer Package dewatering skid with cake storage bin GeoTube GT500 Sump and sump pump Collect filtrate and pump back to head of treatment system; ¼ hp Feed pump (if site requires it) Progressive cavity; 1 gpm; 1 hp Valves and piping Drain lines from treatment process
Recycle lines to head of plant Level indicators For monitoring storage levels
Chemical Storage Cathodes can be cleaned by removing from the MFC tank, soaking for 2 hours in a dilute acid such as acetic acid, scrubbing them, and then returning to the MFC tank. We assumed that enough concentrated acetic acid would be stored onsite for two MFC cleanings and that chemical would be shipped twice per month. Various additional chemicals will be used in the MFC-BF system, depending on the reuse effluent requirements and the chosen tertiary treatment. The amount of chemical stored onsite is included in the summary of the chemical storage elements outlined in Table 7.11.
Table 7.11 Summary of Chemical Storage Elements Item Description Total Storage Onsite Basis Cleaning chemicals Concentrated acetic acid1 150 gal/month 4 MFC cleanings at 1:6
dilution of 30% acetic acid Polymer (if required) Cationic emulsion polymer 50 gal/year Estimated neat polymer
usage from dewatering manufacturer
Polymer feed pump (if required)
Peristaltic metering pump
Valves and piping (if required)
Feed lines; bypass lines; fill lines All PVC
Notes: 1. 100mM of hydrochloric acid can also be used, but food grade 30% acetic acid diluted to 5% onsite was chosen due to
availability, safety, and for ease of use.
7.3.2 Cost Analysis The cost estimate includes both direct and indirect capital cost for construction as well as annual operational costs. As mentioned in Section 7.1, the unit costs for each system were based on the demonstration results, vendor quotes, and previous project experience. The energy consumption of the MFC-BF system includes the various pumps, mixer, and BF aeration. Chemical use
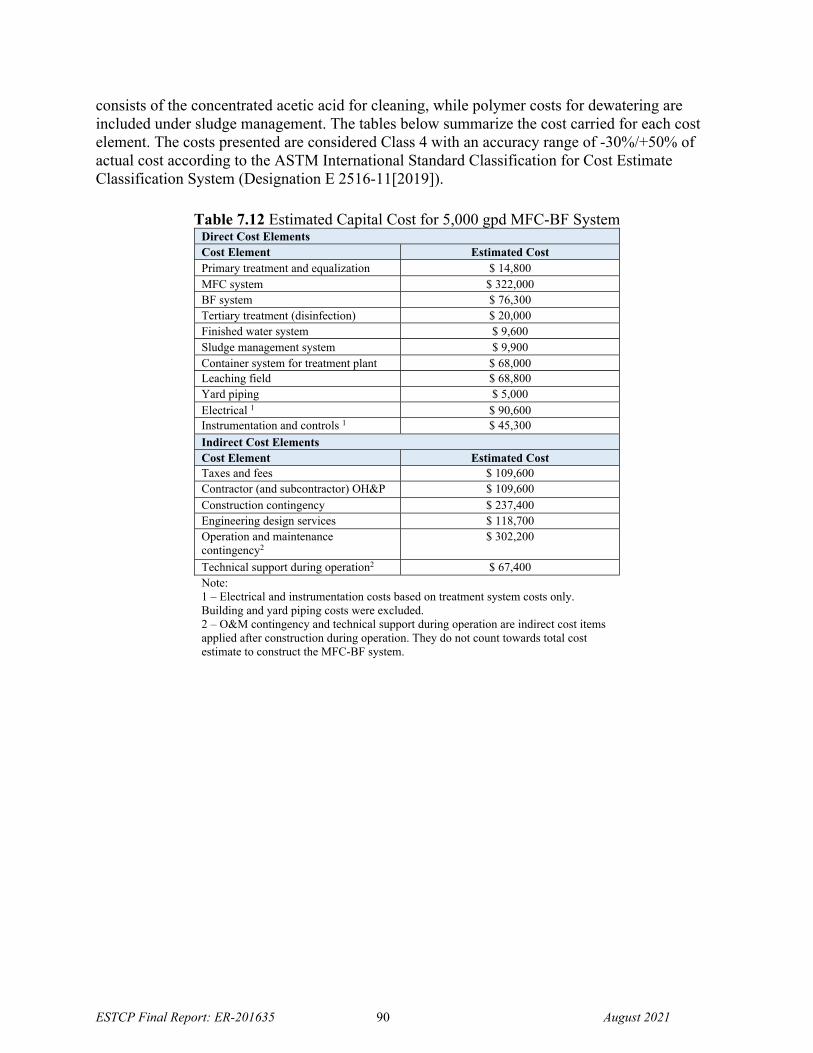
ESTCP Final Report: ER-201635 90 August 2021
consists of the concentrated acetic acid for cleaning, while polymer costs for dewatering are included under sludge management. The tables below summarize the cost carried for each cost element. The costs presented are considered Class 4 with an accuracy range of -30%/+50% of actual cost according to the ASTM International Standard Classification for Cost Estimate Classification System (Designation E 2516-11[2019]).
Table 7.12 Estimated Capital Cost for 5,000 gpd MFC-BF System Direct Cost Elements Cost Element Estimated Cost Primary treatment and equalization $ 14,800 MFC system $ 322,000 BF system $ 76,300 Tertiary treatment (disinfection) $ 20,000 Finished water system $ 9,600 Sludge management system $ 9,900 Container system for treatment plant $ 68,000 Leaching field $ 68,800 Yard piping $ 5,000 Electrical 1 $ 90,600 Instrumentation and controls 1 $ 45,300
Indirect Cost Elements Cost Element Estimated Cost Taxes and fees $ 109,600 Contractor (and subcontractor) OH&P $ 109,600 Construction contingency $ 237,400 Engineering design services $ 118,700 Operation and maintenance contingency2
$ 302,200
Technical support during operation2 $ 67,400 Note: 1 – Electrical and instrumentation costs based on treatment system costs only. Building and yard piping costs were excluded. 2 – O&M contingency and technical support during operation are indirect cost items applied after construction during operation. They do not count towards total cost estimate to construct the MFC-BF system.
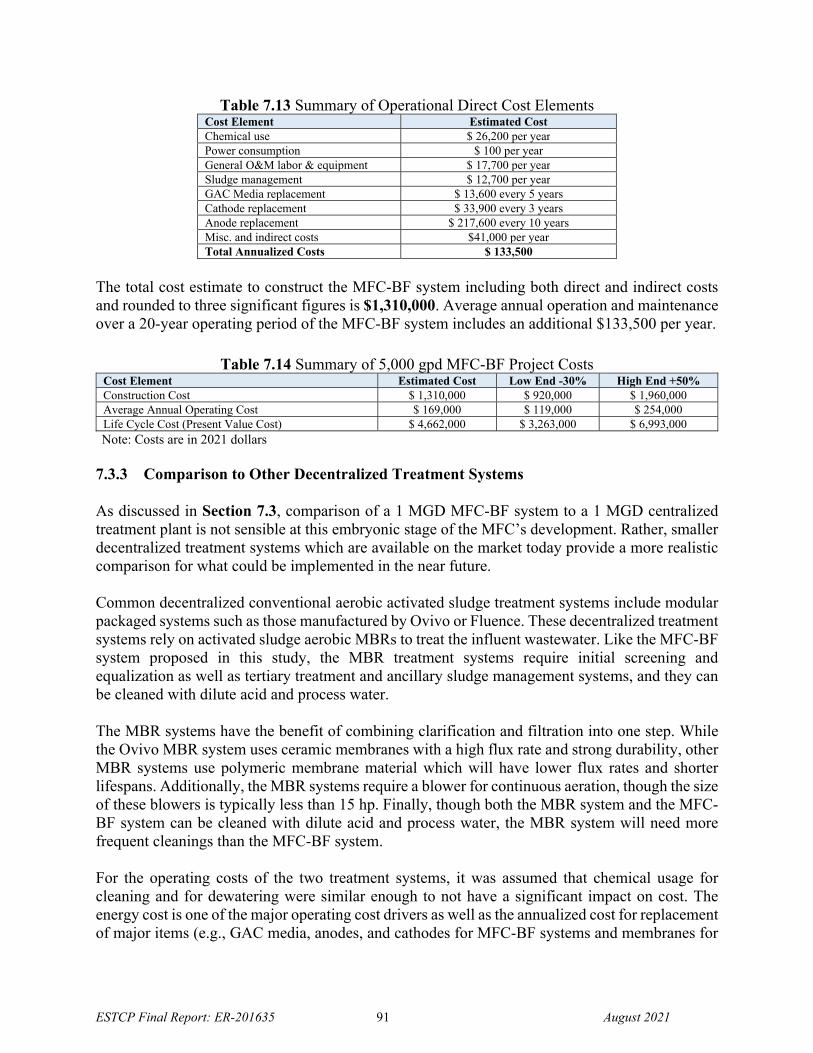
ESTCP Final Report: ER-201635 91 August 2021
Table 7.13 Summary of Operational Direct Cost Elements Cost Element Estimated Cost Chemical use $ 26,200 per year Power consumption $ 100 per year General O&M labor & equipment $ 17,700 per year Sludge management $ 12,700 per year GAC Media replacement $ 13,600 every 5 years Cathode replacement $ 33,900 every 3 years Anode replacement $ 217,600 every 10 years Misc. and indirect costs $41,000 per year Total Annualized Costs $ 133,500
The total cost estimate to construct the MFC-BF system including both direct and indirect costs and rounded to three significant figures is $1,310,000. Average annual operation and maintenance over a 20-year operating period of the MFC-BF system includes an additional $133,500 per year.
Table 7.14 Summary of 5,000 gpd MFC-BF Project Costs Cost Element Estimated Cost Low End -30% High End +50% Construction Cost $ 1,310,000 $ 920,000 $ 1,960,000 Average Annual Operating Cost $ 169,000 $ 119,000 $ 254,000 Life Cycle Cost (Present Value Cost) $ 4,662,000 $ 3,263,000 $ 6,993,000 Note: Costs are in 2021 dollars
7.3.3 Comparison to Other Decentralized Treatment Systems As discussed in Section 7.3, comparison of a 1 MGD MFC-BF system to a 1 MGD centralized treatment plant is not sensible at this embryonic stage of the MFC’s development. Rather, smaller decentralized treatment systems which are available on the market today provide a more realistic comparison for what could be implemented in the near future. Common decentralized conventional aerobic activated sludge treatment systems include modular packaged systems such as those manufactured by Ovivo or Fluence. These decentralized treatment systems rely on activated sludge aerobic MBRs to treat the influent wastewater. Like the MFC-BF system proposed in this study, the MBR treatment systems require initial screening and equalization as well as tertiary treatment and ancillary sludge management systems, and they can be cleaned with dilute acid and process water. The MBR systems have the benefit of combining clarification and filtration into one step. While the Ovivo MBR system uses ceramic membranes with a high flux rate and strong durability, other MBR systems use polymeric membrane material which will have lower flux rates and shorter lifespans. Additionally, the MBR systems require a blower for continuous aeration, though the size of these blowers is typically less than 15 hp. Finally, though both the MBR system and the MFC-BF system can be cleaned with dilute acid and process water, the MBR system will need more frequent cleanings than the MFC-BF system. For the operating costs of the two treatment systems, it was assumed that chemical usage for cleaning and for dewatering were similar enough to not have a significant impact on cost. The energy cost is one of the major operating cost drivers as well as the annualized cost for replacement of major items (e.g., GAC media, anodes, and cathodes for MFC-BF systems and membranes for
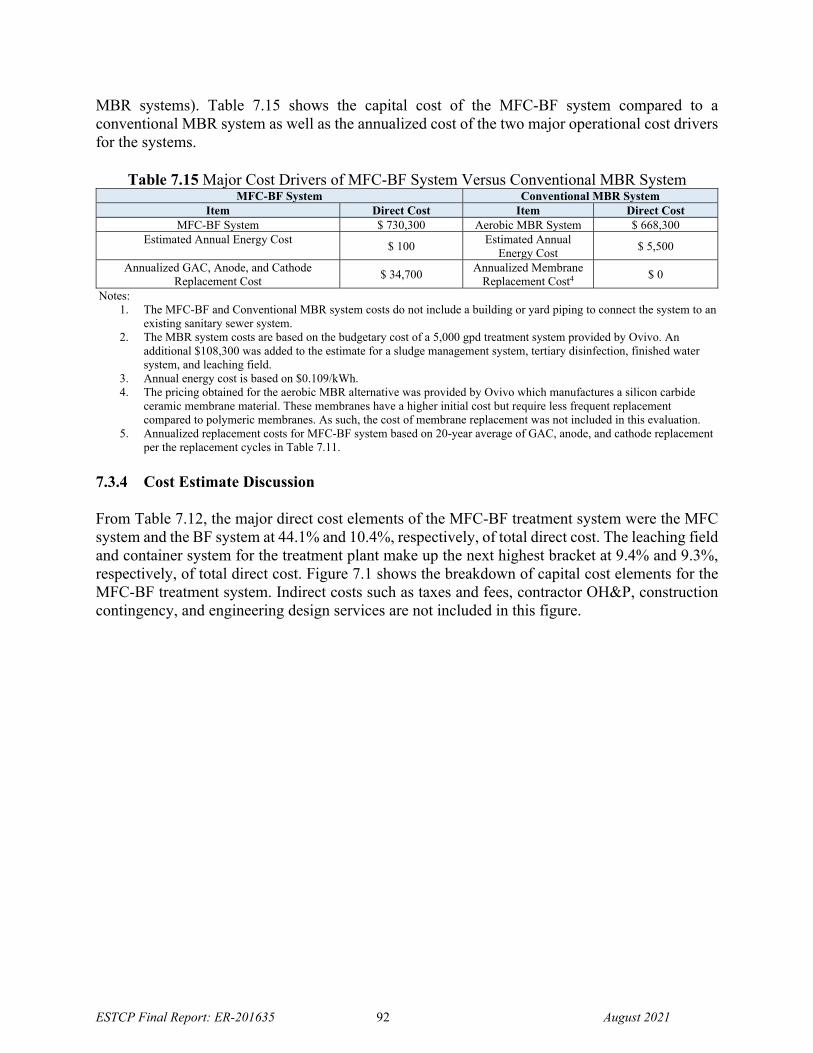
ESTCP Final Report: ER-201635 92 August 2021
MBR systems). Table 7.15 shows the capital cost of the MFC-BF system compared to a conventional MBR system as well as the annualized cost of the two major operational cost drivers for the systems.
Table 7.15 Major Cost Drivers of MFC-BF System Versus Conventional MBR System MFC-BF System Conventional MBR System
Item Direct Cost Item Direct Cost MFC-BF System $ 730,300 Aerobic MBR System $ 668,300
Estimated Annual Energy Cost $ 100
Estimated Annual Energy Cost
$ 5,500
Annualized GAC, Anode, and Cathode Replacement Cost
$ 34,700 Annualized Membrane
Replacement Cost4 $ 0
Notes: 1. The MFC-BF and Conventional MBR system costs do not include a building or yard piping to connect the system to an
existing sanitary sewer system. 2. The MBR system costs are based on the budgetary cost of a 5,000 gpd treatment system provided by Ovivo. An
additional $108,300 was added to the estimate for a sludge management system, tertiary disinfection, finished water system, and leaching field.
3. Annual energy cost is based on $0.109/kWh. 4. The pricing obtained for the aerobic MBR alternative was provided by Ovivo which manufactures a silicon carbide
ceramic membrane material. These membranes have a higher initial cost but require less frequent replacement compared to polymeric membranes. As such, the cost of membrane replacement was not included in this evaluation.
5. Annualized replacement costs for MFC-BF system based on 20-year average of GAC, anode, and cathode replacement per the replacement cycles in Table 7.11.
7.3.4 Cost Estimate Discussion From Table 7.12, the major direct cost elements of the MFC-BF treatment system were the MFC system and the BF system at 44.1% and 10.4%, respectively, of total direct cost. The leaching field and container system for the treatment plant make up the next highest bracket at 9.4% and 9.3%, respectively, of total direct cost. Figure 7.1 shows the breakdown of capital cost elements for the MFC-BF treatment system. Indirect costs such as taxes and fees, contractor OH&P, construction contingency, and engineering design services are not included in this figure.
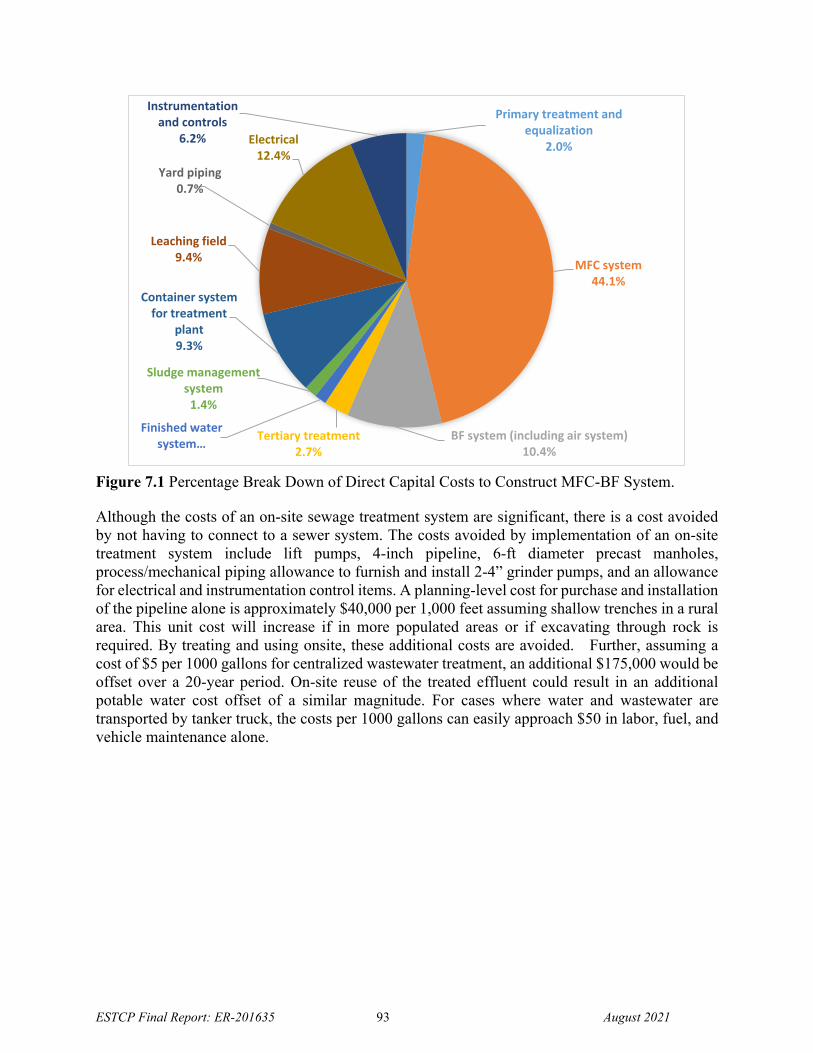
ESTCP Final Report: ER-201635 93 August 2021
Figure 7.1 Percentage Break Down of Direct Capital Costs to Construct MFC-BF System.
Although the costs of an on-site sewage treatment system are significant, there is a cost avoided by not having to connect to a sewer system. The costs avoided by implementation of an on-site treatment system include lift pumps, 4-inch pipeline, 6-ft diameter precast manholes, process/mechanical piping allowance to furnish and install 2-4” grinder pumps, and an allowance for electrical and instrumentation control items. A planning-level cost for purchase and installation of the pipeline alone is approximately $40,000 per 1,000 feet assuming shallow trenches in a rural area. This unit cost will increase if in more populated areas or if excavating through rock is required. By treating and using onsite, these additional costs are avoided. Further, assuming a cost of $5 per 1000 gallons for centralized wastewater treatment, an additional $175,000 would be offset over a 20-year period. On-site reuse of the treated effluent could result in an additional potable water cost offset of a similar magnitude. For cases where water and wastewater are transported by tanker truck, the costs per 1000 gallons can easily approach $50 in labor, fuel, and vehicle maintenance alone.
Primary treatment and equalization
2.0%
MFC system44.1%
BF system (including air system)10.4%
Tertiary treatment 2.7%
Finished water system…
Sludge management system1.4%
Container system for treatment
plant9.3%
Leaching field9.4%
Yard piping0.7%
Electrical12.4%
Instrumentation and controls
6.2%
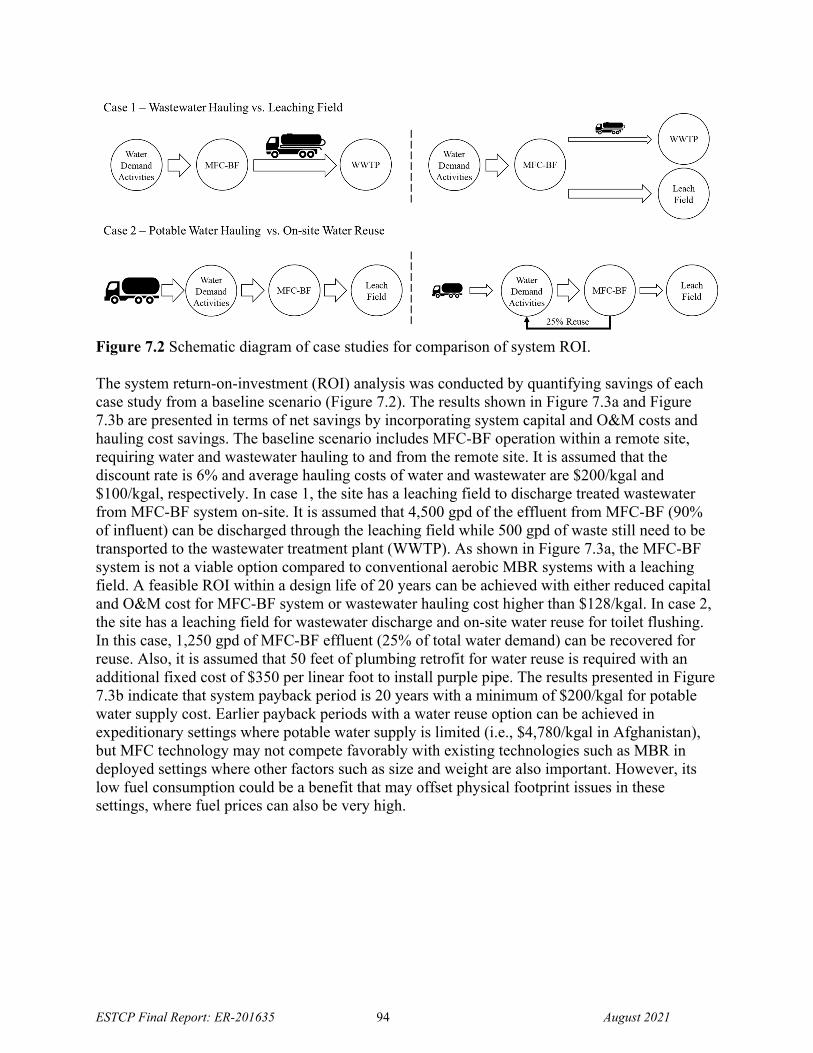
ESTCP Final Report: ER-201635 94 August 2021
Figure 7.2 Schematic diagram of case studies for comparison of system ROI. The system return-on-investment (ROI) analysis was conducted by quantifying savings of each case study from a baseline scenario (Figure 7.2). The results shown in Figure 7.3a and Figure 7.3b are presented in terms of net savings by incorporating system capital and O&M costs and hauling cost savings. The baseline scenario includes MFC-BF operation within a remote site, requiring water and wastewater hauling to and from the remote site. It is assumed that the discount rate is 6% and average hauling costs of water and wastewater are $200/kgal and $100/kgal, respectively. In case 1, the site has a leaching field to discharge treated wastewater from MFC-BF system on-site. It is assumed that 4,500 gpd of the effluent from MFC-BF (90% of influent) can be discharged through the leaching field while 500 gpd of waste still need to be transported to the wastewater treatment plant (WWTP). As shown in Figure 7.3a, the MFC-BF system is not a viable option compared to conventional aerobic MBR systems with a leaching field. A feasible ROI within a design life of 20 years can be achieved with either reduced capital and O&M cost for MFC-BF system or wastewater hauling cost higher than $128/kgal. In case 2, the site has a leaching field for wastewater discharge and on-site water reuse for toilet flushing. In this case, 1,250 gpd of MFC-BF effluent (25% of total water demand) can be recovered for reuse. Also, it is assumed that 50 feet of plumbing retrofit for water reuse is required with an additional fixed cost of $350 per linear foot to install purple pipe. The results presented in Figure 7.3b indicate that system payback period is 20 years with a minimum of $200/kgal for potable water supply cost. Earlier payback periods with a water reuse option can be achieved in expeditionary settings where potable water supply is limited (i.e., $4,780/kgal in Afghanistan), but MFC technology may not compete favorably with existing technologies such as MBR in deployed settings where other factors such as size and weight are also important. However, its low fuel consumption could be a benefit that may offset physical footprint issues in these settings, where fuel prices can also be very high.
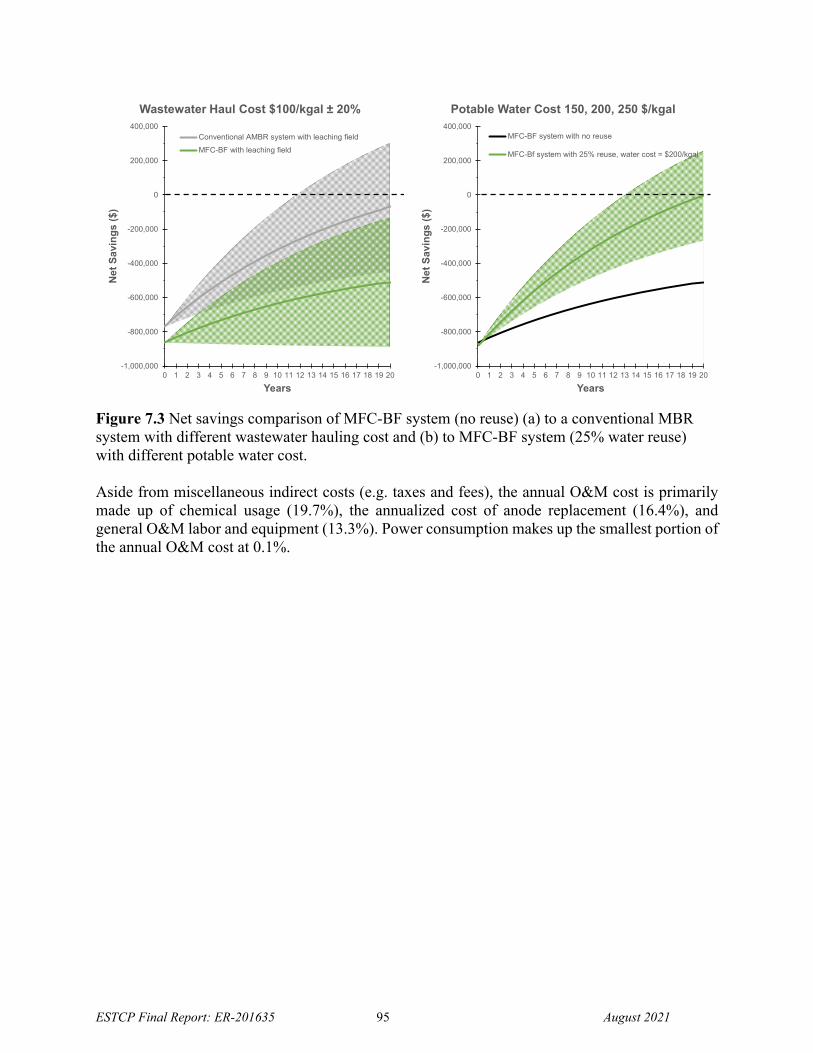
ESTCP Final Report: ER-201635 95 August 2021
Figure 7.3 Net savings comparison of MFC-BF system (no reuse) (a) to a conventional MBR system with different wastewater hauling cost and (b) to MFC-BF system (25% water reuse) with different potable water cost. Aside from miscellaneous indirect costs (e.g. taxes and fees), the annual O&M cost is primarily made up of chemical usage (19.7%), the annualized cost of anode replacement (16.4%), and general O&M labor and equipment (13.3%). Power consumption makes up the smallest portion of the annual O&M cost at 0.1%.
-1,000,000
-800,000
-600,000
-400,000
-200,000
0
200,000
400,000
0 1 2 3 4 5 6 7 8 9 10 11 12 13 14 15 16 17 18 19 20
Net
Sav
ing
s ($
)
Years
Wastewater Haul Cost $100/kgal ± 20%
Conventional AMBR system with leaching field
MFC-BF with leaching field
-1,000,000
-800,000
-600,000
-400,000
-200,000
0
200,000
400,000
0 1 2 3 4 5 6 7 8 9 10 11 12 13 14 15 16 17 18 19 20
Ne
t S
avin
gs
($
)
Years
Potable Water Cost 150, 200, 250 $/kgal
MFC-BF system with no reuse
MFC-Bf system with 25% reuse, water cost = $200/kgal
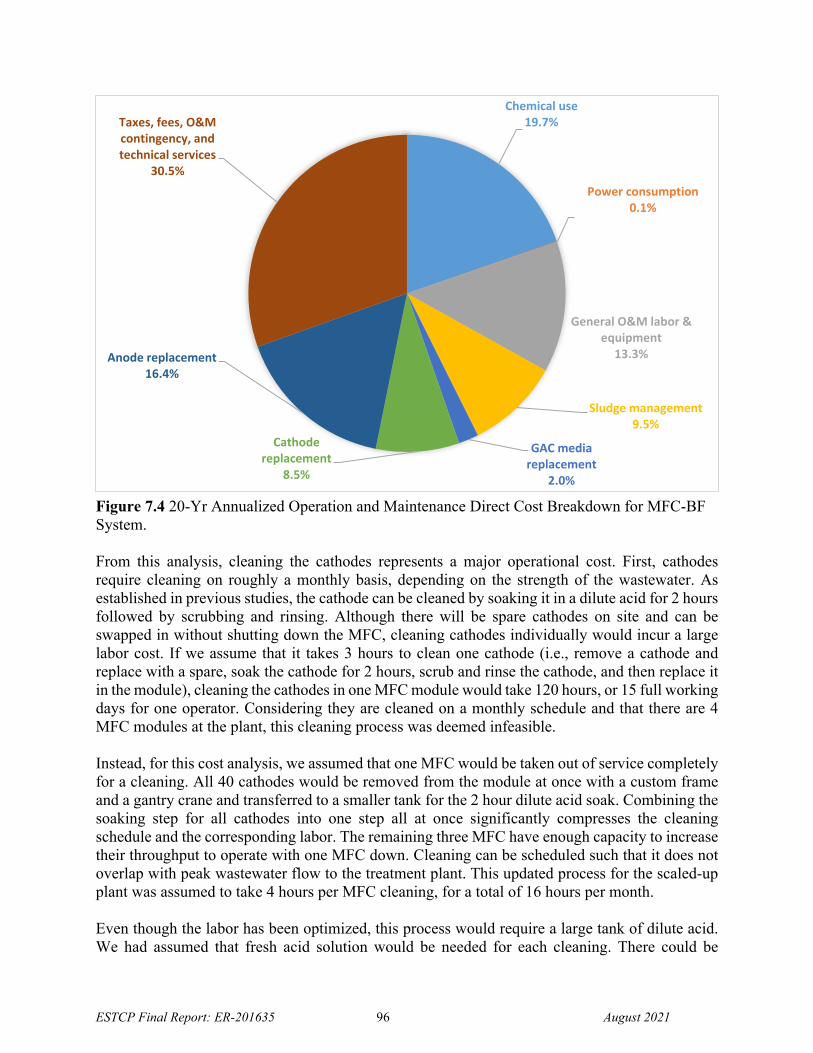
ESTCP Final Report: ER-201635 96 August 2021
Figure 7.4 20-Yr Annualized Operation and Maintenance Direct Cost Breakdown for MFC-BF System. From this analysis, cleaning the cathodes represents a major operational cost. First, cathodes require cleaning on roughly a monthly basis, depending on the strength of the wastewater. As established in previous studies, the cathode can be cleaned by soaking it in a dilute acid for 2 hours followed by scrubbing and rinsing. Although there will be spare cathodes on site and can be swapped in without shutting down the MFC, cleaning cathodes individually would incur a large labor cost. If we assume that it takes 3 hours to clean one cathode (i.e., remove a cathode and replace with a spare, soak the cathode for 2 hours, scrub and rinse the cathode, and then replace it in the module), cleaning the cathodes in one MFC module would take 120 hours, or 15 full working days for one operator. Considering they are cleaned on a monthly schedule and that there are 4 MFC modules at the plant, this cleaning process was deemed infeasible. Instead, for this cost analysis, we assumed that one MFC would be taken out of service completely for a cleaning. All 40 cathodes would be removed from the module at once with a custom frame and a gantry crane and transferred to a smaller tank for the 2 hour dilute acid soak. Combining the soaking step for all cathodes into one step all at once significantly compresses the cleaning schedule and the corresponding labor. The remaining three MFC have enough capacity to increase their throughput to operate with one MFC down. Cleaning can be scheduled such that it does not overlap with peak wastewater flow to the treatment plant. This updated process for the scaled-up plant was assumed to take 4 hours per MFC cleaning, for a total of 16 hours per month. Even though the labor has been optimized, this process would require a large tank of dilute acid. We had assumed that fresh acid solution would be needed for each cleaning. There could be
Chemical use19.7%
Power consumption0.1%
General O&M labor & equipment
13.3%
Sludge management9.5%
GAC media replacement
2.0%
Cathode replacement
8.5%
Anode replacement16.4%
Taxes, fees, O&M contingency, and technical services
30.5%
ESTCP Final Report: ER-201635 97 August 2021
potential cost savings by being able to reuse cleaning solution for at least 2 MFC cleanings, though we do not have the data to support this statement at this time. While chemical usage and labor are significant portions of the operating cost, the anode replacement costs were also noteworthy. After 6 months of operation at pilot-scale, minimal degradation of the anodes was observed, but this replacement cost was included because any municipal wastewater with gritty material will degrade equipment over time. The costs included in the estimate were based on the anode purchase costs from the demonstration skid, as opposed to the cost of a mass-produced anode. We would expect that replacement costs would decrease if mass production of these items increases. Power consumption is the smallest annual operating cost. If research continues on this technology, it has the potential of generating enough electricity to offset power consumption of other ancillary systems, or even achieve net neutral power consumption and would further decrease the annual operating cost of the MFC-BF system. Further Research To be cost competitive with the conventional MBR systems at this scale, the following areas of research should be further developed:
Improve energy generation of the MFC – Improving energy generation can be considered in two areas. First, further development is needed to improve the power density of the cathodes. During the demonstration study, the anode-cathode assemblies produced 0.46 Watts on average. The second facet to improving energy generation is improving the efficiency of converting the small amount of energy generated by each anode/cathode pair to a useable voltage to reduce losses in transmission. In the demonstration pilot plant, the control board was only 42% efficient at converting the mV to V. More than half of the energy generated was lost in the conversion process.
Economies of scale – When this technology can prove its viability in the market, more companies will develop ways to mass produce the cathodes. With the improvement in manufacturing efficiency, the capital and annualized replacement costs for the electrodes will decrease.
Conduct a pilot study to validate MFC performance at ambient temperatures. In this analysis, we assumed that COD removal rates demonstrated with the pilot study would be 10% lower if the water temperature was at 60°F rather than at 95°F. Further testing would be needed to validate this assumption. Otherwise, requiring the higher than ambient water temperatures will add additional equipment cost for a water heater and significant energy consumption to heat the water. Requiring a water heater would negate the benefit of reduced aeration needs on yearly energy consumption.
Cost of sludge management system and disposal. In this analysis, we had assumed that the costs for the dewatering system for both the MFC-BF system and the MBR system were roughly equivalent. The demonstration scale MFC-BF system yielded lower amounts of sludge than conventional treatment systems but since this was only based on one sample,
ESTCP Final Report: ER-201635 98 August 2021
the sludge management costs were assumed to be similar between the MFC-BF system and an MBR system. If proven to be a reality, the lower sludge yield would result in lower polymer usage, less pumping, smaller tanks, and less frequent sludge or biosolid hauling.
By improving the areas above, the MFC-BF treatment system could eventually generate enough energy to offset the annual electrical costs, thereby making it more cost competitive with conventional treatment methods. 7.3.5 Life Cycle Cost Assessment Summary The MFC-BF system life cycle cost assessment included an evaluation of the indirect and direct capital costs to construct a 5,000 gpd treatment system and the major annual operational and maintenance costs. This analysis led to many conclusions which can assist in the further development of this novel technology. The MFC anodes and cathodes make up a substantial proportion of the capital cost of the system, and as a result the estimated capital project cost of the MFC-BF system is higher than a conventional MBR system. However, even without considering the energy produced by the MFC, the estimated annual energy cost to operate the MFC-BF system is approximately 50 times less than that of the conventional MBR system because it does not require continuous aeration. With additional development to improve the cathode density and conversion efficiency, the MFC-BF could become an energy-generating technology. Thus, although the MFC-BF system would appear to incur a somewhat higher initial project cost than the conventional MBR system, the projected 20-year life cycle costs for the two alternatives are very similar. There are specific areas where the MFC-BF system could be further developed which would improve the business case for implementing MFC-BF instead of a conventional technology. The areas of further research that could reduce costs are as follows:
Improve energy generation of the MFC Technological viability for mass production and lower electrode costs Pilot testing of MFC performance at ambient temperatures, to confirm lower sludge yield
compared to conventional aerobic treatment, and for longer durations to confirm the assumptions included in this report related to anode replacement intervals.
The research performed to date has made significant strides in demonstrating the viability of a treatment technology which can decrease electrical costs and potentially become a net positive energy producer, thus improving the overall sustainability of wastewater treatment.
ESTCP Final Report: ER-201635 99 August 2021
8.0 IMPLEMENTATION ISSUES The results and analysis generated in this ESTCP demonstration project indicate that the MFC-BF technology can effectively treat wastewater over sustained periods while requiring considerably less energy than conventional aerobic wastewater treatment processes. However, MFC-BF technology needs to be improved in terms of footprint and cost relative to conventional technologies. LCCA modeling indicates that MFC-BF technology could be economical in some niche small-scale DOD scenarios, such as when serving as an alternative to hauling wastewater from a remote field training site using tanker trucks, though other wastewater treatment technologies would likely be even more economical. With additional improvements in manufacturing of key components and further optimization, MFC technology could be more cost competitive in the future. In the near term, the DOD may have needs for the MFC-BF technology for support of off-grid sites such as field training areas where there is relatively continuous occupancy throughout the year, where energy consumption must be minimized, and where it may not be economically or physically viable to connect the site utilities to centralized infrastructure. Implementation of the technology will be subject to local regulations pertaining to wastewater discharge or reuse. Most state environmental regulators have standard permitting processes for on-site wastewater treatment systems, and applicability of these processes to DOD sites should be reviewed carefully by counsel, facilities management, and environmental staff. Key factors for decision makers to consider when assessing the applicability of MFC-BF technology include: Cost and energy consumption of alternative technologies. Cost and energy consumption of connecting to centralized infrastructure from a given
location versus on-site treatment for discharge or reuse. Availability of staff to support operation and monitoring of a decentralized wastewater
treatment system. Availability of staff, vehicles, and facilities for collecting and processing sludge generated
by a decentralized wastewater treatment system. Resiliency benefits of reusing treated wastewater to help offset potable water requirements
and extend the life of emergency water supplies. The maturity of the MFC-BF system is another important consideration for DOD implementation. Both the MFC and BF technologies are relatively new and are not yet produced at large commercial scale, so costs will be relatively high in the near-future relative to conventional technologies like MBR. Newer technologies also present potential technical risk with respect to long term performance issues that may be identified in the future by early adopters. As the technologies continue to mature, it is expected that performance will be improved, resulting in decreases in cost and footprint. For improving and maturing MFC technology in terms of cost and footprint, it is recommended that future research focus on the following issues:
ESTCP Final Report: ER-201635 100 August 2021
Develop more robust cathodes to avoid water leakage. The current manufacturing system of laser welding with glue was not sufficiently effective to prevent leaks.
Develop more effective capture and conversion of electrical power. Greater electrical power can be recovered using power point tracking systems and more efficient DC-DC converters.
Further decrease spacing between the electrodes. Forcing the flow through the brushes that are kept closer to the cathodes could improve power.
Test pretreatment methods that remove particles entering into the MFC (and BF) to minimize sludge accumulation or clogging.
For improving and maturing the BF technology in terms of cost and performance, it is recommended that future research focus on the following issues:
Long term performance of the BF filter media (over years) Incorporation of complementary filtration media that enhances biological nutrient
removal
ESTCP Final Report: ER-201635 101 August 2021
9.0 REFERENCES 1. UMCSS Center for Sustainable Systems, University of Michigan. 2011. U.S. Wastewater
Treatment Factsheet. Pub No. CSS04-14. http://css.snre.umich.edu/css_doc/CSS04-14.pdf; 2. Assistant Secretary of the Army for Installations Energy and Environment 2014. 3. USEPA; USAID; CDM Smith. 2012. Guidelines for Water Reuse. EPA/600/R-12/618 4. DOD. 2010. U. S. Department of Defense Strategic Sustainability Performance Plan.
FY2010. www.acq.osd.mil/ie/download/green_energy/dod_sustainability/DoD%20SSPP-PUBLIC-26Aug10.pdf.;
5. Scholze, R. J.; Gerdes, G. L.; Goran, W. D.; Hall, J.; Preston, K.; McLeod, M.; Sheets, D.; Sustich, R. 2009. In Proceedings of the Military Applications for Emerging Water Use Technologies Workshop. ERDC/CERL TR-09-12, 2009
6. Barry, J. A. 2012. Characterization of DOD Installation Wastewater Treatment. http://www.serdp.org/Program-Areas/Environmental-Restoration/Wastewater-and-Drinking-Water/Noblis-Report;
7. Logan, B. E.; Regan, J. M. 2006. Microbial fuel cells—challenges and applications. Environmental Science & Technology. 40, (17), 5172-5180.
8. Liu, H.; Ramnarayanan, R.; Logan, B. E. 2004. Production of electricity during wastewater treatment using a single chamber microbial fuel cell. Environmental Science & Technology. 38, (7), 2281-2285.
9. Logan, B. E. 2004. Extracting hydrogen and electricity from renewable resources. Environmental Science & Technology. 38, (9), 160A-167A.
10. Logan, B. E.; Aelterman, P.; Hamelers, B.; Rozendal, R.; Schröder, U.; Keller, J.; Freguiac, S.; Verstraete, W.; Rabaey, K. 2006. Microbial fuel cells: methodology and technology. Environmental Science & Technology. 40, (17), 5181-5192.
11. Cheng, S.; Liu, H.; Logan, B. E. 2006. Power densities using different cathode catalysts (Pt and CoTMPP) and polymer binders (Nafion and PTFE) in single chamber microbial fuel cells. Environmental Science & Technology. 40, 364-369.
12. Zhao, F.; Harnisch, F.; Schröder, U.; Scholz, F.; Bogdanoff, P.; Herrmann, I. 2005. Application of pyrolysed iron (II) phthalocyanine and CoTMPP based oxygen reduction catalysts as cathode materials in microbial fuel cells. Electrochemistry Communications. 7, 1405-1410.
13. Logan, B. E. 2015. Hydrogen and biogas production using microbial electrolysis cells. Invited talk: Special session on Biomass and Beyond: Challenges and Opportunities for Advanced Biofuels from Wet-Waste Feedstocks. In Bioenergy 2015: Opportunities in a Changing Energy Landscape, Washington DC.
14. He, W.; Zhang, X.; Liu, J.; Zhu, X.; Feng, Y.; Logan, B. E. 2015. Microbial fuel cells with separate brush-anode and integrated-spacer dual cathode modules. Environ. Sci. Technol. 2, 186-195.
15. Ren, L.; Zhang, X.; He, W.; Logan, B. E. 2014. High current densities enable exoelectrogens to outcompete aerobic heterotrophs for substrate. Biotechnol. Bioeng. 111, 2163-2169.
16. Zhang, X.; He, W.; Ren, L.; Stager, J.; Evans, P. J.; Logan, B. E. 2015. COD removal characteristics in air-cathode microbial fuel cells. Bioresource Technology. 176, (0), 23-31.
ESTCP Final Report: ER-201635 102 August 2021
17. Ren, L.; Ahn, Y.; Logan, B. E. 2014. Domestic wastewater treatment with a two-stage microbial fuel cell and anaerobic fluidized bed membrane bioreactor (MFC-AFMBR) system. Environ. Sci. Technol. 48, 4199-4206
18. Ward, Laura & Page, Martin & Jurevis, John & Nelson, Andrew & Rivera, Melixa & Hernandez, Margaret & Chappell, Mark & Dusenbury, James. 2015. Assessment of biologically active GAC and complementary technologies for gray water treatment. Journal of Water Reuse and Desalination. 5. 239. 10.2166/wrd.2015.088.
19. Pant, D.; Van Bogaert, G.; De Smet, M.; Diels, L.; Vanbroekhoven, K. 2010. Use of Novel Permeable Membrane and Air Cathodes in Acetate Microbial Fuel Cells. Electrochim. Acta. 55 (26), 7710–7716.
20. Zhang, X.; Pant, D.; Zhang, F.; Liu, J.; He, W.; Logan, B. E. 2014. Long-Term Performance of Chemically and Physically Modified Activated Carbons in Air Cathodes of Microbial Fuel Cells. ChemElectroChem. 1 (11), 1859–1866.
21. Cusick, R. D.; Bryan, B.; Parker, D. S.; Merrill, M. D.; Mehanna, M.; Kiely, P. D.; Liu, G.; Logan, B. E. 2011. Performance of a Pilot-Scale Continuous Flow Microbial Electrolysis Cell Fed Winery Wastewater. Appl. Microbiol. Biotechnol. 89 (6), 2053–2063.
22. Feng, Y.; Yang, Q.; Wang, X.; Logan, B. E. 2010. Treatment of Carbon Fiber Brush Anodes for Improving Power Generation in Air-Cathode Microbial Fuel Cells. J. Power Sources. 195 (7), 1841–1844.
23. Lanas, V.; Ahn, Y.; Logan, B. E. 2014. Effects of Carbon Brush Anode Size and Loading on Microbial Fuel Cell Performance in Batch and Continuous Mode. J. Power Sources. 247, 228–234.
24. Yang, W.; Kim, K. Y.; Saikaly, P. E.; Logan, B. E. 2017. The Impact of New Cathode Materials Relative to Baseline Performance of Microbial Fuel Cells All with the Same Architecture and Solution Chemistry. Energy Environ. Sci. 10 (5), 1025–1033.
25. Vargas, I. T.; Albert, I. U.; Regan, J. M. 2013. Spatial Distribution of Bacterial Communities on Volumetric and Planar Anodes in Single-Chamber Air-Cathode Microbial Fuel Cells. Biotechnol. Bioeng. 110 (11), 3059–3062.
26. Wei, B.; Tokash, J. C.; Zhang, F.; Kim, Y.; Logan, B. E. 2013. Electrochemical Analysis of Separators Used in Single-Chamber, Air-Cathode Microbial Fuel Cells. Electrochim. Acta. 89, 45–51.
27. Yang, W.; Rossi, R.; Tian, Y.; Kim, K. Y.; Logan, B. E. 2018. Mitigating External and Internal Cathode Fouling Using a Polymer Bonded Separator in Microbial Fuel Cells. Bioresour. Technol. 249 (October 2017), 1080–1084.
28. Logan, B. E.; Zikmund, E.; Yang, W.; Rossi, R.; Kim, K.-Y.; Saikaly, P. E.; Zhang, F. 2018. Impact of Ohmic Resistance on Measured Electrode Potentials and Maximum Power Production in Microbial Fuel Cells. Environ. Sci. Technol. 52, 8977–8985.
29. Cheng, S.; Ye, Y.; Ding, W.; Pan, B. 2014. Enhancing Power Generation of Scale-up Microbial Fuel Cells by Optimizing the Leading-out Terminal of Anode. J. Power Sources. 248, 631–638.
30. Dewan, A.; Beyenal, H.; Lewandowski, Z. 2008. Scaling up Microbial Fuel Cells. Environ. Sci. Technol. 42 (20), 7643–7648.
31. Yang, Q.; Feng, Y.; Logan, B. E. 2012. Using Cathode Spacers to Minimize Reactor Size in Air Cathode Microbial Fuel Cells. Bioresour. Technol. 110, 273–277.
ESTCP Final Report: ER-201635 103 August 2021
32. Cheng, S.; Liu, W.; Guo, J.; Sun, D.; Pan, B.; Ye, Y.; Ding, W.; Huang, H.; Li, F. 2014. Effects of Hydraulic Pressure on the Performance of Single Chamber Air-Cathode Microbial Fuel Cells. Biosens. Bioelectron. 56, 264–270.
33. Ahn, Y.; Zhang, F.; Logan, B. E. 2014. Air Humidity and Water Pressure Effects on the Performance of Air-Cathode Microbial Fuel Cell Cathodes. J. Power Sources. 247, 655–659.
34. He, W.; Wallack, M. J.; Kim, K. Y.; Zhang, X.; Yang, W.; Zhu, X.; Feng, Y.; Logan, B. E. 2016. The Effect of Flow Modes and Electrode Combinations on the Performance of a Multiple Module Microbial Fuel Cell Installed at Wastewater Treatment Plant. Water Res. 105, 351–360.
35. Rossi, R. et al. 2018. In situ biofilm removal from air cathodes in microbial fuel cells treating domestic wastewater. Bioresour. Technol., 265, 200−206.
36. Oh, S. E.; Logan, B. E. 2006. Proton Exchange Membrane and Electrode Surface Areas as Factors That Affect Power Generation in Microbial Fuel Cells. Appl. Microbiol. Biotechnol. 70 (2), 162–169.
37. Lanas, V.; Logan, B. E. 2013. Evaluation of Multi-Brush Anode Systems in Microbial Fuel Cells. Bioresour. Technol. 148, 379–385.
38. Logan, B. E.; Hamelers, B.; Rozendal, R.; Schröder, U.; Keller, J.; Freguia, S.; Aelterman, P.; Verstraete, W.; Rabaey, K. 2006. Microbial Fuel Cells: Methodology and Technology. Environ. Sci. Technol. 40 (17), 5181–5192.
39. Rossi, R.; Jones, D.; Myung, J.; Zikmund, E.; Yang, W.; Alvarez, Y.; Pant, D.; Evans, P. J.; Page, M. A.; Cropek, D. M.; et al. 2019. Evaluating a Multi-Panel Air Cathode through Electrochemical and Biotic Tests. Water Res. 148, 51–59.
40. Cheng, S.; Logan, B. E. 2011. Increasing Power Generation for Scaling up Single-Chamber Air Cathode Microbial Fuel Cells. Bioresour. Technol. 102 (6), 4468–4473.
41. Kim, K. Y.; Yang, W.; Logan, B. E. 2015. Impact of Electrode Configurations on Retention Time and Domestic Wastewater Treatment Efficiency Using Microbial Fuel Cells. Water Res. 80, 41–46.
42. Zhang, X.; He, W.; Ren, L.; Stager, J.; Evans, P. J.; Logan, B. E. 2015. COD Removal Characteristics in Air-Cathode Microbial Fuel Cells. Bioresour. Technol. 176, 23–31.
43. Ginestet P., Camacho P. 2007. Technical evaluation of sludge production and reduction. In: Comparative evaluation of sludge reduction routes, pp. 1-15. IWA Publishing Ltd, London, UK. ISBN: 1843391236.
ESTCP Final Report: ER-201635 104 August 2021
APPENDICES
Appendix A: Health and Safety Plan (HASP) This demonstration project was guided by safety protocols outlined in the USACE Safety and Health Requirements Manual, available at: https://www.usace.army.mil/Safety-and-Occupational-Health/Safety-and-Health-Requirements-Manual/
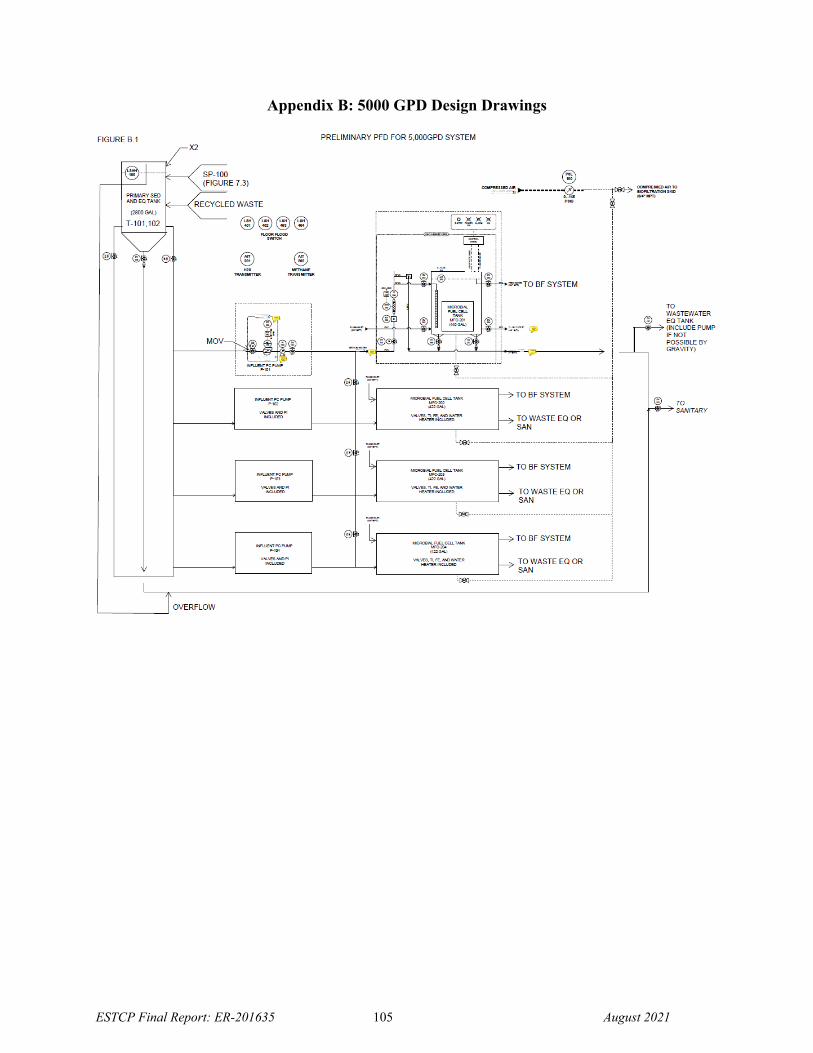
ESTCP Final Report: ER-201635 105 August 2021
Appendix B: 5000 GPD Design Drawings
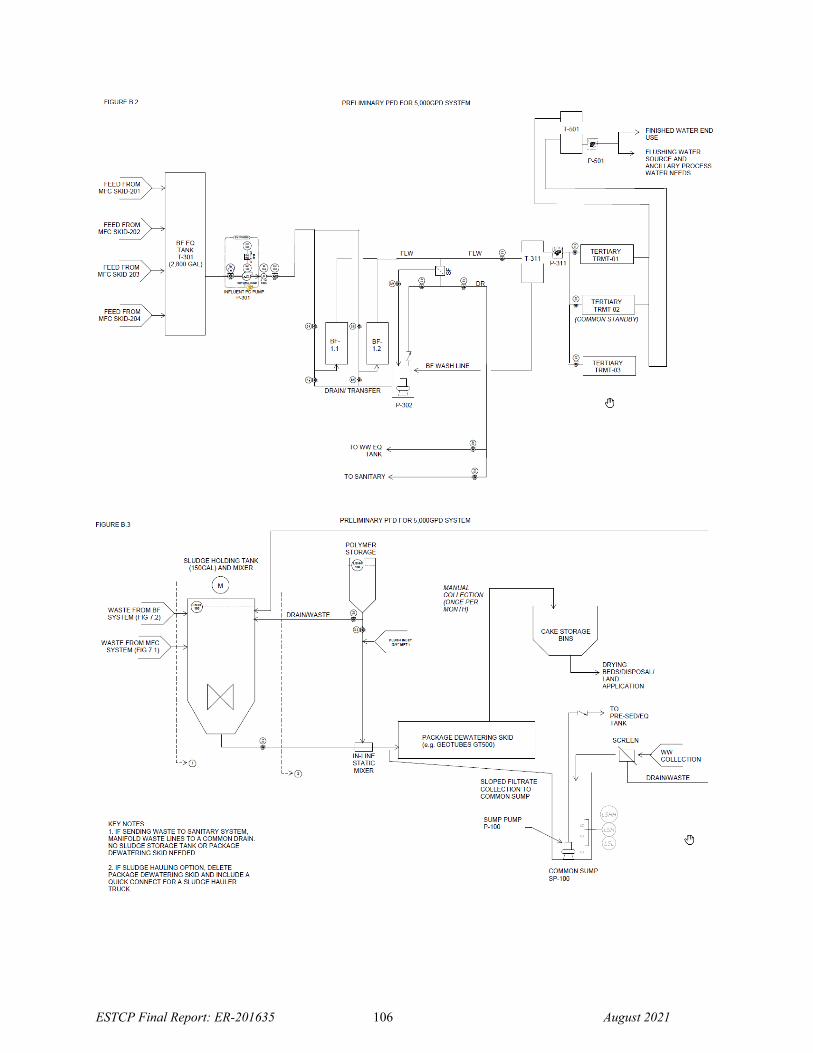
ESTCP Final Report: ER-201635 106 August 2021
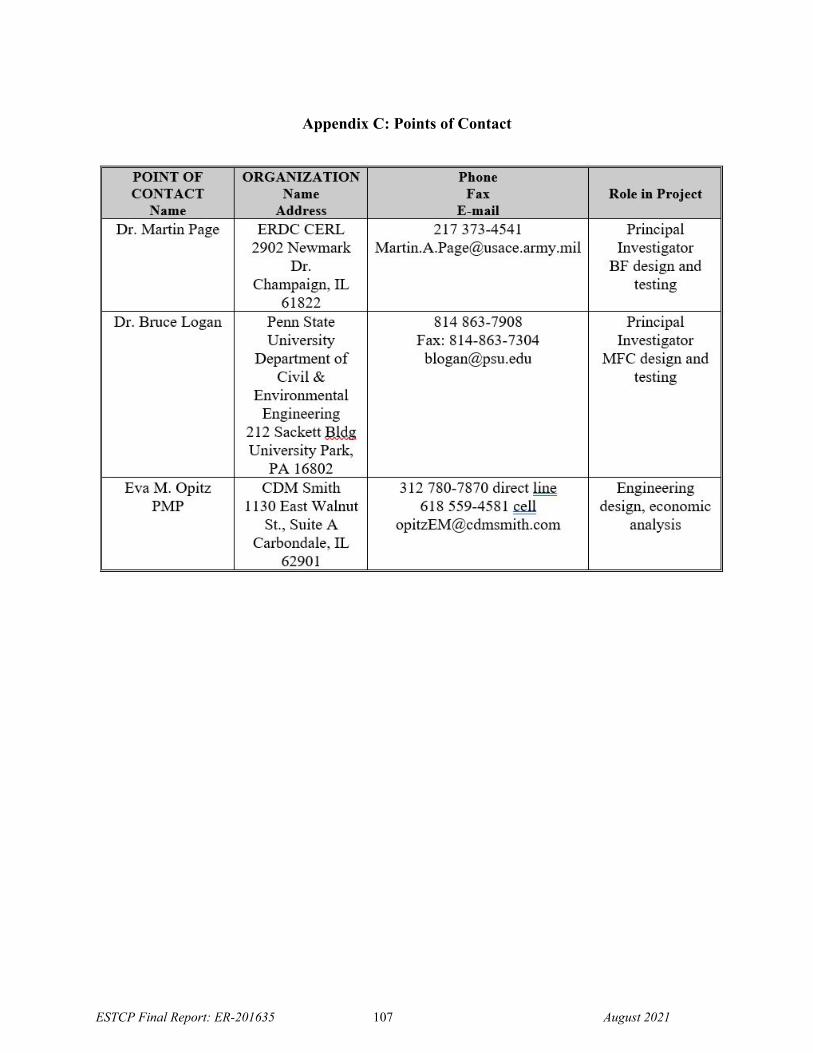
ESTCP Final Report: ER-201635 107 August 2021
Appendix C: Points of Contact
Top Related
Copyright © 2022 FDOKUMEN

