


Bahasa
Halaman
Hukum

How do differences in species and part consumption affectdiet nutrient concentrations? A test with red colobusmonkeys in Kibale National Park, Uganda
Amy M. Ryan1, Colin A. Chapman2,3 and Jessica M. Rothman4,5*1Department of Psychology, Hunter College of the City University of New York, New York City, NY, 10065, U.S.A., 2Department of
Anthropology and McGill School of Environment, McGill University, Montreal, Quebec, Canada, H3A 2T7 , 3Wildlife Conservation Society,
Bronx, New York, NY, U.S.A., 4Department of Anthropology, Hunter College of the City University of New York, New York City, NY,
10065, U.S.A. and 5New York Consortium in Evolutionary Primatology (NYCEP), New York City, NY, U.S.A.
Abstract
Within a primate species, diet can be highly variable in
composition, even at small spatial scales within the same
forest, or temporally, suggesting that primates use different
plant species and parts to meet similar nutritional needs.
To test whether such differences in the plant species and
parts that primates eat affects the nutrient concentrations
that they obtain, we observed feeding of seven groups of
red colobus monkeys (Procolobus rufomitratus) residing in
Kibale National Park, Uganda. The different groups con-
sumed mostly young leaves from many of the same plant
species, but spent different amounts of time feeding on
them. As protein and fibre are suggested to be important
determinants of colobine food choice and abundance, we
analysed multiple samples of 47 food species for protein
and fibre. Despite the differences in the plant species and
parts eaten, the protein and fibre concentrations for the
seven red colobus groups were similar. Our results suggest
that colobus monkeys eating diets with differing amounts
of species and parts may ultimately receive similar
concentrations of nutrients.
Key words: colobus, dietary variability, Kibale, nutritional
ecology, plant chemistry, protein
Resume
Au sein d’une meme espece de primate, la composition du
regime alimentaire peut etre tres variable, meme a petite
echelle spatiale, dans la meme foret, ou temporelle, ce qui
laisse entendre que les primates utilisent des especes et des
parties de plantes differentes pour satisfaire des besoins
nutritionnels semblables. Pour verifier si de telles differ-
ences d’especes vegetales et de parties de plantes con-
sommees par les primates affectent les concentrations de
nutriments obtenues, nous avons observe l’alimentation de
sept groupes de colobes roux (Procolobus rufomitratus)
residant dans le Parc National de Kibale, en Ouganda. Les
differents groupes consommaient principalement de jeunes
feuilles de nombreuses plantes des memes especes, mais ils
passaient une duree differente a s’en nourrir. Comme les
proteines et les fibres sont censees etre des determinants
importants dans le choix et l’abondance de la nourriture
des colobes, nous avons analyse le contenu en proteines et
en fibres de multiples echantillons de 47 especes con-
sommees. Malgre les differences d’especes et de parties de
plantes consommees, les concentrations de proteines et de
fibres etaient semblables pour les sept groupes de colobes
rouges. Nos resultats suggerent que les regimes alimen-
taires des colobes, qui different quant au nombre d’especes
et aux parties de plantes qui les composent, pourraient tout
compte fait contenir des concentrations de nutriments
semblables.
Introduction
There has been a developing awareness of the great
diversity in primate diets on various spatial and temporal
scales (Davies, Bennett & Waterman, 1988; Wrangham,
Conklin-Brittain & Hunt, 1998; Chapman & Chapman,
1999; Yamashita, 2002; Ganas et al., 2004; Russo et al.,
2005; Wieczkowski & Kinnaird, 2008). Previous studies
have demonstrated sympatric species that are largely*Correspondence: E-mail: [email protected]
© 2012 Blackwell Publishing Ltd, Afr. J. Ecol. 1
considered to have similar diets in terms of broad feeding
categories (i.e., frugivory, folivory) in fact consume differ-
ing amounts of shared plant species along with using
different species and parts that other primates do not eat
(Davies, Bennett & Waterman, 1988; Wrangham, Conk-
lin-Brittain & Hunt, 1998; Davies, Oates & Dasilva, 1999;
Dierenfeld & McCann, 1999; Yamashita, 2002; Zhou
et al., 2009). Differences in diet composition as defined by
plant species and parts consumed have also been found in
populations of the same species (Codron et al., 2006;
Twinomugisha et al., 2006; Rothman et al., 2007; Zhou
et al., 2009) including populations that reside in the same
geographic area or even have neighbouring or overlapping
home ranges (Chapman & Chapman, 1999, 2002; Chap-
man, Chapman & Gillespie, 2002; Ganas et al., 2004;
Grassi, 2006; Harris & Chapman, 2007; Potts, Watts &
Wrangham, 2011). However, differences in the quality
and distribution of plants may have a dramatic effect on
group size and population abundance; for example, Fimbel
et al. (2001) suggest that large group sizes in black-and-
white colobus (Colobus angolensis) in Rwanda compared
with other Colobus spp. are a result of the high quality of
mature leaves in comparison with other African forests
because food competition in Rwanda is relaxed.
Nutritional analyses have revealed sympatric species
with dissimilar use of plant species and parts can
ultimately have diets with similar nutritional concentra-
tions (Davies, Bennett & Waterman, 1988; Conklin-
Brittain, Wrangham & Hunt, 1998; Dierenfeld & McCann,
1999). For example, after a previous conclusion that
groups of chimpanzees and three cercopithecine species in
Kibale had differing diet compositions, it was also found
that the groups actually consumed similar diets in terms of
fibre content (Conklin-Brittain, Wrangham & Hunt, 1998).
Comparisons between groups of the same species suggest
conspecifics in different groups use combinations of differ-
ent plant species and parts to acquire similar nutrient
concentrations in their diets. The diets of the golden
monkey (Cercopithecus mitis kandti) and blue monkey
(Cercopithecus mitis stuhlmanni) subspecies residing in two
parks were compared and shown to be compositionally
very different over time, between groups and between
subspecies. However, the overall nutritional components of
the diets were similar in terms of crude protein (CP), acid
detergent fibre (ADF), lipids and sugars (Twinomugisha
et al., 2006). Similar results were obtained in a study of
mountain gorillas (Gorilla beringei) living in different
habitats, for two groups that consumed different plant
species had diets with similar nutritional concentrations of
CP, neutral detergent fibre (NDF) and nonstructural
carbohydrates (Rothman et al., 2007). Conversely, general
environmental conditions may lead to differences in plant
quality, which impacts available nutrients and potentially
physiological parameters (Fimbel et al., 2001).
While these previous studies analysed diet nutritional
content for groups of the same species that reside in different
locations, there is little information on how compositional
diversity relates to nutritional intake for conspecifics that
share the same forest. We address this question by using
long-term dietary data from seven groups of red colobus
monkeys (Procolobus rufomitratus) that reside in Kibale
National Park, Uganda. Red colobus monkeys are folivores
that subsist on a leaf diet of varying quality in terms of
protein-to-fibre ratios and prefer foodswith high protein and
low ADF content (Chapman & Chapman, 2002). The red
colobus groups in Kibale are well-studied, and plant species
and parts fed on by groups across short distances or even
within the same area are quite varied (Chapman &
Chapman, 1999, 2002; Chapman, Chapman & Gillespie,
2002; Chapman & Pavelka, 2005).
To assess the nutrients in plants eaten by different groups
of red colobus, we analysed plant species and parts
consumed for protein and fibre content. The concentrations
of these two nutritional components have been shown to
reliability generate meaningful patterns for primate feeding
behaviour and population density (Milton, 1979; Davies,
Bennett & Waterman, 1988; Barton & Whiten, 1994;
Davies, Oates & Dasilva, 1999; Dierenfeld &McCann, 1999;
Chapman & Chapman, 2002) including for some of the
same groups of red colobus in Kibale that are included in
this investigation (Chapman & Chapman, 2002). We
therefore hypothesized that the variation in diet composi-
tion observed in sympatric red colobus groups will ulti-
mately translate to a similar nutritional profile across
groups in terms of fibre and protein concentrations from the
different combinations of plant species and parts consumed.
Methods
Study site
Kibale National Park (795 km²) (Fig. 1) is located east of
the foothills of the Ruwenzori Mountains in western
Uganda (0°13′–0°41′N and 30°19′–30°32′E). The mean
daily minimum temperature is 15.5°C, and the mean
maximum daily temperature is 23.7°C with little
© 2012 Blackwell Publishing Ltd, Afr. J. Ecol.
2 Amy M. Ryan et al.
seasonal variation. The mean annual rainfall around the
park is 1701 mm (1990–2009), and rainfall is typically
bimodal with two rainy seasons from March to May and
September to November (Chapman et al., 2012).
The red colobus groups studied live in different parts of
Kibale, which are all composed of different tree species and
degrees of human modification. Five of the seven red
colobus groups live in the Kanyawara section, which is in
the northern end of the park and has a range of heavily
logged forest to mostly undisturbed forest (Chapman et al.,
2010). Two red colobus groups are further specified to live
in the forestry components of K30 and K15 within
Kanyawara. The K15 section is considered to be heavily
logged, for it is estimated that this section had 50% of
canopy trees destroyed from incidental damage and
logging, whereas the K30 forestry compartment has not
been commercially logged and the forest has experienced
only very low levels of extraction by pit sawing (Chapman,
Chapman & Gillespie, 2002) (Fig. 1).
Two additional red colobus groups live in sections that
are close to Kanyawara. The northernmost section of the
park and thus north of Kanyawara is Sebatoli, which has a
canopy that mainly consists of timber trees such as
Parinari excelsa, Carapa grandiflora, Olea capensis subspecies
welwitschii, Pouteria altissima, Strombosia scheffleri and
Newtonia bucchananiii (Chapman, Chapman & Gillespie,
2002). The Sebatoli section was commercially logged in
the late 1960s and it is surmised that the section was
logged in a similar fashion as the K15 section, which was
harvested on average by 21 m³ ha�1 or about 7.4
stems ha�1 (Chapman, Chapman & Gillespie, 2002). The
final red colobus group lives in the Dura section of Kibale,
which is south of Kanyawara. Unlike Kanyawara and
Sebatoli, Dura is not considered a Parinari forest because
the timber species such as P. excelsa observed in the
northern half of Kibale are rare in Dura. Instead, Dura is
mostly composed of Pterygota mildbraedii, Cola gigantea,
Piptadeniastrum africanum and Chrysophyllum albidum in
the canopy, and furthermore, the section has not been
greatly impacted by logging or extraction (Chapman,
Chapman & Gillespie, 2002).
Behavioural observations and plant collection
CAC and field assistants observed seven habituated groups
of red colobus monkeys using the observation techniques
described in Chapman, Chapman & Gillespie (2002).
Briefly summarized, during each half-hour while observ-
ing a particular group, observers point-sampled the first
five individuals observed. If the animal was feeding, then
the observers recorded the plant species and part
consumed. The categories for possible plant parts were;
ripe fruit, unripe fruit, flower, young leaf, mature leaf, leaf
petiole, leaf bud, bark, dead wood, pine needles, seeds,
seed pods, fruit (unknown ripeness), pith and soil. Feeding
was noted as discrete behavioural bouts; however, feeding
rates within these bouts were not determined. For the
purposes of analysing the potential differences in diet
between the seven groups, it was assumed that there
were equivalent feeding rates among individuals within
and across the seven groups.
The seven groups were observed at different times with a
varying amount of observations. The Sebatoli group
(N = 18 individuals) was observed from August 1996
through April 1997 for 104 h with 387 feeding records,
and the Dura group (N = 20) was observed from August
1995 through April 1997 for 88 h with 192 feeding
records. For the five groups in Kanyawara, observations of
the group residing in the K30 section of the forest, named
‘Kanyawara 1’ (K.1) (N = 40) in this report, were made
from July 1994 through April 1997 for 1110 h with 3775
feeding records and the group residing in the K15 section
of forest, named ‘Kanyawara 2’ (K.2) (N = 30), were made
from August 1996 through May 1997 for 114 h with 337
feeding records. The Kanyawara 3 (K.3) (N = 48) and
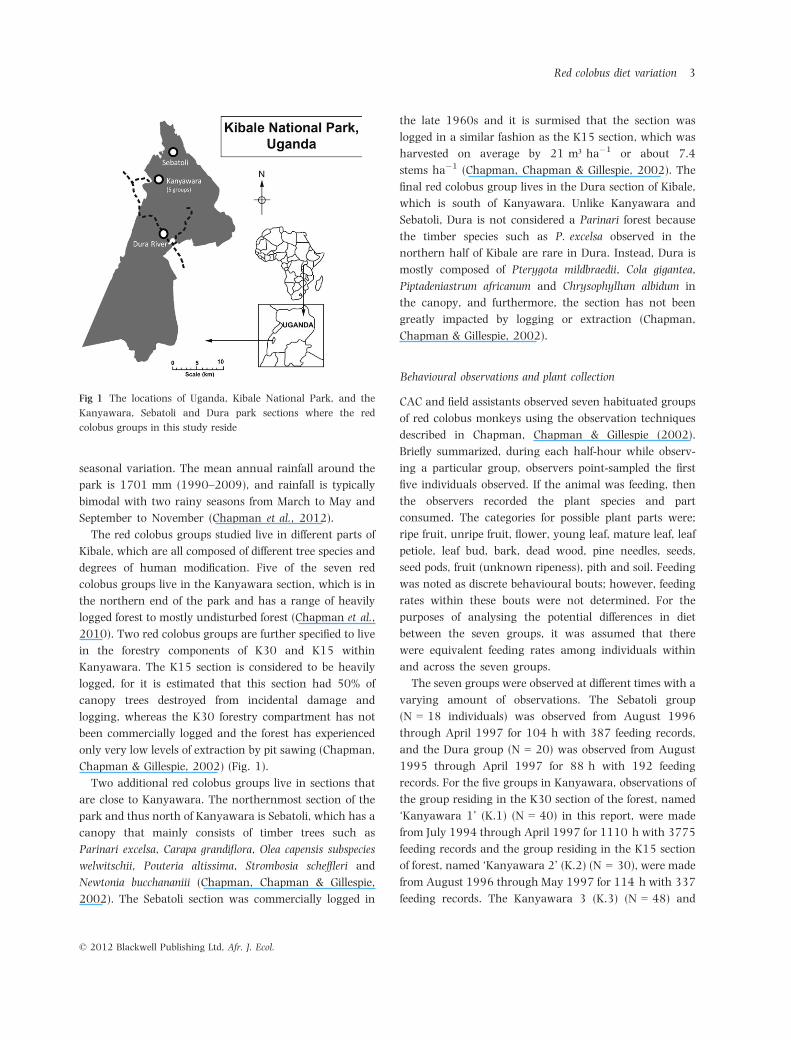
Fig 1 The locations of Uganda, Kibale National Park, and the
Kanyawara, Sebatoli and Dura park sections where the red
colobus groups in this study reside
© 2012 Blackwell Publishing Ltd, Afr. J. Ecol.
Red colobus diet variation 3
Kanyawara 4 (K.4) (N = 24) groups were observed from
August 1998 through June 1999 for 343 and 369 h,
respectively, with 3264 feeding records. Finally, observa-
tions of the Kanyawara 5 (K.5) group (N = 80) were made
from July 2006 through June 2007 for 528 h with 2400
feeding records.
We collected samples of plant species and parts
consumed by the red colobus, and we made every effort
to collect from the same tree and part that at least one
group of the monkeys fed on. Plants were collected from
1999 through 2009 when the colobus monkeys were
observed feeding on them. To account for intraspecific
variability, we sampled 1–10 individuals, depending on
the sample availability (Chapman et al., 2003). Most
samples were acquired by cutting branches with a tree
pruner with about 0.5–1 kg of each part gathered (Rode
et al., 2003; Rothman et al., 2007). We then dried the
samples in a Nesco Plant dehydrator at 40°C, milled the
samples with a Wiley mill with a 1-mm stainless steel
screen and then stored them in a plastic bag until we
transported the samples to Hunter College for nutritional
analysis. On the basis of the factors such as plant species
and part availability, we did not necessarily collect all the
plant samples at the same time as we conducted
behavioural observations; however, each species was
sampled from more than one individual plant when
possible, in different seasons and environments, which
should provide a good representation of its nutrients.
Nutritional and statistical analyses
We determined the monthly percentages of foraging time
spent consuming plant species/part combinations by each
of the seven red colobus groups. The monthly percentages
for each plant species/part combination were then used to
assess annual mean percentage of foraging time for each
species/part and red colobus group. To compare the diet
compositions of the seven groups, we modified the stan-
dard approach typically used for interspecies dietary
overlap. We began by measuring intergroup dietary
overlap using the following formula:
D ¼X
Si
where D is dietary overlap and Si is the percentage of diet
shard between two groups, which is measured using
common plant species/parts combinations. The interspe-
cific dietary variability formula was originally used by
Holmes & Pitelka (1968) and has been since used to
determine dietary overlap in primate diets (Struhsaker,
1975; Chapman, Chapman & Gillespie, 2002; Chapman &
Pavelka, 2005). We used this formula for all possible pair
combinations between the seven groups and then deter-
mined the average dietary overlap. The diet compositions
are presented in Table 1.
We analysed the CP, NDF, ADF and acid detergent lignin
(ADL) content of up to ten samples per species, of the 47
different species and plant parts that contributed to the
total diet for each of the seven groups (Table 2) to account
for known intraspecific variability (Chapman et al., 2003).
Protein and fibre concentrations were determined on a
105°C dry matter (DM) basis (Rothman, Chapman, & Van
Soest, 2012).
We analysed the samples for fibre content by measur-
ing NDF (with a-amylase) and ADF (Van Soest,
Robertson & Lewis, 1991) using filter bags in an A200
fibre analyzer (ANKOM, Macedon, NY, U.S.A.), and we
then analysed the samples for ADL (Goering & Van Soest,
1970). We also analysed the samples using a Leco
TruSpec (Leco, St. Joseph, MI, U.S.A.) via combustion
(AOAC, 1990) to determine total nitrogen (N). We
calculated CP by multiplying N by the standard of 6.25
(Maynard & Loosli, 1969). A subset of samples (n = 29)
was analysed via near infrared reflectance spectroscopy
using a Foss XDS spectrometer (Laurel, MD, U.S.A.)
(Rothman et al., 2009).
Once we measured the fibre and protein concentra-
tions of the various plant species, we calculated the
percentages of fibre and protein in the diet for each
month that each group was observed. The percentage of
each plant part combination included in each group’s
diet was multipled by the plant’s protein or fibre
concentration to determine its content in the group’s
diet. The data were determined to not be normal with
unequal variance. Thus, an independent-samples Kruskal
–Wallis test was used with a = 0.05 (SPSS v.19; IBM,
Armonk, NY, USA) to test whether the differences
observed between groups in terms of diet protein (CP)
and fibre content (NDF, ADF and ADL) were significant.
Results
Diet composition
The average percentage of intergroup dietary overlap was
52.7 ± 15.6%. Across the seven groups, roughly half of
© 2012 Blackwell Publishing Ltd, Afr. J. Ecol.
4 Amy M. Ryan et al.
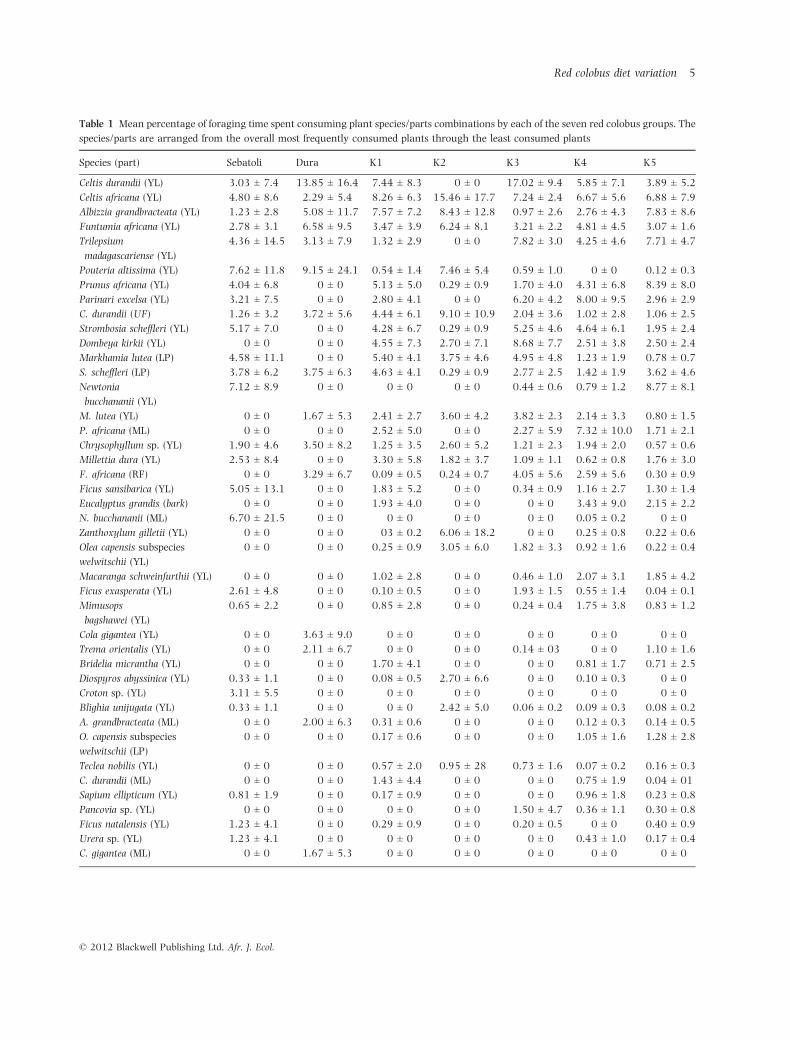
Table 1 Mean percentage of foraging time spent consuming plant species/parts combinations by each of the seven red colobus groups. The
species/parts are arranged from the overall most frequently consumed plants through the least consumed plants
Species (part) Sebatoli Dura K1 K2 K3 K4 K5
Celtis durandii (YL) 3.03 ± 7.4 13.85 ± 16.4 7.44 ± 8.3 0 ± 0 17.02 ± 9.4 5.85 ± 7.1 3.89 ± 5.2
Celtis africana (YL) 4.80 ± 8.6 2.29 ± 5.4 8.26 ± 6.3 15.46 ± 17.7 7.24 ± 2.4 6.67 ± 5.6 6.88 ± 7.9
Albizzia grandbracteata (YL) 1.23 ± 2.8 5.08 ± 11.7 7.57 ± 7.2 8.43 ± 12.8 0.97 ± 2.6 2.76 ± 4.3 7.83 ± 8.6
Funtumia africana (YL) 2.78 ± 3.1 6.58 ± 9.5 3.47 ± 3.9 6.24 ± 8.1 3.21 ± 2.2 4.81 ± 4.5 3.07 ± 1.6
Trilepsium
madagascariense (YL)
4.36 ± 14.5 3.13 ± 7.9 1.32 ± 2.9 0 ± 0 7.82 ± 3.0 4.25 ± 4.6 7.71 ± 4.7
Pouteria altissima (YL) 7.62 ± 11.8 9.15 ± 24.1 0.54 ± 1.4 7.46 ± 5.4 0.59 ± 1.0 0 ± 0 0.12 ± 0.3
Prunus africana (YL) 4.04 ± 6.8 0 ± 0 5.13 ± 5.0 0.29 ± 0.9 1.70 ± 4.0 4.31 ± 6.8 8.39 ± 8.0
Parinari excelsa (YL) 3.21 ± 7.5 0 ± 0 2.80 ± 4.1 0 ± 0 6.20 ± 4.2 8.00 ± 9.5 2.96 ± 2.9
C. durandii (UF) 1.26 ± 3.2 3.72 ± 5.6 4.44 ± 6.1 9.10 ± 10.9 2.04 ± 3.6 1.02 ± 2.8 1.06 ± 2.5
Strombosia scheffleri (YL) 5.17 ± 7.0 0 ± 0 4.28 ± 6.7 0.29 ± 0.9 5.25 ± 4.6 4.64 ± 6.1 1.95 ± 2.4
Dombeya kirkii (YL) 0 ± 0 0 ± 0 4.55 ± 7.3 2.70 ± 7.1 8.68 ± 7.7 2.51 ± 3.8 2.50 ± 2.4
Markhamia lutea (LP) 4.58 ± 11.1 0 ± 0 5.40 ± 4.1 3.75 ± 4.6 4.95 ± 4.8 1.23 ± 1.9 0.78 ± 0.7
S. scheffleri (LP) 3.78 ± 6.2 3.75 ± 6.3 4.63 ± 4.1 0.29 ± 0.9 2.77 ± 2.5 1.42 ± 1.9 3.62 ± 4.6
Newtonia
bucchananii (YL)
7.12 ± 8.9 0 ± 0 0 ± 0 0 ± 0 0.44 ± 0.6 0.79 ± 1.2 8.77 ± 8.1
M. lutea (YL) 0 ± 0 1.67 ± 5.3 2.41 ± 2.7 3.60 ± 4.2 3.82 ± 2.3 2.14 ± 3.3 0.80 ± 1.5
P. africana (ML) 0 ± 0 0 ± 0 2.52 ± 5.0 0 ± 0 2.27 ± 5.9 7.32 ± 10.0 1.71 ± 2.1
Chrysophyllum sp. (YL) 1.90 ± 4.6 3.50 ± 8.2 1.25 ± 3.5 2.60 ± 5.2 1.21 ± 2.3 1.94 ± 2.0 0.57 ± 0.6
Millettia dura (YL) 2.53 ± 8.4 0 ± 0 3.30 ± 5.8 1.82 ± 3.7 1.09 ± 1.1 0.62 ± 0.8 1.76 ± 3.0
F. africana (RF) 0 ± 0 3.29 ± 6.7 0.09 ± 0.5 0.24 ± 0.7 4.05 ± 5.6 2.59 ± 5.6 0.30 ± 0.9
Ficus sansibarica (YL) 5.05 ± 13.1 0 ± 0 1.83 ± 5.2 0 ± 0 0.34 ± 0.9 1.16 ± 2.7 1.30 ± 1.4
Eucalyptus grandis (bark) 0 ± 0 0 ± 0 1.93 ± 4.0 0 ± 0 0 ± 0 3.43 ± 9.0 2.15 ± 2.2
N. bucchananii (ML) 6.70 ± 21.5 0 ± 0 0 ± 0 0 ± 0 0 ± 0 0.05 ± 0.2 0 ± 0
Zanthoxylum gilletii (YL) 0 ± 0 0 ± 0 03 ± 0.2 6.06 ± 18.2 0 ± 0 0.25 ± 0.8 0.22 ± 0.6
Olea capensis subspecies
welwitschii (YL)
0 ± 0 0 ± 0 0.25 ± 0.9 3.05 ± 6.0 1.82 ± 3.3 0.92 ± 1.6 0.22 ± 0.4
Macaranga schweinfurthii (YL) 0 ± 0 0 ± 0 1.02 ± 2.8 0 ± 0 0.46 ± 1.0 2.07 ± 3.1 1.85 ± 4.2
Ficus exasperata (YL) 2.61 ± 4.8 0 ± 0 0.10 ± 0.5 0 ± 0 1.93 ± 1.5 0.55 ± 1.4 0.04 ± 0.1
Mimusops
bagshawei (YL)
0.65 ± 2.2 0 ± 0 0.85 ± 2.8 0 ± 0 0.24 ± 0.4 1.75 ± 3.8 0.83 ± 1.2
Cola gigantea (YL) 0 ± 0 3.63 ± 9.0 0 ± 0 0 ± 0 0 ± 0 0 ± 0 0 ± 0
Trema orientalis (YL) 0 ± 0 2.11 ± 6.7 0 ± 0 0 ± 0 0.14 ± 03 0 ± 0 1.10 ± 1.6
Bridelia micrantha (YL) 0 ± 0 0 ± 0 1.70 ± 4.1 0 ± 0 0 ± 0 0.81 ± 1.7 0.71 ± 2.5
Diospyros abyssinica (YL) 0.33 ± 1.1 0 ± 0 0.08 ± 0.5 2.70 ± 6.6 0 ± 0 0.10 ± 0.3 0 ± 0
Croton sp. (YL) 3.11 ± 5.5 0 ± 0 0 ± 0 0 ± 0 0 ± 0 0 ± 0 0 ± 0
Blighia unijugata (YL) 0.33 ± 1.1 0 ± 0 0 ± 0 2.42 ± 5.0 0.06 ± 0.2 0.09 ± 0.3 0.08 ± 0.2
A. grandbracteata (ML) 0 ± 0 2.00 ± 6.3 0.31 ± 0.6 0 ± 0 0 ± 0 0.12 ± 0.3 0.14 ± 0.5
O. capensis subspecies
welwitschii (LP)
0 ± 0 0 ± 0 0.17 ± 0.6 0 ± 0 0 ± 0 1.05 ± 1.6 1.28 ± 2.8
Teclea nobilis (YL) 0 ± 0 0 ± 0 0.57 ± 2.0 0.95 ± 28 0.73 ± 1.6 0.07 ± 0.2 0.16 ± 0.3
C. durandii (ML) 0 ± 0 0 ± 0 1.43 ± 4.4 0 ± 0 0 ± 0 0.75 ± 1.9 0.04 ± 01
Sapium ellipticum (YL) 0.81 ± 1.9 0 ± 0 0.17 ± 0.9 0 ± 0 0 ± 0 0.96 ± 1.8 0.23 ± 0.8
Pancovia sp. (YL) 0 ± 0 0 ± 0 0 ± 0 0 ± 0 1.50 ± 4.7 0.36 ± 1.1 0.30 ± 0.8
Ficus natalensis (YL) 1.23 ± 4.1 0 ± 0 0.29 ± 0.9 0 ± 0 0.20 ± 0.5 0 ± 0 0.40 ± 0.9
Urera sp. (YL) 1.23 ± 4.1 0 ± 0 0 ± 0 0 ± 0 0 ± 0 0.43 ± 1.0 0.17 ± 0.4
C. gigantea (ML) 0 ± 0 1.67 ± 5.3 0 ± 0 0 ± 0 0 ± 0 0 ± 0 0 ± 0
© 2012 Blackwell Publishing Ltd, Afr. J. Ecol.
Red colobus diet variation 5
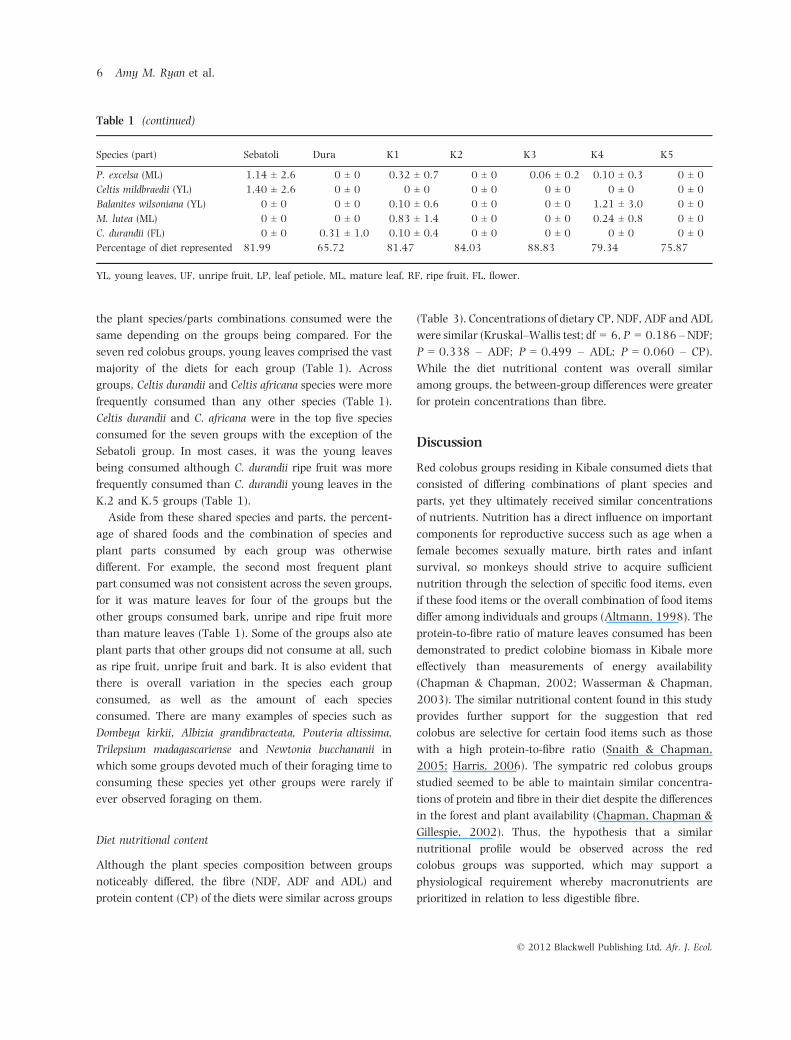
the plant species/parts combinations consumed were the
same depending on the groups being compared. For the
seven red colobus groups, young leaves comprised the vast
majority of the diets for each group (Table 1). Across
groups, Celtis durandii and Celtis africana species were more
frequently consumed than any other species (Table 1).
Celtis durandii and C. africana were in the top five species
consumed for the seven groups with the exception of the
Sebatoli group. In most cases, it was the young leaves
being consumed although C. durandii ripe fruit was more
frequently consumed than C. durandii young leaves in the
K.2 and K.5 groups (Table 1).
Aside from these shared species and parts, the percent-
age of shared foods and the combination of species and
plant parts consumed by each group was otherwise
different. For example, the second most frequent plant
part consumed was not consistent across the seven groups,
for it was mature leaves for four of the groups but the
other groups consumed bark, unripe and ripe fruit more
than mature leaves (Table 1). Some of the groups also ate
plant parts that other groups did not consume at all, such
as ripe fruit, unripe fruit and bark. It is also evident that
there is overall variation in the species each group
consumed, as well as the amount of each species
consumed. There are many examples of species such as
Dombeya kirkii, Albizia grandibracteata, Pouteria altissima,
Trilepsium madagascariense and Newtonia bucchananii in
which some groups devoted much of their foraging time to
consuming these species yet other groups were rarely if
ever observed foraging on them.
Diet nutritional content
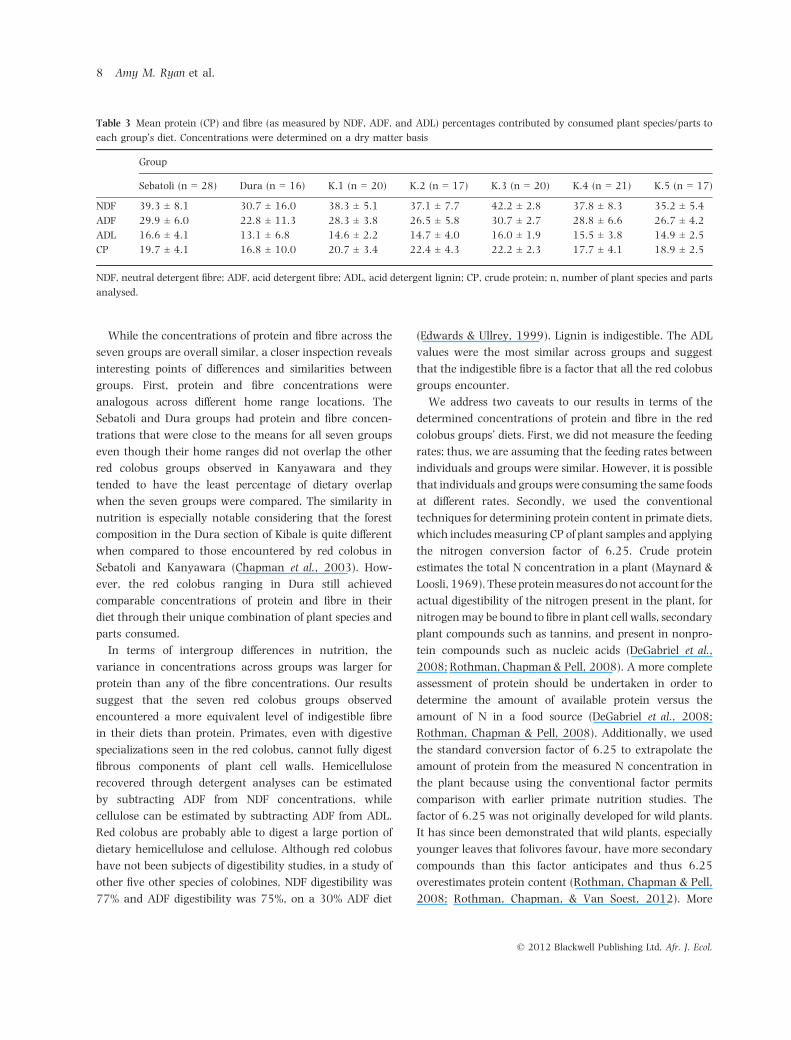
Although the plant species composition between groups
noticeably differed, the fibre (NDF, ADF and ADL) and
protein content (CP) of the diets were similar across groups
(Table 3). Concentrations of dietary CP, NDF, ADF and ADL
were similar (Kruskal–Wallis test; df = 6, P = 0.186 –NDF;
P = 0.338 – ADF; P = 0.499 – ADL; P = 0.060 – CP).
While the diet nutritional content was overall similar
among groups, the between-group differences were greater
for protein concentrations than fibre.
Discussion
Red colobus groups residing in Kibale consumed diets that
consisted of differing combinations of plant species and
parts, yet they ultimately received similar concentrations
of nutrients. Nutrition has a direct influence on important
components for reproductive success such as age when a
female becomes sexually mature, birth rates and infant
survival, so monkeys should strive to acquire sufficient
nutrition through the selection of specific food items, even
if these food items or the overall combination of food items
differ among individuals and groups (Altmann, 1998). The
protein-to-fibre ratio of mature leaves consumed has been
demonstrated to predict colobine biomass in Kibale more
effectively than measurements of energy availability
(Chapman & Chapman, 2002; Wasserman & Chapman,
2003). The similar nutritional content found in this study
provides further support for the suggestion that red
colobus are selective for certain food items such as those
with a high protein-to-fibre ratio (Snaith & Chapman,
2005; Harris, 2006). The sympatric red colobus groups
studied seemed to be able to maintain similar concentra-
tions of protein and fibre in their diet despite the differences
in the forest and plant availability (Chapman, Chapman &
Gillespie, 2002). Thus, the hypothesis that a similar
nutritional profile would be observed across the red
colobus groups was supported, which may support a
physiological requirement whereby macronutrients are
prioritized in relation to less digestible fibre.
Table 1 (continued)
Species (part) Sebatoli Dura K1 K2 K3 K4 K5
P. excelsa (ML) 1.14 ± 2.6 0 ± 0 0.32 ± 0.7 0 ± 0 0.06 ± 0.2 0.10 ± 0.3 0 ± 0
Celtis mildbraedii (YL) 1.40 ± 2.6 0 ± 0 0 ± 0 0 ± 0 0 ± 0 0 ± 0 0 ± 0
Balanites wilsoniana (YL) 0 ± 0 0 ± 0 0.10 ± 0.6 0 ± 0 0 ± 0 1.21 ± 3.0 0 ± 0
M. lutea (ML) 0 ± 0 0 ± 0 0.83 ± 1.4 0 ± 0 0 ± 0 0.24 ± 0.8 0 ± 0
C. durandii (FL) 0 ± 0 0.31 ± 1.0 0.10 ± 0.4 0 ± 0 0 ± 0 0 ± 0 0 ± 0
Percentage of diet represented 81.99 65.72 81.47 84.03 88.83 79.34 75.87
YL, young leaves, UF, unripe fruit, LP, leaf petiole, ML, mature leaf, RF, ripe fruit, FL, flower.
© 2012 Blackwell Publishing Ltd, Afr. J. Ecol.
6 Amy M. Ryan et al.
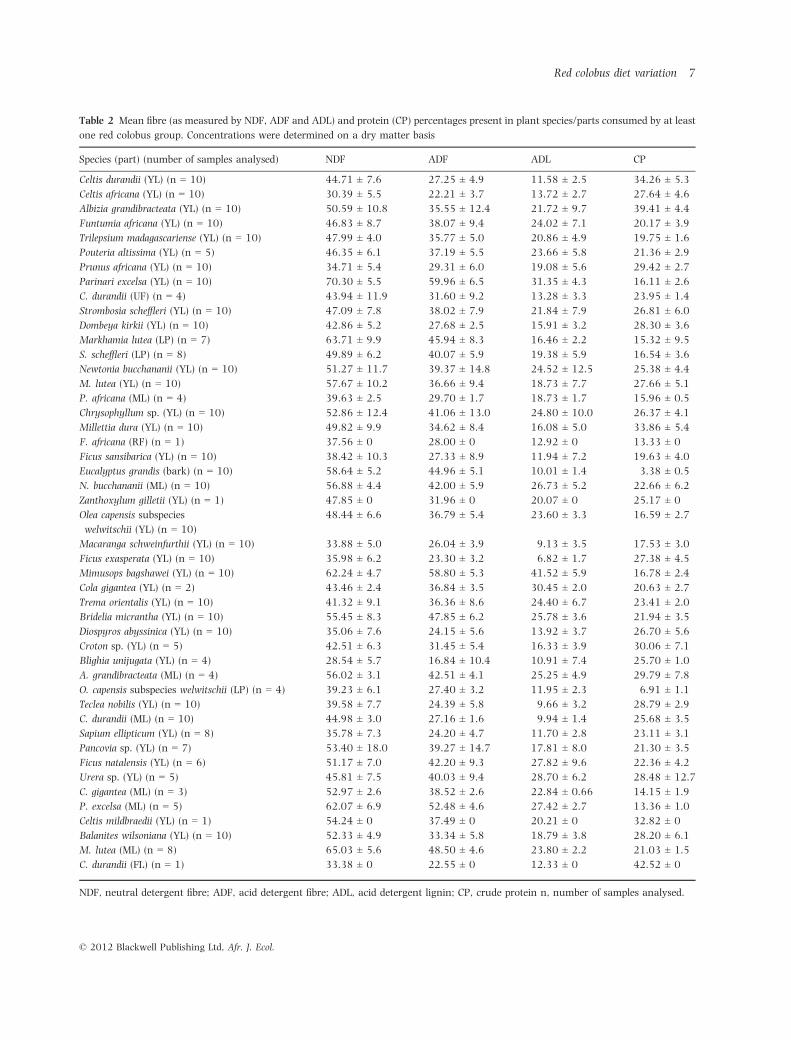
Table 2 Mean fibre (as measured by NDF, ADF and ADL) and protein (CP) percentages present in plant species/parts consumed by at least
one red colobus group. Concentrations were determined on a dry matter basis
Species (part) (number of samples analysed) NDF ADF ADL CP
Celtis durandii (YL) (n = 10) 44.71 ± 7.6 27.25 ± 4.9 11.58 ± 2.5 34.26 ± 5.3
Celtis africana (YL) (n = 10) 30.39 ± 5.5 22.21 ± 3.7 13.72 ± 2.7 27.64 ± 4.6
Albizia grandibracteata (YL) (n = 10) 50.59 ± 10.8 35.55 ± 12.4 21.72 ± 9.7 39.41 ± 4.4
Funtumia africana (YL) (n = 10) 46.83 ± 8.7 38.07 ± 9.4 24.02 ± 7.1 20.17 ± 3.9
Trilepsium madagascariense (YL) (n = 10) 47.99 ± 4.0 35.77 ± 5.0 20.86 ± 4.9 19.75 ± 1.6
Pouteria altissima (YL) (n = 5) 46.35 ± 6.1 37.19 ± 5.5 23.66 ± 5.8 21.36 ± 2.9
Prunus africana (YL) (n = 10) 34.71 ± 5.4 29.31 ± 6.0 19.08 ± 5.6 29.42 ± 2.7
Parinari excelsa (YL) (n = 10) 70.30 ± 5.5 59.96 ± 6.5 31.35 ± 4.3 16.11 ± 2.6
C. durandii (UF) (n = 4) 43.94 ± 11.9 31.60 ± 9.2 13.28 ± 3.3 23.95 ± 1.4
Strombosia scheffleri (YL) (n = 10) 47.09 ± 7.8 38.02 ± 7.9 21.84 ± 7.9 26.81 ± 6.0
Dombeya kirkii (YL) (n = 10) 42.86 ± 5.2 27.68 ± 2.5 15.91 ± 3.2 28.30 ± 3.6
Markhamia lutea (LP) (n = 7) 63.71 ± 9.9 45.94 ± 8.3 16.46 ± 2.2 15.32 ± 9.5
S. scheffleri (LP) (n = 8) 49.89 ± 6.2 40.07 ± 5.9 19.38 ± 5.9 16.54 ± 3.6
Newtonia bucchananii (YL) (n = 10) 51.27 ± 11.7 39.37 ± 14.8 24.52 ± 12.5 25.38 ± 4.4
M. lutea (YL) (n = 10) 57.67 ± 10.2 36.66 ± 9.4 18.73 ± 7.7 27.66 ± 5.1
P. africana (ML) (n = 4) 39.63 ± 2.5 29.70 ± 1.7 18.73 ± 1.7 15.96 ± 0.5
Chrysophyllum sp. (YL) (n = 10) 52.86 ± 12.4 41.06 ± 13.0 24.80 ± 10.0 26.37 ± 4.1
Millettia dura (YL) (n = 10) 49.82 ± 9.9 34.62 ± 8.4 16.08 ± 5.0 33.86 ± 5.4
F. africana (RF) (n = 1) 37.56 ± 0 28.00 ± 0 12.92 ± 0 13.33 ± 0
Ficus sansibarica (YL) (n = 10) 38.42 ± 10.3 27.33 ± 8.9 11.94 ± 7.2 19.63 ± 4.0
Eucalyptus grandis (bark) (n = 10) 58.64 ± 5.2 44.96 ± 5.1 10.01 ± 1.4 3.38 ± 0.5
N. bucchananii (ML) (n = 10) 56.88 ± 4.4 42.00 ± 5.9 26.73 ± 5.2 22.66 ± 6.2
Zanthoxylum gilletii (YL) (n = 1) 47.85 ± 0 31.96 ± 0 20.07 ± 0 25.17 ± 0
Olea capensis subspecies
welwitschii (YL) (n = 10)
48.44 ± 6.6 36.79 ± 5.4 23.60 ± 3.3 16.59 ± 2.7
Macaranga schweinfurthii (YL) (n = 10) 33.88 ± 5.0 26.04 ± 3.9 9.13 ± 3.5 17.53 ± 3.0
Ficus exasperata (YL) (n = 10) 35.98 ± 6.2 23.30 ± 3.2 6.82 ± 1.7 27.38 ± 4.5
Mimusops bagshawei (YL) (n = 10) 62.24 ± 4.7 58.80 ± 5.3 41.52 ± 5.9 16.78 ± 2.4
Cola gigantea (YL) (n = 2) 43.46 ± 2.4 36.84 ± 3.5 30.45 ± 2.0 20.63 ± 2.7
Trema orientalis (YL) (n = 10) 41.32 ± 9.1 36.36 ± 8.6 24.40 ± 6.7 23.41 ± 2.0
Bridelia micrantha (YL) (n = 10) 55.45 ± 8.3 47.85 ± 6.2 25.78 ± 3.6 21.94 ± 3.5
Diospyros abyssinica (YL) (n = 10) 35.06 ± 7.6 24.15 ± 5.6 13.92 ± 3.7 26.70 ± 5.6
Croton sp. (YL) (n = 5) 42.51 ± 6.3 31.45 ± 5.4 16.33 ± 3.9 30.06 ± 7.1
Blighia unijugata (YL) (n = 4) 28.54 ± 5.7 16.84 ± 10.4 10.91 ± 7.4 25.70 ± 1.0
A. grandibracteata (ML) (n = 4) 56.02 ± 3.1 42.51 ± 4.1 25.25 ± 4.9 29.79 ± 7.8
O. capensis subspecies welwitschii (LP) (n = 4) 39.23 ± 6.1 27.40 ± 3.2 11.95 ± 2.3 6.91 ± 1.1
Teclea nobilis (YL) (n = 10) 39.58 ± 7.7 24.39 ± 5.8 9.66 ± 3.2 28.79 ± 2.9
C. durandii (ML) (n = 10) 44.98 ± 3.0 27.16 ± 1.6 9.94 ± 1.4 25.68 ± 3.5
Sapium ellipticum (YL) (n = 8) 35.78 ± 7.3 24.20 ± 4.7 11.70 ± 2.8 23.11 ± 3.1
Pancovia sp. (YL) (n = 7) 53.40 ± 18.0 39.27 ± 14.7 17.81 ± 8.0 21.30 ± 3.5
Ficus natalensis (YL) (n = 6) 51.17 ± 7.0 42.20 ± 9.3 27.82 ± 9.6 22.36 ± 4.2
Urera sp. (YL) (n = 5) 45.81 ± 7.5 40.03 ± 9.4 28.70 ± 6.2 28.48 ± 12.7
C. gigantea (ML) (n = 3) 52.97 ± 2.6 38.52 ± 2.6 22.84 ± 0.66 14.15 ± 1.9
P. excelsa (ML) (n = 5) 62.07 ± 6.9 52.48 ± 4.6 27.42 ± 2.7 13.36 ± 1.0
Celtis mildbraedii (YL) (n = 1) 54.24 ± 0 37.49 ± 0 20.21 ± 0 32.82 ± 0
Balanites wilsoniana (YL) (n = 10) 52.33 ± 4.9 33.34 ± 5.8 18.79 ± 3.8 28.20 ± 6.1
M. lutea (ML) (n = 8) 65.03 ± 5.6 48.50 ± 4.6 23.80 ± 2.2 21.03 ± 1.5
C. durandii (FL) (n = 1) 33.38 ± 0 22.55 ± 0 12.33 ± 0 42.52 ± 0
NDF, neutral detergent fibre; ADF, acid detergent fibre; ADL, acid detergent lignin; CP, crude protein n, number of samples analysed.
© 2012 Blackwell Publishing Ltd, Afr. J. Ecol.
Red colobus diet variation 7
While the concentrations of protein and fibre across the
seven groups are overall similar, a closer inspection reveals
interesting points of differences and similarities between
groups. First, protein and fibre concentrations were
analogous across different home range locations. The
Sebatoli and Dura groups had protein and fibre concen-
trations that were close to the means for all seven groups
even though their home ranges did not overlap the other
red colobus groups observed in Kanyawara and they
tended to have the least percentage of dietary overlap
when the seven groups were compared. The similarity in
nutrition is especially notable considering that the forest
composition in the Dura section of Kibale is quite different
when compared to those encountered by red colobus in
Sebatoli and Kanyawara (Chapman et al., 2003). How-
ever, the red colobus ranging in Dura still achieved
comparable concentrations of protein and fibre in their
diet through their unique combination of plant species and
parts consumed.
In terms of intergroup differences in nutrition, the
variance in concentrations across groups was larger for
protein than any of the fibre concentrations. Our results
suggest that the seven red colobus groups observed
encountered a more equivalent level of indigestible fibre
in their diets than protein. Primates, even with digestive
specializations seen in the red colobus, cannot fully digest
fibrous components of plant cell walls. Hemicellulose
recovered through detergent analyses can be estimated
by subtracting ADF from NDF concentrations, while
cellulose can be estimated by subtracting ADF from ADL.
Red colobus are probably able to digest a large portion of
dietary hemicellulose and cellulose. Although red colobus
have not been subjects of digestibility studies, in a study of
other five other species of colobines, NDF digestibility was
77% and ADF digestibility was 75%, on a 30% ADF diet
(Edwards & Ullrey, 1999). Lignin is indigestible. The ADL
values were the most similar across groups and suggest
that the indigestible fibre is a factor that all the red colobus
groups encounter.
We address two caveats to our results in terms of the
determined concentrations of protein and fibre in the red
colobus groups’ diets. First, we did not measure the feeding
rates; thus, we are assuming that the feeding rates between
individuals and groups were similar. However, it is possible
that individuals and groups were consuming the same foods
at different rates. Secondly, we used the conventional
techniques for determining protein content in primate diets,
which includes measuring CP of plant samples and applying
the nitrogen conversion factor of 6.25. Crude protein
estimates the total N concentration in a plant (Maynard &
Loosli, 1969). These proteinmeasures donot account for the
actual digestibility of the nitrogen present in the plant, for
nitrogenmay be bound to fibre in plant cell walls, secondary
plant compounds such as tannins, and present in nonpro-
tein compounds such as nucleic acids (DeGabriel et al.,
2008; Rothman, Chapman& Pell, 2008). A more complete
assessment of protein should be undertaken in order to
determine the amount of available protein versus the
amount of N in a food source (DeGabriel et al., 2008;
Rothman, Chapman & Pell, 2008). Additionally, we used
the standard conversion factor of 6.25 to extrapolate the
amount of protein from the measured N concentration in
the plant because using the conventional factor permits
comparison with earlier primate nutrition studies. The
factor of 6.25 was not originally developed for wild plants.
It has since been demonstrated that wild plants, especially
younger leaves that folivores favour, have more secondary
compounds than this factor anticipates and thus 6.25
overestimates protein content (Rothman, Chapman & Pell,
2008; Rothman, Chapman, & Van Soest, 2012). More
Table 3 Mean protein (CP) and fibre (as measured by NDF, ADF, and ADL) percentages contributed by consumed plant species/parts to
each group’s diet. Concentrations were determined on a dry matter basis
Group
Sebatoli (n = 28) Dura (n = 16) K.1 (n = 20) K.2 (n = 17) K.3 (n = 20) K.4 (n = 21) K.5 (n = 17)
NDF 39.3 ± 8.1 30.7 ± 16.0 38.3 ± 5.1 37.1 ± 7.7 42.2 ± 2.8 37.8 ± 8.3 35.2 ± 5.4
ADF 29.9 ± 6.0 22.8 ± 11.3 28.3 ± 3.8 26.5 ± 5.8 30.7 ± 2.7 28.8 ± 6.6 26.7 ± 4.2
ADL 16.6 ± 4.1 13.1 ± 6.8 14.6 ± 2.2 14.7 ± 4.0 16.0 ± 1.9 15.5 ± 3.8 14.9 ± 2.5
CP 19.7 ± 4.1 16.8 ± 10.0 20.7 ± 3.4 22.4 ± 4.3 22.2 ± 2.3 17.7 ± 4.1 18.9 ± 2.5
NDF, neutral detergent fibre; ADF, acid detergent fibre; ADL, acid detergent lignin; CP, crude protein; n, number of plant species and parts
analysed.
© 2012 Blackwell Publishing Ltd, Afr. J. Ecol.
8 Amy M. Ryan et al.
appropriate conversion factors to use would be 4.4 (Milton
& Dintzis, 1981) or 4.3 (Conklin-Brittain et al., 1999). The
factor of 6.25 also may not be appropriate for use in all
plant parts such as fruit and flowers with differing
amounts of secondary compounds (Conklin-Brittain et al.,
1999).
An understanding of both diet composition and nutri-
tional content are needed to accurately capture the
dynamics of primate feeding ecology (Harris & Chapman,
2007). The results of the present study add to the growing
literature that demonstrates assumptions about the nutri-
tional quality of diets cannot be made based on informa-
tion about the plant species and parts eaten alone (Davies,
Bennett & Waterman, 1988; Conklin-Brittain, Wrangham
& Hunt, 1998; Davies, Oates & Dasilva, 1999; Dierenfeld &
McCann, 1999; Twinomugisha et al., 2006; Rothman
et al., 2007). Our results support the conclusion that
groups may use different combinations and concentrations
of plant species and parts in their diet but are still selecting
food items that help them obtain similar nutrient
concentrations.
Acknowledgements
Funding for the field work was provided by the Canada
Research Chairs Program, WCS, NSERC and NSF to CAC,
while funding for the laboratory work was provided by
Hunter College and NSF BCS 0922709 to JMR. Permission
to conduct this research was given by the National Council
for Science and Technology and the Uganda Wildlife
Authority. We would like extend a special thank to the
Kibale field assistants for help in Uganda, and Jenny Paltan
and Scott Williams for assistance in the nutritional
analysis. We thank the reviewers for very helpful
comments that improved the manuscript. The authors
declare no conflict of interest, financial or otherwise.
References
Altmann, S.A. (1998) Foraging for Survival: Yearling Baboons in
Africa. The University of Chicago Press, Chicago, IL, U.S.A.
AOAC (1990) Official Methods of Analysis. Association of Official
Analytical Chemists, Arlington, VA, U.S.A.
Barton, R.A. & Whiten, A. (1994) Reducing complex diets to
simple rules: food selection by olive baboons. Behav. Ecol.
Sociobiol. 35, 283–293.
Chapman, C.A. & Chapman, L.J. (1999) Implications of small scale
variation in ecological conditions for the diet and density of red
colobus monkeys. Primates 40, 215–231.
Chapman, C.A. & Chapman, L.J. (2002) Foraging challenges of red
colobus monkeys: influence of nutrients and secondary
compounds. Comp. Biochem. Physiol. A Mol. Integr. Physiol. 133,
861–875.
Chapman, C.A., Chapman, L.J. & Gillespie, T.R. (2002) Scale issues
in the study of primate foraging: red colobus of Kibale National
Park. Am. J. Phys. Anthropol. 117, 349–363.
Chapman, C.A. & Pavelka, M.S.M. (2005) Group size in folivorous
primates: ecological constraints and the possible influence of
social factors. Primates 46, 1–9.
Chapman, C.A., Chapman, L.J., Rode, K.D., Hauck, E.M. &
Mcdowell, L.R. (2003) Variation in the nutritional value of
primate foods: among trees, time periods, and areas. Int. J.
Primatol. 24, 317–333.
Chapman, C.A., Chapman, L.J., Jacob, A.L., Rothman, J.M., Omeja,
P., Reyna-Hurtado, R., Hartter, J. & Lawes, M.J. (2010)
Tropical tree community shifts: implications for wildlife
conservation. Biol. Conserv. 143, 366–374.
Chapman, C.A., Bowman, D.D., Ghai, R.R., Gogarten, J.F.,
Goldberg, T.L., Rothman, J.M., Twinomugisha, D. & Walsh, C.
(2012) Protozoan parasites in group-living primates:
testing the biological island hypothesis. Am. J. Primatol. 74,
510–517.
Codron, D., Lee-Thorp, J.A., Sponheimer, M., De Ruiter, D. &
Codron, J. (2006) Inter- and intrahabitat dietary variability of
chacma baboons (Papio ursinus) in South African savannas
based on fecal delta C-13, delta N-15, and %N. Am. J. Phys.
Anthropol. 129, 204–214.
Conklin-Brittain, N.L., Wrangham, R.W. & Hunt, K.D. (1998)
Dietary response of chimpanzees and cercopithecines to
seasonal variation in fruit abundance. II. Macronutrients. Int. J.
Primatol. 19, 971–998.
Conklin-Brittain, N.L., Dierenfeld, E.S., Wrangham, R.W.,
Norconk, M. & Silver, S.C. (1999) Chemical protein analysis:
a comparison of Kjeldahl crude protein and total ninhydrin
protein from wild, tropical vegetation. J. Chem. Ecol. 25,
2601–2622.
Davies, A.G., Bennett, E.L. & Waterman, P.G. (1988) Food
selection by two south-east Asian colobine monkeys (Presbytis
rubicunda and Presbytis melalophos) in relation to plant
chemistry. Biol. J. Linn. Soc. 34, 33–56.
Davies, A.G., Oates, J.F. & Dasilva, G.L. (1999) Patterns of
frugivory in three West African colobine monkeys. Int. J.
Primatol. 20, 327–357.
Degabriel, J.L., Wallis, I.R., Moore, B.D. & Foley, W.J. (2008) A
simple, integrative assay to quantify nutritional quality of
browses for herbivores. Oecologia 156, 107–116.
Dierenfeld, E.S. & Mccann, C.M. (1999) Nutrient composition of
selected plant species consumed by semi free-ranging lion-
tailed macaques (Macaca silenus) and ring-tailed lemurs
(Lemur catta) on St. Catherine’s Island, Georgia, USA. Zoo Biol.
18, 481–494.
Edwards, M.S. & Ullrey, D.E. (1999) Effect of dietary fiber
concentration on apparent digestibility and digesta passage in
© 2012 Blackwell Publishing Ltd, Afr. J. Ecol.
Red colobus diet variation 9
non-human primates. II. Hindgut- and foregut-fermenting
folivores. Zoo Biol. 18, 537–549.
Fimbel, C., Vedder, A., Dierenfeld, E. & Mulindahabi, F. (2001)
An ecological basis for large group size in Colobus angolensis in
the Nyungwe Forest, Rwanda. Afr. J. Ecol. 39, 83–92.
Ganas, J., Robbins, M.M., Nkurunungi, J.B., Kaplin, B.A. &
Mcneilage, A. (2004) Dietary variability of mountain gorillas in
Bwindi Impenetrable National Park, Uganda. Int. J. Primatol. 25,
1043–1072.
Goering, H.K. & Van Soest, P.J. (1970) Forage Fiber Analysis.
United States Department of Agriculture, Washington, D.C.
Grassi, C. (2006) Variability in habitat, diet, and social structure
of Hapalemur griseus in Ranomafana National Park,
Madagascar. Am. J. Phys. Anthropol. 131, 50–63.
Harris, T.R. (2006) Between-group contest competition for
food in a highly folivorous population of black and white
colobus monkeys (Colobus guereza). Behav. Ecol. Sociobiol. 61,
317–329.
Harris, T.R. & Chapman, C.A. (2007) Variation in diet and ranging
of black and white colobus monkeys in Kibale National Park,
Uganda. Primates 48, 208–221.
Holmes, R.T. & Pitelka, F.A. (1968) Food overlap among
coexisting sandpipers on northern Alaskan tundra. Syst. Zool.
17, 305–318.
Maynard, L.A. & Loosli, J.K. (1969) Animal Nutrition. McGraw-
Hill, New York.
Milton, K. (1979) Factors influencing leaf choice by howler
monkeys: a test of some hypotheses of food selection by
generalist herbivores. Am. Nat. 114, 362–378.
Milton, K. & Dintzis, F.R. (1981) Nitrogen-to-protein conversion
factors for tropical plant samples. Biotropica 13, 177–181.
Potts, K.B., Watts, D.P. & Wrangham, R.W. (2011) Comparative
feeding ecology of two communities of chimpanzees (Pan
troglodytes) in Kibale National Park, Uganda. Int. J. Primatol. 32,
669–690.
Rode, K.D., Chapman, C.A., Chapman, L.J. & Mcdowell, L.R. (2003)
Mineral resource availability and consumption by colobus in
Kibale National Park, Uganda. Int. J. Primatol. 24, 541–
573.
Rothman, J.M., Chapman, C.A. & Pell, A.N. (2008) Fiber-bound
nitrogen in gorilla diets: implications for estimating dietary
protein intake of primates. Am. J. Primatol. 70, 690–694.
Rothman, J.M., Plumptre, A.J., Dierenfeld, E.S. & Pell, A.N. (2007)
Nutritional composition of the diet of the gorilla (Gorilla
beringei): a comparison between two montane habitats. J. Trop.
Ecol. 23, 673–682.
Rothman, J.M., Chapman, C.A., Hansen, J.L., Cherney, D.J.R. & Pell,
A.N. (2009) Rapid assessment of the nutritional value of foods
eaten by mountain gorillas: applying near-infrared reflectance
spectroscopy to primatology. Int. J. Primatol. 30, 729–742.
Rothman, J.M., Chapman, C.A. & Van Soest, P.J. (2012) Methods in
primate nutritional ecology: a user’s guide. Int. J. Primatol. 33,
542–566.
Russo, S.E., Campbell, C.L., Dew, J.L., Stevenson, P.R. & Suarez, S.A.
(2005) A multi-forest comparison of dietary preferences and
seed dispersal by Ateles spp. Int. J. Primatol. 26, 1017–1037.
Snaith, T.V. & Chapman, C.A. (2005) Towards an ecological
solution to the folovore paradox: patch depletion as an indicator
of within-group scramble competition in red colobus monkeys
(Piliocolobus tephrosceles). Behav. Ecol. Sociobiol. 59, 185–190.
Struhsaker, T.T. (1975) The Red Colobus Monkey. The University
of Chicago Press, Chicago, IL.
Twinomugisha, D., Chapman, C.A., Lawes, M.J., O’Driscoll
Worman, C & Danish, L.M. (2006) How does the golden monkey
of the Virungas cope in a fruit-scarce environment? In: Primates
of Western Uganda (Eds N.E. NEWTON-FISHER, H. NOTMAN, J.D.
PATERSON and V. REYNOLDS). Springer Science + Business Media,
LLC, U.S.A.
Van Soest, P.J., Robertson, J.B. & Lewis, B.A. (1991) Methods for
dietary fiber, neutral detergent fiber, and non-starch
polysaccharides in relation to animal nutrition. J. Dairy Sci. 74,
3583–3597.
Wasserman, M.D. & Chapman, C.A. (2003) Determinants of
colobine monkey abundance: the importance of food energy,
protein, and fibre content. J. Anim. Ecol. 72, 650–659.
Wieczkowski, J. & Kinnaird, M. (2008) Shifting forest composition
and primate diets: a 13-year comparison of the Tana River
mangabey and its habitat. Am. J. Primatol. 70, 339–348.
Wrangham, R.W., Conklin-Brittain, N.L. & Hunt, K.D. (1998)
Dietary response of chimpanzees and cercopithecines to
seasonal variation in fruit abundance. I. Antifeedants. Int. J.
Primatol. 19, 949–970.
Yamashita, N. (2002) Diets of two lemur species in different
microhabitats in Beza Mahafaly special reserve, Madagascar.
Int. J. Primatol. 23, 1025–1051.
Zhou, Q., Huang, Z., Wei, X., Wei, F. & Huang, C. (2009) Factors
influencing interannual and intersite variability in the diet of
Trachypithecus francoisi. Int. J. Primatol. 30, 583–599.
(Manuscript accepted 14 May 2012)
doi: 10.1111/j.1365-2028.2012.01346.x
© 2012 Blackwell Publishing Ltd, Afr. J. Ecol.
10 Amy M. Ryan et al.
Top Related
Copyright © 2022 FDOKUMEN

