


Bahasa
Halaman
Hukum

High accuracy determination of the 238U/235U fission cross section ratio up to ∼1 GeVat n TOF (CERN)
C. Paradela,1, 2 M. Calviani,3 D. Tarrıo,1, 4 E. Leal-Cidoncha,1 L.S. Leong,5, 6 L. Tassan-Got,5 C. Le Naour,5
I. Duran,1 N. Colonna,5, ∗ L. Audouin,5 M. Mastromarco,7 S. Lo Meo,8 A. Ventura,9 S. Altstadt,10
J. Andrzejewski,11 M. Barbagallo,7 V. Becares,12 F. Becvar,13 F. Belloni,2 E. Berthoumieux,14 J. Billowes,15
V. Boccone,3 D. Bosnar,16 M. Brugger,3 F. Calvino,17 D. Cano-Ott,12 C. Carrapico,18 F. Cerutti,3 E. Chiaveri,3
M. Chin,3 G. Cortes,19 M.A. Cortes-Giraldo,20 L. Cosentino,21 M. Diakaki,22 C. Domingo-Pardo,23 R. Dressler,24
C. Eleftheriadis,25 A. Ferrari,3 P. Finocchiaro,21 K. Fraval,14 S. Ganesan,26 A.R. Garcıa,27 G. Giubrone,23
M.B. Gomez-Hornillos,19 I.F. Goncalves,18 E. Gonzalez-Romero,12 E. Griesmayer,28 C. Guerrero,3
F. Gunsing,14 P. Gurusamy,26 S. Heinitz,24 D.G. Jenkins,29 E. Jericha,28 F. Kappeler,30 D. Karadimos,31
N. Kivel,24 M. Kokkoris,22 M. Krticka,13 J. Kroll,13 C. Langer,10 C. Lederer,10 H. Leeb,32 R. Losito,3
A. Manousos,25 J. Marganiec,11 T. Martınez,12 C. Massimi,33 P. Mastinu,34 E. Mendoza,27 A. Mengoni,8
P.M. Milazzo,35 F. Mingrone,33 M. Mirea,36 W. Mondalaers,2 A. Musumarra,37 A. Pavlik,38 J. Perkowski,39
A. Plompen,2 J. Praena,20 J. Quesada,20 T. Rauscher,40, 41 R. Reifarth,10 A. Riego,19 F. Roman,3
C. Rubbia,3 R. Sarmento,18 A. Saxena,26 P. Schillebeeckx,42 S. Schmidt,10 D. Schumann,24 G. Tagliente,7
J.L. Tain,23 A. Tsinganis,3 S. Valenta,13 G. Vannini,33 V. Variale,7 P. Vaz,18 R. Versaci,3 M.J. Vermeulen,29
V. Vlachoudis,3 R. Vlastou,43 A. Wallner,44 T. Ware,15 M. Weigand,10 C. Weiß,3 T. Wright,15 and P. Zugec16
(The n TOF Collaboration (www.cern.ch/ntof))1Universidade de Santiago de Compostela, Spain
2European Commission JRC, Institute for Reference Materials and Measurements, Retieseweg 111, B-2440 Geel, Belgium3CERN, Geneva, Switzerland
4Department of Physics and Astronomy, University of Uppsala, Sweden5Centre National de la Recherche Scientifique/IN2P3 - IPN, Orsay, France
6Japan Atomic Energy Agency, JAEA, Japan7Istituto Nazionale di Fisica Nucleare, Bari, Italy
8ENEA, Bologna, Italy9Istituto Nazionale di Fisica Nucleare, Bologna, Italy
10Johann-Wolfgang-Goethe Universitat, Frankfurt, Germany11University of Lodz, Lodz, Poland
12Centro de Investigaciones Energeticas Medioambientales y Tecnologicas, Madrid, Spain13Charles University, Prague, Czech Republic14CEA/Saclay - IRFU, Gif-sur-Yvette, France
15University of Manchester, Oxford Road, Manchester, UK16Department of Physics, Faculty of Science, University of Zagreb, Croatia
17Universidad Politecnica de Madrid, Spain18Instituto Tecnologico e Nuclear(ITN), Lisbon, Portugal19Universitat Politecnica de Catalunya, Barcelona, Spain
20Universidad de Sevilla, Spain21INFN - Laboratori Nazionali del Sud, Catania, Italy
22National Technical University of Athens (NTUA), Greece23Instituto de Fısica Corpuscular, CSIC-Universidad de Valencia, Spain
24Paul Scherrer Institut, 5232 Villigen PSI, Switzerland25Aristotle University of Thessaloniki, Thessaloniki, Greece26Bhabha Atomic Research Centre (BARC), Mumbai, India
27Centro de Investigaciones Energeticas Medioambientales y Tecnologicas (CIEMAT), Madrid, Spain28Atominstitut, Technische Universitat Wien, Austria
29University of York, Heslington, York, UK30Karlsruhe Institute of Technology (KIT), Institut fur Kernphysik, Karlsruhe, Germany
31University of Ioannina, Greece32Atominstitut der Osterreichischen Universitaten, Technische Universitat Wien, Austria
33Dipartimento di Fisica, Universita di Bologna, and Sezione INFN di Bologna, Italy34Istituto Nazionale di Fisica Nucleare, Laboratori Nazionali di Legnaro, Italy
35Istituto Nazionale di Fisica Nucleare, Trieste, Italy36Horia Hulubei National Institute of Physics and Nuclear Engineering - IFIN HH, Bucharest - Magurele, Romania
37Dipartimento di Fisica e Astronomia DFA, Universita di Catania and INFN-Laboratori Nazionali del Sud, Catania, Italy38University of Vienna, Faculty of Physics, Austria
39Uniwersytet Lodzki, Lodz, Poland40Centre for Astrophysics Research, School of Physics,
Astronomy and Mathematics, University of Hertfordshire, Hatfield, United Kingdom
arX
iv:1
410.
7737
v2 [
nucl
-ex]
29
Oct
201
4
2
41Department of Physics, University of Basel, Basel, Switzerland42CEC-JRC-IRMM, Geel, Belgium
43National Technical University of Athens, Greece44Research School of Physics and Engineering, Australian National University, ACT 0200, Australia
(Dated: October 30, 2014)
The 238U to 235U fission cross section ratio has been determined at n TOF up to ∼1 GeV, withtwo different detection systems, in different geometrical configurations. A total of four datasets havebeen collected and compared. They are all consistent to each other within the relative systematicuncertainty of 3-4%. The data collected at n TOF have been suitably combined to yield a uniquefission cross section ratio as a function of the neutron energy. The result confirms current evaluationsup to 200 MeV. A good agreement is also observed with theoretical calculations based on theINCL++/Gemini++ combination up to the highest measured energy. The n TOF results may helpsolving a long-standing discrepancy between the two most important experimental dataset availableso far above 20 MeV, while extending the neutron energy range for the first time up to ∼1 GeV.
PACS numbers: 25
3
I. INTRODUCTION
The neutron-induced fission cross section of the two major isotopes of Uranium, 235U and 238U, are of fundamentalimportance in the field of nuclear technology, as well as for other fields of fundamental and applied Nuclear Physics.In particular, fission cross section data above a few MeV are important for the development of new systems for energyproduction and waste transmutation, for accelerator and space applications, in measurements of high-energy neutronflux, or for the refinement of theoretical models on nuclear fission at high energy. The 235U(n,f ) cross section is astandard at 0.0253 eV and from 0.15 eV to 200 MeV [1, 2], while the 238U(n,f ) is recommended for use as a standardin the neutron energy region between 2 and 200 MeV [3]. While the 235U(n,f ) cross section is commonly used in avariety of fields, for example in neutron flux measurements, from thermal to very high energy, the 238U(n,f ) can bemore conveniently used in the presence of a low energy neutron background, thanks to its high fission threshold.
Despite its importance, few data have been collected up to now on the 238U(n,f )/235U(n,f ) cross section ratioabove 20 MeV. Lisowski et al. [4] measured the ratio at Los Alamos National Laboratory, from 0.5 to 400 MeV.Current evaluated nuclear data libraries [5] and evaluations of cross section standards [1] are mostly based on theseresults. More recently, Shcherbakov et al. [6], measured the ratio between 1 and 200 MeV at the GNEIS facility,Gatchina. Above 50 MeV these results are between 5 and 8% lower than those of Lisowski et al.. On the contrary,results from Nolte et al. [7] seem to confirm the older measurement, but they are affected by a too large systematicuncertainty to draw a final conclusion. New, high accuracy measurements are therefore required to solve the long-standing discrepancy, and improve the accuracy in current evaluations. An extension of the energy range up to higherenergy would also be desirable, as data above 200 Me could prove useful for refining theoretical models, in particularthose used in modern Monte Carlo codes for high-energy neutron transport.
To address the need of new, accurate data to improve current cross section standard, and to extend the currentenergy limit, a series of measurements of the 238U(n,f )/235U(n,f ) cross section ratio were performed at the n TOFfacility at CERN, from 0.5 MeV to 1 GeV, in different experimental campaigns and with different setups. After adescription of the various setups and analysis procedures, in Section II, the n TOF results are presented and comparedwith each other in Section III. Suitably combined in a unique dataset, the n TOF results are then compared withprevious experimental data, with current evaluations and with the predictions of a theoretical model extending up tothe highest measured energy. Conclusions are finally given in Section IV.
II. EXPERIMENTAL SETUP
The measurements were performed at the n TOF facility at CERN [8–11], in different experimental campaignsand with different experimental setups, taking advantage of the very convenient features of the neutron beam, thatmake this facility particularly suitable for measurements of neutron-induced fission cross sections [12]. In particular,the wide energy distribution of the neutron beam, extending over more than ten orders of magnitude, allows one tomeasure the fission cross section up to the GeV region. Furthermore, the long flight path, close to 200 m, ensured agood energy resolution at all energies.
The 238U(n,f )/235U(n,f ) cross section ratio can be determined from the background-subtracted fission events C(En),as a function of neutron energy, according to the following expressions:
σ8(En)
σ5(En)=C8(En)
C5(En)× N5
N8× ε5ε8
× CF (1)
Here the subscripts 8 and 5 refer to the 238U(n,f ) and 235U(n,f ) reactions, respectively, N is the areal density ofthe samples used in the measurements (in atoms/barn), ε the detection efficiency for fission events, and CF accountsfor other correction factors, in particular for the detection dead-time. It is important to note that the ratio does notdepend neither on the shape nor on the absolute value of the neutron flux, since the two samples, having the samediameter, are measured simultaneously and in the same experimental setup, i.e. are exposed to the same neutronflux. As a consequence, the final uncertainties in the cross section ratio will mostly be determined by the uncertaintyon the areal density of the two samples, and on the ratio of the efficiency and dead-time corrections.
The data reported here were collected with two detection systems: a Fission Ionization Chamber (FIC), in whicha single Fission Fragment (FF) is detected, and an array of Parallel Plate Avalanche Counters (PPAC), in whichthe two FF are detected in coincidence. This last detection system was used in two geometrical configurations, i.e.perpendicular to the neutron beam direction, and in a tilted configuration, with the detectors mounted at an angleof 45◦ relative to the neutron beam direction. A brief description of the detectors and other experimental details isgiven below for each setup, together with the systematic uncertainties affecting the corresponding results. All datahere reported were collected with a large-aperture collimator (8 cm diameter). With such an arrangement, the beam
4
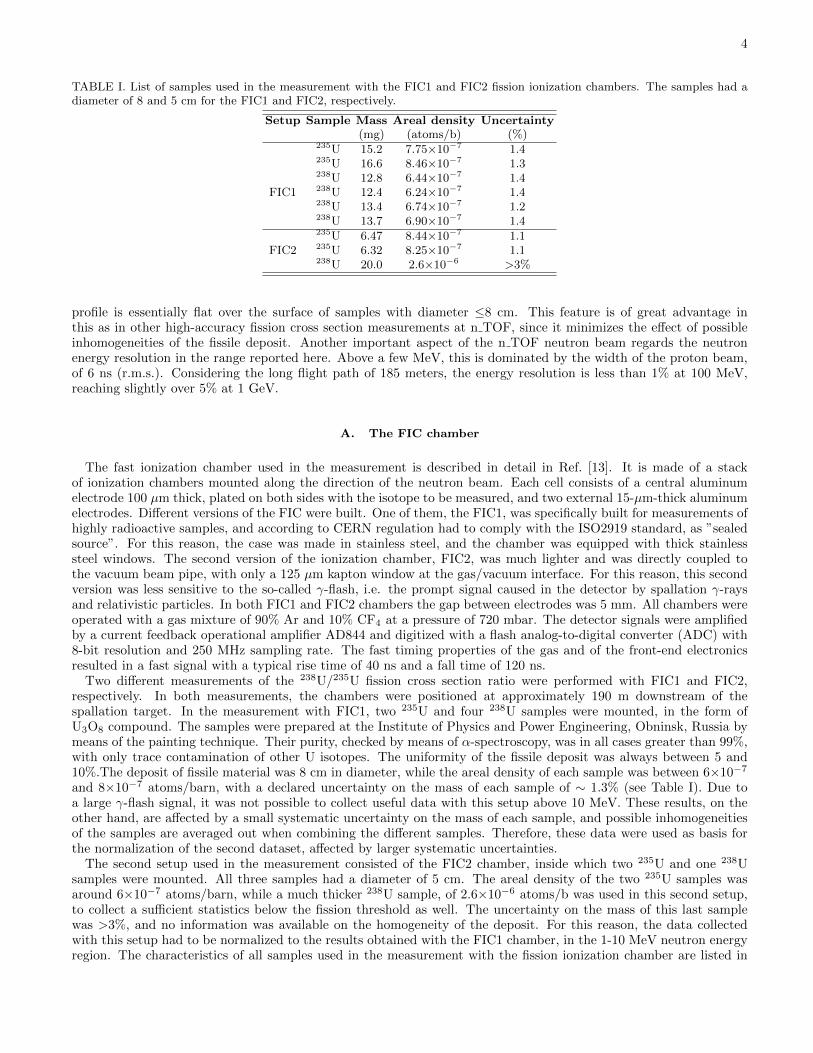
TABLE I. List of samples used in the measurement with the FIC1 and FIC2 fission ionization chambers. The samples had adiameter of 8 and 5 cm for the FIC1 and FIC2, respectively.
Setup Sample Mass Areal density Uncertainty(mg) (atoms/b) (%)
235U 15.2 7.75×10⁻⁷ 1.4235U 16.6 8.46×10⁻⁷ 1.3238U 12.8 6.44×10⁻⁷ 1.4
FIC1 238U 12.4 6.24×10⁻⁷ 1.4238U 13.4 6.74×10⁻⁷ 1.2238U 13.7 6.90×10⁻⁷ 1.4235U 6.47 8.44×10⁻⁷ 1.1
FIC2 235U 6.32 8.25×10⁻⁷ 1.1238U 20.0 2.6×10⁻⁶ >3%
profile is essentially flat over the surface of samples with diameter ≤8 cm. This feature is of great advantage inthis as in other high-accuracy fission cross section measurements at n TOF, since it minimizes the effect of possibleinhomogeneities of the fissile deposit. Another important aspect of the n TOF neutron beam regards the neutronenergy resolution in the range reported here. Above a few MeV, this is dominated by the width of the proton beam,of 6 ns (r.m.s.). Considering the long flight path of 185 meters, the energy resolution is less than 1% at 100 MeV,reaching slightly over 5% at 1 GeV.
A. The FIC chamber
The fast ionization chamber used in the measurement is described in detail in Ref. [13]. It is made of a stackof ionization chambers mounted along the direction of the neutron beam. Each cell consists of a central aluminumelectrode 100 µm thick, plated on both sides with the isotope to be measured, and two external 15-µm-thick aluminumelectrodes. Different versions of the FIC were built. One of them, the FIC1, was specifically built for measurements ofhighly radioactive samples, and according to CERN regulation had to comply with the ISO2919 standard, as ”sealedsource”. For this reason, the case was made in stainless steel, and the chamber was equipped with thick stainlesssteel windows. The second version of the ionization chamber, FIC2, was much lighter and was directly coupled tothe vacuum beam pipe, with only a 125 µm kapton window at the gas/vacuum interface. For this reason, this secondversion was less sensitive to the so-called γ-flash, i.e. the prompt signal caused in the detector by spallation γ-raysand relativistic particles. In both FIC1 and FIC2 chambers the gap between electrodes was 5 mm. All chambers wereoperated with a gas mixture of 90% Ar and 10% CF4 at a pressure of 720 mbar. The detector signals were amplifiedby a current feedback operational amplifier AD844 and digitized with a flash analog-to-digital converter (ADC) with8-bit resolution and 250 MHz sampling rate. The fast timing properties of the gas and of the front-end electronicsresulted in a fast signal with a typical rise time of 40 ns and a fall time of 120 ns.
Two different measurements of the 238U/235U fission cross section ratio were performed with FIC1 and FIC2,respectively. In both measurements, the chambers were positioned at approximately 190 m downstream of thespallation target. In the measurement with FIC1, two 235U and four 238U samples were mounted, in the form ofU3O8 compound. The samples were prepared at the Institute of Physics and Power Engineering, Obninsk, Russia bymeans of the painting technique. Their purity, checked by means of α-spectroscopy, was in all cases greater than 99%,with only trace contamination of other U isotopes. The uniformity of the fissile deposit was always between 5 and10%.The deposit of fissile material was 8 cm in diameter, while the areal density of each sample was between 6×10⁻⁷
and 8×10⁻⁷ atoms/barn, with a declared uncertainty on the mass of each sample of ∼ 1.3% (see Table I). Due toa large γ-flash signal, it was not possible to collect useful data with this setup above 10 MeV. These results, on theother hand, are affected by a small systematic uncertainty on the mass of each sample, and possible inhomogeneitiesof the samples are averaged out when combining the different samples. Therefore, these data were used as basis forthe normalization of the second dataset, affected by larger systematic uncertainties.
The second setup used in the measurement consisted of the FIC2 chamber, inside which two 235U and one 238Usamples were mounted. All three samples had a diameter of 5 cm. The areal density of the two 235U samples wasaround 6×10⁻⁷ atoms/barn, while a much thicker 238U sample, of 2.6×10⁻⁶ atoms/b was used in this second setup,to collect a sufficient statistics below the fission threshold as well. The uncertainty on the mass of this last samplewas >3%, and no information was available on the homogeneity of the deposit. For this reason, the data collectedwith this setup had to be normalized to the results obtained with the FIC1 chamber, in the 1-10 MeV neutron energyregion. The characteristics of all samples used in the measurement with the fission ionization chamber are listed in
5
Table I.For the FIC2 chamber, an electronic compensation technique was applied in order to extract the FF signals from
the tail of the γ-flash at short time-of-flights, i.e. for neutron energies above approximately 10 MeV. The techniqueis based on the observation that the shape of the γ-flash signal is similar for contiguous electrodes. Therefore, bysubtracting the output of two consecutive electrodes, one of them without sample, it is possible to extract clearfission fragment signals. The presence of a residual tail related to the γ-flash required a more careful reconstructionprocedure, with the threshold on the amplitude varying as a function of the neutron energy. The maximum energyreached with this procedure was around 200 MeV.
In order to extract the neutron energy from the measured time-of-flight, a calibration was performed using theresonances in the 235U(n,f) cross section. Corrections for the neutron beam attenuation in the samples and electrodes,and for the divergence of the beam profile, were estimated to be less than 1%, and were therefore neglected. Similarly,corrections for the sample inhomogeneities were considered negligible, in particular since the n TOF neutron beam,for the large aperture collimator, shows a nearly flat spatial profile. On the contrary, corrections had to be appliedfor the detection efficiency and dead-time effects, both of which different for the two samples. Efficiency correctionswere applied only to the FIC1 data, used for normalization. The efficiency, estimated by means of detailed FLUKAsimulations [14] of the energy deposition in the gas as a function of the threshold used in data analysis, was found tobe 94.9% and 96.2% for the thin 235U and 238U samples mounted in FIC1, respectively. Contrary to the efficiency,dead-time corrections had to be applied to both FIC1 and FIC2 data, since they depend both on the sample andneutron energy. Such corrections, based on the non-paralyzable model, were below 5% in the whole neutron energyrange for both thin samples, while it reached ∼10% for the thick 238U sample used in FIC2.
B. The PPAC setup
Fission cross sections have been measured at n TOF with the coincidence technique, using a detection system basedon Parallel Plate Avalanche Counters. The detectors are described in detail in Refs. [15, 16]. They are characterizedby very thin windows, small gaps between electrodes (3 mm) and low pressure of the gas. These features make thedetector practically insensitive to the prompt γ-flash. Furthermore, the signals produced by the FF are very fast, lessthan 10 ns in width, so that the pile-up probability is very small. Most importantly, the very fast timing combinedwith the low sensitivity of the detectors to the γ-flash, allows one to record signals at very short time-of-flights, orequivalently at very high neutron energies, nominally up to 1 GeV.
A stack of Parallel Plate Avalanche Counters, placed in the beam, were used at n TOF for measuring FF incoincidence. The actinide samples were deposited on very thin backing and positioned between two PPACs. Themain advantage of the coincidence technique is the very high efficiency for rejecting the α-particle background relatedto the natural radioactivity of the samples, as well as for discriminating fission against competing reactions, inparticular high-energy neutron-induced reactions on the PPAC structural material, producing recoiling nuclei andcharged particles inside the detectors. Another advantage of PPACs is that they can also supply information on theangular distribution of fission fragments. Each cathode consists of 2-mm-wide strips, suitably read-out to provide aone-dimensional position information. By combining the signals from the two orthogonal cathode strips, the fissionfragment trajectory can be determined, allowing to reconstruct the emission angle. The main drawback of thesystem is represented by a limited angular acceptance, since at relatively large angles one of the fragments looses alarge fraction of its energy in traversing the sample backing and the entrance windows of the detectors, either beingstopped before reaching the gas volume, or falling below the detection threshold. Therefore, while the single techniqueis characterized by an efficiency for detecting the single fragment close to 100% (since the fragment has only to escapefrom the deposit of fissile material), in the coincidence technique the efficiency for grazing trajectories drops rapidly,going to zero for emission angles larger than ∼60◦, the exact limiting angle depending on the thickness of the samplebacking.
In the first experimental campaign at n TOF the PPAC detectors were mounted in the neutron beam perpendicularlyto the beam direction. Hereafter we will refer to this configuration as ”PPAC perpendicular”. As previously mentioned,
TABLE II. Characteristics of the samples used with the PPAC setup, both in the perpendicular configuration and in the firstmeasurement with the tilted configuration (”PPAC tilted 1”).
Sample Mass Areal density Uncertainty(mg) (atoms/b) (%)
235U 13.97 6.98×10⁻⁷ 0.7238U 11.5 5.86×10⁻⁷ 0.7
6
in this configuration the setup is affected by a loss of efficiency for FF emitted at angles larger than ∼60◦. To overcomethe problem of the limited angular coverage, a new geometrical configuration was adopted at n TOF in the secondexperimental campaign, with the detectors and the samples mounted at 45◦ relative to the neutron beam direction. Ascheme of the tilted configuration can be found in [16, 17]. Two measurements were performed with the tilted setup,hereafter referred to as ”PPAC tilted 1”, and ”PPAC tilted 2”. In all cases the samples, prepared at IN2P3-Orsay,were 8 cm in diameter, with the fissile material electro-deposited on a thin aluminum foil of 2.5 µm thickness in thefirst two measurements, and on a 0.7 µm Al backing in the third measurement. The characteristics of the samples usedin the first two cases are listed in Table II. Their thickness and homogeneity was checked by means of the RutherfordBack Scattering spectroscopy (RBS), which also provides the chemical composition of samples and backings. Apartfrom a contamination of ∼6% of 238U in the 235U sample, taken into account in the analysis, only trace concentrationsof other isotopes were found in the samples (see Refs. [15, 18]). The samples of the last measurement (”PPAC tilted2”) have not been characterized with the necessary accuracy. As a consequence, this last dataset has been normalizedto the ENDF/B-VII.1 evaluated ratio between 3 and 5 MeV.
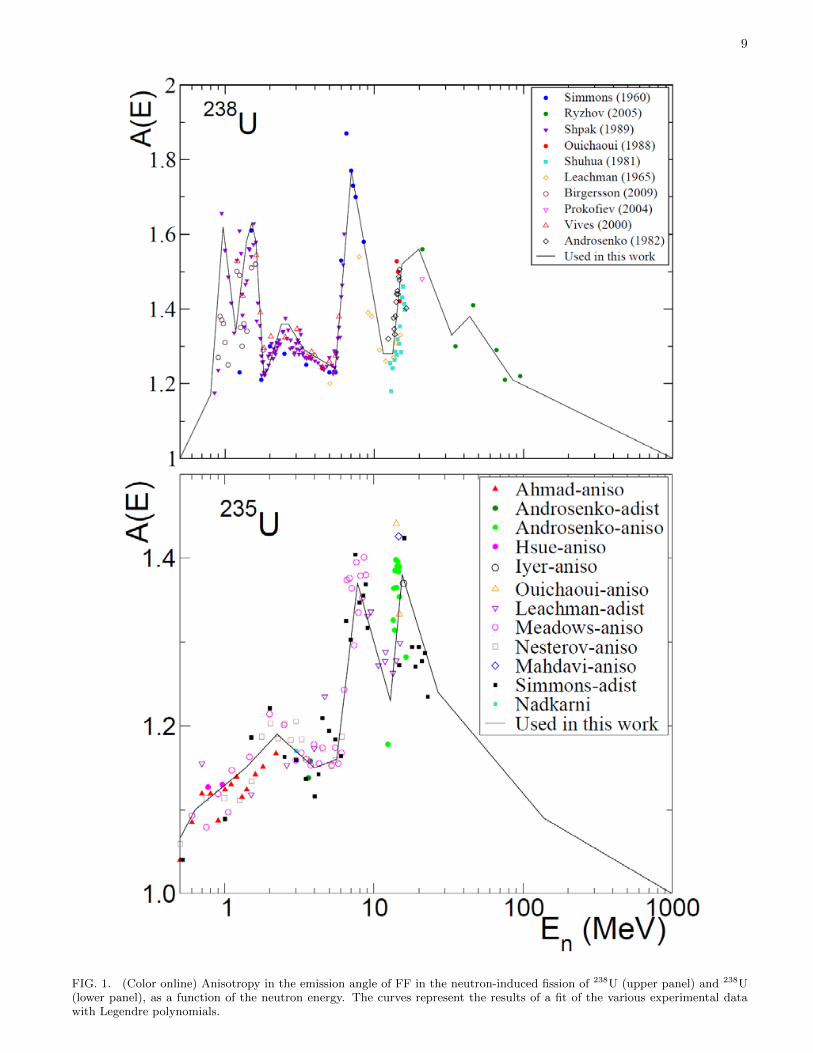
In both perpendicular and tilted configurations, a correction had to be applied for the loss of efficiency related to thestopping of one of the fission fragments in the sample backing. Because of the angular dependence of the efficiency,the fission fragment angular distribution (FFAD) had to be considered. To this end, corrections were calculated,by means of Monte Carlo simulations, on the basis of existing experimental results on the FFAD as a function ofthe neutron energy, reported in the EXFOR database for both isotopes [19]. More details on the procedure can befound in Refs. [15, 18]. The FFAD is expressed as the sum of even Legendre polynomials in terms of the cosine ofthe emission angle (because of the forward-backward symmetry of the emitted FF). In this work, polynomials up tosecond order only were considered, as there is no reliable information in literature about higher order coefficients. Theenergy-dependent coefficients were determined from the so-called anisotropy parameter, A(E), defined as the ratiobetween the emission probability of the FF at 0 and 90◦, W(E,0◦)/W(E,90◦). The angular anisotropy of 235U and238U was obtained by fitting data present in literature, available in the EXFOR database [19]. Since data only goup to ∼20 MeV neutron energy, the anisotropy was constrained to asymptotically approach unity above this energy.The data and the results of the fit are shown in Figure 1.
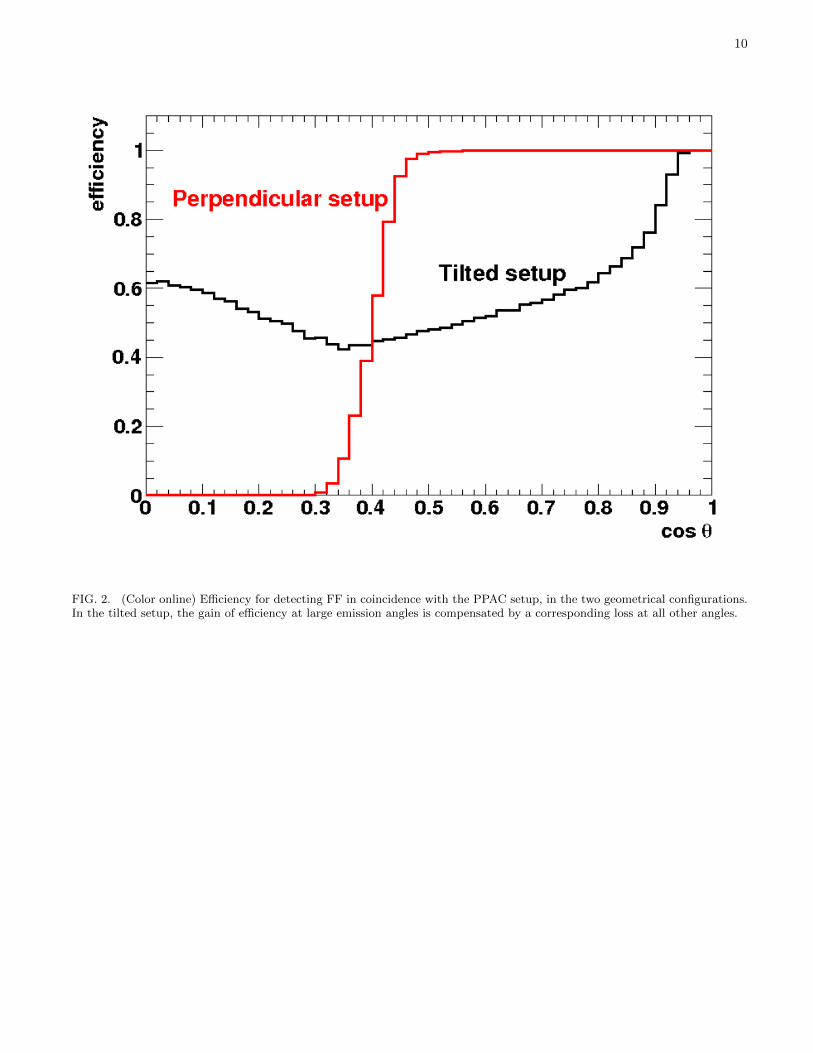
The detection efficiency of the PPAC setup as a function of the FF emission angle is shown in Figure 2 for theperpendicular and tilted configuration. The figure clearly shows the difference between the two configurations: in theperpendicular case, the efficiency is flat up to a given angle (around ∼60◦), and drops to zero above this limit. Onthe contrary, in the tilted configuration all FF emission angles are covered. The gain in efficiency at large angles isobviously compensated by a reduction of the efficiency at smaller angles, due to the cut in the azimuthal angle relatedto the stopping of the fragments in the dead layers (sample backing and PPAC windows). As expected, the globalefficiency, i.e. the efficiency integrated over the polar angle, is the same in both perpendicular and tilted configuration,but the latter has the advantage of a smaller influence of the angular anisotropy of FF emission.
The analysis of the tilted configuration is described in great detail in Refs. [16, 20, 21]. Several conditions wereapplied in order to identify the fission fragments, reconstruct the position of emission from the sample and the emissionangle of each fission fragment, reject all possible sources of background, etc... As previously mentioned, efficiencycorrections in the tilted configuration were estimated by Monte Carlo simulations [20], but in this case the resultswere confirmed by means of a method based exclusively on experimental data [21]. Contrary to the perpendicularconfiguration, a dependence of the efficiency on the polar angle has to be taken into account, together with othereffects related to the viewing angle of the sample by the detectors.
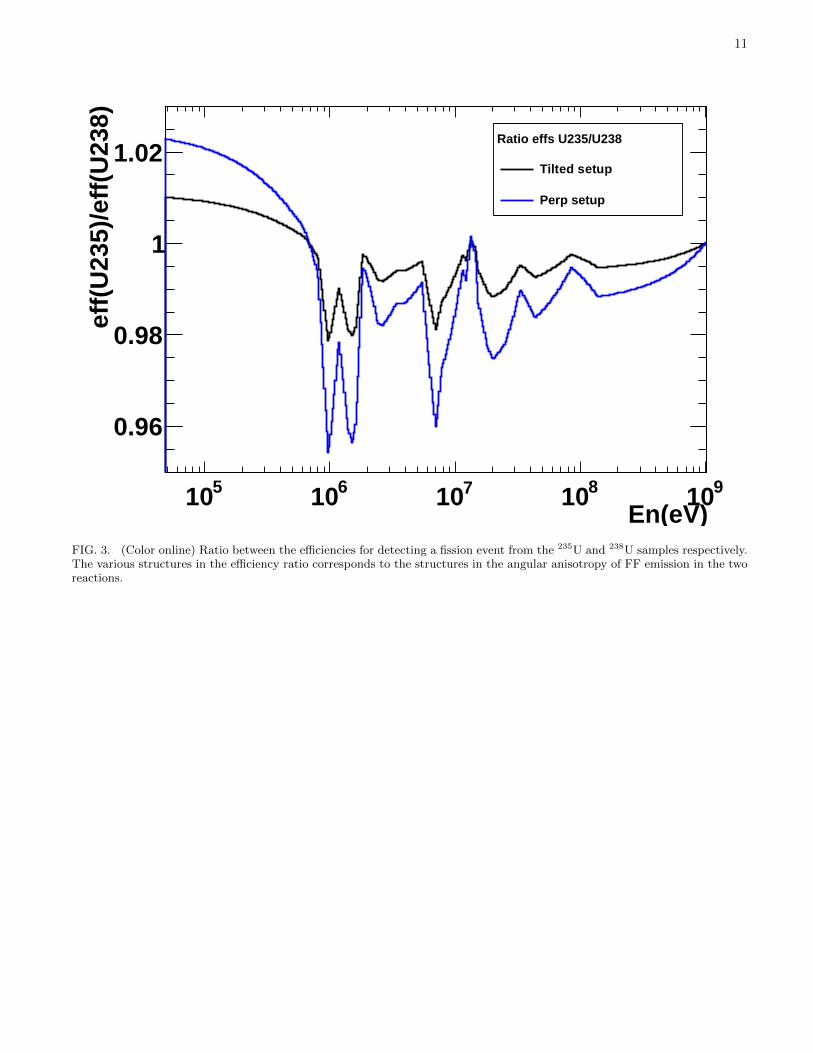
As shown in Eq. 1, the cross section ratio depends on the ratio of the efficiency for detecting a fission event fromthe 235U and the 238U samples respectively. The ratio is shown in Figure 3, for the two different configurations. Inboth cases, the correction is of the order of at most 4%. The systematic uncertainties affecting the various PPACmeasurements, as well as the measurement with the FIC, are listed in Table III.
III. RESULTS AND DISCUSSION
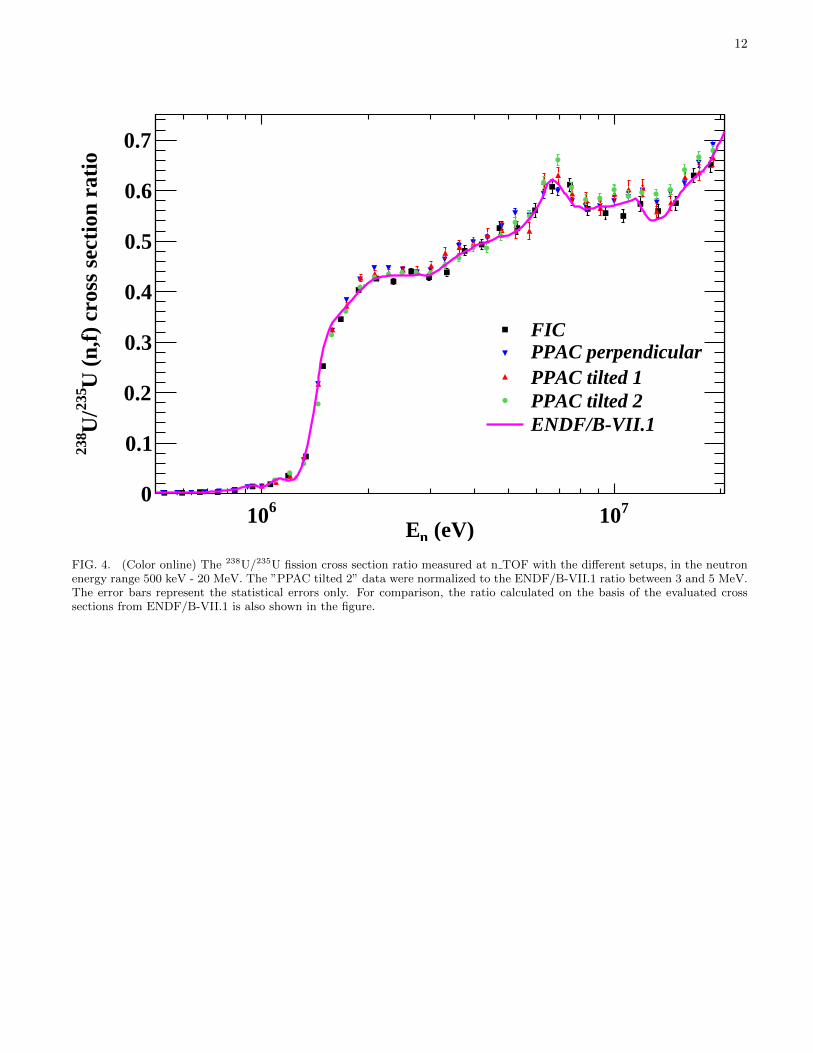
Figure 4 shows the results of the different measurements of the 238U/235U fission cross section ratio, for neutronenergies in the range 500 keV-20 MeV. For comparison, the ratio extracted from the ENDF/B-VII.1 evaluated crosssections, is also shown in the figure. We remark here that for neutron energies below 20 MeV a wealth of data areavailable in literature, with the standard cross section of both isotopes characterized by an uncertainty of less than1%. Therefore the very good agreement between n TOF results and evaluations, evident in Figure 4, provides a strongconfidence on the accuracy of the new data, in particular on the systematic uncertainty related to the sample mass andon the efficiency corrections. Some minor differences can nevertheless be noticed in the Figure, in particular around12 MeV neutron energy, where the dip corresponding to a valley in the 238U(n,f ) cross section is less pronouncedin the n TOF dataset, relative to ENDF/B-VII.1 evaluation. Another minor difference can be observed around the
7
TABLE III. Systematic uncertainties on the data collected in the four different measurements of the 238U/235U fission crosssection ratio. All values are expressed in percentage. ”Others” refers mostly to dead-time corrections. For the last dataset,normalized to ENDF/B-VII.1, the uncertainty in the mass is replaced by the one in the evaluated cross sections.
Setup Samples Efficiency Others TotalFIC 2 1 3 3.5
PPAC perpend. 1.1 3 <1 &3PPAC tilted 1 1.1 2 <1 .3PPAC tilted 2 (∼1) 1 <1 2.5
238U fission threshold, slightly above 1 MeV. In this region, the n TOF data are systematically shifted on the right,with respect to evaluations, possibly indicating a slight underestimate of the value of the fission threshold in theevaluations.
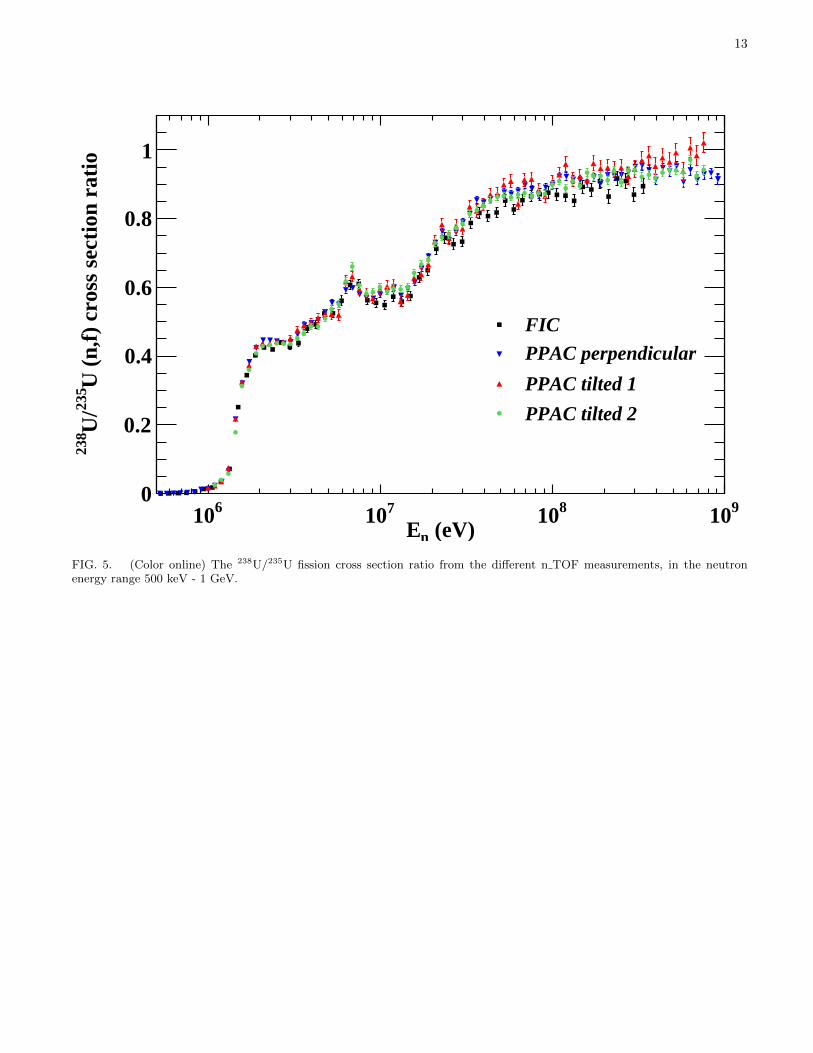
Figure 5 shows the results of the four different measurements at n TOF, from 500 keV to 1 GeV. The error barson the symbols indicate the statistical errors only. Above 20 MeV some differences can be observed between thevarious results. In particular, the FIC results are systematically lower than all the PPAC ones. Among these lastones, the results obtained in the first measurement with the tilted configuration are systematically higher than theother two datasets, with the difference becoming more pronounced above ∼500 MeV. It should be noticed, however,that all observed differences are well within the combined systematic uncertainties affecting the results here reported,as discussed below.
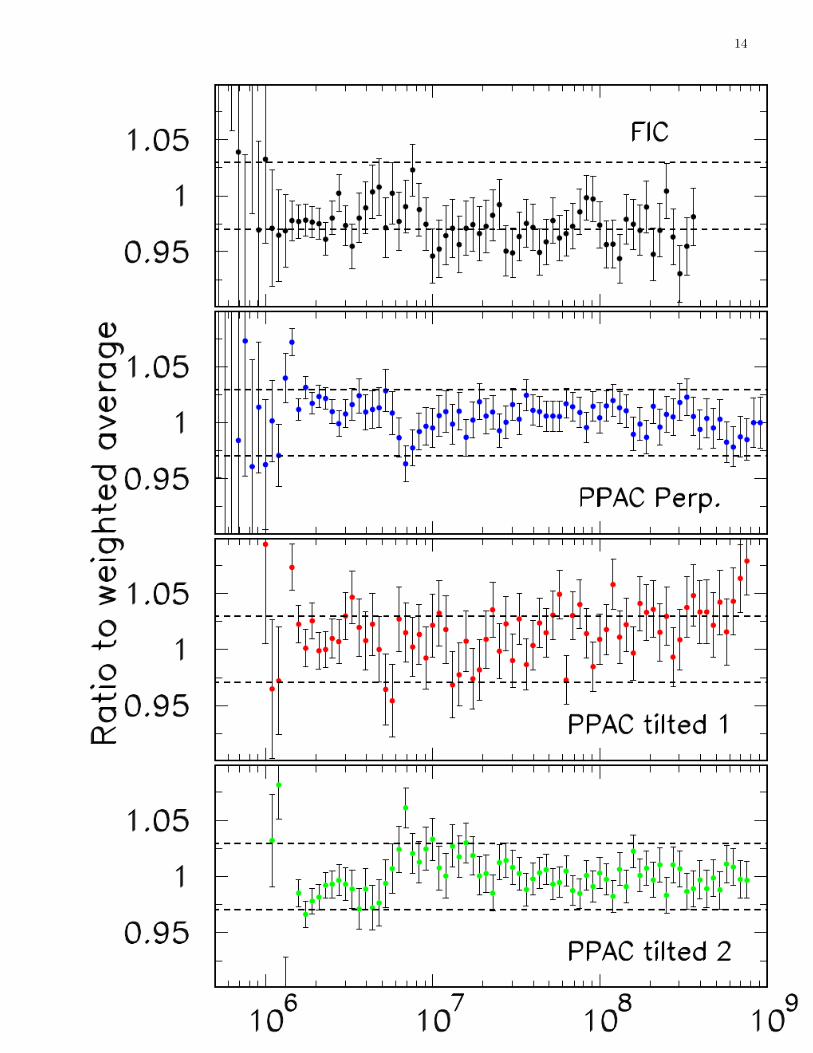
Each of the four datasets collected at n TOF represents a new result by itself, and should be considered indepen-dently from each other, for example in re-evaluating the fission cross section ratio. Nevertheless, for the purpose ofthis paper it may be convenient to combine all four datasets in a single one. To this end, a weighted average wasperformed, taking into account only the statistical errors (since the systematic errors are similar for the differentdatasets, in first approximation they can be neglected in the weighted average). The ratio obtained with this pro-cedure can be more easily compared with data from previous measurements, as well as with evaluations and resultsof theoretical calculations. Furthermore, it can be used to analyze the dispersion of the n TOF datasets and drawfurther conclusions on their accuracy.
This last point is illustrated in Figure 6, which shows the divergence of each n TOF result from their weightedaverage, as a function of the neutron energy. Except for some details, the difference in all cases is within the ∼3%systematic uncertainty associated with each dataset (in the crude approximation adopted here, not taking into accountthe existing correlations between some datasets, the systematic uncertainty on the weighted average is around 1% upto 200 MeV, and between 1 and 2% above this energy). This observation provides further strength on the accuracyof the results here reported.
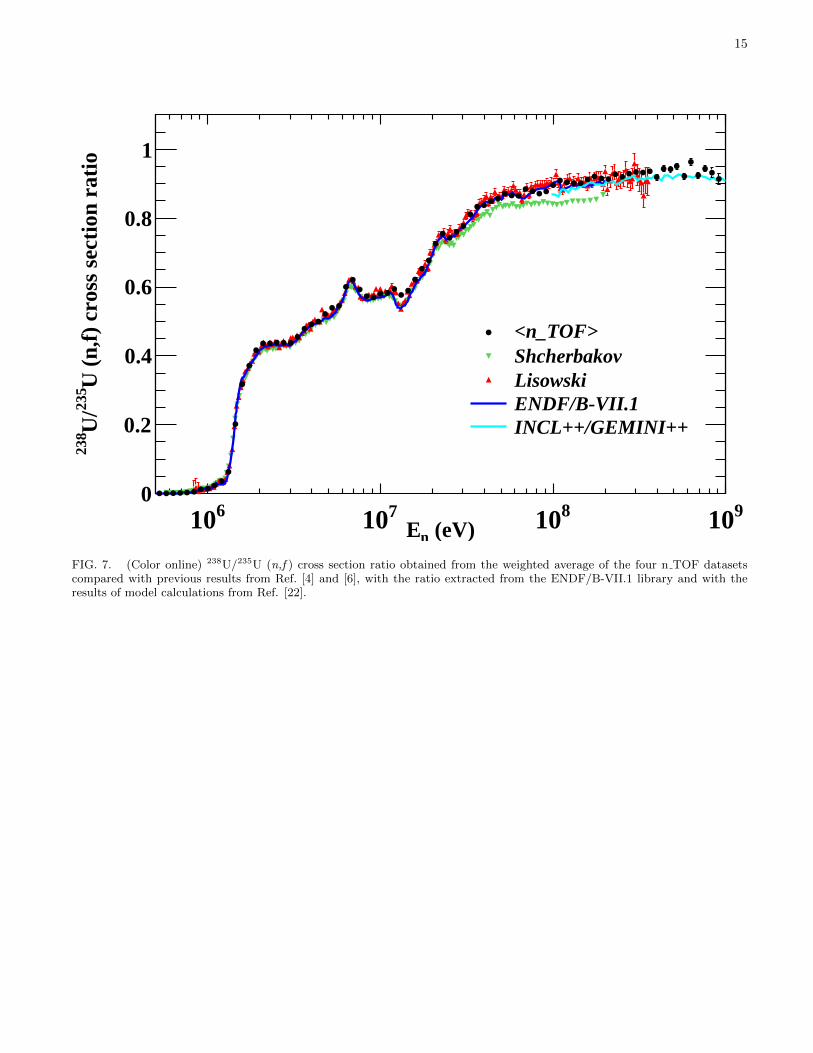
The unique n TOF fission cross section ratio discussed above is compared with the two major datasets extending tohigh energy in Figure 7 (the data from Nolte et al. [7] are not reported in the figure due to their large errors). A verygood agreement is observed with both the data from Lisowski et al. [4] and current ENDF/B-VII.1 evaluation all theway up to 200 MeV, definitely ruling out the lower values reported by Shcherbakov et al. [6]. Above this value, then TOF data seem to maintain a constant or slightly increasing trend, contrary to the data of Lisowski et al., whichseem to indicate the start of a decline in the higher energy points.
Some important information on the fission mechanism at high energy can be extracted from the comparison ofthe present data with the results of recent theoretical calculations of the fission cross sections of various actinidesat high energy. More details on the calculations can be found in [22]. The aim of the work was to provide a meanfor estimating the fission cross section in the hundreds of MeV neutron energy range, in particular above 100 MeV,where no (or very few) reliable data exist. This is also the case for the fission cross section ratio discussed here.In the upper energy range from 200 MeV to 1 GeV, considered in this work, model calculations were performed inorder to estimate the absolute cross sections and, consequently, their ratio, to be compared with the present data.In Ref. [22], (p,f ) and (n,f ) cross sections were evaluated for both isotopes in the energy range from 100 MeV to 1GeV using the intranuclear cascade code INCL++ [23] coupled to the evaporation-fission code GEMINI++ [24]. Twoparameters in the fission model were optimized so to reproduce the (p,f ) cross sections measured in Ref. [25] from200 MeV to 1 GeV (see Ref. [22] for details). The corresponding (n,f ) cross sections were evaluated without furtheradjustment of model parameters, because the models already account for the observed differences in (p,f) and (n,f)cross sections around 200 MeV, while protons and neutrons are expected to have similar behavior with increasingincident energy and the fission cross sections to be of the same order of magnitude around 1 GeV. Such an assumptionmade it possible to reproduce also the (n,f ) data from 100 MeV to 200 MeV, even if the conditions of validity ofthe intranuclear cascade model are poorly satisfied at such relatively low energies. The theoretical cross sections areaffected by statistical errors inherent in the Monte Carlo technique, which propagate to their ratios and have to be
8
considered in the comparison with the experiment. The results of the model calculations are show in Figure 7 by thelight-blue curve. A good agreement is observed at all energies. Although some systematic effects in the calculationsmay be at least partially compensated in the cross section ratio, the good agreement observed in the figure is anevidence that the theoretical treatment of Lo Meo et al. is adequate for predicting fission cross sections of actinidesabove 100 MeV neutron energy.
IV. CONCLUSIONS
The 238U/235U fission cross section ratio has been measured at n TOF, for the first time up to 1 GeV, with twodifferent detection systems, one of which used in two different geometrical configurations. The results of the differentmeasurements agree with each other within the estimated systematic uncertainty on each dataset of approximately3%. Furthermore, the results are in all cases in agreement with evaluated cross sections and standard values between0.5 and 20 MeV, thus providing confidence on their accuracy. The different results have been combined in order toobtain a unique value of the ratio, which has then been compared with previous results and evaluations, up to 200MeV, and with theoretical calculations based on intranuclear cascade model coupled with an evaporation-fission code,all the way up to 1 GeV. The extracted ratio rules out the results of Shcherbakov et al., and is in very good agreementboth with current evaluation and standards, up to 200 MeV, and with theoretical calculations up to 1 GeV. Theseresults could be used to improve the accuracy of current libraries, and in particular of the standard used in a varietyof applications.
ACKNOWLEDGMENTS
The research leading to these results has received funding from the European Atomic Energy Communitys (Euratom)Seventh Framework Program FP7/2007-2011 under the Project CHANDA (GA n. 605203).
[1] A. Carlson et al., Nuclear Data Sheet 110, 3215 (2009).[2] https://www-nds.iaea.org/standards/Data/endf-6-format/std-092 U 235.endf ().[3] http://www-nds.iaea.org/standards/Data/endf-6-format/std-092 U 238.endf ().[4] P. Lisowski et al., Proc. Int. Conf. on Nuclear Data for Science and Technology, May 13-17 1991, Julich, Germany , 732
(1992).[5] https://www-nds.iaea.org/exfor/endf.htm.[6] O. Shcherbakov et al., Journal of Nuclear Science and Technology, Supplement 2 , 230 (2002).[7] R. Nolte et al., Nucl. Sci. Eng. 156, 197 (2007).[8] https://ntof-exp.web.cern.ch/ntof-exp/.[9] U. Abbondanno et al., CERN/INTC-O-011 INTC-2002-037, CERN-SL-2002-053 ECT (2003).
[10] C. Guerrero et al., Eur. Phys. Journ. A 49, 27 (2013).[11] M. Barbagallo et al., Eur. Phys. Journ. A 49, 156 (2013).[12] N. Colonna et al., Energy and Environ. Sci. 3, 1910 (2010).[13] M. Calviani et al., Nucl. Instr. Meth. A 594, 220 (2008).[14] T.T. Bohlen et al., Nuclear Data Sheets 120, 211 (2014).[15] C. Paradela et al., Physical Review C 82, 034601 (2010).[16] U. Tarrıo et al., Nuclear Instrum. Methods Pys. Res., Sect. A 743, 79 (2014).[17] D.Tarrıo et al., Nuclear Data Sheets 119, 35 (2014).[18] U. Tarrıo et al., Physical Review C 83, 044620 (2011).[19] https://www-nds.iaea.org/exfor/exfor.htm.[20] D. Tarrıo, (Ph.D. thesis) Universidade de Santiago de Compostela, Spain (2012).[21] L. Leong et al., (Ph.D. thesis), University of Paris, France (2013).[22] S. Lo Meo et al., Nucl. Phys. A, in press, http://dx.doi.org/10.1016/j.nuclphysa.2014.09.040 (2014).[23] A. Boudard et al., Physical Review C 87, 014606 (2013).[24] D. Mancusi, R.J. Charity and J. Cugnon, Physical Review C 82, 044610 (2010).[25] A. Kotov et al., Physical Review C 74, 034605 (2006).
9
FIG. 1. (Color online) Anisotropy in the emission angle of FF in the neutron-induced fission of 238U (upper panel) and 238U(lower panel), as a function of the neutron energy. The curves represent the results of a fit of the various experimental datawith Legendre polynomials.
10
FIG. 2. (Color online) Efficiency for detecting FF in coincidence with the PPAC setup, in the two geometrical configurations.In the tilted setup, the gain of efficiency at large emission angles is compensated by a corresponding loss at all other angles.
11
En(eV)510 610 710 810 910
eff(
U23
5)/e
ff(U
238)
0.96
0.98
1
1.02Ratio effs U235/U238
Tilted setup
Perp setup
FIG. 3. (Color online) Ratio between the efficiencies for detecting a fission event from the 235U and 238U samples respectively.The various structures in the efficiency ratio corresponds to the structures in the angular anisotropy of FF emission in the tworeactions.
12
(eV)nE610 710
U (
n,f)
cro
ss s
ecti
on r
atio
235
U/
238
0
0.1
0.2
0.3
0.4
0.5
0.6
0.7
FIC PPAC perpendicularPPAC tilted 1 PPAC tilted 2 ENDF/B-VII.1
FIG. 4. (Color online) The 238U/235U fission cross section ratio measured at n TOF with the different setups, in the neutronenergy range 500 keV - 20 MeV. The ”PPAC tilted 2” data were normalized to the ENDF/B-VII.1 ratio between 3 and 5 MeV.The error bars represent the statistical errors only. For comparison, the ratio calculated on the basis of the evaluated crosssections from ENDF/B-VII.1 is also shown in the figure.
13
(eV)nE610 710 810 910
U (
n,f)
cro
ss s
ecti
on r
atio
235
U/
238
0
0.2
0.4
0.6
0.8
1
FIC
PPAC perpendicular
PPAC tilted 1
PPAC tilted 2
FIG. 5. (Color online) The 238U/235U fission cross section ratio from the different n TOF measurements, in the neutronenergy range 500 keV - 1 GeV.
14
FIG. 6. (Color online) Ratio between the various datasets collected in the four different measurements at n TOF and theirweighted average. The dashed lines represent the limit of the 3% uncertainties.
15
(eV)nE610 710 810 910
U (
n,f)
cro
ss s
ecti
on r
atio
235
U/
238
0
0.2
0.4
0.6
0.8
1
<n_TOF> Shcherbakov Lisowski ENDF/B-VII.1 INCL++/GEMINI++
FIG. 7. (Color online) 238U/235U (n,f ) cross section ratio obtained from the weighted average of the four n TOF datasetscompared with previous results from Ref. [4] and [6], with the ratio extracted from the ENDF/B-VII.1 library and with theresults of model calculations from Ref. [22].
Top Related
Copyright © 2022 FDOKUMEN

