


Bahasa
Halaman
Hukum

Page 1/16
Health Risk Assessment and Seasonal Trend of Metals in Arid-Soil-ForageCrops and AnimalsFu Chen
Hohai UniversityLaraib Saqlain
University of SargodhaMuhammad Arslan Ashraf ( [email protected] )
Fujian Normal UniversityKafeel Ahmad
University of SargodhaZafar Iqbal Khan
University of Sargodha
Research Article
Keywords: Seasonal variation, Health risk index, Bio concentration, Pollution Load Index, Pakistan
Posted Date: February 15th, 2022
DOI: https://doi.org/10.21203/rs.3.rs-1347083/v1
License: This work is licensed under a Creative Commons Attribution 4.0 International License. Read Full License
Page 2/16
AbstractBackground: The aim of study was accessing the cobalt (Co) and lead (Pb) contamination in soil, forages and animals. The heavy metal ionsbioaccumulation and escalating transfer to food chain has become main concern for mankind. Nevertheless, they play crucial role in organismalmetabolism, however exceeding threshold level causes toxicity or even system failure. Since the plants are the main source of nutrition supply andcarbohydrates for animal metabolism, therefore mankind exposure risk to food chain heavy metal toxicity increases signi�cantly.
Method: To highlight toxicity levels and exposure risk we designed this �eld study in the nearby areas of district Mianwali, Punjab, Pakistan during differentseasons. and carried out samplings of soil, native �ora. While following research ethics we collected samples of blood, hair and feces from domesticherbivore animals. Traditional wet digestion was carried out in available laboratory facilities, Pb and Co heavy metal concentrations were analyzed withatomic absorption spectrum. With emphasis on health risk index (HRI) and bio-concentration factor (BCF), we also draw attention to pollution load index(PLI), daily intake of metal (DIM), Health Risk Index (HRI) and Enrichment factor (EF).
Results: Our �ndings revealed high Pb concentration (5.29-9.84 mg/kg) in forage during season 1. While our �ndings indicate concentrations of metal indifferent seasons. When the Co concentration in forages was 0.238 to 0.492 mg/kg and Pb was found in the range of 5.29-9.84 mg/kg). Soil samplesshowed higher level of (PLI) Pollution load index. Bio-concentration of cobalt and lead was (0.447- 1.106 and 0.717- 1.152 mg/kg) respectively.
Conclusions: Bio-concentration factor and pollution load index for Co and Pb was noticed signi�cantly higher than 1. Whereas enrichment factor (EF) wasunder permissible limit for both metals, daily intake metal (DIM) and no harmful health risk concentration was found. Therefore, wide-scale regularmonitoring for heavy metal risk assessment on seasonal basis are highly recommended to avoid or minimize further contamination.
1. IntroductionExtreme toxicity for the metal is due to reason that, dissimilar to organic matter, trace metals are not biodegradable although they merely alter theiroxidation state as well as they are very exceedingly persistent in environment having a half-life greater than twenty years (Hadia-e-Fatima et al., 2018).recognized elements are termed as heavy metals and they are characterizing as universal pollutants having densities were greater than 5 gram percentimeter cube (Ashraf et al., 2019; Prieto et al., 2018). In the soil ecosystem heavy metal elements are components of soil. Accumulation of metal in soiland getting mixed with the groundwater is perhaps damaging to livestock, forages and other plants.
In soil heavy metals are present in combined state and are soluble with water. Some heavy metals occur in soil having soluble state of water. These metalsare mobile because they are chelated with other metal and metalloids hence, they are easily available to forage plants. Heavy metals are incorporated intofood chain in a direct pathway when these trace metals are accumulated in forages because forages absorb trace metals from water, air and soil (Chiromaet al., 2014).
Contaminants consisted of toxic consequences of organism’s corpse by producing digestion related issues, malfunctioning of excretive system, immunesystem disorders, respiratory diseases, and glandular failure. Chronic disorders, lethal cancerous tumours, psychological illnesses, reducing growth anddevelopment and psychological illnesses are furthermore linked with toxicosis (Unver et al., 2015).
Forages species that are grown on contaminated soil become more contaminated by the heavy metals (Nadeem et al., 2019). Pasturage grown alongboundaries of highways are promptly in�uenced by heavy metals stress by liberation of unhealthy smoke, these hazardous conditions have moredangerous impacts on forages as compared to others (Dogan et al., 2014a,b). Heavy metals enter food chain �rstly they are accumulated into forage plantbody and soil; through forage consumption heavy metals enter the body of livestock (Khan et al., 2018).
Cobalt is a trace metal in forages shown by its normal concentration level, its normal concentration found in their dry weight is almost 0.1-10 μg g-1. Manyenzymes and coenzymes contain cobalt as their signi�cant constituents. Physiological conditions of forages and their growth is altered by the amount ofCo (cobalt) occurring in rhizosphere and soil. It commonly from complexes while interacting with other metals. Seasonal changes have in�uenced thebioavailability of heavy metals and mature growth and developments of forages (Kalaivanan et al., 2016).
Metabolic pathways of forage plants are directly affected by lead (Pb) accumulation in forages; although, it produces de�ciencies of other metals, lead(Pb) is also responsible of damage to plant cells when its level is above permissible limits and cause toxicity (Bibi et al., 2014). When Pb level is less thanpermissible limits in the soil of an area this is not harmful for grazing ruminants and forage species. If canal water is used for irrigation purpose instead ofindustrial e�uent water and sewage water, the Pb concentration is less in these plants, so the forages less hazardous for the grazing animals.Anthropogenic activities increase the lead (Pb) contamination above the permissible limits and change the extrinsic and intrinsic factors of pasture soil(Shad et al., 2014). This study aims to investigate the concentrations of lead (Pb) and Cobalt (Co) in soil, forage crops and animals. Current study wasdesigned with following objectives; seasonal variations among bioconcentration, pollution load indices and daily intake metals for heavy metalsconcentrations.
2. Materials And Methods2.1 Study Area:
District Mianwali is in south-western region of province Punjab. This district has plains of western area of salt range. It is situated near the Sakesar hill.Mianwali district has boundaries with Khushab, D.I Khan, Bhakkar and Bannu districts. Canal irrigation system is very less developed, only a little area is
Page 3/16
irrigated with Indus river irrigation system. The native of this district is a�liated with bordering plant resources. District Mianwali is divided into threeTehsils such as Piplan, Mianwali and Esakhel. Mianwali city is the larger city. Its human population is about 140000. One of the popular areas is Kalabagh,brown salt hills, Kalabagh Dam, Indus river and Nawab of Kalabagh. At the south side of district tehsil Piplan is situated and towads north-west tehsilEsakhel is located. These areas are economic and commercial zones of the district (Ghani et al., 2016; Qureshi et al., 2007).
2.2 Sample collection from sites
In district Mianwali four sites were selected for sampling. Three samples of agricultural soil, forages and animal blood, hair and feces were taken toexamine the metal pro�le of soil-forage-animal continuum. The samples were taken from Wan bhachran site, Mianwali, Esakhel and Piplan. The summer,autumn and winter seasons were selected for sampling. The samples were taken randomly from sites.
2.3 Soil sample collection
In the district Mianwali four sites were selected to collect the samples. 3 samples of soil were collected with equal distances in the �eld. Stainless steelauger was used to dig up the upper layer of soil about 12-15 cm (Siddique et al., 2019). These samples were packed into plastic bags to avoid the mixingof other chemical compounds into it. Samples were stored in laboratory and labeled then metal analysis was performed. For each sample three compositesamples were made. The collected samples were �rstly air then oven drying at 72℃ for 2 days. The samples were placed in incubators at70℃ temperature for 5 days.
2.4 Forage sample collection
Sterilized apparatus was used to collect the forage samples. Forage and soil were collected from same �eld and place. Only those forages were selectedfor taking samples that are used as common feed of livestock. 3 samples of each forage plant were taken from the sampling area. The samples werewashed with distilled water to clear impurities and dirt. These samples were dried to eliminate moisture in the freshly collected samples. The collectedsamples were dried for further process.
These are following species that were selected for sampling. Calotropis procera (Apocynaceae), Dactyloctenium aegyptium (Poaceae), Partheniumhysterophorus (Asteraceae), Rumex dentatus (Polygonaceae) and Ziziphus jujube (Rhamnaceae).
2.5 Animal blood plasma, hair and feces sample collection
Blood samples of cow, buffalo and sheep of Mianwali was taken in 2020. Young animals within age of two years were selected for sampling. Blood wascollected from four sites of district Mianwali. Animal blood was calculated from 10 animals (Cow, buffalo and sheep) each from each sampling site andheavy metal evaluation was done. Sterilized syringe was used to obtain the blood samples. The grazing ruminant’s blood was taken from the vein. Thevacuum was created in evacuated tubes while collecting blood to minimize the extent of clotting. The blood was collected in heparinized Na-citrate voilesquickly. For 15 minutes blood was centrifuged at 3000 rpm and blood plasma was separated. Polyethylene tubes were used to store the blood plasma andfrozen at -20°C. Hair and feces samples were also collected and stored for the further digestion process.
2.6 Sample measurement and preparation
Arrangement and preparation of samples involves the digestion process. This method of digestion is called wet digestion. It has following steps. Acid andhydrogen per oxide is used for complete digestion process. Distilled water is added after digestion into prepared samples for dilution purpose. After that�ltration of samples occur. In next step Atomic Absorption Spectrophotometer (AAS) is an apparatus through which metal analysis is done.
2.7 Apparatus and chemicals for digestion
Chemicals that are used for digestion process includes the 10 ml Nitric acid ,70% Sulphuric acid (H2SO4), 50% Hydrogen peroxide (H2O2) and newlysynthesized condensed water or distilled (H2O). The apparatus for digestion includes digestion �asks of 100 ml, measuring cylinder (50 ml), beakers(50ml) and (100ml), pipette (10 ml), �lter paper, stirrer, hotplate and gloves.
2.8 Digestion of soil, forages and Animal samples
Digestion of soil and forages and animal samples (blood, hair and faeces) include various steps. First, the samples are air dried and followed by oven driedprocess at 72°C for 5 days until the moisture content is removed. When plants are completely dried, they weighed with electrical balance. Standardprocedure of digestion was applied to digest the samples (Siddique et al. 2019). 1gm sample was weighed by electrical balance and placed in a beaker of50ml. A 10 ml nitric acid was added to beaker and was kept overnight. Hot plate was used for digestion of sample by pouring H2O2 drop wise until solutionbecomes transparent. Cooling at room temperature was done. For dilution 50 ml distilled water added to solution. To �lter the solution Whatman �lterpaper of 42 µm was used. Then this prepared solution was kept in plastic bottles for metal pro�le evaluation.
Blood samples collected from the Mianwali district were stored and freeze at -20°C. For digestion process the samples were from freezer and digested withsame standard procedure as applied to soil and forages (Siddique et al., 2019). Hair sample was sun dried and was cut into pieces of 1.0-2.9 cm. De-ionized water was used to wash the samples and ethanol was also applied to wash. Oven drying process was carried out and for 4 hours and thendesiccator cooling was performed (Hashem et al., 2017). Feces samples were collected from cow, buffalo and sheep after air drying and oven dry thesamples were submitted for digestion (Nicholson et al.1999).

Page 4/16
2.9 Metal pro�le evaluation analysis
The prepared samples were then analyzed for metal contents by Atomic Absorption Spectrophotometer (Perkin-Elmer Corp, 1980). Nutritional minerals thatwere evaluated in the sample were Co and Pb. Standard solution was prepared to get the standardized curve. The metal analysis was done by running thesamples through Atomic Absorption Spectrophotometer. This apparatus is equipped with a graphite furnace. Each metal is measured according to value ofstandard solution. The amount of each metal occurring in the sample is obtained in absolute farm. While sample is run through the Atomic AbsorptionSpectrophotometer the little quantity of sample is sprayed at the �ame. Atomic resonance absorption line by element is calculated and measured. Theapparatus is convenient for analysis. Any radiation that is emitted by �ame had no effect on the working of apparatus. The absorption method isindependent of the excitation potential of the spectral line used.
2.10 Evaluation Indices:
2.10.1 Bio concentration Factor (BCF):
For assessment of metal (mg/kg) transport from agricultural soil and forages that are growing on this soil, a BCF is applied (Cui et al., 2004).
BCF for soil to forage
(BCF) = Level of metal in forage /Level of metal in soil
2.10.2 Pollution load index (PLI)
Liu et al. (2005) described a formula which was used to �nd these indices.
Whereas,
(M)IS = (mg/kg) Concentration of metal that occurs in soil to investigate
(M)RS= Soil reference value of metal (Table 1).
2.10.3 Enrichment factor (EF)
Formula for Enrichment factor is described by Buat-Menard and Chesselet (1979). See the Table 2.
2.10.4 Daily intake of metals (DIM)
Daily intake of metal (DIM) can be calculated by following equation from Sajjad et al. (2009).
Whereas,
Cmetal is the concentration of metals in forages,
Dfood intake is the daily intake of forages,
Baverage weight is the average body weight.
For calculating this daily intake of metal, the conversion factor was taken 0.085 (Jan et al., 2010). Daily intake metal for cow was calculated by usinganimal body weight 600 kg and daily forage intake 12 kg while for sheep body weight was taken 75 kg and daily forage intake 1.3 kg (Johnsen andAaneby, 2019). To calculate the DIM for buffalo body weight was taken 550 kg and daily forage intake (TDI) was taken 12.5 kg (Yang et al., 2020).
Health Risk Index (HRI)
Health risk index is the ratio of daily intake of metals in the forages to oral reference dose (RfD) and was calculated by the help formula (USEPA, 2002).
Page 5/16
DIM = Daily intake of heavy metal
RfD = Oral reference dose (Table 3)
An HRI > 1.0 for any single metal indicates that the health of consumer population is at risk, or it is carcinogenic (USEPA, 2013).
3. ResultsConcentration of Cobalt in soil
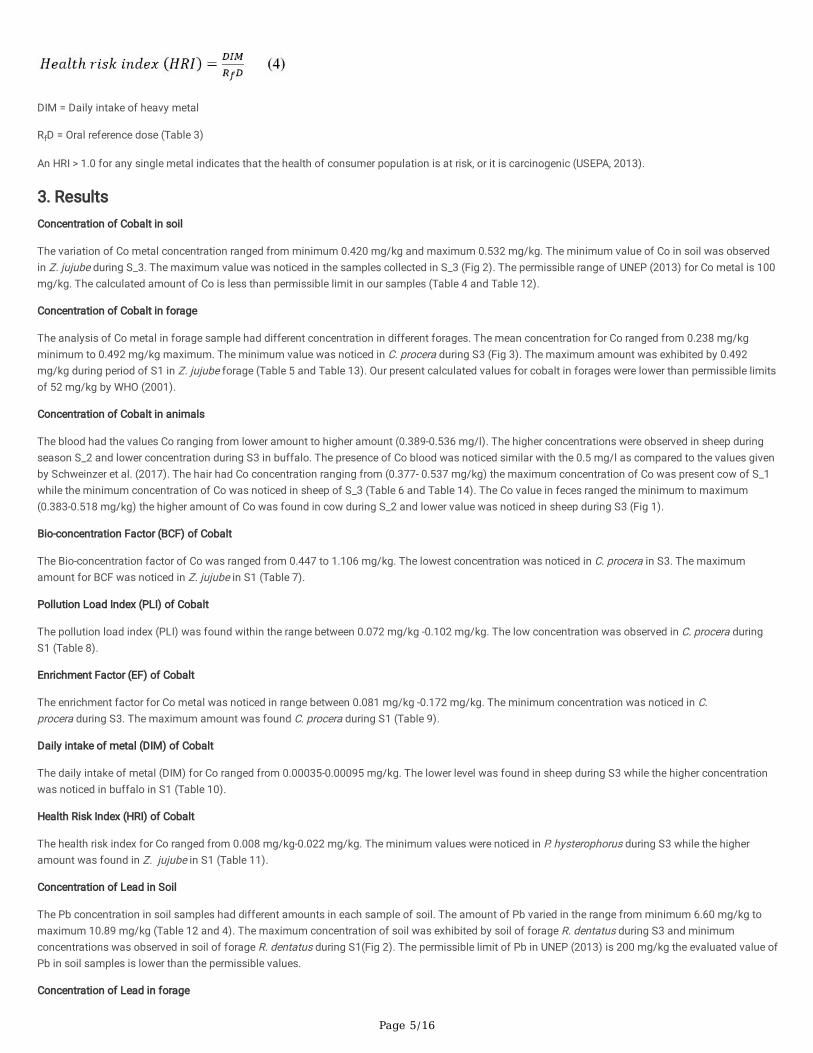
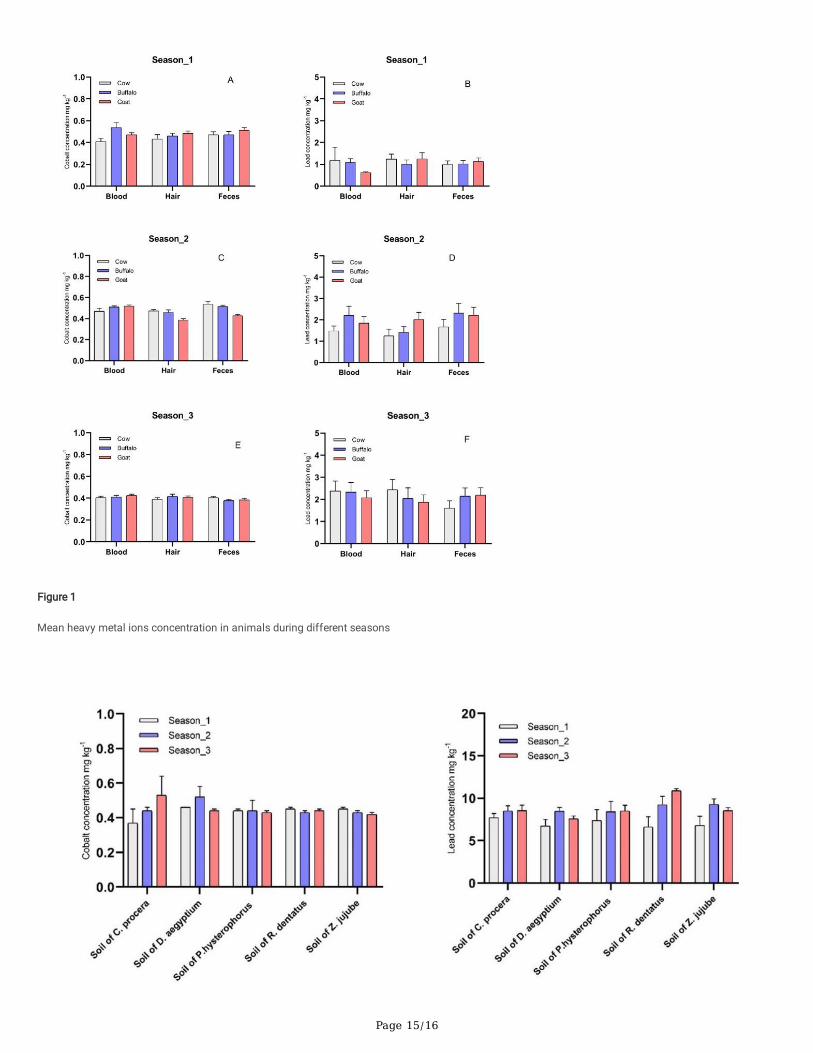
The variation of Co metal concentration ranged from minimum 0.420 mg/kg and maximum 0.532 mg/kg. The minimum value of Co in soil was observedin Z. jujube during S_3. The maximum value was noticed in the samples collected in S_3 (Fig 2). The permissible range of UNEP (2013) for Co metal is 100mg/kg. The calculated amount of Co is less than permissible limit in our samples (Table 4 and Table 12).
Concentration of Cobalt in forage
The analysis of Co metal in forage sample had different concentration in different forages. The mean concentration for Co ranged from 0.238 mg/kgminimum to 0.492 mg/kg maximum. The minimum value was noticed in C. procera during S3 (Fig 3). The maximum amount was exhibited by 0.492mg/kg during period of S1 in Z. jujube forage (Table 5 and Table 13). Our present calculated values for cobalt in forages were lower than permissible limitsof 52 mg/kg by WHO (2001).
Concentration of Cobalt in animals
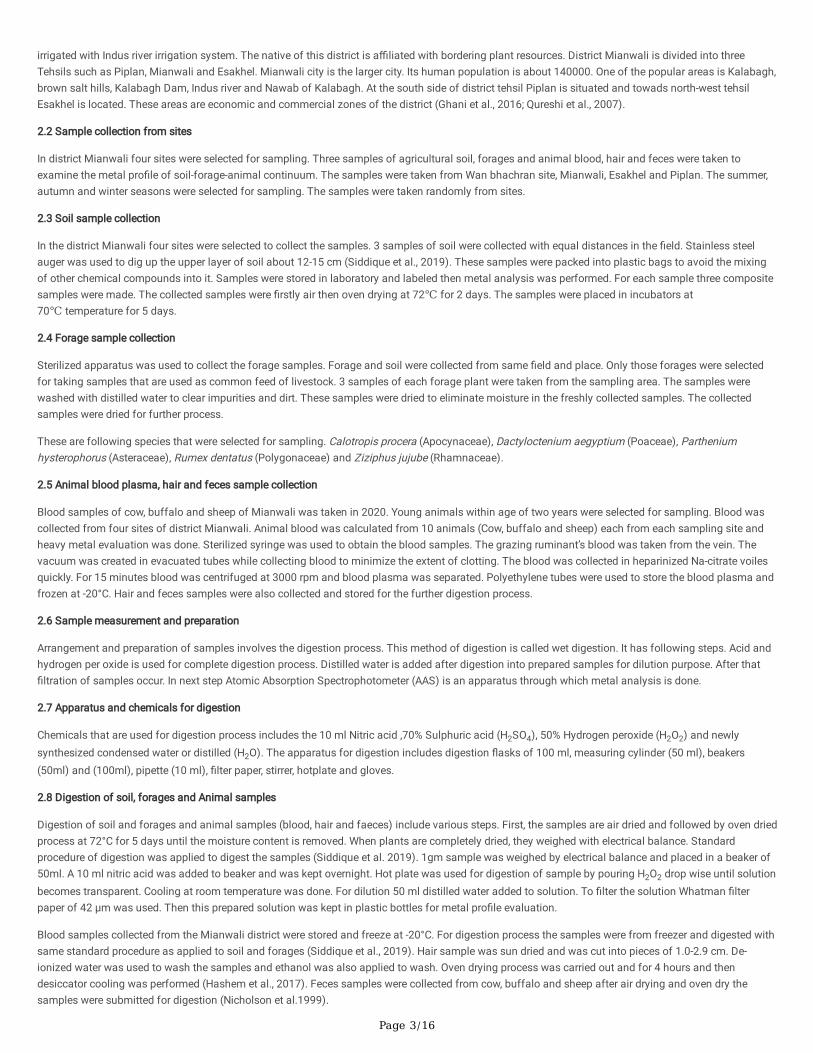
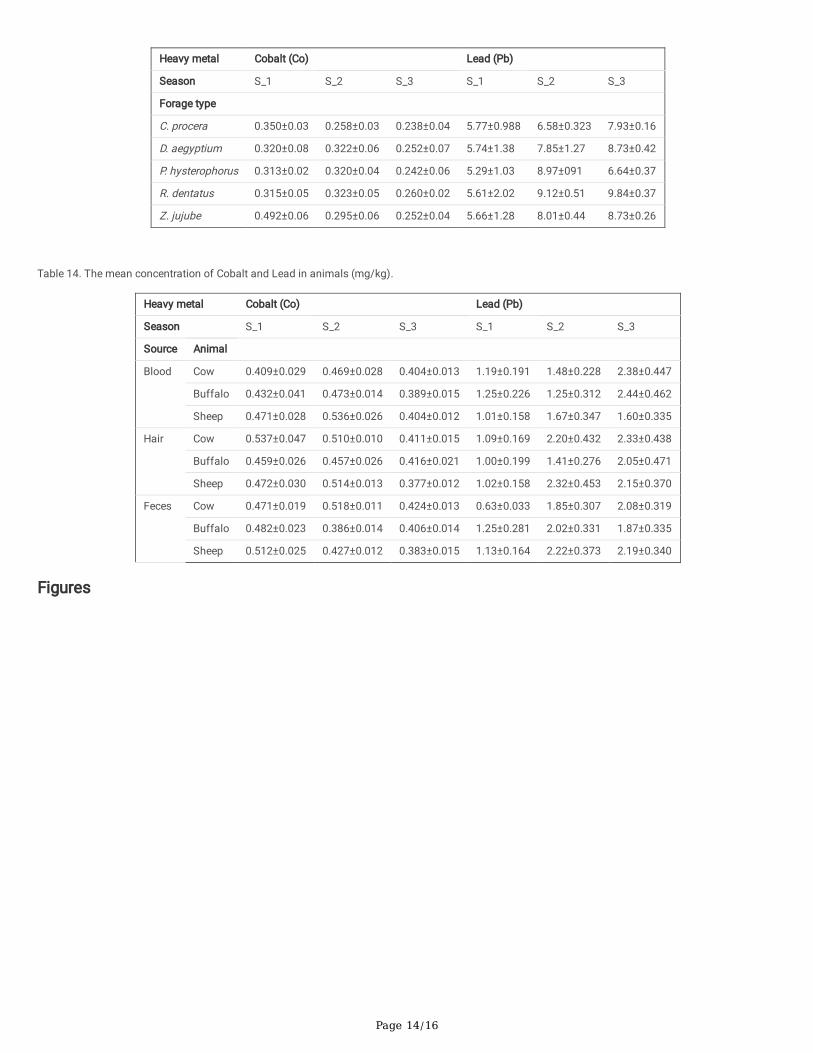
The blood had the values Co ranging from lower amount to higher amount (0.389-0.536 mg/l). The higher concentrations were observed in sheep duringseason S_2 and lower concentration during S3 in buffalo. The presence of Co blood was noticed similar with the 0.5 mg/l as compared to the values givenby Schweinzer et al. (2017). The hair had Co concentration ranging from (0.377- 0.537 mg/kg) the maximum concentration of Co was present cow of S_1while the minimum concentration of Co was noticed in sheep of S_3 (Table 6 and Table 14). The Co value in feces ranged the minimum to maximum(0.383-0.518 mg/kg) the higher amount of Co was found in cow during S_2 and lower value was noticed in sheep during S3 (Fig 1).
Bio-concentration Factor (BCF) of Cobalt
The Bio-concentration factor of Co was ranged from 0.447 to 1.106 mg/kg. The lowest concentration was noticed in C. procera in S3. The maximumamount for BCF was noticed in Z. jujube in S1 (Table 7).
Pollution Load Index (PLI) of Cobalt
The pollution load index (PLI) was found within the range between 0.072 mg/kg -0.102 mg/kg. The low concentration was observed in C. procera duringS1 (Table 8).
Enrichment Factor (EF) of Cobalt
The enrichment factor for Co metal was noticed in range between 0.081 mg/kg -0.172 mg/kg. The minimum concentration was noticed in C.procera during S3. The maximum amount was found C. procera during S1 (Table 9).
Daily intake of metal (DIM) of Cobalt
The daily intake of metal (DIM) for Co ranged from 0.00035-0.00095 mg/kg. The lower level was found in sheep during S3 while the higher concentrationwas noticed in buffalo in S1 (Table 10).
Health Risk Index (HRI) of Cobalt
The health risk index for Co ranged from 0.008 mg/kg-0.022 mg/kg. The minimum values were noticed in P. hysterophorus during S3 while the higheramount was found in Z. jujube in S1 (Table 11).
Concentration of Lead in Soil
The Pb concentration in soil samples had different amounts in each sample of soil. The amount of Pb varied in the range from minimum 6.60 mg/kg tomaximum 10.89 mg/kg (Table 12 and 4). The maximum concentration of soil was exhibited by soil of forage R. dentatus during S3 and minimumconcentrations was observed in soil of forage R. dentatus during S1(Fig 2). The permissible limit of Pb in UNEP (2013) is 200 mg/kg the evaluated value ofPb in soil samples is lower than the permissible values.
Concentration of Lead in forage

Page 6/16
The analysis of variance for Pb showed the signi�cant effect in season. It showed the non-signi�cant effect in soil and Season × soil (Table 5). Theamount of Pb in different samples was different in each forage samples. The minimum amount of Pb was noticed 5.29 mg/kg in P. hysterophorus duringS1 (Table 13). The maximum value of Pb was present in 9.84 mg/kg in R. dentatus during S3 (Fig 3). The Pb concentration was found within thepermissible limits of 10 mg/kg as given by (WHO, 1995).
Concentration of Lead in animals
The analysis of variance for Pb showed the signi�cant effect in Season. The non-signi�cant effect was shown by Animal, Source, Season × Animal,Season × Source, Animal × Source and Season × Animal × Source (Table 6). The Pb concentration in blood ranged from minimum to maximum (1.01-2.44mg/l). The minimum value was noticed in sheep during S1and maximum value was noticed in buffalo during S3 (Table 14). This current investigation forPb in blood was greater as compared to 0.2 mg/l by Puls (1988). The hair had Pb value ranged from lower to higher (1.00-2.33 mg/kg). The maximumvalue of Pb in hair was noticed in cow during S3 and minimum value was found in buffalo in S1 (Fig 1). The Pb in animal feces varied in the range fromminimum to maximum (0.63-2.22 mg/kg). The minimum value was observed in cow during S1 and maximum value was noticed in sheep of S2.
Bio-concentration Factor (BCF) of Lead
The bio-concentration for Pb was ranged from 0.717-1.152 mg/kg. The minimum amount was found in P. hysterophorus during S1 while the maximumamount was depicted by D. aegyptium in S3 (Table 7).
Pollution Load Index (PLI) of Lead
The Pb pollution load index was found similar within the range from 0.809-1.048 mg/kg. The minimum amount was exhibited by the R. dentatus in the S1while the maximum value was depicted by C. procera during S3 (Table 8).
Enrichment Factor (EF) of Lead
The enrichment factor Pb was noticed within the ranged from 1.95- 3.129 mg/kg. The lowest value was noticed in S1 while the highest value was found inS3 (Table 9).
Daily intake metal (DIM) of Lead
The daily intake metal (DIM) was ranged in Pb from 0.0190-0.0078 mg/kg. The minimum value was observed in S1 and was noticed in sheep while themaximum concentration was found in buffalo during S3 (Table 10).
Health Risk Index (HRI) of Lead
The health risk index for Pb varied within range from 1.95-4.75 mg/kg. The minimum concentration was noticed from sheep during S1 while the highestlevel was found in the buffalo in S3 (Table 11).
DiscussionPresent Co concentration in soil was recorded lower than permissible limits 10 mg/kg given by WHO (2000). This current study for Co in soil was inaccordance with the investigations given by Tahir et al., (2017). Our result for soil Co concentration was below as compared to the �ndings of Uren(2013). Nature of soil properties are responsible for occurrence of Co in soil moreover there are other factors that are too responsible for cobalt in soil suchas interface of soil-forage root, mechanism of property and pedo-geochemical effects (Lange et al., 2014). The Pb in soil samples was observed lower thanthat of the values given by Angelova et al. (2010). Pb amount in present �ndings was greater as compared to the values given by Nica et al. (2012). Thecurrent investigation for Pb in soil was lower as compared to narrated concentrations by Boussen et al. (2013). Our present work Pb level in soil wascalculated higher than those given by Salazar et al. (2012). Pb in soil is accumulated due to presence of oxides and hydroxides of elements, mineralsoccurring in clay and organic matter dissolved in soil. Change in pH promotes lead precipitation in soil in form of carbonates, phosphates and hydroxidesetc. When Pb2+ ion form compounds with humic compounds these are less available to forage (Wuana and Okieimen, 2011). Chelating agents are alsoinvolved in increasing or decreasing Pb availability in soil and transfer into forage plants (Butcher, 2009).
These results for Co in forages were observed below than the investigation given by Tahir et al., (2017). Our investigation for Co in forages was noticedgreater than values given by Comino et al. (2011). The Co concentration forages was similar with the observations given by Liu et al. (2020). There aremany interspeci�c and interspeci�c factors in cadmium uptake by forages. Sometime surface of plant is also contaminated with metal rich soil so there ischance to transfer metal in samples so precautious measures should be taken. Some phenotypic variations are also responsible for different concentrationof forage plants (Faucon et al., 2007; Van der Ent et al., 2013). The amount of Pb in forages was found similar with the concentration of Pb given byAngelova et al. (2010). In this present work the Pb level in forage was in high range than the values given by Popovic et al. (2010). This value for Pb inforages was found lower as compared to the investigations by Salazar et al. (2012). In this study the present work was found lower than the Pb levelestimated in forges by Cui et al. (2018). Pb is accumulated in forges near endodermis, it enters in forages through root via apoplast pathway and crossescortex in radial manner. Pb is translocated from root to shoot in forages and endodermis acts as partial barrier. So, Pb is accumulated in roots in higherconcentrations and less shoot of forages Sharma and Dubey (2005).
Page 7/16
This concentration of Co in blood was found in accordance with the results given by Ismael et al. (2015). The cobalt (Co) level in hair of ruminants wasgreater as compared to observations given by Hejna et al. (2018). This present study for Co-occurrence in sheep feces was lower than recordings ofAbrahams (2013). Our work for Co amount in sheep blood was lower than the investigations by Tarhan et al. (2016). The value of Co in blood of cow wasfound similar with the �ndings by Abdel-Salam et al. (2013). The soil hydrogen ion concentration is responsible for Co transfer from soil-forage-animals.The lesser concentration of hydrogen ion is less effective and greater concentration is more effective in transfer of cobalt from soil to forages and forageto grazing ruminants (Čelechovská et al., 2008). The current study for Pb in livestock blood was found lower than depicted results by Ogundiran et al.(2012). Our Pb amount in cow blood was found greater as compared to the results given by Luna et al. (2019). This result for Pb in animal faeces wasfound lower as compared to the work of Ogundiran et al. (2012). Our �ndings for Pb in animal hair were observed higher as compared to the results givenby Patra et al. (2017). Our �ndings for animal blood were found like the narrated value by Swarup et al. (2007). Human activities produce stress toenvironment and increase lead to the environment. The lead containing fodder is consumed by animal and lead accumulation takes place in the animalbody parts (Abdel-Salam et al., 2013).
Safari et al. (2018) reported the similar results with the BCF of Co in current study. In these current �ndings our values were greater than Lotfy and Mostafa(2014). In our present recordings was observed lower as compared to the Kosiorek and Wyszkowski (2019). The value for Pb bio-concentration wasobserved similar with the values given by Nawab et al. (2015). Our work was found higher than the values given by the Sakizadeh et al. (2016). The present�ndings were found greater than the values narrated by Yang et al. (2014).
Our work for PLI cobalt (Co) was found similar as compared to investigations of Chandrasekaran et al. (2015). The current study was greater than recordedvalues given by Sulaiman et al. (2019). Present �ndings were investigated lower for PLI as compared to values given by Pathak et al. (2015). The PLI of Pbin this study was noticed lower than the values (PLI>2) investigated by Nawab et al. (2015). Our recorded values of PLI lead were found in accordance withobservations by Zhuang et al. (2020). These current study Pb pollution load index was found greater than the narrated values of Barakat et al. (2012).
The current recordings for Co metal for (EF) were lower than the values given by Abbaslou et al. (2014). In present �nding of Co was observed greater ascompared to the values given by Giridhar and Samireddypalle (2015). This �nding for Co enrichment factor was similar with the values given by Jing et al.(2019). The enrichment factor (EF) of Pb was ranged in this trend from higher to lower 1.95-3.129 mg/kg. Barakat et al. (2012) gave the greater values ascompared to our work for Pb enrichment factor. Our present recordings were found greater than the �ndings by Marrugo-Negrete et al. (2017). Enuneku etal. (2017) likely found our calculated Pb enrichment factor.
Our daily metal intake metal for Co was lower than daily intake of metal observed by Ismail et al. (2015). These current investigations for Co (DIM) weresimilar with results given by Iwegbue (2010). In current study HRI for Co was in accordance with the concentrations recorded by Simonsen et al.(2012). Present �ndings for health risk index (Co) were similar with recorded values by Khan et al. (2019). Our work for (DIM) Pb was lower as compared tothe values recorded by Smith et al. (2010). The similar value of Pb daily metal intake was found in accordance with the observations by Nadeem et al.(2020). This present work for Pb health risk index was recorded greater than HRI calculated by Nadeem et al. (2020). In this �nding the health risk index(HRI) Pb was observed higher than the values by Ugulu et al. (2020).
ConclusionIt was concluded that seasonal changes gave different �uctuating concentrations of metals and sites also gave �uctuating metal readings in soil-forage-animal continuum. In soil and forage samples collected from semi-arid environment Co and Pb was found toxic according to FAO/WHO. In animal samplesPb showed toxicity while the Co was found safe according to NRC standards. Bio-concentration factor and pollution load index for Co and Pb was noticedgreater than 1. Enrichment factor was also in safe limits for all metals. Daily intake metal and health risk index was found less than 1.
DeclarationsAuthor contribution
Fu Chen, Zafar Iqbal Khan and Kafeel Ahmad supervised the study. Laraib Saqlain, collected samples, Muhammad Arslan Ashraf and Laraib Saqlain wrote�rst draft. Laraib Saqlain conducted experiment. Muhammad Arslan Ashraf participated in statistical data analysis. All authors equally contributed todiscussion.
Acknowledgements
This work was supported by the National Natural Science Foundation of China (No.51974313) and the key project of Jiangsu Key Laboratory of Coal-based Greenhouse Gas Control and Utilization (2020ZDZZ03).
Ethics declarations
Con�ict of interest: The authors declare that they have no con�ict of interest.
Ethical approval: The authors declare that the manuscript has not been published previously.
Consent to participate: All authors voluntarily to participate in this research study.

Page 8/16
Consent to publish: All authors consent to the publication of the manuscript.
Availability of data and materials: All data generated or analyzed during this study are
included in this published article.
Ethical Approval
Institutional Human Ethics Committee of University of Sargodha (Approval No.25-A18 IEC UOS) has allowed all the protocols used in this experiment. tothe commencement of the study. The authors declare 270 that manuscript has not been published previously.
Funding:
Not applicable
References1. Abbaslou, H., Martin, F., Abtahi, A., Moore, F., 2014. Trace element concentrations and background values in the arid soils of Hormozgan Province of
southern Iran. Archives of Agronomy and Soil Science 60, 1125-1143.
2. Abdel-Salam, N.M., Ahmed, S., Basir, A., Rais, A.K., Bibi, A., Ullah, R., Anwar, A.S., Zia, M., Hussain, I., 2013. Distribution of heavy metals in the liver,kidney, heart, pancreas and meat of cow, buffalo, goat, sheep and chicken from Kohat market Pakistan. Life Sci J 10, 937-40.
3. Abrahams, P.W., 2013.Geophagy and the involuntary ingestion of soil. In Essentials of medical geology.Springer, Dordrecht 433-454.
4. Angelova, V.R., Ivanova, R.V., Todorov, J.M., Ivanov, K.I., 2010. Lead, cadmium, zinc, and copper bioavailability in the soil-plant-animal system in apolluted area. The Scienti�c World JOURNAL 10.
5. Ashraf, S., Alia, Q., Zahir, Z.A., Ashraf, S., Asghar, H.N., 2019. Phytoremediation: Environmentally sustainable way for reclamation of heavy metalpolluted soils. Ecotoxicology and environmental safety 174, 714-727.
�. Barakat, A., El-Baghdadi, M., Rais, J., Nadem, S., 2012. Assessment of heavy metal in surface sediments of Day River at Beni-Mellal region,Morocco. Research Journal of Environmental and Earth Sciences 4, 797-806.
7. Bibi, Z., Khan, Z.I., Ahmad, K., Ashraf, M., Hussain, A., Nudrat, A.A., 2014. Vegetables as a potential source of metals and metalloids for humannutrition: a case study of Momordica charantia grown in soil irrigated with domestic sewage water in Sargodha, Pakistan. Pakistan Journal ofZoology 46.
�. Boussen, S., Soubrand, M., Bril, H., Ouerfelli, K., Abdeljaouad, S., 2013. Transfer of lead, zinc and cadmium from mine tailings to wheat (Triticumaestivum) in carbonated Mediterranean (Northern Tunisia) soils. Geoderma 192, 227-236.
9. Buat-Menard, P., Chesselet, R., 1979. Variable in�uence of atmospheric �ux on the trace metal chemistry of oceanic suspended matter. Earth and Plan.Sci. Lett. 42, 398-411
10. Butcher, D.J. 2009. Phytoremediation of lead in soil: recent applications and prospects. Appl. Spectrosc. Rev. 44, 123-139.
11. Čelechovská, O., Malota, L., Zima, S., 2008. Entry of heavy metals into food chains: a 20-year comparison study in northern Moravia (CzechRepublic). Acta Veterinaria Brno 77, 645-652.
12. Chandrasekaran, A., Ravisankar, R., Harikrishnan, N., Satapathy, K.K., Prasad, M.V.R., Kanagasabapathy, K.V., 2015. Multivariate statistical analysis ofheavy metal concentration in soils of Yelagiri Hills, Tamilnadu, India–Spectroscopical approach. Spectrochimica Acta Part A: Molecular andBiomolecular Spectroscopy 137, 589-600.
13. Chiroma, T.M., Ebewele, R.O., Hymore, F.K., 2014. Comparative assessment of heavy metal levels in soil, vegetables and urban grey wastewater usedfor irrigation in Yola and Kano. International refereed journal of engineering and science 3, 01-09.
14. Comino, E., Menegatti, S., Fiorucci, A., Schwitzguebel, J.P. 2011. Accumulation and translocation capacity of As, Co, Cr and Pb by forageplants. Agrochimica 55, 105-115.
15. Cui, T., Fang, L., Wang, M., Jiang, M., Shen, G., 2018. Intercropping of gramineous pasture ryegrass (Lolium perenne L.) and leguminous forage alfalfa(Medicago sativa L.) increases the resistance of plants to heavy metals. Journal of Chemistry.
1�. Dogan, Y., Baslar, S., Ugulu, I., 2014b. A study on detecting heavy metal accumulation through biomonitoring: content of trace elements in plants atMount Kazdagi in Turkey. Appl Ecol Environ Res 12, 627-636.
17. Dogan, Y., Unver, M.C., Ugulu, I., Calis, M., Durkan, N., 2014a. Heavy metal accumulation in the bark and leaves of Juglans regia planted in Artvin City,Turkey. Biotechnology & Biotechnological Equipment 28, 643-649.
1�. Enuneku, A., Biose, E., Ezemonye, L., 2017. Levels, distribution, characterization and ecological risk assessment of heavy metals in roadside soils andearthworms from urban high tra�c areas in Benin metropolis, Southern Nigeria. Journal of environmental chemical engineering 5, 2773-2781.
19. FAO/WHO .2001. Codex Alimentarius Commission. Food additive and contaminants. Joint FAO/WHO Food Standards Programme ALINORM 01/12A1-289.
20. Faucon, M.P., Shutcha, M., Meerts, P., 2007. Revisiting copper and cobalt concentrations in supposed hyperaccumulators from SC Africa: in�uence ofwashing and metal concentrations in soil. Plant Soil 301, 29–36.
Page 9/16
21. Ghani, A., Nadeem, M., Ahmed, M.M., Hussain, M., Ikram, M., Imran, M., 2016. Spatial variations in nutritional and elemental pro�le of Mako (Solanumnigrum) collected from different tehsils of district Mianwali, Punjab, Pakistan. Sci. Int 5251-5255.
22. Giridhar, K., Samireddypalle, A., 2015. Impact of climate change on forage availability for livestock. In Climate change Impact on livestock: adaptationand mitigation. Springer, New Delhi 97-112.
23. Hadia-e-Fatima, A.A., 2018. Heavy metal pollution–A mini review. J Bacteriol Mycol Open Access 6, 179-181.
24. Hashem, M.A., Nur-A-Tomal, M.S., Mondal, N.R., Rahman, M.A. 2017. Hair burning and liming in tanneries is a source of pollution by arsenic, lead, zinc,manganese and iron. Environmental Chemistry Letters 15, 501-506.
25. Hejna, M., Gottardo, D., Baldi, A., Dell’Orto, V., Cheli, F., Zaninelli, M., Rossi, L., 2018. Nutritional ecology of heavy metals. Animal 12, 2156-2170.
2�. Ismael, M., El-Sayed, M.S., Metwally, A.M., Abdullaziz, I.A., 2015. Trace Elements Status and Antioxidants Pro�le in Ill-thrift Buffalo Calves. AlexandriaJournal for Veterinary Sciences 44.
27. Iwegbue, C.M., 2010. Composition and daily intakes of some trace metals from canned beers in Nigeria. Journal of the Institute of Brewing 116, 312-315.
2�. Jan, F.A., Ishaq, M., Khan, S., Ihsanullah, I., Ahmad, I., Shakirullah, M., 2010. A comparative study of human health risks via consumption of food cropsgrown on wastewater irrigated soil (Peshawar) and relatively clean water irrigated soil (lower Dir). Journal of hazardous materials 179, 612-621.
29. Jing, S., Jinyi, W., Xi, L., Jinhua, Q., Suyuan, D., Na, Y., 2019. Effects of Selenium and Cobalt on Germination of Alfalfa (Medicago sativa) at DifferentTemperatures. Animal Husbandry and Feed Science 11, 115-124.
30. Johnsen, I.V., Aaneby, J., 2019. Soil intake in ruminants grazing on heavy-metal contaminated shooting ranges. Science of the total environment 687,41-49.
31. Kalaivanan, D., Ganeshamurthy, A.N., 2016. Mechanisms of heavy metal toxicity in plants. In Abiotic stress physiology of horticultural crops. Springer,New Delhi. 85-102.
32. Khan, Z.I., Ugulu, I., Umar, S., Ahmad, K., Mehmood, N., Ashfaq, A., Bashir, H., Sohail, M., 2018. Potential toxic metal accumulation in soil, forage andblood plasma of buffaloes sampled from Jhang, Pakistan. Bulletin of environmental contamination and toxicology 101, 235-242.
33. Kosiorek, M., Wyszkowski, M., 2019. Remediation of cobalt-polluted soil after application of selected substances and using oat (Avena sativaL.). Environmental Science and Pollution Research 26, 16762-16780.
34. Lange, B., Faucon, M.P., Meerts, P., Shutcha, M., Mahy, G., Pourret, O., 2014. Prediction of the edaphic factors in�uence upon the copper and cobaltaccumulation in two metallophytes using copper and cobalt speciation in soils. Plant and soil 379, 275-287.
35. Liu, W., Ahmad, K., Khan, Z.I., Mughal, N., Wajid, K., Munir, M., Malik, I.S., Bashir, H., Mehmood, N., Muqadas, H., Noorka, I.R., 2020. Comparative study offorage toxic metals of conventional versus non-conventional pastures in relation to animal mineral nutrient allowance. Environmental Science andPollution Research 27, 36579-36586.
3�. Liu, W.H., Zhao, J.Z., Ouyang, Z.Y., Soderlund, L., Liu, G.H., 2005. Impacts of sewage irrigation on heavy metals distribution and contamination inBeijing, China. Environ. Int. 31, 805-812.
37. Lotfy, S.M., Mostafa, A.Z., 2014. Phytoremediation of contaminated soil with cobalt and chromium. Journal of Geochemical Exploration 144, 367-373.
3�. Luna, D., López-Alonso, M., Cedeño, Y., Rigueira, L., Pereira, V., Miranda, M., 2019. Determination of Essential and Toxic Elements in Cattle Blood: Serumvs Plasma. Animals 9,465.
39. Marrugo-Negrete, J., Pinedo-Hernández, J., Díez, S., 2017. Assessment of heavy metal pollution, spatial distribution and origin in agricultural soilsalong the Sinú River Basin, Colombia. Environmental research 154, 380-388.
40. Nadeem, M., Khan, Z.I., Ghazal, M., Akhter, M., Akhter, P., Ahmad, K., Bashir, H., Noorka, I.R., Batool, A.I., Rehman, S., Ainee, A., Khan, I., 2020. Assessmentof Zn and Pb in buffaloes fed on forages irrigated with wastewater in Sahiwal, Sargodha, Pakistan. Pure and Applied Biology (PAB) 9, 728-742.
41. Nadeem, M., Qureshi, T.M., Ugulu, I., Riaz, M.N., An, Q.U., Khan, Z.I., Ashfaq, A., Bashir, H., Dogan, Y., 2019. Mineral, vitamin and phenolic contents andsugar pro�les of some prominent date palm (Phoenix dactylifera) varieties of Pakistan. Pak J Bot 51, 171-178.
42. Nawab, J., Khan, S., Shah, M.T., Qamar, Z., Din, I., Mahmood, Q., slamud, D., Mahmood, Q., Gul, N., Huang, Q., 2015. Contamination of soil, medicinal,and fodder plants with lead and cadmium present in mine-affected areas, Northern Pakistan. Environmental monitoring and assessment 187- 605.
43. Nica, D.V., Bura, M., Gergen, I., Harmanescu, M., Bordean, D.M., 2012. Bioaccumulative and conchological assessment of heavy metal transfer in a soil-plant-snail food chain. Chemistry Central Journal 6, 55.
44. Nicholson, F.A., Chambers, B.J., Williams, J.R., Unwin, R.J., 1999. Heavy metal contents of livestock feeds and animal manures in England andWales. Bioresource Technology 70, 23-31.
45. Ogundiran, M.B., Ogundele, D.T., Afolayan, P.G., Osibanjo, O., 2012. Heavy metals levels in forage grasses, leachate and lactating cows reared aroundlead slag dumpsites in Nigeria. International Journal of Environmental Research 6, 695-702.
4�. Pathak, A.K., Kumar, R., Kumar, P., Yadav, S., 2015. Sources apportionment and spatio-temporal changes in metal pollution in surface and sub-surfacesoils of a mixed type of industrial area in India. Journal of Geochemical Exploration 159, 169-177.
47. Patra, R.C., Swarup, D., Naresh, R., Kumar, P., Nandi, D., Shekhar, P., Roy, S., Ali, S.L., 2007. Tail hair as an indicator of environmental exposure of cows tolead and cadmium in different industrial areas. Ecotoxicology and Environmental Safety 66, 127-131.
4�. Popovic, D., Bozic, T., Stevanovic, J., Frontasyeva, M., Todorovic, D., Ajtic, J., Jokic, V.S., 2010. Concentration of trace elements in blood and feed ofhomebred animals in Southern Serbia. Environmental Science and Pollution Research 17, 1119-1128.

Page 10/16
49. Prieto, M.J., Acevedo, S.O.A., Prieto, G.F., Nallely, T.G., 2018. Phytoremediation of soils contaminated with heavy metals. Biodiversity Int J 2, 362-376.
50. Puls, R., 1988. Mineral levels in animal health diagnostic data. Published by Sherpa International, Clear brook, British Columbia, Canada. 17-152
51. Qureshi, R.A., Gilani, S.A., Ghufran, M.A., 2007. Ethnobotanical studies of plants of Mianwali district Punjab, Pakistan. Pak. J. Bot 39, 2285-2290.
52. Reuter, M.A., Hudson, C., Van Schaik, A., Heiskanen, K., Meskers, C., Hagelüken, C., 2013. UNEP, Environmental risk and challenges and anthropogenicmetals �ow and cycles: A Report of the Working Group on the Global Metal Flows to the International Resource Panel. 231.
53. Safari, M., Ramavandi, B., Sanati, A.M., Sorial, G.A., Hashemi, S., Tahmasebi, S., 2018. Potential of tree leaf/bark to control atmospheric metals in a gasand petrochemical zone. Journal of environmental management 222, 12-20.
54. Sajjad, K., Farooq, R., Shahbaz, S., Khan, M.A., Sadique, M., 2009. Health risk assessment of heavy metals for population via consumption ofvegetables. World Applied Science Journal 6, 1602-1606.
55. Sakizadeh, M., Mirzaei, R., Ghorbani, H., 2016. Accumulation and soil-to-plant transfer factor of lead and manganese in some plant species in Semnanprovince, central Iran. Iranian Journal of Toxicology 10, 29-33.
5�. Salazar, M.J., Rodriguez, J.H., Nieto, G.L., Pignata, M.L., 2012. Effects of heavy metal concentrations (Cd, Zn and Pb) in agricultural soils near differentemission sources on quality, accumulation and food safety in soybean [Glycine max (L.) Merrill]. Journal of hazardous materials, 233, 244-253.
57. Schweinzer, V., Iwersen, M., Drillich, M., Wittek, T., Tichy, A., Mueller, A., KrametterFroetscher, R., 2017. Macromineral and trace element supply in sheepand goats in Austria. Veterin. Medici 62, 62-73.
5�. Shad, H.A., Khan, Z.I., Ahmad, K., Rizwan, Y., Tahir, H.M., 2014. Human health hazards caused by heavy metals accumulation in wheat Variety “Sehar-2006” irrigated with domestic sewage water. Biologia (Pakistan) 60, 99-102.
59. Sharma, P., Dubey, R.S., 2005. Lead toxicity in plants. Brazilian journal of plant physiology 17, 35-52.
�0. Siddique, S., Ahmad, K., Khan, Z.I., Wajid, K., Bashir, H., Munir, M., Nadeem, M., Noorka, I.R., Malik, I.S., Ashfaq, A., Ugulu, I., Akhtar, M., Akhtar, P.,Mehmood, N., Muqadas, H., Shehzadi, M., 2019. Sodium status of soil, forages, and small ruminants of Punjab, Pakistan. Pure and Applied Biology(PAB) 8, 1950-1961.
�1. Simonsen, L.O., Harbak, H., Bennekou, P., 2012. Cobalt metabolism and toxicology—a brief update. Science of the Total Environment 432, 210-215.
�2. Singh, A., Sharma, R.K., Agrawal, M., Marshall, F.M., 2010. Health risk assessment of heavy metals via dietary intake of food stuffs from thewastewater irrigated site of a dry tropical area of India. Food and Chemical Toxicology 48, 611-619.
�3. Smith, K.M., Dagleish, M.P., Abrahams, P.W., 2010. The intake of lead and associated metals by sheep grazing mining-contaminated �oodplainpastures in mid-Wales, UK: II. Metal concentrations in blood and wool. Science of the total environment 408, 1035-1042.
�4. Sulaiman, M.B., Salawu, K., Barambu, A.U., 2019. Assessment of Concentrations and Ecological Risk of Heavy Metals at Resident and RemediatedSoils of Uncontrolled Mining Site at Dareta Village, Zamfara, Nigeria. Journal of Applied Sciences and Environmental Management 23, 187-193.
�5. Swarup, D., Naresh, R., Varshney, V.P., Balagangatharathilagar, M., Kumar, P., Nandi, D., Patra, R.C., 2007. Changes in plasma hormones pro�le and liverfunction in cows naturally exposed to lead and cadmium around different industrial areas. Research in veterinary science 82, 16-21.
��. Tahir, M., Iqbal, M., Abbas, M., Tahir, M.A., Nazir, A., Iqbal, D.N., Kanwal, Q., Hassan, F., Younas, U., 2017. Comparative study of heavy metals distributionin soil, forage, blood and milk. Acta Ecologica Sinica 37, 207-212.
�7. Tarhan, D., Ülgen, S., Alkan, F.A., Erdikmen, D.O., Yaramiş, Ç.P., Or, M.E., Barutçu, Ü.B., 2016. Evaluation of tear and serum trace elements (copper,selenium, and cobalt) in sheep. Turkish Journal of Veterinary and Animal Sciences 40, 34-39.
��. Ugulu, I., Ahmad, K., Khan, Z.I., Munir, M., Wajid, K., Bashir, H., 2020. Effects of organic and chemical fertilizers on the growth, heavy metal/metalloidaccumulation, and human health risk of wheat (Triticum aestivum L.). Environmental Science and Pollution Research 1-13.
�9. Unver, M.C., Ugulu, I., Durkan, N., Baslar, S., Dogan, Y., 2015. Heavy metal contents of Malva sylvestris sold as edible greens in the local markets ofIzmir. Ekoloji 24, 13-25.
70. Uren NC .2013. Cobalt and manganese. In Heavy Metals in Soils. Springer, Dordrecht 335-366.
71. USEPA (US Environmental Protection Agency) .2002. Region 9, Preliminary Remediation Goals. O�ce of Research and Development, Washington, DC,USA.
72. USEPA .2013. Integrated Risk Information System (IRIS). United States Environment Protection Agency.
73. Van der Ent, A., Baker, A.J.M., Reeves, R.D., Pollard, A.J., Schat, H., 2013. Hyperaccumulators of metal and metalloid trace elements: facts and �ction.Plant Soil 362, 319–334.
74. World Health Organization .2001. The World Health Report 2001: Mental health: new understanding, new hope.
75. World Health Organization (WHO) .2000. Safety evaluation of certain food additives and contaminants. International Programme on ChemicalSafety.WHO Food Additive Series 52, 1.
7�. World Health Organization .1995. The World Health Report 1995: bridging the gaps. World Health Organization.
77. Wuana, R.A., Okieimen, F.E., 2011. Heavy metals in contaminated soils: a review of sources, chemistry, risks and best available strategies forremediation. Isrn Ecology.
7�. Yang, S., Liang, S., Yi, L., Xu, B., Cao, J., Guo,Y., Zhou, Y., 2014. Heavy metal accumulation and phytostabilization potential of dominant plant speciesgrowing on manganese mine tailings. Frontiers of Environmental Science & Engineering, 8, 394-404.
79. Yang, Y., Khan, Z.I., Ahmad, K., Arshad, N., Rehman, S.U., Ullah, M.F., Wajid, K., Mahpara, S., Bashir, H., Nadeem, N., Ahmad, T., Munir, M., Malik, I.S.,Ashfaq, A., Ugulu, I., Ma, J., Chen, F., Ahmad, T., 2020.Does the chromium element in forages and fodders grown in contaminated pasture lands cause

Page 11/16
toxicity in livestock: assessing the potential risk. Rev Chim 71, 397-405.
�0. Zhuang, Z., Mu, H.Y., Fu, P.N., Wan, Y.N., Yu, Y., Wang, Q., Li, H.F., 2020. Accumulation of potentially toxic elements in agricultural soil and scenarioanalysis of cadmium inputs by fertilization: A case study in Quzhou county. Journal of Environmental Management 269, 110797.
TablesTable 1. Metal reference value in soil
Metals Reference Values (mg/kg) References
Co 5.23 Shad et al. (2014)
Pb 8.15 Singh et al. (2010)
Table 2. Reference value of metals and metalloids in forage
Metals and metalloids Reference values
Standard forages (mg/kg)
Reference values Standard Soil
Co 50 c 5.23 a
Pb 3 c 8.15 b
Source: a Shad et al. (2014), b Singh et al. (2010), c FAO/WHO (2001)
Table 3. Oral reference dose (mg/kg) for metals
Metals RfD (mg/kg/day)
Co 0.043 b
Pb 0.004 b
Source b= USEPA (2010)
Table 4. Analysis of variance for Cobalt and Lead in soil forages with respect to seasons.
Cobalt (Co) Lead (Pb)
Source Df Mean Square Mean Square
Season 2 0.003ns 15.432**
Soil 4 0.002 ns 1.99 ns
Season × soil 8 0.006 ns 1.916 ns
** = Signi�cant and ns = non signi�cant
Table 5. Analysis of variance for Cobalt and Lead in forages (mg/kg)
Cobalt (Co) Lead (Pb)
Source df Mean Square Mean Square
Season 2 0.045** 34.702***
Soil 4 0.006 ns 2.747 ns
Season x soil 8 0.007 ns 2.357 ns
*** = Signi�cant, ** = Signi�cant and ns = non- signi�cant
Table 6. Analysis of variance for Cobalt and Lead in animal

Page 12/16
Cobalt (Co) Lead (Pb)
Source Df Mean Square Mean Square
Season 2 0.159*** 26.844***
Animal 2 0.009 ns 0.522 ns
Source 2 0.02* 0.197 ns
Season × Animal 4 0.021** 1.331 ns
Season × Source 4 0.012ns 1.324 ns
Animal × Source 4 0.014* 1.282 ns
Season × Animal × Source 8 0.01ns 0.44 ns
*,** and *** = Signi�cant and ns = non- signi�cant
Table 7. Results for BCF of Cobalt and Lead
BCF Heavy metals
Cobalt (Co) Lead (Pb)
Season S_1 S_2 S_3 S_1 S_2 S_3
C. procera 0.946 0.583 0.447 0.748 0.773 0.929
D. aegyptium 0.703 0.617 0.567 0.854 0.928 1.152
P. hysterophorus 0.716 0.727 0.557 0.717 1.067 0.780
R. dentatus 0.705 0.746 0.588 0.850 0.989 0.904
Z. jujube 1.106 0.691 0.600 0.833 0.862 1.025
Table 8. Results for pollution load index (PLI) of Cobalt and Lead
Heavy metal Cobalt (Co) Lead (Pb)
Season S_1 S_2 S_3 S_1 S_2 S_3
C. procera 0.071 0.085 0.102 0.946 1.044 1.048
D. aegyptium 0.087 0.099 0.085 0.825 1.038 0.930
P. hysterophorus 0.084 0.084 0.083 0.904 1.032 1.044
R. dentate 0.085 0.083 0.085 0.809 1.131 1.336
Z. jujube 0.085 0.082 0.080 0.833 1.139 1.045
Table 9. Results for (EF) of Cobalt and Lead
Heavy metal Cobalt (Co) Lead (Pb)
Season S_1 S_2 S_3 S_1 S_2 S_3
C. procera 0.172 0.106 0.081 2.033 2.101 2.523
D. aegyptium 0.128 0.112 0.103 2.320 2.521 3.129
P. hysterophorus 0.130 0.132 0.101 1.95 2.89 2.12
R. dentatus 0.128 0.136 0.107 2.31 2.69 2.45
Z. jujube 0.201 0.126 0.109 2.26 2.34 2.78

Page 13/16
Table 10. Daily intake metal (DIM) of Cobalt and Lead
DIM Heavy metals
Cobalt (Co) Lead (Pb)
animals Forage C.procera
D.aegyptium
P.hysterophorus
R.dentatus
Z.jujube
C.procera
D.aegyptium
P.hysterophorus
R.dentatus
Z.jujube
Cow S_1 0.00059 0.00054 0.00053 0.00054 0.00084 0.0098 0.0097 0.0089 0.0095 0.0096
S_2 0.00044 0.00054 0.00054 0.00055 0.0005 0.0112 0.0133 0.0152 0.0155 0.0136
S_3 0.00041 0.00043 0.00041 0.00044 0.00043 0.0135 0.0148 0.0113 0.0167 0.0148
Buffalo S_1 0.00067 0.00062 0.00061 0.00061 0.00095 0.0111 0.0111 0.0102 0.0108 0.0109
S_2 0.00049 0.00062 0.00061 0.00063 0.00057 0.0127 0.0152 0.0173 0.0176 0.0155
S_3 0.00046 0.00048 0.00046 0.0005 0.00048 0.0153 0.0169 0.0128 0.019 0.0169
Goat S_1 0.00052 0.00047 0.00046 0.00046 0.00073 0.0085 0.0085 0.0078 0.0083 0.0083
S_2 0.00038 0.00047 0.00047 0.00048 0.00044 0.0097 0.0116 0.0132 0.0134 0.0118
S_3 0.00035 0.00037 0.00036 0.00038 0.00037 0.0117 0.0129 0.0098 0.0145 0.0129
Table 11. Results for (HRI) of Cobalt and Lead
HRI Heavy metals
Cobalt (Co) Lead (Pb)
animals Forage C.procera
D.aegyptium
P.hysterophorus
R.dentatus
Z.jujube
C.procera
D.aegyptium
P.hysterophorus
R.dentatus
Z.jujube
Cow S_1 0.013 0.013 0.012 0.012 0.019 2.45 2.44 2.25 2.38 2.41
S_2 0.01 0.013 0.013 0.013 0.012 2.8 3.34 3.81 3.88 3.4
S_3 0.009 0.009 0.009 0.01 0.01 3.37 3.71 2.82 4.18 3.71
Buffalo S_1 0.016 0.014 0.014 0.014 0.022 2.79 2.77 2.55 2.71 2.73
S_2 0.012 0.014 0.014 0.015 0.013 3.18 3.79 4.33 4.4 3.87
S_3 0.011 0.011 0.011 0.012 0.011 3.83 4.22 3.21 4.75 4.22
Goat S_1 0.012 0.011 0.011 0.01 0.017 2.13 2.11 1.95 2.07 2.08
S_2 0.009 0.011 0.01 0.011 0.01 2.42 2.89 3.3 3.36 2.95
S_3 0.008 0.009 0.008 0.008 0.008 2.92 3.22 2.45 3.62 3.22
Table 12. The mean concentration of Cobalt and Lead (mg/kg) in soil
Heavy metal Cobalt (Co) Lead (Pb)
Season S_1 S_2 S_3 S_1 S_2 S_3
Soil of forages
Soil of forage C. procera 0.370±0.075 0.442±0.019 0.532±0.110 7.71±0.479 8.51±0.587 8.54±0.649
Soil of forage D. aegyptium 0.455±0.003 0.520±0.061 0.443±0.015 6.72±0.782 8.46±0.440 7.58±0.321
Soil of forage P. hysterophorus 0.437±0.009 0.440±0.056 0.433±0.009 7.37±1.29 8.41±1.22 8.51±0.673
Soil of forage R. dentatus 0.447±0.014 0.433±0.007 0.442±0.007 6.60±1.22 9.22±1.006 10.89±0.227
Soil of forage Z. jujube 0.445±0.009 0.427±0.014 0.420±0.013 6.79±1.08 9.29±0.642 8.52±0.371
Table 13. The mean concentration of cobalt and Lead in forages (mg/kg).
Page 14/16
Heavy metal Cobalt (Co) Lead (Pb)
Season S_1 S_2 S_3 S_1 S_2 S_3
Forage type
C. procera 0.350±0.03 0.258±0.03 0.238±0.04 5.77±0.988 6.58±0.323 7.93±0.16
D. aegyptium 0.320±0.08 0.322±0.06 0.252±0.07 5.74±1.38 7.85±1.27 8.73±0.42
P. hysterophorus 0.313±0.02 0.320±0.04 0.242±0.06 5.29±1.03 8.97±091 6.64±0.37
R. dentatus 0.315±0.05 0.323±0.05 0.260±0.02 5.61±2.02 9.12±0.51 9.84±0.37
Z. jujube 0.492±0.06 0.295±0.06 0.252±0.04 5.66±1.28 8.01±0.44 8.73±0.26
Table 14. The mean concentration of Cobalt and Lead in animals (mg/kg).
Heavy metal Cobalt (Co) Lead (Pb)
Season S_1 S_2 S_3 S_1 S_2 S_3
Source Animal
Blood Cow 0.409±0.029 0.469±0.028 0.404±0.013 1.19±0.191 1.48±0.228 2.38±0.447
Buffalo 0.432±0.041 0.473±0.014 0.389±0.015 1.25±0.226 1.25±0.312 2.44±0.462
Sheep 0.471±0.028 0.536±0.026 0.404±0.012 1.01±0.158 1.67±0.347 1.60±0.335
Hair Cow 0.537±0.047 0.510±0.010 0.411±0.015 1.09±0.169 2.20±0.432 2.33±0.438
Buffalo 0.459±0.026 0.457±0.026 0.416±0.021 1.00±0.199 1.41±0.276 2.05±0.471
Sheep 0.472±0.030 0.514±0.013 0.377±0.012 1.02±0.158 2.32±0.453 2.15±0.370
Feces Cow 0.471±0.019 0.518±0.011 0.424±0.013 0.63±0.033 1.85±0.307 2.08±0.319
Buffalo 0.482±0.023 0.386±0.014 0.406±0.014 1.25±0.281 2.02±0.331 1.87±0.335
Sheep 0.512±0.025 0.427±0.012 0.383±0.015 1.13±0.164 2.22±0.373 2.19±0.340
Figures
Page 15/16
Figure 1
Mean heavy metal ions concentration in animals during different seasons

Page 16/16
Figure 2
Mean heavy metal ions concentration in different soils of forage during different seasons
Figure 3
Mean heavy metal ions concentration in different forages during different seasons
Top Related
Copyright © 2022 FDOKUMEN

