

Bahasa
Halaman
Hukum

Retrospective Theses and Dissertations Iowa State University Capstones, Theses andDissertations
1991
Guided instruction with Logo programming andthe development of cognitive monitoring strategiesamong college studentsMi Ok Cho LeeIowa State University
Follow this and additional works at: https://lib.dr.iastate.edu/rtd
Part of the Curriculum and Instruction Commons, and the Educational Psychology Commons
This Dissertation is brought to you for free and open access by the Iowa State University Capstones, Theses and Dissertations at Iowa State UniversityDigital Repository. It has been accepted for inclusion in Retrospective Theses and Dissertations by an authorized administrator of Iowa State UniversityDigital Repository. For more information, please contact [email protected].
Recommended CitationLee, Mi Ok Cho, "Guided instruction with Logo programming and the development of cognitive monitoring strategies among collegestudents " (1991). Retrospective Theses and Dissertations. 9545.https://lib.dr.iastate.edu/rtd/9545
INFORMATION TO USERS
This manuscript has been reproduced from the microfilm master. UMI films the text directly from the original or copy submitted. Thus, some
thesis and dissertation copies are in typewriter face, while others may be from aity type of computer printer.
Hie quality of this reproduction is dependent upon the quality of the copy submitted. Broken or indistinct print, colored or poor quality iUustratioDs and photogn^ibs, print bleed through, substandard margins, and improper alignment can adversely affect reproduction.
In the unlikely event that the author did not send UMI a complete manuscript and there are missing pages, these will be noted. Also, if
unauthorized copyright material had to be removed, a note will indicate the deletion.
Oversize materials (e.g., maps, drawings, charts) are reproduced by
sectioning the original, beginning at the upper left-hand comer and continuing from left to right in equal sections with small overlaps. Each
original is also photographed in one exposure and is included in
reduced form at the back of the book.
Photographs included in the original manuscript have been reproduced xerographically in this copy. Higher quality 6" x 9" black and white photographic prints are available for any photographs or illustrations appearing in this copy for an additional charge. Contact UMI directly to order.
Universily Microfilms international A Bell & Howell Information Company
300 North Zeeb Road. Ann Arbor, Ml 48106-1346 USA 313/761-4700 800 521-0600

Order Number 9126213
Guided instruction with Logo programming and the development of cognitive monitoring strategies among college students
Lee, Mi Ok Cho, Ph.D.
Iowa State University, 1991
U M I 3(X)N.ZccbRd. Ann Aibor, MI 48106

Guided instruction with Logo programming and the development of cognitive monitoring strategies among college students
Mi Ok Cho Lee
A Dissertation Submitted to the Graduate Faculty in Partial Fulfillment of the
Requirements for the Degree of
DOCTOR OF PHILOSOPHY
Department: Curriculum and Instruction
Major: Education (Curriculum and Instructional Technology)
Approved:
ijor Departm(
For the Graduate College
Iowa State University Ames, Iowa
1991
Signature was redacted for privacy.
Signature was redacted for privacy.
Signature was redacted for privacy.
ii
TABLE OF CONTENTS PAGE
INTRODUCTION 1
Theoretical Background 5
Statement of Problem 12
Purpose of the Study 14
Research Questions 14
Hypotheses 15
Significance of the Study 17
Limitations 18
Definition of Terms 18
LITERATURE REVIEW 22
Introduction 22
Background of Logo Programming 22
Research on Logo Programming 28
Reasons for Conflicting Research Results on Logo Programming . . 34
Metacognition and the Computer 40
Metacognition 40
Metacognitive Knowledge 43
Cognitive Monitoring 48
Logo-Based Instruction and Development of Cognitive Monitoring . 56
Model of Logo-Based Cognitive Monitoring Instruction 61
Summary 69
iii
METHODOLOGY 72
Introduction 72
Sample 73
Research Design 77
Instructional Materials 85
Experimental Treatment 88
Test Instruments 95
Analysis of Data 109
RESULTS Ill
Introduction Ill
Analysis of Pre-Experimental Measures 112
Hypothesis One 114
Hypothesis Two 115
Hypothesis Three 117
Hypothesis Four 119
Hypothesis Five 121
Hypothesis Six 123
Hypothesis Seven 125
Results for the Basic Logo Comprehension Test 127
Auxiliary Findings 129
Summary 134
iv
SUMMARY, DISCUSSION, IMPUCATIONS,
AND RECOMMENDATIONS 139
Summary of Research Study 139
Discussion of the Study Results 148
Implications for Guided Instruction with Logo Programming .... 162
Recommendations for Further Research 166
Concluding Remarks 167
BIBUOGRAPHY 169
ACKNOWLEDGMENTS 188
APPENDIX A: SAMPLE BACKGROUND QUESTIONNAIRE 190
APPENDIX B: HOMOGENEITY OF SAMPLE BACKGROUNDS .... 194
APPENDIX C: A MODEL OF LOGO-BASED COGNITIVE MONITORING ACI'IVITIES 198
APPENDIX D: INSTRUCTION OUTLINE FOR LECTURE : EXPERIMENTAL GROUP 200
APPENDIX E INSTRUCTION OUTLINE FOR LECTURE : CONTROL GROUP 216
APPENDIX F: TRANSPARENCIES FOR INTRODUCTION TO COGNITIVE MONITORING 231
APPENDIX G: EXAMPLES OF GENERAL COGNITIVE MONITORING ACnVITY SHEETS : EXPERIMENTAL GROUP 239
APPENDIX H: INSTRUCTION OUTLINE FOR LABORATORY : EXPERIMENTAL GROUP 250
V
APPENDIX I: INSTRUCTION OUTLINE FOR LABORATORY : CONTROL GROUP 262
APPENDIX J: STUDENT ACTIVITY SHEETS FOR LECTURE : EXPERIMENTAL GROUP 274
APPENDIX K: STUDENT ACTIVITY SHEETS FOR LECTURE : CONTROL GROUP 286
APPENDIX L- STUDENT ACTIVITY SHEETS FOR LABORATORY : EXPERIMENTAL GROUP 298
APPENDIX M: STUDENT ACTIVITY SHEETS FOR LABORATORY ; CONTROL GROUP 309
APPENDIX N: TRANSPARENCIES FOR EXAMPLES OF HOMEWORK ASSIGNMENT : EXPERIMENTAL GROUP 320
APPENDIX a TRANSPARENCIES FOR EXAMPLES OF HOMEWORK ASSIGNMENT: CONTROL GROUP 327
APPENDIX P: HOMEWORK ASSIGNMENT CRITERIA SHEETS : EXPERIMENTAL GROUP 333
APPENDIX Q: HOMEWORK ASSIGNMENT CRITERIA SHEETS : CONTROL GROUP 338
APPENDIX R; LOGO DECOMPOSING AND PLANNING TEST .... 343
APPENDIX S: LOGO ERROR IDENTIHCATION TEST 350
APPENDIX T: GENERAL DECOMPOSING TEST 358
APPENDIX U: GENERAL PLANNING TEST 363
APPENDIX V: GENERAL ERROR IDENTIHCATION TEST 368
APPENDIX W: BASIC LOGO COMPREHENSION TEST 373

vi
LIST OF TABLES
PAGE TABLE 1. Reliability coefficient of the Logo decomposing and
planning test 101
TABLE 2. Reliability coefficient of the Logo error identification test . . 102
TABLE 3. Reliability coefficient of the general decomposing test. . . .105
TABLE 4. Reliability coefficient of the general planning test 106
TABLE 5. Reliability coefficient of the general error identification test 108
TABLE 6. Comparisons of covariate variable means for treatment groups 113
TABLE 7. Comparisons of categorized variable fiequendes for treatment groups 113
TABLE 8. Wilks multivariate test of significance 114
TABLE 9. Means and standard deviations for the Logo decomposing test 115
TABLE 10. Analysis of covariance for the Logo decomposing test. . . .116
TABLE 11. Means and standard deviations for the Logo planning test. . 117
TABLE 12 Analysis of covariance for the Logo planning test 118
TABLE 13. Means and standard deviations for the Logo error identification test 119
TABLE 14. Analysis of covariance for the Logo error identification test . 120
TABLE 15. Means and standard deviations for the general decomposing test 121
TABLE 16. Analysis of covariance for the general decomposing test. . . 122
vii
TABLE 17. Means and standard deviations for the general planning test 123
TABLE 18. Analysis of covariance for the general planning test .... 124
TABLE 19. Means and standard deviations for the general error identification test 125
TABLE 20. Analysis of covariance for the general error iden^cation test 126
TABLE 21. Means and standard deviations for the multiple choice of basic Logo comprehension test 128
TABLE 22. Analysis of covariance for the multiple choice basic Logo comprehension test 128
TABLE 23. Stepwise multiple regression effect on the treatments of Logo instructional methodology 130
TABLE 24. Correlation matrix among covariates and dependent variables 136
TABLE 25. Correlation matrix for the seven covariates 137
TABLE 26. Correlation matrix for the six dependent variables 138
TABLE 27. Distribution of students by college major 195
TABLE 28. Distribution of students by gender 195
TABLE 29. Distribution of students by year in college 195
TABLE 30. Distribution of students by number of mathematics courses taken in high school 196
TABLE 31. Distribution of students by number of computer courses taken in either hi^ school or college 196
TABLE 32 Distribution of students by computer ownership 196

viii
TABLE 33. Distribution of students by computer confidence scores . . . 197
TABLE 34. Means and standard deviations for the ACT scores 197
ix
LIST OF HGURES
PAGE
FIGURE 1. Recursive cycle of cognitive monitoring 6
FIGURE 2. Two primary brandies of metacognition 42
FIGURE 3. Sequence of experimental study events 78
FIGURE 4. Instructor rotation and Logo units for lecture sections ... 80
FIGURE 5. Test administration period 84
FIGURE 6. Example of Socratic dialogues to elicit cognitive monitoring. 91
FIGURE 7. An example of Logo decomposing and planning problem . . 99
FIGURE 8. An example of general decomposing problem 103

1
INTRODUCTION
Current society is changing rapidly with an expansion of knowledge,
information, and technology. People are increasingly required to become
independent thinkers and creative problem solvers capable of using
knowledge, information, and technology. These demands are increasing the
need for teaching transferable higher-order thinking skills in schools. The
rapid and constant societal change is encouraging educators to dedicate more
attention to the creation of educational environments which can help
students develop thinking skills (National Commission on Excellence in
Education, 1983; Smith, 1987; Task Force on Teaching as a Profession, 1986).
Although the teaching and learning of higher-order thinking skills and
problem solving skills have been a major issue in education for a long time,
the nature of an information society demands such skills more than ever
before. Heading for a new century, schools must respond to a societal change:
As we enter the twenty-first century, schools should not be training children for a given occupation or skill. They should be preparing children to apply knowledge, to solve problems, to make choices, and to participate in setting priorities (Bactian, Fruchter, Gittell, Greer, & Haskins, 1986, p. 31).
In spite of the increasing demand for teaching and learning higher-order
thinking skills, most young American adults lack higher-order thinking skills
such as the ability to infer, integrate, evaluate, and solve problems which
require critical thinking and monitoring (Kirsch & Jimgeblut, 1986; National
Assessment of Educational Progress, 1983, 1988). Furthermore, many college
2
students have great difficulty managing and evaluating their own learning
efforts (Chipman & Segal, 1985; Schoenfeld, 1985; Simpson, 1984).
In schools, educators are now expected to promote students' higher-order
thinking skills in preparation for their lives in the twenty-first century of a
technology-rich, information society. Such a future-oriented education
should help individuals grow capable of using their knowledge and intuition
in solving unfamiliar problems, and making efficient decisions based on
complex and incomplete information. In reality, however, explicit classroom
instruction for these skills is rare (Beck, 1983; Chipman & Segal, 1985;
MacGinitie, 1984). Thus, in order to meet the increasing demand for critical
thinkers and independent problem solvers, schools need to put more
emphasis on developing specific instructional methods for teaching higher-
order thinking skills and problem solving skills.
Recent theoretical developments in cognitive psychology also support
the need for specific instructional methods that provide opportunities for the
development of higher-order thinking skills (Bransford & Vye, 1989;
Sternberg, 1987). In particular, research on metacognition indicates that
cognitive monitoring which controls and manages cognitive activities plays a
vital role in successful problem solving and efficient thinking behaviors
(Brown, 1983,1987; Cavanaugh & Perlmutter, 1982; Rohwer & Thomas, 1989).
Cognitive monitoring involves learning activities such as breaking a large,
complex problem into simpler problems, organizing information, selecting
useful clues, predicting outcomes, planning a solution, executing the plan,
checking the results, identifying problems, and correcting cognitive errors.
3
These cognitive monitoring activities become an important part of efficient
thinking and problem solving behaviors (Baker, 1982, 1989; Brown, 1978;
Cavanaugh & Perlmutter, 1982; Flavell, 1978; Lawson, 1984).
A growing body of educational literature implies that such cognitive
monitoring strategies can be effectively taught in schools if teachers provide
guided instruction for learning the strategies. Guided instruction involves
explidtiy designed instruction targeting specific strategies and mediated
learning activities which guide students to transfer learned strategies to other
learning domains (e g., Como, 1987; Swan & Black, 1989). The guided
instruction that is explidtiy modeled to facilitate the development of
cognitive monitoring helps students consdously direct an on-going learning
process. Such guided instruction requires a teacher mediated learning
environment that leads students to monitor their thinking process through
Socratic questioning. With a teacher mediated approach to practice cognitive
monitoring, students can improve their learning skills durably and
transferrably (Campione, Brown, & Connell, 1988; Feuerstein, 1980; Lochhead,
1985; Nickerson, Perkins, & Smith, 1985; Palinscar & Brown, 1984; Weinstein
& Mayer, 1986).
This research supports the argument that guided instruction of cognitive
monitoring activities can fadlitate a student's acquisition of cognitive
monitoring skills and help a student transfer those skills to other domains.
Further, it argues that a teacher mediated learning enviroiunent along with
an explidt instructional model to target cognitive monitoring strategies is a
critical factor in motivating a student's learning. Such an environment can
4
stimulate students and also provide them with a potential tool that they can
use to activate their cognitive processes while in a learning environment.
It is claimed that teaching and learning computer programming can
fulfill such a need for a dynamic and challenging learning environment, and
Improve a broad range of problem solving skills. In particular, it has been
suggested that Logo programming can be an excellent means for developing
problem solving strategies (Papert, 1980a; Lawler, 1986; Watt, 1982).
Logo provides an environment where children can learn planning and
problem solving skills and some suggest these skills will generalize to other
areas of learning (Bamberger, 1984; Lawler, 1986; Papert, 1980a). With Logo, in
order to produce a drawing or pattern, children must first plan what they want
to do, and then break the problem down into an ordered sequence of simpler
elements. Then, directions for carrying out the elements must be expressed in
the appropriate computer codes. Next, the learners must put their program
into operation, noting whether the turtle does what they want it to do. If it
does not, they must then start checking the program for mistakes and
correcting them. This process not only teaches children an effective approach
to solving problems, it also makes them see mistakes as further problems to be
overcome (Papert, 1980a). Thus, Logo programming can be viewed as a
potential tool to develop guided instruction in order to improve problem
solving skills.
For this study, guided Logo instruction consisted of three pedagogical
elements used to develop students' cognitive monitoring strategies. First,
Logo programming was used as a tool for learning cognitive monitoring
5
strategies. Second, an explicit instructional model which activates cognitive
monitoring strategies was developed. Third, teacher mediated learning to
practice cognitive monitoring activities in Logo programming and to apply
learned strategies to general problem situations was incorporated into guided
instruction. This empirical research investigated how teacher-guided Logo
instruction with such pedagogical elements affected students' development of
cognitive monitoring strategies.
Theoretical Background
In order to provide a background for the research, this section describes
the theoretical A-amework which demonstrates the relationships between
research variables. Specifically, the concepts of cognitive monitoring, Logo
programming, self-discovery learning, and guided instruction are discussed.
Cognitive monitoring
Cognitive monitoring is a process of regulating or evaluating one's on
going cognitive process while solving problems (Baker & Brown, 1984; Brown,
1978; Flavell, 1976; Forrest-Pressley & Waller, 1984). Components of cognitive
monitoring, in general, are identifying problems, breaking the complex
problem into manageable units, planning an efficient solution, self-testing,
and assessing the outcome. Cognitive monitoring directs how one executes a
thinking task. Thus, cognitive monitoring strategies can be applied for most
subjects and in many different problem situations (Brown, 1978,1987; Deny,
1989).
6
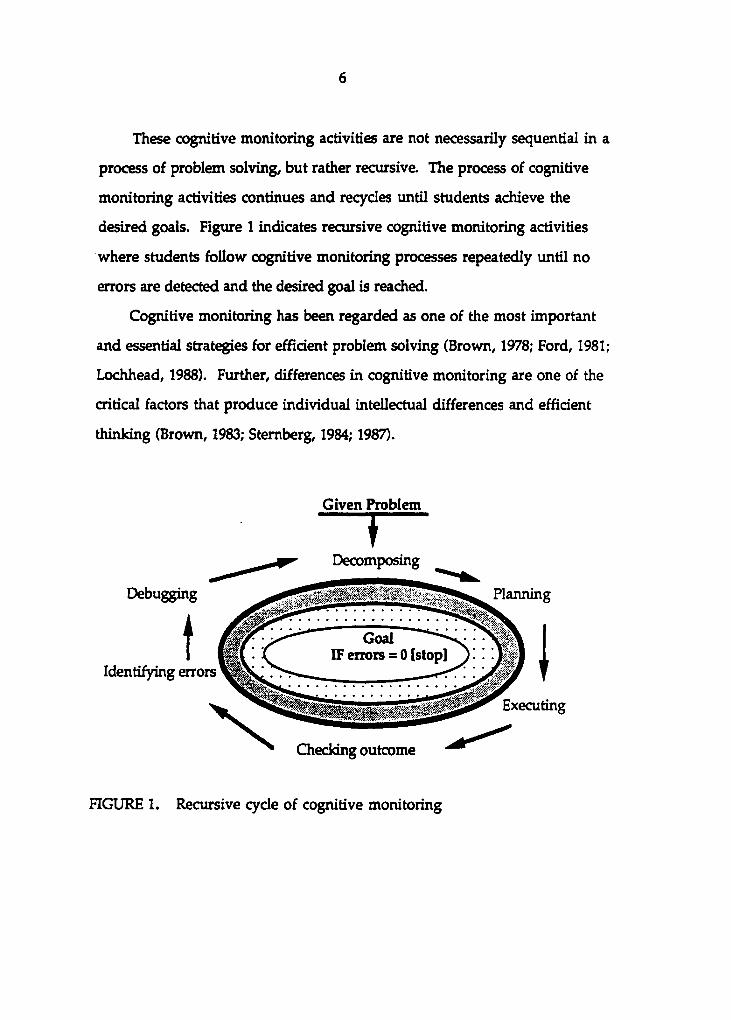
These cognitive monitoring activities are not necessarily sequential in a
process of problem solving, but rather recursive. The process of cognitive
monitoring activities continues and recycles until students achieve the
desired goals. Figure 1 indicates recursive cognitive monitoring activities
where students follow cognitive monitoring processes repeatedly until no
errors are detected and the desired goal is reached.
Cognitive monitoring has been regarded as one of the most important
and essential strategies for efficient problem solving (Brown, 1978; Ford, 1981;
Lochhead, 1988). Further, differences in cognitive monitoring are one of the
critical factors that produce individual intellectual differences and efficient
thinking (Brown, 1983; Sternberg, 1984; 1987).
Given Problem
Planning
Executing
Checking outcome
Decomposing
Debugging
t Identifying errors
FIGURE 1. Recursive cycle of cognitive monitoring
7
There is a considerable difference between the ability of good and poor
problem solvers to utilize cognitive monitoring strategies. Good problem
solvers more often employ cognitive monitoring strategies such as defining a
problem, predicting an outcome, planning ahead, regulating the progress,
checking errors, and modifying thinking processes (Derry, 1989; Zimmerman
& Pons, 1986, 1990; Wagner & Sternberg, 1987). Students with good cognitive
monitoring strategies also perform better than those with poor cognitive
monitoring strategies in domain specific tasks (Brown, Bransford, Ferrara, &
Campione, 1983; Gamer & Kraus, 1981-1982; Palinscar & Brown, 1989).
Despite the value of cognitive monitoring, research suggests that many
college students and adults lack the necessary cognitive monitoring strategies
to maximize learning endeavors and to solve problems efficiently
(Schoenfeld, 1985; Simpson, 1984; Sternberg, 1986). Thus, a need exists to teach
cognitive monitoring strategies to college students and adults in order to help
them become efficient thinkers and independent problem solvers in varied
situations.
Logo programming
Several studies have indicated that computer programming can be used
as a tool to enhance critical, logical, and refiective thinking in the process of
solving problems (Feurzig, Horwitz, & Nickerson, 1981; Nickerson, Perkins, &
Smith, 1985; Papert, 1980a). In particular, proponents of Logo programming
believe that Logo has innate educative properties and provides a special
learning environment for students to develop learning strategies and problem
solving skills (Ryba & Chapman, 1983; Tractenberg, 1985; Watt, 1982). It has
8
been claimed that Logo programming facilitates a learning environment in
which students can practice cognitive monitoring activities (Clements, 1990;
Harvey, 1982; Papert, 1980a). Papert (1980a) pointed out that "in teaching the
computer how to think, children embark on an exploration about how they
themselves think" (p. 19).
The nature of the Logo environment allows students to consciously
reflect and monitor their thinking processes; thus, Logo programming appears
to be a logical and appropriate tool for students to explicitly practice cognitive
monitoring activities.
Self-discoverv Learning
Self-discovery learning has long been an area of discussion and
implementation for instructional developers. Papert's philosophy of learning
Logo is based on a self-discovery method that uses minimal adult guidance.
According to Papert, self-discovery learning is a teaching situation where a
student achieves instructional objectives with limited or no guidance from
the teacher. Papert was greatly influenced by Jean Piaget's theory on the
development of children's cognitive processes. Piaget (1952) believed that
children must build their own intellectual structure and that intellectual
growth is affected by each child's experiences, social interactions, overall
maturation and equilibrium, and not just by the adult intervention.
Further, Jerome Bruner (1966), a major proponent of the self-discovery
method, emphasized the need for children to feel that the activity they are
doing is worthwhile and meaningful. He argued that manipulation and
action are necessary conditions for learning. According to Bruner, a student's

9
intellectual and mental growth are dependent upon the environment in
which students are surrounded.
Papert argued that the Logo environment is an artificial, miniature
reality that allows students to explore their ideas, and manipulate and test
hypotheses by themselves. Through Logo activities, students also interact
socially with groups solving problems together. Further, he argued that the
Logo environment can accelerate a student's intellectual growth. Most
importantly, he suggested that through the self-discovery learning
environment in Logo programming, students sharpen their thinking and
monitor their thinking process while working with the turtle. Papert
reasoned that since Logo gives immediate and explicit, yet non-judgmental
error messages, self-discovery learning can help students gain positive
attitudes toward learning.
Papert (1980a) suggested that teaching without structured curriculum
means supporting children as they build their own intellectual structures with
materials taken from the surrounding culture. Several comprehensive
research projects on Logo used the self-discovery learning method which
allowed students to proceed at their own pace, in their own way, in their own
style, and with their own approach (e.g., Lawler, 1980; Papert, Watt, DiSessa, &
Weir, 1979; Seidman, 1981; Statz, 1973).
Since then, numerous studies have attempted to examine the
effectiveness of the self-discovery learning method in Logo on the
development of various problem solving strategies (e.g., Bamberger, 1984;
Davidson, 1983; Noss, 1984; Pea, 1983; Pea 6 Kurland, 1984; Schwartz, Evans, &
10
Cari^, 1984). However, many of these empirical studies have produced
conflicting results of self-discovery learning method in Logo to develop
cognitive skills and problem solving strategies. Some of the results indicated
that a self-discovery approach to Logo programming improves students'
thinking skills and problem solving strategies. Some of them indicated that
self-discovery learning does not help students develop problem solving
strategies. These conflicting findings challenge researchers to explore new
approaches to teaching Logo programming in order to enhance a student's
problem solving skills, cognitive skills, and metacognition.
Guided instruction
A guided instruction approach is characterized by teacher modeling of
instruction plus mediated learning which guides students to progress
gradually to become independent learners in the context (Como, 1987). An
early theorist for guided instruction, Vygotsky (1978), emphasized the role of
adults in the process of a child's social learning. According to Vygotsky, a
student's higher-order mental capabilities progress from external to internal
mediation processes. Students leam to internalize higher-order thinking
through social interactions with a teacher or more capable peers. Vygotsky
believed that teacher guidance helps students fully internalize their potential
for intellectual growth. In guided instruction, the teacher assigns more
responsibility to students as they become more capable of performing a
complex task. Eventually, the students take the initiative in learning and the
teacher becomes a facilitator to guide them only when needed. In this
manner, students gradually control their on-going cognitive activities. Thus,
11
guided instruction can assist students to focus on the problem, to search
systematically for information, to compare, to develop an insight, to monitor,
and to evaluate their on-going activities carefully (Feuerstein, 1979; Missiuna,
Hunter, Kemp, & Hyslop, 1987; Samuels, 1986).
Proper teacher guidance in learning can help students acquire important
problem solving strategies and transfer those learned strategies to other
learning domains. Palinscar & Brown (1984, 1989) examined a reciprocal
teaching method by which teachers raise questions and guide students to
promote concrete monitoring strategies in reading comprehension. The study
revealed that guided instruction in reading not only promoted reading
comprehension skills but also provided students with concrete methods of
monitoring their understanding.
The guided instruction approach to teaching computer programming has
also been discussed as a method to encourage the transfer of problem solving
skills to other domains. A number of studies examining the self-discovery
approach to learning Logo programming indicated that many students have
difficulties in developing problem solving strategies through the self-
discovery (Fay & Mayer, 1987; Kurland & Pea, 1985; Pea, 1983; Pea & Kurland,
1984; Perkins, 1985; Webb, 1984). Littlefield, Delclos, Lever, Clayton Bransford,
and Franks (1988) claimed that improving students' problem solving skills
was not dependent on the Logo environment itself, but upon the
instructional methods employed with Logo. Recent studies that explored
teaching Logo to elementary students have indicated that a teacher guided
instructional approach is more effective than self-discovery approach in
12
teaching planning skills and problem solving strategies (Clements, 1990;
Lehrer, Sandlio, & Randle, 1988; Miller & Emihovich, 1986; Swan & Black,
1989).
Swan and Black (1989) extensively investigated and reviewed the
research literature regarding outcomes of general problem solving skills from
Logo programming. They concluded that all of the studies reporting positive
results of transfer effect shared pedagogical elements. They indicated that
three common pedagogical elements are likely to encourage the positive
transfer effect (1) concentrating on spedBc aspects of the problem solving
process, (2) providing direct instruction of the target skills, and (3) using a
mediated learning approach to practicing the target skills.
Thus, mere exposure to programming may not be enough to ensure the
mastery of language or transfer of higher-order thinking skills. It has been
suggested that teaching programming requires guided instruction which
positions students toward a higher level of cognitive skills (Seidman, 1987).
Such guided programming instruction may help students acquire more than
technical programming skills, but also higher-order thinking skills and
problem solving strategies.
Statement of Problem
Cognitive monitoring has been a central focus of interest in the study of
efficient learning and thinking for the past decade. Research on cognitive
monitoring is now moving beyond a theoretical Framework. Researchers are

13
beginning to search for proper learning tools and instructional methods that
can facilitate the development of a student's cognitive monitoring strategies.
Computer programming is a potential tool with which students can
naturally manipulate an environment and develop cognitive skills. In
particular, Logo programming has been dted as a powerful vehicle for
teaching students about their own thinking processes through a self-discovery
approach (Papert, 1980a). But there is conflicting evidence for this claim (e.g..
Pea & Kurland, 1984; Salomon & Perkins, 1987). Recently it has been claimed
that Logo programming alone is not enough to facilitate the development of a
student's higher-level cognitive skills. Logo programming combined with
guided instruction is needed to help students acquire more than just technical
programming skills (Seidman, 1987; Swan Sc Black, 1989).
Yet, there is no strong research support for the development of cognitive
monitoring strategies through programming. Past studies on Logo
programming have generated two important research questions: (1) Does
learning Logo programming affect a student's cognitive skills? (2) Does the
instructional method for learning Logo programming affect a student's
cognitive skills? Since cognitive monitoring strategies are considered
essential for efficient problem solving, searching for a proper learning tool
and an instructional method that enhance cognitive monitoring strategies is
necessary.
Because Logo environments allow students to engage in dynamic
activities, such as selecting their own goals, outlining a solution, and testing
hypotheses, Logo is a potentially powerful tool to activate a student's

14
cognitive monitoring strategies. Immediate and explicit error messages in
Logo also motivate students to debug their errors. The nature of the Logo
learning environment can be a tool with which to employ a guided
instructional approach in order to facilitate the development of cognitive
monitoring strategies. However, a limited number of research studies support
the use of Logo in this manner. Further, research on the effectiveness of
guided Logo instruction to develop cognitive monitoring strategies is needed.
Purpose of the Study
The overall purpose of this study was to investigate whether general
cognitive monitoring strategies could be developed through an instructional
unit on computer programming. The study was conducted to examine the
effects of guided instruction with Logo programming on the development of
cognitive monitoring strategies such as decomposing, planning, identifying
errors, and correcting errors in Logo programming problems; and to
investigate the effects of teacher mediated cognitive monitoring practice on
the transfer of cognitive monitoring strategies to problem solving in other
learning domains.
Research Questions
This research specifically sought to address the following questions:
1) Does guided instruction in Logo programming, as compared to self-
discovery learning, facilitate the transfer of cognitive monitoring to other
15
Logo programming situations?
2} Does teacher mediated learning in Logo programming, as compared to
self-discovery learning, facilitate the transfer of cognitive monitoring
strategies to solving problems in other domains?
Hypotheses
In order to measure more specific and operational definitions of
cognitive monitoring strategies, three main components of cognitive
monitoring which can be practiced with Logo programming were used to
develop the hypotheses.
The independent variable in this study was the instructional
methodology: guided Logo instruction vs. self-discovery Logo instruction.
The six dependent variables were analyzed for this study. Three dependent
variables involved near transfer tasks in Logo problems. They were Logo
decomposing skills, Logo planning skills, and Logo error identification and
debugging skills. Another three dependent variables involved far transfer
tasks in other domains. These were general decomposing skills, general
planning skills, and general error identification and debugging skills. These
far transfer tasks asked students to solve problems outside the programming
domains.
Seven control variables were used as covariates in the analysis of the
seven hypotheses: gender, year in college, mathematics courses taken in high
school, computer courses taken in either high school or college, computer
ownership, computer confidence, and ACT scores.
16
Hypothesis 1: The vector of means for the six dependent variables, adjusted by the contribution of the seven covariates, will be significantly different for students in the guided Logo instruction group and students in the self-discovery learning group.
Hvpothesis 2 : The students in the guided Logo instruction group will receive a higher average score than students in the self-discovery learning group on the total points of the Logo decomposing test while covarying seven variables: gender, year in college, mathematics courses taken in high school, computer courses taken in either high school or college, computer ownership, computer confidence, and ACT score.
Hypothesis 3 : The students in the guided Logo instruction group will receive a higher average score than students in the tradition^ self-discovery learning group on the total points of the Logo planning test while covarying seven variables: gender, year in college, mathematics courses taken in high school, computer courses taken in either high school or college, computer ownership, computer confidence, and ACT score.
Hvpothesis 4 : The students in the guided Logo instruction group will receive a higher average score than students in the traditional self-discovery learning group on the total points of the Logo error identification test while covarying seven variables: gender, year in college, mathematics courses taken in high school, computer courses taken in either high school or college, computer ownership, computer confidence, and ACT score.
Hypothesis 5 : The students in the guided Logo instruction group will receive a higher average score than students in the traditional self-discovery learning group on the total points of the general decomposing test while covarying seven variables: gender, year in college, mathematics courses taken in high school, computer courses taken in either high school or college, computer ownership, computer confidence, and ACT score.
Hypothesis 6 : The students in the guided Logo instruction group will receive a higher average score than students in the traditional self-discovery learning group on the total points of the general planning test while covarying seven variables: gender, year in college, mathematics courses taken in high school, computer courses taken in either high
1 7
school or college, computer ownership, computer confidence, and ACT score.
Hypothesis 7 : The students in the guided Logo instruction group will receive a higher average score than students in the traditional self-discovery learning group on the total points of the general error identification test while covarying seven variables: gender, year in college, mathematics courses taken in high school, computer courses taken in either high school or college, computer ownership, computer confidence, and ACT score.
Significance of the Study
Logo is a powerful procedural programming language that has been
advocated as particularly useful in teaching students higher-order thinking
and cognitive monitoring. Logo is useful because students can begin with an
easy introduction to programming. Yet, Logo is complex enough to have the
potential to enhance cognitive skills, critical thinking skills, and problem
solving strategies. Particularly, the turtle graphics, visually presented in Logo,
allow students to easily monitor their thinking processes and to check errors.
The present study is important because it is designed to clarify the issue of
how to teach Logo so as to improve general cognitive monitoring strategies.
The present research should:
1. help researchers and educators better understand how to teach Logo
programming so as to develop students' cognitive monitoring strategies.
2. help researchers and educators better understand the potential of
guided instruction for developing positive attitudes towards learning, thus,
motivating student learning.
1 8
In addition, the research findings are also expected to contribute to the
growing body of knowledge on teaching computer programming and the
development of theory on guided instruction for spedfîc strategies and
metacognitive skills.
Limitations
The study was conducted with acknowledgement of the following
limitations:
1) In general, cognitive monitoring involves broad strategies and mental
activities that extend beyond a narrow problem solving definition. However,
for an operational use of the term, this research defined cognitive monitoring
narrowly and specifically as the ability to decompose a given complex problem
into simpler units, to plan an efficient solution, to execute the plan, to identify
errors, and to debug detected errors. Therefore, the interpretation of the
findings only apply to this narrow definition of cognitive monitoring.
2) Programming instruction was limited to the Logo language, thus,
generalizations to other programming languages and environments are
limited.
3) The sample was college students enrolled in an educational
computing class, thus, generalization to other populations is limited.
Definition of Terms
Checking - A procedure to detect errors in outcomes.
1 9
Cognitive monitoring - Any activities aimed at evaluating or regulating
one's own cognitions (Flavell, 1979). Examples of cognitive monitoring
include planning, checking, self-testing, assessing one's progress, and
correcting one's errors (Van P^eghan & Baker, 1989). This is the highest-
level solution approach that can be used for most subjects and in many
different problem situations (Deny, 1989). For this research, cognitive
monitoring was defined as the ability to decompose a given complex problem
into simpler units, to plan an efficient solution, to execute the plan, to identify
errors, and to debug detected errors.
Debugging - A process of analyzing the procedures that make up a
program in order to improve the behavior of a program that does not do what
you want it to do (Goldenberg, 1982). It is the process of making changes until
a procedure does just what one wants it to do.
Guided Instruction — Guided instruction is characterized as explicitly
modeled instruction targeting specific strategies plus mediated learning which
guides students to become independent learners in the context. Guided
instruction helps students to focus on the problem, to search systematically for
information, to compare, to develop insight, to plan, to execute, and to
evaluate the results. Guided instruction, with its emphasis on cognitive
monitoring strategies and bridging to various situations, would be an ideal
method for teaching computer programming with the ultimate aim of
developing problem solving abilities for students (Samuels, 1986).
Logo - A high level computer programming language developed by
Seymour Papert and his associates at the Massachusetts Institute of
2 0
Technology. It is procedural, interactive, and recursive. It is a list processing
language which combines formal procedural representations with concrete
and immediate feedback. The Logo programming provides a student with a
visual enviroiunent designed to facilitate intellectual exploration and
experimentation. For this study, the software package of LogoWriter, by the
LCSI company, was used in Logo programming activities. LogoWriter has the
same Logo structure as other versions of Logo available, but includes an
improved editor, expanded shapes, and turtle graphic capabilities.
Mediated learning — The teacher guides instructional process through
Socratic dialogue to frame principles which can be applied to a broader context
and bridges the learned specific strategies to other problem situations. In this
approach, the teacher needs to continually encourage students to formulate
general principles from class activities, rather than principles specific to
immediate content. This approach helps students view themselves as active
problem solvers, by being prompted to continually monitor their own
thinking processes.
Planning - A process to determine supplies or strategies needed for
solving a problem efficiently. In programming problems, a student describes
the step-by-step algorithm of things to get to the final goal. A student usually
writes general approaches to solve a problem using natural English (Webb &
Lewis, 1988). How to organize and sequence subparts efficiently in order to
reach the final goal is an important aspect of planning skills.
Problem solving — A process of understanding a problem and then
devising, testing, and examining a solution for a given problem.

2 1
Recursive - A language is recursive if a procedure can be invoked either
directly or indirectly by itself.
Turtle - A computer-controlled "cybernetic animal" that "lives" on the
display screen and responds to Logo commands that make it move and rotate
(Papert, 1980a). It may leave a trail or line behind it during the creation of
drawings.
Turtle graphics - A subset of the Logo language which permits the user
to draw geometric designs by directing a computer to change the "heading"
and the "position" of a small triangular (turtle or other shapes in LogoWriter)
screen object that is referred to as a Turtle.
2 2
LITERATURE REVIEW
Introduction
The purpose of this research was to investigate the effects of guided
instruction with Logo programming on the development of cognitive
monitoring strategies. A summary of previous research and theories relevant
to this study can provide a foundation for the pedagogical implications of
Logo programming instruction on the development of cognitive monitoring
strategies. This chapter will review such research and theories.
This chapter is organized into nine sections: (1) introduction,
(2) background of Logo programming, (3) research on Logo programming,
(4) reasons for conflicting research results on Logo programming,
(5) metacognition and the computer, (6) metacognitive knowledge,
(7) cognitive monitoring, (8) model of Logo-based cognitive monitoring
instruction, and (9) summary.
Background of Logo Programming
Logo : Philosophy of learning
The Logo programming language was developed by Seymour Papert and
his colleagues at the Artificial Intelligence Laboratory at Massachusetts
Institute of Technology in the late 1960s. It was designed to provide a learning
environment which allowed students to leam as naturally as possible. Papert
and his colleagues did not accept the traditional classroom environment and
2 3
the traditional teacher's role. Papert (1980a), the father of Logo programming,
viewed the traditional classroom as an artificial and inefficient learning
environment. According to Papert, schools do not provide the enriched
culture and materials with which students can experiment and leam by doing.
Papert (1980a) viewed the learning of mathematics quite differently from
many other educators. He criticized the manner of teaching mathematics in
schools which be characterized as rote learning, that is, memorizing without
understanding. Papert perceived the computer as a means of making learning
an active and exciting process. He stated that Logo provided a mathland, in
which students can leam mathematics as naturally as they leam to speak
(Solomon, 1986).
Papert was influenced by Piagetian learning theory that suggested
children leam without explicit teaching (Papert, 1980a). For Papert, Piaget was
a theorist who viewed children as builders of their own intellectual structures
without being taught Unlike Piaget, Papert believed that if children are
provided the enriched culture and materials relevant to learning, they can
accelerate the construction of their own cognitive structures regardless of age.
He questioned why children leam some things without formal instruction
and why they do not leam other things even when formal instruction is
provided (Solomon, 1986).
Motivated by this question and inspired by Piaget's view of children as
constructors of their own intellectual, Papert and his colleagues developed a
computer language that would provide an enriched computer culture where
children could explore their ideas and leam by discovery. This computer
2 4
language was called Logo. The pedagogy of Logo is that children learn
through self-guided discovery methods. With Logo, children pursue their
own goals and ideas without a teacher's explicit instruction or systematic
presentation of concepts and skills (Hawkins, 1985). Thus, a primary purpose
of the Logo environment was to foster the development of independent
thinking. An effect of this environment was to alter the role of the teacher
Arom teaching to a central role of assisting and encouraging students to
become independent learners (Maddux & Johnson 1988; Papert, 1980a;
Solomon, 1986).
A potential tool for learning
According to Papert (1980a), Logo was designed with two fundamental
learning principles in mind. First, learning to program a computer can be a
natural process for learning mathematics. The best way to learn French is to
live in France. Likewise, he argued that the best way to learn mathematics is
doing and talking about math in everyday life. Logo can create a mathland in
which a computer becomes a tool for children to play with mathematics.
Therefore, with Logo, children may learn mathematics as naturally as they
learn to talk (Solomon, 1986). Papert developed the turtle, "a computer-
controlled cybernetic animal" (Papert, 1980a, p. 11) to create a mathematical
entity with which children could identify and develop a personal relationship.
Doing mathematics in the Logo environment shifted the role of students
from passive receivers of materials to purposeful, self-directed activators
(Papert, 1980b). Second principle suggests that learning of Logo programming
is not limited to math related subjects. Logo programming can be used in an
2 5
expanding role across the curriculum. When the computer becomes a tool
with which children love to talk, they can use this tool to leam other subject
matter. Logo programming can be a tool to communicate with various subject
areas such as, language arts, physics, music, and art (Fapert, 1980a). Thus, Logo
provides students with enriched computer culture where students incorporate
computer programming into learning various subjects. Much like students
can draw, write, or scribble with a pencil, the computer can be equally a
versatile tool to use in order to leam many other concepts (Papert, 1980b).
Logo is not only the name of a computer language, but also a computer
culture and environment for exploration (Abelson, 1982; Maddux Sc. Johnson,
1988; Papert, 1980a; Solomon, 1975). The Logo environment encourages
children to play the role of a turtle. In the Logo, children act as experimenters
who try to understand the turtle's behavior. As they teach the turtle to move
around a screen, they begin to understand how the turtle moves. They also
understand that the turtle graphic on the screen is the reflection of their
thoughts. Thus, the turtle becomes a mirror which reflects a student's
thought on the screen. In using Logo, "children embark on exploration about
how they themselves think" (Papert, 1980a, p. 19). Logo can be a potential tool
for developing students' self-monitoring skills.
Logo is also a powerful tool to develop debugging skills. When using
Logo, making a mistake is an important factor for learning. According to
Papert, "debugging" is not just a technique but a powerful idea to build an
intellectual structure (Papert, 1980a). In the programming, students do not
question whether it is right or wrong. Instead, they ask whether it is fixable or
2 6
not. The computer becomes an "object-to-think-with." Through the process
of debugging computer programs, students become more articulate about their
debugging strategies and more conscious about developing them. Thus,
debugging becomes part of a dynamic process for growth and development.
Learning is a process of debugging: discovering bugs in programs and
correcting them. Therefore, "children in the Logo environment are engaged
in self-referential discussions about their own thinking " (Papert, 1980a, p. 29).
Advantages of Logo propamming
There are some advantages of Logo programming over other
programming languages. These include the following: (1) the commands are
easy to understand, (2) it provides visual graphics, (3) the language is
procedural, interactive, and recursive.
Logo was designed for children, so the basic commands are easy to learn
as they are simple terms taken from spoken English (e g., FD: forward, BK:
backward, RT: right turn, and PD: pen down, etc). Then, as students progress,
they experience more complex concepts and the powerful structure of Logo
programming. This open-ended learning environment allows students to
build their own intellectual scheme as they explore new ideas and
imaginations. Easy introduction and the sophisticated structure of Logo also
provides with adult programming beginners to develop programming skills.
Thus, "Togo can make a complex exploration possible for learners of all ages,
without imposing artifidal hurdles" (Watt, 1982, p. 112). Logo is versatile
enough to accommodate students of different age levels, ability levels, and
learning styles; thus, it has been used in a wide range of settings.
2 7
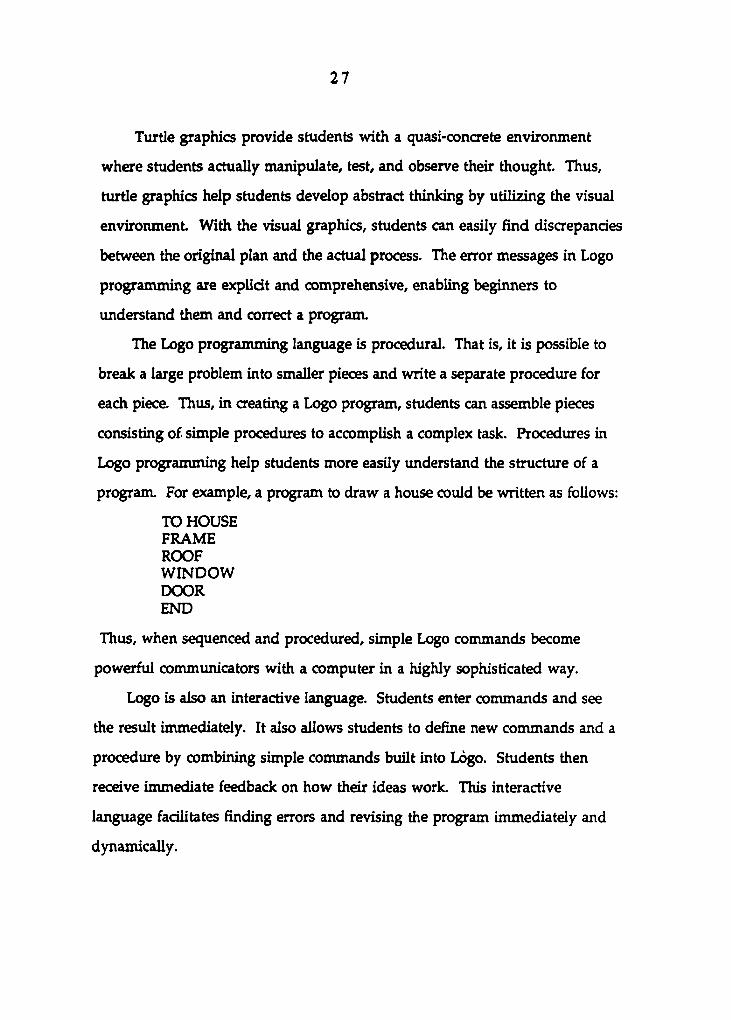
Turtle graphics provide students with a quasi-concrete environment
where students actually manipulate, test, and observe their thought. Thus,
turtle graphics help students develop abstract thinking by utilizing the visual
environment With the visual graphics, students can easily find discrepancies
between the original plan and the actual process. The error messages in Logo
programming are explicit and comprehensive, enabling beginners to
understand them and correct a program.
The Logo programming language is procedural. That is, it is possible to
break a large problem into smaller pieces and write a separate procedure for
each piece. Thus, in creating a Logo program, students can assemble pieces
consisting of simple procedures to accomplish a complex task. Procedures in
Logo programming help students more easily understand the structure of a
program. For example, a program to draw a house could be written as follows:
TO HOUSE FRAME ROOF WINDOW DOOR END
Thus, when sequenced and procedured, simple Logo commands become
powerful communicators with a computer in a highly sophisticated way.
Logo is also an interactive language. Students enter commands and see
the result immediately. It also allows students to define new commands and a
procedure by combining simple commands built into Logo. Students then
receive immediate feedback on how their ideas work. This interactive
language facilitates finding errors and revising the program immediately and
dynamically.

2 8
Logo is a recursive language. That is a procedure may call itself inside the
procedure. Then, the same graphics or codes are repeated until a specific
condition is met. Recursion greatly facilitates programming when a process
must be repeated many times with a systematic modification being made each
time. Thus, the recursive nature of Logo allows students to express large and
complex programming problems in a compact form. Learning the concept of
recursion is valuable not only in computer science but also in other subjects,
such as mathematics and science, since the concept of repetition is heavily
involved in learning these subjects. Most actions and problems in human life
are recursive, but students often do not realize that Learning the concept of
recursive procedure may help students understand the natural processes
which are recursive in real life.
Research on Logo Programming
Supportive evidence for implications of Logo programming
The Brookline Logo project (Papert, Watt, DiSessa, & Weir, 1979),
conducted by MIT Logo Group, was one of the earliest studies examining the
effectiveness of Logo programming. This project provided extensive
documentation on Logo programming experience. During the 1977-1978
school years, sixth grade students in a selected school learned Logo
programming. However, only sixteen students were targeted for anecdotal
records. These sixteen students represented an intellectually heterogeneous
group. They worked in small groups with trained Logo teachers, as well as
regular classroom teachers. A self-discovery based instructional approach was

2 9
employed. Children were allowed to set their own goal, proceed with their
own learning, and achieve the goal. Teachers carefully observed each
student's work and recorded individual's progress, attitudes about the
working with Logo, and the learning style used in the Logo environment.
The anecdotal documents from this project indicated that Logo programming
enhanced students' problem solving skills, cognitive abilities, and positive
attitudes toward Logo. Even slow learners made large gains in their learning
through a self-discovery approach.
The following year, Robert Lawler conducted an in-depth case study with
the Logo programming. In his six month study, Lawler observed his eight
years old son's experience using Logo programming. Again, a self-discovery
Logo learning environment with minimal adult teaching was used. Lawler
reported that the benefits of the Logo experience became clear when his son
solved complex mathematical, non-Logo related problems using Logo
strategies (Lawler, 1980).
In the mid-1980s, researchers began to conduct more quantitative and
empirical studies on possible outcomes of Logo programming. Clements and
GuUo (1984) did an extensive empirical study on the effectiveness of Logo
programming on a number of cognitive and metacognitive outcomes. These
outcomes included creativity, classification, sedation of skills, and
metacognition. In this study, eighteen first-grade students were randomly
selected and assigned to either a Logo group or computer assisted instruction
(CAD group for the twelve week experiment The teachers employed guided
discovery learning with strong teacher mediation focused on planning and
3 0
debugging skills. Results of the study revealed that the Logo programming
group scored significantly higher on the metacognition and divergent
thinking post-tests than the CAI group. No significant differences were found
for the groups on measures of general cognitive abilities.
As an extension of the 1984 study, Qements (1987) conducted a
longitudinal study of Logo programming on the delayed effects in the areas of
cognitive abilities and achievement. The same children Arom the 1984 study
took tests on achievement and cognitive abilities in the beginning of their
third grade year. The results indicated that the Logo group did better on
metacomponents, reading comprehension, and vocabulary test items than the
CAI group.
Bamberger (1984) also adopted the guided self-discovery learning method
of Logo programming for her study. She examined the effect of learning Logo
on the development of problem solving strategies. In her study, thirty fourth-
grade students were randomly assigned to a Logo group and a control group.
The Logo group received programming instruction 45 minutes, three days a
week for eleven weeks, and the control group received the standard fourth
grade math curriculum. Guided discovery learning for the Logo environment
was employed with emphasis on the need for planning, breaking large
problems into manageable units, guessing and checking work, and looking
back strategies. Only a post-test was administered. The investigators
concluded that the Logo group was more likely to use problem solving
strategies, such as planning, checking, and looking back, when solving non-
computer mathematical word problems.
3 1
Another study of the discovery learning in a Logo environment was
conducted by Miller, Kelly, and Kelly (1988). However, instead of guided
discovery learning, they emphasized a pair discovery learning approach.
Miller and his colleagues investigated effects of Logo programming on
problem solving and spatial relations ability. Two fifth-grade and two sixth-
grade classes were selected from two elementary schools. 85 out of 174
students were assigned to the Logo group and 89 students were assigned to the
control group. In the Logo treatment, after the teacher introduced new
commands and concepts, students worked in pairs. They were encouraged to
plan and produce their own drawings. The partners helped each other
develop their ideas and debug mistakes. The control group did not receive
any Logo instruction and attended regular mathematics class. However, some
students used a computer occasionally for drill and practice in math. The
experiment consisted of eighty sessions and each session was thirty minutes
long. Significant differences in the favor of the Logo group on the measures
of Logo-related and general problem solving skills were found. The Logo
group also showed significantly higher scores than the control group on
mental rotations on geometric tests.
Non-significant findings for implications of Logo programming
On the other hand, some of empirical research examining the problem
solving benefits of Logo programming resulted in non-significant outcomes.
The Bank Street College Logo group conducted an extensive investigation of
effects of Logo programming on cognitive abilities and planning skills based
on Papert's philosophy of the Logo environment. Pea and Kurland (1984)
3 2
examined the effects of Logo instruction on planning skills. In their first
study, they selected nine- to twelve-year old students and randomly assigned
them to a Logo programming group and a non-Logo group. Over one year
period, students in the Logo group received 30 hours of Logo instruction using
a self-discovery approach. After the experiment, the student's ability to
efficiently plan a real-life task of scheduling chores in a classroom was
assessed. This test assessed transfer of planning skills from Logo to a new
situation. The results indicated no significant difference between two groups
in planning skills.
In Pea and Kurland's second study (1984), the same teachers took a more
direct role in Logo instruction. A pretest and a posttest were administered to
assess students' planning skills. Again, the results showed no significant
difference between the Logo group and the non-Logo group in their ability to
plan the scheduling of chores in a classroom.
Deldos, Littlefield, and Bransford (1985) examined the effects of the
instructional approach used with Logo on general problem solving skills. In
their study, unstructured, self-discovery Logo instruction was contrasted with
structured teacher mediated Logo instruction. Fifth grade students received
Logo instruction one hour a day for a six week period. Both Logo mastery and
general problem solving skills were assessed. The results indicated that
students receiving explidt Logo instruction produced higher scores on the
Logo mastery test, but no significant difference in general problem solving
skills was found.
3 3
Missiuna, Hunter, Kemp, and Hyslop (1987) examined the effectiveness
of Logo instruction on the transfer of problem solving skills from a computer
programming environment to the real world. They developed six units of
Logo curriculum for children in grades 1 - 6; one to be taught at each grade
level. For the study, the subjects were a total of 231 third- and fifth-grade
students, all of who were given the Canadian Cognitive Abilities Test as a pre
test and assigned to one of three treatment groups: (1) the "Thinking with
Logo" curriculum; (2) the traditional Logo curriculum; and (3) a control group.
In the "thinking with Logo" group, teachers facilitated the learning of
problem solving skills by utilizing a medlational style of teaching through
Sooratic dialogues. In the traditional Logo curriculum, teachers emphasized
specific Logo skills. The teacher of the control group did not receive any
inservice training nor was Logo utilized in her classroom. The students in the
control group participated in a regular mathematics course. The study lasted
twelve weeks and each treatment group received instruction two times a
week. At the end of the 12 week period, the cognitive abilities posttest was
given. The result revealed that the third grade students in the 'Thinking
with Logo" curriculum and traditional Logo curriculum showed
improvements on the cognitive ability posttest The result indicated that the
fifth grade students in all three groups improved on the cognitive ability
posttest. However, there were no significant differences in the magnitude of
the improvement of problem solving skills among the three different
treatment groups.

3 4
Reasons for Conflicting Research Results on Logo Programming
Although some educators have made strong claims for the utility of
computer programming as a vehicle for developing general problem solving
skills, the numerous studies of Logo programming have yielded conflicting
results. Why have some studies yielded more promising results than others?
No single explanation for the conflicting results seems plausible and the
conflicting results seem to be attributable to several factors.
Instructional methodology; Self-discoverv vs. mediated learning
Early proponents of Logo programming argued that teaching Logo
through self-discovery learning, as compared to direct, explicit instruction,
allowed children to explore ideas freely and to reflect false thinking processes
without any negative feedback, and therefore, helped children to learn more
and to develop more positive attitudes (Green & Jaeger, 1983; Lawler, 1982;
Papert, 1980a; Schiftinan, Tobin, & Buchanan, 1982). Green and Jaeger (1983)
have shown that children were capable of directing their own learning, and
that Logo was an excellent tool to discover successful ways of solving
problems. The Brookline Logo Project and Lawler's dissertation strongly
supported the value of self-discovery learning for teaching Logo.
However, on the basis of intensive empirical evidence from well
designed experimental studies, the Bank Street College Logo group challenged
the concept of a self-discovery method for teaching Logo. Pea (1983) criticized
the anecdotal evidence on self-discovery Logo and argued that both
quantitative and qualitative research are necessary to demonstrate the effects
3 5
of Logo. Pea and Kurland (1984,1987) argued that Logo is not taught
effectively through a self-discovery learning approach and that students
would not develop general problem solving skills unless those skills were
taught directly.
Leron (1985) indicated that children did not leam carefully in discovery
learning environments, rather under such a condition, most children tended
to fall into a "hacking" style of programming which was not conducive to
learning deep and sophisticated ideas. Several empirical studies adapting a
teacher-mediated approach for teaching Logo produced positive outcomes
consistently in the areas of problem solving or metacognition (Bamberger,
1984; Clements, 1987,1990; Clements & Gullo, 1984; Deldos, Littiefield, &
Bransford, 1985; Miller, Kelly, & Kelly, 1988). These studies suggested that
mediated learning, that guides and facilitates a student's thinking and
problem solving skills, and forms bridges between Logo programming and
real world problem solving situations, was more effective than self-discovery
learning where students were in charge of learning by doing with minimal
intervention from others (Clements and Merriman, 1988; Emihovich &
Miller, 1986; Mayer, 1988; Salomon & Gardner, 1986).
Tvpes of strategies: General vs. specific problem solving strategv
The type of instructional method is not the only reason for conflicting
outcomes in Logo research. Studies examining specific problem solving
strategies have produced conflicting researdi outcomes also. Despite the fact
that several studies were carefully designed to compare mediated instruction
to self-discovery instruction (Littiefield, Deldos, Lever, Clayton, Bransford, &
3 6
Franks, 1988; Missiuna, Hunter, Kemp, & Hyslop, 1987), these studies have
failed to provide positive evidence for the far transfer of problem solving
skills. Apparently, other factors contributed to students gaining problem
solving skills.
Some researchers have focused on defining specific strategies of problem
solving skills necessary for students to acquire and use in solving real world
problems. These researchers suggested that students need to be explicitly
trained in specific strategies so that they can apply the learned strategies in
novel situations. The following list of research studies have indicated that
when narrow and specific problem solving skills were targeted students were
likely to transfer these skills to non-Logo problems: divergent thinking,
metacognition (Qements, 1987; Clements & GuUo, 1984), mental rotations of
geometric (Miller, Kelly, éc Kelly, 1988), Cartesian coordination (Thompson &
Wang, 1988), analogical Reasoning (Clement, Kurland, Mawby, & Pea, 1986)
planning and geometry concepts ( Lehrer, Sandlio, & Randle, 1988b).
Swan and Black (1989) strongly supported this point of view in their
study. From their comprehensive review of the literature on Logo
programming in relation to problem solving strategies, they concluded that "a
pedagogical approach incorporating an explicit instruction in particular
problem solving skills and mediated practice applying them will support the
transfer of problem solving skills from Logo programming to non-computing
domains" (p. 73). They attempted to design an instructional model based on
three pedagogical elements: (1) explicit instruction, (2) specific aspects of
problem solving skills, and (3) mediated practice of these specific skills. In
3 7
their research, they spedHcally targeted the problem solving skills of subgoal
formation, forward chaining, backward chaining, systematic trial and error,
alternative representation, and analogy. A significant improvement in
problem solving skills was found in the experimental group that employed
these three pedagogical elements, as compared to other control groups (self-
discovery learning condition and non-computer problem solving group). The
positive results were consistent among ditferent grade levels, except for the
alternative representation skill.
Thus, many researchers have agreed that teachers need to provide
explicit instruction of specific thinking or problem solving skills in the Logo
environment (Carver, 1987; Grandgenett, 1989; Swan & Black, 1989). And
many researchers point out that Logo has the potential to be a powerful tool
for developing this explicit instructional model and for teachers to provide
the mediated practice of specific aspects of problem solving skills (Clements,
1990; Deldos, Littlefield, & Bransford, 1985; Emihovich & Miller, 1986; Leron,
1985; Mayer, 1988; Missiuna, Hunter, Kemp, & Hyslop, 1987; Salomon &
Gardner, 1986).
Transfer mechanism; Near transfer vs. far transfer
Researchers, who have examined the transfer effects of spedfic problem
solving strategies learned from programming, have investigated general
transfer effects of learned strategies between domains in many different fields
(e.g., Cormier & Hagman, 1987; Swan & Black, 1989). Salomon and Perkins
(1987) have developed a theory for interpreting transfer effects of computer
progranuning. They proposed two theoretical transfer mechanisms that help
3 8
to explain the conflicting outcomes of Logo research. They argued that the
acquisition and transfer of strategies can be achieved through two distinct
routes: low road transfer and high road transfer.
According to Salomon and Perkins, the low road transfer is the process of
achieving near transfer effects. Near transfer refers to utilization of acquired
skills in similar contexts or situations. Through a low road transfer
mechanism, students repeatedly practice strategies with a variety of problems.
This procedure leads students to profîdent mastery of the strategies and to
their automatic employment. Then, when the learners encounter a similar
problem situation the transfer takes place on its own without much awareness
or mindful guidance by the student. Thus, near transfer is achieved through
low road mechanism. Low road transfer facilitates the automatic application
of mastered mental skills to similar problem situations. However, low road
transfer cannot account for the transfer of disciplined strategies when practice
to near automatic!ty is not provided or an unfamiliar situation is
encountered.
According to Salomon and Perkins, the transfer of disciplined strategies
can take place even if these strategies are not practiced to be automatized or
mastered. High road transfer entails a process of "mindful abstraction"
including deliberate, effortful thinking, and metacognitively guided
"decontextualization" of principles, strategies, or rules (Salomon & Globerson,
1987). Through the high road transfer process, far ti-ansfer of internalized
strategies occurs to other unfamiliar learning situations. Far transfer refers to
the ti-ansfer of learned skills to different contexts or situations and is
3 9
accomplished through high road transfer mechanism. Similarly, Vygotsky
(1978) discussed "intellectualization" which means content-free principles or
strategies that learners apply to new and perceptually dissimilar problem
situations. Metacognitive guidance of principles and strategies are essential
for the high road transfer.
Logo programming can be an instrument for promoting either of the two
transfer mechanisms. Yet, educators are more interested in the development
of the high road transfer mechanism, since far transferrable skills are to be
utilized in dissimilar, "decontext" situations.
Research suggests that the use of Logo environment to develop problem
solving skills requires the incorporation of explicit instruction on spedfîc, far
transferrable strategies, and teacher mediation for practicing those strategies
(Mayer, 1988; Seidman, 1987; Swan & Black, 1989). These results suggest that
such a Logo environment can help students mindfully use Logo as a tool for
developing problem solving strategies. Accordingly, teacher mediated practice
of learned strategies helps students mindfully abstract the acquired strategies
from the learning situation and internalize those skills for application to
other situations. Therefore, the research suggests that the following tri-
combination of instructional approaches is likely to facilitate fransfer of the
internalized strategies to novel situations: (1) explicit instructional model of
specific, content-free strategies, (2) Logo programming as a tool to facilitate a
dynamic learning environment, and (3) teacher-mediated practice of learned
strategies.
4 0
Metacognition and the Computer
The technological revolution has accelerated the need for students'
learning in a variety of academic disciplines, ranging from language to art,
athletics, and even medidne. In particular, role of computer technology in
empowering students' learning capabilities to meet this need is a major
concern to educators and cognitive psychologists. As metacognition becomes
an important issue in teaching students to be independent thinkers and
problem solvers, educators have paid close attention to the role of the
computer in the classroom. The educational community has begun to
examine the power of computer technology to assist students in becoming
better thinkers, better learners, and better problem solvers.
Since computers became part of the school curriculum, the research
focusing on the use of computers as a tool to teach higher-order thinking
skills has increased in recent years. This section discusses research trends in
the area of metacognition and the use of the computer to facilitate a learning
environment to develop metacognition.
Metacognition
The study of metacognition has become a major interest in the area of
cognitive psychology. The growing body of research on metacognition is in
the areas of memory development (metamemory), language (metalinguistic),
reading (comprehension monitoring), communication
(metacommunication), mathematics and science, and general problem
4 1
solving. John Flavell (1976), who first used the term metacognition in the
1970s, defines it as follows:
metacognition refers to one's knowledge concerning one's cognitive processes and products or anything related to them, e g., the learning-relevant properties of information or data. For example, I am engaging in metacognition...if I notice that I am having more trouble learning A than B; if it strikes me that I should double-check C before accepting it as a fact; if it occurs to me that I had better scrutinize each and every alternative in multiple choice type task before deciding which is the best one....Metacognition refers, among other things, to the active monitoring and consequent regulation and orchestration of these processes in relation to the cognitive objects or data on which they bear, usually in the service of some concrete [problem solving] goal or objectives (p. 232).
In the most general sense, metacognition refers to the knowledge and
skills one uses to control one's cognition. Metacognition requires individuals
to observe their own thought processes and to be aware of how they go about
their own thinking so that they can better accomplish their cognitive goals
(Beyer, 1987). Although it is a broad and somewhat fuzzy concept, it has
influenced research on student learning and thinking.
Metacognition consists of two separate, but closely related concepts:
(1) knowledge about one's own cognition system called metacognitive
knowledge and (2) executive control of one's own cognitive process called
cognitive monitoring (Brown, Bransford, Ferrara, & Campione, 1983;
Cavanaugh & Perlmutter, 1982; Deull, 1986; Flavell, 1976,1979; Garofalo &
Lester, 1985) (Hgure 2). Both metacognitive knowledge and cognitive
monitoring have captured the attention of psychologists and educators.
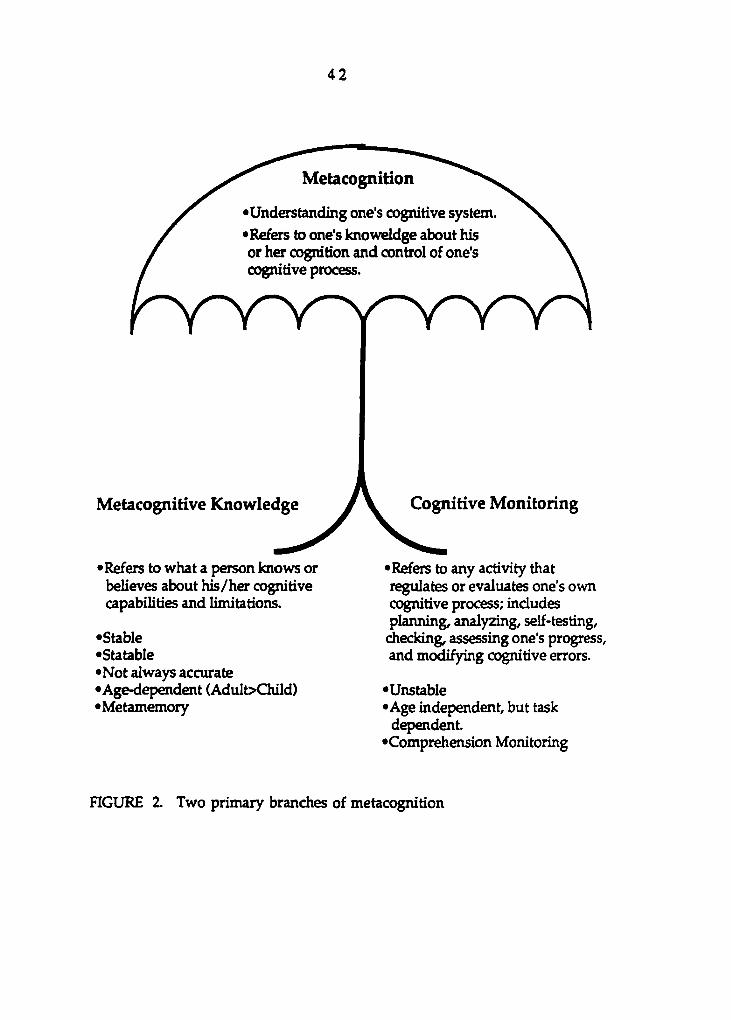
4 2
Metacognition
•Understanding one's cognitive system.
•Refers to one's knoweldge about his or her cognition and control of one's cognitive process.
Metacognitive Knowledge
•Refers to what a person knows or believes about his/her cognitive capabilities and limitations.
•Stable •Statable •Not always accurate •Age-dependent (Adult>Child) •Metamemory
Cognitive Monitoring
•Refers to any activity that regulates or evaluates one's own cognitive process; includes planning, analyzing, self-testing, diecking, assessing one's progress, and modifying cognitive errors.
•Unstable •Age independent, but task
dependent. •Comprehension Monitoring
FIGURE 2. Two primary branches of metacognition
4 3
Metacognitive Knowledge
Definition of metacognitive knowledge
Metacognitive knowledge is concerned with what one knows about one's
cognitive capabilities, processes, resources, and limitations in relation to
performance on a specific cognitive task (Brown, Similey, & Lawton, 1978;
Flavell, 1979). Metacognitive knowledge consists of three variables: person
variables, task variables, and strategy variables (Flavell, 1979). These variables
interact each other and affect the outcome of a cognitive enterprise.
Person variables encompass one's belief about oneself and other people
as cognitive beings. An example of a person variable is a student's belief that
he or she does better on constructed response tests than on multiple-choice
tests. A second example of a person variable is a belief that one has more
difficulty in analogical reasoning tasks as compared to one's peer group. A
belief that one needs to read classroom materials more carefully than one
would read if reading for pleasure is another example.
Task variables usually include knowledge of what the characteristics of a
cognitive task imply regarding the difficulty of the task and how best to
approach the task. For example, tasks including familiar topics are easier to
understand than unfamiliar topics; recalling the gist of a narrative is easier
than recalling its exact wording; and organized materials are easier to
remember than scrambled materials.
Strategy variables involve knowledge about when, where, and how to
apply diHerent strategies in order to carry out a cognitive task. An example of
a strategy variable is using a mnemonic technique to memorize scrambled
4 4
materials. As another example, organizing and chunking given materials
according to certain categories is easier to remember than memorizing words
separately. Flavell (1979) also pointed out that most metacognitive knowledge
involves interactions and combinations of these variables. Similar to other
types of knowledge, metacognitive knowledge can be accessed consciously or
automatically and it may not always be accurate.
Brown (1978,1987) believed that metacognitive knowledge is relatively
stable over time (e g., if a student believes today that she can leam better by
putting information into her own words, it is likely she will continue to
believe that tomorrow). It is statable by the learner; that is, she can reflect on
the cognitive processes involved and discuss them with others. Thus, this
form of knowledge may not be accurate in that sometimes the person believes
certain facts about cognition that are not true. Metacognitive knowledge is
also late-developing, so it is more complete in the older learner. In general,
adults have better metacognitive knowledge than children (Brown, Bransford,
Ferrara, & Campione, 1983). Students' metacognitive knowledge about their
capabilities and limitations as learners helps them alter difficulties in their
learning. Thus, metacognitive knowledge may play an important role in
producing a significant learning performance.
Research on metacognitive knowledge
Most studies on metacognitive knowledge have dealt with human
memory development as a person grows. Adults or older learners typically
have better knowledge about their cognitive abilities and processes than
younger learners. Flavell, Friedricks, and Hoyt (1970) demonstrated that older
4 5
children better predicted their performance and remembered more objects on
a serial recall task than did younger students. Similarly, several studies found
that adults or older mentally retarded learners made more accurate
predictions on their memory span than did children or younger mentally
retarded learners (Brown, Campione, & Murphy, 1977; Yussen & Levy, 1975).
Brown, Campione, Barclay, Lawton, and Jones (in Brown, 1978) examined
the ability of children to predict the outcomes of using different study
strategies. Children viewed a four-segment video tape of a twelve-year-old
learning a twelve item list of pictures. The twelve-year-old used the study
strategies of categorizing, rehearsing, labeling, and looking. Brown et al.
found that a majority of the first- and third- graders correctly knew that
categorization and rehearsal were more effective study strategies than labeling
and looking, whereas four-year-olds selected evenly across the four strategies.
Armbruster, Echols, and Brown (1983) also found in their study that good
readers can adjust their reading strategies to fit the specific purposes at hand.
This ability to adjust reading strategies gradually increased with age and
reading ability.
Some researchers conducted study on the metacognitive knowledge of
task variables. Danner (1976) examined children's sensitivity to the
organization of sentences. In the experiment, children listened and recalled
two passages, each consisting of twelve sentences. Within the twelve
sentences, there were three topics each containing four sentences. Sometimes
the four sentences were grouped together under the topic and sometimes they
were not The results revealed that children better recalled the grouped
4 6
sentences and categorized materials than the ungrouped sentences. Myers and
Paris (1978) also found that both second and sixth graders believed that
familiarity with a story's content facilitates story comprehension; and
preferred stories are easier to read than disliked ones.
Metacoynitive knowledge and domain specific task performance
Although metacognitive knowledge is considered to be one of the critical
factors in a cognitive task performance, studies on metacognitive knowledge
and task performance have not always shown a significant relationship. In
several correlation studies, a weak positive relationship has been found
between metamemory (which refers to metacognitive knowledge about the
memory) and memory performance.
Cavanaugh and Borkowski (1980) determined the nature and strength of
connections between metamemory, strategy use, and recall accuracy from a
developmental perspective. In the study, subjects Arom kindergarten, first,
third, and fifth grades participated in two sessions. In Session I, multiple
memory tasks were selected to examine the generalization of metamemory-
memory connections. In Session H, several methods were employed: (1) free
sort to learn a categorizable list, (2) cognitive cuing in which category pictures
served as cues to recall a categorizable list, and (3) alphabet search in which
students had an unanticipated recall test for randomly presented letters of the
alphabet. The research question was whether good metamemory was
necessary for successful memory performance. No significant relationship
between metacognitive knowledge and task performance at an individual
level was found.
4 7
Yussen and Berman (1981) showed a further inconsistent result in the
metamemory-memory relationship. In their study, a significant relationship
between metamemory and free recall tasks was found, but no significant
relationship for metamemory and recognition tasks was found.
Research in other fields also indicated inconsistent patterns of results.
Zutell (1981) examined the relationship between metalinguistic knowledge
(metacognitive knowledge about language) and spelling performance. The
results revealed that there were strong correlations between metalinguistic
knowledge and spelling performance in a kindergarten sample, but not in a
first-grade sample.
Kurdek and Burt (1981) examined relationships between the
metacommunicative, metamemorial, and metasodal-cognitive skills among
first- through sixth-grade students. The question of interest was in the
relationships across these three metacognitive domains, as well as in the
developmental trends. Low positive correlations between tasks within and
across the three domains were found, but there was no consistent pattern of
relationships across the grade levels.
Several reasons may account for these inconsistent results. First,
metacognitive knowledge may be specific to a domain as well as to a given
task. Thus metalinguistic processing would not be expected to generalize to
tasks in other domains such as communication or social cognition.
Accordingly, the measurement of difierent domain specific metacognitive
knowledge with ditferent task performances could bear inconsistent
outcomes. Second, lack of congruency between sets of instruments could also
4 8
lead to unexpected results. Researchers need to make sure that there is a
congruency between topics assessed in the metacognitive knowledge test and
the performance. A third reason for the inconsistent results of studies in
metacognitive knowledge and task performances centers around
environmental concerns. Since metacognitive knowledge assessment and
performance are two different task environments, the nature of the
interaction between child and experimenters might be different. In
metacognitive knowledge, the subjects are asked to reflect in an open-ended
manner; whereas in task performance, they must perform against a discrete
criterion (Lawson, 1984).
The conflicting evidence for metacognitive knowledge and task
performance does not provide firm guidelines for remediation of learning
problems, although research on metacognitive knowledge helps educators
develop an understanding of learning. Therefore, further research may need
to challenge the conflicting evidence.
Cognitive Monitoring
Definition of cognitive monitoring
Called metacognitive strategies (Flavell, 1979), regulation of cognition
(Brown, 1978; Brown, Bransford, Ferrara, 6 Campione, 1983), and executing
control process (Gamer, 1987; Lawson, 1984; Sternberg, 1984), cognitive
monitoring involves controlling one's cognitive system. The role of
cognitive monitoring has been emphasized in cognitive strategy research in
recent years.
4 9
Cognitive monitoring can be defined as any activity that regulates or
evaluates one's own cognitive process (Flavell, 1976; Forrest-Pressley &
Waller, 1984). In its most general sense, cognitive monitoring refers to
monitoring and evaluating one's own thinking process or system. Students
with the most effective thinking processes tend to consciously direct their own
thinking (Beyer, 1987). When students deliberately monitor their own
thinking, they are involved in cognitive monitoring activities. Cognitive
monitoring activities generally involve defining a desired goal, breaking the
goal into subgoal units, planning how to accomplish the goal, carrying out the
plan, and modifying errors. Highlights of cognitive monitoring activities
include monitoring a solution process, identifying errors, and revising the
plan and actions in the process itself (Beyer, 1987; Brown, 1987; Brown,
Bransford, Ferrara, & Campione, 1983; Van Haneghan & Baker, 1989; Lawson,
1984; Schoenfeld, 1985; Sternberg, 1988).
Cognitive monitoring is considered to be important for efficient learning.
Cognitive information-processing (CIP) psychologists have developed a
concept of cognitive monitoring that is called executive control processing in
the human mind. According to the CIP view, learning process consists of
three main components: input, cognitive processes, and output. First, the
information is coming into the human mind. Then, cognitive processes are
involved in taking in information, performing mental operations on it, and
storing it. At last, the responses go out from human cognitive system
(Frederikson, 1984), The role of executive control processing in human
cognitive system is to direct cognitive activities at each processing stage and
5 0
monitor the cognitive functions as a whole through the many processing
steps. Thus, conscious executive control processing becomes the essence of
intelligent activity in learning and problem solving (Brown, 1978). To the QP
psychologists, executive control processing is the heart of cognitive activities
and learning. Miller, Galanter, and Pribram (1960) indicated that human
behaviors are derived from the execution of plans, that control the order of
sequenced actions that can be performed. Thus, learning only occurs when a
student has some kind of plan and when she or he executes the plan and
monitors the progress of the plan that is being activated.
Cognitive monitoring is a high-level cognitive process since it controls
the cognition system in order to perform successfully a given task.
Monitoring one's cognitive processes usually involves not only looking
ahead to predict an appropriate outcome, but also looking backward Arom the
outcome to the plan (Costa, 1984). When a student attacks a given problem,
she goes through cognitive monitoring activities recursively in order to
control and regulate her thinking processes until she is satisfied with the
result.
Several studies have consistently supported that cognitive monitoring
strategies can be developed through explicit instruction and experience
regardless of student age (Beyer, 1987; Brown, Bransford, Ferrara, & Campione,
1983; Calfee, 1984; Hyde, 1989; Schoenfeld, 1985; Sternberg, 1988). A valuable
aspect of teaching cognitive monitoring is that it is content-free strategies, that
is, it can be applied to any subject or any problem situation (Beyer, 1987;
Brown, 1978; Meichenbaum, Burland, Gruson, & Cameron, 1985).
5 1
Researchers agree that development of cognitive monitoring strategies is
essential to good problem solving (Brown, Campione, & Day, 1981; Brown &
DeLoche, 1978; Lawson, 1984; Sternberg, 1984; Van Haneghan & Baker, 1989).
Efficient cognitive monitoring strategies lead students to become efficient
problem solvers and independent thinkers. Therefore, teaching cognitive
monitoring to develop learning strategies seems a reasonable goal.
Research on cognitive monitoring
Psychologists interested in metacognition have contributed information
to the area of reading comprehension and cognitive monitoring. Markman
(1977, 1981) investigated how children's awareness of their own
comprehensive skills was changed developmentally. In her study, both young
children and older children were given game instructions and magic-trick
instructions to evaluate. Both young and older children were told explicitly
that they should tell the researcher if the information was not clarified. As
the researcher directed steps of action, children followed the instruction. The
results revealed that younger students were not aware of their comprehension
failure. Younger children were less likely than older students to inform the
researcher when instructions were not clear. They also failed to recognize that
their comprehension of instructions was not correct.
As an individual grows in relation to metacognitive development, she
becomes more active and self-directive in monitoring her own cognitive
system. Thus, children may develop the ability to monitor and evaluate their
cognitive processes as they mature. Older students are more likely to utilize a
variety of cognitive strategies while younger students take a passive approach
5 2
to comprehension, and fail to understand information (Brown, 1975; Gamer,
1987; Markman, 1977,1981; Paris & Lindauer, 1977; Wagoner, 1983).
Although several studies indicate that cognitive monitoring may
develops as learners mature (e.g.. Brown, 1975; Markman, 1977,1981; Paris &
Lindauer, 1977), educators and cognitive psychologists agree that cognitive
monitoring can be taught eHectively to any grade levels if proper learning
environments are provided. Researchers have emphasized teaching of
cognitive monitoring strategies and have researched individual differences in
a homogeneous age group (Baker & Brown, 1984a; Brown, Campione, & Day,
1981; Van Haneghan & Baker, 1989; Palinscar & Brown, 1989; Pressley, 1986).
However, only a few studies have been done on adult metacognition. Baker
and Brown (1984b) stated that "it is unfortunate that there is not more
research activity in the area of adult metacognition. Anyone who has ever
taught a group of college students must know that their metacognitive skills
in a variety of domains could stand considerable enhancing!" (p. 380).
A limited number of studies on adult metacognition suggest that
cognitive monitoring activities play a vital role in task performance. Poor
performers do not monitor their performance or modify their strategies in
ways that are appropriate for changing task situations. Good adult readers
plan strategies, monitor an on-going performance, revise their previous
strategies, and thus perform at a high level (Bereiter and Bird, 1985;
Lundeberg, 1987; Smith, 1982; Wagner & Sternberg, 1987). These studies
indicated that high-achieving students and low-achieving students differed
greatly in the use of cognitive monitoring strategies, such as seeking
5 3
information, planning ahead, evaluating the process, and modifying
strategies. Thus, high-achieving students were more likely to activate
cognitive monitoring than were low-achieving students (McCombs 6
Marzano, 1990; Wagner & Sternberg, 1987; Zimmerman and Pons, 1986, 1990).
Simpson's (1984) anecdotal observation of study strategies used by college
freshmen indicated that most students used a single strategy over again, even
though the problem was not appropriate for the strategy. Moreover, these
students did not engage in the cognitive monitoring activities of planning,
checking, evaluating, and regulating, which are necessary for self-regulation of
learning.
Most adults and older students have difficulty with complex problems
although they do not have difficulties in solving non-ambiguous, simple
problems. When the task requires a deliberate and efficient application of
strategic planning and logical reasoning processes, poor problem solvers often
fail to engage in cognitive monitoring activities. Many college students are
engaged in mathematical problem solving with a strategic misfunction that is
primarily inadequate in the area of goal setting, monitoring, and evaluation of
plans (Schoenfeld, 1983; 1985). Schoenfeld indicated that the majority of
students mindlessly read a math problem, pick a direction, and work on it
until they run out of time.
Cognitive monitoring strategies are vital skills for problem solving and
critical to explaining individual differences in intelligence. As compared to
the research on metacognitive knowledge, research on cognitive monitoring
consistentiy demonstrates a positive relationship between cognitive
5 4
monitoring activity and task performance (e.g., Derry, 1989; Smith, 1982;
Wagner & Sternberg, 1987). Successful learners can reflect on their problem
solving activities and apply them to novel situations. In contrast, less
successful learners are less aware of utilizing cognitive monitoring strategies
and less likely to apply problem solving activities to new situations. Thus,
researchers have searched for ways to improve cognitive monitoring
strategies in order to enhance students' learning performance.
Computer as a tool to teach cognitive monitoring
Recently, computers have been considered as a possible tool to make
students better thinkers, better learners, and better problem solvers.
Computers can provide explicit models for an information representation of
processes and cognitive monitoring strategies (Salomon, 1988). Computers
have been used to enhance students' comprehension monitoring by
providing a microworld-Iike environment in which students are encouraged
to monitor their cognitive processes (Carrasquillo & Nunez, 1988).
The use of the computer as a tool to enhance learning strategies has had
an impact on learning disabled students particularly. White and Denny (1983)
investigated the advantages of teaching computer literacy to learning disabled
adolescents. The students in the Hill Top program were mathematically
learning disabled. They were also verbally, perceptually, or visually learning
disabled. As a general academic program at Hill Top Preparatory School,
students at the eighth and ninth grade pre-algebra level were introduced to
computer components and the simple reproduction of BASIC programs early
in the semester. Then they moved to a more advanced computer literacy
5 5
course and integrated the use of computers into subject matters such as math,
science, and sodal studies. The teachers applied a metacognitive teaching style
which guided students to organize and monitor their own learning. Through
the semester, the computer was used as a tool to provide an elective model of
learning how to learn. Strategies of reviewing steps, checking and debugging,
exchanging ideas, and organizing information were reinforced during the
dass. At the end of semester, most learning disabled students reached their
academic achievement successfully. They were able to manage their own
learning with minimal instructor guidance. Their interest in subject matter
was also improved significantly.
Computer word processing offers another possible solution for learning
disabled students with writing problems. Computer word processing makes it
easier for students to compose, revise, and edit documents. It also motivates
students who struggle with an expression of ideas, organization of topics,
spelling of words, and grammar. If the unique features of computers as
writing tools are integrated into good writing instruction, students may
improve their writing skills. Morocco, Neuman, Cushman, Packard, and
Neale (1987) investigated the use of word processing technology for learning
disabled students. Teachers provided students with cognitive monitoring
strategies for generating ideas, organizing information, and revising the ideas.
The teachers used the computer to facilitate these cognitive monitoring
interventions by making the students' writing process more visible. Students
could improve not only writing skills but also the general skills of managing
the steps of writing, organizing, planning, monitoring, and rethinking. This
5 6
study showed that computers as a writing tool can be used to provide learning
disabled students with metacognitive styles of instruction.
Carrasquillo and Nunez (1988) investigated the effects of computer-based
metacognitive strategies on reading comprehension. The computer-based
instruction included summarizing, clarifying, and questioning processes. The
instruction also contained modeling of reading comprehension skills and
reminders of the monitoring comprehension strategy throughout the
program. The results indicated that training in metacognitive strategies can
enhance reading comprehension skills, performance, and recalling and
organizing events in the narrative. The Hndings have implied that unique
technological attributes of the computer can be used to affect cognitive
processes during reading.
The role of the computer, as shown in the above studies, becomes an
"intellectual partnership" (Salomon, 1988) to teach cognitive monitoring
strategies. In particular, microworld-like computer environments allow
students to become active, constructing architects of their own learning
(Papert, 1980a). Thus, students are likely to practice problem solving in a
microworld-like environment provided by a computer, since the computer
environment encourages students to construct their own learning through
exploring and manipulating their own ideas.
Logo-Based Instruction and Development of Cognitive Monitoring
Logo programming involves manipulating incoming information,
constructing hypotheses, transforming and coding information, detecting
5 7
errors, and debugging the outcomes until a given problem is solved. Thus,
Logo programming has the potential to invoke a student's self-monitoring
skills through the looping of the testing and checking process (Papert, 1980a;
Qements, 1986,1990). Particularly, Logo programming allows students to be
aware of their thinking errors explicitly by providing visual results of their
thinking in graphics on the screen. The visual outcome of Logo graphics
immediately reflects students' thinking results, thus motivating them to track
the original thinking process and find the error in thinking occurred. Thus,
the Logo programming environment can strengthen cognitive monitoring
abilities, since it facilitates students' explicit reflection on their own problem
solving processes (Qements, 1990).
Several empirical studies on the effectiveness of Logo programming on
young children's metacognitive skills have been done. Miller and Emihovich
(1986) examined the effects of mediated Logo programming on students' self-
monitoring skills. Preschool children with mediated-Logo programming
made significantly better progress in enhancing their ability of monitoring an
on-going task, detecting embedded errors, correcting errors, and evaluating
message ambiguity than children in CAI treatment. In this study, the teacher
used a mediated style of teaching, such as catching students' thinking flaws
and encouraging students to verbalize reasoning processes by providing
Socratic questioning.
Richard Lehrer and his colleagues (Lehrer, Guckenberg, & Lee, 1988a)
examined a wide range of cognitive and metacognitive effects by employing
an inquiry-based instructional method to teach Logo programming. The
5 8
inquiry-based instructional method indicates that teachers lead questions and
help students overcome misconceptions by presenting counter-examples in
conjunction with concepts to be learned. Forty-five third-graders were
randomly assigned to one of three treatment groups: Logo group, geometry
Logo group and problem solving software control group. The inquiry-based
instructional method was applied to all of the three groups. However, the
goals of instruction varied in each group. The instruction for the Logo group
emphasized Logo programming skills and general thinking skills. The
geometry Logo group focused on learning geometry concepts using Logo
programming. Thus, Logo was used as a subject matter tool. The control
group used various problem solving softwares excluding Logo. All software
used in the control group generally acknowledged as useful for the
development problem solving skills. The results indicated that both the Logo
group and geometry Logo group solved a planning task more efficiently and
developed more dynamic descriptions of geometry concepts than the control
group. However, only students in the geometry Logo group demonstrated
improvement on metacognitive skills, such as integrating old problems and
new information and monitoring processes. Again, the geometry Logo group
showed significant improvement of task performance. The overall results
indicated that targeting specific knowledge helped students develop
knowledge application. These results also indicated that Logo could be a
powerful medium to facilitate metacognitive skills.
Qements (1990) conducted a more indepth empirical study on the effects
of a theoretically-based Logo environment on metacognitive abilities. He
5 9
employed Sternberg's componential theory of metacomponents.
Metacomponents refer to higher-order control processes used for executive
planning, monitoring, and evaluating of one's performance in a task
(Sternberg, 1988). In this research study, Qements hypothesized that effects of
a Logo environment based on metacompcnential processes would be stronger
for the development of three metacomponents: deciding on the nature of the
problem, selecting a representation, and monitoring solution processes.
Forty-eight third-graders were randomly assigned to either a Logo
programming group or a CAI control group. Utilizing a teacher mediated
learning method with the Logo group, the teacher was heavily involved in
student learning. The teacher led Socratic questioning and gradually reduced
her role as students progressed so that they could take charge of their own
learning. The Logo instructional environment included a review of previous
work, a teacher-centered introduction of new commands and information,
and independent student work on either self-selected projects or teacher
selected problems.
When students worked on their project, procedural thinking was
introduced. Students were challenged to decompose the problem, construct
plan, and predict solutions. The "homunculi", cartoon anthropomorphisms
of the metacomponential processes, was introduced to the students. Four
types of Tiomunculi" were introduced as a part of the Logo-programming and
problem-solving process; the problem decider, the representer, the strategy
planner, and the debugger. The teacher provided both summaries and group
discussion to share ideas at the end of class.
6 0
Students in the CAI control group received instruction designed to
develop creative problem solving and literacy. The instructional content
included drawing programs and writing compositions using Milliken's
Writing Workshop which provided integrated package of prewriting
programs, a word processor, and postwriting or editing programs.
After the experiment, the researcher interviewed students to test the
outcome of the treatment. The results revealed that the Logo programming
group scored significantly higher on the total assessment of executive
processing than the CAI group. However, only monitoring the solution
process and selecting representation showed significant structural coefficients
on the correctness measure.
Overall, these studies suggest that a teacher's use of mediated teaching
techniques during the Logo instruction could be a critical variable in students'
acquisition of cognitive monitoring strategies. Although a Logo environment
has the potential to fostering explicit monitoring of cognitive processes, these
results indicate that the teacher mediated intervention should be provided
with students in order to develop such strategies. In general, Logo
programming involves operations of transforming incoming information in
the context of constructing, coding, and modifying sequences (Cements, 1990).
The process of Logo programming allows students to think and discuss their
ideas, and test their hypotheses. These features of Logo can be fully utilized if
teacher mediated learning is incorporated into the Logo environment. Thus,
this type of guided Logo instruction may help students elicit cognitive
monitoring activities while solving Logo programming problems.
6 1
Model of Logo-Based Cognitive Monitoring Instruction
Components of cognitive monitoring processes
The cognitive monitoring activities used in this study are decomposing
the problem, planning the solution, executing the plan, identifying errors, and
debugging the errors. These are the main components of cognitive
monitoring activities that can be easily facilitated in a Logo environment.
Decomposing: Decomposing refers to breaking a complex problem into
smaller, manageable subproblems, thus simplifying the complex information.
Each unit of the subproblem contains solvable problems. Breaking a complex
problem into several separate units make the solution more obvious to the
problem solvers. Thus, students are less likely to be confused and make errors
(Swan & Black, 1989). The decomposing skills are one of the principal factors
in programming and are also significant problem solving skills (Linn &
Dalbey, 1985; Varden & Summer, 1984). Students need to leam how to divide
a complex problem into an appropriate set of subproblems.
In Logo, small subprocedures are easily written and they can be the pieces
of an orchestrated plan for a single problem. These subprocedures can be
called from anywhere in a program. Thus, once subproblems are solved, the
program, which accomplishes the desired goal, can simply be a list of
subprocedures. When complex knowledge or problems can be broken up into
"mind size bites", they are more communicable, more assimilable, easily
solvable, and more simply constructible (Papert, 1980a). Thus, Logo
programming provides an environment where students can decompose
complex graphics into subparts.
6 2
Planning; Planning refers to the conscious and deliberate organization
and sequence of actions oriented toward accomplishing a problem goal (Hayes-
Roth & Hayes-Roth, 1979; Pea, 1982; Rogoff, Gauvain, & Gardner, 1987).
Planning the solution process requires a deliberate search and proper strategies
for an efficient solution, not just trial and error or habitual solutions.
Planning in programming demands a cognitive involvement that goes
beyond rote memorization or other low level thinking abilities. Elective
cognitive monitoring activities involve how students will carry out a solution
and why they propose to do it in a particular way. Thus, careful planning
makes the execution of an efficient solution easy. Careful planning also
makes possible the achievement of the desired goal with less errors, and
improves the quality of the solution (Beyer, 1987). The procedural nature of
Logo programming helps students sequence the action of plan and search for
an efficient solution. In Logo programming, students define subprocedures,
sequence operations, identify potential obstacles, find possible ways to
overcome these obstacles, and predict results.
Executing: Executing refers to carrying out a plarmed solution. In the
executing process, students actually transform their plan to Logo commands
so that the turtle on the screen can produce an outcome according to the
operator's commands. This step allows students to run the written program,
to see the actual outcome, and to bridge to the monitoring solution process.
Identifying the error Identifying the error refers to 1) discovering errors
which cause a discrepancy between the desired goal and the actual outcome, 2)
understanding misconceptions or thinking errors, and 3) explaining what the
6 3
given errors are (Beyer, 1987; Van Haneghan & Baker, 1989). Error
identification is an extremely important cognitive monitoring process since
this process alerts students to monitor their thinking process consciously. It
also encourages students to go back to previous steps and re-examine the
process until they locate where the error occurs, understand what caused such
an error, and diagnose the underlying misconceptions that the error reflects.
Because Logo provides students with immediate graphic depiction of errors
and explicit error messages (Clements, 1990), it may encourage problem
identification activities.
Debugging: Debugging refers to correcting detected errors. The skills of
debugging are an important ones. It is thought that teaching children how to
debug their own knowledge or thinking errors is more important than
teaching them the knowledge itself (Brown, Burton, & De Kleer, 1982; Carver,
1987; Papert, 1980a). The Logo programming environment can be an ideal
place to learn debugging because it provides students with immediate feedback
on how the program works and explicit error messages indicating specific
locations. Debugging skills are general skills that can be applied outside the
domain of programming.
These major components of cognitive monitoring were selected because
they fit most naturally in the Logo environment. Logo can provide quasi-
concrete environment where students explore abstract ideas, manipulate
them, and receive immediate and concrete feedback. Thus, Logo can be used
as a tool to model formal cognitive monitoring activities in the process of
programming.
6 4
Mediated learning environment
Although Logo has a great potential to facilitate cognitive monitoring
strategies and other problem solving strategies, learning to program does not
naturally improve those strategies. A teacher cannot expect students to
improve cognitive monitoring strategies if she lets students just play with
Logo by providing a self-discovery learning environment. Previous research
results suggest that teacher mediated learning in the guided Logo instruction
needs to be considered in order to help students consciously monitor their
thinking strategies.
The concept of mediated learning is based on Vygotsky's (1978) theory of
cultural development. According to his theory, a great deal of a child's
intellectual development is mediated by adults. Children first experience a set
of metacognitive activities through adult modeled frameworks and guidance.
As a child becomes more experienced with the adult help and more capable of
performing complex tasks, the adult gradually reduces her role of modeling,
guiding, and correcting the child. Thus, the child gradually takes
responsibility for learning and actively involves in task performance. Then,
the child takes on more complex problems by herself and transforms the
learned strategies to her own (Vygotsky, 1978). Through the adult-child
mediated interaction, the child ultimately internalizes a set of metacognitive
activities originally performed by the adult and becomes an independent
thinker and problem solver. In this manner, the metacognitive process is
gradually passed to the child.
6 5
Vygotsky thought that the adult should serve as a mediating agent to
help a child learn how to control and regulate her cognitive activities. With
numerous mediated social learning experiences, a child gradually takes over
externally imposed higher-order mental regulative processes and eventually
internalizes the processes. Thus, Vygotsky envisioned an acquisition of
cognitive skills and metacognitive skills as a co-constructive process of social-
cultural learning. According to Vygotsky, the learning process consists of
three components: a stimuli, a mediator, and a response. The role of a
mediator in the learning process is selecting, filtering, framing, ordering and
interpreting stimuli, and guiding a child to respond appropriately.
Feuerstein et al. (1985), however, argued that not all adult-child
interaction has a mediational value. According to Feuerstein, the interaction
between teacher and learner requires such characteristics as intentionality,
transcendence, and meaning in order to have a mediational value.
Intentionality refers to a mediator's recognition of her mediating role which
makes both child and mediator more attentive. Assigned meaning refers to
the mediator assigning values to particular aspects of a stimulus event. In the
interaction between the child and mediator, the event presented to the child
must have an affective, motivational, and value-oriented significance and
meaning. Transcendence has to do with a mediator's generalizing such
meaning beyond that event (Feuerstein, Jensen, Hofftnan, & Rand, 1985;
Feuerstein, Rand, & Rynders, 1988). Thus, Feuerstein believed that a
mediating adult should select, frame, and level the external world in order to
focus on a child's attention to the general, transferrable meanings with specific
6 6
actions that the child might acquire in particular ways of apprehending and
responding to the world.
Feuerstein et al. (1985) examined a mediated learning program for
educationally disadvantaged adolescents, which is called "instrumental
Enrichment." The lessons consisted of sets of relatively content-free materials
designed to develop metacognitive skills. The metacognitive skills taught
included planning, systematically attacking the problem, comparing objectives
and information, constructing relationships among given information in
order to solve the problem, and providing supportive evidences for answers.
The role of a mediator was to produce reflective, insightful processes for the
learners and to encourage them to think divergently from such content-free
materials to other situations. This study reported that students receiving the
"Instrumental Enrichment" program showed greater improvements on a
variety of measures assessing cognitive and academic abilities than did
students in the control group. Follow-up studies found that such gains were
maintained over a period of two years without any additional intervention.
Lochhead and Whimbey (1987) developed materials designed to cue
metacognitive activities and thinking aloud through pair problem solving.
The teacher's role in this program was to reinforce the rules such as sitting
with a pair of students, monitoring their activities, and paying particular
attention to the listener. The teacher also emphasized to the problem solvers
that getting the right answer was not as important as verbalizing the route
that they used to get to an answer. Through thinking aloud in the pair
problem solving process, the students came to understand how and why they
6 7
had reached an incorrect conclusion, thus they corrected errors easily and were
less likely to make the same errors again. After students mastered the basic
technique, a teacher provided a variety of support and coaching, but in general
the role of teacher was more like a listener than a problem solver. This study
indicated that the problem solving technique of "thinking aloud" successfully
enhanced students' metacognitive skills and task performance.
Similarly, Palinscar and Brown (1984,1989) used reciprocal teaching
methods for developing reading comprehension skills. Reciprocal teaching
involves a form of guided cooperative learning from which the learner
acquires knowledge and strategies through expert scaffolding by the teacher.
In this study, the teacher modeled guided instruction which included
scaffolding-questioning, clarifying, summarizing, and predicting an outcome.
As students mastered the teacher-modeled techniques, they gradually
progressed to the more challenging level and finally they fully adopted the
leader role. Thus, they independently monitored their learning process. The
results of the study indicated that many students at risk for academic difficulty
achieved on criterion performance measures and were able to transfer learned
strategies to other learning domains. The results also suggested that when the
reciprocal teaching method was applied, students learned elective means of
learning from the text.
Research on reciprocal teaching methods has indicated that guided
instruction, in which a teacher frames the instructional model and utilizes
mediative interaction with students, helps students improve reading
comprehension skills. The teacher mediated learning also improved the use
6 8
of metacognitive strategies, in particular, self-monitoring of one's
understanding, to other problem solving domains (Brown, Campione, & Day,
1981; Palinscar & Brown, 1984,1989). Mediated learning techniques have
successfully been used to teach a variety of specific subject areas, such as
developing mathematic problem solving skills (Schoenfeld, 1985), writing
(Flower, 1985), social studies (Como, 1987), and science (Larkin, 1980).
Mediated learning has been effective for teaching both general and domain
specific learning, and problem solving strategies.
Recently, researchers have suggested that formal design strategies are
required to develop explicit instruction in order to benefit a student's learning
and thinking (Mayer, 1988; Missiuna, Hunter, Kemp, & Hyslop, 1987;
Salomon, 1988; Salomon & Gardner, 1986). Then, the instruction designed for
improving learning and thinking needs to be delivered to students through
teacher mediated intervention. The teacher mediated intervention guides
students to adopt the fundamental principles and rules that can be applied to
other learning domains. Similarly, the teaching of computer programming
needs a special environment that supports the development of thinking skills
and transfer of cognitive skills rather than a environment that focuses only
on programming mastery (Seidman, 1987; Swan & Black, 1989).
Mindful experiences and logical thinking with programming do not
happen automatically through the progranuning experience itself. The
mediated interaction between the teacher and the students needs to be
incorporated into programming instruction in order to maximize the
potential of Logo programming (e.g., Leron, 1985; Mayer, 1988; Miller &
6 9
Emihovich, 1986; Salomon & Perkins, 1987; Seidman, 1987). The teacher, as a
mediator in Logo programming, needs to carefully frame instruction to help
students consciously monitor their on-going thinking processes while solving
a problem by encouraging students to attack the problem mindfully. Thus, the
mediator first needs to design cognitive monitoring activities for the Logo
problems and lead students to transfer the cognitive monitoring activities to
real life problems.
As students gradually perform cognitive monitoring strategies, they are
likely to solve more complex problems and perform complex tasks
successfully. Thus, students eventually internalize cognitive monitoring
strategies and activate those strategies without teacher guidance. In the
process of mediated practice with Logo programming, the teacher must foster
the process of reflective thinking leading to insight by appropriate questioning
and by exposing students to models of formal cognitive monitoring.
Summary
The purpose of this chapter was to review previous research in order to
provide theoretical frameworks for the pedagogical implications of Logo
instruction on the development of cognitive monitoring strategies. Research
involving the development of general problem solving skills through
learning Logo programming has produced conflicting evidence. The early
proponents of Logo programming claimed that students developed cognitive
skills and problem solving strategies through a self-discovery learning
method (e.g., Lawler, 1980; Papert, Watt, DiSessa, & Weir, 1979; Watt, 1982).
7 0
However, most of these studies were based on anecdotal and observational
discourse. In the mid-1980s, many researchers attempted to investigate
empirically the effects of Logo programming on the development of cognitive
skills and problem solving skills. Many of these empirical studies indicated
non-significant evidence of the self-discovery approach to Logo programming
for the development of students' problem solving strategies. From the
previous studies, researchers agreed that the eAectiveness of instructional
techniques need to be examined in the teaching and learning of programming
(e.g.. Pea & Kurland, 1984; Delclos, Littlefield, & Bransford, 1985; Seidman,
1987).
Despite the strong theoretical research based on the cognitive
monitoring, research involving teaching cognitive monitoring through
computer programming is in the early stages. Studies on metacognition
strongly argue that teaching cognitive monitoring in order to help students
become independent problem solvers and efficient thinkers is an important
issue for educators. Most researchers in the area agree that guided instruction
and mediated learning are likely to improve cognitive monitoring strategies
and students' learning outcomes (e.g.. Baker & Brown, 1984b; Brown, 1983;
Brown, Campione, & Day, 1981; Palinscar & Brown, 1989; Schoenfeld, 1985;
Van Haneghan & Baker, 1989). Many researchers also agree that the use of the
computer as an instructional tool is a promising feature to enhance student
thinking strategies (e.g., Mayer, 1988; Carrasquillo & Nunez, 1988; Salomon,
1988).
7 1
However, research on teaching cognitive monitoring strategies through
programming seems to have placed little emphasis on the need to
systematically help students reflect on their approaches to programming and
think about their cognitive activities as instances of more general problem
solving strategies. The Logo environment is an artificial microworld where
students create a problem, test a solution, and inspect an output dynamically
CPapert, 1980a; Clements, 1990). In particular, the Logo environment seems to
have a natural potential for facilitating cognitive monitoring processes. To
use this potential, the research suggests that guided instruction, which
involves explicit instructional modeling focusing on specific strategies and
teacher mediated learning activities, needs to be incorporated into the Logo
microworld environment (e.g., Grandgenett, 1989; Seidman, 1987; Swan &
Black, 1989). An empirical investigation on teaching cognitive monitoring
strategies through Logo programming is an encouraged area of research.
Further, strong theoretical research on instructional methodology encourages
researchers to examine the effectiveness of various instructional techniques
on the development of cognitive monitoring strategies.
7 2
METHODOLOGY
Introduction
This chapter describes the procedures and methods used to examine the
etfects of guided instruction with Logo programming on the development of
cognitive monitoring strategies. More specifically, this research selected Logo
programming as a possible tool to develop and test an explicit instructional
model for cognitive monitoring activities. Teacher mediated learning was
employed to help students consciously use a model of cognitive monitoring
strategies in Logo problems as well as in everyday problem examples. The
research targeted the development of the following cognitive monitoring
strategies: decomposing, planning, identifying errors, and debugging them.
The chapter is organized into the following six main sections:
1. sample of subjects used in the study
2. research design used in conducting the study
3. instructional materials and procedures developed for the study
4. experimental treatment employed in the study
5. test instruments used to measure the ejects of treatments
6. procedures for data analysis
These six sections describe the methodology that was incorporated to examine
the guided instruction in Logo programming used for the development and
transfer of cognitive monitoring strategies.
7 3
Sample
Students enrolled in Secondary Education 101, Educational Applications
of Computers, in the fall semester of 1990 at Iowa State University participated
in this study. This 3-credit introductory educational computing course for pre-
service teachers is designed to help students develop basic skills for using
computers in instruction. The course outline included six major applications
of computers: word processing, Logo programming, databases, spreadsheets,
desktop publishing, and mainframe computer use. This study involved the
four week Logo programming unit.
Of the 144 students initially enrolled, 132 participated in this study. The
data from the remaining 12 students were not included because they missed
more than two sessions during the four week Logo unit.
At the beginning of the course, students in the sample were given a brief
questionnaire designed to provide information on academic background as
well as personal background. This demographic information was used to
investigate the homogeneity of the control and experimental groups.
Subject demographic information
College major of subjects The majority of students enrolled in the course
were elementary education majors. Approximately sixty-six percent of the
subjects reported elementary education as their major. About five percent of
the students listed secondary education as their major, 10.6% were physical
education majors, and 18.2% of students listed themselves as non-teacher
7 4
education majors, but indicated majors such as business, sociology,
agricultural studies, or communication.
College major distribution for the treatment groups indicated that 69.2%
of the experimental group students were elementary education majors, 6.2%
were in secondary education, 9.2% were in physical education, and 15.4% of
students majored in non-teacher education. In the control group, 627% were
elementary majors, 4.5% secondary majors, 11.9% were in physical education,
and 20.9 % were in non-teacher education (see Appendix B, Table 27).
Gender Seventy-eight percent of the total sample was female and 22%
male. Eighty percent of the experimental group was female, and 20% male.
Seventy-six percent of the control group was female and 23.9% male (see
Appendix B, Table 28).
Year in school The data collected indicated that 14% of the students were
freshmen, 23% sophomores, 36% juniors, and 27% seniors. In the
experimental group, 13.8% of the sample were freshmen; 24.6%, sophomores;
38.5%, juniors; and 23.1%, seniors. In the control group, 11.9% were
freshmen; 23.9%, sophomores; 34.3%, juniors; and 29.9%, seniors (see
Appendix B, Table 29).
Math back^ound The subjects reported their mathematics background
by indicating the number of advanced math courses they had taken in high
school. The math courses tabulated included advanced algebra, geometry,
math analysis, and calculus. Five percent of the subjects had never taken any
of the math courses listed above. Seventeen percent of the subjects had taken

7 5
1 math course, 46% of the subjects had taken 2 math courses, 28% had taken 3
math courses, and 3.8% of subjects had taken all of the listed math courses.
In the experimental group, five percent of the subjects had never taken
any advanced math course in high school, 15% had taken one math course,
47.7% had 2 math courses, and 27.7% had 3 math courses; 4.6% had 4 or more
advanced math courses. Similarly, 6% of students in the control group never
had advanced math courses in high school; 19.4% had one course; 43.3% had 2
math courses; 28.4% had 3 math courses, and 3% had 4 or more math courses
in high school (see Appendix B, Table 30).
Computer course experience The subjects reported on the amount of
formal computer instruction they had received by indicating the number of
computer courses they had taken in either high school or college. The
computer course experience of the sample was quite limited. Forty-four
percent of the sample had never taken a computer course in either high
school or college. Thirty-eight percent had taken only one computer course,
12.9% had 2 computer courses, 45% had 3 computer courses, and less than 1%
of the subjects had taken more than 4 computer courses in either high school
or college.
Forty-three percent of students in the experimental group had never
taken a computer course in either high school or college; 32.3% had taken one
computer course; 18.5% had 2 computer courses, and 6.2% had 3 computer
courses. Similarly, 44.8% of students in the control group never had a
computer course before; 37.9% had taken one course; 12.9% had 2 computer
7 6
courses; 46% had 3 computer courses, and 0.8% had 4 or more computer
courses either in the high school or college level (see Appendix B, Table 31).
Computer ownership Eighteen percent of the total sample had their own
computer at home. About twenty percent of the students in the experimental
treatment had their own computer at home. Sixteen percent of the students
in the control group had their own computer (see Appendix B, Table 32).
Computer confidence In response to 10 questions measuring computer
confidence, 121% of students reported that they were not confident; 50% were
a little confident; 25.8% were confident; 12.1% were very confident.
Responses from students in the experimental group indicated that 15.4%
were not confident; 523% were a little confident; 20% were confident; 12.3%
were very confident. Nine percent of students in the control group reported
that they were not confident; 47.7% responded that they were a little confident;
31.4% were confident; 11.9% were very confident (see Appendix B, Table 33).
Distribution of ACT score Although students were asked to report their
ACT scores on the survey, the researcher obtained students' ACT scores from
the registrar office in order to ensure accurate data. Data accessed from the
registrar's office indicated that the mean for the total subjects was 19.717 and
the standard deviation was 3.448. For the experimental group, the mean of
ACT scores was 19.828 and the standard deviation was 3.688. The mean of
ACT scores for the control group was 19.603 and standard deviation was 3.211
(see Appendix B, Table 34).
7 7
Research Design
Random assignment
The study employed a one factor analysis of covariance design in order to
examine both the near and far transfer ejects of the treatment.
ACT scores were used as the pre-experimental measurement of students'
academic performance. The researcher accessed students' ACT scores from the
Registrar's office. ACT scores for five students out of the 132 were
unavailable. ACT means for each of the nine laboratory sections were
calculated. Due to the complex laboratory schedules, assigning each
individual randomly into either experimental or control group was practically
impossible. Thus, the subjects were randomly assigned to the respective
treatment group according to laboratory means of their ACT scores by use of a
table of random numbers and a class roster. Seven laboratories ranged from
18 to 20 students. Two laboratories ranged from 6 to 8 students. As a result of
the stratified random sampling and assigrunent, five sections of 65 students
were assigned into the experimental group and four sections of 67 students
were assigned into the control group. A test of equality of mean ACT scores
for the groups was computed and resulted in a failure to reject the null
hypothesis. It was therefore inferred that the groups were equivalent on the
ACT measure at the 95% confidence level.
Experimental procedures
The initial demographic questionnaire was given to students during the
first week of the course. After completing the initial questionnaire, students
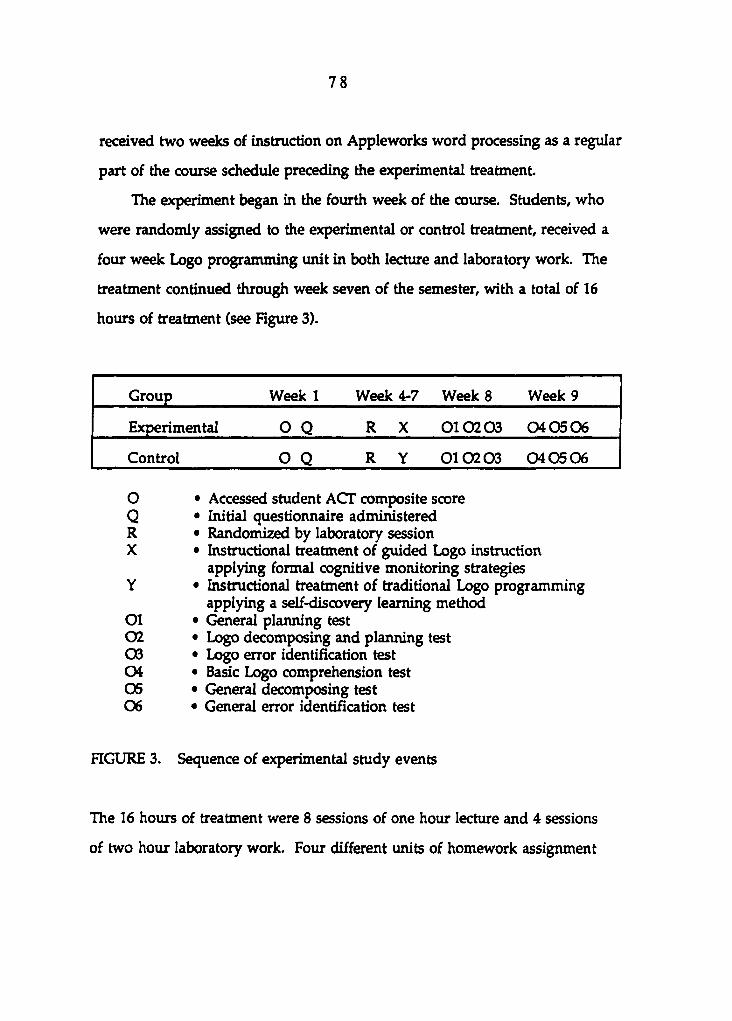
7 8
received two weeks of instruction on Appleworks word processing as a regular
part of the course schedule preceding the experimental treatment.
The experiment began in the fourth week of the course. Students, who
were randomly assigned to the experimental or control treatment, received a
four week Logo programming unit in both lecture and laboratory work. The
treatment continued through week seven of the semester, with a total of 16
hours of treatment (see Rgure 3).
Group Week 1 Week 4-7 Week 8 Week 9
Experimental 0 Q R X 010203 040506
Control 0 Q R Y 010203 040506
0 • Accessed student ACT composite score Q • Initial questionnaire administered R • Randomized by laboratory session X • Instructional treatment of guided Logo instruction
applying formal cognitive monitoring strategies Y • Instructional treatment of traditional Logo programming
applying a self-discovery learning method 01 • General planning test 02 • Logo decomposing and planning test 03 • Logo error identification test 04 • Basic Logo comprehension test 06 • General decomposing test 06 • General error identification test
FIGURE 3. Sequence of experimental study events
The 16 hours of treatment were 8 sessions of one hour lecture and 4 sessions
of two hour laboratory work. Four different units of homework assignment
7 9
were given during the study period. Each homework assigiunent required at
least two hours of work (see Appendices N, O, P, and Q). Outcome measures
were completed during weeks 8 and 9 of the study.
Procedures for additional research controls
Lecture instructor controls In order to control the instructor variable in
the lecture sessions, a specific lesson outline was provided to each of the two
instructors each day. The two instructors were the professor for the course,
and a laboratory instructor who had taught elementary school students for
seven years. The second instructor also had extensive experience in teaching
problem solving. Both instructors were female. The instructors had prior
experience in working together to teach problem solving skills.
The instructors rotated teaching assignments so that they each taught
both the experimental and control groups an equal amount of time as shown
in Figure 4. That is, one instructor taught the experimental treatment in both
morning and afternoon sections, while the other instructor was teaching the
other group of students with a control group treatment in a different room for
the same morning and afternoon sections. On the second day of the lecture
for each week, the instructor who previously used the experimental treatment
with the appropriate sample, used the control treatment with the other
sample group and the other instructor used the experimental treatment with
the appropriate group. The two instructors followed this rotation plan until
the research experiment was over.
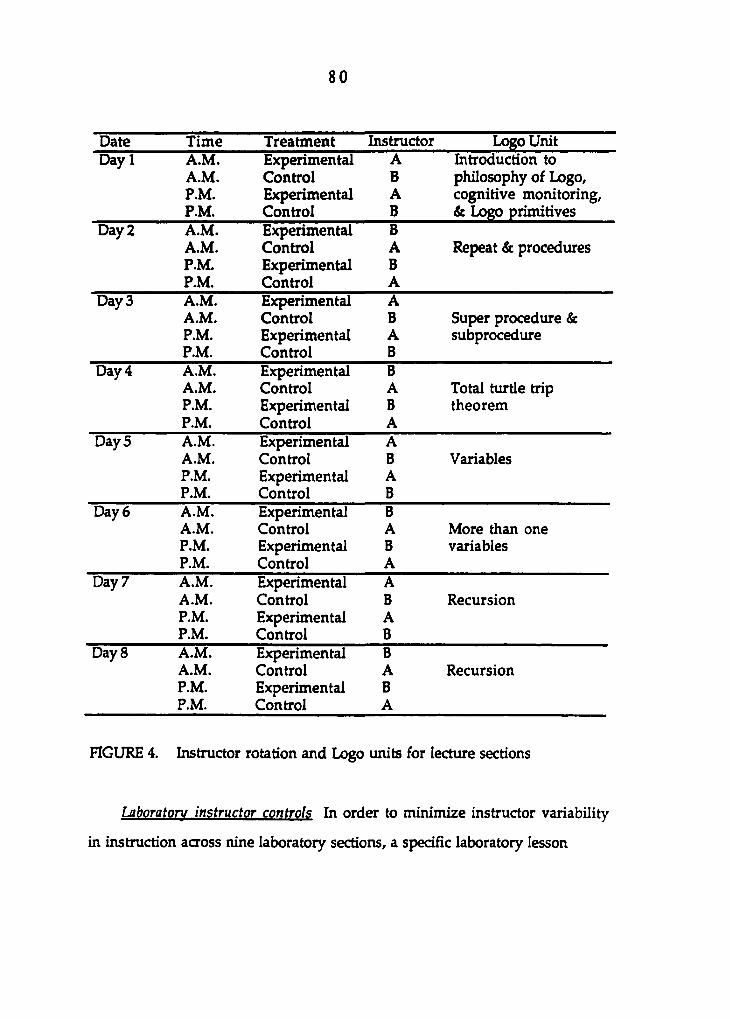
8 0
Date Time Treatment Instructor Logo Unit Day 1 A.M. Experimental A Introduction to
AM. Control B philosophy of Logo, P.M. Experimental A cognitive monitoring. P.M. Control B & Logo primitives
Day 2 AM. Experimental B A.M. Control A Repeat & procedures P.M. Experimental B P.M. Control A
Day 3 A.M. Experimental A AM. Control B Super procedure & P.M. Experimental A subprocedure P.M. Control B
Day 4 A.M. Experimental B A.M. Control A Total turtle trip P.M. Experimental B theorem P.M. Control A
Day 5 A.M. Experimental A A.M. Control B Variables P.M. Experimental A P.M. Control B
Day 6 A.M. Experimental B A.M. Control A More than one P.M. Experimental B variables P.M. Control A
Day 7 A.M. Experimental A AM. Control B Recursion P.M. Experimental A P.M. Control B
Day 8 A.M. Experimental B A.M. Control A Recursion P.M. Experimental B P.M. Control A
FIGURE 4. Instructor rotation and Logo units for lecture sections
Laboratory instructor controls In order to minimize instructor variability
in instruction across nine laboratory sections, a specific laboratory lesson
8 1
outline was provided to instructors of both treatment groups. Each of four
instructors taught both an experimental and control group, and an additional
instructor taught one laboratory section with an experimental treatment.
Pedagogical controls In order to ensure that instructors utilized a pure
instructional treatment and did not mix other instructional techniques,
explicit instructional outlines and content were provided for each class
meeting (Appendices D, E, H, and 1). These pedagogical outlines, along with
the student worksheets, were carefully sequenced, containing the identical
content of problems and examples for both treatment groups. These detailed
lesson outlines were used in all lectures and laboratory work throughout the
entire unit.
In addition to daily lesson outlines, the researcher provided
individualized training for each class session to help instructors eliminate
mixing instructional treatments. For laboratory sessions, this training
included reading the instructional materials and discussing the methodology
for the class session. Then, the instructors watched a 20 minute videotape that
included a model of teaching techniques for a guided instruction in Logo
programming. The laboratory instructor also micro taught a sample lesson in
front of the researcher and received suggestions from the researcher. Finally,
in order to ensure that the training and materials were being correctly
implemented by the laboratory instructors, the major professor of the class
periodically monitored the laboratory instruction in person.
The researcher also observed the lecture instructional process. The
lecture instructors met with the researcher twice a week for 60 minutes each
8 2
week in order to review previous and future lessons. The researcher also
videotaped each lecture instruction as well as laboratory instruction, reviewed
the videotape, and commented about each instructor's teaching method.
Introduction for cofnitive monitoring strate^es control Both the
experimental and control groups received the 30 minute introduction of the
philosophy of Logo programming, cognitive monitoring, and the component
processes of cognitive monitoring at the beginning of the Logo programming
unit. The brief introduction to cognitive monitoring included a general
definition of cognitive monitoring, an example of utilizing cognitive
monitoring strategies in an everyday life problem, a brief definition of the
theoretical components of the skills, an example of utilizing specific
components in solving a problem, and an example of the components used in
Logo programming (Appendix F).
Following this brief introduction, students began to receive their
respective instructional treatments. The treatment for the experimental
group emphasized use of the cognitive monitoring components in solving
their programming problems, whereas the control group emphasized self-
discovery learning with use of their own strategies in solving the
programming problems.
Classroom Controls In order to prevent differences due to the
environment effect, the classroom environment was controlled. For the
lecture session, since classes were split into two groups meeting
simultaneously, two separate rooms were necessary for each class. The
schedules were adjusted so that each of the rooms was used an equal number

8 3
of times by the experimental and control treatments. Thus, half of the
experimental sections, and half of the control sections were scheduled in each
of the two classrooms. Individual experimental and control sections always
met in the same location. Careful attendance records and quizzes were kept to
prevent students A-om showing up in the wrong room. All of the
instructional aids, such as an overhead projector, liquid crystal projection
devices, mobile computers for demonstration, etc., were equally provided to
both classrooms. For the laboratory sessions, each treatment group used the
same room and equipment for the laboratory work, thus, no laboratory
environmental difference for the experimental and control groups was
expected.
Procedures for administration of studv instruments
Each of the test instruments for the study was administered over the two
week period directly following the programming unit. Two students, one
from the experimental group and the other from the control group, dropped
the course during the experimental period because of personal problems.
Thus, 130 students completed the entire study. All of the tests were required
course activities and used to determine course grades.
The general planning test, the Logo decomposing and planning test, and
the Logo error identification test were administered the eighth week of the
course. This was the first week following the completion of the Logo unit.
The general planning test was administered in the lecture and had a time
limit of forty minutes. The Logo decomposing and planning test and the Logo
error identification test were treated as part of a laboratory midterm
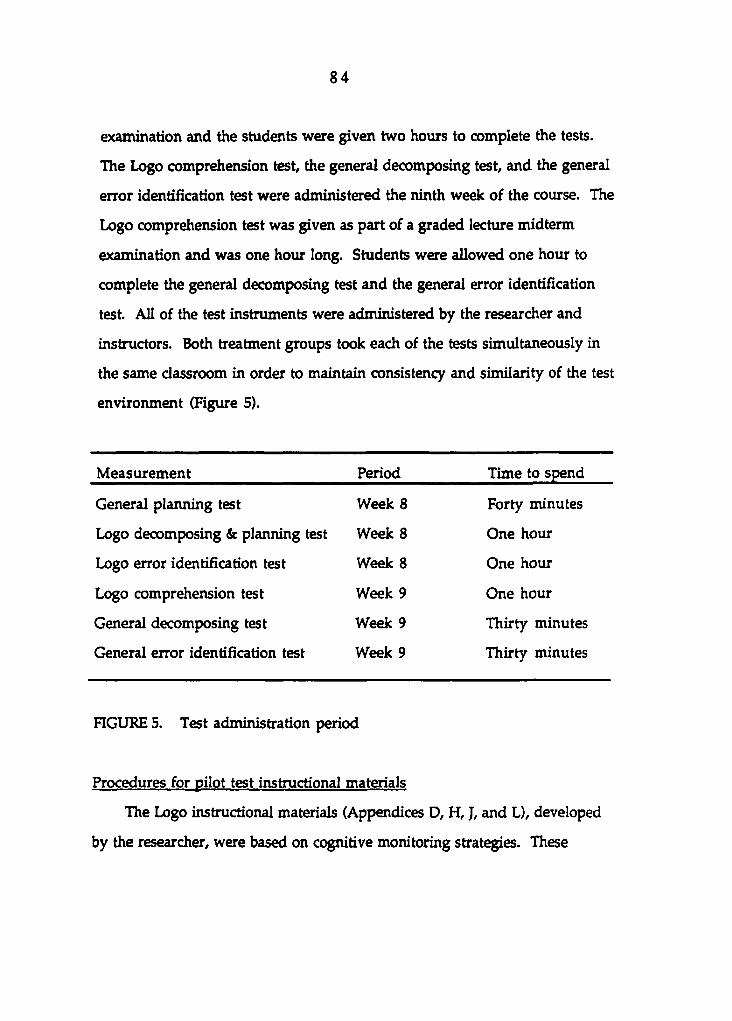
8 4
examination and the students were given two hours to complete the tests.
The Logo comprehension test, the general decomposing test, and the general
error identification test were administered the ninth week of the course. The
Logo comprehension test was given as part of a graded lecture midterm
examination and was one hour long. Students were allowed one hour to
complete the general decomposing test and the general error identification
test. All of the test instruments were administered by the researcher and
instructors. Both treatment groups took each of the tests simultaneously in
the same classroom in order to maintain consistency and similarity of the test
environment (Figure 5).
Measurement Period Time to spend
General planning test Week 8 Forty minutes
Logo decomposing & planning test Week 8 One hour
Logo error identification test Week 8 One hour
Logo comprehension test Week 9 One hour
General decomposing test Week 9 Thirty minutes
General error identification test Week 9 Thirty minutes
FIGURE 5. Test administration period
Procedures for pilot test instructional materials
The Logo instructional materials (Appendices D, H, J, and L), developed
by the researcher, were based on cognitive monitoring strategies. These
8 5
instructional materials were piloted to ensure their appropriateness for use in
the actual study. A regularly scheduled Secondary Education 101 class, during
the summer of 1990, was used for this purpose. During the pilot study,
instructional materials were critiqued and revised for both content and
sequence. The fall semester instructors for the course, a summer instructor
for Secondary Education 101 class, and the researcher shared information,
observed instructional processes, discussed the merits and weaknesses, and
suggested revisions. The researcher's records, student feedback, and daily
videotaped classroom observations were also used to revise the instructional
materials.
Instructional Materials
Instructional materials for the treatment
Instructional unit The Logo lesson unit involved five main sections;
introduction to Logo programming and primitives, procedures and sub-
procedures, total turtle trip theorem, variables, and recursions. Logo problems
and examples ranged successively from simple procedures using turtie
graphics, to more difficult problems utilizing multiple variables and
recursion. As resources for developing course content, LogoWorks: Lessons
in Logo, by Cory and Walker (1986) and Logo: MIT Logo for the Apple, by
Billstein, Libeskind, and Lott (1985) were referred to provide in-class problems
and examples. Content sheets for the experimental and control groups are
given in Appendices J, K, L, and M. Each Logo session consisted of two
sections: lecture and laboratory instructional materials.
8 6
Lecture materials Each instructional outline for the lecture section
contained an introduction of new programming commands, rationale for
learning these commands, demonstration of programming with the new
commands, two sets of Logo programming problems for the student activity,
introduction to homework assigiunent, and a quiz (Appendix D). The
instruction outline also indicated the role of the instructor in the
experimental group. The instructor's role indicated in the outline was to
encourage students to follow the cognitive monitoring activities consciously
by using Socratic dialogue. The activity worksheets for the experimental
group contained one set of problems for a teacher-student cooperative activity
utilizing formal cognitive monitoring steps and one set of problems for a
student activity for practicing formal cognitive monitoring activities
(Appendix J). In addition, an example of daily life problems was presented so
that students could apply formal cognitive monitoring activities to general
problem situations (Appendix G).
The Logo programming content for the control group was exactly the
same as the experimental group (Appendix E). Only the role of instructor, as
indicated in the instructional outline, was different than in the experimental
group. The role of the instructor indicated in the instructional outline for the
control group was to facilitate a self-discovery approach to the problems, to
encourage students to attack the problems with their own learning style, and
to monitor the progress. The activity sheets for the control group contained
two sets of problems for a student activity. The activity sheets included
general guidelines of solving problems so that students could refer to their
8 7
problem solving tasks (Appendix K). However, students were encouraged to
utilize their own methods to solve the problems.
Laboratory materials For the laboratory work, each instructional outline
for the experimental group contained a review of new commands learned
from the lecture, in-depth demonstration of examples applying the new
commands, three sets of Logo problems from a simple to a more complex
difficulty level, and an introduction to the homework assignment (Appendix
H). The laboratory instructor's role indicated in the instructional outline was
to guide students to employ cognitive monitoring strategies to solve the
problems. The activity worksheets contained one set of problem for the
teacher-student cooperative activity utilizing formal cognitive monitoring
activities and two sets of problems for a student activity to practice consciously
formal cognitive monitoring activities (Appendix L).
The Logo programming content for the control group was the same as
the experimental group (Appendix 1). The laboratory instructor's role, as
indicated in the instructional outline, was that of a facilitator to provide a self-
discovery learning environment. The activity worksheets for the control
group contained three sets of problems for a student activity. Although the
general guidelines of the problem solving process were provided at the
bottom of the worksheets, students were allowed a large degree of freedom in
the process of solving the problems (Appendix M).
8 8
Experimental Treatment
Experimental group
The experimental group received guided Logo instruction as an
experimental treatment. The guided instruction involved taking students
step-by-step through a structured approach of applying specific cognitive
monitoring strategies to solve a given programming problem. The students
in the experimental group were required to use specifically modeled cognitive
monitoring activities whenever they solved the programming problems.
Thus, the experimental treatment emphasized an acquisition of
metacognitive skills in the process of solving programming problems. They
were also encouraged to transfer the learned skills to other learning domains.
The following three pedagogical elements were stressed in the guided
instruction; (I) selecting Logo programming as a particular tool to teach
cognitive monitoring strategies, (2) modeling explicit instruction of cognitive
monitoring activities, and (3) teacher mediated learning to guide students to
apply the cognitive monitoring strategies to Logo problems as well as other
learning domains.
First pedagogical element The experimental treatment used Logo
programming as a tool to practice cognitive monitoring strategies rather than
learning programming as an activity itself. Students were told not to jump
into programming on the computer, but rather to follow sequentially the steps
of cognitive monitoring activities. Students were allowed about 10 minutes to
work through the first two steps of the cognitive monitoring activities before
they turned on the computer. Then, they spent 10 minutes more working
8 9
through the last two steps of the cognitive monitoring activities. The
instructor guided students to follow consciously these cognitive monitoring
processes by Socratic questioning, and close observation to ensure that
everyone was actively engaged in the step-by-step process as it was designed on
the instructional worksheets. The instructor also emphasized that Logo
programming is a way to learn cognitive monitoring strategies and
encouraged students to focus on the cognitive monitoring activities while
solving an assigned programming problem.
Second pedagogical element In order to facilitate the development of
cognitive monitoring strategies, five cognitive monitoring activities were
modeled for solving the programming problems (Appendix C). The
components of decomposing, planning, executing, identifying the error, and
debugging were explicitly structured into the programming activity to help
students consciously monitor their on-going thinking processes (Appendices J
and L).
The decomposing activity was designed to help students search for
definite and necessary elements or segments of a complex graphic problem.
Students were encouraged to find critical clues that could make the graphic
less confusing. For example, students might select the following three
elementary shapes in order to draw a house: a sqmre for a house frame and
windows, a rectangle for a door and a chimney, and a triangle for the roof.
The planning activity was designed to help students organize and
sequence the decomposed information and elements. Most important,
students needed to search for strategies to develop an efficient solution to the
9 0
problem. They also needed to consider structure and modularity of the
program. Thus, the planning activity helped students understand important
concepts of total turtle trip theorem, repeat, procedures, variables, and
recursion and apply those concepts to develop an efHdent solution to the
programming problem.
The executing step was designed to help students translate the planned
solution into Logo programming commands and execute them on a
computer. Students were encouraged to reflect their planning steps while
writing the codes for the solution.
In the process of identifying the error, students were encouraged to
describe the discrepancy between the desired graphic and the actual outcome,
if there were any errors. Describing discrepancies also helped students to
easily locate the statements which might cause the errors. For example, if the
discrepancy was the orientation of the graphic, then students would look at
the turtle's turn, rather than the distance. Then, students needed to locate
procedures that might cause critical errors. Finally, students needed to state
what was wrong with the procedures they located. In the identifying the error
activity, students were encouraged to consciously attempt to understand their
misconception or thinking errors. Then, as a debugging activity, students were
told to correct the errors on the computer.
The structured model of cognitive monitoring activities was employed
recursively until students solved a given problem. Students were encouraged
to utilize a cognitive monitoring cycle in a non-linear way in which they went
back to any step of the components if they thought the critical errors occurred
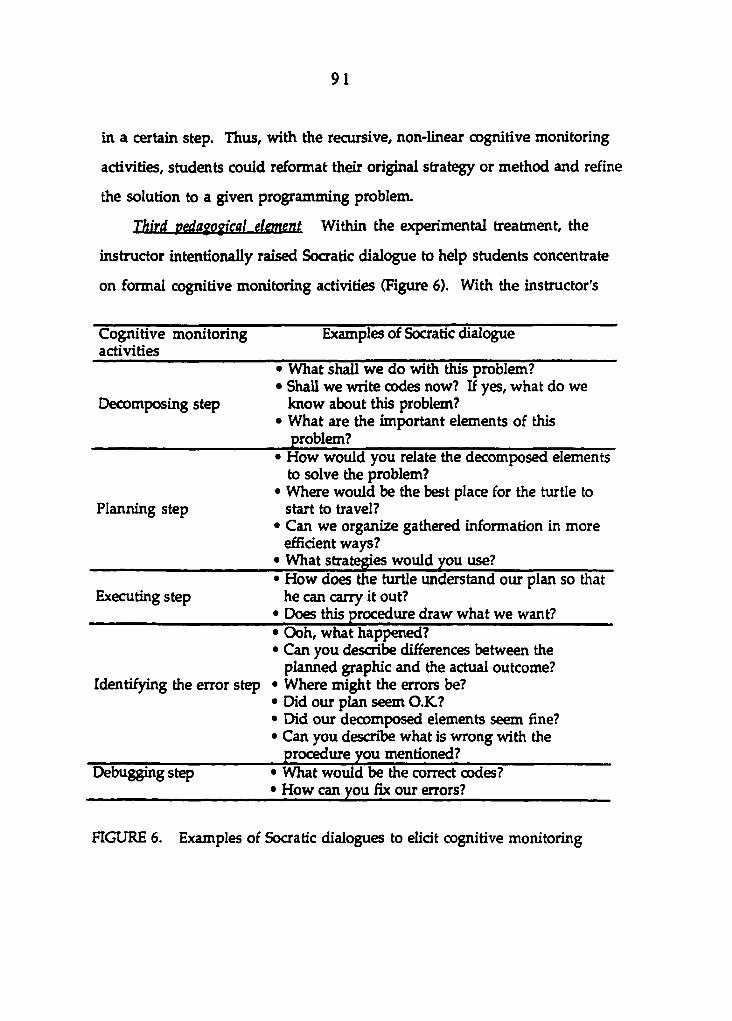
9 1
in a certain step. Thus, with the recursive, non-linear cognitive monitoring
activities, students could reformat their original strategy or method and refine
the solution to a given programming problem.
Third pedagogical element Within the experimental treatment, the
instructor intentionally raised Socratic dialogue to help students concentrate
on formal cognitive monitoring activities (Figure 6). With the instructor's
Cognitive monitoring Examples of Socratic dialogue activities
• What shall we do with this problem? • Shall we write codes now? If yes, what do we
Decomposing step know about this problem? • What are the important elements of this
problem? • How would you relate the decomposed elements
to solve the problem? • Where would be the best place for the turtle to
Planning step start to travel? • Can we organize gathered information in more
efficient ways? • What strategies would you use? • How does the turtle understand our plan so that
Executing step he can carry it out? • Does this procedure draw what we want? • Ooh, what happened? • Can you describe differences between the
planned graphic and the actual outcome? Identifying the error step • Where might the errors be?
• Did our plan seem O.K.? • Did our decomposed elements seem fine? • Can you describe what is wrong with the
procedure you mentioned? Debugging step • What would be the correct codes?
• How can you fix our errors?
FIGURE 6. Examples of Socratic dialogues to elicit cognitive monitoring
9 2
mediation, students worked through the steps of formal cognitive monitoring
activities on worksheets which were designed to elicit the cognitive
monitoring strategies. The first time, the instructor and students completed
the worksheet together through a Socratic dialogue format. Then, students
went through the formal cognitive monitoring activities on the student
activity worksheet by themselves. The student activity worksheets contained
an explicit model for the formal cognitive monitoring activities (see
Appendices J and L).
Finally, the instructor presented general problem situations from various
subject areas and guided students to utilize learned cognitive monitoring
processes while they were solving the given problem (Appendix G). The
instructor emphasized that such cogniUve monitoring strategies are the
highest level of approach to solve problems and can be applied across subjects
and situations. She also stressed why monitoring on-going thinking processes
was important in the problem solving process.
As the Logo session progressed, the instructor gradually reduced her
responsibility to lead students to engage in cognitive monitoring activities and
passed the leadership to the students. Thus, each student gradually took more
responsibility for her learning. In the experimental treatment, the most
important goal was that the students gradually internalized learned strategies
and were able to utilize those strategies whenever they needed them.
The control group
The control group was involved in Logo programming based on a self-
discovery learning method. In contrast to the experimental group, students in
9 3
the control group did not focus explicitly on the formal cognitive monitoring
process while solving the Logo problems. However, the lesson outline was
carefully designed in order to deliver the same information given to the
experimental group (Appendices E and 1). In the lecture, the instructor
introduced rationale, new concepts, and commands for the Logo instruction
unit Then, students worked individually on activity sheets in order to solve
the given programming problems. Students in the control group received a
large degree of freedom when they solved Logo programming problems.
Finally, the instructor gathered one or more different answers from students
and presented the solution to the entire class. If the answer produced errors,
then students debugged the errors by themselves without the instructor's
help. Thus, students in the control group spent more time programming
according to their own learning style and were able to compare several
different solutions.
The role of the laboratory instructor was also rather limited in the control
group, since the instructor led the students' activities by following the
traditional Logo philosophy of self-discovery, in which students explored their
ideas, and attempted to utilize various problem solving strategies and
methods according to their own learning styles with minimal adult
intervention. Thus, both lecture and laboratory instruction for the control
group allowed students as much freedom as possible in solving each assigned
programming problem so that students could test their ideas and strategies.
In order to prevent students from randomly engaging in problem
solving, Polya's (1973) four steps to mathematical problem solving were
9 4
presented in the activity sheets as general guidelines for the control group
(Appendices K and M). However, the instructor did not use these steps
formally. Problem solving activities for the control group were not structured
as the experimental group and did not use formal cognitive monitoring
components.
Instructors working in the control group were directed to maintain, as
much as possible, a self-discovery Logo programming environment while
students worked at the computer. The instructors avoided helping students
unless they specifically asked for assistance. They avoided giving direct
answers and assisted students by asking small Socratic questions when
students were having trouble with programming. The students in the control
group were encouraged to keep records of their work. Thus, in the control
group, the solution process and strategies were expected to be quite different
from student to student according to their own learning styles.
The instructional sequence of the control group provided hands-on
computer time approximately twice as long as that of the experimental group.
The experimental group spent more time practicing cognitive monitoring
strategies by using specific components of cognitive monitoring activities and
less time experiencing hands-on computer programming. On the other hand,
students in the control group spent most of their time on the computer, trying
to program and experiment with their solutions. This additional exploration
time was thought to be helpful to the self-discovery Logo approach.

9 5
Test Instniments
Seven instruments used in this study were as follows:
1) the questionnaire for the sample demographic information,
2 the Logo decomposing and planning test,
3) the Logo error identification test,
4) the general decomposing test,
5) the general planning test,
6) the general error identification test, and
7 the basic Logo comprehension test
The questionnaire was used as a pre-experimental measurement. The
Logo decomposing and planning test, and the Logo error identification test
were used to measure near transfer effects of cognitive monitoring strategies.
The general decomposing test, the general planning test, and the general error
identification test were used to measure far transfer effects of cognitive
monitoring strategies. The basic Logo comprehension test, developed by
Grandgenett (1989), was used to measure students' knowledge of basic Logo
content.
Development of questionnaire
The questionnaire was developed in order to collect demographic
information on the subjects (Appendix A). The questionnaire items were
selected by the researcher with advise from her major professor, a psychology
professor, and a computer science professor. The items were designed to
obtain students' academic background information as well as their attitudes
9 6
toward the computer. Among those items, the following seven variables
were selected as pre-experimental measurements in order to control
differences between the experimental and control groups: gender, year in
school, mathematics course experience, computer course experience,
computer ownership, computer confidence, and ACT score.
Development of test instruments
In this section, the process of developing five test instruments was
described. In order to develop the following test instruments, the researcher
conducted a literature review in each of the subject areas. The main literature
review included:
1) the Logo decomposing and planning test: Billstein, Libeskind, and Lott
(1985), Clements (1986,1987, 1990), Cory and Walker (1986), Lehrer (1989), and
Papert (1980a).
2) the Logo error identification test: Billstein, Libeskind, and Lott (1985),
Carver (1987), Qements (1986,1987,1990), Cory and Walker (1986), Deny
(1989), Van Haneghan and Baker (1989), Lehrer (1989), and Papert (1980a).
3) the general decomposing test: Bransford and Stein (1984), Burton
(1984a, 1984b), Derry (1989) Hyde (1989), NCTM (1965,1987,1988), Swan and
Black (1989), and Whimbey and Lochhead (1982)
4) the general planning test: Dulit (1975), Goldin & Hayes-Roth (1980), Pea
and Kurland (1984), and Rebok (1989).
5) the general error identification test: Bransford and Stein (1984), Burton
(1984a, 1984b), Derry (1989), Hyde (1989), NCTM (1965,1987,1988), Sternberg
(1986), Van Haneghan and Baker (1989), and Whimbey and Lochhead (1982).
9 7
Then using telephone discussion, the researcher consulted some of the
authors to develop test items in the context of this research theme. After the
consultation, some of authors provided the researcher with detailed research
materials relevant to this work. Following this consultation and a review of
the provided materials, the researcher also had discussion on potential test
items with professors in computer science, psychology, mathematics, and
teacher education, in order to confirm the content validity of the test items.
After several informal pilot studies, the researcher modified and refined the
tests. Then, the refined tests were again piloted with the students in
Secondary Education 101, in Spring and Summer, 1990 (the same course used
in the main study in Fall, 1990).
The researcher and one other instructor scored the collected tests
individually in order to test the reliability of scoring system. A Pearson
correlation was applied to measure the reliability of scoring-rescoring for each
test The correlation coefficients for scoring-rescoring reliability were r=.97
(p<.001) for the Logo decomposing and planning test, r=.97 (p<.001) for the
Logo error identification test, r=.98 (p<.001) for the general decomposing test,
r=.94 (pc.OOl) for the general plaiming test, and r=.97 (p<.001) for the general
error identification test.
Logo decomposing and planning test
The purpose of this test was to evaluate students' abilities to break a
complex Logo graphic into simpler, elementary shapes and to devise a
modular and efficient solution to the programming problem. This test
contained five different items from simple problems to difficult ones

9 8
(Appendix R). Each problem provided a graphic which had not been used in
the class activity and was scored first for the decomposing skills and second for
the planning skills.
There were three questions for each problem. The first question (part A)
was to measure a student's decomposing skills. Students were asked to break
down the given graphic and list the names of subprocedures they would use
in a program to create the graphic. The second question (part B) was to
measure a student's ability to plan an efficient solution to the problem.
Students needed to think not only about the efficient turtle trip but also the
logic and modularity of the planning to solve the problem. In the third
question (part C), students were requested to write Logo code consistent with
their solution. The third question was used to help an instructor better
understand a student's planning strategies.
The decomposing portion was scored according to the following
procedures:
"T I Absolute value of score I = the optimal number of decomposed subprocedures - the number of student's subprocedures
2. Possible score = 5-1 Absolute value of score I
For example, in the following Logo decomposing and planning problem
(Hgure 7), the optimal number of subprocedures was set up as one (a
rectangle) in the example, because the same rectangle could be used repeatedly
to obtain the solution. If the student indicated one subprocedure, her absolute
value of score became zero. Then, her possible score for this problem would
be five points. If the students indicated three subprocedures, her absolute
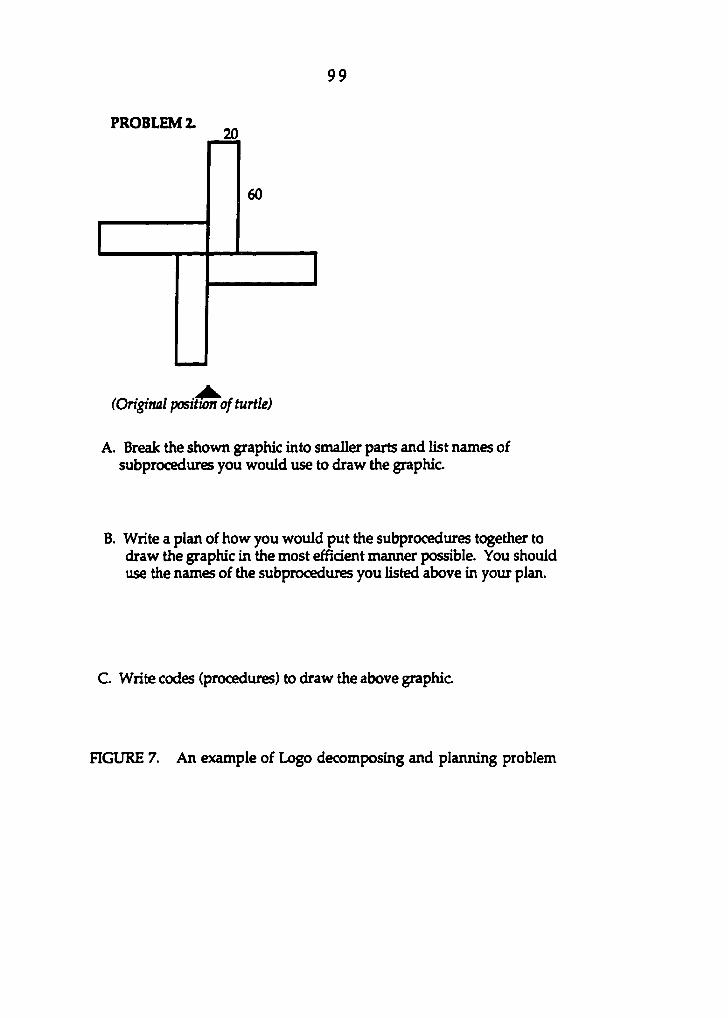
9 9
PROBLEM 2. 2 0
60 60
(Original position of turtle)
A. Break the shown graphic into smaller parts and list names of subprocedures you would use to draw the graphic
B. Write a plan of how you would put the subprocedures together to draw the graphic in the most efBdent manner possible. You should use the names of the subprocedures you listed above in your plan.
C. Write codes (procedures) to draw the above graphic
FIGURE 7. An example of Logo decomposing and planning problem
1 0 0
value of score became two. Thus, her possible decomposing score would be
three points. The optimal number of decomposed subprocedures was
different from one problem to another, but the possible decomposing score for
each problem was five. Thus total possible decomposing score was 25 points (5
points for each problem X 5).
For the Logo planning, the optimal planning solution was to
demonstrate logic in thinking, contain no error in their planning (e.g., if
students missed a turtle movement in their planning, turning the turtle, size,
and so on.}, and demonstrate modularity of planning. The total possible
planning score for part B in each problem was five points. For example, in
Figure 7, the optimal planning would be: (1) move the turtle to center,
(2) draw size of 20 60 rectangle, (3) turn 90 degrees, and (4) repeat this
procedure four times in applying the total turtle trip theorem. If the student
indicated the above procedures for part B, she gained five points for that
problem. For the logic of thinking, if the student missed a turtle movement
first, one point was subtracted fi-om 5 (-1 point); no repeat statements received
minus two points (-2 points); if the planning produced a totally different
figure, then zero points (0 points) was given for scoring part B. The optimal
planning strategy was different for each problem but the possible score for part
B in each problem was five.
For scoring the part C, a total of 10 points were given for each problem.
Omitting necessary statements in the procedure yielded minus one point
(-1 point) for each (e.g., Rt, Lt, Fd, Bk, Pu, Pd, for verifying variables, and
To-End statement). Missing a necessary subprocedure produced minus two
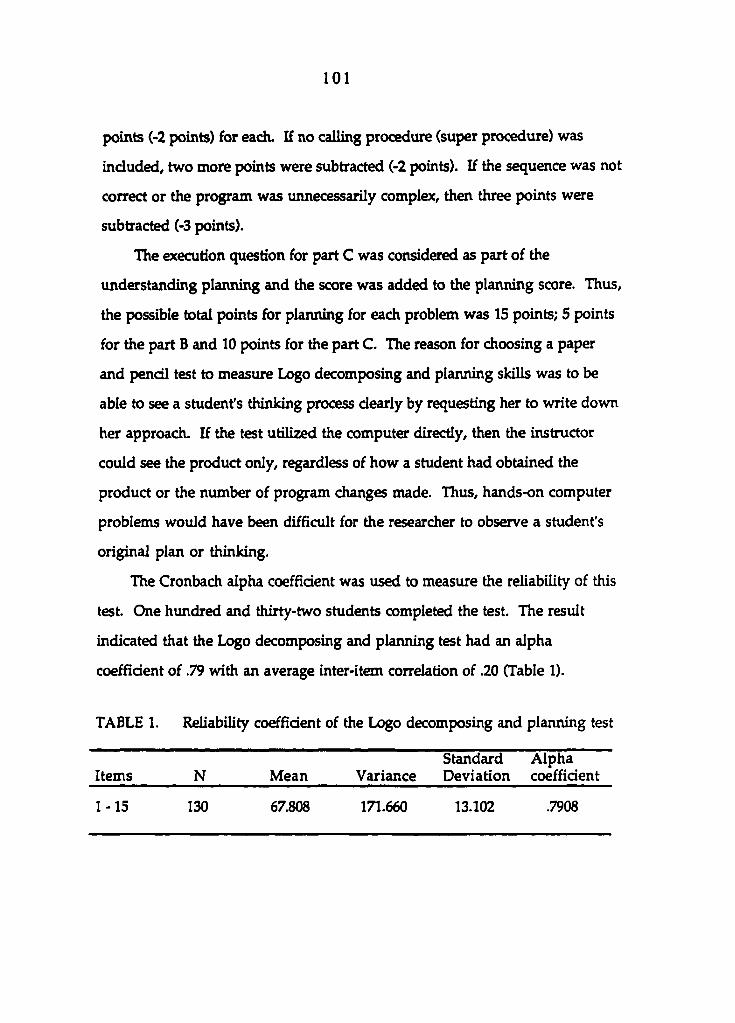
1 0 1
points (-2 points) for each. If no calling procedure (super procedure) was
included, two more points were subtracted (-2 points). If the sequence was not
correct or the program was unnecessarily complex, then three points were
subtracted (-3 points).
The execution question for part C was considered as part of the
understanding planning and the score was added to the plaiming score. Thus,
the possible total points for plaiming for each problem was 15 points; 5 points
for the part B and 10 points for the part C. The reason for choosing a paper
and pencil test to measure Logo decomposing and planning skills was to be
able to see a student's thinking process clearly by requesting her to write down
her approach. If the test utilized the computer directly, then the instructor
could see the product only, regardless of how a student had obtained the
product or the number of program changes made. Thus, hands-on computer
problems would have been difHcult for the researcher to observe a student's
original plan or thinking.
The Cronbach alpha coefficient was used to measure the reliability of this
test. One hundred and thirty-two students completed the test. The result
indicated that the Logo decomposing and planning test had an alpha
coefficient of .79 with an average inter-item correlation of .20 (Table I).
TABLE 1. Reliability coefficient of the Logo decomposing and planning test
Standard Alpha Items N Mean Variance Deviation coefficient
1-15 130 67.808 171.660 13.102 .7908
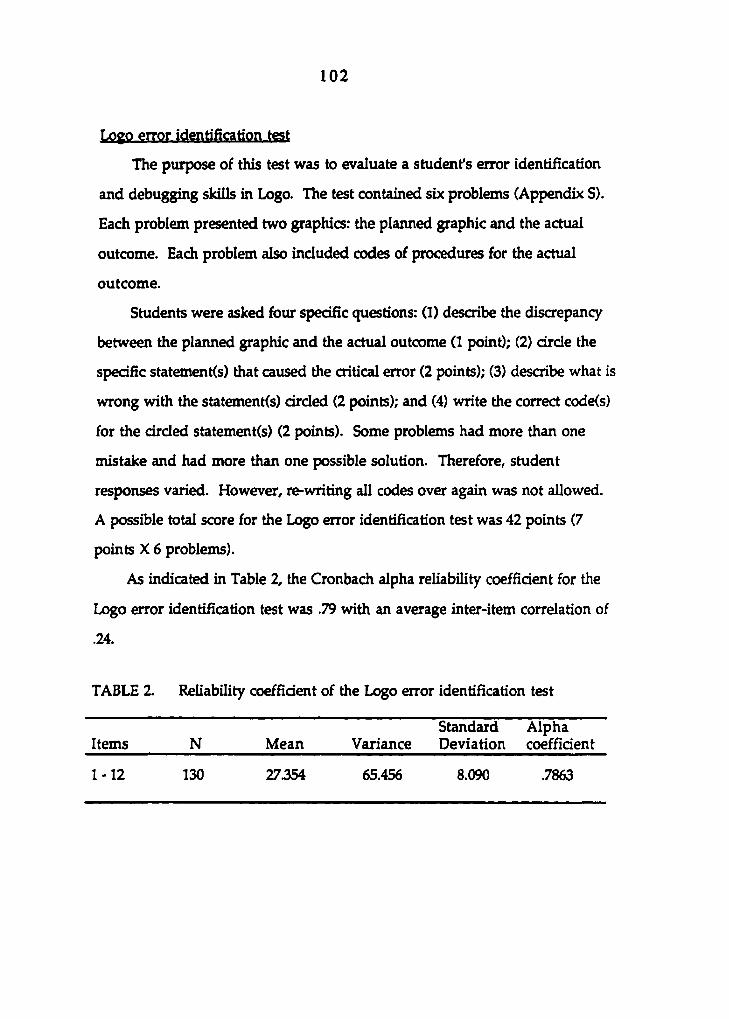
1 0 2
Logo error identification test
The purpose of this test was to evaluate a student's error identification
and debugging skills in Logo. The test contained six problems (Appendix S).
Each problem presented two graphics: the planned graphic and the actual
outcome. Each problem also included codes of procedures for the actual
outcome.
Students were asked four specific questions: (1) describe the discrepancy
between the planned graphic and the actual outcome (1 point); (2) circle the
specific statemenKs) that caused the critical error (2 points); (3) describe what is
wrong with the statemenKs) circled (2 points); and (4) write the correct code(s)
for the circled statementCs) (2 points). Some problems had more than one
mistake and had more than one possible solution. Therefore, student
responses varied. However, re-writing all codes over again was not allowed.
A possible total score for the Logo error identification test was 42 points (7
points X 6 problems).
As indicated in Table 2, the Cronbach alpha reliability coefficient for the
Logo error identification test was .79 with an average inter-item correlation of
.24.
TABLE 2. Reliability coefficient of the Logo error identification test
Standard Alpha Items N Mean Variance Deviation coefficient
1-12 130 27354 65.456 8.090 .7863
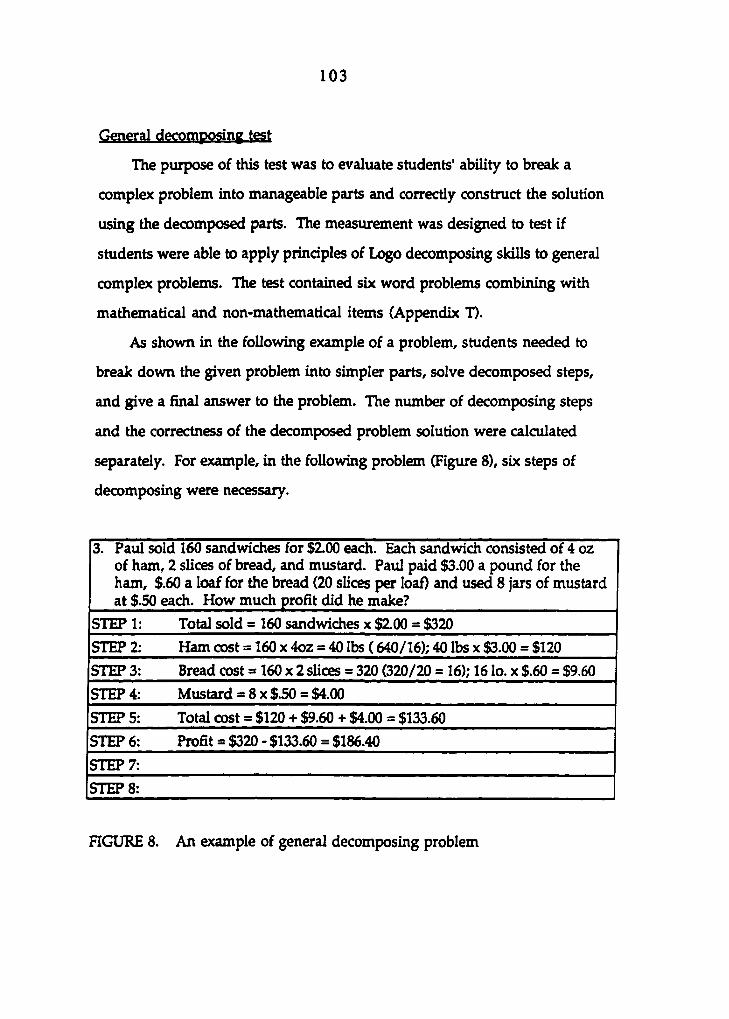
1 0 3
General decomposing test
The purpose of this test was to evaluate students' ability to break a
complex problem into manageable parts and correctly construct the solution
using the decomposed parts. The measurement was designed to test if
students were able to apply principles of Logo decomposing skills to general
complex problems. The test contained six word problems combining with
mathematical and non-mathematical items (Appendix T).
As shown in the following example of a problem, students needed to
break down the given problem into simpler parts, solve decomposed steps,
and give a fînal answer to the problem. The number of decomposing steps
and the correctness of the decomposed problem solution were calculated
separately. For example, in the following problem (Figure 8), six steps of
decomposing were necessary.
3. Paul sold 160 sandwiches for $200 each. Each sandwich consisted of 4 oz of ham, 2 slices of bread, and mustard. Paul paid $3.00 a pound for the ham, $.60 a loaf for the bread (20 slices per loaf) and used 8 jars of mustard at $.50 each. How much profit did he make?
STEPl Total sold = 160 sandwiches x $200 = $320
STEP2 Ham cost = 160 x 4oz = 40 lbs ( 640/16); 40 lbs x $3.00 = $120
STEP3 Bread cost = 160 x 2 slices = 320 (320/20 = 16); 16 lo. x $.60 = $9.60
STEP 4 Mustard = 8x $.50 = $4.00
STEPS Total cost = $120 + $9.60 + $4.00 = $133.60
STEP6 Profit = $320 - $133.60 = $186.40
STEP7
STEP8
FIGURE 8. An example of general decomposing problem
1 0 4
Each correctly decomposed step gained one point (1 point) and each
correct answer to the decomposed problem solution also gained one point
(1 point). However, if students obtained an incorrect answer at an earlier step
and used the same answer consistently, they lost a point only once. Thus, the
scoring criteria contained the following points:
problem 1: 5 steps of decomposing (5 points in total) and correctness of
each step of the decomposed problem (5 points in total),
problem 2: 6 steps of decomposing (6 points in total) and correctness of
each step of the decomposed problem (6 points in total),
problem 3: 6 steps of decomposing (6 points in total) and correctness of
each step of the decomposed problem (6 points in total),
problem 4: 6 steps of decomposing (6 points in total) and correctness of
each step of the decomposed problem (6 points in total),
problem 5: 5 steps of decomposing (5 points in total) and correctness of
each step of the decomposed problem (5 points total),
problem 6: 5 steps of decomposing (4 points in total) and correctness of
each step of the decomposed problem (4 points in total).
Thus, the possible total score for the general decomposing test was 64 points.
The Cronbach alpha reliability coefficient for the general decomposing
test was .74 with an average inter-item correlation of .19 (Table 3).
General planning test
The purpose of this test was to measure a student's ability to organize
given information, to order a sequence of actions to be performed, and to
think logically in order to achieve the goal most efficiently. The test contained
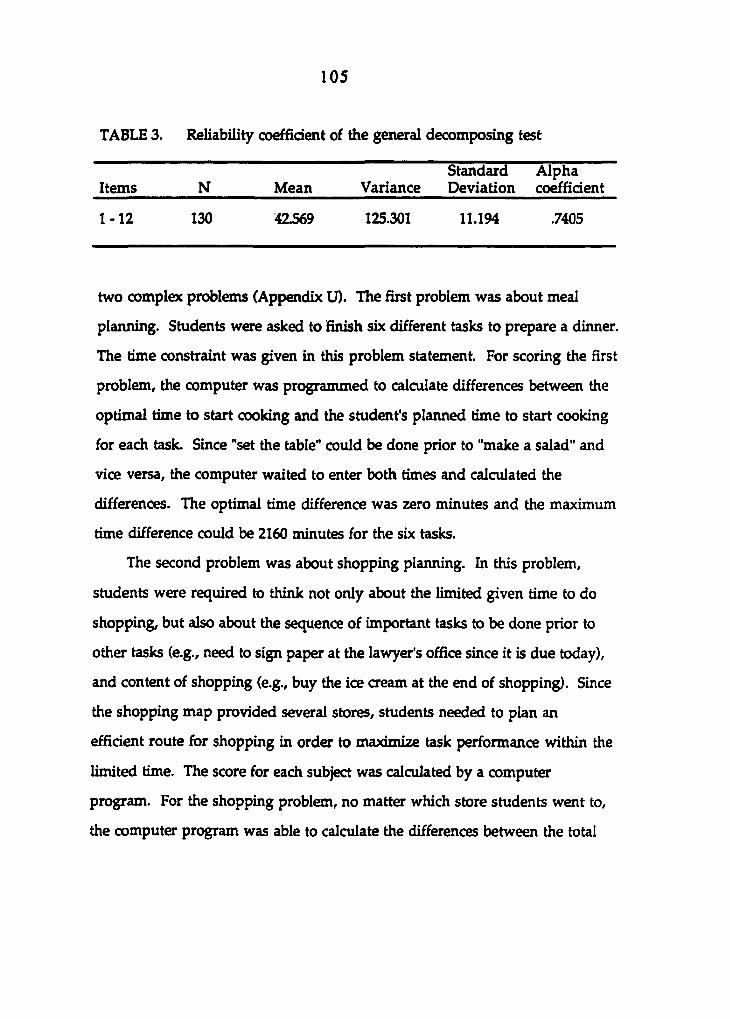
1 0 5
TABLE 3. Reliability coefficient of the general decomposing test
Items N Mean Variance Standard Deviation
Alpha coefficient
1-12 130 42.569 125.301 11.194 .7405
two complex problems (Appendix U). The first problem was about meal
planning. Students were asked to finish six different tasks to prepare a dinner.
The time constraint was given in this problem statement For scoring the first
problem, the computer was programmed to calculate differences between the
optimal time to start cooking and the student's planned time to start cooking
for each task. Since "set the table" could be done prior to "make a salad" and
vice versa, the computer waited to enter both times and calculated the
differences. The optimal time difference was zero minutes and the maximum
time difference could be 2160 minutes for the six tasks.
The second problem was about shopping planning. In this problem,
students were required to think not only about the limited given time to do
shopping, but also about the sequence of important tasks to be done prior to
other tasks (e.g., need to sign paper at the lawyer's office since it is due today),
and content of shopping (e.g., buy the ice cream at the end of shopping). Since
the shopping map provided several stores, students needed to plan an
efficient route for shopping in order to maximize task performance within the
limited time. The score for each subject was calculated by a computer
program. For the shopping problem, no matter which store students went to,
the computer program was able to calculate the differences between the total
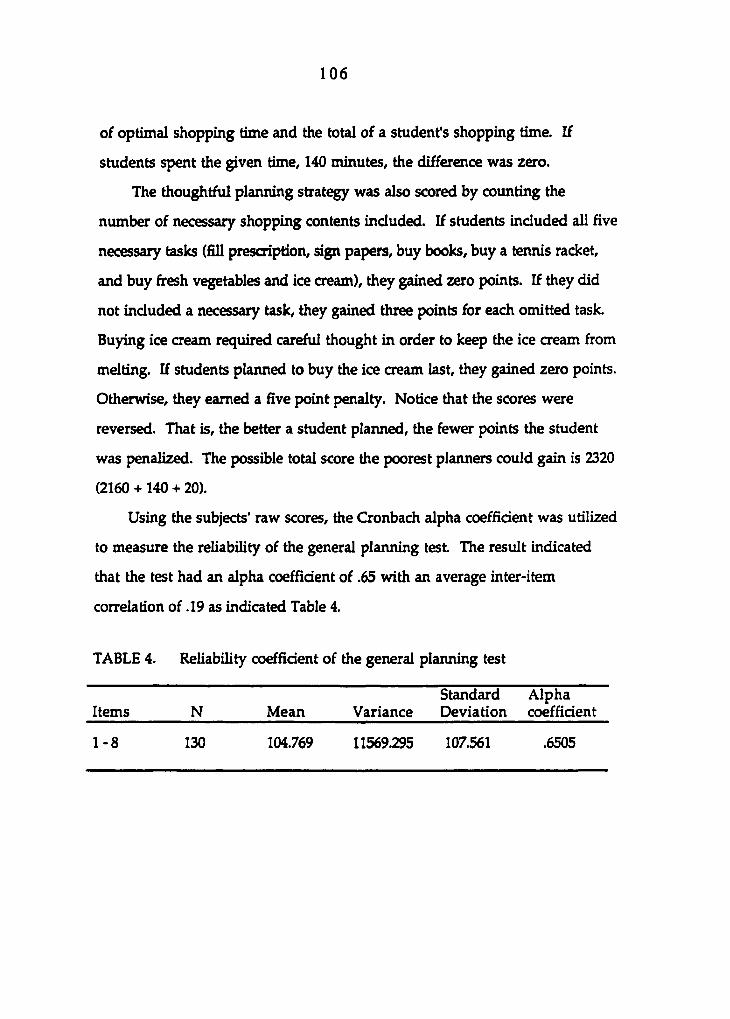
1 0 6
of optimal shopping time and the total of a student's shopping time. If
students spent the given time, 140 minutes, the difference was zero.
The thoughtful planning strategy was also scored by counting the
number of necessary shopping contents included. If students included all Ave
necessary tasks (511 prescription, sign papers, buy books, buy a tennis racket,
and buy A-esh vegetables and ice cream), they gained zero points. If they did
not included a necessary task, they gained three points for each omitted task.
Buying ice cream required careful thought in order to keep the ice cream from
melting. If students planned to buy the ice cream last, they gained zero points.
Otherwise, they earned a five point penalty. Notice that the scores were
reversed. That is, the better a student planned, the fewer points the student
was penalized. The possible total score the poorest plaiwers could gain is 2320
(2160 + 140 + 20).
Using the subjects' raw scores, the Cronbach alpha coefficient was utilized
to measure the reliability of the general planning test The result indicated
that the test had an alpha coefficient of .65 with an average inter-item
correlation of .19 as indicated Table 4.
TABLE 4. Reliability coefficient of the general planning test
Items N Mean Variance Standard Deviation
Alpha coefficient
1-8 130 104.769 11569.295 107.561 .6505
1 0 7
The raw scores were linearly transformed in order to make high
performance positive. The scores were converted to a percentage by using the
following formula:
Percentage - Total maximum points - Student total points
Total maximum points
Then, the transformed scores for each subject were used for the statistical
analysis of the hypotheses. Since the planning score was linearly transformed,
it did not affect the correlation of this score with other measures.
General error identification test
The purpose of this test was to evaluate students' ability to detect what
was wrong with a given problem, find errors in a given solution process,
explain cause of the errors, and correct the indicated errors. The measurement
was to test if students were able to apply monitoring strategies to other
domain problems. The test contained six word problems combined with
mathematical and non-mathematical items (Appendix V). Each problem
presented steps of the solution process and final answer. Then students were
asked four specific questions: (1) whether the given solution process and
answer to the problem is correct or not; (2) if the solution is not correct, then
drcle the specific statement(s) that caused the critical error (2 points); (3)
describe what is wrong with the statement(s) circled (2 points); and (4) write
the correct answer (2 points). For the second question, if students included the
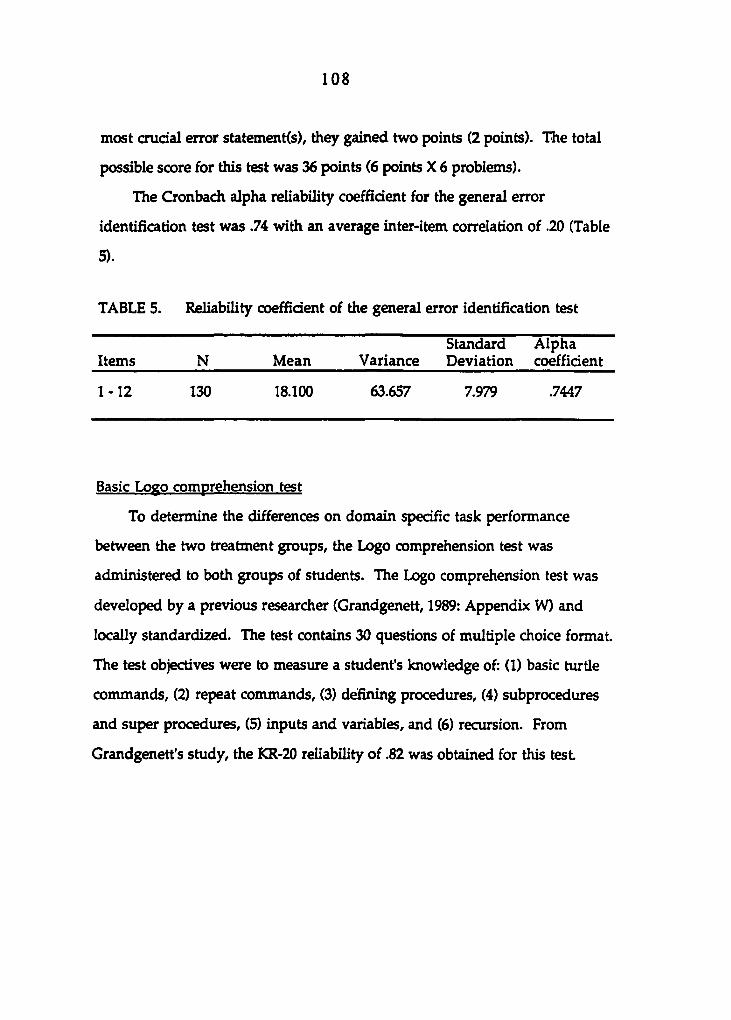
1 0 8
most crudal error statement(s), they gained two points (2 points). The total
possible score for this test was 36 points (6 points X 6 problems).
The Cronbach alpha reliability coefficient for the general error
identification test was .74 with an average inter-item correlation of .20 (Table
5).
TABLE 5. Reliability coefficient of the general error identification test
Standard Alpha Items N Mean Variance Deviation coefficient
1-12 130 18.100 63.657 7.979 .7447
Basic Logo comprehension test
To determine the ditferences on domain specific task performance
between the two treatment groups, the Logo comprehension test was
administered to both groups of students. The Logo comprehension test was
developed by a previous researcher (Grandgenett, 1989: Appendix W) and
locally standardized. The test contains 30 questions of multiple choice format.
The test objectives were to measure a student's knowledge of: (1) basic turtle
commands, (2) repeat commands, (3) defining procedures, (4) subprocedures
and super procedures, (5) inputs and variables, and (6) recursion. From
Grandgenett's study, the KR-20 reliability of .82 was obtained for this test.
1 0 9
Analysis of Data
Data collected from the tests were analyzed by using the Statistical
Package for Social Science (SPSS^) program at the Computation Center, Iowa
State University. Statistical analyses consisted of two parts: (1) descriptive
statistics for the general description of the data and (2) inferential statistics to
test the research hypotheses.
Descriptive statistics were used to give a general picture of the
characteristics of the sample. Descriptive statistics on the general
characteristics of the sample were summarized in the sample section of this
chapter.
A student t-test was applied to the following five background variables to
test for any significant differences between the experimental and control
group: mathematics courses taken at high school, computer courses taken
either at high school or college, computer confidence scores, and ACT scores.
A non-parametric Chi-square test was used to test independence of selected
categorical measures: gender, year in college, and computer ownership.
A t-test of the Pearson product-moment correlation was applied to test
any significant relationships among the following six dependent variables:
Logo decomposing score, Logo planning score, Logo error identification score,
general decomposing score, general planning score, and general error
identification score.
To test the research hypotheses, several statistical methods were
employed. First, multivariate analysis of covariance (MANOVA) was used to
test overall transfer effects of guided instruction with Logo programming.

1 1 0
Second, analysis of covariance (ANCOVA) was used to test hypotheses of each
individual dependent variable. Gender, year in college, mathematics courses
taken in high school, computer courses taken in either high school or college,
computer ownership, computer confidence scores, and ACT scores were used
as covariates. A multiple regression analysis was also used to identify the
most influenced dependent variable by the treatment.
I l l
RESULTS
Introduction
The purpose of this chapter is to present the results of the statistical
analyses applied to the data collected from the research instruments. The
study focused on the effects of guided instruction with Logo programming on
the development of cognitive monitoring strategies. To achieve the purpose
of the study, the instructional treatment (guided instruction vs. self-discovery
learning) was implemented as the independent variable. Then, the transfer
effect (near vs. far transfer) was measured by administering research
instruments. Effects of the instructional treatment on the acquisition of basic
Logo programming concepts were also tested by administering the multiple
choice basic Logo comprehension test
This chapter is organized into five sections. In the first section,
comparisons of the groups on the pre-experimental measures are presented.
The findings are presented to establish the equality of the two groups prior to
the beginning of the experiment after random assignment. In the second
section, each of the seven formal hypotheses is presented and relevant
findings are summarized. In the third section, findings fiom the basic Logo
comprehension test are presented. Hndings of this research that were not
included in the hypotheses are presented in the forth section titled auxiliary
findings. The final section of the chapter provides a summary of the research
results.
1 1 2
Analysis of Pre-Experimental Measures
As stated in Chapter 3, a questionnaire was given to collect data on
gender, year in college, number of mathematics courses taken in high school,
number of computer courses taken either in high school or college, computer
ownership, and computer confidence. The students' ACT scores, from the
Iowa State University Registrar's office, were also obtained. These data were
analyzed to determine whether or not differences existed between the
experimental and control groups prior to the treatment.
A t-test was calculated to determine if differences on the following
selected measures existed: mathematics courses taken in high school,
computer courses taken either in high school or college, computer confidence
scores, and ACT scores (Table 6). A nonparametric Chi-square test was
conducted to determine independence of selected categorical measures:
gender, year in college, and computer ownership (Table 7).
The results from both tests showed that there were no significant
differences between the two groups on the variables of gender, year in college,
mathematics courses taken in high school, computer courses taken either in
high school or college, computer ownership, computer confidence scores, and
ACT scores. Seven subjects did not have ACT score records, four from the
control group and three from the experimental group. In the experimental
period, two subjects dropped out of the course for personal reasons, one from
each group. Thus, a total 125 subjects were used to analyze the hypotheses for
this study.
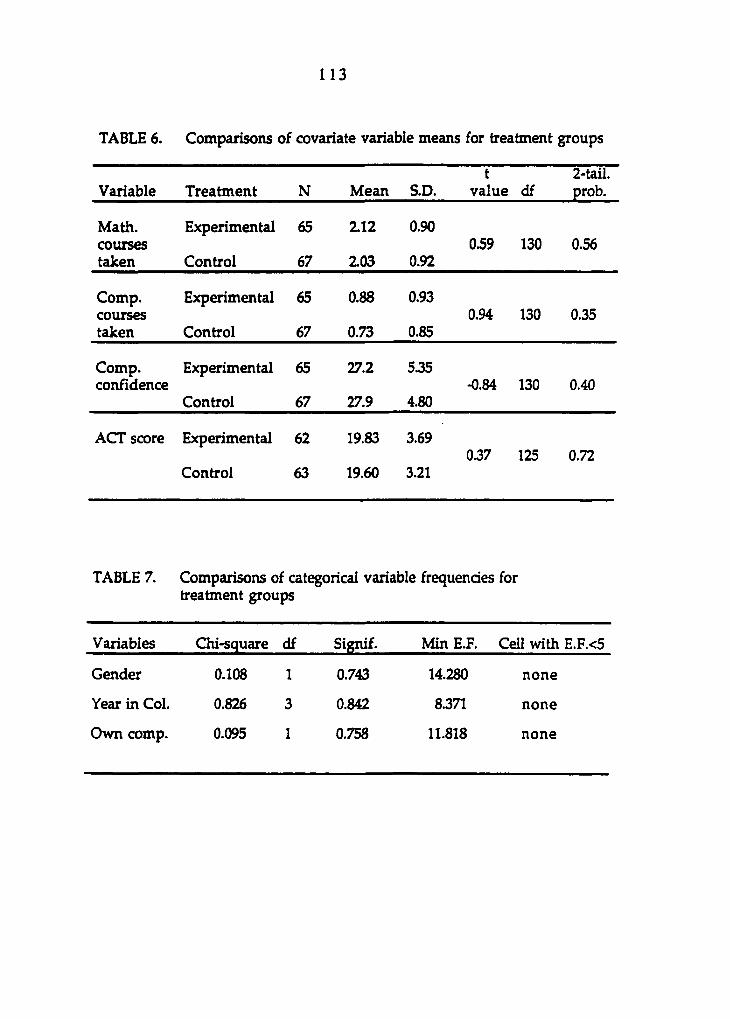
1 1 3
TABLE 6. Comparisons of covariate variable means for treatment groups
t 2-tail. Variable Treatment N Mean S.D. value df prob.
Math, courses
Experimental 65 2.12 0.90 0.59 130 0.56
taken Control 67 2.03 0.92
Comp. courses
Experimental 65 0.88 0.93 0.94 130 0.35
taken Control 67 0.73 0.85
Comp. conscience
Experimental
Control
65
67
27.2
27.9
535
4.80 -0.84 130 0.40
ACT score Experimental
Control
62
63
19.83
19.60
3.69
3.21 0.37 125 0.72
TABLE 7. Comparisons of categorical variable frequencies for treatment groups
Variables Chi-square df Signif. Min E.F. Cell with E.F.<5
Gender 0.108 1 0.743 14.280 none
Year in Col. 0.826 3 0.842 8.371 none
Own comp. 0.095 1 0.758 11.818 none
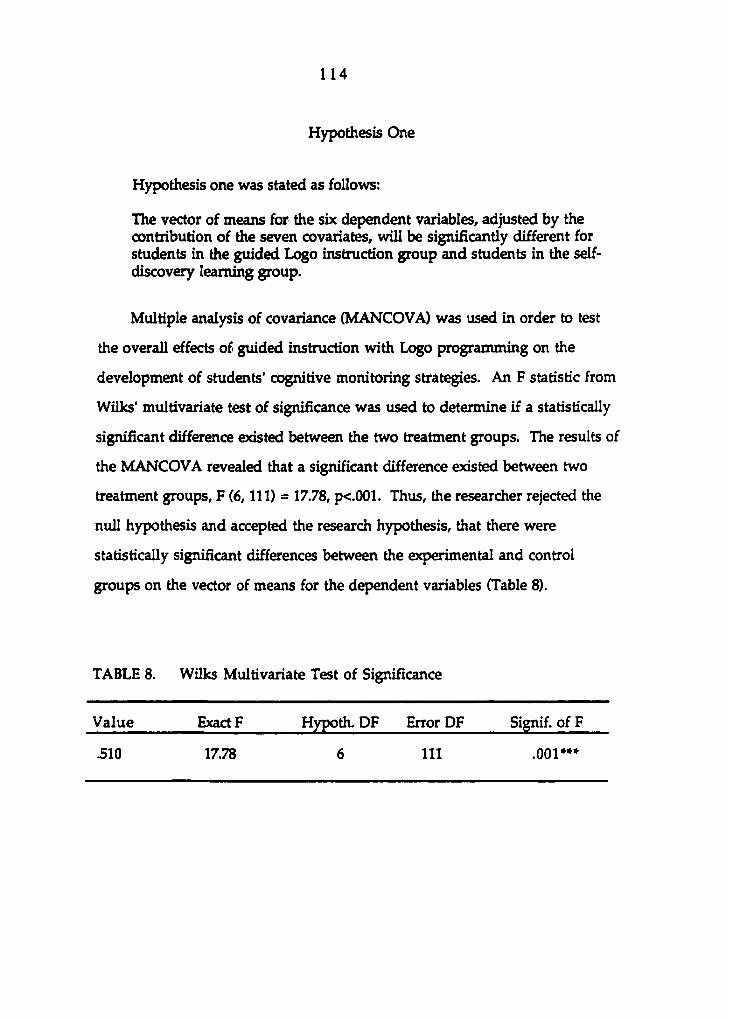
1 1 4
Hypothesis One
Hypothesis one was stated as follows:
The vector of means for the six dependent variables, adjusted by the contribution of the seven covariates, will be significantly different for students in the guided Logo instruction group and students in the self-discovery learning group.
Multiple analysis of covariance (MANCOVA) was used in order to test
the overall effects of guided instruction with Logo programming on the
development of students' cognitive monitoring strategies. An F statistic from
Wilks' multivariate test of significance was used to determine if a statistically
significant difference existed between the two treatment groups. The results of
the MANCOVA revealed that a significant difference existed between two
treatment groups, F (6, 111) = 17.78, p<.001. Thus, the researcher rejected the
null hypothesis and accepted the research hypothesis, that there were
statistically significant differences between the experimental and control
groups on the vector of means for the dependent variables (Table 8).
TABLE 8. Wilks Multivariate Test of Significance
Value ExactF Hypoth. DF Error DF Signif. of F
.510 17.78 6 111 .001»»»
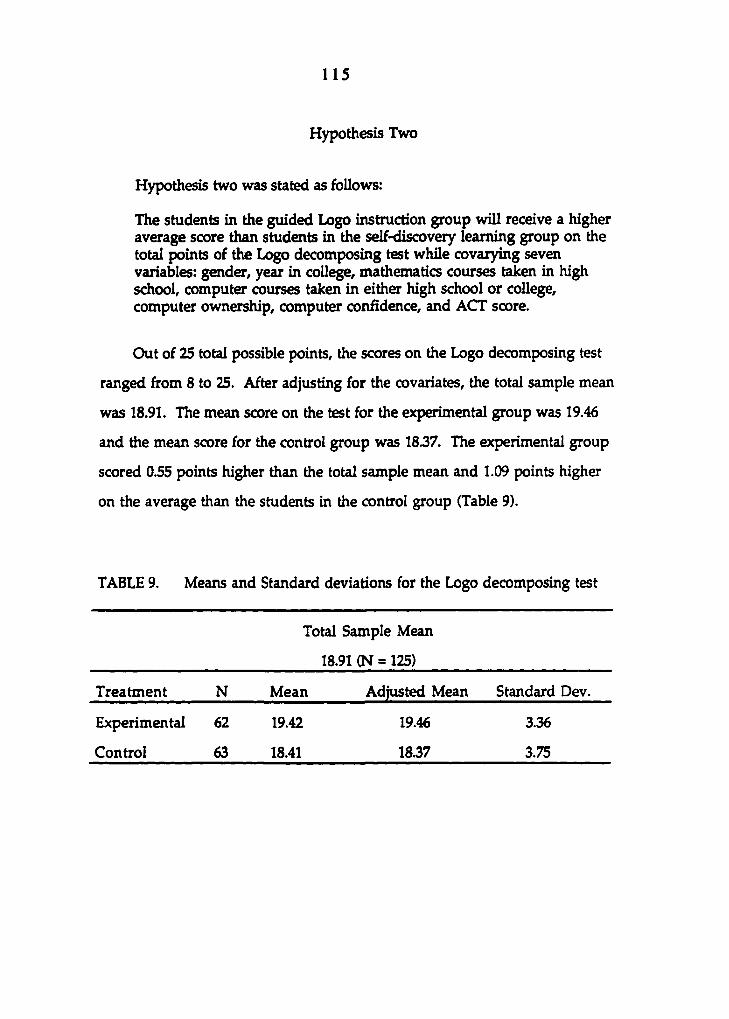
1 1 5
Hypothesis Two
Hypothesis two was stated as follows:
The students in the guided Logo instruction group will receive a higher average score than students in the self-discovery learning group on the total points of the Logo decomposing test while covarying seven variables: gender, year in college, mathematics courses taken in high school, computer courses taken in either high school or college, computer ownership, computer confidence, and ACT score.
Out of 25 total possible points, the scores on the Logo decomposing test
ranged from 8 to 25. After adjusting for the covariates, the total sample mean
was 18.91. The mean score on the test for the experimental group was 19.46
and the mean score for the control group was 1837. The experimental group
scored 0.55 points higher than the total sample mean and 1.09 points higher
on the average than the students in the control group (Table 9).
TABLE 9. Means and Standard deviations for the Logo decomposing test
Total Sample Mean
18.91 (N = 125)
Treatment N Mean Adjusted Mean Standard Dev.
Experimental 62 19.42 19.46 3.36
Control 63 18.41 1837 3.75
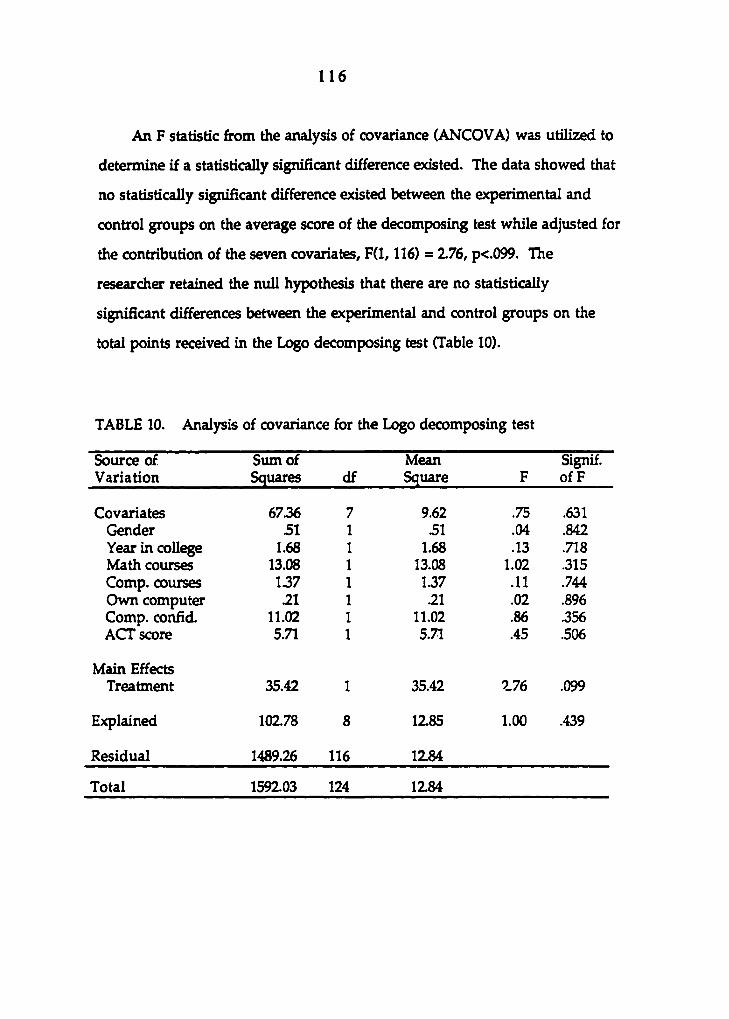
1 1 6
An F statistic from the analysis of covariance (ANCOVA) was utilized to
determine if a statistically significant difference existed. The data showed that
no statistically significant difference existed between the experimental and
control groups on the average score of the decomposing test while adjusted for
the contribution of the seven covariates, F(l, 116) = 2.76, p<.099. The
researcher retained the null hypothesis that there are no statistically
significant differences between the experimental and control groups on the
total points received in the Logo decomposing test (Table 10).
TABLE 10. Analysis of covariance for the Logo decomposing test
Source of Variation
Sum of Squares df
Mean Square F
Signif. of F
Covariates 6736 7 9.62 .75 .631 Gender 51 1 .51 .04 .842 Year in college 1.68 1 1.68 .13 .718 Math courses 13.08 1 13.08 1.02 .315 Comp. courses 137 1 137 .11 .744 Own computer 21 1 21 .02 .896 Comp. confid. 11.02 1 11.02 .86 .356 ACT score 5.71 1 5.71 .45 .506
Main Effects Treatment 35.42 1 35.42 276 .099
Explained 102.78 8 1285 1.00 .439
Residual 1489.26 116 1284
Total 1592.03 124 1284
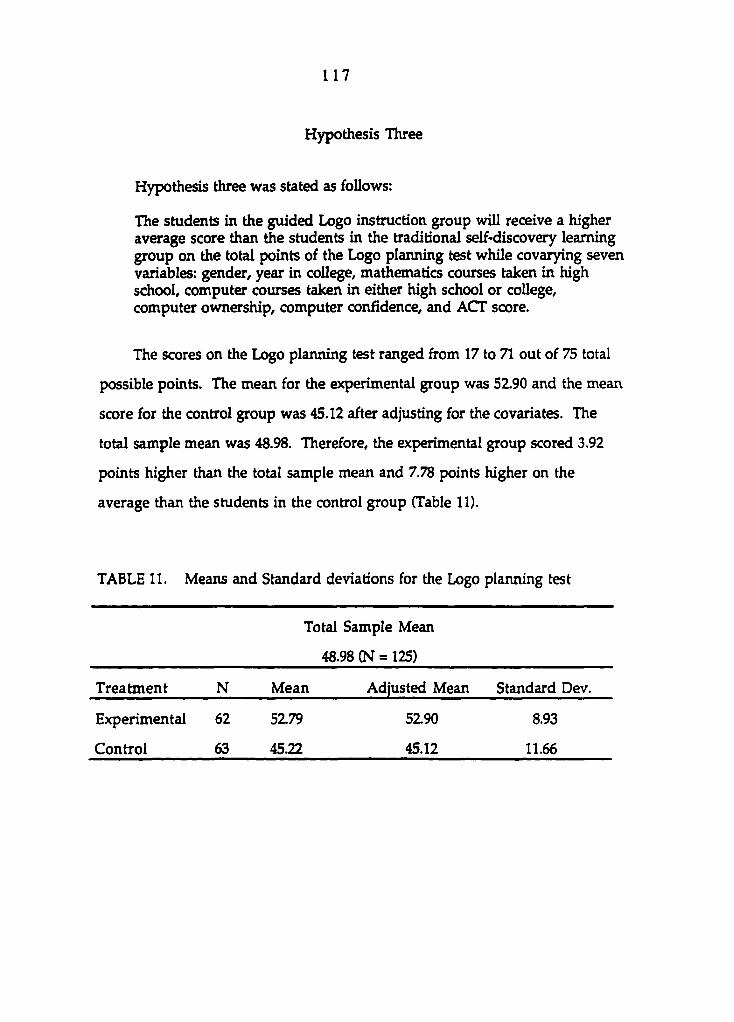
1 1 7
Hypothesis Three
Hypothesis three was stated as follows:
The students in the guided Logo instruction group will receive a higher average score than Ae students in the traditional self-discovery learning group on the total points of the Logo planning test while covarying seven variables: gender, year in college, mathematics courses taken in high school, computer courses taken in either high school or college, computer ownership, computer confidence, and ACT score.
The scores on the Logo planning test ranged firom 17 to 71 out of 75 total
possible points. The mean for the experimental group was 52.90 and the mean
score for the control group was 45.12 after adjusting for the covariates. The
total sample mean was 48.98. Therefore, the experimental group scored 3.92
points higher than the total sample mean and 7.78 points higher on the
average than the students in the control group (Table 11).
TABLE 11. Means and Standard deviations for the Logo planning test
Total Sample Mean
48.98 (N = 125)
Treatment N Mean Adjusted Mean Standard Dev.
Experimental 62 5279 5290 8.93
Control 63 45.22 45.12 11.66
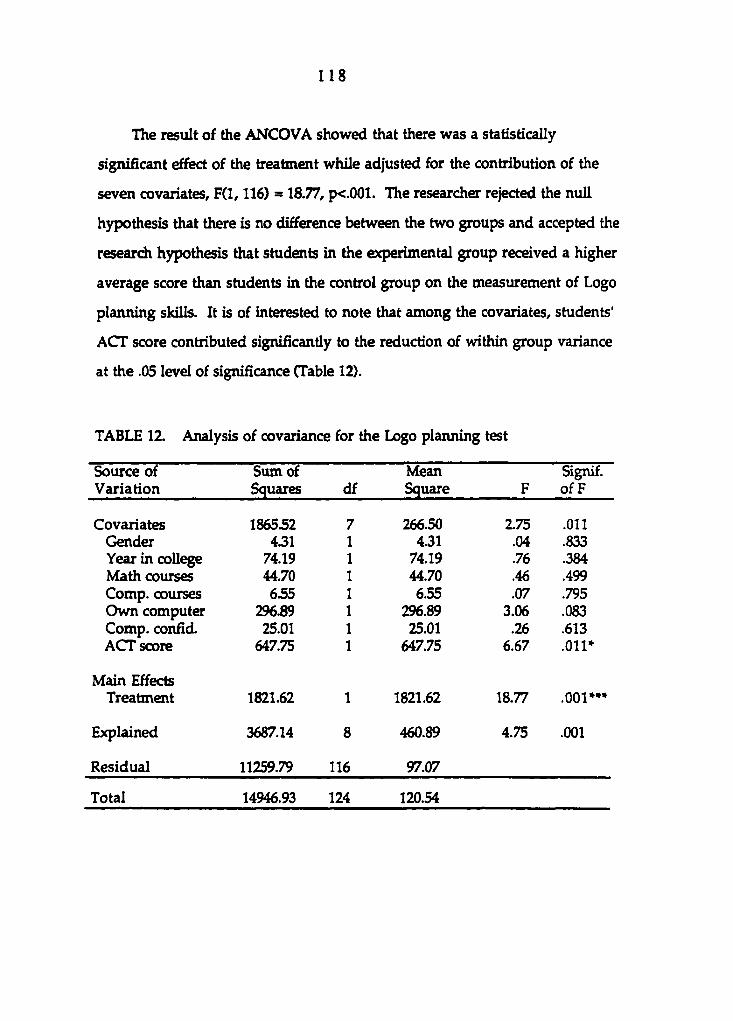
1 1 8
The result of the ANCOVA showed that there was a statistically
significant effect of the treatment while adjusted for the contribution of the
seven covariates, F(l, 116) = 18.77, p<.001. The researcher rejected the null
hypothesis that there is no difference between the two groups and accepted the
research hypothesis that students in the experimental group received a higher
average score than students in the control group on the measurement of Logo
planning skills. It is of interested to note that among the covariates, students'
ACT score contributed significantly to the reduction of within group variance
at the .05 level of significance (Table 12).
TABLE 12. Analysis of covariance for the Logo planning test
Source of Variation
Sum of Squares df
Mean Square F
Signif. of F
Covariates 186552 7 266.50 2.75 .011 Gender 431 1 4.31 .04 .833 Year in college 74.19 1 74.19 .76 .384 Math courses 44.70 1 44.70 .46 .499 Comp. courses 655 1 6.55 .07 .795 Own computer 296.89 1 296.89 3.06 .083 Comp. confid. 25.01 1 25.01 .26 .613 ACT score 647.75 1 647.75 6.67 .011*
Main Effects Treatment 1821.62 1 1821.62 18.77 .001»"
Explained 3687.14 8 460.89 4.75 .001
Residual 11259.79 116 97.07
Total 14946.93 124 120.54
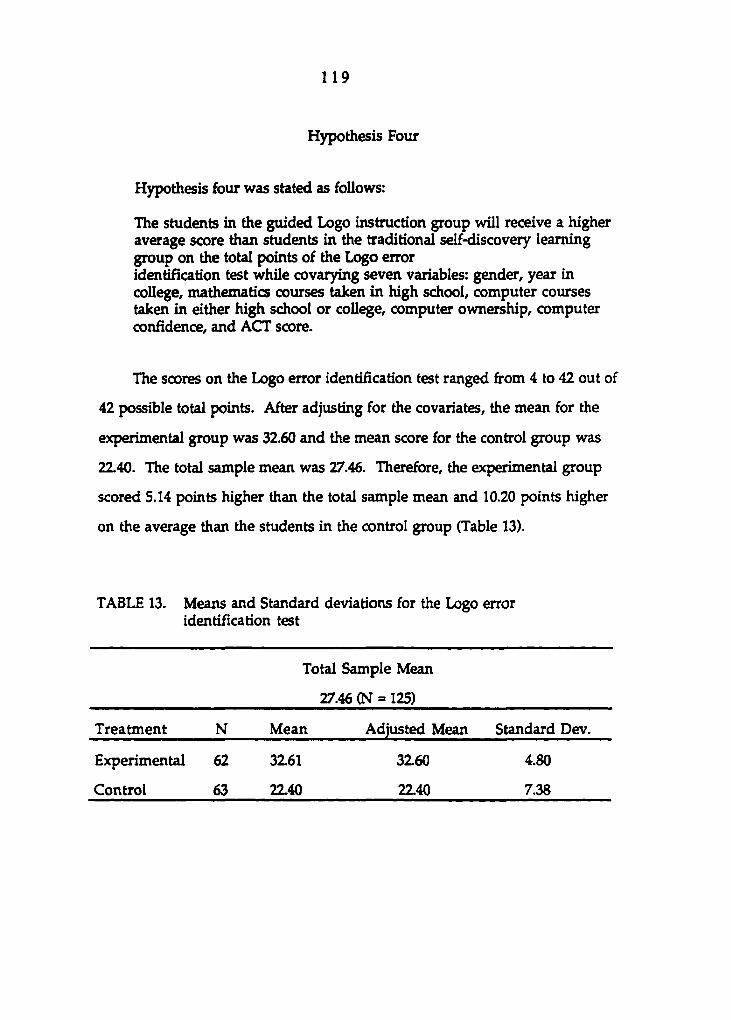
1 1 9
Hypothesis Four
Hypothesis four was stated as follows:
The students in the guided Logo instruction group will receive a higher average score than students in the traditional self-discovery learning group on the total points of the Logo error identifîcation test while covarying seven variables: gender, year in college, mathematics courses taken in high school, computer courses taken in either high school or college, computer ownership, computer confidence, and ACT score.
The scores on the Logo error identification test ranged from 4 to 42 out of
42 possible total points. After adjusting for the covariates, the mean for the
experimental group was 32.60 and the mean score for the control group was
22.40. The total sample mean was 27.46. Therefore, the experimental group
scored 5.14 points higher than the total sample mean and 10.20 points higher
on the average than the students in the control group (Table 13).
TABLE 13. Means and Standard deviations for the Logo error identification test
Total Sample Mean
27.46 (N = 125)
Treatment N Mean Adjusted Mean Standard Dev.
Experimental 62 32.61 32.60 4.80
Control 63 22.40 22.40 7.38
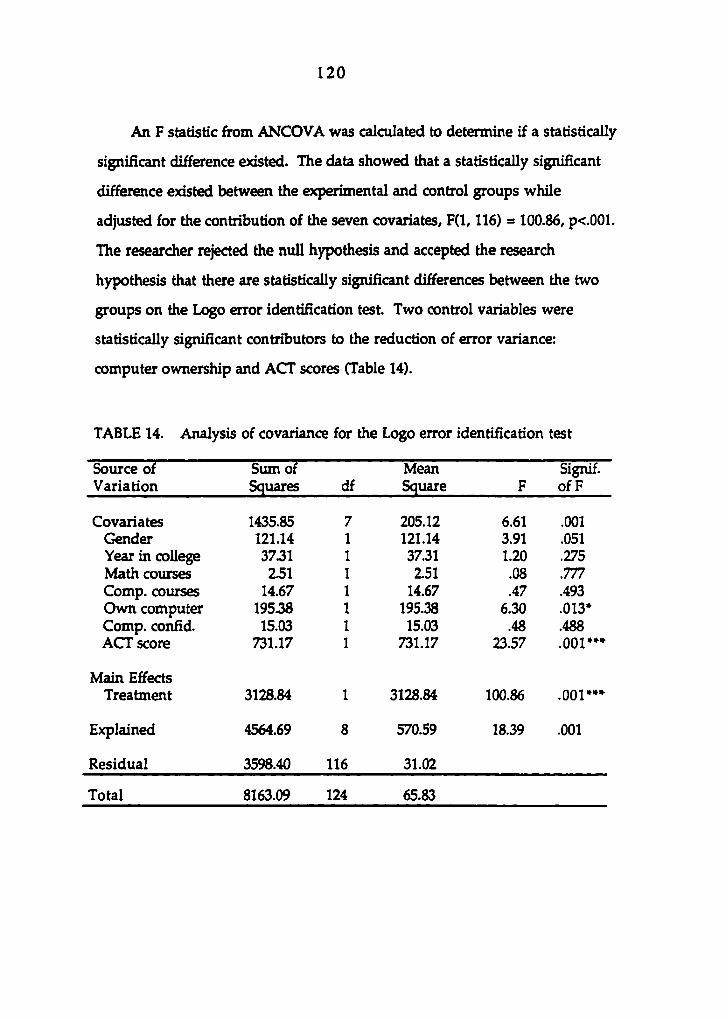
1 2 0
An F statistic from ANCOVA was calculated to determine if a statistically
significant difference existed. The data showed that a statistically significant
difference existed between the experimental and control groups while
adjusted for the contribution of the seven covariates, F(l, 116) = 100.86, p<.001.
The researcher rejected the null hypothesis and accepted the research
hypothesis that there are statistically significant differences between the two
groups on the Logo error identification test. Two control variables were
statistically significant contributors to the reduction of error variance:
computer ownership and ACT scores (Table 14).
TABLE 14. Analysis of covariance for the Logo error identification test
Source of Variation
Sum of Squares df
Mean Square F
Signif. of F
Covariates 1435.85 7 205.12 6.61 .001 Gender 121.14 1 121.14 3.91 .051 Year in college 3731 1 37.31 1.20 .275 Math courses 251 1 2.51 .08 .777 Comp. courses 14.67 1 14.67 .47 .493 Own computer 19538 1 195.38 6.30 .013» Comp. confid. 15.03 1 15.03 .48 .488 ACT score 731.17 1 731.17 23.57 .001***
Main Effects Treatment 3128.84 1 3128.84 100.86 .001***
Explained 4564.69 8 570.59 18.39 .001
Residual 3598.40 116 31.02
Total 8163.09 124 65.83
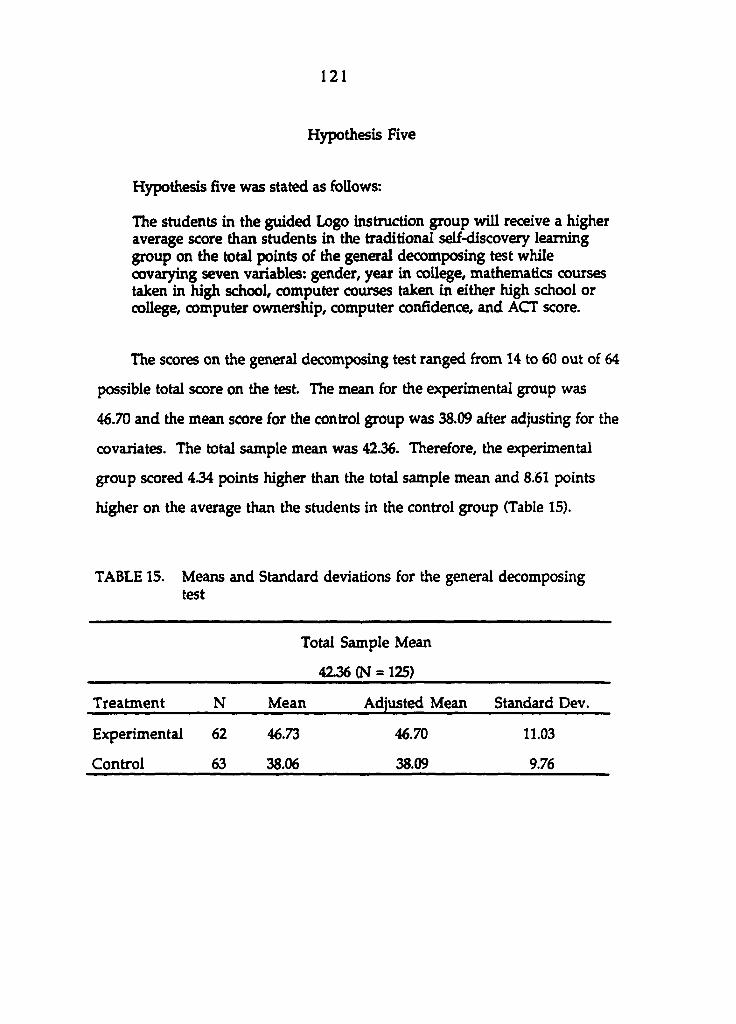
1 2 1
Hypothesis Five
Hypothesis five was stated as follows:
The students in the guided Logo instruction group will receive a higher average score than students in the traditional self-discovery learning group on the total points of the general decomposing test while covarying seven variables: gender, year in college, mathematics courses taken in high school, computer courses taken in either high school or college, computer ownership, computer confidence, and ACT score.
The scores on the general decomposing test ranged from 14 to 60 out of 64
possible total score on the test. The mean for the experimental group was
46.70 and the mean score for the control group was 38.09 after adjusting for the
covaxiates. The total sample mean was 42.36. Therefore, the experimental
group scored 434 points higher than the total sample mean and 8.61 points
higher on the average than the students in the control group (Table 15).
TABLE 15. Means and Standard deviations for the general decomposing test
Total Sample Mean
4236 (N = 125)
Treatment N Mean Adjusted Mean Standard Dev.
Experimental 62 46.73 46.70 11.03
Control 63 38.06 38.09 9.76
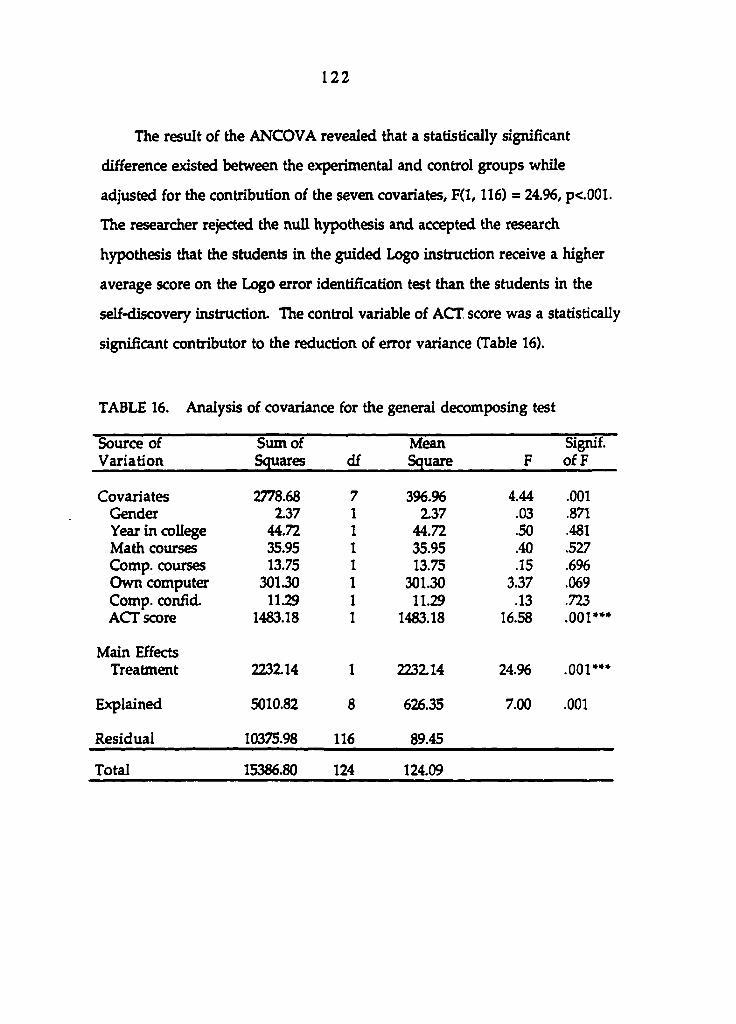
1 2 2
The result of the ANCOVA revealed that a statistically significant
ditference existed between the experimental and control groups while
adjusted for the contribution of the seven covariates, F(l, 116) = 24.96, p<.001.
The researcher rejected the null hypothesis and accepted the research
hypothesis that the students in the guided Logo instruction receive a higher
average score on the Logo error identification test than the students in the
self-discovery instruction. The control variable of ACT score was a statistically
significant contributor to the reduction of error variance (Table 16).
TABLE 16. Analysis of covariance for the general decomposing test
Source of Sum of Mean Signif. Variation Squares df Square F of F
Covariates 2778.68 7 396.96 4.44 .001 Colder 237 1 2.37 .03 .871 Year in college 44.72 1 44.72 .50 .481 Math courses 35.95 1 35.95 .40 .527 Comp. courses 13.75 1 13.75 .15 .696 Own computer 301J0 1 301.30 3.37 .069 Comp. confid. 1129 1 11.29 .13 .723 ACT score 1483.18 1 1483.18 16.58 .001*»»
Main Effects Treatment 2232.14 1 223214 24.96 .001»»»
Explained 5010.82 8 626.35 7.00 .001
Residual 10375.98 116 89.45
Total 15386.80 124 124.09
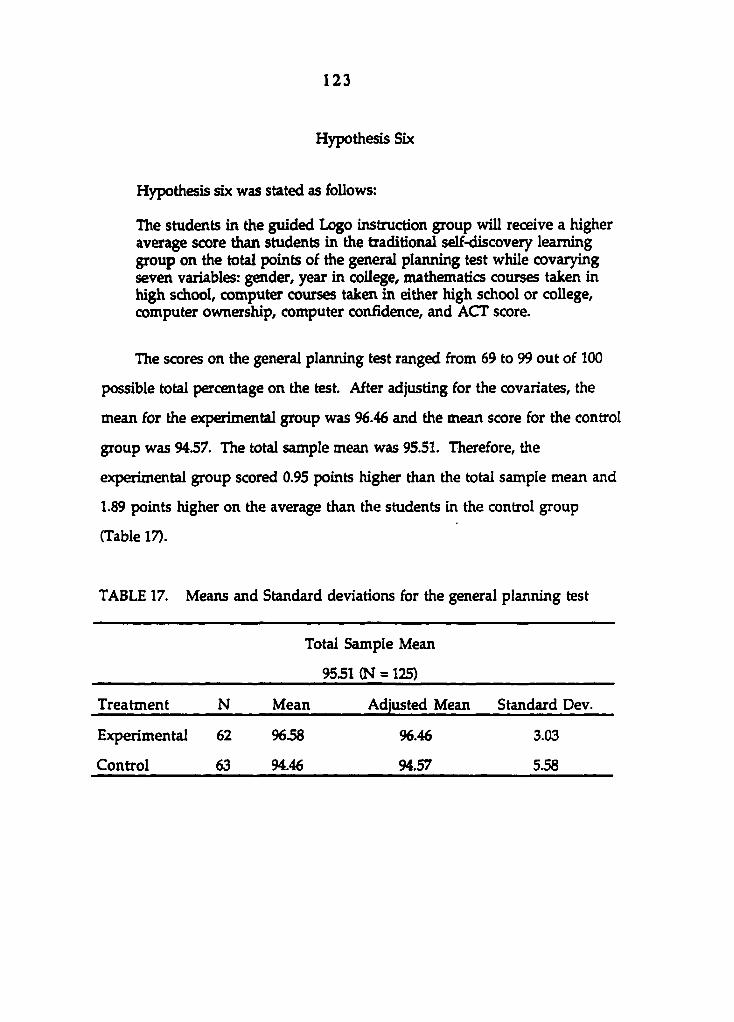
1 2 3
Hypothesis Six
Hypothesis six was stated as follows:
The students in the guided Logo instruction group will receive a higher average score than students in the traditional self-discovery learning group on the total points of the general planning test while covarying seven variables: gender, year in college, mathematics courses taken in high school, computer courses takai in either high school or college, computer ownership, computer confidence, and ACT score.
The scores on the general planning test ranged from 69 to 99 out of 100
possible total percentage on the test. After adjusting for the covariates, the
mean for the experimental group was 96.46 and the mean score for the control
group was 94.57. The total sample mean was 95.51. Therefore, the
experimental group scored 0.95 points higher than the total sample mean and
1.89 points higher on the average than the students in the control group
(Table 17).
TABLE 17. Means and Standard deviations for the general planning test
Total Sample Mean
9551 (N = 125)
Treatment N Mean Adjusted Mean Standard Dev.
Experimental 62 9658 96.46 3.03
Control 63 94.46 94.57 5.58
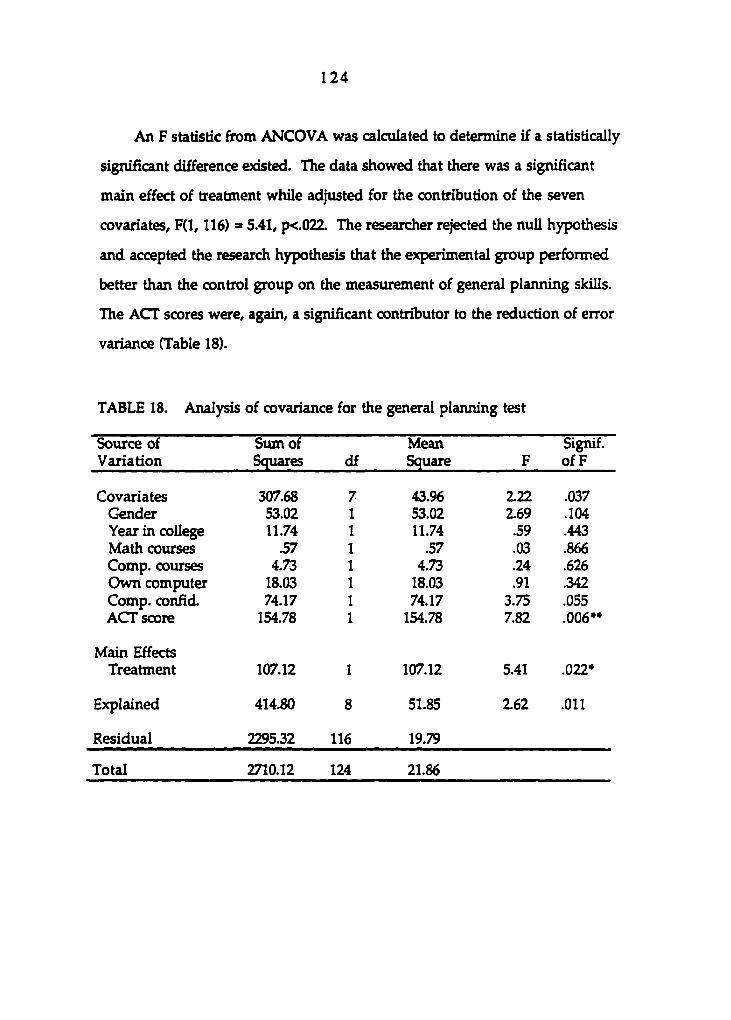
1 2 4
An F statistic from ANCOVA was calculated to determine if a statistically
significant difference existed. The data showed that there was a significant
main effect of treatment while adjusted for the contribution of the seven
covariates, F(l, 116) = 5.41, p<.02Z The researcher rejected the null hypothesis
and accepted the research hypothesis that the experimental group performed
better than the control group on the measurement of general planning skills.
The ACT scores were, again, a significant contributor to the reduction of error
variance (Table 18).
TABLE 18. Analysis of covariance for the general planning test
Source of Sum of Mean Signif. Variation Squares df Square F of F
Covariates 307.68 7 43.96 2.22 .037 Gender 53.02 1 53.02 2.69 .104 Year in college 11.74 1 11.74 .59 .443 Math courses S7 1 .57 .03 .866 Comp. courses 4.73 1 4.73 .24 .626 Own computer 18.03 1 18.03 .91 .342 Comp. confid. 74.17 1 74.17 3.75 .055 ACT score 154.78 1 154.78 782 .006*'
Main Effects Treatment 107.12 1 107.12 5.41 .022*
Explained 414.80 8 51.85 262 .011
Residual 229532 116 19.79
Total 2710.12 124 21.86

1 2 5
Hypothesis Seven
Hypothesis seven was stated as follows:
The students in the guided Logo instruction group will receive a higher average score than students in the traditional self-discovery learning group on the total points of the general error identification test while covarying seven variables: gender, year in college, mathematics courses taken in high school, computer courses taken in either high school or college, computer ownership, computer confidence, and ACT score.
Out of 36 possible total points, the scores on the general error
identification test ranged from 0 to 36. The mean for the experimental group
was 21.36 and the mean score for the control group was 14.84 after adjusting
for the covariates. The total sample mean was 18.07. Therefore, the
experimental group scored 3.29 points higher than the total sample mean and
6.52 points higher on the average than the students in the control group
(Table 19).
TABLE 19. Means and Standard deviations for the general error identification test
Total Sample Mean
18.07 (N = 125)
Treatment N Mean Adjusted Mean Standard Dev.
Experimental 62 2137 21.36 7.77
Control 63 14.83 14.84 6.76
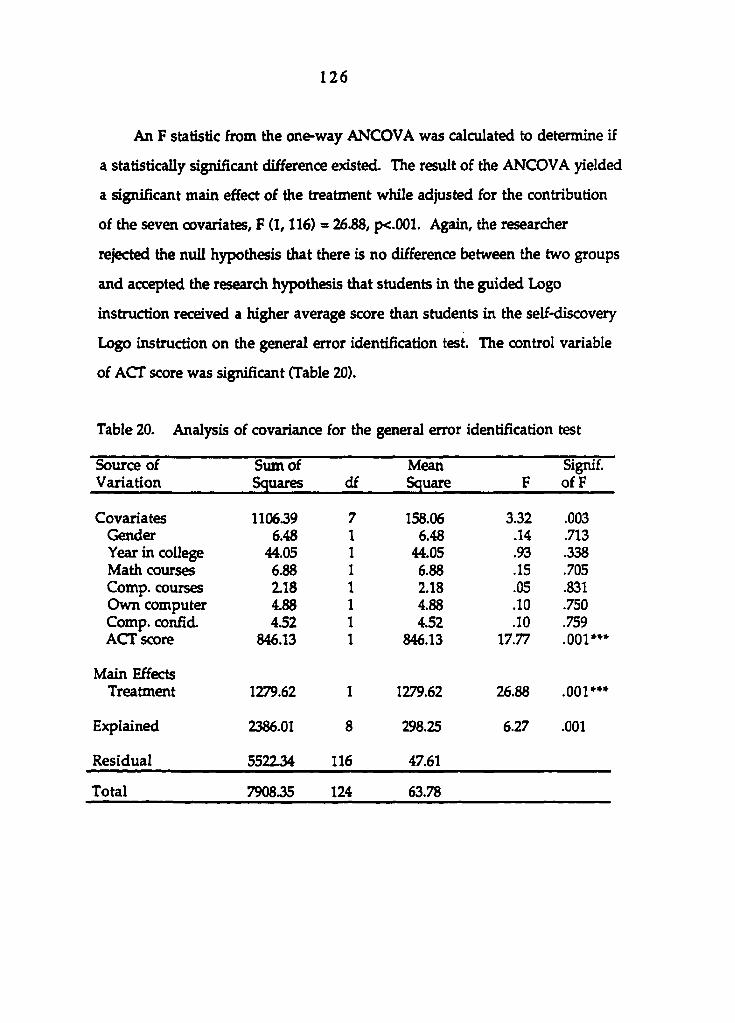
1 2 6
An F statistic from the one-way ANCOVA was calculated to determine if
a statistically significant difference existed. The result of the ANCOVA yielded
a significant main effect of the treatment while adjusted for the contribution
of the seven covariates, F (1,116) = 26.88, fX.OOl. Again, the researcher
rejected the null hypothesis that there is no difference between the two groups
and accepted the research hypothesis that students in the guided Logo
instruction received a higher average score than students in the self-discovery
Logo instruction on the general error identification test. The control variable
of ACT score was significant (Table 20).
Table 20. Analysis of covariance for the general error identification test
Source of Variation
Sum of Squares df
Mean Square F
Signif. of F
Covariates 110639 7 158.06 3.32 .003 Gender 6.48 1 6.48 .14 .713 Year in college 44.05 1 44.05 .93 .338 Math courses 6.88 1 6.88 .15 .705 Comp. courses 118 1 2.18 .05 .831 Own computer 4.88 1 4.88 .10 .750 Comp. confid. 4.52 1 4.52 .10 .759 ACT score 846.13 1 846.13 17.77 .001»*»
Main Effects Treatment 1279.62 1 1279.62 26.88 .001»**
Explained 2386.01 8 298.25 6.27 .001
Residual 552234 116 47.61
Total 790835 124 63.78
1 2 7
Results for the Basic Logo Comprehension Test
The multiple choice basic Logo comprehension test was administered to
measure students' ability to demonstrate basic commands and concepts of the
Logo programming language. The test was used to measure whether both the
experimental and the control group received an equal amount of
comprehensive knowledge about Logo. Since, the treatment for the study was
delivery method, not instructional content, the researcher expected that the
students in both the experimental and control groups should be able to
demonstrate comparable amounts of basic knowledge about Logo.
To test the difference between the experimental and control group means
for the basic Logo comprehension test, analysis of covariance was used. The
scores on the basic Logo comprehension test ranged from 12 to 29 out of 30
possible points. After adjusting for the covariates, the mean for the
experimental group was 22.52 and the mean score for the control group was
21.84. The total sample mean was 22.18. Therefore, the experimental group
scored 0.34 points higher than \he total sample mean and 0.68 points higher
on the average than the students in the control group (Table 21).
An F statistic was calculated to determine if a statistically significant
difference existed. An F value of 1.30 was calculated. The data did not show
that a statistically significant difference existed between the experimental and
control groups while adjusted for the contribution of the seven covariates.
The researcher failed to reject the null hypothesis. The result showed that the
ACT covariate contributed significantly to reducing the mean square error
(Table 22).
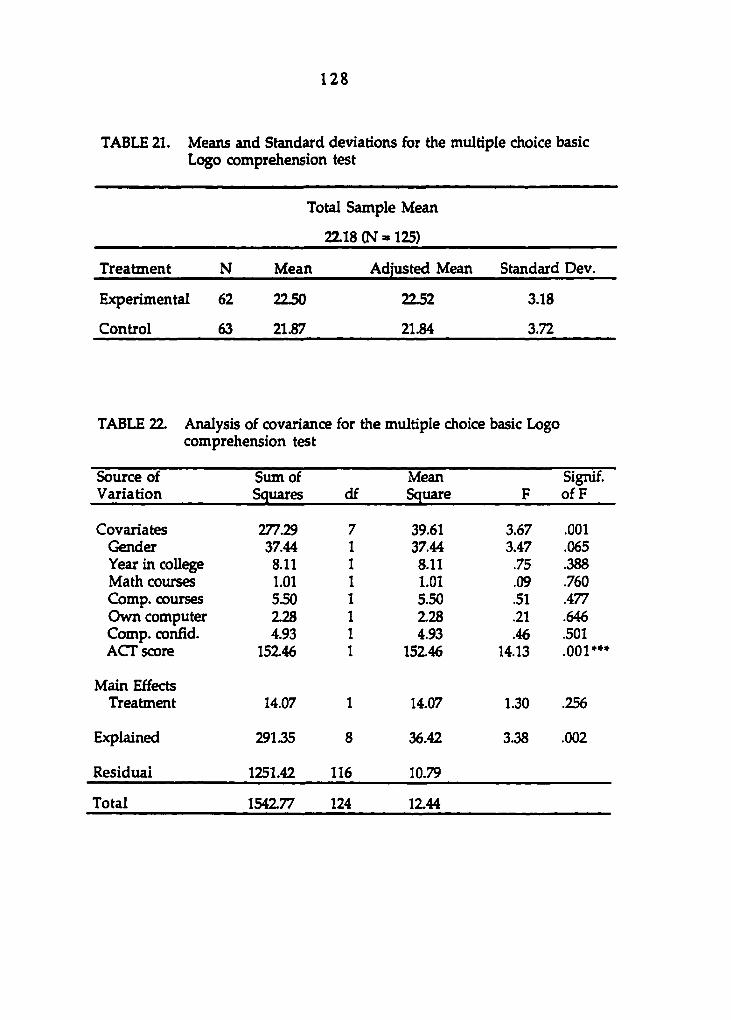
1 2 8
TABLE 21. Means and Standard deviations for the multiple choice basic Logo comprehension test
Total Sample Mean
22.18 (N = 125)
Treatment N Mean Adjusted Mean Standard Dev.
Experimental 62 22.50 2252 3.18
Control 63 21.87 21.84 3.72
TABLE 22. Analysis of covariance for the multiple choice basic Logo comprehension test
Source of Sum of Mean Signif. Variation Squares df Square F of F
Covariates 27729 7 39.61 3.67 .001 Gender 37.44 1 37.44 3.47 .065 Year in college 8.11 1 8.11 .75 .388 Math courses 1.01 1 1.01 .09 .760 Comp. courses 550 1 5.50 .51 .477 Own computer 128 1 228 .21 .646 Comp. confid. 4.93 1 4.93 .46 .501 ACT score 15246 1 15246 14.13 .001*»»
Main Effects Treatment 14.07 1 14.07 1.30 .256
Explained 29135 8 36.42 3.38 .002
Residual 1251.42 116 10.79
Total 154277 124 1244

1 2 9
Auxiliary Findings
In the process of analyzing the data collected for this study, the researcher
was interested in finding which dependent variable was most significantly
influenced by the two different treatments. Along with this finding, the
researcher was also interested in the relationships of covariates and the
dependent variables.
The most influenced dependent variable bv the treatment
In conducting the analysis of the data gathered for this study, the
researcher was interested in the level of treatment influence on the dependent
variables. Thus, the researcher was interested in finding which dependent
variable was influenced most by the treatment.
The stepwise multiple regression was done to examine a combined
contribution of the dependent variables to the prediction of the classification
of subjects: the guided Logo instruction group and the self-discovery learning
group. First, the seven covariates were entered in the multiple regression.
for seven covariates were .036. The result of the enter regression method
revealed that none of the covariates contributed to the prediction of the
treatments, F (7,117) = .631, p < .729. Then, the six dependent variables were
treated as independent variables and were entered stepwise. On the basis of
the stepwise multiple regression analysis, the result revealed that the
treatment had the most influence on the Logo error identification test score at
the .001 level of significance, F (8,116) = 13.63, p < .001. r2 for the Logo error
identification test was .485 and the gained was .449. The next entered

1 3 0
variable was general error identification skills; total of was .498. However,
the gained R^ was only .013. The last variable entered in the stepwise
multiple regression was general decomposing skills with R^ = .502 and the
gained r2 =.004 at 0.5 level of pin (Table 23).
TABLE 23. Stepwise multiple regression effect on the treatments of Logo instructional methodology
Multiple Changed Adjusted
Variable R R Square R Square^ RSquare Bb
Covariat.*^ .1907 .0364 — -.0213 Act -.0092 Comsd -.0626 Sex -.0590 Own -.0838 Year .0324 Confid. .0180 Math .0005
(Constant) 1.2099
Logo Mon^ .6961 .4845 +.4481 .4490 -.0456
(Constant) 1.9667
Gen Mon® .7059 .4983 +.0138 .4591 -.0090 (Constant) 1.9320
Gen Dec^ .7089 5025 +.0042 .4589 -.0037 (Constant) 1.9591
^Changed r2 is the gained r2 value when other variables were entered. is the coefficient of the variable in the prediction equation.
cSeven covariates were entered all together prior to the stepwise multiple regression.
^Logo mon indicates Logo error identification skills. ^Gen mon indicates general error identification skills. ^Gen dec indicates general decomposing skills.
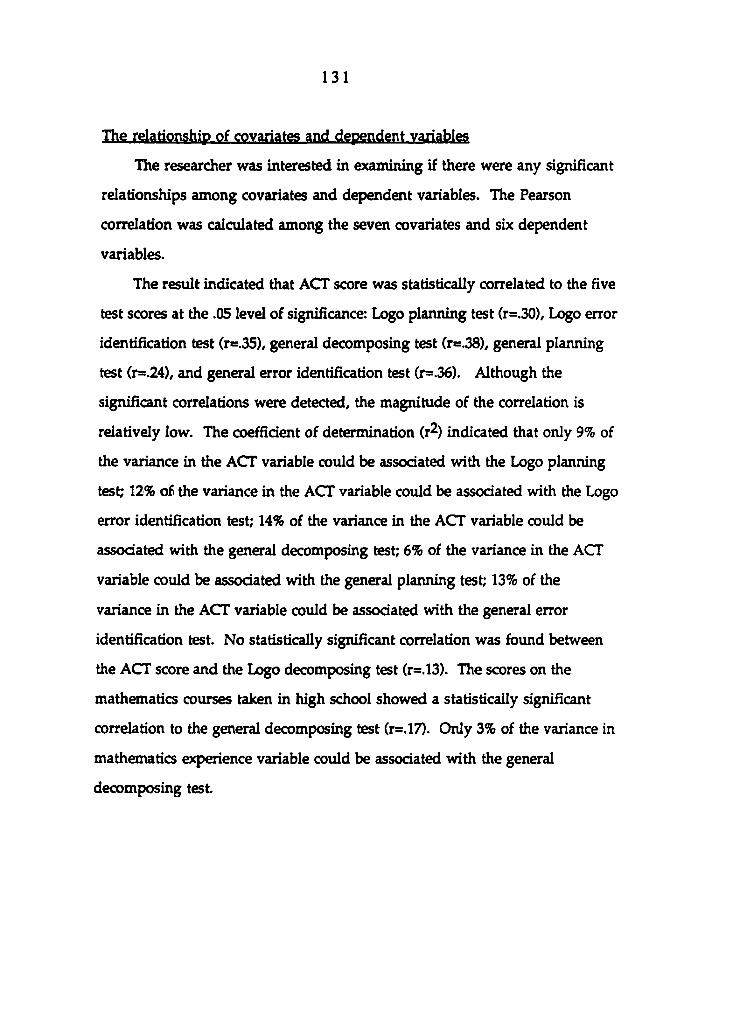
1 3 1
The relationship of covariates and dependent variables
The researcher was interested in examining if there were any significant
relationships among covariates and dependent variables. The Pearson
correlation was calculated among the seven covariates and six dependent
variables.
The result indicated that ACT score was statistically correlated to the five
test scores at the .05 level of significance: Logo planning test (r=.30), Logo error
identification test (r=.35), general decomposing test (r=.38), general planning
test (r=.24), and general error identification test (r=.36). Although the
significant correlations were detected, the magnitude of the correlation is
relatively low. The coefficient of determination (r^) indicated that only 9% of
the variance in the ACT variable could be associated with the Logo planning
test; 12% of the variance in the ACT variable could be associated with the Logo
error identification test; 14% of the variance in the ACT variable could be
associated with the general decomposing test; 6% of the variance in the ACT
variable could be associated with the general planning test; 13% of the
variance in the ACT variable could be associated with the general error
identification test. No statistically significant correlation was found between
the ACT score and the Logo decomposing test (r=.13). The scores on the
mathematics courses taken in high school showed a statistically significant
correlation to the general decomposing test (r=.17). Only 3% of the variance in
mathematics experience variable could be associated with the general
decomposing test
1 3 2
The results indicated that computer ownership correlated statistically to
three test scores at the .05 level of signiHcance: Logo planning test (r=.20), Logo
error identification test (r=.22), and general decomposing test (r=.21). The
correlation coefficient indicated that 4% of the variance in computer
ownership variable could be associated with the Logo planning test; 5% of the
variance could be associated with the Logo error identification test; 4% of the
variance could be associated with the general decomposing test.
The correlation matrix showed that gender, year in college, number of
computer courses taken either in high school or college, and the computer
confidence had no correlation to any dependent variables (Table 24, p. 136).
Correlations among covariates
The correlation matrix was calculated to determine the relationships of
the seven covariates. The correlation matrix revealed that there was a
relatively low correlation between ACT and year in college (r = .235),
mathematics courses taken in high school (r = .284), and computer confidence
(r = .215). The squared correlation coefficient ( r^ ) indicated that only 6% of
the variance in the ACT variable could be associated with the variance in year
in college; 8% could be associated with the variance in mathematics courses;
5% could be associated with the variance in computer confidence. The
computer confidence also had low correlation to computer ownership (r =
.217), mathematics courses taken in high school (r = .280), and computer
courses taken in either high school or college (r = .276). The coefficient of
determination ( r^ ) indicated that only 5% of the variance in the computer
confidence could be associated with the variance in computer ownership; 8%
1 3 3
could be associated with the variance in mathematics courses; 8% could be
associated with the variance in computer courses. There was a significant
relationship between mathematics courses taken in high school and computer
courses taken in either high school or college (r = .295). However, only 9% of
the variance in mathematics courses could be associated with the variance in
the computer courses (Table 25, p. 137).
Correlations among the six dependent variables
A correlation matrix was calculated to determine the relationships of the
six dependent variables. The correlation matrix showed that there were
statistically significant relationships between the Logo error identification
skills and Logo planning skills (r = .609), Logo error identification skills and
general decomposing skills (r = .578), and Logo error identification skills and
general error identification skills (r = .552). The squared correlation coefficient
(r^) indicated that over 37% of the variance in Logo error identification skills
was related to the variances in Logo planning skills; 33% of the variance was
associated with general error identification skills; 30% of the variance was
associated with general error identification skills.
The result revealed that there were relatively significant relationships
between Logo planning skills and general decomposing skills (r = .494); Logo
planning skills and Logo decomposing skills (r = .407); Logo planning skills
and general error identification skills (r = .447); and Logo planning skills and
general planning skills (r = .402). Coefficients of determination indicated that
over 24% of the variance in Logo planning skills was associated with the
variance in general decomposing skills; 17% was related to Logo decomposing
1 3 4
skills; 20% was related to general monitoring skills; 16% was related to general
planning skills.
The result showed that general decomposing skills had a relatively
significant relationship with general error identification skills. The
correlation coefficient indicated that 21% of the variance in general
decomposing skills was associated with the variance in general error
identification skills (Table 26, p. 138).
Summary
In this chapter, results were reported from the examination of the effects
of guided instruction in Logo programming on the development of cognitive
monitoring strategies. In the first section, statistical analysis of the pre-
experimental measures was reported. No statistically significant differences
were found between the experimental and the control groups on the students'
academic and demographic backgrounds.
In the second section, the results relating to the seven hypotheses were
reported. Multivariate analysis of covariance was used to analyze the
hypothesis on the effectiveness of the treatment on the overall dependent
variables. The result indicated that there was a statistically significant
di^erence between the two groups on the vector of means for the six
dependent variables. The analysis of covariance was utilized to test the
following six dependent variables: Logo decomposing skills, Logo planning
skills, Logo error identification skills, general decomposing skills, general
planning skills, and general error identification skills. The ANCOVA results
1 3 5
indicated that students in the guided Logo instruction group performed
significantly higher than students in self-discovery instruction group on the
measurements of the following skills: Logo planning skills, Logo error
identification skills, general decomposing skills, general planning skills, and
general error identification skills. There was no statistically difference
between the two groups on the Logo decomposing test.
In the auxiliary finding section, the dependent variable most significantly
influenced by the treatment was reported. The multiple regression analysis
showed that Logo error identification skills were influenced the most by the
experimental treatment. In addition to this, the correlation of covariates and
dependent variables were reported. The ACT variable showed significant
relationships with dependent variables. The correlations among seven
covariates and among six dependent variables were also reported in this
section. Relatively low or no statistically significant relationships between
covariates were found. There were relatively significant correlations among
several dependent variables.

1 3 6
Tables for auxiliary results
TABLE 24. Correlation matrix among covariates and dependent variables
Logo decomp.
Logo planning
Logo error, id. debug.
general decomp.
general planning
general error, id. debug.
Gender -.017 (N=130) p= .846
.043 (N=130) p= .631
-.158 (N=130) p= .072
-.020 (N=130) p= .830
.094 (N=130) p= .286
-.068 (N=130) p= .444
Year in college
.041 (N=130) p= .646
.095 (N=130) p= J81
-.018 (N=130) p= .838
.014 (N=130) p=.874
.159 (N=130) p= .072
.011 (N=130) p= .903
Math. courses taken
.133 (N=130) p=.132
.169 (N=130) p= .054
.145 (N=130) p= .099
.176» (N=130) p=.047
.026 (N=130) p= .766
125 (N=130) p= .156
Comp. courses taken
.057 (N=130) p=318
.022 (N=130) p= .805
.058 (N=130) p= .514
.055 (N=130) p= .535
.008 (N=130) p= .924
-.027 (N=130) p= .762
Access, of own comp.
.091 (N=130) p=302
.204* (N=130) p= .020
.216» (N=130) p= .013
.209» (N=130) p= .017
.0917 (N=130) p= .300
.111 (N=130) p= .208
Comp. confidence
.121 (N=130) p=.171
.157 (N=130) p= .074
.071 (N=130) p= .423
.128 (N=130) p= .147
-.078 (N=130) p= .380
.086 (N=130) p= .332
ACT score
.129 (N=125) p= .153
300" (N=125) p= .001
.351*" (N=125) p= .000
.380»" (N=125) p= .000
.243»» (N=125) p= .006
.360»»» (N=125) p= .000
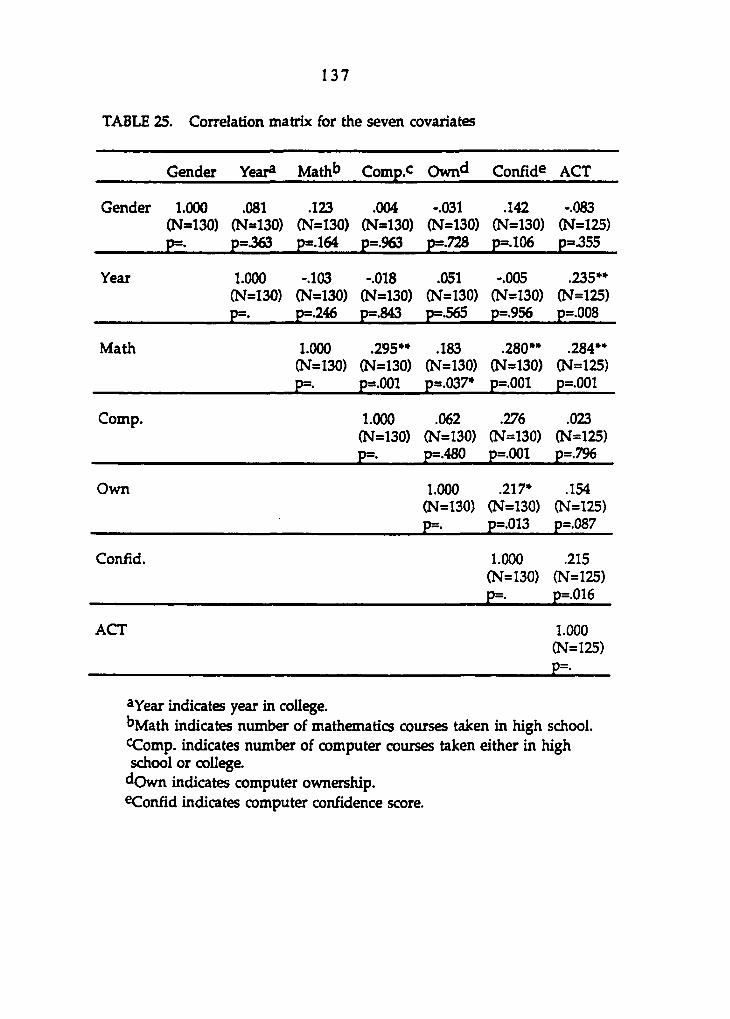
1 3 7
TABLE 25. Correlation matrix for the seven covariates
Gender Year® Mathb Comp.c Ownd Confide ACT
Gender 1.000 (N=130) p=.
.081 (N=130) p=J63
.123 (N=130) p=.164
.004 (N=130) p=.963
-.031 (N=130) p=.728
.142 (N=130) p=.106
-.083 (N=125) p=355
Year 1.000 (N=130) P=.
-.103 (N=130) P=-246
-.018 (N=130) p=.843
.051 (N=130) p=565
-.005 (N=130) p=.956
.235»» (N=125) p=.008
Math 1.000 (N=130) p=.
.295»» (N=130) p=.001
.183 (N=130) p=.037»
.280»» (N=130) p=.001
.284»» (N=125) p=.001
Comp. 1.000 (N=130) p=.
.062 (N=130) p=.480
.276 (N=130) p=.001
.023 (N=125) p=.796
Own 1.000 (N=130) p=.
.217» (N=130) p=.013
.154 (N=125) p=.087
Confid. 1.000 (N=130) p=.
.215 (N=125) p=.016
ACT 1.000 (N=125) p=.
^Year indicates year in college. ^Math indicates number of mathematics courses taken in high school. (KZomp. indicates number of computer courses taken either in high school or college.
(^Own indicates computer ownership. ®Confid indicates computer confidence score.
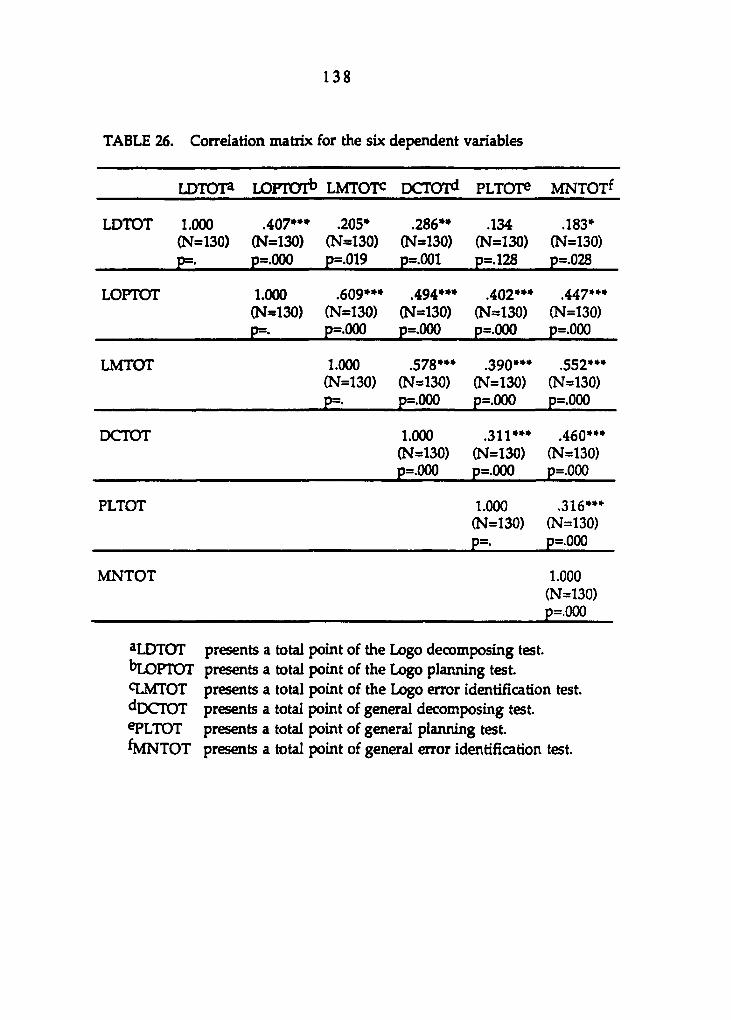
1 3 8
TABLE 26. Correlation matrix for the six dependent variables
LDTOT®
1 1 Dcrord FLTOre MNTOTf
LDTOT 1.000 (N=130) p=.
.407»»* .205» (N=130) (N=130) p=.000 p=.019
.286»» (N=130) p=.001
.134 (N=130) p=.128
.183» (N=130) p=.028
LOPTOT 1.000 .609»»» (N=130) (N=130) p=. p=.000
.494»»» (N=130) p=.000
.402»»» (N=130) p=.000
.447»»» (N=130) p=.000
LMTOT 1.000 (N=130) p=.
.578»»» (N=130) p=.000
.390»»» (N=130) p=.000
.552»»» (N=130) p=.000
DCTOT 1.000 (N=130) p=.000
.311»»» (N=130) p=.000
.460»»» (N=130) p=.000
PLTOT 1.000 (N=130) p=.
.316»»» (N=130) p=.000
MNTOT H
i S
aLDTOT presents a total point of the Logo decomposing test. (^LOPTOT presents a total point of the Logo planning test. CLMTOT presents a total point of the Logo error identification test. (^DCTOT presents a total point of general decomposing test. ®PLTOT presents a total point of general planning test ^MNTOT presents a total point of general error identification test.
1 3 9
SUMMARY, DISCUSSION, IMPLICATIONS, AND RECOMMENDATIONS
The purpose of this chapter is to summarize the research study, discuss
the findings, present implications for guided instruction with Logo
programming, and suggest recommendations for further research. The
chapter is organized into the following sections:
1. Summary of the research study
2. Discussion of the study results
3. Implications for guided instruction with Logo programming
4. Recommendations for further research
5. Concluding remarks
Summary of the Research Study
The focus of the research was to examine the effects of guided instruction
with Logo programming on the development of cognitive monitoring
strategies.
Development of the study
As our society changes and becomes more complex, and as new
knowledge and technology emerge, the need for teaching students
independent thinking and problem solving skills is increasing. Responding
to ever increasing societal demands, educators continue to search for proper
learning tools and methodologies to improve students' higher-order thinking
and problem solving skills. In particular, cognitive monitoring has been a
1 4 0
primary concern of educators and cognitive psychologists as research indicates
that cognitive monitoring is an important strategy for efficient thinking and
problem solving. The term cognitive monitoring is relatively new, but the
basic concept has been widely accepted in most areas of research. Cognitive
monitoring is defined as regulating and monitoring one's on-going thinking
process consciously and deliberately (Brown, 1987; Lawson, 1984; Van
Haneghan & Baker, 1989). Although, it has been considered as one of the
most important strategies in efficient thinking and problem solving, special
training focusing on cognitive monitoring has been relatively limited. More
empirical research is needed to test the potential effects of various
instructional tools and methods used to develop cognitive monitoring
strategies. One learning tool that has been advocated as a potential tool to
improve problem solving strategies is Logo programming. However, there is
very little empirical research available that tests the effects of using Logo
programming as a learning tool to improve students' cognitive monitoring
strategies.
The purpose of this study was to empirically examine the effectiveness of
guided instruction with Logo programming on the development of cognitive
monitoring strategies among college students. Logo programming was
selected as a learning tool to provide a dynamic and challenging learning
environment.
Three pedagogical elements were employed in constructing the guided
instruction. First, Logo programming was selected as the particular tool to
teach cognitive monitoring strategies. Second, an explicit model of the
1 4 1
components of the cognitive monitoring processes was incorporated into
learning Logo programming; this model included the following steps:
decomposing, planning, executing, identifying the error, and debugging.
Third, teacher mediated learning of cognitive monitoring activities was
provided not only in solving domain specific Logo problems, but also in
utilizing the transfer of learned strategies to everyday problem solving
situations. The teacher mediated learning environment, in which the teacher
encouraged students to follow the steps of the cognitive monitoring process
through Socratic dialogue and monitored a student's work, was designed to
help students gradually progress in the use of cognitive monitoring strategies
and internalize these strategies.
This research focused on two transfer effects of guided instruction with
Logo programming. First, the near transfer effect of such instruction on the
development of cognitive monitoring strategies in solving Logo
programming problems was examined. Second, the far transfer effect of
guided Logo instruction on the development of cognitive monitoring
strategies in solving everyday problems was studied.
The subjects were 132 students enrolled in class of Secondary Education
101 in the Fall, 1990 at Iowa State University. This class entitled "Educational
Applications of Computers", is a three credit elective course for pre-service
teachers. At the beginning of the course, a questionnaire was given to the
subjects in order to obtain academic and demographic data on each student.
From the academic and demographic data, the following seven variables were
1 4 2
used as covariates: gender, year in college, mathematics courses taken in high
school, computer courses taken in either high school or college, computer
ownership, computer confidence, and students' ACT score. The study
employed a one factor analysis of covariance design. ACT scores, obtained
from the Registrar's office, were used as the pre-experimental measurement of
students' academic performance. ACT means for each of the nine laboratory
sections were calculated. Then, students were randomly assigned to either the
experimental or control treatment by laboratory means of their ACT scores.
As a result, 65 students were in the experimental group and 67 were in the
control group. No significant differences existed between the experimental
and control groups on the mean of ACT scores. During the experimental
period, two students dropped the course because of personal reasons, one from
each treatment. Therefore, 130 subjects completed the entire study.
The experimental group received guided instruction in Logo
programming that systematically guided students through formal cognitive
monitoring activities while solving Logo problems; students practiced each of
the following: decomposing, planning, executing, identifying errors, and
debugging errors. Students in the experimental group also received teacher
mediated practice in cognitive monitoring activities dealing with everyday
problems. In the teacher mediated learning environment, either the teacher
provided problem situations or asked students to list problem situations
where cognitive monitoring strategies could be utilized. Then, through
Socratic dialogue, the teacher guided students in applying the learned
1 4 3
strategies from Logo problem solving to the given non-Logo problem
situations.
The control group received instruction based on a self-discovery learning
approach. The lesson outline was carefully designed in order to deliver the
same information given to the experimental group. Thus, both groups
received the same Logo programming content, problem sets, and assignments.
Only the instructional treatment delivering that content varied between the
guided Logo group and traditional self-discovery group.
After four weeks of intensive Logo instruction, both groups were given
five tests in order to determine the transfer effects. Two tests were used to
measure the near transfer effect: (1) the Logo decomposing and planning test
and (2) the Logo error identification test. The following three tests were used
to determine the far transfer effect: (1) the general decomposing test, (2) the
general planning test, and (3) the general error identification test. These tests
involved non-Logo problems. A multiple choice Logo comprehension test
was also administered to indicate relative basic comprehensive knowledge of
Logo programming in both treatment groups.
Collected data were analyzed using the SPSS^ program. The statistical
techniques used were:
1. Descriptive statistics were used to obtain a general picture of the
sample regarding the research variables. Those statistics included frequencies,
percentages, mean, standard deviation, etc.
1 4 4
2. A student t-test and nonparametric Qu-square test were used to obtain
homogeneity of academic and demographic background between the two
treatment groups.
3. A Multiple analysis of covariance (MANCOVA) was used to
determine the differences in combined means of the dependent variables for
the two groups.
4. An analysis of covariance (ANCOVA) was used to determine the
differences between the two groups on the Logo decomposing skills, Logo
planning skills, Logo error identification skills, general decomposing skills,
general planning skills, general error identification skills, and basic Logo
comprehensive knowledge.
5. A stepwise multiple regression was used to determine the best
contributor of dependent variables for the classification of treatments when
the covariates were encountered.
6. The Pearson correlation was used to observe the relationships among
covariates and dependent variables, covariates themselves, and dependent
variables.
Results of the studv
Statistical analysis of the pre-experimental measures was reported. Based
on the statistical analysis of student t-test and nonparametric Chi-square test,
the researcher noted that there were no statistically significant differences
between the two groups on any of the following background characteristics: (1)
demographic background: gender, year in college, accessibility of their own
computer, and computer confidence, and (2) academic background:
1 4 5
mathematics courses taken in high school, computer courses taken either in
high school or college, and ACT scores.
Seven hypotheses were established to examine the transfer effects of
guided Logo instruction on the development of cognitive monitoring
strategies. The independent variable was the instructional methodology to
teach Logo programming: guided Logo instruction vs. self-discovery
instruction. The six dependent variables for the study were Logo
decomposing skills, Logo planning skills, Logo error identification skills,
general decomposing skills, general planning skills, and general error
identification skills. Seven variables were used as covariates in the analysis of
the hypotheses: gender, year in coUege, mathematics courses taken in high
school, computer courses taken in either high school or college, computer
ownership, computer confidence, and ACT scores.
Hypothesis one predicted there were differences in the combined means
of the dependent variables between the guided Logo instruction group and the
self-discovery instruction group while adjusted for the contribution of the
seven covariates. A MANCOVA test was used to analyze the hypothesis.
The result revealed that there were statistically significant differences in the
vector of means for the experimental group and the control group. Following
this test, an ANCOVA test was used to test if there were difference between
the two groups on each of the dependent variable.
Hypothesis two predicted that students in the guided Logo instruction
group would receive a higher average score than students in the self-discovery
learning group on the Logo decomposing test while adjusted for the
1 4 6
contribution of the seven covariates. The result showed that there was no
significant main effect of the treatment on the Logo decomposing test
Hypothesis three of the study predicted that students in the guided Logo
instruction group would receive a higher average score than students in the
self-discovery learning group on the Logo planning test while adjusted for the
contribution of the seven covariates. The result revealed that there was a
statistically significant difference between two groups on the Logo planning
test.
Hypothesis four predicted that students in the guided Logo instruction
group would receive a higher average score than students in the self-discovery
learning group on the Logo error identification test while adjusted for the
contribution of the seven covariates. The result showed that there was a
statistically significant difference between the two groups on the Logo error
identification test.
Hypothesis five predicted that students in the guided Logo instruction
group would receive a higher average score than students in the self-discovery
learning group on the general decomposing test while adjusted for the
contribution of the seven covariates. The result indicated that there was a
statistically significant difference between the two groups on the general
decomposing test
Hypothesis six predicted that students in the guided Logo instruction
group would receive a higher average score than students in the self-discovery
learning group on the general planning test while adjusted for the
contribution of the seven covariates. The result revealed that there was a

1 4 7
statistically significant difference between the two groups on the general
planning test.
Hypothesis seven for the study predicted that students in the guided Logo
instruction group would receive a higher average score than students in the
self-discovery learning group on the general error identification test while
adjusted for the contribution of the seven covariates. The result showed that
there was a statistically significant difierence between the two groups on the
general error identification test.
The results of the basic Logo comprehension test were reported. Since
this test was used to examine the equality of Logo instructional content, the
researcher expected that there would be no difference between the two groups
on the acquisition of basic knowledge of Logo programming. An ANCOVA
test was used to analyze the basic Logo comprehension test. The result
revealed that there was no statistically significant difference between the two
groups on the test.
Auxiliary findings were also reported. The researcher first was interested
in finding which dependent variable was influenced the most by the
treatment A stepwise multiple regression was used to test. The result
indicated that the Logo error identification skills were most significantly
influenced by the treatment Then, the correlation matrix was reported to
determine if there were significant relationships among covariates and
dependent variables. The result revealed that low correlations of covariates
and dependent variables existed. The largest correlation was between the ACT
covariate and general decomposing skills.
1 4 8
The correlation matrix of the seven control variables was reported to
determine the relationship among covariates. The result indicated that there
were very low or no signiAcant relationships among covariates. The
computer confidence and mathematics courses taken in high school showed
the largest relationship with 8% of the shared variance.
The correlation matrix among the six dependent variables was also
reported. The result indicated that there were statistically significant
relationships among several of the dependent variables. These included
significant relationships between Logo planning skills and Logo error
identification skills; general decomposing skills and Logo error identification
skills; Logo error identification skills and general error identification skills.
Discussion of the Study Results
Discussion of overall transfer effect results
As reported in the previous chapter, the vector means of the dependent
variables were significantly different between the guided Logo group and the
self-discovery group. Since the combined dependent variables included both
the near and far transfer effects of guided instruction, the significant result
indicates that the treatment influenced the acquisition of cognitive
monitoring strategies in Logo programming as well as outside of
programming domains. This finding supports previous Logo research
suggesting that guided instruction with Logo programming could facilitate the
development of specifically targeted strategies (Grandgenett, 1989; Seidman,
1987; Swan Sc Black, 1989). This finding also contributes to the research
1 4 9
suggesting that guided instruction focusing on specific strategies helps
students acquire and transfer those strategies to their learning in other
domains (Brown, 1983; Brown, Campione, & Day, 1981; Palinscar & Brown,
1989). Thus, this result suggests that guided instruction with Logo
programming targeting cognitive monitoring strategies will make a positive
difference in the development of students' cognitive monitoring strategies.
Discussion of near transfer effect results
Three main cognitive monitoring strategies, which were utilized in the
Logo programming instruction, were measured in order to determine the
near transfer effect of the treatment.
Lo^ decomposing skills Since students in the guided Logo group were
strongly encouraged and guided to decompose given Logo problems before
they planned and executed the problem, the researcher expected that this
group would develop a higher level of decomposing skills than the control
group. However, the result indicated that no statistically significant difference
existed between the two groups on the measurement of decomposing skills.
Both the guided instruction group and self-discovery group showed relatively
equal performance on the decomposing test.
One possible explanation for the statistically non-significant result would
be that the nature of Logo programming itself encourages students to break
down a complex graphic into subparts. Since Logo is a graphic oriented and
procedural programming language, it may help students naturally break a
large chunk of program into smaller pieces and write separate procedures for
each piece. Thus, the structure of the language itself may encourage the

1 5 0
development of decomposing skills. Both treatment groups were able to break
down a complex graphic into simpler, essential shapes (e.g., circle, square,
triangle, etc) after four weeks of intensive Logo programming instruction.
Another possible interpretation would be that identifying elemental
shapes from the given graphic was a rather simple problem for college
students. Students in both groups might have developed a certain level of
decomposing skills and were able to use them when the problem was
obviously breakable into subproblems. However, it is possible that more
complex problems might have yielded different results.
Logo planning skills Students in the guided Logo programming group
earned a higher mean score on the Logo planning test than students in the
self-discovery group. Explicitly modeled instruction for planning activities in
the guided Logo group seemed to facilitate the development of plarming
strategies. Particularly, with a mediated intervention, the instructors in the
guided Logo group not only encouraged students to plan the solution, but also
encouraged students to sequence the given information, and create an
efficient solution before jumping into the execution.
When an explicit model for the planning process is delivered through
teacher mediated planning activities, this learning environment may
encourage students to begin to intentionally and deliberately decide on the
nature of problem constraints, organize given information, and search for an
efficient solution. Students in the experimental group were able to
demonstrate a more logical, modular, and efficient solution process than
students in the control group.
1 5 1
This result supports and expands the previous research on Logo
programming and planning skills. In the Pea and Kurland study (1984), a self-
discovery approach to Logo programming was emphasized. Well trained
Logo teachers carefully monitored student work, but did not provide
structured instruction. The result of a year-long and intensive study
concluded that self-discovery learning in Logo did not facilitate any aspects of
planning skills. On the contrary, Lehrer, Guckenberg, and Sandlio's study
(1988b) indicated that teacher mediated Logo experience facilitated students'
planning skills. The result of this study supports previous research suggesting
teacher mediated instruction in Logo programming is needed for developing
planning skills. It appears that guided instruction is necessary in order to help
students learn beyond technical programming skills.
Logo error identification skills The result of Logo error identification
test revealed that students in the guided Logo instruction group performed
significantly higher on the Logo error identification test than students in the
self-discovery learning environment. This positive outcome was expected
since students in the guided Logo instruction group learned a systematic
approach to identifying the errors. The students were first asked to identify
the discrepancy of the planned graphic and the actual outcome. This first step
led students to visibly think about particular error statements or errors in the
product (e g., the leaves did not turn a greater degree, the orientation needed
to be left to right, and the door in the house was skewed to the left, etc.). Then,
students were led to the second step, to locate a procedure that possibly caused
errors. Once they located the error procedure, the instructor encouraged
1 5 2
students to explain clearly what was wrong in that procedure before they
began debugging (e g., the right turn angle turned too much, the turtle needed
to turn left before going forward, and the turtle needed to move back to the
initial position before drawing the next figure, etc.). These specific steps for
identifying the error alerted students to consciously regulate and monitor
error identification part of the solution processes.
This result indicated that although Logo has the potential to facilitate the
debugging process, students do not develop these skills automatically by just
experiencing Logo. In the error identification test, students were asked to
write down clearly information about errors in the given solutions. Students
who had received guidance on a systematic approach to the error
identification activity showed better ability to clearly identify and explain the
errors than students in the self-discovery group. The former group also
showed better debugging skills than the latter group. The result strongly
supports previous research suggesting explicitly modeled instruction for error
identification and debugging helps students develop these skills (e.g., Carver,
1987; Carver & Wahr, 1986).
Summary of discussion for the near transfer effects
Overall, the positive near transfer effects for the cognitive monitoring
strategies support the use of guided Logo instruction. The students in the
guided Logo group were encouraged to follow steps of formal cognitive
monitoring activities to solve in-class Logo problems as well as to complete
homework assignments. Students in the guided Logo instruction spent much
less time on programming experience than the self<discovery group since
1 5 3
Logo was used as a tool to practice particular problem solving strategies.
Nevertheless, this group performed better on the measurement of Logo
planning and Logo error identification skills. This study supports the
previous research suggesting that a self-discovery approach to Logo
programming does not seem to develop planning skills, debugging skills, and
problem solving skills (Carver, 1987; Leron, 1985; Mayer, 1988; Pea & Kurland,
1984). The results from this study, combined with the others, suggest that a
guided instructional approach to teaching cognitive monitoring strategies
through Logo programming is necessary to achieve near transfer effects.
Thus, positive results on the near transfer effect of guided instruction in Logo
programming significantly contribute to the body of research knowledge on
the importance of Logo instructional methodology.
Discussion of far transfer effects of cognitive monitoring
In addition to the Logo tests, general decomposing skills, planning skills,
and error identification skills were measured to determine the far transfer
effect of the experimental treatment.
Ceneral decomposing skills Since Logo itself heavily relies on
mathematical concepts, the general decomposing test items consisted equally
of math related problems and non-math related problems. Students who
received guided instruction performed significantly better than students in the
self-discovery learning group not only on the steps of decomposing a given
problem, but also on the correctness of decomposed, partial problem solutions.
A major question was raised from this finding. There was no significant
near transfer effect of guided Logo instruction whereas there was a significant
1 5 4
far transfer e^ect. Two possible interpretations emerge from this result. First,
the decomposing skills of breaking down the problem into simpler units may
not be fully explored when studaits solve rather simple and visible problems.
However, students who were encouraged and explicitly taught to decompose
Logo problems might have internalized these skills. Thus, when students
were challenged with complex and unfamiliar problems, they might have
deliberately utilized the principle of decomposing strategies that they learned.
Second, in the guided instruction with Logo programming, teacher
mediated practice of decomposing strategies was provided to solve everyday
problem situations. This may have helped students to apply the underlying
principle of decomposing to complex problems outside of the Logo domains.
Although, the nature of Logo programming may facilitate decomposing skills
within Logo problem domains, students may not be able to apply these skills
outside Logo programming domains unless teacher mediated practice of
decomposing skills outside the Logo domains is provided.
General planning skills A test with everyday problem situations (meal
planning and shopping planning) was administered to determine planning
strategies. Students in the experimental group performed significantly better
on the measurement of general planning skills than students in the control
group. This finding supports previous research suggesting that a guided
learning environment using Logo programming improves students'
planning skills in non-Logo problem situations (Bamberger, 1984; Lehrer,
Guckenberg, & Leonard, 1988b).
1 5 5
In this study, students in the guided Logo instruction group were
encouraged to emphasize planning the solution to given Logo problems as a
part of the cognitive monitoring activities. The planning activity was more
than just solving the problem. Through Socratic dialogue, students were
directed to intentionally look for hints and clues from the given information
and were continually encouraged to organize the information, arrange the
sequence of action, and devise an efficient solution to the problem. The
teacher also presented examples of everyday problems and guided students to
apply the principle of learned planning strategies to solve the given problems.
These conscious efforts to teach planning appear to have empowered students
to increase their ability to apply planning skills to real-life problem situations.
General error identification skills Students in the guided Logo
instruction performed significantly better on the general error identification
test than students in the self-discovery Logo group. When a systematic
approach to the error identification and debugging was provided and
practiced, students were able to utilize this approach to solve problems outside
the Logo domains.
Students in the guided Logo instruction group were encouraged to
consciously utilize the steps of error identification through teacher mediated
error identification activities: explain the difference between the initial goal
and the actual outcome, locate statements where the error might occur,
explain the misconception in the statements located, and debug the errors.
These systematic steps of error identification were consistent during the Logo
instruction as well as solving outside of the Logo problems. Intensive practice
1 5 6
in these specific steps of identifying the error and debugging activities might
have helped students internalize the principles of error identification and
utilize these principles in other domains of learning.
Summary of discussion for the far transfer effects
Although some researchers agreed that experiencing computer
programming itself enhances higher-order thinking skills and general
problem solving skills (e g.. Green & Jaeger, 1983; Lawler, 1985; Papert, 1980a;
Watt, 1982), the results from this research do not support these claims. The
results strongly support the body of research knowledge that an explicit
instructional model of particular problem solving skills along with teacher
mediated learning is necessary to produce the positive transfer of those
problem solving skills (e.g., Derry, 1989; Grandgenett, 1989; Palinscar & Brown,
1984, 1989; Schoenfeld, 1985; Swan & Black, 1989; Van Haneghan & Baker,
1989).
The positive results of far transfer effects in this study also significantly
contribute to the theoretical research on the high road transfer mechanism.
When students were trained to utilize decontextualized strategies and
principles deliberately and consciously, they are likely to transfer them to any
other learning domains even though the strategies and principles were not
automatized (e.g., Salomon & Gardner, 1987; Salomon & Globerson, 1987;
Vygotsky, 1978). The researcher did not expect that students would master
cognitive monitoring strategies automatically from four weeks of guided Logo
instruction. However, the research clearly supported the concept that students
were able to use the principles of these strategies in solving problems within
1 5 7
the Logo domains as well as outside of the programming domains. The
results suggest that the guided Logo instruction environment is necessary in
order to help students develop specific problem solving strategies while
learning Logo programming.
Discussion of basic Logo comprehension results
A basic Logo comprehension multiple choice test was administered in
the study to determine the basic knowledge and concepts of Logo
programming. This test was used to examine the Logo instructional content
between the guided Logo group and the self-discovery Logo group. The result
revealed that no significant differences existed between treatment groups on
the mean score for the basic Logo comprehension test Since the content of
the test was related to Logo instructional objectives taught in both treatment
groups, this result implied that both treatment groups achieved a relatively
equal knowledge about basic Logo commands aad concepts.
The statistically shown equal achievement of both treatment groups on
the basic Logo comprehension test provided the researcher with an
encouraging interpretation for the transfer effects of the treatment. This study
examined the effectiveness of different instructional methodologies
delivering the same instructional content. If basic knowledge about Logo
programming had differed significantly, then conclusions about transfer
effects would be confounded. It could have been concluded that not just
instructional technique affected the transfer effect, but also instructional
content could have affected transfer effect. However, the measurement of
comprehensive knowledge of Logo content did not show a difference between
1 5 8
the two treatments. Therefore, it is reasonable to conclude that the study was
relatively successful in focusing on cognitive monitoring transfer differences,
rather than on the basic comprehensive knowledge difference between the
Logo instructional treatments.
It is also interesting to note that the comprehension of the instructional
Logo content between groups was statistically equivalent although the
students in the guided Logo group generally spent less time on the hands-on
Logo programming experience and spent more time on utilizing cognitive
monitoring strategies than the students in the self-discovery Logo group.
Such a result suggests that guided programming instruction, not focusing on
the programming experience itself but emphasizing content-free strategies,
still achieves at least an equivalent acquisition of knowledge about the Logo
programming language.
Discussion of auxiliary findings
Several additional statistics were gathered and reported in the study in
order to support the discussion of the main hypotheses results. Discussion
and implications of these additional findings will be reported in this section.
Discussion for the most influenced dependent variable The researcher
was interested in examining which dependent variable was most significantly
infiuenced by the treatments. In order to examine this, a stepwise multiple
regression was used. The result of this analysis indicated that the Logo error
identification skills contributed most to the classification of the treatments.
According to this result, it seemed reasonable to conclude that the guided
1 5 9
instruction in Logo programming had the most significant impact on the Logo
error identification skills.
A possible explanation would be that an explicit instructional model for
error identification and the Logo learning environment provided a very
powerful way to help students monitor their solution process and debug
errors while solving problems. Logo, which provides graphic output and
explicit error messages on the screen, appeared to be a powerful tool to
facilitate a model of the error identification process. According to Papert
(1980a), the learning of Logo programming helps students learn debugging
strategies and develop self-monitoring. The results of this study support
Papert's point of view that Logo can be a tool to develop student debugging
skills. It appears that when the nature of the Logo environment is combined
with an explicit model of error identification and debugging, students may
accelerate their error identification and debugging skills. Thus, it seems
reasonable to suggest that a systematic model for error identification that can
be incorporated into the Logo environment is needed in order to maximize
the development of error identification and debugging skills (e.g.. Carver &
Klahr, 1986; Carver, 1987).
Discussion of contributions of the control variables An analysis of
covariance indicated that only one covariate, ACT score, consistently
contributed to the reduction of error variance across the dependent variables
within the treatment groups. Students with higher ACT scores demonstrated
better performance on any task given in this study regardless of the treatment.
Given that the ACT test is designed to predict academic success and that all

1 6 0
tests administered in this study were academically oriented, this result is not
surprising.
Computer ownership contributed only to the reduction of error variance
on the Logo error identification skills within two groups. Although students
own computers, such computer ownership did not seem to impact
significandy on students' outcomes as measured in this study.
The result of no significant contribution of computer course experiences
and math course experiences to the error reduction also suggests that although
Logo is a math oriented computer programming language, the instructional
methodology could make a diHerence on the development of student's
thinking skills regardless of their previous computer or math experience.
Discussion of correlation result amonf covariates The result of the
correlation among covariates revealed that very low or no significant
relationships among covariates existed among the seven covariates. Among
the variables, computer confidence and mathematics courses taken in high
school showed the largest magnitude of relationship with only eight percent
of the shared variance. This was a supportive result for this study. If there
were significant correlations among covariates that were used to reduce error
variance within the treatment groups, it would be concluded that similar
covariates were used, and increased degrees of freedom unnecessarily.
Fortunately, relatively low or no significant correlations among control
variables existed. Thus, it seems reasonable to conclude that the covariates
selected for this study were relatively independent and were used successfully
in order to control errors within the two groups.
1 6 1
One interesting insight was gained from this result The computer
confidence did not show significant relationships with either students'
computer experience or computer ownership. Instead, it showed a positive
correlation to the students' mathematics course experiences in high school. It
appears that students who have taken more advanced math courses have
more confidence in the use of computers in general.
Discussion of correlation result amottf dependent variables The
relationships among six dependent variables were also reported as auxiliary
findings. Relatively moderate but statistically significant relationships among
dependent variables were found. Among them, Logo planning skills and
Logo error identification skills showed the largest magnitude of a relationship
with 36% of the shared variance. A possible explanation would be that when
students spend more time planning the solution and defining the nature of
the problem, they are better prepared to clearly identify the error in the
outcome. Possibly, elements of these two tests could be combined into a single
test in order to measure Logo planning and error identification skills.
Although the correlation results were statistically significant for the Logo
error identification skills with general decomposing skills and general error
identification skills, the shared variances for these dependent variables were
below 26%. Thus, these dependent variables seem to be measuring relatively
independent outcomes.
1 6 2
Implications for Guided Instruction with Logo Programming
It has been suggested that Logo programming helps students develop
problem solving strategies and an awareness of their thinking processes
(Qements, 1990; Papert, 1980a; Watt, 1982). However, previous research
produced conflicting results for this claim. The empirical research conducted
in this study supports the previous research suggesting that systematically
guided instruction needs to be provided in Logo programming in order to
help students develop efficient thinking skills and problem solving strategies
(Grandgenett, 1989; Leron, 1985; Pea Sc Kurland, 1987; Seidman, 1987; Swan &
Black, 1989).
Proponents of self-discovery leanUng may argue that structuring
instruction for Logo programming limits students' imagination and
opportunities to explore their own ideas and thoughts. However, in this
study, although teacher frameworked instruction and problems were
provided, students were strongly encouraged to create their own solutions and
multiple solutions were encouraged. In the guided instruction for this study,
only the steps of cognitive monitoring processes while solving the problems
were structured and explicitly guided. For example, students could not use the
computer unless they completed the steps of decomposing and planning.
However, various solutions according to student learning style were
encouraged and accepted. Several different solutions to a given problem were
discussed with the use of the cognitive monitoring model. Thus, although
students used a uniform model of cognitive monitoring activities, their
solutions could be different A-om each other. Students also had chances to

1 6 3
create their own problems. Homework assignments were given each week
and students were encouraged to create their own challenges. For example,
students were asked to create their own graphic designs that utilized total
turtle trip theorem, variables, and recursion, etc However, they were
required to follow the steps of cognitive monitoring activities given to them
on planning sheets.
There are several advantages of structuring Logo programming
instruction. First, teacher provided problems may give students more
challenging and exciting directions. When, students select their own
problems, they may create very limited problems that do not go beyond their
ability. Thus, students lose motivation to experience challenging problems.
On the other hand, some students design very complex problems beyond their
capabilities of solving. Students in this situation often become discouraged
easily and acquire negative attitudes toward learning programming. Thus,
guided Logo instruction may help students gradually develop their
programming skills and understand underlying concepts of Logo
programming. Guided instruction in Logo programming also helps students
develop specific problem solving strategies and guides them to apply these
strategies beyond the programming level. Guided Logo instruction can clarify
the degree of the teacher's role in the learning environment. Structuring the
degree of the teacher's mediated role helps the teacher constantly monitor her
level of intervention. Thus, guided Logo instruction helps a teacher and the
students recognize the level of learning progress and develop mutual
interaction. Guided Logo instruction also helps the teacher lead students
1 6 4
gradually from simple to difficult problem situations with minimal
threatening situations. Thus, guided instruction in Logo programming can
provide the learning environment in which the teacher and the students
become co-constructors of intellectual and emotional growth.
The results of this study strongly support the benefits of guided Logo
instruction over a self-discovery approach to Logo programming. Specifically,
the results from this study suggest the following for Logo instructional
programs:
1. Teaching decontextual strategies intensively and deliberately
empowered students' capability of utilizing these strategies in other learning
domain. In this study, five specific components of cognitive monitoring
strategies were illustrated and targeted as cross contextual strategies:
decomposing, planning, executing, identifying errors, and debugging errors.
Students who were encouraged to focus on specific cognitive monitoring
strategies demonstrated better performance in programming domain tasks as
well as outside programming domain tasks.
2. An explicit and recursive model for cognitive monitoring activities:
decomposing, planning, executing, identifying the error, and debugging
empowered students practicing cognitive monitoring strategies in the process
of solving computer programming problems, while not focusing on the
technical programming skill itself. The results of this study indicate that a
structured model of cognitive monitoring activities facilitates students to
consciously engage in monitoring their learning progress, thus, allowing
them to manage the complex information to be learned.
1 6 5
3. The teacher mediated practice of cognitive monitoring activities
provided a promising teaching technique to facilitate student involvement in
an active problem solving process. The results of this study provide strong
evidence that teacher mediated Logo instruction progressively guides students
to learn efficient thinking and problem solving skills. Through teacher
mediated intervention, students actively engage in learning beyond the
technical programming skills (Emihovich & Miller, 1986; Leron, 1985; Pea &
Kurland, 1987; Salomon & Perkins, 1987; Swan & Black, 1989). The results
demonstrated the efficiency of an explicit instructional model and mediated
intervention for teaching cognitive monitoring strategies in Logo
programming.
4. This study also indicated that teacher mediated practice of cognitive
monitoring strategies outside programming problems facilitated far transfer.
The role of the teacher in this study was not only to encourage students to
engage in cognitive monitoring activities in Logo programming but also to
present various examples of everyday problems and to guide students to
utilize learned strategies in general problem situations. Thus, teacher
mediated problem solving activities provide an opportunity for students to
mindfully engage in the acquisition of cognitive and metacognitive skills and
to transfer those learned skills to other domains of learning (Anderson &
Reiser, 1985; Feuerstein, 1980; Salomon & Perkins, 1987; Singley & Anderson,
1989; Vygotsky, 1978). The teacher mediated practice of cognitive monitoring
strategies in solving everyday problems provided encouraging results for the
far transfer eAect.
1 6 6
5. Positive results from this study indicated that a structured
instructional model with teacher mediated training of cognitive monitoring
helped students intensively and deliberately monitor their on-going thinking
processes, thus internalize these strategies although the length of instructional
time was relatively short
Recommendations for Further Research
Based on the findings of the study, the following recommendations for
further research emerge:
1. The treatment period in this study was relatively short A study over a
longer period of time seems warranted from the positive findings of this
study. A longer study might reveal different effects for each group.
2. It is possible that an explicit instructional model of cognitive
monitoring and the nature of mediated learning can be constructed in other
subject matters and can be utilized as effectively as the Logo computing
environment to teach cognitive monitoring strategies. Further investigation
of these possibilities could yield alternative learning tools to teach higher-
order thinking strategies.
3. This research focused on college students in order to examine the
effects of guided instruction with Logo programming. Younger students may
respond differently to the guided Logo instruction. The positive results from
this study suggest the need of further research on guided instruction with
Logo programming and the development of cognitive monitoring strategies
among various age levels and grade levels.
1 6 7
4. Some studies indicated that students leam differently according to
their achievement level. Low achievers might leam better through
systematically guided instruction whereas high achievers might leam better
through self-discovery learning. However, this issue was not addressed in
this study. Further studies should examine the influence of student
achievement level and other learner characteristics on the treatment effects.
Concluding Remarks
This study focused on guided Logo instruction and the development of
cognitive monitoring strategies. The study was conducted to provide
empirical evidence for the conflicting results on the effects of instructional
methodology in teaching problem solving through Logo programming.
There are numerous research studies on Logo programming targeting
elementary school students. Yet, there is little evidence of how Logo
programming can be used for college students in order to improve their
thinking skills and problem solving skills. Although it is known that
younger students leam more effectively through structured instruction than
older students, this research suggested that adults also need guided instruction
in order to develop problem solving skills through programming activities.
The study also clearly supported the power of guided instruction with
Logo programming to develop cognitive monitoring strategies. SpedBcally,
Logo programming appears to be a powerful tool to provide dynamic learning
environments where students can develop abstract thinking. This study

1 6 8
indicated that guided instruction facilitated the potential of Logo
programming to provide students with cognitive monitoring activities.
Educators are facing the fundamental issue of teaching transferrable skills
to help students become independent learners and problem solvers in order to
keep up with a rapidly changing technological information society. Cognitive
monitoring has been considered as teachable, decontextual, and transferrable
higher-order thinking strategy. It has been regarded as one of the most
important and essential strategies for efficient thinking and problem solving.
To respond to the need of a technological information society, this research
demonstrated a successful instructional technique for developing cognitive
monitoring strategies. Guided instruction with computer programming and
the development of cognitive monitoring is an area of research that deserves
continued attention.
169
BIBLIOGRAPHY
Abelson, H. (1982). Apple Logo. Peterborough, New Hampshire: Byte/McGraw-Hill.
Anderson, J. R. (1983). The Architecture of Cognition. Cambridge, MA: Harvard University Press.
Anderson, J. R. (1985). Cognitive Psychology and Its Implications. New York, NY: W. H. Freeman.
Anderson, J. R., & Reiser, B. J. (1985). The LISP tutor. Byte. 10, 159-175.
Armbruster, B. B., Echols, C. R, & Brown, A. L. (1983). The role of metacognition in reading to leam: A developmental perspective (Reading Report. No. 40). Urbana, IL; University of Illinois, Center for the Study of Reading.
Bactian, A., Fruchter, N., Gittell, M., Greer, C., & Haskins, K. (1986). Choosing Equality: The Case for Democratic Schooling. Philadelphia: Temple University Press.
Baker, L. (1982). An evaluation of the role of metacognitive deficits in learning disabilities. Topics in Learning and Learning Disabilities. 2,27-35.
Baker, L. (1989). Metacognition, Comprehension Monitoring, and the Adult Reader. Educational Psvchologv Review. 1(1), 3-38.
Baker, L, & Brown, A. L (1984a). Metacognitive skills and reading. In P. D. Pearson (Ed.), Handbook of Reading Research. New York, NY: Longman.
Baker, L, & Brown, A. L. (1984b). Cognitive monitoring in reading. In J. Flood (Ed.), Understanding reading comprehension: Cognition. language, and the structure of prose. Newark, DE: International Reading Association.
Bamberger, H. J. (1984). The effect of Logo (Turtle Graphics) on the problem solving strategies used by fourth grade children. Unpublished doctoral dissertation. The University of Maryland, ML.
170
Baron, J. (1981). Reflective thinking as a goal of education. Intelligence. & 291-309.
Beck, T. L. (1983). Developing comprehension: The impact of the directed reading lesson. In R. Anderson, J. Osborne, and J. Tiemey (Eds.), Learning to Read in American Schools: Basal Readers and content Texts. Hillsdale, NJ: Lawrence Erlbaum Associates.
Bereiter, C., & Bird, M. (1985). Use of thinking aloud in identification and teaching of reading comprehension strategies. Cognition and Instruction. Z 131-156.
Beyer, B. K. (1987). Practical Strategies for the Teaching of Thinking. Boston, MA: AUyn and Bacon.
Billstein, R,, Libeskind, S., & Lott, J. W. (1985). Apple Logo: Programming and Problem Solving. Menlo Park, CA: The Benjamin/Cununings Publishing Company.
Bransford, J. D., & Stein, B. S. (1984). The IDEAL problem solver: A guide for improving thinking, learning, and creativity. New York, NY: W. H. Freeman and Company.
Bransford, J. D., & Vye, N. J. (1989). A perspective on cognitive research and its implications for instruction. In L B. Resnick and L. E. Klopfer, Toward the Thinking Curriculum: Current Cognitive Research. Alexandria, VA: 1989 Yearbook of the Association for Supervision and Curriculum Development.
Brown, A. L. (1975). The development of memory: Knowing, knowing about knowing, and knowing how to know. In R W. Reese (Ed.), Advances in child development and behavior (Vol. 10). New York, NY: Academic.
Brown, A. L. (1978). Knowing when, where, and how to remember: A problem of metacognition. In R. Glaser (Ed.), Advances in instructional psychology (VoL 1). Hillsdale, NJ: Lawrence Erlbaum Associates.
Brown, A. L (1983). Learning to learn how to read. In J. Langer and T. Smith-Burke (Eds.), Reader meets author, bridging the gap: A psvcholinguistic and social linguistic perspective. Newark, NJ: Dell.
171
Brown, A. (1987). Metacogniiion, executive control, self-regulation,and oèxer more mysterious mechanisms. In F. E. Weinert & R. H. Kluwe (Eds.). Metacognition. motivation, and understanding. Hillsdale, NJ: Lawrence Erlbaum Associates.
Brown, A. L, Bransford, J. D., Ferrara, R. A., & Campione, J. C. (1983). Learning remembaing and understanding. In J. H. Flavell and E. M. Markman (Eds.), Handbook of child psvchology. Vol. PI. Cognitive Development. New York, NY: Wiley.
Brown, J. S., & Burton, R. R. (1978). Diagnostic models for procedural bugs in basic mathematical skills. Cognitive Science. Z, 155-192.
Brown, J. S., Burton, R. R., & De Kleer, J. (1982). Pedagogical natural language and knowledge engineering techniques in SOPHIE. In D. Sleeman and J. S. Brown (Eds.), Intelligent Tutoring Systems. New York, NY: Academic Press.
Brown, A. L., Campione, J. C., & Murphy, M. D. (1977). Maintenance and generalization of trained metamnemonic awareness by educable retarded children. Tournai of Experimental Child Psvchologv. 24.191-211.
Brown, A. L, Campione, J. C., & Day, J. D. (1981). Learning to leam: On training students to leam from text Educational Researcher. Ig, 14-21.
Brown, A. L., & DeLoche, J. S. (1978). Skills, plans, and self-regulation. In R. S. Siegler (Ed.), Children's thinldng: What develops? Hillsdale, NJ: Lawrence Erlbaum Associates.
Brown, A. L, Similey, S. S., & Lawton, S. C. (1978). The effects of experience on the selection of suitable retrieval cues for studying prose. Child Development. 49. 829-835.
Bruner, J. S. (1966). Toward a theory of instruction. New York, NY: Norton.
Burton, L (1984a). Mathematical thinking: the struggle for meaning. Tournai for Research in Mathematics Education. 15.35-49.
Burton, L (1984b). Thinking Things Through: Problem Solving in Mathematics. Oxford: Basil Blackwell.
172
Calfee, R. (1984). Applying cognitive psychology to educational practice: The mind of the reading teacher. Unpublished manuscript, Stanford Uniyersity, Stanford, CA.
Campione, J. C., & Brown, A. L (1977). Memory and metamemory development in educatable retarded children. In R. V. Kail and J. W. Hagen (Eds.), Perspectives on the Development of Memory and Cognition. Hillsdale, NJ: Erlbaum.
Campione, J. C., & Brown, A. L. (1978). Towards a theory of intelligence: Contributions from research with retarded children. Intelligence. 2, 279-304
Campione, J. C., Brown, A. L, & Connell, M L. (1988). Metacognition: On the importance of understanding what you are doing? In R. I. Charles and E. A. Silver (Eds.), Teaching and assessing of mathematical problem solving. Reston, VA: Lawrence Erlbaum Associates.
Carbonell, J. (1983). Learning by analogy: Formulating and generalizing plans from past experience. In R. S. Michalski, J. G. Carbonell, and T. M. Mitchell (Eds ), Machine Learning. Palo Alto, CA: Tioga.
Carrasquillo, A., & Nunez, D. (1988). Computer-assisted metacognitive strategies and reading comprehension skills of ESL elementary school students. Technical Report No. 143. ERIC ED 301 838.
Carver, S. M. (1987). Transfer of Logo debugging skill: analysis, instruction, and assessment. Unpublished doctoral dissertation. Pittsburgh, PA: Carnegie-Mellon University.
Carver, S. M, & Klahr, D. (1986). Assessing children's Logo debugging skills with a formal model. Tournai of Educational Computing Research. 2(4), 487-525.
Cavanaugh, J. C., & Borkowski, J. G. (1980). Searching for metamemory-memory connections: A developmental study. Developmental Psychology. 16,441-453.
Cavanaugh, J. C., & Perlmutter, M. (1982). Metamemory; A critical examination. Child Development. 53.11-28.

173
Chipman, S. R, & Segal, J. W. (1985). Higher cognitive goals for education. In J. W. Segal, S. F. Chipman, and R. Glaser (Eds.), Thinking and Learning Skills. Vol. 2: Current Research and Open Questions. Hillsdale, NJ: Erlbaum.
Qancey, W. J. (1982). Tutoring rules for guiding a case method dialog. In D. Sleeman and J. S. Brown (Eds ), Intelligent Tutorint^ Systems. New York, NY: Academic.
Clement, C. A., Kurland, D. M., Mawby, R., & Pea, R. D. (1986). Analogical reasoning and computer programming. Tournai of Educational Computing Research. 1(1), 73-94.
Clements, D. H. (1986). Logo and cognition: A theoretical foundation. Computers in Human Behavior. Z 95-110.
Clements, D. H. (1987). Longitudinal study of the effects of Logo programming on cognitive abilities and achievement. Tournai of Educational Computing Research. 1(1), 73-94,
Clements, D. H. (1990). Metacomponential Development in a Logo Programming Environment Tournai of Educational Psvcholoev. 82(1), 141-149.
Clements, D. H., & GuUo, D. F. (1984). Effects of computer programming on young children's cognition. Tournai of Educational Psvchology. 7^ 1051-1058.
Clements, D. H., & Merriman, S. (1988). Componential Developments in Logo programming environments. In R. E. Mayer (Ed.), Teaching and Learning Computer Programming: Multiple Research Perspectives. Hillsdale, NJ: Erlbaum.
Cormier, S., & Hagman, J. (1987). Transfer of Learning. Contemporary Research and Applications. San Diego, CA: Academic Press.
Como, L (1987). Teaching and self-regulated learning. In D. Berliner and R. Roushine (Eds.), Talk to Teachers. New York, NY: Random House.
Cory, S., & Walker, M. (1986). Logo Works: Lessons in Logo. Cambridge, MA: Terrapin Logo.

174
Costa, A. L. (1984). Mediating the metacognitive. Educational Leadership. fi(3), 57-67.
Dalbey, J., & Linn, M. C. (1985). The demands and requirements of computer programming; A literature review. Tournai of Educational Computing Research. L 253-274.
Banner, F. W. (1976). Children's understanding of intersentence organization in the recall of short descriptive passages. Tournai of Educational Psvchologv. 174-183.
Davidson, L. J. (1983). Thinking backward. Unpublished manuscript, Cambridge, MA: The Phoenix School.
Delclos, V. R., Littlefîeld, J., Sc Bransford, J. D. (1985). Teaching thinking through Logo: The importance of method. Roeper Review. 7(3). 153-156.
IDerry, S. J. (1989). Strategy and expertise in solving word problems. In C. B. McOormick, G. E. Miller, M. Pressley (Eds.), Cognitive strategy research: From basic research to educational applicaHons. New York, NY: Springer-Verlag.
DeuU, O. K. (1986). Metacognitive skills. In G. D. Phye & T. Andre (Eds.), Cognitive classroom learning: understanding, thinking, and problem solving. Orlando, FL: Academic Press.
Dulit, E. (1975). Adolescent thinking a la Piaget: The formal stage. In Robert Grinder (ed.). Studies in Adolescences: A book of readings in adolescent development. New York, NY: Macmillan Publishing.
Emihovich, C., & Miller, G. E. (1986). Verbal mediation in Logo instruction: Learning fix>m a Vygotskian perspective. Paper presented at the AERA. ERIC ED 276 411.
Fay, A. L., & Mayer, R. E. (1987). Children's naive conceptions and confusions about LCXSO graphics commands. Tournai of Educational Psychology. 22, 254-268.
Feuerstein, R- (1979). The dvnamic assessment of retarded performers: The learning potential assessment device, theorv. instruments, and techniques. Baltimore, MD: University Park Press.
175
Feuerstein, R. (1980). Instrumental Enrichment. Baltimore, MD: University Park Press.
Feuerstein, R., Jensen, M., HoAnan, M. B., & Rand, Y. (1985). Instrumental enrichment, an intervention program for structural cognitive modifiability: Theory and practice. In J. W. Segal, S. F. Chipman, and R. Glaser (Eds.), Thinking and Learning Skills. Vol. 1: Relating Instruction to Research. Hillsdale. NT; Erlbaum.
Feuerstein, R., Rand, Y., & Rynders, J. E. (1988). Don't Accept Me as I am: Helping "Retarded" People to Excel. New York, NY: Plenum Press.
Feurzig, W., Horwitz, A., & Nickerson, R. S. (1981). Microcomputers in Education. Cambridge, MA: Bolt, Baranek, and Newmann.
Flavell, J. H. (1976). Metacognidve aspects of problem solving. In L. Resnick (Ed.). The nature of intelligence. Hillsdale, NJ: Erlbaum.
Flavell, J. H. (1978). Comments. In R. S. Siegler (ed.). Children's thinking: What develops? Hillsdale, NJ: Erlbaum.
Flavell, J. H. (1979). Metacognition and cognitive monitoring: A new area of cognitive-developmental inquiry. American Psychologist. 34. 906-911.
Flavell, J. H. (1981). Cognitive monitoring. In W. P. Dickson (Ed.), Children's oral communication skills. New York, NY: Academic Press.
Flavell, J. H., Friedricks, A. G., & Hoyt, J. D. (1970). Developmental changes in memorization processes. Cognitive Psychology. 1, 324-340.
Flower, L (1985). Rhetorical problem solving: Cognition and professional writing. Pittsburgh, PA: Camegie-Mellon University: Communications design center.
Ford, N. (1981). Recent approaches to the study and teaching of "effective learning" in higher education. Review of Educational Research. 51(3), 345-377.
Forrest-Pressley, D. L, & Waller, T. G. (1984). Cognition. Metacognition. and Reading. New York, NY: Springer-Verlag.
176
Frederikson, N. (1984). Implications of cognitive theory for instruction in problem solving. Review of Educational Research. 54. 363-407.
Gamer, R. (1987). Metacopiition and Reading Comprehension. Norwood, NJ: Ablex Publishing.
Gamer, R., & Kraus, C (1981-1982). Good and poor comprehender differences in knowing and regulating reading behaviors. Educational Research Quarterly. 6.5-12.
Garofalo, J., & Lester, F. K. (1985). Metacognition, cognitive monitoring, and mathematical performance. Toumal for Research in Mathematics Education. 16(3). 163-176.
Gentner, D. (1987). Mechanisms of Analogical Learning. Urbana, IL: Department of Computer Science, University of Illinois.
Goldenberg, E P. (1982). Logo - A cultural glossary. BYTE. 7(8). 210-228.
Goldin, S. E., & Hayes-Roth, B. (1980). Individual Differences in Planning Processes. Rand N-1488-ONR. Santa Monica, CA: The Office of Naval Research.
Grandgenett, N. F. (1989). An investigation of the potential of guided Loeo programming instruction for use in the development and transfer of analogical reasoning. Unpublished doctoral dissertation. Iowa State University, Ames, lA.
Green, C. & Jaeger, C. (1983). Teacher. Kids, and Logo. Irvine, CA: Educomputer Publishing.
Greeno, J. S. (1983). Forms of understanding in mathematical problem solving. In S. Paris, G. M Olson, and H. W. Stevenson (Eds ), Learning and Motivation in the Classroom. Hillsdale, NJ: Erlbaum.
Harvey, B. (1982). Why Logo? Bvte. 7(8), 163-171.
Hawkins, J. (1985). The interpretation of Logo in practice. Technical Report No. 34. Bank Street CoUege of Education. New York, NY: Center for Children and Technology.
177
Hayes-Roth, B. (1980). Estimation of time requirements during planning: Interactions between motivation and cognition. A Rand Note N-1581-ONR. Santa Monica, CA: The Office of Naval Research.
Hayes-Roth, B., & Hayes-Roth, F. (1979). A cognitive model of planning. Cognitive Science. ^ 275-310.
Hunt, E. (1983). On the nature of intelligence. Science. 141-146.
Hyde, A. A. (1989). Thinking in context: Teaching cognitive processes across the elementarv school curriculum. New York, NY: Longman.
Kirsch, L S., & Jimgeblut, A. (1986). Literacv: Profiles of America's Young Adults. (Report No. 16-pl-02). Princeton, NJ: Educational Testing Service.
Klahr, D, & Carver, S. (1988). Cognitive objectives in a Logo debugging curriculum: Instruction, learning, and transfer. Cognitive Psychology. 20,362-404.
Kurdek, L. A., & Burt, C. W. (1981). First-through sixth-grade children's metacognitive skills: Generality and cognitive correlates. Merrill-Palmer Ouarterlv. 2L 287-308.
Kurland, D. M., & Pea, R. D. (1985). Children's mental models of recursive Logo programs. Tournai of Educational Computing Research. 1, 235-244.
Larkin, J. (1980). Teaching problem solving in physics: The psychological laboratory and the practical classroom. In D. T. Tuma and F. Reif (Eds.), Problem Solving and Education: Issues in Teaching and Research. Hillsdale, NJ: Erlbaum.
Lawler, R. W. (1980). Extending a powerful idea (Logo Memo No. 58). Cambridge, MA- Massachusetts Institute of Technology, Artificial Intelligence Laboratory.
Lawler, R. W. (1982). Designing computer-based microworlds. Byte. 7(6), 138-160.
Lawler, R, W. (1985). Computer Experience and Cognitive Development: A Child's Learning in a Computer Culture. New York, NY: Halsted Press.
178
Lawson, M. J. (1984). Being executive about metacognition. In J. R. Kirby fed.). Cognitive Strategies and Educational Performance. Orlando, FL: Academic Press.
Lehrer, R. (1989). Computer-assisted strategic instruction. In C. B. McCormick, G. E. Miller, M. Pressley (Eds.), Cognitive strategy research: From basic research to educational applications. New York, NY: Springer-Verlag.
Lehrer, R., Guckenberg, T., & Lee, O. (1988a). Comparative study of the cognitive consequences of inquiry-based Logo instruction. Tournai of Educational Psychology. gQ(4), 543-553.
Lehrer, R., Sandlio, L, & Randle, L. (1988b). Learning pre-proof geometry with Logo. Paper presented at the annual meeting of the American Educational Research Association, New Orleans, NJ.
Leron, U. (1985). Logo today: vision and reality. The Computing Teacher. 12(5), 26-32
Linn, M. C., & Dalbcy, J. (1985). The demands and requirements of computer programming: a literature review. Tournai of Educational Computing Research. 1(13). 253-274.
Littlefield, J., Delclos, V. R-, Lever, S., Clayton, K. N., Bransford, J. D., & Franks, J. J. (1988). Learning Logo: Method of teaching, transfer, of general skills, and attitudes toward school and computers. In R. E. Mayer (Ed.), Teaching and Learning Computer Programming : Multiple Research Perspectives. Hillsdale, NJ: Lawrence Erlbaum Associates.
Lochhead, J. (1985). Teaching analytic reasoning skills through pair problem solving. In J. W. Segal, S. F. Chipman, and R. Glaser (Eds ), Thinking and Learning Skills. Vol. 1: Relating Instruction to Research. Hillsdale, NJ: Erlbaum.
Lochhead, J. (1988). Toward a scientific practice of mathematics education. Paper presented at the conference "Toward a Scientific Practice of Science Education". Berkeley, CA. ERIC ED 294 747.
Lochhead, J., & Whimbey, A. (1987). Teaching analytical reasoning through thinking aloud pair problem solving. In J. E. Stice (Ed.), Developing
179
critical thinkiny and problem-solving abilities. San Francisco, CA: Jossey-Bass.
Lundeberg, M. A. (1987). Metacognitive aspects of reading comprehension: Studying understanding in legal case analysis. Reading Researcher Quarterly. 22.407-432.
MacGinitie, W. H. (1984). Readability as a solution adds to the problem. In R. Anderson, J. Osborne, and J. Hemey (Eds.), Learning to Read in American Schools: Basal Iteaders and Content Texts. Hillsdale, NJ: Erlbaum.
Maddux, C. D. (1985). The need for science versus passion in educational computing. Computers in the Schools. 2(2/3). 9-10.
Maddux, C. D. (1989). Logo: Scientific dedication or religious fonatidsm in the 1990s? Educational Technology. 29(2). 18-23.
Maddux, C. D., & Johnson, D. L (1988). Logo: Methods and Curriculum for Teachers. New York, NY: The Haworth Press.
Markman, E. M (1977). Realizing that you don't understand: A preliminary investigation. Child Development. 42, 986-992
Markman, E. M. (1981). Comprehension monitoring. In W. P. Dickson (Ed.), Children's Oral Communication Skills. New York, NY: Academic Press.
Mayer, R. E. (1983). Thinking, Problem Solving. Cognition. New York, NY: W. H. Freeman and Company.
Mayer, R. E. (1988). Introduction to research on teaching and learning computer programming. In R. E Mayer (Ed.), Teaching and learning computer programming: Multiple research perspectives. Hillsdale, NJ: Lawrence Erlbaum Associates.
McCombs, 6. L., & Marzano, R. J. (1990). Putting the self in self-regulated learning: The self as agent in integrating will and skill. Educational Psychologist. 25(1), 51-69.
Meichenbaum, D., Burland, S., Gruson, L, & Cameron, R. (1985). Metacognitive Assessment In S. R. Yussen (Ed.), The growth of reflection in children. Orlando, FL: Academic Press, Inc

180
Miller, G. E., & Emihovich, C (1986). The effects of mediated programming instruction on preschool children's self-monitoring. Tournai of Educational Computing Research. 2(3), 283-297.
Miller, G., Galanter, E., & Pribram, K. (1960). Plans and Structure of behavior. New York, NY: Holt
Miller, R. B., Kelly, G. N., & Kelly, J. T. (1988). Effects of Logo computer programming experience on problem solving and spatial relations ability. Contemporary Educational Psvcholoyv. 11(4), 348-357.
Missiuna, C., Hunter, J., Kemp, T., & Hyslop, I. (1987). Development and evaluation of the "thinking with Logo curriculum". Technical Report No. 143. Edmonton, Alberta. ERIC ED 287 453.
Morocco, C. C., Neuman, S. B., Cushman, R, Packard, D., & Neale, A. (1987). Teachers, children and the magical writing machine: Instructional contexts for word processing with learning disabled children. Final report and "I know what to say" writing activities for the magical machine. Newton, MA: Education Department Center.
Myers, M., & Paris, S. G. (1978). Children's metacognitive knowledge about reading. Tournai of Educational Psvchologv. 70.680-690.
National Assessment of Educational Progress. (1983). The Third National Mathematics Assessment: Results. Trends, and Issues (Report No. 13-MA-01). Denver, CO: Educational Commission of the States.
National Assessment of Educational Progress. (1988). The Mathematics Report Card: Are We Measuring Up. Princeton, NJ: Educational Testing Service.
National Commission on Excellence in Education. (1983). A Nation at Risk: The Imperative for Educational Reform. Washington, DC: United States Department of Education.
NCTM. (1965). Mathematical challenges. Reston, VA: The National Council of Teachers of Mathematics.
NCTM. (1987). Teaching and learning: A problem-solving focus. Reston, Virginia: The National Council of Teachers of Mathematics.
181
NCTM. (1988). Mathematics Teachers. Reston, Virginia: The National Council of Teachers of Mathematics.
Nickerson, R. S. (1983). Computer programming as a vehicle for teaching thinking skills. Thinkiny. 1(3-4), 42-48.
Nickerson, R. S., Perkins, D. N., & Smith, E. E. (1985). The Teaching of Thinking. Hillsdale, NJ: Lawrence Erlbaum Associates.
Noss, R. (1984). Explorations in mathematical thinking: Some implications from Logo classrooms. Pre-Proceedings of the 1984 International Logo conference. 85-91, Cambridge, MA.
Palinscar, A. S., & Brown, A. L (1984). Reciprocal teaching of comprehension-fostering and comprehension-monitoring activities. Cognition and Instruction. L 117-175.
Palinscar, A. S., & Brown, A. L (1989). Instruction for self-regulated reading. In L B. Resnick and L E. Wopfer, Toward the Thinking Curriculum: Current Cognitive Research. Alexandria, VA: 1989 Yearbook of the Association for Supervision and Curriculum Development.
Papert, S. (1980a). Mindstorms: Children. Computers, and Powerful Ideas. New York, NY: Basic Books, Inc.
Papert, S. (1980b). New cultures from new technologies. BYTE. 5(9), 230-240.
Papert, S. (1987). Computer criticism vs. technocentric thinking. Educational Researcher. 1^1), 22-30.
Papert, S., Watt, D., DiSessa, A., & Weir, S. (1979). Fmal Report of the Brookline Logo Project. (Logo Memo 53). Cambridge, MA: MIT Artificial Intelligence Laboratory.
Paris, S. G., & Lindauer, B. K (1977). Constructive aspects of children's comprehension and memory. In R. V. Kail, Jr., and J. W. Hagen (Eds.), Perspectives on the development of memory and cognition. Hillsdale, NJ: Lawrence Erlbaum Associates.
182
Pea, R. D. (1982). What is planning development the development of? In D. Forbes and M. Greenberg (Eds.). Children's planning strategies. San Francisco, CA: Jossey-Baœ.
Pea, R. D. (1983). Logo programming and problem solving. Technical Report No. 12. New York, NY: Bank Street College of Education, Center for Children and Technology.
Pea, R. D., & Kurland, D. M. (1984). On the cognitive effects of learning computer programming. New Ideas in Psvchologv. 2,137-168.
Pea, R. D., & Kurland, D. M. (1987). Logo programming and the development of plaiming skills. In K. Sheingold and R. D. Pea (Eds ), Mirrors of Minds. Norwood, NJ: Ablex Publishing.
Pea, R. D., Kurland, D. M., & Hawkins, J. (1985). Logo and the development of thinking skills. In M. Chen and W. Paisley (Eds.). Children and Microcomputers: Research on the Newest Medium. Beverly Hills, CA: Sage Publications.
Perkins, D. N. (1985). The fingertip effect: How information-processing technology shapes thinking. Educational Researcher. 14.11-17.
Piaget,J. (1952). The child's conception of number. New York, NY: William Norton and Co.
Polya, G. (1973). How to Solve It. Princeton, NJ: Princeton University Press.
Pressley, M. (1986). The relevance of the good strategy user model to the teaching of mathematics. Educational Psychologist. 21(162), 139-161.
Rebok, G. W. (1989). Plan, Actions, and Transactions in Solving Everyday Problems. In J. D. Sinnott (Ed.), Everyday problem solving: Theory and applications. New York, NY: Ptaeger Publishers.
Rogoff, B., Gauvain, M., & Gardner, W. (1987). The development of children's skills in adjusting plans to circumstances. In S. L. Friedman, E. K. Scholnick, and R. R. Cocking (Eds ), Blueprints for thinking: The role of planning in cognitive development. New York, NY: Cambridge University Press.
183
Rohwer, W. D. Jr., & Thomas, J. W. (1989). Domain-Spedfic Knowledge, Metacognition, and the Promise of Instructional Reform. In C. B. McCormick, G. E. Miller, M. Pressley (Eds.), Cognitive strategy research: from basic research to educational applications. New York, NY: Springer-Verlag.
Ryba, K. A., & Chapman, J. W. (1983). Toward improving learning strategies and personal adjustment with computers. The Computing Teacher. 11(1), 48-49.
Salomon, G. (1988). AI in Reverse: Computer tools that become cognitive. Paper presented at AERA. New Orleans, LA. ERIC ED 295 610.
Salomon, G., & Gardner, H. (1986). The computer as educator: Lessons from television research. Educational Researcher. 15(1). 13-19.
Salomon, G., & Globerson, T. (1987). Skill may not be enough: The role of mindfulness in learning and transfer. International Tournai of Educational Research. 11.623-637.
Salomon, G., & Perkins, D. N. (1987). Transfer of cognitive skills from programming: When and how? Tournai of Educational Computing Research. 3(2). 149-169.
Samuels, M. (1986). Instrumental Enrichment with learning disabled students. Paper presented at the International Association for Children with Learning Disabilities Meeting, Edmonton, Alberta.
Schiffman, G., Tobin, D., & Buchanan, B. (1982). Microcomputer instruction for the learning disabled. Tournai of Learning Disabilities. 15. 557-559.
Schoenfeld, A. H. (1983). On failing to think mathematically: Some kinds of mathematical malfunctions in college students. Focus on Learning Problems in Mathematics. 5,93-104.
Schoenfeld, A. H. (1985). Metacognitive and epistemological issues in mathematical understanding. In E. A. Silver (Ed.), Teaching and learning mathematical problem solving: Multiple research perspectives. Hillsdale, NJ: Lawrence Erlbaum Associates.
184
Schwartz, T. A., Evans, R, & Caritj, W. H. (1984). Looking into a large-scale Logo project. Paper presented at American Educational Research Association, New Orleans, LA.
Seidman, R.H. (1981). The effects of Learning a computer programming language on the logical reasoning of school children. Paper presented at the American Educational Research Association Conference, New York, NY.
Seidman, R. H. (1987). Research on teaching and learning computer programming symposium. Paper presented to AERA, Washington, DC ERIC ED 287 442.
Simpson, M. L. (1984). The status of study strategy instruction: Implications for classroom teachers. Tournai of Reading. 28/136-142.
Singley, M. K, & Anderson, J. R. (1989). The transfer of cognitive skill. Cambridge, MA: Harvard University Press.
Smith, F. (1982). Understanding reading (3rd ed.). New York, NY: Holt, Rinehart, & Winston.
Smith, K. A. (1987). Educational engineering: Heuristics for improving learning effectiveness and efficiency. Engineering Education. 77(5),
274-279.
Solomon, C. J. (1975). Leading a child to a computer culture (Logo Memo 20). Cambridge: Massachusetts Institute of Technology, Artificial Intelligence Laboratory.
Solomon, C. J. (1982). Introducing Logo to children. BYTE. 7(8), 196-208.
Solomon, C J. (1986). Computer environments for children: A reflection on theories of learning and education. Cambridge, MA: The MIT Press.
Stat2,J. (1973). Problem Solving and Logo: Final Report of the Svracuse Logo F^oiect. Syracuse, NY: Syracuse University.
Sternberg, R. J. (1977). Intelligence, information processing, and analogical reasoning: The componential analvsis of human abilities. Hillsdale, NJ: Lawerence Erlbaum Associates.
185
Sternberg, R. J. (1980). Sketch of a componential subtheory of human intelligence. Behavioral and Brain Sciences. 3. 573-584.
Sternberg, R. J. (1984). What should intelligence tests test?: Implications of a triarchic theory of intelligence for intelligence testing. Educational Researcher. 13,5-15.
Sternberg, R. J. (1985). Beyond TO; A triarchic theory of human intelligence. New York, NY: Cambridge University Press.
Sternberg, R. J. (1986). Intelligence applied: Understanding and increasing your intellectual skills. San Diego, CA: Harcourt Brace Jovanovich.
Sternberg, R. J. (1987). Teaching intelligence: The application of cognitive psychology to the improvement of intellectual skills. In J. B. Baron & R. J. Sternberg (Eds.), Teaching thinking skills: Theorv and practice. New York, NY: W. H. Freeman and Company.
Sternberg, R. J. (1988). Intelligence. In R. J. Sternberg and E. E. Smith(Eds.), The psvcholoyv of human thought. Cambridge, MA: Cambridge University Press.
Sternberg, R. J., & Powell, J. S. (1983). The development of intelligence. In P. H. Mussen (Ed.), Handbook of Child Psychology (Vol. 3). New York, NY: Wiley.
Swan, K., & Black, J. B. (1989). Logo Programming and the Teaching and Learning of Problem Solving. CCT Report 89-1. Columbia University, New York, NY.
Task Force on Teaching As a Profession. (1986). A Nation Prepared: Teachers for the 21st Century. Washington, DC: Carnegie Forum on Education and the Economy,
Thompson, A. D., & Wang, H, M. C (1988). Effects of a Logo microworld on student ability to transfer a concept. Tournai of Educational Computing Research. ̂ 3), 335-347.
Tractenberg, R. (1985). Logo and the education of the hearing impaired. Computers in the Schools. 2(2/3), 283-297.
186
Van Haneghan, J. P., & Baker, L. (1989). Cognitive monitoring in mathematics. In C. B. McCormick, G. E. Miller, M. Pressley (Eds.), Copiitive strategy research: From basic research to educational applications. New York, NY: Springer-Verlag.
Varden, S., & Summer, S. (1984). What are we going to teach the teachers? Logo and Educational Computing Tournai. 2(1), 6-10.
Vygotsky, L S. (1978). Mind in Sodetv: The Development of Higher Psychological Processes. Cambridge, MA: Harvard University Press.
Wagner, R. K, & Sternberg, R. J. (1987). Executive control in reading comprehension. In B. Britton & S. M. Glynn (Eds.), Executive control processes in reading. Hillsdale, NJ: Lawrence Erlbaum Associates.
Wagoner, S. A. (1983). Comprehension monitoring: What it is and what we know about it. Reading Research Quarterly. 18.328-346.
Watt, M. (1982). What is Logo? Creative Computing. 8(10), 112-129.
Webb, N. M. (1984). \ficrocomputer learning in small groups: Cognitive requirements and group processes. Tournai of Educational Psychology. ^ 1076-1088.
Webb, N. M., & Lewis, S. (1988). The social context of learning computer programming. In R. E. Mayer (Ed ), Teaching and Learning Computer Programming : Multiple Research Perspectives. Hillsdale, NJ: Lawrence Erlbaum Associates.
Weinstein, C. E., & Mayer, R. E. (1986). The teaching of learning strategies. In M. C. Wittrock (ed.). Handbook of research on teaching (3rd ed,). New York, NY: Macmillan.
Whimbey, A., & Lochhead, J. (1982). Problem Solving and Comprehension. Philadelphia, PA: The Franklin Institute Press.
White, J. M., 6c Denny, V. S. (1983). Metacognition and computers with learning disabled adolescents. Paper presented at the Annual convention of the Association for Children and Adults with Learning Disabilities, San Francisco, CA.

187
Yussen, S. R., & Bennan, L. (1981). Memory predictions for recall and recognition in first-, third-, and fifth-grade children. Developmental Psvcholofv. 2Z 224-229.
Yussen, S. R, & Levy, V. M., Jr. (1975). Developmental changes in predicting one's own span of shorterm memory. Tournai of Experimental Child Psychology. 19,502-508.
Zimmerman, B. J., & Pons, M. M. (1986). Development of a structured interview of assessing student use of self-regulated learning strategies. American Educational Research Tournai. 22,614-628.
Zimmerman, B. J., & Pons, M. M. (1990). Student differences in self-regulated learning: Relating grade, sex, and giftedness to self-efficacy and strategy use. Tournai of Educational Psvcholoyv. 82(1). 51-59.
Zutell, J. (1981). Cognitive development, metalinguistic ability and invented spellings: comparisons and correlations. In M. Kamil (ed,). Directions in reading: Research and instruction. Thirtieth yearbook of the National Reading Conference. Washington, DC: National Reading Conference.
1 8 8
ACKNOWLEDGEMENTS
I am deeply indebted to Dr. Ann D. Thompson for her assistance with my
graduate study in curriculum and instructional technology. In developing
and implementing this research project, she allowed an enormous amount of
time for the discussion of the research. Without her thoughtful and
insightful comments, this research would not be possible. She also supported
me in many emotional aspects. My sincere thanks to Dr. Ann D. Thompson.
I extend my deep gratitude to the following committee members for their
support, guidance, and cooperation: Dr. Tom Andre, Dr. William Miller, Dr.
Anton Netusil, and Dr. Rex Thomas. Dr. Andre's guidance was very helpful
for the development of the theoretical framework for this research. Dr.
William Miller and Dr. Rex Thomas helped me develop very interesting and
reliable test instruments. Dr. Anton Netusil's and Dr. William Miller's
guidance was very helpful for the statistical analysis of the research data.
There are many who have helped me along the way to enlighten, refine
and enhance any thought and concept that I had for research: Dr. Douglas
Clements at New York State University in Buffalo, Dr. Karen Swan at SUNY
Albany in New York, Dr. Richard Lehrer at University of Wisconsin-Madison,
Dr. George Rebok at State University of New York, Dr. Robert Sternberg at
Stanford University, and Dr. Michael Pressley at University of Wisconsin-
Madison. I also thank my colleagues who participated as instructors in my
study: Julie Hamilton, Coimie Margrave, Matt Maurer, Sarvinder Naberhaus,
and Denise Schmidt. Each of these people deserves my sincere gratitude for
the signiHcant part they played in this endeavor.
1 8 9
I would like to especially thank those who supported me and encouraged
me to get through the end of the tunnel: my brothers and sisters for their
support and encouragement over the years, my mother for her prayers and
her hopes for me to achieve high academic goals, my father-in-law and
mother-in-law for their encouragement.
Above all, I thank my wonderful husband, Kwan Eung, for his love,
encouragement, and support. Being grateful to all of them, I dedicate this
dissertation to my daughter who at five, shared my excitement, hope,
discouragement, and frustration along the way. She has always brought a
shiny smile into my heart. Without her love, patience, and help I could
never have finished my research. She asked everyday, "study done,
mommy?" Yes. Young, it's done because of your love!

1 9 0
APPENDIX A: SAMPLE BACKGROUND QUESTIONNAIRE
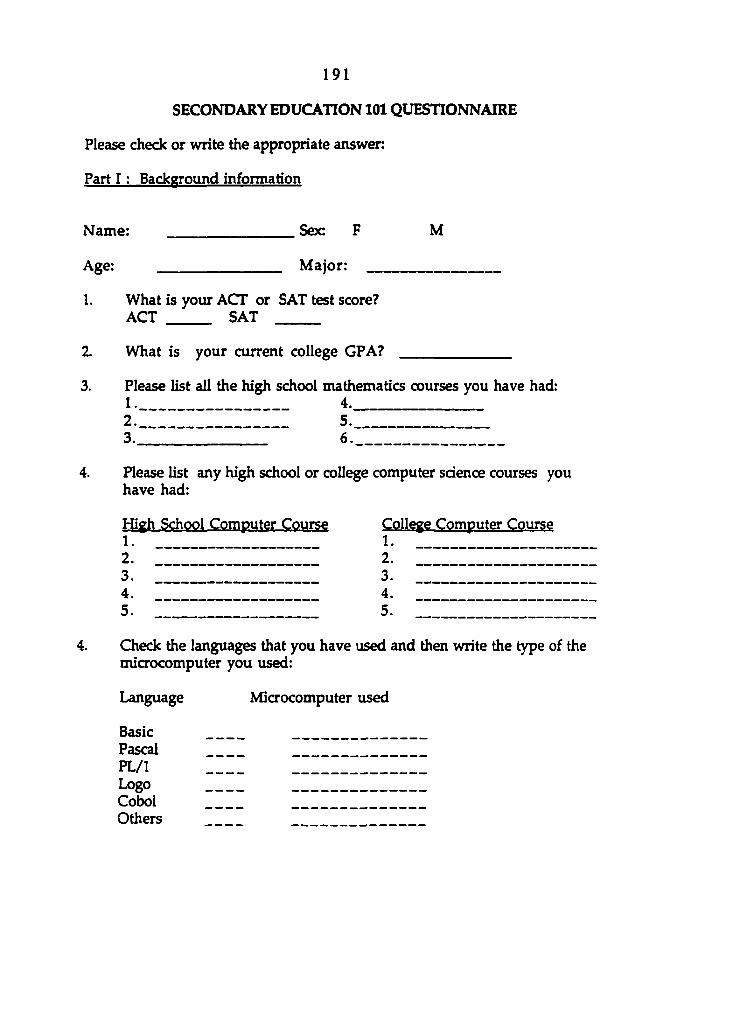
1 9 1
SECONDARY EDUCATION 101 QUESTIONNAIRE
Please check or write the appropriate answer:
Part I : Background information
Name: Sex: F M
Age: Major:
1. What is your ACT or SAT test score? ACT SAT
Z What is your current college CPA?
3. Please list all the high school mathematics courses you have had: 1 . 4. 2 . 5. 3 . 6.
4. Please list any high school or college computer science courses you have had:
High School Computer Course College Computer Course
2. 2. 3. 3. 4. 4. 5. 5.
4. Check the languages that you have used and then write the type of the microcomputer you used:
Language Microcomputer used
Basic Pascal PL/1 Logo Cobol Others

1 9 2 What microcomputer software packages have you used for the following applications? List no more than three for each application and leave it blank if you have used none.
a. Word processing & text editing (e.g. Appleworks, Macwrite, Wordstar, others. ) 1. Z 3.
b. Desktop publishing (e g. Printshop, Newsroom, Pagemaker, others...) 1. Z 3.
c Database management (e.g. Bankstreet filer, PC file, Microsoftworks, others.) 1. Z 3.
d. Electronic spreadsheet (e.g. Lotus 123, Microsoftworks, Appleworks, others ) 1. Z 3.
e. Programming (e.g. Logo, Logowriter, Basic, Superpilot, others.) 1. Z 3.
f. Educational software (e.g. Oregon trail. Racket boot, others..) 1. Z 3.
g. Graphic tools (e.g. Macpaint, Macdraw, Harvard Graphics, others..) 1. Z 3.
h. Games (Specify..) 1. Z 3.
i. Electronic networks (Telecommunications) 1. Z 3.
j. Other, please specify..
Do you have your own computer? 1. _ Yes 2. _ No
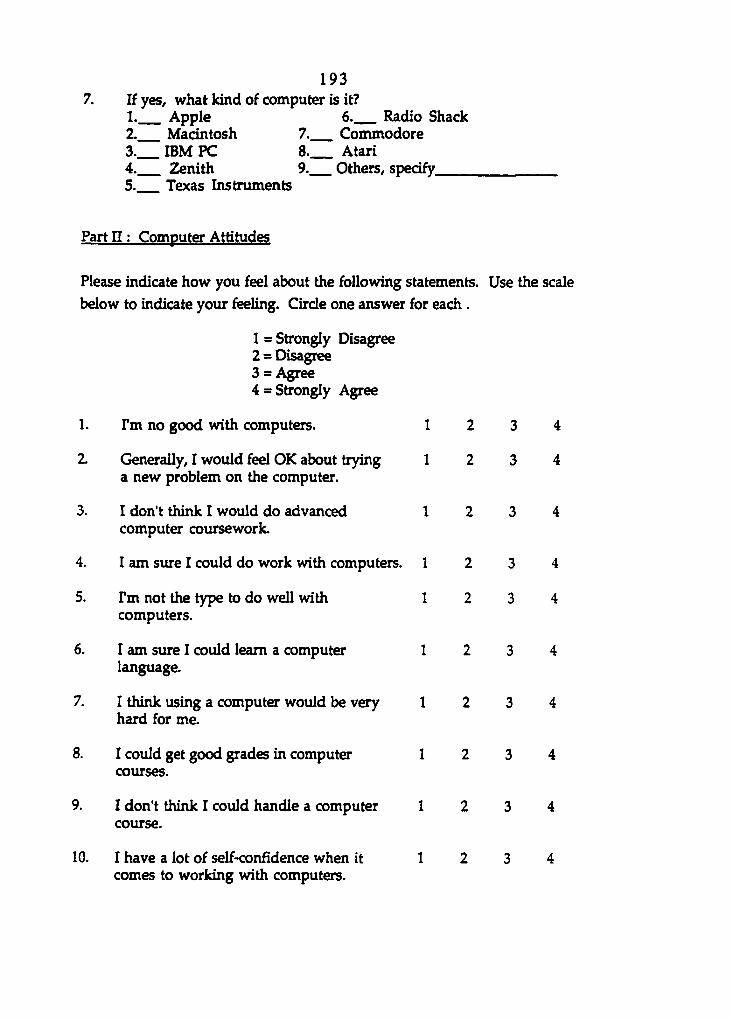
1 9 3 7. If yes, what kind of computer is it?
1 . Apple 6. Radio Shack 2 . Macintosh 7. Commodore 3 . IBM PC 8. Atari 4 . 2tenith 9. Others, specify 5. Texas Instruments
Part n ; Computer Attitudes
Please indicate how you feel about the following statements. Use the scale
below to indicate your feeling. Circle one answer for each .
1 = Strongly Disagree 2 = Disagree 3 = Agree 4 = Strongly Agree
1. Fm no good with computers. 12 3 4
2. Generally, I would feel OK about trying 12 3 4 a new problem on the computer.
3. I don't think I would do advanced 12 3 4 computer coursework.
4. I am sure I could do work with computers. 12 3 4
5. Fm not the type to do well with 12 3 4 computers.
6. I am sure I could learn a computer 12 3 4 language.
7. I think using a computer would be very 12 3 4 hard for me.
8. I could get good grades in computer 12 3 4 courses.
9. I don't think I could handle a computer 12 3 4 course.
10. I have a lot of self-confidence when it 12 3 4 comes to working with computers.

1 9 4
APPENDIX B: HOMOGENEITY OF SAMPLE BACKGROUNDS
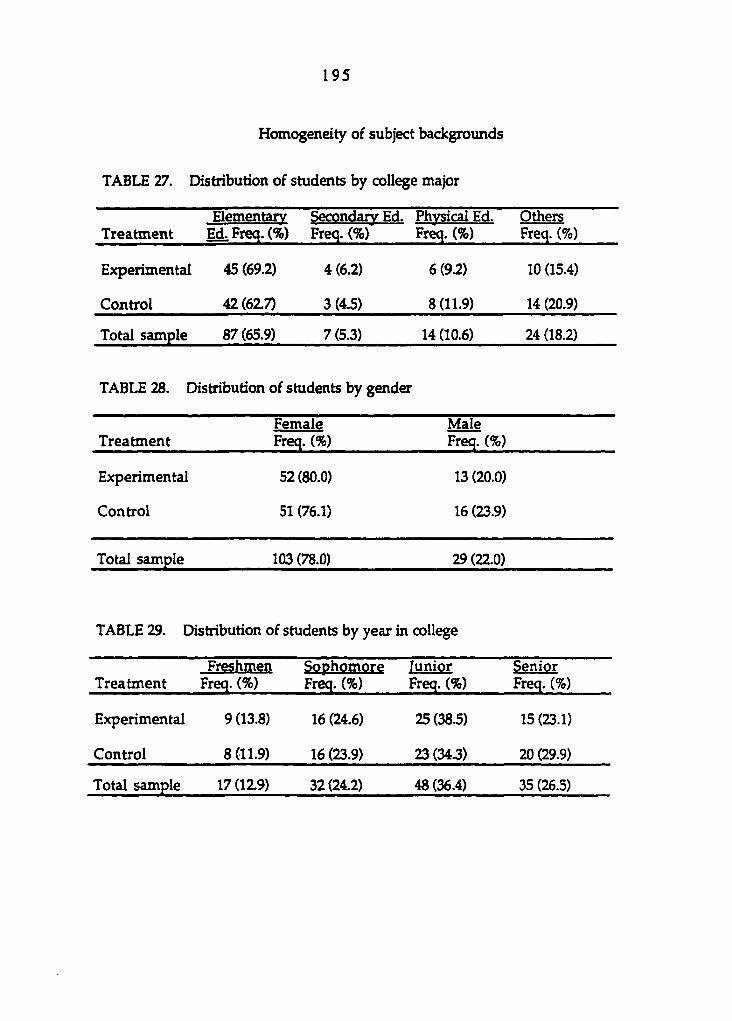
1 9 5
Homogeneity of subject backgrounds
TABLE 27. Distribution of students by college major
Treatment Elementary
Ed. Freq. (%) Secondary Ed. Freq. (%)
Physical Ed. Freq. (%)
Others Freq. (%)
Experimental 45 (69.2) 4 (6.2) 6 (9.2) 10 (15.4)
Control 42(62.7) 3 (4.5) 8 (11.9) 14 (20.9)
Total sample 87 (65.9) 7(5.3) 14 (10.6) 24 (18.2)
TABLE 28. Distribution of students by gender
Treatment Female Freq. (%)
Male Freq. (%)
Experimental 52(80.0) 13 (20.0)
Control 51 (76.1) 16 (23.9)
Total sample 103 (78.0) 29 (22.0)
TABLE 29. Distribution of students by year in I college
Treatment Freshmen
Freq. (%) Sophomore Freq. (%)
lunior Freq. (%)
Senior Freq. (%)
Experimental 9 (13.8) 16 (24.6) 25(385) 15 (23.1)
Control 8 (11.9) 16(23.9) 23 (34J) 20 (29.9)
Total sample 17(12.9) 32(24.2) 48 (36.4) 35 (26.5)
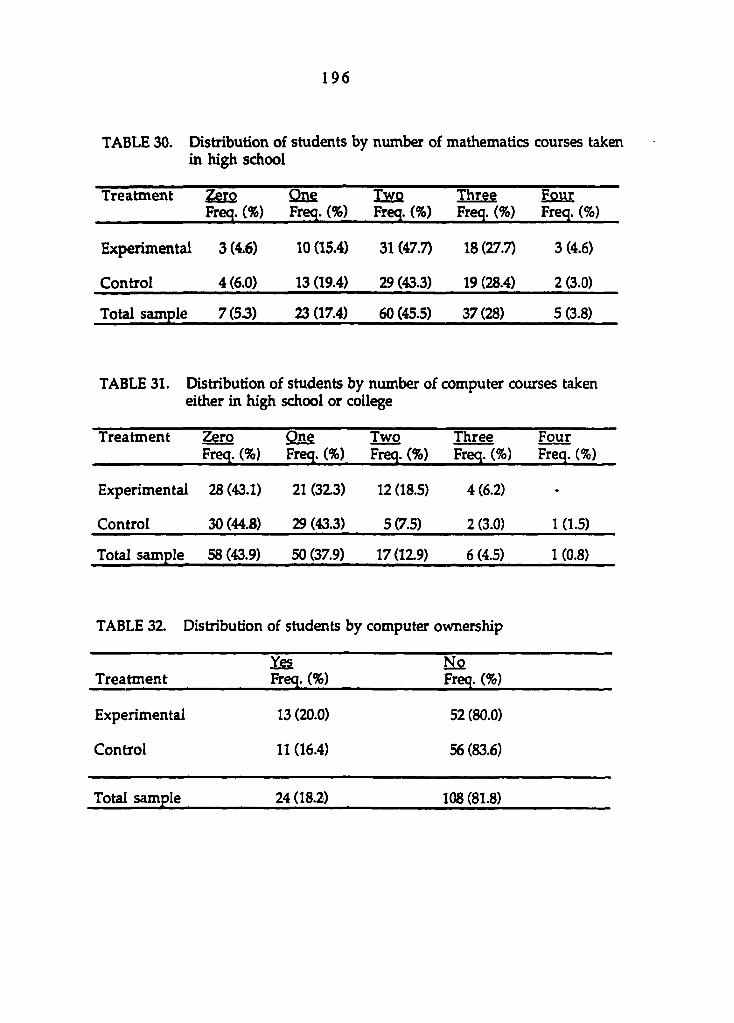
1 9 6
TABLE 30. Distribution of students by number of mathematics courses taken in high school
Treatment Zero Freq. (%)
One Freq. (%)
Two Freq. (%)
Three Freq. (%)
Fpur Freq. (%)
Experimental 3(4.6) 10(15.4) 31 (47.7) 18 (27.7) 3 (4.6)
Control 4 (6.0) 13 (19.4) 29 (43.3) 19 (28.4) 2 (3.0)
Total sample 7(53) 23 (17.4) 60 (45.5) 37(28) 5 (3.8)
TABLE 31. Distribution of students by number of computer courses taken either in high school or college
Treatment Zero Freq. (%)
Qne Freq. (%)
Two Freq. (%)
Three Freq. (%)
Four Freq. (%)
Experimental 28 (43.1) 21 (313) 12(18.5) 4(6.2) -
Control 30 (44.8) 29 (43.3) 5(7.5) 2 (3.0) I (1.5)
Total sample 58 (43.9) 50 (37.9) 17(129) 6(4.5) 1 (0.8)
TABLE 32. Distribution of students by computer ownership
Treatment YgS Freq. (%)
Ha Freq. (%)
Experimental 13 (20.0) 52(80.0)
Control 11 (16.4) 56 (83.6)
Total sample 24 (18.2) 108 (81.8)
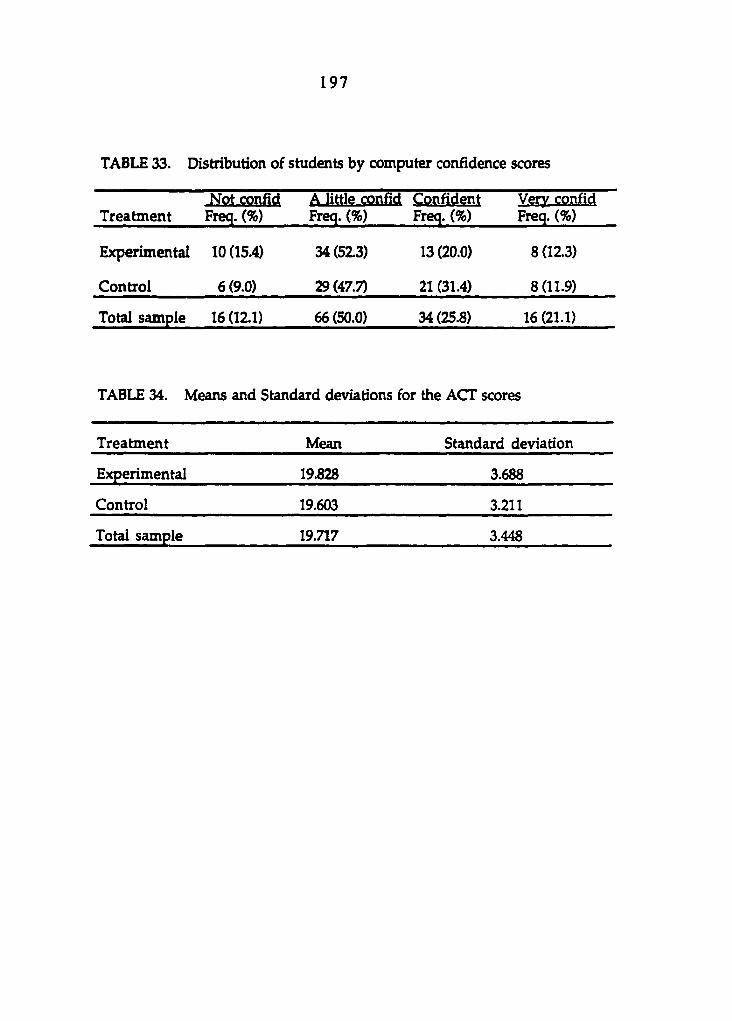
1 9 7
TABLE 33. Distribution of students by computer confidence scores
Treatment Not confid
Freq. (%) A little confid Freq. (%)
Confident Verv confid Freq. (%) Freq. (%)
Experimental 10(15.4) 34(52.3) 13(20.0) 8(12.3)
Control 6 (9.0) 29(47.7) 21 (31.4) 8 (11.9)
Total sample 16 (12.1) 66 (50.0) 34(25.8) 16(21.1)
TABLE 34. Means and Standard deviations for the ACT scores
Treatment Mean Standard deviation
Experimental 19.828 3.688
Control 19.603 3.211
Total sample 19.717 3.448

1 9 8
APPENDIX C: A MODEL OF LOGO-BASED COGNTIIVE MONITORING ACUVmES
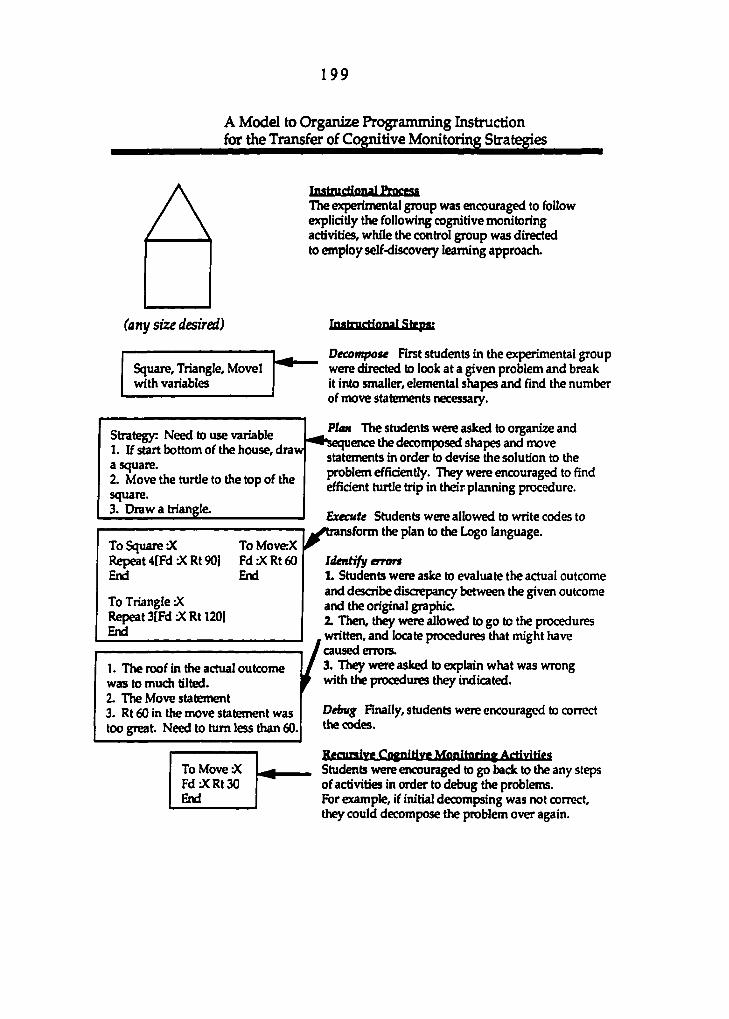
1 9 9
A Model to Organize Programming Instruction Jor^heTranstoofC^nitive^fonitOTingS^
(any size desired)
Square, Triangle, Movel with variables
Strategy: Need to use variable 1. If start bottom of the house, draw a square. 2. Move the turtle to the top of the square. 3. Draw a triangle.
To Square :X ToMoverX Repeat 4fFdJ(Rt 901 Fd JCRt60 End End
To Triangle zX Repeat 3(FdJ(Rt 1201 End
1. The roof in the actual outcome was to much lilted. 2. The Move statement 3. Rt 60 in the move statement was too great. Need to turn less than 60.
To Move :X Fd J(Rt30 End
Inatmctional Pro«M The experimental group was encouraged to follow explicitly the following cognitive monitoring activities, while the control group was directed to employ self-discovery learning approach.
Tnatnifrtanal Stf pa;
Decompose First students in the experimental group were directed to look at a given problem and break it into smaller, elemental shapes and find the number of move statements necessary.
Plan The students were asked to organize and ^^sequence the decomposed shapes and move
statements in order to devise the solution to the problem efficiently. They were encouraged to find efficient turtle trip in their planning procedure.
Execute Students were allowed to write codes to ^^transform the plan to the Logo language.
Identify errors 1. Students were aske to evaluate the actual outcome and describe discrepancy between the given outcome and the original graphic 2. Then, they were allowed to go to the procedures written, and locate procedures that might have caused errors. 3. They were asked to explain what was wrong with the procedures they indicated.
Debug Finally, students were encouraged to correct the codes.
RfminqW Coytiitiw Monifairiny Arfivirigs Students were encouraged to go back to the any steps of activities in order to debug the problems. For example, if initial decompsing was not correct, they could decompose the problem over again.

2 0 0
APPENDIX D: INSTRUCTION OUTLINE FOR LECTURE: EXPERIMENTAL GROUP
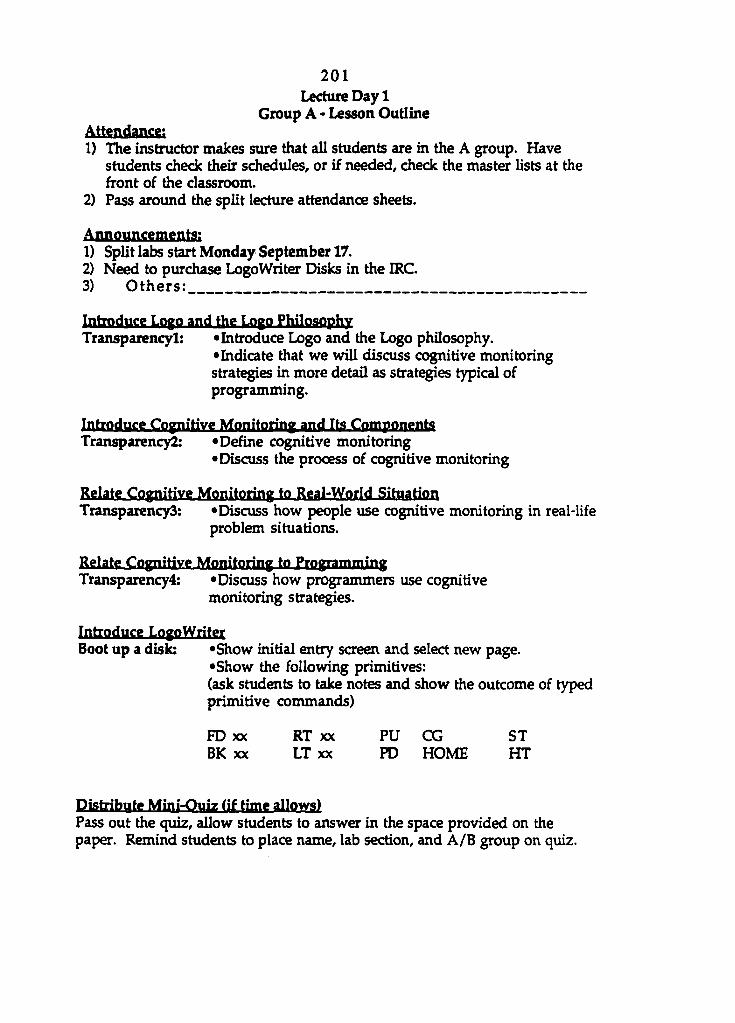
2 0 1 Lecture Day 1
Group A - Lesson Outline Attendance; 1) The instructor makes sure that all students are in the A group. Have
students check their schedules, or if needed, check the master lists at the front of the classroom.
2) Pass around the split lecture attendance sheets.
Annonnwinentg; 1) Split labs start Monday September 17. 2) Need to purchase LogoWriter Disks in the IRC. 3) Others:
Introduce Logo and the Logo Philosophy Transparency!: «Introduce Logo and the Logo philosophy.
•Indicate that we will discuss cognitive monitoring strategies in more detail as strategies typical of programming.
Introduce Cognirive Monitoriny and Its Components Transparency2: «Define cognitive monitoring
«Discuss the process of cognitive monitoring
Relate Cognitive Monitoring to Real-World Situation TransparencyS: «Discuss how people use cognitive monitoring in real-life
problem situations.
Relate Cognitive Monitoring to Frogramming Transparency4: «Discuss how programmers use cognitive
monitoring strategies.
Introduce LogoWriter Boot up a disk: «Show initial entry screen and select new page.
«Show the following primitives: (ask students to take notes and show the outcome of typed primitive commands)
FD XX RT XX PU CG ST BK XX LT XX PD HOME HT
Distribute Mini-Quiz (if time allows) Pass out the quiz, allow students to answer in the space provided on the paper. Remind students to place name, lab section, and A/B group on quiz.

2 0 2 Lecture Day2
Group A - Lesson Outline Attendance: 1) The instructor makes sure that all students are in the A group. Have
students check their schedules, or if needed, check the master lists at the Aront of the classroom. (Before class starts.)
2) Pass around the split lecture attendance sheets.
Announcements: 1} Split labs started yesterday Monday September 17. 2) Meed to purchase LogoWriter Disks in the IRC. 3) Others:
Review PrimiHvea On computer «Review briefly booting up LogoWriter as it boots.
•Review primitives (emphasize PU, PD, CG). •Discuss primitive sequence to draw a SQUARE.
Introduce the Repeat Command On computer •Introduce the repeat command for drawing a SQUARE.
Repeat 4 [FD 50 RT 90]
•Ask students to predict what will happen, and where the turtle will be positioned when a change is made:
Repeat 4 > Repeat 3, Repeat 8
Intyp^lwCT PiQ«d\OTS •Rationale of learning procedures:
1. Most problems are larger and more complex than the human can handle. •Decomposition of complex problems into manageable "mind-
size" bites is important to successful problem solving. 2. Dealing with a chunk of information rather than a single piece of
information is important to solving problems. •Students can more easily understand the meaning of given
information and better utilize it. 3. Programming in chunks is a more efficient way of handling the
information than as a whole. 4. "Top-down" approach of solving the problem is useful to develop
good planning strategies. (Super procedure - subprocedure) •View the whole problem and see how its parts are inter-related.
5. Flexibility of dealing with information. •Students apply the information to other problem situations.
6. Developing organizational strategies. •Organizing partitioned subprocedures to make meaningful products.

2 0 3
On computer •Introduce Flip Side and explain the difference between Flip Side and Front Screen. (Apple-F for editor)
To Square Repeat 4 [Fd 40 Rt 90] End
On Computer
•Change input number within the editor to a different size: Fd50 > Fd80
•Show that the computer now knows a new word by: Repeat 12 [ Square Rt 30]
Activity Sheet Lggturg2/Group A; (pass out sheet) (Students need to write on the sheet in case of a quiz and midterm test, which may or may not be opai notes!!) Transparency!: •The instructor leads students in applying the steps of
cognitive monitoring strategies on the sheet She uses Socratic dialogue in order for students to focus on their thinking process deliberately. (Decompose, Plan, Execute) •Show the result. •Identify Problem:
1. Locate the code<s) that causes bugs. 2. Discuss what the problem is in the code(s).
•Debug 3. Correct the code. •Allow students to apply the steps of cognitive monitoring strategies for about 5 minutes. (Decompose, Plan, Execute) •Gather a common solution and write it on the transparency. •Show a student example of the solution. •Identify Problem:
1. Locate the code(s) that causes bugs. 2. Discuss what the problem is in the code(s).
•Debug; 3. Correct the code.
•Ask students if they have a different solution. •Discuss internal an^e of 120 degrees and external angle of 120 degrees.
Transparency2:
On Computer

2 0 4
Relate Coynirive Monitoriny to Word Problem Solving Transparency3: «Discuss how to utilize cognitive monitoring components
in a given problem solving situation. Saving the Project On the Diak On computer: «Show namepage command of: np "name-of-project.
•Discuss a necessity of hitting <escape> to save the project.
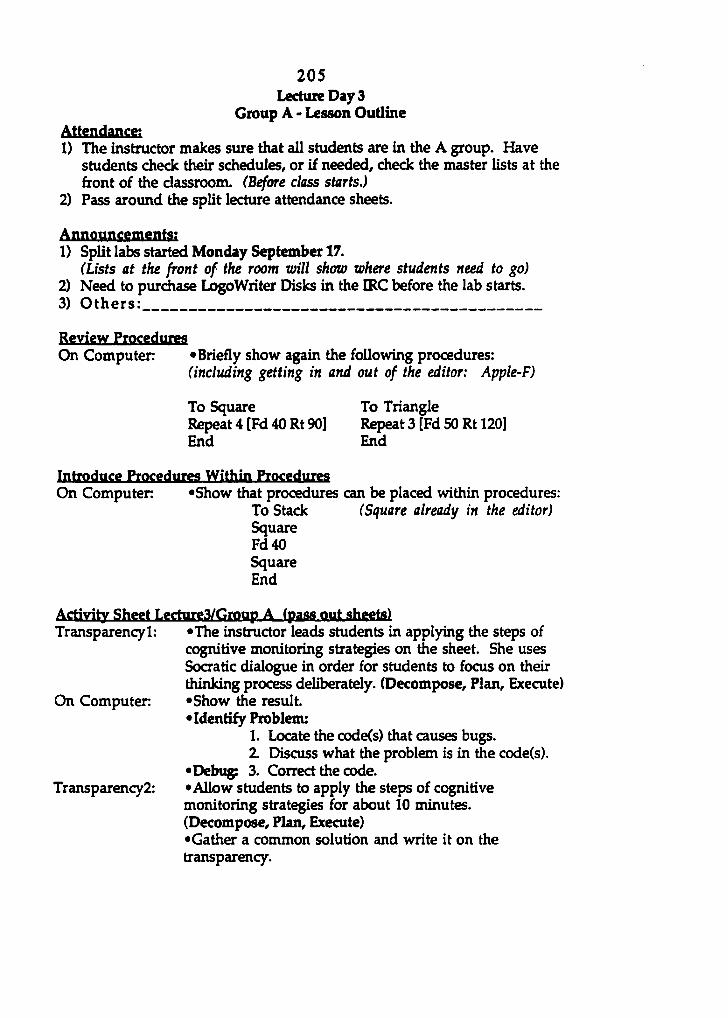
2 0 5 Lecture Day 3
Group A - Lesson Outline Attendance: 1) The instructor makes sure that all students are in the A group. Have
students check their schedules, or if needed, check the master lists at the front of the classroom. (Before class starts.)
2) Pass around the split lecture attendance sheets.
Annottncements; 1) Split labs started Monday September 17.
(Lists at the front of the room will show where students need to go) 2) Need to purdiase LogoWriter Disks in the IRC before the lab starts. 3) Others:
Review Procedures On Computer «Briefly show again the following procedures:
(including getting in and out of the editor: Apple-F)
To Square To Triangle Repeat4[Fd40Rt90] Repeat 3 [Fd 50 Rt 120] End End
Introduce Procédures Within Procedures On Computer «Show that procedures can be placed within procedures:
To Stack (Square already in the editor) Square Fd40 Square End
Activity Sheet LectureS/Group A (pass out sheets) Transparency!:
On Computer
Transparency 2:
•The instructor leads students in applying the steps of cognitive monitoring strategies on the sheet. She uses Socratic dialogue in order for students to focus on their thinking process deliberately. (Decompose, Plan, Execute) •Show the result. •Identify Problem:
1. Locate the code(s) that causes bugs. 2. Discuss what the problem is in the code(s).
•Debug; 3. Correct the code. •Allow students to apply the steps of cognitive monitoring strategies for about 10 minutes. (Decompose, Plan, Execute) •Gather a common solution and write it on the transparency.
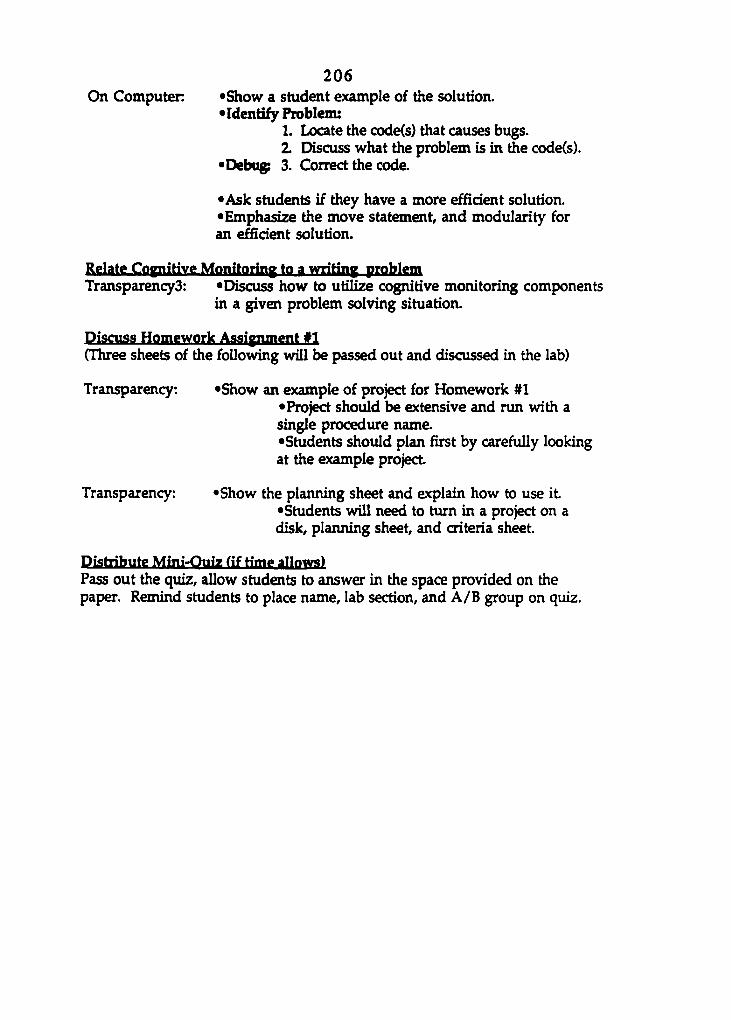
2 0 6 On Computer "Show a student example of the solution.
•Identify Problem: 1. Locate the code(s) that causes bugs. 2. Discuss what the problem is in Ae code(s).
•Debug; 3. Correct the code.
•Ask students if they have a more efficient solution. •Emphasize the move statement, and modularity for an efficient solution.
Relate Coptirive Monitorfay to a wriHny problem Transparency3: •Discuss how to utilize cognitive monitoring components
in a given problem solving situation.
Discuss Homework Assignment #1 (Three sheets of the following will be passed out and discussed in the lab)
Transparency; •Show an example of project for Homework #1 •Project should be extensive and run with a single procedure name. •Students should plan first by carefully looking at the example project
Transparency: «Show the planning sheet and explain how to use it. •Students will need to turn in a project on a disk, planning sheet, and criteria sheet.
Distribute Mini-Quiz ( i f time allows) Pass out the quiz, allow students to answer in the space provided on the paper. Remind students to place name, lab section, and A/B group on quiz.
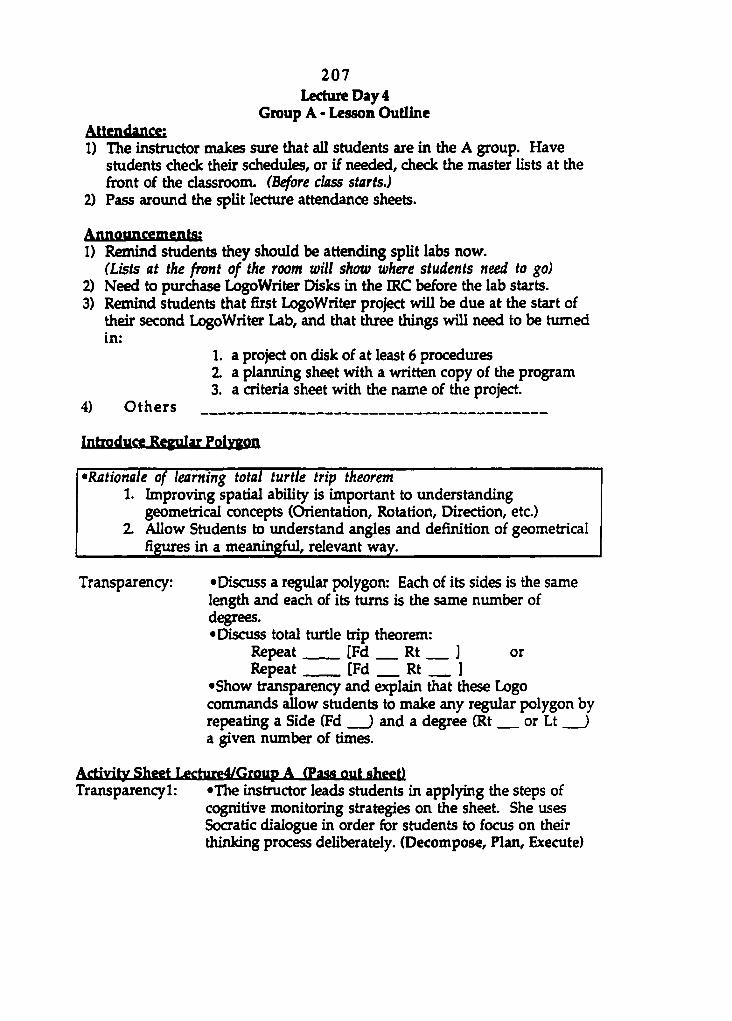
2 0 7 Lecture Day 4
Group A • Lesson Outline Attendance; 1) The instructor makes sure that all students are in the A group. Have
students check their schedules, or if needed, check the master lists at the front of the classroom. (Before class starts.)
2) Pass around the split lecture attendance sheets.
Announcements! 1) Remind students they should be attending split labs now.
(Lists at the front of the roam will show where students need to go) 2) Need to purchase LogoWriter Disks in the IRC before the lab starts. 3) Remind students that first LogoWriter project will be due at the start of
their second LogoWriter Lab, and that three things will need to be turned in:
1. a project on disk of at least 6 procedures 2. a planning sheet with a written copy of the program 3. a criteria sheet with the name of the project.
4) Others
Introduce Regular Polygon
•Rationale of learning total turtle trip theorem 1. Improving spatial ability is important to understanding
geometrical concepts (Orientation, Rotation, Direction, etc.) 2. Allow Students to understand angles and definition of geometrical
figures in a meaningful, relevant way.
Transparency: «Discuss a regular polygon: Each of its sides is the same length and each of its turns is the same number of degrees. •Discuss total turtle trip theorem:
Repeat [Fd Rt ] or Repeat [Fd Rt ]
•Show transparency and explain that these Logo commands allow students to make any regular polygon by repeating a Side (Fd ) and a degree (Rt or Lt ) a given number of times.
Activity Sheet Lgghirg4/Group A (Pass out shggt) Transparency!: •The instructor leads students in applying the steps of
cognitive monitoring strategies on the sheet. She uses Soaatic dialogue in order for students to focus on their thinking process deliberately. (Decompose, Plan, Execute)
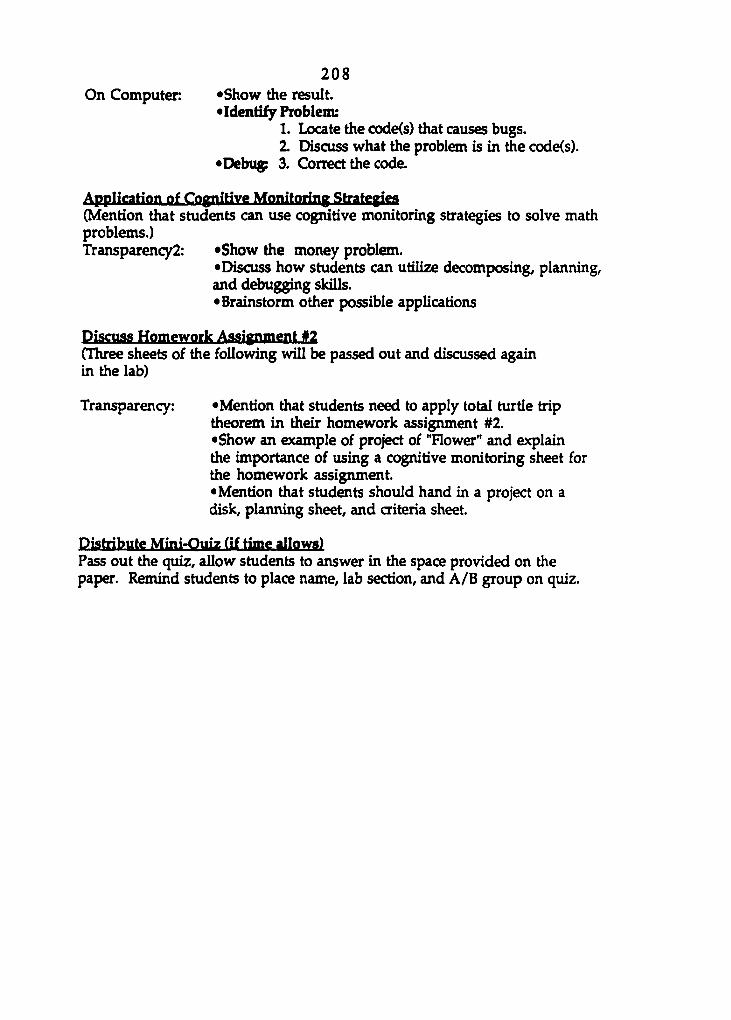
208 On Computer: «Show the result.
•Identify Problem: 1. Locate the code<s) that causes bugs. 2. Discuss what the problem is in the code(s).
•Debug: 3. Correct the code.
Application of CogniHve Monitoring Strategiea (Mention that students can use cognitive monitoring strategies to solve math problems.) Transparency!: «Show the money problem.
•Discuss how students can utilize decomposing, planning, and debugging skills. •Brainstorm other possible applications
Discuss Homework Assignment #2 (Three sheets of the following will be passed out and discussed again in the lab)
Transparency: «Mention that students need to apply total turtle trip theorem in their homework assignment #2. •Show an example of project of "Flower" and explain the importance of using a cognitive monitoring sheet for the homework assignment. •Mention that students should hand in a project on a disk, planning sheet, and criteria sheet.
Distribute Mini-Quiz (if time allows) Pass out the quiz, allow students to answer in the space provided on the paper. Remind students to place name, lab section, and A/B group on quiz.
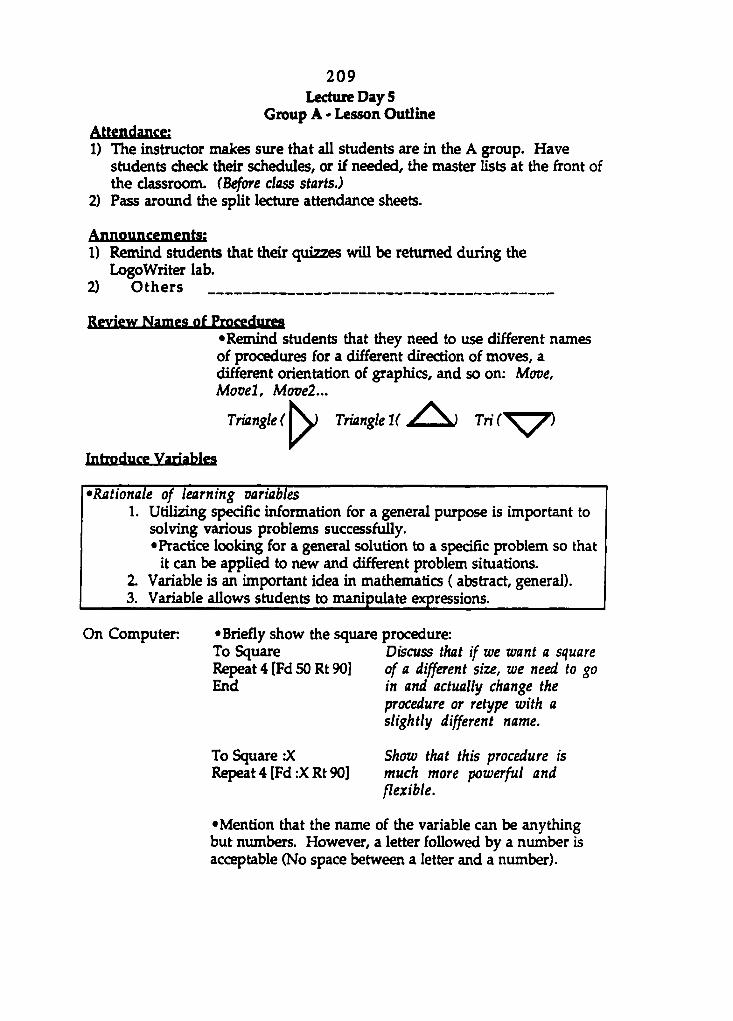
2 0 9 Lecture Day 5
Group A - Lesson Outline Attendante; 1) The instructor makes sure that all students are in the A group. Have
students check their schedules, or if needed, the master lists at the front of the classroom. (Before class starts.)
2) Pass around the split lecture attendance sheets.
Announcements: 1) Remind students that their quizzes wiU be returned during the
LogoWriter lab. 2) Others
Review Namga of Proggdurea •Remind students that they need to use different names of procedures for a different direction of moves, a different orientation of graphics, and so on: Move, Movel, Movel...
Introduce Variables
Trfnnohif ) Tri(\y^)
•Rationale of learning variables 1. Utilizing specific information for a general purpose is important to
solving various problems successfully. •Practice looking for a general solution to a specific problem so that
it can be applied to new and different problem situations. 2. Variable is an important idea in mathematics ( abstract, general). 3. Variable allows students to manipulate expressions.
On Computer: Briefly show the square procedure: To Square Discuss that if we want a square
of a different size, we need to go in and actually change the procedure or retype with a slightly different name.
Repeat4(Fd50Rt90] End
To Square 'X Show that this procedure is Repeat 4 [Fd :X Rt 90] much more powerful and
flexible.
•Mention that the name of the variable can be anything but numbers. However, a letter followed by a number is acceptable (No space between a letter and a number).
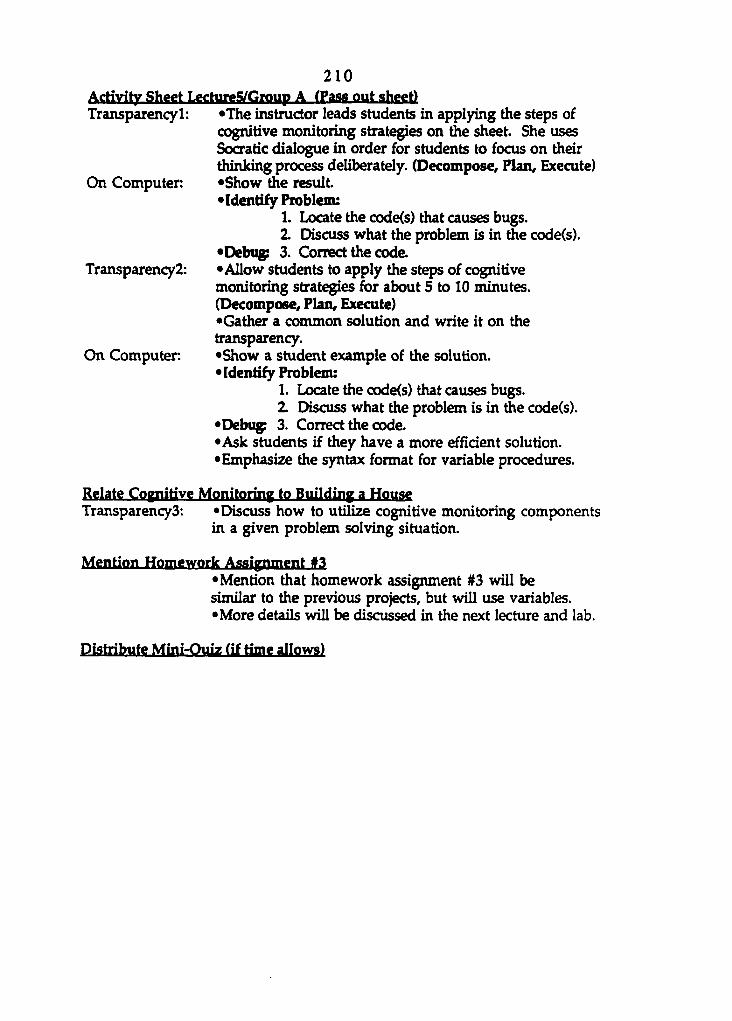
2 1 0 Activity Sheet LgctureS/Group A (Pass out sheet)
Transparency 1: «The instructor leads students in applying the steps of cognitive monitoring strategies on the sheet. She uses Somatic dialogue in order for students to focus on their thinking process deliberately. (Decompose, Plan, Execute)
On Computer «Show the result. •Identify Problem:
1. Locate the code(s) that causes bugs. 2. Discuss what the problem is in Ae code(s).
•Debug; 3. Correct the code. Transparency!: •Allow students to apply the steps of cognitive
monitoring strategies for about 5 to 10 minutes. (Decompose, Plan, Execute) •Gather a common solution and write it on the transparency. •Show a student example of the solution. •Identify Problem:
1. Locate the code(s) that causes bugs. 2. Discuss what the problem is in the code(s).
•Debug; 3. Correct the code. •Ask students if they have a more efficient solution. •Emphasize the syntax format for variable procedures.
Relate Cognitive Monitoriny to Building a House TransparencyS: • Discuss how to utilize cognitive monitoring components
in a given problem solving situation.
On Computer.
Mention Homework Assignment #3
•Mention that homework assignment #3 will be similar to the previous projects, but will use variables. •More details will be discussed in the next lecture and lab.
Distribute Mini-Quiz (if time allows)
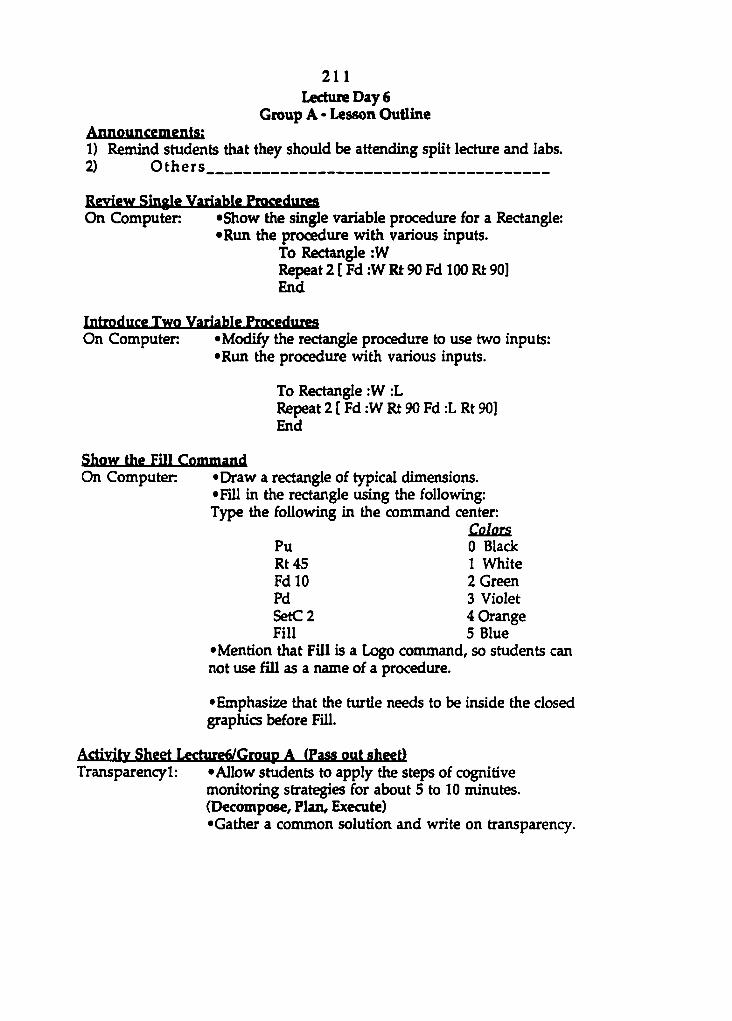
2 1 1 Lecture Day 6
Group A - Lesson Outline AnnoHncements; 1) Remind students that they should be attending split lecture and labs. 2) Others
Review Single Variable Procedurea On Computer «Show the single variable procedure for a Rectangle:
•Run the procedure with various inputs. To Rectangle :W Repeat 2 [ Fd :W Rt 90 Fd 100 Rt 90] End
Introduce Two Variable Procedurea On Computer «Modify the rectangle procedure to use two inputs:
•Run the procedure with various inputs.
To Rectangle :W :L Repeat 2 [ Fd :W Rt 90 Fd :L Rt 90] End
Show the Fill Command On Computer •Draw a rectangle of typical dimensions.
•Fill in the rectangle using the following: Type the following in the command center:
Colors Pu 0 Black Rt45 1 White Fd 10 2 Green Pd 3 Violet SetC 2 4 Orange Fill 5 Blue
•Mention that Fill is a Logo command, so students can not use fill as a name of a procedure.
•Emphasize that the turtle needs to be inside the closed graphics before RU.
Activity Sheet Lecture6/Group A (Pass out sheet) Transparency!: •Allow students to apply the steps of cognitive
monitoring strategies for about 5 to 10 minutes. (Decompose, Plan, Execute) •Gather a common solution and write on transparency.
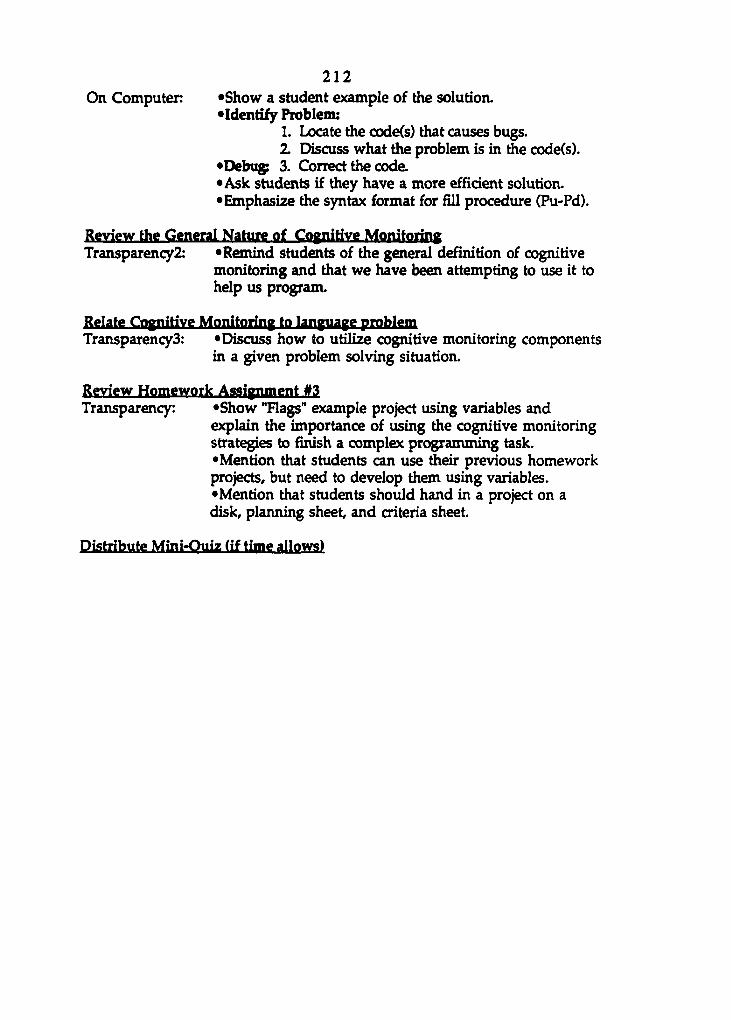
2 1 2 On Computer «Show a student example of the solution.
•Identify Problem: 1. Locate the code(s} that causes bugs. 2. Discuss what the problem is in Ae code(s).
•Debug; 3. Correct the code. •Ask students if they have a more effîdent solution. •Emphasize the syntax format for fill procedure (Pu-Pd).
Review the General Nature of Cognitive Monitoriny Transparency2: «Remind students of the general deHnition of cognitive
monitoring and that we have been attempting to use it to help us program.
Relate CogniHve Monitoring to language problem Transparency3: "Discuss how to utilize cognitive monitoring components
in a given problem solving situation.
Review Homework Assignment #3 Transparency: «Show "Flags" example project using variables and
explain the importance of using the cognitive monitoring strategies to finish a complex programming task. •Mention that students can use their previous homework projects, but need to develop them using variables. •Mention that students should hand in a project on a disk, planning sheet, and criteria sheet.
Distribute Mini-Quiz (if time allows)
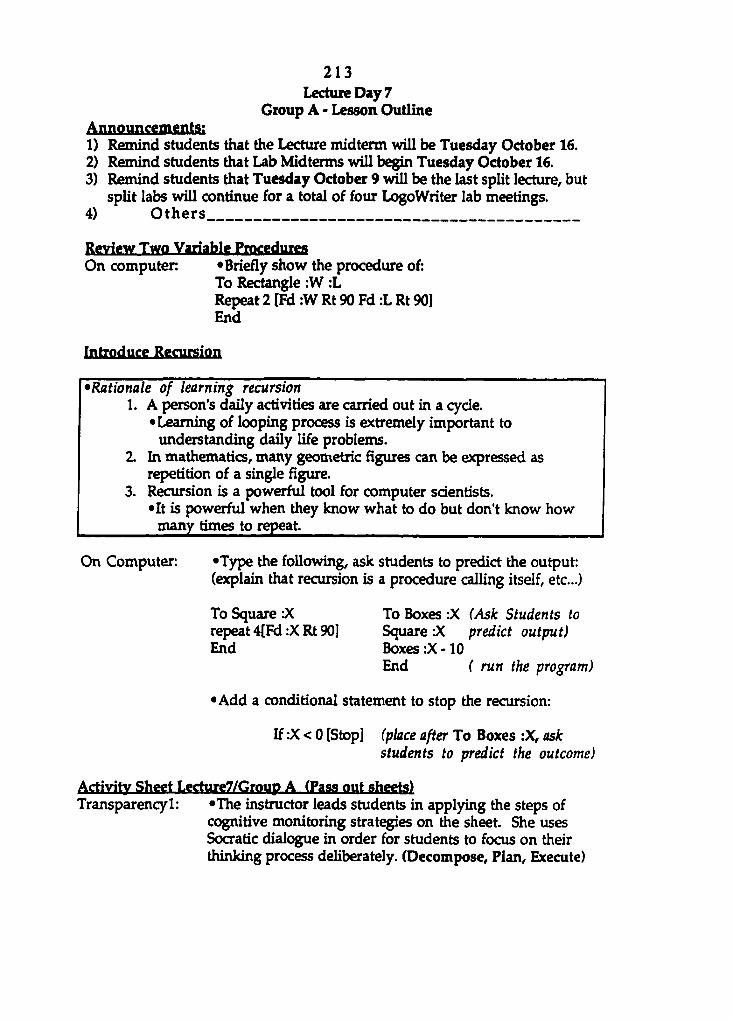
2 1 3 Lecture Day 7
Group A - Lesson Outline Annottnçemgnts; 1) Remind students that the Lecture midterm will be Tuesday October 16. 2) Remind students that Lab Midterms will begin Tuesday October 16. 3) Remind students that Tuesday October 9 will be the last split lecture, but
split labs will continue for a total of four LogoWriter lab meetings. 4) Others
Review Two Variable Procedures On computer: «Briefly show the procedure of:
To Rectangle :W :L Repeat 2 [Fd :W Rt 90 Fd :L Rt 90] End
Introduce Recursion
•Rationale of learning recursion 1. A person's daily activities are carried out in a cycle.
«Learning of looping process is extremely important to understanding daily life problems.
2. In mathematics, many geometric figures can be expressed as repetition of a single figure.
3. Recursion is a powerful tool for computer scientists. •It is powerful when they know what to do but don't know how
many times to repeat.
On Computer: «Type the following, ask students to predict the output: (explain that recursion is a procedure calling itself, etc...)
To Square :X To Boxes X (Ask Students to repeat 4(Fd :X Rt 90] Square :X predict output) End Boxes :X -10
End ( run the program)
«Add a conditional statement to stop the recursion:
If JC < 0 [Stop] (place after To Boxes :X, ask students to predict the outcome)
Activity Sheet Lecture7/Group A (Pass out sheets) Transparency!: «The instructor leads students in applying the steps of
cognitive monitoring strategies on the sheet. She uses Socratic dialogue in order for students to focus on their thinking process deliberately. (Decompose, Plan, Execute)
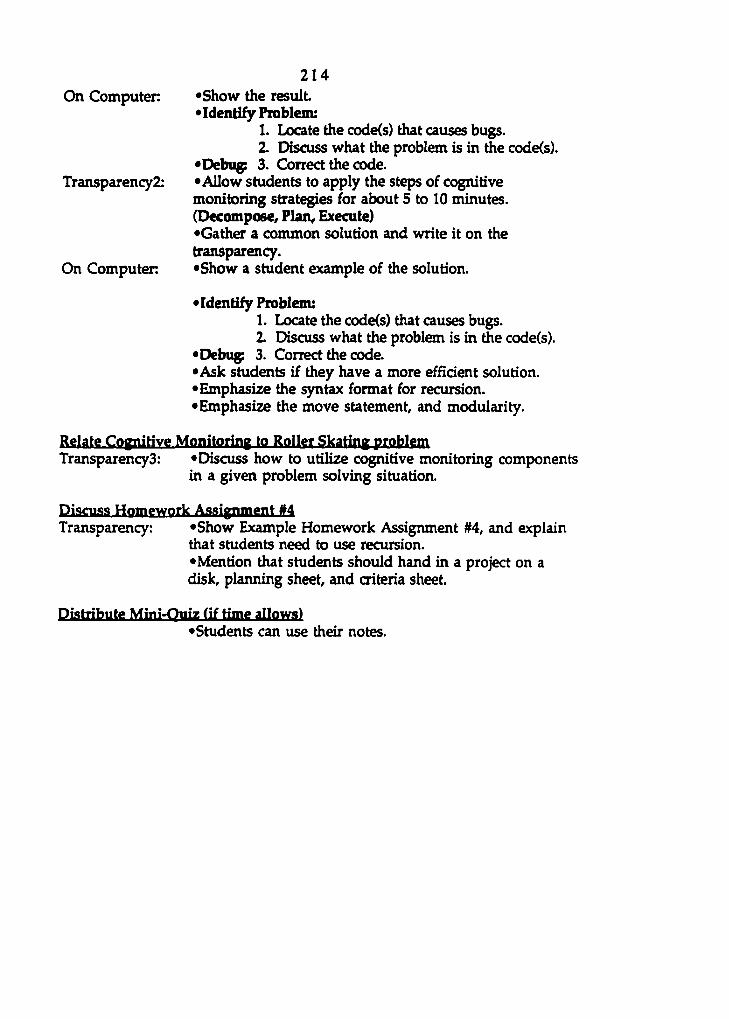
On Computer
Transparency2:
On Computer
2 1 4 •Show the result. • Identify Problem:
1. Locate the code(s} that causes bugs. 2. Discuss what the problem is in the code(s).
«Debug 3. Correct the code. •Allow students to apply the steps of cognitive monitoring strategies for about 5 to 10 minutes. (Decompose, Plan, Execute) •Gather a common solution and write it on the transparency. •Show a student example of the solution.
•Identify Problem: 1. Locate the code(s) that causes bugs. 2. Discuss what the problem is in Ae code(s).
•Debug; 3. Correct the code. •Ask students if they have a more efficient solution. •Emphasize the syntax format for recursion. •Emphasize the move statement, and modularity.
Relate CogniHve Monitoring to Roller Skating problem Transparency3: «Discuss how to utilize cognitive monitoring components
in a given problem solving situation.
Discuss Homework Assignment #4 Transparency: •Show Example Homework Assignment #4, and explain
that students need to use recursion. •Mention that students should hand in a project on a disk, planning sheet, and criteria sheet.
Distribute Mini-Ouiz (if time allows) •Students can use their notes.
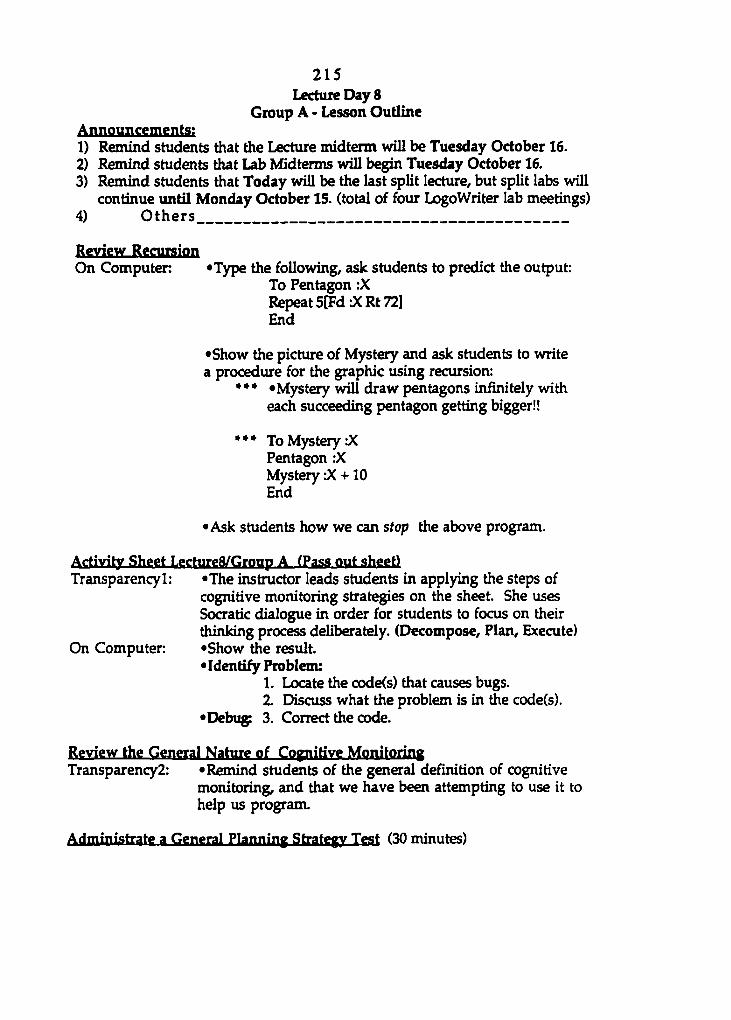
2 1 5 Lecture Day 8
Group A - Lesson Outline AnnoHncementSt 1) Remind students that the Lecture midterm will be Tuesday October 16. 2) Remind students that Lab Midterms will begin Tuesday October 16. 3) Remind students that Today will be the last split lecture, but split labs will
continue until Monday October 15. (total of four LogoWriter lab meetings) 4) Others
Review Rtciirsion On Computer «Type the following, ask students to predict the output:
To Pentagon :X Repeat 5[Fd Oi Rt 72] End
•Show the picture of Mystery and ask students to write a procedure for the graphic using recursion:
«Mystery will draw pentagons infinitely with each succeeding pentagon getting bigger!!
To Mystery Pentagon :X Mystery :X +10 End
•Ask students how we can stop the above program.
Activity Sheet LgctureS/Group A (Pass out sheet) Transparency!: •The instructor leads students in applying the steps of
cognitive monitoring strategies on the sheet. She uses Socratic dialogue in order for students to focus on their thinking process deliberately. (Decompose, Plan, Execute)
On Computer: •Show the result. •Identify Problem:
1. Locate the code(s) that causes bugs. 2. Discuss what the problem is in the code(s).
•Debug 3. Correct the code.
Review the General Nature of Copiirive Monitoring Transparency2: •Remind students of the general definition of cognitive
monitoring, and that we have been attempting to use it to help us program.
Administrate a General Planning Strategy Test (30 minutes)

2 1 6
APPENDIX E: INSTRUCTION OUTLINE FOR LECTURE: CONTROL GROUP
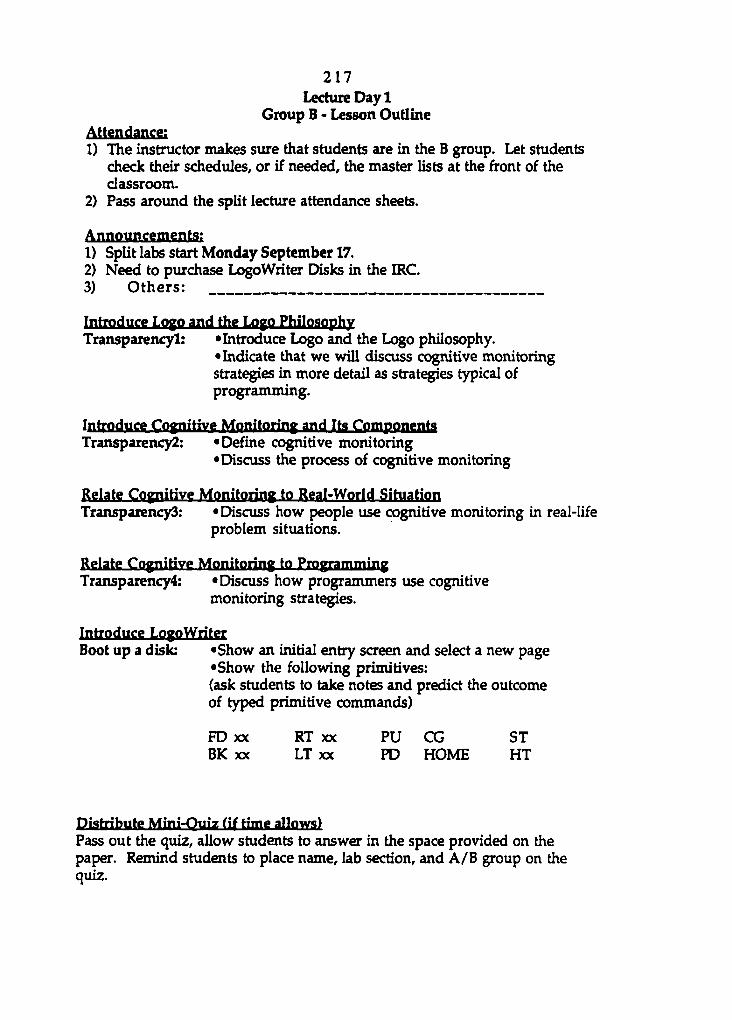
2 1 7 Lecture Day 1
Group B • Lesson Outline Attendante; 1) The instructor makes sure that students are in the B group. Let students
check their schedules, or if needed, the master lists at the A-ont of the classroom.
2) Pass around the split lecture attendance sheets.
Announcements: 1) Split labs start Monday September 17. 2) Need to purchase LogoWriter Disks in the IRC. 3) Others:
Introduce Logo and the Logo Philosophy Transparency!: «Introduce Logo and the Logo philosophy.
•Indicate that we will discuss cognitive monitoring strategies in more detail as strategies typical of programming.
Introduce CopiiHve Monitoring and Its Components TransparencyZ: «Define cognitive monitoring
•Discuss the process of cognitive monitoring
Relate Cognitive Monitoring to Real-World Situation Transpaiency3: •Discuss how people use cognitive monitoring in real-life
problem situations.
Relate Cognitive Monitoring to Programming Transparency4: «Discuss how programmers use cognitive
monitoring strategies.
Introduce LogoWriter Boot up a disk: «Show an initial entry screen and select a new page
«Show the following primitives: (ask students to take notes and predict the outcome of typed primitive commands)
FD XX RT XX PU CG ST BK XX LT XX PD HOME HT
Distribute Mini-Quiz ( i f t i m e allows) Pass out the quiz, allow students to answer in the space provided on the paper. Remind students to place name, lab section, and A/B group on the quiz.
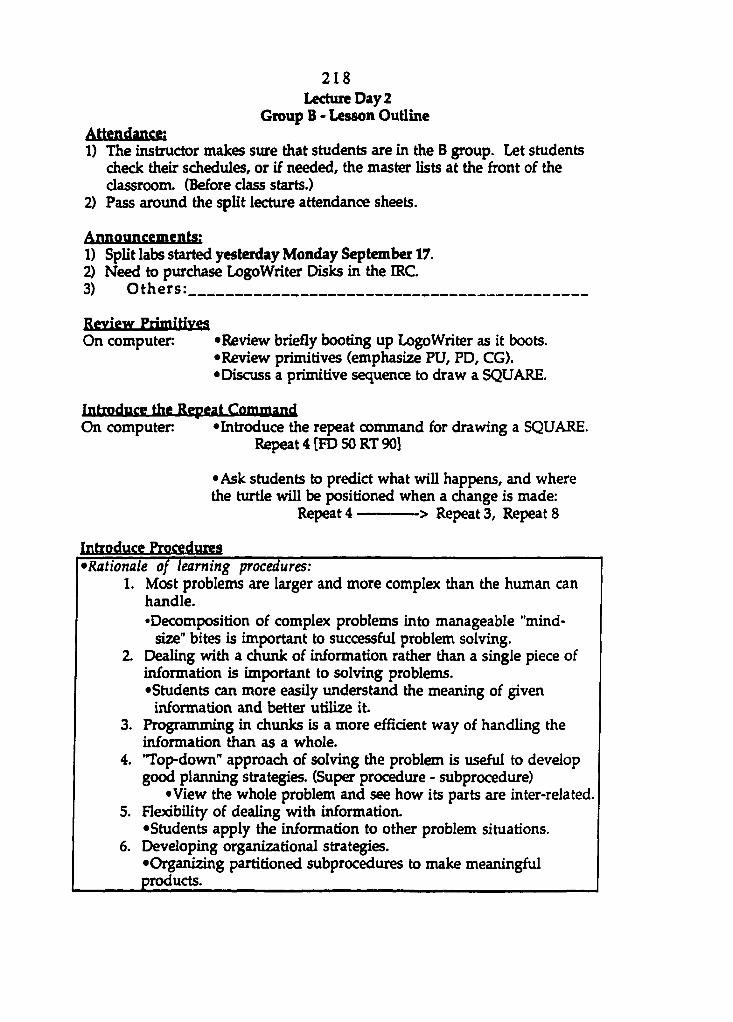
2 1 8 Lecture Day2
Group B - Lesson Outline Attendance; 1} The instructor makes sure that students are in the B group. Let students
check their schedules, or if needed, the master lists at the front of the classroom. (Before class starts.)
2) Pass around the split lecture attendance sheets.
Announcements; 1) Split labs started yesterday Monday September 17. 2) Need to purchase LogoWriter Disks in the IRC 3) Others:
RcYiew PrimitiYW On computer: «Review briefly booting up LogoWriter as it boots.
•Review primitives (emphasize PU, PD, CG). «Discuss a primitive sequence to draw a SQUARE.
Introduce the Repeat Command On computer «Introduce the repeat command for drawing a SQUARE.
Repeat 4 [FD SORT 90]
«Ask students to predict what will happens, and where the turtle will be positioned when a change is made:
Repeat 4 > Repeat 3, Repeat 8
Introduce Procedures •Rationale of learning procedures:
1. Most problems are larger and more complex than the human can handle. •Decomposition of complex problems into manageable "mind-
size" bites is important to successful problem solving. 2. Dealing with a chunk of information rather than a single piece of
information is important to solving problems. «Students can more easily understand the meaning of given
information and better utilize it. 3. Programming in chunks is a more efficient way of handling the
information than as a whole. 4. Top-down" approach of solving the problem is useful to develop
good planning strategies. (Super procedure - subprocedure) •View the whole problem and see how its parts are inter-related.
5. Flexibility of dealing with information. •Students apply the information to other problem situations.
6. Developing organizational strategies. •Organizing partitioned subprocedures to make meaningful products.
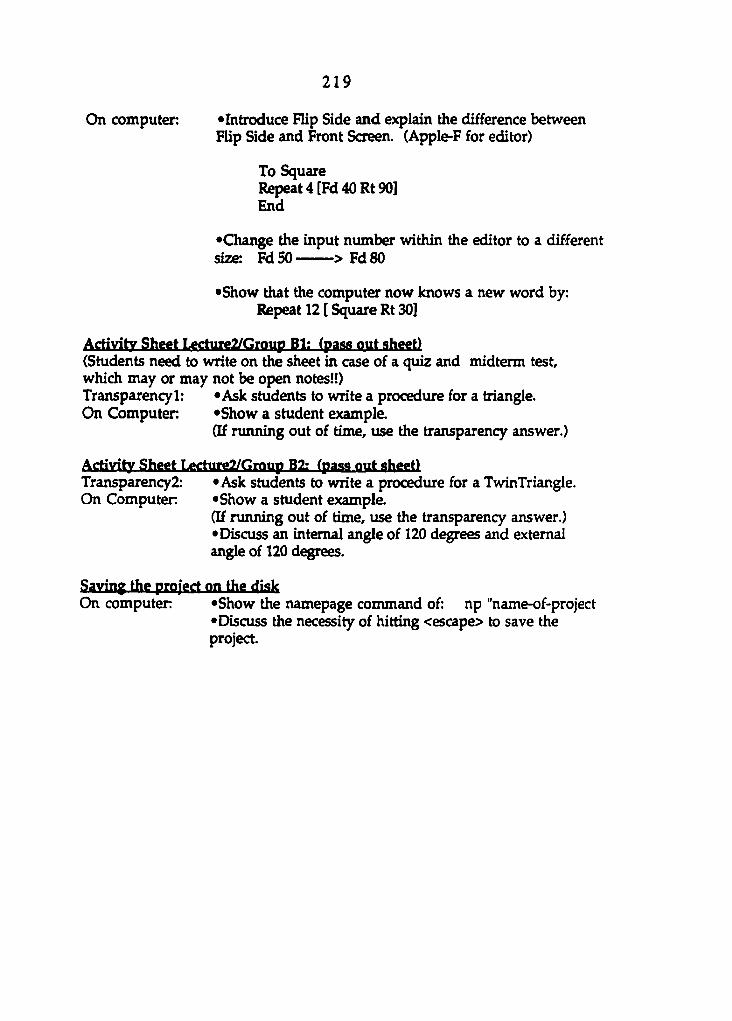
2 1 9
On computer • Introduce Flip Side and explain the difference between Flip Side and Front Screen. (Apple-F for editor)
To Square Repeat 4 [Fd 40 Rt 90] End
•Change the input number within the editor to a different size: FdSO > Fd80
•Show that the computer now knows a new word by: Repeat 12 [ Square Rt 30]
Activity Sheet Lgcture2/Group Bl: (pass out sheet) (Students need to write on the sheet in case of a quiz and midterm test, which may or may not be open notes!!) Transparency!: •Ask students to write a procedure for a triangle. On Computer •Show a student example.
(If running out of time, use the transparency answer.)
Activity Sheet Lggtm-g2/Group B2: (pass out sheet) Transparency!: «Ask students to write a procedure for a TwinTriangle. On Computer «Show a student example.
(If running out of time, use the transparency answer.) •Discuss an internal angle of 120 degrees and external angle of 120 degrees.
Saving the projerf on the disk On computer «Show the namepage command of: np "name-of-project
•Discuss the necessity of hitting <escape> to save the project.
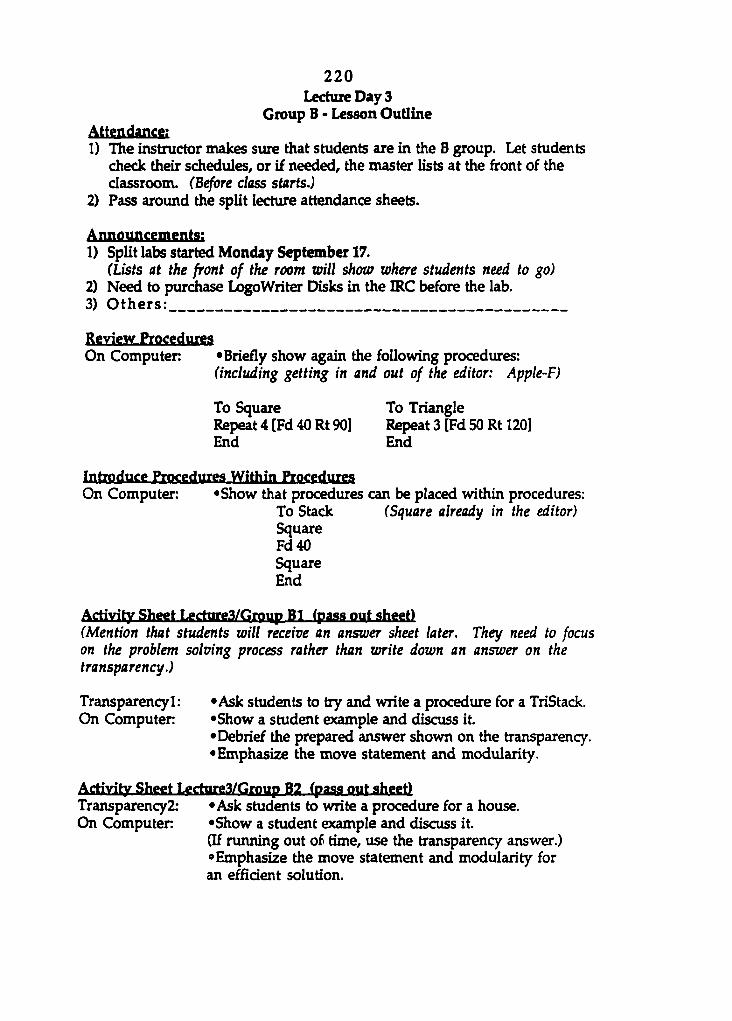
220 LectuzeDayS
Group B - Lesson Outline Attendance; 1) The instructor makes sure that students are in the B group. Let students
check their schedules, or if needed, the master lists at the front of the classroom. (B^ore class starts.)
2) Pass around the split lecture attendance sheets.
Annottncementg; 1) split labs started Monday September 17.
(Lists at the front of the room will shono where students need to go) 2) Need to purchase LogoWriter Disks in the IRC before the lab. 3) Others:
Review Procediireg On Computer «Briefly show again the following procedures:
(including getting in and out of the editor: Apple-F)
To Square To Triangle Repeat 4 [Fd 40 Rt 90] Repeat 3 [Fd 50 Rt 120] End End
Introduce Procedures Within Procedures On Computer "Show that procedures can be placed within procedures:
To Stack (Square already in the editor) Square Fd40 Square End
Activity Sheet Lggture3/Group 81 (pass out sheet) (Mention that students will receive an answer sheet later. They need to focus on the problem solving process rather than write down an answer on the transparency.)
Transparency!: «Ask students to try and write a procedure for a TriStack. On Computer «Show a student example and discuss it.
•Debrief the prepared answer shown on the transparency. •Emphasize the move statement and modularity.
Activity Sheet Lecture3/Group B2 (pass out sheet) Transparency2: •Ask students to write a procedure for a house. On Computer •Show a student example and discuss it.
(If running out of time, use the transparency answer.) •Emphasize the move statement and modularity for an efficient solution.
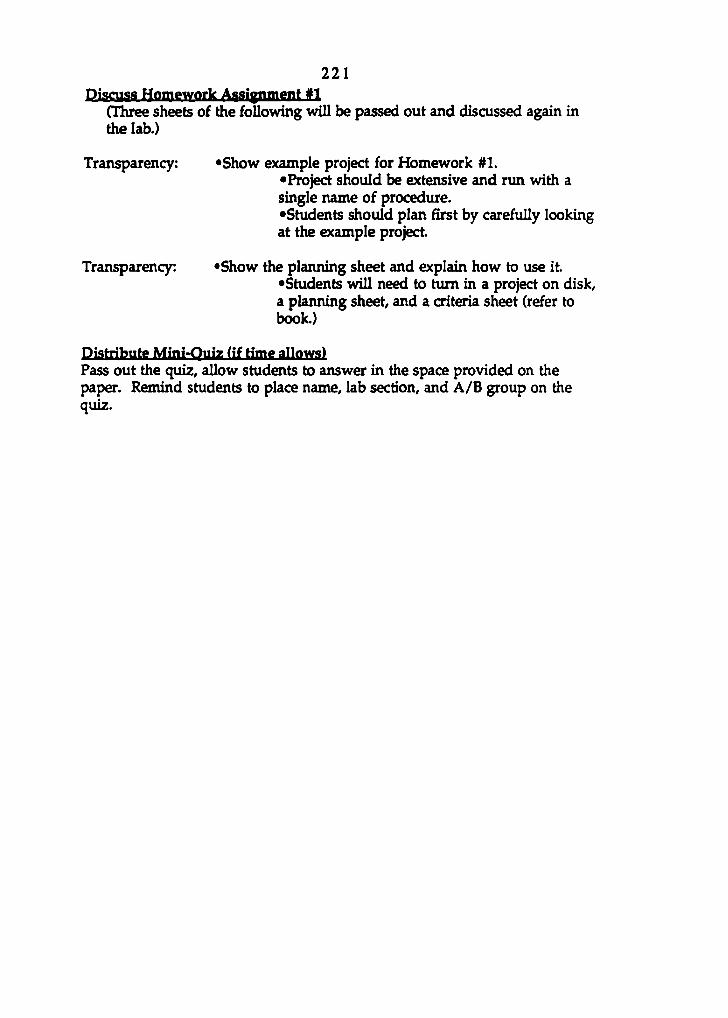
221 PisnMS Homework Assignment #1
(Three sheets of the following will be passed out and discussed again in the lab.)
Transparency: «Show example project for Homework #1. •Project should be extensive and run with a single name of procedure. •Students should plan first by carefully looking at the example project.
Transparency: "Show the plaiming sheet and explain how to use it. •Students will need to turn in a project on disk, a planning sheet, and a criteria sheet (refer to book.)
Distribute Mini-Quiz fîf time allows) Pass out the quiz, allow students to answer in the space provided on the paper. Remind students to place name, lab section, and A/B group on the quiz.
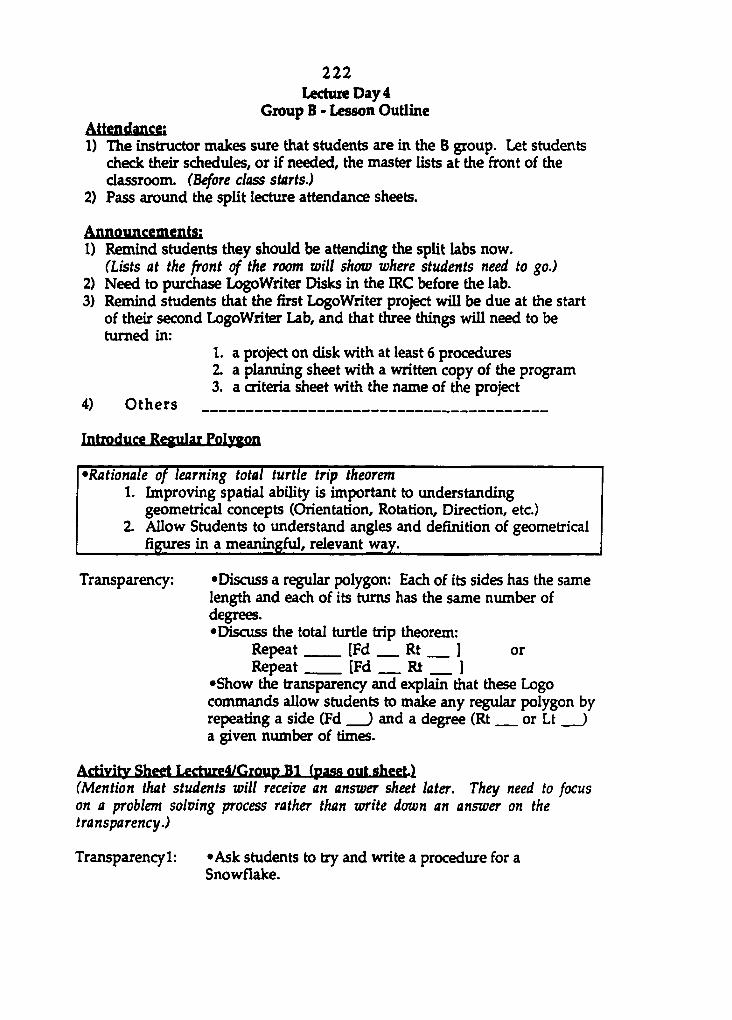
222 Lecture Day 4
Group B - Lesson Outline Attendance: 1) The instructor makes sure that students are in the B group. Let students
check their schedules, or if needed, the master lists at the front of the classroom. (Before class starts.)
2) Pass around the split lecture attendance sheets.
Announcements; 1) Remind students they should be attending the split labs now.
(Lists at the front of the room will show where students need to go.) 2) Need to purchase LogoWriter Disks in the IRC before the lab. 3) Remind students that the first LogoWriter project will be due at the start
of their second LogoWriter Lab, and that three things will need to be turned in:
1. a project on disk with at least 6 procedures 2. a planning sheet with a written copy of the program 3. a criteria sheet with the name of the project
4) Others
Introdttw RwUar Polygon
•Rationale of learning total turtle trip theorem 1. Improving spatial ability is important to understanding
geometrical concepts ((Mentation, Rotation, Direction, etc.) 2. Allow Students to understand angles and definition of geometrical
figures in a meaningful, relevant way.
Transparency: «Discuss a regular polygon: Each of its sides has the same length and each of its turns has the same number of degrees. •Discuss the total turtle trip theorem:
Repeat [Fd Rt ] or Repeat [Fd Rt ]
•Show the transparency and explain that these Logo commands allow students to make any regular polygon by repeating a side (Fd ) and a degree (Rt or Lt ) a given number of times.
Activity Sheet Lgcture4/Group B1 (pass out shecL) (Mention that students will receive an answer sheet later. They need to focus on a problem solving process rather than write down an answer on the transparency.)
Transparency!: •Ask students to try and write a procedure for a Snowflake.
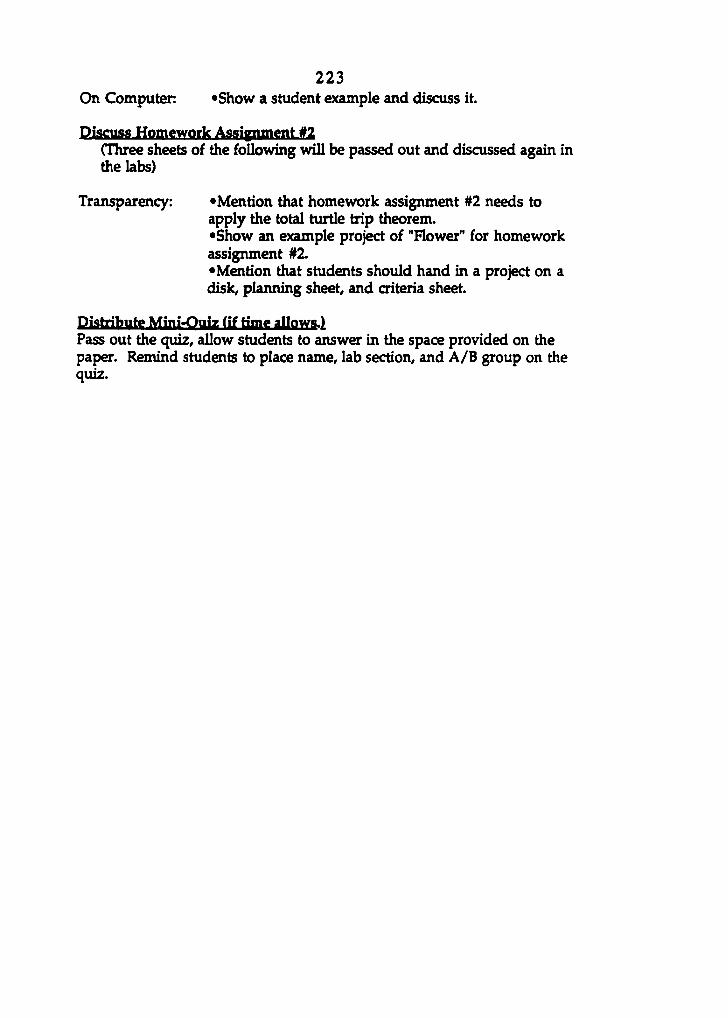
223 On Computer «Show a student example and discuss it
PisCTM Homework Awlgnment #2 (Three sheets of the following will be passed out and discussed again in the labs)
Transparency: «Mention that homework assignment #2 needs to apply the total turtle trip theorem. •Show an example project of "Flower" for homework assignment #2. •Mention that students should hand in a project on a disk, planning sheet, and criteria sheet.
Distribute Mini-Quiz (if Kmg allows.) Pass out the quiz, allow students to answer in the space provided on the paper. Remind students to place name, lab section, and A/B group on the quiz.
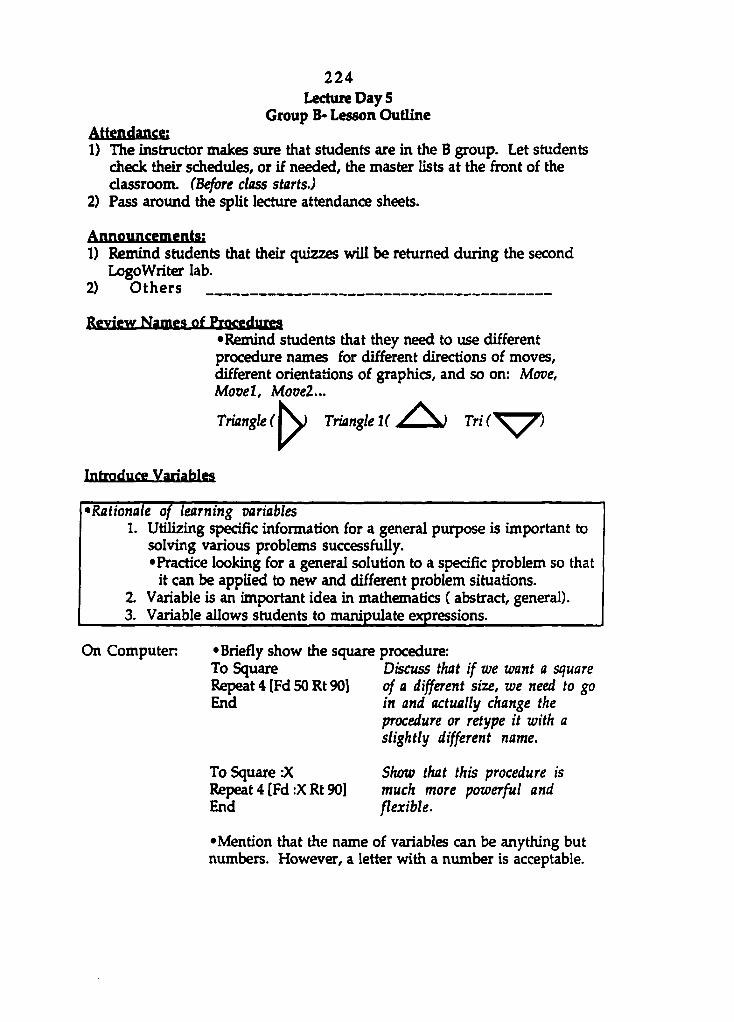
224 Lecture Day 5
Group B- Lesson Outline Attendance! 1) The instructor makes sure that students are in the B group. Let students
check their schedules, or if needed, the master lists at the front of the classroom. (Before class starts.)
2) Pass around the split lecture attendance sheets.
Announcements! 1) Remind students that their quizzes will be returned during the second
LogoWriter lab. 2) Others
Review Names o f Procedures •Remind students that they need to use different procedure names for different directions of moves, different orientations of graphics, and so on: Move, Movel, MoveZ...
Triangle 1( Tri(\y)
Introduce Variables
•Rationale of learning variables 1. Utilizing specific information for a general purpose is important to
solving various problems successfully. •Practice looking for a general solution to a specific problem so that
it can be applied to new and different problem situations. 2 Variable is an important idea in mathematics ( abstract, general). 3. Variable allows students to manipulate expressions.
On Computer Briefly show the square procedure: To Square Discuss that if we want a square
of a different size, we need lo go in and actually change the procedure or retype it with a slightly different name.
Repeat 4 [Fd 50 Rt 90] End
To Square :X Show that this procedure is Repeat 4 [Fd :X Rt 90] much more powerful and End flexible.
•Mention that the name of variables can be anything but numbers. However, a letter with a number is acceptable.
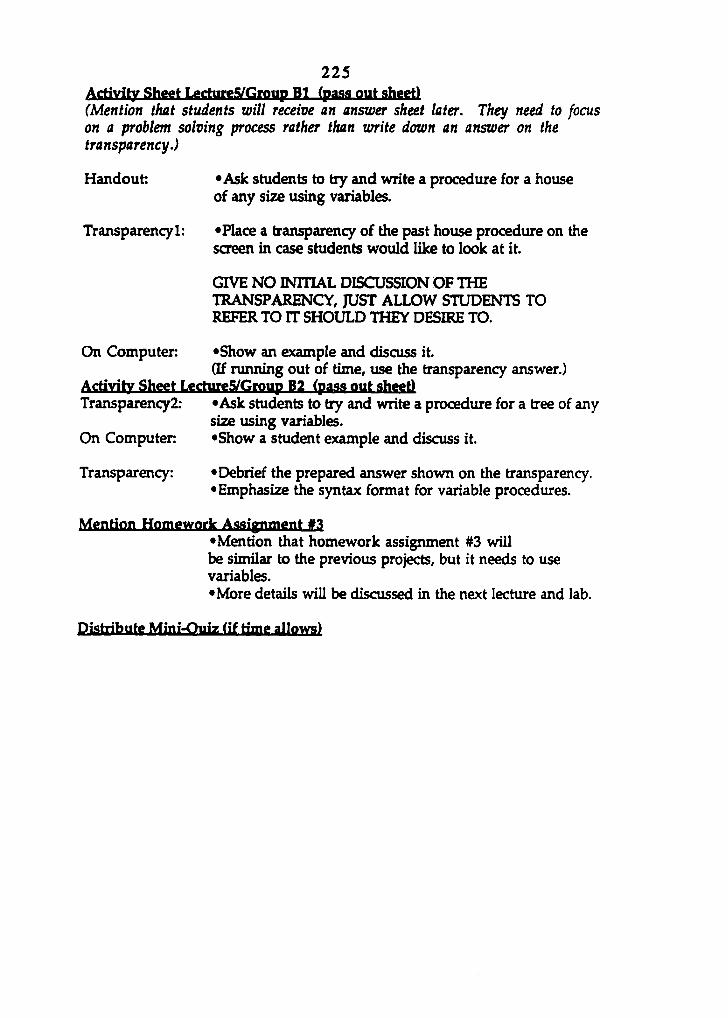
225 Activity Sheet LectureS/Group B1 (pass out sheet) (Mention that students will receive an answer sheet later. They need to focus on a problem solving process rather than write down an answer on the transparency.)
Handout: «Ask students to try and write a procedure for a house of any size using variables.
Transparency!: «Place a transparency of the past house procedure on the screen in case students would like to look at it.
GIVE NO INITIAL DISCUSSION OF THE TRANSPARENCY, JUST ALLOW STUDENTS TO REFER TO rr SHOULD THEY DESIRE TO.
On Computer: «Show an example and discuss it. (If ruiming out of time, use the transparency answer.)
Activitv Sheet LectureS/Group B2 (pass out sheet) Transparency2: «Ask students to try and write a procedure for a tree of any
size using variables. On Computer: «Show a student example and discuss it.
Transparency: «Debrief the prepared answer shown on the transparency. •Emphasize the syntax format for variable procedures.
Mention Homework Aaigiunent f3 «Mention that homework assignment #3 will be similar to the previous projects, but it needs to use variables. «More details will be discussed in the next lecture and lab.
Distribute Mini-Quiz (if time allows)
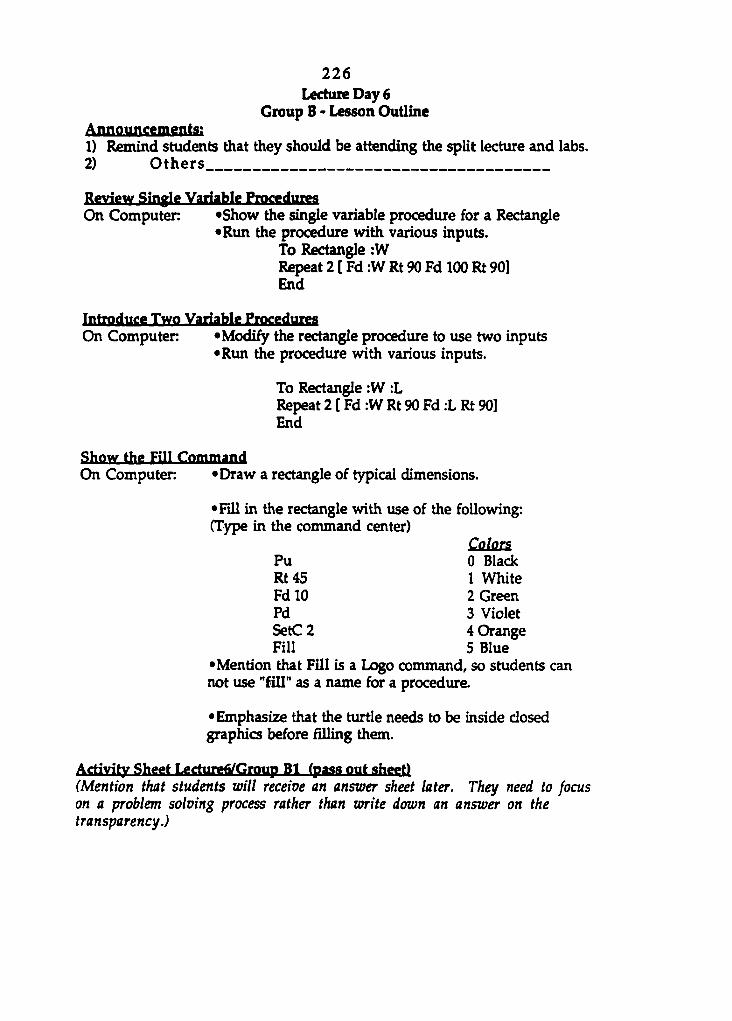
226 Lecture Day 6
Group B - Lesson Outline Announcements: 1) Remind students that they should be attending the split lecture and labs. 2) Others
Review Single Variable Procedures On Computer «Show the single variable procedure for a Rectangle
•Run the procedure with various inputs. To Rectangle :W Repeat 2 [ Fd :W Rt 90 Fd 100 Rt 90] End
Introduce Two Variable Procedures On Computer «Modify the rectangle procedure to use two inputs
•Run the procedure with various inputs.
To Rectangle :W :L Repeat 2 [ Fd :W Rt 90 Fd :L Rt 90] End
Show the Fill Command On Computer «Draw a rectangle of typical dimensions.
•Fill in the rectangle with use of the following: (Type in the command center)
Colors Pu 0 Black Rt45 1 White Fd 10 2 Green Fd 3 Violet SetC 2 4 Orange Fill 5 Blue
•Mention that Fill is a Logo command, so students can not use "fill" as a name for a procedure.
•Emphasize that the turtle needs to be inside closed graphics before filling them.
Activity Sheet Lecturefi/Group B1 (pass out shggt) (Mention that students will receive an answer sheet later. They need to focus on a problem solving process rather than write down an answer on the transparency.)
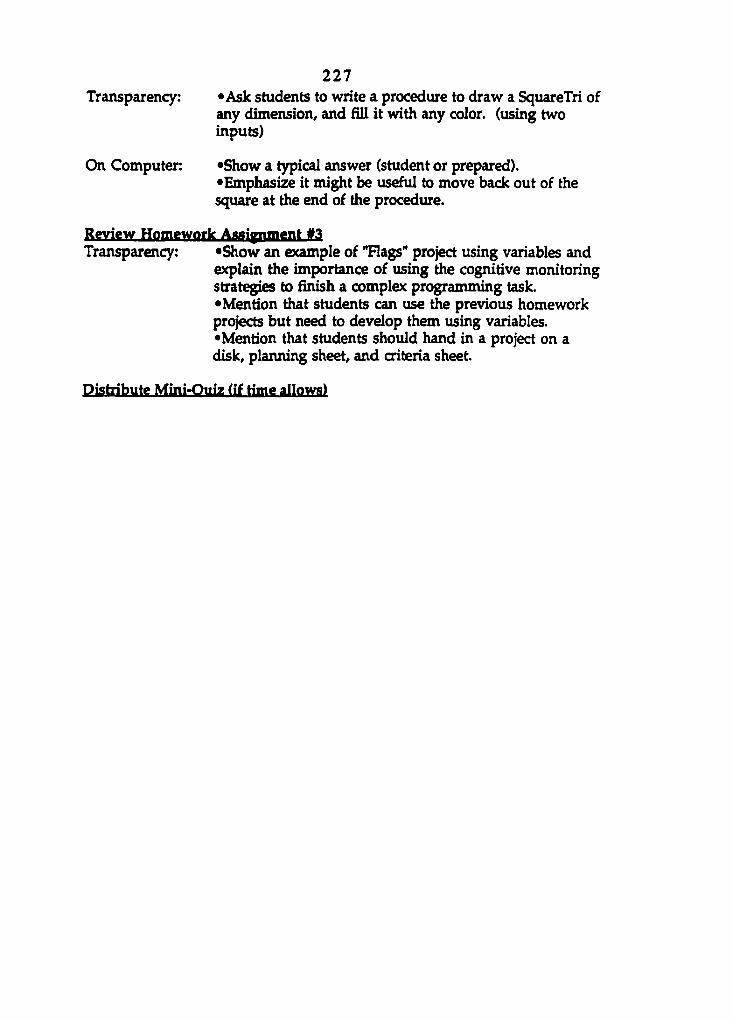
227 Transparency: «Ask students to write a procedure to draw a SquareTri of
any dimension, and fill it with any color, (using two inputs)
On Computer «Show a typical answer (student or prepared). •Emphasize it might be useful to move back out of the square at the end of the procedure.
Review Homework Aasigiunent #3 Transparency; •Show an example of "Flags" project using variables and
explain the importance of using the cognitive monitoring strategies to finish a complex programming task. •Mention that students can use the previous homework projects but need to develop them using variables. •Mention that students should hand in a project on a disk, planning sheet, and criteria sheet.
Distribute Mini-Quiz ( i t time allows)

228 LectuieDay?
Group B - Lesson Outline
Announcements; 1) Remind students that the Lecture midterm will be Tuesday October 16. 2) Remind students that Lab Midterms will begin Tuesday October 16. 3) Remind students that Tuesday October 9 be the last split lecture, but
split labs will continue for a total of four LogoWriter lab meetings. 4) Others
Review Two Variable Procedures On computer: «Briefly show the procedure of:
To Rectangle :W :L Repeat 2 [Fd :W Rt 90 Fd :L Rt 90] End
Introduce Recursion
•Rationale of learning recursion 1. A person's daily activities are carried out in a cycle.
•Learning of looping process is extremely important to understanding daily life problems.
2. In mathematics, many geometric figures can be expressed as repetition of a single figure.
3. Recursion is a powerful tool for computer scientists. •It is powerful when they know what to do but don't know how
many times to repeat.
On Computer: «Type the following, ask students to predict the output: (explain that recursion is a procedure that calls itself, etc...)
To Square :X To Boxes -X (Ask Students to repeat 4[Fd:XRt 90] Square :X predict the output) End Boxes :X -10
End ( run the program)
•Add a conditional statement to stop the recursion:
If < 0 [Stop] (Place after To Boxes :X • 10, ask students to predict the outcome)
Activity Sheet Lecture7/Group B1 (pass out sheet) (Mention that students will receive an answer sheet later. They need to focus on a problem solving process rather than write down an answer on the transparency.)
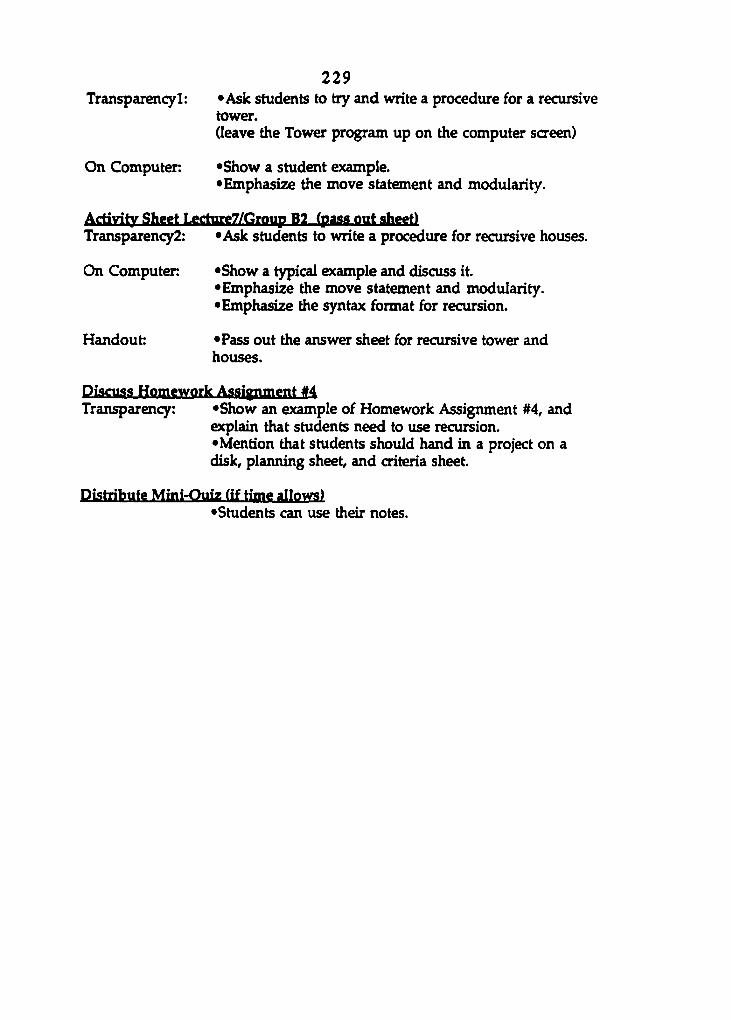
229 Transparency!: «Ask students to try and write a procedure for a recursive
tower. (leave the Tower program up on the computer screen)
On Computer. «Show a student example. •Emphasize the move statement and modularity.
Activitv Sheet Lgctiire7/Group B2 (pass out sheet) TransparencyZ: «Ask students to write a procedure for recursive houses.
On Computer: «Show a typical example and discuss it. •Emphasize the move statement and modularity. •Emphasize the syntax format for recursion.
Handout: «Pass out the answer sheet for recursive tower and houses.
Discuss Homework Assignment »4 Transparency: •Show an example of Homework Assignment #4, and
explain that students need to use recursion. •Mention that students should hand in a project on a disk, planning sheet, and criteria sheet.
Distribute Mini-Quiz (if time allows) •Students can use their notes.
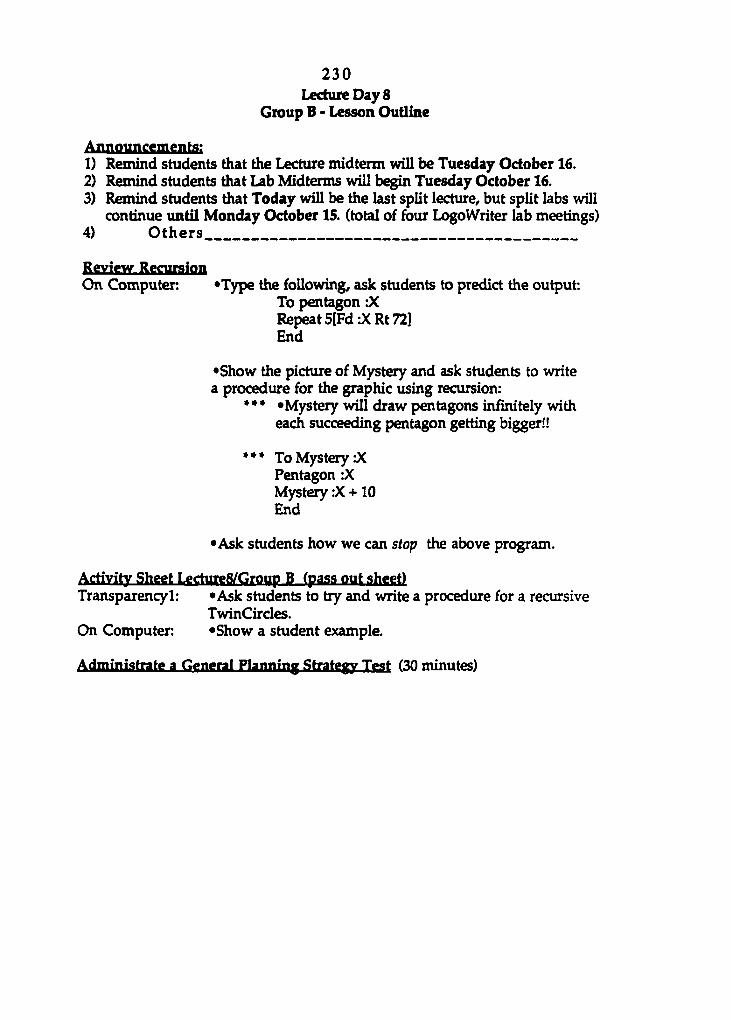
230 Lecture Day 8
Group B - Lesson Outline
Announcements! 1) Remind students that the Lecture midterm will be Tuesday October 16. 2) Remind students that Lab Midterms will begin Tuesday October 16. 3) Remind students that Today will be the last split lecture, but split labs will
continue until Monday October 15. (total of four LogoWriter lab meetings) 4) Others
Review Recursion On Computer. •Type the following, ask students to predict the output:
To pentagon :X Repeat 5(FdJ(Rt 72] End
•Show the picture of Mystery and ask students to write a procedure for the graphic using recursion:
*** «Mystery will draw pentagons infinitely with each succeeding pentagon getting bigger!!
To Mystery :X Pentagon :X Mystery :X +10 End
•Ask students how we can stop the above program.
Activity Sheet LecturgS/Group B (pass out sheet) Transparency!: «Ask students to try and write a procedure for a recursive
TwinCircles. On Computer «Show a student example.
Administrate a General Planning Strategy Test (30 minutes)

231
APPENDIX F: TRANSPARENCIES FOR INTRODUCTION TO COGNITIVE MONITORING
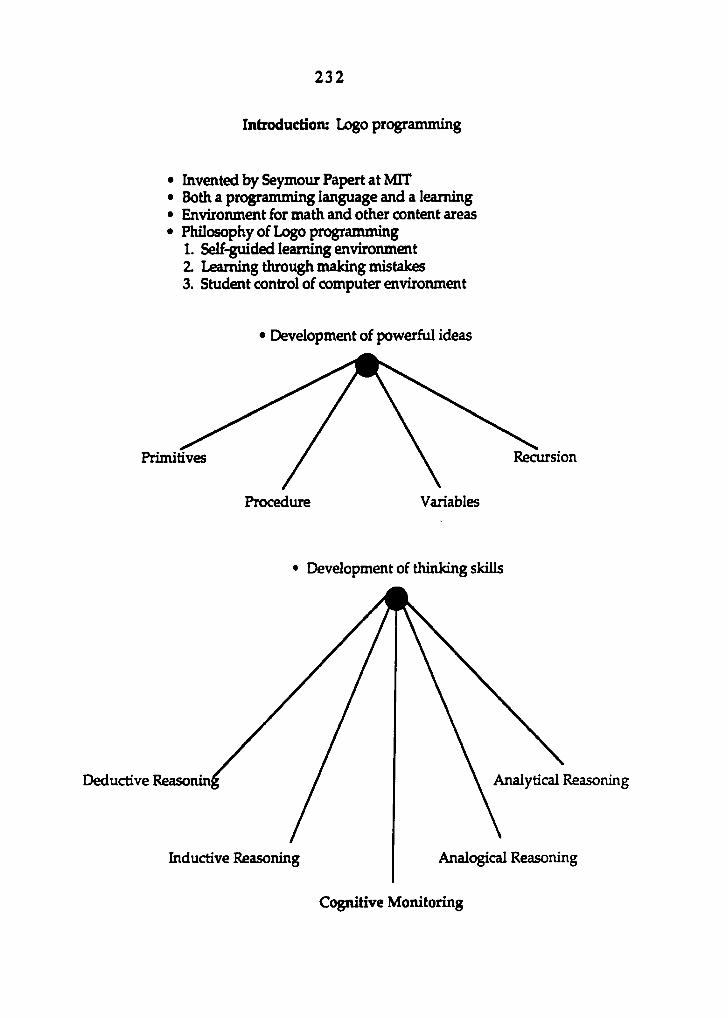
232
Introduction: Logo programming
• Invented by Seymour Papert at MTT • Both a programming language and a learning • Environment for math and other content areas • Philosophy of Logo programming
1. Self-guided learning environment 2. Learning through making mistakes 3. Student control of computer environment
• Development of powerful ideas
Recursion Primitives
Variables Procedure
• Development of thinking skills
Analytical Reasoning Deductive Reasonini
Analogical Reasoning Inductive Reasoning
Cognitive Monitoring
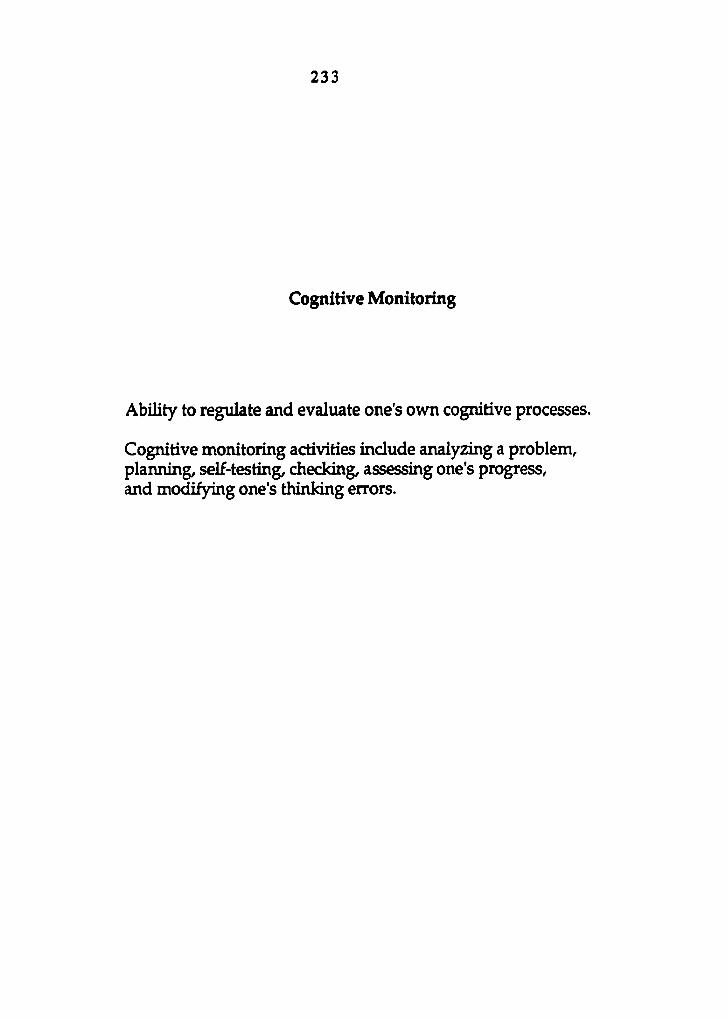
233
Cognitive Monitoring
Ability to regulate and evaluate one's own cognitive processes.
Cognitive monitoring activities include analyzing a problem, planning, self-testing, checking, assessing one's progress, and modifying one's thinking errors.
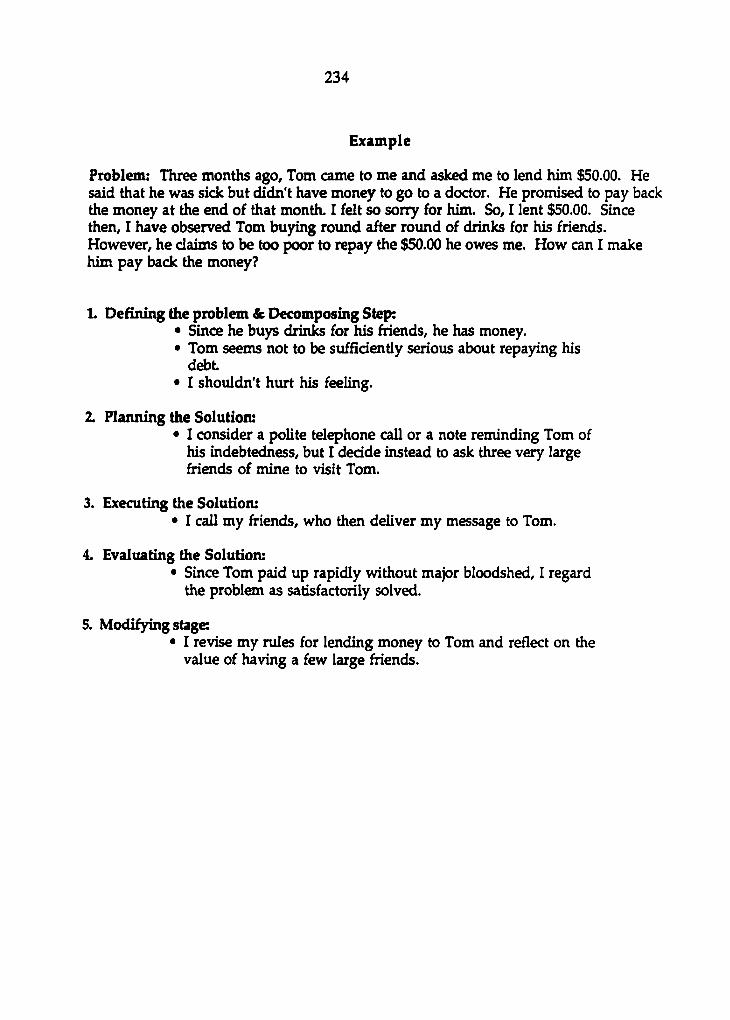
234
Example
Problem: Three months ago, Tom came to me and asked me to lend him $50.00. He said that he was sick but didn't have money to go to a doctor. He promised to pay back the money at the end of that month. I felt so sorry for him. So, I lent $50.00. Since then, I have observed Tom buying round after round of drinks for his friends. However, he claims to be too poor to repay the $50.00 he owes me. How can I make him pay back the money?
L Defining the problem & Decomposing Step: • Since he buys drinks for his Mends, he has money. • Tom seems not to be sufficiently serious about repaying his
dd7t • I shouldn't hurt his feeling.
1 Planning the Solution: • I consider a polite telephone call or a note reminding Tom of
his indebtedness, but I dedde instead to ask three very large friends of mine to visit Tom.
3. Executing the Solution: • I call my friends, who then deliver my message to Tom.
4. Evaluating the Solution: • Since Tom paid up rapidly without major bloodshed, I regard
the problem as satisfactorily solved.
5. Modifying stage: • I revise my rules for lending money to Tom and reflect on the
value of having a few large friends.
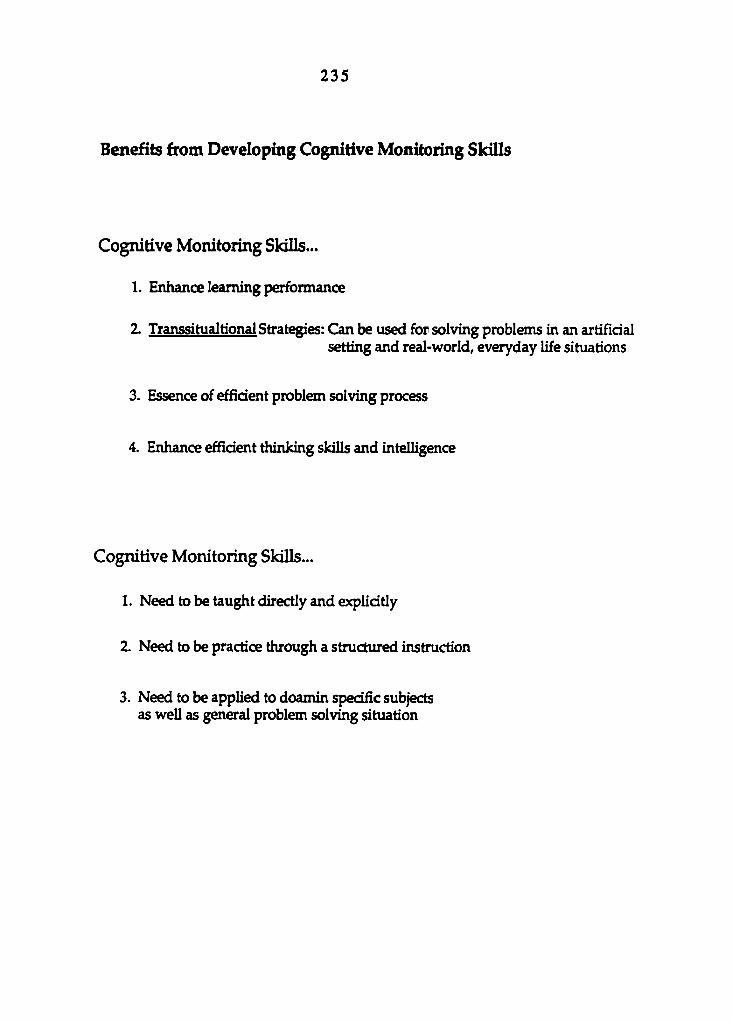
235
Benefits from Developing Cognitive Monitoring Skills
Cognitive Monitoring Skills...
1. Enhance learning performance
2. Transsitualtional Strategies: Can be used for solving problems in an artificial setting and real-world, everyday life situations
3. Essence of efficient problem solving process
4. Enhance efficient thinking skills and intelligence
Cognitive Monitoring Skills...
1. Need to be taught directly and explicitly
Z Need to be practice through a structured instruction
3. Need to be applied to doamin specific subjects as well as general problem solving situation
236
5 Basic Components of Cognitive Monitgnpg
1. Decompose Break a complex problem into smaller, self-contained problems and solve each part correctly.
2. Plan Consciously organize and sequence the decomposed problems to devise the solution to the problem efficiently.
3. Execute Test planned hypotheses or solutions.
4. Identify Problem
Evaluate the actual outcome, locate errors, and explain the problem.
5. Debug Correct the detected errors or misconceptions.
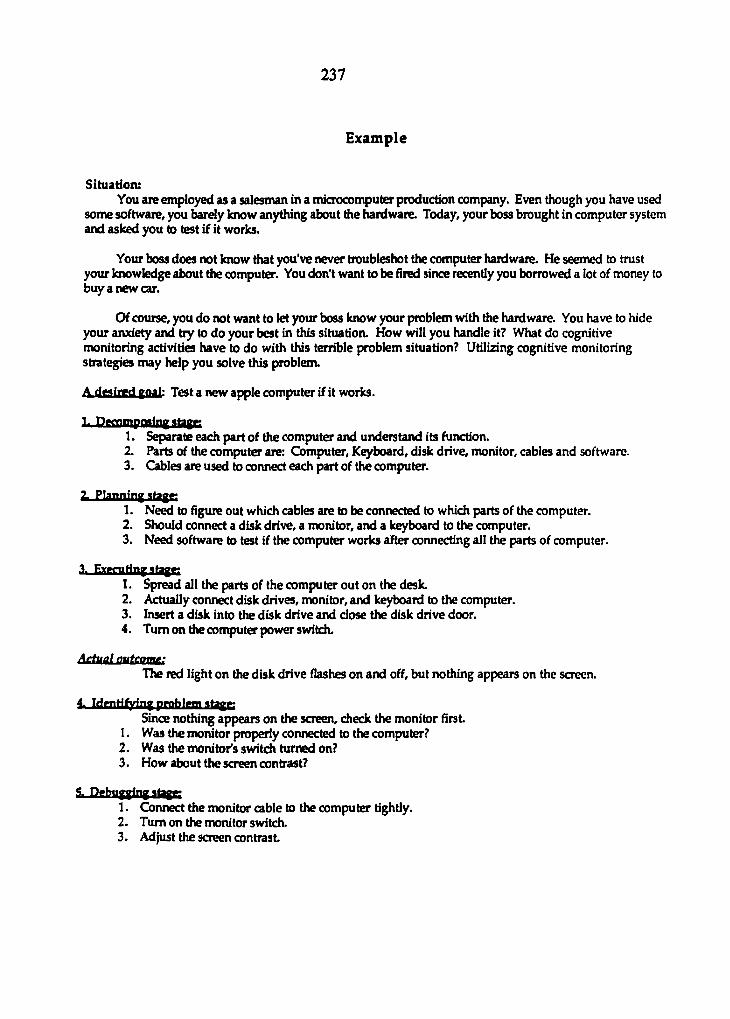
237
Example
Situation: You are employed as a salesman in a microcomputer production company. Even though you have used
some software, you barely know anything about the hardware. Today, your boss brought in computer system and asked you to test if it works.
Your boss does not know that you've never troubleshot the computer hardware. He seemed to trust your knowledge about the computer. You don't want to be fired since recently you borrowed a lot of money to buy a new car.
Of course, you do not want to let your boss know your problem with the hardware. You have to hide your anxiety and try to do your best in this situation. How will you handle it? What do cognitive monitoring activities have to do with this terrible problem situation? Utilizing cognitive monitoring strategies may help you solve this problem.
A deatrgd yoal: Test a new apple computer if it works.
1. Dfcnmpaaingittagfi 1. Separate each part of the computer and understand its function. 2. Parts of the computer are: Computer, Keyboard, disk drive, monitor, cables and software. 3. Cables are used to connect each part of the computer.
2. Planning atagK 1. Need to figure out which cables are to be connected to which parts of the computer. 2. Should connect a disk drive, a monitor, and a keyboard to the computer. 3. Need software to test if the computer works after connecting all the parts of computer.
3. berating atagn 1. Spread all the parts of the computer out on the desk. 2. Actually connect disk drives, monitor, and keyboard to the computer. 3. Insert a disk into the disk drive and dose the disk drive door. 4. Turn on the computer power switch.
Ai±ial autamu: The red light on the disk drive flashes on and off, but nothing appears on the screen.
4. Idgnrifyinyprohlwnatagg; Since nothing appears on the screen, check the monitor first
1. Was the monitor properly connected to the computer? 2. Was the monitor's switch turned on? 3. How about the screen contrast?
1. Connect the monitor cable to the computer tightly. 2. Turn on the monitor switch. 3. Adjust the screen contrast
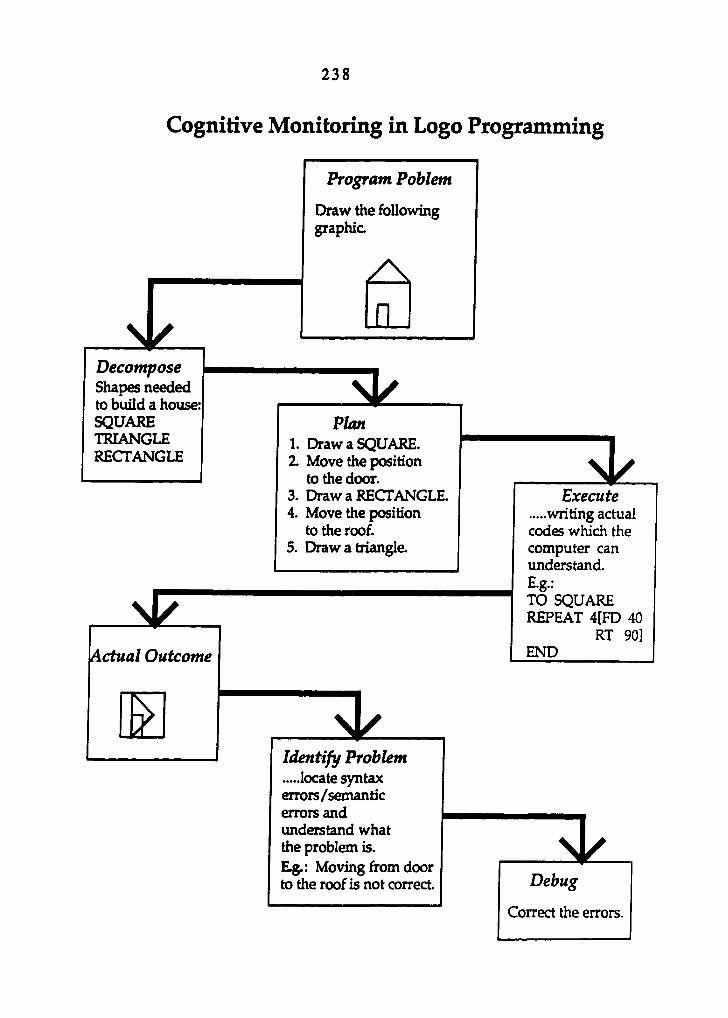
238
Cognitive Monitoring in Logo Programming
JZ Decompose Shapes needed to build a house: SQUARE TRIANGLE RECTANGLE
Actual Outcome
Program Poblem
Draw the following graphic
n
5k Plan
1. Draw a SQUARE. 2. Move the position
to the door. 3. Draw a RECTANGLE. 4. Move the position
to the roof. 5. Draw a triangle.
3d Execute
writing actual codes which the computer can understand. E.g.: TO SQUARE REPEAT 4[FD 40
RT 90] END
Identify Problem locate syntax
errors/semantic errors and understand what the problem is. E^: Moving from door to the roof is not correct.
Correct the errors

239
APPENDIX G: EXAMPLES OF GENERAL COGNITIVE MONITORING ACTIVITY SHEETS: EXPERIMENTAL GROUP
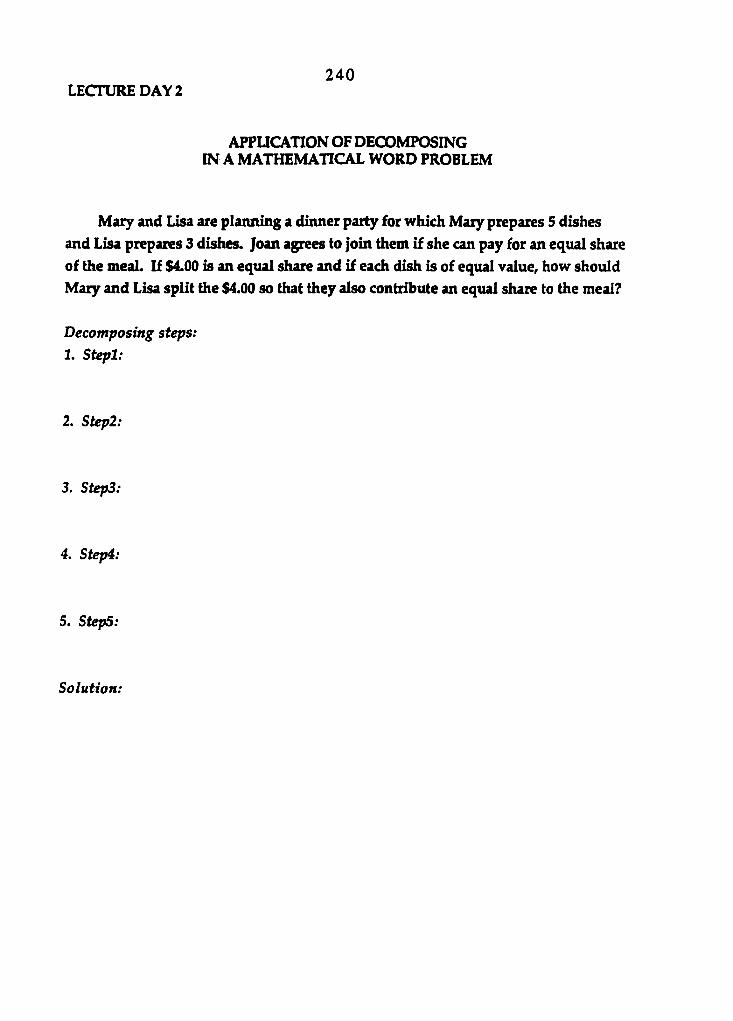
LECTURE DAY 2 240
APPUCATION OF DECOMPOSING IN A MATHEMATICAL WORD PROBLEM
Mary and Lisa are planning a dinner party for which Mary prepares 5 dishes
and Lisa prepares 3 dishes. Joan agrees to join them if she can pay for an equal share of the meaL If $4.00 is an equal share and if each dish is of equal value, how should Mary and Lisa split the $4.00 so that they also contribute an equal share to the meal?
Decomposing steps:
1. Stepl:
2. Step2:
3. Step3:
4. Step4:
5. StepS:
Solution:
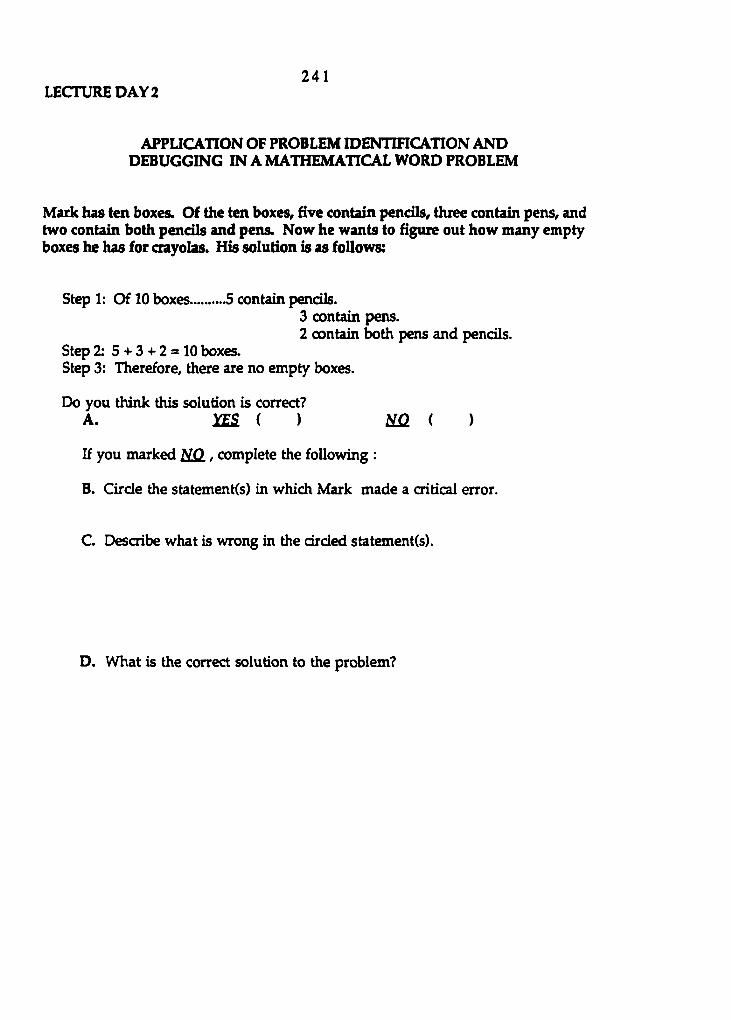
LECTURE DAY 2 241
APPUCATION OF PROBLEM IDENTIFICATION AND DEBUGGING IN A MATHEMATICAL WORD PROBLEM
Mark has ten boxes. Of the ten boxes, five contain pencils, three contain pens, and two contain both pendls and pens. Now he wants to figure out how many empty boxes he has for crayolas. His solution is as follows:
Step 1: Of 10 boxes 5 contain pencils. 3 contain pens. 2 contain both pens and pendls.
Step 2: 5 + 3 + 2 = 10 boxes. Step 3: Therefore, there are no empty boxes.
Do you think this solution is correct? A. lES ( ) m ( )
If you marked NO , complete the following :
B. Circle the statement(s) in which Mark made a critical error.
C Describe what is wrong in the circled statement(s).
D. What is the correct solution to the problem?
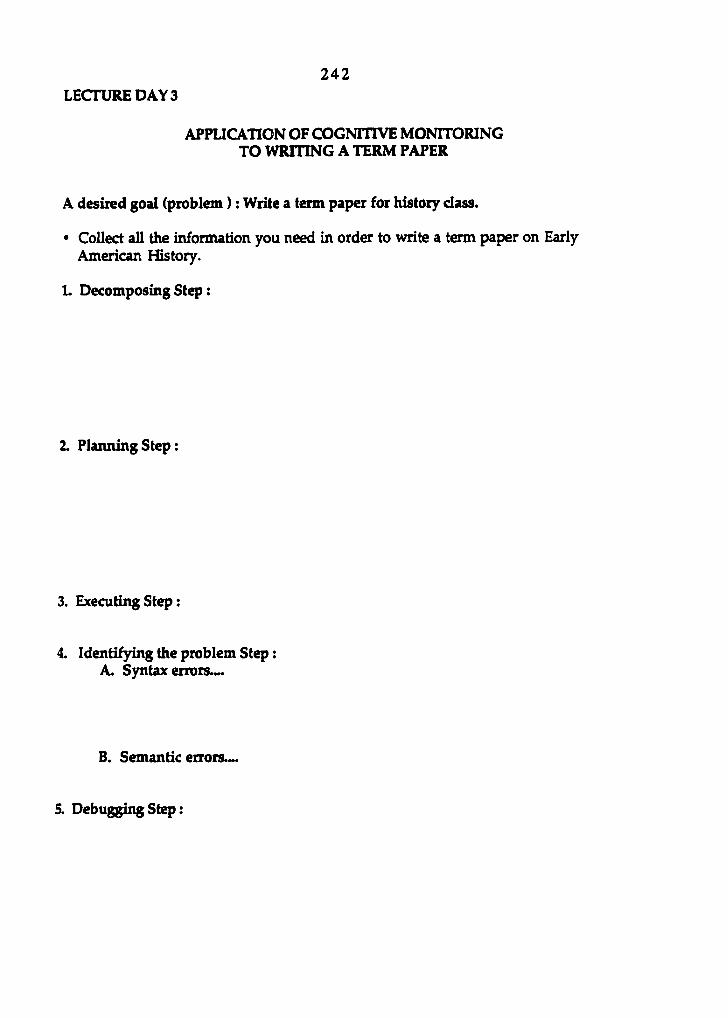
LECTURE DAY 3 242
APPUCAnON OF COGNITIVE MONITORING TO WRITING A TERM PAPER
A desired goal (problem ) : Write a term paper for history class.
• Collect all the information you need in order to write a term paper on Early American History.
1. Decomposing Step :
1 Planning Step :
3. Executing Step :
4. Identifying the problem Step : A. Syntax errors.-.
B. Semantic errors.-.
5. Debugging Step :
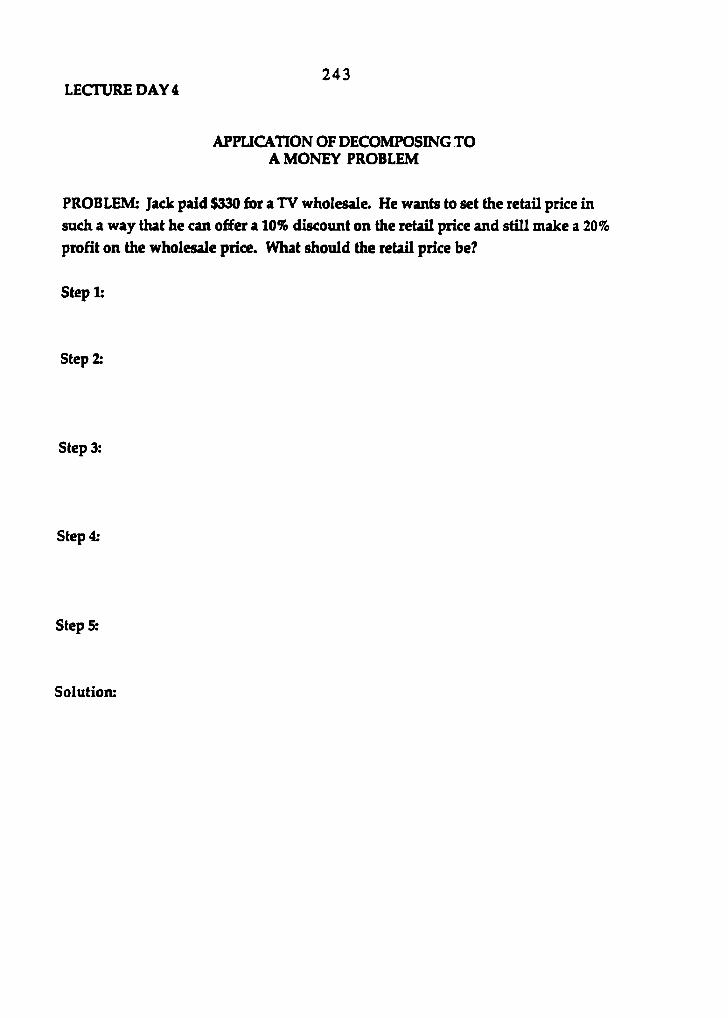
LECTURE DAY 4 243
APPUCATION OF DECOMPOSING TO A MONEY PROBLEM
PROBLEM: Jack paid $330 for a TV wholesale. He wants to set the retail price in such a way that he can offer a 10% discount on the retail price and still make a 20% profit on the wholesale price. What should the retail price be?
Stepl:
Step 2:
Step 3:
Step 4:
Step 5:
Solution:

LECTURE DAY 4 244
APPUCATION OF PROBLEM IDENTIHCATION TO A MONEY PROBLEM
John has 5 times as many quarters as dimes. The value of the quarters exceeds the value of the dimes by $2J0. How many dimes does he have?
John's solution is as follows:
Step 1: John has dimes = D, and quarters = 5 x D.
Step 2: Since the value of quarters (5D) exceeds the value of the dimes (D) by $2.30, the equation will be 5D - D = $230.
Step 3: 4D = $230, D = $38, therefore 50 cents.
John has 5 dimes.
Do you think this solution is correct? A . ( ) m i )
If you marked NO , answer the following questions.
B. Circle the statement(s) in which John made a critical error.
C Describe what is wrong in the drded statement(s).
D. What is the correct solution to the problem?

LECTURE DAY 5 245
APPUCATION OF COGNITIVE MONITORING TO BUILD A HOUSE
The Ritfscher Aunily is building a new house. Scott is an electrician and Pole is a
plumber. JilL Kerri, Pat, and Tom are good hard workers and good with their hands. So they are going to do most of the work themselves.
Here is a list of the tasks, the amount of time needed to complete each task,
and the order in which the tasks must be completed.
Task Time Preceding Steps
A. Site preparation 4 days none
B. Foundation 6 days site preparation (A)
C Drains & services 3 days site preparation (A)
D. Framing 10 days foundation (B)
E Roof 5 days framing (D)
F. Windows 2 days roof (E)
G. Plumbing 4 days drains & services (C), roof (E)
H. Electrical work 3 days roof(E)
L Insulation 2 days plumbing (G), electrical work (H)
J. SheU 6 days windows (F)
K. Cleanup and painting 6 days insulation (I)
Question L* On what day will Scott and Pole be needed?
Question 2: Jill and Kerri will only be able to help during cleanup and painting. Until then they will be with their grandparents. How long will their vacation be?
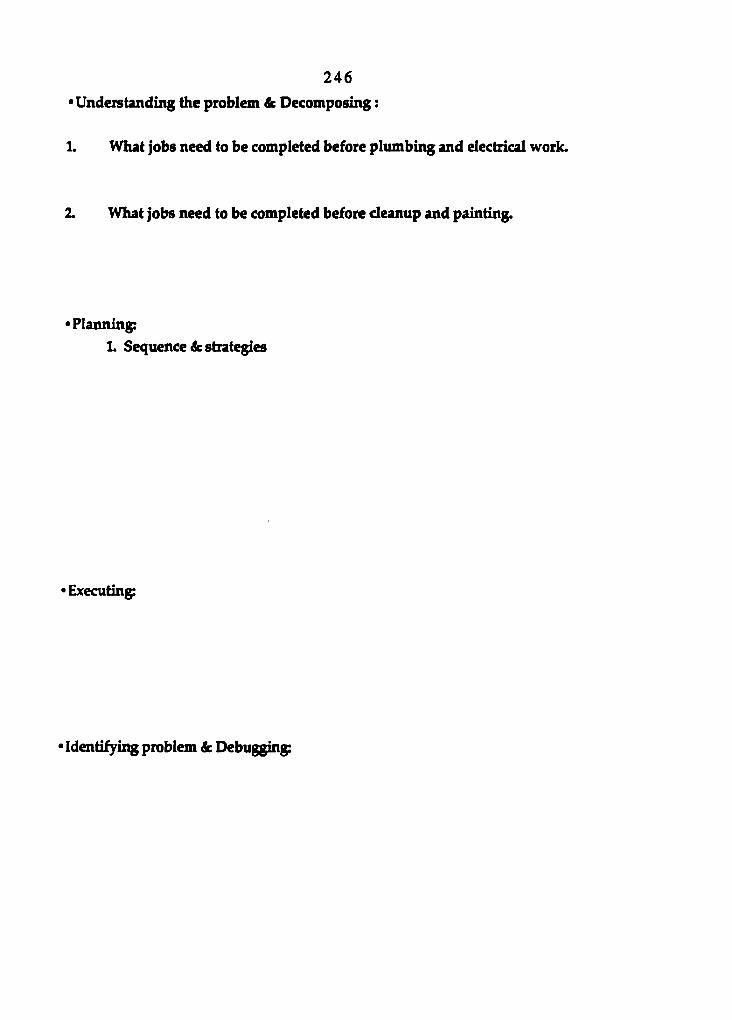
246
•Understanding the problem & Decomposing :
1. What jobs need to be completed before plumbing and electrical work.
2. What jobs need to be completed before cleanup and painting.
•Planning: L Sequence & strategies
•Executing:
Identifying problem & Debugging:
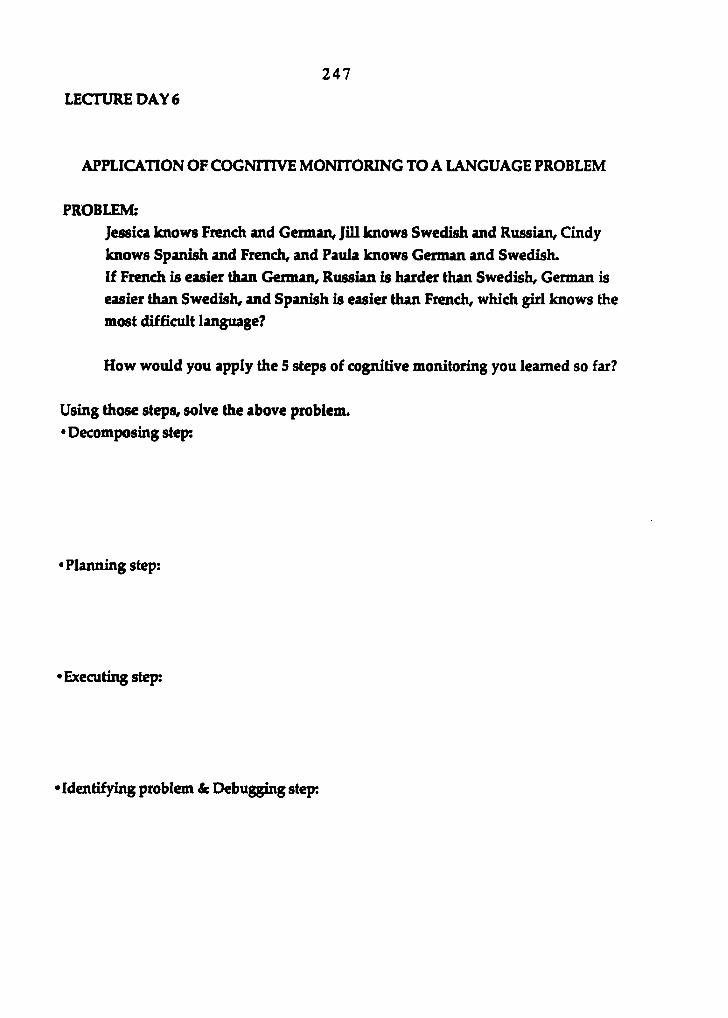
LECTURE DAY 6
247
APPLICATION OF COGNITIVE MONITORING TO A LANGUAGE PROBLEM
PROBLEM:
Jessica knows French and German^ Jill knows Swedish and Russian^ Cindy knows Spanish and French, and Paula knows German and Swedish. If French is easier than German, Russian is harder than Swedish, German is easier than Swedish, and Spanish is easier than French, which girl knows the
most difficult language?
How would you apply the 5 steps of cognitive monitoring you learned so far?
Using those steps, solve the above problem. * Decomposing step:
•Planning step:
•Executing step:
Identifying problem & Debugging step:
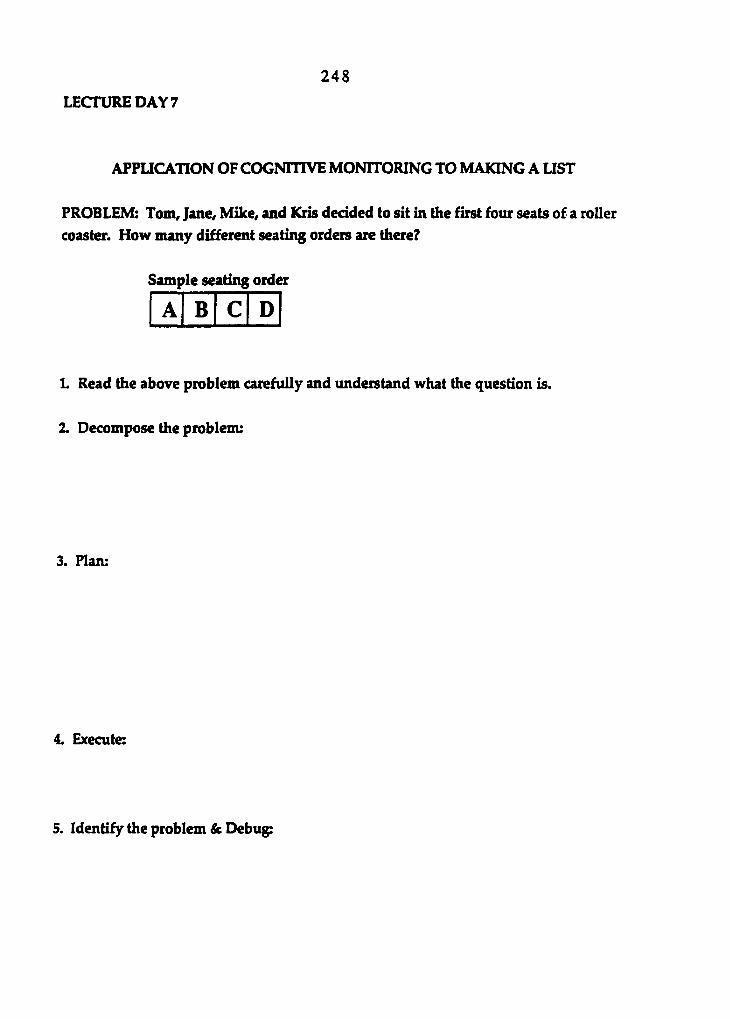
2 4 8
LECTURE DAY 7
APPUCATION OF COGNITIVE MONITORING TO MAKING A LIST
PROBLEM: Tom, Jane, Mike, and Kris dedded to sit in the first four seats of a roller coaster. How many different seating orders are there?
Sample seating order
A B C D
L Read the above problem carefully and understand what the question is.
2. Decompose the problem:
3. Plan:
4. Execute:
5. Identify the problem & Debug:
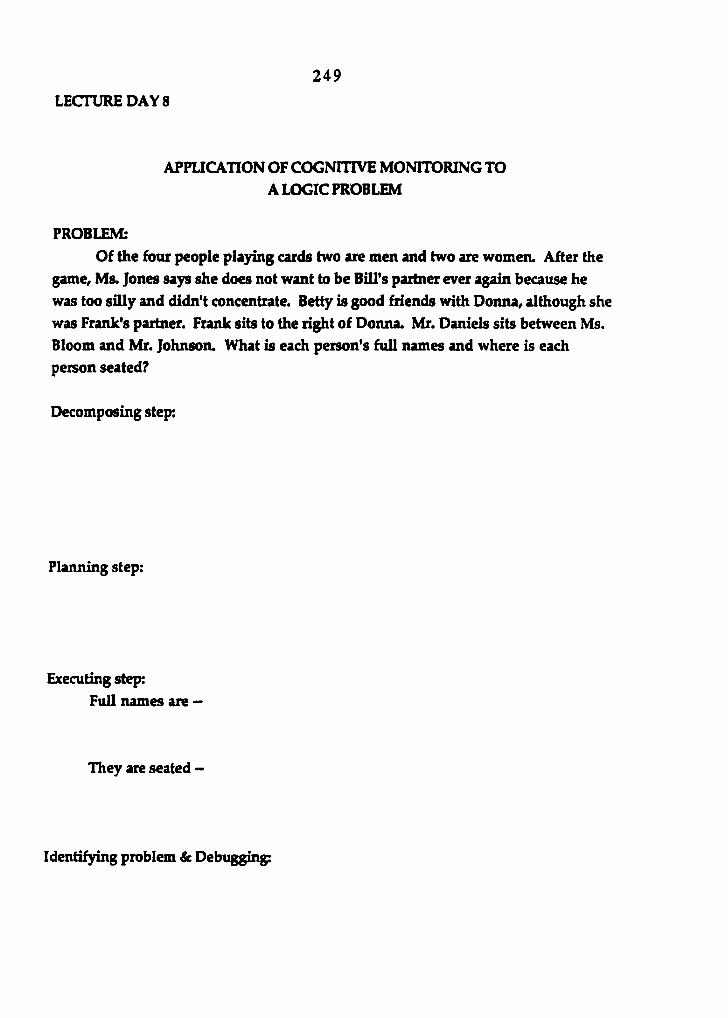
LECTURE DAY 8
249
APPUCAnON OF COGNITIVE MONITORING TO A LOGIC PROBLEM
PROBLEM:
Of the four people playing cards two are men and two are women. After the
game, Ms. Jones says she does not want to be Bill's partner ever again because he was too silly and didn't concentrate. Betty is good friends with Donna, although she was Frank's partner. Frank sits to the right of Donna. Mr. Daniels sits between Ms.
Bloom and Mr. Johnson. What is each person's full names and where is each person seated?
Decomposing step:
Planning step:
Executing step:
Full names are —
They are seated -
Identifying problem & Debugging;

250
APPENDIX H: INSTRUCTION OUTLINE FOR LABORATORY: EXPERIMENTAL GROUP

251 Lab Day 1
Group A - Lesson Outline
Attendance. Record Keeping. Announcements • Ask each student their name and place a check on the roster as they enter.
(Please make sure students are in the right place!) • Collect AppleWorks Assignment (Let students keep their data disk). • Mention to students that part of the instruction will involve turning on and
turning oH the monitors so that everyone is doing the same thing.
Boot up LogoWriter MONITORS ON • Make sure all students have a LogoWriter disk. (If not, loan or trade disks.) • Have students boot up LogoWriter, and start a new page.
PracHce with the PrimiHves On Computers: «Allow students to practice using the primitive commands.
(about 5 minutes, primitives are on the chalkboard.)
FD XX RT XX PU HT HOME BK XX LT XX PD ST CG
Practice with the Repeat Statement On Computers: •Allow students to practice using the repeat commands.
(Exploration for about 5 minutes, trying these examples.) (These should be on the chalkboard, too.)
Review Procedures Demonstration:
Repeat 4 [Fd 50 Rt 90] Repeat 3 [Fd 50 Rt 120] Repeat 2 [Fd 50 Rt 90 Fd 100 Rt 90]
MONITORS OFF •Show how to enter the "open-apple-P' editor. •Show again how to build these procedures:
(square) (triangle) (rectangle)
To Square Repeat 4[Fd 50 Rt 90] End
To Triangle Repeat 3[Fd 50 Rt 120] End
On Computer: MONITORS ON
•Have students enter and test the Square and Triangle procedures. •Have students enter and test the Rectangle procedure. (About 5 minutes.)
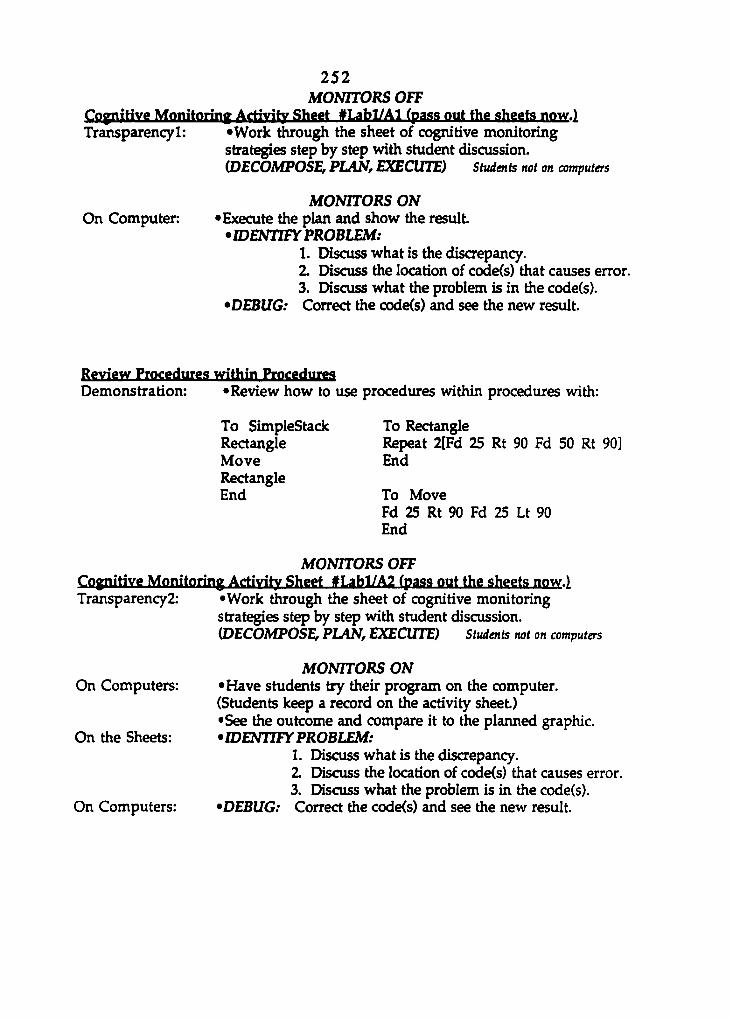
252 MONITORS OFF
Cognitive Monitoring Activity Sheet #Labl/Al (pass out the sheets now.) Transparency!:
On Computer.
•Work through the sheet of cognitive monitoring strategies step by step with student discussion. (DECOMPOSE, PLAN, EXECUTE) Students not on computers
MONITORS ON •Execute the plan and show the result.
•IDENTIFY PROBLEM: 1. Discuss what is the discrepancy. 2. Discuss the location of code(s) that causes error. 3. Discuss what the problem is in the code(s).
•DEBUG: Correct the code(s) and see the new result.
Review Procedures within Procedures Demonstration: «Review how to use procedures within procedures with:
To SimpleStack Rectangle Move Rectangle End
To Rectangle Repeat 2[Fd 25 Rt 90 Fd 50 Rt 90] End
To Move Fd 25 Rt 90 Fd 25 Lt 90 End
MONHORS OFF Cognitive Monitoring Activity Sheet »LabiyA2 (pass out the sheets now.) Transparency 2:
On Computers:
On the Sheets:
On Computers:
•Work through the sheet of cognitive monitoring strategies step by step with student discussion. (DECOMPOSE, PLAN, EXECUTE) Students not on computers
MONITORS ON •Have students try their program on the computer. (Students keep a record on the activity sheet.) •See the outcome and compare it to the plarmed graphic. •IDENTIFY PROBLEM:
1. Discuss what is the discrepancy. 2. Discuss the location of code(s) that causes error. 3. Discuss what the problem is in the code(s).
•DEBUG: Correct the code(s) and see the new result.

253 MOMTORS OFF
CogniHvg Monitoring Artivity Sheet #Labl/A3 fpass out the sheets now.) TransparencyS: «Allow students to apply the steps of cognitive monitoring (Student activity) strategies for about 10 minutes.
(DECOMPOSE, PLAN, EXECUTE)
On Computers: On the Sheets:
MONITORS ON •Have students try their program on the computer. •IDENTIFY PROBLEM:
1. Discuss what is the discrepancy. 2. Discuss the location of code(s) that causes error. 3. Discuss what the problem is in the code(s).
On Computers: •DEBUG: Correct the code(s) and see the new result. •INSTRUCTOR HELPS STUDENTS INDIVIDUALLY. FEEL FREE TO TALK ABOUT THEIR PROJECTS AND ALLOW STUDENTS TO COOPERATE WTTH EACH OTHER TO CORRECT ERRORS.
MONTTORS OFF Review Homework Assignment #1
•Make sure that students have a homework planning sheet. •Insure that students have a homework grading sheet. (Students will hand in disk, planning sheet, & grading sheet) •Discuss what will need to be handed in for a grade.
Transparency: «Show an example of Homework Assignment #1 on transparency.
STUDENTS MUST SHOW A FAIRLY COMPLETE PLANNING SHEET TO THE LAB INSTRUCTOR BEFORE BEING ALLOWED TO TURN ON THEIR MONITOR AND WORK ON THE COMPUTER.
MONTTORS ON Allow students to work on Homework
•For the rest of the time, students work on their own homework. •To save, use NP "lastname 1, and press <escape>.
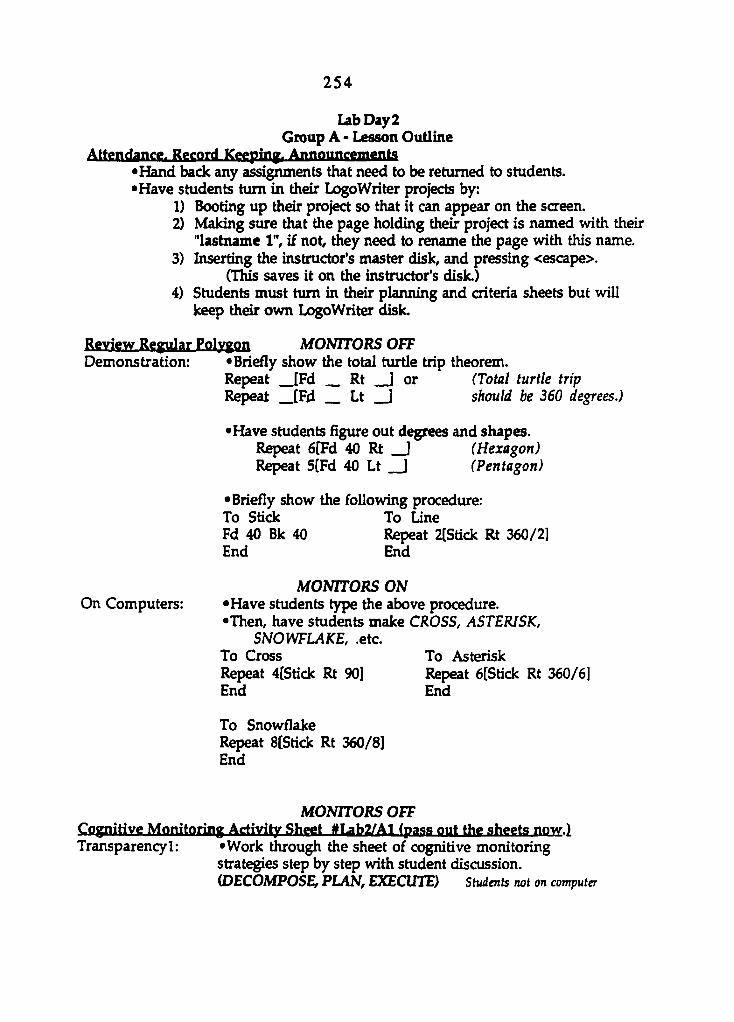
254
Lab Day 2 Group A. • Lesson Outline
Attendance. Record Keeping. Announcements •Hand back any assignments that need to be returned to students. •Have students turn in their LogoWriter projects by:
1) Booting up their project so that it can appear on the screen. 2) Making sure that the page holding their project is named with their
"lastname 1", if not, they need to rename the page with this name. 3} Inserting the Instructor's master disk, and pressing <escape>.
Cn^ saves it on the instructor's disk.) 4) Students must turn in their plaimlng and criteria sheets but will
keep their own LogoWriter disk.
Review Regular Polvyon MONITORS OFF Demonstration: «Briefly show the total turtle trip theorem.
Repeat [Fd Rt ] or (Total turtle trip Repeat _[Fd Lt ] should be 360 degrees.)
•Have students figure out degrees and shapes. Repeat 6[Fd 40 Rt ] (Hexagon) Re^at 5(Fd 40 Lt I (Pentagon)
•Briefly show the following procedure: To Stick To Line Fd 40 Bk 40 Repeat 2[Sdck Rt 360/21 End End
On Computers: MONITORS ON
•Have students type the above procedure. •Then, have students make CROSS, ASTERISK,
SNOWFLAKE, etc. To Cross To Asterisk Repeat 4[Stick Rt 90] Repeat 6[Stick Rt 360/6] End End
To Snowflake Repeat 8[Stick Rt 360/8] End
MONITORS OFF Cognitive Monitoring Activity Sheet #Lab2/Al fpass nut the sheets now.) Transparency!: «Work through the sheet of cognitive monitoring
strategies step by step with student discussion. (DECOMPOSE/ PLAN, EXECUTE) Students not on computer
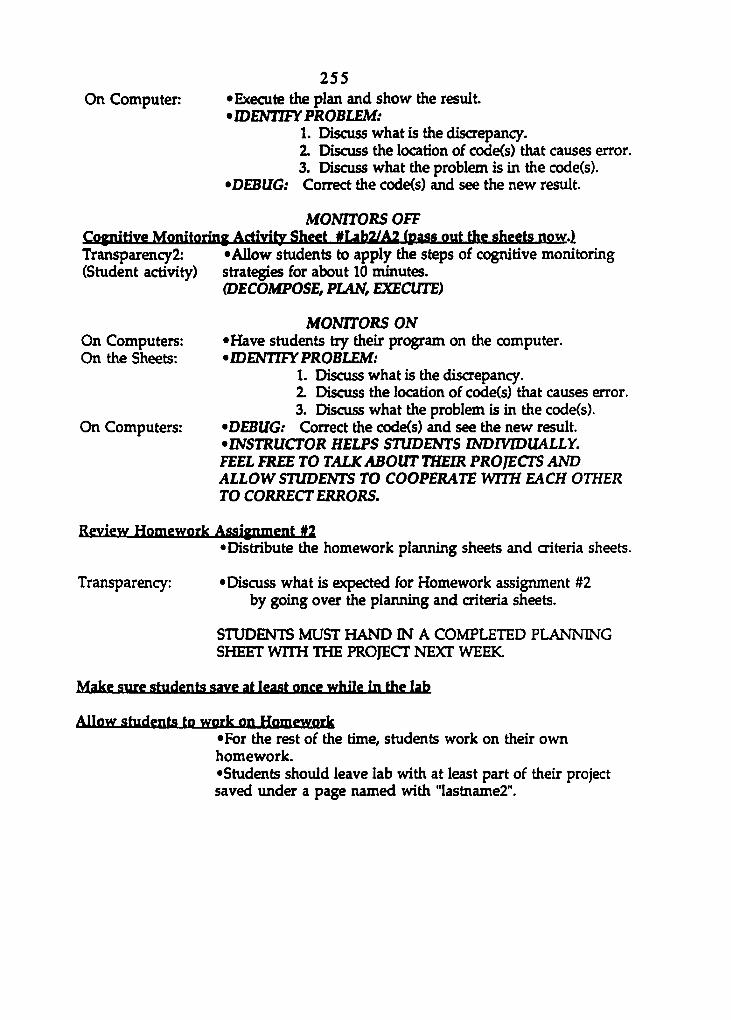
255 On Computer «Exécuté the plan and show the result.
•IDENTIFY PROBLEM: 1. Discuss what is the discrepancy. 2. Discuss the location of code(s) that causes error. 3. Discuss what the problem is in the code(s).
•DEBUG: Correct the code<s} and see the new result.
MOMTORS OFF Cognitive Monitoring Activity Sheet #Lab2/A2 (pass out the sheets now.) Transparency!: «Allow students to apply the steps of cognitive monitoring (Student activity) strategies for about 10 minutes.
(DECOMPOSE, PLAN, EXECUTE)
On Computers: On the Sheets:
On Computers:
MONTTORS ON •Have students try their program on the computer. •IDENTIFY PROBLEM:
1. Discuss what is the discrepancy. 2. Discuss the location of code(s) that causes error. 3. Discuss what the problem is in the code(s).
•DEBUG: Correct the code(s) and see the new result. •INSTRUCTOR HELPS STUDENTS INDIVIDUALLY. FEEL FREE TO TALK ABOUT THEIR PROJECTS AND ALLOW STUDENTS TO COOPERATE WTTH EACH OTHER TO CORRECT ERRORS.
Review Homework Assignment #2 •Distribute the homework planning sheets and criteria sheets.
Transparency: •Discuss what is expected for Homework assignment #2 by going over the planning and criteria sheets.
STUDENTS MUST HAND IN A COMPLETED PLANNING SHEET WITH THE PROJECT NEXT WEEK.
Make sure studgnts save at least once while in the lab
Allow students to work on Homework •For the rest of the time, students work on their own homework. •Students should leave lab with at least part of their project saved under a page named with "Iastname2".
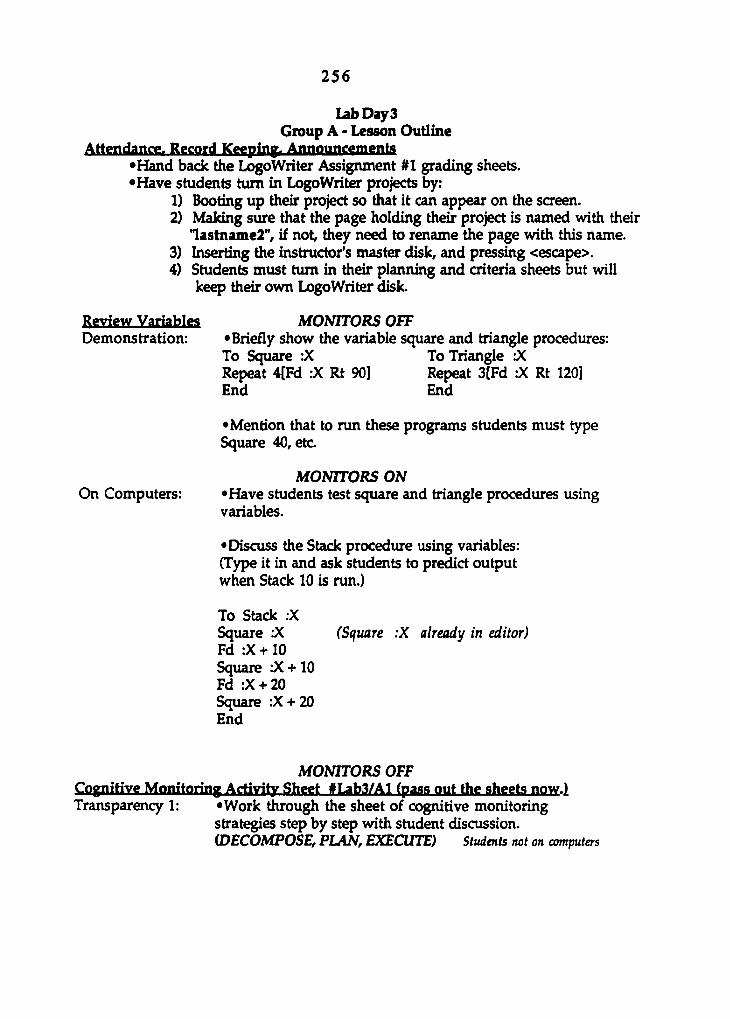
256
Lab Day 3 Group A - Lesson Outline
Attendance. Record Keeping. Announcement •Hand back the LogoWriter Assignment #1 grading sheets. •Have students turn in LogoWriter projects by:
1) Booting up their project so that it can appear on the screen. 2} Making sure that the page holding their project is named with their
"lastnameZ", if not, they need to rename the page with this name. 3) Inserting the instructor's master disk, and pressing <escape>. 4) Students must turn in their planning and criteria sheets but will
keep their own LogoWriter disk.
Review Variables MONITORS OFF Demonstration: «Briefly show the variable square and triangle procedures:
To Square :X To Triangle -X Repeat 4[Fd :X Rt 90] Repeat 3(Fd -X Rt 120] End End
•Mention that to run these programs students must type Square 40, etc
MONITORS ON On Computers: «Have students test square and triangle procedures using
variables.
•Discuss the Stack procedure using variables: (Type it in and ask students to predict output when Stack 10 is run.)
To Stack X Square X (Square :X already in editor) Fd :X +10 Square :X +10 Fd :X + 20 Square :X + 20 End
MONITORS OFF Cognitive Monitoring Activity Sheet #Lab3/Al (pass out the sheets now.) Transparency 1: •Work through the sheet of cognitive monitoring
strategies step by step with student discussion. (DECOMPOSE, PLAN, EXECUTE) Students not on computers
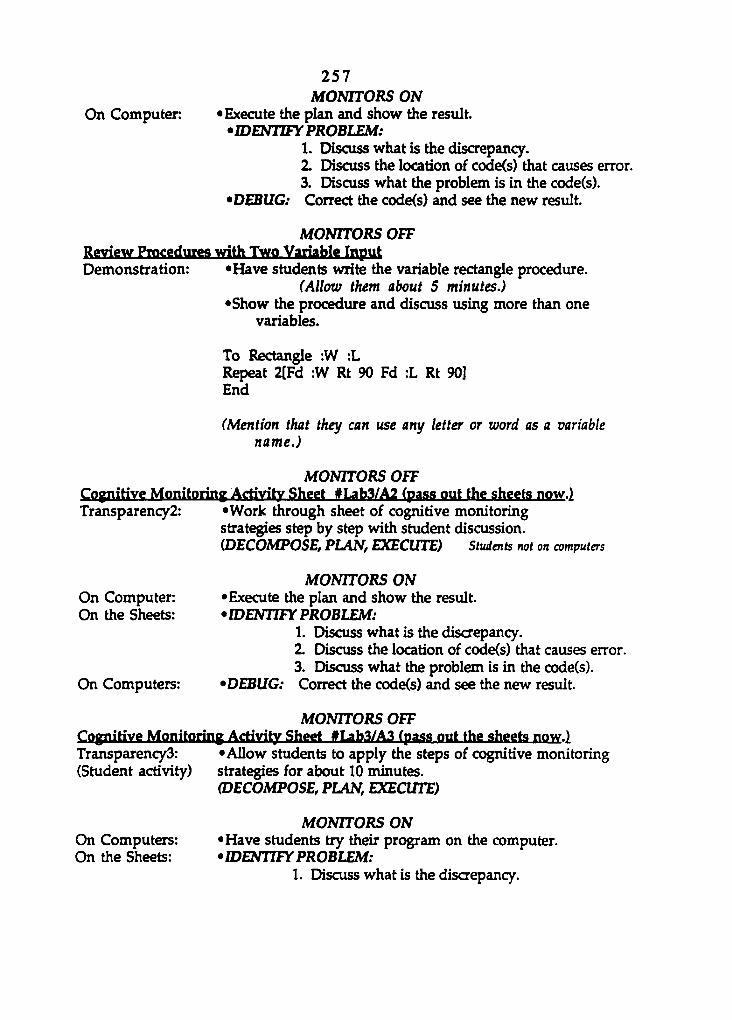
257 MONITORS ON
On Computer: «Execute the plan and show the result •IDENTIFY PROBLEM:
1. Discuss what is the discrepancy. 2. Discuss the location of code(s) that causes error. 3. Discuss what the problem is in the codeCs).
•DEBUG: Correct the code(s) and see the new result.
MONITORS OFF Review PTOcedures with Two Variable Input Demonstration: «Have students write the variable rectangle procedure.
(Allow them about 5 minutes.) •Show the procedure and discuss using more than one
variables.
To Rectangle :W :L Repeat 2[Fd :W Rt 90 Fd :L Rt 90] End
(Mention that they can use any letter or word as a variable name.)
MONITORS OFF CogniKve Monitoring Activity Sheet »Lab3/A2 (pass out the sheets now.) Transparency2: «Work through sheet of cognitive monitoring
strategies step by step with student discussion. (DECOMPOSE, PLAN, EXECUTE) Students not on computers
On Computer On the Sheets:
On Computers:
MONITORS ON •Execute the plan and show the result. •IDENTIFY PROBLEM:
1. Discuss what is the discrepancy. 2. Discuss the location of code(s) that causes error. 3. Discuss what the problem is in the code(s).
•DEBUG: Correct the code(s) and see the new result.
MOmrORS OFF Cognitive Monitoring Acrivity Sheet »Lab3/A3 (pass out the sheets now.) TransparencyS: •Allow students to apply the steps of cognitive monitoring (Student activity) strategies for about 10 minutes.
(DECOMPOSE, PLAN, EXECUTE)
On Computers: On the Sheets:
MONITORS ON •Have students try their program on the computer. •IDENTIFY PROBLEM:
1. Discuss what is the discrepancy.
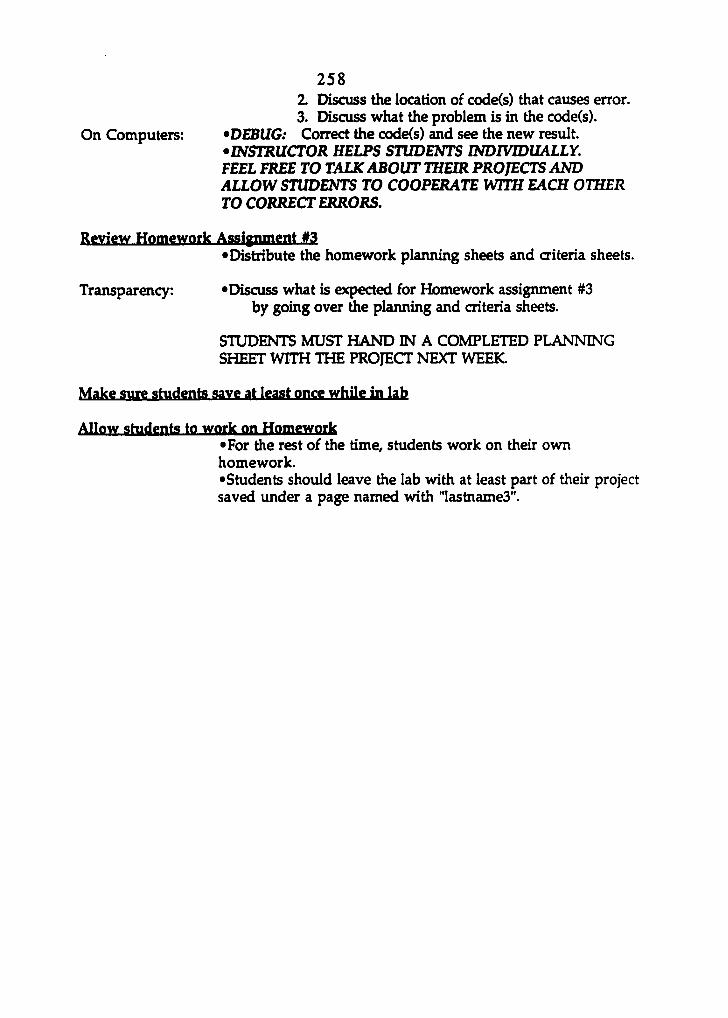
258 2. Discuss the location of code(s) that causes error. 3. Discuss what the problem is in the code(s).
On Computers: •DEBUG: Correct the code(s) and see the new result. •INSTRUCTOR HELPS STUDENTS INDIVIDUALLY. FEEL FREE TO TALK ABOUT THEIR PROJECTS AND ALLOW STUDENTS TO COOPERATE WTTH EACH OTHER TO CORRECT ERRORS.
Review Homework Assignment #3 •Distribute the homework planning sheets and criteria sheets.
Transparency: "Discuss what is expected for Homework assignment #3 by going over the planning and criteria sheets.
STUDENTS MUST HAND IN A COMPLETED PLANNING SHEET WITH THE PROJECT NEXT WEEK
Make sure students save at least once while in lab
Allow students to work on Homework •For the rest of the time, students work on their own homework. •Students should leave the lab with at least part of their project saved under a page named with "lastname3".
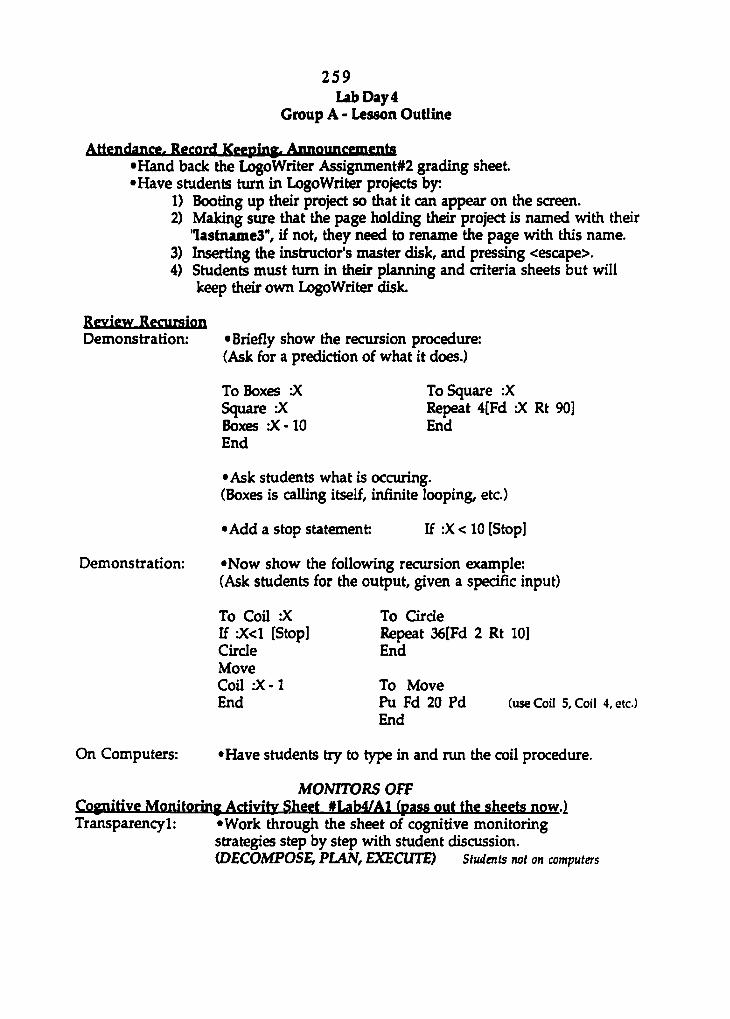
259 Lab Day 4
Group A - Lesson Outline
Attendance. Record Keeping. Announcements •Hand back the LogoWriter Assigninent#2 grading sheet. •Have students turn in LogoWriter projects by:
1) Booting up their project so that it can appear on the screen. 2) Making sure that the page holding their project is named with their
'lastnameS", if not, they need to rename the page with this name. 3) Inserting the instructor's master disk, and pressing <escape>. 4) Students must turn in their planning and criteria sheets but will
keep their own LogoWriter disk.
Review Rwmsion Demonstration: •Briefly show the recursion procedure:
(Ask for a prediction of what it does.)
To Boxes X To Square :X Square 'X Repeat 4[Fd X Rt 90] Boxes :X -10 End End
•Ask students what is occuring. (Boxes is calling itself, inHnite looping, etc.)
•Add a stop statement: If :X < 10 [Stop]
Demonstration: •Now show the following recursion example: (Ask students for the output, given a spedfîc input)
To Coil :X To Circle If X<1 [Slop] Repeat 36[Fd 2 Rt 10] Circle End Move Coil :X -1 To Move End Pu Fd 20 Pd (use Coil 5, Coil 4, etc.)
End
On Computers: «Have students try to type in and run the coil procedure.
MONITORS OFF Cognitive Monitoring Activity Sheet #Lab4/Al (pass out the sheets now.) Transparency!: •Work through the sheet of cognitive monitoring
strategies step by step with student discussion. (DECOMPOSE, PLAN, EXECUTE) Students not on computers
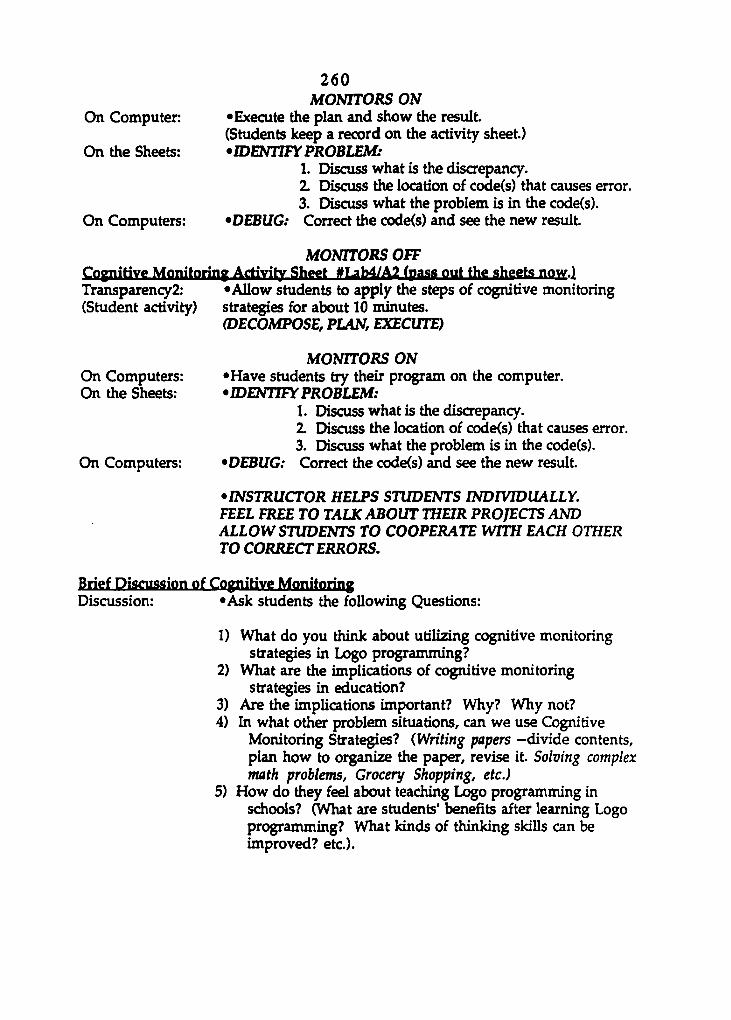
On Computer:
On the Sheets:
On Computers:
260 MONITORS ON
•Execute the plan and show the result. (Students keep a record on the activity sheet.) •IDENTIFY PROBLEM:
1. Discuss what is the discrepancy. 2. Discuss the location of code(s) that causes error. 3. Discuss what the problem is in the code(s).
•DEBUG: Correct the code<s) and see the new result.
MONITORS OFF Cognitive Monitoriny Activity Sheet #Lab4/A2 faass out the sheets now.) Transparency!: «Allow students to apply the steps of cognitive monitoring (Student activity) strategies for about 10 minutes.
(DECOMPOSE, PLAN, EXECUTE)
On Computers: On the Sheets:
On Computers:
MONTFORS ON •Have students try their program on the computer. • IDENTIFY PROBLEM:
1. Discuss what is the discrepancy. 2. Discuss the location of code(s) that causes error. 3. Discuss what the problem is in the code(s).
•DEBUG: Correct the code(s) and see the new result.
•INSTRUCTOR HELPS STUDENTS INDIVIDUALLY. FEEL FREE TO TALK ABOUT THEIR PROJECTS AND ALLOW STUDENTS TO COOPERATE WTTH EACH OTHER TO CORRECT ERRORS.
Brief Discussion of Cognitive Monitoring Discussion: •Ask students the following Questions:
1)
2)
3) 4)
5)
What do you think about utilizing cognitive monitoring strategies in Logo programming?
What are the implications of cognitive monitoring strategies in education?
Are the implications important? Why? Why not? In what other problem situations, can we use Cognitive
Monitoring Strategies? (Writing papers -divide contents, plan how to organize the paper, revise it. Solving complex math problems, Grocery Shopping, etc.)
How do they feel about teaching Logo programming in schools? (What are students' benefits after learning Logo programming? What kinds of thinking skills can be improved? etc.).
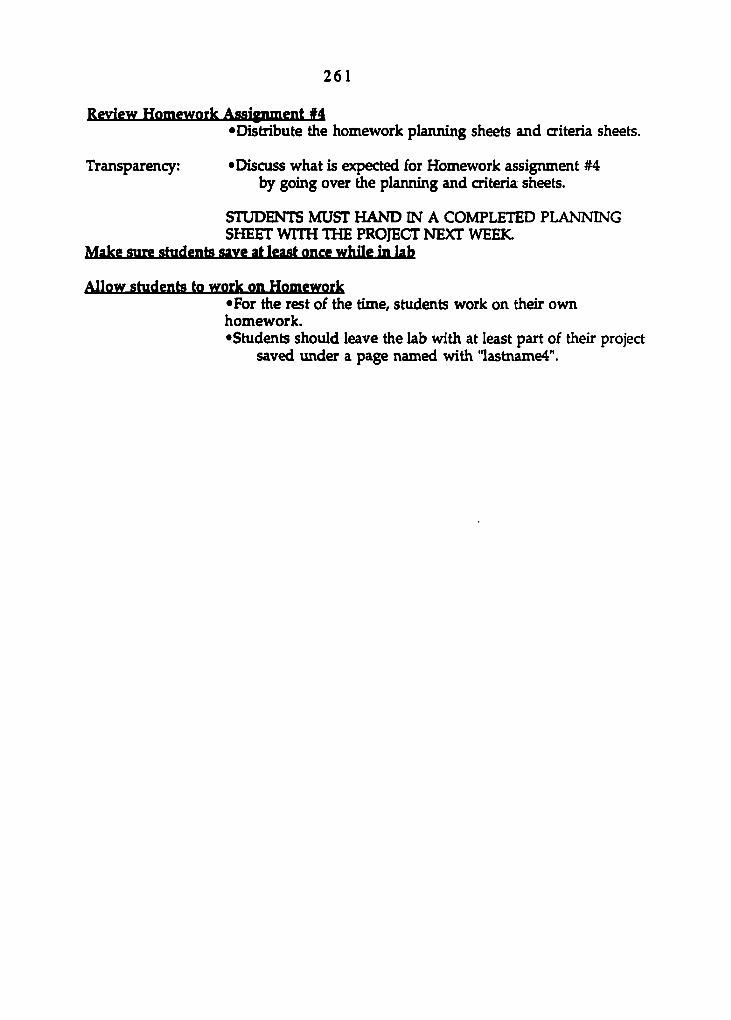
261
Review Homework Assignment #4 •Distribute the homework planning sheets and criteria sheets.
Transparency: «Discuss what is expected for Homework assignment #4 by going over the planning and criteria sheets.
STUDENTS MUST HAND IN A COMPLETED PLANNING SHEET WITH THE PROJECT NEXT WEEK
Make sure students save at least ance whfle in lab
Allow students to work on Homework •For the rest of the time, students work on their own homework. •Students should leave the lab with at least part of their project
saved under a page named with "lastname4".

262
APPENDIX I: INSTRUCTION OUTLINE FOR LABORATORY: CONTROL GROUP
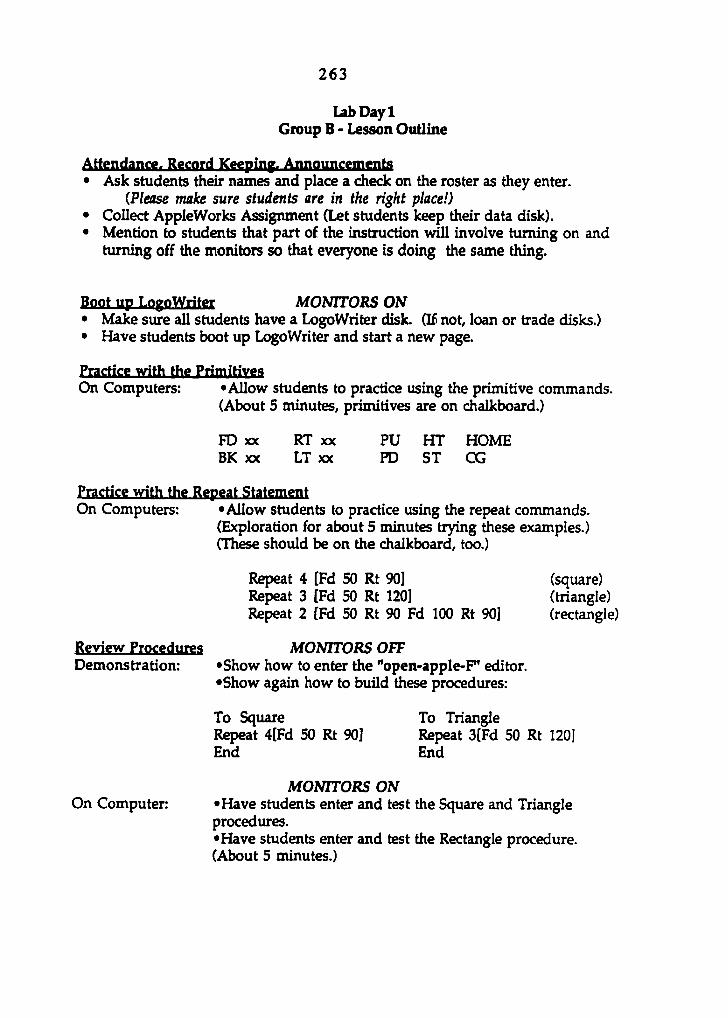
263
Lab Day 1 Group B - Lesson Outline
Attendance. Record Keeping. Announcements • Ask students their names and place a check on the roster as they enter.
(Please make sure students are in the right place!) • Collect AppleWorks Assignment (Let students keep their data disk). • Mention to students that part of the instruction will involve turning on and
turning off the monitors so that everyone is doing the same thing.
Boot up LogoWriter MONITORS ON • Make sure all students have a LogoWriter disk. (If not, loan or trade disks.) • Have students boot up LogoWriter and start a new page.
Practice with the Primitives On Computers: «Allow students to practice using the primitive commands.
(About 5 minutes, primitives are on chalkboard.)
FD XX RT XX PU HT HOME BK XX LT XX PD ST CG
Practice with the Repeat Statement On Computers: «Allow students to practice using the repeat commands.
(Exploration for about 5 minutes trying these examples.) (These should be on the chalkboard, too.)
Review Procédures Demonstration:
Repeat 4 [Fd 50 Rt 90] Repeat 3 [Fd 50 Rt 120] Repeat 2 [Fd 50 Rt 90 Fd 100 Rt 90]
MONITORS OFF •Show how to enter the "open-apple-P editor. •Show again how to build these procedures:
(square) (triangle) (rectangle)
To Square Repeat 4[Fd 50 Rt 90] End
To Triangle Repeat 3[Fd 50 Rt 120] End
On Computer: MONITORS ON
•Have students enter and test the Square and Triangle procedures. •Have students enter and test the Rectangle procedure. (About 5 minutes.)
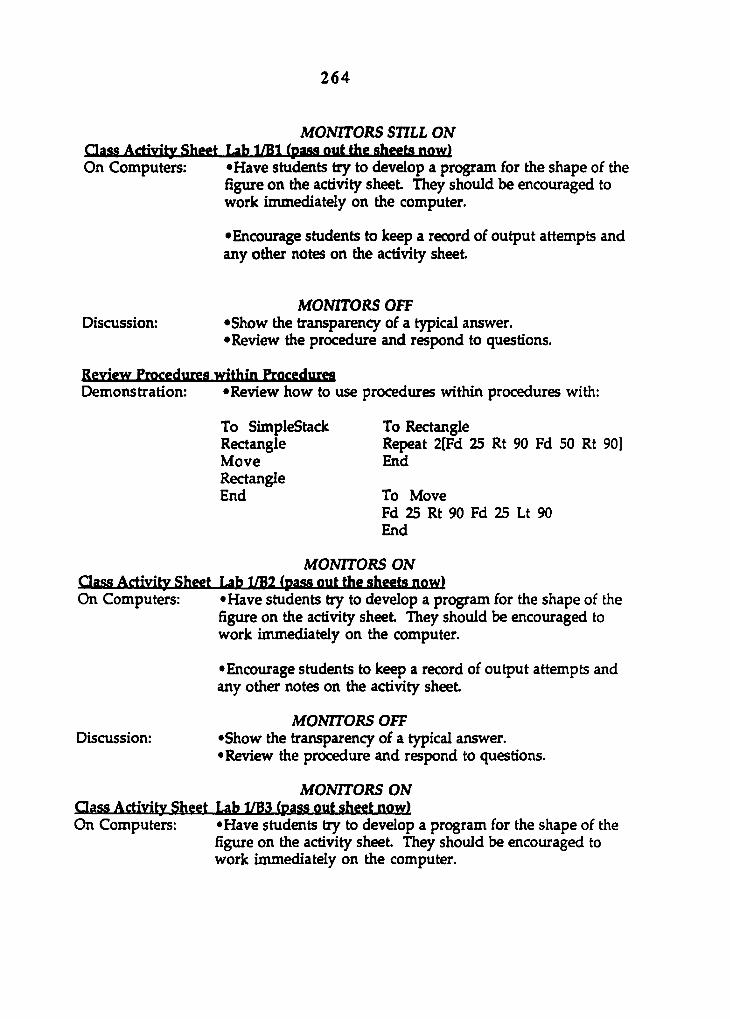
264
MONITORS STILL ON aass Acrivity Sheet Lab ITBl (pass out the sheets now) On Computers: «Have students try to develop a program for the shape of the
figure on the activity sheet They should be encouraged to work immediately on the computer.
•Encourage students to keep a record of output attempts and any other notes on the activity sheet.
MONITORS OFF Discussion: «Show the transparency of a typical answer.
•Review the procedure and respond to questions.
Review Procedures within Procedures Demonstration: «Review how to use procedures within procedures with:
To SimpleStack To Rectangle Rectangle Repeat 2[Fd 25 Rt 90 Fd 50 Rt 90] Move End Rectangle End To Move
Fd 25 Rt 90 Fd 25 Lt 90 End
MONITORS ON aass Activity Sheet Lab UBl fpass out the sheets now) On Computers: «Have students try to develop a program for the shape of the
figure on the activity sheet They should be encouraged to work immediately on the computer.
•Encourage students to keep a record of output attempts and any other notes on the activity sheet
Discussion: MONITORS OFF
•Show the transparency of a typical answer. •Review the procedure and respond to questions.
MONITORS ON aass Activity Sheet Lab 1/B3 (pass out sheet now) On Computers: •Have students try to develop a program for the shape of the
figure on the activity sheet They should be encouraged to work immediately on the computer.

265 •Encourage students to keep a record of output attempts and any other notes on the activity sheet
MONITORS OFF Discussion: «Show the transparency of a typical answer.
•Review the procedure and respond to questions.
MONITORS STILL OFF Review Homework Awigiungnt #1
•Make sure that students have a homework planning sheet. •Make sure that students have a homework grading sheet.
(They will hand in disk, planning sheet, & grading sheet) •Discuss what needs to be handed in for a grade.
Transparency: «Show an example of Homework Assignment #1 on transparency.
MONITORS ON •Encourage students to start their assignment by working on the computer immediately. They can write out their planning sheets at any time; however, must be completed as part of the overall assignment.
•For the rest of the time, students work on their own homework. •To save, use NP "lastname 1, and press <escape>.
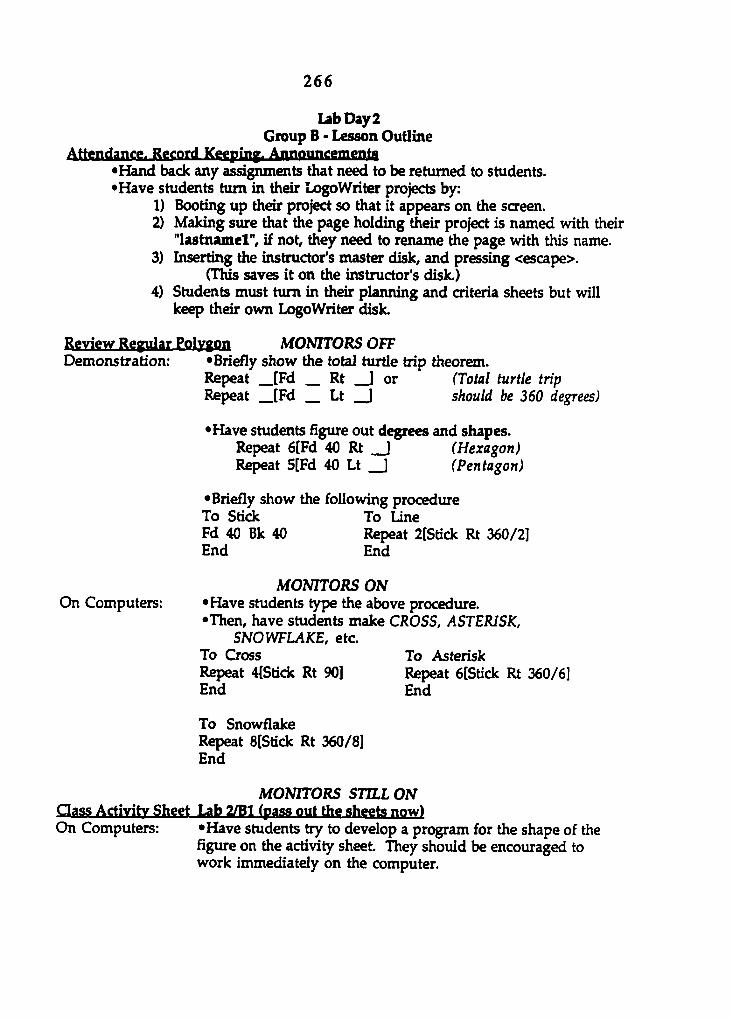
266
Lab Day 2 Group B - Lesson Outline
Attendance. Record Keeping. Announcemenfai •Hand back any assignments that need to be returned to students. •Have students turn in their LogoWriter projects by:
1) Booting up their project so that it appears on the screen. 2) Making sure that the page holding their project is named with their
"lastnamel", if not, they need to rename the page with this name. 3) Inserting the instructor's master disk, and pressing <escape>.
(This saves it on the instructor's disk.) 4) Students must turn in their planning and criteria sheets but will
keep their own LogoWriter disk.
Review Regular Polygon MONITORS OFF Demonstration: • Briefly show the total turtle trip theorem.
Repeat [Fd Rt ] or (Total turtle trip Repeat [Fd Lt ] should be 360 degrees)
•Have students figure out degrees and shapes. Repeat 6[Fd 40 Rt ] (Hexagon) Re^at 5[Fd 40 Lt ] (Pentagon)
•Briefly show the following procedure To Stick To Line Fd 40 Bk 40 Repeat 2(Stick Rt 360/2] End End
On Computers: MONITORS ON
•Have students type the above procedure. •Then, have students make CROSS, ASTERISK,
SNOWFLAKE, etc. To Cross To Asterisk Repeat 4(Stick Rt 90] Repeat 6[Stick Rt 360/6] End End
To Snowflake Repeat 8[Stick Rt 360/8] End
MONITORS STILL ON Qass Activity Sheet Lab 2/Bl (pass out the sheets now) On Computers: «Have students try to develop a program for the shape of the
figure on the activity sheet They should be encouraged to work immediately on the computer.
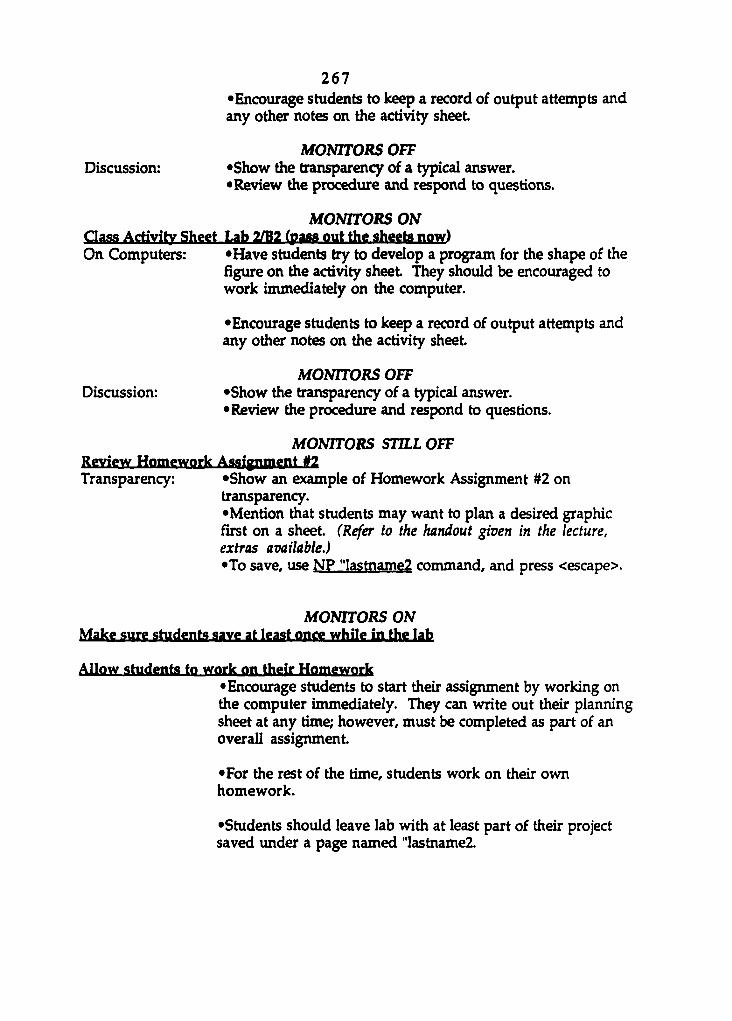
267 •Encourage students to keep a record of output attempts and any other notes on the activity sheet.
MONITORS OFF Discussion: «Show the transparency of a typical answer.
•Review the procedure and respond to questions.
MONITORS ON Qass Activity Sheet Lab 2/B2 (pass out the sheets now) On Computers: «Have students try to develop a program for the shape of the
figure on the activity sheet They should be encouraged to work immediately on the computer.
•Encourage students to keep a record of output attempts and any other notes on the activity sheet.
MONITORS OFF Discussion: •Show the transparency of a typical answer.
•Review the procedure and respond to questions.
MONITORS STILL OFF Review Homework Assignment #2 Transparency: «Show an example of Homework Assignment #2 on
transparency. •Mention that students may want to plan a desired graphic first on a sheet. (Refer to the handout given in the lecture, extras available.) •To save, use NP "lastname2 command, and press <escape>.
MONITORS ON Make sure student* save at least once while In the lab
Allow students to work on their Homework •Encourage students to start their assignment by working on the computer immediately. They can write out their planning sheet at any time; however, must be completed as part of an overall assignment.
•For the rest of the time, students work on their own homework.
•Students should leave lab with at least part of their project saved under a page named "lastnameZ
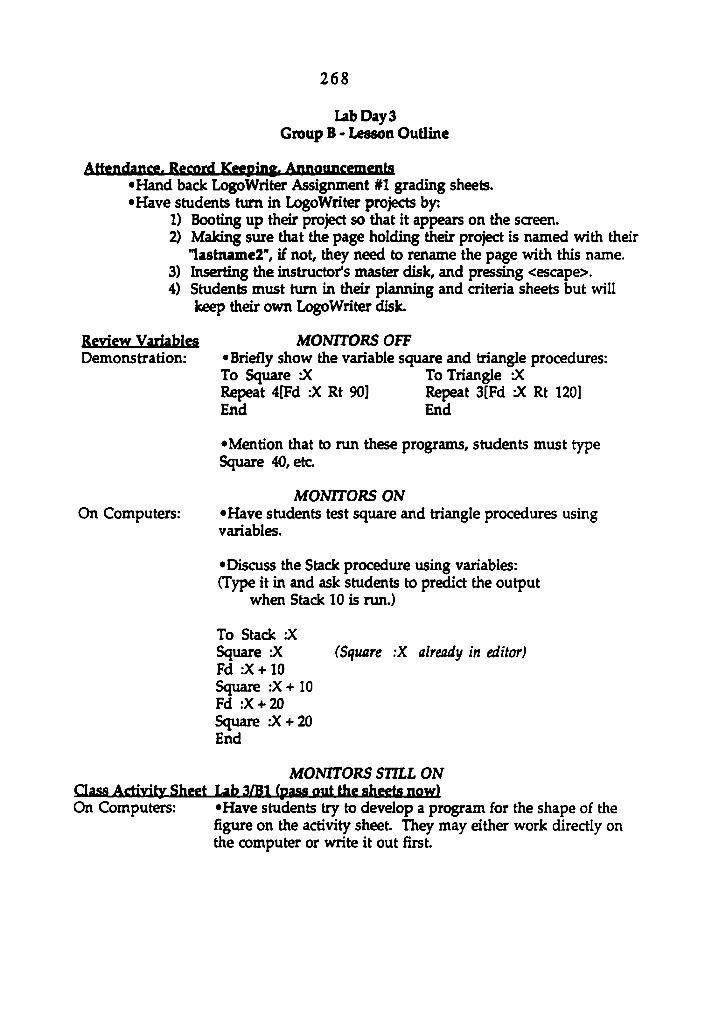
268
Lab Day 3 Group B - Lesson Outline
Attendangg. Rggnrd Kggpiny. Annoimcemenfa» •Hand back Logo Writer Assignment #1 grading sheets. •Have students turn in LogoWriter projects by:
1) Booting up their project so that it appears on the screen. 2) Making sure that the page holding their project is named with their
'lastname2", if not, they need to rename the page with this name. 3) Inserting the instructor's master disk, and pressing <escape>. 4) Students must turn in their planning and criteria sheets but will
keep their own LogoWriter disk.
Review Variables MONITORS OFF Demonstration: •Briefly show the variable square and triangle procedures:
To Square :X To Triangle -X Repeat 4[Fd :X Rt 90] Repeat 3(Fd :X Rt 120] End End
•Mention that to run these programs, students must type Square 40, etc
MONITORS ON On Computers: «Have students test square and triangle procedures using
variables.
•Discuss the Stack procedure using variables: (Type it in and ask students to predict the output
when Stack 10 is run.)
To Stack 'X Square X (Square :X already in editor) Fd :X +10 Square :X + 10 Fd :X + 20 Square :X + 20 End
MONITORS STILL ON aass Activity Sheet Lab 3/Bl (pass out the sheete now) On Computers: •Have students try to develop a program for the shape of the
figure on the activity sheet. They may either work directly on the computer or write it out first.
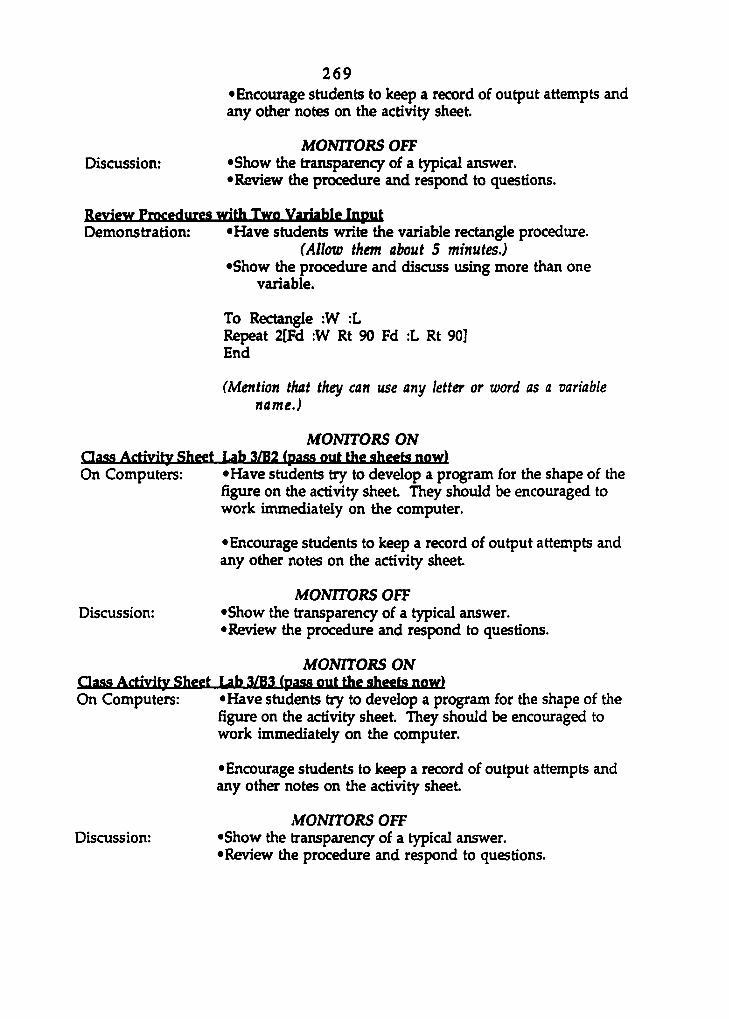
269 •Encourage students to keep a record of output attempts and any other notes on the activity sheet
MONITORS OFF Discussion: «Show the transparency of a typical answer.
•Review the procedure and respond to questions.
Review Procedures with Two Variable Input Demonstration: «Have students write the variable rectangle procedure.
(Allow them about 5 minutes.) •Show the procedure and discuss using more than one
variable.
To Rectangle :W :L Repeat 2[Fd :W Rt 90 Fd :L Rt 90] End
(Mention that they can use any letter or word as a variable name.)
MONITORS ON aass Activity Sheet Lab 3/B2 (pass out the sheets now) On Computers: •Have students try to develop a program for the shape of the
figure on the activity sheet They should be encouraged to work immediately on the computer.
•Encourage students to keep a record of output attempts and any other notes on the activity sheet
Discussion: MONITORS OFF
•Show the transparency of a typical answer. •Review the procedure and respond to questions.
MONTTORS ON Qass Activity Sheet Lab 3/B3 (pass out the sheets now) On Computers: •Have students try to develop a program for the shape of the
figure on the activity sheet They should be encouraged to work immediately on the computer.
•Encourage students to keep a record of output attempts and any other notes on the activity sheet
MONTTORS OFF Discussion: •Show the transparency of a typical answer.
•Review the procedure and respond to questions.
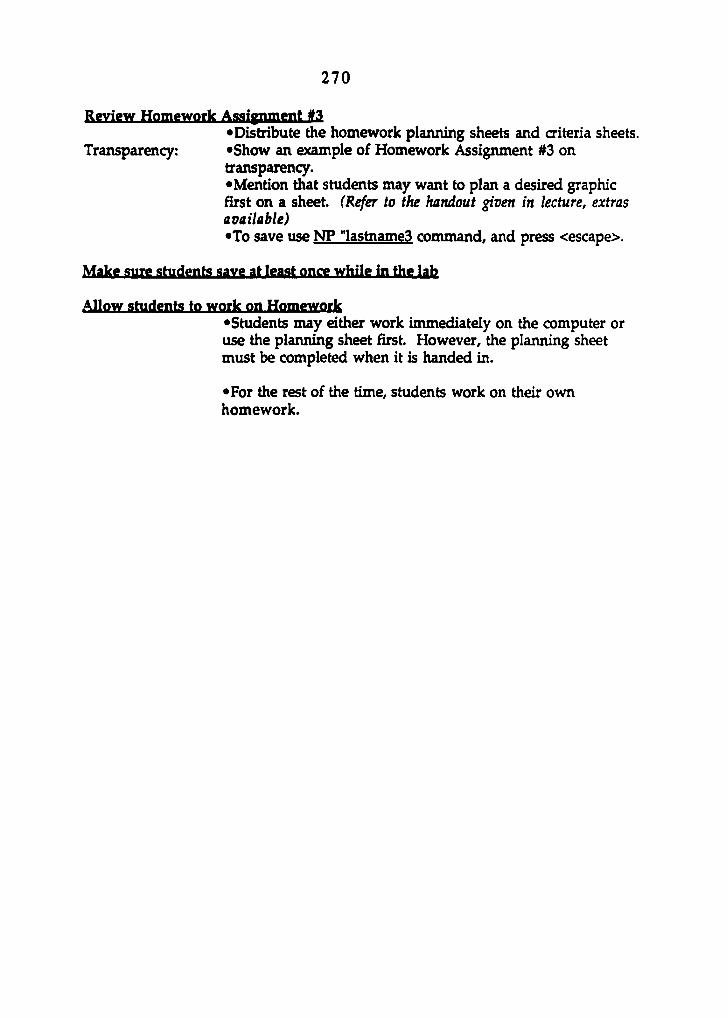
270
Review Homgwork Assignment #3 •Distribute the homework planning sheets and criteria sheets.
Transparency: «Show an example of Homework Assignment #3 on transparency. •Mention that students may want to plan a desired graphic first on a sheet. (Refer to the handout given in lecture, extras available) •To save use NP "lastnameS command, and press <escape>.
Make sure students save at least once while in the lab
Allow students to work on Homework •Students may either work immediately on the computer or use the planning sheet first. However, the planning sheet must be completed when it is handed in.
•For the rest of the time, students work on their own homework.
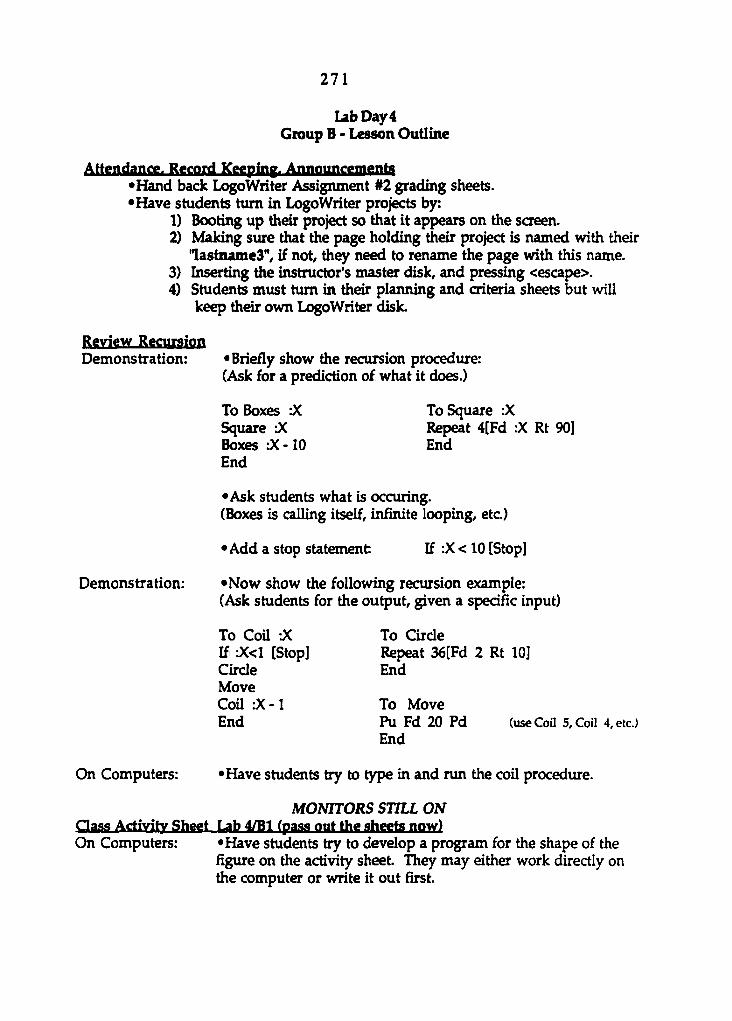
271
LabDay4 Group B - Lesson Outline
Attgndangg, Record Keeping. Announcements •Hand back Logo Writer Assigiunent #2 grading sheets. •Have students turn in LogoWriter projects by:
1) Booting up their project so that it appears on the screen. 2) Making sure that the page holding their project is named with their
'lastnameS", if not, they need to rename the page with this name. 3} Inserting the instructor's master disk, and pressing <escape>. 4) Students must turn in their planning and criteria sheets but will
keep their own LogoWriter disk.
Review Recursion Demonstration: «Briefly show the recursion procedure:
(Ask for a prediction of what it does.)
To Boxes :X To Square :X Square Repeat 4[Fd :X Rt 90] Boxes :X -10 End End
•Ask students what is occuring. (Boxes is calling itself, infinite looping, etc)
•Add a stop statement If :X < 10 [Stop]
Demonstration: •Now show the following recursion example: (Ask students for the output, given a specific input)
To Coil 'X To Circle If •X<1 [Stop] Repeat 36[Fd 2 Rt 10] Circle End Move Coil :X -1 To Move End Pu Fd 20 Pd (use Coil 5, Coil 4, etc.)
End
On Computers: •Have students try to type in and run the coil procedure.
MONITORS STILL ON aass Activity Sheet Lab 4/Bl fpam out the sheets now) On Computers: •Have students try to develop a program for the shape of the
figure on the activity sheet. They may either work directly on the computer or write it out first.

272
•Encourage students to keep a record of output attempts and any other notes on the activity sheet.
MONITORS OFF Discussion: «Show the transparency of a typical answer.
•Review the procedure and respond to questions.
MomroRS ON aasa Activity Shggt Lab 4/B2 (pam out the sheets now) On Computers: «Have students try to develop a program for the shape of the
figure on the activity sheet They may either work directly on the computer or write it out first.
•Encourage students to keep a record of output attempts and any other notes on the activity sheet.
MOmrORS OFF Discussion: "Show the transparency of a typical answer.
•Review the procedure and respond to questions.
Brief Discussion of Logo Discussion: •Ask students the following Questions:
1) What do you think about a self-discovery learning approach in Logo programming?
2) What are the implications of a self-discovery learning approach in education?
3) Are the implications important? Why? Why not? 4) How could you use LogoWriter in the classroom?
(contests, projects, etc.) 5) Does using LogoWriter in pairs help or hurt students? 6) How old should students be to begin Logo programming?
(actually any age, etc)
Review Homework Assignment #4
•Distribute the homework planning sheets and criteria sheets. Transparency: •Show an example of Homework Assignment #4 on
transparency. •Mention that students may want to plan a desired graphic first on a sheet. (Refer to the handout given in lecture, extras available.) •To save, use NP "lastname4 command, and press <escape>.
Make sme students save at least once while in lab

273
Allow shidt'nts to work on Homework •Students may either work immediately on the computer or use the planning sheet first. However, the planning sheet must be completed when it is handed in. •For the rest of the time, students work on their own homework.

274
APPENDIX J: STUDENT ACTIVITY SHEETS FOR LECTURE: EXPERIMENTAL GROUP
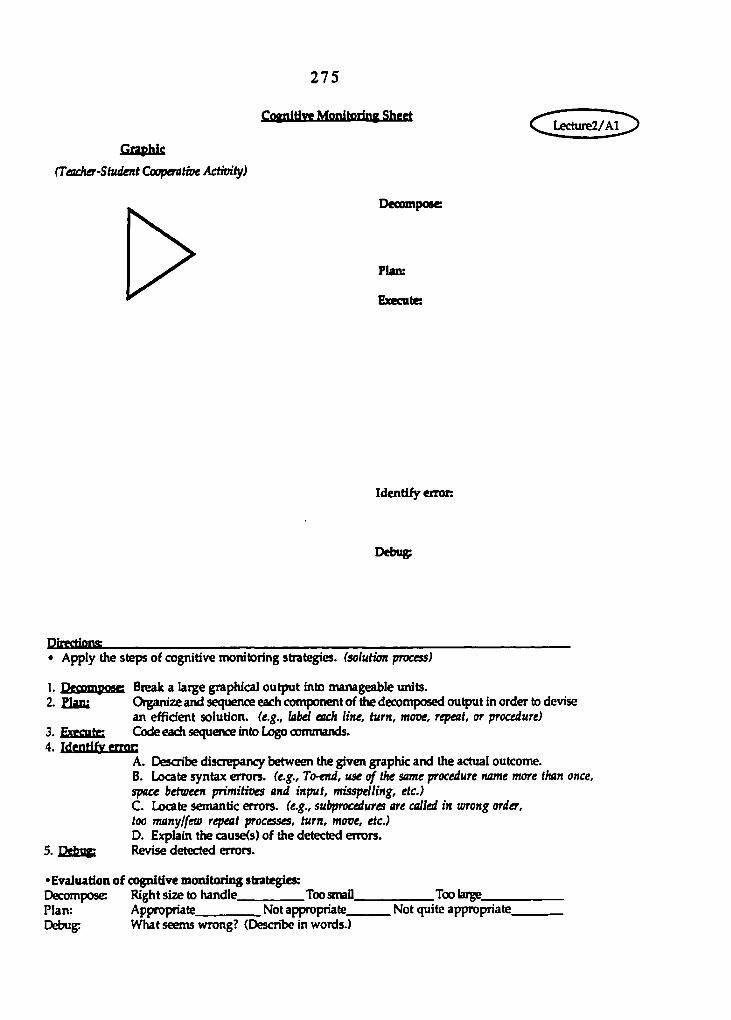
275
Cognitive Monitoring Sheet
COBhk (Teacher-Student Coopentioe AcHvify)
Decompose
Plan:
Execute:
Identify eiron
Debug:
Directions: • Apply the steps of cognitive monitoring strategies, (solution process)
1. Décomposé Break a laige graphical output into manageable units. 2. Plan; Otganize and sequence each component of the decomposed output in order to devise
an efficient solution, (e.g., label each line, turn, move, repeat, or procedure) 3. Execute; Code each sequence into Logo commands.
4. Identify groc A. Describe discrepancy between the given graphic and the actual outcome. B. Locate syntax errors. (e.g., To-tnd, use of the same procedure name more than once, space between primitives and input, misspelling, etc.) C Locate semantic errors. (e.g., subprocedures are called in wrong order, too manylfew repeat processes, turn, move, etc.) D. Explain the cause<s) of the detected errors.
5. TVhugT Revise detected errors.
•Evaluation of cognitive monitoring strategies: Decompose: Right size to handle Too small Too laige Plan: Appropriate Not appropriate Not quite appropriate Debug: What seems wrong? (Describe in words.)
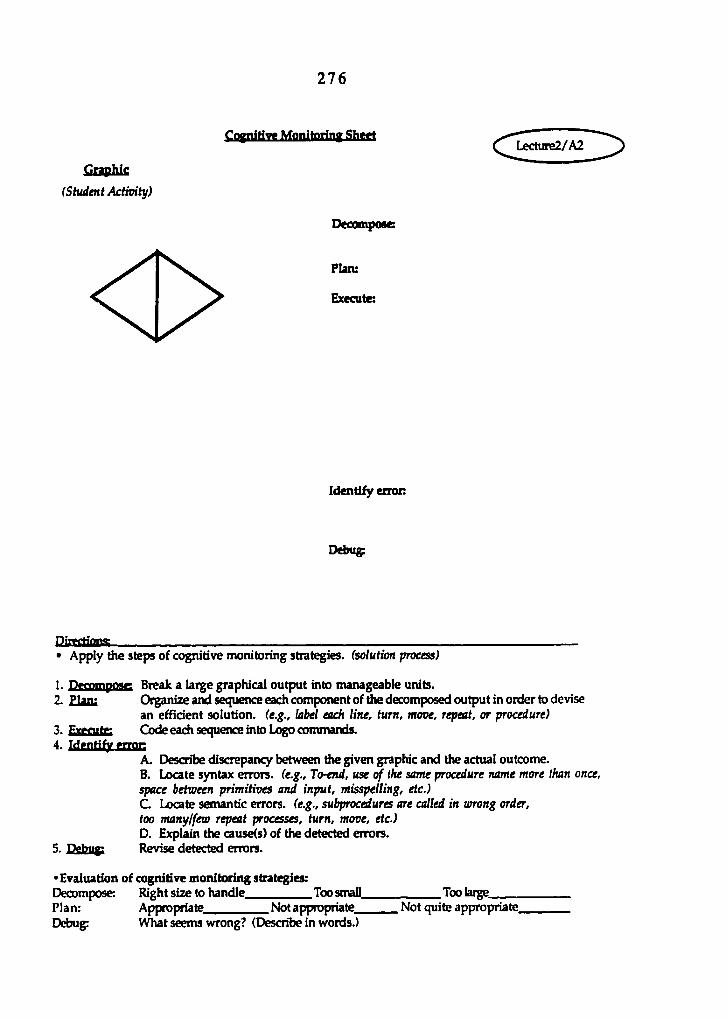
276
CopiiHve Monitoring Sheet
Graphic
(Student Actioity)
Decompose:
Plan:
Execute:
^^Lecture2/A2
Identify eiron
Debug:
PirfctifliM; • Apply the steps of cognitive monitoring strategies, (solution process)
1. rVfnmposg Break a large graphical output into manageable units. 2. Plan; Organize and sequence each component of the decomposed output in order to devise
an efOdent solution, (e.g., label each line, turn, move, repeat, or procedure) 3. EaoMlte Code each sequence into Logo commands. 4. Tdenrify error
A. Describe discrepancy between the given graphic and the actual outcome. B. Locate syntax errors. (e.g., To-end, use of the same procedure name more than once, space between primitives and input, misspelling, etc.) C Locate semantic errors. (e.g., subprocedures are called in wrong order, loo manylfew repeat processes, turn, move, etc.) D. Explain the cause(s) of the detected errors.
5. TVhup Revise detected errors.
• Evaluation of cognitive monitoring strategies: Decompose: Right size to handle Too small Too laige Plan: Appropriate Not appropriate Not quite appropriate Debug: What seems wrong? (Describe in words.)
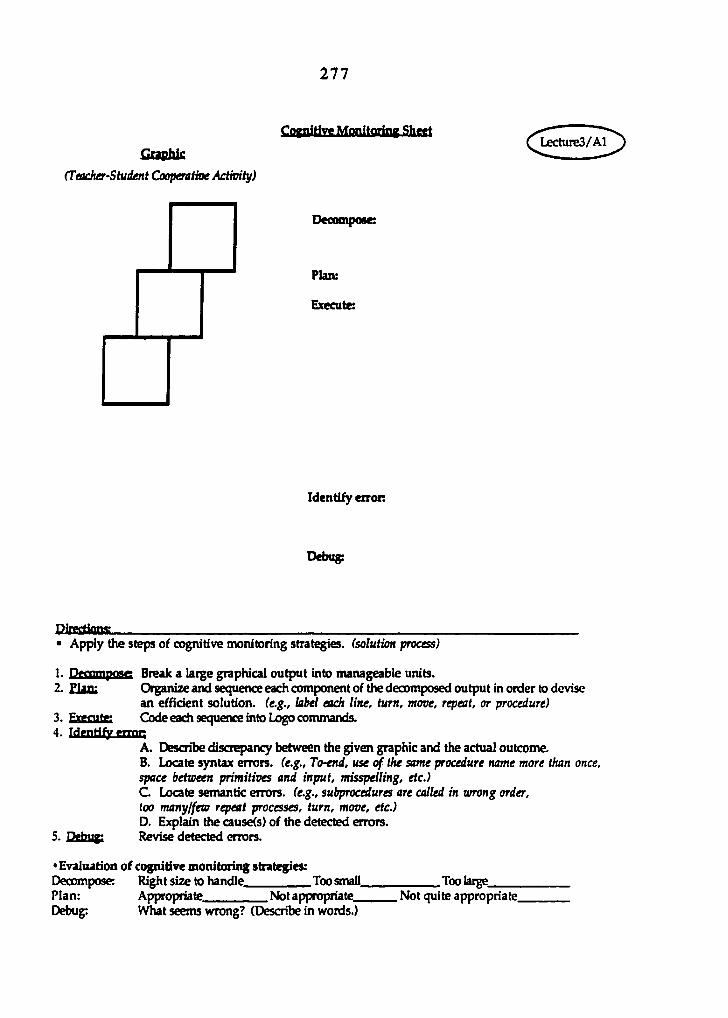
I l l
CognitiYC Monitoring Shwt
Graphic
(Ttacher-Student Coopentioe Activity)
Lectures/A1
Dccompoac:
Plan:
Execute:
Identify eiron
Debug:
PirKtiflnS • Apply the steps of cognitive monitoring strategies, (solution process)
1. Dffompmw: Break a large graphical output into manageable units. 2. Plan; Organize and sequence each component of the decomposed output in order to devise
an efficient solution. (e.g., label each line, turn, move, repeat, or procedure) 3. ExegntK Code each sequence into Logo commands. 4. Identify BiBC
A. Describe discrepancy between the given graphic and the actual outcome. B. Locate syntax errors. (e.g., To-end, use of the same procedure name more than once, space between primitives and input, misspelling, etc.) C Locate semantic errors. (e.g., subprocedures are called in rorong order, too manylfea repeat processes, turn, move, etc.) D. Explain the cause(s) of the detected errors.
5. T>htip Revise detected errors.
• Evaluation of cognitive monitoring strategies: Decompose Right size to handle Too small Too large Plan: Appropriate Not appropriate Not quite appropriate Debug: What seems wrong? (Describe in words.)
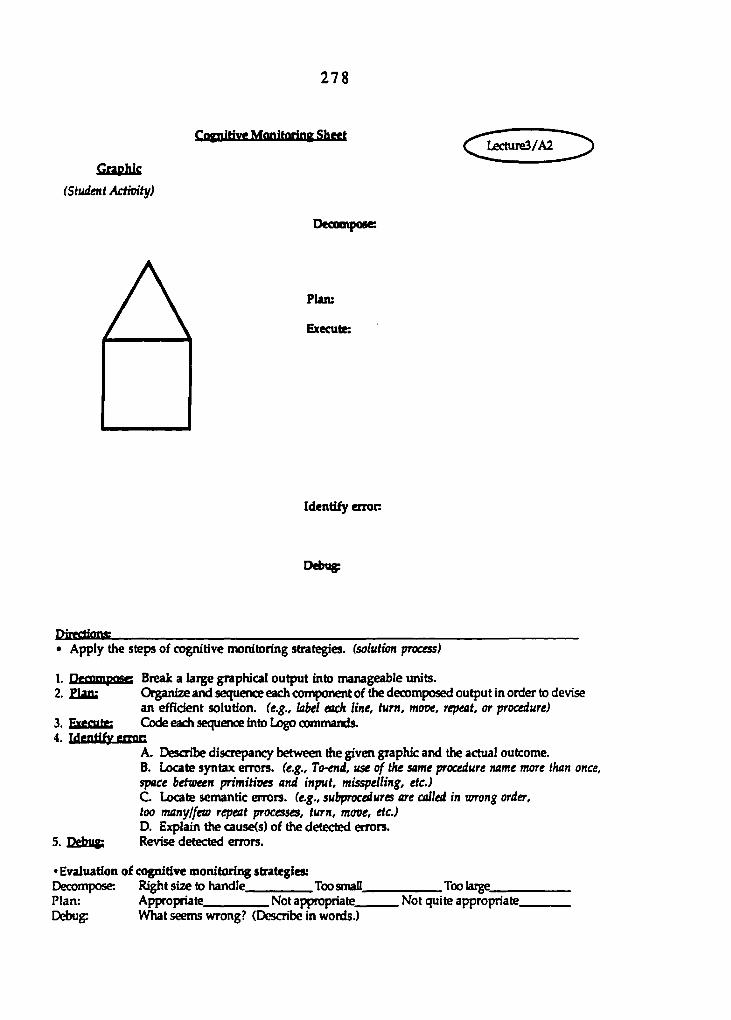
2 7 8
Copdtive Monifairiny Sheet
CoBhic (Student Activity)
^^Lgctute3/A2
DccompoM:
Plan:
Execute:
Identify erroc
Debug:
• Apply the steps of cognitive monitoring strategies, (solution process)
1. Dccompaac Break a laige graphical output into manageable units. 2. Plan; Organize and sequence each component of the decomposed output in order to devise
an efOdent solution. (e.g., label each line, turn, move, repeat, or procedure) 3. Fwoite Code each sequence into Logo commands. 4. Identify crmn
A. Describe discrepancy between the given graphic and the actual outcome. B. Locate syntax errors, (e.g., To-end, use of the same procedure name more than once, space between primitives and input, misspelling, etc.) C Locate semantic errors. (e.g., subprocedures are called in wrong order, too manylfew repeat processes, turn, move, etc.) D. Explain the cause<s) of the detected errors.
5. nphiiy Revise detected errors.
• Evaluation of cognitive monitoring strategies: Decompose: Right size to handle Too small Too large Plan: Appropriate Not appropriate Not quite appropriate Debug: What seems wrong? (Describe in words.)
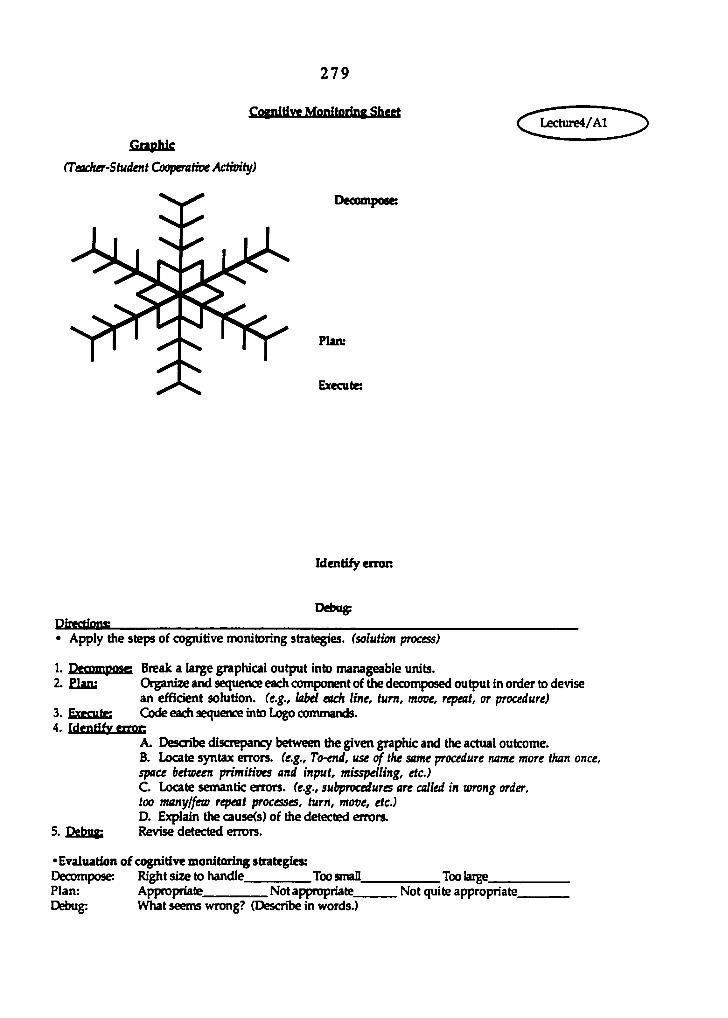
279
CognitiYC Monitoring Sheet
Graphic
(Teacher-Student Cooperatioe Activity)
^Tecture4/Al
Dccod^MMC:
Identify erron
Debug
PirectlQM; • Apply the steps of cognitive monitoring strategies, (solution process)
1. Decompose Break a large graphical output into manageable units. 2. Plam Organize and sequence each component of the decomposed output in order to devise
an efOdent solution, (e.g., label each line, turn, move, repeat, or procedure) 3. Execute; Code each sequence into Logo commands. 4. Identify eiron
A. Describe discrepancy between the given graphic and the actual outcome. B. Locate syntax errors. (e.g., To-end, use of t^ same procedure name more than once, space between primitives and input, misspelling, etc.) C Locate semantic errors. (e.g., subprocedures are called in ivrong order, too manylfew repeat processes, turn, move, etc.) D. Explain the cause(s) of the detected errors.
5. rvhiip Revise detected errors.
• Evaluation of cognitive monitoring strategies: Decompose: Right size to handle Too small Too laige Plan: Appropriate Not appropriate Not quite appropriate Debug: What seems wrong? (Describe in words.)
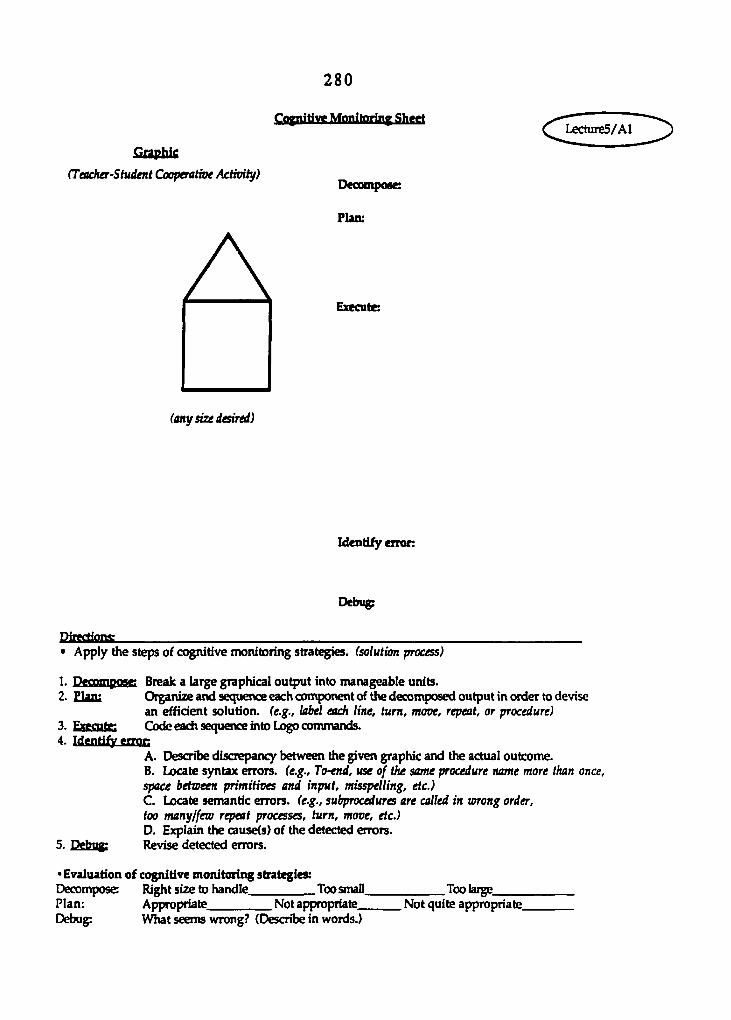
2 8 0
Graphie
(Teacher-Student Cooperatioe AcHoity)
Copdtive Monitoriny Sheet
DecompoM:
Plan:
^^Lecture5/Al
Execute:
(any sae desired)
Identify oron
Debug
EHrecaona; • Apply the steps of cognitive monitoring strategies, (solution process)
1. Decompose: Break a large graphical output into manageable units. 2. Plan: Otganize and sequence each component of the decomposed output in order to devise
an efficient solution. (e.g.. labd each line, turn, move, repeat, or procedure) 3. Execute; Code each sequence into Logo commands. 4. Mcntifr etren
A. Describe discrepancy between the given graphic and the actual outcome. B. Locate syntax errors. (e.g., To-end, use of the same procedure name more than once, space between primitives and input, misspelling, etc.) C Locate semantic errors. (e.g., subprocedures are called in wrong order. too manylfew repeat processes, turn, move, etc.) D. Explain the causes) of the detected errors.
5. n-kip Revise detected errors.
• Evaluation of cognitive monitoring strategies: Decompose Right size to handle Too small Too large Plan: Appropriate Not appropriate Not quite appropriate Debug: What seems wrong? (Describe in words.)
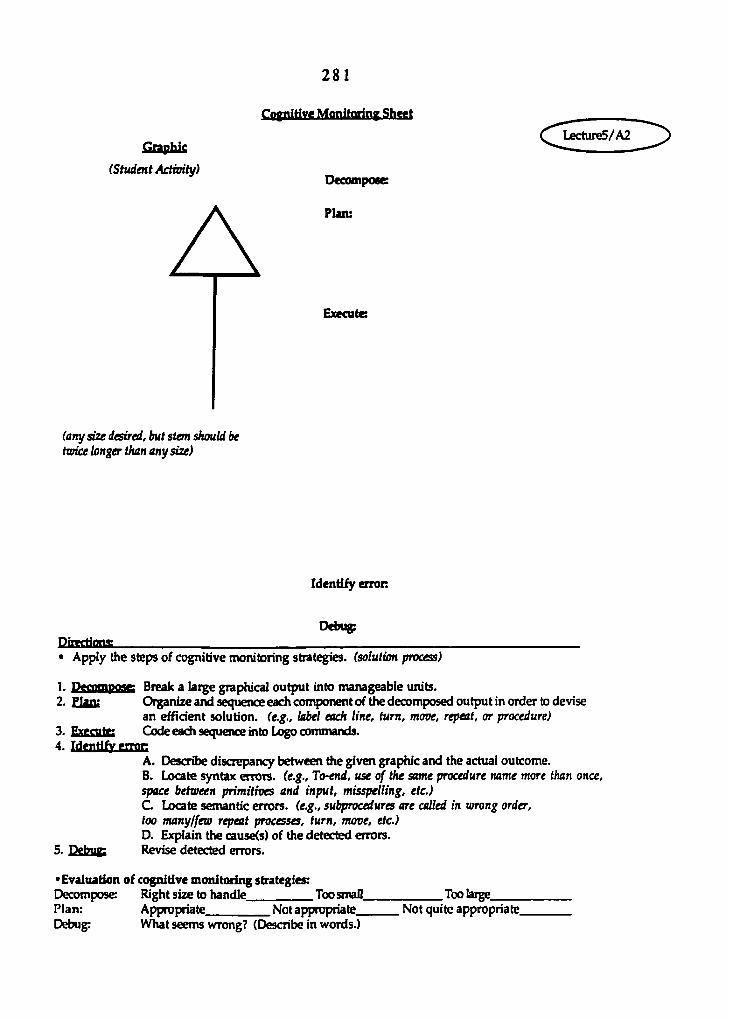
281
Graphic
(Student Activity)
Cnpdtive Monitoring Sheet
Decompose
Plan:
^Lecture5/A2
Execute
(any size desired, but stem should be twice longer than any size)
Directions:
Identify error
Debug:
• Apply the steps of cognitive monitoring strategies, (solution process)
1. Decompose: Break a laige graphical output into manageable units. 2. Plan: Organize and sequence each component of the decomposed output in order to devise
an efficient solution. (e.g., label each line, turn, move, repeat, or procedure) 3. Execute: Code each sequence into Logo commands. 4. Identify aioc
A. Describe discrepancy between the given graphic and the actual outcome. B. Locate syntax errors. (e.g., To-emf, use of t^ same procedure name more than once, space between primitives and input, misspelling, etc.) C. Locate semantic errors. (e.g., subprocedures are called in wrong order, loo manyffew repeat processes, turn, move, etc.) D. Explain the cause(s) of the detected errors.
5. ggbug Revise detected errors.
•Evaluation of cognitive monitoring strategies: Decompose Right size to handle Too small Too iaige Plan: Appropriate Not appropriate Not quite appropriate Debug: VVhat seems wrong? (Describe in words.)
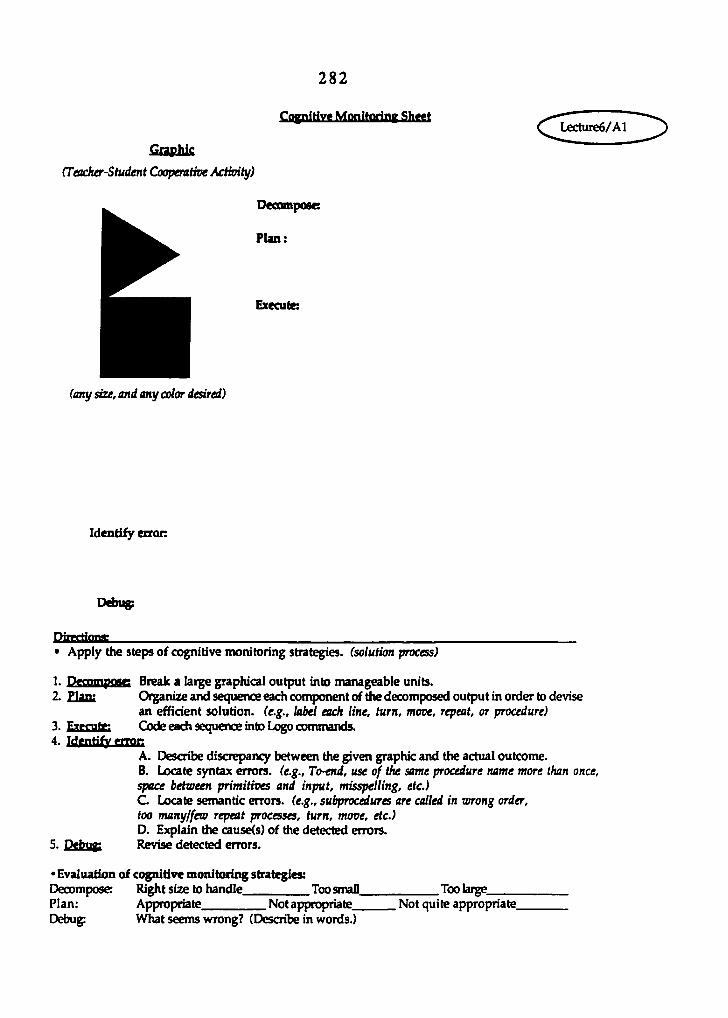
282
Cognitive Monitarinf Sheet
Graphic
(Ttocher-Student Coopentioe Activity)
^^Lecture6/Al
Decompose
Plan:
Execute:
(any size, and any color desired)
Identify erron
Debug;
E>iiccttons • Apply the steps of cognitive monitoring strategies, (solution process)
1. Décomposé: Break a lai^e graphical output into manageable units. Z Plan; Organize and sequence each component of the decomposed output in order to devise
an efficient solution. (e.g., label auh line, turn, move, repeat, or procedure) 3. Execute; Code each sequence into Logo commands. 4. Identify «TOC
A. Describe discrepancy between the given graphic and the actual outcome. B. Locate syntax errors. (e.g., To-end, use of the same procedure name more than once, space between primitives and input, misspelling, etc.) C Locate semantic errors. (e.g., subprocedures are called in virong order, too manylfew repeat processes, turn, move, etc.) D. Explain the causes) of the detected errors.
5. Hptwy Revise detected errors.
« Evaluation of cognitive monitoring strategies: Decompose Right size to handle Too small Too large Plan: Appropriate Not appropriate Not quite appropriate Debug: What seems wrong? (Describe in words.)

Graphic
(Teacher-Student Cooperatioe Actioity)
2 8 3
Coynitivg Monitoring Sheet
Decompose
Plan:
^^Lecture7/Al
Execute:
(using recursion)
Identify error
Debug;
Pimtionai • Apply the steps of cognitive monitoring strategies, (solution process)
1. Decompose Break a laige graphical output into manageable units. 2. Plan; Organize and sequence each component of the decomposed output in order to devise
an efficient solution. (e.g,, label each line, turn, move, repeal, or procedure) 3. Execute; Gxle each sequence into Logo commands. 4. MmtiiycgQC
A. Describe discrepancy between the given graphic and the actual outcome. B. Locate syntax errors. (e.g., To-end, use of the same procedure name more than once, space between primitives and input, misspelling, etc.) C Locate semantic errors. (e.g,, subprocedures are called in wrong order, too manylfea repeat processes, turn, move, etc.) D. Explain the causeCs) of the detected errors.
5. Debug; Revise detected errors.
• Evaluation of cognitive monitoring strategies: Decompose Right size to handle ToosmaD Toolaige Plan: Appropriate Not appropriate Not quite appropriate Debug: What seems wrong? (Describe in words.)
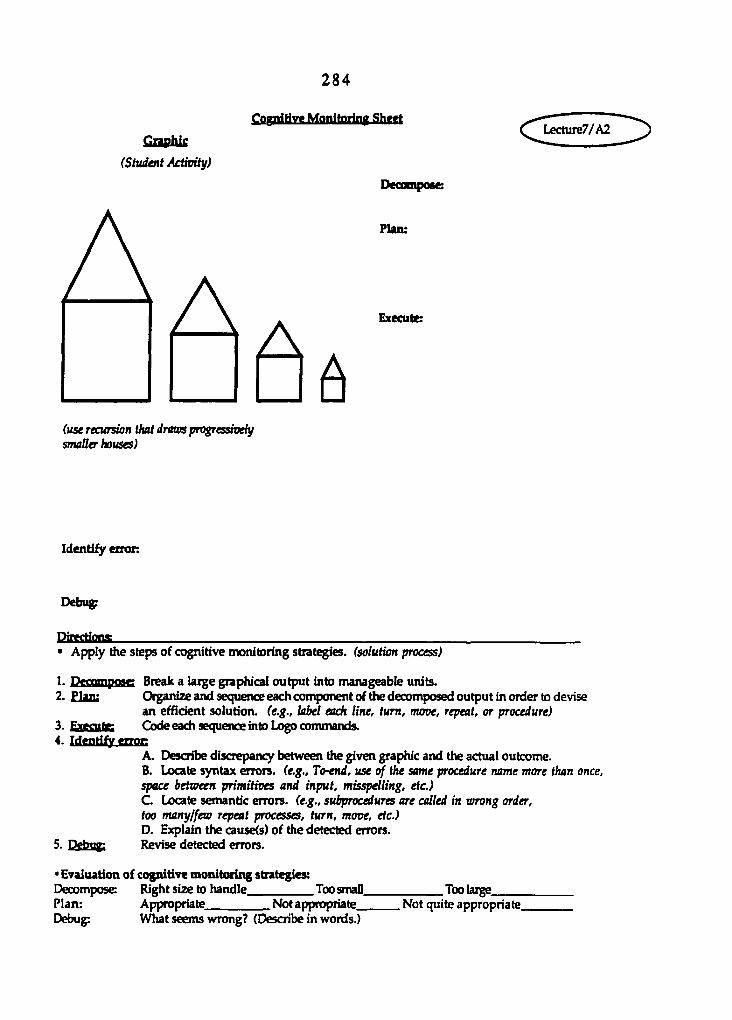
284
CognitiYC MflnitQring Sheet
Graphic
(Student Activity)
^^Lecture7/A2
DcoompoM:
Plan:
Execute:
(use recursion thai drmvs progressioehf smaller houses)
Identify enon
Debug:
Pirectjong • Apply the steps of cognitive monitoring strategies, (solution process)
1. PwawnpoM: Break a large graphical output into manageable units. 2. Plan; Organize and sequence each component of the decomposed output in order to devise
an efficient solution. (e.g., label each line, turn, move, repeat, or procedure) 3. Execute: Code each sequence into Logo commands. 4. Identify enac
A. Describe discrepancy between the given graphic and the actual outcome. B. Locate syntax errors. (e.g., To-end, use the same procedure name more than once, space between primitives and input, misspelling, etc.) C Locate semantic errors. (e.g., subprocedures are called in lorong order, too manylfew repeat processes, turn, move, etc.) D. Explain the cause<s) of the detected errors.
5. n-hiig? Revise detected errors.
• Evaluation of cognitive monitoring strategies: Decompose: Right size to handle Too small Too lai^ Plan: Appropriate Not appropriate Not quite appropriate Debug: What seems wrong? (Describe in words.)

285
Cognitive Manlteriiiy She#* ^Tecture8/Al
Graphic
(Tmcher-Sludent Cooperative Actwibf)
Deoooipose:
(uâng recursion)
Identify erroR
Debug:
PiTKtkma: • Apply the steps of cognitive monitoring strategies, (solution process)
1. rvcnmpft«>f Break a large graphical output into manageable units. 2. Plan; Organize and sequence each component of the decomposed output in order to devise
an efficient solution. (e.g., label each line, turn, move, repeat, or procedure) 3. E»gnte Code each sequence into Logo commands. 4. Tdwirifyrrmr;
A. Describe discrepancy between the given graphic and the actual outcome. B. Locate syntax errors. (e.g., To-end, use ^ t^ same procedure name more than once, space between primitives and input, misspelling, etc.) C Locate semantic errors. (e.g., subprocedures are called in wrong order, too manylfea repeat processes, turn, move, etc.) D. Explain the cause(s) of the detected errors.
5. TVhnp Revise detected errors.
* Evaluation of cognitive monitoring strategies: Decompose Right size to handle Too small Too large Plan: Appropriate Not appropriate Not quite appropriate Debug; What seems wrong? (Describe in words.)

286
APPENDIX K: STLTOENT ACnVTTY SHEETS FOR LECTURE: CONTROL GROUP
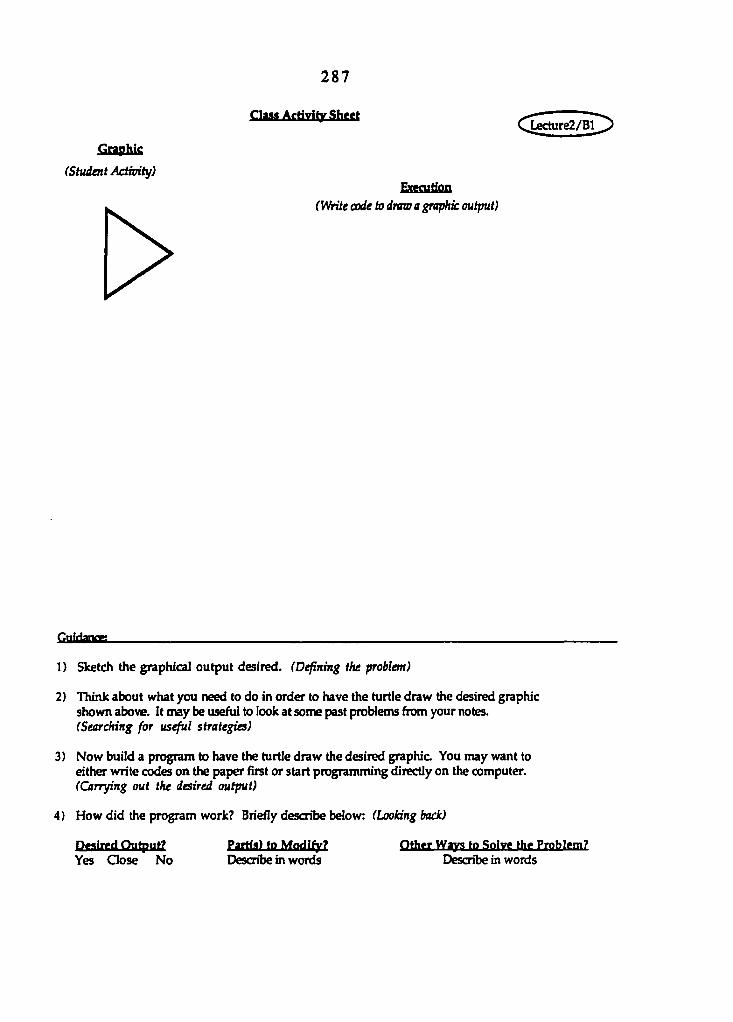
287
ClaM Activity Sheet Xecture2/Bl
Graphic
(Student AcOaity) Execution
(Write code to draw a graphic output)
finiftaiïT;
I ) Sketch the graphical output desired. (Defining the problem)
2) Think about what you need to do in order to have the turtle draw the desired graphic shown above. It may be useful to look at some past problems from your notes. (Searching for useful strategies)
3) Now build a program to have the turtle draw the desired graphic You may want to either write codes on the paper first or start programming directly on the computer. ((Carrying out the desired output)
4) How did the program work? Briefly describe below: (Looking back)
Yes Oose No Partfa) to Modify? Describe in words
Other Ways to Solve the Problem? Describe in words
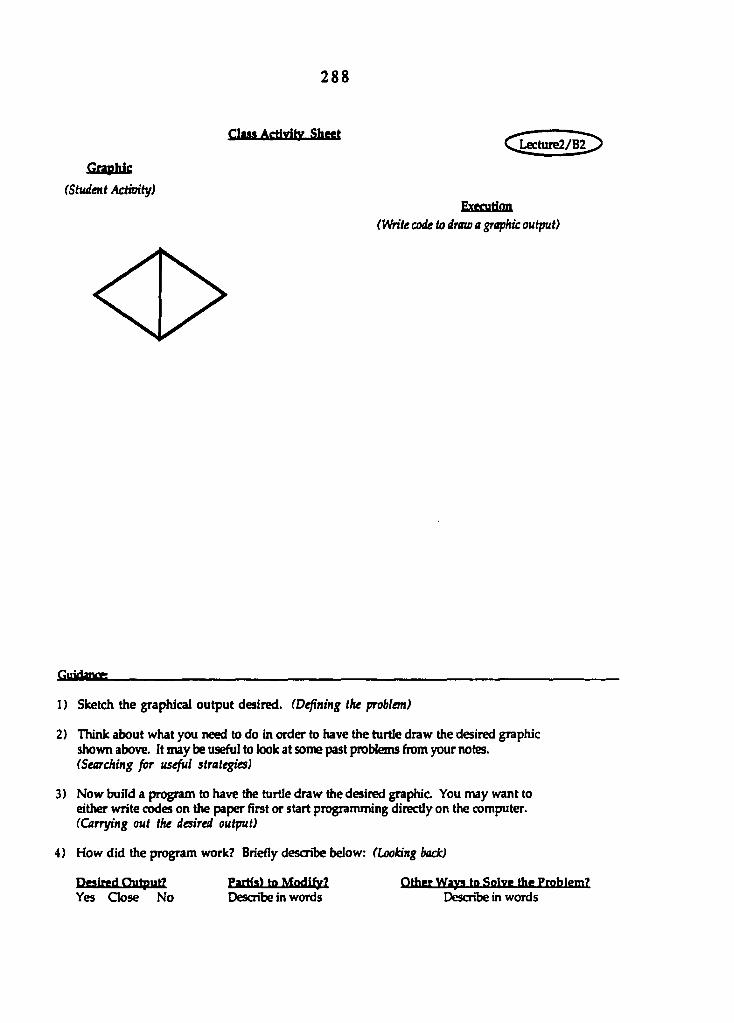
288
Claaa Activity Sheet L«:ture2/B2
CoBhic (Student Actioibf)
Execution (V/rite code to draw a graphic output)
finiiiaiMTî
1 ) Sketch the graphical output desired. (Defining the problem)
2 ) Think about what you need to do in order to have the turtle draw the desired graphic shown above. It may be useful to look at some past problems from your notes. (Searching for useful strategies)
3) Now build a program to have the turtle draw the desired graphic You may want to either write codes on the paper first or start programming directly on the computer. (Carrying out the desired output)
4) How did the program work? Briefly describe below: (Looking back)
Deaired Output? PartfO to Modify? Other Ways to Solve the Problem? Yes Gose No Describe in words Describe in words
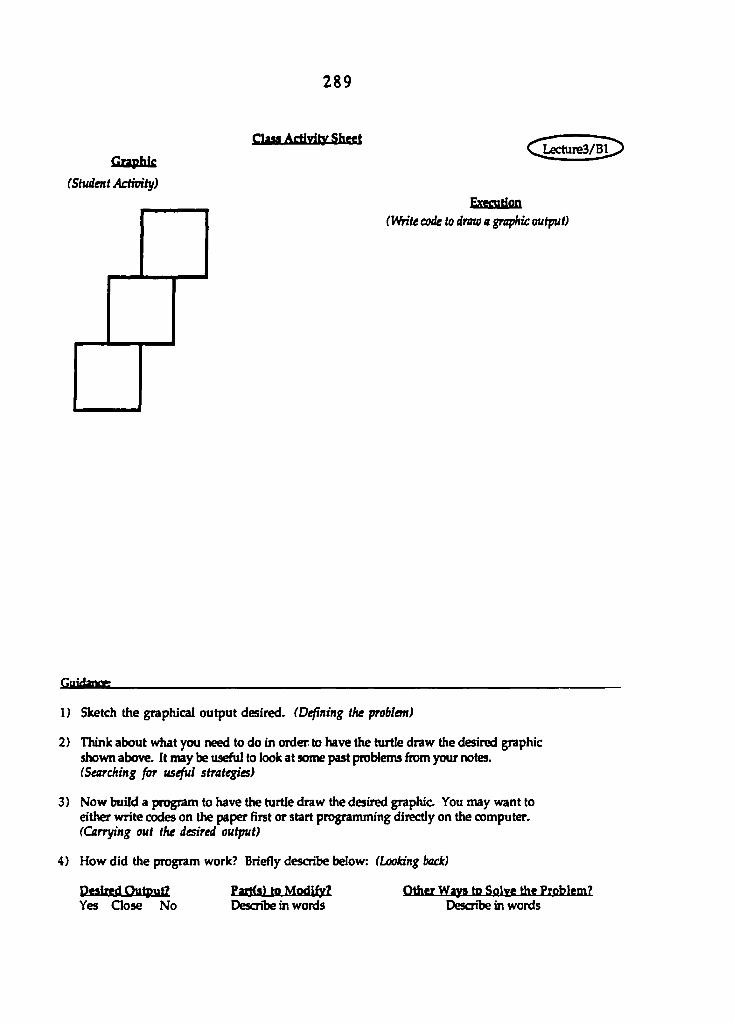
289
Graphic
(Student Activity)
1 ) Sketch the graphical output desired. (Defining the problem)
2} Think about what you need to do in order to have the turtle draw the desired graphic shown above. It may be useful to look at some past probiemsfnnn your notes. (Searching for useful strategies)
3) Now build a program to have the turtle draw the desired graphic You may want to either write codes on the paper first or start programming directly on the computer. (Carrying out the desired output)
4) How did the program work? Briefly describe below: (Looking back)
Claaa Activity ShMt Lecture3/Bl
Execution (Write code to draw a graphic output)
Deaiigd Output? Yes Qose No
Paitfa) to Modify? Describe in words
Other Ways to Solve the Problem? Describe in words
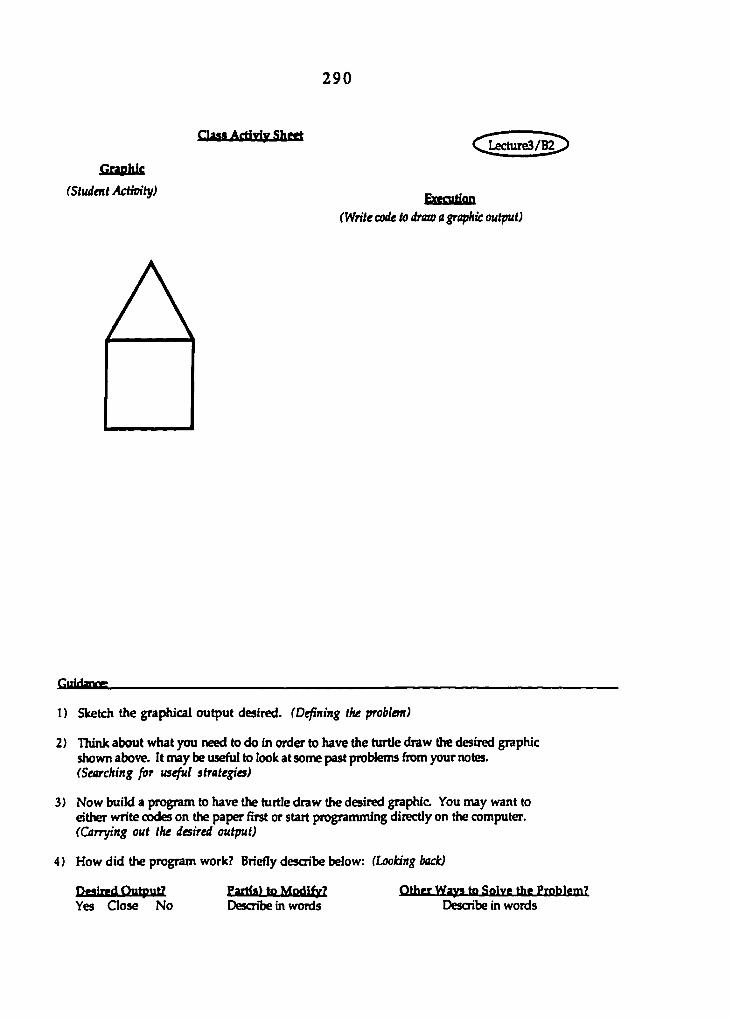
290
Craphic
(Student Activity) Esecutifla
(Write code to draw a graphic output)
rtriHaw
1) Sketch the graphical output desired. (Defining the problem)
2} Think about what you need to do in order to have the turtle draw the desired graphic shown above. It may be useful to kx)k at some past problems Aom your notes. (Searching for useful strategies)
3) Now build a program to have the turtle draw the desired graphic You may want to either write codes on the paper first or start programming directly on the computer. (Carrying out the desired output)
4) How did the program work? Briefly describe below: (Looking back)
n»<iT>d Output? Part(a> to Modify? Other Ways to Solve the Problem? Yes Close No Describe in words Describe in words
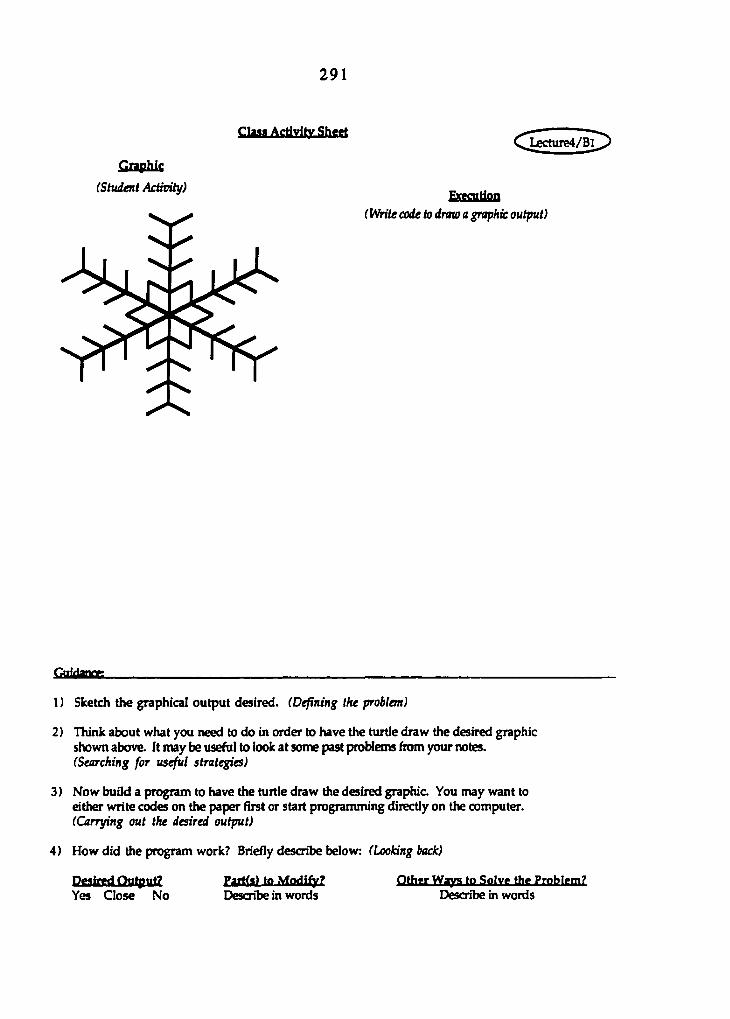
291
ClM» Activity Sheet
Graphic
(Student Activity) Execution
(Vfrite code to draw a graphic output)
fiiiirianiT!
1 ) Sketch the graphical output desired. (Defining the problem)
2 ) Think about what you need to do in order to have the turtle draw the desired graphic shown above. It may be useful to look at some past pmWems Aom your notes. (Searching for useful strategies)
3) Mow build a program to have the turtle draw the desired graphic You may want to either write codes on the paper first or start programming directly on the computer. (Carrying out the desired output)
4) How did the program work? Briefly describe below: (Looking back)
PMirgd Output? Parffa) to Modify? Qthtf Ways to SoIyc Uic Problem? Yes Gose No Describe in words Describe in words
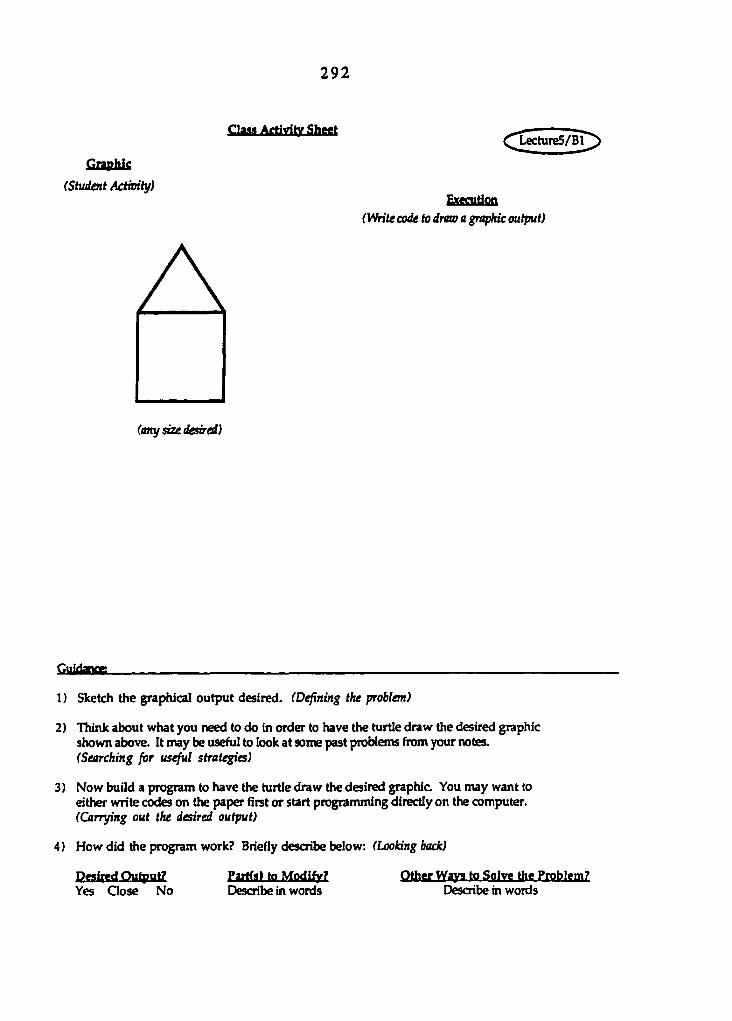
292
Graphic
(Student Activity)
(Write code to dnm a graphic output)
aaMAftivitv Sheet Lecture5/Bl
Exemtifla
(any size desired)
riMidaim
1) Sketch the graphical output desired. (Defining the problem)
2) Think about what you need to do in order to have the turtle draw the desired graphic shown above. It may be useful to look at some past problems from your notes. (Searching for useful strategies)
3) Now build a program to have the turtle draw the desired graphic You may want to either write codes on the paper first or start programming directly on the computer. (Carrying out the desired output)
4) How did the program work? Briefly describe below: (Looking back)
Yes Qose No Partfa) to Modify? Describe in words
Other Ways to Solve the Problem? Describe in words

293
na«« AfHvllySh*,*
Graphic
(Student Aciivih/)
Lecture5/B2
A ExecuHon
(Vfrite code to draw a graphic output)
(am/ size desired, but the stem should be twice as bng as the length of one triangle side)
rmVfaiw
1 ) Sketch the graphical output desired. (Defining the problem)
2) Think about what you need to do in order to have the turtle draw the desired graphic shown above. It may be useful to look at some past problems Aom your notes. (Searching for useful strategies)
3) Now build a program to have the turtle draw the desired graphic You may want to either write codes on the paper first or start programming directly on the computer. (Carrying out the desired output)
4) How did the program work? Briefly describe below; (Looking back)
PMired Output? Paitfa) to Modi^? Other Ways to Solve the Problem? Yes Gose No Describe in words Describe in words
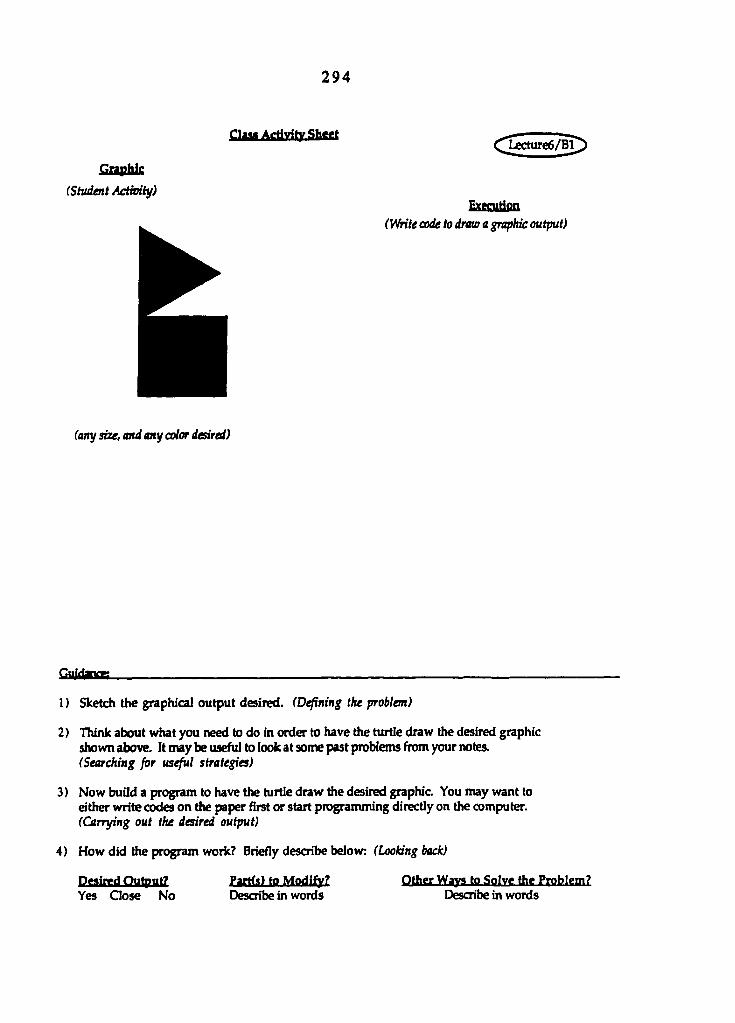
294
ClaM Activity Sheet
Graphic
(Student Actioity)
(Write code to draw a graphic output)
(any size, and any color desired)
GyMann
1 ) Sketch the graphical output desired. (Defining the problem)
2) Think about what you need to do in order to have the turtle draw the desired graphic shown above. It may be useful to look at some past problems Aom your notes. (Searching for useful strategies)
3 ) Now build a program to have the turtle draw the desired graphic You may want to either write codes on the paper first or start programming directly on the computer. (Carrying out the desired output)
4) How did the program work? Briefly describe below: (Looking back)
Desired Output? Partf«) to Modify? QthCT Ways tO So Iy C thc Problem? Yes Gose No Describe in words Describe in words

295
ûaphic (Studat Actimty)
Clasa Activity Sheet L£Cture7/Bl
Execution (Vfrite code to draw a graphie output)
(usùtg recursion)
r:iiiAww
I ) Sketch the graphical output desired. (Defining the problem)
2) Think about what you need to do in order to have the turtle draw the desired graphic shown above. It may be useful to look at some past problems from your notes. (Searching for useful strategies)
3) Mow build a program to have the turtle draw the desired graphic You may want to either write codes on the paper first or start programming directly on the computer. (Carrying out the desired output)
4) How did the program work? Briefly describe below: (Looking back)
Desired Output? Yes Close No
ParKal to Modify? Describe in words
Other Wavs to Solve the Problem? Describe in words
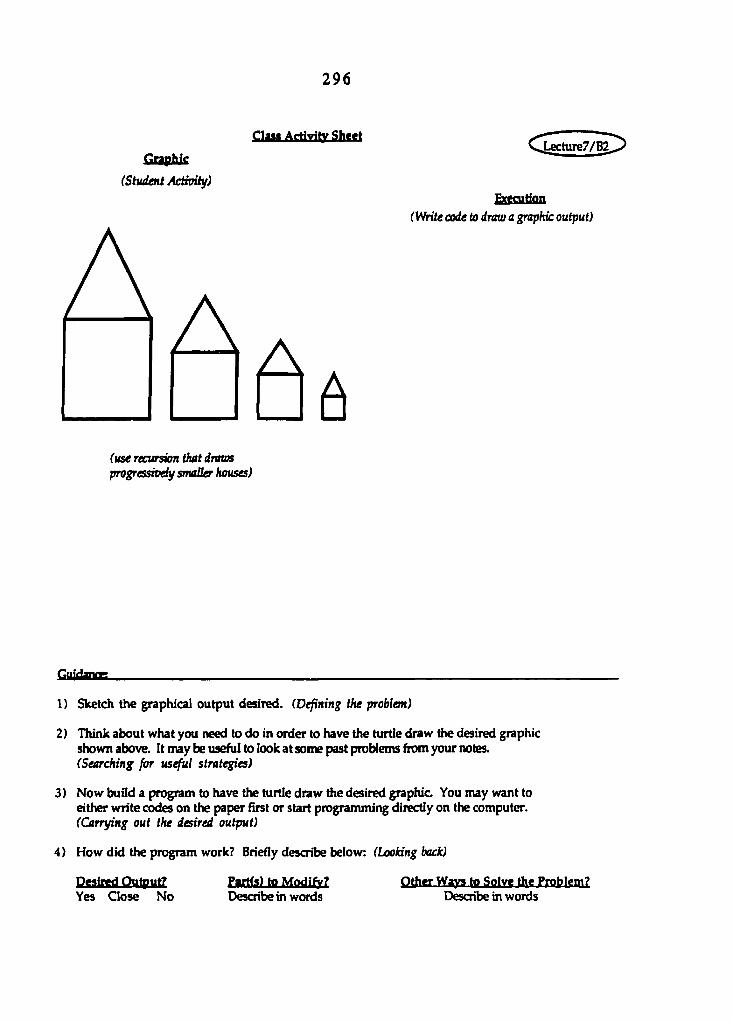
296
Graphic
(Studat Activit/)
ClaM Activity Sheet iecture7/B2
EsfifliliaD (Vfrite code to draw a graphic output)
(use recursion that draws progressivdi/ smaOer houses)
fiuidaur;
1) Sketch the graphical output desired. (Defining the problem)
2) Think about what you need to do in order to have the turtle draw the desired graphic shown above. It may be useful to look at some past problems from your notes. (Searching for useful strate^)
3) Now build a program to have the turtle draw the desired graphic. You may want to either write codes on the paper first or start programming directly on the computer. (Carrying out the desired output)
4) How did the program work? Briefly describe below: (Looking back)
Partfa) to Modify? Describe in words
Other Ways to Solve the Problem? Describe in words Yes Close No
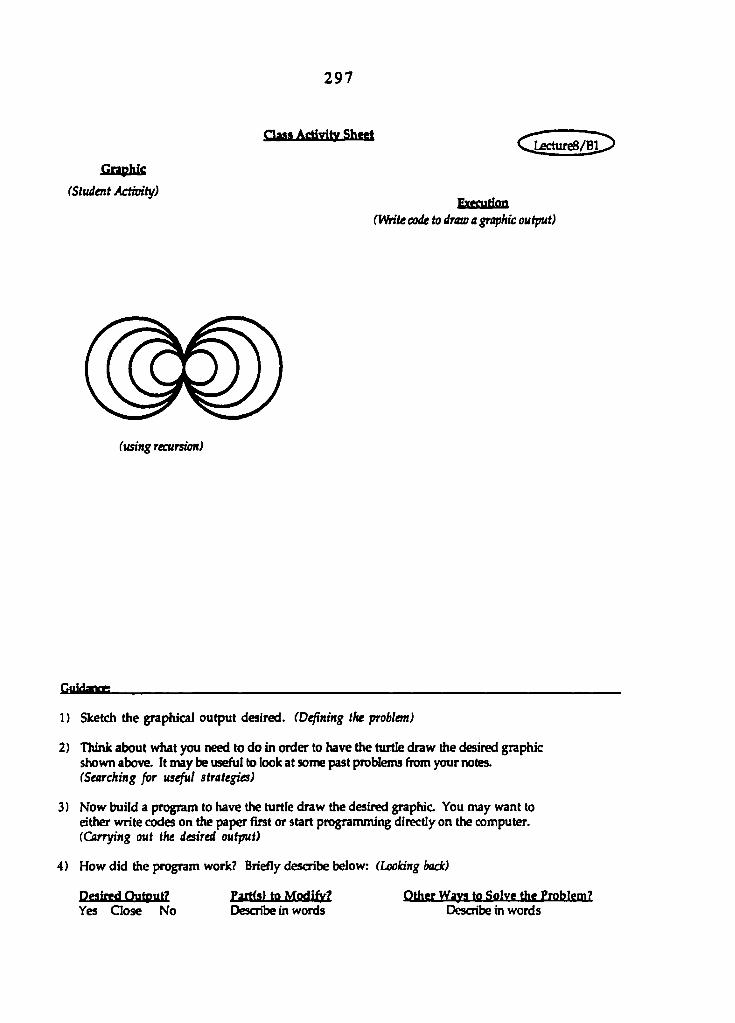
297
Graphic
(Student Actwity) Euaition
(VMte code to draw a graphic output)
(using recursion)
r.niAant*'
1) Sketch the graphical output desired. (Defining the problem)
2 ) Think about what you need to do in order to have the turtle draw the desired graphic shown above. It may be useful to look at some past problems from your notes. (Searching for useful strategies)
3) Now build a program to have the turtle draw the desired graphic You may want to either write codes on the paper Hrst or start programming directly on the computer. (Carrying out the desired output)
4) How did the program work? Briefly describe below: (Looking back)
Desired Output? Partfs) to Modify? Other Waya to Solve the Problem? Yes Close No Describe in words Describe in words

298
APPENDIX L: STUDENT ACTIVITY SHEETS FOR LABORATORY: EXPERIMENTAL GROUP

299
CogniHve Monitariny Sheet
Graphic
(Teacher-Student Cooperative Actimty)
Decompose
Plan:
Execute
Identify error
Debug:
Pirettott • Apply the steps of cognitive monitoring strategies, (solution process)
1. Decompose; Break a large graphical output into manageable units. 2. Plan: Organize ai^ sequence each component of the decomposed output in order to devise
an efficient solution. (e.g., label each line, turn, move, repeat, or procedure) 3. Execute; Code each sequence into Logo commands.
4. Mcntifr cnofi A. Describe discrepancy between the given graphic and the actual outcome. B. Locate syntax errors. (e.g., To-end, use of the same procedure name more than once, space between primitives and input, misspelling, etc.) C Locate semantic errors. (e.g., subprocedures are called in wrong order, too manylfew repeat processes, turn, move, etc.) D. Explain the causeKs) of the detected errors.
5. Qcbug: Revise detected errors.
•Evaluation of cognitive monitoring strategies: Decompose Right size to handle Too small Too laige Plan: Appropriate Not appropriate Not quite appropriate Debug: What seems wrong? (Describe in words.)
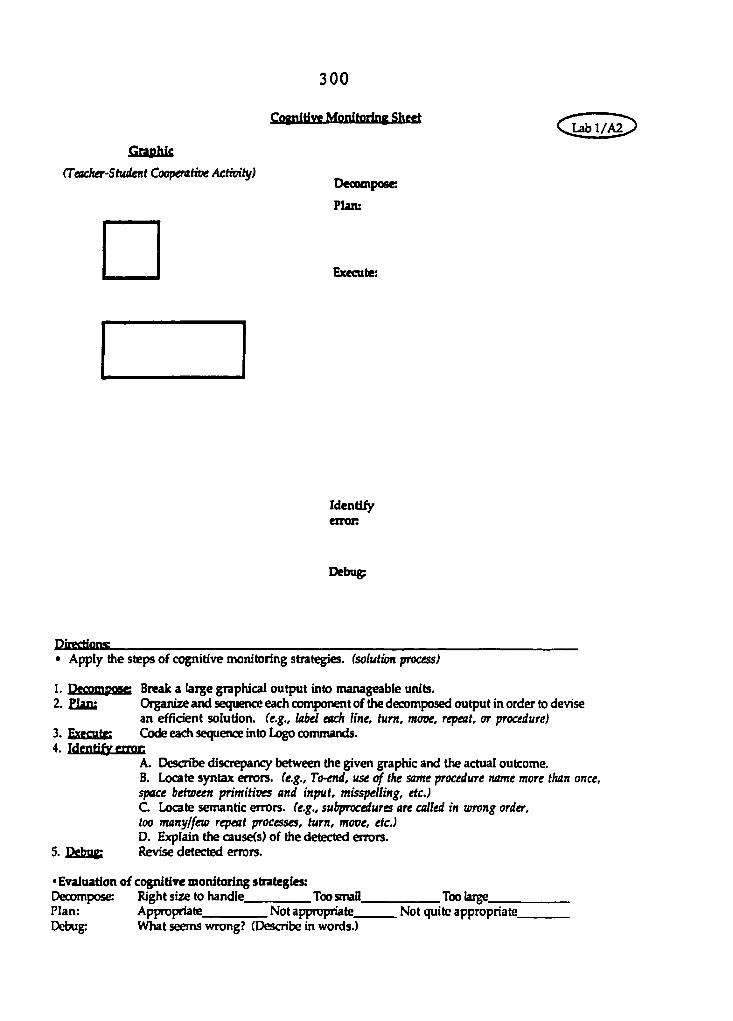
300
Copiitivg Monitoring Sheet
Graphic
CTeacher-Studait Coopentm Activity) Décomposé:
Plan:
Execute:
Identify enon
Debug;
Pirectfons • Apply the steps of cognitive monitoring strategies, (solution process)
1. Decompose Break a large graphical output into manageable units. 2. Plan: Organize and sequence each component of the decomposed output in order to devise
an effident solution, (e.g., label each line, turn, move, repeat, or procedure) 3. Execute: Code each sequence into Lo^ commands. 4. Identify OTPC
A. Describe discrepancy between the given graphic and the actual outcome. B. Locate syntax errors. (e.g., To-end, use of the same procedure name more than once, space between primitives and input, misspelling, etc.) C. Locate semantic errors. (e.g., subprocedures are called in umng order, loo manytfew repeat processes, turn, move, etc.) D. Explain the causes) of the detected errors.
5. Ddae Revise detected errors.
• Evaluation of cognitive monitoring strategies: Decompose: Right size to handle Too small Too large Plan: Appropriate Not appropriate Not quite appropriate Debug: What seems wrong? (Describe in words.)

301
Coptitive Motiitoriny Sh<«t Ub 1/A3
Graphic
(Student AcHvity)
Décomposé:
Plan:
Execute:
Identify eiron
Debug:
• Apply the steps of cognitive monitoring strategies, (solution process)
1. Decompoag Break a large graphical output into manageable units. 2- Plan; Organize and sequence each component of the decomposed output in order to devise
an effldent solution, (e.g., labd each line, turn, move, repeat, or procedure) 3. Execnte; Code each sequence into Logo commands. 4. Identify cnnc
A. Describe discrepancy between the given graphic and the actual outcome. B. Locate syntax errors. (e.g., To-end, use of the same procedure name more than once, space between primitives and input, misspelling, etc.) C Locate semantic errors. (e.g., subprocedures are called in lorong order, too manylfea repeat processes, turn, move, etc.) D. Explain the cause(s) of the detected errors.
5. rwhap Revise detected errors.
• Evaluation of cognitive monitoring strategies: Decompose Right size to handle Too small Too laige Plan: Appropriate Not appropriate Not quite appropriate Debug: What seems wrong? (Describe in words.)

302
CogniHve Monltoriny Sheet
Graphic
(Teacher-Student Coopérative Activiij/) Deonnposc:
Plan:
Execute:
Identify mon
Debug:
t?lrKtMm3s • Apply the steps of cognitive monitoring strategies, (solution process)
1. Decompose: Break a large graphical output into manageable units. 2. Plan: Organize and sequence each component of the decomposed output in order to devise
an efficient solution. (e.g., label each line, turn, move, repeat, or procedure) 3. Execute: Code each sequence into Logo commands. 4. MentiiygrBC
A. Describe discrepancy between the given graphic and the actual outcome. B. Locate syntax errors. (e.g., To-end, use of the same procedure name more than once, space between primitives and input, misspelling, etc.) C Locate semantic errors. (e.g., subprocedures are called in wrong order, too manylfew repeat processes, turn, move, etc.) D. Explain the cause(s) of the detected errors.
5. nphnp Revise detected errors.
• Evaluation of cognitive monitoring strategies: Decompose: Right size to handle Too small Too large Plan: Appropriate Not appropriate Not quite appropriate Debug: What seems wrong? (Describe in words.)
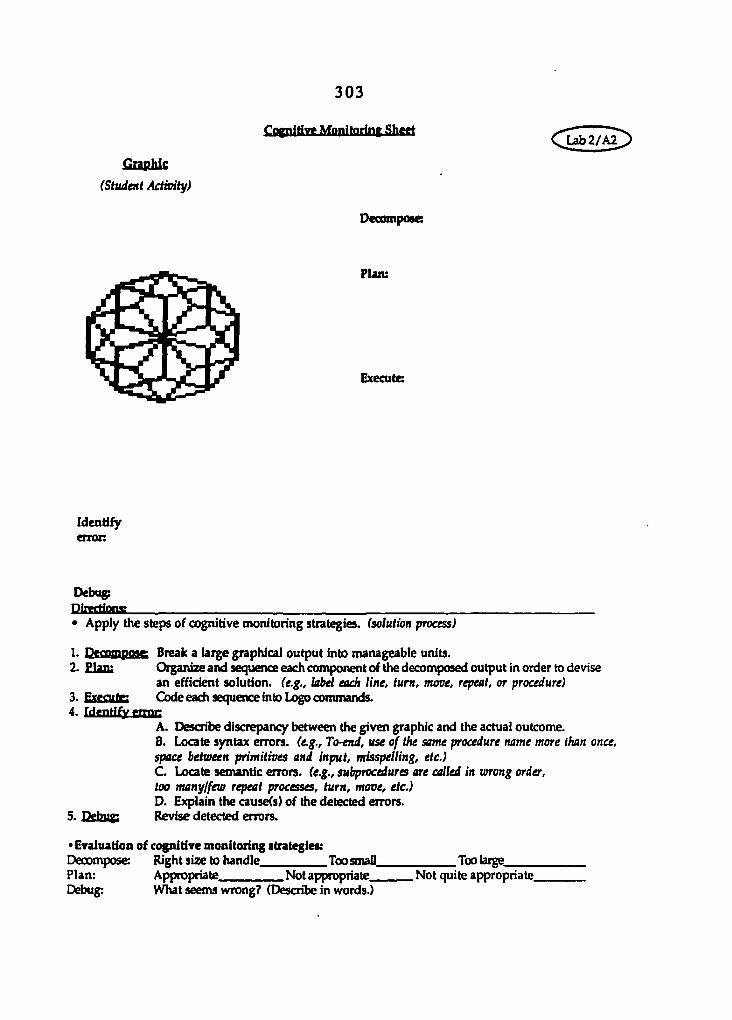
303
Cognitive Monihiriny Sheet Lab2/A2
Graphic
(Student Actioity)
Dcoompose
Plaiu
Execute:
Identify error
Debug; PirectioM! • Apply the steps of cognitive monitoring strategies, (solution process)
1. Decompoae: Break a large graphical output into manageable units. 2. Plan; Organize and sequence each component of the decomposed output in order to devise
an efficient solution. (e.g., kbel each line, turn, move, repeat, or procedure) 3. Execute: Code each sequence into Logo commands. 4. Menrify man
A. Describe discrepancy between the given graphic and the actual outcome. B. Locate syntax errors. (e.g., To-end, use of the same procedure name more than once, space between primitives and input, misspelling, etc.) C Locate semantic errors. (e.g., subprocedures are called in wrong order, too manylfew repeat processes, turn, move, etc.) D. Explain the causes) of the detected errors.
5. Pfhup Revise detected errors.
• Evaluation of cognitive monitoring strategies: Decompose Right size to handle ToosmaQ Too large Plan: Appropriate Not appropriate Not quite appropriate Debug: What seems wrong? (Describe in words.)
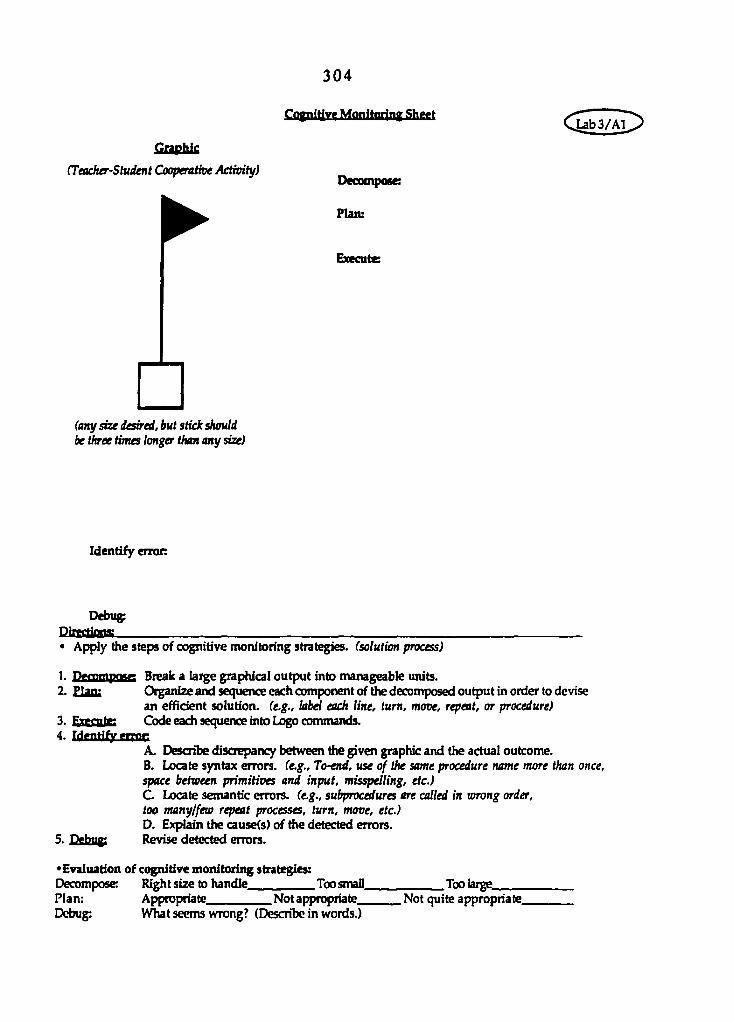
304
Cognitive Monifairinf Shett
Graphic
(Teadur-Student Coopentioe Activity)
• DecunpoM:
Flatu
Execute
(any size desired, but stick should be three times Umger than any size)
Identify error
Debug; PilKtimai • Apply the steps of cognitive monitoring strategies, (solution process)
1. iVminpntf; Break a large graphical output into manageable units. 2- Plan; Organize and sequence each component of the decomposed output in order to devise
an efHdent solution. (e.g., label each line, turn, move, repeat, or procedure) 3. Exemtg; Code each sequence into Logo commands. 4. Identify ciTBc
A. Describe discrepancy between the given graphic and the actual outcome. B. Locate syntax errors. (e.g., To-end, use of the same procedure name more than once, space between primitives and input, misspelling, etc.) C Locate semantic errors. (e.g., subprocedures are called in wrong order, too manylfew repeat processes, turn, move, etc.) D. Explain the cause<s) of the detected errors.
5. Hphng» Revise detected errors.
• Evaluation of cognitive monitoring strategies: Decompose: Right size to handle Too small Too large Plan: Approptiate Not appropriate Not quite appropriate Debug: What seems wrong? (Describe in words.)
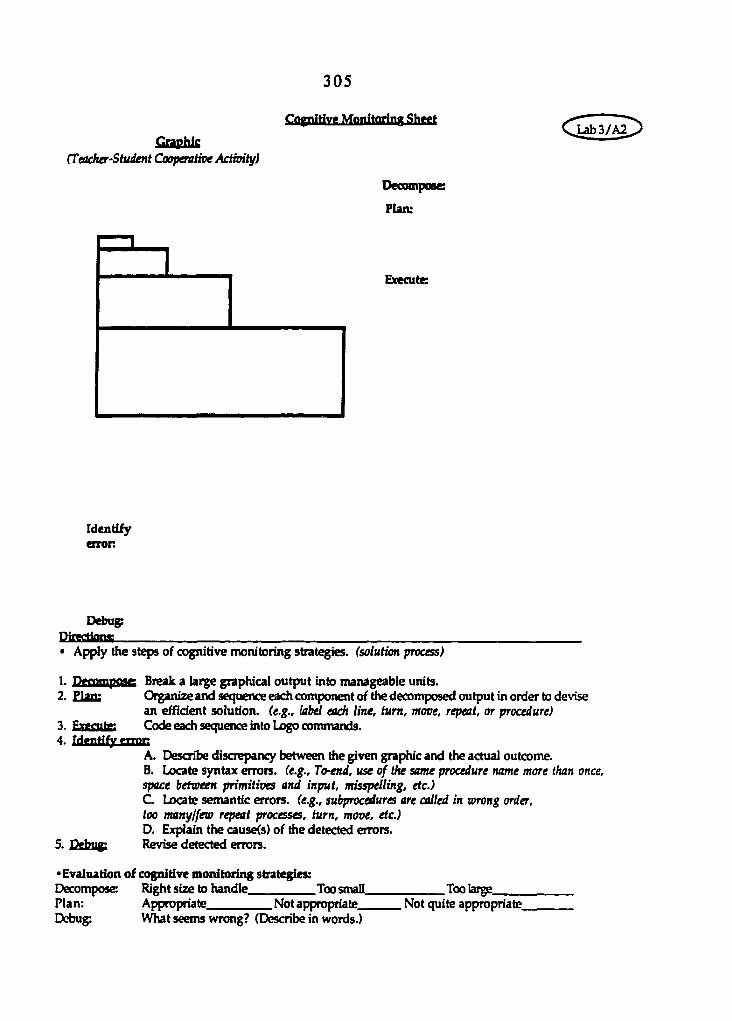
Graphic CTeacher-Studait Coopérative Actioity)
305
Copdtive Monitoring Sheet
Decompose
Plan:
^3/A2
Execute
Identify eiron
Debug: Oirpcrtnng • Apply the steps of cognitive monitoring strategies, (solution process)
1. J2gflaoplHC Break a laige graphical output into manageable units. 2. Plan; Otganize and sequence each component of the decomposed output in order to devise
an efficient solution. (e.g., label each line, turn, move, repeat, or procedure) 3. ExecuiK Code each sequence into Logo commands. 4. idmUfy mmc
A. Describe discrepancy between the given graphic and the actual outcome. B. Locate syntax errors. (e.g., To-end, use of the same procedure name more than once, space between primitives and input, misspelling, etc.) C Locate semantic errors, (e.g., subprocedures are called in wrong order, too manylfew repeat processes, turn, move, etc.) D. Explain the cause(s) of the detected errors.
5. Revise detected errors.
•Evaluation of cognitive monitoring strategies: Decompose Right size to handle Too small Too large Plan: Appropriate Not appropriate Not quite appropriate Debug: What seems wrong? (Describe in words.)
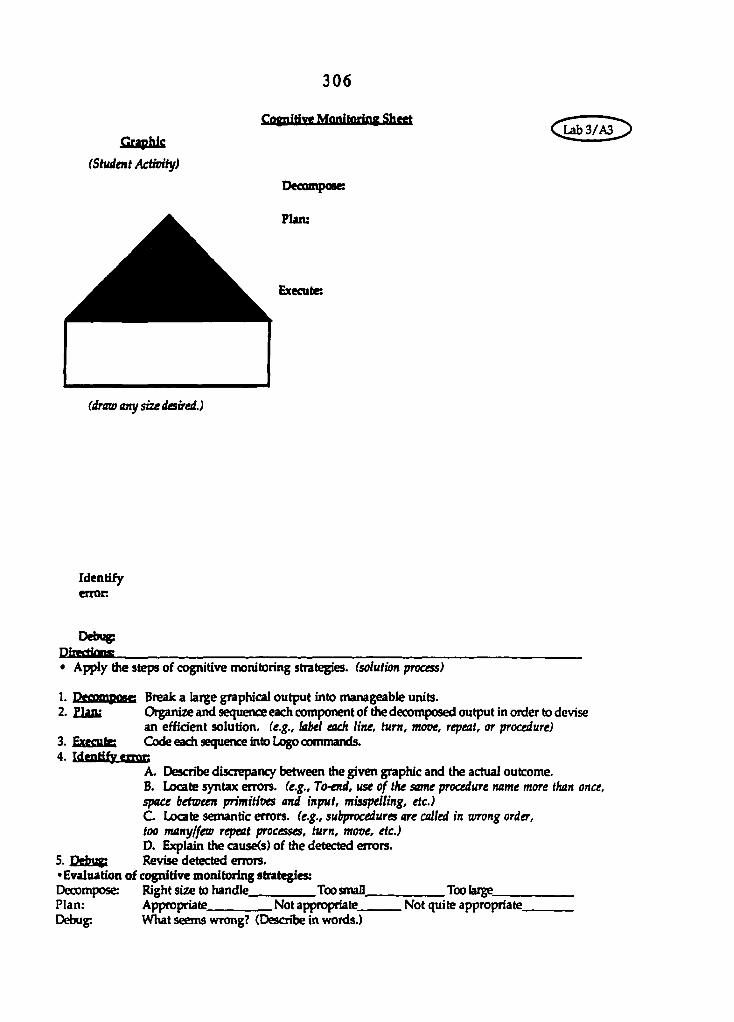
306
Graphic
(Student Activity)
1^3 /A3
(draw any size desired.)
Identify eiTon
Debug PhTrtinm; • Apply die steps of cognitive monitoring strategies, (solution process)
1. PecompoM: Break a large graphical output into manageable units. 2. Plan: Organize and sequence each component of the decomposed output in order to devise
an effîdent solution. (e.g., label each line, turn, move, repeat, or procedure) 3. E»cntei Code each sequence into Logo commands. 4. Identify error;
A. Describe discrepancy between the given graphic and the actual outcome. B. Locate syntax errors. (e.g., To-end, use of t^ same procedure name more than once, space between primitives and input, misspelling, etc.) C Locate semantic errors, (e.g., subprocedures are called in wrong order, too manylfew repeat processes, turn, move, etc.) D. Explain the causes) of the detected errors.
5. DdZUB Revise detected errors. •Evaluation of cognitive monitoring strategies: Decompose Right size to handle Too small Too large Plan: Appropriate Not appropriate Not quite appropriate Debug: What seems wrong? (Describe in words.)
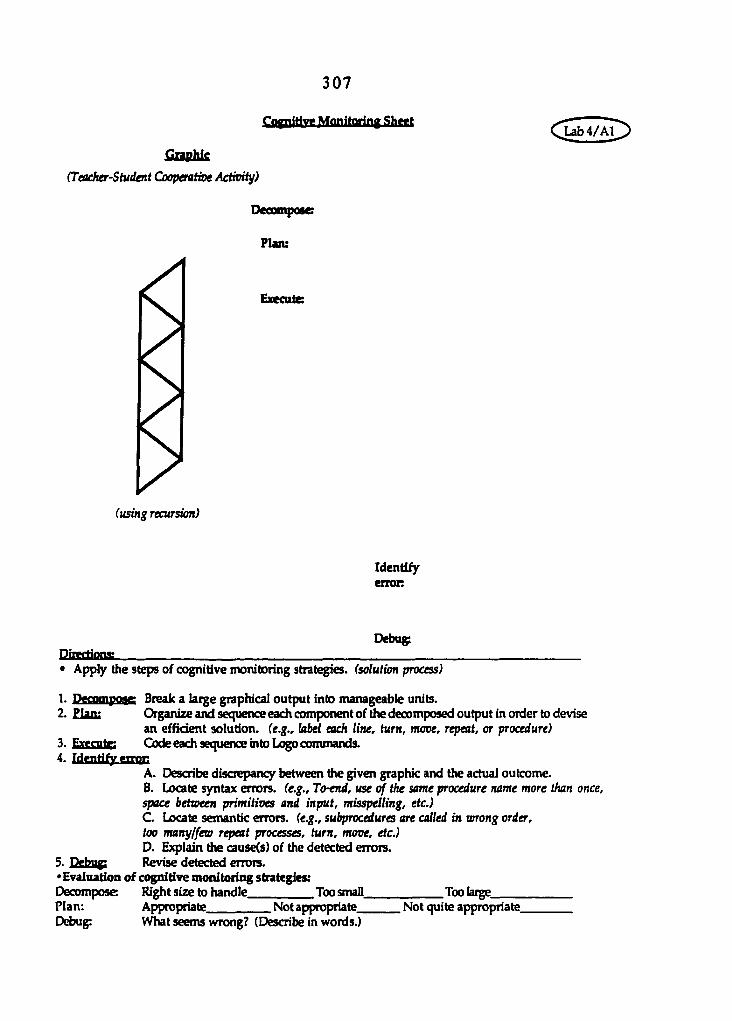
3 0 7
Coynltive Monifairing Sheet
Graphic
(Ttacher-Shident Cooperatioe Actwity)
Dcoomposc:
Flam
Execute
(using recursion)
Identify enron
Debug DgKHonas • Apply the steps of cognitive monitoring strategies, (solution process)
1. Dgcompoae Break a large graphical output into manageable units. 2. Plan: Organize and sequence each component of the decomposed output in order to devise
an efficient solution. (e.g., label each line, turn, move, repeat, or procedure) 3. Execntg; Code each sequence into Logo commands. 4. Identify cnac
A. Describe discrepancy between the given graphic and the actual outcome. B. Locate syntax errors, (e.g., To^d, use of t^ same procedure name more than once, space betioeen primitives and input, misspelling, etc.) C Locate semantic errors. (e.g., subprocedures are called in wrong order, too manylfem repeat processes, turn, move, etc.) D. Explain the causes) of the detected errors.
5. TVhuf Revise detected errors. • Evaluation of cognitive monitoring strategies: Decompose Right size to handle Too small Too large Plan: Appropriate Not appropriate Not quite appropriate Debug: VVhat seems wrong? (Describe in words.)
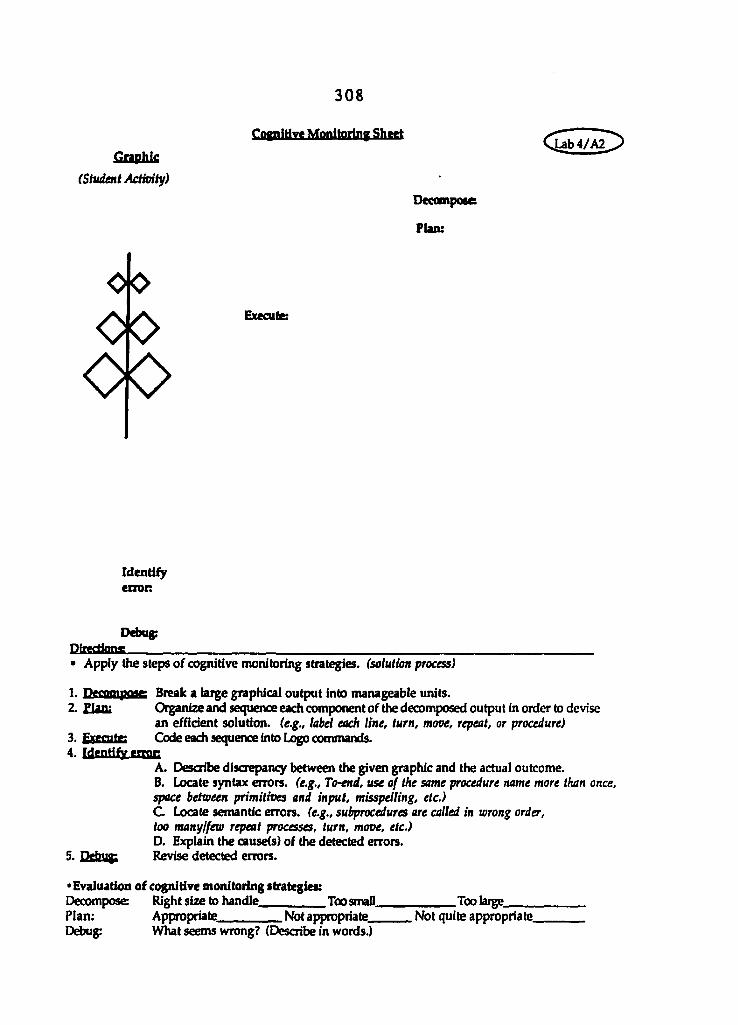
3 0 8
CognWve Monitoring Sheet
(Studat Actioihf)
ÎAb4/A2_ Graphic
Decompose
Plan:
^ Execute
00
Identify erron
Debug Dtmtionai • Apply the steps of cognitive monitoring strategies, (solution process)
1. jjfiomjlflie Break a large graphical output into manageable units. 2. Plan: Organize and sequence each component of tiw decomposed output in order to devise
an efficient solution, (e.g., label each line, turn, move, repeat, or procedure) 3. Ettcnte Code each sequence into Logo commands. 4. TdenHfy error
A. Describe discrepancy between the given graphic and the actual outcome. B. Locate syntax errors. (e.g., To-end, use of the same procedure name more than once, space between primitives and input, misspelling, etc.) C Locate semantic errors. (e.g., subprocedures are called in wrong order, too manylfew repeat processes, turn, move, etc.) D. Explain the cause(s) of the detected errors.
5. TVhuf Revise detected errors.
• Evaluation of cognitive monitoring strategies: Decompose Right size to handle Too small Too large Plan: Appropriate Not appropriate Not quite appropriate Ddxjg: What seems wrong? (Describe in words.)

3 0 9
APPENDIX M: STUDENT ACTIVITY SHEETS FOR LABORATORY: CONTROL GROUP
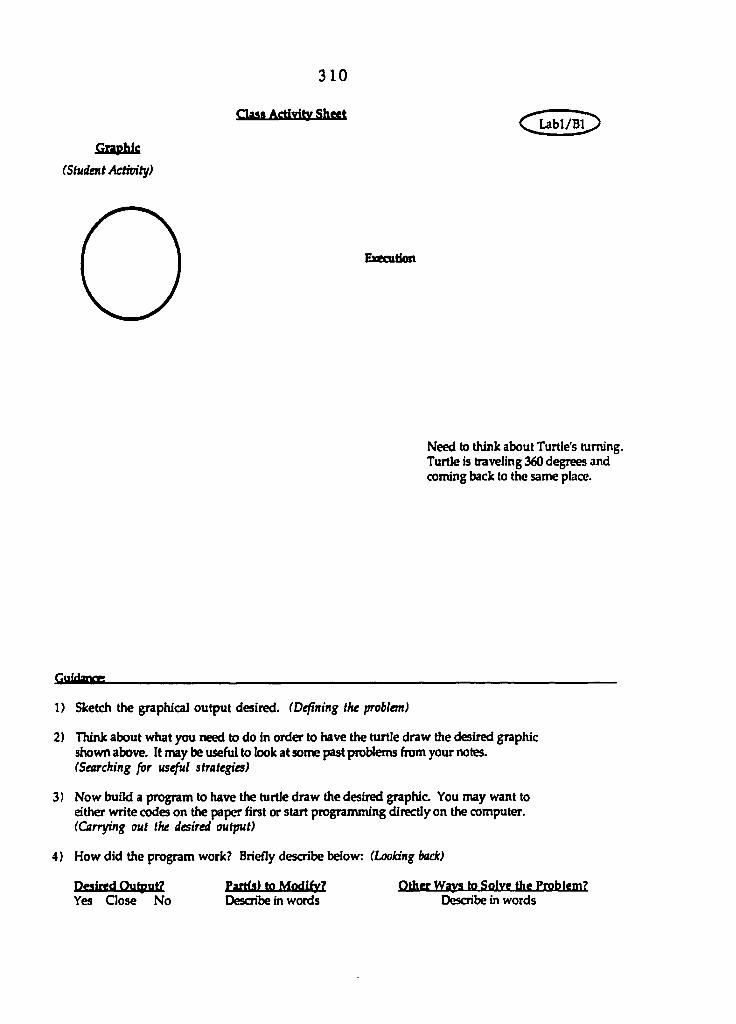
3 1 0
Clag» Activity Sheet
Graphic
(Student Activity)
Execution
Need to think about Turtle's turning. Turtle is traveling 360 degrees and coining back to the same place.
Qiidamr
1) Sketch the graphical output desired. (Defining the problem)
2) Think about what you need to do in order to have the turtle draw the desired graphic shown above. It may be useful to look at some past problems from your notes. (Searching for useful strategies)
3) Now build a program to have the turtle draw the desired graphic You may want to either write codes on the paper first or start programming directly on the computer. (Carrying out the desired output)
4) How did the program work? Briefly describe below: (Looking back)
Desired Output? Yes Qose No
Partfa) to Modify? Describe in words
Other Ways to Solve the Problem? Describe in words

3 1 1
Claa» Activity Sheet
Graphic
(Student Actimh/) Execution
riAfanop.
1 ) Sketch the graphical output desired. (Defining the problem)
2) Think about what you need to do in order to have the turtle draw the desired graphic shown above. It may be useful to look at some past problems Aom your notes. (Searching far useful strategies)
3) Now build a program to have the turtle draw the desired graphic You may want to either write codes on the paper first or start programming directly on the computer. (Carrying out the desired output)
4) How did the program work? Briefly describe below: (Looking back)
Desired Output? Yes Cose No
Partfg) to Modify? Describe in words
Other Ways to Solve the Problem? Describe in words
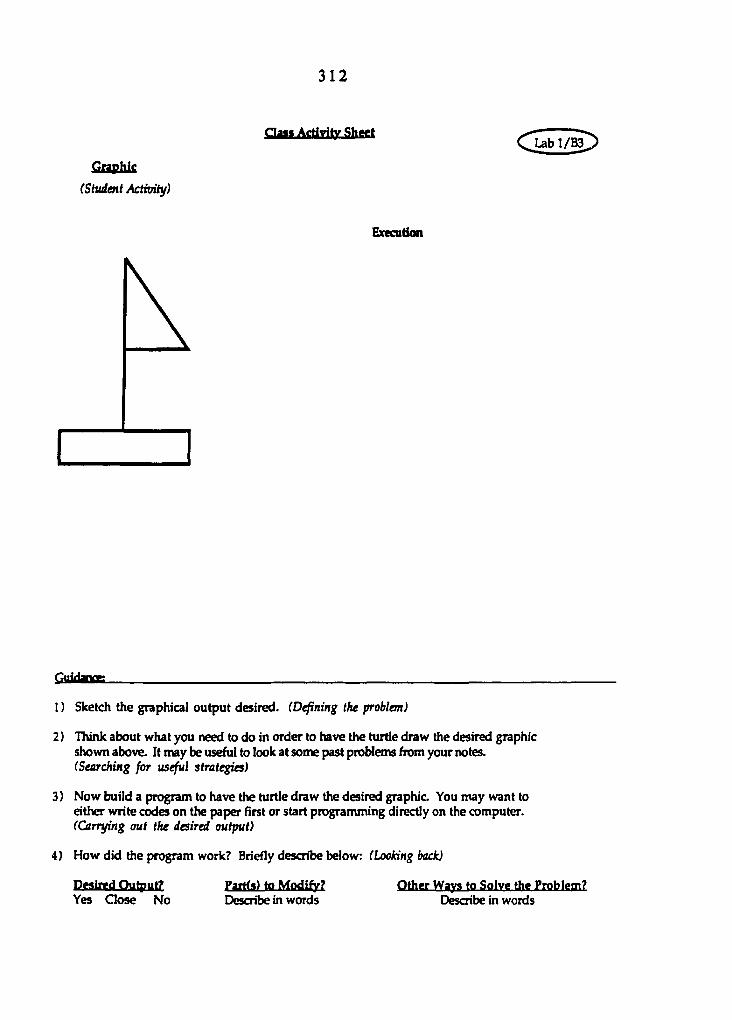
3 1 2
aaaaAcflYityShMt Labl/B3
Gophic
(Student Activity)
Execution
piriHatv»-
I ) Sketch the graphical output desired. (Defining the problem)
2) Think about what you need to do in order to have the turtle draw the desired graphic shown above. It may be useful to look at some past problems ftom your notes. (Searching for useful strategies)
3} Now build a program to have the turtle draw the desired graphic You may want to either write codes on the paper first or start programming directly on the computer. ((Carrying out the desired output)
4) How did the program work? Briefly describe below: (Looking back)
Desired Output? Yes Gose No
Partfa) to Modify? Describe in words
Other Ways to Solve the Problem? Describe in words
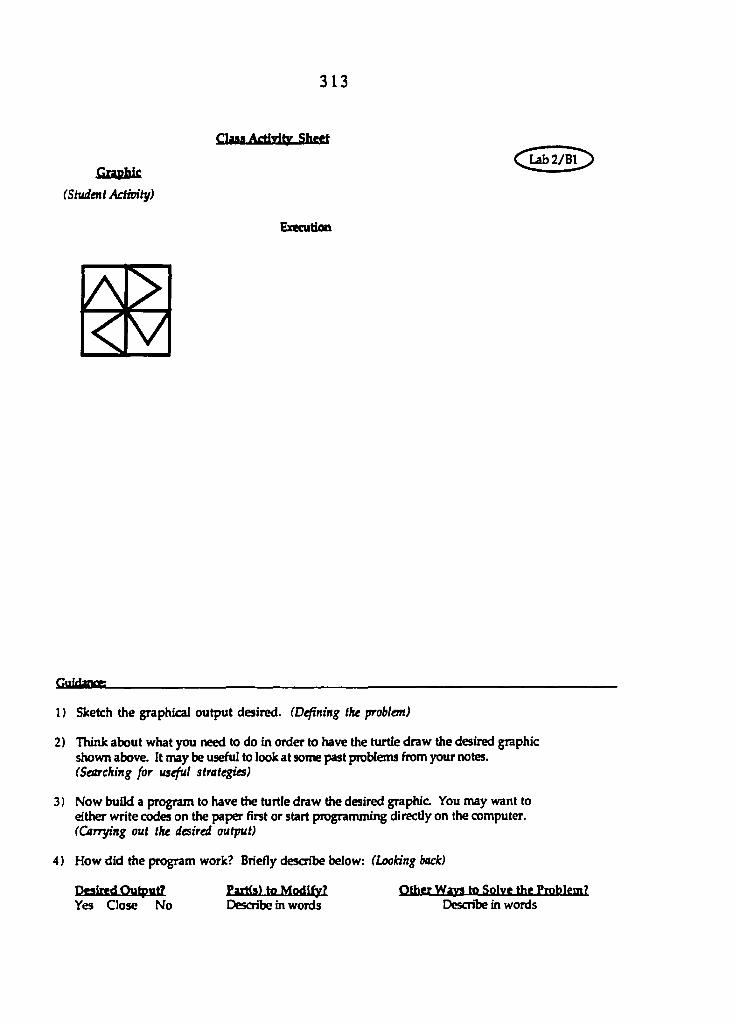
3 1 3
aaaa Activity Sheet
Graphic
(Student Activity)
Lab2/Bl
Execution
Qiitlaur
I ) Sketch the graphical output desired. (Defining the problem)
2) Think about what you need to do in order to have the turtle draw the desired graphic shown above. It may be useful to look at some past problems ftom your notes. (Searching for useful strategies)
3 ) Now build a program to have the turtle draw the desired graphic You may want to either write codes on the paper first or start programming directly on the computer. (Carrying out the desired output)
4} How did the program work? Briefly describe below: (Looking back)
Desired Output? Yes Qose No
Parts) to Modify? Describe in words
Other Ways to Solve the Problem? Describe in words
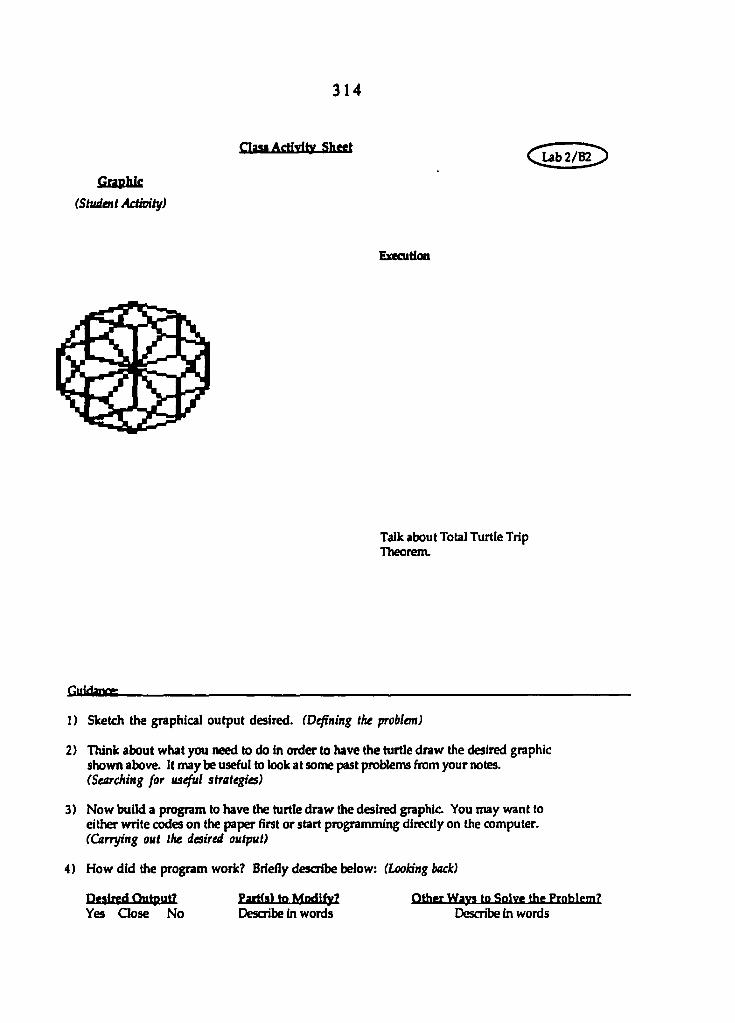
3 1 4
aaia Activity ShMt Lab2/B2
Graphic
(Student Actioity)
Execution
Talk about Total Turtle Trip Theorem.
fiiiiriarer;
1 ) Sketch the graphical output desired. (Defining the problem)
2) Think about what you need to do in order to have the turtle draw the desired graphic shown above. It may be useful to look at some past problems from your notes. (Searching for useful strategies)
3) Now bufld a program to have the turtle draw the desired graphic You may want to either write codes on the paper first or start programming directly on the computer. (Carrying out the desired output)
4) How did the program work? Briefly describe below: (Looking back)
Pgaired Output? Part(a) to Modify? Other Ways to Solve the Problem? Yes Close No Describe in words Describe in words
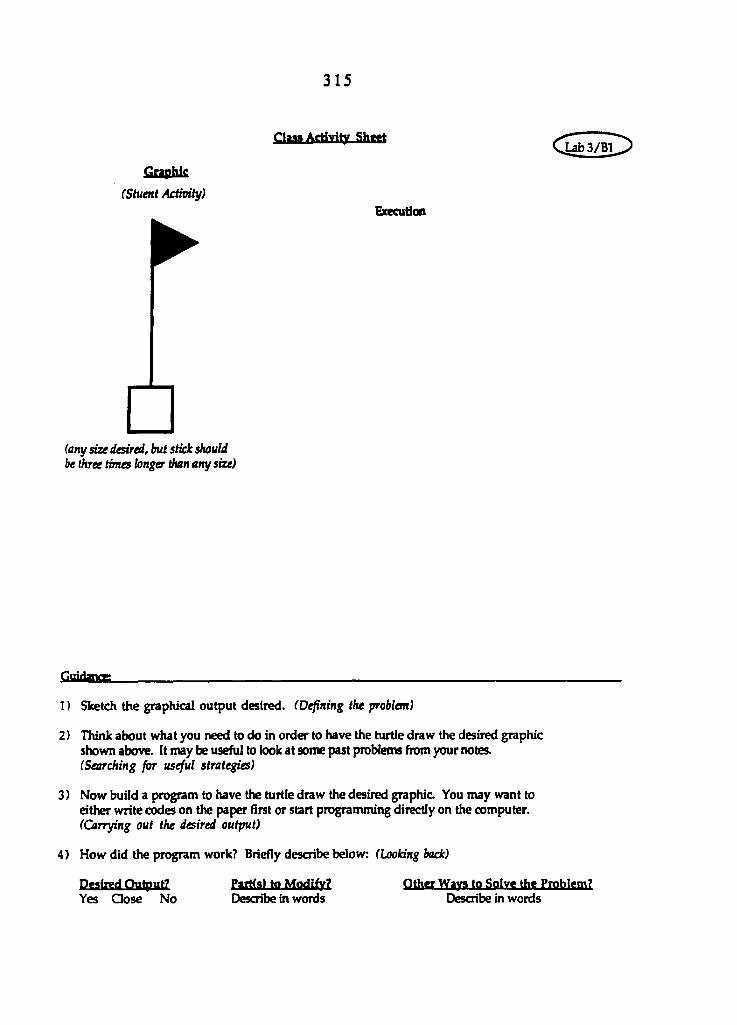
3 1 5
ClaM Activity Shttt Ub3/Bl
Graphic
(Stuent Activiiy) Execution
•
(any ste desired, but stick should be three times longer than any size)
I ) Sketch the graphical output desired. (Defining the problem)
2) Think about what you need to do in order to have the turtle draw the desired graphic shown above. It may be useful to look at some past problems from your notes. (Searching for useful strategies)
3} Now build a program to have the turtle draw the desired graphic You may want to either write codes on the paper first or start programming directly on the computer. (Carrying out the desired output)
4) How did the program work? Briefly describe below: (Looking back)
Yes Gose No Partfs) to Modify? Describe in words
Other Ways to Solve the Problem? Describe in words
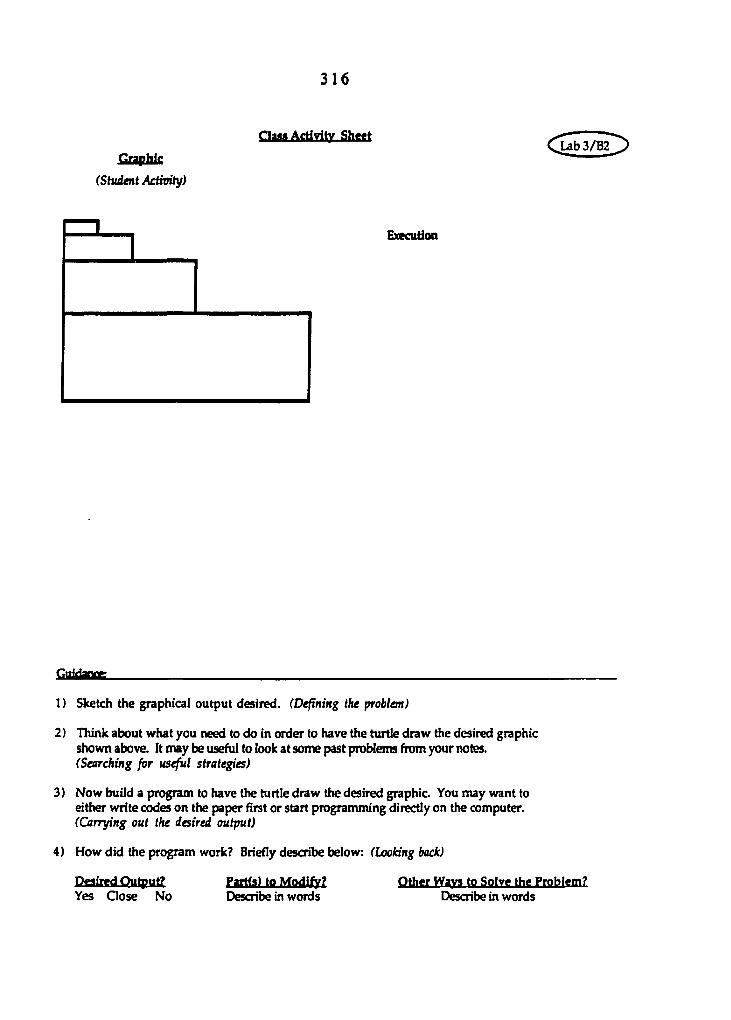
3 1 6
Graphic
(Student Activity)
fiirittoïTî
1 ) Sketch the graphical output desired. (Defining the problem)
2) Think about what you need to do in order to have the turtle draw the desired graphic shown above. It may be useful to look at some past problems from your notes. (Searching for useful strategies)
3) Now build a program to have the turtle draw the desired graphic. You may want to either write codes on the paper first or start programming directly on the computer. (Carrying out the desired output)
4) How did the program work? Briefly describe below: (Looking back)
ClaM Activity Sheet
Execution
Desired Output? Yes Gose No
Partfs) to Modify? Describe in words
Other Ways to Solve the Problem? Describe in words
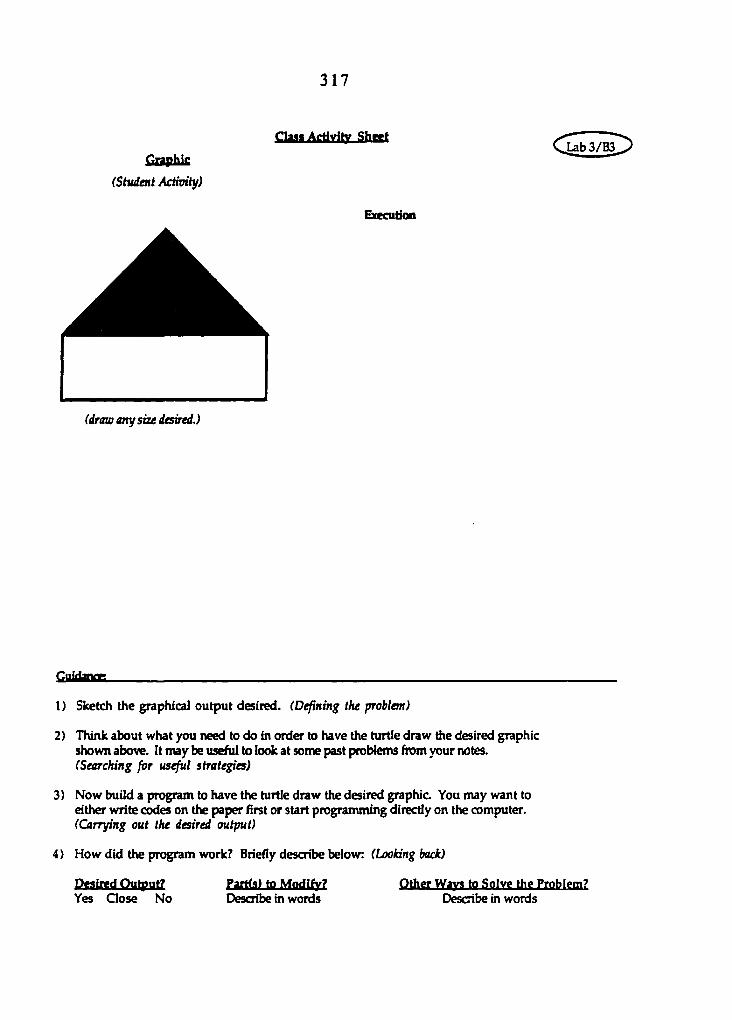
3 1 7
fÎTaphic
(Student Activity)
Claai Activity Sheet I^b3/B3
Execution
(draw arty size desired.)
ggjdaocg
1 ) Sketch the graphical output desired. (Defining the problem)
2) Think about what you need to do in order to have the turtle draw the desired graphic shown above. It may be useful to look at some past problems from your notes. (Searching for useful strategies)
3) Now build a program to have the turtle draw the desired graphic You may want to either write codes on the paper first or start programming directly on the computer. (Carrying out the desired output)
4) How did the program work? Briefly describe below: (Looking back)
Deaired Output? Yes Gose No
Partfa) to Modify? Other Ways to Solve the Problem? Describe in words Describe in words
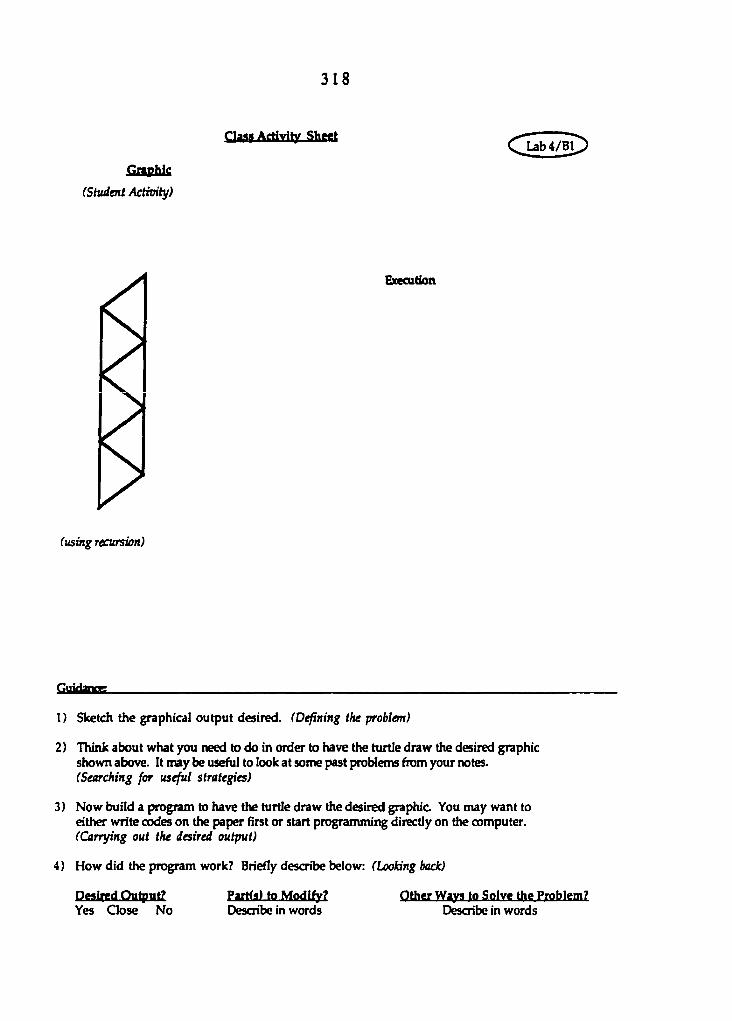
3 1 8
axM Activity Sheet
Graphic
(Shident Activity)
Execution
(using recursion)
riri/fanr».
I ) Sketch the graphical output desired. (Defining the problem)
2) Think about what you need to do in order to have the turtle draw the desired graphic shown above. It may be useful to look at some past problems from your notes. (Searching for useful strategies)
3} Now build a program to have the turtle draw the desired graphic You may want to either write codes on the paper first or start programming directly on the computer. ((Carrying out the desired output)
4) How did the program work? Briefly describe below: (Looking back)
Desired Output? Partfs) to Modify? Other Ways to Solve the Problem? Yes Qose No Describe in words Describe in words

3 1 9
ClM» Actfvity Sheet
Craphlf
(Student Activih/) Execudon
0 0
00 00
Giihbnm
1} Sketch the graphical output desired. (Defining the problan)
2) Think about what you need to do in order to have the turtle draw the desired graphic shown above. It may be useful to look at some past problems from your notes. (Searching for useful strategies)
3) Now build a program to have the turtle draw the desired graphic. You may want to either write codes on the paper first or start programming directly on the computer. (Carrying out the desired output)
4) How did the program work? Briefly describe below: (Looking back)
Deaiwd Output? Partfa) to Modify? Other Ways to Solve the Problem? Yes Close No Describe in words Describe in words
Lab 4/62

3 2 0
APPENDIX N: TRANSPARENCIES FOR EXAMPLES OF HOMEWORK ASSIGNMENT: EXPERIMENTAL GROUP
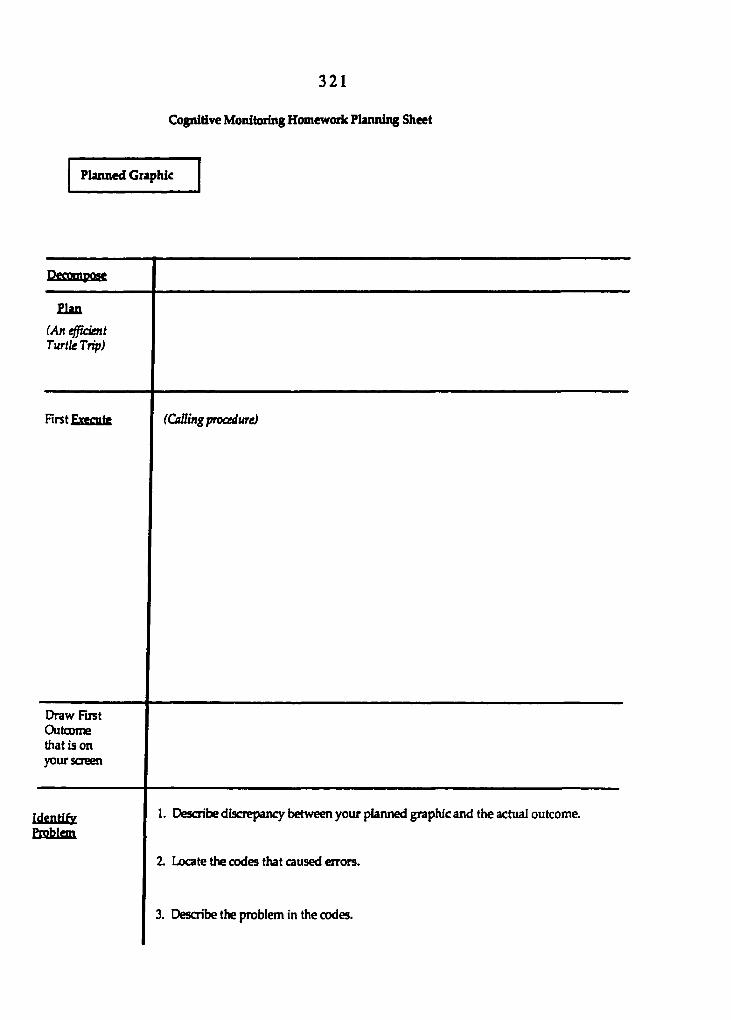
3 2 1
Cognitive Monitoring Homework Planning Sheet
Planned Graphic
Pttpmpoac
Plan
(Anefpdent TurtUTrip)
First Exécute (Calling pncedure)
Draw First Outcome that is on your screen
Identify Problem
1. Describe discrepancy between your planned graphic and the actual outcome.
2. Locate the codes that caused errors.
3. Describe the problem in the codes.

3 2 2
Homewoik il Pio]ect Cognitive Monitoring Sheet
Planned Graphic
O Decampoae Body, Cab, Wheel
flan (An efficient TurtleTrip)
For Truck (calling procedure), draw cab • draw body - turn turtle - draw wheel -move turtle to the left, at the end of body • draw wheel
First Execute
(Calling procedure) To Tnjck Cab Body Move Wheel Movel Wheel End
To Cab Repeat 4[Fd 20 Rt 90] End
To Wheel Repeat 36[Fd 2 RT 101 End
To Body Repeat 2(Fd 30 Lt 90 Fd 60 Lt 901 End
To Movel Fd 50 End
To Move Lt 90 End
Draw First Outcome that is on your screen a
Identify
cixss
1. Describe discrepancy between your planned graphic and actual outcome.
Position of wheels should be down.
2. Locate the codes that caused the errors.
To Wheel Repeat 36(Fd 2 Rt 10) End
3. Describe what seemed wrong in the codes.
Turtle needs to turn to the left, instead of to the right.
Ddzilg Correct errors on the computer.
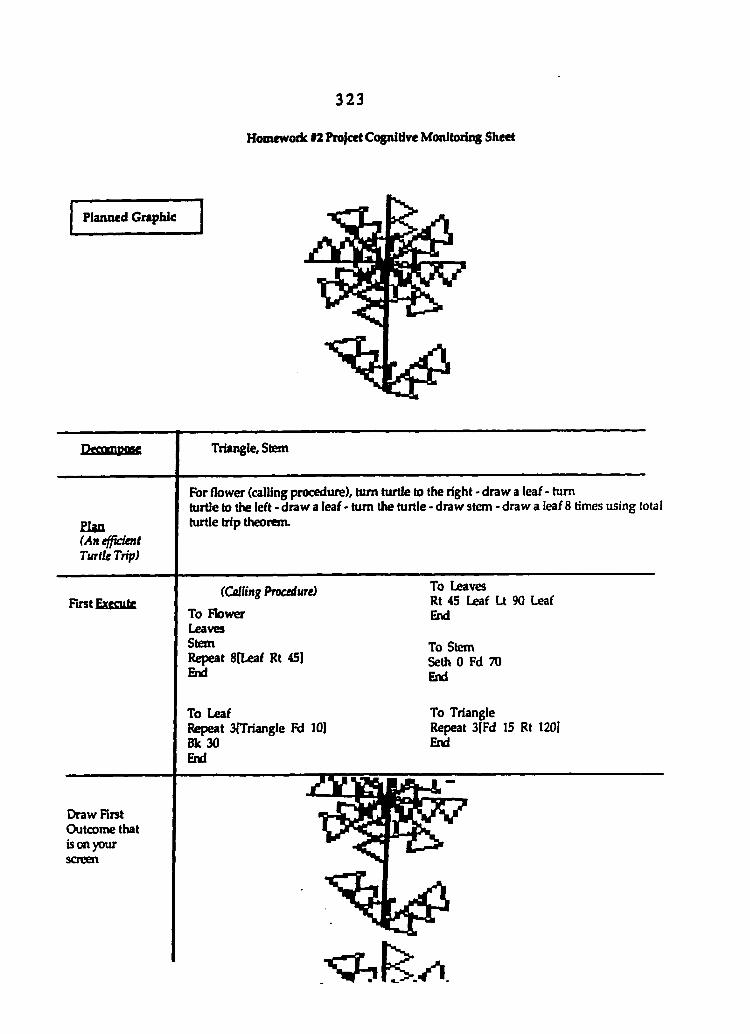
3 2 3
Homcwoik #2 Projcct Cognitive Monitoring Sheet
Planned Graphic
Triangle, Stem
Elan (An efficient Turtle Trip)
For flower (calling procedure), turn turtle to the right - draw a leaf - turn turtle to the left - draw a leaf - turn the turile - draw stem - draw a leaf 8 times using total turtle trip theorem.
First Execute (Calling Procedure)
To Flower Leaves Stem Repeat 8[Leaf Rt 451 Bid
To Leaf Repeat SpTriangle Fd 10] Bk 30 End
To Leaves Rt 45 Leaf Lt 90 Leaf End
To Stem Seth 0 Fd 70 End
To Triangle Repeat 3(Fd 15 Rt 1201 End
Draw First Outcome that is on your screen
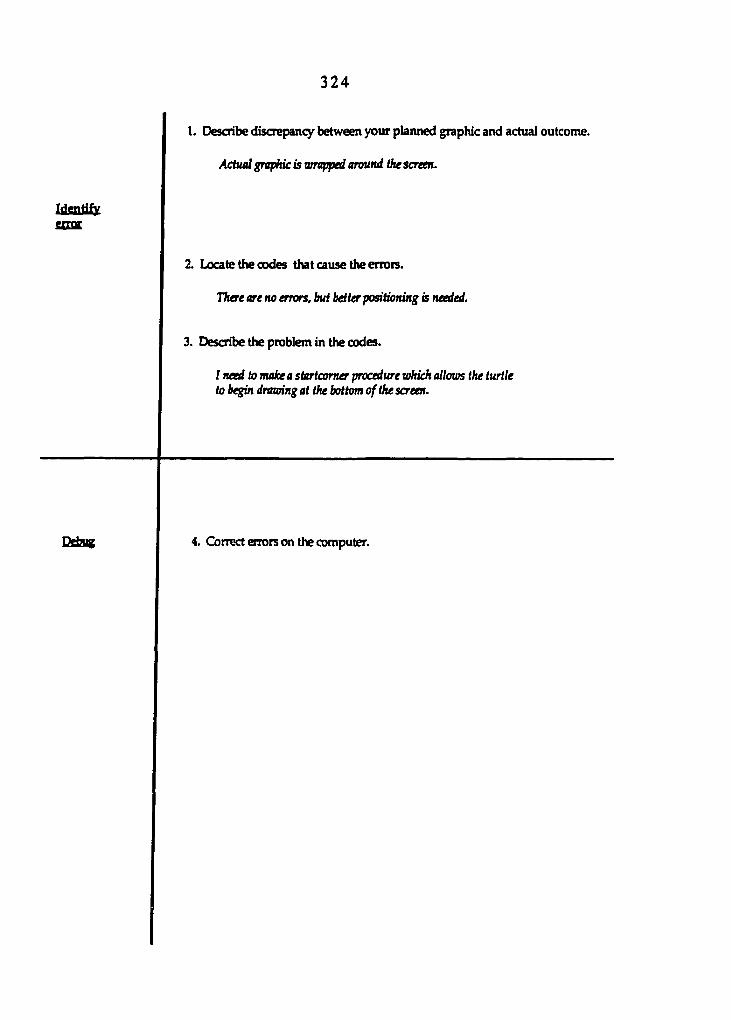
3 2 4
1. Describe discrepancy between your planned graphic and actual outcome.
Actualgrapkicis wrapped around ihescreen.
2. Locate the codes that cause the errors.
There are no errors, but better positioning à needed.
3. Describe the problem in the codes.
I need to make a startcomer procedure which allows the turtle to begin drawing at the bottom of the screen.
Debug 4. Qjrrect errors on the computer.
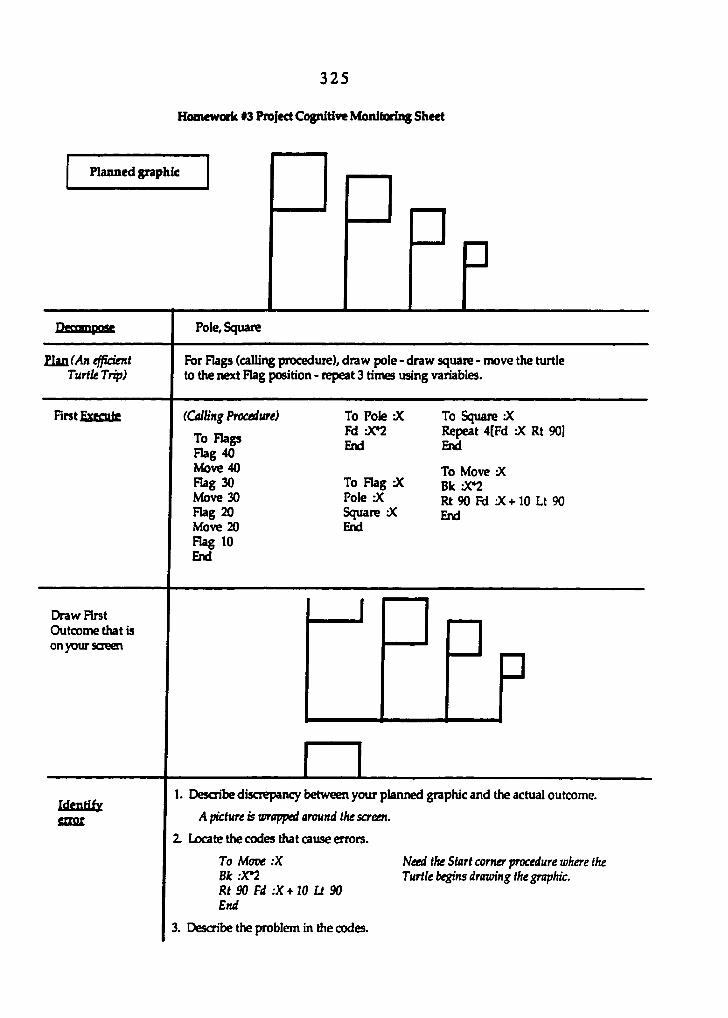
3 2 5
Homework #3 Project Cognitive Monitoring Sheet
Planned graphic
Pcnmpoae
tlaa(An efficient TurtUTrip)
Pole, Square
For Flags (calling procedure), draw pole - draw square - move the turtle to the next Flag position - repeat 3 times using variables.
First EafMite (QilUng Procedure)
To Flags Flag 40 Mow 40 Flag 30 Mow 30 Flag 20 Move 20 Flag 10 End
To Pole X Fd End
To Flag -X Pole X Square X End
To Square :X Repeat 4[Fd X Rt 90] End
To Move :X Bk Rt 90 M J( + 10 Lt 90 End
Draw First Outcome that is on your screen
Identify sasa
1. Describe discrepancy between your planned graphic and the actual outcome.
A picture is wrapped around the screen.
Z Locate the codes that cause errors.
To Move :X Bk:X*2 Rt 90 Fd :X+W U 90 End
3. Describe the problem in the codes.
Need the Start comer procedure where the Turtle begins drawing the graphic.
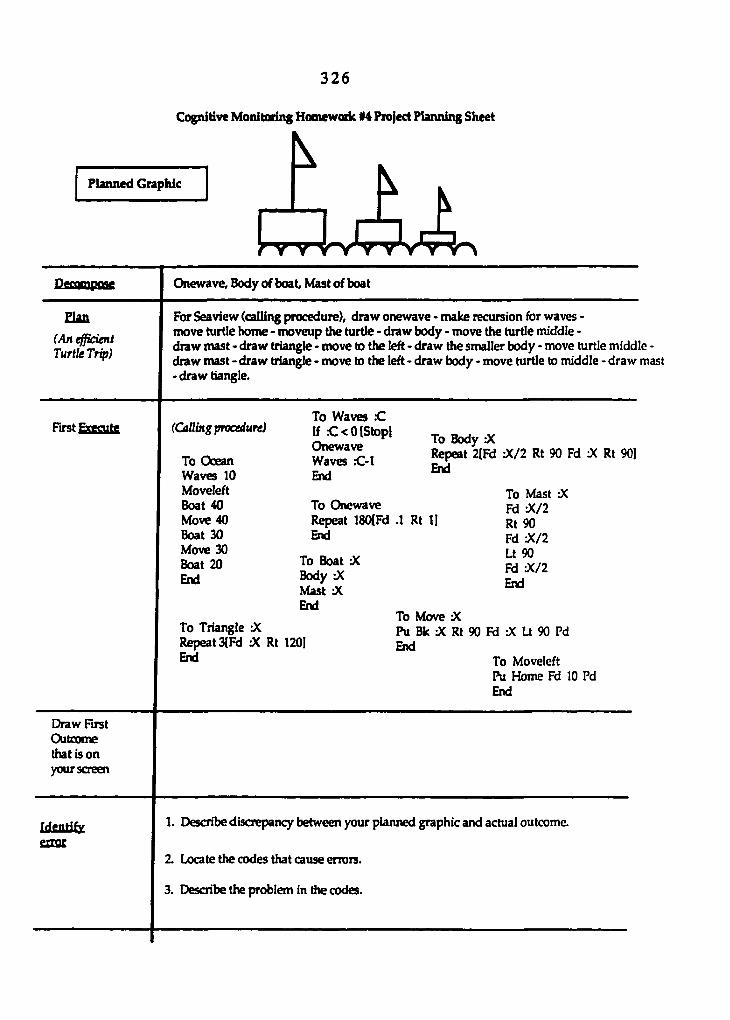
3 2 6
Planned Graphic
Cognitive Monitoring Homeworic #4 Project Planning Sheet
Pccanpoac Onewave, Body of boat. Mast of boat
Plan
(An efficient TurtteTrip)
For Seaview (calling procedure), draw onewave - make recursion for waves -move turtle home - moveup the turtle - draw body - move the turtle middle -draw mast - draw triangle - move to the left • draw the smaller body • move turtle middle -draw mast - draw triangle • move to the left - draw body - move turtle to middle - draw mast -draw tiangle.
First Execute (CaBing procedure)
To Ocean Waves 10 Moveleft Boat 40 Move 40 Boat 30 Move 30 Boat 20 Enl
To Waves .-C If <% < 0 (Stop) Onewave Waves KZ-l End
To Body Repeat 2(Fd X/l Rt 90 Fd :X Rt 90] End
To Onewave Repeat 180(Fd .1 Rt 1] End
To Boat -X Body JC Mast :X End
To Triangle :X Repeat 3(Fd X Rt 120] End
To Mast X F d X / 2 Rt 90 F d X / 2 Lt 90 F d X / 2 End
To Move :X P u B k J C R t 9 0 F d a L t 9 0 P d End
To Moveleft Pu Home Fd 10 Pd End
Draw First Outcome that is on your screen
Mgnrify
error
1. Describe discrepancy between your planned graphic and actual outcome.
2. Locate the codes that cause errors.
3. Describe the problem in the codes.

3 2 7
APPENDIX O: TRANSPARENCIES FOR EXAMPLES OF HOMEWORK ASSIGNMENT: CONTROL GROUP
3 2 8
Homewoik Project Planning Sheet
Planned Graphic
(Calling procedure)
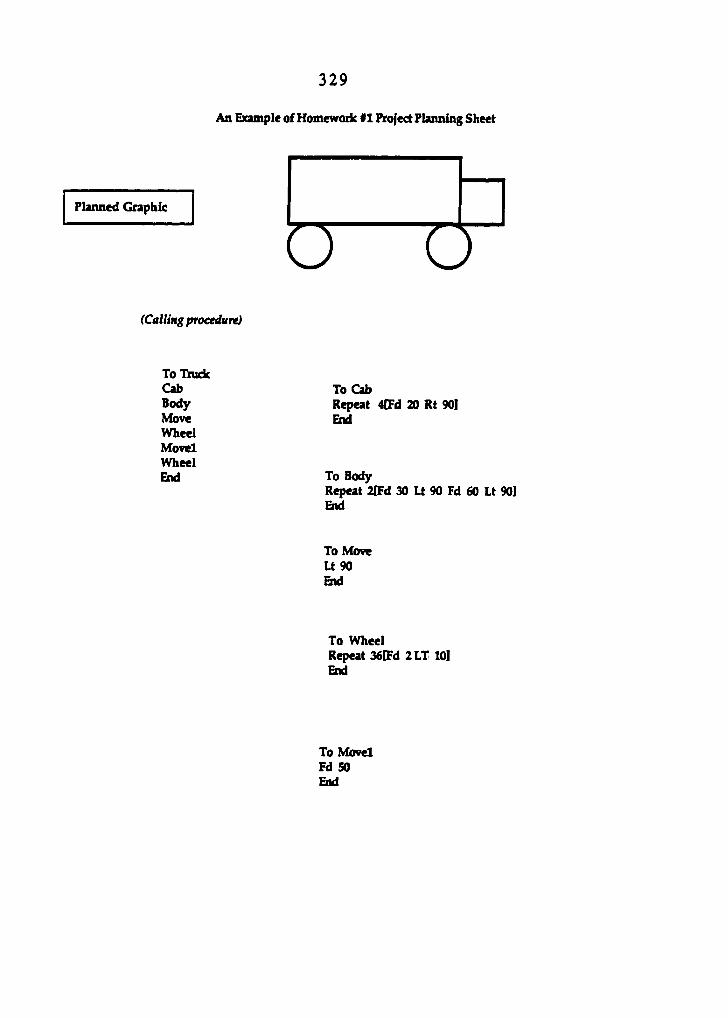
3 2 9
An Example of Homework *1 Project Planning Sheet
Planned Graphic
o (Calling procedure)
To Thick Cab Body Move Wheel Movel Wheel End
To Cab Repeat 4{Fd 20 Rt 90] End
To Body Repeat 2{Fd 30 Lt 90 Fd 60 Lt 90] End
To Move Lt 90 End
To Wheel Repeat 36CFd 2LT 10] End
To Miovel Fd 50 End
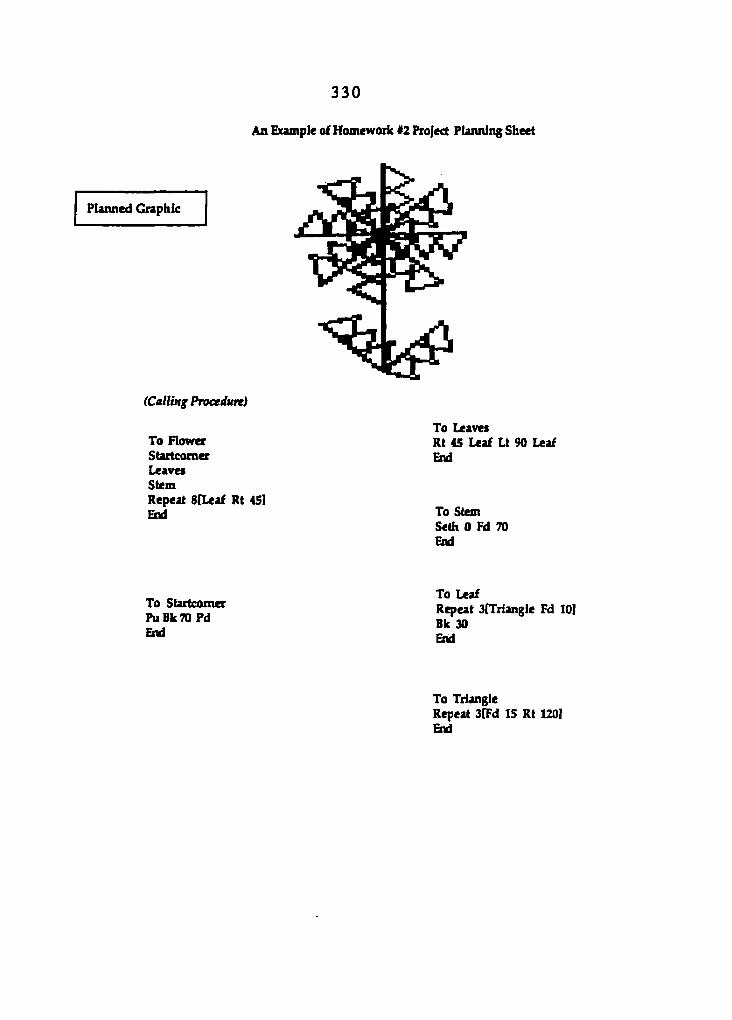
3 3 0
An Example of Homework <2 Project Planning Sheet
Planned Graphic
(Calling Procedure)
To Flower Startcomer Leaves Stem Repeat 8[Lcaf Rt 45] Ewl
To Leaves Rt 45 Leaf Lt 90 Leaf End
To Stem Seth 0 Fd 70 End
To Startcomer PuBkTO Pd End
To Leaf Repeat SfTriangle Fd 10] Bk 30 End
To Triangle Repeat 3(Fd 15 Rt 120] End
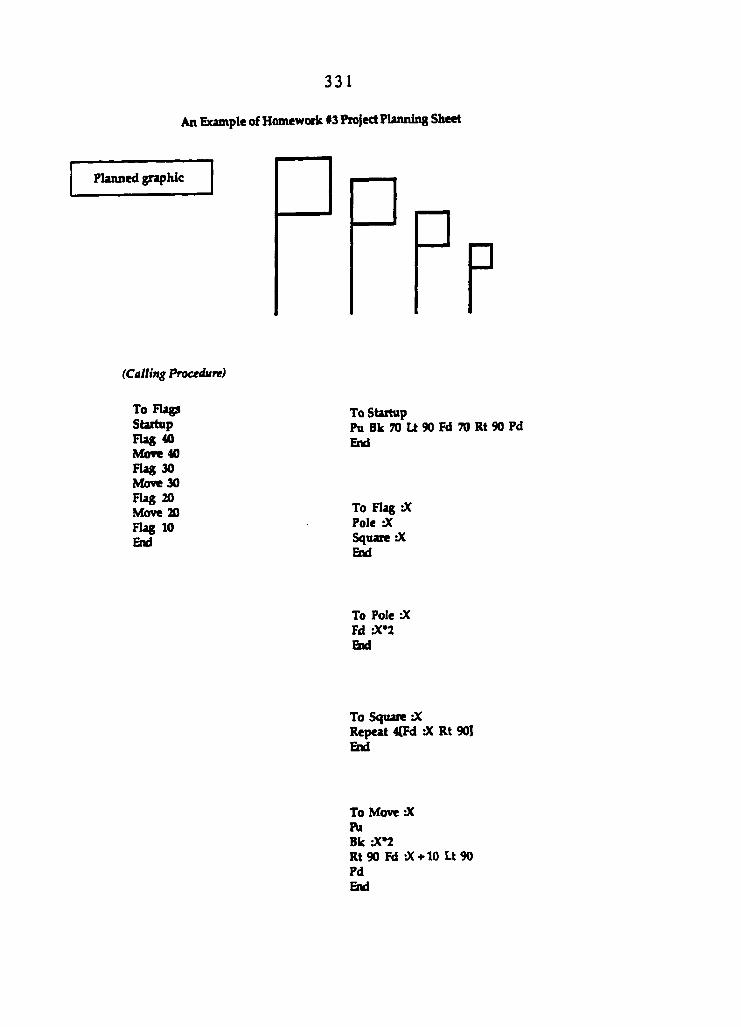
3 3 1
An Example of Homeworic «3 Project Planning Sheet
Planned gr^hic
•
(Calling Procedure)
To Flags To Startup Startup PuBk70U90Fd70Rt90Pd Hag 40 Ewi Move 40 Flag 30 Move 30 Flag 20 N t o S e M T o F l a g : X Flag 10 Pole 'X End Square X
End
To Pole -X Fd 'X*2 find
To Square :X Repeat 4(Fd X Rt 90] End
To Move X Pu Bk X*! R t 9 0 F d X * 1 0 L t 9 0 Pd End
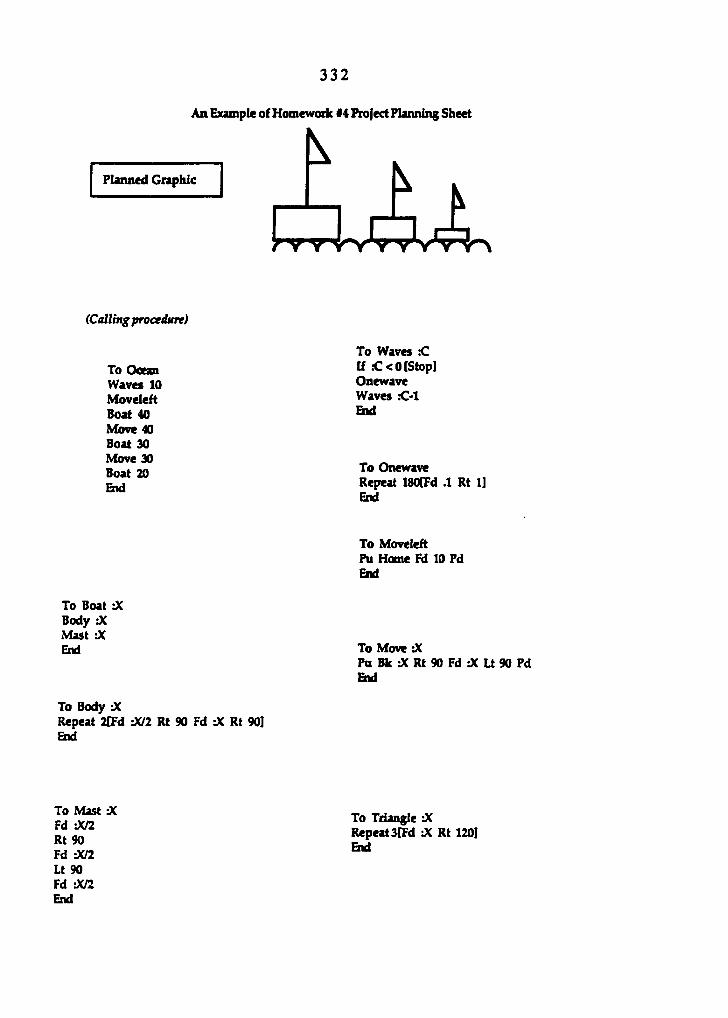
3 3 2
An Example of Homewoik #4 Fra}ect Planning Sheet
Planned Graphic
(Calling proeeiure)
To Ocean Waves 10 Moveleft Boat 40 Move 40 Boat 30 Move 30 Boat 20 End
To Waves <1 If C < 0 [Stop] Onewave Waves C I End
To Onewave Repeat 180[Fd .1 Rt 1] EKI
To Body :X Repeat 2[Fd :X/2 Rt 90 Fd :X Rt 90] Bid
To Moveleft Pu Home Fd 10 Pd End
To Boat :X Body :X Mast iX End To Move :X
Pa Bk :X Rt 90 Fd :X Lt 90 Pd Enl
fÎ To Triangle JC ^ Repeat 3(Fd X Rt 120]
?dS/2 ^ Lt 90 Fd -Ml End

3 3 3
APPENDIX P: HOMEWORK ASSIGNMENT CRITERIA SHEETS: EXPERIMENTAL GROUP
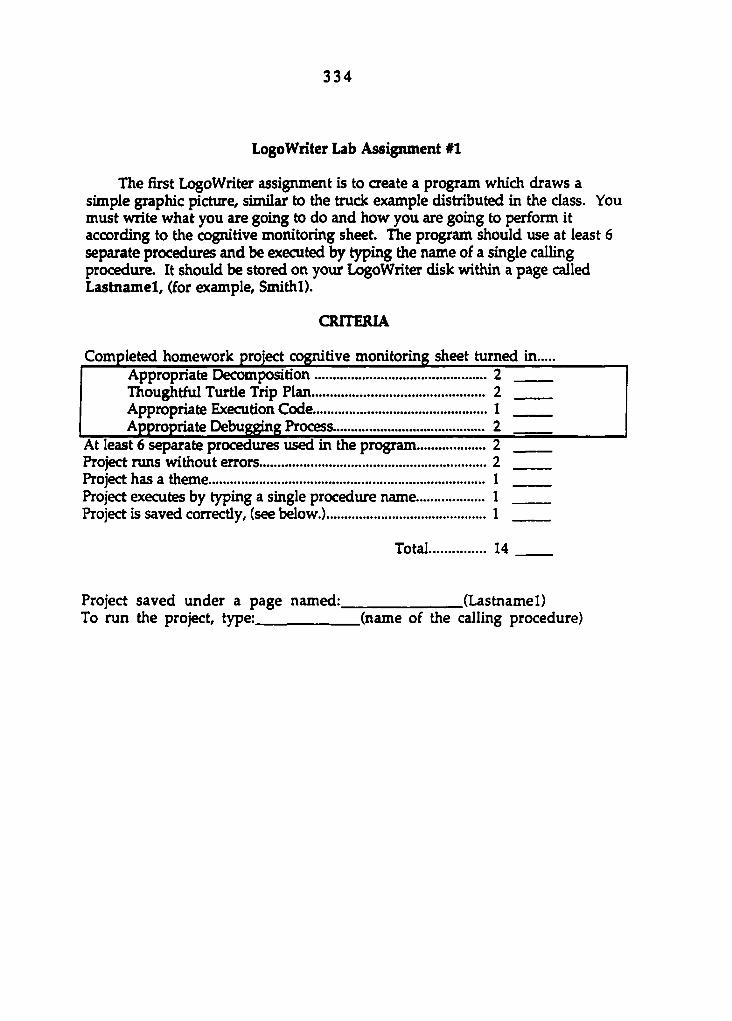
3 3 4
LogoWriter Lab Assignment #1
The first LogoWriter assigiunent is to create a program which draws a simple graphic picture, similar to the truck example distributed in the class. You must write what you are going to do and how you are going to perform it according to the cognitive monitoring sheet. TTie program should use at least 6 separate procedures and be executed by typing the name of a single calling procedure. It should be stored on your LogoWriter disk within a page called Lastnamel, (for example, Smithl).
CRITERIA
Completed homework project cognitive monitoring sheet turned in Appropriate Decomposition 2 Thoughtful Turtle Trip Plan 2 Appropriate Execution Code. 1 Appropriate Debugging Process 2
At least 6 separate procedures used in the program 2 Project runs without errors 2 Project has a theme. 1 Project executes by typing a single procedure name 1 Project is saved correctly, (see below.) 1
Total 14
Project saved under a page named: (Lastnamel) To run the project, type: (name of the calling procedure)
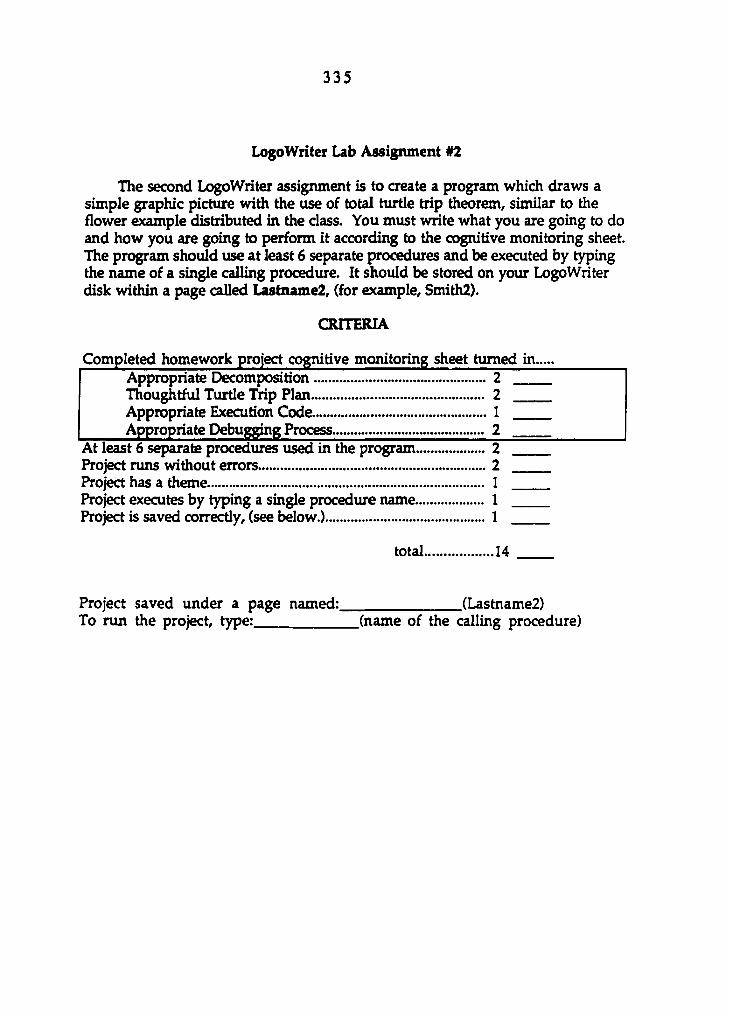
3 3 5
LogoWriter Lab Assignment #2
The second LogoWriter assignment is to create a program which draws a simple graphic picture with the use of total turtle trip theorem, similar to the flower example distributed in the class. You must write what you are going to do and how you are going to perform it according to the cognitive monitoring sheet. The program should use at least 6 separate procedures and be executed by typing the name of a single calling procedure. It should be stored on your LogoWriter disk within a page called Lastname2, (for example, Smith2).
CRITERIA
Completed homework project cognitive monitoring sheet turned in Appropriate Decomposition 2 Thoughtful Turtle Trip Plan 2 Appropriate Execution Code. 1 Appropriate Debugging Process 2
At least 6 separate procedures used in the program 2 Project runs without errors 2 Project has a theme. 1 Project executes by typing a single procedure name 1 Project is saved correctly, (see bdow.) 1
total 14
Project saved under a page named: (Lastname2) To run the project, type: (name of the calling procedure)
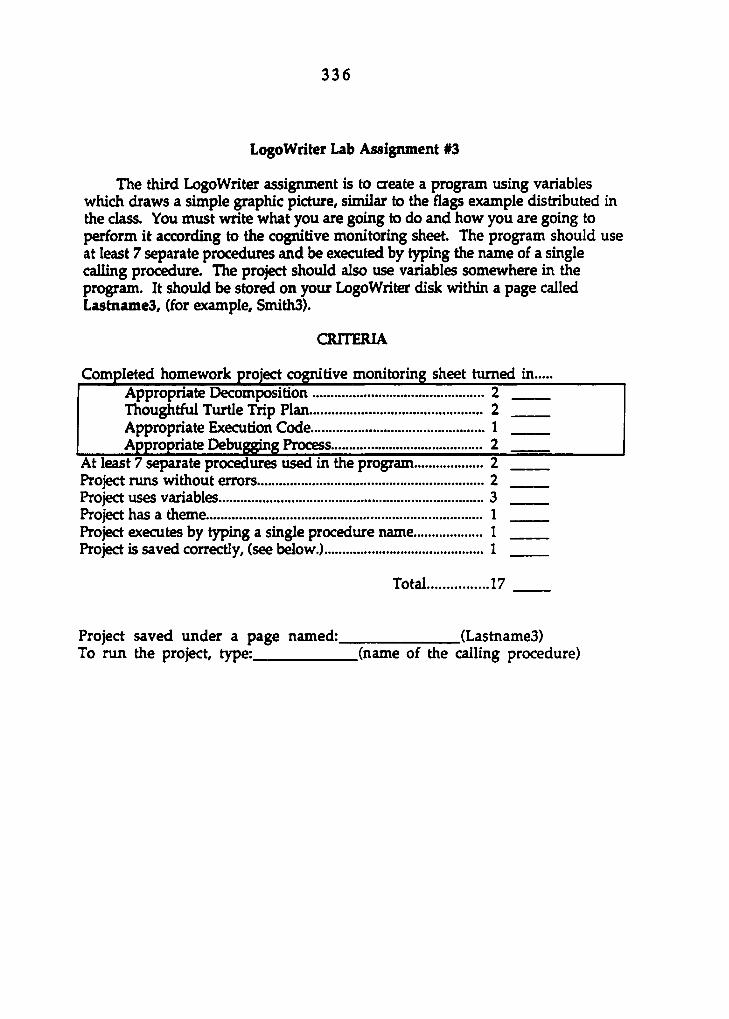
3 3 6
LogoWriter Lab Assignment #3
The third LogoWriter assignment is to create a program using variables which draws a simple graphic picture, similar to the flags example distributed in the class. You must write what you are going to do and how you are going to perform it according to the cognitive monitoring sheet. The program should use at least 7 separate procedures and be executed by typing the name of a single calling procedure. The project should also use variables somewhere in the program. It should be stored on your LogoWriter disk within a page called LastnameS, (for example, SmithS).
CRITERIA
Completed homework project cognitive monitoring sheet turned in Appropriate Decomposition 2 Thoughtful Turtle Trip Plan 2 Appropriate Execution Code 1 Appropriate Debugging Process 2
At least 7 separate procedures used in the program 2 Project runs without errors 2 Project uses variables 3 Project has a theme 1 Project executes by typing a single procedure name 1 Project is saved correctly, (see below.) 1
Total 17
Project saved under a page named: (Lastname3) To run the project, type: (name of the calling procedure)
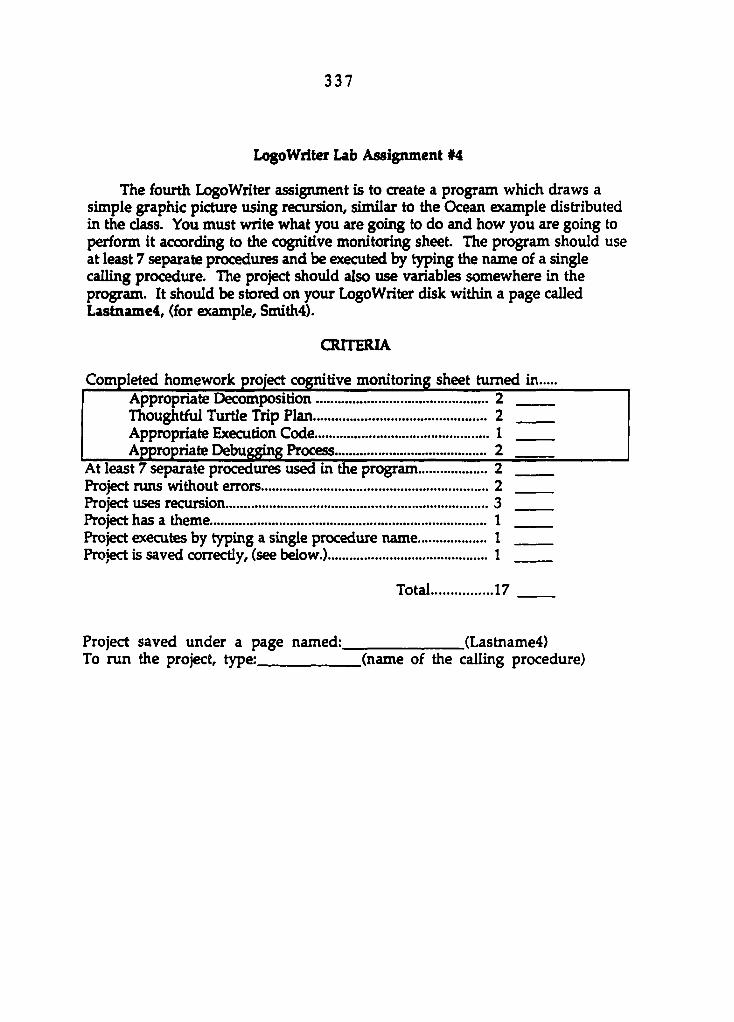
3 3 7
Logo Writer Lab Assignment #4
The fourth LogoWriter assignment is to create a program which draws a simple graphic picture using recursion, similar to the Ocean example distributed in the class. You must write what you are going to do and how you are going to perform it according to the cognitive monitoring sheet. The program should use at least 7 separate procedures and be executed by typing the name of a single calling procedure. The project should also use variables somewhere in the program. It should be stor^ on your LogoWriter disk within a page called Lastname4, (for example, Smith4).
CRITERIA
Completed homework project cognitive monitoring sheet turned in Appropriate Decomposition 2 Thoughtful Turtle Trip Plan 2 Appropriate Execution Code. 1 Appropriate Debugging Process 2
At least 7 separate procedures used in the program 2 Project runs without errors 2 Project uses recursion 3 Project has a theme 1 Project executes by typing a single procedure name 1 Project is saved correctly, (see bdow.) 1
Total 17
Project saved under a page named: (Lastname4) To run the project, type: (name of the calling procedure)

3 3 8
APPENDIX Q: HOMEWORK ASSIGNMENT CRITERIA SHEETS: CONTROL GROUP
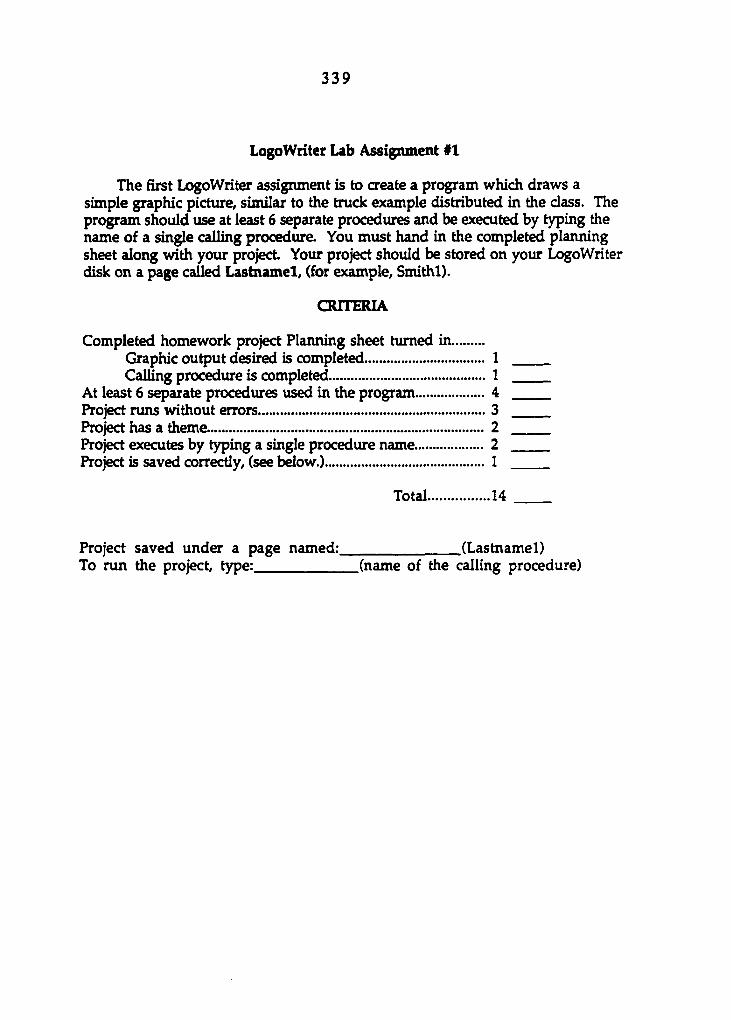
3 3 9
LogoWriter Lab Assignment #1
The first LogoWriter assignment is to create a program which draws a simple graphic picture, similar to the truck example distributed in the class. The program should use at least 6 separate procedures and be executed by typing the name of a single calling procedure. You must hand in the completed planning sheet along with your project Your project should be stored on your LogoWriter disk on a page caUed Lastnamel, (for example, Smithl).
CRITERIA
Completed homework project Planning sheet turned in Graphic output desired is completed 1 Calling proc^ure is completed 1
At least 6 separate procedures used in the program 4 Project runs without errors 3 Project has a theme. 2 Project executes by typing a single procedure name 2 Project is saved correctly, (see bdow.) 1
Total 14
Project saved under a page named: (Lastnamel) To run the project, type: (name of the calling procedure)
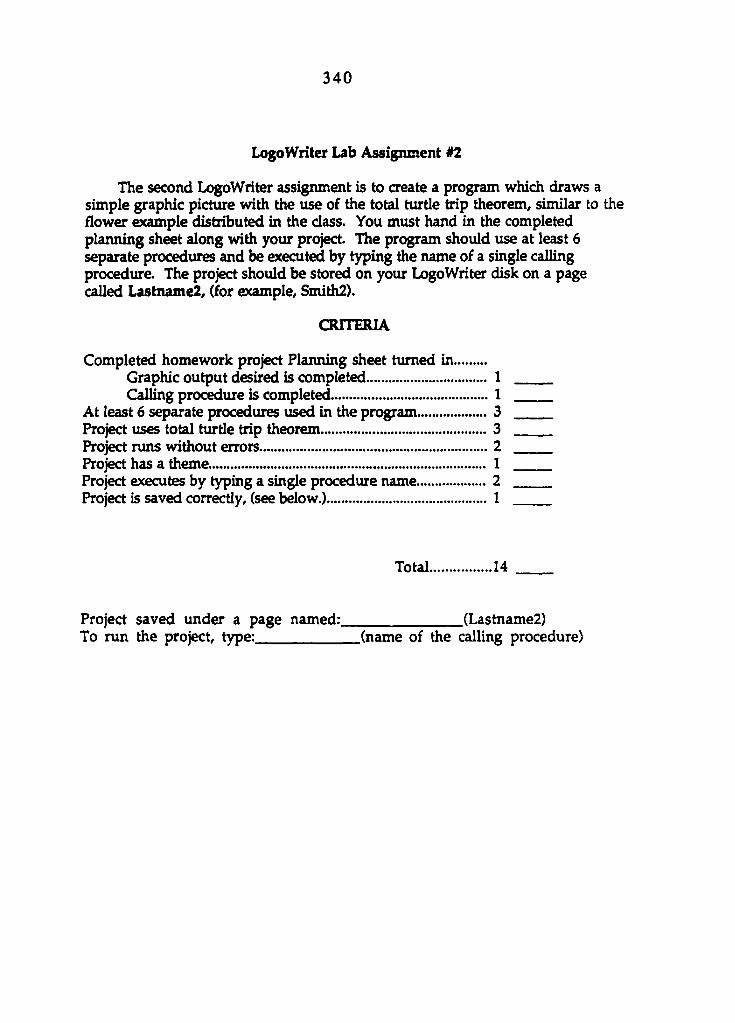
3 4 0
Logo Writer Lab Assignment #2
The second LogoWriter assignment is to create a program which draws a simple graphic picture with the use of the total turtle trip theorem, similar to the flower example distributed in the class. You must hand in the completed planning sheet along with your project. The program should use at least 6 separate procedures and be executed by typing the name of a single calling procedure. The project should be stored on your LogoWriter disk on a page called Lastname2, (for example, Smith2).
CRITERIA
Completed homework project Planning sheet turned in Graphic output desired is completed 1 Calling proc^ure is completed 1
At least 6 separate procedures iised in the program 3 Project uses total turtle trip theorem 3 Project runs without errors 2 Project has a theme. 1 Project executes by typing a single procedure name 2 Project is saved correctly, (see below.) 1
Total 14
Project saved under a page named: (Lastname2) To run the project, type: (name of the calling procedure)
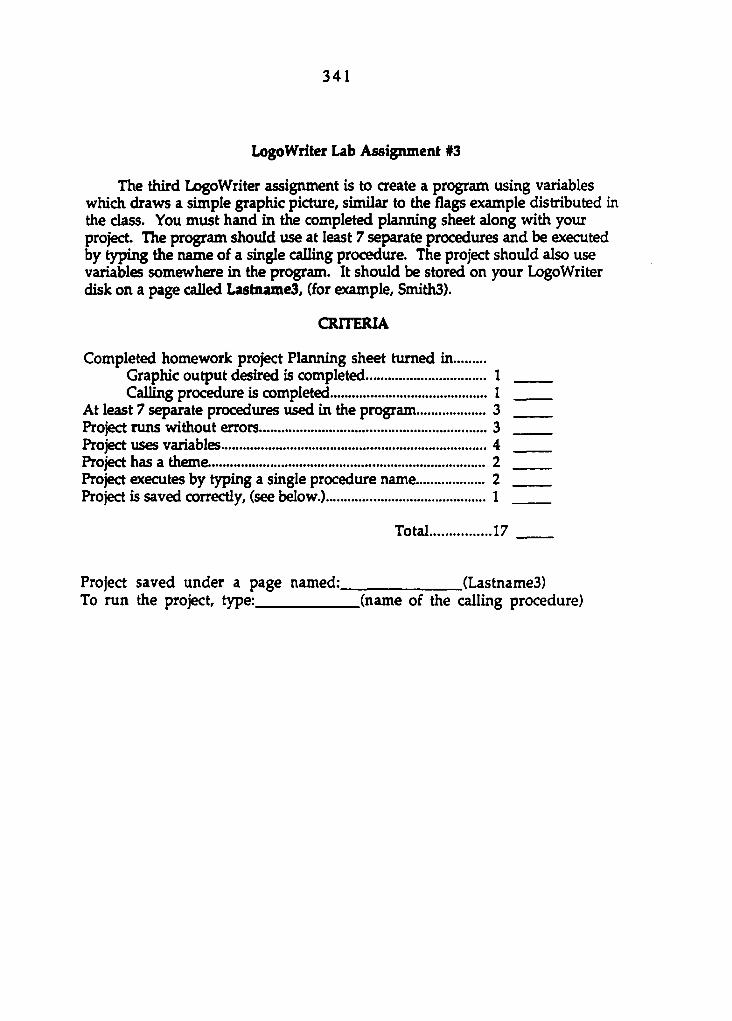
3 4 1
LogoWriter Lab Assignment #3
The third LogoWriter assignment is to create a program using variables which draws a simple graphic picture, similar to the flags example distributed in the class. You must hand in the completed planning sheet along with your project. The program should use at least 7 separate procedures and be executed by typing the name of a single calling procedure. The project should also use variables somewhere in the program. It should be stored on your LogoWriter disk on a page called Lastname3, (for example, Smith3).
CRITERIA
Completed homework project Planning sheet turned in Graphic output desired is completed 1 Calling proc^ure is completed 1
At least 7 separate procedures used in the program 3 Project runs without errors 3 Project uses variables 4 Project has a theme. 2 Project executes by typing a single procedure name 2 Project is saved correctly, (see below.) 1
Total 17
Project saved under a page named: (LastnameS) To run the project, type: (name of the calling procedure)
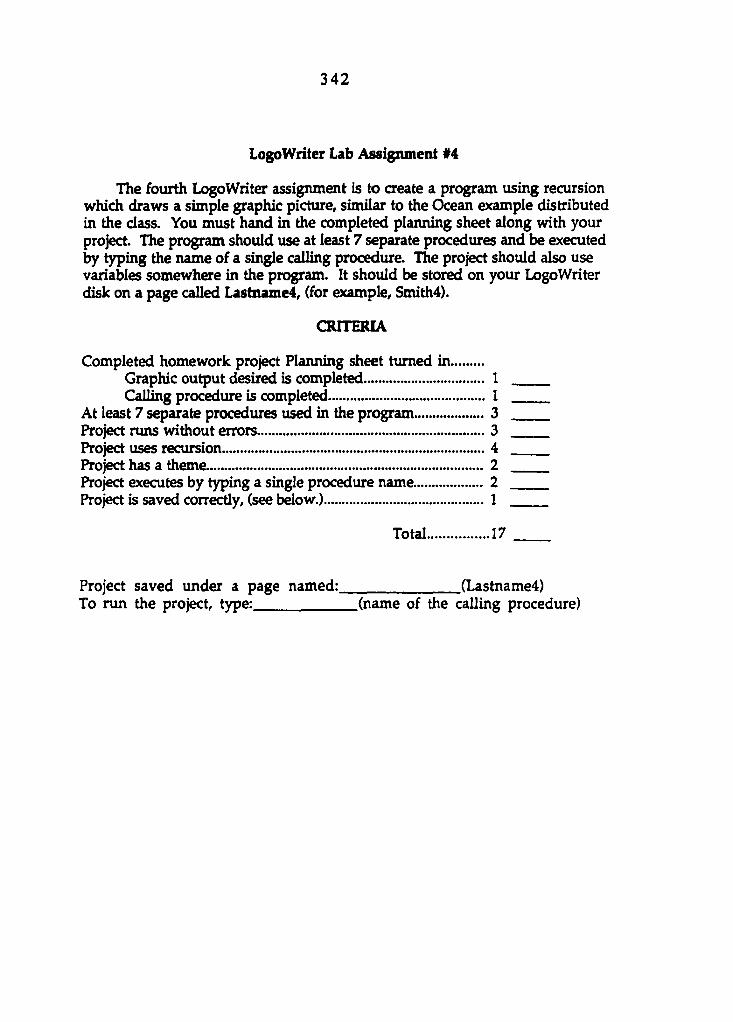
3 4 2
LogoWriter Lab Assignment #4
The fourth LogoWriter assignment is to create a program using recursion which draws a simple graphic picture, similar to the Ocean example distributed in the class. You must hand in the completed planning sheet along with your project. The program should use at least 7 separate procedures and be executed by typing the name of a single calling procedure. The project should also use variables somewhere in the program. It should be stored on your LogoWriter disk on a page called Lastname4, (for example, Smith4).
CRITERIA
Completed homework project Planning sheet turned in Graphic output desired is completed 1 Calling procedure is completed 1
At least 7 separate procedures used in the program 3 Project runs without errors 3 Project uses recursion 4 Project has a theme. 2 Project executes by typing a single procedure name 2 Project is saved corre<^y, (see bdow.) 1
Total 17
Project saved under a page named: (Lastname4) To run the project, type: (name of the calling procedure)

3 4 3
APPENDIX R: LCX30 DECOMPOSING AND PLANNING TEST
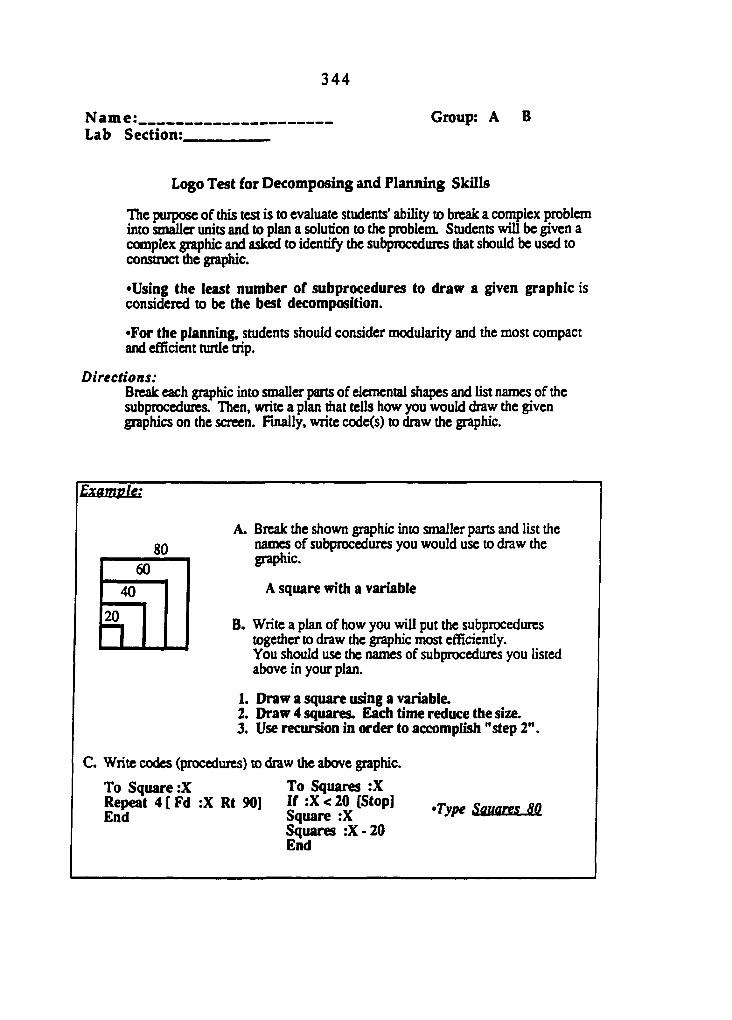
3 4 4
Name; Group: A B Lab Section:
Logo Test for Decomposing and Planning Skills
The purpose of this test is to evaluate students' ability to break a complex problem into smaller units and to plan a solution to the problem. Students will be given a complex graphic and ad ̂to identify the subprocedurcs that should be used to construct the graphic.
•Using the least number of subprocedures to draw a given graphic is considered to be the best decomposition.
•For the planning, students should consider modularity and the most compact and efficient turtle trip.
Directions: Break each graphic into smaller parts of elemental shapes and list names of the subprocedures. Then, write a plan that tells how you would draw die given graphics on the screen. Finally, write code(s) to draw die graphic.
Example:
A. Break the shown graphic into smaller parts and list the names of subprocedures you would use to draw the graphic.
A square with a variable
B. Write a plan of how you will put the subprocedures together to draw the graphic most effîciendy. You should use the names of subprocedures you listed above in your plan.
1. Draw a square using a variable. 2. Draw 4 squares. Each time reduce the size. 3. Use recursion in order to accomplish "step 2".
C. Write codes (procedures) to draw the above graphic.
To Square :X To Squares :X
Squares :X-20 End
80 60
40
20
1
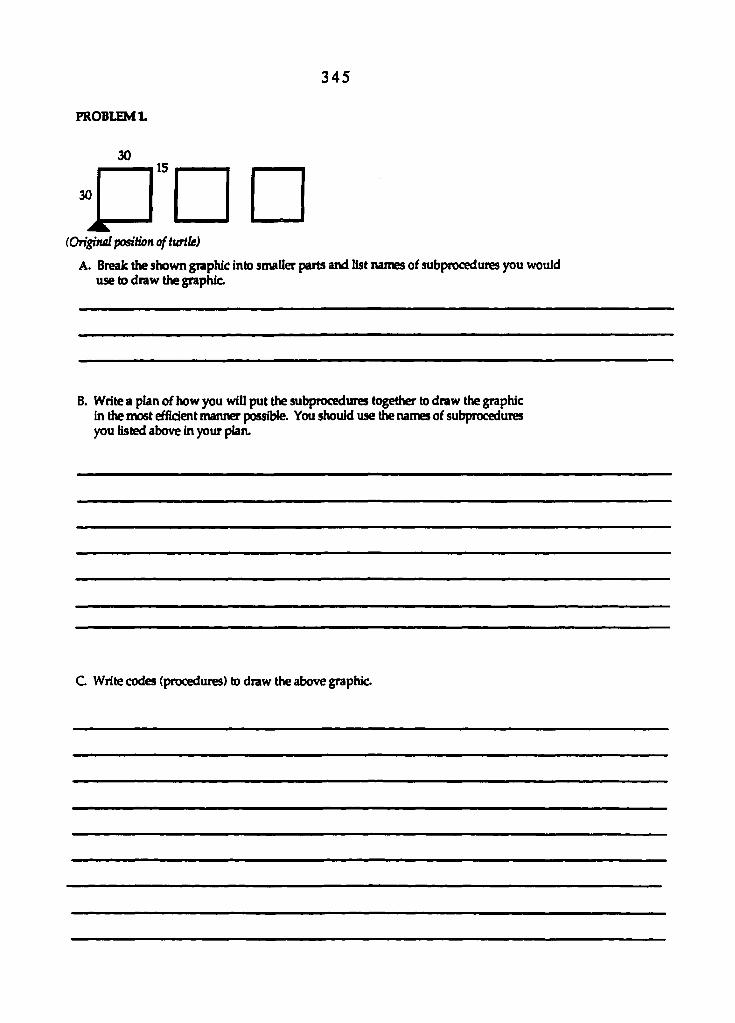
3 4 5
PROBLEM 1.
30
O'oo (Original jnâtion ofturik)
A. Break the shown graphic into smaller parts and list names of subprocedures you would use to draw the graphic
B. Write a plan of how you will put the subprocedures together to draw the graphic in the most efficient manner possible. You should use the names of subprocedures you listed above in your plan.
C Write codes (procedures) to draw the above graphic.
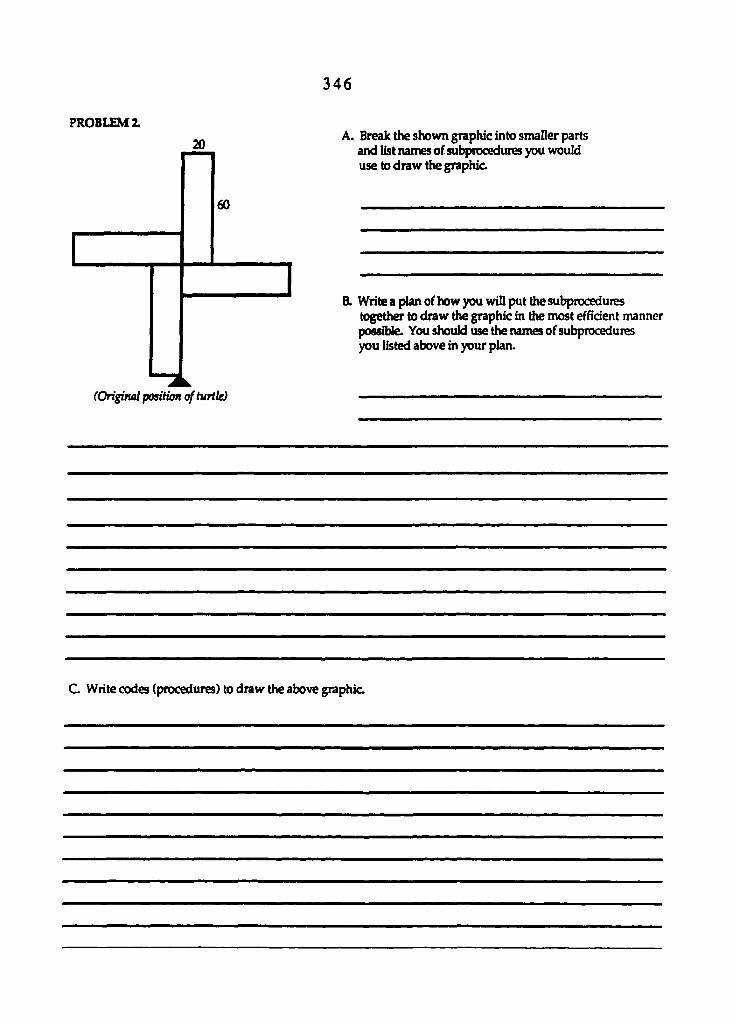
PROBLEM Z 20
60 60
(Original position of turtle)
3 4 6
A. Break the shown graphic into smaller parts and list names of subprooedures you would use to draw the graphic
B. Write a plan of how you will put the subprocedures together to draw the graphic in the most efficient manner possible. You should use the names of subprocedures you listed above in your plan.
C. Write codes (procedures) to draw the above graphic
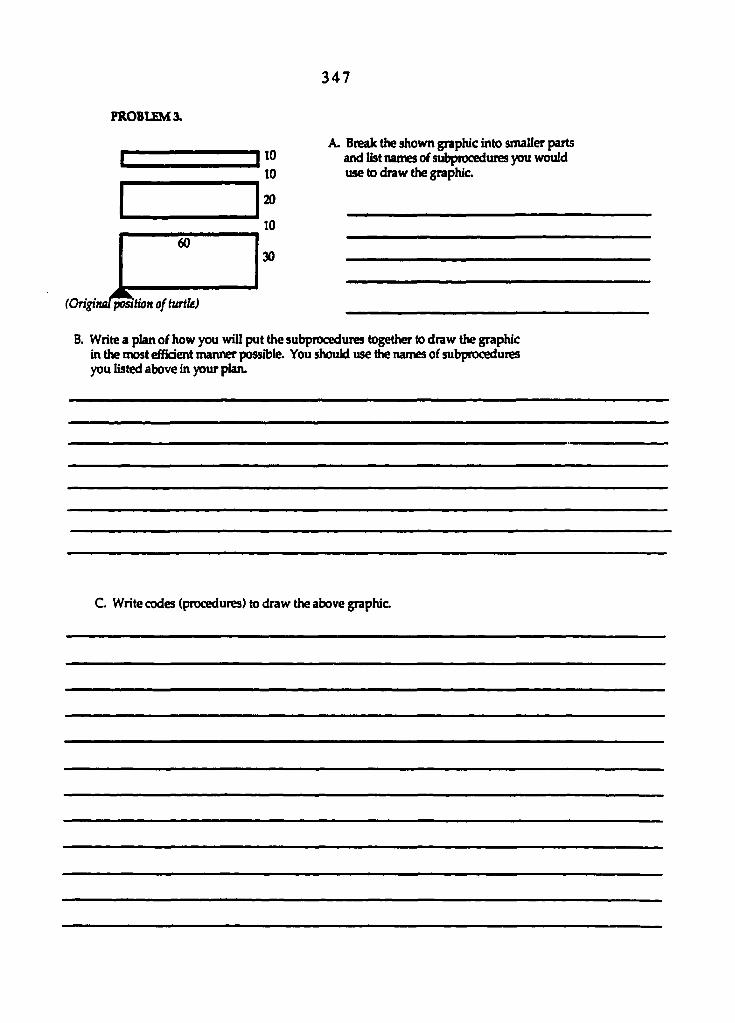
3 4 7
PROBLEMS.
A. Break the shown graphic into smaller parts and list names of subprocedures you would use to draw the graphic.
(Origitial position of turtle)
B. Write a plan of how you will put the subprocedures together to draw the graphic in the most efficient manner possible. You should use the names of subpnsœdures you listed above in your plan.
C Write codes (procedures) to draw the above graphic
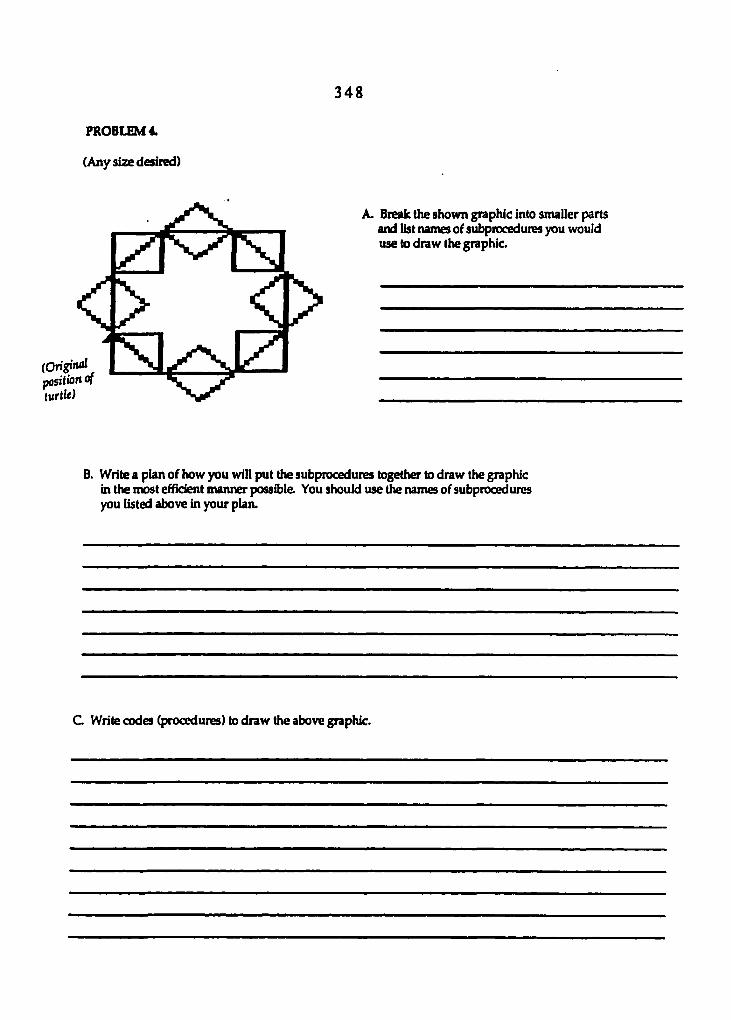
3 4 8
PROBLEMS
(Any size desired)
(Original positionof turtle)
A. Break the shown graphic into smaller parts and list names of subprocedures you would use to draw the graphic.
B. Write a plan of how you will put the subprocedures together to draw the graphic in the most efficient manner possible You should use (he names of subprocedures you listed above in your plan.
C Write codes (procedures) to draw the above graphic.
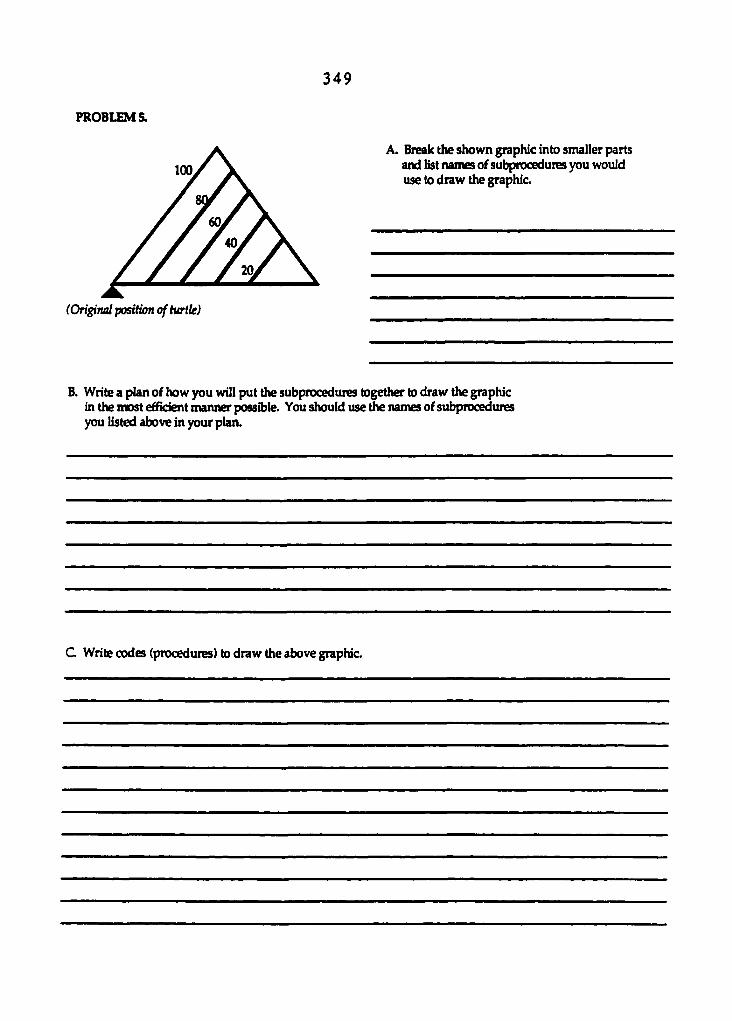
3 4 9
PROBLEMS.
A. Break the shown graphic into smaller parts and list names of subprocedures you would use to draw the graphic.
(Original position of turtle)
B. Write a plan of how you will put the subprocedures together to draw the graphic in the most efficient manner possible. You should use the names of subprocedures you listed above in your plan.
C Write codes (procedures) to draw the above graphic.

3 5 0
APPENDIX S: LCXSO ERROR IDENTMCAITON TEST
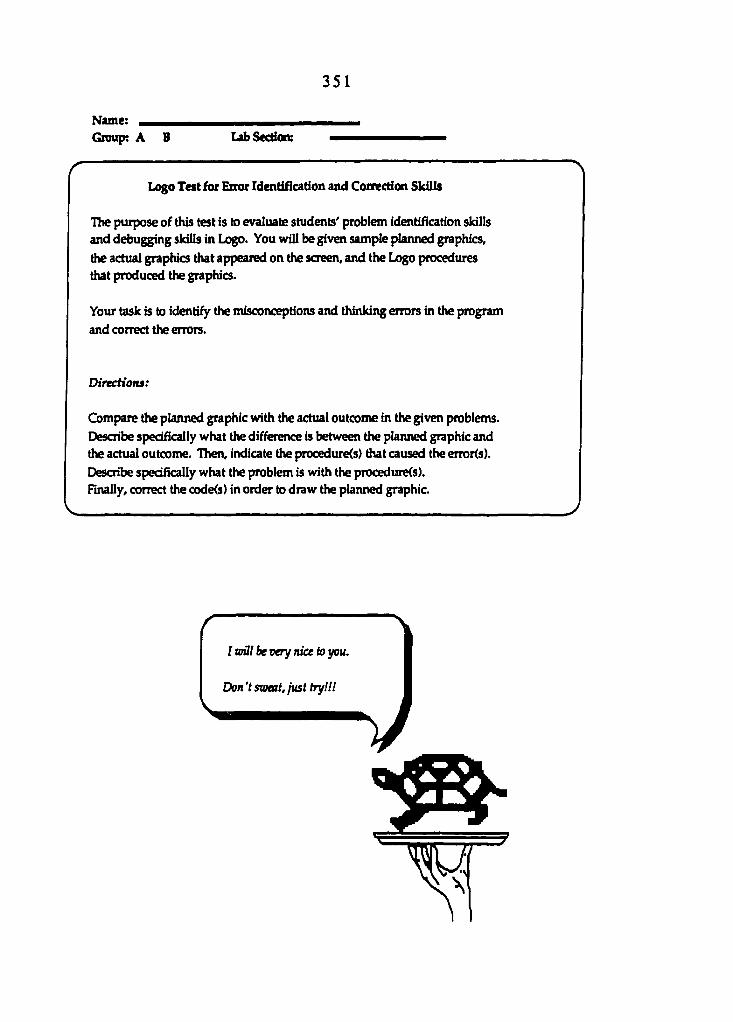
3 5 1
Name: Group: A B Lab Scction:
Logo Test for Error Identification and Correction Skills
The purpose of this test is to evaluate students' problem identification skills
and debugging skills in Logo. You will be given sample planned graphics,
the actual graphics that appeared on the screen, and the Logo procedures
that produced the graphics.
Your task is to identify the misconceptions and thinking errors in the program
and correct the errors.
Directions:
Compare the planned graphic with the actual outcome in the given problems.
Describe specifically what the difference is between the planned graphic and
the actual outcome. Then, indicate the procedure(s) that caused the erroKs).
Describe specifically what the problem is with the procedure(s).
Finally, correct the code<s) in order to draw the planned graphic
I toûl be very nice to you.
Don't sweat, just trylH
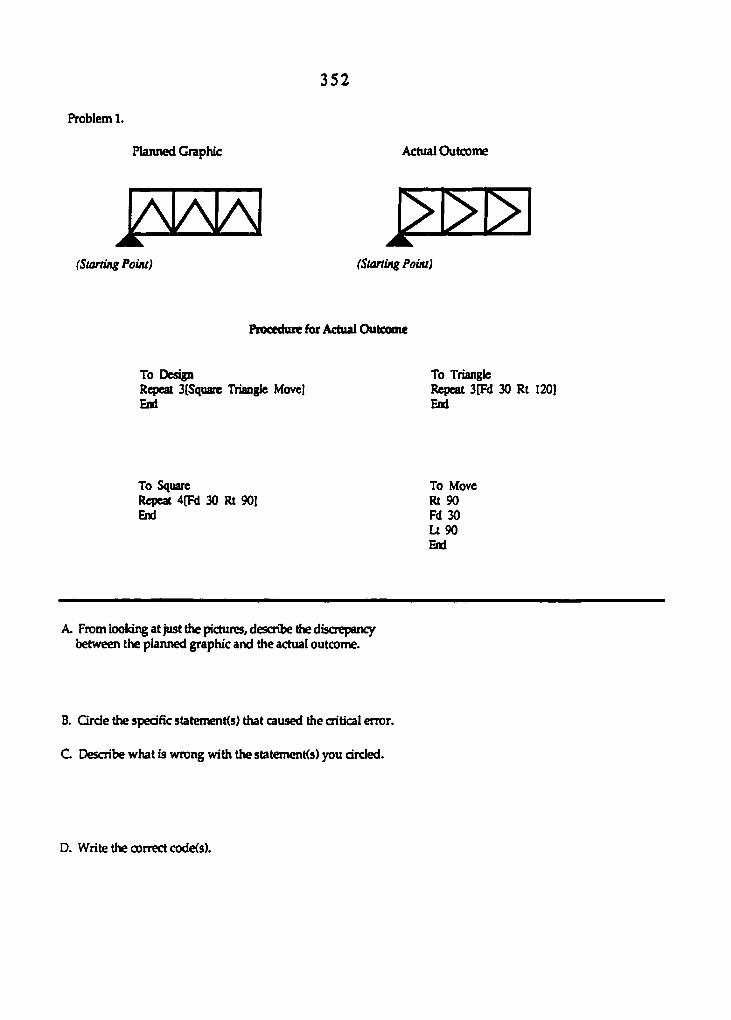
3 5 2
Problem 1.
Planned Graphic Actual Outcome
AIAIAI (SU2rting Point) (Starting Point)
Procedure for Actual Outcome
To Design Repeat 3(Square Triangle Move) End
To Triangle Repeat 3[Fd 30 Rt 120] Eni
To Square Repeat 4[Fd 30 Rt 90] End
To Move Rt 90 Fd 30 Lt 90 Eld
A. From looking at just the pictures, describe the discrepancy between the planned graphic and the actual outcome.
B. Circle the spedHc statemenKs) that caused the critical error.
C Describe what is wrong with the statemenKs) you circled.
D. Write the correct code(s).
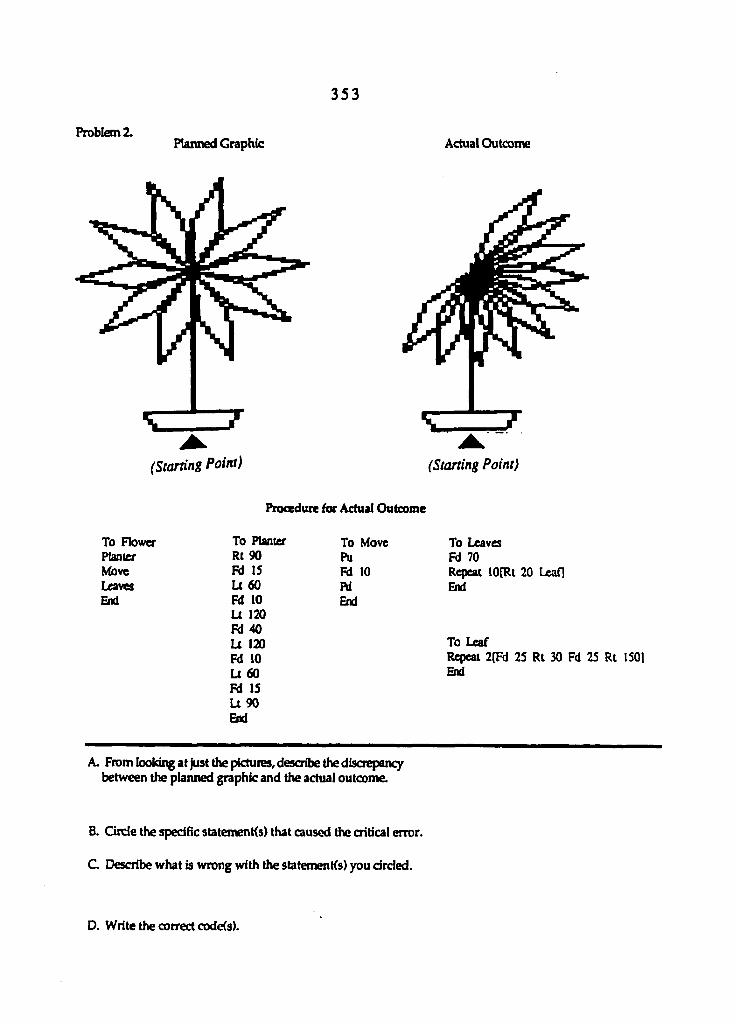
3 5 3
Problem 2. Planned Graphic Actual Outcome
(Starting Point) (Starting Point)
Procedure for Actual Outcome
To Flower To Planter To Move Plan 1er Rt 90 Pu Move Fd 15 Fd 10 Leaves U 60 Fd End Fd 10 End
U 120 Fd 40 Lt 120 Fd 10 Lt 60 Fd 15 U 90 End
To Leaves Fd 70 Repeat 10(Rl 20 Leaf] End
To Leaf Repeat 2[Fd 25 Rt 30 Fd 25 Rt 1501 Eld
A. From looking at just the pictures, describe the discrepancy between the planned graphic and the actual outcome.
B. Circle the specific statemenKs) that caused the critical error.
C Describe what is wrong with the statements) you circled.
D. Write the correct code(s).
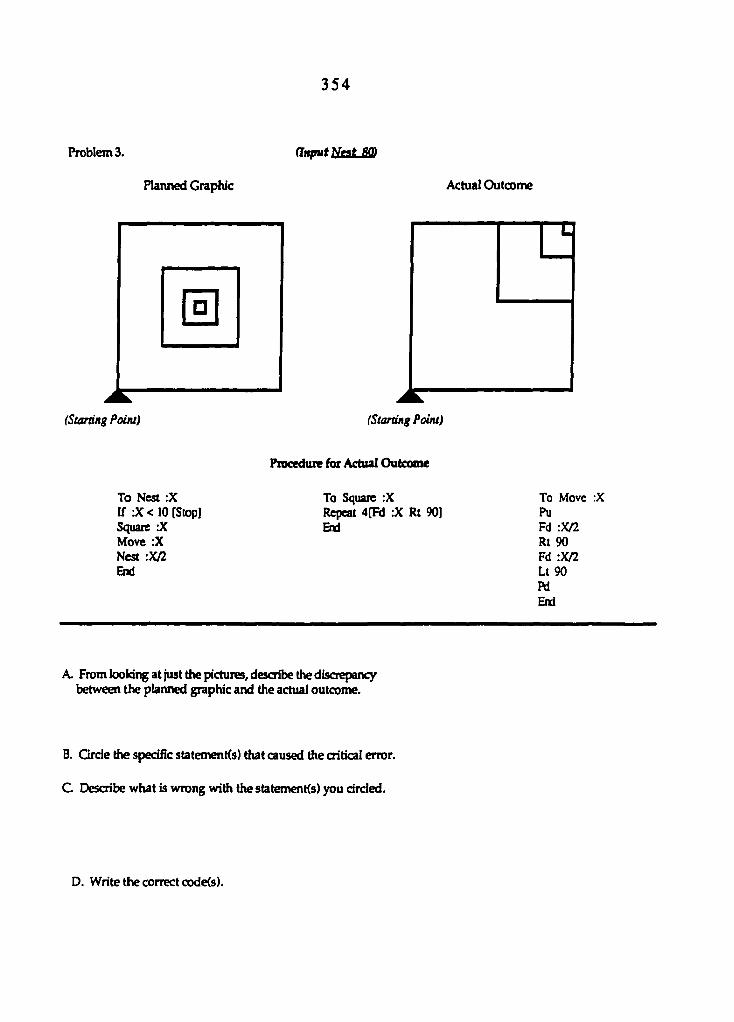
3 5 4
Problem 3. (Input Nêat 80)
Planned Graphic Actual Outcome
(Starting Point) (Starting Point)
Procedure for Actual Outcome
To Nest :X To Square :X To Move :X If JC< 10 [Stop] Repeat 4[Fd JC Rt 90] Pu Square X Bd Fd :X/2 Move :X Rt 90 Nest :X/2 Fd :X/2 End Lt 90
Pd End
A. From looking at just the pictures, describe the discrepancy between the planned graphic and the actual outcome.
B. Circle the specific statemenKs) that caused the critical error.
C Describe what is wrong with the statemenKs) you drcled.
D. Write the correct code(s).
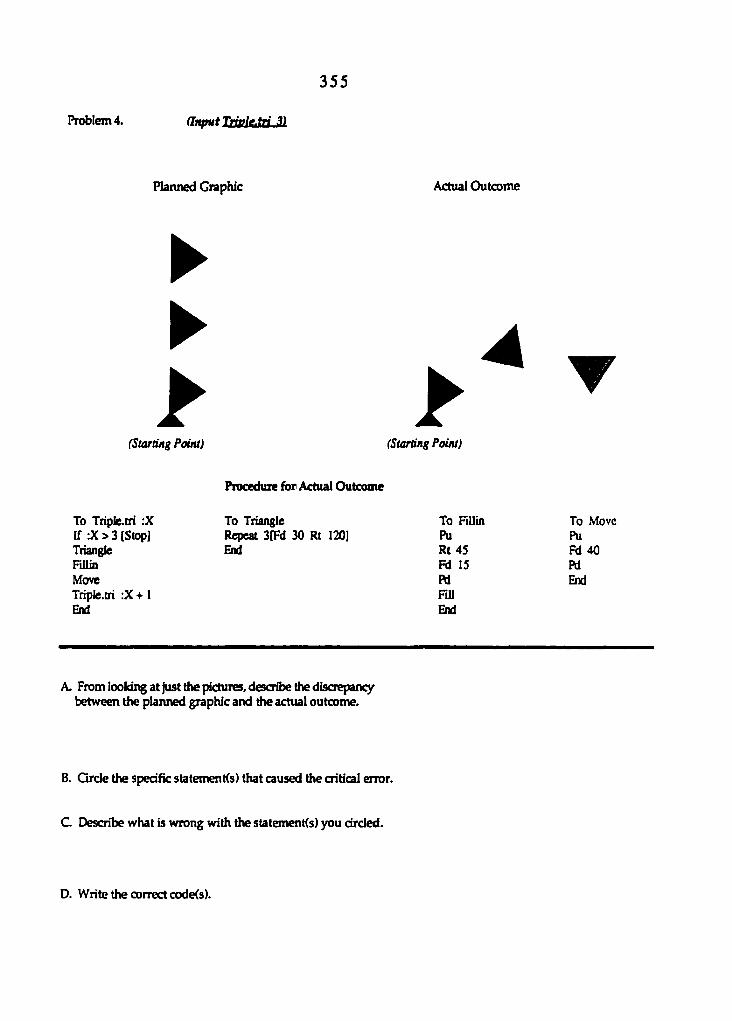
3 5 5
Problem 4. (Input Triple.tri 3)
Planned Graphic Actual Outcome
• •
> (Starting Point)
To Triple.tri :X If :X > 3 [Slop] Triangle FiUin Move Triple.tri :X +1 E»1
> (Starting Point)
4 T
Procedure for Actual Outcome
To Triangle Repeal 3(Fd 30 Rt 120) End
To FiUin Pu Rt 45 Fd 15 pa HU End
To Move Pu Fd 40 Pd End
A. From looking at just the pictures, describe the discrepancy between the planned graphic and die actual outcome.
B. Grde the specific statemenKs) that caused the critical error.
C Describe what is wrong with the statemenKs) you drcled.
D. Write the correct code(s).

3 5 6
Problon 5. Planned Graphic
CJ
Actual Outcome
Q
(Starting Point) (Starling Point)
Procedure for Actual Outcome
To Flag To Stand :X To Pick :X To Square :X Stand 30 Square :X If :X < I [Slop] Repeat 4[Fd :X Rt 90] Pick 30 Fd JC Square :X End End Rt 90 Pick ;X-10
Fd JC/2 End U 90 Fd JC*3 End
A. From looking at just the pictures, describe the discrepancy between the planned graphic and the actual outcome.
B. Circle the specific statemenKs) that caused the critical error.
C Describe what is wrong with the statemenKs) you circled.
D. Write the correct code(s).
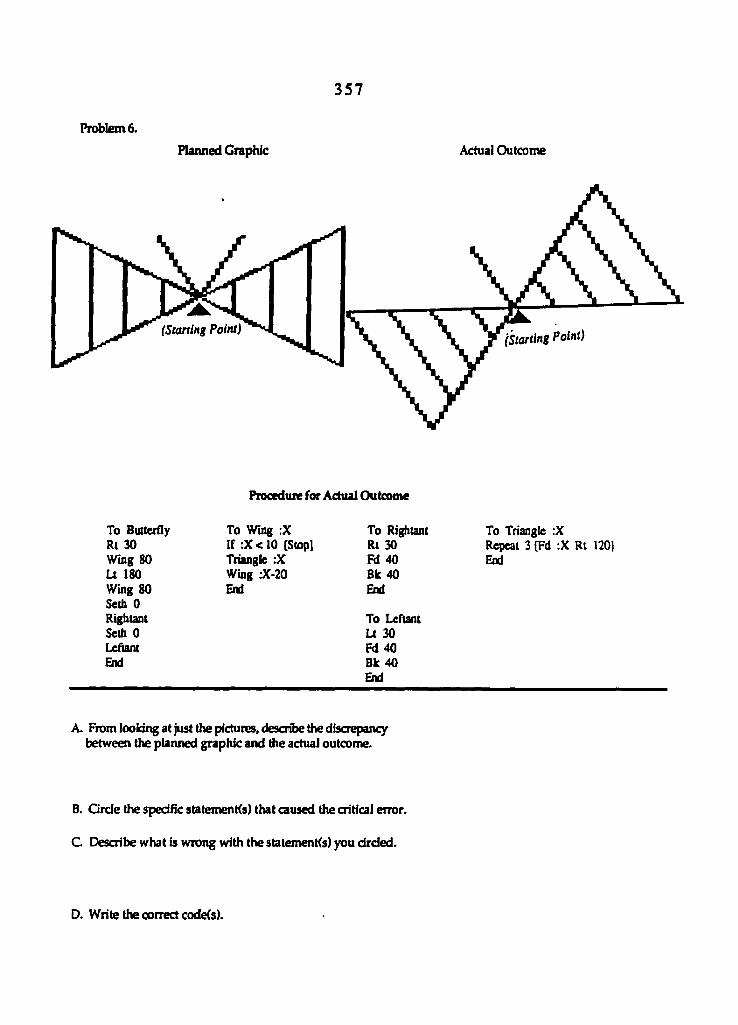
3 5 7
Problem 6.
Planned Graphic Actual Outcome
(Starting Point) (Starting Point)
Procedure for Actual Outcome
To Butterfly To Wing :X To Rightant Rt 30 If :X<10 {Slop] Rt 30 Wing 80 Triangle :X Fd 40 Lt 180 Wing JC-20 Bk 40 Wing 80 End End Seth 0 Rigiitant To Leftant Seth 0 U 30 Lefiam M 40 End Bk 40
Eld
To Triangle :X Repeal 3 (Fd ;X Rl 120) Eld
A. From looking at just the pictures, describe the discrepancy between the planned graphic and the actual outcome.
B. Grde the specific statemenKs) that caused the critical error.
C Describe what is wrong with the statemenKs) you drded.
D. Write the correct code<s).

3 5 8
APPENDIX T: GENERAL DECOMPOSING TEST
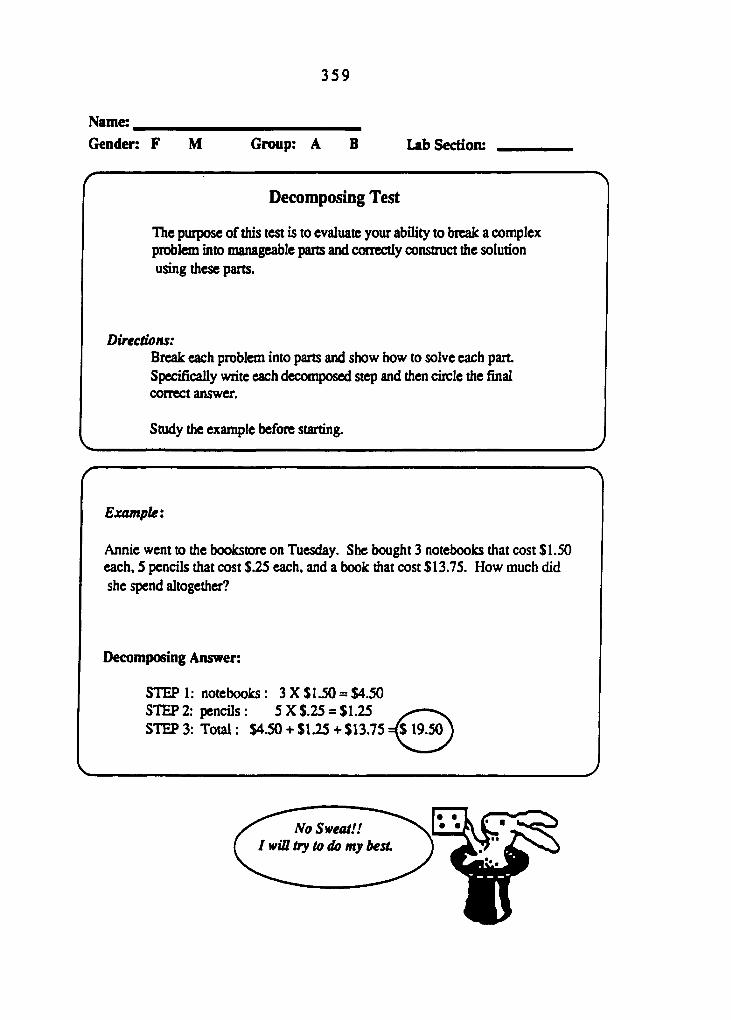
3 5 9
Name:
Gender: F M Group: A B Lab Section:
r Decomposing Test
The purpose of this test is to evaluate your ability to break a complex problem into manageable parts and conectly construct the solution using these parts.
Directions: Break each problem into parts and show how to solve each part Specifically write each decomposed step and then circle the final correct answer.
Study the example before starting.
Example:
Annie went to the bookstore on Tuesday. She bought 3 notebooks that cost $1.50 each, 5 pencils that cost $.25 each, and a book that cost $13.75. How much did she spend altogether?
Decomposing Answer:
V
STEP 1: notebooks : 3 X $U0 = $4.50 STEP 2: pencils : 5 X $.25 = $1.25 STEP 3: Total : $4.50 + $1.25 + $13.75
No Sweat!! I win by to do my besL

3 6 0 • • • RemindeR It is not necessary to fill all the steps given!!!
1. Tom, a teacher, has thirty students in his classroom. They have sworn that they can each keep a secret for one full day. On Monday at 9:00 a.m. Tom tells a secret to two students. They must keep the secret until Tuesday at 9:00 a.m., when they may each tell two other students and no more than that. Those students must keep the secret until 9:00 A.M. the next day, when they can each tell two more students, and so on. If all the students keep the secret for exactly one day, on what day will the entire class know the secret? (Students who have been told the secret are marked with a red pin so they will not be told again.)
STEPl
STEP2
STEP3
STEP 4
STEPS
STEP6
STEP7
STEPS
STEP9
2. In an African language lev klula buj means "buy green peppers". Ajm buj gyst means "big green cars" and ikuka lev ajm means "quickly ^y cars". How would you say big peppers in this African language?
STEPl
STEP2
STEP3
STEP4
STEPS
STEP6
STEP7
STEPS
STEP9
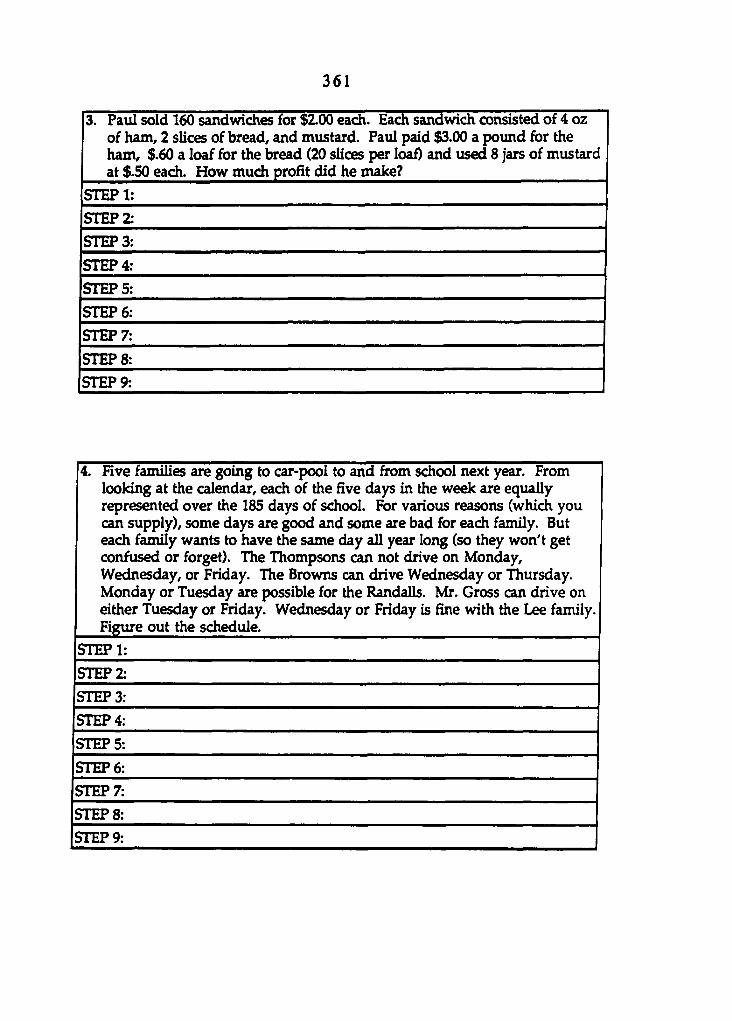
3 6 1
3. Paul sold 160 sandwiches for $200 each. Each sandwich consisted of 4 oz of ham, 2 slices of bread, and mustard. Paul paid $3.00 a pound for the ham, $.60 a loaf for the bread (20 slices per loaf) and used 8 jars of mustard at $.50 each. How much profit did he make?
STEPl
STEP2
STEP3
STEP4
STEPS
STEP6
STEP7
STEPS
STEP9
4. Hve families are going to car-pool to and fnm school next year. From looking at the calendar, each of the five days in the week are equally represented over the 185 days of school. For various reasons (which you can supply), some days are good and some are bad for each family. But each family wants to have the same day all year long (so they won't get confused or forget). The Thompsons can not drive on Monday, Wednesday, or Friday. The Browns can drive Wednesday or Thursday. Monday or Tuesday are possible for the Randalls. Mr. Gross can drive on either Tuesday or Friday. Wednesday or Friday is fine with the Lee family. Figure out the schedule.
STEP 1
STEP2
STEPS
STEP 4
STEPS
STEP6
STEP7
STEPS
STEP9
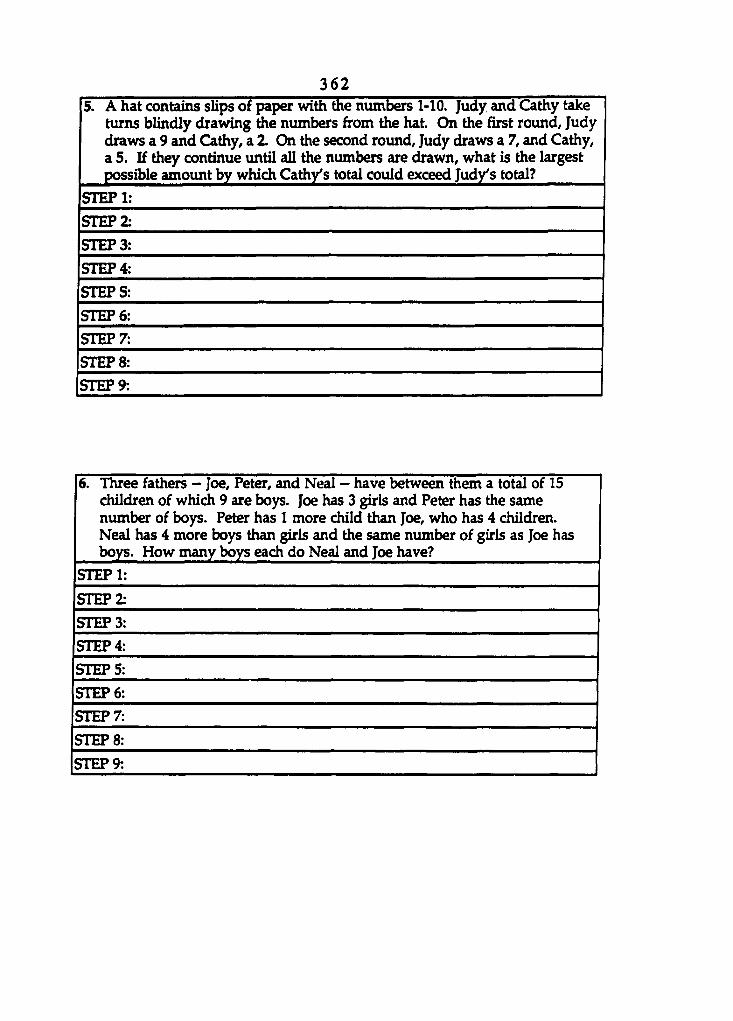
3 6 2 5. A hat contains slips of paper with the numbers l-IO. Judy and Cathy take
turns blindly drawing the numbers from the hat. On the first round, Judy draws a 9 and Cathy, a 2. On the second round, Judy draws a 7, and Cathy, a 5. If they continue until all the numbers are drawn, what is the largest possible amount by which Cathy's total could exceed Judy's total?
STEPl
STEP2
STEP3
STEP4
STEPS
STEP6
STEP7
STEPS
STEP9
6. Three fathers - Joe, Peter, and Neal - have between them a total of 15 children of which 9 are boys. Joe has 3 girls and Peter has the same number of boys. Peter has 1 more child than Joe, who has 4 children. Neal has 4 more boys than girls and the same number of girls as Joe has boys. How many boys each do Neal and Joe have?
STEPl
STEP2
STEPS
STEP4
STEPS
STEP6
STEP7
STEPS
STEP9

3 6 3
APPENDIX U: GENERAL PLANNING TEST
3 6 4
Name: _____
Group: A B
Lab Section:
Planning Strategy Test
Hie purpose of this test is to evaluate students' ability to organize given information, to order the sequence of actions to be performed, and think logically in order to achieve the goal most efficiently.
Directions:
Read the given problem carefully, and specifically describe your solution processes to the problem.
Try to seek cues or hints in a given problem.
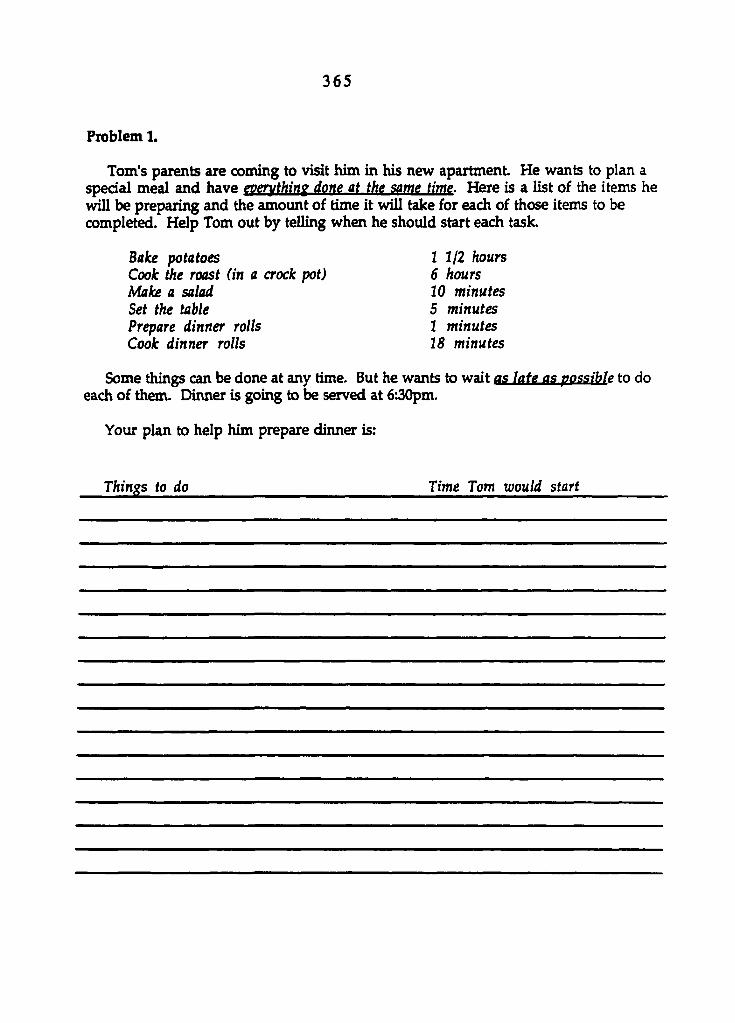
3 6 5
Problem L
Tom's parents are coming to visit him in his new apartment. He wants to plan a spedal meal and have evervthirtf done at the same time. Here is a list of the items he
be preparing and the amount of time it will take for each of those items to be completed. Help Tom out by telling when he should start each task.
Bake potatoes Cook the roast (in a crock pot) Make a salad Set the table Prepare dinner rolls Cook dinner rolls
1 1/2 hours 6 hours 10 minutes 5 minutes 1 minutes 18 minutes
Some things can be done at any time. But he wants to wait as late as possible to do each of them. Dinner is going to be served at 6:30pm.
Your plan to help him prepare dinner is:
Things to do Time Tom would start
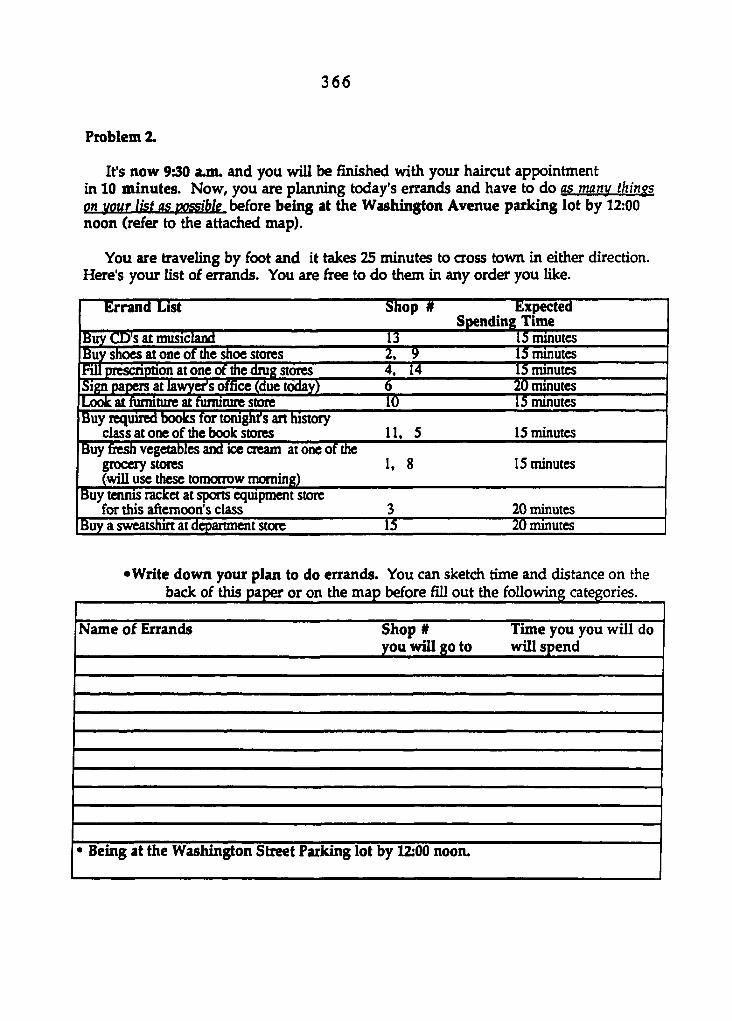
3 6 6
Problem 2.
It's now 9:30 ajn. and you will be finished with your haircut appointment in 10 minutes. Now, you are planning today's errands and have to do as many thirty on your list as possible tefore being at the Washington Avenue parking lot by 12:00 noon (refer to the attached map).
You are traveling by foot and it takes 25 minutes to cross town in either direction. Here's your list of errands. You are free to do them in any order you like.
Errand List Shop # Expected Spending Time
Buy CD's at musicland 13 15 minutes Buy shoes at one of the shoe stores 2. 9 15 minutes Fill prescription at one of the drug stores 4, 14 15 minutes Sign papers at lawyer's ofRce (due today) 6 20 minutes Look at furniture at furniture store 10 15 minutes Buy required books for tonight's art history
class at one of the book stores 11, 5 15 minutes Buy fitesh vegetables and ice cream at one of the
grocery stores (will use these tomorrow morning)
1. 8 15 minutes
Buy tennis racket at sports equipment store for this afternoon's class 3 20 minutes
Buy a sweatshirt at department store 15 20 minutes
•Write down your plan to do errands. You can sketch time and distance on the back of this paper or on the map before fill out the following categories.
Name of Errands Shop # Time you you will do you will go to will spend
• Being at the Washington Street Parking lot by 12:00 noon.
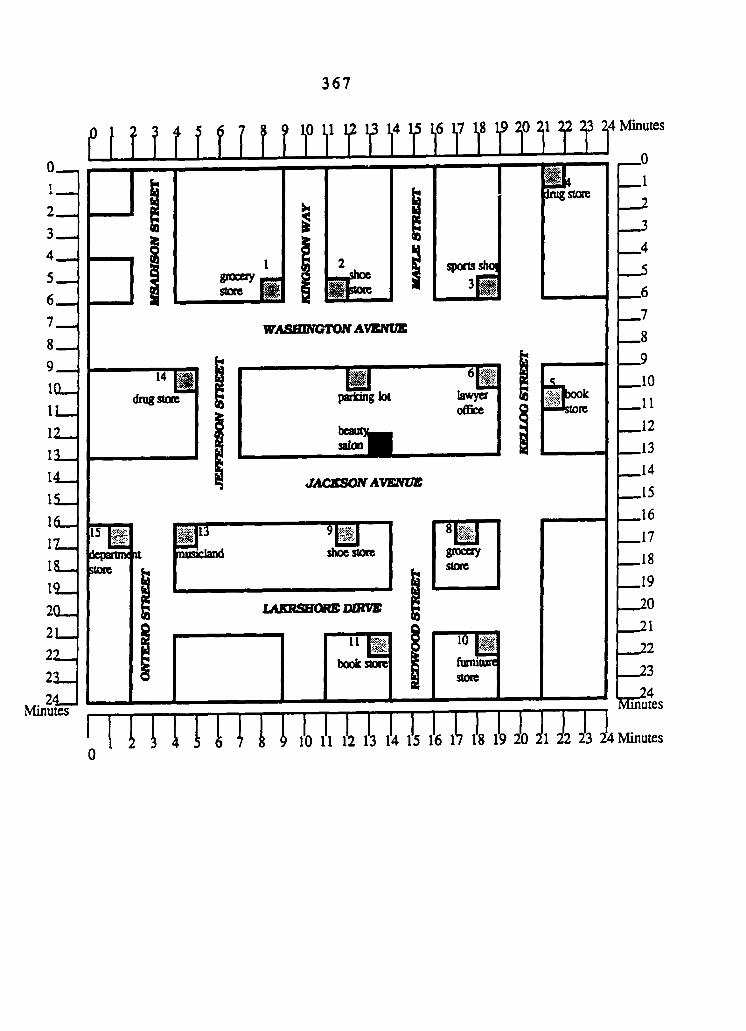
3 6 7
f i i i t i f t t t î M n ' f M f n n î ï t 1
1 grocery _ store ̂ 1
2 \ sports sbo|
WilSHlNCTQIY AVENUE
drug store parking kK
beauq^—
lawyer office
JACESON AVENUE
Î5W deportm^ store
musKland shoe store
« grocery store
lASRSHQRB ODZVB
ll g g
bookstore 1 funuturt store
Inig store
rrrmrn 10 11 12 13 14 ll iL A ll ll Jo Jl J2 J3 J :4 Minutes

3 6 8
APPENDIX V: GENERAL ERROR IDENTinCATIGN TEST
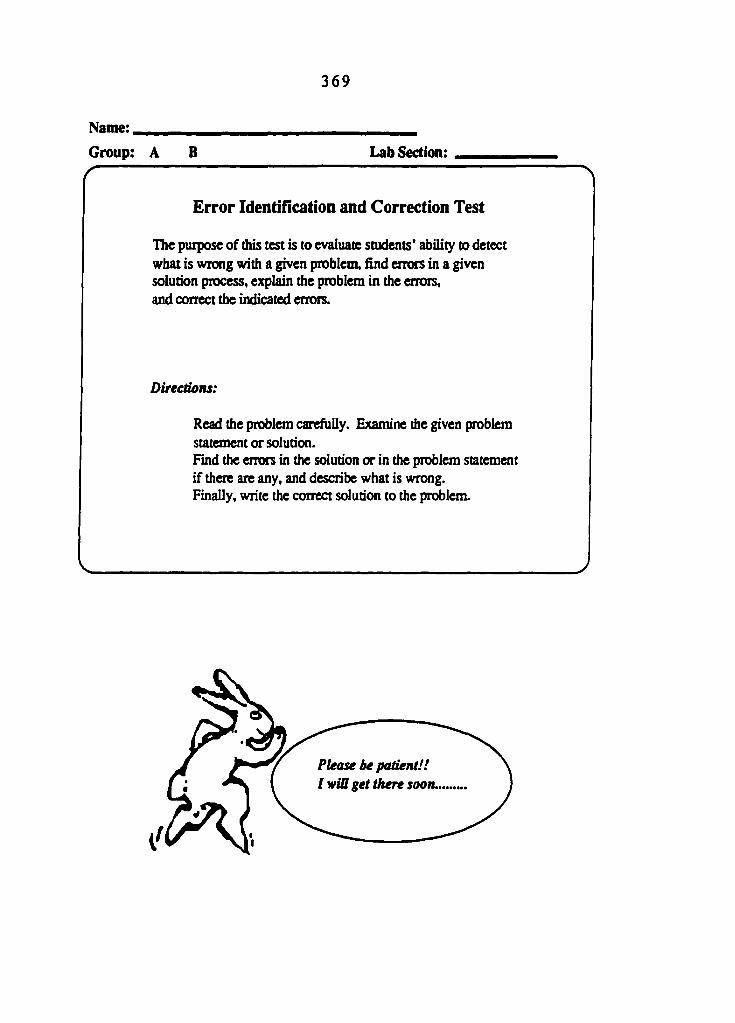
3 6 9
Name: ___________________
Group: A B Lab Section: _____ r
Error Identification and Correction Test
The purpose of this test is to evaluate students' ability to detect what is wrong with a given problem, find errors in a given solution process, explain the problem in the errors, and correct the indicated errors.
Directions:
Read the problem carefully. Examine the given problem statement or solution. Rnd the errors in the solution or in the problem statement if there are any, and describe what is wrong. Finally, write the correct solution to the problem.
Please be patient!! / wtff get there soon..
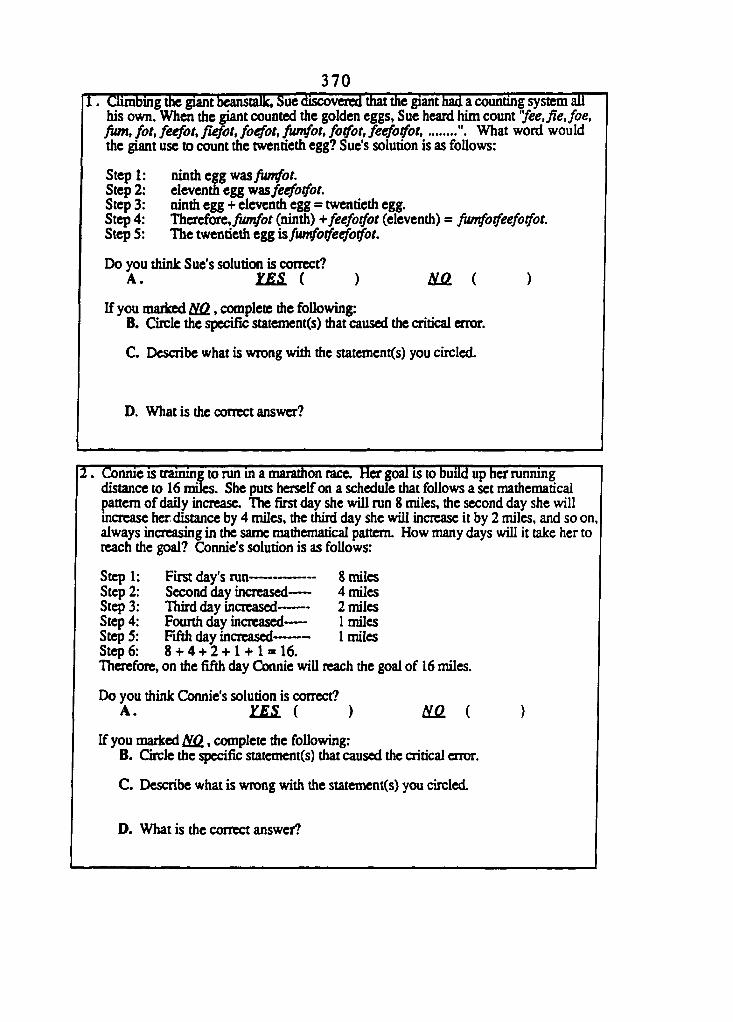
3 7 0 1. Climbing the giant beanstalk. Sue discovered that the giant had a counting system all
his own. When die giant counted the golden eggs, Sue heard him count "fee, fie, foe, fion, fot, ferfot, fûfot, fo^ot, funtfot, fotfot, feefotfot, What word would the giant use to count the twentieth egg? Sue's solution is as follows:
Step 1: ninth egg wisfunrfot. Step 2: elevendi egg wasfetfotfot. Step 3: ninth egg + eleventh egg = twentieth egg. Step 4: Therefore,,̂ <m/bf (ninth) •¥ feefotfot (elevendi) = fiurtfotfeefotfot. Step 5: The twentieth egg isfimfotfetforfot.
Do you think Sue's solution is correct? A. ÏES. ( ) mi)
If you marked M2, complete the following: B. Circle the specific statement(s) that caused the critical error.
C. Describe what is wrong witii the statement(s) you circled.
D. What is the correct answer?
Connie is training to nm in a marathon race. Her goal is to build up her running distance to 16 miles. She puts herself on a schedule that follows a set mathematical pattern of daily increase. The first day she will run 8 miles, the second day she will increase her distance by 4 miles, the third day she will increase it by 2 miles, and so on always increasing in the same nuthematical pattern. How many days will it take her to reach the goal? Connie's solution is as follows:
Step 1 Step 2 Step 3 Step 4 Step 5 Step 6
First day's run 8 miles Second day increased— 4 miles Third day increased 2 miles Fourth day increased— 1 miles Fifth day increased 1 miles 8 + 4 + 2 + 1 + 1 = 16.
Therefore, on the fifth day Connie will reach the goal of 16 miles.
Do you think Connie's solution is correct? A. Zfl ( ) ùiû. i
If you marked ̂ , complete the following: B. Circle the specific statement(s) that caused the critical error.
C. Describe what is wrong with the statement(s) you circled.
D. What is the correct answer?

3 7 1 3. Two men did one-fourth of a job in 8 days. Then, because of an emergency, it became
necessary lo complete the job in the next 4 days. How many additional men were added to the crew of 2 to accomplish this?
Step 1: 2 men X 8 days = 16 man-days. Step 2: It requires 16 man-days to do 1/4 of the job. Step 3: Three quarters of the job remains to be done.
Therefore, 16 X 3/4 = 12 man-days. Step 4: The job must be completed in 4 days, so
12/4 = 3. Step 5: Therefore, 3-2=1. Just one additional man is needed.
Do you think this solution is conect? A. ms. ( ) m ( )
If you marked MZ, complete the following: B. Circle the specific statement(s) that caused the critical error.
C. Describe what is wrong with the statement(s) you circled.
D. What is the conect answer?
4. On a certain day Jack ate lunch at Long John Silvers, checked out 3 books ftom the library {O' Pioneer by Willa Gather, For Whom the Bell Tolls by Ernest Hamingway, and Gone with the Wind by Margaret Mitchell), visited the museum, and had a cavi^ filled. Long John Silvers is clos^ on Wednesday, the libraiy is closed on weekends, and the museum is opened on Monday, Wednesday, and Friday. Jack's Dentist has office hours Tuesday, Friday and Saturday. Now, Jack is trying to figure out on which day of the week he can do all these diings. His solution is as follows.
Step 1. Long John Silvers is closed on Wednesday, so.... S M T W TH F SAT
Step 2 the library is closed on weekends.... S. M T % TH F SAI
Step 3 the museum is only open Monday, Wednesday, and Friday.... i M T % TH E SAI
Step 4 and dendst has office hours Tuesday, Friday, and Saturday.... S MI % TH E SAI
Therefore, the answer is Thursday. Jack can do all of the listed things on Thursday.
Do you think Jack's solution is correct? A. m ( ) mi )
If you marked HQ., complete the following: B. Cirde the specific statement(s) that caused the critical error.
C. Describe what is wrong widi die statement(s) you circled.
D. What is the correct answer?
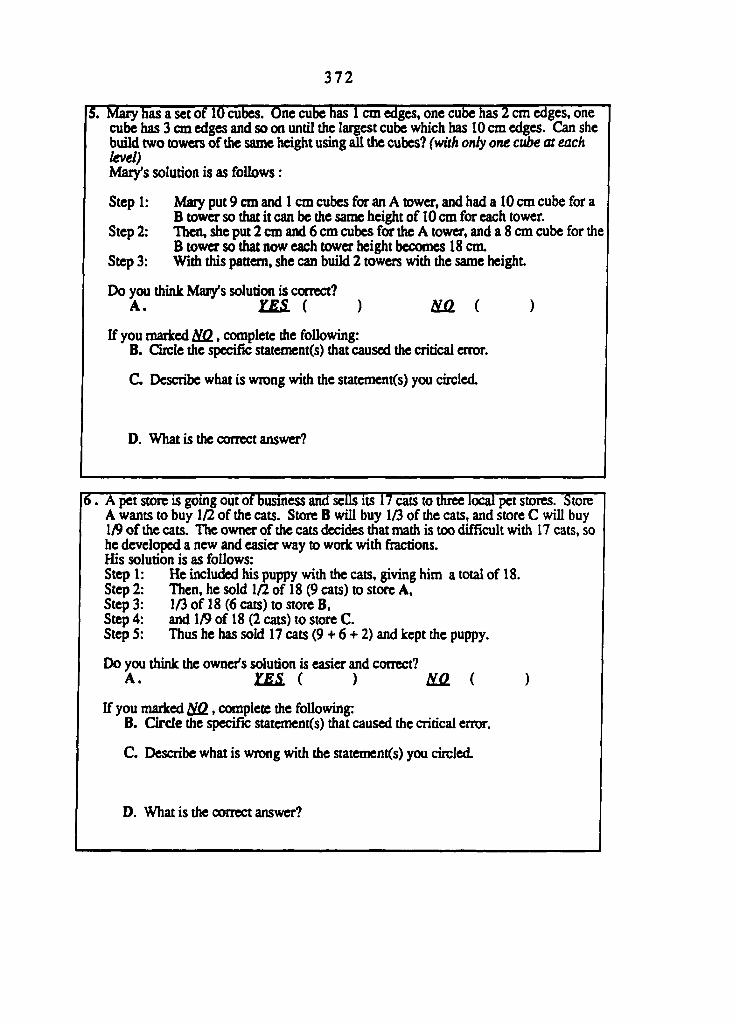
3 7 2
5. Mary has a set of 10 cubes. One cube has 1 on edges, one cube has 2 cm edges, one cube has 3 cm edges and so on until the largest cute which has 10 cm edges. Can she build two towers of the same height using the cubes? (with onty one ci&g at each level) Mary's solution is as follows :
Step 1: Maty put 9 cm and 1 cm cubes for an A tower, and had a 10 cm cube for a B tower so that it can be the same height of 10 cm for each tower.
Step 2: Then, she put 2 cm and 6 cm cubes for the A tower, and a 8 cm cube for the B tower so that now each tower height becomes 18 cm.
Step 3: With this pattern, she can build 2 towers with the same height
Do you think Mary's solution is conect? A. ÏES. ( ) mi)
If you mariced M2, complete the following: B. Circle the specific statement(s) that caused die critical error.
C. Describe what is wrong with the statement(s) you circled.
D. What is the correct answer?
6. A pet store is going out of business and sells its 17 cats to three local pet stores. Store A wants to buy 1/2 of the cats. Store B will buy 1/3 of the cats, and store C will buy 1^ of the cats. The owner of die cats decides diat math is too difficult with 17 cats, so he developed a new and easier way to woric with Actions. His solution is as follows: Step 1 : He included his puppy with the cats, giving him a total of 18. Step 2: Then, he sold 1/2 of 18 (9 cats) to store A, Step 3: 1/3 of 18 (6 cats) to store B, Step 4: and 1/9 18 (2 cats) to store C. Step 5: Thus he has sold 17 cats (9 + 6 + 2) and kept the puppy.
Do you think the owner's solution is easier and correct? A. ÏES. ( ) mi)
If you marked HQ. > complete the following: B. Circle the speciHc statement(s) that caused the critical errw.
C. Describe what is wrong with die statement(s) you circled.
D. What is the correct answer?

3 7 3
APPENDIX W: BASIC LOGO COMPREHENSION TEST

3 7 4
fattodnetonr Wilc Comnrehemton Teat (Turtle Graphics)
The following is a list of general objectives tested by this test. Hie test Is designed to examine the basic knowledge and imderstfmdlng of some fundamental Logo commands and concepts. This test is targeted at the Bloom Taxonomy levels of Knowledge and Comprehension only, and does not attempt to measure higher levels of learning. Higher order programming concepts such as modularity, and top-down design, are utilized in the test questions, but are not targeted specifically for evaluation.
Baric Oblccttm»
L Basic Turtle Commands (Primitives) 1.1) The student is able to identify the function of primitive commands. 1.2) The student Is able to dlflerentlate between pre-dellned primitive commands, and user defined
procedures, within the Logo language. 1.3) The student Is able to predict changes In the turtle's state, (heading and position), implemented
by sequences of primitive commands. 1.4) The student Is able to predict the graphical output produced by sequences of primitive
commands.
Z Repeat Cammaiidi 2.1) The student Is able to Identify the proper syntax of the repeat command. 2.2) The student is able to select an equivalent repeat statement for a repeated sequence of primitive
commands. 2.3) The student Is able to recognize that the repeat statement Is a more efTeclent and simpliHed
structure for repeated sequences of primitives or procedures. 2.4) The student is able to predict the output effect of Uie repeat command used with primitives and
defined procedures.
3L Basic Procednres 3.1) The student Is able to identify the proper syntax for defining a procedure. 3.2) The student Is able to recognize that a procedure Is basically a set of conunand steps defined to
perfonn some task. 3.3) The student is able to predict the output effects of procedures using sequenced primitive
commands and the repeat command. 3.4) The student Is able to predict the output effects of procedures when used in combination with
primitive and repeat commands. 3.5) The student Is able to Identify operational features of the LogoWriter Editor.
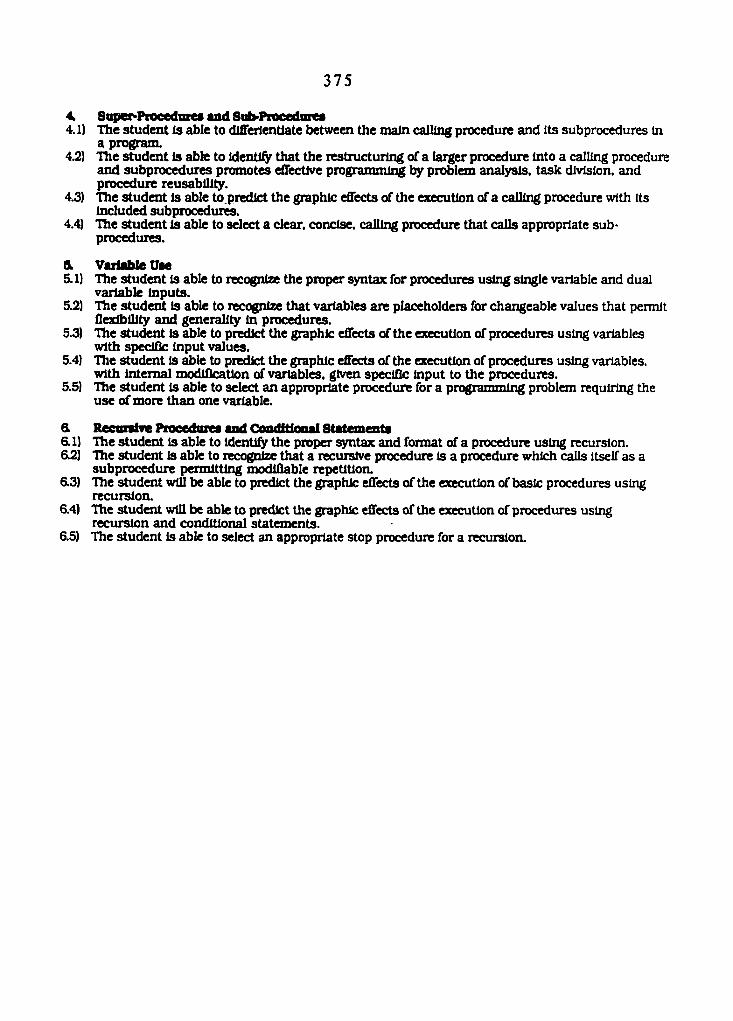
3 7 5
4 Snper-Piocednies and Sub-Procedures 4.1) The student is able to differlentlate between the main calling procedure and its subprocedures in
a program. 42) The student Is able to identic that the restructuring of a larger procedure into a calling procedure
and subprocedures promotes eflective programming by problem analysis, task division, and procedure reusability.
4.3) The student is able to.predlct the graphic eflects of the execution of a calling procedure with its included subprocedures.
4.4) The student is able to select a clear, concise, calling procedure that calls appropriate sub-procedures.
& Variable Um 5.1) The student is able to recognize the proper syntax for procedures using single variable and dual
variable Inputs. 5.2) The student is able to recognize that variables are placeholders for changeable values that permit
flexibility and generality in procedures. 5.3) Hie student is able to predict the graphic effects of the execution of procedures using variables
with specific input values. 5.4) The student Is able to predict the graphic effects of the execution of procedures using variables,
with Internal modification of variables, given specific input to the procedures. 5.5) The student Is able to select an appropriate procedure for a programming problem requiring the
use of more than one variable.
ft Recuiaite Procedure# and Conditiaoal Statements 6.1) The student is able to identify the proper syntax and format of a procedure using recursion. 6.2) The student is able to recognize that a recursive procedure Is a procedure which calls itself as a
subprocedure permitting modifiable repetition. 6.3) The student wlQ be able to predict the graphic effects of the execution of basic procedures using
recursion. 6.4) The student will be able to predict the graphb: eflects of the execution of procedures using
recursion and conditional statements. 6.5) The student is able to select an appropriate stop procedure for a recursion.
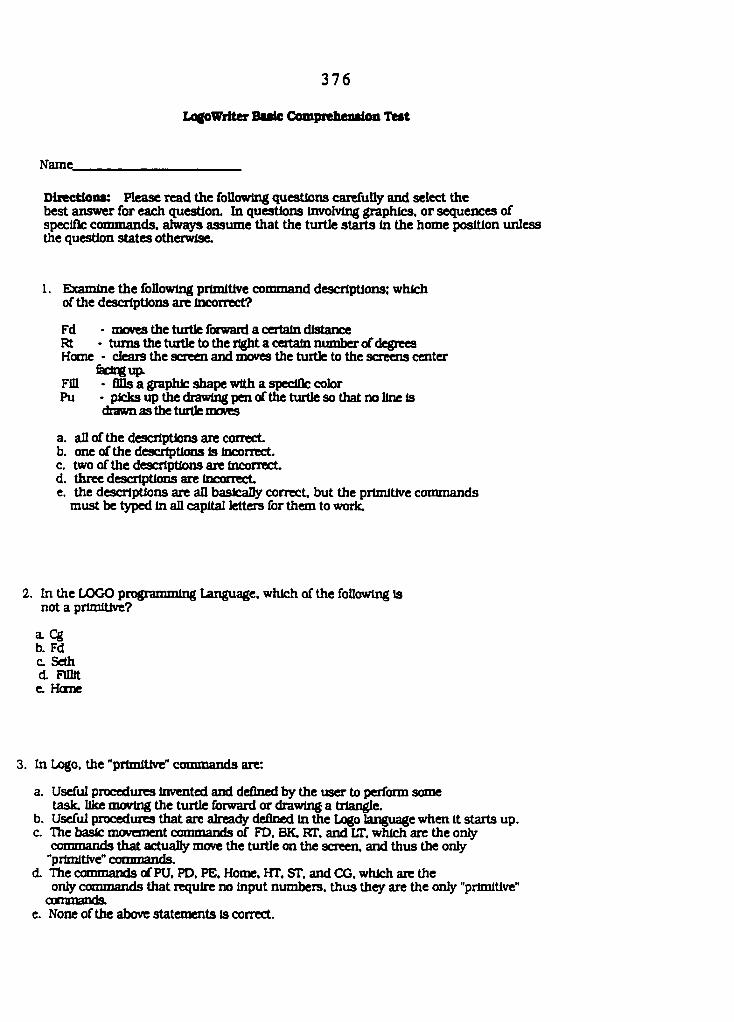
3 7 6
LogoWfiter Basic Comprehenskm Test
Name
Dlxeetloiis: Please read the following questions carefuQy and select the best answer for each question. In questions involving graphics, or sequences of specific commands, always assume that the turtle starts in the home position unless the question states otherwise.
1. Ebcamine the following primitive command descriptions: which of the descriptions are incorrect?
Fd - moves the turtle forward a certain distance Rt • turns the turtle to the right a certain number of degrees Home - clears the screen and moves the turtle to the screens center
Êdngtqx Fin - flDs a graphic shape with a specific color Pu • picks up the drawing pen of the turtle so that no line is
drawn as the turtle mwes
a. all of the descriptions are correct b. one of the descrfptioQS is Incorrect. c. two of the descriptions are incorrect. d. three descrtptions are incorrect e. the descriptions are aO basically correct but the primitive commands
must be typed In all capital letters for them to woric
2. In the LOGO programming Language, which of the following is not a primitive?
a. eg b. Fd c. Seth d. Fimt e. Heme
3. In Logo, the "primitive" commands are:
a. Useful procedures invented and defined by the user to perform some task, like moving the turtle forward or drawing a triangle.
b. Useful procedures that are alreac^ defined in &e Logo language when it starts up. c. The ba^ movement commands of FD. BK. RT. and LT. which are the onty
commands that actually move the turtle on the screen, and thus the only "primitive" commands.
d. The commands of PU. PD. PE. Home. HT. ST. and CG. which are the only commands that require no input numbers, thus they are the onfy "primitive"
commands. e. None of the above statements is correct.
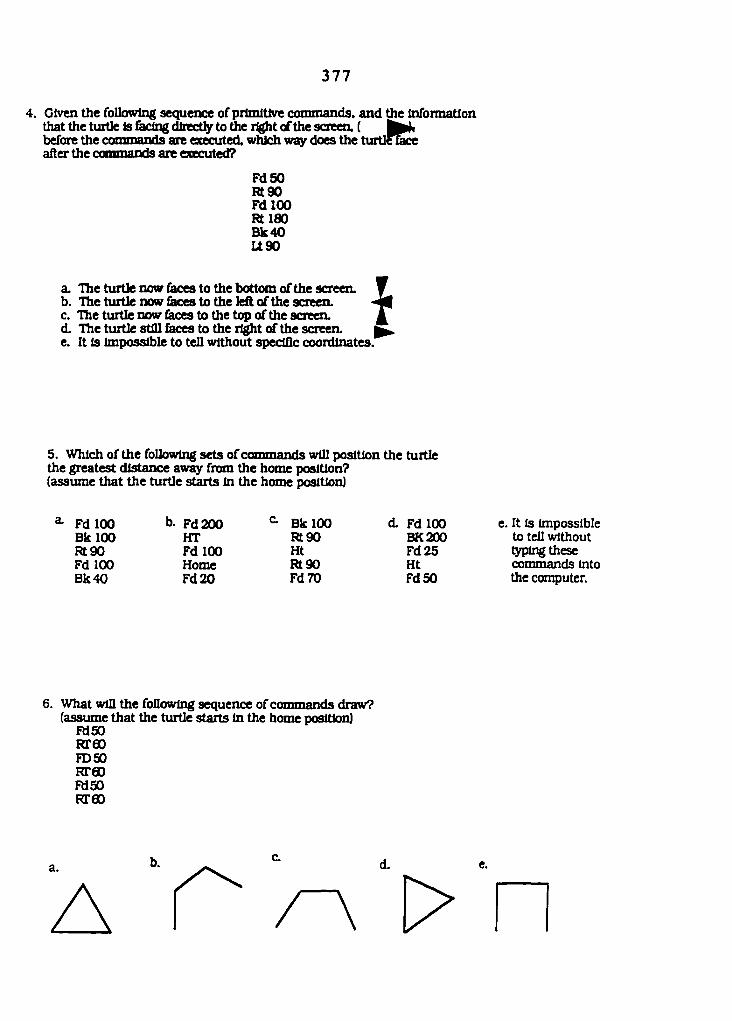
3 7 7
4. Given the following sequence of primitive commands, and the infomiatlon that the turtle is fa^dlrcctty to Ôie light of the screen. ( before the ronnnanris are executed, which wzy does the turtl̂ ice after the commands are executed?
FdSO Rt90 FdlOO RtlSO Bk40 U90
a. The turtle now fisuxs to the bottom of the screen. b. The turtle now faces to the left of the screen. c. The turtle now laces to the top of the screen. d. The turtle still faces to the rljpit of the screen. e. It Is impossible to tell without specific coordinates.'
i
5. Which of the following sets of commands will position the turtle the greatest distance away from the home position? (assume that the turtle starts In the home position)
Fd 100 b. Fd 200 Bk 100 d. Fd 100 e. It Is Impossible Bk 100 HT Rt90 BK200 to tell without Rt90 FdlOO Ht Fd25 typing these Fd 100 Home Rt 90 Ht commands into Bk40 Fd20 FdTO FdSO the computer.
6. What win the following sequence of commands draw? (assume that the turtle starts in the home position)
R150 Rreo FDSO Rreo FdSO Rreo
b. d.
0

3 7 8
7. What will be drawn by the foDowlng sequence of commands? (assume that the turtle starts in the home position)
FdSO Rt90 FdSO Home FdSO
c. A e. None of These
8. Which of the following Repeat commands will not produce an error message when it is executed?.
a. Repeat |Fd 50 Bk 50 RtGQ b. Repeat Fd 50 (Rt 901 c. Repeat 3 (Fd 50 Bk 5(9 d. Repeat4[PuRt90 FdSO M Bk50| e. All of the above statements will produce error messages.
9. Which of the choices below is the most efildent replacement for this set of commands to the right?
Sctc3 FdSO RtTO FdSO RtTO FdSO RtTO FdSO Rt90
a. SetcS Repeat 3 (Fd 50 Rt TOI FdSO Rt90
b. SetcS Repeat 4 (Fd SO Rt 701 Rt90
c. Setc3 Fd200 Rt210 Rt90
d. Repeat 3 (Setc 3 Fd SO Rt TOI FdSO Rt90
e. Repeat 3 ISctc 3 Fd SO Rt 701

3 7 9
10. In Logo, the Repeat command:
a. will make the turtle do something exactly twice, (Tor instance: Repeat Square draws two squares exactty the same).
b. provides the capability to simplify repeated sequences of commands into a single more eflteient command.
c. must be u^ when drawing a square, triangle, rectangle, or circle. d. will make the turtle do something over and over forever, until the programmer
presses the "open-apple" and "S" teys. e. none ofthe above are correct
11. What shape would the following repeat command draw? (assume that the turtle starts In the home position) ^
Repeat 5 (Fd 50 Bk 50 Rt 45]
a. b.
V e.
None of These
12. Which of the following procedures will not produce an error message when the procedure is executed?
a. Vee b. To U4S Vee BkSO U45 Rt90 BkSO FdSO Rt90 End FdSO
End
To Vee Lt45 BkSO Rt90 FdSO Stop
To Vee U45 BkSO Rt90 FdSO To End
e. all of these win produce error messages
13. In LogoWrlter. the term "Procedure" basically stands for
a. the technique for drawing step by step pictures with a computer b. a set of defined command steps to perform some task c. the important problem solving steps of defining the problem, choosing a plan,
carrying out the plan, and looking back at the solution. d. all the important commands for using the editor, such as "open-apple r e. none of the above

3 8 0
14. Which of the following procedures would correctly draw the figure shown below? (assume that the turtle starts In the home position)
a. To Peak Kr45 FdiSO Rr45 FdSO End
b. To Peak FdSO KTSO FdSO End
To Peak FT 45 FdSO Rr90 FdSO End
d To Peak Rt90 FdSO Rt45 FdSO End
e. None of TTiesc
IS. Given the Square procedure, what would be the graphical result of the following sequence of commands? (assume that the turtle starts in the home position]
rommanri Sfnumnr#-eg Repeat 4 (Square Rt 90| FdSO Square
To Square Repeat 4 |Fd SO Rt 90| End
e. None d These
16. When using the LogoWrlter editor, it is Important to:
a. press "open-apple-r when entering the editor and "escape" when esdtlng the editor.
b. begin every student defined procedure with the word To" and end every student defined procedure with the word "End".
c. begin a brand new pa^ for each new procedure. d. none of the above are correct e. all of the above are correct
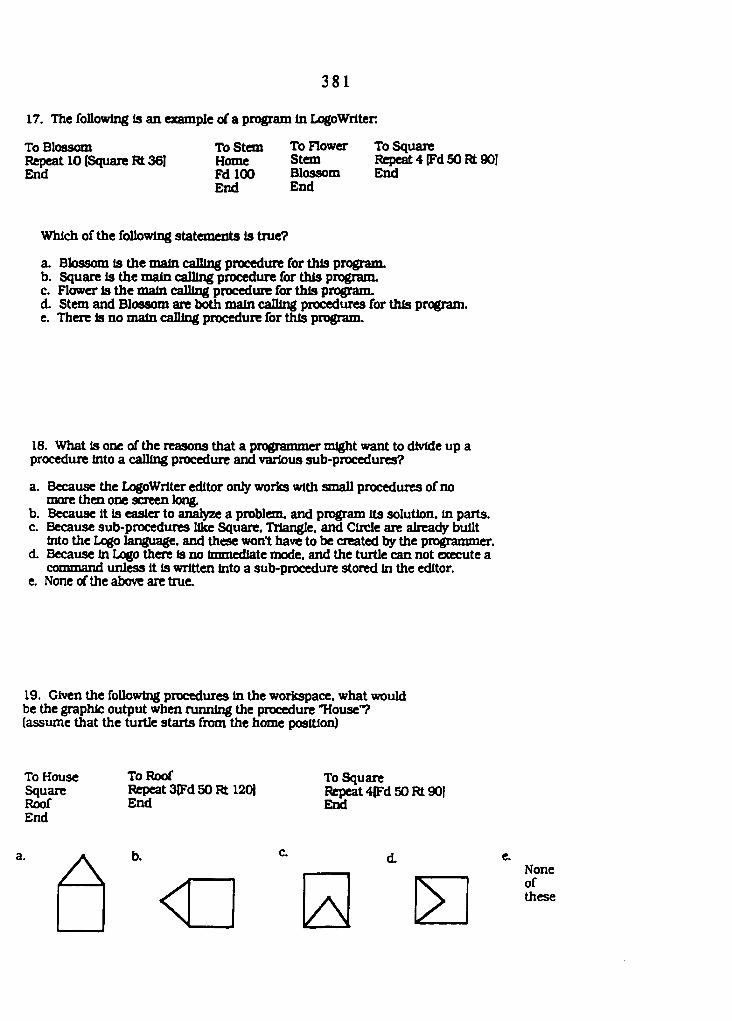
3 8 1
17. The following Is an example of a program In LogoWriten
To Blossom Repeat 10 (Square Rt 36] End
To Stem To Flower To Square Home Stem Repeat 4 (Fd 50 Rt 90] Pd 100 Blossom End End End
Which of the following statements is true?
a. Blossom is the main calling procedure for this program. b. Square is the main calling procedure for this program. c. Flower is the main calling procedure for this program. d. Stem and Blossom are both main calling procedures for this program. e. There is no main caning procedure for this program.
18. What is one of the reasons that a programmer might want to dMde up a procedure into a calling procedure and various sub-procedures?
a. Because the LogoWrlter editor only works with small procedures of no more then one screen long.
b. Because it is easier to aiulyze a problem, and program its solution, in parts. c. Because sub-procedures like Square. Triangle, and Circle are already built
into the Logo language, and these won't have to be created ly the programmer. d. Because in Logo there is no immediate mode, and the turtle can not execute a
command unless It Is written Into a sub-procedure stored In the editor. e. None of the above are true.
19. Given the following procedures in the workspace, what would be the graphic output when running the procedure "House"? (assume that the turtle starts from the home position)
To House To Roof To Square Square Repeat 3tFd 50 Rt 120) Repeat 4|Fd 50 Rt 90! Roof End End End
a. b. c. d. e. None of these
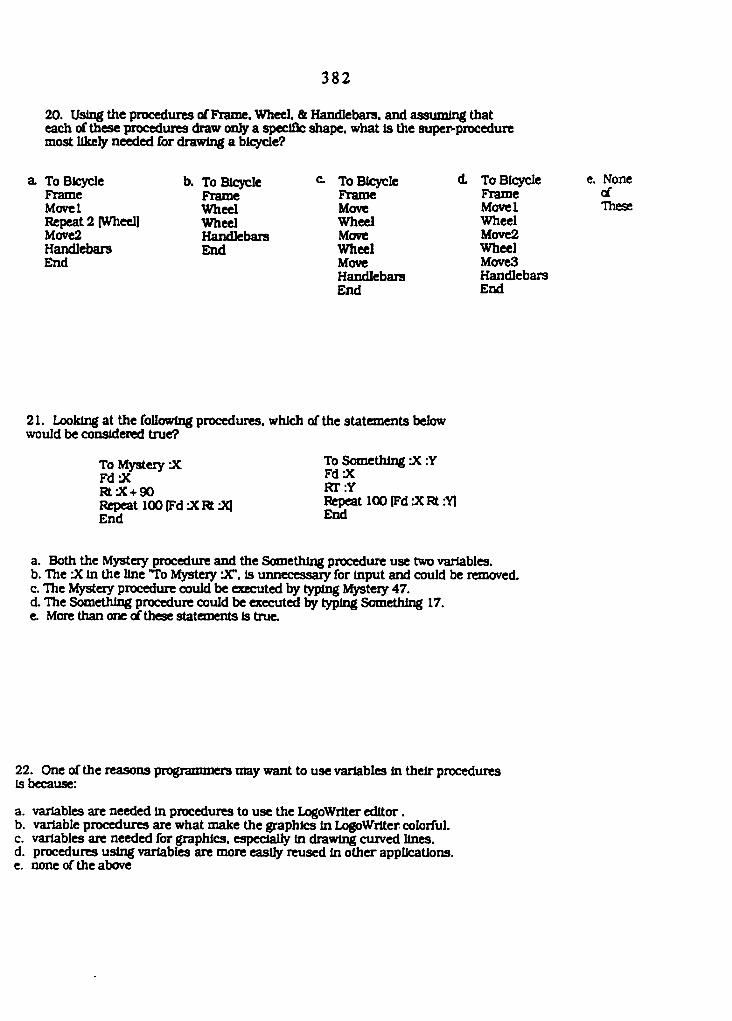
3 8 2
20. Using the procedures of Frame. Wheel. & Handlebars, and assuming that each of these procedures draw only a speclQc shape, what is the super-procedure most Ilkety nràded for drawing a bl<ycle?
a. To Bicycle Frame Movel Repeat 2 (Wheel] Move2 Handlebars E^d
b. To Bicycle Frame Wheel Wheel Handlebars End
To Bicycle Frame Move Wheel Move Wheel Move Handlebars End
To BIqrcle Frame Movel Wheel Move2 Wheel Moves Handlebars End
e. None rf These
21. Looking at the following procedures, which of the statements below would be considered true?
To Mystery :X To S^thlng X :Y FdJC M:X Rt j( + 90 RT : Y Repeat 100 (FdJCRtrX] Re^t 100 (Fd JC Rt :Y1 End End
a. Both the Mysteiy procedure and the Something procedure use two variables. b. The JC in the line To Mysteiy X", Is unnecessary for input and could be removed. c. The Vfystery procedure could be executed by typing &^teiy 47. d. The Something procedure could be executed by typing Something 17. e. More than one ofthese statements Is true.
22. One of the reasons programmers may want to use variables In their procedures is because:
a. variables are needed in procedures to use the LogoWrlter editor. b. variable procedures are what make the graphics In LogoWrlter colorful. c. variables are needed for graphics, espedally In drawing curved lines. d. procedures using variables are more easily reused in other applications. e. none of the above
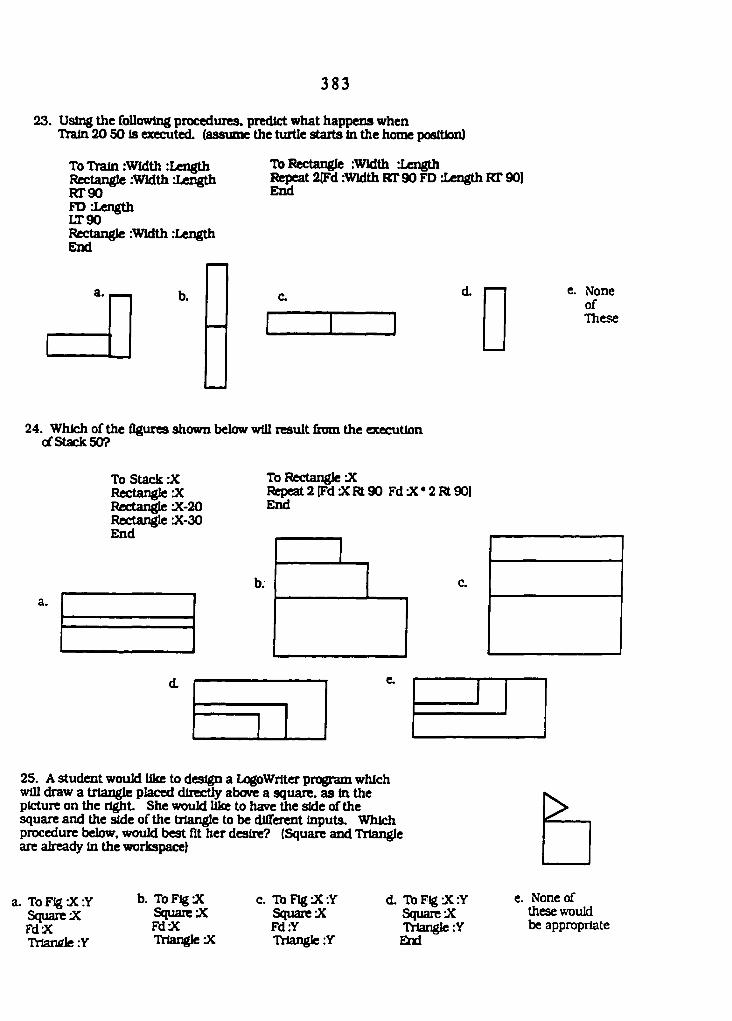
3 8 3
23. Using the following procedures, predict what happens when Ttain 20 50 is executed, (assume the turtle starts in the home position)
To Train :Width :Length Rectangle :WIdth length RTSO FD length LT90 Rectangle Width .-Length End
To Rectangle :Wldth length Repeat 2(Fd :Wldth RT90 FD length RT 90] End
a. b. d. — e. None of These
24. Which of the figures shown below wlU result from the execution of Stack 50?
To Stack -Ji Rectangle :X Rectangle JC-20 Rectangle X-SO End
Td Rectangle JC Repeat2[FdiXRt90 FdJC*2Rt90| End
b;
a.
25. A student would like to design a LogoWrlter program which will draw a triangle placed directly above a square, as In the picture on the rtght She would like to have Uie side of the square and the side of the triangle to be different inputs. Which procedure below, would best fit her desire? (Square and Triangle are already in the workspace)
a. ToFlg JC;Y b. ToFlgX c. ToFlgJCzY d. ToFlg JC;Y e. None of Square X Square X Square X Square X these would FdX Mac Fd:Y TMangk:Y be appropriate Triangle :Y TWangle X Triangle :Y Eiid
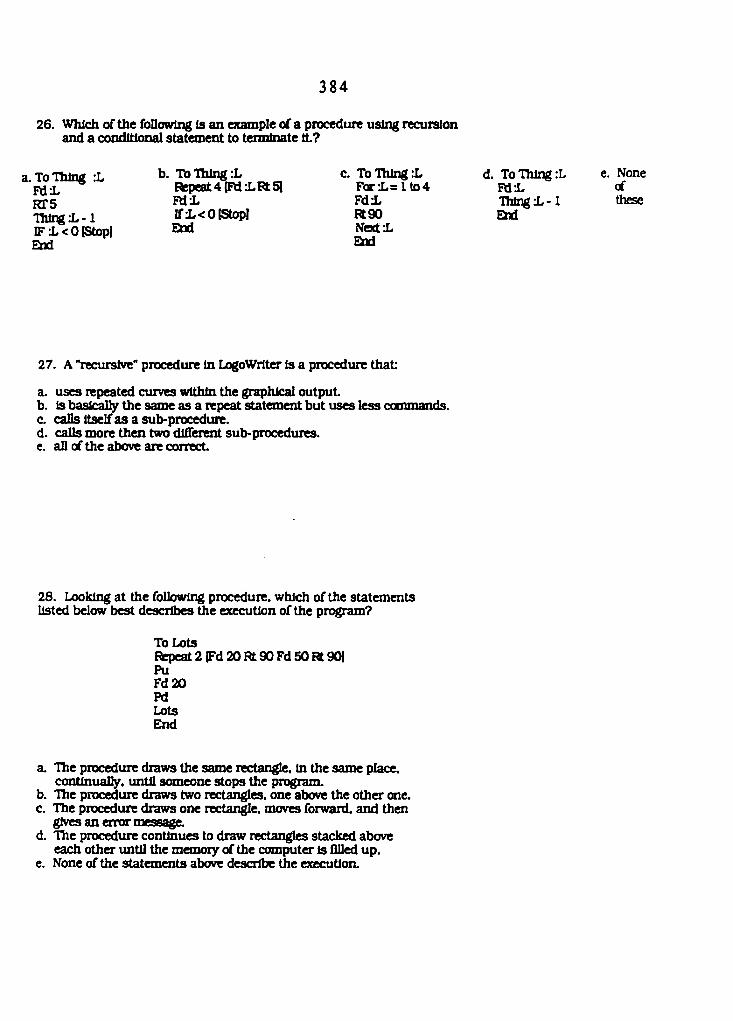
3 8 4
26. Which of the following Is an example of a procedure using recursion and a conditional statement to terminate it?
a. To Thing :L Fidi RTS Thingi,-1 IFi,<0 (StopI End
b. To Thing X Repeat4(Pd-J<Bt5l Mi ff:L<0(Stopl End
c. Tb Thing :L Fori=lto4 Fdi Rtgo Nexti, Eui
d. To Thing :L Ftii Thlngi-1 Ehd
e. None of these
27. A "recursive" procedure In LogoWrlter is a procedure that:
a. uses repeated curves within the graphical output b. is basickOy the same as a repeat statement but uses less commands. c. caUs Itself as a sub-procedure. d. calls more then two different sub-procedures. e. aO of the above are correct.
28. Looking at the following procedure, which of the statements listed below best describes Uie execution of the program?
To Lots Repeat 2 [Fd 20 Rt 90 Fd 50 Rt 90i Pu Fd20 Pd Lots End
a. The procedure draws the same rectangle, in the same place, continually, until someone stops the program.
b. The procedure draws two rectangles, one above the other one. c. The procedure draws one rectangle, moves forward, and then
gives an error message. d. The procedure continues to draw rectangles stacked above
each other until the memory of the computer is Oiled up. e. None of the statements aboi% desoribe the execution.
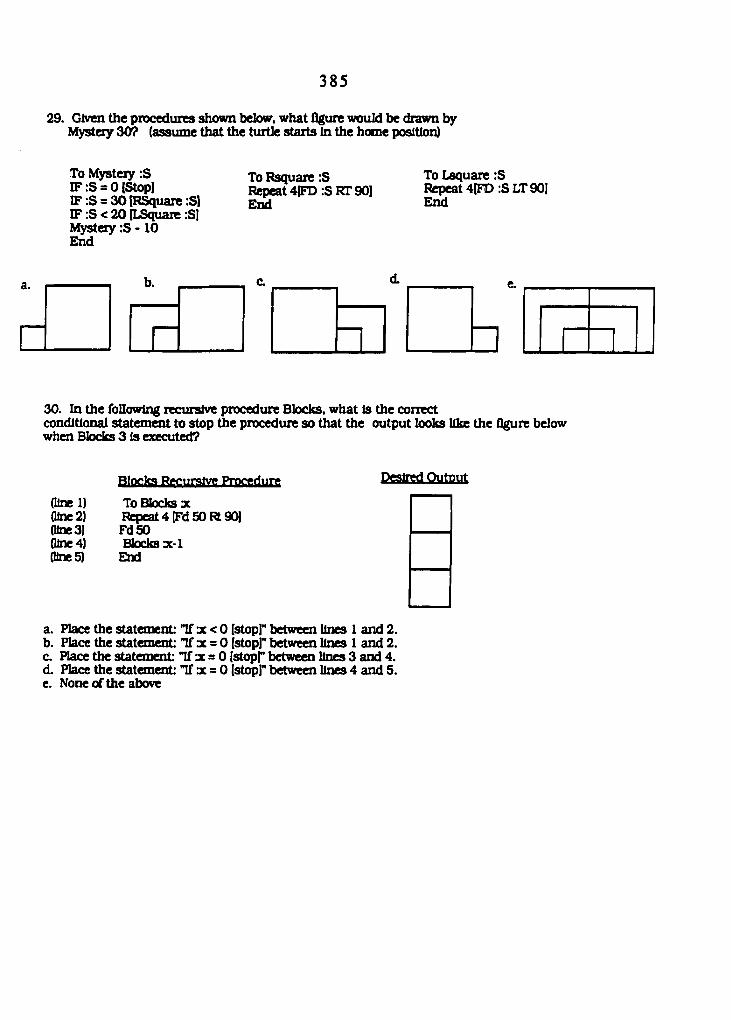
3 8 5
29. Given the pnxxduies shown below, what figure would be drawn by Mystery 30? (assume that the turtle starts In the home position)
To Mystery :S % Rsquare :S To Lsquare :S IF :S = 0 IStopl Repeat 4IFD :S RT 901 Repeat 4{FD :S LT 901 IF:S = 30[RSquare:S| End End IF :S < 20 (LSquare :S] Mystery :S - 10 End
a.
30. In the following recursive procedure Blocks, what is the correct conditional statement to stop the procedure so that the output looks like the ûgure below when Blocks 3 Is executed?
Blocks Rgffurslve Procedure PCSirrf QtitPtit
(Une 1) To Bkxks x (Une2) Repeat 4 [Fd SO Rt 901 (I1ik3) FdSO (line 4) Blocks 3C-1 (UneS) End
a. Place the statement: Tf 3c<0 (stop)"between lines 1 and2. b. Place the statement: Tf 3c = 0 [stopr between lines I and 2. c. Place the statement "If x s 0 (stopr between lines 3 and 4. d. Place the statement: "If x = 0 (stoip)" between lines 4 and 5. e. None of the above
Copyright © 2022 FDOKUMEN

