


Bahasa
Halaman
Hukum

Green Fluorescent Protein as an Indicator of Cryoinjury in Tissues
ADAM B. SLADE,1 LORENZO A. MARTINEZ-SUASTEGUI,2 FLORIAN VIE,3 and GUILLERMO AGUILAR1,4
1Department of Mechanical Engineering, University of California Riverside, Riverside, CA 92521, USA; 2ESIME Azcapotzalco,Instituto Politecnico Nacional, Avenida de las Granjas No. 682, Colonia Santa Catarina, Delegacion Azcapotzalco, Mexico,Distrito Federal 02250, Mexico; 3Department of Nuclear Engineering, National Graduate School of Engineering and ResearchCenter of Caen (ENSICAEN), 6, Boulevard du Marechal Juin CS 45053, 14050 Caen Cedex 04, France; and 4Department of
Bioengineering, University of California Riverside, Riverside, CA 92521, USA
(Received 25 March 2013; accepted 18 July 2013; published online 30 July 2013)
Associate Editor James Tunnell oversaw the review of this article.
Abstract—The fluorescence intensity of Green FluorescentProtein (GFP) has previously been demonstrated to be anaccurate indicator of cellular viability following cryoinsult inindividual GFP-transfected cells. In an attempt to ascertainwhether GFP fluorescence intensity may also be used as aviability indicator following cryogenic insults in whole tissues,this study examines the transient fluorescence intensity ofGFP-transfected mouse hepatic tissue ex vivo followingcryoinsult. The observed trends are compared with diffu-sion-based models. It was observed that the fluorescenceintensity of the exposed tissues exhibited slow exponentialdecay, while the solution in which the tissues were placedinversely gained fluorescence. This slow decay (~3 h) is incontrast to the rapidly diminished fluorescence intensity(seconds) seen in GFP-cell cultures following cryoinsult.These trends suggest that mass diffusion of GFP in theinterstitial space, and ultimately into the surrounding med-ium, is the primary mechanism which determines the fluores-cence loss in cryoinjured tissues. These results suggest GFP-transfected tissues may be effectively used as indicators ofcryoinjury, and hence viability, following hypothermal insultprovided that a sufficiently long incubation is held beforeobservation. It was found that ameaningful observation (15%reduction in fluorescence) could be made three hourssubsequent to cryoinjury for the tissues used in this study.
Keywords—Cryoinsult, Cryosurgery, Diffusion, Hyperther-
mia, Hypothermia, Fluorescence, Laser, Viability.
INTRODUCTION
Cryosurgery—the precise application of cryogenictemperatures—is often used to selectively devitalize
cancerous or precancerous tumors, arresting itspropagation through healthy tissue. These low tem-peratures serve to rupture the plasma cell membranes,or to dehydrate the cells as to render their vitalitycompromised. To determine the success of a cryosur-gical protocol, it is of critical importance that thetissues cryogenically treated, as well as the surround-ing tissues, be evaluated for their viability. Currentviability protocols require the tissue to be excised fromthe treatment site and examined in vitro.9,17 Theseprocedures are invasive and provide only informationtraceable to the moment in time when the biopsy wasobtained. Non-invasive viability assays can be utilizedto determine cellular viability, but require the additionof chemical tracers (which are often toxic or photo-toxic) to the living tissue.13 While viability can bedetermined optically without tracers, this is done on acell-to-cell basis,4 and assessing the viability of awhole tissue would not be feasible using those meth-ods.
Green Fluorescent Protein (GFP) is a proteinderived from jellyfish which can be and has beentransposed into the genome of a myriad of organisms.It has the effect of causing transfected tissues to fluo-resce green when illuminated with blue light, and hasrecently found use as a viability assay in cell cultures.3
GFP has the advantage over other viability assays inthat it can be examined in situ, and can also be con-tinuously monitored to examine the transient viabilityof the cells using optical imaging, thereby making it anideal indicator of animal tissue viability in researchprotocols.
The GFP molecule has a tight cylindrical barrelshape, which protects it from a moderate range ofthermal trauma,18 however, at sufficiently elevatedtemperatures (>50 �C) its structure becomes ‘‘unwound’’,
Address correspondence to Guillermo Aguilar, Department of
Mechanical Engineering, University of California Riverside, Riverside,
CA 92521, USA. Electronic mail: [email protected], lamartinezs@
ipn.mx, [email protected]
Annals of Biomedical Engineering, Vol. 41, No. 12, December 2013 (� 2013) pp. 2676–2686
DOI: 10.1007/s10439-013-0874-7
0090-6964/13/1200-2676/0 � 2013 Biomedical Engineering Society
2676
it is compromised (irreversibly denatured) and exhibitsloss of fluorescence.1 In contrast, after exposing GFPcells to cryogenic temperatures (liquid nitrogen:2196 �C), they appear to remain stable and exhibitonly a slightly reduced quantum fluorescent yield.6,10
Therefore, while GFP-transfected tissue exhibitsimmediate loss of fluorescence following hyperthermalinsults, hypothermal insults have no such immediateeffect. In fact, in preliminary trials using GFP asan indicator of viability in whole tissues, it wasobserved that there is a delayed response on the orderof several hours to changes in fluorescence in cryoin-jured tissues.7 In addition to temperature, GFP fluo-rescence also exhibits sensitivity to the pH of itsenvironment. However, while the fluorescent yielddrops off in very acidic or basic solutions, there is arelatively wide range of pH values for which fluores-cence is stable.1,2
This tissue-based studies are in contrast with singlecell studies, which report immediate fluorescencechange following both hyperthermal and hypothermalinsults.3 Furthermore, in the latter study focused oncell cultures, it was implied that the loss of cell fluo-rescence following cryoinsult corresponds with thephysical loss of GFP from inside a GFP-transfectedcell, however, it was not demonstrated conclusivelythat this was the only driver contributing to fluores-cence loss, nor the transient fluorescence intensity de-cay following cryoinsult was reported. This opened aninteresting quandary as it is also plausible, in principle,that the viability of cells transfected with the GFPvector is also linked to the relative amount ofexpressed fluorescence, with the most brightly fluo-rescing cells being viable, and apoptotic or necroticcells exhibiting diminished fluorescence.14
This work aims to observe the time-dependent nat-ure of GFP fluorescence to identify the mechanism thatdrives fluorescence loss after hypothermal insults. Forthis purpose, it is hypothesized that there is a rela-tionship between the fluorescence of a GFP-transfectedtissue post-cryogenic insult and the rate of diffusion ofGFP from the compromised tissue into the surround-ing tissue or incubation medium. To prove thishypothesis, the known phenomena which affect thefluorescence of GFP (i.e., pH, temperature, excitationlight intensity and excitation duration) are maintainedwithin ranges known not to affect GFP fluorescenceyield. The transient fluorescence of a cryogenically-treated tissue is then compared to mass diffusionmodels to determine its correlation (or lack thereof).Finally, the fluorescence of the incubation medium iscompared to the total fluorescence of the tissue toestablish a balance between tissue and incubationmedium fluorescence gain/loss.
MATERIALS AND METHODS
GFP Tissue Harvesting and Sample Preparation
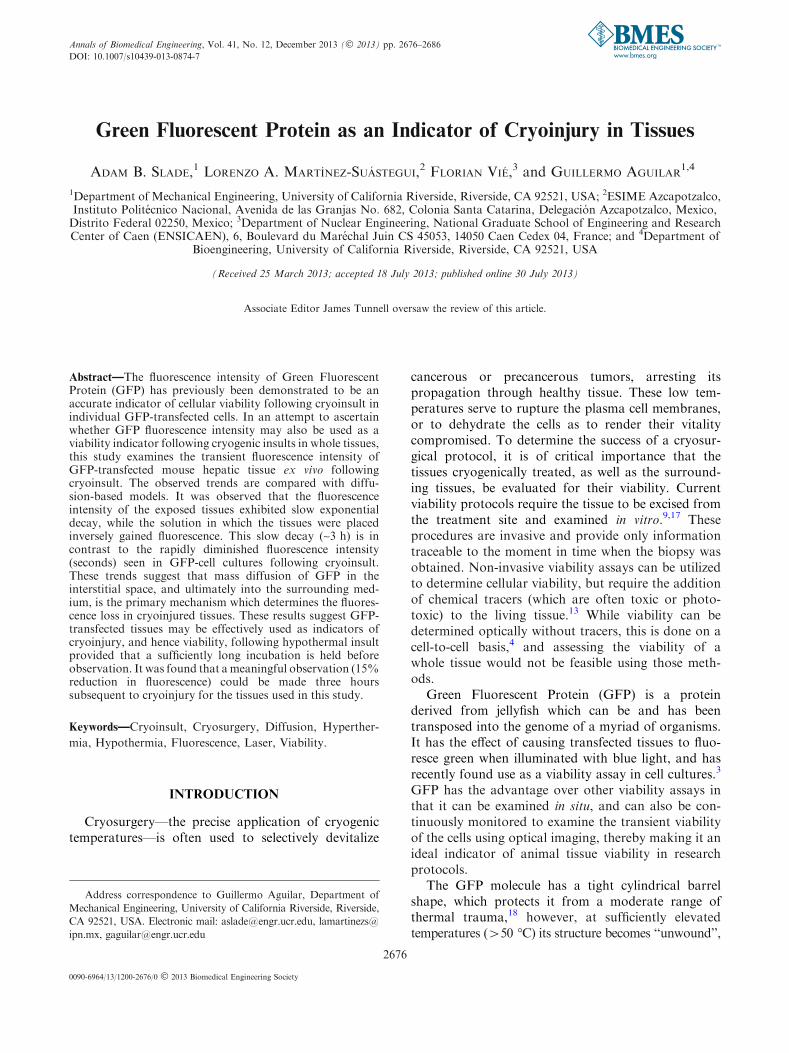
The strain of GFP used in this study is the enhancedGFP which has an electromagnetic radiation absorp-tion (excitation) peak at 488 nm (blue light), and anemission peak at 509 nm (green light) (Fig. 1).
According to protocols A-20080013 andA-20080019, approved by the UCR Institutional Ani-mal Care and Use Committee (IACUC), all GFP-transfected tissues used in this study were harvestedfrom the hepatic tissue of GFP-transfected mice. Thisspecific tissue was chosen due to its large size, ease ofextraction and similar thermal properties compared toother available organs.7 The specific GFP vectortranscription used, C57BL/6-tg(UBC-GFP)30Scha/J,universally expresses GFP in mouse tissue under thehuman ubiquitin C (UBC) promoter.12 This strain ofGFP was used as it has relatively little overlap in itsexcitation and emission curves (only between 470 and530 nm), thus the excitation source light may becompletely isolated from captured emission light fromthe tissue to eliminate all crossover illumination.
After the mice were euthanized via CO2 asphyxia-tion, the liver was excised and cut into squares of6 9 6 mm, and left at its native thickness of approxi-mately (but not uniformly, exactly) 4.4 mm. Thethickness of the samples varied spatially by up toapproximately 20% from their mean value, as deter-mined visually. These dimensions were chosen as theywere similar in size to previous GFP-tissue studies
FIGURE 1. GFP excitation and emission curves. The curvesshow the relative strength of excitation and emission wave-lengths for GFP. The overlap of the two curves indicates thewavelengths at which GFP both absorbs and emits light. Toeliminate crossover, a low-pass filter at 500 nm is used for theillumination, and a band-pass filter with lower-limit at 510 nmis used for the fluorescence. Figure adapted from NikonMicroscopyU.
Green Fluorescent Protein as an Indicator of Cryoinjury in Tissues 2677
performed in this laboratory.7 Following excision andtrimming, all samples were immersed together in50 mL of isotonic Phosphate Buffered Saline (PBS)solution (pH 7.4) to prevent tissue damage due tocellular dehydration. The PBS also served to maintainthe pH level without significant change. Samplesremained in this holding vessel for approximately2 min to allow for experimental preparation time.
Control samples were removed from the holdingvessel and placed in an isolated 34 mm cylindricalvessel and covered with 5 mL of fresh PBS. The sam-ples slated for cryoinjury were removed from theholding vessel, and one side was exposed for oneminute to a cryoprobe cooled by circulating liquidnitrogen at 2196 �C. This exposure time was longenough to ensure that the entire sample was uniformlycooled to a temperature of 2150 �C or lower as mea-sured by a 0.2 mm-diameter hypodermic thermocoupleinserted into the sample’s center, ensuring completecellular necrosis. Following the cryoprobe contact,cryoinjured samples were placed in fresh PBS (identicalto control tissues) at room temperature (23 �C),thawing in a few seconds. Nothing was placed over thesample/PBS as to keep the optical path clear. Both thecryoinjured samples and control samples were thenisolated from all light to prevent photobleaching. Tentissue samples were used in the experiments, with fiveas control tissues (no thermal damage) and theremainder as cryogenically injured tissues (necrotic). Inaddition, one sample served as an inverse control,where all GFP within the tissue was irreversiblydenatured through immersing the sample in water at100 �C for 5 min. Also, a set of four samples wereprepared for qualitative visual analysis, consisting oftwo tissue samples prepared in the same manner as thecontrol/cryogenic treatments described above; onesample cryogenically treated through submersion inliquid nitrogen for 5 min; and one sample boiled inwater for 5 min.
Fluorescent Image Acquisition
A custom fluorescence microscope was constructedto measure the fluorescence intensity of the GFP-transfected tissue as a function of time. A briefdescription of the experimental apparatus is as follows.
When the sample is to be illuminated (fluorescentlyexcited), a mechanical shutter blocking a broadbandlight source (Fiber Lite� MI-150 utilizing an EKE21 V 150 W halogen projector lamp routed via stockfiber optics) opens (Fig. 2-1), allowing light to proceedthrough focusing optics and a low-pass excitation filter(Thorlabs, model FES0500). The mechanical shutter isused to limit exposure and thus prevent photobleachof the GFP within the tissue. After the light passes
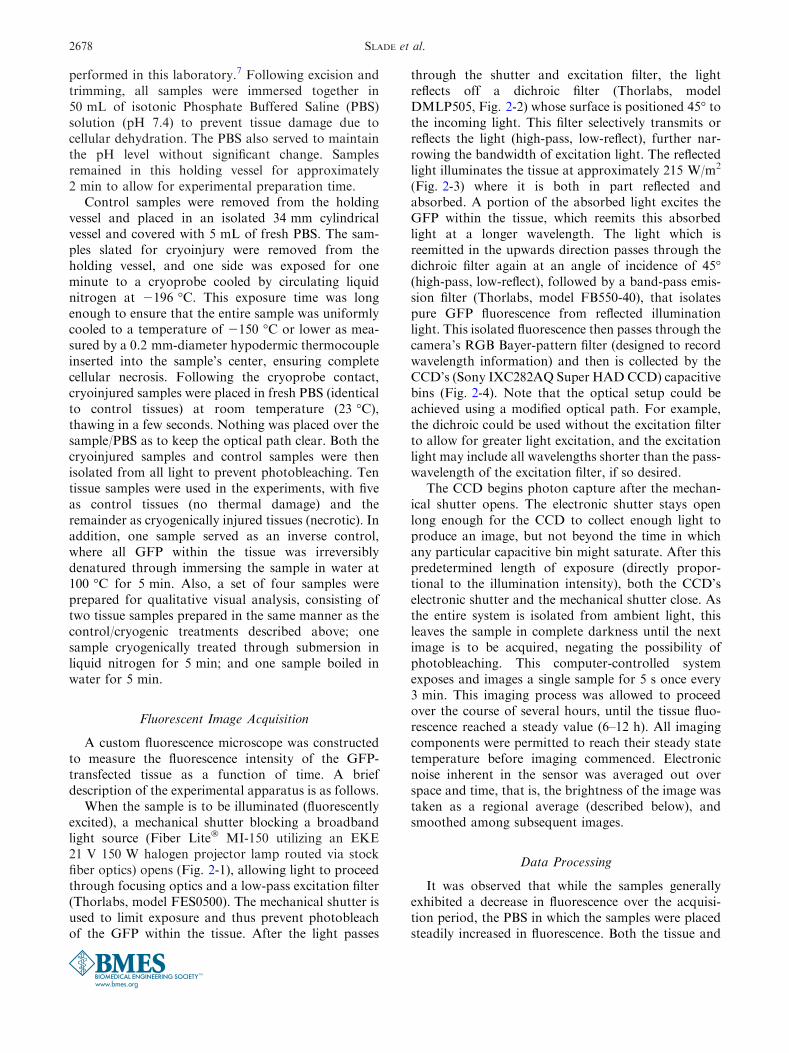
through the shutter and excitation filter, the lightreflects off a dichroic filter (Thorlabs, modelDMLP505, Fig. 2-2) whose surface is positioned 45� tothe incoming light. This filter selectively transmits orreflects the light (high-pass, low-reflect), further nar-rowing the bandwidth of excitation light. The reflectedlight illuminates the tissue at approximately 215 W/m2
(Fig. 2-3) where it is both in part reflected andabsorbed. A portion of the absorbed light excites theGFP within the tissue, which reemits this absorbedlight at a longer wavelength. The light which isreemitted in the upwards direction passes through thedichroic filter again at an angle of incidence of 45�(high-pass, low-reflect), followed by a band-pass emis-sion filter (Thorlabs, model FB550-40), that isolatespure GFP fluorescence from reflected illuminationlight. This isolated fluorescence then passes through thecamera’s RGB Bayer-pattern filter (designed to recordwavelength information) and then is collected by theCCD’s (Sony IXC282AQ Super HADCCD) capacitivebins (Fig. 2-4). Note that the optical setup could beachieved using a modified optical path. For example,the dichroic could be used without the excitation filterto allow for greater light excitation, and the excitationlight may include all wavelengths shorter than the pass-wavelength of the excitation filter, if so desired.
The CCD begins photon capture after the mechan-ical shutter opens. The electronic shutter stays openlong enough for the CCD to collect enough light toproduce an image, but not beyond the time in whichany particular capacitive bin might saturate. After thispredetermined length of exposure (directly propor-tional to the illumination intensity), both the CCD’selectronic shutter and the mechanical shutter close. Asthe entire system is isolated from ambient light, thisleaves the sample in complete darkness until the nextimage is to be acquired, negating the possibility ofphotobleaching. This computer-controlled systemexposes and images a single sample for 5 s once every3 min. This imaging process was allowed to proceedover the course of several hours, until the tissue fluo-rescence reached a steady value (6–12 h). All imagingcomponents were permitted to reach their steady statetemperature before imaging commenced. Electronicnoise inherent in the sensor was averaged out overspace and time, that is, the brightness of the image wastaken as a regional average (described below), andsmoothed among subsequent images.
Data Processing
It was observed that while the samples generallyexhibited a decrease in fluorescence over the acquisi-tion period, the PBS in which the samples were placedsteadily increased in fluorescence. Both the tissue and
SLADE et al.2678
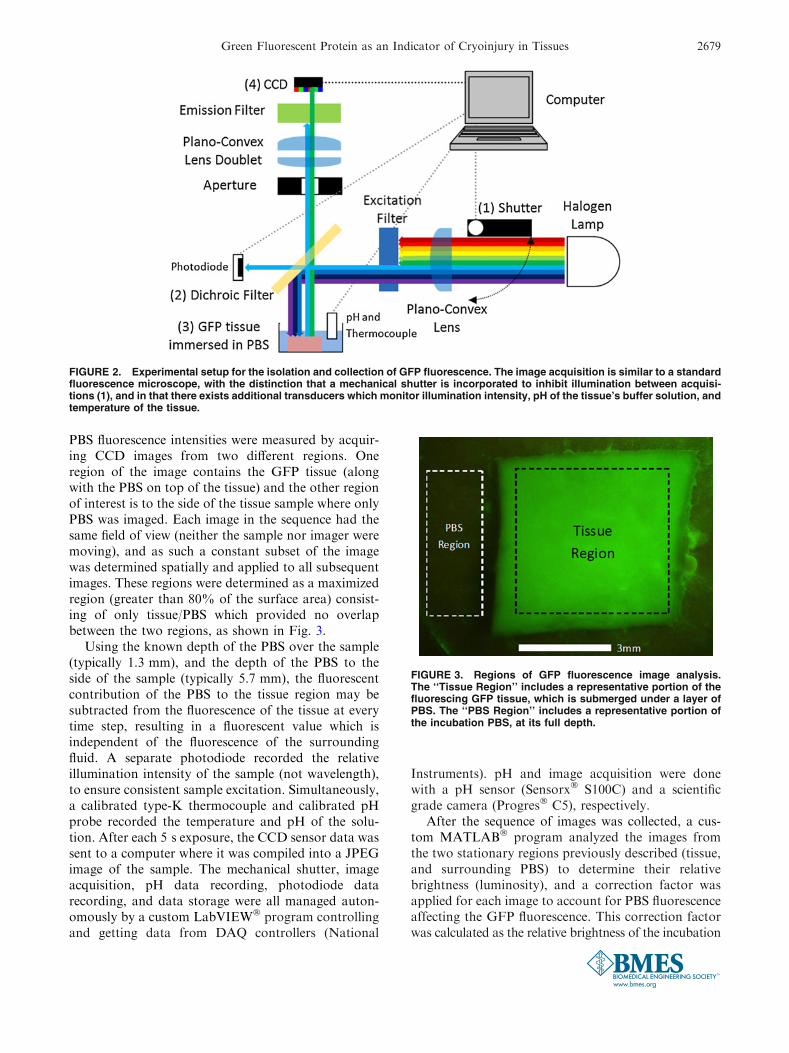
PBS fluorescence intensities were measured by acquir-ing CCD images from two different regions. Oneregion of the image contains the GFP tissue (alongwith the PBS on top of the tissue) and the other regionof interest is to the side of the tissue sample where onlyPBS was imaged. Each image in the sequence had thesame field of view (neither the sample nor imager weremoving), and as such a constant subset of the imagewas determined spatially and applied to all subsequentimages. These regions were determined as a maximizedregion (greater than 80% of the surface area) consist-ing of only tissue/PBS which provided no overlapbetween the two regions, as shown in Fig. 3.
Using the known depth of the PBS over the sample(typically 1.3 mm), and the depth of the PBS to theside of the sample (typically 5.7 mm), the fluorescentcontribution of the PBS to the tissue region may besubtracted from the fluorescence of the tissue at everytime step, resulting in a fluorescent value which isindependent of the fluorescence of the surroundingfluid. A separate photodiode recorded the relativeillumination intensity of the sample (not wavelength),to ensure consistent sample excitation. Simultaneously,a calibrated type-K thermocouple and calibrated pHprobe recorded the temperature and pH of the solu-tion. After each 5 s exposure, the CCD sensor data wassent to a computer where it was compiled into a JPEGimage of the sample. The mechanical shutter, imageacquisition, pH data recording, photodiode datarecording, and data storage were all managed auton-omously by a custom LabVIEW� program controllingand getting data from DAQ controllers (National
Instruments). pH and image acquisition were donewith a pH sensor (Sensorx� S100C) and a scientificgrade camera (Progres� C5), respectively.
After the sequence of images was collected, a cus-tom MATLAB� program analyzed the images fromthe two stationary regions previously described (tissue,and surrounding PBS) to determine their relativebrightness (luminosity), and a correction factor wasapplied for each image to account for PBS fluorescenceaffecting the GFP fluorescence. This correction factorwas calculated as the relative brightness of the incubation
FIGURE 2. Experimental setup for the isolation and collection of GFP fluorescence. The image acquisition is similar to a standardfluorescence microscope, with the distinction that a mechanical shutter is incorporated to inhibit illumination between acquisi-tions (1), and in that there exists additional transducers which monitor illumination intensity, pH of the tissue’s buffer solution, andtemperature of the tissue.
FIGURE 3. Regions of GFP fluorescence image analysis.The ‘‘Tissue Region’’ includes a representative portion of thefluorescing GFP tissue, which is submerged under a layer ofPBS. The ‘‘PBS Region’’ includes a representative portion ofthe incubation PBS, at its full depth.
Green Fluorescent Protein as an Indicator of Cryoinjury in Tissues 2679
fluid in the region without tissue, versus the regioncontaining tissue. Furthermore, the data from thephotodiode which measured the source light inten-sity was included for an additional correctionfactor to rectify any differences in the illuminationsource.
The basic algorithm of the code included applyingthe user-defined crops to each image region. The dig-ital-filter was then applied by deleting the blue-channeldata from the image. The average spatial luminancesof the tissue crop and PBS crop were determined(AvIm). Finally the adjusted luminance of the tissuecrop (AdIm) was obtained by subtraction of theproduct of the PBS luminance (AvPBS) with thedetermined percentage of PBS depth above the tissue(PerOver) (typically 23%) from the average luminance,as shown in the following equation. This was repeatedfor all images in the sequence, as denoted by the sub-script in the equation.
AdImi ¼ AvImi � PerOver� AvPBSið Þ ð1Þ
The output from the MATLAB� image analysis wasa matrix giving the raw and corrected tissue luminancefor each time step. As it was assumed that GFP fluo-resces most brightly in healthy, viable tissue, and thatthe tissue was most healthy/viable immediately afterharvest, the first time step was defined as 100% lumi-nance, and all the data was normalized to that timestep. When plotted, this gives the normalized luminanceof the tissue versus time. It is also noted that the CCDused was tested for its linear response to illuminationlevels, to ensure that relative fluorescence levels weredirectly proportional to their relative CCD values.
The data processing workflow is displayed in Fig. 4.
Finite Element Method (FEM) Modeling
To test the hypothesis of diffusion driving thetransient nature of the fluorescence, a finite elementmethod model was created using COMSOL� simula-tion software. The intention of the model was toexamine if transient diffusion was the only physicalphenomena responsible for the fluorescent intensityloss of the treated tissue samples. The model involvedthree-dimensional diffusion in a constant-temperatureenvironment. The governing equation used by thesoftware to evaluate the concentration gradients isbased on Fick’s second law,
dts@c
@tþr � �Drcð Þ ¼ R ð2Þ
where D is the diffusion coefficient for GFP in extra-cellular-matrix, c is the concentration, R (set to zero) is
the reaction rate, and d is the time-scale coefficient (setto 1, to reflect actual time). The approximations usedassume dilute aqueous solutions and, while the tissue isnot an aqueous solution, the fluid content of the tissueis sufficiently high that the approximation is valid.Also note that D for GFP in extracellular-matrixis used in our simulations with a value of 5.6E211m2/s,5,8,15 rather than the diffusion coefficient of GFPin tissue because the simulation is only meant as anorder-of-magnitude comparison to the observed loss offluorescence. Also, while the diffusion coefficient ofGFP within the nucleus or cytosol is reported inthe literature,16 the value for GFP in mouse hepatictissue is not readily available. The size of the simu-lated tissue matched that of the experimental tissue(6 9 6 9 4.4 mm), and the initial normalized concen-tration (c) of the sample was set to 1 (100%). Allboundary conditions of the model were approximatedas a constant concentration (c) of zero, as it is assumedthat the surrounding fluid contains no GFP and thatthe far-removed boundaries remain at that concentra-tion as time progresses. This approximation is valid asa large fluid-to-tissue volume ratio (32:1) was used inthe experiments.
As an order of magnitude analysis, the characteristiclength of diffusion is useful:
LD ¼ffiffiffiffiffiffiffiffi
4Dtp
ð3Þ
where LD is the diffusion length, D is the diffusioncoefficient, and t is a characteristic time. This will beused to explain the differences between single cell GFPviability experiments, and experiments using bulk tis-sue samples.
As visualization of the COMSOL� model wouldhave to match the optical properties of the experi-mental tissue, one further, major, approximation wasmade. The model was assumed to have no diffusionacross the bottom surface. In reality there would be nodiffusion across the bottom surface, as it was notexposed to the surrounding PBS (in contact with bot-tom surface of Petri dish), but the top surface wasexposed to PBS and would naturally have some dif-fusion. The depth of PBS above the tissue in theexperiments was minimized (approx. 1.3 mm) as tominimize diffusion in that direction, while still keepingthe sample hydrated. As the top and bottom surfaceswere more-or-less boundaries to diffusion, and seeingthat the optical depth of the tissue was unknown, thecomputational model was collapsed to be a two-dimensional model (with a 6 9 6 mm domain) bytaking the average fluorescence at all depths (z-direc-tion). All boundary conditions and coefficients usedwere identical to the 3D model.
SLADE et al.2680
GFP Conservation
GFP originally within the tissue was traced from itsorigin to its final position with the objective to assessthe total fluorescence of the entire system (PBS andtissue) for all time steps. In doing so, we aimed atdetermining if fluorescence intensity loss in the tissuewas simply due to diffusion to the surrounding mediaor if GFP was destroyed or denatured during theprocedure. The challenge to this analysis was in thatnot all fluorescence in the tissue is available to excita-tion or collection of emission at all times, due to a finiteoptical penetration depth of the tissue. To examine allfluorescence potential of the tissue, the tissue was dis-sociated into a suspension of individual cells. This wasdone with three sets of six tissue samples (18 tissuesamples). Each set had three samples dedicated tocryoinjury, and three to control.
In the dissociation procedure, tissue samples weretreated with identical thermal insults as in the tradi-tional experiment, however, after incubating in PBS,the sample was removed to a new volume of PBSmixed with collagenase enzyme (to target only collagenpeptide bonds, ignoring all other structures (i.e. GFP) 11),for extracellular matrix dissolution at a concentrationof 100 units/mL. The sample was then permitted to
dissociate over the next 24 h, after which fluorescenceof the resulting mixture was examined. As the intentionwas to examine the average fluorescence of the entiresystem, cellular integrity did not matter at this point,only GFP integrity. The original incubation PBS wasretained for fluorescent analysis, independent of thefluorescence of the dissociated tissue.
As each time-step required an entire tissue sample tobe dissociated, samples were only obtained at 1, 3, and6 h duration, due to limited resources. While this dis-tribution is not ideal for determining the rapidresponse of GFP fluorescence, it proved to be sufficientin demonstrating the overall trends in fluorescence.Three complete data sets were obtained and averagedusing this procedure, for a total of nine samples for thecontrol, and nine for the cryoinjured sample.
RESULTS
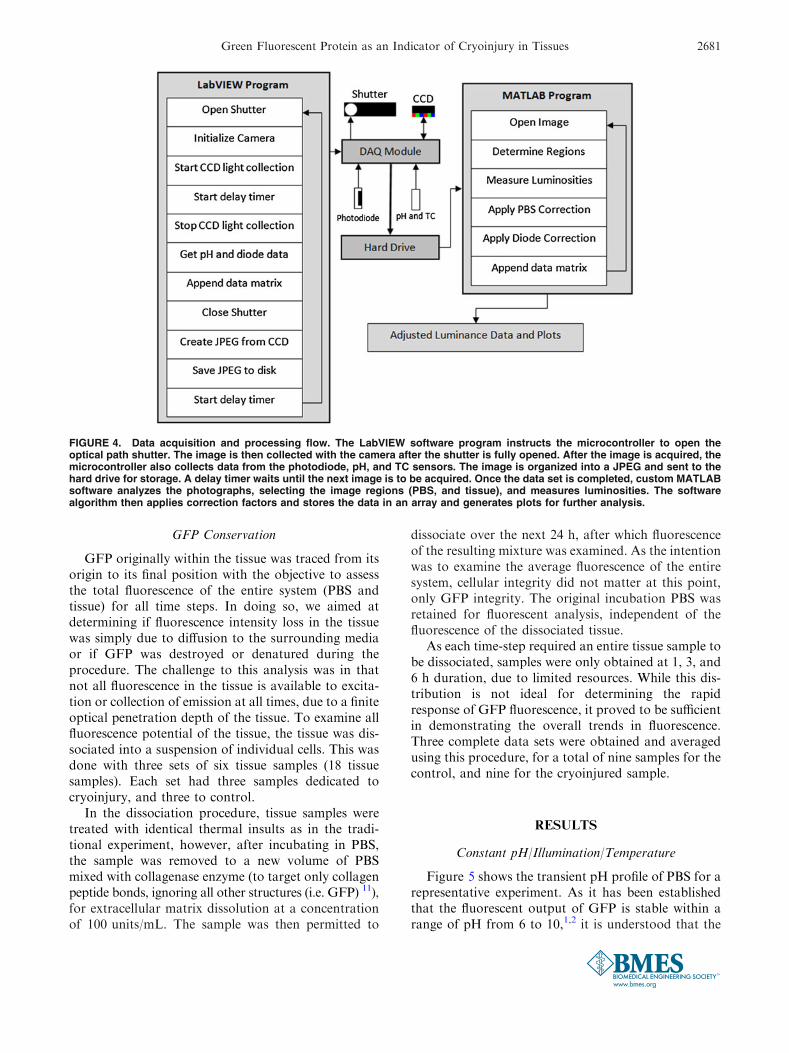
Constant pH/Illumination/Temperature
Figure 5 shows the transient pH profile of PBS for arepresentative experiment. As it has been establishedthat the fluorescent output of GFP is stable within arange of pH from 6 to 10,1,2 it is understood that the
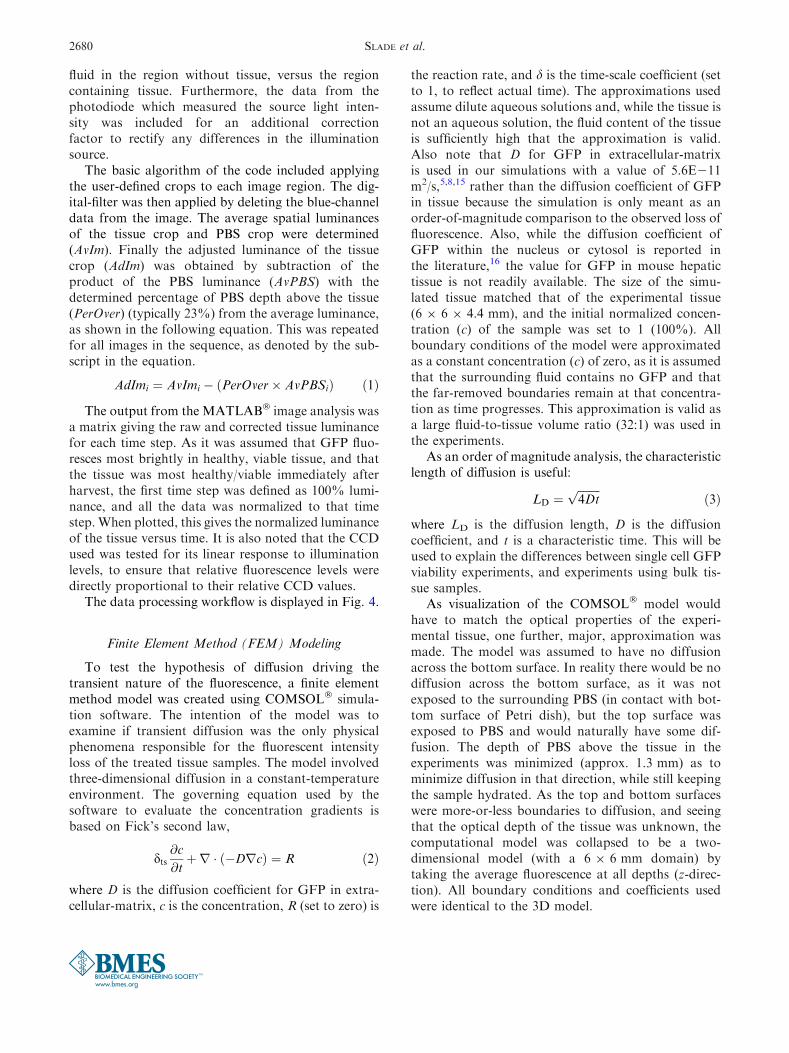
FIGURE 4. Data acquisition and processing flow. The LabVIEW software program instructs the microcontroller to open theoptical path shutter. The image is then collected with the camera after the shutter is fully opened. After the image is acquired, themicrocontroller also collects data from the photodiode, pH, and TC sensors. The image is organized into a JPEG and sent to thehard drive for storage. A delay timer waits until the next image is to be acquired. Once the data set is completed, custom MATLABsoftware analyzes the photographs, selecting the image regions (PBS, and tissue), and measures luminosities. The softwarealgorithm then applies correction factors and stores the data in an array and generates plots for further analysis.
Green Fluorescent Protein as an Indicator of Cryoinjury in Tissues 2681
observed change in pH will not have any impact of thefluorescent yield of the GFP.
The transient level of excitation light for a repre-sentative experiment also shows minimal variabilitynot exceeding 5% of the average value (Fig. 4).However, the fluorescent output of the sample is highlydependent on the illumination intensity, and should becompensated for. To achieve this compensation, eachtime step was normalized to the measured excitationlevel for that particular time step.
Finally, the temperature of the system was deter-mined at every time step, and never varied more than±2 �C from a mean value of 23 �C. This minimal vari-ability has negligible influence over GFP fluorescence.10
Optical Results
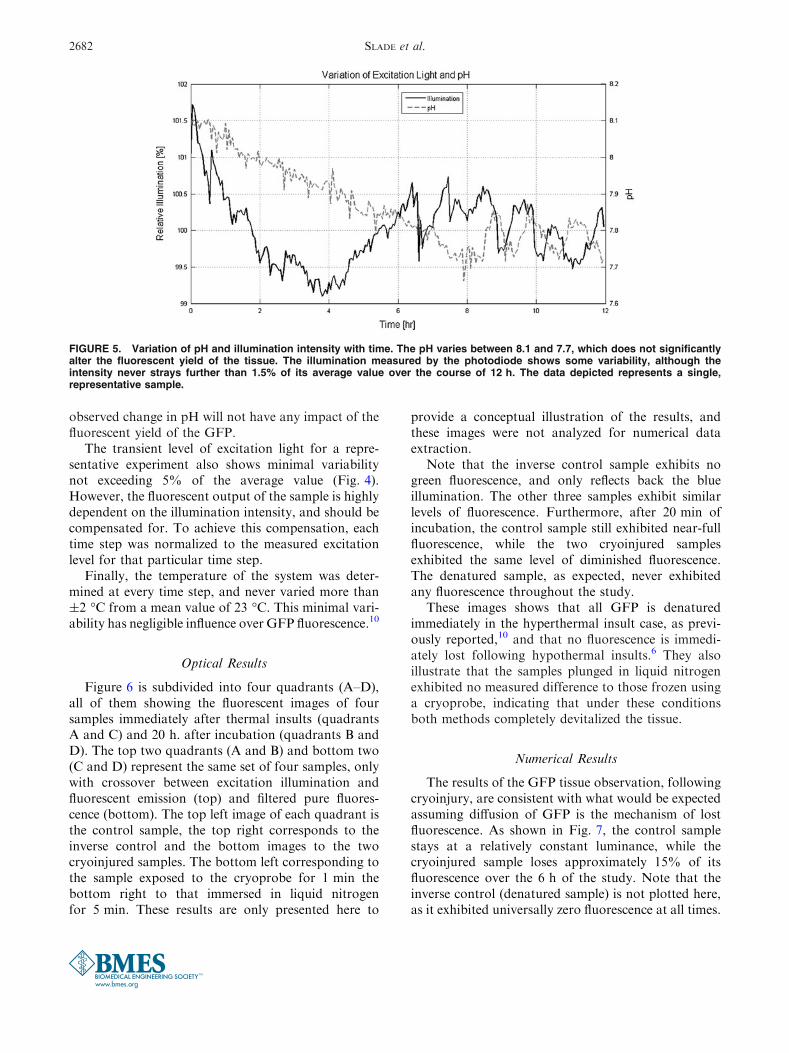
Figure 6 is subdivided into four quadrants (A–D),all of them showing the fluorescent images of foursamples immediately after thermal insults (quadrantsA and C) and 20 h. after incubation (quadrants B andD). The top two quadrants (A and B) and bottom two(C and D) represent the same set of four samples, onlywith crossover between excitation illumination andfluorescent emission (top) and filtered pure fluores-cence (bottom). The top left image of each quadrant isthe control sample, the top right corresponds to theinverse control and the bottom images to the twocryoinjured samples. The bottom left corresponding tothe sample exposed to the cryoprobe for 1 min thebottom right to that immersed in liquid nitrogenfor 5 min. These results are only presented here to
provide a conceptual illustration of the results, andthese images were not analyzed for numerical dataextraction.
Note that the inverse control sample exhibits nogreen fluorescence, and only reflects back the blueillumination. The other three samples exhibit similarlevels of fluorescence. Furthermore, after 20 min ofincubation, the control sample still exhibited near-fullfluorescence, while the two cryoinjured samplesexhibited the same level of diminished fluorescence.The denatured sample, as expected, never exhibitedany fluorescence throughout the study.
These images shows that all GFP is denaturedimmediately in the hyperthermal insult case, as previ-ously reported,10 and that no fluorescence is immedi-ately lost following hypothermal insults.6 They alsoillustrate that the samples plunged in liquid nitrogenexhibited no measured difference to those frozen usinga cryoprobe, indicating that under these conditionsboth methods completely devitalized the tissue.
Numerical Results
The results of the GFP tissue observation, followingcryoinjury, are consistent with what would be expectedassuming diffusion of GFP is the mechanism of lostfluorescence. As shown in Fig. 7, the control samplestays at a relatively constant luminance, while thecryoinjured sample loses approximately 15% of itsfluorescence over the 6 h of the study. Note that theinverse control (denatured sample) is not plotted here,as it exhibited universally zero fluorescence at all times.
FIGURE 5. Variation of pH and illumination intensity with time. The pH varies between 8.1 and 7.7, which does not significantlyalter the fluorescent yield of the tissue. The illumination measured by the photodiode shows some variability, although theintensity never strays further than 1.5% of its average value over the course of 12 h. The data depicted represents a single,representative sample.
SLADE et al.2682
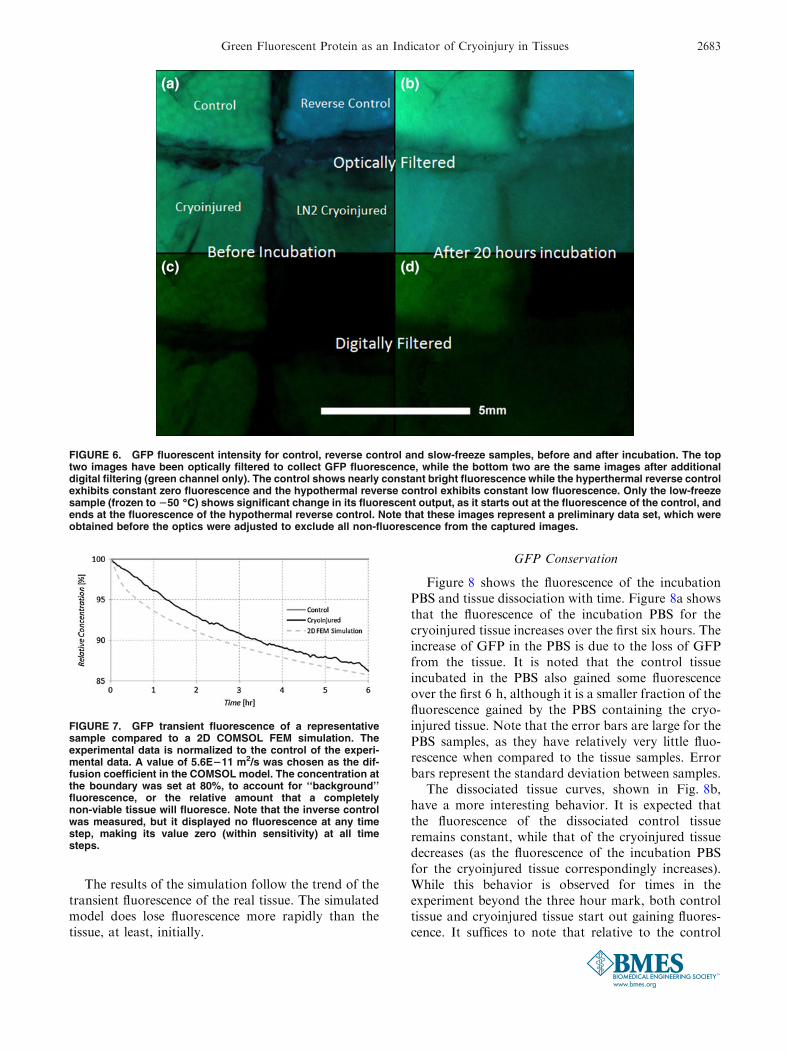
The results of the simulation follow the trend of thetransient fluorescence of the real tissue. The simulatedmodel does lose fluorescence more rapidly than thetissue, at least, initially.
GFP Conservation
Figure 8 shows the fluorescence of the incubationPBS and tissue dissociation with time. Figure 8a showsthat the fluorescence of the incubation PBS for thecryoinjured tissue increases over the first six hours. Theincrease of GFP in the PBS is due to the loss of GFPfrom the tissue. It is noted that the control tissueincubated in the PBS also gained some fluorescenceover the first 6 h, although it is a smaller fraction of thefluorescence gained by the PBS containing the cryo-injured tissue. Note that the error bars are large for thePBS samples, as they have relatively very little fluo-rescence when compared to the tissue samples. Errorbars represent the standard deviation between samples.
The dissociated tissue curves, shown in Fig. 8b,have a more interesting behavior. It is expected thatthe fluorescence of the dissociated control tissueremains constant, while that of the cryoinjured tissuedecreases (as the fluorescence of the incubation PBSfor the cryoinjured tissue correspondingly increases).While this behavior is observed for times in theexperiment beyond the three hour mark, both controltissue and cryoinjured tissue start out gaining fluores-cence. It suffices to note that relative to the control
FIGURE 6. GFP fluorescent intensity for control, reverse control and slow-freeze samples, before and after incubation. The toptwo images have been optically filtered to collect GFP fluorescence, while the bottom two are the same images after additionaldigital filtering (green channel only). The control shows nearly constant bright fluorescence while the hyperthermal reverse controlexhibits constant zero fluorescence and the hypothermal reverse control exhibits constant low fluorescence. Only the low-freezesample (frozen to 250 �C) shows significant change in its fluorescent output, as it starts out at the fluorescence of the control, andends at the fluorescence of the hypothermal reverse control. Note that these images represent a preliminary data set, which wereobtained before the optics were adjusted to exclude all non-fluorescence from the captured images.
FIGURE 7. GFP transient fluorescence of a representativesample compared to a 2D COMSOL FEM simulation. Theexperimental data is normalized to the control of the experi-mental data. A value of 5.6E211 m2/s was chosen as the dif-fusion coefficient in the COMSOL model. The concentration atthe boundary was set at 80%, to account for ‘‘background’’fluorescence, or the relative amount that a completelynon-viable tissue will fluoresce. Note that the inverse controlwas measured, but it displayed no fluorescence at any timestep, making its value zero (within sensitivity) at all timesteps.
Green Fluorescent Protein as an Indicator of Cryoinjury in Tissues 2683
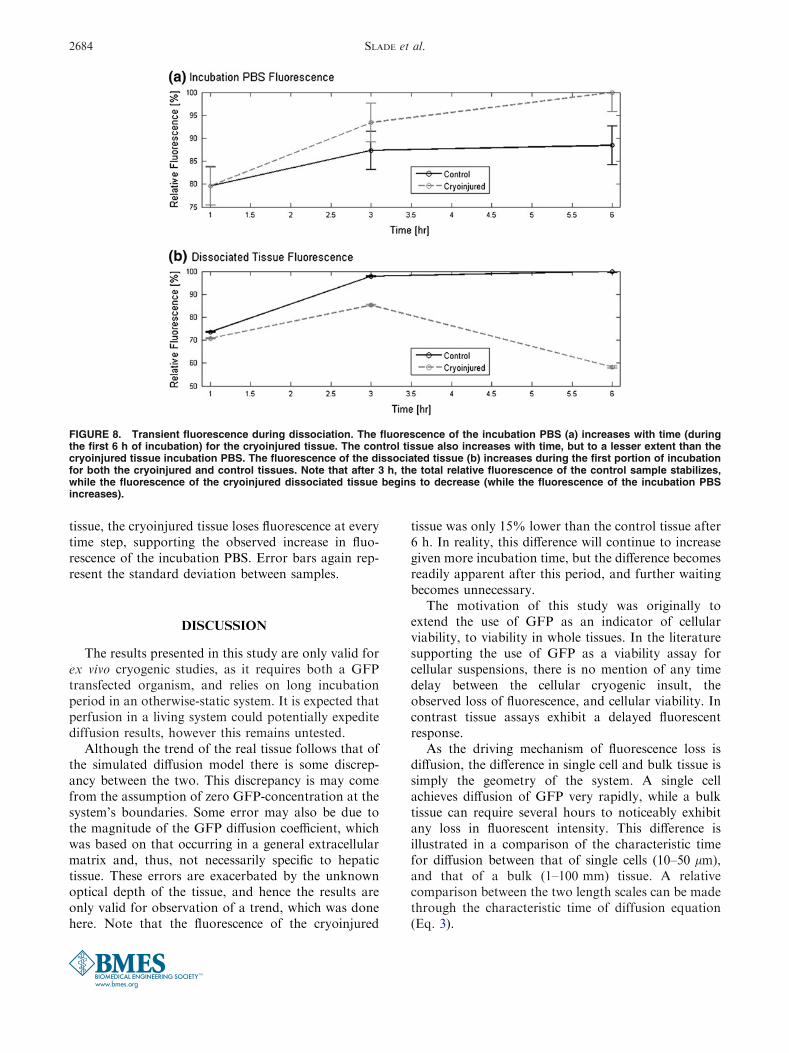
tissue, the cryoinjured tissue loses fluorescence at everytime step, supporting the observed increase in fluo-rescence of the incubation PBS. Error bars again rep-resent the standard deviation between samples.
DISCUSSION
The results presented in this study are only valid forex vivo cryogenic studies, as it requires both a GFPtransfected organism, and relies on long incubationperiod in an otherwise-static system. It is expected thatperfusion in a living system could potentially expeditediffusion results, however this remains untested.
Although the trend of the real tissue follows that ofthe simulated diffusion model there is some discrep-ancy between the two. This discrepancy is may comefrom the assumption of zero GFP-concentration at thesystem’s boundaries. Some error may also be due tothe magnitude of the GFP diffusion coefficient, whichwas based on that occurring in a general extracellularmatrix and, thus, not necessarily specific to hepatictissue. These errors are exacerbated by the unknownoptical depth of the tissue, and hence the results areonly valid for observation of a trend, which was donehere. Note that the fluorescence of the cryoinjured
tissue was only 15% lower than the control tissue after6 h. In reality, this difference will continue to increasegiven more incubation time, but the difference becomesreadily apparent after this period, and further waitingbecomes unnecessary.
The motivation of this study was originally toextend the use of GFP as an indicator of cellularviability, to viability in whole tissues. In the literaturesupporting the use of GFP as a viability assay forcellular suspensions, there is no mention of any timedelay between the cellular cryogenic insult, theobserved loss of fluorescence, and cellular viability. Incontrast tissue assays exhibit a delayed fluorescentresponse.
As the driving mechanism of fluorescence loss isdiffusion, the difference in single cell and bulk tissue issimply the geometry of the system. A single cellachieves diffusion of GFP very rapidly, while a bulktissue can require several hours to noticeably exhibitany loss in fluorescent intensity. This difference isillustrated in a comparison of the characteristic timefor diffusion between that of single cells (10–50 lm),and that of a bulk (1–100 mm) tissue. A relativecomparison between the two length scales can be madethrough the characteristic time of diffusion equation(Eq. 3).
FIGURE 8. Transient fluorescence during dissociation. The fluorescence of the incubation PBS (a) increases with time (duringthe first 6 h of incubation) for the cryoinjured tissue. The control tissue also increases with time, but to a lesser extent than thecryoinjured tissue incubation PBS. The fluorescence of the dissociated tissue (b) increases during the first portion of incubationfor both the cryoinjured and control tissues. Note that after 3 h, the total relative fluorescence of the control sample stabilizes,while the fluorescence of the cryoinjured dissociated tissue begins to decrease (while the fluorescence of the incubation PBSincreases).
SLADE et al.2684
Solving for t in the equation, it can be demonstratedthat the characteristic time of diffusion over the cel-lular length scale is on the order of several seconds,while the characteristic time of diffusion over the bulklength scale occurs on the order of several hours. Thus,the loss of GFP fluorescence following cryogenic insultmay be fully explained by the onset of diffusion of theGFP molecules from the tissue. This result supportsthe observation that for a single cell the fluorescenceloss following cryoinsult occurs over the course of afew seconds,3 while the fluorescence loss from a net-work of cells (tissue) occurs over the course of a fewhours. Further studies may describe the correlation oftissue size determining the characteristic time of dif-fusion, and the actual observed changes in fluores-cence.
Since all factors typically affecting fluorescenceyield, such as exposure duration, excitation lightintensity, temperature, pH, were kept constant in ourstudy, the observed fluorescence drop can only beattributed to either one of two factors, or both: (1)GFP diffusion from the affected cells into the sur-rounding medium and/or (2) intracellular effects lead-ing to cell apoptosis and/or necrosis that ultimatelyyield GFP diminished fluorescence. As the observeddrop in fluorescence corresponds with increased fluo-rescence in the incubation medium, the second condi-tion alone cannot account for the drop in fluorescence,therefore GFP diffusion appears to be if not the onlyone, at least the major driving force behind transientfluorescence. Furthermore, the trends of the effectivediminished fluorescence of the tissue seem to be wellrepresented by Fick’s 2nd law (Fig. 6), suggestingagain that GFP diffusion is, if not the only mechanismresponsible for GFP loss, at least the dominant phe-nomenon. As such, factors which affect the speed ofdiffusion (geometry, temperature, surrounding fluid,diffusion coefficient, etc.) will greatly affect therequired duration of incubation. For example, for thehepatic tissue used in this study, a rectangular paral-lelepiped with dimensions 6 9 6 9 4.4 mm with adiffusion rate of 5.6E211 m2/s led to an incubationtime of approximately 3.5 h before significant changesin fluorescence could be observed.
CONCLUSION
The loss of fluorescence in cryogenically-treatedcells and tissues is due to the diffusion of GFP from thecell/tissue onto the surrounding media (extracellularspace/medium), onset by the cryogenic insult.
The loss of GFP in cryoinjured tissues will not,however, be immediately apparent, as the diffusionrequired to show regions of damaged tissue may take
hours. The required incubation period for cryoinjuredGFP tissues before checking viability will depend onall environmental factors which govern diffusion.Future studies may be dedicated to determining theincubation period required given a variety of researchconditions in a variety of tissues. For the samples usedin this study, an incubation period of approximately3.5 h is sufficient to observe a significant drop influorescence (>10%).
Provided the aforementioned precautions andallowances are made, GFP may be successfully used asan indicator of viability in ex vivo GFP-transfectedcryoinjured tissues. It shares all the same benefits ofusing GFP as a viability assay in single cells, while onlyrequiring more time to exhibit and obtain the results.As fluorescence can be ascertained in situ, GFP as anindicator of viability in cryoinjured tissues can poten-tially be a valuable technique where more traditionalassays may be inappropriate in preclinical trials.
ACKNOWLEDGMENTS
ABS acknowledges financial support from 2011 UCMEXUS Dissertation Research Grant.
CONFLICTS OF INTEREST
No conflicts of interest to declare.
REFERENCES
1Alkaabi, K. M., A. Yafea, and S. S. Ashraf. Effect of pHon Thermal-and Chemical-Induced Denaturation of GFP.Heidelberg: Springer, 2005.2Campbell, T. N., and F. Y. M. Choy. The effect of pH ongreen fluorescent protein: a brief review. Mol. Biol. Today2(1):1–4, 2001.3Elliott, G., J. McGrath, and E. Crockett-Torabi. Greenfluorescent prote: a novel viability assay for cryobiologicalapplications. Cryobiology 40(4):360–369, 2000.4Ericsson, M., D. Hanstorp, P. Hagberg, J. Enger, andT. Nystrom. Sorting out bacterial viability with opticaltweezers. J. Bacteriol. 182(19):5551–5555, 2000.5Houtsmuller, A. B. Fluorescence recovery after photoble-aching: application to nuclear proteins. Adv. Biochem. Eng.Biotechnol. 95:177–199, 2005.6Leiderman, P., D. Huppert, and N. Agmon. Transition inthe temperature-dependence of GFP fluorescence: fromproton wires to proton exit. Biophys. J. 90(3):1009–1018,2006.7Martınez-Suastegui, L., B. Duperray, F. Godinez, G.Guillen, A. Slade, and G. Aguilar. Laser-assisted cryosur-gery in ex vivo mice hepatic tissue: viability assays usinggreen fluorescent protein. Ann. Biomed. Eng. 39(2):636–648, 2011.
Green Fluorescent Protein as an Indicator of Cryoinjury in Tissues 2685
8Mobility of Molecules and Particles within the Cytoplasmof a Living Cell. http://www.zeiss.de/C12567BE00472A5C/EmbedTitelIntern/Application_Cellular_Cytoplasm/$File/CELLMEASURE2.PDF.9Muldrew, K., M. Hurtig, K. Novak, N. Schachar, andL. E. McGann. Localization of freezing injury in articularcartilage. Cryobiology 31(1):31–38, 1994.
10Nagy, A., A. Malnasi-Csizmadia, B. Somogyi, and D.Lorinczy. Thermal stability of chemically denatured greenfluorescent protein (GFP): a preliminary study. Thermo-chim. Acta 410(1–2):161–163, 2004.
11Saito, N., M. Zhao, L. Li, E. Baranov, M. Yang, Y. Ohta,K. Katsuoka, S. Penman, and R. M. Hoffman. High effi-ciency genetic modification of hair follicles and growinghair shafts. Proc. Natl. Acad. Sci. 99(20):13120–13124,2002.
12Schaefer, B. C., M. L. Schaefer, J. W. Kappler, P. Marrack,and R. M. Kedl. Observation of antigen-dependent CD8+T-cell/dendritic cell interactions in vivo. Cell. Immunol.214(2):110–122, 2001.
13Schreer, A., C. Tinson, J. P. Sherry, and K. Schirmer.Application of Alamar blue/5-carboxyfluorescein diacetate
acetoxymethyl ester as a noninvasive cell viability assay inprimary hepatocytes from rainbow trout. Anal. Biochem.344(1):76–85, 2005.
14Strebel, A., T. Harr, F. Bachmann, M. Wernli, and P. Erb.Green fluorescent protein as a novel tool to measureapoptosis and necrosis. Cytometry 43(2):126–133, 2001.
15Swaminathan, R., C. P. Hoang, and A. S. Verkman.Photobleaching recovery and anisotropy decay of greenfluorescent protein GFP-S65T in solution and cells: cyto-plasmic viscosity probed by green fluorescent proteintranslational and rotational diffusion. Biophys. J. 72(4):1900–1907, 1997.
16Wachsmuth, M., W. Waldeck, and J. Langowski. Anom-alous diffusion of fluorescent probes inside living cell nucleiinvestigated by spatially-resolved fluorescence correlationspectroscopy. J. Mol. Biol. 298(4):677–689, 2000.
17Yang, H., J. Acker, A. Chen, and L. McGann. In situassessment of cell viability. Cell Transplant 7(5):443–451,1998.
18Youvan, D. C., and M. E. Michel-Beyerle. Structure andfluorescence mechanism of GFP. Nat. Biotechnol. 14:1219–1220, 1996.
SLADE et al.2686
Copyright © 2022 FDOKUMEN

