


Bahasa
Halaman
Hukum

Global Energy uses an integrated fuel forecasting approach based upon a common data
model, best in class fundamental modeling solutions, and our Global Energy expertise to
provide the best available analysis of fuel and electricity supply and demand fundamentals,
expected prices and how they are formed. The results of this integrated fuel forecasting
strategy provide a consistent approach to fuel prices across all Global Energy advisory and
consulting services to enable our clients to turn their strategy analysis into credible results.
Global Energy uses a three-step process to achieve an integrated fuel forecast:
1. Fuel Demand for Power Generation from ENERPRISE Market Analytics™. Global
Energy uses a fundamental approach to forecast power demand in each region of North
America using its Market Analytics™ system—the standard of the industry for energy
data management and production simulation modeling. ENERPRISE Market Analytics™ is
a sophisticated, relational database that operates with PROSYM™, a state-of-the-art,
multi-area, chronological production simulation model.
2. GPCM and CQMM Fuels Models. Expected fuel demand for power generation serves as
an input in Global Energy’s Gas Pipeline Competition Model (GPCM) gas model and Coal
Quality Market Model (CQMM) coal model both developed by RBAC Inc. to develop a
fundamental analysis of fuel supply and demand and expected wholesale fuel prices.
Separately, we use Global Energy World Oil model to provide global oil supply and
demand inputs.
3. Expected Wholesale Electricity Prices. Expected fuel prices are then used as an input
to Market Analytics™ to produce wholesale expected prices and their implications
across each region in North America for Global Energy advisory services.
This Global Energy Integrated Fuels Forecast Best Practice provides an independent,
transparent, consistent approach to fuel analysis utilizing the best available data and
software models appropriate to the task integrated into a complete market advisory
service.
Integrated Fuels Analysis Global Energy Decisions Best Practice
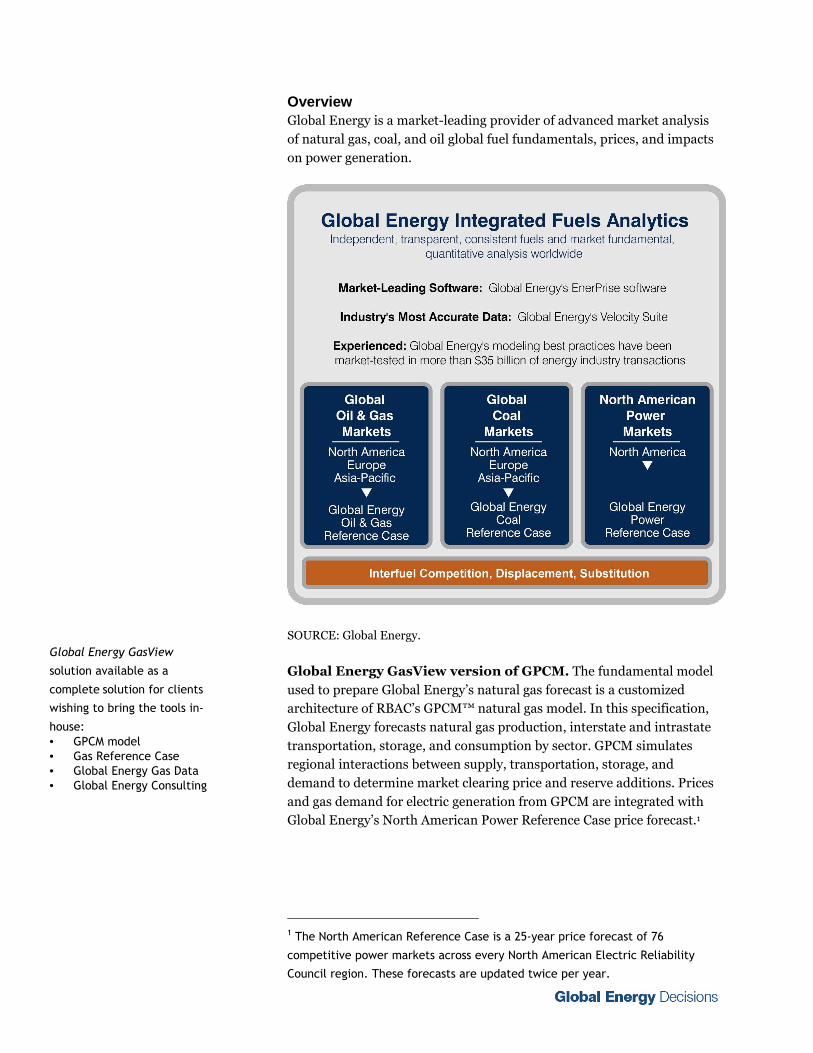
Overview Global Energy is a market-leading provider of advanced market analysis
of natural gas, coal, and oil global fuel fundamentals, prices, and impacts
on power generation.
SOURCE: Global Energy.
Global Energy GasView version of GPCM. The fundamental model
used to prepare Global Energy’s natural gas forecast is a customized
architecture of RBAC’s GPCM™ natural gas model. In this specification,
Global Energy forecasts natural gas production, interstate and intrastate
transportation, storage, and consumption by sector. GPCM simulates
regional interactions between supply, transportation, storage, and
demand to determine market clearing price and reserve additions. Prices
and gas demand for electric generation from GPCM are integrated with
Global Energy’s North American Power Reference Case price forecast.1
1 The North American Reference Case is a 25-year price forecast of 76
competitive power markets across every North American Electric Reliability
Council region. These forecasts are updated twice per year.
Global Energy GasView
solution available as a
complete solution for clients
wishing to bring the tools in-
house:
• GPCM model
• Gas Reference Case
• Global Energy Gas Data
• Global Energy Consulting
Best Practice: Global Energy Integrated Fuels Forecasting
© 2006 | Global Energy Decisions | 1
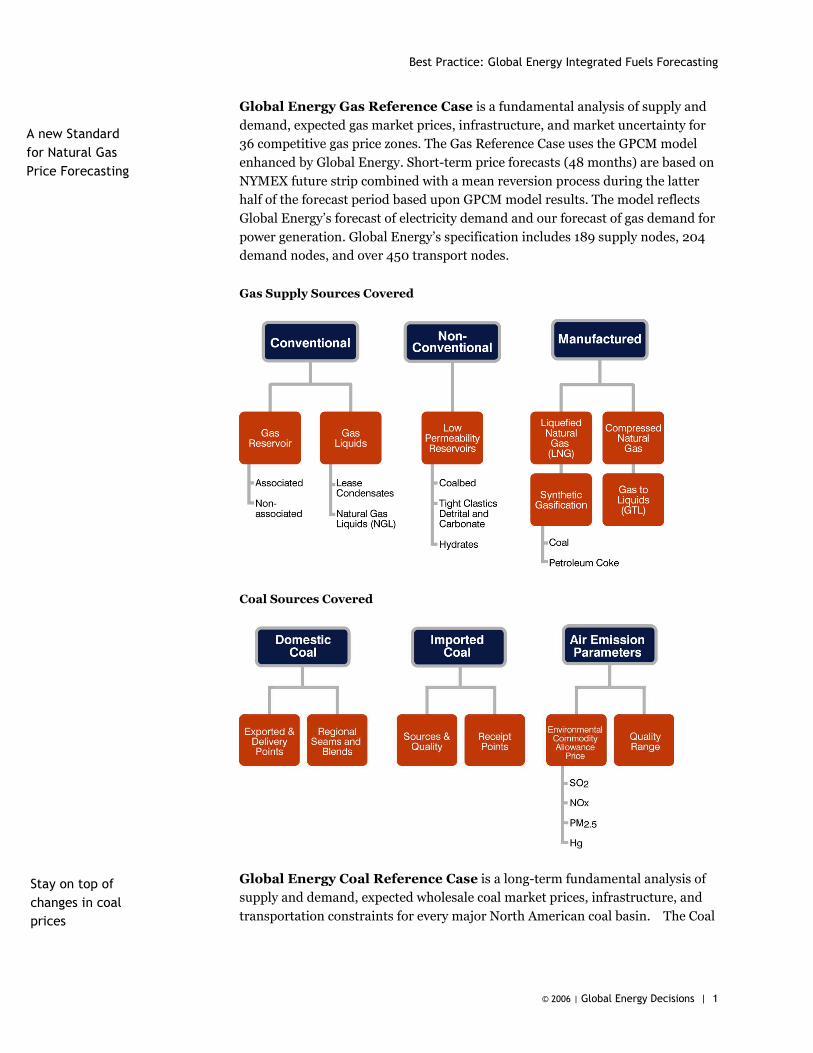
Global Energy Gas Reference Case is a fundamental analysis of supply and
demand, expected gas market prices, infrastructure, and market uncertainty for
36 competitive gas price zones. The Gas Reference Case uses the GPCM model
enhanced by Global Energy. Short-term price forecasts (48 months) are based on
NYMEX future strip combined with a mean reversion process during the latter
half of the forecast period based upon GPCM model results. The model reflects
Global Energy’s forecast of electricity demand and our forecast of gas demand for
power generation. Global Energy’s specification includes 189 supply nodes, 204
demand nodes, and over 450 transport nodes.
Gas Supply Sources Covered
Coal Sources Covered
Global Energy Coal Reference Case is a long-term fundamental analysis of
supply and demand, expected wholesale coal market prices, infrastructure, and
transportation constraints for every major North American coal basin. The Coal
A new Standard
for Natural Gas
Price Forecasting
Stay on top of
changes in coal
prices
Best Practice: Global Energy Integrated Fuel Price Forecasting
2
Reference Case focuses on the productive capacity of each basin and implications
for coal prices of deliverability and other market issues. Global Energy’s long-
term coal forecast is derived using RBAC’s CQMMTM (Coal Quality Market
Model) in conjunction with Global Energy’s short-term econometric model for
the best view of near-term and long-term factors affecting coal market prices.
CoalView Interactive is a web-based, interactive, short-term coal market
forecast service designed for top-level overview of the U.S. coal market providing
daily-updated, marked-to-market, two-year forward monthly FOB mine and
barge price forecasts for 16 common U.S. coals. CoalView lets you add your own
price inputs and see them instantly collected, summarized, and displayed for all
16 coals.
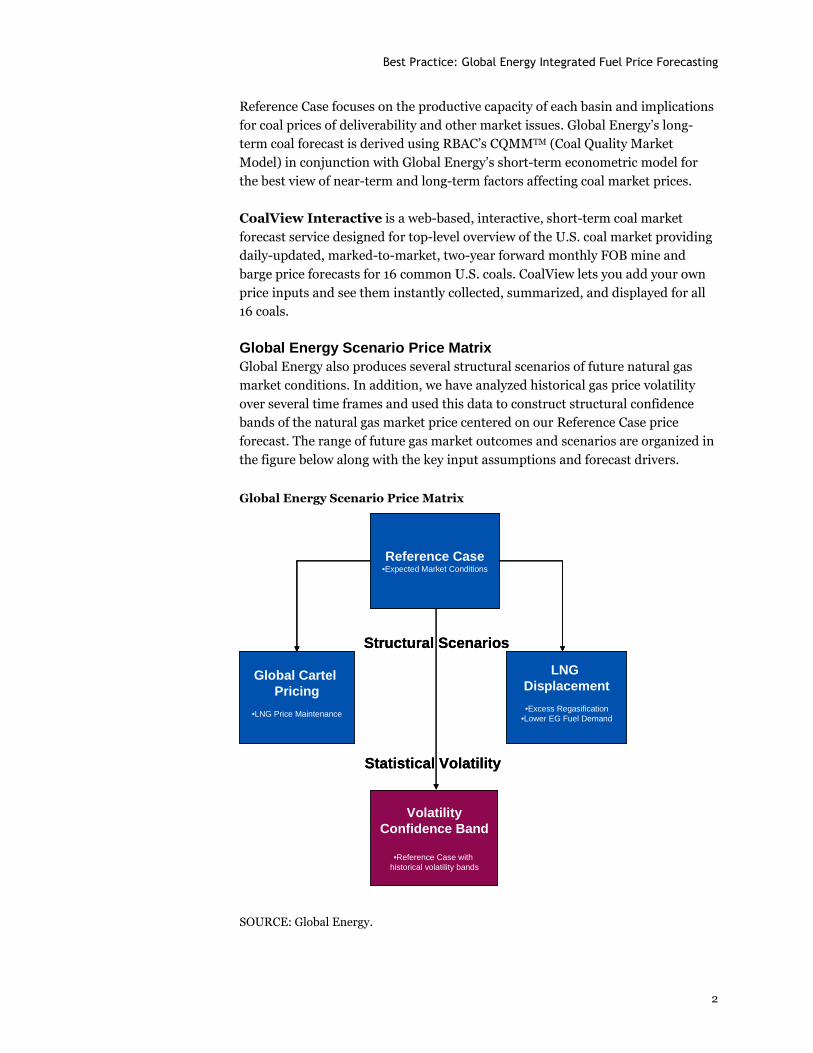
Global Energy Scenario Price Matrix Global Energy also produces several structural scenarios of future natural gas
market conditions. In addition, we have analyzed historical gas price volatility
over several time frames and used this data to construct structural confidence
bands of the natural gas market price centered on our Reference Case price
forecast. The range of future gas market outcomes and scenarios are organized in
the figure below along with the key input assumptions and forecast drivers.
Global Energy Scenario Price Matrix
Reference Case•Expected Market Conditions
Global Cartel Pricing
•LNG Price Maintenance
VolatilityConfidence Band
•Reference Case with historical volatility bands
LNG Displacement
•Excess Regasification•Lower EG Fuel Demand
Structural Scenarios
Statistical Volatility
Reference Case•Expected Market Conditions
Global Cartel Pricing
•LNG Price Maintenance
VolatilityConfidence Band
•Reference Case with historical volatility bands
LNG Displacement
•Excess Regasification•Lower EG Fuel Demand
Structural Scenarios
Statistical Volatility
SOURCE: Global Energy.
GLOBAL ENERGY FUELS CONSULTING CREDENTIALS
| 3
Modeling Tools Used in Global Energy Fuels Consulting. Our work is
done using one or more of the following solutions:
• Global Energy EnerPrise Market Analytics
• Global Energy EnerPrise Planning & Risk
• Global Energy Strategic Planning, (formerly Midas Gold)
• Global Energy Velocity Suite database services
• Global Energy MAPS for geospatial mapping and graphics solutions
• RBAC’s GPCM model for natural gas modeling
• RBAC’s CQMM model for coal market modeling
Fuel Price Forecast Methodology
Fuel Oil Forecast. Since crude oil is the raw material used to produce distillate
oil, jet kerosene, and heavy fuel oil (e.g., various sulfur grades of #6 residual oil),
as well as gasoline, Global Energy derives fuel oil forecasts for generators from
our West Texas Intermediate (WTI) Reference Case Forecast.
Global Energy produces its WTI Reference Case based on NYMEX future prices
for WTI Oil and Fuel Oil #2, product price relationships between fuel oils and
long-term supply and demand analysis of the WTI, and global crude oil markets.
The WTI forecast is based on 43 months of NYMEX futures prices and on
subsequent supply/demand fundamentals for the remainder for the forecast
period. The WTI NYMEX prices are incorporated directly for the first 24 months
and for the following 24 months by mean regression analysis with the
supply/demand analysis. A similar approach is used to forecast near-term natural
gas prices. The NYMEX trading dates for the fall 2005 forecast were September
12-14, 2005. Therefore, from April 2009 to the balance of the forecast period,
prices are based on econometric analysis of supply/demand fundamentals
prepared by Global Energy.
Incorporating the NYMEX prices thus captures a snapshot of the then-current
trading value and volatility cost during the first 48 months of the forecast period
including the geopolitical risk premiums and other market trading costs. Beyond
the NYMEX-influenced forecast period, the WTI price range is approximately 35
to $40/Bbl (2005$) between 2010 and 2029. This is due to Global Energy’s
analysis of the full-cycle replacement cost for OPEC production—in particular for
Saudi Arabia—and our analysis of downstream-of-the-wellhead production
capacity, and the costs for infrastructural capacity for refining, storage, and
transportation are evaluated, as well as global oil demand.
Best Practice: Global Energy Integrated Fuel Price Forecasting
4
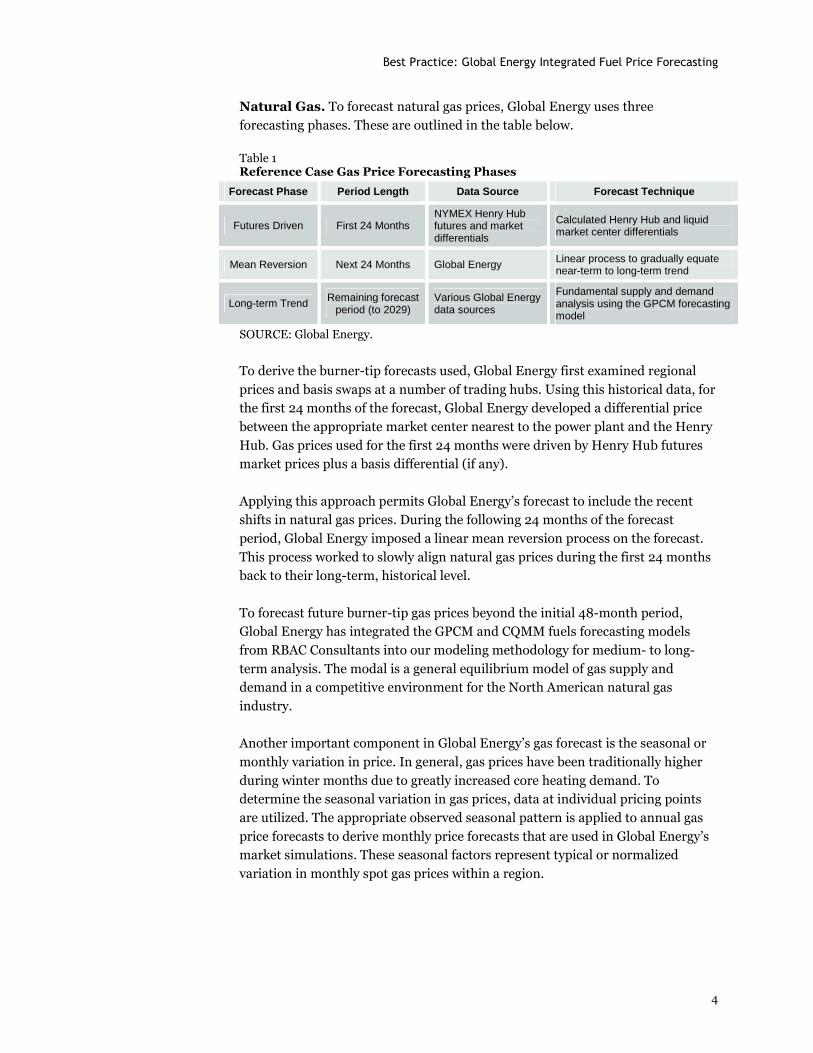
Natural Gas. To forecast natural gas prices, Global Energy uses three
forecasting phases. These are outlined in the table below.
Table 1 Reference Case Gas Price Forecasting Phases
Forecast Phase Period Length Data Source Forecast Technique
Futures Driven First 24 Months NYMEX Henry Hub futures and market differentials
Calculated Henry Hub and liquid market center differentials
Mean Reversion Next 24 Months Global Energy Linear process to gradually equate near-term to long-term trend
Long-term Trend Remaining forecast period (to 2029)
Various Global Energy data sources
Fundamental supply and demand analysis using the GPCM forecasting model
SOURCE: Global Energy.
To derive the burner-tip forecasts used, Global Energy first examined regional
prices and basis swaps at a number of trading hubs. Using this historical data, for
the first 24 months of the forecast, Global Energy developed a differential price
between the appropriate market center nearest to the power plant and the Henry
Hub. Gas prices used for the first 24 months were driven by Henry Hub futures
market prices plus a basis differential (if any).
Applying this approach permits Global Energy’s forecast to include the recent
shifts in natural gas prices. During the following 24 months of the forecast
period, Global Energy imposed a linear mean reversion process on the forecast.
This process worked to slowly align natural gas prices during the first 24 months
back to their long-term, historical level.
To forecast future burner-tip gas prices beyond the initial 48-month period,
Global Energy has integrated the GPCM and CQMM fuels forecasting models
from RBAC Consultants into our modeling methodology for medium- to long-
term analysis. The modal is a general equilibrium model of gas supply and
demand in a competitive environment for the North American natural gas
industry.
Another important component in Global Energy’s gas forecast is the seasonal or
monthly variation in price. In general, gas prices have been traditionally higher
during winter months due to greatly increased core heating demand. To
determine the seasonal variation in gas prices, data at individual pricing points
are utilized. The appropriate observed seasonal pattern is applied to annual gas
price forecasts to derive monthly price forecasts that are used in Global Energy’s
market simulations. These seasonal factors represent typical or normalized
variation in monthly spot gas prices within a region.
GLOBAL ENERGY FUELS CONSULTING CREDENTIALS
| 5
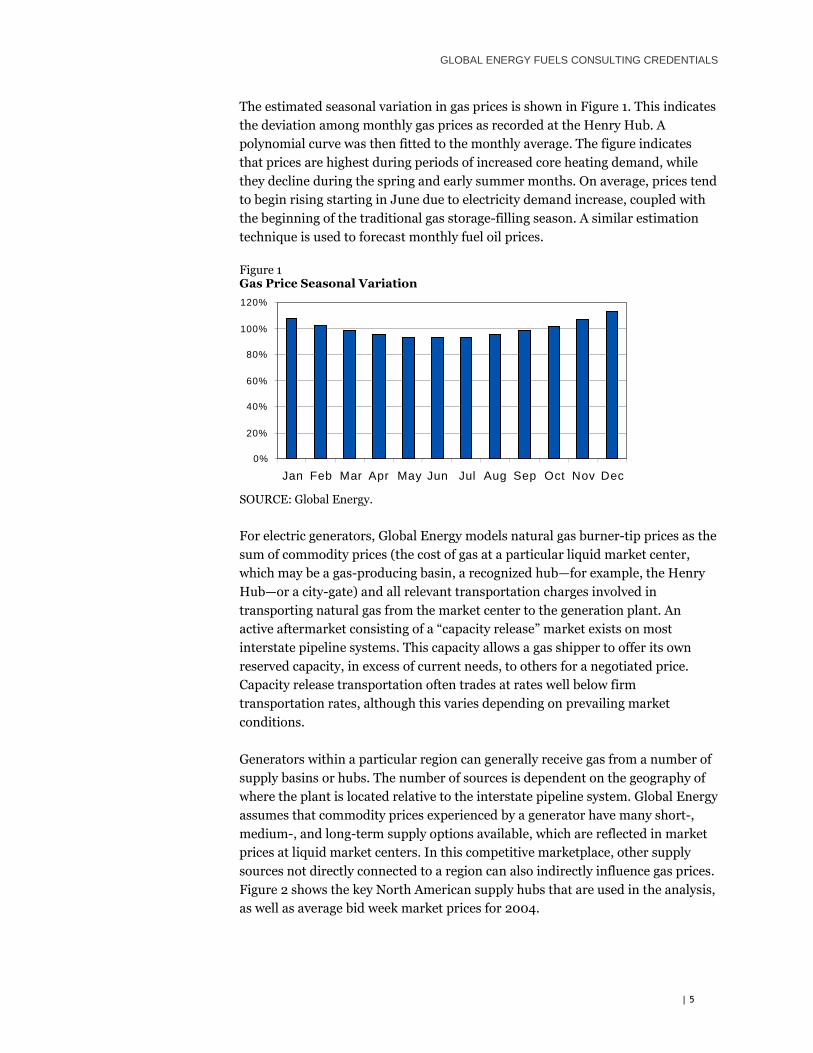
The estimated seasonal variation in gas prices is shown in Figure 1. This indicates
the deviation among monthly gas prices as recorded at the Henry Hub. A
polynomial curve was then fitted to the monthly average. The figure indicates
that prices are highest during periods of increased core heating demand, while
they decline during the spring and early summer months. On average, prices tend
to begin rising starting in June due to electricity demand increase, coupled with
the beginning of the traditional gas storage-filling season. A similar estimation
technique is used to forecast monthly fuel oil prices.
Figure 1 Gas Price Seasonal Variation
0%
20%
40%
60%
80%
100%
120%
Jan Feb Mar Apr May Jun Jul Aug Sep Oct Nov Dec
SOURCE: Global Energy.
For electric generators, Global Energy models natural gas burner-tip prices as the
sum of commodity prices (the cost of gas at a particular liquid market center,
which may be a gas-producing basin, a recognized hub—for example, the Henry
Hub—or a city-gate) and all relevant transportation charges involved in
transporting natural gas from the market center to the generation plant. An
active aftermarket consisting of a “capacity release” market exists on most
interstate pipeline systems. This capacity allows a gas shipper to offer its own
reserved capacity, in excess of current needs, to others for a negotiated price.
Capacity release transportation often trades at rates well below firm
transportation rates, although this varies depending on prevailing market
conditions.
Generators within a particular region can generally receive gas from a number of
supply basins or hubs. The number of sources is dependent on the geography of
where the plant is located relative to the interstate pipeline system. Global Energy
assumes that commodity prices experienced by a generator have many short-,
medium-, and long-term supply options available, which are reflected in market
prices at liquid market centers. In this competitive marketplace, other supply
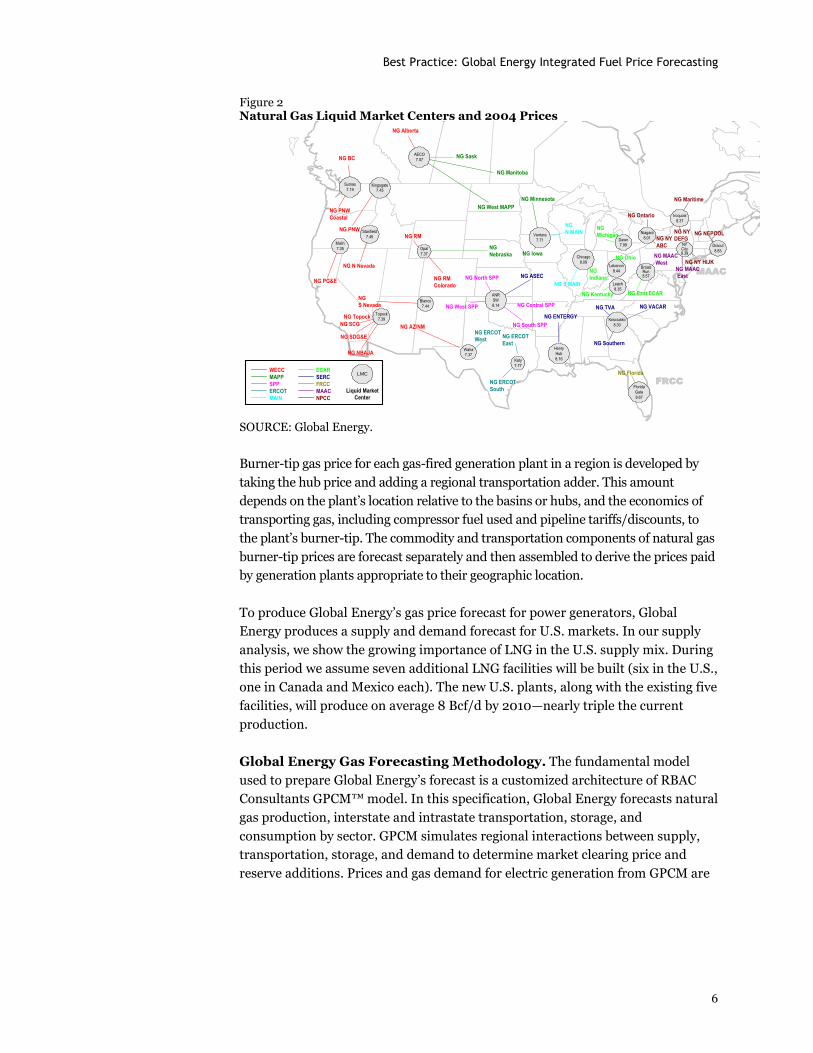
sources not directly connected to a region can also indirectly influence gas prices.
Figure 2 shows the key North American supply hubs that are used in the analysis,
as well as average bid week market prices for 2004.
Best Practice: Global Energy Integrated Fuel Price Forecasting
6
Figure 2 Natural Gas Liquid Market Centers and 2004 Prices
WECCWECCWECCWECC
MAPPMAPPMAPPMAPP
SPPSPPSPPSPP
ERCOTERCOTERCOTERCOT
SERCSERCSERCSERC
FRCCFRCCFRCCFRCC
MAINMAINMAINMAIN
ECARECARECARECAR
MAACMAACMAACMAAC
NPCCNPCCNPCCNPCC
NG PG&E
NG NEPOOL
NG N Nevada
NG SCG
NG SDG&E
NG
S Nevada
NG AZ/NM
NG BC
NG PNW
Coastal
NG PNW
NG Sask
NG Manitoba
NG Minnesota
NG Ontario
NG Maritime
NG
Nebraska
NG RM
NG RM
Colorado
NG North SPP
NG Central SPPNG West SPP
NG ASEC
NG Iowa
NG
N MAIN
NG Florida
NG Southern
NG VACARNG TVA
NG ENTERGY
NG Kentucky NG East ECAR
NG
Indiana
NG Ohio
NG NY
ABC
NG South SPP
NG NBAJA
NG West MAPP
NG Alberta
NG S MAIN
NG
Michigan
WECC
MAPP
SPP
ERCOT
MAIN
ECAR
SERC
FRCC
MAAC
NPCC
LMC
Liquid Market
Center
Lebanon
8.44
NG NY HIJK
Dracut
8.65
Dawn7.99
Chicago
8.09
Ventura
7.71
Opal
7.37
Sumas
7.19Kingsgate7.45
Stanfield
7.49
Malin
7.35
Topock7.39
Florida
Gate
8.67
Katy
7.77
Waha7.37
ANRSW
8.14
NYCity9.39
NG MAAC
East
Iroquois
8.37
NG NY
DEFG
AECO
7.07
Blanco
7.44
Leach
8.35
BroadRun8.57
Kosciusko
8.30
NG ERCOT
West
NG ERCOT
South
NG ERCOT
East
NG MAAC
West
NG Topock
Niagara
8.01
Henry
Hub
8.16
SOURCE: Global Energy.
Burner-tip gas price for each gas-fired generation plant in a region is developed by
taking the hub price and adding a regional transportation adder. This amount
depends on the plant’s location relative to the basins or hubs, and the economics of
transporting gas, including compressor fuel used and pipeline tariffs/discounts, to
the plant’s burner-tip. The commodity and transportation components of natural gas
burner-tip prices are forecast separately and then assembled to derive the prices paid
by generation plants appropriate to their geographic location.
To produce Global Energy’s gas price forecast for power generators, Global
Energy produces a supply and demand forecast for U.S. markets. In our supply
analysis, we show the growing importance of LNG in the U.S. supply mix. During
this period we assume seven additional LNG facilities will be built (six in the U.S.,
one in Canada and Mexico each). The new U.S. plants, along with the existing five
facilities, will produce on average 8 Bcf/d by 2010—nearly triple the current
production.
Global Energy Gas Forecasting Methodology. The fundamental model
used to prepare Global Energy’s forecast is a customized architecture of RBAC
Consultants GPCM™ model. In this specification, Global Energy forecasts natural
gas production, interstate and intrastate transportation, storage, and
consumption by sector. GPCM simulates regional interactions between supply,
transportation, storage, and demand to determine market clearing price and
reserve additions. Prices and gas demand for electric generation from GPCM are
GLOBAL ENERGY FUELS CONSULTING CREDENTIALS
| 7
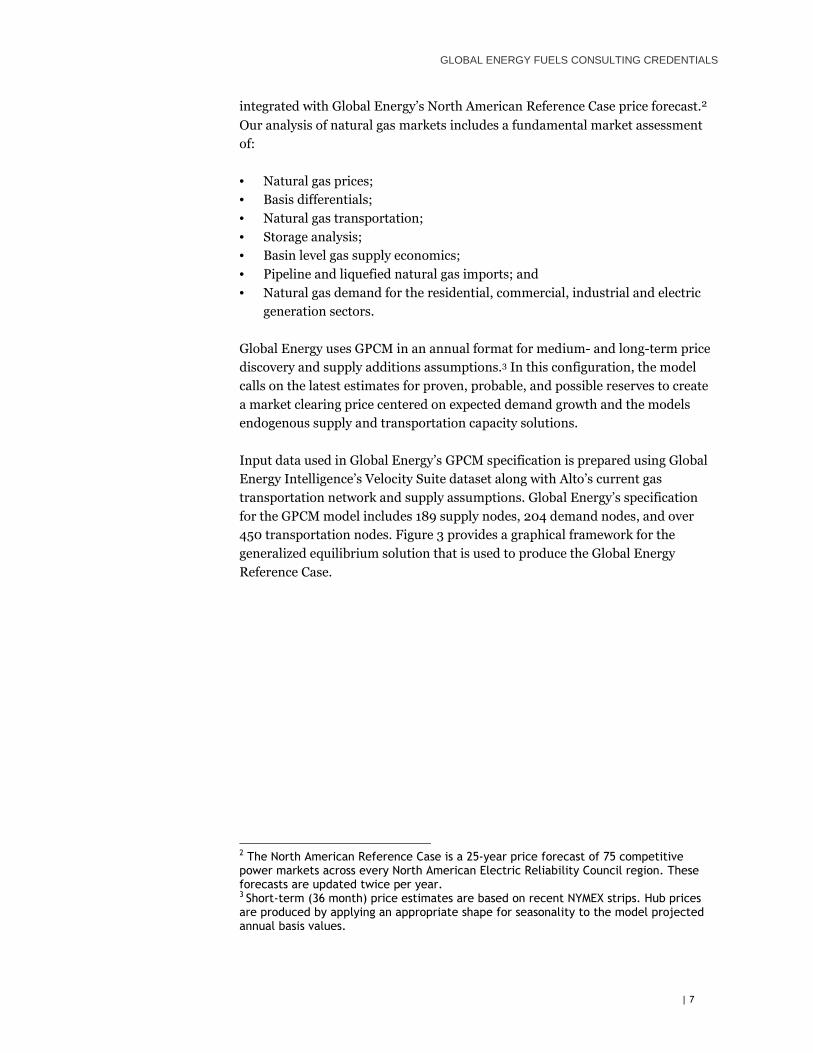
integrated with Global Energy’s North American Reference Case price forecast.2
Our analysis of natural gas markets includes a fundamental market assessment
of:
• Natural gas prices;
• Basis differentials;
• Natural gas transportation;
• Storage analysis;
• Basin level gas supply economics;
• Pipeline and liquefied natural gas imports; and
• Natural gas demand for the residential, commercial, industrial and electric
generation sectors.
Global Energy uses GPCM in an annual format for medium- and long-term price
discovery and supply additions assumptions.3 In this configuration, the model
calls on the latest estimates for proven, probable, and possible reserves to create
a market clearing price centered on expected demand growth and the models
endogenous supply and transportation capacity solutions.
Input data used in Global Energy’s GPCM specification is prepared using Global
Energy Intelligence’s Velocity Suite dataset along with Alto’s current gas
transportation network and supply assumptions. Global Energy’s specification
for the GPCM model includes 189 supply nodes, 204 demand nodes, and over
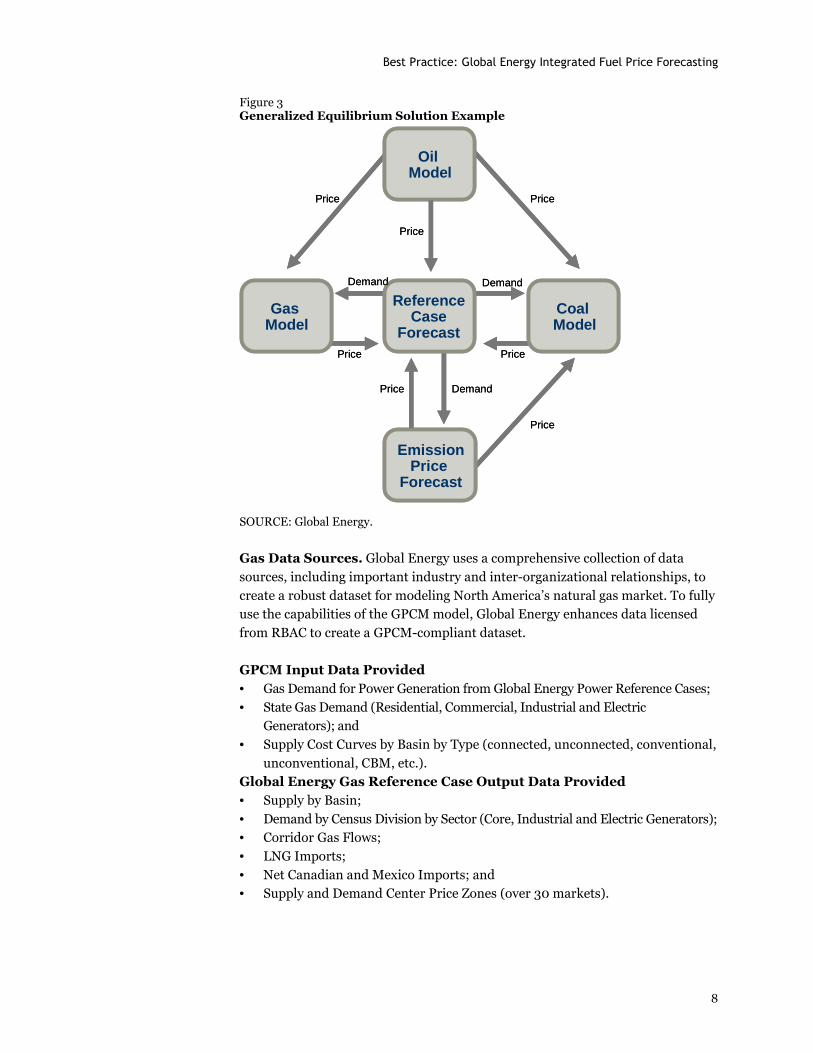
450 transportation nodes. Figure 3 provides a graphical framework for the
generalized equilibrium solution that is used to produce the Global Energy
Reference Case.
2 The North American Reference Case is a 25-year price forecast of 75 competitive power markets across every North American Electric Reliability Council region. These forecasts are updated twice per year. 3 Short-term (36 month) price estimates are based on recent NYMEX strips. Hub prices are produced by applying an appropriate shape for seasonality to the model projected annual basis values.
Best Practice: Global Energy Integrated Fuel Price Forecasting
8
Figure 3 Generalized Equilibrium Solution Example
Demand
EmissionPrice
Forecast
Price
Oil Model
Coal Model
GasModel
ReferenceCase
ForecastPrice Price
Price
Price
Demand Demand
PricePrice
Demand
EmissionPrice
Forecast
Price
Oil Model
Coal Model
GasModel
ReferenceCase
ForecastPrice Price
Price
Price
Demand Demand
PricePrice
SOURCE: Global Energy.
Gas Data Sources. Global Energy uses a comprehensive collection of data
sources, including important industry and inter-organizational relationships, to
create a robust dataset for modeling North America’s natural gas market. To fully
use the capabilities of the GPCM model, Global Energy enhances data licensed
from RBAC to create a GPCM-compliant dataset.
GPCM Input Data Provided • Gas Demand for Power Generation from Global Energy Power Reference Cases;
• State Gas Demand (Residential, Commercial, Industrial and Electric
Generators); and
• Supply Cost Curves by Basin by Type (connected, unconnected, conventional,
unconventional, CBM, etc.).
Global Energy Gas Reference Case Output Data Provided
• Supply by Basin;
• Demand by Census Division by Sector (Core, Industrial and Electric Generators);
• Corridor Gas Flows;
• LNG Imports;
• Net Canadian and Mexico Imports; and
• Supply and Demand Center Price Zones (over 30 markets).
GLOBAL ENERGY FUELS CONSULTING CREDENTIALS
| 9
Gas Supply Fundamentals. Global Energy uses supply data as reported by the
United States Geological Survey (USGS), Petro Data Source, the National
Petroleum Council (NPC), the Potential Gas Committee (PGC), and the National
Energy Board of Canada (NEB). These data sources are used as a starting point
for creating the Global Energy supply outlook. The Petro Data Source data that is
reported by basin and state in the Global Energy Velocity Suite is used as a cross-
reference for historical production. The most recent USGS, NPC, and PGC reports
are used as reference for resource potential out of the modeled supply nodes.
Generally, supply nodes are modeled as proven, probable, or possible in each
model-defined basin. Resource and O&M costs are derived from Global Energy
industry research.
Gas Pipeline and Storage. The data used to model natural gas infrastructure
is obtained, when available, from pipeline and storage company Websites. In
some instances Website data is supplemented with docket and Form-2 filings
submitted to FERC. Additionally, Global Energy cross-references electronic data
with system maps and other publicly available informational postings. Global
Energy reviews and updates the transportation data including capacity, tariffs,
embedded cost, discounting behavior, dates of entry of prospective new pipelines,
and the costs of these new pipelines.
Gas Demand. Global Energy forecasts natural gas demand using regression
analyses at the state level for each natural gas demand sector (industrial,
commercial, residential).4 Both linear and lognormal regressions are employed to
determine a best fit. When the results from lognormal and linear regression
analysis are inconclusive, alternative methods—such as time series analysis—are
used for forecasting demand and price elasticity.
Historical natural gas consumption data used in Global Energy’s demand forecast
is derived from EIA Form-176, EIA Form-906, EIA’s Natural Gas Monthly
publication and Statistics Canada. United States consumption data is sourced
from Global Energy’s VELOCITY SUITE. Canadian data is developed from data
sources that are available for purchase on the Statistics Canada Website. The
historical dataset includes monthly estimates of natural gas consumption by
sector for each U.S. state and Canadian province since 1997.5 To produce a
monthly demand forecast the historical consumption data is regressed against
independent variables such as:
• Price: Global Energy uses historical, regional natural gas spot prices as
reported by EIA, Natural Gas Intelligence. Daily spot market data is used to
derive a monthly average price.
4 Electric generation demand is derived from the Global Energy Reference Case through an iterative modeling cycle. 5 Historical consumption for Hawaii and the Canadian territories is not considered.
Best Practice: Global Energy Integrated Fuel Price Forecasting
10
• Heating degree days (HDD): A measure of how cold a location is over a period of time
relative to a base temperature most commonly specified as 65 degrees Fahrenheit.
The measure is computed for each day by subtracting the average of the day’s
high and low temperatures from the base temperature (65 degrees), with
negative values set equal to zero. Each day’s heating degree days are summed
to create a heating degree day measure for a specified reference period.
Heating degree-days are used in energy analysis as an indicator of space
heating energy requirements or use. State level historical data is obtained
from the National Oceanic and Atmospheric Administration (NOAA).
• Cooling degree days (CDD): A measure of how warm a location is over a
period of time relative to a base temperature, most commonly specified as 65
degrees Fahrenheit. The measure is computed for each day by subtracting the
base temperature (65 degrees) from the average of the day’s high and low
temperatures, with negative values set equal to zero. Each day’s cooling
degree-days are summed to create a cooling degree day measure for a
specified reference period. Cooling degree days are used in energy analysis as
an indicator of air conditioning energy requirements or use. State level
historical data is obtained from the National Oceanic and Atmospheric
Administration (NOAA).
• Population: State level historical data and estimates are obtained from the
United States Census Bureau. Population data for Canada is sourced from
Statistics Canada.
• Income: State level historical data is obtained from the U.S. Department of
Commerce Bureau of Economic Analysis (BEA).
• Manufacturing Gross State Product (MGSP): State level historical data is
obtained from the U.S. Department of Commerce Bureau of Economic
Analysis (BEA).
Global Energy Coal Forecasting Methodology. Coal is the dominant input
fuel in regions that contain, or are nearby to the major coal producing areas. Coal
represents well above 50 percent of the input fuel for electricity generation in
ECAR, MAPP, SPP, MAIN, and SERC regions. Similarly, coal is the largest input
fuel for electricity generation (though with less than 50 percent of the market) in
MAAC and WECC. Coal generation is the largest electricity source—especially in
the interior parts of the region where large coal deposits are located and often
supply nearby power plants.
Understanding the role and importance of coal as a primary fuel is essential to
effectively modeling and assessing the market fundamentals of the electric power
industry. Global Energy Decision’s coal price forecasting is based on short-term
and long-term coal price forecasting models. Because coal prices respond to
model inputs differently depending over time, Global Energy has developed an
econometrically based short-term model and a supply-and-demand based long-
term model. In both coal price forecasting models, model output is intrinsically
GLOBAL ENERGY FUELS CONSULTING CREDENTIALS
| 11
linked to price forecasts for competitive fuel (i.e., natural gas), ensuring that the
competitive interplay between coal and natural gas prices remain intact.
Coal Quality Market Model (CQMM). Global Energy’s long-term coal
forecast is derived using RBAC’s CQMMTM (Coal Quality Market Model) in
conjunction with Global Energy’s short-term econometric model for the best view
of near-term and long-term factors affecting coal market prices.
Global Energy provides enhanced coal market data as an input to the CQMM
model to improve modeling performance and provide a consistent, high quality
starting point for analysis.
Oil and gas prices have shown a high correlation over time. Similarly, gas and
coal prices have also shown a relatively high correlation over time. NYMEX coal
prices, for example, have tracked to natural gas prices with a coefficient of
determination (R2) equal to 0.7. As the marginally priced fuel in many markets,
natural gas prices set the ceiling to which coal can go.
Within the spectrum of coal types, Powder River Basin coal competes with most
coal qualities because of its abundance, low cost, and desirable quality. Typical
PRB coal quality is 8,700 Btu/lb with an average of 0.70 lbsSO2/MMBtu. As a
comparison, coal that is considered to be in compliance with the Clean Air Act
amendments of 1990 has a sulfur content of 1.20 lbsSO2/MMBtu or less. With
SO2 allowance prices reaching into the $850/ton range and NYMEX coal trading
at $2.50/MMBtu, PRB coal at $0.50/MMBtu continues to be in strong demand.
Despite the strong demand for PRB coal, a key driver in keeping the price of PRB
coal down is the insufficient rail capacity out of the PRB. The Joint Line, operated
by Burlington Northern Santa Fe and Union Pacific, has the capacity to handle
about 350 million tons per year. However, the permitted capacity of coal mine
operations in the PRB exceeds 500 million tons per year. This discrepancy has
prevented PRB coal from reaching its full market potential as the mines are
unable to sell their full capacity of coal, resulting in depressed prices. In response
to this demand, additional rail capacity is being developed out of the PRB.
Currently, the Joint Line is being triple tracked; expansion of the DME rail line
from Belle Fourche to Gillette is expected to be completed by 2010; and the
Tongue River Railroad expansion from Birney to Miles City continues to move
toward regulatory approval. Therefore, for forecast periods of five years and less,
short-term coal prices are heavily dependent on marketplace fluctuations as:
• Weather;
• Coal stockpile volumes;
• Short-term natural gas forecasts;
• Short-term SO2 allowance price forecasts;
• Recently signed coal contract data;
Best Practice: Global Energy Integrated Fuel Price Forecasting
12
• Known transportation constraints;
• Known supply constraints (e.g., significant mine outages);
• Known competitive fuel constraints (e.g., nuclear plant outages); and
• Inter-and intra-fuel competition.
In the short term, factors such as new plant development, technology advances,
and reserve conditions do not significantly influence prices because these factors
often require five years or more before their effects are felt. Temperature
differences will drive up or down coal prices, depending on the season. The size of
coal stockpiles will influence coal prices as utilities replenish or use their stocks.
Short-term forecasts of natural gas will typically set a ceiling on coal prices.
Emissions allowance price forecasts will influence coal-on-coal competition.
Recently signed contracts will also influence the short-term coal market as they
give an indication of how the market prices the future value of coal.
An advantage of short-term forecasts is that often many of the input parameters
are defined. Known transportation constraints impact short-term coal prices.
Diminished rail capacity can result in higher prices for alternative coal supplies
and a reduction in stockpiles at plants that burn PRB coal. Similarly, known
supply and competitive fuel constraints will also influence coal prices. Finally,
inter- and intra-fuel competition will play a major role in the ultimate pricing of
coal. It is critical that coal models incorporate competing fuel price forecasts to
ensure that prices do not unrealistically diverge from the competition.
Factors in Coal Modeling. Long-term coal price forecasting is dependent on:
• Reserve conditions;
• Reserve accessibility;
• Transportation trends;
• Development of enhanced coal technology (such as gasification and K-Fuel
coal quality enhancement);
• Future air emissions regulations;
• New emission control construction;
• Long-term SO2 allowance price forecasts;
• New plant development; and
• Inter- and intra-fuel competition.
Weather, coal contract data, stockpile fluctuations, and mine outages do not have
significant impact on long-term coal prices as these factors are assumed to take
on a “steady-state” value over time.
For PRB coal, the dominant long-term factors are reserve conditions, reserve
accessibility, transportation constraints, technology advances, and the price of
competing coal and gas. Reserve conditions can be used to determine extraction
costs of the coal. Reserve accessibility and transportation constraints will help

GLOBAL ENERGY FUELS CONSULTING CREDENTIALS
| 13
determine the amount of coal that can reach the market. Technology advances
will impact future extraction and transportation costs. Technology advances such
as gasification and K-Fuel coal upgrading may also open PRB coal to new
markets. The price of coal-on-coal and gas-on-coal competition will also
determine the extent to which PRB coal will penetrate new markets and retain its
hold on existing markets.
Beyond the dominant long-term factors, other factors in the long-term forecast
will also influence PRB prices. Future air emissions will impact SO2 allowance
price forecasts. Additionally, the Clean Air Mercury Rule will impact PRB coal.
With its low halogen content, the mercury in PRB coal is more likely to turn into
gaseous elemental mercury during combustion, a form that is not captured as a
co-benefit in SO2 scrubbers and NOX SCR devices. The Clean Air Interstate Rule
will also impact the combustion of coal in the eastern 28 states. The scheduled
construction of over 50,000 MW of emission control devices will decrease the
demand for low sulfur coal. With over 68,000 MW of new coal burning power
plants proposed to be constructed over the next decade, the impact on coal
demand will be significant. The location of these plants will place affect
transportation capacity and coal prices.
Putting It All Together Global Energy’s state-of-the-art approach to Integrated Fuel Forecasting enables
the best available look at long-term supply and demand fundamentals in each
fuel stream as well as for fuel demand for power generation all seamlessly
integrated through Global Energy’s common data model, iterative simulation
modeling methodology, and our transparent, consistent, independent market
advisory service to interpret the modeling results and implications for our clients.
For more information on Global Energy’s Advisory Services talk to your account executive, visit our
home page at www.globalenergy.com or call Global Energy at 720-240-5554.
Copyright © 2022 FDOKUMEN

