


Bahasa
Halaman
Hukum

ARTICLE IN PRESS
www.elsevier.com/locate/tvjl
The Veterinary Journal xxx (2007) xxx–xxx
TheVeterinary Journal
Genetic parameters of biokinematic variables of the trot in SpanishPurebred horses under experimental treadmill conditions
M. Valera a,*, A.M. Galisteo b, A. Molina c, F. Miro b, M.D. Gomez c, M.R. Cano b,E. Aguera b
a Department of Agro-Forestry Sciences, EUIT, University of Sevilla, Ctra. Utrera km 1, 41013 Sevilla, Spainb Department of Compared Anatomy and Pathology, University of Cordoba, Ctra. Madrid-Cadiz, km 396a, 14071 Cordoba, Spain
c Department of Genetics, University of Cordoba, Ctra. Madrid-Cadiz, km 396a, 14071 Cordoba, Spain
Accepted 11 July 2007
Abstract
The purpose of this study was to estimate the genetic parameters of biokinematic variables in Spanish Purebred (SPB) horses in orderto select those of sufficient interest to be measured in the pre-selection of the animals for possible inclusion in the breeding programme.Kinematic analysis of 130 SPB horses 4.6 ± 1.5 years old were recorded at the trot (4 m/s) on a treadmill. Genetic parameters were esti-mated using VCE software and a bivariate mixed animal model including age and stud as fixed effects and animal additive genetic effectand residual error as random effects.
In general, heritabilities were high (0.33–0.88). The angular variables presented the lowest heritabilities, whereas the maximum heightof the fore-hoof and the duration of swing phase in the hindlimb gave the highest scores. Genetic correlations were also very high, so itwas possible to reduce the number of breeding programme characteristics to stride duration, hindlimb swing phase duration, range ofstifle and elbow angles, minimal angle of carpus, and minimal retraction-protraction angle of the hindlimb.� 2007 Elsevier Ltd. All rights reserved.
Keywords: Heritability; Genetic correlation; Equine locomotion; Biokinematic
Introduction
Traits based on competition and performance test scoresrepresent the main selection criteria in most breedingschemes of sport horses. Additionally, it has been sug-gested that a gait and conformation test could be appliedto detect young horses with good dressage ability moreaccurately (Barrey et al., 2002b). For equine performanceit is possible to select by movement results because thereis a favourable genetic correlation (Saastamoinen et al.,1998). From a biological point of view, locomotion canbe defined as the ultimate mechanical expression of exerciseactivity and, in order to sustain an exercise activity, theorganism requires a synergy between several systems (Bar-
1090-0233/$ - see front matter � 2007 Elsevier Ltd. All rights reserved.
doi:10.1016/j.tvjl.2007.07.031
* Corresponding author. Tel.: +34 957211070; fax: +34 957218707.E-mail address: [email protected] (M. Valera).
Please cite this article in press as: Valera, M. et al., Genetic parameterinary Journal (2007), doi:10.1016/j.tvjl.2007.07.031
rey, 1999). Estimations of cardiovascular, metabolic, mus-cular and locomotor traits are used in breedingprogrammes, since a significant relationship with competi-tion results has been reported (Rivero and Barrey, 2001).
The Spanish Purebred (SPB) horse, the Andalusian, isthe most important breed in Spain and is employed in lei-sure and sports activities, mainly in classical dressage whereit can compete to the highest standards in internationaldressage events. A Breeding Scheme for SPB horses wasdeveloped recently with the aim of improving dressage per-formance and a number of studies have already been car-ried out to assess aerobic capacity and fitness (Castejonet al., 1994). Variations in blood parameters (Rubioet al., 1995) have been studied using a treadmill underexperimental conditions (Valette et al., 1991), and otherstudies carried out in this laboratory include an examina-tion of muscle fibre type characteristics (Lopez-Rivero
ters of biokinematic variables of the trot in Spanish ..., The Ve-
2 M. Valera et al. / The Veterinary Journal xxx (2007) xxx–xxx
ARTICLE IN PRESS
et al., 1989, 1993) and an assessment of the normal kine-matic pattern at hand-led walk (Galisteo et al., 2001),hand-led trot and mounted trot (Morales et al., 1998a,b;Cano et al., 1999, 2000, 2001a,b).
A study of genetic parameters (heritability and geneticcorrelations) for kinematic variables of the trot has notbeen reported although locomotion analysis has consider-able potential in the selection of performance horses(Holmstrom, 1994) and knowledge of genetic parametersis essential (Ducro et al., 2005).
Gait analysis could provide early criteria for breedingin dressage and jumping breeding programmes (Barreyet al., 2002a), since trot characteristics in young horsescan be used objectively to predict locomotor performancein future adult horses (Back et al., 1994b). The aim ofthe present study was to determine genetic parametersfor the biokinematic variables of the trot in SPB horseson a treadmill. The range of variables was used to estab-lish an efficient methodology for the pre-selection ofanimals.
Materials and methods
A total of 130 SPB males, registered in the Stud-book, were evaluatedat the Laboratory of Equine Performance Control (Veterinary Faculty ofCordoba, Spain). The animals, which came from 24 stud farms, were agedbetween 4 and 7 years (mean 4.6 ± 1.5 years).
Biokinematic analysis at the trot on a treadmill
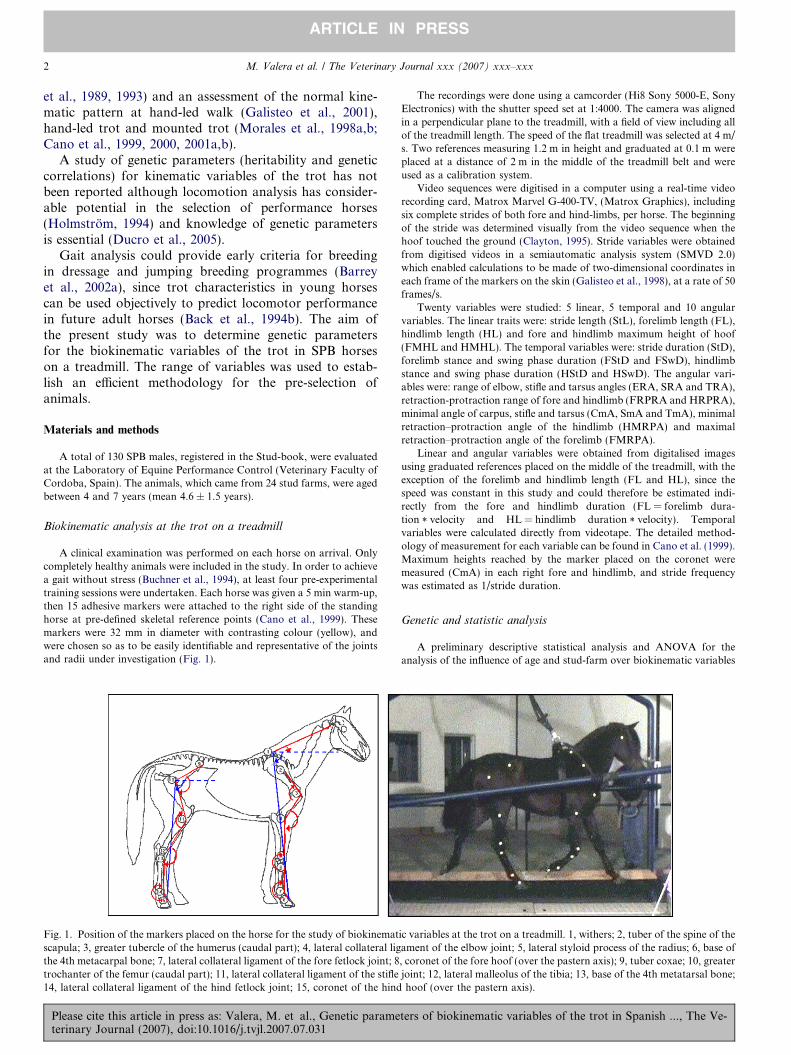
A clinical examination was performed on each horse on arrival. Onlycompletely healthy animals were included in the study. In order to achievea gait without stress (Buchner et al., 1994), at least four pre-experimentaltraining sessions were undertaken. Each horse was given a 5 min warm-up,then 15 adhesive markers were attached to the right side of the standinghorse at pre-defined skeletal reference points (Cano et al., 1999). Thesemarkers were 32 mm in diameter with contrasting colour (yellow), andwere chosen so as to be easily identifiable and representative of the jointsand radii under investigation (Fig. 1).
Fig. 1. Position of the markers placed on the horse for the study of biokinematscapula; 3, greater tubercle of the humerus (caudal part); 4, lateral collateral ligthe 4th metacarpal bone; 7, lateral collateral ligament of the fore fetlock joint; 8trochanter of the femur (caudal part); 11, lateral collateral ligament of the stifle14, lateral collateral ligament of the hind fetlock joint; 15, coronet of the hind
Please cite this article in press as: Valera, M. et al., Genetic parameterinary Journal (2007), doi:10.1016/j.tvjl.2007.07.031
The recordings were done using a camcorder (Hi8 Sony 5000-E, SonyElectronics) with the shutter speed set at 1:4000. The camera was alignedin a perpendicular plane to the treadmill, with a field of view including allof the treadmill length. The speed of the flat treadmill was selected at 4 m/s. Two references measuring 1.2 m in height and graduated at 0.1 m wereplaced at a distance of 2 m in the middle of the treadmill belt and wereused as a calibration system.
Video sequences were digitised in a computer using a real-time videorecording card, Matrox Marvel G-400-TV, (Matrox Graphics), includingsix complete strides of both fore and hind-limbs, per horse. The beginningof the stride was determined visually from the video sequence when thehoof touched the ground (Clayton, 1995). Stride variables were obtainedfrom digitised videos in a semiautomatic analysis system (SMVD 2.0)which enabled calculations to be made of two-dimensional coordinates ineach frame of the markers on the skin (Galisteo et al., 1998), at a rate of 50frames/s.
Twenty variables were studied: 5 linear, 5 temporal and 10 angularvariables. The linear traits were: stride length (StL), forelimb length (FL),hindlimb length (HL) and fore and hindlimb maximum height of hoof(FMHL and HMHL). The temporal variables were: stride duration (StD),forelimb stance and swing phase duration (FStD and FSwD), hindlimbstance and swing phase duration (HStD and HSwD). The angular vari-ables were: range of elbow, stifle and tarsus angles (ERA, SRA and TRA),retraction-protraction range of fore and hindlimb (FRPRA and HRPRA),minimal angle of carpus, stifle and tarsus (CmA, SmA and TmA), minimalretraction–protraction angle of the hindlimb (HMRPA) and maximalretraction–protraction angle of the forelimb (FMRPA).
Linear and angular variables were obtained from digitalised imagesusing graduated references placed on the middle of the treadmill, with theexception of the forelimb and hindlimb length (FL and HL), since thespeed was constant in this study and could therefore be estimated indi-rectly from the fore and hindlimb duration (FL = forelimb dura-tion * velocity and HL = hindlimb duration * velocity). Temporalvariables were calculated directly from videotape. The detailed method-ology of measurement for each variable can be found in Cano et al. (1999).Maximum heights reached by the marker placed on the coronet weremeasured (CmA) in each right fore and hindlimb, and stride frequencywas estimated as 1/stride duration.
Genetic and statistic analysis
A preliminary descriptive statistical analysis and ANOVA for theanalysis of the influence of age and stud-farm over biokinematic variables
ic variables at the trot on a treadmill. 1, withers; 2, tuber of the spine of theament of the elbow joint; 5, lateral styloid process of the radius; 6, base of, coronet of the fore hoof (over the pastern axis); 9, tuber coxae; 10, greaterjoint; 12, lateral malleolus of the tibia; 13, base of the 4th metatarsal bone;hoof (over the pastern axis).
ters of biokinematic variables of the trot in Spanish ..., The Ve-
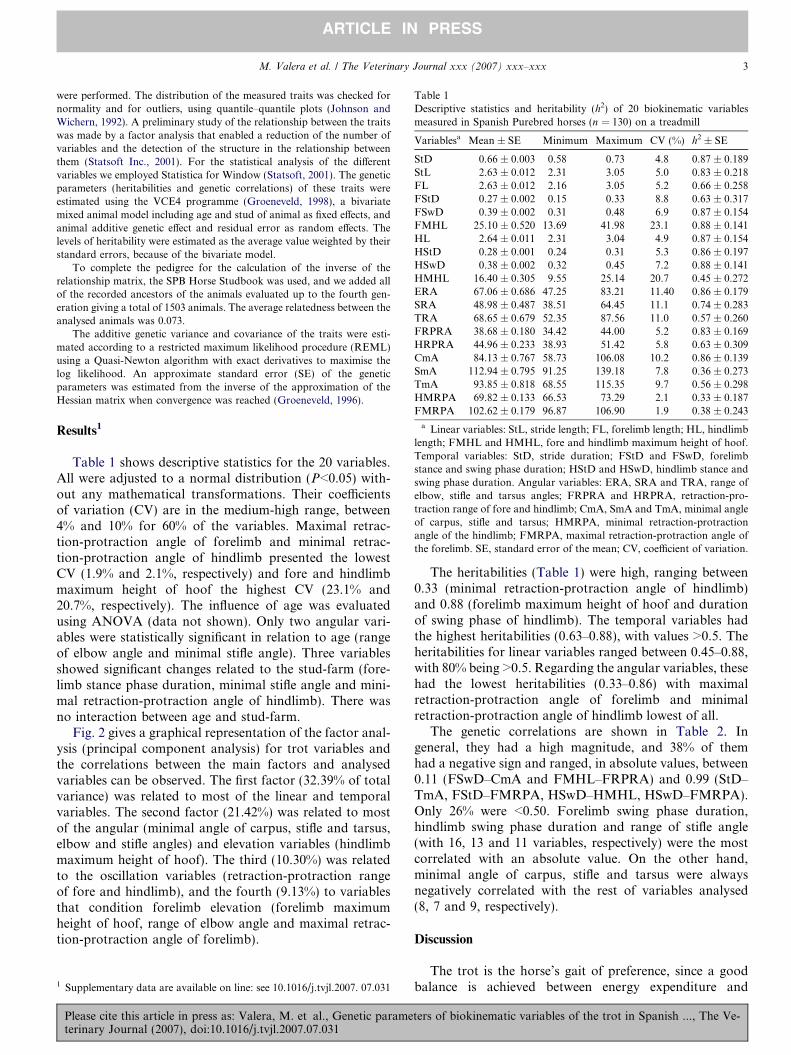
Table 1Descriptive statistics and heritability (h2) of 20 biokinematic variablesmeasured in Spanish Purebred horses (n = 130) on a treadmill
Variablesa Mean ± SE Minimum Maximum CV (%) h2 ± SE
StD 0.66 ± 0.003 0.58 0.73 4.8 0.87 ± 0.189StL 2.63 ± 0.012 2.31 3.05 5.0 0.83 ± 0.218FL 2.63 ± 0.012 2.16 3.05 5.2 0.66 ± 0.258FStD 0.27 ± 0.002 0.15 0.33 8.8 0.63 ± 0.317FSwD 0.39 ± 0.002 0.31 0.48 6.9 0.87 ± 0.154FMHL 25.10 ± 0.520 13.69 41.98 23.1 0.88 ± 0.141HL 2.64 ± 0.011 2.31 3.04 4.9 0.87 ± 0.154HStD 0.28 ± 0.001 0.24 0.31 5.3 0.86 ± 0.197HSwD 0.38 ± 0.002 0.32 0.45 7.2 0.88 ± 0.141HMHL 16.40 ± 0.305 9.55 25.14 20.7 0.45 ± 0.272ERA 67.06 ± 0.686 47.25 83.21 11.40 0.86 ± 0.179SRA 48.98 ± 0.487 38.51 64.45 11.1 0.74 ± 0.283TRA 68.65 ± 0.679 52.35 87.56 11.0 0.57 ± 0.260FRPRA 38.68 ± 0.180 34.42 44.00 5.2 0.83 ± 0.169HRPRA 44.96 ± 0.233 38.93 51.42 5.8 0.63 ± 0.309CmA 84.13 ± 0.767 58.73 106.08 10.2 0.86 ± 0.139SmA 112.94 ± 0.795 91.25 139.18 7.8 0.36 ± 0.273TmA 93.85 ± 0.818 68.55 115.35 9.7 0.56 ± 0.298HMRPA 69.82 ± 0.133 66.53 73.29 2.1 0.33 ± 0.187FMRPA 102.62 ± 0.179 96.87 106.90 1.9 0.38 ± 0.243
a Linear variables: StL, stride length; FL, forelimb length; HL, hindlimblength; FMHL and HMHL, fore and hindlimb maximum height of hoof.Temporal variables: StD, stride duration; FStD and FSwD, forelimbstance and swing phase duration; HStD and HSwD, hindlimb stance andswing phase duration. Angular variables: ERA, SRA and TRA, range ofelbow, stifle and tarsus angles; FRPRA and HRPRA, retraction-pro-traction range of fore and hindlimb; CmA, SmA and TmA, minimal angleof carpus, stifle and tarsus; HMRPA, minimal retraction-protractionangle of the hindlimb; FMRPA, maximal retraction-protraction angle ofthe forelimb. SE, standard error of the mean; CV, coefficient of variation.
M. Valera et al. / The Veterinary Journal xxx (2007) xxx–xxx 3
ARTICLE IN PRESS
were performed. The distribution of the measured traits was checked fornormality and for outliers, using quantile–quantile plots (Johnson andWichern, 1992). A preliminary study of the relationship between the traitswas made by a factor analysis that enabled a reduction of the number ofvariables and the detection of the structure in the relationship betweenthem (Statsoft Inc., 2001). For the statistical analysis of the differentvariables we employed Statistica for Window (Statsoft, 2001). The geneticparameters (heritabilities and genetic correlations) of these traits wereestimated using the VCE4 programme (Groeneveld, 1998), a bivariatemixed animal model including age and stud of animal as fixed effects, andanimal additive genetic effect and residual error as random effects. Thelevels of heritability were estimated as the average value weighted by theirstandard errors, because of the bivariate model.
To complete the pedigree for the calculation of the inverse of therelationship matrix, the SPB Horse Studbook was used, and we added allof the recorded ancestors of the animals evaluated up to the fourth gen-eration giving a total of 1503 animals. The average relatedness between theanalysed animals was 0.073.
The additive genetic variance and covariance of the traits were esti-mated according to a restricted maximum likelihood procedure (REML)using a Quasi-Newton algorithm with exact derivatives to maximise thelog likelihood. An approximate standard error (SE) of the geneticparameters was estimated from the inverse of the approximation of theHessian matrix when convergence was reached (Groeneveld, 1996).
Results1
Table 1 shows descriptive statistics for the 20 variables.All were adjusted to a normal distribution (P<0.05) with-out any mathematical transformations. Their coefficientsof variation (CV) are in the medium-high range, between4% and 10% for 60% of the variables. Maximal retrac-tion-protraction angle of forelimb and minimal retrac-tion-protraction angle of hindlimb presented the lowestCV (1.9% and 2.1%, respectively) and fore and hindlimbmaximum height of hoof the highest CV (23.1% and20.7%, respectively). The influence of age was evaluatedusing ANOVA (data not shown). Only two angular vari-ables were statistically significant in relation to age (rangeof elbow angle and minimal stifle angle). Three variablesshowed significant changes related to the stud-farm (fore-limb stance phase duration, minimal stifle angle and mini-mal retraction-protraction angle of hindlimb). There wasno interaction between age and stud-farm.
Fig. 2 gives a graphical representation of the factor anal-ysis (principal component analysis) for trot variables andthe correlations between the main factors and analysedvariables can be observed. The first factor (32.39% of totalvariance) was related to most of the linear and temporalvariables. The second factor (21.42%) was related to mostof the angular (minimal angle of carpus, stifle and tarsus,elbow and stifle angles) and elevation variables (hindlimbmaximum height of hoof). The third (10.30%) was relatedto the oscillation variables (retraction-protraction rangeof fore and hindlimb), and the fourth (9.13%) to variablesthat condition forelimb elevation (forelimb maximumheight of hoof, range of elbow angle and maximal retrac-tion-protraction angle of forelimb).
1 Supplementary data are available on line: see 10.1016/j.tvjl.2007. 07.031
Please cite this article in press as: Valera, M. et al., Genetic parameterinary Journal (2007), doi:10.1016/j.tvjl.2007.07.031
The heritabilities (Table 1) were high, ranging between0.33 (minimal retraction-protraction angle of hindlimb)and 0.88 (forelimb maximum height of hoof and durationof swing phase of hindlimb). The temporal variables hadthe highest heritabilities (0.63–0.88), with values >0.5. Theheritabilities for linear variables ranged between 0.45–0.88,with 80% being >0.5. Regarding the angular variables, thesehad the lowest heritabilities (0.33–0.86) with maximalretraction-protraction angle of forelimb and minimalretraction-protraction angle of hindlimb lowest of all.
The genetic correlations are shown in Table 2. Ingeneral, they had a high magnitude, and 38% of themhad a negative sign and ranged, in absolute values, between0.11 (FSwD–CmA and FMHL–FRPRA) and 0.99 (StD–TmA, FStD–FMRPA, HSwD–HMHL, HSwD–FMRPA).Only 26% were <0.50. Forelimb swing phase duration,hindlimb swing phase duration and range of stifle angle(with 16, 13 and 11 variables, respectively) were the mostcorrelated with an absolute value. On the other hand,minimal angle of carpus, stifle and tarsus were alwaysnegatively correlated with the rest of variables analysed(8, 7 and 9, respectively).
Discussion
The trot is the horse’s gait of preference, since a goodbalance is achieved between energy expenditure and
ters of biokinematic variables of the trot in Spanish ..., The Ve-
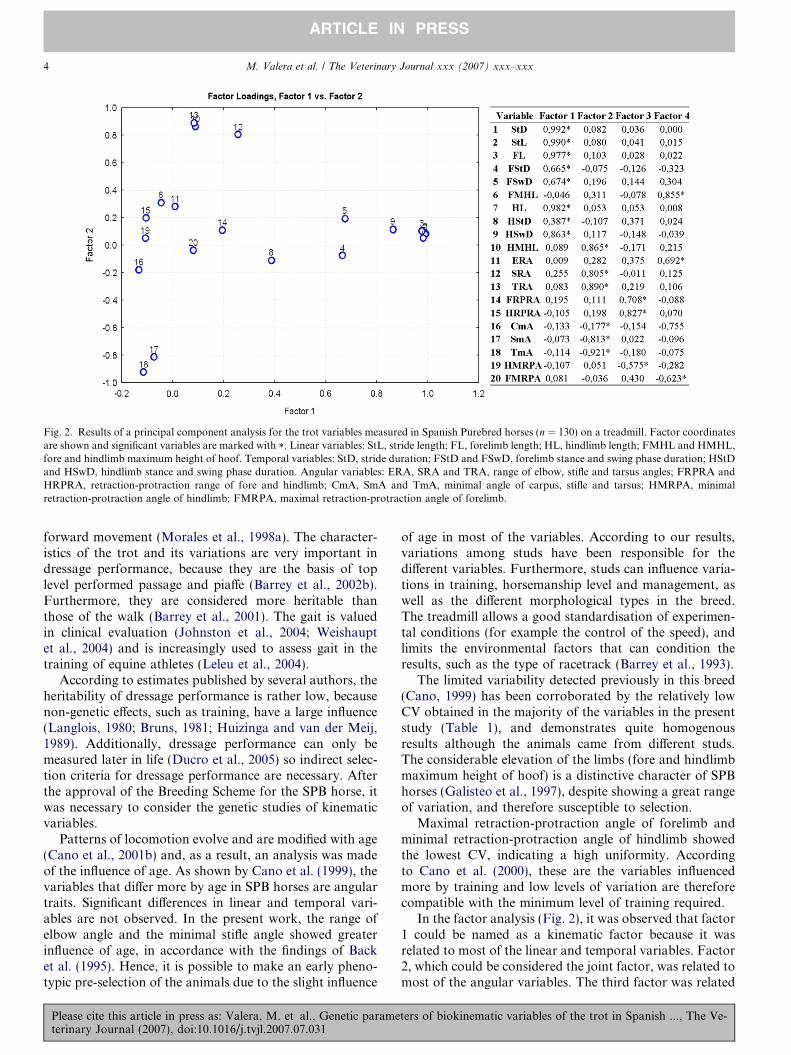
Fig. 2. Results of a principal component analysis for the trot variables measured in Spanish Purebred horses (n = 130) on a treadmill. Factor coordinatesare shown and significant variables are marked with *. Linear variables: StL, stride length; FL, forelimb length; HL, hindlimb length; FMHL and HMHL,fore and hindlimb maximum height of hoof. Temporal variables: StD, stride duration; FStD and FSwD, forelimb stance and swing phase duration; HStDand HSwD, hindlimb stance and swing phase duration. Angular variables: ERA, SRA and TRA, range of elbow, stifle and tarsus angles; FRPRA andHRPRA, retraction-protraction range of fore and hindlimb; CmA, SmA and TmA, minimal angle of carpus, stifle and tarsus; HMRPA, minimalretraction-protraction angle of hindlimb; FMRPA, maximal retraction-protraction angle of forelimb.
4 M. Valera et al. / The Veterinary Journal xxx (2007) xxx–xxx
ARTICLE IN PRESS
forward movement (Morales et al., 1998a). The character-istics of the trot and its variations are very important indressage performance, because they are the basis of toplevel performed passage and piaffe (Barrey et al., 2002b).Furthermore, they are considered more heritable thanthose of the walk (Barrey et al., 2001). The gait is valuedin clinical evaluation (Johnston et al., 2004; Weishauptet al., 2004) and is increasingly used to assess gait in thetraining of equine athletes (Leleu et al., 2004).
According to estimates published by several authors, theheritability of dressage performance is rather low, becausenon-genetic effects, such as training, have a large influence(Langlois, 1980; Bruns, 1981; Huizinga and van der Meij,1989). Additionally, dressage performance can only bemeasured later in life (Ducro et al., 2005) so indirect selec-tion criteria for dressage performance are necessary. Afterthe approval of the Breeding Scheme for the SPB horse, itwas necessary to consider the genetic studies of kinematicvariables.
Patterns of locomotion evolve and are modified with age(Cano et al., 2001b) and, as a result, an analysis was madeof the influence of age. As shown by Cano et al. (1999), thevariables that differ more by age in SPB horses are angulartraits. Significant differences in linear and temporal vari-ables are not observed. In the present work, the range ofelbow angle and the minimal stifle angle showed greaterinfluence of age, in accordance with the findings of Backet al. (1995). Hence, it is possible to make an early pheno-typic pre-selection of the animals due to the slight influence
Please cite this article in press as: Valera, M. et al., Genetic parameterinary Journal (2007), doi:10.1016/j.tvjl.2007.07.031
of age in most of the variables. According to our results,variations among studs have been responsible for thedifferent variables. Furthermore, studs can influence varia-tions in training, horsemanship level and management, aswell as the different morphological types in the breed.The treadmill allows a good standardisation of experimen-tal conditions (for example the control of the speed), andlimits the environmental factors that can condition theresults, such as the type of racetrack (Barrey et al., 1993).
The limited variability detected previously in this breed(Cano, 1999) has been corroborated by the relatively lowCV obtained in the majority of the variables in the presentstudy (Table 1), and demonstrates quite homogenousresults although the animals came from different studs.The considerable elevation of the limbs (fore and hindlimbmaximum height of hoof) is a distinctive character of SPBhorses (Galisteo et al., 1997), despite showing a great rangeof variation, and therefore susceptible to selection.
Maximal retraction-protraction angle of forelimb andminimal retraction-protraction angle of hindlimb showedthe lowest CV, indicating a high uniformity. Accordingto Cano et al. (2000), these are the variables influencedmore by training and low levels of variation are thereforecompatible with the minimum level of training required.
In the factor analysis (Fig. 2), it was observed that factor1 could be named as a kinematic factor because it wasrelated to most of the linear and temporal variables. Factor2, which could be considered the joint factor, was related tomost of the angular variables. The third factor was related
ters of biokinematic variables of the trot in Spanish ..., The Ve-
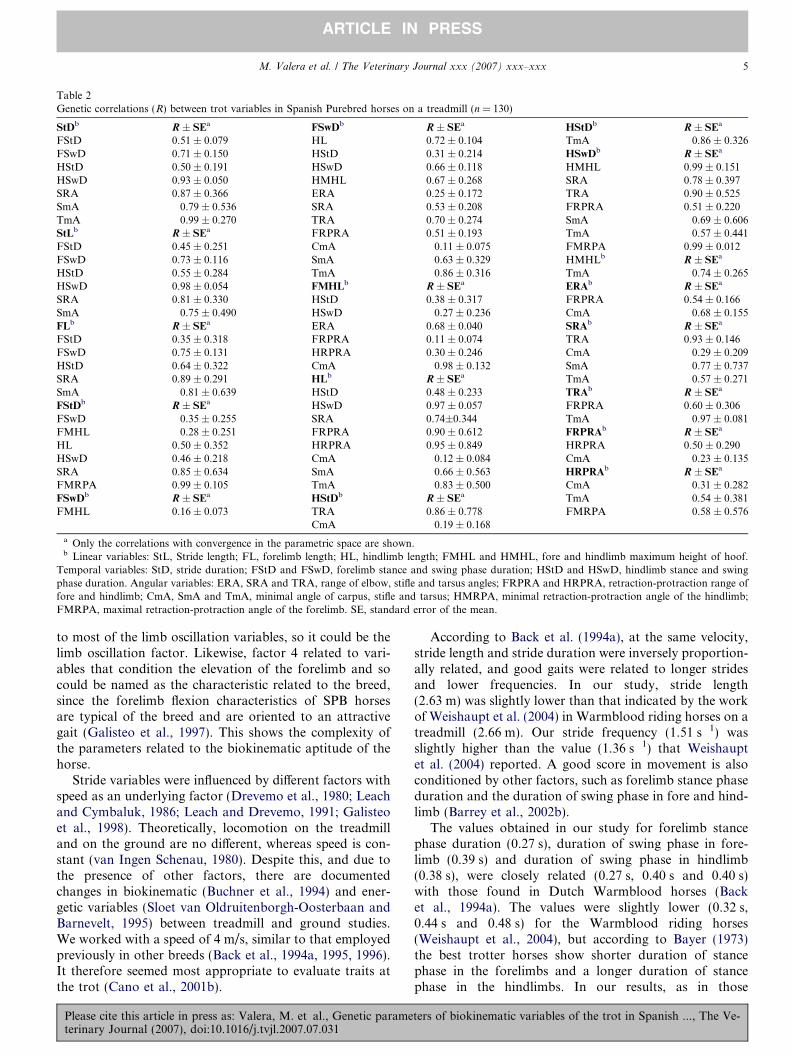
Table 2Genetic correlations (R) between trot variables in Spanish Purebred horses on a treadmill (n = 130)
StDb R ± SEa FSwDb R ± SEa HStDb R ± SEa
FStD 0.51 ± 0.079 HL 0.72 ± 0.104 TmA �0.86 ± 0.326FSwD 0.71 ± 0.150 HStD 0.31 ± 0.214 HSwDb R ± SEa
HStD 0.50 ± 0.191 HSwD 0.66 ± 0.118 HMHL 0.99 ± 0.151HSwD 0.93 ± 0.050 HMHL 0.67 ± 0.268 SRA 0.78 ± 0.397SRA 0.87 ± 0.366 ERA 0.25 ± 0.172 TRA 0.90 ± 0.525SmA �0.79 ± 0.536 SRA 0.53 ± 0.208 FRPRA 0.51 ± 0.220TmA �0.99 ± 0.270 TRA 0.70 ± 0.274 SmA �0.69 ± 0.606StLb R ± SEa FRPRA 0.51 ± 0.193 TmA �0.57 ± 0.441FStD 0.45 ± 0.251 CmA �0.11 ± 0.075 FMRPA 0.99 ± 0.012FSwD 0.73 ± 0.116 SmA �0.63 ± 0.329 HMHLb R ± SEa
HStD 0.55 ± 0.284 TmA �0.86 ± 0.316 TmA �0.74 ± 0.265HSwD 0.98 ± 0.054 FMHLb R ± SEa ERAb R ± SEa
SRA 0.81 ± 0.330 HStD 0.38 ± 0.317 FRPRA 0.54 ± 0.166SmA �0.75 ± 0.490 HSwD �0.27 ± 0.236 CmA �0.68 ± 0.155FLb R ± SEa ERA 0.68 ± 0.040 SRAb R ± SEa
FStD 0.35 ± 0.318 FRPRA 0.11 ± 0.074 TRA 0.93 ± 0.146FSwD 0.75 ± 0.131 HRPRA 0.30 ± 0.246 CmA �0.29 ± 0.209HStD 0.64 ± 0.322 CmA �0.98 ± 0.132 SmA �0.77 ± 0.737SRA 0.89 ± 0.291 HLb R ± SEa TmA �0.57 ± 0.271SmA �0.81 ± 0.639 HStD 0.48 ± 0.233 TRAb R ± SEa
FStDb R ± SEa HSwD 0.97 ± 0.057 FRPRA 0.60 ± 0.306FSwD �0.35 ± 0.255 SRA 0.74±0.344 TmA �0.97 ± 0.081FMHL �0.28 ± 0.251 FRPRA 0.90 ± 0.612 FRPRAb R ± SEa
HL 0.50 ± 0.352 HRPRA 0.95 ± 0.849 HRPRA 0.50 ± 0.290HSwD 0.46 ± 0.218 CmA �0.12 ± 0.084 CmA �0.23 ± 0.135SRA 0.85 ± 0.634 SmA �0.66 ± 0.563 HRPRAb R ± SEa
FMRPA 0.99 ± 0.105 TmA �0.83 ± 0.500 CmA �0.31 ± 0.282FSwDb R ± SEa HStDb R ± SEa TmA �0.54 ± 0.381FMHL 0.16 ± 0.073 TRA 0.86 ± 0.778 FMRPA �0.58 ± 0.576
CmA �0.19 ± 0.168
a Only the correlations with convergence in the parametric space are shown.b Linear variables: StL, Stride length; FL, forelimb length; HL, hindlimb length; FMHL and HMHL, fore and hindlimb maximum height of hoof.
Temporal variables: StD, stride duration; FStD and FSwD, forelimb stance and swing phase duration; HStD and HSwD, hindlimb stance and swingphase duration. Angular variables: ERA, SRA and TRA, range of elbow, stifle and tarsus angles; FRPRA and HRPRA, retraction-protraction range offore and hindlimb; CmA, SmA and TmA, minimal angle of carpus, stifle and tarsus; HMRPA, minimal retraction-protraction angle of the hindlimb;FMRPA, maximal retraction-protraction angle of the forelimb. SE, standard error of the mean.
M. Valera et al. / The Veterinary Journal xxx (2007) xxx–xxx 5
ARTICLE IN PRESS
to most of the limb oscillation variables, so it could be thelimb oscillation factor. Likewise, factor 4 related to vari-ables that condition the elevation of the forelimb and socould be named as the characteristic related to the breed,since the forelimb flexion characteristics of SPB horsesare typical of the breed and are oriented to an attractivegait (Galisteo et al., 1997). This shows the complexity ofthe parameters related to the biokinematic aptitude of thehorse.
Stride variables were influenced by different factors withspeed as an underlying factor (Drevemo et al., 1980; Leachand Cymbaluk, 1986; Leach and Drevemo, 1991; Galisteoet al., 1998). Theoretically, locomotion on the treadmilland on the ground are no different, whereas speed is con-stant (van Ingen Schenau, 1980). Despite this, and due tothe presence of other factors, there are documentedchanges in biokinematic (Buchner et al., 1994) and ener-getic variables (Sloet van Oldruitenborgh-Oosterbaan andBarnevelt, 1995) between treadmill and ground studies.We worked with a speed of 4 m/s, similar to that employedpreviously in other breeds (Back et al., 1994a, 1995, 1996).It therefore seemed most appropriate to evaluate traits atthe trot (Cano et al., 2001b).
Please cite this article in press as: Valera, M. et al., Genetic parameterinary Journal (2007), doi:10.1016/j.tvjl.2007.07.031
According to Back et al. (1994a), at the same velocity,stride length and stride duration were inversely proportion-ally related, and good gaits were related to longer stridesand lower frequencies. In our study, stride length(2.63 m) was slightly lower than that indicated by the workof Weishaupt et al. (2004) in Warmblood riding horses on atreadmill (2.66 m). Our stride frequency (1.51 s�1) wasslightly higher than the value (1.36 s�1) that Weishauptet al. (2004) reported. A good score in movement is alsoconditioned by other factors, such as forelimb stance phaseduration and the duration of swing phase in fore and hind-limb (Barrey et al., 2002b).
The values obtained in our study for forelimb stancephase duration (0.27 s), duration of swing phase in fore-limb (0.39 s) and duration of swing phase in hindlimb(0.38 s), were closely related (0.27 s, 0.40 s and 0.40 s)with those found in Dutch Warmblood horses (Backet al., 1994a). The values were slightly lower (0.32 s,0.44 s and 0.48 s) for the Warmblood riding horses(Weishaupt et al., 2004), but according to Bayer (1973)the best trotter horses show shorter duration of stancephase in the forelimbs and a longer duration of stancephase in the hindlimbs. In our results, as in those
ters of biokinematic variables of the trot in Spanish ..., The Ve-
6 M. Valera et al. / The Veterinary Journal xxx (2007) xxx–xxx
ARTICLE IN PRESS
obtained by Back et al. (1994a), the values of these vari-ables are practically equal.
According to Barrey et al. (1997), a good trotter musthave great flexion of the elbow and carpus joints at thebeginning of the swing phase, variables that are not modi-fied with training in SPB horses (Cano et al., 2000). Ouraverage value for the range of elbow angle (67.06�) washigher than that found by Back et al. (1994a, 1995,1996). That the value of the oscillation range of this jointwas higher in SPB horses was expected, because, accordingto Cano et al. (2001a), the greater forelimb elevation at thetrot is a distinctive feature of their locomotion, comparedwith other breeds.
The range of movement of the tarsal and knee joints,and the angle of retraction of hindlimbs reflect the capacityof propulsion, implied in the generation of the impulse ofdisplacement (Holmstrom et al., 1994). According to Backet al. (1994a), the range of movement in the stifle and tarsaljoints is correlated with good gait punctuations and mustbe larger. In the present study, SPB horses showed a largerrange of movement in these joints (48.98� movement in thestifle and 68.65� for the tarsal joint) than the Dutch Warm-blood horses analysed by Back et al. (1994a). As a conse-quence they exhibited elevated movement (Barrey et al.,2002b), whereas the movements of Warmblood horsesare more extended.
The duration of the oscillation, the total range of pro-traction-retraction and the maximum flexion of the tarsaljoint can be considered indicative characteristics of thequality of the movement (Back et al., 1994b), since theyallow objective predictions to be made of mature locomo-tion. In general, SPB horses flex their joints more thanother breeds, due to the greater flexion of elbow and carpaljoints (Cano et al., 2001b). Thus, for example, the minimal
tarsus angle showed an average value (55.4�) higher thanfound in Dutch Warmblood horses (Back et al., 1995).
Due to the low heritability of dressage performancetraits, the use of indirect breeding criteria is essential toimprove this aptitude. According to Barrey et al. (2002b),indirect breeding selection using biokinematic variablescould be more efficient than selection based on perfor-mance results. It has been assumed that some specific char-acteristics of the gaits could be selected genetically andcontribute to dressage performance (Barrey et al., 2002b).The trot is the most important gait in the total score fordressage in competition (Biau and Barrey, 2004). The cor-relation between trot score and total dressage score is 0.73(Wallin et al., 2003).
According to Barrey et al. (2002a), the characteristics oftrot show a moderate to high heritability, and they shouldtherefore be used for early dressage selection (2–3 years).Although in the literature we reviewed information isscarce about the genetic parameters of these variables,and the heritability values that were found oscillatebetween 0.10 (Meinardus et al., 1986) and 0.50 (Ducroet al., 2002). However, in general, the heritabilitiesobtained in the present work have been high. Some 80%
Please cite this article in press as: Valera, M. et al., Genetic parameterinary Journal (2007), doi:10.1016/j.tvjl.2007.07.031
of variables showed heritabilities >0.5, which can be due,in addition to the nature of the characters, to the lack ofgenetic selection (Falconer and MacKay, 1996) in thisbreed. On the other hand, it could be caused by the greatercontrol of the environment in which the information wascollected. The standard errors are quite high for the geneticparameters reflecting the limited number of animalsincluded in the study because of the complexity and labourintensity of the test and variables estimation.
In general, the angular variables, maximal retraction–protraction angle of the forelimb (0.33), minimal retrac-tion–protraction angle of the hindlimb (0.38) and minimalstifle angle (0.36), presented the lowest heritabilities,although these are medium level values. This finding couldbe due to the fact that the first two variables are moreaffected by differences in training levels (Cano et al.,2000) than the others. The highest heritability (0.88)obtained was for forelimb maximum height of hoof andduration of swing phase in the hindlimbs. The medium–high heritability of most of the analysed variables ensurea suitable genetic answer if used as selection criteria. Onthe other hand, the genetic correlations also resulted invery high values (about 75% were >0.50) and 37.8% werenegative – the minimal angle of carpus, stifle and tarsusare always negatively correlated with the rest of the vari-ables because the decrease in this parameter always pro-duces an increase in the others. Fore and hindlimb swingphase duration and range of stifle angle had a higher num-ber of significant correlations (16, 13 and 11, respectively).These genetic results, together with the phenotypic correla-tions showed in the factor analysis, can contribute to selectthe variables to control on the treadmill.
Taking our results at face value, we can consider thathindlimb swing phase duration and range of stifle anglemust be included as pre-selection criteria for animals thatare going to be included in the Breeding Scheme of theSPB horse because, in addition to being highly correlated,they have high heritabilities and influence the hindlimbfunction, which is clearly very important for dressage horses(Holmstrom, 1994). Although forelimb swing phase dura-tion presented higher correlations with the rest of the vari-ables compared to the hindlimb swing phase duration, it isvery much influenced by the level of training (Cano et al.,2000), which mitigates against the inclusion of forelimbswing phase duration in an early selection programme.
The inclusion of the range of elbow angle and the min-imal angle of the carpus are recommended both for theirimportance in dressage (Holmstrom et al., 1995) and alsobecause they showed high heritabilities. The same appliesto stride duration, which influences stride frequency, andthis variable must be low for horses performing in dressage(Barrey et al., 2002a). Finally, instead of showing a lowerheritability, minimal retraction–protraction angle of thehindlimb must be included because it is important in thecollection of the limbs, essential for some exercises in dres-sage, and was not correlated with the other variablesstudied.
ters of biokinematic variables of the trot in Spanish ..., The Ve-
M. Valera et al. / The Veterinary Journal xxx (2007) xxx–xxx 7
ARTICLE IN PRESS
Conclusions
The biokinematic characteristics measured on the tread-mill have high heritabilities in SPB horses, which imply thatthey could be used as an efficient tool for selecting breedinghorses. However, in order to develop this selective process,it is essential to reduce the number of variables. It is neces-sary to verify the relationship between the variables anddressage performance in competition so as to select breed-ing criteria definitively, and this can be done using the com-petition scores obtained by young horses (4–6 years old) inspecific tests held in Spain since 2004. Thus characteristicssuch as hindlimb swing phase duration and range of stifleangle must be maintained as they show higher genetic cor-relations with the rest of the biokinematic variables, andtheir heritabilities are sufficiently high. The range of elbowangle, minimal angle of carpus and stride duration couldalso be included in the breeding programme because, inaddition to showing a suitable level of heritability, theirimportance in dressage performance has been emphasisedby other authors. Given the importance of the minimalretraction-protraction angle of the hindlimb in the collec-tion of the limbs, this factor could also be included in theBreeding Scheme of SPB horses despite its lowerheritability.
Acknowledgements
This work was financed with FEDER funds through theproject Morpho-functional evaluation in the Breedingscheme of Spanish Purebred (Andalusian) horses (1FD97-0891), awarded to the University of Cordoba (Spain). Thiswork was partially funded by a grant from the Junta deAndalucıa given to M.D. Gomez (BOJA n� 120, 21-06-2004).
Appendix A. Supplementary data
Supplementary data associated with this article can befound, in the online version, at doi:10.1016/j.tvjl.2007.07.031.
References
Back, W., Barneveld, A., Bruin, G., Schamhardt, H.C., Hartman, W.,1994a. Kinematic detection of superior gait quality in young trottingWarmbloods. Veterinary Quarterly 16, 91–96.
Back, W., Schamhardt, H.C., Barneveld, A., 1994b. Longitudinal devel-opment of the kinematics of 4-, 10-, 18- and 26-month-old DutchWarmblood horses. Equine Veterinary Journal 17, 3–6.
Back, W., Schamhardt, H.C., Hartman, W., Bruin, G., Barneveld, A.,1995. Predictive value of foal kinematics for the locomotor perfor-mance of adult horses. Research in Veterinary Science 59, 64–69.
Back, W., Schamhardt, H.C., Barneveld, A., 1996. Are kinematic of thewalk related to the locomotion of a Warmblood horse at the trot?Veterinary Quarterly 18, 79–84.
Barrey, E., Galloux, P., Valette, J.P., Auvinet, B., Wolter, R., 1993. Stridecharacteristics of overground versus treadmill locomotion in theSaddle Horse. Acta Anatomica 146, 90–94.
Please cite this article in press as: Valera, M. et al., Genetic parameterinary Journal (2007), doi:10.1016/j.tvjl.2007.07.031
Barrey, E., Fazio, E., Ferlazzo, A., Lindner, A., Lopez-Rivero, J.L., 1997.Performance diagnosis of horses. Wageningen Pers. Wageningen. TheNetherlands.
Barrey, E., 1999. Methods, applications and limitations of gait analysis inhorses. The Veterinary Journal 157, 7–22.
Barrey, E., Evans, S.E., Evans, D.l., Curtis, R.A., Quinton, R., Rose, R.J.,2001. Locomotion evaluation for racing in thoroughbreds. EquineVeterinary Journal 33, 99–103.
Barrey, E., Deslines, F., Blouin, C., Langlois, B., 2002a. Heritabilities ofgait characteristics: application for breeding in dressage. Conferenceon Equine Sports. In: Lindner, A. (Ed.), Medicine and Science, Theelite Dressage and Three-Days-Event Horse, pp. 91–95.
Barrey, E., Desliens, F., Poirel, D., Biau, S., Rivero, J.L., Langlois, B.,2002b. Early evaluation of dressage ability in different breeds. EquineVeterinary Journal 34, 319–324.
Bayer, A., 1973. Analysis of movement of trotting horses by means ofungulography. Journal of Veterinary Medicine Series A 20, 209–211.
Biau, S., Barrey, E., 2004. Relationship between stride characteristics andscores in dressage tests. Pferdeheilkunde 20, 140–144.
Bruns, E., 1981. Estimation of the breeding value of stallions from thetournament performance of their offspring. Livestock ProductionScience 8, 465–473.
Buchner, H.H., Savelberg, H.H., Schamhardt, H.C., Merkens, H.W.,Barneveld, A., 1994. Kinematics of treadmill versus overgroundlocomotion in horses. Veterinary Quarterly 16, 87–90.
Cano, M.R., 1999. Estudio biocinematico del patron locomotor normal enel caballo Pura Raza Espanol al trote. In: Analisis Biocinematico delTrote en el Caballo. PhD. Thesis, University of Cordoba, Spain.
Cano, M.R., Miro, F., Vivo, J., Galisteo, A.M., 1999. Comparativebiokinematic study of young and adult Andalusian horses at the trot.Journal of Veterinary Medicine Series A 46, 91–101.
Cano, M.R., Miro, F., Aguera, E., Galisteo, A.M., 2000. Influence oftraining on the biokinematics in trotting Andalusian horses. VeterinaryResearch Communications 24, 477–489.
Cano, M.R., Vivo, J., Miro, F., Morales, J.L., Galisteo, A.M., 2001a.Kinematic characteristics of Andalusian, Arabian and Anglo-Arabianhorses: a comparative study. Research in Veterinary Science 71, 147–153.
Cano, M.R., Miro, F., Monterde, J.G., Diz, A., Martın, J., Galisteo, M.,2001b. Changes due to age in the kinematics of trotting Andalusianfoals. Equine Veterinary Journal 33, 116–121.
Castejon, F.M., Rubio, D., Tovar, P., Vinuesa, M., Riber, C., 1994. Acomparative study of aerobic capacity and fitness in three differenthorse breeds (Andalusian, Arabian and Anglo-Arabian). Journal ofVeterinary Medicine Series A 41, 645–652.
Clayton, H.M., 1995. Comparison of the stride kinematics of the collected,medium and extended walks in horses. American Journal of VeterinaryResearch 56, 849–852.
Drevemo, S., Dalin, G., Fredircson, I., Hjerten, G., 1980. The analysis oflinear and temporal stride characteristics of trotting Standardbred.Equine Veterinary Journal 12, 60–65.
Ducro, B.J., Speelman, H., Koenen, E.P.C., van Tartwijk, J.M., 2002.Genetic relations between the first stallion inspection and the dressageand show jumping competition results in the Dutch WarmbloodRiding horse population. In: Proceedings of the 7th World Congresson Genetics Applied to Livestock Production, Montpellier, France.
Ducro, B.J., Koenen, E.P., van Tartwijk, J.M., 2005. Genetic correlationsbetween movement and free-jumping traits and performance in show-jumping and dressage competition of Dutch Warmblood Horses. In:Proceedings of the 56th European Association for Animal ProductionMeeting, Uppsala, Sweden.
Falconer, D.S., MacKay, T.F., 1996. Introduction to QuantitativeGenetics, fourth ed. Prentice-Hall, Harlow, UK.
Galisteo, A.M., Vivo, J., Cano, M.R., Morales, J.L., Miro, F., Aguera, E.,1997. Differences between breeds Dutch Warmblood vs AndalusianPurebreed in forelimb kinematics. Journal of Equine Science 8, 43–47.
Galisteo, A.M., Cano, M.R., Morales, J.L., Vivo, J., Miro, F., 1998. Theinfluence of speed and height at the withers in the kinematics of sound
ters of biokinematic variables of the trot in Spanish ..., The Ve-
8 M. Valera et al. / The Veterinary Journal xxx (2007) xxx–xxx
ARTICLE IN PRESS
horses at the hand-led trot. Veterinary Research Communications 22,415–423.
Galisteo, A.M., Morales, J.L., Cano, M.R., Miro, F., Aguera, E., Vivo, J.,2001. Interbreed differences in Equine Forelimb Kinematics at thewalk. Journal of Veterinary Medicine Series A 48, 277–285.
Groeneveld, E., 1996. REML VCE a Multivariate Multil ModelRestricted Maximum Likelihood (Co) Variance Component Estima-tion Package, version 3.2, User’s Guide. Editor E. Groeneveld,Institute of Animal Husbandry and Animal Ethology. FederalResearch Center of Agriculture. Neustadt, Germany.
Groeneveld, E., 1998. VCE version 4.0. A Multivariate Variance Compo-nent Estimation Package. In: Proceedings of the 6th World Congress onGenetics Applied to Livestock Production, Armidale, Australia.
Holmstrom, M., 1994. Quantitative studies on conformation and gaitanalyses in the riding horse. Thesis, SLU, Uppsala.
Holmstrom, M., Fredicson, I., Drevemo, S., 1994. Biokinematic analysisof the Swedish Warmblood riding horse at trot. Equine VeterinaryJournal 26, 235–240.
Holmstrom, M., Fredricson, I., Drevemo, S., 1995. Biokinematic effect ofcollection on the trotting gaits in the elite dressage horse. EquineVeterinary Journal 27, 281–287.
Huizinga, H.A., van der Meij, G.J.W., 1989. Estimated parameters ofperformance in jumping and dressage competition of the DutchWarmblood horse. Livestock Production Science 21, 333–345.
Johnson, R.A., Wichern, D.W., 1992. Applied Multivariate StatisticalAnalysis. Prentice-Hall, New Jersey.
Johnston, C., Holm, K.R., Erichsen, C., Eksell, P., Drevemo, S., 2004.Kinematic evaluation of the back in fully functioning riding horses.Equine Veterinary Journal 36, 495–498.
Langlois, B., 1980. Heritability of racing ability in thoroughbreds – areview. Livestock Production Science 7, 591–605.
Leach, D.H., Cymbaluk, N.F., 1986. Relationship between stride length,stride frequency, velocity and morphometrics of foals. AmericanJournal of Veterinary Research 47, 2090–2097.
Leach, D.H., Drevemo, S., 1991. Velocity-dependent changes in stridefrequency and length of trotters on a treadmill. American Journal ofVeterinary Research 48, 880–888.
Leleu, C., Bariller, F., Cotrel, C., Barrey, E., 2004. Reproducibility of alocomotor test for trotter horses. The Veterinary Journal 168, 160–166.
Lopez-Rivero, J.L., Aguera, E., Monterde, J.G., Rodrıguez, M.V., Miro,F., 1989. Comparative study of muscle fibre type composition in themiddle gluteal muscle of Andalusian, Thoroughbred and Arabianhorses. Journal of Equine Veterinary Science 9, 337–340.
Lopez-Rivero, J.L., Diz, A.M., Monterde, J.G., Aguera, E., 1993.Intramuscular distribution of fibre types in the gluteus medius of the
Please cite this article in press as: Valera, M. et al., Genetic parameterinary Journal (2007), doi:10.1016/j.tvjl.2007.07.031
horse: a histochemical analysis. Anatomia, Histologia, Embryologia22, 233–240.
Meinardus, H., Miesner, K., Bruns, E., 1986. Analysis of fieldperformance testing of mares. In: Proceedings of the 37th AnnualMeeting of the European Association for Animal Production,Budapest, Hungary.
Morales, J.L., Manchado, M., Cano, M.R., Miro, F., Galisteo, A.M.,1998a. Temporal and linear kinematics in elite and riding horses at thetrot. Journal of Equine Veterinary Science 18, 835–839.
Morales, J.L., Manchado, M., Vivo, J., Galisteo, A.M., Aguera, E., Miro,F., 1998b. Angular kinematic patterns of limbs in elite and ridinghorses at trot. Equine Veterinary Journal 30, 528–533.
Rivero, J.L., Barrey, E., 2001. Heritabilities and genetic and phenotypicparameters for gluteus medius muscle fibre type composition, fibre sizeand capillaries in purebred Spanish horses. Livestock ProductionScience 72, 233–241.
Rubio, M.D., Munoz, A., Santisteban, R., Tovar, P., Castejon, F.M.,1995. Comparative hematological study of two breeds of foals(Andalusian and Arab) subjected to exercise of progressive intensity.Journal of Veterinary Medicine Science 57, 311–315.
Saastamoinen, M., Suontama, M., Ojala, M., 1998. Heritability ofconformation traits and their relationships to racing performance inthe Finnhorse trotter. In: Proceedings of the 6th World Congress onGenetics Applied to Livestock Production, Armidale, Australia, pp.396–399.
Sloet van Oldruitenborgh-Oosterbaan, M.M., Barnevelt, A., 1995. Com-parison of the workload of Dutch Warmblood horses ridden normallyand on a treadmill. Veterinary Record 137, 136–139.
Statsoft, Inc., 2001. STATISTICA (data analysis software system), version6. http://www.statsoft.com.
Valette, J.P., Barrey, E., Wolter, R., 1991. Multivariate analysis of exerciseparameters measured during an incremental treadmill test. In: PerssonS.G.B., Lindholm A., Jeffcott, L.B. (Eds.), Equine Exercise Physiol-ogy, vol. 3. ICEEP Publications, Davis, California.
Van Ingen Schenau, G.J., 1980. Some fundamental aspects of thebiomechanics of overground versus treadmill locomotion. Medicineand Science in Sports and Exercise 12 (4), 257–261.
Wallin, L., Strandberg, E., Philipsson, J., 2003. Genetic correlationsbetween field test results of Swedish Warmblood Riding horses as 4-year-olds and life time performance results in dressage and show-jumping. Livestock Production Science 82, 61–71.
Weishaupt, A., Wiestner, T., Hogg, P., Jordan, P., Auer, J.A., 2004.Vertical ground reaction force-time histories of sound Warmbloodhorses trotting on a treadmill. Equine Veterinary Journal 168, 304–311.
ters of biokinematic variables of the trot in Spanish ..., The Ve-
Top Related
Copyright © 2022 FDOKUMEN

