


Bahasa
Halaman
Hukum

ARTICLE IN PRESS
Chemical Engineering Science 61 (2006) 3806–3817www.elsevier.com/locate/ces
Flow phenomena and flooding limitations in a phase transitionextraction column
Amos Ullmanna,∗, Mordechai Zamira, Reyimu Abudua, Zvi Ludmerb
aFaculty of Engineering, Tel Aviv University, Tel Aviv 69978, IsraelbFaculty of Agriculture, Hebrew University of Jerusalem, Rehovot, Israel
Received 2 November 2005; received in revised form 9 January 2006; accepted 11 January 2006
Abstract
The flooding limitations of liquid–liquid countercurrent two-phase flow in a phase transition extraction (PTE) column were investigated bothexperimentally and theoretically. The solvents used in the PTE process are partially miscible and posses a critical point of miscibility. In theexperiments, the effect of the settlers’ inclination on the onset of flooding in non-isothermal PTE column was investigated. It was found thatflooding conditions in the column can be postponed by using off-horizontal settlers. This led to the development of a novel structure of a PTEcolumn with improved throughputs.
A model is suggested for predicting flooding conditions in the PTE column. It combines a recently developed two-fluid model with improvedtheory-based closure relations for laminar stratified flow, with a non-isothermal model for evaluating the composition in the mixing sectionand the internal streams in the column. The results of the combined model favorably predict the experimental flooding flow rates.� 2006 Elsevier Ltd. All rights reserved.
Keywords: Unit operation; Phase change; Flooding; Separation; Extraction; Multiphase flow
1. Introduction
Flooding limitations set a restriction for the maximum flowrate in equipment, based on countercurrent two-phase flow,such as extraction columns. Higher throughput in the processwould enable reduction of the production costs. A novel ex-traction process, which is based on phase transition of a par-tially miscible solvents system, provides high stage efficiencywhile overcoming common drawbacks of conventional extrac-tion processes (Ullmann et al., 1995, 1997).
The phase transition extraction (PTE) process is based onthe use of a class of solvents that have a critical solutiontemperature (CST) with the feed liquid. In the PTE column,heating and cooling sections replace the mixing and settling sec-tions of conventional extraction columns. Countercurrent feedand solvent streams passing through these sections are heated
∗ Corresponding author. Tel.: +972 3 6407829; fax: +972 3 6407334.E-mail addresses: [email protected] (A. Ullmann),
[email protected] (Z. Ludmer).
0009-2509/$ - see front matter � 2006 Elsevier Ltd. All rights reserved.doi:10.1016/j.ces.2006.01.019
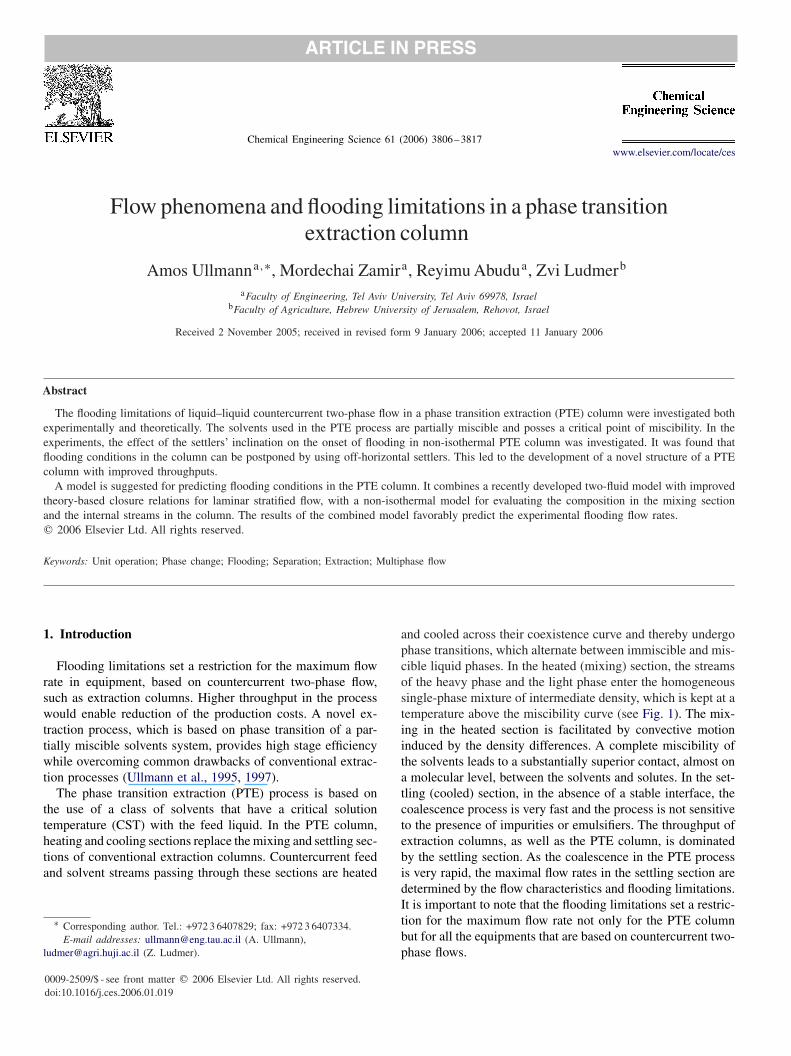
and cooled across their coexistence curve and thereby undergophase transitions, which alternate between immiscible and mis-cible liquid phases. In the heated (mixing) section, the streamsof the heavy phase and the light phase enter the homogeneoussingle-phase mixture of intermediate density, which is kept at atemperature above the miscibility curve (see Fig. 1). The mix-ing in the heated section is facilitated by convective motioninduced by the density differences. A complete miscibility ofthe solvents leads to a substantially superior contact, almost ona molecular level, between the solvents and solutes. In the set-tling (cooled) section, in the absence of a stable interface, thecoalescence process is very fast and the process is not sensitiveto the presence of impurities or emulsifiers. The throughput ofextraction columns, as well as the PTE column, is dominatedby the settling section. As the coalescence in the PTE processis very rapid, the maximal flow rates in the settling section aredetermined by the flow characteristics and flooding limitations.It is important to note that the flooding limitations set a restric-tion for the maximum flow rate not only for the PTE columnbut for all the equipments that are based on countercurrent two-phase flows.
ARTICLE IN PRESSA. Ullmann et al. / Chemical Engineering Science 61 (2006) 3806–3817 3807
MixingSection
Tem
pera
ture
Density
SINGLEPHASE
TWO
PHASES
A
SettlingSection Light
PhaseHeavyPhase
CST
Coexistencecurve
Fig. 1. Schematic description of the temperature-induced phase transitioncycle in the PTE process (UCST solvent system). The solid line representsheating into the single-phase region; the dotted line represents cooling andphase separation.
Higher throughput in the PTE process would enable reduc-tion of the production costs. Ullmann et al. (2001) suggestedthat the flooding limitation can be postponed by using off-horizontal inclined settlers. However, the flooding delay wastested with off-horizontal settlers in an isothermal column only.Its implementation in the non-isothermal PTE column still hasto be tested. It is worth noting that conventional extractioncolumns (unlike PTE columns) must be operated at vertical po-sition for preventing segregation of the phases in the mixingsections (Lo et al., 1983).
In the present work, the unique flow phenomena associatedwith the PTE column have been studied experimentally andtheoretically. In the PTE column, the countercurrent flow of thefeed and solvent streams is accompanied by phase transitionimposed by the temperature variation along the column. Thereare no reports in the literature on this type of non-isothermalcountercurrent flow phenomena. Furthermore, available exper-imental data on countercurrent liquid–liquid inclined isother-mal flows are limited. The current experimental and theoreti-cal study has focused on the flow in the PTE column in orderto identify optimal operation conditions, which will allow anincrease of the throughput while overcoming the flooding lim-itations.
A new structure of extraction column with inclined (slightlyoff-horizontal) settlers was examined. The change of the flowpattern from dispersed flow (in the conventional vertical design)to stratified flow in the off-horizontal settlers was investigated.It was assumed that forcing countercurrent stratified flow in thesettlers would reduce entrainment and postpone the floodingwithout affecting the mass transfer in the mixers where a singlehomogenous phase exists.
2. Experimental
In order to study the flow characteristics and the floodinglimitations of the PTE columns, a versatile experimental setupwas designed and constructed. The setup enables operation ofthe column either in isothermal or non-isothermal (PTE) modes.The inclination of the whole column, or of each of its sections,can be set to any desired angle. The maximal flow rates and theholdup at various inclinations were measured. The column istransparent, thereby enables to follow the mechanisms leadingto flooding.
2.1. The solvent system
The PTE process is based on using partially miscible sol-vent systems that possess a CST. An example of a coexistencecurve showing the variation of the density with temperaturein such a system is given in Fig. 1. “Single phase” denotesregions of complete miscibility, and “Two phases” denotes re-gions of heterogeneous mixtures of two mutually saturatedliquid phases. The solid line represents heating into the singlephase region (in the mixing section); the dotted line representscooling and phase separation (in the settler). Point “A” denotesa temperature-density condition where phase transition occurs.The location of point “A” along the coexistence curve dependson the overall mixture composition. The maximum tempera-ture of the miscibility curves corresponds to an upper criti-cal solution temperature (UCST). A more complete descriptionof the PTE column operation principles is given by Ullmannet al. (1995, 1997).
The solvent system used in the present study is a mix-ture of ethyl acetate, water and ethanol with an UCST of42 ◦C. At room temperature, this solvent system forms twophases with a density ratio (organic/aqueous) of �2/�1 ≈0.95, viscosity ratio of �̃ = �1/�2 ≈ 1.7 and surface ten-sion � ≈ 0.004 N/m. The corresponding Eotvos number ofthe system is Eo = ��gD2/� ≈ 20 � 1, hence, the systemis gravity dominated. It should be noted that some changesin the mixture composition and temperature between differ-ent runs cause a variation of the phases’ physical properties(in the range of ��/�1 = ±0.02 and for the viscosity ratio,��̃ = ±0.25).
2.2. The experimental setup
A schematic description of the flow system and the auxiliaryequipment is depicted in Fig. 2. The configuration shown inFig. 2 has three stages, consisting of three vertical mixers andfour slightly off-horizontal inclined settlers. The mixers andsettlers are built as transparent shell and tube heat exchang-ers. The heat exchangers are 300 mm long and with an ID of14.4 mm. The test column design is modular; whereby the num-ber of sections and their inclination can be easily altered (e.g.,seven sections are shown in Fig. 2). The heat exchangers areconnected to each other by Teflon flexible connector, whichpermits positioning of each section at any inclination between

3808 A. Ullmann et al. / Chemical Engineering Science 61 (2006) 3806–3817
ARTICLE IN PRESS
Fig. 2. Schematic description of the non-isothermal experimental setup. Theconfiguration shown has three stages consisting of three vertical mixers andfour slightly off-horizontal inclined settlers. The small boxes attached to thesides of the mixers and settlers represent heat exchangers.
0◦ and 90◦ to the horizontal. Teflon connectors were selectedin order to improve the thermal insulation between the coldand hot heat exchangers. The entry devices used to introducethe liquids into the test section are designed to minimize en-trance disturbances. The entry sections at the column top andbottom are identical. These sections are 140 mm long, wherethe first 80 mm was shaped as a cylinder (32 mm I.D.); the restwas shaped as an entry cone.
The liquids flow under gravity from two feed reser-voirs through a set of calibrated rotameters (Gilmont cali-brated/correlated flow meters with an accuracy of ±2%) intothe test section, and collected back in two storage tanks. Thelatter are used also as liquid separators.
Needle valves are used to control the liquids’ flow rates(Gilmont micrometer valve, 20 turns with Teflon O rings). Theinlet streams, consisting of the heavy and the light phases ofethyl acetate, water and ethanol solvent system, were saturatedwith each other at ambient temperature before being introducedinto the column. The heavy phase is introduced at the column’s
upper end and removed from the bottom, through an additionalset of a control valve and a rotameter, back into its storage tank.The light phase overflows from the top of the column into thelight phase storage tank. The ranges of light and heavy phaseflow rates tested are 0–50.8 and 0–77.7 ml/min, respectively.The maximal liquids flow rates correspond to Reynolds numberless than 100, hence all data correspond to laminar flow.
In the isothermal operation mode the temperature was keptconstant throughout the column sections. Whereas, in thenon-isothermal (PTE) mode, different temperatures, above andbelow the UCST, were maintained in the mixing and set-tling sections, respectively. In this way, the countercurrentlight phase and heavy phase streams passing those sectionsare heated and cooled across their coexistence curve andthereby undergo phase transitions, which alternate betweenstates of two distinct liquid phases and a single homogeneousphase.
The temperature in each of the sections (heat exchangers)was controlled separately using heating and cooling ther-mostatic baths. The use of a separate thermostatic bath (foreither heating or cooling) for every single heat exchangerpermitted easy temperature control of the solvent streamsin the column. Ethanol and water were used as cooling andheating liquids, respectively. The temperatures in each ofthe column sections were measured continuously by ther-mocouples placed in the solvent streams and in the thermo-static bathe. The data were collected by a continuous datalogger.
In the present study, a single-stage PTE column, consistingof two settlers and a single mixer, was tested. As mentionedabove, different sections of the column were made of glass,to facilitate visual examination of the streams. Specifically, itenabled to verify the complete miscibility of the streams in themixing section (the fluid becomes clear).
The flow patterns and the location of the interface betweenthe light and heavy phases in the settling sections are iden-tified and recorded using a commercial digital video camera(Sony VCT-D680RM). The camera is mounted on a supportwith a height adjustment mechanism. The camera position isindicated by a dial of 5 mm full scale, with 0.01 mm gradua-tions. The camera was first positioned to have its focus on theinner tube wall and then moved to a second position to haveits focus on the interface. The difference between these posi-tions provides a measure of the heavy (or light) layer thickness.In order to obtain easy identification of the interface level, astriped background (white/pink, 5 mm wide) was placed be-hind the optical box. A distortion of stripes indicates the lo-cation of the liquid–liquid interface. Illumination by incandes-cence lamps (positioned above and below the optical box) wasreflected from the white strips through the optical box to thecamera lens.
Validation of the holdup measurement technique (which isbased on the above measurement of the interface level) wascarried out by comparing the measured value of the holdup in asealed tube filled with known liquid volumes. The relative errorin the holdup is evidently higher for thinner layers; however,the relative error was less than 1% (for more details see Zamir,
ARTICLE IN PRESSA. Ullmann et al. / Chemical Engineering Science 61 (2006) 3806–3817 3809
2003). In the flow system, the establishment of fully developedconditions was verified by taking measurements of the holdupat several locations along the middle section of the pipe. In allcases, the variations of the holdup were random and limited tothe measurement error range.
The composition in the mixing section, characterized by thevolumetric fraction of the heavy phase, �1, was measured asa function of the inlet stream flow rates. Samples withdrawncarefully from the mixing section were cooled to ambient tem-perature, thereby separated into heavy and light phases. Thevolumetric fraction was obtained by the measured volumes�1 =V1/(V1 +V2) where V1 and V2 are the volume of the heavyand light phases in the mixer section.
In order to obtain the flooding point, the flow rate of eitherthe light phase or the heavy phase is held constant and that ofthe other phase gradually increased until observing the pres-ence of one phase in the outlet of the other phase. The presenceof one phase in the other phase is very easy to inspect, sinceeven a tiny amount of second phase will give the outlet streaman opaque appearance. The inception of entrainment insteadof a complete flooding was detected in the experiments in or-der to avoid the necessity to restart the experiments and reachsteady state conditions after each experimental run. It is impor-tant to note that, as a result of the small density difference be-tween the streams in the PTE column, unstable conditions lead-ing to complete flooding may occur soon after entrainment isdetected.
Steady-state conditions in each of the experiments have beenfound to be approached by the time the liquid content in thecolumn has been replaced two to three times. A steady-statecondition is considered when the outlet flow rates and temper-atures are found to be constant through successive measure-ments. Further details on the experimental setup and the oper-ation procedure are provided in Zamir (2003).
3. Experimental results
Two sets of experiments were conducted. In the first set, theeffect of inclination on the flow characteristics was studied inthe isothermal column. The effect of the settlers’ inclinationon the onset of flooding in non-isothermal column (PTE) wasinvestigated in the second set of experiments.
3.1. Effect of inclination on the flow characteristics inisothermal column
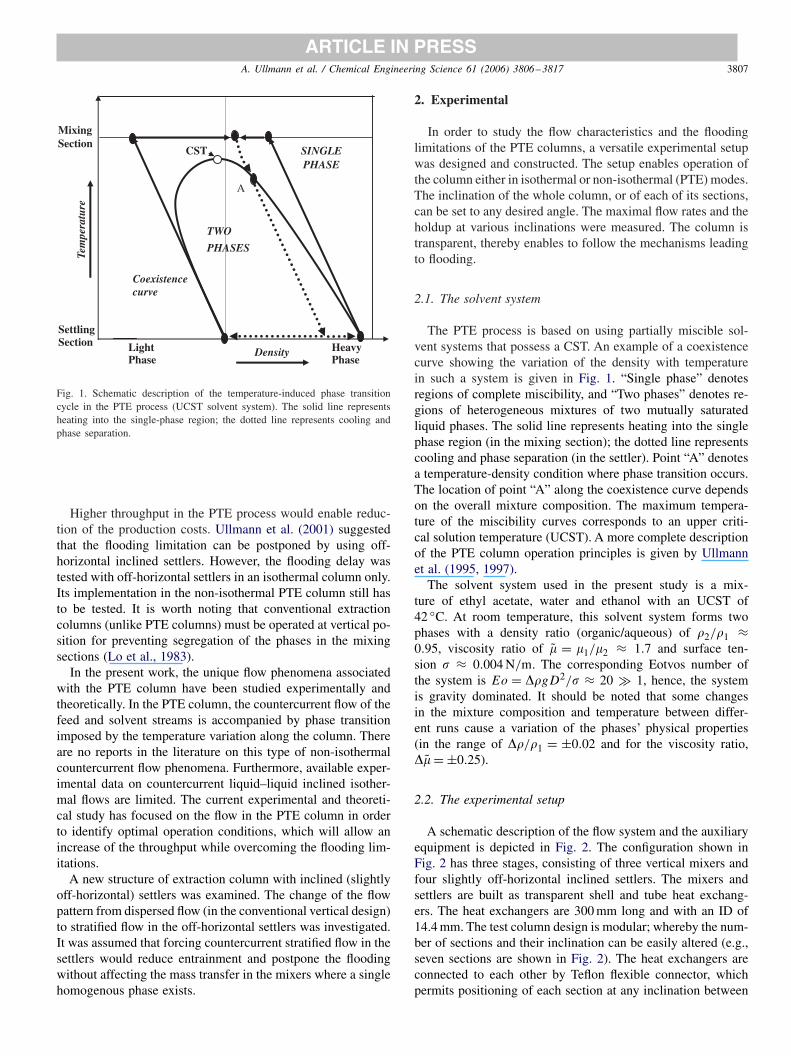
A preliminary set of experiments, investigating the flow char-acteristics of isothermal countercurrent flow was conducted.The flow characteristics and flooding limitations in the set-tling section were examined using the isothermal experimen-tal setup. Fixing the test section at different inclinations gavedetails on the effect of inclination on the flow pattern. Fig. 3shows a schematic description of the flow patterns obtainedin the column for isothermal countercurrent flow of relativelylow flow rates of the light and heavy phases. In a vertical col-umn (Fig. 3a), the basic flow pattern is dispersed flow, witheither the heavy phase dispersed in the light phase (light phase
(a) (b) (c)
Fig. 3. Description of the flow pattern in countercurrent flow: (a) Verticalcolumn: The pattern is of dispersed flow either heavy drops in a lightcontinuous phase light phase dominated zone (LPD), or drops of the lightphase dispersed in the continuous heavy phase heavy phase dominated zone(HPD). (b) Off-vertical column: The pattern is of stratified—dispersed flow.This has both dispersed flow, as in the vertical column, and stratification dueto the inclination of the column. This mixed pattern holds for both the LPDand the HPD zones. (c) Inclined column: The flow pattern is fully stratified,or stratified—wavy in relatively steep inclinations. Again, this flow patternis in both the HPD and LPD zones.
dominated, LPD), or the light phase dispersed in the heavyphase (heavy phase dominated, HPD). These two configurationsof dispersed flow can be simultaneously obtained in the column,separated by a dividing interface (DI). Obviously, each of thetwo configurations is associated with a different in situ holdupand thus, with a different pressure gradient. Therefore, bymanipulating the resistance at the heavy phase outlet, the loca-tion of the DI can be placed at any position along the column.With a sufficiently low resistance, the flow configuration in theentire column is LPD (the DI is out of the column bottom).On the other hand, with a high resistance, the flow configura-tion is entirely HPD (the DI is out of the column top). Whenthe DI is set within the column, the HPD configuration pre-vails at the lower section of the column, while in the uppersection, the LPD configuration is obtained (see also the de-scription of countercurrent vertical spray column in Treybal(1963, p. 473).
With tilting the column from the vertical (Fig. 3b), the phasestend to segregate, even with the liquids of the small densitydifferential used in this study. The two configurations obtainedin this case correspond to stratified-dispersed flow both in theHPD and in the LPD zones. Inclining the tube further, results ina complete segregation of the phases (Fig. 3c). The basic flowpattern in both zones is then stratified flow with either a wavyor smooth interface. The fast separation of the phases can alsobe attributed to the reduced settling distance of the separatingdroplets in the inclined tube (Treybal, 1963). The flow in theHPD zone corresponds to a thick layer of the heavy phaseflowing counter currently to a thin layer of the light phase,while in the LPD a thin layer of the heavy phase is obtained.Similarly to the operation of a vertical column, the locationof the interface between these two zones can be controlled byadjusting the resistance at the heavy phase outlet. Thereby, the
3810 A. Ullmann et al. / Chemical Engineering Science 61 (2006) 3806–3817
ARTICLE IN PRESS
LPD
HPD
DI
q2
q1
Velocity profiles
q2
q1
q2
q1
q1
(a)
(b)
Fig. 4. The internal streams near the DI where HPD becomes LPD:(a) schematic representation and (b) a picture showing the flow patterns.q1 = 7 (ml/ min), q2 = 9 (ml/ min), �1 = 947.3 (kg/m3), ��= 30.7 (kg/m3),�1 = 0.00357 (kg/m/s), �̃ = 1.52, � = 30◦.
entire column can be occupied by either one of these two flowconfigurations, or by both of them.
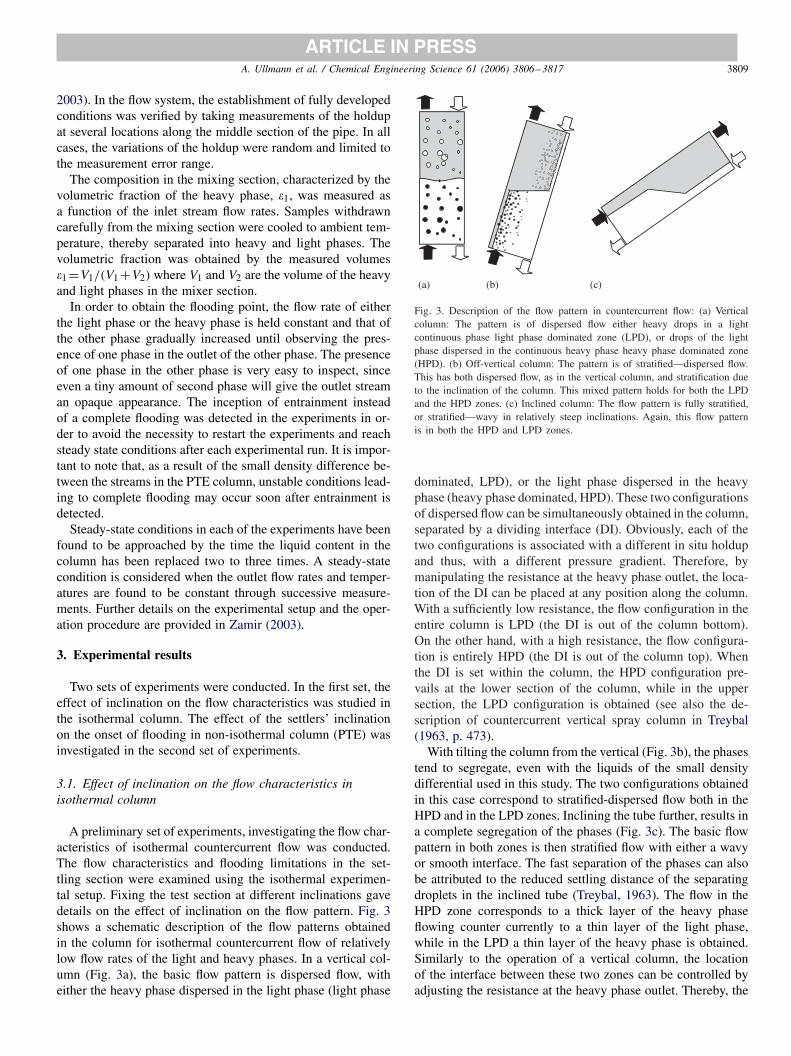
Fig. 4 shows an enlarged photo of the region where the trans-formation occurs from an HPD zone to an LPD zone, undersmooth stratified flow conditions. As mentioned above, the flowin the HPD zone corresponds to a thick layer of the heavy phaseflowing counter currently to a thin layer of the light phase. Inthe LPD zone, the heavy phase layer is the thin layer. Wherethe two phases come in contact (at the interface) we have acontinuous velocity profile. We can deduce from this that if thevelocity of the interface is not zero, the phases on both sides ofthe interface will be moving in the same direction. In counter-current flow, this is expressed in the formation of a backflowstream in the thick layers. In the DI the thick layer changesfrom HPD to LPD. This transition is accompanied by a rever-sal in the direction of the backflow stream. It should be men-tioned that the “bulge” (seen in the enlarged photo (b)) in theDI zone is probably a result of this reversal of the backflowdirection.
A schematic description of the streams in a single-stage ex-traction column which consists of a vertical middle (mixing)section and two inclined end sections (settlers) is shown inFig. 5. When the column is operated under isothermal con-
DI
HPD
LPD
LPDDI
HPD, DL/H
HPD
LPD
LPD, DH/L
LPD, DH/L
DI
q2q1
HPD, DL/H
HPD
HPD
LPD
q2q1
q1
q2
q1
q1
q2
q2
q1
q2
Fig. 5. Schematic representation of the flow configuration in an isothermalcolumn where the settlers are slightly off horizontal. Note that there is aninterface between the heavy phase (in white) and the light phase (in color)that runs throughout the column. The DI is the change from the HPD zoneto the LPD zone: (a) the DI is in the top settler, (b) the DI is situated in themixer and (c) the DI is in the bottom settler.
ditions, an interface between light and heavy phase existsthroughout the column. The position of the DI (defined above),can be determined by changing the resistance in the heavy phaseoutlet. The higher is this resistance; the more the column will beoccupied with the heavier phase. In the most extreme case, thiswill drive the DI all the way out of the top of the column, andthe entire column will be in the HPD mode. This still means thata thin layer of the light phase will be present in both inclinedsettlers, and the light phase will exist as drops in the mixer.With somewhat lower resistance, the DI will move into the topsettler (as in Fig. 5a) and the LPD mode region will be limitedto the top of the upper settler. The rest of the column will be oc-cupied by the LPD mode. Lowering the outlet resistance furtherresults in the migration of the DI into the mixer (see Fig. 5b).In this section the LPD mode corresponds to drops of the heavyphase moving down through a continuous light phase, while inthe HPD mode (below the DI) drops of the light phase move upthrough a continuous heavy phase. With even lower resistance,the DI moves to the lower settler (see Fig. 5c), and most ofthe column is in the LPD mode. Eventually, further loweringof the outlet resistance would move the DI entirely out of thebottom of the column, resulting in a LPD mode throughout thecolumn.
3.2. Effect of settlers’ inclination on the flooding in the PTEcolumn
Based on the above findings, a new basic structure of col-umn with vertical mixers and inclined settlers was studied. Itwas assumed that the change of the flow pattern from dispersedflow (in a conventional vertical design) to stratified flow, in theslightly inclined settler configuration, will postpone the flood-ing. However, in order to avoid degradation of the streams mix-
ARTICLE IN PRESSA. Ullmann et al. / Chemical Engineering Science 61 (2006) 3806–3817 3811
0
5
10
15
20
25
30
0 10 15 20 25 30q1, Heavy [ml/min]
q 2, L
ight
[m
l/min
]
Settlers in slightly offhorizontal position
Vertical column
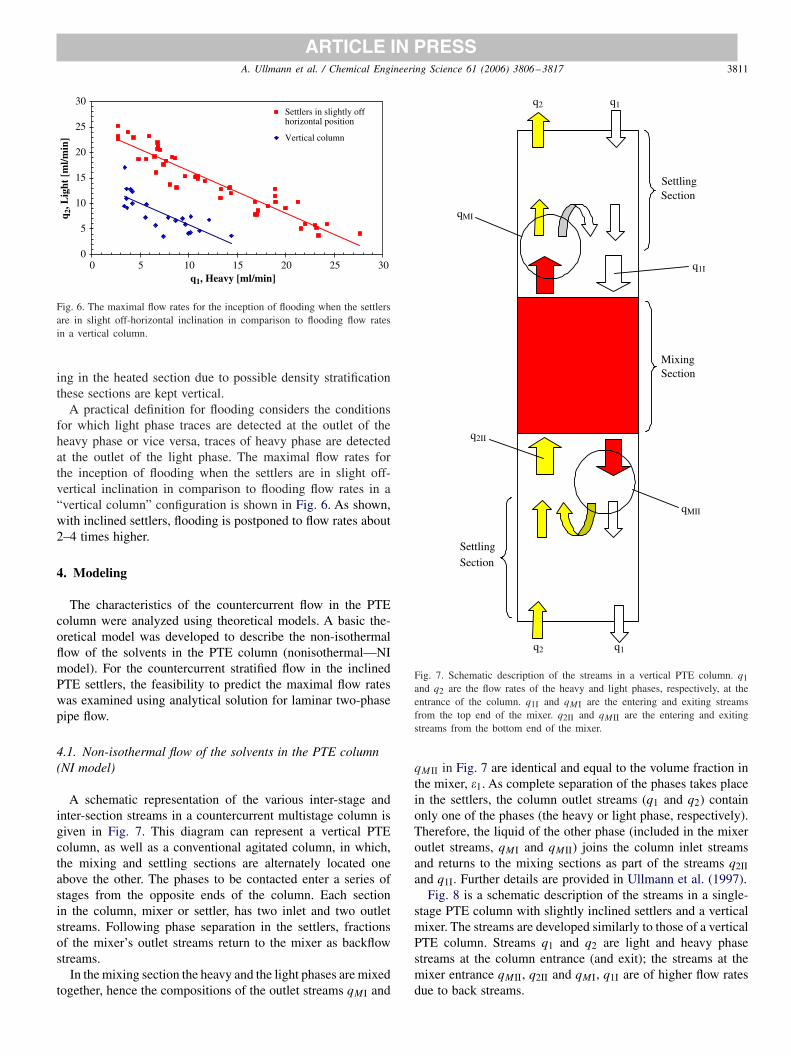
5
Fig. 6. The maximal flow rates for the inception of flooding when the settlersare in slight off-horizontal inclination in comparison to flooding flow ratesin a vertical column.
ing in the heated section due to possible density stratificationthese sections are kept vertical.
A practical definition for flooding considers the conditionsfor which light phase traces are detected at the outlet of theheavy phase or vice versa, traces of heavy phase are detectedat the outlet of the light phase. The maximal flow rates forthe inception of flooding when the settlers are in slight off-vertical inclination in comparison to flooding flow rates in a“vertical column” configuration is shown in Fig. 6. As shown,with inclined settlers, flooding is postponed to flow rates about2–4 times higher.
4. Modeling
The characteristics of the countercurrent flow in the PTEcolumn were analyzed using theoretical models. A basic the-oretical model was developed to describe the non-isothermalflow of the solvents in the PTE column (nonisothermal—NImodel). For the countercurrent stratified flow in the inclinedPTE settlers, the feasibility to predict the maximal flow rateswas examined using analytical solution for laminar two-phasepipe flow.
4.1. Non-isothermal flow of the solvents in the PTE column(NI model)
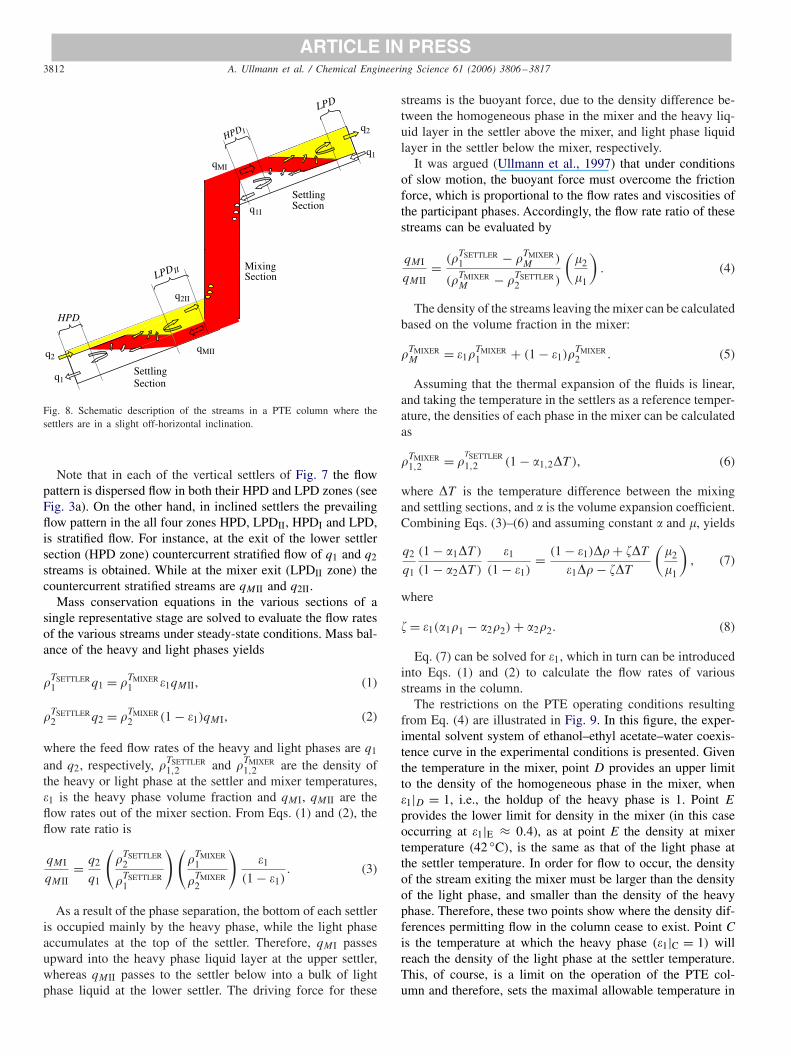
A schematic representation of the various inter-stage andinter-section streams in a countercurrent multistage column isgiven in Fig. 7. This diagram can represent a vertical PTEcolumn, as well as a conventional agitated column, in which,the mixing and settling sections are alternately located oneabove the other. The phases to be contacted enter a series ofstages from the opposite ends of the column. Each sectionin the column, mixer or settler, has two inlet and two outletstreams. Following phase separation in the settlers, fractionsof the mixer’s outlet streams return to the mixer as backflowstreams.
In the mixing section the heavy and the light phases are mixedtogether, hence the compositions of the outlet streams qMI and
Settling
Section
Settling Section
Mixing Section
qMI
q2 q1
q2II
q2 q1
qMII
q1I
Fig. 7. Schematic description of the streams in a vertical PTE column. q1and q2 are the flow rates of the heavy and light phases, respectively, at theentrance of the column. q1I and qMI are the entering and exiting streamsfrom the top end of the mixer. q2II and qMII are the entering and exitingstreams from the bottom end of the mixer.
qMII in Fig. 7 are identical and equal to the volume fraction inthe mixer, �1. As complete separation of the phases takes placein the settlers, the column outlet streams (q1 and q2) containonly one of the phases (the heavy or light phase, respectively).Therefore, the liquid of the other phase (included in the mixeroutlet streams, qMI and qMII) joins the column inlet streamsand returns to the mixing sections as part of the streams q2IIand q1I. Further details are provided in Ullmann et al. (1997).
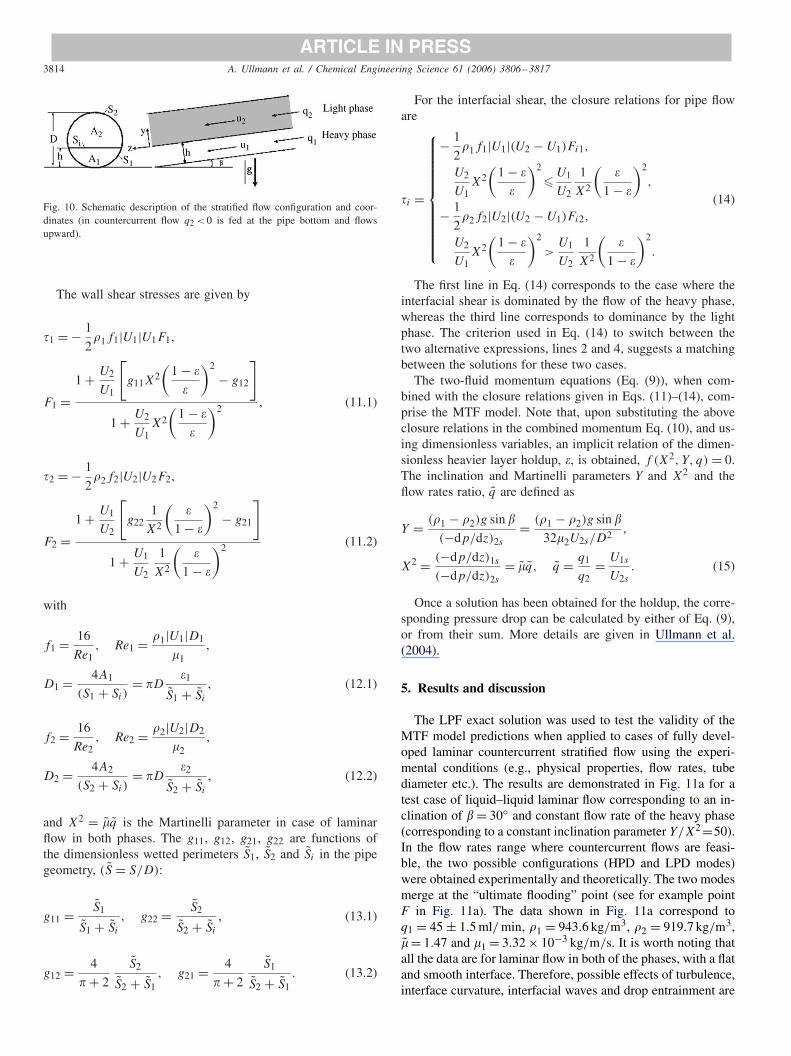
Fig. 8 is a schematic description of the streams in a single-stage PTE column with slightly inclined settlers and a verticalmixer. The streams are developed similarly to those of a verticalPTE column. Streams q1 and q2 are light and heavy phasestreams at the column entrance (and exit); the streams at themixer entrance qMII, q2II and qMI, q1I are of higher flow ratesdue to back streams.
3812 A. Ullmann et al. / Chemical Engineering Science 61 (2006) 3806–3817
ARTICLE IN PRESS
q2
q1
qMII
q1I
q2
q1qMI
q2II
SettlingSection
MixingSectionLPDII
HPD
SettlingSection
HPDI
LPD
Fig. 8. Schematic description of the streams in a PTE column where thesettlers are in a slight off-horizontal inclination.
Note that in each of the vertical settlers of Fig. 7 the flowpattern is dispersed flow in both their HPD and LPD zones (seeFig. 3a). On the other hand, in inclined settlers the prevailingflow pattern in the all four zones HPD, LPDII, HPDI and LPD,is stratified flow. For instance, at the exit of the lower settlersection (HPD zone) countercurrent stratified flow of q1 and q2streams is obtained. While at the mixer exit (LPDII zone) thecountercurrent stratified streams are qMII and q2II.
Mass conservation equations in the various sections of asingle representative stage are solved to evaluate the flow ratesof the various streams under steady-state conditions. Mass bal-ance of the heavy and light phases yields
�TSETTLER1 q1 = �TMIXER
1 �1qMII, (1)
�TSETTLER2 q2 = �TMIXER
2 (1 − �1)qMI, (2)
where the feed flow rates of the heavy and light phases are q1
and q2, respectively, �TSETTLER1,2 and �TMIXER
1,2 are the density ofthe heavy or light phase at the settler and mixer temperatures,�1 is the heavy phase volume fraction and qMI, qMII are theflow rates out of the mixer section. From Eqs. (1) and (2), theflow rate ratio is
qMI
qMII= q2
q1
(�TSETTLER
2
�TSETTLER1
)(�TMIXER
1
�TMIXER2
)�1
(1 − �1). (3)
As a result of the phase separation, the bottom of each settleris occupied mainly by the heavy phase, while the light phaseaccumulates at the top of the settler. Therefore, qMI passesupward into the heavy phase liquid layer at the upper settler,whereas qMII passes to the settler below into a bulk of lightphase liquid at the lower settler. The driving force for these
streams is the buoyant force, due to the density difference be-tween the homogeneous phase in the mixer and the heavy liq-uid layer in the settler above the mixer, and light phase liquidlayer in the settler below the mixer, respectively.
It was argued (Ullmann et al., 1997) that under conditionsof slow motion, the buoyant force must overcome the frictionforce, which is proportional to the flow rates and viscosities ofthe participant phases. Accordingly, the flow rate ratio of thesestreams can be evaluated by
qMI
qMII= (�TSETTLER
1 − �TMIXERM )
(�TMIXERM − �TSETTLER
2 )
(�2
�1
). (4)
The density of the streams leaving the mixer can be calculatedbased on the volume fraction in the mixer:
�TMIXERM = �1�
TMIXER1 + (1 − �1)�
TMIXER2 . (5)
Assuming that the thermal expansion of the fluids is linear,and taking the temperature in the settlers as a reference temper-ature, the densities of each phase in the mixer can be calculatedas
�TMIXER1,2 = �
TSETTLER1,2 (1 − �1,2�T ), (6)
where �T is the temperature difference between the mixingand settling sections, and � is the volume expansion coefficient.Combining Eqs. (3)–(6) and assuming constant � and �, yields
q2
q1
(1 − �1�T )
(1 − �2�T )
�1
(1 − �1)= (1 − �1)�� + ��T
�1�� − ��T
(�2
�1
), (7)
where
� = �1(�1�1 − �2�2) + �2�2. (8)
Eq. (7) can be solved for �1, which in turn can be introducedinto Eqs. (1) and (2) to calculate the flow rates of variousstreams in the column.
The restrictions on the PTE operating conditions resultingfrom Eq. (4) are illustrated in Fig. 9. In this figure, the exper-imental solvent system of ethanol–ethyl acetate–water coexis-tence curve in the experimental conditions is presented. Giventhe temperature in the mixer, point D provides an upper limitto the density of the homogeneous phase in the mixer, when�1|D = 1, i.e., the holdup of the heavy phase is 1. Point E
provides the lower limit for density in the mixer (in this caseoccurring at �1|E ≈ 0.4), as at point E the density at mixertemperature (42 ◦C), is the same as that of the light phase atthe settler temperature. In order for flow to occur, the densityof the stream exiting the mixer must be larger than the densityof the light phase, and smaller than the density of the heavyphase. Therefore, these two points show where the density dif-ferences permitting flow in the column cease to exist. Point Cis the temperature at which the heavy phase (�1|C = 1) willreach the density of the light phase at the settler temperature.This, of course, is a limit on the operation of the PTE col-umn and therefore, sets the maximal allowable temperature in

ARTICLE IN PRESSA. Ullmann et al. / Chemical Engineering Science 61 (2006) 3806–3817 3813
Fig. 9. Description of the interaction between the phase densities, composition and temperature in the PTE process for an ethanol–ethyl acetate–water system.The temperature range depicted is the one in which the experiments described were performed. Points D and E are the operational limits in this PTE column.Point D is the maximum density that can be reached in the mixer as it consists of purely heavy phase. Point E is the minimum density that may be reached inthe mixer, as it is the same density as the light phase in the settler. Point C is the temperature at which the phase in the mixer (consists of purely heavy phase)reaches the density of the light phase in the settler. Note that, for this specific solvent system, this temperature TMIXER|max = 76 ◦C is purely theoretical, asthe liquid evaporates before this point can be reached.
the mixer (Tmax = 76 ◦C). In this specific solvent system thistemperature is theoretical as the solvent evaporates before thistemperature is reached. The minimal allowable mixer tempera-ture (point A) lays on the coexistence curve and is determinedby the holdup, �1, in the mixer which in turn, is a function ofthe inlet flowrates, the liquid properties and �T (see Eq. (7)).The actual operational mixer density, point B, should thereforebe located between the above-mentioned limiting conditions,and is a function of the holdup and mixer temperature.
4.2. Theoretical models for laminar stratified flow
Analysis of countercurrent stratified flows, in case oflaminar flow with flat interface between the phases, can beconducted by exact solution of the mass and momentum con-servation equations using the bi-polar coordinates system. Thecomplete exact solution for fully developed stratified laminarflow in inclined pipes is given in Ullmann et al. (2004). Theexpressions and the computations involved in this LaminarPipe Flow (LPF) model are rather complex. On the other hand,the application of the traditional two-fluid (TF) model (Taiteland Dukler, 1976), which employs single-phase-based closurerelations, is problematic for liquid–liquid inclined flows and itspredictions are poor (Ullmann et al., 2003). New theory-based
closure relations for laminar stratified flows were recently de-rived and implemented in the TF integral momentum and massconservation equations (Ullmann et al., 2004). The new closurerelations are formulated in terms of the single-phase-based ex-pressions, which are augmented by the two-phase interactionfactors. It was shown that the new closure relations overcomethe difficulties encountered in the commonly used TF modelsand its predictions closely follow the LPF exact solution. Theequations of this modified two-fluid (MTF) model are hereinbriefly summarized.
Assuming a fully developed stratified flow, the integral formsof the momentum equations for the two fluids are
− A1dp
dz+ �1S1 − �iSi + �1A1g sin � = 0,
− A2dp
dz+ �2S2 + �iSi + �2A2g sin � = 0, (9)
where A1,2 and S1,2 are the cross-sectional area and the wallperimeter of each of the fluids, respectively, and Si is the inter-facial perimeter (see Fig. 10). The insitu holdup of the heavierphase is � = 4A1/D2. Eliminating the pressure drop yields
�1(S1/A1) − �2(S2/A2) − �iSi(1/A1 + 1/A2)
+ (�1 − �2)g sin � = 0. (10)
3814 A. Ullmann et al. / Chemical Engineering Science 61 (2006) 3806–3817
ARTICLE IN PRESS
Fig. 10. Schematic description of the stratified flow configuration and coor-dinates (in countercurrent flow q2 < 0 is fed at the pipe bottom and flowsupward).
The wall shear stresses are given by
�1 = − 1
2�1f1|U1|U1F1,
F1 =1 + U2
U1
[g11X
2(
1 − �
�
)2
− g12
]
1 + U2
U1X2
(1 − �
�
)2 , (11.1)
�2 = − 1
2�2f2|U2|U2F2,
F2 =1 + U1
U2
[g22
1
X2
(�
1 − �
)2
− g21
]
1 + U1
U2
1
X2
(�
1 − �
)2 (11.2)
with
f1 = 16
Re1, Re1 = �1|U1|D1
�1,
D1 = 4A1
(S1 + Si)= D
�1
S̃1 + S̃i
, (12.1)
f2 = 16
Re2, Re2 = �2|U2|D2
�2,
D2 = 4A2
(S2 + Si)= D
�2
S̃2 + S̃i
, (12.2)
and X2 = �̃q̃ is the Martinelli parameter in case of laminarflow in both phases. The g11, g12, g21, g22 are functions ofthe dimensionless wetted perimeters S̃1, S̃2 and S̃i in the pipegeometry, (S̃ = S/D):
g11 = S̃1
S̃1 + S̃i
, g22 = S̃2
S̃2 + S̃i
, (13.1)
g12 = 4
+ 2
S̃2
S̃2 + S̃1, g21 = 4
+ 2
S̃1
S̃2 + S̃1. (13.2)
For the interfacial shear, the closure relations for pipe floware
�i =
⎧⎪⎪⎪⎪⎪⎪⎪⎪⎪⎪⎨⎪⎪⎪⎪⎪⎪⎪⎪⎪⎪⎩
− 1
2�1f1|U1|(U2 − U1)Fi1,
U2
U1X2(
1 − �
�
)2
� U1
U2
1
X2
(�
1 − �
)2
,
− 1
2�2f2|U2|(U2 − U1)Fi2,
U2
U1X2(
1 − �
�
)2
>U1
U2
1
X2
(�
1 − �
)2
.
(14)
The first line in Eq. (14) corresponds to the case where theinterfacial shear is dominated by the flow of the heavy phase,whereas the third line corresponds to dominance by the lightphase. The criterion used in Eq. (14) to switch between thetwo alternative expressions, lines 2 and 4, suggests a matchingbetween the solutions for these two cases.
The two-fluid momentum equations (Eq. (9)), when com-bined with the closure relations given in Eqs. (11)–(14), com-prise the MTF model. Note that, upon substituting the aboveclosure relations in the combined momentum Eq. (10), and us-ing dimensionless variables, an implicit relation of the dimen-sionless heavier layer holdup, �, is obtained, f (X2, Y, q) = 0.The inclination and Martinelli parameters Y and X2 and theflow rates ratio, q̃ are defined as
Y = (�1 − �2)g sin �
(−dp/dz)2s
= (�1 − �2)g sin �
32�2U2s/D2 ,
X2 = (−dp/dz)1s
(−dp/dz)2s
= �̃q̃, q̃ = q1
q2= U1s
U2s
. (15)
Once a solution has been obtained for the holdup, the corre-sponding pressure drop can be calculated by either of Eq. (9),or from their sum. More details are given in Ullmann et al.(2004).
5. Results and discussion
The LPF exact solution was used to test the validity of theMTF model predictions when applied to cases of fully devel-oped laminar countercurrent stratified flow using the experi-mental conditions (e.g., physical properties, flow rates, tubediameter etc.). The results are demonstrated in Fig. 11a for atest case of liquid–liquid laminar flow corresponding to an in-clination of � = 30◦ and constant flow rate of the heavy phase(corresponding to a constant inclination parameter Y/X2 =50).In the flow rates range where countercurrent flows are feasi-ble, the two possible configurations (HPD and LPD modes)were obtained experimentally and theoretically. The two modesmerge at the “ultimate flooding” point (see for example pointF in Fig. 11a). The data shown in Fig. 11a correspond toq1 = 45 ± 1.5 ml/ min, �1 = 943.6 kg/m3, �2 = 919.7 kg/m3,�̃ = 1.47 and �1 = 3.32 × 10⁻³ kg/m/s. It is worth noting thatall the data are for laminar flow in both of the phases, with a flatand smooth interface. Therefore, possible effects of turbulence,interface curvature, interfacial waves and drop entrainment are
ARTICLE IN PRESSA. Ullmann et al. / Chemical Engineering Science 61 (2006) 3806–3817 3815
0.0
0.2
0.4
0.6
0.8
1.0
-10.0 -8.0 -6.0 -4.0 -2.0 0.0 2.0 4.0
1/X2
hold
up
Y/X2=50
LPF
MTF
µ1/µ2=1.47
µ1/µ2=1.9
β=30°
β=5.5°
experiments
F
0.00
0.20
0.40
0.60
0.80
1.00
0.00 0.20 0.40 0.60 0.80 1.00
LPF
Cal
cula
ted
(a) (b)
Fig. 11. (a) Comparison of the MTF model predictions for the holdup with the LPF solution (� = 30◦ and �̃ = 1.47). Experimental data correspond toq1 = 45 ± 1.5 ml/ min, �1 = 943.6 kg/m3, �2 = 919.7 kg/m3, �̃ = 1.47 and �1 = 3.32 × 10⁻³ kg/m/s and (b) comparison of the LPF solution for the holdupwith the results of the MTF model, for � = 5.5◦ and �̃ = 1.9.
0.0
0.2
0.4
0.6
0.8
1.0
0.0 0.2 0.4 0.6 0.8 1.0q1/(q1+q2)
ε1=
V1/
(V1+
V2)
NI ModelExperiment
Average Properties:
∆ρinlet=28.6 [kg/m3] ρ1=951 [kg/m3] µ1/µ2=1.48µ1=0.00348 [kg/m/sec]α1=0.00021,α2=0.00108 [1/°C] ∆T=20°C
Fig. 12. Calculated and experimental results of the phase volume fractions inthe mixer �1, as a function of the inlet streams flow rate fraction q1/(q1 +q2).
ruled out. The figure demonstrates the favorable agreement be-tween the data and results of both the LPF exact solution andMTF model. The good agreement between the exact LPF so-lution and the MTF model is also demonstrated by the resultsin Fig. 11b. The points in Fig. 11b correspond to various flowrates, similar to those used in the experiments, in a slightly in-clined pipe (�=5.5◦, similar to the inclination of the settlers inthe PTE column) and �̃ = 1.9. As the MTF model predictionspractically match with the LPF exact solution, it can conve-niently replace the complicated LPF solution for predicting theflooding conditions.
The flooding conditions in the non-isothermal PTE columnare determined by the internal countercurrent streams in theHPDI or LPDII zones (see Fig. 8). These internal streams aredependent on the volume fraction in the mixer, which can beevaluated based on the NI model. Fig. 12 shows a comparison
0
0.5
1
1.5
2
0 0.2 0.4 0.6 0.8 1q1/(q1+q2)
Nor
mal
ized
Flo
w R
ates
q2II/(q1+q2) qMII/(q1+q2)
q2/(q1+q2) q1/(q1+q2)
Average Properties:
∆ρinlet=28.6 [kg/m3] ρ1=951 [kg/m3] µ1/µ2=1.48µ1=0.00348 [kg/m/sec]α1=0.00021,α2=0.00108 [1/°C]∆T=20°C
Fig. 13. Calculated flow rate variation of the internal streams at the uppersection of the lower settler as a function of the flow rates of the enterancestreams. The solid lines show the flow rates of the internal exit stream qMIIand the internal inlet q2II at the bottom of the mixer. The distances betweenthe solid and the dashed lines (qMII −q1)/(q1 −q2) and (q2II −q2)/(q1 −q2)
represents the back streams leaving and reentering the mixer.
between the calculated and experimental values of the volumefraction of the heavy phase in the mixer, �1, as a function ofthe inlet streams flow rate fraction q1/(q1 +q2). As shown, thepredicted values are generally in a good agreement with the ex-perimental data. Fig. 12 raises an interesting point related to theexistence of limiting values for the solvents volume fraction inthe mixer. These limiting values appear in Fig. 12 as minimumvalues for �1 when q1/(q1 + q2) → 0. The limiting values aremerely a result of the need for a density difference between themixer and the settler sections as a driving force for qMI andqMII streams (see also the discussion with reference to Fig. 9).
3816 A. Ullmann et al. / Chemical Engineering Science 61 (2006) 3806–3817
ARTICLE IN PRESS
0.0001
0.001
0.01
0.1
0.0001 0.001 0.01 0.11
|U2S|, Light phase (inlet/outlet) [m/sec]
|U1S
|, H
eavy
pha
se (i
nlet
/ out
let)
[m/s
ec]
LPDII
HPDI
HPD or LPD at the entrance and exit sections
∆ρinlet=40.9 [kg/m3]
ρ1=961 [kg/m3] µinlet=1.76
µ1=0.00355 [kg/m/sec]
α1=α2=0.0008 [1/°C]
Tsettler=20°C, ∆T=22°C
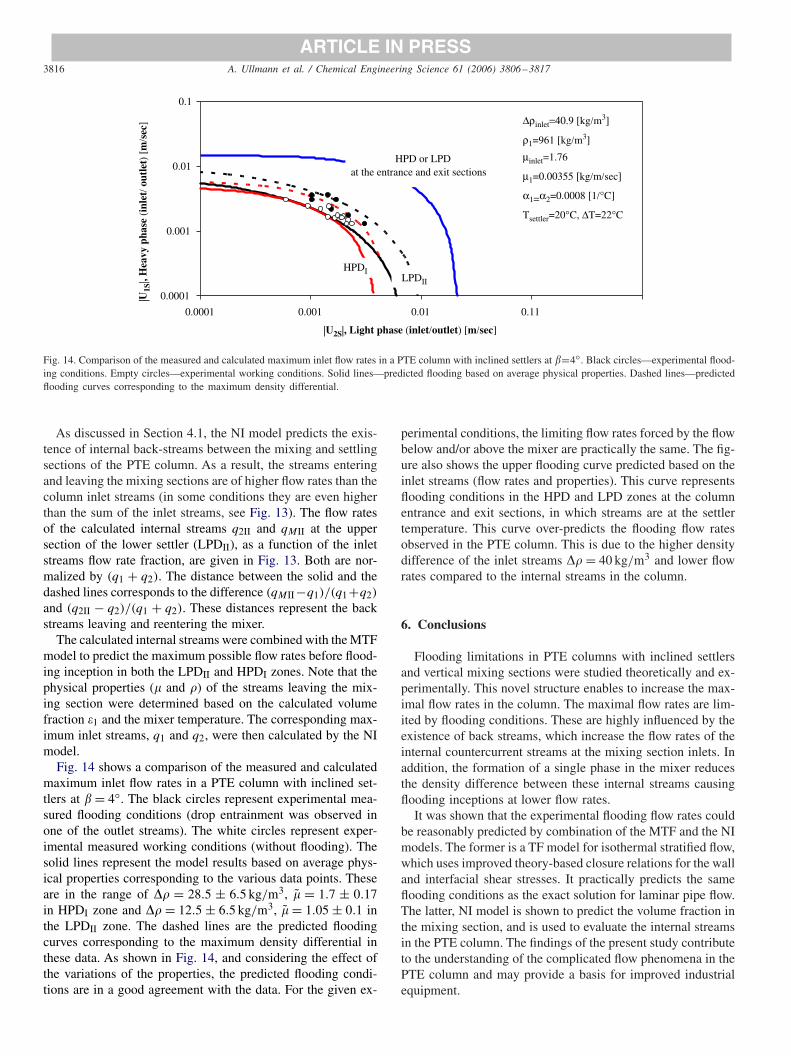
Fig. 14. Comparison of the measured and calculated maximum inlet flow rates in a PTE column with inclined settlers at �=4◦. Black circles—experimental flood-ing conditions. Empty circles—experimental working conditions. Solid lines—predicted flooding based on average physical properties. Dashed lines—predictedflooding curves corresponding to the maximum density differential.
As discussed in Section 4.1, the NI model predicts the exis-tence of internal back-streams between the mixing and settlingsections of the PTE column. As a result, the streams enteringand leaving the mixing sections are of higher flow rates than thecolumn inlet streams (in some conditions they are even higherthan the sum of the inlet streams, see Fig. 13). The flow ratesof the calculated internal streams q2II and qMII at the uppersection of the lower settler (LPDII), as a function of the inletstreams flow rate fraction, are given in Fig. 13. Both are nor-malized by (q1 + q2). The distance between the solid and thedashed lines corresponds to the difference (qMII−q1)/(q1+q2)
and (q2II − q2)/(q1 + q2). These distances represent the backstreams leaving and reentering the mixer.
The calculated internal streams were combined with the MTFmodel to predict the maximum possible flow rates before flood-ing inception in both the LPDII and HPDI zones. Note that thephysical properties (� and �) of the streams leaving the mix-ing section were determined based on the calculated volumefraction �1 and the mixer temperature. The corresponding max-imum inlet streams, q1 and q2, were then calculated by the NImodel.
Fig. 14 shows a comparison of the measured and calculatedmaximum inlet flow rates in a PTE column with inclined set-tlers at � = 4◦. The black circles represent experimental mea-sured flooding conditions (drop entrainment was observed inone of the outlet streams). The white circles represent exper-imental measured working conditions (without flooding). Thesolid lines represent the model results based on average phys-ical properties corresponding to the various data points. Theseare in the range of �� = 28.5 ± 6.5 kg/m3, �̃ = 1.7 ± 0.17in HPDI zone and �� = 12.5 ± 6.5 kg/m3, �̃ = 1.05 ± 0.1 inthe LPDII zone. The dashed lines are the predicted floodingcurves corresponding to the maximum density differential inthese data. As shown in Fig. 14, and considering the effect ofthe variations of the properties, the predicted flooding condi-tions are in a good agreement with the data. For the given ex-
perimental conditions, the limiting flow rates forced by the flowbelow and/or above the mixer are practically the same. The fig-ure also shows the upper flooding curve predicted based on theinlet streams (flow rates and properties). This curve representsflooding conditions in the HPD and LPD zones at the columnentrance and exit sections, in which streams are at the settlertemperature. This curve over-predicts the flooding flow ratesobserved in the PTE column. This is due to the higher densitydifference of the inlet streams �� = 40 kg/m3 and lower flowrates compared to the internal streams in the column.
6. Conclusions
Flooding limitations in PTE columns with inclined settlersand vertical mixing sections were studied theoretically and ex-perimentally. This novel structure enables to increase the max-imal flow rates in the column. The maximal flow rates are lim-ited by flooding conditions. These are highly influenced by theexistence of back streams, which increase the flow rates of theinternal countercurrent streams at the mixing section inlets. Inaddition, the formation of a single phase in the mixer reducesthe density difference between these internal streams causingflooding inceptions at lower flow rates.
It was shown that the experimental flooding flow rates couldbe reasonably predicted by combination of the MTF and the NImodels. The former is a TF model for isothermal stratified flow,which uses improved theory-based closure relations for the walland interfacial shear stresses. It practically predicts the sameflooding conditions as the exact solution for laminar pipe flow.The latter, NI model is shown to predict the volume fraction inthe mixing section, and is used to evaluate the internal streamsin the PTE column. The findings of the present study contributeto the understanding of the complicated flow phenomena in thePTE column and may provide a basis for improved industrialequipment.
ARTICLE IN PRESSA. Ullmann et al. / Chemical Engineering Science 61 (2006) 3806–3817 3817
References
Lo, T.C., Baird, M.H.I., Hanson, C., 1983. Handbook of Solvent Extraction.Wiley-International.
Taitel, Y., Dukler, A.E., 1976. A model for predicting flow regime transitionsin horizontal and near horizontal gas–liquid flow. A.I.Ch.E. Journal 22,47–55.
Treybal, R.E., 1963. Liquid Extraction. second ed. McGraw-Hill, New York.Ullmann, A., Ludmer, Z., Shinnar, R., 1995. Phase transition extraction using
solvent mixtures with a critical point of miscibility. A.I.Ch.E. Journal 41(3), 488–500.
Ullmann, A., Ludmer, Z., Shinnar, R., 1997. Novel continuous multistageextraction column based on phase transition of critical-solution mixtures.Chemical Engineering Science 52 (4), 567–581.
Ullmann, A., Zamir, M., Ludmer, Z., Brauner, N., 2001, Flow pattern andflooding mechanisms in liquis liquid countercurrent flow in inclined tubes.Proceedings of the Third ICMF New Orleans.
Ullmann, A., Zamir, M., Ludmer, Z., Brauner, N., 2003. Stratified laminarcountercurrent flow of two liquid phases in inclined tube. InternationalJournal of Multiphase flow 29, 1583–1604.
Ullmann, A., Goldstein, A., Zamir, M., Brauner, N., 2004. Closure relationsfor the shear stresses in two-fluid models for laminar stratified flow.International Journal of Multiphase Flow 30 (7–8), 877–900.
Zamir, M., 2003. An investigation into the flow phenomena in inclined phasetransition, extraction (PTE) columns based on solvent mixtures with acritical point of miscibility. Ph.D. Thesis, Faculty of Engineering, Tel-AvivUniversity, Israel, 2003.
Top Related
Copyright © 2022 FDOKUMEN

