


Bahasa
Halaman
Hukum

Farmworker Children’s Residential Non-Dietary ExposureEstimates from Micro-Level Activity Time Series
PALOMA I. BEAMERa,*, ROBERT A. CANALESb, ASA BRADMANc, and JAMES O. LECKIEdaCommunity, Environment and Policy, Mel and Enid Zuckerman College of Public Health, Universityof Arizona, Tucson, Arizona, USAbDepartment of Natural Sciences and Math, Eugene Lang College, The New School, New York,New York, USAcCenter for Children’s Environmental Health Research, School of Public Health, University ofCalifornia Berkeley, Berkeley, California, USAdExposure Research Group, Department of Civil and Environmental Engineering, StanfordUniversity, Stanford, California, USA
AbstractFarmworkers’ children may have increased pesticide exposure through dermal absorption and non-dietary ingestion, routes that are difficult to measure and model. The Cumulative AggregateSimulation of Exposure (CASE) model, integrates the complexity of human behavior and variabilityof exposure processes by combining micro-level activity time series (MLATS) and mechanisticexposure equations. CASE was used to estimate residential non-dietary organophosphate pesticideexposure (i.e., inhalation, dermal, and non-dietary ingestion) to California farmworker children andevaluate the micro-activity approach. MLATS collected from children and distributions developedfrom pesticide measurements in farmworkers’ residences served as inputs. While estimated diazinonexposure was greater for inhalation, chlorpyrifos exposure was greater for the other routes. Greatervariability existed between children ( ) than within each child’s simulations( ) for dermal and non-dietary ingestion. Dermal exposure simulations were notsignificantly different than measured values from dosimeters worn by the children. Non-dietaryingestion exposure estimates were comparable to duplicate diet measurements, indicating this routemay contribute substantially to aggregate exposure. The results suggest the importance of the micro-activity approach for estimating non-dietary exposure. Other methods may underestimate exposurevia these routes. Model simulations can be used to identify at-risk children and target interventionstrategies.
KeywordsDermal exposure; Non-dietary ingestion exposure; Children; Exposure assessment; Farmworkers;Pesticides; Chlorpyrifos; Diazinon; Organophosphate; Time series; Micro-activity approach
© 2009 Elsevier Ltd. All rights reserved.*Corresponding Author: Paloma I. Beamer, 1295 N. Martin Avenue, P.O. Box 245210, Tucson, AZ 85724. Telephone: 1-520-626-0006;Fax: 1-520-626-8009; [email protected]'s Disclaimer: This is a PDF file of an unedited manuscript that has been accepted for publication. As a service to our customerswe are providing this early version of the manuscript. The manuscript will undergo copyediting, typesetting, and review of the resultingproof before it is published in its final citable form. Please note that during the production process errors may be discovered which couldaffect the content, and all legal disclaimers that apply to the journal pertain.
NIH Public AccessAuthor ManuscriptEnviron Int. Author manuscript; available in PMC 2010 November 1.
Published in final edited form as:Environ Int. 2009 November ; 35(8): 1202–1209. doi:10.1016/j.envint.2009.08.003.
NIH
-PA Author Manuscript
NIH
-PA Author Manuscript
NIH
-PA Author Manuscript
IntroductionThe Food Quality Protection Act (FQPA) of 1996 requires the United States EnvironmentalProtection Agency (US EPA) set pesticide food tolerances accounting for aggregate (multipleroute) and cumulative (multiple chemicals exhibiting a common mechanism of toxicity)exposures through drinking water, dietary and non-dietary pathways with an emphasis onchildren. Compared to adults, young children are more susceptible to pesticide exposure dueto their unique activities and physiological characteristics. They more frequently mouth theirhands and objects and spend more time playing and crawling on the floor, which may lead toincreased non-dietary exposure to contaminants (Goldman, 1998; Lewis et al., 1994; Tulve etal., 2002; Zartarian et al., 1998). Physiologically, young children are more susceptible toadverse health effects due to their developing organs, nervous and immune systems, low bodyweights and high exertion levels (Crom, 1994; Milsap and Jusko, 1994). Farmworkers’ childrenmay have higher levels of pesticides in their residential environments compared to childrenfrom non-agricultural families, which may be due to aerosol drift or occupational take-homecontamination on clothing, shoes or skin (Arcury et al., 2006; Bradman et al., 2007; Bradmanet al., 1997; Curl et al., 2002; Eskenazi et al., 1999; Fenske et al., 2005; Fenske, 1997; Fenskeet al., 2000b; Fenske et al., 2002; Lambert et al., 2005; McCauley et al., 2001; Petchuay et al.,2006; Simcox et al., 1995).
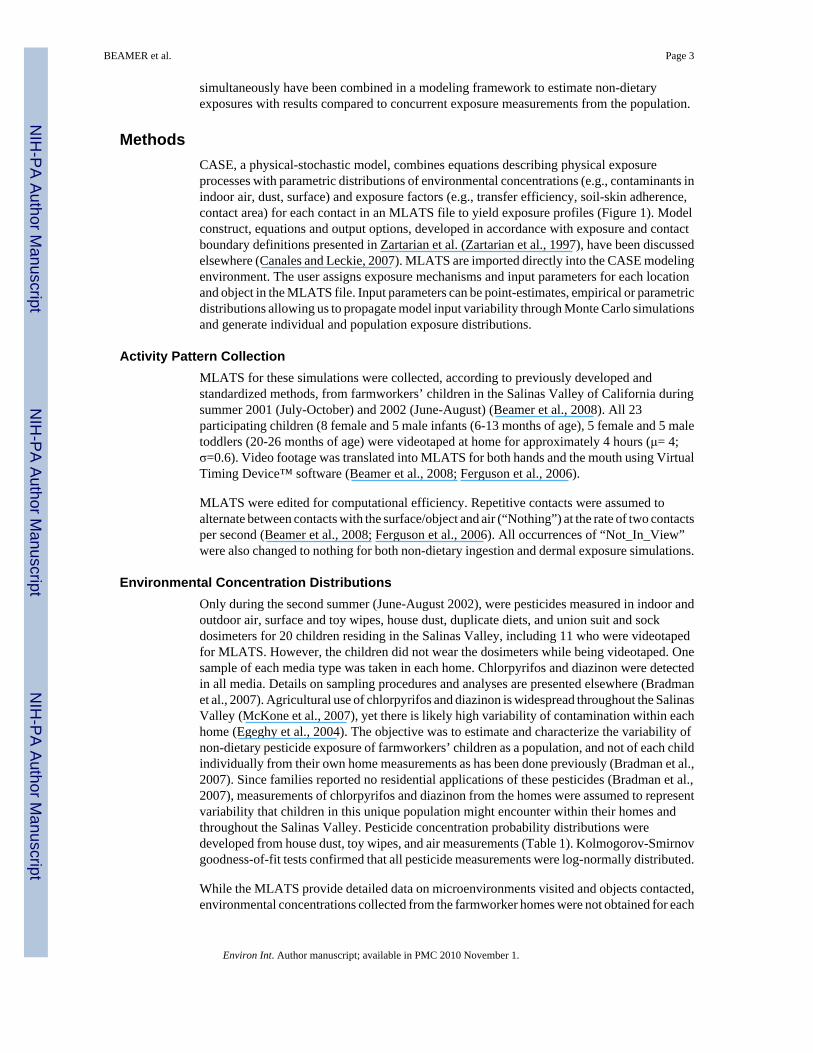
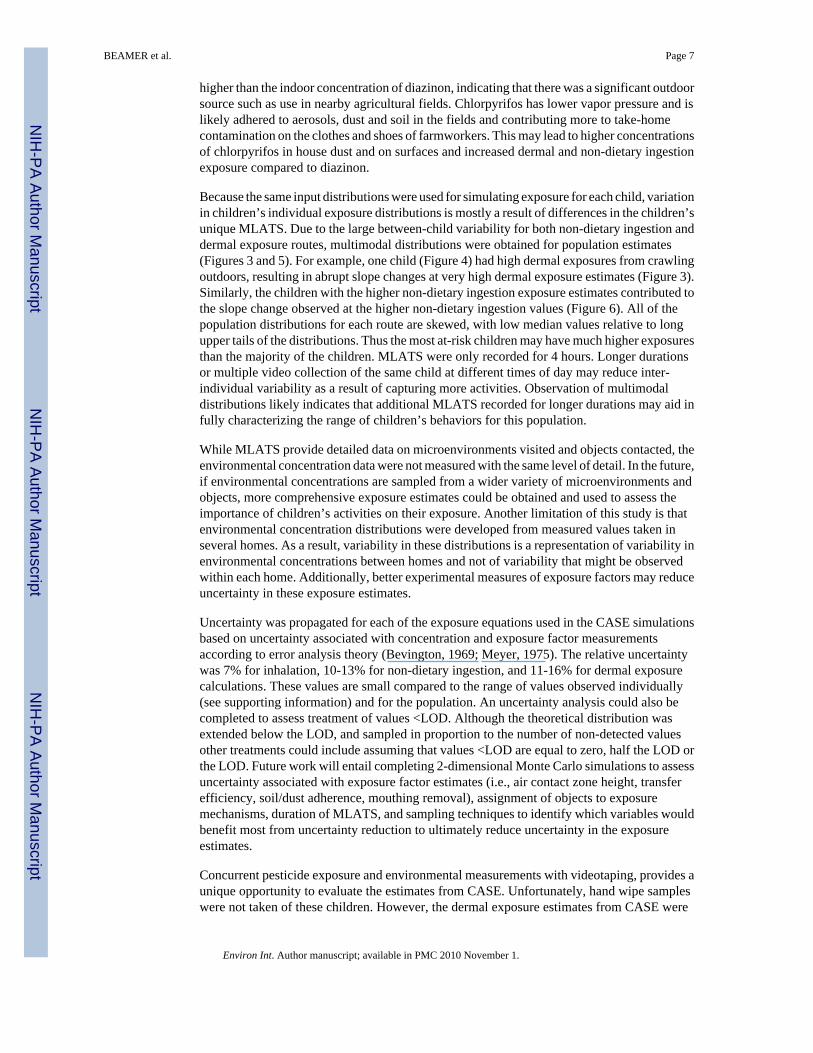
In response to the FQPA, US EPA identified dermal and non-dietary ingestion exposureassessments as high priorities (Cohen Hubal et al., 2000). These exposure routes are difficultto measure due to complex human behavior and exposure mechanisms (Fenske, 1993; VanHemmen and Brouwer, 1995; Zartarian and Leckie, 1998) and modeling requires detailedmouthing and dermal contact activity data. Videotaping methods to obtain micro-activity data(Ferguson et al., 2006; Zartarian et al., 1997) and the Cumulative Aggregate Simulation ofExposure (CASE) model that utilizes this data to estimate non-dietary exposure have beenpreviously developed (Canales and Leckie, 2007). Specifically, micro-level activity time series(MLATS) preserve the sequence of contact events and locations visited by a child, providingthe basis for CASE calculations (Figure 1). Each line of a MLATS file represents a new mouthor hand contact with an object and is assigned an exposure mechanism corresponding to aspecific equation in CASE (i.e., air immersion, liquid immersion, residue contact, soil/dustadherence, aerosol deposition, and removal) (Canales and Leckie, 2007). Incorporation ofmicro-activity data and multiple exposure mechanisms into CASE allows for a more detailedrepresentation of dermal and non-dietary ingestion exposure not possible from other forms ofactivity data (Cohen Hubal et al., 2000; Tulve et al., 2002). Stochastic inputs and Monte Carlosimulations can yield estimates of individual and population exposure distributions. Bypreserving the sequence of loading and removal actions in MLATS, resulting exposure profilesfrom model simulations can highlight which micro-activities lead to significant exposures andaid development of intervention strategies.
The goal of this paper is a methodological evaluation of the micro-activity approach by usingCASE to estimate residential exposure to the organophosphate pesticides chlorpyrifos anddiazinon for a population of farmworkers’ children in the Salinas Valley of California. Thesepesticides were chosen because of their historical residential and continuing agricultural use,common mechanism of toxicity (inhibition of acetylcholinesterase and developmentalneurotoxicity), prevalence in residential environments and density of available literature datanecessary to provide model input parameters (Bradman et al., 2007; Morgan et al., 2005; Panget al., 2002; Rudel et al., 2003; Slotkin and Seidler, 2007). MLATS collected from the children(n=23) in conjunction with residential pesticide concentrations measured in farmworkerresidences (n=20) served as inputs (Beamer et al., 2008; Bradman et al., 2007). This workprovides an evaluation of the micro-activity approach and is the first published example in thepeer-reviewed literature that micro-activity data and environmental measurements collected
BEAMER et al. Page 2
Environ Int. Author manuscript; available in PMC 2010 November 1.
NIH
-PA Author Manuscript
NIH
-PA Author Manuscript
NIH
-PA Author Manuscript
simultaneously have been combined in a modeling framework to estimate non-dietaryexposures with results compared to concurrent exposure measurements from the population.
MethodsCASE, a physical-stochastic model, combines equations describing physical exposureprocesses with parametric distributions of environmental concentrations (e.g., contaminants inindoor air, dust, surface) and exposure factors (e.g., transfer efficiency, soil-skin adherence,contact area) for each contact in an MLATS file to yield exposure profiles (Figure 1). Modelconstruct, equations and output options, developed in accordance with exposure and contactboundary definitions presented in Zartarian et al. (Zartarian et al., 1997), have been discussedelsewhere (Canales and Leckie, 2007). MLATS are imported directly into the CASE modelingenvironment. The user assigns exposure mechanisms and input parameters for each locationand object in the MLATS file. Input parameters can be point-estimates, empirical or parametricdistributions allowing us to propagate model input variability through Monte Carlo simulationsand generate individual and population exposure distributions.
Activity Pattern CollectionMLATS for these simulations were collected, according to previously developed andstandardized methods, from farmworkers’ children in the Salinas Valley of California duringsummer 2001 (July-October) and 2002 (June-August) (Beamer et al., 2008). All 23participating children (8 female and 5 male infants (6-13 months of age), 5 female and 5 maletoddlers (20-26 months of age) were videotaped at home for approximately 4 hours (μ= 4;σ=0.6). Video footage was translated into MLATS for both hands and the mouth using VirtualTiming Device™ software (Beamer et al., 2008; Ferguson et al., 2006).
MLATS were edited for computational efficiency. Repetitive contacts were assumed toalternate between contacts with the surface/object and air (“Nothing”) at the rate of two contactsper second (Beamer et al., 2008; Ferguson et al., 2006). All occurrences of “Not_In_View”were also changed to nothing for both non-dietary ingestion and dermal exposure simulations.
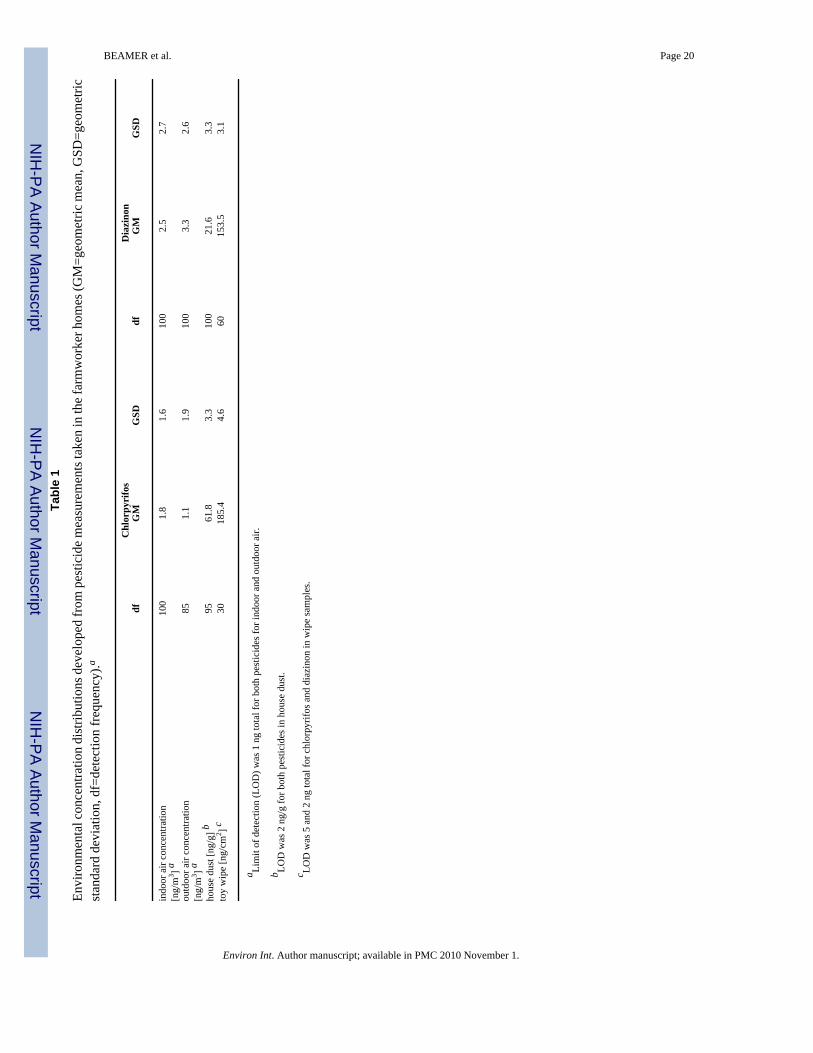
Environmental Concentration DistributionsOnly during the second summer (June-August 2002), were pesticides measured in indoor andoutdoor air, surface and toy wipes, house dust, duplicate diets, and union suit and sockdosimeters for 20 children residing in the Salinas Valley, including 11 who were videotapedfor MLATS. However, the children did not wear the dosimeters while being videotaped. Onesample of each media type was taken in each home. Chlorpyrifos and diazinon were detectedin all media. Details on sampling procedures and analyses are presented elsewhere (Bradmanet al., 2007). Agricultural use of chlorpyrifos and diazinon is widespread throughout the SalinasValley (McKone et al., 2007), yet there is likely high variability of contamination within eachhome (Egeghy et al., 2004). The objective was to estimate and characterize the variability ofnon-dietary pesticide exposure of farmworkers’ children as a population, and not of each childindividually from their own home measurements as has been done previously (Bradman et al.,2007). Since families reported no residential applications of these pesticides (Bradman et al.,2007), measurements of chlorpyrifos and diazinon from the homes were assumed to representvariability that children in this unique population might encounter within their homes andthroughout the Salinas Valley. Pesticide concentration probability distributions weredeveloped from house dust, toy wipes, and air measurements (Table 1). Kolmogorov-Smirnovgoodness-of-fit tests confirmed that all pesticide measurements were log-normally distributed.
While the MLATS provide detailed data on microenvironments visited and objects contacted,environmental concentrations collected from the farmworker homes were not obtained for each
BEAMER et al. Page 3
Environ Int. Author manuscript; available in PMC 2010 November 1.
NIH
-PA Author Manuscript
NIH
-PA Author Manuscript
NIH
-PA Author Manuscript
of the unique microenvironments or objects. Therefore, several assumptions were made inselecting the distributions for location and object concentrations. The 9 unique locationcategories visited by the children were grouped into indoor (bathroom, bedroom, kitchen, andliving room/den) and outdoor (garage, patio, street/sidewalk, vehicle, and yard) locations.Distributions for object/surface concentrations were assigned according to the exposuremechanism and are described in the next section.
Assignment of Exposure MechanismsBecause none of the families reported directly applying pesticides in their homes, it wasassumed that the predominant pathways of residential contamination would be aerosol driftfrom agriculture and occupational take-home contamination on the parents’ clothing, shoes orskin (Bradman et al., 1997; Eskenazi et al., 1999; Fenske et al., 2000a; Fenske et al., 2002).Most likely, pesticides in homes would be adhered to soil or dust rather than as direct residues.Therefore, the majority of objects were assigned to the soil/dust adherence mechanism andhouse dust concentration distributions (Table 1) were used for contaminant loading. Theseobjects are: animal, floors, dirt, toys, footwear, paper, vegetation, fabric, metal, rock/brick andplastic surfaces.
Wipes were taken from toys given to the children by researchers that had been in the housesfor only a few days (Bradman et al., 2007). Wipes were assumed to represent contaminantloading for surfaces that are cleaned more frequently (i.e., food containers, body, head, clothes,and towel/washcloth). These objects, along with hands when assessing non-dietary ingestionexposure, were assigned to the residue transfer mechanism. Hand concentration values forhand-to-mouth contacts were sampled from each child’s unique empirical dermal loadingdistribution from left and right hand simulations.
Concentration distributions were developed by excluding samples below the limit of detection(LOD). However, the CASE framework samples from the lower tail of the distributionextending below the LOD according to the proportion of the original non-detectable values.Chlorpyrifos was only detected in 35% of the toy wipes. To avoid bias in distributiondevelopment, non-detectable observations were replaced with random numbers between 0 andthe limit of detection prior to distribution development.
Hand or mouth contacts with food were assumed to result in no non-dietary residentialexposure. Hand contacts with “Nothing” were assigned to the air immersion mechanism fordermal exposure simulations with air concentration corresponding to the currentmicroenvironment. Hand contacts with the mouth and water were assumed to result in areduction in dermal exposure through the removal mechanism.
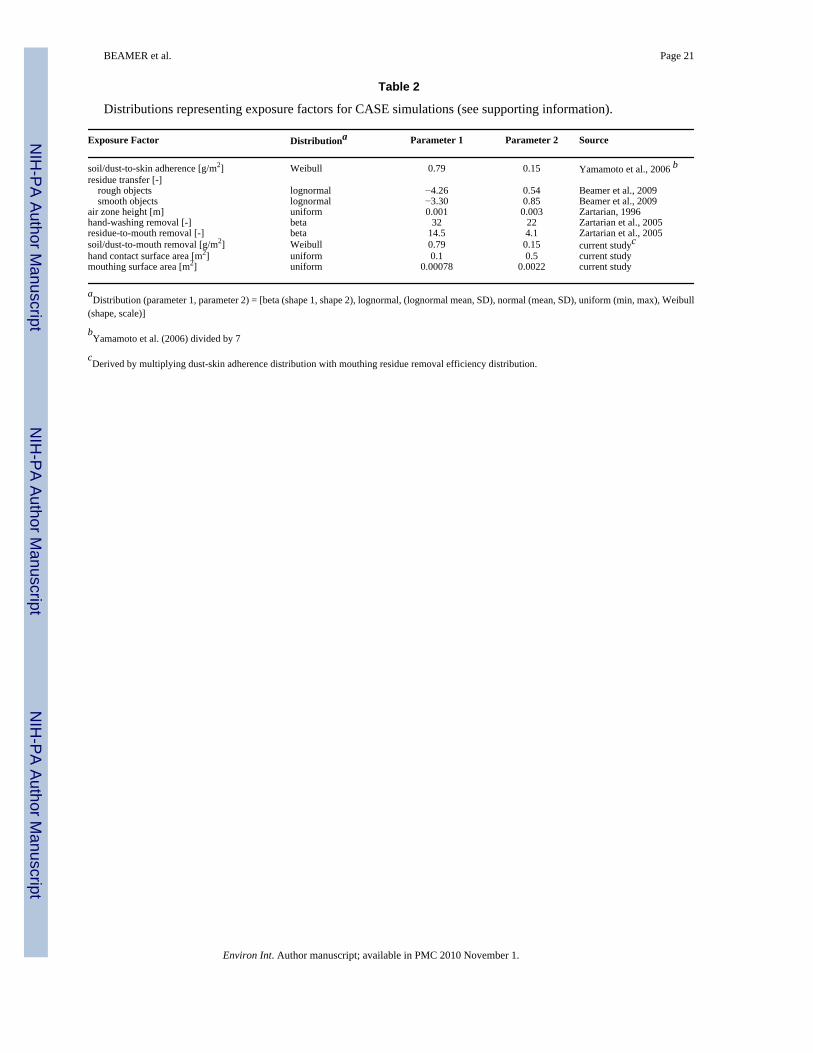
Exposure Factor DistributionsExposure factor values (Table 2) were obtained from relevant experimental data in theliterature, assumed, or derived from related experimental data (Beamer et al., 2009;Yamamotoet al., 2006;Zartarian et al., 2005;Zartarian, 1996). Exposure factors were assumed to bepesticide-independent. Lognormal probability distributions for dermal residue transferefficiency were developed for chlorpyrifos from carpet, vinyl and foil surfaces previously(Beamer et al., 2009). Dermal residue transfer efficiency from carpets was assumed to representtextured surfaces (i.e., head, hands, and body), while the distribution for vinyl could be usedto represent smooth surfaces (food container).
Studies have demonstrated that particles adhered to hands are generally < 63 μm in size (Choateet al., 2006; Yamamoto et al., 2006), thus the same distribution was used for soil and dustadherence. Yamamoto et al. (2006) present a distribution for soil/dust adhered to children’s
BEAMER et al. Page 4
Environ Int. Author manuscript; available in PMC 2010 November 1.
NIH
-PA Author Manuscript
NIH
-PA Author Manuscript
NIH
-PA Author Manuscript
hands following playing. Cohen Hubal et al. (2005) report that there is negligible transfer after7 hand contacts. Therefore, the values presented by Yamamoto et al. (2006) were divided by7 to develop the soil/dust adherence distribution for individual contacts.
The air contact zone height is a necessary parameter for estimation of dermal exposure fromair immersion. It is defined as the height in which any molecule has a 100% probability ofintersecting the skin contact boundary in the specified time interval (Zartarian, 1996; Zartarianet al., 1997). Based on dermal contact times of 5-50 seconds with “Nothing” from an earliervideotape translation study of farmworker children (Zartarian et al., 1997) and a diffusivity of0.01 cm2/sec for gases in air (Cussler, 1984; Schwarzenbach et al., 1993), Zartarian (1996)estimated a range of 1-3 cm for the air contact zone height using film theory, penetration theoryand surface renewal theory. As not much information is known on this parameter, a uniformdistribution was assumed for this parameter, bound by the range calculated above.
Distributions of mouthing removal of residues and removal by washing hands were obtainedfrom Zartarian et al., (2005). Data for mouthing removal of dust/soil from hands and/or objectsare scarce (Canales, 2004). These values are different from the unitless mouthing removal ofresidues, because they have units of mass per area, similar to dust-to-skin adherence. The dustadherence distribution (Yamamoto et al., 2006) was multiplied by the mouthing removaldistribution (Zartarian et al., 2005) using a Monte Carlo simulation to construct a distributionfor mouthing removal of dust/soil.
Data is scarce for the contact-specific surface area for each mechanism. A uniform distributionof 0.1 to 0.5 was assumed for fractional surface area for hand contacts with all objects includingthe mouth, based on experience with translating MLATS from a study of suburban childrenfor surface area (Ferguson et al., 2006). This represents that either the front or back of the handis in contact with an object, and this contact can range from a full hand press to just contactwith the finger tips. Mouthing contact-specific surface area data for adults were obtained(Leckie et al., 2000) that were adjusted for children using allometric methods (O’Flaherty,1994).
Aggregate Cumulative Exposure Simulations and Data AnalysisCASE was used to estimate farmworkers’ children residential exposure to chlorpyrifos anddiazinon simultaneously. Monte Carlo simulations were conducted, using input distributionsrepresenting exposure factors and environmental concentrations for chlorpryrifos and diazinon,for each MLATS file to obtain individual exposure distributions for each route. To achievestability in results, 5,000 simulations were completed for each child, resulting in 115,000unique exposure scenarios that were combined to obtain population exposure distributions(Figure 1). MLATS files for mouthing behavior were utilized to estimate hourly non-dietaryingestion and temporally-averaged inhalation exposure, while hand-specific temporally-averaged dermal exposure was estimated from left and right hand MLATS individually.Although person-oriented simulations were not completed where each child’s exposures wereonly calculated based on the environmental measurements from their own homes, thevariability within and between the simulations for each child was examined to understand therole of environmental concentrations and MLATS in the overall variability observed in thepopulation. Within-individual variance and between-individual variance were calculated usinglog transformed values according to Rappaport (Rappaport, 2000). The exposure simulationswere tested for differences between age groups (i.e., infants and toddlers) and gender using theWilcoxon rank sum test.
BEAMER et al. Page 5
Environ Int. Author manuscript; available in PMC 2010 November 1.
NIH
-PA Author Manuscript
NIH
-PA Author Manuscript
NIH
-PA Author Manuscript
ResultsInhalation Exposure
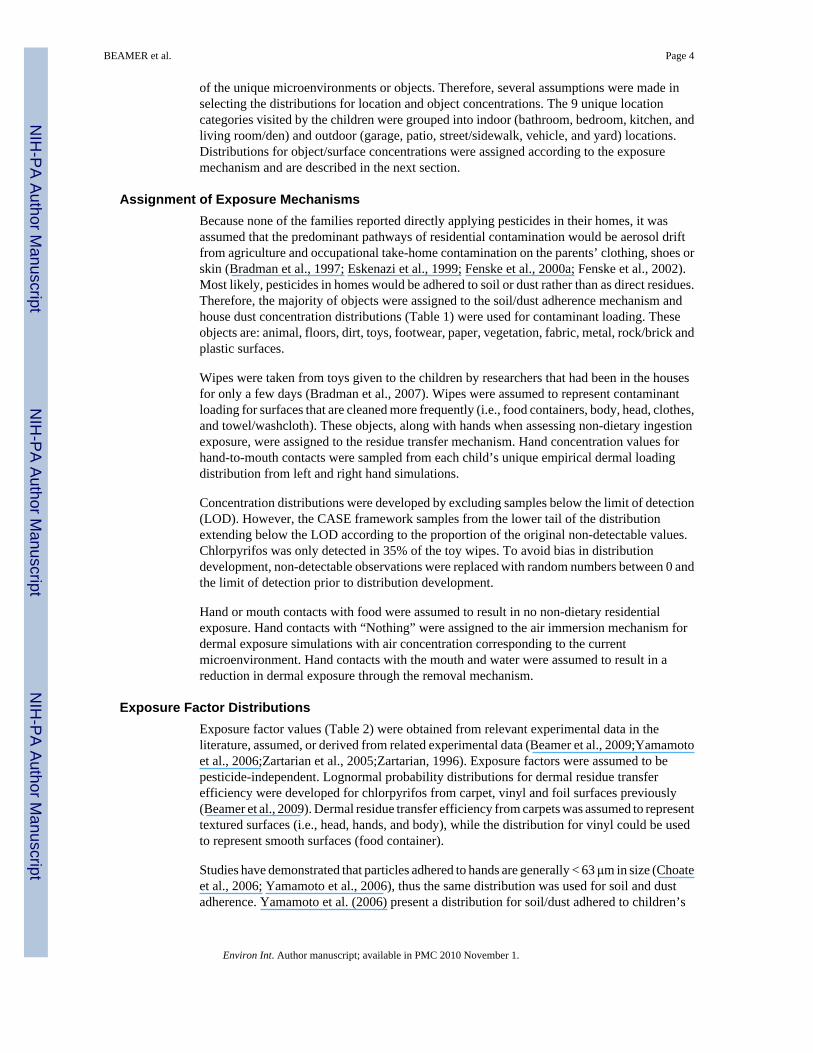
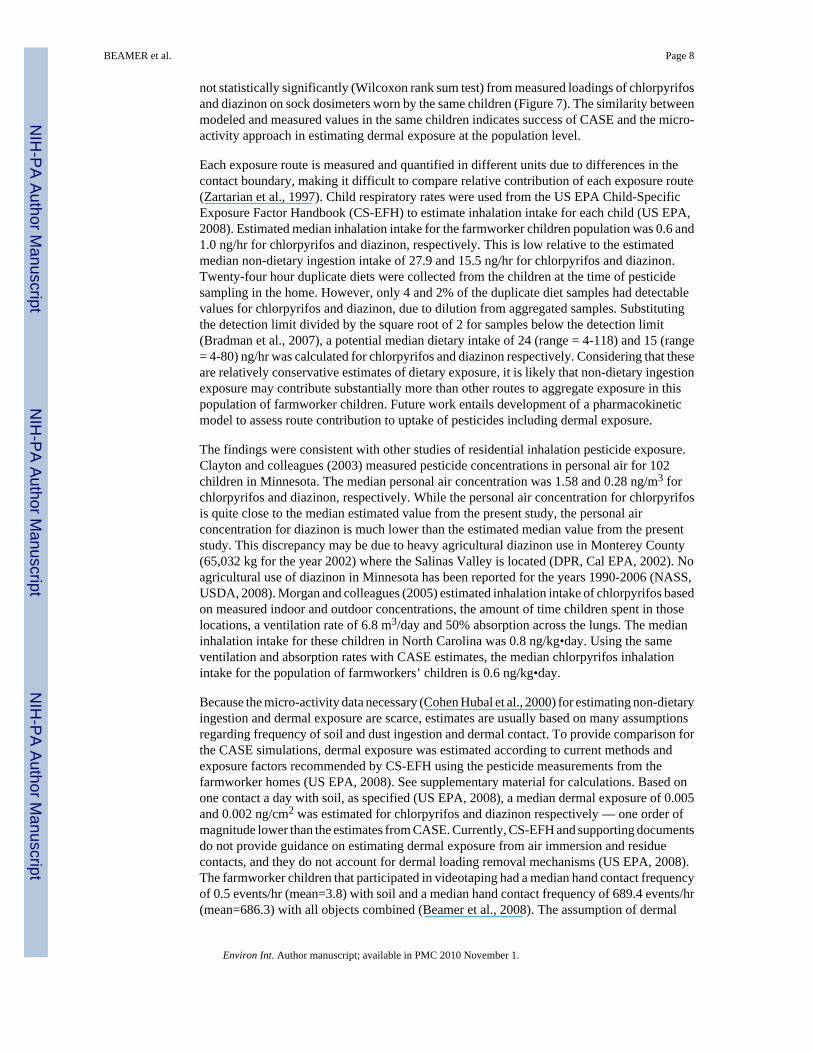
Temporally-averaged inhalation exposure estimates for the farmworkers’ children populationare depicted in Figure 2. Median estimated inhalation exposure for the population was 1.8 and4.0 ng/m3 for chlorpyrifos and diazinon, respectively. Within-child variability( ) was higher than between-child variability ( ). Seesupplementary material for complete results.
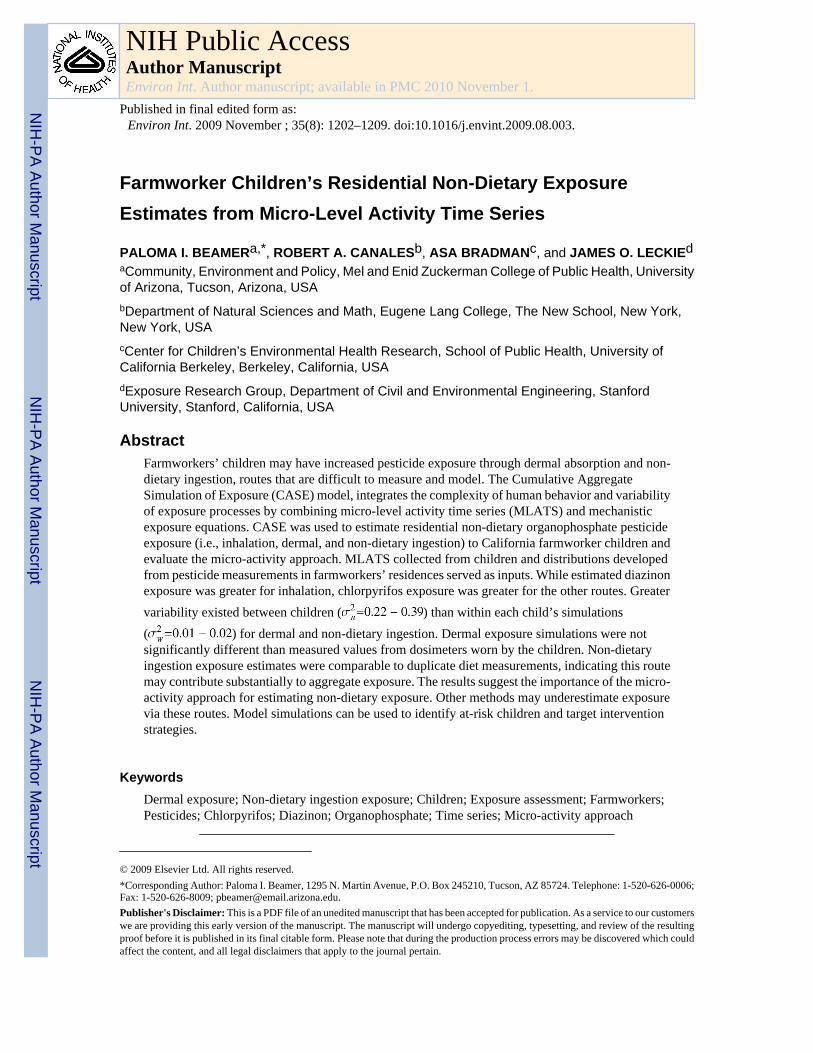
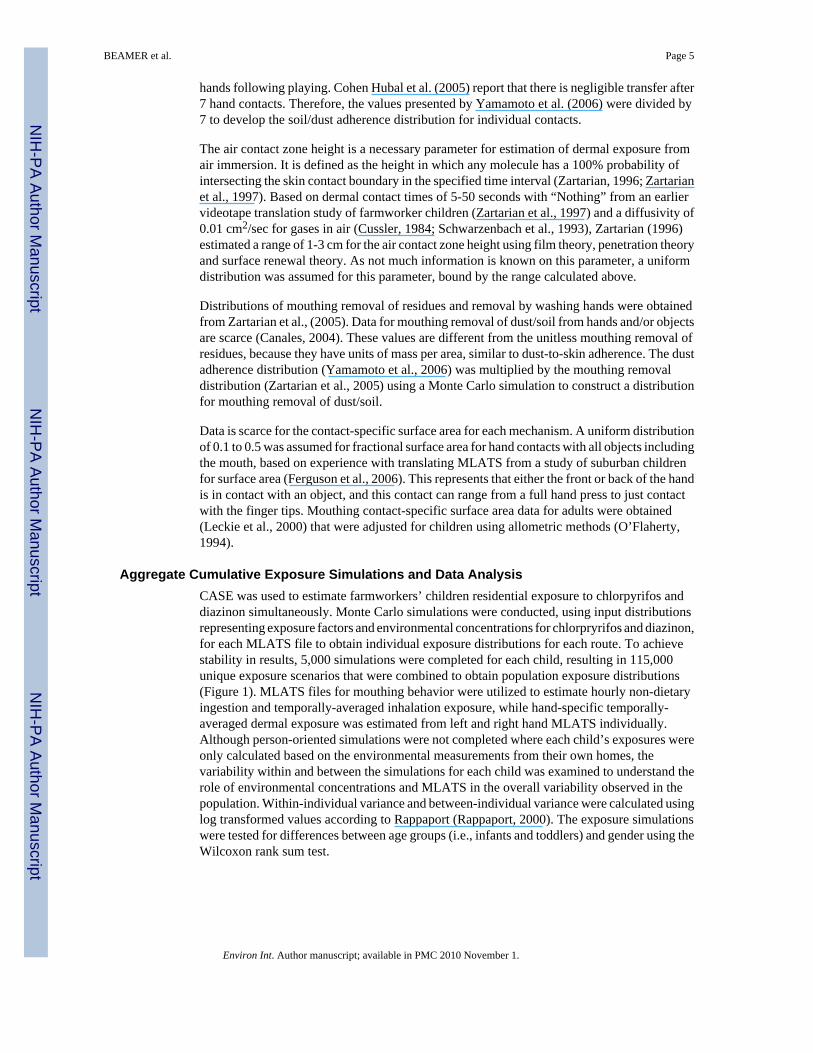
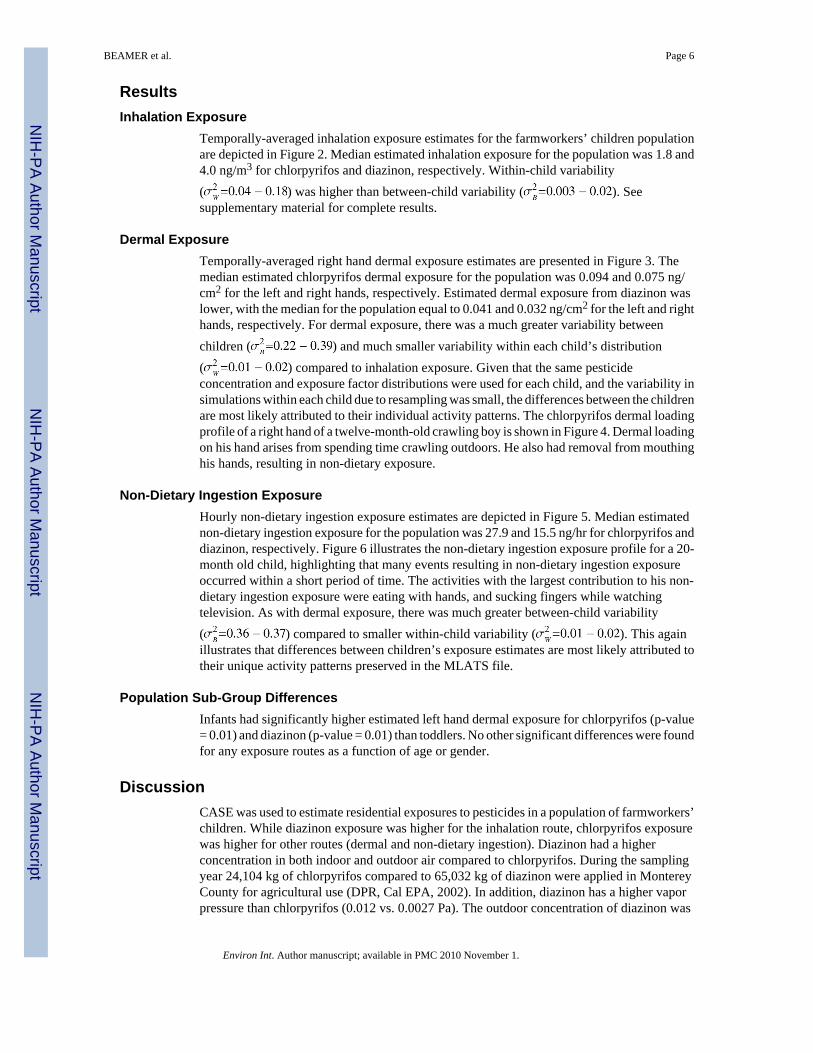
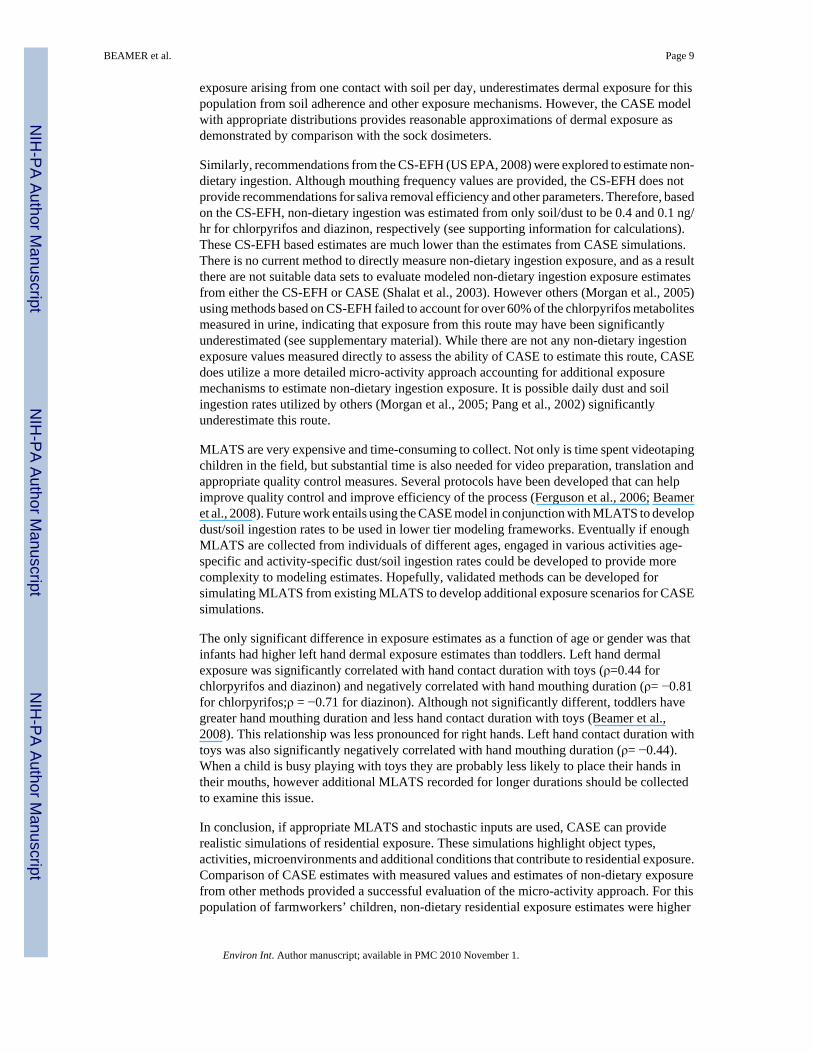
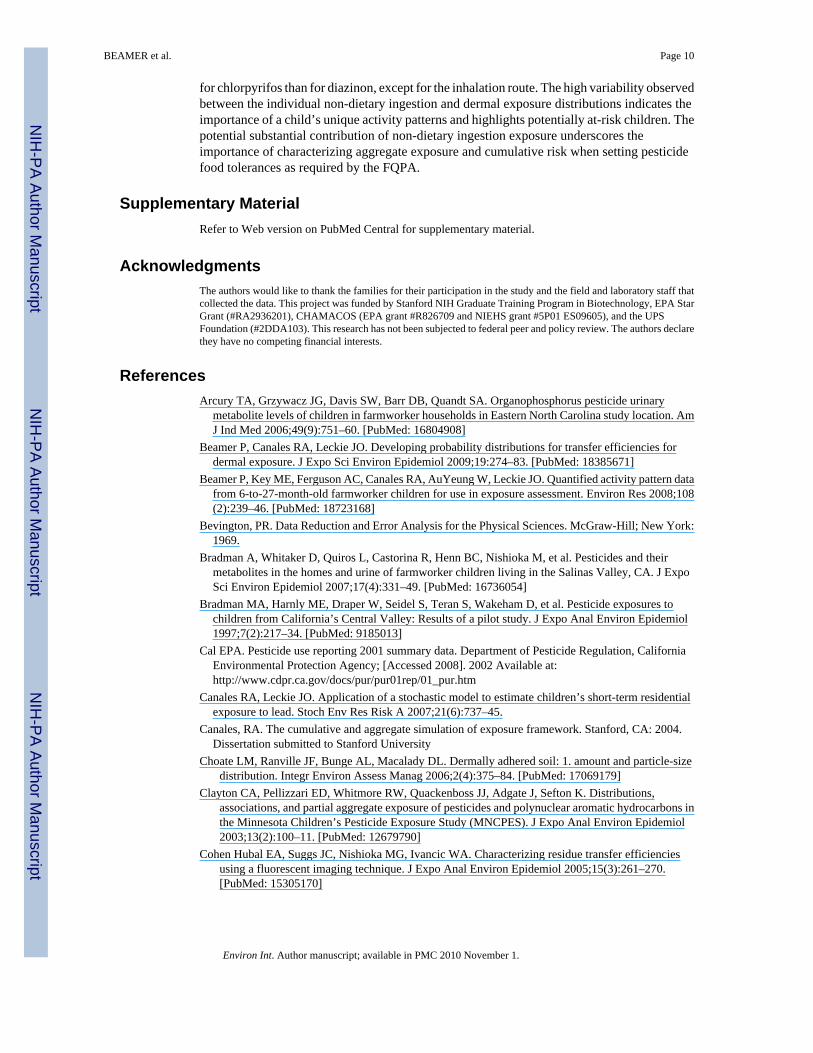
Dermal ExposureTemporally-averaged right hand dermal exposure estimates are presented in Figure 3. Themedian estimated chlorpyrifos dermal exposure for the population was 0.094 and 0.075 ng/cm2 for the left and right hands, respectively. Estimated dermal exposure from diazinon waslower, with the median for the population equal to 0.041 and 0.032 ng/cm2 for the left and righthands, respectively. For dermal exposure, there was a much greater variability betweenchildren ( ) and much smaller variability within each child’s distribution( ) compared to inhalation exposure. Given that the same pesticideconcentration and exposure factor distributions were used for each child, and the variability insimulations within each child due to resampling was small, the differences between the childrenare most likely attributed to their individual activity patterns. The chlorpyrifos dermal loadingprofile of a right hand of a twelve-month-old crawling boy is shown in Figure 4. Dermal loadingon his hand arises from spending time crawling outdoors. He also had removal from mouthinghis hands, resulting in non-dietary exposure.
Non-Dietary Ingestion ExposureHourly non-dietary ingestion exposure estimates are depicted in Figure 5. Median estimatednon-dietary ingestion exposure for the population was 27.9 and 15.5 ng/hr for chlorpyrifos anddiazinon, respectively. Figure 6 illustrates the non-dietary ingestion exposure profile for a 20-month old child, highlighting that many events resulting in non-dietary ingestion exposureoccurred within a short period of time. The activities with the largest contribution to his non-dietary ingestion exposure were eating with hands, and sucking fingers while watchingtelevision. As with dermal exposure, there was much greater between-child variability( ) compared to smaller within-child variability ( ). This againillustrates that differences between children’s exposure estimates are most likely attributed totheir unique activity patterns preserved in the MLATS file.
Population Sub-Group DifferencesInfants had significantly higher estimated left hand dermal exposure for chlorpyrifos (p-value= 0.01) and diazinon (p-value = 0.01) than toddlers. No other significant differences were foundfor any exposure routes as a function of age or gender.
DiscussionCASE was used to estimate residential exposures to pesticides in a population of farmworkers’children. While diazinon exposure was higher for the inhalation route, chlorpyrifos exposurewas higher for other routes (dermal and non-dietary ingestion). Diazinon had a higherconcentration in both indoor and outdoor air compared to chlorpyrifos. During the samplingyear 24,104 kg of chlorpyrifos compared to 65,032 kg of diazinon were applied in MontereyCounty for agricultural use (DPR, Cal EPA, 2002). In addition, diazinon has a higher vaporpressure than chlorpyrifos (0.012 vs. 0.0027 Pa). The outdoor concentration of diazinon was
BEAMER et al. Page 6
Environ Int. Author manuscript; available in PMC 2010 November 1.
NIH
-PA Author Manuscript
NIH
-PA Author Manuscript
NIH
-PA Author Manuscript
higher than the indoor concentration of diazinon, indicating that there was a significant outdoorsource such as use in nearby agricultural fields. Chlorpyrifos has lower vapor pressure and islikely adhered to aerosols, dust and soil in the fields and contributing more to take-homecontamination on the clothes and shoes of farmworkers. This may lead to higher concentrationsof chlorpyrifos in house dust and on surfaces and increased dermal and non-dietary ingestionexposure compared to diazinon.
Because the same input distributions were used for simulating exposure for each child, variationin children’s individual exposure distributions is mostly a result of differences in the children’sunique MLATS. Due to the large between-child variability for both non-dietary ingestion anddermal exposure routes, multimodal distributions were obtained for population estimates(Figures 3 and 5). For example, one child (Figure 4) had high dermal exposures from crawlingoutdoors, resulting in abrupt slope changes at very high dermal exposure estimates (Figure 3).Similarly, the children with the higher non-dietary ingestion exposure estimates contributed tothe slope change observed at the higher non-dietary ingestion values (Figure 6). All of thepopulation distributions for each route are skewed, with low median values relative to longupper tails of the distributions. Thus the most at-risk children may have much higher exposuresthan the majority of the children. MLATS were only recorded for 4 hours. Longer durationsor multiple video collection of the same child at different times of day may reduce inter-individual variability as a result of capturing more activities. Observation of multimodaldistributions likely indicates that additional MLATS recorded for longer durations may aid infully characterizing the range of children’s behaviors for this population.
While MLATS provide detailed data on microenvironments visited and objects contacted, theenvironmental concentration data were not measured with the same level of detail. In the future,if environmental concentrations are sampled from a wider variety of microenvironments andobjects, more comprehensive exposure estimates could be obtained and used to assess theimportance of children’s activities on their exposure. Another limitation of this study is thatenvironmental concentration distributions were developed from measured values taken inseveral homes. As a result, variability in these distributions is a representation of variability inenvironmental concentrations between homes and not of variability that might be observedwithin each home. Additionally, better experimental measures of exposure factors may reduceuncertainty in these exposure estimates.
Uncertainty was propagated for each of the exposure equations used in the CASE simulationsbased on uncertainty associated with concentration and exposure factor measurementsaccording to error analysis theory (Bevington, 1969; Meyer, 1975). The relative uncertaintywas 7% for inhalation, 10-13% for non-dietary ingestion, and 11-16% for dermal exposurecalculations. These values are small compared to the range of values observed individually(see supporting information) and for the population. An uncertainty analysis could also becompleted to assess treatment of values <LOD. Although the theoretical distribution wasextended below the LOD, and sampled in proportion to the number of non-detected valuesother treatments could include assuming that values <LOD are equal to zero, half the LOD orthe LOD. Future work will entail completing 2-dimensional Monte Carlo simulations to assessuncertainty associated with exposure factor estimates (i.e., air contact zone height, transferefficiency, soil/dust adherence, mouthing removal), assignment of objects to exposuremechanisms, duration of MLATS, and sampling techniques to identify which variables wouldbenefit most from uncertainty reduction to ultimately reduce uncertainty in the exposureestimates.
Concurrent pesticide exposure and environmental measurements with videotaping, provides aunique opportunity to evaluate the estimates from CASE. Unfortunately, hand wipe sampleswere not taken of these children. However, the dermal exposure estimates from CASE were
BEAMER et al. Page 7
Environ Int. Author manuscript; available in PMC 2010 November 1.
NIH
-PA Author Manuscript
NIH
-PA Author Manuscript
NIH
-PA Author Manuscript
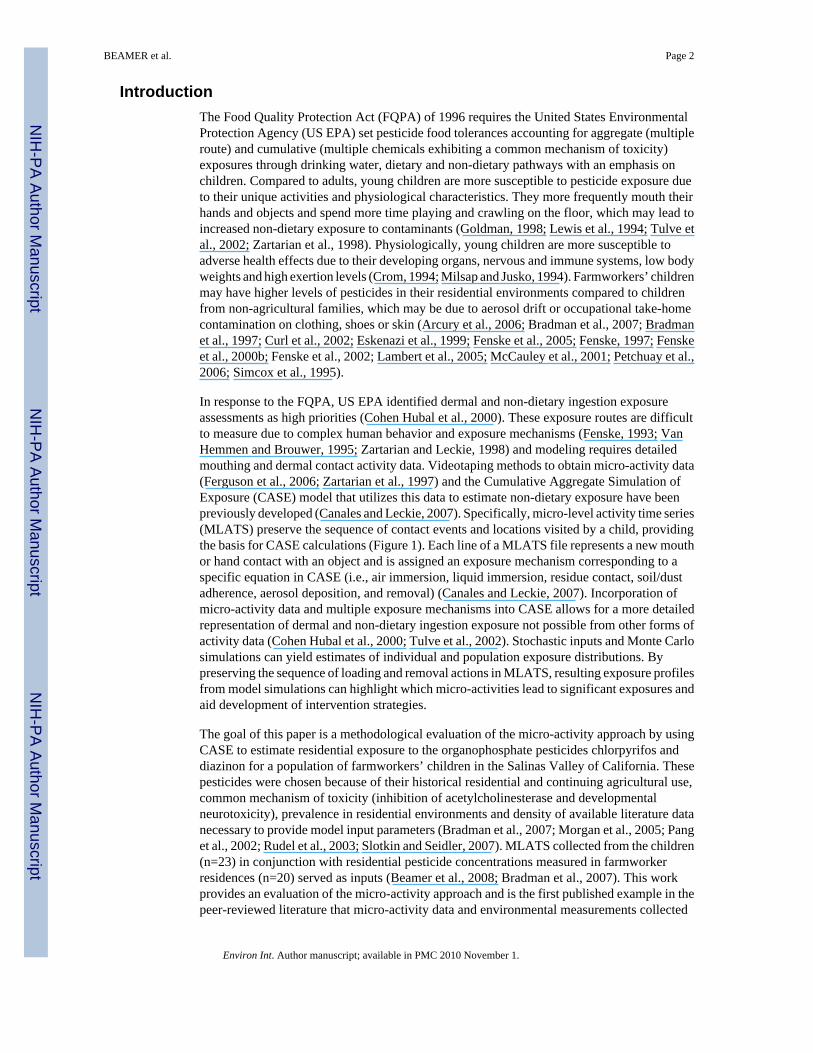
not statistically significantly (Wilcoxon rank sum test) from measured loadings of chlorpyrifosand diazinon on sock dosimeters worn by the same children (Figure 7). The similarity betweenmodeled and measured values in the same children indicates success of CASE and the micro-activity approach in estimating dermal exposure at the population level.
Each exposure route is measured and quantified in different units due to differences in thecontact boundary, making it difficult to compare relative contribution of each exposure route(Zartarian et al., 1997). Child respiratory rates were used from the US EPA Child-SpecificExposure Factor Handbook (CS-EFH) to estimate inhalation intake for each child (US EPA,2008). Estimated median inhalation intake for the farmworker children population was 0.6 and1.0 ng/hr for chlorpyrifos and diazinon, respectively. This is low relative to the estimatedmedian non-dietary ingestion intake of 27.9 and 15.5 ng/hr for chlorpyrifos and diazinon.Twenty-four hour duplicate diets were collected from the children at the time of pesticidesampling in the home. However, only 4 and 2% of the duplicate diet samples had detectablevalues for chlorpyrifos and diazinon, due to dilution from aggregated samples. Substitutingthe detection limit divided by the square root of 2 for samples below the detection limit(Bradman et al., 2007), a potential median dietary intake of 24 (range = 4-118) and 15 (range= 4-80) ng/hr was calculated for chlorpyrifos and diazinon respectively. Considering that theseare relatively conservative estimates of dietary exposure, it is likely that non-dietary ingestionexposure may contribute substantially more than other routes to aggregate exposure in thispopulation of farmworker children. Future work entails development of a pharmacokineticmodel to assess route contribution to uptake of pesticides including dermal exposure.
The findings were consistent with other studies of residential inhalation pesticide exposure.Clayton and colleagues (2003) measured pesticide concentrations in personal air for 102children in Minnesota. The median personal air concentration was 1.58 and 0.28 ng/m3 forchlorpyrifos and diazinon, respectively. While the personal air concentration for chlorpyrifosis quite close to the median estimated value from the present study, the personal airconcentration for diazinon is much lower than the estimated median value from the presentstudy. This discrepancy may be due to heavy agricultural diazinon use in Monterey County(65,032 kg for the year 2002) where the Salinas Valley is located (DPR, Cal EPA, 2002). Noagricultural use of diazinon in Minnesota has been reported for the years 1990-2006 (NASS,USDA, 2008). Morgan and colleagues (2005) estimated inhalation intake of chlorpyrifos basedon measured indoor and outdoor concentrations, the amount of time children spent in thoselocations, a ventilation rate of 6.8 m3/day and 50% absorption across the lungs. The medianinhalation intake for these children in North Carolina was 0.8 ng/kg•day. Using the sameventilation and absorption rates with CASE estimates, the median chlorpyrifos inhalationintake for the population of farmworkers’ children is 0.6 ng/kg•day.
Because the micro-activity data necessary (Cohen Hubal et al., 2000) for estimating non-dietaryingestion and dermal exposure are scarce, estimates are usually based on many assumptionsregarding frequency of soil and dust ingestion and dermal contact. To provide comparison forthe CASE simulations, dermal exposure was estimated according to current methods andexposure factors recommended by CS-EFH using the pesticide measurements from thefarmworker homes (US EPA, 2008). See supplementary material for calculations. Based onone contact a day with soil, as specified (US EPA, 2008), a median dermal exposure of 0.005and 0.002 ng/cm2 was estimated for chlorpyrifos and diazinon respectively — one order ofmagnitude lower than the estimates from CASE. Currently, CS-EFH and supporting documentsdo not provide guidance on estimating dermal exposure from air immersion and residuecontacts, and they do not account for dermal loading removal mechanisms (US EPA, 2008).The farmworker children that participated in videotaping had a median hand contact frequencyof 0.5 events/hr (mean=3.8) with soil and a median hand contact frequency of 689.4 events/hr(mean=686.3) with all objects combined (Beamer et al., 2008). The assumption of dermal
BEAMER et al. Page 8
Environ Int. Author manuscript; available in PMC 2010 November 1.
NIH
-PA Author Manuscript
NIH
-PA Author Manuscript
NIH
-PA Author Manuscript
exposure arising from one contact with soil per day, underestimates dermal exposure for thispopulation from soil adherence and other exposure mechanisms. However, the CASE modelwith appropriate distributions provides reasonable approximations of dermal exposure asdemonstrated by comparison with the sock dosimeters.
Similarly, recommendations from the CS-EFH (US EPA, 2008) were explored to estimate non-dietary ingestion. Although mouthing frequency values are provided, the CS-EFH does notprovide recommendations for saliva removal efficiency and other parameters. Therefore, basedon the CS-EFH, non-dietary ingestion was estimated from only soil/dust to be 0.4 and 0.1 ng/hr for chlorpyrifos and diazinon, respectively (see supporting information for calculations).These CS-EFH based estimates are much lower than the estimates from CASE simulations.There is no current method to directly measure non-dietary ingestion exposure, and as a resultthere are not suitable data sets to evaluate modeled non-dietary ingestion exposure estimatesfrom either the CS-EFH or CASE (Shalat et al., 2003). However others (Morgan et al., 2005)using methods based on CS-EFH failed to account for over 60% of the chlorpyrifos metabolitesmeasured in urine, indicating that exposure from this route may have been significantlyunderestimated (see supplementary material). While there are not any non-dietary ingestionexposure values measured directly to assess the ability of CASE to estimate this route, CASEdoes utilize a more detailed micro-activity approach accounting for additional exposuremechanisms to estimate non-dietary ingestion exposure. It is possible daily dust and soilingestion rates utilized by others (Morgan et al., 2005; Pang et al., 2002) significantlyunderestimate this route.
MLATS are very expensive and time-consuming to collect. Not only is time spent videotapingchildren in the field, but substantial time is also needed for video preparation, translation andappropriate quality control measures. Several protocols have been developed that can helpimprove quality control and improve efficiency of the process (Ferguson et al., 2006; Beameret al., 2008). Future work entails using the CASE model in conjunction with MLATS to developdust/soil ingestion rates to be used in lower tier modeling frameworks. Eventually if enoughMLATS are collected from individuals of different ages, engaged in various activities age-specific and activity-specific dust/soil ingestion rates could be developed to provide morecomplexity to modeling estimates. Hopefully, validated methods can be developed forsimulating MLATS from existing MLATS to develop additional exposure scenarios for CASEsimulations.
The only significant difference in exposure estimates as a function of age or gender was thatinfants had higher left hand dermal exposure estimates than toddlers. Left hand dermalexposure was significantly correlated with hand contact duration with toys (ρ=0.44 forchlorpyrifos and diazinon) and negatively correlated with hand mouthing duration (ρ= −0.81for chlorpyrifos;ρ = −0.71 for diazinon). Although not significantly different, toddlers havegreater hand mouthing duration and less hand contact duration with toys (Beamer et al.,2008). This relationship was less pronounced for right hands. Left hand contact duration withtoys was also significantly negatively correlated with hand mouthing duration (ρ= −0.44).When a child is busy playing with toys they are probably less likely to place their hands intheir mouths, however additional MLATS recorded for longer durations should be collectedto examine this issue.
In conclusion, if appropriate MLATS and stochastic inputs are used, CASE can providerealistic simulations of residential exposure. These simulations highlight object types,activities, microenvironments and additional conditions that contribute to residential exposure.Comparison of CASE estimates with measured values and estimates of non-dietary exposurefrom other methods provided a successful evaluation of the micro-activity approach. For thispopulation of farmworkers’ children, non-dietary residential exposure estimates were higher
BEAMER et al. Page 9
Environ Int. Author manuscript; available in PMC 2010 November 1.
NIH
-PA Author Manuscript
NIH
-PA Author Manuscript
NIH
-PA Author Manuscript
for chlorpyrifos than for diazinon, except for the inhalation route. The high variability observedbetween the individual non-dietary ingestion and dermal exposure distributions indicates theimportance of a child’s unique activity patterns and highlights potentially at-risk children. Thepotential substantial contribution of non-dietary ingestion exposure underscores theimportance of characterizing aggregate exposure and cumulative risk when setting pesticidefood tolerances as required by the FQPA.
Supplementary MaterialRefer to Web version on PubMed Central for supplementary material.
AcknowledgmentsThe authors would like to thank the families for their participation in the study and the field and laboratory staff thatcollected the data. This project was funded by Stanford NIH Graduate Training Program in Biotechnology, EPA StarGrant (#RA2936201), CHAMACOS (EPA grant #R826709 and NIEHS grant #5P01 ES09605), and the UPSFoundation (#2DDA103). This research has not been subjected to federal peer and policy review. The authors declarethey have no competing financial interests.
ReferencesArcury TA, Grzywacz JG, Davis SW, Barr DB, Quandt SA. Organophosphorus pesticide urinary
metabolite levels of children in farmworker households in Eastern North Carolina study location. AmJ Ind Med 2006;49(9):751–60. [PubMed: 16804908]
Beamer P, Canales RA, Leckie JO. Developing probability distributions for transfer efficiencies fordermal exposure. J Expo Sci Environ Epidemiol 2009;19:274–83. [PubMed: 18385671]
Beamer P, Key ME, Ferguson AC, Canales RA, AuYeung W, Leckie JO. Quantified activity pattern datafrom 6-to-27-month-old farmworker children for use in exposure assessment. Environ Res 2008;108(2):239–46. [PubMed: 18723168]
Bevington, PR. Data Reduction and Error Analysis for the Physical Sciences. McGraw-Hill; New York:1969.
Bradman A, Whitaker D, Quiros L, Castorina R, Henn BC, Nishioka M, et al. Pesticides and theirmetabolites in the homes and urine of farmworker children living in the Salinas Valley, CA. J ExpoSci Environ Epidemiol 2007;17(4):331–49. [PubMed: 16736054]
Bradman MA, Harnly ME, Draper W, Seidel S, Teran S, Wakeham D, et al. Pesticide exposures tochildren from California’s Central Valley: Results of a pilot study. J Expo Anal Environ Epidemiol1997;7(2):217–34. [PubMed: 9185013]
Cal EPA. Pesticide use reporting 2001 summary data. Department of Pesticide Regulation, CaliforniaEnvironmental Protection Agency; [Accessed 2008]. 2002 Available at:http://www.cdpr.ca.gov/docs/pur/pur01rep/01_pur.htm
Canales RA, Leckie JO. Application of a stochastic model to estimate children’s short-term residentialexposure to lead. Stoch Env Res Risk A 2007;21(6):737–45.
Canales, RA. The cumulative and aggregate simulation of exposure framework. Stanford, CA: 2004.Dissertation submitted to Stanford University
Choate LM, Ranville JF, Bunge AL, Macalady DL. Dermally adhered soil: 1. amount and particle-sizedistribution. Integr Environ Assess Manag 2006;2(4):375–84. [PubMed: 17069179]
Clayton CA, Pellizzari ED, Whitmore RW, Quackenboss JJ, Adgate J, Sefton K. Distributions,associations, and partial aggregate exposure of pesticides and polynuclear aromatic hydrocarbons inthe Minnesota Children’s Pesticide Exposure Study (MNCPES). J Expo Anal Environ Epidemiol2003;13(2):100–11. [PubMed: 12679790]
Cohen Hubal EA, Suggs JC, Nishioka MG, Ivancic WA. Characterizing residue transfer efficienciesusing a fluorescent imaging technique. J Expo Anal Environ Epidemiol 2005;15(3):261–270.[PubMed: 15305170]
BEAMER et al. Page 10
Environ Int. Author manuscript; available in PMC 2010 November 1.
NIH
-PA Author Manuscript
NIH
-PA Author Manuscript
NIH
-PA Author Manuscript
Cohen Hubal EA, Sheldon LS, Zufall MJ, Burke JM, Thomas KW. The challenge of assessing children’sresidential exposure to pesticides. J Expo Anal Environ Epidemiol 2000;10(6):638–49. [PubMed:11138656]
Crom WR. Pharmacokinetics in the child. Environ Health Perspect 1994;102:111–7. [PubMed: 7737035]Curl CL, Fenske RA, Kissel JC, Shirai JH, Moate TF, Griffith W, et al. Evaluation of take-home
organophosphorus pesticide exposure among agricultural workers and their children. Environ HealthPerspect 2002;110(12):A787–92. [PubMed: 12460819]
Cussler, EL. Diffusion: Mass transfer in fluid systems. Cambridge University Press; Cambridge England:1984.
Egeghy PP, Quackenboss JJ, Catlin S, Ryan PB. Determinants of temporal variability in NHEXAS-Maryland environmental concentrations, exposures, and biomarkers. J Expo Sci Environ Epidemiol2004;15(5):388–97.
Eskenazi B, Bradman A, Castorina R. Exposures of children to organophosphate pesticides and theirpotential adverse health effects. Environ Health Perspect 1999;107(Suppl 3):409–19. [PubMed:10346990]
Fenske RA, Lu C, Curl CL, Shirai JH, Kissel JC. Biologic monitoring to characterize organophosphoruspesticide exposure among children and workers: An analysis of recent studies in Washington state.Environ Health Perspect 2005;113(11):1651–7. [PubMed: 16263526]
Fenske RA. Pesticide exposure assessment of workers and their families. Occup Med 1997;12(2):221–37. [PubMed: 9220483]
Fenske RA. Dermal exposure assessment techniques. Ann Occup Hyg 1993;37(6):687–706. [PubMed:8304685]
Fenske RA, Lu CS, Barr D, Needham L. Children’s exposure to chlorpyrifos and parathion in anagricultural community in Central Washington State. Environ Health Perspect 2002;110(5):549–53.[PubMed: 12003762]
Fenske RA, Kissel JC, Lu CS, Kalman DA, Simcox NJ, Allen EH, et al. Biologically based pesticidedose estimates for children in an agricultural community. Environ Health Perspect 2000a;108(6):515–20. [PubMed: 10856024]
Fenske RA, Lu CS, Simcox NJ, Loewenherz C, Touchstone J, Moate TF, et al. Strategies for assessingchildren’s organophosphorus pesticide exposures in agricultural communities. J Expo Anal EnvironEpidemiol 2000b;10(6):662–71. [PubMed: 11138658]
Ferguson AC, Canales RA, Beamer P, AuYeung W, Key M, Munninghoff A, et al. Video methods in thequantification of children’s exposures. J Expo Anal Environ Epidemiol 2006;16:287–98.
Goldman LR. Linking research and policy to ensure children’s environmental health. Environ HealthPerspect 1998;106(Suppl 3):857–62. [PubMed: 9646049]
Lambert WE, Lasarev M, Muniz J, Scherer J, Rothlein J, Santana J, et al. Variation in organophosphatepesticide metabolites in urine of children living in agricultural communities. Environ Health Perspect2005;113(4):504–8. [PubMed: 15811843]
Leckie, JO.; Naylor, KA.; Canales, RA.; Ferguson, AC.; Cabrera, NL.; Hurtado, AL., et al. Quantifyingchildren’s microlevel activity data from existing videotapes. Stanford, CA: 2000. Report by ExposureResearch Group, Stanford University for US EPA; Report: U2F112OT-RT-99-001182
Lewis RG, Fortmann RC, Camann DE. Evaluation of methods for monitoring the potential exposure ofsmall children to pesticides in the residential environment. Arch Environ Con Tox 1994;26(1):37–46.
McCauley LA, Lasarev MR, Higgins G, Rothlein J, Muniz J, Ebbert C, et al. Work characteristics andpesticide exposures among migrant agricultural families: A community-based research approach.Environ Health Perspect 2001;109(5):533–8. [PubMed: 11401767]
McKone TE, Castorina R, Harnly ME, Kuwabara Y, Eskenazi B, Bradman A. Merging models andbiomonitoring data to characterize sources and pathways of human exposure to organophosphoruspesticides in the Salinas valley of California. Environ Sci Technol 2007;41(9):3233–40. [PubMed:17539531]
Meyer, SL. Data Analysis for Scientists and Engineers. Wiley; New York: 1975.Milsap RL, Jusko WJ. Pharmacokinetics in the infant. Environ Health Perspect 1994;102:107–10.
[PubMed: 7737034]
BEAMER et al. Page 11
Environ Int. Author manuscript; available in PMC 2010 November 1.
NIH
-PA Author Manuscript
NIH
-PA Author Manuscript
NIH
-PA Author Manuscript
Morgan MK, Sheldon LS, Croghan CW, Jones PA, Robertson GL, Chuang JC, et al. Exposures ofpreschool children to chlorpyrifos and its degradation product 3, 5, 6-trichloro-2-pyridinol in theireveryday environments. J Expo Anal Environ Epidemiol 2005;15:297–309. [PubMed: 15367928]
O’Flaherty EJ. Physiologic changes during growth and development. Environ Health Perspect 1994;102(Suppl 11):103–6.
Pang YH, MacIntosh DL, Camann DE, Ryan B. Analysis of aggregate exposure to chlorpyrifos in theNHEXAS-Maryland investigation. Environ Health Perspect 2002;110(3):235–40. [PubMed:11882473]
Petchuay C, Visuthismajarn P, Vitayavirasak B, Hore P, Robson MG. Biological monitoring oforganophosphate pesticides in preschool children in an agricultural community in Thailand. Int JOccup Environ Health 2006;12(2):133–41.
Rappaport, SM. Interpreting levels of exposures to chemical agents. In: Harris, RL., editor. Patty’sIndustrial Hygiene. Vol. 5th Edition. Vol. Volume 1. John Wiley & Sons, Inc.; New York: 2000.
Rudel RA, Camann DE, Spengler JD, Korn LR, Brody JG. Phthalates, alkylphenols, pesticides,polybrominated diphenyl ethers, and other endocrine-disrupting compounds in indoor air and dust.Environ Sci Technol 2003;37(20):4543–53. [PubMed: 14594359]
Schwarzenbach, RP.; Gschwend, PM.; Imboden, DM. Environmental Organic Chemistry. Wiley & Sons;New York: 1993.
Shalat SL, Donnelly KC, Freeman NCG, Calvin JA, Ramesh S, Jimenez M, et al. Nondietary ingestionof pesticides by children in an agricultural community on the US/Mexico border: Preliminary results.J Expo Anal Environ Epidemiol 2003;13(1):42–50. [PubMed: 12595883]
Simcox NJ, Fenske RA, Wolz SA, Lee IC, Kalman DA. Pesticides in household dust and soil: Exposurepathways for children of agricultural families. Environ Health Perspect 1995;103(12):1126–34.[PubMed: 8747019]
Slotkin TA, Seidler FJ. Comparative developmental neurotoxicity of organophosphates in vivo:Transcriptional responses of pathways for brain cell development, cell signaling, cytotoxicity andneurotransmitter systems. Brain Res Bull 2007;72(46):232–74. [PubMed: 17452286]
Tulve NS, Suggs JC, McCurdy T, Cohen Hubal EAC, Moya J. Frequency of mouthing behavior in youngchildren. J Expo Anal Environ Epidemiol 2002;12(4):259–64. [PubMed: 12087432]
USDA. Agricultural chemical use database. National Agricultural Statistics Service, United StatesDepartment of Agriculture; [Accessed: 4/3/2009]. 2008 Available at:http://www.pestmanagement.info/nass/
US EPA. Child-specific exposure factors handbook. U.S. Environmental Protection Agency;Washington, DC: 2008. Report: EPA/600/R-06/096F
Van Hemmen JJ, Brouwer DH. Assessment of dermal exposure to chemicals. Sci Total Environ 1995;168(2):131–41. [PubMed: 7481731]
Yamamoto N, Takahashi Y, Yoshinaga J, Tanaka A, Shibata Y. Size distributions of soil particles adheredto Children’s hands. Arch Environ Contam Toxicol 2006;51(2):157–63. [PubMed: 16583253]
Zartarian, VG.; Xue, J.; Ozkaynak, H.; Dang, H.; Glen, G.; Smith, L., et al. Final Report. U.S.Environmental Protection Agency; Washington, DC: 2005. A probabilistic exposure assessment forchildren who contact CCA-treated playsets and decks using the stochastic human exposure and dosesimulation model for the wood preservative scenario (SHEDS-WOOD). Report: EPA/600/X-05/009
Zartarian V, Leckie JO. Dermal exposure: The missing link. Environ Sci Technol 1998;32(5):134A–7A.Zartarian V, Ott WR, Duan N. A quantitative definition of exposure and related concepts. J Expo Anal
Environ Epidemiol 1997;7(4):411–37. [PubMed: 9306230]Zartarian, VG. A physical-stochastic model for understanding dermal exposure to chemicals. Stanford
University; Stanford, CA: 1996. DissertationZartarian VG, Ferguson AC, Leckie JO. Quantified mouthing activity data from a four-child pilot field
study. J Expo Anal Environ Epidemiol 1998;8(4):543–53.
BEAMER et al. Page 12
Environ Int. Author manuscript; available in PMC 2010 November 1.
NIH
-PA Author Manuscript
NIH
-PA Author Manuscript
NIH
-PA Author Manuscript
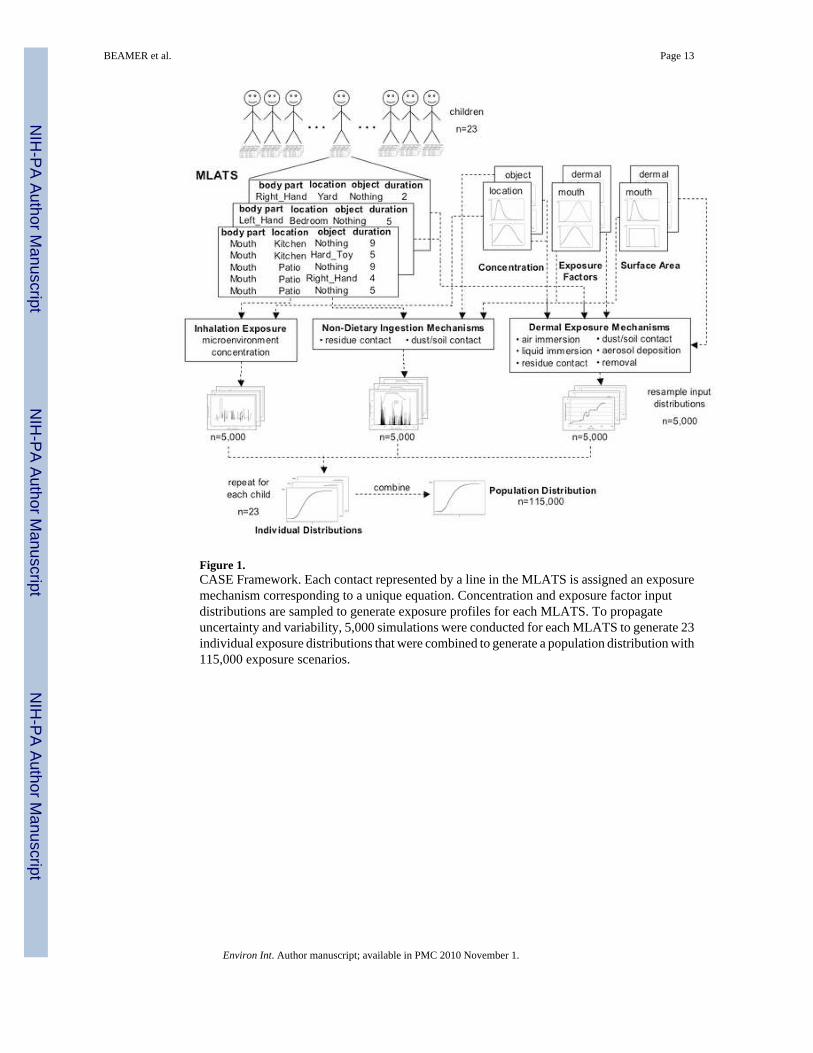
Figure 1.CASE Framework. Each contact represented by a line in the MLATS is assigned an exposuremechanism corresponding to a unique equation. Concentration and exposure factor inputdistributions are sampled to generate exposure profiles for each MLATS. To propagateuncertainty and variability, 5,000 simulations were conducted for each MLATS to generate 23individual exposure distributions that were combined to generate a population distribution with115,000 exposure scenarios.
BEAMER et al. Page 13
Environ Int. Author manuscript; available in PMC 2010 November 1.
NIH
-PA Author Manuscript
NIH
-PA Author Manuscript
NIH
-PA Author Manuscript
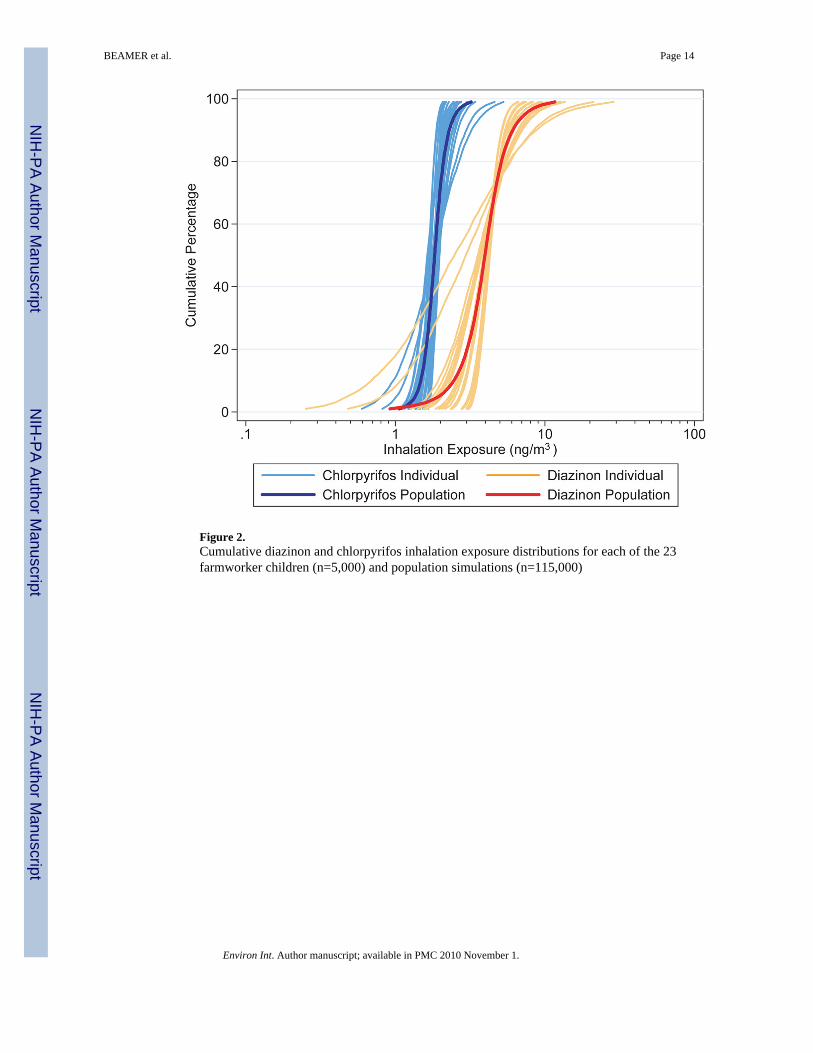
Figure 2.Cumulative diazinon and chlorpyrifos inhalation exposure distributions for each of the 23farmworker children (n=5,000) and population simulations (n=115,000)
BEAMER et al. Page 14
Environ Int. Author manuscript; available in PMC 2010 November 1.
NIH
-PA Author Manuscript
NIH
-PA Author Manuscript
NIH
-PA Author Manuscript
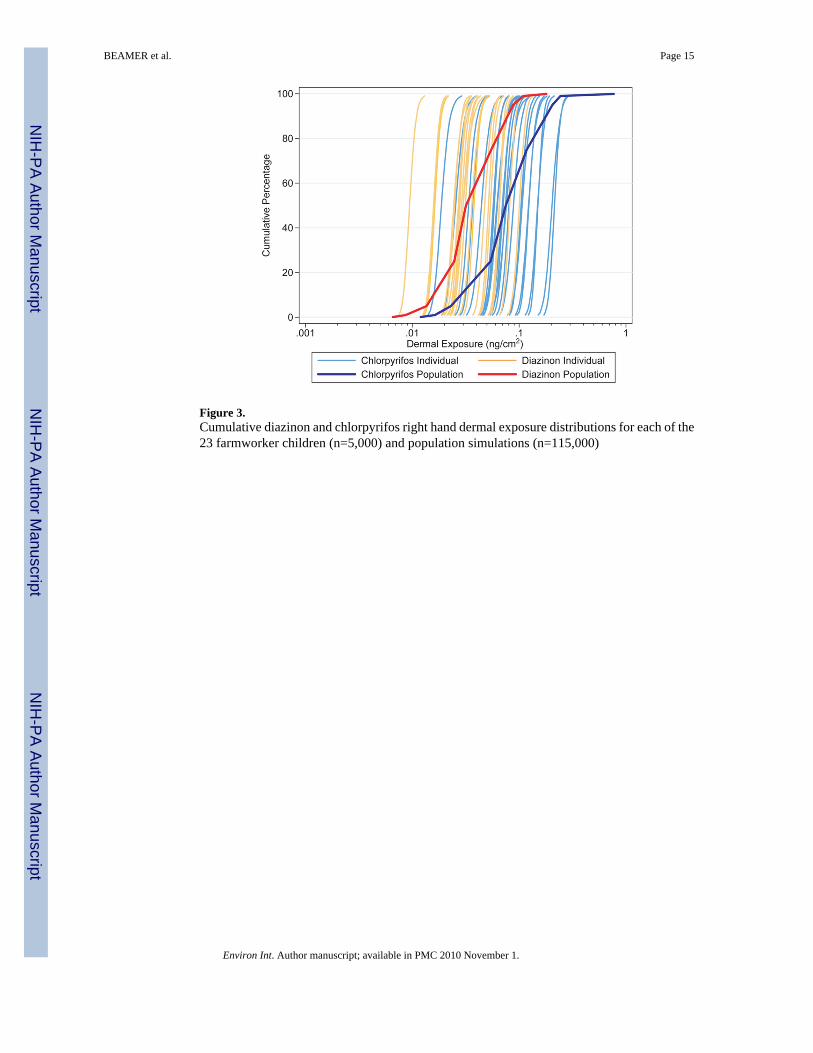
Figure 3.Cumulative diazinon and chlorpyrifos right hand dermal exposure distributions for each of the23 farmworker children (n=5,000) and population simulations (n=115,000)
BEAMER et al. Page 15
Environ Int. Author manuscript; available in PMC 2010 November 1.
NIH
-PA Author Manuscript
NIH
-PA Author Manuscript
NIH
-PA Author Manuscript
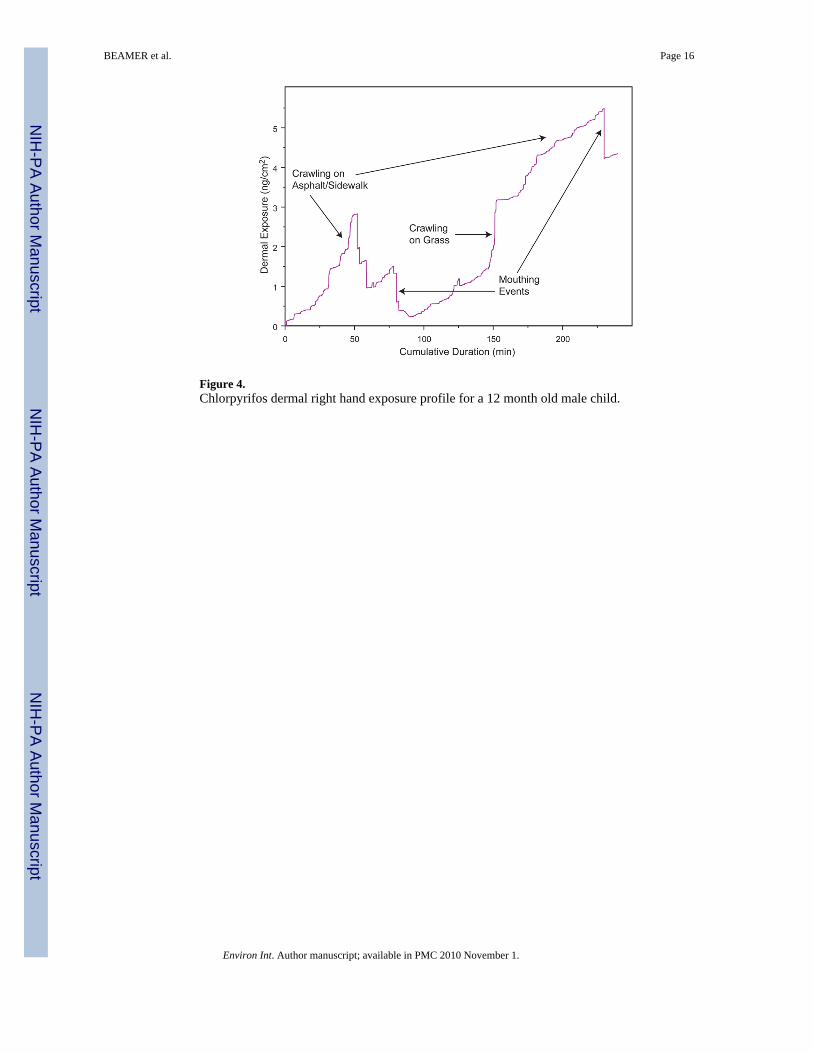
Figure 4.Chlorpyrifos dermal right hand exposure profile for a 12 month old male child.
BEAMER et al. Page 16
Environ Int. Author manuscript; available in PMC 2010 November 1.
NIH
-PA Author Manuscript
NIH
-PA Author Manuscript
NIH
-PA Author Manuscript
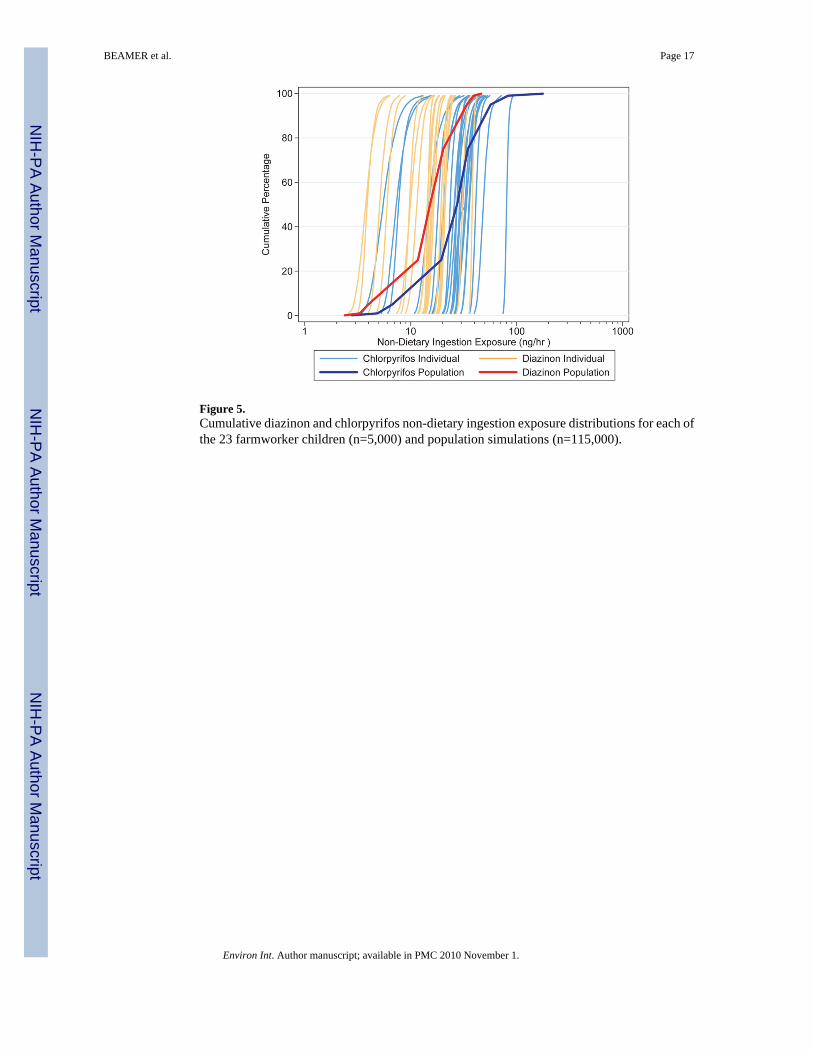
Figure 5.Cumulative diazinon and chlorpyrifos non-dietary ingestion exposure distributions for each ofthe 23 farmworker children (n=5,000) and population simulations (n=115,000).
BEAMER et al. Page 17
Environ Int. Author manuscript; available in PMC 2010 November 1.
NIH
-PA Author Manuscript
NIH
-PA Author Manuscript
NIH
-PA Author Manuscript
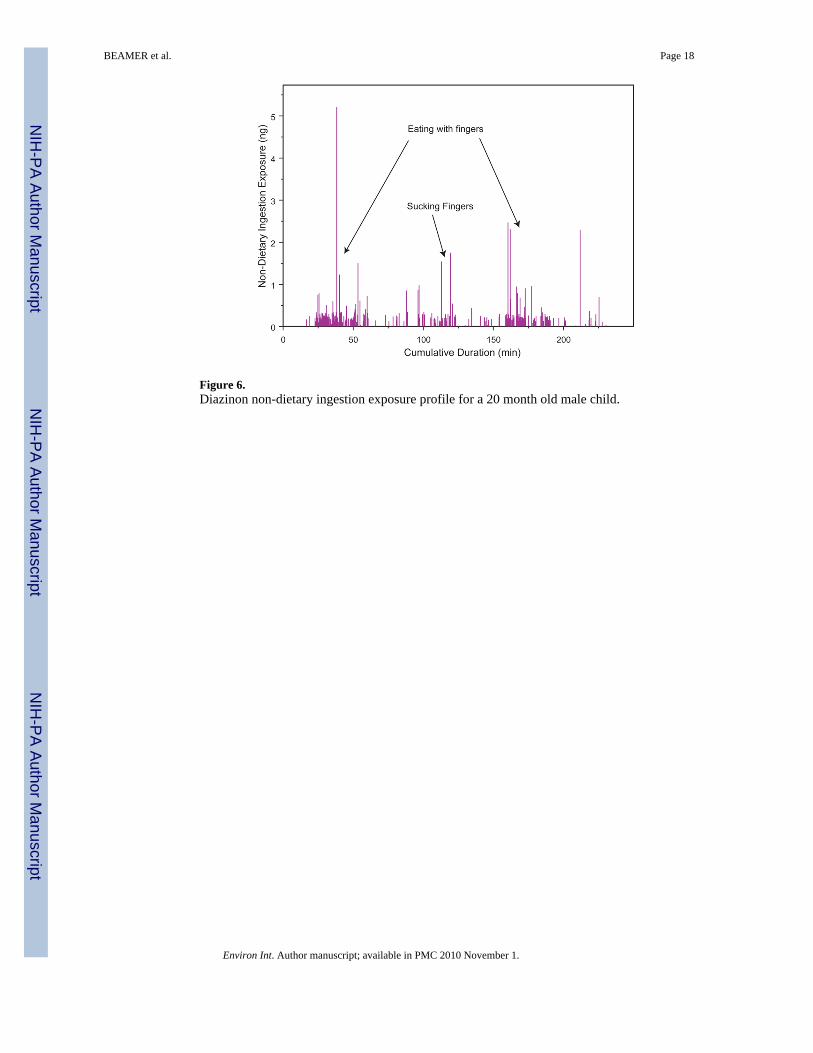
Figure 6.Diazinon non-dietary ingestion exposure profile for a 20 month old male child.
BEAMER et al. Page 18
Environ Int. Author manuscript; available in PMC 2010 November 1.
NIH
-PA Author Manuscript
NIH
-PA Author Manuscript
NIH
-PA Author Manuscript
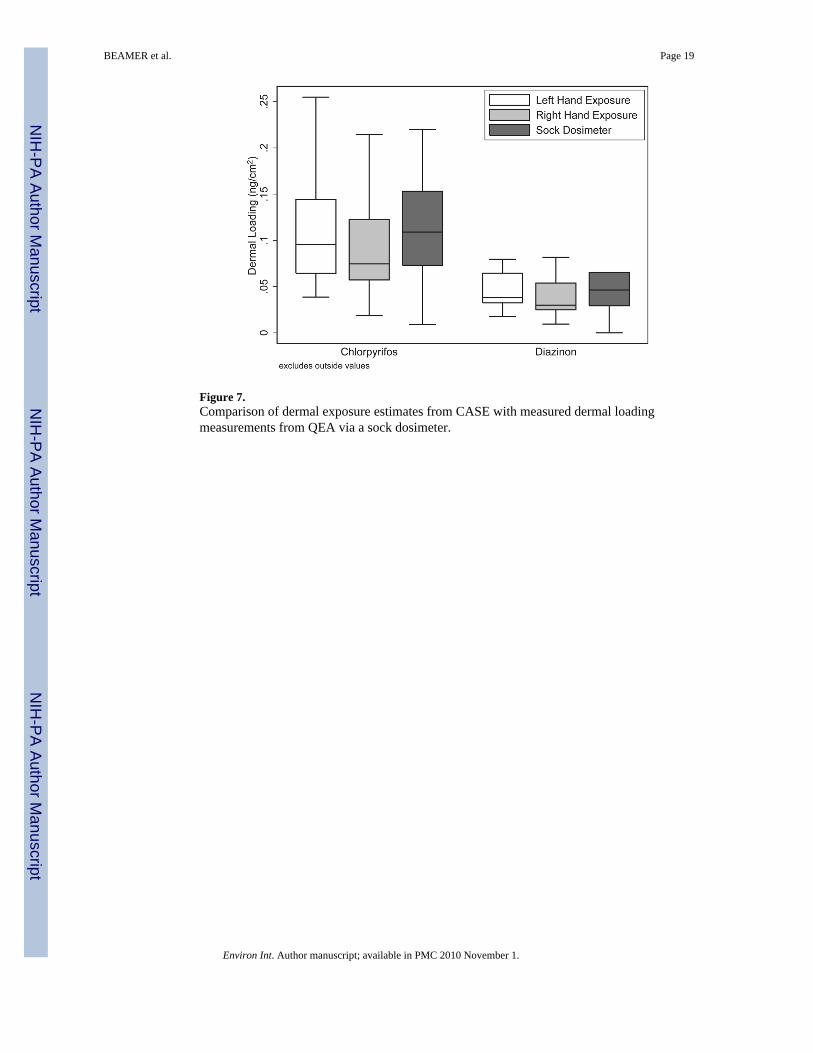
Figure 7.Comparison of dermal exposure estimates from CASE with measured dermal loadingmeasurements from QEA via a sock dosimeter.
BEAMER et al. Page 19
Environ Int. Author manuscript; available in PMC 2010 November 1.
NIH
-PA Author Manuscript
NIH
-PA Author Manuscript
NIH
-PA Author Manuscript
NIH
-PA Author Manuscript
NIH
-PA Author Manuscript
NIH
-PA Author Manuscript
BEAMER et al. Page 20Ta
ble
1
Envi
ronm
enta
l con
cent
ratio
n di
strib
utio
ns d
evel
oped
from
pes
ticid
e m
easu
rem
ents
take
n in
the
farm
wor
ker h
omes
(GM
=geo
met
ric m
ean,
GSD
=geo
met
ricst
anda
rd d
evia
tion,
df=
dete
ctio
n fr
eque
ncy)
.a
Chl
orpy
rifo
sD
iazi
non
dfG
MG
SDdf
GM
GSD
indo
or a
ir co
ncen
tratio
n[n
g/m
3 ] a10
01.
81.
610
02.
52.
7
outd
oor a
ir co
ncen
tratio
n[n
g/m
3 ] a85
1.1
1.9
100
3.3
2.6
hous
e du
st [n
g/g]
b95
61.8
3.3
100
21.6
3.3
toy
wip
e [n
g/cm
2 ] c30
185.
44.
660
153.
53.
1
a Lim
it of
det
ectio
n (L
OD
) was
1 n
g to
tal f
or b
oth
pest
icid
es fo
r ind
oor a
nd o
utdo
or a
ir.
b LOD
was
2 n
g/g
for b
oth
pest
icid
es in
hou
se d
ust.
c LOD
was
5 a
nd 2
ng
tota
l for
chl
orpy
rifos
and
dia
zino
n in
wip
e sa
mpl
es.
Environ Int. Author manuscript; available in PMC 2010 November 1.
NIH
-PA Author Manuscript
NIH
-PA Author Manuscript
NIH
-PA Author Manuscript
BEAMER et al. Page 21
Table 2
Distributions representing exposure factors for CASE simulations (see supporting information).
Exposure Factor Distributiona Parameter 1 Parameter 2 Source
soil/dust-to-skin adherence [g/m2] Weibull 0.79 0.15 Yamamoto et al., 2006 bresidue transfer [-] rough objects lognormal −4.26 0.54 Beamer et al., 2009 smooth objects lognormal −3.30 0.85 Beamer et al., 2009air zone height [m] uniform 0.001 0.003 Zartarian, 1996hand-washing removal [-] beta 32 22 Zartarian et al., 2005residue-to-mouth removal [-] beta 14.5 4.1 Zartarian et al., 2005soil/dust-to-mouth removal [g/m2] Weibull 0.79 0.15 current studychand contact surface area [m2] uniform 0.1 0.5 current studymouthing surface area [m2] uniform 0.00078 0.0022 current study
aDistribution (parameter 1, parameter 2) = [beta (shape 1, shape 2), lognormal, (lognormal mean, SD), normal (mean, SD), uniform (min, max), Weibull
(shape, scale)]
bYamamoto et al. (2006) divided by 7
cDerived by multiplying dust-skin adherence distribution with mouthing residue removal efficiency distribution.
Environ Int. Author manuscript; available in PMC 2010 November 1.
Top Related
Copyright © 2022 FDOKUMEN

