


Bahasa
Halaman
Hukum


University of Tennessee, KnoxvilleTrace: Tennessee Research and CreativeExchange
Doctoral Dissertations Graduate School
5-2005
Factors Affecting Uses and Impacts of PerformanceMeasures in Mid-Sized U.S. CitesYeonsoo ChungUniversity of Tennessee - Knoxville
This Dissertation is brought to you for free and open access by the Graduate School at Trace: Tennessee Research and Creative Exchange. It has beenaccepted for inclusion in Doctoral Dissertations by an authorized administrator of Trace: Tennessee Research and Creative Exchange. For moreinformation, please contact [email protected].
Recommended CitationChung, Yeonsoo, "Factors Affecting Uses and Impacts of Performance Measures in Mid-Sized U.S. Cites. " PhD diss., University ofTennessee, 2005.https://trace.tennessee.edu/utk_graddiss/1898

To the Graduate Council:
I am submitting herewith a dissertation written by Yeonsoo Chung entitled "Factors Affecting Uses andImpacts of Performance Measures in Mid-Sized U.S. Cites." I have examined the final electronic copy ofthis dissertation for form and content and recommend that it be accepted in partial fulfillment of therequirements for the degree of Doctor of Philosophy, with a major in Political Science.
David H. Folz, Major Professor
We have read this dissertation and recommend its acceptance:
Michael R. Fitzgerald, William Lyons, Bruce E. Tonn
Accepted for the Council:Dixie L. Thompson
Vice Provost and Dean of the Graduate School
(Original signatures are on file with official student records.)
To the Graduate Council: I am submitting herewith a dissertation written by Yeonsoo Chung entitled “Factors Affecting Uses and Impacts of Performance Measures in Mid-Sized U.S. Cites” I have examined the final electronic copy of this dissertation for form and content and recommend that it be accepted in partial fulfillment of the requirements for the degree of Doctor of Philosophy, with a major in Political Science.
David H. Folz Major Professor
We have read this dissertation and recommend its acceptance: Michael R. Fitzgerald William Lyons Bruce E. Tonn
Accepted for the Council: Anne Mayhew Vice Chancellor and Dean of Graduate Studies
(Original Signatures are on file with official student records)

FACTORS AFFECTING USES AND IMPACTS OF PERFORMANCE MEASURES IN MID-SIZED U.S.
CITIES
A Dissertation Presented for the
Doctor of Philosophy Degree
The University of Tennessee, Knoxville
Yeonsoo Chung May 2005

Dedication
This dissertation is dedicated with love and appreciation to:
my parents, Gil-Hwa Chung and Jung-Soo Cho,
my wife, Jooyoung
and
my children,
Hunkyo & Emily
ii

Acknowledgements
I wish to thank all those who helped me complete my Ph.D. degree in Political
Science. I wish to express the deepest appreciation to my major professor, Dr. David H.
Folz, for his guidance, encouragement, support and patience during the entire process
of this dissertation project. Without his contribution to the research, it would have
never been completed.
I would also like to thank my committee members, Dr. Michael R. Fitzgerald,
Dr. William Lyons, and Dr. Bruce E. Tonn, for their comments, support and
encouragement.
I am so grateful to the local executives who kindly responded the mail survey.
I wish to express gratitude for their time and effort.
Finally, I wish to express my love and appreciation to my dear, patient wife,
Jooyoung and my children, Hunkyo and Emily who loved and supported me all the
time. A special expression of appreciation goes to my parents, Gil-Hwa Chung and
Jung-Soo Cho, who patiently supported and encouraged me to complete this study.
iii
Abstract
This research investigates the factors that affect municipal use of and the
impacts they experience with performance measures among mid-sized U.S. cities. The
goal of this research project is to advance our knowledge about the adoption, use, and
impact of performance measures among mid-sized cities. Several research questions
were developed and a mail survey was administered to 670 city officials in cities with
populations 25,000 to 250,000 in order to help provide answers to these questions. A
total of 280 completed surveys were returned for a response rate of about 42 percent.
Among the chief findings of this study are that larger mid-sized cities are more
likely to adopt and use performance measures. Performance measures also are more
likely to be adopted and used by cities that have a council-manager form of
government rather than by cities with a mayor-council form of government.
The performance results expected to be achieved by municipal officials
respondents corresponded with the three reasons that local officials cited as being most
important for adopting. Analysis indicated that there is very little, if any, “cognitive
dissonance” with respect to the reasons offered for adopting performance measures
and what local officials expected to see as a result of their implementation.
The study’s findings suggest that local officials in mid-sized cities believe that
performance measures have real value for improving the quality of management and
budget decisions. Moreover, they think that the information generated by these
measures helps their cities to respond to citizen demands for greater accountability. In
addition, many local officials believe that the use of performance measures has helped
iv
to improve the quality of communications with citizens about how well the city
performs its service responsibilities.
Performance measures tend to be used more extensively when managers are
the primary audience for performance data, when their staff has data analysis talent
and when council understands performance information and provides adequate
financial support for collecting performance data.
This study finds that support by government stakeholder groups, particularly
department heads, line supervisors and city employees, local elected officials,
particularly city council members, and citizens and community interest group leaders
are especially important in terms of whether performance measures are likely to be
perceived as having a significant positive impact on the local decision making
process.
v
Table of Contents
Chapter 1: Introduction ……………………………………………………………... 1
I. Problem Statement …………………………………………………………... 1
II. Research Questions and Objectives ………………………………………… 5
III. Research Methods …………………………………………………………. 7
IV. Dependent Variables ………………………………………………………. 9
V. Independent Variables …………………………………………………….. 11
VI. Scope and Limitations of Research ……………………………………..... 13
Chapter 2: Literature Review ………………………………………………………. 14
I. Performance Measurement in the Public Sector ....…………………………. 14
II. Development and Use of Performance Measurement
in Local Government………………………………………………………. 19
III. The Literature Relevant to Adoption and Use of Performance
Measures in Local Government ……………………………………………. 26
III-I. Political Factors ……………………………………………………. 26
III-II. Managerial Factors ………………………………………………... 29
III-III. Demographic Factors …………………………………………….. 33
IV. Ongoing Municipal Performance Measurement Programs
in the States ………………………………………………………………… 34
IV-I. The North Carolina Local Government Performance Measurement
Project ………………………………………………………………... 35
IV-II. The South Carolina Municipal Benchmarking Project …………... 39
IV-III. The Tennessee Municipal Benchmarking Project ………………. 49
V. Limitations of Performance Measurement ………………………………… 52
VI. Performance Measurement and Evaluation ………………………………. 54
vi

Chapter 3: A Profile of Mid-Sized Cities that Use Performance Measures ……….. 58
I. Features and Characteristics of Mid-Sized Cities that Use
Performance Measures …………………………………………………….. 59
I-I. City Size, Region, and Form of Government ………………………. 60
I-II. A Profile of the Structural Features of Mid-Sized U.S. Cities …….. 66
I-III. Unionization and Labor-Management Relations …………………. 74
I-IV. Income, Race and Education ……………………………………… 76
II. Profile of the Responding Municipal Executives …………………………. 76
III. The Organizational Features of Municipal Performance
Measurement Efforts ………………………………………………………. 80
III-I. Location of Primary Responsibility for Developing or Devising
Performance Measures ……………………………………………….. 80
III-II. Primary Audiences for Reports or Information about Service or
Performance Measures ……………………………………………….. 82
III-III. The Length of Performance Measurement Use …………………. 84
III-IV. Performance Measurement Capacity ……………………………. 84
III-V. Management and Non-Management Employees’ Attitudes toward
Organizational Changes ……………………………………………… 86
III-VI. Council or Commission Members’ Support for Performance
Measures ……………………………………………………………… 88
IV. Summary …………………………………………………………………. 89
Chapter 4: Analysis of the Applications and Impacts of Performance Measures
in Mid-Sized Cities ……………………………………………………………… 93
I. The Uses and Applications of Performance Measures …………………….. 93
I-I. The Types of Performance Measures Used ………………………… 94
I-II. Factors Associated with Adoption of the Types of Performance
Measures ……………………………………………………………... 95
I-III. Types of Performance Measures Used For Different Services …… 99
vii
I-IV. Factors Associated with Types of Performance Measures Used
for Most Commonly Provided Services ………….............................. 102
I-V. The Reasons for Adoption of Performance Measures ……………. 108
I-VI. The Results Expected from the Use of Performance Measures …. 111
I-VII. The Use of Performance Measures for Different Types
of Decisions …………………………………………………………. 115
I-VIII. Explaining Differences in Decision Applications of
Performance Measures ………………………………………………. 117
II. The Impacts of Performance Measures …………………………………… 123
II-I. Executive Ratings of the Actual Impact of Performance
Measures …………………………………………………………….. 124
II-II. Factors Associated with Differences in the Ratings of Actual
Experiences with Performance Measures …………………………… 125
II-III. How Helpful Are Performance Measures? ……………………… 139
II-IV. Have Performance Measures Affected the Quality of
Decisions? …………………………………………………………… 142
II-V. City Staff and Citizens’ Perspectives on the Use of Performance
Measures …………………………………………………………….. 145
III. Summary ……………………………………………………………….... 150
Chapter 5: Conclusion ……………………………………………………………. 160
References ………………………………………………………………………... 172
Appendix …………………………………………………………………………. 183
Vita ……………………………………………………………………………...... 192
viii
List of Tables
Table 1-1. Distribution of Survey Responses, September 2004 ……………………. 10
Table 3-1. Adoption and use of performance measures by city population size
(in percentages) …………………………………………………………………... 61
Table 3-2. Adoption and use of performance measures by municipal budget size
(in percentages) …………………………………………………………………... 61
Table 3-3. Adoption and use of performance measures by the number of full-time
municipal employees (in percentages) …………………………………………... 63
Table 3-4. Adoption and use of performance measures by form of government
(in percentages) ………………………………………………………………….. 63
Table 3-5. Adoption and use of performance measures by region
(in percentages) ………………………………………………………………….. 65
Table 3-6. Form of government by region (in percentages) ……………………….. 65
Table 3-7. City features …………………………………………………………….. 68
Table 3-8. Government structures in US cities …………………………………….. 72
Table 3-9. Adoption and use of performance measures by government structures
(in percentages) ………………………………………………………………….. 72
Table 3-10. Adoption and use of performance measures by the presence of CAO
position in mayor-council form of government (in percentages) ……………….. 73
Table 3-11. Adoption and use of performance measures by the percent of full-time
equivalent employees unionized (in percentages) ……………………………… 74
Table 3-12. Adoption and use of performance measures by the nature of labor-
management relations among city personnel (in percentages) …………………. 75
Table 3-13. Adoption and use of performance measures by selected mean city
characteristics …………………………………………………………………… 77
Table 3-14. Distribution of responding municipal executives, September 2004 ….. 77
Table 3-15. Tenure of responding municipal executives in that position,
September 2004 …………………………………………………………………. 79
ix
Table 3-16. Tenure of responding municipal executives in local government,
September 2004 …………………………………………………………………... 79
Table 3-17. Location of primary responsibility for developing or devising
performance measures ……………………………………………………………. 81
Table 3-18. Primary audiences for reports or information about service or
performance measures ……………………………………………………………. 83
Table 3-19. How long your city used performance measures ………………………. 85
Table 3-20. Performance measurement capacity ……………………………………. 85
Table 3-21. Management and non-management employees’ attitudes toward
organizational changes (in percentages) …………………………………………. 87
Table 3-22. Council or commission members’ support for performance measures ... 88
Table 4-1. Types of performance measures adopted and used ……………………... 95
Table 4-2. Adoption of types of performance measures and attitudinal variables …. 96
Table 4-3. Types of measures adopted by council support for performance
measurement …………………………………………………………………….. 98
Table 4-4. Types of performance measures used in different services ……………. 100
Table 4-5. Cumulative performance measurement score by primary audiences for
reports or information about the service or performance measures …………….. 104
Table 4-6. Cumulative performance measurement score by capacity for and
applications of performance measurement ……………………………………… 105
Table 4-7. Cumulative performance measurement score and organizational
features ………………………………………………………………………….. 107
Table 4-8. Classification of the extent of use of performance measures for
different types of decisions ……………………………………………………. 118
Table 4-9. Extent of use of each measure by primary audiences for reports or
information about the service or performance measures ………………………. 119
Table 4-10. Extent of use of performance measures by capacity indicators of
performance measurement programs …………………………………………... 121
Table 4-11. Extent to use of performance measures by city council features ……. 122
x

Table 4-12. City officials’ actual experience with performance measures ………... 125
Table 4-13. City’s actual experience with performance measures by form of
government (in percentages) ……………………………………………………. 127
Table 4-14. City’s actual experience with performance measures by overall
capacity and adequacy of cities’ resources for collecting and using
performance data and information ………………………………………………. 129
Table 4-15. Regression of performance measures’ impact rating and selected
organizational and program features ……………………………………………. 131
Table 4-16. City’s actual experience with performance measures by
organizational features ………………………………………………………….. 133
Table 4-17. Regression of performance measures’ impact and characteristics
of the organizational culture …………………………………………………….. 135
Table 4-18. Regression of performance measures’ impact and selected
organizational and program features and selected characteristics of the
organizational culture …………………………………………………………… 137
Table 4-19. Correlations of expectations for and actual results realized from
the use of performance measures ……………………………………………….. 138
Table 4-20. The helpfulness of performance measurement with specific
management challenges ………………………………………………………… 140
Table 4-21.The overall impacts of performance measures on the quality
of decision making ……………………………………………………………… 142
Table 4-22. The overall impacts of performance measures on the quality
of decision making by the key features of city departments and
organizational features ………………………………………………………….. 144
Table 4-23. City administrators’ opinions about the performance measures
employed ……………………………………………………………………….. 146
Table 4-24. The impact of performance measures on the quality of
decision making when support is evidenced by government stakeholders ……. 148
Table 4-25. Citizens’ support for local performance measurement effort ……….. 149
xi

Table 4-26. The impact of performance measures on the quality of decision
making and citizens’ support for the local performance measurement effort ….. 150
xii

List of Figures
Figure 4-1 Why performance measures are adopted ………………………………. 109
Figure 4-2 City officials’ expected results for performance measures ……………. 113
Figure 4-3 Type of measures used for each activity ………………………………. 116
xiii
CHAPTER 1
INTRODUCTION
I. Problem Statement
Performance measurement in public organizations has gained a great deal of
interest since the 1990s. Paul Epstein, a long-time supporter of performance
measurement, proclaimed that “the time for performance measurement is finally
coming!” (Epstein 1992, 513). Performance measurement also has been touted as a
strategy for “reinventing” government (Osborne and Gaebler 1992).
The idea that government performance should be measured, however, is not
new. The history of performance measures begins with Fredrick Taylor’s principles of
scientific management at the turn of the century (de Lancer Julnes 1999; Rivenbark
and Kelly 2000; Streib and Poister 1998). As Charles A. Bowsher, comptroller general
of the United States, stated in his testimony before the U.S. Senate in 1992: “Public
officials must be able to better ensure our citizens that the government can effectively
account for where their tax dollars go and how they are used. … States, localities, and
other countries are moving forward on performance measurement. It creates a focus on
results and can improve government operations” (Bowsher 1992, 1). He also stated
1
that citizen surveys consistently report that Americans believe that some 40 percent of
public funds are either wasted or spent unnecessarily (Bowsher 1993).
It is now widely believed that performance measurement in public
organizations can enhance public confidence by informing citizens about the use of
their tax dollars (Benowitz and Schein 1996; Grifel 1993; Wholey 1999). Ammons
argues, for instance, that “Performance measures document what was done by various
governmental department or units, and ideally, how well it was done and what
difference it made. Through documentation, outstanding departments and entire
organizations earn the trust of their clients and citizens as they demonstrate a good
return in services provided for tax dollars” (Ammons 1995a, 17).
Several national organizations such as the National Academy of Public
Administration (1991), the American Society for Public Administration (1992), the
Governmental Accounting Standards Board (1994), and the Governmental Finance
Officers Association (1994) have encouraged expansion of measurement to support
decision making, reporting, and management (Epstein and Olson 1996; GASB 1997;
Streib and Poister 1998; Tigue 1994). The International City/County Management
Association (ICMA) and the Urban Institute also favor performance management
2
(Ammons 1995a; Liner et al. 2001). The ICMA’s Center for Performance
Measurement, along with the Urban Institute, continues to support efforts to
institutionalize the use and effectiveness of performance monitoring, measurement,
and reporting by local governments (Willoghby and Melkers 2001).
Performance measurement has received increased interest and attention from a
diverse group of proponents that includes public officials, business leaders, community
activists, and average citizens concerned about educational quality, health care
outcomes, crime control results, and whether public programs are providing-as the
British put it-“value for money” (Shick 1990, 33). Schick suggests that “measurement
of performance is an old practice that is taking on a new lease” (Schick 1990, 26).
Despite widespread interest, only a small number of public organizations
actually conduct performance measurement studies, report performance indicators and
use this information in actual decision making (de Lancer Julnes 1999; de Lancer
Julnes and Holzer 2001; GASB 1997; Hatry et al. 1990; Walker 2001). The American
Society for Public Administration admitted that “use of performance measurement is
still the exception rather than the norm in American government organizations”
(ASPA 1992, 1). Nyhan and Marlowe (1995) also concluded that despite the many
3

recent improvements, performance measurement in the public sector remains in an
“embryonic” stage. Despite the advantages of using performance measures, such as
supporting decision making, improving service performance, enhancing reporting, and
other rationales noted in the literature, the majority of state and local governments
have not systematically developed and used performance measures (de Lancer Julnes
1999; GASB 1997). Coplin et al. (2002) argue that “Despite some significant
examples of use, measuring government performance is far from a common practice”
(700).
Most government agencies may collect data that is or could be used for
performance measurement; however, they do not have a system in place to use those
data as part of the decision-making about resource allocation or resource deployment
(Coplin, Merget, and Bourdeaux 2002). Further the literature has comparatively few
examples of how local governments have used performance measures to support
decision making, performance monitoring, improving service performance, or its
effects.
4

II. Research Questions and Objectives
A performance measurement can generate a great deal of information but it
also can be very expensive to collect performance data. In order to justify the cost, the
information from performance measurement actually should be used. Collecting and
reporting information is a meaningless exercise if the information is not used to inform
decisions about the things that the information is intended to affect. If that is the case,
performance measurement may eventually fall into disuse. The difficulty that many
local governments face is not necessarily in knowing how to develop appropriate and
reliable performance measures, but rather in understanding how best to integrate the
results from these measures into the management and operational decision-making of
the organization (Grifel 1996).
The purpose of this study is to examine the factors that affect adoption, use
and impact of performance measures in mid-sized U.S. cities. For those localities that
adopt performance measurement, the objective is to ascertain whether and how they
use performance information for different types of policy and management decisions.
(de Lancer Julnes and Holzer 2001).
5

The problem of utilization of performance measures is a multifaceted one
(Patton 1978). As the GAO has observed, having good performance measures is
important, but it is also important that they actually be used by decision makers (U.S.
General Accounting Office 1992). Though a number of jurisdictions regularly monitor
performance, relatively few report that they use this information in substantive ways to
improve services (Coplin, Merget, and Bourdeaux 2002; Poister and Streib 1999;
Wholey and Hatry 1992). Kamensky (1993) argues that even when organizations
develop performance measures, the biggest challenge is to get them to use their
measures for their intended purposes.
The goal of this research project is to advance our knowledge about the
adoption and use of performance measures in mid-sized cities. The aim is to provide
information that may be useful for jurisdictions that may be considering using various
measures or that have not yet fully implemented performance measures. Which
measures are most frequently adopted and why? How are they actually used? What do
managers report about their value and utility? The specific questions discussed in this
research are: (1) what are the major factors that affect uses of performance measures in
6

local government, and (2) what are the major impacts of using performance measures
in local government.
III. Research Methods
This section explains the research methods employed in this study. Survey
questions were developed for this research and a mail survey was administered to city
officials in mid-sized cities to gather information about the adoption and use of
performance measures in local governments. The survey instrument designed for this
survey is shown in appendix. The distribution of survey responses and the profiles of
respondents are presented in this section as are the limitations of this study.
The data collected for this research project were collected from a mail survey
and from US census data sources. A mail survey was sent to 670 chief administrative
officials in US municipalities with populations 25,000 to 250,000. These mid-sized
cities are the target population. There are a total of 1,339 municipalities with
populations in the 25,000 to 250,000 range. A stratified random sample of 670 cities
(about 50%) was obtained from the International City/County Management
Association (ICMA) in 2004. The names and addresses of local chief administrative
7

officers were obtained from the ICMA along with a data file containing descriptive
data for each city such as population, region, metropolitan status, and form of
government.
There are several reasons for choosing cities with populations between 25,000
and 250,000 as the target population. First, data are available for these cities from
secondary sources. Secondly, the cost to include the larger number of smaller cities is
prohibitive. In addition, the adoption and use of performance measures in smaller
cities is believed to be less prevalent because of their more limited fiscal resources and
technical expertise to implement performance measurement. Finally, previous
researchers, such as Streib and Poister (Streib and Poister 2002, Poister and Streib
1999; Streib and Poister 1998) used the same population class for their study of
municipal performance measures. Using the same population class allows the results
of this study to be compared with previous research findings.
The survey instrument was mailed in two rounds during the summer of 2004.
A total of 280 completed surveys were returned for a response rate of about 42 percent.
Most surveys were completed by city managers (147, 54.0%) or assistant city
managers (43, 15.8%), but in some cases they were filled in by mayors and chief of
8

staff to the mayor (12, 4.4%), finance or budget directors (18, 6.6%), human resource
directors (16, 5.9%), or other high level-officials (36, 13.2%).
Table 1-1 shows that the distribution of responses obtained are comparable to
the distribution of cities in the target population. In the case of population, the survey
response percentages generally are within a few percentage points of target population.
In terms of geographic region, municipalities from the northeast are 6.7% under
represented. In terms of form of government, municipalities with mayor-council form
of government are 6.6% under represented and municipalities with council-manager
form of government are 7.4% over represented.
IV. Dependent Variables
There are two main sets of dependent variables in this research. The first set
concerns the uses of performance measures. These include the types of performance
measures that mid-sized cities use, the reasons they adopted these measures, the results
that local officials expected to see based on the use of these measures, and the types of
decision applications for which various performance measures are used.
9

Table 1-1. Distribution of Survey Responses, September 2004 Target population Survey responses DifferenceClassification Number Percent Number Percent % Population group 100,000-249,999 88 13.1 44 15.7 2.6 50,000-99,999 197 29.4 75 26.8 -2.6 25,000-49,999 385 57.5 161 57.5 0 Total 670 100 280 100 0 Geographic region Northeast 164 24.5 50 17.8 -6.7 North Central 165 24.6 70 25.0 0.4 South 162 24.2 77 27.5 3.3 West 179 26.7 83 29.7 3.0 Total 670 100 280 100 0 Form of government Mayor-council 219 32.7 73 26.1 -6.6 Council-manager 422 63.0 197 70.4 7.4 Commission 11 1.6 5 1.8 0.2 Town meeting 5 .7 1 .4 -0.3 Representative town meeting
13 1.9 4 1.4 -0.5
Total 670 100.0 280 100.0 0
10
Classifications that describe the types and extent of the adoption of performance
measures, such as output, outcome, efficiency, service quality, and citizen
satisfaction are identified.
The second set of the dependent variable involves the perceived impacts of
performance measures. These include executive ratings of the actual impact of
performance measures and their perceptions of the overall helpfulness of
performance measures. These variables are analyzed to determine the extent to
which the use of various performance measures affect executive decision making in
terms of services, programs, budgets, staffing levels, and other types of
organizational decisions.
V. Independent Variables
There are three main sets of independent variables. The first concerns the
features and characteristics of mid-sized U.S. cities that use performance measures.
The second set concerns the characteristics of municipal executives. The final set
concerns the organizational features of the municipal performance measurement
efforts. These features are important for understanding which mid-sized cities use
11

performance measures. They also help to advance our understanding of the variation
in experiences among the municipalities that use performance measures.
The features of the mid-sized cities that use performance measures include
city size, region, structural features, the extent of employee unionization and mean
income, racial and educational characteristics. The profile data for the responding
municipal executives include their official title or position, their length of tenure in
that position, and their length of professional service in local government. The
organizational features of municipal performance measurement efforts include the
locus of primary responsibility for developing or devising service and performance
measures, the primary audience for reports on or information about service
performance, the length of time that cities have used performance measures, and the
respondents’ assessment of the overall capacity and adequacy of city’s resources for
collecting and using performance information. Also used are the attitudes of various
municipal actors that concern the uses and applications of performance measures in
their cities. Finally, executive perceptions about city staff and citizen’s perspectives
on the use of performance measures are used as independent variables.
12

VII. Scope and Limitations of Research
The focus of this research is to identify the factors that affect the adoption,
use and impacts of performance measures among mid-sized cities. The findings of
this research can only be generalized to cities with the 25,000 to 250,000 population
range. This research is cross-sectional so generalizations can only apply to the state
of performance measurement uses and impacts in 2004.
13
CHAPTER 2
LITERATURE REVIEW
This chapter summarizes the literature on performance measurement in the
public sector and the development and use of performance measurement in local
government. Then literature relevant to the adoption and use of performance
measures in local government is discussed. And then several ongoing municipal
performance measurement programs in the States are overviewed. Performance
measurement project from North Carolina, South Carolina and Tennessee will be
illustrated. Finally, potential barriers to effective use of performance measures and
the relationship between performance measurement and program evaluation are also
discussed.
I. Performance Measurement in the Public Sector
Performance measurement in the public sector has expanded due to a great
deal of interest since the 1990s. Wechsler and Clary (2000) report that “the 1990s
witnessed an explosion of efforts designed to improve government performance”
14

(264). The current emphasis on performance measurement does not mean that this is
a new field to public organizations (Bouckaert 1990). The first use of performance
measurement can be traced back in activities of the New York Bureau of Municipal
Research in 1907 (Cope 1996; Williams 2003). According to Williams (2003), the
efforts of the New York Bureau of Municipal Research were well-known as the
origins of modern budgeting but were less well-known as the origins of
performance- and productivity-measurement practices. The development and use of
performance measures has also been traced to a 1938 document by Ridley and
Simon (Fisher 1996; Hatry 1996). Ridley teamed with Simon and wrote a book
urging local governments to measure their performance and offered guidelines
(Ridley and Simon 1943). They suggest various types of information that local
governments might use to monitor various local services and to assess how well
these services were being delivered. Performance measurement has been supported
on federal, state, and local governments in the United States since the 1940s (Nyhan
and Marlowe 1995).
Development of budget mechanisms at the federal level contributed to
growth in the use of performance measurement at federal, state, and local levels. The
15
Hoover Commission worked successfully to streamline the federal government by
introducing the concept of performance budgeting (Ammons 1995c; Fisher 1996).
During the 1960s, 1970s, and 1980s, the use of performance measurement gained a
great deal of attention in many localities, states, and federal agencies (Wholey 1997).
Performance measurement was often supported in conjunction with efforts to
introduce new budget models such as planning-programming-budgeting systems
(PPBS), zero-based budgeting (ZBB), management by objectives (MBO),
performance based budgeting (PBB), and benchmarking (Fisher 1996). The Total
Quality Management (TQM) movement of the 1990s emphasized the importance of
focusing on customers, monitoring fact-based quality, and using of performance
measurement data as input to the analysis of program performance. Thus, it is
consistent with those local governments that measure customer/citizen perceptions
of service and seek to focus on quality and outcomes (Leithe 1997).
By the early 1990s, many national associations and organizations were
encouraging additional emphasis on performance measurement and monitoring. The
American Society for Public Administration (ASPA), the Governmental Accounting
Standards Board (GASB), the Government Finance Officers Association (GFOA),
16

the International City/County Management Association (ICMA), and the National
Academy of Public Administration (NAPA) have all supported the improvement of
performance measurement and monitoring (Ammons 1995c; Fisher 1996). The
establishment of Vice President Gore’s National Performance Review (NPR) and
passage of the federal Government Performance and Results Act of 1993 (or GPRA)
also supported performance measurement activities at the federal level and
encouraged the adoption of performance measurement initiatives at the state and
local level (Fisher 1996). The results of NPR strongly encouraged the use of
performance measures as one of the several recommendations to improve
government (Gore 1993). GPRA requires all federal agencies to develop strategic
plans, set agreed-upon goals and objectives, and measure their progress toward these
goals.
Expanded use of performance measurement is an international phenomenon,
as indicated by performance measurement initiatives in New Zealand, Australia, and
Great Britain (Hatry 1999; Leithe 1997). According to Ghobadian and Ashworth
(1994), performance measurement and review became vogue among local
governments in the United Kingdom in the early 1980s. They provide five reasons:
17
pressure from the central government; greater public expectations and consumerism;
compulsive competitive tendering (contracting to provide local government
services); changing culture and attitudes among local government managers; and
loss of confidence in government. Bouckaert (1996) also supports performance
measurement as one of the four administrative reforms taking place in Europe. He
argues that there are some major common evolutions in performance measurement
in all European countries. Performance measurement is becoming more “extensive,”
more “intensive,” and more “external” (234). Kouzmin and his colleagues (1999)
conclude that a major trend in OECD (the Organization for Economic Cooperation
and Development) countries is “the development of measurement systems which
enable comparison of similar activities across a number of areas,” (122) and which
“help to establish a performance-based culture in the public sector” (123). Kettle
(1997) calls measuring government performance a “Global Revolution” in
performance management.
18

II. Development and Use of Performance Measurement in Local Government
This section presents summaries of research on performance measurement
development and use in local government. The vast majority of research on the
development and use of performance measures has been based on surveys trying to
measure the extent of use and the types of performance measures used.
Ammons (1995b) provides an extensive review of research from 1970s and
1980s on local government performance. The research concludes that significant
numbers of jurisdictions reported their use of performance measures. Ammons’s
own survey (1995b), conducted in 1993, is focused narrowly on recreation and
library services. He found that despite survey responses indicating widespread and
fairly sophisticated performance measurement systems, more exacting research
involving examination of actual performance reporting documents reveals far more
limited development (Ammons 1995b; 1995c). Ammons, through the
comprehensive review of prior research on the use of performance measurement,
concludes that most cities and counties place limited emphasis on and make little
use of performance measures. Ammons (1995b) argues that “Despite growing
momentum in support of performance measurement and even recent legislation
19
requiring measurement at the federal level and in some states, as yet no decree has
forced broad compliance at the local level” (38). Ammons concluded that “Only
gradual gains in local government performance measurement have been evident in a
recent decade. Even among jurisdictions with fairly sophisticated measurement
systems, the extent to which those measures are incorporated into managerial and
legislative decisions remains an open question” (46).
Tigue (1994) reports the survey results of 1,000 GFOA members of local
and state governments in the United States and Canada. The study showed that 60
percent of the respondents reported the use of performance measurement for
management, budgeting, or planning. Budget documents were the most common
instrument for reporting performance measures (69 percent), followed by internal
management reports (57 percent), other public reports written for elected officials
and citizens (39 percent), and finally, annual financial reports (23 percent). The
majority of respondents (62 percent) reported using performance measurement in all
three activities (management, budgeting, and planning), although more survey
respondents reported using performance measures in management activities than
either planning or budgeting. This is in contrast to Ammons’s conclusion (1995b)
20

that even in the most sophisticated performance measurement systems, the extent to
which performance measures have been integrated into managerial decision-making
remains an open question.
The GASB research series titled Service Efforts and Accomplishments: Its
Time Has Come covered 12 state and local services, focusing on services offered by
many state and local governments. Hatry, et al. (1990) summarized the research
results in an overview volume. The research methodology included literature
reviews, examination of reports from state and local agencies, interviews with
practitioners and public officials, and in some cases, mail surveys of public officials.
Research issues included the types of SEA (Service Efforts and Accomplishments)
indicators considered for reporting; the extent to which these measures are valid;
disaggregation of data; comparison to be reported; explanatory data and how it
should be presented; communication and display of SEA information; the feasibility
of obtaining and reporting SEA data; and the uses for and users of SEA data. The
GASB concluded that up-to-date technology had developed sufficiently to warrant
widespread experimentation with the use of SEA indicators in external reports,
including the annual financial report. The GASB identified six uses of performance
21
data: (1) providing greater accountability; (2) motivating public employees; (3)
stimulating public interest; (4) aiding budget decision-making; (5) providing a
factual basis for policy decisions; and (6) encouraging improvement in government
programs and policies.
In 1996, two years after the issuing of GASB’s Concept Statement No. 2,
the GASB, working in conjunction with the National Academy of Public
Administration, undertook a survey to follow-up on their earlier research to assess
the extent of experimentation. The survey is intended to understand whether the
extent of use of performance measures had changed, by examining current and
planned development and use (GASB 1997). The GASB found that 53 percent of the
900 entities that responded (a response rate of 18 percent out of 5,013) had
developed some form of performance measures but only 33 percent reported having
developed output or outcome measures. Over 57 percent of county officials that
responded reported having developed performance measures, while less than 40
percent of counties that responded reported having developed output or outcome
measures. Less than 45 percent of municipal officials that responded reported they
have developed performance measures (30 percent of municipalities that respond
22
have developed outputs or outcomes). When asked whether output or outcome
measures were used for strategic planning, resource allocation, or program
monitoring, only 23 percent to 28 percent responded affirmatively. These results
appear to be somewhat consistent with the earlier research reviewed by Ammons
(1995b) from the 1970s and 1980s. The results from the GASB survey, however,
indicated fewer claims of development and use of performance measurement,
despite the increased popularity of performance measurement within the public
administration.
The result of the GASB’s survey indicated that while the number of
organizations that have attempted to develop performance measurement systems is
encouraging, the focus of these efforts is not always on outputs or outcomes. Of
particular concern is that the information derived is not always used to guide
decision making (de Lancer Julnes and Holzer 2001). The result of the GASB’s
second survey indicates that most of the state and local governments have developed
and implemented performance measures. The survey result also shows that most of
these measures, however, are input or activity/process measures. The researchers
23
conclude that many of state and local governments are still working to develop true
outcome and explanatory measures (GASB 2002).
David Walker, comptroller general of the United States, reports the survey
results of 3,800 federal managers at the Performance Conference subtitled Managing
for Results, which was sponsored by National Academy of Public Administration on
June 12, 2001. He argues that even though a greater percentage of federal managers
reported that their programs had various performance measures, the benefit of
collecting performance information is only fully realized when this information is
actually used. Managers reported that their use of performance information was
significantly lower for important management activities, including setting program
priorities, adopting new program approaches, and coordinating program effort with
other organizations (Walker 2001).
Poister and Streib (1999) conducted a survey of municipalities with
populations in excess of 25,000. In a survey where over one-half (694 of 1,218) of
the cities responded, the authors found that 38 percent of respondents reported using
performance measures. The most frequently cited motivations for using performance
measures were support for management decisions and citizen accountability,
24

although citizen groups were rarely involved in developing performance measures.
The functions for which performance measurement was deemed most important
were strategic management, strategic planning, and budgeting. In terms of problems
with performance measures, over 80 percent of respondents said that they sometimes
or usually have trouble measuring the quality of programs and services, while
almost 60 percent reported trouble keeping performance measures current, and just
over 60 percent reported trouble getting lower level employees to support
performance measurement systems. Over 50 percent reported timeliness as being a
problem.
Berman and Wang (2000) reports the results of a 1998 survey administered
to county managers in jurisdictions with populations over 50,000. Consistent with
other recent surveys, the authors found that 33.6 percent of U.S. counties use
performance measurement. The survey assessed county readiness for performance
measurement. Increased awareness of the need for accountability, and increased
ability to determine service efficiency, effectiveness, and timeliness were the most
frequently cited outcomes from the use of performance measurement.
25

III. The Literature Relevant to Adoption and Use of Performance Measures in
Local Government
This section presents factors that affect adoption and use of performance
measurement in local government. Literatures are reviewed on three approaches-
political factors, managerial factors, and demographic factors. Political factors
affecting the adoption and use of performance measures in local government include
external support from council members and citizens and top management
commitment. Managerial factors include professional competency, resources,
mission/goal orientation, and organizational culture. Demographic factors consist of
unionization, population size, budget size, and form of government.
III-I. Political Factors
1. External support from council members and citizens
Theories of management reform regard external support, such as support of
elected officials, as an important condition for implementation. Support from elected
officials and citizens legitimizes and encourages performance measurement in
public organizations because performance measurement can be viewed as an
26
administrative response to citizens’ demand for accountability and service quality
(Aristiqueta 2000; Cope 1995; Kettle 1994).
Organizations experimenting with performance measures asserted that the
success of a performance measurement system depends partly on the support of
elected officials and the public (Bowden 1996; Cannon 1996). De Lancer Julnes and
Holzer (2001) suggest that “The support from citizens and elected officials may
come in two ways: first, by allowing the organization to devote resources to the
effort, and second, by using the information even when the results contravene a
political agenda” (697).
External support also stabilizes top management responses to delay or even
opposition by lower managers and employees. Wang and Berman (2000) found that
support from elected officials and citizens enhances the deployment of performance
measurement. Wang and Berman (2000) assert that “Although performance
measurement is often viewed as an effort to make government more entrepreneurial
and businesslike, its implementation occurs in a context of bureaucratic politics that
involves elected officials” (405). Furthermore, Newcomer (1997) argues that
“Defining performance is an inherently political process… Knowledge of political
27
context is more valuable than methodological expertise in this endeavor, though
both are necessary skills” (12). Kearney and Berman (1999) also contend that “If
politics is disjointed from efforts to implement performance improvement, success is
extremely unlikely” (4).
2. Top management commitment to performance measurement
One of the findings of the NPR study includes the importance of leadership
in designing and deploying performance measurement systems (NPR 1997). Strong
leadership from the top is often cited as a critical determinant of success in any
management innovation (Mihm 2002; Sanders 1998; Wholey 2002). Hendrick
(2000) reports that strong political leadership and the capacity of managerial
appointments are crucial to the implementation of performance-oriented government
reform. Grifel (1993) also argues that clear support and directions from the city
manager or chief administrator are critical to the success of a performance
measurement system.
The fragmentation of local government has long been cited as an impediment
to coordination, accountability, equitable financing, and economies of scale (Morgan
1984). Various researchers discuss the leadership roles of central management
28

agencies, such as budget and finance offices and the office of the city managers, in
the implementation of performance measurement (Radin 1998). These offices play
an important role because performance measurement often requires a broad and
cross-departmental perspective of government performance. For example,
measuring outcomes in local economic development often requires economic
development agencies as well as planning departments. Central agencies also play
an important role ensuring that performance measures reflect the interests of
external stakeholders. In addition, the coordinated efforts by central management
offices help ensure that all departments follow similar procedures and develop
measures.
III-II. Managerial Factors
1. Professional competence
Professional competence refers to the personnel’s ability to develop,
implement, and analyze of performance measurement. Many researchers suggest a
close link between effective implementation of management initiatives and
professional competency (Rainey 1998; Streib and Poister 1990; Thompson and
Sanders 1998). For example, Wildavsky (1997) argues that planning-programming-
29

budgeting systems require agencies to meet the rigorous and difficult requirements
of technical analysis for forecasting, estimating, and analyzing each alternative.
The shortage of analytical skills has long been recognized as a significant
barrier to a local government’s ability to identify performance strengths and
weaknesses (Hatry and Fisk 1971; Holzer 1976). In the performance measurement
literature, scholars have argued the importance of competent personnel. They also
argue that the professional competence can be measured as competent personnel and
adequate information infrastructures. (Grizzle 1985; Lee 1997; Wholey and Hatry
1992). If professional competence is important, then ensuring it must become central
in development and use of performance measurement.
2. Resources
Adequate and consistent resources can be critical for the use of performance
measurement. The availability of resources can become a key obstacle to the
adoption of a comprehensive system of performance measures. As noted by Wholey
and Hatry (1992), “The cost of performance monitoring must always be balanced
against the value of performance monitoring in improving government performance
and credibility” (609). Organizations need adequate funds to hire competent
30
employees, to develop appropriate performance indicators, to collect performance
data, and to analyze performance. A continual budget allocation and adequate
funding are necessary for an organization to develop a long-term, historical
performance information data set.
3. Mission and goal orientation
Missions are the reasons why organizations exist. Scholars have argued that
a primary function of performance measurement is to specify and articulate broad
and abstract goals and missions so that goals and missions can be evaluated
(Ammons 1995a; Hatry et al. 1992; Leithe 1997). Bowsher (1992) argues that the
first step for agencies to improve accountability for program results is to clearly
articulate their missions (1992). Fisher (1996) also argues that developing
performance measures begins with a clear statement of the program’s mission.
Clearly, mission/goal orientation can spur the initiation of performance
measurement.
However, success in developing a mission does not always lead to the
implementation of performance measurement. A thoughtful procedure is needed to
define and articulate a mission and specify appropriate performance indicators to
31
assess achievement (Wang and Berman 2000). This procedure often requires
extensive preparation in indicator development, data analysis, and evaluation.
Sometimes the same goal may have different meanings for different stakeholders
(Perrin 1998). The impact of mission/goal orientation on the actual use of
performance measurement is unclear.
4. Organizational culture
Culture is an important aspect of the performance measurement process, one
that often is overlooked in the pursuit of excellence. Implementing a performance
measurement system means fundamental changes that may be threatening to an
organization, regardless of their potential value in a particular context (Marshall
1996; Merjanian 1996). For change to occur in an organization, managers must
create or seek favorable conditions for it. Creating such a climate requires the
organization first to build the awareness that change is needed and then gain the
support of the people who must implement and cooperate with the change.
Hendrick (2000) argues that one important factor for successful
implementation of reform is “an open, flexible, tolerant, and forgiving culture that
allows organization to explore options, learn, and make mistakes” (316). Marris and
32

Rein (1973) suggest that public bureaucracies are slow to innovate because the
dominant social classes prefer the status quo. Risk-taking offers the public sector
manager few tangible rewards for success, but substantial public criticism and
penalties for failure (Ammons 1985).
III-III. Demographic Factors
1. Unionization
Unionization can be a deterrent to the implementation of performance
measures. Ammons argues that unionization is a deterrent to innovation and change
(Ammons 1992). Unions have tended to oppose differential treatment based upon
productivity, employee reductions, and outsourcing government functions (Stanley
1972). Unions have also opposed innovations in personnel development or
technology when the result is considered disruptive or threatening to employees
(Greiner et al. 1981). If unionization has a tendency to oppose practices that could
disrupt or threaten employees, it would be expected that the level of unionization
would be negatively related to implementation of performance measures. However,
the negative impact of unionization on the implementation of performance measures
in local government might be small. Hayes (1977) argues that major conflicts
33

between management and organized labor have occurred in relatively few cities and
suggests that most municipal employees view productivity improvement with
“equanimity, if not indifference.”
2. Population size and form of government
Larger jurisdictions are more likely to have resources for performance
measurement systems and to monitor performance results. Poister and Streib (1999)
found that performance measurement use was more common in larger jurisdictions.
Performance measures are used by only 30 percent of cities with populations less
than 50,000, while they are used by over 75 percent of cities with 250,000. Poister
and Streib (1999) also found that performance measures are used more frequently in
cities with the council-manager form of government than in those with mayor-
council system.
IV. Ongoing Municipal Performance Measurement Programs in the States
This section introduces three recent performance measurement projects in
local government. It includes that the North Carolina Local Government Performance
Measurement Project, The South Carolina Municipal Benchmarking Project, and The
34

Tennessee Municipal Benchmarking Project. The reviewing of these three projects can
help us to understand some lessons learned and obstacles that cope with.
IV-I. The North Carolina Local Government Performance Measurement
Project
Overview
In the fall of 1995, fourteen large cities and counties in North Carolina
agreed to participate in a performance measurement project that would attempt to
measure and compare selected local government services and costs that would allow
them to compare their performance with other cities in the state. A meeting was held
in early 1995 involving representatives from larger localities as well as staff from
the Institute of Government, the North Carolina League of Municipalities, and the
North Carolina Association of County Commissioners. Seven of the jurisdictions
were the state’s larger cities, forming Phase I of what is now known as the North
Carolina Local Government Performance Measurement Project. Seven service areas
were selected: (1) Residential refuse collection; (2) Household recycling; (3) Yard
waste/leaf collection; (4) Police patrol; (5) Police investigations; (6) Emergency
communications; and (7) Street maintenance and repair.
35
Phase II was initiated in January 1996, with seven large counties
participating. Seven service were selected for study during this phase of the project:
(1) Building inspection; (2) Environmental inspections; (3) Emergency medical
services; (4) Jail operations; (5) Pretrial release; (6) Foster care; and (7) Abuse and
neglect investigations. Phase III of the North Carolina Project began in January of
1997, constituting of fourteen medium-size cities and seven medium-size counties
from North Carolina jurisdictions. The participating units studied the same areas of
services as Phase I and II. Information on the North Carolina Government
Performance Measurement Project is obtained from The Institute of Government
(2004). Additional information can be found from the web site listed in the reference.
The Goals of the North Carolina Local Government Performance
Measurement Project
1. To develop/expand the use of performance measurement in local government.
2. To produce reliable performance and cost data for comparison. 3. To facilitate the use of performance and cost data for service or process
improvement.
Types of Performance Measures
Three types of performance measures have been used:
1. Workload measures: These measures are used to demonstrate the extent of
36
the need for a particular service that is provided by a locality. An example of a workload measure is tons of residential refuse collected.
2. Efficiency measures: The project uses efficiency measures to assess the relative cost or efforts expended in the provision of a service. These measures may include cost per unit of service provided, cost per unit of output, or the cost of service provided per full time equivalent position. An example of efficiency measures is cost per ton of residential refuse collected.
3. Effectiveness measures: These measures assess service quality by documenting the extent to which the locality responds to a specific need or demand; and/or by reporting the citizens’ perception of quality or effectiveness. An example of an effectiveness measures is complaints per 1,000 collection points of residential refuse.
Performance and Cost Data Reports
The performance and cost data reports published by the North Carolina
project are partitioned by the service area and by jurisdiction. A standard two-page
layout is employed for illustrating a unit’s performance and cost data for each
service area. The first page contains the result of workload, efficiency and
effectiveness measure. The second page contains four clusters of information.
The first provides the city or the county profile-representing statistics like
population density, land area served, topography, median age and unemployment
rate, which may affect service performance and cost. Some of the general
characteristics, such as population, appear in the city profiles for all of the service
areas. Others, such as the crime rate for serious offenses, appear in only selected
37
profiles. The second cluster provides the full cost profile by actual dollars and by a
percentage. A cost accounting model is used to calculate full or total cost of
providing each service area under study. The third cluster contains the service
profile data. This identifies important dimensions of service organization and
method of delivery. It contains the data used to calculate the performance measures
and other important statistics for the service area under study. The final cluster
contains the explanatory information. It provides a description of the service area;
processes of delivery; and discusses the conditions that affect service, performance,
and cost. The explanatory information often provides the critical factors in
explaining variances in performance measures.
Some Lessons Learned
1. Local governments can produce accurate, reliable, and comparable performance and cost data, which can be used for service or process improvement.
2. Specific service definitions are vital to performance measurement, including explanatory information.
3. Data availability and quality are very important to performance measurement.
4. Auditing or verifying the accuracy of performance data is a necessary component of performance measurement and benchmarking.
5. Performance measurement and cost accounting are time consuming. However, performance measures provide valuable information in the quest to provide quality services at reasonable cost.
38

Benefits and Results
In addition to the specific results for participating cities, this project has
achieved some overall goals and produced some lessons regarding cost accounting
and performance measurement. A guide to the North Carolina Local Government
Performance Measurement Project has been developed that describes the methods
and techniques developed and used in the project. The project’s methodology
describes unit and service profiles, performance measurement, cost accounting, and
results have been explained. Useful comparative performance and cost data have
emerged from the project for the services studied. The project succeeded in
achieving consensus on service definitions and measurement formulae by involving
many officials from the participating cities.
IV-II. The South Carolina Municipal Benchmarking Project
Overview
In 1996, the Governmental Research and Services unit of the Institute for
Public Services and Research in the University of South Carolina began a pilot
project to provide municipalities in South Carolina with a means to easily compare
performance data on municipal services. The services that are included in this effort
39

are: police, fire, solid waste services, and parks and recreation. Parks and recreation
measures were in the pilot phase in 1996 and the committee developed and refined
measures over the next year.
As the department managers meet in each of these areas to share data and
analyze performance results, they are able to learn best practices from their peers
and how they are handling service delivery challenges. City managers and
administrators learn about efficient service delivery methods and the true cost of
service delivery. Information on the South Carolina Municipal Benchmarking
Project is obtained from Berger (2002) and Berger and Tomes (2002).
Current Project Status
Phase I of the Benchmarking Project, which focused on the development of
service measures and creating collection methodologies, was successfully completed
in the spring of 1999. At that time, the Steering Committee decided to open the
Project to all interested cities with a population of 5,000 or greater. This population
size was chosen based on the level of resource commitment (i.e., money and staff
time) that it had required from the pilot phase of participants.
40

In a strategic direction meeting in the fall of 2001, the Steering Committee
decided to add parks and recreation as a new service area. A draft report of the
performance results was published in the fall of 2002.
Participants
There were currently 17 participating municipalities in the 2001-2002
project year. Nine of these municipalities have been participants since the pilot
phase of the Project in 1996.
Measures
Once the service areas were identified, the service committees began
developing a standard set of balanced measures and were encouraged to identify
measures from the following categories: input, output, outcome, efficiency, and
quality.
One of the challenges of the Benchmarking Project is balancing the needs of
the different audiences and users (e.g., city managers/administrators, department
managers, citizens, etc.). City council members are interested in an “executive
summary” review of their city departments, while department managers find more
value in a detailed analysis of the performance results. Project staff have created
41
reports tailored to meet the interest and needs of the varying audiences. Each year
the participants are asked to refine the list of measures based on the utility of the
performance information.
Service Profile
An immediate discovery in the pilot phase of this Project was that not all
cities deliver services in a similar manner. When benchmarking, it is imperative that
all services and measures be fully defined to avoid erroneous comparisons. Each
service committee took on the task of creating a “service profile” for its area to
account for the operational differences in the participating departments.
Process Model
The South Carolina Municipal Benchmarking Model can be replicated by
using the project’s process model.
Step 1: Establish goals and deliverables for the project
In 1996, eleven cities were asked to participate in the pilot phase of the
Benchmarking Project based on demographic representation across the state, interest
in measuring organizational performance, and their demonstrated leadership abilities
in encouraging and sustaining organizational participation in such a project.
42

Eleven cities agreed to commit their resources to the three-year pilot project and
work to accomplish the following deliverables:
To develop a standard set of performance measures for three key services and define consistent data retrieval methods;
To develop a standard costing methodology for each service area; To develop and implement a standardized customer survey instrument to
collect quality measurement information; To create a common list of profile such as level of service, method of
service delivery, and other information that should be considered when comparing performance and cost statistics; and
To create a training component for the second phase of the Project when new municipalities would be invited to participate.
Step 2: Create a structure to support the attainment of the goals and deliverables
Careful consideration was given to how the Project would be staffed and
structured. The Benchmarking Project is structured according to the following
committees: Steering Committee, Finance Committee and Service Committees for
each service area.
Steering Committee
The Steering Committee is composed of the city managers and
administrators from the participating municipalities. Representatives from the
Municipal Association of South Carolina, the State Comptroller General’s Office,
and Clemson University’s Strom Thurmond Institute were also asked to lend their
43

expertise and cooperation in the Project’s infancy. The primary purpose of the
Steering Committee is to provide leadership and direction for the Project as well as
ensure full participation from staff serving on the service committees.
Responsibilities of the committee are summarized below:
Selection of core services to be included in the Project; Final approval of all performance measurement and profile information to
be included in the system; Determine reporting formats and methods for distributing performance
information;
Finance Committee
The structure and purpose of Finance Committee has evolved since the pilot
phase of the Project. The primary charge of the Finance Committee was to develop
the cost accounting model for the Project and to identify potential vendor to provide
this service for participating cities. The committee membership has since been
expanded to include finance director/officers from each of the participating
jurisdictions.
44
Service Committee
The service committees are designed to provide expertise and buy-in from
the managers who would most likely be positioned to implement the changes and
improvements that commonly occur from benchmarking performance.
The service committee members’ major tasks are:
Development profile factors related to the service area (e.g., functions performed, collection method, etc.);
Develop standard performance measures for Steering Committee approval; Collect and submit performance measurement data for their department as
defined by the committee; Serve as peer reviewers of the data; Analyze the performance of their departments; and, Seek out the best practices for their service and ways to adapt these to their
departments.
Project Staff
Staff from the Governmental Research and Services unit serves as Project
managers and provides facilitative and operational support to the Project.
Major tasks are:
Development of the Project model; Facilitating meetings; Coordinating logistics; Collecting data; Developing the database; Publishing reports; and, Sustaining participants in the analysis and utilization of the benchmarking
45

results.
Step3: Select service areas to be benchmarked
After much discussion and debate, the Project’s Steering Committee
decided to focus on police, fire and solid waste services for the pilot project. As is
the case in many jurisdictions, the majority of the municipal budget is dedicated to
these three service areas. It is important to maximize efforts by selecting those
services that have greater opportunity for improvement.
There are several components to these services and not all cities define them
or deliver services in similar manner. When benchmarking, it is imperative that all
services and measures by fully defined to avoid erroneous comparisons. Since there
will always be differences among organizations, each service committee took on the
task of creating a service profile for its areas to help delineate some of the
uniqueness.
Step 4: Develop a balanced set of performance measures
In order to achieve balance of indicators, the service committee members
were encouraged to identify measures from the following categories: input, output,
outcome, efficiency, and quality. The committees reviewed measures that had been
46
developed from the North Carolina Performance Measurement Project, largely so
that municipalities would have the option to benchmark across state lines if they had
similar sets of measurement data. Since interstate benchmarking was a secondary
goal, the South Carolina Municipal Benchmarking Project allowed committees to
refine or develop new measures where appropriate.
Step 5: Develop a set of profile factors to assist in selecting partners
The service committees also developed profile factors that would explain
differences in service populations, terrain and other factors that might affect
performance. The profile factors are also helpful in selecting benchmarking partners.
Since each service is different, a set of profile information was created for each
service area.
Step 6: Determine which measures should be collected through an outside source to
ensure integrity
Quality measures by nature can be subjective because they gauge how well
an organization met the expectations of its customers. Most systems rely on
customer complaints to evaluate quality. Problems of this passive method of data
collection are that it can be skewed tremendously by “over zealous” citizens
47

(selection bias). A random, telephone survey of citizens in each participating city
was developed and employed.
Rather than focusing on rank, the Steering Committee created categories
and each city was placed according to their score. The Project’s Steering Committee
decided to develop a standard costing methodology that included both direct and
indirect costs. The traditional “cost per capita” method can provide a skewed
perspective to an interested citizen wanting to evaluate the efficiency of his city’s
services. Since smaller jurisdictions usually serve a smaller population, the cost per
unit of service will most likely be higher than that of their larger counterparts.
In directing cost software:
Governmental Software Systems, Inc. (See www.gss-software.com)
DMG Maximus
Step 7: Test data collection methods and redesign measures where necessary
Each of the service committees collected data for each measure and then
discussed collection problems or issues they encountered while trying to capture
results. Several measures were altered or removed due to the collection costs or
concerns that the data would not be useful.
48
IV-III. The Tennessee Municipal Benchmarking Project
Beginning in fall 2000, the Municipal Technical Advisory Service (MTAS)
formulated a proposal and secured approval from the University of Tennessee Institute
for Public Service for a project to begin a comparative performance measurement, or
benchmarking, project with a small group of Tennessee cities. The goals of the project
are to compare the relative cost, efficiency and effectiveness of a set of municipal
services by using a collaborative approach with the participating cities, and to set
standards and identify “best practices” in municipal government for use and
comparison by all Tennessee cities.
After researching similar projects nationally and in other states, MTAS staff
concluded that the model that appeared to be the most adaptable to Tennessee was a
project operated by the Institute of Government at the University of North Carolina -
Chapel Hill. UNC developed a project beginning in 1995 involving, initially, 10
large North Carolina cities. They later replicated the project with a group of large
counties, and a group of smaller cities and counties.
A group of eleven Tennessee cities initially agreed to participate in January
2001. The participant cities were selected based on their previously expressed interest
49
in such a project, along with other municipalities that MTAS staff felt were either
already familiar with benchmarking, or who had the strong potential to be active
participants. While there are a number of Tennessee cities that could participate, the
goal was to select only a few cities, balanced by both form of government and
geographically, that could contribute to and make a success of the project. Three cities
in the group have a Strong Mayor form of government and the balance are Council-
Manager governments.
The cities that agreed to participate met with two representatives of the UNC
program in a two-day conference in January 2001, in Knoxville. At the conclusion of
that conference, the participating cities selected three services (Police Patrol, Fire
Services, Residential Solid Waste Collection) to be “benchmarked” in the first year of
the project. After the initial meeting involving eleven cities, three cities later withdrew
from the program because of internal demands on their staff time and turnover among
key staff, and one city was added. The project now has nine participating cities.
Each city designated at least one representative from each service area, along
with a finance representative, to serve on “Service Area Committees,” which defined
the boundaries of the service to be measured, developed benchmarks for all aspects of
50
the service, and reported those results back to a Steering Committee of one
representative from each city, which has overall responsibility for all aspects of the
project. In the case of the Finance Committee, their task was to determine a common
cost accounting methodology to apply to the services being benchmarked.
In the initial phase, some staff time in each department was needed to review
proposed data collection forms, which are simple one or two page surveys for each
service. As services are added, additional Service Area Committees will be formed,
which will meet infrequently once benchmarks are established for that service.
Data collection is consciously designed to not require any additional effort beyond
information that is currently collected for standard police, fire, and solid waste
operations and required reporting.
The plan for this project is to expand it slowly over time by adding both
services to be benchmarked and participant cities. Over the next year, one or two
service areas may be added and there may be additional 2 to 5 cities that choose to
participate.
One of the long-term benefits to all Tennessee cities will be the development
of a wealth of information on municipal costs and performance that other cities and
51

towns can use, even if they are not direct participants. The project will also generate
conferences and publications discussing “best practices” that will inevitably emerge as
cities begin to compare themselves with each other in such an in-depth project. The
intention is to use the information generated by this project to evaluate and improve
the efficiency and effectiveness of all Tennessee cities’ services. Information on
Tennessee Municipal Benchmarking Project is obtained from the Municipal Technical
Advisory Service (2003).
V. Limitations of Performance Measurement
The types of performance measures being used in local government depend,
in large part, upon the proposed uses of measures being collected. Performance
measures have been used for determining the efficiency of public programs by
following a private sector model that compares inputs to outputs produced. Since the
1990s, performance measurement systems have focused on monitoring the
effectiveness of programs by focusing on intermediate and long-term outcomes. The
difficulty in doing so is that performance measurement on its own may not be
52

accountable for all of the factors that may influence outcomes being achieved
(Newcomer 1997; Newcomer 1996).
Despite the advantages of using performance measures for decision-making,
program monitoring, and reporting, performance measurement does have some
limitations. These limitations may influence the success of the performance
measurement system. Many scholars have discussed the limitations and unintended
consequences of measuring performance with suggestions of preventing these
negative factors of performance measurement (Ammons 1999; Bouckaert and Peters
2002; Grizzle 2002; Hatry 2002; Hatry, Gerhart, and Marshall 1994).
Perrin (1998) provides a list of eight factors and he argues that these were
“inherent flaws and limitations in the use of performance indicators to ascertain
program performance” (370). These included:
varying interpretations of the “same” terms and concepts; goal displacement; use of meaningless and irrelevant measures; cost shifting; disguising of subgroup distinctions through misleading aggregate indicators; the limitations of objective-based approaches; uselessness for decision making and resource allocation; and less focus on outcomes.
53

In addition, Perrin argued that the failed history of earlier performance
measurement efforts is evidence of its inherent limitations. Bernstein (1999), on the
other hand, counter-argued that some of these opinions may be equally said of other
efforts by governments to be accountable. However, Perrin’s opinions may represent
widely held opinions.
Perrin argues that for performance measurement to be used effectively: (1)
programs need to be provided with adequate resources, including technical expertise,
for the effective development of performance indicators; (2) stakeholders need to be
actively involved in the development and use of measures; and (3) considerable time
needs to be provided to develop, test, refine, revise and update measures (377).
VI. Performance Measurement and Evaluation
Exploration of the differences between performance measurement and
evaluation is useful, because it highlights legitimate claims that performance
measurement may be limited, and indicates the importance of emphasizing the
appropriate use of performance measures. It is tempting to blur the distinction
between performance measurement and evaluation, because it is held that there is a
54
relationship between performance measurement and evaluation (Kimm 1995;
Wholey 1989). The two are historically linked because much of the basis for
performance-based management comes from the use of program evaluation
techniques to improve performance (Kimm 1995).
A critical distinction of the relationship between evaluation and
performance measurement lies in assessing factors that influence the results reported
with performance measurement system. Assessing factors that influence
performance is beyond the scope of most performance measurement systems,
because such systems usually are not comprehensive enough to eliminate plausible
alternative explanations for changes that may not have resulted from the program
itself, but rather from factors beyond the program manager’s control. Identifying and
communicating the reasons that programs do not perform as expected is the area of
program evaluation (Wholey and Newcomer 1997). Performance measurement
typically captures quantitative indicators that may measure what is occurring with
regard to program outputs and perhaps outcomes but, in itself, does not address how
and why changes may be occurring (Newcomer 1997).
55

Information on how to improve program operations must venture beyond
performance data to more detailed and comprehensive research than performance
measurement systems are able to provide. Funders and elected officials demand
evidence of a program’s impact, but conducting evaluations to provide such
evidence is methodologically demanding and resource-intensive. The movement in
the 1980s toward rapid, low-cost program and management reviews that evaluate
processes rather than results led to expanded use of performance measurement
(Newcomer 1996).
Performance measurement can be considered a field of program evaluation.
However, program evaluation usually refers to in-depth, special studies that not only
examine a program’s outcomes but also identify the “whys,” including the extent to
which the program actually caused the outcomes. Because of the time and cost
involved, in-depth evaluations are usually done much less frequently and only for
selected programs. Thus, performance measurement systems and in-depth program
evaluations are complementary activities that can nourish and enhance each other
(Hatry 1999). In addition, Hatry (1999) presents three limitations of performance
measurement.
56

These include:
1. Performance data do not, by themselves, tell why the outcomes occurred. 2. Some outcomes cannot be measured directly (e.g., prevention of crime or
reduction of illicit drug use). 3. The information provided by performance measurement is just part of the
information managers and elected officials need to make decisions. Performance measurement does not replace the need for basic expenditure data or political judgments, nor does it replace the need for common sense or good management.
57

CHAPTER 3
A PROFILE OF MID-SIZED CITIES THAT USE PERFORMANCE
MEASURES
The purpose of this chapter is to describe the features, characteristics and
survey results for mid-sized U.S. cities that use performance measures. This chapter
also profiles the municipal executives who responded to the national survey. In
addition, the organizational features of municipal performance measurement efforts
are described. These features are important for understanding which mid-sized cities
use performance measures. In Chapter 4, these features are used as independent
variables in analyses that help to advance our understanding of the variation in
experiences among the municipalities that use performance measures.
The features of the mid-sized cities that use performance measures reported
in this chapter include distributions by city size, region, structural features, the
extent of employee unionization and mean income, racial and educational
characteristics. Profile data for the responding municipal executives include their
official title or position, their length of tenure in that position, and their length of
58

professional service in local government. The organizational features of municipal
performance measurement efforts include the locus of primary responsibility for
developing or devising service and performance measures, the primary audience for
reports on or information about service performance, the length of time that cities
have used performance measures, and the respondents’ assessment of the overall
capacity and adequacy of city’s resources for collecting and using performance
information. Also reported are the attitudes of various municipal actors that concern
the uses and applications of performance measures in their cities.
I. Features and Characteristics of Mid-Sized Cities that Use Performance
Measures
Of the total of 280 survey responses, 185 cities indicated that they adopted
and actually use performance measures, 87 cities reported that they have not adopted
any type of performance measures and only 8 cities reported that they have adopted
some type of performance measures but never actually used them. The profile data
for mid-sized cities presented in this section compares the 87 cities that have not
59

adopted performance measures with the 185 cities that have adopted and actually
use performance measures.
I-I. City Size, Region, and Form of Government
City size was measured by population size, total operating budget for FY
2004, and the number of full time city employees (FTEs). Table 3-1 shows the
population distribution of cities based on whether they have or have not adopted and
currently use performance measures.
This distribution shows that cities in larger population categories are more
likely to adopt and use performance measures. In fact, the relationship between
population size and whether a city adopts and uses performance measures is strong
(gamma = .404) and statistically significant (χ2 = 20.252; df = 4, p = .000). This
finding reflects the fact that larger cities may have more resources and a higher level
of expertise to develop and use performance measures.
Likewise, Table 3-2 shows that the cities with larger operating budgets are
more likely to adopt and use performance measures. There is a statistically
significant, strong positive relationship between budget size and the adoption and
use of performance measures.
60

Table 3-1. Adoption and use of performance measures by city population size (in percentages) Population range
25,000-
29,999
30,000-
39,999
40,000-
49,999
50,000-
99,999
100,000
& larger Number
Total
percent
Not adopted 53.1 39.4 29.5 21.4 16.3 87 32.0
Adopted and use 46.9 60.6 70.5 78.6 83.7 185 68.0
Number 49 66 44 70 43 272
Percent 100.0 100.0 100.0 100.0 100.0 100.0
Note: gamma = .404; χ2 = 20.252; df = 4, p = .000
Table 3-2. Adoption and use of performance measures by municipal budget size (in percentages) Operating budget ranges FY 2004
Less than
$25,000,000
$25,000,000-
$39,999,000
$40,000,000-
$64,999,999
$65,000,000-
$99,999,999
$100,000,000
& up Number
Total
percent
Not adopted 46.2 39.0 36.0 24.0 20.3 83 32.3
Adopted and
use
53.8 61.0 64.0 76.0 79.7 174 67.7
Number 52 41 50 50 64 257
Percent 100.0 100.0 100.0 100.0 100.0 100.0
Notes: a) gamma = .311; χ2 = 11.507; df = 4, p = .021 b) There are 15 missing cases.
61

Almost 80 percent of the cities that have budgets larger than $100 million
reported that their city has adopted and uses performance measures while only about
54 percent of the cities with budgets of less than $25 million reported that they
adopted and use performance measures.
Table 3-3 shows another general indicator of city size. The mean size of the
municipal workforce for mid-sized cities is 566 employees. There is a statistically
significant, strong positive relationship between a city’s number of full-time
equivalent employees and its adoption and use of performance measures. Cities with
larger municipal workforces are more likely to number among the mid-sized cities
that adopt and use performance measures. In fact, more than 80 percent of the cities
that has 400 or more full-time employees use performance measures. On the other
hand, less than 60 percent of the cities with smaller full-time workforces use
performance measures.
Using the traditional dichotomy of municipal government structure, Table
3-4 indicates that the mid-sized cities with council-manager structures are more
likely to adopt and use of performance measures (Cramer’s V = .158) than mayor-
62
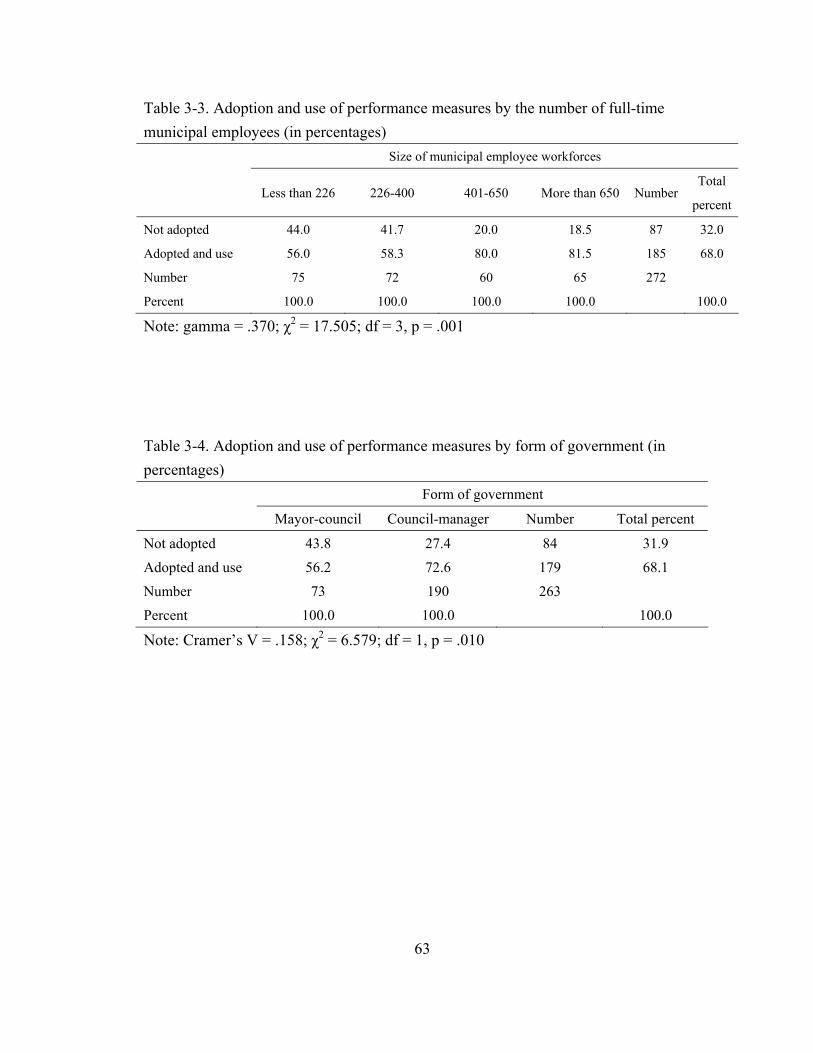
Table 3-3. Adoption and use of performance measures by the number of full-time municipal employees (in percentages) Size of municipal employee workforces
Less than 226 226-400 401-650 More than 650 Number
Total
percent
Not adopted 44.0 41.7 20.0 18.5 87 32.0
Adopted and use 56.0 58.3 80.0 81.5 185 68.0
Number 75 72 60 65 272
Percent 100.0 100.0 100.0 100.0 100.0
Note: gamma = .370; χ2 = 17.505; df = 3, p = .001
Table 3-4. Adoption and use of performance measures by form of government (in percentages) Form of government
Mayor-council Council-manager Number Total percent
Not adopted 43.8 27.4 84 31.9 Adopted and use 56.2 72.6 179 68.1 Number 73 190 263 Percent 100.0 100.0 100.0
Note: Cramer’s V = .158; χ2 = 6.579; df = 1, p = .010
63

council cities. The relationship is statistically significant (χ2 = 6.579; df = 1, p
= .010). Cities with mayor-council governments are much less likely to adopt and
use performance measures. Total number of cities for this analysis is 263. Nine
cities are excluded. They are 5 cities with commission form of government, 1 town
meeting form of government, and 3 representative town meeting form of
government.
Table 3-5 shows the relationship between region and adoption and use of
performance measures. The relationship is weak (Cramer’s V = .187) but
statistically significant (χ2 = 9.466; df = 3, p = .024). Western and southern cities are
more likely to adopt and use performance measures than cities in the north-central
and northeastern regions. It is suspected that this relationship occurs because these
regions may have a larger number of mid-sized cities with a council-manager form
of governmental structure.
Evidence of this connection between region and from of government is
shown in Table 3-6. There is a statistically significant, moderately strong
relationship between form of government and region.
64
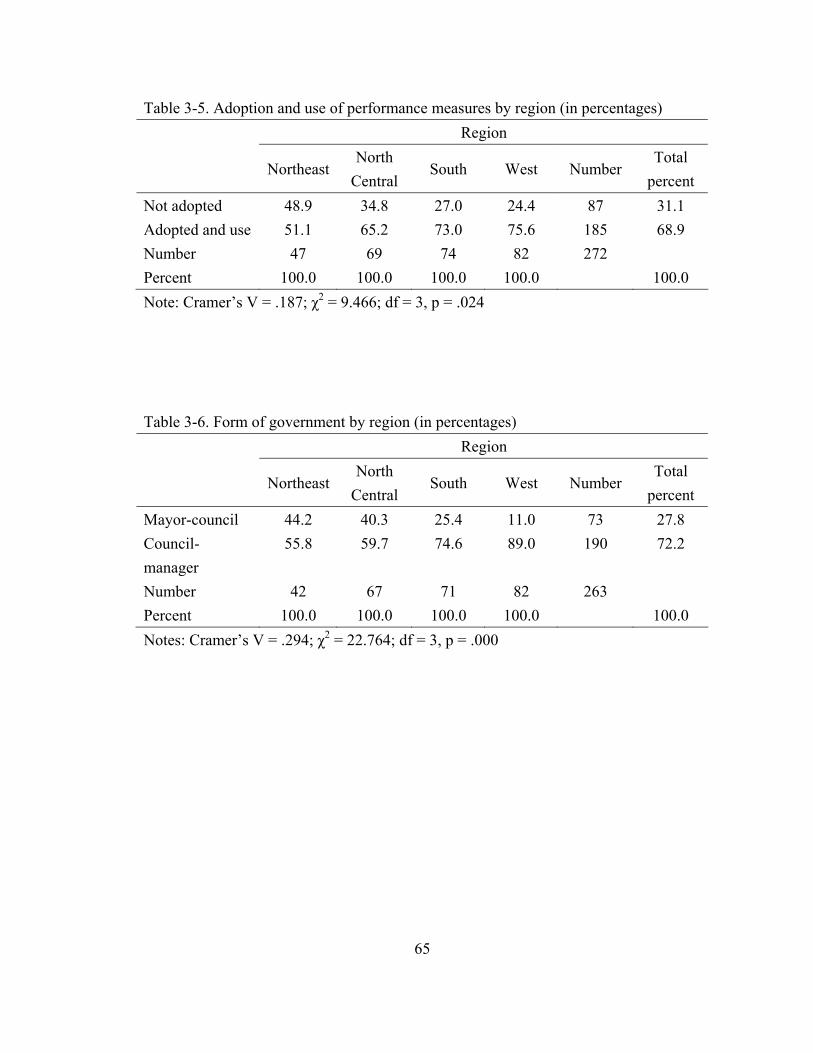
Table 3-5. Adoption and use of performance measures by region (in percentages) Region
NortheastNorth
Central South West Number
Total percent
Not adopted 48.9 34.8 27.0 24.4 87 31.1 Adopted and use 51.1 65.2 73.0 75.6 185 68.9 Number 47 69 74 82 272 Percent 100.0 100.0 100.0 100.0 100.0 Note: Cramer’s V = .187; χ2 = 9.466; df = 3, p = .024
Table 3-6. Form of government by region (in percentages) Region
NortheastNorth
Central South West Number
Total percent
Mayor-council 44.2 40.3 25.4 11.0 73 27.8 Council-manager
55.8 59.7 74.6 89.0 190 72.2
Number 42 67 71 82 263 Percent 100.0 100.0 100.0 100.0 100.0 Notes: Cramer’s V = .294; χ2 = 22.764; df = 3, p = .000
65
Western and southern cities are in fact more likely to have council-manager
form of government than north-central and northeastern cities. This regional over-
representation of the council-manager form helps to explain why cities in these
regions are more likely to adopt and use performance measures. There are simply
more council-manager governments in the West and South.
I-II. A Profile of the Structural Features of Mid-Sized U.S. Cities
To what extent have mid-sized U.S. cities adopted the changes in municipal
structure that are described by Frederickson, Johnson, and Wood (2004)? Frederickson,
Johnson, and Wood (2004) argue that the debate over the strengths and weaknesses of
the two dominant forms of American local government, the council-manager system
and mayor-council system, has tended to obscure a profound pattern of changes that
have been under way in each form of city government. Because of this, structural
changes in American cities in the last 50 years are not well understood.
Most public administration scholars believe that governmental structure and
form matter for a variety of reasons (Lineberry and Fowler 1967; Morgan and England
1999; Svara 1990; Weaver and Rockman 1993; Welch and Bledsoe 1988). How power
and authority in local government are structured, for example, shapes the nature and
66
process of decision making and represents an authoritative allocation of values
(Lasswell 1936). The structure of local government also affects citizens’ access to
decision making arenas, the ability of different interests to achieve their goals and
consequently what policies emerge from the governmental process.
How do these structural features relate to the adoption and use of
performance measures by cities? Data were collected on several structural
characteristics of mid-sized cities. Table 3-7 summarizes the distributions of several
key features of municipal structure.
Following the conceptual definitions advanced by Frederickson, Johnson,
and Wood (2004) and Folz and French (2005, forthcoming), cities were classified
into one of the three basic types: “political” (the traditional mayor-council form),
“administrative” (the traditional council-manager form) and “adaptive” (a
combination of features from the other two types). These scholars conceptualized
the three main forces that have influenced the contemporary pattern of structural
change and diffusion as drives for “political leadership,” “political responsiveness,”
“and administrative efficiency.” They suggested that if the observed patterns of
67
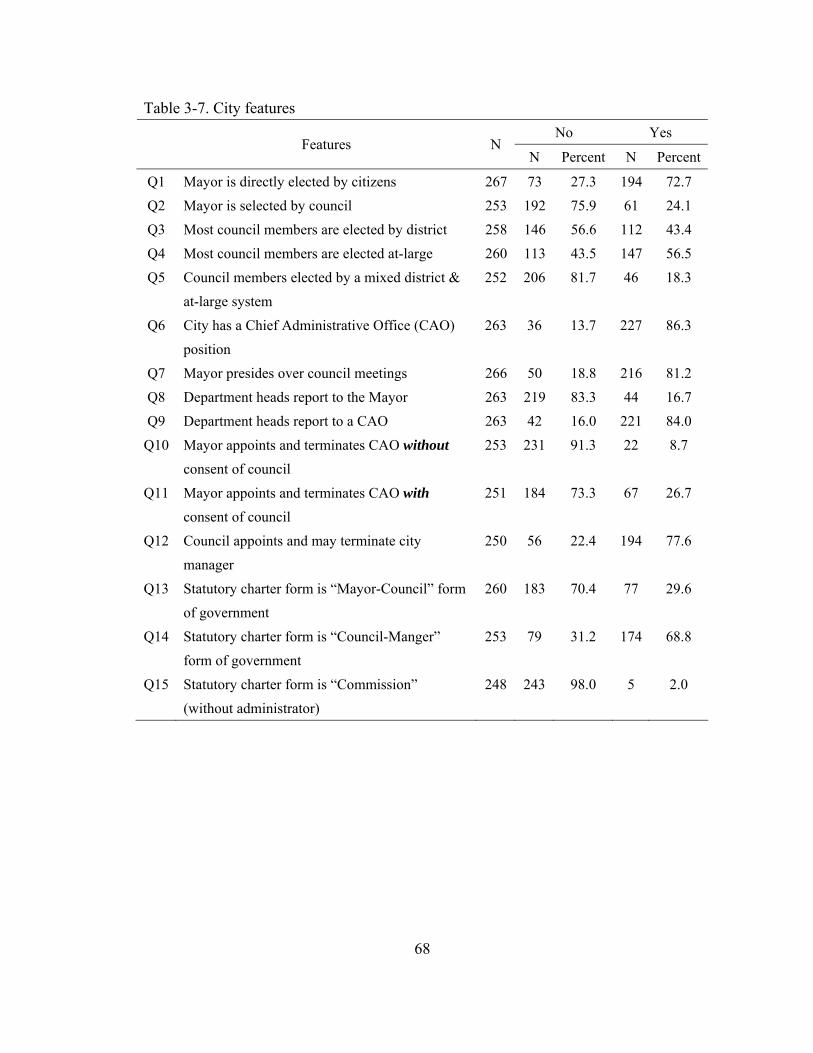
Table 3-7. City features No Yes
Features N N Percent N Percent
Q1 Mayor is directly elected by citizens 267 73 27.3 194 72.7 Q2 Mayor is selected by council 253 192 75.9 61 24.1 Q3 Most council members are elected by district 258 146 56.6 112 43.4 Q4 Most council members are elected at-large 260 113 43.5 147 56.5 Q5 Council members elected by a mixed district &
at-large system 252 206 81.7 46 18.3
Q6 City has a Chief Administrative Office (CAO) position
263 36 13.7 227 86.3
Q7 Mayor presides over council meetings 266 50 18.8 216 81.2 Q8 Department heads report to the Mayor 263 219 83.3 44 16.7 Q9 Department heads report to a CAO 263 42 16.0 221 84.0
Q10 Mayor appoints and terminates CAO without consent of council
253 231 91.3 22 8.7
Q11 Mayor appoints and terminates CAO with consent of council
251 184 73.3 67 26.7
Q12 Council appoints and may terminate city manager
250 56 22.4 194 77.6
Q13 Statutory charter form is “Mayor-Council” form of government
260 183 70.4 77 29.6
Q14 Statutory charter form is “Council-Manger” form of government
253 79 31.2 174 68.8
Q15 Statutory charter form is “Commission” (without administrator)
248 243 98.0 5 2.0
68
change in municipal structure continue, there will be fewer cities in the “political”
and “administrative” categories and more cities in one of the “adaptive” categories.
Accordingly, the modal city of the future may likely have a directly elected mayor, a
professional city manager or chief administrative officer, some or all council
members elected from districts, a civil service merit system, formal bid and
purchasing controls, and required external audits.
Empirical analyses by Frederickson, Johnson and Wood of 1996 data that
they obtained from the ICMA and their 1998 survey of a small sample of cities
larger than 10,000 population suggested that most cities with one of the two
dominant charter forms (between 69% and 71%) already have adopted at least some
of the features of the other type that qualifies them for placement in one of three
“adapted city” types. They estimated that cities in the “political” category comprised
between 8% to 16.3% of the all cities while “administrative” cities constituted about
14.7% to 21% of the total.
To what extent have mid-sized US cities emulated these changes? The cities
in this study were classified into one of the three types according to the following
features:
69
“Political” cities:
Mayor-council charter form Direct popular election of the mayor No chief administrative officer Most council members elected from district
“Adapted” cities:
Statutory charter form either mayor-council or council-manager Mayor either directly elected or selected by council & may have veto power Has or likely to have a chief administrative officer Council elected by district, at-large or mixed
“Administrative” cities:
Council-manager form Mayor is selected from among council or has no executive powers Full-time professional administrator usually called a city manager Most council members elected at-large
The specific method used to classify cities into one of the three categories
followed these decision rules: Cities that answered “Yes” on Q1, Q3, and Q13, and
“No” on Q6 in Table 3-7 were placed in the “political” category. Cities answered
“Yes” on Q2, Q4, Q11, and Q14 in Table 3-7 were categorized as “administrative”
cities. The remaining cities that had a mix of features from each of the two other
types were categorized as “adapted” cities.
70
My findings are compared with those reported by Frederickson, Johnson,
and Wood (2004) and Folz and French (2005, forthcoming) in Table 3-8.
These data show that structural changes are pervasive in cities in each of the 3
studies, but they are most pronounced in mid-sized cities. One could conclude that
mid-sized cities are at the vanguard of adopting those features of political or
administrative structures that municipal officials believe will help to advance the
responsiveness as well as the accountability of their municipal functions and
services.
The relationship in Table 3-9 shows no evidence of a statistically significant
association between the type of governmental structure and the adoption and use of
performance measures by mid-sized cities. However, it is clear that adapted and
administrative cities have much higher rate of adoption and use of performance
measures when compared to political cities.
Features of political cities and adapted cities were compared in order to
explore why adapted cities have a comparable level of adoption and use of
performance measures with administrative cities.
71

Table 3-8. Government structures in US cities Frederickson et al,
1998 Large cities
Folz & French, 2000
Small cities
Chung, 2004 Cities 25,000-
250,000 Type structure N Percent N Percent N Percent Political 19 16.3 63 12.4 22 8.2 Adapted 80 69.0 281 55.3 194 71.4 Administrative 17 14.7 164 32.3 52 19.4 Total 116 100.0 508 100.0 268 100.0
Table 3-9. Adoption and use of performance measures by government structures (in percentages) Government structures
Political Adapted Administrative Number Total percent
Not adopted 50.0 29.9 30.8 85 31.7 Adopted and use 50.0 70.1 69.2 183 68.3 Number 22 194 52 268 Percent 100.0 100.0 100.0 100.0
Note: Cramer’s V = .118; χ2 = 3.714; df = 2, p = .156
72
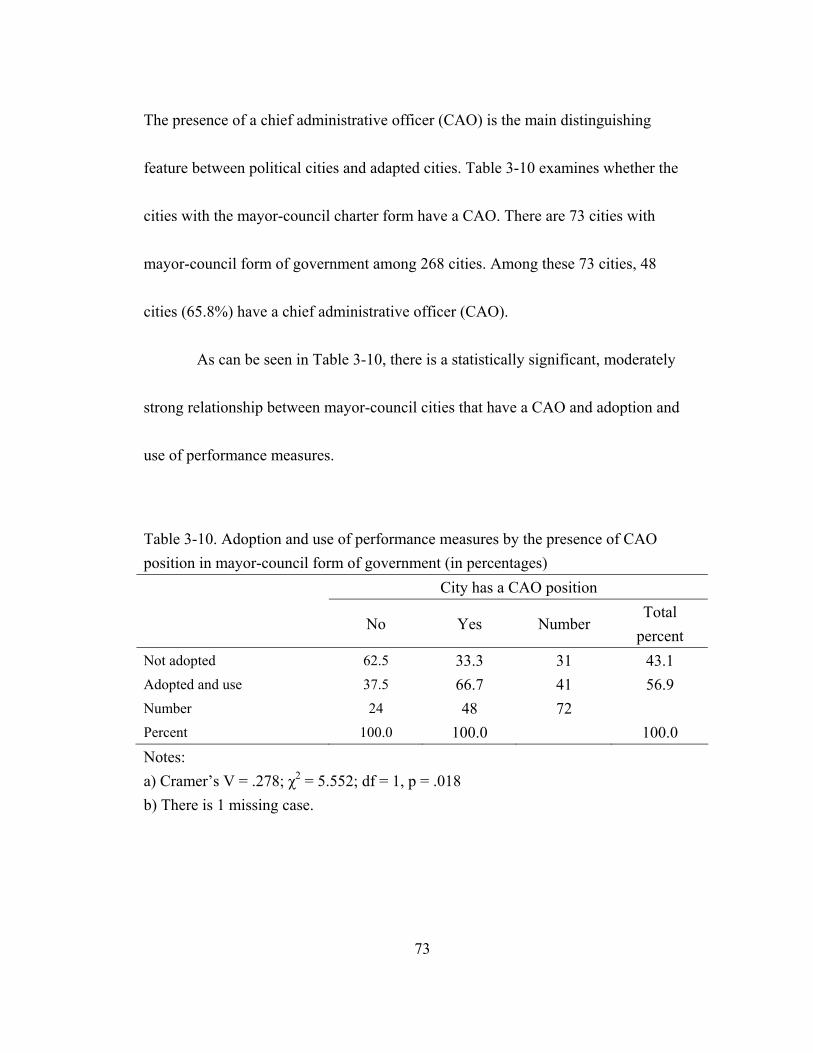
The presence of a chief administrative officer (CAO) is the main distinguishing
feature between political cities and adapted cities. Table 3-10 examines whether the
cities with the mayor-council charter form have a CAO. There are 73 cities with
mayor-council form of government among 268 cities. Among these 73 cities, 48
cities (65.8%) have a chief administrative officer (CAO).
As can be seen in Table 3-10, there is a statistically significant, moderately
strong relationship between mayor-council cities that have a CAO and adoption and
use of performance measures.
Table 3-10. Adoption and use of performance measures by the presence of CAO position in mayor-council form of government (in percentages) City has a CAO position
No Yes Number Total
percent Not adopted 62.5 33.3 31 43.1 Adopted and use 37.5 66.7 41 56.9 Number 24 48 72 Percent 100.0 100.0 100.0 Notes: a) Cramer’s V = .278; χ2 = 5.552; df = 1, p = .018 b) There is 1 missing case.
73

Thus, it is clear that many of the cities that have a mayor-council form of
government also have a CAO and are therefore more likely to adopt and use
performance measures than mayor-council cities that do not have this professional
assistance. The presence of professional administrators appears to help facilitate the
adoption and use of performance measures in mid-sized cities.
I-III. Unionization and Labor-Management Relations
Table 3-11 shows the relationship between the percent of FTEs unionized
and the adoption and use of performance measures. The relationship is negative but
not statistically significant (χ2 = 4.529; df = 3, p = .210).
Table 3-11. Adoption and use of performance measures by the percent of full-time equivalent employees unionized (in percentages) Percent of full time municipal employees unionized
0% 1-60% 61-80%
More than 80%
Number Total
percent Not adopted 31.9 30.6 23.3 40.3 87 32.1 Adopted and use 68.1 69.4 76.7 59.7 184 67.9 Number 72 62 60 77 271 Percent 100.0 100.0 100.0 100.0 100.0 Note: gamma = -.083; χ2 = 4.529; df = 3, p = .210
74

This finding suggests that cities with the largest proportions of their workforces that
are unionized appear to be among those that are least likely to adopt and use
performance measures.
Table 3-12 shows the relationship between the nature of labor-management
relations among city employees and the adoption and use of performance measures.
While the relationship is not statistically significant (χ2 = .957; df = 2, p = .620), the
local officials that most often characterize their labor-management relations among
city employees as “good” are the cities that appear to adopt and use performance
measures with somewhat higher frequency.
Table 3-12. Adoption and use of performance measures by the nature of labor-management relations among city personnel (in percentages) Nature of labor-management relations
Poor Fair Good Number
Total percent
Not adopted 33.3 35.5 29.6 82 31.8 Adopted and use 66.7 64.5 70.4 176 68.2 Number 6 93 159 258 Percent 100.0 100.0 100.0 100.0 Note: gamma =.125; χ2 = .957; df = 2, p = .620
75

I-IV. Income, Race and Education
Table 3-13 shows the relationship between performance measures and
selected mean city characteristics. No statistically significant relationships are found
among the city characteristics and the adoption and use performance measures. This
finding suggests that mid-sized cities with different economic, racial, and
educational features are equally likely to adopt and use service performance
measures.
II. Profile of the Responding Municipal Executives
Table 3-14 profiles the executives of mid-sized cities that responded to the
national survey. Following their proportion of the target population, most surveys
were completed by city managers (54.2%) or assistant city managers (15.5%).
Mayors or their chief of staffs completed 4.5% of the surveys while finance or
budget directors completed 6.8%, human resource directors completed 6.1% and
other municipal executives completed 12.9% of the surveys.
76

Table 3-13. Adoption and use of performance measures by selected mean city characteristics City characteristics
Median
household
income
Per capita
income
Percent
White
Percent of
high school
graduates
Percent of
college
graduates
Not adopted 47,542.28 22,709.63 76.79 82.42 28.97
Adopted and use 48,872.76 23,751.03 76.86 84.16 29.80
All cities 48,445.82 23,416.85 76.84 83.60 29.53
Note: None of city characteristics are associated with adoption and use of performance measures at a statistically significant .05 level.
Table 3-14. Distribution of responding municipal executives, September 2004 Survey Respondents: Number Percent City Manager 143 54.2 Assistant City Manager 41 15.5 Mayor or Chief of Staff to the Mayor 12 4.5 Finance or Budget Director 18 6.8 Human Resource Director 16 6.1 Others 34 12.9 Total 264 100.0 Note: There are 8 missing cases.
77
Table 3-15 shows the length of time that the responding municipal
executives have held their respective positions. About one-half of municipal
executives have held their current positions for less than 5 years. About one-fourth
of executives have held their positions between 5 to 10 years. Just over one-quarter
have served in their current positions for more than 10 years.
Table 3-16 indicates the range of experience that the responding municipal
executives have in local government. About one-half of municipal executives have
served in local government about 20 years. Over one-quarter of executives answered
that they have served more than 28 years in local government.
There are no statistically significant relationships between adoption and use
of performance measures and the tenure of municipal executives, or the length of
their experience in local government. Consequently, municipal officials, regardless
of their experience in local government service, appear to see some merit in
adopting and using performance measures.
78

Table 3-15. Tenure of responding municipal executives in that position, September 2004 How long have you that position Number Percent 1-2 years 69 25.4 3-4 years 63 23.1 5-10 years 69 25.4 More than 10 years 71 26.1 Total 272 100.0
Table 3-16. Tenure of responding municipal executives in local government, September 2004 How many years of local government services do you have
Number Percent
1-12 years 70 25.7 13-20 years 65 23.9 21-28 years 65 23.9 More than 28 years 72 26.5 Total 272 100.0
79
III. The Organizational Features of Municipal Performance Measurement
Efforts
This section describes the organizational locus of primary responsibility for
developing or devising performance measures, the primary audience for reports or
information about the service or performance measures, the length of performance
measurement use, and the overall capacity and adequacy of city’s resources for
collecting and using performance information. This section also reports findings
concerning the attitudes of both management and non-management employees’
toward organizational changes and city council members’ extent of support for the
use of performance measures.
III-I. Location of Primary Responsibility for Developing or Devising
Performance Measures
The location of primary responsibility for developing or devising
performance measures offers some insights into how performance measures are
developed or devised by mid-sized cities. Respondents were asked to identify the
individuals or groups who have the primary responsibility for developing or
80

devising performance measures for their jurisdiction. The choices covered a range of
administrative and elected positions. Table 3-17 shows the response distribution.
One-half of city officials indicated that the primary responsibility for
developing or devising performance measures is located in operating departments. It
is not a surprise that operating departments are most likely to involve development
of performance measures. Each department knows their work more than any other
part of the administration. When combined with the 10 percent that delegate this
responsibility to the budget office, it is apparent that the largest proportions of mid-
sized cities have decentralized the locus of responsibility for developing
performance measures.
Table 3-17. Location of primary responsibility for developing or devising performance measures No. reporting % of reporting City Manager’s office 62 34.1 Mayor’s office 9 4.9 Operating Departments 91 50.0 City Council Staff Office 1 0.5 Budget Office 19 10.4 Note: Based on 182 responses
81
Only 5 percent of cities locate the primary responsibility for developing or
devising performance measures in the office of the mayor. Among the 182 valid
responses, only 1 city placed the source of primary responsibility for developing or
devising performance measures in the city council staff office. Clearly, developing
performance measures is an executive branch function that for the most part has
been delegated to line or staff departments.
III-II. Primary Audiences for Reports or Information about Service or
Performance Measures
Examining who receives reports or information about service or
performance measures provides some insights into how performance measurement
efforts are used. Respondents were asked to identify those individuals and groups
who are the primary audience for performance measurement reports in their
jurisdiction. The options covered a range of administrative and elected officials as
well as state and federal funding agencies and citizen advisory boards or groups.
Table 3-18 shows the results. It may be that different levels of detail are
presented to each group of recipient because survey results do not indicate the
82

Table 3-18. Primary audiences for reports or information about service or performance measures No. reporting % of reportingCity manager, chief administrative officer, or other executive staff
145 78.4
City council members 131 70.8 Department heads, program managers, other line managers
119 64.3
Mayor or professional staff in the mayor’s office 68 36.8 Budget officials, personnel officials, other professional staff
70 37.8
Citizen advisory boards or groups 37 20.0 State and federal funding agencies 11 5.9 Other 4 1.4 Note: The percentages are based on 185 responding.
amount, frequency and type of information received by the different individuals and
groups listed. However, it is clear that top administrative officers are most likely to
receive performance measurement reports. However a prominent recipient is the city
council.
Over 70% of respondents indicated that the city council members are the
primary audience for performance data and reports. Interestingly, department heads
were less likely to be placed as a primary audience than were city council members
suggesting that audience for data on performance measures is mostly external to the
83

departments. Finally, citizen advisory boards and state and federal agencies were far
less likely to be chosen as a primary audience for performance reports.
III-III. The Length of Performance Measurement Use
Table 3-19 indicates the length of time that cities have used performance
measures. That the use of performance measures is still in its nascency is suggested
by the finding that over half of the cities reported that they have used performance
measures less than 7 years. Only 18 percent of the cities reported that they have used
performance measures for more than 10 years.
III-IV. Performance Measurement Capacity
Table 3-20 shows that more than half of the respondents indicated that most
city departments in their city have adequate or sufficient funding to collect
performance data. Less than half reported that most city departments have the
capacity to compare service performance data with that obtained by other cities.
Just over one-third of city officials think that most city departments have the
staff with the skill to analyze performance data. Less than one-fourth of city officials
report that their city departments use the measures to track service performance over
time and to set annual performance.
84
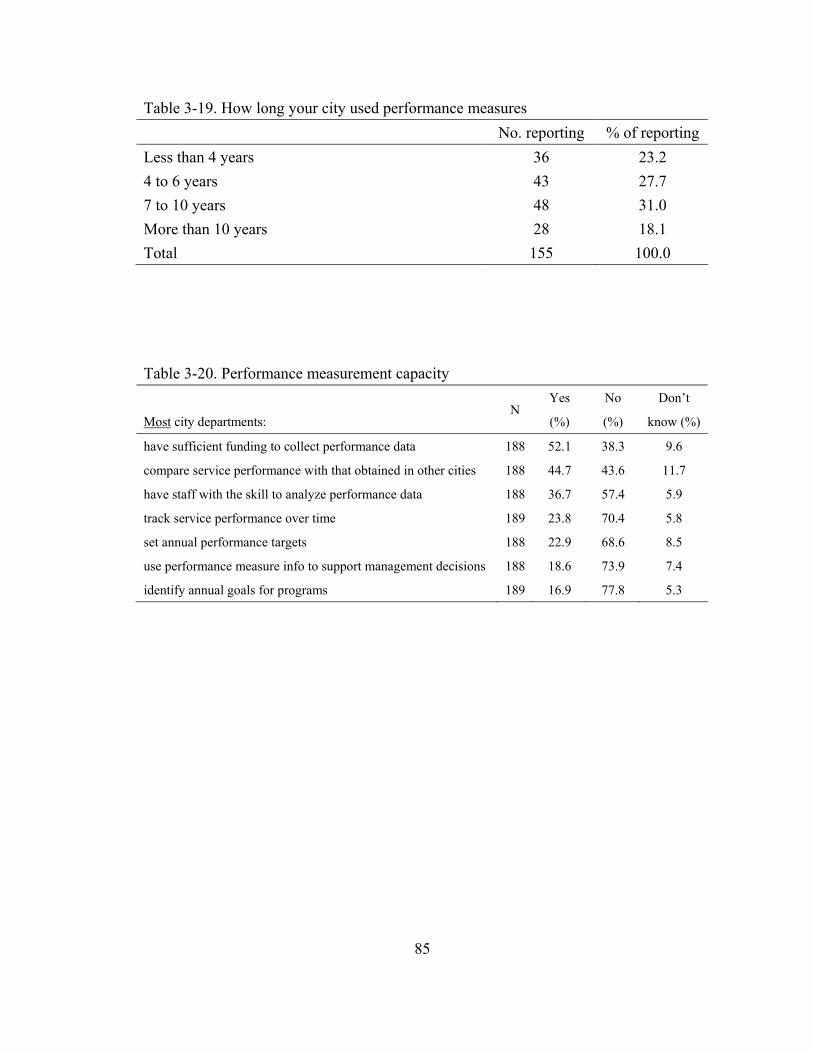
Table 3-19. How long your city used performance measures No. reporting % of reportingLess than 4 years 36 23.2 4 to 6 years 43 27.7 7 to 10 years 48 31.0 More than 10 years 28 18.1 Total 155 100.0
Table 3-20. Performance measurement capacity
Most city departments: N
Yes
(%)
No
(%)
Don’t
know (%)
have sufficient funding to collect performance data 188 52.1 38.3 9.6
compare service performance with that obtained in other cities 188 44.7 43.6 11.7
have staff with the skill to analyze performance data 188 36.7 57.4 5.9
track service performance over time 189 23.8 70.4 5.8
set annual performance targets 188 22.9 68.6 8.5
use performance measure info to support management decisions 188 18.6 73.9 7.4
identify annual goals for programs 189 16.9 77.8 5.3
85

Less than 20% of respondents reported that most city departments use
performance measurement information to actually support management decisions
and to identify annual goals for programs. That most cities do not actually use
performance data to support management decision or to set annual performance
goals, suggest that most cities have not yet realized the potential benefits or impacts
that performance measurement promises for promoting more accountable
government operations.
III-V. Management and Non-Management Employees’ Attitudes toward
Organizational Changes
Table 3-21 shows the results of management and non-management
employees’ attitudes toward organizational changes. More than 90% of respondents
agree that management is willing to implement organizational change whenever
appropriate while less than half (40.5%) of respondents agree that non-management
employees generally are receptive to change in organizational policies. Almost 90%
of respondents agree that management views performance measurement as an
important basis for making decisions.
86

Table 3-21. Management and non-management employees’ attitudes toward organizational changes (in percentages)
N Strongly
DisagreeDisagree Agree
Strongly
Agree
Management is willing to implement
organizational change whenever appropriate.
176 1.7 7.4 64.8 26.1
Management views performance measurement as
an important basis for making decisions.
170 1.2 10.0 69.4 19.4
Non-management employees generally are
receptive to change in organizational policies.
168 7.1 52.4 37.5 3.0
Elected officials generally support innovative
ideas for improvement.
171 1.2 9.4 69.6 19.9
We have a reward/incentive system that
encourages risk-taking.
167 15.6 56.3 23.4 4.8
Moreover, about 90% of respondents agree that elected officials generally
support innovative ideas for improvement. Yet, only about one-quarter of
respondents agree that their city has a reward/incentive system in place that
encourages risk-taking. The apparent disconnect is troubling between the low report
of the actual use of performance data for making management decisions and setting
goals, and the large proportion of executives who “strongly agree” that performance
data are important for making decisions. If executives are not using these data for
making management decisions, what management decision applications do
performance data have? This issue will be explored in more depth in Chapter 4.
87
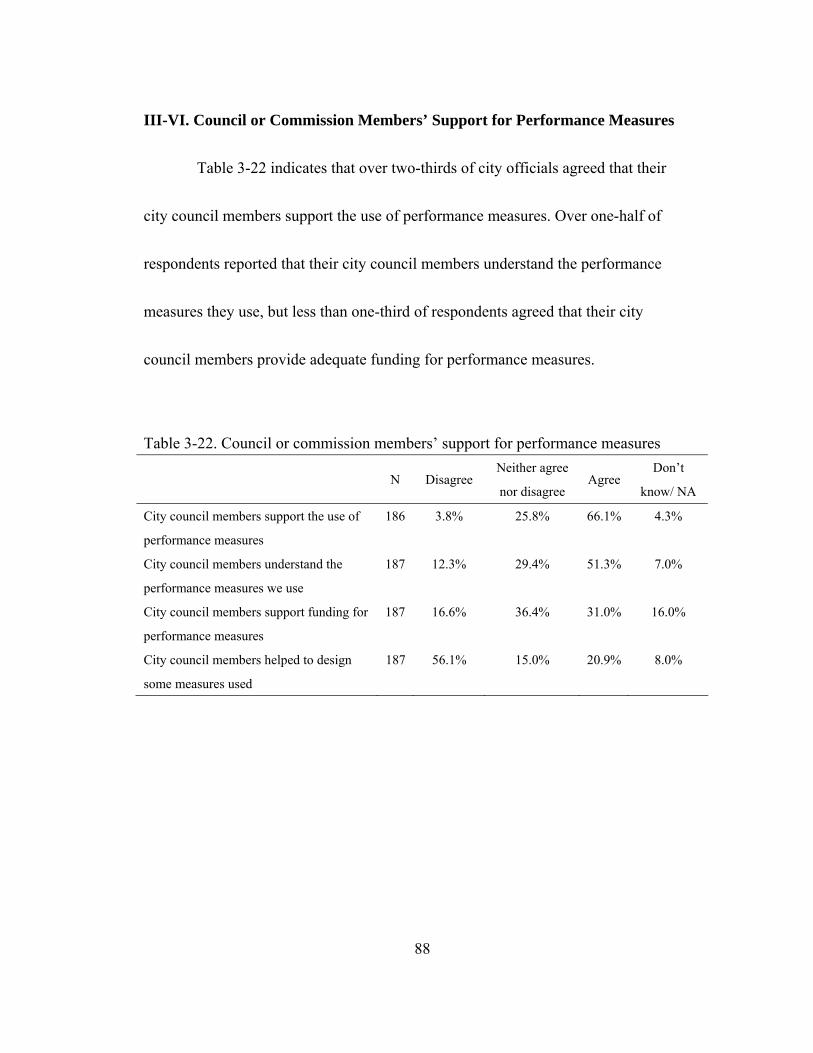
III-VI. Council or Commission Members’ Support for Performance Measures
Table 3-22 indicates that over two-thirds of city officials agreed that their
city council members support the use of performance measures. Over one-half of
respondents reported that their city council members understand the performance
measures they use, but less than one-third of respondents agreed that their city
council members provide adequate funding for performance measures.
Table 3-22. Council or commission members’ support for performance measures
N Disagree Neither agree
nor disagree Agree
Don’t
know/ NA
City council members support the use of
performance measures
186 3.8% 25.8% 66.1% 4.3%
City council members understand the
performance measures we use
187 12.3% 29.4% 51.3% 7.0%
City council members support funding for
performance measures
187 16.6% 36.4% 31.0% 16.0%
City council members helped to design
some measures used
187 56.1% 15.0% 20.9% 8.0%
88

IV. Summary
This chapter described the features and characteristics that mid-sized cities
that use and do not use performance measures. It also profiled responding municipal
executives, and the key organizational features of municipal performance
measurement efforts.
Larger cities, in terms of population size, operating budgets and full time
employees are more likely to adopt and use performance measures. Performance
measures also are more likely to be adopted and used by cities with a council-
manager form of government than by cities with a mayor-council form of
government.
Western and southern cities are more likely to adopt and use performance
measures than north central and northeastern cities but these regional differences are
explained by the fact that western and southern cities have a larger number of
council-manager governments. Following the conceptual definitions advanced by
Frederickson, Johnson, and Wood (2004), cities were divided into three categories,
such as “political,” “adapted,” and “administrative.” Comparing with previous
research, this study finds that structural changes are especially pervasive in mid-
89

sized cities. Mid-sized cities have the largest proportion of “adapted” city structures.
Mid-sized administrative cities also have much higher rate of adoption and use of
performance measures when compared to political cities. “Adapted” cities have a
comparable level of adoption and use of performance measures with administrative
cities because of the widespread presence of professional administrators (CAOs).
The level of unionization and labor-management relations suggests that
those with higher levels of employee unionization may be somewhat less likely to
adopt and use of performance measures. The mean city characteristics on income,
race, and education are not statistically significantly related to the adoption and use
of performance measures.
Top administrative officers are most likely to receive performance
measurement reports; however city council members are also a prominent audience
for performance reports. Over 70% of respondents placed the city council members
among their primary audience. Interestingly, department heads and mayors were less
likely to be placed as a primary audience than were city council members. Citizen
advisory boards and state and federal agencies were far less likely to be chosen as a
primary audience.
90
Half of the cities reported that they have used performance measures less
than 7 years. Less than 20 percent of the cities reported that they have used
performance measures more than 10 years. More than 90% of respondents agree that
management is willing to implement organizational change whenever appropriate
while less than half (40.5%) of respondents agree that non-management employees
generally are receptive to change in organizational policies. While most respondents
agree that management views performance measurement as an important basis for
making decisions, only about 20% strongly agree with this view. About 90% of
respondents agree that elected officials generally support innovative ideas for
improvement but only about one-quarter of respondents have a reward/incentive
system in place that encourages risk-taking.
Only about one-third of city officials think that most of their city’s
departments have the staff with the skill to analyze performance data. Less than one-
fourth of city officials report that their city departments use the measures to track
service performance over time and to set annual performance. Less than 20% of
respondents reported that most city department use performance measure
information to support management decisions and to identify annual goals for
91
programs. Over two-thirds of city officials agreed that their city council members
support the use of performance measures. Finally, over one-half of respondents
reported that their city council members understand the performance measures they
use, but less than one-third of respondents agreed that their city council members
provide adequate funding for performance measures.
92

CHAPTER 4
ANALYSES OF THE APPLICATIONS AND IMAPCTS OF
PERFORMANCE MEASURES IN MID-SIZED CITIES
The purpose of this chapter is to report the survey results and to analyze the
relationship between key dependent variables and the independent variables
discussed in Chapter 3. This chapter has two main parts: (1) the uses and
applications of performance measures and (2) local officials’ views about the
impacts of performance measures.
I. The Uses and Applications of Performance Measures
This section describes and analyzes the factors associated with the types of
performance measures used by mid-sized cities, the reasons they adopted these
measures, the results that local officials expected to see and the types of decision
applications of the various performance measures. Following the principle objective
of this research project, analyses of these variables can help to advance our
understanding of how mid-sized cities actually use performance measures and what
93

variables may be useful in explaining variations in their use. In other words, this
chapter explores the variation among cities in terms of the type of performance
measures used, the reasons these particular measures are used, what local officials
expected as a result of the use of these measures and the extent to which they use
various performance measures for different types of decisions.
I-I. The Types of Performance Measures Used
The respondents were asked whether they had “not adopted,” “adopted but
do not currently use,” or “currently use” different types of performance indicators.
These types included workload or output measures, efficiency or unit cost measures,
outcome or effectiveness measures, service quality measures and client or citizen
satisfaction measures. Table 4-1 indicates that workload or output measures are the
most widely used measures (55.7%) followed in frequency by citizen satisfaction
measures (49.5%) and service quality measures (49.1%). Efficiency or unit cost
measures are adopted and used by less than 40% of mid-sized cities.
Altogether, less than nine percent of cities indicated that they have adopted
but do not currently use any performance measures. Of the 280 surveys returned by
municipal officials, only 87 or 31.1% indicated that their cities had not adopted any
94
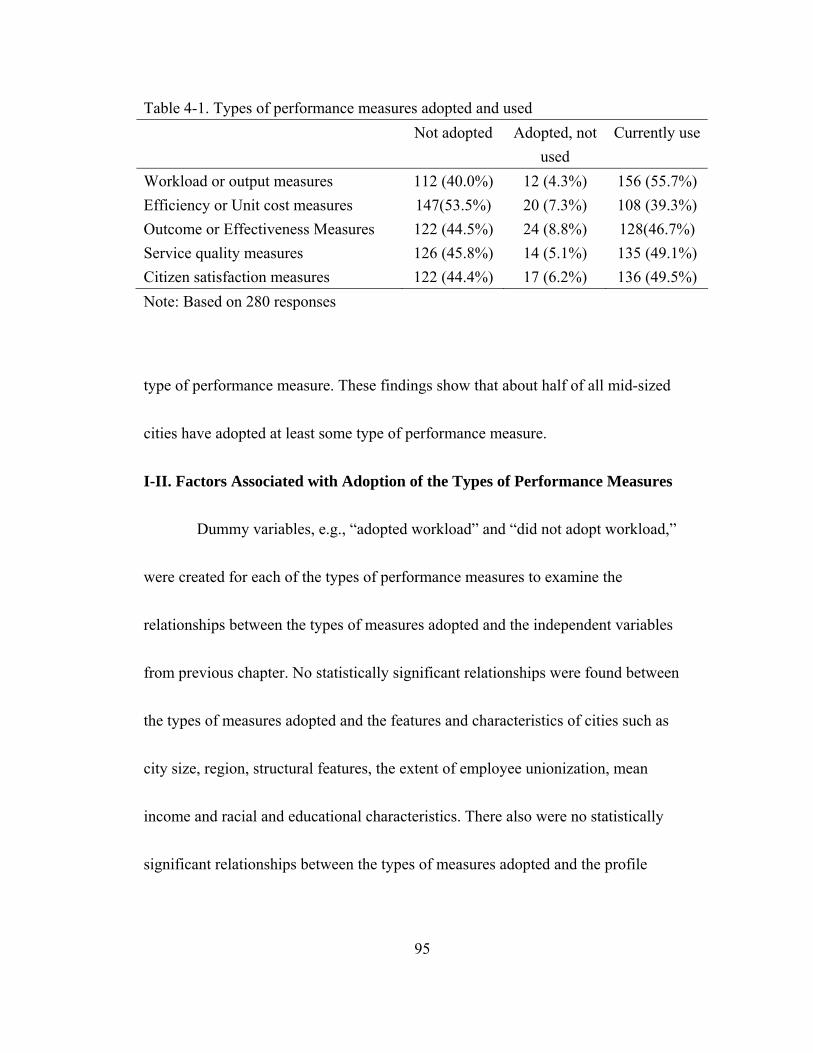
Table 4-1. Types of performance measures adopted and used Not adopted Adopted, not
used Currently use
Workload or output measures 112 (40.0%) 12 (4.3%) 156 (55.7%)Efficiency or Unit cost measures 147(53.5%) 20 (7.3%) 108 (39.3%)Outcome or Effectiveness Measures 122 (44.5%) 24 (8.8%) 128(46.7%) Service quality measures 126 (45.8%) 14 (5.1%) 135 (49.1%)Citizen satisfaction measures 122 (44.4%) 17 (6.2%) 136 (49.5%)Note: Based on 280 responses
type of performance measure. These findings show that about half of all mid-sized
cities have adopted at least some type of performance measure.
I-II. Factors Associated with Adoption of the Types of Performance Measures
Dummy variables, e.g., “adopted workload” and “did not adopt workload,”
were created for each of the types of performance measures to examine the
relationships between the types of measures adopted and the independent variables
from previous chapter. No statistically significant relationships were found between
the types of measures adopted and the features and characteristics of cities such as
city size, region, structural features, the extent of employee unionization, mean
income and racial and educational characteristics. There also were no statistically
significant relationships between the types of measures adopted and the profile
95

features of municipal executives. Analysis of the organizational features of
performance measurement efforts also indicated that none of these factors was
associated with the adoption of the various types of performance measures.
However, two attitudinal variables were related to the adoption of particular
types of performance measures. Table 4-2 shows that, in cities where city executives
view performance measures as an important basis for making decisions, the use of
efficiency, outcome and service quality measures is more common.
Table 4-2. Adoption of types of performance measures and attitudinal variables Organizational Features
Management
willing to
implement
organizational
change
Management
views performance
measurement as an
important basis for
making decisions
Non-
management
employees are
receptive to
organizational
change
Elected
officials
generally
support
innovative
improvements
City has a
reward/
incentive
system that
encourages
risk-taking
Workload .223 .361 .452* .138 .041
Efficiency .141 .454* .066 .276 .155
Outcome .259 .566* .255 .227 .197
Service
quality
.266 .393* .293 .321 .259
Citizen
satisfaction
-.027 .139 .096 .114 .122
Notes: Gamma values shown * .05 significance level
96
This finding suggests that these types of performance measures may have more
value for managerial decision making. Also, in cities where employees are generally
receptive to organizational policy change, a city is more likely to adopt and use
workload measures. This finding suggests that employee resistance to the adoption
of workload measures is likely to be low when workers are generally receptive to
organizational changes, especially those that they may perceive as non-threatening.
None of the other attitudinal variables were related at a statistically significant level
with the adoption of particular types of performance measures.
Table 4-3 shows that two of the features of the city councils’ views on
performance measures are associated with adoption of different types of
performance measures. The cities with council members that the respondents think
understand performance measures are more likely to adopt and use workload,
service quality, and citizen satisfaction measures to gauge service performance. Also,
the cities in which council members support funding for performance measurement
are more likely to adopt outcome and citizen satisfaction measures.
97

Table 4-3. Types of measures adopted by council support for performance measurement
Council/Commission Stake:
City council
members understand
performance
measures
City council
members support
the use of
performance
measures
City council
members helped to
design some
measures used
City council
members support
funding for
performance
measures
Workload .190* .016 .087 .075
Efficiency .105 .038 .025 .086
Outcome .116 .035 .081 .219*
Service quality .211* .128 .071 .185
Citizen
satisfaction
.210* .145 .029 .272*
Notes: Cramer’s V measures shown * .05 significance level
Clearly, the type of performance measures a city is likely to adopt appear to
be influenced by the extent to which the city council understands what’s involved in
measuring performance. This understanding appears to lead to financial support for
performance measures. Both of these factors point to a higher probability that a city
will adopt at least outcome and citizen satisfaction measures. In fact, city council
members’ understanding of performance measures is strongly associated with
council members’ support funding for performance measures (r = .643, p = .000).
98

I-III. Types of Performance Measures Used For Different Services
What types of performance measures are used in the variety of services
provided by cities? Table 4-4 indicates that considerable variation exists in the use
of performance measures used in different service areas. The data in Table 4-4 are
ordered by the frequency of use of workload measures, which is the most widely
used type of performance indicator among mid-sized cities.
Performance measures generally are used most often for the city services
that typically comprise the largest proportions of municipal budgets. These include
public safety services, streets, code enforcement, fleet maintenance and parks and
recreation. On average, about half of all mid-sized cities use all five types of
performance measures for these services. Not surprisingly, these services also tend
to be among the services for which performance is easiest to measure. Typically,
these services have outputs and outcomes that are more readily quantified. By
contrast, the various staff functions and human services provided by cities present
more difficult and challenging measurement issues in terms of performance.
Accordingly, cities use performance measures much less frequently and also use
fewer types of measures for these services.
99
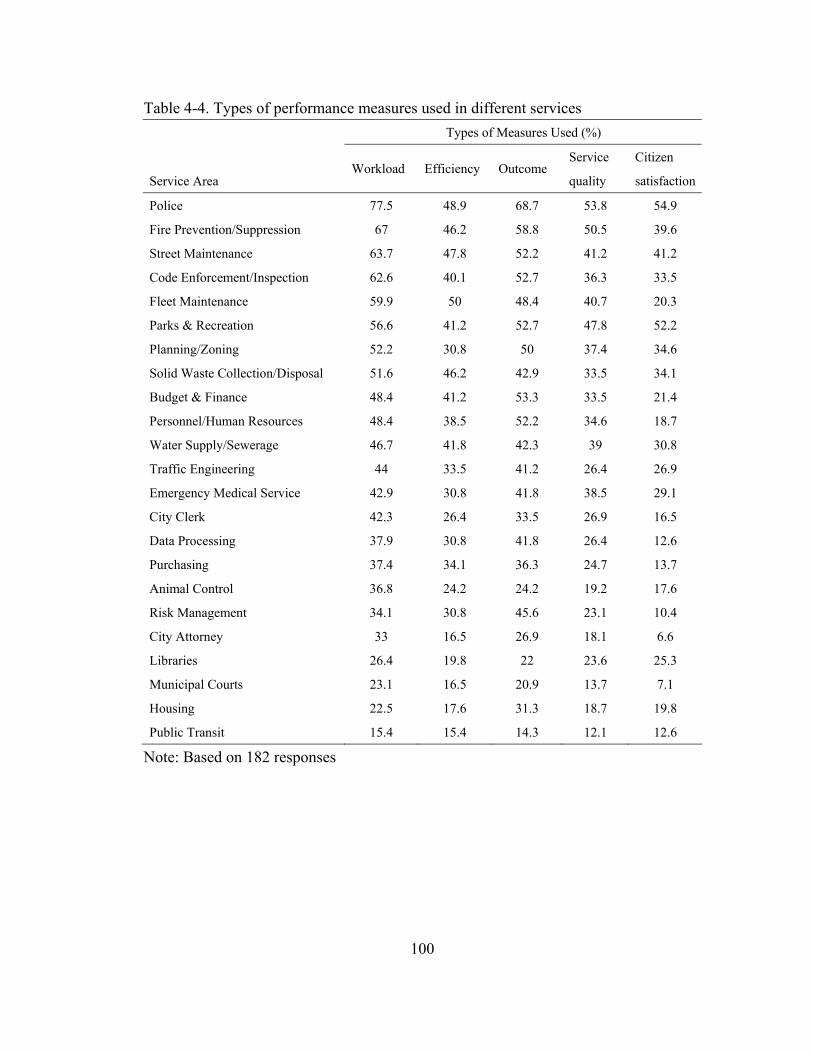
Table 4-4. Types of performance measures used in different services Types of Measures Used (%)
Service Area Workload Efficiency Outcome
Service
quality
Citizen
satisfaction
Police 77.5 48.9 68.7 53.8 54.9
Fire Prevention/Suppression 67 46.2 58.8 50.5 39.6
Street Maintenance 63.7 47.8 52.2 41.2 41.2
Code Enforcement/Inspection 62.6 40.1 52.7 36.3 33.5
Fleet Maintenance 59.9 50 48.4 40.7 20.3
Parks & Recreation 56.6 41.2 52.7 47.8 52.2
Planning/Zoning 52.2 30.8 50 37.4 34.6
Solid Waste Collection/Disposal 51.6 46.2 42.9 33.5 34.1
Budget & Finance 48.4 41.2 53.3 33.5 21.4
Personnel/Human Resources 48.4 38.5 52.2 34.6 18.7
Water Supply/Sewerage 46.7 41.8 42.3 39 30.8
Traffic Engineering 44 33.5 41.2 26.4 26.9
Emergency Medical Service 42.9 30.8 41.8 38.5 29.1
City Clerk 42.3 26.4 33.5 26.9 16.5
Data Processing 37.9 30.8 41.8 26.4 12.6
Purchasing 37.4 34.1 36.3 24.7 13.7
Animal Control 36.8 24.2 24.2 19.2 17.6
Risk Management 34.1 30.8 45.6 23.1 10.4
City Attorney 33 16.5 26.9 18.1 6.6
Libraries 26.4 19.8 22 23.6 25.3
Municipal Courts 23.1 16.5 20.9 13.7 7.1
Housing 22.5 17.6 31.3 18.7 19.8
Public Transit 15.4 15.4 14.3 12.1 12.6
Note: Based on 182 responses
100
In terms of the specific types of performance measures, the distributions in
Table 4-4 show that more cities use workload and outcome measures than service
quality and citizen satisfaction measures for various city services. Generally,
efficiency measures are the type of performance measures that are used least
frequently. Perhaps local officials have decided to place a more emphasis on service
outcomes rather than on service efficiency in keeping with trends in the private
sector service industries. On the other hand, perhaps they have encountered more
employee resistance in measuring efficiency. Alternatively, perhaps cities simply
have found efficiency measures to be less useful than other measures for making
various types of decisions. Considering the array of possible circumstances and
conditions that affect service efficiency, indicators that simply measure the unit
costs of a service may not have the same value as measures that focus on whether
valued outputs and outcomes are actually achieved. The following section examines
some of the factors that are associated with the particular types of measures used for
the six services most commonly provided by mid-sized cities.
101
I-IV. Factors Associated with Types of Performance Measures Used for Most
Commonly Provided Services
The six most commonly provided services, police, fire, streets, code
enforcement, fleet maintenance and parks and recreation, were chosen for analyses
among the twenty-three services provided by municipal governments. A score for
each city was computed for each of the six services that ranged between 0 and 5
depending on the number of different types of performance measures the city used
for that service. A “cumulative performance measurement score” was then
computed for each city based in the sum of scores for each of the six core services.
These cumulative scores measure the extent to which cities use different types of
measures for the six services. The scores ranged between 0 and 30. These
cumulative performance measurement scores are used as a dependent variable in
analyses with the independent variables described in Chapter 3. The objective is to
understand what factors may be linked with cities that use a broader or more
extensive range of measures for commonly provided services.
These analyses yielded several statistically significant relationships that
merit comment. As one might expect, larger cities as measured by population size,
102
size of operating budget and the number of full-time employees are more likely to
use a broader, more extensive array of different types of performance measures for
the six services. The relationships for total population size show that r = .336, p
= .000. For operating budget, r = .373, p = .000. For the number of employees, r
= .418, and p = .000. At least in part, the magnitude of available resources appears to
account for why some cities use a broader array of performance measures. They can
simply afford to do more than cities with less abundant resources.
The relationships between various organizational features of municipal
performance measurement efforts and the cumulative performance measurement
scores are presented in Table 4-5. In particular, this table shows the relationships
between cumulative performance measurement scores and the primary audiences
that respondents identified for the reports or information about collected
performance measures. The cities that identify the city council, department heads
and state or federal funding agencies as important stakeholders in performance
reports are also the cities that are more likely to use a broader array of performance
measurement types to evaluate the performance of the six commonly provided
services.
103
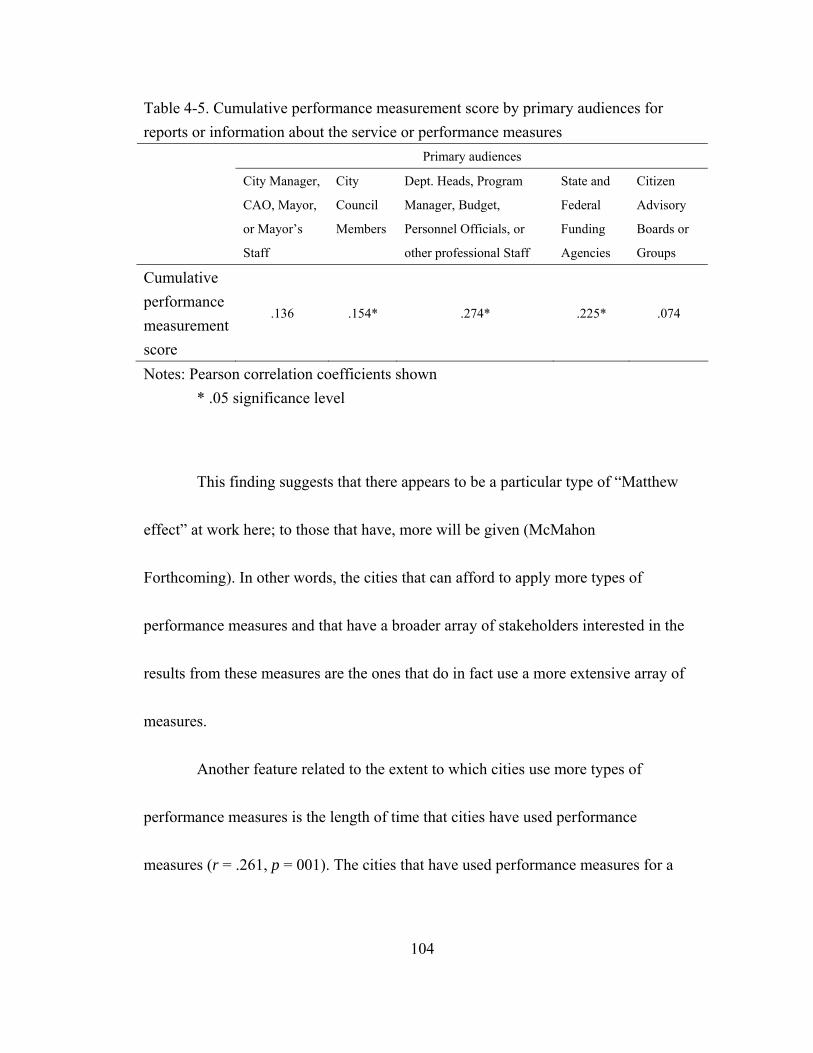
Table 4-5. Cumulative performance measurement score by primary audiences for reports or information about the service or performance measures
Primary audiences
City Manager,
CAO, Mayor,
or Mayor’s
Staff
City
Council
Members
Dept. Heads, Program
Manager, Budget,
Personnel Officials, or
other professional Staff
State and
Federal
Funding
Agencies
Citizen
Advisory
Boards or
Groups
Cumulative performance measurement score
.136 .154* .274* .225* .074
Notes: Pearson correlation coefficients shown * .05 significance level
This finding suggests that there appears to be a particular type of “Matthew
effect” at work here; to those that have, more will be given (McMahon
Forthcoming). In other words, the cities that can afford to apply more types of
performance measures and that have a broader array of stakeholders interested in the
results from these measures are the ones that do in fact use a more extensive array of
measures.
Another feature related to the extent to which cities use more types of
performance measures is the length of time that cities have used performance
measures (r = .261, p = 001). The cities that have used performance measures for a
104

longer period of time are also more likely to use a broader array of performance
measures to evaluate the six core services.
Table 4-6 shows relationships between cumulative performance
measurement score and indicators of the overall capacity of cities for collecting and
using performance data. Most of the features of city departments in Table 4-6 are
related in the expected positive direction with the cumulative performance
measurement scores.
Table 4-6. Cumulative performance measurement score by capacity for and applications of performance measurement Most city departments: have staff
skilled in
data
analysis
have
sufficient
funding to
collect
performa-
nce data
track
service
perfor-
mance
over
time
compare
service
performan-
ce with
other
cities
identify
annual
goals for
programs
use
performance
measure info
to support
management
decisions
set
annual
perfor
mance
targets
Cumulative
performance
measurement
score
.289* .216* .141 .249* .227* .274* .244*
Notes: Pearson correlation coefficients shown * .05 significance level
105

The cities that apply a broader range of performance measures to the six
commonly provided services have staff skilled in analyzing performance data,
sufficient funding to collect performance data, an interest in comparing performance
with other cities, use performance data to help identify annual program goals, use
performance measures to support management decisions and, also use these data to
set annual performance targets.
The relationships between the cumulative performance measurement score
and other features of the city’s organizational culture are presented in Table 4-7.
Broader use of different types of performance measures is more common among
cities where management is willing to implement organization change, views
performance data as an important factor in making decisions, and has in place a
reward/incentive system that encourages risk-taking. It is also more likely among
cities where non-management employees are more receptive to change in
organization policies. Clearly, various features of organizational culture appear to
matter in terms of the executives’ use of a wider array of measures to track the
performance of those services that consume large proportions of the typical
municipal budget.
106
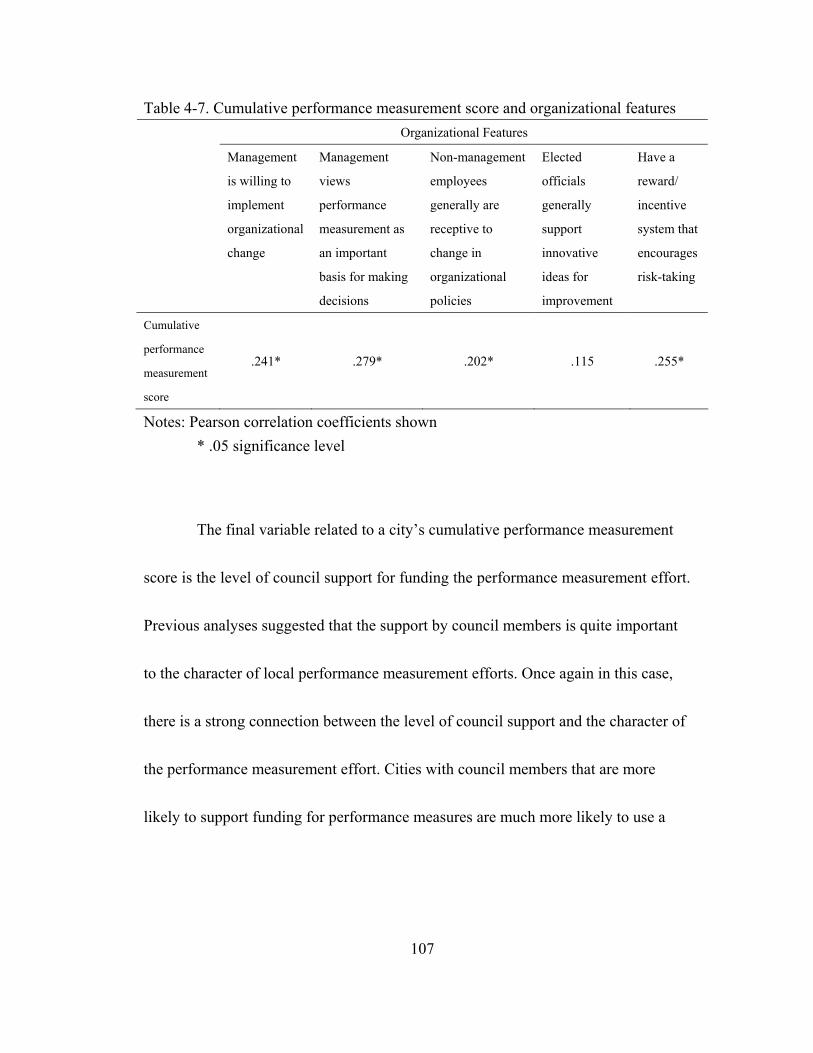
Table 4-7. Cumulative performance measurement score and organizational features Organizational Features
Management
is willing to
implement
organizational
change
Management
views
performance
measurement as
an important
basis for making
decisions
Non-management
employees
generally are
receptive to
change in
organizational
policies
Elected
officials
generally
support
innovative
ideas for
improvement
Have a
reward/
incentive
system that
encourages
risk-taking
Cumulative
performance
measurement
score
.241* .279* .202* .115 .255*
Notes: Pearson correlation coefficients shown * .05 significance level
The final variable related to a city’s cumulative performance measurement
score is the level of council support for funding the performance measurement effort.
Previous analyses suggested that the support by council members is quite important
to the character of local performance measurement efforts. Once again in this case,
there is a strong connection between the level of council support and the character of
the performance measurement effort. Cities with council members that are more
likely to support funding for performance measures are much more likely to use a
107

broader array of different performance measures for the six most commonly
provided services (r = .293, p = .000).
I-V. The Reasons for Adoption of Performance Measures
What reasons do city officials offer for why their jurisdictions adopted
performance measures? Respondents were asked to rank what they considered to be
the three most important reasons among six possible choices. This question was
partially open-ended and allowed respondents to write in another reason that was not
among those listed.
A fairly strong consensus on the reasons for adopting performance measures
emerges in the response distribution illustrated in Figure 4-1. The three reasons cited
most often by local officials for why their city adopted performance measures were
“to improve management decisions” (81.9%), “to support budget
recommendations/decisions” (71.9%) and “to respond to citizen demands for greater
accountability (68.6%).” Just over a third (35.7%) selected “to comply with the
wishes of elected city officials.” Only small proportions chose one of the remaining
reasons. Seven respondents provided a reason that was not among those listed.
These included to improve service delivery, to provide quality service and equity, to
108

3.8%
8.6%
14.1%
35.7%
68.6%
71.9%
81.9%
0% 10% 20% 30% 40% 50% 60% 70% 80% 90%
Other
To respond to pressurefrom various community
groups
To comply w ith state orfederal reporting
requirements
To comply w ith w ishes ofelected city off icials
To respond to citizendemands for greater
accountability
To support budgetrecommendations/decisions
To improve managementdecisions
Note: Based on 185 responses
Figure 4-1. Why performance measures are adopted
109
measure how well the city serves its citizens, to improve customer service, to
improve performance, to improve efficiency and effectiveness and to gain feedback.
“To improve employee performance” was not listed as one of the choices in
question number 3 (see Appendix). The rationale for this decision was to ascertain
whether any local officials considered this reason to be important enough to write in
the blank for the “other” choice in that partially closed-ended question. That no local
officials identified “improving employee performance” as a reason for adopting
performance measures suggests that they understood the purpose of the performance
measures that were being adopted. In other words, they appreciated that these
measures would apply to programs and services and not to individual employees.
The reasons reported in Figure 4-1 are generally consistent with those
reported by previous research. For instance, Streib and Poister (1998) found that the
three most often cited reasons for beginning using performance measures were “to
make better management decisions” (94%), to respond to “citizen demands for
greater accountability” (44%), and to respond to “pressure from elected officials”
(26%). Unlike previous research however, this survey finds that support for making
budget recommendations and decisions is now one of the most important reasons
110
reported for adopting performance measures. This suggests that local officials may
be realizing the value of integrating performance measures in decisions and
recommendations about budget allocation decisions to an extent not reported
previously.
I-VI. The Results Expected from the Use of Performance Measures
What results did city officials really expect to see after using the
performance measures they adopted? To what extent do these expected results
actually correspond to the most prominent reasons why they adopted performance
measures in the first place? What the analyses in this section attempt to measure is
whether there is any cognitive disconnect that may exist among city officials with
respect to the rationales they offered for adopting performance measures and what
they actually expected to see in terms of concrete results after the use of these
measures. In other words, to what extent do the expected benefits of adopting
performance measures correspond to what city officials really believe will be
achieved through their use? Is the adoption of these measures merely “window
dressing,” a response to pressures by peers or other community stakeholders who do
not wish for their community to seem non-progressive since other cities are
111
measuring performance? Do city officials really expect to see results that relate to
the avowed reasons for adopting performance measures?
City officials were asked to indicate what specific results they expected to
see after using the performance measures adopted by their city. Respondents were
instructed to choose as many of the outcomes that applied to them or to write in
results they expected to see but which were not listed. Figure 4-2 illustrates that the
three most commonly expected results were “stronger justification for management
decisions” (73.5%), “stronger justification for budget requests” (72.9%) and
“improved communication with citizens about service performance” (68.0%). Even
though improved employee performance is not on the most important reasons for
adopting performance measures, almost half of city officials expected to see
improvement of employee performance after adopting performance measures.
The results expected to be achieved by respondents appear to correspond to
the three most frequently cited reasons why their city adopted performance measures.
Correlation analyses indicate moderately strong, statistically significant relationships
between the respondents’ ranking of the three most prominently mentioned reasons
for adopting performance measures and the three most frequently cited expected
112
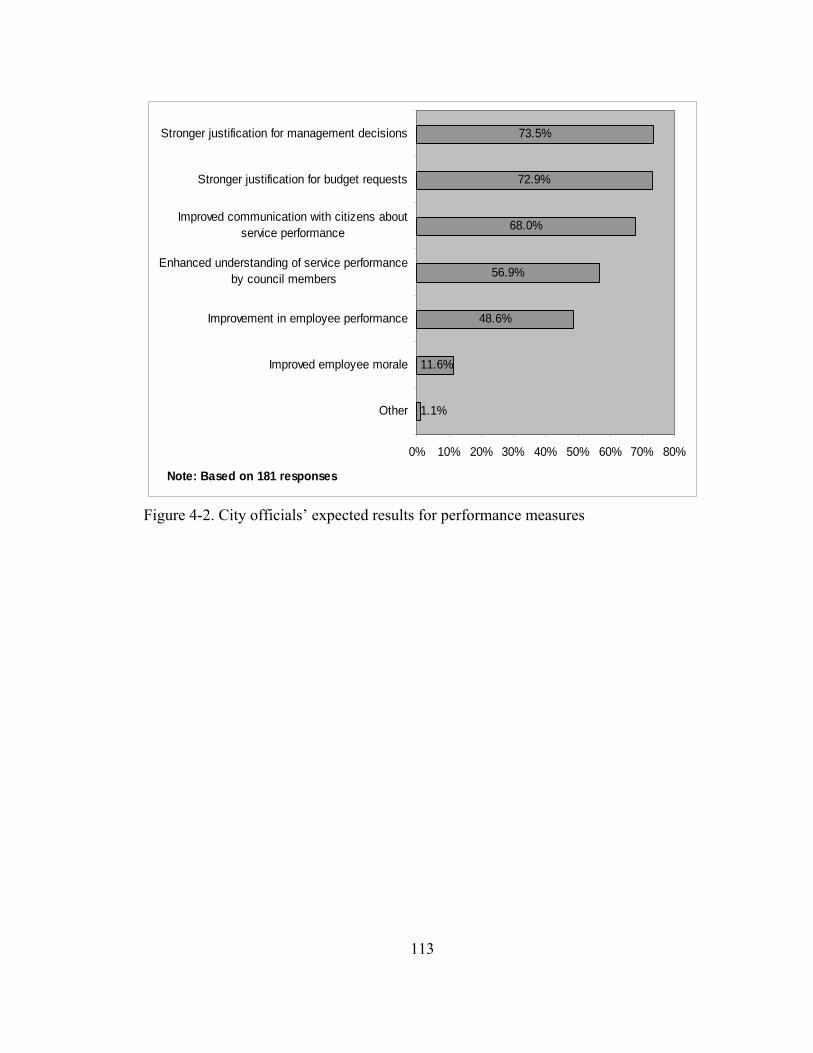
1.1%
11.6%
48.6%
56.9%
68.0%
72.9%
73.5%
0% 10% 20% 30% 40% 50% 60% 70% 80%
Other
Improved employee morale
Improvement in employee performance
Enhanced understanding of service performanceby council members
Improved communication with citizens aboutservice performance
Stronger justification for budget requests
Stronger justification for management decisions
Note: Based on 181 responses
Figure 4-2. City officials’ expected results for performance measures
113
results. The correlation between the ranking of the management rationale and the
expected result of having a stronger justification for management decisions is -.19.
The correlation between the budget rationale and stronger justification for budget
requests is -.20 and the relationship between the greater accountability to citizens
rationale and the expected result of improved communication with citizens about
service performance is -.21. All of these relationships are statistically significant at
the .05 level.
These relationships are substantively significant in that they suggest that
there is very little, if any, “cognitive dissonance” with respect to the reasons offered
for adopting performance measures and what local officials expected to see as a
result of their implementation. For some time now, a point of debate in the
government performance literature has concerned whether performance measures
are used more for public relations purposes (“window dressing”) or for improving
the quality of management and budget decisions. These findings suggest that local
officials in mid-sized cities appear to believe that performance measures have real
value for improving the quality of management and budget decisions. Moreover,
they appear to believe that the information generated by these measures can help the
114

115
city to respond to citizen demands for greater accountability and to improve the
quality of communications with citizens about how well the city performs its service
responsibilities.
I-VII. The Use of Performance Measures for Different Types of Decisions
What types of performance measures do city officials use for qualitatively different
types of decisions? Figure 4-3 indicates that cities generally use performance
measures somewhat less often for strategic planning and reporting to citizens/ media
than for other decisions related to resource allocation, managing/evaluating
programs, reports to elected officials, and internal management reports.
Generally, outcome measures are the most widely used type of performance
measure. Only for resource allocation decisions are workload measures used more
frequently than outcome measures. The widespread use of outcome measures
suggests that city officials value the type of performance data that indicate how well
services and programs are performing. This finding generally corresponds to that
reported by De Lancer Julnes and Holzer (2001) and previous GASB studies (1997).
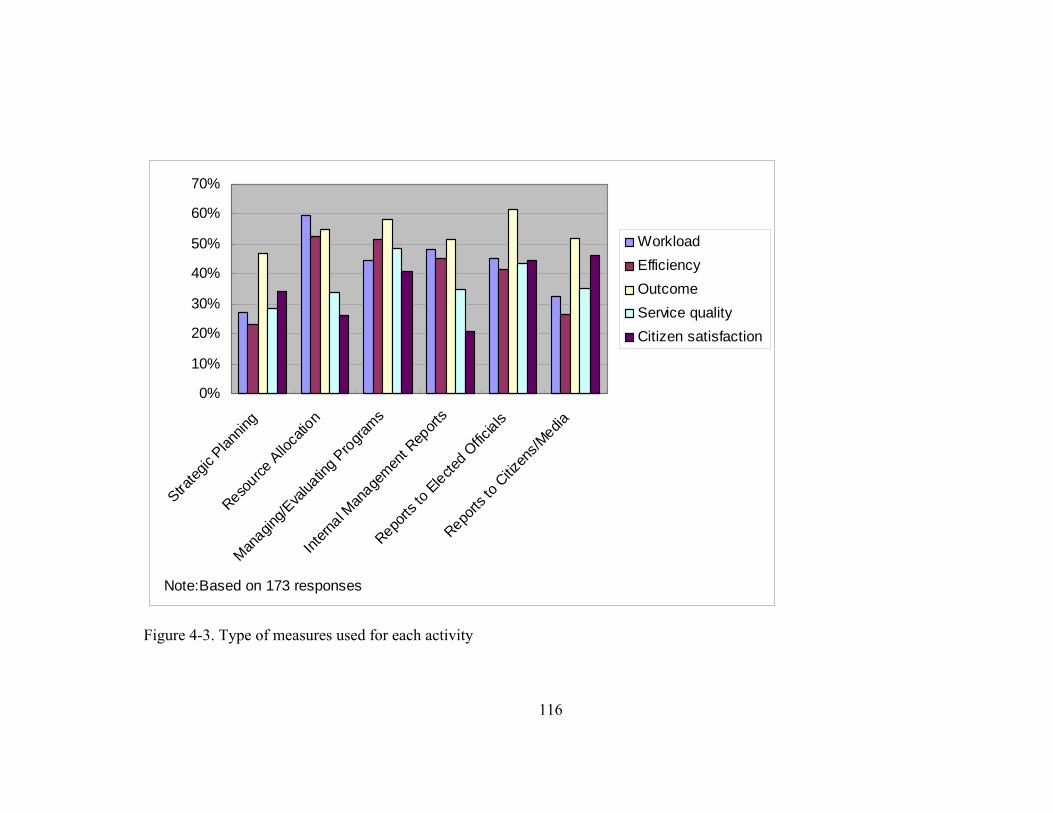
0%
10%
20%
30%
40%
50%
60%
70%
Strateg
ic Plan
ning
Resource
Alloca
tion
Managin
g/Eva
luatin
g Programs
Intern
al Man
agemen
t Rep
orts
Reports
to Electe
d Offic
ials
Reports
to C
itizen
s/Media
Note:Based on 173 responses
Workload Efficiency Outcome Service qualityCitizen satisfaction
116
Figure 4-3. Type of measures used for each activity
These studies also found that output measures were the most widely used for
different types of decisions. That workload measures tend to be used more frequently
for resource allocation decisions makes intuitive sense considering the fact that service
demands are and should be of principal importance in allocating major slices of the
budget resource pie.
I-VIII. Explaining Differences in Decision Applications of Performance Measures
While the previous analyses indicated the types of measures that cities
generally rely upon for different types of decisions, this analysis examines the extent
to which cities actually use each particular measure to help make decisions in various
areas. In other words, how extensively do cities use particular measures for different
decision applications? To measure the extent to which cities relied on a particular
measure for different types of decisions, new variables were created. The objective is
to understand what factors are related to those cities that rely on particular measures to
a greater extent in making different types of decisions.
For each type of performance measure, cities were categorized as being one of
three groups. The cities that used workload measures for four or more types of
decisions were placed in a “high use” category. Cities that used workload measures for
117
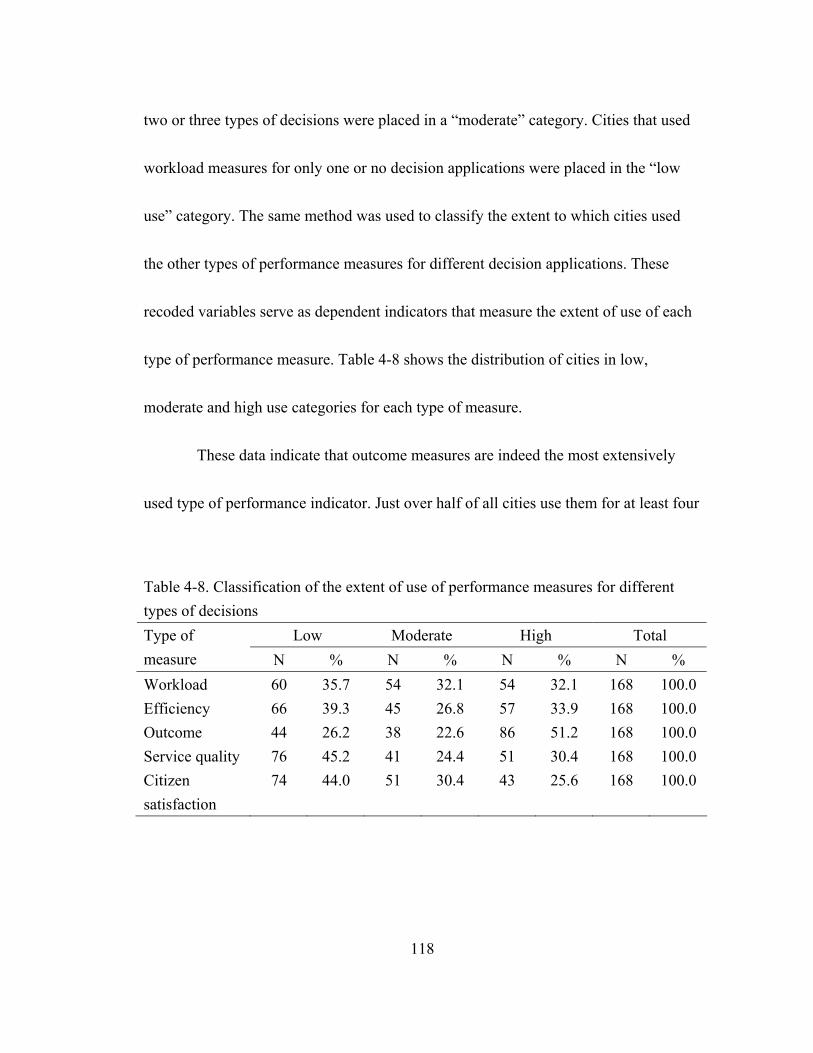
two or three types of decisions were placed in a “moderate” category. Cities that used
workload measures for only one or no decision applications were placed in the “low
use” category. The same method was used to classify the extent to which cities used
the other types of performance measures for different decision applications. These
recoded variables serve as dependent indicators that measure the extent of use of each
type of performance measure. Table 4-8 shows the distribution of cities in low,
moderate and high use categories for each type of measure.
These data indicate that outcome measures are indeed the most extensively
used type of performance indicator. Just over half of all cities use them for at least four
Table 4-8. Classification of the extent of use of performance measures for different types of decisions
Low Moderate High Total Type of measure N % N % N % N % Workload 60 35.7 54 32.1 54 32.1 168 100.0Efficiency 66 39.3 45 26.8 57 33.9 168 100.0Outcome 44 26.2 38 22.6 86 51.2 168 100.0Service quality 76 45.2 41 24.4 51 30.4 168 100.0Citizen satisfaction
74 44.0 51 30.4 43 25.6 168 100.0
118

or more types of decision applications. The measures likely to be used for the fewest
types of decisions are service quality and citizen satisfaction evaluations.
What features of the local performance measurement effort are related to the
extent to which cities use the various performance measures? The statistical results of
several bivariate analyses are reported in Table 4-9. These associations indicate that
statistically significant relationships exist only for those cities that report that the
primary audiences for performance data are department heads, line supervisors and
budget officers.
Table 4-9. Extent of use of each measure by primary audiences for reports or information about the service or performance measures
Primary audience for performance reports
City Manager,
CAO, Mayor,
or Mayor’s
Staff
City
Council
Members
Dept. Heads, Program
Managers and Budget
Officers
State and
Federal
Funding
Agencies
Citizen
Advisory
Boards or
Groups
Workload .070 .097 .266* .159 .040
Efficiency .027 .100 .081 .168 .137
Outcome .094 .096 .207* .162 .115
Service quality .133 .188 .239* .158 .140
Citizen
satisfaction
.090 .161 .063 .066 .081
Notes: Cramer’s V measures shown * .05 significance level
119

For these cities, workload, outcome, and service quality measures are the most widely
used for more types of decisions. These associations suggest the types of measures that
are most likely to yield the kind of information of most value to managers for the
broadest array of decisions that confront them.
Other features of municipal performance measurement efforts that proved to
be related to the extent to which certain performance measures were used for different
types of decisions are presented in Table 4-10. These associations show that having
staff with the skill to analyze performance data is related to the extent to which each
type of performance measure is used. The cities that have sufficient funding to collect
performance data are most likely to use workload and efficiency measures for more
types of decisions.
For cities that track their performance over time, efficiency and service quality
are the measures used most extensively. For cities that engage in performance
comparisons with other jurisdictions, workload, efficiency and citizen satisfaction
measures are more widely used.
120

Table 4-10. Extent of use of performance measures by capacity indicators of performance measurement programs Most city departments: have
staff to
analyze
data
have
sufficient
funding to
collect
performance
data
track
service
perfor-
mance
over
time
compare
service
performance
with other
cities
identify
annual
programs
use
performance
measure
info to
support
management
decisions
set annual
performance
targets
Workload .254* .277* .078 .216* .217* .172 .271* Efficiency .199* .313* .210* .260* .139 .143 .214* Outcome .304* .114 .171 .121 .340* .287* .330* Service
quality
.307* .125 .203* .114 .170 .227* .185
Citizen
satisfaction
.220* .165 .159 .224* .038 .138 .209*
Notes: Cramer’s V measures shown * .05 significance level
Among the cities that use performance data for identifying annual program
goals, workload and outcome measures are used most extensively. The cities that
report actually using performance data to support management decisions rely most
extensively on outcome and service quality indicators. For cities that use performance
data to set specific performance targets for programs and services, all measures except
those that measure service quality are used extensively.
121
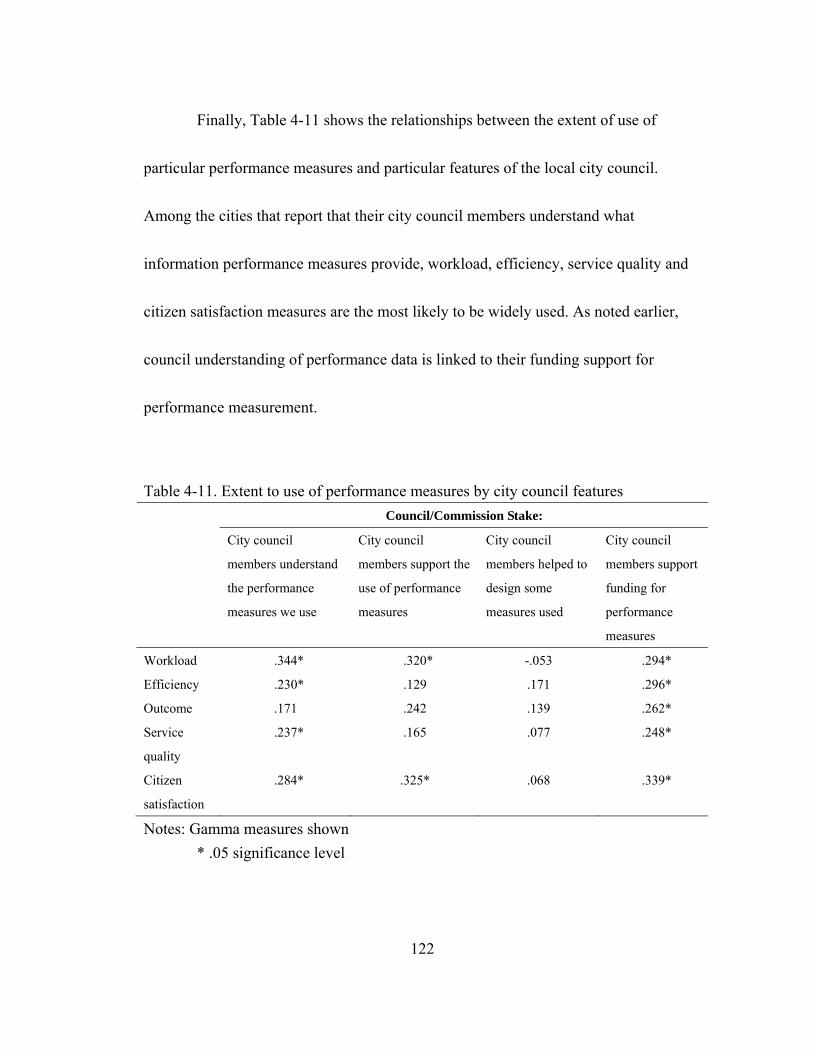
Finally, Table 4-11 shows the relationships between the extent of use of
particular performance measures and particular features of the local city council.
Among the cities that report that their city council members understand what
information performance measures provide, workload, efficiency, service quality and
citizen satisfaction measures are the most likely to be widely used. As noted earlier,
council understanding of performance data is linked to their funding support for
performance measurement.
Table 4-11. Extent to use of performance measures by city council features Council/Commission Stake:
City council
members understand
the performance
measures we use
City council
members support the
use of performance
measures
City council
members helped to
design some
measures used
City council
members support
funding for
performance
measures
Workload .344* .320* -.053 .294*
Efficiency .230* .129 .171 .296*
Outcome .171 .242 .139 .262*
Service
quality
.237* .165 .077 .248*
Citizen
satisfaction
.284* .325* .068 .339*
Notes: Gamma measures shown * .05 significance level
122
Not surprisingly, when council funding support is forthcoming, cities are likely to use
each of the five types of performance measures for the broadest array of decision
applications.
These analyses specify the various types of circumstances that are related to
how extensively cities use different types of performance measures for making various
decisions. Generally, these findings indicate that performance measures tend to be
used more extensively when managers are the primary audience for performance data,
when their staff has data analysis talent and when council understands performance
information and provides adequate financial support for collecting performance data.
II. The Impacts of Performance Measures
The section examines several dimensions of how local executives perceive the
actual impacts that resulted from their city’s use of performance measures. To what
extent did the cities’ experiences with the performance measures they adopted meet,
exceed, or fall short of executives’ expectations? What explains variation in these
assessments? To what extent do municipal executives consider the use of performance
measures to have been helpful in making progress on a variety of challenges that
123
confront mid-sized cities? What factors are associated with the executives’ perceptions
about the relative helpfulness of these measures? What kind of impact has the use of
performance measurement data had on the quality of the executive decisions and why?
Finally, this section examines what executives think about the extent to which the use
of performance measures has received support by local stakeholders that include
various municipal staff and community actors.
II-I. Executive Ratings of the Actual Impact of Performance Measures
To make some general assessment about the impact of performance measures,
respondents were asked to indicate whether their city’s actual experience with
performance measures generally “fell short,” “met,” or “exceeded” their expectations.
As Table 4-12 shows, the majority of executives thought that results matched their
expectations. Less than 10 percent indicated that their experience with performance
measures actually exceeded their expectations. Consequently, just over two-thirds of
executives in mid-sized cities think that the impacts that they observed as a result of
using performance measures either met or exceeded their expectations. Of course, this
analysis assumes that the direction of these impacts was positive and not negative.
Interestingly, almost 20% or about one in five executives thought that their
124
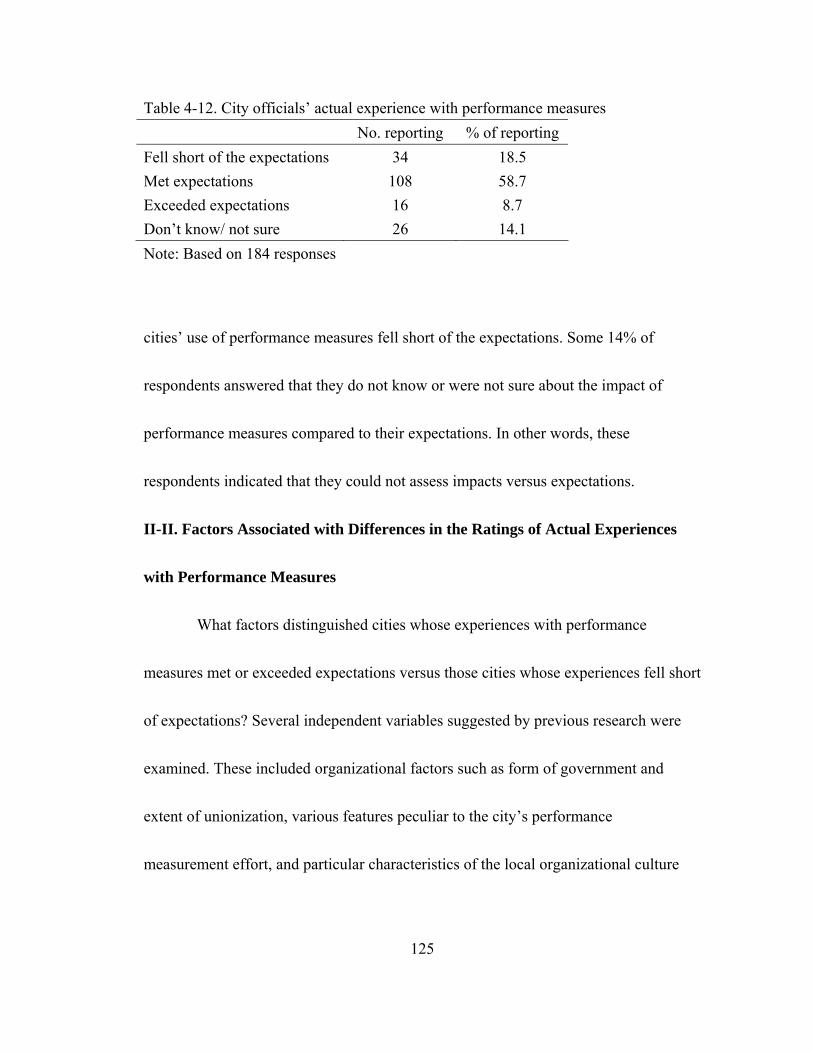
Table 4-12. City officials’ actual experience with performance measures No. reporting % of reportingFell short of the expectations 34 18.5 Met expectations 108 58.7 Exceeded expectations 16 8.7 Don’t know/ not sure 26 14.1 Note: Based on 184 responses
cities’ use of performance measures fell short of the expectations. Some 14% of
respondents answered that they do not know or were not sure about the impact of
performance measures compared to their expectations. In other words, these
respondents indicated that they could not assess impacts versus expectations.
II-II. Factors Associated with Differences in the Ratings of Actual Experiences
with Performance Measures
What factors distinguished cities whose experiences with performance
measures met or exceeded expectations versus those cities whose experiences fell short
of expectations? Several independent variables suggested by previous research were
examined. These included organizational factors such as form of government and
extent of unionization, various features peculiar to the city’s performance
measurement effort, and particular characteristics of the local organizational culture
125
such as the level of stakeholders support for organizational change and the use of
performance measures. In addition, the different ratings that executives assigned to
their actual experience with performance measures was compared with the particular
results that they expected to see from the use of performance measures that are
reported in Figure 4-2.
For purposes of analysis, the dependent variable “city officials’ actual
experience with performance measures” was recoded to create a dichotomous variable
categorized as “fell short of the expectations” or “met or exceeded expectations.” The
“don’t know/not sure” responses were excluded from these analyses.
Table 4-13 shows the relationship between cities’ actual experience with
performance measures and their form of government. A moderately strong, statistically
significant relationship exists (Cramer’s V = .216). This result indicates that cities with
a council-manager form of government are more likely to have an experience with
performance measures that met or exceeded their expectations compared to cities that
have a mayor-council form of government. Clearly, executives in council-manager
governments appear to have had an experience with performance measurement
implementation that more closely aligned with their expectations.
126

Table 4-13. City’s actual experience with performance measures by form of government (in percentages) Form of government
Mayor-council Council-manager Number Total percent
Fell short of the expectations
37.5 16.1 31 20.7
Met or exceeded expectations
62.5 83.9 119 79.3
Number 32 118 150 Percent 100.0 100.0 100.0
Note: Cramer’s V = .216; χ2 = 7.030; df = 1, p = .008
Previous research has suggested that the extent to which the city’s labor force
is unionized might affect perceptions about the actual impact of performance measures
in a community. No statistically significant relationship exists between a city’s form of
government and its extent of employee unionization. However, this factor may have an
independent effect on the perceptions of impact. In fact, analysis indicates a fairly
strong, negative and statistically significant relationship between these two factors.
The larger the percentage of full-time employees who were members of unions, the
more likely executives perceived performance measures to have fallen short of their
expectations (r = -.203, p = .013). Conversely, the executives of cities with smaller
proportions of their workforce that were unionized are more likely to perceive that
127
performance measures met or exceeded their expectations. Consequently, this finding
suggests that there may be other factors in addition to the level of professionalism
among city executives that affect their perceptions of the actual impact that
performance measures have had compared to their expectations.
Accordingly, several features of the organizational environment were analyzed
to determine whether any relationships exist that may help to specify why executives’
perceptions of the actual performance measures differed from their expectations.
It was found that the length of time a city has used performance measures is
correlated with the executives’ perceptions of their actual impact (r =.200). This
relationship is statistically significant at the .05 level. It indicates that cities with more
experience with performance measurement are more likely to have an actual
experience that met or exceeded their expectations. Conversely, cities with less
experience were more likely to have executives who indicated that performance
measures had not met their expectations. This finding suggests that the longer
performance measures are in place and the more experience local officials have with
them, the more likely perceptions of their impact correspond to expectations.
128
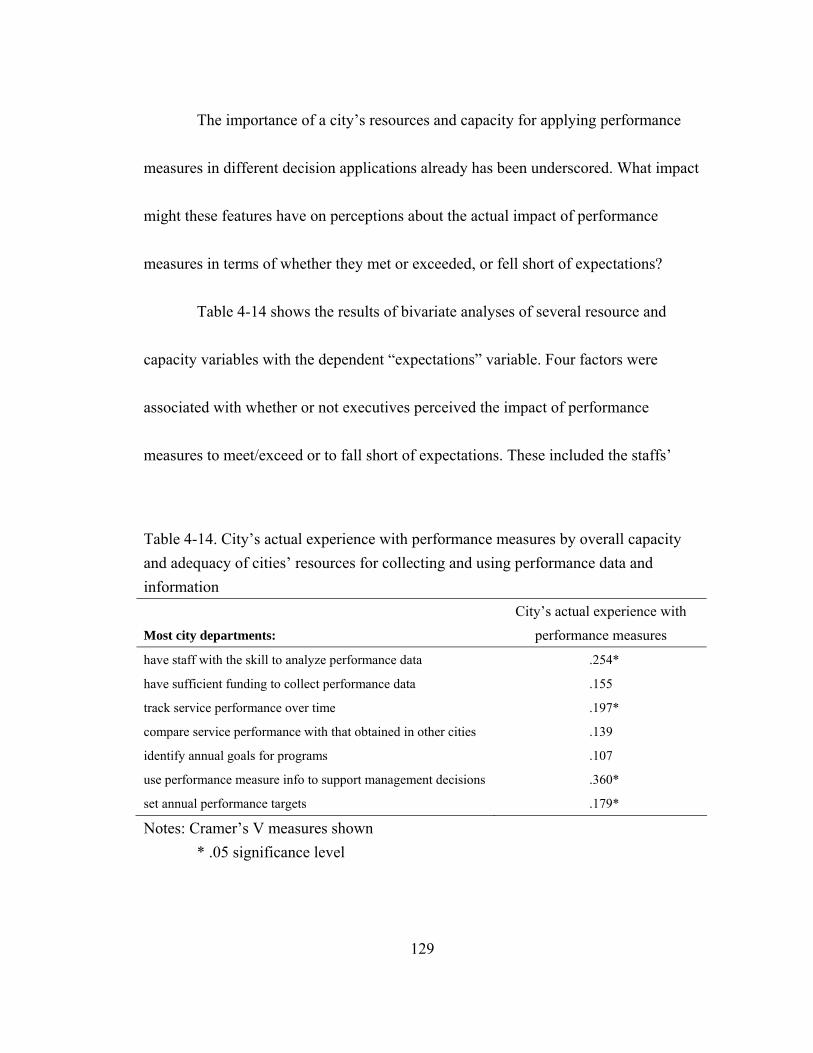
The importance of a city’s resources and capacity for applying performance
measures in different decision applications already has been underscored. What impact
might these features have on perceptions about the actual impact of performance
measures in terms of whether they met or exceeded, or fell short of expectations?
Table 4-14 shows the results of bivariate analyses of several resource and
capacity variables with the dependent “expectations” variable. Four factors were
associated with whether or not executives perceived the impact of performance
measures to meet/exceed or to fall short of expectations. These included the staffs’
Table 4-14. City’s actual experience with performance measures by overall capacity and adequacy of cities’ resources for collecting and using performance data and information
Most city departments:
City’s actual experience with performance measures
have staff with the skill to analyze performance data .254*
have sufficient funding to collect performance data .155
track service performance over time .197*
compare service performance with that obtained in other cities .139
identify annual goals for programs .107
use performance measure info to support management decisions .360*
set annual performance targets .179*
Notes: Cramer’s V measures shown * .05 significance level
129

skills to analyze performance data, tracking service performance over time, using
performance measurement information to support management decisions, and setting
annual performance targets. In practical terms, these associations mean that in the
cities that have the staff resources and skills to analyze performance data, executives
are more likely to perceive that their expectations for performance measures were met
or exceeded.
This relationship remains statistically significant even after controlling for
form of government. Among those cities that lack the skill to analyze performance
data, 34% of executives perceived that actual impacts fell short of expectations.
Likewise, about the same proportion perceived that actual impacts fell short of
expectations among the cities that did not track performance over time or use
performance data to set annual performance targets for programs.
For cities that used performance measures to support management decisions, a
strong correlation exists with an assessment of impact that met or exceeded
expectations. Conversely, among those municipalities where performance information
was not used to support management decisions, 52% felt that the impact of using these
measures fell short of expectations.
130

Regression analysis of the variables identified as being related to the
dependent variable “impact” rating (met/exceeded or fell short of expectations) is
displayed in Table 4-15. Several regression diagnostic procedures were used to test for
collinearity, but no evidence of this problem was found in this model. This analysis
shows that all of the variables in the model explain about 14% of the variation in how
executives perceive the impact of performance measures.
Table 4-15. Regression of performance measures’ impact rating and selected organizational and program features
Variable Un-standardized Coefficients
StandardizedCoefficients
t Sig.
B Beta constant -.133 -.466 .642 Form of government 7.327E-02 .073 .772 .442 Percent workforce unionized -2.101E-03 -.187 -2.005 .048 Length of time performance measures used
8.405E-03 .133 1.450 .150
Staff with analytical skills .181 .203 2.123 .036 Track performance over time -2.242E-02 -.023 -.224 .823 Use performance data to support management decisions
.292 .266 2.510 .014
Use performance data to set annual performance targets
5.560E-03 .006 .059 .953
R2 = .198, Adjusted R2 = .140 N = 105
131
As indicated by the standardized beta values, the three variables that are most
important in terms of having an independent effect on whether executives are likely to
think that performance measures met or exceeded expectations, controlling for the
effects of all of the other variables in the model are: the use of performance measures
to support management decisions, having staff with analytical skills, and having a
lower proportion of the workforce that is unionized.
Another set of factors that previous research suggested might be related to
how city executives perceive the impacts of performance measures involve
characteristics of the organizational culture. These include the perspectives of local
stakeholders such as employee support for organizational change and the city council’s
understanding of and support for the performance measurement effort. Table 4-16
shows that eight features of the local organizational culture are positively related to
executives’ assessments of the impact of performance measures. In other words,
among cities that exhibit these features, executives are much more likely to perceive
that the actual experience with performance measures has met or exceeded
expectations. Of course, the converse is also true; among the cities that do not exhibit
132
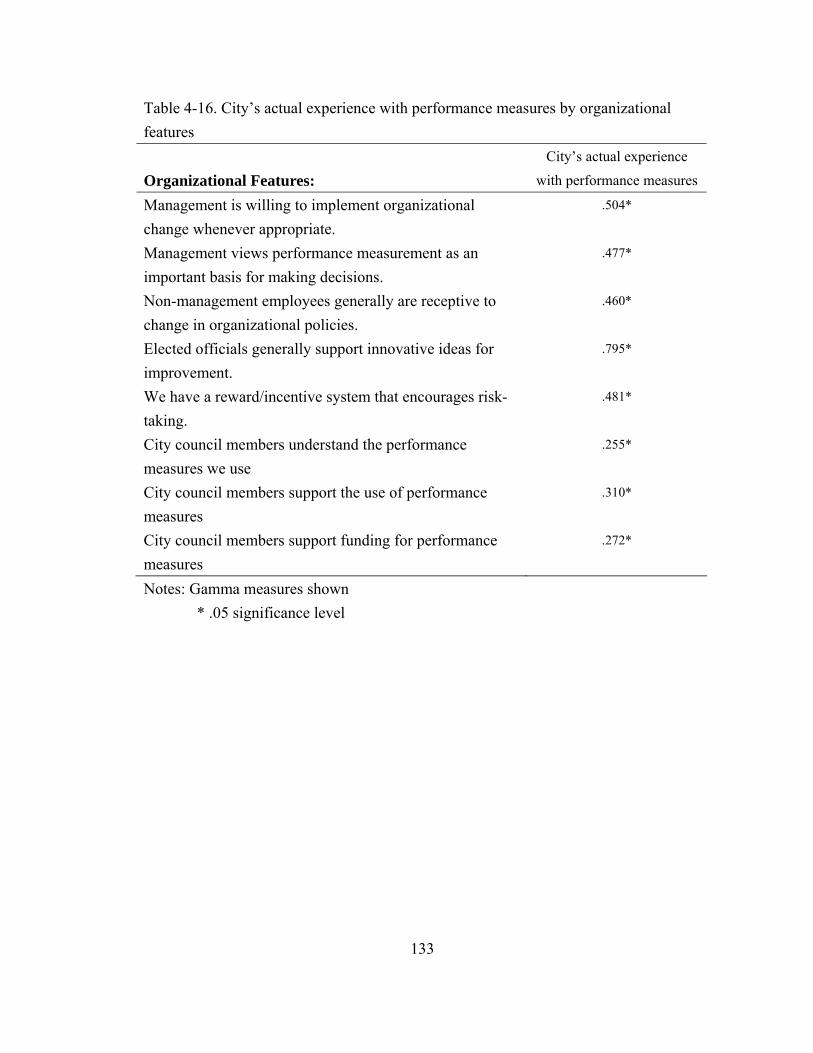
Table 4-16. City’s actual experience with performance measures by organizational features Organizational Features:
City’s actual experience with performance measures
Management is willing to implement organizational change whenever appropriate.
.504*
Management views performance measurement as an important basis for making decisions.
.477*
Non-management employees generally are receptive to change in organizational policies.
.460*
Elected officials generally support innovative ideas for improvement.
.795*
We have a reward/incentive system that encourages risk-taking.
.481*
City council members understand the performance measures we use
.255*
City council members support the use of performance measures
.310*
City council members support funding for performance measures
.272*
Notes: Gamma measures shown * .05 significance level
133

these features, executives are more likely to believe that performance measures have
fallen short of expectations.
Table 4-17 shows the results of a regression analysis involving the impact
rating as the dependent variable and seven organizational culture variables that
remained in the model. Several regression diagnostic procedures were used to test for
collinearity, but no evidence of this problem was found in this model. Altogether, the
variables in the model explain over 57% of the variation in how executives perceive
the impact of performance measures.
The two characteristics of organizational culture that are most important
include whether managers view performance measures as an important basis for
making decisions and whether management is willing to implement whatever
organizational changes are appropriate in light of the results suggested by performance
evaluations. None of the other variables in the model had a statistically significant
independent impact on how executives perceived the impact of performance measures.
This analysis suggests that what is important in determining whether performance
measures meet or exceed expectations is whether managers see performance data as an
important element in making more informed decisions and then whether they are
134

Table 4-17. Regression of performance measures’ impact and characteristics of the organizational culture Variables Un-standardized
Coefficients Standardized Coefficients
t Sig.
B Beta Constant 1.040 5.051 .000 Management willingness to implement change
-1.009 -.736 -3.639 .000
Management views PM as important for decisions
.944 .944 4.999 .001
Non-management employees receptive to policy changes
-1.643E-02 -.026 -.161 .873
Have reward/incentive system that encourages risk-taking
.113 .165 1.072 .293
City council understands performance measures
1.158E-02 .010 .046 .964
City council supports use of performance measures
2.800E-02 .025 .112 .911
City council provides funding support for PM
-.119 -.131 -.517 .609
R2 = .499, Adjusted R2 = .369 N = 49
135
actually willing to make the organizational changes suggested by the performance data
that they have collected.
To determine which factors, regardless of type, were the most important in
explaining whether performance measures met or exceeded official’s expectations, a
regression model was created that included only the five statistically significant factors
from the previous two regression models. Several regression diagnostic procedures
were used to test for collinearity, but no evidence of this problem was found in this
model. Table 4-18 shows the results of this regression analysis.
This analysis shows that the five variables in the model explain just over 21%
of the variance in the perceived impact of performance measures. Interestingly, the
only variables that were statistically significant were the three organizational and
program features that proved to be significant in the model in Table 4-15.
Consequently, it is clear that the specific organizational and program characteristics
are more important in explaining whether performance measures met or exceeded
officials’ expectations than were features of the city’s organizational culture.
136

Table 4-18. Regression of performance measures’ impact and selected organizational and program features and selected characteristics of the organizational culture Variables Un-standardized
Coefficients Standardized Coefficients
t Sig.
B Beta Constant -.103 -.532 .596 Management willingness to implement change
.143 .092 1.071 .287
Management views PM as important for decisions
.192 .152 1.680 .096
Percent workforce unionized -.002 -.182 -2.249 .026 Staff with analytical skills .147 .172 2.011 .047 Use performance data to support management decisions
.242 .227 2.510 .013
R2 = .244, Adjusted R2 = .211 N = 123
A final set of factors was examined that involved the variables presented in
Figure 4-1. The objective was to determine if any statistically significant relationships
might exist between the various results city officials expected to see after
implementing performance measures and their perception of whether these measures
met/exceeded or fell short of these expectations. Among the six variables in Figure 4-1,
only one proved to be related at a statistically significant level with how executives
perceived the impact of performance measures (See table 4-19). Among those cities
that expected the use of performance measures to result in a stronger justification for
137
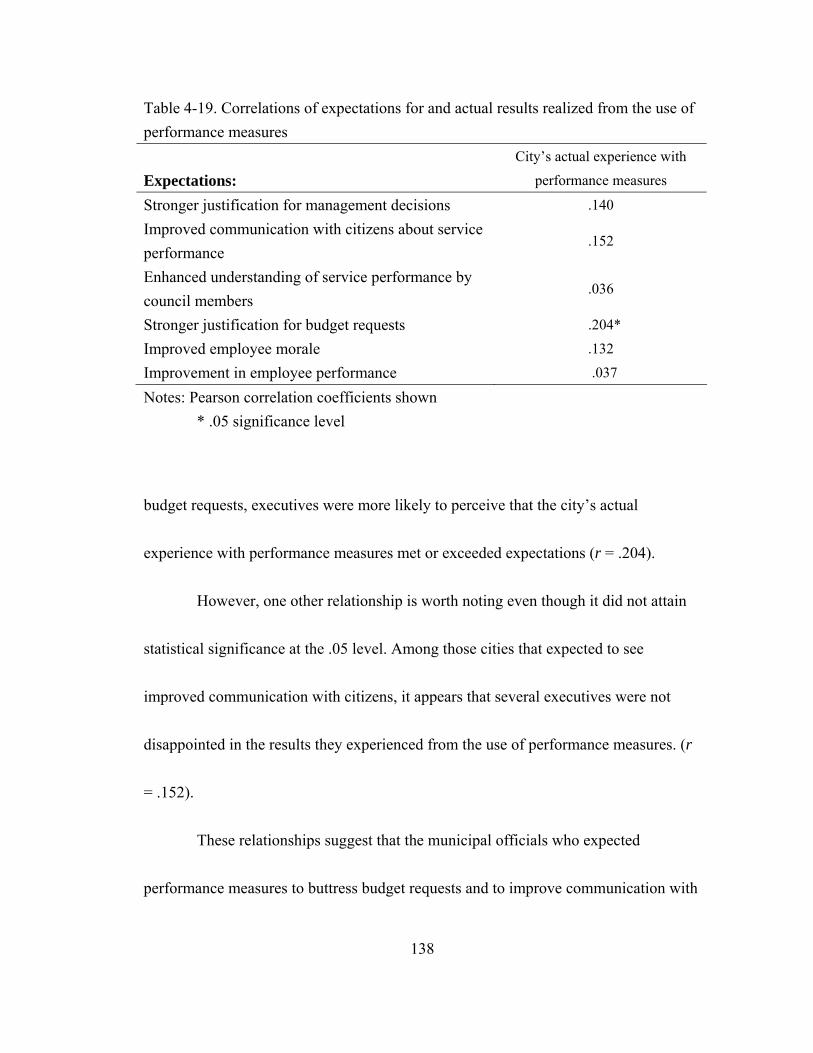
Table 4-19. Correlations of expectations for and actual results realized from the use of performance measures Expectations:
City’s actual experience with performance measures
Stronger justification for management decisions .140
Improved communication with citizens about service performance
.152
Enhanced understanding of service performance by council members
.036
Stronger justification for budget requests .204*
Improved employee morale .132
Improvement in employee performance .037
Notes: Pearson correlation coefficients shown * .05 significance level
budget requests, executives were more likely to perceive that the city’s actual
experience with performance measures met or exceeded expectations (r = .204).
However, one other relationship is worth noting even though it did not attain
statistical significance at the .05 level. Among those cities that expected to see
improved communication with citizens, it appears that several executives were not
disappointed in the results they experienced from the use of performance measures. (r
= .152).
These relationships suggest that the municipal officials who expected
performance measures to buttress budget requests and to improve communication with
138
citizens were also likely to think that performance measures helped them to realize
these expectations.
II-III. How Helpful Are Performance Measures?
Respondents were asked to rate the overall helpfulness of the performance
measures used in their city with respect to several specific management challenges. As
shown in Table 4-20, most city officials believe that performance measures used by
their city were either somewhat or very helpful in most of the areas offered in the
survey. The data in table 4-20 are ordered by the percentage of respondents who
thought that performance measures were very helpful in the particular ways offered.
More than half of the officials believed that performance measures used by
their city were very helpful in improving quality of decisions and facilitating the
setting of program goals. Over 40% of officials indicated that their performance
measures were very helpful for focusing program priorities, enhancing accountability
of individual managers, and making better communication between administrators and
elected officials.
Many city officials also reported that performance measures were at least
somewhat helpful in several other areas. About half of the respondents thought they
139
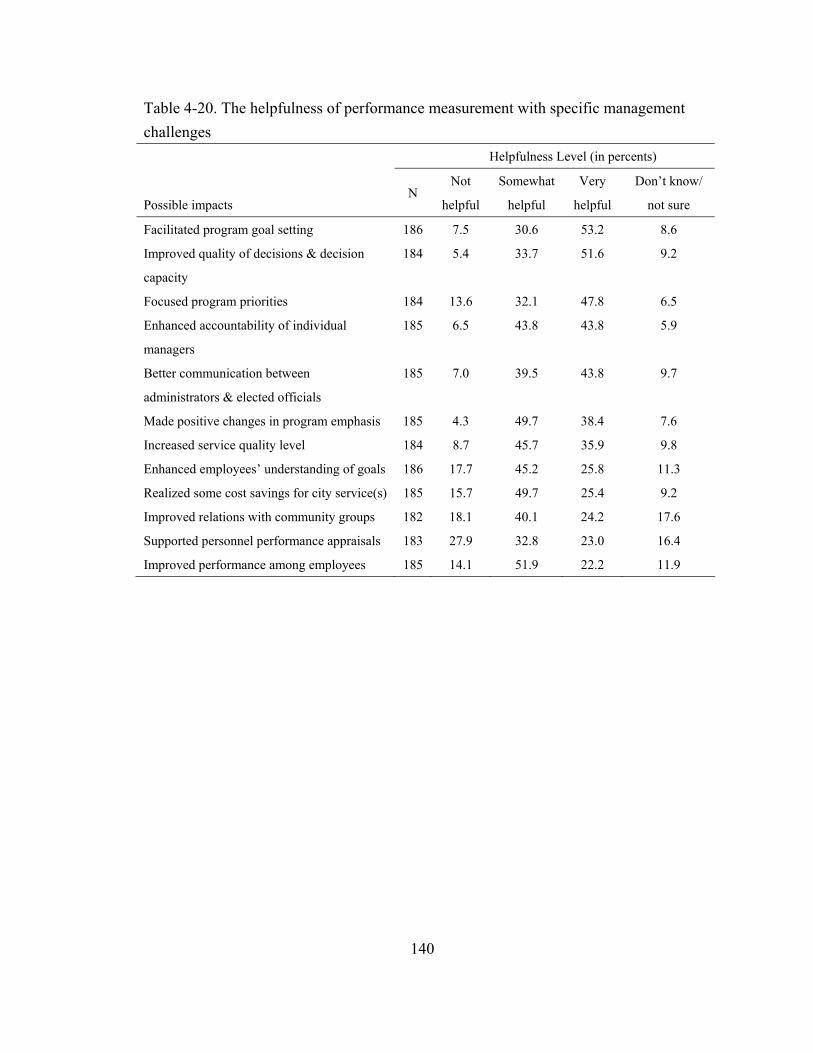
Table 4-20. The helpfulness of performance measurement with specific management challenges Helpfulness Level (in percents)
Possible impacts
N Not
helpful
Somewhat
helpful
Very
helpful
Don’t know/
not sure
Facilitated program goal setting 186 7.5 30.6 53.2 8.6
Improved quality of decisions & decision
capacity
184 5.4 33.7 51.6 9.2
Focused program priorities 184 13.6 32.1 47.8 6.5
Enhanced accountability of individual
managers
185 6.5 43.8 43.8 5.9
Better communication between
administrators & elected officials
185 7.0 39.5 43.8 9.7
Made positive changes in program emphasis 185 4.3 49.7 38.4 7.6
Increased service quality level 184 8.7 45.7 35.9 9.8
Enhanced employees’ understanding of goals 186 17.7 45.2 25.8 11.3
Realized some cost savings for city service(s) 185 15.7 49.7 25.4 9.2
Improved relations with community groups 182 18.1 40.1 24.2 17.6
Supported personnel performance appraisals 183 27.9 32.8 23.0 16.4
Improved performance among employees 185 14.1 51.9 22.2 11.9
140

were somewhat helpful in making positive changes in program emphases and in
realizing some cost savings for city services.
The largest proportion of respondents (27.9%) thought that performance
measures were not helpful at all in terms of supporting personnel performance
appraisals. This finding is not surprising since performance data are mainly aimed at
evaluating the different dimensions of service or program performance rather than that
of individual employees. Still more than half of executives thought that these data
were at least somewhat helpful in this regard. Perhaps the performance measures used
helped managers to focus on the particular areas of programs and services or the
various groups of employees that exhibited either particularly low or high performance
levels. Streib and Poister (1998) found that there were very few areas in which large
percentages of the respondents reported that performance measures made a substantial
impact. They found that the highest percentages for improvements concerned the
accountability of managers (30%) and improvements in employee focus on
organizational goals (28%). In both cases, this study shows that approximately 40% of
the respondents thought that performance measures were at least somewhat helpful.
Only 20% of the respondents to the Streib and Poister (1998) survey indicated that a
141
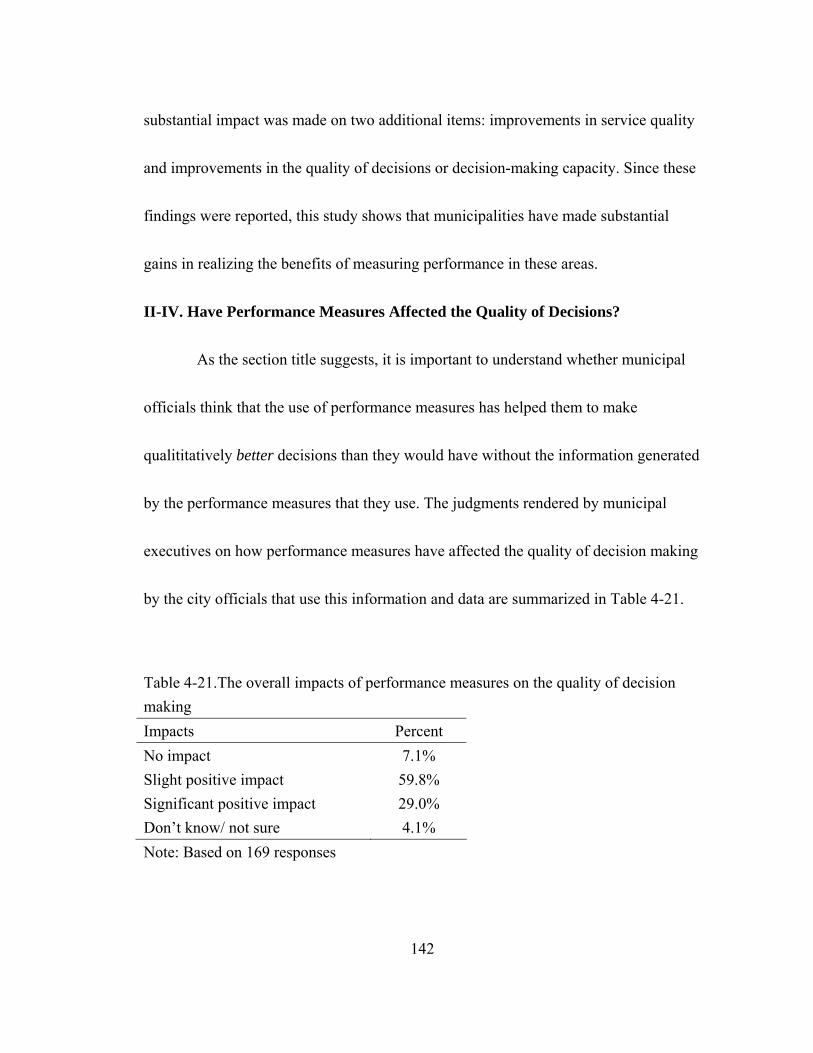
substantial impact was made on two additional items: improvements in service quality
and improvements in the quality of decisions or decision-making capacity. Since these
findings were reported, this study shows that municipalities have made substantial
gains in realizing the benefits of measuring performance in these areas.
II-IV. Have Performance Measures Affected the Quality of Decisions?
As the section title suggests, it is important to understand whether municipal
officials think that the use of performance measures has helped them to make
qualititatively better decisions than they would have without the information generated
by the performance measures that they use. The judgments rendered by municipal
executives on how performance measures have affected the quality of decision making
by the city officials that use this information and data are summarized in Table 4-21.
Table 4-21.The overall impacts of performance measures on the quality of decision making Impacts Percent No impact 7.1% Slight positive impact 59.8% Significant positive impact 29.0% Don’t know/ not sure 4.1% Note: Based on 169 responses
142

Just under one-third of executives believe that the use of performance
measures has had a significant positive impact on the quality of decision making by
local officials. Another 60% of executives believe that the use of performance
measures has had at least a slight positive impact on the quality of decision making.
Only 7.1% believed that the use of performance measures had no impact on the quality
of decision making. That 88.8% of responding executives thought that performance
measures had at least some kind of positive impact on the quality of decisions is
certainly encouraging for advocates of performance measurement.
What factors help to explain why some executives thought that performance
measures had no or a slight impact and why others thought that they had a significant
positive impact on decision making? The variables associated with this opinion on the
impact of performance on the quality of decisions are presented in Table 4-22.
The key features of city departments that are associated with executive
judgments that performance measures had a significant positive impact on the quality
of decision making are the practice of using these measures to track performance over
time and using these data to support management decisions. The organizational
143

Table 4-22. The overall impacts of performance measures on the quality of decision making by the key features of city departments and organizational features
Most city departments:
Overall impacts of performance measures on the quality of decision making
track service performance over time .178*
use performance measure info to support management decisions
.332*
Organizational Features:
Management views performance measurement as an important basis for making decisions.
.135
Elected officials generally support innovative ideas for improvement.
.226*
We have a reward/incentive system that encourages risk-taking.
.131
City council members support the use of performance measures
.113
City council members support funding for performance measures
.345*
Notes: Pearson correlation coefficients shown * .05 significance level
144

features that were related at a statistically significant level are having elected officials
who are generally supportive of innovative ideas for improvement and having city
council members who are willing to allocate sufficient funds to support the
performance measurement program.
These findings suggest the particular ways that performance data are used and
the organizational features that, if present, appear to lead to performance measures
having a significant positive impact on the decision making process in mid-sized cities.
Once again, having the support of local elected officials and particularly having city
council members who are willing to support the performance measurement program
are factors of paramount importance in understanding whether performance measures
are likely to have a significant positive impact on the local decision making process.
II-V. City Staff and Citizens’ Perspectives on the Use of Performance Measures
In order to be successfully implemented, performance measures should have
support from the city staff who are responsible for collecting and using these data, and
ideally, support from citizen stakeholders who have an interest in what they reveal
about how well city services and programs perform. This section focuses on city staff
and citizens’ perspectives on the use of performance measures.
145
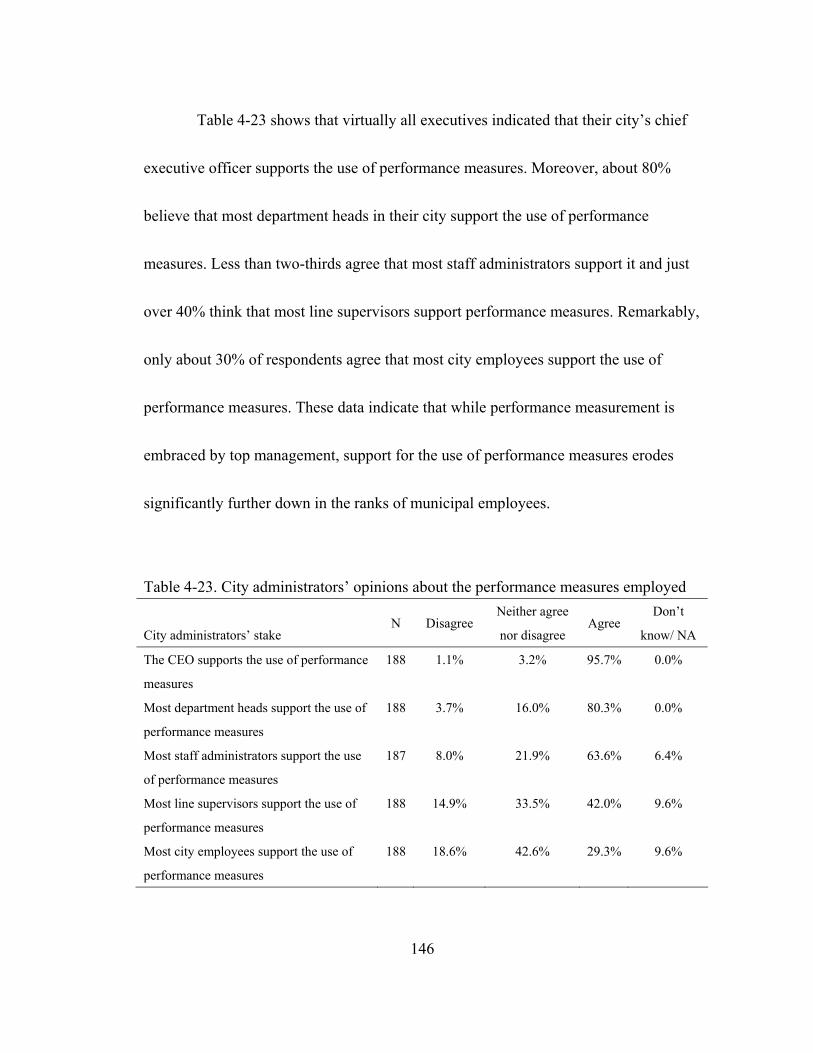
Table 4-23 shows that virtually all executives indicated that their city’s chief
executive officer supports the use of performance measures. Moreover, about 80%
believe that most department heads in their city support the use of performance
measures. Less than two-thirds agree that most staff administrators support it and just
over 40% think that most line supervisors support performance measures. Remarkably,
only about 30% of respondents agree that most city employees support the use of
performance measures. These data indicate that while performance measurement is
embraced by top management, support for the use of performance measures erodes
significantly further down in the ranks of municipal employees.
Table 4-23. City administrators’ opinions about the performance measures employed
City administrators’ stake N Disagree
Neither agree
nor disagree Agree
Don’t
know/ NA
The CEO supports the use of performance
measures
188 1.1% 3.2% 95.7% 0.0%
Most department heads support the use of
performance measures
188 3.7% 16.0% 80.3% 0.0%
Most staff administrators support the use
of performance measures
187 8.0% 21.9% 63.6% 6.4%
Most line supervisors support the use of
performance measures
188 14.9% 33.5% 42.0% 9.6%
Most city employees support the use of
performance measures
188 18.6% 42.6% 29.3% 9.6%
146
When less than one in three executives think that most employees support
performance measures, much additional work appears to be required in order to
persuade or convince municipal workers to embrace or to at least see the merits of
supporting local performance measurement efforts.
Berman & Wang (2000) found the similar results in their survey of county
government use of performance measures. They reported that almost 90% of county
manager supported the use of performance measures, about three-quarters of
department heads supported the use of performance measures, and almost half of line
supervisors supported performance measures. However, only 36.5% of county
executives thought that most county employees supported the use of performance
measures.
Analyses indicate that support from each of these government stakeholders is
certainly important in terms of the impact that performance measures have on the
quality of local decisions. As Table 4-24 indicates, support by government stakeholder
groups, particularly department heads, line supervisors and city employees is
especially important if performance measures are to have a significant positive impact
on the quality of local decisions.
147

Table 4-24. The impact of performance measures on the quality of decision making when support is evidenced by government stakeholders
City administrators’ stake
Impact of performance measures
on quality of decision making
The CEO supports the use of performance measures .292*
Most department heads support the use of performance measures .406*
Most staff administrators support the use of performance measures .411*
Most line supervisors support the use of performance measures .329*
Most city employees support the use of performance measures .358*
Notes: Cramer’s V measures shown * .05 significance level
Another set of stakeholders that executives rated as being an important
audience for performance measures are citizens and community interest group leaders.
As noted previously, a widely held expectation by executives was that performance
measures would help to improve communication with these community stakeholders.
To what extent do executives think that citizens and community leaders exhibit buy-in
to the local performance measurement effort? The distributions in Table 4-25 indicate
that local officials have made some progress among community leaders. Not quite half
of executive respondents (44.7%) think that community leaders support the city’s use
of performance measures.
148

Table 4-25. Citizens’ support for local performance measurement effort
Citizen/ community stake N Disagree
Neither agree
nor disagree Agree
Don’t
know/ NA
Community leaders support the use of
performance measures
188 4.8% 28.2% 44.7% 22.3%
Citizens think the city is more accountable
for results because performance measures
are used
188 10.1% 29.8% 33.5% 26.6%
Citizen advisory boards support use of
performance measures
187 10.2% 24.1% 30.5% 35.3%
However, only about a third of executives think that citizens now believe that
the city is more accountable for results since using performance measures. Likewise,
only 30.5% of executives think that their citizen advisory boards support the use of
performance measures. Clearly, much more work remains to be done to communicate
the value of performance measures and what local officials believe to be the impact
these measures have had on the quality of local decisions.
The bivariate analyses presented in Table 4-26 suggest that it would definitely
be worth the effort of local officials to engage citizens and citizen advisory board
members in discussions and communications about the impacts that performance
measures have on the quality of decisions by local officials.
149
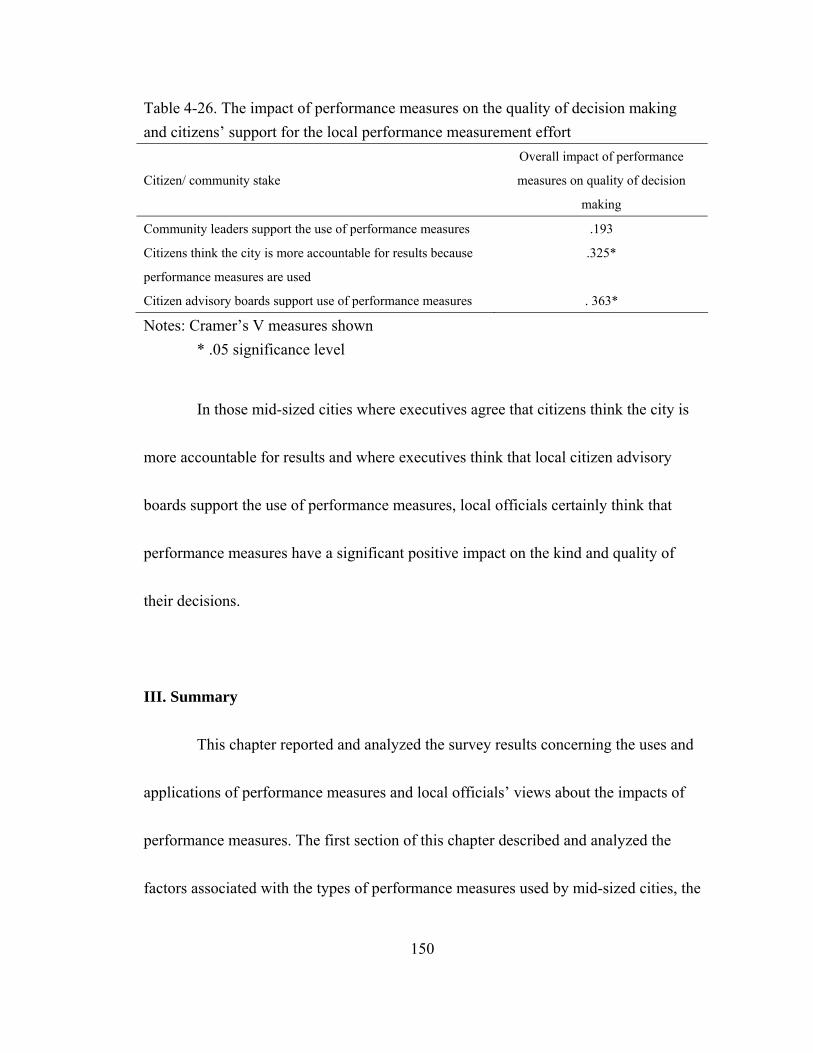
Table 4-26. The impact of performance measures on the quality of decision making and citizens’ support for the local performance measurement effort
Citizen/ community stake
Overall impact of performance
measures on quality of decision
making
Community leaders support the use of performance measures .193
Citizens think the city is more accountable for results because
performance measures are used
.325*
Citizen advisory boards support use of performance measures . 363*
Notes: Cramer’s V measures shown * .05 significance level
In those mid-sized cities where executives agree that citizens think the city is
more accountable for results and where executives think that local citizen advisory
boards support the use of performance measures, local officials certainly think that
performance measures have a significant positive impact on the kind and quality of
their decisions.
III. Summary
This chapter reported and analyzed the survey results concerning the uses and
applications of performance measures and local officials’ views about the impacts of
performance measures. The first section of this chapter described and analyzed the
factors associated with the types of performance measures used by mid-sized cities, the
150
reasons they adopted these measures, the results that local officials expected to see and
the types of decision applications of the various performance measures.
This research finds that workload or output measures are the most widely used
measures (55.7%) followed in frequency by citizen satisfaction measures (49.5%) and
service quality measures (49.1%). Efficiency or unit cost measures are adopted and
used by less than 40% of mid-sized cities. However, about half of all mid-sized cities
have adopted at least some type of performance measure.
The types of performance measures a city is likely to adopt is influenced by
the extent to which the city council understands what’s involved in measuring
performance. This understanding appears to lead to financial support for performance
measures. City council members’ understanding of performance measures is strongly
associated with council members’ support funding for performance measures.
Performance measures are most often used by those city services that typically
comprise the largest proportions of a municipal budget such as public safety, streets,
fleet maintenance and parks and recreation. On average, about half of all cities use all
five types of performance measures for these services. These services also tend to be
among the easiest types of services to measure the performance. By contrast, the
151

various staff functions and human services provided by cities present more difficult
and challenging measurement issues in terms of performance. Not surprisingly, cities
that provide these services generally use performance measures less frequently and
also use fewer types of measures.
In terms of the specific types of performance measures, more cities use
workload and outcome measures than service quality and citizen satisfaction measures
for various city services. Generally, efficiency measures are the least frequently used.
Perhaps local officials have decided to place a more emphasis on service outcomes
rather than on service efficiency in keeping with trends in the private sector service
industries.
Larger cities as measured by population size, size of operating budget and the
number of full-time employees are more likely to use a broader, more extensive array
of different types of performance measures for core six services. The cities that
identify the city council, department heads and state or federal funding agencies as
important stakeholders in performance reports are also the cities that are more likely to
use a broader array of performance measurement types to evaluate the performance of
the six commonly provided services. This finding suggests that there appears to be a
152

particular type of “Matthew effect” at work; to those that have, more will be given. In
other words, the cities that can afford to apply more types of performance measures
and that have a broader array of stakeholders interested in the results from these
measures are the ones that do in fact use a more extensive array of measures. The cities
that have used performance measures for a longer period of time are also more likely
to use a broader array of performance measures to evaluate the six core services.
Clearly, the various features of organizational culture appear to matter in
terms of the willingness to use a wider array of measures to track the performance of
those services that consume large proportions of the typical municipal budget.
Previous analyses suggested that the support by council members is quite important to
the character of local performance measurement efforts. This study also finds a strong
connection between the type of council support and the character of the performance
measurement effort. Cities with council members that are more likely to support
funding for performance measures are much more likely to use a broader array of
different performance measures.
The three most often cited reasons for their adoption and use of performance
measures are to improve management decisions (81.9%), to support budget
153

recommendations/decisions (71.9%) and “to respond to citizen demands for greater
accountability (68.6%).” Just over a third (35.7%) selected “to comply with the wishes
of elected city officials. Much smaller proportions indicated that performance
measures were adopted “to comply with state or federal reporting requirements”
(14.1%) and to respond to pressure from various community groups. These findings
are generally consistent with previous research (Streib and Poister 1998). Unlike
previous research however, this survey finds that support for making budget
recommendations and decisions is now one of the most important reasons reported for
adopting performance measures. This suggests that local officials may realize the
value of integrating performance measures in decisions and recommendations about
budget allocation decisions to an extent not reported previously.
The three most commonly expected results from the use of performance
measures were “stronger justification for management decisions” (73.5%), “stronger
justification for budget requests” (72.9%) and “improved communication with citizens
about service performance” (68.0%).
The results expected to be achieved by respondents appear to correspond to
the three most frequently cited reasons why their city adopted performance measures.
154
These relationships are substantively significant in that they suggest that there is very
little, if any, “cognitive dissonance” with respect to the reasons offered for adopting
performance measures and what local officials expected to see as a result of their
implementation. For some time now, a point of debate in the government performance
literature has concerned whether performance measures are used more for public
relations purposes (“window dressing”) or for improving the quality of management
and budget decisions. These findings suggest that local officials in mid-sized cities
appear to believe that performance measures have real value for improving the quality
of management and budget decisions. Moreover, they appear to believe that the
information generated by these measures can help the city to respond to citizen
demands for greater accountability and to improve the quality of communications with
citizens about how well the city performs its service responsibilities.
Generally, outcome measures are the most widely used type of performance
measure. Only for resource allocation decisions are workload measures used more
frequently than outcome measures. The widespread use of outcome measures makes it
apparent that city officials value the type of performance data that indicate how well
155

services and programs are performing. This finding generally corresponds to that
reported by De Lancer Julnes and Holzer (2001) and previous GASB studies (1997).
Performance measures tend to be used more extensively when managers are the
primary audience for performance data, when their staff has data analysis talent and
when council understands performance information and provides adequate financial
support for collecting performance data.
The second section of this chapter examined several dimensions of how local
executives perceive the actual impacts that resulted from their city’s use of
performance measures. Over two-thirds of executives in mid-sized cities think that the
impacts that they observed as a result of using performance measures met or exceeded
their expectations. Cities with a council-manager form of government are more likely
to have an experience with performance measures that met or exceeded their
expectations compared to cities that have a mayor-council form of government. It was
found that the length of time a city has used performance measures is correlated with
the executives’ perceptions of their actual impact. This indicates that cities with more
experience with performance measurement are more likely to have an actual
experience that met or exceeded their expectations. This finding suggests that the
156
longer performance measures are in place and the more experience local officials have
with them, the more likely perceptions of their impact correspond to expectations.
This research finds that executives are more likely to perceive that their
expectations for performance measures have been met or exceeded when city staffs
have the resources and skills to analyze performance data. The standardized beta
values of the regression analysis indicates that the three factors that are most important
in terms of having an independent effect on whether an executives are likely to think
that performance measures met or exceeded expectations are the use of performance
measures to support management decisions, having staff with analytical skills, and
having a lower proportion of the workforce that is unionized.
Analyses indicate that what is important in determining whether performance
measures meet or exceed expectations is whether managers see performance data as an
important element in making more informed decisions and then whether they are
actually willing to make the organizational changes suggested by the performance data
that they have collected. The municipal officials who expected performance measures
to buttress budget requests and to improve communication with citizens also were
likely to think that performance measures helped them to realize these expectations.
157
Most city officials believe that the performance measures used by their city
were either somewhat or very helpful. Almost 90% of responding executives thought
that performance measures had at least some kind of helpful impact on the quality of
decisions. These findings suggest that the particular ways that performance data are
used and the presence of certain features of organizational cultures lead to performance
measures having a significant positive impact on the decision making process in mid-
sized cities. Having the support of local elected officials and particularly having city
council members who are willing to support the performance measurement program
are factors of paramount importance in understanding whether performance measures
are likely to have a significant positive impact on the local decision making process.
Support by government stakeholder groups, particularly department heads,
line supervisors and city employees are especially important in terms of whether
performance measures are perceived to have a significant positive impact on the
quality of local decisions. Another set of stakeholders that executives rated as being an
important audience for performance measures are citizens and community interest
group leaders. A widely held expectation by executives was that performance
measures would help to improve communication with these community stakeholders.
158

However, these results suggest that much more work remains to be done to
communicate the value of performance measures to these community actors.
159

CHAPTER 5
CONCLUSION
Based on a randomly selected stratified sample of executives in mid-sized
cities, 66% indicated that they adopted and actually use performance measures, 31%
reported that they have not adopted any type of performance measures and only 0.03%
have adopted some type of performance measures but have never actually used them.
In terms of features and characteristics of mid-sized cities that use performance
measures, this study finds that larger cities in terms of population size, operating
budgets and full time employees are more likely to adopt and use performance
measures. This finding reflects the fact that larger cities typically have more resources
and staff expertise to develop and use performance measures.
Performance measures also are more likely to be adopted and used by cities
with a council-manager form of government than by cities with a mayor-council form
of government. Western and southern cities are more likely to adopt and use
performance measures than north central and northeastern cities, but these regional
160
differences are explained by the fact that more western and southern cities have a
larger number of council-manager governments.
Following the conceptual definitions advanced by Frederickson, Johnson, and
Wood (2004), this study finds that structural changes are especially pervasive in mid-
sized cities. The largest proportion of mid-sized cities has an “adapted” city structure.
Mid-sized “administrative” cities have much higher rate of adoption and use of
performance measures when compared to political cities but “adapted” cities have a
comparable level of adoption and use of performance measures with administrative
cities because of the widespread presence of professional administrators (CAOs) in
this structure.
The level of unionization among city employees indicates that those cities
with higher levels of employee unionization are somewhat less likely to adopt and use
of performance measures. The mean city characteristics of income, race, and education
are not statistically significantly related to the adoption and use of performance
measures. This means that mid-sized cities with different economic, racial, and
educational features are equally likely to adopt and use service performance measures.
161

Municipal officials, regardless of their experience in local government service, see
some merit in adopting and using performance measures.
One-half of mid-sized city officials indicated that the primary responsibility
for developing or devising performance measures is located in operating departments.
It is not a surprise that operating departments are most likely to involve development
of performance measures. Developing performance measures is an executive branch
function. For the most part, it has been delegated to line or staff department heads.
That the use of performance measures is still in its nascency is suggested by
the finding that over half of the cities reported that they have used performance
measures less than 7 years. Only 18 % of the cities reported that they have used
performance measures for more than 10 years.
More than 90% of respondents agree that management is willing to implement
organizational change whenever appropriate while less than half (40.5%) of
respondents agree that non-management employees generally are receptive to change
in organizational policies. While most respondents agree that management views
performance measurement as an important basis for making decisions, only about 20%
strongly agree with this view. About 90% of respondents agree that elected officials
162
generally support innovative ideas for improvement but only about one-quarter of
respondents have a reward/incentive system in place that encourages risk-taking.
Only about one-third of city officials think that most of their city’s
departments have the staff with the skill to analyze performance data. Less than one-
fourth of city officials report that their city departments use the measures to track
service performance over time and to set annual performance. Less than 20% of
respondents reported that most city departments use performance measure information
to support management decisions and to identify annual goals for programs. That
many cities do not actually use performance data to support management decision or to
set annual performance goals, suggest that most cities have not yet realized the
potential benefits or impacts that performance measurement promises for promoting
more accountable government operations. However, among those cities that do use
performance measures for these functions, executives are much more likely to think
that the use of these measures has met or exceeded expectations.
Over two-thirds of city officials agreed that their city council members support
the use of performance measures. Over one-half of executives reported that their city
council members understand the performance measures they use, but less than one-
163
third of respondents agreed that their city council members provide adequate funding
for performance measures.
Consistent with previous research findings, this study shows that cities are less
inclined to use unit cost or efficiency measures than other types of measures even
though efficiency measures are often presumed to be important for budgeting purposes.
The type of performance measures a city is likely to adopt appear to be
influenced by the extent to which the city council understands what’s involved in
measuring performance. This understanding appears to lead to financial support for
performance measures.
Performance measures generally are used most often for the city services that
typically comprise the largest proportions of municipal budgets. These include public
safety services, streets, code enforcement, fleet maintenance and parks and recreation.
On average, about half of all mid-sized cities use all five types of performance
measures for these services. The cities that identify the city council, department heads
and state or federal funding agencies as important stakeholders in performance reports
are also the cities that are more likely to use a broader array of performance
measurement types to evaluate the performance of the six commonly provided services.
164
The cities that apply a broader range of performance measures to the six commonly
provided services have staff skilled in analyzing performance data, sufficient funding
to collect performance data, an interest in comparing performance with other cities,
use performance data to help identify annual program goal and use these data to
support management decisions and to set annual performance targets. Broader use of
different types of performance measures is more common among cities where
management is willing to implement organization change, views performance data as
an important factor in making decisions and has in place a reward/incentive system
that encourages risk-taking. It is also more likely in cities where non-management
employees are more receptive to change in organization policies. Clearly, the various
features of organizational culture matter in terms of a city’s use of a wider array of
measures to track the performance of those services that consume largest proportions
of the typical municipal budget.
The three reasons cited most often by local officials for why their city adopted
performance measures were “to improve management decisions” (81.9%), “to support
budget recommendations/decisions” (71.9%) and “to respond to citizen demands for
greater accountability (68.6%).” Just over a third (35.7%) selected “to comply with the
165
wishes of elected city officials.” Unlike previous research however, this survey finds
that support for making budget recommendations and decisions is now one of the most
important reasons reported for adopting performance measures. This suggests that
more local officials realize the value of integrating performance measures in decisions.
The three most commonly expected results were “stronger justification for
management decisions” (73.5%), “stronger justification for budget requests” (72.9%)
and “improved communication with citizens about service performance” (68.0%).
The results expected to be achieved by respondents correspond to the three most
frequently cited reasons for why their city adopted performance measures. These
relationships are substantively significant in that they suggest that there is very little, if
any, “cognitive dissonance” with respect to the reasons offered for adopting
performance measures and what local officials expected to see as a result of their
implementation. While there has been debate in the government performance literature
concerning whether performance measures are used more for public relations purposes
(“window dressing”) than for improving the quality of management and budget
decisions, these findings suggest that local officials in mid-sized cities believe that
performance measures have real value for improving the quality of management and
166

budget decisions. Moreover, they appear to believe that the information generated by
these measures can help the city to respond to citizen demands for greater
accountability and to improve the quality of communications with citizens about how
well the city performs its service responsibilities.
Generally, this sturdy finds that performance measures are used more
extensively when managers are the primary audience for performance data, when their
staff has data analysis talent and when city council members understand performance
information and provide adequate financial support for collecting performance data.
This study indicates that most city officials recognize the value of
performance measures for helping to improve management decisions. Top city
officials appear to have a high level of commitment to refining these measures and
extending their application to more community services. However, one of the main
challenges they confront continues to be “buy-in” by line supervisors and their
employees with respect to the value and applications of performance measures. This
finding suggests that there continues to be a certain level of fear or anxiety about the
use of performance measures among most city employees.
167

This research finds that over two-thirds of executives in mid-sized cities think
that the impacts that they observed as a result of using performance measures met or
exceeded their expectations. Cities with a council-manager form of government are
more likely to have an experience with performance measures that met or exceeded
their expectations compared to cities that have a mayor-council form of government.
The length of time a city has used performance measures is correlated with the
executives’ perceptions of their actual impact. The longer performance measures are in
place and the more experience local officials have with them, the more likely
perceptions of their impact correspond to expectations.
This research finds that executives are more likely to perceive that their
expectations for performance measures have been met or exceeded when their staffs
have the resources and skills to analyze performance data. The use of performance
measures is most likely to meet or exceed expectations when performance measures
are used to support management decisions, when staffs have adequate analytical skills,
and when a lower proportion of the workforce is unionized.
Analyses suggest that what is important in determining whether performance
measures meet or exceed expectations is whether managers see performance data as an
168

important element in making more informed decisions and then whether they are
actually willing to make the organizational changes suggested by the performance data
that they have collected. The municipal officials who expected performance measures
to buttress budget requests and to improve communication with citizens also were
likely to think that performance measures helped them to realize these expectations.
Most city officials believe that the performance measures used by their city
were either somewhat or very helpful in most decision areas. Almost 90% of
executives thought that performance measures had at least some kind of positive
impact on the quality of their decisions. Having the support of local elected officials
and having city council members who are willing to support the performance
measurement program are factors of paramount importance in understanding whether
performance measures are likely to have a significant positive impact on the local
decision making process.
Support by government stakeholder groups, particularly department heads,
line supervisors and city employees are especially important if performance measures
are to have a significant positive impact on the quality of local decisions. Likewise,
support by citizens and community interest group leaders is also important. While
169
most executives thought that performance measures would help to improve
communication with these two groups of stakeholders, clearly, much more work
remains to be done to communicate the value of performance measures to employees
and the impact performance feedback has had in terms of improving the quality of
decisions and enhancing the city’s accountability for results.
This research finds that 66% of mid-sized U.S. cities adopted and actually use
performance measures. Earlier research conducted by Poister and Streib (1999)
indicated that only about 38 percent of cities in this population range had adopted
performance measures. Consequently, it appears that mid-sized cities have been very
active in terms of adopting performance measures during this five year period. They
may very well be in the vanguard of both adopting using and refining measures for
service and program performance. Future research might compare the rate of adoption
of performance measures by mid-sized cities with communities below or above this
population range to determine whether mid-sized cities are the source for the diffusion
of innovations in performance measures.
This research also finds that government structure really matters the adoption
and use of performance measures. Why are the governments with council-manager
170

form more likely to adopt performance measures than the governments with mayor-
council form? One possible avenue of explanation that merits additional study
concerns the impacts and consequences of having professional administrators (CAOs)
responsible for managing and using performance measures.
This research finds that while performance measurement is embraced by top
management, support for the use of performance measures erodes significantly further
down in the ranks of municipal employees. Further research should seek to determine
why lower-level employees are less supportive of performance measures and what
would be required for them to boost their level of support for these measures. Since
this study finds that cities with higher levels of employee unionization do not appear to
realize all of the expected benefits of measuring performance, future study should
focus on understanding how collective bargaining might conflict with the objectives of
a performance measurement system.
In depth comparative case studies are needed to investigate why some local
governments adopted and use performance measures and why others do not. While
idiographic research has limitations, it also has the advantage of avoiding problems in
trying to compare communities that have widely varying measures for services.
171

References
172
American Society for Public Administration. 1992. Resolution Encouraging the Use of Performance Measurement and Reporting by Government Organizations. Washington, D.C.: American Society for Public Administration, adopted April 14, 1992.
Ammons, David N. 1999. A Proper Mentality for Benchmarking. Public Administration Review 59(2): 105-9. _______________. 1995a. Performance Measurement in Local Government. In Accountability for Performance: Measurement and Monitoring in Local Government, edited by David N. Ammons, 15-32. Washington, DC: International City/County Management Association. _______________. 1995b. Overcoming the Inadequacies of Performance Measurement in Local Government: The Case of Libraries and Leisure Services. Public Administration Review 55(1): 37-47. _______________. 1995c. Introduction. In Accountability for Performance: Measurement and Monitoring in Local Government, edited by David N. Ammons, 1-12. Washington, DC: International City/County Management Association. _______________. 1992. Productivity Barriers in the Public Sector. In Public Productivity Handbook, edited by Marc Holzer, 117-36. New York, NY: Marcel Dekker, Inc. _______________. 1985. Common Barriers to Productivity Improvement in Local Government. Public Productivity Review 19(4): 293-310. Aristiqueta, Maria. 2000. Measuring Performance in State Government. In Handbook of State Government Administration, edited by John J. Gargan, 347-61. New York, NY: Marcel Dekker, Inc. Benowitz, Phillip S. and Robert Schein. 1996. Performance Measurement in Local Government. The Municipal Year Book, 19-23. Washington, DC: International City/County Management Association. Berger, Anna. 2002. The South Carolina Municipal Benchmarking Project: An Endeavor Toward Excellence at the Local Level. Public Policy and Practice 1(3): 24-32, USC Institute Public Service and Policy Research http://www.iopa.sc.edu/eJournal/benchmarking.htm
173
Berger, Anna and Bill Tomes. 2002. The South Carolina Municipal Benchmarking Project: Beyond the Data to Tangible Results. Public Policy and Practice 2(1): 15-23, USC Institute Public Service and Policy Research http://www.iopa.sc.edu/eJournal/archives.htmBerman, Evan and XiaoHu Wang. 2000. Performance Measurement in U.S. Counties: Capacity for Reform. Public Administration Review 60(5): 409-20. Bernstein, David J. 1999. Comments on Perrin’s Effective Use and Misuse of Performance Measurement. American Journal of Evaluation 20(1): 85-93. Bouckaert, Geert. 1996. Measurement of Public Sector Performance: Some European
Perspective. In Organizational Performance and Measurement in the Public Sector: Toward Service, Effort, and Accomplishment Reporting, edited by Arie Halachmi and Geert Bouckaert, 223-37. Westport, CT: Quorum Books.
_______________. 1990. The History of the Productivity Movement. Public Productivity and Management Review 15(1): 53-89. Bouckaert, Geert and B. Guy Peters. 2002. Performance Measurement and Management: The Achilles’ Heel in Administrative Modernization. Public Performance and Management Review 25(4): 359-62. Bowden, Mison. 1996. Development and Use of Outcome Information in Government: Oregon Department of Transportation. Washington, DC: ASPA, Center for Accountability and Performance. Bowsher, Charles A. 1993. Improving Government: Need to Reexamine Organization and Performance. Testimony before the Committee on Governmental Affairs, United States Senate. Washington, D.C.: U.S. General Accounting Office (GAO/T-GGD-93-9). _______________. 1992. Performance Measurement: An Important Tool in Managing for Results. Testimony before the Committee on Governmental Affairs, United States Senate. Washington, D.C.: U.S. General Accounting Office (GAO/T-GGD-92-35). Cannon, John. 1996. Utah Tomorrow. Washington, DC: ASPA, Center for Accountability and Performance. Cope, Glen Hahn. 1996. Budgeting for Public Programs. In Handbook of Public Administration, edited by James L. Perry, 397-310. San Francisco, CA: Jossey-Bass Publishers.
174
_______________. 1995. Budgeting for Performance in Local Government. The Municipal Year Book, 42-52. Washington, DC: International City/County Management Association. Coplin, William D., Merget Astrid E. and Carolyn Bourdeaux. 2002. The Professional Researcher as Change Agent in the Government-Performance Movement. Public Administration Review 62(6): 699-711. de Lancer Julnes, Patricia. 1999. Lessons Learned About Performance Measurement. International Review of Public Administration 4(2): 45-55. de Lancer Julnes, Patricia and Marc Holzer. 2001. Promoting the Utilization of Performance Measures in Public Organizations: An Empirical Study of Factors Affecting Adoption and Implementation. Public Administration Review 61(6): 693-708. Epstein, Paul D. 1992. Get Ready: The Time for Performance Measurement Is Finally
Coming! Public Administration Review 52(5): 513-19. Epstein, Jeff and Raymond T. Olson. 1996. Lessons Learned by State and Local Government. Public Manager 25(3): 41-4. Fisher, Richard J. 1996. An Overview of Performance Measurement. Public Management 76(9): s2-s8. Folz, David H. and P. Edward French. 2005, forthcoming. Managing America's Small Communities: People, Politics, and Performance. Lanham, MD: Rowman and Littlefield Publishers. Frederickson, George H., Gary Alan Johnson, and Curtis H. Wood. 2004. The Changing Structure of American Cities: A Study of the Diffusion of Innovation. Public Administration Review 64(3): 320-30. _______________. 2003. Adapted City: Institutional Dynamics and Structural Change. Armonk, NY: ME Sharpe, Inc. Ghobadian, A. and J. Ashworth. 1994. Performance Measurement in Local Government: Concept and Practice. International Journal of Operations and Production Management 14(5): 35-51. Gore, Albert. 1993. Creating a Government that Works Better and Cost Less: Report of the National Performance Review. Washington, DC: U.S. Government Printing Office.
175

Governmental Accounting Standards Board (GASB) and National Academy of Public Administration. 1997. Report on Survey of State and Local Government Use and Reporting of Performance Measures: First Questionnaire Results. http://www.seagov.org/sea_gasb_project/1997_Survey.pdf Governmental Accounting Standards Board (GASB). 2002. Performance Measurement at the State and Local Levels: A Summary of Survey Results. http://www.seagov.org/sea_gasb_project/1998_Survey.pdf Greiner, John M. 1996. Positioning Performance Measurement for the Twenty-first
Century. In Organizational Performance and Measurement in the Public Sector: Toward Service, Effort, and Accomplishment Reporting, edited by Arie Halachmi and Geert Bouckaert, 11-50. Westport, CT: Quorum Books.
Greiner, John M., Harry P. Hatry, Margo P. Koss, Annie P. Millar, and Jane P. Woodward. 1981. Productivity and Motivation: A Review of State and Local Government Initiatives. Washington, D.C.: Urban Institute. Grifel, Stuart S. 1996. Organizational Culture: Its Importance in Performance Measurement. Public Management 76(9): s19-s20. ____________. 1993. Performance Measurement and Budgetary Decision Making. Public Productivity and Management Review 16(4): 403-7. Grizzle, Gloria A. 2002. Performance Measurement and Dysfunction: The Dark Side of Quantifying Work. Public Performance and Management Review 25(4): 363-69. _______________. 1985. Performance Measures for Budget Justifications: Developing a Selection Strategy. Public Productivity Review 9(4): 328-41. Hatry, Harry P. 2002. Performance Measurement: Fashions and Fallacies. Public
Performance and Management Review 25(4): 352-58. ____________. 1999. Performance Measurement: Getting Results. Washington, DC: The Urban Institute. ____________. 1996. Tracking the Quality of Services. In Handbook of Public Administration, edited by James L. Perry, 537-554. San Francisco, CA: Jossey-Bass Publishers. Hatry, Harry P., Craig Gerhart and Martha Marshall. 1994. Eleven Ways to Make
Performance More Useful to Public Managers. Public Management 76(9): s15- s18.
176
Hatry, Harry P. and Donald M. Fisk. 1971. Improving Productivity and Productivity Measurement in Local Governments. Washington, D.C.: Urban Institute.
Hatry, Harry P., James R. Fountain, Jonathan M. Sullivan, and Lorraine Kremer. 1990. Service Efforts and Accomplishments Reporting: Its Time Has Come-An Overview. Norwalk, CT: Governmental Accounting Standards Board. Hatry, Harry P., Louise H. Blair, Donald M. Fisk, John R. Hall, and Phillip S. Schaenman. 1992. How Effective Are Your Community Services? Procedures for Measuring Their Quality. Washington, DC: The Urban Institute and International City/County Management Association. Hayes, Frederick O’R. 1977. Productivity in Local Government. Lexington, MA:
Lexington Books. Hendrick, Rebecca. 2000. Comprehensive Management and Budgeting Reform in Local Government: The Case of Milwaukee. Public Productivity and Management Review 23(3): 312-37. Holzer, Mark ed. 1976. Productivity in Public Organizations. Port Washington,
NY: Kennikat Press. Kamensky, John M. 1993. Program Performance Measures: Designing a System to Manage for Results. Public Productivity and Management Review 16(4): 395- 407. Kearney, Richard C. and Evan M. Berman. 1999. Introduction. In Public Sector
Performance: Management, Motivation, and Measurement, edited by Richard C. Kearney and Evan M. Berman, 1-5. Boulder, CO: Westview Press.
Kettle, Donald F. 1997. The Global Revolution in Public Management: Driving Themes, Missing Links. Journal of Policy Analysis and Management 16(3): 446-62. ____________. 1994. Reinventing Government? Appraising the National Performance Review. Washington, DC: Brookings Institution. Kimm, V. 1995. GPRA: Early Implementation. The Public Manager 21(1): 11-14. Kouzmin, Alexander, Elke Löffler, Helmut Klages, and Nada Korac-Kakabadse. 1999.
Benchmarking and Performance Measurement in Public Sectors. International Journal of Public Sector Management 12(2): 121-44.
Lasswell, Harold D. 1936 Politics: Who Gets What, When, and How? New York: McGraw-Hill.
177
Lee, Robert. 1997. A Quarter Century of State Budgeting Practices. The Public Management 57(2): 133-40. Leithe, Joni L. 1997. Implementing Performance Measurement in Government. Chicago, IL: Government Finance Officers Association. Lineberry, Robert L. and Edmond P. Fowler. 1967. Reformism and Public Policies in American Cities. American Political Science Review 61(3): 701-16. Liner, Blain E., Harry P. Hatry, Elisa Vinson, Ryan Allen, Pat Dusenbury, Scott Bryant, and Ron Snell. 2001. Making Results-Based State Government Work. Washington, DC: The Urban Institute. Marris, Peter and Martin Rein. 1973. Dilemmas of Social Reform: Poverty and Community Action in the United States. Chicago: Aldine Publishing Co. Marshall, Martha. 1996. Development and Use of Outcome Information in Government,
Prince William County, Virginia. Washington, D.C.: ASPA, Center for Accountability and Performance.
McMahon, Martin James. Forthcoming. The Matthew Effect and Federal Taxation. Boston College Law Review http://ssrn.com/abstract=608967Merjanian, Ara. 1996. Strategic Budgeting in Texas: A Systems Approach to Planning,
Budgeting, and Performance Measurement. Washington, D.C.: ASPA, Center for Accountability and Performance.
Mihm, Christopher J. 2002. Beyond Plans, Promises and Good Intentions: Instilling Results-Oriented Management in Federal Agencies. In Meeting Challenges of Performance-Oriented Government, edited by Kathryn Newcomer, Edward T. Jennings, Jr., Cheryle Broom and Allen Lomax, 37-48. Washington, DC: The American Society for Public Administration/Center for Accountability and Performance.
Morgan, David R. 1984. Manage Urban America. Monterey, CA: Brooks/Cole Publishing Co. Morgan, David R. and Robert E. England. 1999. Managing Urban America. New York: Chatham House Publishers. Municipal Technical Advisory Service. 2003. Tennessee Municipal Benchmarking Project: FY 2002 Annual Report. Institute for Public Service, The University of Tennessee. http://www.mtas.utk.edu/public/web.nsf/search/Home?Opendocument
178
National Performance Review. 1997. Serving the American Public: Best Practices in Performance Measurement. http://govinfo.library.unt.edu/npr/library/papers/benchmrk/nprbook.html#strat egies Newcomer, Kathryn E. 1997. Using Performance Measurement to Improve Programs. In Using Performance Measurement to Improve Public and Nonprofit Programs, New Directions for Evaluation, Number 75, edited by Kathryn E. Newcomer, 5-14. San Francisco, CA: Jossey-Bass Publishers. __________________. 1996. Evaluating Public Programs. In Handbook of Public Administration, edited by James L. Perry, 555-573. San Francisco, CA: Jossey-Bass Publishers. North Carolina Local Government Performance Measurement Project. http://www.teri.res.in/teriin/users/case4.htmNorth Carolina Benchmarking Project.
http://www.iog.unc.edu/programs/perfmeas/index.htmlNyhan, Ronald C. and Herbert A Maslow. 1995. Performance Measurement in the Public Sector: Challenges and Opportunities. Public Productivity and Management Review 18 (4): 333-48. Osborne, David and Peter Plastrik. 1997. Banishing Bureaucracy: The Five Strategies for Reinventing Government. Reading, MA: Addison-Wesley. Osborne, David and Ted Gaebler. 1992. Reinventing Government. New York: Addison-Wesley. Patton, Michael Q. 1978. Utilization-Focused Evaluation. Beverly Hills, CA: Sage Publications. Perrin, Burt. 1998. Effective Use and Misuse of Performance Measurement. American
Journal of Evaluation 19 (3): 367-79. Poister, Theodore H. and Gregory Streib. 1999. Performance Measurement in Municipal Government: Assessing the State of the Practice. Public Administration Review 59(4): 325-35. Radin, Beryl A. 1998. The Government Performance and Result Act (GPRA): Hydra- Headed Monster or Flexible Management Tool. Public Administration Review 58(4): 307-16.
179

Rainey, Hal. G. 1998. Ingredient for Success: Five Factors Necessary for Transforming Government. In Transforming Government: Lessons from the Reinvention Laboratories, edited by Patricia W. Ingraham, James R. Tompson, and Ronald P. Sanders, 147-72. San Francisco, CA: Jossey-Bass Publishers. Ridley,Clarence E. and Herbert A. Simon. 1943. Measuring Municipal Activities: A Survey of Suggested Criteria for Appraising Administration. Chicago: International City Managers’ Association. Rivenbark, William C. and Janet M. Kelly. 2000. Performance Measurement: A Local Government Response. Journal of Public Budgeting, Accounting and Financial Management 12(1): 74-86. Sanders, Ronald P. 1998. Heroes of the Revolution: Characteristics and Strategies of
Reinvention Leaders. In Transforming Government: Lessons from the Reinvention Laboratories, edited by Patricia W. Ingraham, James R. Tompson, and Ronald P. Sanders, 29-57. San Francisco, CA: Jossey-Bass Publishers.
Schick, Allen. 1990. Budgeting for Results: Recent Developments in Five Industrialized Countries. Public Administration Review 50(1): 26-34. Stanley, David T. 1972. Managing Local Government Under Union Pressure: Studies of Unionism in Government. Washington, D.C.: Brookings Institution. Streib, Gregory D. and Theodore H. Poister. 2002. The Use of Strategic Planning in Municipal Governments. In The Municipal Year Book, 2002, 18-25. Washington, DC: International City/County Management Association. _________________________________. 1999. Assessing the Validity, Legitimacy, and Functionality of Performance Measurement Systems in Municipal Government. American Review of Public Administration 29(2): 107-23. _________________________________. 1998. Performance Measurement in Municipal Governments. In The Municipal Year Book, 1998, 9-15. Washington, DC: International City/County Management Association. _________________________________. 1990. Strategic Planning in U.S. Cities:
Patterns of Use, Perceptions of Effectiveness, and an Assessment of Strategic Capacity. American Journal of Public Administration 20(1): 29-44.
Svara, James H. 1990. Official Leadership in The City: Patterns of Conflict and Cooperation. Oxford: Oxford University Press.
180

The Institute of Government. 2004. North Carolina Local Government Performance Measurement Project: Final Report on City Services for Fiscal Year 2002- 2003. School of Government, The University of North Carolina at Chapel Hill. Thompson, James R. and Ronald P. Sanders. 1988. In Transforming Government: Lessons from the Reinvention Laboratories, edited by Patricia W. Ingraham, James R. Tompson, and Ronald P. Sanders, 97-121. San Francisco, CA: Jossey-Bass Publishers. Tigue, Patricia. 1994. Use of Performance Measures by GFOA Members. Government Finance Review 10(6): 42-44. U.S. General Accounting Office. 1992. Program Performance Measures: Federal Agency Collection and Use of Performance Data. Washington, D.C.: United States General Accounting Office (GAO/GGD-92-65). Walker, David M. 2001. The Performance Conference: Managing for Results
www.gao.gov from the comptroller general Wang, XiaoHu and Evan Berman. 2000. Hypotheses about Performance Measurement in Counties: Finding from a Survey. Journal of Public Administration Research and Theory 11(3): 403-28. Weaver, R. Kent and Bert A. Rockman. 1993. Do Institutions Matter? Government Capabilities in the United States and Abroad. Washington, D.C.: Brookings Institution. Wechsler, Barton and Clary Bruce. 2000. Implementing Performance Government: A
Symposium Introduction. Public Productivity and Management Review 23(3): 264-66.
Welch, Susan and Timothy Bledsoe. 1988. Urban Reform and Consequences. Chicago: University of Chicago Press. Wholey, Joseph S. 2002. Making Results Count in Public and Nonprofit Organizations: Balancing Performance with Other Values. In Meeting Challenges of Performance-Oriented Government, edited by Kathryn Newcomer, Edward T. Jennings, Jr., Cheryle Broom and Allen Lomax, 13-35. Washington, DC: The American Society for Public Administration/Center for Accountability and Performance. ________________. 1999. Performance-Based Management: Responding to the Challenges. Public Productivity and Management Review 22(4): 288-307.
181

________________. 1997. Trends in Performance Measurement: Challenges for Evaluators. In Evaluation for 21st Century, edited by Eleanor Chelimsky and William R. Shadish, 123-34. Thousand Oaks, CA: Sage Publications. ________________. 1989. Introduction: How Evaluation can Improve Agency and Program Performance. In Improving Government Performance, edited by Joseph S. Wholey and Kathryn E. Newcomer, 1-15. San Francisco, CA: Jossey-Bass Publishers. Wholey, Joseph S. and Harry Hatry. 1992. The Case for Performance Monitoring. Public Administration Review 52(6): 604-10. Wholey, Joseph S. and Kathryn E. Newcomer. 1997. Clarifying Goals, Reporting Results. In Using Performance Measurement to Improve Public and Nonprofit Programs, New Directions for Evaluation, Number 75, edited by Kathryn E. Newcomer, 91-99. San Francisco, CA: Jossey-Bass Publishers. Wildavsky, Aaron. 1997. Rescuing Policy Analysis from PPBS. In Classics of Public Administration, edited by Jay Shafritz and Albert Hyde, 275-88. Fort Worth, TX: Harcourt Brace & Co. Williams, Daniel W. 2003. Measuring Government in the Early Twentieth Century. Public Administration Review 63(6): 643-59. Willoughby, Katherine G. and Julia E. Melkers. 2001. Performance Budgeting in the States. In Quicker, Better, Cheaper? Managing Performance in American Government, edited by Dall W. Forsythe, 335-64. Albany, New York: Rockefeller Institute Press.
182

Appendix
183
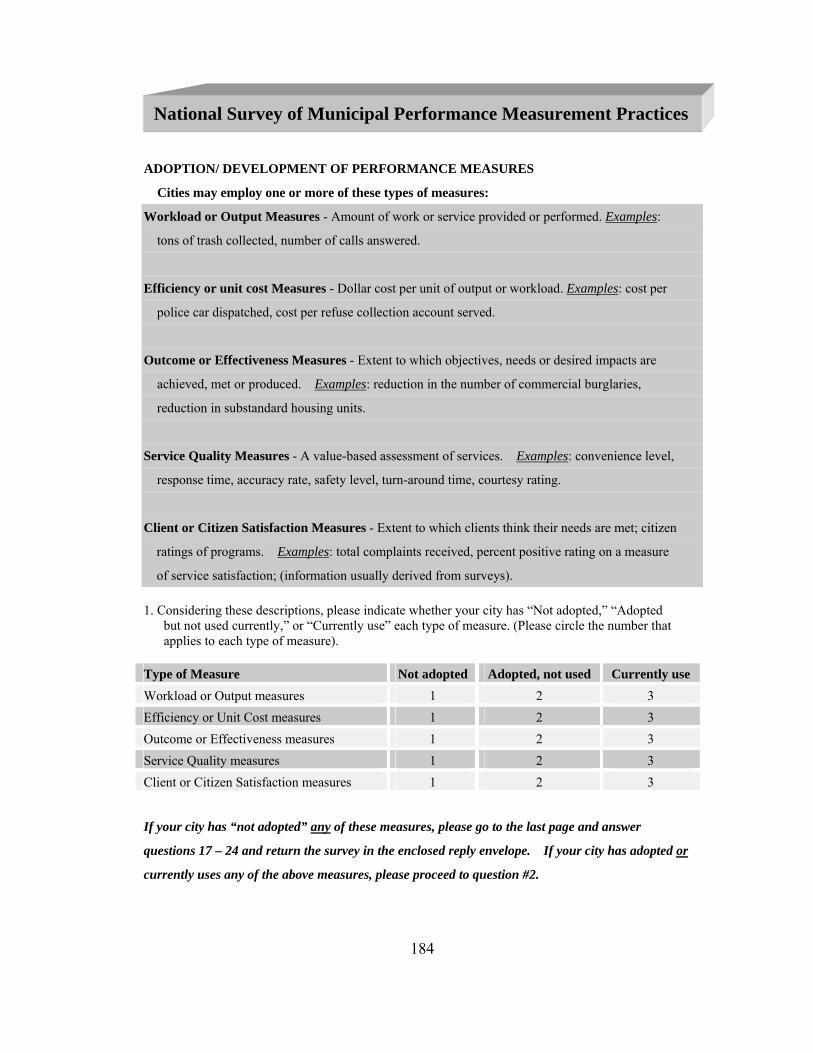
National Survey of Municipal Performance Measurement Practices
ADOPTION/ DEVELOPMENT OF PERFORMANCE MEASURES
Cities may employ one or more of these types of measures:
Workload or Output Measures - Amount of work or service provided or performed. Examples:
tons of trash collected, number of calls answered.
Efficiency or unit cost Measures - Dollar cost per unit of output or workload. Examples: cost per
police car dispatched, cost per refuse collection account served.
Outcome or Effectiveness Measures - Extent to which objectives, needs or desired impacts are
achieved, met or produced. Examples: reduction in the number of commercial burglaries,
reduction in substandard housing units.
Service Quality Measures - A value-based assessment of services. Examples: convenience level,
response time, accuracy rate, safety level, turn-around time, courtesy rating.
Client or Citizen Satisfaction Measures - Extent to which clients think their needs are met; citizen
ratings of programs. Examples: total complaints received, percent positive rating on a measure
of service satisfaction; (information usually derived from surveys). 1. Considering these descriptions, please indicate whether your city has “Not adopted,” “Adopted but not used currently,” or “Currently use” each type of measure. (Please circle the number that applies to each type of measure). Type of Measure Not adopted Adopted, not used Currently useWorkload or Output measures 1 2 3 Efficiency or Unit Cost measures 1 2 3 Outcome or Effectiveness measures 1 2 3 Service Quality measures 1 2 3 Client or Citizen Satisfaction measures 1 2 3
If your city has “not adopted” any of these measures, please go to the last page and answer
questions 17 – 24 and return the survey in the enclosed reply envelope. If your city has adopted or
currently uses any of the above measures, please proceed to question #2.
184
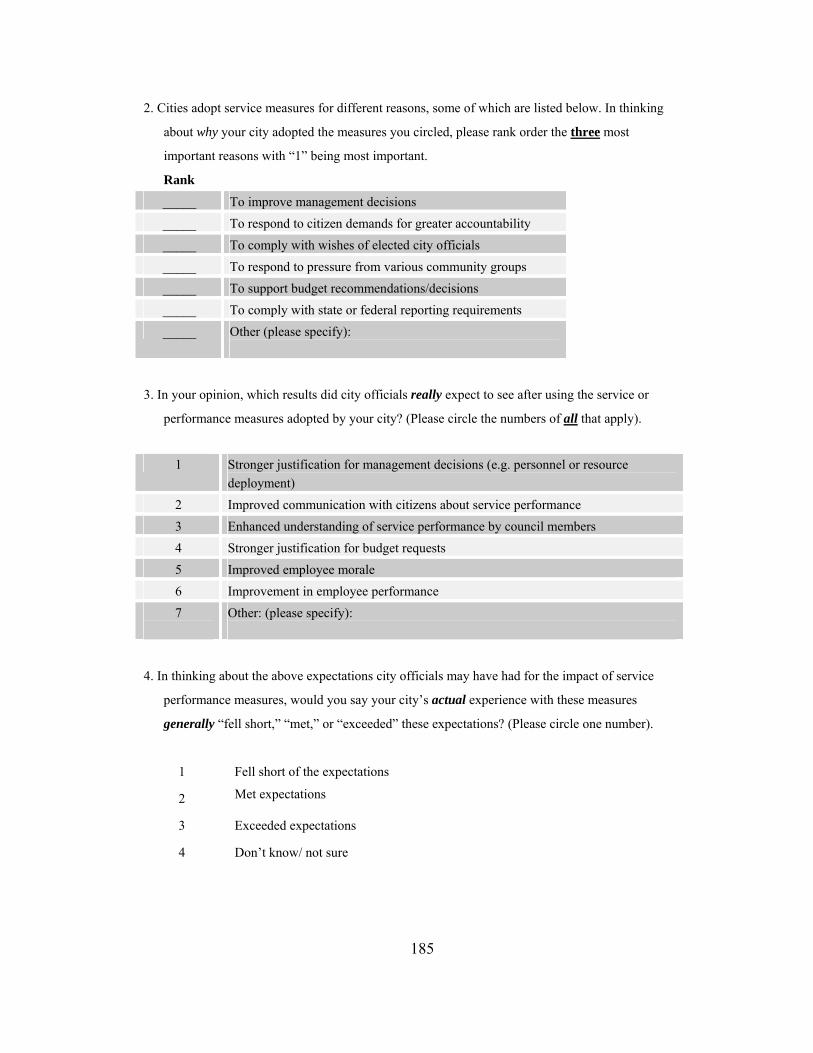
2. Cities adopt service measures for different reasons, some of which are listed below. In thinking
about why your city adopted the measures you circled, please rank order the three most
important reasons with “1” being most important.
Rank
_____ To improve management decisions _____ To respond to citizen demands for greater accountability _____ To comply with wishes of elected city officials _____ To respond to pressure from various community groups _____ To support budget recommendations/decisions _____ To comply with state or federal reporting requirements _____ Other (please specify):
3. In your opinion, which results did city officials really expect to see after using the service or
performance measures adopted by your city? (Please circle the numbers of all that apply).
1 Stronger justification for management decisions (e.g. personnel or resource deployment)
2 Improved communication with citizens about service performance 3 Enhanced understanding of service performance by council members 4 Stronger justification for budget requests 5 Improved employee morale 6 Improvement in employee performance 7
Other: (please specify):
4. In thinking about the above expectations city officials may have had for the impact of service
performance measures, would you say your city’s actual experience with these measures
generally “fell short,” “met,” or “exceeded” these expectations? (Please circle one number).
1 Fell short of the expectations
2 Met expectations
3 Exceeded expectations
4 Don’t know/ not sure
185
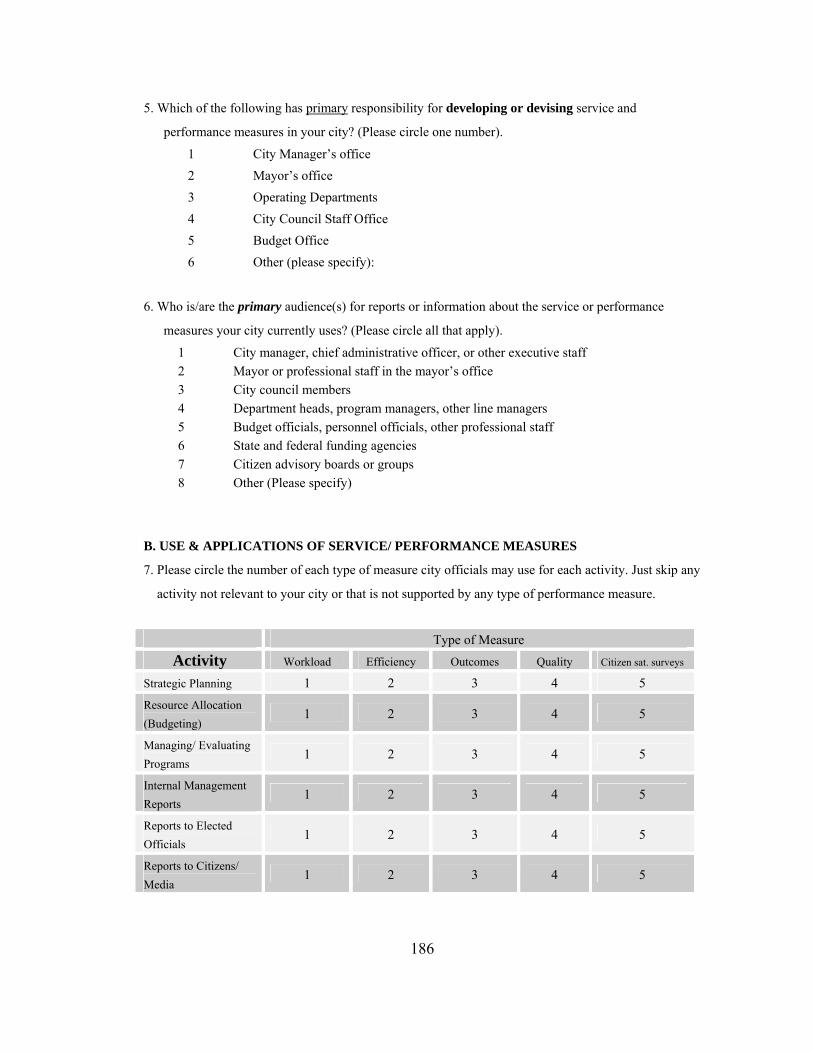
5. Which of the following has primary responsibility for developing or devising service and
performance measures in your city? (Please circle one number).
1 City Manager’s office 2 Mayor’s office 3 Operating Departments 4 City Council Staff Office 5 Budget Office 6 Other (please specify):
6. Who is/are the primary audience(s) for reports or information about the service or performance
measures your city currently uses? (Please circle all that apply).
1 City manager, chief administrative officer, or other executive staff 2 Mayor or professional staff in the mayor’s office 3 City council members 4 Department heads, program managers, other line managers 5 Budget officials, personnel officials, other professional staff 6 State and federal funding agencies 7 Citizen advisory boards or groups 8 Other (Please specify)
B. USE & APPLICATIONS OF SERVICE/ PERFORMANCE MEASURES
7. Please circle the number of each type of measure city officials may use for each activity. Just skip any
activity not relevant to your city or that is not supported by any type of performance measure.
Type of Measure Activity Workload Efficiency Outcomes Quality Citizen sat. surveys
Strategic Planning 1 2 3 4 5 Resource Allocation (Budgeting)
1 2 3 4 5
Managing/ Evaluating Programs
1 2 3 4 5
Internal Management Reports
1 2 3 4 5
Reports to Elected Officials
1 2 3 4 5
Reports to Citizens/ Media
1 2 3 4 5
186

8. Please circle the number of all the types of measures currently used by personnel in each service area.
Just skip any service not provided by your city or that does not use any type of measure.
Type of Measure
Service Workload Efficiency Outcomes Quality Citizen sat. surveys
Police 1 2 3 4 5
Fire Prevention/Suppression 1 2 3 4 5
Emergency Medical Service 1 2 3 4 5
Animal Control 1 2 3 4 5
Planning/Zoning 1 2 3 4 5
Code Enforcement/Inspection 1 2 3 4 5
Housing 1 2 3 4 5
Water Supply/Sewerage 1 2 3 4 5
Solid Waste Collection/Disposal 1 2 3 4 5
Street Maintenance 1 2 3 4 5
Traffic Engineering 1 2 3 4 5
Public Transit 1 2 3 4 5
Libraries 1 2 3 4 5
Parks & Recreation 1 2 3 4 5
City Attorney 1 2 3 4 5
City Clerk 1 2 3 4 5
Municipal Courts 1 2 3 4 5
Purchasing 1 2 3 4 5
Fleet Maintenance 1 2 3 4 5
Risk Management 1 2 3 4 5
Data Processing 1 2 3 4 5
Budget & Finance 1 2 3 4 5
Personnel/Human Resources 1 2 3 4 5
187

C. IMPACTS OF PERFORMANCE MEASUREMENT
9. How would you rate the overall helpfulness of the performance measures used in your city with respect
to each of these possible impacts? (Please circle one number for each possible impact). Helpfulness Level
Possible Impact
Not helpful
Somewhat Helpful
Very Helpful
Don’t know/ not sure
Made positive changes in program emphasis 1 2 3 4
Improved performance among employees 1 2 3 4
Improved quality of decisions & decision capacity 1 2 3 4
Facilitated program goal setting 1 2 3 4
Focused program priorities 1 2 3 4
Supported personnel performance appraisals 1 2 3 4
Increased service quality level 1 2 3 4
Enhanced employees’ understanding of goals 1 2 3 4
Improved relations with community groups 1 2 3 4
Realized some cost savings for city service(s) 1 2 3 4
Better communication between administrators & elected officials
1 2 3 4
Enhanced accountability of individual managers 1 2 3 4
D. CONSUMERS OF PERFORMANCE MEASUREMENT INFORMATION
10. How have the majority of city council or commission members received the information about the
service or performance measures used. (Please circle the number for your opinion that best describes
the majority of members on the council/commission). Council/ Commission Stake
Disagree Neither Agree nor Disagree
Agree Don’t know/ not applicable
City council members understand the performance measures we use
1 2 3 4
City council members support the use of performance measures
1 2 3 4
City council members helped to design some measures used
1 2 3 4
City council members support funding for performance measures
1 2 3 4
188
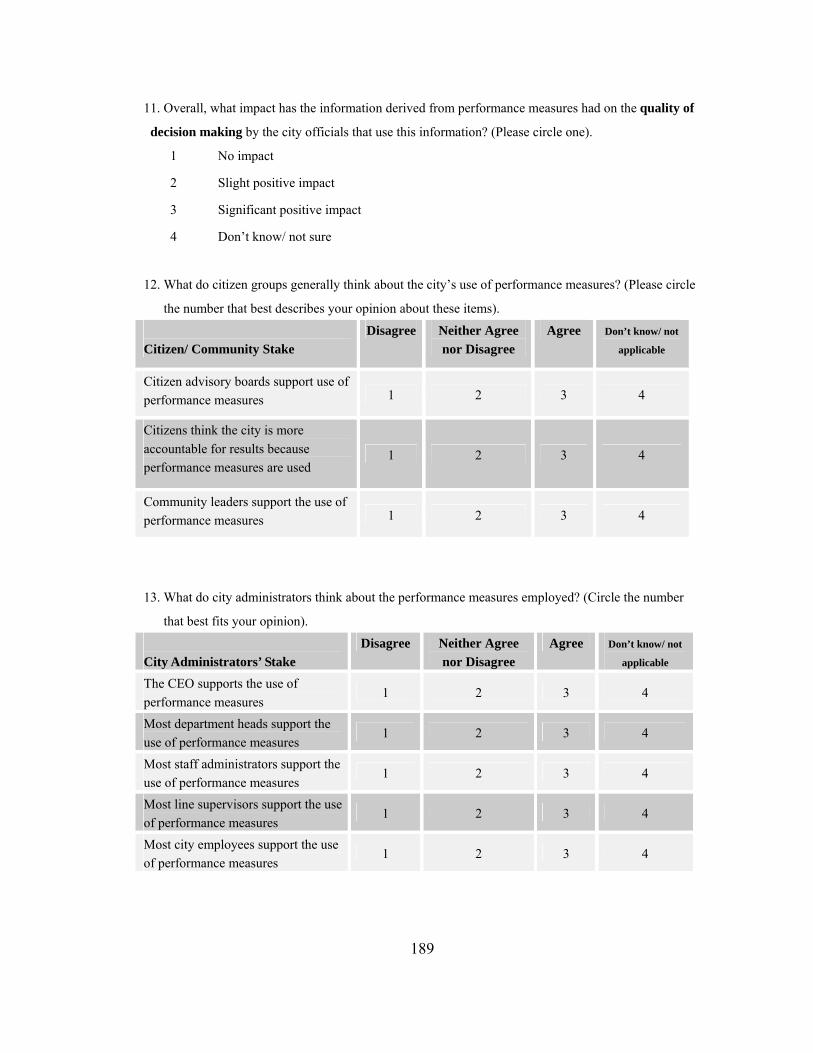
11. Overall, what impact has the information derived from performance measures had on the quality of
decision making by the city officials that use this information? (Please circle one).
1 No impact
2 Slight positive impact
3 Significant positive impact
4 Don’t know/ not sure
12. What do citizen groups generally think about the city’s use of performance measures? (Please circle
the number that best describes your opinion about these items).
Citizen/ Community Stake
Disagree Neither Agree nor Disagree
Agree Don’t know/ not
applicable
Citizen advisory boards support use of performance measures 1 2 3 4
Citizens think the city is more accountable for results because performance measures are used
1 2 3 4
Community leaders support the use of performance measures 1 2 3 4
13. What do city administrators think about the performance measures employed? (Circle the number
that best fits your opinion).
City Administrators’ Stake
Disagree Neither Agree nor Disagree
Agree Don’t know/ not
applicable The CEO supports the use of performance measures
1 2 3 4
Most department heads support the use of performance measures
1 2 3 4
Most staff administrators support the use of performance measures
1 2 3 4
Most line supervisors support the use of performance measures
1 2 3 4
Most city employees support the use of performance measures
1 2 3 4
189
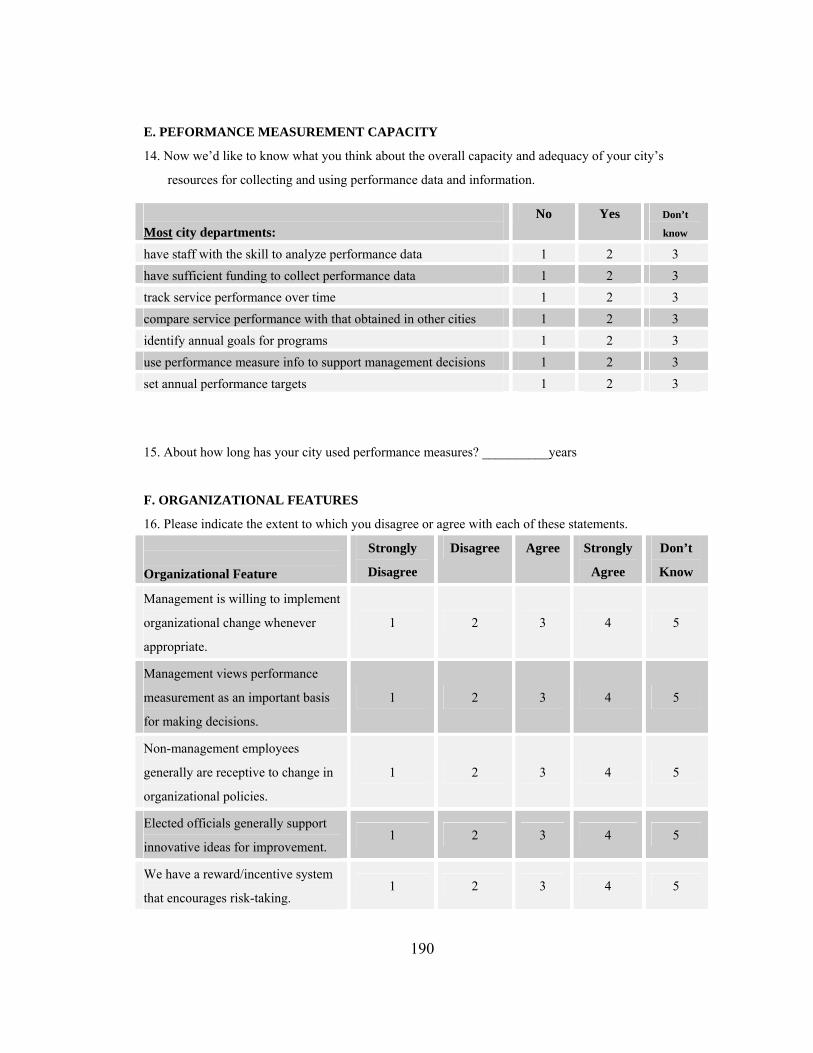
E. PEFORMANCE MEASUREMENT CAPACITY
14. Now we’d like to know what you think about the overall capacity and adequacy of your city’s
resources for collecting and using performance data and information.
Most city departments:
No Yes Don’t
know have staff with the skill to analyze performance data 1 2 3 have sufficient funding to collect performance data 1 2 3 track service performance over time 1 2 3 compare service performance with that obtained in other cities 1 2 3 identify annual goals for programs 1 2 3 use performance measure info to support management decisions 1 2 3 set annual performance targets 1 2 3 15. About how long has your city used performance measures? __________years
F. ORGANIZATIONAL FEATURES
16. Please indicate the extent to which you disagree or agree with each of these statements. Organizational Feature
Strongly
Disagree
Disagree Agree Strongly
Agree
Don’t
Know
Management is willing to implement
organizational change whenever
appropriate.
1 2 3 4 5
Management views performance
measurement as an important basis
for making decisions.
1 2 3 4 5
Non-management employees
generally are receptive to change in
organizational policies.
1 2 3 4 5
Elected officials generally support
innovative ideas for improvement. 1 2 3 4 5
We have a reward/incentive system
that encourages risk-taking. 1 2 3 4 5
190

G. CITY CHARACTERISTICS
17. Please indicate whether your city has any of the following features.
Feature No Yes Mayor is directly elected by citizens 1 2 Mayor is selected by council 1 2 Most council members are elected by district 1 2 Most council members are elected at-large 1 2 Council members elected by a mixed district & at-large system 1 2 City has a Chief Administrative Office (CAO) position 1 2 Mayor presides over council meetings 1 2 Department heads report to the Mayor 1 2 Department heads report to a CAO 1 2 Mayor appoints and terminates CAO without consent of council 1 2 Mayor appoints and terminates CAO with consent of council 1 2 Council appoints and may terminate city manager 1 2 Statutory charter form is “Mayor-Council” form of government 1 2 Statutory charter form is “Council-Manger” form of government 1 2 Statutory charter form is “Commission” (without administrator) 1 2 18. What was your city’s total operating budget for FY 2004? $___________________________
19. About how many full-time equivalent employees (FTEs) are employed in your city? _________
20. About what percent, if any, of all FTEs are unionized? ___________%
21. Generally, how would you characterize the nature of labor-management relations among city
personnel? (Please circle one choice).
1 Poor -- Relations are strained in many areas, creating a multitude of problems
2 Fair -- Relations are good in some areas, but there are problems in others
3 Good -- Management & labor usually work well together; only a few minor problem areas
22. What is your official title/position? _____________________________________________
23. How long have you held that position? __________years
24. About how many years of local government service do you have? __________ years
Thank you very much for answering these questions. Your help is sincerely appreciated!
If you would like to receive an executive summary of the results of this national survey, please print
your e-mail address here: _________________________________________________
191

Vita
Yeonsoo Chung was born in Kyeongju, Korea on March 5, 1965. He received
B.A. in public Administration in March, 1987 and M.A. in Public Administration in
August, 1989 from Yonsei University in Seoul, Korea. He also received Master of
Pulbic Administration in August, 1997 from the North Carolina State University in
Raleigh, North Carolina. He received Ph.D. in Political Science from the University of
Tennessee in Knoxville, Tennessee.
Dr. Chung is a member of American Society for Public Administration and
International City/County Management Association.
192
Top Related
Copyright © 2022 FDOKUMEN

